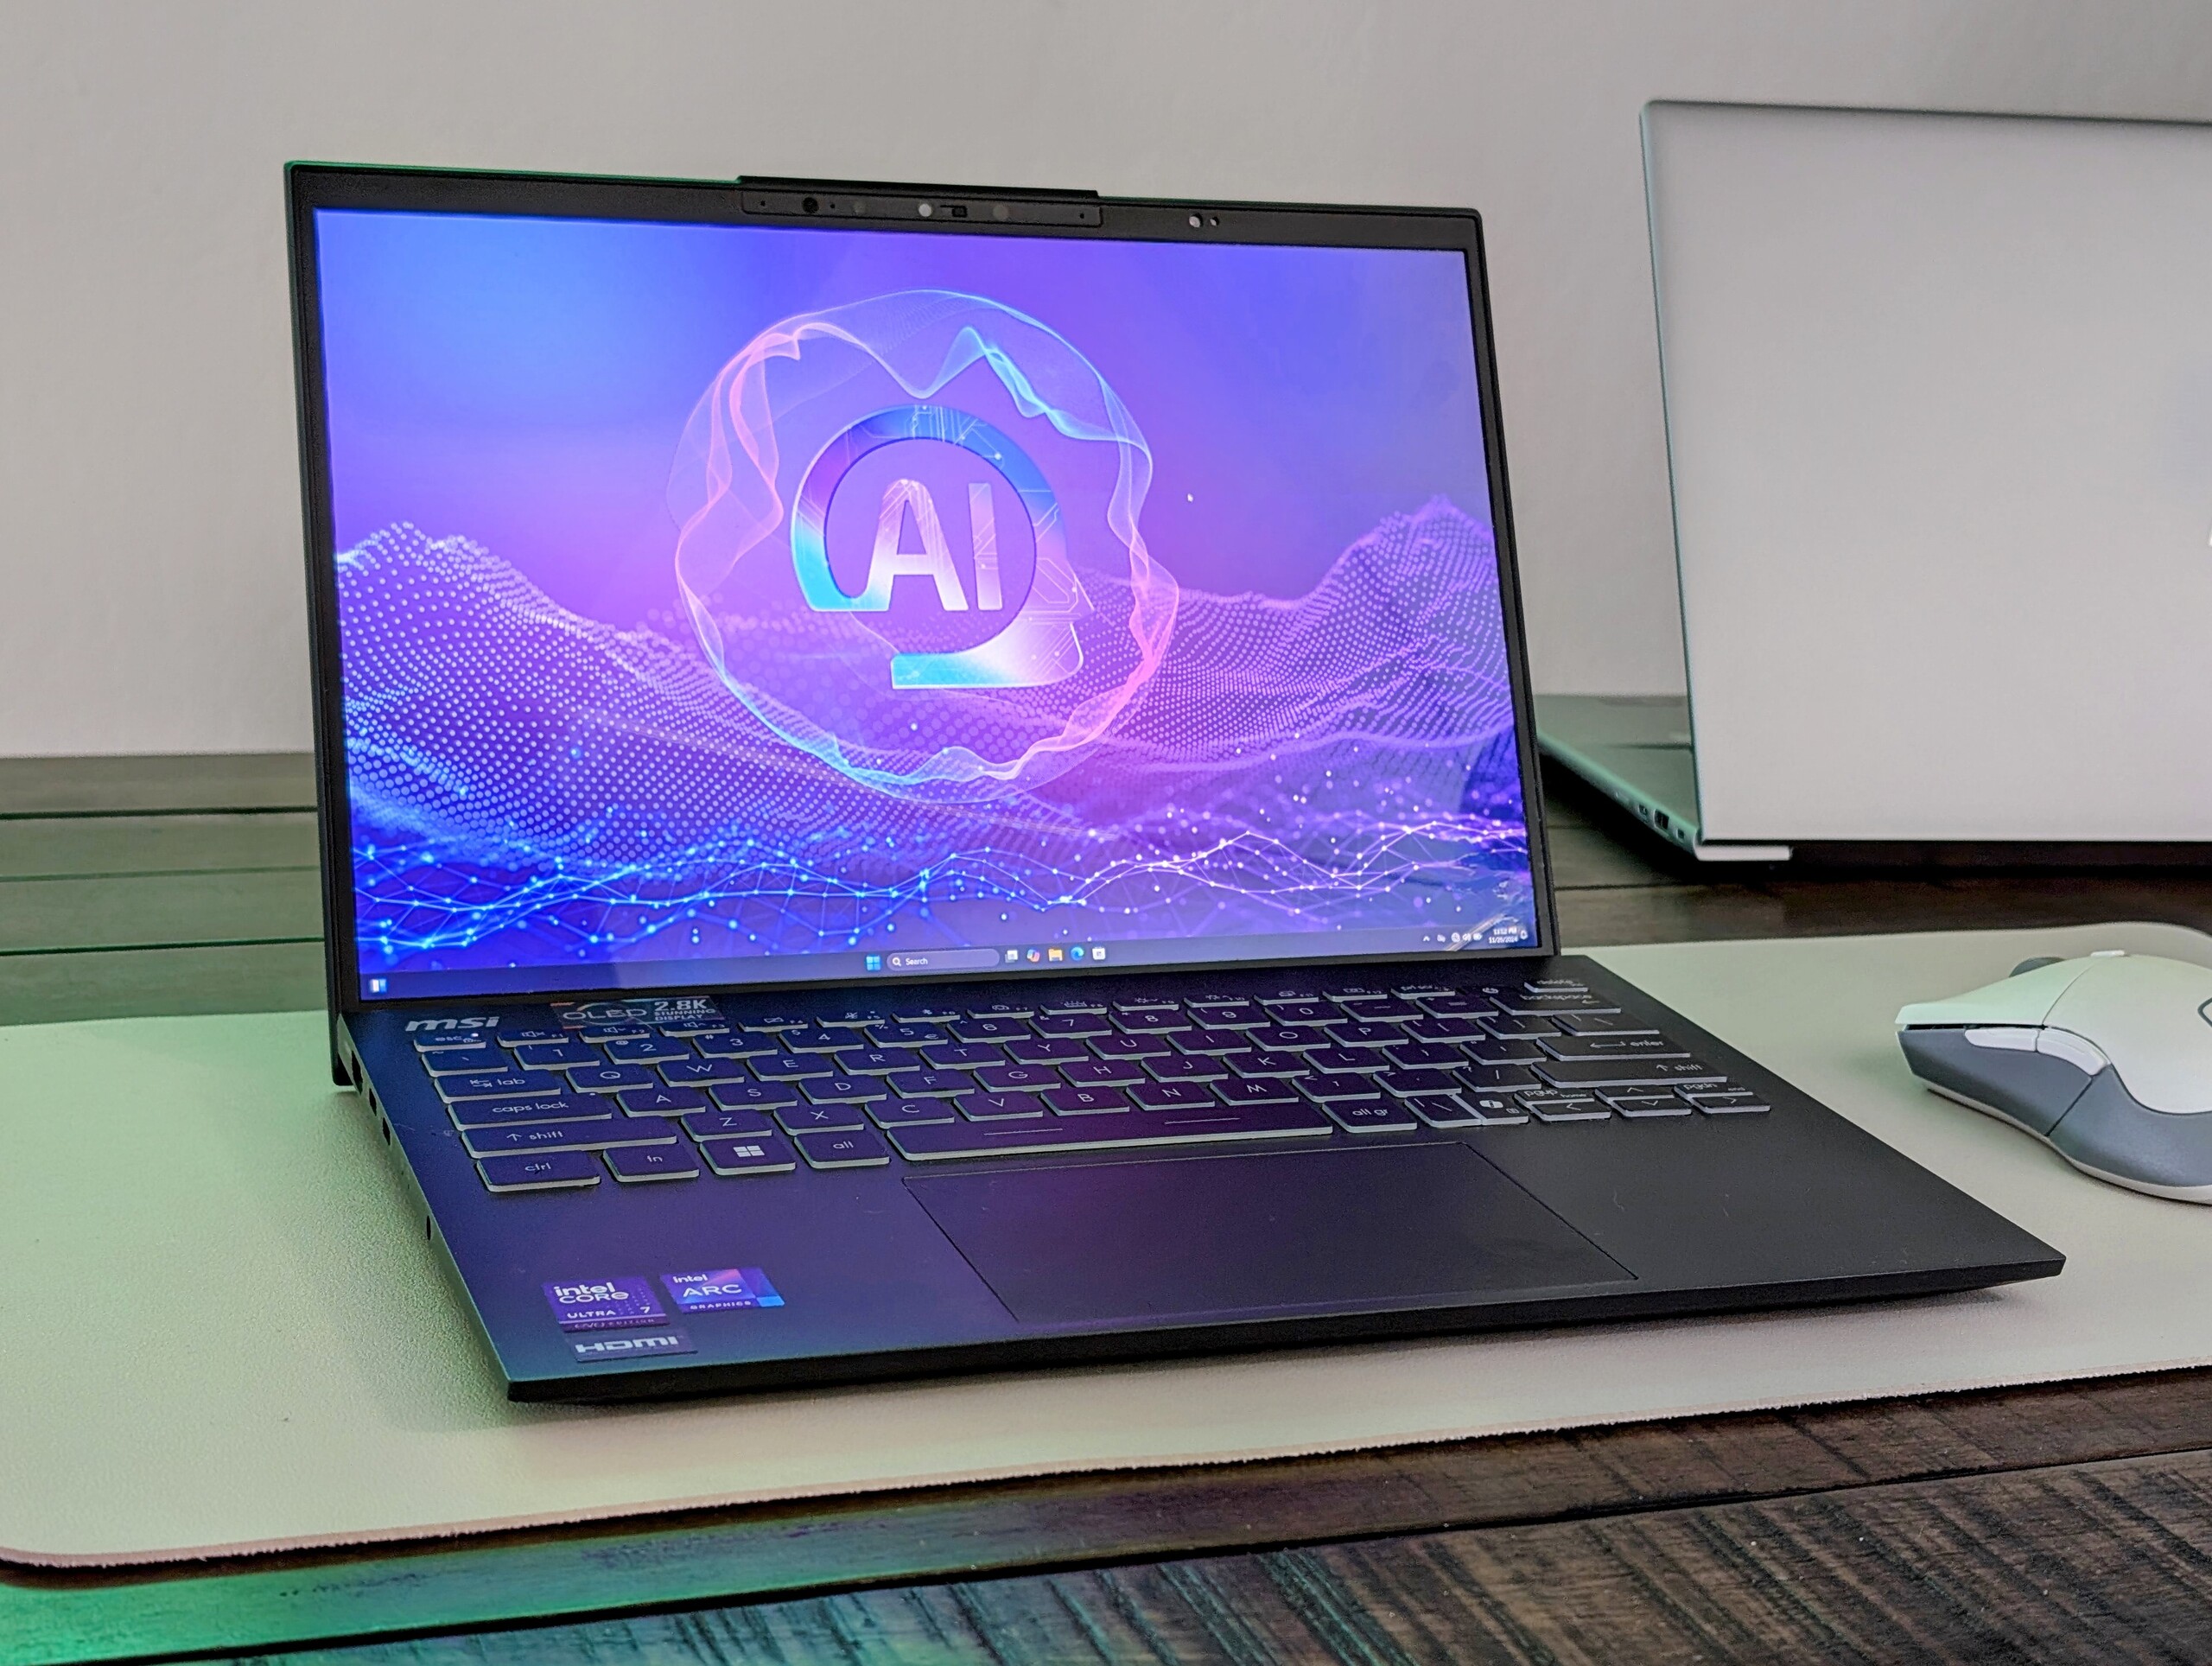
MSI Prestige 13 AI Plus Evo im Test: Großartige Grafikleistung für unter 1 kg
Großartige Symbiose mit Core Ultra 7 258V.
MSI hat sein leichtestes 13-Zoll-Notebook mit Lunar-Lake-Prozessoren aufgefrischt, die die älteren Meteor-Lake-Optionen ersetzen. Dies erhöht Akkulaufzeit und Grafikleistung, nicht aber Lüftergeräusch oder Gewicht.Allen Ngo, 👁 Allen Ngo, ✓ Andrea Grüblinger (übersetzt von DeepL / Ninh Duy) Veröffentlicht am 🇺🇸 🇫🇷 ...
Fazit - Beeindruckende Performance bei geringem Gewicht
Eine unserer Hauptbeschwerden über das Prestige 13 AI Evo war die unerwartet starke Prozessordrosselung bei CPU-intensiver Last. Die neue Lunar Lake CPU behebt dieses Problem, indem sie das maximale Turbo-Boost-Potenzial senkt und gleichzeitig das minimale Leistungsniveau bei der Ausführung solcher Lasten anhebt. Dies führt zu einer gleichmäßigeren und schnelleren Leistung, was für Content Creators oder Redakteure, die größere Dateien oder Videos verarbeiten oder kodieren müssen, erfreulich sein dürfte. Darüber hinaus wirken sich diese Vorteile nicht nennenswert auf Akkulaufzeit, die Temperatur oder das Lüftergeräusch aus.
Auch die Grafikleistung hat sich deutlich verbessert - je nach Anwendung um das 1,5- bis 2-fache. Obwohl die Arc 140V bei weitem kein Gaming-Chip ist, ist ihre Performance beeindruckend, vor allem, wenn man berücksichtigt, wie leicht das MSI-Notebook ist.
Während sich die Leistung fast überall verbessert hat, bleiben alle anderen Nachteile, die wir bei unserem Prestige 13 AI Evo Test erwähnt haben, leider bestehen. Das 1800p OLED-Display ist zwar scharf und lebendig, aber nur auf 60 Hz beschränkt und bietet keine VRR- oder Touchscreen-Optionen. Auch die Qualität der Webcam und die Stabilität des Gehäuse sind mit den schwereren Alternativen von Dell oder HP nicht zu vergleichen. Nichtsdestotrotz bietet das MSI viel Leistung und eine gute Anschlussausstattung für sein Gewicht.
Pro
Contra
Preis und Verfügbarkeit
Das MSI Prestige 13 AI Plus Evo in der Version mit 3,3" 2.8K OLED Display, Intel Core Ultra 7 258V, 32GB DDR5 RAM und 1TB SSD kostet bei notebooksbilliger.de 1.800 Euro. Für 200 Euro weniger erhalten sie bei notebooksbilliger.de auch die Konfiguration mit Intel Core Ultra 7 155H.
Mögliche Konkurrenten im Vergleich
Bild | Modell / Test | Preis ab | Gewicht | Dicke | Display |
|---|---|---|---|---|---|
| MSI Prestige 13 AI Plus Evo A2VMG Intel Core Ultra 7 258V ⎘ Intel Arc Graphics 140V ⎘ 32 GB RAM | Bestpreis 1197€ Media Markt.at 2. 1547.56€ galaxus.at 3. 1699€ Coolblue1400 USD | 970 g | 16.9 mm | 13.30" 2880x1800 255 PPI OLED | |
| MSI Prestige 13 AI Evo Intel Core Ultra 7 155H ⎘ Intel Arc 8-Core iGPU ⎘ 32 GB RAM, 1024 GB SSD | Amazon: Geizhals Suche | 967 g | 16.9 mm | 13.30" 2880x1800 OLED | |
| Dell XPS 13 9350 Intel Core Ultra 7 256V ⎘ Intel Arc Graphics 140V ⎘ 16 GB RAM, 512 GB SSD | Amazon: Geizhals Suche | 1.2 kg | 15.3 mm | 13.40" 1920x1200 169 PPI IPS | |
| Framework Laptop 13.5 Core Ultra 7 155H Intel Core Ultra 7 155H ⎘ Intel Arc 8-Core iGPU ⎘ 32 GB RAM | Amazon: 1. ALLDOCUBE 13-Zoll-2-in-1-Tab... 2. Blackview Laptop Acebook 12,... 3. Laptiptop 13.5" LED Display ... Listenpreis: 1500 USD | 1.4 kg | 15.85 mm | 13.50" 2880x1920 256 PPI IPS | |
| Lenovo Yoga Book 9 13IMU9 Intel Core Ultra 7 155U ⎘ Intel Graphics 4-Core iGPU (Meteor / Arrow Lake) ⎘ 16 GB RAM | Amazon: Bestpreis 2499€ nullprozentshop.de 2. 2499€ notebooksbilliger.de 3. 2520€ notebooksbilliger.at | 1.4 kg | 15.95 mm | 13.30" 2880x1800 255 PPI OLED | |
| HP Dragonfly G4 Intel Core i7-1365U ⎘ Intel Iris Xe Graphics G7 96EUs ⎘ 16 GB RAM, 512 GB SSD | Amazon: Geizhals Suche | 1.1 kg | 16.3 mm | 13.50" 1920x1280 171 PPI IPS |
Nur sechs Monate nach der Einführung des ursprünglichen Prestige 13 AI Evo hat MSI das Modell bereits mit neueren Intel-Prozessoren aufgefrischt. Das Prestige 13 AI Plus Evo wird mit Lunar Lake CPUs anstelle von Meteor Lake ausgeliefert.
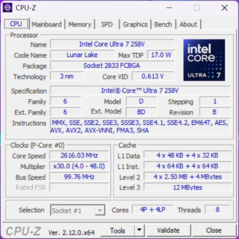
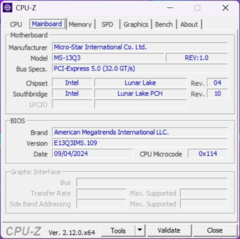
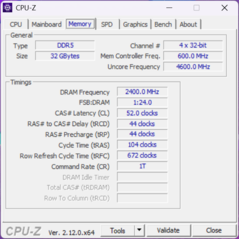
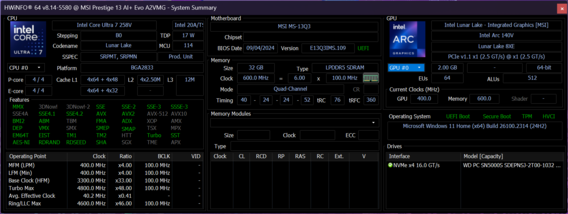
Bei unserem Testgerät handelt es sich um eine mittlere Konfiguration mit dem Core Ultra 7 258V, 32 GB LPDDR5x-8533 RAM und einem 1800p OLED-Display für etwa 1.800 Euro. Andere SKUs mit einem Core Ultra 9 288V oder Core Ultra 7 256V mit der Hälfte des Arbeitsspeichers sind auch verfügbar.
Zu den Konkurrenten gehören andere High-End-Subnotebooks wie das Dell XPS 13 9350, Framework Laptop 13.5 oder das HP Dragonfly 14.
Weitere MSI-Testberichte:
Spezifikationen
Preisvergleich
Gehäuse
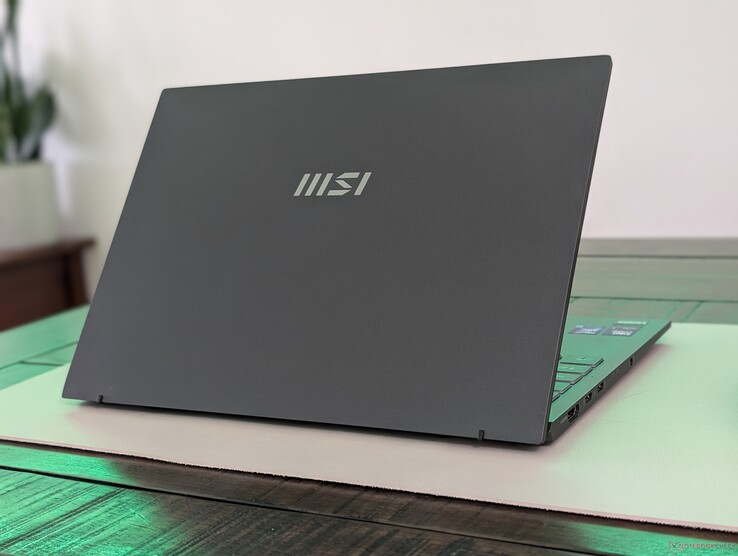
Wir empfehlen Ihnen, sich unseren Test zum Prestige 13 AI Evo anzusehen, da es äußerlich keine Unterschiede zu unserem Prestige 13 AI Plus Evo gibt. Das System ist mit weniger als 1 kg eines der leichtesten 13-Zoll-Subnotebooks auf dem Markt. Das Gehäuse neigt im Vergleich zu schwereren Modellen wie dem XPS 13 eher zum Verbiegen und Knarzen.
Anschlussausstattung
Das Prestige 13 AI ist eines der wenigen verbleibenden Subnotebooks mit sowohl integriertem HDMI als auch USB-A Ports. Wir schätzen es, dass das System nicht vollständig auf USB-C Ports setzt.
SD-Kartenleser
| SD Card Reader | |
| average JPG Copy Test (av. of 3 runs) | |
| Framework Laptop 13.5 Core Ultra 7 155H (Toshiba Exceria Pro SDXC 64 GB UHS-II) | |
| MSI Prestige 13 AI Evo (Angelbird AV Pro V60) | |
| MSI Prestige 13 AI Plus Evo A2VMG (Angelbird AV Pro V60) | |
| maximum AS SSD Seq Read Test (1GB) | |
| Framework Laptop 13.5 Core Ultra 7 155H (Toshiba Exceria Pro SDXC 64 GB UHS-II) | |
| MSI Prestige 13 AI Evo (Angelbird AV Pro V60) | |
| MSI Prestige 13 AI Plus Evo A2VMG (Angelbird AV Pro V60) | |
Kommunikation
Interessanterweise wird unser Gerät mit dem Intel Killer AX1775s ausgeliefert und nicht mit dem BE1750W wie bei der Core Ultra 7 155H Konfiguration. Der AX1775s unterstützt im Gegensatz zum BE1750W kein Wi-Fi 7.
Webcam
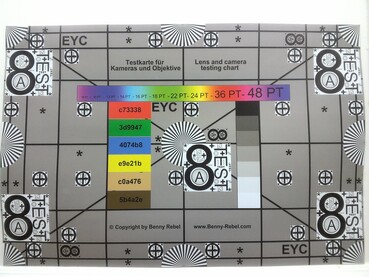
Die Qualität der Webcam wurde von 2 MP beim Vorgängermodell auf 5 MP für schärfere Bilder verbessert.
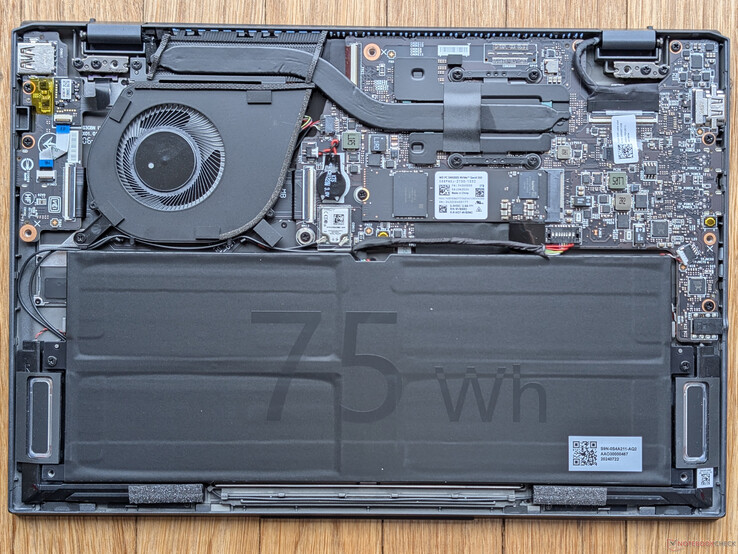
Wartung
Nachhaltigkeit
Das Modell entspricht den EPEAT Silver-Richtlinien für Nachhaltigkeit. Die Verpackung besteht größtenteils aus Pappe und Papier mit einer Plastikhülle um das Notebook und das Netzteil.
Display
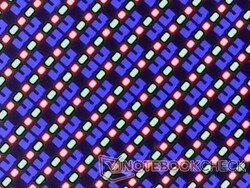
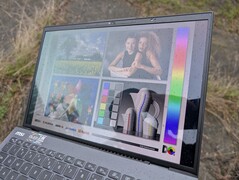
Das 1800p Samsung OLED-Display bleibt das gleiche wie zuvor. Die Bildqualität ist zwar ausgezeichnet und weist keine Probleme mit der Körnigkeit auf, aber wir hätten uns ein Upgrade der Bildwiederholfrequenz auf 90 Hz oder 120 Hz gewünscht, da 60 Hz für ein High-End-Subnotebook allmählich veraltet sind.
Die maximale Helligkeit kann bis zu 598 nits erreichen, wenn Sie den HDR-Modus aktivieren. Im SDR-Modus liegt die maximale Helligkeit bei 382 nits.
| |||||||||||||||||||||||||
Ausleuchtung: 99 %
Helligkeit Akku: 382.4 cd/m²
Kontrast: ∞:1 (Schwarzwert: 0 cd/m²)
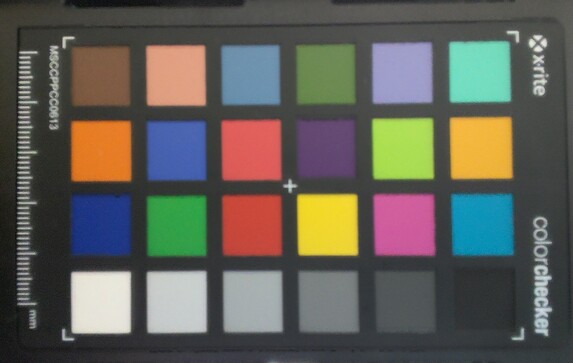
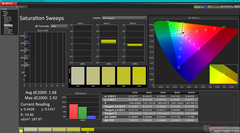
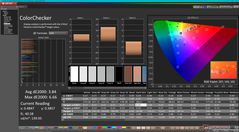
ΔE ColorChecker Calman: 3.84 | ∀{0.5-29.43 Ø4.76}
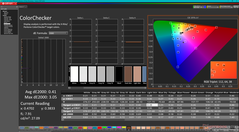
calibrated: 0.41
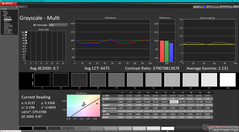
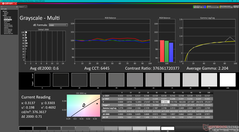
ΔE Greyscale Calman: 0.7 | ∀{0.09-98 Ø5}
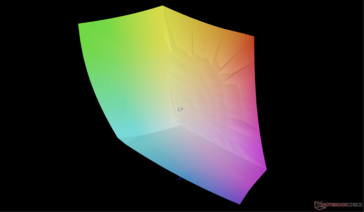
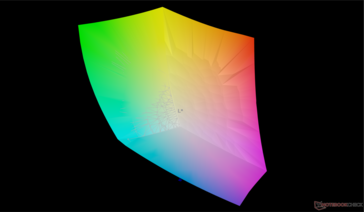
95.8% AdobeRGB 1998 (Argyll 3D)
100% sRGB (Argyll 3D)
99.9% Display P3 (Argyll 3D)
Gamma: 2.23
CCT: 6475 K
| MSI Prestige 13 AI Plus Evo A2VMG ATNA33AA07-0, OLED, 2880x1800, 13.3", 60 Hz | MSI Prestige 13 AI Evo ATNA33AA07-0, OLED, 2880x1800, 13.3", 60 Hz | Dell XPS 13 9350 LG Philips 134WU2, IPS, 1920x1200, 13.4", 120 Hz | Framework Laptop 13.5 Core Ultra 7 155H BOE NE135A1M-NY1, IPS, 2880x1920, 13.5", 120 Hz | Lenovo Yoga Book 9 13IMU9 SDC ATNA33AA02-0, OLED, 2880x1800, 13.3", 60 Hz | HP Dragonfly G4 Chi Mei CMN13C0, IPS, 1920x1280, 13.5", 60 Hz | |
|---|---|---|---|---|---|---|
| Display | 1% | -21% | -17% | 0% | -20% | |
| Display P3 Coverage (%) | 99.9 | 99.9 0% | 67.3 -33% | 72.8 -27% | 99.7 0% | 68.4 -32% |
| sRGB Coverage (%) | 100 | 100 0% | 99 -1% | 98.6 -1% | 100 0% | 98.3 -2% |
| AdobeRGB 1998 Coverage (%) | 95.8 | 97.8 2% | 68.6 -28% | 72.9 -24% | 97 1% | 70.4 -27% |
| Response Times | 25% | -1503% | -1567% | -1% | -1933% | |
| Response Time Grey 50% / Grey 80% * (ms) | 1.94 ? | 1.54 ? 21% | 37.3 ? -1823% | 41.9 ? -2060% | 1.88 ? 3% | 48.8 ? -2415% |
| Response Time Black / White * (ms) | 2.02 ? | 1.44 ? 29% | 25.9 ? -1182% | 23.7 ? -1073% | 2.1 ? -4% | 31.3 ? -1450% |
| PWM Frequency (Hz) | 60 ? | 240 ? | 60 ? | |||
| PWM Amplitude * (%) | 21.9 | |||||
| Bildschirm | 3% | 17% | -108% | -50% | -27% | |
| Helligkeit Bildmitte (cd/m²) | 382.4 | 404 6% | 462.8 21% | 498.5 30% | 362.6 -5% | 408.8 7% |
| Brightness (cd/m²) | 383 | 407 6% | 435 14% | 464 21% | 368 -4% | 399 4% |
| Brightness Distribution (%) | 99 | 98 -1% | 87 -12% | 86 -13% | 97 -2% | 90 -9% |
| Schwarzwert * (cd/m²) | 0.19 | 0.36 | 0.32 | |||
| Delta E Colorchecker * | 3.84 | 2.1 45% | 1.92 50% | 4.27 -11% | 4.66 -21% | 2.02 47% |
| Colorchecker dE 2000 max. * | 6.66 | 4.3 35% | 3.45 48% | 7.08 -6% | 7.25 -9% | 3.84 42% |
| Colorchecker dE 2000 calibrated * | 0.41 | 0.48 -17% | 1.26 -207% | 0.56 -37% | 0.61 -49% | |
| Delta E Graustufen * | 0.7 | 1.2 -71% | 0.6 14% | 4.7 -571% | 2.6 -271% | 2.3 -229% |
| Gamma | 2.23 99% | 2.16 102% | 2.19 100% | 2.09 105% | 2.2 100% | 2.2 100% |
| CCT | 6475 100% | 6465 101% | 6539 99% | 7417 88% | 6055 107% | 6203 105% |
| Kontrast (:1) | 2436 | 1385 | 1278 | |||
| Durchschnitt gesamt (Programm / Settings) | 10% /
7% | -502% /
-246% | -564% /
-329% | -17% /
-29% | -660% /
-343% |
* ... kleinere Werte sind besser
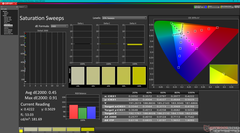
Das Display ist ab Werk gut kalibriert mit durchschnittlichen Graustufen- und ColorChecker deltaE-Werten von nur 0,7 bzw. 3,84.
Reaktionszeiten (Response Times) des Displays
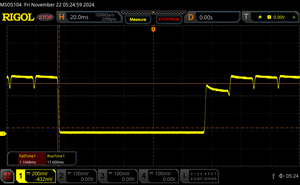
| ↔ Reaktionszeiten Schwarz zu Weiß | ||
|---|---|---|
| 2.02 ms ... steigend ↗ und fallend ↘ kombiniert | ↗ 0.92 ms steigend | |
| ↘ 1.1 ms fallend | ||
| Die gemessenen Reaktionszeiten sind sehr kurz, wodurch sich der Bildschirm auch für schnelle 3D Spiele eignen sollte. Im Vergleich rangierten die bei uns getesteten Geräte von 0.1 (Minimum) zu 240 (Maximum) ms. » 11 % aller Screens waren schneller als der getestete. Daher sind die gemessenen Reaktionszeiten besser als der Durchschnitt aller vermessenen Geräte (20.1 ms). | ||
| ↔ Reaktionszeiten 50% Grau zu 80% Grau | ||
| 1.94 ms ... steigend ↗ und fallend ↘ kombiniert | ↗ 1 ms steigend | |
| ↘ 0.94 ms fallend | ||
| Die gemessenen Reaktionszeiten sind sehr kurz, wodurch sich der Bildschirm auch für schnelle 3D Spiele eignen sollte. Im Vergleich rangierten die bei uns getesteten Geräte von 0.165 (Minimum) zu 636 (Maximum) ms. » 9 % aller Screens waren schneller als der getestete. Daher sind die gemessenen Reaktionszeiten besser als der Durchschnitt aller vermessenen Geräte (31.5 ms). | ||
Bildschirm-Flackern / PWM (Pulse-Width Modulation)
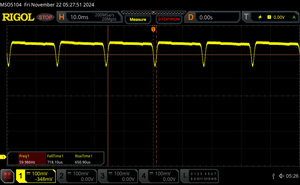
| Flackern / PWM festgestellt | 60 Hz Amplitude: 21.9 % | ≤ 100 % Helligkeit | |
Das Display flackert mit 60 Hz (im schlimmsten Fall, eventuell durch Pulsweitenmodulation PWM) bei einer eingestellten Helligkeit von 100 % und darunter. Darüber sollte es zu keinem Flackern kommen. Die Frequenz von 60 Hz ist sehr gering und daher kann es bei allen Usern zu sichtbaren Flackern, brennenden Augen oder Kopfweh kommen. Im Vergleich: 53 % aller getesteten Geräte nutzten kein PWM um die Helligkeit zu reduzieren. Wenn PWM eingesetzt wurde, dann bei einer Frequenz von durchschnittlich 8020 (Minimum 5, Maximum 343500) Hz. | |||
Performance
Testbedingungen
Wir haben sowohl Windows als auch MSI Center auf den Modus Performance eingestellt, bevor wir die folgenden Benchmarks durchgeführt haben. Der Cooler-Boost-Modus (maximaler Lüftermodus) ist ebenfalls verfügbar, hat aber keinen signifikanten Einfluss auf die Leistung, wie unsere Benchmarks weiter unten zeigen werden.
Prozessor
Im Vergleich zum Core Ultra 7 155H hat unser Core Ultra 7 258V ein langsameres Turbo-Boost-Potenzial, aber eine stabilere und schnellere Leistung über einen längeren Zeitraum. Dies wird deutlich, wenn Sie CineBench R15 xT in einer Schleife laufen lassen. Die Grafik unten zeigt, dass die Core Ultra 7 155H Konfiguration unsere Core Ultra 7 258V Konfiguration nur zu Beginn des Tests übertrifft, bevor sie nach der ersten Schleife stärker gedrosselt wird.
Cinebench R15 Multi Loop
Cinebench R23: Multi Core | Single Core
Cinebench R20: CPU (Multi Core) | CPU (Single Core)
Cinebench R15: CPU Multi 64Bit | CPU Single 64Bit
Blender: v2.79 BMW27 CPU
7-Zip 18.03: 7z b 4 | 7z b 4 -mmt1
Geekbench 6.5: Multi-Core | Single-Core
Geekbench 5.5: Multi-Core | Single-Core
HWBOT x265 Benchmark v2.2: 4k Preset
LibreOffice : 20 Documents To PDF
R Benchmark 2.5: Overall mean
* ... kleinere Werte sind besser
AIDA64: FP32 Ray-Trace | FPU Julia | CPU SHA3 | CPU Queen | FPU SinJulia | FPU Mandel | CPU AES | CPU ZLib | FP64 Ray-Trace | CPU PhotoWorxx
| Performance Rating | |
| Framework Laptop 13.5 Core Ultra 7 155H | |
| MSI Prestige 13 AI Plus Evo A2VMG | |
| Dell XPS 13 9350 | |
| Durchschnittliche Intel Core Ultra 7 258V | |
| Lenovo Yoga Book 9 13IMU9 | |
| MSI Prestige 13 AI Evo | |
| HP Dragonfly G4 | |
| AIDA64 / FP32 Ray-Trace | |
| MSI Prestige 13 AI Plus Evo A2VMG | |
| Dell XPS 13 9350 | |
| Durchschnittliche Intel Core Ultra 7 258V (8454 - 12781, n=25) | |
| Framework Laptop 13.5 Core Ultra 7 155H | |
| Lenovo Yoga Book 9 13IMU9 | |
| HP Dragonfly G4 | |
| MSI Prestige 13 AI Evo | |
| AIDA64 / FPU Julia | |
| MSI Prestige 13 AI Plus Evo A2VMG | |
| Dell XPS 13 9350 | |
| Framework Laptop 13.5 Core Ultra 7 155H | |
| Durchschnittliche Intel Core Ultra 7 258V (40875 - 63401, n=25) | |
| MSI Prestige 13 AI Evo | |
| Lenovo Yoga Book 9 13IMU9 | |
| HP Dragonfly G4 | |
| AIDA64 / CPU SHA3 | |
| MSI Prestige 13 AI Plus Evo A2VMG | |
| Framework Laptop 13.5 Core Ultra 7 155H | |
| Dell XPS 13 9350 | |
| Durchschnittliche Intel Core Ultra 7 258V (1930 - 2817, n=25) | |
| Lenovo Yoga Book 9 13IMU9 | |
| MSI Prestige 13 AI Evo | |
| HP Dragonfly G4 | |
| AIDA64 / CPU Queen | |
| Framework Laptop 13.5 Core Ultra 7 155H | |
| HP Dragonfly G4 | |
| MSI Prestige 13 AI Evo | |
| MSI Prestige 13 AI Plus Evo A2VMG | |
| Durchschnittliche Intel Core Ultra 7 258V (48816 - 49818, n=24) | |
| Dell XPS 13 9350 | |
| Lenovo Yoga Book 9 13IMU9 | |
| AIDA64 / FPU SinJulia | |
| Framework Laptop 13.5 Core Ultra 7 155H | |
| MSI Prestige 13 AI Evo | |
| Lenovo Yoga Book 9 13IMU9 | |
| HP Dragonfly G4 | |
| Dell XPS 13 9350 | |
| MSI Prestige 13 AI Plus Evo A2VMG | |
| Durchschnittliche Intel Core Ultra 7 258V (3817 - 4440, n=25) | |
| AIDA64 / FPU Mandel | |
| MSI Prestige 13 AI Plus Evo A2VMG | |
| Dell XPS 13 9350 | |
| Durchschnittliche Intel Core Ultra 7 258V (21670 - 33565, n=25) | |
| Framework Laptop 13.5 Core Ultra 7 155H | |
| MSI Prestige 13 AI Evo | |
| Lenovo Yoga Book 9 13IMU9 | |
| HP Dragonfly G4 | |
| AIDA64 / CPU AES | |
| Framework Laptop 13.5 Core Ultra 7 155H | |
| MSI Prestige 13 AI Evo | |
| Lenovo Yoga Book 9 13IMU9 | |
| Dell XPS 13 9350 | |
| MSI Prestige 13 AI Plus Evo A2VMG | |
| Durchschnittliche Intel Core Ultra 7 258V (30957 - 40753, n=25) | |
| HP Dragonfly G4 | |
| AIDA64 / CPU ZLib | |
| Framework Laptop 13.5 Core Ultra 7 155H | |
| Lenovo Yoga Book 9 13IMU9 | |
| MSI Prestige 13 AI Plus Evo A2VMG | |
| Durchschnittliche Intel Core Ultra 7 258V (422 - 632, n=25) | |
| MSI Prestige 13 AI Evo | |
| Dell XPS 13 9350 | |
| HP Dragonfly G4 | |
| AIDA64 / FP64 Ray-Trace | |
| MSI Prestige 13 AI Plus Evo A2VMG | |
| Dell XPS 13 9350 | |
| Durchschnittliche Intel Core Ultra 7 258V (4258 - 6930, n=25) | |
| Framework Laptop 13.5 Core Ultra 7 155H | |
| Lenovo Yoga Book 9 13IMU9 | |
| MSI Prestige 13 AI Evo | |
| HP Dragonfly G4 | |
| AIDA64 / CPU PhotoWorxx | |
| MSI Prestige 13 AI Plus Evo A2VMG | |
| Durchschnittliche Intel Core Ultra 7 258V (44223 - 59245, n=25) | |
| Dell XPS 13 9350 | |
| Framework Laptop 13.5 Core Ultra 7 155H | |
| Lenovo Yoga Book 9 13IMU9 | |
| MSI Prestige 13 AI Evo | |
| HP Dragonfly G4 | |
System Performance
CrossMark: Overall | Productivity | Creativity | Responsiveness
WebXPRT 3: Overall
WebXPRT 4: Overall
Mozilla Kraken 1.1: Total
| PCMark 10 / Score | |
| Dell XPS 13 9350 | |
| Durchschnittliche Intel Core Ultra 7 258V, Intel Arc Graphics 140V (6265 - 7314, n=22) | |
| Framework Laptop 13.5 Core Ultra 7 155H | |
| MSI Prestige 13 AI Plus Evo A2VMG | |
| Lenovo Yoga Book 9 13IMU9 | |
| MSI Prestige 13 AI Evo | |
| HP Dragonfly G4 | |
| PCMark 10 / Essentials | |
| Lenovo Yoga Book 9 13IMU9 | |
| HP Dragonfly G4 | |
| Framework Laptop 13.5 Core Ultra 7 155H | |
| Durchschnittliche Intel Core Ultra 7 258V, Intel Arc Graphics 140V (9295 - 11467, n=22) | |
| MSI Prestige 13 AI Plus Evo A2VMG | |
| Dell XPS 13 9350 | |
| MSI Prestige 13 AI Evo | |
| PCMark 10 / Productivity | |
| Dell XPS 13 9350 | |
| Durchschnittliche Intel Core Ultra 7 258V, Intel Arc Graphics 140V (7357 - 9619, n=22) | |
| MSI Prestige 13 AI Evo | |
| Framework Laptop 13.5 Core Ultra 7 155H | |
| MSI Prestige 13 AI Plus Evo A2VMG | |
| Lenovo Yoga Book 9 13IMU9 | |
| HP Dragonfly G4 | |
| PCMark 10 / Digital Content Creation | |
| MSI Prestige 13 AI Plus Evo A2VMG | |
| Dell XPS 13 9350 | |
| Durchschnittliche Intel Core Ultra 7 258V, Intel Arc Graphics 140V (8914 - 10308, n=22) | |
| Framework Laptop 13.5 Core Ultra 7 155H | |
| Lenovo Yoga Book 9 13IMU9 | |
| MSI Prestige 13 AI Evo | |
| HP Dragonfly G4 | |
| CrossMark / Overall | |
| Dell XPS 13 9350 | |
| MSI Prestige 13 AI Plus Evo A2VMG | |
| Framework Laptop 13.5 Core Ultra 7 155H | |
| Durchschnittliche Intel Core Ultra 7 258V, Intel Arc Graphics 140V (1551 - 1742, n=21) | |
| HP Dragonfly G4 | |
| Lenovo Yoga Book 9 13IMU9 | |
| MSI Prestige 13 AI Evo | |
| CrossMark / Productivity | |
| Dell XPS 13 9350 | |
| MSI Prestige 13 AI Plus Evo A2VMG | |
| Durchschnittliche Intel Core Ultra 7 258V, Intel Arc Graphics 140V (1479 - 1684, n=21) | |
| HP Dragonfly G4 | |
| Framework Laptop 13.5 Core Ultra 7 155H | |
| MSI Prestige 13 AI Evo | |
| Lenovo Yoga Book 9 13IMU9 | |
| CrossMark / Creativity | |
| MSI Prestige 13 AI Plus Evo A2VMG | |
| Dell XPS 13 9350 | |
| Framework Laptop 13.5 Core Ultra 7 155H | |
| Durchschnittliche Intel Core Ultra 7 258V, Intel Arc Graphics 140V (1727 - 1977, n=21) | |
| HP Dragonfly G4 | |
| Lenovo Yoga Book 9 13IMU9 | |
| MSI Prestige 13 AI Evo | |
| CrossMark / Responsiveness | |
| HP Dragonfly G4 | |
| Framework Laptop 13.5 Core Ultra 7 155H | |
| Dell XPS 13 9350 | |
| MSI Prestige 13 AI Plus Evo A2VMG | |
| Durchschnittliche Intel Core Ultra 7 258V, Intel Arc Graphics 140V (1246 - 1411, n=21) | |
| MSI Prestige 13 AI Evo | |
| Lenovo Yoga Book 9 13IMU9 | |
| WebXPRT 3 / Overall | |
| Dell XPS 13 9350 | |
| HP Dragonfly G4 | |
| MSI Prestige 13 AI Plus Evo A2VMG | |
| Framework Laptop 13.5 Core Ultra 7 155H | |
| Durchschnittliche Intel Core Ultra 7 258V, Intel Arc Graphics 140V (219 - 317, n=21) | |
| Lenovo Yoga Book 9 13IMU9 | |
| MSI Prestige 13 AI Evo | |
| WebXPRT 4 / Overall | |
| MSI Prestige 13 AI Plus Evo A2VMG | |
| Dell XPS 13 9350 | |
| Durchschnittliche Intel Core Ultra 7 258V, Intel Arc Graphics 140V (199.5 - 291, n=21) | |
| HP Dragonfly G4 | |
| Framework Laptop 13.5 Core Ultra 7 155H | |
| Lenovo Yoga Book 9 13IMU9 | |
| MSI Prestige 13 AI Evo | |
| Mozilla Kraken 1.1 / Total | |
| Lenovo Yoga Book 9 13IMU9 | |
| MSI Prestige 13 AI Evo | |
| Framework Laptop 13.5 Core Ultra 7 155H | |
| HP Dragonfly G4 | |
| Durchschnittliche Intel Core Ultra 7 258V, Intel Arc Graphics 140V (468 - 559, n=23) | |
| MSI Prestige 13 AI Plus Evo A2VMG | |
| Dell XPS 13 9350 | |
* ... kleinere Werte sind besser
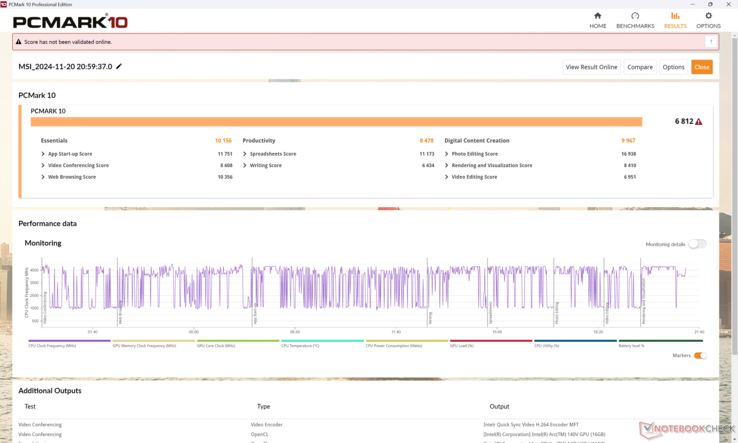
| PCMark 10 Score | 6812 Punkte | |
Hilfe | ||
| AIDA64 / Memory Copy | |
| MSI Prestige 13 AI Plus Evo A2VMG | |
| Durchschnittliche Intel Core Ultra 7 258V (104408 - 114336, n=25) | |
| Dell XPS 13 9350 | |
| MSI Prestige 13 AI Evo | |
| Lenovo Yoga Book 9 13IMU9 | |
| Framework Laptop 13.5 Core Ultra 7 155H | |
| HP Dragonfly G4 | |
| AIDA64 / Memory Read | |
| Dell XPS 13 9350 | |
| Durchschnittliche Intel Core Ultra 7 258V (82846 - 89417, n=25) | |
| MSI Prestige 13 AI Plus Evo A2VMG | |
| Framework Laptop 13.5 Core Ultra 7 155H | |
| MSI Prestige 13 AI Evo | |
| Lenovo Yoga Book 9 13IMU9 | |
| HP Dragonfly G4 | |
| AIDA64 / Memory Write | |
| MSI Prestige 13 AI Plus Evo A2VMG | |
| Durchschnittliche Intel Core Ultra 7 258V (108842 - 117989, n=25) | |
| Dell XPS 13 9350 | |
| MSI Prestige 13 AI Evo | |
| Framework Laptop 13.5 Core Ultra 7 155H | |
| HP Dragonfly G4 | |
| Lenovo Yoga Book 9 13IMU9 | |
| AIDA64 / Memory Latency | |
| MSI Prestige 13 AI Evo | |
| Lenovo Yoga Book 9 13IMU9 | |
| Framework Laptop 13.5 Core Ultra 7 155H | |
| MSI Prestige 13 AI Plus Evo A2VMG | |
| Dell XPS 13 9350 | |
| Durchschnittliche Intel Core Ultra 7 258V (95 - 101.1, n=25) | |
| HP Dragonfly G4 | |
* ... kleinere Werte sind besser
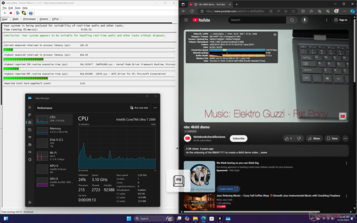
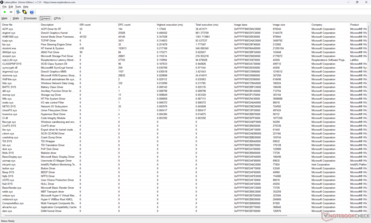
DPC-Latenzzeit
| DPC Latencies / LatencyMon - interrupt to process latency (max), Web, Youtube, Prime95 | |
| MSI Prestige 13 AI Evo | |
| Lenovo Yoga Book 9 13IMU9 | |
| HP Dragonfly G4 | |
| MSI Prestige 13 AI Plus Evo A2VMG | |
| Framework Laptop 13.5 Core Ultra 7 155H | |
* ... kleinere Werte sind besser
Speichergeräte
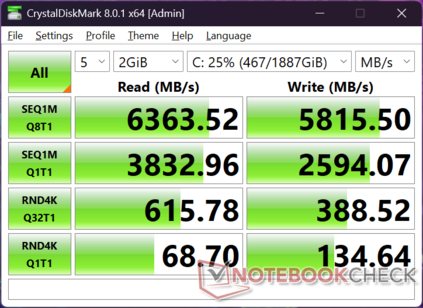
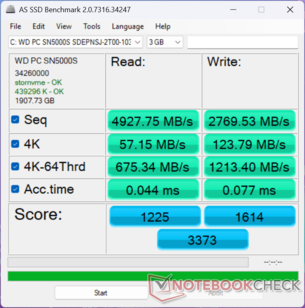
Unser Gerät wird mit dem WD SN5000S anstelle der Samsung PM9A1, die in unserer Core Ultra 7 155H-Konfiguration verwendet wurde, ausgeliefert. Das Laufwerk weist keine der Throttling-Probleme auf, die wir bei der ursprünglichen Prestige 13 AI erlebt haben.
| Drive Performance Rating - Percent | |
| MSI Prestige 13 AI Evo | |
| Framework Laptop 13.5 Core Ultra 7 155H | |
| HP Dragonfly G4 | |
| MSI Prestige 13 AI Plus Evo A2VMG | |
| Lenovo Yoga Book 9 13IMU9 | |
| Dell XPS 13 9350 | |
* ... kleinere Werte sind besser
Disk Throttling: DiskSpd Read Loop, Queue Depth 8
GPU Performance
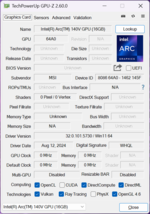
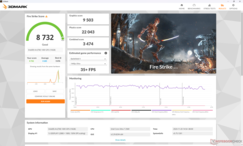
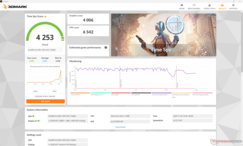
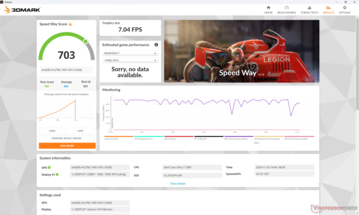
Der neue integrierte Arc 140V Grafikprozessor ist wohl eines der größten Upgrades gegenüber dem Arc 8 in der Core Ultra 7 155H Konfiguration. Die 3DMark-Ergebnisse sind 1,5 bis 2 Mal schneller und dies lässt sich gut auf Spielszenarien wie GTA V oder sogar Cyberpunk 2077 übertragen, wo die Core Ultra 7 155H Konfiguration tendenziell schlechter abschneidet.
| Leistungsprofil | Grafik-Score | Physik-Wertung | Kombinierte Punktzahl |
| Performance Modus (Kühler-Boost eingeschaltet) | 9513 | 21842 | 3426 |
| Performance Modus (Kühler-Boost aus) | 9503 | 22043 | 3474 |
| Ausgeglichener Modus | 9376 | 21037 | 3019 |
| Batteriebetrieb | 9471 | 21837 | 3440 |
Wenn Sie das System mit aktiviertem Cooler Boost oder im Modus "Ausbalanciert" oder auch nur im Akkubetrieb betreiben, hat dies keine nennenswerten Auswirkungen auf die Leistung, wie unsere obige Fire Strike Ergebnistabelle zeigt.
| 3DMark 11 Performance | 11114 Punkte | |
| 3DMark Cloud Gate Standard Score | 33012 Punkte | |
| 3DMark Fire Strike Score | 8732 Punkte | |
| 3DMark Time Spy Score | 4253 Punkte | |
| 3DMark Steel Nomad Score | 681 Punkte | |
Hilfe | ||
* ... kleinere Werte sind besser
| Performance Rating - Percent | |
| MSI Prestige 13 AI Plus Evo A2VMG | |
| Dell XPS 13 9350 | |
| Framework Laptop 13.5 Core Ultra 7 155H | |
| MSI Prestige 13 AI Evo -2! | |
| Lenovo Yoga Book 9 13IMU9 -2! | |
| HP Dragonfly G4 -2! | |
| Cyberpunk 2077 - 1920x1080 Ultra Preset (FSR off) | |
| MSI Prestige 13 AI Plus Evo A2VMG | |
| Framework Laptop 13.5 Core Ultra 7 155H | |
| Dell XPS 13 9350 | |
| Lenovo Yoga Book 9 13IMU9 | |
| Baldur's Gate 3 - 1920x1080 Ultra Preset AA:T | |
| MSI Prestige 13 AI Plus Evo A2VMG | |
| Framework Laptop 13.5 Core Ultra 7 155H | |
| Dell XPS 13 9350 | |
| GTA V - 1920x1080 Highest AA:4xMSAA + FX AF:16x | |
| MSI Prestige 13 AI Plus Evo A2VMG | |
| Dell XPS 13 9350 | |
| Framework Laptop 13.5 Core Ultra 7 155H | |
| HP Dragonfly G4 | |
| MSI Prestige 13 AI Evo | |
| Final Fantasy XV Benchmark - 1920x1080 High Quality | |
| MSI Prestige 13 AI Plus Evo A2VMG | |
| Dell XPS 13 9350 | |
| Framework Laptop 13.5 Core Ultra 7 155H | |
| MSI Prestige 13 AI Evo | |
| HP Dragonfly G4 | |
| Lenovo Yoga Book 9 13IMU9 | |
| Strange Brigade - 1920x1080 ultra AA:ultra AF:16 | |
| Dell XPS 13 9350 | |
| MSI Prestige 13 AI Plus Evo A2VMG | |
| Framework Laptop 13.5 Core Ultra 7 155H | |
| MSI Prestige 13 AI Evo | |
| Lenovo Yoga Book 9 13IMU9 | |
| HP Dragonfly G4 | |
| Dota 2 Reborn - 1920x1080 ultra (3/3) best looking | |
| MSI Prestige 13 AI Plus Evo A2VMG | |
| Dell XPS 13 9350 | |
| Framework Laptop 13.5 Core Ultra 7 155H | |
| Lenovo Yoga Book 9 13IMU9 | |
| HP Dragonfly G4 | |
| MSI Prestige 13 AI Evo | |
| X-Plane 11.11 - 1920x1080 high (fps_test=3) | |
| MSI Prestige 13 AI Plus Evo A2VMG | |
| Framework Laptop 13.5 Core Ultra 7 155H | |
| MSI Prestige 13 AI Evo | |
| Dell XPS 13 9350 | |
| HP Dragonfly G4 | |
| Lenovo Yoga Book 9 13IMU9 | |
Cyberpunk 2077 ultra FPS Chart
| min. | mittel | hoch | max. | |
|---|---|---|---|---|
| GTA V (2015) | 161.6 | 155.6 | 67.4 | 26.7 |
| Dota 2 Reborn (2015) | 97.2 | 87.8 | 72.1 | 83 |
| Final Fantasy XV Benchmark (2018) | 84 | 46.2 | 31.7 | |
| X-Plane 11.11 (2018) | 56.6 | 42.6 | 36.9 | |
| Far Cry 5 (2018) | 92 | 57 | 49 | 45 |
| Strange Brigade (2018) | 216 | 74.6 | 63 | 55.4 |
| Tiny Tina's Wonderlands (2022) | 72.1 | 53.3 | 36 | 28 |
| F1 22 (2022) | 96.2 | 88.5 | 63.9 | 19.9 |
| Baldur's Gate 3 (2023) | 39.6 | 33.5 | 29.8 | 29.1 |
| Cyberpunk 2077 (2023) | 46.6 | 37.4 | 32.5 | 28.5 |
Emissionen
Lautstärke
Das Lüftergeräusch ist im Allgemeinen lauter als zuvor, wenn anspruchsvollere Lasten wie Spiele ausgeführt werden. Wenn Sie Cyberpunk 2077 im Modus Performance laufen lassen, beträgt der Geräuschpegel des Lüfters 45 dB(A) im Vergleich zu fast 51 dB(A) im Modus Cooler Boost.
Lautstärkediagramm
| Idle |
| 24.8 / 24.8 / 26.7 dB(A) |
| Last |
| 36.8 / 50.8 dB(A) |
 | ||
30 dB leise 40 dB(A) deutlich hörbar 50 dB(A) störend |
||
min: | ||
| MSI Prestige 13 AI Plus Evo A2VMG Arc 140V, Core Ultra 7 258V | MSI Prestige 13 AI Evo Arc 8-Core, Ultra 7 155H, Samsung PM9A1 MZVL21T0HCLR | Dell XPS 13 9350 Arc 140V, Core Ultra 7 256V, Micron 2550 512GB | Framework Laptop 13.5 Core Ultra 7 155H Arc 8-Core, Ultra 7 155H | Lenovo Yoga Book 9 13IMU9 Graphics 4-Core iGPU (Arrow Lake), Ultra 7 155U | HP Dragonfly G4 Iris Xe G7 96EUs, i7-1365U, Micron 3400 MTFDKBA512TFH 512GB | |
|---|---|---|---|---|---|---|
| Geräuschentwicklung | 6% | 11% | 1% | 16% | 12% | |
| aus / Umgebung * (dB) | 24.1 | 23.4 3% | 24.1 -0% | 24 -0% | 23.3 3% | 23.3 3% |
| Idle min * (dB) | 24.8 | 23.4 6% | 24.4 2% | 24.1 3% | 23.3 6% | 23.5 5% |
| Idle avg * (dB) | 24.8 | 26.9 -8% | 24.4 2% | 25.1 -1% | 23.3 6% | 23.5 5% |
| Idle max * (dB) | 26.7 | 26.9 -1% | 24.4 9% | 27 -1% | 24.6 8% | 26.8 -0% |
| Last avg * (dB) | 36.8 | 32 13% | 26.2 29% | 38.4 -4% | 26.2 29% | 27.2 26% |
| Cyberpunk 2077 ultra * (dB) | 44.5 | 34.2 23% | 43.7 2% | |||
| Last max * (dB) | 50.8 | 40.3 21% | 45.2 11% | 45.8 10% | 27.3 46% | 35 31% |
| Witcher 3 ultra * (dB) | 32 | 27.3 | 32.7 |
* ... kleinere Werte sind besser
Temperatur
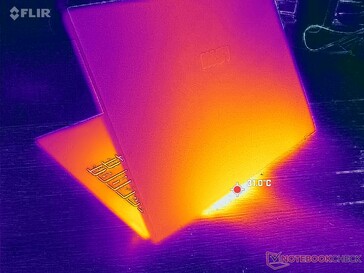
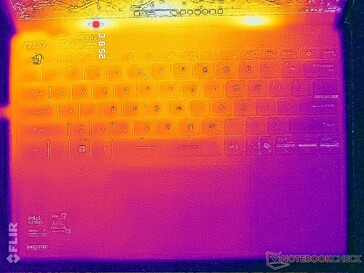
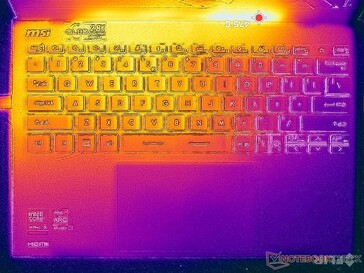
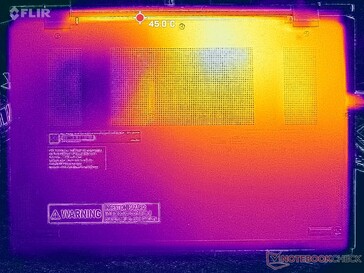
(±) Die maximale Temperatur auf der Oberseite ist 43.4 °C. Im Vergleich liegt der Klassendurchschnitt bei 35.9 °C (von 21.4 bis 59 °C für die Klasse Subnotebook).
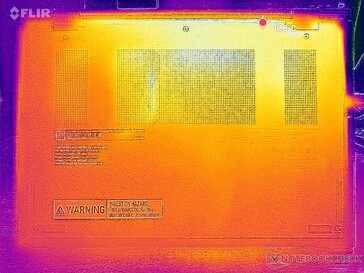
(±) Auf der Unterseite messen wir eine maximalen Wert von 42.4 °C (im Vergleich zum Durchschnitt von 39.3 °C).
(+) Ohne Last messen wir eine durchschnittliche Temperatur von 23.4 °C auf der Oberseite. Der Klassendurchschnitt erreicht 30.8 °C.
(+) Die Handballen und der Touchpad-Bereich sind mit gemessenen 29.8 °C kühler als die typische Hauttemperatur und fühlen sich dadurch kühl an.
(±) Die durchschnittliche Handballen-Temperatur anderer getesteter Geräte war 28.2 °C (-1.6 °C).
| MSI Prestige 13 AI Plus Evo A2VMG Intel Core Ultra 7 258V, Intel Arc Graphics 140V | MSI Prestige 13 AI Evo Intel Core Ultra 7 155H, Intel Arc 8-Core iGPU | Dell XPS 13 9350 Intel Core Ultra 7 256V, Intel Arc Graphics 140V | Framework Laptop 13.5 Core Ultra 7 155H Intel Core Ultra 7 155H, Intel Arc 8-Core iGPU | Lenovo Yoga Book 9 13IMU9 Intel Core Ultra 7 155U, Intel Graphics 4-Core iGPU (Meteor / Arrow Lake) | HP Dragonfly G4 Intel Core i7-1365U, Intel Iris Xe Graphics G7 96EUs | |
|---|---|---|---|---|---|---|
| Hitze | 3% | 8% | -6% | -9% | -2% | |
| Last oben max * (°C) | 43.4 | 40.9 6% | 34.8 20% | 42.8 1% | 39.2 10% | 38.6 11% |
| Last unten max * (°C) | 42.4 | 40.4 5% | 37.4 12% | 45.2 -7% | 41 3% | 40.4 5% |
| Idle oben max * (°C) | 25.4 | 25 2% | 25.4 -0% | 27.2 -7% | 32.2 -27% | 28.2 -11% |
| Idle unten max * (°C) | 25.6 | 25.5 -0% | 26.2 -2% | 28.6 -12% | 31.6 -23% | 29 -13% |
* ... kleinere Werte sind besser
Stresstest
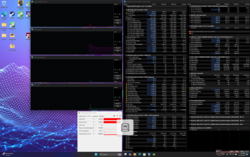
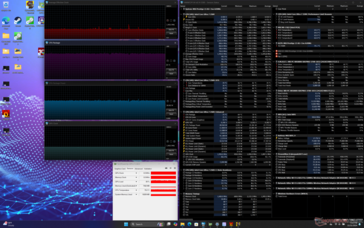
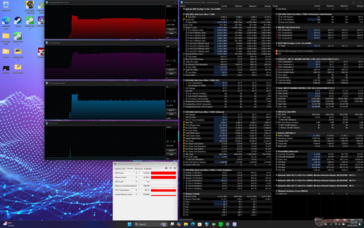
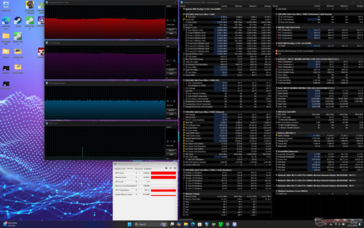
Bei der Ausführung von Prime95, steigt die CPU für etwa 30 Sekunden auf 3,6 GHz, 40 W und 82 °C an. Danach sinkt sie schnell ab und stabilisiert sich bei 2,9 GHz und 27 W und behält eine kühlere Kerntemperatur von 77 °C bei. Wenn Cooler Boost aktiviert ist, sinkt die Kerntemperatur leicht, während die Taktraten fast gleich bleiben.
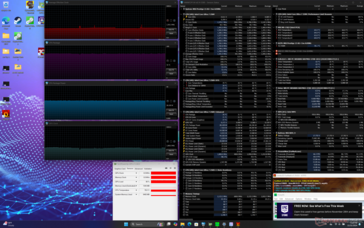
Beim Spielen stabilisiert sich die Kerntemperatur bei 75 °C, verglichen mit 71 °C beim Dell XPS 13 mit einer ähnlichen Lunar Lake CPU.
| Durchschnittlicher CPU-Takt (GHz) | GPU-Takt (MHz) | Durchschnittliche CPU-Temperatur (°C) | |
| System Leerlauf | -- | 400 | 32 |
| Prime95 Stress (Cooler Boost aus) | 2.9 | -- | 77 |
| Prime95 Stress (Cooler Boost an) | 3.0 | -- | 75 |
| Prime95 + FurMark Stress | 1.6 | 1800 | 76 |
| Cyberpunk 2077 Stress | 1.5 | 1950 | 75 |
MSI Prestige 13 AI Plus Evo A2VMG Audio Analyse
(+) | Die Lautsprecher können relativ laut spielen (84.5 dB)
Bass 100 - 315 Hz
(-) | kaum Bass - 19.4% niedriger als der Median
(±) | durchschnittlich lineare Bass-Wiedergabe (9.6% Delta zum Vorgänger)
Mitteltöne 400 - 2000 Hz
(±) | zu hohe Mitten, vom Median 6.4% abweichend
(+) | lineare Mitten (5.1% Delta zum Vorgänger)
Hochtöne 2 - 16 kHz
(±) | zu hohe Hochtöne, vom Median nur 6.1% abweichend
(+) | sehr lineare Hochtöne (4.6% Delta zum Vorgänger)
Gesamt im hörbaren Bereich 100 - 16.000 Hz
(±) | hörbarer Bereich ist durchschnittlich linear (18.2% Abstand zum Median)
Im Vergleich zu allen Geräten derselben Klasse
» 51% aller getesteten Geräte dieser Klasse waren besser, 7% vergleichbar, 41% schlechter
» Das beste Gerät hat einen Delta-Wert von 5%, durchschnittlich ist 18%, das schlechteste Gerät hat 53%
Im Vergleich zu allen Geräten im Test
» 39% aller getesteten Geräte waren besser, 8% vergleichbar, 54% schlechter
» Das beste Gerät hat einen Delta-Wert von 4%, durchschnittlich ist 24%, das schlechteste Gerät hat 134%
Apple MacBook Pro 16 2021 M1 Pro Audio Analyse
(+) | Die Lautsprecher können relativ laut spielen (84.7 dB)
Bass 100 - 315 Hz
(+) | guter Bass - nur 3.8% Abweichung vom Median
(+) | lineare Bass-Wiedergabe (5.2% Delta zum Vorgänger)
Mitteltöne 400 - 2000 Hz
(+) | ausgeglichene Mitten, vom Median nur 1.3% abweichend
(+) | lineare Mitten (2.1% Delta zum Vorgänger)
Hochtöne 2 - 16 kHz
(+) | ausgeglichene Hochtöne, vom Median nur 1.9% abweichend
(+) | sehr lineare Hochtöne (2.7% Delta zum Vorgänger)
Gesamt im hörbaren Bereich 100 - 16.000 Hz
(+) | hörbarer Bereich ist sehr linear (4.6% Abstand zum Median
Im Vergleich zu allen Geräten derselben Klasse
» 0% aller getesteten Geräte dieser Klasse waren besser, 0% vergleichbar, 100% schlechter
» Das beste Gerät hat einen Delta-Wert von 5%, durchschnittlich ist 17%, das schlechteste Gerät hat 45%
Im Vergleich zu allen Geräten im Test
» 0% aller getesteten Geräte waren besser, 0% vergleichbar, 100% schlechter
» Das beste Gerät hat einen Delta-Wert von 4%, durchschnittlich ist 24%, das schlechteste Gerät hat 134%
Energieverwaltung
Stromverbrauch
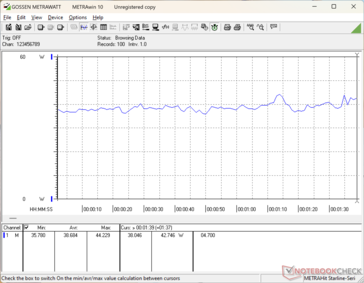
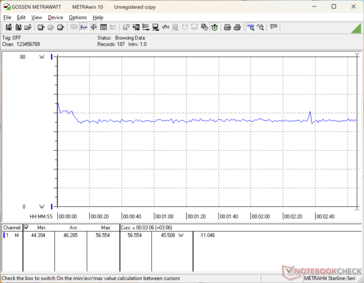
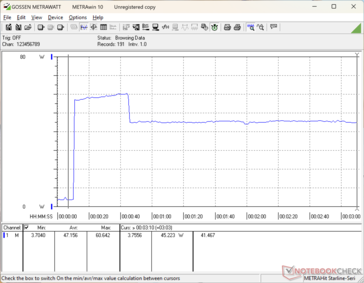
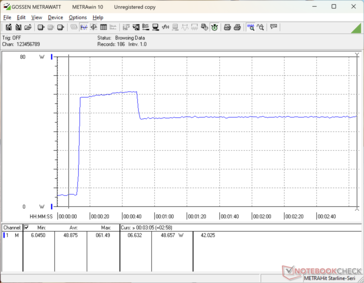
Das System wird hungriger als die Core Ultra 7 155H Konfiguration, wenn Sie CPU-lastige Aufgaben über längere Zeiträume ausführen, da es nicht so stark gedrosselt wird. Auch beim Spielen ist der Verbrauch um etwa 50 Prozent höher aufgrund der viel schnelleren Grafikleistung.
| Aus / Standby | |
| Idle | |
| Last |
|
Legende:
min: | |
| MSI Prestige 13 AI Plus Evo A2VMG Core Ultra 7 258V, Arc 140V, , OLED, 2880x1800, 13.3" | MSI Prestige 13 AI Evo Ultra 7 155H, Arc 8-Core, Samsung PM9A1 MZVL21T0HCLR, OLED, 2880x1800, 13.3" | Dell XPS 13 9350 Core Ultra 7 256V, Arc 140V, Micron 2550 512GB, IPS, 1920x1200, 13.4" | Framework Laptop 13.5 Core Ultra 7 155H Ultra 7 155H, Arc 8-Core, , IPS, 2880x1920, 13.5" | Lenovo Yoga Book 9 13IMU9 Ultra 7 155U, Graphics 4-Core iGPU (Arrow Lake), , OLED, 2880x1800, 13.3" | HP Dragonfly G4 i7-1365U, Iris Xe G7 96EUs, Micron 3400 MTFDKBA512TFH 512GB, IPS, 1920x1280, 13.5" | |
|---|---|---|---|---|---|---|
| Stromverbrauch | -10% | 27% | 4% | -56% | -5% | |
| Idle min * (Watt) | 3.5 | 4.5 -29% | 1.3 63% | 2.5 29% | 7.1 -103% | 4.1 -17% |
| Idle avg * (Watt) | 5.9 | 8 -36% | 2.5 58% | 5.2 12% | 9.1 -54% | 7.5 -27% |
| Idle max * (Watt) | 10 | 8.7 13% | 4.1 59% | 5.8 42% | 18.4 -84% | 8.2 18% |
| Last avg * (Watt) | 38.7 | 36.1 7% | 40.1 -4% | 47.5 -23% | 51.3 -33% | 35.5 8% |
| Cyberpunk 2077 ultra external monitor * (Watt) | 45.6 | 43.1 5% | 52.4 -15% | |||
| Cyberpunk 2077 ultra * (Watt) | 46.3 | 46.1 -0% | 54.5 -18% | |||
| Last max * (Watt) | 61.5 | 65 -6% | 57.3 7% | 61.5 -0% | 65.5 -7% | 66.5 -8% |
| Witcher 3 ultra * (Watt) | 29.7 | 41.5 | 37.5 |
* ... kleinere Werte sind besser
Power Consumption Cyberpunk / Stress Test
Power Consumption external Monitor
Akkulaufzeit
Die Laufzeiten sind dank der effizienteren Lunar Lake Prozessoren fast zwei Stunden länger als bei der Core Ultra 7 155H Konfiguration.
| MSI Prestige 13 AI Plus Evo A2VMG Core Ultra 7 258V, Arc 140V, 75 Wh | MSI Prestige 13 AI Evo Ultra 7 155H, Arc 8-Core, 75 Wh | Dell XPS 13 9350 Core Ultra 7 256V, Arc 140V, 55 Wh | Framework Laptop 13.5 Core Ultra 7 155H Ultra 7 155H, Arc 8-Core, 61 Wh | Lenovo Yoga Book 9 13IMU9 Ultra 7 155U, Graphics 4-Core iGPU (Arrow Lake), 80 Wh | HP Dragonfly G4 i7-1365U, Iris Xe G7 96EUs, 68 Wh | |
|---|---|---|---|---|---|---|
| Akkulaufzeit | -13% | 54% | -22% | -25% | 19% | |
| WLAN (h) | 13.4 | 11.6 -13% | 20.6 54% | 10.5 -22% | 10.1 -25% | 15.9 19% |
| H.264 (h) | 16.7 | |||||
| Last (h) | 2.8 | 2.4 | 1.5 | 3.2 | ||
| Idle (h) | 56.8 | 38.3 | 42.5 |
Notebookcheck Bewertung
MSI Prestige 13 AI Plus Evo A2VMG
- 26.11.2024 v8
Allen Ngo
Transparenz
Die Auswahl der zu testenden Geräte erfolgt innerhalb der Redaktion. Das vorliegende Testmuster wurde dem Autor vom Hersteller oder einem Shop zu Testzwecken leihweise zur Verfügung gestellt. Eine Einflussnahme des Leihstellers auf den Testbericht gab es nicht, der Hersteller erhielt keine Version des Reviews vor der Veröffentlichung. Es bestand keine Verpflichtung zur Publikation. Als eigenständiges, unabhängiges Unternehmen unterliegt Notebookcheck keiner Diktion von Herstellern, Shops und Verlagen.
So testet Notebookcheck
Pro Jahr werden von Notebookcheck hunderte Laptops und Smartphones unabhängig in von uns standardisierten technischen Verfahren getestet, um eine Vergleichbarkeit aller Testergebnisse zu gewährleisten. Seit rund 20 Jahren entwickeln wir diese Testmethoden kontinuierlich weiter und setzen damit Branchenstandards. In unseren Testlaboren kommt ausschließlich hochwertiges Messequipment in die Hände erfahrener Techniker und Redakteure. Die Tests unterliegen einer mehrstufigen Kontrolle. Unsere komplexe Gesamtbewertung basiert auf hunderten fundierten Messergebnissen und Benchmarks, womit Ihnen Objektivität garantiert ist. Weitere Informationen zu unseren Testmethoden gibt es hier.

















 Total Sustainability Score:
