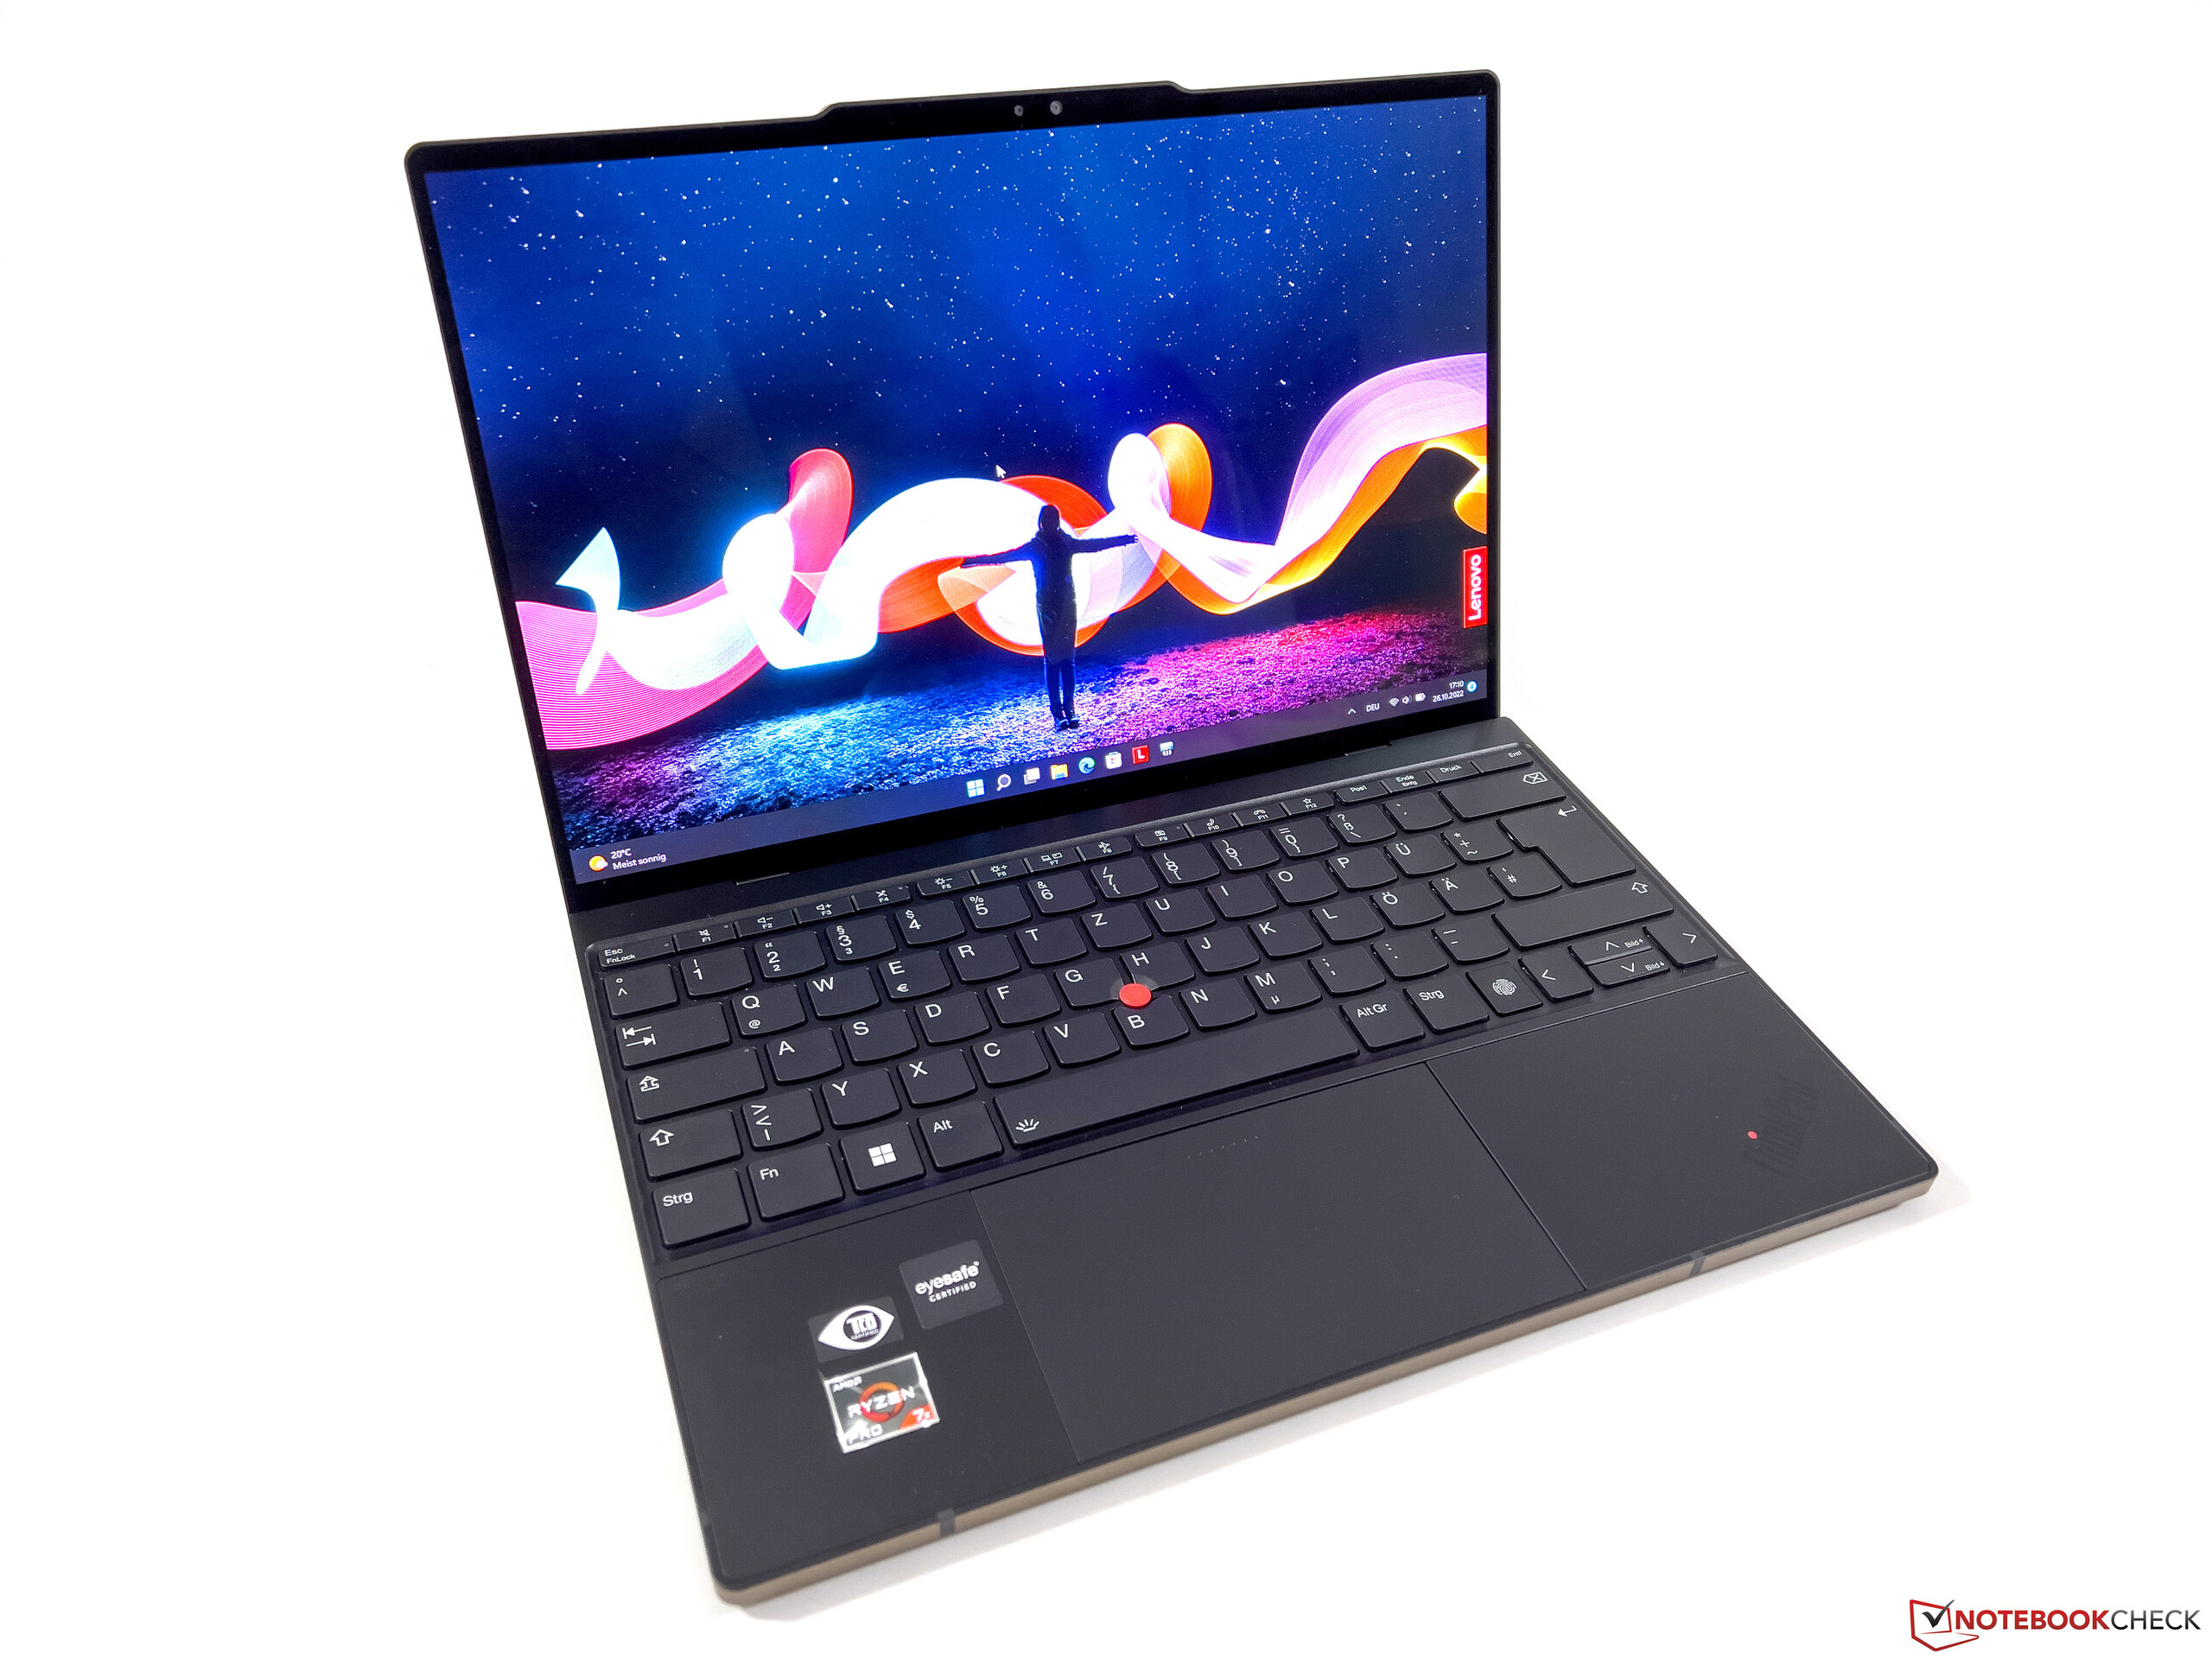
ThinkPad Z13 Gen 2 Laptop im Test: Lenovos Antwort auf das Dell XPS 13

Das Subnotebook stellt ein Update des ThinkPad Z13 G1 aus dem letzten Jahr dar und bietet neuere Zen 4 CPU-Optionen. Das Gehäuse bleibt ansonsten optisch identisch, und auch die Display-Optionen sind ähnlich. Wir empfehlen einen Blick in unseren Testbericht zum ThinkPad Z13 G1, da die meisten unserer Kommentare zu diesem System auch für das ThinkPad Z13 G2 relevant sind.
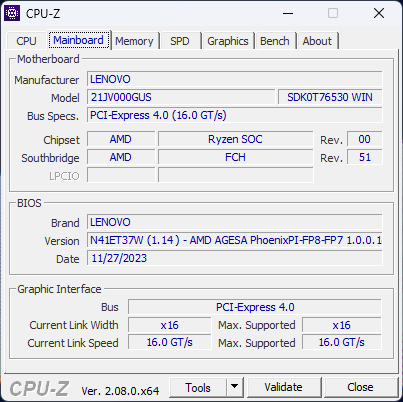
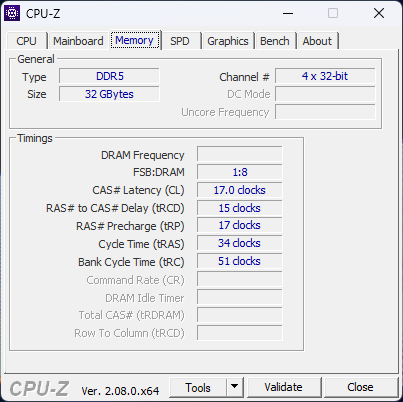
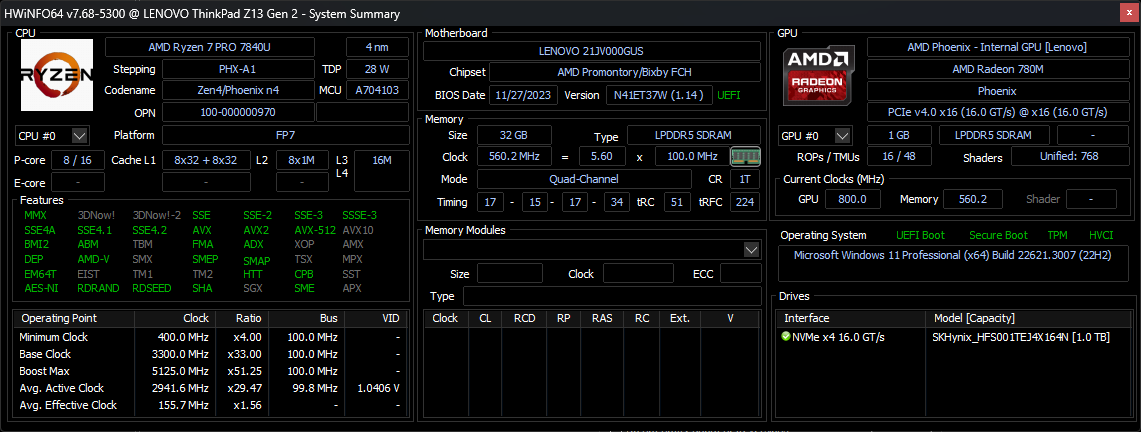
Unser Testgerät ist in einer High-End-Konfiguration mit Ryzen 7 Pro 7840U-CPU, einem 1800p 60 Hz OLED-Touchscreen und 32 GB RAM erhältlich, und dies für etwa ~1.690 Euro. Es sind auch andere Konfigurationen verfügbar, darunter Modelle mit Ryzen 5 Pro 7540U, einem 1200p IPS-Display, 16 GB RAM und optionaler WWAN-Funktion.
Das ThinkPad Z13 G2 konkurriert auf dem Markt der geschäftsorientierten 13-Zoll-Subnotebooks mit anderen Modellen wie dem HP Dragonfly G4, dem Dell Latitude 13 7340, dem XPS 13, der Toshiba Portege-Serie, oder der MSI Summit-Serie.
Weitere Lenovo Bewertungen:
Mögliche Konkurrenten im Vergleich
Bew. | Datum | Modell | Gewicht | Dicke | Größe | Auflösung | Preis ab |
|---|---|---|---|---|---|---|---|
| 89.5 % v7 (old) | 01 / 2024 | Lenovo ThinkPad Z13 Gen 2 R7 PRO 7840U, Radeon 780M | 1.2 kg | 13.99 mm | 13.30" | 2880x1800 | |
| 91.9 % v7 (old) | 07 / 2023 | HP Dragonfly G4 i7-1365U, Iris Xe G7 96EUs | 1.1 kg | 16.3 mm | 13.50" | 1920x1280 | |
| 90.2 % v7 (old) | 10 / 2023 | Dell Latitude 13 7340 i5-1345U i5-1345U, Iris Xe G7 80EUs | 1.1 kg | 18.2 mm | 13.30" | 1920x1200 | |
| 90.5 % v7 (old) | 08 / 2022 | Lenovo ThinkPad Z13 21D2CTO1WW R5 PRO 6650U, Radeon 660M | 1.2 kg | 13.99 mm | 13.30" | 1920x1200 | |
| 89.5 % v7 (old) | 08 / 2023 | Lenovo ThinkPad X1 Nano Gen 3 i7-1360P, Iris Xe G7 96EUs | 989 g | 14.8 mm | 13.00" | 2160x1350 | |
| 87.5 % v7 (old) | 10 / 2023 | Framework Laptop 13.5 Ryzen 7 7840U R7 7840U, Radeon 780M | 1.3 kg | 15.85 mm | 13.50" | 2256x1504 |
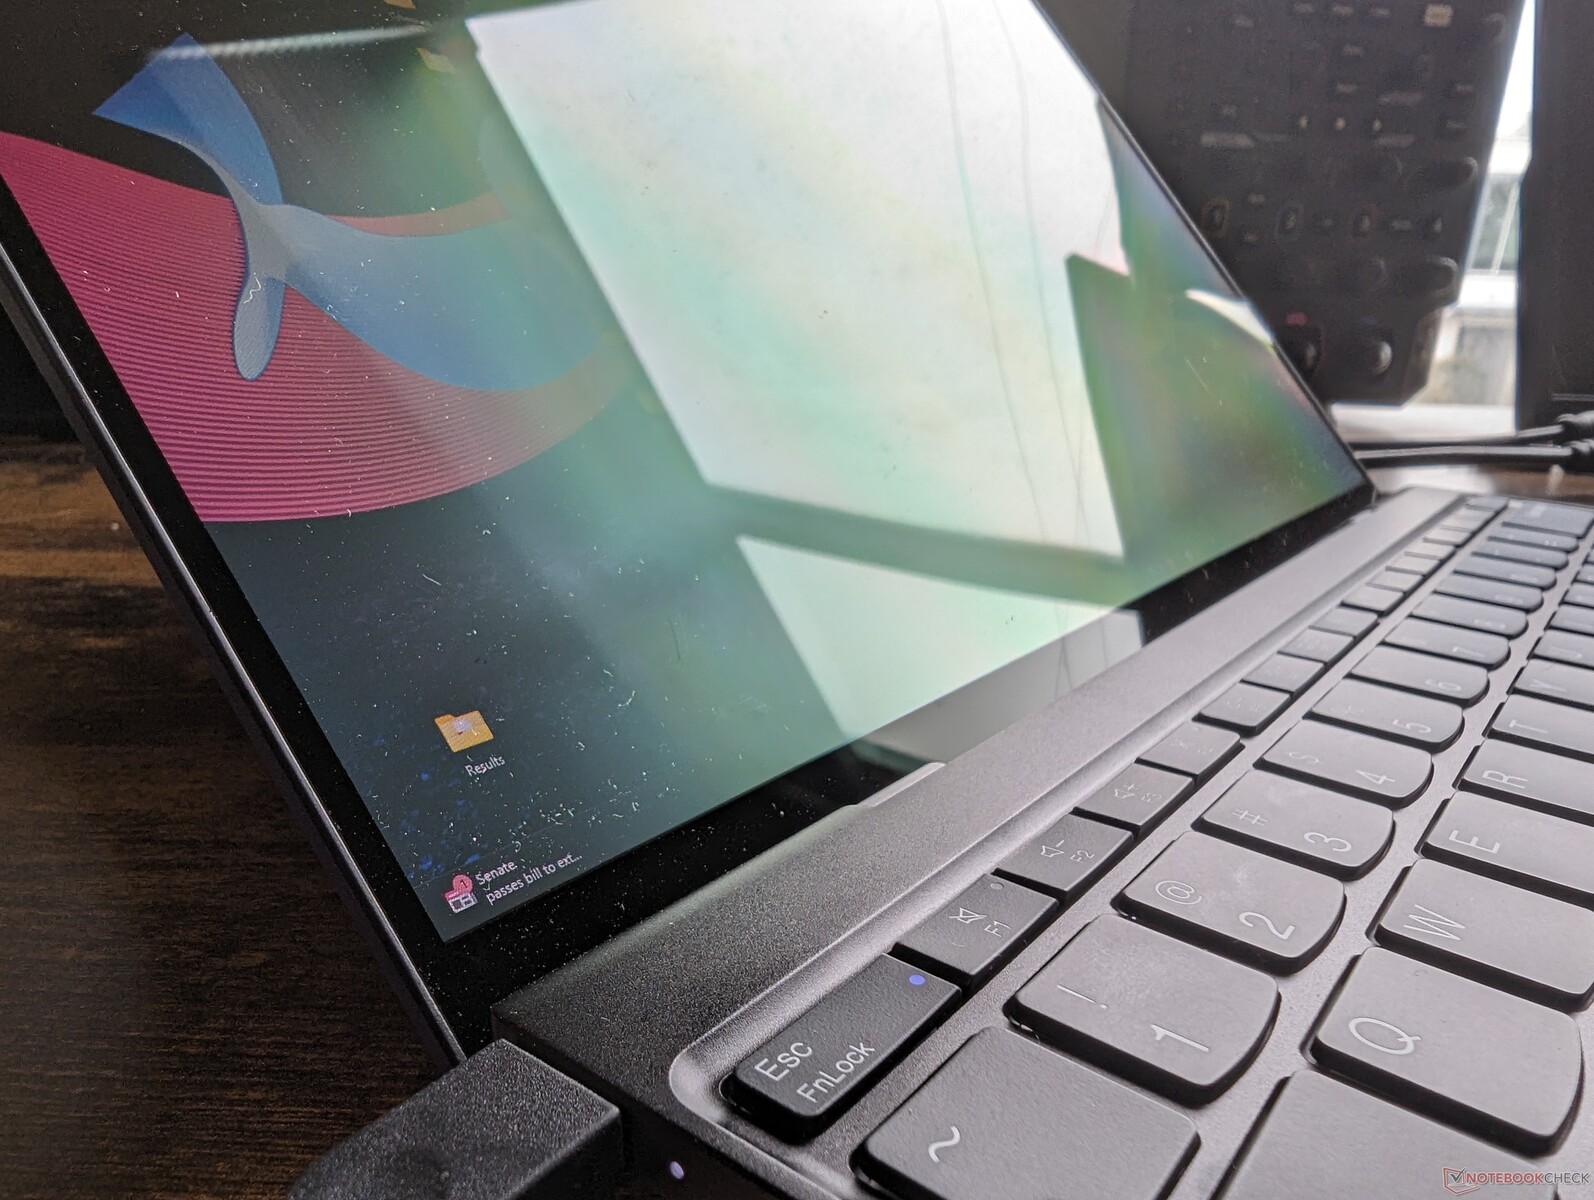
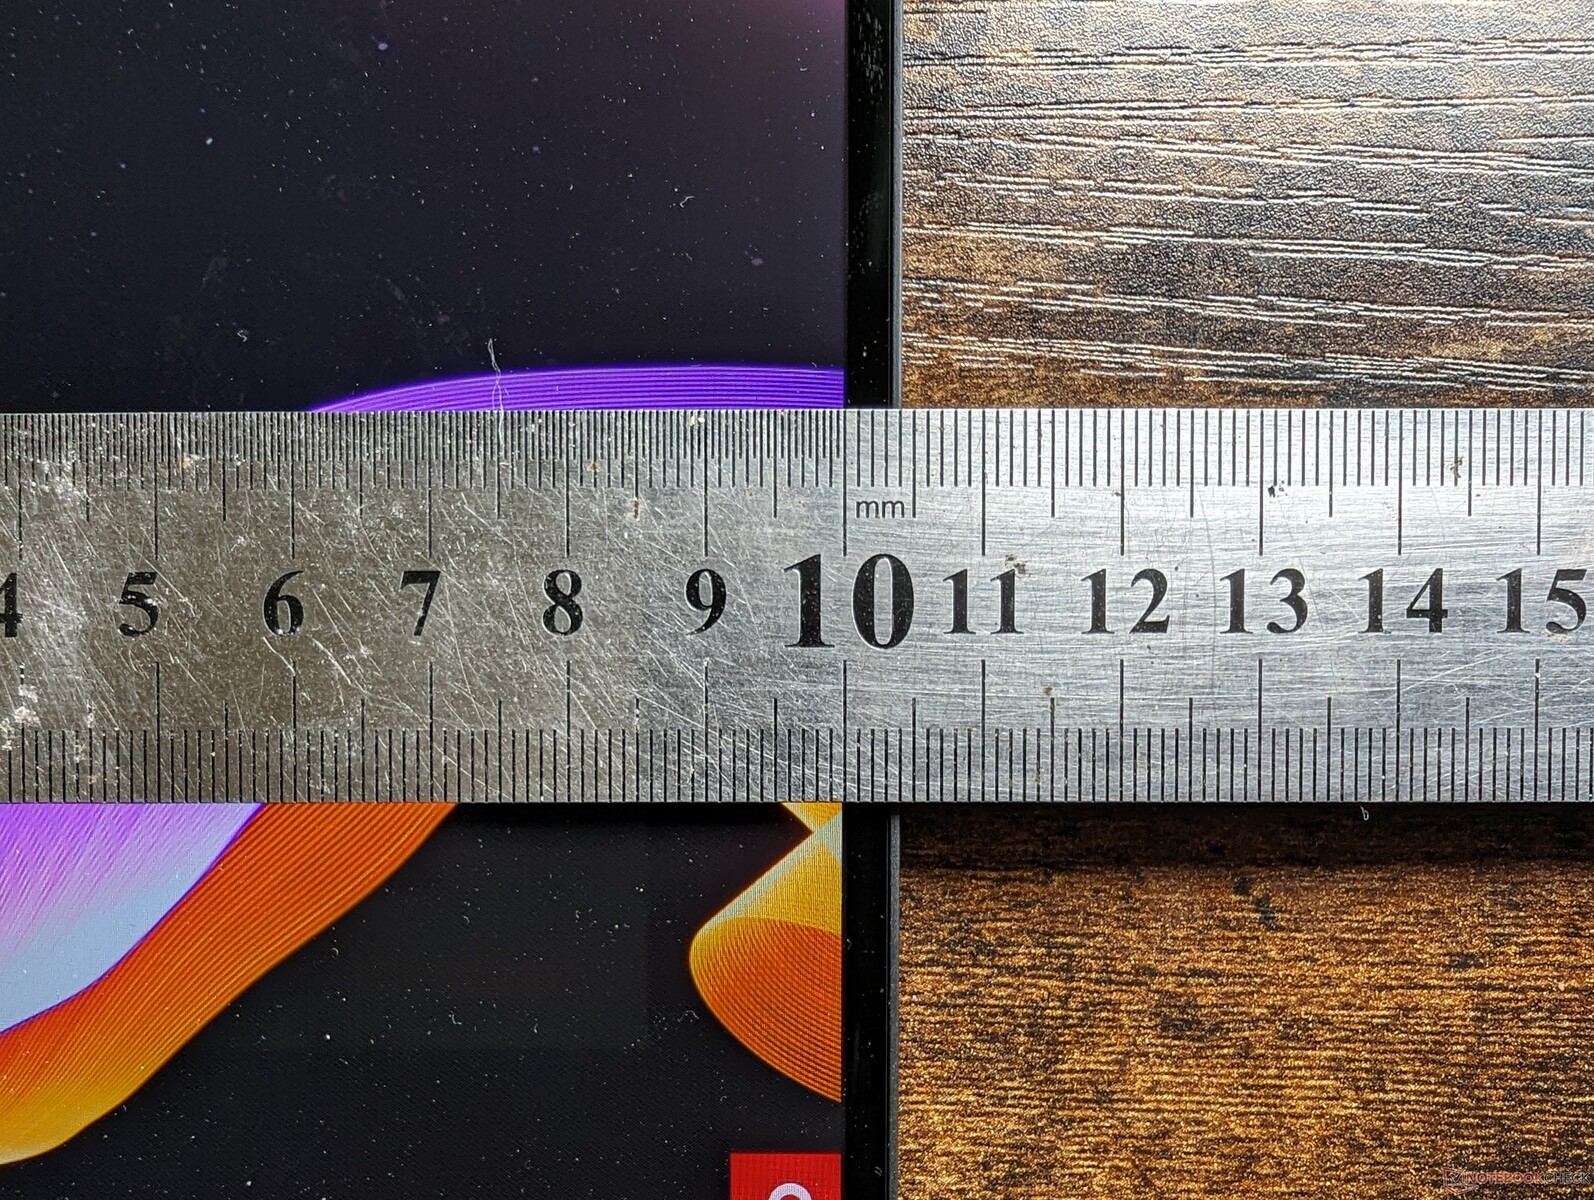
Gehäuse
Kommunikation
Unser Gen 2-Gerät ist mit dem MediaTek Wi-Fi 6E MT7922 ausgestattet, anstelle des Qualcomm WCN685x, das im Gen 1-Modell des letzten Jahres verbaut war. Ansonsten gibt es keine nennenswerten Unterschiede, da das MediaTek-Modul sowohl Wi-Fi 6 als auch 6E-Konnektivität unterstützt.
Webcam
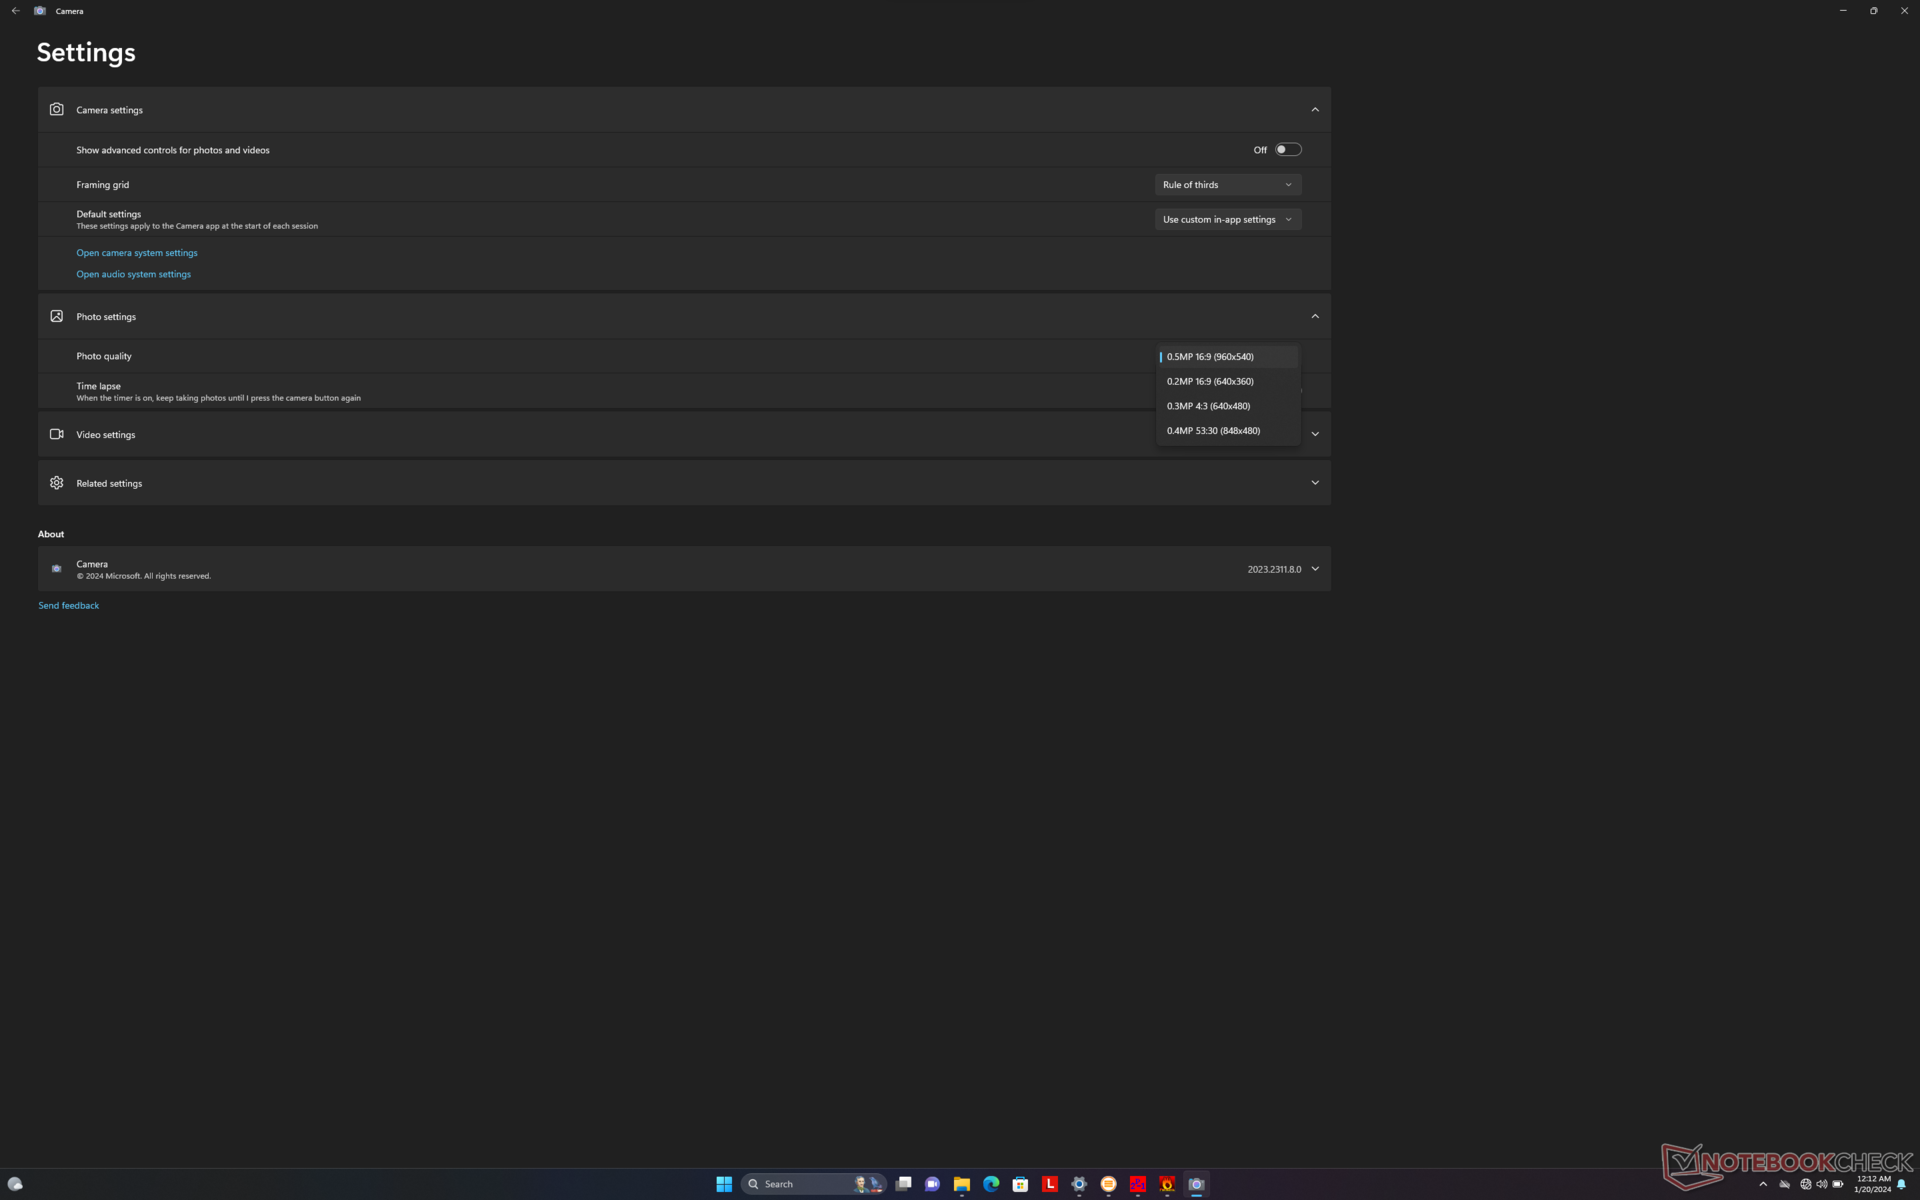
Obwohl das Lenovo-Modell mit einer 2-MP-Webcam ausgeliefert wird, kann die Windows-Kamera-App nur bis zu 0,5 MP auswählen, wie auf dem rechten Screenshot ersichtlich ist. Ein ähnliches Problem hatten wir bereits beim HP Pavilion Plus 14, das ebenfalls mit einer AMD Zen 4 CPU ausgestattet war.


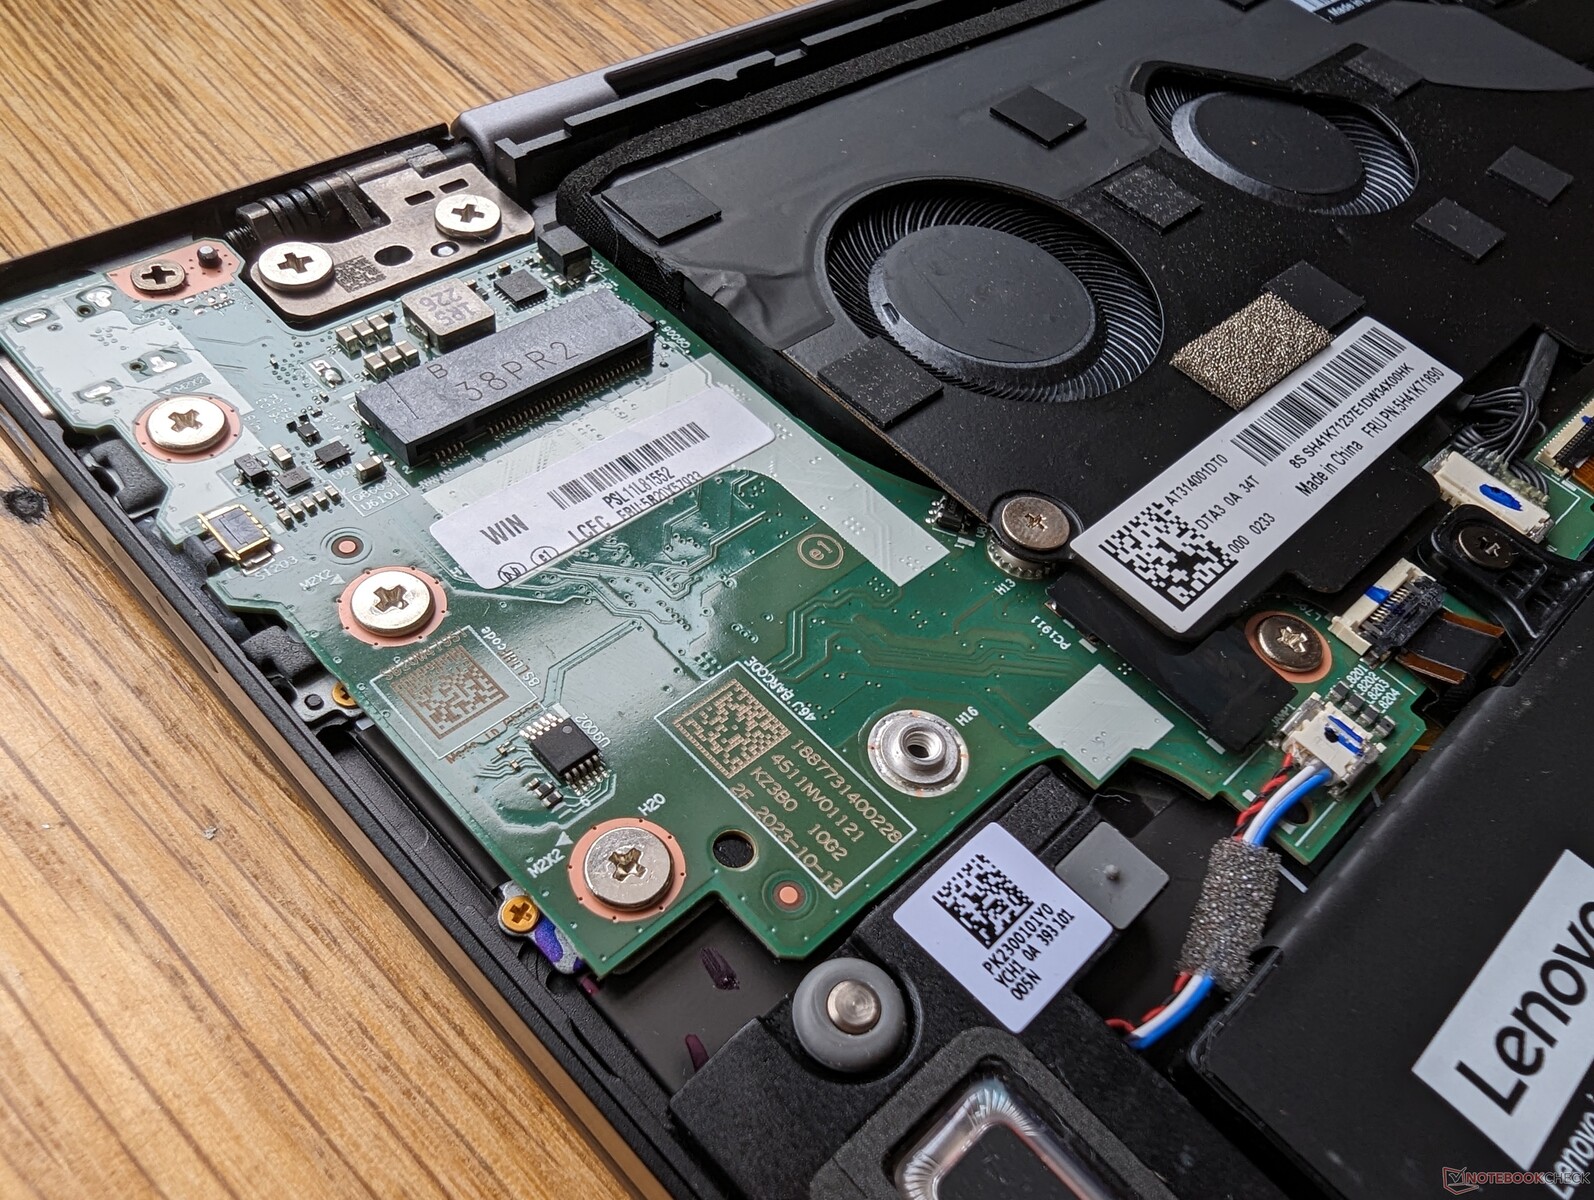
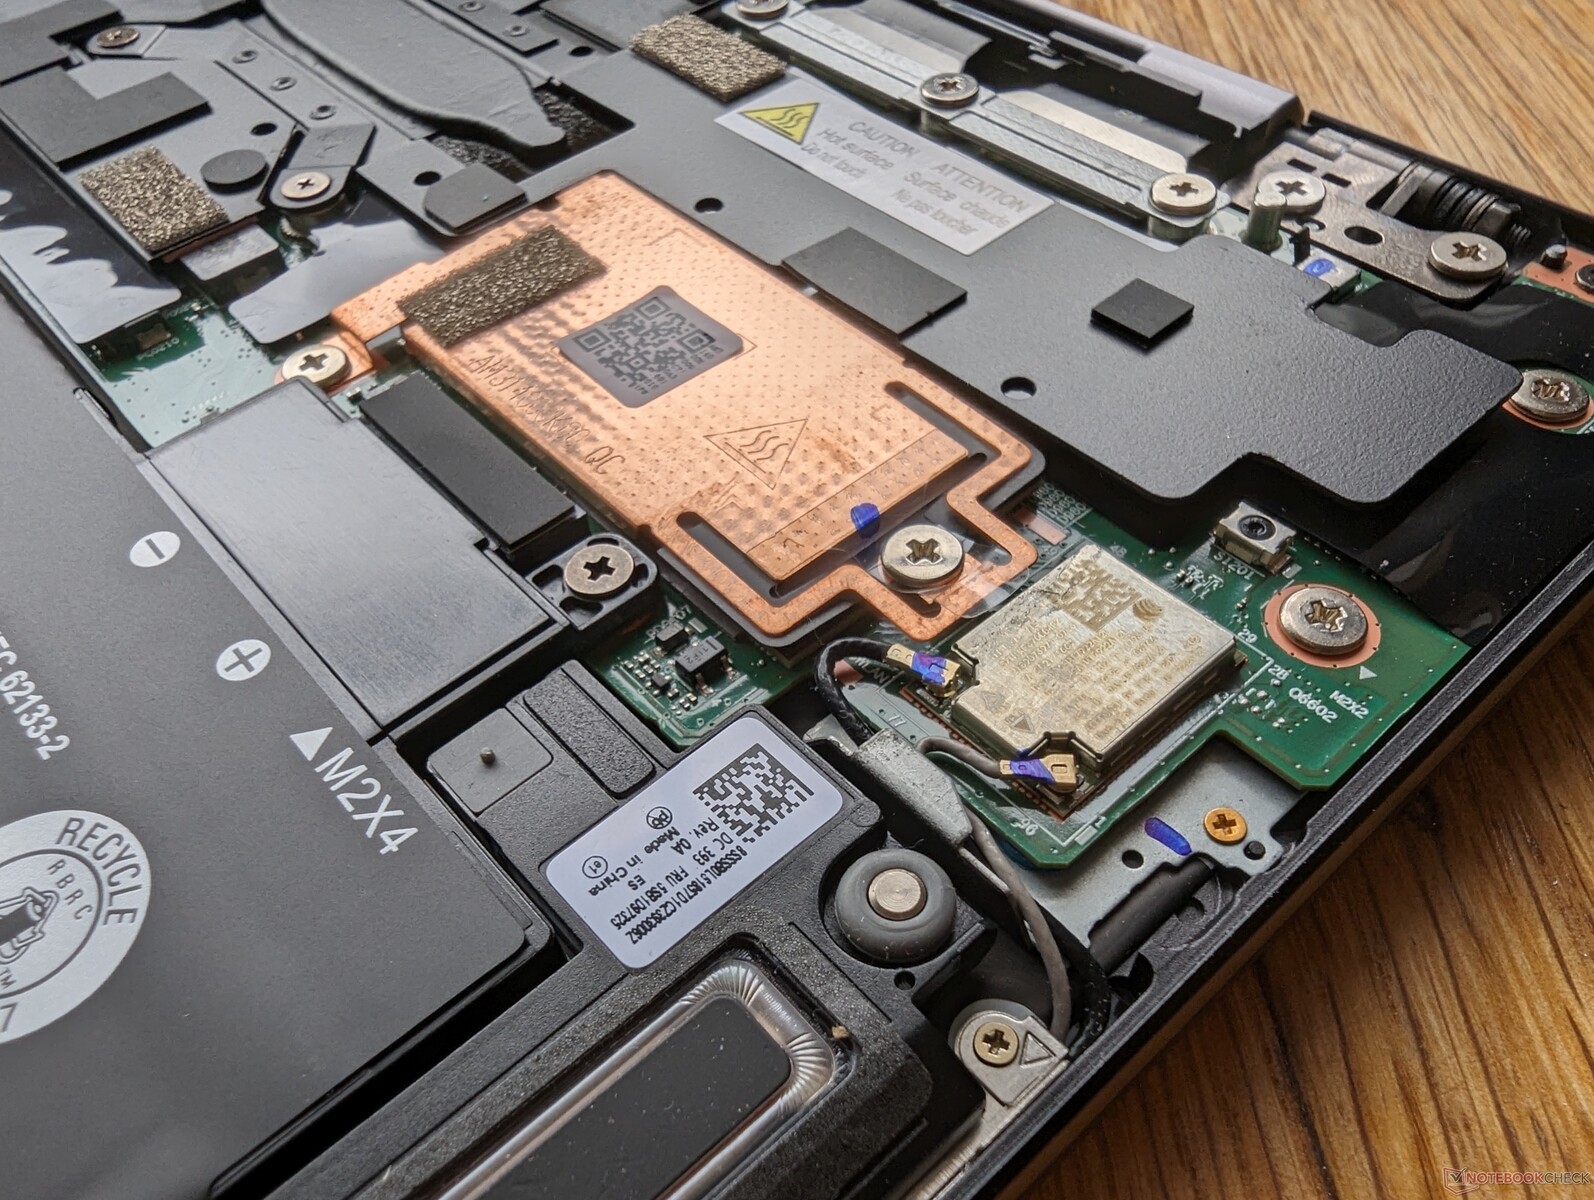
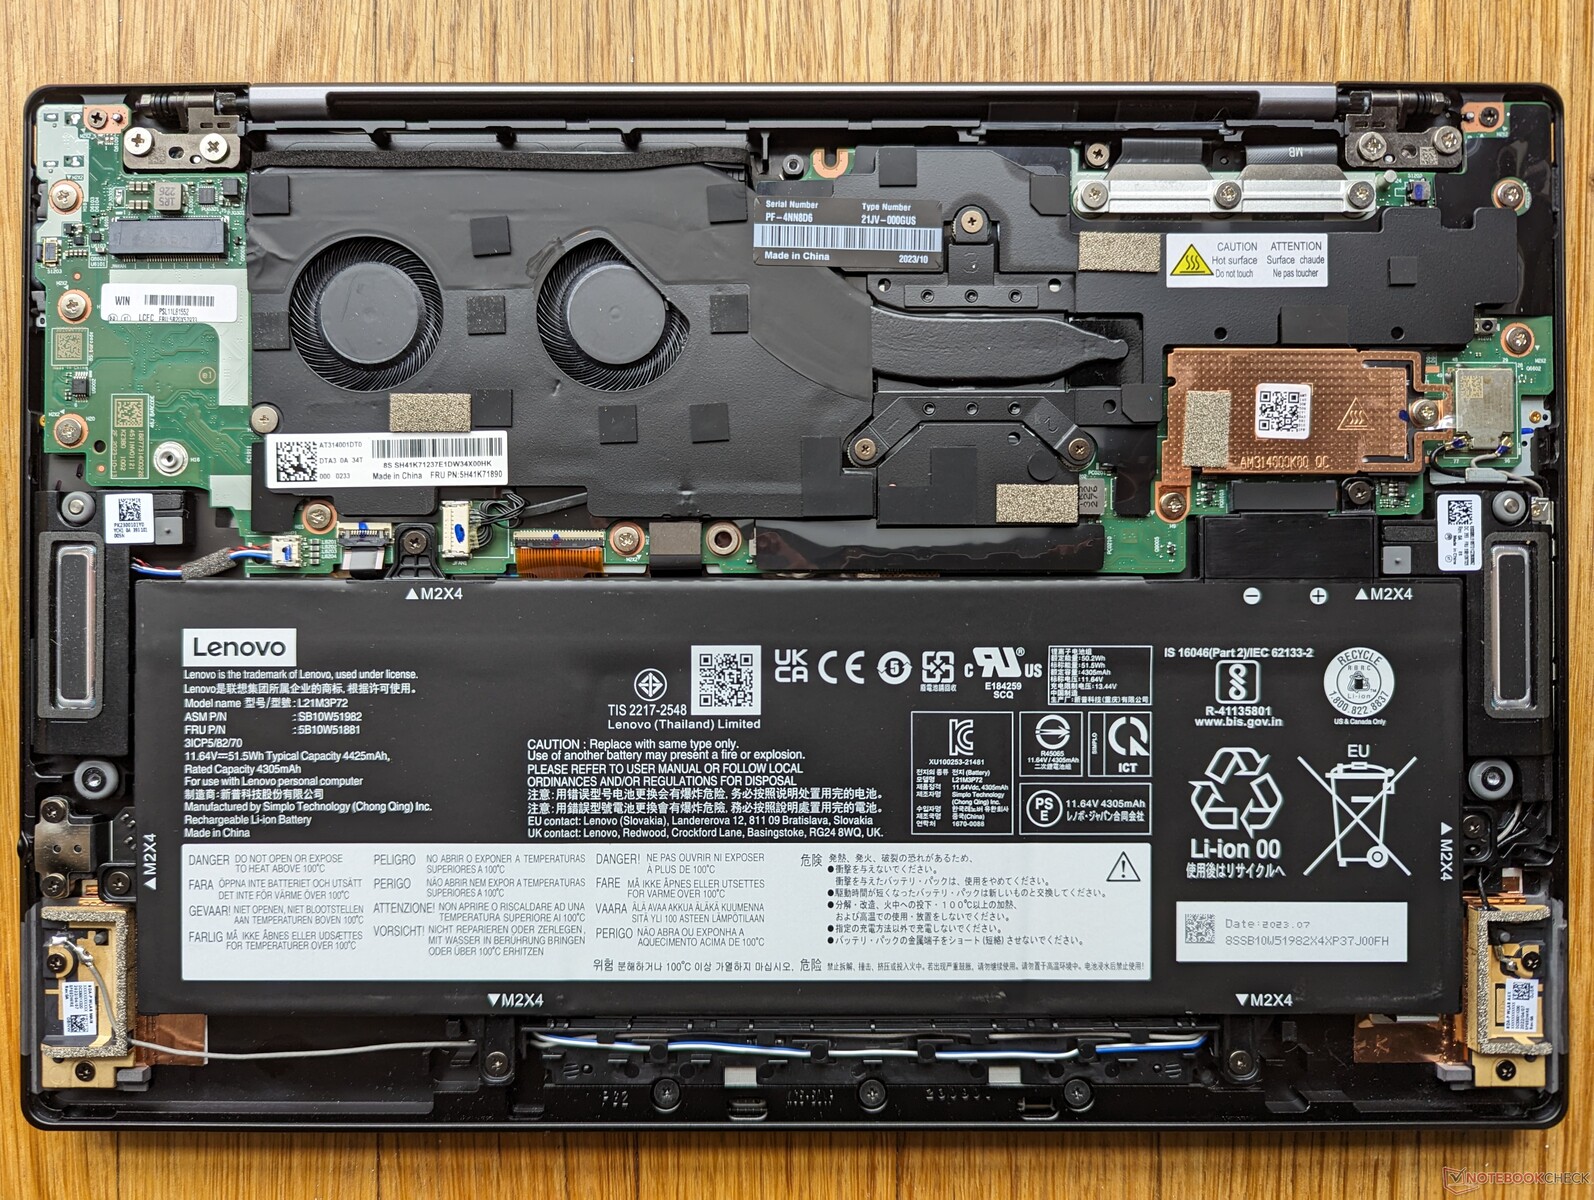
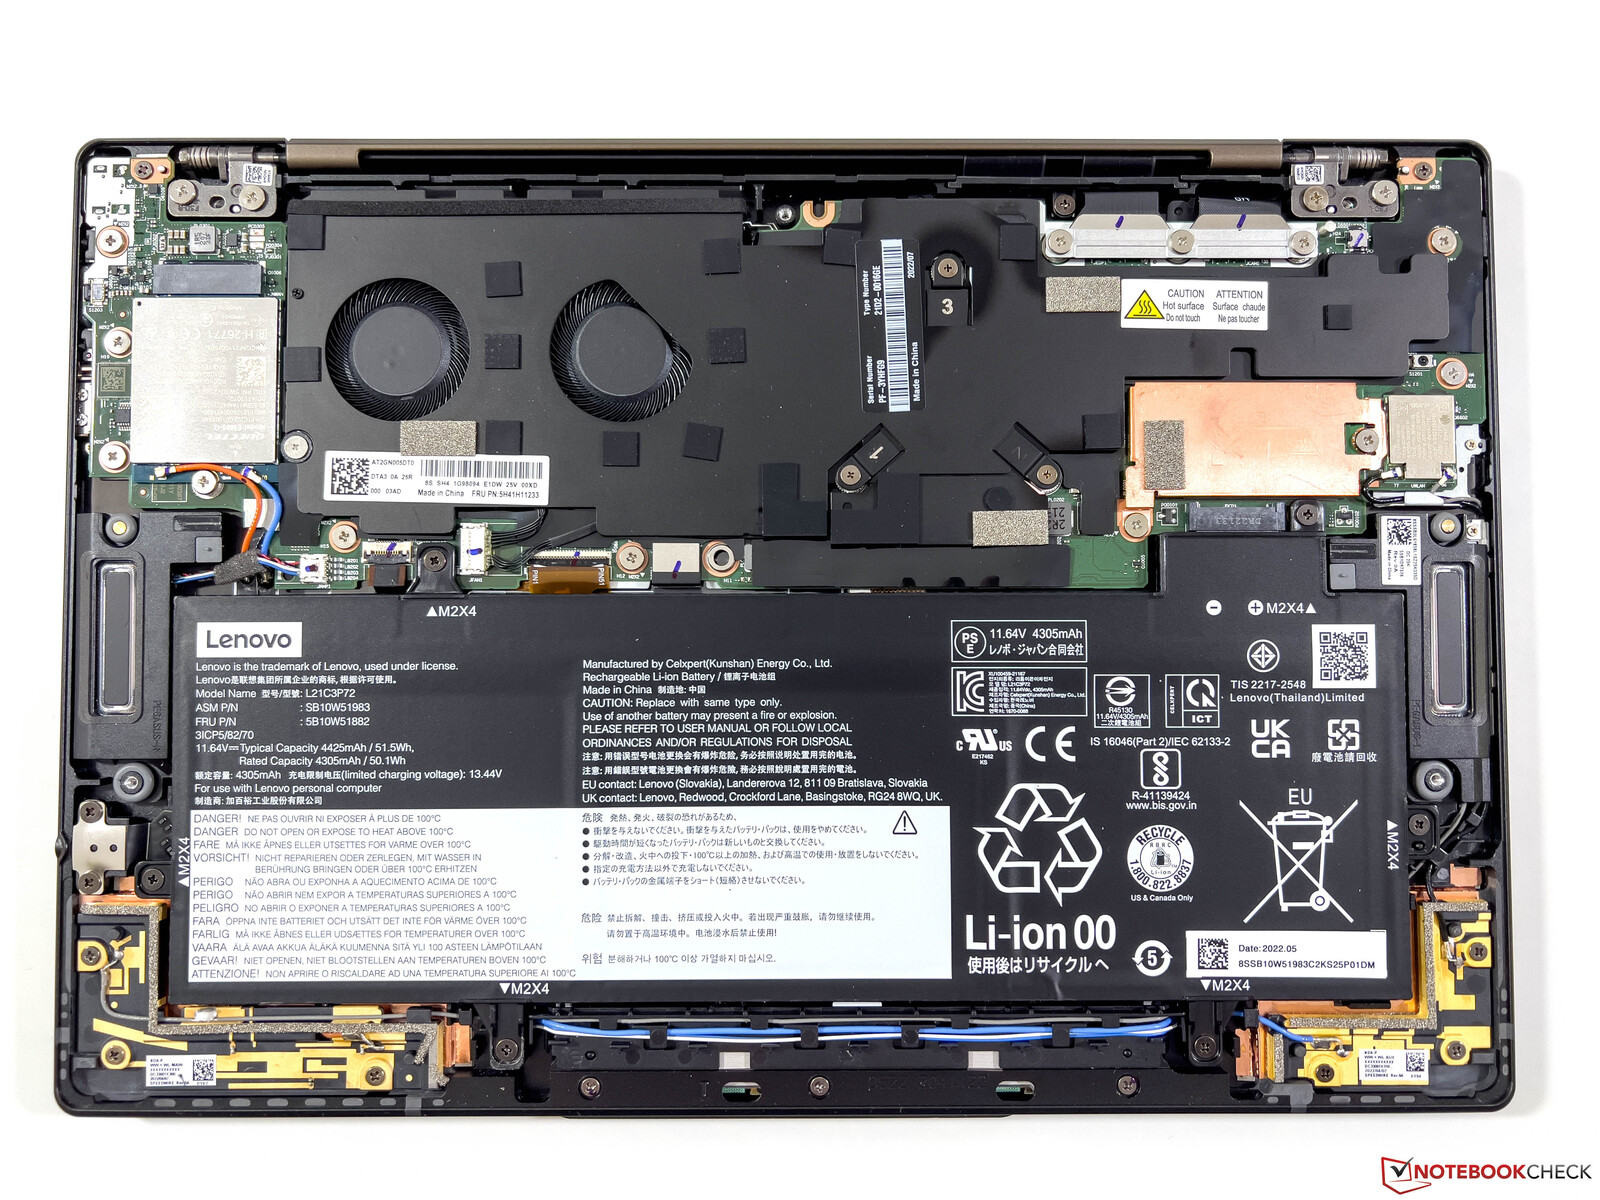
Wartung
Es gibt keine wesentlichen internen Unterschiede zwischen den Modellen Gen 1 und Gen 2.
Garantie
Die Basisgarantiezeit beträgt 36 Monate, falls das Gerät in Deutschland erworben wurde.
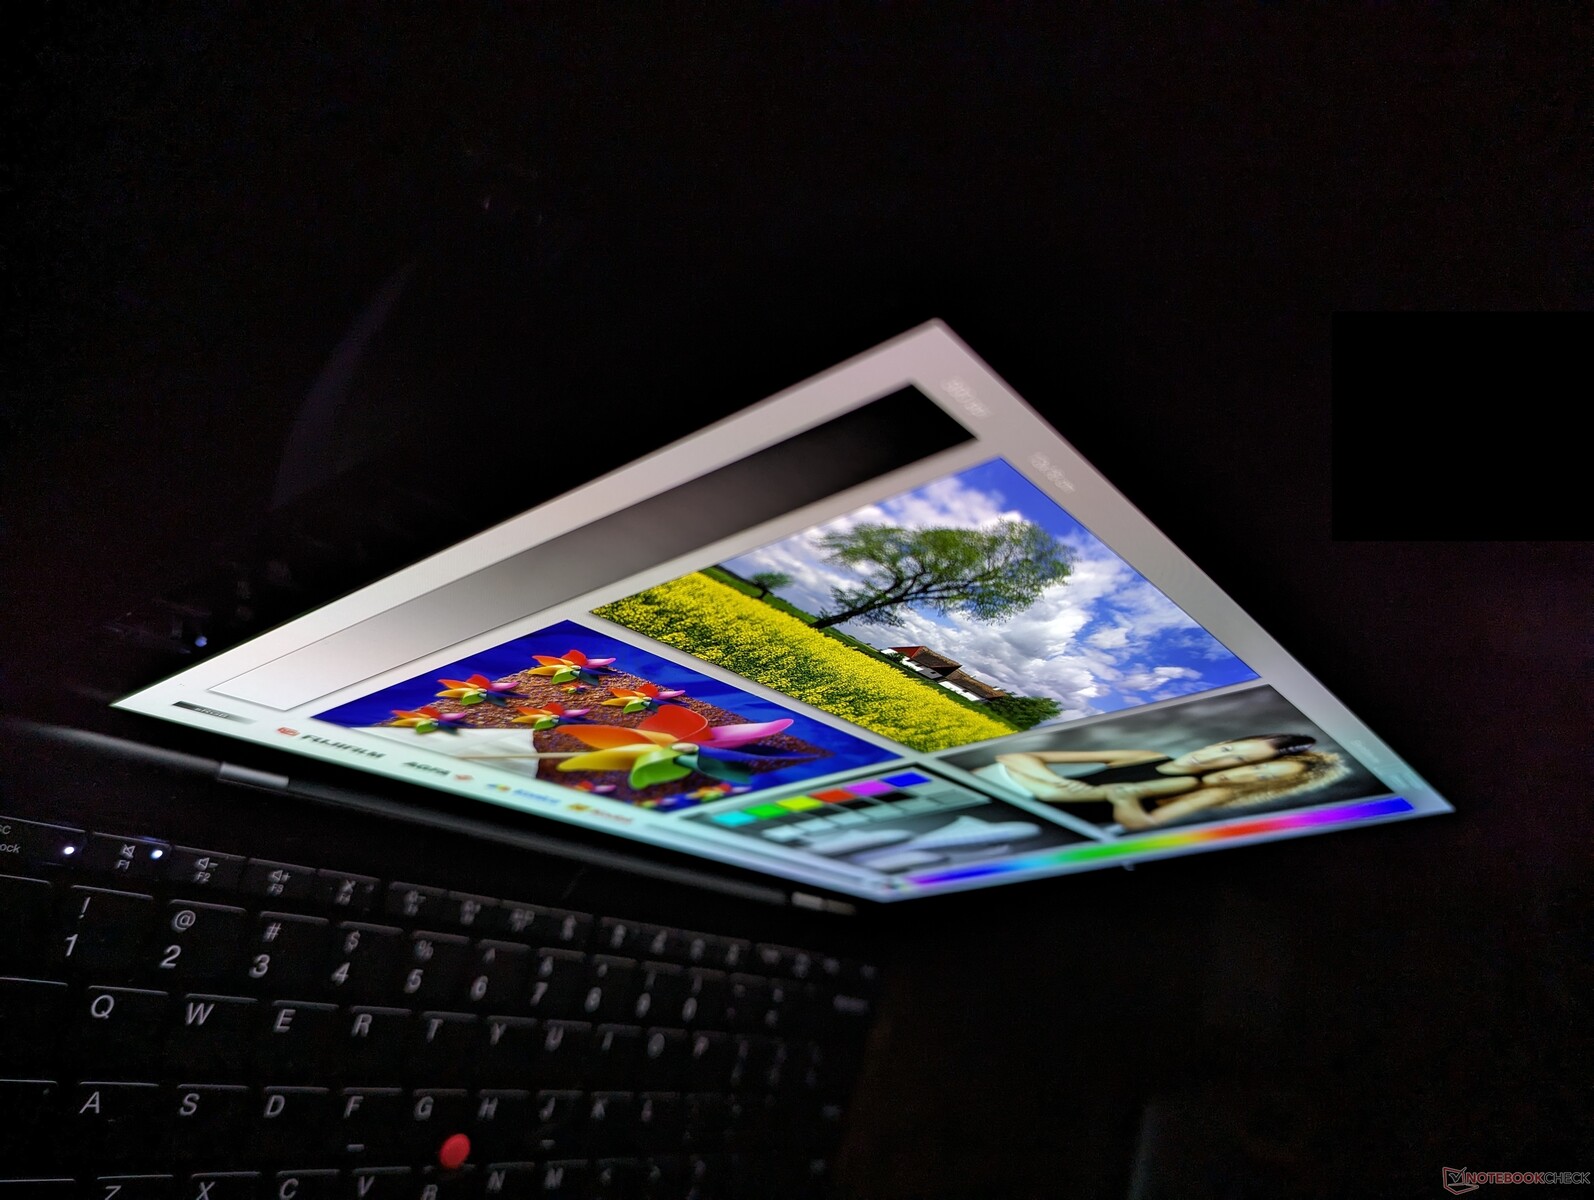
Display
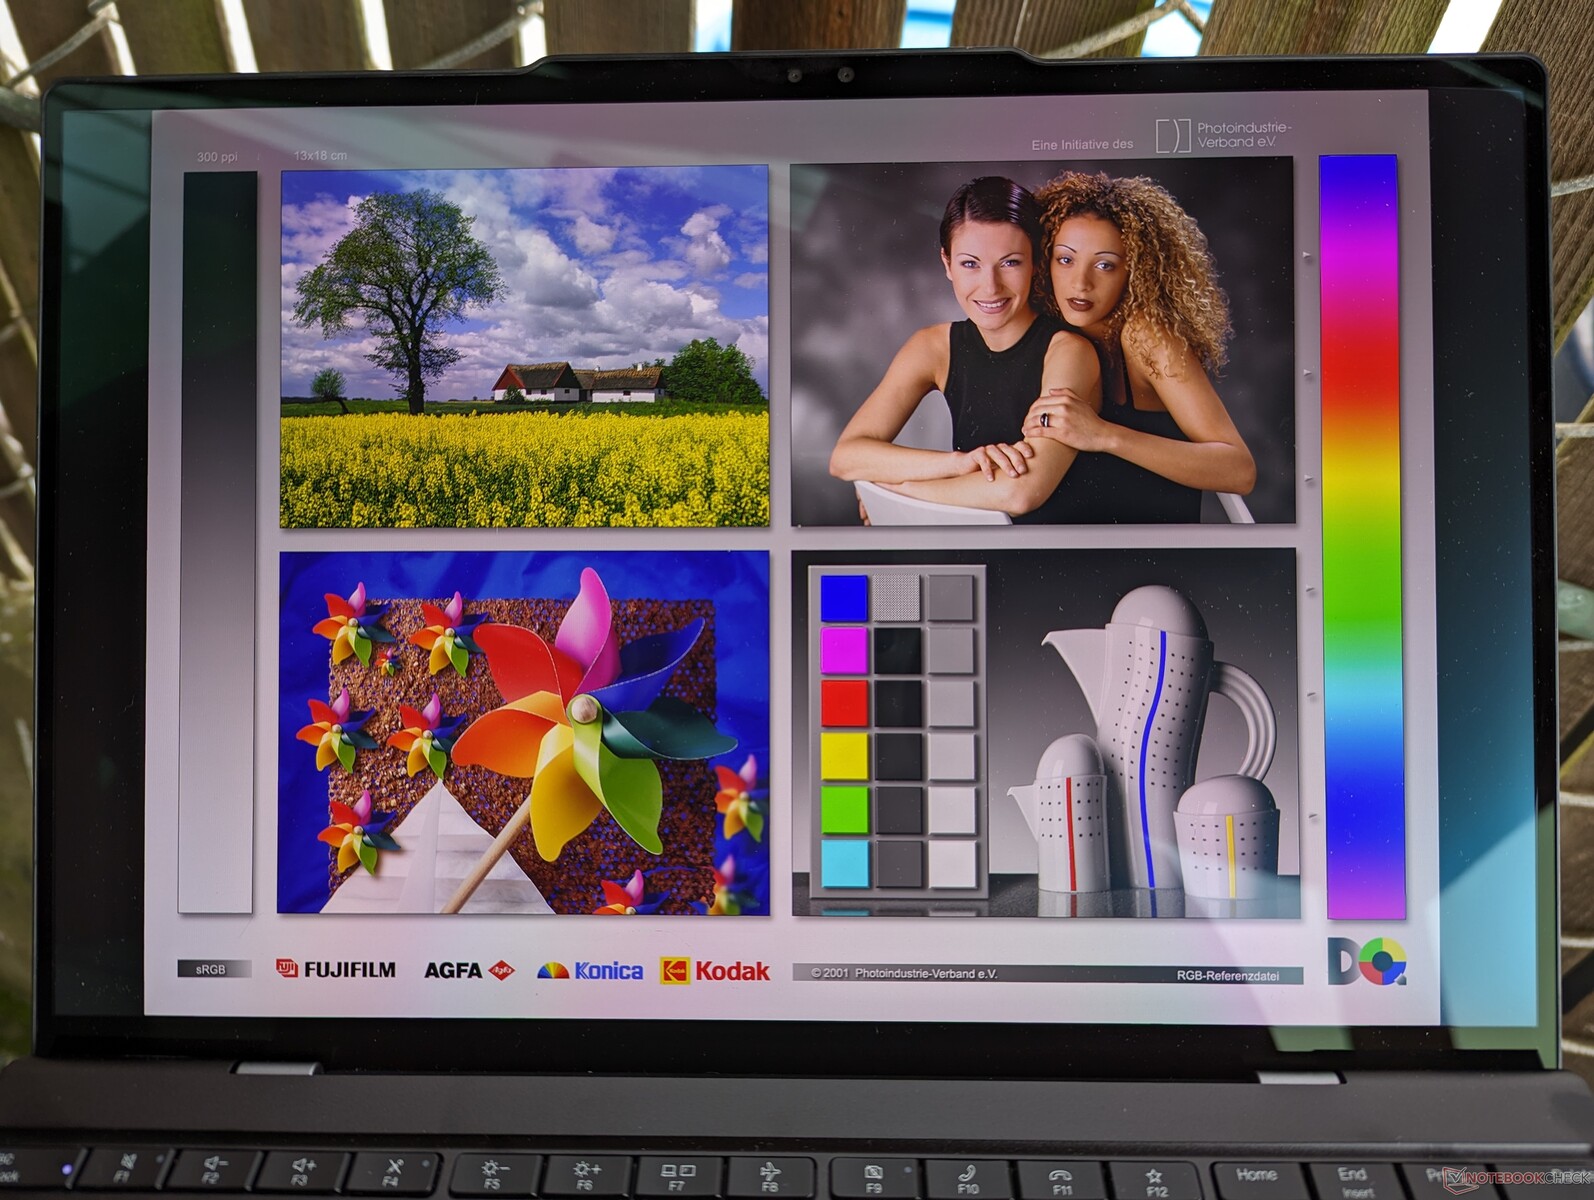
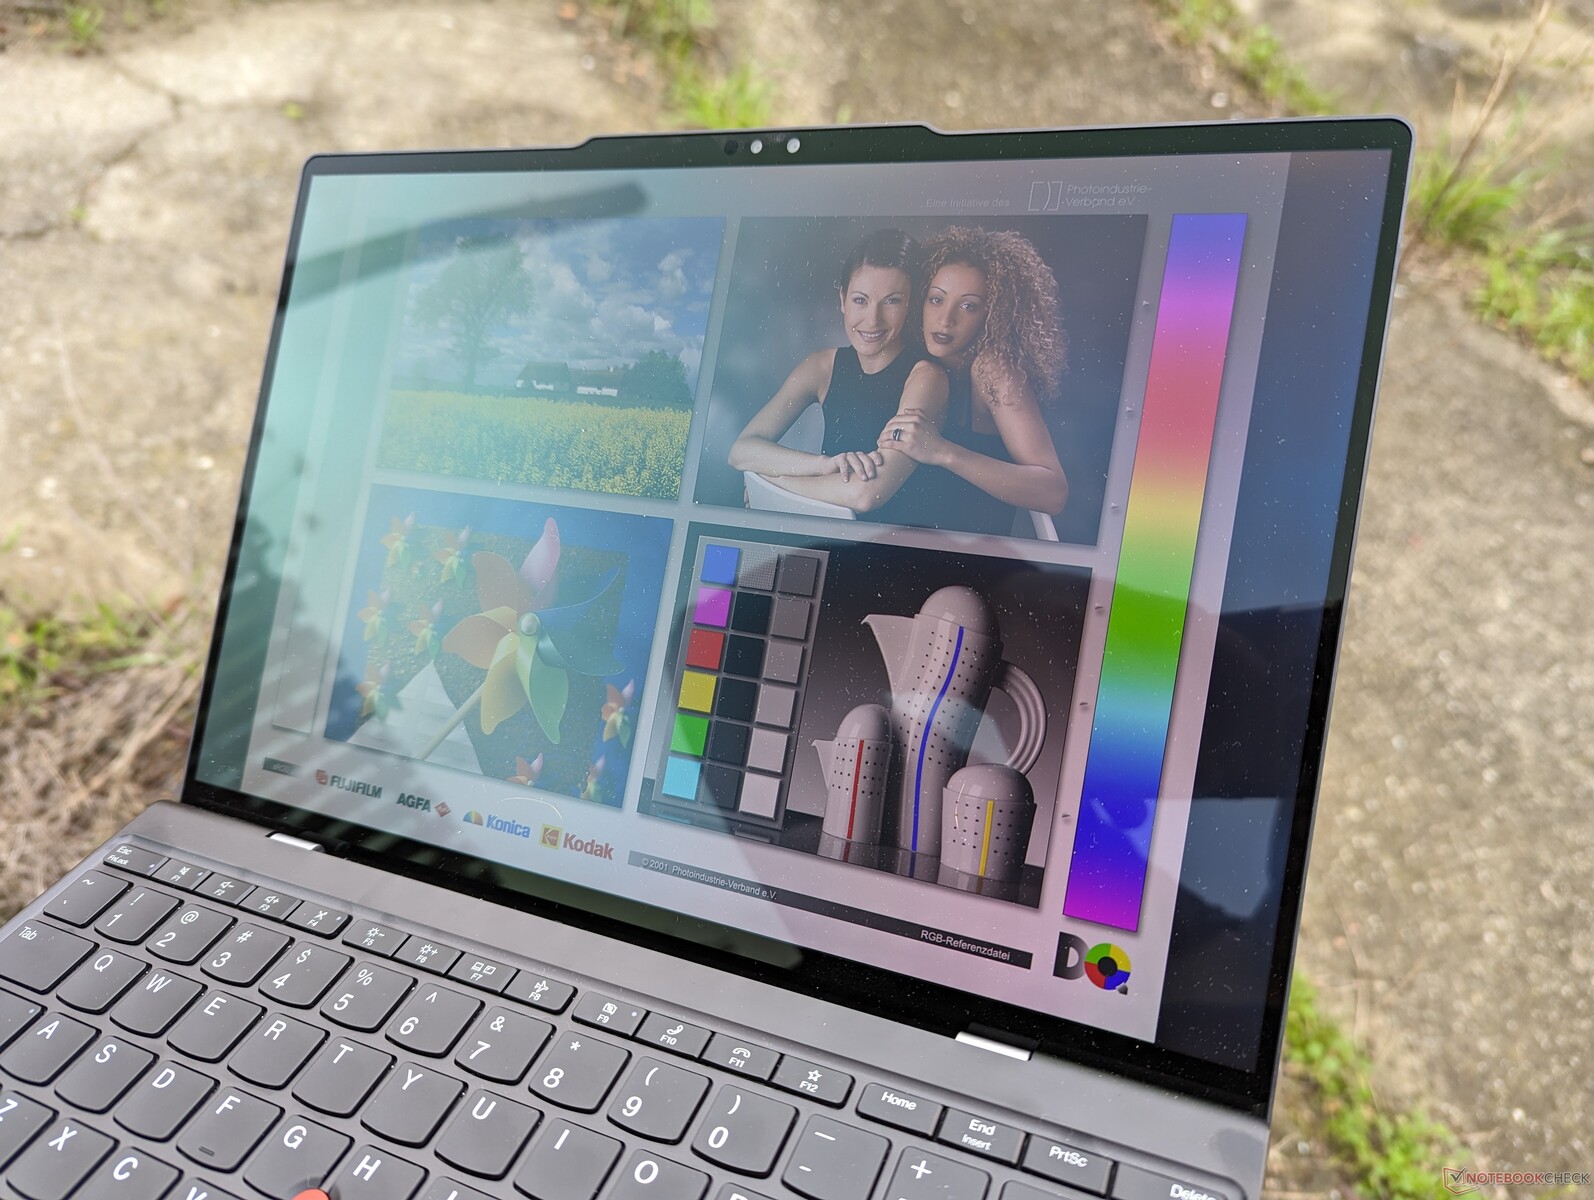
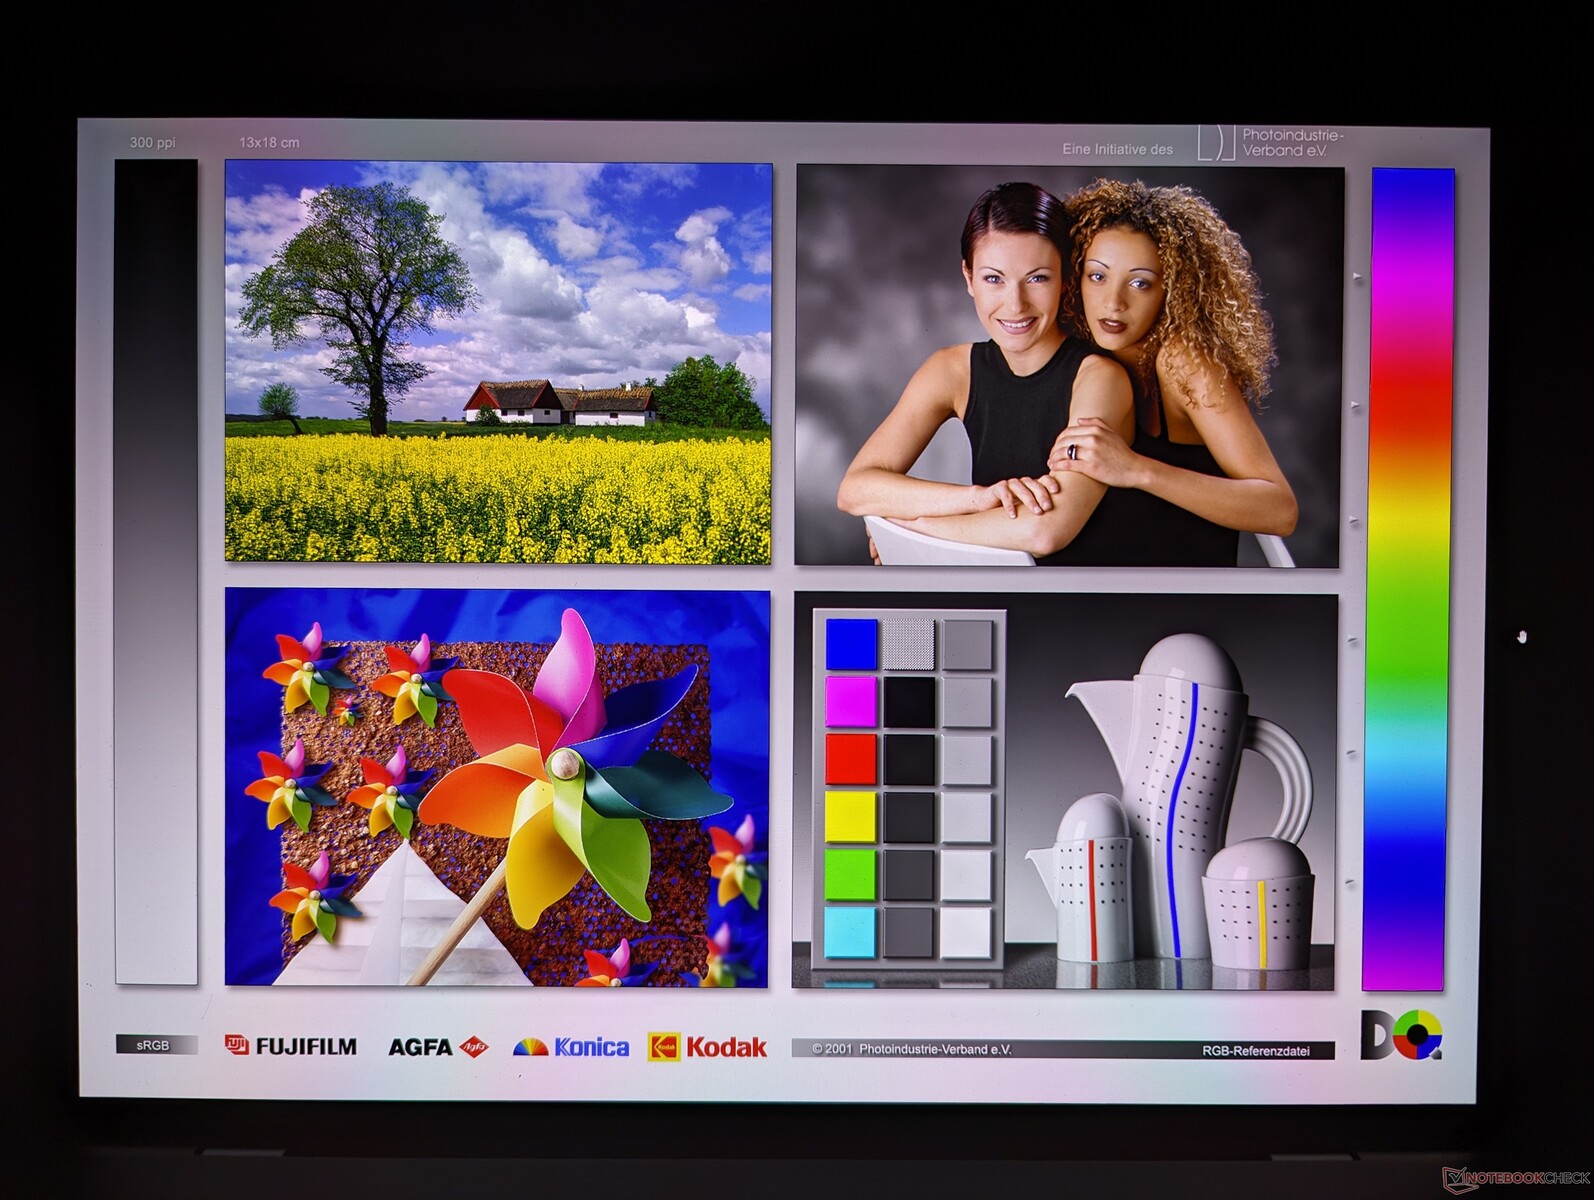
Der Samsung ATNA33AA02-0 1800p OLED-Touchscreen in unserem ThinkPad Z13 G2 ist identisch mit dem des ursprünglichen ThinkPad Z13 G1. Das Panel deckt DCI-P3 und HDR400 ab, was sattere Farben bietet als die meisten IPS-Panels anderer Subnotebooks. Es ist bedauerlich, dass es keine neuen Display-Optionen für das diesjährige Z13 G2 Modell gibt. Die Bildwiederholfrequenz von 60 Hz wirkt allmählich veraltet, insbesondere wenn 90 Hz- oder 120 Hz-Optionen immer verbreiteter werden.
Die maximale Helligkeit liegt standardmäßig bei 400 nits. HP ist nach wie vor einer der wenigen großen Hersteller, der deutlich hellere 1000-Nit-Panels auf vielen seiner konkurrierenden Subnotebooks, wie der 14-Zoll EliteBook 840 Serie anbietet. Wenn die Sichtbarkeit im Freien eine entscheidende Rolle spielt, kann ein Gerät wie das Elite Dragonfly eine sinnvolle Alternative zum ThinkPad Z13 sein.
| |||||||||||||||||||||||||
Ausleuchtung: 99 %
Helligkeit Akku: 372 cd/m²
Kontrast: ∞:1 (Schwarzwert: 0 cd/m²)
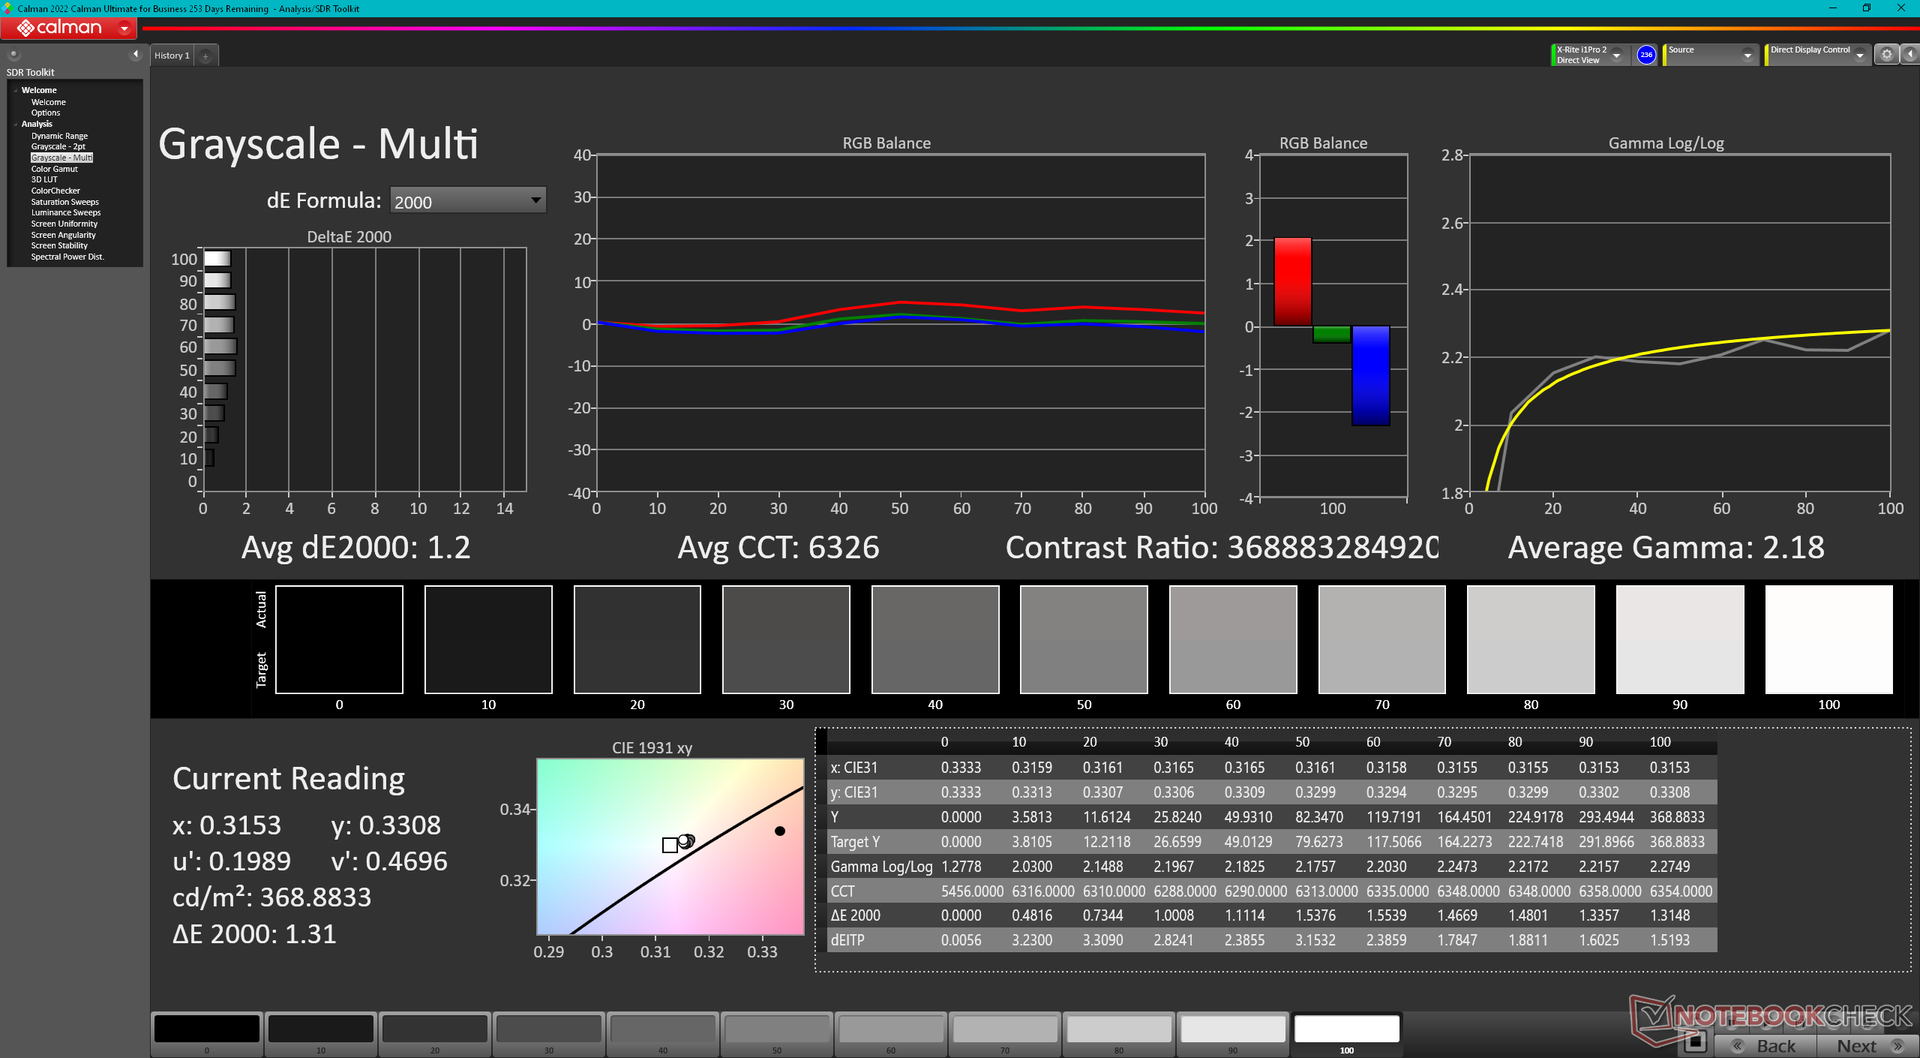
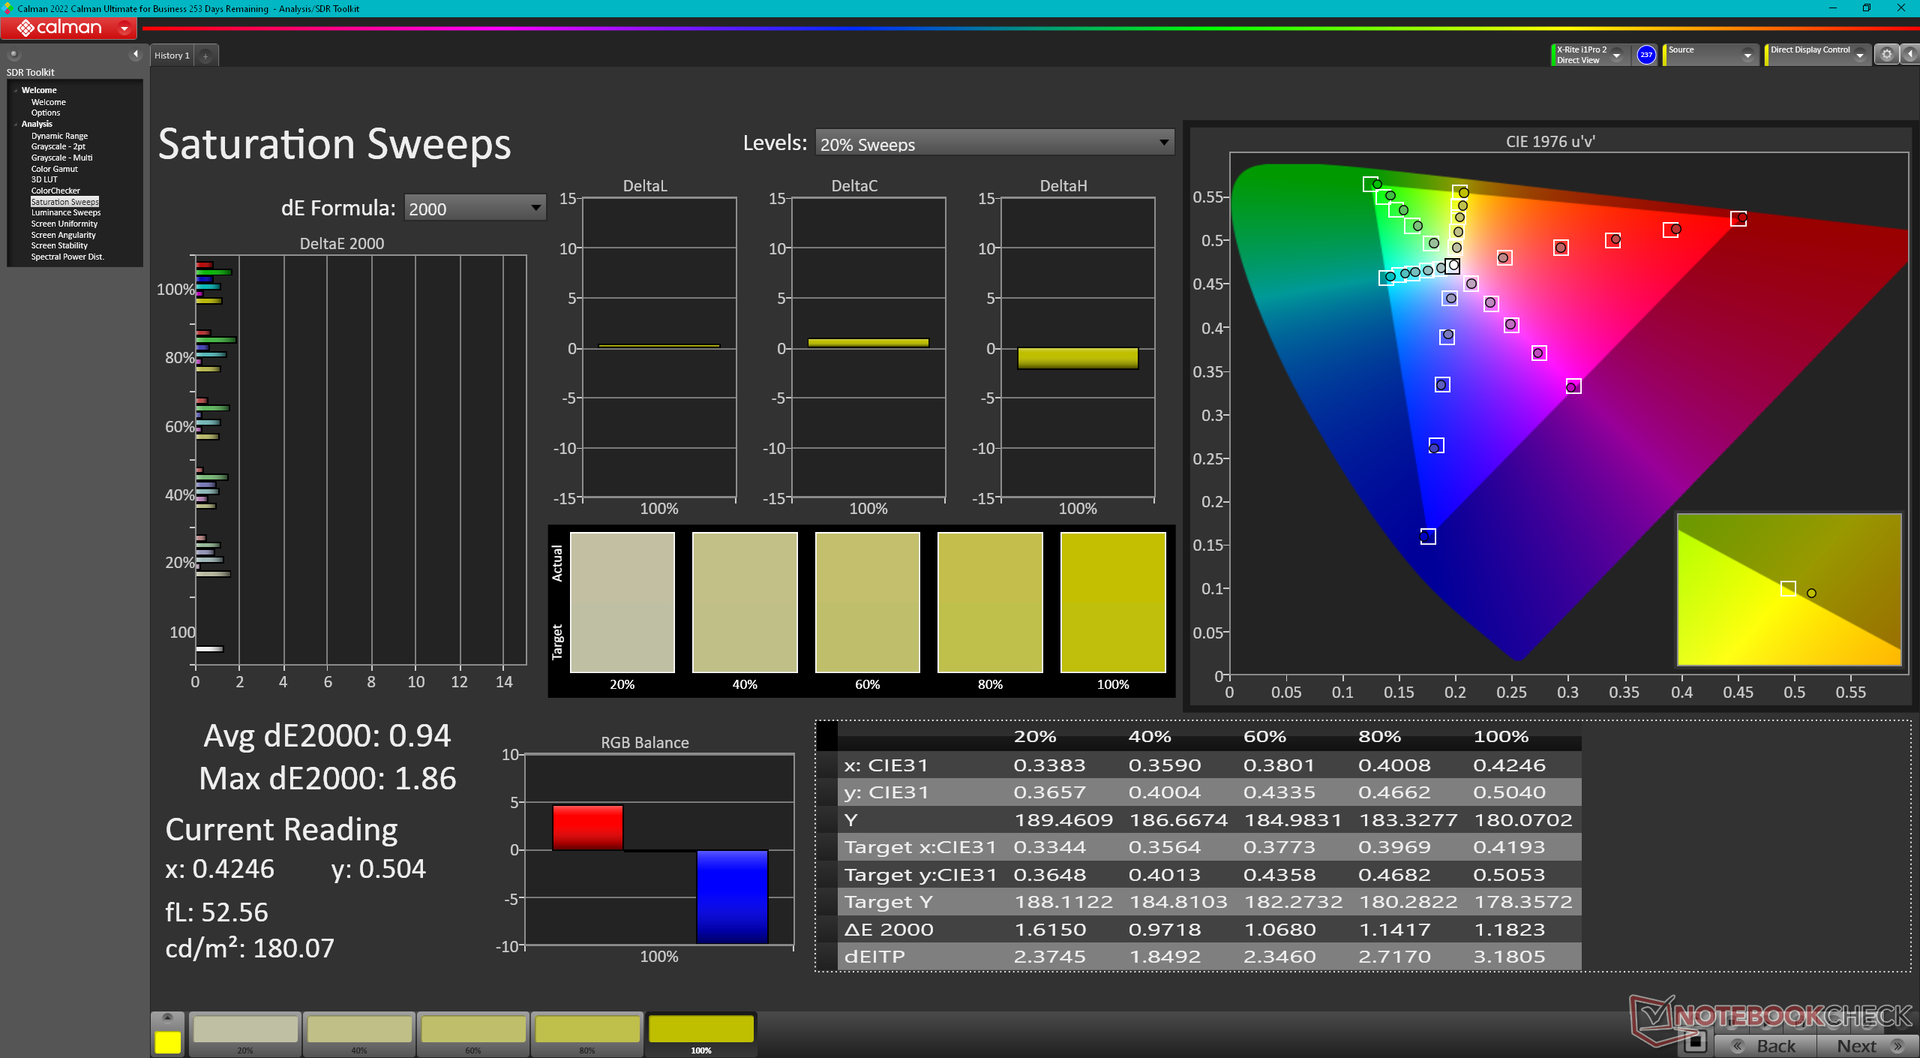
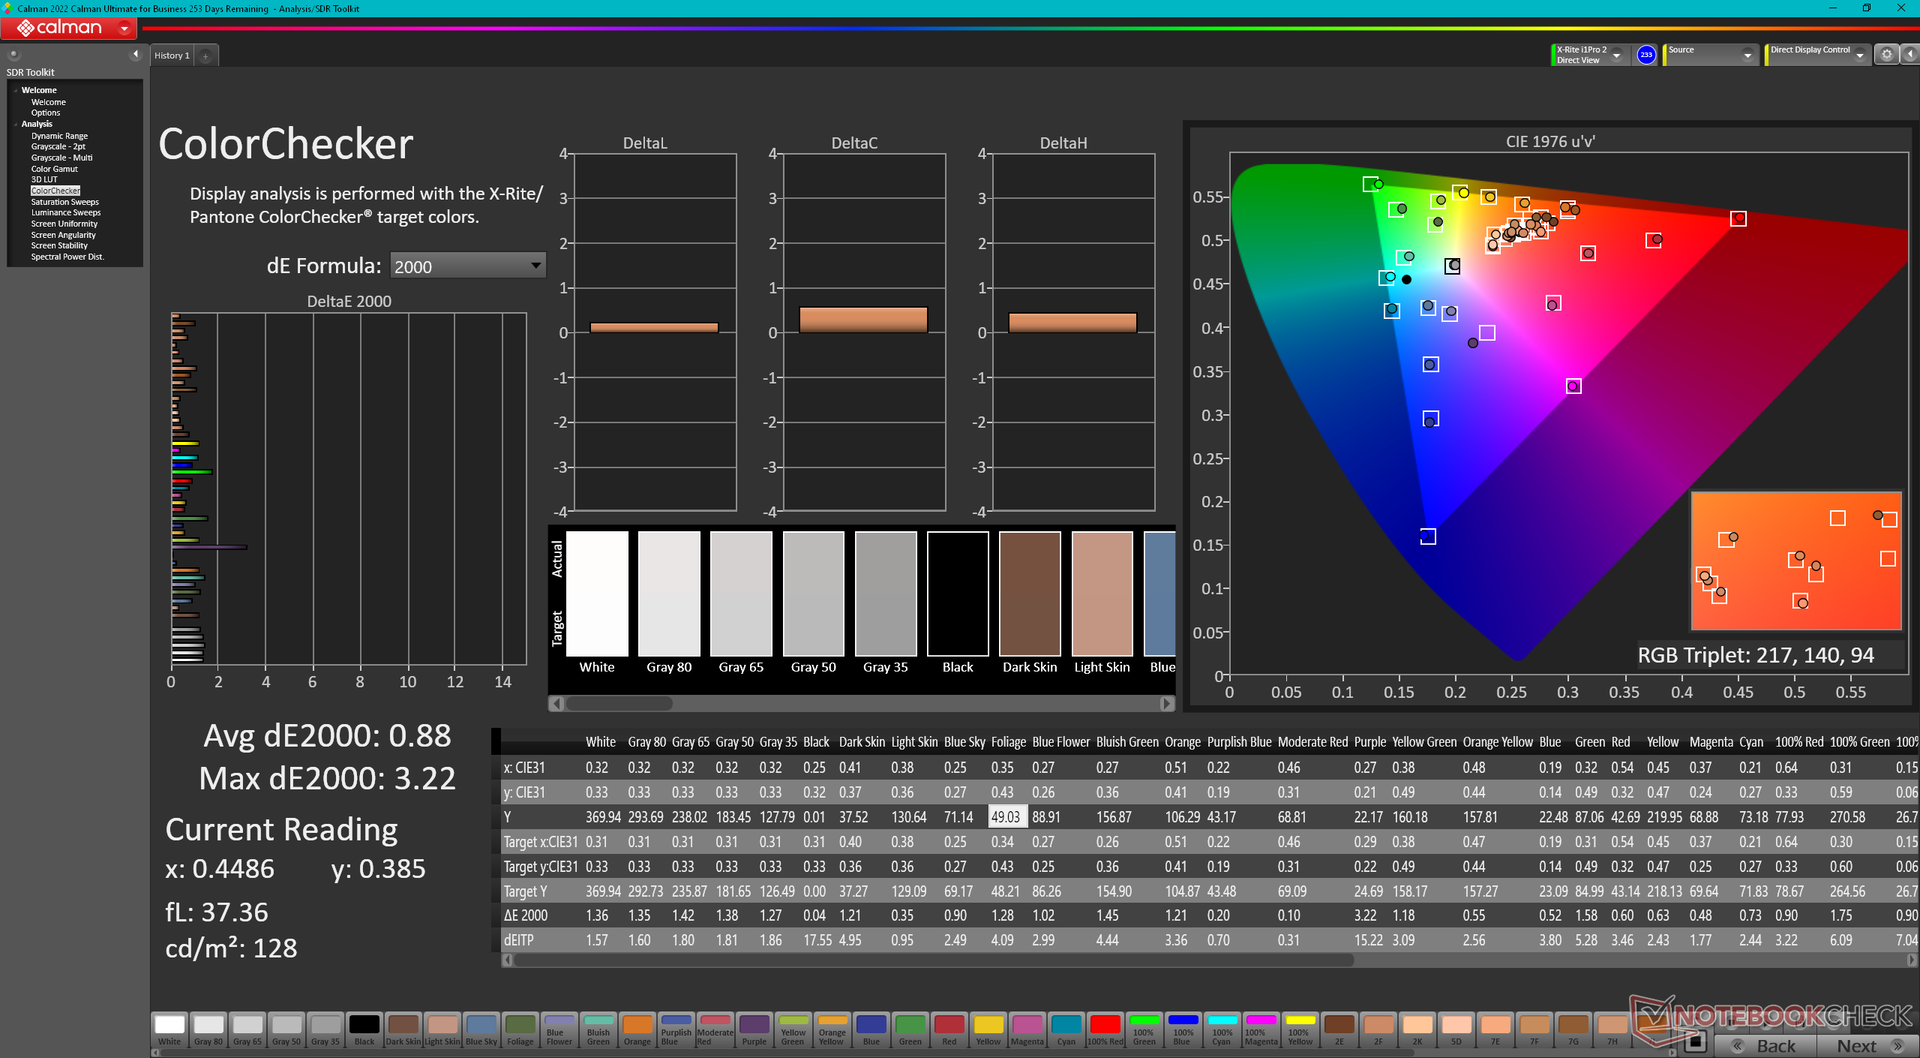
ΔE ColorChecker Calman: 0.88 | ∀{0.5-29.43 Ø4.72}
ΔE Greyscale Calman: 1.2 | ∀{0.09-98 Ø4.97}
97.3% AdobeRGB 1998 (Argyll 3D)
100% sRGB (Argyll 3D)
99.7% Display P3 (Argyll 3D)
Gamma: 2.18
CCT: 6326 K
| Lenovo ThinkPad Z13 Gen 2 ATNA33AA02-0, OLED, 2880x1800, 13.3" | HP Dragonfly G4 Chi Mei CMN13C0, IPS, 1920x1280, 13.5" | Dell Latitude 13 7340 i5-1345U Chi Mei 133JCG, IPS, 1920x1200, 13.3" | Lenovo ThinkPad Z13 21D2CTO1WW NV133WUM-N63, IPS LED, 1920x1200, 13.3" | Lenovo ThinkPad X1 Nano Gen 3 MND007ZA1-3, IPS, 2160x1350, 13" | Framework Laptop 13.5 Ryzen 7 7840U BOE CQ NE135FBM-N41, IPS, 2256x1504, 13.5" | |
|---|---|---|---|---|---|---|
| Display | -20% | -22% | -21% | -20% | -20% | |
| Display P3 Coverage (%) | 99.7 | 68.4 -31% | 65.9 -34% | 67.7 -32% | 68.5 -31% | 69 -31% |
| sRGB Coverage (%) | 100 | 98.3 -2% | 96.8 -3% | 96.5 -3% | 99.5 0% | 99.1 -1% |
| AdobeRGB 1998 Coverage (%) | 97.3 | 70.4 -28% | 67.8 -30% | 69.7 -28% | 69.7 -28% | 71.1 -27% |
| Response Times | -1774% | -1775% | -1589% | -1437% | -1816% | |
| Response Time Grey 50% / Grey 80% * (ms) | 2.1 ? | 48.8 ? -2224% | 51 ? -2329% | 49 ? -2233% | 39.9 ? -1800% | 50.4 ? -2300% |
| Response Time Black / White * (ms) | 2.2 ? | 31.3 ? -1323% | 29.04 ? -1220% | 23 ? -945% | 25.8 ? -1073% | 31.5 ? -1332% |
| PWM Frequency (Hz) | 60.1 ? | |||||
| Bildschirm | -39% | -107% | -32% | -22% | -46% | |
| Helligkeit Bildmitte (cd/m²) | 372 | 408.8 10% | 471 27% | 418 12% | 461.2 24% | 436 17% |
| Brightness (cd/m²) | 375 | 399 6% | 437 17% | 379 1% | 428 14% | 416 11% |
| Brightness Distribution (%) | 99 | 90 -9% | 87 -12% | 81 -18% | 86 -13% | 89 -10% |
| Schwarzwert * (cd/m²) | 0.32 | 0.2033 | 0.33 | 0.29 | 0.36 | |
| Delta E Colorchecker * | 0.88 | 2.02 -130% | 3.24 -268% | 1.7 -93% | 1.79 -103% | 1.81 -106% |
| Colorchecker dE 2000 max. * | 3.22 | 3.84 -19% | 7.19 -123% | 3.3 -2% | 3.3 -2% | 4.73 -47% |
| Delta E Graustufen * | 1.2 | 2.3 -92% | 4.6 -283% | 2.3 -92% | 1.8 -50% | 2.9 -142% |
| Gamma | 2.18 101% | 2.2 100% | 2.14 103% | 2.24 98% | 2.27 97% | |
| CCT | 6326 103% | 6203 105% | 6520 100% | 6499 100% | 6588 99% | 6784 96% |
| Kontrast (:1) | 1278 | 2317 | 1267 | 1590 | 1211 | |
| Colorchecker dE 2000 calibrated * | 0.61 | 1.08 | 1.1 | 0.47 | 0.45 | |
| Durchschnitt gesamt (Programm / Settings) | -611% /
-349% | -635% /
-387% | -547% /
-312% | -493% /
-278% | -627% /
-361% |
* ... kleinere Werte sind besser
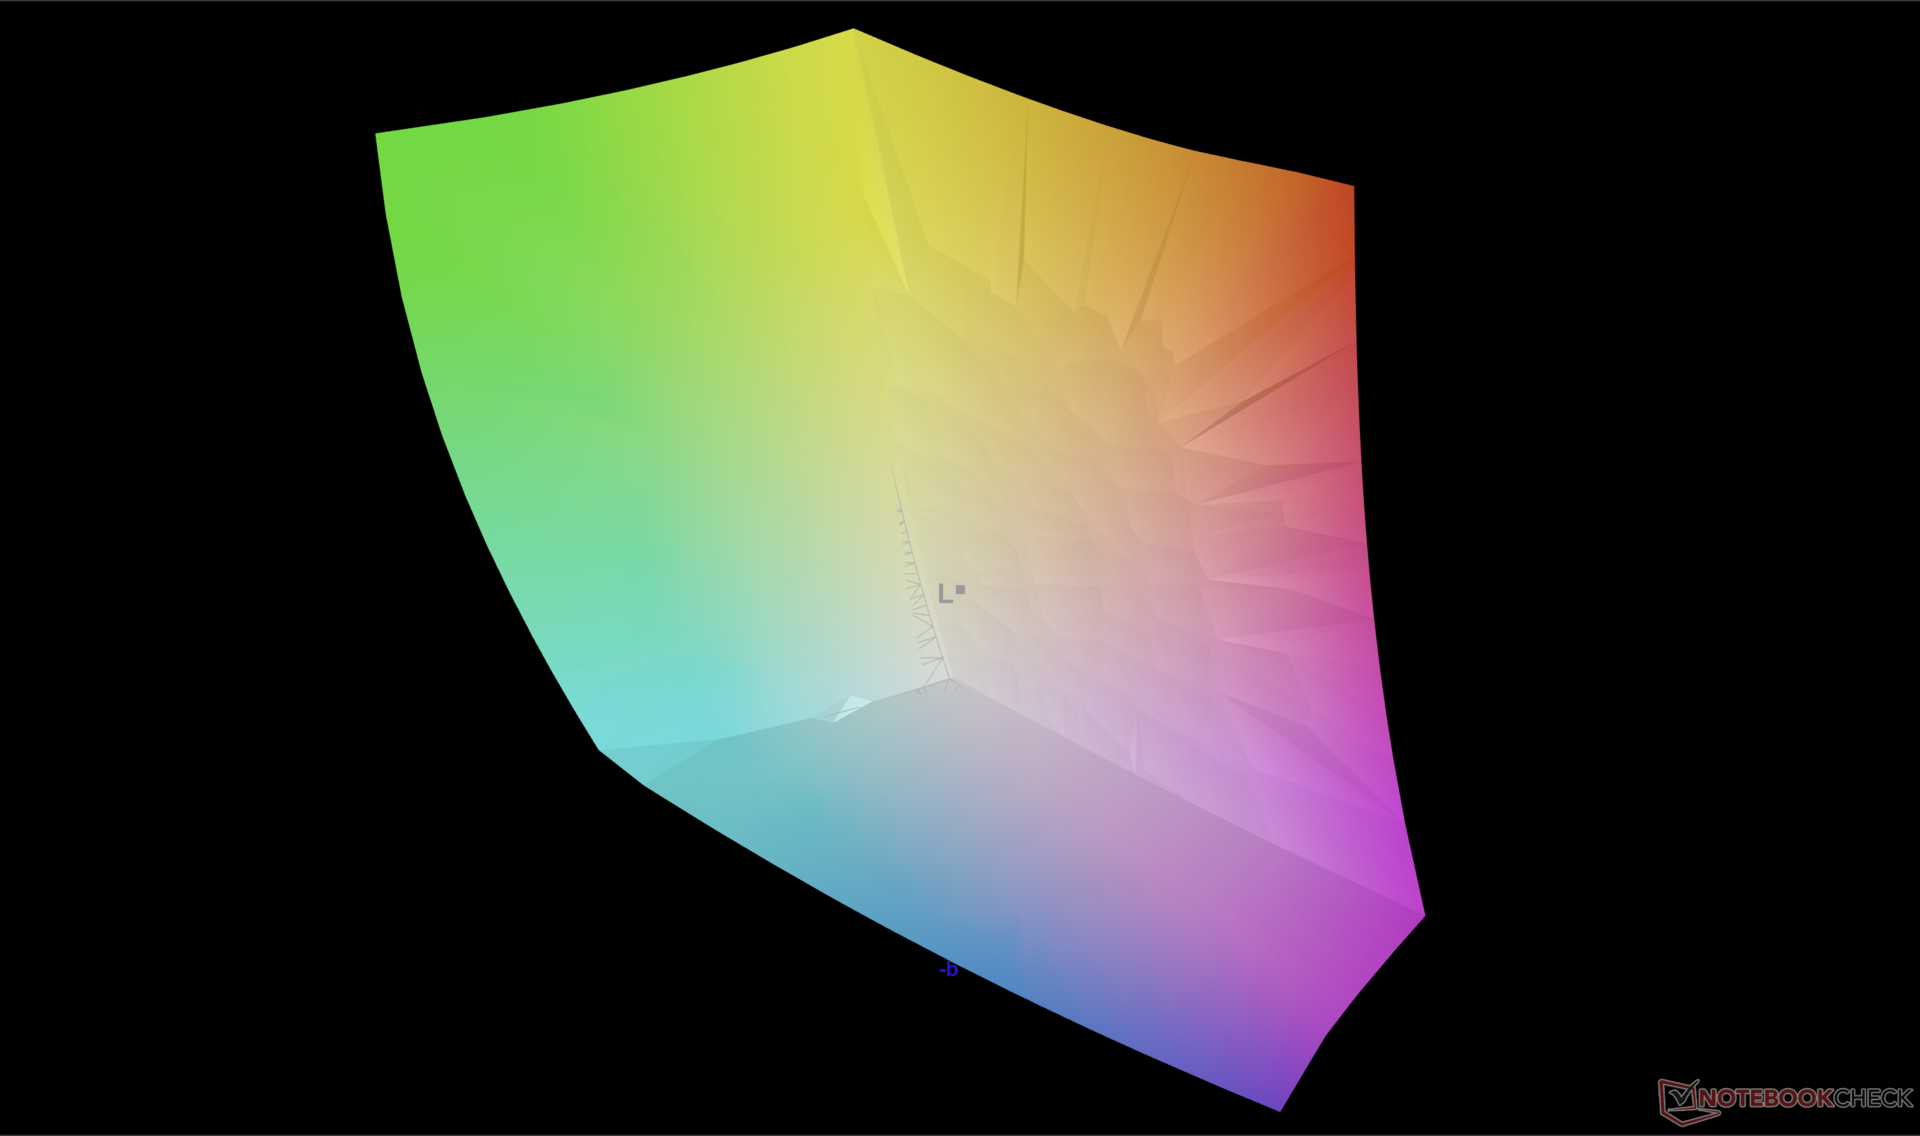
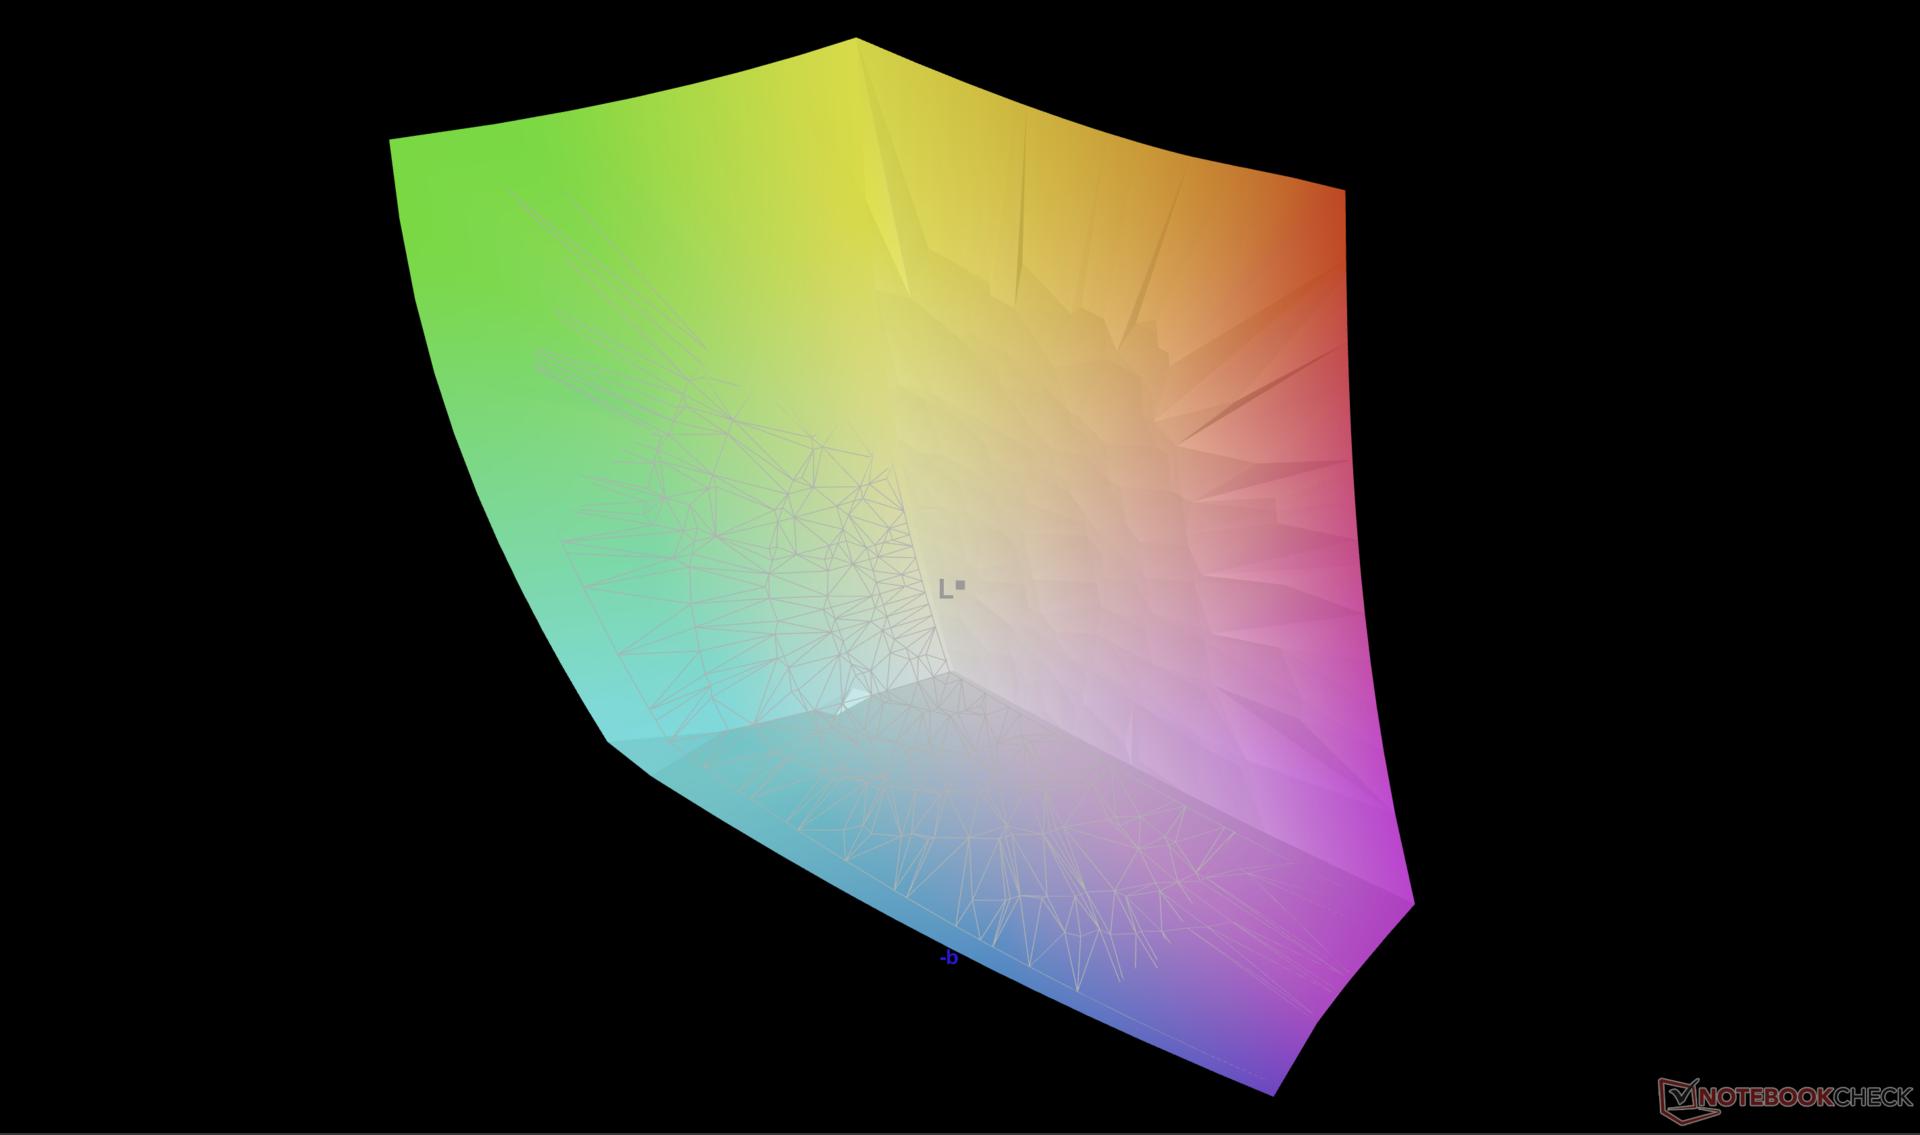
Das Display ist ab Werk gut kalibriert und weist durchschnittliche Graustufen- und Farb-DeltaE-Werte von nur 1,2 bzw. 0,88 auf. Allerdings sind die Farben standardmäßig auf sRGB eingestellt, obwohl das OLED-Panel volle DCI-P3-Farben unterstützt.
Reaktionszeiten (Response Times) des Displays
| ↔ Reaktionszeiten Schwarz zu Weiß | ||
|---|---|---|
| 2.2 ms ... steigend ↗ und fallend ↘ kombiniert | ↗ 1 ms steigend | 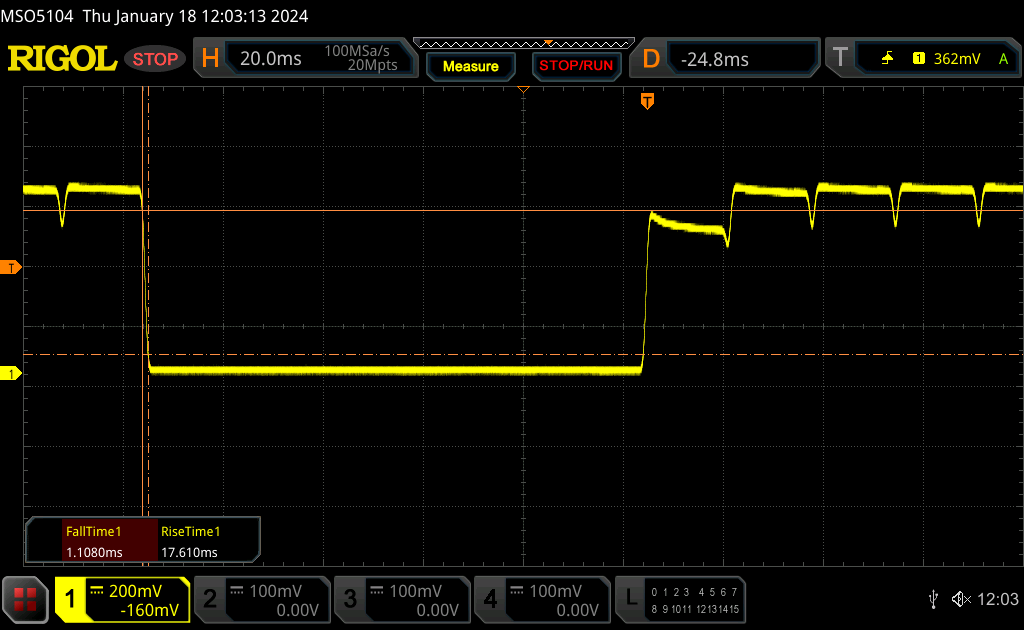 |
| ↘ 1.2 ms fallend | ||
| Die gemessenen Reaktionszeiten sind sehr kurz, wodurch sich der Bildschirm auch für schnelle 3D Spiele eignen sollte. Im Vergleich rangierten die bei uns getesteten Geräte von 0.1 (Minimum) zu 240 (Maximum) ms. » 12 % aller Screens waren schneller als der getestete. Daher sind die gemessenen Reaktionszeiten besser als der Durchschnitt aller vermessenen Geräte (19.8 ms). | ||
| ↔ Reaktionszeiten 50% Grau zu 80% Grau | ||
| 2.1 ms ... steigend ↗ und fallend ↘ kombiniert | ↗ 1.1 ms steigend | 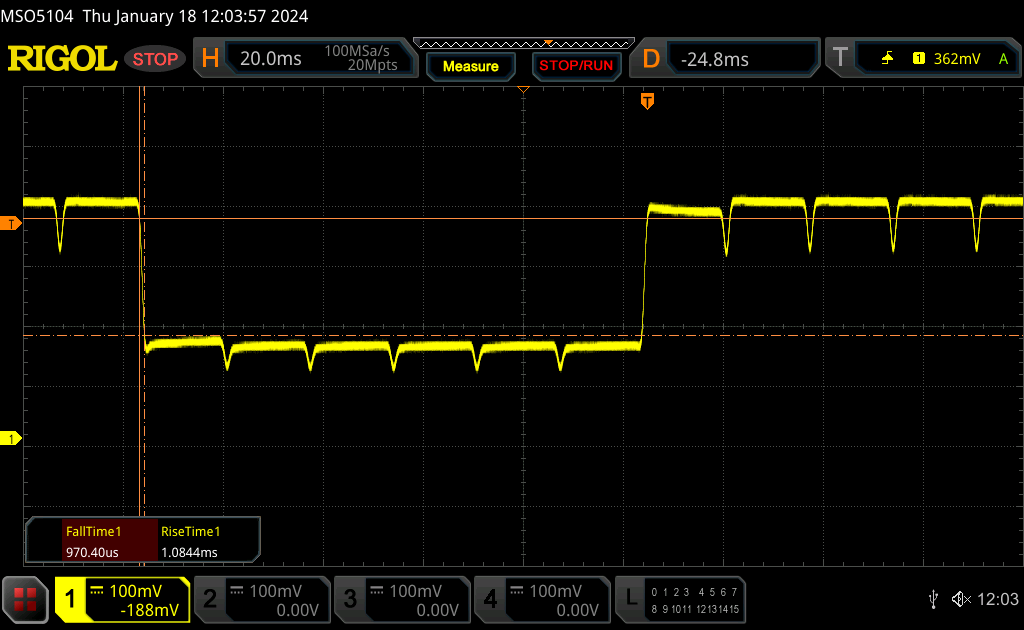 |
| ↘ 1 ms fallend | ||
| Die gemessenen Reaktionszeiten sind sehr kurz, wodurch sich der Bildschirm auch für schnelle 3D Spiele eignen sollte. Im Vergleich rangierten die bei uns getesteten Geräte von 0.165 (Minimum) zu 636 (Maximum) ms. » 11 % aller Screens waren schneller als der getestete. Daher sind die gemessenen Reaktionszeiten besser als der Durchschnitt aller vermessenen Geräte (31 ms). | ||
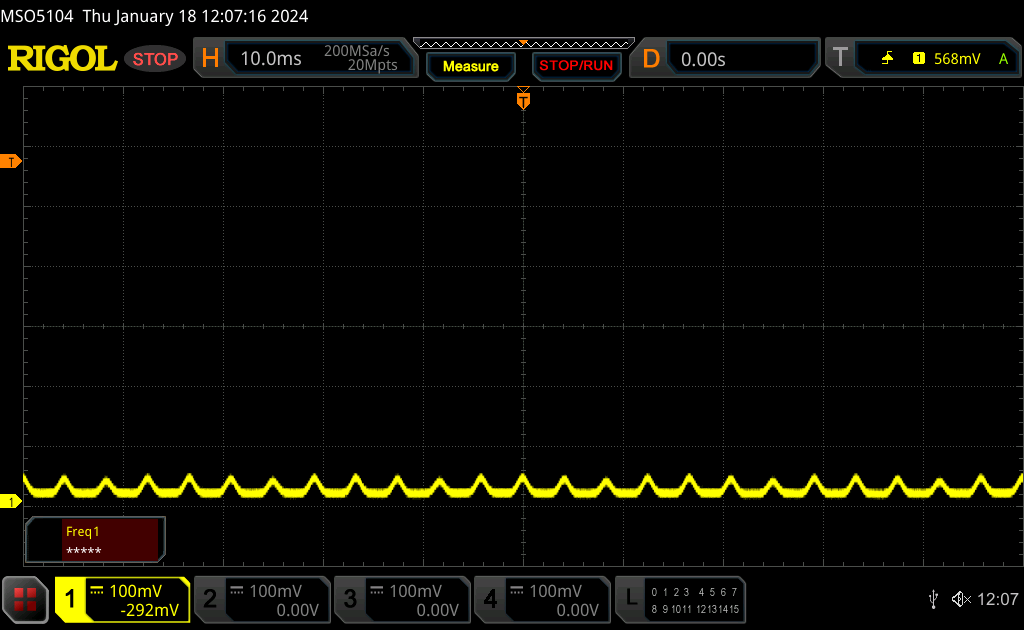
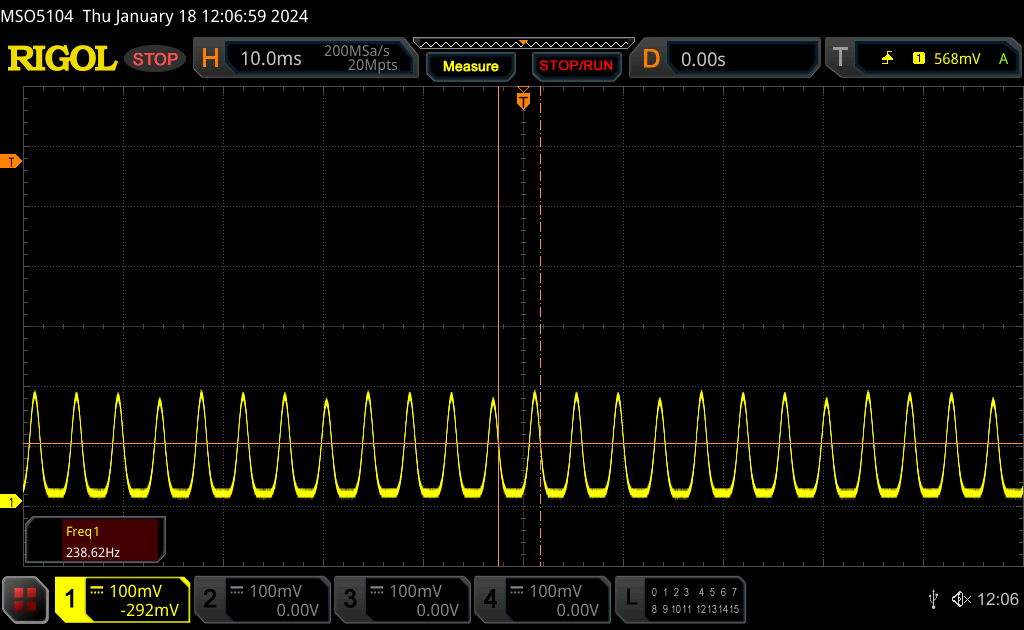
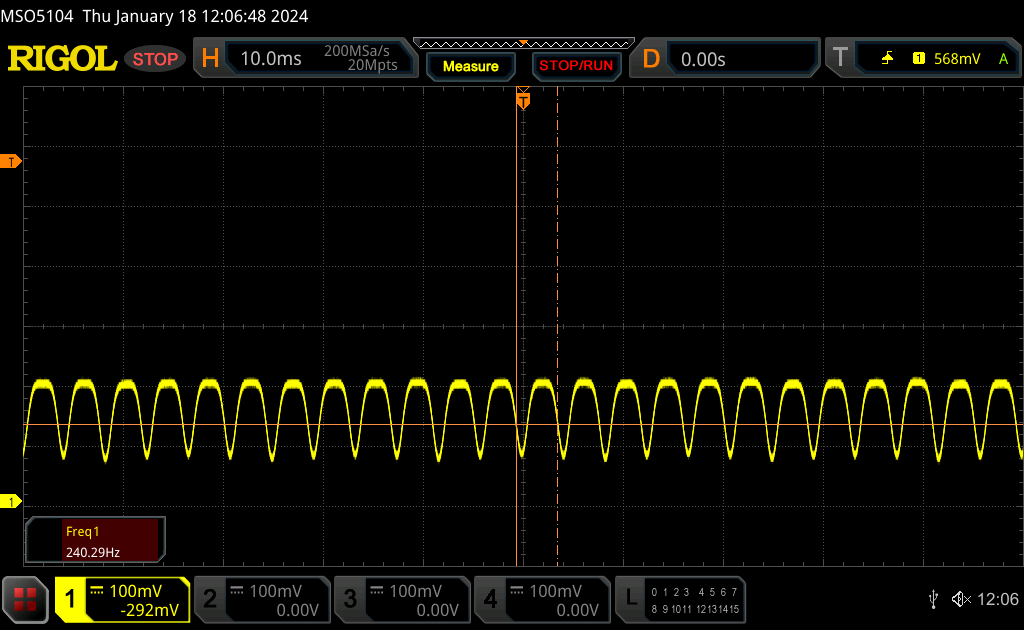
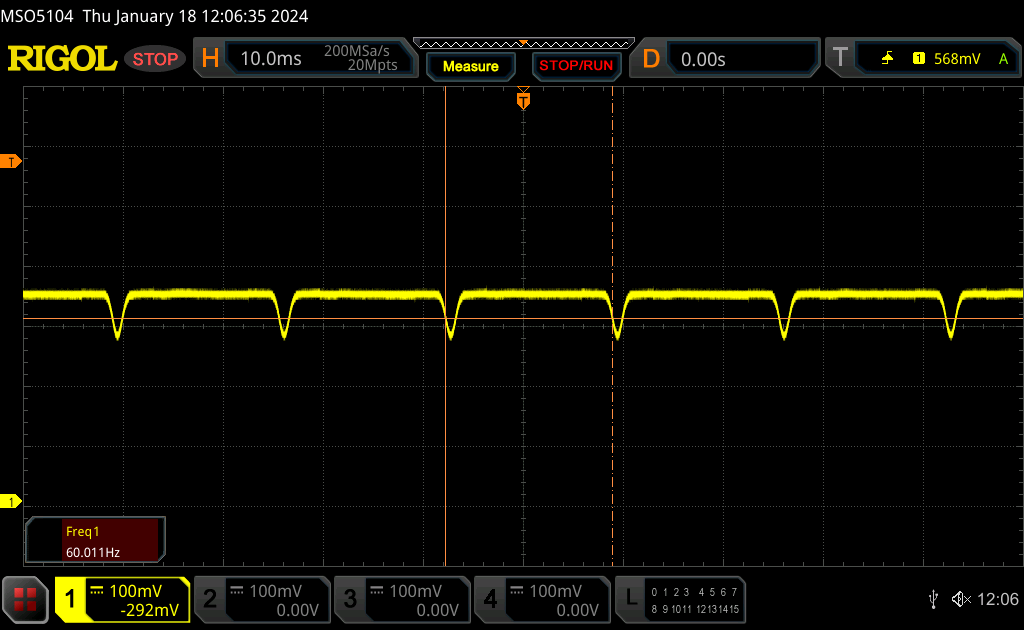
Bildschirm-Flackern / PWM (Pulse-Width Modulation)
| Flackern / PWM festgestellt | 60.1 Hz | ≤ 100 % Helligkeit | 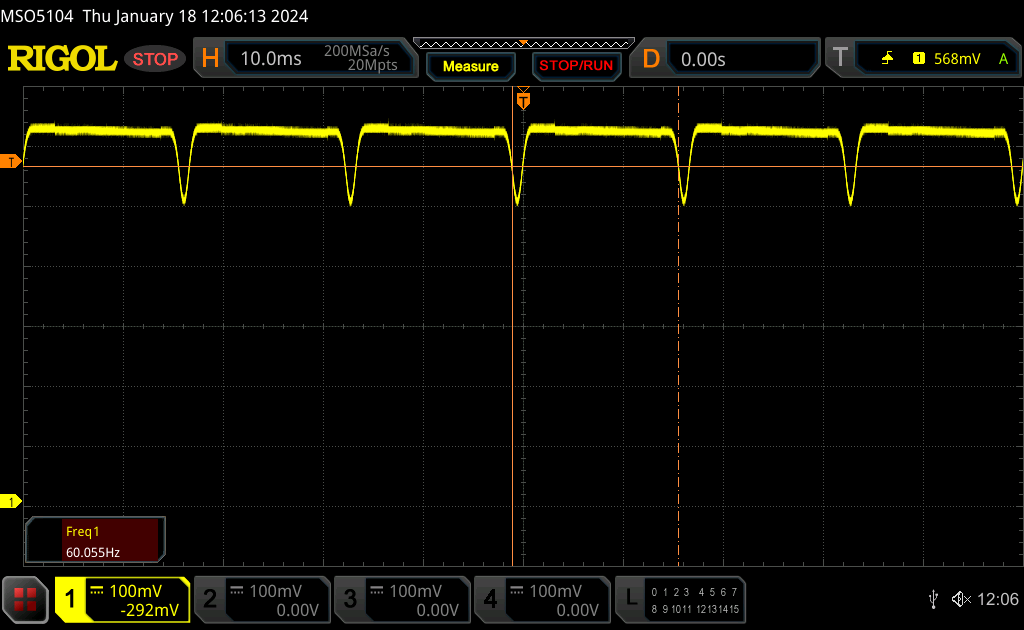 |
Das Display flackert mit 60.1 Hz (im schlimmsten Fall, eventuell durch Pulsweitenmodulation PWM) bei einer eingestellten Helligkeit von 100 % und darunter. Darüber sollte es zu keinem Flackern kommen. Die Frequenz von 60.1 Hz ist sehr gering und daher kann es bei allen Usern zu sichtbaren Flackern, brennenden Augen oder Kopfweh kommen. Im Vergleich: 52 % aller getesteten Geräte nutzten kein PWM um die Helligkeit zu reduzieren. Wenn PWM eingesetzt wurde, dann bei einer Frequenz von durchschnittlich 7763 (Minimum 5, Maximum 343500) Hz. | |||
Wie bei den meisten anderen OLED-Panels ist auch auf diesem Display eine Pulsweitenmodulation oder ein Flackern auf allen Helligkeitsstufen vorhanden. Die Frequenz liegt stabil bei 238,6 Hz von 0 bis 52 Prozent Helligkeit, bevor sie von 53 bis 100 Prozent Helligkeit auf 60 Hz wechselt.

Performance
Testbedingungen
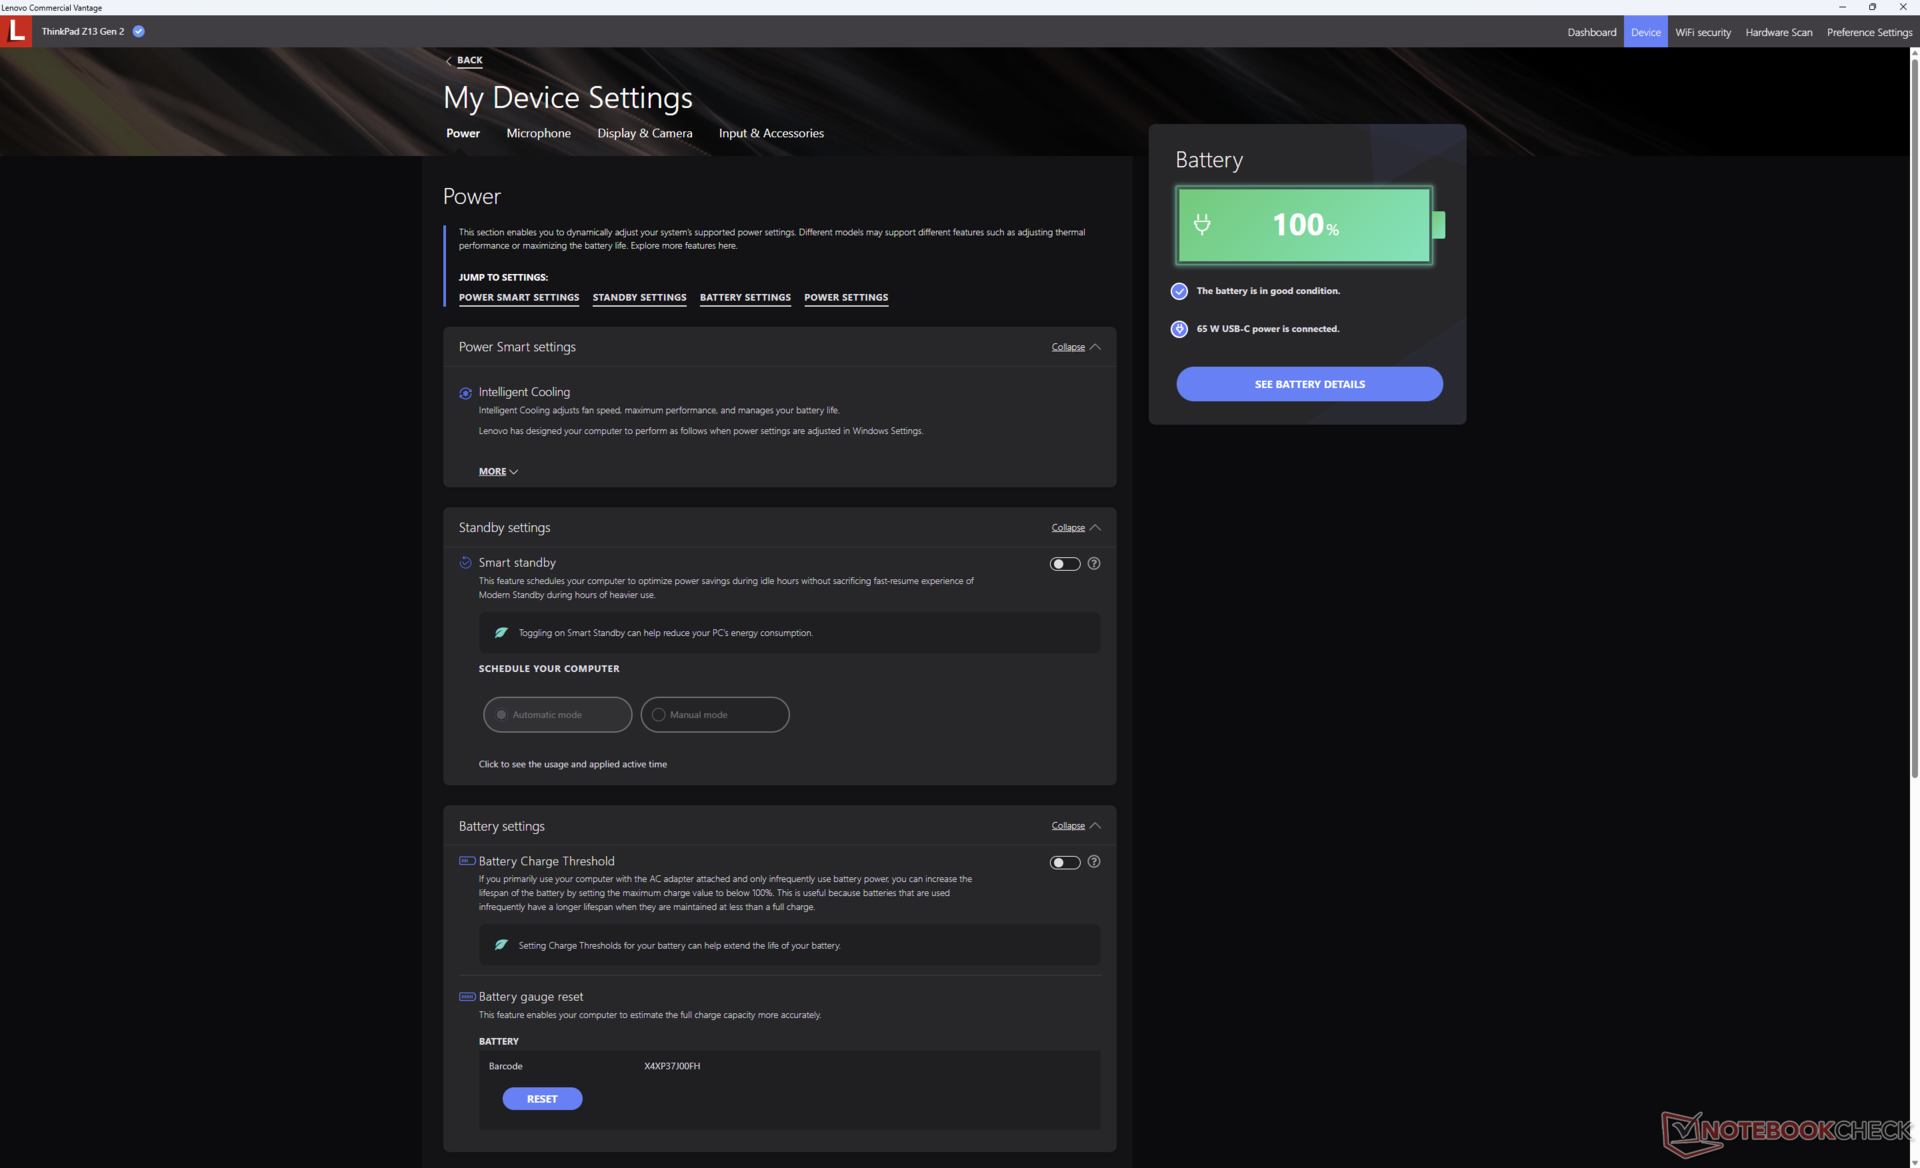
Wir haben Windows im Performance-Modus eingestellt, bevor wir die unten genannten Benchmarks durchgeführt haben. Die vorinstallierte Lenovo Commercial Vantage Software bietet keine separaten Energieprofiloptionen, um die Anzahl der Einstellungen zu reduzieren.
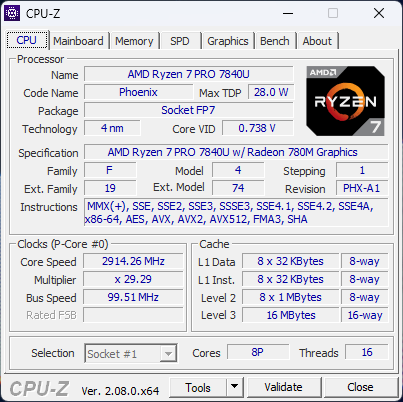
Prozessor
Die mobilen Zen-4-CPUs haben bisher beeindruckende Leistungen gezeigt, und der Ryzen 7 Pro 7840U mit acht Kernen ist da keine Ausnahme. Die AMD-CPU ist ebenso schnell oder sogar schneller als jeder konkurrierende Intel Core-U oder Core-P Prozessor der 13. Generation, einschließlich des Core i7-1370P. Sie übertrifft zudem den seltenen Ryzen 7 Pro 6860Z im letztjährigen ThinkPad Z13 G1 um etwa 15 bis 20 Prozent, sowohl bei Single- als auch bei Multi-Thread-Last.
Die Nachhaltigkeit der Leistung ist trotz des kompakten 13-Zoll-Formfaktors hervorragend. Bei wiederholter Ausführung des CineBench R15 xT in einer Schleife, blieben die Ergebnisse von Anfang bis Ende konstant, was auf stabile Taktraten bei anspruchsvoller Last schließen lässt.
Ein Downgrade auf die Hexa-Core-Konfiguration des Ryzen 5 Pro 7540U dürfte die Prozessorleistung um etwa 20 bis 30 Prozent beeinträchtigen.
Cinebench R15 Multi Dauertest
Cinebench R23: Multi Core | Single Core
Cinebench R20: CPU (Multi Core) | CPU (Single Core)
Cinebench R15: CPU Multi 64Bit | CPU Single 64Bit
Blender: v2.79 BMW27 CPU
7-Zip 18.03: 7z b 4 | 7z b 4 -mmt1
Geekbench 6.7: Multi-Core | Single-Core
Geekbench 5.5: Multi-Core | Single-Core
HWBOT x265 Benchmark v2.2: 4k Preset
LibreOffice : 20 Documents To PDF
R Benchmark 2.5: Overall mean
| CPU Performance Rating | |
| Asus ROG Flow X13 GV302XV | |
| Framework Laptop 13.5 Ryzen 7 7840U | |
| Lenovo ThinkPad Z13 Gen 2 | |
| Durchschnittliche AMD Ryzen 7 PRO 7840U | |
| Lenovo ThinkPad X1 Nano Gen 3 | |
| Lenovo Yoga Slim 7 Carbon 13IAP7-82U9005FGE -2! | |
| HP Dragonfly G4 -2! | |
| Lenovo ThinkPad L13 Yoga G4 i7-1355U | |
| Dell Latitude 13 7340 i5-1345U -2! | |
| Lenovo Yoga 6 13 83B2001SGE -2! | |
| Lenovo ThinkPad Z13 21D2CTO1WW -2! | |
| HP EliteBook x360 830 G10 7L7U1ET | |
| Dell Latitude 9330 -2! | |
| Dell Latitude 5320-TM4V2 -3! | |
| Lenovo ThinkBook Plus Gen2 Core i5 -3! | |
| Geekbench 6.7 / Multi-Core | |
| Lenovo ThinkPad Z13 Gen 2 | |
| Asus ROG Flow X13 GV302XV | |
| Lenovo ThinkPad X1 Nano Gen 3 | |
| Framework Laptop 13.5 Ryzen 7 7840U | |
| Durchschnittliche AMD Ryzen 7 PRO 7840U (7596 - 12069, n=5) | |
| Lenovo ThinkPad L13 Yoga G4 i7-1355U | |
| HP EliteBook x360 830 G10 7L7U1ET | |
| Geekbench 6.7 / Single-Core | |
| Asus ROG Flow X13 GV302XV | |
| Framework Laptop 13.5 Ryzen 7 7840U | |
| Lenovo ThinkPad L13 Yoga G4 i7-1355U | |
| Lenovo ThinkPad X1 Nano Gen 3 | |
| Lenovo ThinkPad Z13 Gen 2 | |
| Durchschnittliche AMD Ryzen 7 PRO 7840U (1896 - 2508, n=5) | |
| HP EliteBook x360 830 G10 7L7U1ET | |
Cinebench R23: Multi Core | Single Core
Cinebench R20: CPU (Multi Core) | CPU (Single Core)
Cinebench R15: CPU Multi 64Bit | CPU Single 64Bit
Blender: v2.79 BMW27 CPU
7-Zip 18.03: 7z b 4 | 7z b 4 -mmt1
Geekbench 6.7: Multi-Core | Single-Core
Geekbench 5.5: Multi-Core | Single-Core
HWBOT x265 Benchmark v2.2: 4k Preset
LibreOffice : 20 Documents To PDF
R Benchmark 2.5: Overall mean
* ... kleinere Werte sind besser
AIDA64: FP32 Ray-Trace | FPU Julia | CPU SHA3 | CPU Queen | FPU SinJulia | FPU Mandel | CPU AES | CPU ZLib | FP64 Ray-Trace | CPU PhotoWorxx
| Performance Rating | |
| Framework Laptop 13.5 Ryzen 7 7840U | |
| Lenovo ThinkPad Z13 Gen 2 | |
| Durchschnittliche AMD Ryzen 7 PRO 7840U | |
| Lenovo ThinkPad Z13 21D2CTO1WW | |
| Lenovo ThinkPad X1 Nano Gen 3 | |
| HP Dragonfly G4 | |
| Dell Latitude 13 7340 i5-1345U | |
| AIDA64 / FP32 Ray-Trace | |
| Framework Laptop 13.5 Ryzen 7 7840U | |
| Lenovo ThinkPad Z13 Gen 2 | |
| Durchschnittliche AMD Ryzen 7 PRO 7840U (17604 - 23889, n=5) | |
| Lenovo ThinkPad Z13 21D2CTO1WW | |
| Lenovo ThinkPad X1 Nano Gen 3 | |
| HP Dragonfly G4 | |
| Dell Latitude 13 7340 i5-1345U | |
| AIDA64 / FPU Julia | |
| Framework Laptop 13.5 Ryzen 7 7840U | |
| Lenovo ThinkPad Z13 Gen 2 | |
| Durchschnittliche AMD Ryzen 7 PRO 7840U (77578 - 100087, n=5) | |
| Lenovo ThinkPad Z13 21D2CTO1WW | |
| Lenovo ThinkPad X1 Nano Gen 3 | |
| HP Dragonfly G4 | |
| Dell Latitude 13 7340 i5-1345U | |
| AIDA64 / CPU SHA3 | |
| Framework Laptop 13.5 Ryzen 7 7840U | |
| Lenovo ThinkPad Z13 Gen 2 | |
| Durchschnittliche AMD Ryzen 7 PRO 7840U (3611 - 4394, n=5) | |
| Lenovo ThinkPad Z13 21D2CTO1WW | |
| Lenovo ThinkPad X1 Nano Gen 3 | |
| HP Dragonfly G4 | |
| Dell Latitude 13 7340 i5-1345U | |
| AIDA64 / CPU Queen | |
| Lenovo ThinkPad Z13 Gen 2 | |
| Framework Laptop 13.5 Ryzen 7 7840U | |
| Durchschnittliche AMD Ryzen 7 PRO 7840U (95020 - 110151, n=5) | |
| Lenovo ThinkPad X1 Nano Gen 3 | |
| Lenovo ThinkPad Z13 21D2CTO1WW | |
| HP Dragonfly G4 | |
| Dell Latitude 13 7340 i5-1345U | |
| AIDA64 / FPU SinJulia | |
| Framework Laptop 13.5 Ryzen 7 7840U | |
| Lenovo ThinkPad Z13 Gen 2 | |
| Durchschnittliche AMD Ryzen 7 PRO 7840U (12250 - 14151, n=5) | |
| Lenovo ThinkPad Z13 21D2CTO1WW | |
| Lenovo ThinkPad X1 Nano Gen 3 | |
| HP Dragonfly G4 | |
| Dell Latitude 13 7340 i5-1345U | |
| AIDA64 / FPU Mandel | |
| Framework Laptop 13.5 Ryzen 7 7840U | |
| Lenovo ThinkPad Z13 Gen 2 | |
| Durchschnittliche AMD Ryzen 7 PRO 7840U (41143 - 53280, n=5) | |
| Lenovo ThinkPad Z13 21D2CTO1WW | |
| Lenovo ThinkPad X1 Nano Gen 3 | |
| HP Dragonfly G4 | |
| Dell Latitude 13 7340 i5-1345U | |
| AIDA64 / CPU AES | |
| Framework Laptop 13.5 Ryzen 7 7840U | |
| Durchschnittliche AMD Ryzen 7 PRO 7840U (66300 - 142329, n=5) | |
| Lenovo ThinkPad Z13 Gen 2 | |
| Lenovo ThinkPad Z13 21D2CTO1WW | |
| Lenovo ThinkPad X1 Nano Gen 3 | |
| HP Dragonfly G4 | |
| Dell Latitude 13 7340 i5-1345U | |
| AIDA64 / CPU ZLib | |
| Framework Laptop 13.5 Ryzen 7 7840U | |
| Lenovo ThinkPad Z13 Gen 2 | |
| Durchschnittliche AMD Ryzen 7 PRO 7840U (777 - 1004, n=5) | |
| Lenovo ThinkPad X1 Nano Gen 3 | |
| Lenovo ThinkPad Z13 21D2CTO1WW | |
| HP Dragonfly G4 | |
| Dell Latitude 13 7340 i5-1345U | |
| AIDA64 / FP64 Ray-Trace | |
| Framework Laptop 13.5 Ryzen 7 7840U | |
| Lenovo ThinkPad Z13 Gen 2 | |
| Durchschnittliche AMD Ryzen 7 PRO 7840U (9494 - 12540, n=5) | |
| Lenovo ThinkPad Z13 21D2CTO1WW | |
| Lenovo ThinkPad X1 Nano Gen 3 | |
| HP Dragonfly G4 | |
| Dell Latitude 13 7340 i5-1345U | |
| AIDA64 / CPU PhotoWorxx | |
| Lenovo ThinkPad X1 Nano Gen 3 | |
| Lenovo ThinkPad Z13 Gen 2 | |
| HP Dragonfly G4 | |
| Durchschnittliche AMD Ryzen 7 PRO 7840U (33564 - 38442, n=5) | |
| Dell Latitude 13 7340 i5-1345U | |
| Framework Laptop 13.5 Ryzen 7 7840U | |
| Lenovo ThinkPad Z13 21D2CTO1WW | |
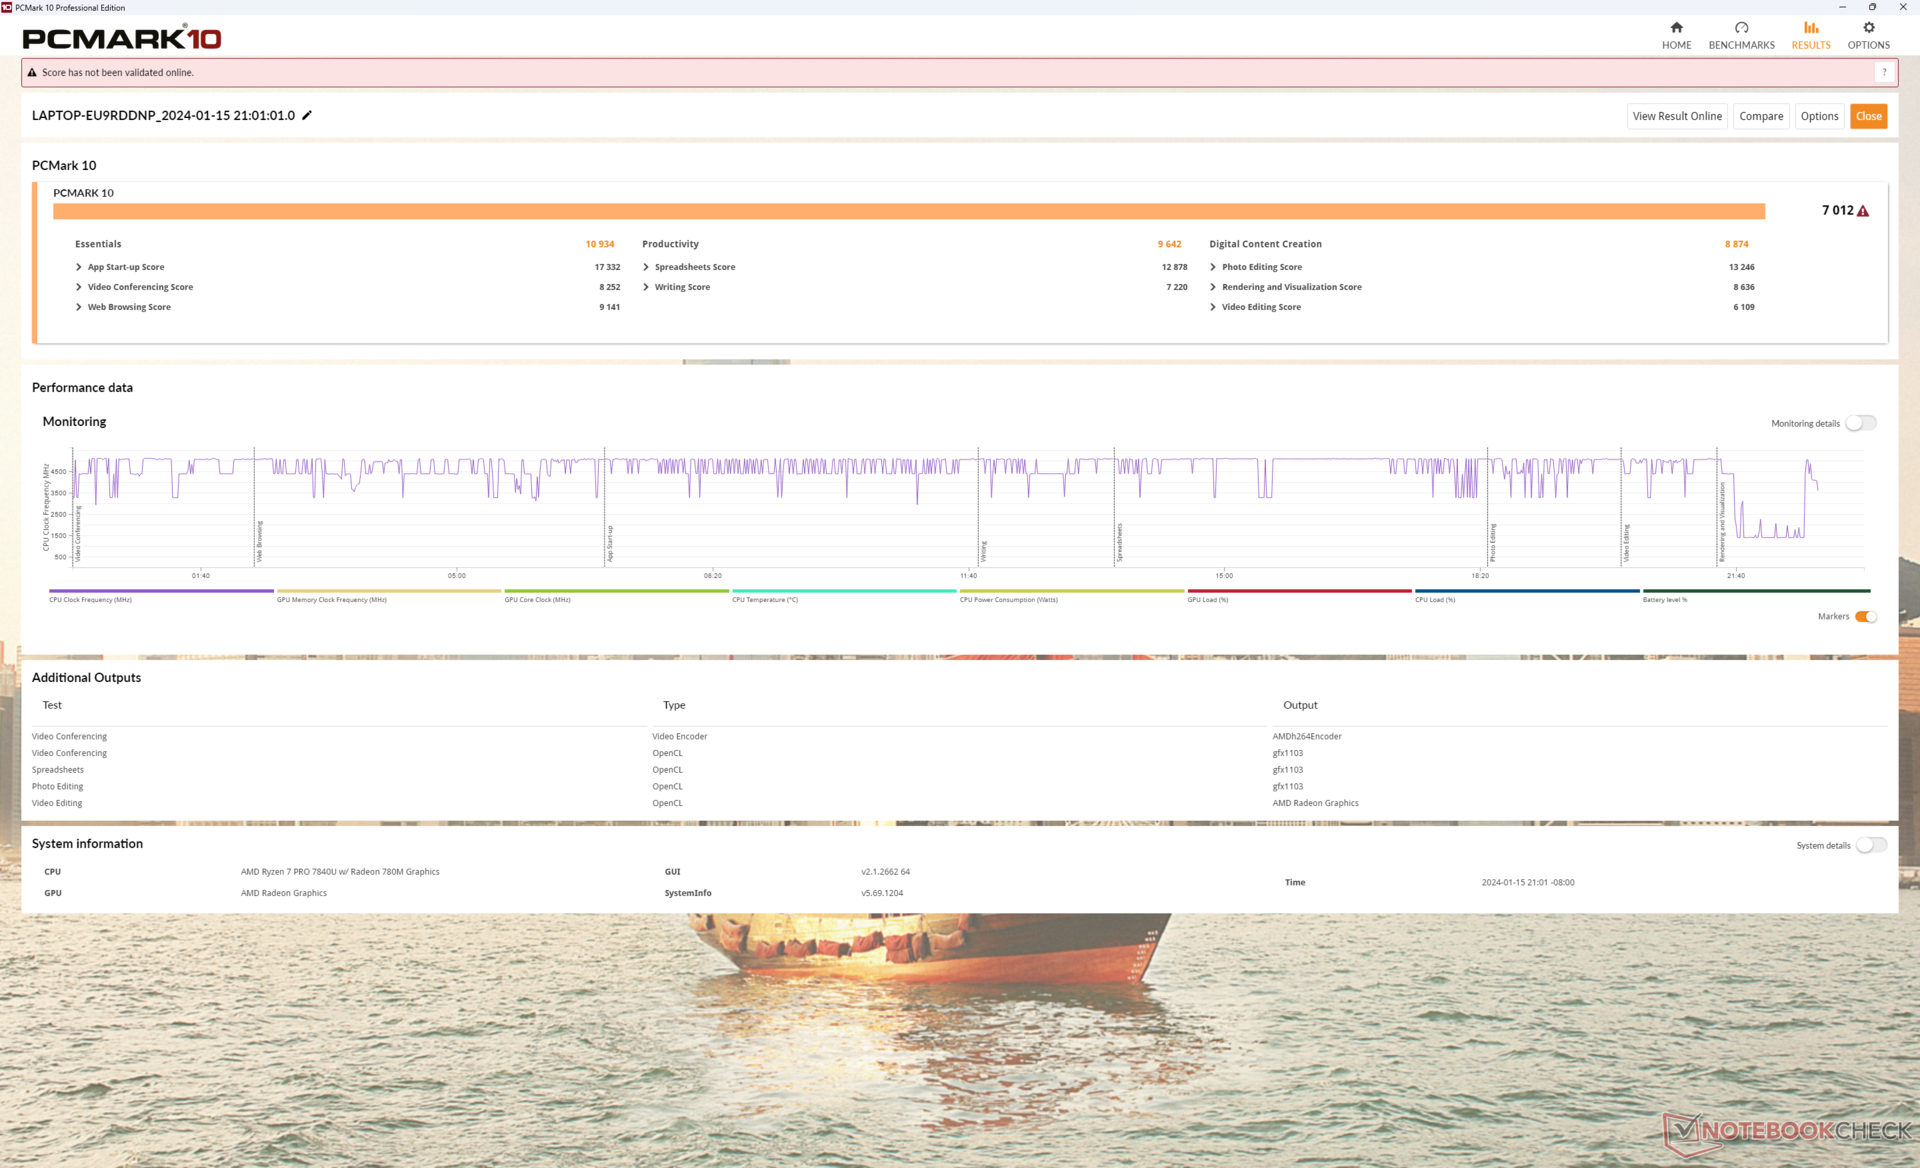
System Performance
Die PCMark-Ergebnisse sind deutlich höher als beim letztjährigen ThinkPad Z13 G1 mit Ryzen 5, insbesondere im Untertest "Erstellung digitaler Inhalte", wo die GPU-Leistung entscheidend ist.
CrossMark: Overall | Productivity | Creativity | Responsiveness
WebXPRT 3: Overall
WebXPRT 4: Overall
Mozilla Kraken 1.1: Total
| PCMark 10 / Score | |
| Framework Laptop 13.5 Ryzen 7 7840U | |
| Lenovo ThinkPad Z13 Gen 2 | |
| Durchschnittliche AMD Ryzen 7 PRO 7840U, AMD Radeon 780M (6541 - 7012, n=5) | |
| Lenovo ThinkPad X1 Nano Gen 3 | |
| HP Dragonfly G4 | |
| Lenovo ThinkPad Z13 21D2CTO1WW | |
| Dell Latitude 13 7340 i5-1345U | |
| PCMark 10 / Essentials | |
| Framework Laptop 13.5 Ryzen 7 7840U | |
| Lenovo ThinkPad Z13 Gen 2 | |
| HP Dragonfly G4 | |
| Lenovo ThinkPad X1 Nano Gen 3 | |
| Durchschnittliche AMD Ryzen 7 PRO 7840U, AMD Radeon 780M (10055 - 10934, n=5) | |
| Dell Latitude 13 7340 i5-1345U | |
| Lenovo ThinkPad Z13 21D2CTO1WW | |
| PCMark 10 / Productivity | |
| Framework Laptop 13.5 Ryzen 7 7840U | |
| Lenovo ThinkPad Z13 Gen 2 | |
| Durchschnittliche AMD Ryzen 7 PRO 7840U, AMD Radeon 780M (8921 - 9933, n=5) | |
| Lenovo ThinkPad Z13 21D2CTO1WW | |
| Lenovo ThinkPad X1 Nano Gen 3 | |
| HP Dragonfly G4 | |
| Dell Latitude 13 7340 i5-1345U | |
| PCMark 10 / Digital Content Creation | |
| Framework Laptop 13.5 Ryzen 7 7840U | |
| Lenovo ThinkPad Z13 Gen 2 | |
| Durchschnittliche AMD Ryzen 7 PRO 7840U, AMD Radeon 780M (7806 - 8874, n=5) | |
| Lenovo ThinkPad X1 Nano Gen 3 | |
| HP Dragonfly G4 | |
| Lenovo ThinkPad Z13 21D2CTO1WW | |
| Dell Latitude 13 7340 i5-1345U | |
| CrossMark / Overall | |
| Lenovo ThinkPad X1 Nano Gen 3 | |
| Framework Laptop 13.5 Ryzen 7 7840U | |
| HP Dragonfly G4 | |
| Durchschnittliche AMD Ryzen 7 PRO 7840U, AMD Radeon 780M (1533 - 1669, n=5) | |
| Lenovo ThinkPad Z13 Gen 2 | |
| Dell Latitude 13 7340 i5-1345U | |
| Lenovo ThinkPad Z13 21D2CTO1WW | |
| CrossMark / Productivity | |
| Lenovo ThinkPad X1 Nano Gen 3 | |
| Framework Laptop 13.5 Ryzen 7 7840U | |
| HP Dragonfly G4 | |
| Durchschnittliche AMD Ryzen 7 PRO 7840U, AMD Radeon 780M (1461 - 1624, n=5) | |
| Dell Latitude 13 7340 i5-1345U | |
| Lenovo ThinkPad Z13 Gen 2 | |
| Lenovo ThinkPad Z13 21D2CTO1WW | |
| CrossMark / Creativity | |
| Lenovo ThinkPad X1 Nano Gen 3 | |
| Framework Laptop 13.5 Ryzen 7 7840U | |
| Lenovo ThinkPad Z13 Gen 2 | |
| Durchschnittliche AMD Ryzen 7 PRO 7840U, AMD Radeon 780M (1697 - 1824, n=5) | |
| HP Dragonfly G4 | |
| Dell Latitude 13 7340 i5-1345U | |
| Lenovo ThinkPad Z13 21D2CTO1WW | |
| CrossMark / Responsiveness | |
| Lenovo ThinkPad X1 Nano Gen 3 | |
| Framework Laptop 13.5 Ryzen 7 7840U | |
| HP Dragonfly G4 | |
| Durchschnittliche AMD Ryzen 7 PRO 7840U, AMD Radeon 780M (1049 - 1499, n=5) | |
| Dell Latitude 13 7340 i5-1345U | |
| Lenovo ThinkPad Z13 21D2CTO1WW | |
| Lenovo ThinkPad Z13 Gen 2 | |
| WebXPRT 3 / Overall | |
| Framework Laptop 13.5 Ryzen 7 7840U | |
| Lenovo ThinkPad X1 Nano Gen 3 | |
| HP Dragonfly G4 | |
| Lenovo ThinkPad Z13 Gen 2 | |
| Durchschnittliche AMD Ryzen 7 PRO 7840U, AMD Radeon 780M (259 - 317, n=5) | |
| Lenovo ThinkPad Z13 21D2CTO1WW | |
| WebXPRT 4 / Overall | |
| Lenovo ThinkPad X1 Nano Gen 3 | |
| HP Dragonfly G4 | |
| Framework Laptop 13.5 Ryzen 7 7840U | |
| Durchschnittliche AMD Ryzen 7 PRO 7840U, AMD Radeon 780M (234 - 245, n=2) | |
| Lenovo ThinkPad Z13 Gen 2 | |
| Lenovo ThinkPad Z13 21D2CTO1WW | |
| Mozilla Kraken 1.1 / Total | |
| Lenovo ThinkPad Z13 21D2CTO1WW | |
| Lenovo ThinkPad Z13 Gen 2 | |
| Durchschnittliche AMD Ryzen 7 PRO 7840U, AMD Radeon 780M (523 - 571, n=5) | |
| Dell Latitude 13 7340 i5-1345U | |
| Framework Laptop 13.5 Ryzen 7 7840U | |
| Lenovo ThinkPad X1 Nano Gen 3 | |
| HP Dragonfly G4 | |
* ... kleinere Werte sind besser
| PCMark 10 Score | 7012 Punkte | |
Hilfe | ||
| AIDA64 / Memory Copy | |
| Lenovo ThinkPad X1 Nano Gen 3 | |
| Durchschnittliche AMD Ryzen 7 PRO 7840U (66487 - 67856, n=5) | |
| Lenovo ThinkPad Z13 Gen 2 | |
| Framework Laptop 13.5 Ryzen 7 7840U | |
| HP Dragonfly G4 | |
| Dell Latitude 13 7340 i5-1345U | |
| Lenovo ThinkPad Z13 21D2CTO1WW | |
| AIDA64 / Memory Read | |
| Lenovo ThinkPad X1 Nano Gen 3 | |
| Framework Laptop 13.5 Ryzen 7 7840U | |
| Lenovo ThinkPad Z13 Gen 2 | |
| Durchschnittliche AMD Ryzen 7 PRO 7840U (47725 - 50543, n=5) | |
| HP Dragonfly G4 | |
| Dell Latitude 13 7340 i5-1345U | |
| Lenovo ThinkPad Z13 21D2CTO1WW | |
| AIDA64 / Memory Write | |
| Lenovo ThinkPad X1 Nano Gen 3 | |
| Durchschnittliche AMD Ryzen 7 PRO 7840U (89477 - 94965, n=5) | |
| Lenovo ThinkPad Z13 Gen 2 | |
| Framework Laptop 13.5 Ryzen 7 7840U | |
| Dell Latitude 13 7340 i5-1345U | |
| HP Dragonfly G4 | |
| Lenovo ThinkPad Z13 21D2CTO1WW | |
| AIDA64 / Memory Latency | |
| Lenovo ThinkPad Z13 Gen 2 | |
| Durchschnittliche AMD Ryzen 7 PRO 7840U (128.6 - 138.9, n=5) | |
| Lenovo ThinkPad Z13 21D2CTO1WW | |
| Dell Latitude 13 7340 i5-1345U | |
| Lenovo ThinkPad X1 Nano Gen 3 | |
| HP Dragonfly G4 | |
| Framework Laptop 13.5 Ryzen 7 7840U | |
* ... kleinere Werte sind besser
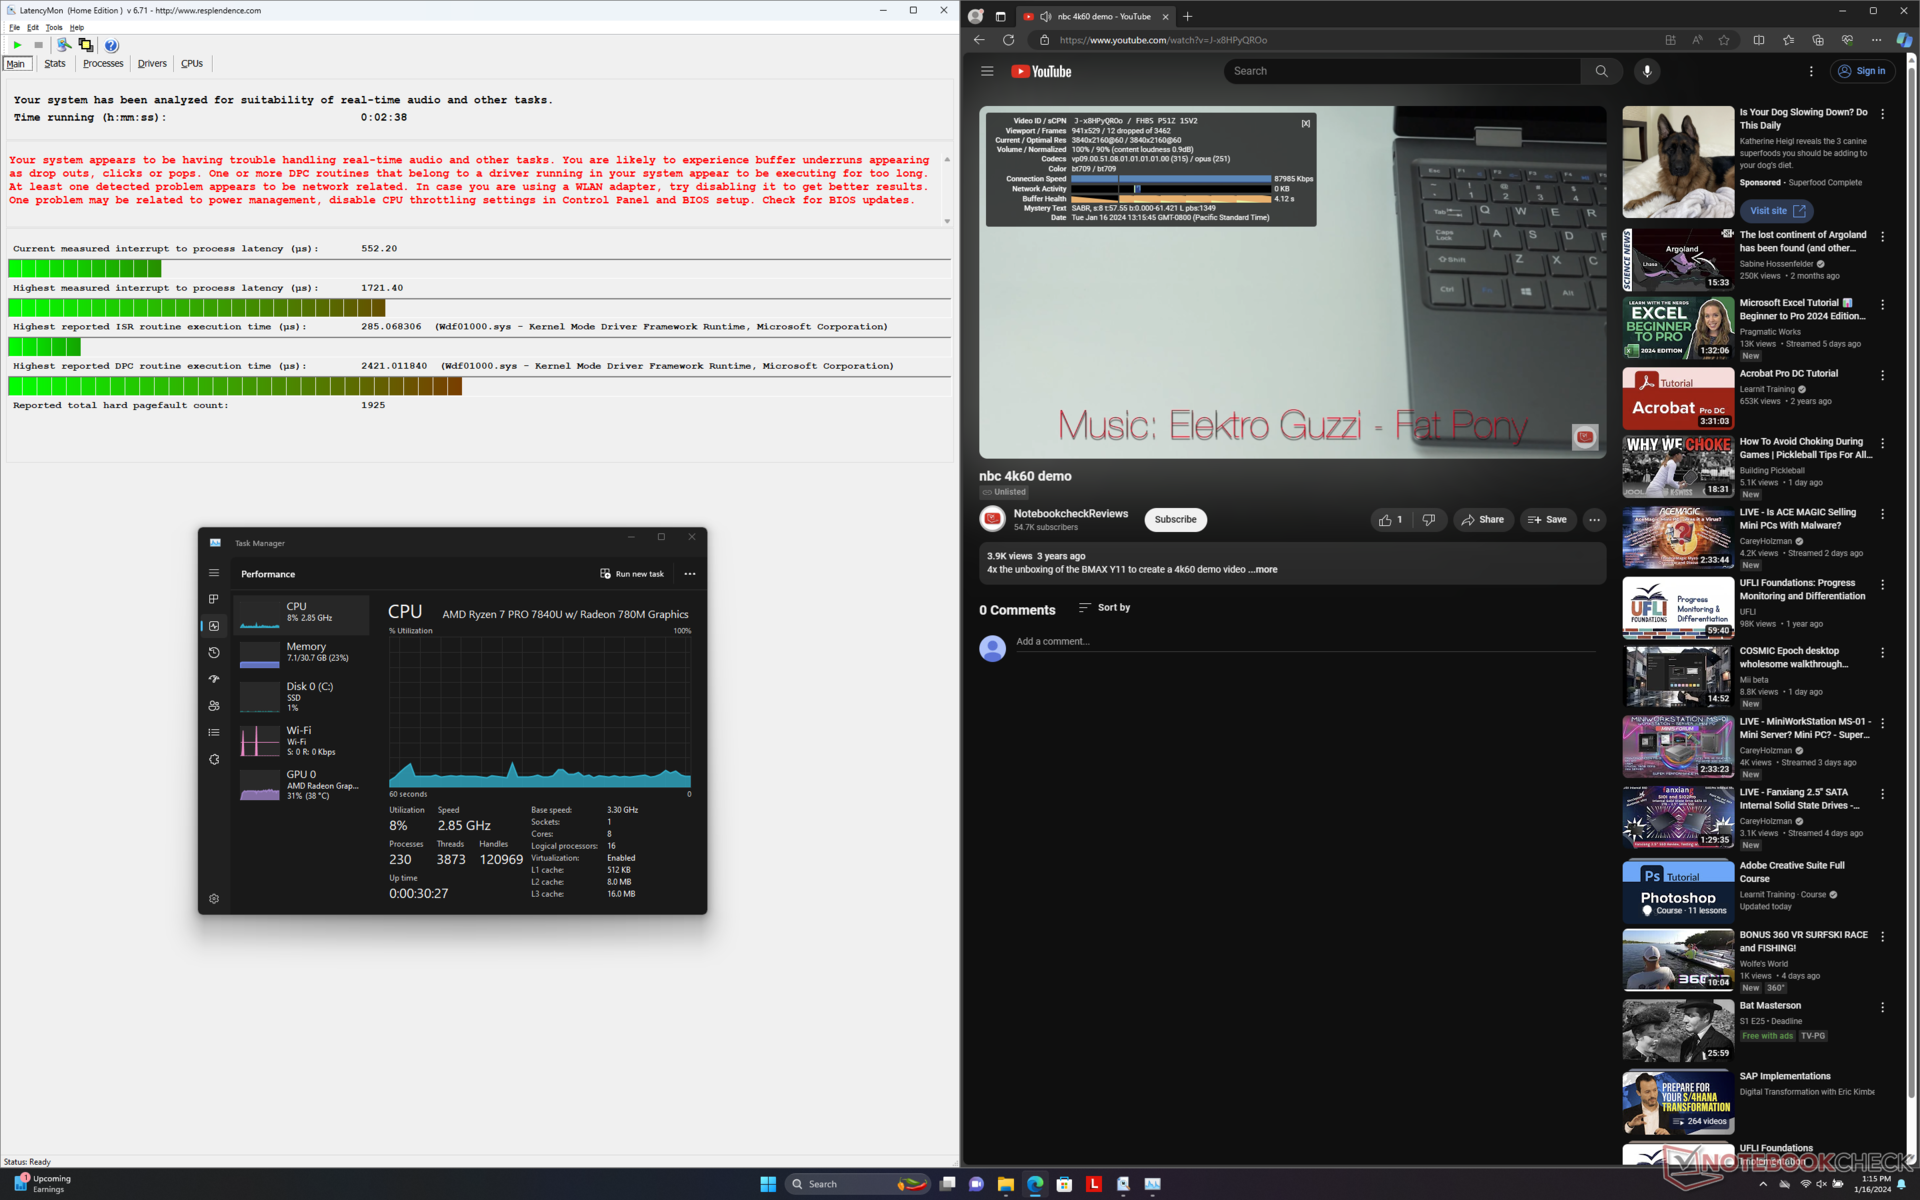
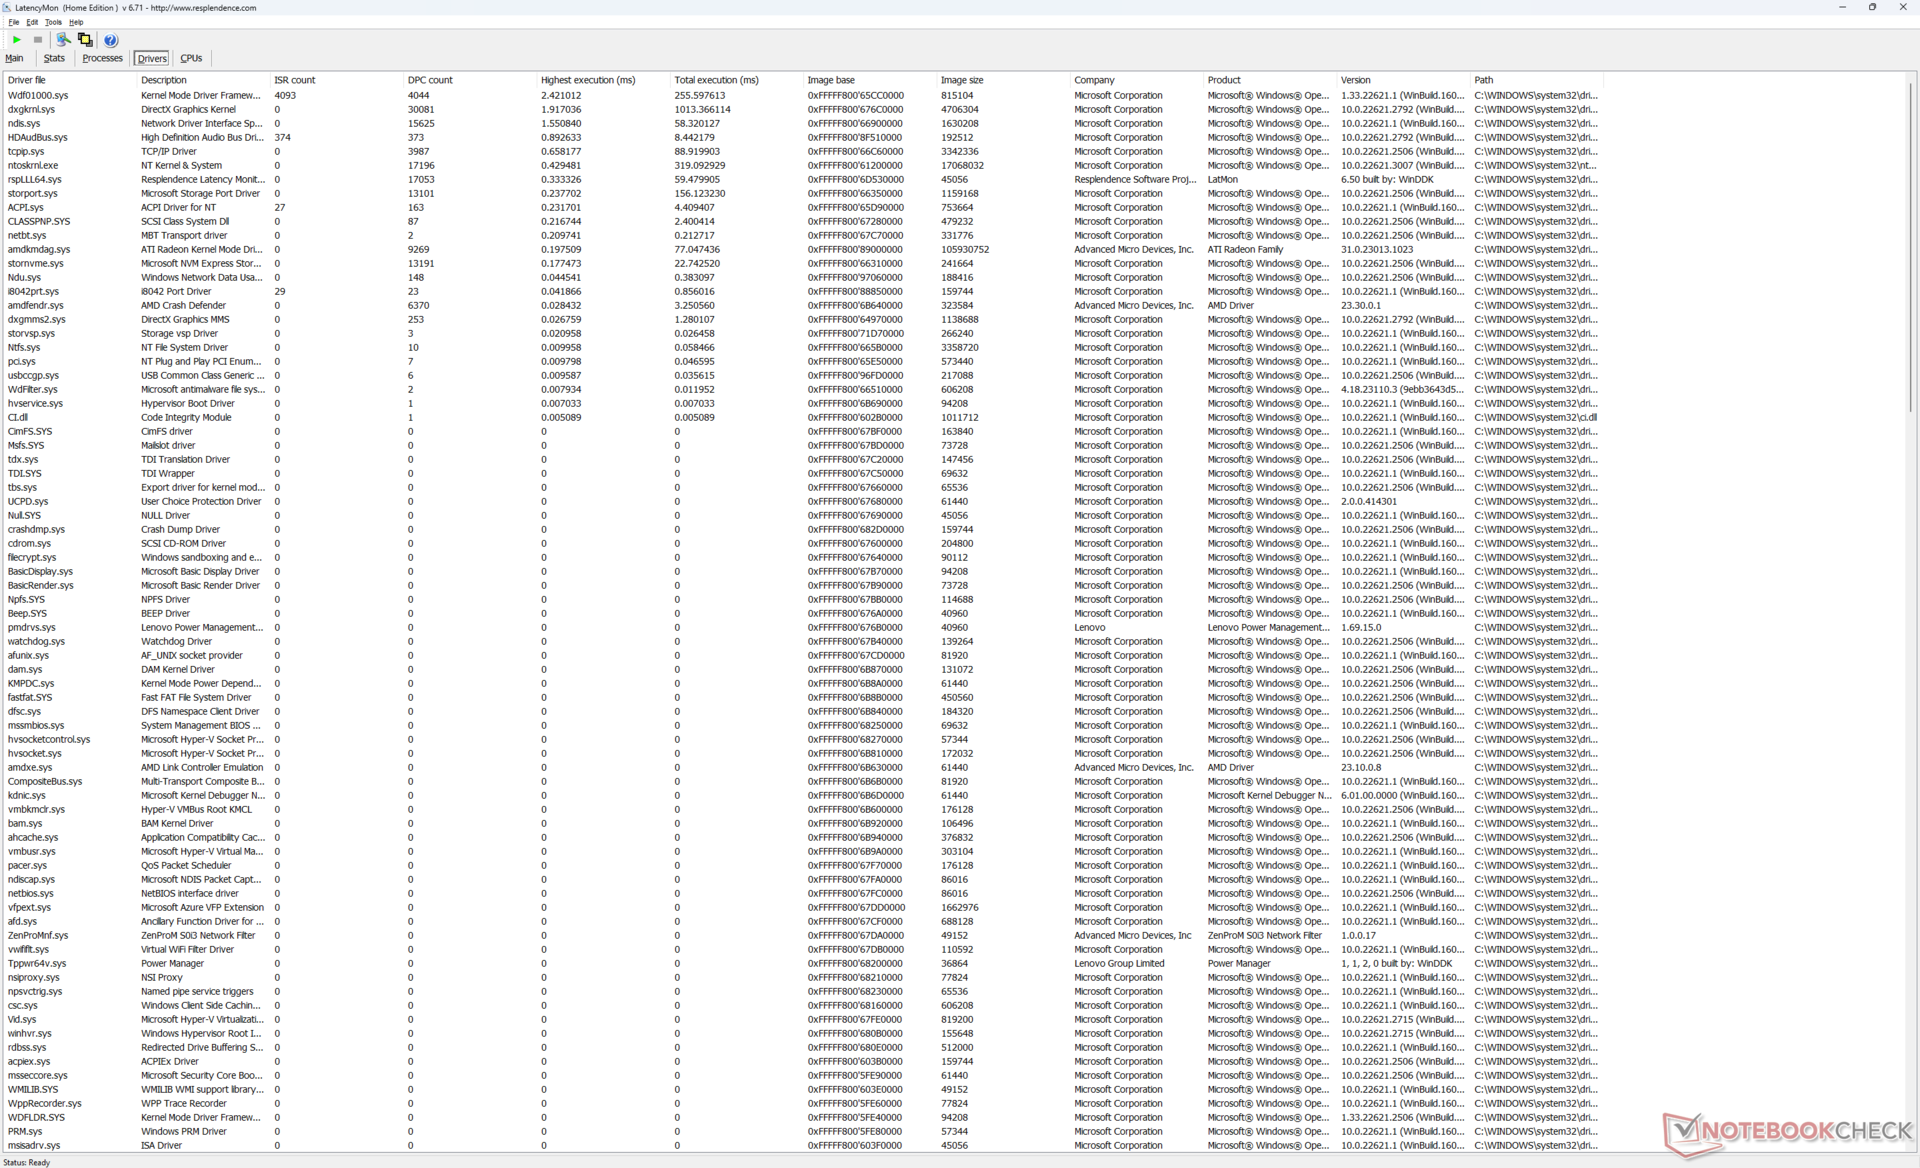
DPC-Latenzen
LatencyMon zeigt sowohl DPC-Probleme als auch Bildausfälle bei der Wiedergabe von 4K-Videoinhalten mit 60 FPS. Letzteres ist besonders enttäuschend, da die Bildaussetzer in regelmäßigen Abständen auftreten und auf ein zugrunde liegendes Treiberproblem hindeuten. Im Vergleich dazu zeigen die meisten Intel-basierten Laptops keine Bildausfälle bei Durchführung des gleichen Tests.
| DPC Latencies / LatencyMon - interrupt to process latency (max), Web, Youtube, Prime95 | |
| Lenovo ThinkPad X1 Nano Gen 3 | |
| Lenovo ThinkPad Z13 Gen 2 | |
| Dell Latitude 13 7340 i5-1345U | |
| HP Dragonfly G4 | |
| Framework Laptop 13.5 Ryzen 7 7840U | |
| Lenovo ThinkPad Z13 21D2CTO1WW | |
* ... kleinere Werte sind besser
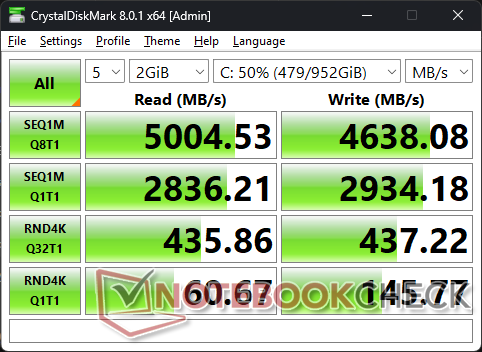
Massenspeicher
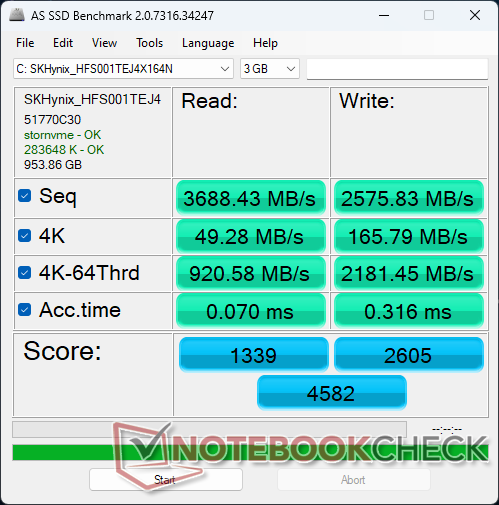
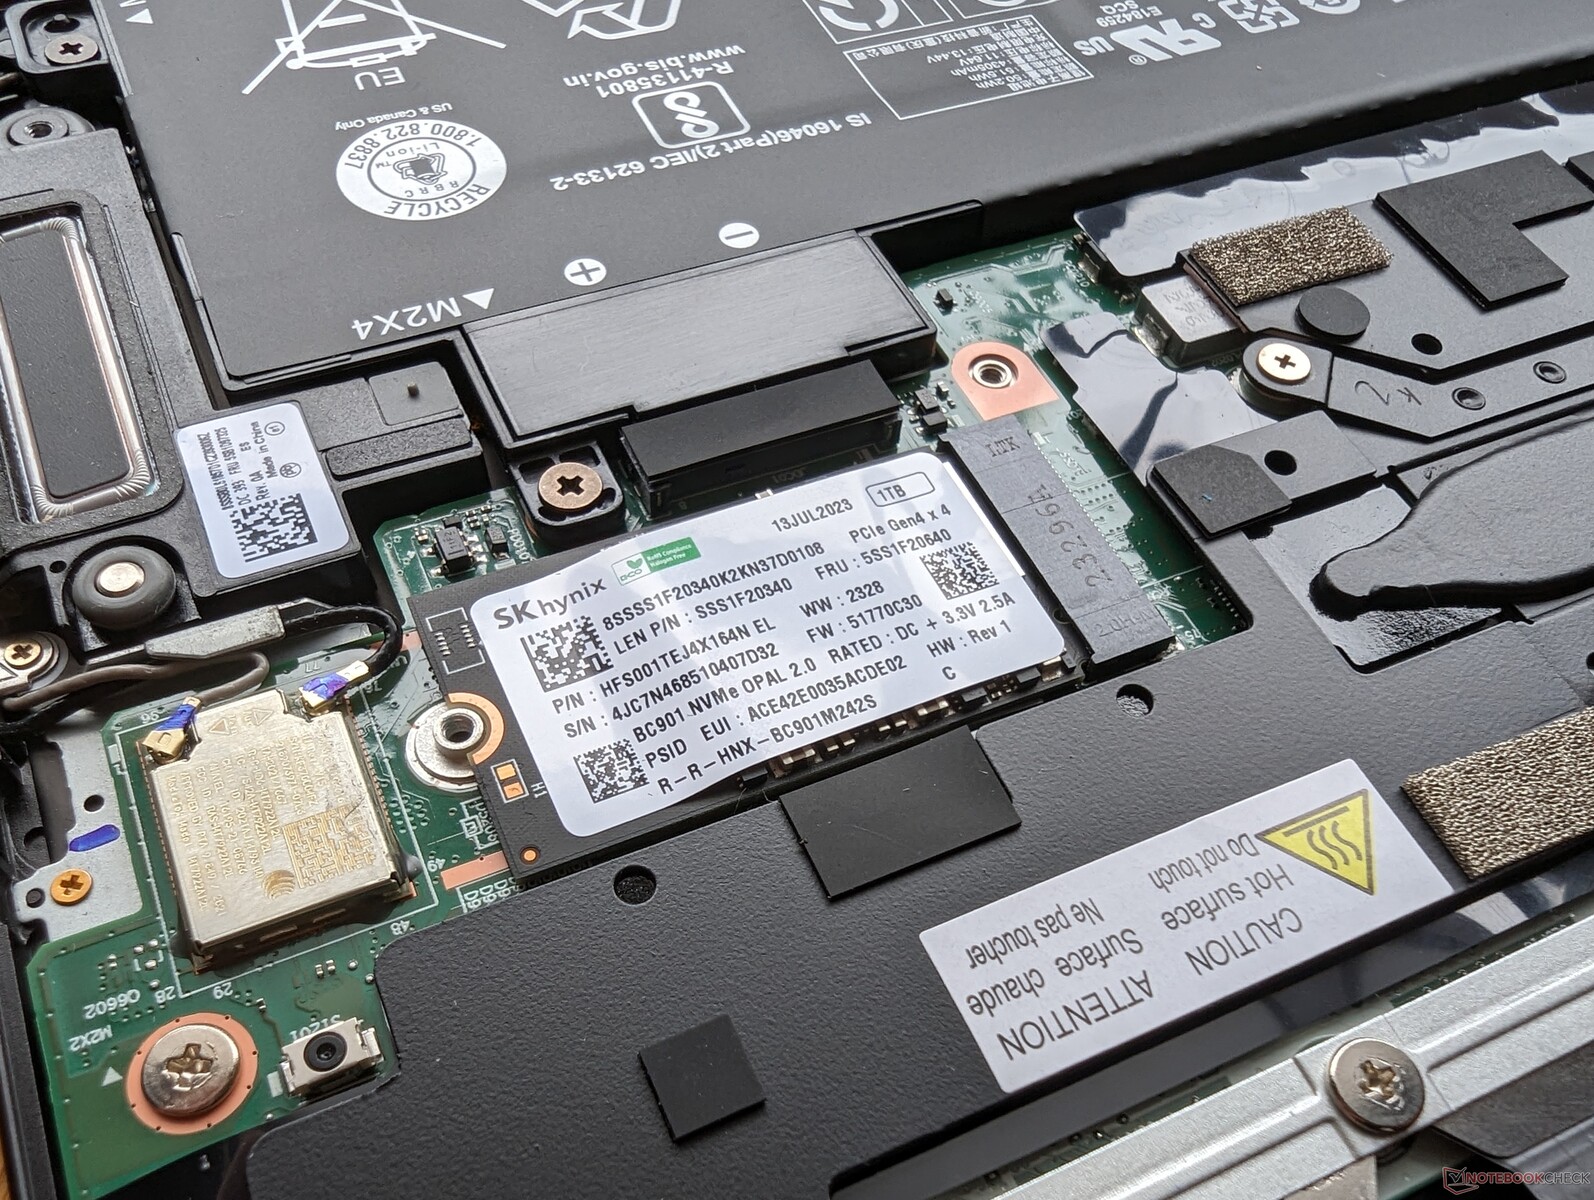
Unser Gerät wird mit einer Mittelklasse-SK Hynix HFS001TEJ4X164N PCIe4 x4 NVMe SSD ausgeliefert. Die maximalen Übertragungsraten liegen konstant bei etwa 4600 MB/s im Vergleich zu über 7000 MB/s bei der größeren Samsung PM9A1-Serie. Das Laufwerk zeigt kein Throttling-Verhalten, selbst wenn es mehrere Minuten lang belastet wird.

| Drive Performance Rating - Percent | |
| Framework Laptop 13.5 Ryzen 7 7840U -11! | |
| HP Dragonfly G4 | |
| Lenovo ThinkPad Z13 Gen 2 | |
| Lenovo ThinkPad X1 Nano Gen 3 | |
| Lenovo ThinkPad Z13 21D2CTO1WW | |
| Dell Latitude 13 7340 i5-1345U | |
* ... kleinere Werte sind besser
Disk-Throttling: DiskSpd Read Loop, 8 Runden
GPU Performance
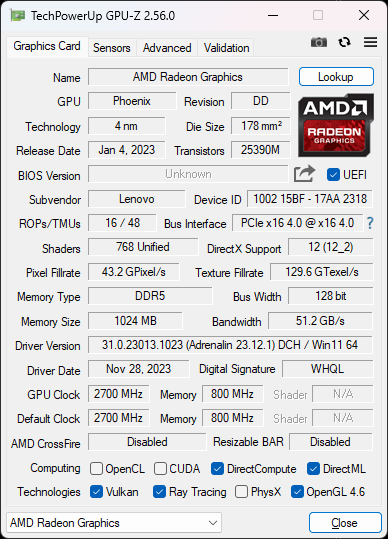
Die Radeon 780M stellt einen signifikanten Leistungssprung von etwa 60 bis 70 Prozent im Vergleich zu den schwächeren Radeon 660M oder 740M Optionen dar. Obwohl sie vielleicht nicht mehr die schnellste integrierte GPU-Lösung ist, übertrifft sie dennoch jede Alternative bis Ende 2023. Beliebte oder anspruchsvolle Titel wie Baldur's Gate 3 oder Tiny Tina's Wonderlands Wonderlands laufen bei 1080p mit den meisten Einstellungen auf "Low" sehr gut.
Wie unsere Ergebnistabelle von 3DMark 11 zeigt, sind die Leistungsunterschiede zwischen dem Balanced-Modus und dem Performance-Modus größer als erwartet. Man sollte bei anspruchsvollen Aufgaben im Performance-Modus bleiben, um die CPU voll auszunutzen.
| Energieprofile | CPU-Leistung | Grafikleistung | Gesamtwert |
| Performance-Modus | 18262 | 12223 | 7186 |
| Balanced-Modus | 13081 (-28%) | 8298 (-32%) | 5422 (-25%) |
| Battery Power | 17161 (6-%) | 11257 (-8%) | 5254 (-27%) |
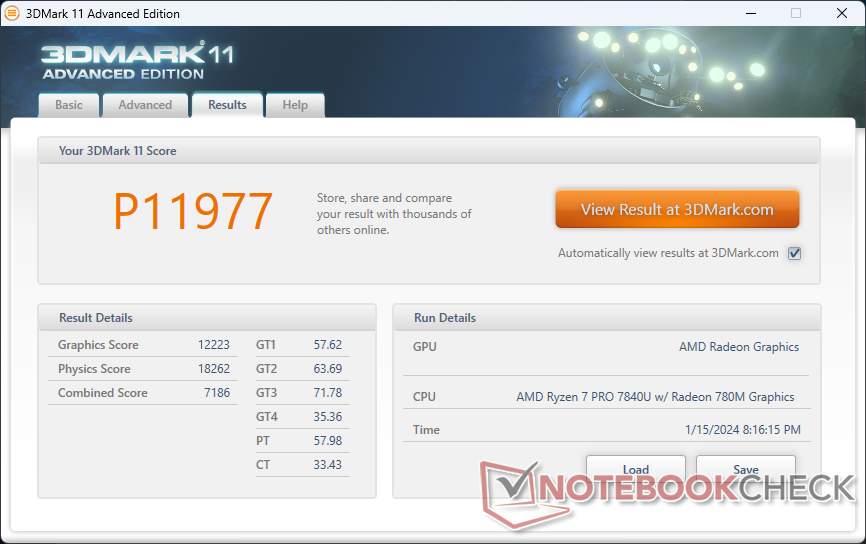
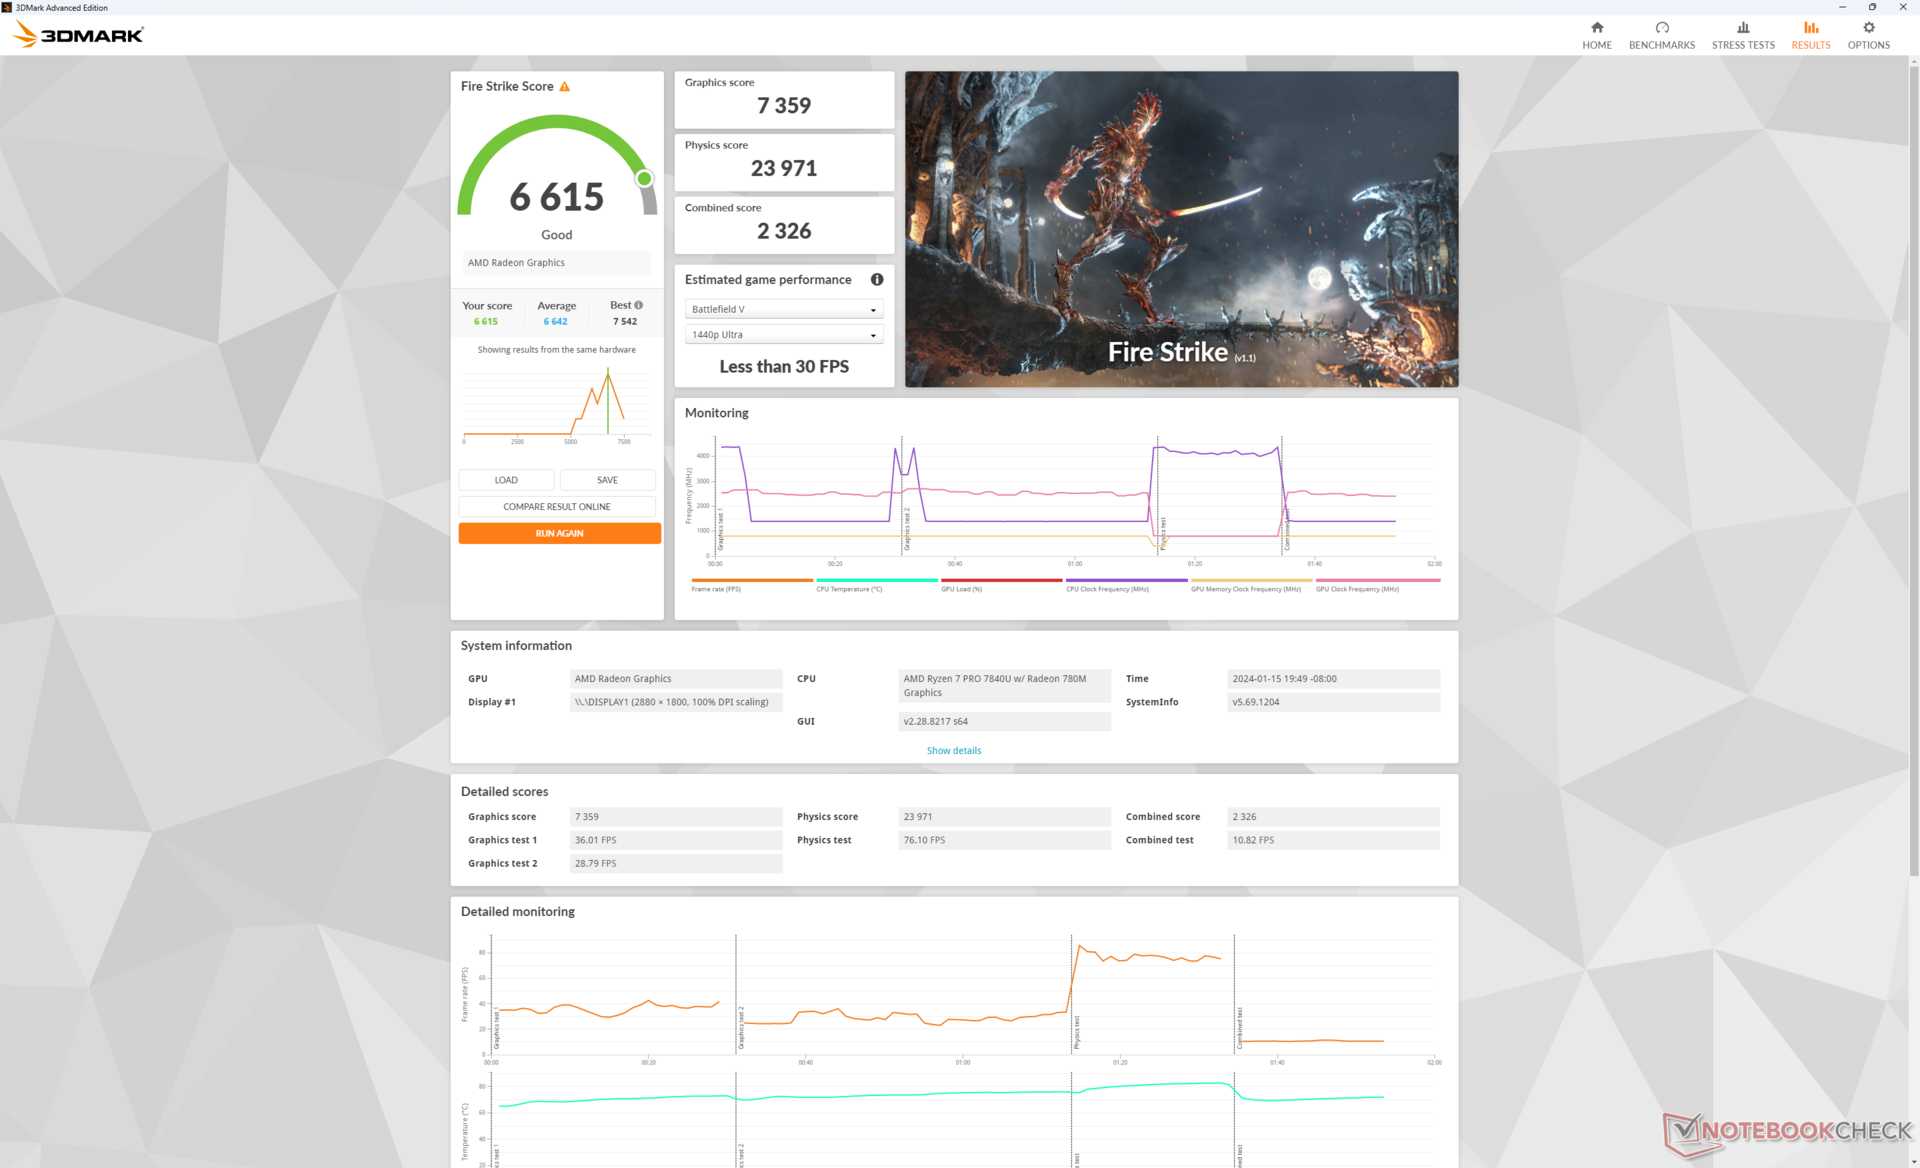
| 3DMark 11 Performance | 11977 Punkte | |
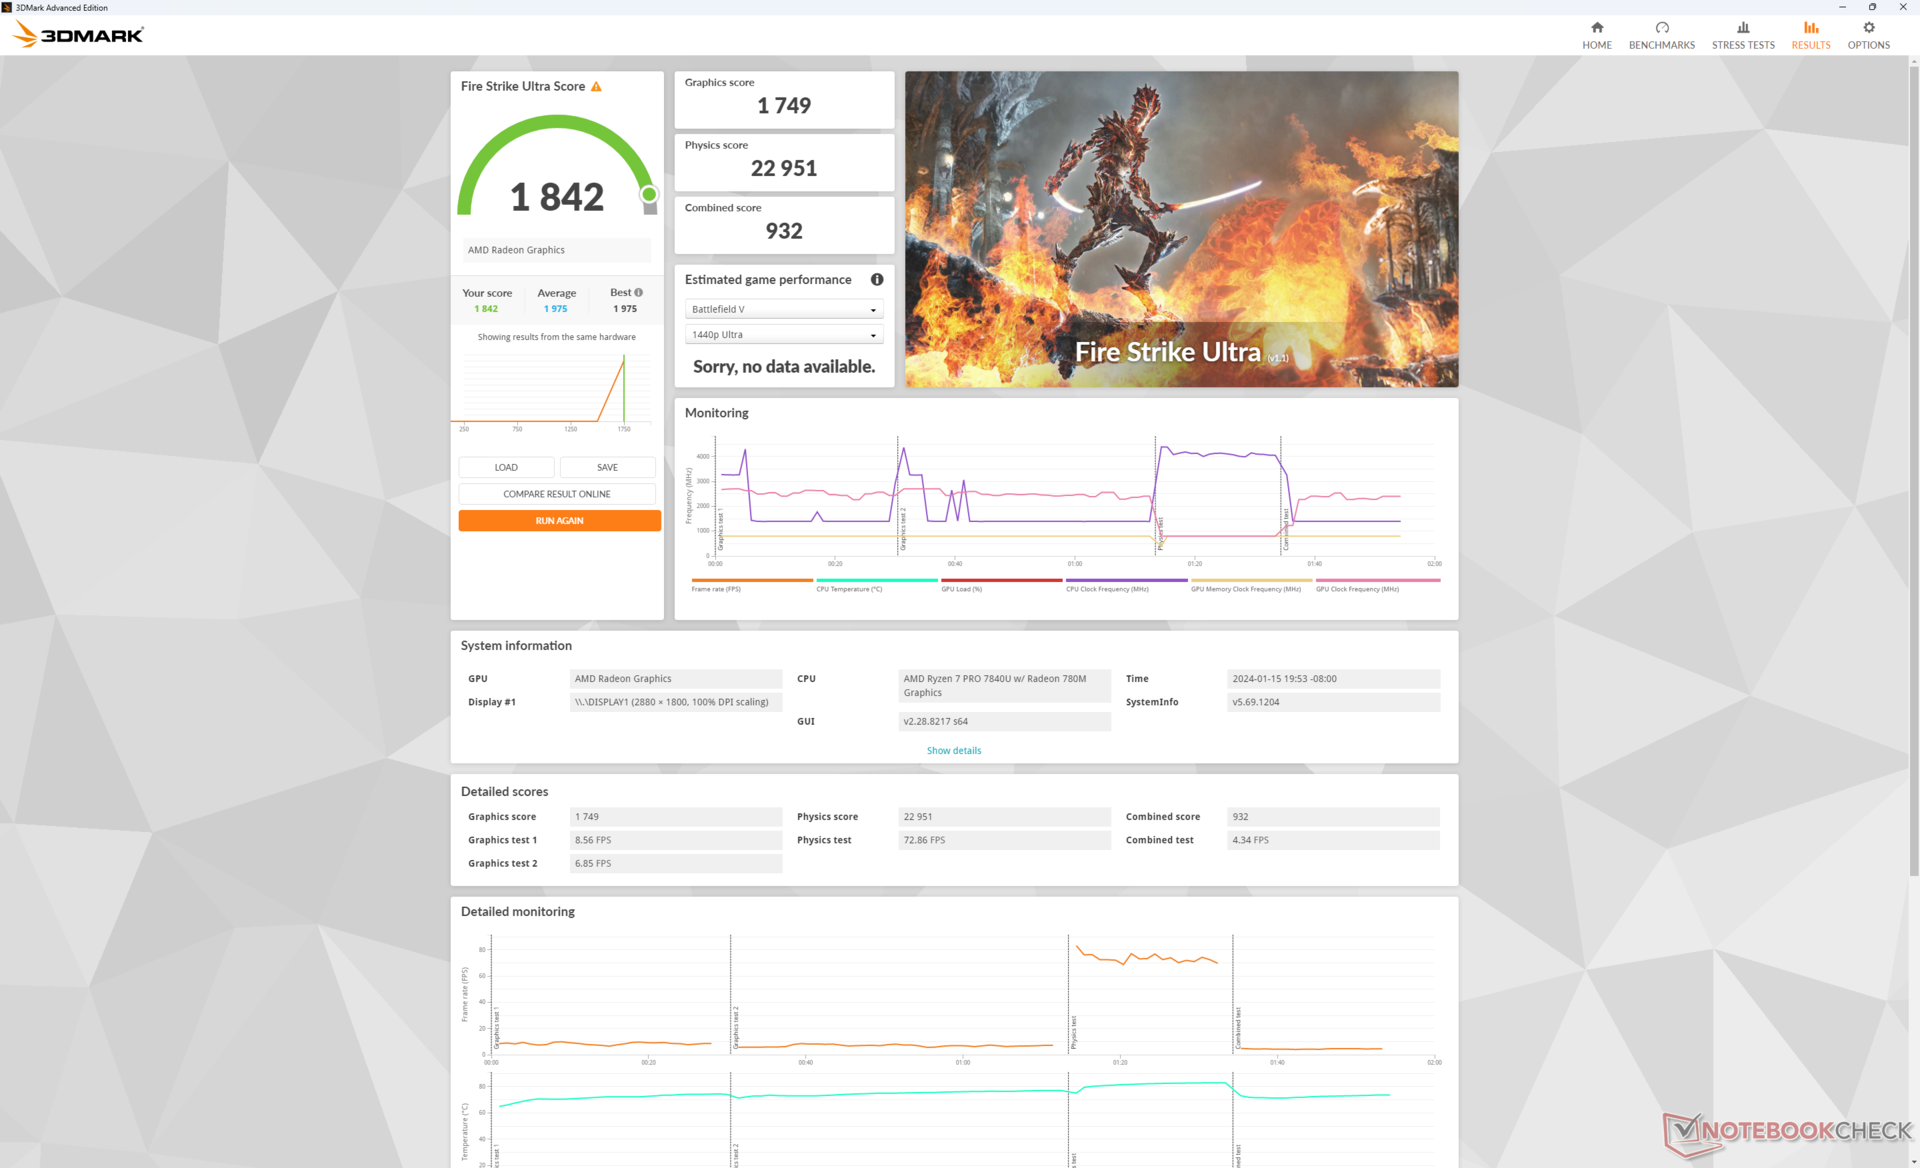
| 3DMark Fire Strike Score | 6615 Punkte | |
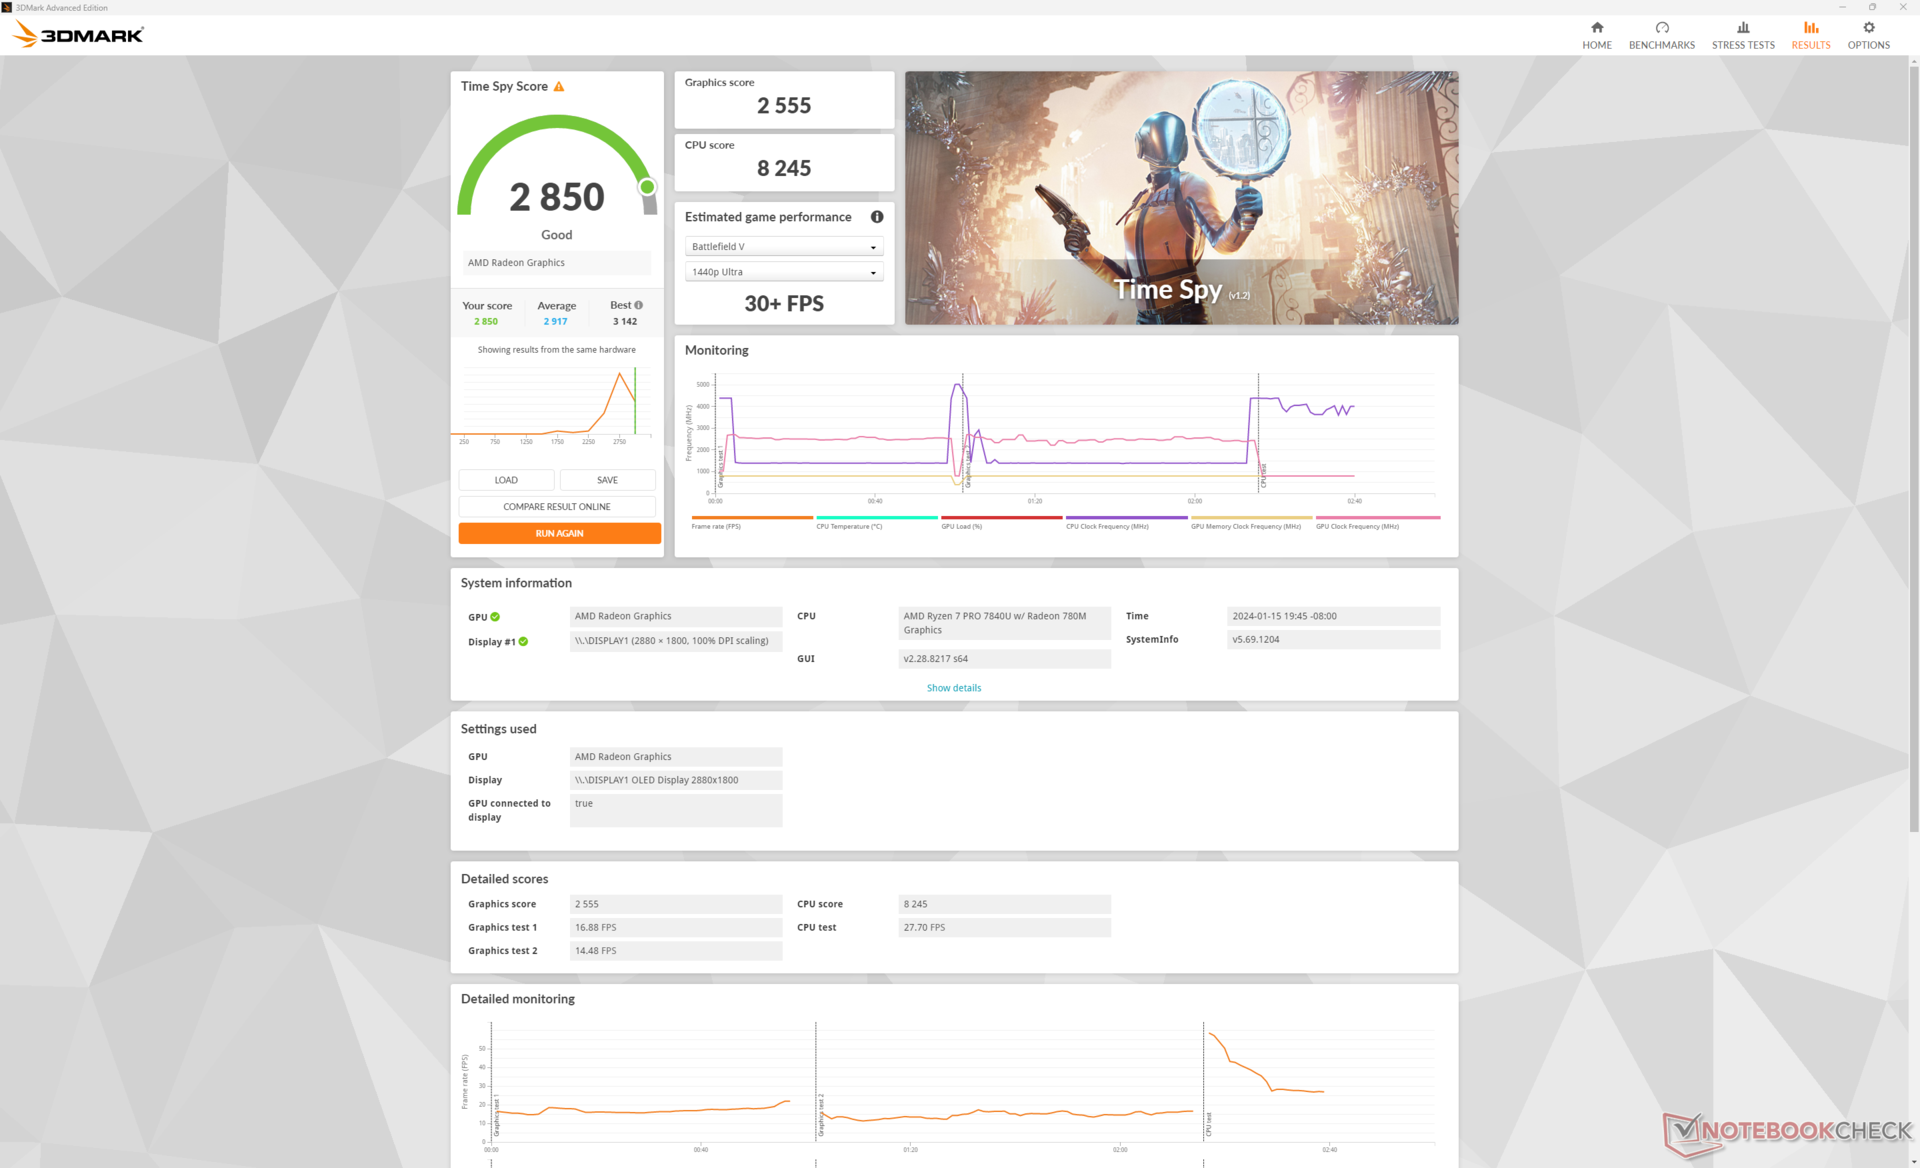
| 3DMark Time Spy Score | 2850 Punkte | |
Hilfe | ||
* ... kleinere Werte sind besser
| Cyberpunk 2077 | |
| 1280x720 Low Preset (FSR off) | |
| Durchschnittliche AMD Radeon 780M (41.8 - 80.6, n=38) | |
| Lenovo ThinkPad Z13 Gen 2 | |
| 1920x1080 Low Preset (FSR off) | |
| Durchschnittliche AMD Radeon 780M (23.9 - 52.1, n=63) | |
| Lenovo ThinkPad Z13 Gen 2 | |
| 1920x1080 Medium Preset (FSR off) | |
| Durchschnittliche AMD Radeon 780M (16.3 - 37.5, n=59) | |
| Lenovo ThinkPad Z13 Gen 2 | |
| 1920x1080 High Preset (FSR off) | |
| Durchschnittliche AMD Radeon 780M (13.8 - 29.6, n=59) | |
| Lenovo ThinkPad Z13 Gen 2 | |
| 1920x1080 Ultra Preset (FSR off) | |
| Durchschnittliche AMD Radeon 780M (11.5 - 26.3, n=54) | |
| Lenovo ThinkPad Z13 Gen 2 | |
| Baldur's Gate 3 | |
| 1280x720 Low Preset AA:SM | |
| Durchschnittliche AMD Radeon 780M (30.7 - 67.6, n=34) | |
| Lenovo ThinkPad Z13 Gen 2 | |
| 1920x1080 Low Preset AA:SM | |
| Lenovo ThinkPad Z13 Gen 2 | |
| Durchschnittliche AMD Radeon 780M (20.2 - 44.1, n=47) | |
| 1920x1080 Medium Preset AA:T | |
| Lenovo ThinkPad Z13 Gen 2 | |
| Durchschnittliche AMD Radeon 780M (15.7 - 36.8, n=50) | |
| 1920x1080 High Preset AA:T | |
| Lenovo ThinkPad Z13 Gen 2 | |
| Durchschnittliche AMD Radeon 780M (13.3 - 30.6, n=50) | |
| 1920x1080 Ultra Preset AA:T | |
| Lenovo ThinkPad Z13 Gen 2 | |
| Durchschnittliche AMD Radeon 780M (12.8 - 29.6, n=49) | |
Witcher 3 FPS-Diagramm
| min. | mittel | hoch | max. | |
|---|---|---|---|---|
| The Witcher 3 (2015) | 116.7 | 45.8 | 28.6 | |
| Dota 2 Reborn (2015) | 113.7 | 96.7 | 83.1 | 72.2 |
| Final Fantasy XV Benchmark (2018) | 69.8 | 35.3 | 26.5 | |
| X-Plane 11.11 (2018) | 43.1 | 33 | 27.1 | |
| Far Cry 5 (2018) | 69 | 37 | 34 | 34 |
| Strange Brigade (2018) | 141.9 | 61.2 | 50.4 | 43 |
| Tiny Tina's Wonderlands (2022) | 64.7 | 47.1 | 31.5 | 25.2 |
| F1 22 (2022) | 84.2 | 74.7 | 53.6 | 14.6 |
| Baldur's Gate 3 (2023) | 39.1 | 31.7 | 26.1 | 25.7 |
| Cyberpunk 2077 (2023) | 38 | 29.4 | 23.5 | 20.3 |
Emissionen
Geräuschemissionen
Zwischen den Energieprofilen Balanced und Performance besteht ein erheblicher Unterschied im Lüftergeräusch. Wenn wir zum Beispiel Witcher 3 im Balanced-Modus spielen, beträgt das Lüftergeräusch nur 37 dB(A) im Vergleich zu 44,8 dB(A) im Performance-Modus. Dies steht im Zusammenhang mit den oben erwähnten unerwartet großen Leistungsunterschieden zwischen den beiden Energieprofilen. Ansonsten bleibt das System mit 28,3 dB(A) bei anspruchsloser Last wie Browsen oder Videos im Vergleich zu einem ruhigen Hintergrund von 25,1 dB(A) weitgehend leise.
Lautstärkediagramm
| Idle |
| 25.8 / 25.8 / 28.3 dB(A) |
| Last |
| 28.3 / 44.8 dB(A) |
 | ||
30 dB leise 40 dB(A) deutlich hörbar 50 dB(A) störend |
||
min: | ||
| Lenovo ThinkPad Z13 Gen 2 Radeon 780M, R7 PRO 7840U, SK hynix BC901 HFS001TEJ4X164N | HP Dragonfly G4 Iris Xe G7 96EUs, i7-1365U, Micron 3400 MTFDKBA512TFH 512GB | Dell Latitude 13 7340 i5-1345U Iris Xe G7 80EUs, i5-1345U, Kioxia BG5 KBG50ZNS512G | Lenovo ThinkPad Z13 21D2CTO1WW Radeon 660M, R5 PRO 6650U, Lenovo UMIS AM630 RPJTJ512MGE1QDQ | Lenovo ThinkPad X1 Nano Gen 3 Iris Xe G7 96EUs, i7-1360P, Lenovo UMIS AM6A0 RPJTJ512MKP1QDQ | Framework Laptop 13.5 Ryzen 7 7840U Radeon 780M, R7 7840U, WD PC SN740 512GB SDDPNQD-512G | |
|---|---|---|---|---|---|---|
| Geräuschentwicklung | 12% | 2% | 7% | 10% | 1% | |
| aus / Umgebung * (dB) | 25.1 | 23.3 7% | 25.02 -0% | 23.71 6% | 22.9 9% | 22.6 10% |
| Idle min * (dB) | 25.8 | 23.5 9% | 25.02 3% | 23.71 8% | 23 11% | 22.6 12% |
| Idle avg * (dB) | 25.8 | 23.5 9% | 25.02 3% | 23.71 8% | 23 11% | 22.6 12% |
| Idle max * (dB) | 28.3 | 26.8 5% | 25.02 12% | 23.71 16% | 23 19% | 24.2 14% |
| Last avg * (dB) | 28.3 | 27.2 4% | 35.07 -24% | 32.35 -14% | 32.8 -16% | 35.8 -27% |
| Witcher 3 ultra * (dB) | 44.8 | 32.7 27% | 38.8 13% | 36.9 18% | 46.5 -4% | |
| Last max * (dB) | 44.8 | 35 22% | 38.2 15% | 39.53 12% | 36.9 18% | 48.9 -9% |
* ... kleinere Werte sind besser
Temperatur
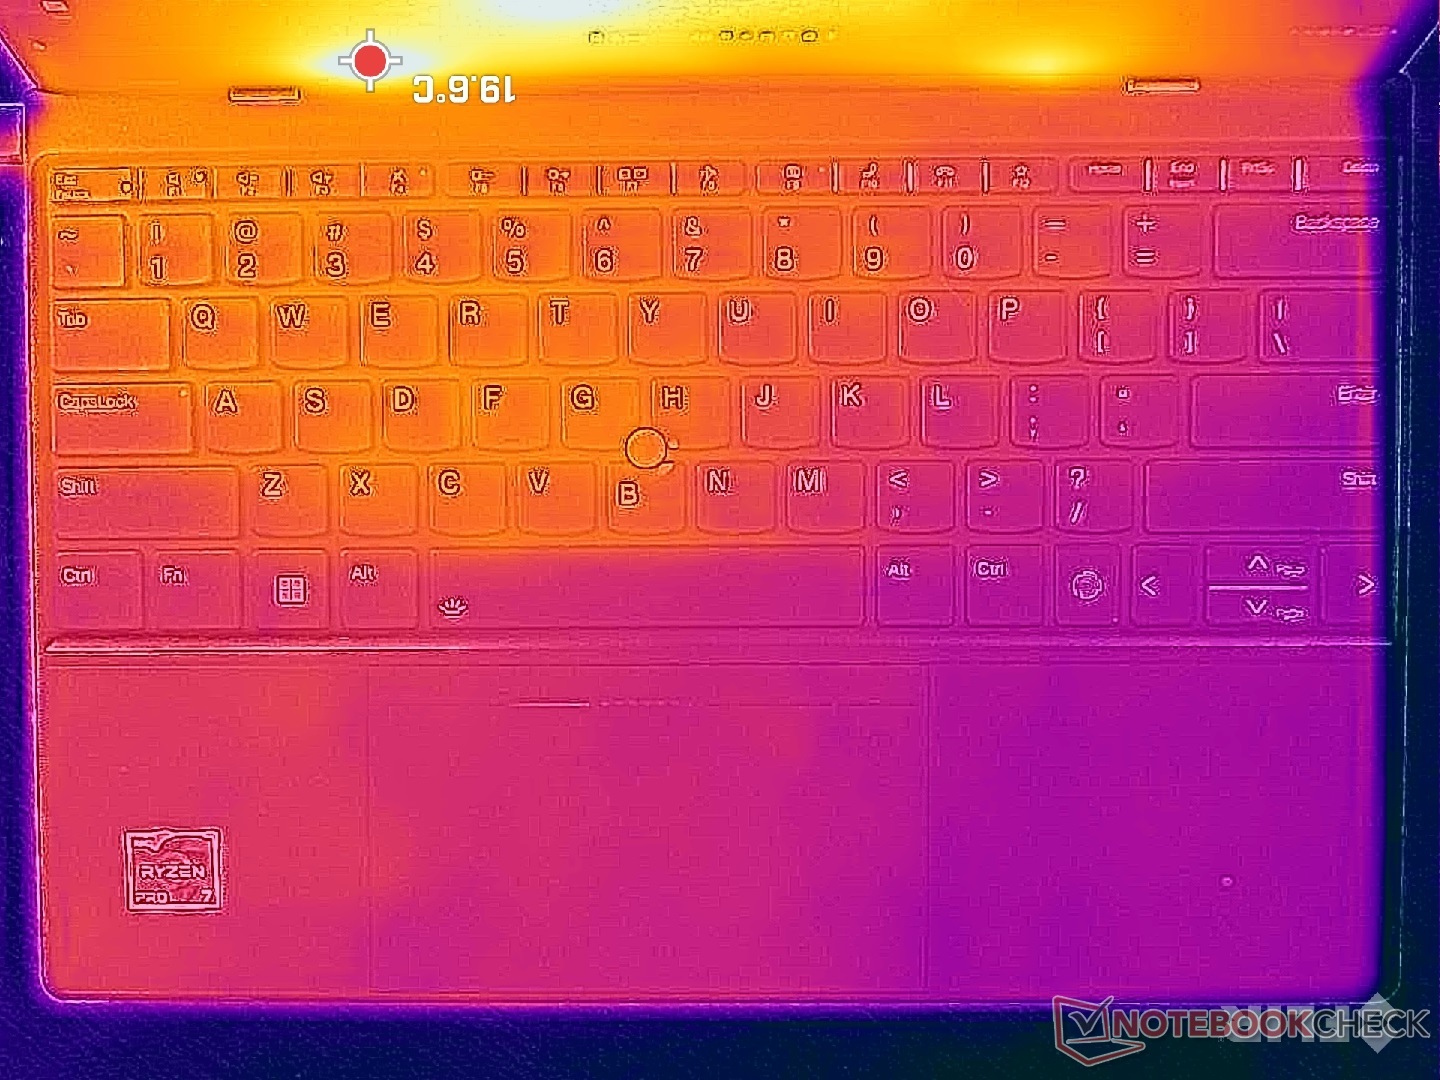
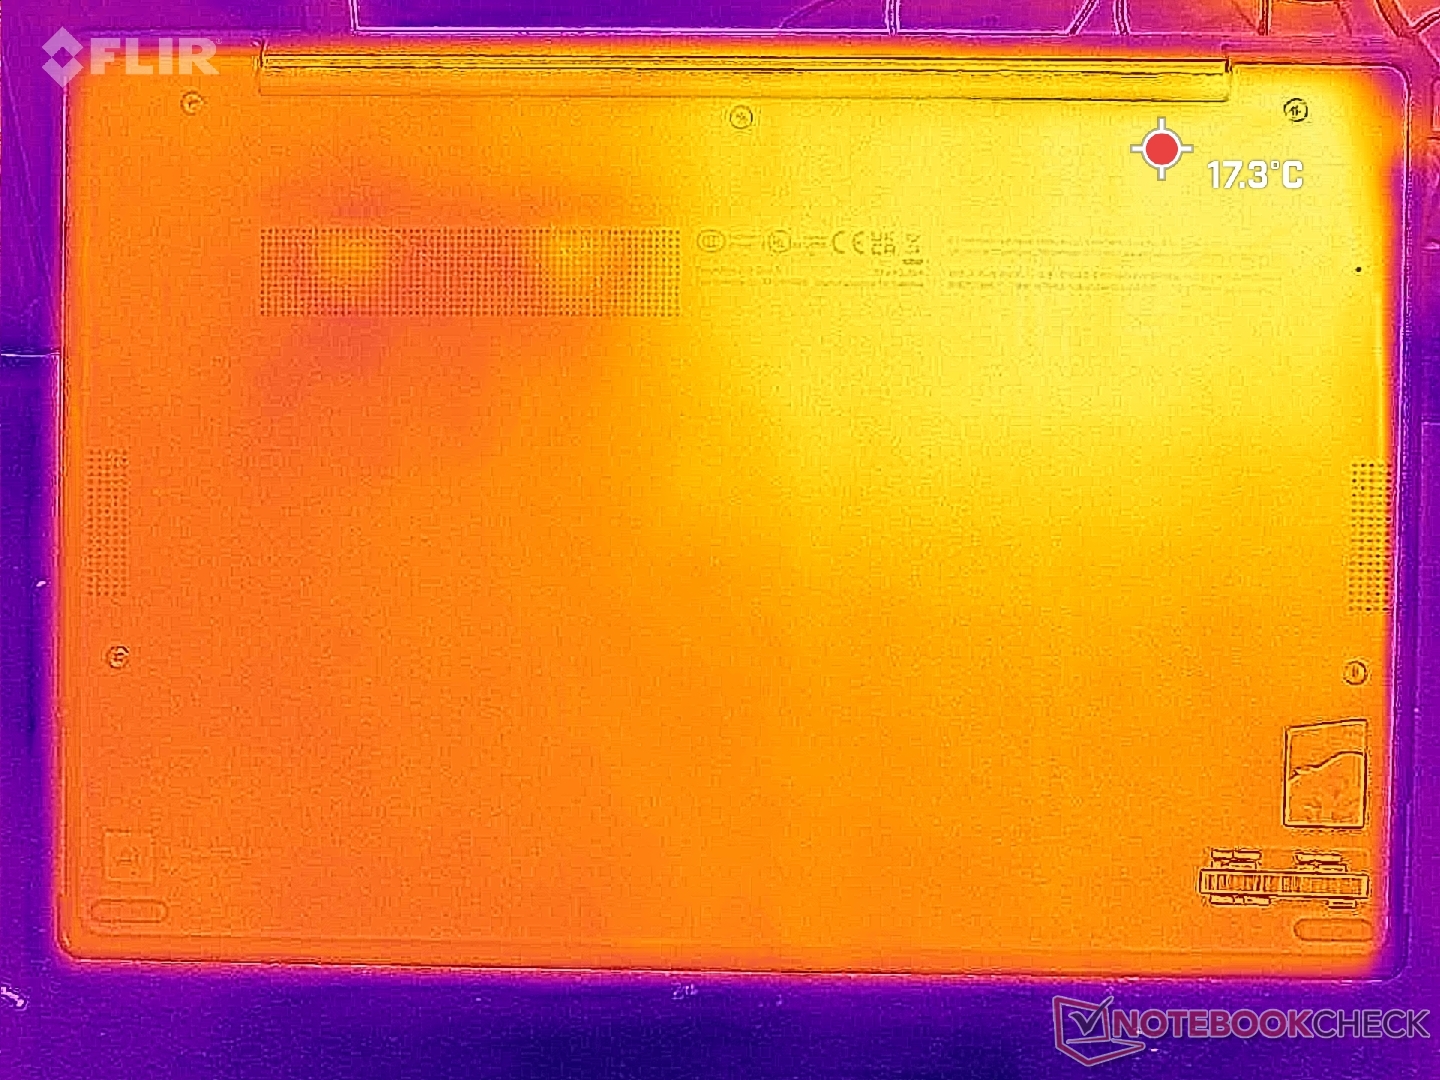
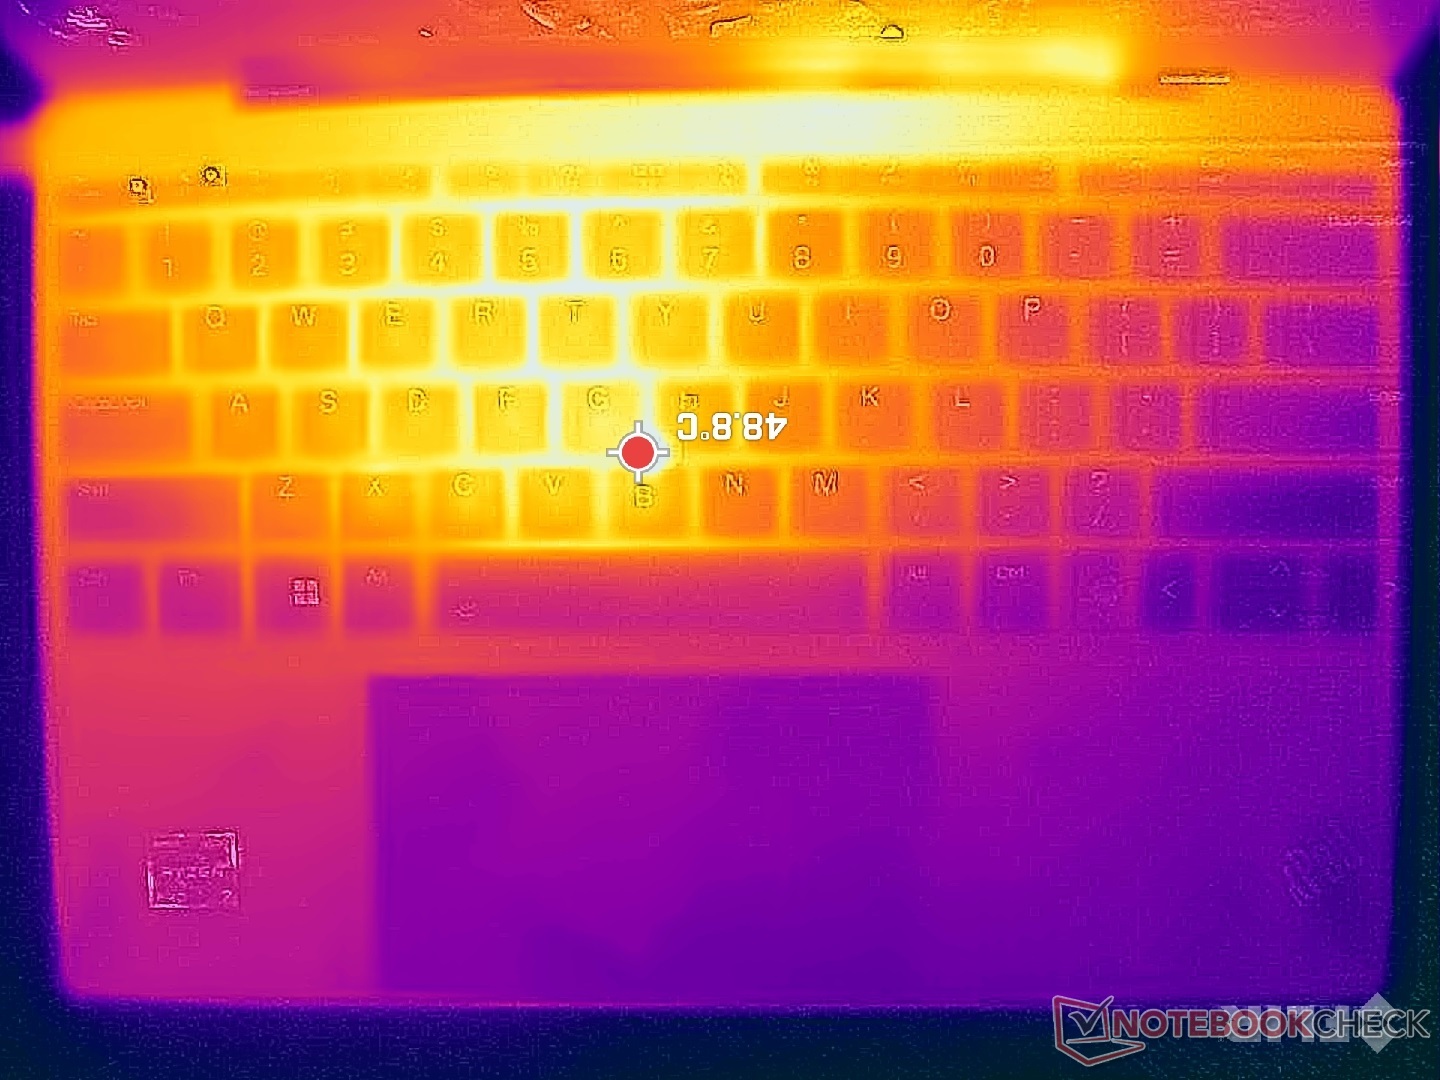
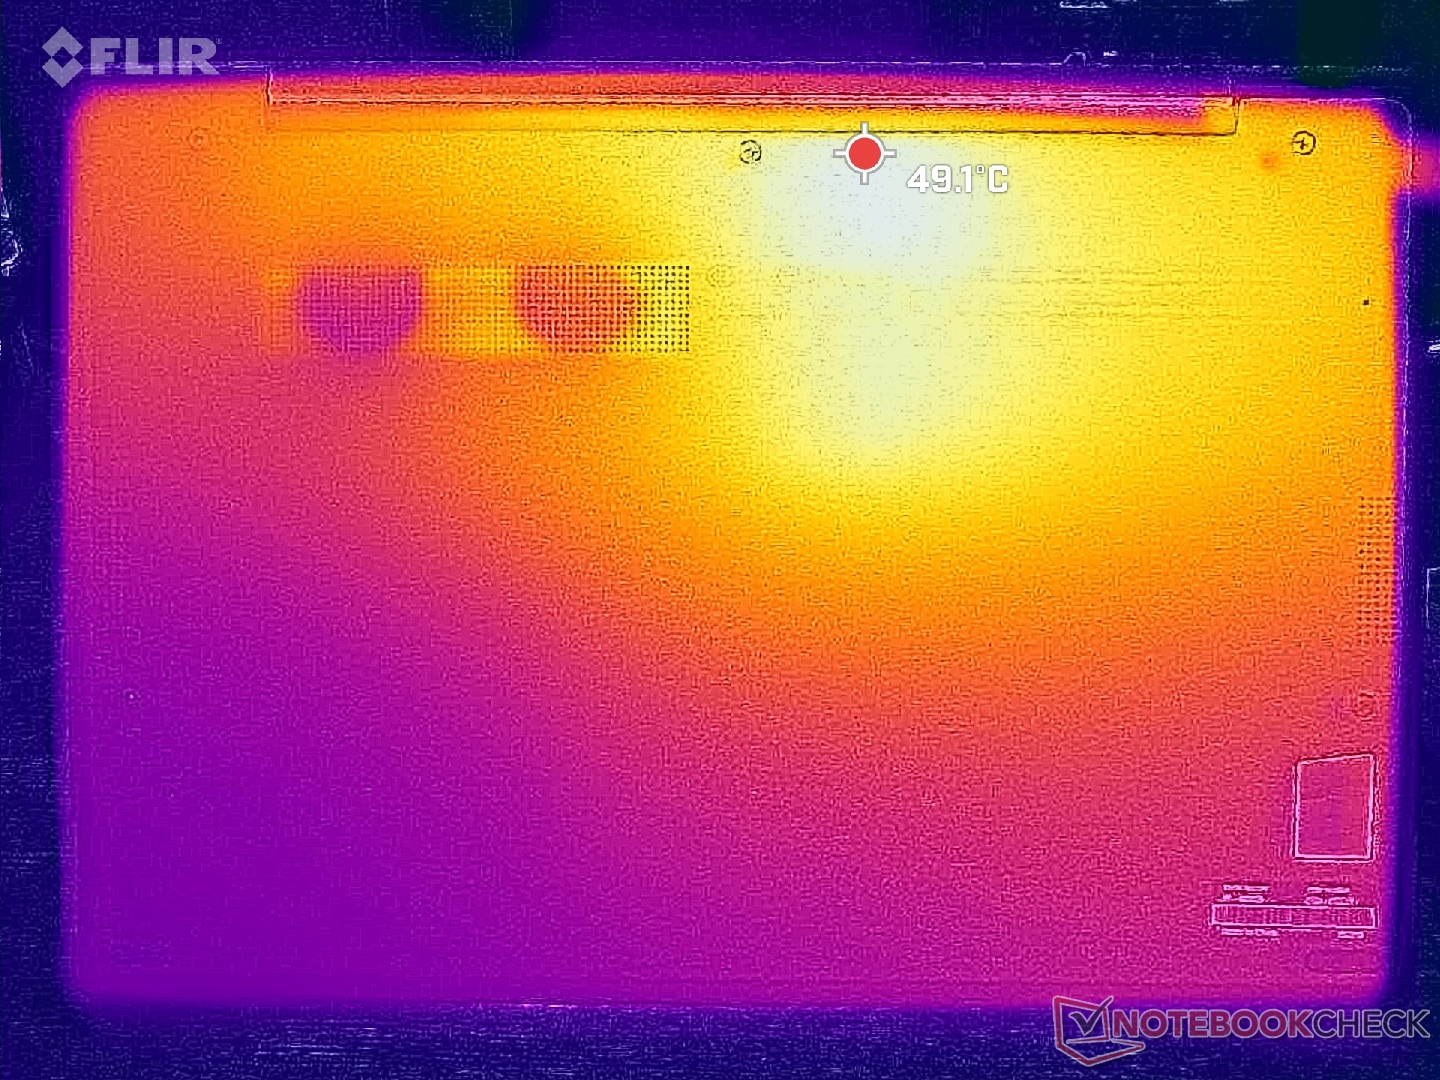
Aufgrund des kompakten Designs und des Metallgehäuses können die Oberflächentemperaturen bei anspruchsvoller Last sehr warm werden. In der Mitte der Tastatur und an der Unterseite können die heißen Stellen über 46 °C bzw. 48 °C erreichen, während es beim HP Dragonfly G4 mit dem langsameren Core i7-1365U nur 39 °C bis 41 °C sind.
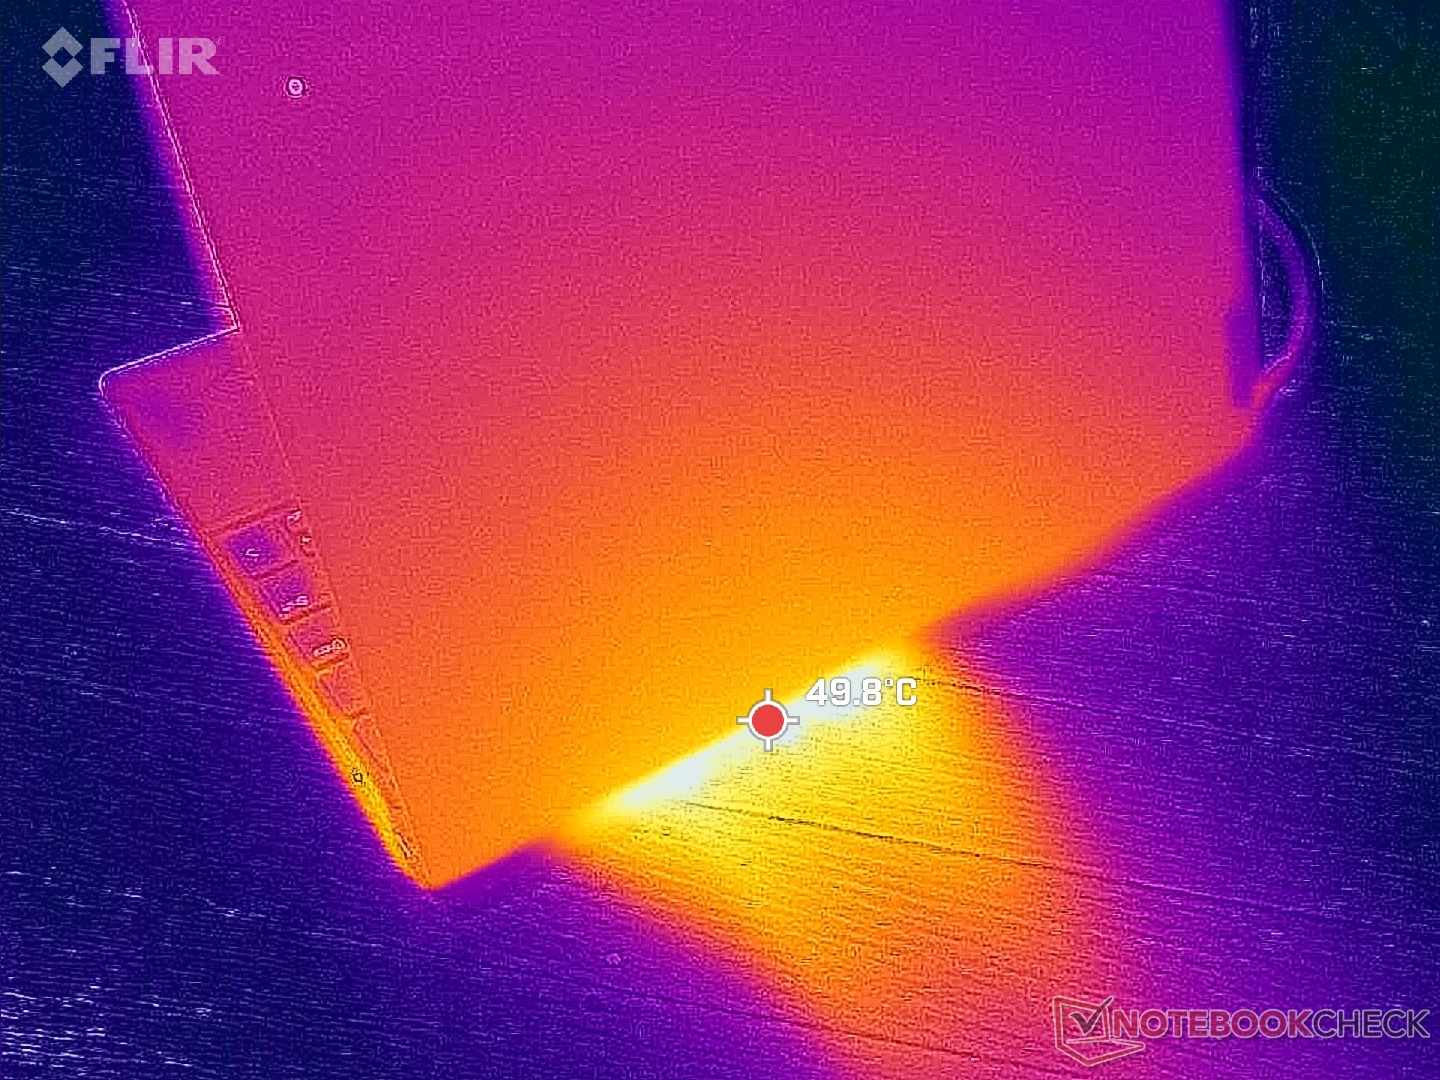
(-) Die maximale Temperatur auf der Oberseite ist 46.2 °C. Im Vergleich liegt der Klassendurchschnitt bei 35.9 °C (von 21.4 bis 59 °C für die Klasse Subnotebook).
(-) Auf der Unterseite messen wir eine maximalen Wert von 48.4 °C (im Vergleich zum Durchschnitt von 39.2 °C).
(+) Ohne Last messen wir eine durchschnittliche Temperatur von 22.1 °C auf der Oberseite. Der Klassendurchschnitt erreicht 30.8 °C.
(+) Die Handballen und der Touchpad-Bereich sind mit gemessenen 29.2 °C kühler als die typische Hauttemperatur und fühlen sich dadurch kühl an.
(±) Die durchschnittliche Handballen-Temperatur anderer getesteter Geräte war 28.2 °C (-1 °C).
| Lenovo ThinkPad Z13 Gen 2 AMD Ryzen 7 PRO 7840U, AMD Radeon 780M | HP Dragonfly G4 Intel Core i7-1365U, Intel Iris Xe Graphics G7 96EUs | Dell Latitude 13 7340 i5-1345U Intel Core i5-1345U, Intel Iris Xe Graphics G7 80EUs | Lenovo ThinkPad Z13 21D2CTO1WW AMD Ryzen 5 PRO 6650U, AMD Radeon 660M | Lenovo ThinkPad X1 Nano Gen 3 Intel Core i7-1360P, Intel Iris Xe Graphics G7 96EUs | Framework Laptop 13.5 Ryzen 7 7840U AMD Ryzen 7 7840U, AMD Radeon 780M | |
|---|---|---|---|---|---|---|
| Hitze | -4% | 0% | -15% | -1% | -11% | |
| Last oben max * (°C) | 46.2 | 38.6 16% | 34.3 26% | 44.9 3% | 44 5% | 42 9% |
| Last unten max * (°C) | 48.4 | 40.4 17% | 37.6 22% | 44.3 8% | 43.2 11% | 47.4 2% |
| Idle oben max * (°C) | 23.2 | 28.2 -22% | 28.4 -22% | 31.4 -35% | 25.6 -10% | 28.8 -24% |
| Idle unten max * (°C) | 23 | 29 -26% | 28.8 -25% | 31.5 -37% | 25.6 -11% | 29.6 -29% |
* ... kleinere Werte sind besser
Stresstest
Unter Prime95-Stress erhöht sich die CPU auf 4 GHz und 51 W, bevor sie schnell abfällt und sich bei 3,3 GHz, 35 W und 86 °C stabilisiert. Das ist wärmer als bei den meisten anderen Subnotebooks wie dem Dragonfly G4, wo sich die Kerntemperatur bei 76 °C stabilisiert, sobald derselbe Test ausgeführt wird.
Wenn CPU und GPU unter Prime95 und FurMark gleichzeitig voll belastet werden, kommt es zu starkem Throttling bei wechselnden Taktraten, wie der Screenshot unten zeigt. Dies tritt glücklicherweise nicht auf, wenn reale Lasten ausgeführt werden. Beispielsweise liefert Witcher 3 viel stabilere Taktraten und konsistentere Leistungsergebnisse.
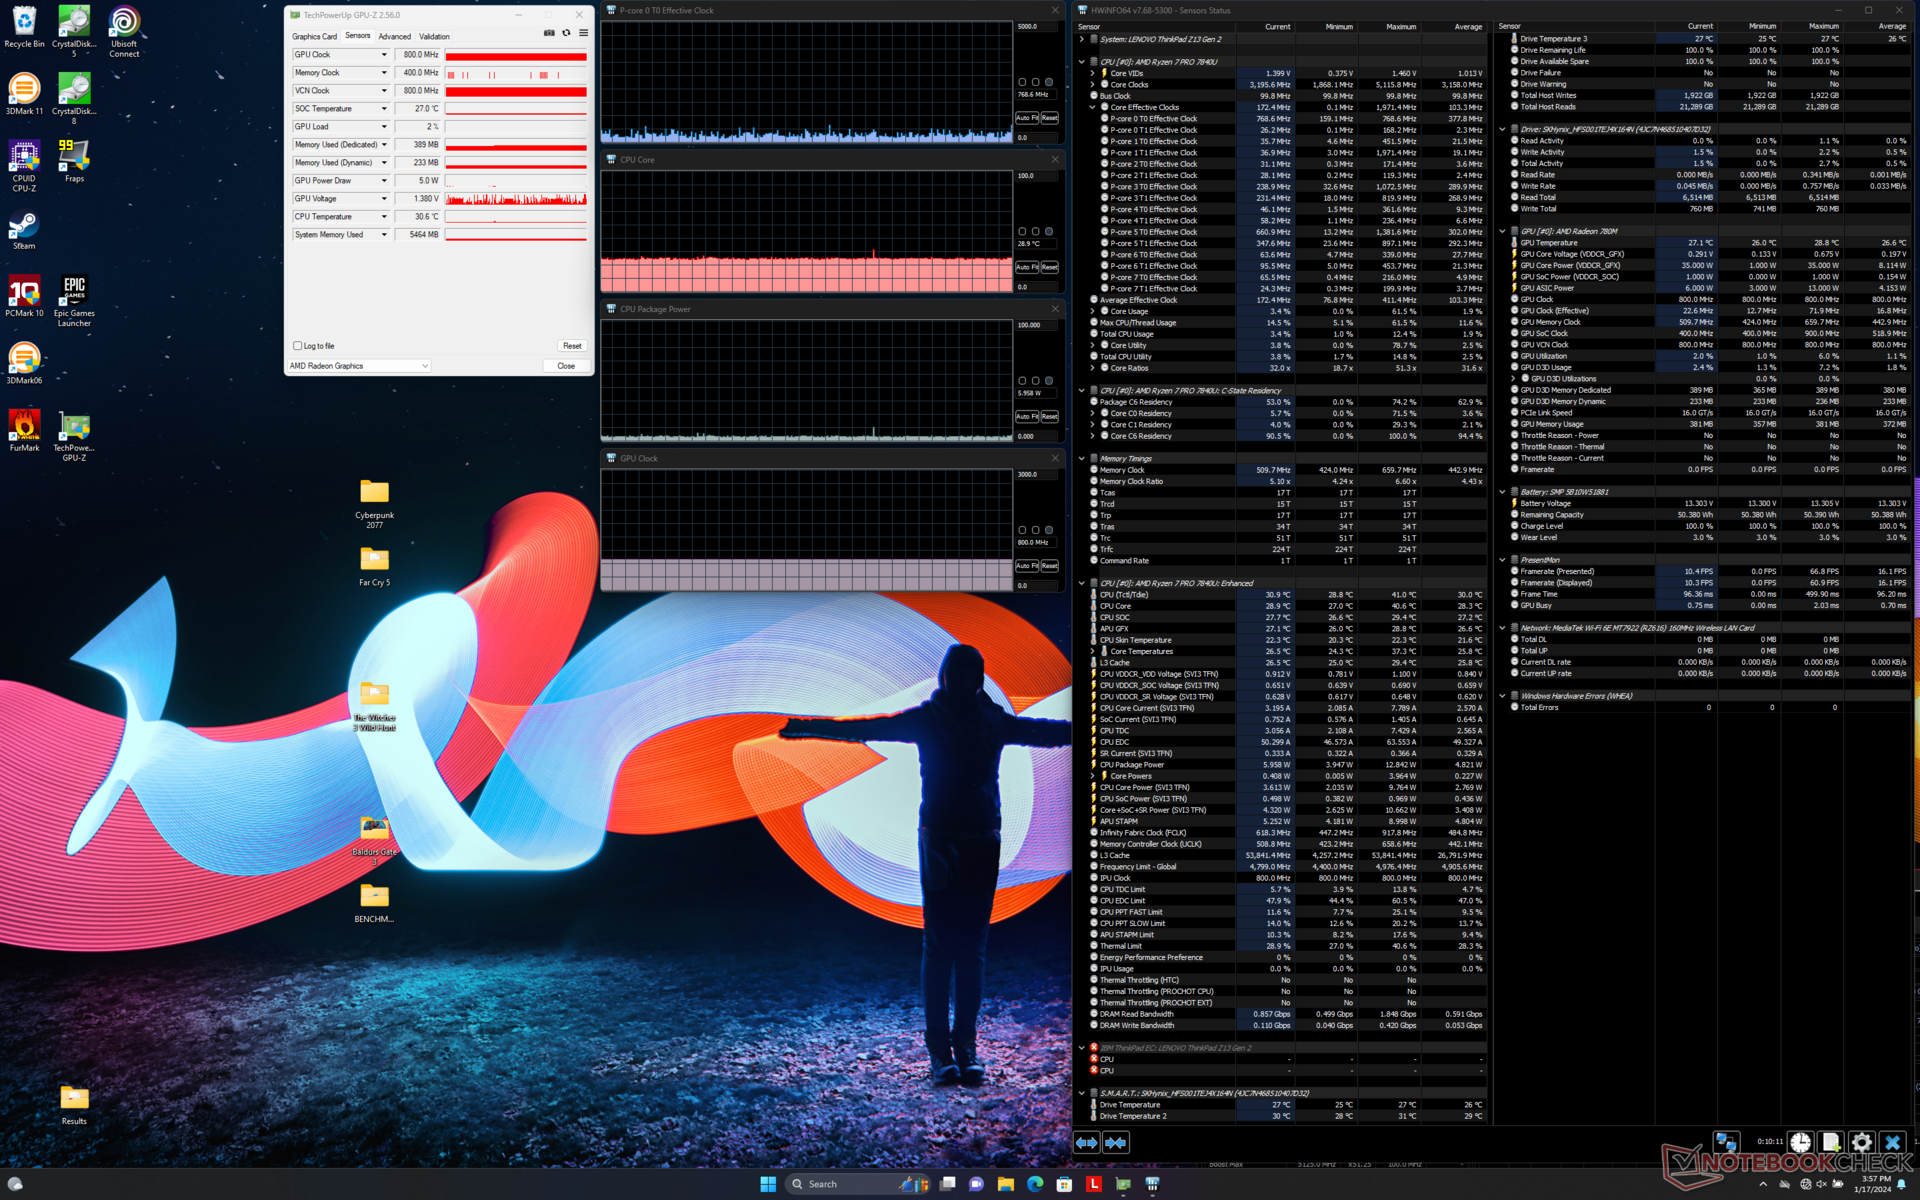
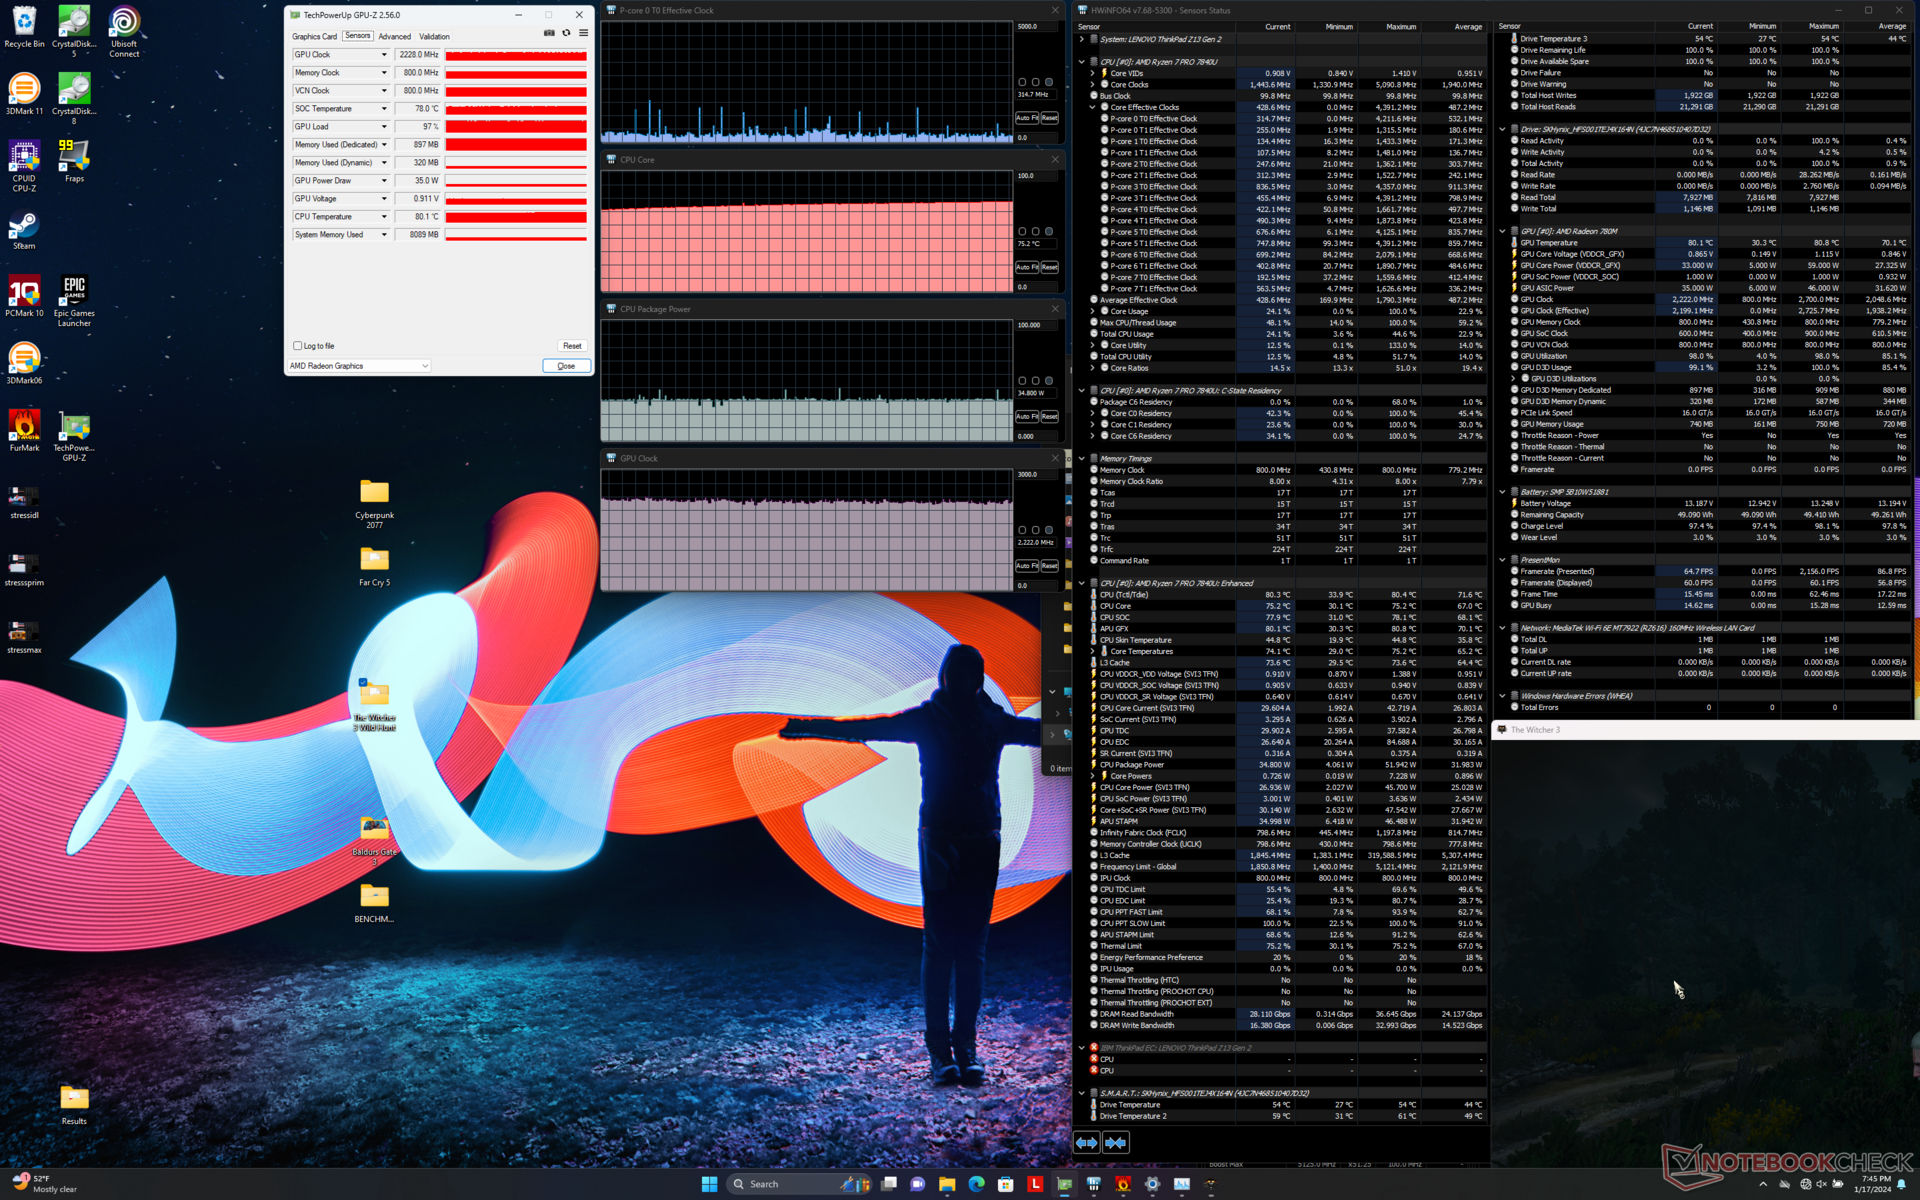
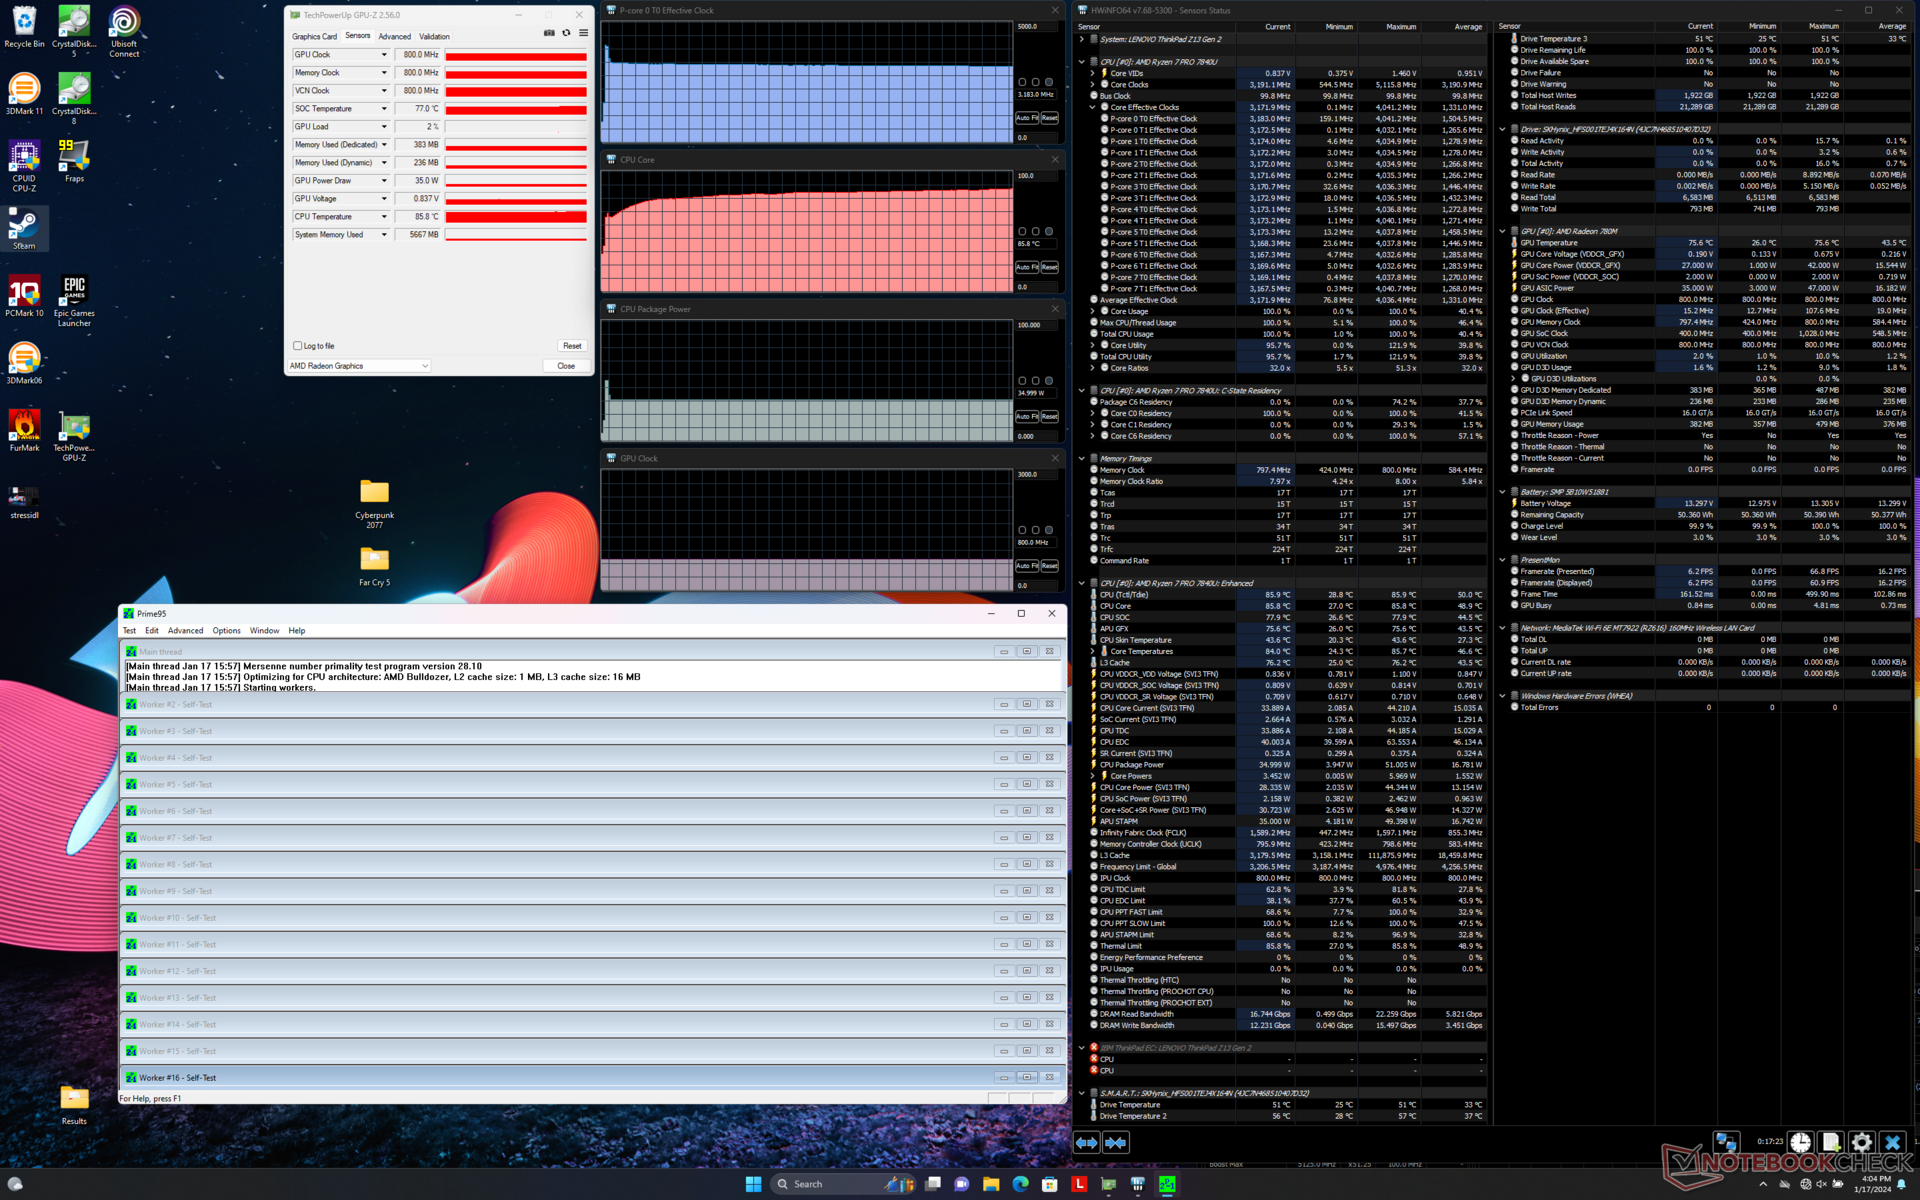
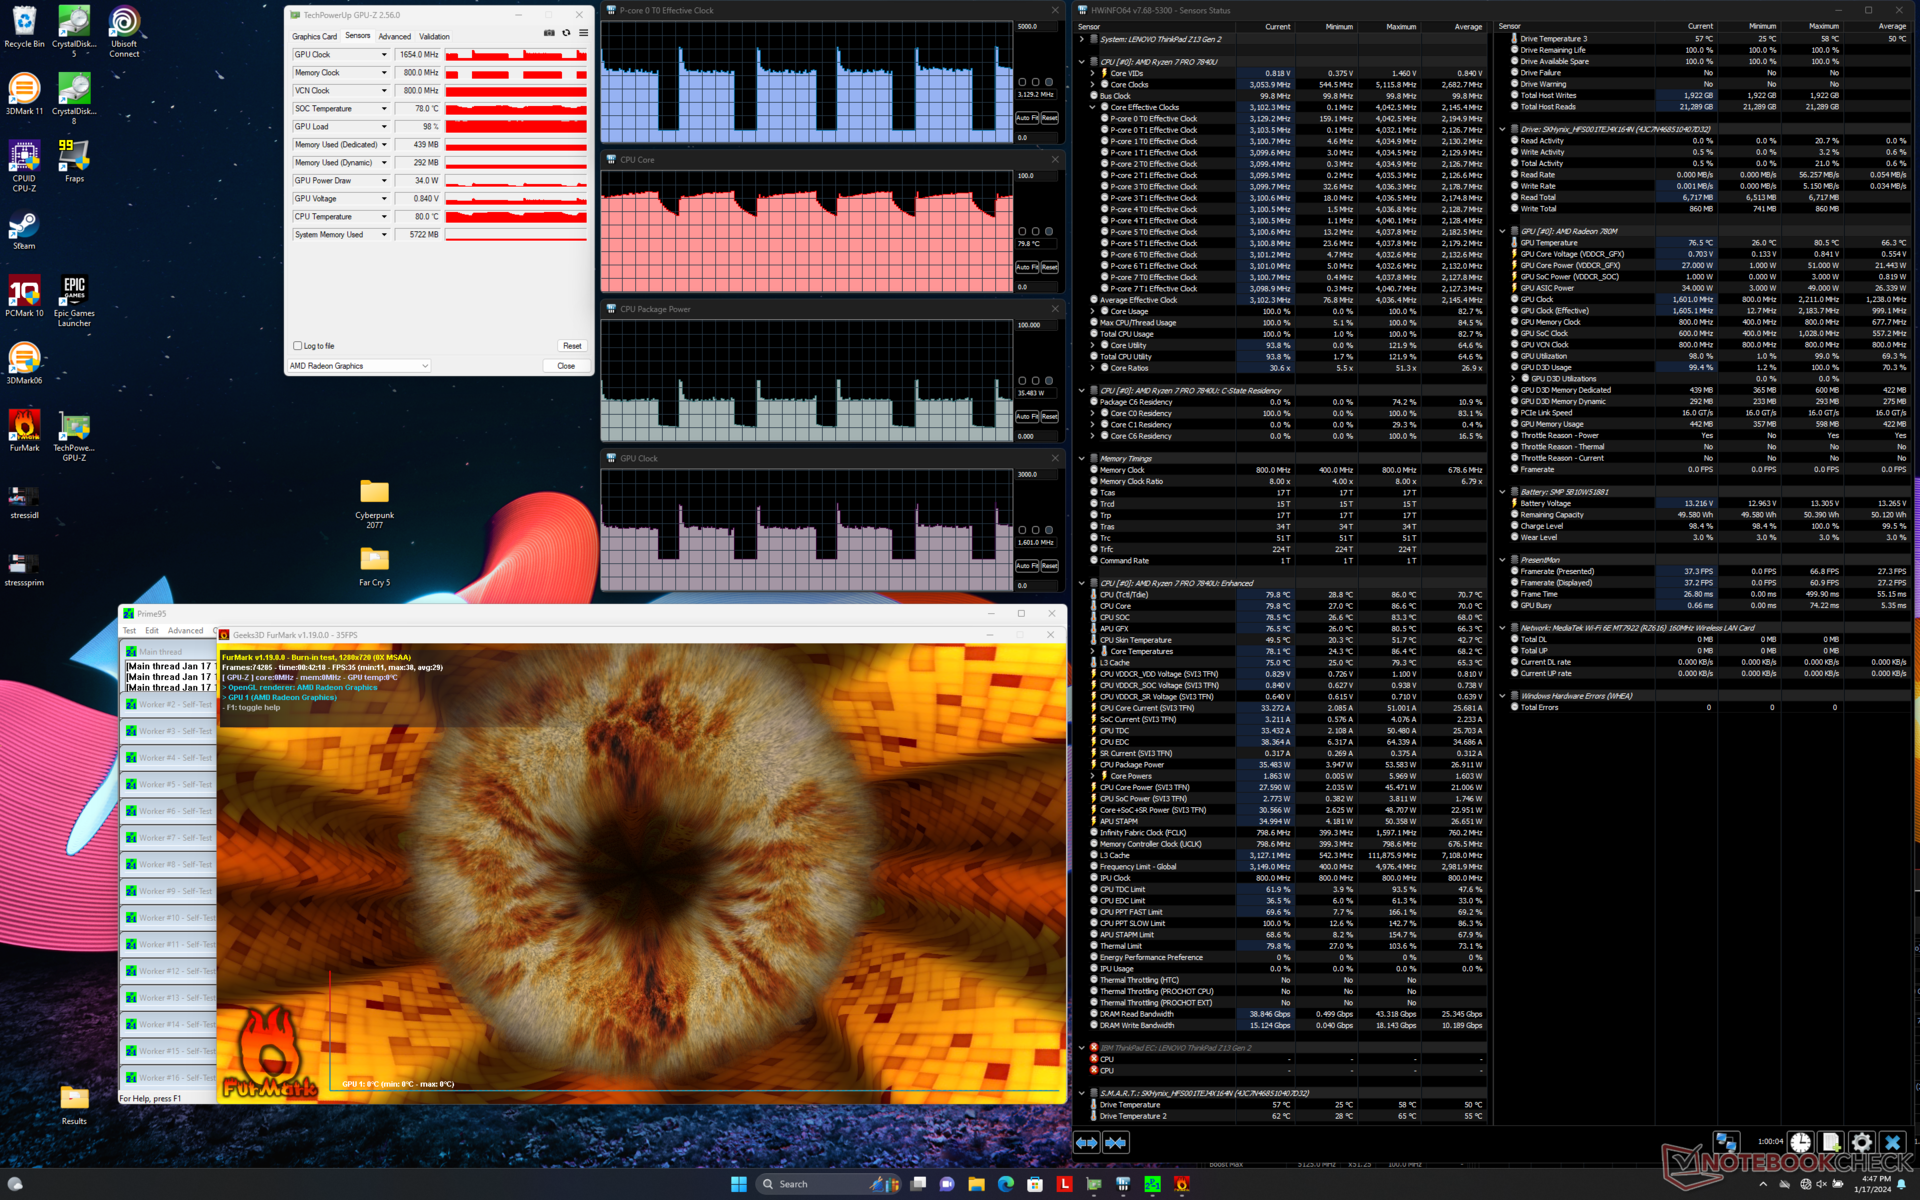
| CPU-Takt (GHz) | GPU-Takt (MHz) | Durchschnittliche CPU-Temperatur (°C) | |
| System im Leerlauf | -- | -- | 29 |
| Prime95 Stresstest | 3.2 | -- | 86 |
| Prime95 + FurMark Stresstest | 0.5 - 2.6 | 800 - 2100 | 62 - 84 |
| Witcher 3 Stresstest | ~0.3 | 2228 | 76 |
Lautsprecher
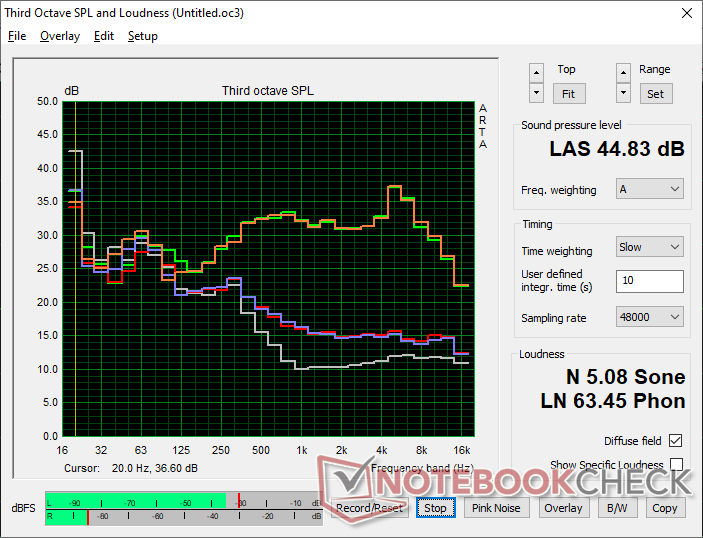
Lenovo ThinkPad Z13 Gen 2 Audio Analyse
(±) | Mittelmäßig laut spielende Lautsprecher (81.3 dB)
Bass 100 - 315 Hz
(±) | abgesenkter Bass - 12.6% geringer als der Median
(±) | durchschnittlich lineare Bass-Wiedergabe (11.8% Delta zum Vorgänger)
Mitteltöne 400 - 2000 Hz
(+) | ausgeglichene Mitten, vom Median nur 3.6% abweichend
(+) | lineare Mitten (3.9% Delta zum Vorgänger)
Hochtöne 2 - 16 kHz
(+) | ausgeglichene Hochtöne, vom Median nur 2.3% abweichend
(+) | sehr lineare Hochtöne (5.3% Delta zum Vorgänger)
Gesamt im hörbaren Bereich 100 - 16.000 Hz
(+) | hörbarer Bereich ist sehr linear (12.6% Abstand zum Median
Im Vergleich zu allen Geräten derselben Klasse
» 18% aller getesteten Geräte dieser Klasse waren besser, 4% vergleichbar, 77% schlechter
» Das beste Gerät hat einen Delta-Wert von 5%, durchschnittlich ist 18%, das schlechteste Gerät hat 53%
Im Vergleich zu allen Geräten im Test
» 11% aller getesteten Geräte waren besser, 3% vergleichbar, 86% schlechter
» Das beste Gerät hat einen Delta-Wert von 4%, durchschnittlich ist 23%, das schlechteste Gerät hat 134%
Apple MacBook Pro 16 2021 M1 Pro Audio Analyse
(+) | Die Lautsprecher können relativ laut spielen (84.7 dB)
Bass 100 - 315 Hz
(+) | guter Bass - nur 3.8% Abweichung vom Median
(+) | lineare Bass-Wiedergabe (5.2% Delta zum Vorgänger)
Mitteltöne 400 - 2000 Hz
(+) | ausgeglichene Mitten, vom Median nur 1.3% abweichend
(+) | lineare Mitten (2.1% Delta zum Vorgänger)
Hochtöne 2 - 16 kHz
(+) | ausgeglichene Hochtöne, vom Median nur 1.9% abweichend
(+) | sehr lineare Hochtöne (2.7% Delta zum Vorgänger)
Gesamt im hörbaren Bereich 100 - 16.000 Hz
(+) | hörbarer Bereich ist sehr linear (4.6% Abstand zum Median
Im Vergleich zu allen Geräten derselben Klasse
» 0% aller getesteten Geräte dieser Klasse waren besser, 0% vergleichbar, 100% schlechter
» Das beste Gerät hat einen Delta-Wert von 5%, durchschnittlich ist 17%, das schlechteste Gerät hat 45%
Im Vergleich zu allen Geräten im Test
» 0% aller getesteten Geräte waren besser, 0% vergleichbar, 100% schlechter
» Das beste Gerät hat einen Delta-Wert von 4%, durchschnittlich ist 23%, das schlechteste Gerät hat 134%
Energieverwaltung
Energieaufnahme
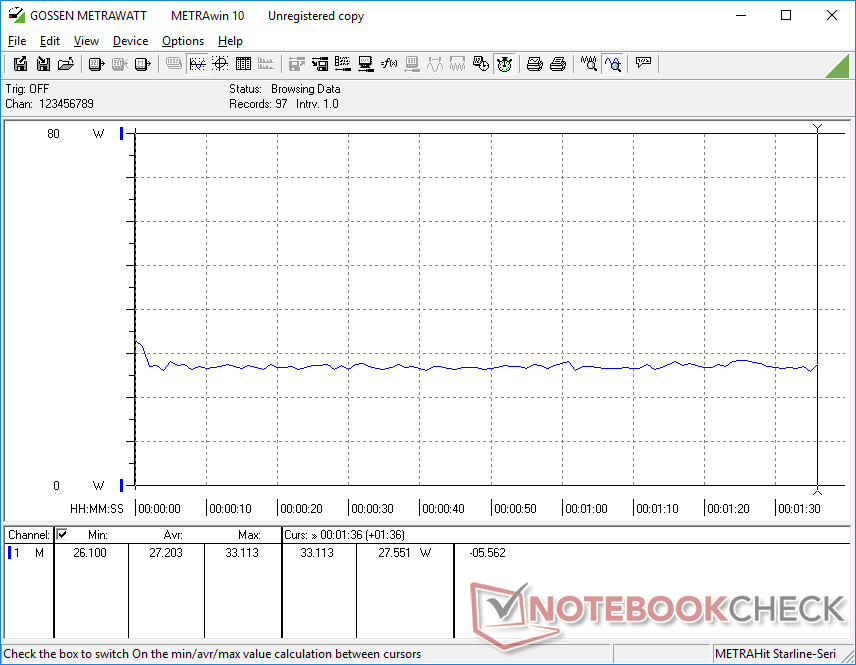
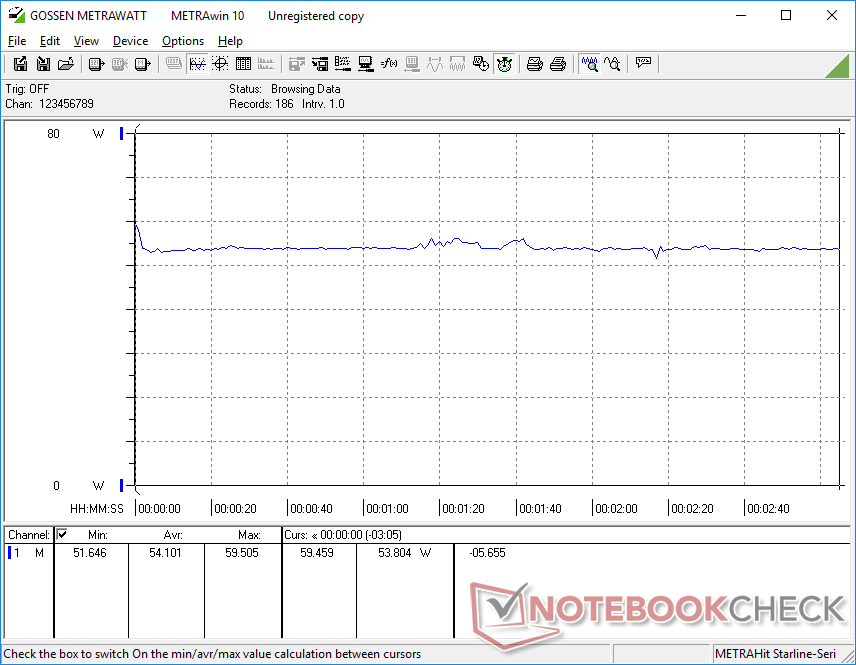
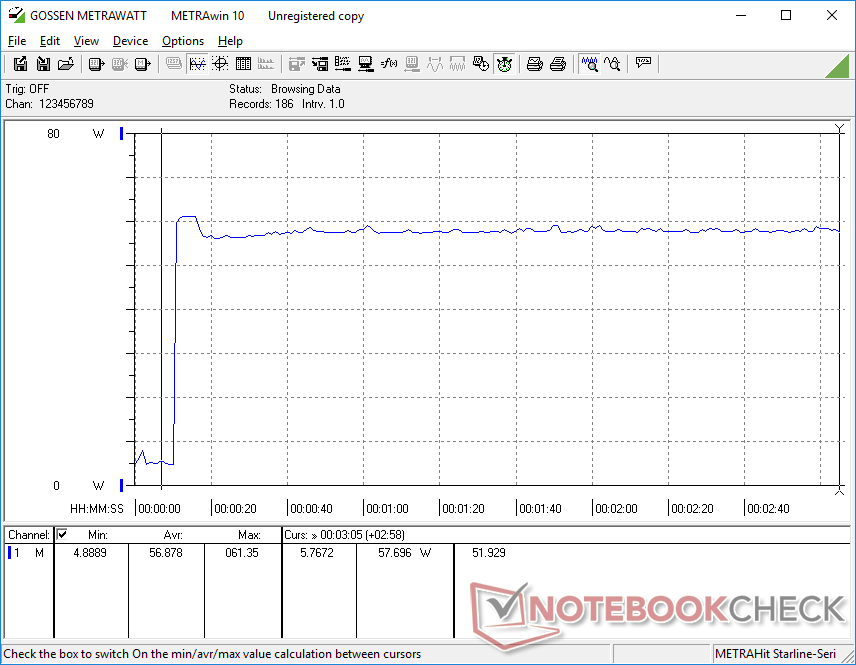
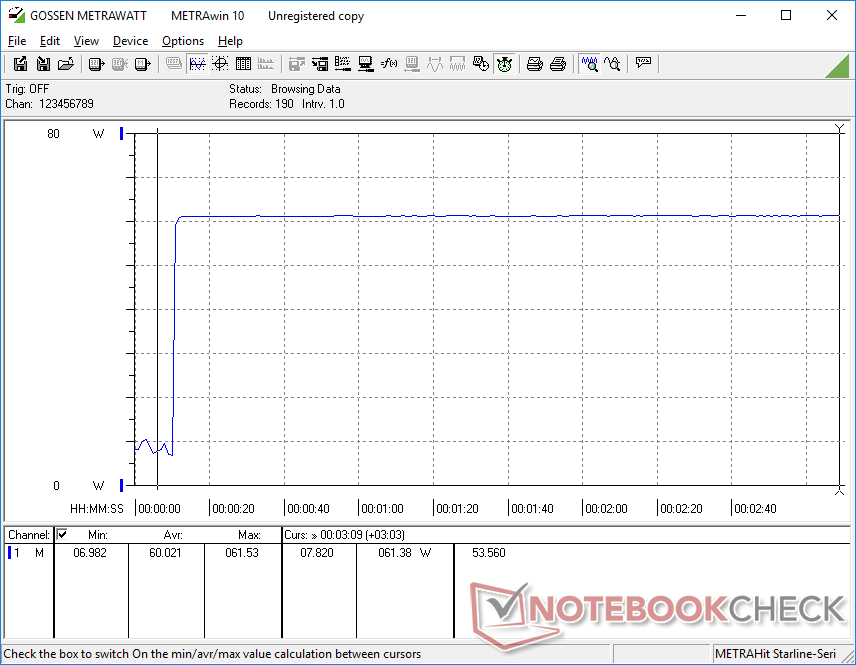
Die Energieaufnahme ist durchweg höher im Vergleich zum ThinkPad Z13 G1 was zur kürzeren Akkulaufzeit im nächsten Abschnitt beiträgt. Beispielsweise würde die Ausführung von Witcher 3, 55 W verbrauchen, verglichen mit nur 30 W beim letztjährigen Modell. Natürlich bedeutet die höhere Leistung unserer Radeon 780M im Vergleich zur Radeon 660M, dass die höheren Verbrauchswerte nicht ohne Grund sind.
Allein das OLED-Panel benötigt im Vergleich zu IPS eine beträchtliche Menge Strom. Im Leerlauf bei maximaler Helligkeit und einem hellen, weißen Bildschirm, wie z. B. einer typischen Webseite, werden fast 13 W verbraucht, verglichen mit weniger als der Hälfte bei der IPS-Konfiguration des ThinkPad Z13 G1.
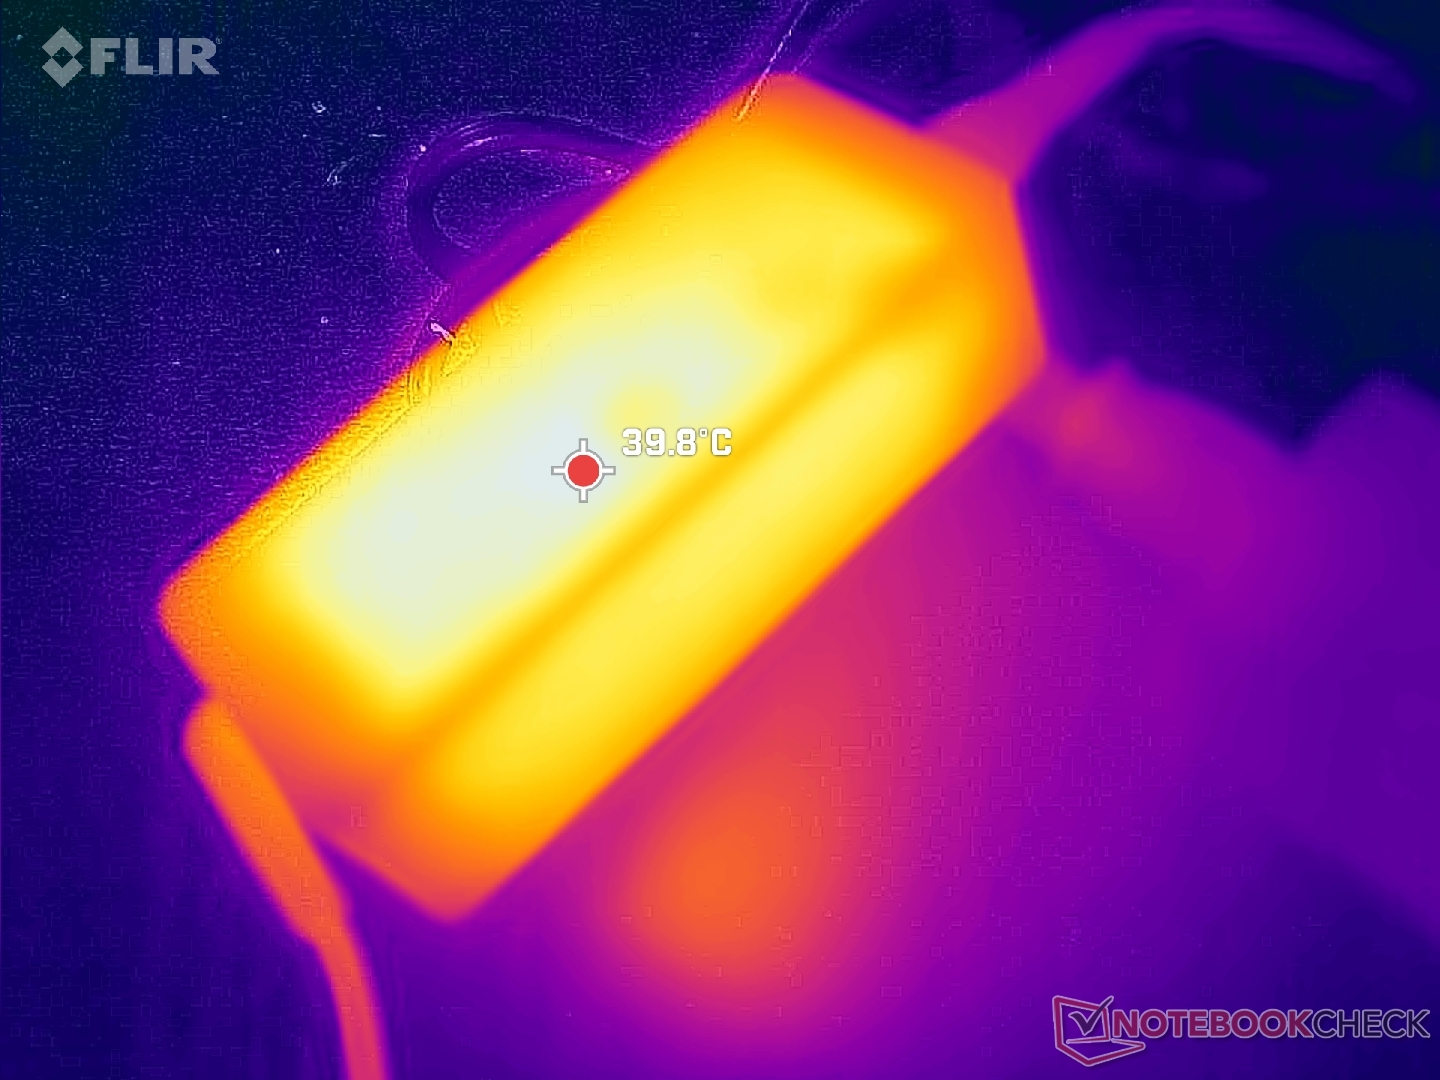
Mit dem kleinen (~10,8 x 4,8 x 2,9 cm) 65-W-USB-C-Netzteil können wir eine maximale Leistungsaufnahme von 62 W messen, wenn die CPU zu 100% ausgelastet ist. Der Ladevorgang verlangsamt sich daher, wenn gleichzeitig anspruchsvolle Lasten ausgeführt werden. Ein größeres 100-Watt-Netzteil wäre vor allem für Power-User besser geeignet gewesen.
| Aus / Standby | |
| Idle | |
| Last |
|
Legende:
min: | |
| Lenovo ThinkPad Z13 Gen 2 R7 PRO 7840U, Radeon 780M, SK hynix BC901 HFS001TEJ4X164N, OLED, 2880x1800, 13.3" | HP Dragonfly G4 i7-1365U, Iris Xe G7 96EUs, Micron 3400 MTFDKBA512TFH 512GB, IPS, 1920x1280, 13.5" | Dell Latitude 13 7340 i5-1345U i5-1345U, Iris Xe G7 80EUs, Kioxia BG5 KBG50ZNS512G, IPS, 1920x1200, 13.3" | Lenovo ThinkPad Z13 21D2CTO1WW R5 PRO 6650U, Radeon 660M, Lenovo UMIS AM630 RPJTJ512MGE1QDQ, IPS LED, 1920x1200, 13.3" | Lenovo ThinkPad X1 Nano Gen 3 i7-1360P, Iris Xe G7 96EUs, Lenovo UMIS AM6A0 RPJTJ512MKP1QDQ, IPS, 2160x1350, 13" | Framework Laptop 13.5 Ryzen 7 7840U R7 7840U, Radeon 780M, WD PC SN740 512GB SDDPNQD-512G, IPS, 2256x1504, 13.5" | |
|---|---|---|---|---|---|---|
| Stromverbrauch | 6% | 9% | 16% | 12% | 2% | |
| Idle min * (Watt) | 5.8 | 4.1 29% | 2.37 59% | 2.4 59% | 3.3 43% | 4 31% |
| Idle avg * (Watt) | 6.2 | 7.5 -21% | 6.19 -0% | 4.6 26% | 6.5 -5% | 6.5 -5% |
| Idle max * (Watt) | 12.7 | 8.2 35% | 14.1 -11% | 5.1 60% | 7.1 44% | 6.8 46% |
| Last avg * (Watt) | 27.2 | 35.5 -31% | 36.3 -33% | 53.1 -95% | 40.7 -50% | 48 -76% |
| Witcher 3 ultra * (Watt) | 54.1 | 37.5 31% | 24.9 54% | 27.6 49% | 37 32% | 52.3 3% |
| Last max * (Watt) | 61.4 | 66.5 -8% | 69.13 -13% | 63.7 -4% | 58.6 5% | 55.2 10% |
* ... kleinere Werte sind besser
Energieverbrauch Witcher 3 / Stresstest
Energieverbrauch externer Monitor
Akkulaufzeit
Die Laufzeiten sanken aufgrund des höher auflösenden OLED-Panels deutlich. Unser ThinkPad Z13 G1 mit dem Basis-IPS-Panel (1.200p) hielt beispielsweise über 14 Stunden durch, während es bei unserem ThinkPad Z13 G2 nur knapp 8 Stunden waren.
Das Aufladen von der leeren bis zur vollen Kapazität dauerte mit fast 2,5 Stunden länger als erwartet, verglichen mit 1,5 Stunden bei den meisten anderen Laptops.
| Lenovo ThinkPad Z13 Gen 2 R7 PRO 7840U, Radeon 780M, 51.5 Wh | HP Dragonfly G4 i7-1365U, Iris Xe G7 96EUs, 68 Wh | Dell Latitude 13 7340 i5-1345U i5-1345U, Iris Xe G7 80EUs, 57 Wh | Lenovo ThinkPad Z13 21D2CTO1WW R5 PRO 6650U, Radeon 660M, 51.5 Wh | Lenovo ThinkPad X1 Nano Gen 3 i7-1360P, Iris Xe G7 96EUs, 49.5 Wh | Framework Laptop 13.5 Ryzen 7 7840U R7 7840U, Radeon 780M, 61 Wh | |
|---|---|---|---|---|---|---|
| Akkulaufzeit | 104% | 92% | 85% | 0% | 55% | |
| WLAN (h) | 7.8 | 15.9 104% | 15 92% | 14.4 85% | 7.8 0% | 12.1 55% |
| Idle (h) | 42.5 | |||||
| Last (h) | 3.2 | 2.9 | 1.9 | |||
| H.264 (h) | 16.3 |
Pro
Contra
Fazit — Rund um die Leistungsverbesserungen
Der Hauptunterschied zwischen dem ThinkPad Z13 Gen 1 und dem Z13 Gen 2 liegt in der Ausstattung letzteres mit AMD Zen 4 CPU-Optionen. Wenn die zusätzliche Leistung nicht benötigt wird, kann das Z13 Gen 1 im Wesentlichen ein identisches Benutzererlebnis bieten, da es die gleichen Display-Optionen und physischen Eigenschaften aufweist. Die Zen 3+ Prozessoren aus dem letzten Jahr sind bereits leistungsstark, und die neuen Zen 4-Optionen dürften vor allem Power-User und Grafik-Editoren ansprechen, aber nicht für Benutzer, die einfache Browser- oder Tabellenkalkulationsaufgaben ausführen.
Käufer sollten beachten, dass das OLED-Panel in unseren WLAN-Tests die Akkulaufzeit im Vergleich zum IPS-Basispanel um bis zu 6 Stunden verkürzen kann. Die tieferen Farben, die schnelleren Reaktionszeiten, die HDR-Unterstützung und die höhere Auflösung haben in dieser Hinsicht definitiv Nachteile.
Die AMD Zen 4 Pro CPU-Upgrades sind lobenswert, aber das 60-Hz-Display und die 2-MP-Webcam wirken langsam veraltet, besonders für ein High-End-Subnotebook.
Für ein mögliches ThinkPad Z13 Gen 3 in der Zukunft würden wir gerne aktualisierte Display-Optionen mit höheren Bildwiederholraten und hellerer Hintergrundbeleuchtung sehen, um besser mit der Asus Zenbook Serie oder der HP Dragonfly-Serie konkurrieren zu können, wo 120-Hz- bzw. 1000-Nit-Displays verfügbar sind. Ein verbessertes Feedback der Tastatur und des Clickpads könnte auch traditionelle ThinkPad-Nutzer überzeugen, die Z-Serie auszuprobieren. Ansonsten fühlt sich das Metallgehäuse weiterhin modern und konkurrenzfähig gegenüber den Alternativen von Dell XPS oder HP Elite an.
Preis und Verfügbarkeit
Lenovo bietet das ThinkPad Z13 G2 ab sofort zu Preisen ab 1.489 Euro für die Ryzen-7-Basiskonfiguration mit 1200p-IPS an.
Lenovo ThinkPad Z13 Gen 2
- 20.01.2024 v7 (old)
Allen Ngo
Transparenz
Die Auswahl der zu testenden Geräte erfolgt innerhalb der Redaktion. Das vorliegende Testmuster wurde dem Autor vom Hersteller oder einem Shop zu Testzwecken leihweise zur Verfügung gestellt. Eine Einflussnahme des Leihstellers auf den Testbericht gab es nicht, der Hersteller erhielt keine Version des Reviews vor der Veröffentlichung. Es bestand keine Verpflichtung zur Publikation. Als eigenständiges, unabhängiges Unternehmen unterliegt Notebookcheck keiner Diktion von Herstellern, Shops und Verlagen.
So testet Notebookcheck
Pro Jahr werden von Notebookcheck hunderte Laptops und Smartphones unabhängig in von uns standardisierten technischen Verfahren getestet, um eine Vergleichbarkeit aller Testergebnisse zu gewährleisten. Seit rund 20 Jahren entwickeln wir diese Testmethoden kontinuierlich weiter und setzen damit Branchenstandards. In unseren Testlaboren kommt ausschließlich hochwertiges Messequipment in die Hände erfahrener Techniker und Redakteure. Die Tests unterliegen einer mehrstufigen Kontrolle. Unsere komplexe Gesamtbewertung basiert auf hunderten fundierten Messergebnissen und Benchmarks, womit Ihnen Objektivität garantiert ist. Weitere Informationen zu unseren Testmethoden gibt es hier.
Preisvergleich

