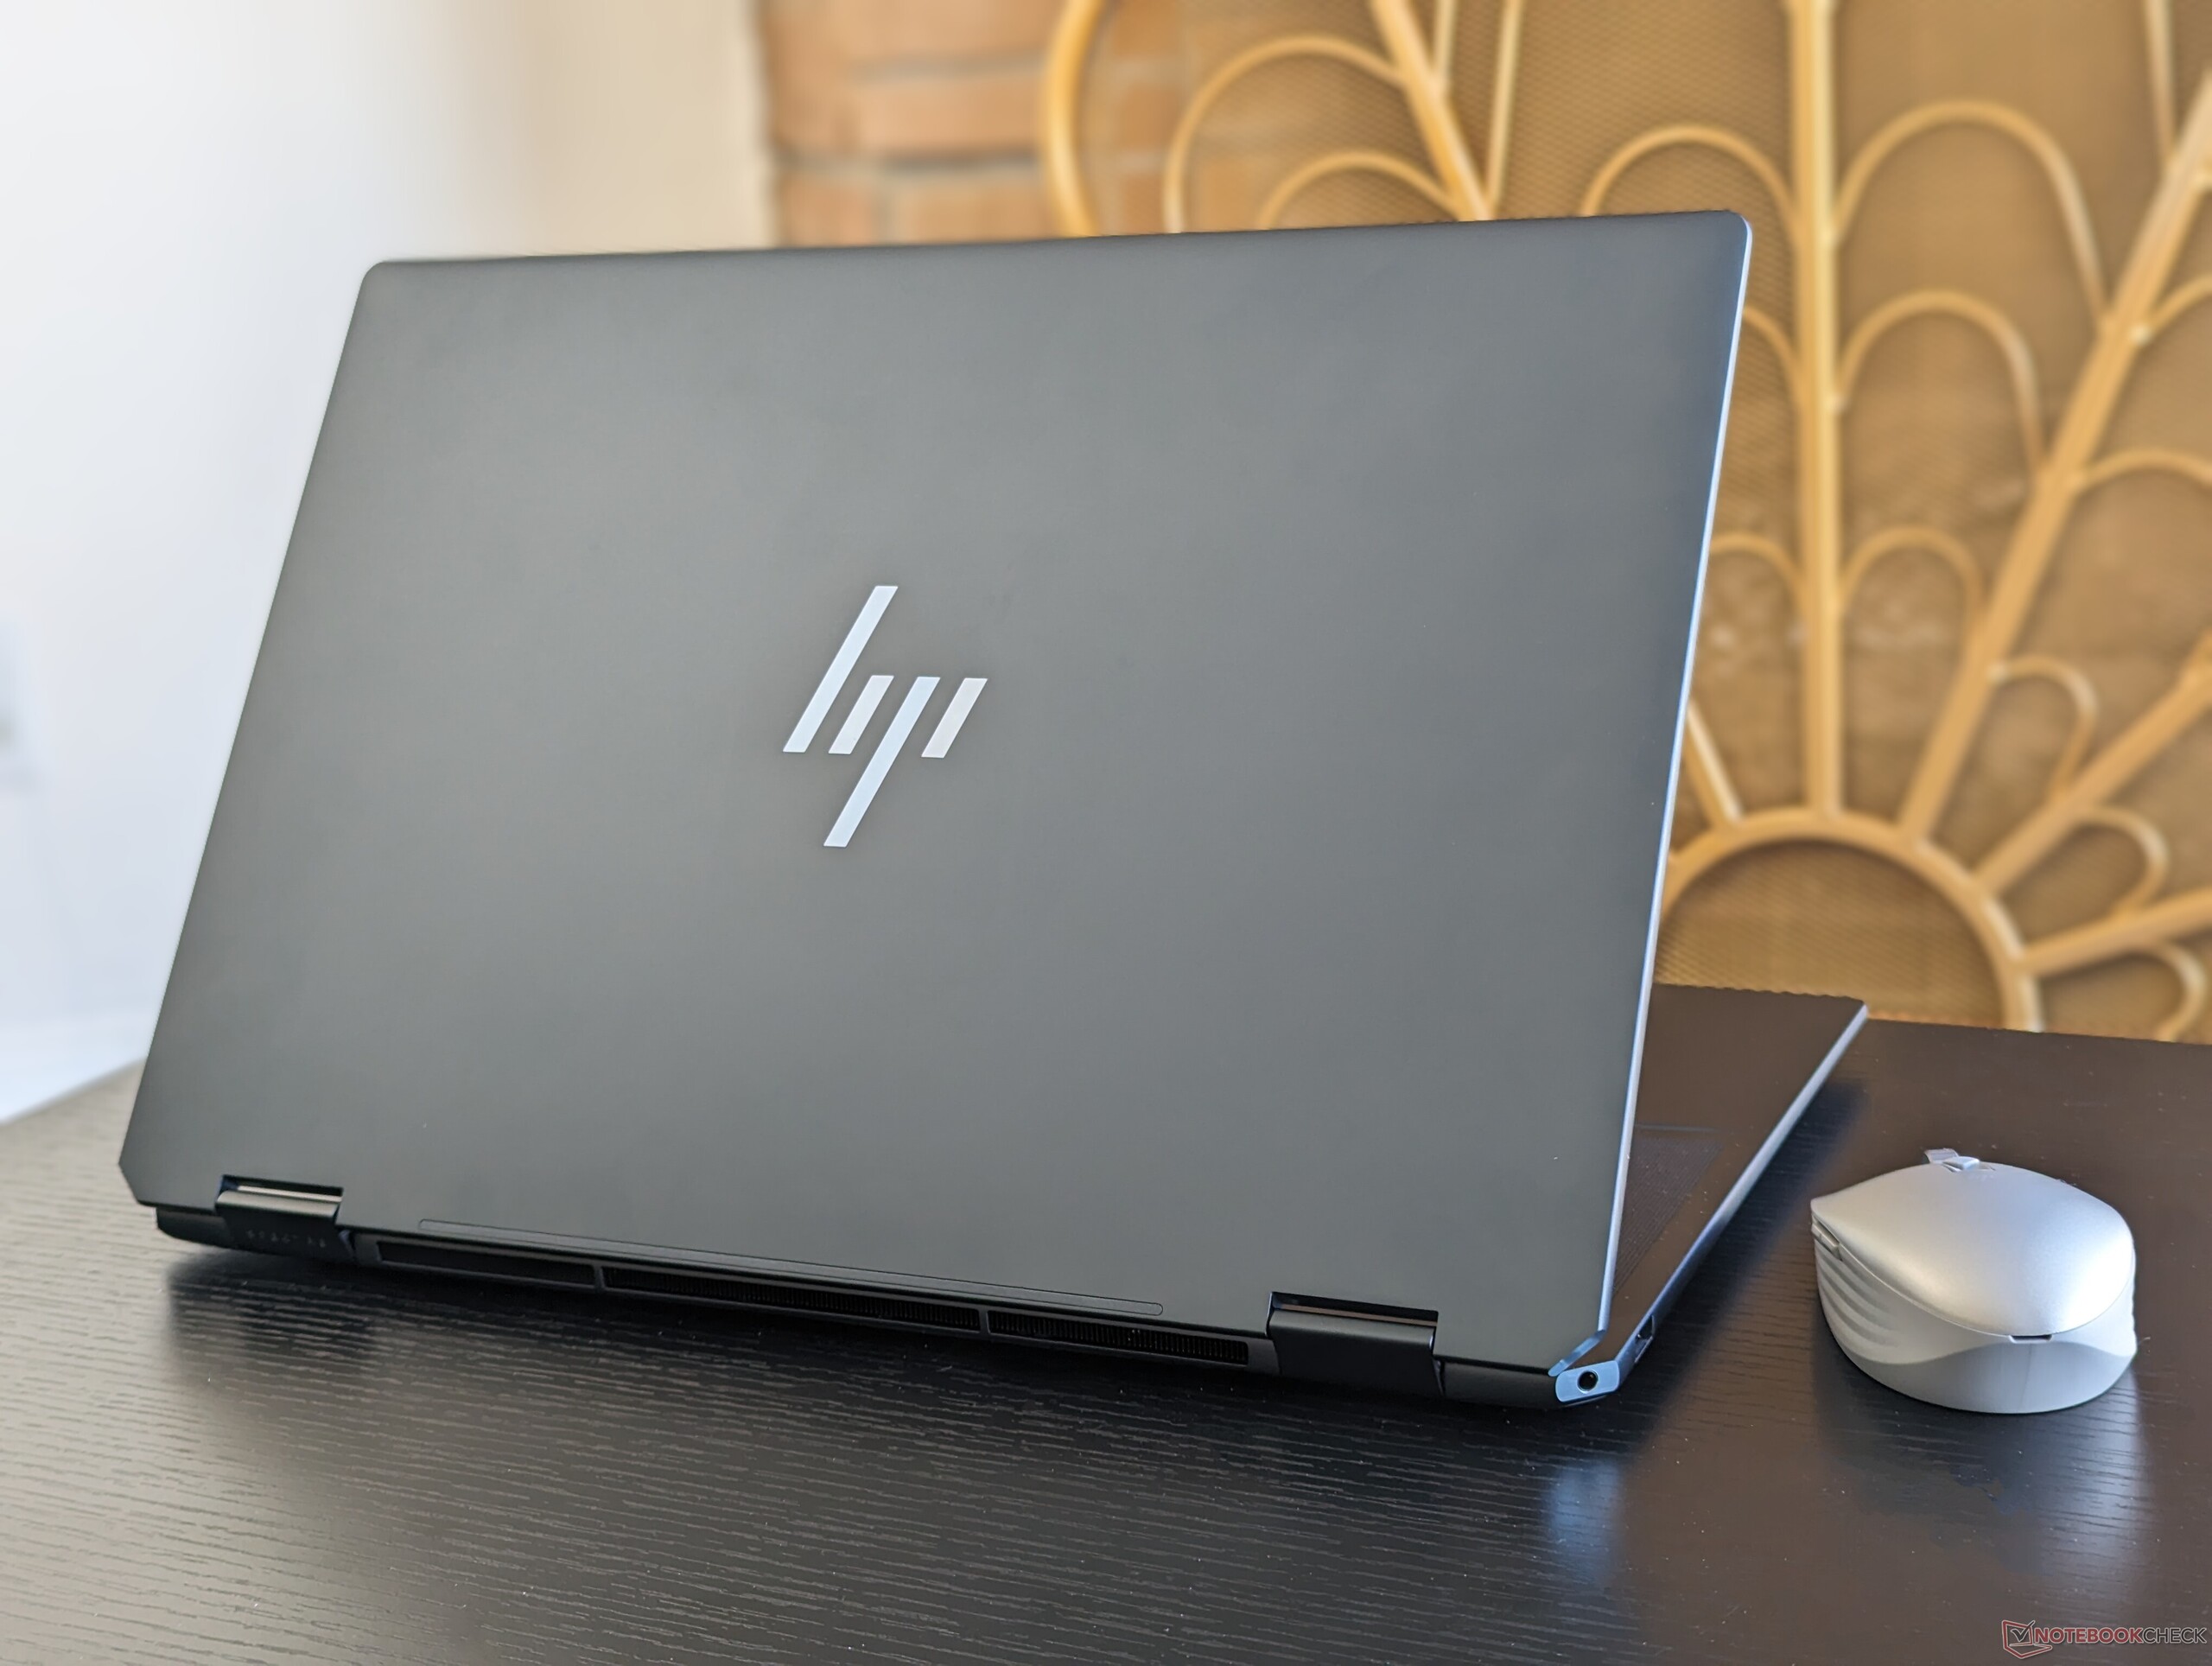
HP Spectre x360 16 Convertible im Test: Jetzt mit 55 W GeForce RTX 4050 Grafik

Nachdem wir kürzlich die iGPU-Version des neuen Spectre x360 16 getestet haben, nehmen wir nun die GeForce RTX-Konfiguration desselben Modells genauer unter die Lupe. Im Wesentlichen sind alle anderen Aspekte des Notebooks zwischen den beiden Konfigurationen identisch, weshalb wir empfehlen, unseren bisherigen Test der iGPU SKU zu lesen, um mehr über die physischen Eigenschaften des Convertible-Notebooks zu erfahren.
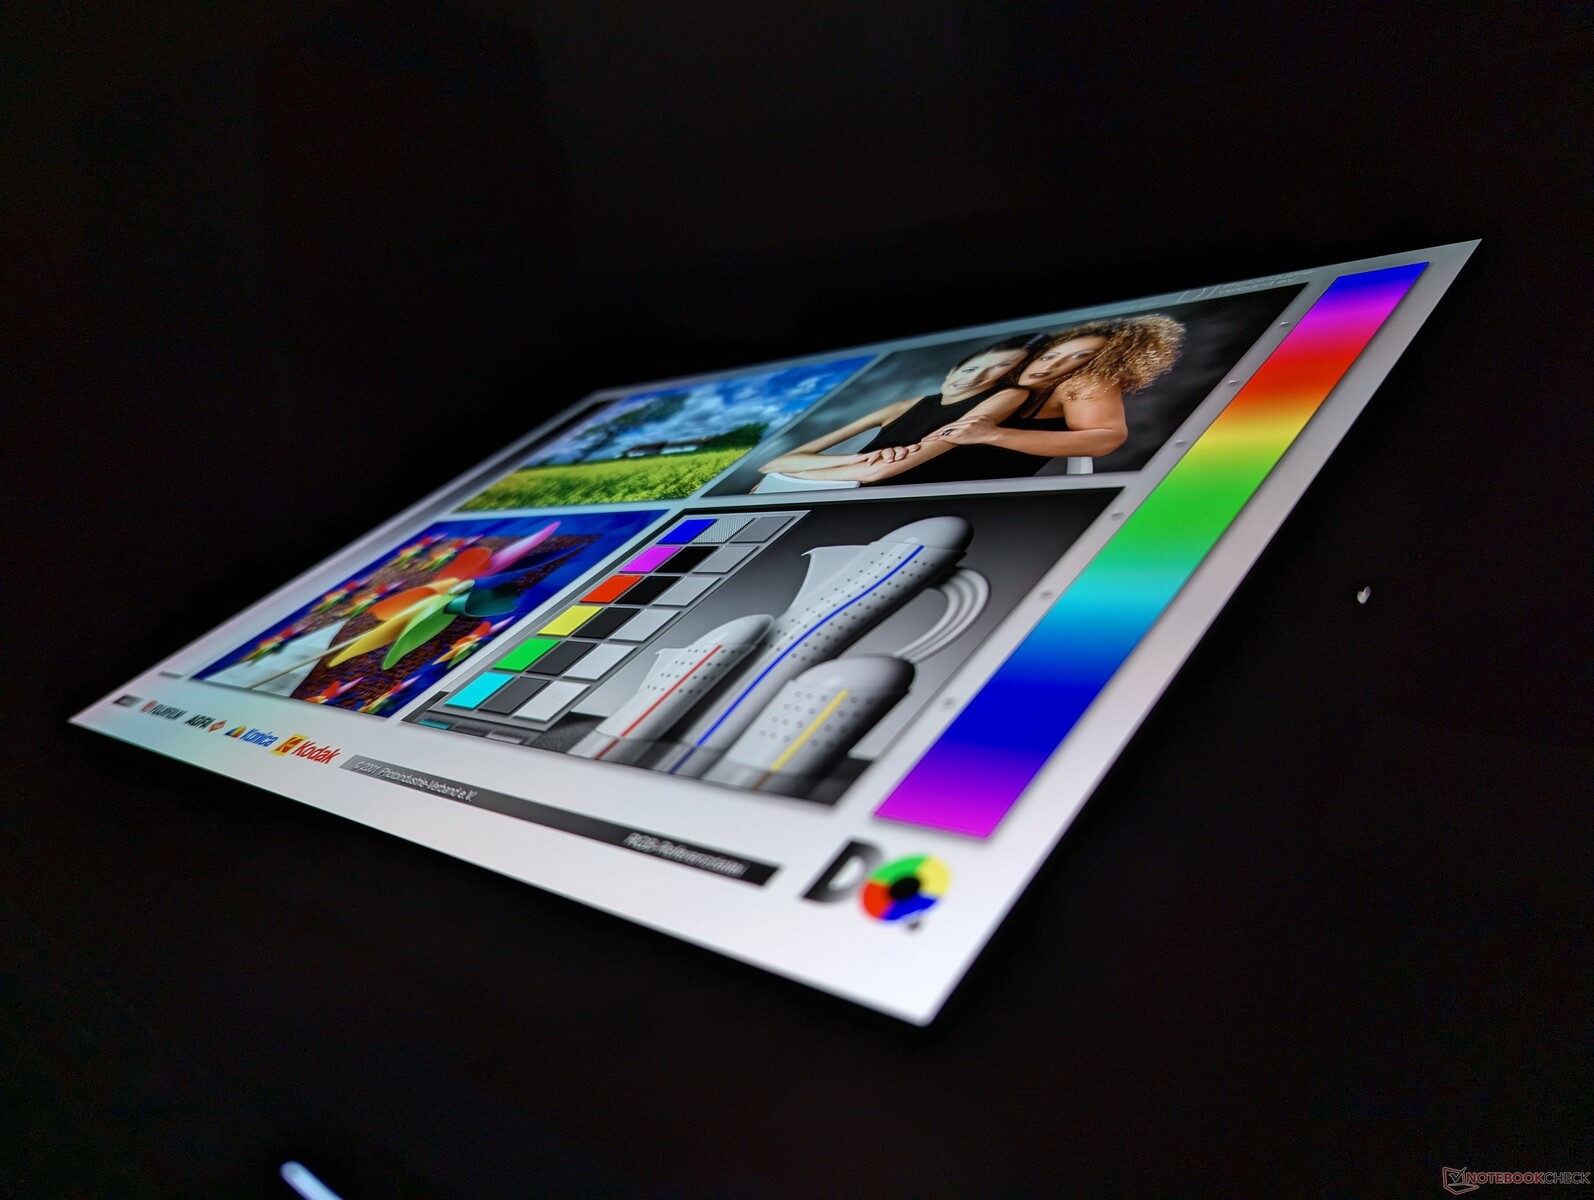
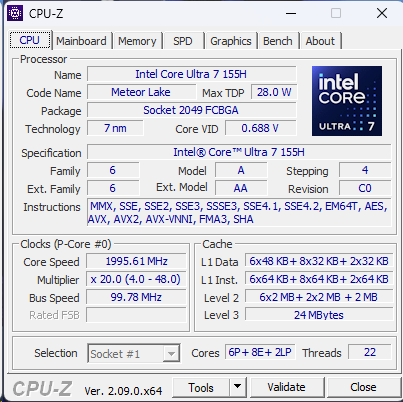
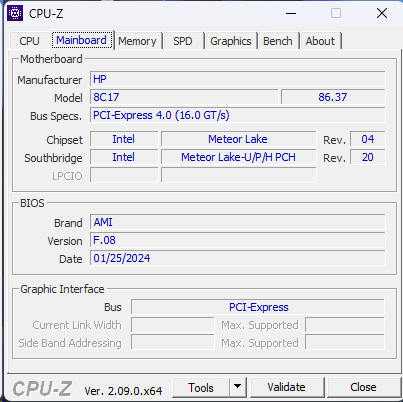
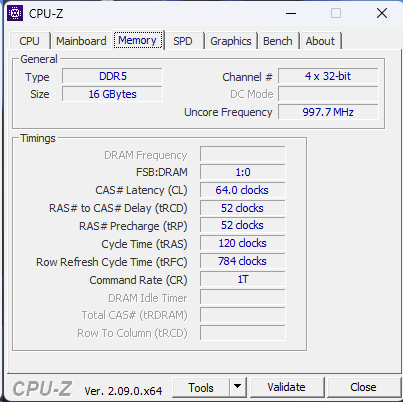
Unser Testgerät ist mit einem Core Ultra 7 155H Prozessor der 1. Generation, einer 55 W GeForce RTX 4050 GPU, 16 GB fest verlötetem RAM und einem 1800p OLED-Touchscreen ausgestattet und kostet etwa 1.700 Euro Andere SKUs können mit doppeltem RAM oder einem 1600p 120 Hz IPS-Touchscreen ausgestattet sein, aber alle verwenden denselben Core Ultra 7 Prozessor und die RTX 4050 GPU.
Weitere HP Bewertungen:
Mögliche Konkurrenten im Vergleich
Bew. | Datum | Modell | Gewicht | Dicke | Größe | Auflösung | Preis ab |
|---|---|---|---|---|---|---|---|
| 91.1 % v7 (old) | 03 / 2024 | HP Spectre x360 16 RTX 4050 Ultra 7 155H, GeForce RTX 4050 Laptop GPU | 2 kg | 19.8 mm | 16.00" | 2880x1800 | |
| 91.4 % v7 (old) | 02 / 2024 | HP Spectre x360 16-aa0074ng Ultra 7 155H, Arc 8-Core | 1.9 kg | 19.8 mm | 16.00" | 2880x1800 | |
| 87.3 % v7 (old) | 01 / 2023 | HP Spectre x360 2-in-1 16-f1075ng i7-12700H, Iris Xe G7 96EUs | 2 kg | 19.9 mm | 16.00" | 3072x1920 | |
| 90 % v7 (old) | 02 / 2024 | Honor MagicBook Pro 16 2024 Ultra 7 155H, GeForce RTX 4060 Laptop GPU | 1.9 kg | 17.9 mm | 16.00" | 3072x1920 | |
| 88.1 % v7 (old) | 12 / 2023 | MSI Prestige 16 B1MG-001US Ultra 7 155H, Arc 8-Core | 1.6 kg | 19.1 mm | 16.00" | 2560x1600 | |
| 85.8 % v7 (old) | 11 / 2023 | LG Gram 2in1 16 16T90R - G.AA78G i7-1360P, Iris Xe G7 96EUs | 1.5 kg | 17.2 mm | 16.00" | 2560x1600 |
Gehäuse
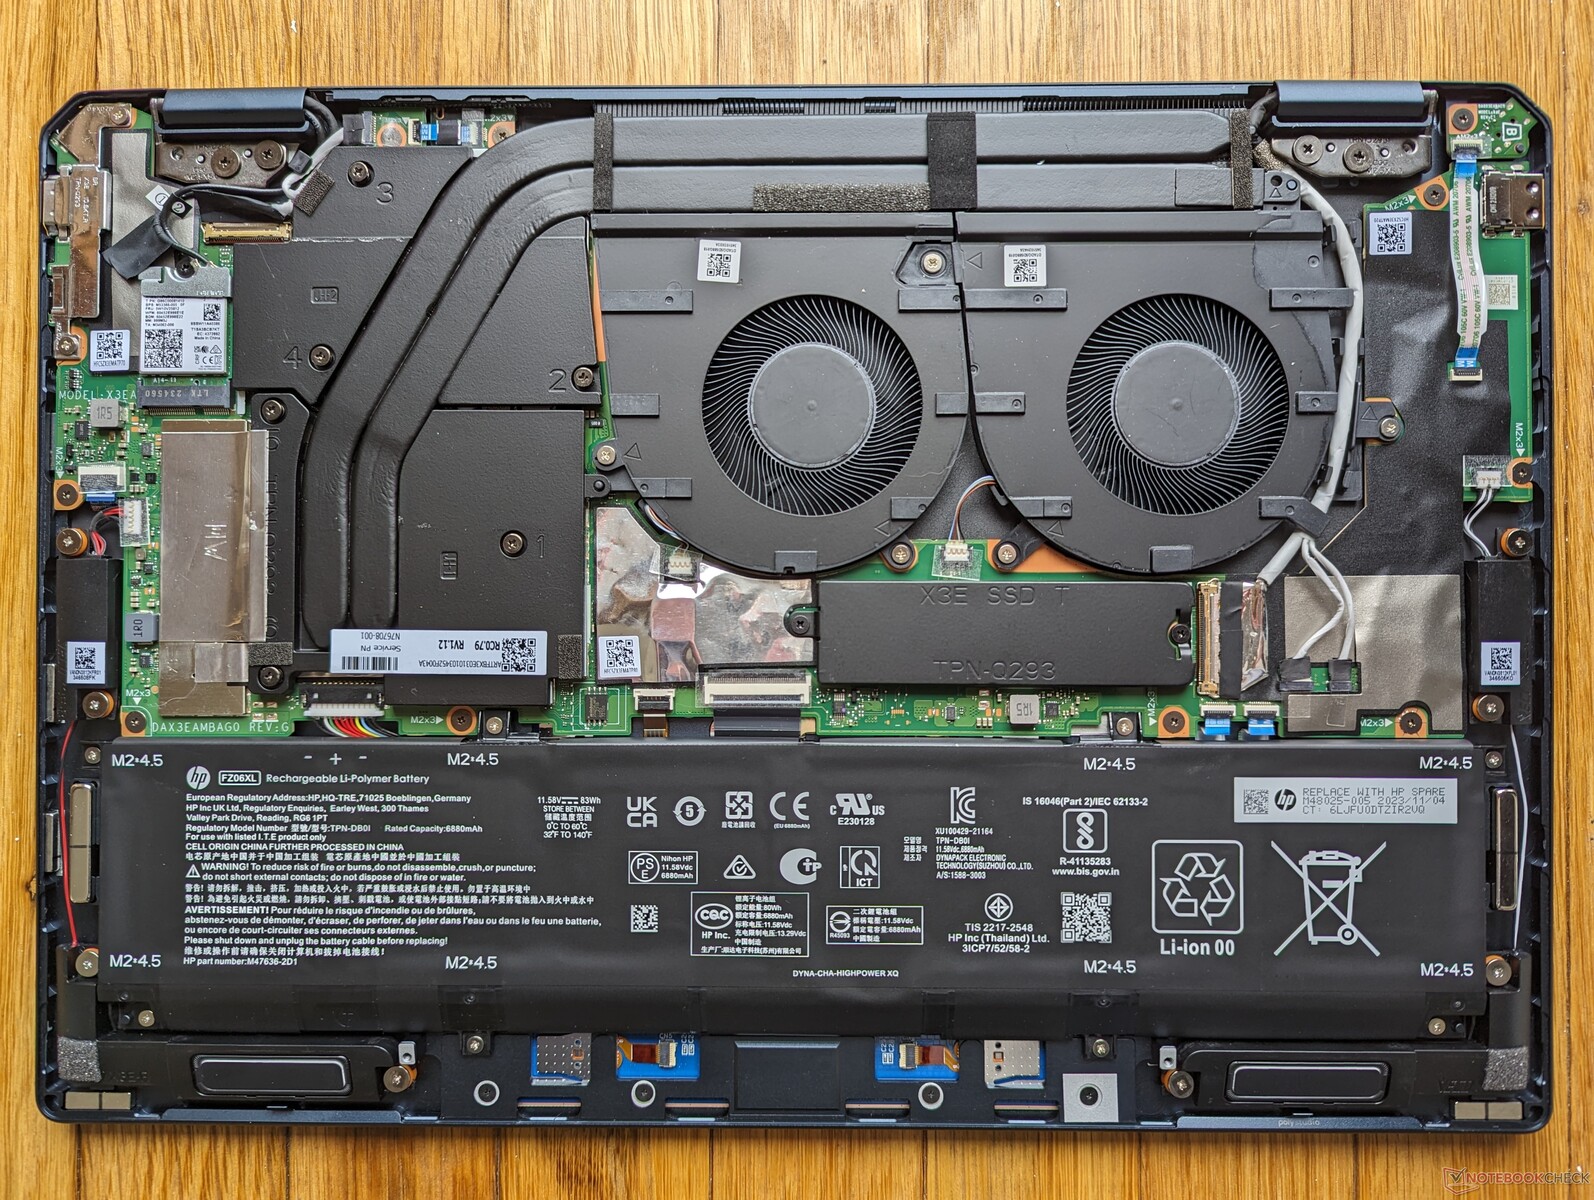
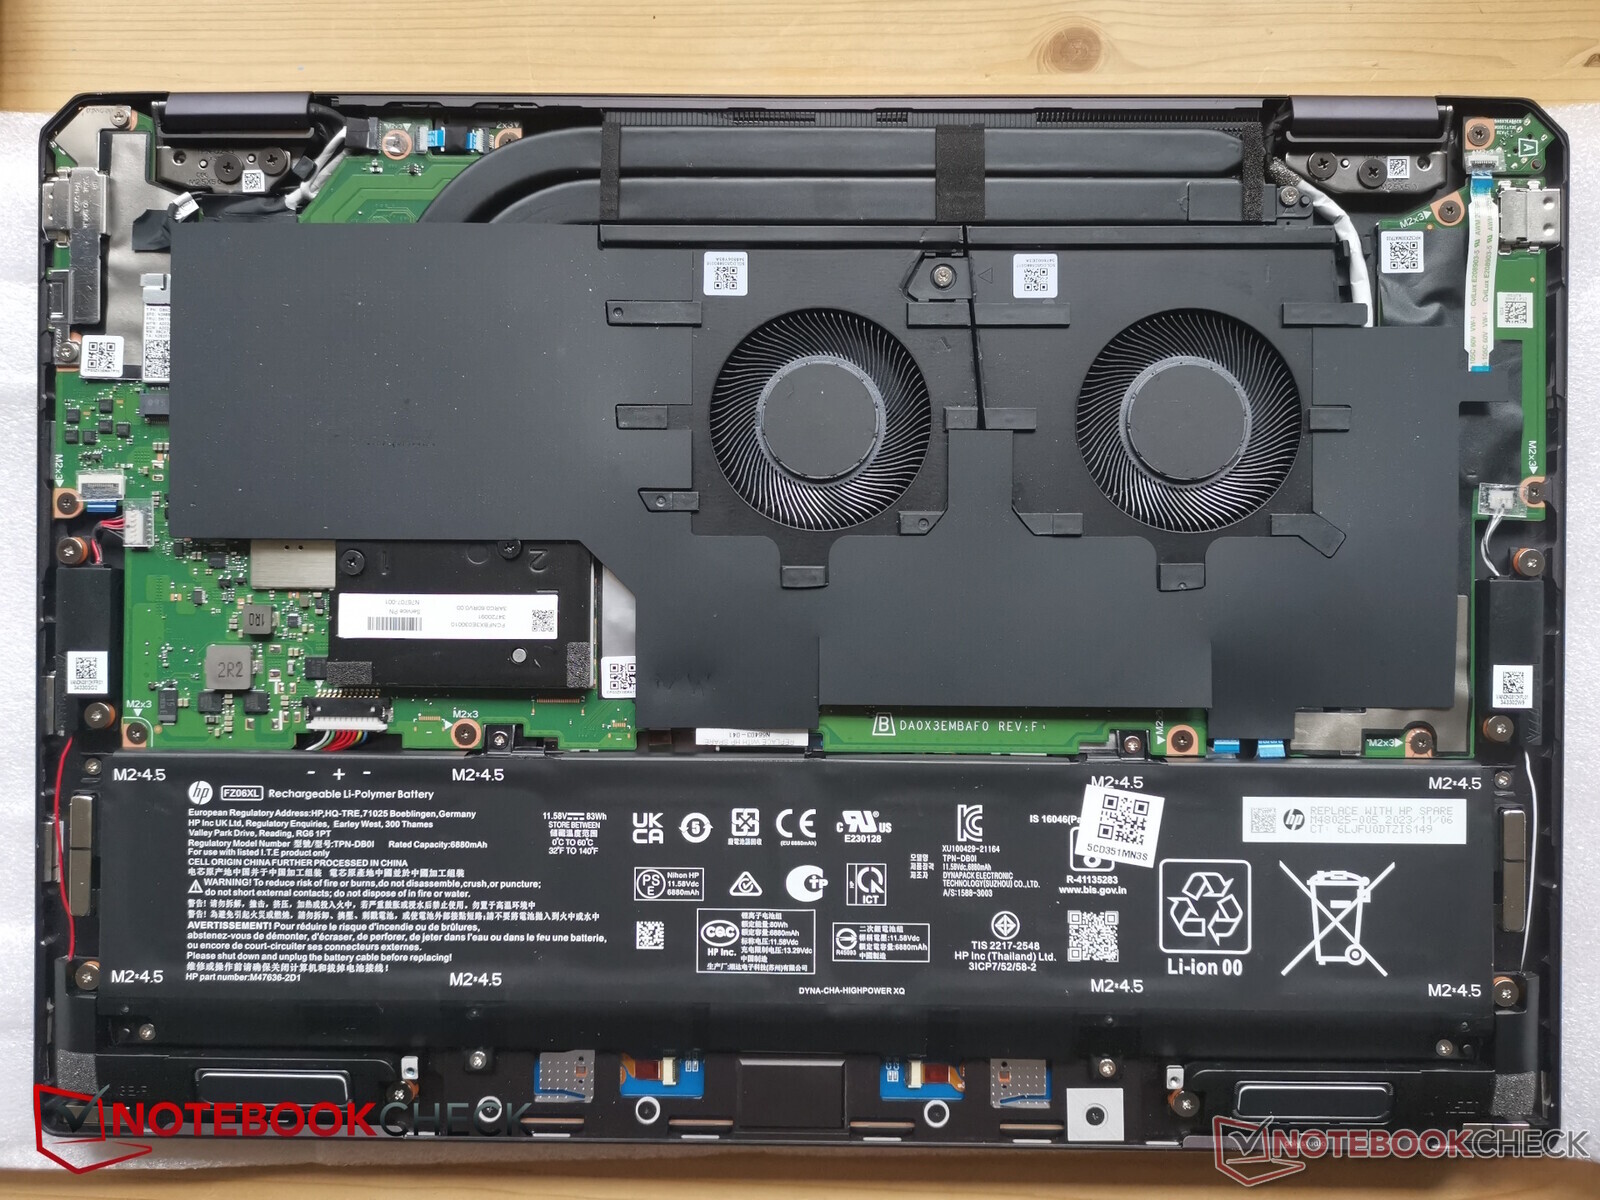
Die dGPU-Konfiguration ist mit etwa 100 g etwas schwerer als die iGPU-Option.
Kommunkation
Webcam


Wartung
Die dGPU-Konfiguration weist längere Kupfer-Heatpipes auf als die iGPU-Version (siehe unten), was zu einem etwas höheren Gewicht beiträgt. Ansonsten ist die Hauptplatine nahezu identisch
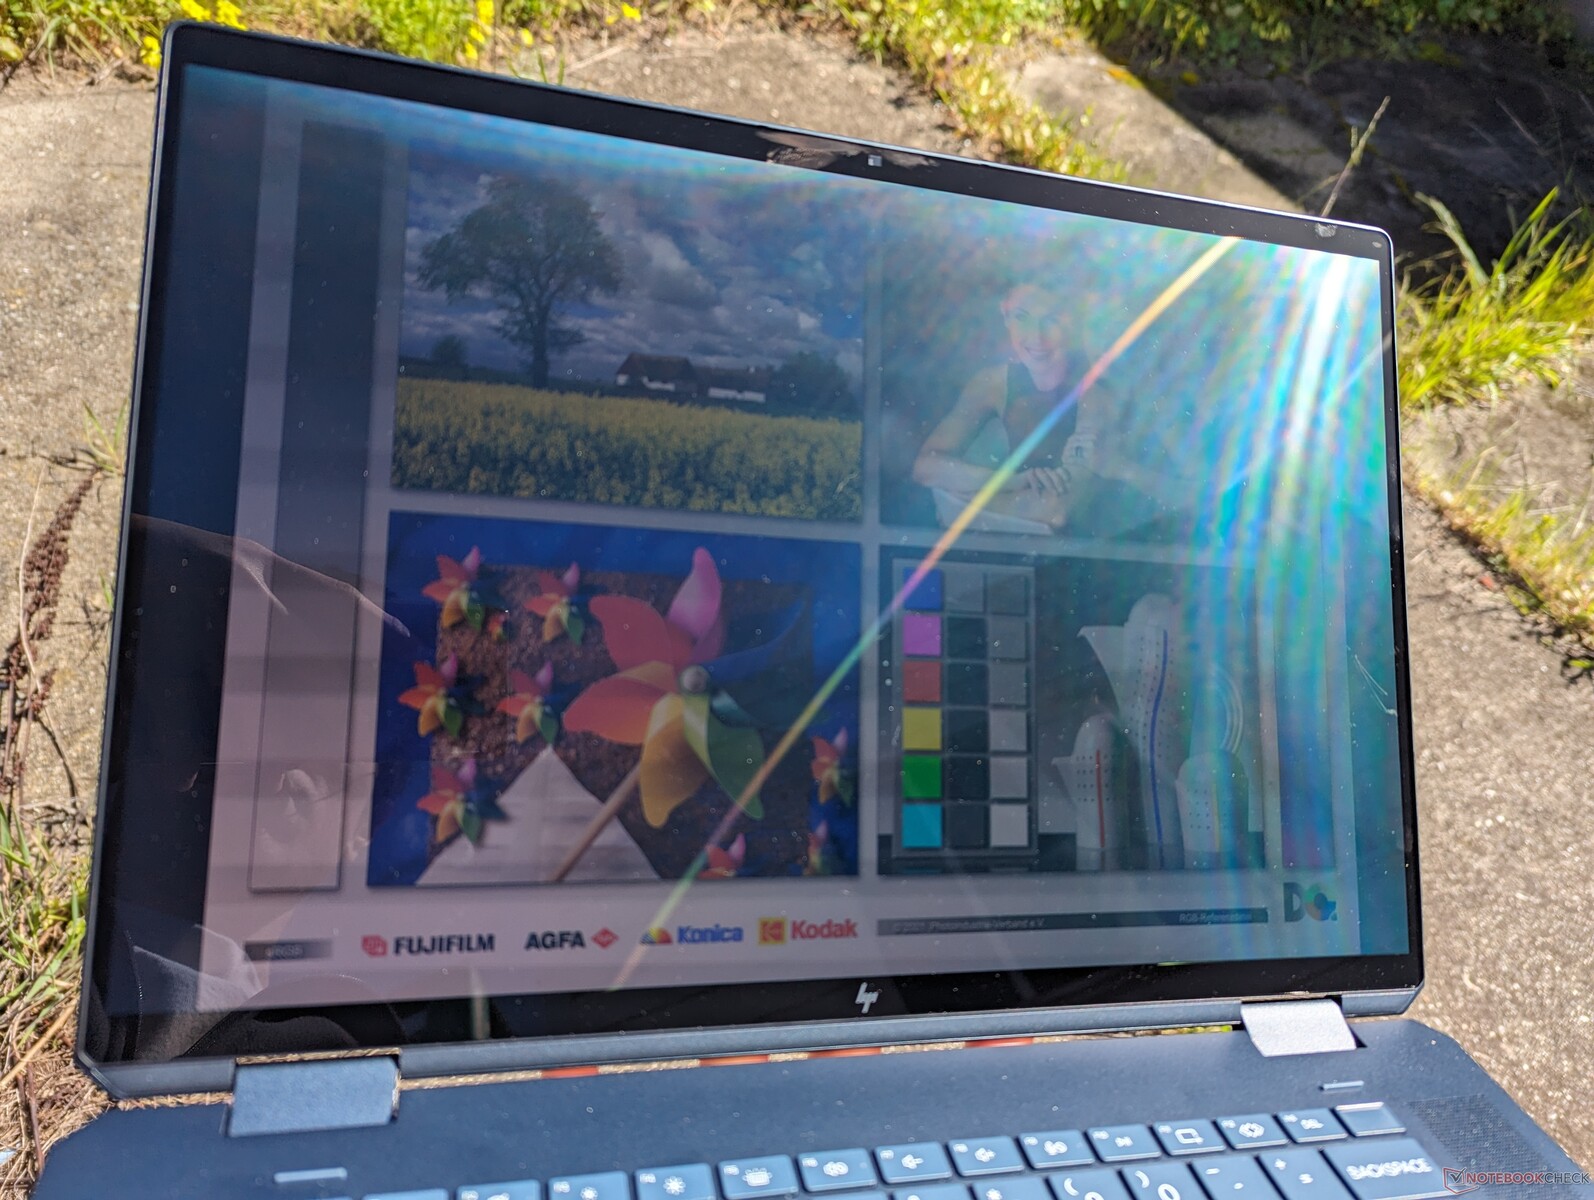
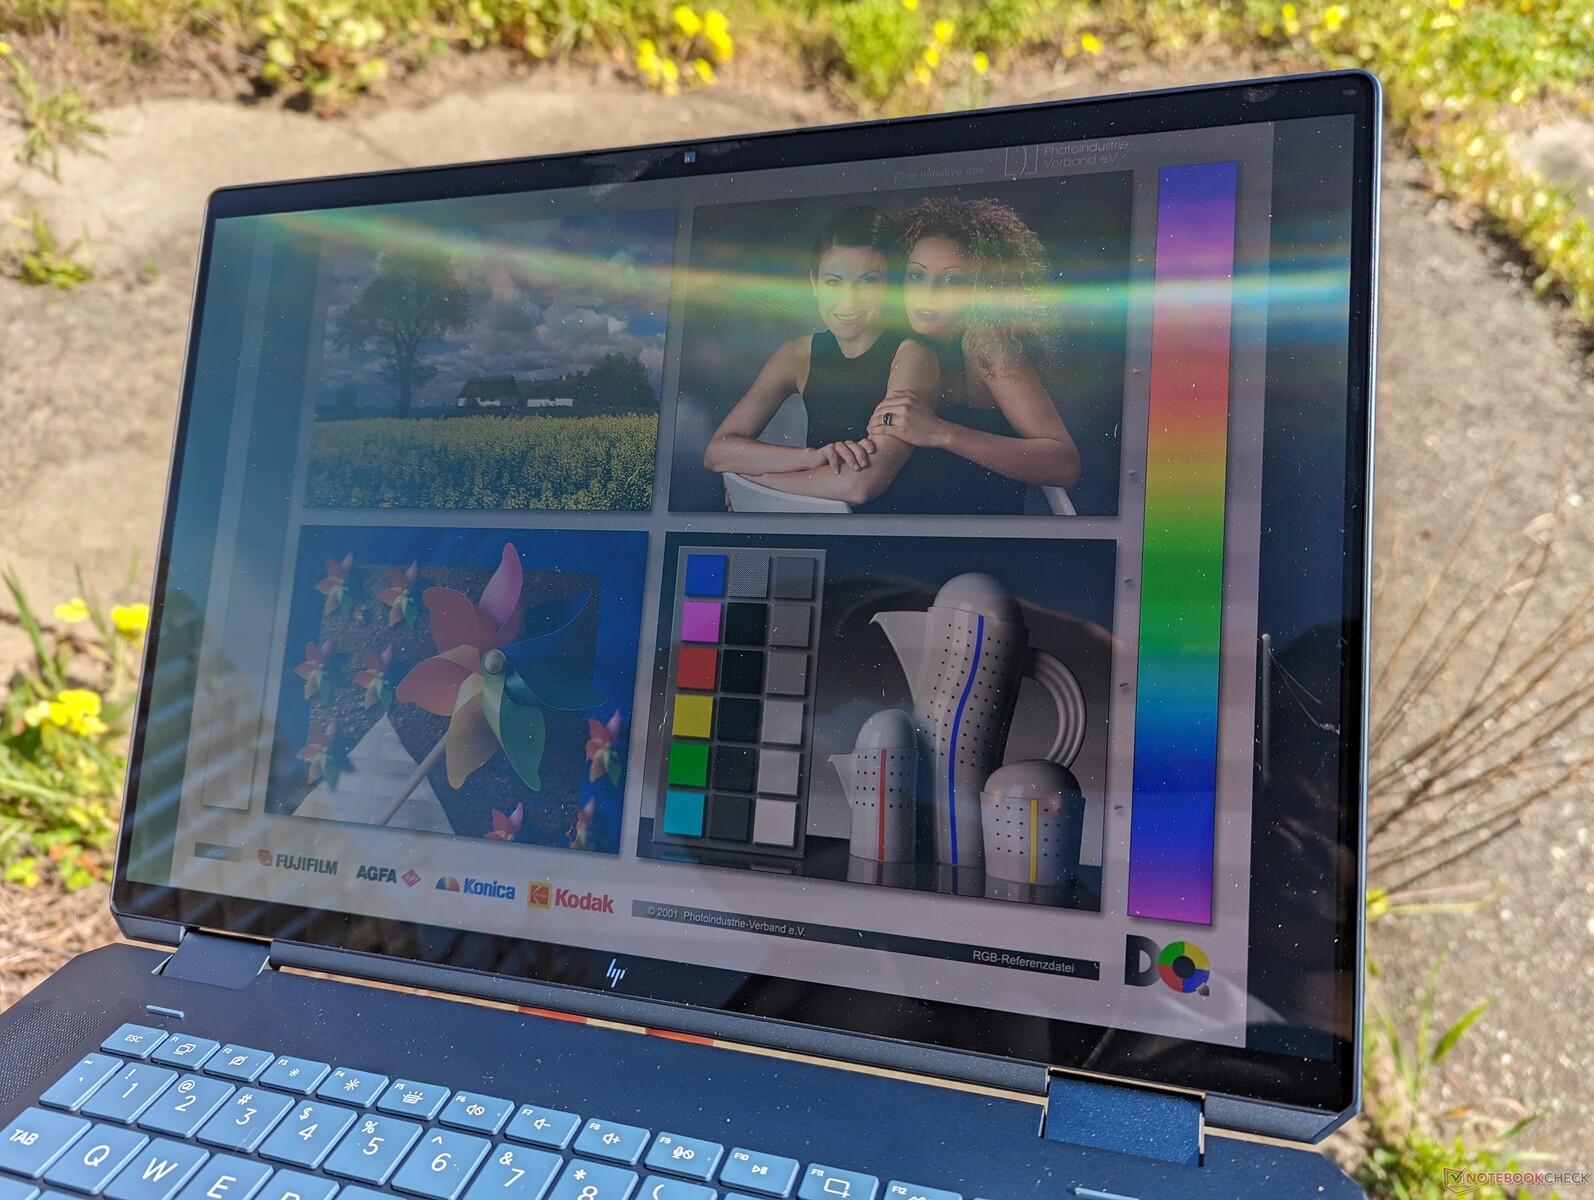
Display
| |||||||||||||||||||||||||
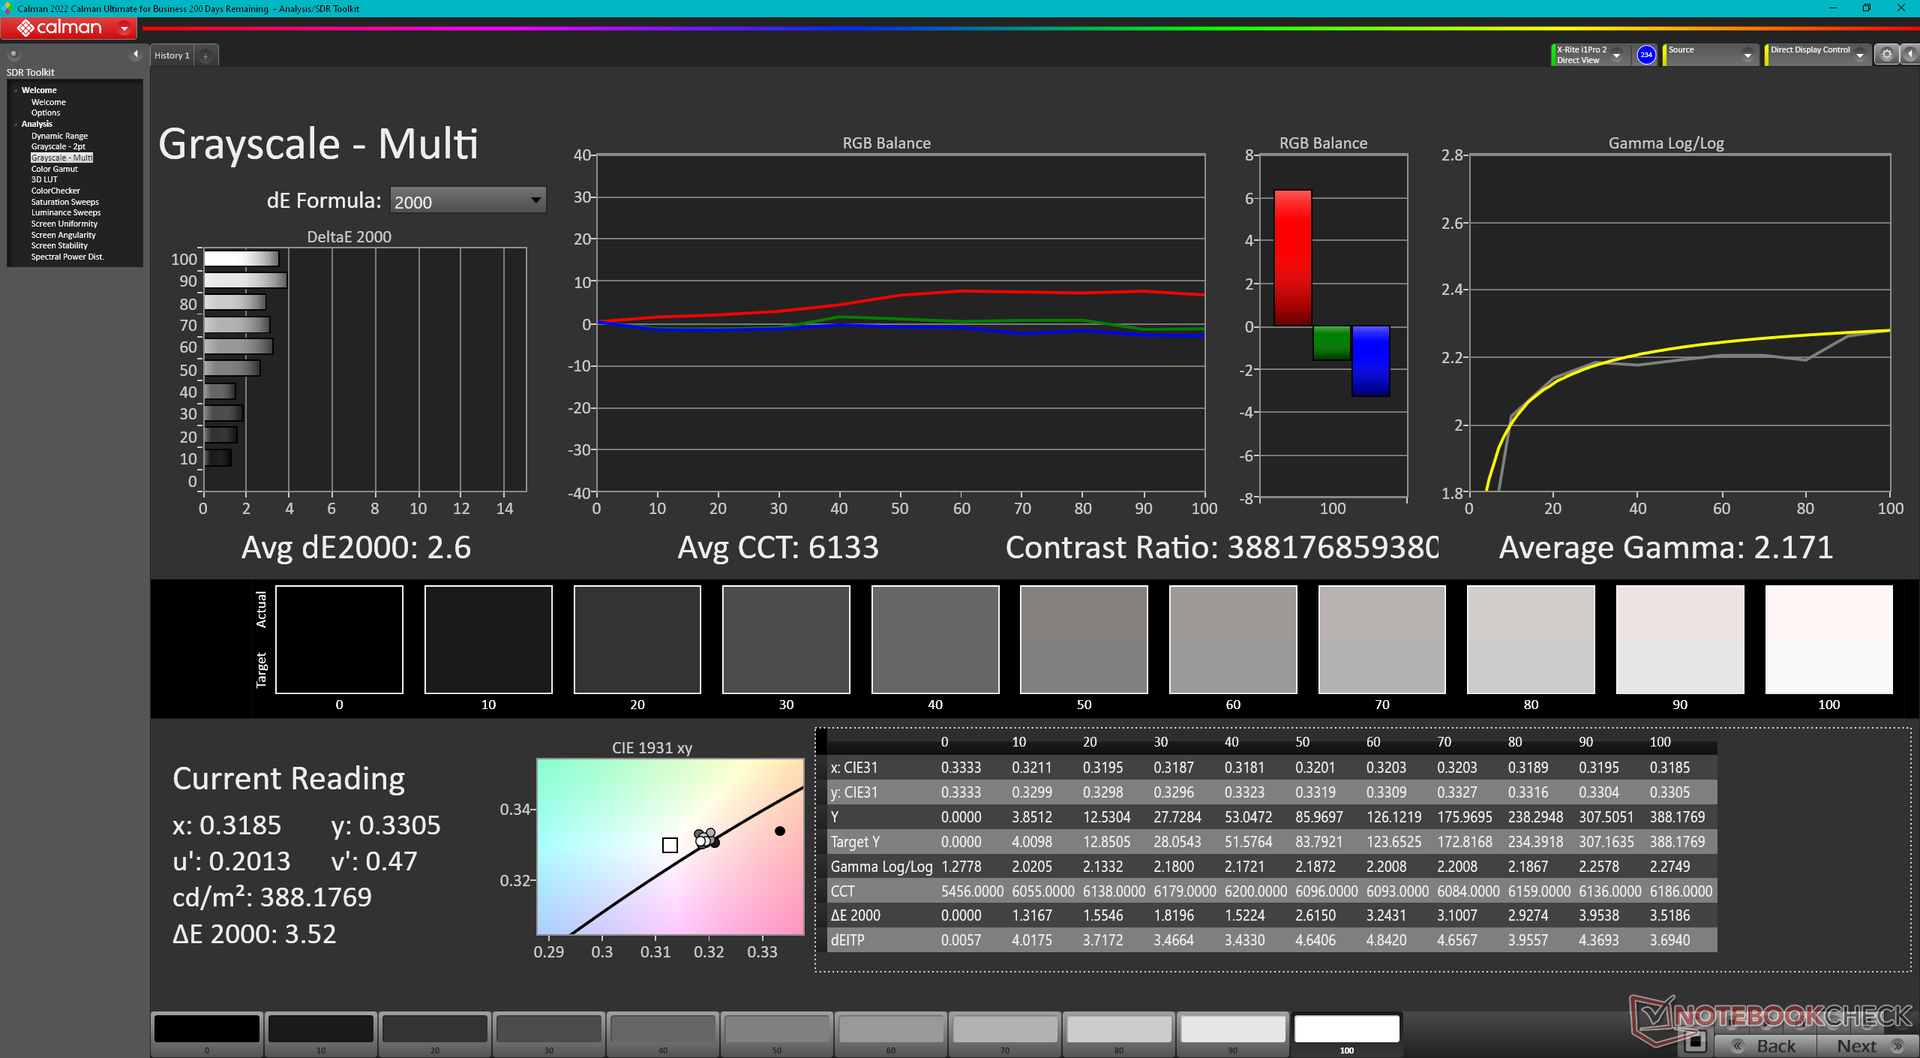
Ausleuchtung: 99 %
Helligkeit Akku: 385.2 cd/m²
Kontrast: ∞:1 (Schwarzwert: 0 cd/m²)
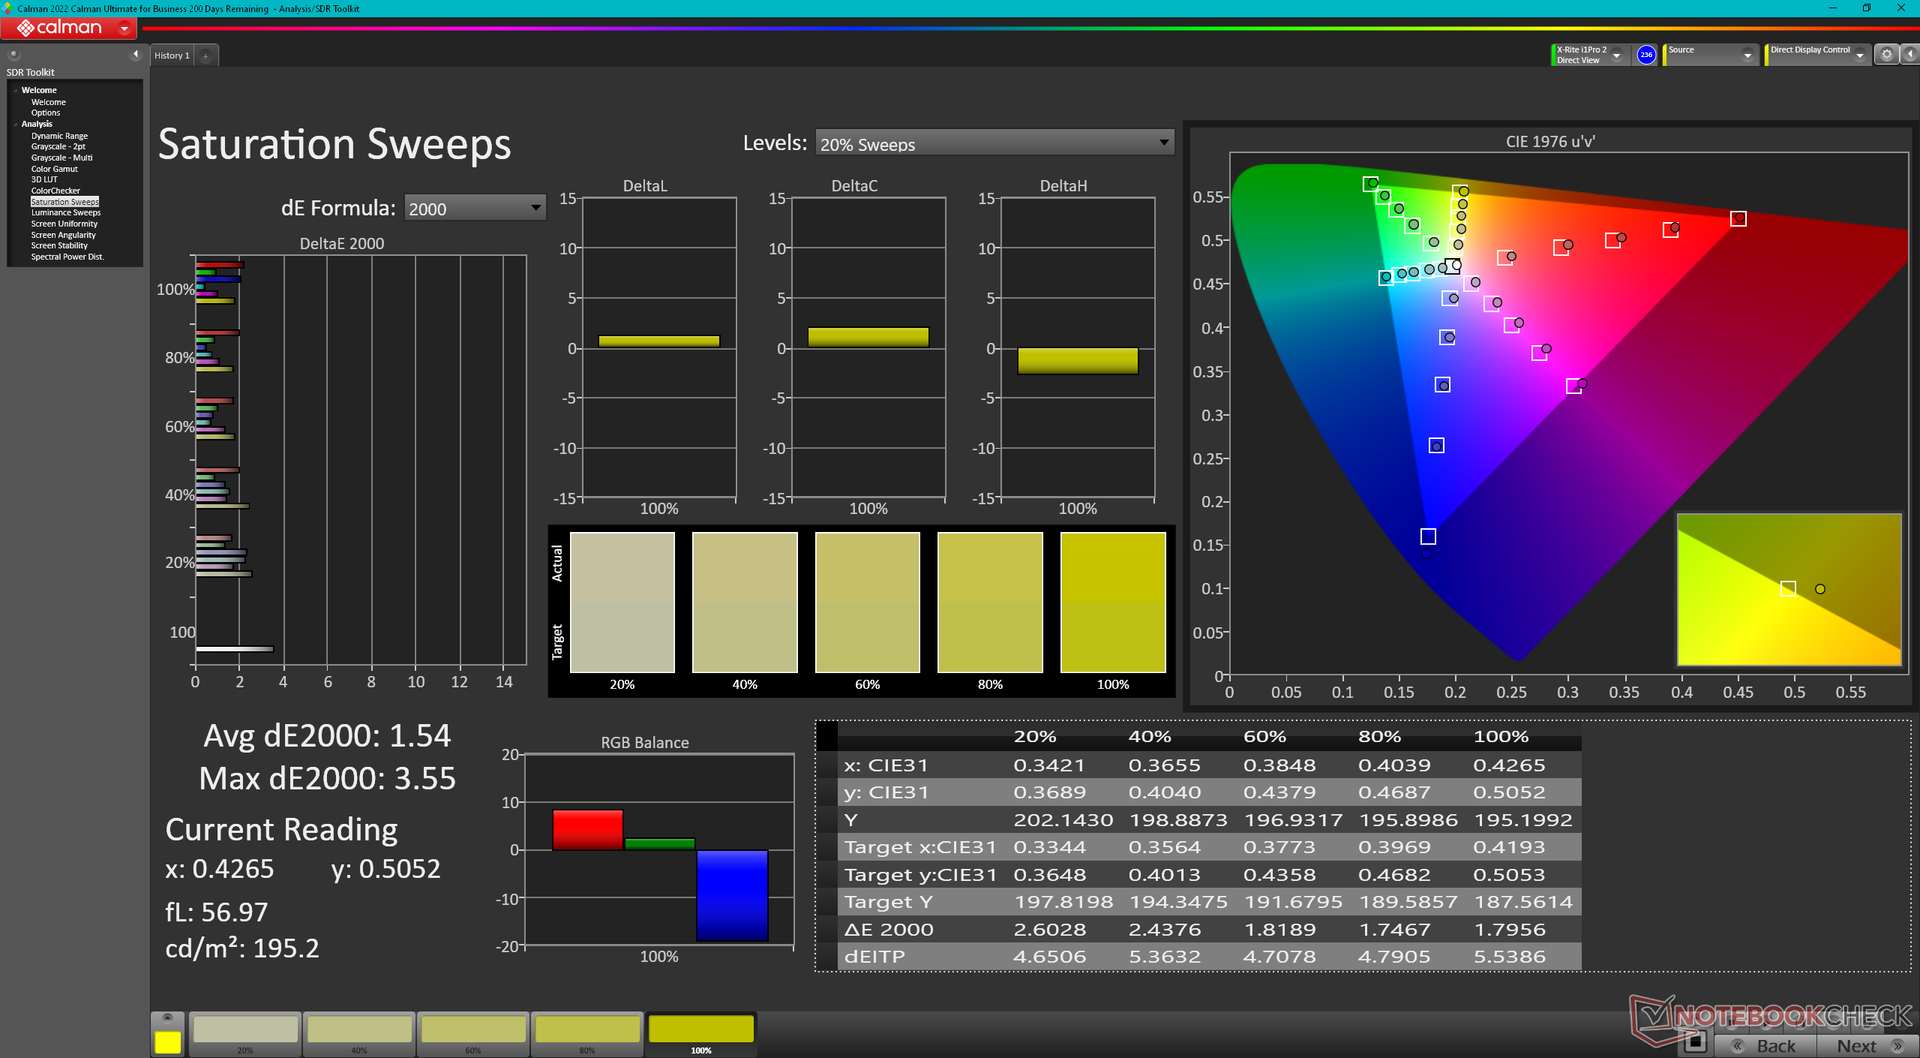
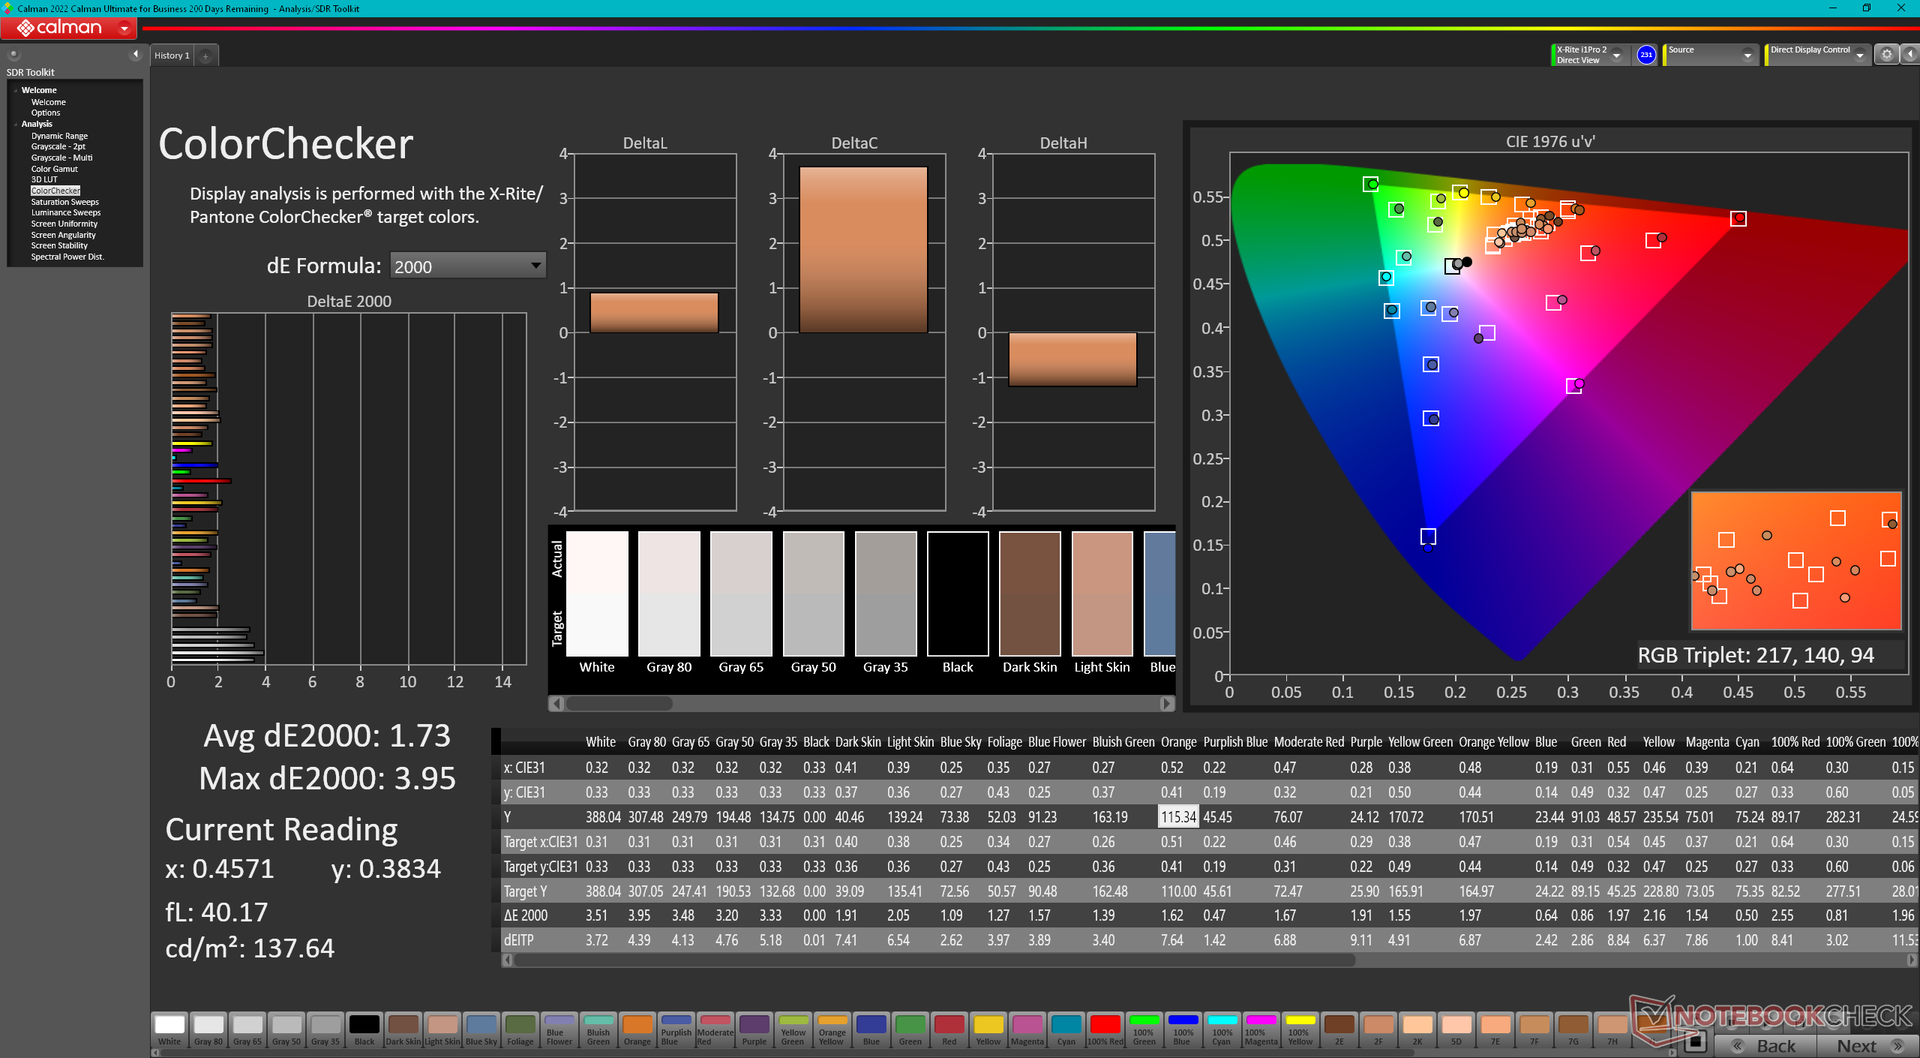
ΔE ColorChecker Calman: 1.73 | ∀{0.5-29.43 Ø4.71}
ΔE Greyscale Calman: 2.6 | ∀{0.09-98 Ø4.96}
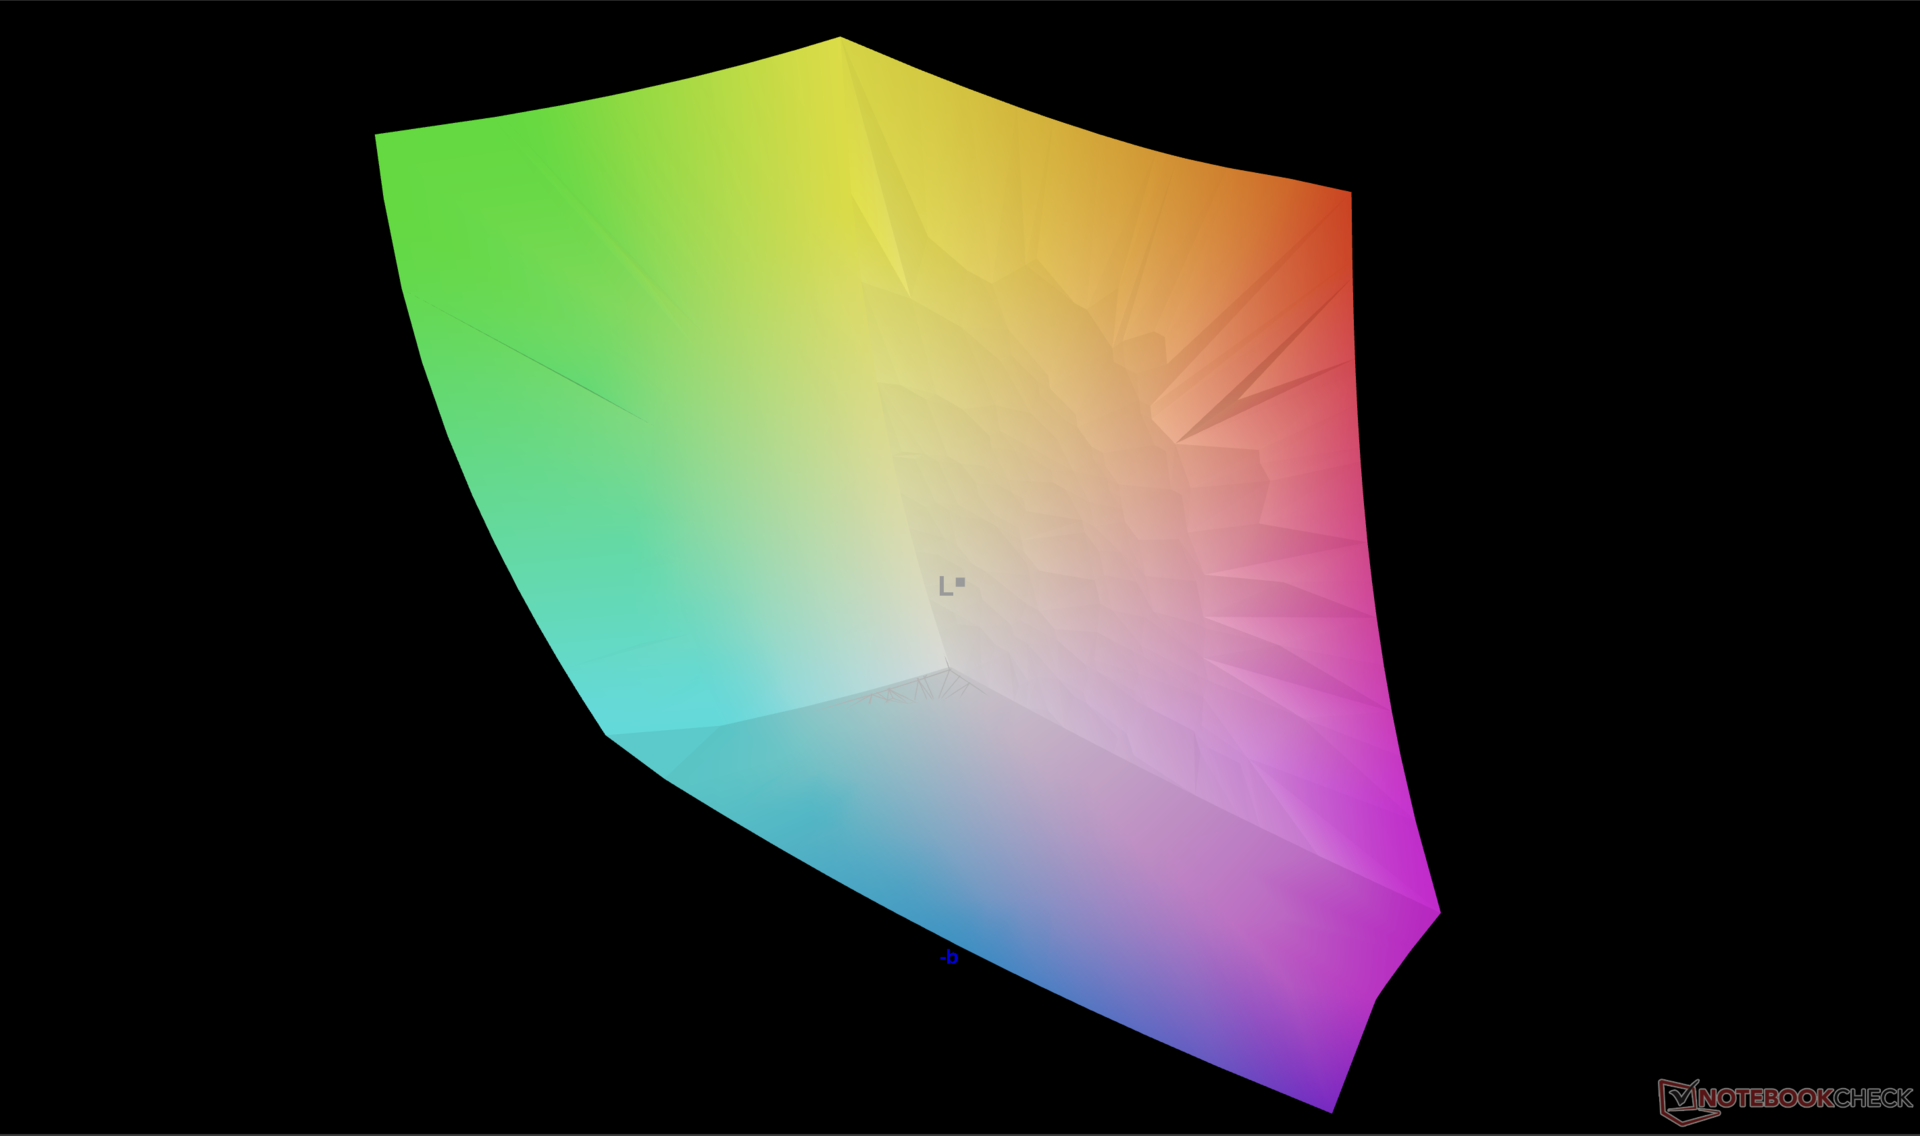
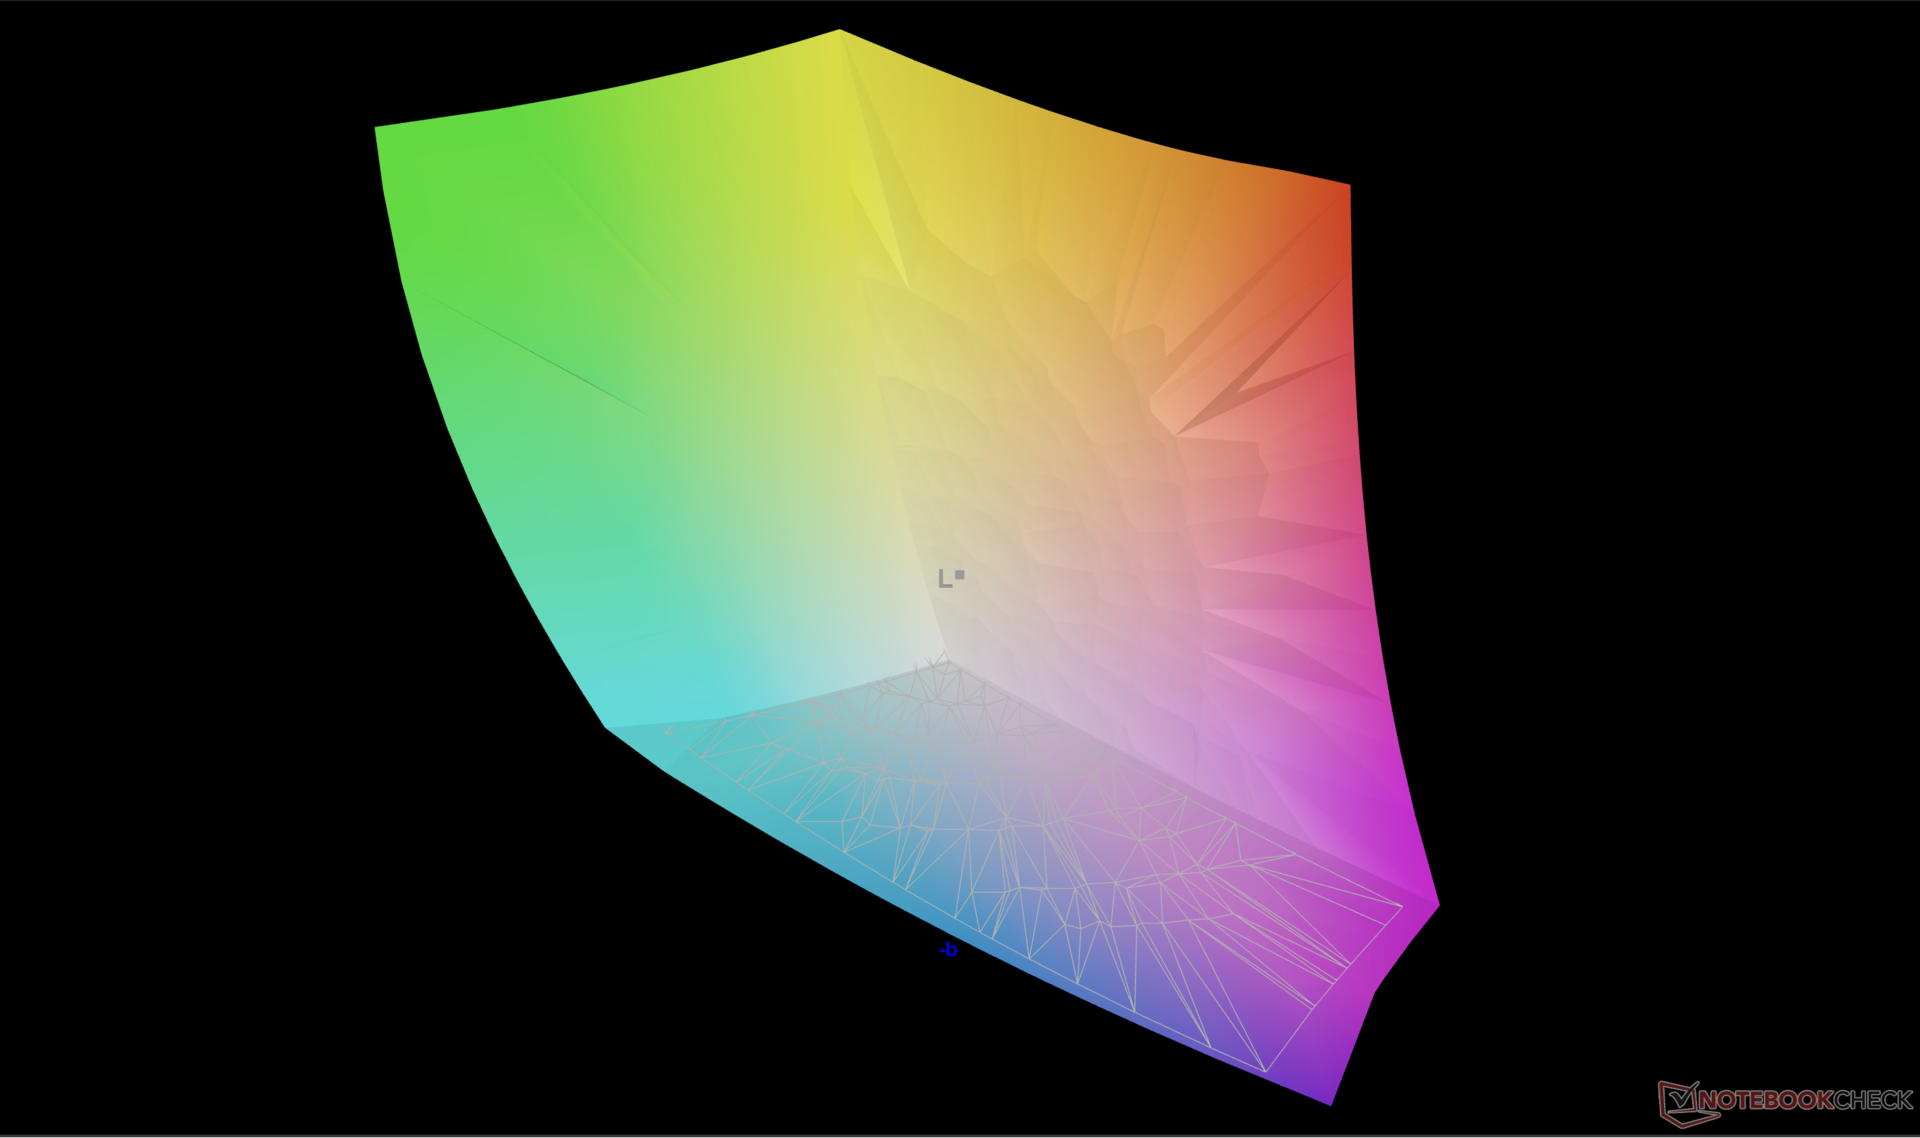
96.7% AdobeRGB 1998 (Argyll 3D)
100% sRGB (Argyll 3D)
99.6% Display P3 (Argyll 3D)
Gamma: 2.17
CCT: 6133 K
| HP Spectre x360 16 RTX 4050 Samsung SDC41A6, OLED, 2880x1800, 16" | HP Spectre x360 16-aa0074ng Samsung SDC41A6, OLED, 2880x1800, 16" | HP Spectre x360 2-in-1 16-f1075ng AU Optronics AUO50A3, IPS, 3072x1920, 16" | Honor MagicBook Pro 16 2024 TL160MDMP01, IPS, 3072x1920, 16" | MSI Prestige 16 B1MG-001US AU Optronics B160QAN03.R, IPS, 2560x1600, 16" | LG Gram 2in1 16 16T90R - G.AA78G LP160WQ1-SPB2, IPS, 2560x1600, 16" | |
|---|---|---|---|---|---|---|
| Display | -1% | -15% | -3% | -5% | -5% | |
| Display P3 Coverage (%) | 99.6 | 98.9 -1% | 75.6 -24% | 98.8 -1% | 96.7 -3% | 96.5 -3% |
| sRGB Coverage (%) | 100 | 99.9 0% | 100.2 0% | 100 0% | 99.8 0% | 99.9 0% |
| AdobeRGB 1998 Coverage (%) | 96.7 | 94.4 -2% | 77.2 -20% | 89.1 -8% | 84.6 -13% | 84.6 -13% |
| Response Times | -10% | -4862% | -630% | -5038% | -3606% | |
| Response Time Grey 50% / Grey 80% * (ms) | 0.78 ? | 0.8 ? -3% | 52 ? -6567% | 6.3 ? -708% | 49.4 ? -6233% | 38.4 ? -4823% |
| Response Time Black / White * (ms) | 0.86 ? | 1 ? -16% | 28 ? -3156% | 5.6 ? -551% | 33.9 ? -3842% | 21.4 ? -2388% |
| PWM Frequency (Hz) | 480 ? | 480 | ||||
| Bildschirm | -7% | -102% | 13% | -88% | -58% | |
| Helligkeit Bildmitte (cd/m²) | 385.2 | 424 10% | 425 10% | 551 43% | 473.6 23% | 329 -15% |
| Brightness (cd/m²) | 387 | 425 10% | 406 5% | 524 35% | 456 18% | 310 -20% |
| Brightness Distribution (%) | 99 | 99 0% | 78 -21% | 91 -8% | 87 -12% | 88 -11% |
| Schwarzwert * (cd/m²) | 0.24 | 0.52 | 0.19 | 0.39 | ||
| Delta E Colorchecker * | 1.73 | 2.37 -37% | 5.8 -235% | 1.7 2% | 5.9 -241% | 3.52 -103% |
| Colorchecker dE 2000 max. * | 3.95 | 4.97 -26% | 11.03 -179% | 4.1 -4% | 9.37 -137% | 6.96 -76% |
| Delta E Graustufen * | 2.6 | 2.55 2% | 7.57 -191% | 2.4 8% | 7.3 -181% | 5.75 -121% |
| Gamma | 2.17 101% | 2.49 88% | 6600 0% | 2.2 100% | 1.9 116% | 2.137 103% |
| CCT | 6133 106% | 6548 99% | 6842 95% | 7260 90% | 7584 86% | |
| Colorchecker dE 2000 calibrated * | 2.26 | 4.16 | 1 | 0.89 | 1.15 | |
| Kontrast (:1) | 1771 | 1060 | 2493 | 844 | ||
| Durchschnitt gesamt (Programm / Settings) | -6% /
-6% | -1660% /
-943% | -207% /
-108% | -1710% /
-966% | -1223% /
-688% |
* ... kleinere Werte sind besser
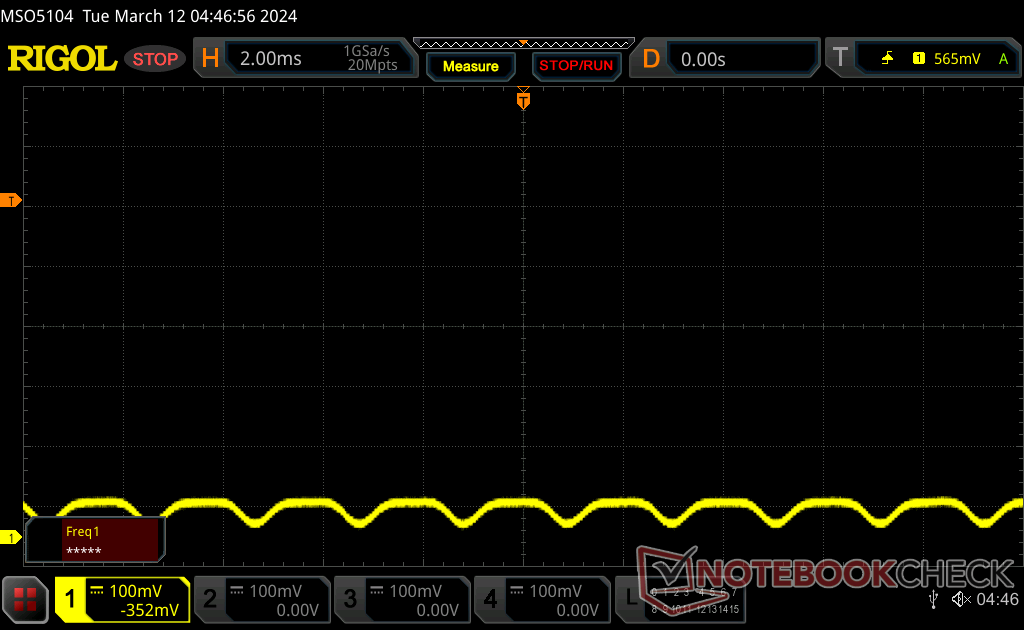
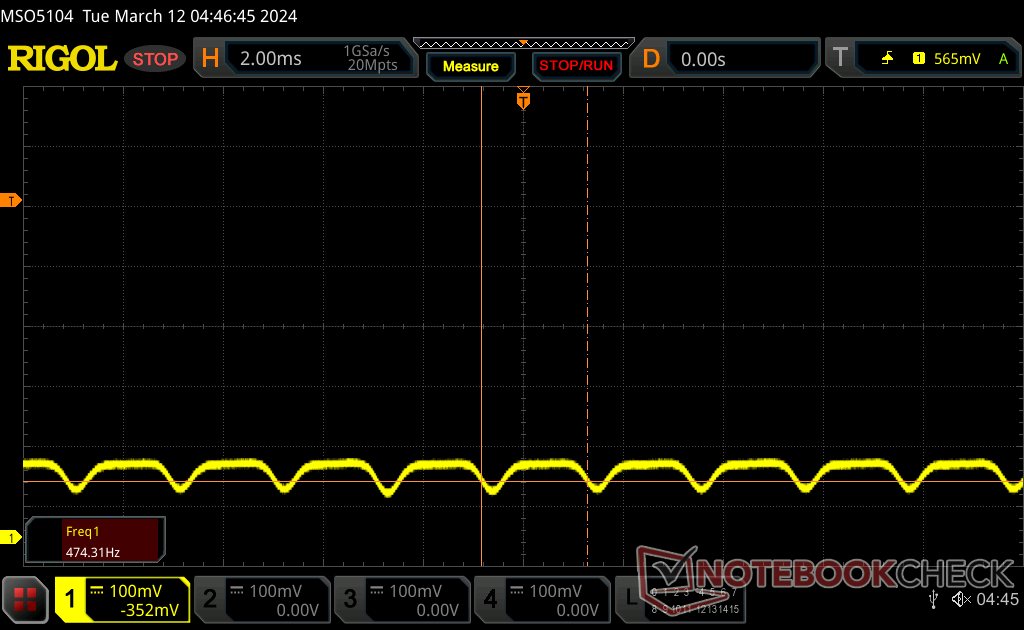
Reaktionszeiten (Response Times) des Displays
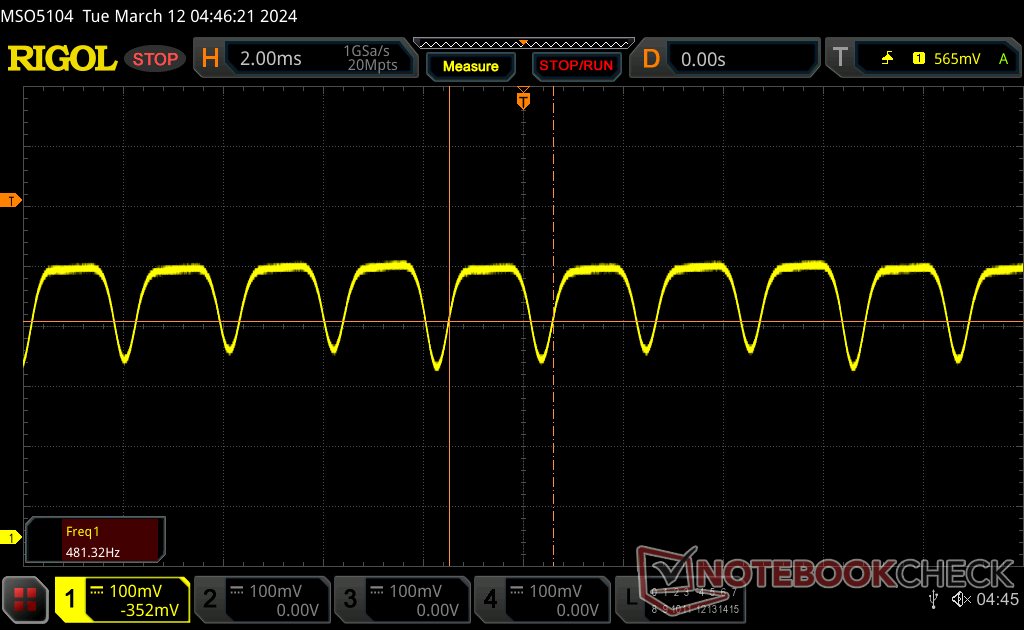
| ↔ Reaktionszeiten Schwarz zu Weiß | ||
|---|---|---|
| 0.86 ms ... steigend ↗ und fallend ↘ kombiniert | ↗ 0.4 ms steigend | 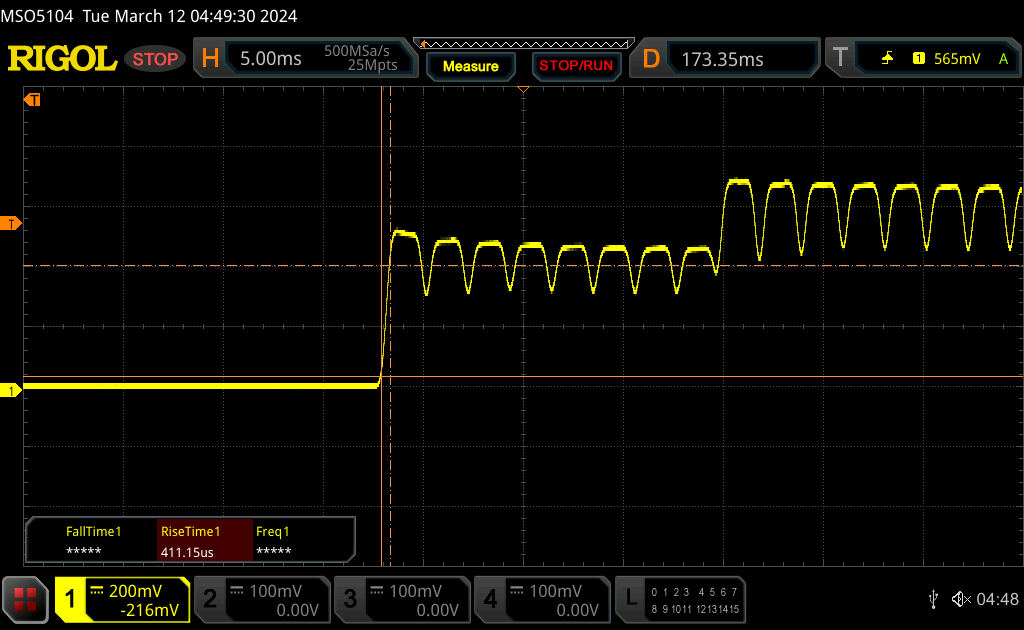 |
| ↘ 0.46 ms fallend | ||
| Die gemessenen Reaktionszeiten sind sehr kurz, wodurch sich der Bildschirm auch für schnelle 3D Spiele eignen sollte. Im Vergleich rangierten die bei uns getesteten Geräte von 0.1 (Minimum) zu 240 (Maximum) ms. » 3 % aller Screens waren schneller als der getestete. Daher sind die gemessenen Reaktionszeiten besser als der Durchschnitt aller vermessenen Geräte (19.8 ms). | ||
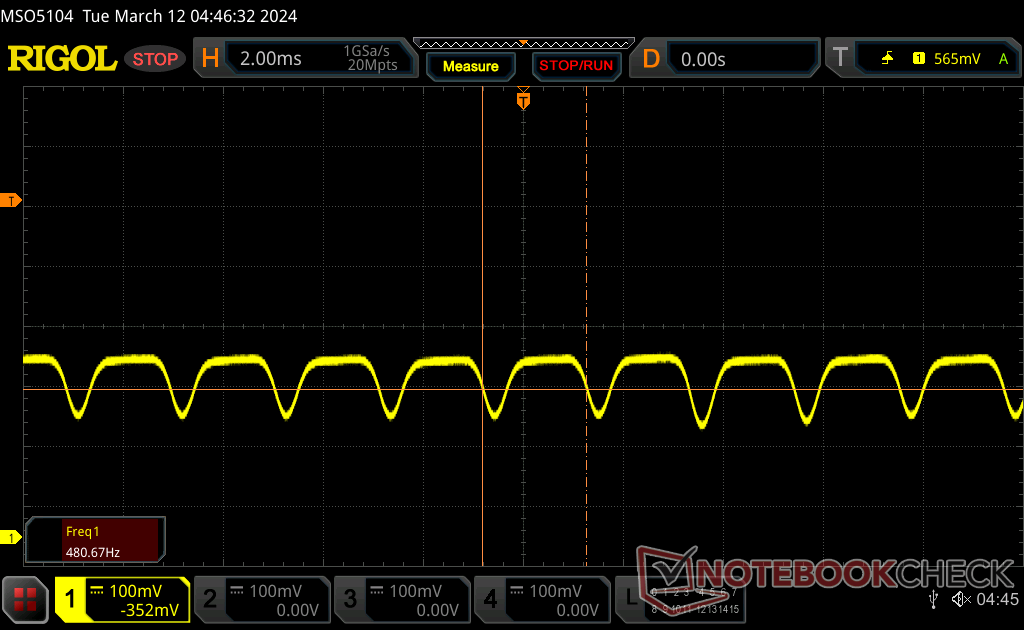
| ↔ Reaktionszeiten 50% Grau zu 80% Grau | ||
| 0.78 ms ... steigend ↗ und fallend ↘ kombiniert | ↗ 0.44 ms steigend |  |
| ↘ 0.34 ms fallend | ||
| Die gemessenen Reaktionszeiten sind sehr kurz, wodurch sich der Bildschirm auch für schnelle 3D Spiele eignen sollte. Im Vergleich rangierten die bei uns getesteten Geräte von 0.165 (Minimum) zu 636 (Maximum) ms. » 3 % aller Screens waren schneller als der getestete. Daher sind die gemessenen Reaktionszeiten besser als der Durchschnitt aller vermessenen Geräte (31 ms). | ||
Bildschirm-Flackern / PWM (Pulse-Width Modulation)
| Flackern / PWM festgestellt | 480 Hz | ≤ 100 % Helligkeit | 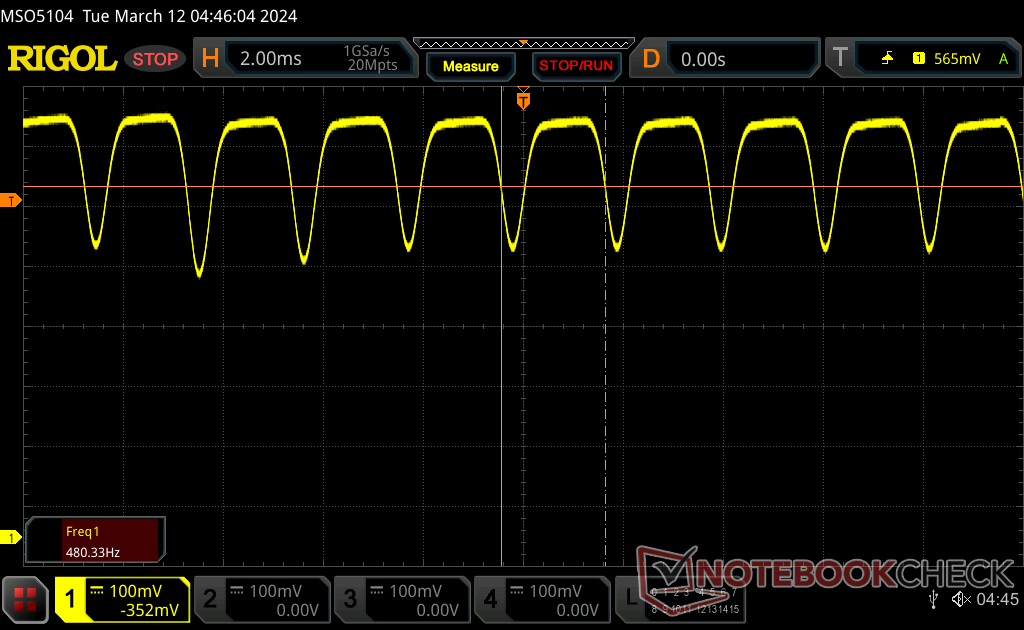 |
Das Display flackert mit 480 Hz (im schlimmsten Fall, eventuell durch Pulsweitenmodulation PWM) bei einer eingestellten Helligkeit von 100 % und darunter. Darüber sollte es zu keinem Flackern kommen. Die Frequenz von 480 Hz ist relativ hoch und sollte daher auch bei den meisten Personen zu keinen Problemen führen. Empfindliche User sollen laut Berichten aber sogar noch bei 500 Hz und darüber ein Flackern wahrnehmen. Im Vergleich: 52 % aller getesteten Geräte nutzten kein PWM um die Helligkeit zu reduzieren. Wenn PWM eingesetzt wurde, dann bei einer Frequenz von durchschnittlich 7751 (Minimum 5, Maximum 343500) Hz. | |||


Performance

Testbedingungen
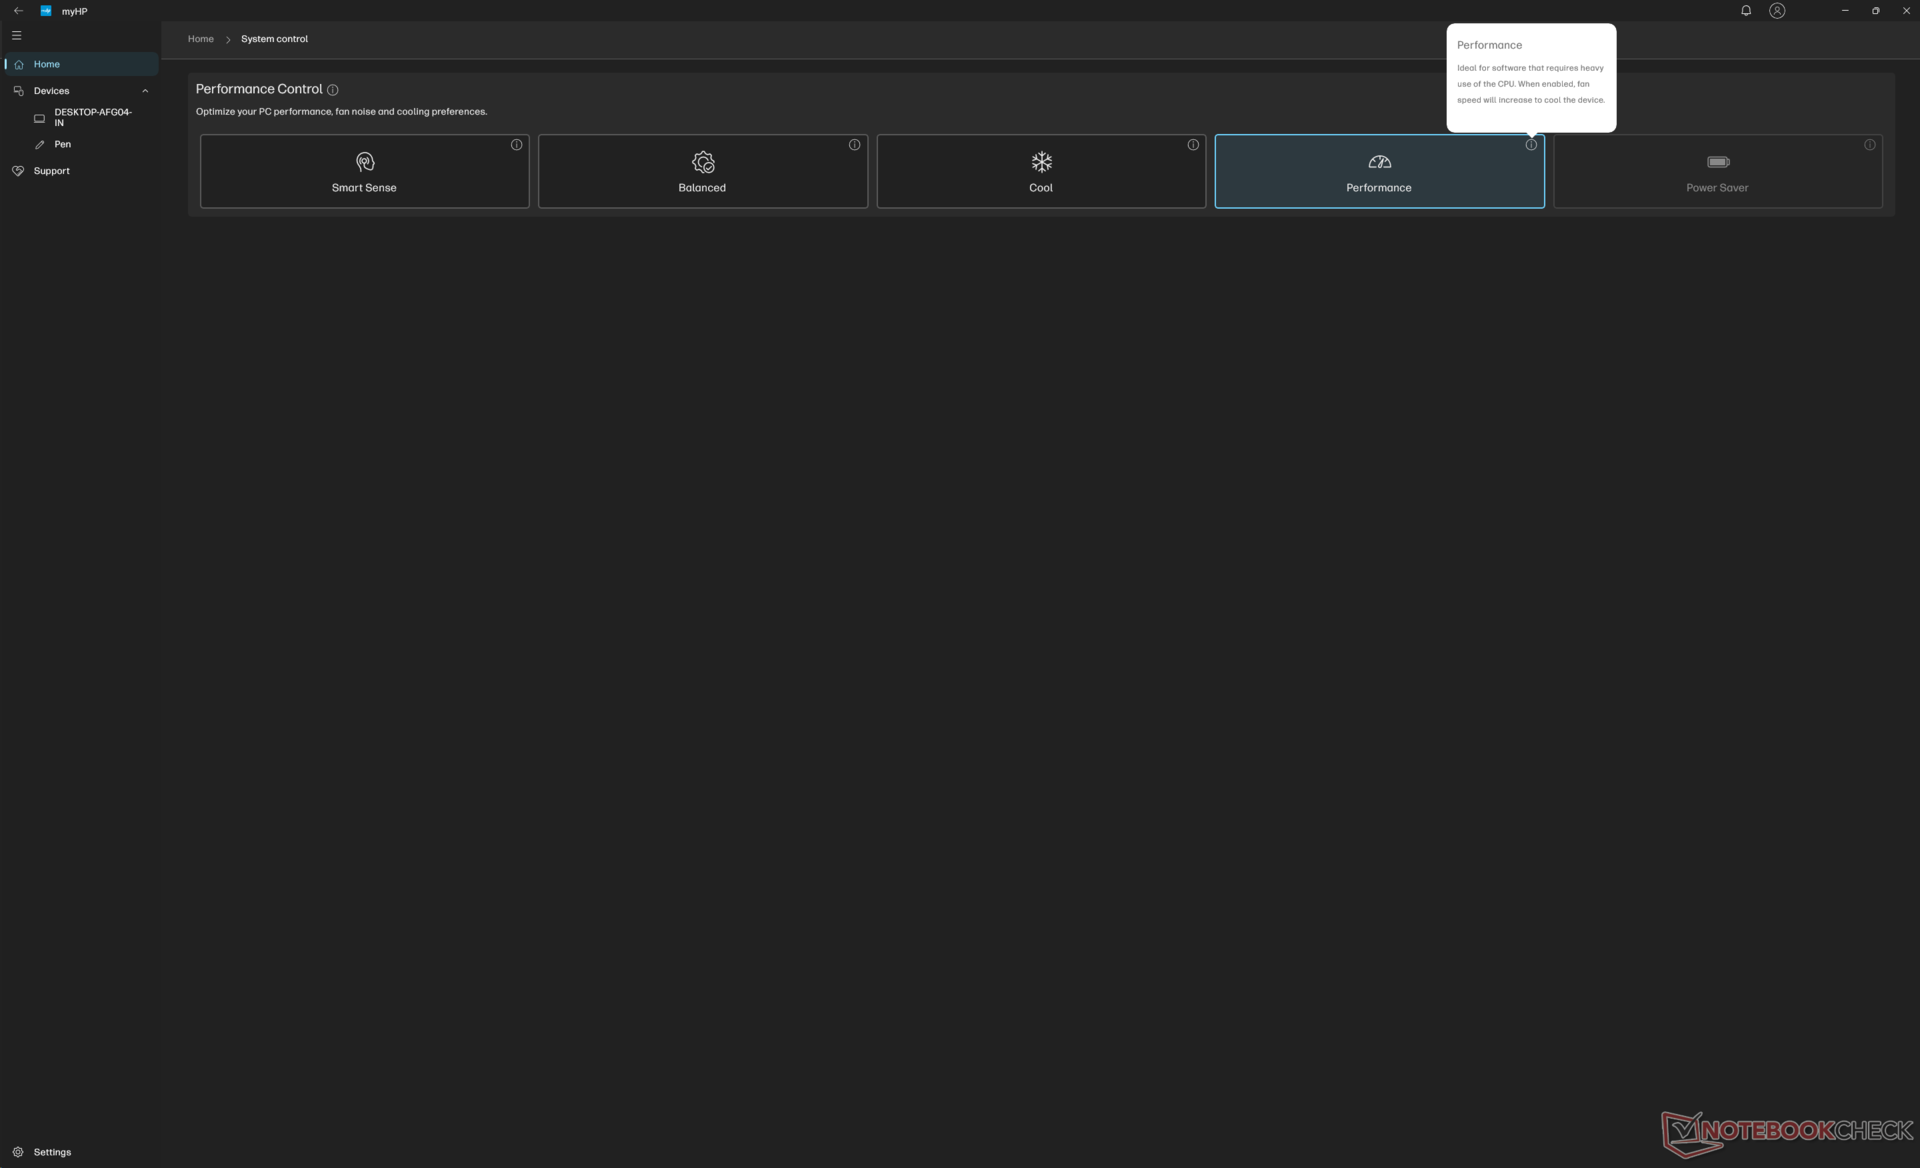
Wir haben Windows und MyHP auf ihre jeweiligen Leistungsmodi eingestellt, bevor wir die folgenden Benchmarks durchgeführt haben. Sowohl MyHP als auch der Omen Gaming Hub sind auf dem System installiert, aber die meisten wichtigen Funktionen in Bezug auf Benutzerfreundlichkeit und Energieprofile sind an MyHP gebunden.
Prozessor
Der Core Ultra 7 155H in unserer dGPU-Konfiguration liefert niedrigere Leistungswerte als derselbe Prozessor in unserer iGPU-Konfiguration. Der Unterschied zwischen den beiden Systemen kann bis zu 20 Prozent betragen, und selbst nach mehreren wiederholten Tests verbessern sich die Ergebnisse nicht. Bei genauerer Betrachtung der Leistungsaufnahme der CPU-Platine in beiden Konfigurationen erreichte die CPU in unserer dGPU-Einheit nur 28 W, während sich die gleiche CPU in unserer iGPU-Einheit bei einem höheren Leistungsniveau von 40 W stabilisierte.
HP ist sich bewusst, dass die CPU "bei bestimmten Arbeitslasten fälschlicherweise gedrosselt wird" und dass ein Software-Update in Arbeit ist, um dieses Problem zu beheben. Wir werden die neuen Ergebnisse hier hinzufügen, sobald das Update verfügbar ist.
Cinebench R15 Multi Dauertest
Cinebench R23: Multi Core | Single Core
Cinebench R20: CPU (Multi Core) | CPU (Single Core)
Cinebench R15: CPU Multi 64Bit | CPU Single 64Bit
Blender: v2.79 BMW27 CPU
7-Zip 18.03: 7z b 4 | 7z b 4 -mmt1
Geekbench 6.7: Multi-Core | Single-Core
Geekbench 5.5: Multi-Core | Single-Core
HWBOT x265 Benchmark v2.2: 4k Preset
LibreOffice : 20 Documents To PDF
R Benchmark 2.5: Overall mean
| Geekbench 6.7 / Single-Core | |
| Lenovo ThinkPad P1 G6-21FV000DGE | |
| HP Pavilion Plus 16-ab0456tx | |
| Honor MagicBook Pro 16 2024 | |
| HP Spectre x360 16-aa0074ng | |
| Durchschnittliche Intel Core Ultra 7 155H (1901 - 2473, n=52) | |
| LG Gram 2in1 16 16T90R - G.AA78G | |
| Lenovo Thinkpad X1 Fold 16 | |
| HP Spectre x360 16 RTX 4050 | |
| Lenovo ThinkBook 16 G6 ABP | |
| Lenovo ThinkPad E16 G1-21JUS08X00 | |
Cinebench R23: Multi Core | Single Core
Cinebench R20: CPU (Multi Core) | CPU (Single Core)
Cinebench R15: CPU Multi 64Bit | CPU Single 64Bit
Blender: v2.79 BMW27 CPU
7-Zip 18.03: 7z b 4 | 7z b 4 -mmt1
Geekbench 6.7: Multi-Core | Single-Core
Geekbench 5.5: Multi-Core | Single-Core
HWBOT x265 Benchmark v2.2: 4k Preset
LibreOffice : 20 Documents To PDF
R Benchmark 2.5: Overall mean
* ... kleinere Werte sind besser
AIDA64: FP32 Ray-Trace | FPU Julia | CPU SHA3 | CPU Queen | FPU SinJulia | FPU Mandel | CPU AES | CPU ZLib | FP64 Ray-Trace | CPU PhotoWorxx
| Performance Rating | |
| Honor MagicBook Pro 16 2024 | |
| MSI Prestige 16 B1MG-001US | |
| HP Spectre x360 16 RTX 4050 | |
| Durchschnittliche Intel Core Ultra 7 155H | |
| HP Spectre x360 16-aa0074ng | |
| HP Spectre x360 2-in-1 16-f1075ng | |
| LG Gram 2in1 16 16T90R - G.AA78G | |
| AIDA64 / FP32 Ray-Trace | |
| Honor MagicBook Pro 16 2024 | |
| MSI Prestige 16 B1MG-001US | |
| HP Spectre x360 16 RTX 4050 | |
| Durchschnittliche Intel Core Ultra 7 155H (6670 - 18470, n=50) | |
| HP Spectre x360 16-aa0074ng | |
| HP Spectre x360 2-in-1 16-f1075ng | |
| LG Gram 2in1 16 16T90R - G.AA78G | |
| LG Gram 2in1 16 16T90R - G.AA78G | |
| AIDA64 / FPU Julia | |
| Honor MagicBook Pro 16 2024 | |
| MSI Prestige 16 B1MG-001US | |
| HP Spectre x360 16 RTX 4050 | |
| Durchschnittliche Intel Core Ultra 7 155H (40905 - 93181, n=50) | |
| HP Spectre x360 16-aa0074ng | |
| HP Spectre x360 2-in-1 16-f1075ng | |
| LG Gram 2in1 16 16T90R - G.AA78G | |
| AIDA64 / CPU SHA3 | |
| Honor MagicBook Pro 16 2024 | |
| MSI Prestige 16 B1MG-001US | |
| HP Spectre x360 16 RTX 4050 | |
| Durchschnittliche Intel Core Ultra 7 155H (1940 - 4436, n=50) | |
| HP Spectre x360 16-aa0074ng | |
| HP Spectre x360 2-in-1 16-f1075ng | |
| LG Gram 2in1 16 16T90R - G.AA78G | |
| AIDA64 / CPU Queen | |
| MSI Prestige 16 B1MG-001US | |
| HP Spectre x360 2-in-1 16-f1075ng | |
| HP Spectre x360 16-aa0074ng | |
| Honor MagicBook Pro 16 2024 | |
| Durchschnittliche Intel Core Ultra 7 155H (64698 - 94181, n=50) | |
| LG Gram 2in1 16 16T90R - G.AA78G | |
| HP Spectre x360 16 RTX 4050 | |
| AIDA64 / FPU SinJulia | |
| Honor MagicBook Pro 16 2024 | |
| MSI Prestige 16 B1MG-001US | |
| HP Spectre x360 16 RTX 4050 | |
| HP Spectre x360 16-aa0074ng | |
| Durchschnittliche Intel Core Ultra 7 155H (5639 - 10647, n=50) | |
| HP Spectre x360 2-in-1 16-f1075ng | |
| LG Gram 2in1 16 16T90R - G.AA78G | |
| AIDA64 / FPU Mandel | |
| Honor MagicBook Pro 16 2024 | |
| MSI Prestige 16 B1MG-001US | |
| HP Spectre x360 16 RTX 4050 | |
| Durchschnittliche Intel Core Ultra 7 155H (18236 - 47685, n=50) | |
| HP Spectre x360 16-aa0074ng | |
| HP Spectre x360 2-in-1 16-f1075ng | |
| LG Gram 2in1 16 16T90R - G.AA78G | |
| AIDA64 / CPU AES | |
| Honor MagicBook Pro 16 2024 | |
| HP Spectre x360 2-in-1 16-f1075ng | |
| LG Gram 2in1 16 16T90R - G.AA78G | |
| Durchschnittliche Intel Core Ultra 7 155H (45713 - 152179, n=50) | |
| MSI Prestige 16 B1MG-001US | |
| HP Spectre x360 16 RTX 4050 | |
| HP Spectre x360 16-aa0074ng | |
| AIDA64 / CPU ZLib | |
| Honor MagicBook Pro 16 2024 | |
| MSI Prestige 16 B1MG-001US | |
| HP Spectre x360 16 RTX 4050 | |
| Durchschnittliche Intel Core Ultra 7 155H (557 - 1250, n=50) | |
| HP Spectre x360 16-aa0074ng | |
| HP Spectre x360 2-in-1 16-f1075ng | |
| LG Gram 2in1 16 16T90R - G.AA78G | |
| AIDA64 / FP64 Ray-Trace | |
| Honor MagicBook Pro 16 2024 | |
| MSI Prestige 16 B1MG-001US | |
| HP Spectre x360 16 RTX 4050 | |
| Durchschnittliche Intel Core Ultra 7 155H (3569 - 9802, n=50) | |
| HP Spectre x360 16-aa0074ng | |
| HP Spectre x360 2-in-1 16-f1075ng | |
| LG Gram 2in1 16 16T90R - G.AA78G | |
| AIDA64 / CPU PhotoWorxx | |
| HP Spectre x360 16-aa0074ng | |
| HP Spectre x360 16 RTX 4050 | |
| Durchschnittliche Intel Core Ultra 7 155H (32719 - 54223, n=50) | |
| MSI Prestige 16 B1MG-001US | |
| Honor MagicBook Pro 16 2024 | |
| LG Gram 2in1 16 16T90R - G.AA78G | |
| HP Spectre x360 2-in-1 16-f1075ng | |
Stresstest
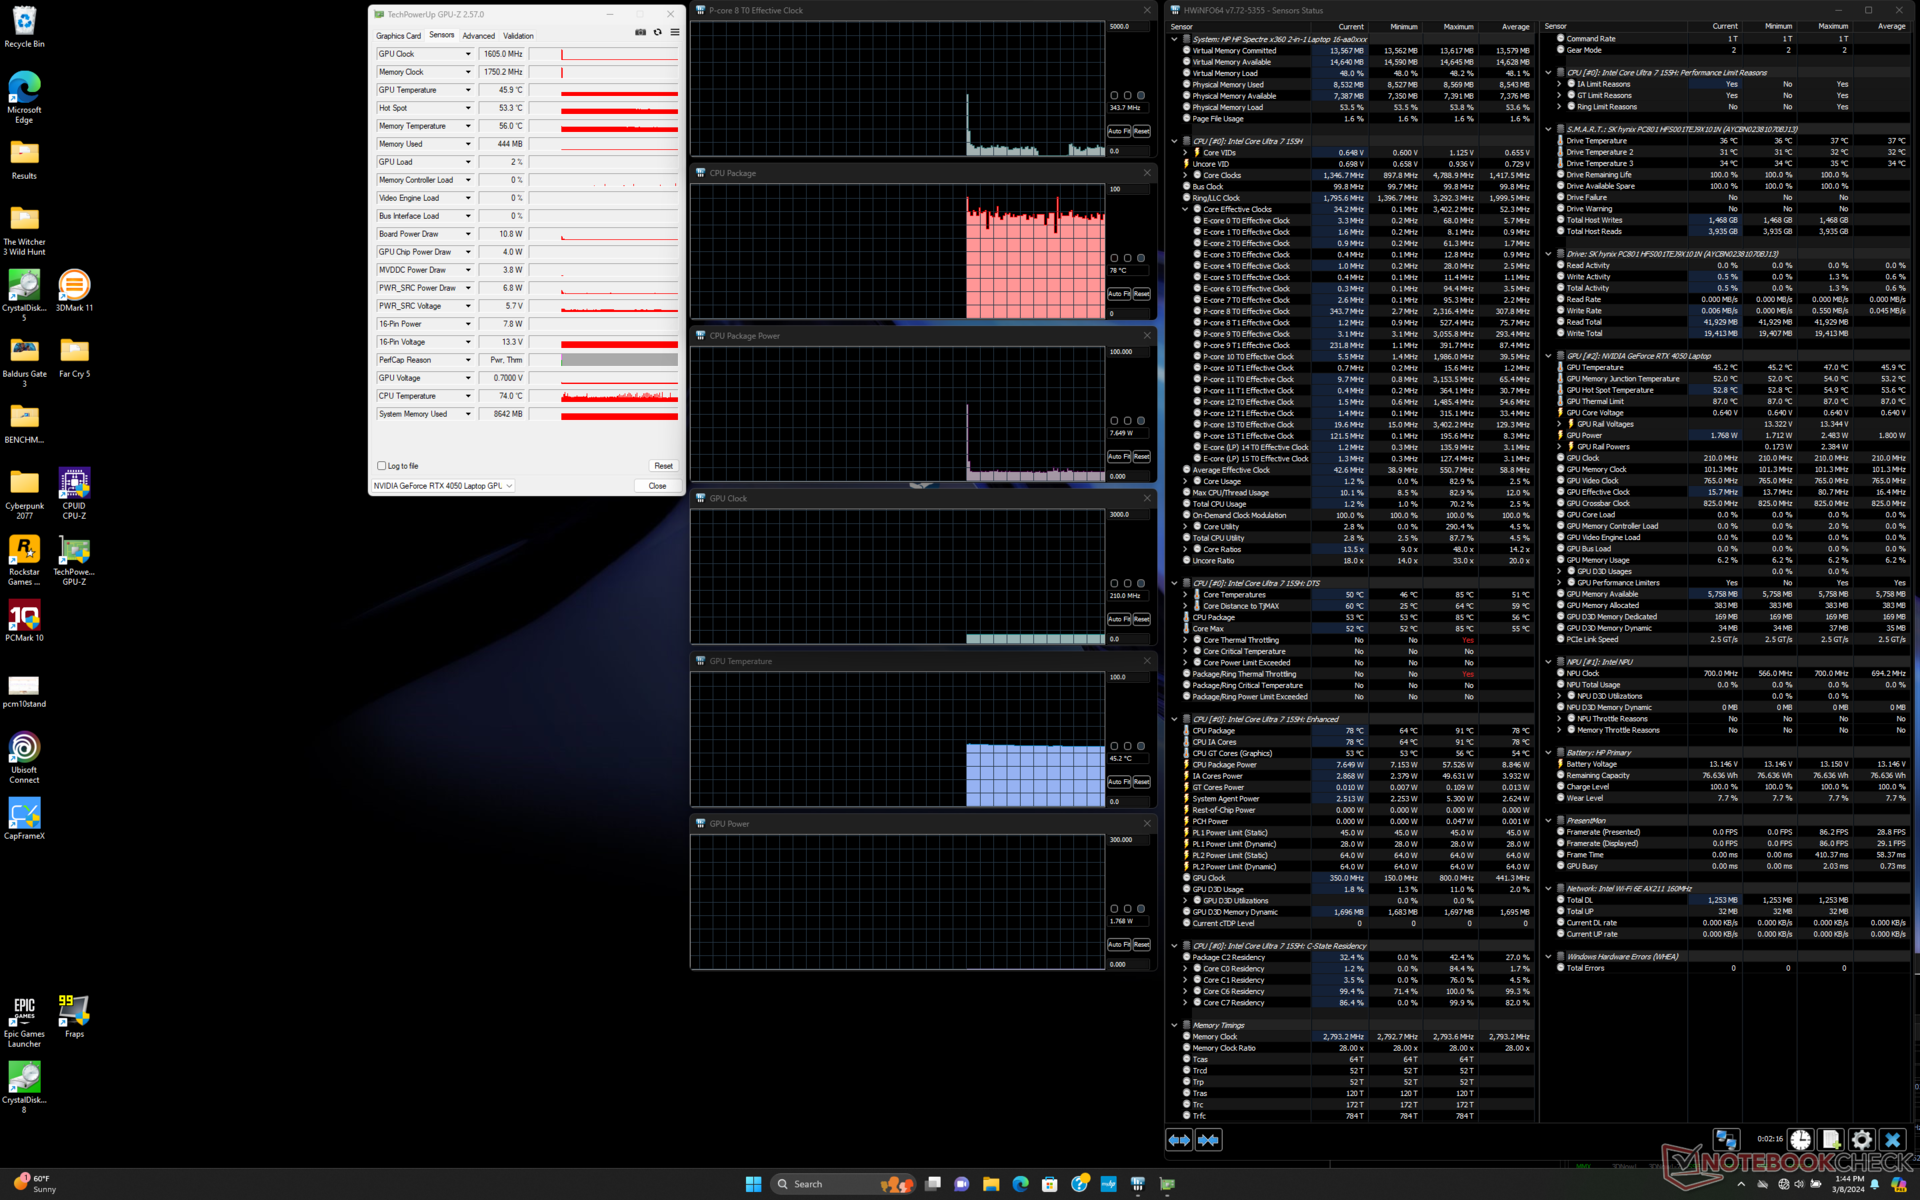
Die CPU-Taktraten und die Leistungsaufnahme des Boards beim Starten des Prime95-Stresses erreichen 3,2 GHz bzw. 65 W, bevor sie einige Sekunden später auf nur 1,4 GHz und 28 W fallen, was einen relativ starken Leistungsabfall darstellt. Die Kerntemperatur würde bis zu 95 °C erreichen, wenn der Turbo Boost 3,2 GHz erzielt, daher sind die niedrigeren Taktraten notwendig, um die Temperaturen in Schach zu halten.
Die Grafikleistung unterscheidet sich zwischen den Modi Balanced und Performance. Beispielsweise stabilisieren sich die GPU-Taktrate und die Leistungsaufnahme der Grafikkarte bei der Ausführung von Witcher 3 im Balanced-Modus bei 1920 MHz bzw. 39 W im Vergleich zu 2235 MHz und 53 W im Performance-Modus. Die Kerntemperaturen sind im Performance-Modus ebenfalls wärmer, wie die folgende Tabelle zeigt.
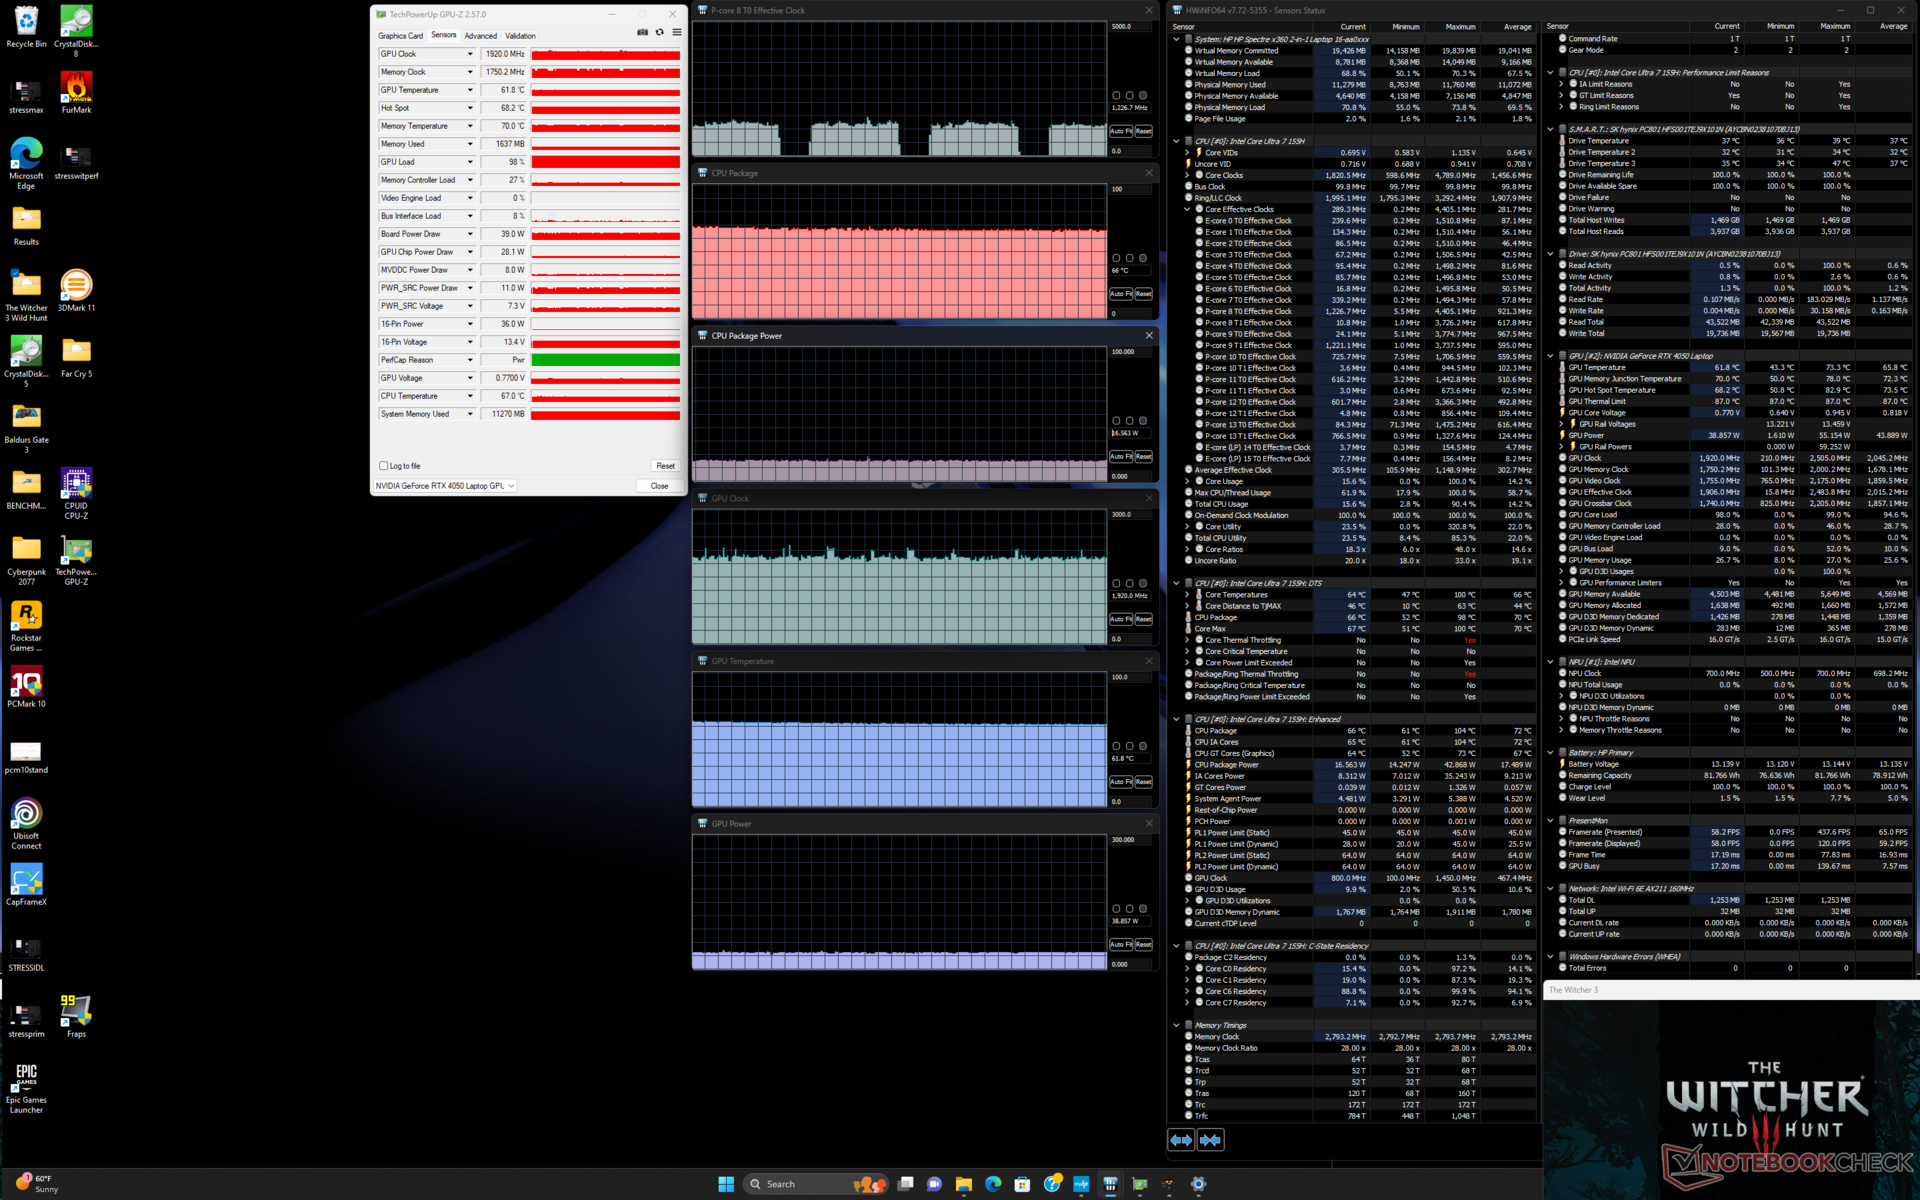

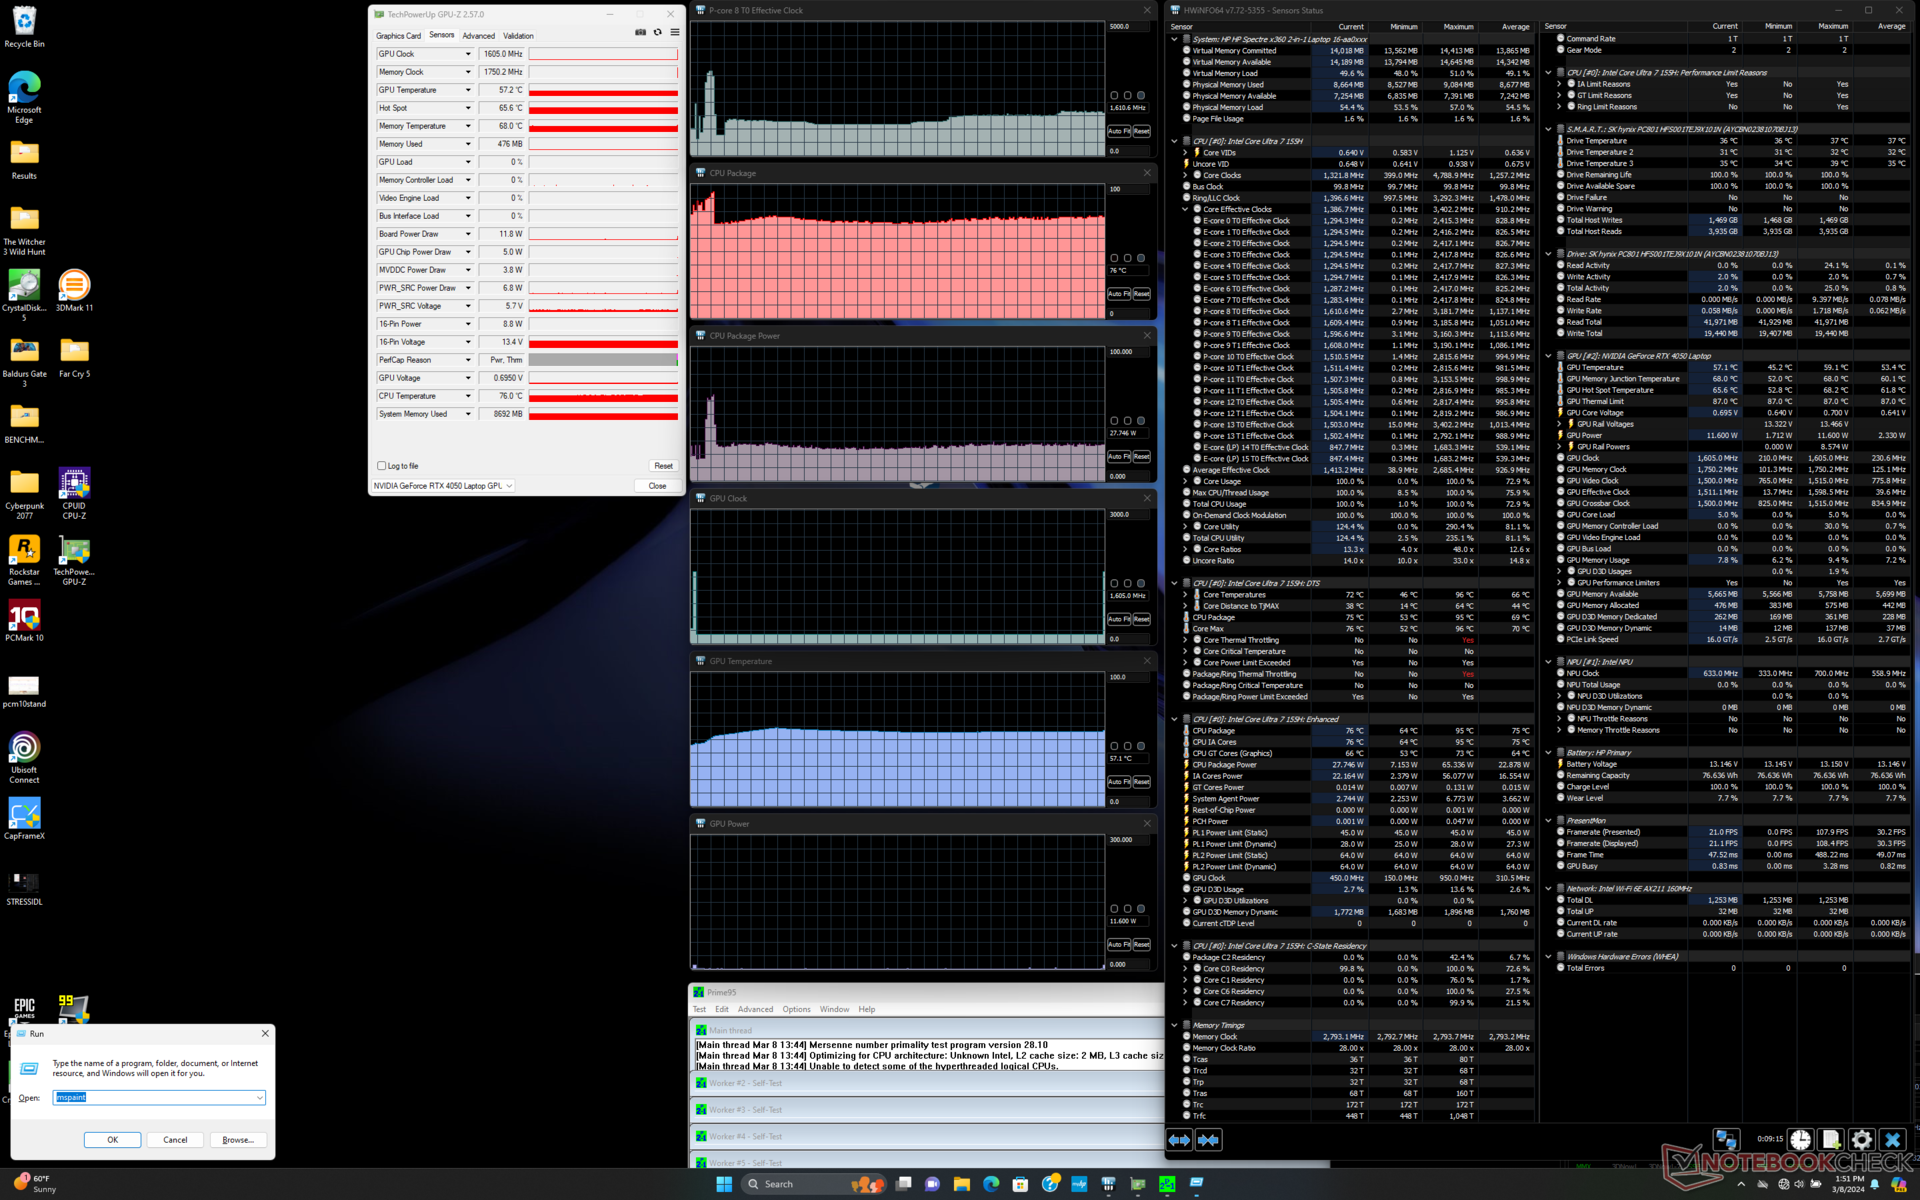
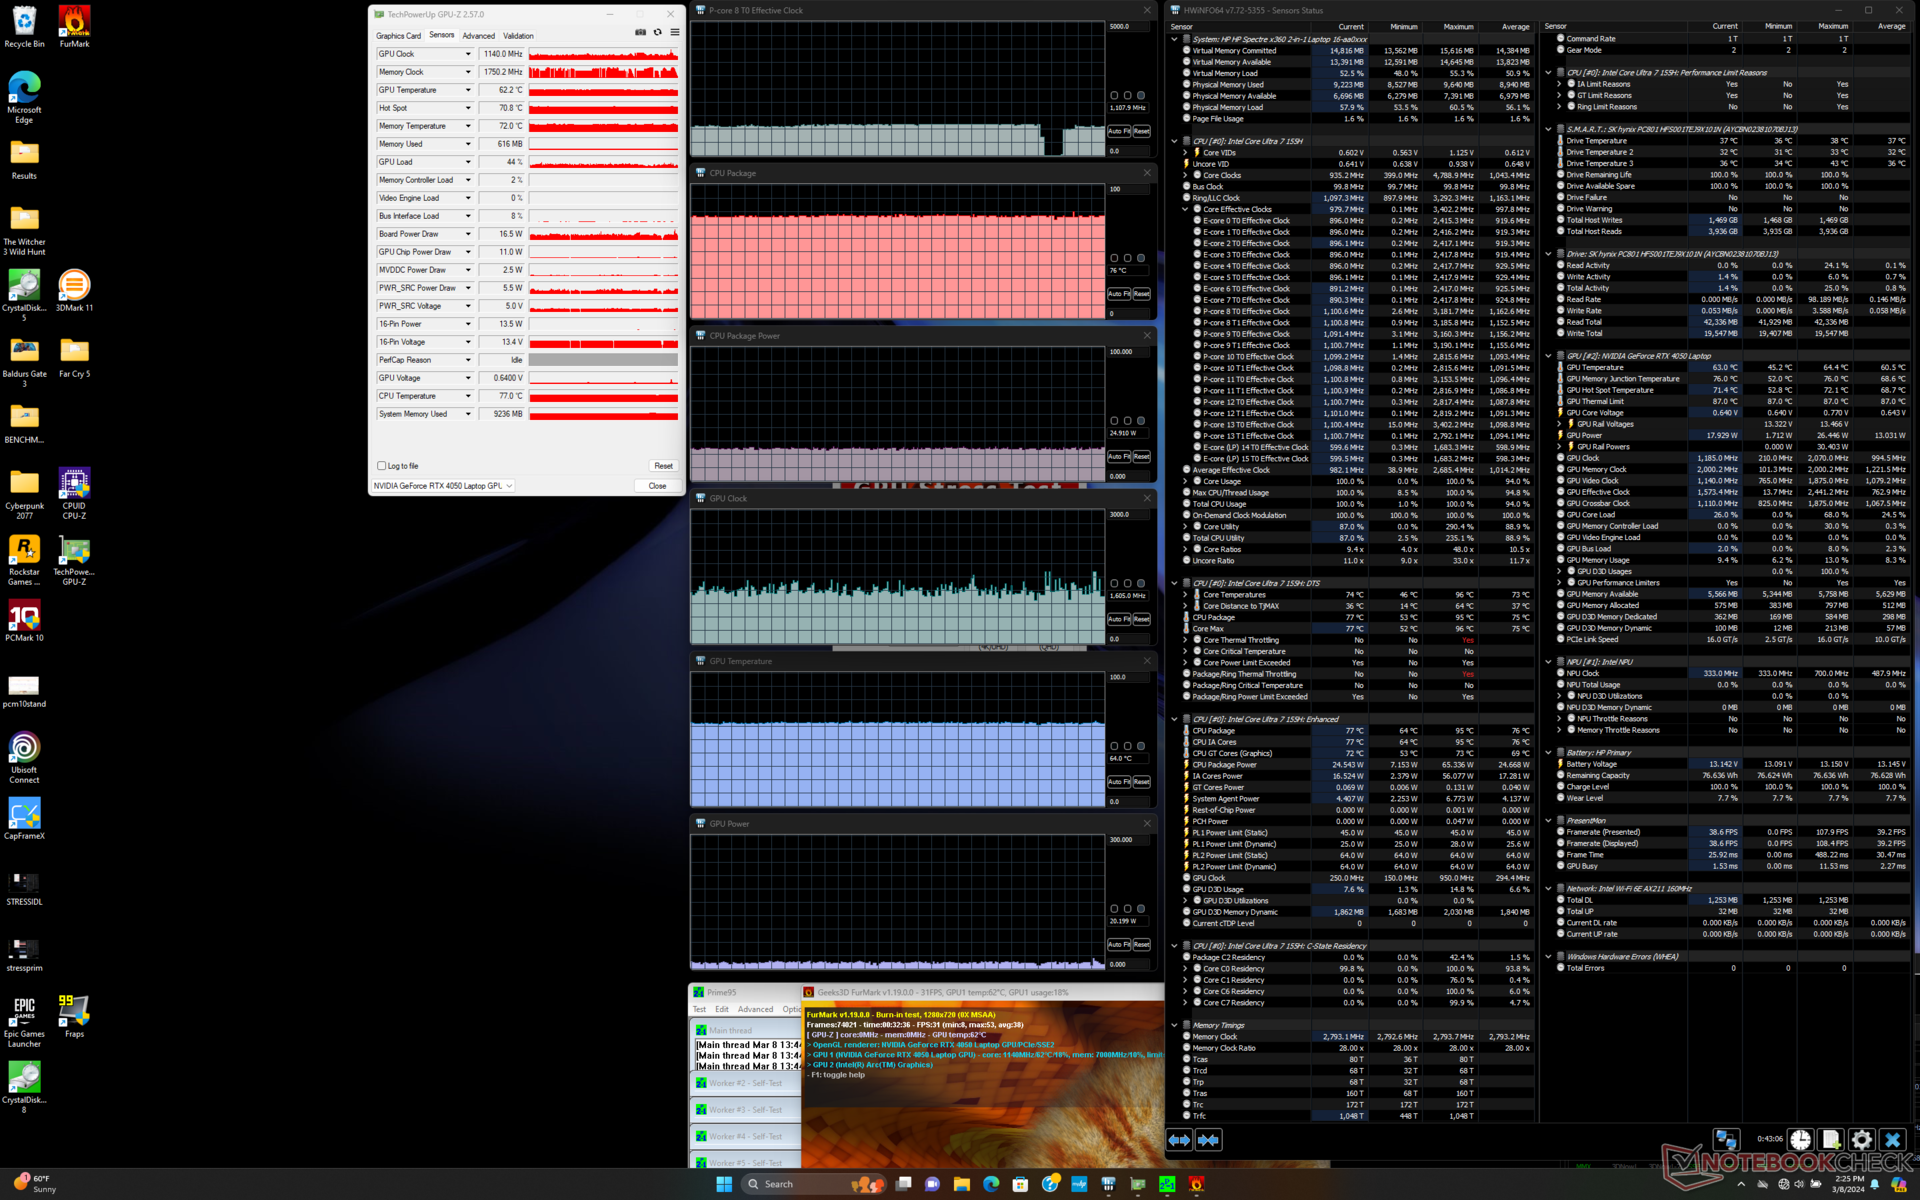
| CPU-Takt (GHz) | GPU-Takt (MHz) | Durchschnittliche CPU-Temperatur (°C) | Durchschnittliche GPU-Temperatur (°C) | |
| System im Leerlauf | -- | -- | 53 | 45 |
| Prime95 Stresstest | ~1.5 | -- | 75 | 57 |
| Prime95 + FurMark Stresstest | ~1.1 | ~1140 | 77 | 64 |
| Witcher 3 Stresstest (Balanced-Modus) | ~1.1 | 1920 | 66 | 62 |
| Witcher 3 Stresstest (Performance-Modus) | ~1.1 | 2235 | 72 | 71 |
System Performance
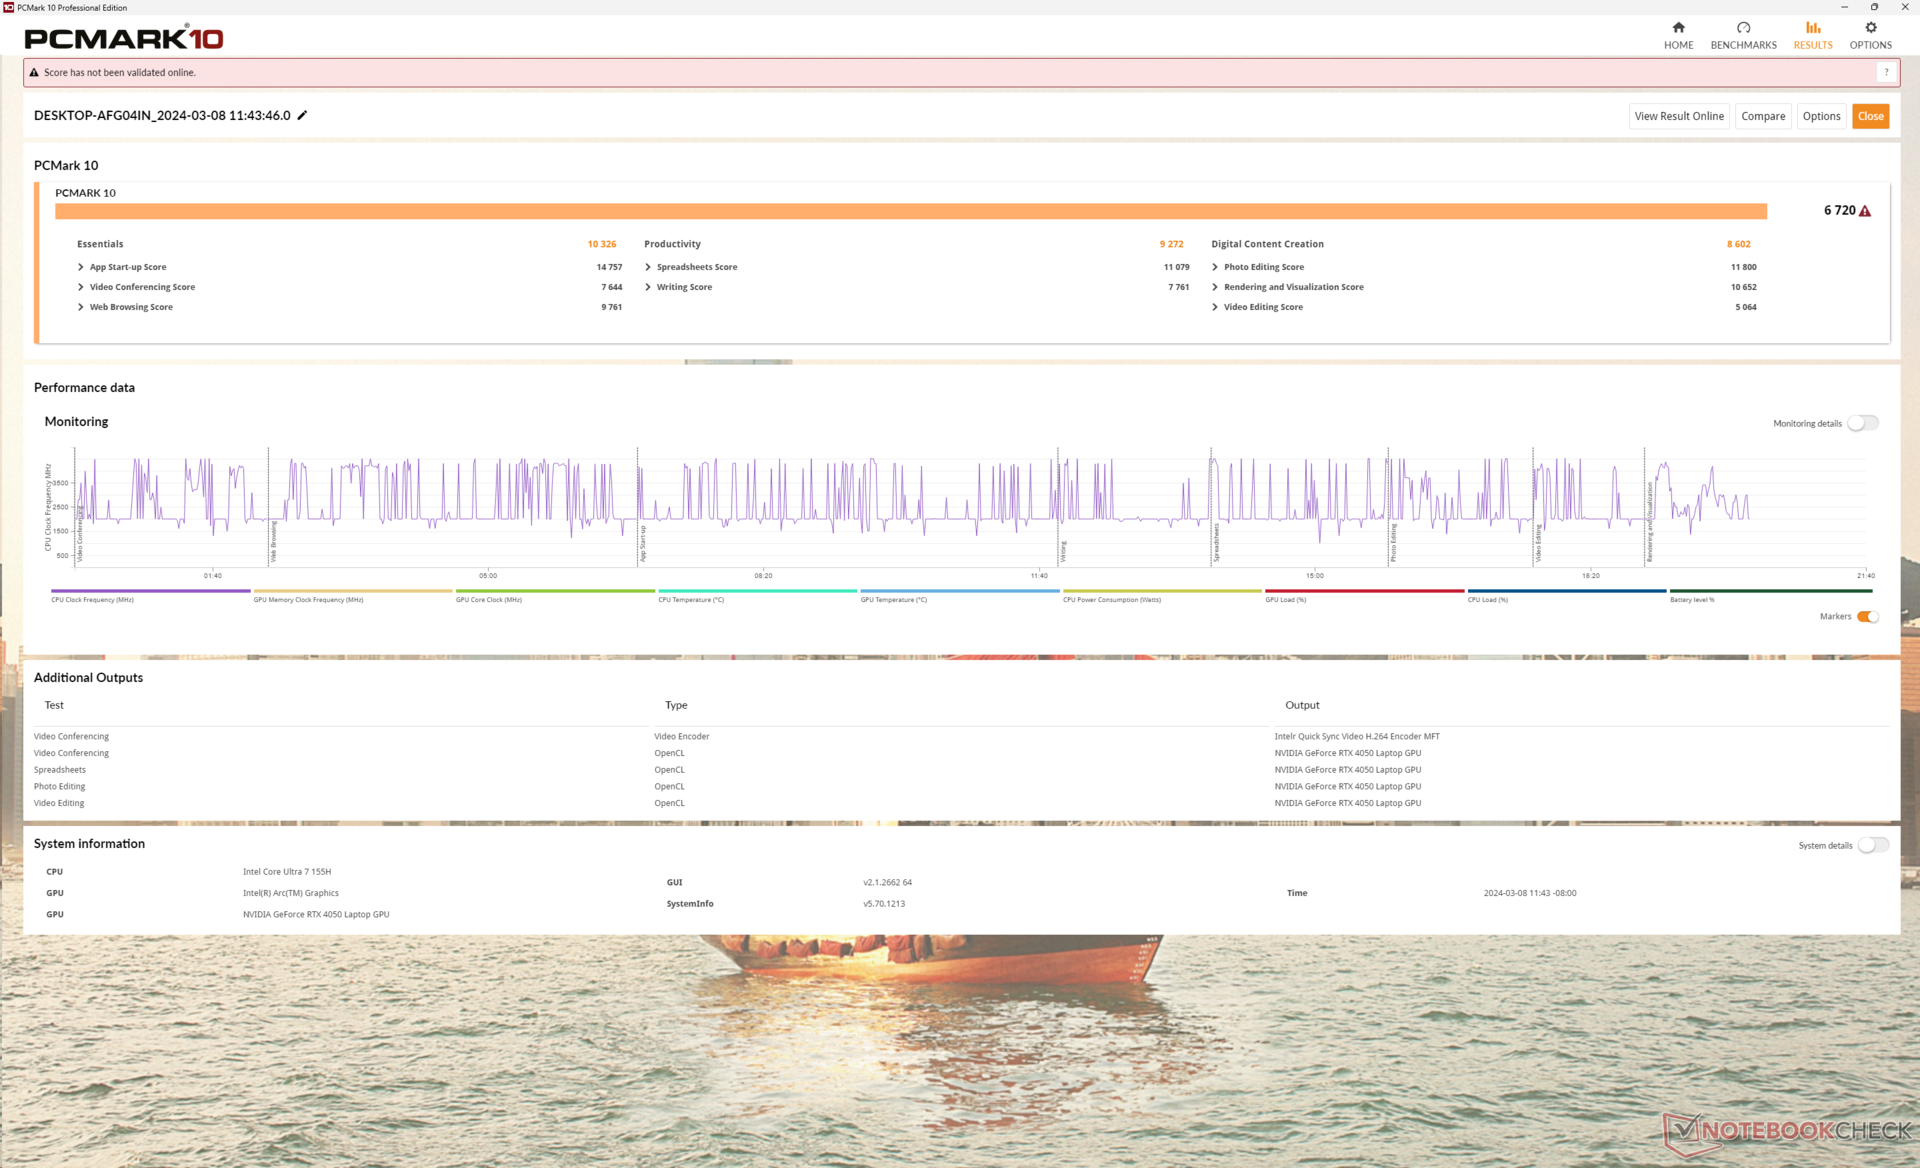
Die Ergebnisse des PCMark 10 sind mit denen der iGPU-Konfiguration des gleichen Modells vergleichbar, obwohl unsere dGPU-Version deutlich schneller ist. Allerdings war der PCMark noch nie ein genaues GPU-Benchmarking-Tool für Systeme mit Optimus 1.0-Grafik wie unsere Spectre x360 16-Serie.
CrossMark: Overall | Productivity | Creativity | Responsiveness
WebXPRT 3: Overall
WebXPRT 4: Overall
Mozilla Kraken 1.1: Total
| PCMark 10 / Score | |
| MSI Prestige 16 B1MG-001US | |
| HP Spectre x360 16-aa0074ng | |
| Durchschnittliche Intel Core Ultra 7 155H, NVIDIA GeForce RTX 4050 Laptop GPU (6537 - 6973, n=5) | |
| Honor MagicBook Pro 16 2024 | |
| HP Spectre x360 16 RTX 4050 | |
| HP Spectre x360 2-in-1 16-f1075ng | |
| LG Gram 2in1 16 16T90R - G.AA78G | |
| PCMark 10 / Essentials | |
| LG Gram 2in1 16 16T90R - G.AA78G | |
| MSI Prestige 16 B1MG-001US | |
| HP Spectre x360 2-in-1 16-f1075ng | |
| HP Spectre x360 16-aa0074ng | |
| HP Spectre x360 16 RTX 4050 | |
| Durchschnittliche Intel Core Ultra 7 155H, NVIDIA GeForce RTX 4050 Laptop GPU (9463 - 10446, n=5) | |
| Honor MagicBook Pro 16 2024 | |
| PCMark 10 / Productivity | |
| HP Spectre x360 16 RTX 4050 | |
| Durchschnittliche Intel Core Ultra 7 155H, NVIDIA GeForce RTX 4050 Laptop GPU (8769 - 9272, n=5) | |
| HP Spectre x360 16-aa0074ng | |
| MSI Prestige 16 B1MG-001US | |
| Honor MagicBook Pro 16 2024 | |
| HP Spectre x360 2-in-1 16-f1075ng | |
| LG Gram 2in1 16 16T90R - G.AA78G | |
| PCMark 10 / Digital Content Creation | |
| Honor MagicBook Pro 16 2024 | |
| MSI Prestige 16 B1MG-001US | |
| Durchschnittliche Intel Core Ultra 7 155H, NVIDIA GeForce RTX 4050 Laptop GPU (8602 - 10622, n=5) | |
| HP Spectre x360 16-aa0074ng | |
| HP Spectre x360 16 RTX 4050 | |
| HP Spectre x360 2-in-1 16-f1075ng | |
| LG Gram 2in1 16 16T90R - G.AA78G | |
| CrossMark / Overall | |
| MSI Prestige 16 B1MG-001US | |
| Honor MagicBook Pro 16 2024 | |
| HP Spectre x360 16-aa0074ng | |
| HP Spectre x360 2-in-1 16-f1075ng | |
| Durchschnittliche Intel Core Ultra 7 155H, NVIDIA GeForce RTX 4050 Laptop GPU (1552 - 1740, n=5) | |
| HP Spectre x360 16 RTX 4050 | |
| LG Gram 2in1 16 16T90R - G.AA78G | |
| CrossMark / Productivity | |
| HP Spectre x360 2-in-1 16-f1075ng | |
| MSI Prestige 16 B1MG-001US | |
| Honor MagicBook Pro 16 2024 | |
| HP Spectre x360 16-aa0074ng | |
| Durchschnittliche Intel Core Ultra 7 155H, NVIDIA GeForce RTX 4050 Laptop GPU (1459 - 1659, n=5) | |
| LG Gram 2in1 16 16T90R - G.AA78G | |
| HP Spectre x360 16 RTX 4050 | |
| CrossMark / Creativity | |
| MSI Prestige 16 B1MG-001US | |
| HP Spectre x360 16-aa0074ng | |
| Durchschnittliche Intel Core Ultra 7 155H, NVIDIA GeForce RTX 4050 Laptop GPU (1811 - 1943, n=5) | |
| HP Spectre x360 16 RTX 4050 | |
| Honor MagicBook Pro 16 2024 | |
| HP Spectre x360 2-in-1 16-f1075ng | |
| LG Gram 2in1 16 16T90R - G.AA78G | |
| CrossMark / Responsiveness | |
| HP Spectre x360 2-in-1 16-f1075ng | |
| Honor MagicBook Pro 16 2024 | |
| MSI Prestige 16 B1MG-001US | |
| LG Gram 2in1 16 16T90R - G.AA78G | |
| HP Spectre x360 16-aa0074ng | |
| Durchschnittliche Intel Core Ultra 7 155H, NVIDIA GeForce RTX 4050 Laptop GPU (1167 - 1467, n=5) | |
| HP Spectre x360 16 RTX 4050 | |
| WebXPRT 3 / Overall | |
| MSI Prestige 16 B1MG-001US | |
| Honor MagicBook Pro 16 2024 | |
| HP Spectre x360 16 RTX 4050 | |
| Durchschnittliche Intel Core Ultra 7 155H, NVIDIA GeForce RTX 4050 Laptop GPU (262 - 285, n=5) | |
| HP Spectre x360 16-aa0074ng | |
| HP Spectre x360 2-in-1 16-f1075ng | |
| LG Gram 2in1 16 16T90R - G.AA78G | |
| WebXPRT 4 / Overall | |
| MSI Prestige 16 B1MG-001US | |
| HP Spectre x360 16-aa0074ng | |
| Honor MagicBook Pro 16 2024 | |
| HP Spectre x360 16 RTX 4050 | |
| Durchschnittliche Intel Core Ultra 7 155H, NVIDIA GeForce RTX 4050 Laptop GPU (247 - 260, n=5) | |
| HP Spectre x360 2-in-1 16-f1075ng | |
| Mozilla Kraken 1.1 / Total | |
| LG Gram 2in1 16 16T90R - G.AA78G | |
| HP Spectre x360 16 RTX 4050 | |
| MSI Prestige 16 B1MG-001US | |
| HP Spectre x360 2-in-1 16-f1075ng | |
| Honor MagicBook Pro 16 2024 | |
| HP Spectre x360 16-aa0074ng | |
| Durchschnittliche Intel Core Ultra 7 155H, NVIDIA GeForce RTX 4050 Laptop GPU (416 - 561, n=5) | |
* ... kleinere Werte sind besser
| PCMark 10 Score | 6720 Punkte | |
Hilfe | ||
| AIDA64 / Memory Copy | |
| HP Spectre x360 16-aa0074ng | |
| HP Spectre x360 16 RTX 4050 | |
| Honor MagicBook Pro 16 2024 | |
| Durchschnittliche Intel Core Ultra 7 155H (62397 - 96791, n=50) | |
| MSI Prestige 16 B1MG-001US | |
| LG Gram 2in1 16 16T90R - G.AA78G | |
| HP Spectre x360 2-in-1 16-f1075ng | |
| AIDA64 / Memory Read | |
| HP Spectre x360 16 RTX 4050 | |
| HP Spectre x360 16-aa0074ng | |
| Durchschnittliche Intel Core Ultra 7 155H (60544 - 90647, n=50) | |
| Honor MagicBook Pro 16 2024 | |
| MSI Prestige 16 B1MG-001US | |
| LG Gram 2in1 16 16T90R - G.AA78G | |
| HP Spectre x360 2-in-1 16-f1075ng | |
| AIDA64 / Memory Write | |
| HP Spectre x360 16 RTX 4050 | |
| LG Gram 2in1 16 16T90R - G.AA78G | |
| MSI Prestige 16 B1MG-001US | |
| Honor MagicBook Pro 16 2024 | |
| HP Spectre x360 16-aa0074ng | |
| Durchschnittliche Intel Core Ultra 7 155H (58692 - 93451, n=50) | |
| HP Spectre x360 2-in-1 16-f1075ng | |
| AIDA64 / Memory Latency | |
| Durchschnittliche Intel Core Ultra 7 155H (116.2 - 233, n=50) | |
| Honor MagicBook Pro 16 2024 | |
| HP Spectre x360 16-aa0074ng | |
| HP Spectre x360 16 RTX 4050 | |
| MSI Prestige 16 B1MG-001US | |
| LG Gram 2in1 16 16T90R - G.AA78G | |
| HP Spectre x360 2-in-1 16-f1075ng | |
* ... kleinere Werte sind besser
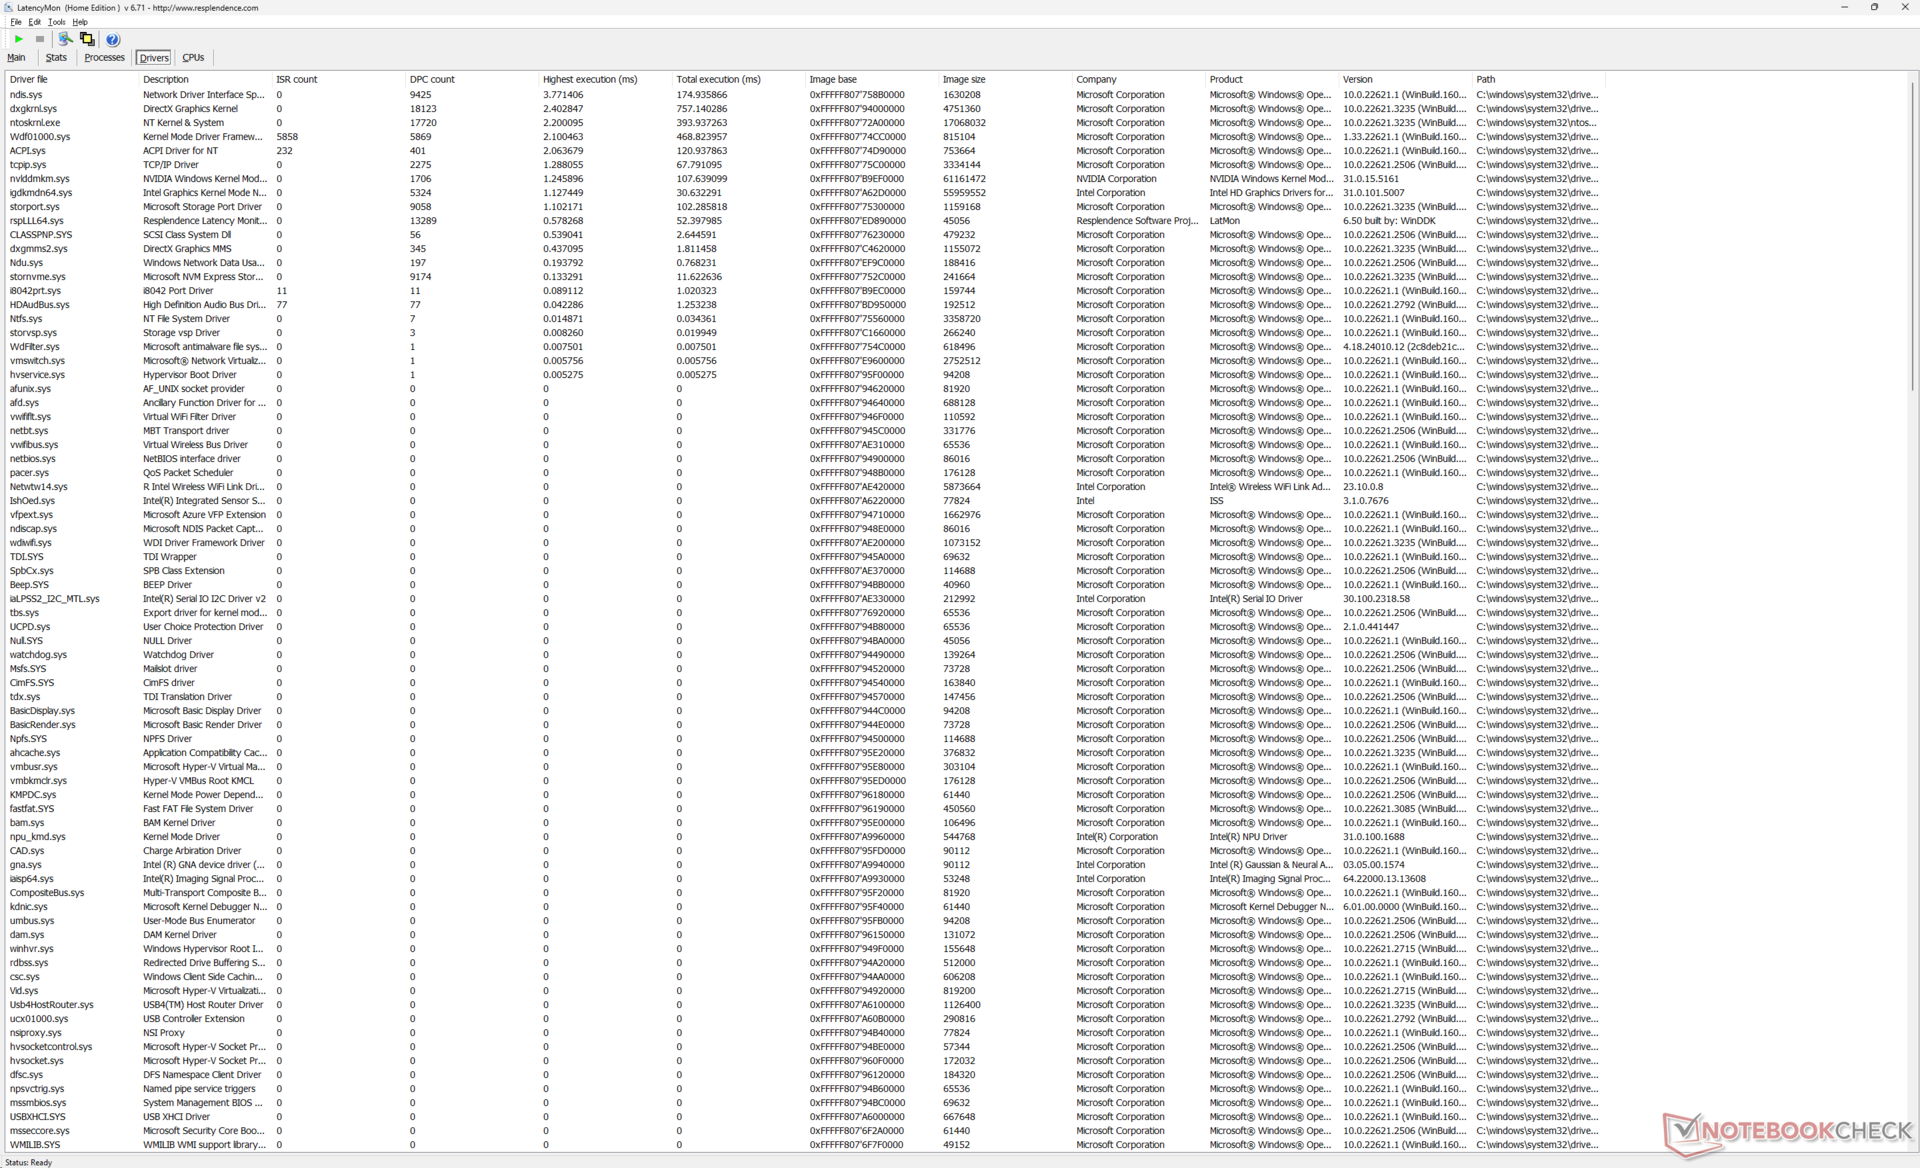
DPC-Latenzen
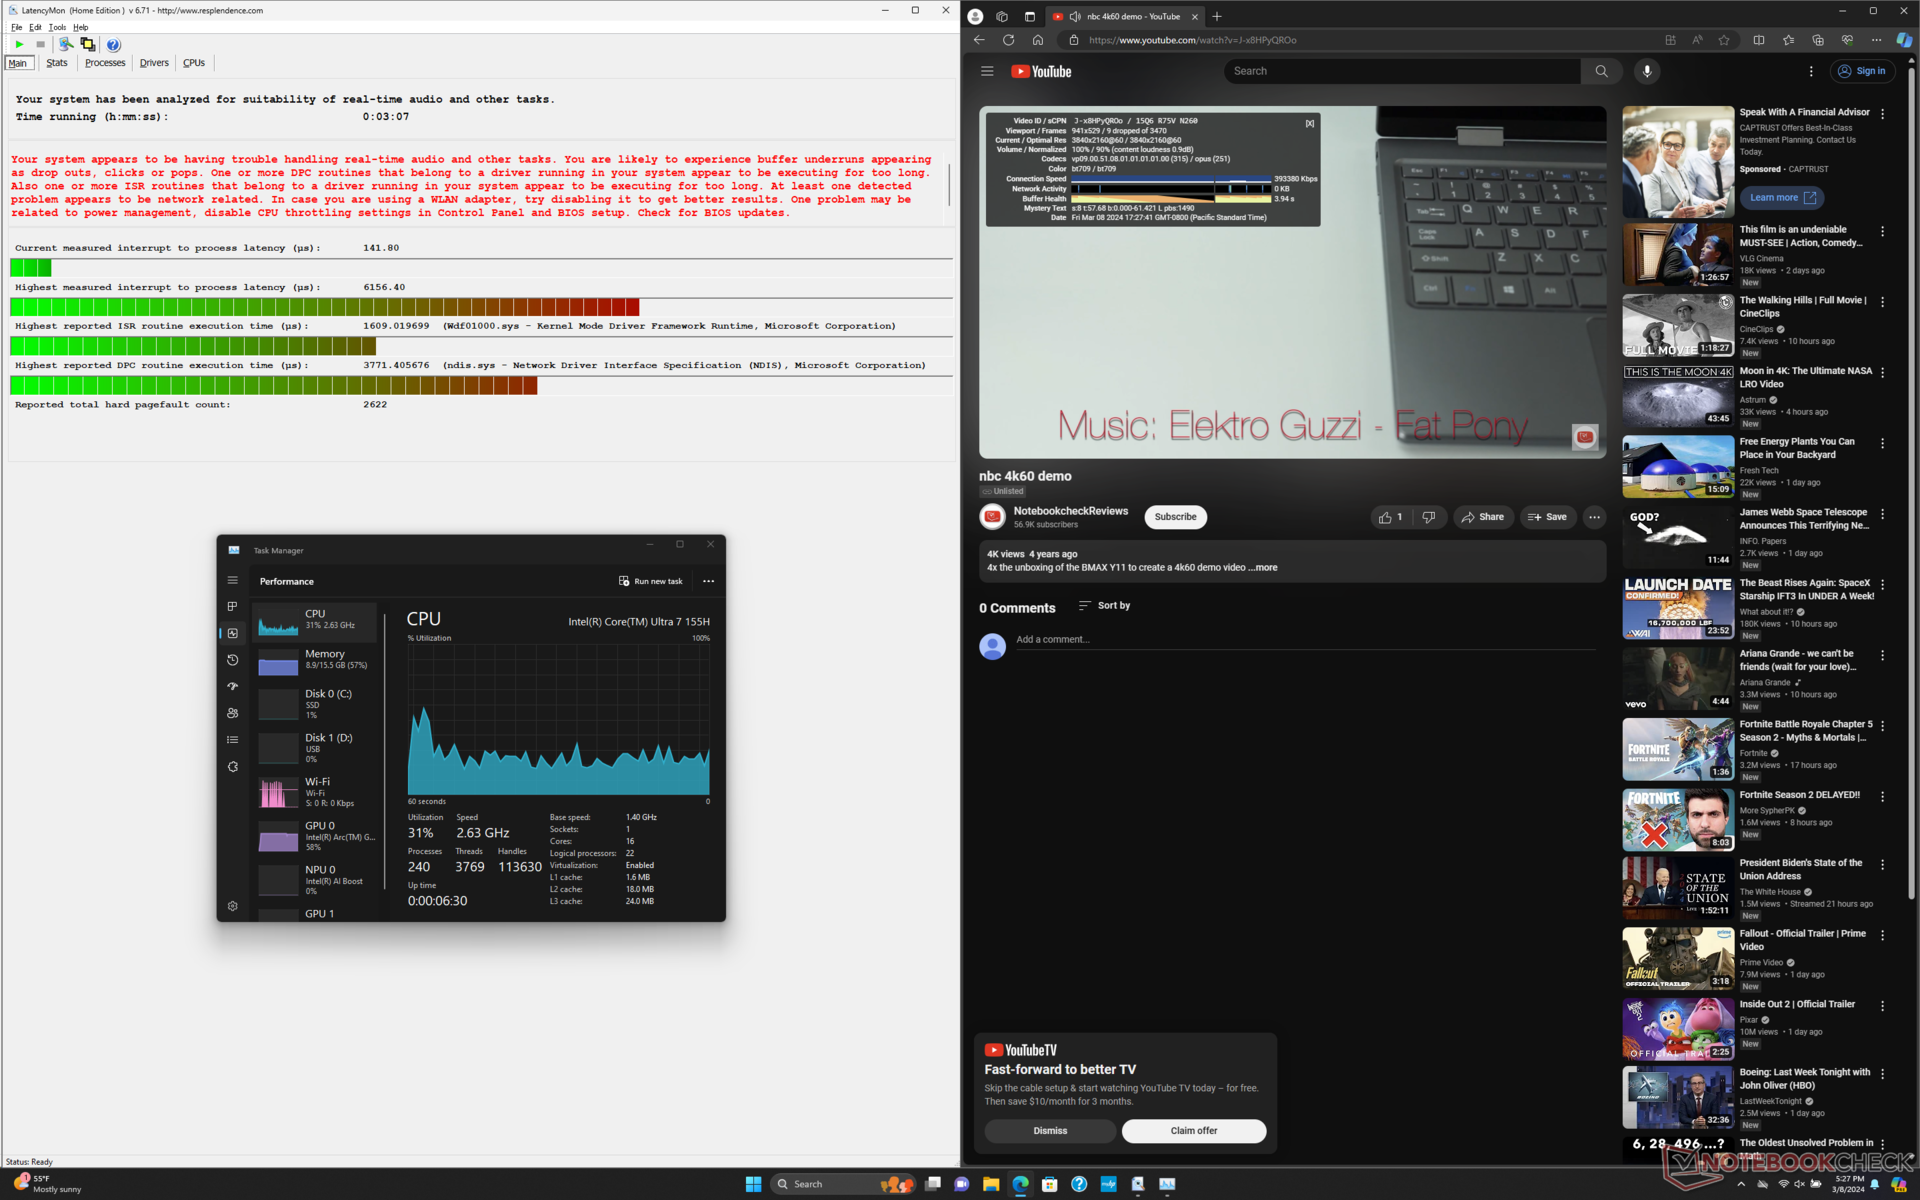
LatencyMon zeigt sowohl DPC-Probleme als auch Bildaussetzer während unseres einminütigen 4K60-Videotests. Unser iGPU-Testgerät wies während desselben Tests ebenfalls Bildaussetzer auf, was auf ein mögliches Problem bei beiden Konfigurationen hindeutet.
| DPC Latencies / LatencyMon - interrupt to process latency (max), Web, Youtube, Prime95 | |
| LG Gram 2in1 16 16T90R - G.AA78G | |
| HP Spectre x360 16 RTX 4050 | |
| Honor MagicBook Pro 16 2024 | |
| HP Spectre x360 2-in-1 16-f1075ng | |
| HP Spectre x360 16-aa0074ng | |
| MSI Prestige 16 B1MG-001US | |
* ... kleinere Werte sind besser
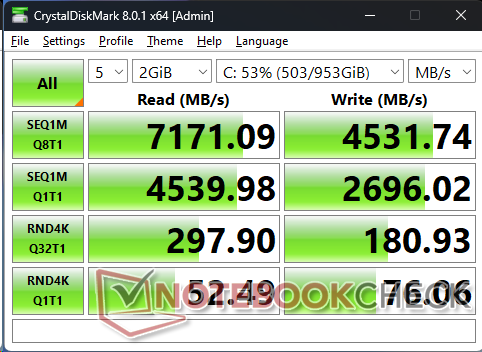
Massenspeicher
Unser spezielles Testgerät wird mit dem SK Hynix PC801 anstelle des Kioxia XG8 ausgeliefert. Die Übertragungsraten sind dennoch ausgezeichnet, ohne nennenswerte Drosselungsprobleme, wenn DiskSpd in einer Schleife läuft.

* ... kleinere Werte sind besser
Dauerleistung Lesen: DiskSpd Read Loop, Queue Depth 8
GPU Performance
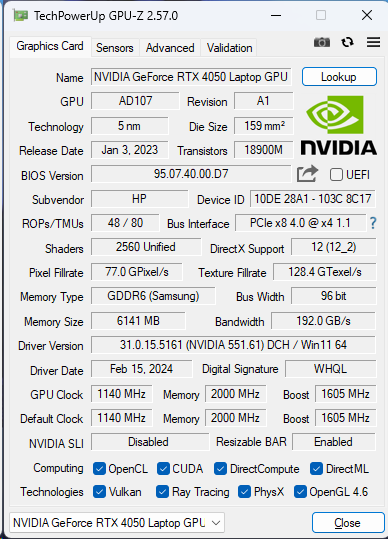
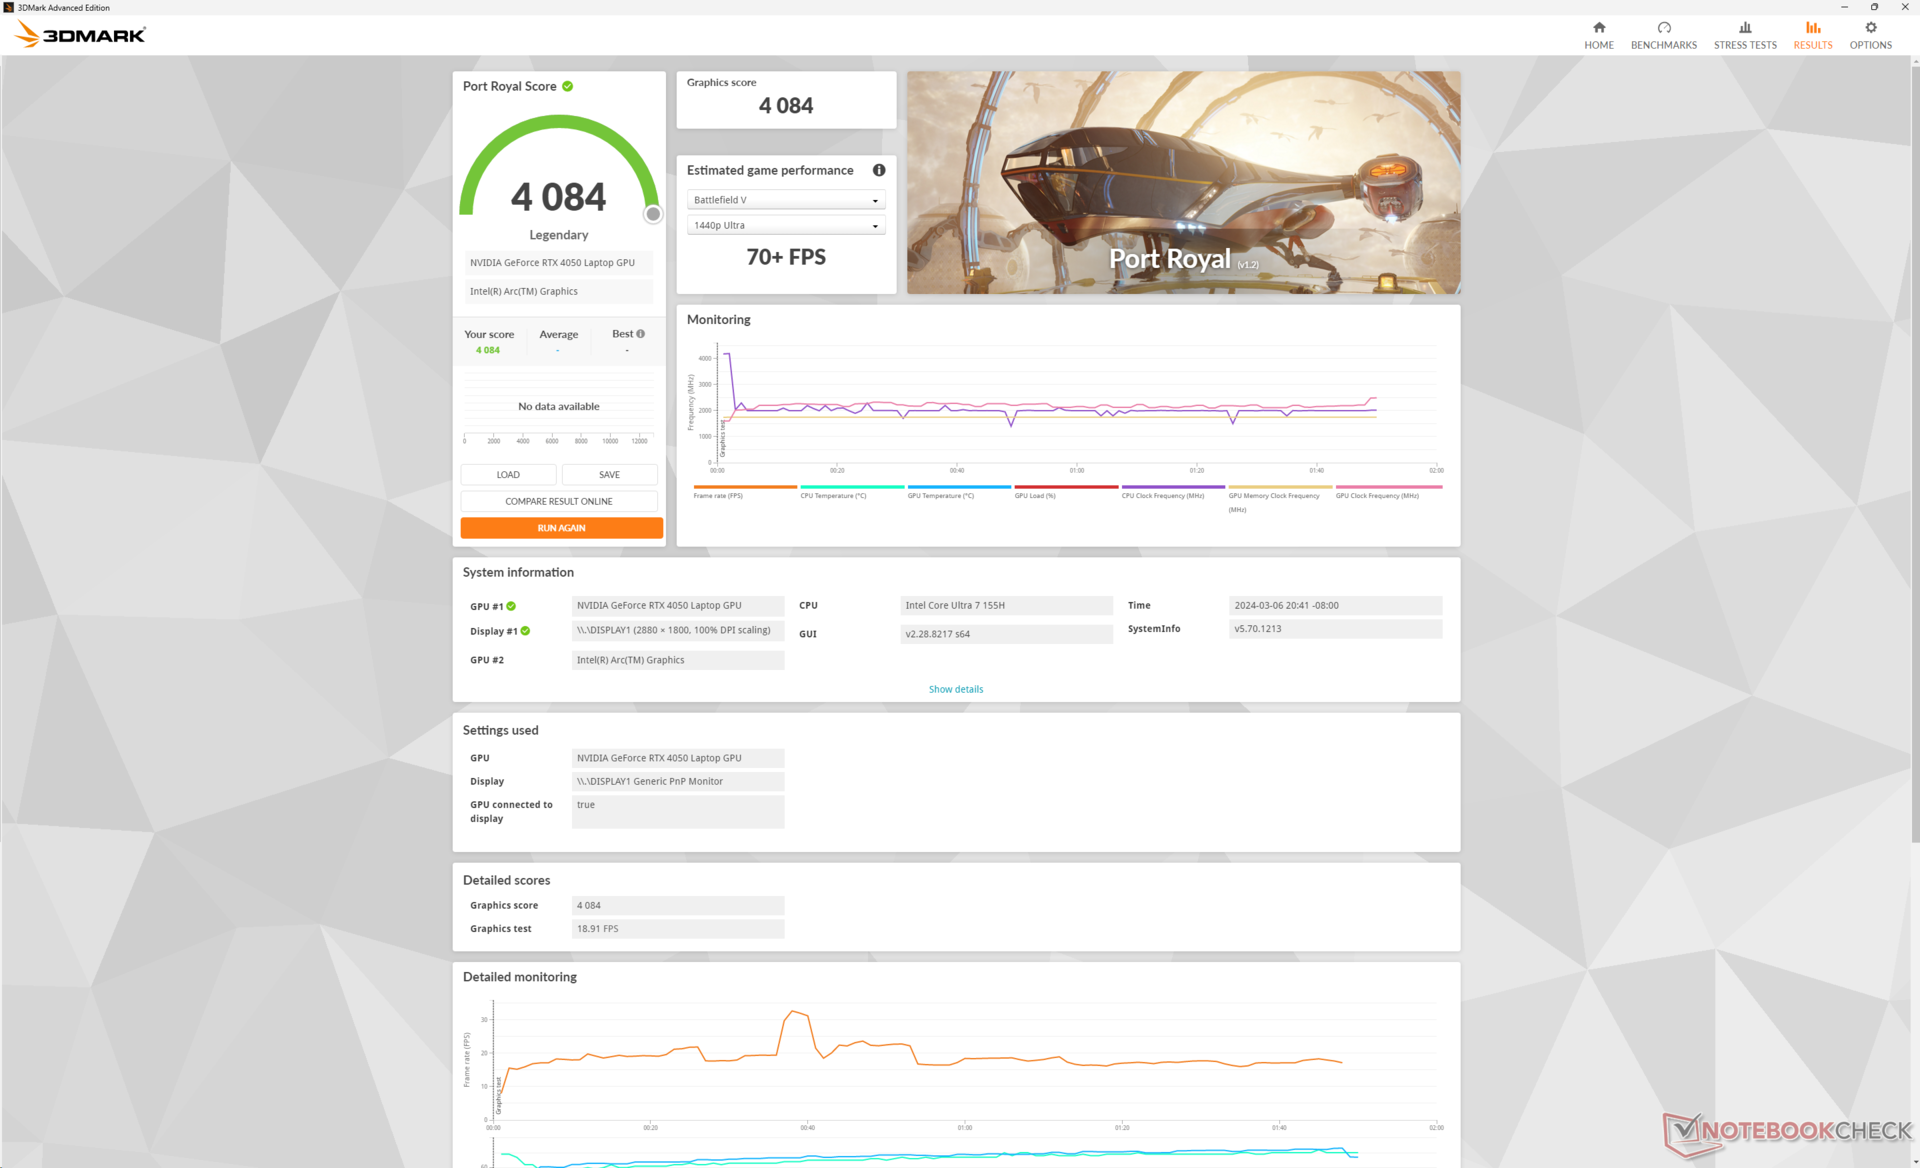
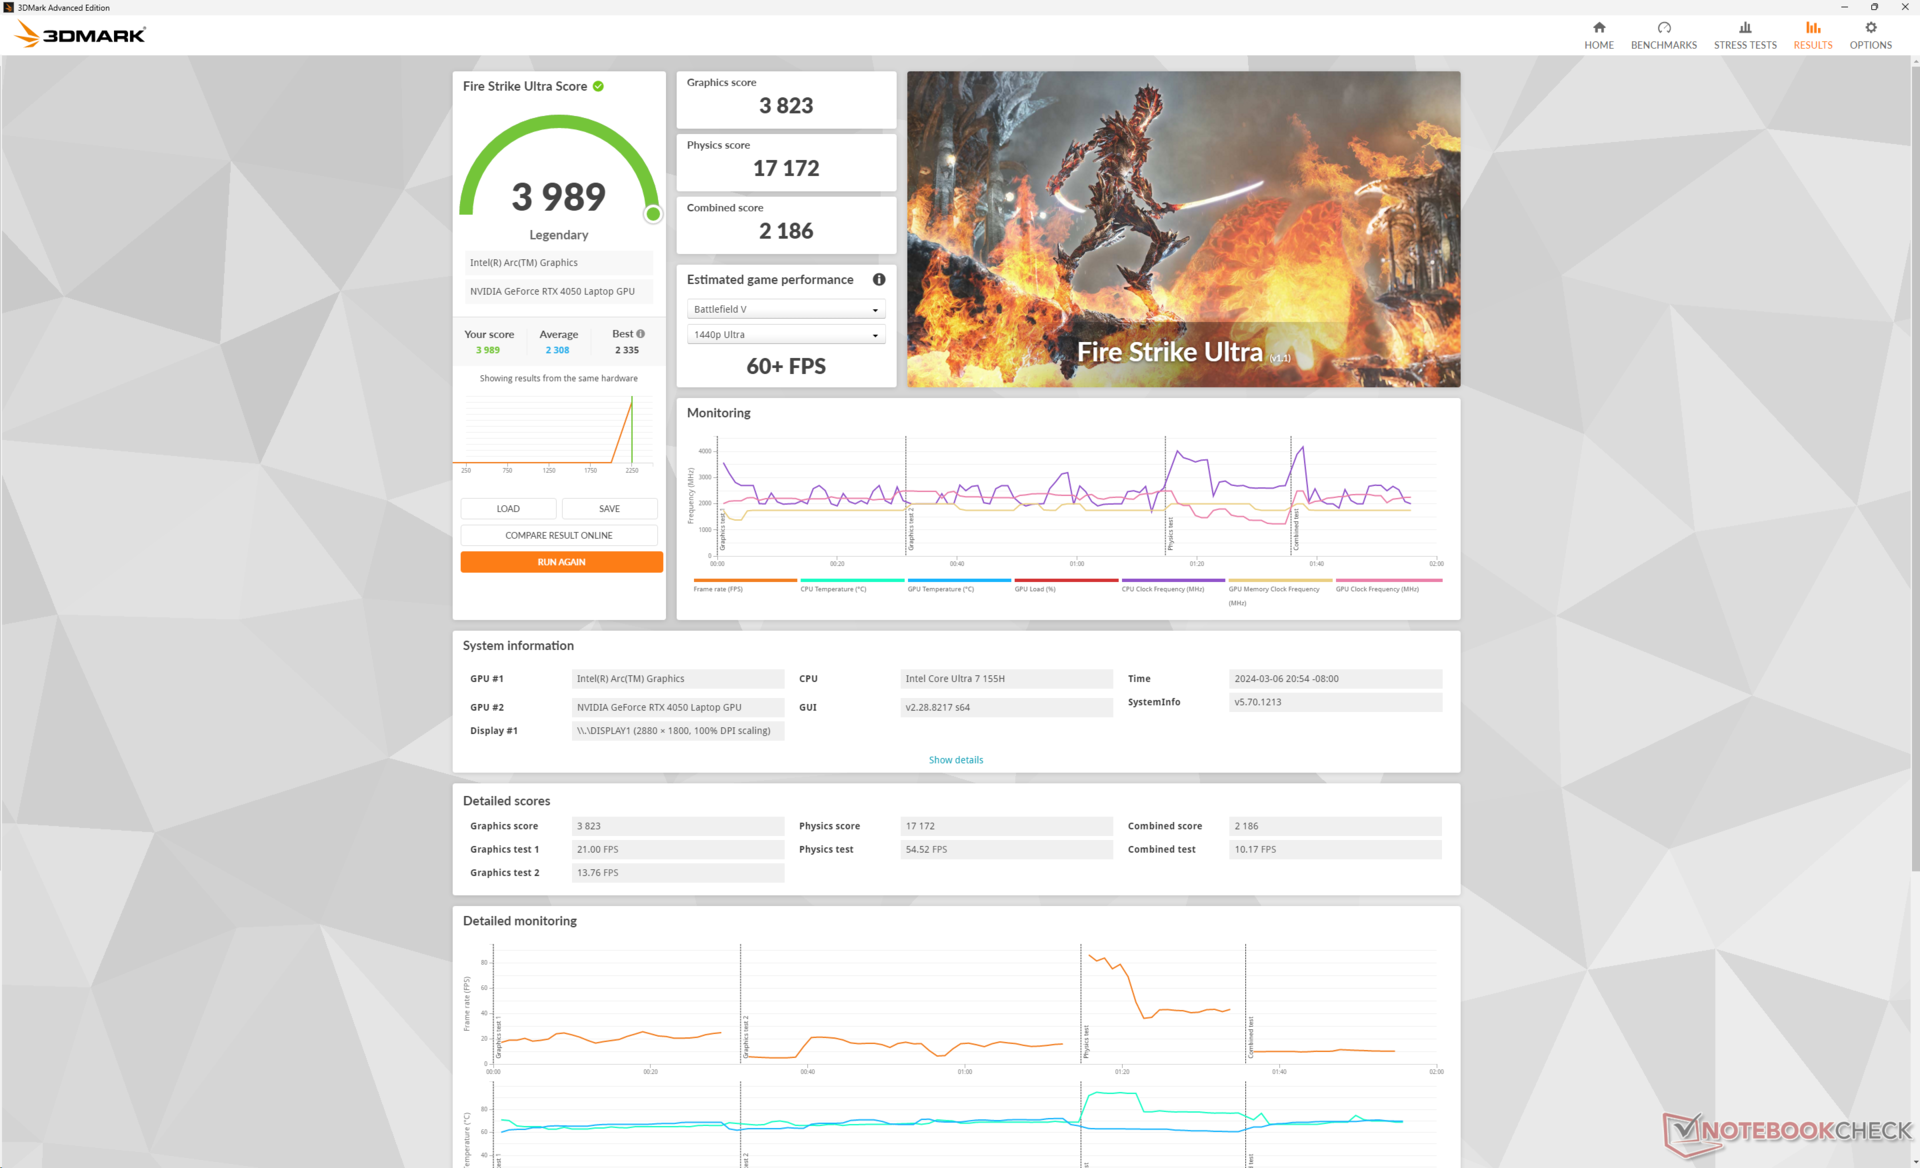
Unnötig zu erwähnen, dass die GeForce RTX 4050 einen massiven Leistungsschub gegenüber der integrierten Arc 8 bietet. Die 3DMark-Ergebnisse sind etwa doppelt so hoch, während die CUDA-Beschleunigung das Rendering in Blender fast um den Faktor 10 beschleunigt.
Im Vergleich zu anderen Laptops mit der gleichen RTX 4050 GPU schneidet das Spectre x360 16 jedoch schlechter ab. Das TGP-Ziel von 55 W ist niedriger als bei konkurrierenden Laptops wie dem Acer Predator Helios oder Victus 15, die 130 W bzw. 75 W benötigen. Infolgedessen sind die 3DMark-Ergebnisse etwa 10 bis 15 Prozent langsamer als der durchschnittliche Laptop in unserer Datenbank mit der gleichen GeForce RTX 4050 GPU.
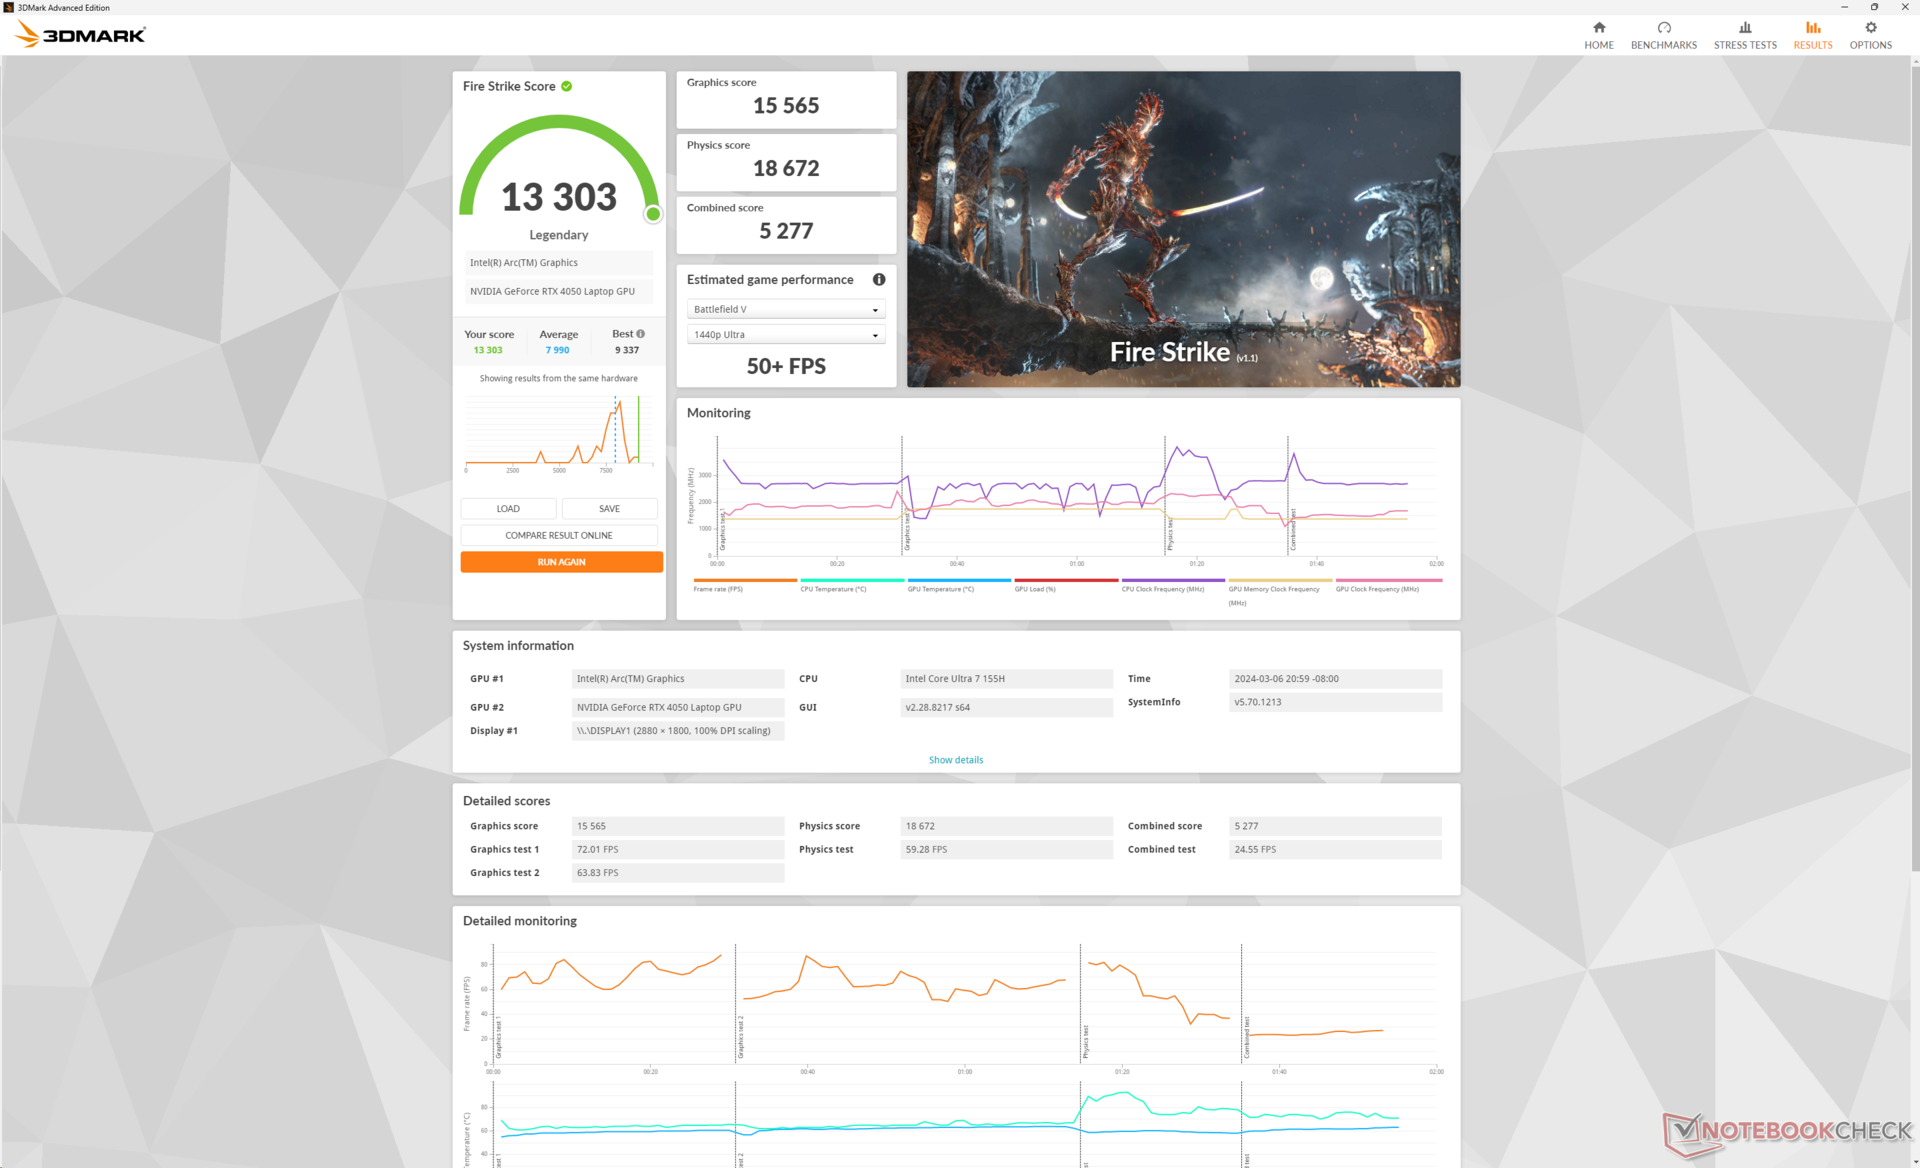
| Energieprofile | Grafikleistung | CPU-Leistung | Gesamtwert |
| Performance-Modus | 17908 | 17248 | 7364 |
| Balanced-Modus | 15565 (-13%) | 18672 (+8%) | 5277 (-28%) |
| Battery Power | 14156 (-21%) | 21326 (+24%) | 5985 (-19%) |
Die Ergebnisse von Fire Strike sind uneinheitlich, wie unsere Tabelle oben zeigt. Der CPU-Score steigt im Balanced-Modus und Battery, während das Gegenteil für den GPU-Score gilt, selbst nach mehreren Wiederholungstests im kalten Zustand. Auch hier ist sich HP des Problems bewusst und sagt, dass eine Lösung in Arbeit ist.
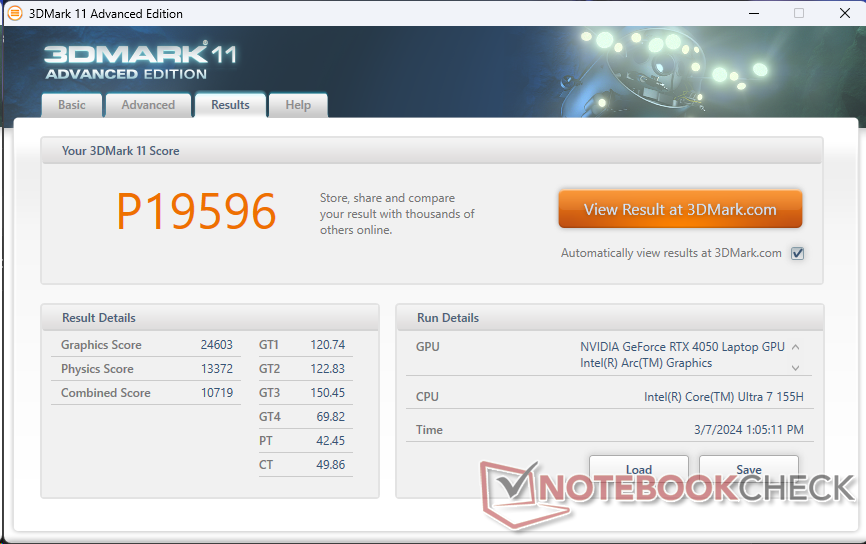
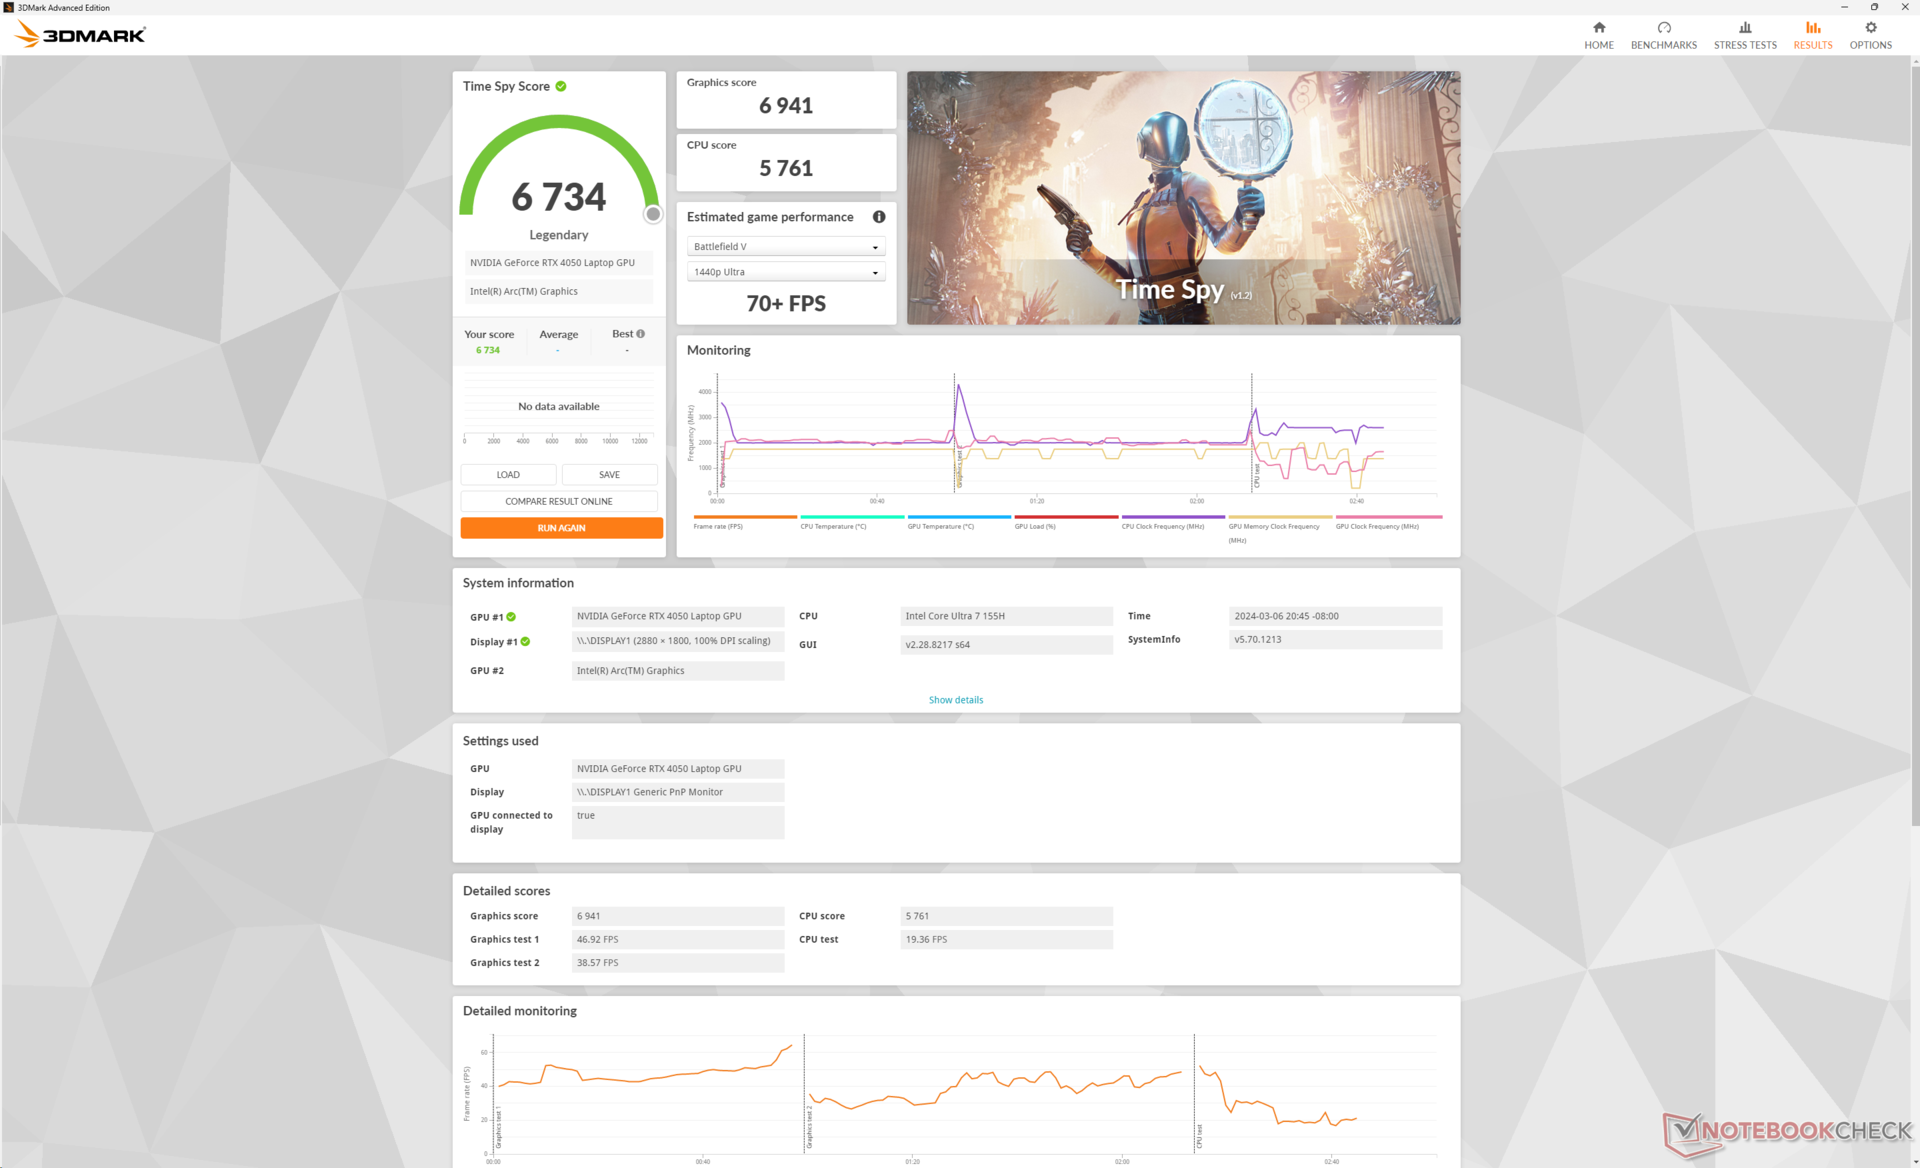
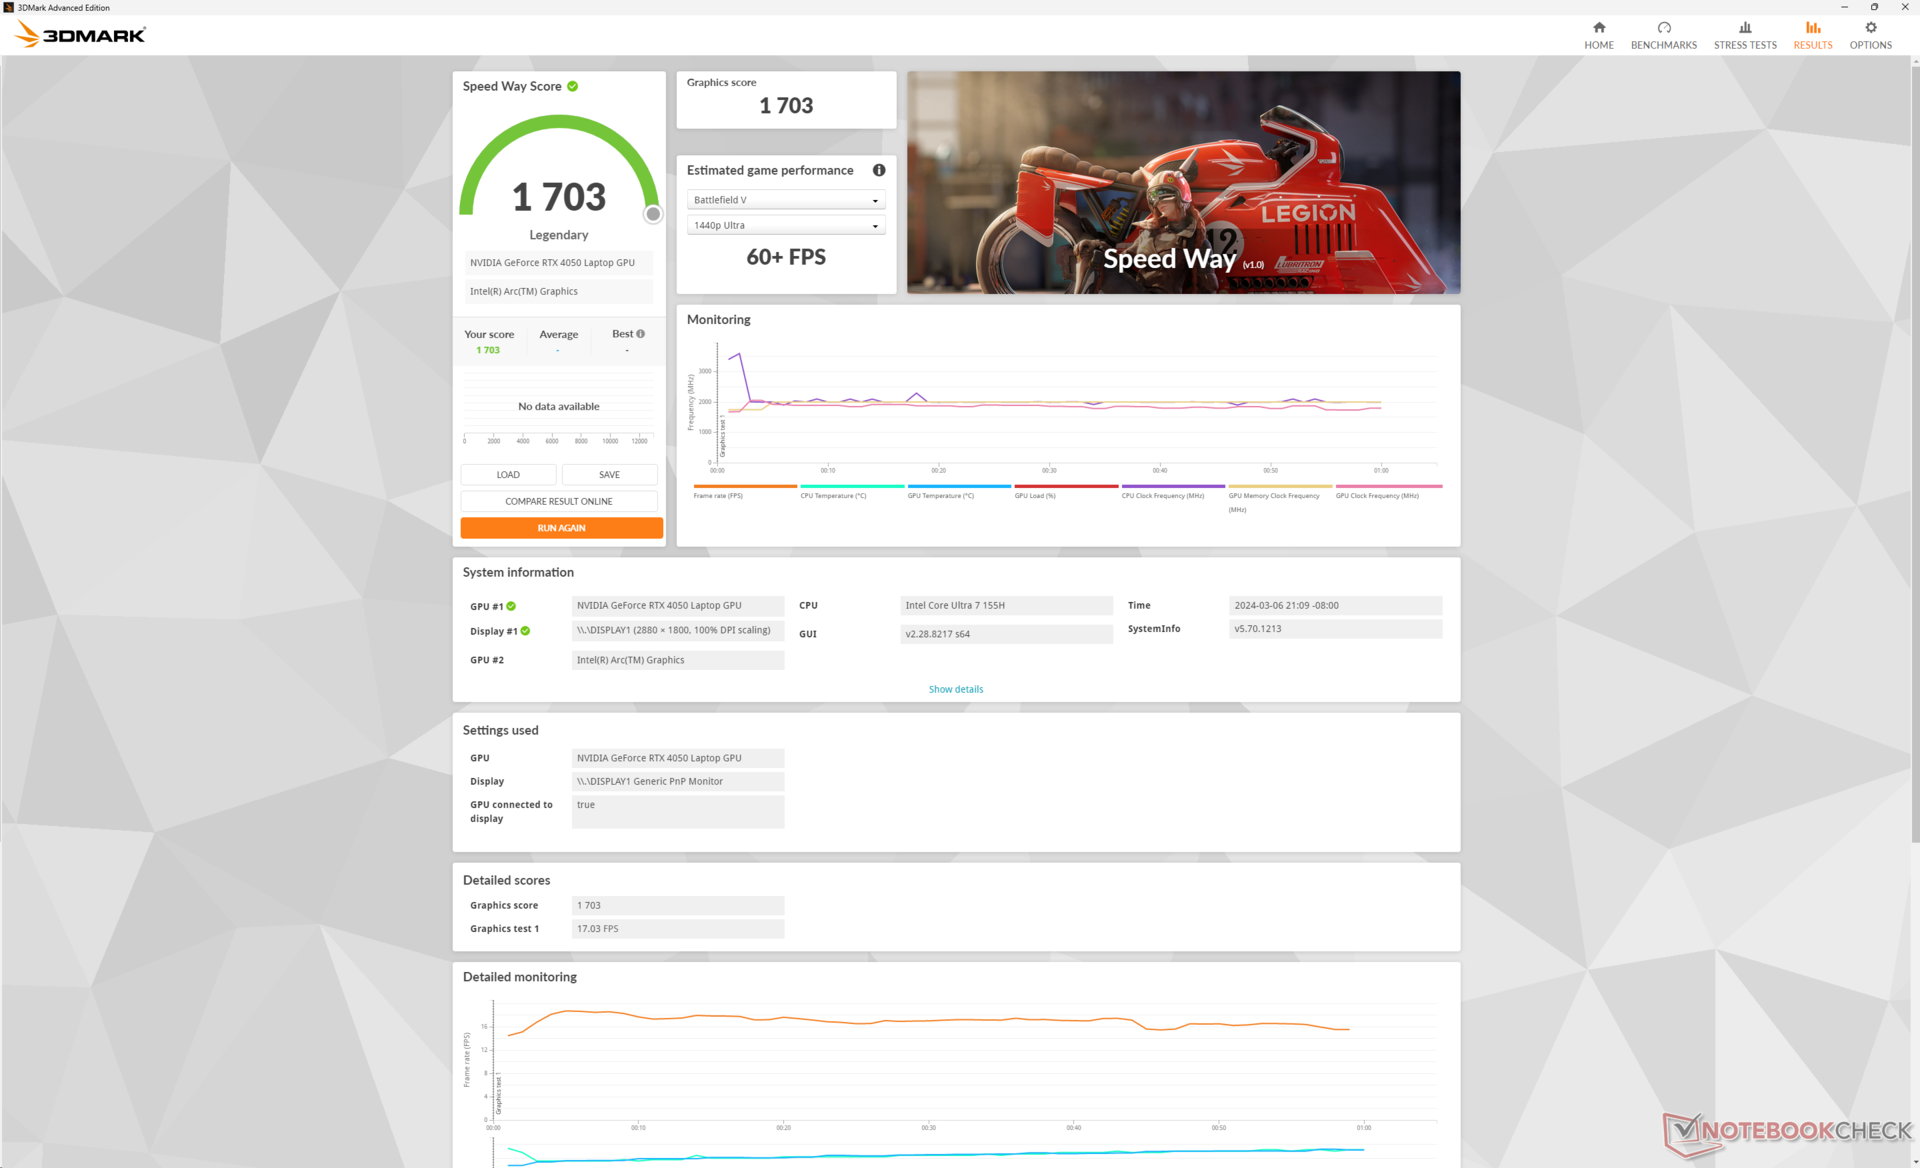
| 3DMark 11 Performance | 19596 Punkte | |
| 3DMark Fire Strike Score | 15586 Punkte | |
| 3DMark Time Spy Score | 6734 Punkte | |
Hilfe | ||
* ... kleinere Werte sind besser
Gaming Performance
Die GeForce RTX 4050 ist trotz ihres Status als Einstiegs-RTX-GPU leistungsstark für Spiele. Anspruchsvolle Titel wie Cyberpunk 2077 laufen selbst bei 1080p Ultra-Einstellungen ohne DLSS-Verbesserungen reibungslos. Bei höheren Auflösungen können jedoch gelegentlich Ruckler auftreten, weshalb niedrigere Einstellungen empfohlen werden, um die Frameraten stabil zu halten. Spiele sehen auf dem nativen 1800p OLED-Display sehr scharf aus, aber es kann erforderlich sein, die meisten grafischen Effekte herunterzuschrauben, um die Leistung zu optimieren.
| The Witcher 3 - 1920x1080 Ultra Graphics & Postprocessing (HBAO+) | |
| Honor MagicBook Pro 16 2024 | |
| HP Spectre x360 16 RTX 4050 | |
| MSI Prestige 16 B1MG-001US | |
| HP Spectre x360 16-aa0074ng | |
| LG Gram 2in1 16 16T90R - G.AA78G | |
| HP Spectre x360 2-in-1 16-f1075ng | |
| GTA V - 1920x1080 Highest AA:4xMSAA + FX AF:16x | |
| Honor MagicBook Pro 16 2024 | |
| HP Spectre x360 16 RTX 4050 | |
| HP Spectre x360 16-aa0074ng | |
| LG Gram 2in1 16 16T90R - G.AA78G | |
| HP Spectre x360 2-in-1 16-f1075ng | |
| Final Fantasy XV Benchmark - 1920x1080 High Quality | |
| Honor MagicBook Pro 16 2024 | |
| HP Spectre x360 16 RTX 4050 | |
| MSI Prestige 16 B1MG-001US | |
| HP Spectre x360 16-aa0074ng | |
| LG Gram 2in1 16 16T90R - G.AA78G | |
| HP Spectre x360 2-in-1 16-f1075ng | |
| Strange Brigade - 1920x1080 ultra AA:ultra AF:16 | |
| Honor MagicBook Pro 16 2024 | |
| HP Spectre x360 16 RTX 4050 | |
| HP Spectre x360 16-aa0074ng | |
| MSI Prestige 16 B1MG-001US | |
| LG Gram 2in1 16 16T90R - G.AA78G | |
| HP Spectre x360 2-in-1 16-f1075ng | |
| Dota 2 Reborn - 1920x1080 ultra (3/3) best looking | |
| Honor MagicBook Pro 16 2024 | |
| HP Spectre x360 16 RTX 4050 | |
| MSI Prestige 16 B1MG-001US | |
| HP Spectre x360 16-aa0074ng | |
| LG Gram 2in1 16 16T90R - G.AA78G | |
| HP Spectre x360 2-in-1 16-f1075ng | |
| X-Plane 11.11 - 1920x1080 high (fps_test=3) | |
| Honor MagicBook Pro 16 2024 | |
| HP Spectre x360 16 RTX 4050 | |
| HP Spectre x360 2-in-1 16-f1075ng | |
| LG Gram 2in1 16 16T90R - G.AA78G | |
| MSI Prestige 16 B1MG-001US | |
| HP Spectre x360 16-aa0074ng | |
| Tiny Tina's Wonderlands | |
| 1920x1080 Medium Preset (DX12) | |
| Durchschnittliche NVIDIA GeForce RTX 4050 Laptop GPU (93.4 - 149.2, n=7) | |
| HP Spectre x360 16 RTX 4050 | |
| Lenovo ThinkPad E16 G1 Core i5-1335U | |
| 1920x1080 High Preset (DX12) | |
| Durchschnittliche NVIDIA GeForce RTX 4050 Laptop GPU (63.3 - 99.5, n=7) | |
| HP Spectre x360 16 RTX 4050 | |
| Lenovo ThinkPad E16 G1 Core i5-1335U | |
| 1920x1080 Badass Preset (DX12) | |
| Durchschnittliche NVIDIA GeForce RTX 4050 Laptop GPU (49.8 - 77.3, n=7) | |
| HP Spectre x360 16 RTX 4050 | |
| Lenovo ThinkPad E16 G1 Core i5-1335U | |
| 2560x1440 Badass Preset (DX12) | |
| Durchschnittliche NVIDIA GeForce RTX 4050 Laptop GPU (33.6 - 49.5, n=4) | |
| HP Spectre x360 16 RTX 4050 | |
| Baldur's Gate 3 | |
| 1920x1080 Medium Preset AA:T | |
| Durchschnittliche NVIDIA GeForce RTX 4050 Laptop GPU (56 - 91.9, n=10) | |
| HP Spectre x360 16 RTX 4050 | |
| 1920x1080 High Preset AA:T | |
| Durchschnittliche NVIDIA GeForce RTX 4050 Laptop GPU (49.8 - 83.5, n=10) | |
| HP Spectre x360 16 RTX 4050 | |
| 1920x1080 Ultra Preset AA:T | |
| HP Spectre x360 16 RTX 4050 | |
| Durchschnittliche NVIDIA GeForce RTX 4050 Laptop GPU (48.3 - 81.3, n=11) | |
| 2560x1440 Ultra Preset AA:T | |
| HP Spectre x360 16 RTX 4050 | |
| Durchschnittliche NVIDIA GeForce RTX 4050 Laptop GPU (32.4 - 55, n=7) | |
Witcher 3 FPS-Diagramm
| min. | mittel | hoch | max. | QHD | |
|---|---|---|---|---|---|
| GTA V (2015) | 171.3 | 162.2 | 135.3 | 76.7 | 57.3 |
| The Witcher 3 (2015) | 299 | 209.6 | 120.1 | 62.7 | |
| Dota 2 Reborn (2015) | 142 | 124.2 | 119.6 | 106.4 | |
| Final Fantasy XV Benchmark (2018) | 132.7 | 94.5 | 68.6 | 49.6 | |
| X-Plane 11.11 (2018) | 100.6 | 86.7 | 69.7 | ||
| Far Cry 5 (2018) | 97 | 93 | 95 | 87 | 64 |
| Strange Brigade (2018) | 299 | 171.1 | 137.4 | 121.3 | 81.2 |
| Tiny Tina's Wonderlands (2022) | 135.1 | 113.4 | 75.4 | 59.1 | 40.4 |
| F1 22 (2022) | 159.4 | 146.6 | 124.6 | 42 | 26.9 |
| Baldur's Gate 3 (2023) | 84.9 | 71.4 | 64 | 63.1 | 42.5 |
| Cyberpunk 2077 (2023) | 79.3 | 63.3 | 53.5 | 46 | 27.5 |
Emissionen - Eines der leisesten 16-Zoll Convertibles
Geräuschemissionen
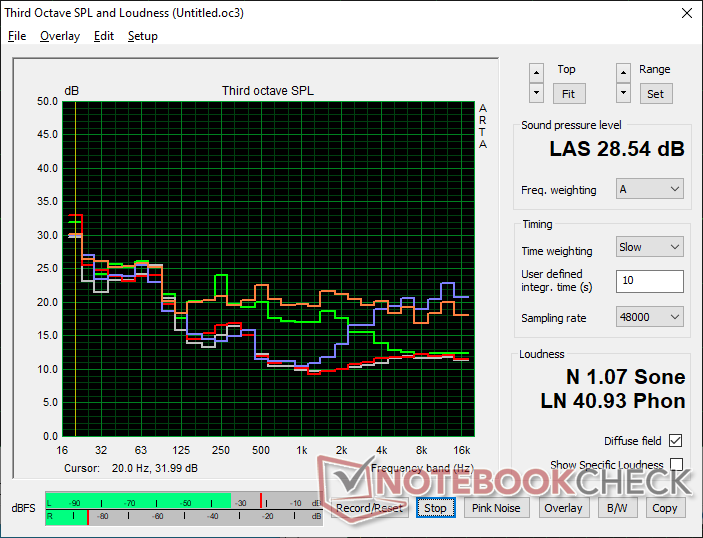
Das Lüftergeräusch ist nur minimal lauter als bei der iGPU-Konfiguration, die bereits sehr leise war. Wir messen maximal 32 dB(A) beim Spielen im Performance-Modus, verglichen mit 29 dB(A) bei der iGPU-Version oder 39 dB(A) beim Design des letztjährigen Spectre x360 16.
Lautstärkediagramm
| Idle |
| 23.6 / 23.6 / 23.6 dB(A) |
| Last |
| 29.2 / 32.1 dB(A) |
 | ||
30 dB leise 40 dB(A) deutlich hörbar 50 dB(A) störend |
||
min: | ||
| HP Spectre x360 16 RTX 4050 GeForce RTX 4050 Laptop GPU, Ultra 7 155H, SK hynix PC801 HFS001TEJ9X101N | HP Spectre x360 16-aa0074ng Arc 8-Core, Ultra 7 155H, Kioxia XG8 KXG80ZNV1T02 | HP Spectre x360 2-in-1 16-f1075ng Iris Xe G7 96EUs, i7-12700H, SK Hynix PC711 1TB HFS001TDE9X073N | Honor MagicBook Pro 16 2024 GeForce RTX 4060 Laptop GPU, Ultra 7 155H, WD PC SN740 SDDPNQD-1T00 | MSI Prestige 16 B1MG-001US Arc 8-Core, Ultra 7 155H, Samsung PM9A1 MZVL22T0HBLB | LG Gram 2in1 16 16T90R - G.AA78G Iris Xe G7 96EUs, i7-1360P, Samsung PM9A1 MZVL21T0HCLR | |
|---|---|---|---|---|---|---|
| Geräuschentwicklung | 8% | -21% | -13% | -24% | -12% | |
| aus / Umgebung * (dB) | 23.3 | 23 1% | 26 -12% | 24 -3% | 24.5 -5% | 25.1 -8% |
| Idle min * (dB) | 23.6 | 23 3% | 26 -10% | 24 -2% | 24.5 -4% | 25.1 -6% |
| Idle avg * (dB) | 23.6 | 23 3% | 26 -10% | 24 -2% | 26.3 -11% | 25.1 -6% |
| Idle max * (dB) | 23.6 | 23 3% | 26 -10% | 27.2 -15% | 26.3 -11% | 26.1 -11% |
| Last avg * (dB) | 29.2 | 23 21% | 42.9 -47% | 29 1% | 36.5 -25% | 31.4 -8% |
| Witcher 3 ultra * (dB) | 32.1 | 27 16% | 42.9 -34% | 42.1 -31% | 46.3 -44% | 41.1 -28% |
| Last max * (dB) | 32.1 | 28.62 11% | 39.1 -22% | 45 -40% | 52.9 -65% | 36.6 -14% |
* ... kleinere Werte sind besser
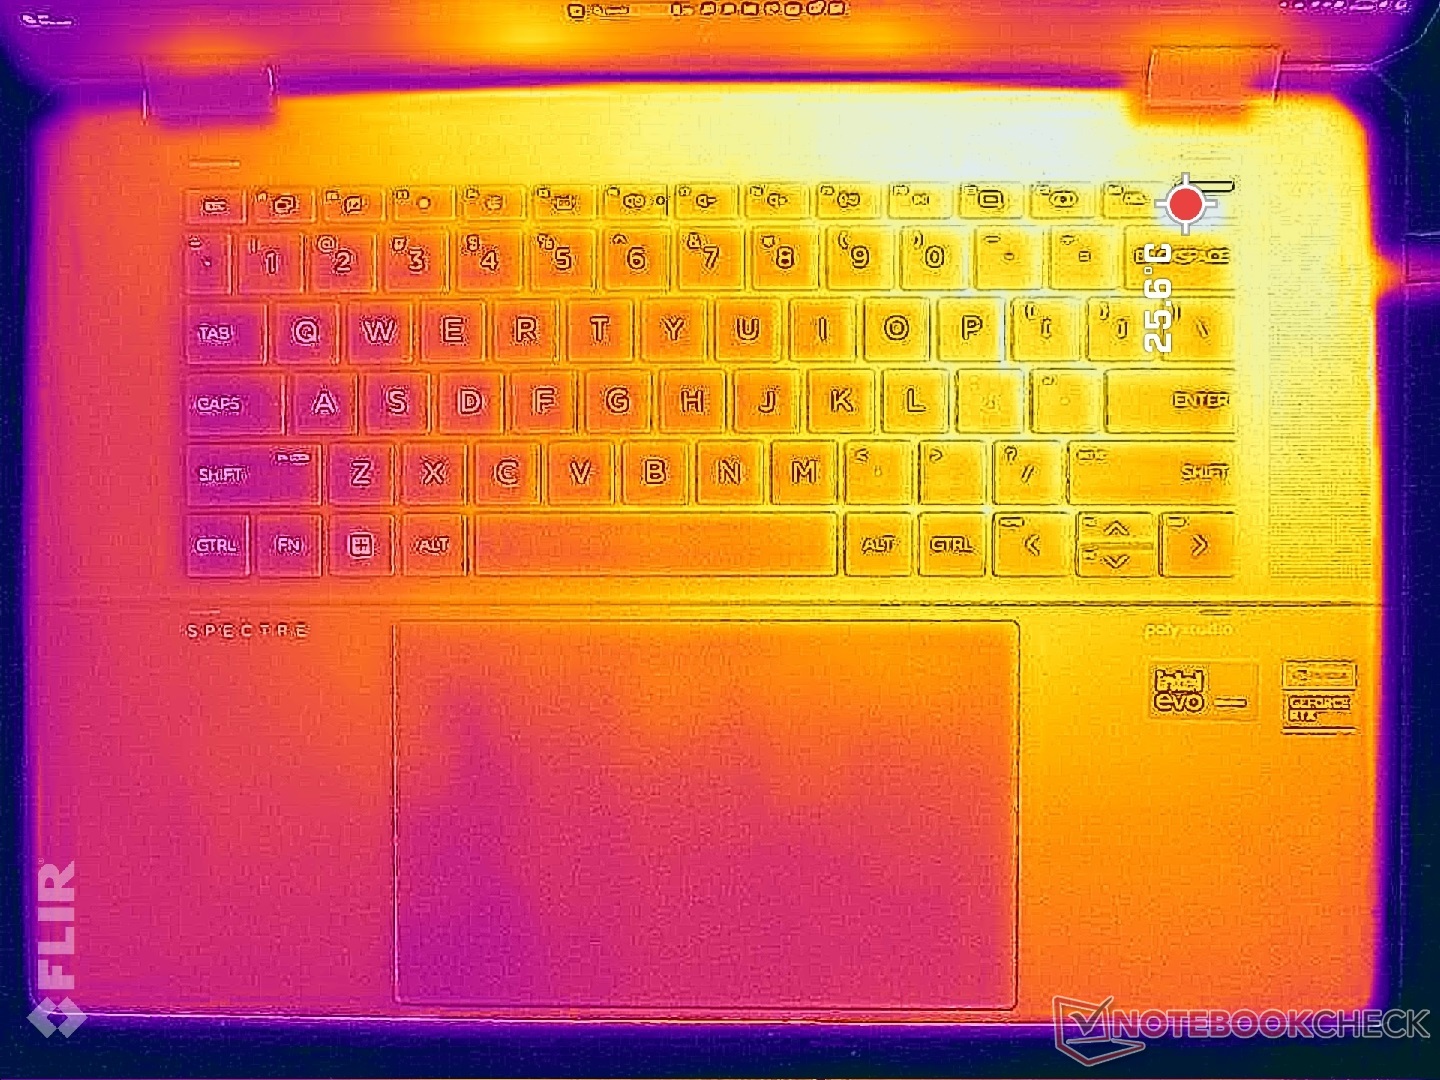
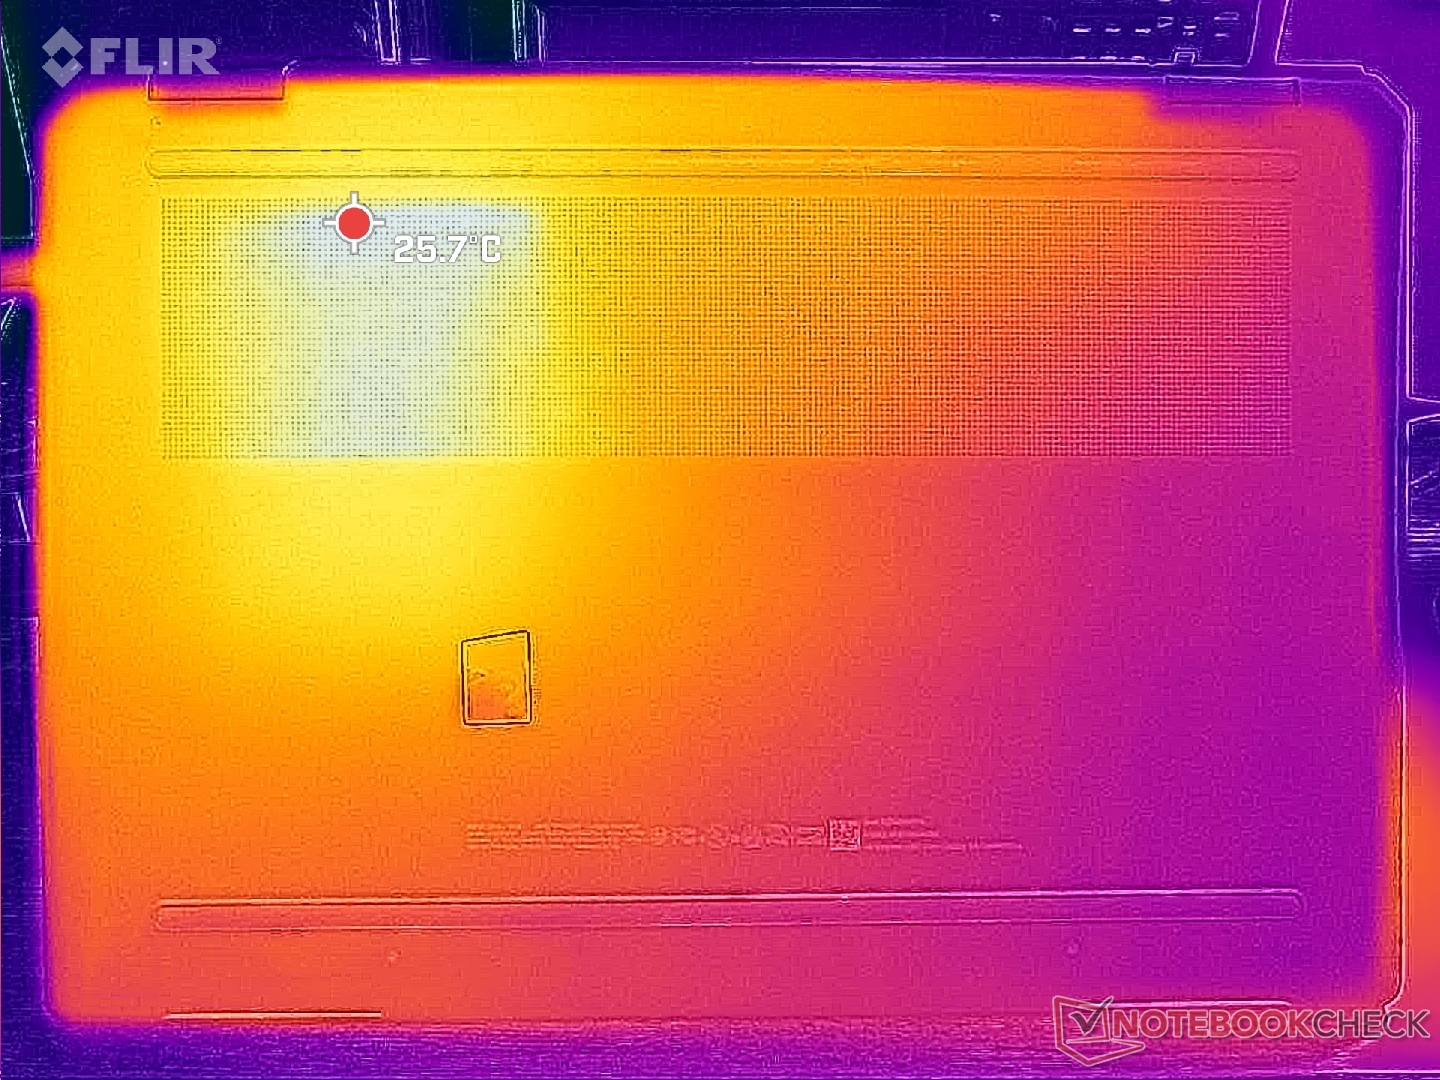
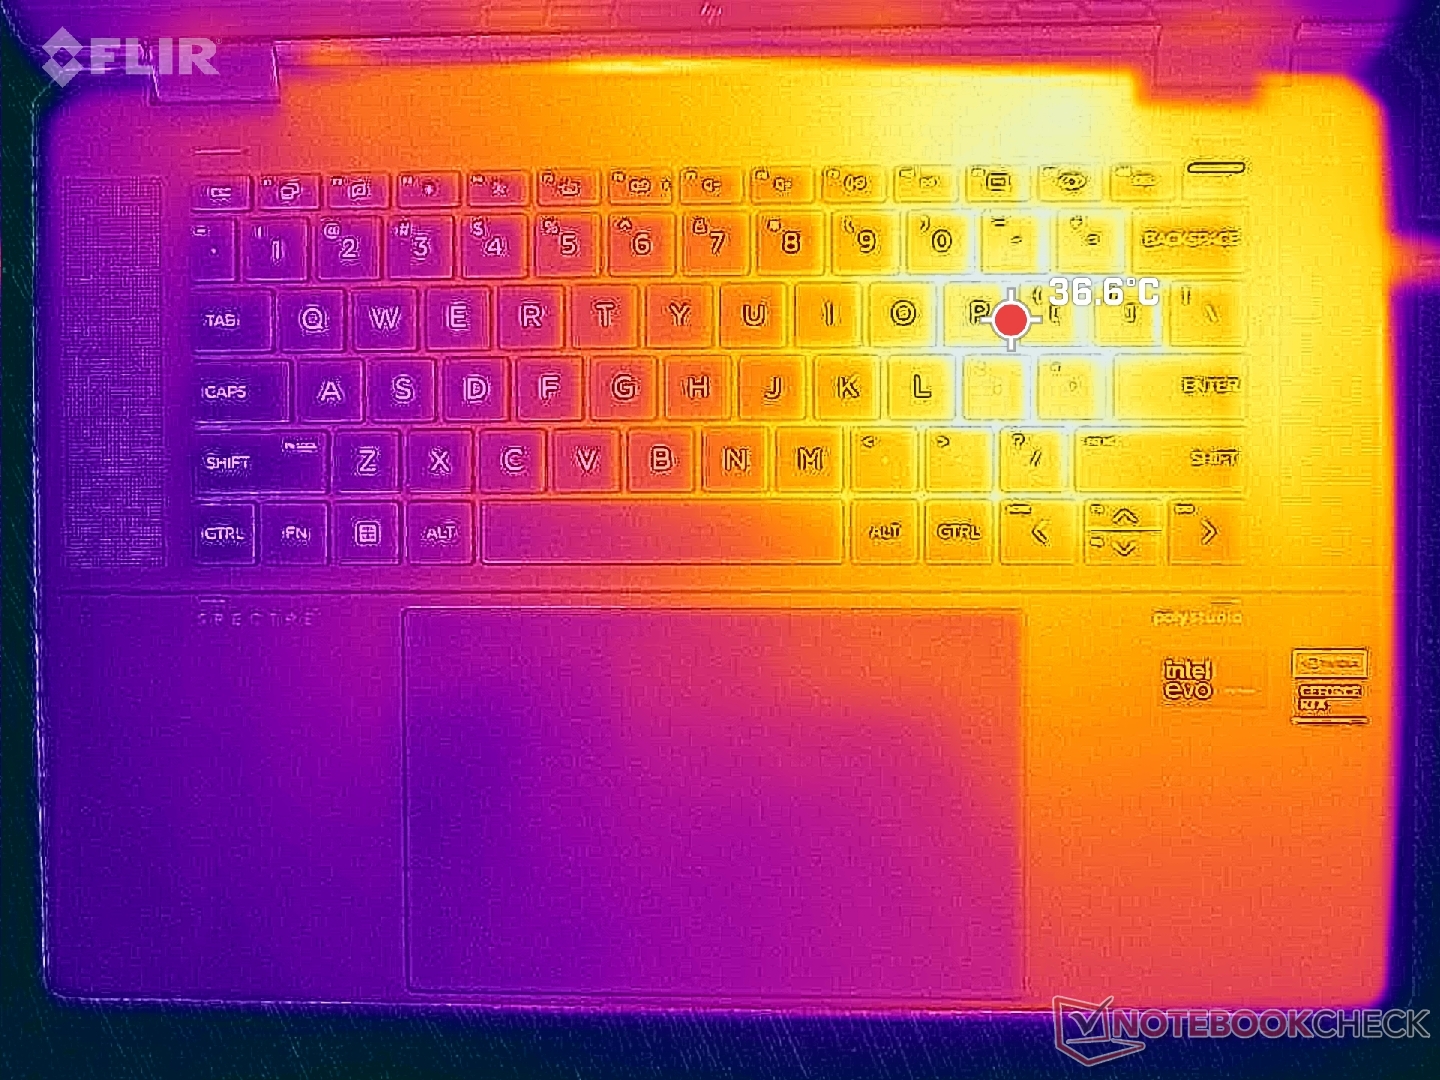
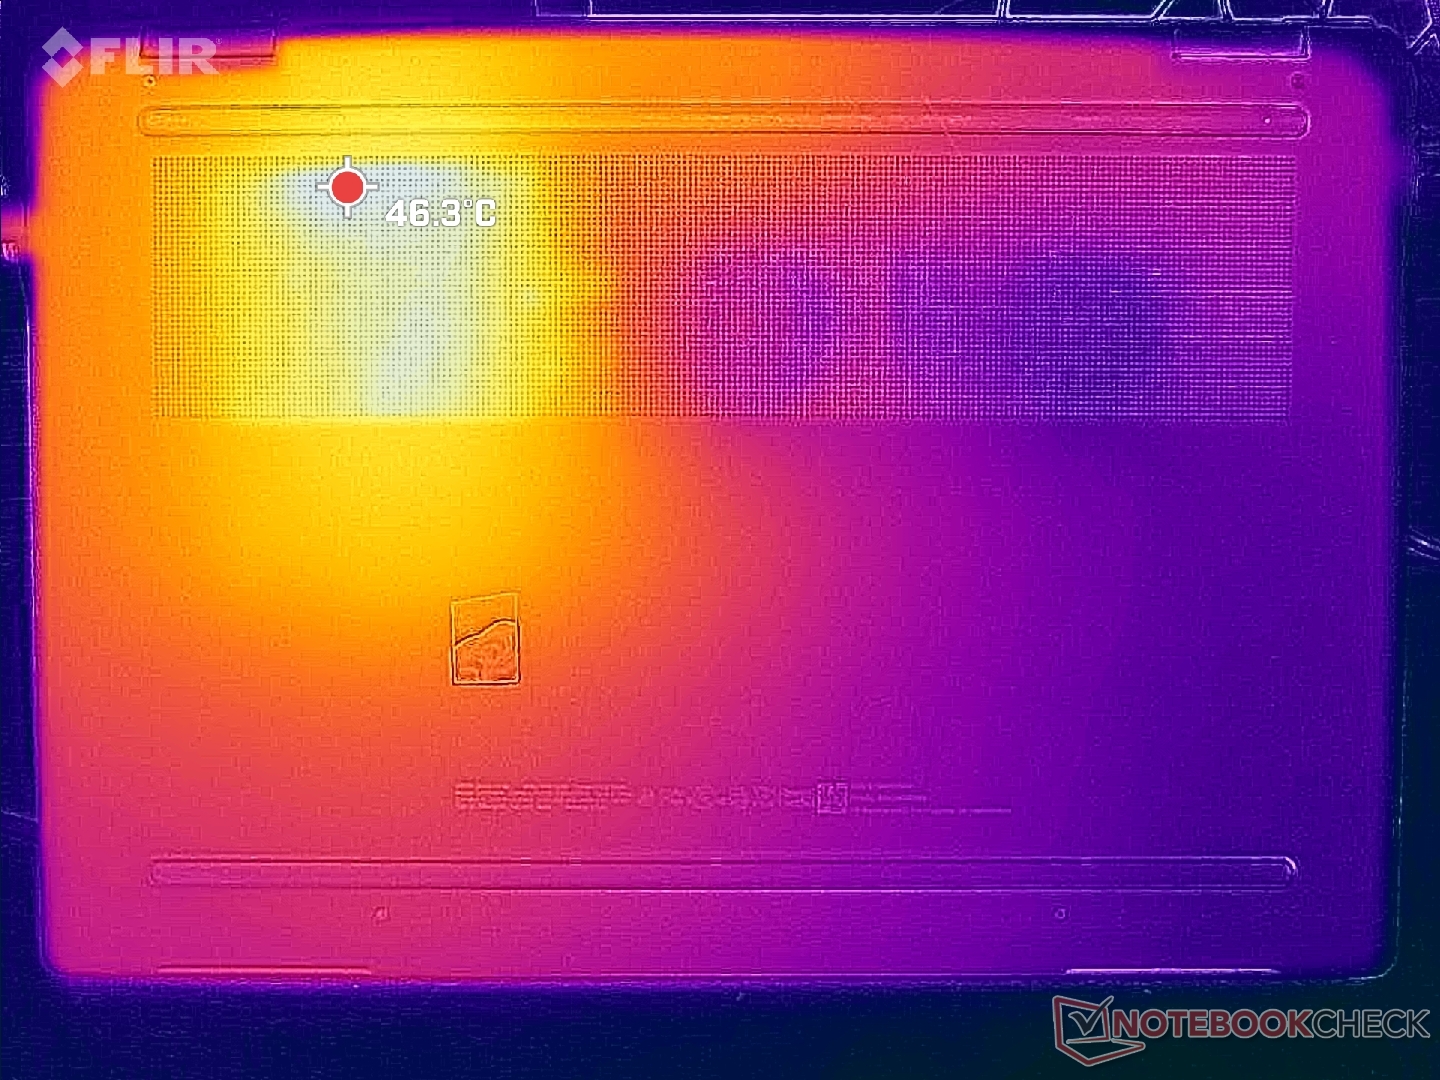
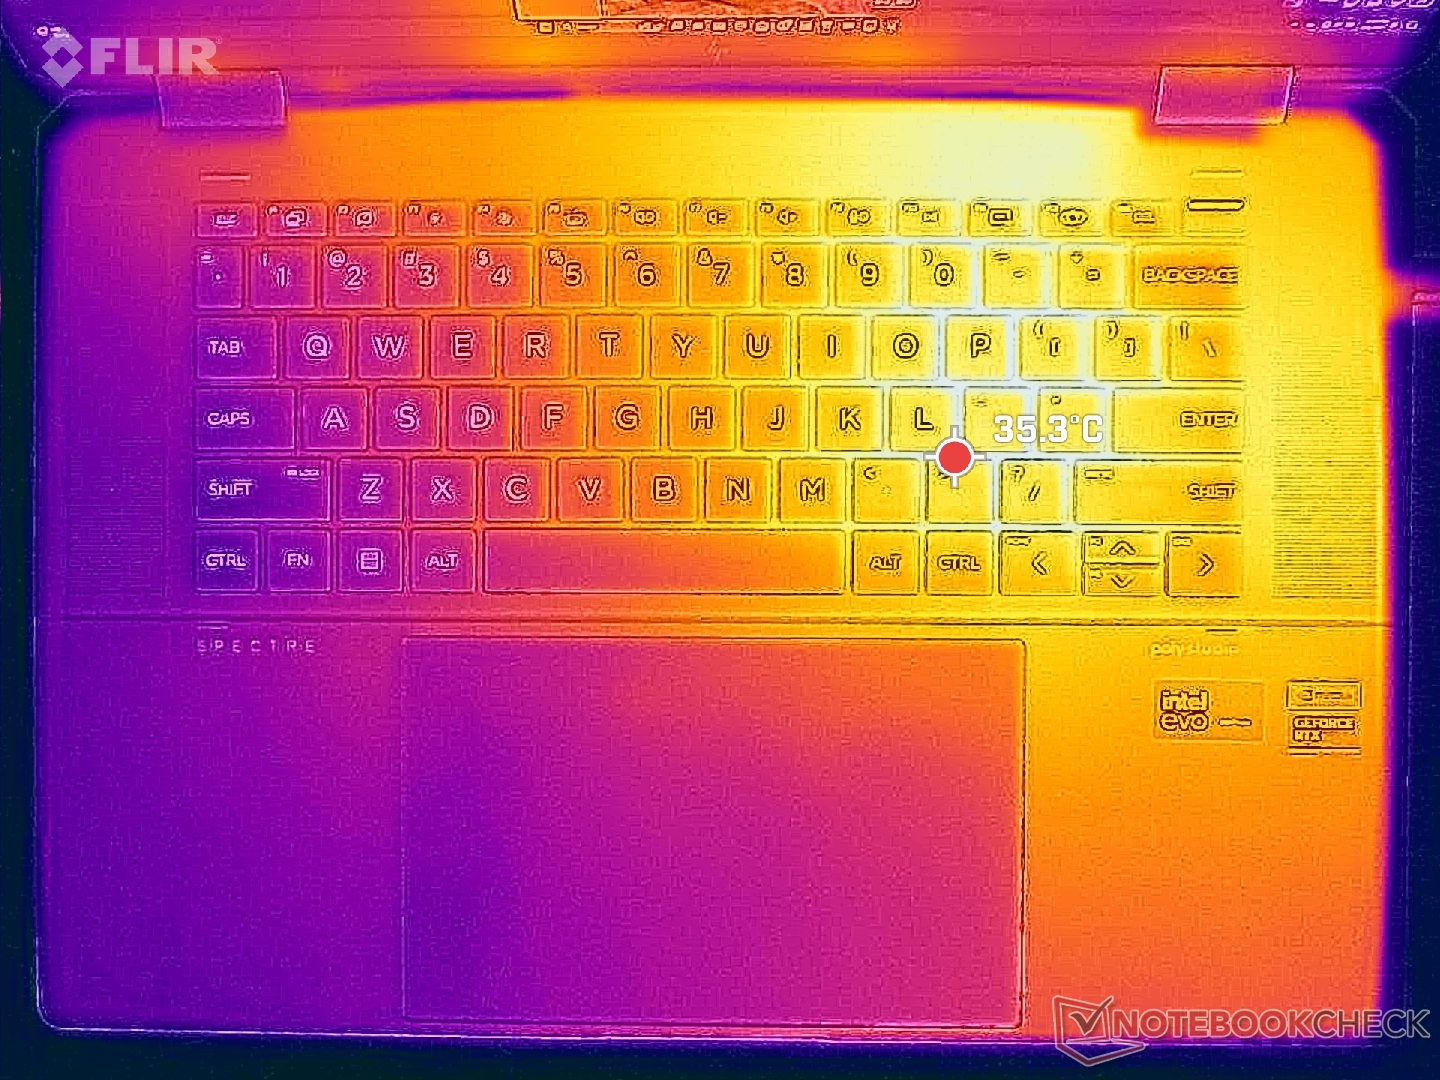
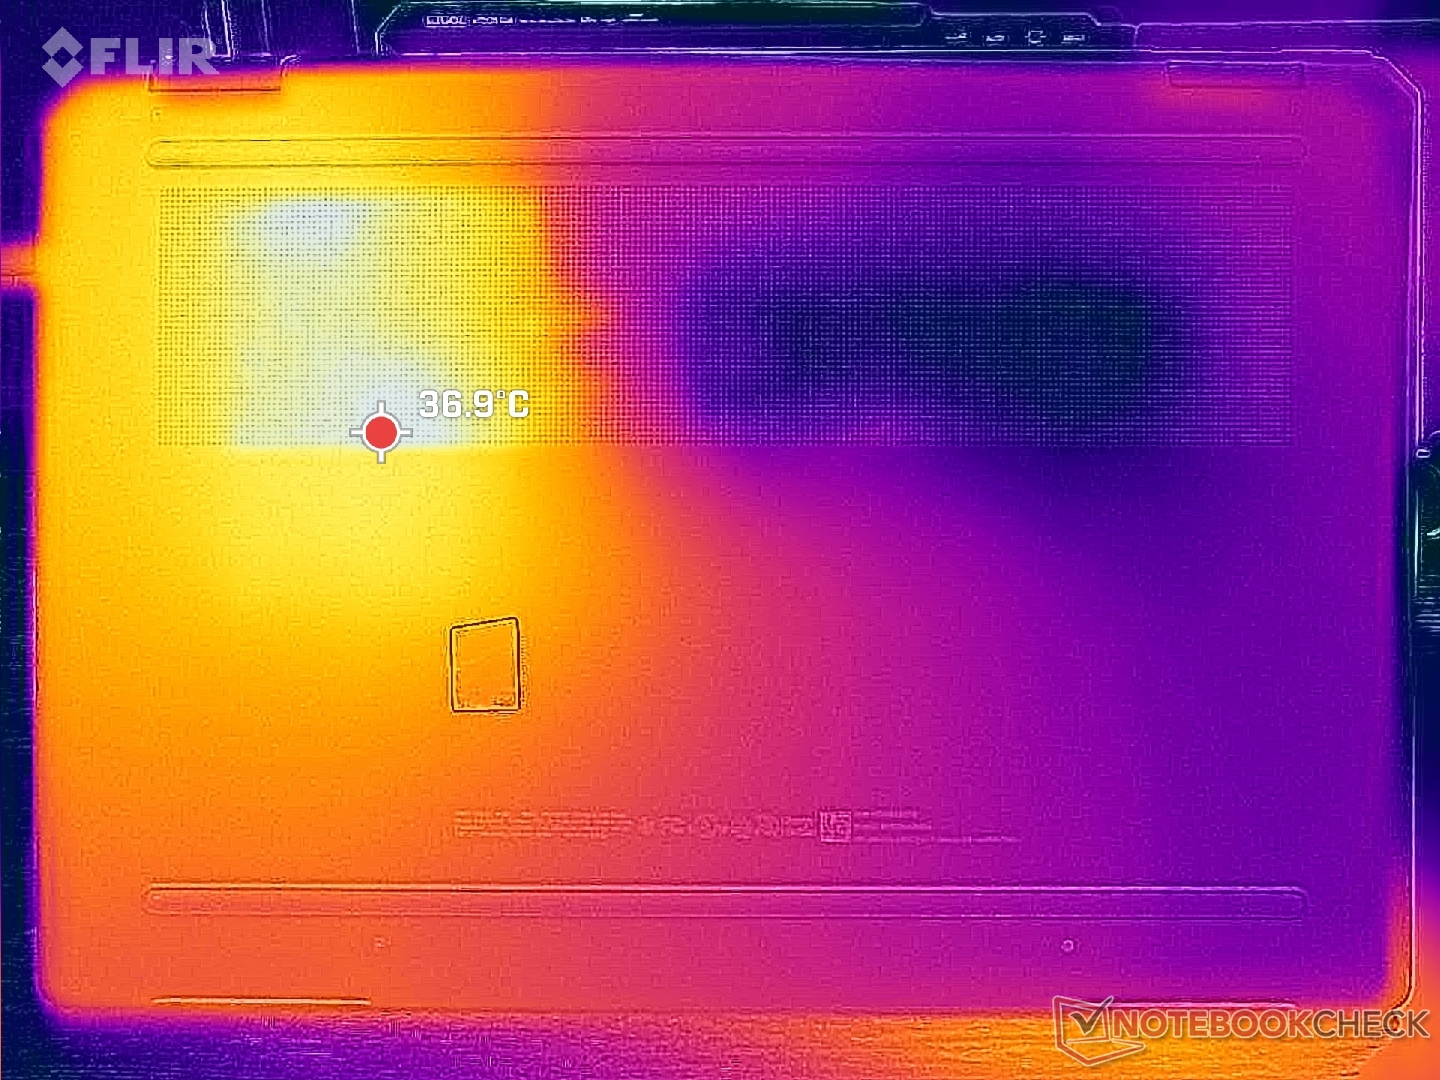
Temperatur
Die Oberflächentemperaturen sind auf der rechten Hälfte des Laptops wieder viel wärmer als auf der linken, wie die Temperaturkarten unten zeigen, was auf das Design der Kühllösung zurückzuführen ist. Die Hotspots sind bei unserer dGPU-Version vorhersehbar wärmer als bei der iGPU-Version; die Ober- und Unterseite erreichen bei der Ausführung von Witcher 3 bis zu 40 bzw. 46 °C, während es bei der iGPU-Version nur 35 bzw. 40 °C sind.
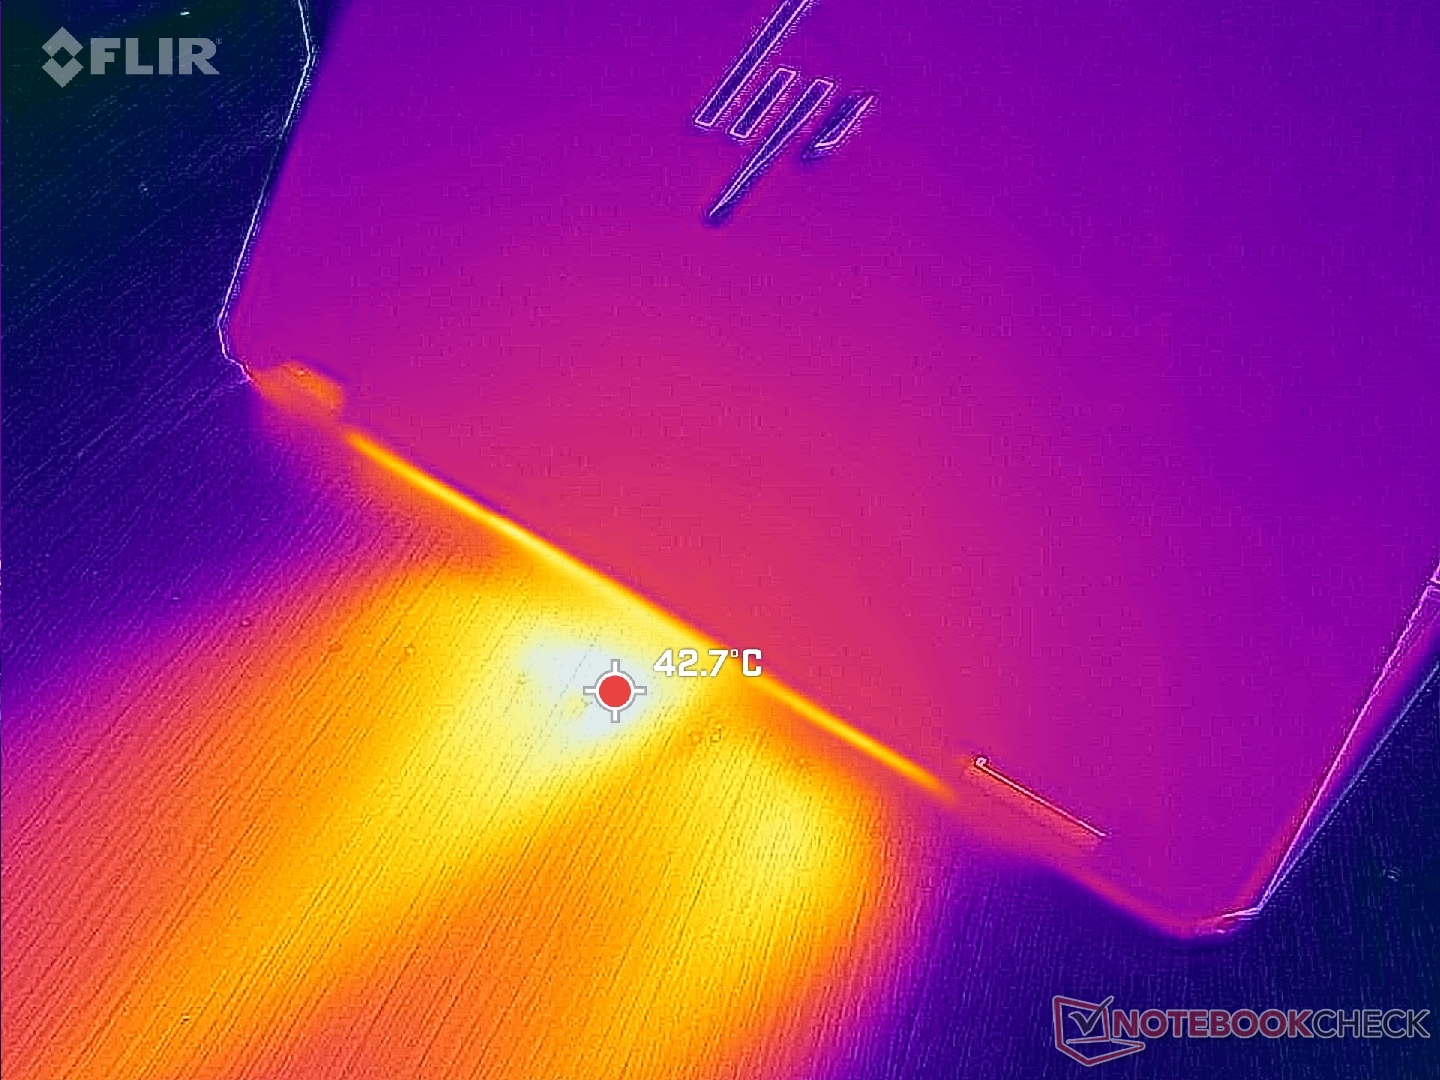
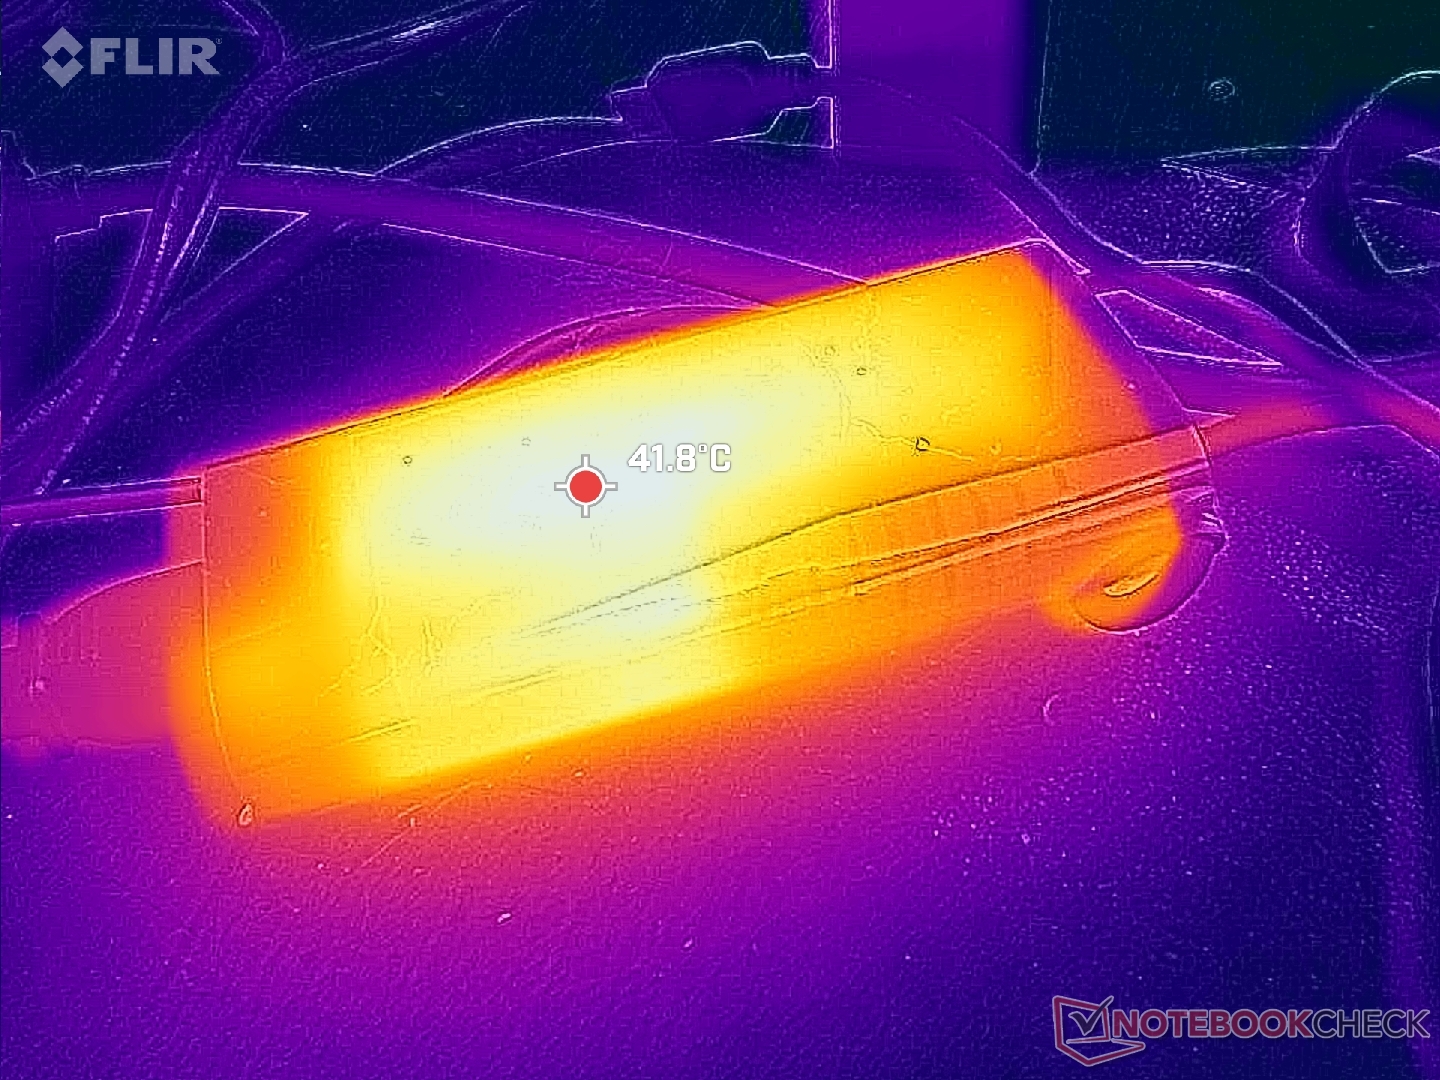
(+) Die maximale Temperatur auf der Oberseite ist 39.6 °C. Im Vergleich liegt der Klassendurchschnitt bei 35.4 °C (von 19.6 bis 60 °C für die Klasse Convertible).
(+) Auf der Unterseite messen wir eine maximalen Wert von 39.2 °C (im Vergleich zum Durchschnitt von 36.9 °C).
(+) Ohne Last messen wir eine durchschnittliche Temperatur von 26.1 °C auf der Oberseite. Der Klassendurchschnitt erreicht 30.3 °C.
(+) Beim längeren Spielen von The Witcher 3 erhitzt sich das Gerät durchschnittlich auf 31.6 °C. Der Durchschnitt der Klasse ist derzeit 30.3 °C.
(+) Die Handballen und der Touchpad-Bereich erreichen maximal 32.2 °C und damit die typische Hauttemperatur und fühlen sich daher nicht heiß an.
(-) Die durchschnittliche Handballen-Temperatur anderer getesteter Geräte war 28 °C (-4.2 °C).
| HP Spectre x360 16 RTX 4050 Intel Core Ultra 7 155H, NVIDIA GeForce RTX 4050 Laptop GPU | HP Spectre x360 16-aa0074ng Intel Core Ultra 7 155H, Intel Arc 8-Core iGPU | HP Spectre x360 2-in-1 16-f1075ng Intel Core i7-12700H, Intel Iris Xe Graphics G7 96EUs | Honor MagicBook Pro 16 2024 Intel Core Ultra 7 155H, NVIDIA GeForce RTX 4060 Laptop GPU | MSI Prestige 16 B1MG-001US Intel Core Ultra 7 155H, Intel Arc 8-Core iGPU | LG Gram 2in1 16 16T90R - G.AA78G Intel Core i7-1360P, Intel Iris Xe Graphics G7 96EUs | |
|---|---|---|---|---|---|---|
| Hitze | -1% | 8% | 9% | -1% | -24% | |
| Last oben max * (°C) | 39.6 | 37 7% | 37.4 6% | 39.7 -0% | 48.8 -23% | 55 -39% |
| Last unten max * (°C) | 39.2 | 44 -12% | 39.1 -0% | 42.9 -9% | 47.6 -21% | 55.4 -41% |
| Idle oben max * (°C) | 29 | 31 -7% | 27.1 7% | 23.7 18% | 24.2 17% | 34.9 -20% |
| Idle unten max * (°C) | 31.6 | 29 8% | 26.3 17% | 23.5 26% | 23.6 25% | 30 5% |
* ... kleinere Werte sind besser
Lautsprecher
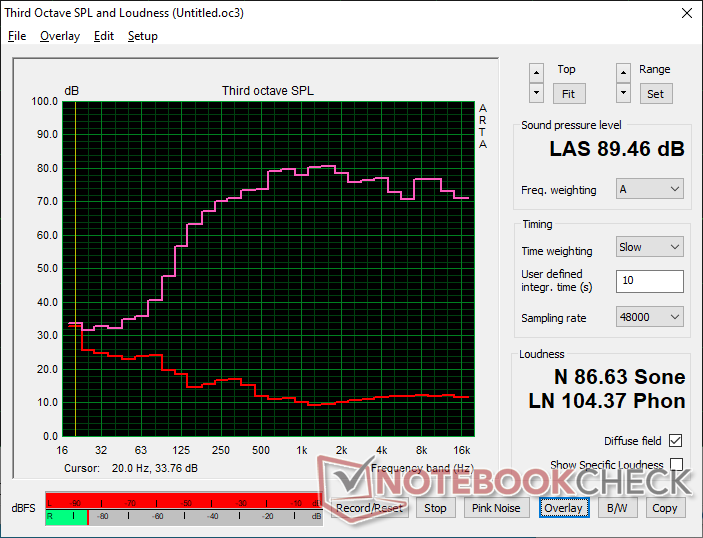
HP Spectre x360 16 RTX 4050 Audio Analyse
(+) | Die Lautsprecher können relativ laut spielen (89.5 dB)
Bass 100 - 315 Hz
(±) | abgesenkter Bass - 13.2% geringer als der Median
(±) | durchschnittlich lineare Bass-Wiedergabe (7.9% Delta zum Vorgänger)
Mitteltöne 400 - 2000 Hz
(+) | ausgeglichene Mitten, vom Median nur 3.2% abweichend
(+) | lineare Mitten (3% Delta zum Vorgänger)
Hochtöne 2 - 16 kHz
(+) | ausgeglichene Hochtöne, vom Median nur 1.6% abweichend
(+) | sehr lineare Hochtöne (3.5% Delta zum Vorgänger)
Gesamt im hörbaren Bereich 100 - 16.000 Hz
(+) | hörbarer Bereich ist sehr linear (9.2% Abstand zum Median
Im Vergleich zu allen Geräten derselben Klasse
» 4% aller getesteten Geräte dieser Klasse waren besser, 1% vergleichbar, 95% schlechter
» Das beste Gerät hat einen Delta-Wert von 6%, durchschnittlich ist 20%, das schlechteste Gerät hat 57%
Im Vergleich zu allen Geräten im Test
» 3% aller getesteten Geräte waren besser, 1% vergleichbar, 96% schlechter
» Das beste Gerät hat einen Delta-Wert von 4%, durchschnittlich ist 23%, das schlechteste Gerät hat 134%
Apple MacBook Pro 16 2021 M1 Pro Audio Analyse
(+) | Die Lautsprecher können relativ laut spielen (84.7 dB)
Bass 100 - 315 Hz
(+) | guter Bass - nur 3.8% Abweichung vom Median
(+) | lineare Bass-Wiedergabe (5.2% Delta zum Vorgänger)
Mitteltöne 400 - 2000 Hz
(+) | ausgeglichene Mitten, vom Median nur 1.3% abweichend
(+) | lineare Mitten (2.1% Delta zum Vorgänger)
Hochtöne 2 - 16 kHz
(+) | ausgeglichene Hochtöne, vom Median nur 1.9% abweichend
(+) | sehr lineare Hochtöne (2.7% Delta zum Vorgänger)
Gesamt im hörbaren Bereich 100 - 16.000 Hz
(+) | hörbarer Bereich ist sehr linear (4.6% Abstand zum Median
Im Vergleich zu allen Geräten derselben Klasse
» 0% aller getesteten Geräte dieser Klasse waren besser, 0% vergleichbar, 100% schlechter
» Das beste Gerät hat einen Delta-Wert von 5%, durchschnittlich ist 17%, das schlechteste Gerät hat 45%
Im Vergleich zu allen Geräten im Test
» 0% aller getesteten Geräte waren besser, 0% vergleichbar, 100% schlechter
» Das beste Gerät hat einen Delta-Wert von 4%, durchschnittlich ist 23%, das schlechteste Gerät hat 134%
Energieverwaltung
Energieaufnahme
Die Ausführung von Witcher 3 im Performance-Modus erfordert etwa 93 W oder fast das Doppelte im Vergleich zur iGPU-Konfiguration. Die Frameraten sind mit der Nvidia-GPU um das Zwei- bis Dreifache schneller, sodass sich der höhere Stromverbrauch aus Sicht der Leistung pro Watt immer noch lohnt.
Eine Wiederholung des oben genannten Tests im Balanced-Modus anstelle des Performance-Modus würde den Verbrauch auf 75 W senken. Die Energieeinsparungen stimmen mit unseren TGP-Beobachtungen im Abschnitt "Stresstest" oben überein. Wenn Sie das Beste aus Ihrem System herausholen möchten, sollten Sie den Leistungsmodus über MyHP aktivieren.
Wir konnten eine temporäre maximale Leistungsaufnahme von 121 W von dem kleinen bis mittelgroßen (~13,8 x 6,5 x 2,9 cm) 140-W-USB-C-Netzteil aufzeichnen, wenn die CPU und GPU jeweils zu 100 % ausgelastet sind. Die Ladegeschwindigkeit wird nicht signifikant beeinflusst, da die Leistungsdrosselung wie oben erwähnt sehr schnell einsetzt, um den Verbrauch in den 70-W-Bereich zu senken. Beachten Sie, dass die iGPU-Konfiguration stattdessen mit einem kleineren 100-W-USB-C-Adapter geliefert wird.
(Hinweis der Redaktion: Dieser Abschnitt wird aktualisiert, sobald die Reparaturen an unserem Metrahit Energy-Multimeter abgeschlossen sind. Wir entschuldigen uns für die Unannehmlichkeiten).
| Aus / Standby | |
| Idle | |
| Last |
|
Legende:
min: | |
| HP Spectre x360 16 RTX 4050 Ultra 7 155H, GeForce RTX 4050 Laptop GPU, SK hynix PC801 HFS001TEJ9X101N, OLED, 2880x1800, 16" | HP Spectre x360 16-aa0074ng Ultra 7 155H, Arc 8-Core, Kioxia XG8 KXG80ZNV1T02, OLED, 2880x1800, 16" | HP Spectre x360 2-in-1 16-f1075ng i7-12700H, Iris Xe G7 96EUs, SK Hynix PC711 1TB HFS001TDE9X073N, IPS, 3072x1920, 16" | Honor MagicBook Pro 16 2024 Ultra 7 155H, GeForce RTX 4060 Laptop GPU, WD PC SN740 SDDPNQD-1T00, IPS, 3072x1920, 16" | MSI Prestige 16 B1MG-001US Ultra 7 155H, Arc 8-Core, Samsung PM9A1 MZVL22T0HBLB, IPS, 2560x1600, 16" | LG Gram 2in1 16 16T90R - G.AA78G i7-1360P, Iris Xe G7 96EUs, Samsung PM9A1 MZVL21T0HCLR, IPS, 2560x1600, 16" | |
|---|---|---|---|---|---|---|
| Stromverbrauch | 48% | 26% | -10% | 33% | 39% | |
| Idle min * (Watt) | 5.8 | 4.1 29% | 9 -55% | 5.2 10% | 3 48% | 5.5 5% |
| Idle avg * (Watt) | 12.3 | 4.5 63% | 11.1 10% | 14.4 -17% | 9.5 23% | 7.2 41% |
| Idle max * (Watt) | 33.9 | 5.9 83% | 16.4 52% | 15.4 55% | 12 65% | 12.9 62% |
| Last avg * (Watt) | 83.3 | 51.2 39% | 38.3 54% | 105.4 -27% | 68.3 18% | 55 34% |
| Witcher 3 ultra * (Watt) | 89.1 | 47.6 47% | 34.4 61% | 107.6 -21% | 59.8 33% | 47 47% |
| Last max * (Watt) | 120.8 | 90.4 25% | 82.5 32% | 195.2 -62% | 104.8 13% | 63.6 47% |
* ... kleinere Werte sind besser
Energieverbrauch Witcher 3 / Stresstest
Energieverbrauch externer Monitor
Akkulaufzeit
Die Akkulaufzeit ist erwartungsgemäß kürzer als bei der iGPU-Konfiguration, aber der Unterschied ist erstaunlich gering. Mit dem Balanced-Profil konnten wir 11 Stunden reale Surfzeit erreichen, also nur etwa eine Stunde weniger als mit der iGPU-Einheit. Die Entscheidung für die IPS-Konfiguration wird die Laufzeiten wahrscheinlich verlängern.
| HP Spectre x360 16 RTX 4050 Ultra 7 155H, GeForce RTX 4050 Laptop GPU, 83 Wh | HP Spectre x360 16-aa0074ng Ultra 7 155H, Arc 8-Core, 83 Wh | HP Spectre x360 2-in-1 16-f1075ng i7-12700H, Iris Xe G7 96EUs, 83 Wh | Honor MagicBook Pro 16 2024 Ultra 7 155H, GeForce RTX 4060 Laptop GPU, 75 Wh | MSI Prestige 16 B1MG-001US Ultra 7 155H, Arc 8-Core, 99.9 Wh | LG Gram 2in1 16 16T90R - G.AA78G i7-1360P, Iris Xe G7 96EUs, 80 Wh | |
|---|---|---|---|---|---|---|
| Akkulaufzeit | 9% | -5% | 11% | 66% | 8% | |
| WLAN (h) | 11 | 12 9% | 10.5 -5% | 12.2 11% | 18.3 66% | 11.9 8% |
| H.264 (h) | 14.4 | 11.2 | 13.1 | |||
| Last (h) | 2.3 | 1.6 | 1 | 2.8 | 2 | |
| Idle (h) | 20.6 | 25.1 |
Pro
Contra
Fazit — Vielseitig auf Kosten der Leistung
Mit einer diskreten GeForce RTX 4050 Grafik gehört das HP Spectre x360 16 zu den leisesten und tragbarsten 16-Zoll-Convertible-Notebooks auf dem Markt. Dieses Gerät ist für Power-Nutzer konzipiert, die Unterwegs sind und die tiefen P3-Farben und den 2-in-1-Formfaktor des OLED-Touchscreens nutzen möchten. Aus dieser Perspektive ist das Modell ein Erfolg.
Das schlanke Design erforderte Leistungskompromisse. Insbesondere die 55-Watt-RTX-4050-GPU ist deutlich langsamer als die meisten anderen Laptops mit der gleichen Grafikoption. Das Spectre x360 16 ist für seine Größe natürlich immer noch schnell, aber seine GeForce GPU ist aufgrund des niedrigen TGP-Ziels definitiv am unteren Ende des Spektrums angesiedelt. Nutzer, die die Leistung maximieren wollen oder den 2-in-1-Formfaktor nicht nützlich finden, sollten stattdessen das MSI Prestige 16 oder Honor MagicBook Pro 16 in Betracht ziehen, die mit höherwertigen RTX-Grafiken als das HP konfiguriert werden können, während sie eine ähnliche Philosophie des dünnen und leichten Designs beibehalten.
Das Spectre x360 16 ist ein hochwertiges und gut verarbeitetes 16-Zoll-Convertible. Die Leistung ist im Allgemeinen ausgezeichnet, aber es gibt sicherlich schnellere Alternativen, wenn man bereit ist, auf das 2-in-1-Design zu verzichten.
Darüber hinaus müssen wir erwähnen, dass die CPU-Performance der dGPU-Konfiguration zum Zeitpunkt des Schreibens langsamer ist als erwartet. HP behauptet, dass ein Hotfix im Gange ist. Sobald der Hotfix wirksam wird, werden wir den Abschnitt über die CPU aktualisieren. Sonst scheint die GPU ordnungsgemäß zu funktionieren.
Preis und Verfügbarkeit
HP liefert das Spectre x360 16 2-in-1 mit GeForce RTX 4050-Grafik ab sofort zu Preisen ab 1.799 Euro.
HP Spectre x360 16 RTX 4050
- 13.03.2024 v7 (old)
Allen Ngo
Transparenz
Die Auswahl der zu testenden Geräte erfolgt innerhalb der Redaktion. Das vorliegende Testmuster wurde dem Autor vom Hersteller oder einem Shop zu Testzwecken leihweise zur Verfügung gestellt. Eine Einflussnahme des Leihstellers auf den Testbericht gab es nicht, der Hersteller erhielt keine Version des Reviews vor der Veröffentlichung. Es bestand keine Verpflichtung zur Publikation. Als eigenständiges, unabhängiges Unternehmen unterliegt Notebookcheck keiner Diktion von Herstellern, Shops und Verlagen.
So testet Notebookcheck
Pro Jahr werden von Notebookcheck hunderte Laptops und Smartphones unabhängig in von uns standardisierten technischen Verfahren getestet, um eine Vergleichbarkeit aller Testergebnisse zu gewährleisten. Seit rund 20 Jahren entwickeln wir diese Testmethoden kontinuierlich weiter und setzen damit Branchenstandards. In unseren Testlaboren kommt ausschließlich hochwertiges Messequipment in die Hände erfahrener Techniker und Redakteure. Die Tests unterliegen einer mehrstufigen Kontrolle. Unsere komplexe Gesamtbewertung basiert auf hunderten fundierten Messergebnissen und Benchmarks, womit Ihnen Objektivität garantiert ist. Weitere Informationen zu unseren Testmethoden gibt es hier.
Preisvergleich

