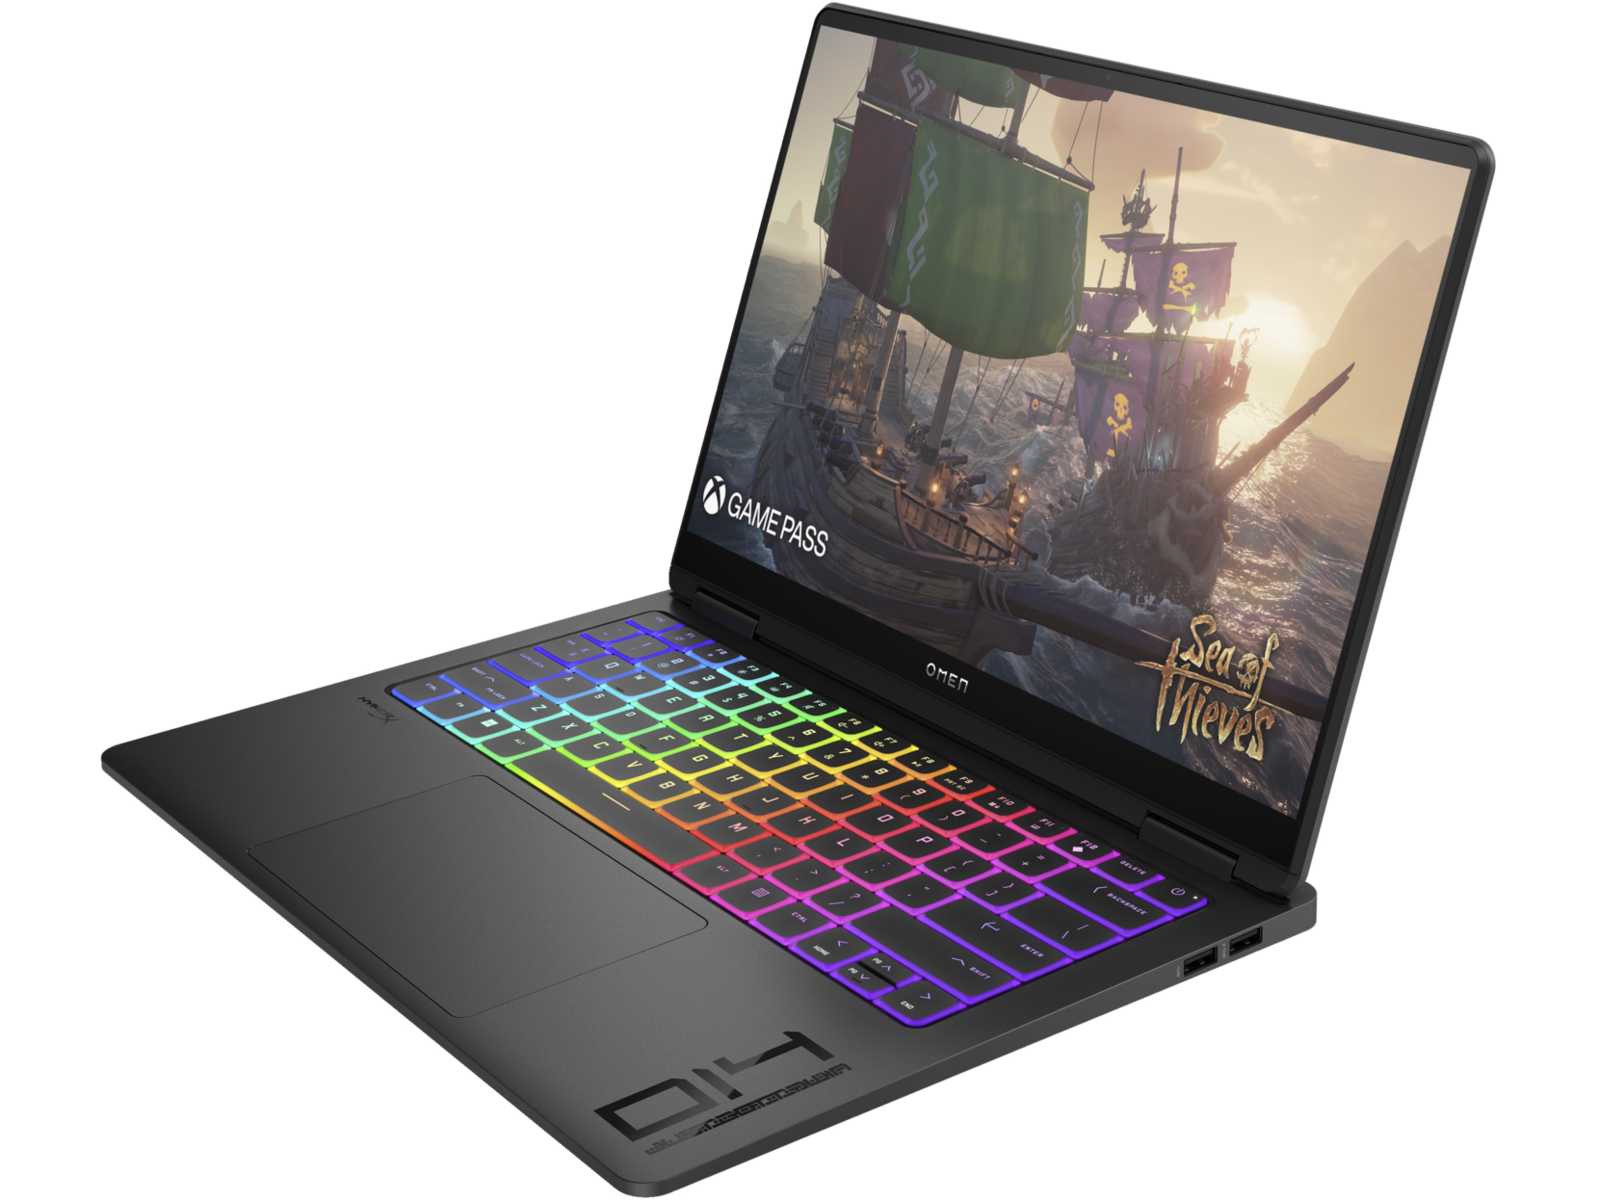
HP Omen Transcend 14 Laptop im Test: Razer Blade-Alternative die eine Überlegung wert ist

Das auf der CES 2024 vorgestellte Omen Transcend 14 wurde für Studenten oder Gamer entwickelt, die überall spielen, basteln und kreativ sein wollen, wobei der Schwerpunkt auf der Portabilität liegt. Es ist folglich eines der kleinsten und leichtesten Notebooks in der Omen-Familie mit einer Bildschirmgröße von nur 14 Zoll.
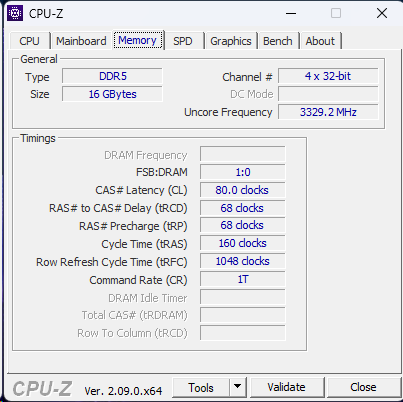
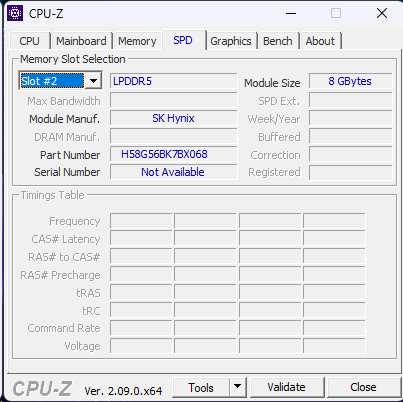
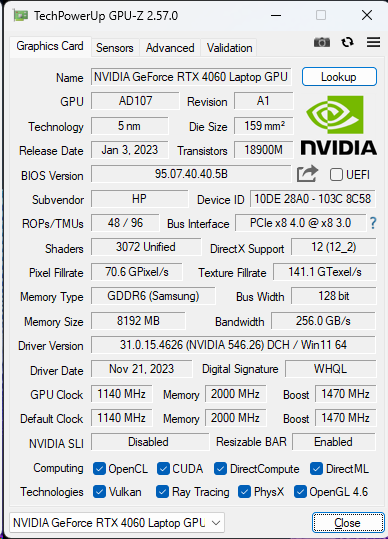
Unser Testgerät wurde in einer Mittelklasse-Konfiguration mit der Core Ultra 7 155H CPU, 16 GB LPDDR5x RAM und 50 W GeForce RTX 4060 GPU für ca. 2,169 Euro geliefert. Andere Konfigurationen sind mit der langsameren RTX 4050, der schnelleren RTX 4070 oder der Core Ultra 9 185H erhältlich, die zwischen ~1,380 und 1,900 Euro kosten, aber alle Optionen sind mit dem gleichen 2880 x 1800 120 Hz OLED-Display ausgestattet.
Alternativen zum Omen Transcend 14 sind andere leistungsstarke 14-Zoll-Notebooks mit GeForce RTX-Grafik wie das Razer Blade 14, Asus Zephyrus G14 oder das Lenovo Legion Slim 5 14.
Weitere HP Bewertungen:
Mögliche Konkurrenten im Vergleich
Bew. | Datum | Modell | Gewicht | Dicke | Größe | Auflösung | Preis ab |
|---|---|---|---|---|---|---|---|
| 88.5 % v7 (old) | 03 / 2024 | HP Omen Transcend 14-fb0014 Ultra 7 155H, GeForce RTX 4060 Laptop GPU | 1.6 kg | 18 mm | 14.00" | 2880x1800 | |
| 93 % v7 (old) | 02 / 2024 | Asus ROG Zephyrus G14 2024 GA403U R9 8945HS, GeForce RTX 4070 Laptop GPU | 1.5 kg | 16.3 mm | 14.00" | 2880x1800 | |
| 89.7 % v7 (old) | 02 / 2024 | Razer Blade 14 RZ09-0508 R9 8945HS, GeForce RTX 4070 Laptop GPU | 1.9 kg | 17.99 mm | 14.00" | 2560x1600 | |
| 87.7 % v7 (old) | 09 / 2023 | Lenovo Legion Slim 5 14APH8 R7 7840HS, GeForce RTX 4060 Laptop GPU | 1.7 kg | 20.79 mm | 14.50" | 2880x1600 | |
| 93.2 % v7 (old) | 12 / 2023 | Apple MacBook Pro 14 2023 M3 Pro Apple M3 Pro 11-Core, M3 Pro 14-Core GPU | 1.6 kg | 15.5 mm | 14.20" | 3024x1964 | |
| 85.5 % v7 (old) | 10 / 2023 | Microsoft Surface Laptop Studio 2 RTX 4060 i7-13700H, GeForce RTX 4060 Laptop GPU | 2 kg | 22 mm | 14.40" | 2400x1600 |
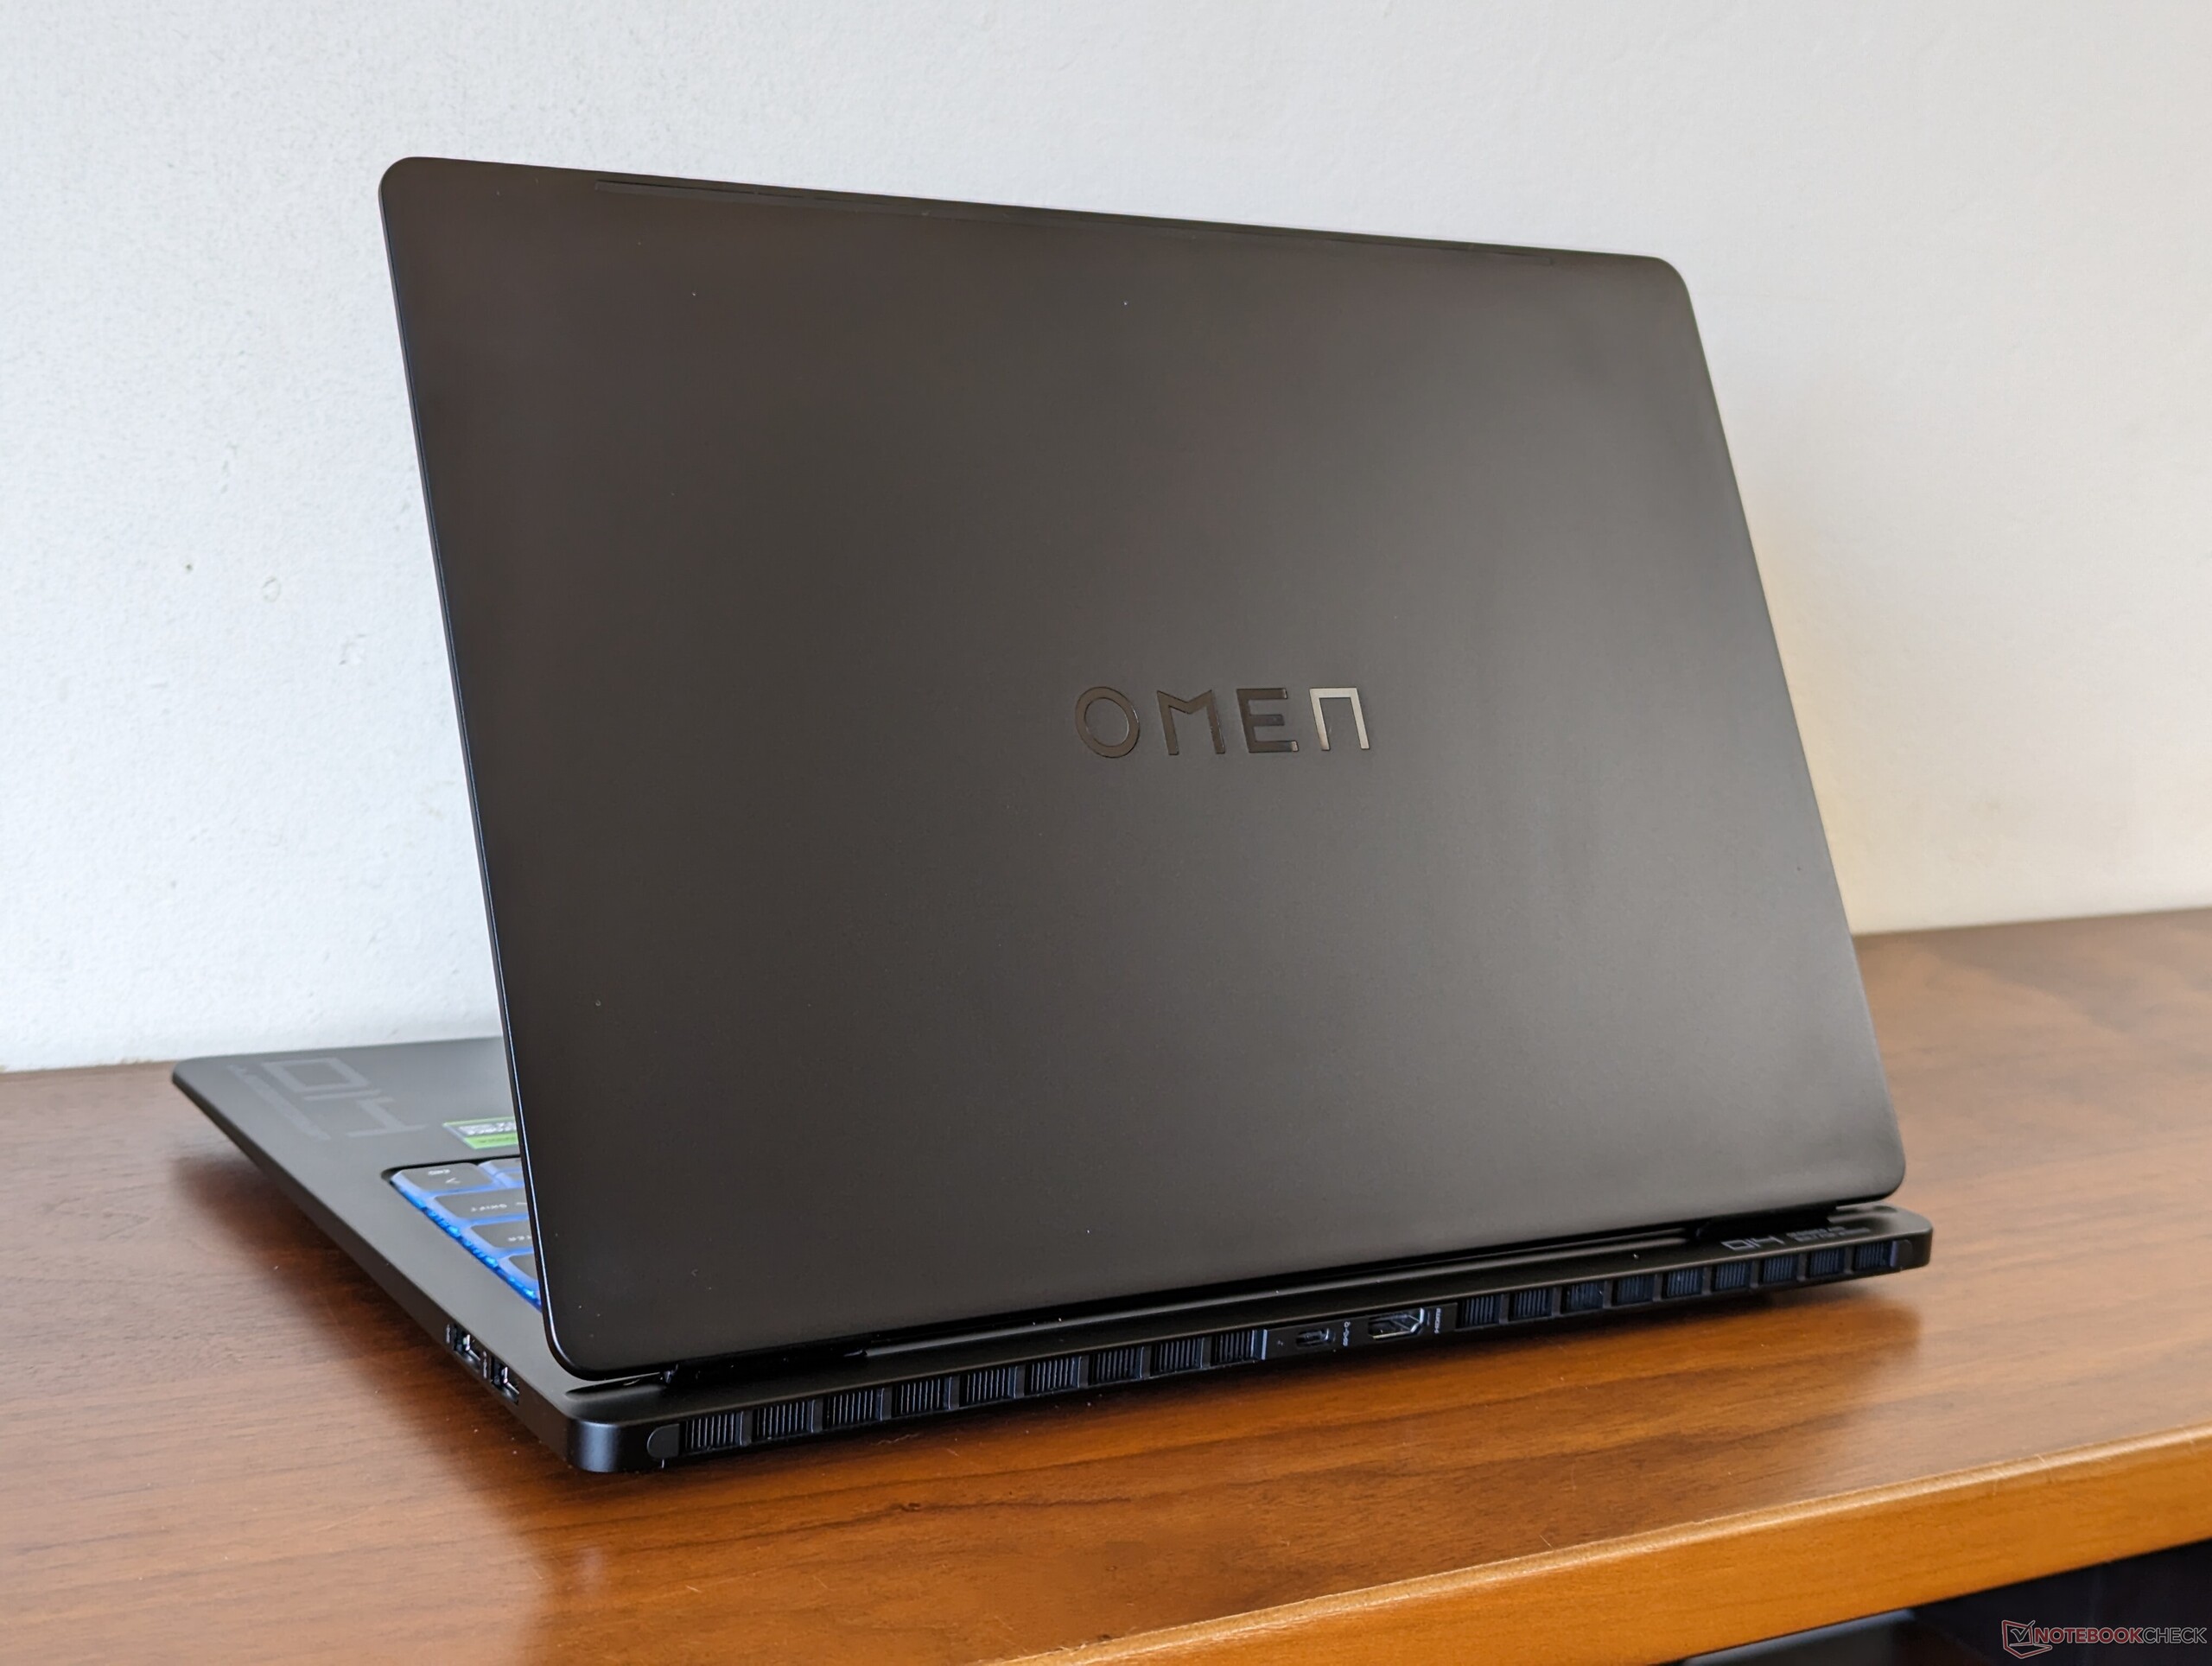
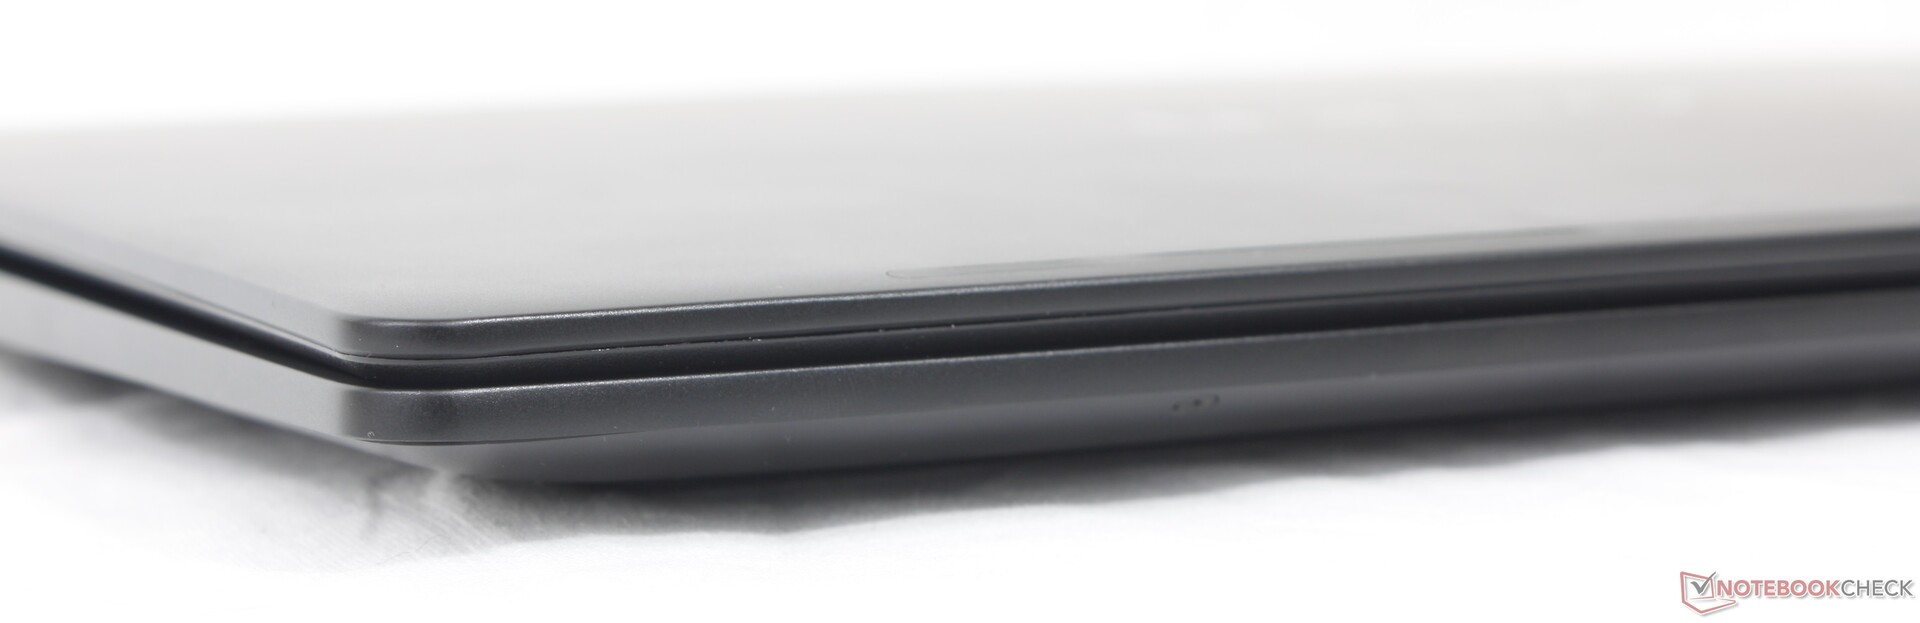
Gehäuse — Das bislang dünnste Omen
Das Gehäuse ist vom größeren Omen Transcend 16 inspiriert, einschließlich der leicht vorstehenden Rückseite, der einfarbigen Farbe, der glatten, flachen Oberflächen mit abgerundeten Ecken und Kanten und der minimalen Akzente. Es ist ein sauberer und dezenter Look, der im Gegensatz zum gamer-lastigen Zephyrus G14-Design in die meisten Umgebungen passt.
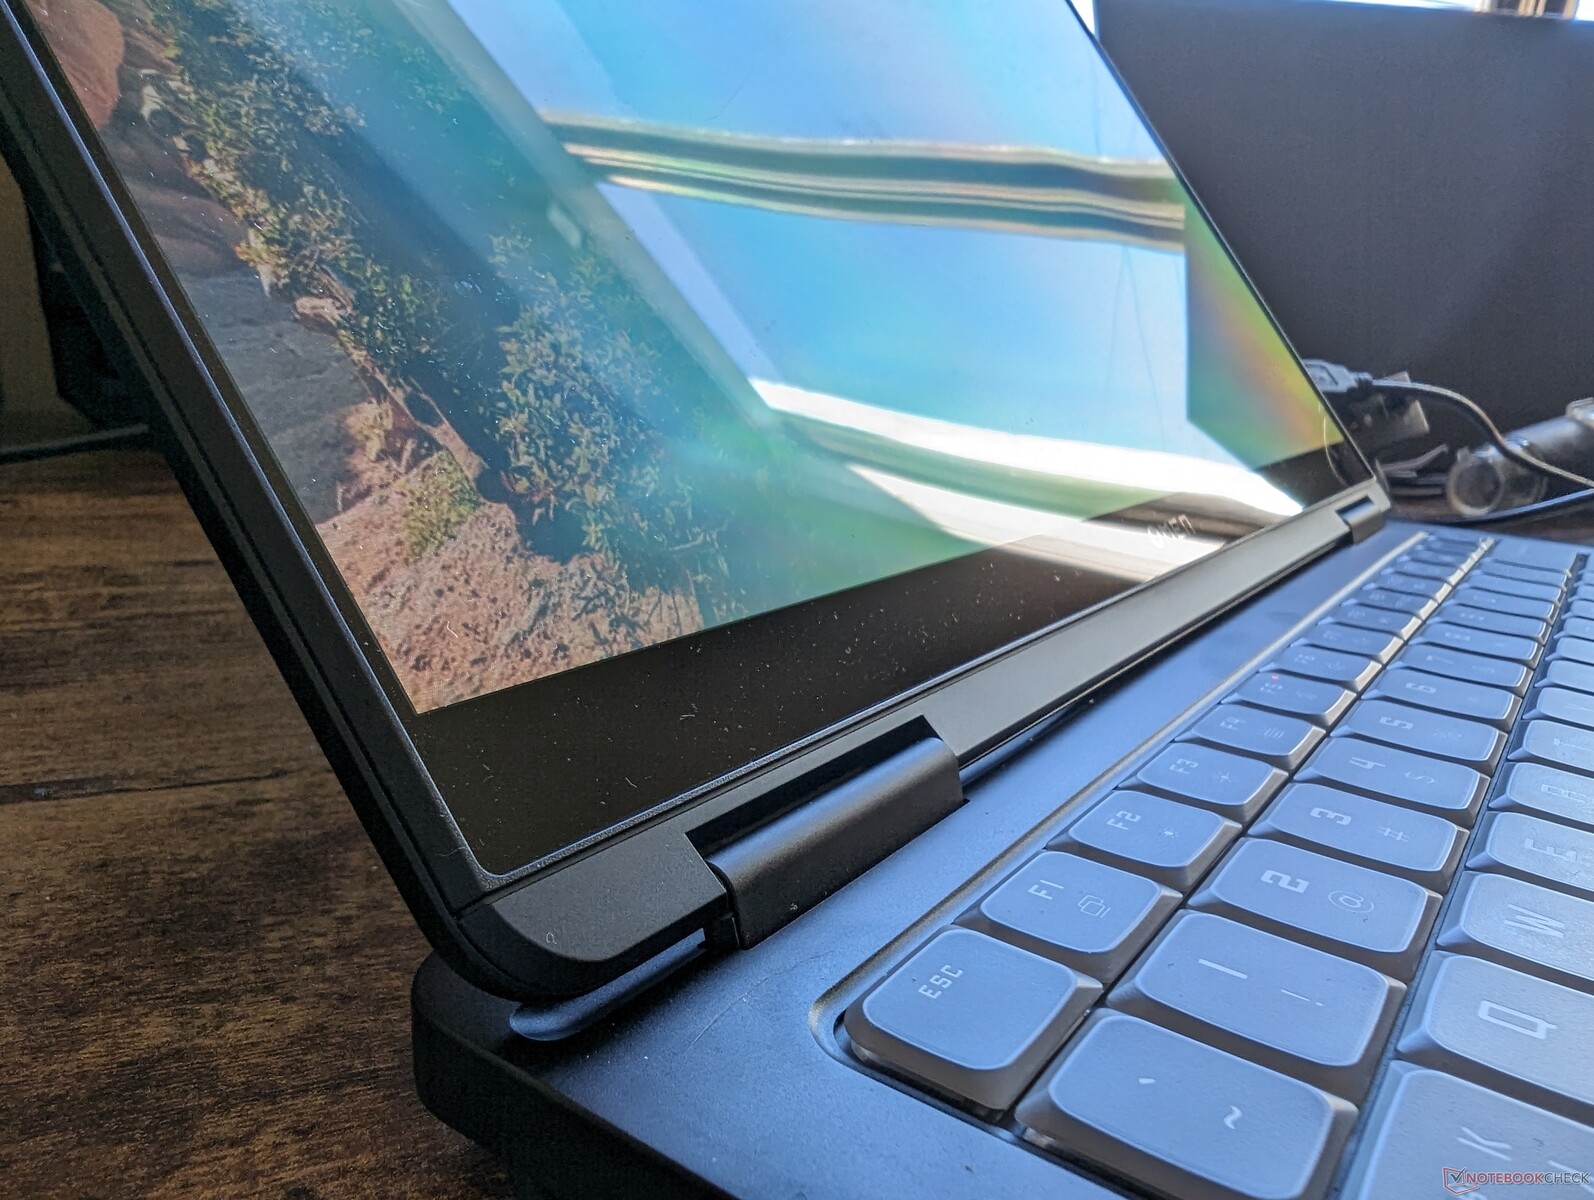
Leider ist die Stabilität spürbar geringer als beim Blade 14 oder Zephyrus G14. Insbesondere der Deckel des HP ist deutlich anfälliger für Verbiegen, Verwinden und Wippen. Der Einbau stärkerer Scharniere hätte die Langlebigkeit und den Gesamteindruck des Gehäuses deutlich verbessert.
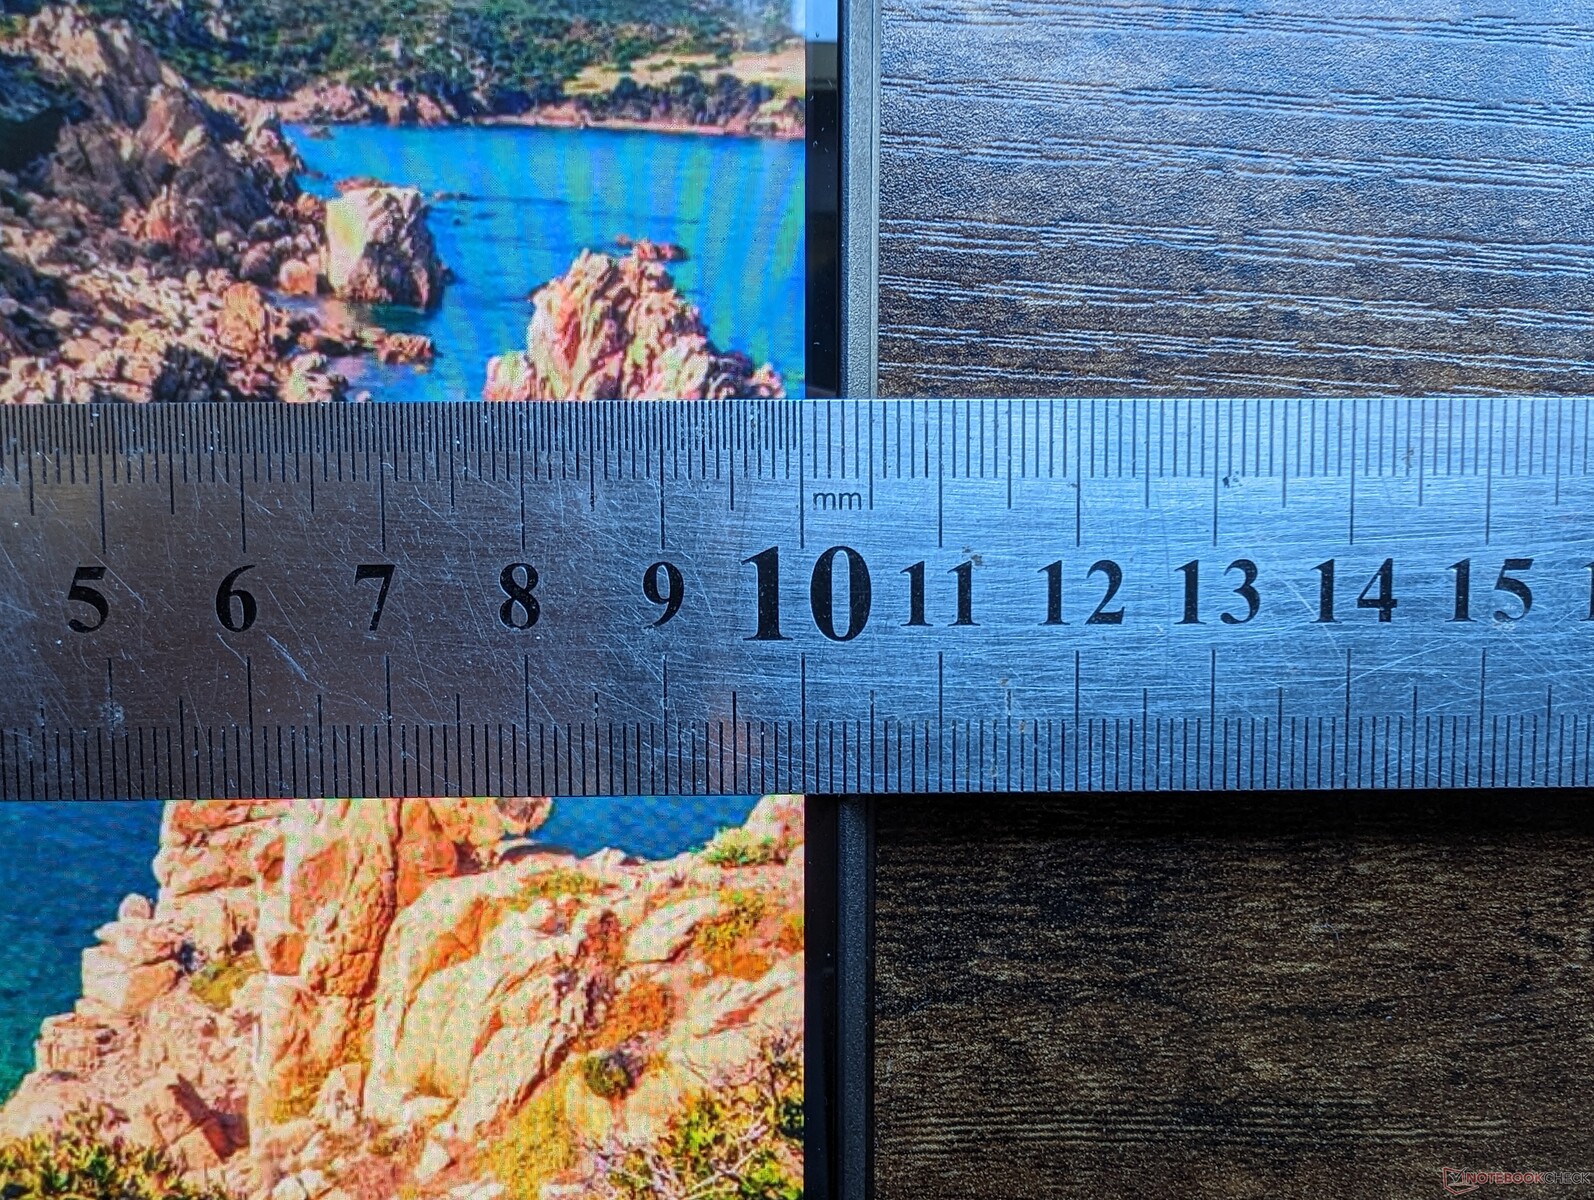
Das Modell ist nur 1 bis 2 mm dicker als das Blade 14 oder das Zephyrus G14 von 2024, aber nur geringfügig größer in der Grundfläche. Die kleinen Größenunterschiede sind in der Praxis so vernachlässigbar, dass sich unser HP immer noch genauso tragbar anfühlt wie seine nächsten 14,0-Zoll-Konkurrenten. Das Legion Slim 5 14 von Lenovo ist deutlich größer, bietet dafür aber auch einen etwas größeren 14,5-Zoll-Bildschirm.
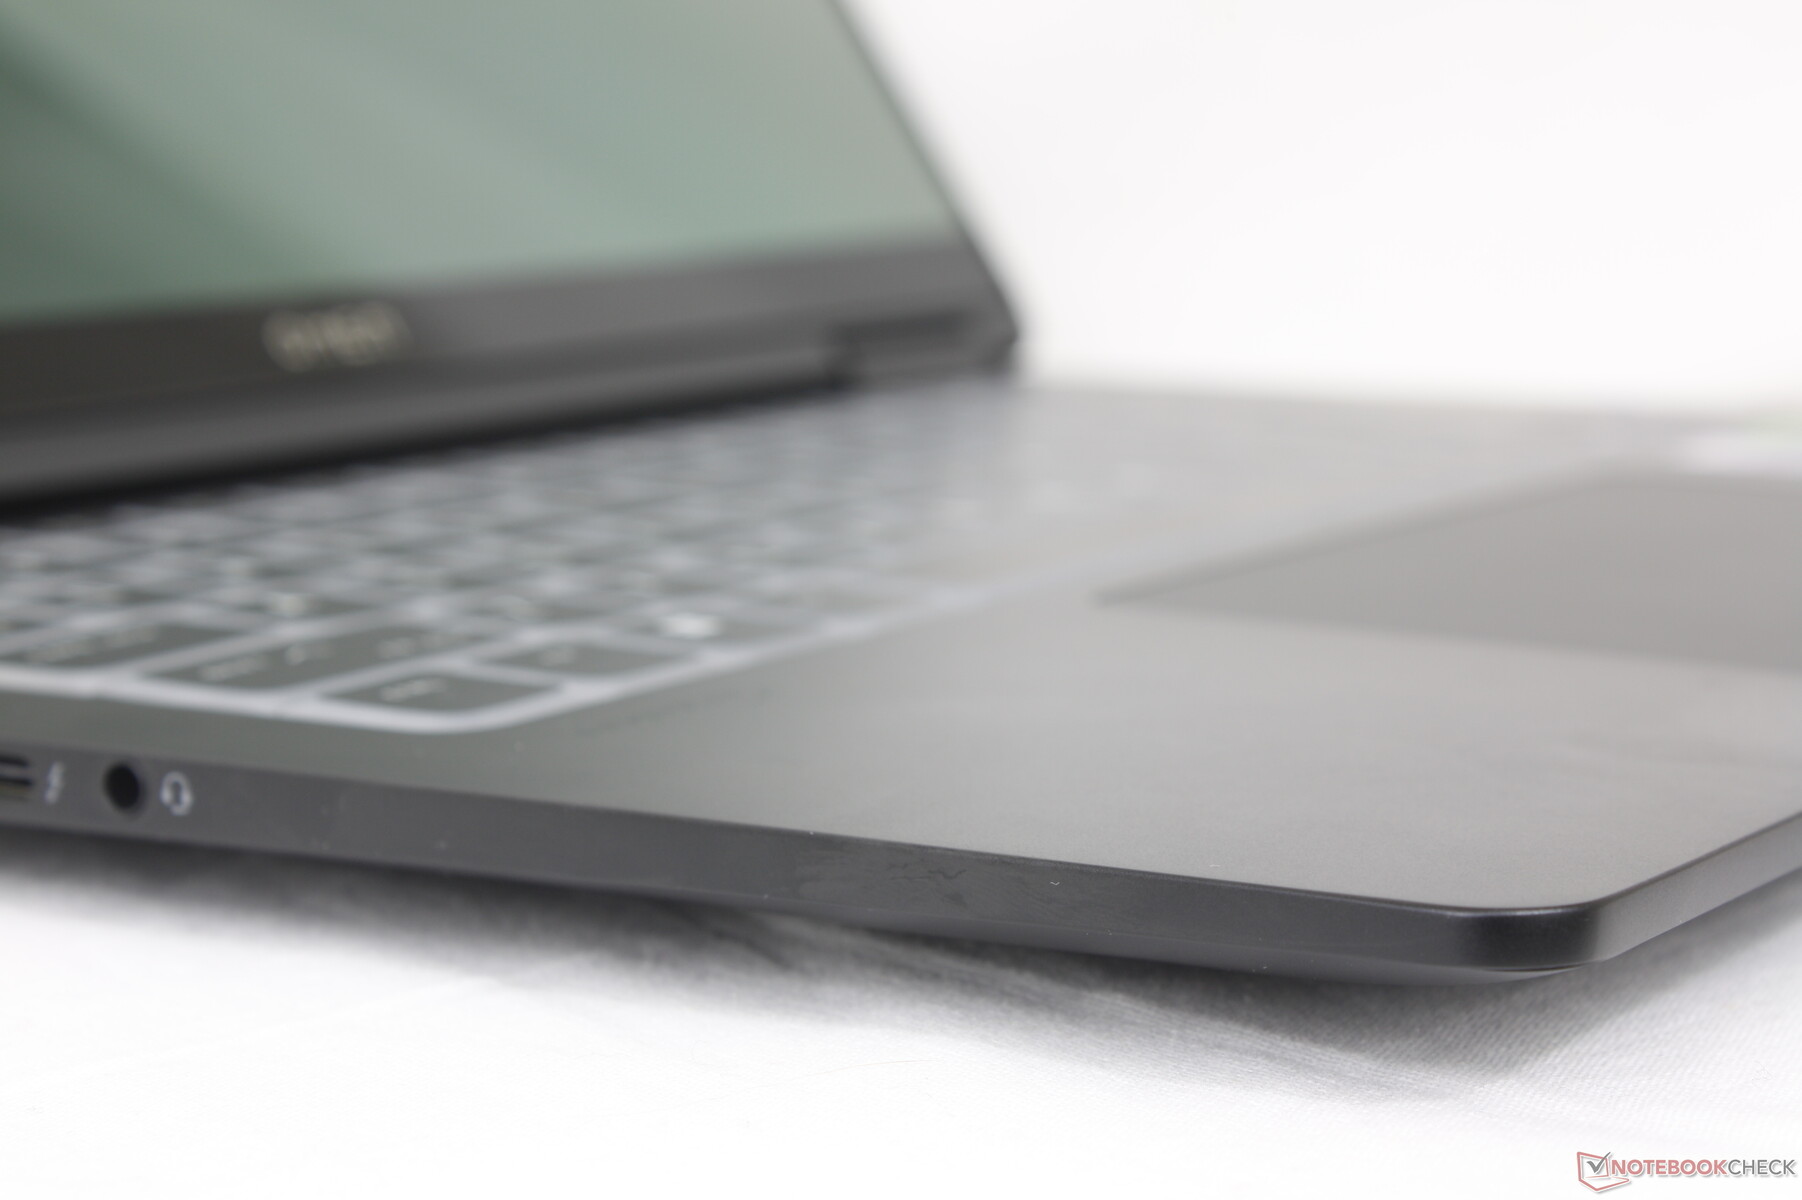
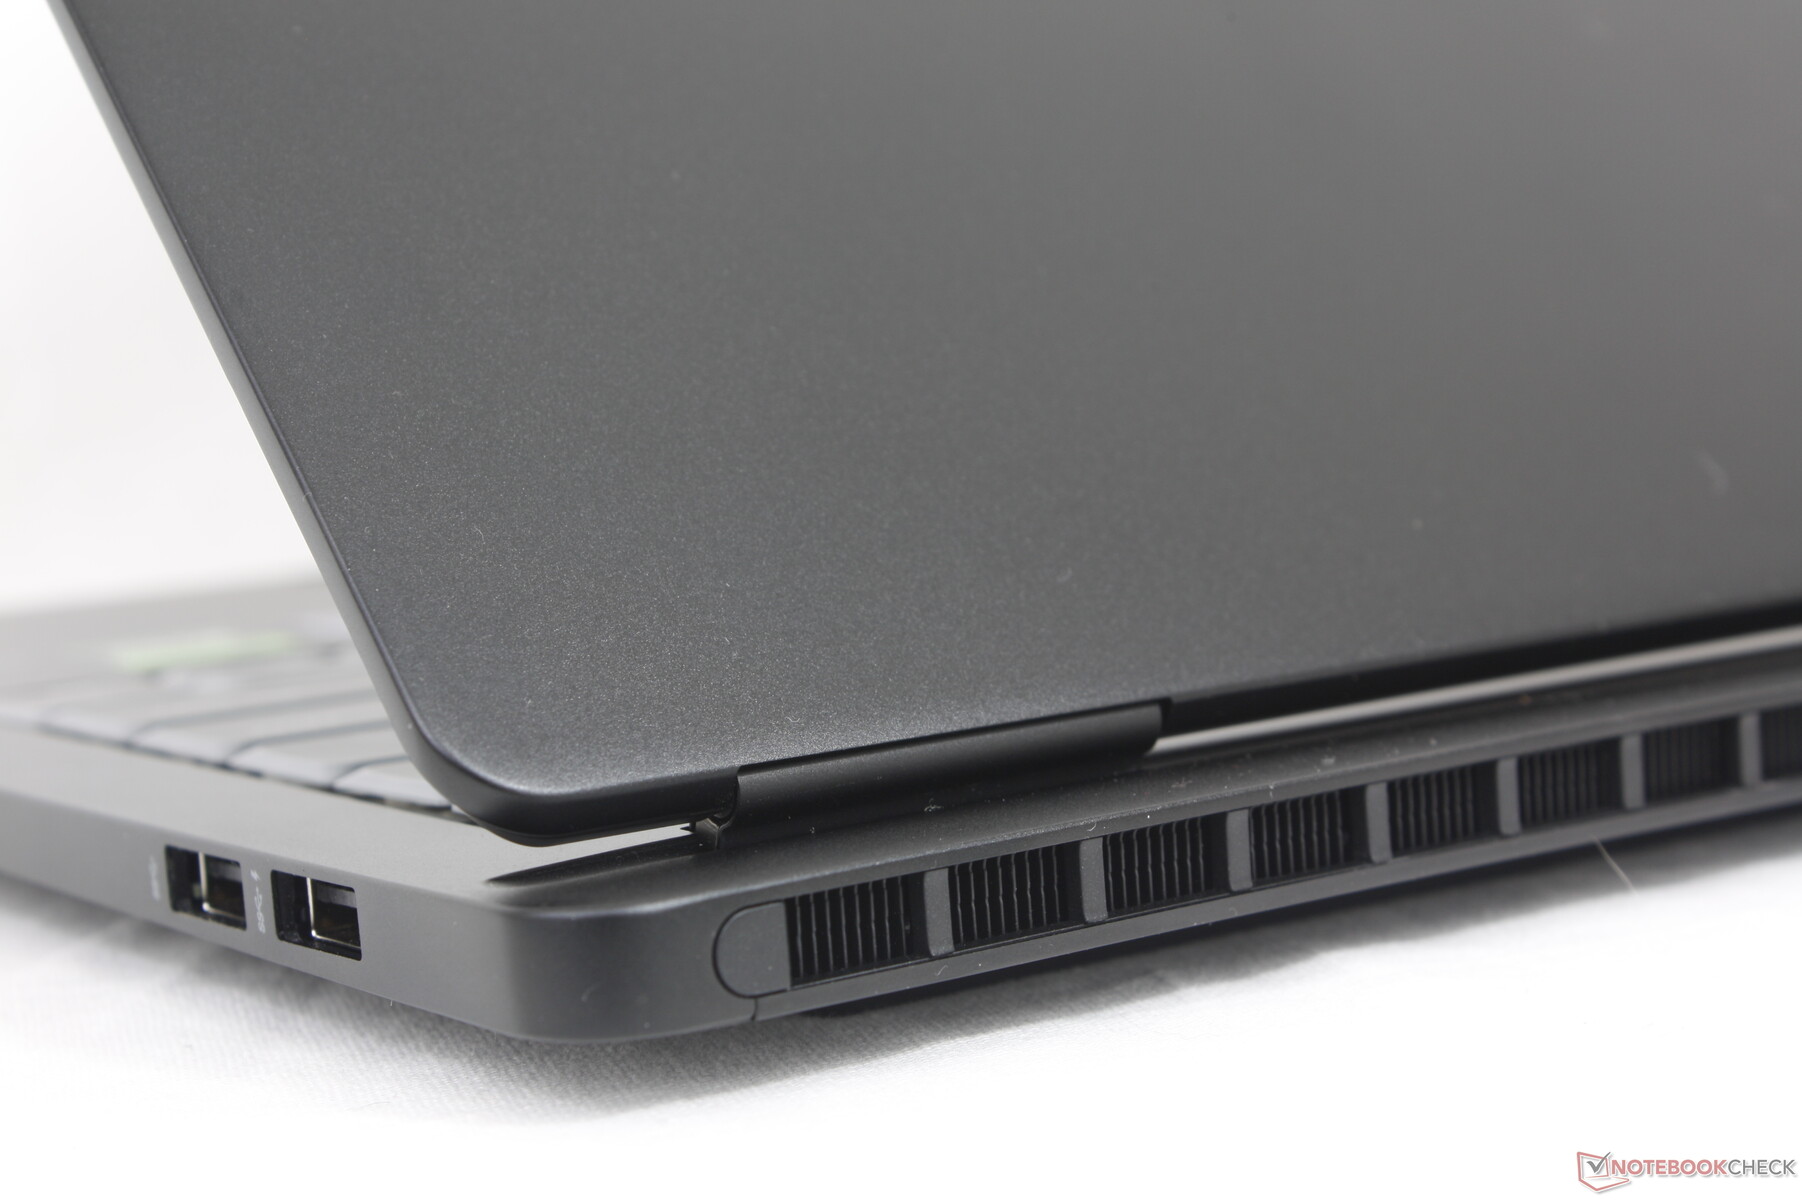
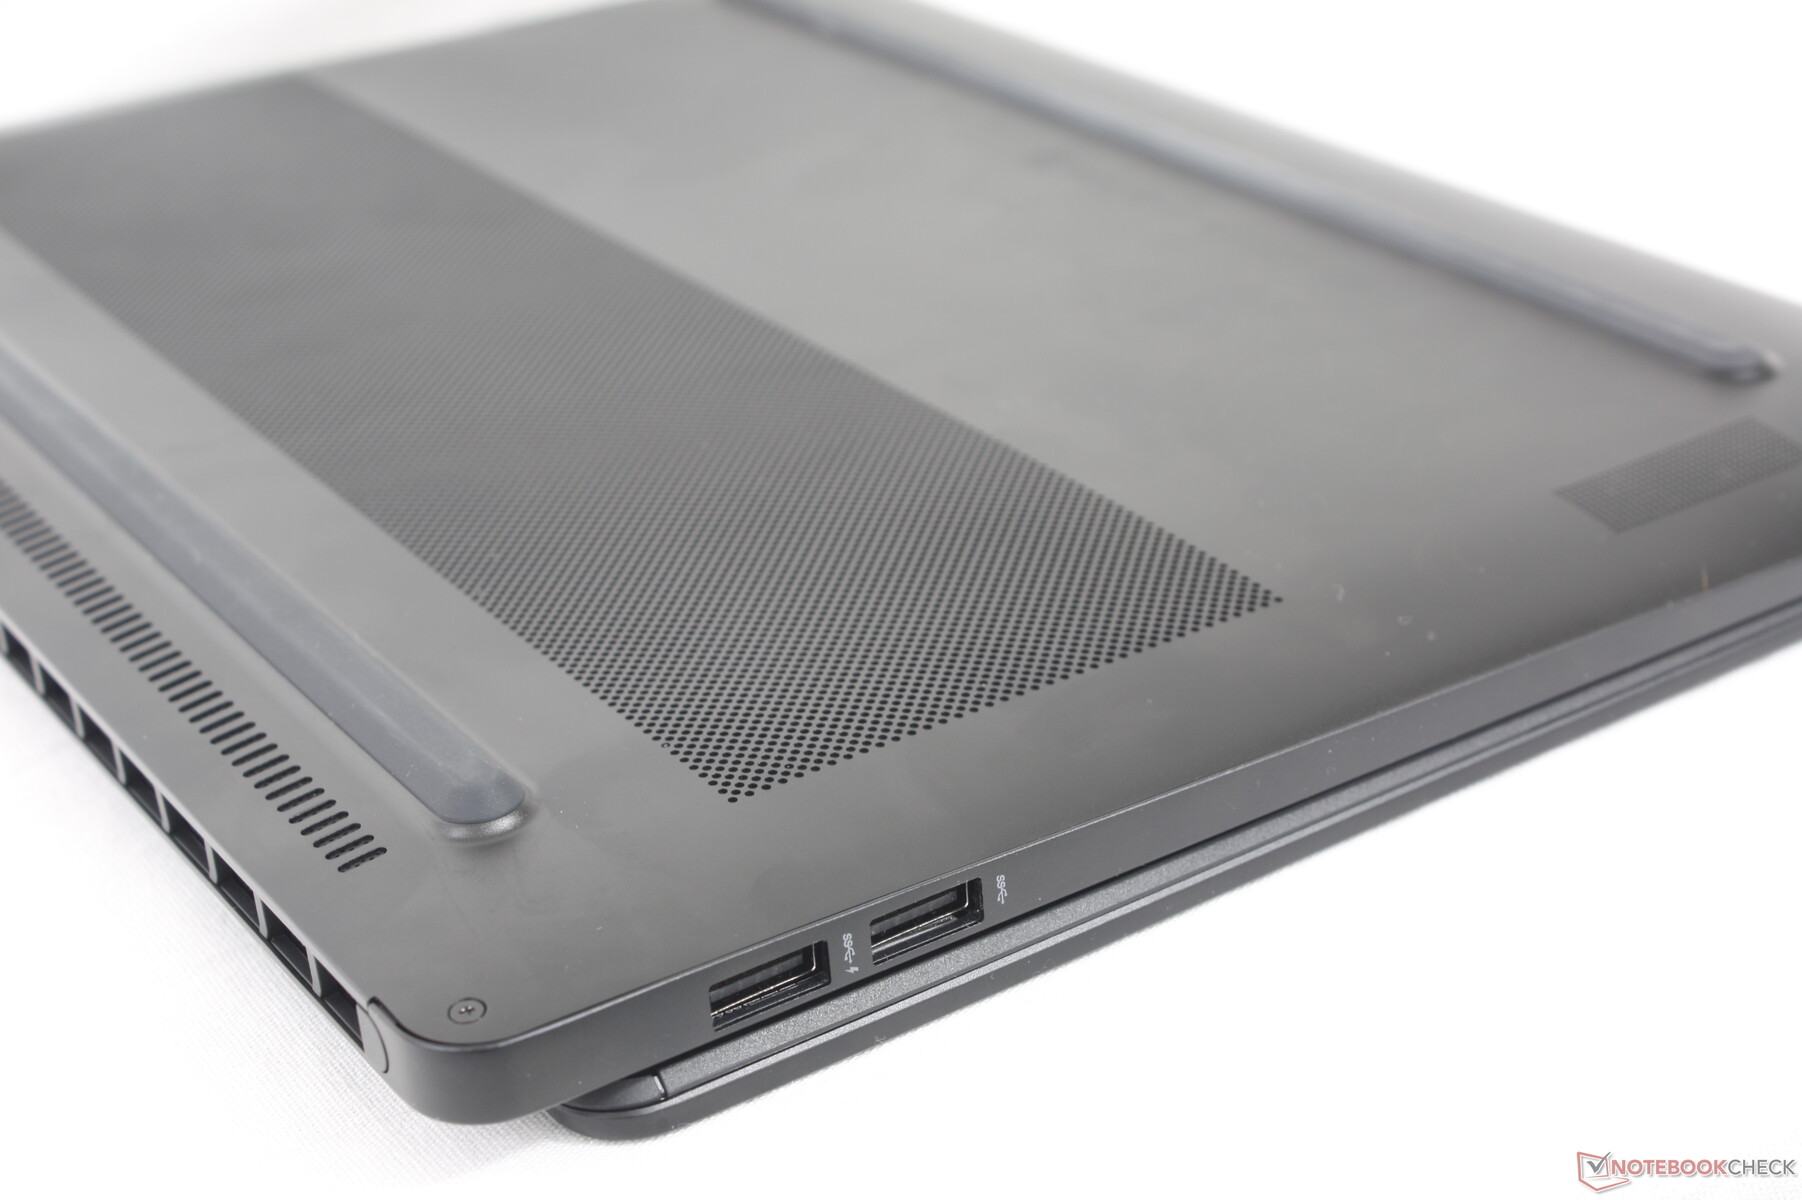
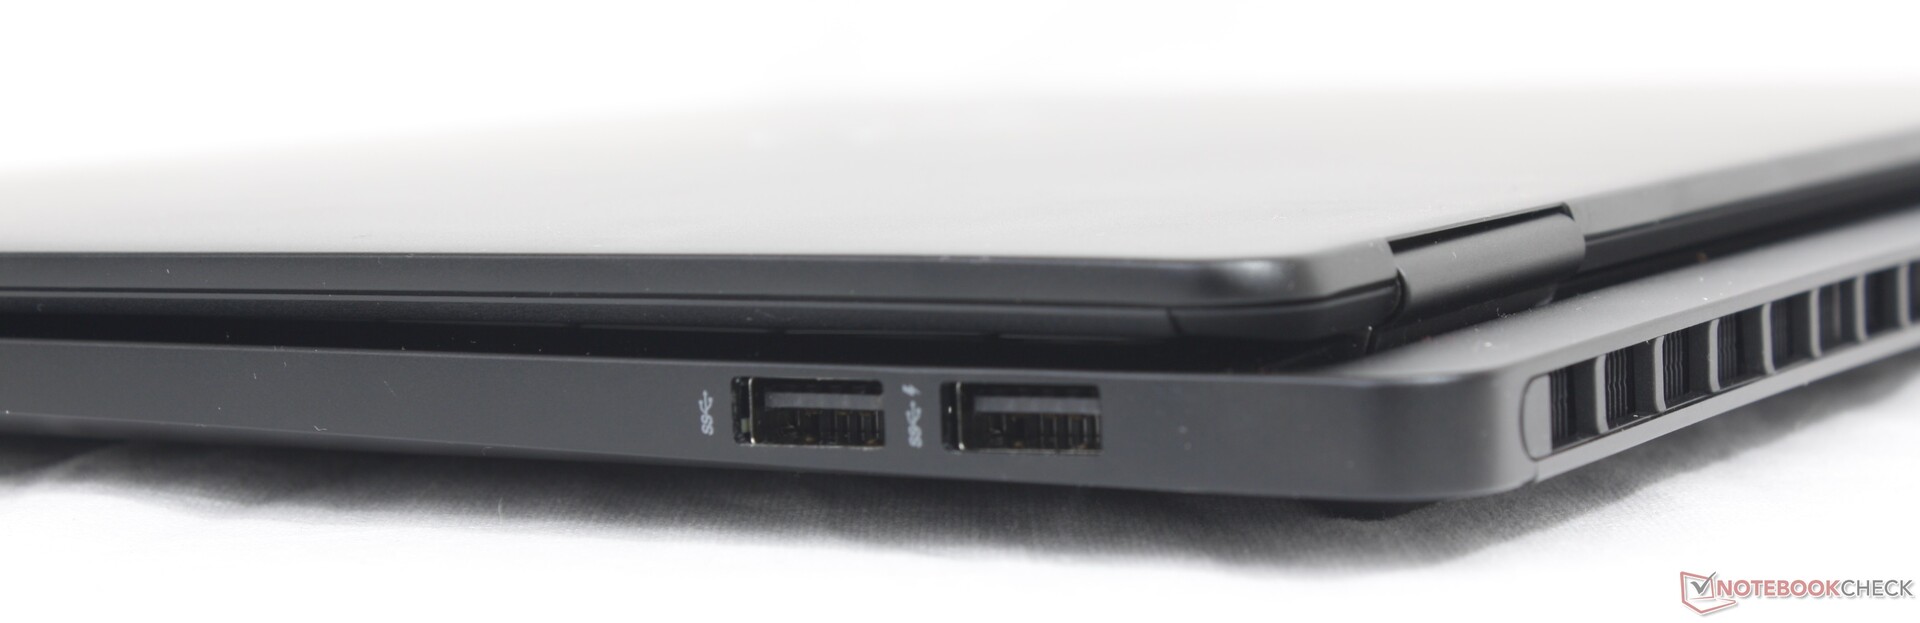
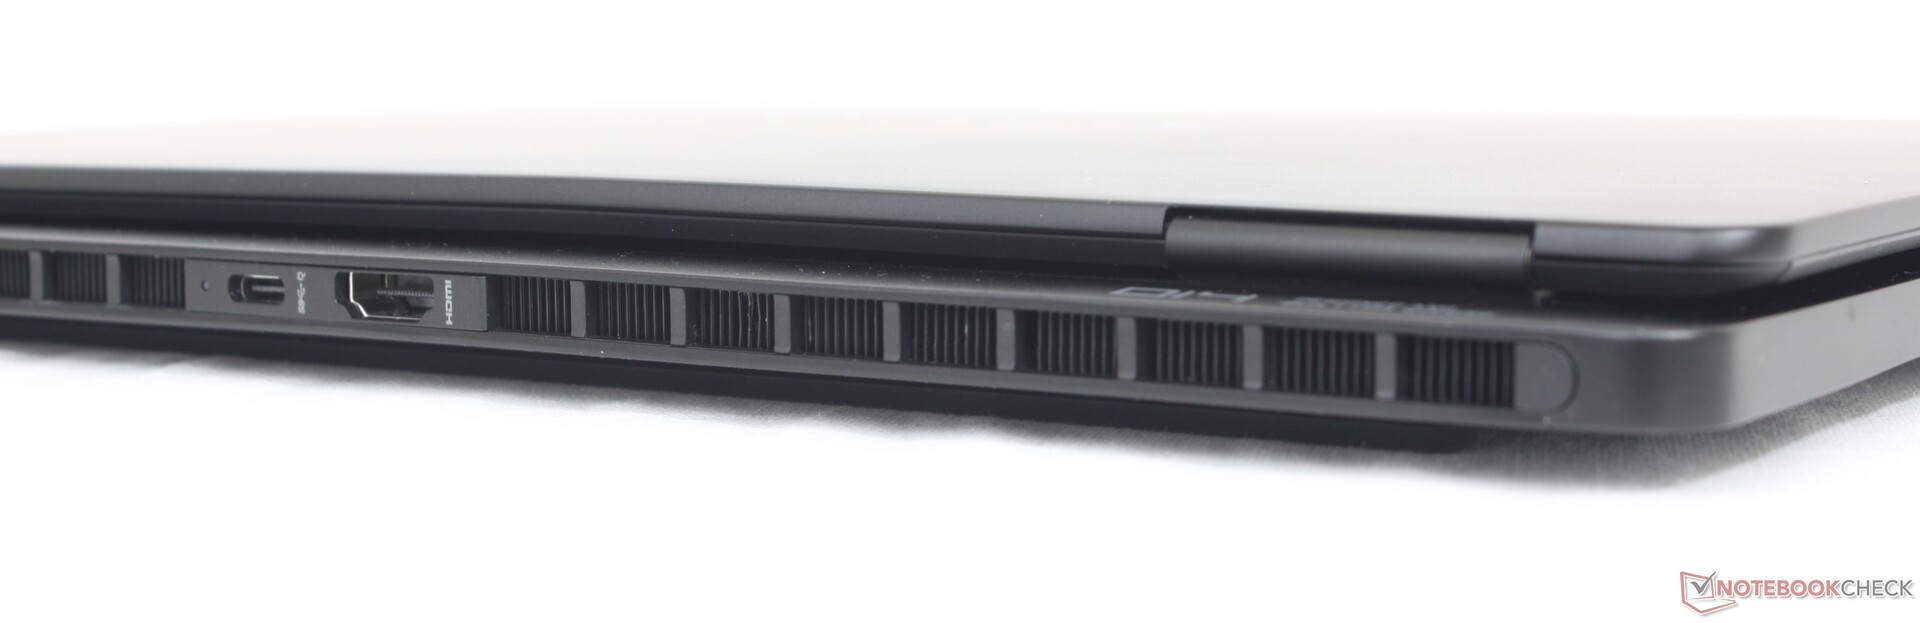
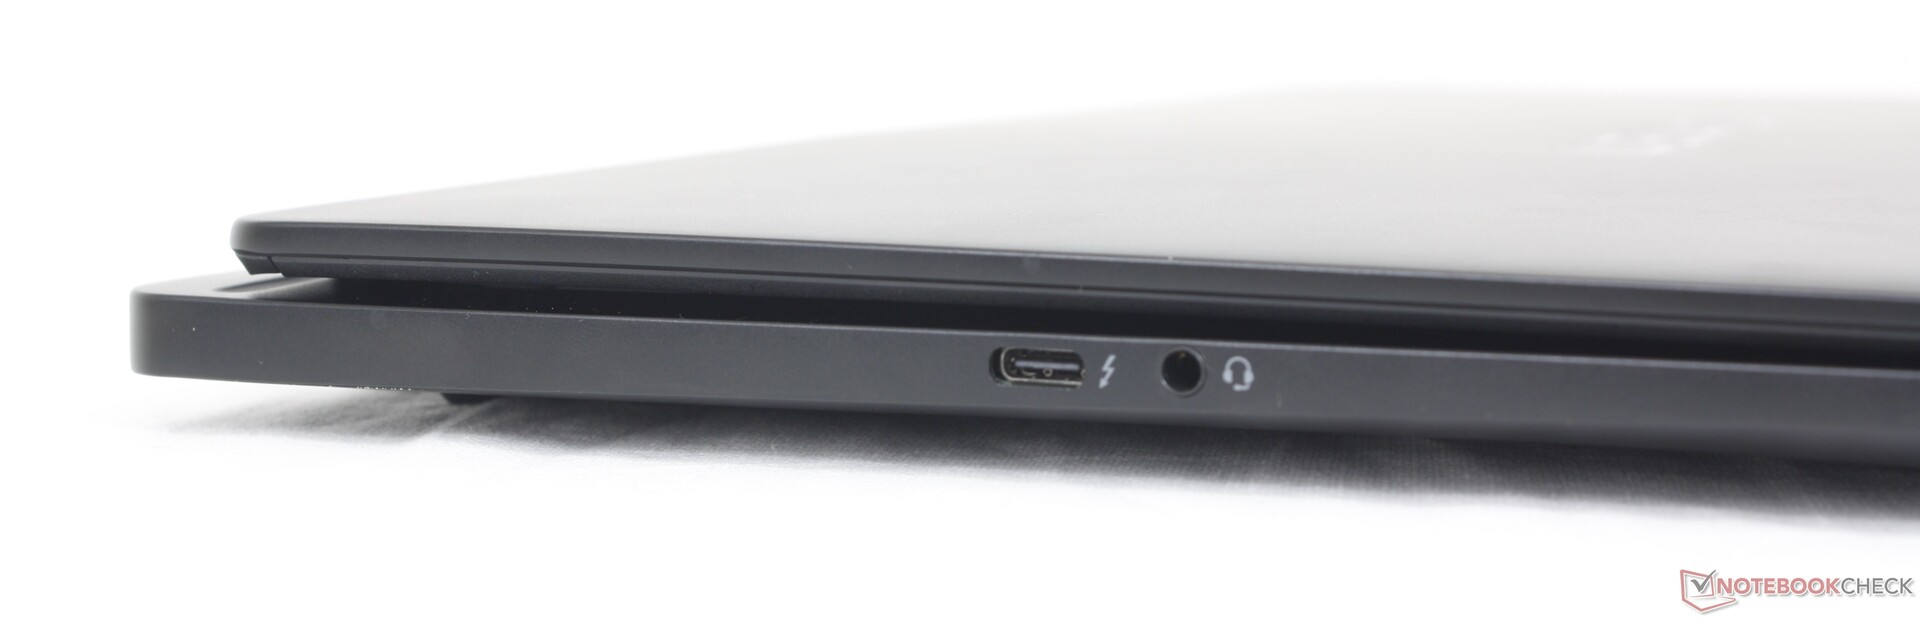
Ausstattung — Ähnlich wie bei Blade 14
Die Anschlussoptionen sind identisch mit denen des Razer Blade 14, wenn auch anders angeordnet. Beachten Sie, dass das System zwar über einen der beiden USB-C-Anschlüsse aufgeladen werden kann, aber nur der hintere USB-C-Anschluss eine Ladeleistung von 140 W unterstützt. Das Netzteil muss daher an den hinteren USB-C-Anschluss verbunden werden, um die volle Systemleistung zu erhalten. Andernfalls erscheint ein Pop-up-Fenster, das den Benutzer über die verringerte Leistung informiert, wenn das Netzteil an den "falschen" USB-C-Anschluss angeschlossen ist.
Kommunikation
SKUs können entweder mit Wi-Fi 6E- oder Wi-Fi 7-WLAN-Modulen ausgeliefert werden. Unser Testgerät ist mit dem Intel BE200 für Wi-Fi 7-Konnektivität ausgestattet. Obwohl wir noch keinen Wi-Fi 7-Testrouter erworben haben, konnten wir eine stabile Leistung und keine Probleme feststellen, als wir das Gerät mit unserem Asus AXE11000 Wi-Fi 6E-Netzwerk verbunden haben.
| Networking | |
| iperf3 transmit AXE11000 | |
| Asus ROG Zephyrus G14 2024 GA403U | |
| Razer Blade 14 RZ09-0508 | |
| Lenovo Legion Slim 5 14APH8 | |
| Microsoft Surface Laptop Studio 2 RTX 4060 | |
| HP Omen Transcend 14-fb0014 | |
| iperf3 receive AXE11000 | |
| Asus ROG Zephyrus G14 2024 GA403U | |
| Microsoft Surface Laptop Studio 2 RTX 4060 | |
| Razer Blade 14 RZ09-0508 | |
| Lenovo Legion Slim 5 14APH8 | |
| HP Omen Transcend 14-fb0014 | |
| iperf3 transmit AXE11000 6GHz | |
| Lenovo Legion Slim 5 14APH8 | |
| Razer Blade 14 RZ09-0508 | |
| HP Omen Transcend 14-fb0014 | |
| iperf3 receive AXE11000 6GHz | |
| Razer Blade 14 RZ09-0508 | |
| HP Omen Transcend 14-fb0014 | |
| Lenovo Legion Slim 5 14APH8 | |
Webcam
Die 2-MP-Webcam verfügt über IR, aber keinen Privacy Shutter. Die Bildqualität ist seltsamerweise wärmer als erwartet, wenn man sie mit den Webcams der meisten anderen Laptops vergleicht.


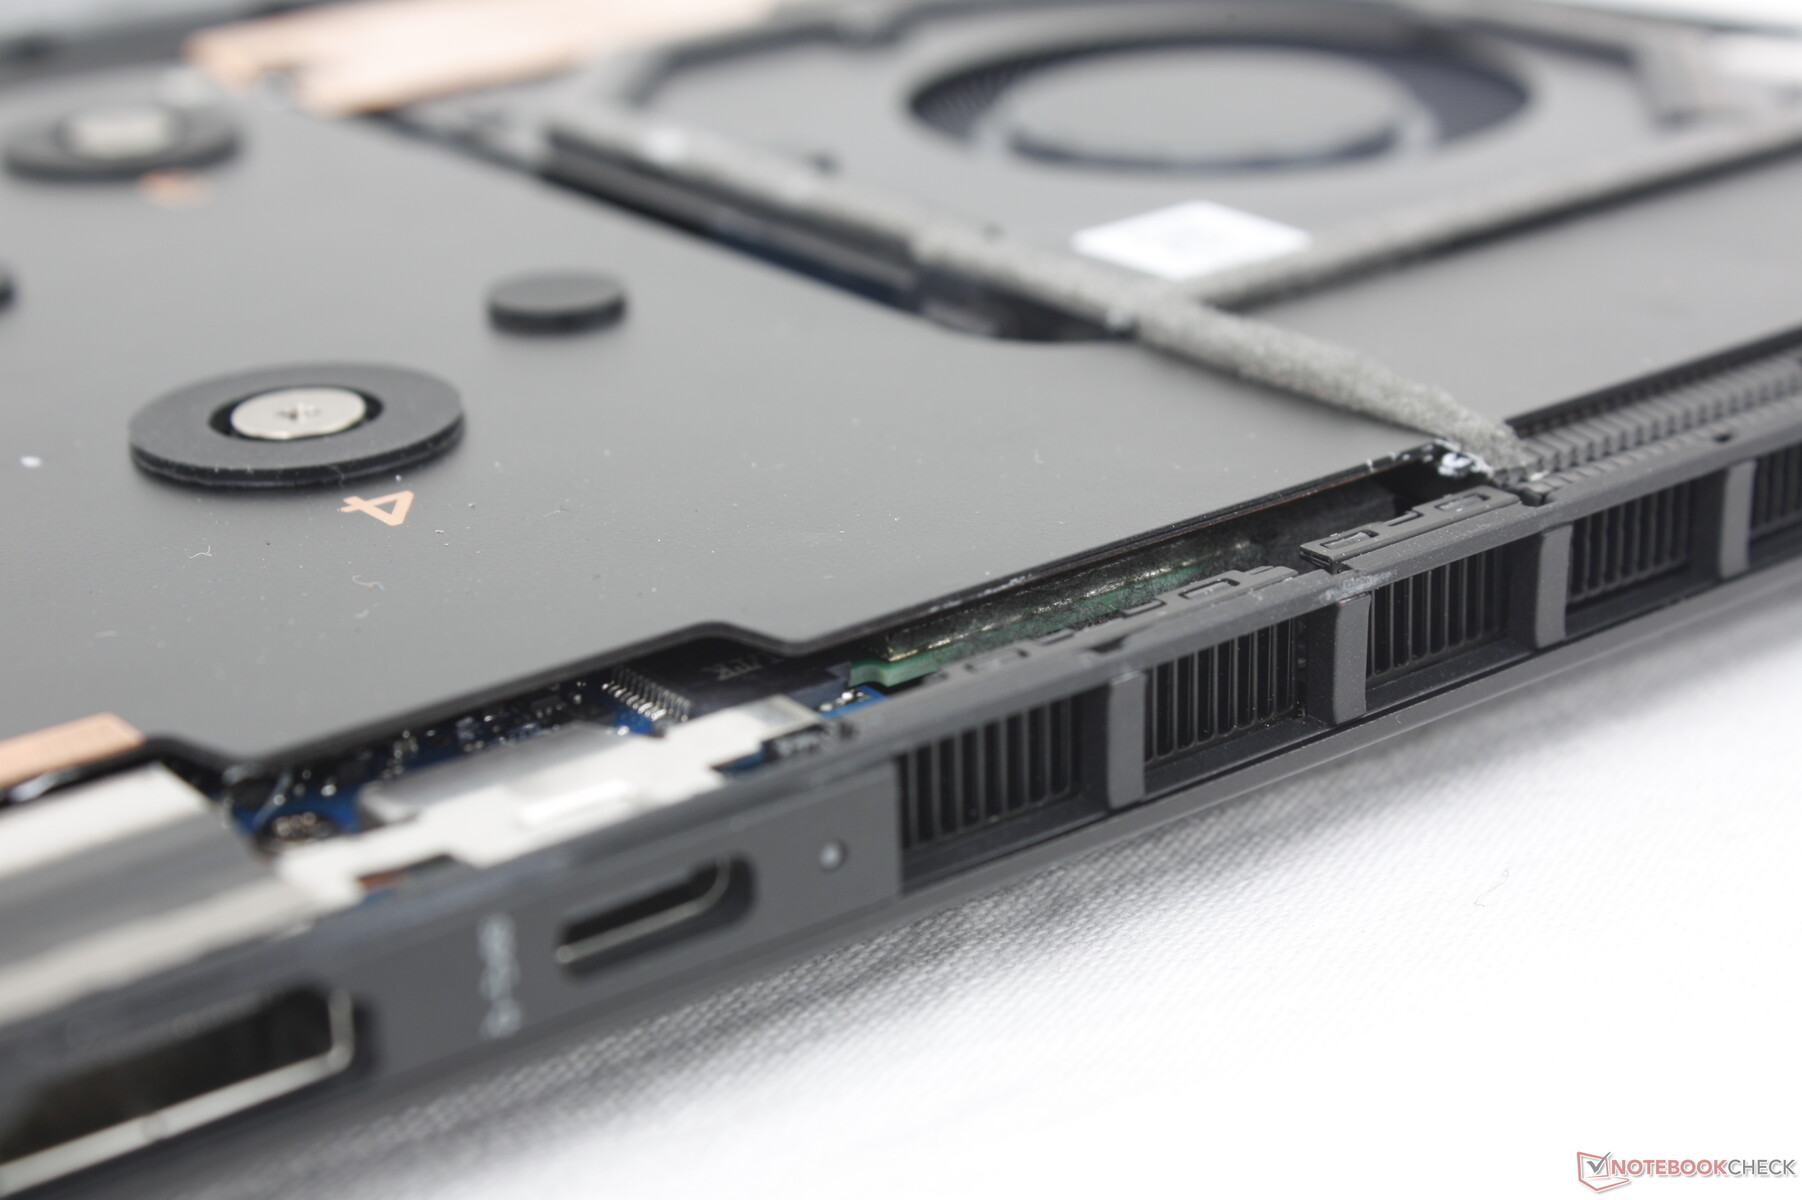
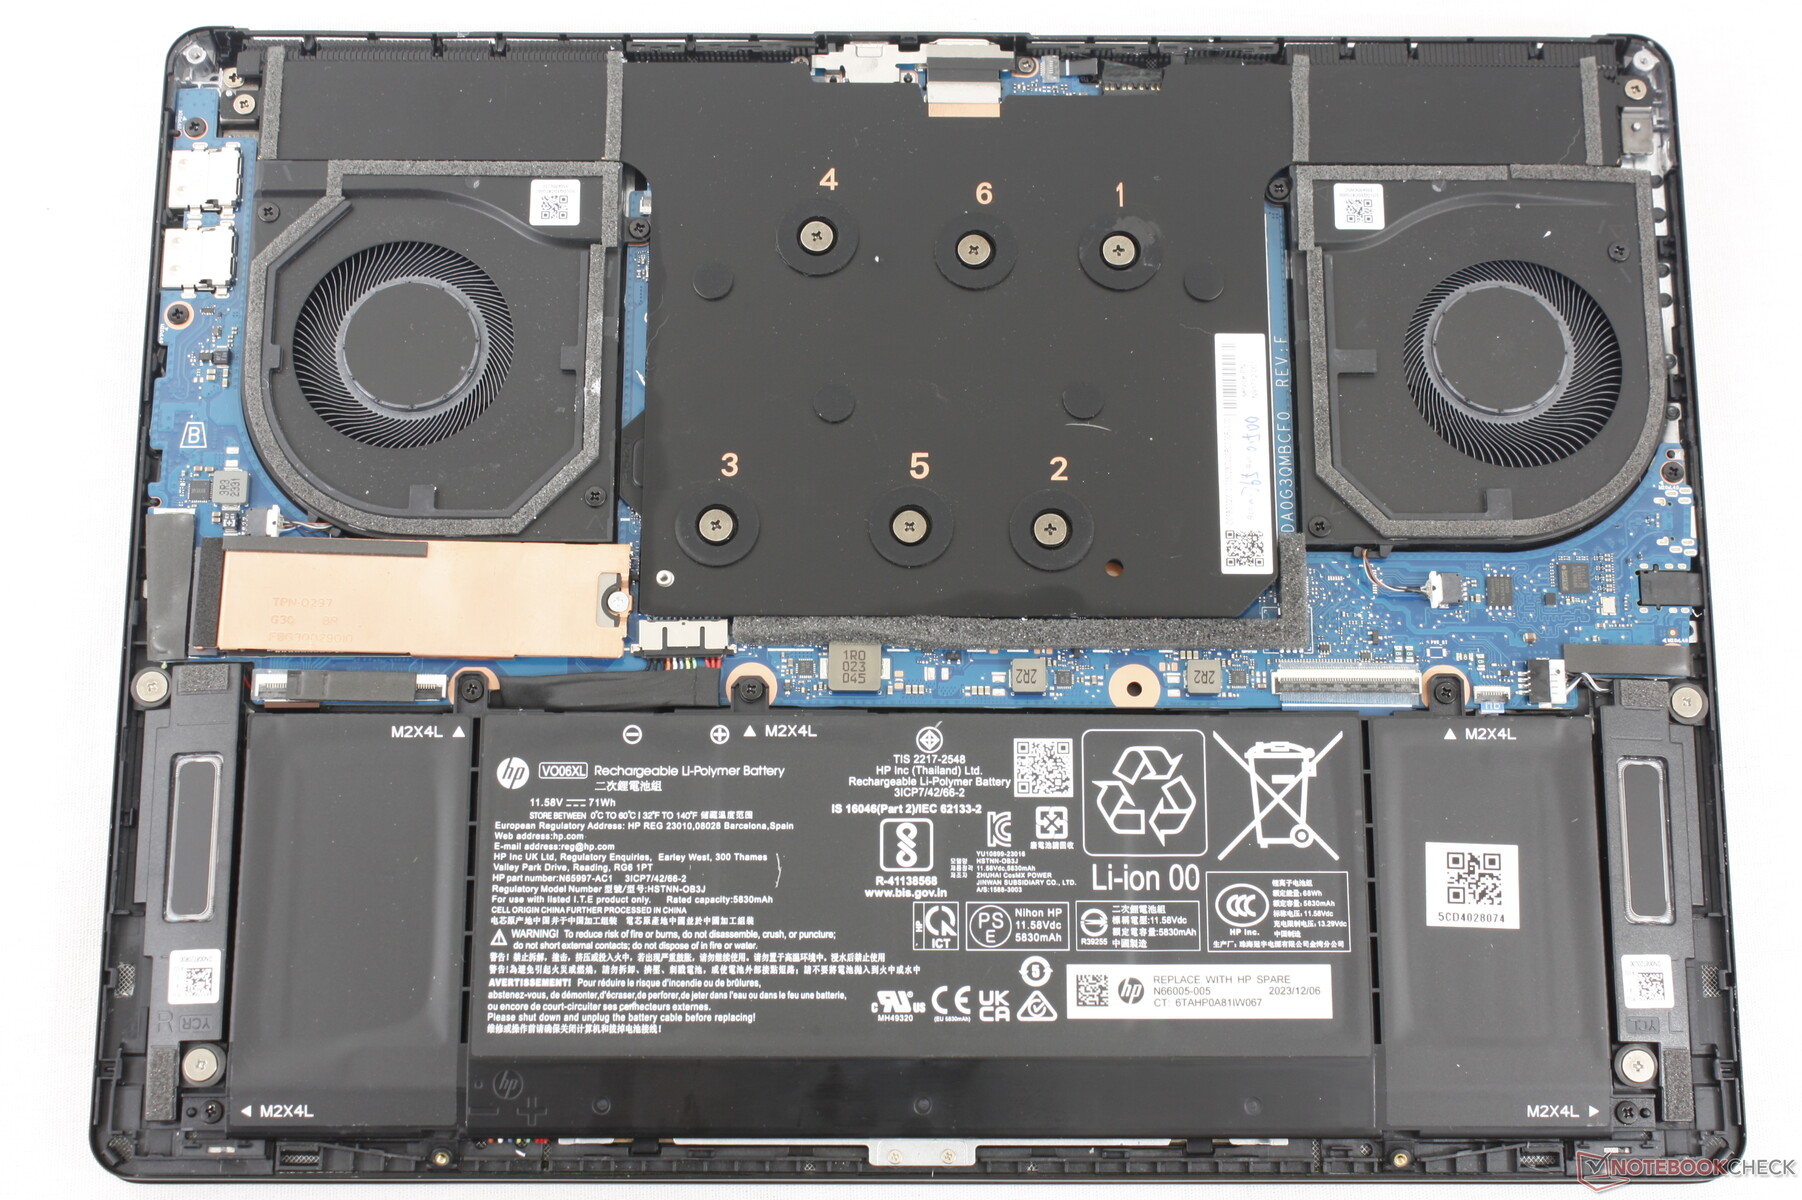
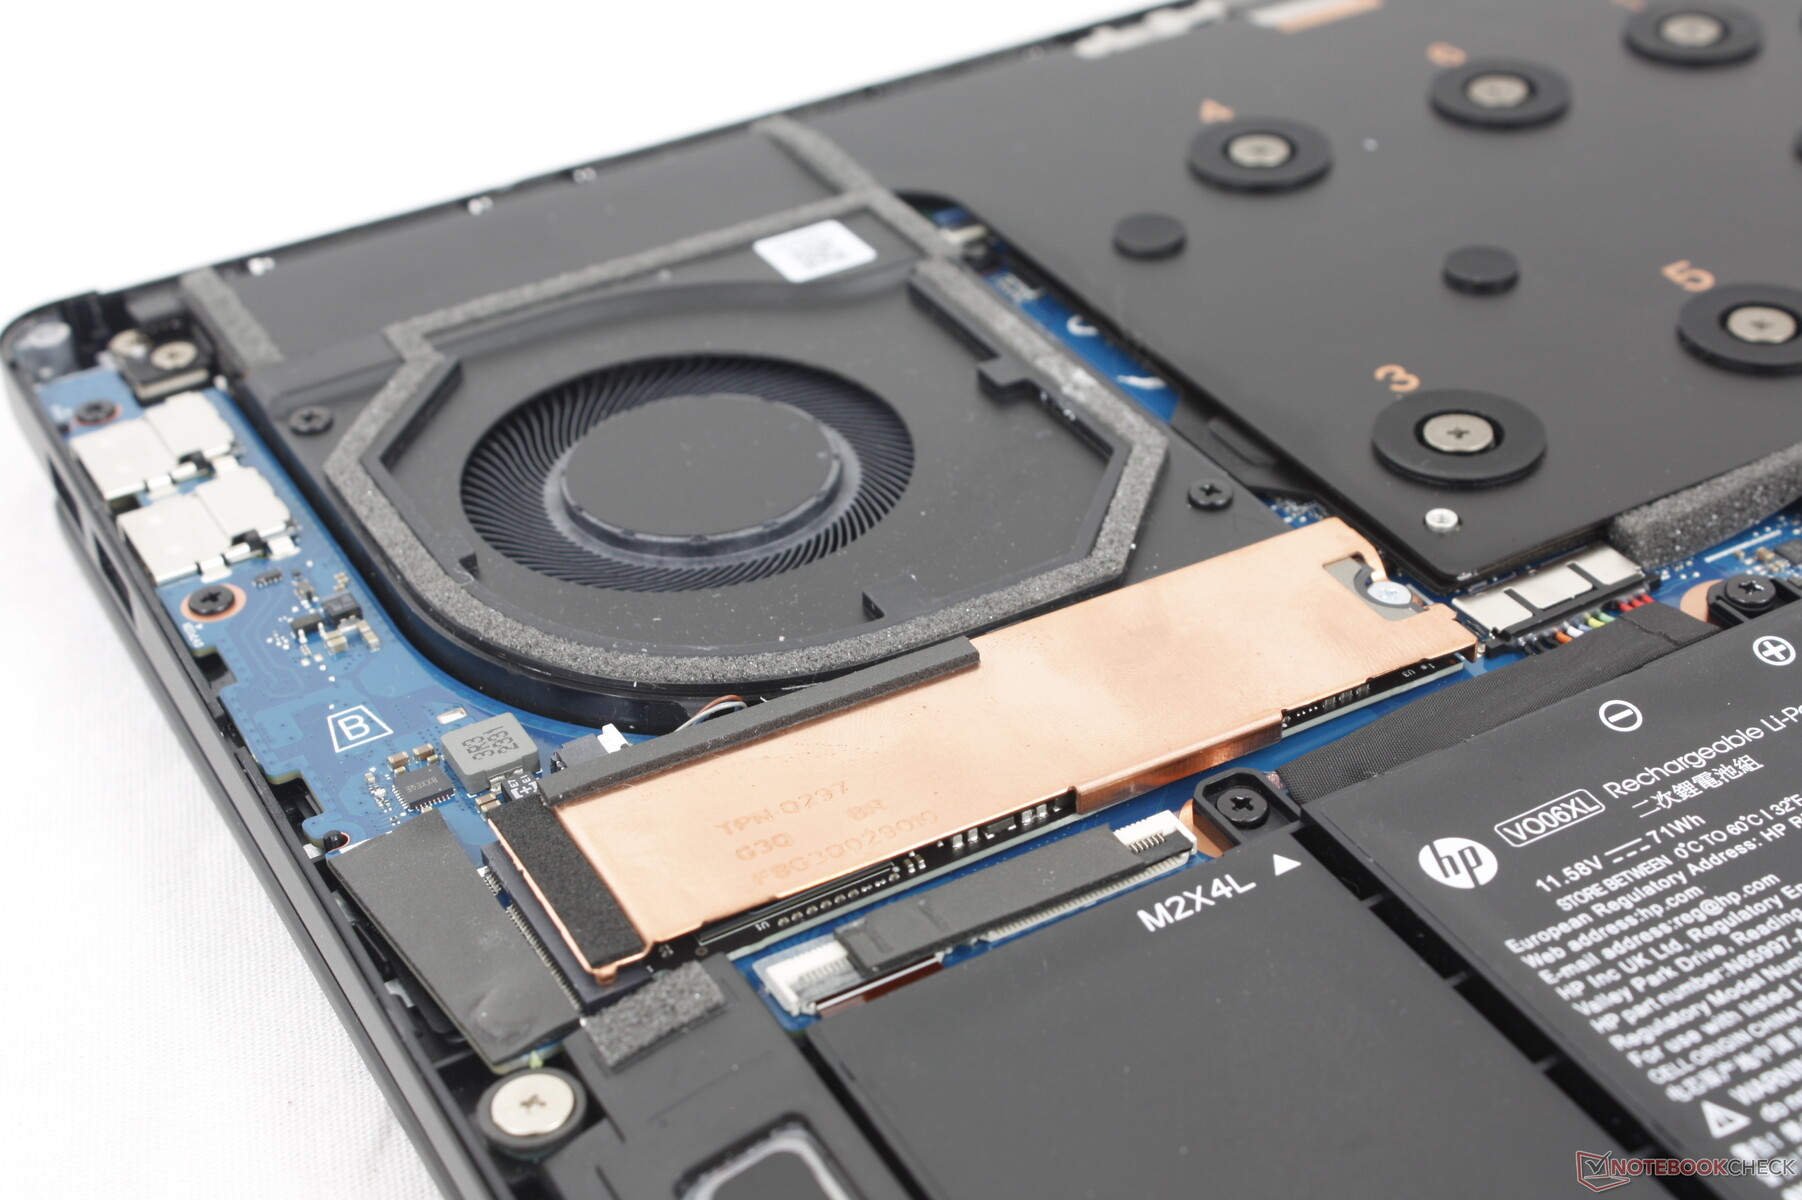
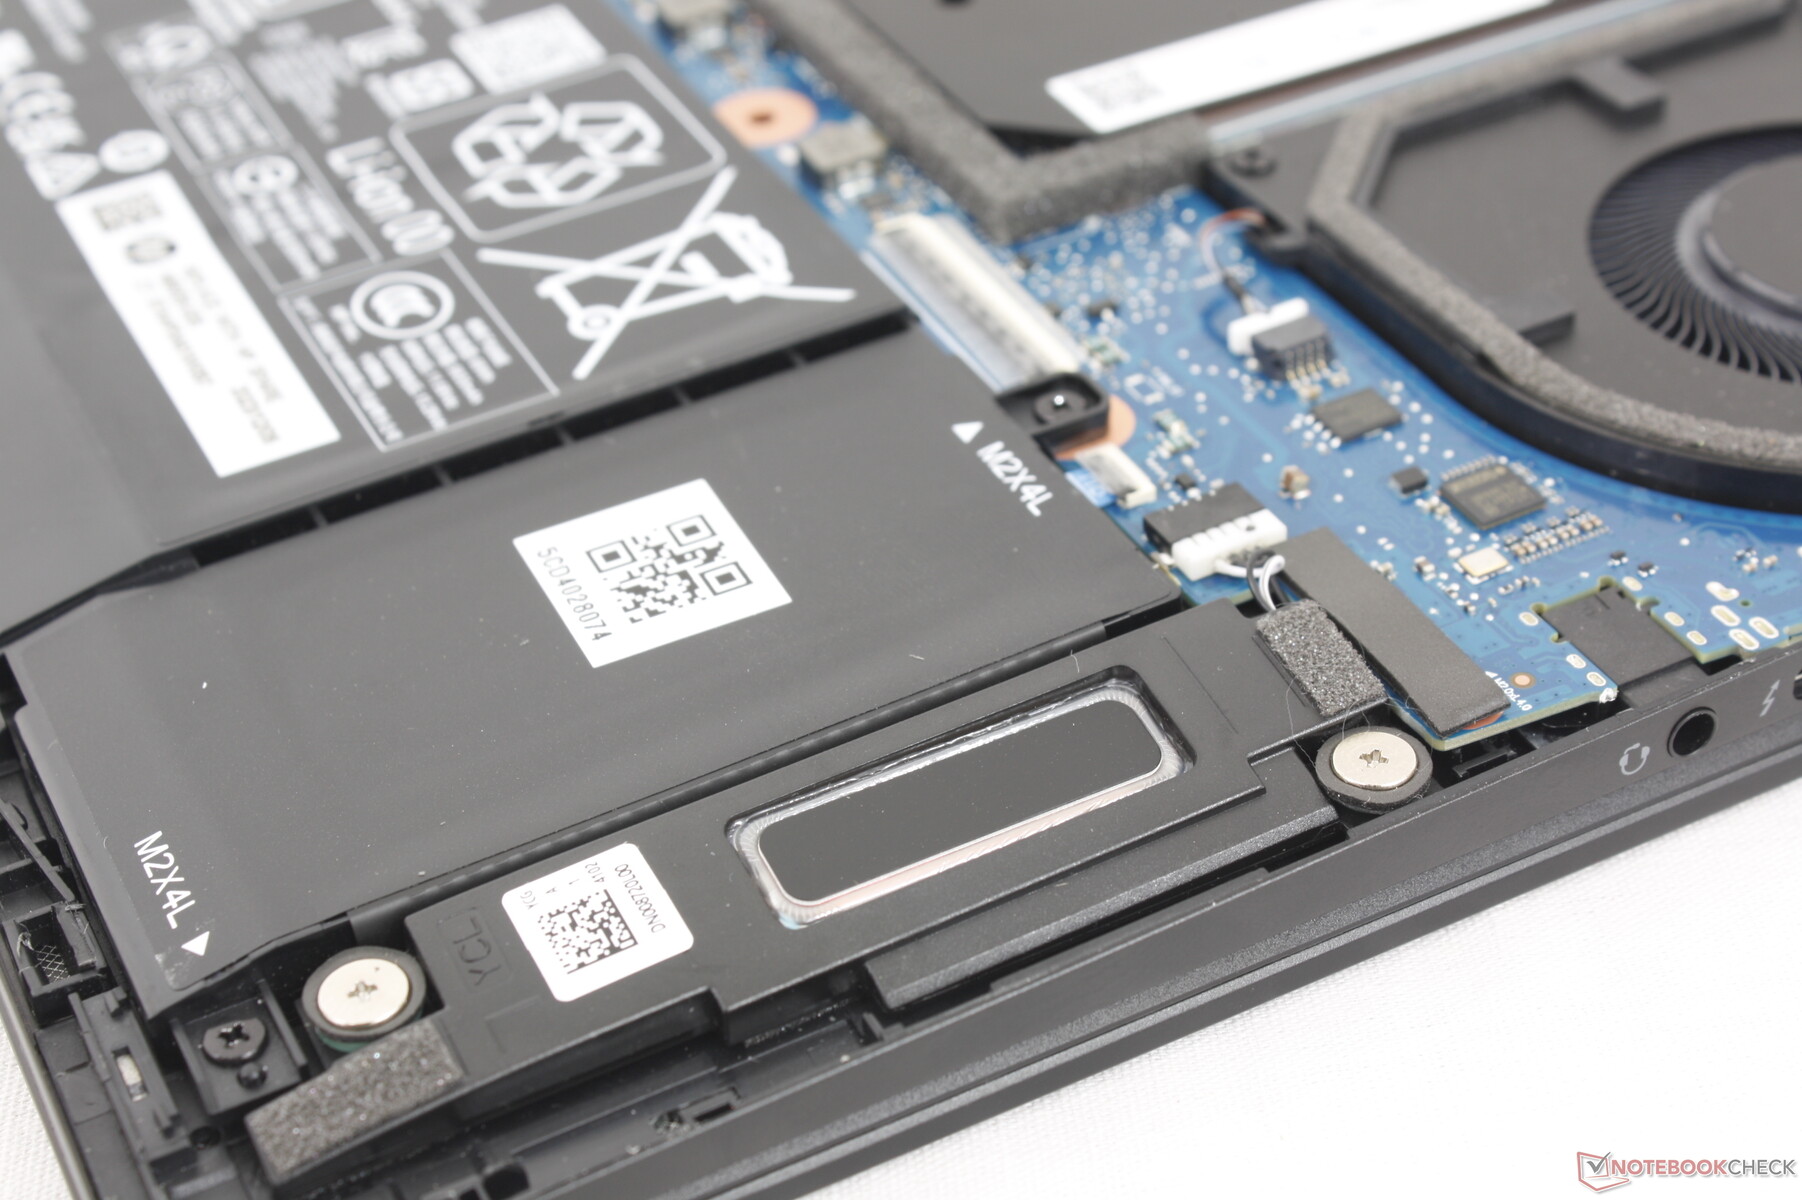
Wartung
Die Bodenplatte ist mit nur vier kleinen Kreuzschlitzschrauben befestigt, was eine relativ einfache Wartung ermöglicht. Die Platte ist jedoch sowohl fest angebracht als auch an den Kanten scharfkantig. Daher empfehlen wir, beim Entfernen der Bodenplatte eine Kunststoffkante wie eine Kreditkarte zu verwenden.
Zubehör & Garantie
Bestimmte Konfigurationen enthalten ein drahtloses HyperX Cloud III Headset. Ansonsten erhält der Käufer den üblichen Papierkram und einen AC-Adapter.
Beim Kauf in Deutschland gilt die übliche einjährige Herstellergarantie.
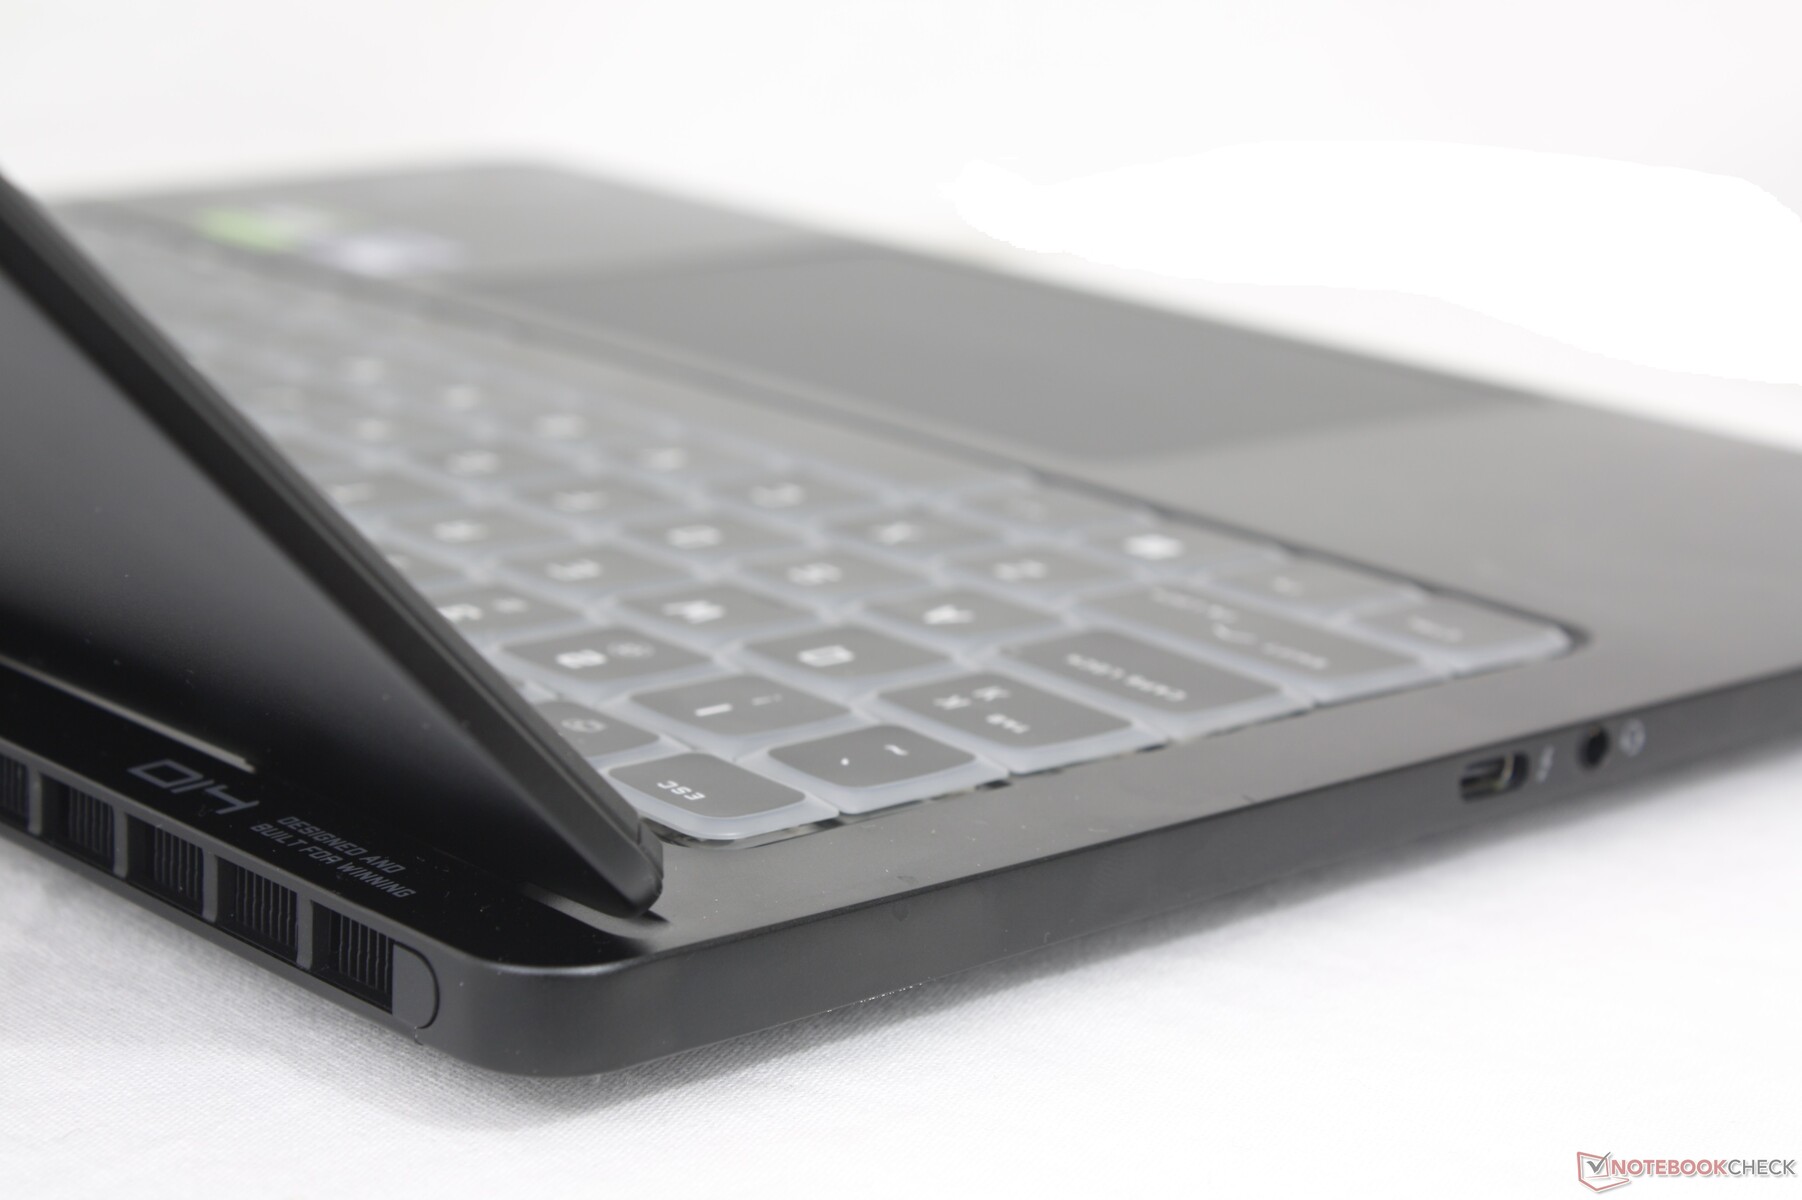
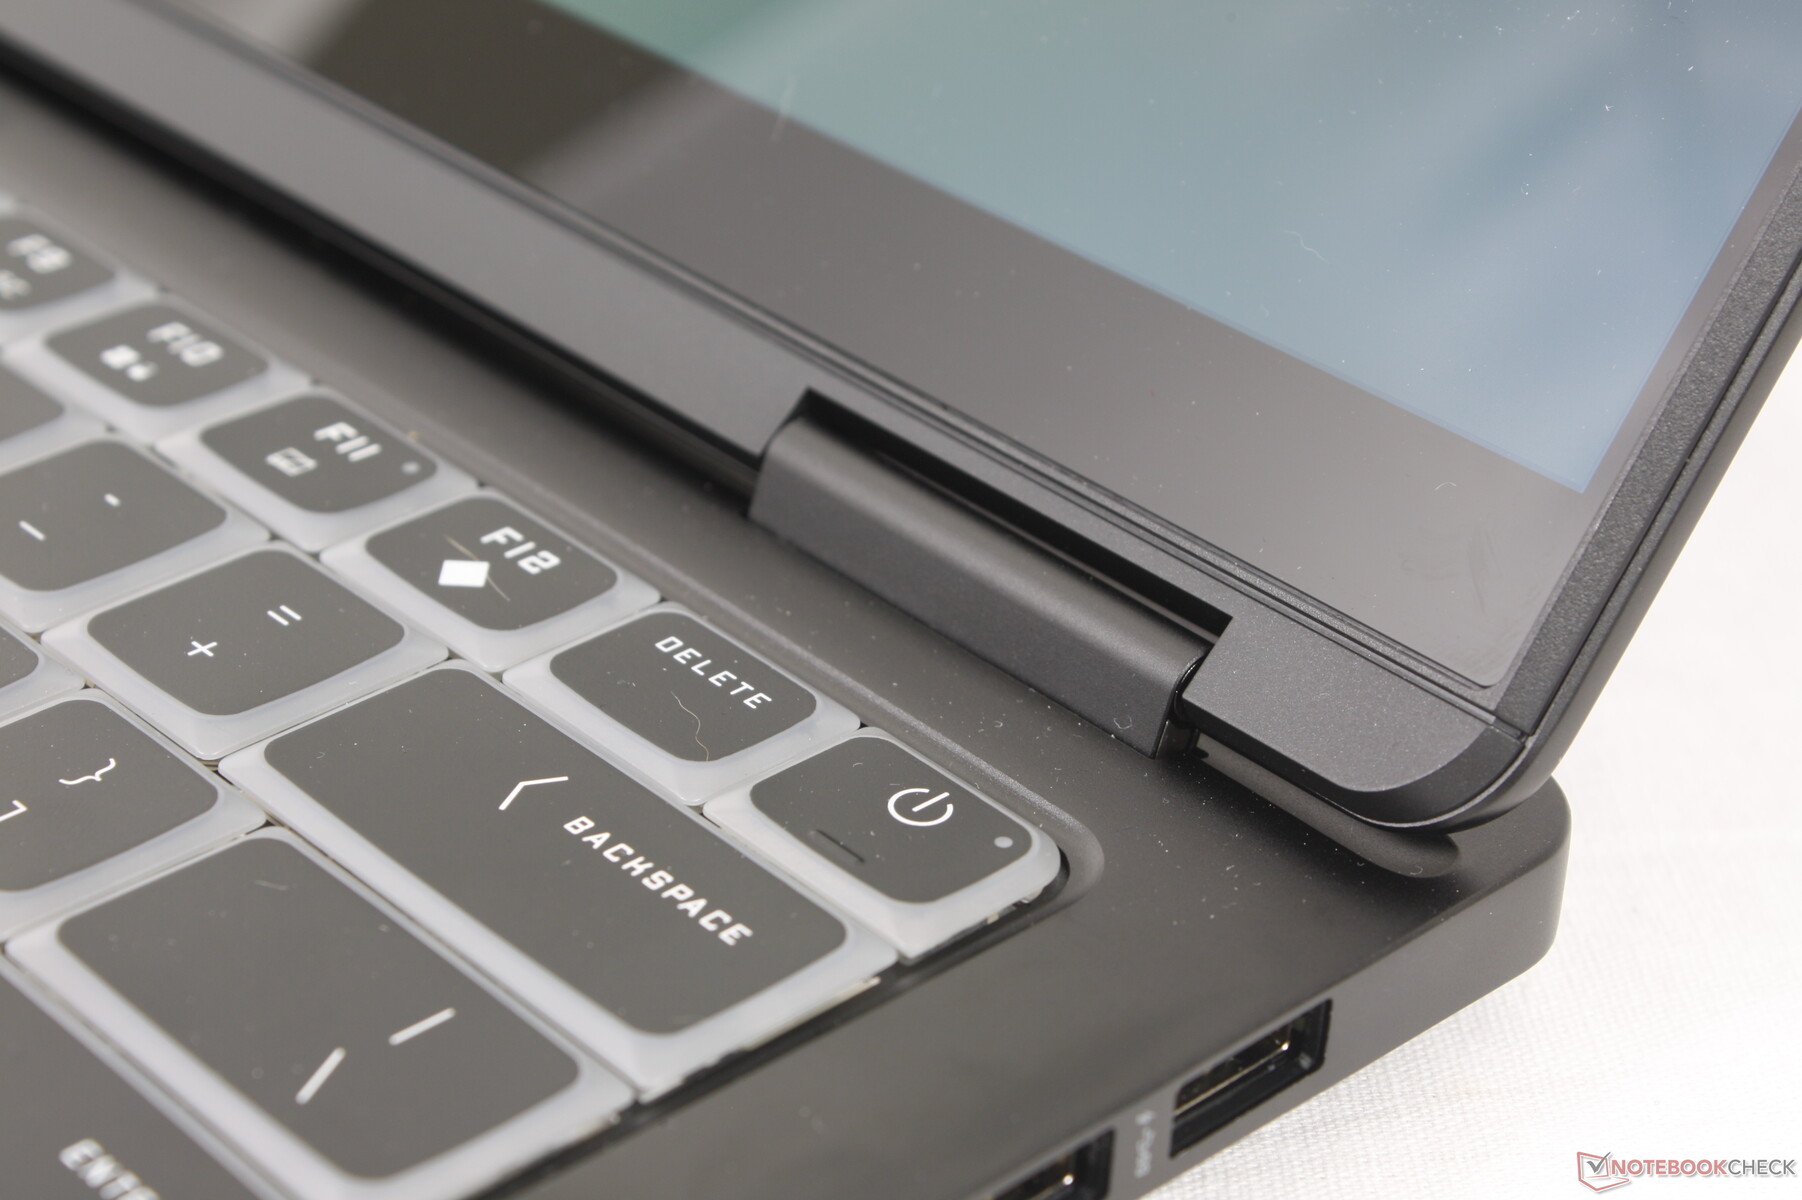
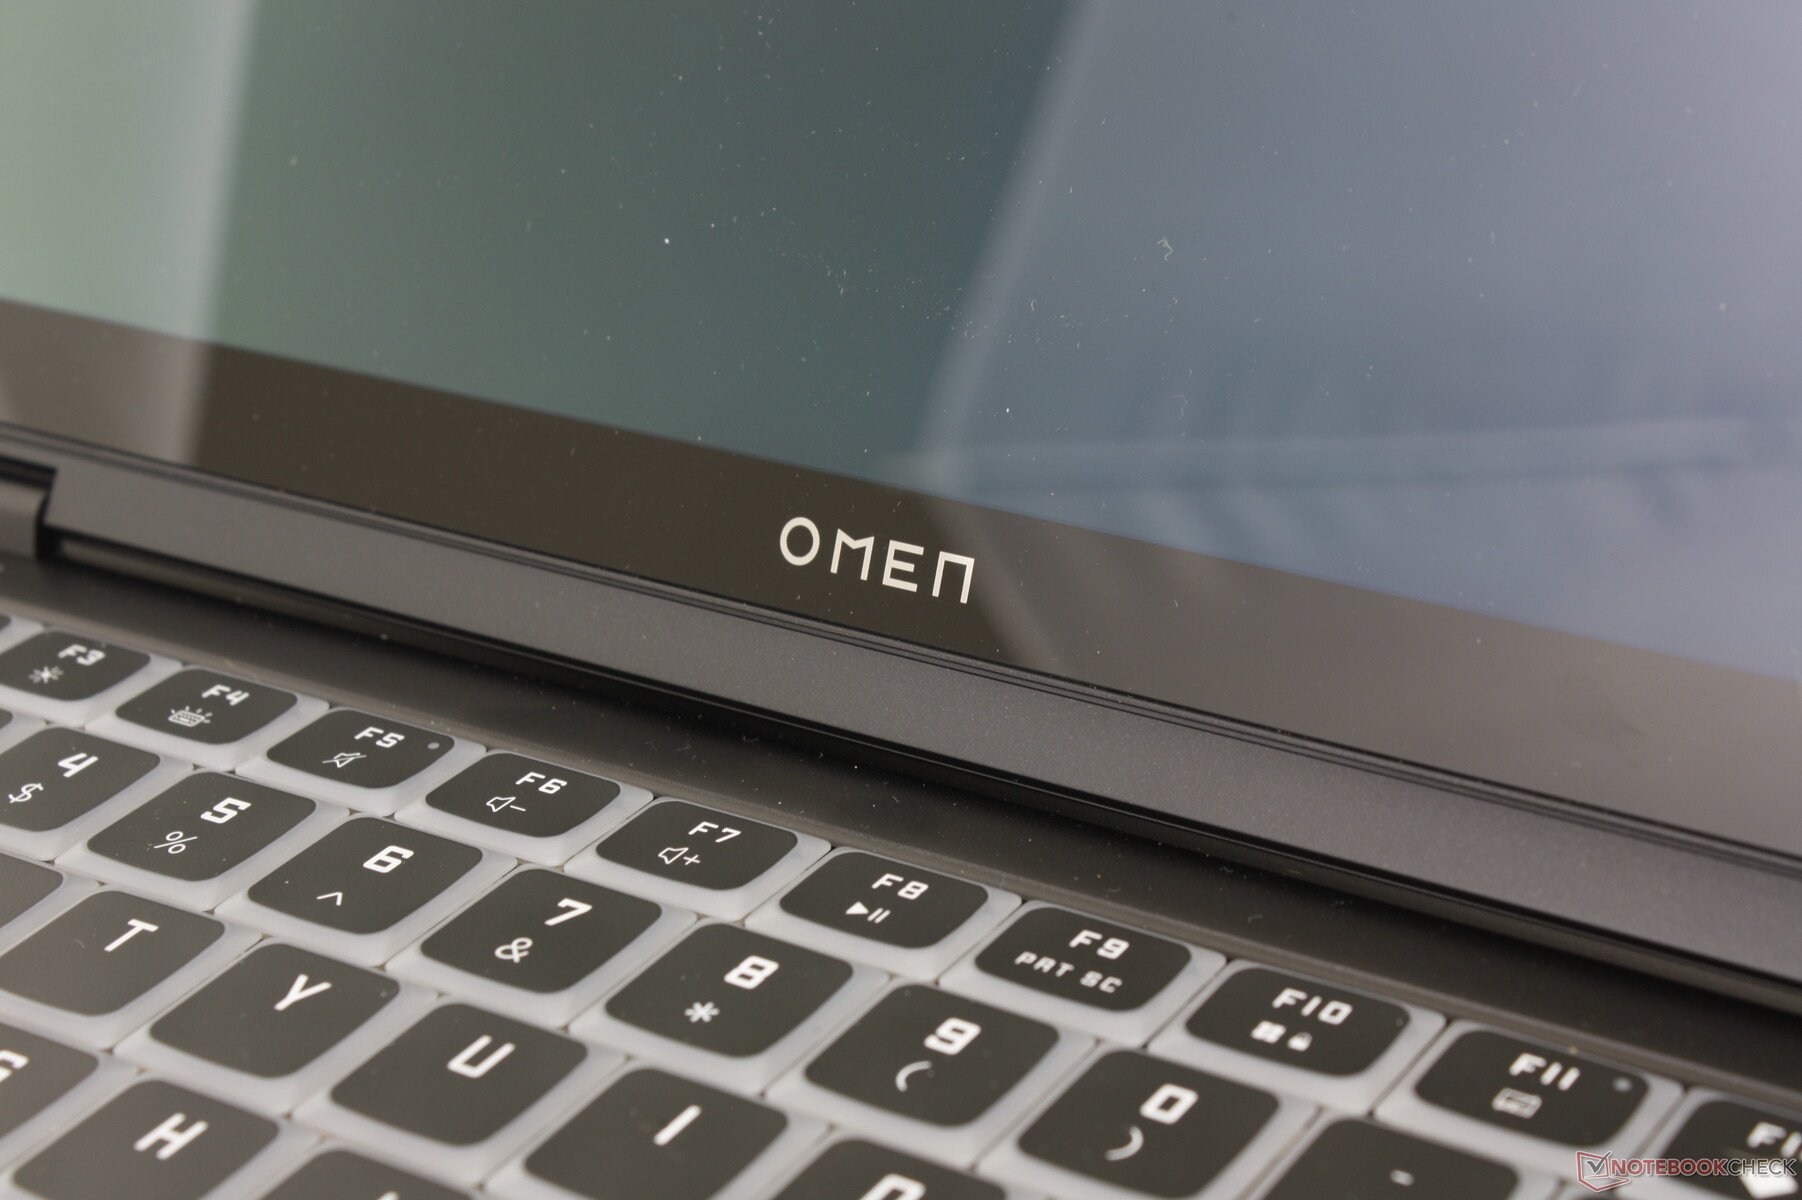
Eingabegeräten — Groß und farbenfroh
Tastatur
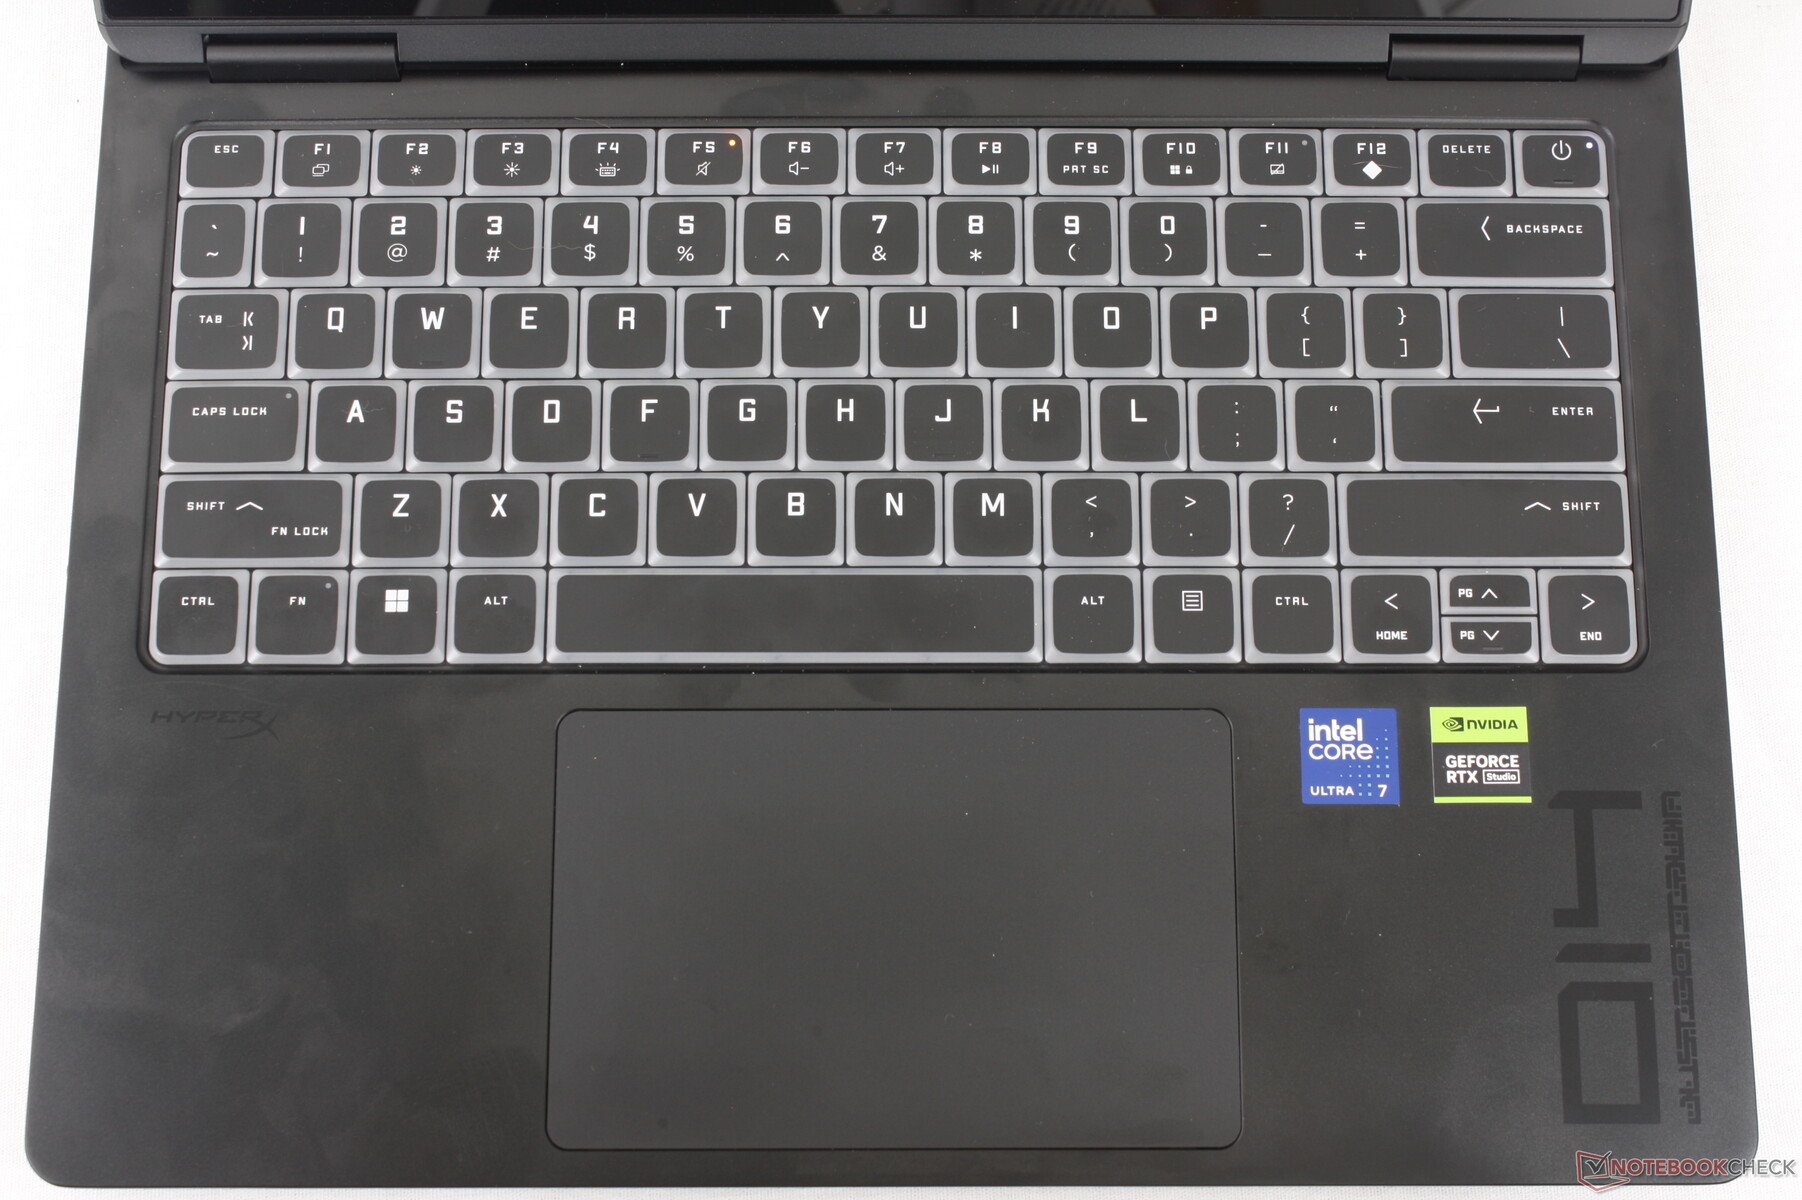
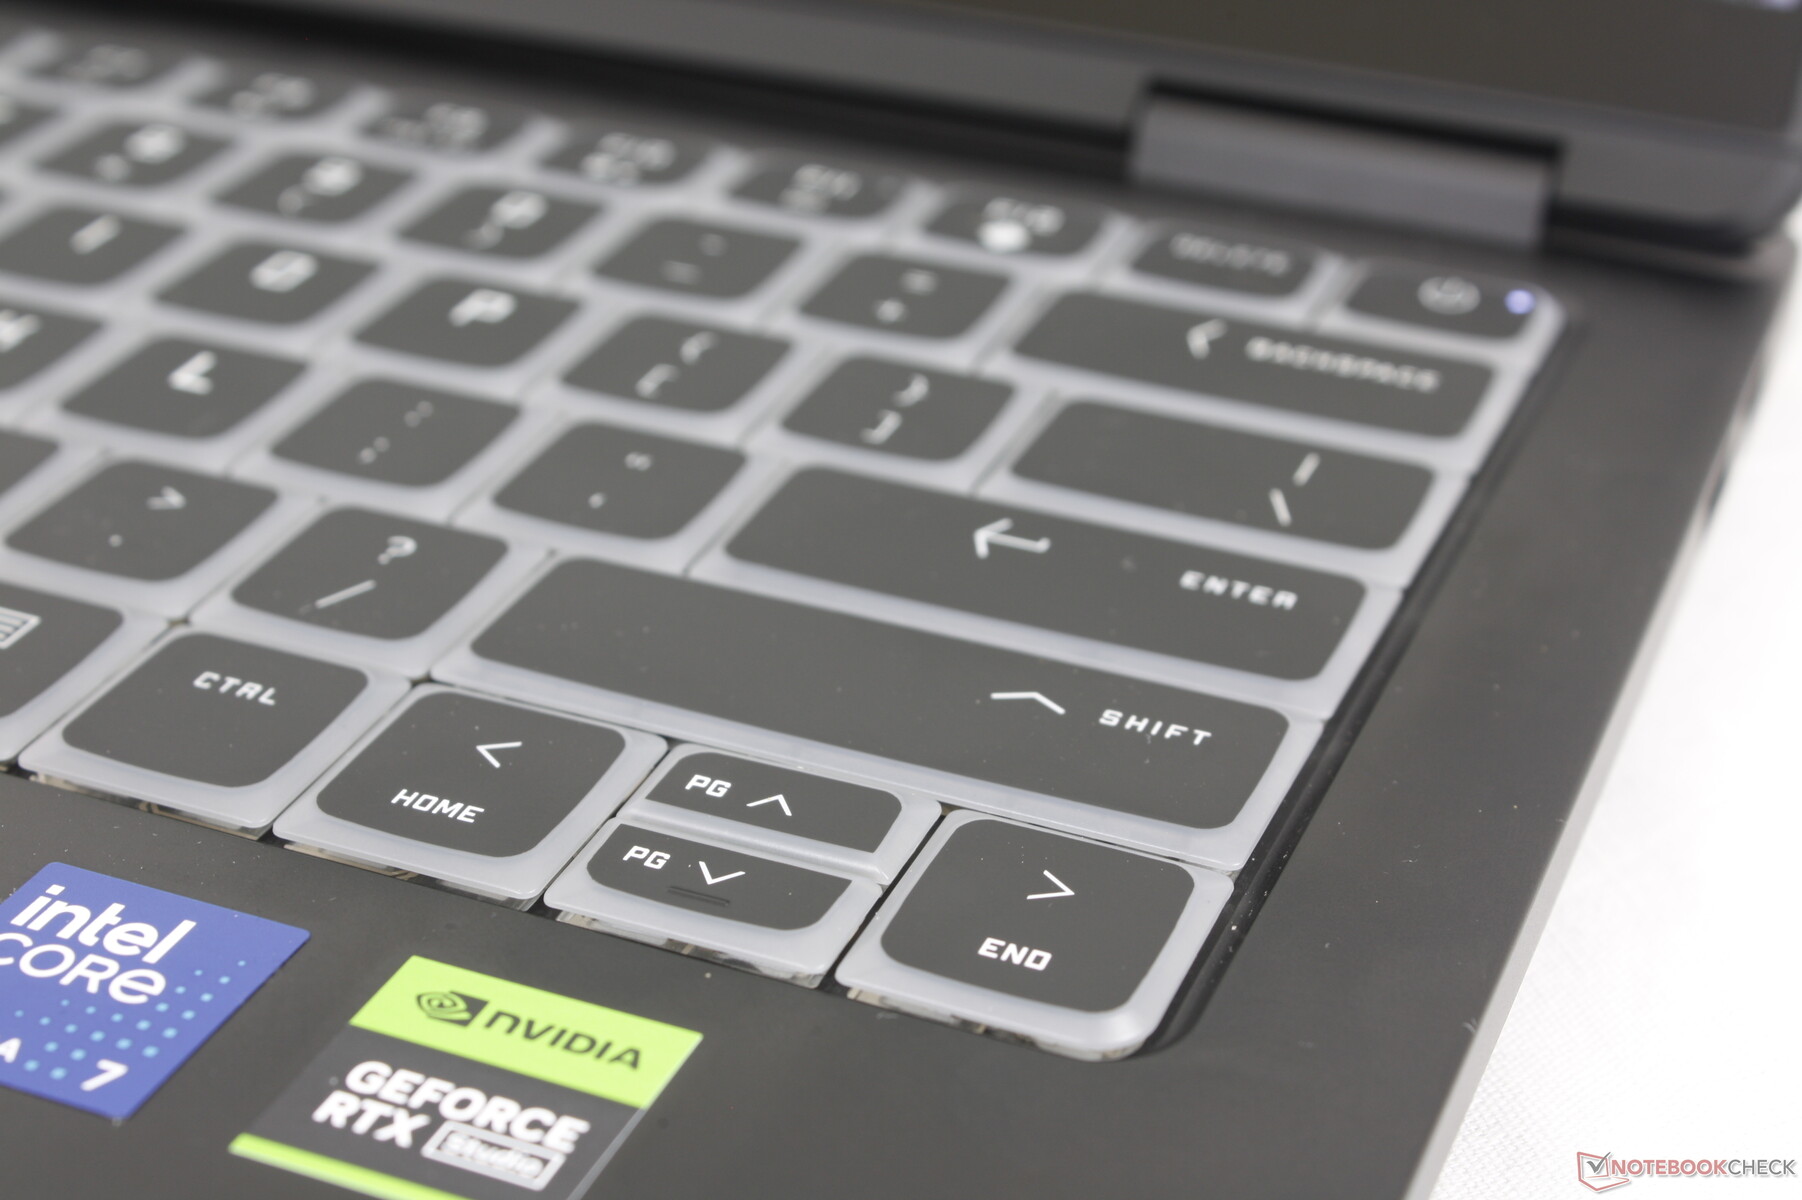
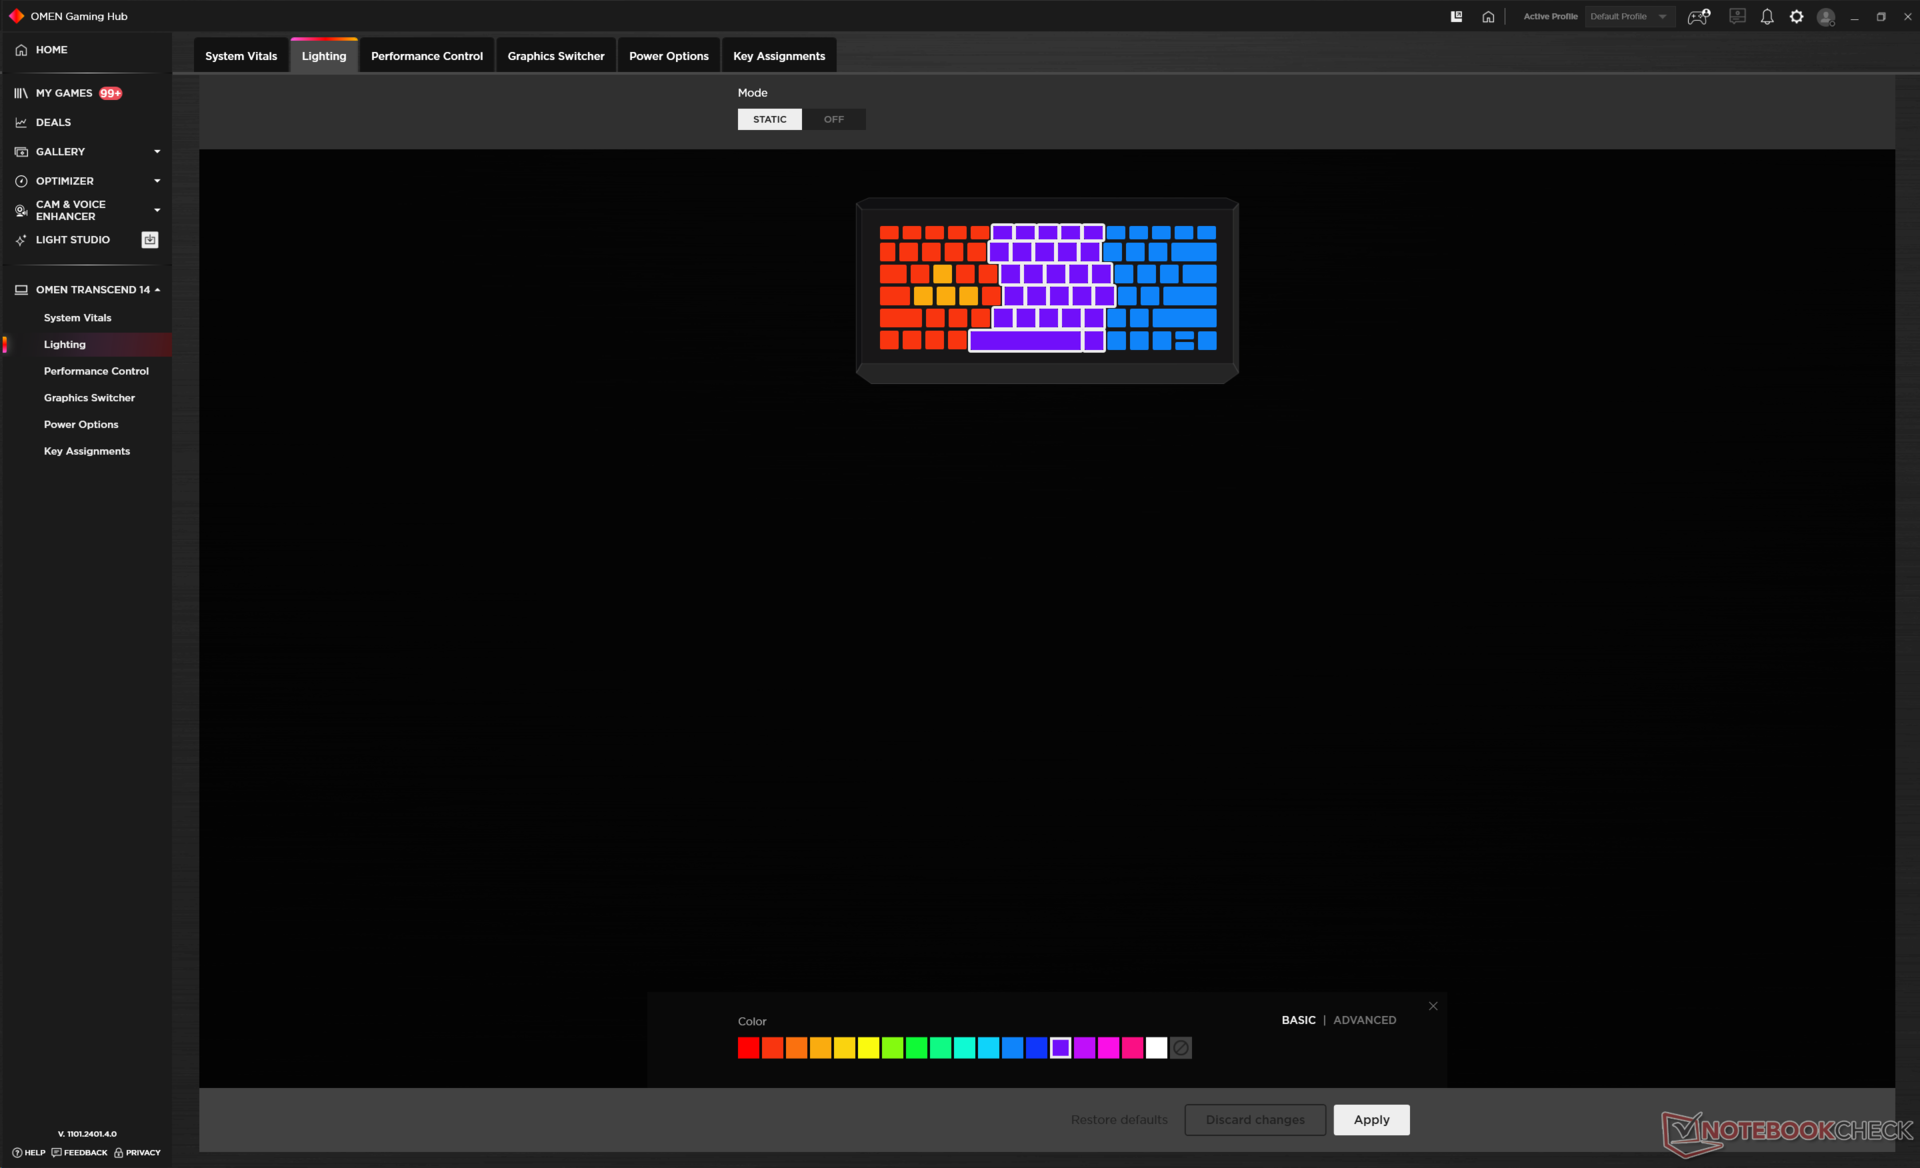
Im Gegensatz zu den Chiclet-Tastaturen der meisten anderen Laptops verfügt das Modell über ein gitterloses Tastaturdesign. Dieser Ansatz ermöglicht größere Tasten mit mehr Lichtdurchlässigkeit um den Umfang herum, um den RGB-Effekt zu maximieren, wenn die Hintergrundbeleuchtung aktiv ist. Es ist zugegebenermaßen eine optisch befriedigende Veränderung, die dazu beiträgt, das Omen Transcend 14 von der Konkurrenz und sogar von anderen Omen-Gaming-Laptops zu unterscheiden.
Das Tippen fühlt sich knackiger und weniger schwammig an als beim Blade 14, aber das Klappern ist dadurch etwas schärfer und lauter. Der Tastenhub ist nach wie vor sehr gering, was eine Folge des dünnen Gehäusedesigns ist.
Beachten Sie, dass die Hintergrundbeleuchtung der Tastatur auf nur vier verschiedene Zonen beschränkt ist, da eine RGB-Beleuchtung pro Taste nicht unterstützt wird.
Touchpad
Das Clickpad ist kleiner als das des Blade 14 (12,5 x 8 cm vs. 15 x 8,5 cm), aber immer noch geräumig für einen 14-Zoll-Bildschirm. Bei mittleren bis hohen Geschwindigkeiten gleitet es geschmeidig, bei niedrigeren Geschwindigkeiten bleibt es für präzisere Klicks oder Aktionen etwas hängen.
Allerdings ist der Hubweg beim Drücken des Clickpads erwartungsgemäß recht gering. Das Feedback ist ausreichend und nichts Ungewöhnliches für ein typisches Ultrabook.


Display - Ähnlich wie Zephyrus G14

Unser HP verwendet ein ähnliches Samsung OLED-Panel wie das des 2024 Zephyrus G14. Beide unterstützen HDR500, eine native Bildwiederholrate von 120 Hz, volle P3-Farben und die gleiche native 1800p-Auflösung. Das Seherlebnis zwischen den beiden Modellen ist daher im Wesentlichen das gleiche, trotz der viel höheren Startpreise des Asus. Bemerkenswert ist, dass das Blade 14 das einzige der drei Modelle ist, das keine OLED- oder HDR-Konfiguration hat.
Die maximale Helligkeit von 500 nits kann nur erreicht werden, wenn HDR aktiviert ist und die Inhalte HDR unterstützen. Ansonsten sind normale SDR-Inhalte auf knapp 400 nits begrenzt.
Das OLED-Display ist eines der wenigen, das die dynamische Bildwiederholfrequenz von Windows zwischen 60 Hz und 120 Hz unterstützt. Leider wird VRR in Spielen (G-Sync oder FreeSync) nicht unterstützt.
| |||||||||||||||||||||||||
Ausleuchtung: 98 %
Helligkeit Akku: 386.3 cd/m²
Kontrast: ∞:1 (Schwarzwert: 0 cd/m²)
ΔE ColorChecker Calman: 4.03 | ∀{0.5-29.43 Ø4.73}
calibrated: 1.07
ΔE Greyscale Calman: 1.2 | ∀{0.09-98 Ø4.97}
96.1% AdobeRGB 1998 (Argyll 3D)
100% sRGB (Argyll 3D)
99.6% Display P3 (Argyll 3D)
Gamma: 2.25
CCT: 6280 K
| HP Omen Transcend 14-fb0014 Samsung SDC4197, OLED, 2880x1800, 14" | Asus ROG Zephyrus G14 2024 GA403U ATNA40CU05-0, OLED, 2880x1800, 14" | Razer Blade 14 RZ09-0508 TL140ADXP04-0, IPS, 2560x1600, 14" | Lenovo Legion Slim 5 14APH8 Samsung SDC ATNA45AF02-2, OLED, 2880x1600, 14.5" | Apple MacBook Pro 14 2023 M3 Max Mini-LED, 3024x1964, 14.2" | Microsoft Surface Laptop Studio 2 RTX 4060 LQ144P1JX01, IPS, 2400x1600, 14.4" | |
|---|---|---|---|---|---|---|
| Display | -2% | -5% | 0% | 0% | -21% | |
| Display P3 Coverage (%) | 99.6 | 99.6 0% | 96.9 -3% | 99.9 0% | 99.2 0% | 66.7 -33% |
| sRGB Coverage (%) | 100 | 100 0% | 99.8 0% | 100 0% | 99 -1% | |
| AdobeRGB 1998 Coverage (%) | 96.1 | 89.9 -6% | 85 -12% | 96.5 0% | 68.9 -28% | |
| Response Times | 30% | -668% | 3% | -8578% | -6144% | |
| Response Time Grey 50% / Grey 80% * (ms) | 0.86 ? | 0.62 ? 28% | 6 ? -598% | 0.79 ? 8% | 80.8 ? -9295% | 77.6 ? -8923% |
| Response Time Black / White * (ms) | 0.99 ? | 0.68 ? 31% | 8.3 ? -738% | 1.01 ? -2% | 78.8 ? -7860% | 34.3 ? -3365% |
| PWM Frequency (Hz) | 479 ? | 960 ? | 240.5 ? | 14878 ? | 17600 ? | |
| Bildschirm | 35% | 16% | 1% | 27% | 43% | |
| Helligkeit Bildmitte (cd/m²) | 386.3 | 423 10% | 484.1 25% | 377.5 -2% | 610 58% | 511 32% |
| Brightness (cd/m²) | 389 | 424 9% | 466 20% | 381 -2% | 600 54% | 503 29% |
| Brightness Distribution (%) | 98 | 98 0% | 89 -9% | 97 -1% | 96 -2% | 89 -9% |
| Schwarzwert * (cd/m²) | 0.01 | 0.38 | 0.26 | |||
| Delta E Colorchecker * | 4.03 | 0.7 83% | 2.23 45% | 4.19 -4% | 1.7 58% | 0.5 88% |
| Colorchecker dE 2000 max. * | 6.69 | 1.8 73% | 4.57 32% | 7.02 -5% | 2.3 66% | 1.1 84% |
| Colorchecker dE 2000 calibrated * | 1.07 | 0.74 31% | 0.81 24% | |||
| Delta E Graustufen * | 1.2 | 0.8 33% | 1.6 -33% | 1.2 -0% | 2.1 -75% | 0.8 33% |
| Gamma | 2.25 98% | 2.18 101% | 2.24 98% | 2.22 99% | 2.22 99% | 2.19 100% |
| CCT | 6280 104% | 6505 100% | 6816 95% | 6296 103% | 6874 95% | 6650 98% |
| Kontrast (:1) | 42300 | 1274 | 1965 | |||
| Durchschnitt gesamt (Programm / Settings) | 21% /
24% | -219% /
-103% | 1% /
1% | -2850% /
-1888% | -2041% /
-1099% |
* ... kleinere Werte sind besser
Reaktionszeiten (Response Times) des Displays
| ↔ Reaktionszeiten Schwarz zu Weiß | ||
|---|---|---|
| 0.99 ms ... steigend ↗ und fallend ↘ kombiniert | ↗ 0.46 ms steigend | 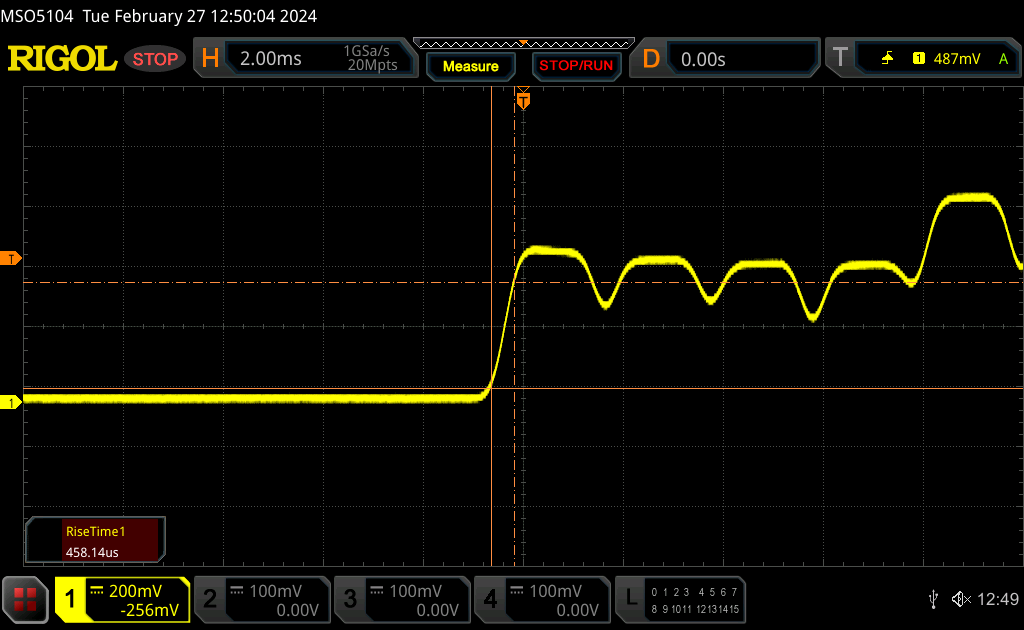 |
| ↘ 0.53 ms fallend | ||
| Die gemessenen Reaktionszeiten sind sehr kurz, wodurch sich der Bildschirm auch für schnelle 3D Spiele eignen sollte. Im Vergleich rangierten die bei uns getesteten Geräte von 0.1 (Minimum) zu 240 (Maximum) ms. » 4 % aller Screens waren schneller als der getestete. Daher sind die gemessenen Reaktionszeiten besser als der Durchschnitt aller vermessenen Geräte (19.9 ms). | ||
| ↔ Reaktionszeiten 50% Grau zu 80% Grau | ||
| 0.86 ms ... steigend ↗ und fallend ↘ kombiniert | ↗ 0.45 ms steigend | 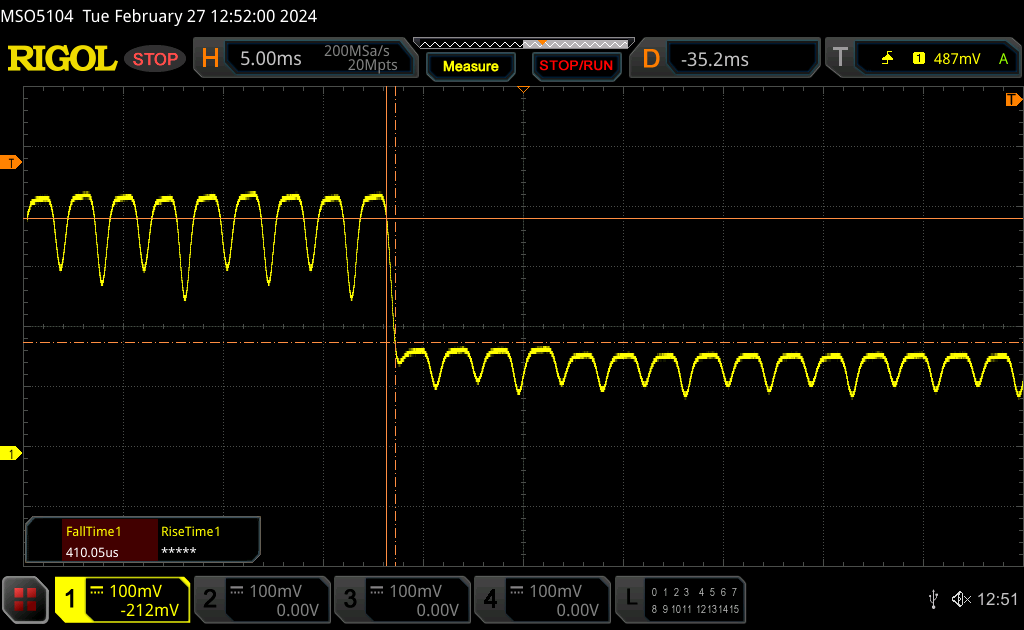 |
| ↘ 0.41 ms fallend | ||
| Die gemessenen Reaktionszeiten sind sehr kurz, wodurch sich der Bildschirm auch für schnelle 3D Spiele eignen sollte. Im Vergleich rangierten die bei uns getesteten Geräte von 0.165 (Minimum) zu 636 (Maximum) ms. » 3 % aller Screens waren schneller als der getestete. Daher sind die gemessenen Reaktionszeiten besser als der Durchschnitt aller vermessenen Geräte (31.1 ms). | ||
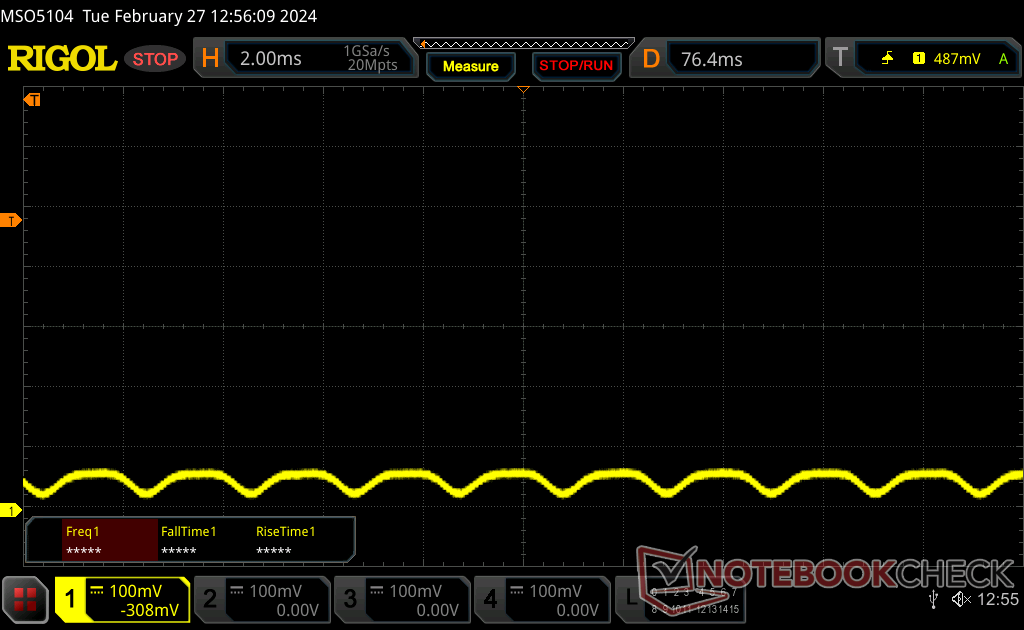
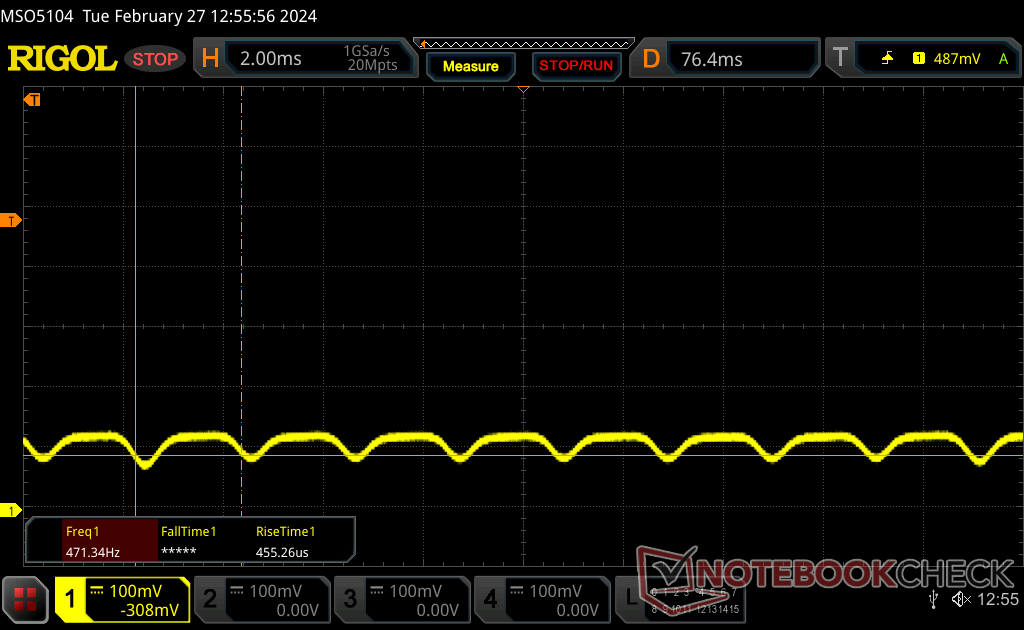
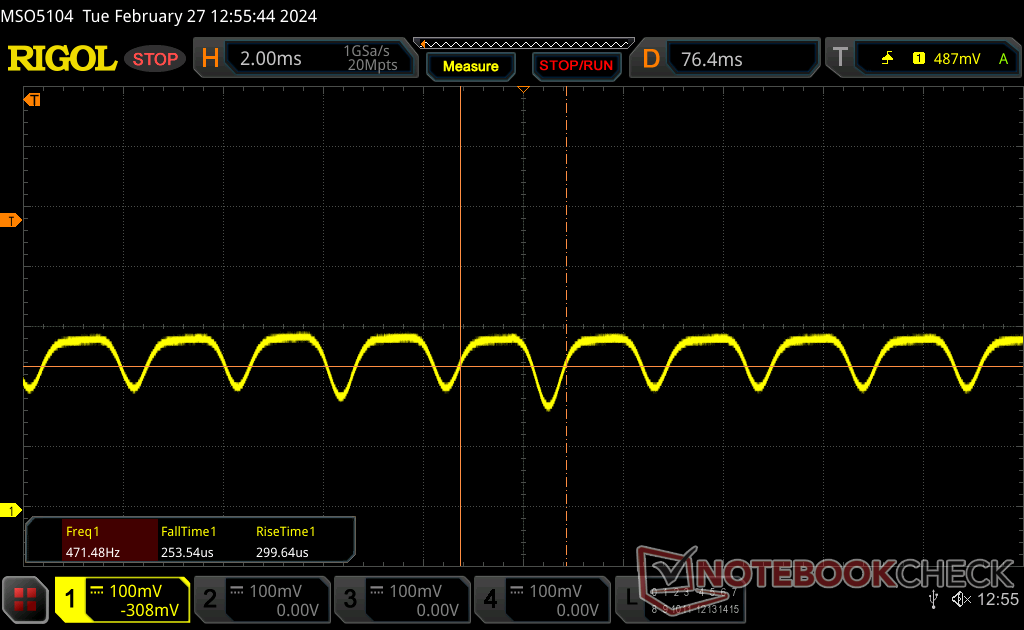
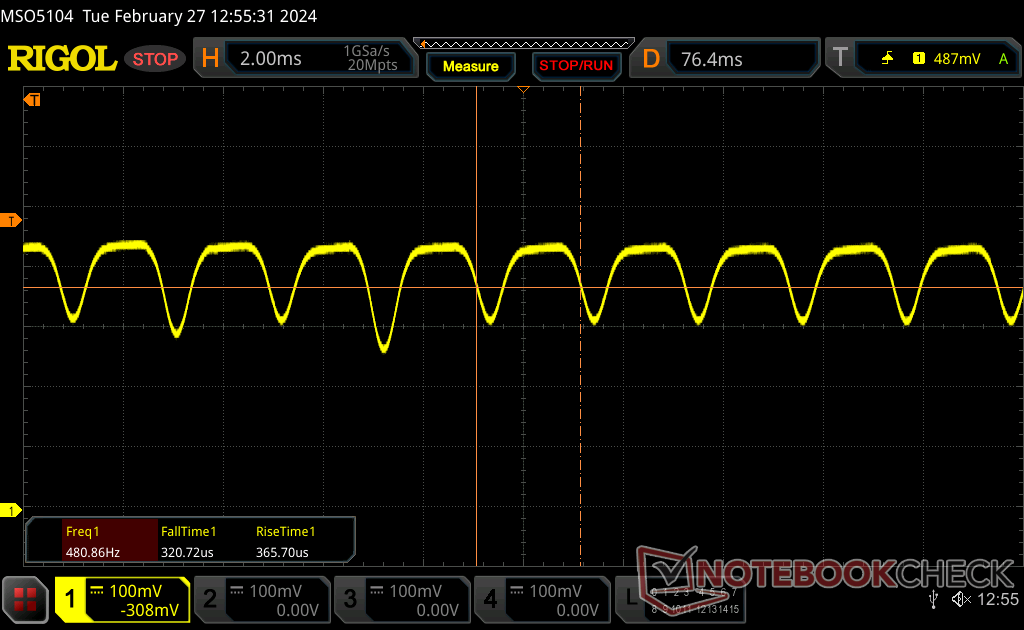
Bildschirm-Flackern / PWM (Pulse-Width Modulation)
| Flackern / PWM festgestellt | 479 Hz | ≤ 100 % Helligkeit | 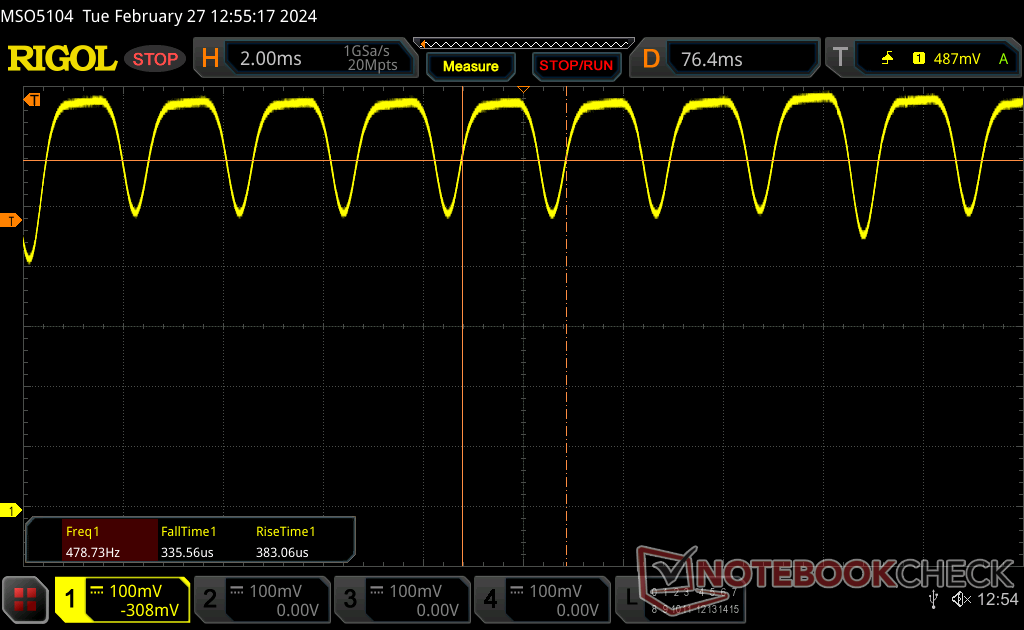 |
Das Display flackert mit 479 Hz (im schlimmsten Fall, eventuell durch Pulsweitenmodulation PWM) bei einer eingestellten Helligkeit von 100 % und darunter. Darüber sollte es zu keinem Flackern kommen. Die Frequenz von 479 Hz ist relativ hoch und sollte daher auch bei den meisten Personen zu keinen Problemen führen. Empfindliche User sollen laut Berichten aber sogar noch bei 500 Hz und darüber ein Flackern wahrnehmen. Im Vergleich: 52 % aller getesteten Geräte nutzten kein PWM um die Helligkeit zu reduzieren. Wenn PWM eingesetzt wurde, dann bei einer Frequenz von durchschnittlich 7798 (Minimum 5, Maximum 343500) Hz. | |||
Eine konstante Pulsweitenmodulation von 479 Hz ist bei allen Helligkeitsstufen von 0 bis 100 Prozent erkennbar. Die Frequenz ändert sich unabhängig von der Prozentzahl nicht.
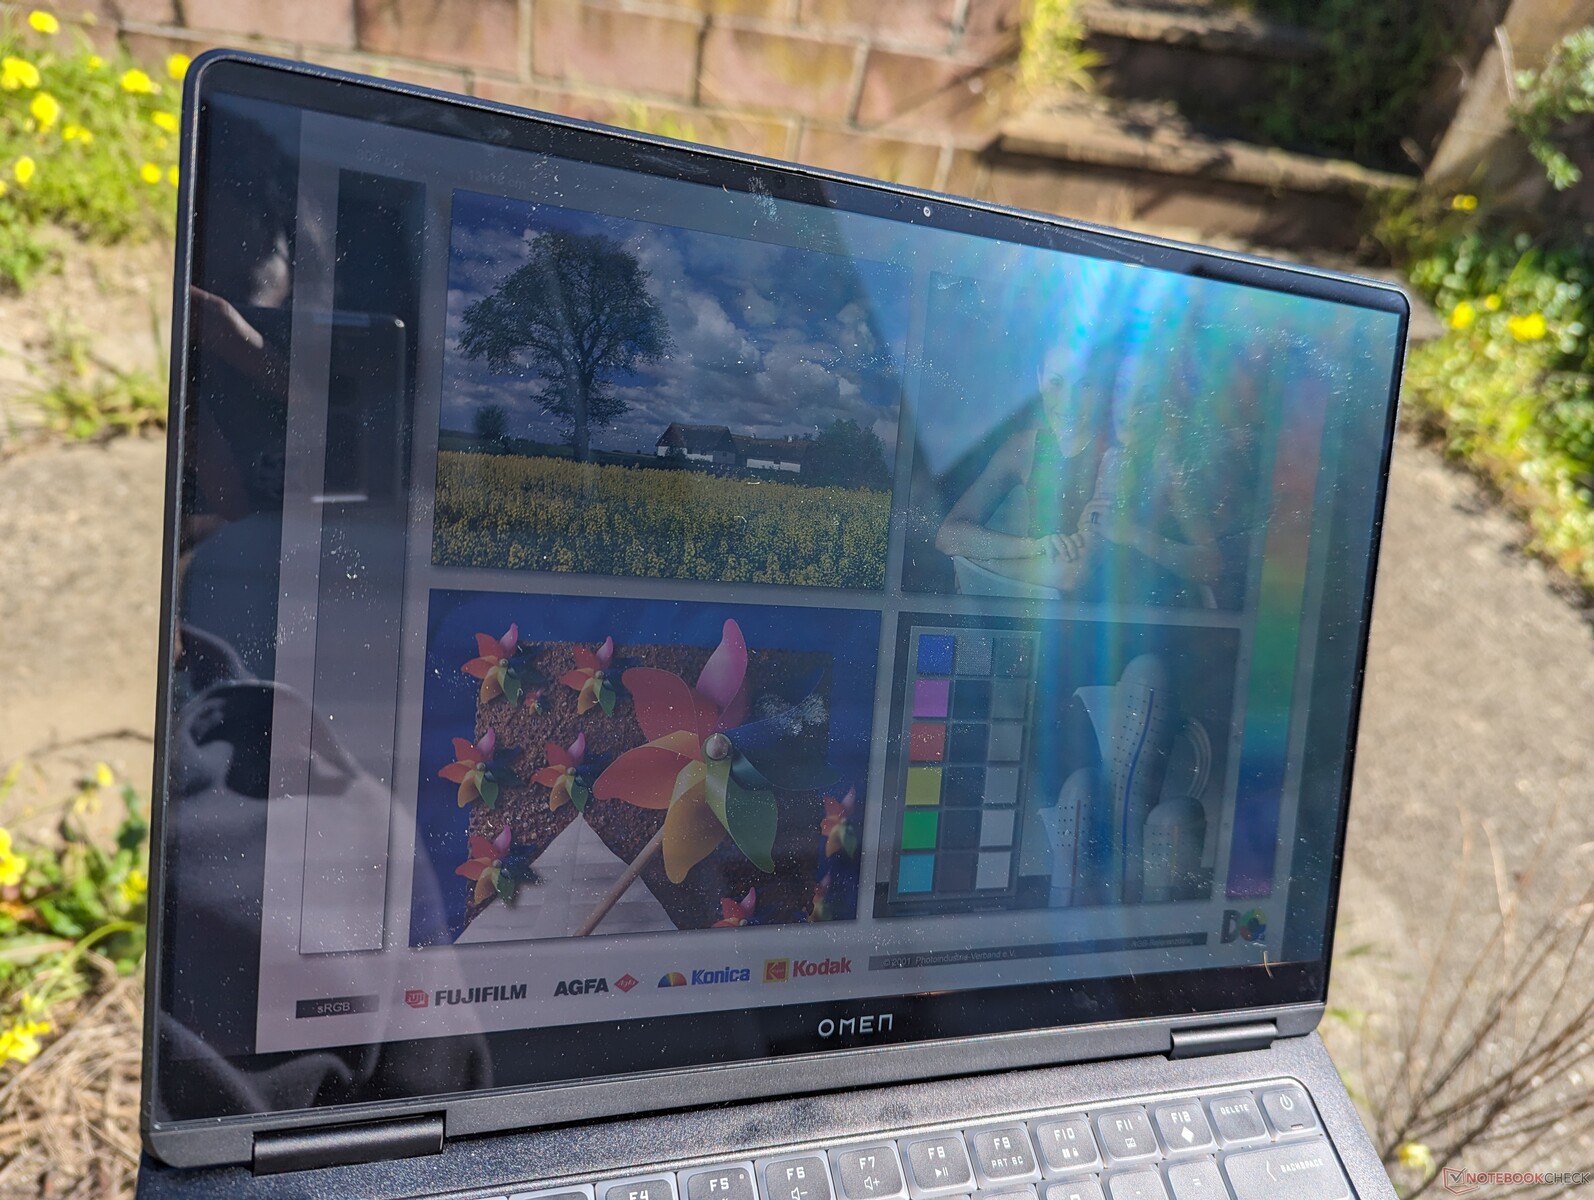
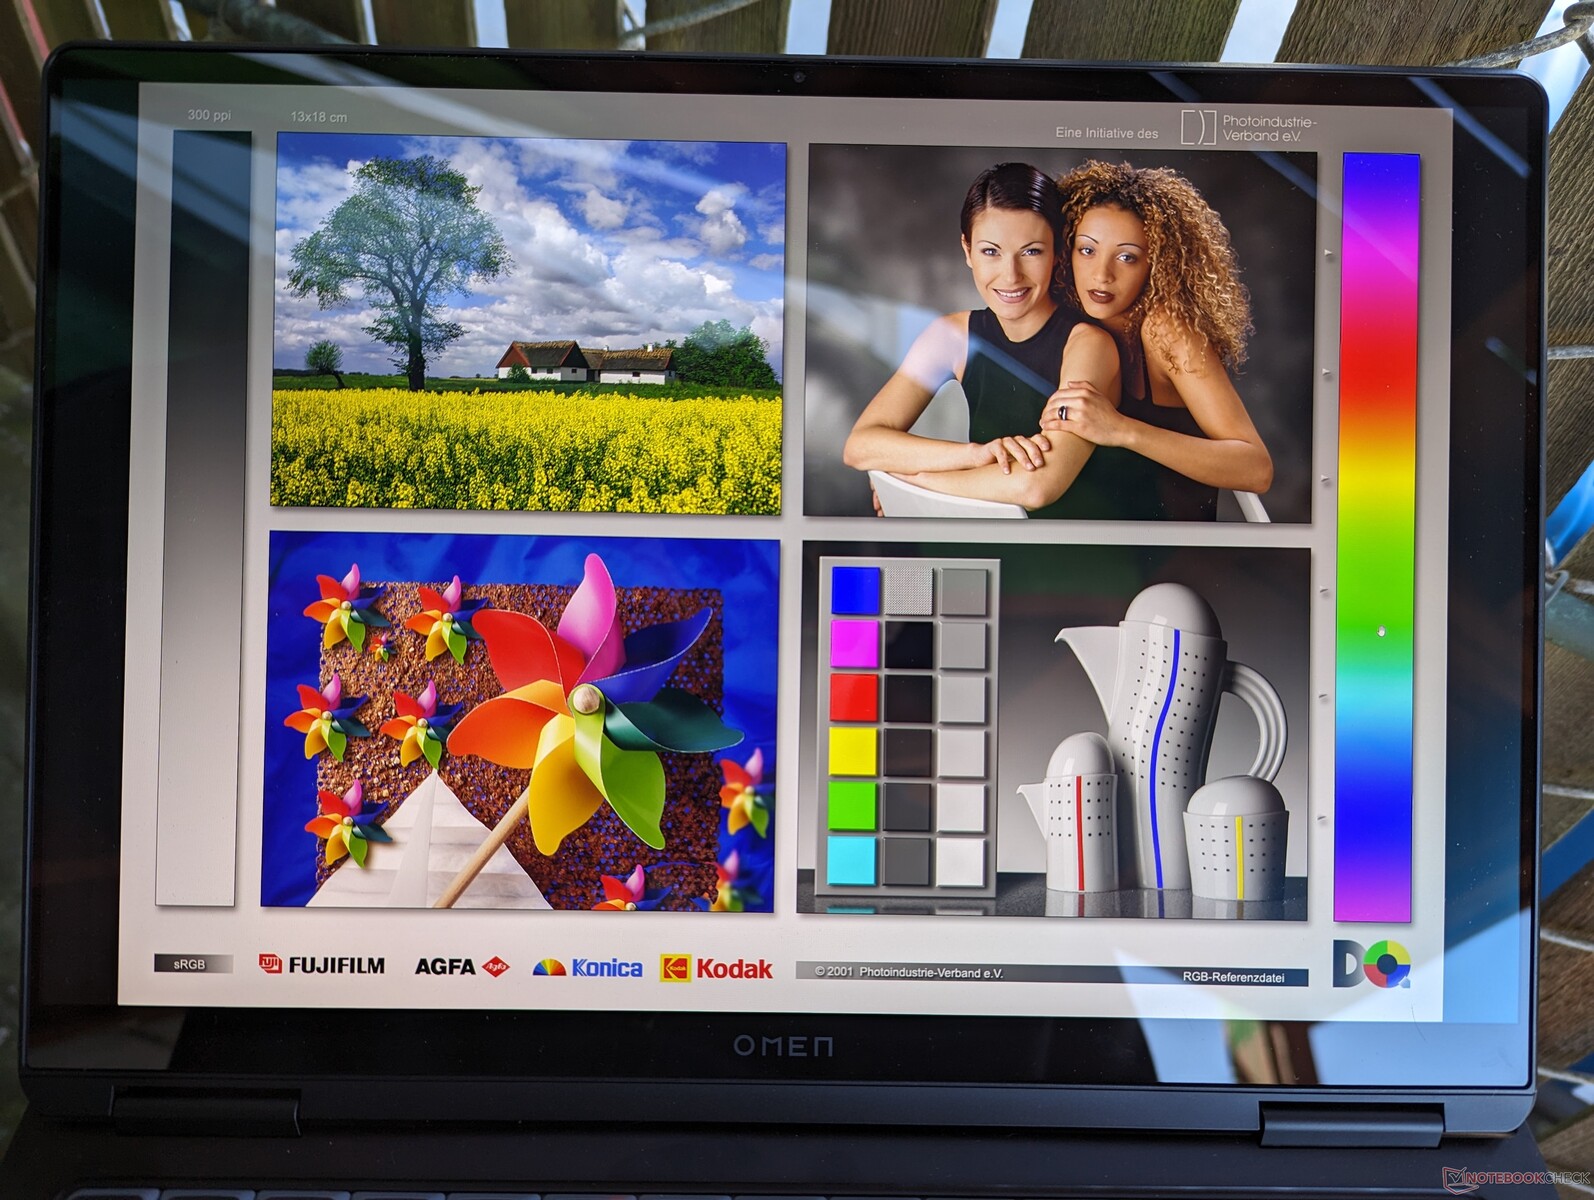
Die Sichtbarkeit im Freien ist in etwa vergleichbar mit der des Zephyrus G14, aber schlechter als beim Blade 14, da letzteres ein mattes Panel und ein helleres Display verwendet, um Blendungen zu reduzieren. Das System mag zwar kompakt und im Freien leicht zu handhaben sein, aber der spiegelnde Bildschirm wurde nicht für so helles Umgebungslicht entwickelt.

Performance — Meteor Lake + Ada Lovelace
Testbedingungen
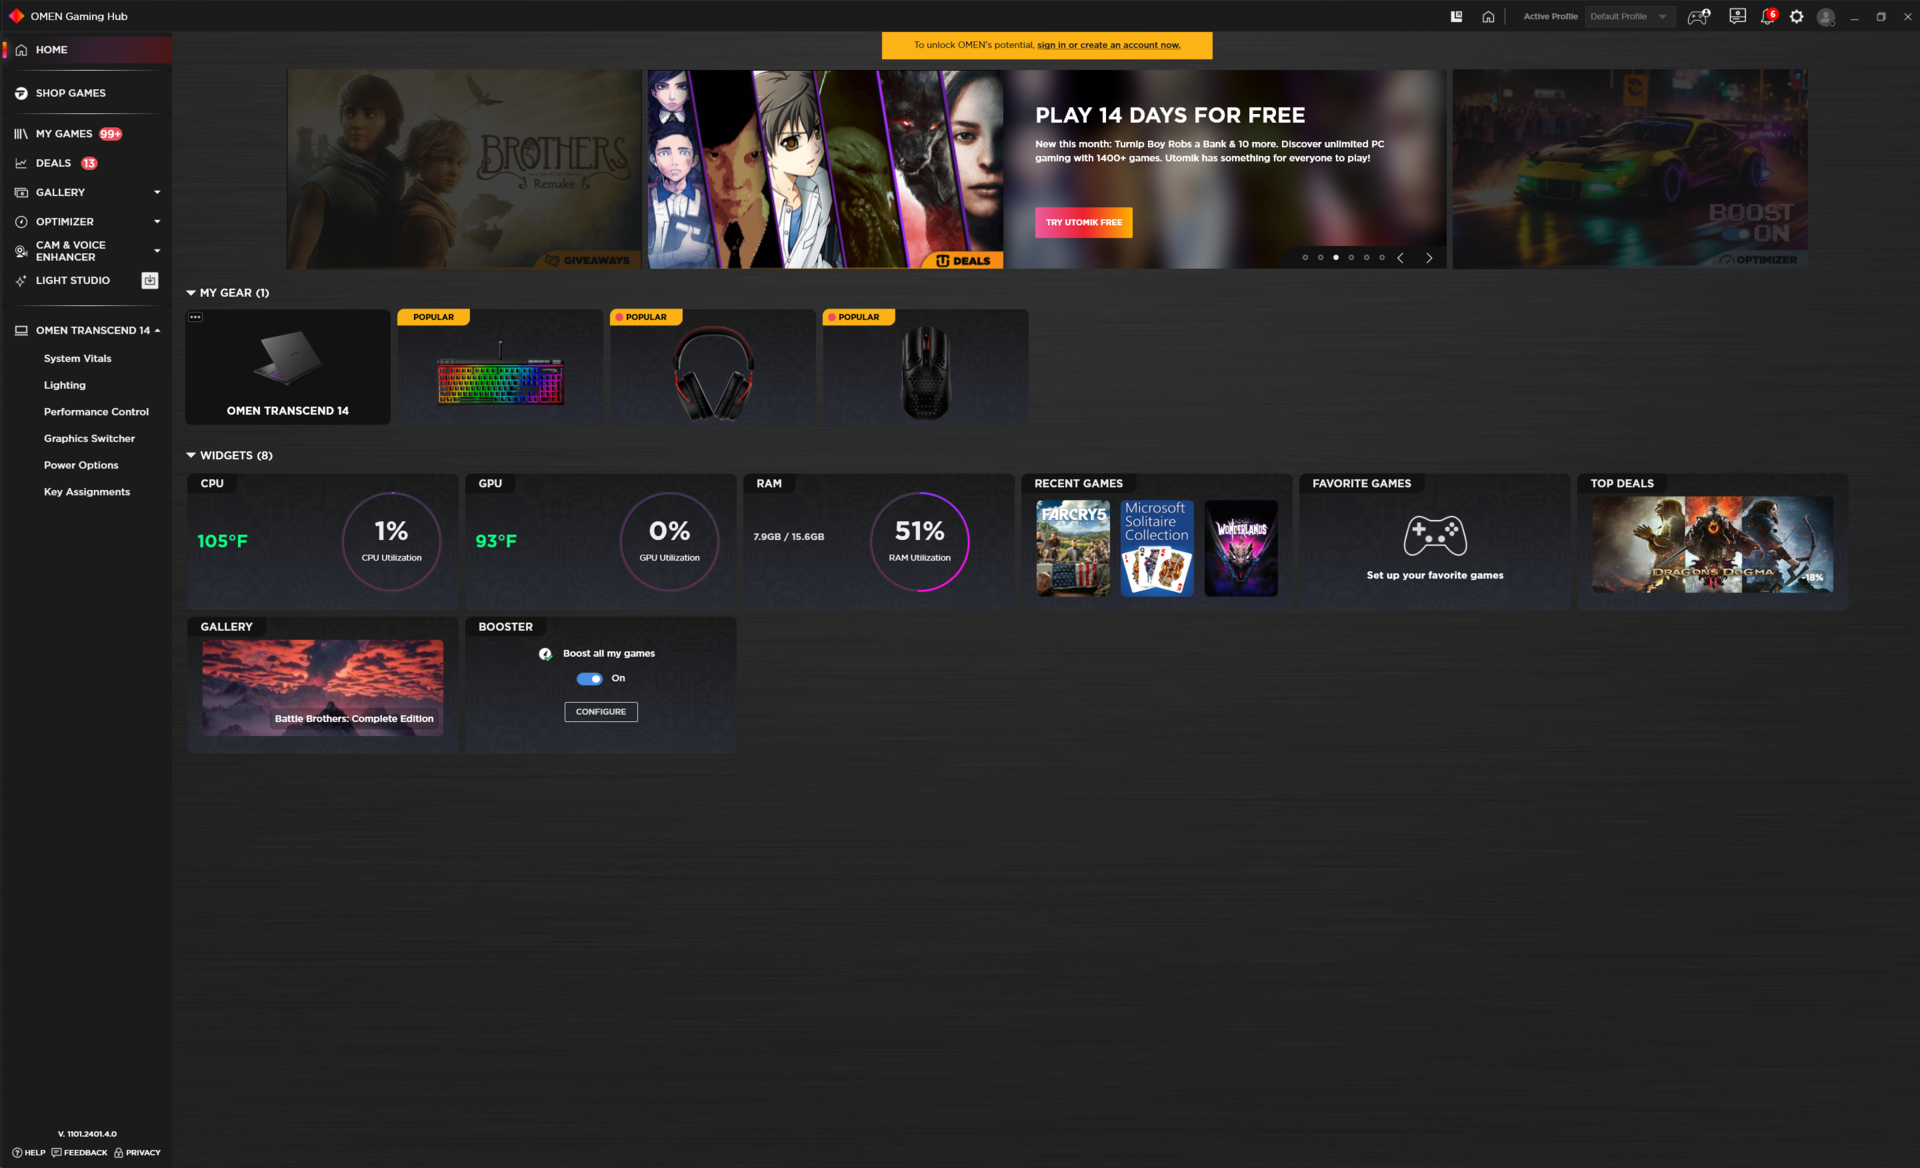
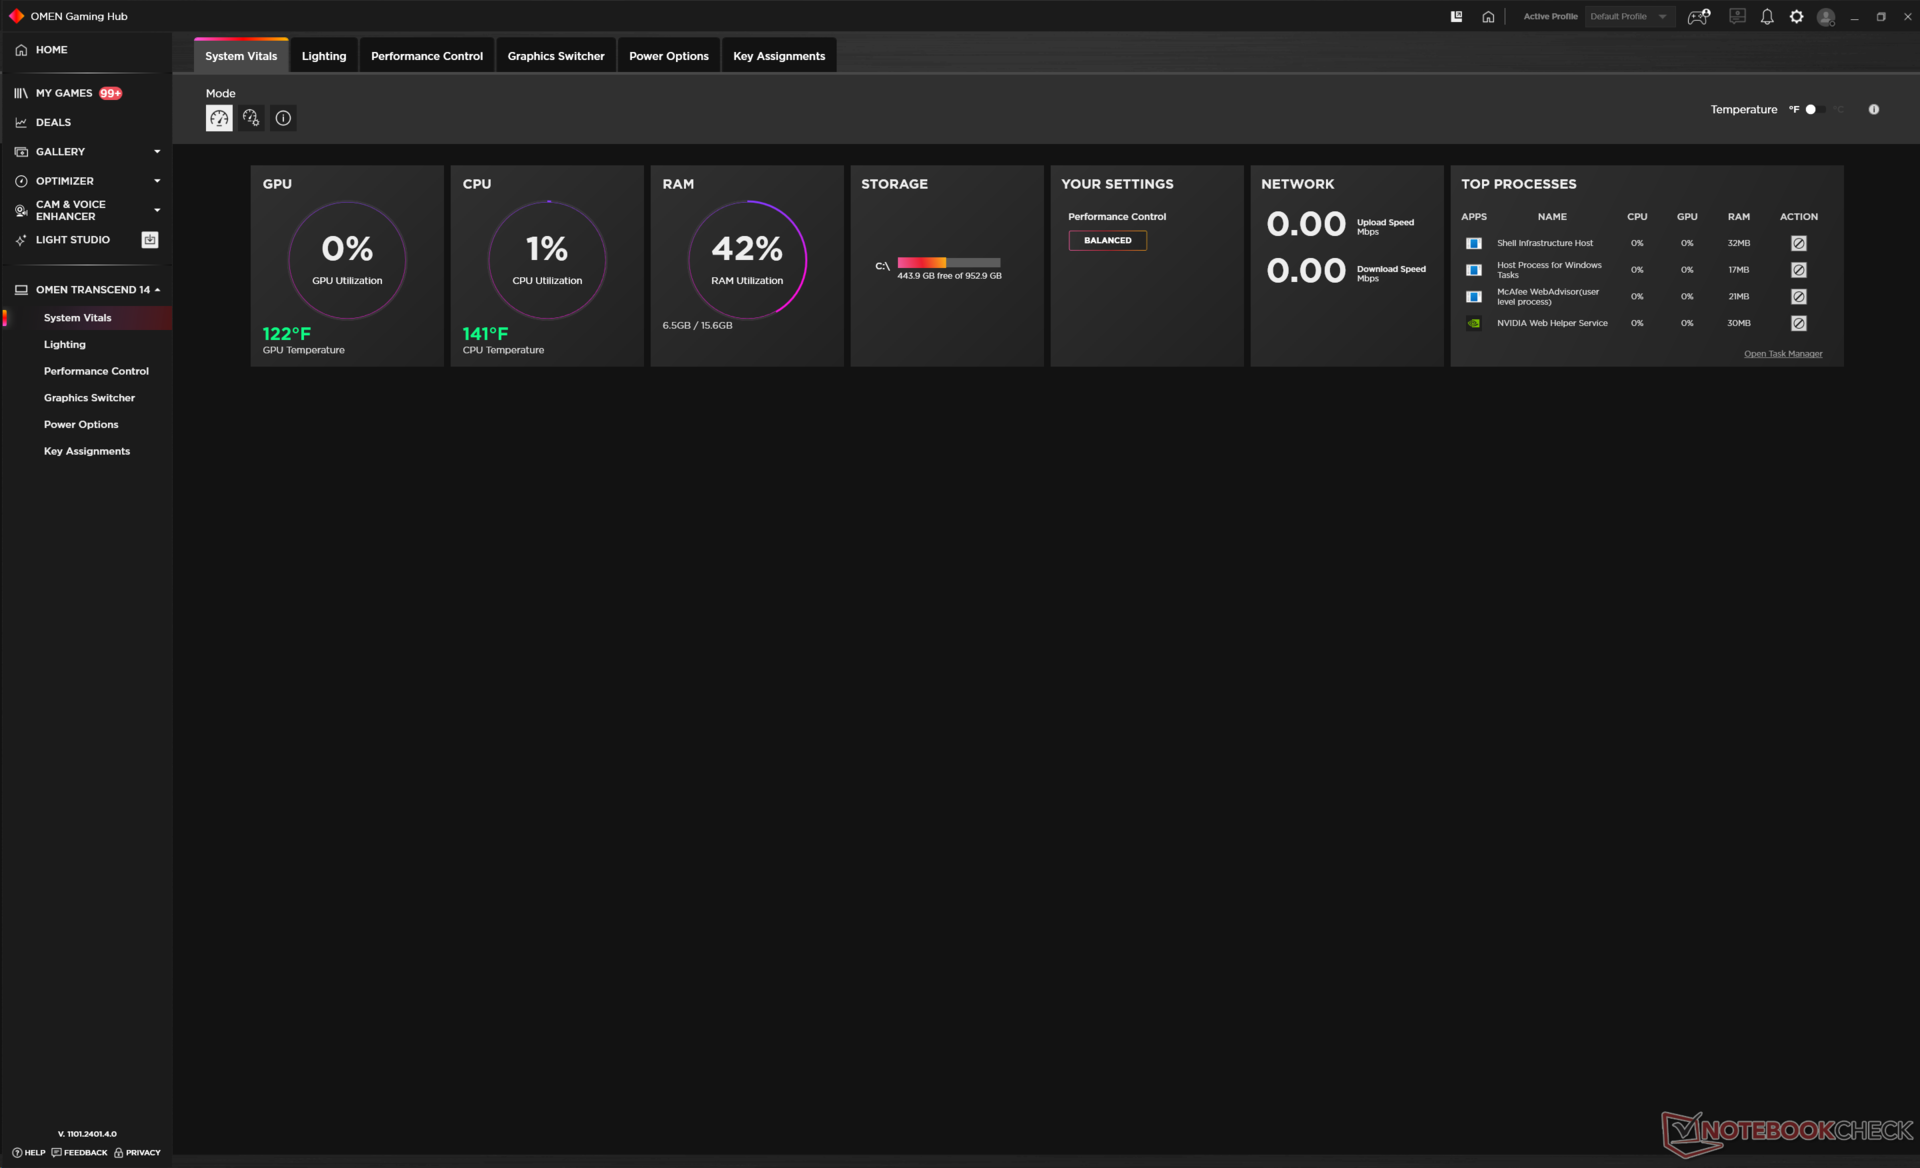
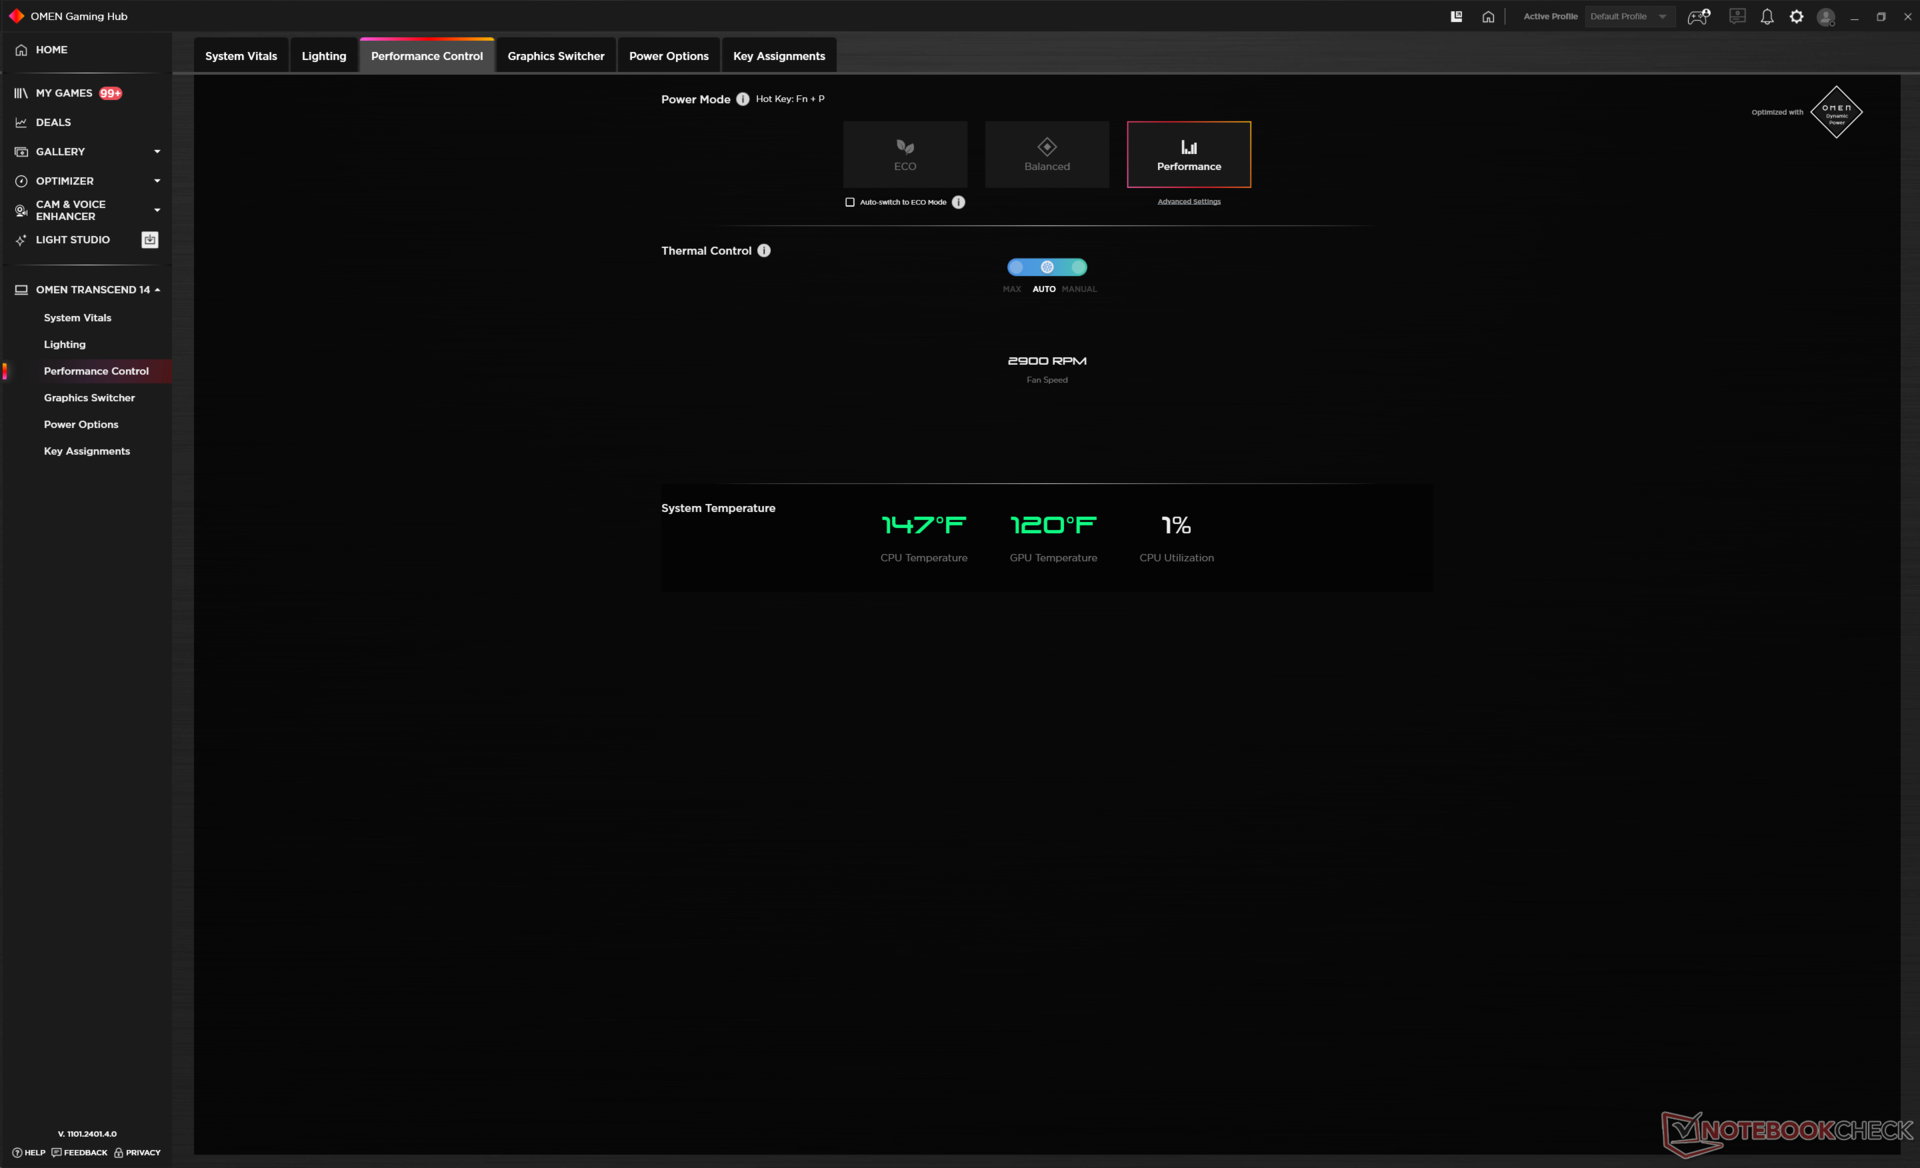
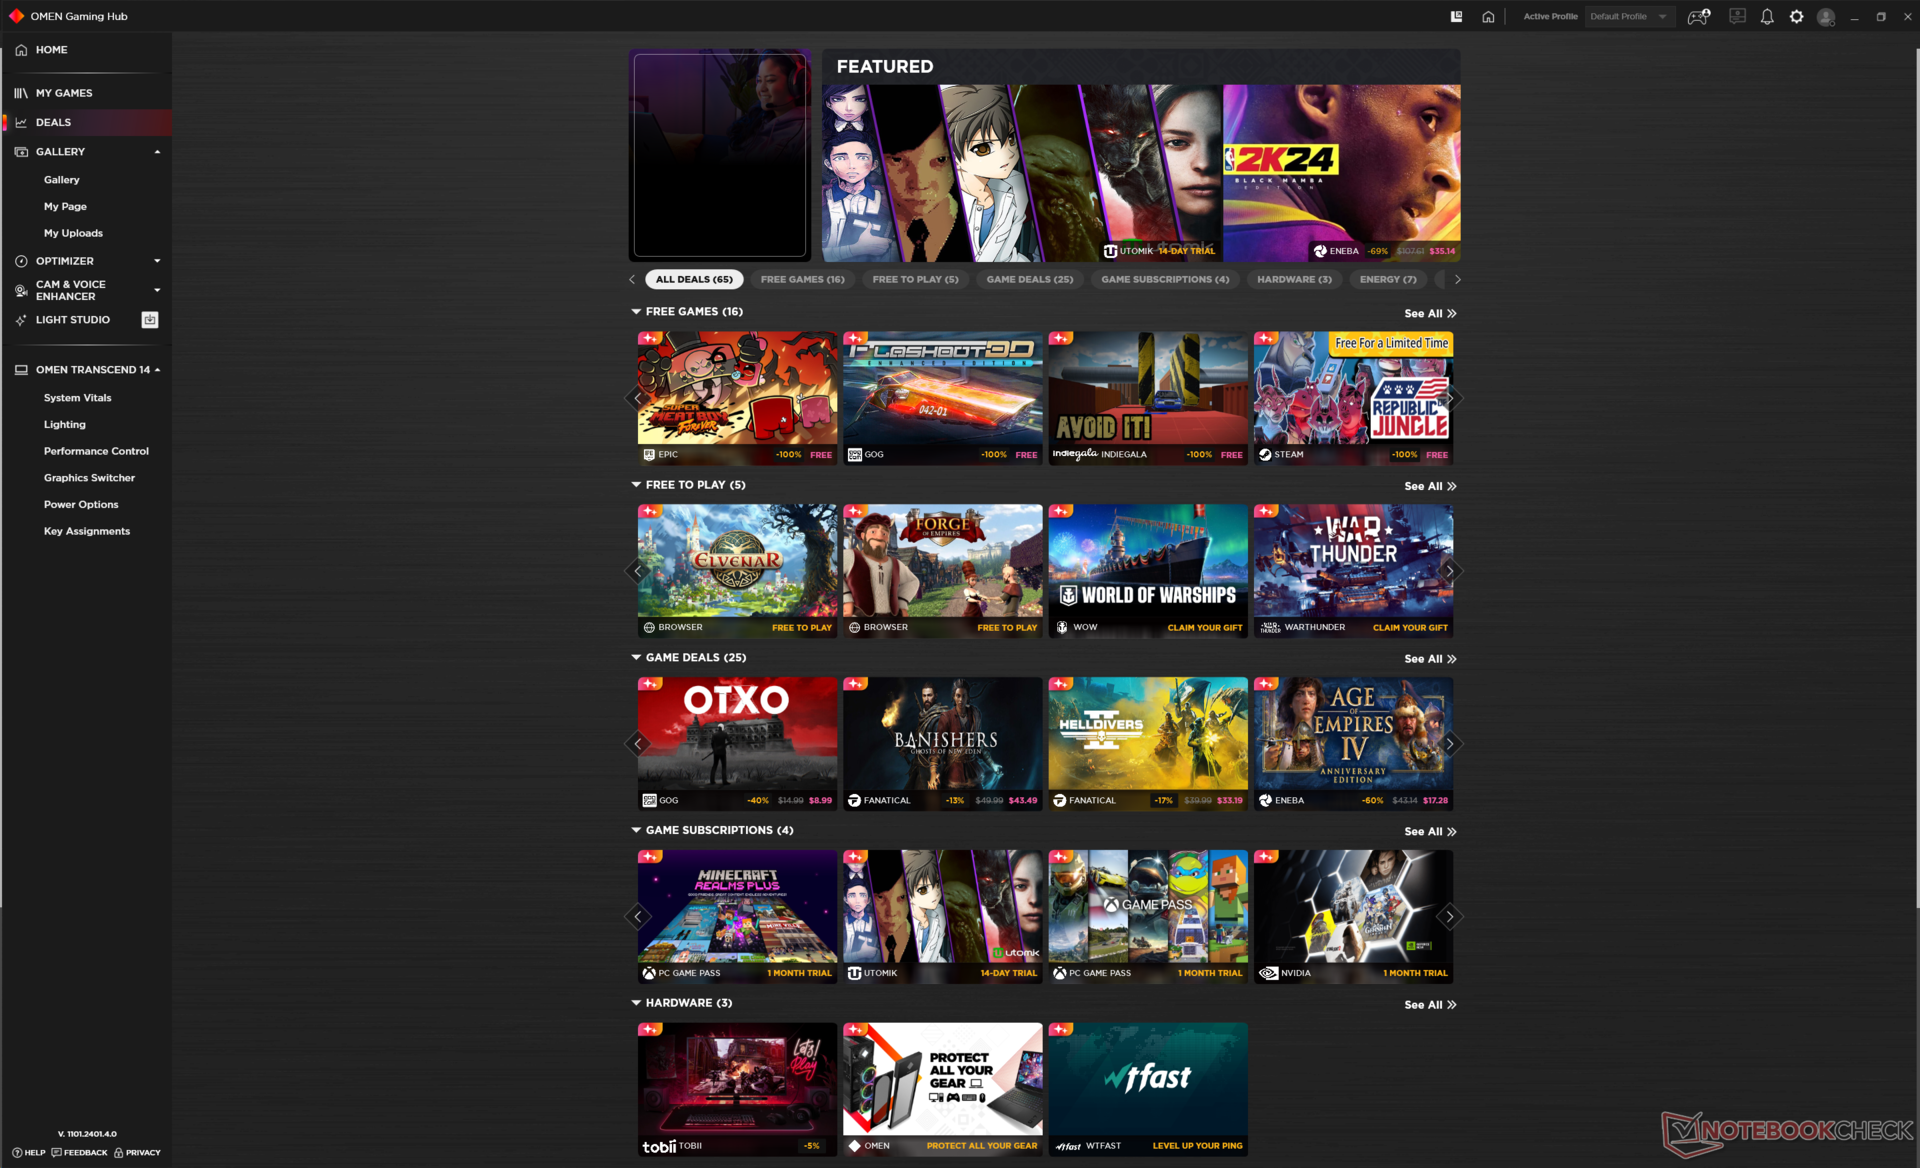
Wir haben sowohl Windows als auch Omen Gaming Hub auf den Performance-Modus mit aktivem Max-Lüfter-Modus eingestellt, bevor wir die folgenden Benchmarks durchgeführt haben. Wir empfehlen Besitzern, sich mit Omen Gaming Hub vertraut zu machen, da sich hier die wichtigsten Einstellungen befinden, darunter Echtzeit-Systemvitalwerte, Beleuchtung, Energie- und Lüfterprofile sowie der Grafikumschalter. Die Software integriert auch einen digitalen Shop mit Spielen, was die Bedienung umständlich machen kann, wenn man nur eine einfache Einstellung umschalten möchte. So sind beispielsweise die wichtigen Energie- und Lüfterprofile in Untermenüs versteckt, die drei separate Mausklicks erfordern. Der Startbildschirm der Software ist nicht sehr anpassbar, und die Werbung ist ärgerlicherweise immer im Vordergrund.
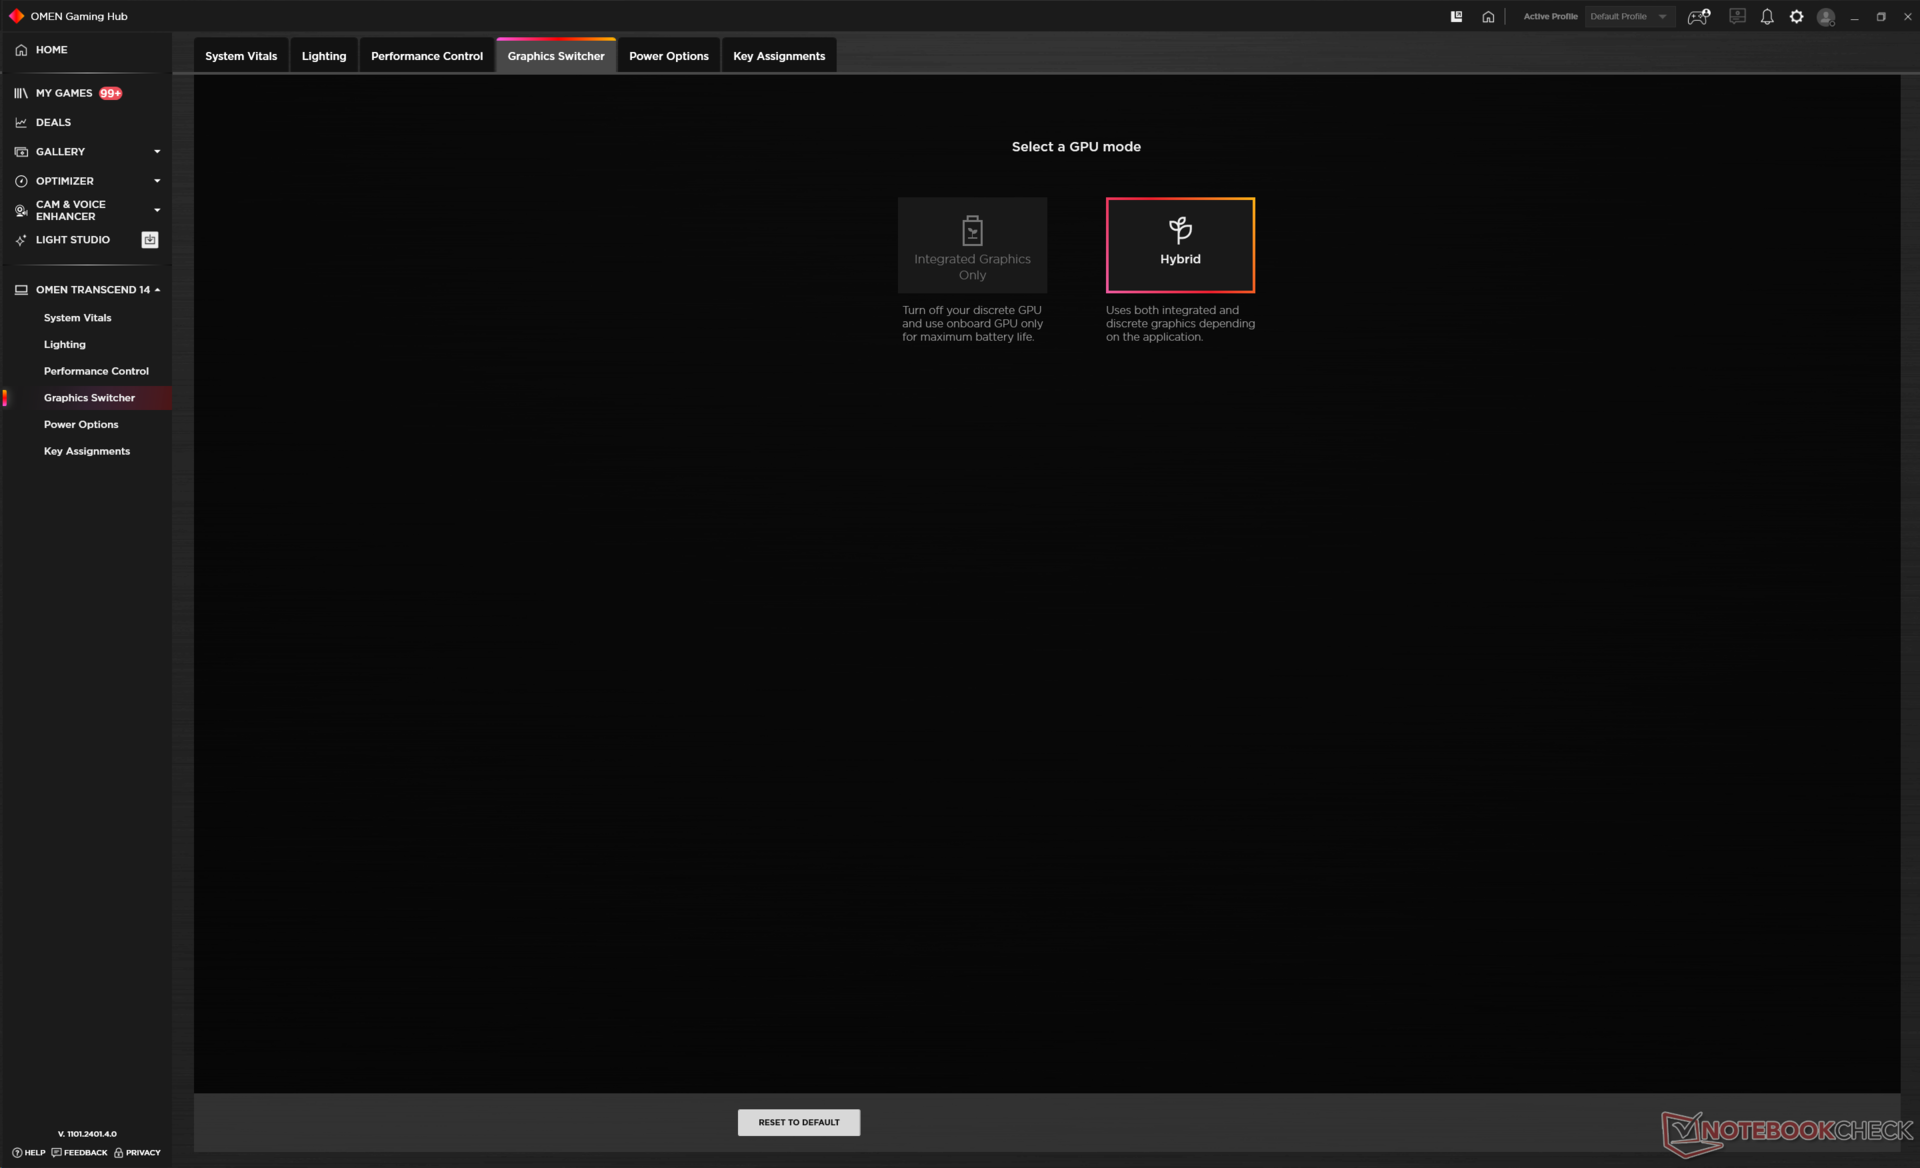
MUX wird nicht unterstützt; das System kann nur zwischen dem iGPU-Modus und dem Hybrid (Optimus)-Modus ohne dGPU-Option wechseln. Beim Wechsel zwischen den beiden Modi ist ein Neustart erforderlich. HP sagt, dass ein MUX-Switch in Betracht gezogen wurde, aber dass der Leistungsgewinn im Verhältnis zum höheren Stromverbrauch sehr gering wäre. DirectX Cross Adapter Scan-Out (CASO) hilft, die Leistung im Optimus-Modus zu erhöhen, so dass er näher am MUX-Modus liegen könnte.
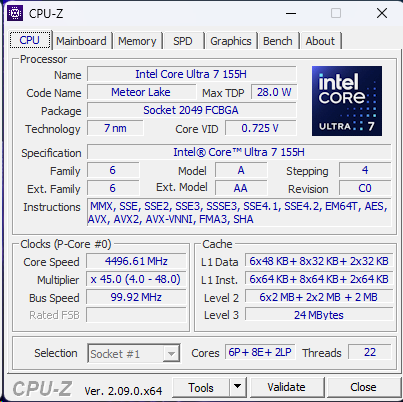
Prozessor
Die rohe Prozessorleistung ist im Wesentlichen identisch mit der des Core i7-13700H, den unser Core Ultra 7 155H ersetzt. Der Core i7-13700H ist keineswegs langsam, wie es bei größeren Gaming-Notebooks wie dem Victus 16 der Fall ist, aber die CPU kann sich für Leistungsjäger dennoch wie ein Seitwärtsschritt anfühlen.
Der Hauptvorteil der neuen CPU ist die integrierte NPU zur Beschleunigung von KI-Aufgaben wie Microsoft Copilot oder Webcam-bezogene Funktionen für Videokonferenzen. Die neueste Anwendung, die von der NPU profitiert, ist OpenVINO, das bald in der Lage sein wird, Video-Streaming-Aufgaben von der CPU oder GPU auf die NPU zu verlagern und dabei die durchschnittliche Bildrate um 25 bis 35 Prozent zu verbessern. Dennoch sind die derzeitigen NPU-Anwendungen äußerst begrenzt und für die große Mehrheit der Nutzer nicht geeignet. Copilot beispielsweise ist zum Zeitpunkt der Erstellung dieses Artikels immer noch vollständig Cloud-basiert, und die OpenVINO-Funktionen sind für Nicht-Streamer nicht von Nutzen. Es wird erwartet, dass bis 2025 und darüber hinaus mehr Anwendungen die NPU nutzen werden.
Die Nachhaltigkeit der Leistung ist ausgezeichnet und die Ergebnisse kommen dem Ryzen 9 8945HS oder Ryzen 7 7840HS im Legion Slim 5 14 bzw. Blade 14 sehr nahe.
Cinebench R15 Multi Dauertest
Cinebench R23: Multi Core | Single Core
Cinebench R20: CPU (Multi Core) | CPU (Single Core)
Cinebench R15: CPU Multi 64Bit | CPU Single 64Bit
Blender: v2.79 BMW27 CPU
7-Zip 18.03: 7z b 4 | 7z b 4 -mmt1
Geekbench 6.7: Multi-Core | Single-Core
Geekbench 5.5: Multi-Core | Single-Core
HWBOT x265 Benchmark v2.2: 4k Preset
LibreOffice : 20 Documents To PDF
R Benchmark 2.5: Overall mean
* ... kleinere Werte sind besser
AIDA64: FP32 Ray-Trace | FPU Julia | CPU SHA3 | CPU Queen | FPU SinJulia | FPU Mandel | CPU AES | CPU ZLib | FP64 Ray-Trace | CPU PhotoWorxx
| Performance Rating | |
| Razer Blade 14 RZ09-0508 | |
| Asus ROG Zephyrus G14 2024 GA403U | |
| Lenovo Legion Slim 5 14APH8 | |
| HP Omen Transcend 14-fb0014 | |
| Durchschnittliche Intel Core Ultra 7 155H | |
| Microsoft Surface Laptop Studio 2 RTX 4060 | |
| AIDA64 / FP32 Ray-Trace | |
| Lenovo Legion Slim 5 14APH8 | |
| Razer Blade 14 RZ09-0508 | |
| Asus ROG Zephyrus G14 2024 GA403U | |
| HP Omen Transcend 14-fb0014 | |
| Durchschnittliche Intel Core Ultra 7 155H (6670 - 18470, n=50) | |
| Microsoft Surface Laptop Studio 2 RTX 4060 | |
| AIDA64 / FPU Julia | |
| Lenovo Legion Slim 5 14APH8 | |
| Razer Blade 14 RZ09-0508 | |
| Asus ROG Zephyrus G14 2024 GA403U | |
| HP Omen Transcend 14-fb0014 | |
| Microsoft Surface Laptop Studio 2 RTX 4060 | |
| Durchschnittliche Intel Core Ultra 7 155H (40905 - 93181, n=50) | |
| AIDA64 / CPU SHA3 | |
| Razer Blade 14 RZ09-0508 | |
| Lenovo Legion Slim 5 14APH8 | |
| Asus ROG Zephyrus G14 2024 GA403U | |
| HP Omen Transcend 14-fb0014 | |
| Durchschnittliche Intel Core Ultra 7 155H (1940 - 4436, n=50) | |
| Microsoft Surface Laptop Studio 2 RTX 4060 | |
| AIDA64 / CPU Queen | |
| Razer Blade 14 RZ09-0508 | |
| Lenovo Legion Slim 5 14APH8 | |
| Asus ROG Zephyrus G14 2024 GA403U | |
| Microsoft Surface Laptop Studio 2 RTX 4060 | |
| HP Omen Transcend 14-fb0014 | |
| Durchschnittliche Intel Core Ultra 7 155H (64698 - 94181, n=50) | |
| AIDA64 / FPU SinJulia | |
| Razer Blade 14 RZ09-0508 | |
| Asus ROG Zephyrus G14 2024 GA403U | |
| Lenovo Legion Slim 5 14APH8 | |
| HP Omen Transcend 14-fb0014 | |
| Durchschnittliche Intel Core Ultra 7 155H (5639 - 10647, n=50) | |
| Microsoft Surface Laptop Studio 2 RTX 4060 | |
| AIDA64 / FPU Mandel | |
| Razer Blade 14 RZ09-0508 | |
| Lenovo Legion Slim 5 14APH8 | |
| Asus ROG Zephyrus G14 2024 GA403U | |
| HP Omen Transcend 14-fb0014 | |
| Durchschnittliche Intel Core Ultra 7 155H (18236 - 47685, n=50) | |
| Microsoft Surface Laptop Studio 2 RTX 4060 | |
| AIDA64 / CPU AES | |
| Razer Blade 14 RZ09-0508 | |
| Asus ROG Zephyrus G14 2024 GA403U | |
| Durchschnittliche Intel Core Ultra 7 155H (45713 - 152179, n=50) | |
| HP Omen Transcend 14-fb0014 | |
| Lenovo Legion Slim 5 14APH8 | |
| Microsoft Surface Laptop Studio 2 RTX 4060 | |
| AIDA64 / CPU ZLib | |
| Razer Blade 14 RZ09-0508 | |
| Lenovo Legion Slim 5 14APH8 | |
| Asus ROG Zephyrus G14 2024 GA403U | |
| HP Omen Transcend 14-fb0014 | |
| Durchschnittliche Intel Core Ultra 7 155H (557 - 1250, n=50) | |
| Microsoft Surface Laptop Studio 2 RTX 4060 | |
| AIDA64 / FP64 Ray-Trace | |
| Razer Blade 14 RZ09-0508 | |
| Lenovo Legion Slim 5 14APH8 | |
| Asus ROG Zephyrus G14 2024 GA403U | |
| HP Omen Transcend 14-fb0014 | |
| Microsoft Surface Laptop Studio 2 RTX 4060 | |
| Durchschnittliche Intel Core Ultra 7 155H (3569 - 9802, n=50) | |
| AIDA64 / CPU PhotoWorxx | |
| HP Omen Transcend 14-fb0014 | |
| Durchschnittliche Intel Core Ultra 7 155H (32719 - 54223, n=50) | |
| Microsoft Surface Laptop Studio 2 RTX 4060 | |
| Razer Blade 14 RZ09-0508 | |
| Asus ROG Zephyrus G14 2024 GA403U | |
| Lenovo Legion Slim 5 14APH8 | |
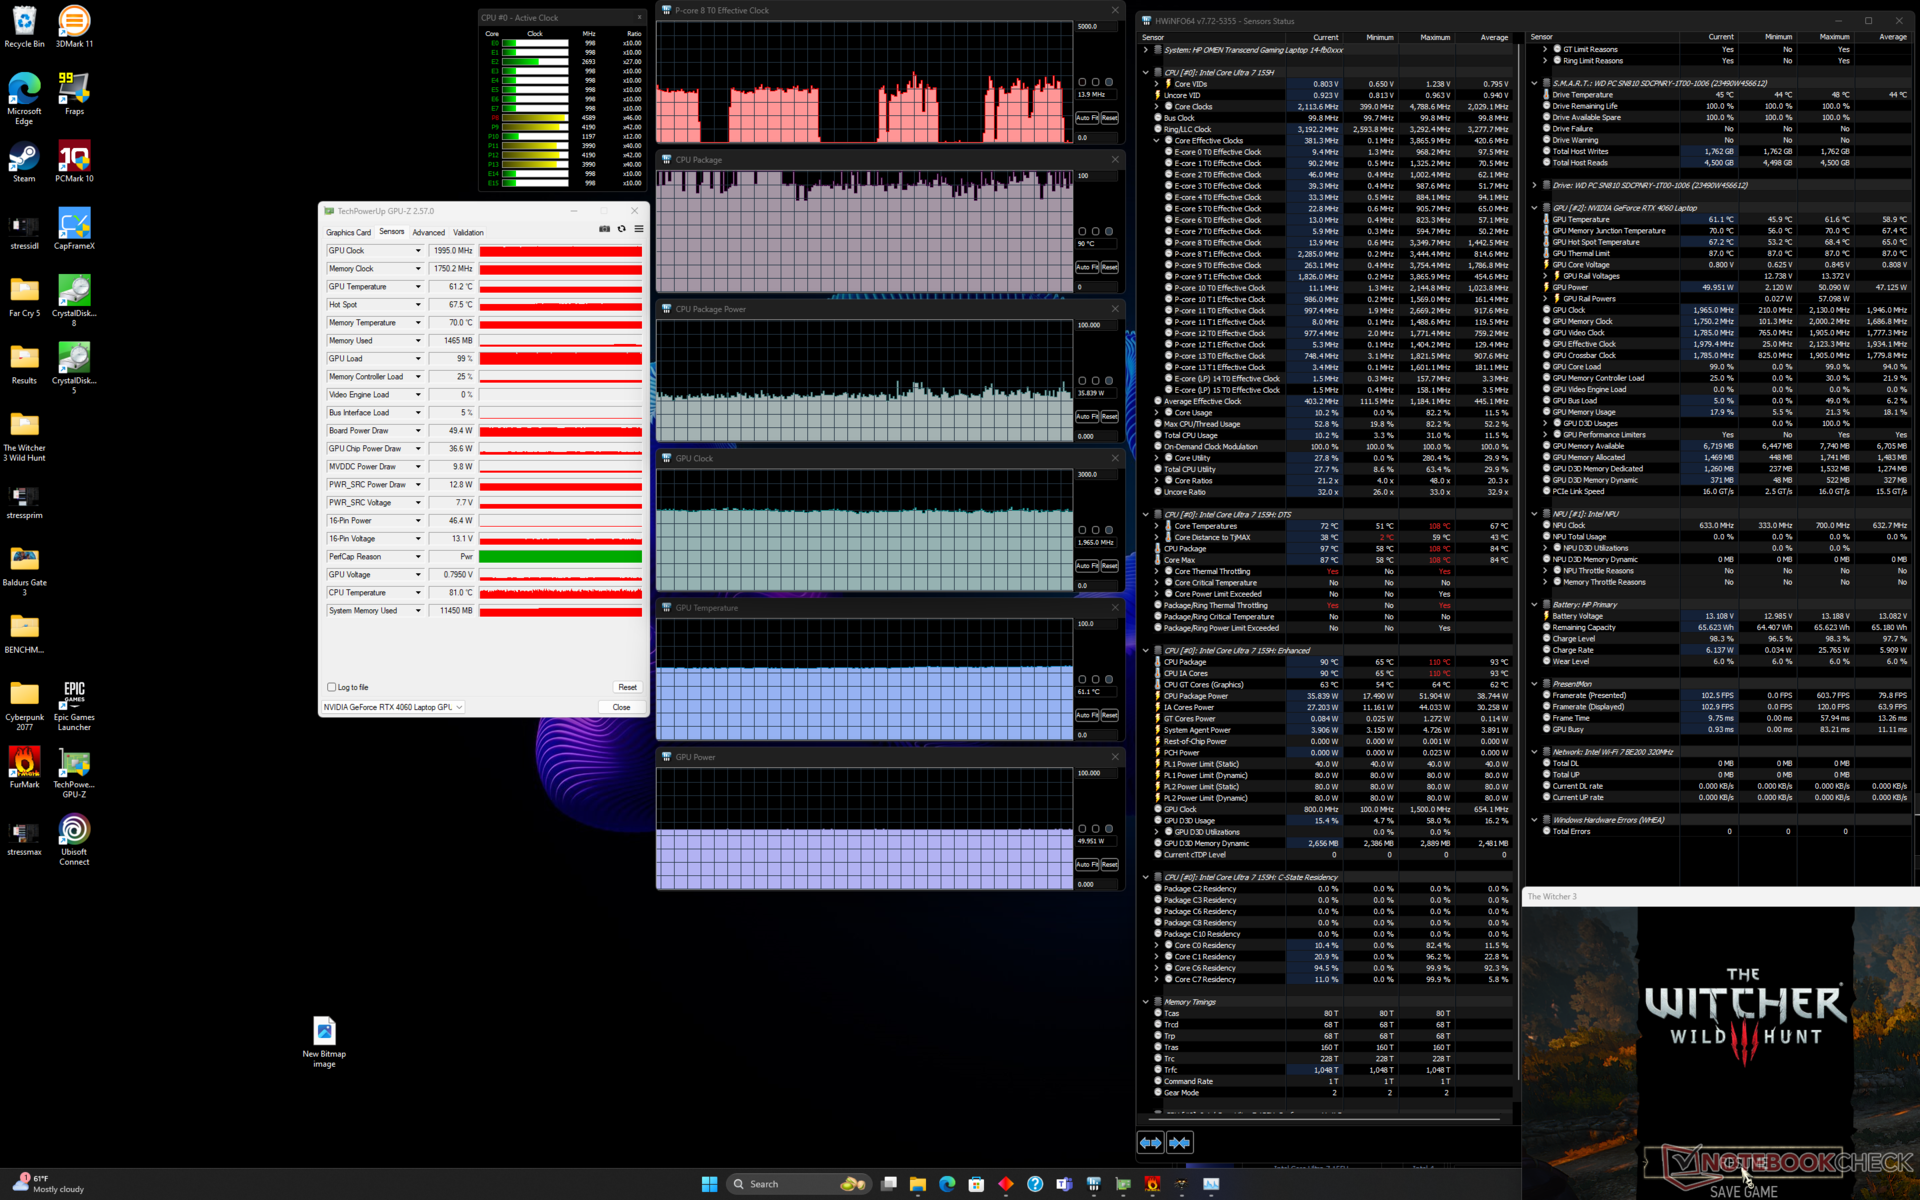
Stresstest
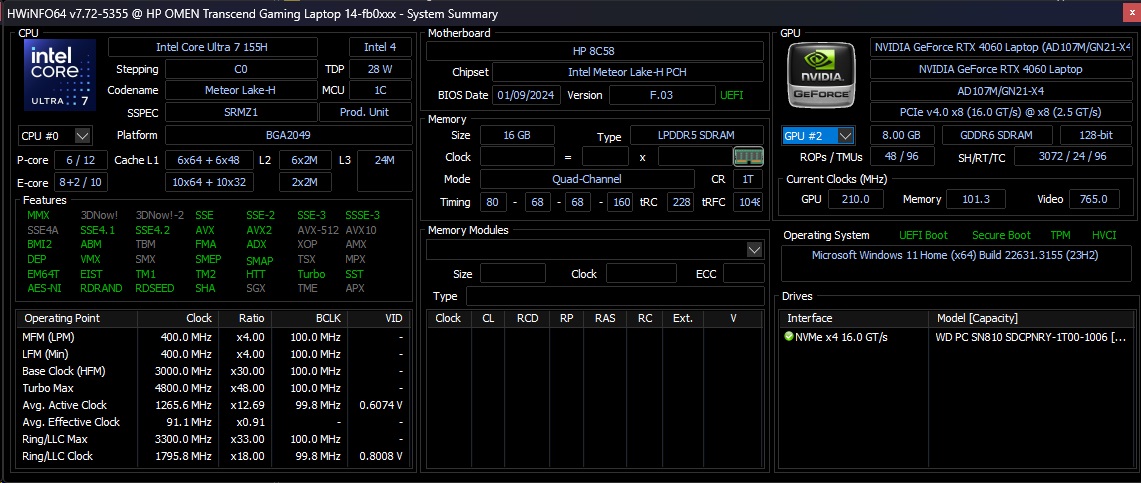
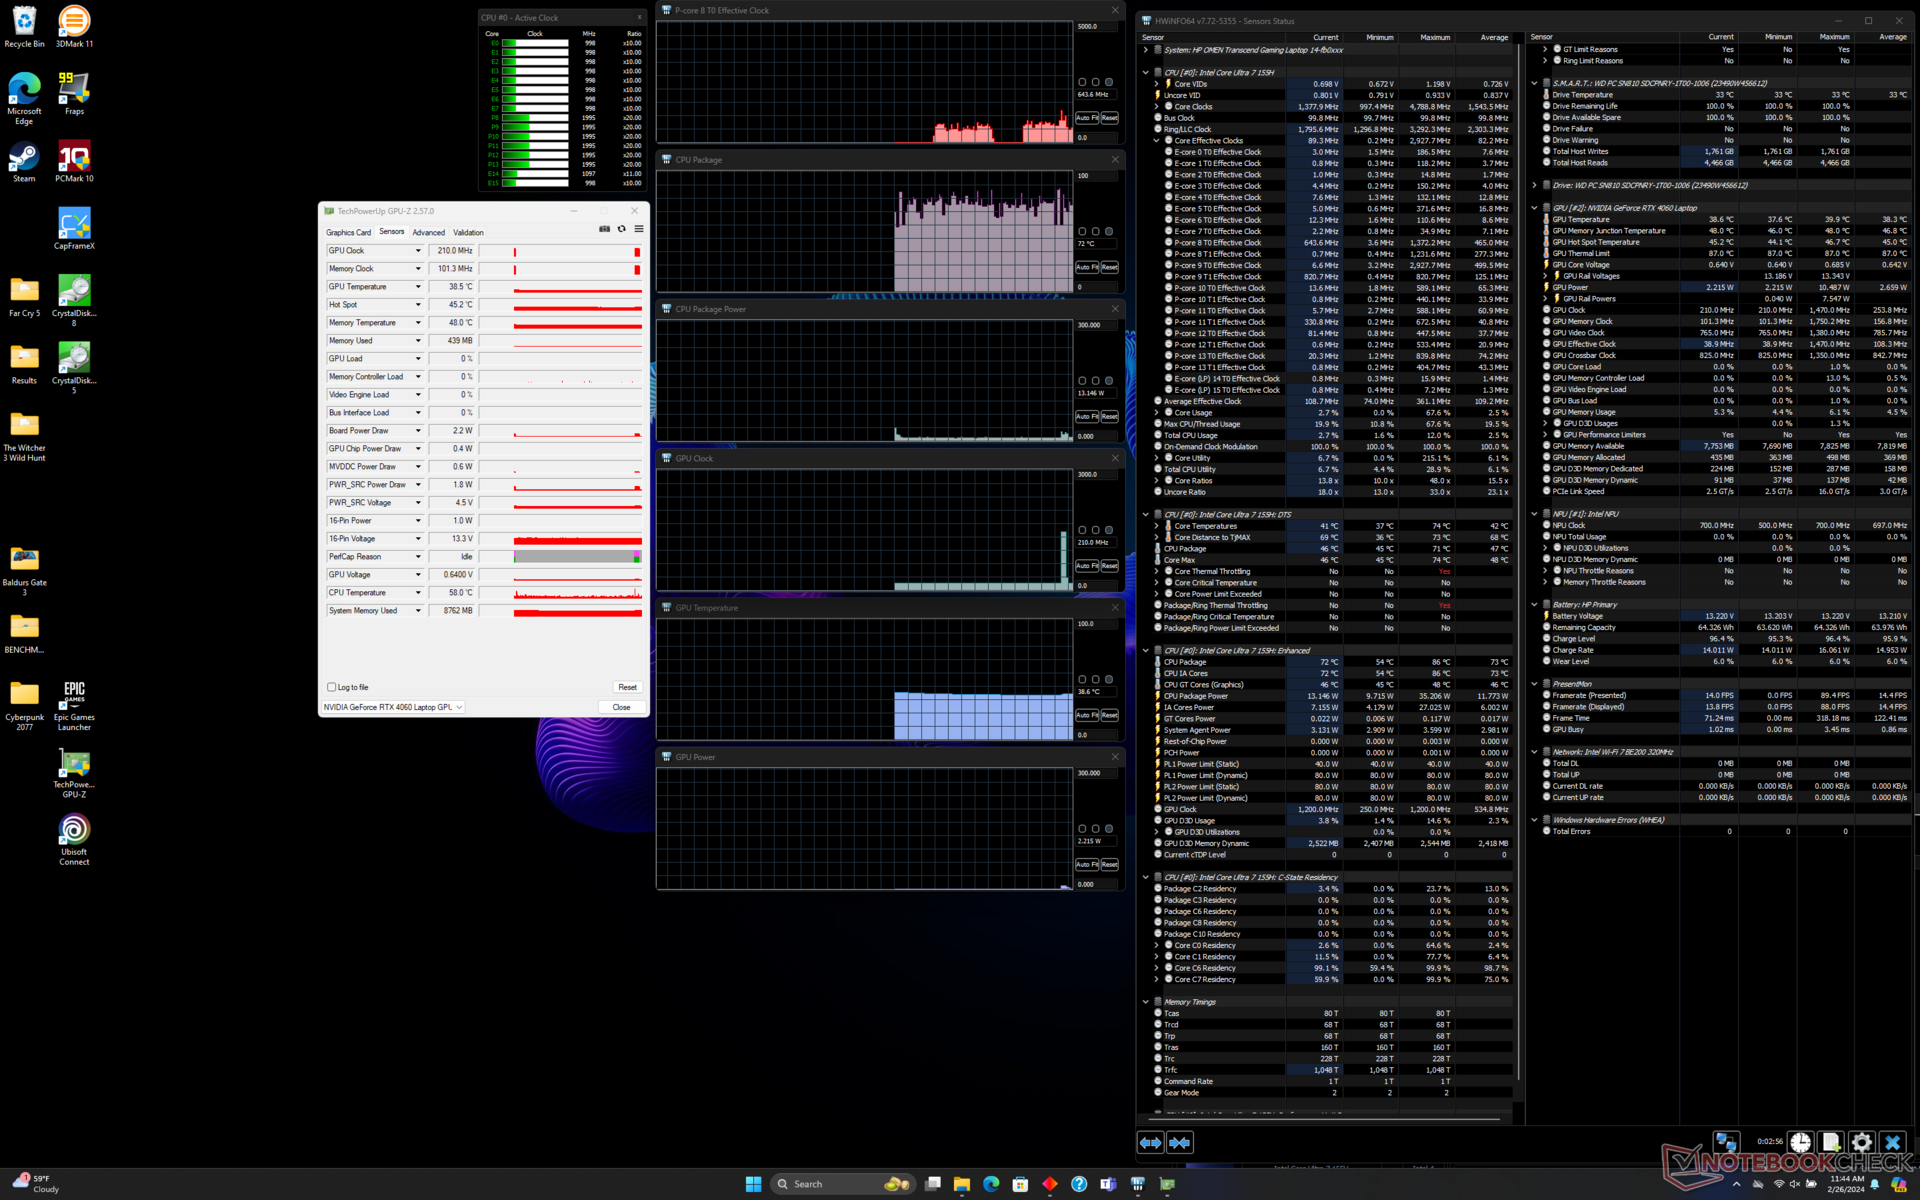
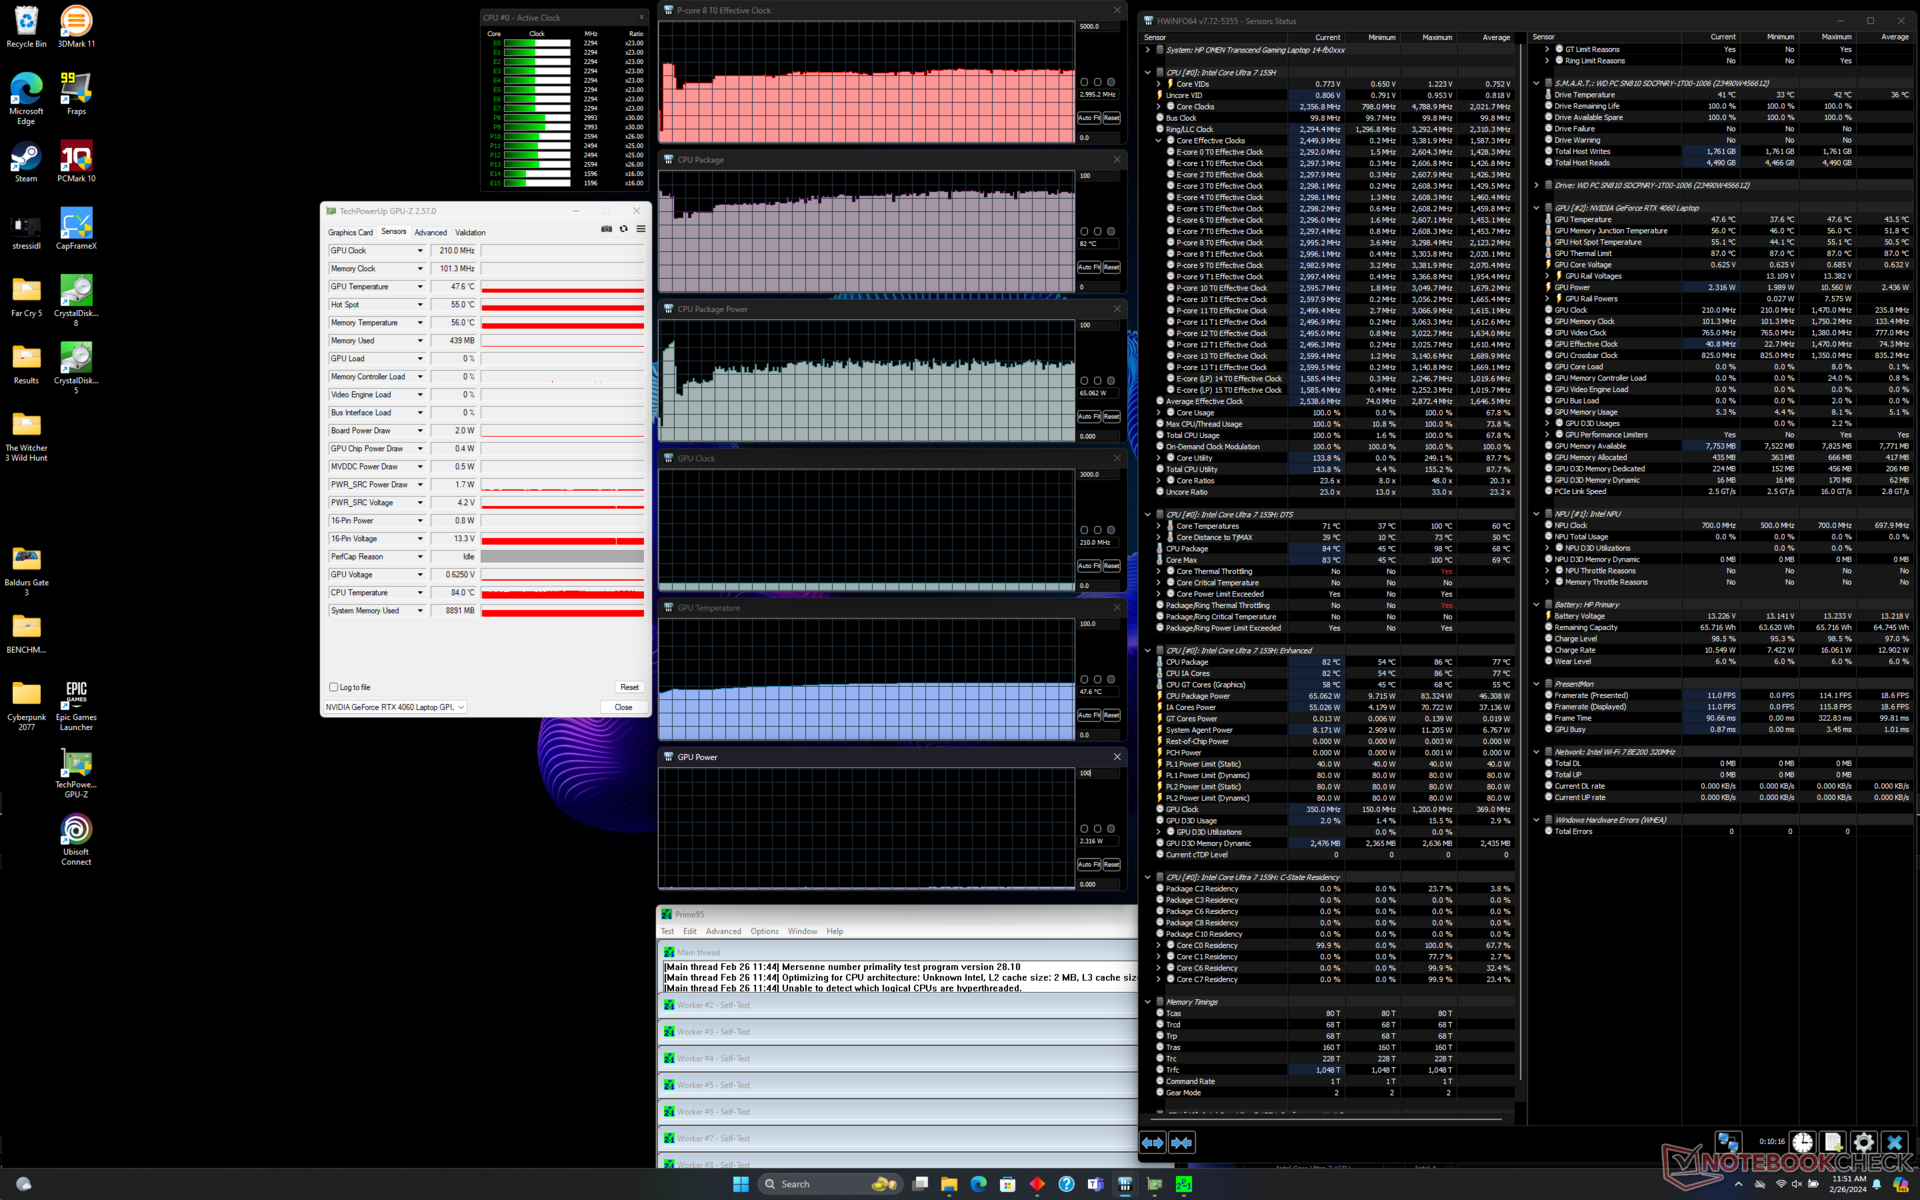
Beim Starten des Prime95-Stresses stieg die CPU in den ersten paar Sekunden auf 3,3 GHz, 83 W und 98 °C, bevor sie abfiel und sich bei 3,0 GHz, 65 W und 71 °C stabilisierte. HWiNFO berichtet von großen und unregelmäßigen Temperaturunterschieden zwischen den DTS- und Enhanced-Sensoren, aber beide sind dennoch in den Screenshots unten zu sehen. Nichtsdestotrotz kann die CPU trotz der geringen Größe und des geringen Gewichts anständige Turbo-Boost-Geschwindigkeiten beibehalten und mit dem Ryzen 9 8945HS konkurrieren.
Wenn Sie Witcher 3 im Performance-Modus mit aktiviertem und deaktiviertem Max Fan spielen, werden Sie keine großen Unterschiede feststellen, da sogar die TGP-Werte im Wesentlichen gleich bleiben. Es ist also nicht notwendig, den Max-Lüfter zu aktivieren, um beim Spielen die maximale Leistung aus dem System herauszuholen. Diese Ergebnisse stimmen mit unseren Fire Strike Ergebnissen im Abschnitt GPU-Leistung unten überein. Ein Absenken auf den Balanced-Modus hat jedoch leichte Auswirkungen auf die Leistung, da der TGP-Wert von 50 W auf 46 W sinkt.
Obwohl HP mit einem TGP von 50 W und einem zusätzlichen dynamischen Boost von 15 W wirbt, erreicht die GPU-Leistung laut HWiNFO unabhängig vom Spiel immer noch einen Höchstwert von 50 W. Im Vergleich dazu würde die gleiche RTX 4060 GPU im Legion Slim 5 14 bei 98 W liegen.
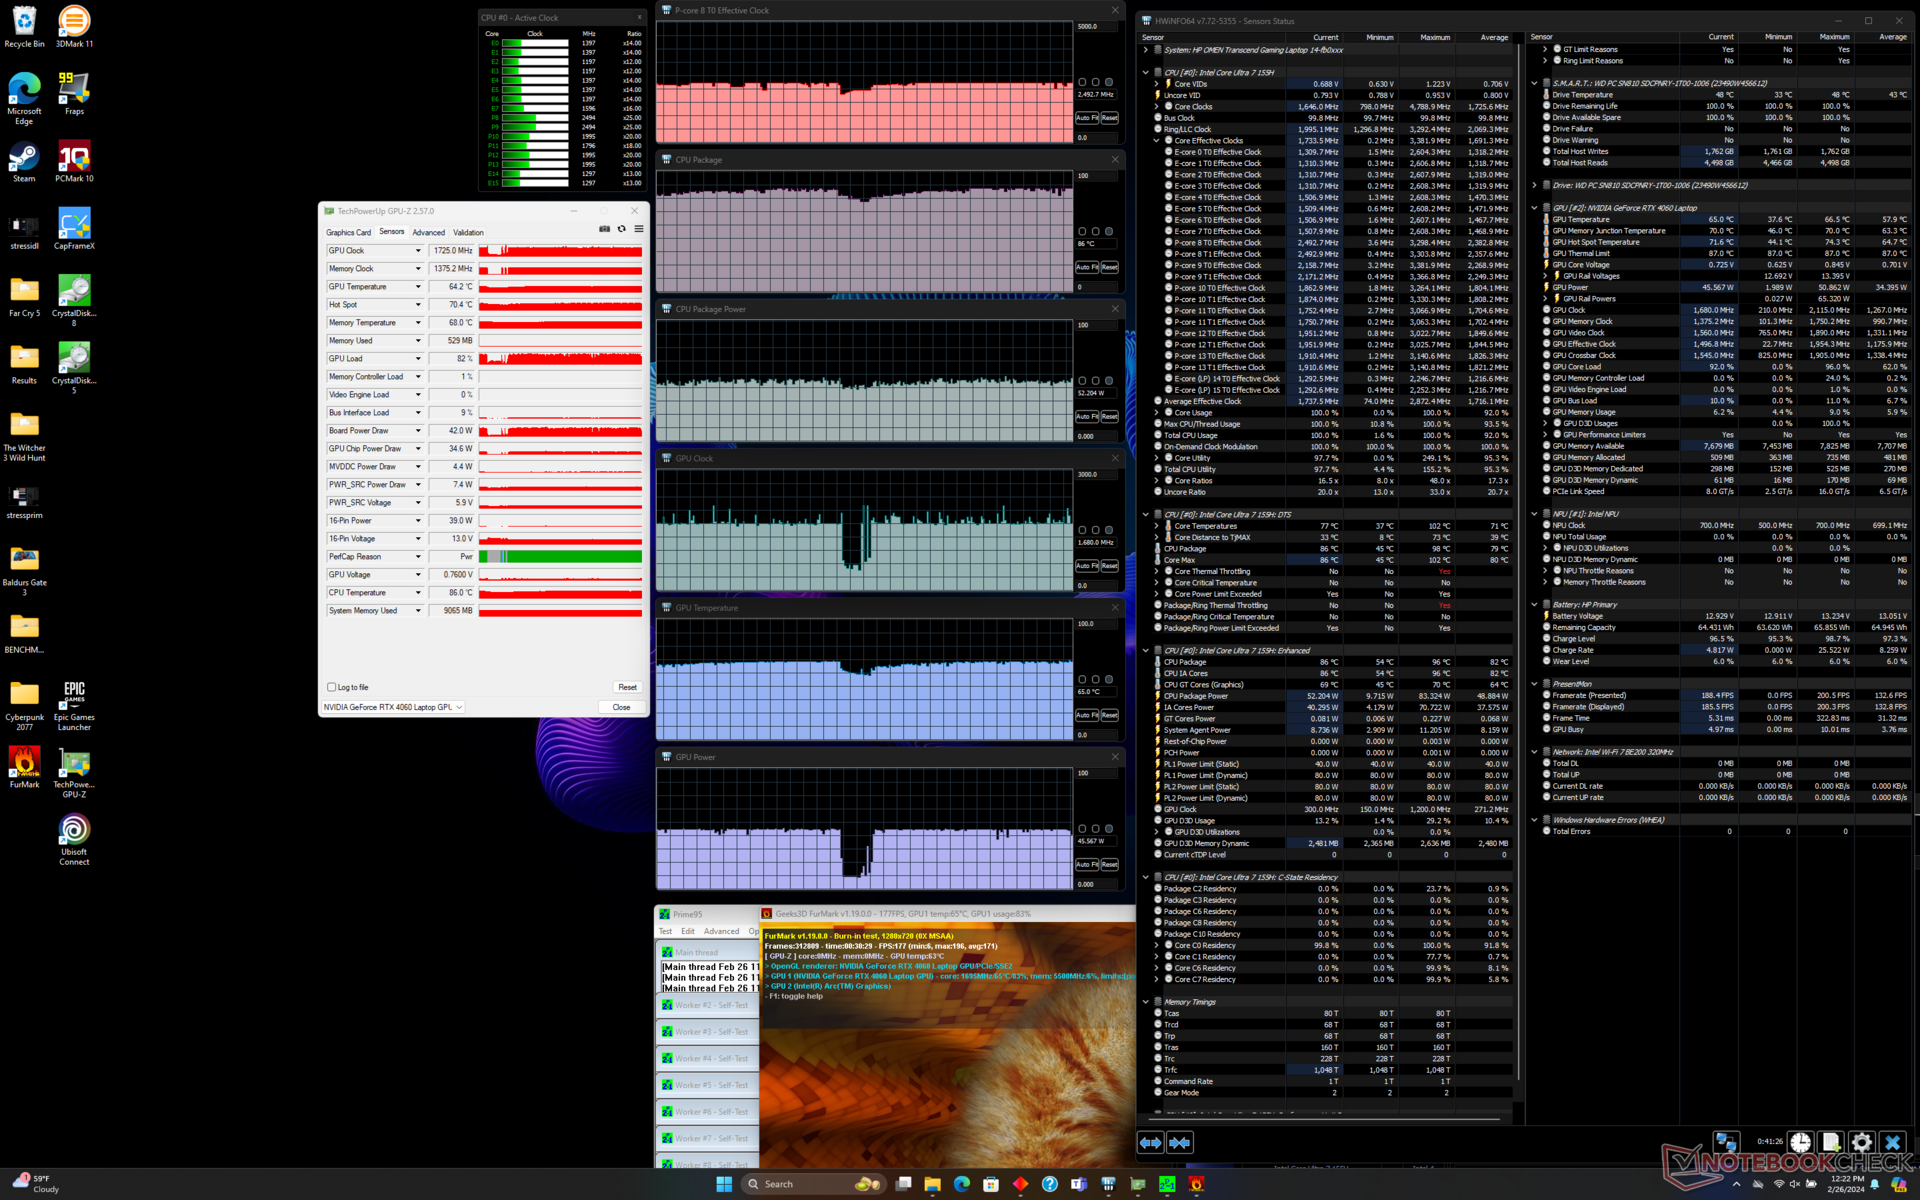
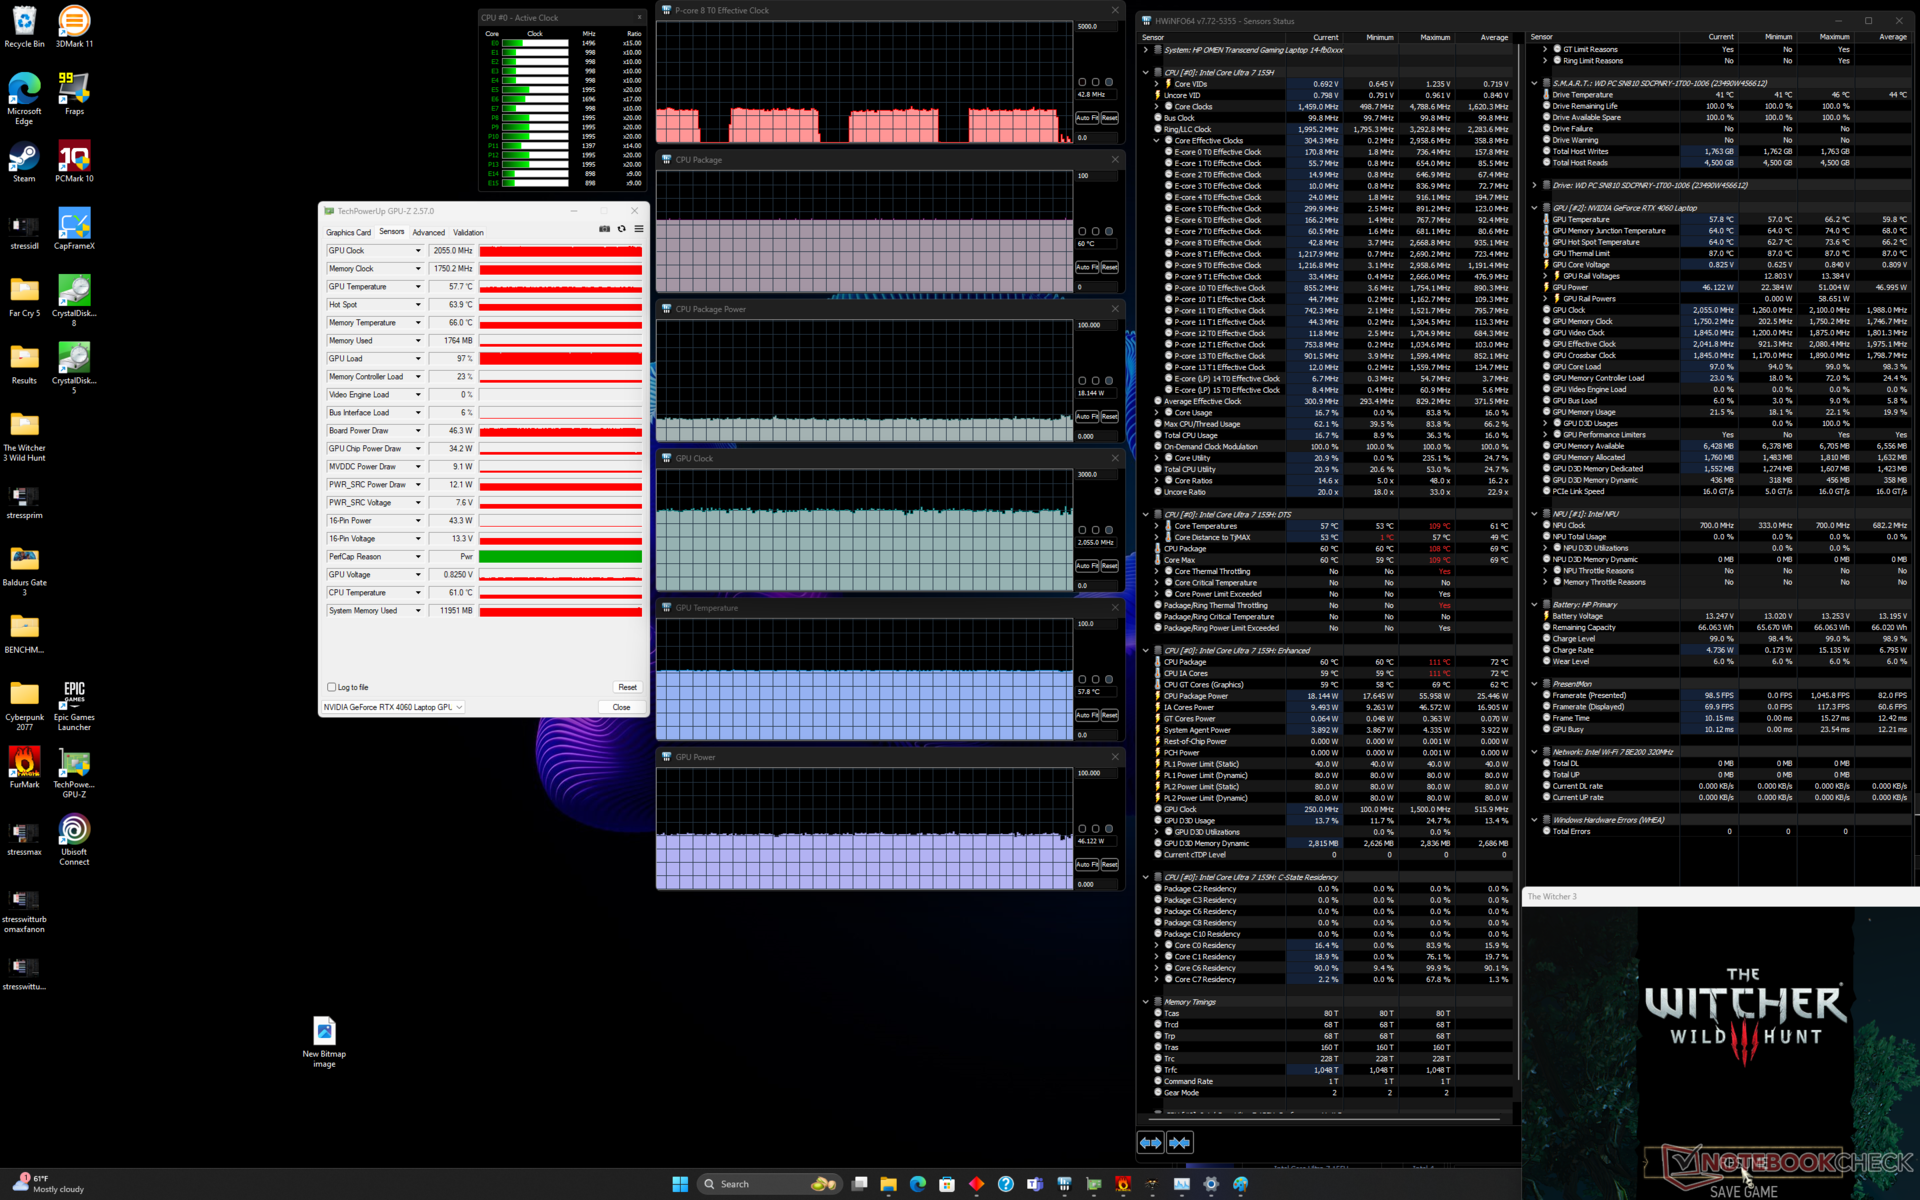
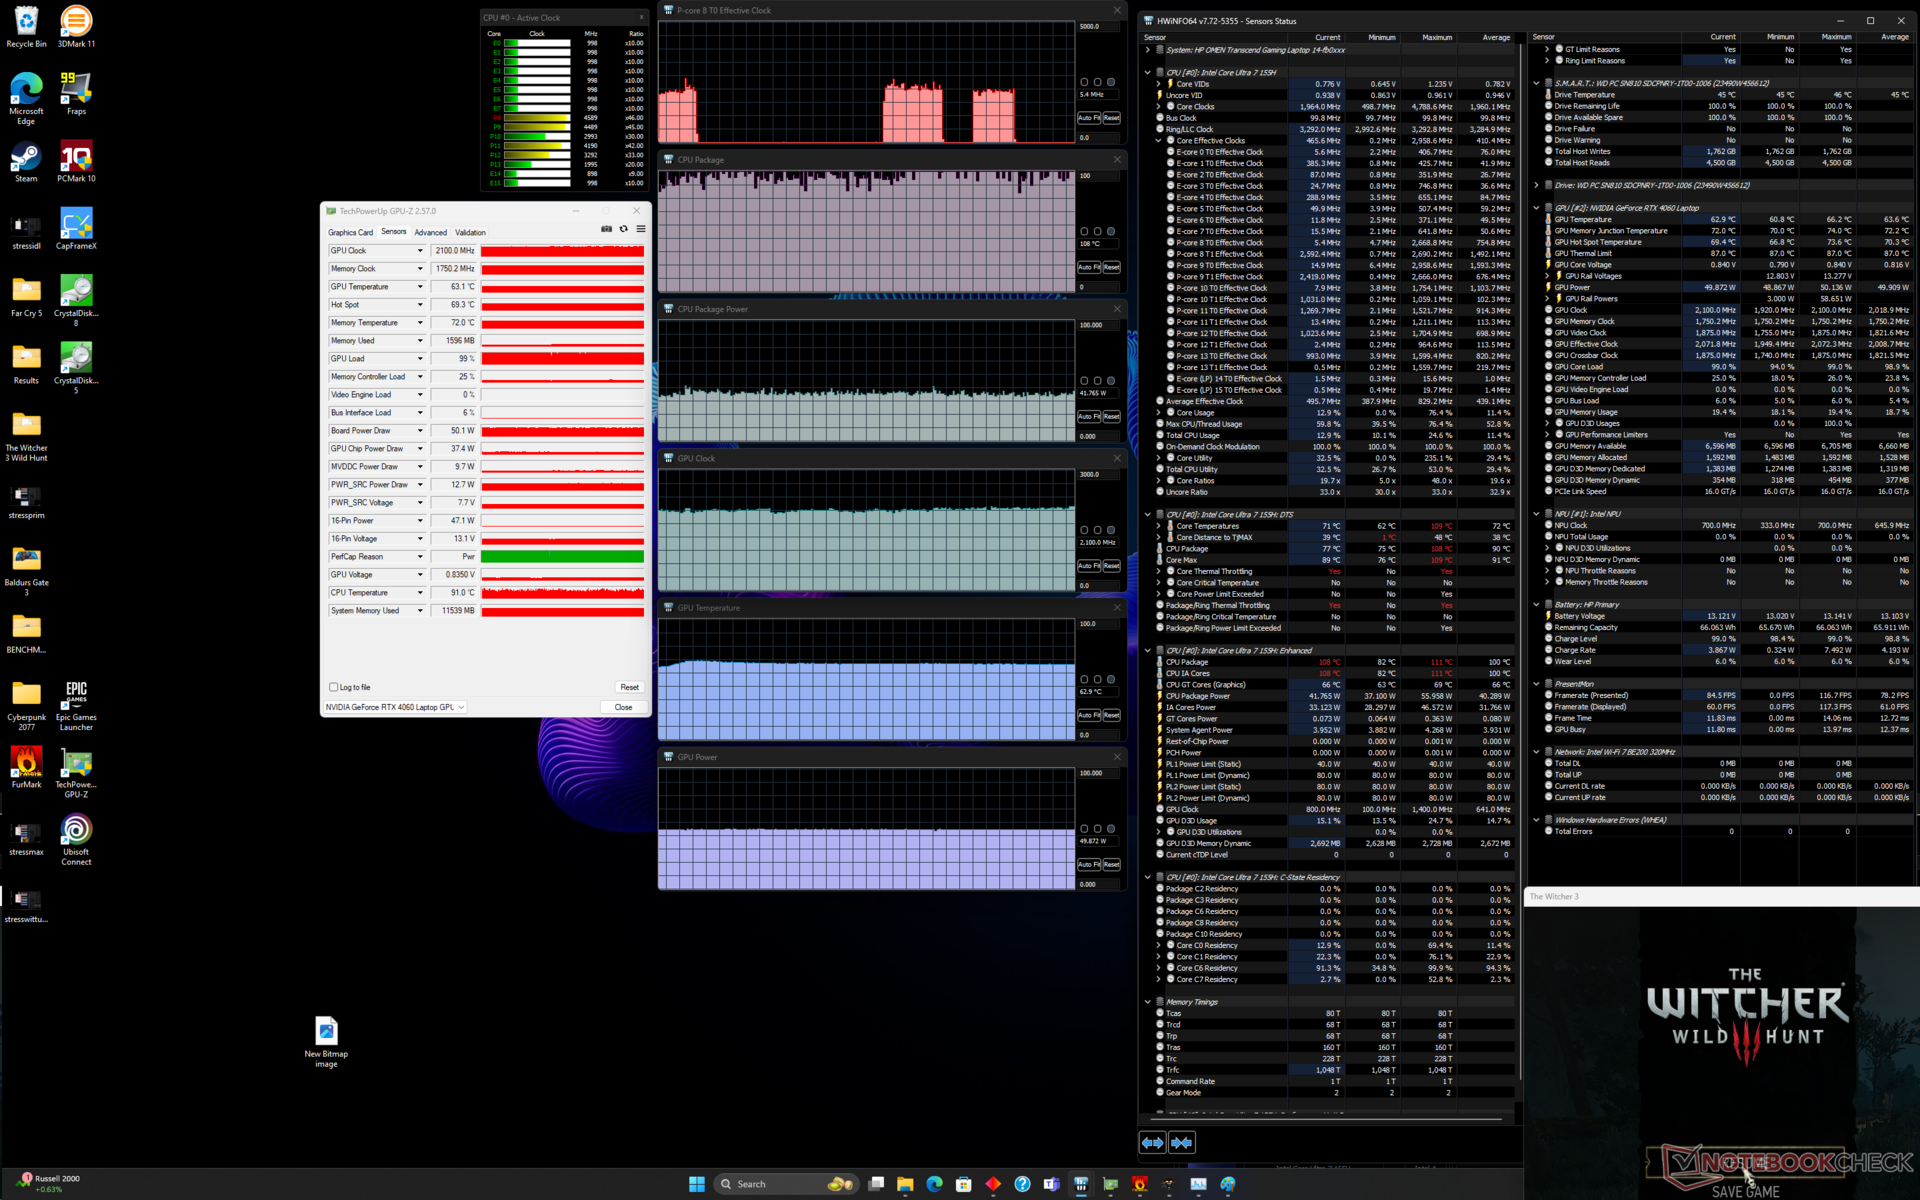
| CPU-Takt (GHz) | GPU-Takt (MHz) | Durchschnittliche CPU-Temperatur (°C) | Durchschnittliche GPU-Temperatur (°C) | |
| System im Leerlauf | -- | -- | 46 | 39 |
| Prime95 Stresstest | 2.9 - 3.0 | -- | 84 | 48 |
| Prime95 + FurMark Stresstest | 2.4 - 2.5 | 570 - 1680 | 86 | 52 - 65 |
| Witcher 3 Stresstest (Performance-Modus mit ausgeschaltetem Max Fan) | ~2.0 | 2100 | 77+ | 63 |
| Witcher 3 Stresstest (Performance-Modus mit Max Fan an) | ~2.0 | 1995 | ~97 | 61 |
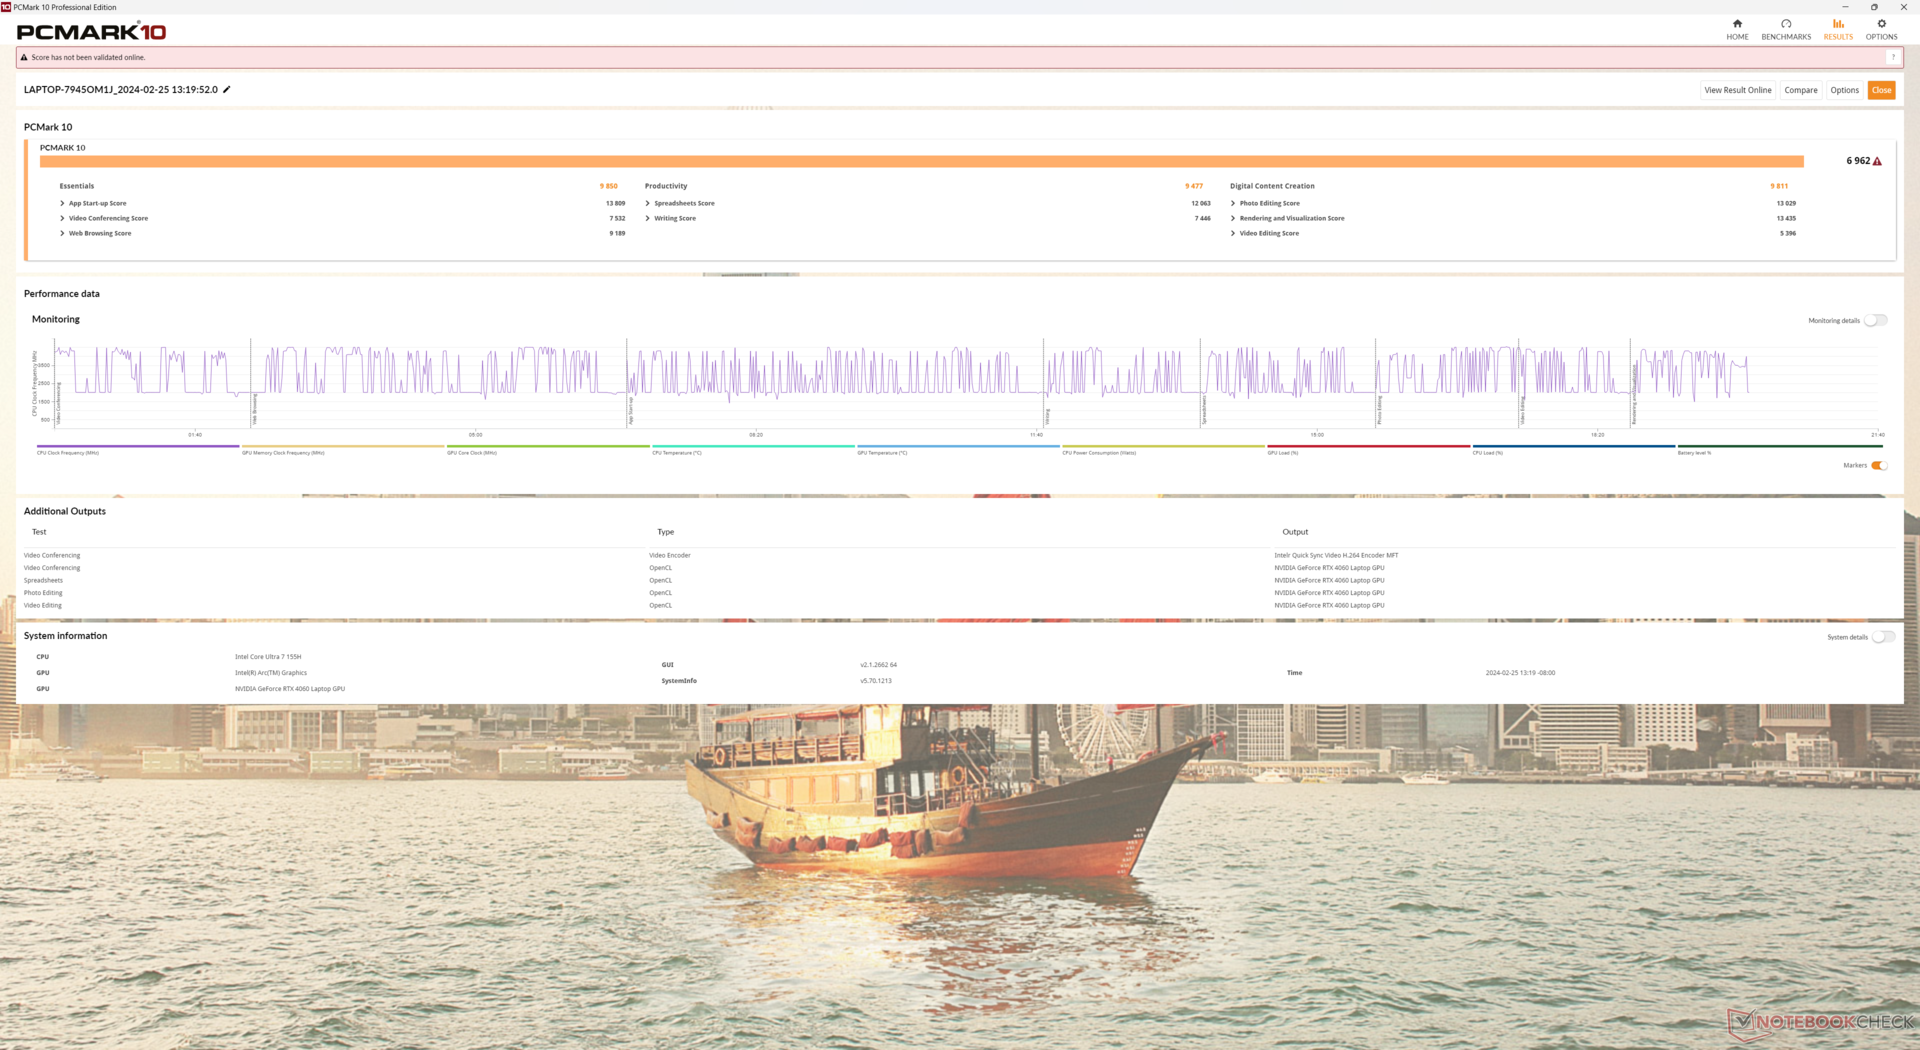
System Performance
Die PCMark 10 Scores sind etwas niedriger als die der Konkurrenten wie dem Surface Laptop Studio 2 oder dem Lenovo Legion Slim 5 14, was zum Teil an den niedrigeren TGP-Zielen unseres Omen Transcend 14 liegt. Es ist jedoch anzumerken, dass das HP-Modell mit sehr schnellem 7467 MHz LPDDR5x RAM ausgestattet ist, während der Arbeitsspeicher der meisten anderen Laptops mit 6400 MHz oder langsamer läuft. Die AIDA-Speicher-Benchmark-Ergebnisse sind daher spürbar schneller als die der konkurrierenden 14-Zoll-Systeme.
CrossMark: Overall | Productivity | Creativity | Responsiveness
WebXPRT 3: Overall
WebXPRT 4: Overall
Mozilla Kraken 1.1: Total
| PCMark 10 / Score | |
| Razer Blade 14 RZ09-0508 | |
| Lenovo Legion Slim 5 14APH8 | |
| Asus ROG Zephyrus G14 2024 GA403U | |
| Microsoft Surface Laptop Studio 2 RTX 4060 | |
| Durchschnittliche Intel Core Ultra 7 155H, NVIDIA GeForce RTX 4060 Laptop GPU (6751 - 7370, n=5) | |
| HP Omen Transcend 14-fb0014 | |
| PCMark 10 / Essentials | |
| Razer Blade 14 RZ09-0508 | |
| Lenovo Legion Slim 5 14APH8 | |
| Microsoft Surface Laptop Studio 2 RTX 4060 | |
| Durchschnittliche Intel Core Ultra 7 155H, NVIDIA GeForce RTX 4060 Laptop GPU (9476 - 10446, n=5) | |
| Asus ROG Zephyrus G14 2024 GA403U | |
| HP Omen Transcend 14-fb0014 | |
| PCMark 10 / Productivity | |
| Razer Blade 14 RZ09-0508 | |
| Lenovo Legion Slim 5 14APH8 | |
| Asus ROG Zephyrus G14 2024 GA403U | |
| HP Omen Transcend 14-fb0014 | |
| Microsoft Surface Laptop Studio 2 RTX 4060 | |
| Durchschnittliche Intel Core Ultra 7 155H, NVIDIA GeForce RTX 4060 Laptop GPU (8079 - 9477, n=5) | |
| PCMark 10 / Digital Content Creation | |
| Razer Blade 14 RZ09-0508 | |
| Lenovo Legion Slim 5 14APH8 | |
| Asus ROG Zephyrus G14 2024 GA403U | |
| Microsoft Surface Laptop Studio 2 RTX 4060 | |
| Durchschnittliche Intel Core Ultra 7 155H, NVIDIA GeForce RTX 4060 Laptop GPU (9811 - 11620, n=5) | |
| HP Omen Transcend 14-fb0014 | |
| CrossMark / Overall | |
| Apple MacBook Pro 14 2023 M3 Pro | |
| Lenovo Legion Slim 5 14APH8 | |
| Razer Blade 14 RZ09-0508 | |
| Asus ROG Zephyrus G14 2024 GA403U | |
| Microsoft Surface Laptop Studio 2 RTX 4060 | |
| Durchschnittliche Intel Core Ultra 7 155H, NVIDIA GeForce RTX 4060 Laptop GPU (1540 - 1746, n=5) | |
| HP Omen Transcend 14-fb0014 | |
| CrossMark / Productivity | |
| Lenovo Legion Slim 5 14APH8 | |
| Apple MacBook Pro 14 2023 M3 Pro | |
| Razer Blade 14 RZ09-0508 | |
| Asus ROG Zephyrus G14 2024 GA403U | |
| Microsoft Surface Laptop Studio 2 RTX 4060 | |
| Durchschnittliche Intel Core Ultra 7 155H, NVIDIA GeForce RTX 4060 Laptop GPU (1436 - 1684, n=5) | |
| HP Omen Transcend 14-fb0014 | |
| CrossMark / Creativity | |
| Apple MacBook Pro 14 2023 M3 Pro | |
| Microsoft Surface Laptop Studio 2 RTX 4060 | |
| Asus ROG Zephyrus G14 2024 GA403U | |
| Lenovo Legion Slim 5 14APH8 | |
| Razer Blade 14 RZ09-0508 | |
| Durchschnittliche Intel Core Ultra 7 155H, NVIDIA GeForce RTX 4060 Laptop GPU (1811 - 1929, n=5) | |
| HP Omen Transcend 14-fb0014 | |
| CrossMark / Responsiveness | |
| Lenovo Legion Slim 5 14APH8 | |
| Razer Blade 14 RZ09-0508 | |
| Asus ROG Zephyrus G14 2024 GA403U | |
| Apple MacBook Pro 14 2023 M3 Pro | |
| Durchschnittliche Intel Core Ultra 7 155H, NVIDIA GeForce RTX 4060 Laptop GPU (1165 - 1631, n=5) | |
| Microsoft Surface Laptop Studio 2 RTX 4060 | |
| HP Omen Transcend 14-fb0014 | |
| WebXPRT 3 / Overall | |
| Apple MacBook Pro 14 2023 M3 Pro | |
| Razer Blade 14 RZ09-0508 | |
| Lenovo Legion Slim 5 14APH8 | |
| Microsoft Surface Laptop Studio 2 RTX 4060 | |
| Asus ROG Zephyrus G14 2024 GA403U | |
| Durchschnittliche Intel Core Ultra 7 155H, NVIDIA GeForce RTX 4060 Laptop GPU (274 - 290, n=5) | |
| HP Omen Transcend 14-fb0014 | |
| WebXPRT 4 / Overall | |
| Microsoft Surface Laptop Studio 2 RTX 4060 | |
| Razer Blade 14 RZ09-0508 | |
| Lenovo Legion Slim 5 14APH8 | |
| Durchschnittliche Intel Core Ultra 7 155H, NVIDIA GeForce RTX 4060 Laptop GPU (236 - 262, n=5) | |
| Asus ROG Zephyrus G14 2024 GA403U | |
| HP Omen Transcend 14-fb0014 | |
| Mozilla Kraken 1.1 / Total | |
| HP Omen Transcend 14-fb0014 | |
| Durchschnittliche Intel Core Ultra 7 155H, NVIDIA GeForce RTX 4060 Laptop GPU (519 - 585, n=5) | |
| Asus ROG Zephyrus G14 2024 GA403U | |
| Lenovo Legion Slim 5 14APH8 | |
| Microsoft Surface Laptop Studio 2 RTX 4060 | |
| Razer Blade 14 RZ09-0508 | |
| Apple MacBook Pro 14 2023 M3 Pro | |
* ... kleinere Werte sind besser
| PCMark 10 Score | 6962 Punkte | |
Hilfe | ||
| AIDA64 / Memory Copy | |
| HP Omen Transcend 14-fb0014 | |
| Durchschnittliche Intel Core Ultra 7 155H (62397 - 96791, n=50) | |
| Lenovo Legion Slim 5 14APH8 | |
| Asus ROG Zephyrus G14 2024 GA403U | |
| Razer Blade 14 RZ09-0508 | |
| Microsoft Surface Laptop Studio 2 RTX 4060 | |
| AIDA64 / Memory Read | |
| HP Omen Transcend 14-fb0014 | |
| Durchschnittliche Intel Core Ultra 7 155H (60544 - 90647, n=50) | |
| Microsoft Surface Laptop Studio 2 RTX 4060 | |
| Razer Blade 14 RZ09-0508 | |
| Lenovo Legion Slim 5 14APH8 | |
| Asus ROG Zephyrus G14 2024 GA403U | |
| AIDA64 / Memory Write | |
| Asus ROG Zephyrus G14 2024 GA403U | |
| Lenovo Legion Slim 5 14APH8 | |
| Razer Blade 14 RZ09-0508 | |
| HP Omen Transcend 14-fb0014 | |
| Microsoft Surface Laptop Studio 2 RTX 4060 | |
| Durchschnittliche Intel Core Ultra 7 155H (58692 - 93451, n=50) | |
| AIDA64 / Memory Latency | |
| HP Omen Transcend 14-fb0014 | |
| Durchschnittliche Intel Core Ultra 7 155H (116.2 - 233, n=50) | |
| Lenovo Legion Slim 5 14APH8 | |
| Asus ROG Zephyrus G14 2024 GA403U | |
| Razer Blade 14 RZ09-0508 | |
| Microsoft Surface Laptop Studio 2 RTX 4060 | |
* ... kleinere Werte sind besser
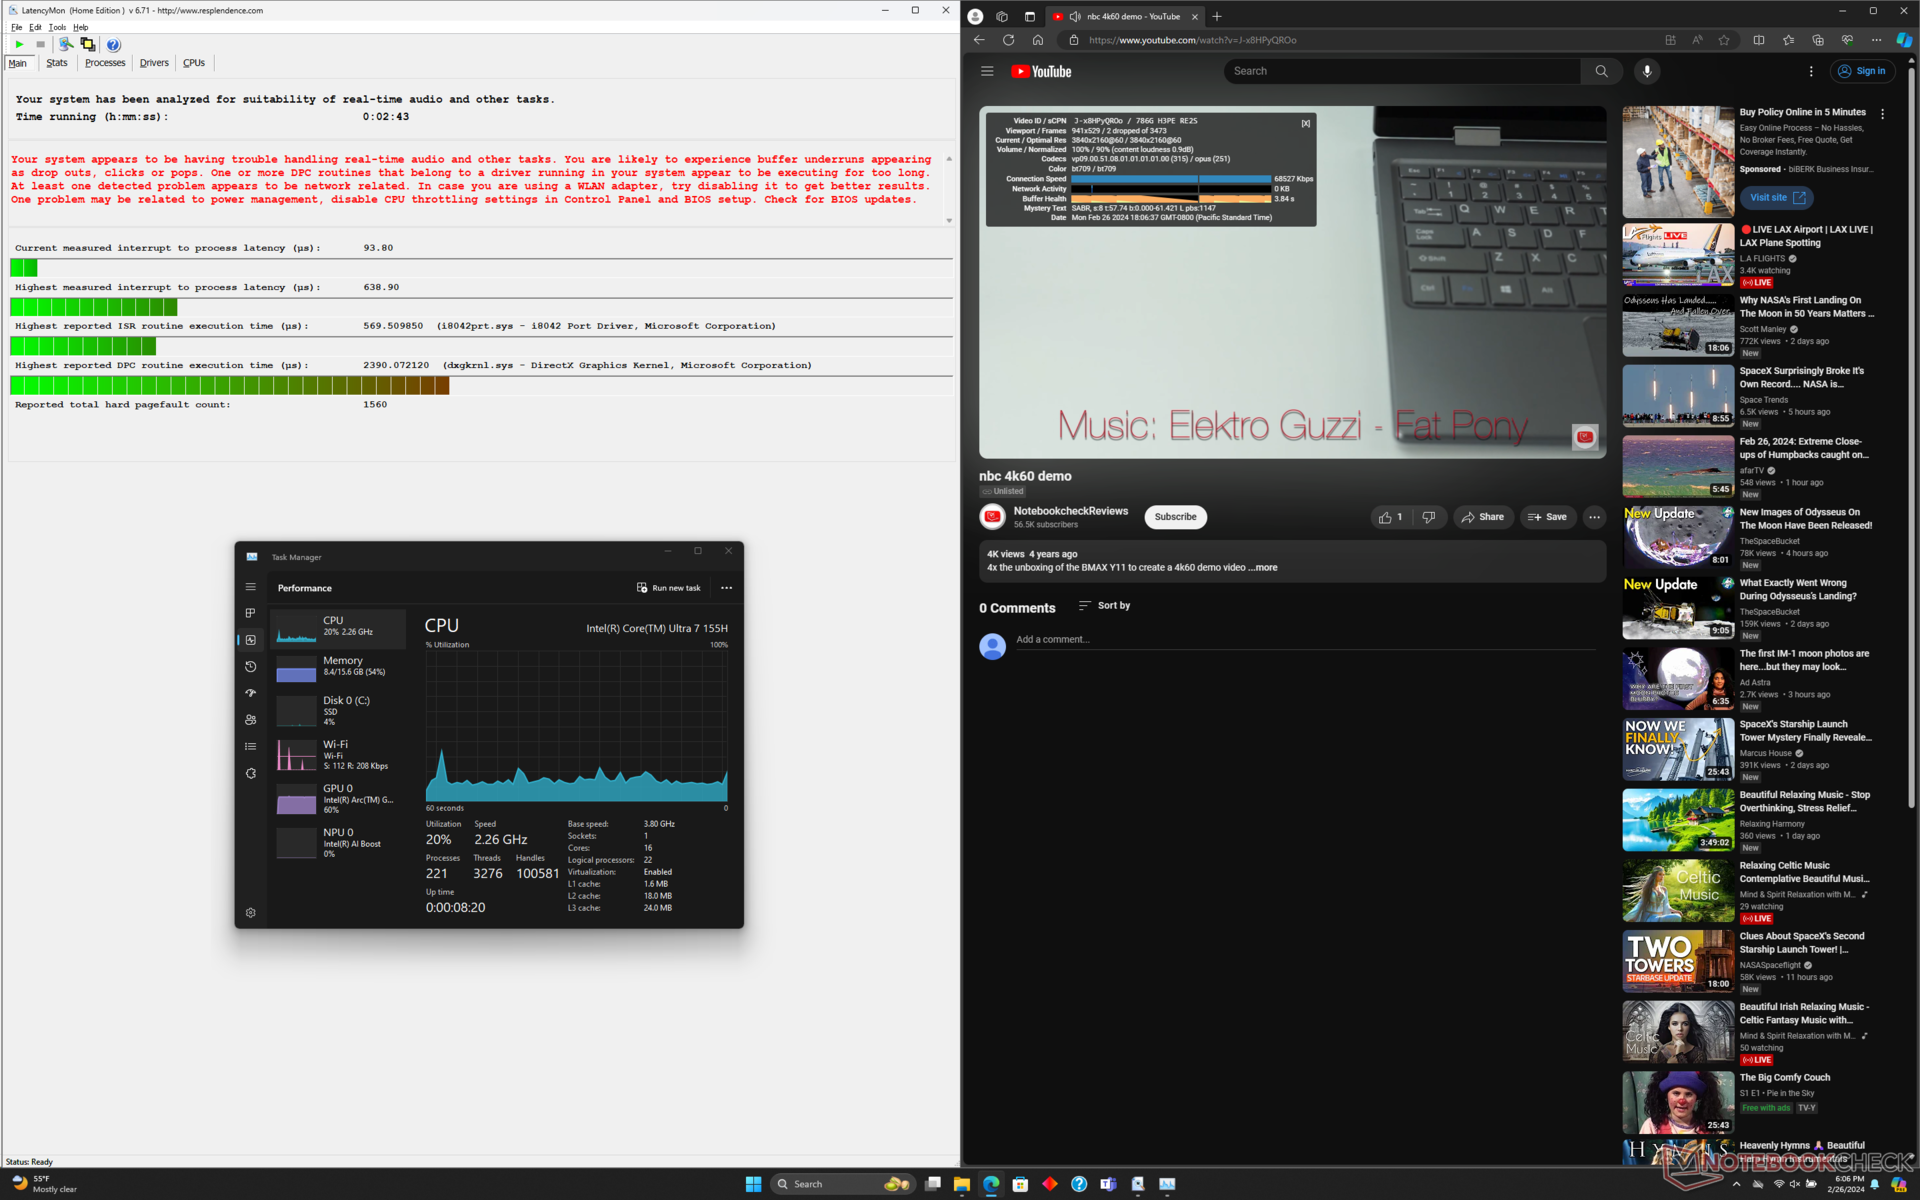
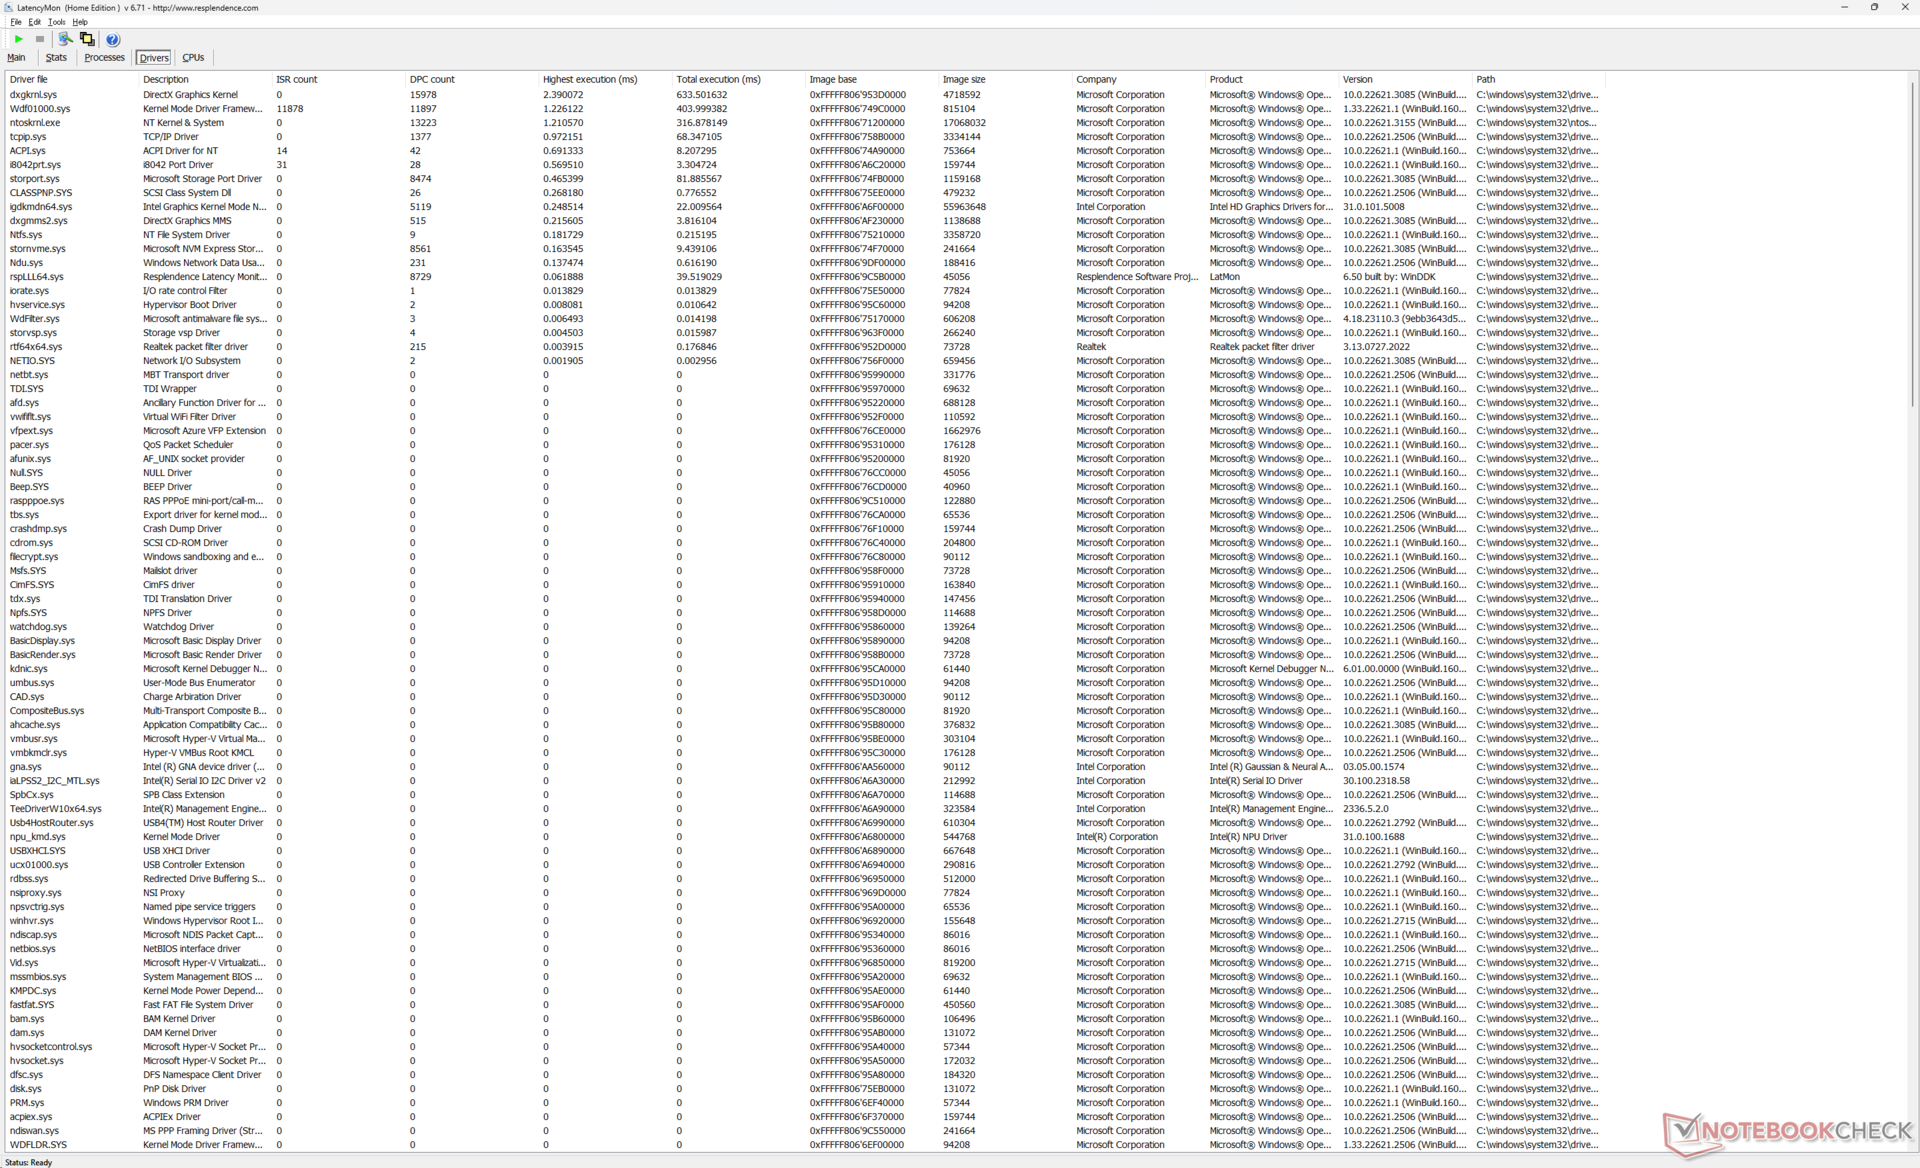
DPC-Latenzen
LatencyMon zeigt leichte DPC-Probleme beim Öffnen mehrerer Browser-Tabs unserer Homepage. Die 4K-Videowiedergabe bei 60 FPS ist ansonsten perfekt. Lediglich beim Start des Microsoft Snippet-Tools wurden zwei dropped frames am Ende des Videos aufgezeichnet.
| DPC Latencies / LatencyMon - interrupt to process latency (max), Web, Youtube, Prime95 | |
| Microsoft Surface Laptop Studio 2 RTX 4060 | |
| Lenovo Legion Slim 5 14APH8 | |
| Razer Blade 14 RZ09-0508 | |
| HP Omen Transcend 14-fb0014 | |
| Asus ROG Zephyrus G14 2024 GA403U | |
* ... kleinere Werte sind besser
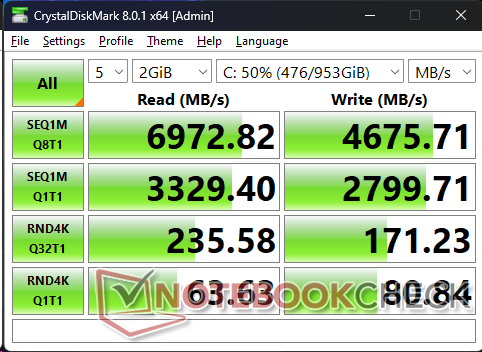
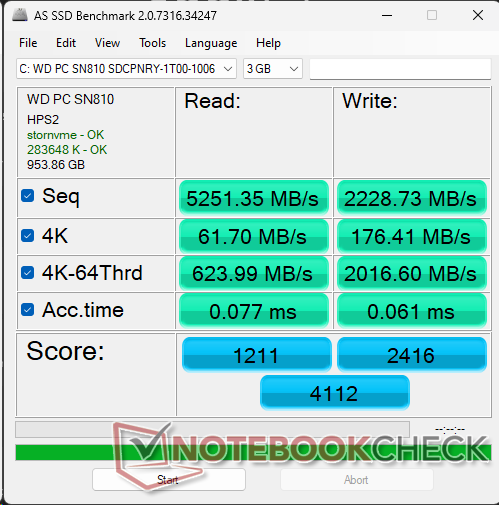
Massenspeicher
Unser Gerät wird mit einer 1-TB WDC PC SN810 PCIe4-x4-NVMe-SSD geliefert, die keinen Platz für eine zweite Option bietet. Die maximalen Übertragungsraten liegen konstant bei ~7000 MB/s, wenn DiskSpd in einer Schleife läuft, was darauf hindeutet, dass es keine größeren Drosselungsprobleme gibt.

| Drive Performance Rating - Percent | |
| Lenovo Legion Slim 5 14APH8 | |
| Razer Blade 14 RZ09-0508 | |
| Microsoft Surface Laptop Studio 2 RTX 4060 | |
| HP Omen Transcend 14-fb0014 | |
| Asus ROG Zephyrus G14 2024 GA403U | |
* ... kleinere Werte sind besser
Dauerleistung Lesen: DiskSpd Read Loop, Queue Depth 8
GPU Performance — 50 W GeForce RTX-Grafik
Das Omen Transcend 14 ist eines der wenigen Notebooks, die mit einer niedrigen 50 W TGP GeForce RTX 4060 mit zusätzlichem 15-W-Dynamic-Boost (50 W + 15 W) arbeiten. Obwohl unser Modell mit den gleichen GPU-Optionen wie das Blade 14, Legion Slim 5 14 oder 2024 Zephyrus G14 ausgestattet ist, arbeiten diese Alternativen mit viel höheren TGP-Zielen für mehr Leistung. Das Lenovo-System bietet beispielsweise eine um 30 bis 35% schnellere Grafikleistung als unser HP, da seine RTX 4060 einen TGP von 105 W anstrebt. Selbst das Yoga Pro 9 mit der RTX 4050 kann in vielerlei Hinsicht mit unserer RTX 4060 mithalten.
Die CUDA-Beschleunigung für das Rendering in Blender ist nur bis zu 10 Prozent langsamer als der durchschnittliche RTX 4060 Laptop in unserer Datenbank, was ein viel kleineres Delta ist als die oben erwähnten 3DMark-Unterschiede. Daher eignet sich das HP-System eher für die Bearbeitung und Erstellung von Inhalten als für reine Spiele.
Der Wechsel zur RTX 4070 wird die Leistung voraussichtlich nur um 10 bis 15 Prozent erhöhen, während der Wechsel zur RTX 4050 die Leistung voraussichtlich um 15 bis 20 Prozent verringern wird.
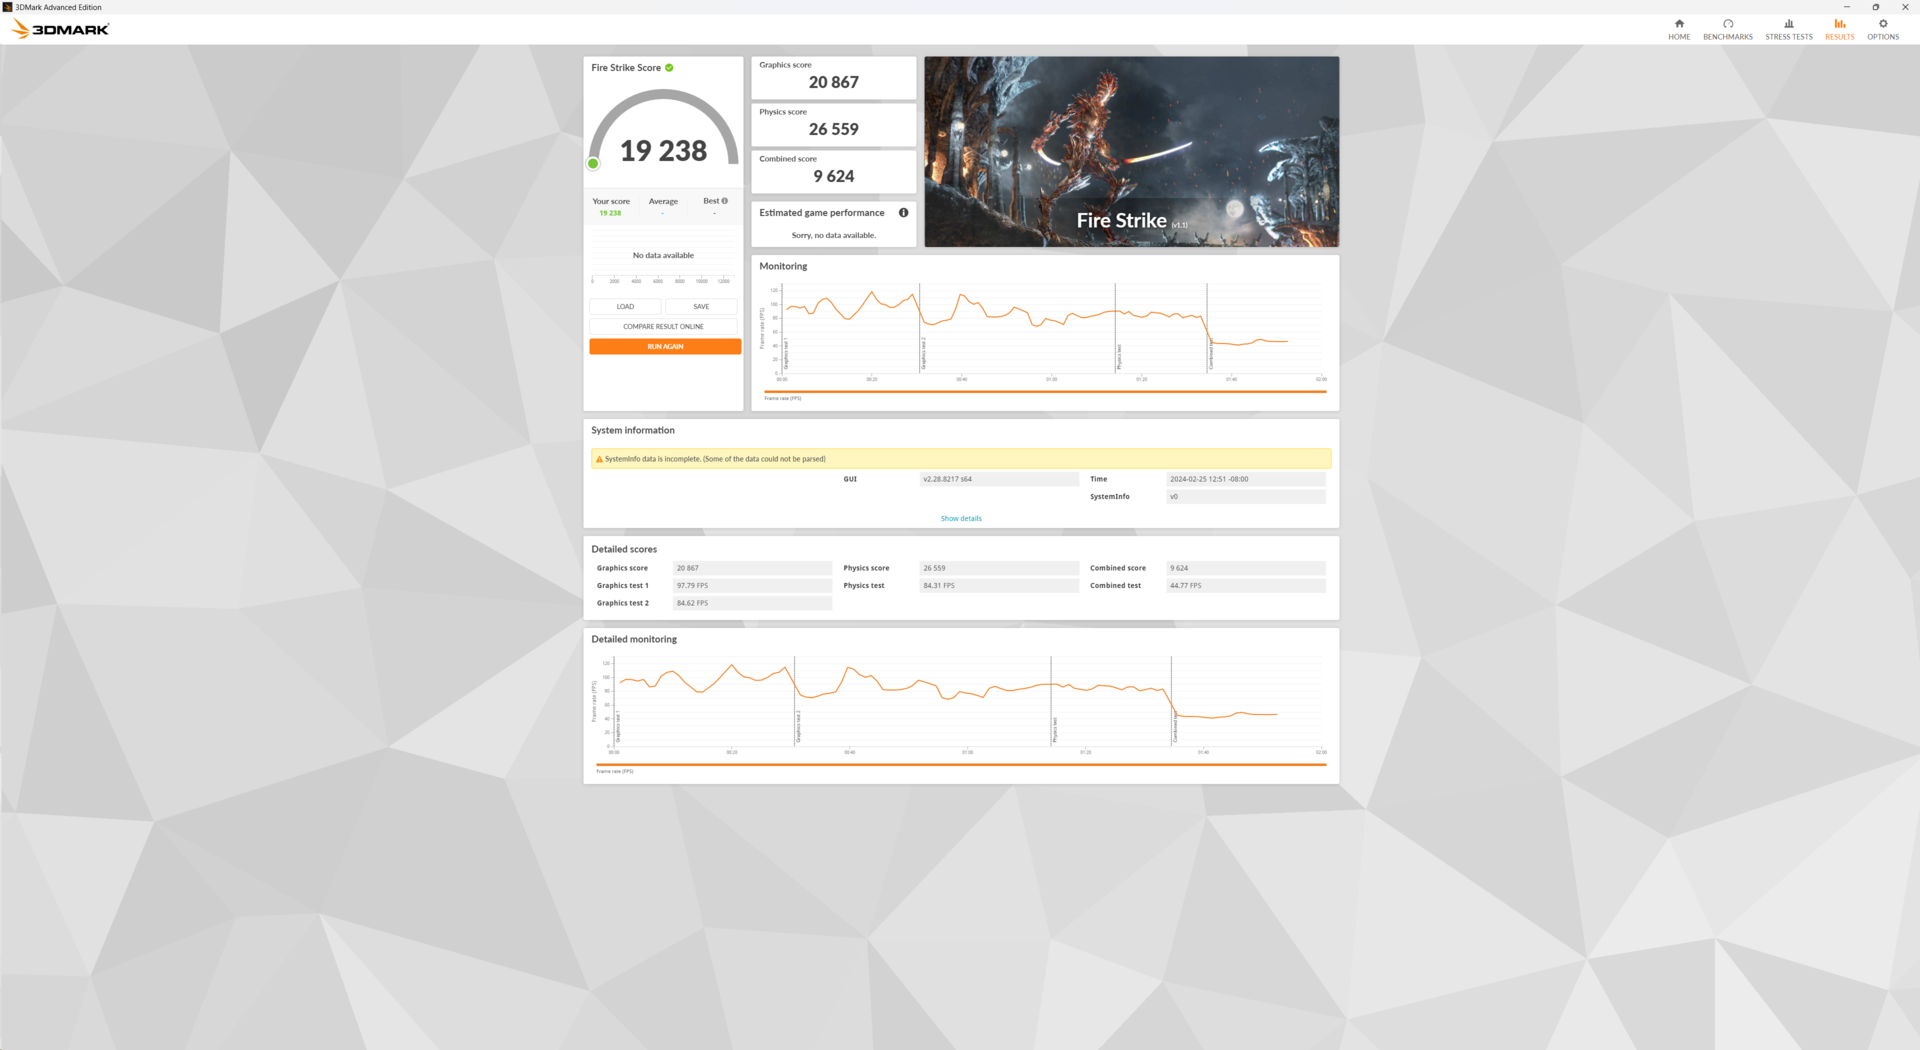
| Energieprofile | Grafikleistung | CPU-Leistung | Gesamtwert |
| Performance-Modus mit Max Fan an | 20867 | 26559 | 9624 |
| Performance-Modus mit ausgeschaltetem Max Fan | 20566 (-1%) | 26455 (-0%) | 9526 (-1%) |
| Balanced-Modus | 19100 (-9%) | 25431 (-4%) | 7277 (-24%) |
| Battery Power | 18522 (-11%) | 24240 (-9%) | 7508 (-22%) |
Beachten Sie, dass der Max Fan-Modus wenig bis gar keinen Einfluss auf die Gesamtleistung hat, wie unsere Fire Strike-Ergebnistabelle oben zeigt. Wenn Sie jedoch auf den Balanced-Modus oder den Battery Power zurückgehen, kann sich dies stärker auf die Leistung auswirken.
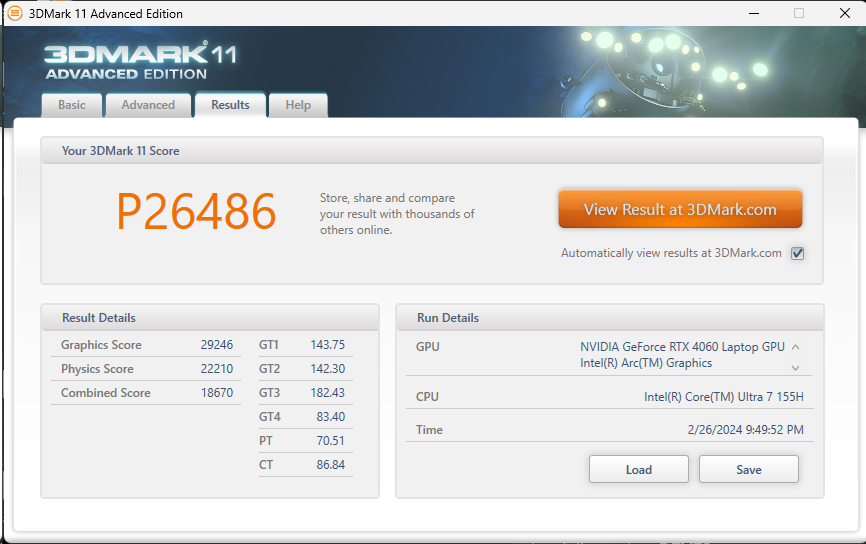

| 3DMark 11 Performance | 26486 Punkte | |
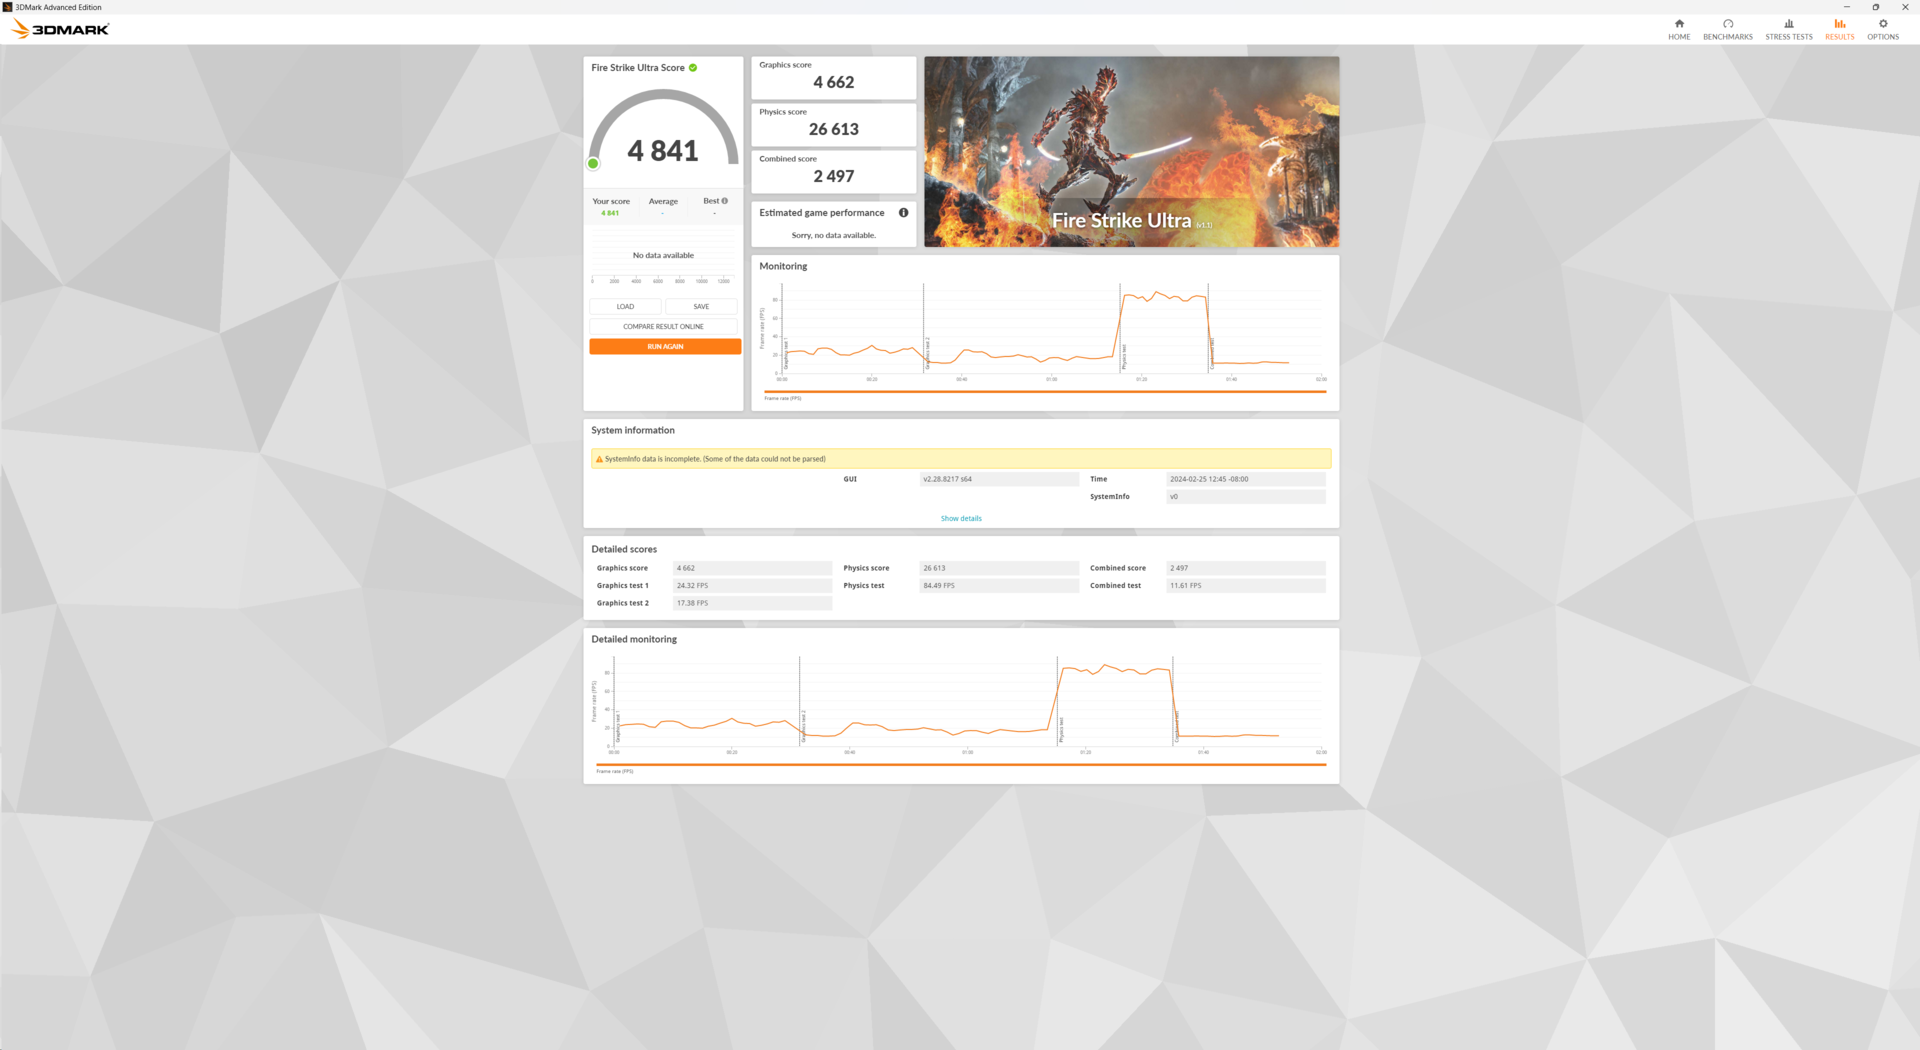
| 3DMark Fire Strike Score | 19238 Punkte | |
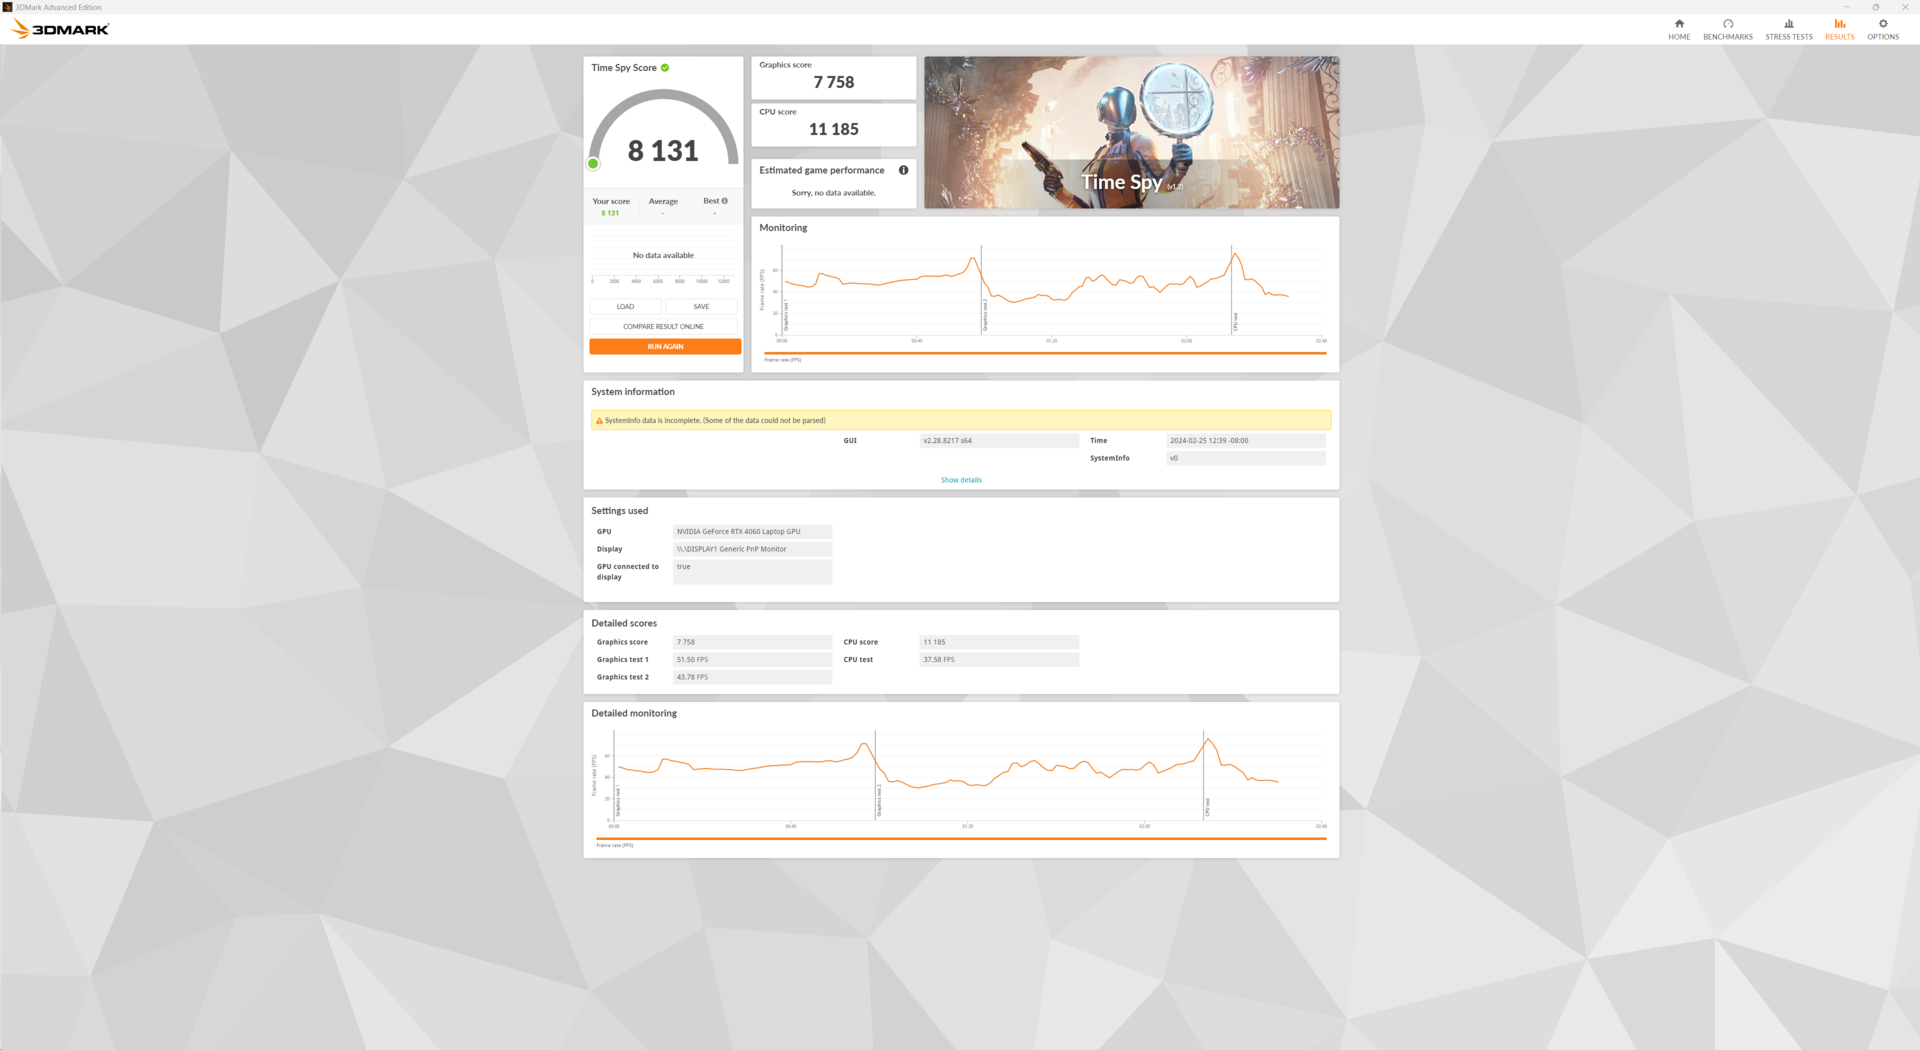
| 3DMark Time Spy Score | 8131 Punkte | |
Hilfe | ||
* ... kleinere Werte sind besser
Gaming Performance
Alle Spiele lassen sich auf dem 1800p-Display gut spielen, sogar anspruchsvolle Titel wie Cyberpunk 2077 oder Baldur's Gate 3, trotz der langsamer als üblichen RTX 4060 Leistung. Wir empfehlen jedoch, die Einstellungen auf den niedrigen bis mittleren Bereich herunterzudrehen und DLSS zu aktivieren, wenn es verfügbar ist, um ein 60-FPS-Ziel zu erreichen.
| The Witcher 3 - 1920x1080 Ultra Graphics & Postprocessing (HBAO+) | |
| Razer Blade 14 RZ09-0508 | |
| Lenovo Legion Slim 5 14APH8 | |
| Asus ROG Zephyrus G14 2024 GA403U | |
| Microsoft Surface Laptop Studio 2 RTX 4060 | |
| HP Omen Transcend 14-fb0014 | |
| Apple MacBook Pro 14 2023 M3 Pro | |
| GTA V - 1920x1080 Highest AA:4xMSAA + FX AF:16x | |
| Razer Blade 14 RZ09-0508 | |
| Lenovo Legion Slim 5 14APH8 | |
| HP Omen Transcend 14-fb0014 | |
| Asus ROG Zephyrus G14 2024 GA403U | |
| Microsoft Surface Laptop Studio 2 RTX 4060 | |
| Apple MacBook Pro 14 2023 M3 Pro | |
| Final Fantasy XV Benchmark - 1920x1080 High Quality | |
| Razer Blade 14 RZ09-0508 | |
| Lenovo Legion Slim 5 14APH8 | |
| Asus ROG Zephyrus G14 2024 GA403U | |
| Microsoft Surface Laptop Studio 2 RTX 4060 | |
| HP Omen Transcend 14-fb0014 | |
| Strange Brigade - 1920x1080 ultra AA:ultra AF:16 | |
| Lenovo Legion Slim 5 14APH8 | |
| Asus ROG Zephyrus G14 2024 GA403U | |
| Microsoft Surface Laptop Studio 2 RTX 4060 | |
| HP Omen Transcend 14-fb0014 | |
| Dota 2 Reborn - 1920x1080 ultra (3/3) best looking | |
| Razer Blade 14 RZ09-0508 | |
| Microsoft Surface Laptop Studio 2 RTX 4060 | |
| Lenovo Legion Slim 5 14APH8 | |
| HP Omen Transcend 14-fb0014 | |
| Asus ROG Zephyrus G14 2024 GA403U | |
| X-Plane 11.11 - 1920x1080 high (fps_test=3) | |
| Microsoft Surface Laptop Studio 2 RTX 4060 | |
| Lenovo Legion Slim 5 14APH8 | |
| Asus ROG Zephyrus G14 2024 GA403U | |
| HP Omen Transcend 14-fb0014 | |
| Razer Blade 14 RZ09-0508 | |
Witcher 3 FPS-Diagramm
| min. | mittel | hoch | max. | QHD | 4K | |
|---|---|---|---|---|---|---|
| GTA V (2015) | 170.2 | 165.2 | 155.2 | 96.7 | 74 | 68.8 |
| The Witcher 3 (2015) | 340.1 | 261.8 | 149.9 | 80.2 | 50.6 | |
| Dota 2 Reborn (2015) | 149.8 | 134.9 | 129.5 | 121.1 | 106.2 | |
| Final Fantasy XV Benchmark (2018) | 165 | 116 | 83.2 | 60.1 | 32.6 | |
| X-Plane 11.11 (2018) | 116.5 | 102.2 | 79.5 | 68.4 | ||
| Far Cry 5 (2018) | 145 | 121 | 114 | 107 | 80 | 39 |
| Strange Brigade (2018) | 367 | 220 | 173.2 | 151.1 | 102 | 54.5 |
| Tiny Tina's Wonderlands (2022) | 164.4 | 131.5 | 86.6 | 67.5 | 45.3 | 21.9 |
| F1 22 (2022) | 197.8 | 194.8 | 146.4 | 49 | 31 | 14.8 |
| Baldur's Gate 3 (2023) | 104.2 | 85.2 | 76.6 | 73.2 | 48.9 | 24.8 |
| Cyberpunk 2077 (2023) | 103.5 | 77.7 | 65.2 | 56.7 | 32.9 | 13.8 |
Emissionen
Geräuschemissionen
Das Lüfterverhalten und die Geräuschentwicklung sind direkt mit den Energieprofilen in der Omen Gaming Hub Software verknüpft. Im iGPU-Modus und im Profil Balanced-Modus sind die Lüfter über lange Zeiträume hinweg sehr leise, sogar während der ersten Benchmarkszene des 3DMark 06. Im dGPU- und Performance-Modus tendiert das Lüftergeräusch jedoch dazu, sich bei 29 bis 31 dB(A) zu bewegen, unabhängig von der Bildschirmlast. Wenn Sie Wert auf leise Lüfter legen, sollten Sie sich an den iGPU-Modus halten.
Das Lüftergeräusch beim Spielen pendelt sich bei 47 dB(A) mit ausgeschaltetem Max Fan und 52 dB(A) mit eingeschaltetem Max Fan ein. Dieser Bereich ist vergleichbar mit dem, den wir beim Blade 14 oder Zephyrus G14 gemessen haben, was bedeutet, dass das Omen Transcend 14 trotz des niedrigeren TGP-Ziels beim Spielen nicht merklich leiser ist.
Lautstärkediagramm
| Idle |
| 24.7 / 24.7 / 24.7 dB(A) |
| Last |
| 25.2 / 52 dB(A) |
 | ||
30 dB leise 40 dB(A) deutlich hörbar 50 dB(A) störend |
||
min: | ||
| HP Omen Transcend 14-fb0014 GeForce RTX 4060 Laptop GPU, Ultra 7 155H, WDC PC SN810 1TB | Asus ROG Zephyrus G14 2024 GA403U GeForce RTX 4070 Laptop GPU, R9 8945HS, WD PC SN560 SDDPNQE-1T00 | Razer Blade 14 RZ09-0508 GeForce RTX 4070 Laptop GPU, R9 8945HS, Samsung PM9A1 MZVL21T0HCLR | Lenovo Legion Slim 5 14APH8 GeForce RTX 4060 Laptop GPU, R7 7840HS, SK Hynix HFS001TEJ9X115N | Apple MacBook Pro 14 2023 M3 Pro M3 Pro 14-Core GPU, Apple M3 Pro 11-Core, Apple SSD AP0512Z | Microsoft Surface Laptop Studio 2 RTX 4060 GeForce RTX 4060 Laptop GPU, i7-13700H, Kioxia XG8 KXG80ZNV1T02 | |
|---|---|---|---|---|---|---|
| Geräuschentwicklung | -8% | -5% | -14% | 9% | -15% | |
| aus / Umgebung * (dB) | 24.5 | 23.9 2% | 24.3 1% | 22.8 7% | 24.1 2% | 23.9 2% |
| Idle min * (dB) | 24.7 | 23.9 3% | 25 -1% | 22.8 8% | 24.1 2% | 23.9 3% |
| Idle avg * (dB) | 24.7 | 23.9 3% | 25 -1% | 27.3 -11% | 24.1 2% | 24.4 1% |
| Idle max * (dB) | 24.7 | 23.9 3% | 25 -1% | 30.7 -24% | 24.1 2% | 26.9 -9% |
| Last avg * (dB) | 25.2 | 46.2 -83% | 33 -31% | 41.6 -65% | 25.1 -0% | 48.5 -92% |
| Witcher 3 ultra * (dB) | 47 | 46.2 2% | 49.5 -5% | 52.8 -12% | 25.1 47% | 51.8 -10% |
| Last max * (dB) | 52 | 46.2 11% | 51.9 -0% | 52.6 -1% | 49.4 5% | 51.8 -0% |
* ... kleinere Werte sind besser
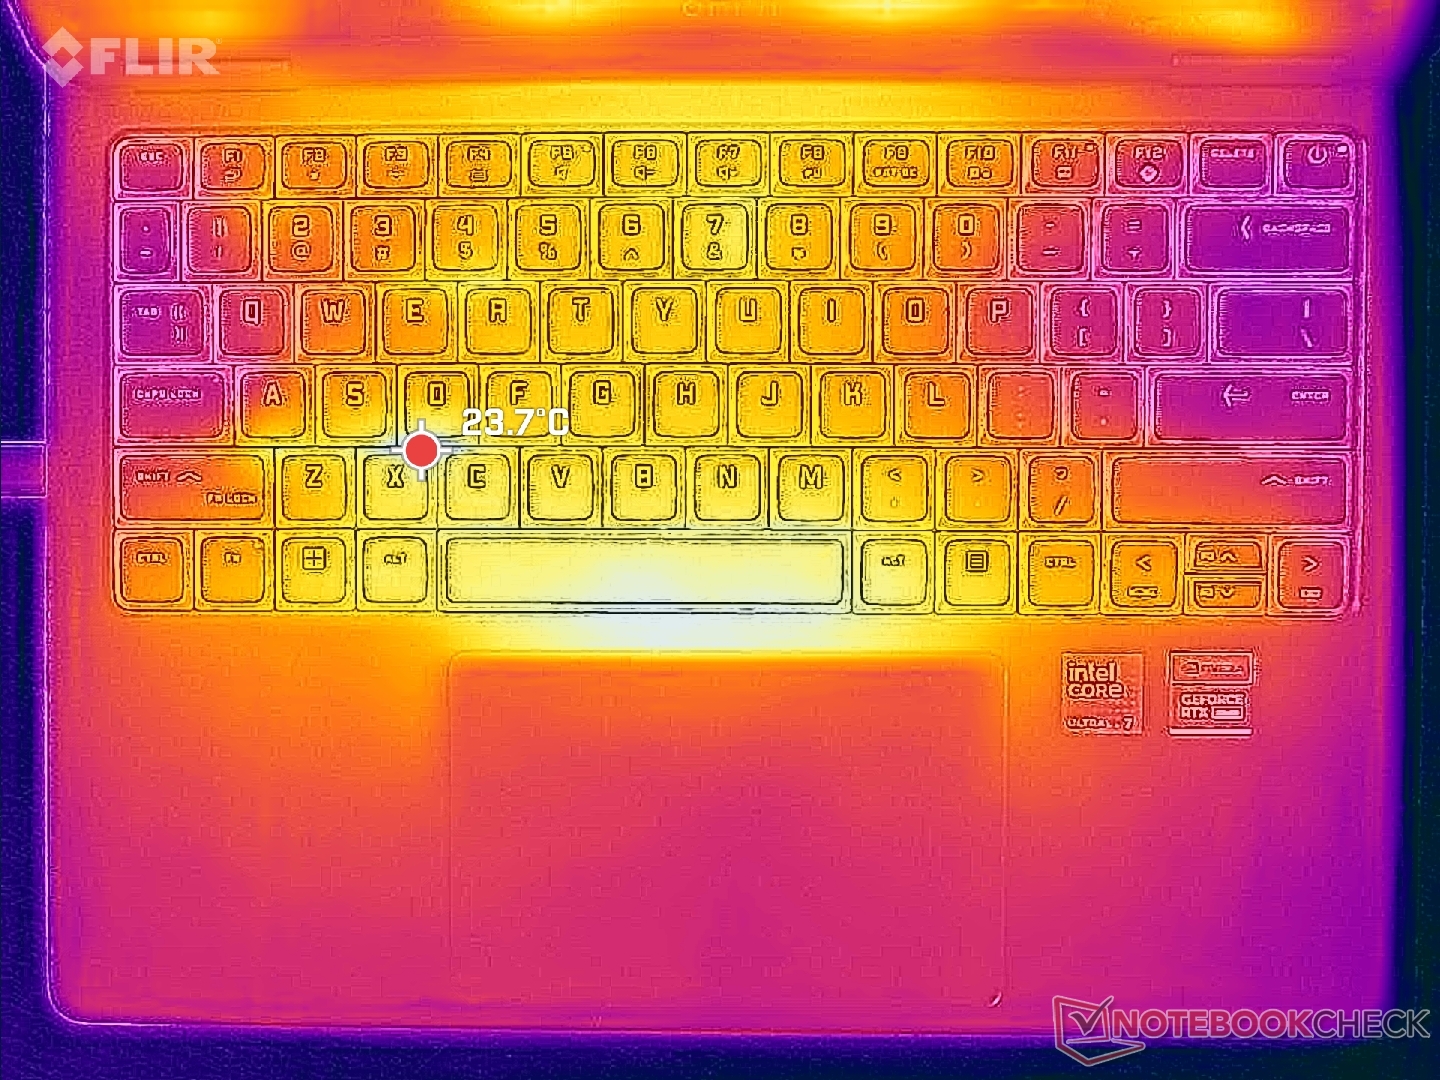
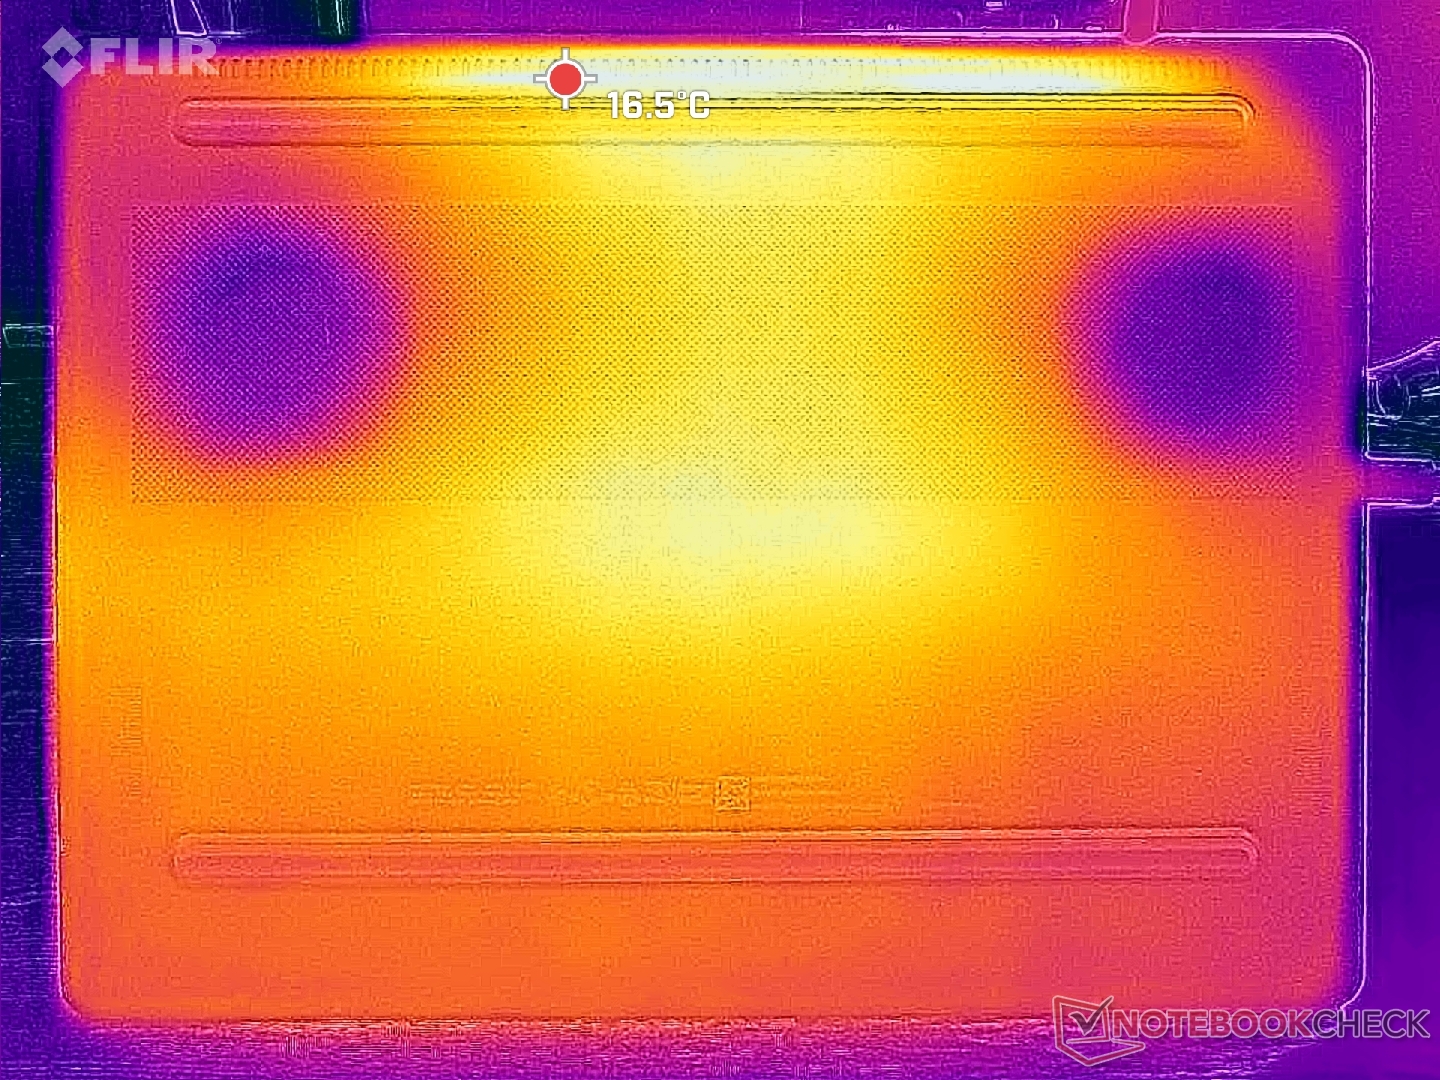
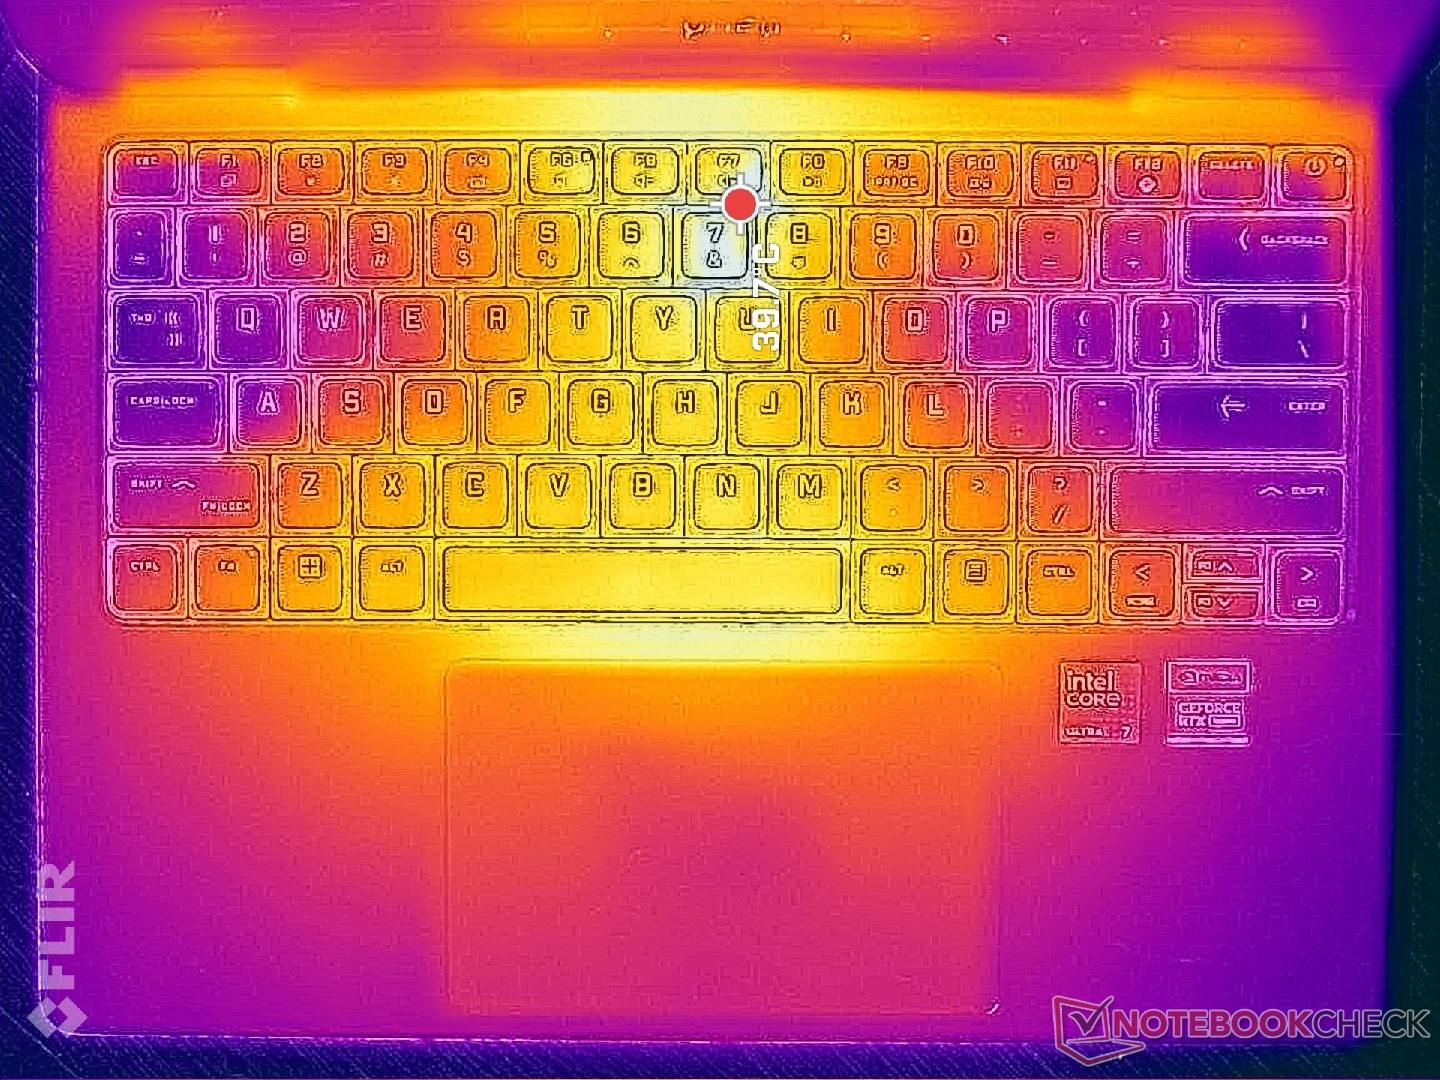
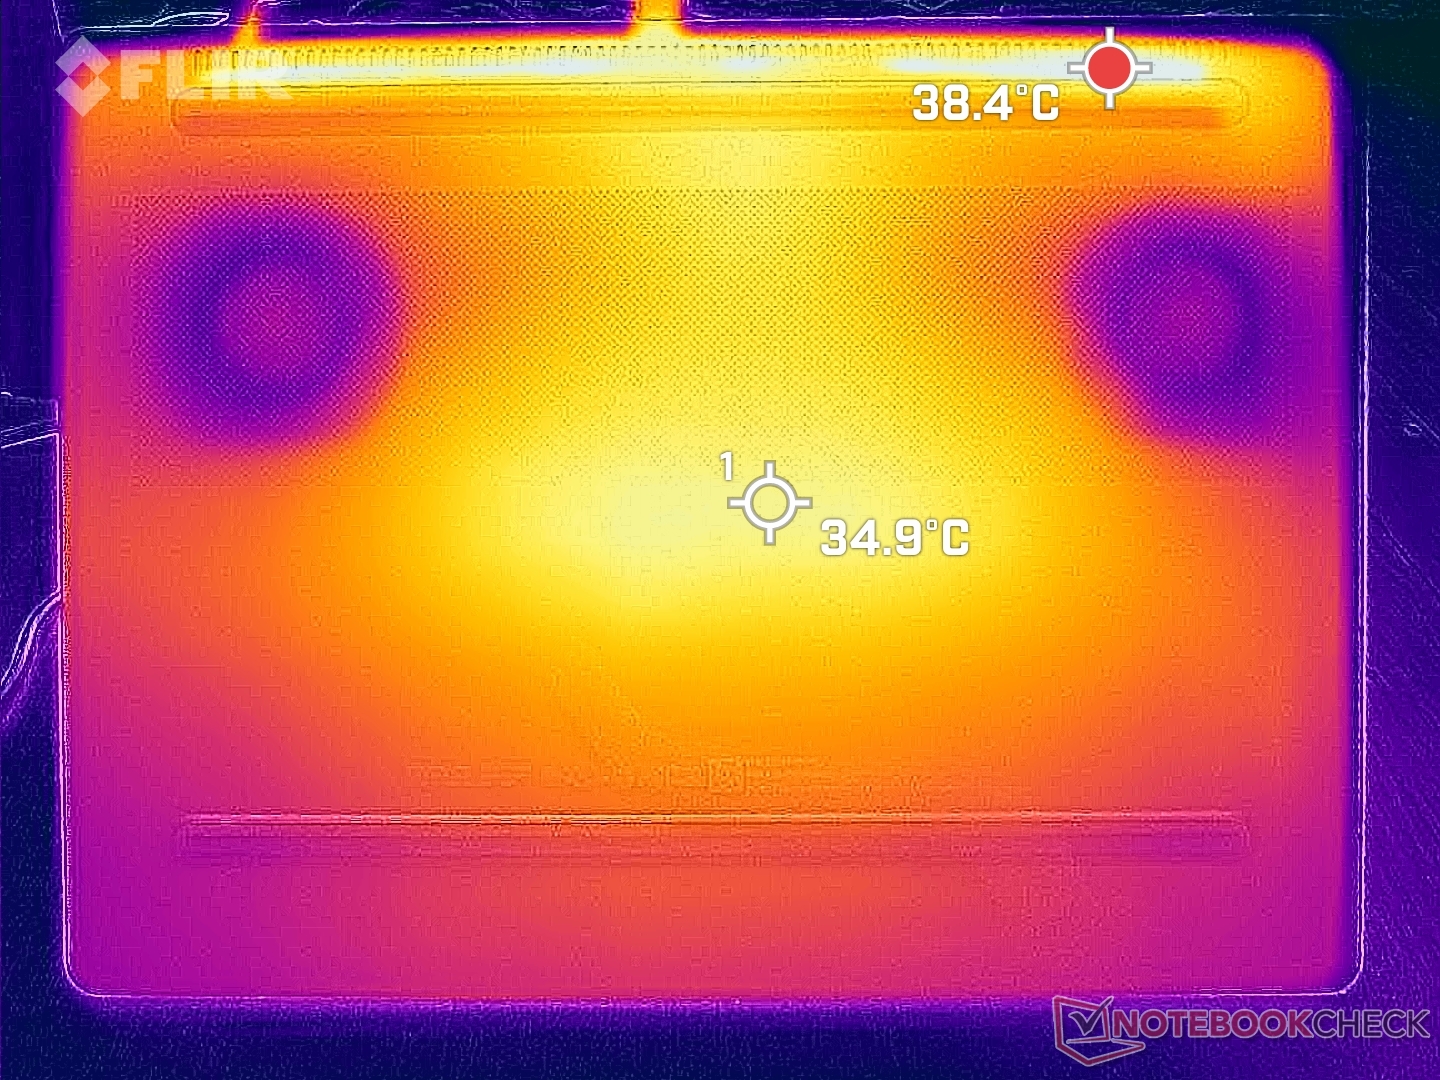
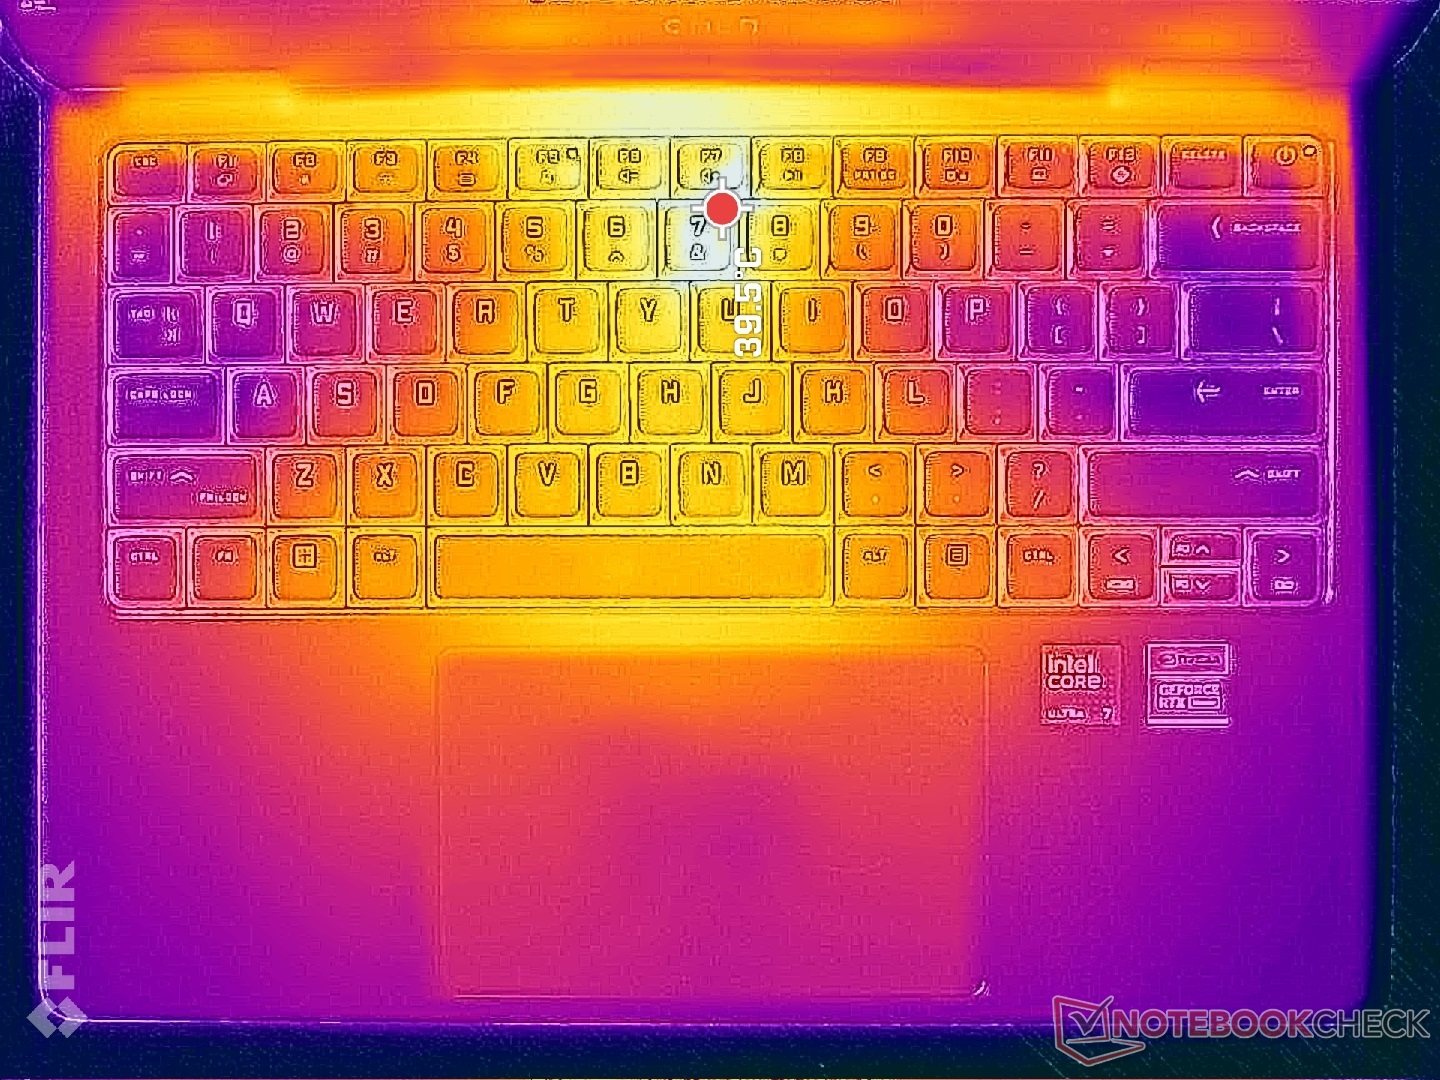
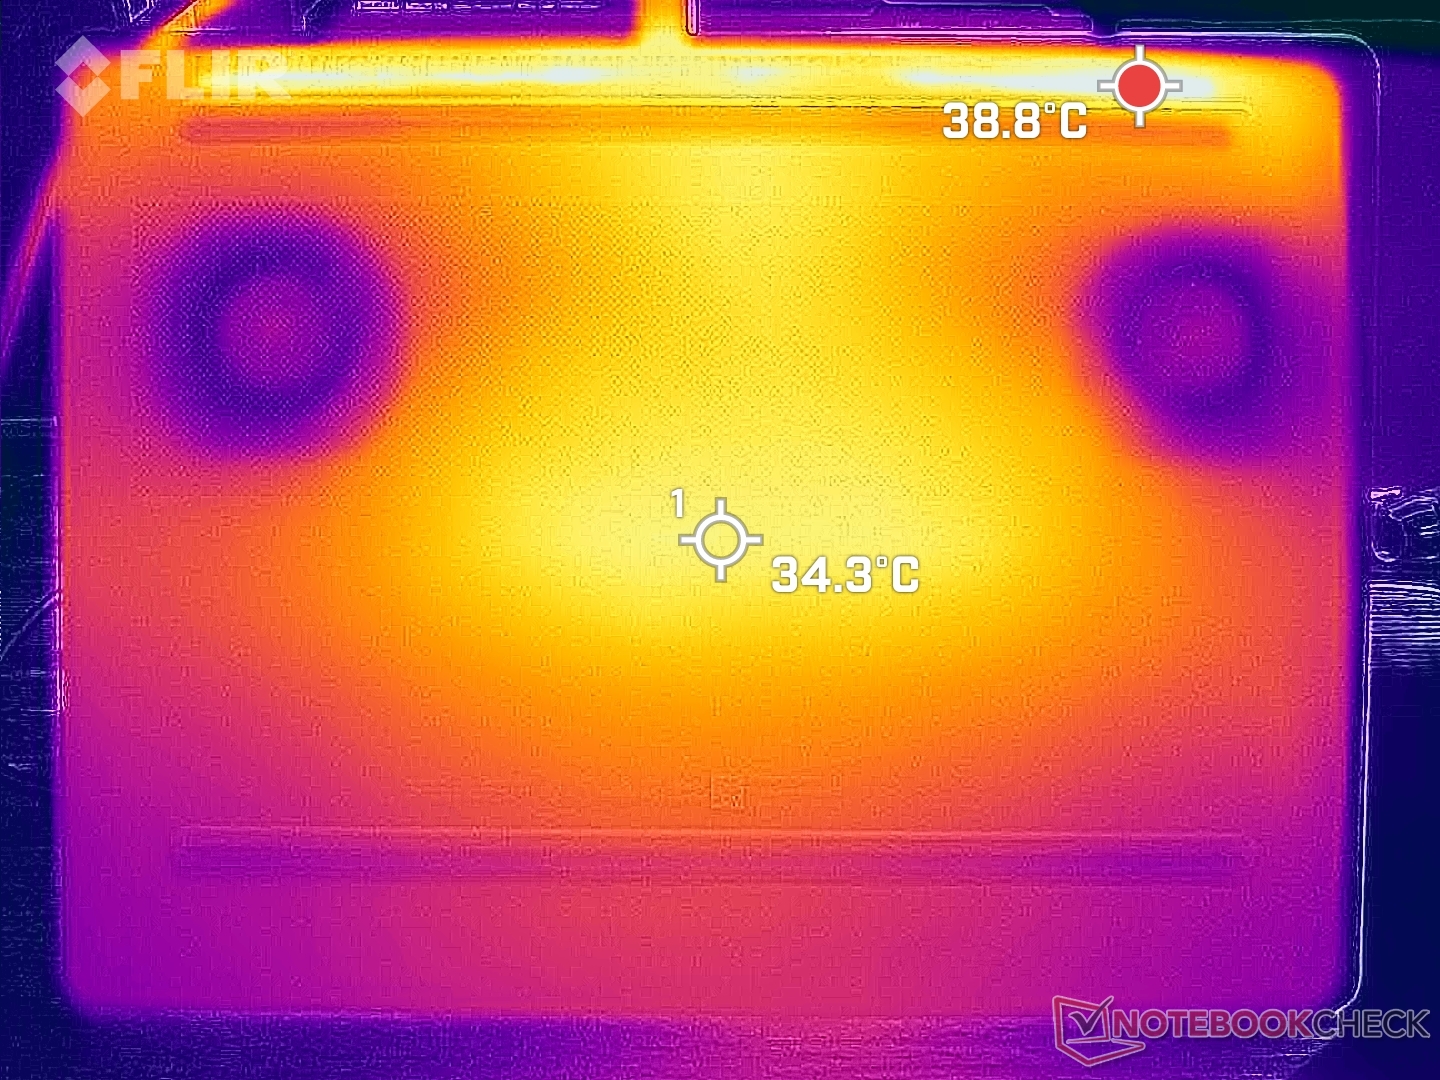
Temperatur
Die Oberflächentemperaturen sind am wärmsten in der Mitte der Tastatur, wo Hotspots 40 °C bzw. 35 °C auf der Ober- und Unterseite erreichen können. Die Maximalwerte sind kühler als wir für ein so kleines Gehäuse erwartet hätten, da Alternativen wie das Razer Blade 14 oder Asus Zephyrus G14 auf beiden Seiten im mittleren bis hohen 40 °C Bereich wärmer sein können. Die Handballenablagen fühlen sich beim Spielen nie unangenehm warm an.
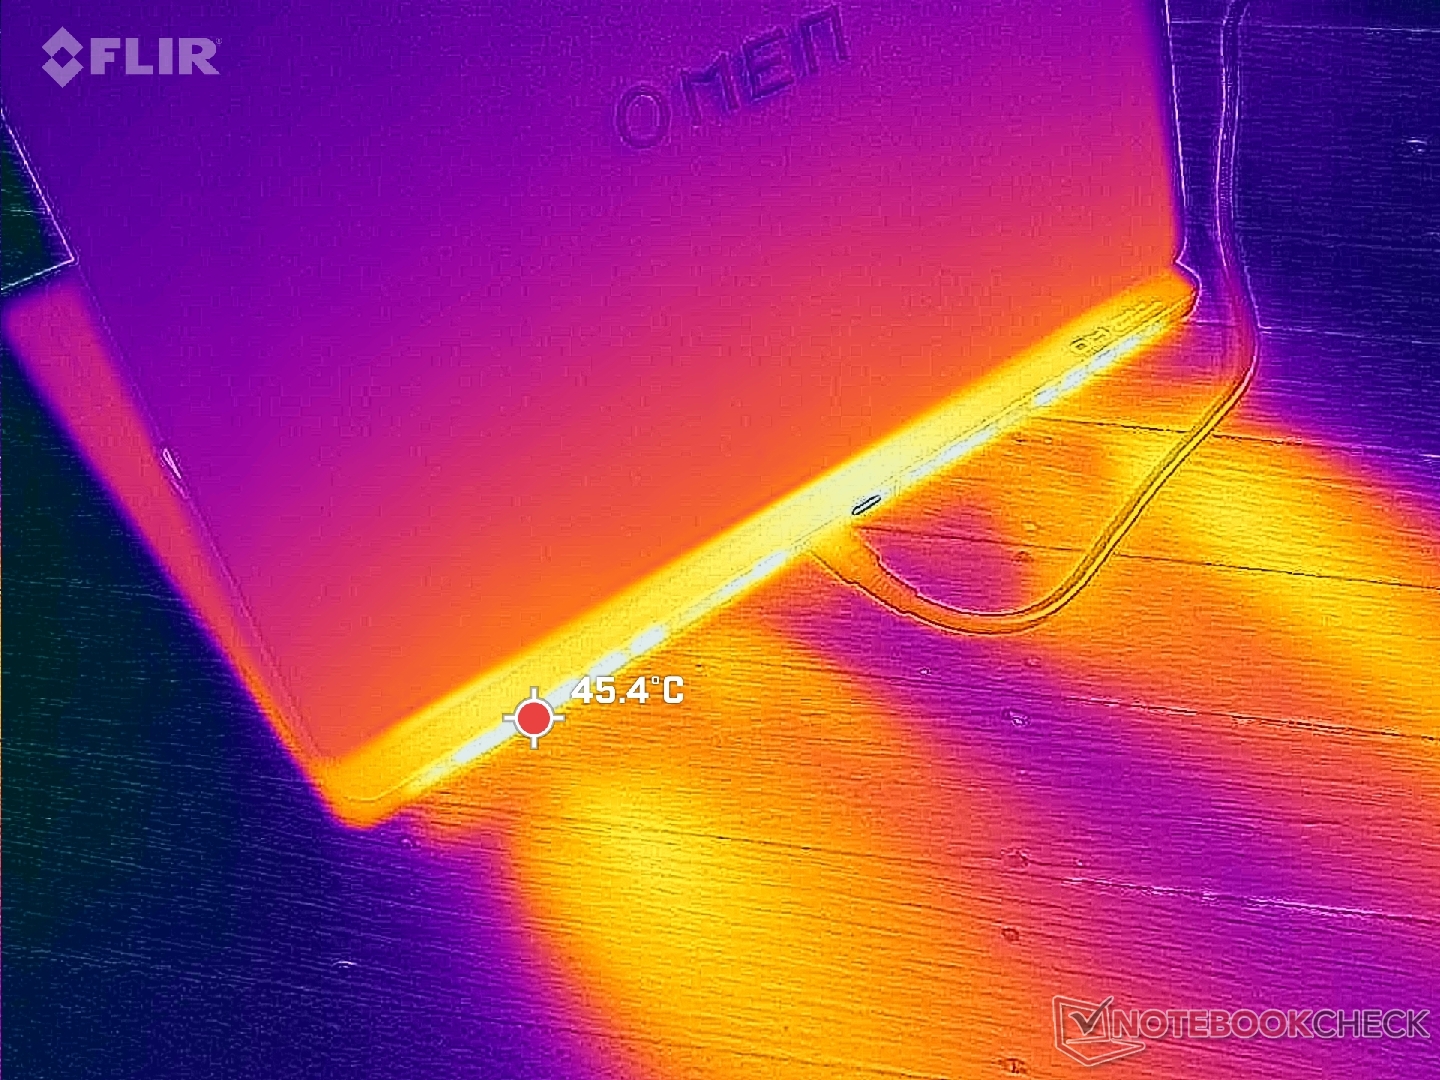
(±) Die maximale Temperatur auf der Oberseite ist 41.2 °C. Im Vergleich liegt der Klassendurchschnitt bei 40.4 °C (von 21.2 bis 68.8 °C für die Klasse Gaming).
(+) Auf der Unterseite messen wir eine maximalen Wert von 39 °C (im Vergleich zum Durchschnitt von 43.2 °C).
(+) Ohne Last messen wir eine durchschnittliche Temperatur von 24.4 °C auf der Oberseite. Der Klassendurchschnitt erreicht 33.9 °C.
(±) Beim längeren Spielen von The Witcher 3 erhitzt sich das Gerät durchschnittlich auf 34.8 °C. Der Durchschnitt der Klasse ist derzeit 33.9 °C.
(+) Die Handballen und der Touchpad-Bereich erreichen maximal 33 °C und damit die typische Hauttemperatur und fühlen sich daher nicht heiß an.
(-) Die durchschnittliche Handballen-Temperatur anderer getesteter Geräte war 28.8 °C (-4.2 °C).
| HP Omen Transcend 14-fb0014 Intel Core Ultra 7 155H, NVIDIA GeForce RTX 4060 Laptop GPU | Asus ROG Zephyrus G14 2024 GA403U AMD Ryzen 9 8945HS, NVIDIA GeForce RTX 4070 Laptop GPU | Razer Blade 14 RZ09-0508 AMD Ryzen 9 8945HS, NVIDIA GeForce RTX 4070 Laptop GPU | Lenovo Legion Slim 5 14APH8 AMD Ryzen 7 7840HS, NVIDIA GeForce RTX 4060 Laptop GPU | Apple MacBook Pro 14 2023 M3 Pro Apple M3 Pro 11-Core, Apple M3 Pro 14-Core GPU | Microsoft Surface Laptop Studio 2 RTX 4060 Intel Core i7-13700H, NVIDIA GeForce RTX 4060 Laptop GPU | |
|---|---|---|---|---|---|---|
| Hitze | -12% | -22% | -13% | 6% | -4% | |
| Last oben max * (°C) | 41.2 | 46.6 -13% | 41.8 -1% | 40.4 2% | 42 -2% | 40.4 2% |
| Last unten max * (°C) | 39 | 47.8 -23% | 42.2 -8% | 49.4 -27% | 38.3 2% | 42.2 -8% |
| Idle oben max * (°C) | 26.2 | 26.7 -2% | 34.8 -33% | 28.2 -8% | 23 12% | 26.6 -2% |
| Idle unten max * (°C) | 25.4 | 27.8 -9% | 37.4 -47% | 29.8 -17% | 22.8 10% | 27 -6% |
* ... kleinere Werte sind besser
Lautsprecher
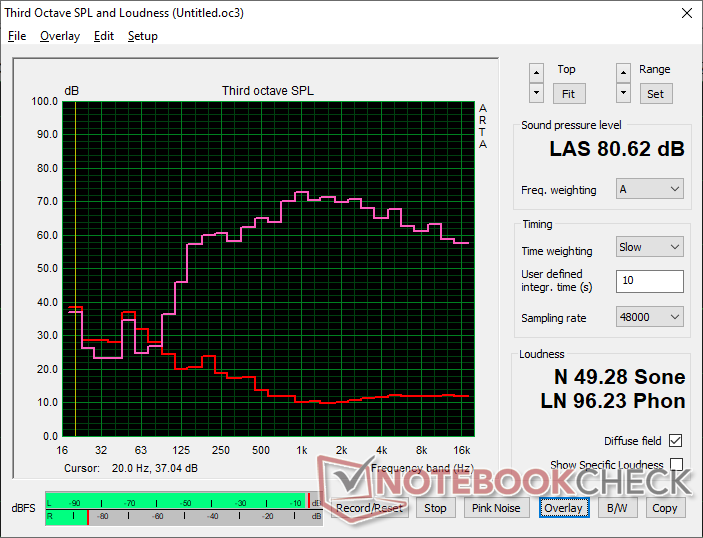
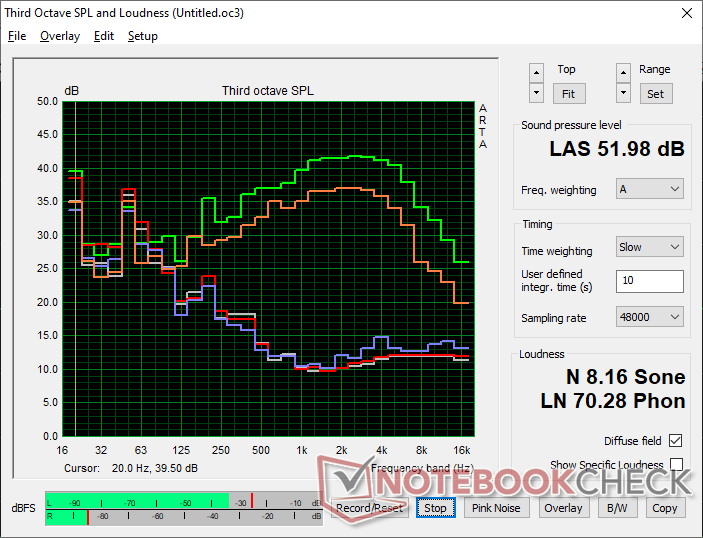
HP Omen Transcend 14-fb0014 Audio Analyse
(±) | Mittelmäßig laut spielende Lautsprecher (80.6 dB)
Bass 100 - 315 Hz
(±) | abgesenkter Bass - 10.3% geringer als der Median
(±) | durchschnittlich lineare Bass-Wiedergabe (11.8% Delta zum Vorgänger)
Mitteltöne 400 - 2000 Hz
(±) | zu hohe Mitten, vom Median 5.1% abweichend
(+) | lineare Mitten (5.3% Delta zum Vorgänger)
Hochtöne 2 - 16 kHz
(+) | ausgeglichene Hochtöne, vom Median nur 2.9% abweichend
(+) | sehr lineare Hochtöne (4.9% Delta zum Vorgänger)
Gesamt im hörbaren Bereich 100 - 16.000 Hz
(+) | hörbarer Bereich ist sehr linear (12.8% Abstand zum Median
Im Vergleich zu allen Geräten derselben Klasse
» 16% aller getesteten Geräte dieser Klasse waren besser, 4% vergleichbar, 80% schlechter
» Das beste Gerät hat einen Delta-Wert von 6%, durchschnittlich ist 18%, das schlechteste Gerät hat 132%
Im Vergleich zu allen Geräten im Test
» 12% aller getesteten Geräte waren besser, 3% vergleichbar, 85% schlechter
» Das beste Gerät hat einen Delta-Wert von 4%, durchschnittlich ist 24%, das schlechteste Gerät hat 134%
Apple MacBook Pro 16 2021 M1 Pro Audio Analyse
(+) | Die Lautsprecher können relativ laut spielen (84.7 dB)
Bass 100 - 315 Hz
(+) | guter Bass - nur 3.8% Abweichung vom Median
(+) | lineare Bass-Wiedergabe (5.2% Delta zum Vorgänger)
Mitteltöne 400 - 2000 Hz
(+) | ausgeglichene Mitten, vom Median nur 1.3% abweichend
(+) | lineare Mitten (2.1% Delta zum Vorgänger)
Hochtöne 2 - 16 kHz
(+) | ausgeglichene Hochtöne, vom Median nur 1.9% abweichend
(+) | sehr lineare Hochtöne (2.7% Delta zum Vorgänger)
Gesamt im hörbaren Bereich 100 - 16.000 Hz
(+) | hörbarer Bereich ist sehr linear (4.6% Abstand zum Median
Im Vergleich zu allen Geräten derselben Klasse
» 0% aller getesteten Geräte dieser Klasse waren besser, 0% vergleichbar, 100% schlechter
» Das beste Gerät hat einen Delta-Wert von 5%, durchschnittlich ist 17%, das schlechteste Gerät hat 45%
Im Vergleich zu allen Geräten im Test
» 0% aller getesteten Geräte waren besser, 0% vergleichbar, 100% schlechter
» Das beste Gerät hat einen Delta-Wert von 4%, durchschnittlich ist 24%, das schlechteste Gerät hat 134%
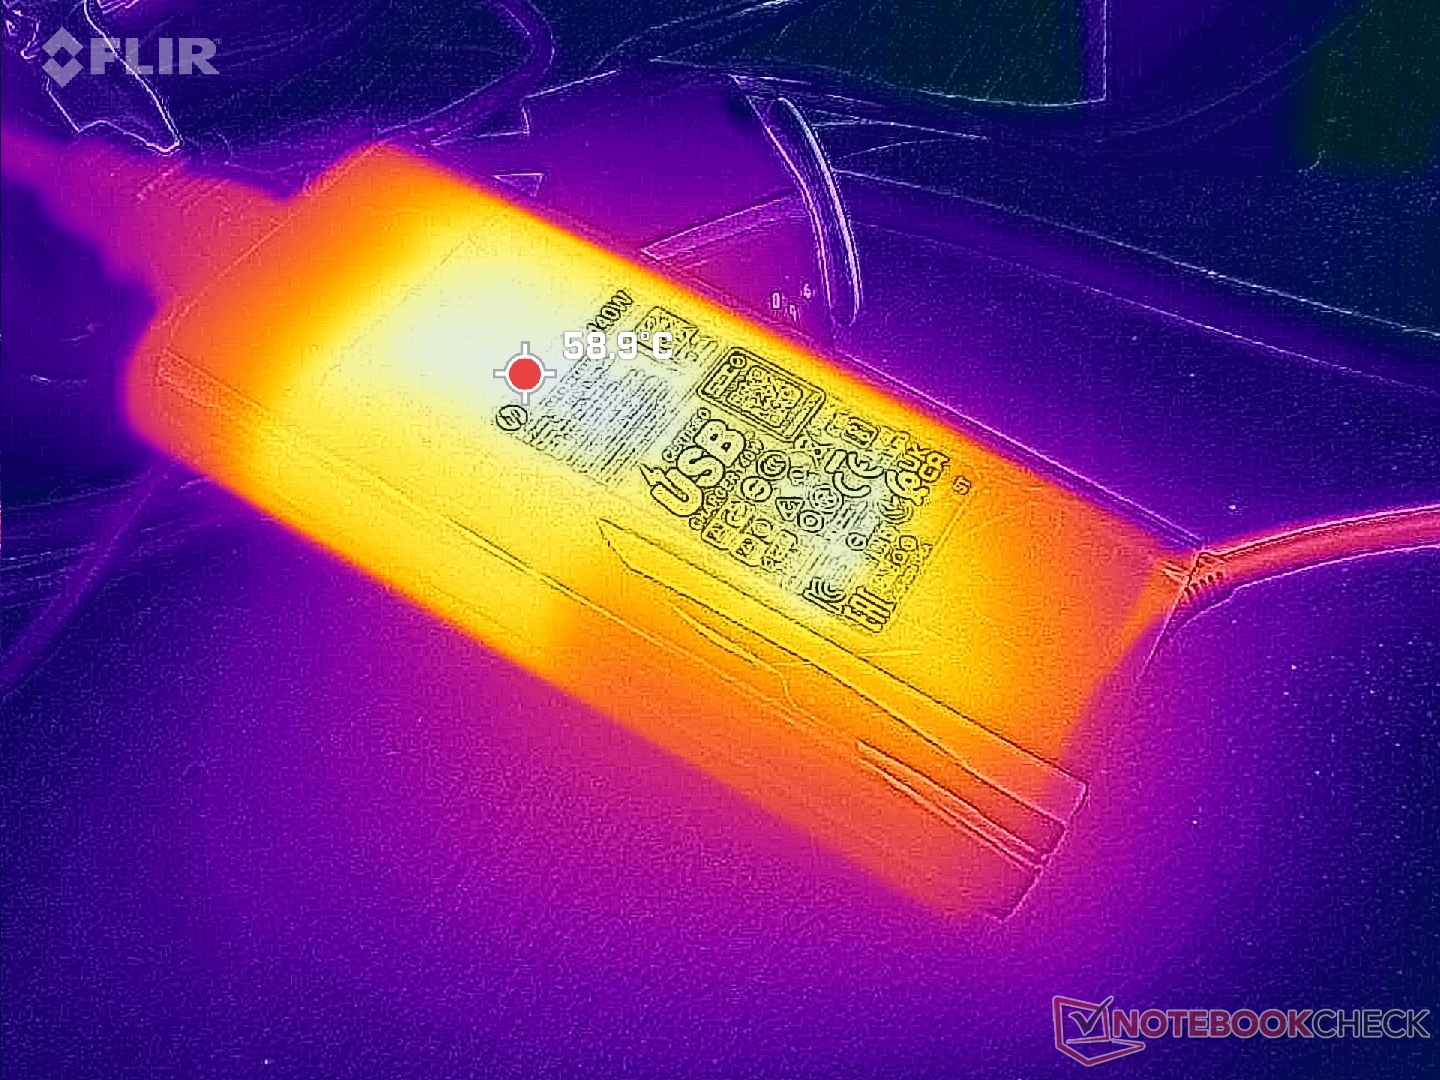
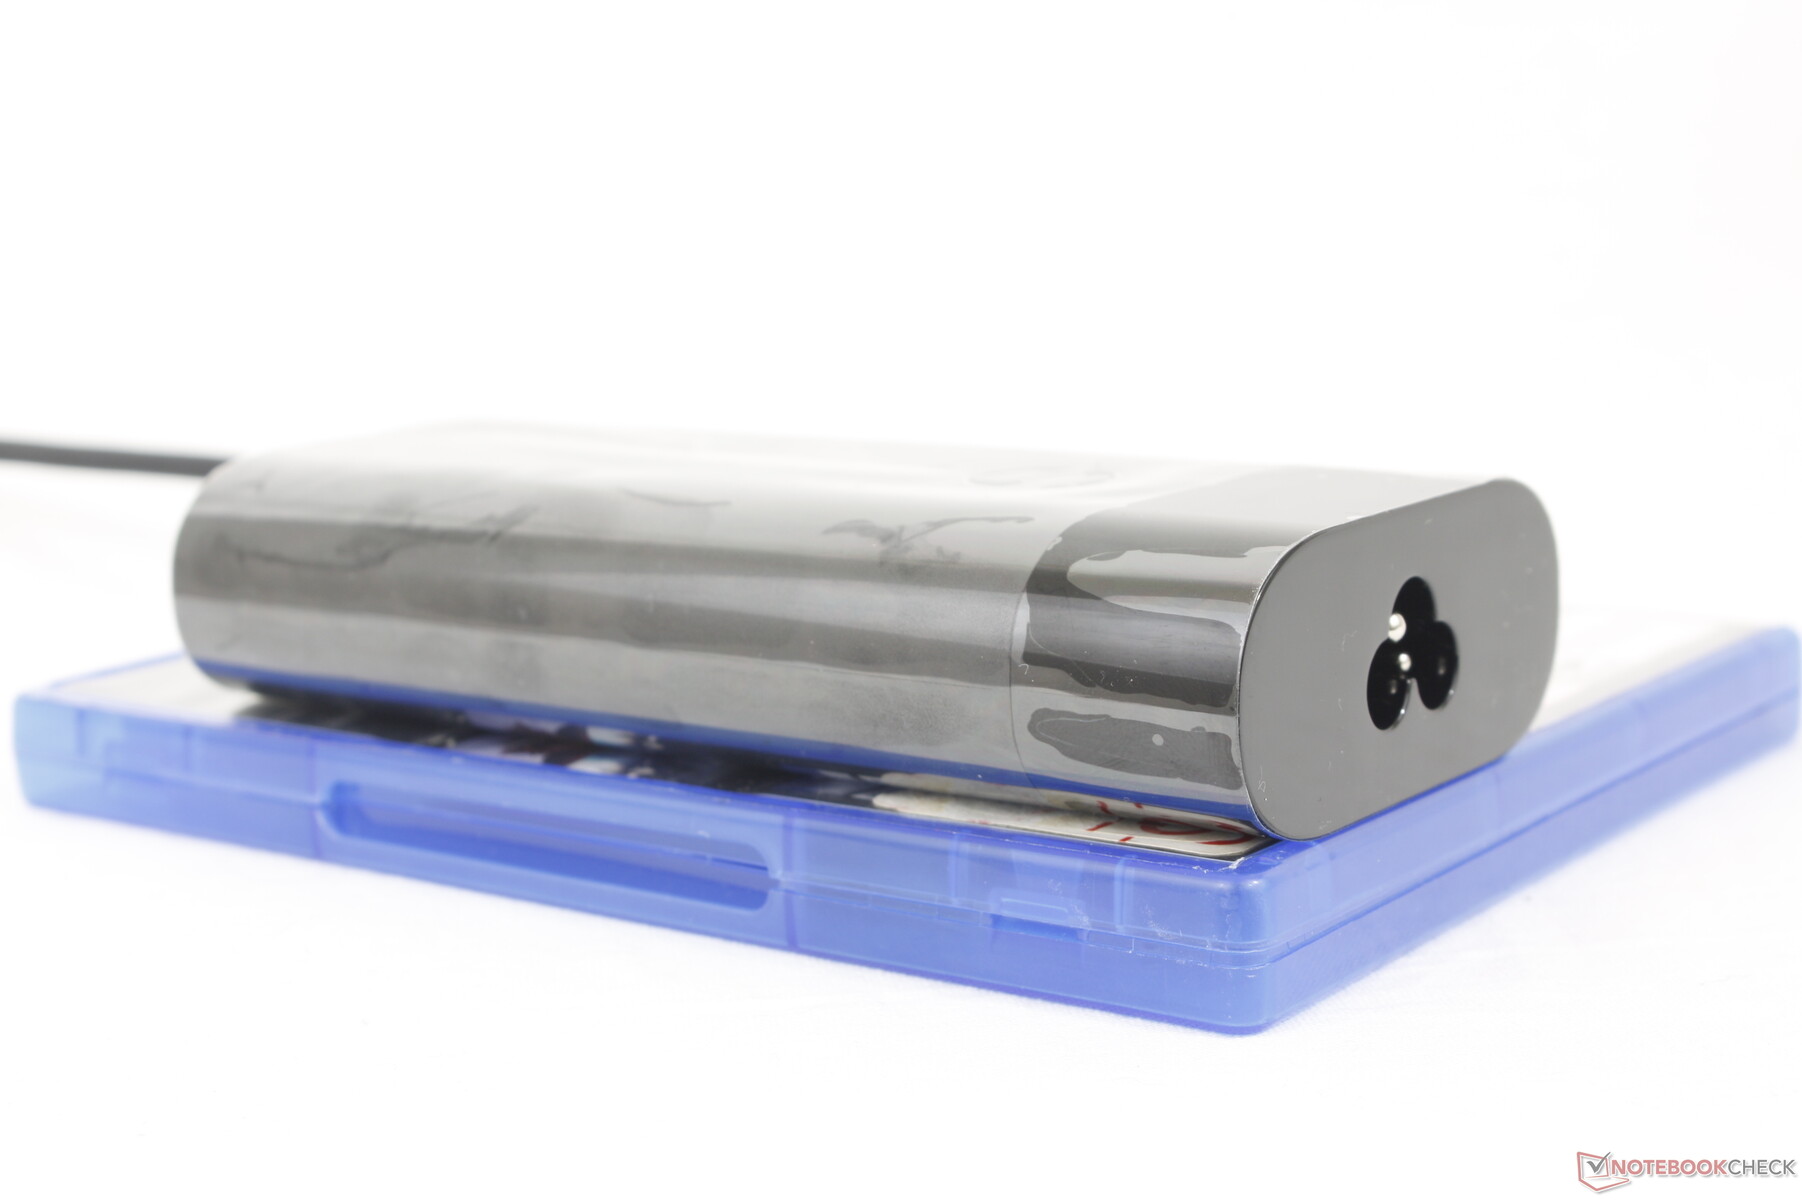
Energieverwaltung — kein spezielles Netzteil erforderlich
Energieaufnahme
Die Nutzung von Witcher 3 verbraucht etwa 118 W und ist damit vergleichbar mit dem Zephyrus G14, aber immer noch viel niedriger als beim Blade 14. Der Verbrauchsunterschied zwischen unserem Omen Transcend 14 und dem Blade 14 beträgt etwa 60 W, wobei ein Großteil davon auf das höhere TGP-Ziel des schwereren Razer-Systems zurückzuführen ist.
Ein wichtiges Unterscheidungsmerkmal zwischen den Modellen von HP, Razer und Asus ist, dass das HP ein universelles (~13,8 x 6,5 x 2,8 cm) 140-W-USB-C-Netzteil verwendet, während die Modelle von Razer und Asus ihre eigenen proprietären 240-W- bzw. 180-W-Lösungen haben. Das bedeutet, dass das Netzteil des HP einfach und kostengünstig ausgetauscht werden kann, falls Sie jemals ein zweites benötigen, aber seine geringere Ausgangsleistung schränkt die GPU-Leistung im Vergleich zur Konkurrenz ein.
(Anmerkung der Redaktion: Dieser Abschnitt wird aktualisiert, sobald die Reparaturen an unserem Metrahit Energy-Multimeter abgeschlossen sind. Wir entschuldigen uns für die Unannehmlichkeiten).
| Aus / Standby | |
| Idle | |
| Last |
|
Legende:
min: | |
| HP Omen Transcend 14-fb0014 Ultra 7 155H, GeForce RTX 4060 Laptop GPU, WDC PC SN810 1TB, OLED, 2880x1800, 14" | Asus ROG Zephyrus G14 2024 GA403U R9 8945HS, GeForce RTX 4070 Laptop GPU, WD PC SN560 SDDPNQE-1T00, OLED, 2880x1800, 14" | Razer Blade 14 RZ09-0508 R9 8945HS, GeForce RTX 4070 Laptop GPU, Samsung PM9A1 MZVL21T0HCLR, IPS, 2560x1600, 14" | Lenovo Legion Slim 5 14APH8 R7 7840HS, GeForce RTX 4060 Laptop GPU, SK Hynix HFS001TEJ9X115N, OLED, 2880x1600, 14.5" | Apple MacBook Pro 14 2023 M3 Pro Apple M3 Pro 11-Core, M3 Pro 14-Core GPU, Apple SSD AP0512Z, Mini-LED, 3024x1964, 14.2" | Microsoft Surface Laptop Studio 2 RTX 4060 i7-13700H, GeForce RTX 4060 Laptop GPU, Kioxia XG8 KXG80ZNV1T02, IPS, 2400x1600, 14.4" | |
|---|---|---|---|---|---|---|
| Stromverbrauch | 16% | -64% | 2% | 43% | 30% | |
| Idle min * (Watt) | 9.1 | 6.9 24% | 20.9 -130% | 7.3 20% | 2.3 75% | 3 67% |
| Idle avg * (Watt) | 12.6 | 8.6 32% | 25.6 -103% | 9.6 24% | 13.1 -4% | 7.1 44% |
| Idle max * (Watt) | 27.4 | 9 67% | 32.1 -17% | 17.3 37% | 13.3 51% | 7.6 72% |
| Last avg * (Watt) | 63.5 | 75.2 -18% | 72.7 -14% | 76.6 -21% | 47.4 25% | 73.1 -15% |
| Witcher 3 ultra * (Watt) | 118.9 | 109.7 8% | 182.1 -53% | 152 -28% | 42.8 64% | 113.9 4% |
| Last max * (Watt) | 135.3 | 161.6 -19% | 228.4 -69% | 160.9 -19% | 73.6 46% | 128.5 5% |
* ... kleinere Werte sind besser
Energieverbrauch Witcher 3 / Stresstest
Energieverbrauch externer Monitor
Akkulaufzeit
HP empfiehlt, DirectX Cross Adapter Scan-Out (CASO) im BIOS zu aktivieren, um die Akkulaufzeit zu erhöhen. Wir konnten Laufzeiten von 423 Minuten bzw. 517 Minuten im WLAN-Modus mit deaktivierter bzw. aktivierter Funktion aufzeichnen, was darauf hindeutet, dass das Umschalten von CASO einen spürbaren Unterschied bei den Laufzeiten bewirken kann. HP kündigt an, dass in Kürze ein Software-Update zur Verfügung stehen wird, das CASO standardmäßig aktiviert. Dennoch ist es ratsam, den iGPU-Modus und die dynamische Bildwiederholrate zu aktivieren, um die Akkulaufzeit zu verlängern.
Das Aufladen von leerem auf volle Kapazität mit dem mitgelieferten Netzteil dauert etwa 90 Minuten.
| HP Omen Transcend 14-fb0014 Ultra 7 155H, GeForce RTX 4060 Laptop GPU, 71 Wh | Asus ROG Zephyrus G14 2024 GA403U R9 8945HS, GeForce RTX 4070 Laptop GPU, 73 Wh | Razer Blade 14 RZ09-0508 R9 8945HS, GeForce RTX 4070 Laptop GPU, 68 Wh | Lenovo Legion Slim 5 14APH8 R7 7840HS, GeForce RTX 4060 Laptop GPU, 73.6 Wh | Apple MacBook Pro 14 2023 M3 Pro Apple M3 Pro 11-Core, M3 Pro 14-Core GPU, 72.6 Wh | Microsoft Surface Laptop Studio 2 RTX 4060 i7-13700H, GeForce RTX 4060 Laptop GPU, 58 Wh | |
|---|---|---|---|---|---|---|
| Akkulaufzeit | 4% | -10% | 2% | 54% | 49% | |
| Idle (h) | 10.4 | 8 -23% | 10.5 1% | |||
| WLAN (h) | 8.6 | 9.3 8% | 7.1 -17% | 7.5 -13% | 16.3 90% | 8.3 -3% |
| Last (h) | 1.1 | 1.1 0% | 1.2 9% | 1.3 18% | 1.3 18% | 2.2 100% |
| H.264 (h) | 12.1 | 20.2 | 11.3 |
Pro
Contra
Fazit — Gute Balance zwischen Leistung und Preis
Die Nutzer auf dem Markt für ein 14-Zoll-Gaming-Notebook werden das HP Omen Transcend 14 unweigerlich mit den beiden Top-Playern in dieser Kategorie vergleichen: dem Razer Blade 14 und dem Asus Zephyrus G14. Der vielleicht größte und bemerkenswerteste Vorteil des HP ist der viel niedrigere Einstiegspreis im Vergleich zu den beiden Alternativen, während es dennoch ähnliche GeForce RTX 4060- und 4070-Optionen sowie ein hochwertiges 120 Hz DCI-P3 OLED-Display bietet. Bei den Spezifikationen und Abmessungen wurden keine Abstriche gemacht, obwohl das System Hunderte von Euro weniger kostet.
Das große Sternchen, das über dem HP hängt, ist sein niedrigeres TGP-Ziel von nur 50 bis 65 W im Vergleich zu 90 W und 140 W bei den oben erwähnten Asus und Razer. Wenn Sie also alle drei Systeme mit der gleichen GeForce RTX 4060 GPU konfigurieren, würde die GPU im HP eine Stufe niedriger arbeiten und eher einer RTX 4050 entsprechen. Das soll nicht heißen, dass das System langsam ist, aber Leistungsjäger werden wahrscheinlich von dem HP abgeschreckt.
Das erste 14-Zoll-Omen-Notebook macht vieles richtig, wenn es um das Aussehen, die Spezifikationen und den Preis geht. Es ist deutlich billiger als die Konkurrenz, aber dafür ist die Leistung etwas langsamer.
Ein weiterer Knackpunkt sind die Scharniere des HP, die durchaus stabiler sein könnten. Das Blade 14 und das Zephyrus G14 fühlen sich in dieser Hinsicht besser verarbeitet an.
Trotz der wenigen Schwächen ist das Omen Transcend 14 im Vergleich zur Konkurrenz preislich fairer. Man bekommt immer noch GeForce RTX-Grafik, ein hochwertiges Display und eine reisefreundliche Größe, genau wie beim Razer oder Asus. Wir empfehlen allerdings, mit den Scharnieren vorsichtig zu sein.
Preis und Verfügbarkeit
HP liefert das Omen Transcend 14 in der Konfiguration dieses Tests für 2,169 Euro aus, während die Konfiguration mit Core Ultra 9 185H und RTX 4070 für 2,699 Euro erhältlich ist.
HP Omen Transcend 14-fb0014
- 05.03.2024 v7 (old)
Allen Ngo
Transparenz
Die Auswahl der zu testenden Geräte erfolgt innerhalb der Redaktion. Das vorliegende Testmuster wurde dem Autor vom Hersteller oder einem Shop zu Testzwecken leihweise zur Verfügung gestellt. Eine Einflussnahme des Leihstellers auf den Testbericht gab es nicht, der Hersteller erhielt keine Version des Reviews vor der Veröffentlichung. Es bestand keine Verpflichtung zur Publikation. Als eigenständiges, unabhängiges Unternehmen unterliegt Notebookcheck keiner Diktion von Herstellern, Shops und Verlagen.
So testet Notebookcheck
Pro Jahr werden von Notebookcheck hunderte Laptops und Smartphones unabhängig in von uns standardisierten technischen Verfahren getestet, um eine Vergleichbarkeit aller Testergebnisse zu gewährleisten. Seit rund 20 Jahren entwickeln wir diese Testmethoden kontinuierlich weiter und setzen damit Branchenstandards. In unseren Testlaboren kommt ausschließlich hochwertiges Messequipment in die Hände erfahrener Techniker und Redakteure. Die Tests unterliegen einer mehrstufigen Kontrolle. Unsere komplexe Gesamtbewertung basiert auf hunderten fundierten Messergebnissen und Benchmarks, womit Ihnen Objektivität garantiert ist. Weitere Informationen zu unseren Testmethoden gibt es hier.
Preisvergleich

