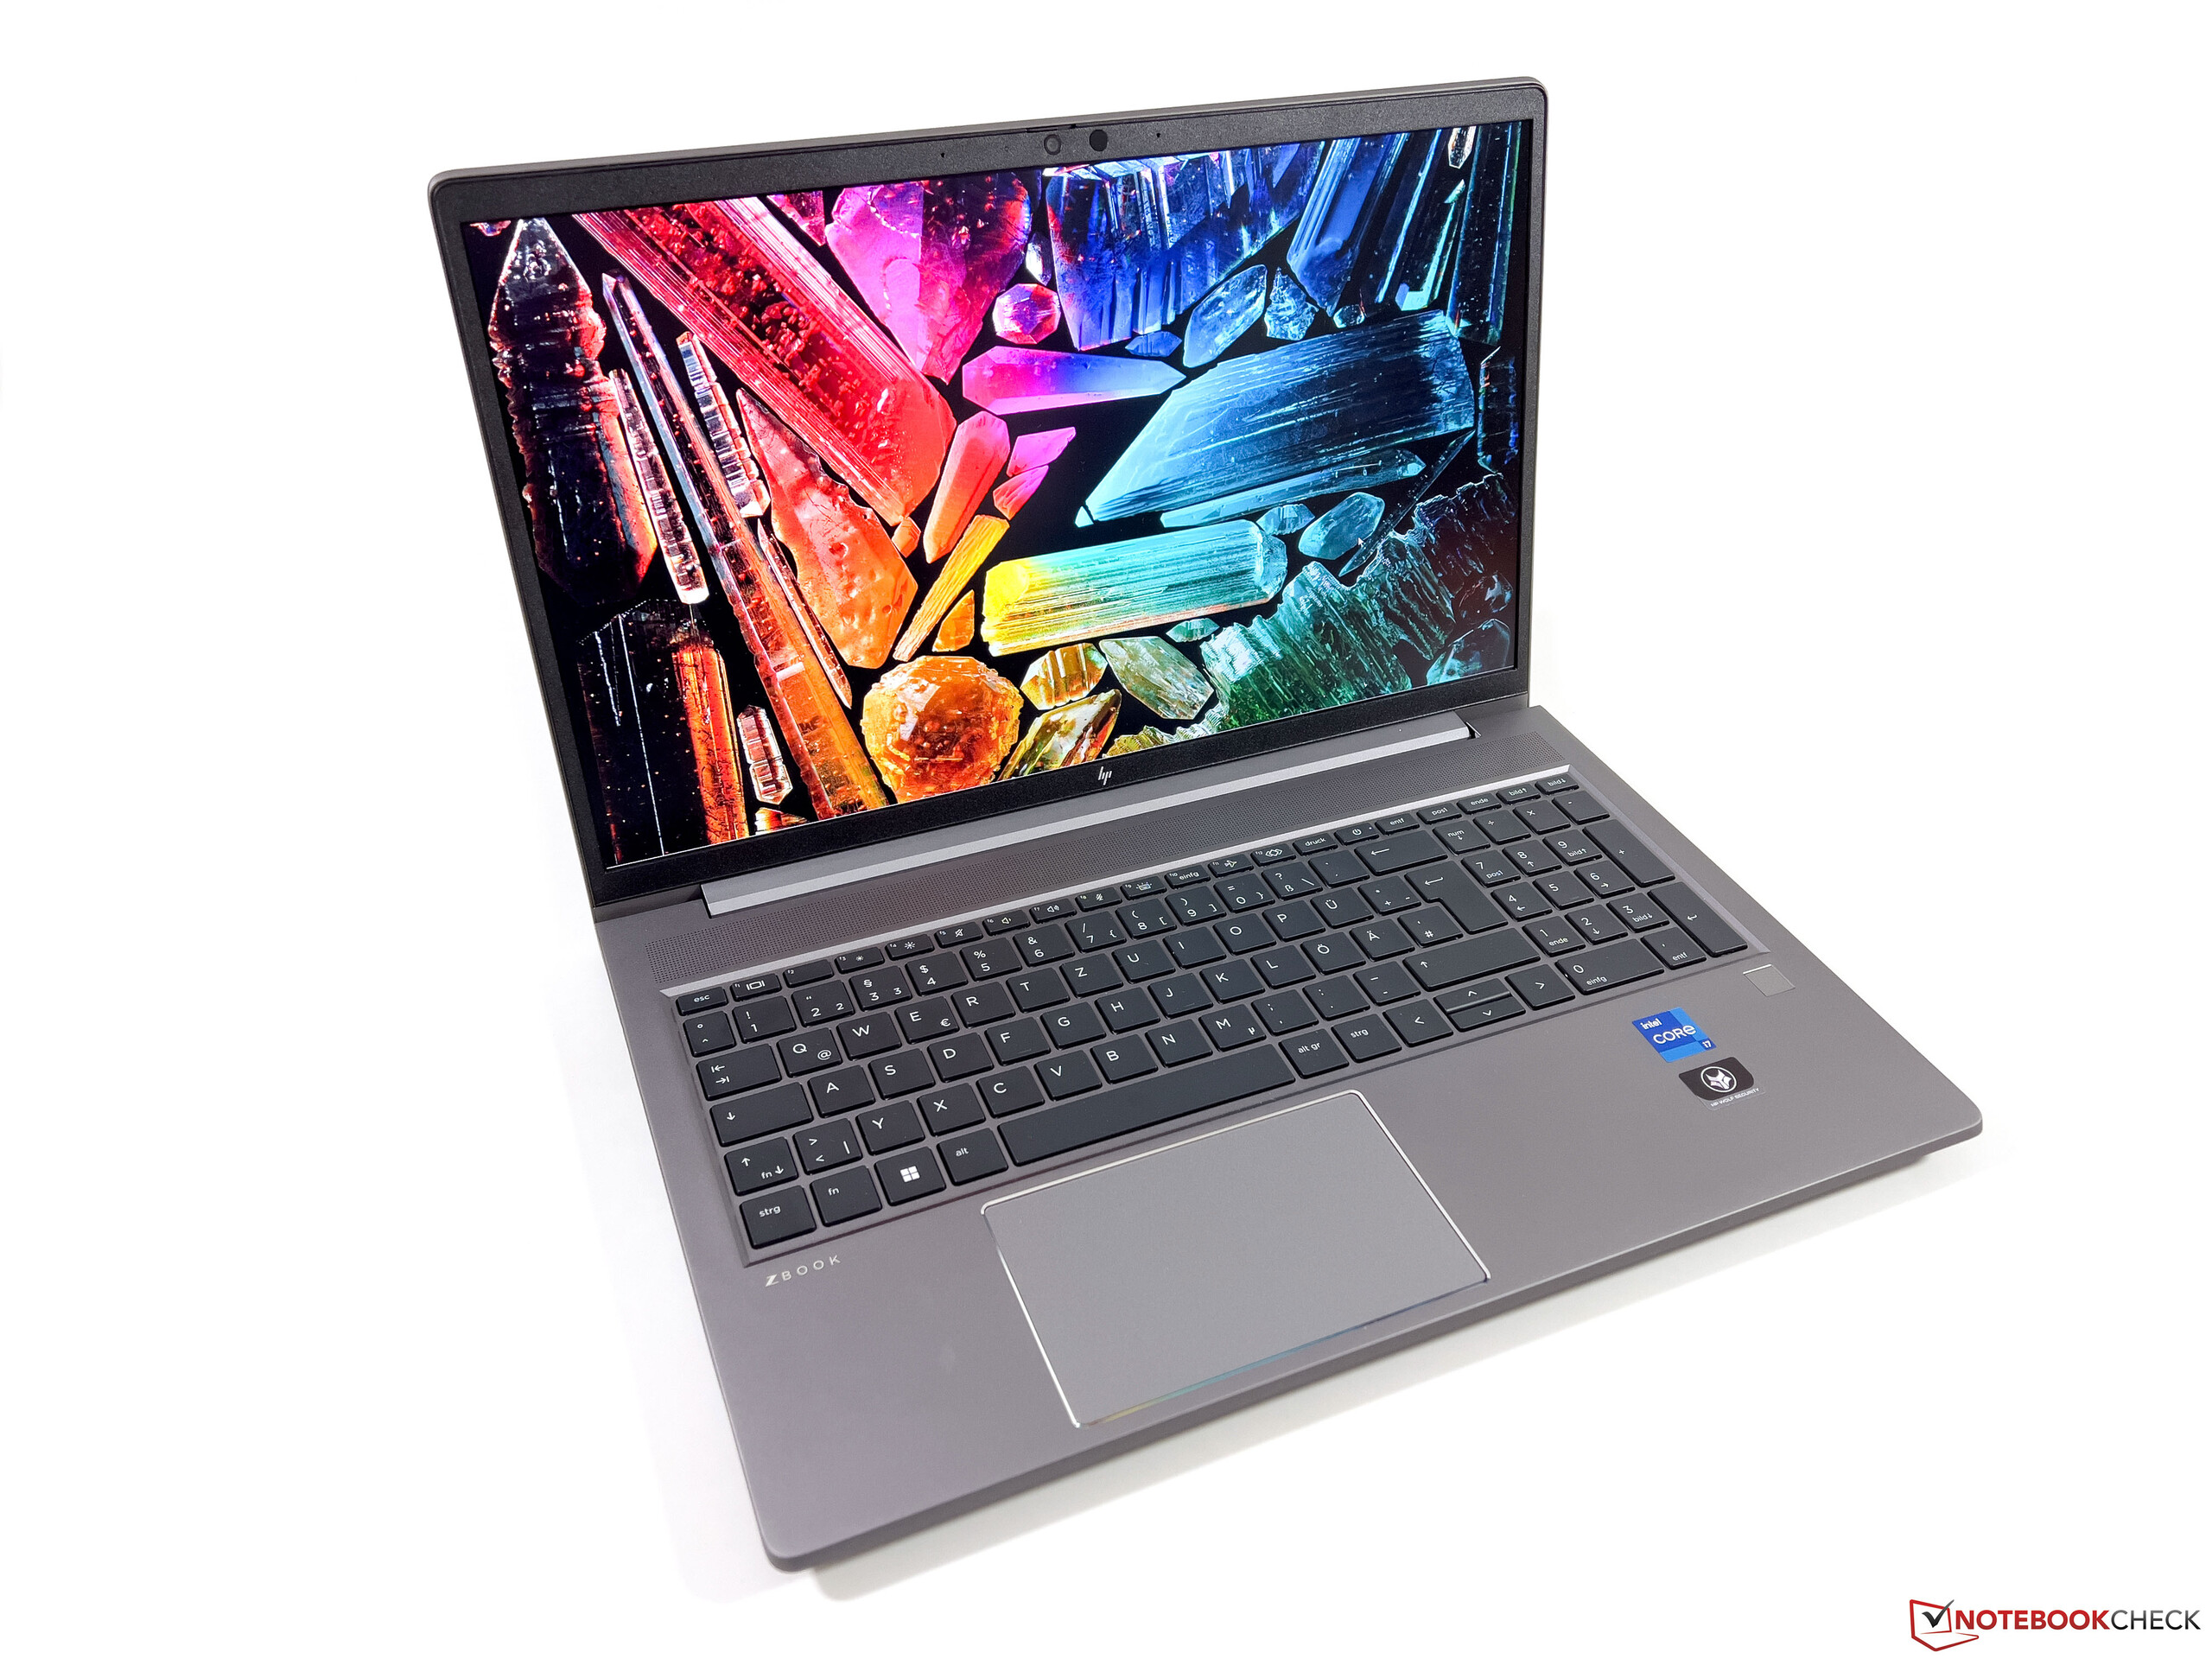
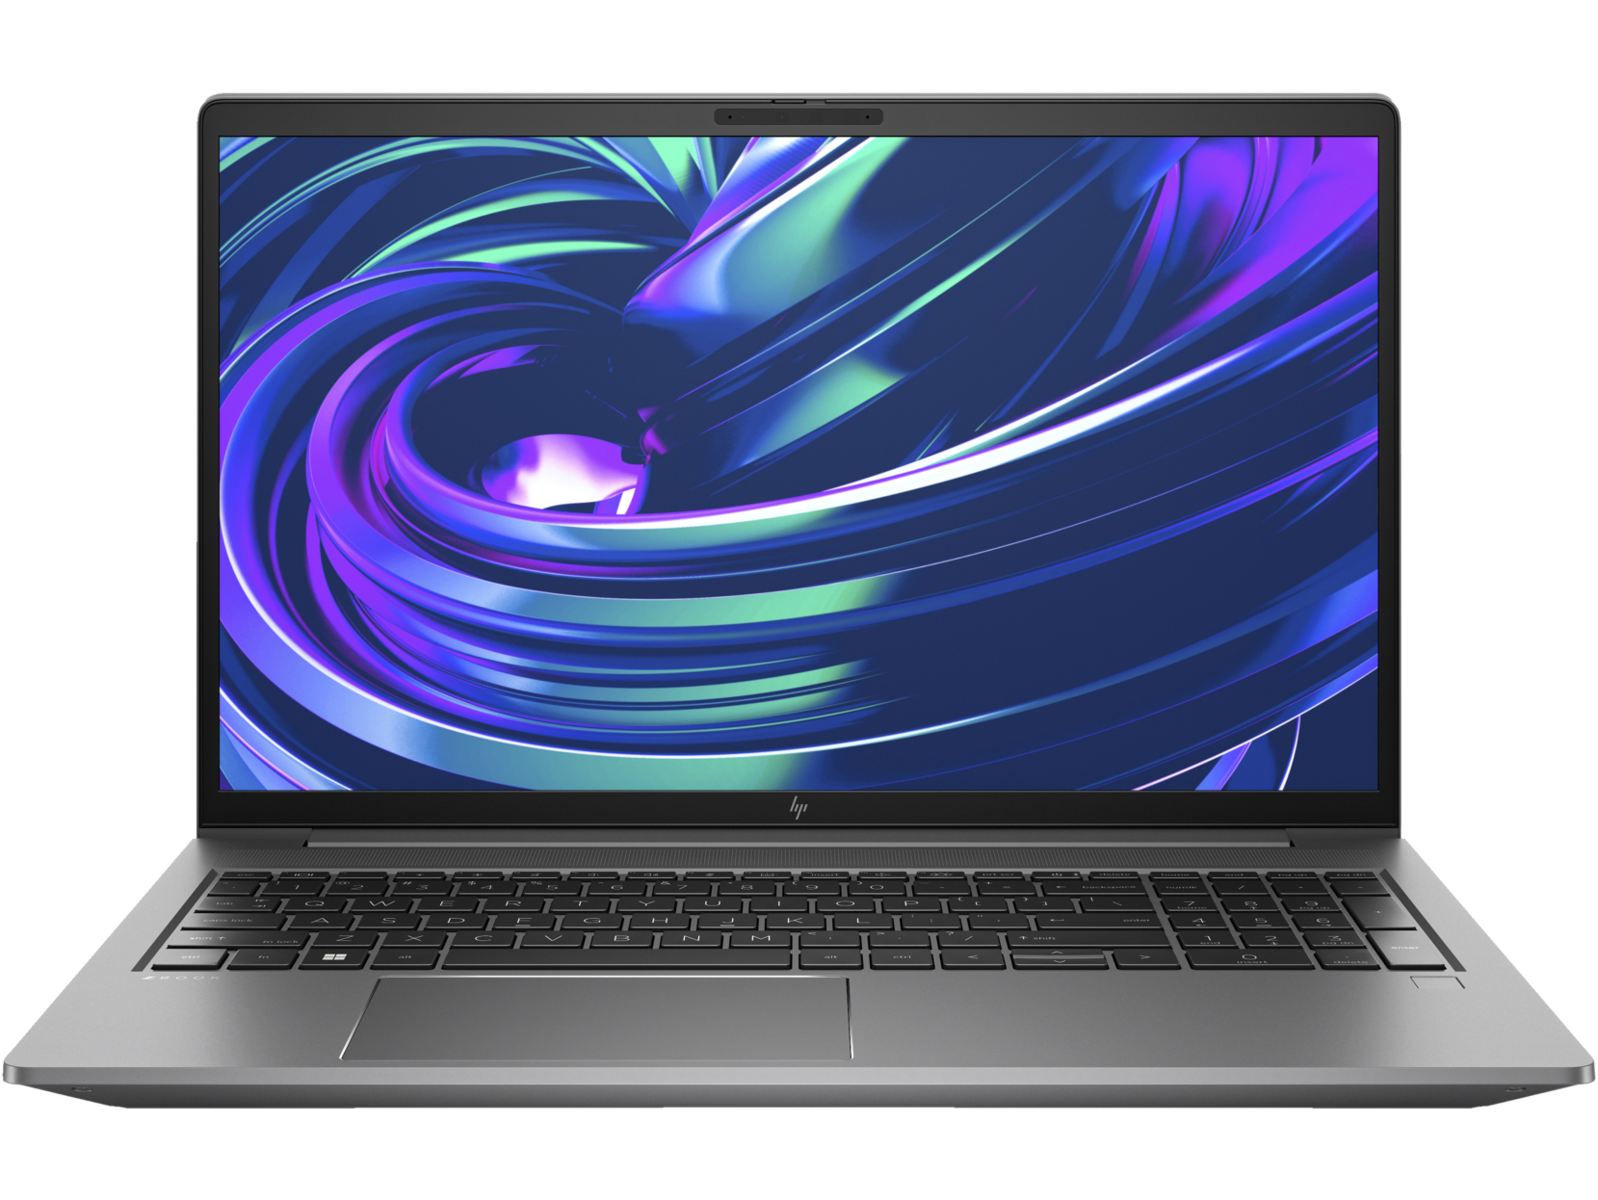
HP ZBook Power 15 G10 Workstation Test: Ausgezeichnete Alternative zum ThinkPad P15v

Das HP ZBook Power 15 G10 ersetzt das ZBook Power 15 G9 aus dem letzten Jahr, indem es die IntelCPUs der 12. Generation von Alder Lake durch neuere Optionen der 13. Generation von Raptor Lake und AMD Ryzen Zen 4 ersetzt. Das Gehäuse ist ansonsten identisch mit dem ZBook Power 15 G9 oder ZBook Power 15 G8. Daher empfehlen wir Ihnen, einen Blick auf unsere älteren Testberichte zu werfen, um mehr über die physischen Eigenschaften des Modells zu erfahren.
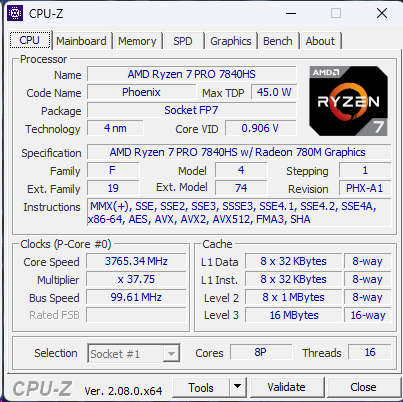
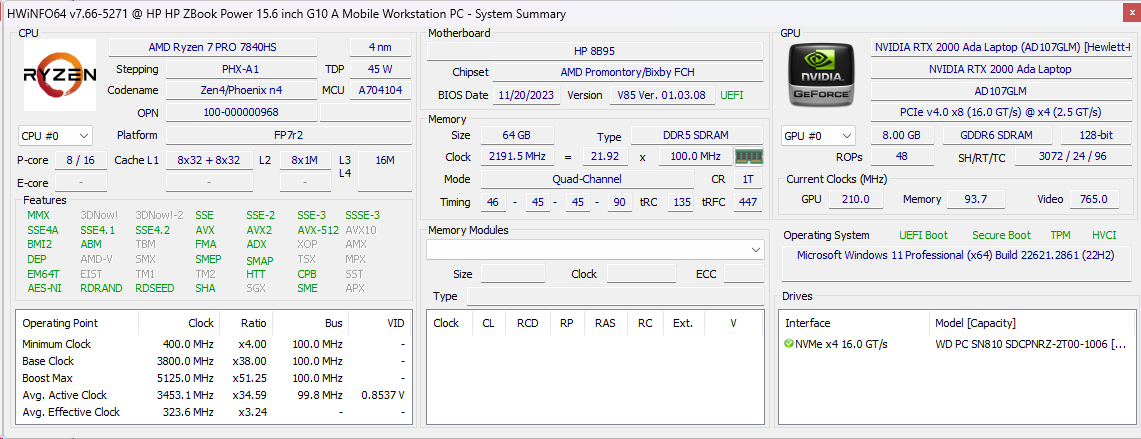
Unser spezifisches Testgerät ist die höchste AMD Konfiguration mit der Ryzen-7-Pro-7940HS-CPU, Nvidia-RTX-2000-Ada-GPU, 1.440p-IPS-Display und 64 GB DDR5-5600-RAM für ca. 2.600 US-Dollar. Kleinere SKUs mit dem Ryzen 5 7640HS, 1.080p-Display und nur integrierter Grafik sind für nur 1.600 US-Dollar erhältlich. Beachten Sie, dass Konfigurationen mit Intel CPUs als ZBook Power 15 G10 bezeichnet werden, während Konfigurationen mit AMD CPUs als ZBook Power 15 G10 A verkauft werden.
Alternativen zum ZBook Power 15 G10 sind andere ultradünne Workstations wie das Dell Precision 5560, Lenovo ThinkPad P15v G3 oder Asus ExpertBook B6 Flip.
Weitere HP Testberichte:
Mögliche Konkurrenten im Vergleich
Bew. | Datum | Modell | Gewicht | Dicke | Größe | Auflösung | Preis ab |
|---|---|---|---|---|---|---|---|
| 88.9 % v7 (old) | 12 / 2023 | HP ZBook Power 15 G10 R7 PRO 7840HS, RTX 2000 Ada Generation Laptop | 2 kg | 22.9 mm | 15.60" | 2560x1440 | |
| 87.4 % v7 (old) | 01 / 2023 | HP ZBook Power 15 G9 6B8C4EA i7-12700H, RTX A2000 Laptop GPU | 2 kg | 22.8 mm | 15.60" | 3840x2160 | |
| 87.8 % v7 (old) | 04 / 2023 | Lenovo ThinkPad P15v G3 21EM001AGE R7 PRO 6850H, RTX A2000 Laptop GPU | 2.2 kg | 22.7 mm | 15.60" | 3840x2160 | |
| 88.3 % v7 (old) | 10 / 2021 | Dell Precision 5000 5560 i7-11850H, RTX A2000 Laptop GPU | 2 kg | 18 mm | 15.60" | 3840x2400 | |
| 91.7 % v7 (old) | 10 / 2023 | Lenovo ThinkPad P1 G6-21FV000DGE i9-13900H, RTX 2000 Ada Generation Laptop | 1.9 kg | 17.5 mm | 16.00" | 2560x1600 | |
| 89.6 % v7 (old) | 01 / 2023 | Asus ExpertBook B6 Flip B6602FC2 i9-12950HX, RTX A2000 Laptop GPU | 2.8 kg | 27.2 mm | 16.00" | 2560x1600 |
Gehäuse
Kommunikation
| Networking | |
| iperf3 transmit AX12 | |
| Dell Precision 5000 5560 | |
| iperf3 receive AX12 | |
| Dell Precision 5000 5560 | |
| iperf3 transmit AXE11000 | |
| HP ZBook Power 15 G10 | |
| Lenovo ThinkPad P1 G6-21FV000DGE | |
| Asus ExpertBook B6 Flip B6602FC2 | |
| Lenovo ThinkPad P15v G3 21EM001AGE | |
| iperf3 receive AXE11000 | |
| Lenovo ThinkPad P1 G6-21FV000DGE | |
| Lenovo ThinkPad P15v G3 21EM001AGE | |
| Asus ExpertBook B6 Flip B6602FC2 | |
| HP ZBook Power 15 G10 | |
| iperf3 transmit AXE11000 6GHz | |
| HP ZBook Power 15 G9 6B8C4EA | |
| HP ZBook Power 15 G10 | |
| Asus ExpertBook B6 Flip B6602FC2 | |
| Lenovo ThinkPad P15v G3 21EM001AGE | |
| iperf3 receive AXE11000 6GHz | |
| HP ZBook Power 15 G9 6B8C4EA | |
| Asus ExpertBook B6 Flip B6602FC2 | |
| Lenovo ThinkPad P15v G3 21EM001AGE | |
| HP ZBook Power 15 G10 | |
Webcam
Während unser ZBook Power G9 mit einer 1-MP-Webcam ausgestattet war, verfügt das getestete Power G10 stattdessen über eine 5-MP-Webcam für ein wesentlich schärferes Bild. Die IR-Funktionen und der physische Auslöser bleiben unverändert.


Wartung
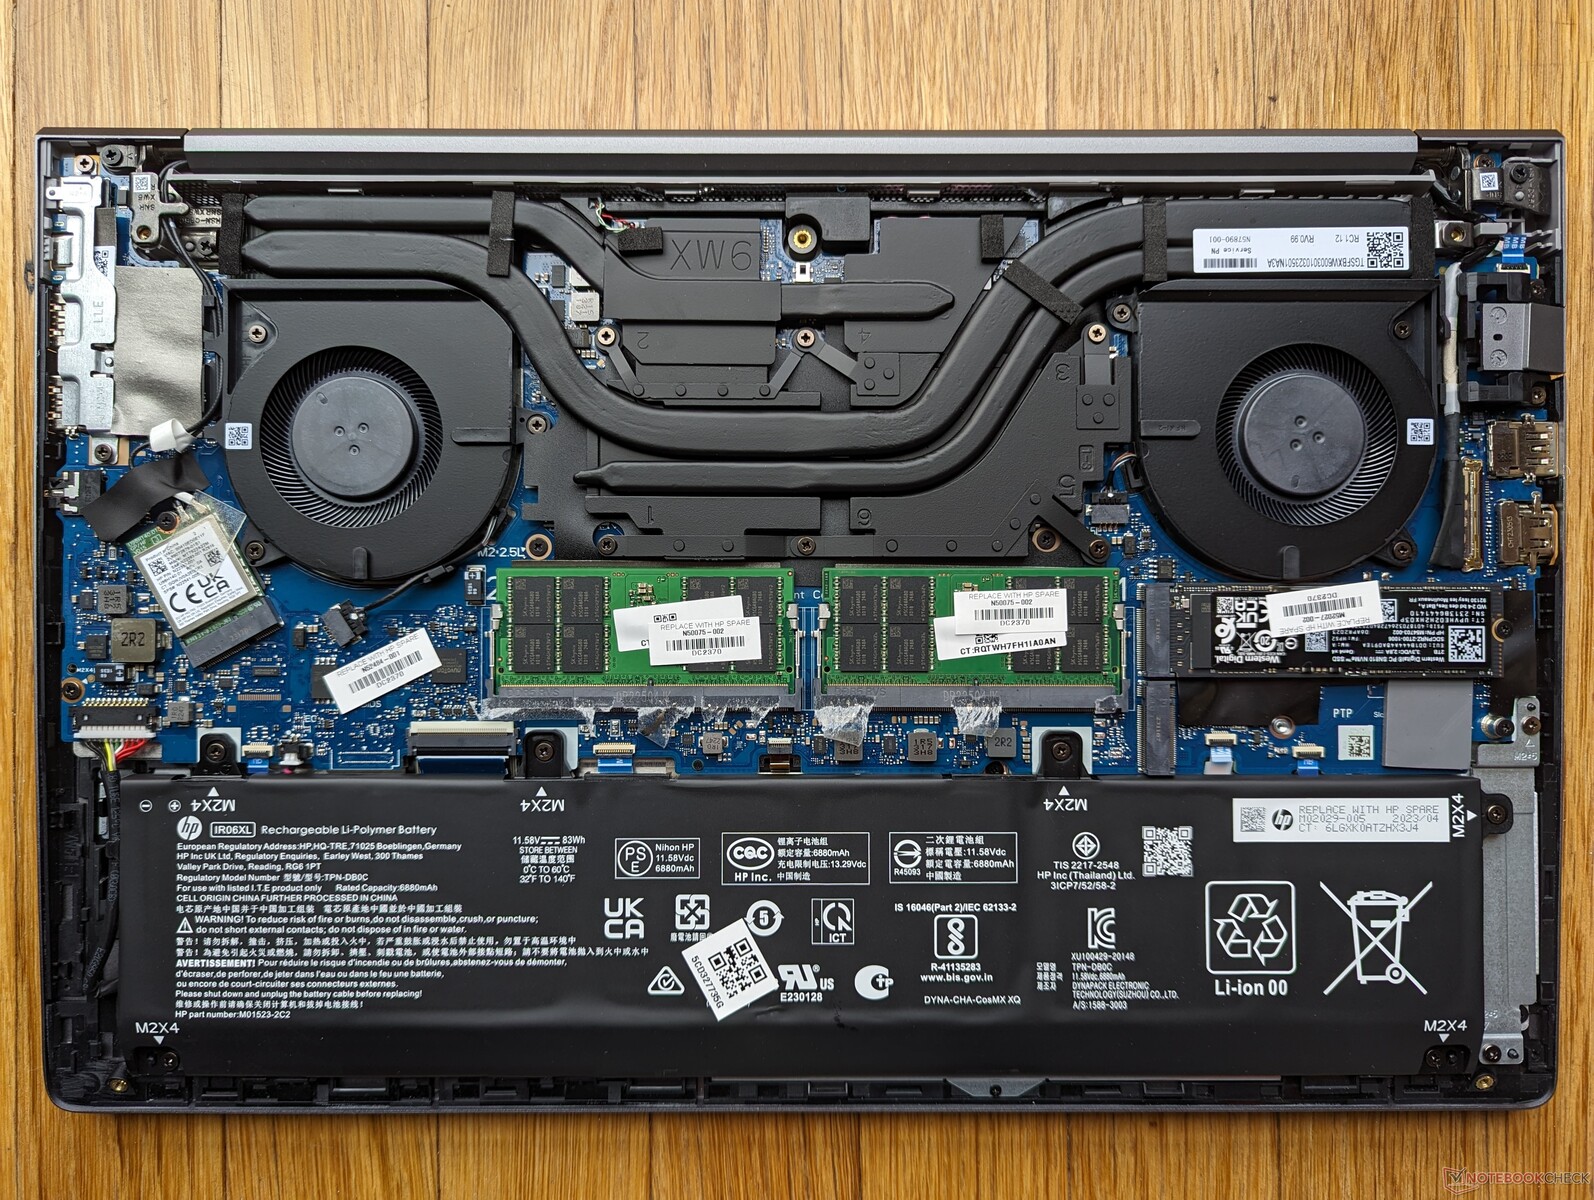
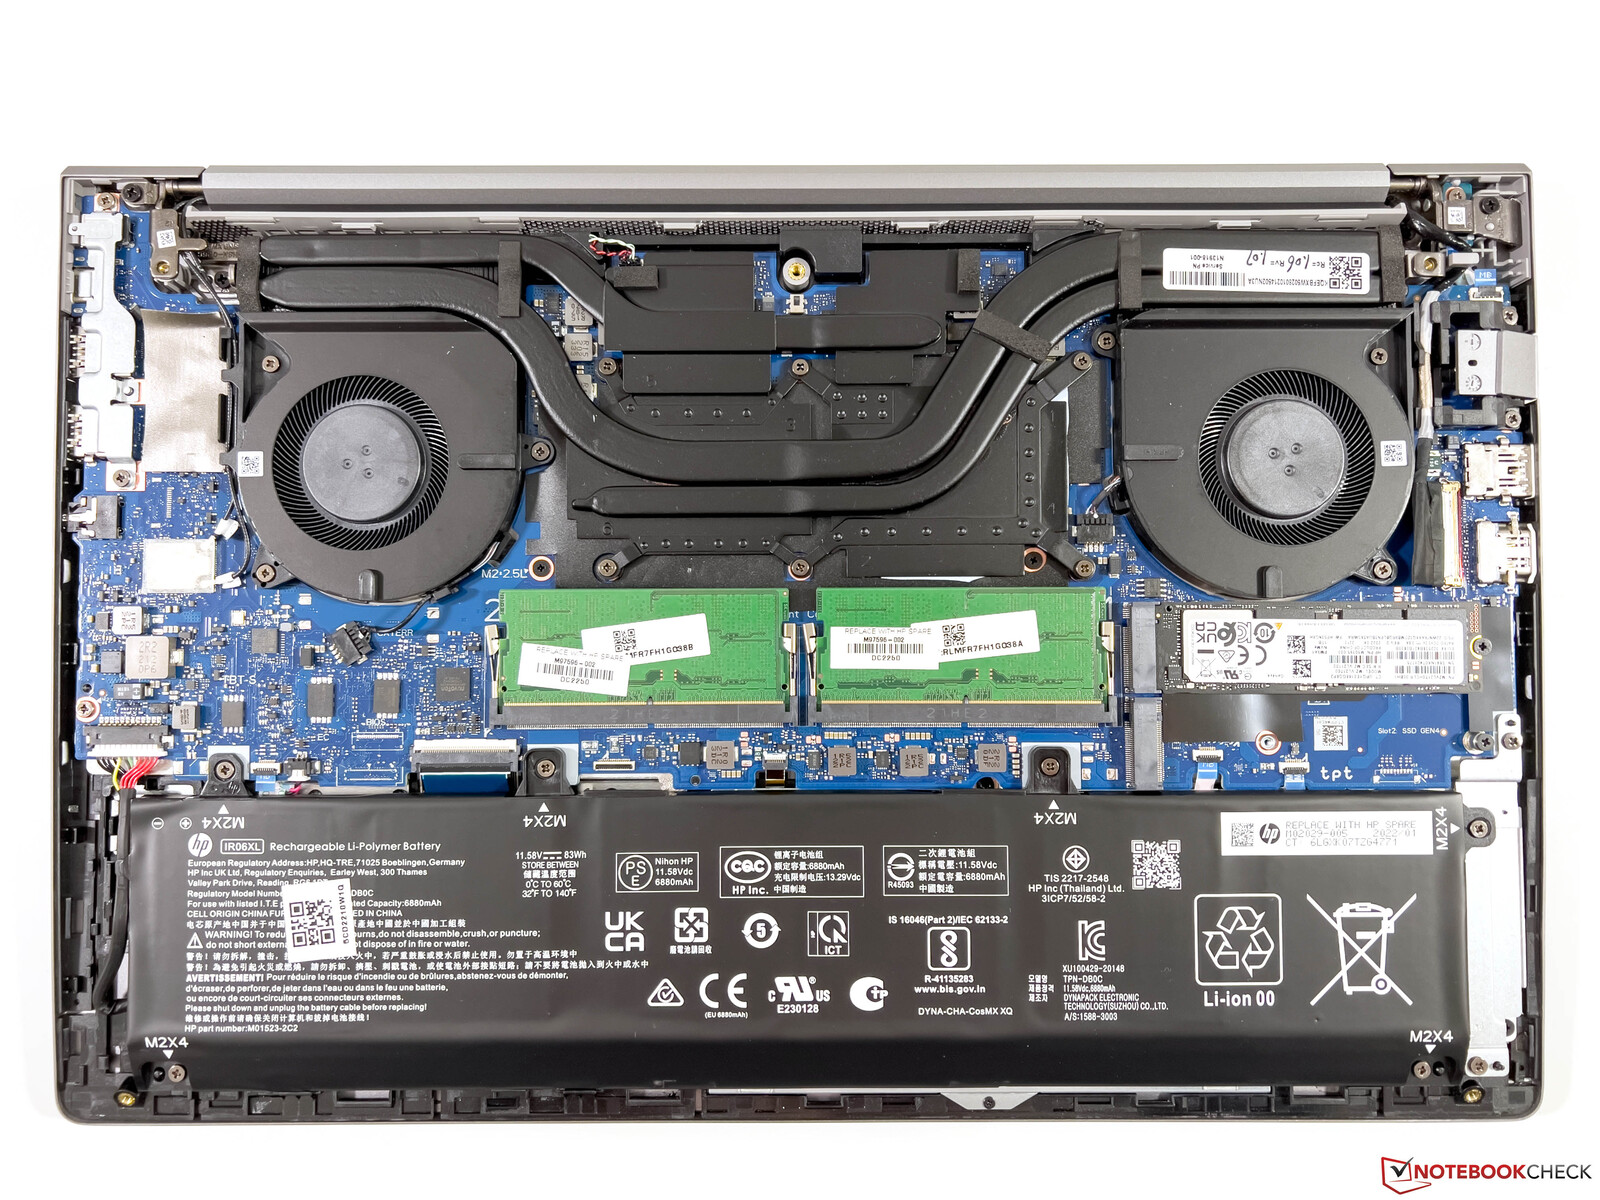
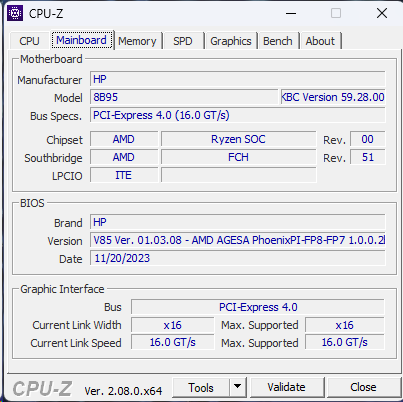
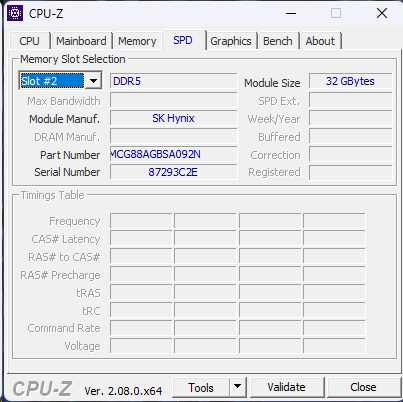
HP hat eine kleine, aber bemerkenswerte Änderung vorgenommen: Das M.2-WLAN-Modul ist jetzt austauschbar, während es beim letztjährigen ZBook Power 15 G9 noch fest verlötet war. Alles andere bleibt unverändert, einschließlich der zwei DDR5-SODIMM-Steckplätze und der zwei M.2-PCIe4-x4-Steckplätze.
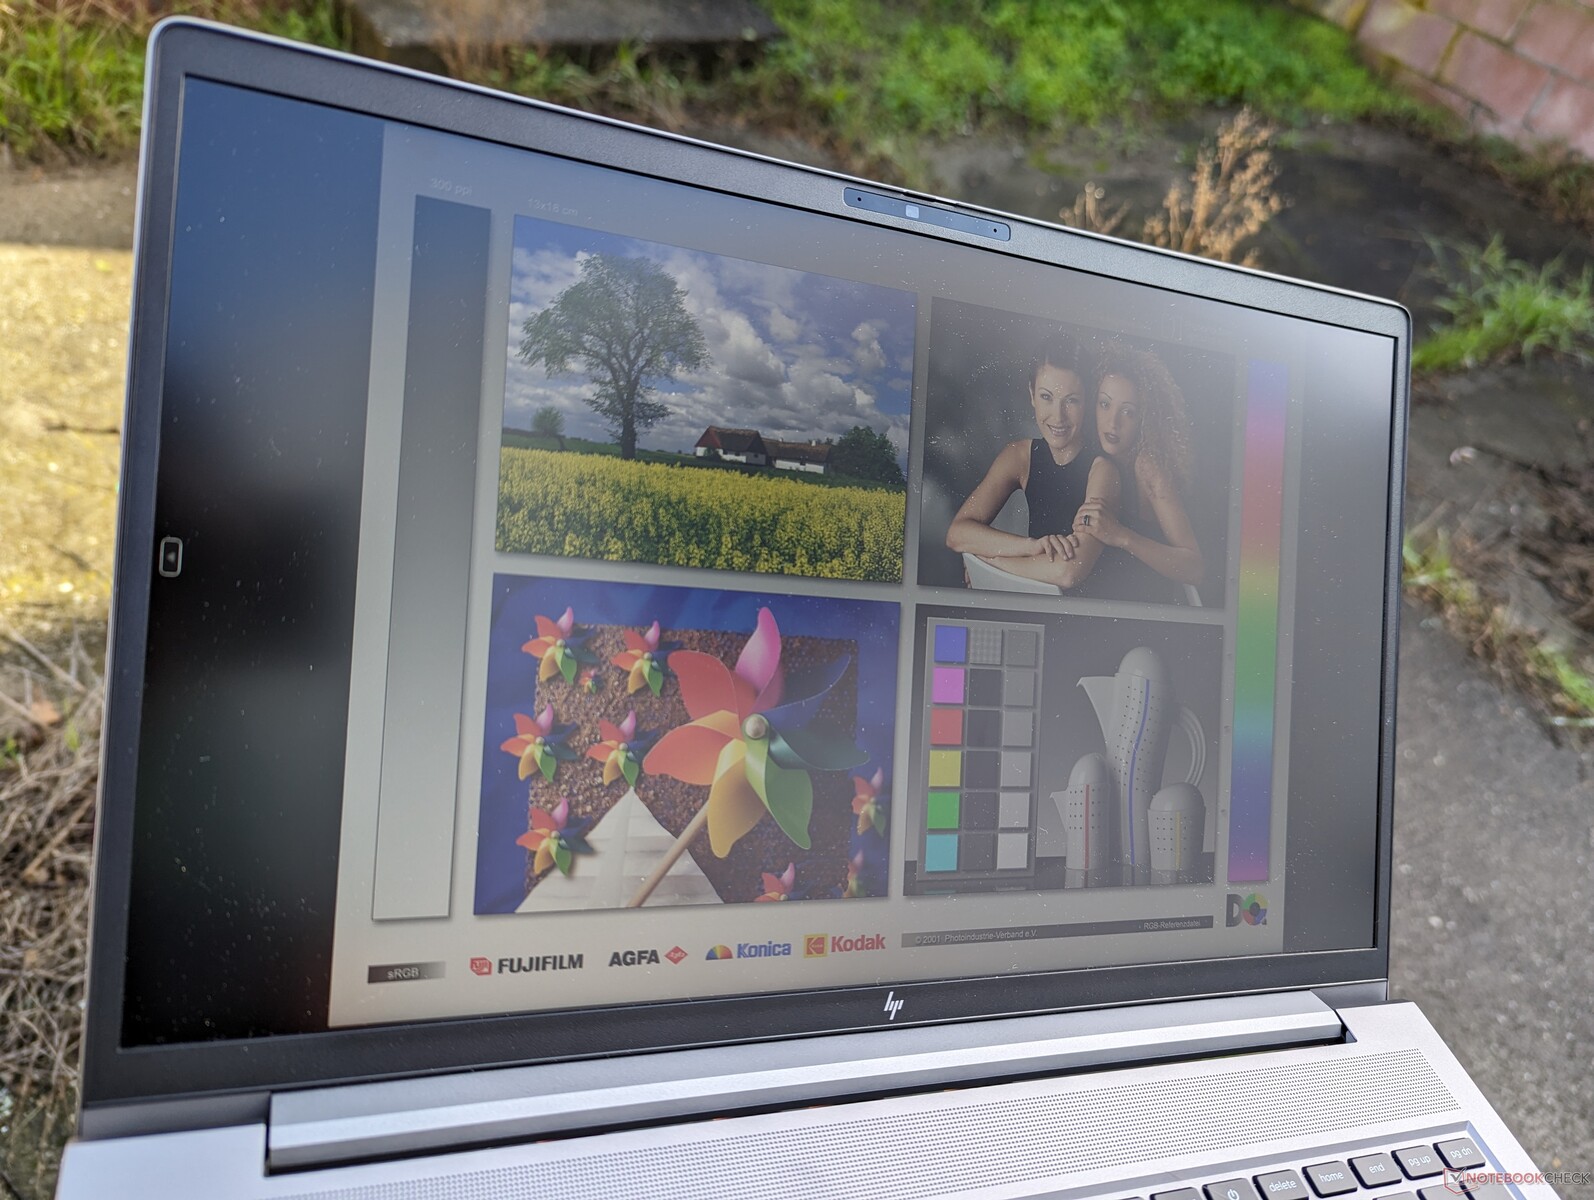
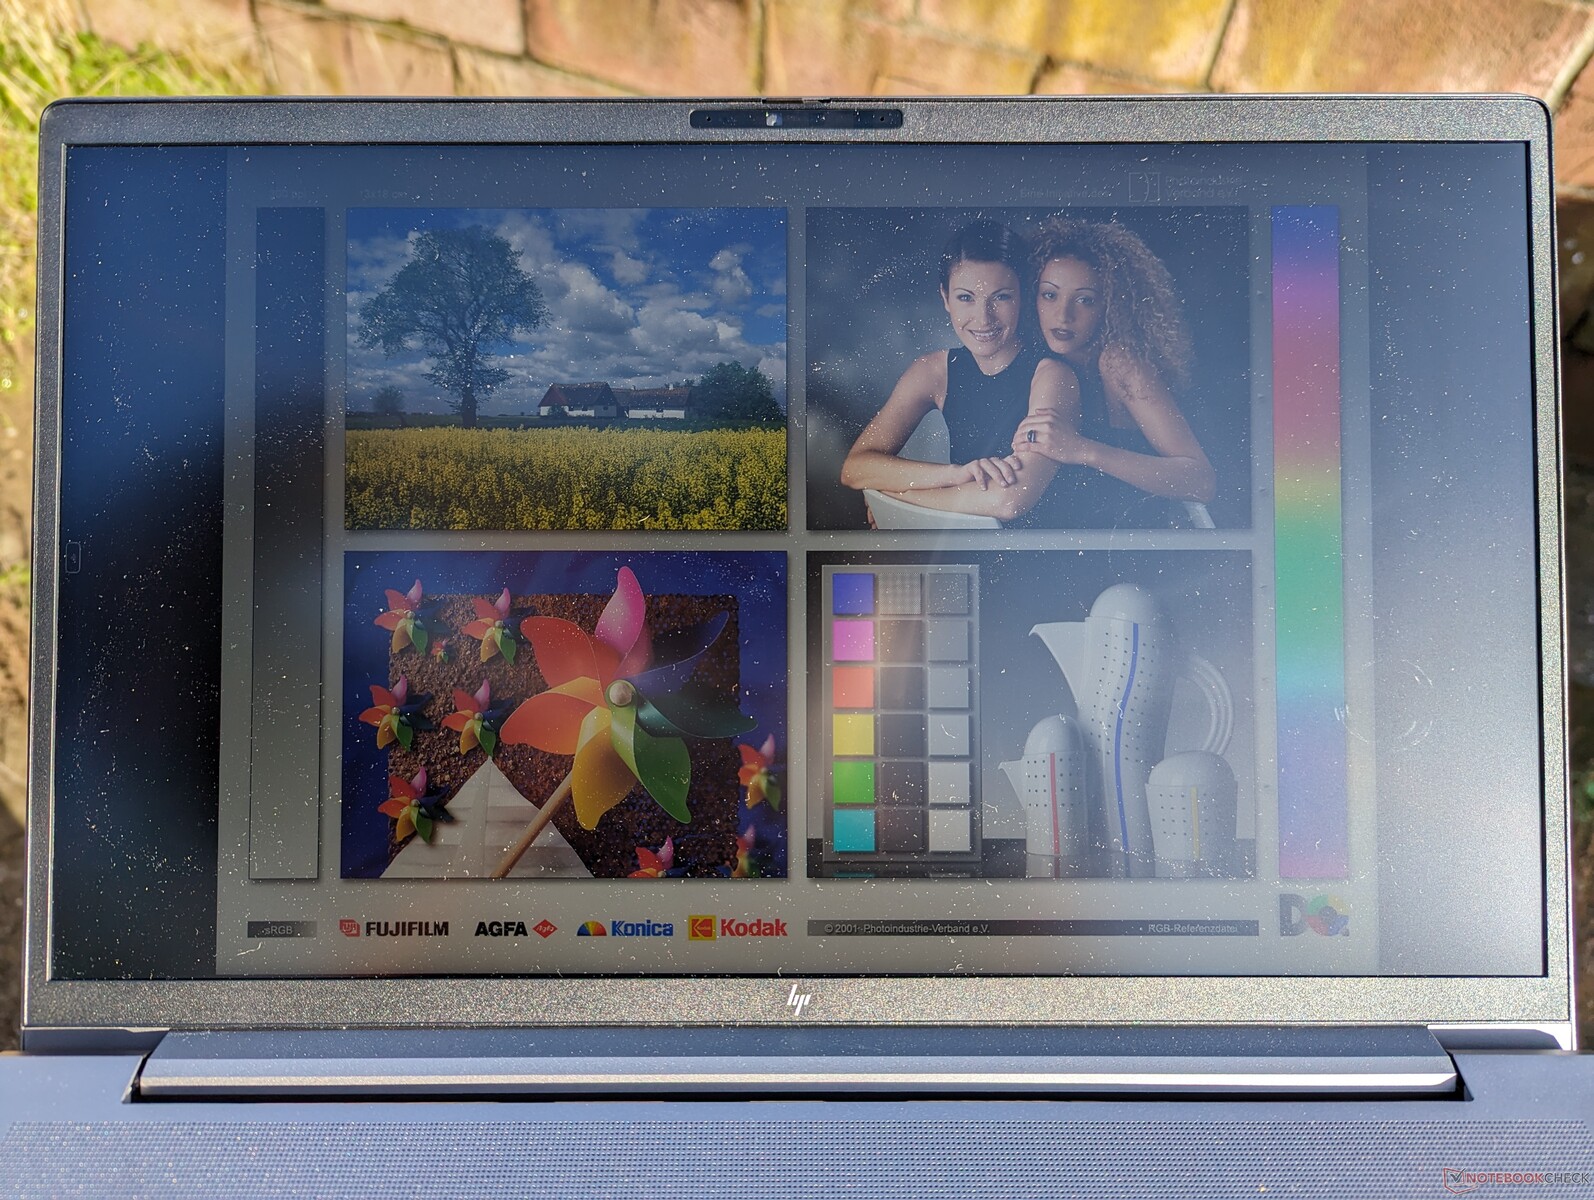
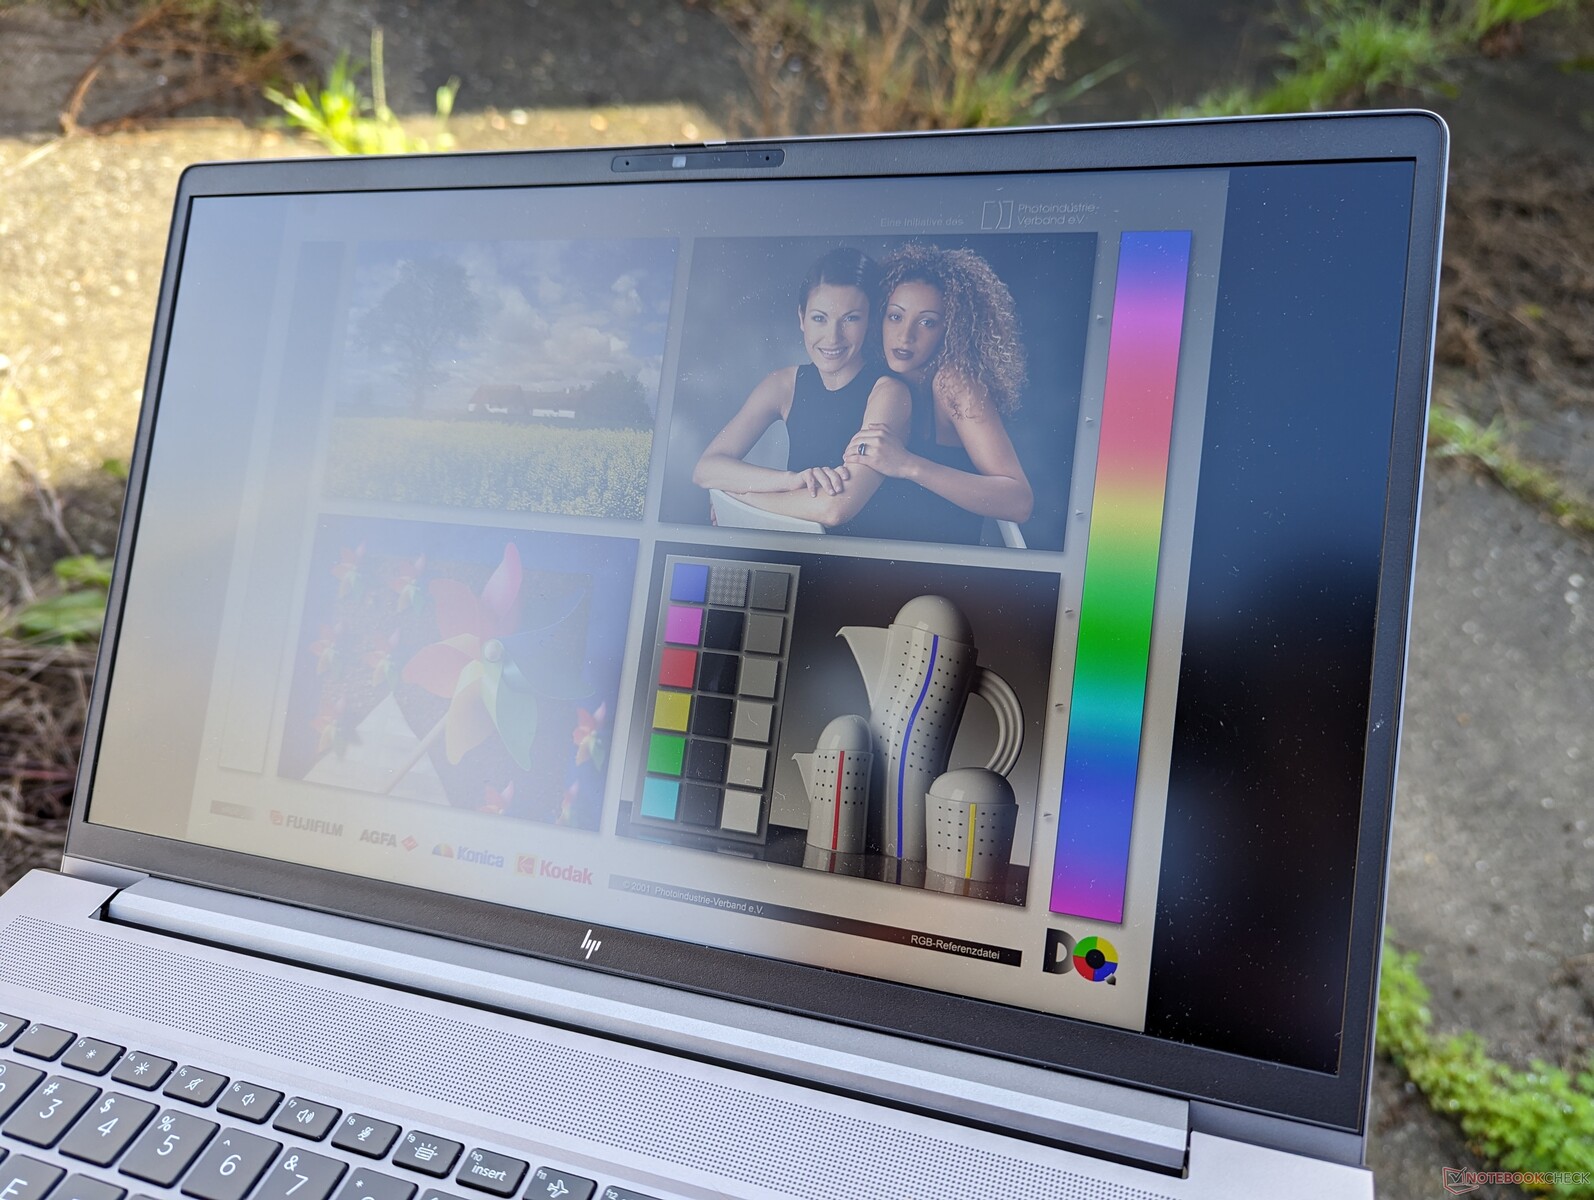
Display
Das Modell bietet die folgenden vier matten Display-Optionen:
- 1.080p, 250 Nits, 60 % sRGB, Touchscreen
- 1.080p, 250 Nits, 60 % sRGB, nicht berührungsempfindlich
- 1.080p, 400 Nits, 100 % sRGB, nicht berührungsempfindlich
- 1.440p, 300 Nits, 100 % sRGB, ohne Berührung, 120 Hz
Wenn Sie nicht unbedingt auf einen Touchscreen angewiesen sind, empfehlen wir Ihnen, die beiden 250-Nit-Optionen zu meiden, da sie jeweils nur 45 % von NTSC abdecken und die Farben deutlich schwächer sind.
Aus unbekannten Gründen bietet HP für keine der ZBook-Power-G10-Konfigurationen 4K-Optionen an, obwohl diese zuvor für das ZBook Power G9 verfügbar waren. Wir vermuten, dass dies an Lieferproblemen liegen könnte, da die Hersteller derzeit von 16:9-15,6-Zoll-Panels auf 16:10-16-Zoll-Panels umsteigen.
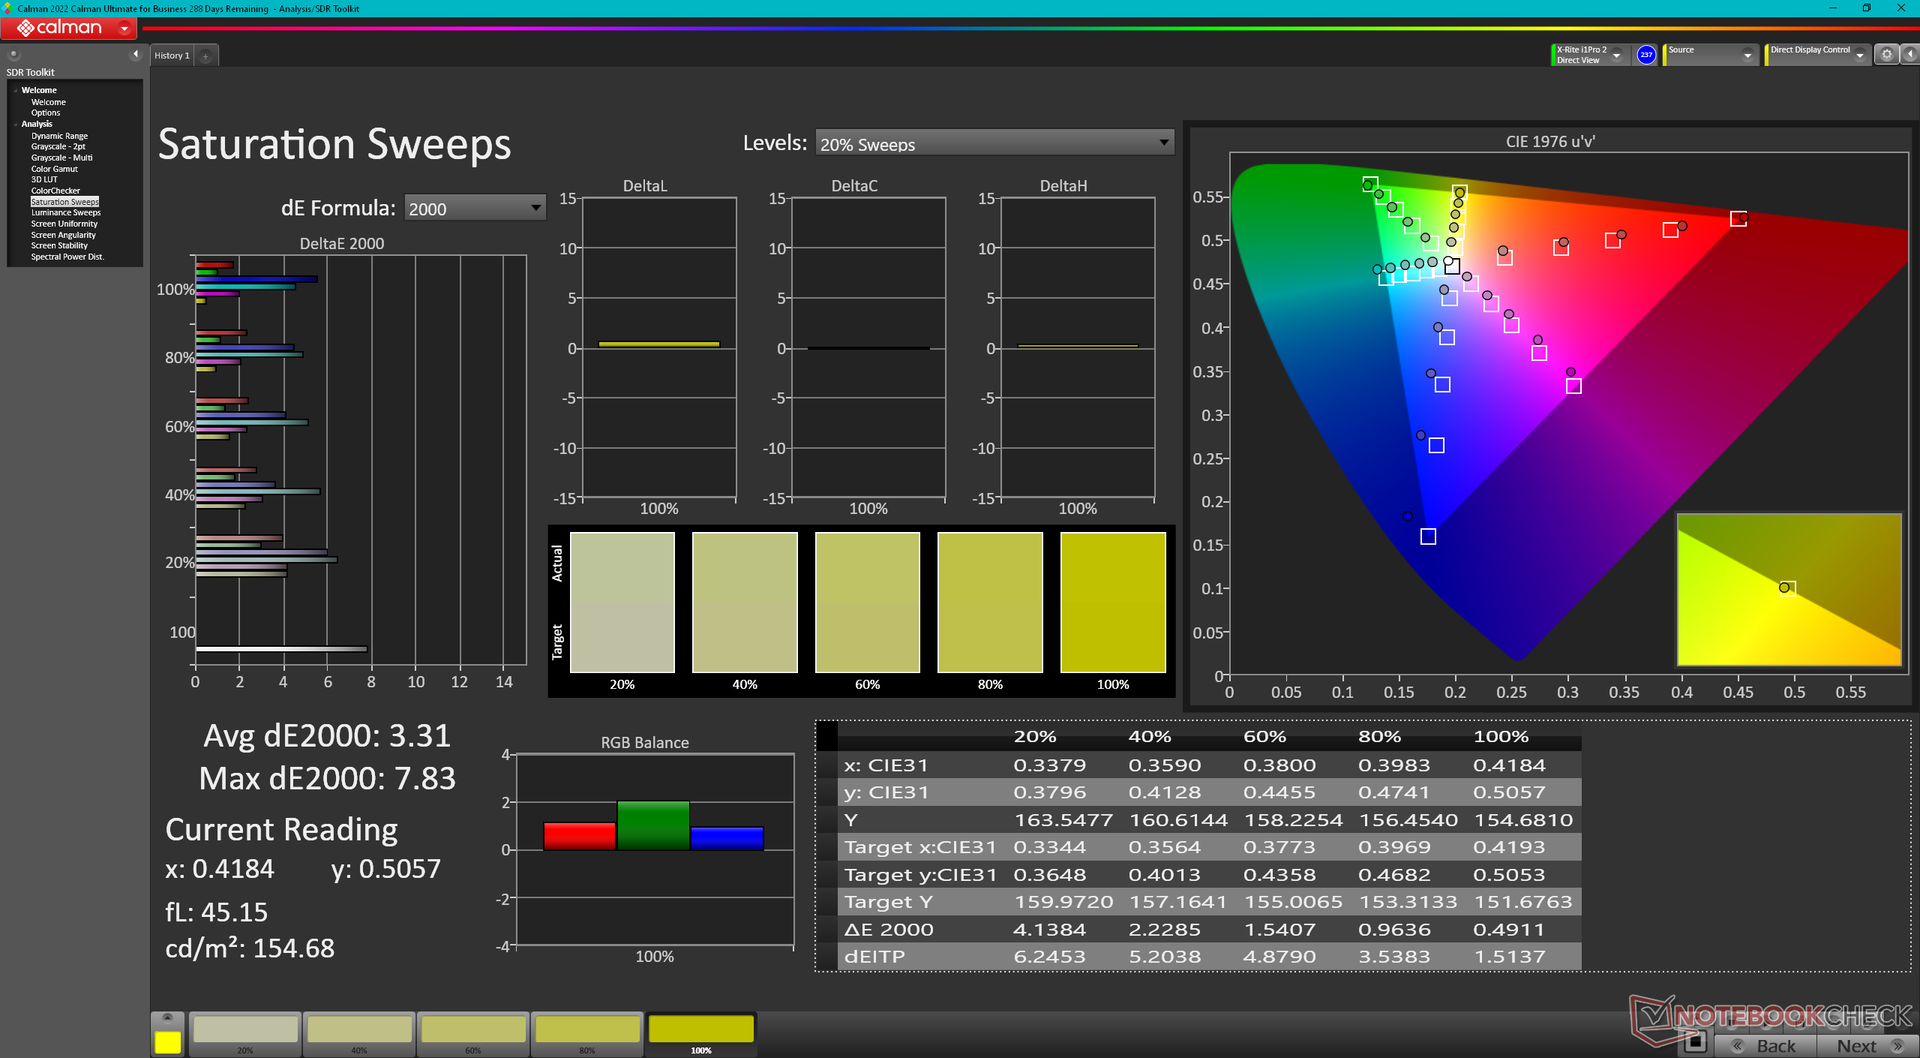
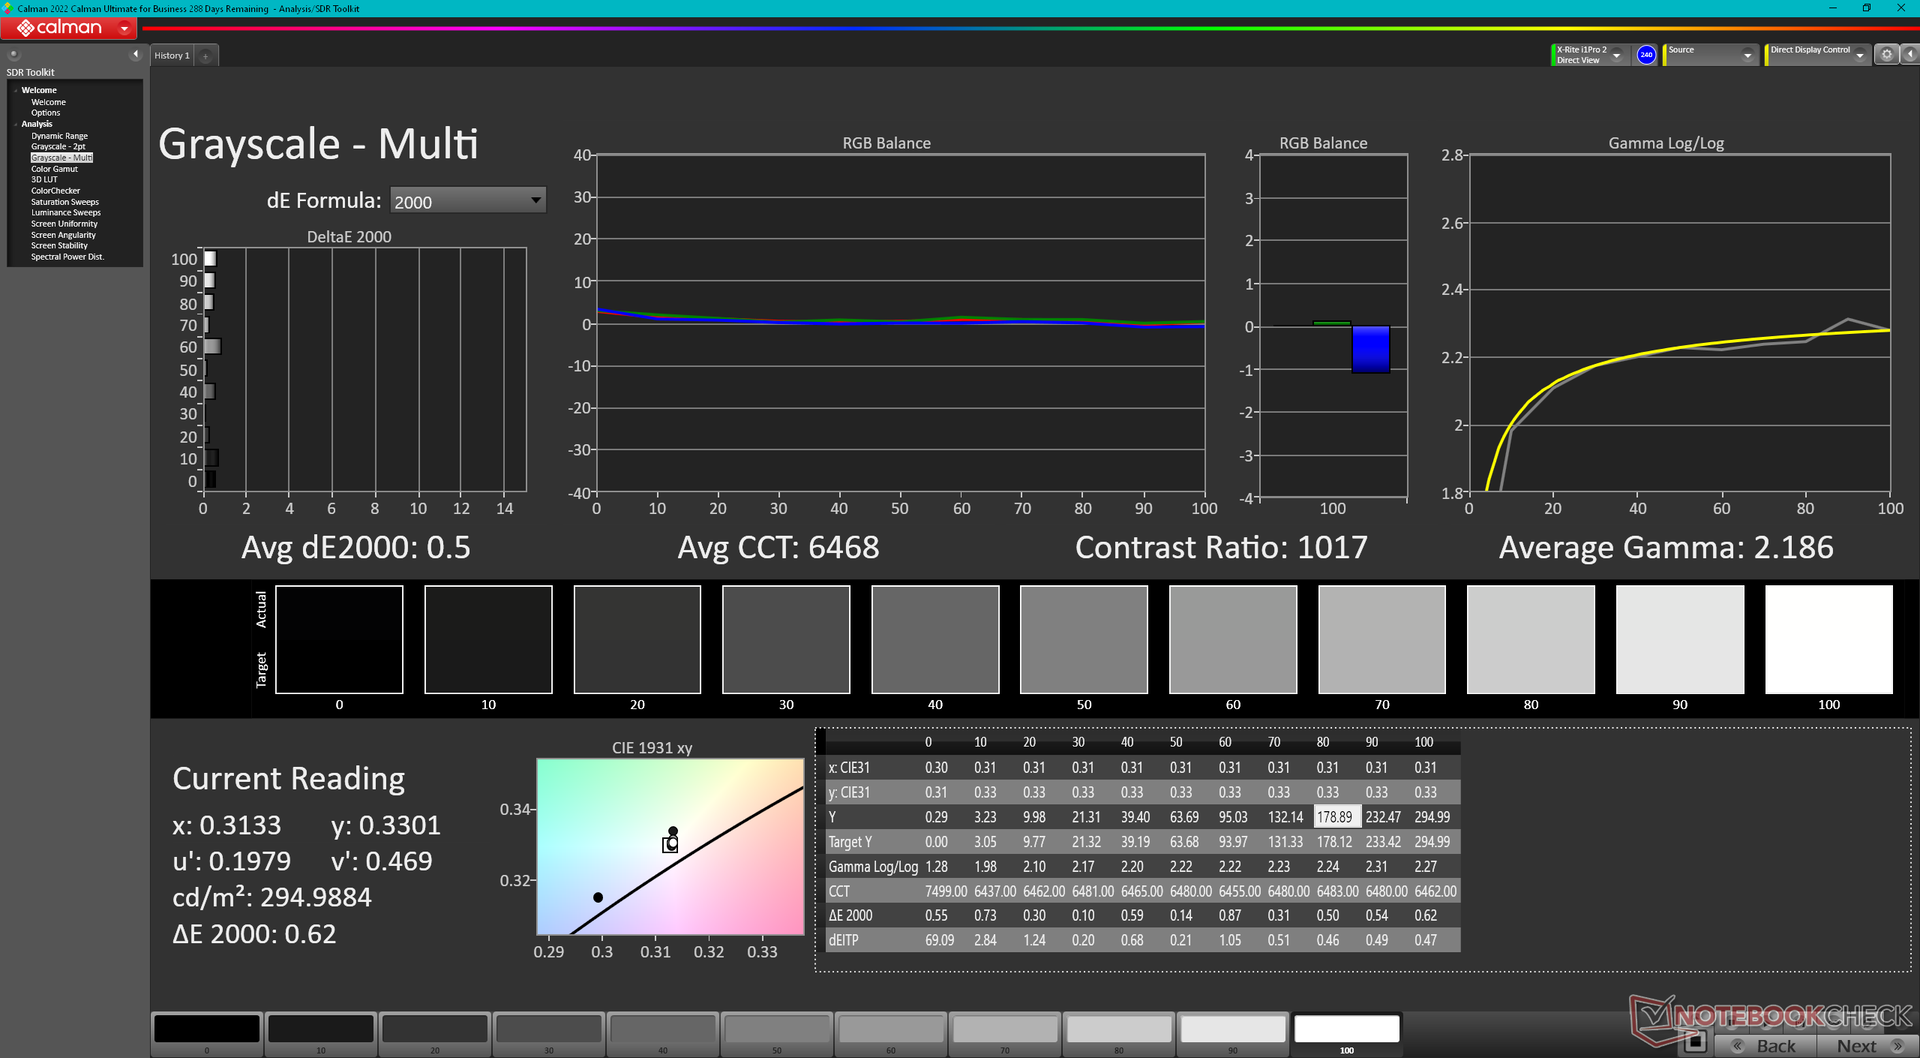
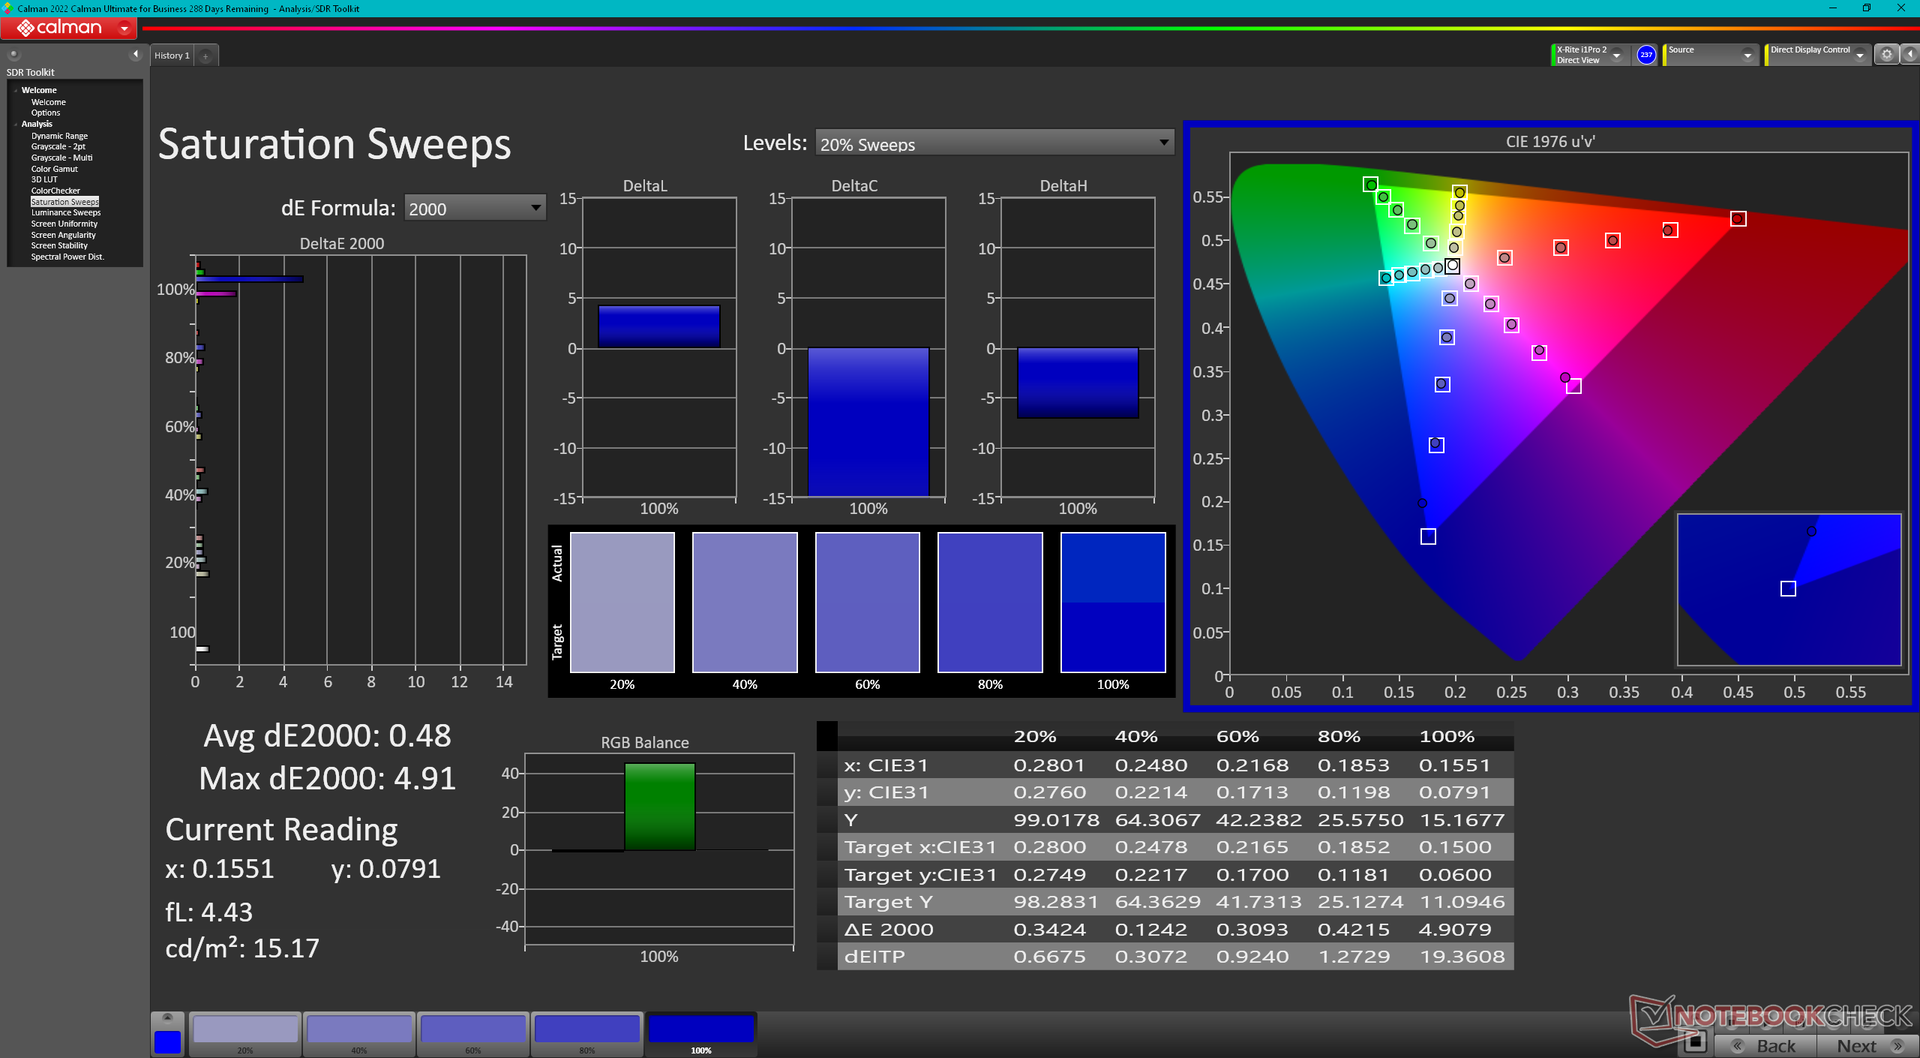
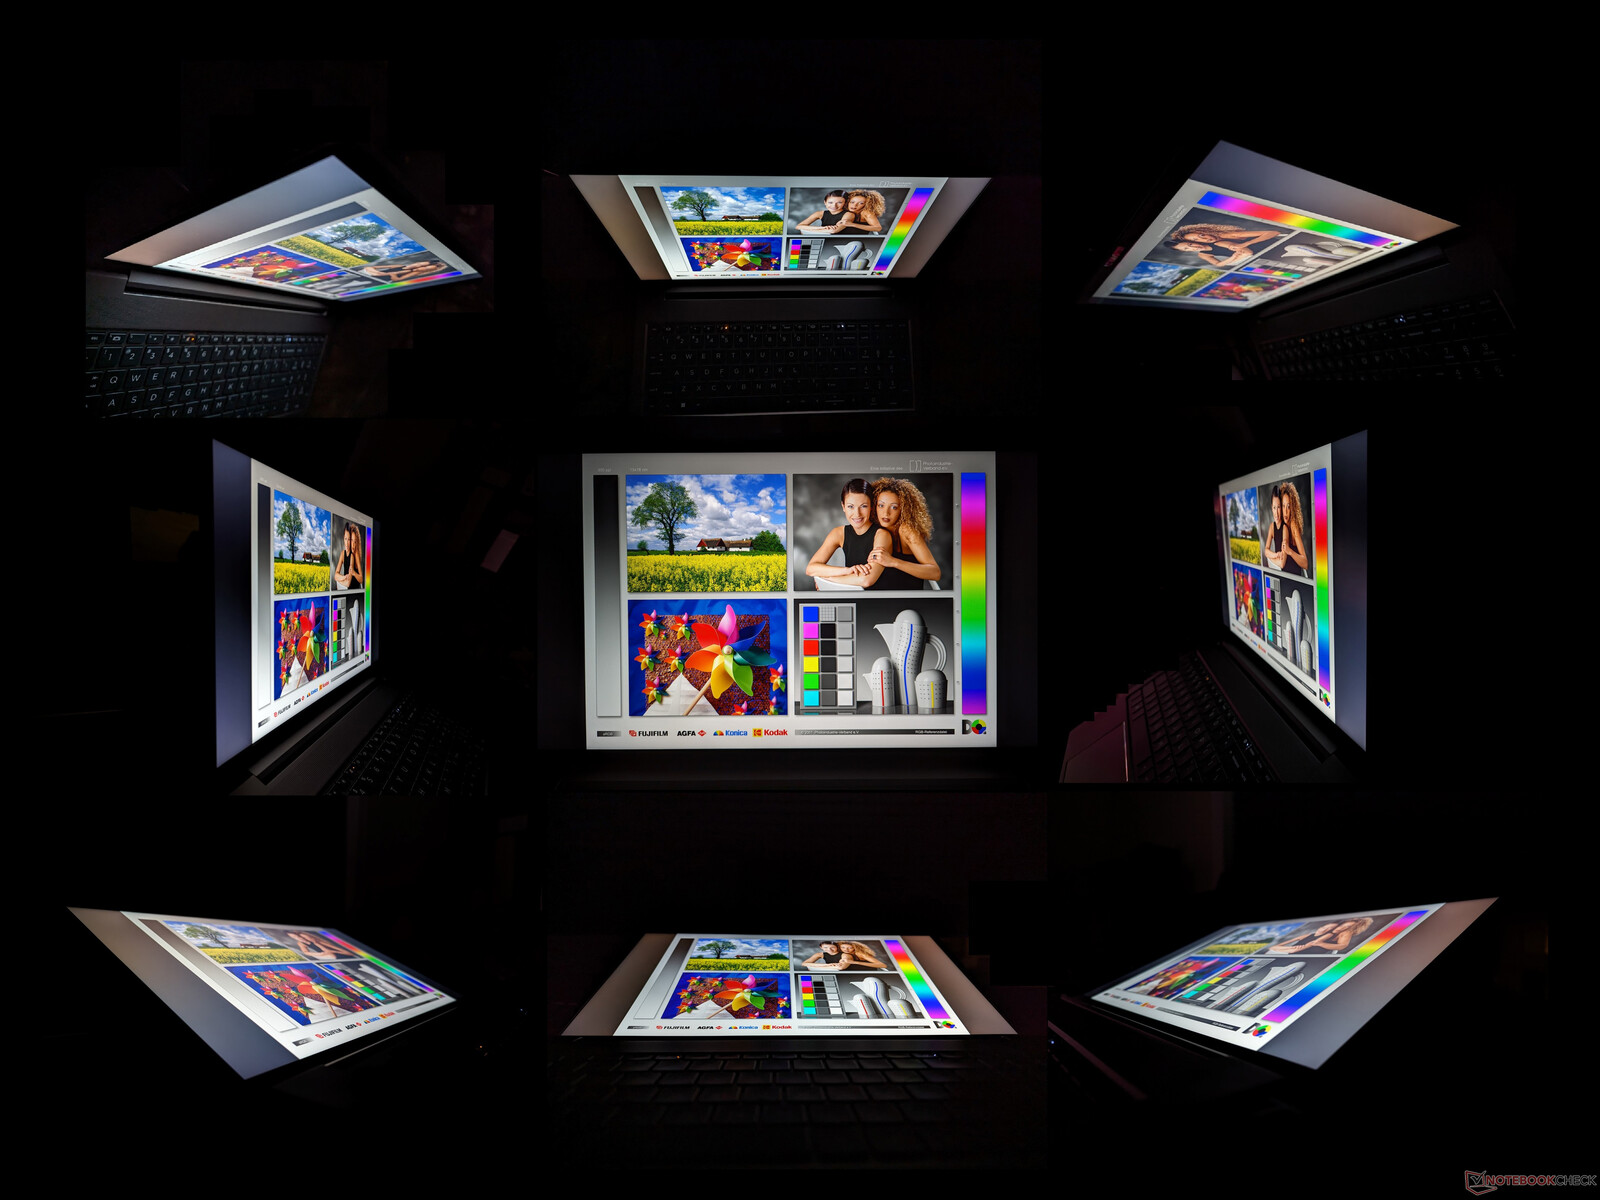
Unser 1.440p-Panel ist mit seiner hohen Bildwiederholfrequenz, den schnellen Reaktionszeiten und den akkuraten sRGB-Farben dennoch hervorragend für die Erstellung von Inhalten und sogar für Spiele geeignet. Es ist vielleicht nicht OLED oder 4K, aber es ist immer noch eines der besseren 15,6-Zoll-IPS-Displays auf dem Markt.

| |||||||||||||||||||||||||
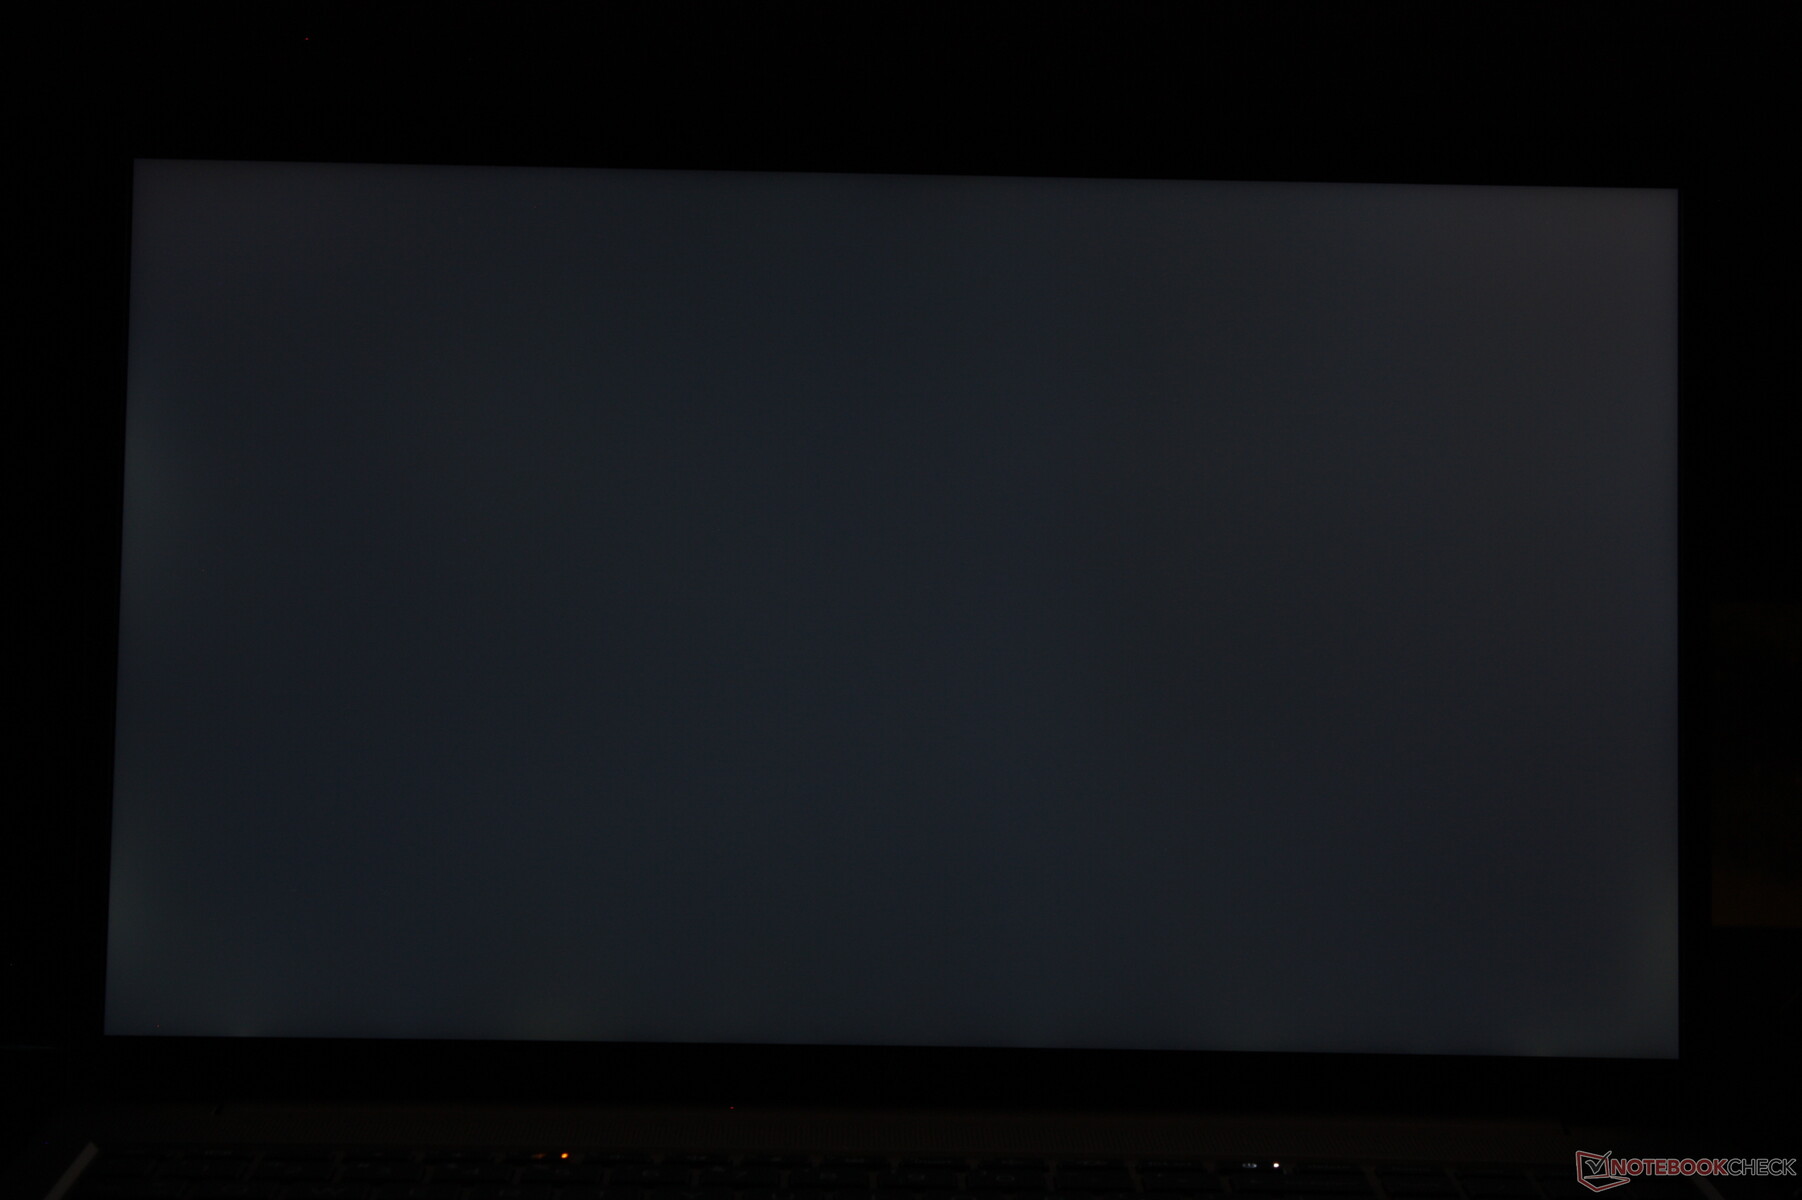
Ausleuchtung: 83 %
Helligkeit Akku: 313.8 cd/m²
Kontrast: 1082:1 (Schwarzwert: 0.29 cd/m²)
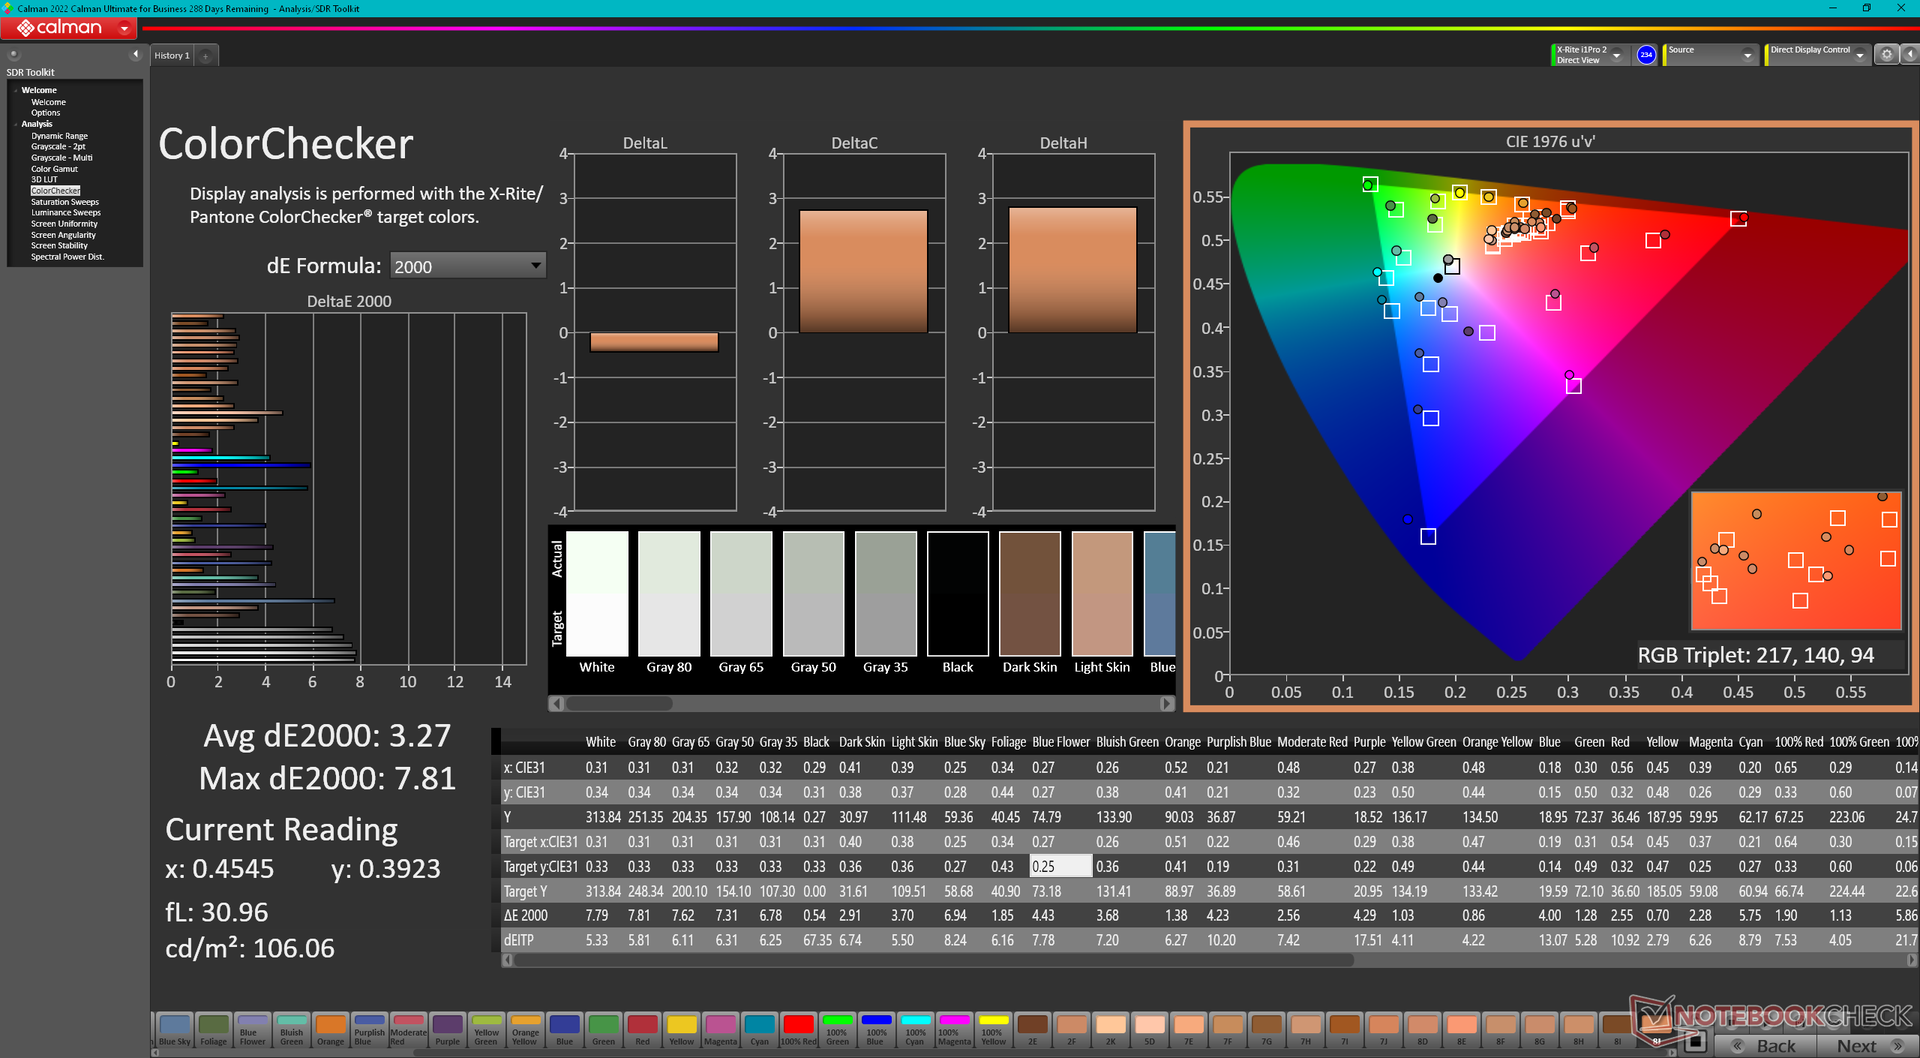
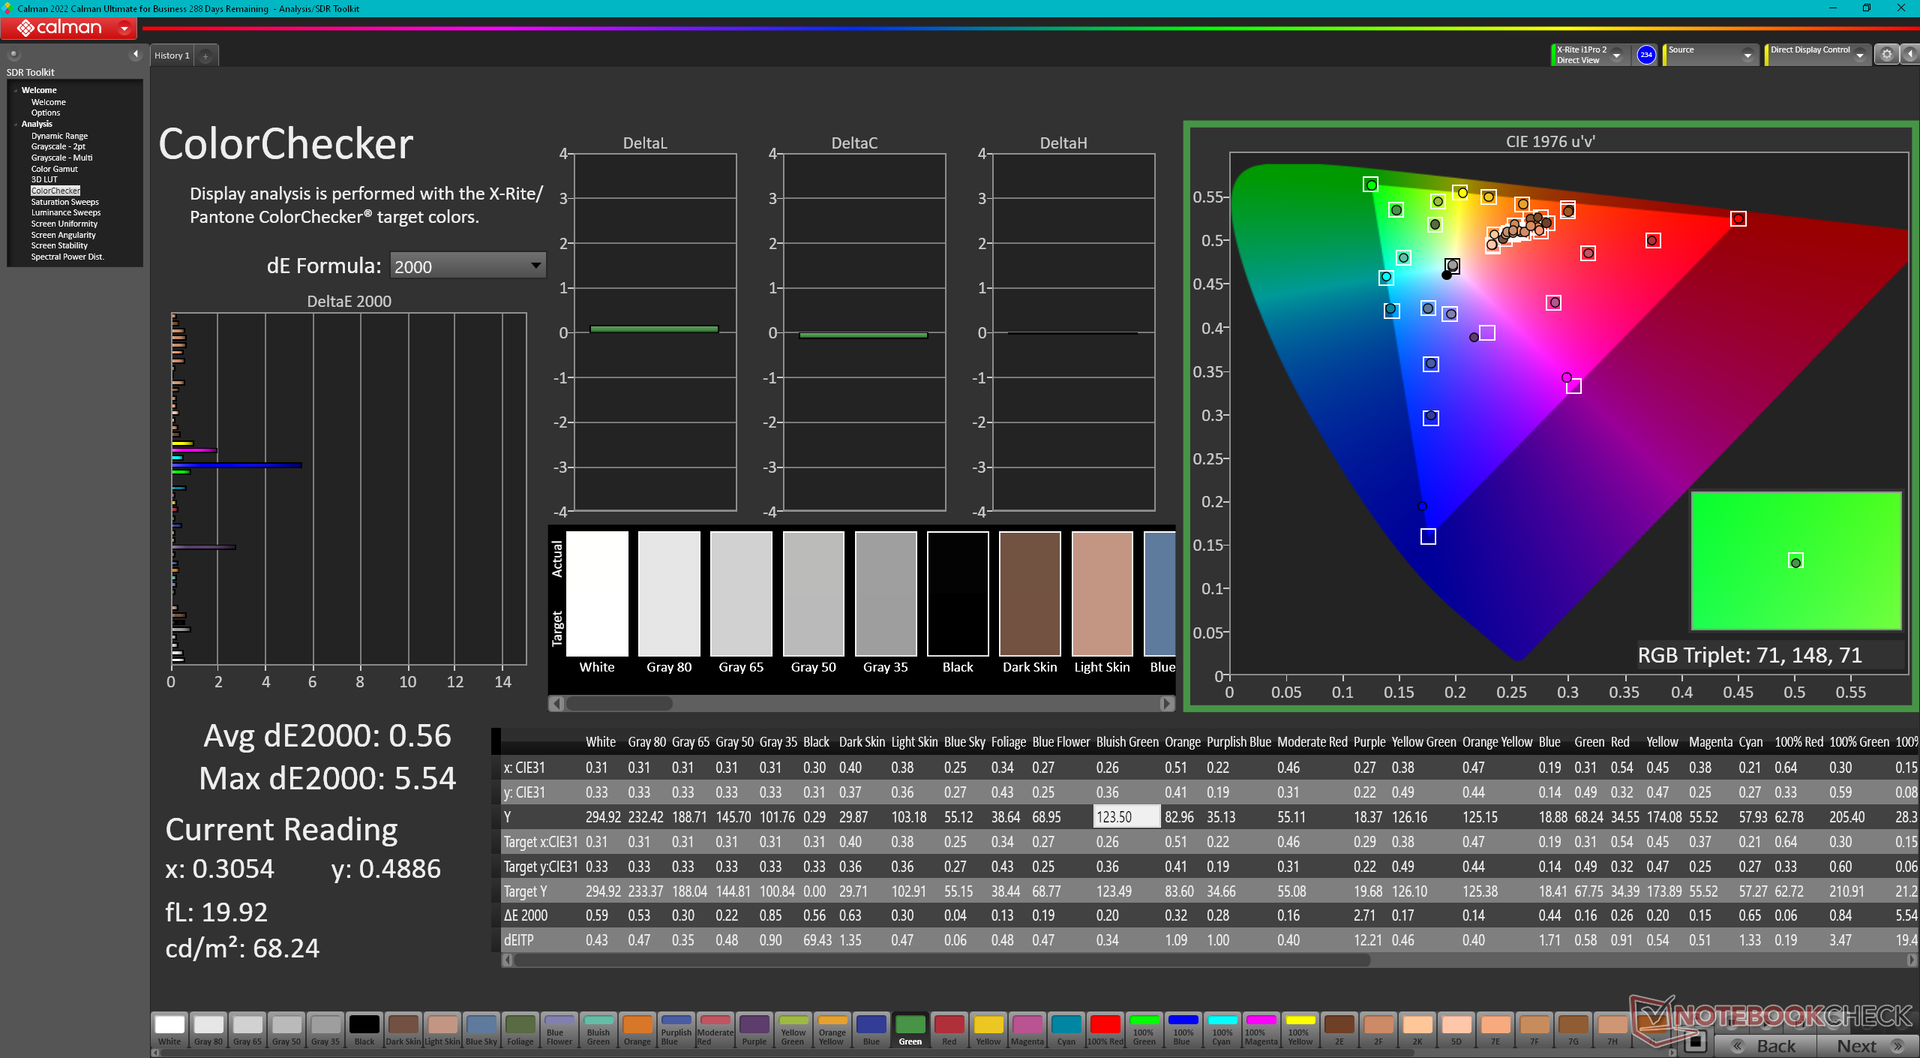
ΔE ColorChecker Calman: 3.27 | ∀{0.5-29.43 Ø4.73}
calibrated: 0.56
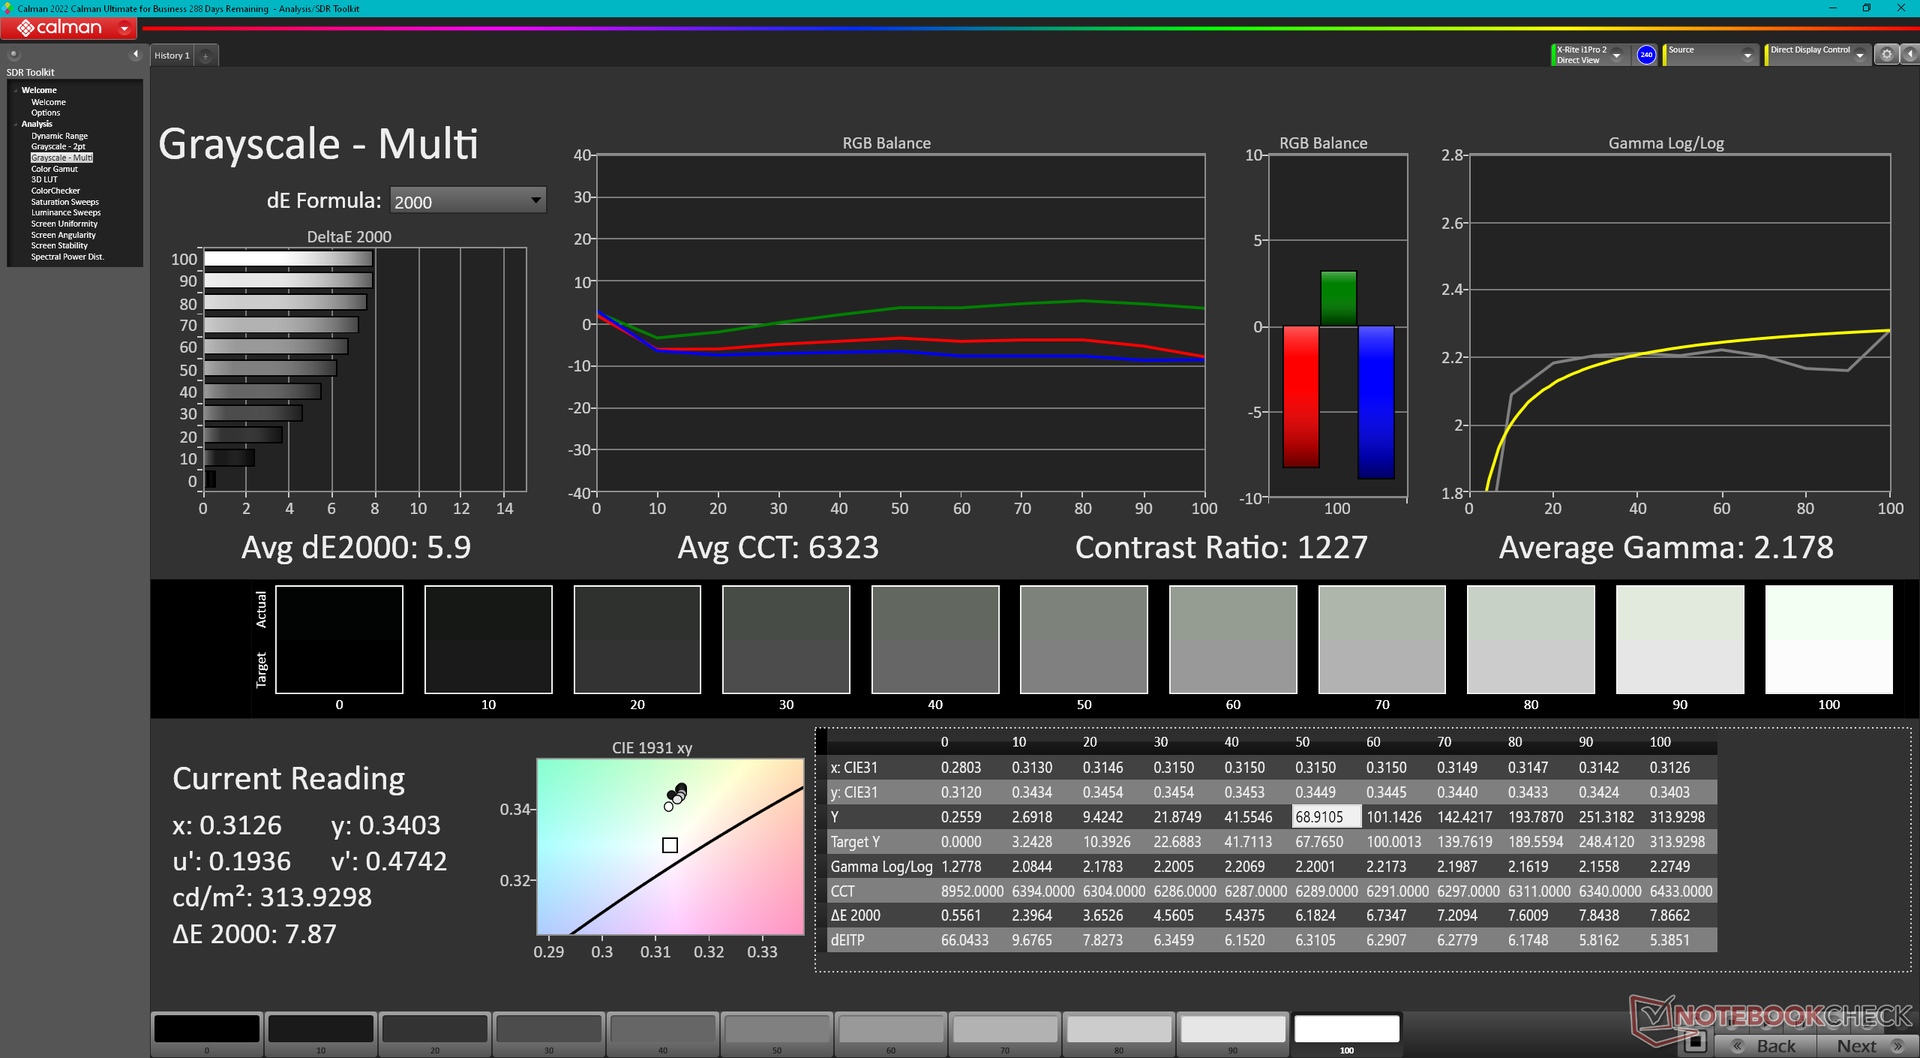
ΔE Greyscale Calman: 5.9 | ∀{0.09-98 Ø4.97}
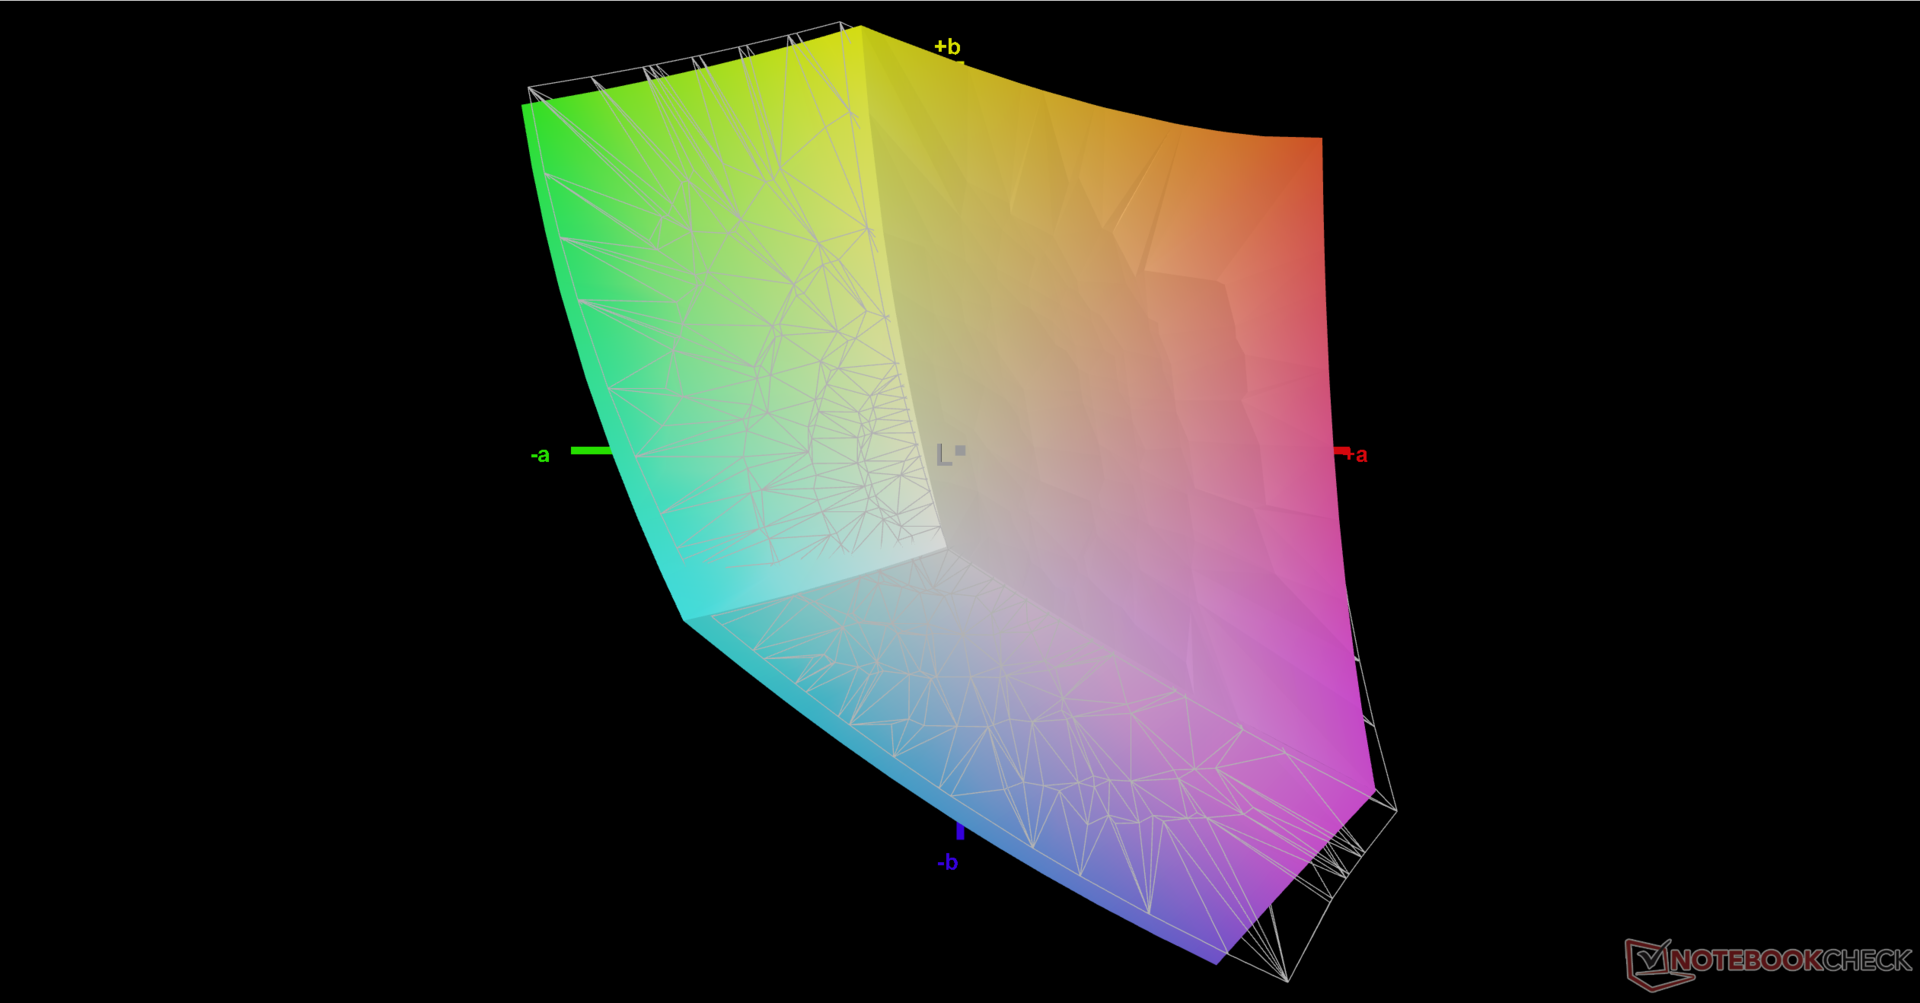
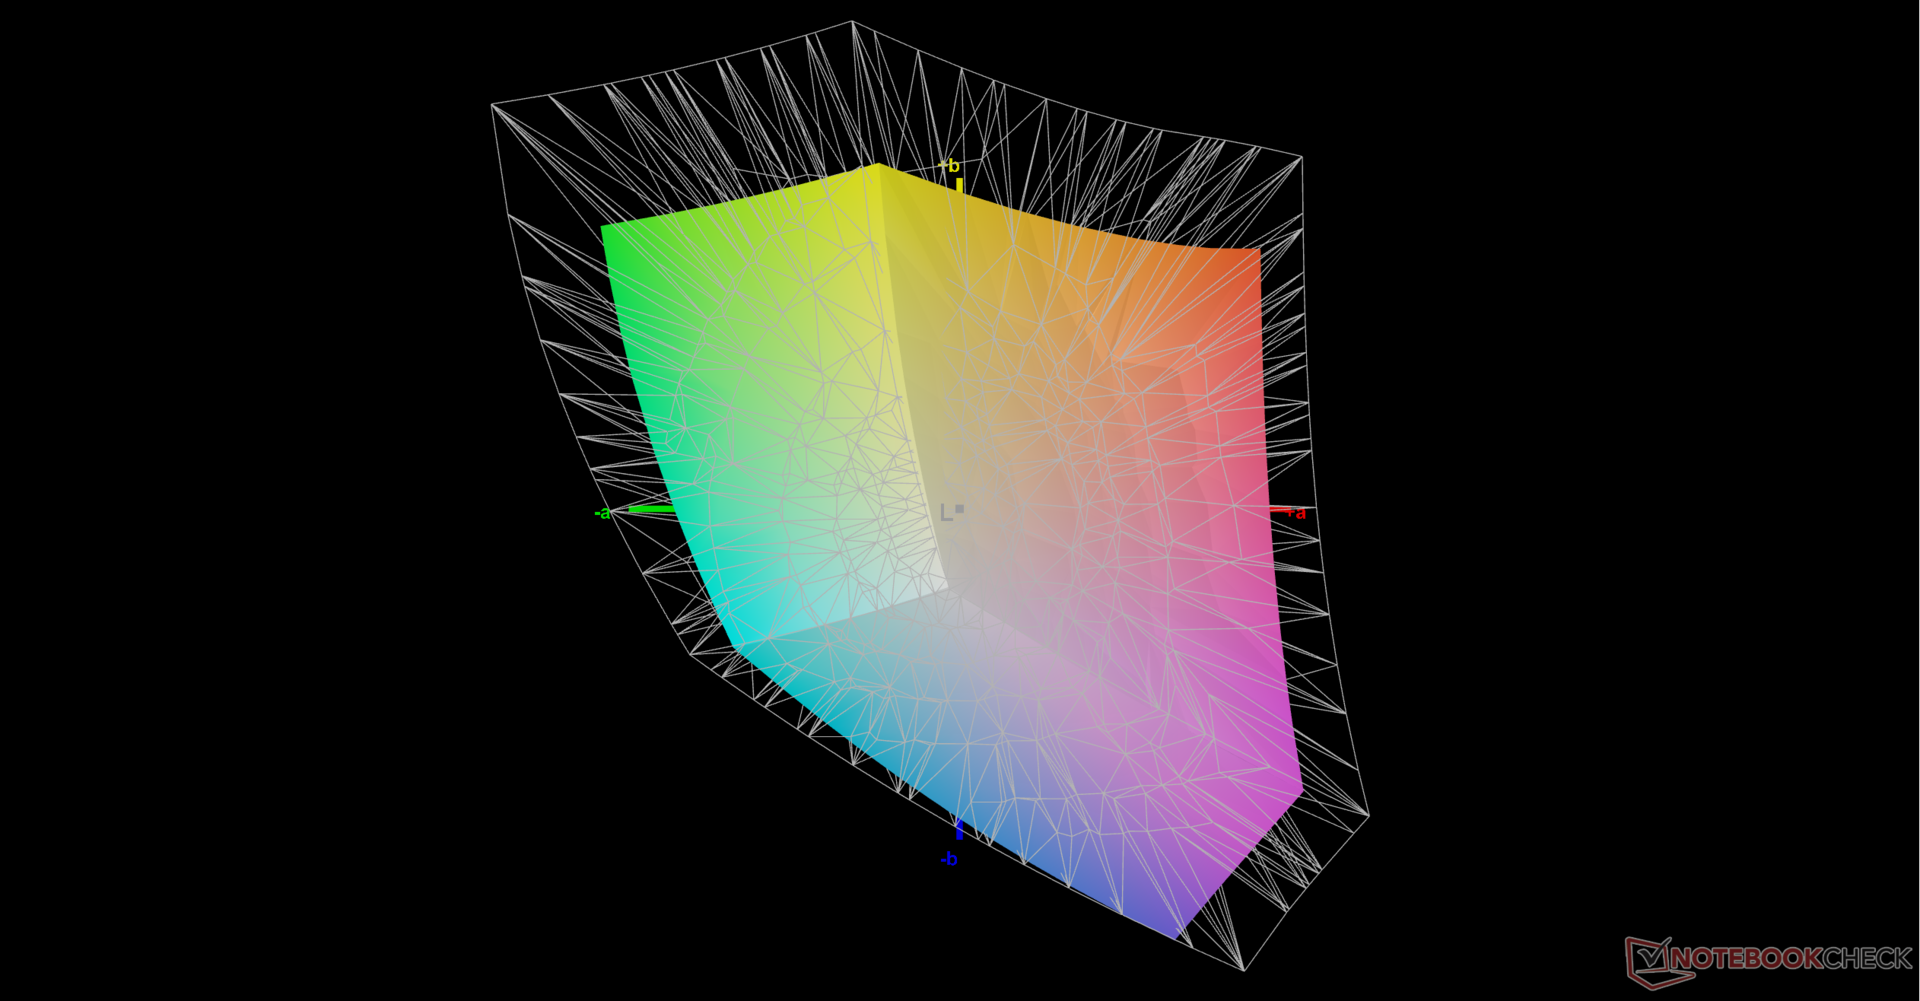
70.5% AdobeRGB 1998 (Argyll 3D)
95.6% sRGB (Argyll 3D)
68.2% Display P3 (Argyll 3D)
Gamma: 2.18
CCT: 6323 K
| HP ZBook Power 15 G10 BOE0B6A, IPS, 2560x1440, 15.6" | HP ZBook Power 15 G9 6B8C4EA LGD073F, IPS, 3840x2160, 15.6" | Lenovo ThinkPad P15v G3 21EM001AGE NE156QUM-N6C, IPS LED, 3840x2160, 15.6" | Dell Precision 5000 5560 Sharp LQ156R1, IPS, 3840x2400, 15.6" | Lenovo ThinkPad P1 G6-21FV000DGE NE160QDM-NY1, IPS, 2560x1600, 16" | Asus ExpertBook B6 Flip B6602FC2 AU Optronics Model: AUOE495, IPS, 2560x1600, 16" | |
|---|---|---|---|---|---|---|
| Display | 1% | 26% | 29% | 1% | 23% | |
| Display P3 Coverage (%) | 68.2 | 69.1 1% | 89.9 32% | 94.9 39% | 68.1 0% | 97.9 44% |
| sRGB Coverage (%) | 95.6 | 97.7 2% | 100 5% | 100 5% | 97.5 2% | 99.89 4% |
| AdobeRGB 1998 Coverage (%) | 70.5 | 69.6 -1% | 99.9 42% | 100 42% | 70.2 0% | 85.52 21% |
| Response Times | -214% | -211% | -228% | 2% | -120% | |
| Response Time Grey 50% / Grey 80% * (ms) | 13 ? | 45.8 ? -252% | 46.7 ? -259% | 47.2 ? -263% | 13.7 ? -5% | 36 ? -177% |
| Response Time Black / White * (ms) | 10.4 ? | 28.6 ? -175% | 27.3 ? -163% | 30.4 ? -192% | 9.6 ? 8% | 17 ? -63% |
| PWM Frequency (Hz) | ||||||
| Bildschirm | 18% | 5% | 7% | 30% | -20% | |
| Helligkeit Bildmitte (cd/m²) | 313.8 | 392 25% | 588 87% | 501.5 60% | 521 66% | 440 40% |
| Brightness (cd/m²) | 302 | 388 28% | 536 77% | 467 55% | 484 60% | 418 38% |
| Brightness Distribution (%) | 83 | 88 6% | 83 0% | 83 0% | 89 7% | 82 -1% |
| Schwarzwert * (cd/m²) | 0.29 | 0.15 48% | 0.38 -31% | 0.44 -52% | 0.36 -24% | 0.3 -3% |
| Kontrast (:1) | 1082 | 2613 141% | 1547 43% | 1140 5% | 1447 34% | 1467 36% |
| Delta E Colorchecker * | 3.27 | 3.2 2% | 3.9 -19% | 4.73 -45% | 1.2 63% | 2.81 14% |
| Colorchecker dE 2000 max. * | 7.81 | 7 10% | 8.8 -13% | 8.45 -8% | 2.5 68% | 4.62 41% |
| Colorchecker dE 2000 calibrated * | 0.56 | 1.2 -114% | 1 -79% | 0.51 9% | 1 -79% | 2.99 -434% |
| Delta E Graustufen * | 5.9 | 4.9 17% | 7.1 -20% | 3.6 39% | 1.4 76% | 0.91 85% |
| Gamma | 2.18 101% | 2.13 103% | 2.12 104% | 2.08 106% | 2.25 98% | 2.2 100% |
| CCT | 6323 103% | 5982 109% | 7268 89% | 6447 101% | 6682 97% | 6600 98% |
| Durchschnitt gesamt (Programm / Settings) | -65% /
-19% | -60% /
-21% | -64% /
-22% | 11% /
20% | -39% /
-25% |
* ... kleinere Werte sind besser
HP liefert das Modell nicht vorkalibriert aus, was für ein Notebook der ZBook Klasse sehr schade ist. Die durchschnittlichen Graustufen- und Farb-DeltaE-Werte ab Werk liegen bei 5,9 bzw. 3,27, wobei die Farbtemperatur etwas zu warm ist. Wenn wir den Bildschirm selbst kalibrieren würden, würden sich die durchschnittlichen DeltaE-Werte auf nur 0,5 und 0,56 verbessern. Unsere kalibrierte ICM-Datei steht oben zum kostenlosen Download bereit.
Reaktionszeiten (Response Times) des Displays
| ↔ Reaktionszeiten Schwarz zu Weiß | ||
|---|---|---|
| 10.4 ms ... steigend ↗ und fallend ↘ kombiniert | ↗ 5.5 ms steigend | 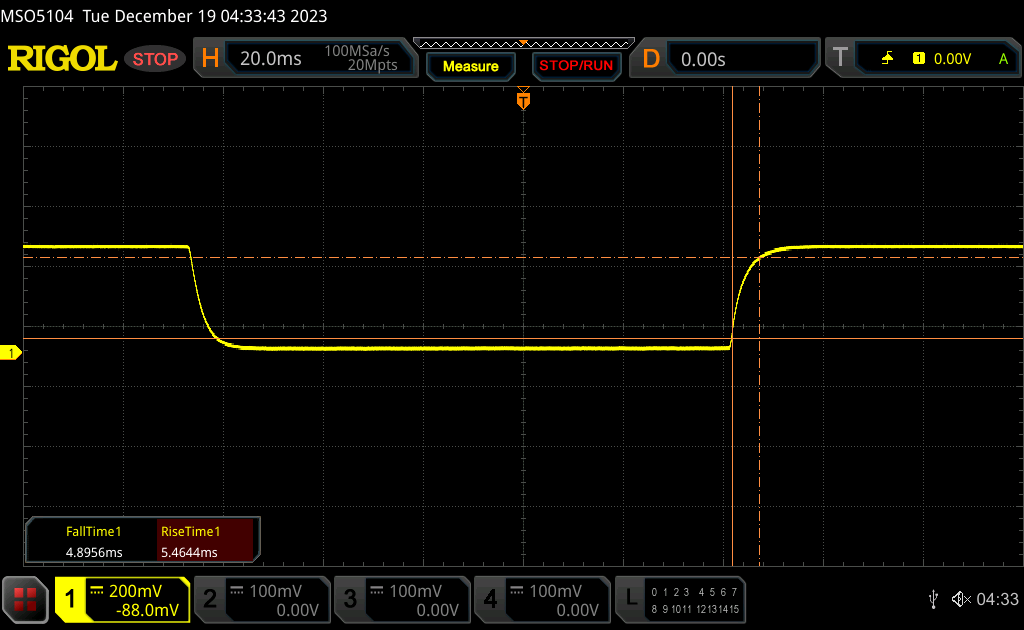 |
| ↘ 4.9 ms fallend | ||
| Die gemessenen Reaktionszeiten sind gut, für anspruchsvolle Spieler könnten der Bildschirm jedoch zu langsam sein. Im Vergleich rangierten die bei uns getesteten Geräte von 0.1 (Minimum) zu 240 (Maximum) ms. » 28 % aller Screens waren schneller als der getestete. Daher sind die gemessenen Reaktionszeiten besser als der Durchschnitt aller vermessenen Geräte (19.9 ms). | ||
| ↔ Reaktionszeiten 50% Grau zu 80% Grau | ||
| 13 ms ... steigend ↗ und fallend ↘ kombiniert | ↗ 6.4 ms steigend | 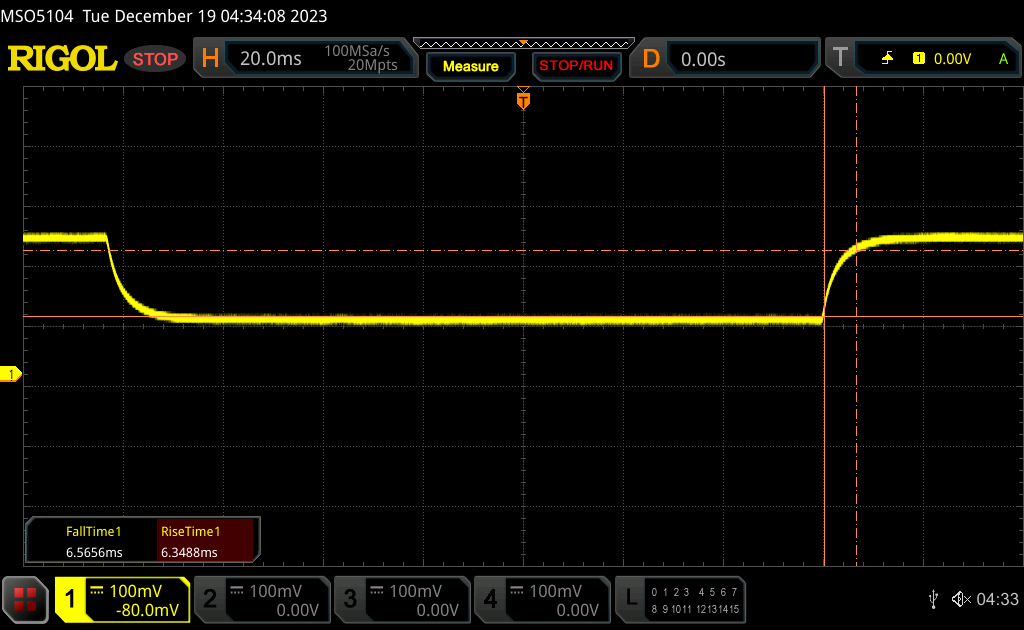 |
| ↘ 6.6 ms fallend | ||
| Die gemessenen Reaktionszeiten sind gut, für anspruchsvolle Spieler könnten der Bildschirm jedoch zu langsam sein. Im Vergleich rangierten die bei uns getesteten Geräte von 0.165 (Minimum) zu 636 (Maximum) ms. » 26 % aller Screens waren schneller als der getestete. Daher sind die gemessenen Reaktionszeiten besser als der Durchschnitt aller vermessenen Geräte (31.1 ms). | ||
Bildschirm-Flackern / PWM (Pulse-Width Modulation)
| Flackern / PWM nicht festgestellt | 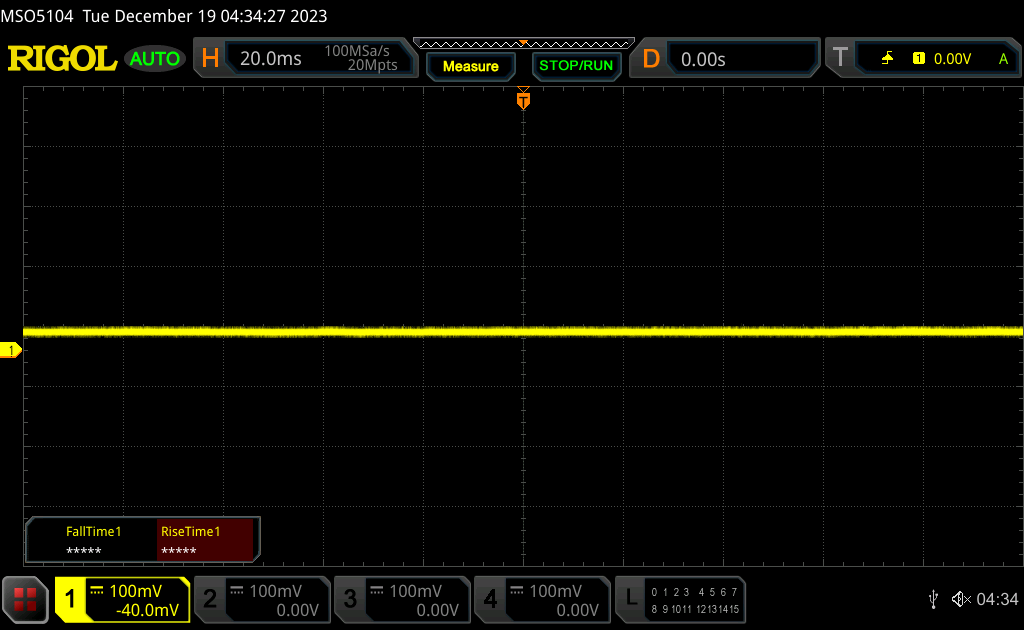 | ||
Im Vergleich: 52 % aller getesteten Geräte nutzten kein PWM um die Helligkeit zu reduzieren. Wenn PWM eingesetzt wurde, dann bei einer Frequenz von durchschnittlich 7791 (Minimum 5, Maximum 343500) Hz. | |||
Performance
Testbedingungen
Wir haben sowohl Windows als auch die Nvidia Systemsteuerung auf den Modus Performance eingestellt, bevor wir die folgenden Benchmarks durchgeführt haben. Das System scheint keine zusätzlichen Energieprofile von HP zu haben.
Optimus wird wie erwartet unterstützt, aber es gibt keinen ECC-VRAM-Modus wie bei dem dickeren ZBook Fury 16 G10 mit der schnelleren RTX 5000 Ada.
Prozessor
Der Ryzen 7 Pro 7840HS bietet eine bis zu 20 Prozent schnellere Multi-Thread-Leistung als der Core i7-12700H im ZBook Power 15 G9 vom letzten Jahr. Für eine noch schnellere Leistung sollten Sie sich jedoch für die Konfiguration mit dem Intel Core i9-13900H entscheiden, der bis zu 30 Prozent schneller arbeitet als unser Ryzen 7.
Ein Downgrade auf den Ryzen 5 Pro 7640HS von unserem Ryzen 7 Pro 7840HS wird die Leistung voraussichtlich um 25 bis 30 Prozent verringern. Auf der anderen Seite lässt ein Upgrade auf den Ryzen 9 Pro 7940HS die Leistung nur geringfügig um etwa 5 bis 10 Prozent steigen, basierend auf unsere Messungen beim Lenovo ThinkPad Z16 Gen 2. Die Leistung pro Dollar nimmt also deutlich ab, wenn Sie mit Ryzen 9 statt mit Ryzen 7 konfigurieren.
Cinebench R15 Multi Loop
Cinebench R23: Multi Core | Single Core
Cinebench R20: CPU (Multi Core) | CPU (Single Core)
Cinebench R15: CPU Multi 64Bit | CPU Single 64Bit
Blender: v2.79 BMW27 CPU
7-Zip 18.03: 7z b 4 | 7z b 4 -mmt1
Geekbench 5.5: Multi-Core | Single-Core
HWBOT x265 Benchmark v2.2: 4k Preset
LibreOffice : 20 Documents To PDF
R Benchmark 2.5: Overall mean
| HWBOT x265 Benchmark v2.2 / 4k Preset | |
| HP ZBook Fury 16 G10 | |
| Asus ExpertBook B6 Flip B6602FC2 | |
| Lenovo ThinkPad Z16 Gen 2 | |
| HP ZBook Power 15 G10 | |
| HP ZBook Studio 16 G9 62U04EA | |
| Lenovo ThinkPad P1 G6-21FV000DGE | |
| Durchschnittliche AMD Ryzen 7 PRO 7840HS (18.1 - 19.9, n=2) | |
| HP ZBook Power 15 G9 6B8C4EA | |
| HP ZBook Firefly 14 G10 A | |
| Lenovo ThinkPad P15v G3 21EM001AGE | |
| Dell Precision 5000 5560 | |
| Lenovo ThinkPad P15v G2 21A9000XGE | |
* ... kleinere Werte sind besser
AIDA64: FP32 Ray-Trace | FPU Julia | CPU SHA3 | CPU Queen | FPU SinJulia | FPU Mandel | CPU AES | CPU ZLib | FP64 Ray-Trace | CPU PhotoWorxx
| Performance Rating | |
| HP ZBook Power 15 G10 | |
| Durchschnittliche AMD Ryzen 7 PRO 7840HS | |
| Lenovo ThinkPad P1 G6-21FV000DGE | |
| Lenovo ThinkPad P15v G3 21EM001AGE | |
| Asus ExpertBook B6 Flip B6602FC2 | |
| HP ZBook Power 15 G9 6B8C4EA | |
| Dell Precision 5000 5560 -9! | |
| AIDA64 / FP32 Ray-Trace | |
| HP ZBook Power 15 G10 | |
| Durchschnittliche AMD Ryzen 7 PRO 7840HS (25606 - 25776, n=2) | |
| Lenovo ThinkPad P1 G6-21FV000DGE | |
| Asus ExpertBook B6 Flip B6602FC2 | |
| Lenovo ThinkPad P15v G3 21EM001AGE | |
| HP ZBook Power 15 G9 6B8C4EA | |
| AIDA64 / FPU Julia | |
| HP ZBook Power 15 G10 | |
| Durchschnittliche AMD Ryzen 7 PRO 7840HS (107907 - 109059, n=2) | |
| Lenovo ThinkPad P15v G3 21EM001AGE | |
| Lenovo ThinkPad P1 G6-21FV000DGE | |
| Asus ExpertBook B6 Flip B6602FC2 | |
| HP ZBook Power 15 G9 6B8C4EA | |
| AIDA64 / CPU SHA3 | |
| HP ZBook Power 15 G10 | |
| Durchschnittliche AMD Ryzen 7 PRO 7840HS (4631 - 4656, n=2) | |
| Lenovo ThinkPad P1 G6-21FV000DGE | |
| Asus ExpertBook B6 Flip B6602FC2 | |
| HP ZBook Power 15 G9 6B8C4EA | |
| Lenovo ThinkPad P15v G3 21EM001AGE | |
| AIDA64 / CPU Queen | |
| Lenovo ThinkPad P1 G6-21FV000DGE | |
| HP ZBook Power 15 G10 | |
| Durchschnittliche AMD Ryzen 7 PRO 7840HS (97729 - 115640, n=2) | |
| Asus ExpertBook B6 Flip B6602FC2 | |
| Lenovo ThinkPad P15v G3 21EM001AGE | |
| HP ZBook Power 15 G9 6B8C4EA | |
| AIDA64 / FPU SinJulia | |
| HP ZBook Power 15 G10 | |
| Durchschnittliche AMD Ryzen 7 PRO 7840HS (14693 - 14742, n=2) | |
| Lenovo ThinkPad P15v G3 21EM001AGE | |
| Asus ExpertBook B6 Flip B6602FC2 | |
| Lenovo ThinkPad P1 G6-21FV000DGE | |
| HP ZBook Power 15 G9 6B8C4EA | |
| AIDA64 / FPU Mandel | |
| HP ZBook Power 15 G10 | |
| Durchschnittliche AMD Ryzen 7 PRO 7840HS (57502 - 58181, n=2) | |
| Lenovo ThinkPad P15v G3 21EM001AGE | |
| Lenovo ThinkPad P1 G6-21FV000DGE | |
| Asus ExpertBook B6 Flip B6602FC2 | |
| HP ZBook Power 15 G9 6B8C4EA | |
| AIDA64 / CPU AES | |
| Lenovo ThinkPad P15v G3 21EM001AGE | |
| HP ZBook Power 15 G10 | |
| Durchschnittliche AMD Ryzen 7 PRO 7840HS (84454 - 85341, n=2) | |
| Lenovo ThinkPad P1 G6-21FV000DGE | |
| Asus ExpertBook B6 Flip B6602FC2 | |
| HP ZBook Power 15 G9 6B8C4EA | |
| AIDA64 / CPU ZLib | |
| Lenovo ThinkPad P1 G6-21FV000DGE | |
| HP ZBook Power 15 G10 | |
| Durchschnittliche AMD Ryzen 7 PRO 7840HS (1032 - 1043, n=2) | |
| Asus ExpertBook B6 Flip B6602FC2 | |
| HP ZBook Power 15 G9 6B8C4EA | |
| Lenovo ThinkPad P15v G3 21EM001AGE | |
| Dell Precision 5000 5560 | |
| AIDA64 / FP64 Ray-Trace | |
| HP ZBook Power 15 G10 | |
| Durchschnittliche AMD Ryzen 7 PRO 7840HS (13545 - 13800, n=2) | |
| Lenovo ThinkPad P1 G6-21FV000DGE | |
| Asus ExpertBook B6 Flip B6602FC2 | |
| Lenovo ThinkPad P15v G3 21EM001AGE | |
| HP ZBook Power 15 G9 6B8C4EA | |
| AIDA64 / CPU PhotoWorxx | |
| HP ZBook Power 15 G10 | |
| HP ZBook Power 15 G9 6B8C4EA | |
| Asus ExpertBook B6 Flip B6602FC2 | |
| Durchschnittliche AMD Ryzen 7 PRO 7840HS (24325 - 42810, n=2) | |
| Lenovo ThinkPad P1 G6-21FV000DGE | |
| Lenovo ThinkPad P15v G3 21EM001AGE | |
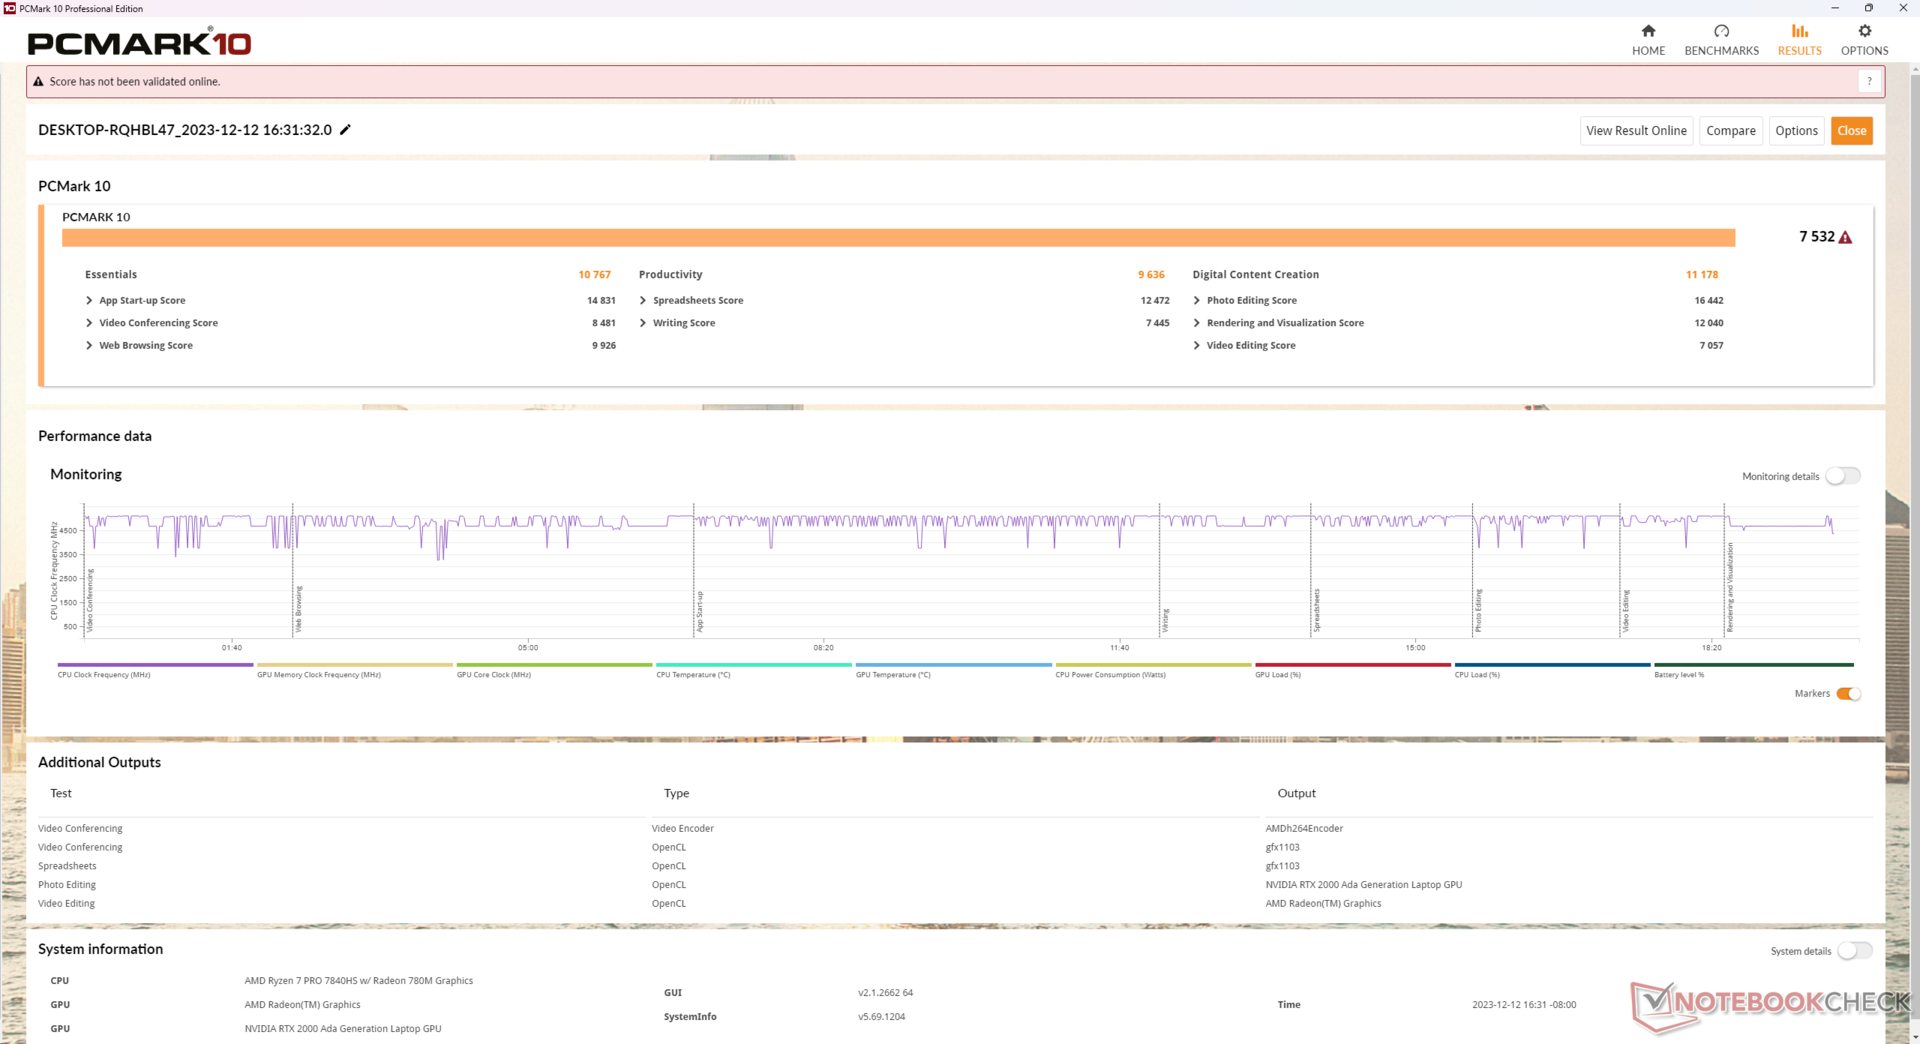
System Performance
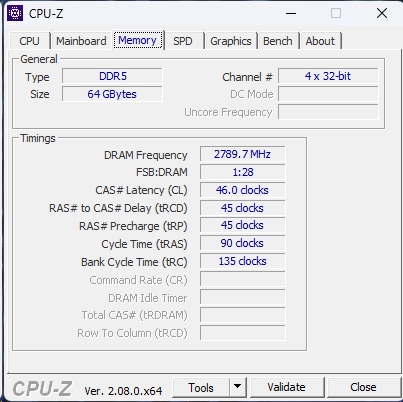
Die PCMark Ergebnisse sind hervorragend und liegen durchweg über denen anderer Workstations mit der älteren Nvidia RTX A2000, einschließlich des ZBook Power 15 G9. Der schnelle 5.600-MHz-Arbeitsspeicher ist ebenfalls ein Highlight, wie die hohen AIDA64-Speicherwerte zeigen.
CrossMark: Overall | Productivity | Creativity | Responsiveness
WebXPRT 3: Overall
WebXPRT 4: Overall
Mozilla Kraken 1.1: Total
| PCMark 10 / Score | |
| HP ZBook Power 15 G10 | |
| Durchschnittliche AMD Ryzen 7 PRO 7840HS, NVIDIA RTX 2000 Ada Generation Laptop (n=1) | |
| Lenovo ThinkPad P1 G6-21FV000DGE | |
| Asus ExpertBook B6 Flip B6602FC2 | |
| Dell Precision 5000 5560 | |
| Lenovo ThinkPad P15v G3 21EM001AGE | |
| HP ZBook Power 15 G9 6B8C4EA | |
| PCMark 10 / Essentials | |
| Lenovo ThinkPad P1 G6-21FV000DGE | |
| Asus ExpertBook B6 Flip B6602FC2 | |
| HP ZBook Power 15 G10 | |
| Durchschnittliche AMD Ryzen 7 PRO 7840HS, NVIDIA RTX 2000 Ada Generation Laptop (n=1) | |
| Dell Precision 5000 5560 | |
| Lenovo ThinkPad P15v G3 21EM001AGE | |
| HP ZBook Power 15 G9 6B8C4EA | |
| PCMark 10 / Productivity | |
| Asus ExpertBook B6 Flip B6602FC2 | |
| Lenovo ThinkPad P1 G6-21FV000DGE | |
| HP ZBook Power 15 G10 | |
| Durchschnittliche AMD Ryzen 7 PRO 7840HS, NVIDIA RTX 2000 Ada Generation Laptop (n=1) | |
| Dell Precision 5000 5560 | |
| Lenovo ThinkPad P15v G3 21EM001AGE | |
| HP ZBook Power 15 G9 6B8C4EA | |
| PCMark 10 / Digital Content Creation | |
| HP ZBook Power 15 G10 | |
| Durchschnittliche AMD Ryzen 7 PRO 7840HS, NVIDIA RTX 2000 Ada Generation Laptop (n=1) | |
| Lenovo ThinkPad P1 G6-21FV000DGE | |
| Asus ExpertBook B6 Flip B6602FC2 | |
| Lenovo ThinkPad P15v G3 21EM001AGE | |
| HP ZBook Power 15 G9 6B8C4EA | |
| Dell Precision 5000 5560 | |
| CrossMark / Overall | |
| Asus ExpertBook B6 Flip B6602FC2 | |
| Lenovo ThinkPad P1 G6-21FV000DGE | |
| HP ZBook Power 15 G9 6B8C4EA | |
| HP ZBook Power 15 G10 | |
| Durchschnittliche AMD Ryzen 7 PRO 7840HS, NVIDIA RTX 2000 Ada Generation Laptop (n=1) | |
| Lenovo ThinkPad P15v G3 21EM001AGE | |
| CrossMark / Productivity | |
| Asus ExpertBook B6 Flip B6602FC2 | |
| Lenovo ThinkPad P1 G6-21FV000DGE | |
| HP ZBook Power 15 G10 | |
| Durchschnittliche AMD Ryzen 7 PRO 7840HS, NVIDIA RTX 2000 Ada Generation Laptop (n=1) | |
| HP ZBook Power 15 G9 6B8C4EA | |
| Lenovo ThinkPad P15v G3 21EM001AGE | |
| CrossMark / Creativity | |
| Asus ExpertBook B6 Flip B6602FC2 | |
| Lenovo ThinkPad P1 G6-21FV000DGE | |
| HP ZBook Power 15 G9 6B8C4EA | |
| HP ZBook Power 15 G10 | |
| Durchschnittliche AMD Ryzen 7 PRO 7840HS, NVIDIA RTX 2000 Ada Generation Laptop (n=1) | |
| Lenovo ThinkPad P15v G3 21EM001AGE | |
| CrossMark / Responsiveness | |
| Asus ExpertBook B6 Flip B6602FC2 | |
| Lenovo ThinkPad P1 G6-21FV000DGE | |
| HP ZBook Power 15 G9 6B8C4EA | |
| HP ZBook Power 15 G10 | |
| Durchschnittliche AMD Ryzen 7 PRO 7840HS, NVIDIA RTX 2000 Ada Generation Laptop (n=1) | |
| Lenovo ThinkPad P15v G3 21EM001AGE | |
| WebXPRT 3 / Overall | |
| Lenovo ThinkPad P1 G6-21FV000DGE | |
| HP ZBook Power 15 G10 | |
| Durchschnittliche AMD Ryzen 7 PRO 7840HS, NVIDIA RTX 2000 Ada Generation Laptop (n=1) | |
| Asus ExpertBook B6 Flip B6602FC2 | |
| HP ZBook Power 15 G9 6B8C4EA | |
| Dell Precision 5000 5560 | |
| Lenovo ThinkPad P15v G3 21EM001AGE | |
| WebXPRT 4 / Overall | |
| Lenovo ThinkPad P1 G6-21FV000DGE | |
| Asus ExpertBook B6 Flip B6602FC2 | |
| HP ZBook Power 15 G9 6B8C4EA | |
| HP ZBook Power 15 G10 | |
| Durchschnittliche AMD Ryzen 7 PRO 7840HS, NVIDIA RTX 2000 Ada Generation Laptop (n=1) | |
| Lenovo ThinkPad P15v G3 21EM001AGE | |
| Mozilla Kraken 1.1 / Total | |
| Lenovo ThinkPad P15v G3 21EM001AGE | |
| Dell Precision 5000 5560 | |
| HP ZBook Power 15 G10 | |
| Durchschnittliche AMD Ryzen 7 PRO 7840HS, NVIDIA RTX 2000 Ada Generation Laptop (n=1) | |
| HP ZBook Power 15 G9 6B8C4EA | |
| Asus ExpertBook B6 Flip B6602FC2 | |
| Lenovo ThinkPad P1 G6-21FV000DGE | |
* ... kleinere Werte sind besser
| PCMark 10 Score | 7532 Punkte | |
Hilfe | ||
| AIDA64 / Memory Copy | |
| HP ZBook Power 15 G10 | |
| HP ZBook Power 15 G9 6B8C4EA | |
| Asus ExpertBook B6 Flip B6602FC2 | |
| Durchschnittliche AMD Ryzen 7 PRO 7840HS (34323 - 67943, n=2) | |
| Lenovo ThinkPad P1 G6-21FV000DGE | |
| Lenovo ThinkPad P15v G3 21EM001AGE | |
| AIDA64 / Memory Read | |
| HP ZBook Power 15 G9 6B8C4EA | |
| HP ZBook Power 15 G10 | |
| Asus ExpertBook B6 Flip B6602FC2 | |
| Durchschnittliche AMD Ryzen 7 PRO 7840HS (30787 - 61660, n=2) | |
| Lenovo ThinkPad P1 G6-21FV000DGE | |
| Lenovo ThinkPad P15v G3 21EM001AGE | |
| AIDA64 / Memory Write | |
| HP ZBook Power 15 G10 | |
| HP ZBook Power 15 G9 6B8C4EA | |
| Durchschnittliche AMD Ryzen 7 PRO 7840HS (39362 - 83167, n=2) | |
| Asus ExpertBook B6 Flip B6602FC2 | |
| Lenovo ThinkPad P1 G6-21FV000DGE | |
| Lenovo ThinkPad P15v G3 21EM001AGE | |
| AIDA64 / Memory Latency | |
| Durchschnittliche AMD Ryzen 7 PRO 7840HS (99.6 - 101.2, n=2) | |
| HP ZBook Power 15 G10 | |
| Lenovo ThinkPad P15v G3 21EM001AGE | |
| Asus ExpertBook B6 Flip B6602FC2 | |
| HP ZBook Power 15 G9 6B8C4EA | |
| Lenovo ThinkPad P1 G6-21FV000DGE | |
* ... kleinere Werte sind besser
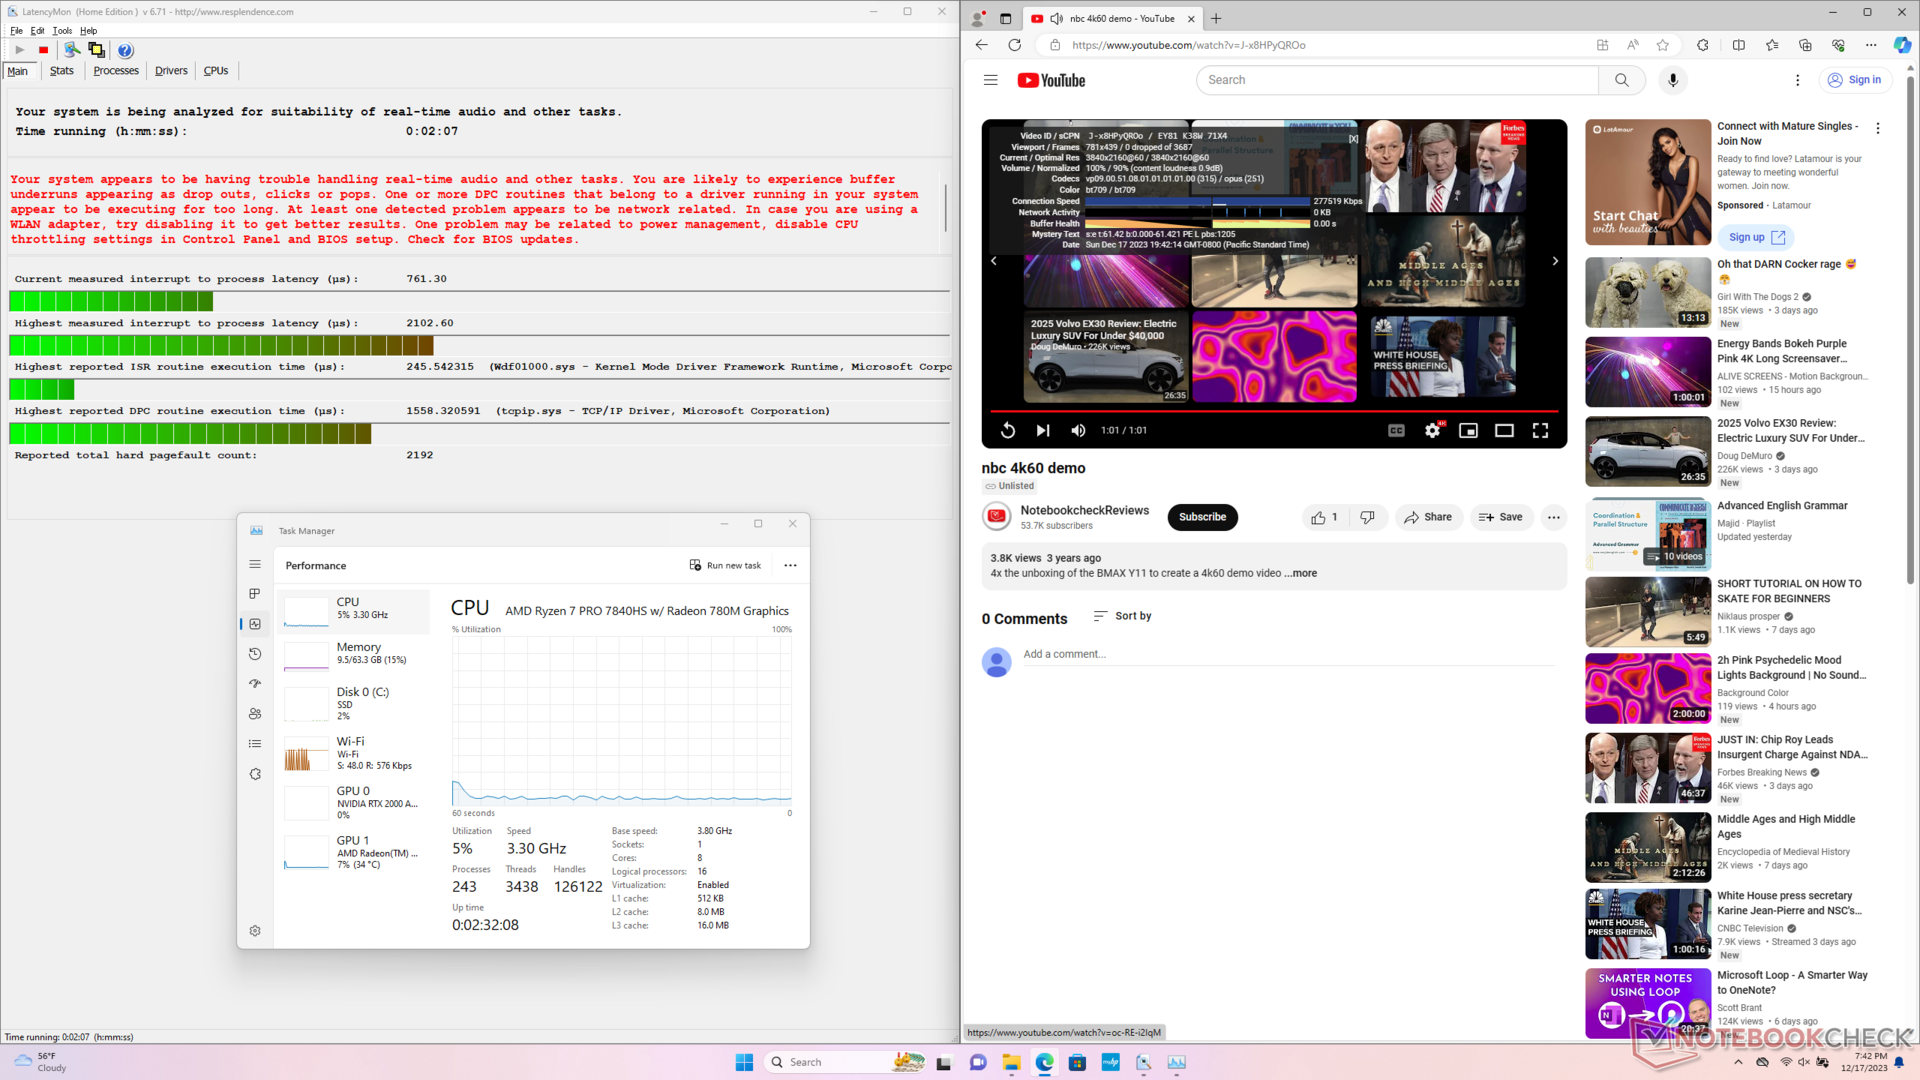
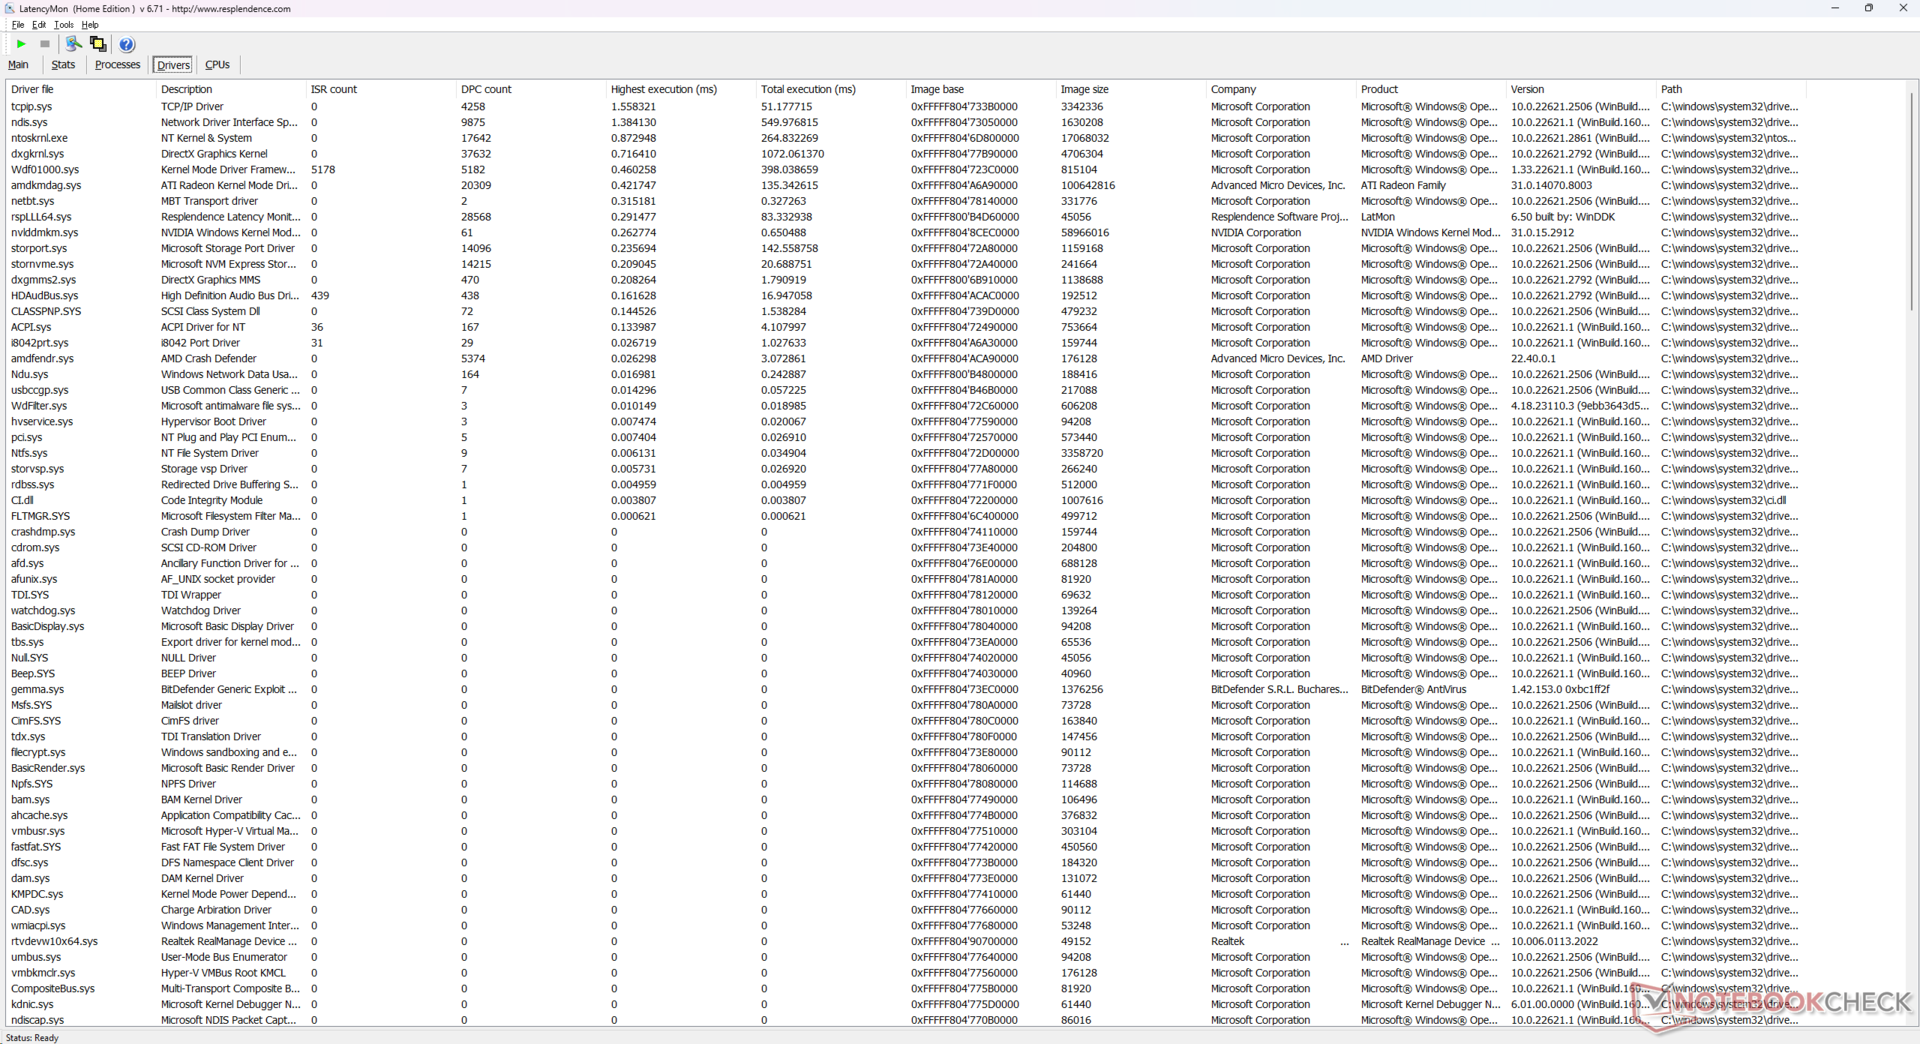
DPC-Latenzzeit
LatencyMon zeigt DPC-Probleme beim Öffnen mehrerer Browser Tabs unserer Homepage. Die 4K-Videowiedergabe bei 60 fps ist ansonsten perfekt, und es wurden keine Bildaussetzer verzeichnet.
| DPC Latencies / LatencyMon - interrupt to process latency (max), Web, Youtube, Prime95 | |
| Lenovo ThinkPad P1 G6-21FV000DGE | |
| Asus ExpertBook B6 Flip B6602FC2 | |
| HP ZBook Power 15 G10 | |
| HP ZBook Power 15 G9 6B8C4EA | |
| Dell Precision 5000 5560 | |
| Lenovo ThinkPad P15v G3 21EM001AGE | |
* ... kleinere Werte sind besser
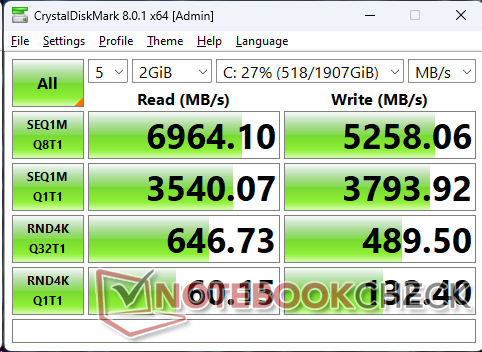
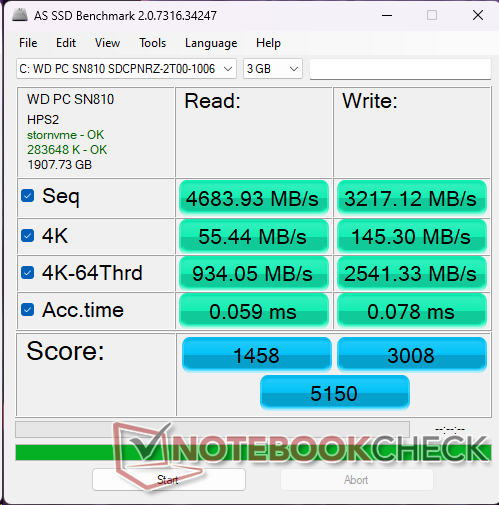
Speichergeräte
Unser Gerät kommt mit dem WDC PC SN810 anstelle des Samsung PM9A1 des letztjährigen Modells. Im Allgemeinen ist das WDC-Laufwerk langsamer als das Samsung Laufwerk, wenn es um das Lesen und Schreiben kleiner 4K-Blöcke bei hoher Warteschlangentiefe geht. HP ermöglicht es den Käufern, das System mit SED- oder Nicht-SED-Laufwerken zu konfigurieren, aber HP führt die betreffenden SSD-Marken nicht ausdrücklich auf.

* ... kleinere Werte sind besser
Disk Throttling: DiskSpd Read Loop, Queue Depth 8
GPU Performance
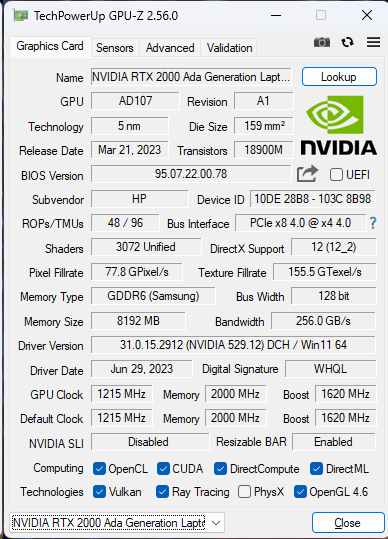
Die Nvidia RTX 2000 Ada ist ein spürbares Upgrade gegenüber der RTX A2000 im letztjährigen ZBook Power 15 G9 und ein wichtiger Grund für die Wahl des neueren G10 Modells gegenüber der Vorgängerversion. Die rohe Grafikleistung ist etwa 55 bis 65 Prozent schneller, und auch die SpecViewPerf Ergebnisse sind durchweg besser.
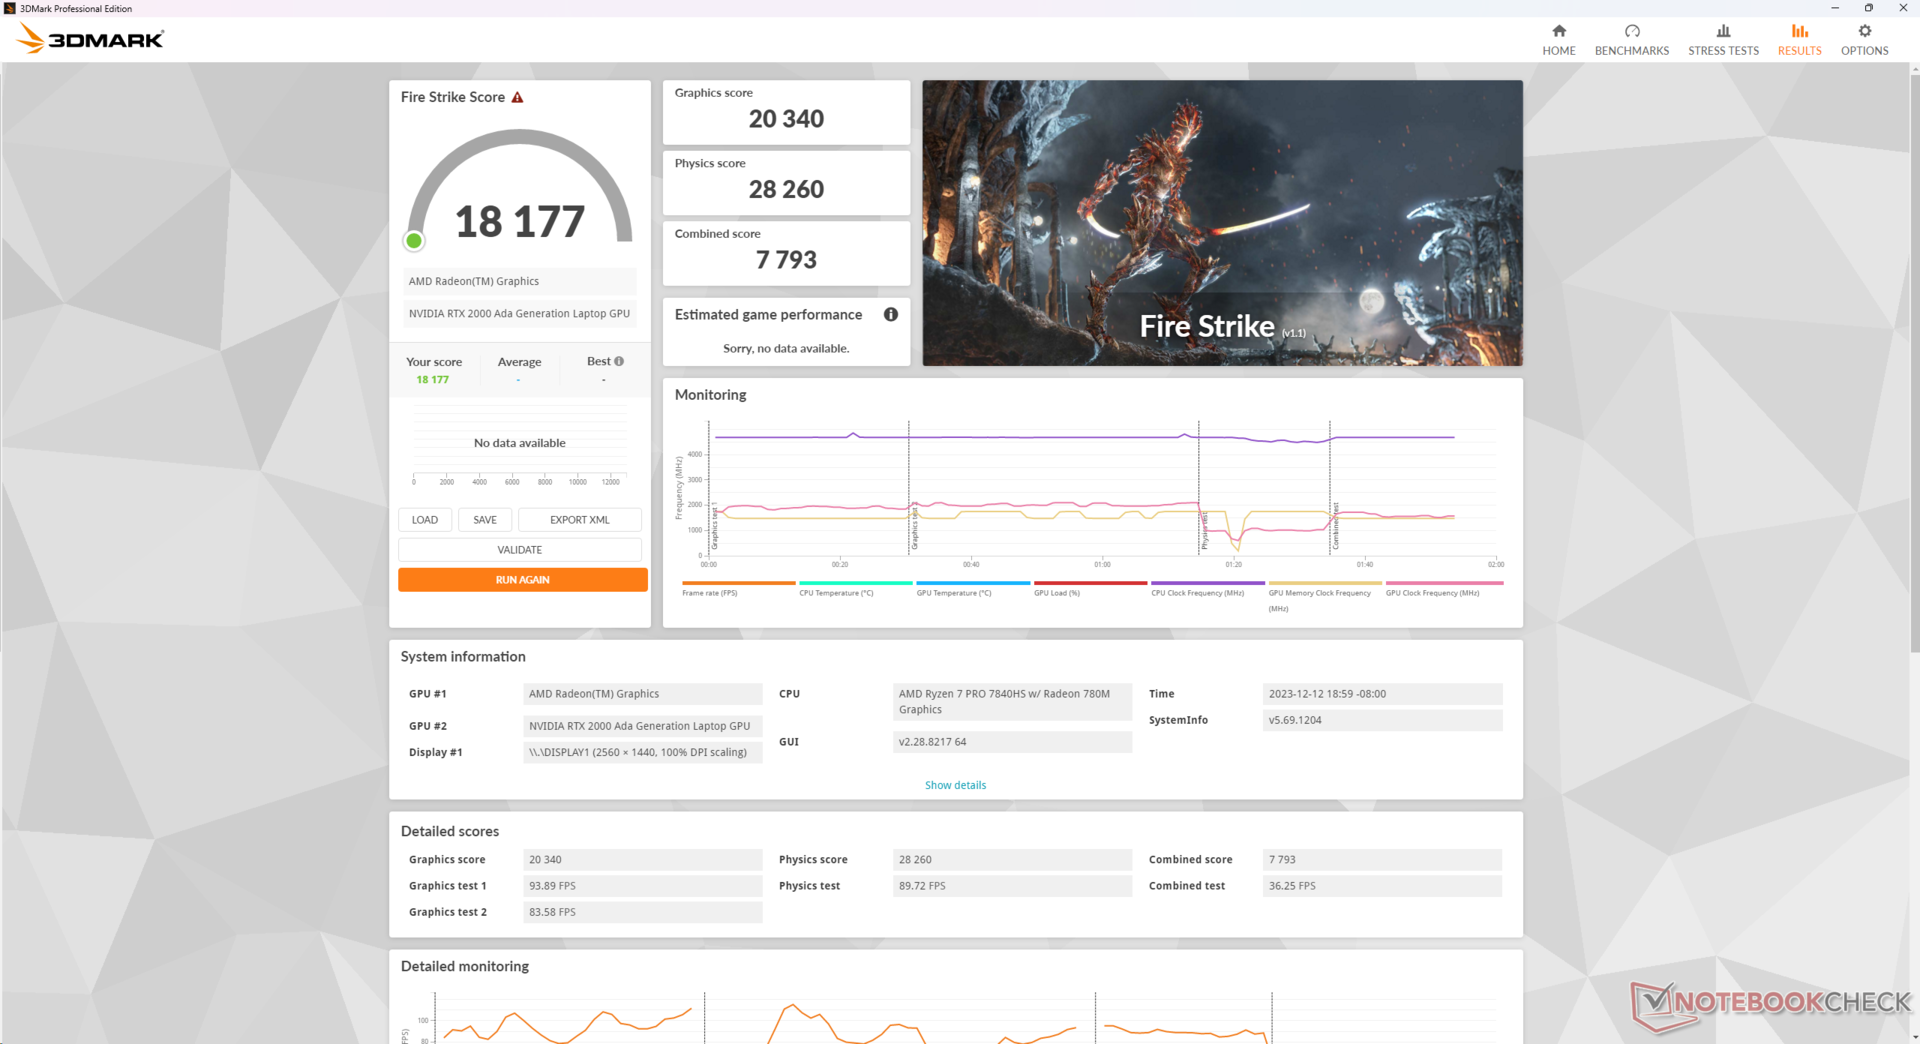
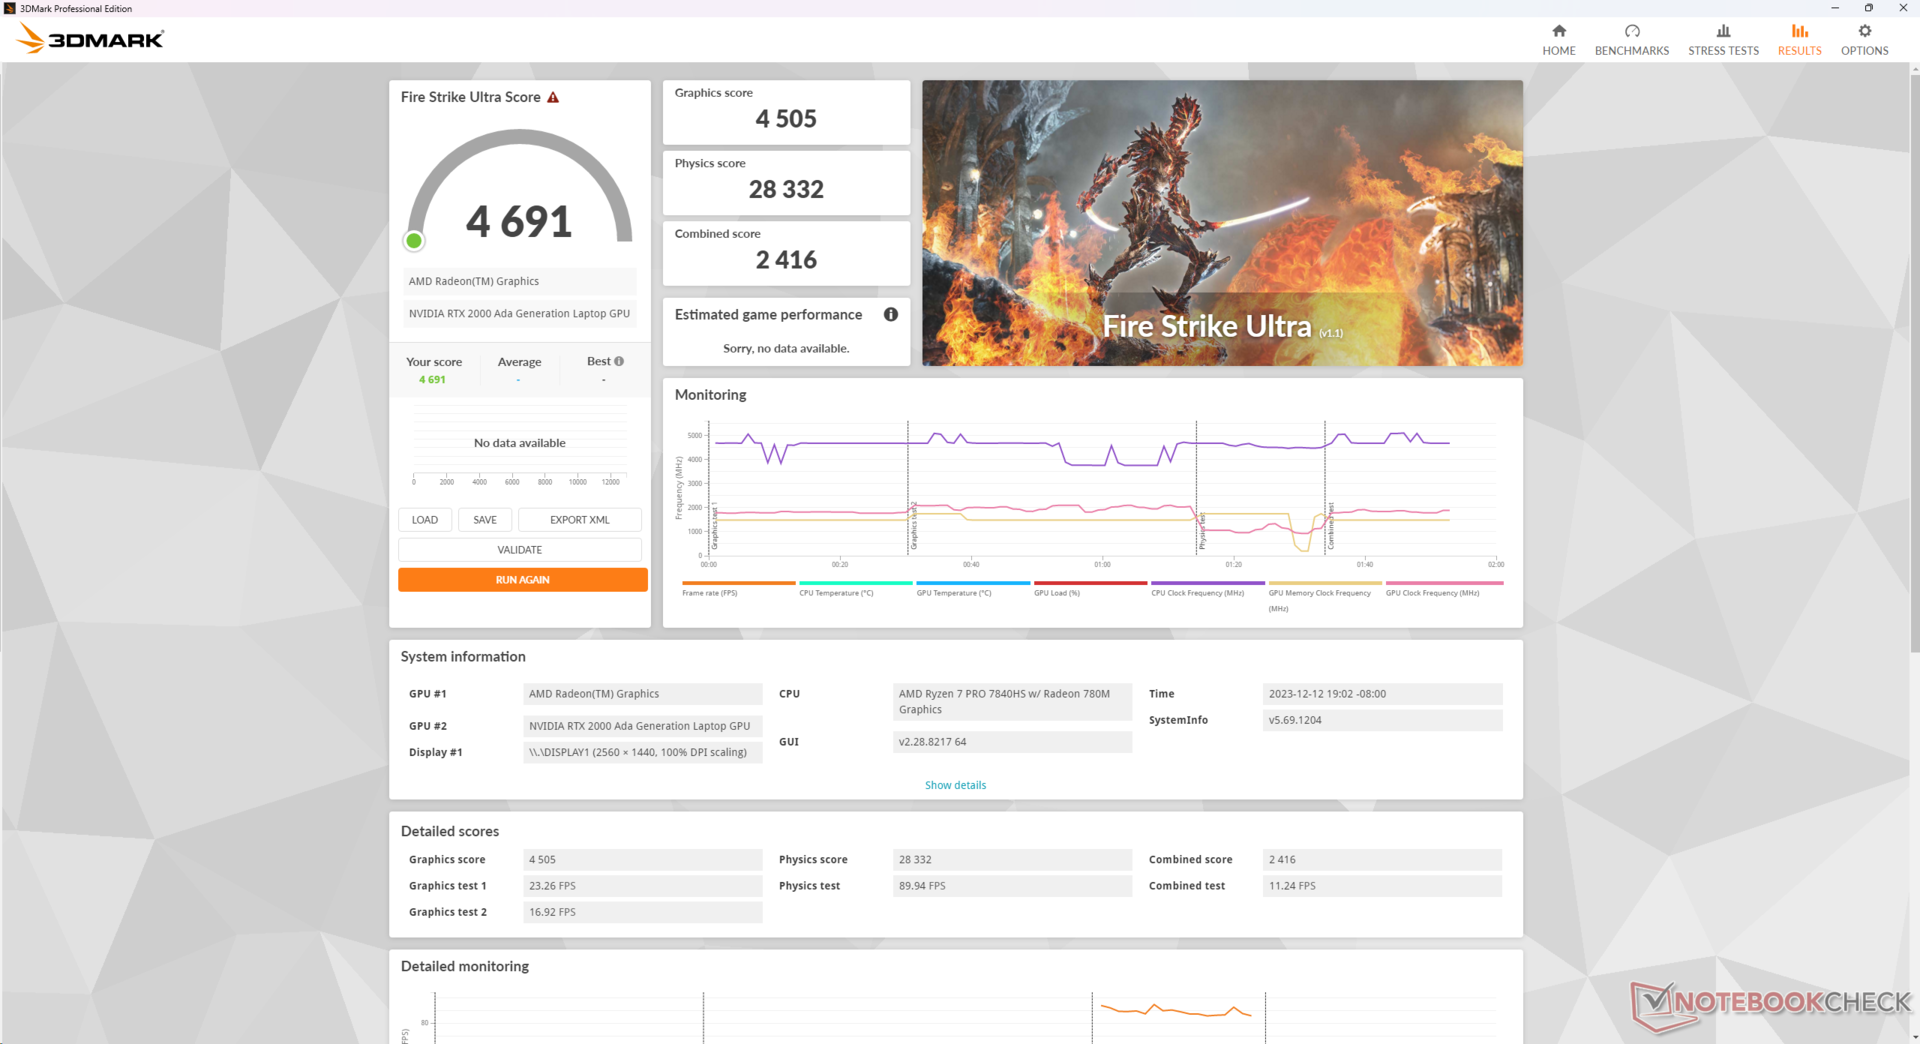
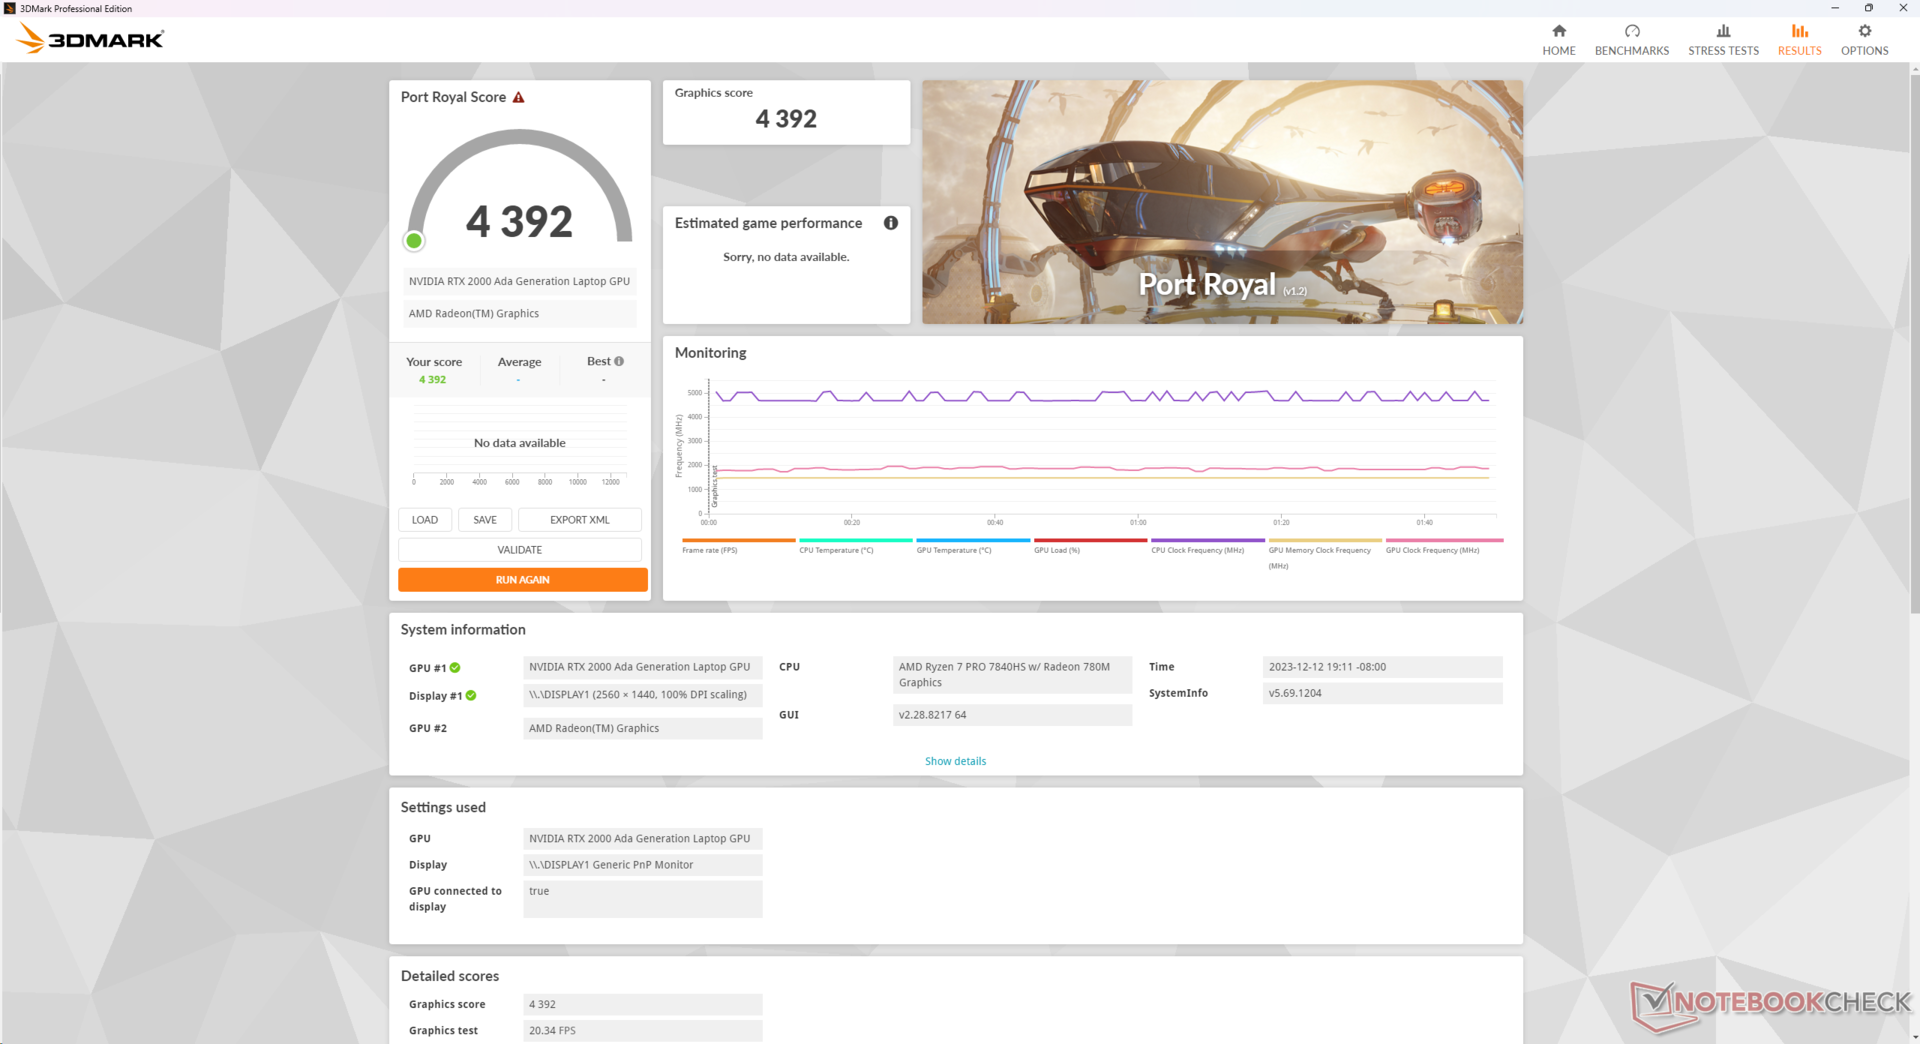
Der Betrieb im Modus "Ausbalanciert" anstelle des Modus " Performance " scheint sich nicht auf die CPU- oder GPU-Leistung auszuwirken, wie unsere Fire-StrikeErgebnisse unten zeigen. Im Akkubetrieb verringert sich die Leistung jedoch erheblich, selbst wenn der Modus Performance eingestellt ist.
| Leistungsprofil | Physik-Ergebnis | Grafik-Punktzahl | Kombinierte Punktzahl |
| Performance-Modus (im Netzbetrieb) | 28.260 | 20.340 | 7.793 |
| Ausgeglichener Modus (im Netzbetrieb) | 27.579 (-0 %) | 20.812 (-0 %) | 7.877 (-0 %) |
| Performance Modus (bei Batteriebetrieb) | 6.105 (-78 %) | 12.744 (-37 %) | 2.392 (-69 %) |
Ärgerlicherweise bietet HP die RTX 3000 Ada GPU nur für Intel Konfigurationen des ZBook Power 15 G10 an, während AMD Konfigurationen auf die RTX 2000 Ada beschränkt sind. Die 3000-Ada-GPU bietet etwa 5 bis 15 Prozent mehr Leistung als die 2000 Ada, basierend auf unseren Messungen beim kleineren Dell Precision 5480.
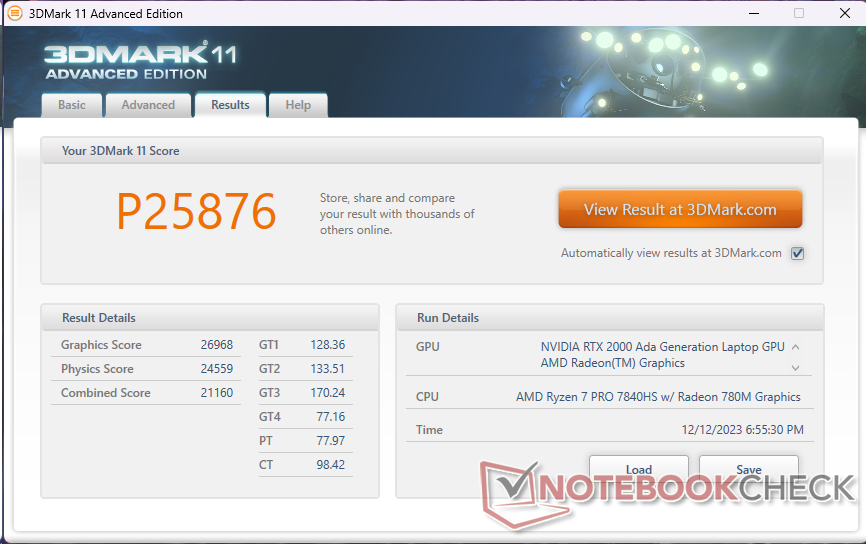

| 3DMark 11 Performance | 25876 Punkte | |
| 3DMark Fire Strike Score | 18177 Punkte | |
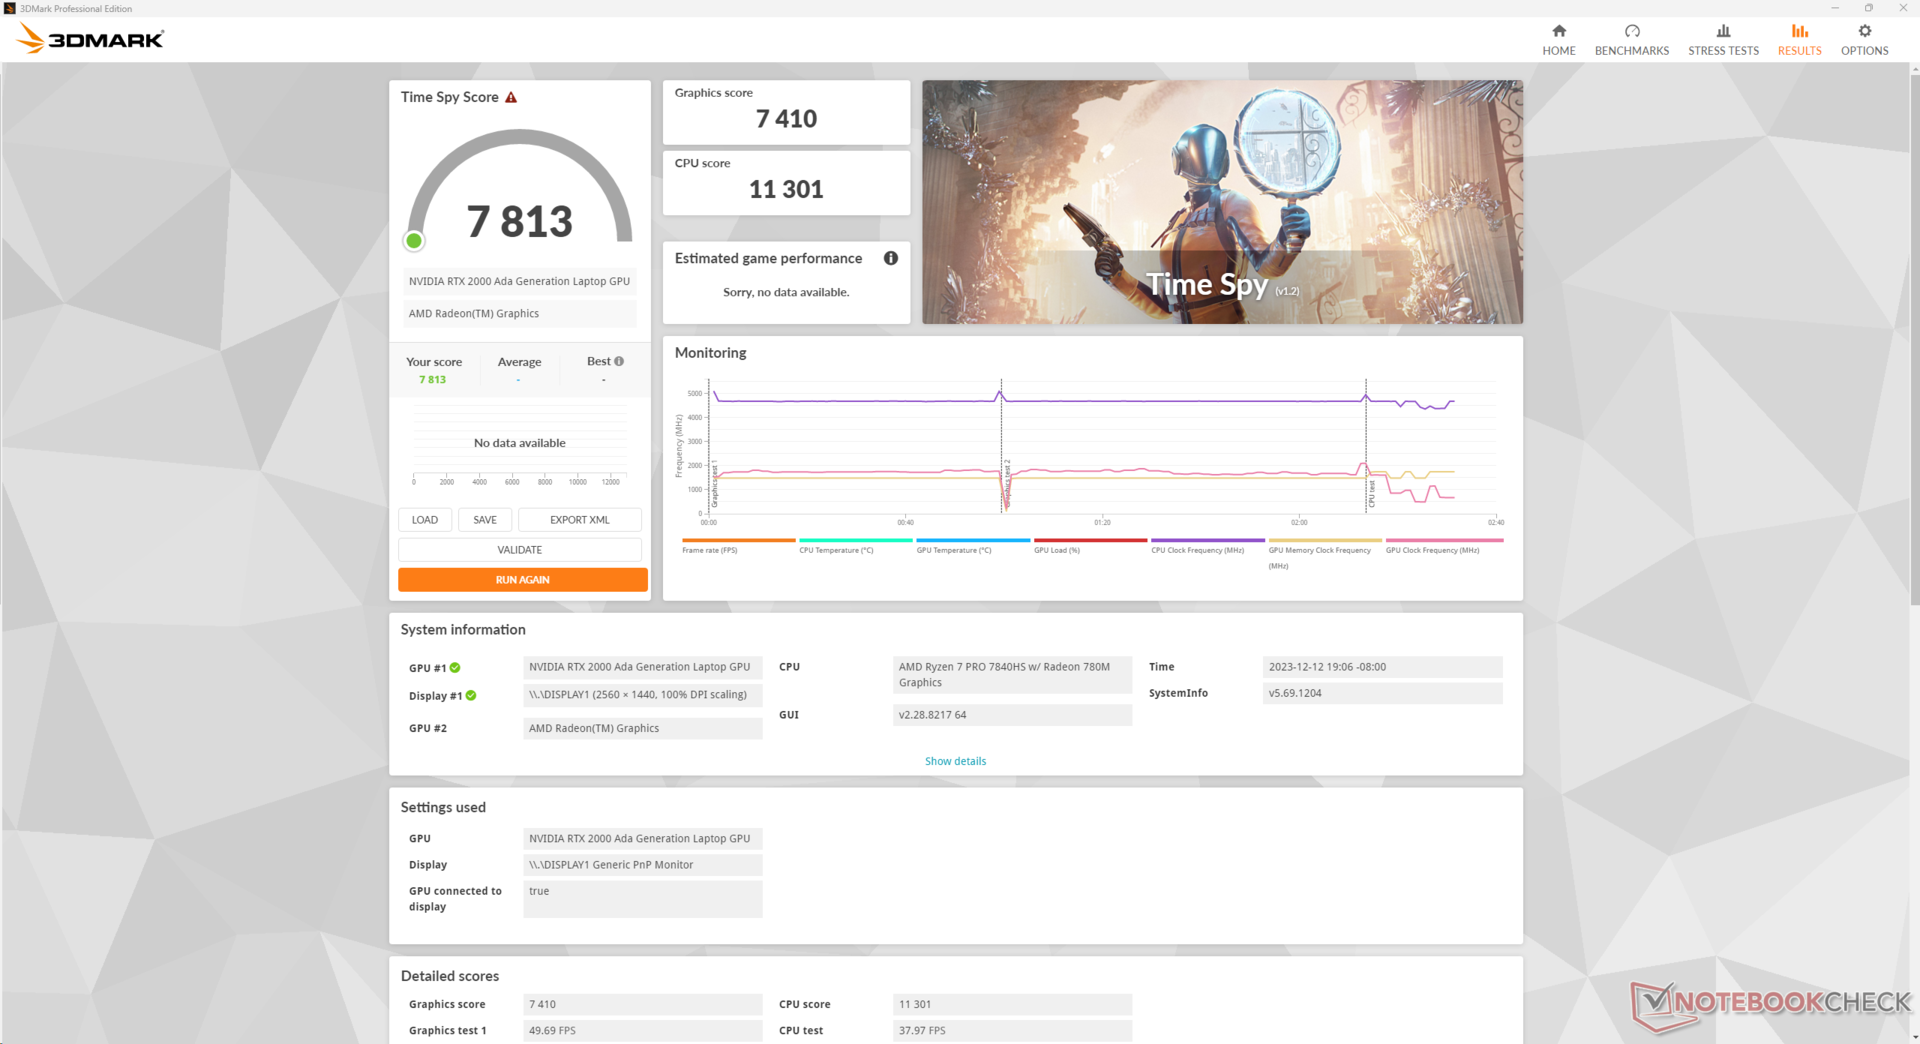
| 3DMark Time Spy Score | 7813 Punkte | |
Hilfe | ||
* ... kleinere Werte sind besser
Spiele-Performance
Insgesamt ähnelt die Gaming Performance am meisten der GeForce RTX 4050, obwohl die 2000 Ada mehr vereinheitlichte Pipelines, TMUs, VRAM und eine größere Speicherbandbreite integriert hat. Anspruchsvolle Spiele wie Cyberpunk 2077 sind mit 1.080p und extremen Einstellungen spielbar, aber niedrigere Einstellungen sind erforderlich, wenn Sie mit der nativen 1.440p-Auflösung spielen.
| Cyberpunk 2077 | |
| 1920x1080 Low Preset (FSR off) | |
| HP ZBook Power 15 G10 | |
| Durchschnittliche NVIDIA RTX 2000 Ada Generation Laptop (81.1 - 85.4, n=2) | |
| Lenovo ThinkPad Z16 Gen 2 | |
| 1920x1080 Medium Preset (FSR off) | |
| HP ZBook Power 15 G10 | |
| Durchschnittliche NVIDIA RTX 2000 Ada Generation Laptop (61.4 - 64.5, n=2) | |
| Lenovo ThinkPad Z16 Gen 2 | |
| 1920x1080 High Preset (FSR off) | |
| HP ZBook Power 15 G10 | |
| Durchschnittliche NVIDIA RTX 2000 Ada Generation Laptop (51.7 - 55.2, n=2) | |
| Lenovo ThinkPad Z16 Gen 2 | |
| 1920x1080 Ultra Preset (FSR off) | |
| HP ZBook Power 15 G10 | |
| Durchschnittliche NVIDIA RTX 2000 Ada Generation Laptop (44.8 - 48.3, n=2) | |
| Lenovo ThinkPad Z16 Gen 2 | |
| 2560x1440 Ultra Preset (FSR off) | |
| HP ZBook Power 15 G10 | |
| Durchschnittliche NVIDIA RTX 2000 Ada Generation Laptop (29.7 - 29.9, n=2) | |
| Lenovo ThinkPad Z16 Gen 2 | |
| 1920x1080 Ray Tracing Ultra Preset (DLSS off) | |
| HP ZBook Power 15 G10 | |
| Durchschnittliche NVIDIA RTX 2000 Ada Generation Laptop (19.2 - 21.6, n=2) | |
| Lenovo ThinkPad Z16 Gen 2 | |
Witcher 3 FPS Chart
| min. | mittel | hoch | max. | QHD | |
|---|---|---|---|---|---|
| GTA V (2015) | 178.1 | 170.6 | 157.7 | 86.2 | 60.6 |
| The Witcher 3 (2015) | 336.4 | 219 | 127.9 | 65.5 | |
| Dota 2 Reborn (2015) | 155 | 140.8 | 136.9 | 132 | |
| Final Fantasy XV Benchmark (2018) | 173.3 | 93.5 | 67.7 | 50.3 | |
| X-Plane 11.11 (2018) | 80.6 | 73 | 52.5 | ||
| Far Cry 5 (2018) | 151 | 110 | 102 | 95 | 63 |
| Strange Brigade (2018) | 332 | 183 | 148.4 | 132.5 | 94.1 |
| Tiny Tina's Wonderlands (2022) | 119.8 | 110.5 | 77.3 | 62.3 | 43.5 |
| F1 22 (2022) | 166.7 | 151.8 | 119.9 | 44.2 | 28.9 |
| Cyberpunk 2077 (2023) | 85.4 | 64.5 | 55.2 | 48.3 | 29.9 |
Emissionen
Systemrauschen
Das Lüftergeräusch ist im Wesentlichen identisch mit dem des Vorjahresmodells mit ähnlichen Minimal- und Maximalwerten trotz der Leistungsunterschiede. Die internen Lüfter unseres G10-Geräts sind bei der Ausführung des 3DMark 06 etwas länger leise als bei unserem G9-Gerät, aber das hängt natürlich von den anfänglichen Temperaturbedingungen ab.
Das Lüftergeräusch im Betrieb Witcher 3 bleibt zwischen den Modi Balanced und Performance gleich, was mit unseren Testergebnissen übereinstimmt, die minimale Unterschiede zwischen den beiden Leistungsprofilen zeigen.
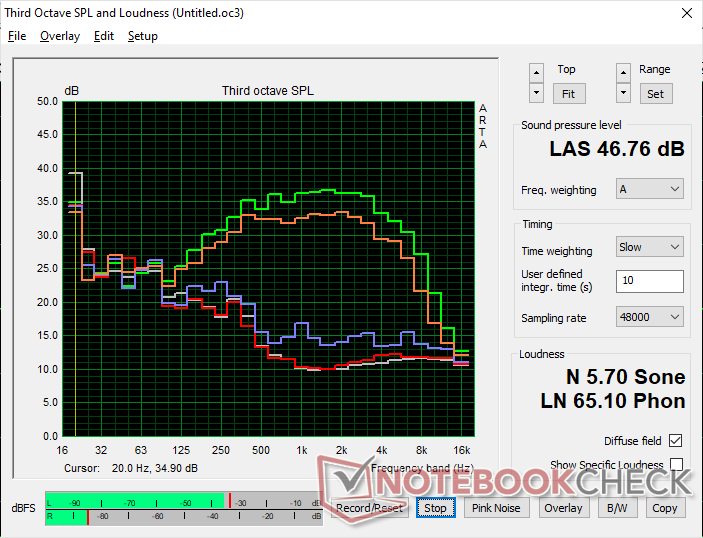
Lautstärkediagramm
| Idle |
| 24.4 / 24.4 / 24.4 dB(A) |
| Last |
| 27.4 / 46.8 dB(A) |
 | ||
30 dB leise 40 dB(A) deutlich hörbar 50 dB(A) störend |
||
min: | ||
| HP ZBook Power 15 G10 RTX 2000 Ada Generation Laptop, R7 PRO 7840HS, WDC PC SN810 2TB | HP ZBook Power 15 G9 6B8C4EA RTX A2000 Laptop GPU, i7-12700H, Samsung PM9A1 MZVL21T0HCLR | Lenovo ThinkPad P15v G3 21EM001AGE RTX A2000 Laptop GPU, R7 PRO 6850H, SK Hynix PC711 1TB HFS001TDE9X081N | Dell Precision 5000 5560 RTX A2000 Laptop GPU, i7-11850H, Samsung PM9A1 MZVL22T0HBLB | Lenovo ThinkPad P1 G6-21FV000DGE RTX 2000 Ada Generation Laptop, i9-13900H, SK Hynix PC711 1TB HFS001TDE9X084N | Asus ExpertBook B6 Flip B6602FC2 RTX A2000 Laptop GPU, i9-12950HX, Samsung PM9A1 MZVL21T0HCLR | |
|---|---|---|---|---|---|---|
| Geräuschentwicklung | -8% | 3% | 5% | -10% | -34% | |
| aus / Umgebung * (dB) | 24.2 | 23.8 2% | 23.2 4% | 23.4 3% | 24.5 -1% | 26 -7% |
| Idle min * (dB) | 24.4 | 23.8 2% | 23.2 5% | 23.6 3% | 24.5 -0% | 32.4 -33% |
| Idle avg * (dB) | 24.4 | 23.8 2% | 23.2 5% | 23.6 3% | 24.5 -0% | 32.4 -33% |
| Idle max * (dB) | 24.4 | 23.8 2% | 23.2 5% | 23.6 3% | 24.5 -0% | 32.4 -33% |
| Last avg * (dB) | 27.4 | 42.9 -57% | 35 -28% | 25.8 6% | 48 -75% | 51.9 -89% |
| Witcher 3 ultra * (dB) | 43.3 | 44.5 -3% | 37.9 12% | 40.1 7% | 40.7 6% | |
| Last max * (dB) | 46.8 | 47.9 -2% | 37.5 20% | 41.4 12% | 48 -3% | 52.1 -11% |
* ... kleinere Werte sind besser
Temperatur
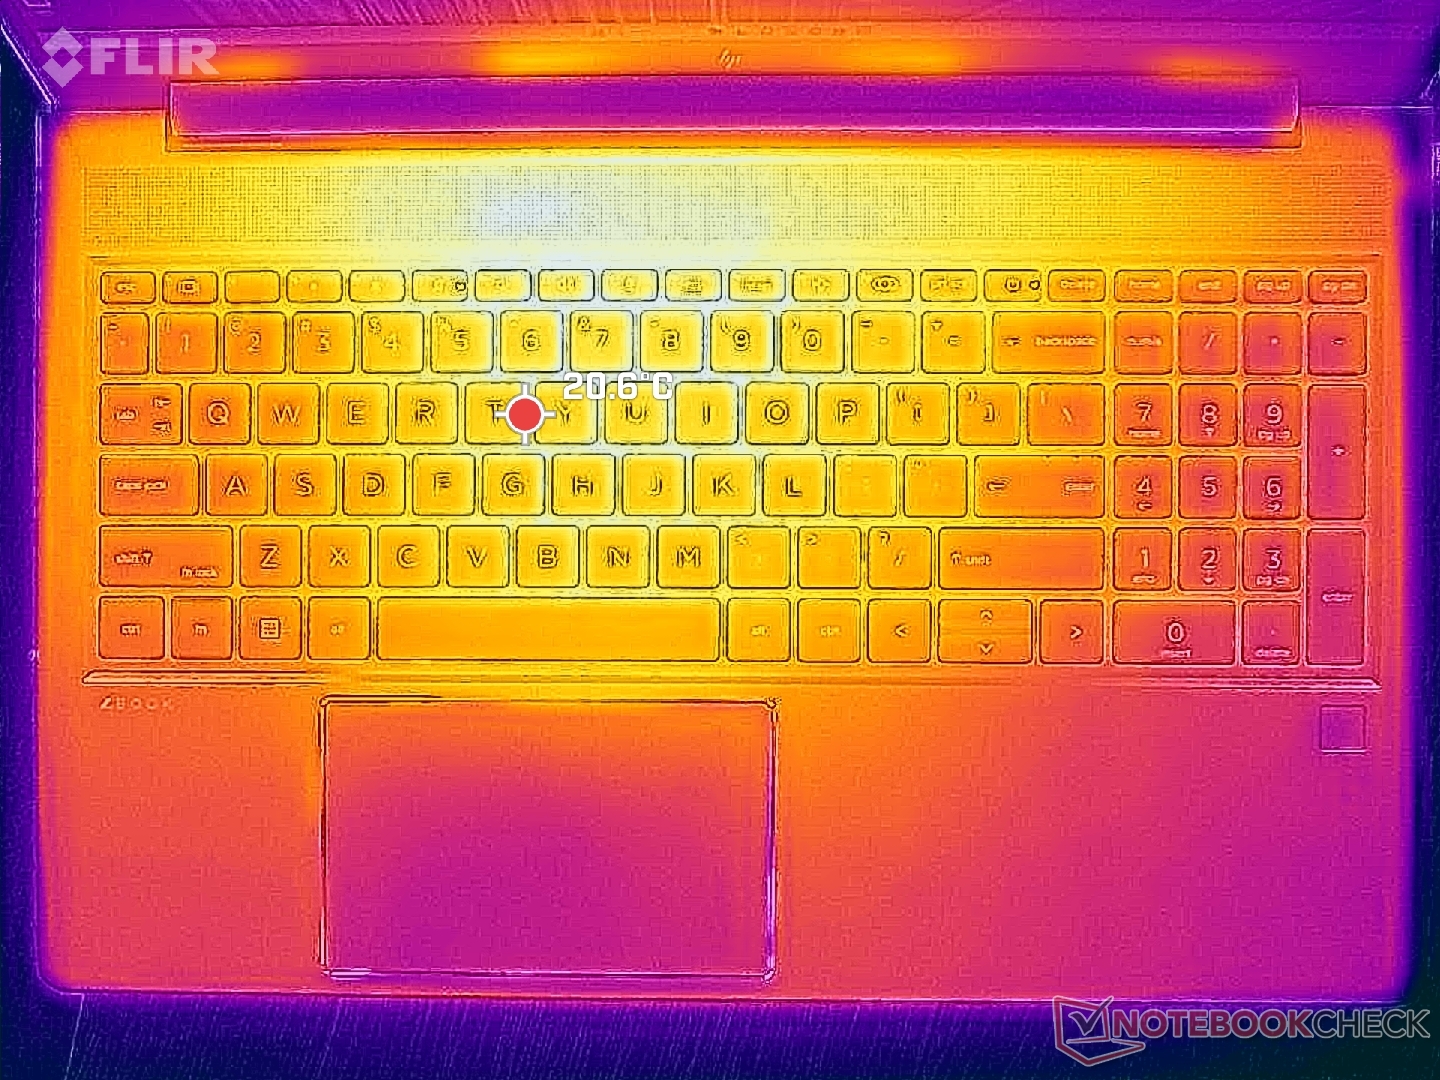
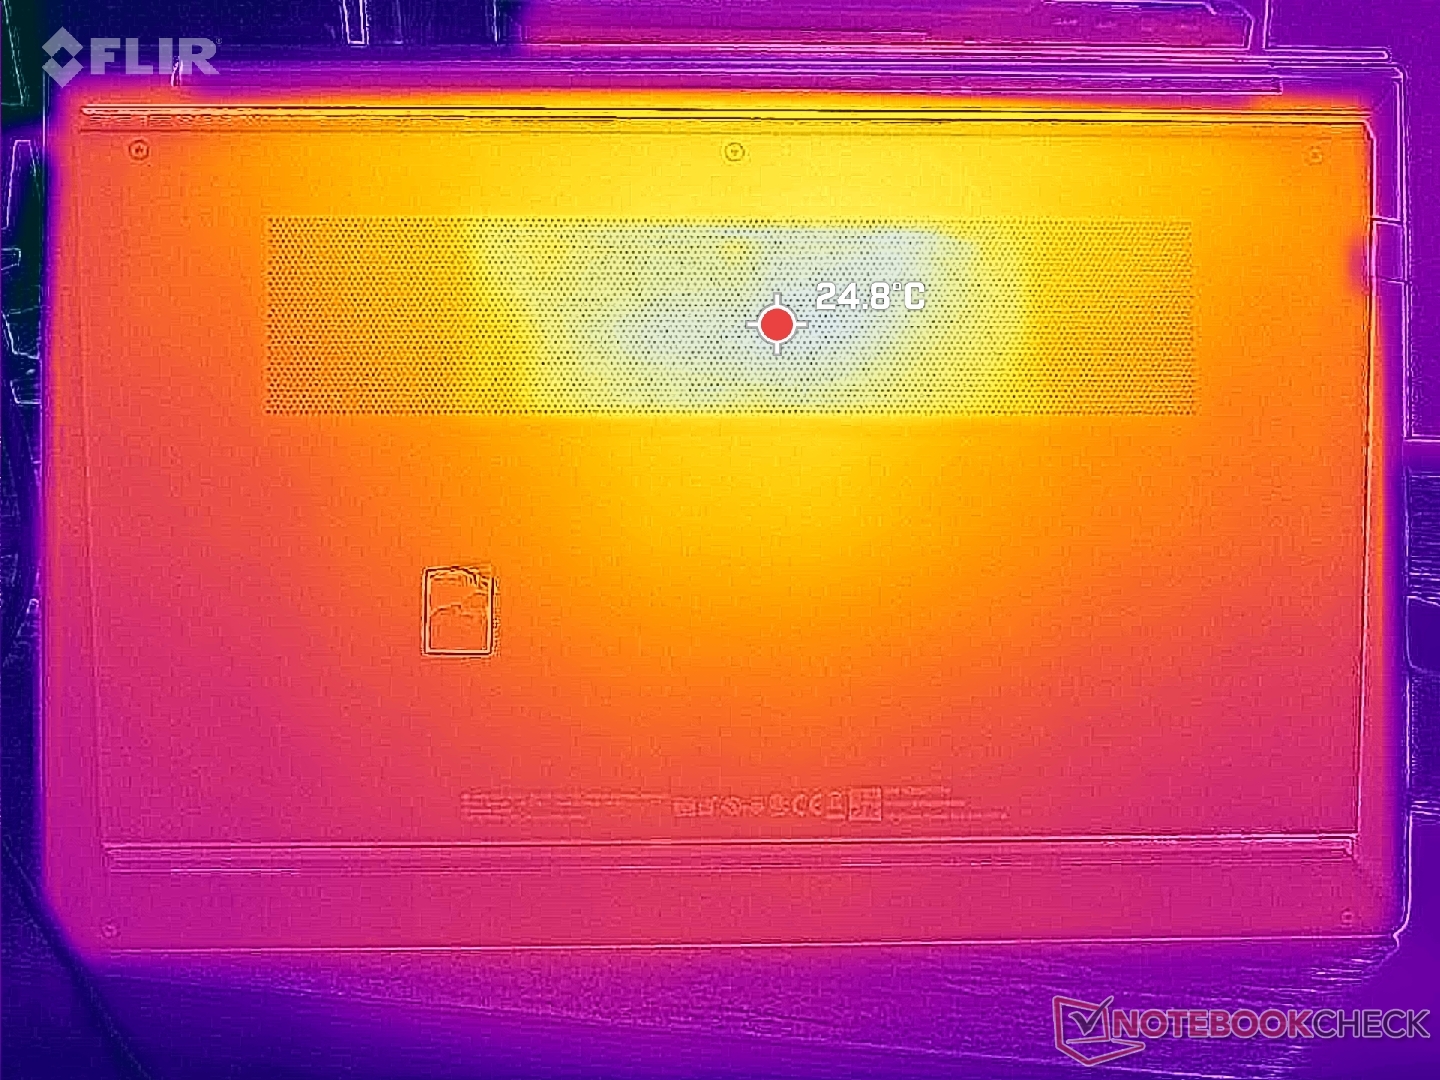
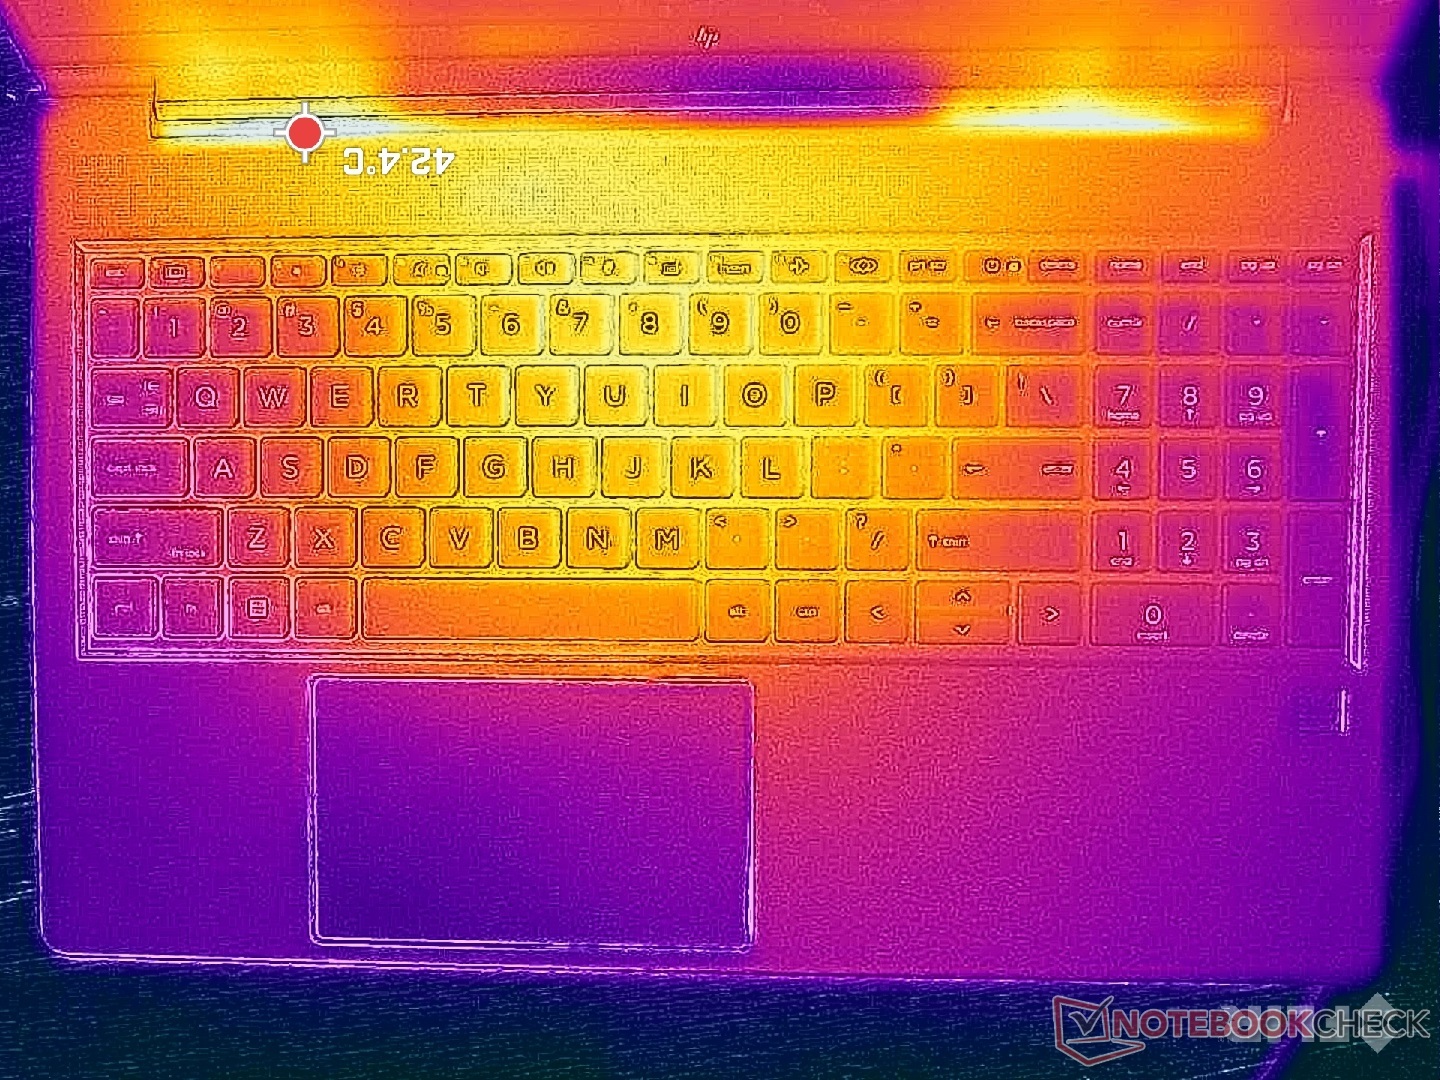
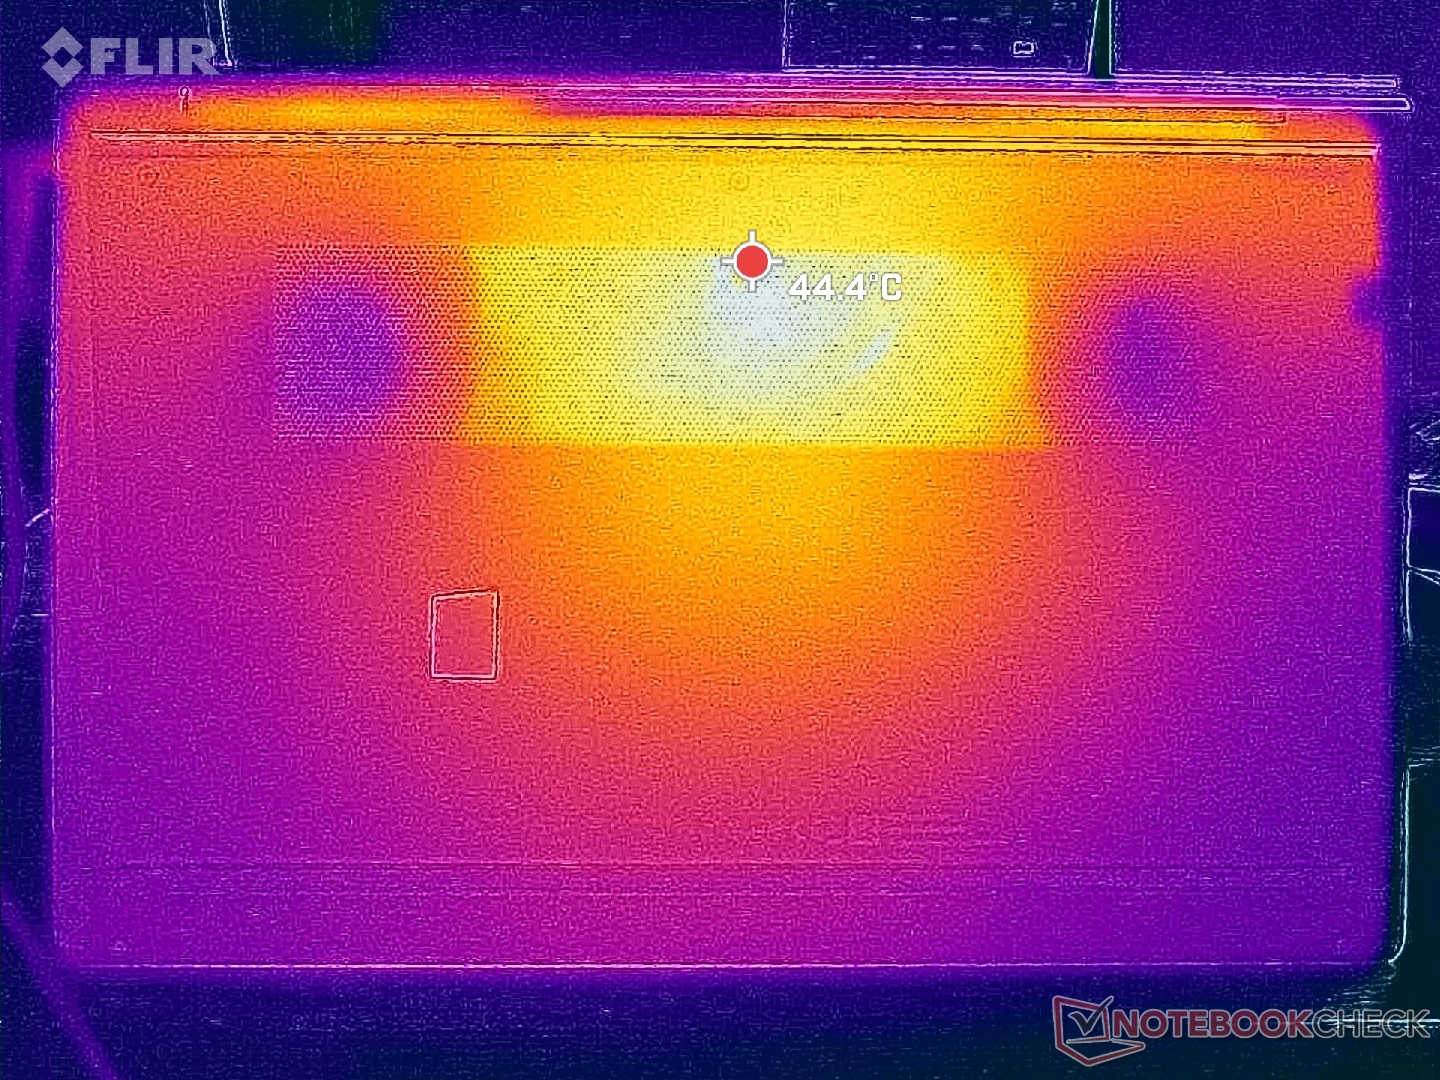
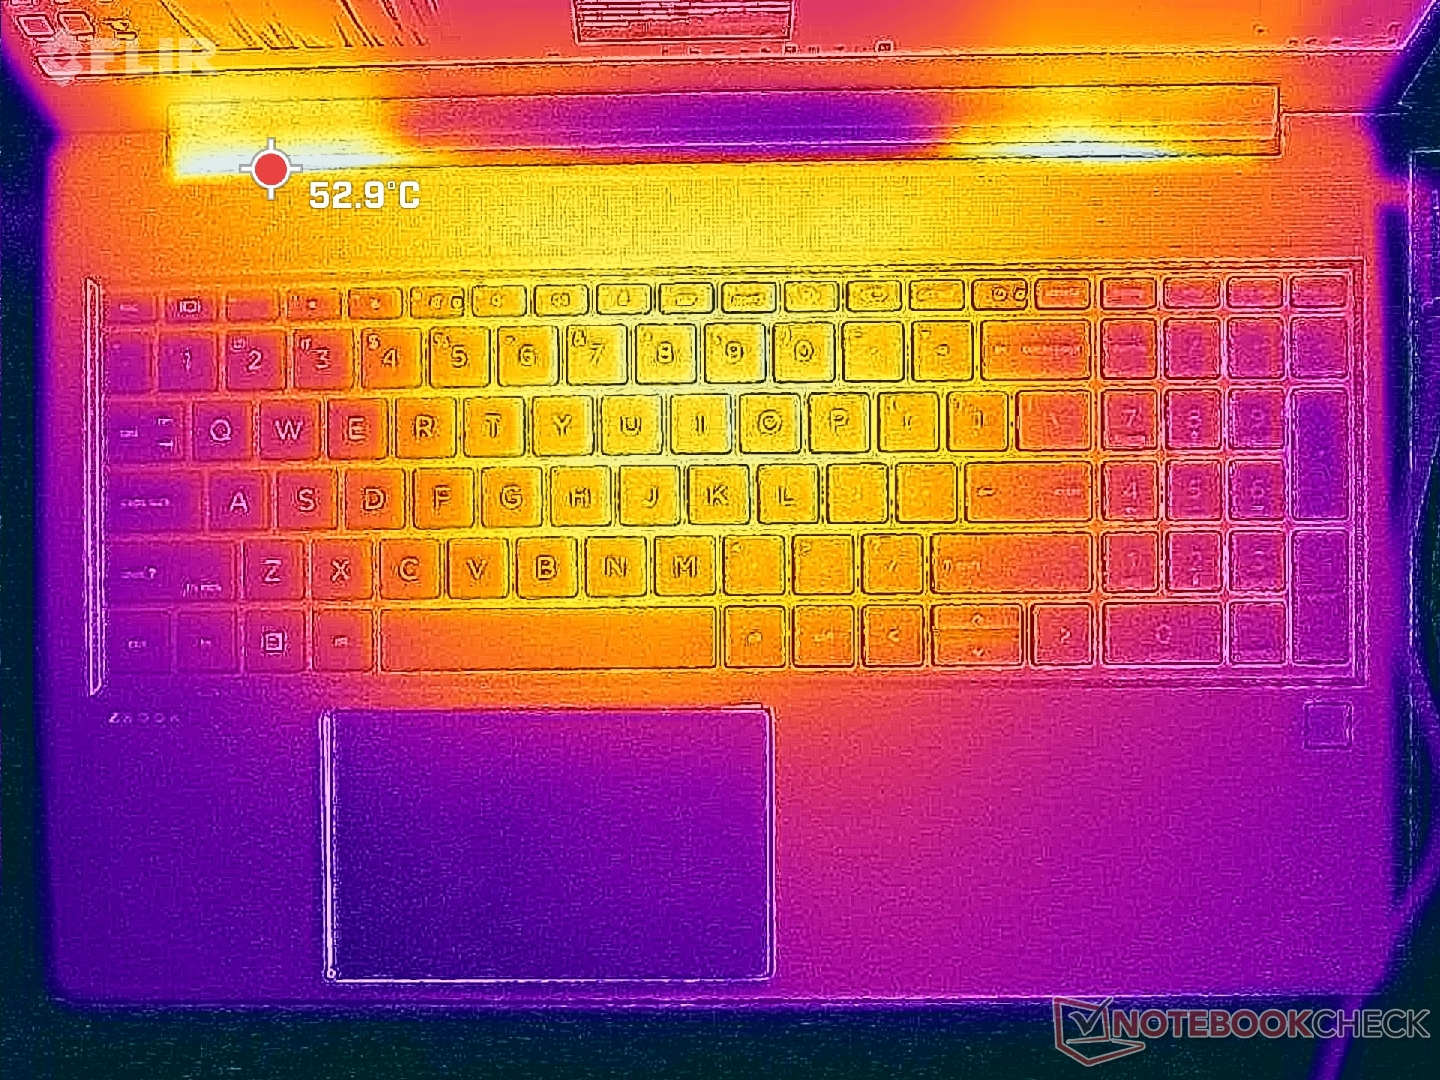
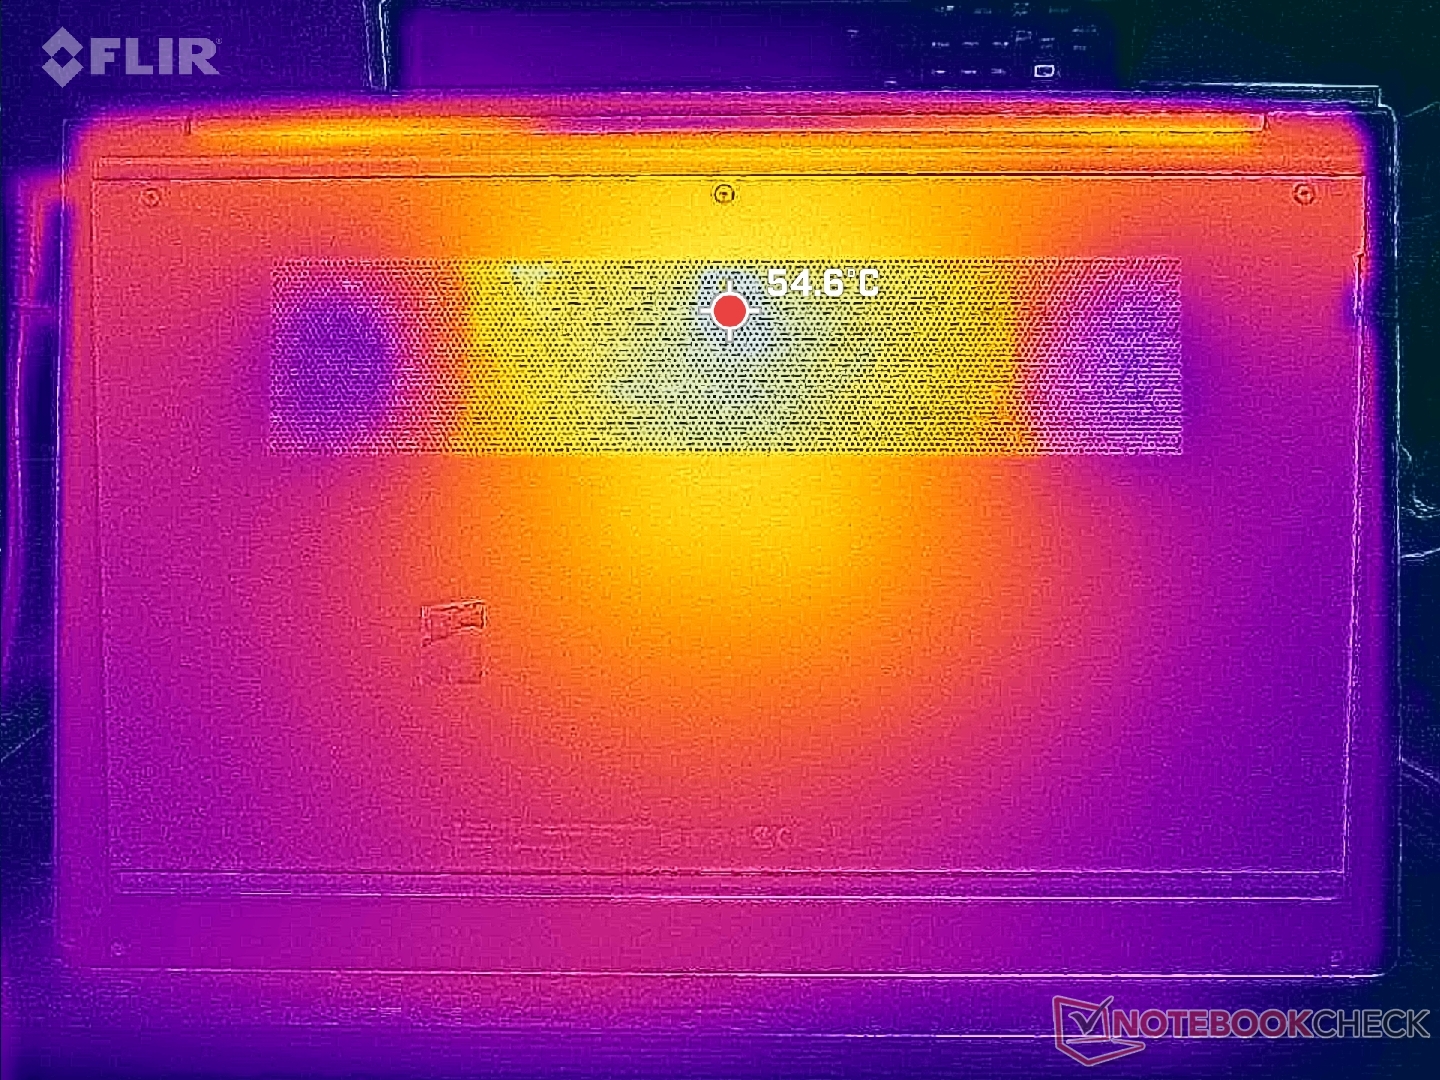
Die Oberflächentemperaturen sind in der Mitte am wärmsten und an den Seiten der Tastatur oder an den Rändern des Gehäuse kühler. Heiße Stellen in der Mitte und an der Unterseite der Tastatur können über 42 °C erreichen, was einige Grad kühler ist als bei der Konkurrenz ThinkPad P1 G6 mit der gleichen RTX-2000-GPU.
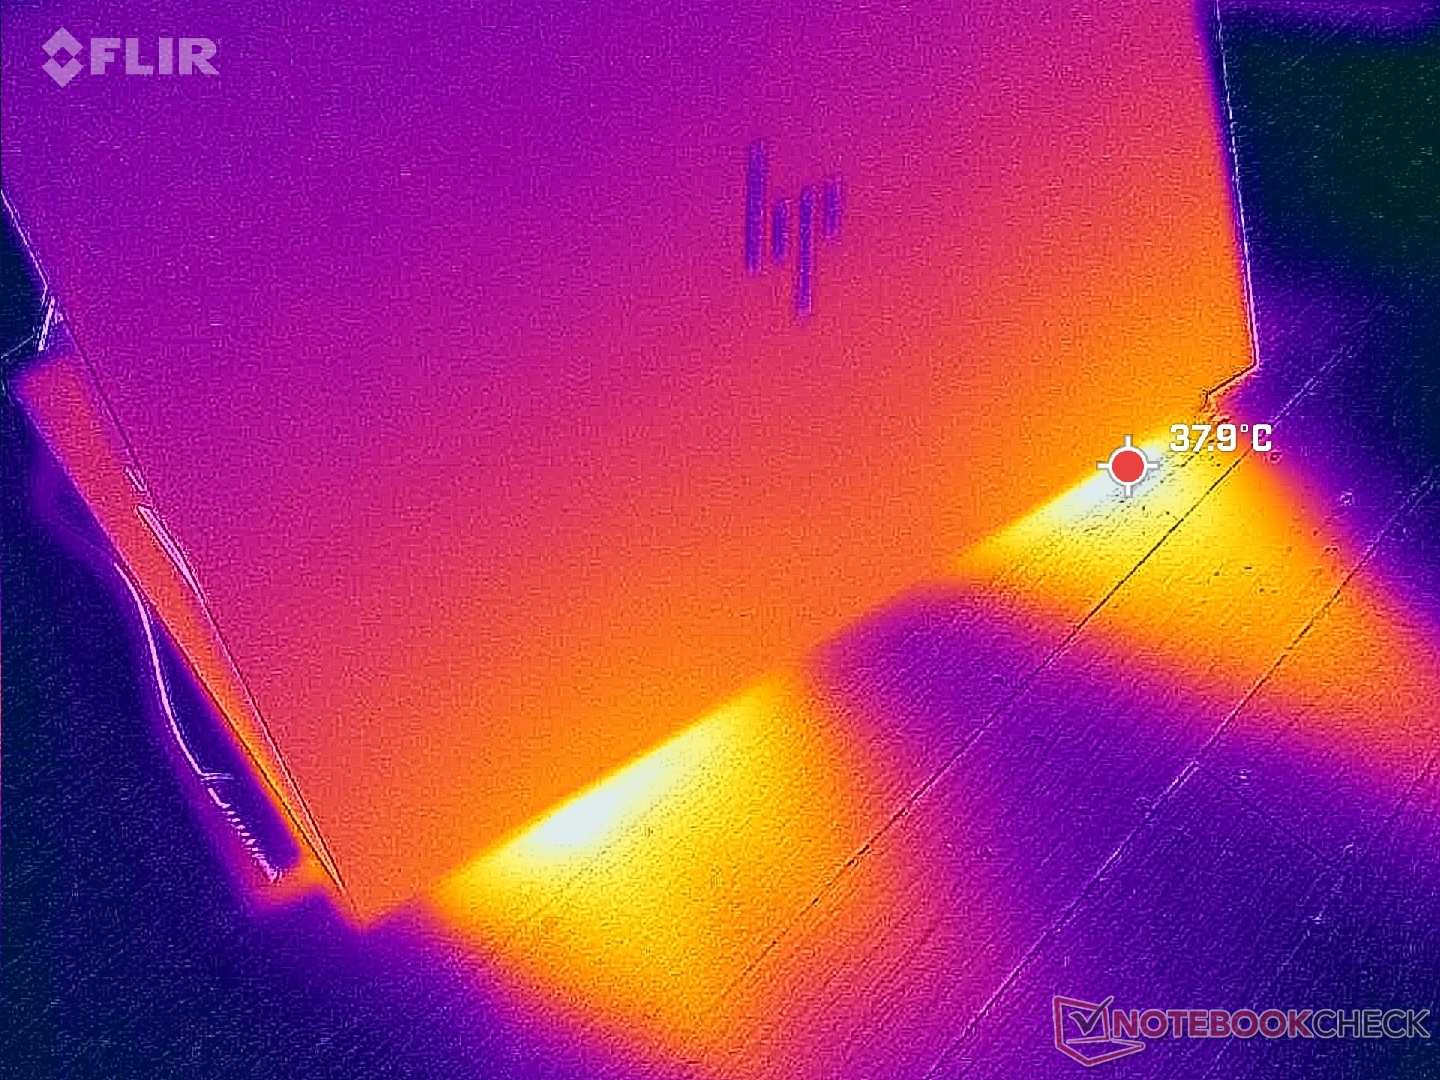
(±) Die maximale Temperatur auf der Oberseite ist 42.4 °C. Im Vergleich liegt der Klassendurchschnitt bei 38.2 °C (von 22.2 bis 69.8 °C für die Klasse Workstation).
(-) Auf der Unterseite messen wir eine maximalen Wert von 47.8 °C (im Vergleich zum Durchschnitt von 41.1 °C).
(+) Ohne Last messen wir eine durchschnittliche Temperatur von 24.4 °C auf der Oberseite. Der Klassendurchschnitt erreicht 32 °C.
(+) Beim längeren Spielen von The Witcher 3 erhitzt sich das Gerät durchschnittlich auf 31.2 °C. Der Durchschnitt der Klasse ist derzeit 32 °C.
(+) Die Handballen und der Touchpad-Bereich sind mit gemessenen 27.6 °C kühler als die typische Hauttemperatur und fühlen sich dadurch kühl an.
(±) Die durchschnittliche Handballen-Temperatur anderer getesteter Geräte war 27.8 °C (+0.2 °C).
| HP ZBook Power 15 G10 AMD Ryzen 7 PRO 7840HS, NVIDIA RTX 2000 Ada Generation Laptop | HP ZBook Power 15 G9 6B8C4EA Intel Core i7-12700H, NVIDIA RTX A2000 Laptop GPU | Lenovo ThinkPad P15v G3 21EM001AGE AMD Ryzen 7 PRO 6850H, NVIDIA RTX A2000 Laptop GPU | Dell Precision 5000 5560 Intel Core i7-11850H, NVIDIA RTX A2000 Laptop GPU | Lenovo ThinkPad P1 G6-21FV000DGE Intel Core i9-13900H, NVIDIA RTX 2000 Ada Generation Laptop | Asus ExpertBook B6 Flip B6602FC2 Intel Core i9-12950HX, NVIDIA RTX A2000 Laptop GPU | |
|---|---|---|---|---|---|---|
| Hitze | 7% | -2% | -16% | -9% | -10% | |
| Last oben max * (°C) | 42.4 | 40.3 5% | 48.7 -15% | 48.2 -14% | 47.1 -11% | 48.4 -14% |
| Last unten max * (°C) | 47.8 | 48.3 -1% | 50.5 -6% | 42.6 11% | 56.5 -18% | 52.3 -9% |
| Idle oben max * (°C) | 26.8 | 23.7 12% | 25 7% | 34.8 -30% | 28.1 -5% | 27.8 -4% |
| Idle unten max * (°C) | 27.2 | 23.8 12% | 25.4 7% | 35.2 -29% | 27.6 -1% | 30.3 -11% |
* ... kleinere Werte sind besser
Stresstest
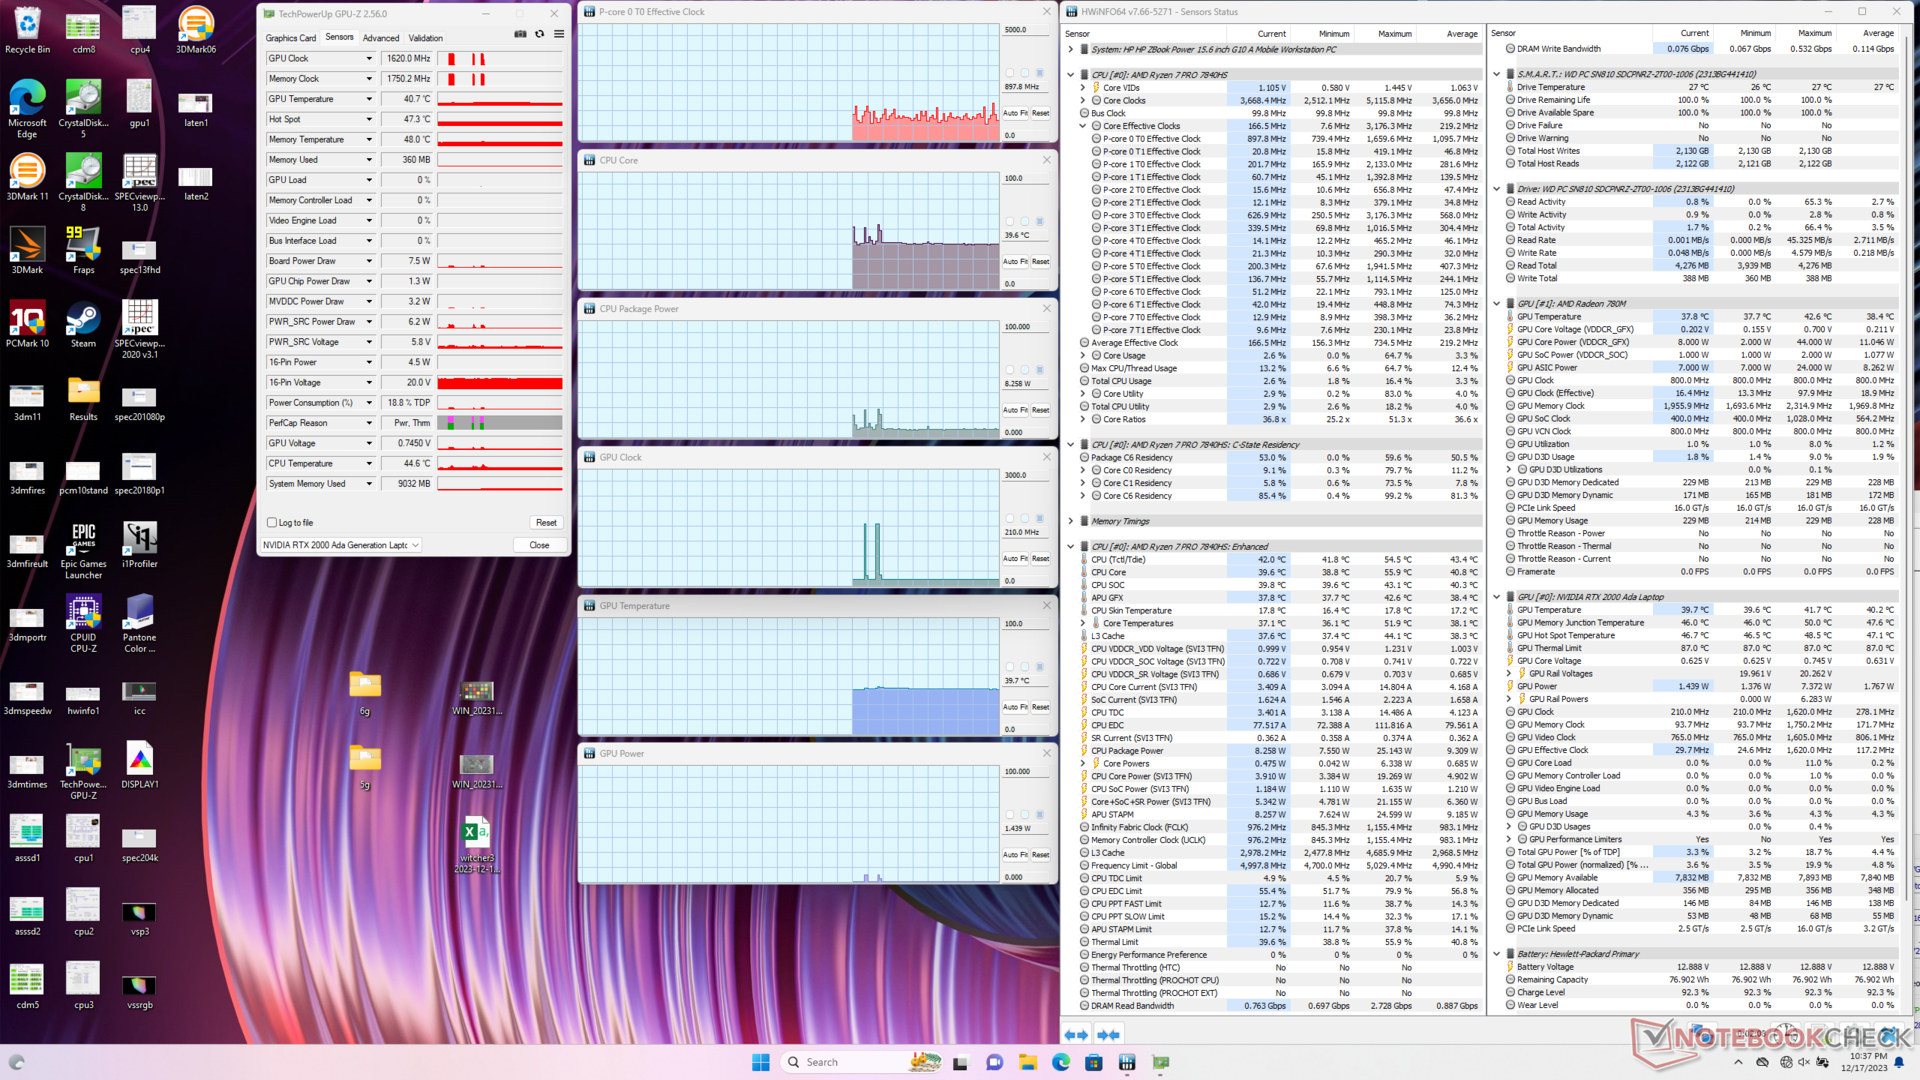
Bei der Belastung mit Prime95 stieg die CPU nur in den ersten paar Sekunden auf 4,2 GHz und 65 W, bevor sie leicht abfiel und sich bei 4,0 GHz und 54 W stabilisierte. Die Kerntemperatur war mit 87 °C recht warm, aber das ist bei vielen Zen-4-Laptops wohl die Regel. Wiederholt man diesen Test mit dem ThinkPad Z16 G2, stabilisiert sich die Ryzen 9 CPU bei 100 °C.
Die Ausführung von Witcher 3 im Modus Balanced zeigt keine signifikanten Unterschiede bei den Temperaturen oder Taktraten im Vergleich zum Modus Performance, was sich mit unseren Beobachtungen auf Fire Strike im obigen Abschnitt deckt. Die Leistungsaufnahme des GPU-Boards liegt bei 44 W und nicht bei den angestrebten 50 W.
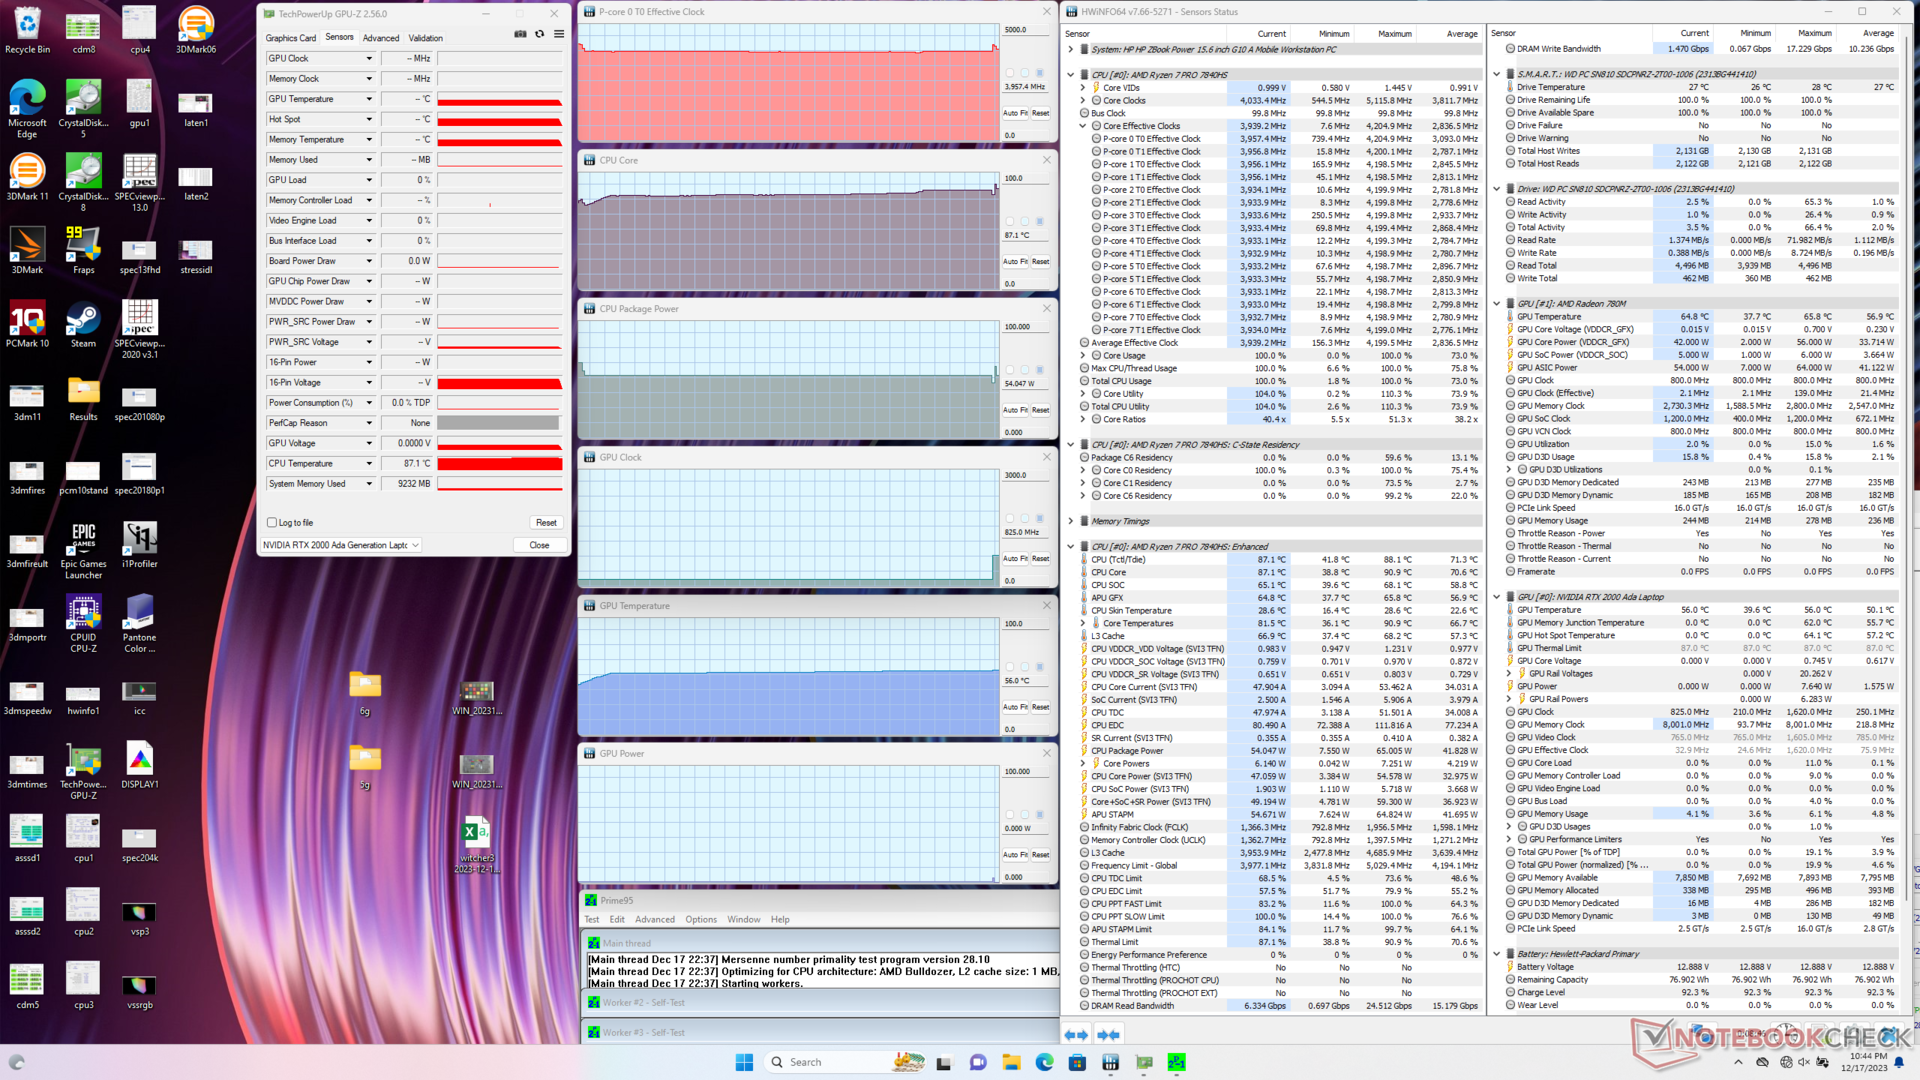
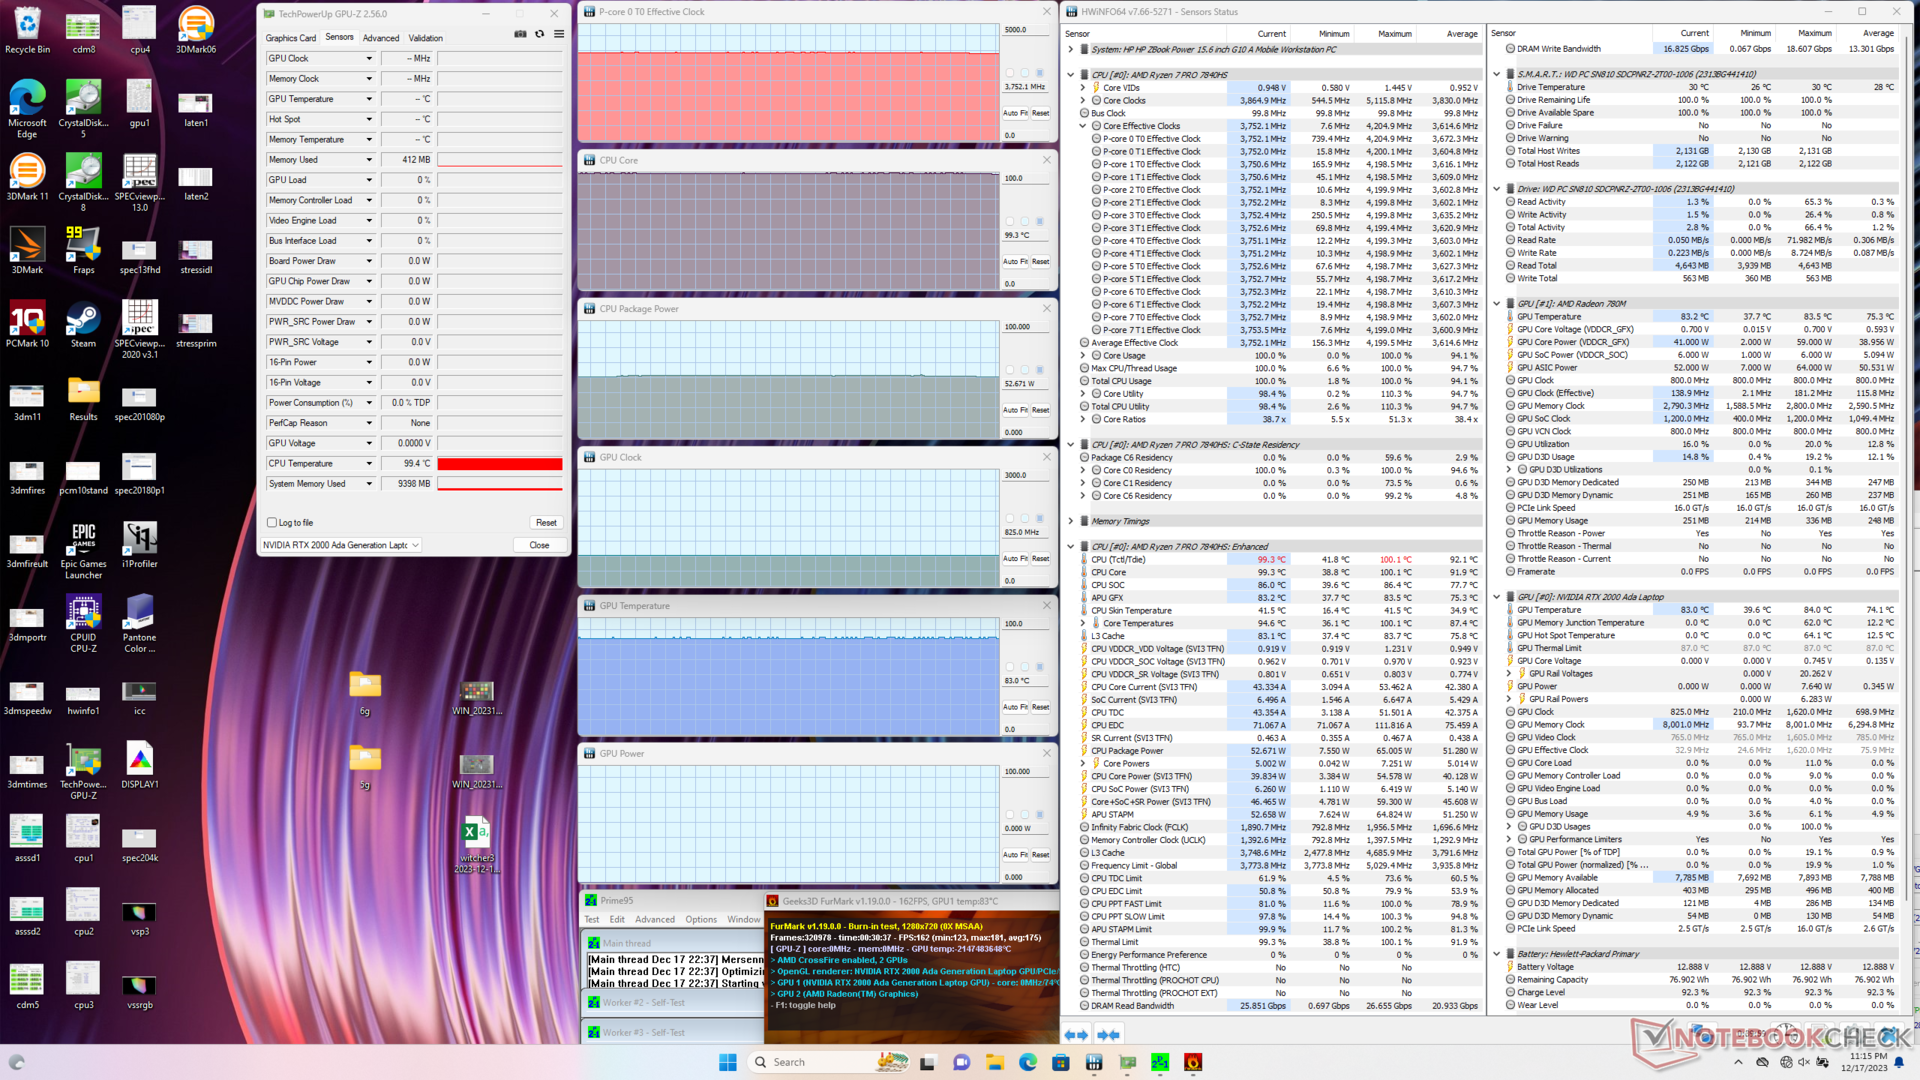
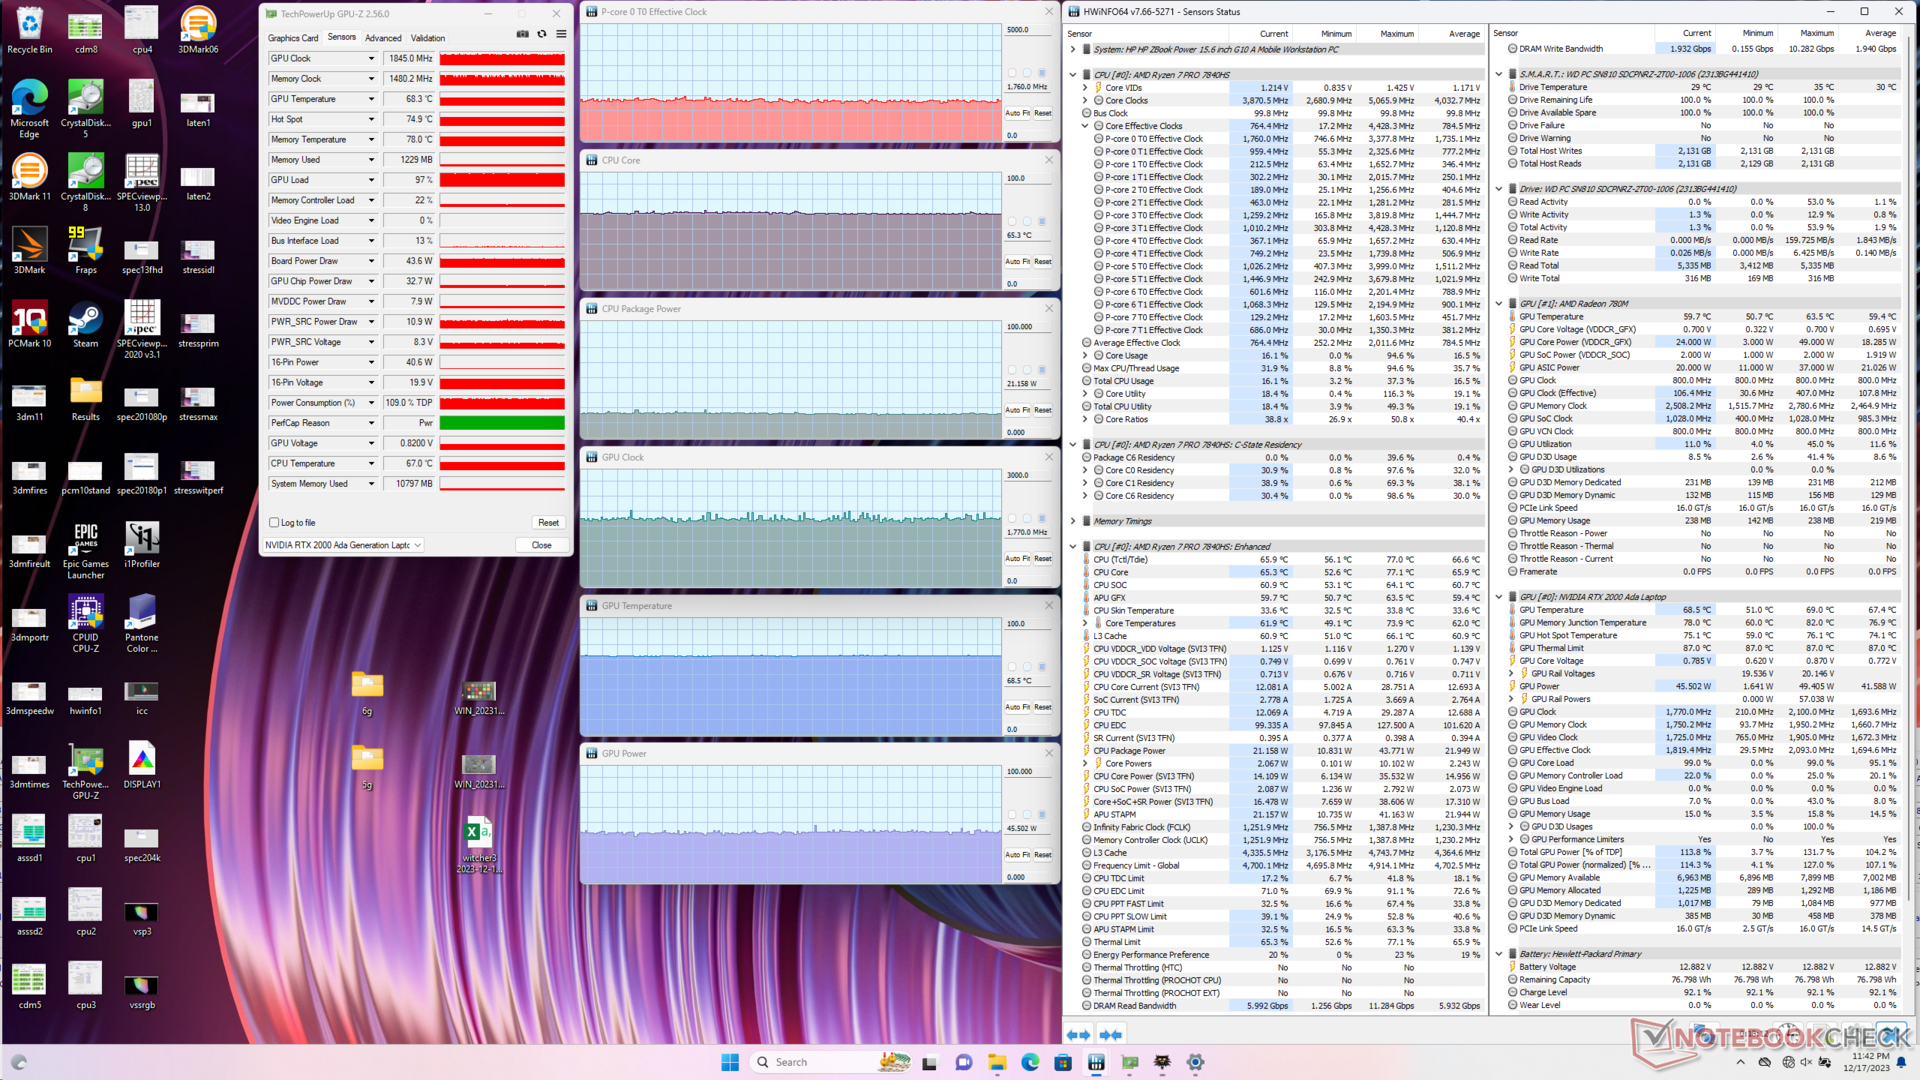
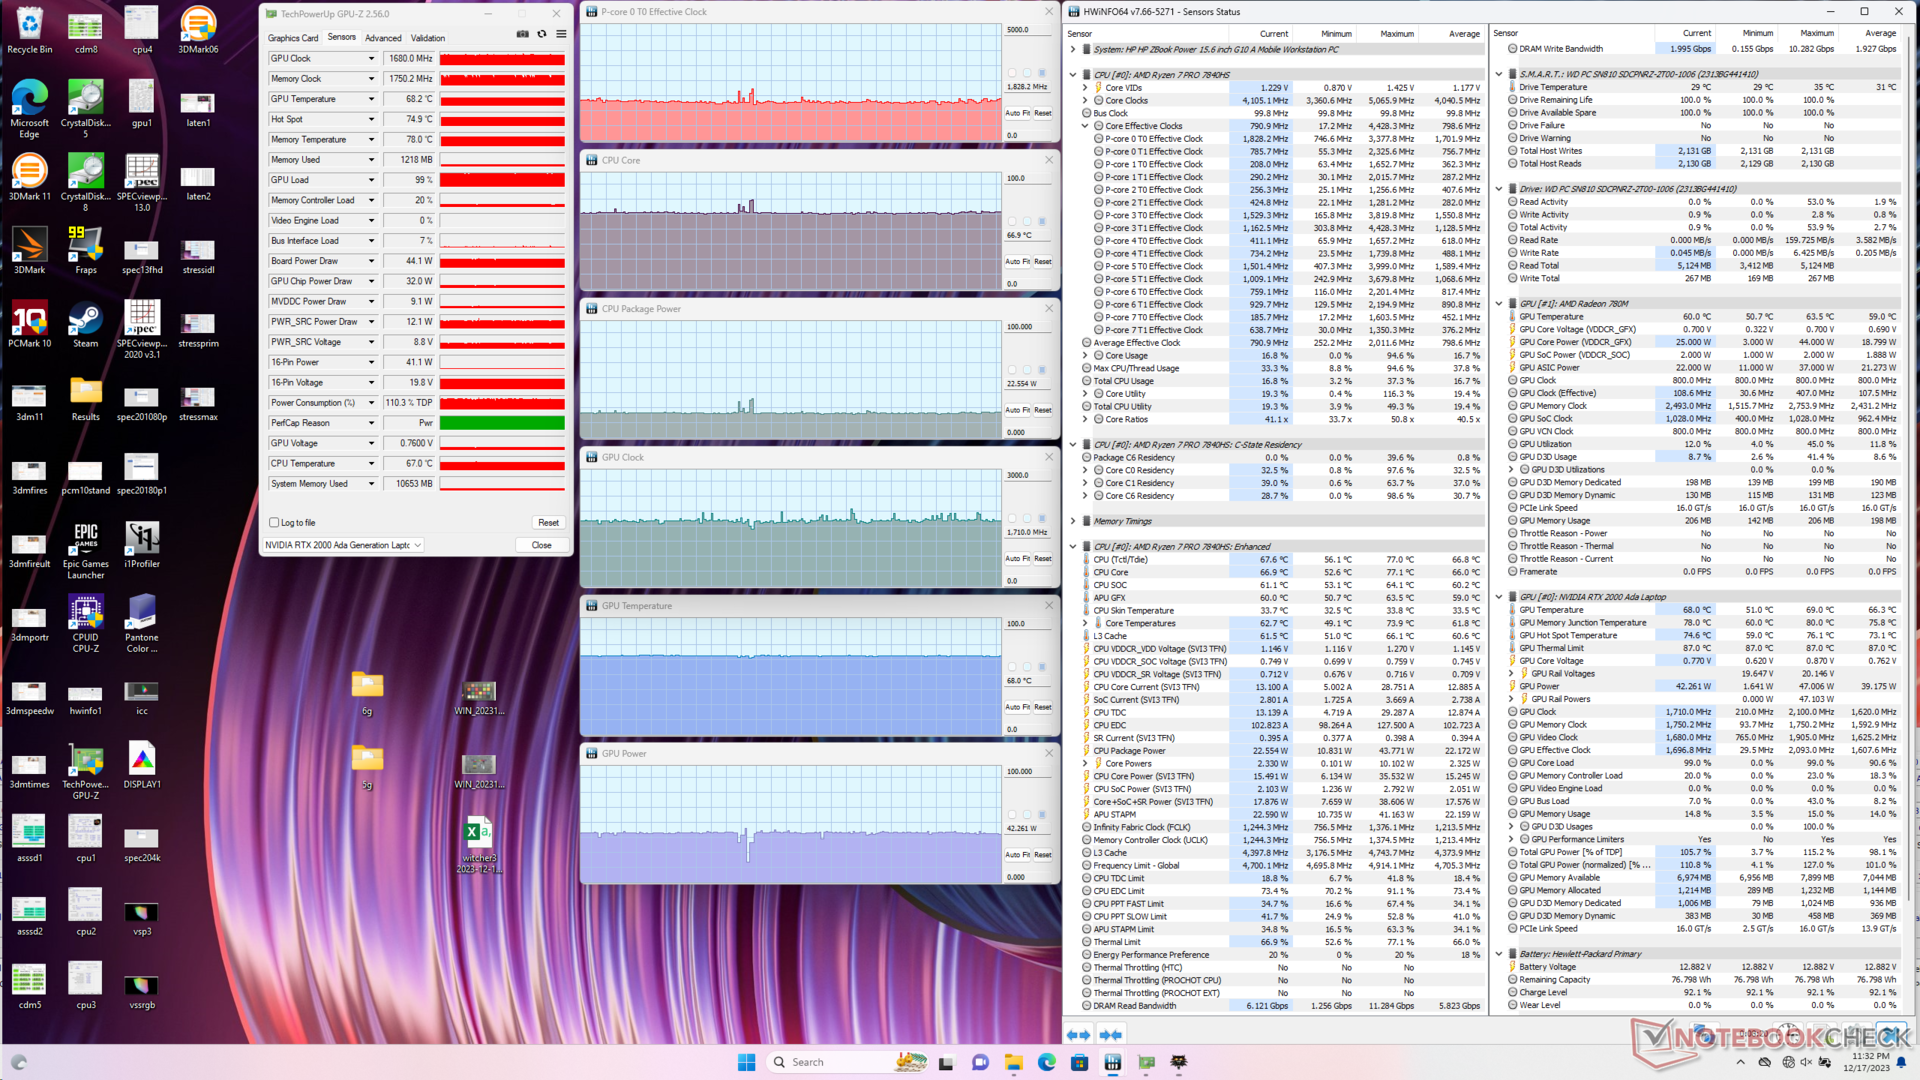
| CPU-Takt (GHz) | GPU-Takt (MHz) | durchschnittliche CPU-Temperatur (°C) | durchschnittliche GPU-Temperatur (°C) | |
| System Leerlauf | -- | -- | 40 | 40 |
| Prime95, Stress | 4,0 | -- | 87 | 56 |
| Prime95 + FurMark, Stress | 3,8 | 825 | 99 | 83 |
| Witcher 3, Stress (Ausgewogener Modus) | 1,8 | 1.770 | 65 | 69 |
| Witcher 3, Stress (Performance Modus) | 1,8 | 1.710 | 67 | 68 |
Energieverwaltung
Stromverbrauch
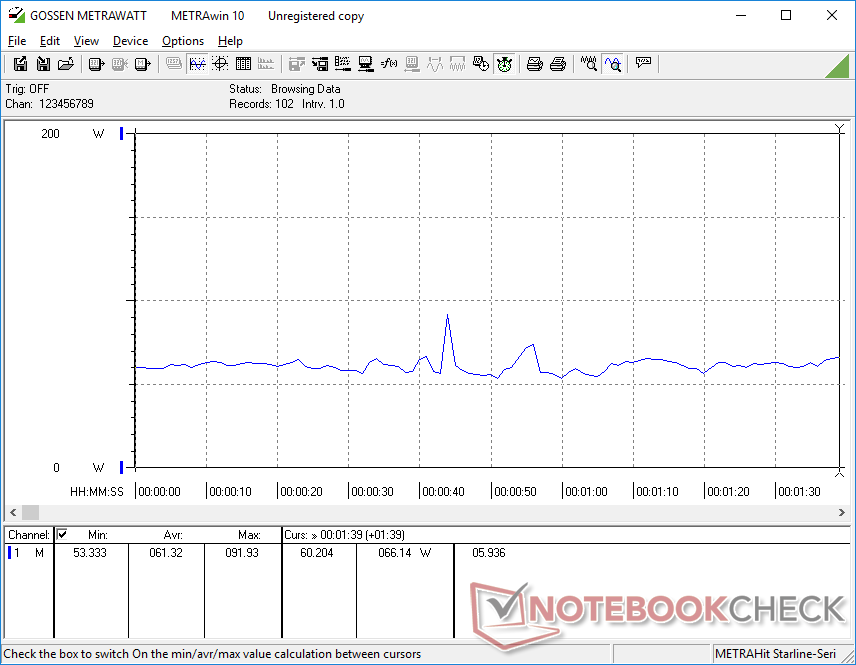
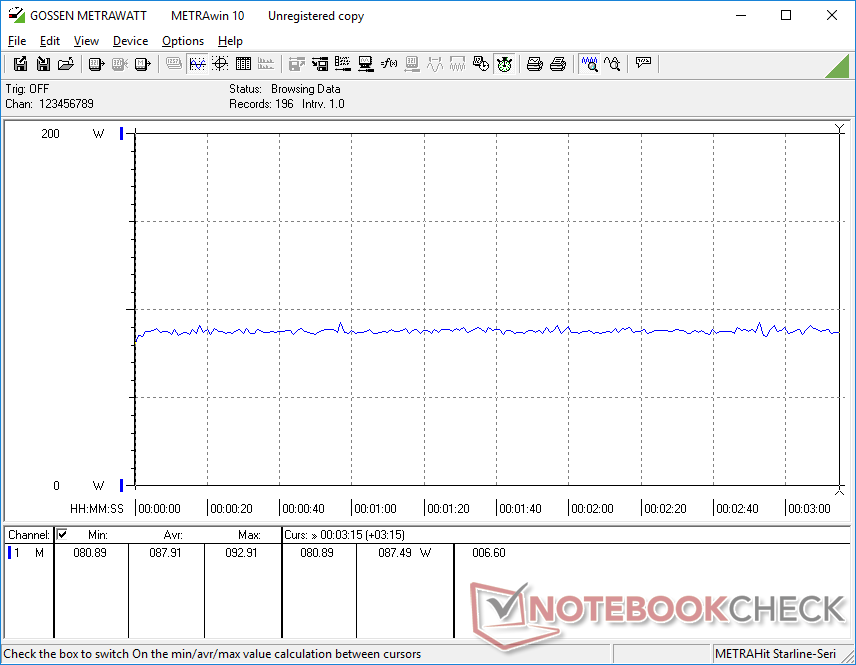
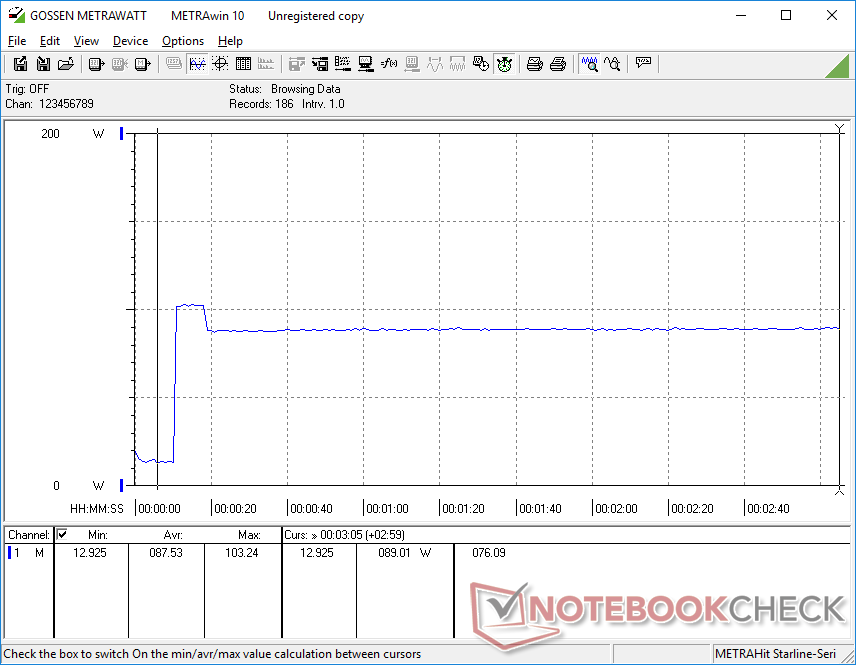
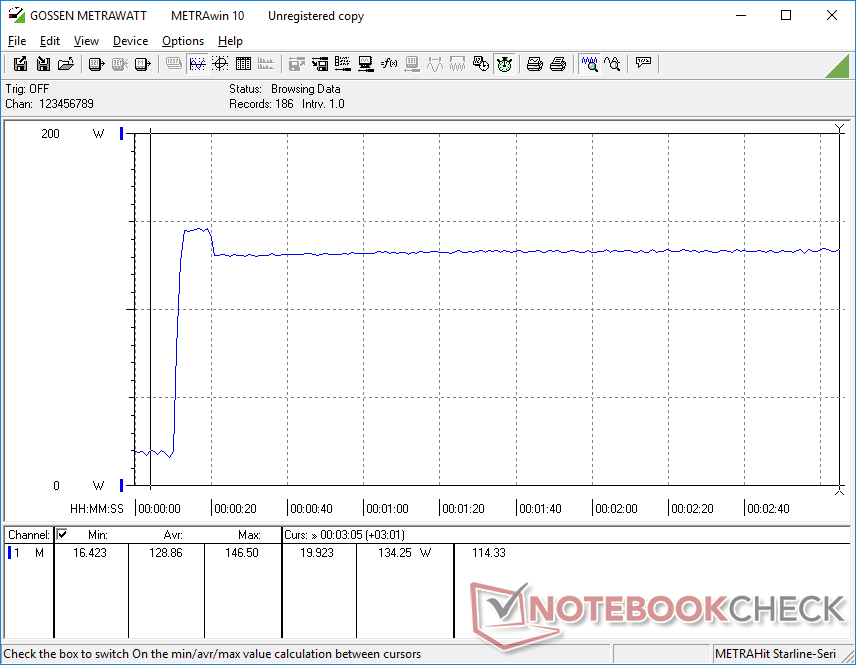
Der Stromverbrauch ist insgesamt höher als beim letztjährigen Modell, was mit der höheren Leistung unserer Konfiguration korreliert. Die Leistung pro Watt ist jedoch immer noch zugunsten unseres neueren Modells, vor allem wenn es um die Grafikleistung geht. Zum Beispiel erfordert die Ausführung von Prime95 16 Prozent mehr Strom für 20 Prozent schnellere Multi-Thread-Leistung als der Core i7-12700H im ZBook Power 15 G9, während die Ausführung von FurMark nur 14 Prozent mehr Strom für bis zu 65 Prozent mehr Grafikleistung erfordert.
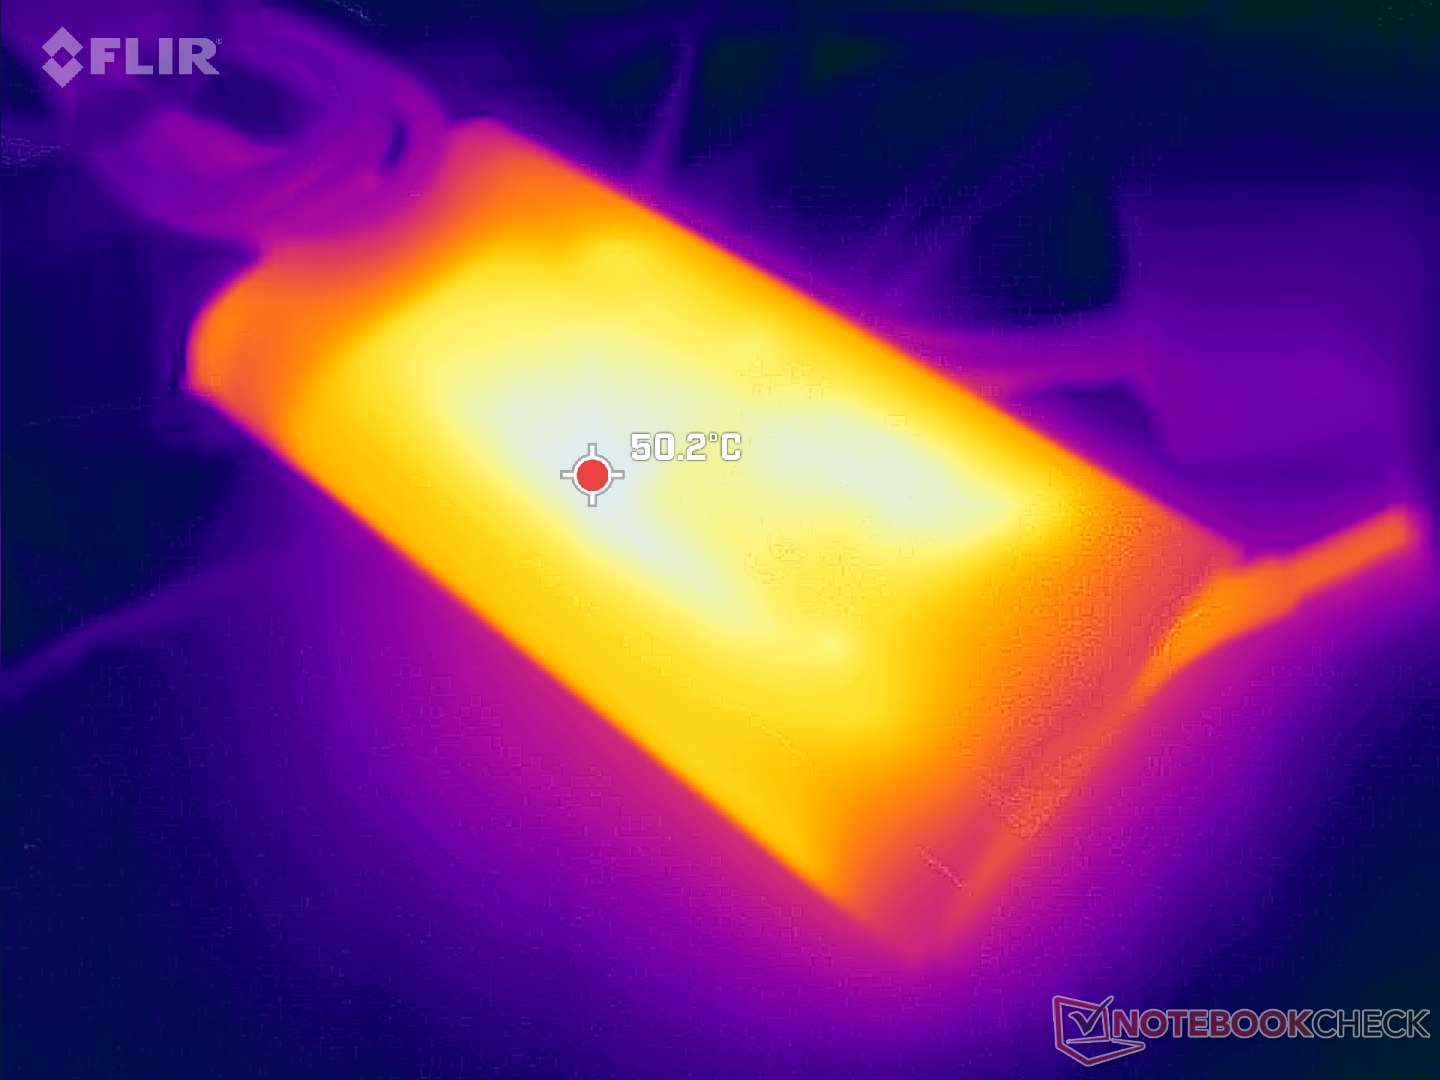
Das mittelgroße (~13,8 x 6,5 x 2,3 cm) 150-W-Netzteil hat sich nicht verändert, da das ZBook Power 15 G10 mit dem gleichen Stromverbrauch wie das ZBook Power 15 G9 arbeitet. Das USB-C-Laden wird dennoch unterstützt. Unser 135-W-USB-C-Ladegerät von Lenovo ist beispielsweise mit unserem HP Testgerät kompatibel.
| Aus / Standby | |
| Idle | |
| Last |
|
Legende:
min: | |
| HP ZBook Power 15 G10 R7 PRO 7840HS, RTX 2000 Ada Generation Laptop, WDC PC SN810 2TB, IPS, 2560x1440, 15.6" | HP ZBook Power 15 G9 6B8C4EA i7-12700H, RTX A2000 Laptop GPU, Samsung PM9A1 MZVL21T0HCLR, IPS, 3840x2160, 15.6" | Lenovo ThinkPad P15v G3 21EM001AGE R7 PRO 6850H, RTX A2000 Laptop GPU, SK Hynix PC711 1TB HFS001TDE9X081N, IPS LED, 3840x2160, 15.6" | Dell Precision 5000 5560 i7-11850H, RTX A2000 Laptop GPU, Samsung PM9A1 MZVL22T0HBLB, IPS, 3840x2400, 15.6" | Lenovo ThinkPad P1 G6-21FV000DGE i9-13900H, RTX 2000 Ada Generation Laptop, SK Hynix PC711 1TB HFS001TDE9X084N, IPS, 2560x1600, 16" | Asus ExpertBook B6 Flip B6602FC2 i9-12950HX, RTX A2000 Laptop GPU, Samsung PM9A1 MZVL21T0HCLR, IPS, 2560x1600, 16" | |
|---|---|---|---|---|---|---|
| Stromverbrauch | 11% | -11% | -24% | -30% | -81% | |
| Idle min * (Watt) | 5.3 | 3.9 26% | 6.3 -19% | 6.2 -17% | 8.3 -57% | 10.5 -98% |
| Idle avg * (Watt) | 9.9 | 7.2 27% | 13.9 -40% | 13.9 -40% | 14.5 -46% | 11.9 -20% |
| Idle max * (Watt) | 16.7 | 8.5 49% | 14.5 13% | 23.8 -43% | 15.3 8% | 18 -8% |
| Last avg * (Watt) | 61.3 | 87.2 -42% | 82.8 -35% | 95.7 -56% | 91.8 -50% | 182 -197% |
| Witcher 3 ultra * (Watt) | 87.9 | 86.8 1% | 88.8 -1% | 87 1% | 104.7 -19% | 177.5 -102% |
| Last max * (Watt) | 145.3 | 139 4% | 124.8 14% | 132.6 9% | 164.5 -13% | 229 -58% |
* ... kleinere Werte sind besser
Power Consumption Witcher 3 / Stresstest
Power Consumption external Monitor
Akkulaufzeit
Die Laufzeiten entsprechen fast genau denen, die wir beim Vorjahresmodell gemessen haben, trotz der Unterschiede bei CPU, GPU und Display. Zehn Stunden Surfen in der realen Welt sind vergleichbar mit dieser Leistung vieler Ultrabooks der Consumer-Klasse.
| HP ZBook Power 15 G10 R7 PRO 7840HS, RTX 2000 Ada Generation Laptop, 83 Wh | HP ZBook Power 15 G9 6B8C4EA i7-12700H, RTX A2000 Laptop GPU, 83 Wh | Lenovo ThinkPad P15v G3 21EM001AGE R7 PRO 6850H, RTX A2000 Laptop GPU, 68 Wh | Dell Precision 5000 5560 i7-11850H, RTX A2000 Laptop GPU, 86 Wh | Lenovo ThinkPad P1 G6-21FV000DGE i9-13900H, RTX 2000 Ada Generation Laptop, 90 Wh | Asus ExpertBook B6 Flip B6602FC2 i9-12950HX, RTX A2000 Laptop GPU, 90 Wh | |
|---|---|---|---|---|---|---|
| Akkulaufzeit | 0% | -31% | -37% | -5% | -13% | |
| WLAN (h) | 10 | 10 0% | 6.9 -31% | 6.3 -37% | 9.5 -5% | 8.7 -13% |
| H.264 (h) | 10.7 | 11.2 | 5.8 | |||
| Last (h) | 1.8 | 1.8 | 1.1 | 1.7 | ||
| Idle (h) | 12 | 12.5 |
Pro
Contra
Fazit - Wenn es nicht kaputt ist, lassen Sie die Hände von einer Reparatur
Das Design des ZBook Power 15 G10 wird bald drei Jahre alt. Es ist eine der wenigen verbleibenden 15,6-Zoll-Workstations im 16:9-Format, die sowohl mit AMD-Zen-Pro-CPUs als auch mit Nvidia-RTX-Ada-GPUs ausgestattet sind, während die meisten anderen in dieser Kategorie zu 16:10-Formfaktoren mit zusätzlichen Display-Optionen wie OLED und 4K übergegangen sind. Wenn der größere Formfaktor und die neueren Bildschirme für Ihre Arbeitsanforderungen wichtig sind, dann sollten Sie vielleicht warten, bis HP das ZBook-Power-Design auffrischt oder sich nach Alternativen wie dem Lenovo ThinkPad P1 G6 stattdessen umsehen. Wenn nicht, dann ist das ZBook Power 15 G10 immer noch eine klassische und zuverlässige Option.
Für mögliche 16:10-Revisionen in der Zukunft würden wir uns wünschen, dass HP die Extrameile geht und sowohl ECC-RAM als auch ECC-VRAM unterstützt und nur über USB-C auflädt. Das proprietäre AC-Ladegerät ist immer schwieriger zu rechtfertigen, da die nächste Generation von Thunderbolt USB-C-Ladevorgänge mit bis zu 240 W unterstützen kann.
Das ZBook Power 15 G10 wird wahrscheinlich eine der letzten 15,6-Zoll-Workstations von HP sein, bevor die Serie mit einem moderneren 16:10-Design aufgefrischt wird.
Das wichtigste Unterscheidungsmerkmal zwischen dem ZBook Power 15 G9 und dem G10 ist, dass Letzteres mit Ada-Lovelace-GPUs ausgestattet ist, die eine viel höhere Leistung pro Watt bieten als die älteren Ampere-GPUs. Wenn Sie Wert auf die neueren CPUs und GPUs legen, dann ist das G10 dem G9 vorzuziehen. Ansonsten ist die Benutzererfahrung zwischen den Modellen im Wesentlichen identisch, auch bei Nutzung im Akku.
Preis und Verfügbarkeit
Bei cn-w.de ist das HP ZBook Power 15 G10 derzeit mit Ryzen-7- und Nvidia-2000-Ada-HP-Konfiguration für 1.718 Euro bestellbar. Auf der Homepage von HP sind die unterschiedlichen verfügbaren Konfigurationen gelistet.
HP ZBook Power 15 G10
- 20.12.2023 v7 (old)
Allen Ngo
Transparenz
Die Auswahl der zu testenden Geräte erfolgt innerhalb der Redaktion. Das vorliegende Testmuster wurde dem Autor vom Hersteller oder einem Shop zu Testzwecken leihweise zur Verfügung gestellt. Eine Einflussnahme des Leihstellers auf den Testbericht gab es nicht, der Hersteller erhielt keine Version des Reviews vor der Veröffentlichung. Es bestand keine Verpflichtung zur Publikation. Als eigenständiges, unabhängiges Unternehmen unterliegt Notebookcheck keiner Diktion von Herstellern, Shops und Verlagen.
So testet Notebookcheck
Pro Jahr werden von Notebookcheck hunderte Laptops und Smartphones unabhängig in von uns standardisierten technischen Verfahren getestet, um eine Vergleichbarkeit aller Testergebnisse zu gewährleisten. Seit rund 20 Jahren entwickeln wir diese Testmethoden kontinuierlich weiter und setzen damit Branchenstandards. In unseren Testlaboren kommt ausschließlich hochwertiges Messequipment in die Hände erfahrener Techniker und Redakteure. Die Tests unterliegen einer mehrstufigen Kontrolle. Unsere komplexe Gesamtbewertung basiert auf hunderten fundierten Messergebnissen und Benchmarks, womit Ihnen Objektivität garantiert ist. Weitere Informationen zu unseren Testmethoden gibt es hier.
Preisvergleich

