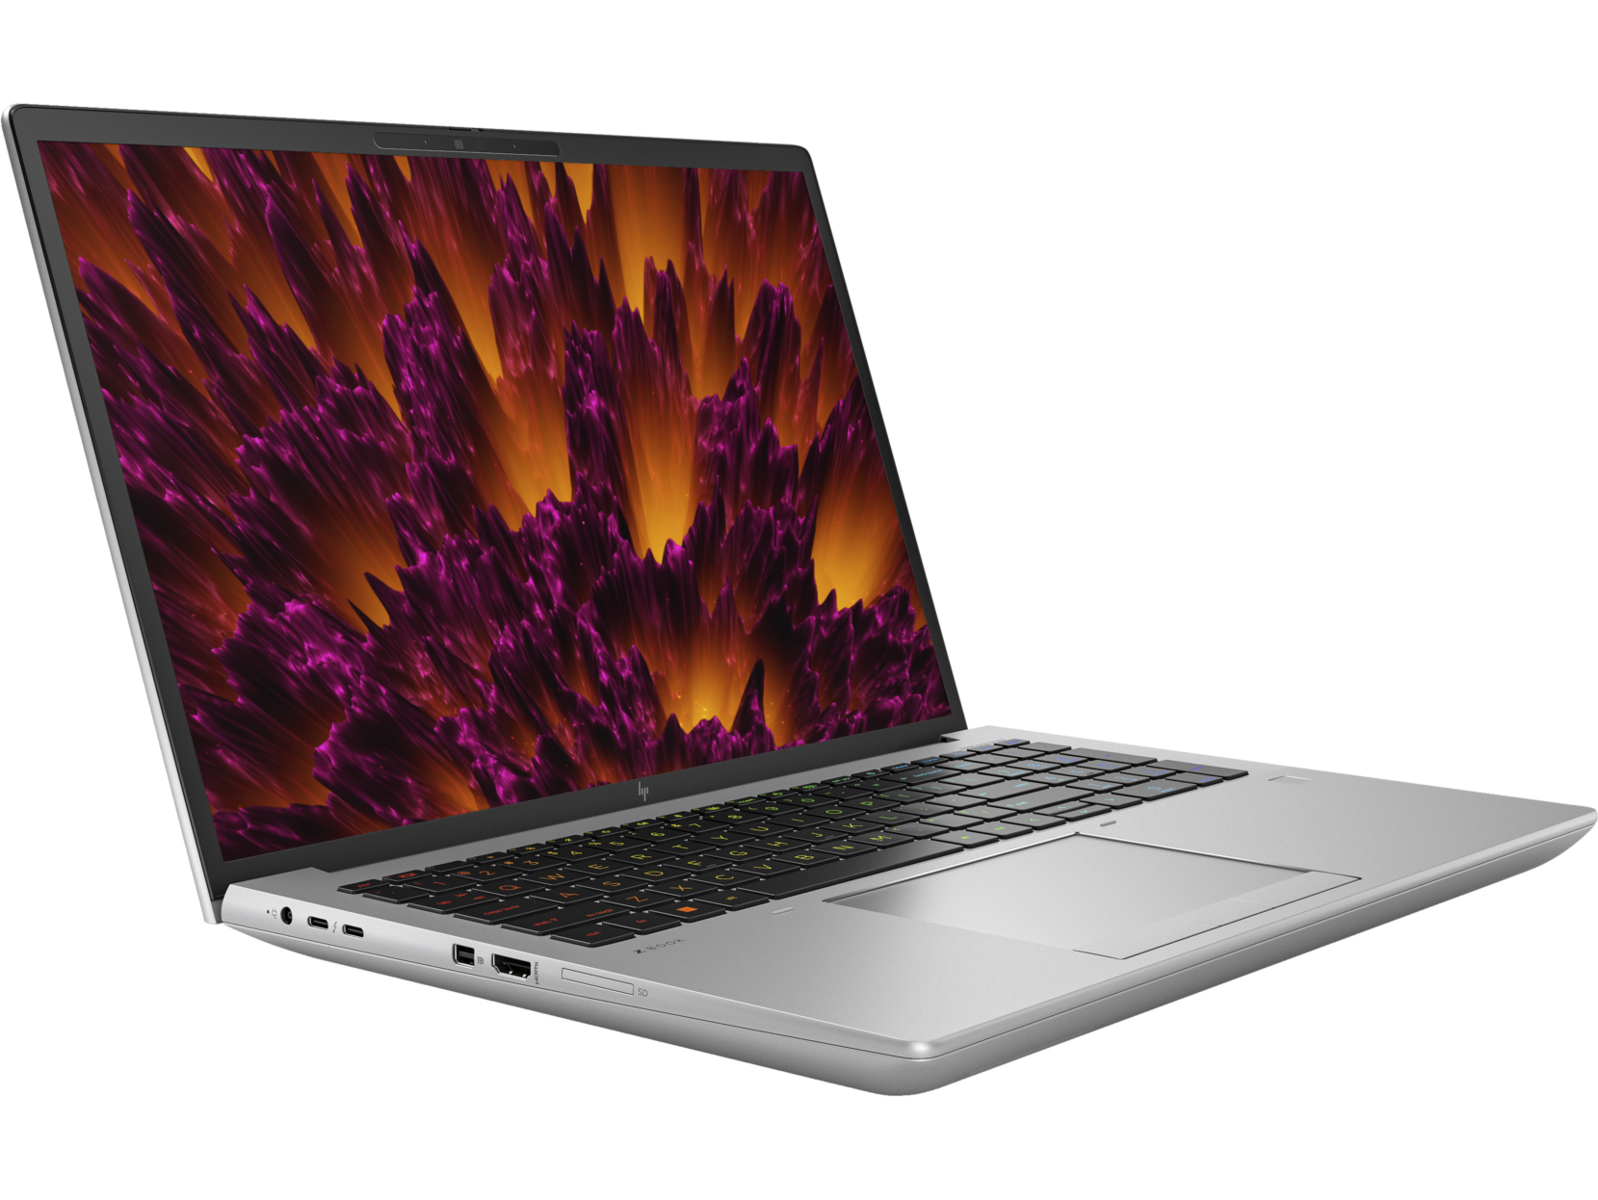
HP ZBook Fury 16 G10: mobile Workstation mit 100 W Nvidia RTX 5000 Ada im Test

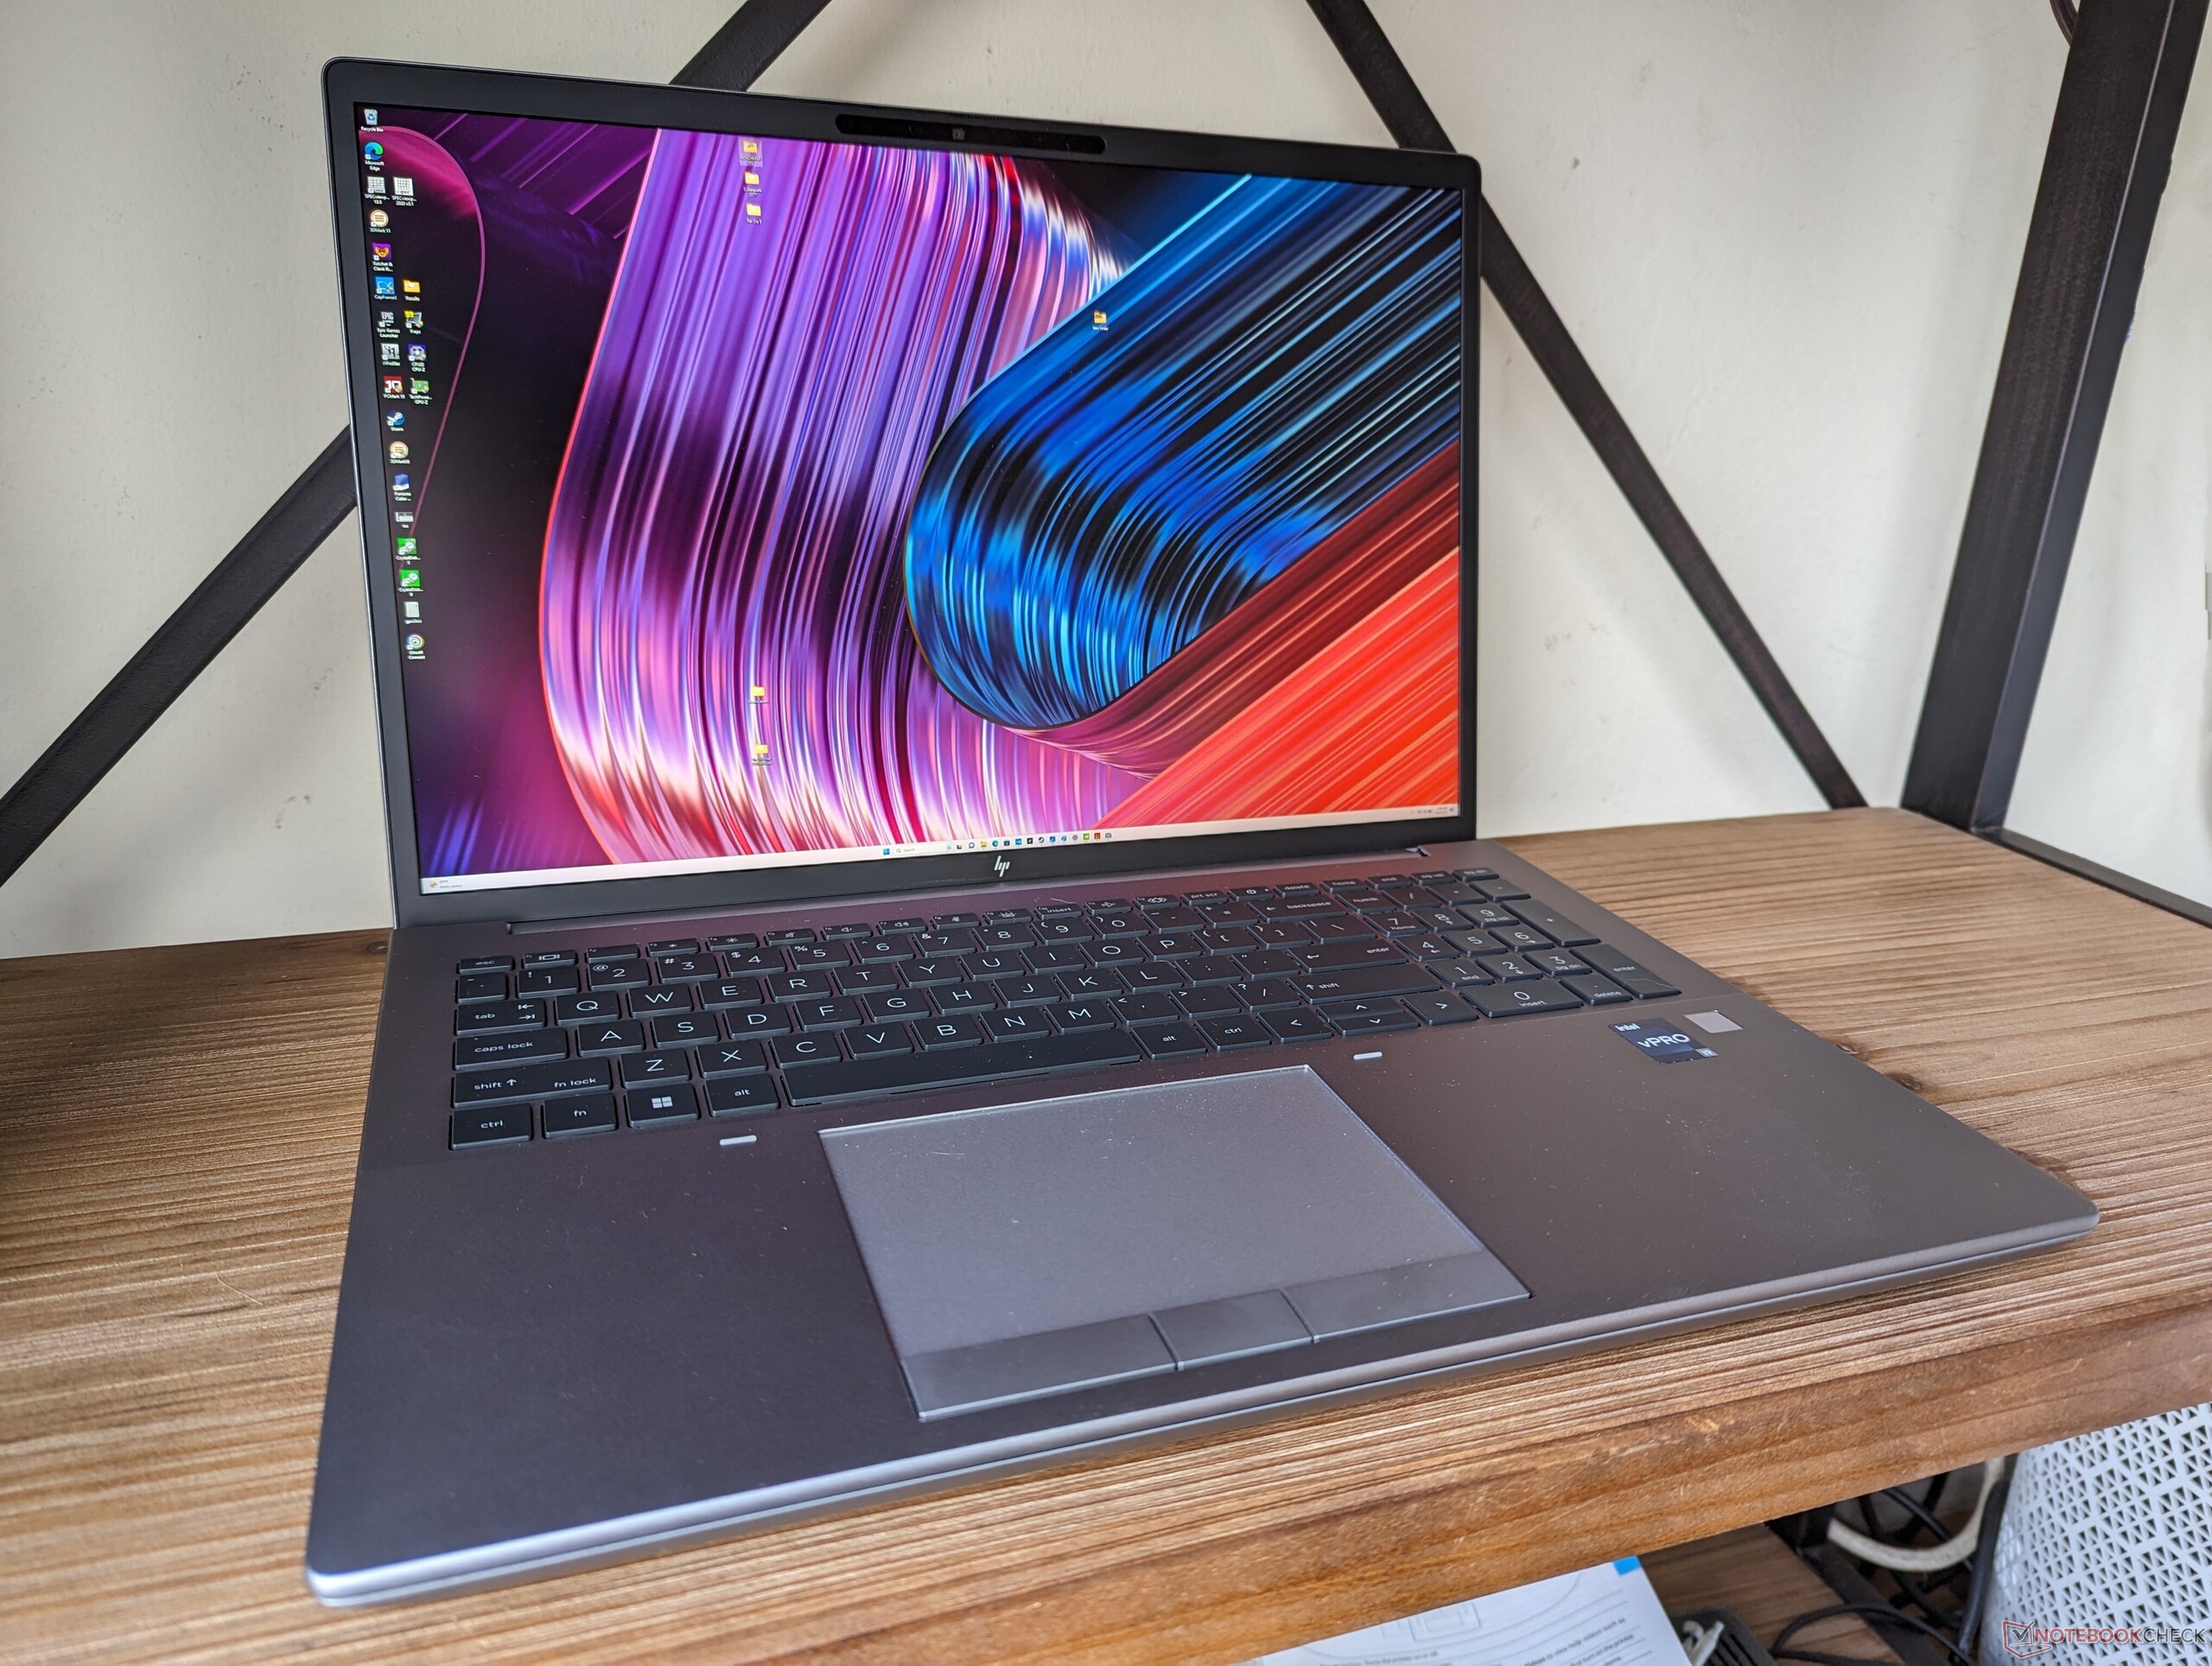
Das ZBook Fury 16 G10 ist der direkte Nachfolger des ZBook Fury 16 G9 aus dem letzten Jahr. Es verfügt über eine neue Raptor-Lake-HX-CPU der 13. Generation und Nvidia-RTX-Ada-GPU-Optionen, die die älteren Alder-Lake- bzw. RTX-Ampere-Prozessoren der 12. Generation ablösen. Das neue Modell ist ansonsten optisch identisch mit dem Fury 16 G9 und wir empfehlen daher unseren Test für das letztjährige Modell, um mehr über die physischen Eigenschaften des Fury 16 G10 zu erfahren.
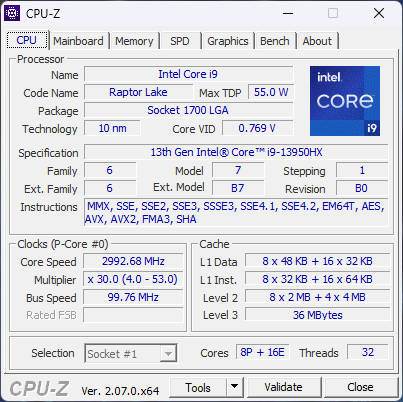
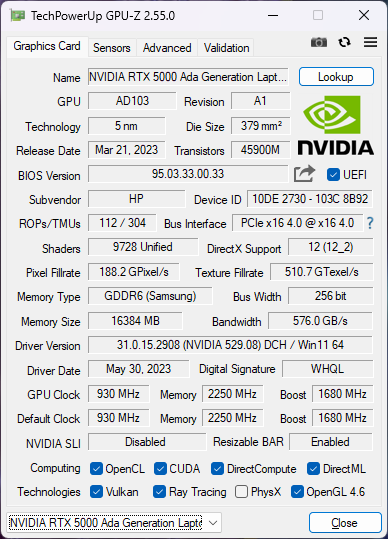
Unser spezifisches Testgerät ist eine High-End-Konfiguration mit Core i9-13950HX, Nvidia RTX 5000 Ada und 2400p-IPS-Display für ca. 5.300 USD im Einzelhandel. Schwächere Konfigurationen sind zu niedrigeren Einstiegspreisen erhältlich, wie die offizielle HP-Spezifikationsliste zeigt.
Zu den Alternativen zum Fury 16 G10 gehören andere mobile 16-Zoll-Workstations wie das Dell Precision 5680, das Lenovo ThinkPad P16 G1, das MSI CreatorPro Z16P oder das Asus ProArt StudioBook 16.
Mehr HP-Bewertungen:
Mögliche Konkurrenten im Vergleich
Bew. | Datum | Modell | Gewicht | Dicke | Größe | Auflösung | Preis ab |
|---|---|---|---|---|---|---|---|
| 92.3 % v7 (old) | 09 / 2023 | HP ZBook Fury 16 G10 i9-13950HX, RTX 5000 Ada Generation Laptop | 2.6 kg | 28.5 mm | 16.00" | 3840x2400 | |
| 91 % v7 (old) | 06 / 2023 | HP ZBook Fury 16 G9 i9-12950HX, RTX A5500 Laptop GPU | 2.6 kg | 28.5 mm | 16.00" | 3840x2400 | |
| 89 % v7 (old) | 08 / 2023 | Dell Precision 5000 5680 i9-13900H, RTX 5000 Ada Generation Laptop | 2.3 kg | 22.17 mm | 16.00" | 3840x2400 | |
| 91 % v7 (old) | 02 / 2023 | Lenovo ThinkPad P16 G1 RTX A5500 i9-12950HX, RTX A5500 Laptop GPU | 3 kg | 30.23 mm | 16.00" | 3840x2400 | |
| 84.3 % v7 (old) | 11 / 2022 | MSI CreatorPro Z16P B12UKST i7-12700H, RTX A3000 Laptop GPU | 2.4 kg | 19 mm | 16.00" | 2560x1600 | |
v (old) | 11 / 2021 | Asus ProArt StudioBook 16 W7600H5A-2BL2 W-11955M, RTX A5000 Laptop GPU | 2.4 kg | 21.4 mm | 16.00" | 3840x2400 |
Gehäuse - Vertrautes Design beim ZBook Fury 16 G9
SD-Kartenleser
| SD Card Reader | |
| average JPG Copy Test (av. of 3 runs) | |
| Dell Precision 5000 5680 (Toshiba Exceria Pro SDXC 64 GB UHS-II) | |
| MSI CreatorPro Z16P B12UKST (AV Pro V60) | |
| HP ZBook Fury 16 G10 (Toshiba Exceria Pro SDXC 64 GB UHS-II) | |
| HP ZBook Fury 16 G9 (PNY EliteX-PRO60) | |
| Lenovo ThinkPad P16 G1 RTX A5500 (Toshiba Exceria Pro SDXC 64 GB UHS-II) | |
| Asus ProArt StudioBook 16 W7600H5A-2BL2 (AV Pro SD microSD 128 GB V60) | |
| maximum AS SSD Seq Read Test (1GB) | |
| Dell Precision 5000 5680 (Toshiba Exceria Pro SDXC 64 GB UHS-II) | |
| HP ZBook Fury 16 G10 (Toshiba Exceria Pro SDXC 64 GB UHS-II) | |
| Asus ProArt StudioBook 16 W7600H5A-2BL2 (AV Pro SD microSD 128 GB V60) | |
| HP ZBook Fury 16 G9 (PNY EliteX-PRO60) | |
| MSI CreatorPro Z16P B12UKST (AV Pro V60) | |
| Lenovo ThinkPad P16 G1 RTX A5500 (Toshiba Exceria Pro SDXC 64 GB UHS-II) | |
Kommunikation
| Networking | |
| iperf3 transmit AX12 | |
| Asus ProArt StudioBook 16 W7600H5A-2BL2 | |
| iperf3 receive AX12 | |
| Asus ProArt StudioBook 16 W7600H5A-2BL2 | |
| iperf3 transmit AXE11000 | |
| HP ZBook Fury 16 G10 | |
| Lenovo ThinkPad P16 G1 RTX A5500 | |
| Dell Precision 5000 5680 | |
| HP ZBook Fury 16 G9 | |
| iperf3 receive AXE11000 | |
| HP ZBook Fury 16 G9 | |
| HP ZBook Fury 16 G10 | |
| Lenovo ThinkPad P16 G1 RTX A5500 | |
| Dell Precision 5000 5680 | |
| iperf3 transmit AXE11000 6GHz | |
| MSI CreatorPro Z16P B12UKST | |
| Lenovo ThinkPad P16 G1 RTX A5500 | |
| HP ZBook Fury 16 G10 | |
| Dell Precision 5000 5680 | |
| iperf3 receive AXE11000 6GHz | |
| MSI CreatorPro Z16P B12UKST | |
| HP ZBook Fury 16 G10 | |
| Lenovo ThinkPad P16 G1 RTX A5500 | |
| Dell Precision 5000 5680 | |
Webcam
HP-Laptops haben weiterhin einige der höchstauflösenden Webcams auf dem Markt. Der 5-MP-Sensor des Fury 16 G10 bietet ein viel saubereres Bild als die 2-MP-Webcam des Precision 5680.


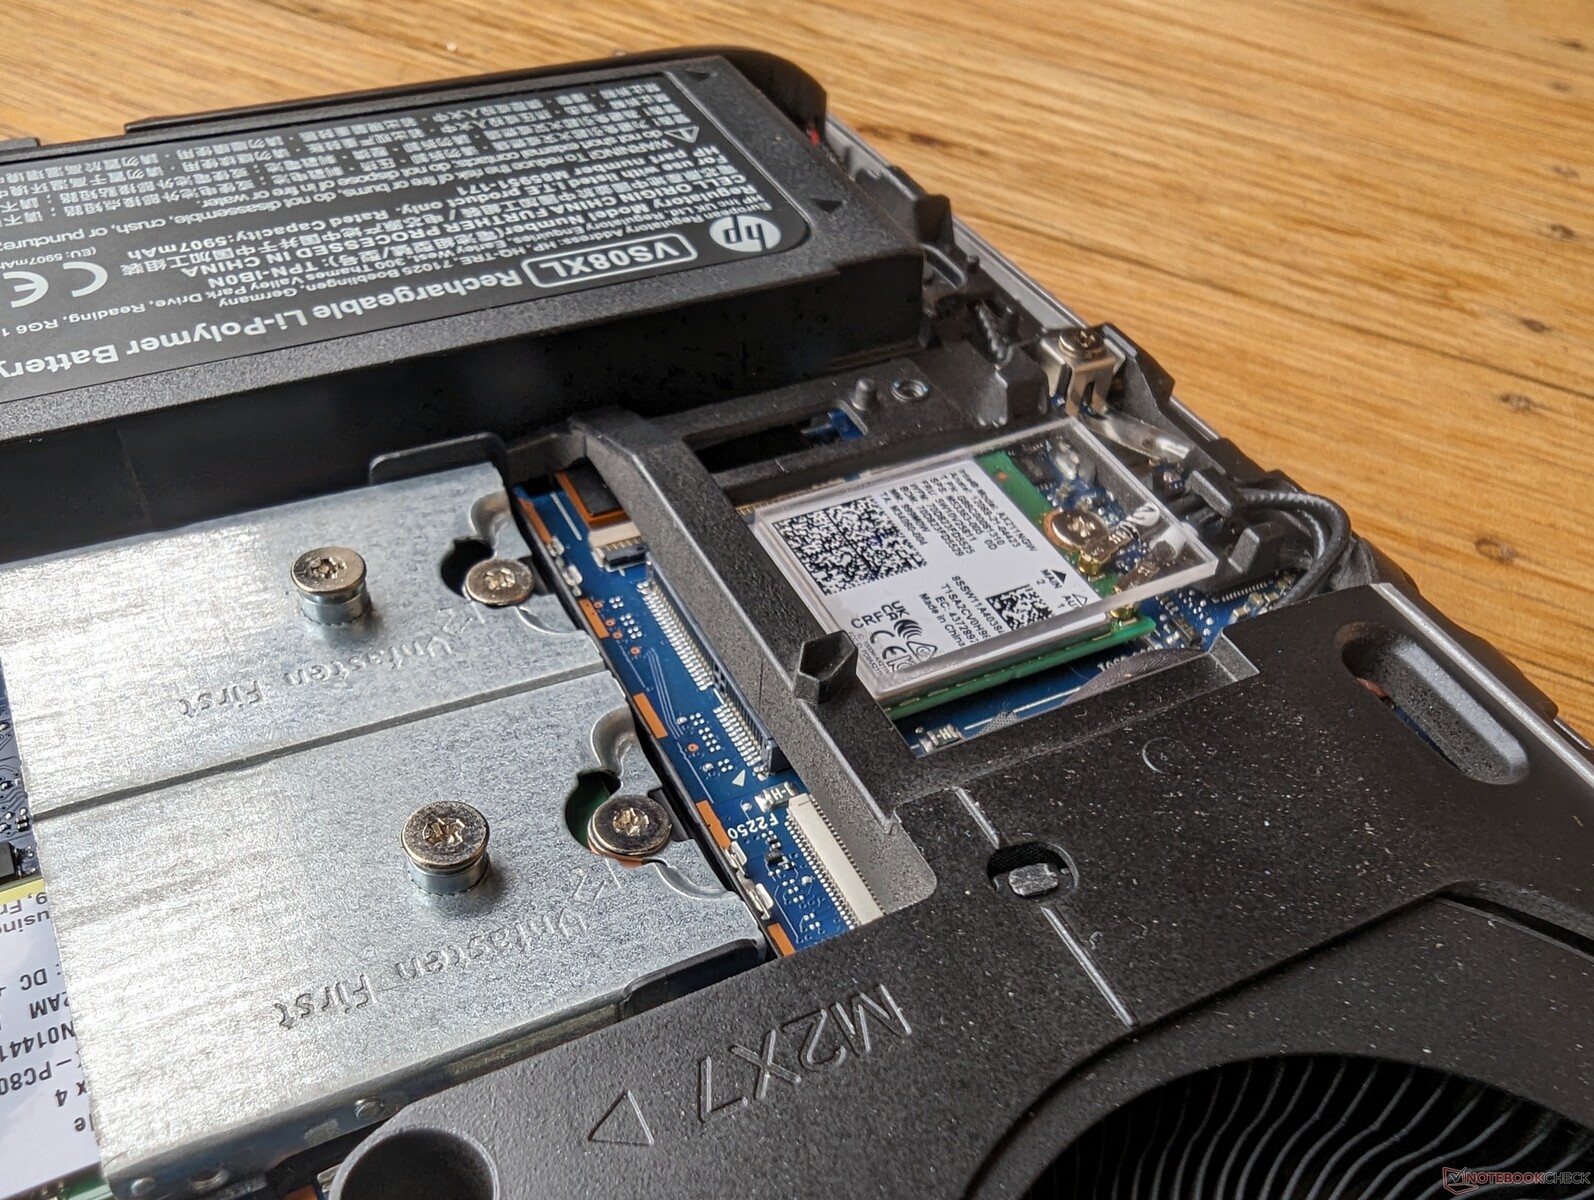
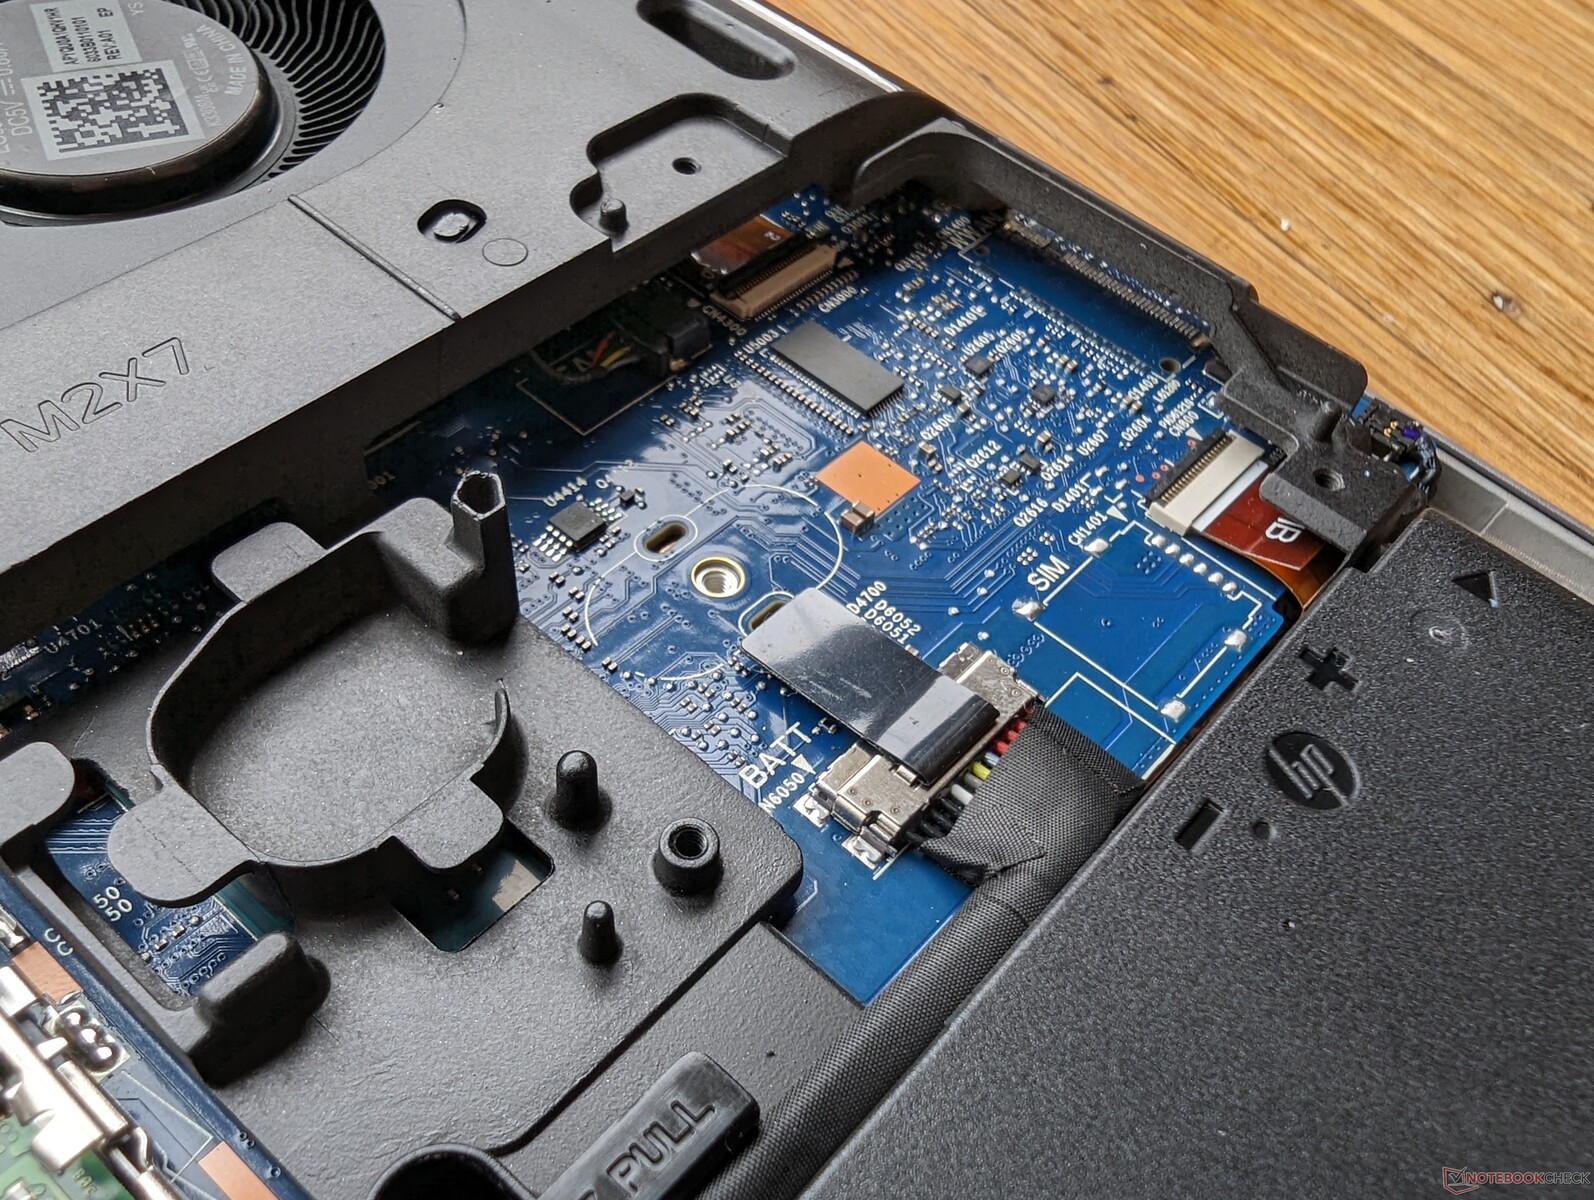
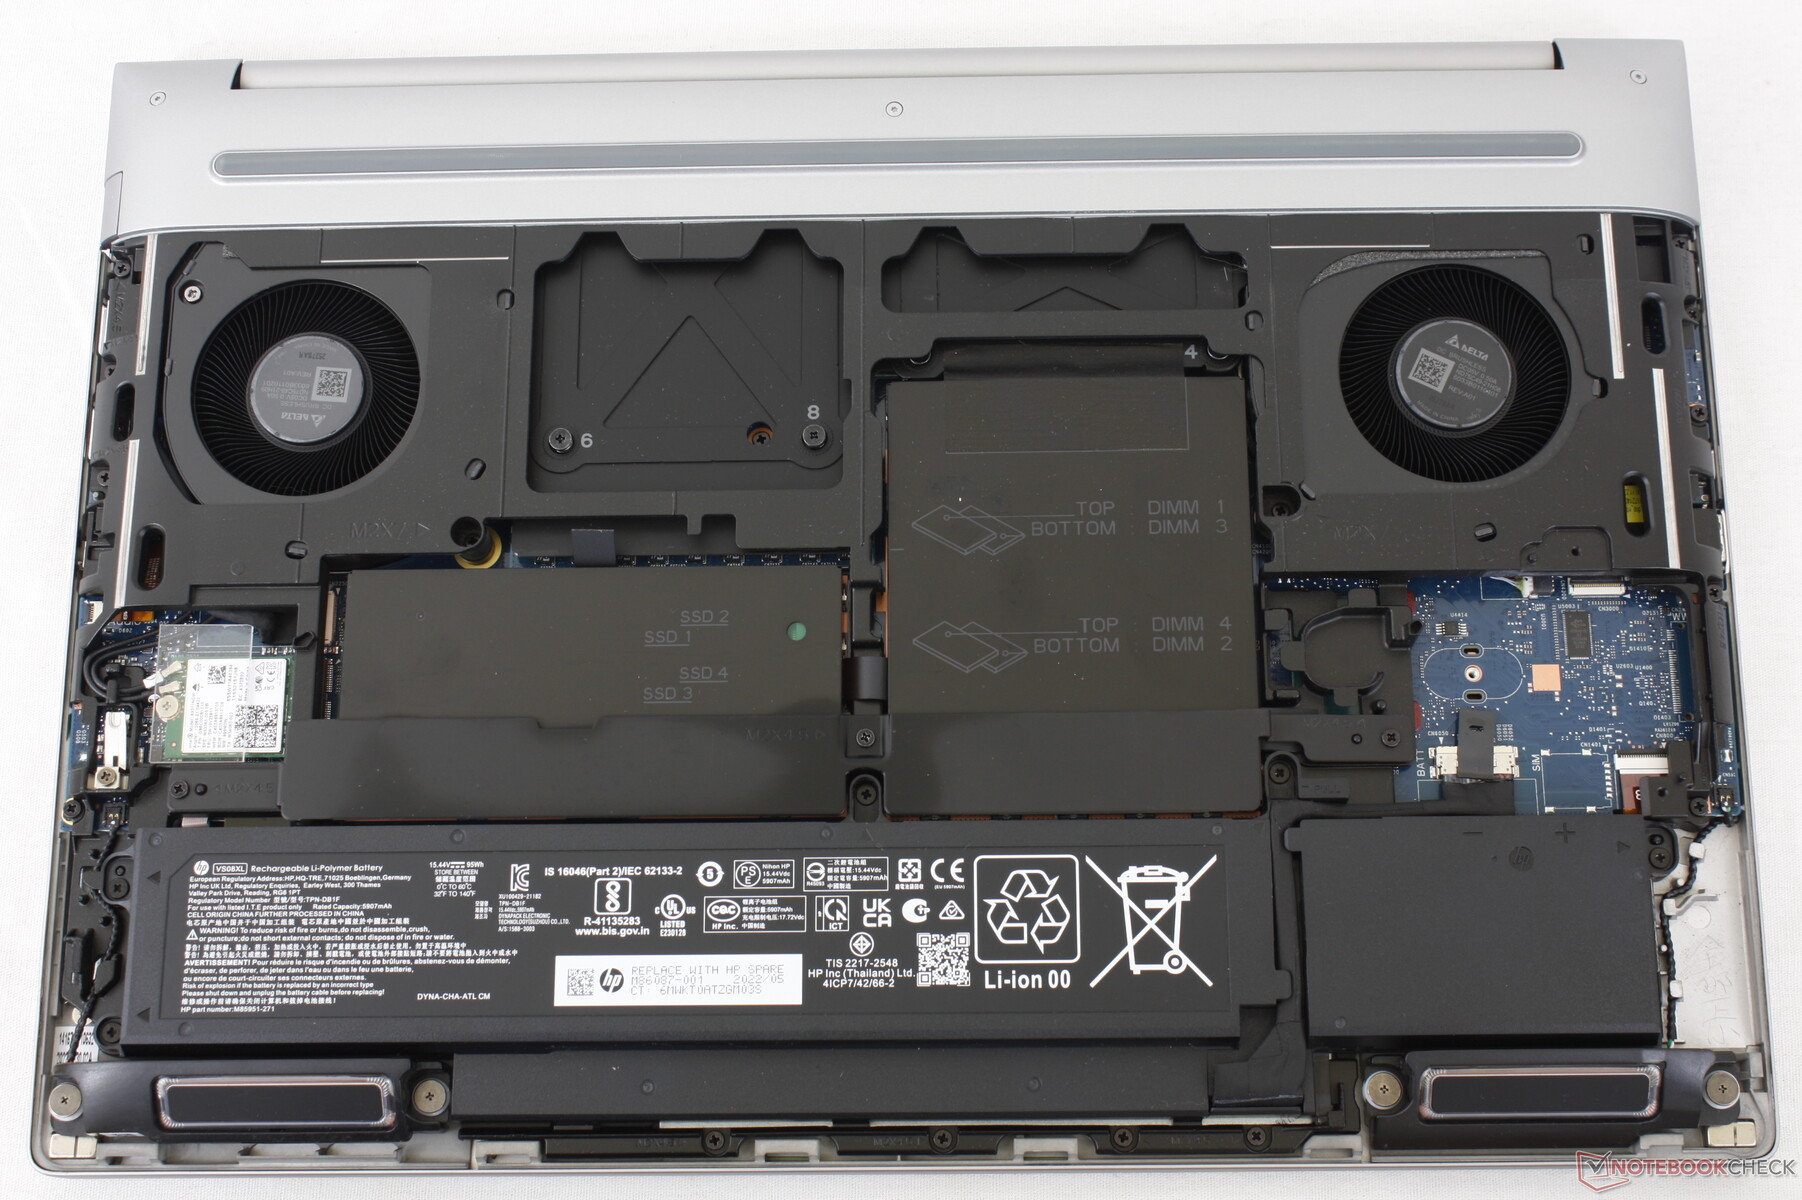
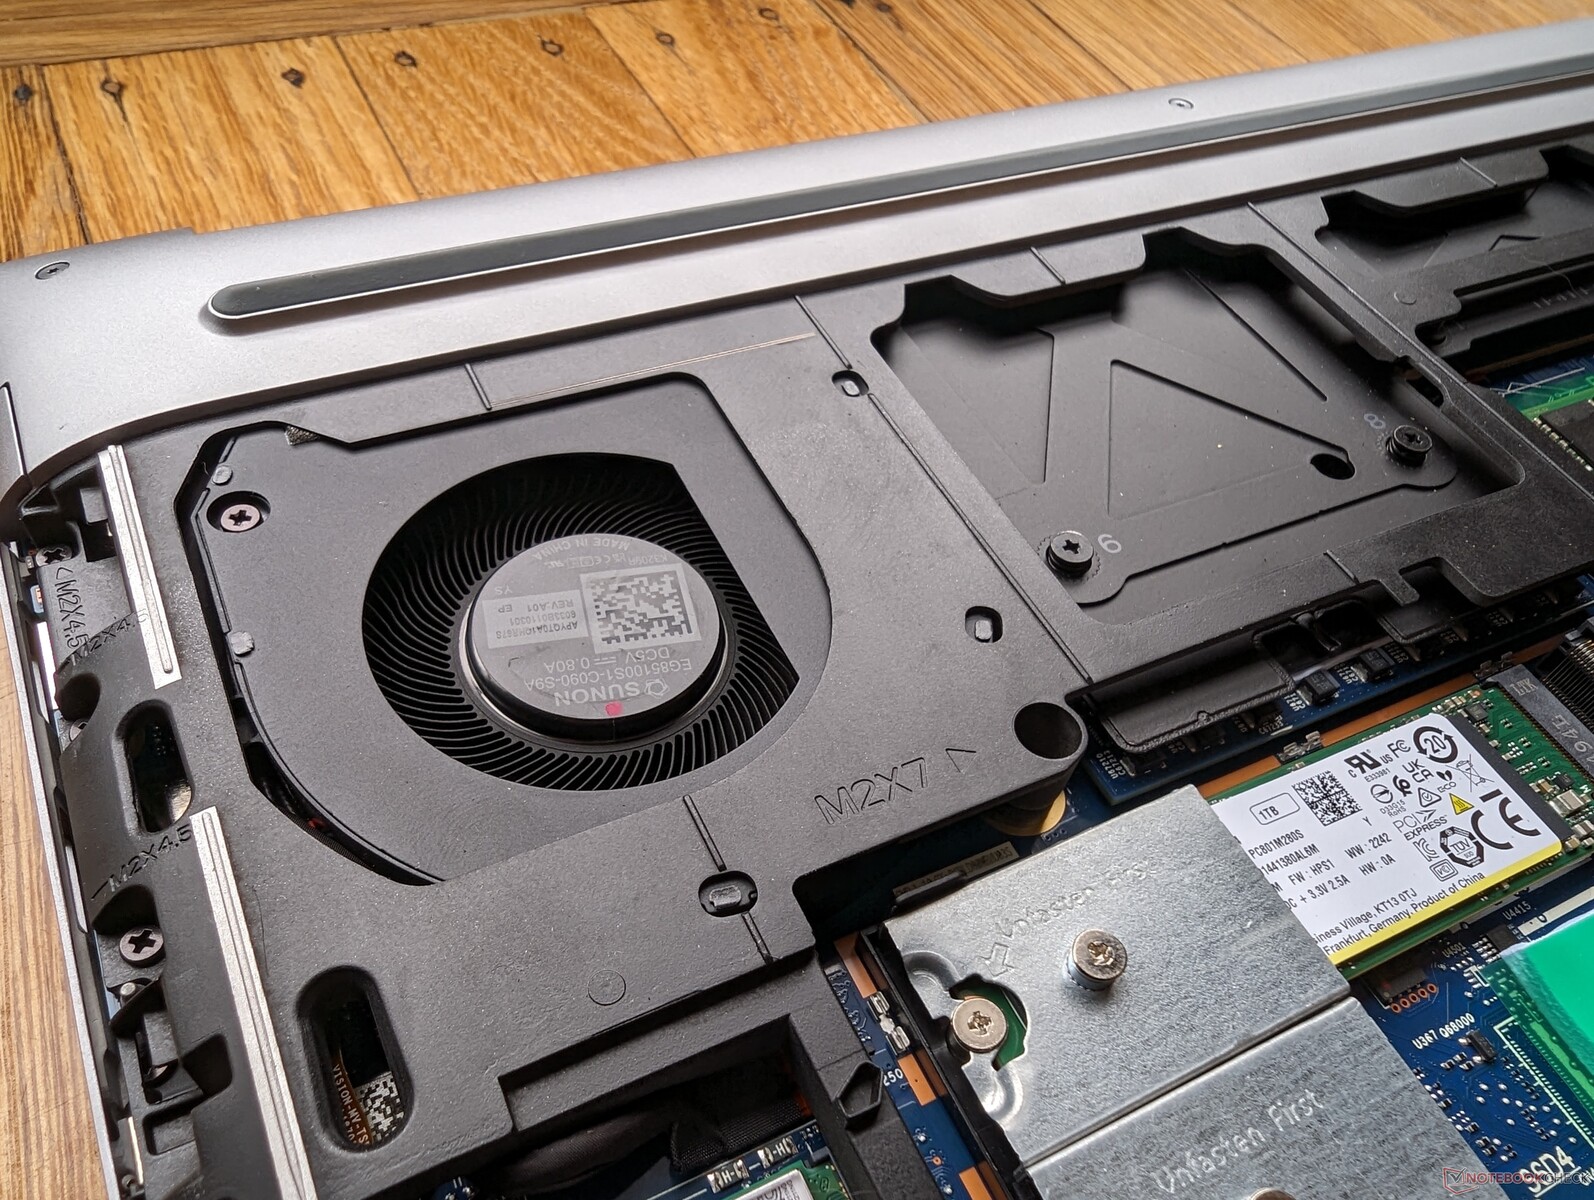
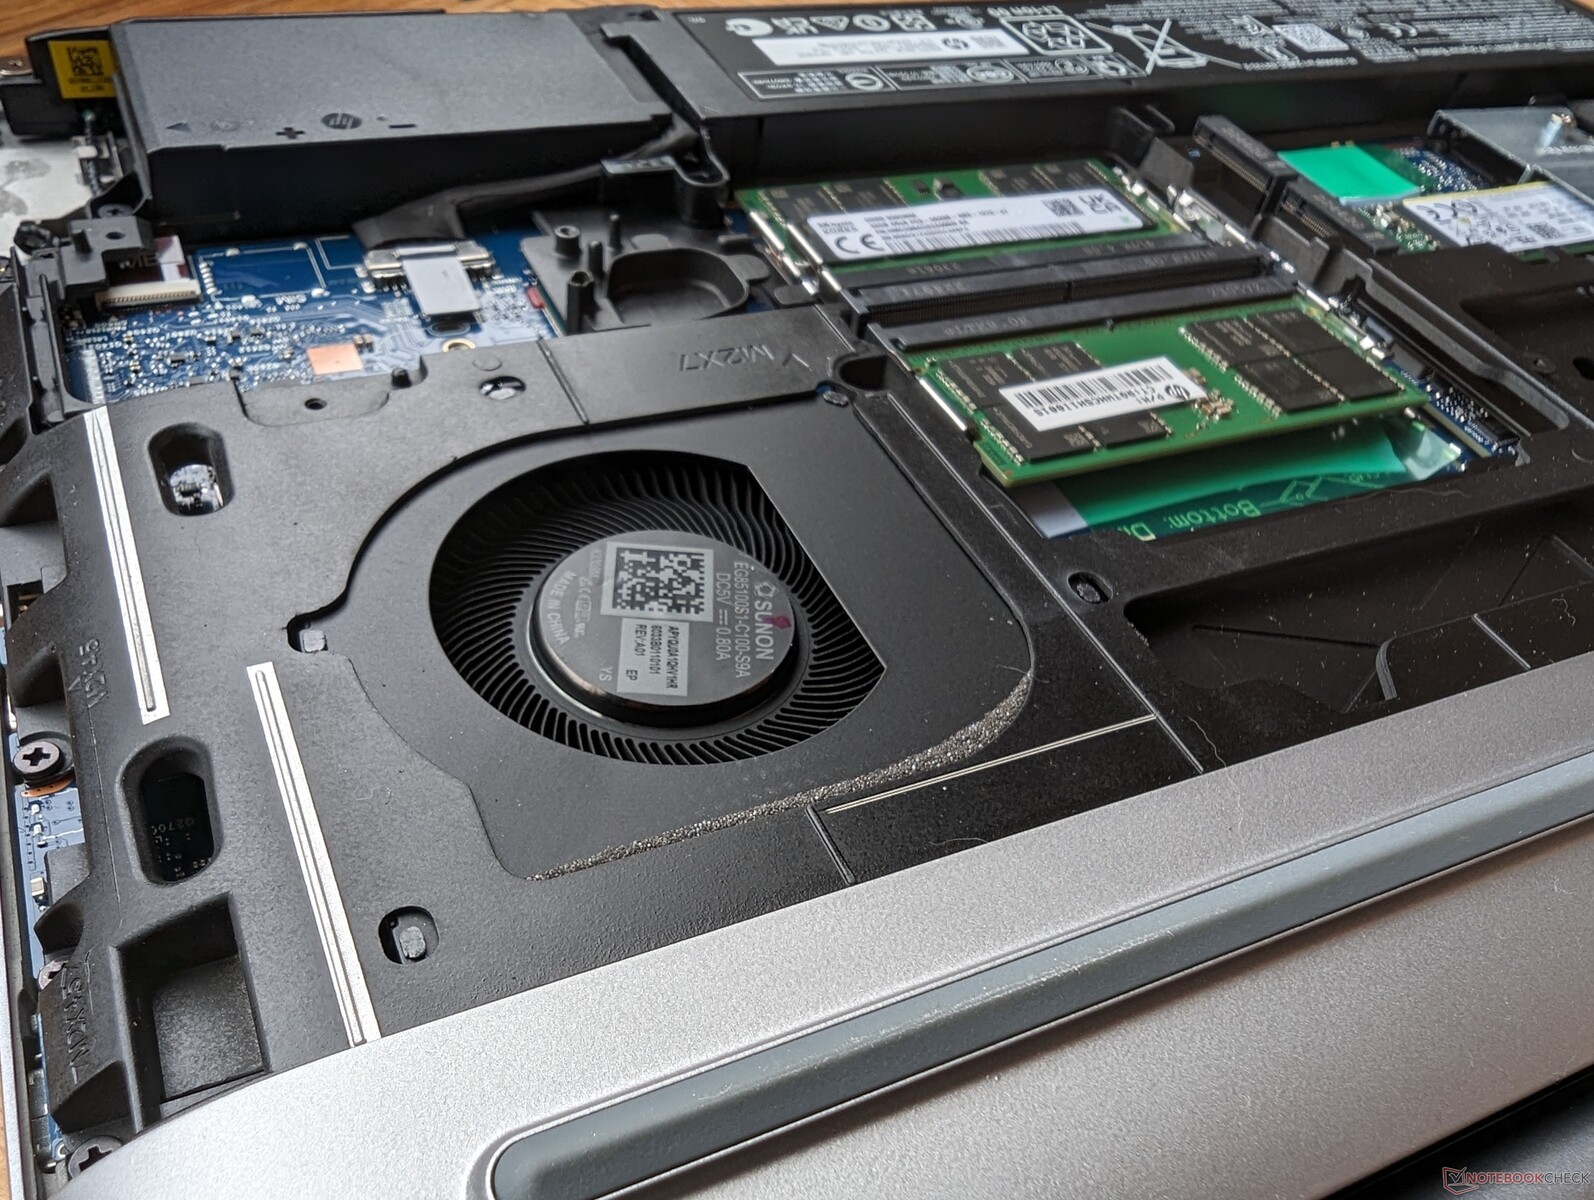
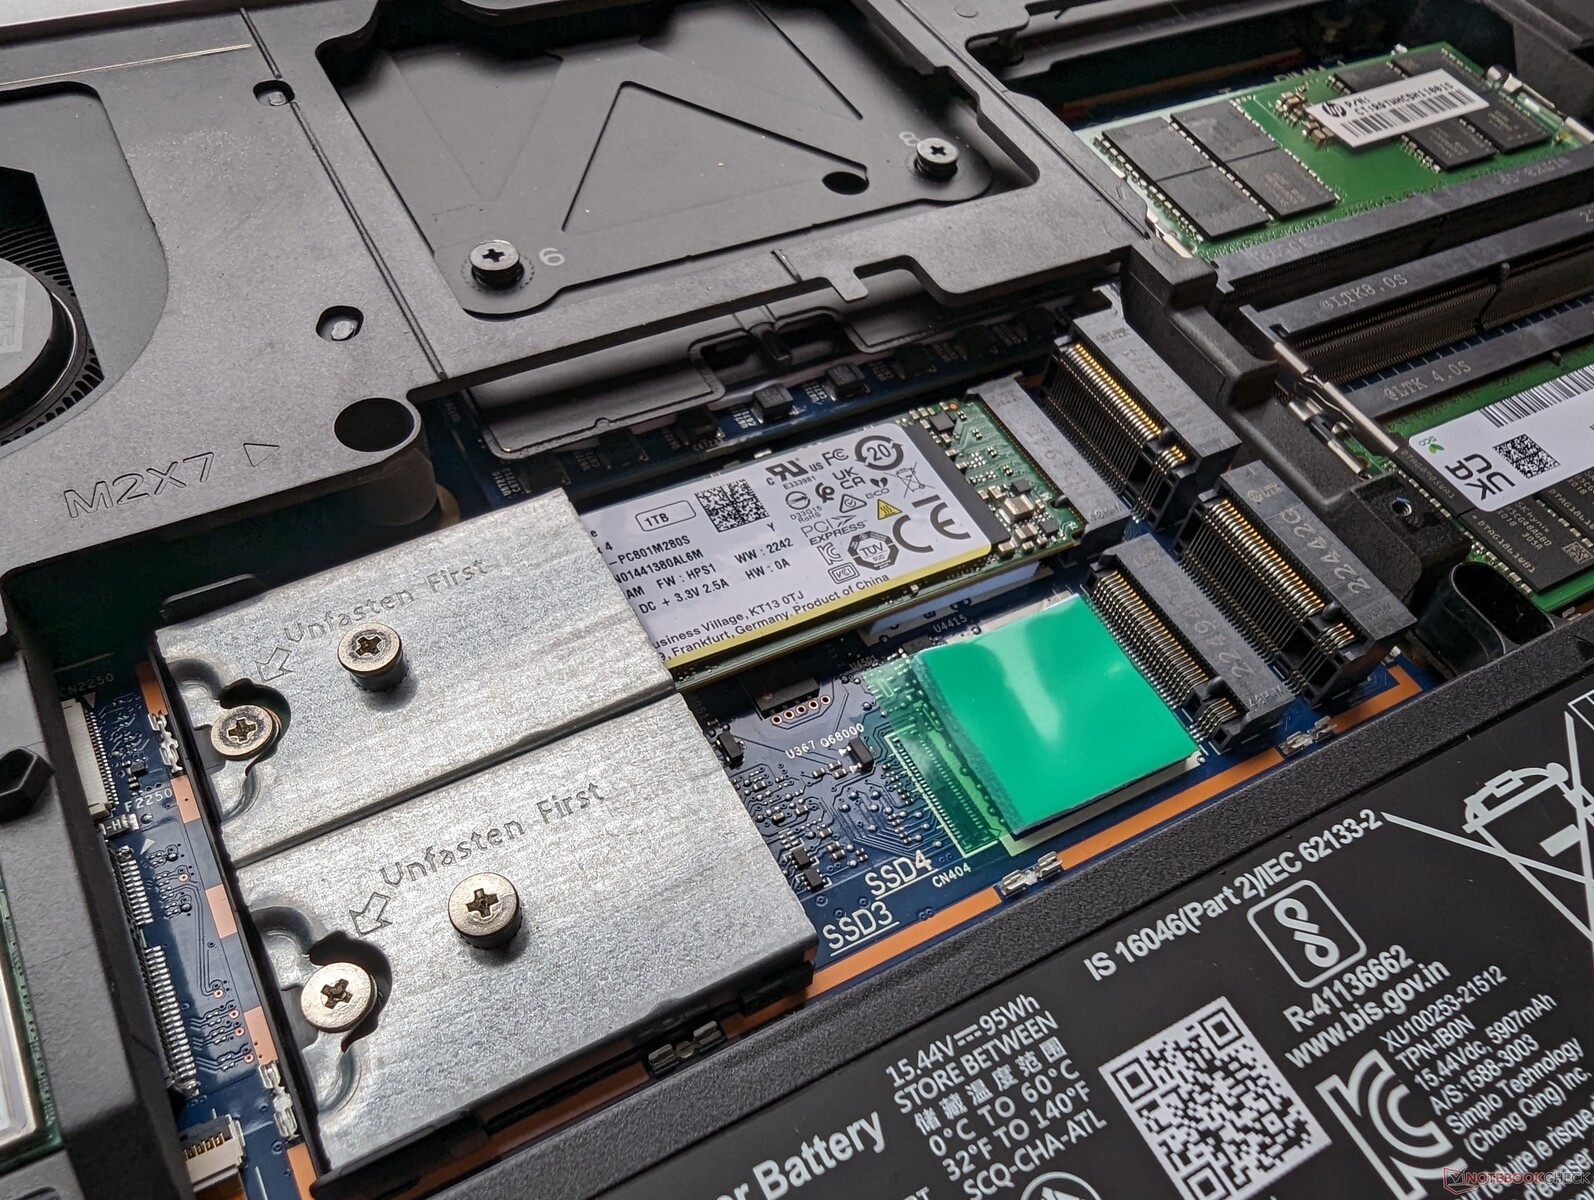
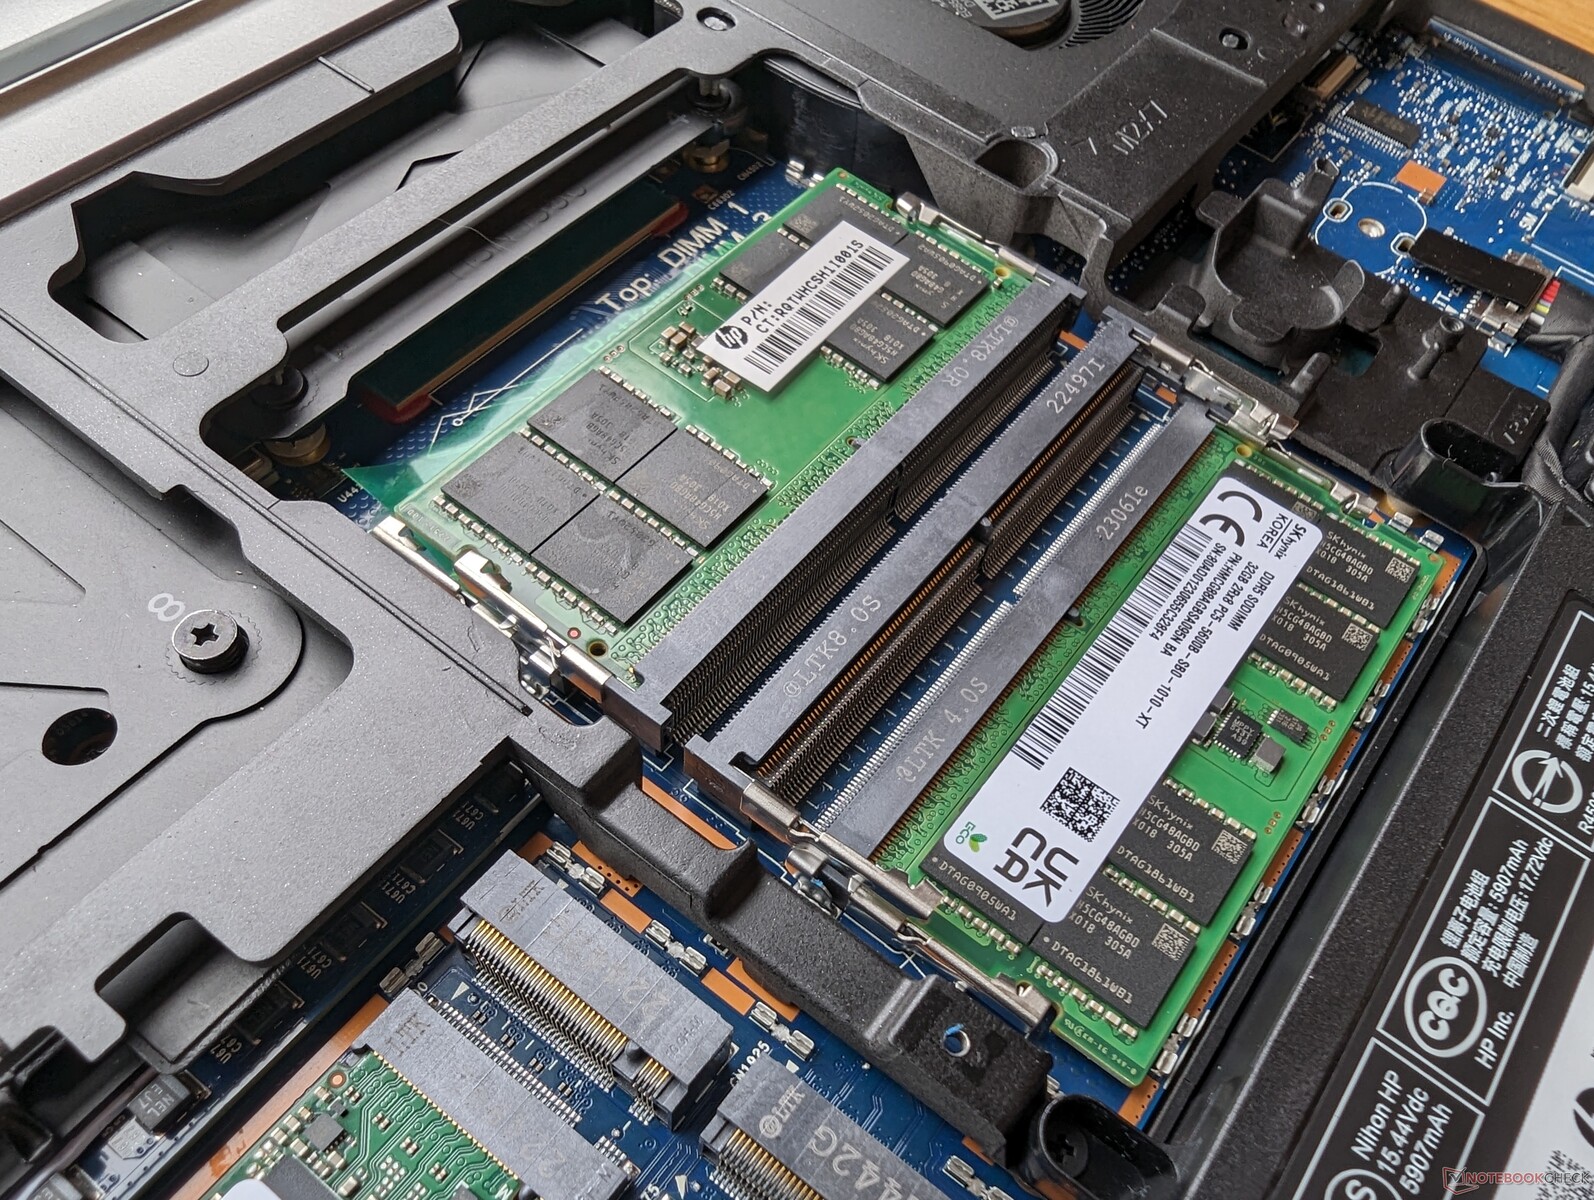
Wartung
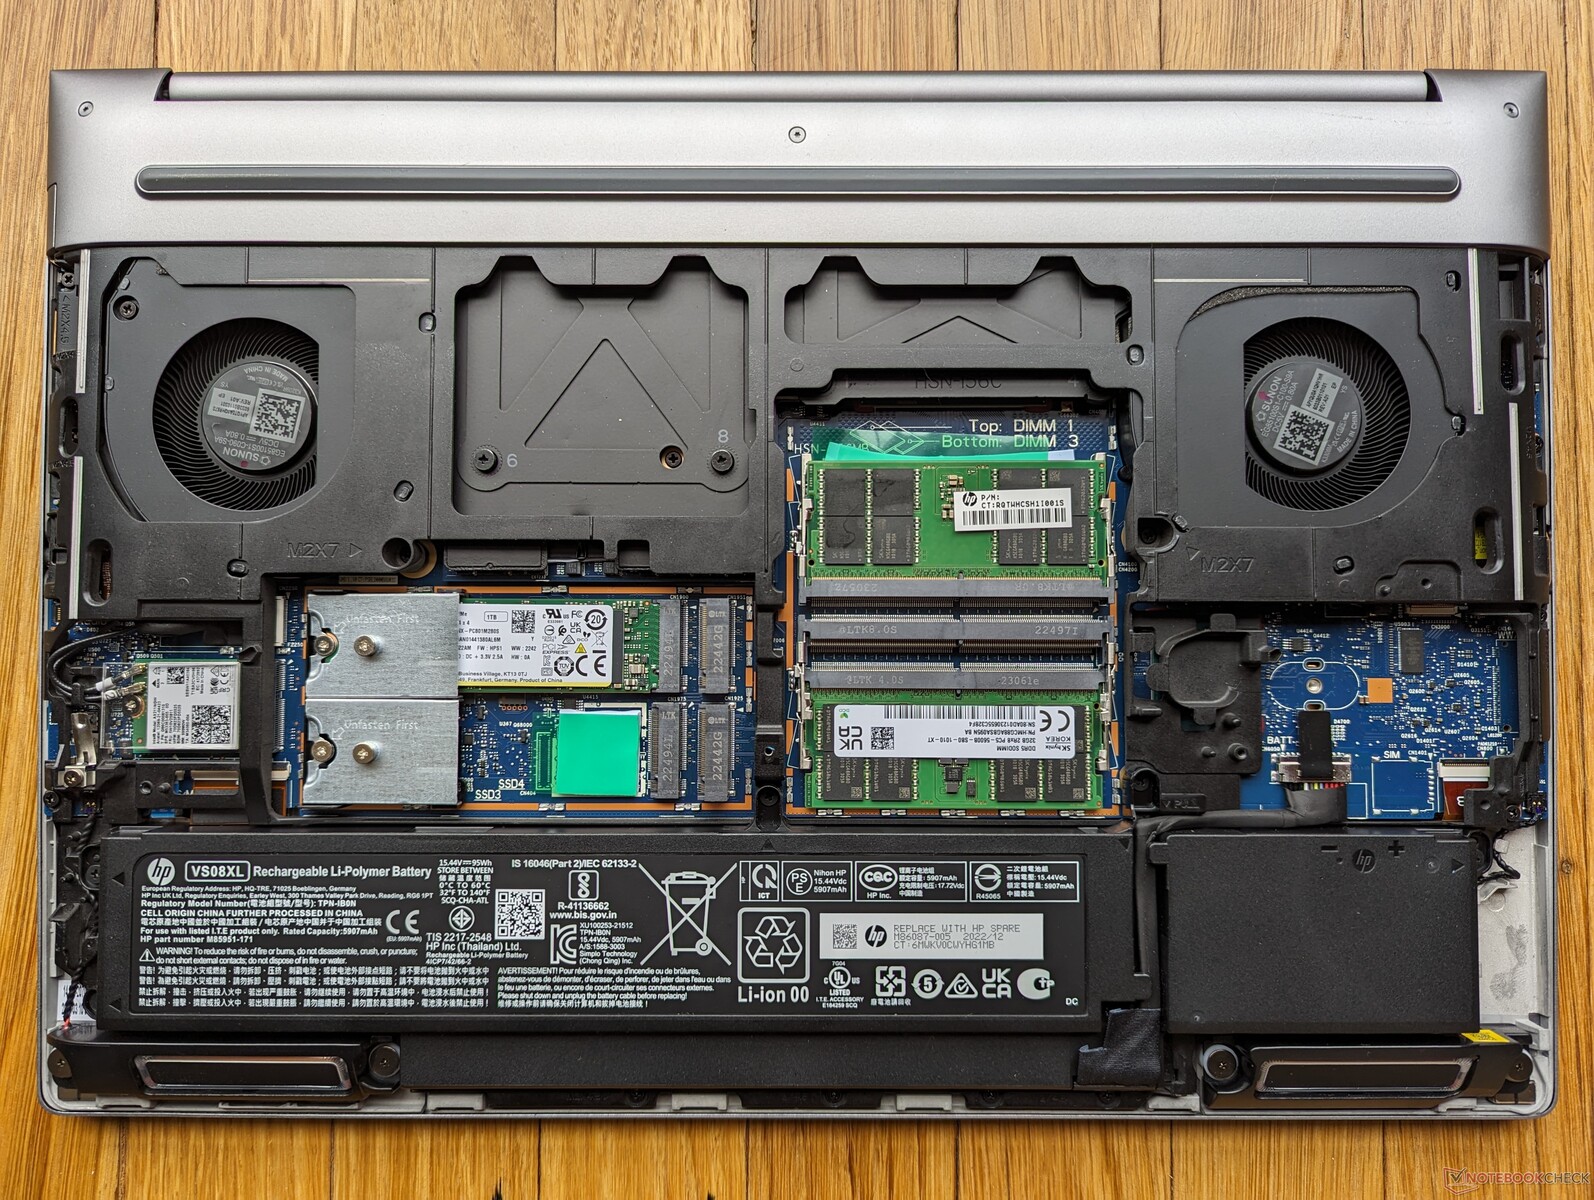
Die Wartung ist "werkzeuglos" in dem Sinne, dass die Bodenplatte ohne Werkzeug entfernt werden kann. Im Inneren wird jedoch ein Schraubenzieher benötigt, um die Metallplatte zu entfernen, die vier SSDs und vier RAM-Module schützt.
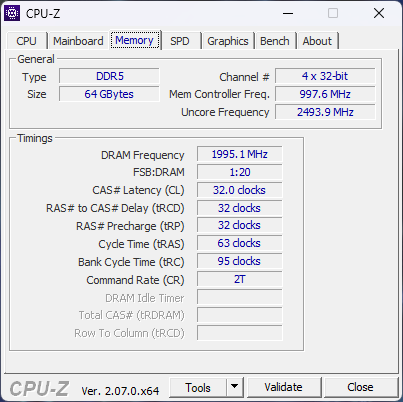
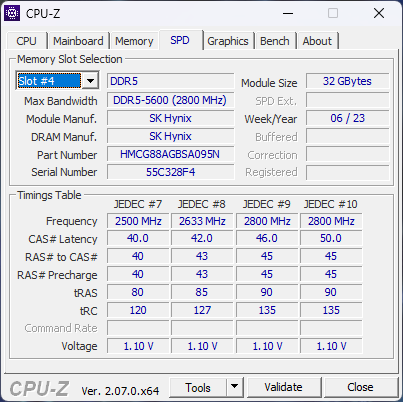
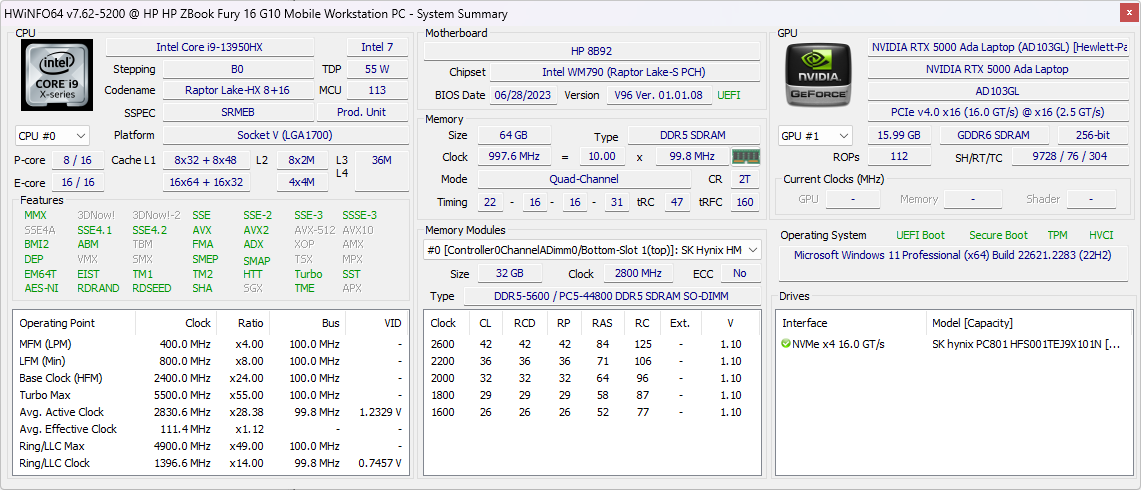
Bis zu 128 GB RAM werden unterstützt, allerdings nur bis zu 4000 MT/s.
Zubehör und Garantie
Im Karton befinden sich außer dem Netzteil und den Papieren keine weiteren Extras.
Display
Die folgenden drei eDP+PSR (Panel Self Refresh) Display-Optionen sind für das 16 Zoll Fury 16 G10 erhältlich. Unser Gerät wurde mit der fettgedruckten Option konfiguriert:
- 3840 x 2400, 60 Hz, OLED, Touchscreen, 400 nits, 100% DCI-P3, glänzend
- 3840 x 2400, 120 Hz, IPS, berührungslos, 500 nits, 100 % DCI-P3, matt
- 1920 x 1200, 60 Hz, IPS, berührungslos, 1000 nits, 100 % sRGB, matt
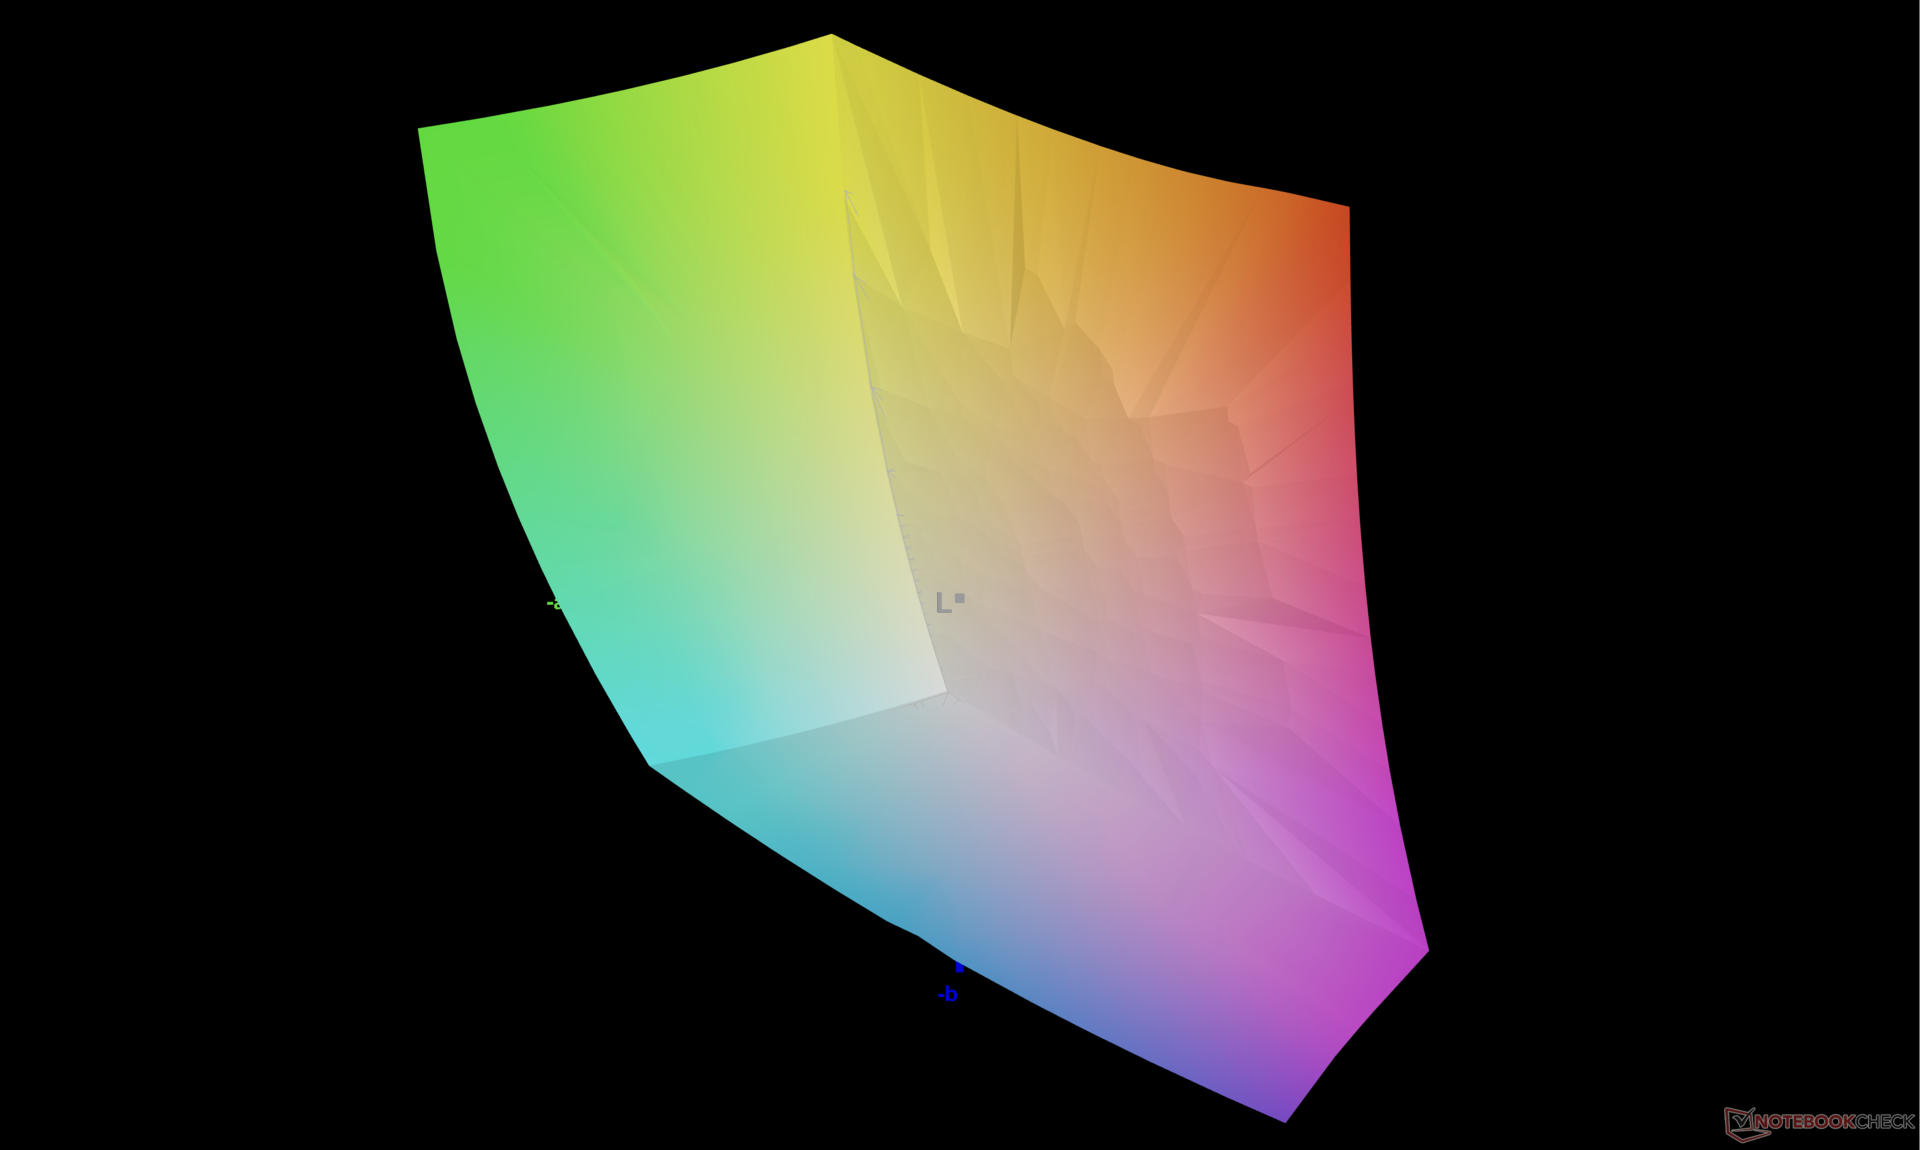
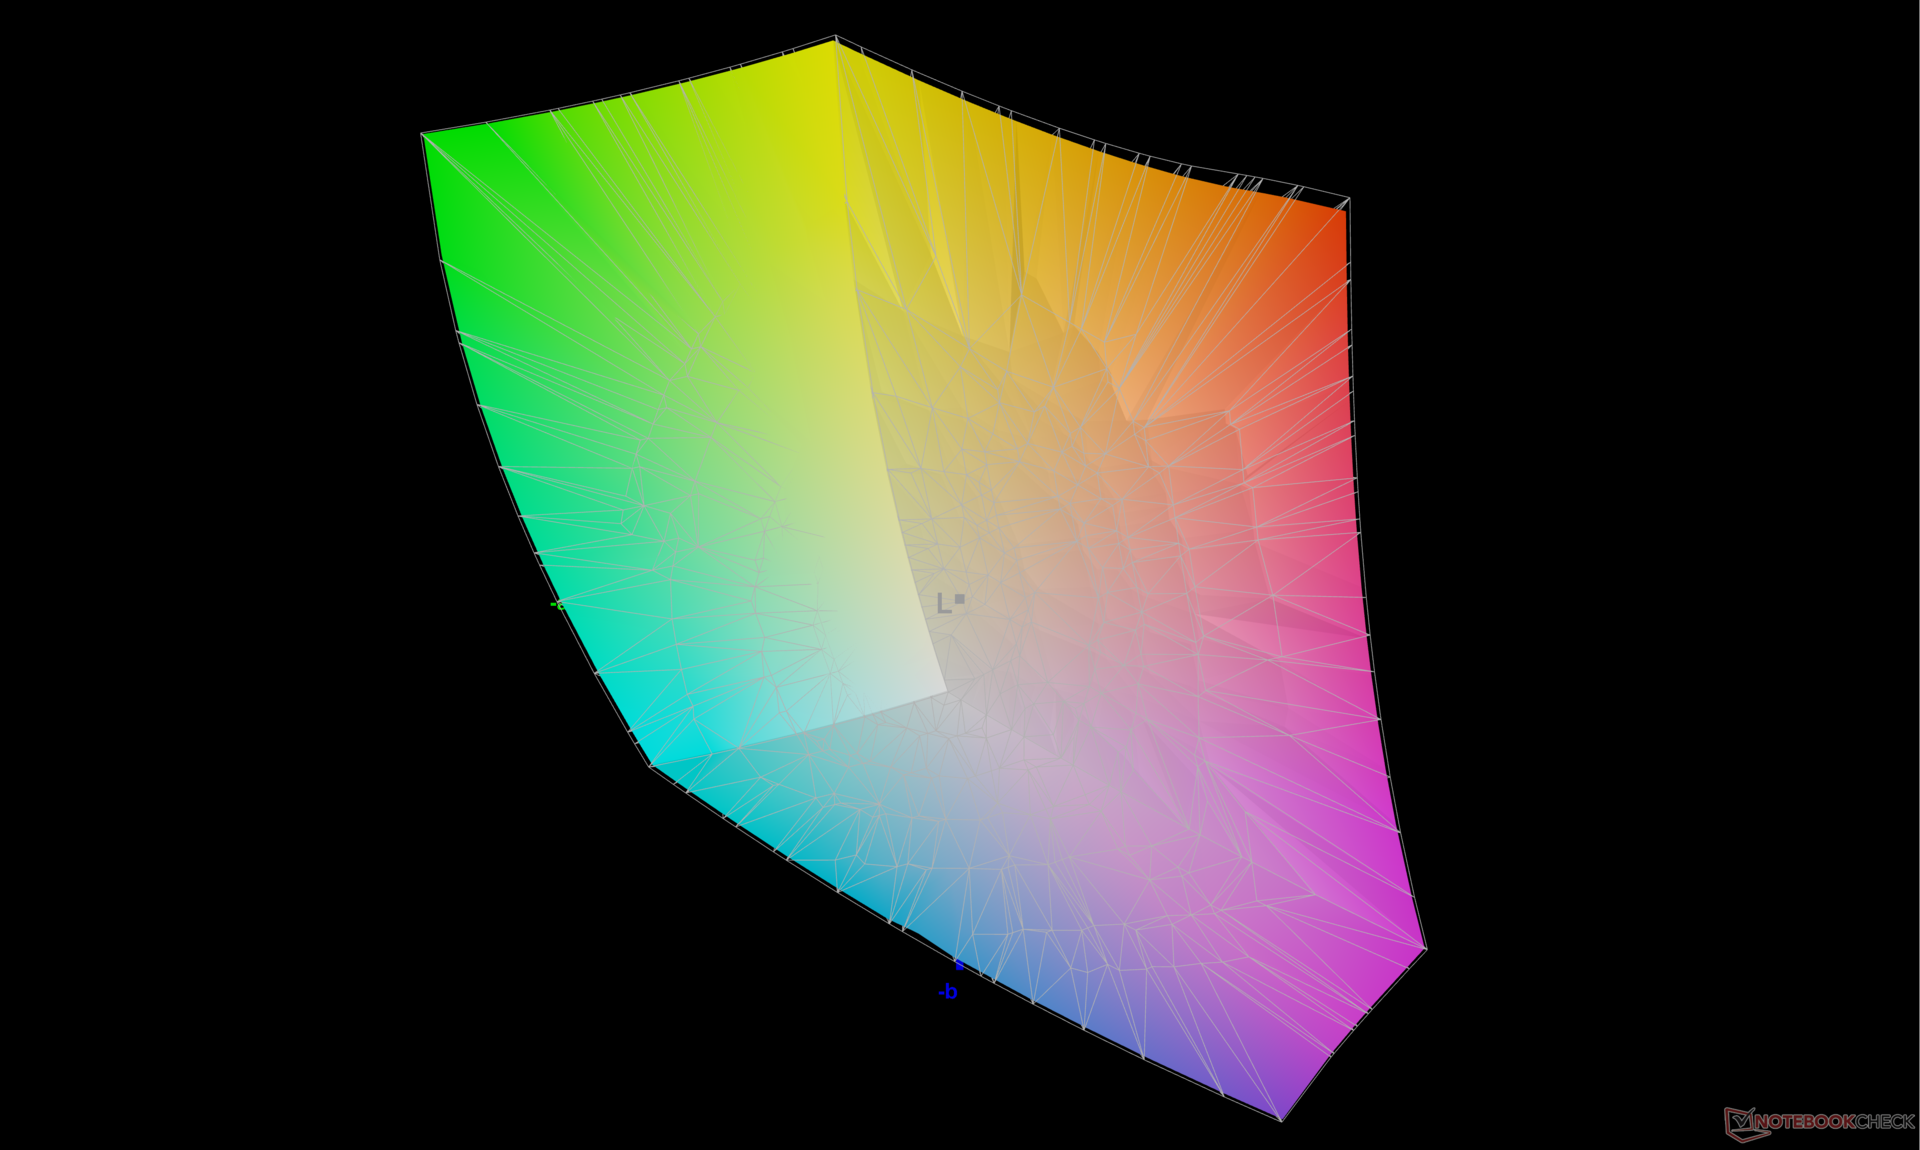
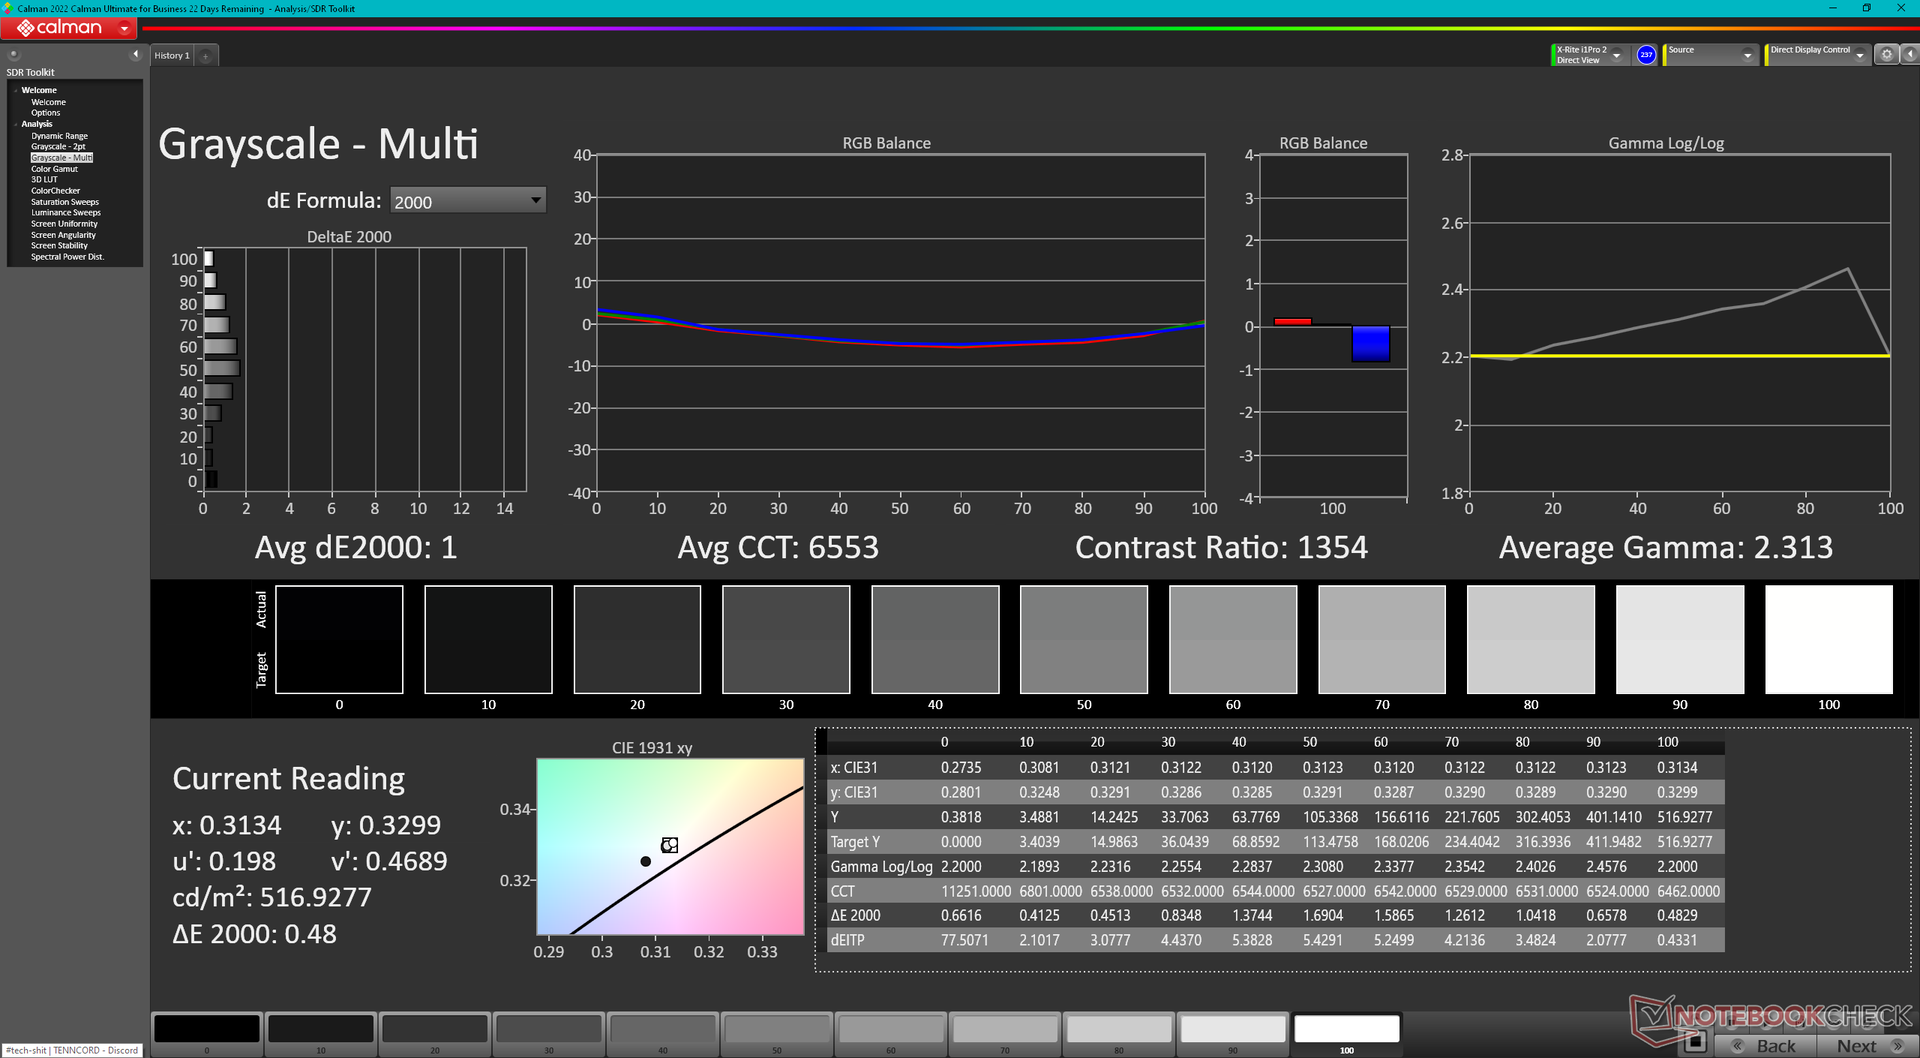
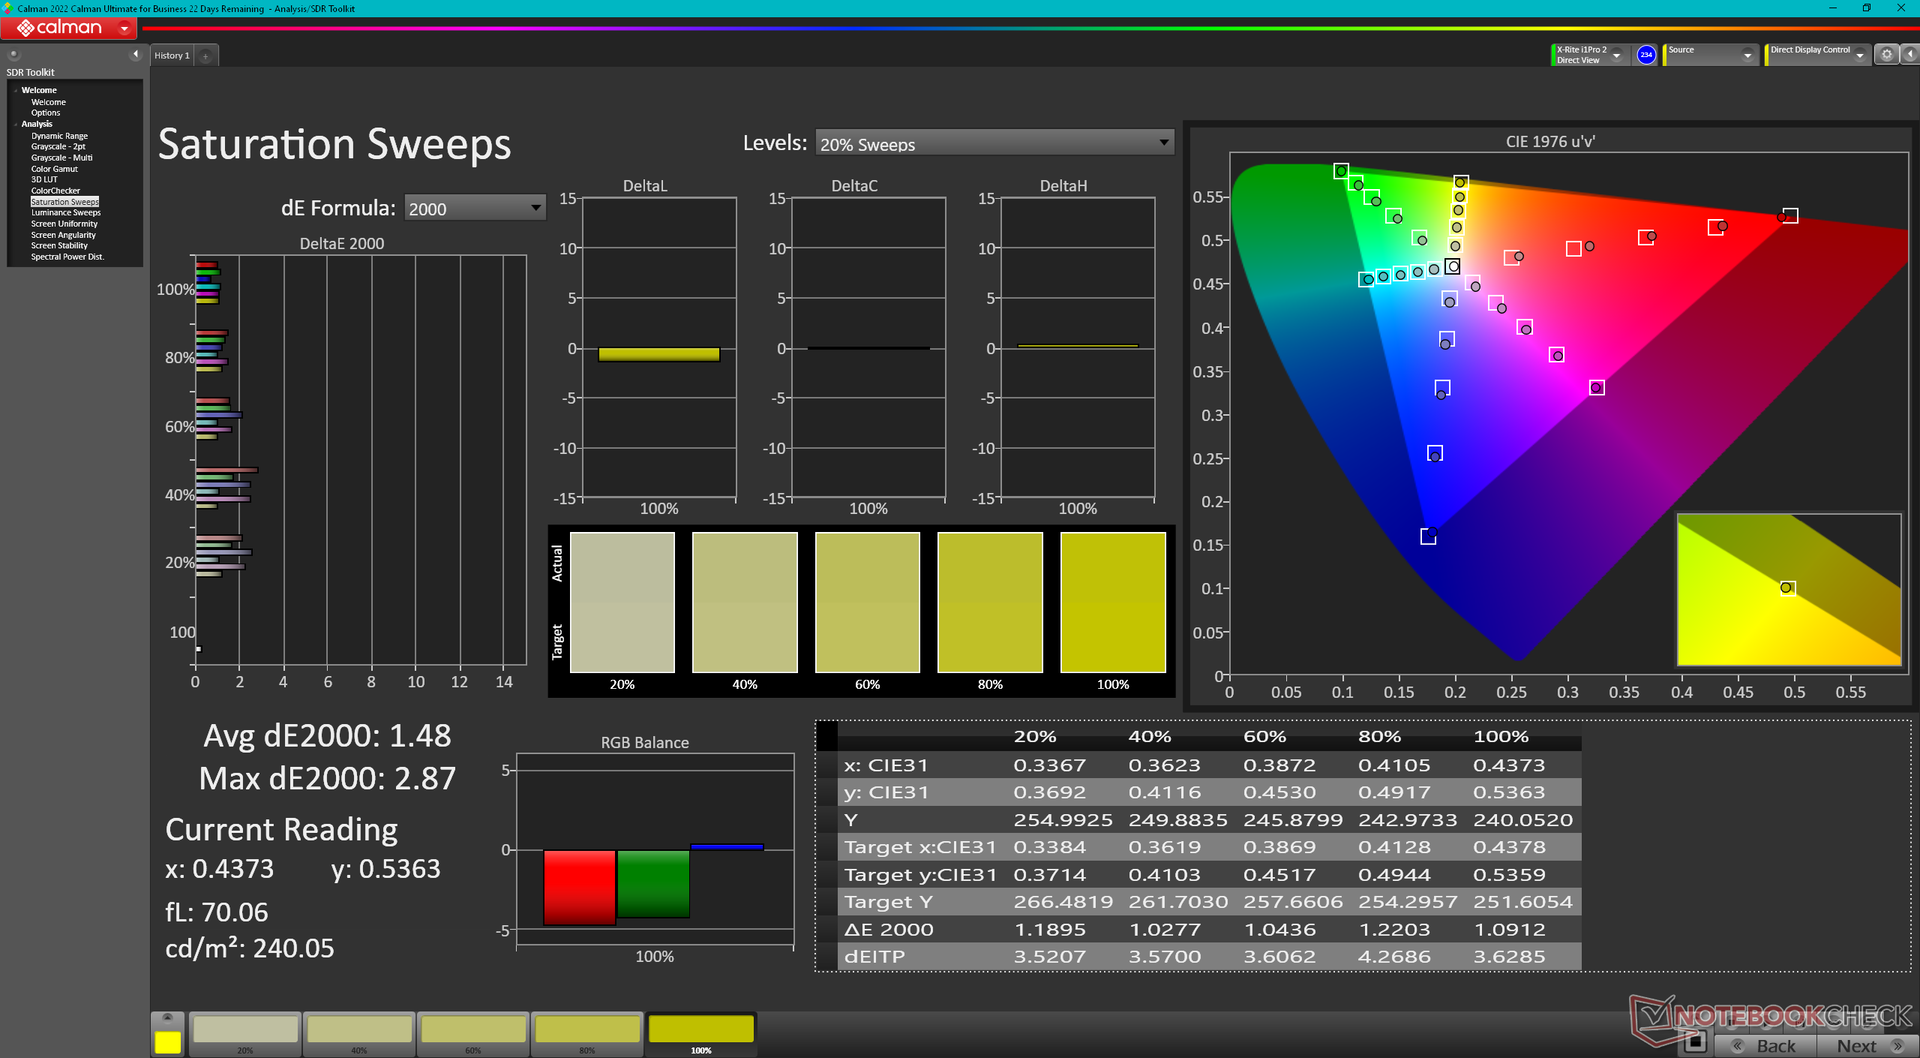
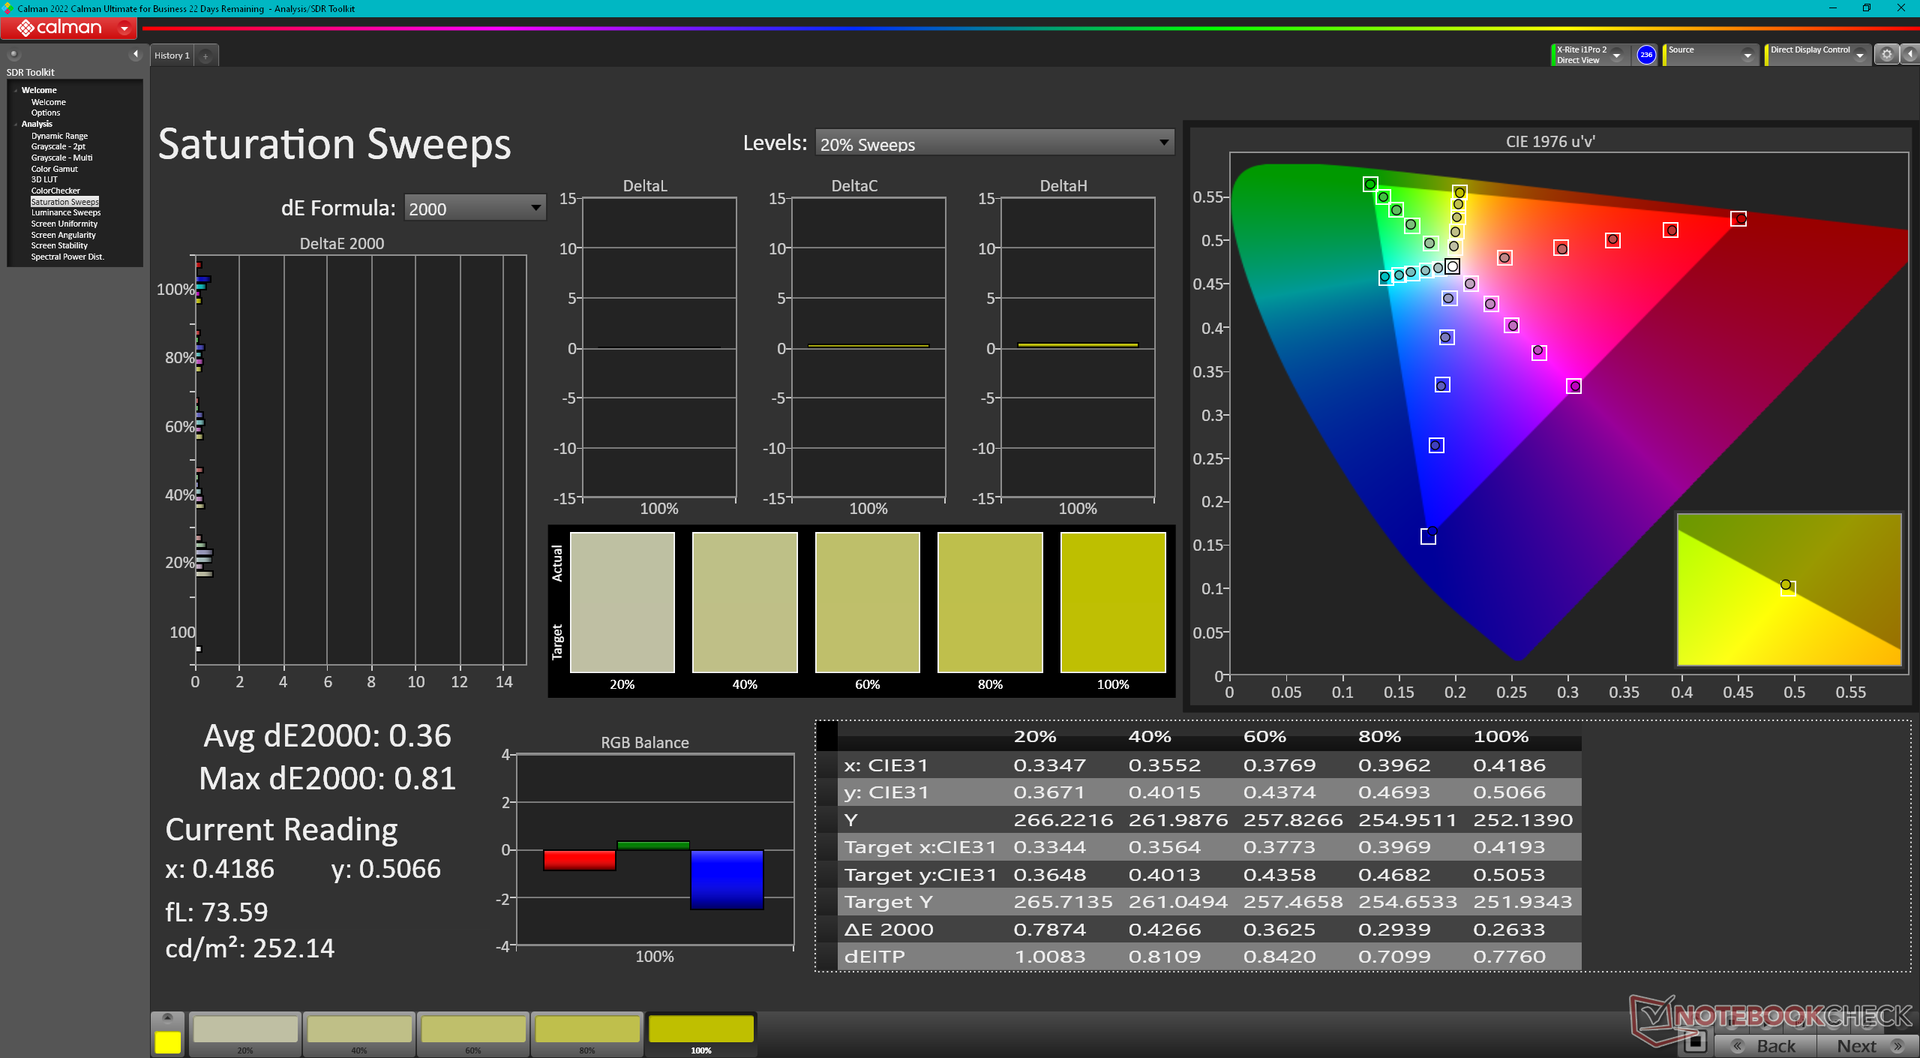
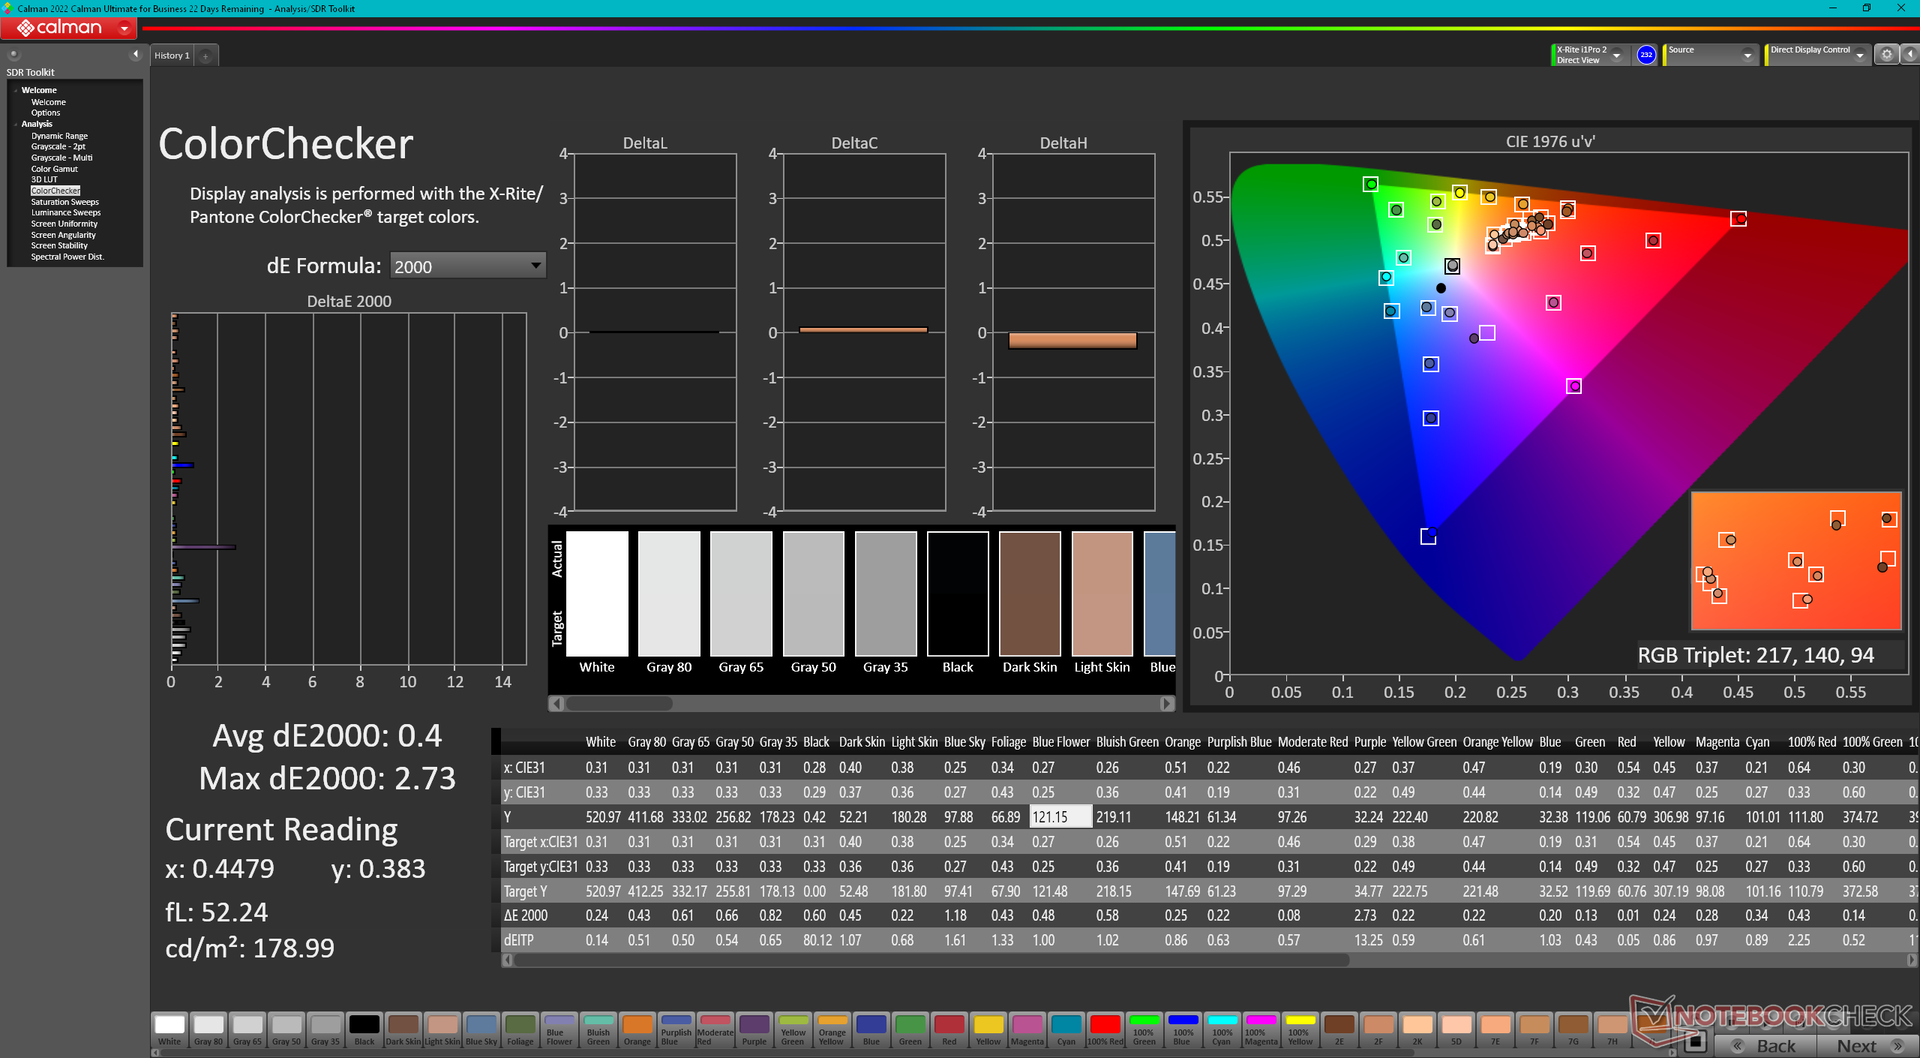
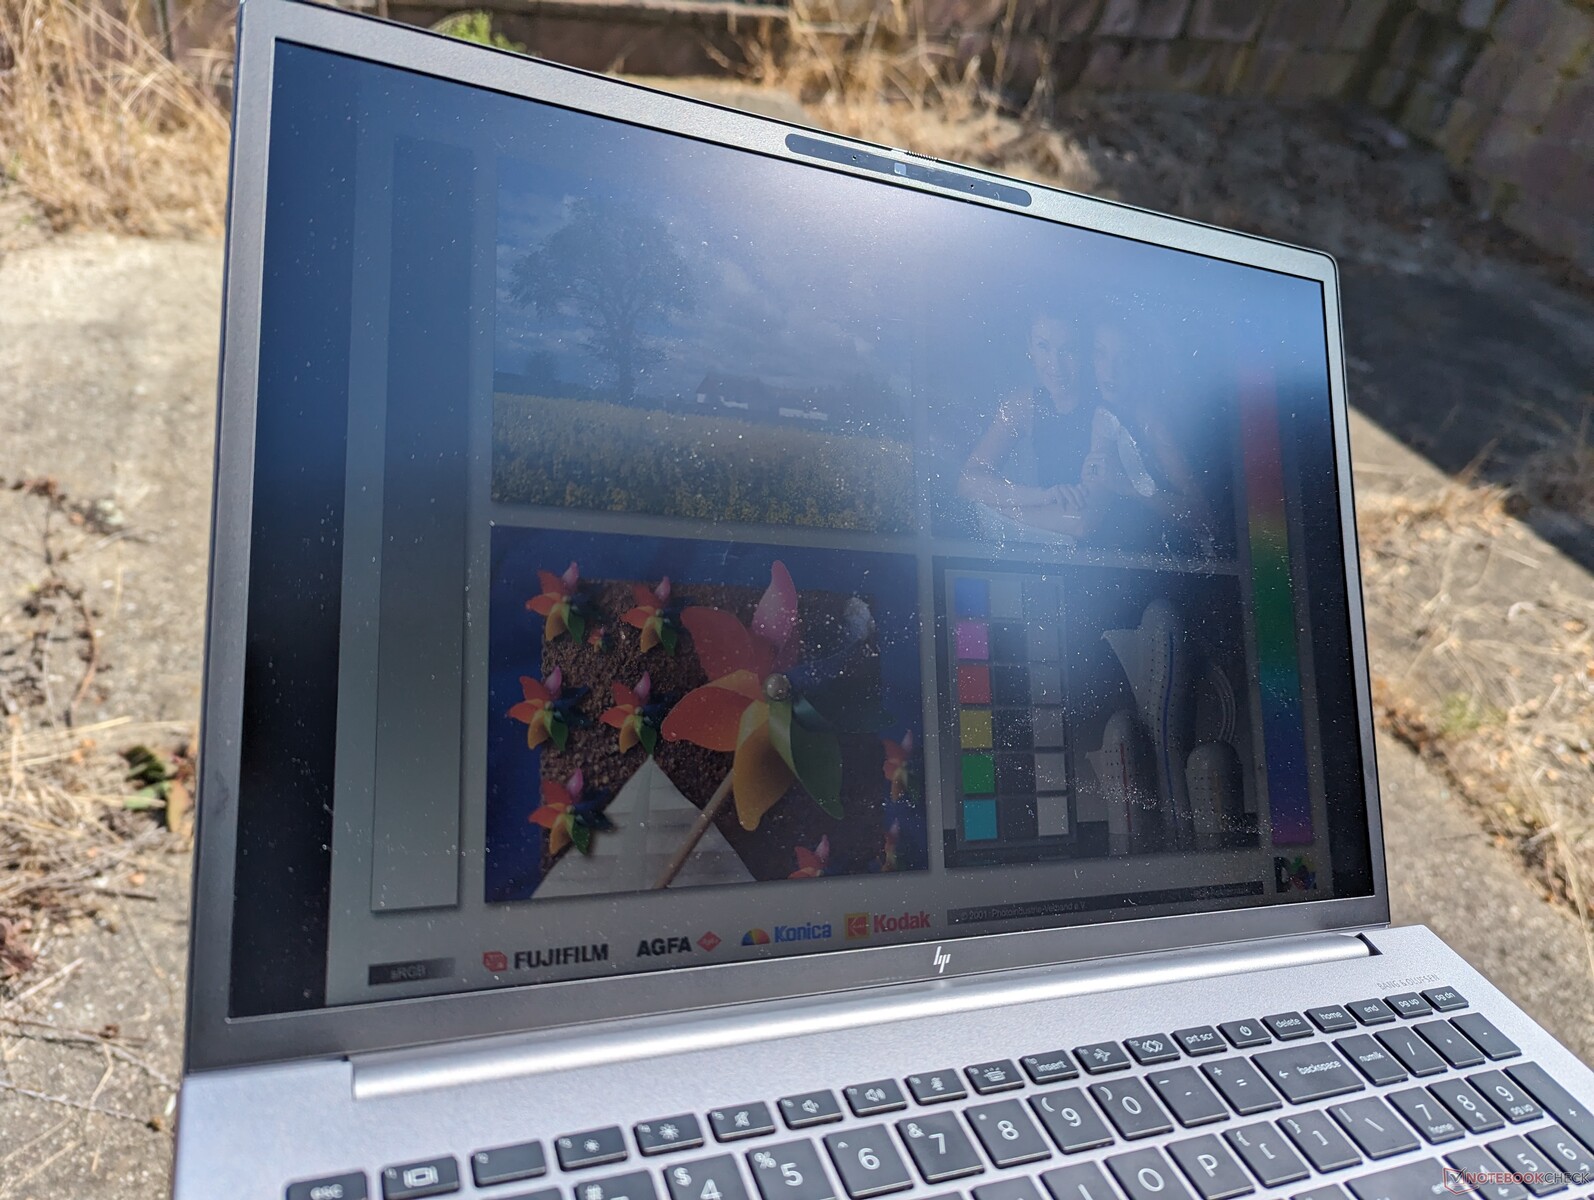
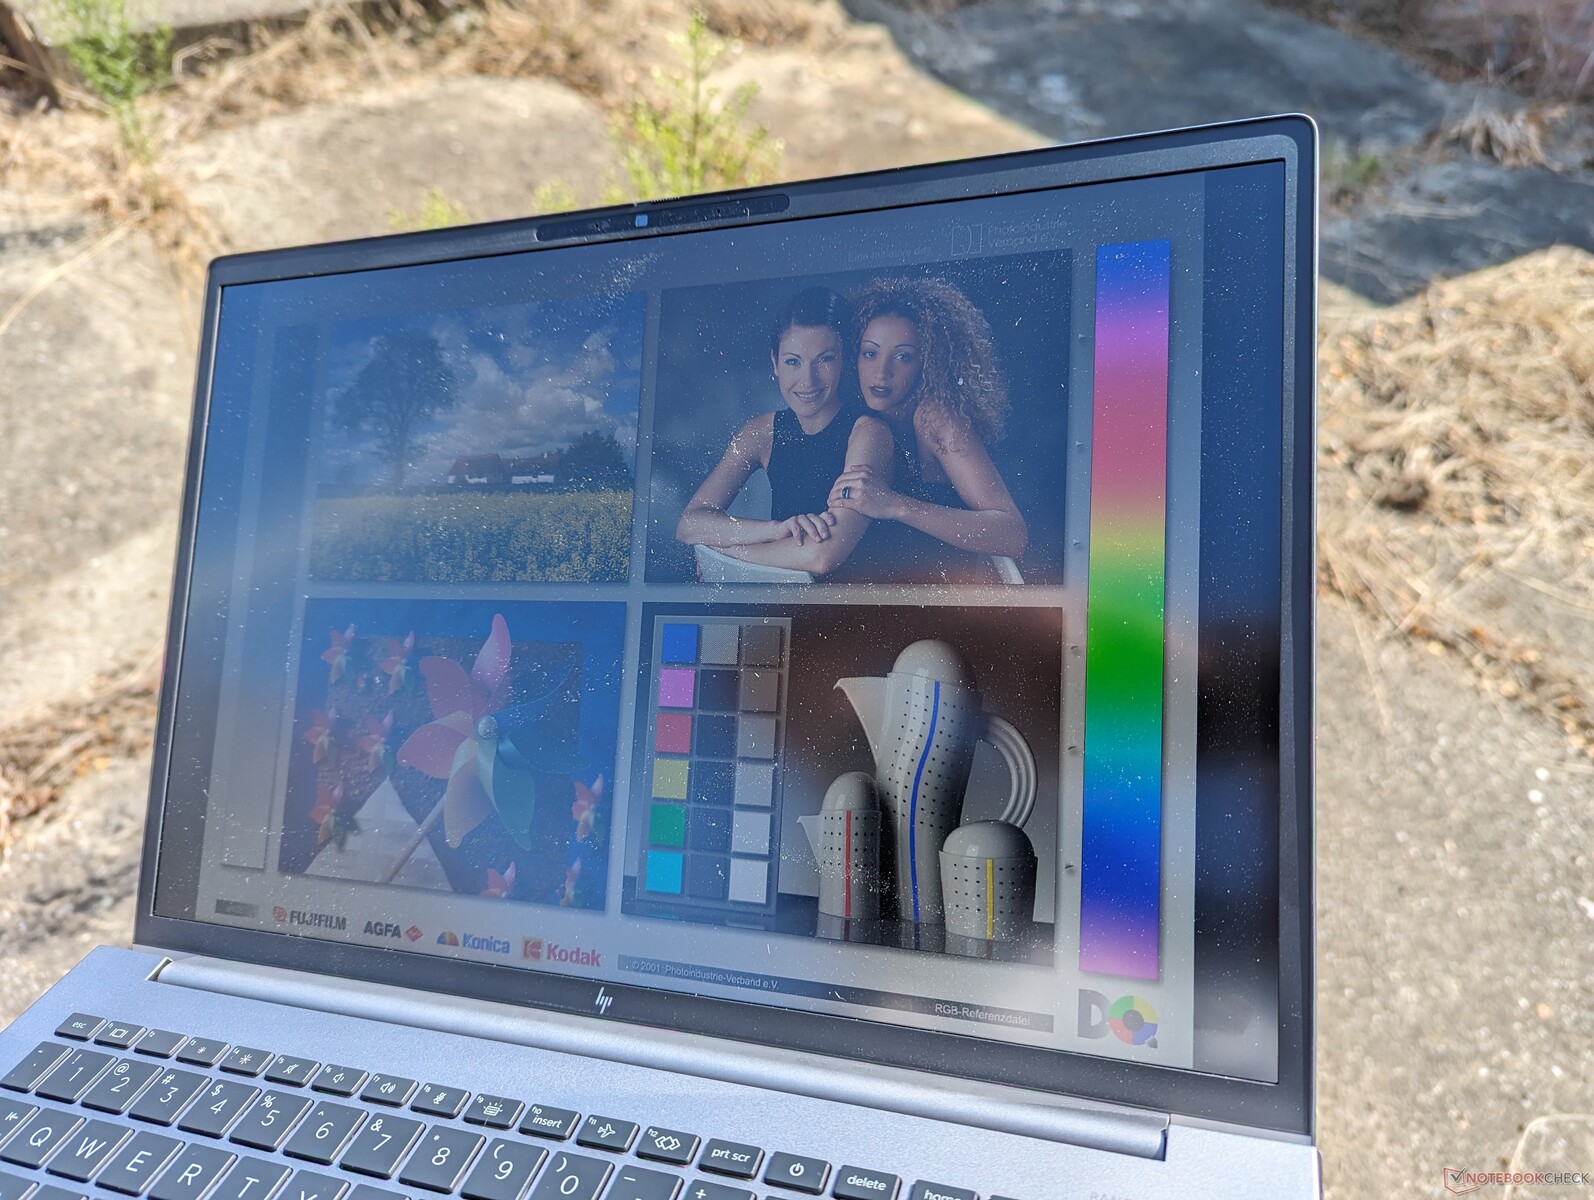
Unsere unabhängigen Messungen mit einem X-Rite-Colorimeter bestätigen sowohl die volle P3-Abdeckung als auch die 500-Nit-Maximalhelligkeit wie vom Hersteller beworben. Die Bildwiederholfrequenz von 120 Hz ist ebenfalls ein deutlicher Fortschritt gegenüber dem 60 Hz-Panel des letztjährigen Fury 16 G9. Dies ist eine der wenigen Workstations auf dem Markt, die ein 4K-IPS-Panel mit P3-Farben und einer schnellen 120-Hz-Bildwiederholrate bieten.

| |||||||||||||||||||||||||
Ausleuchtung: 90 %
Helligkeit Akku: 514.6 cd/m²
Kontrast: 1119:1 (Schwarzwert: 0.46 cd/m²)
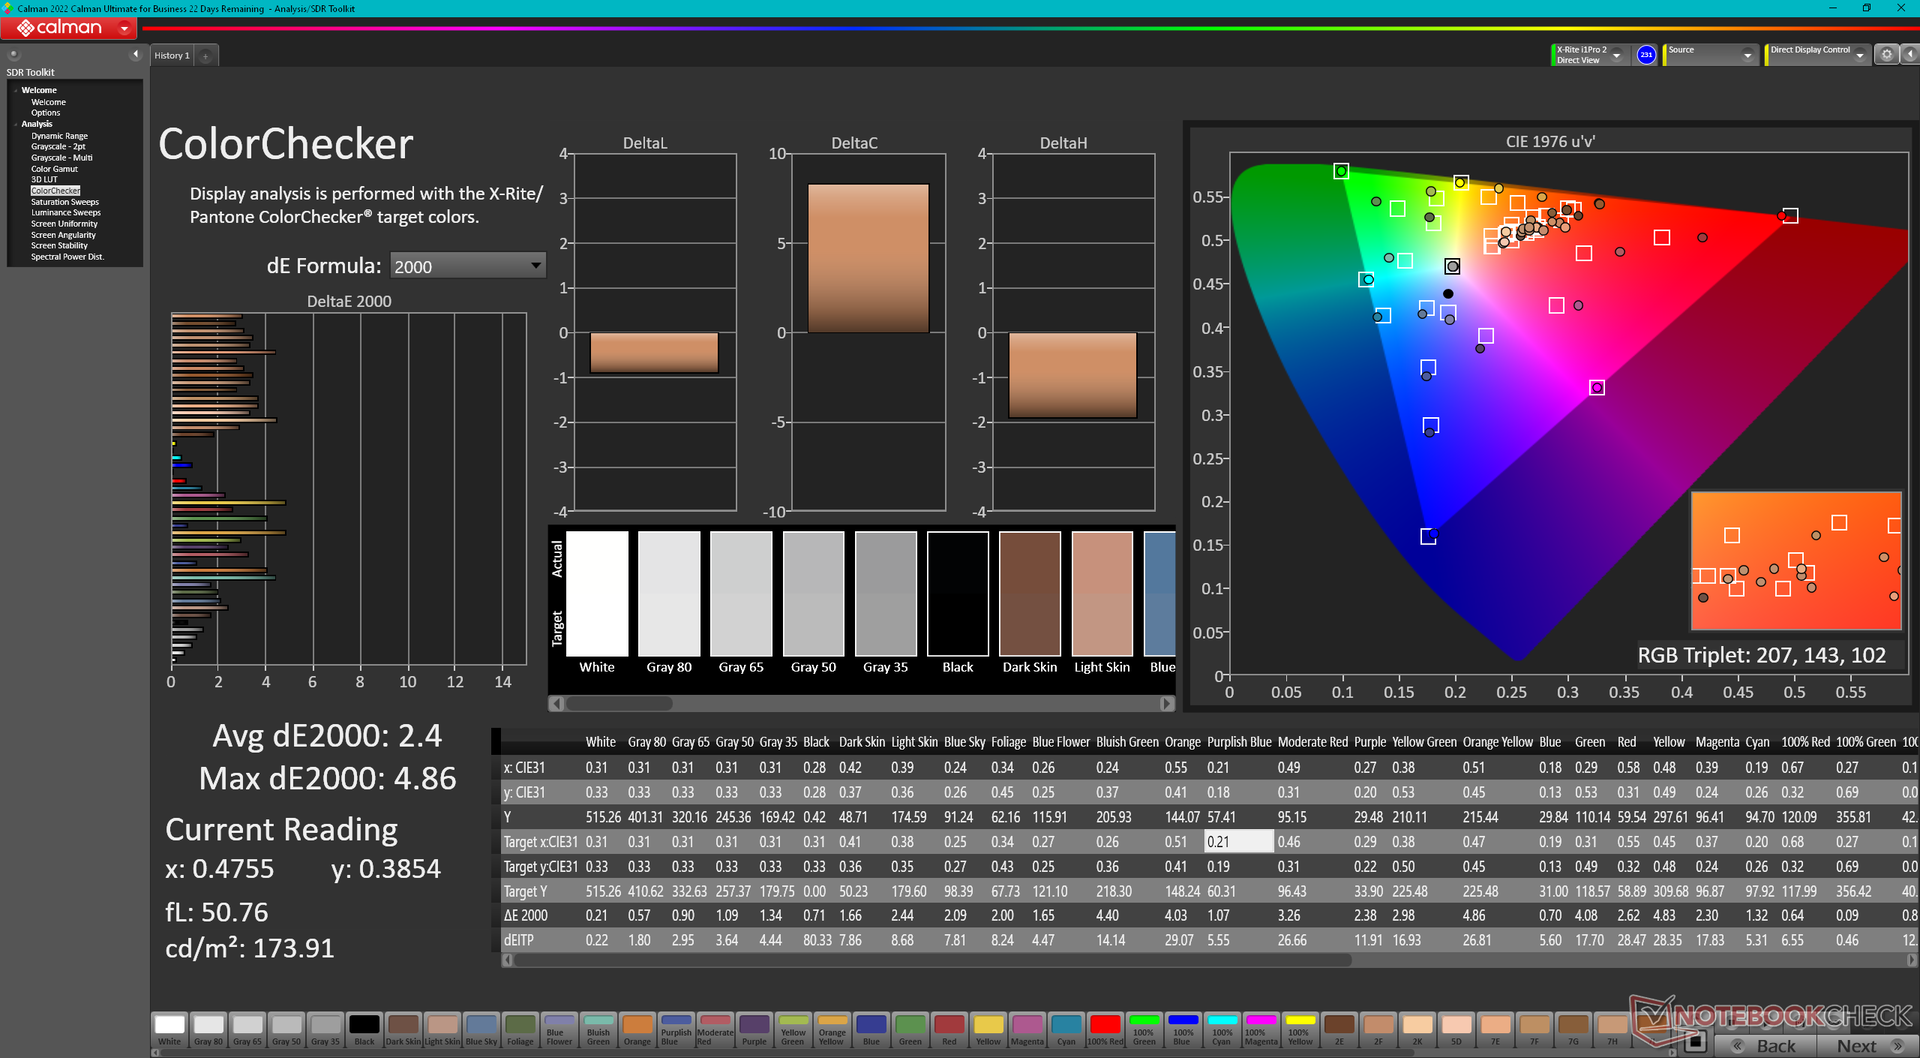
ΔE ColorChecker Calman: 2.4 | ∀{0.5-29.43 Ø4.72}
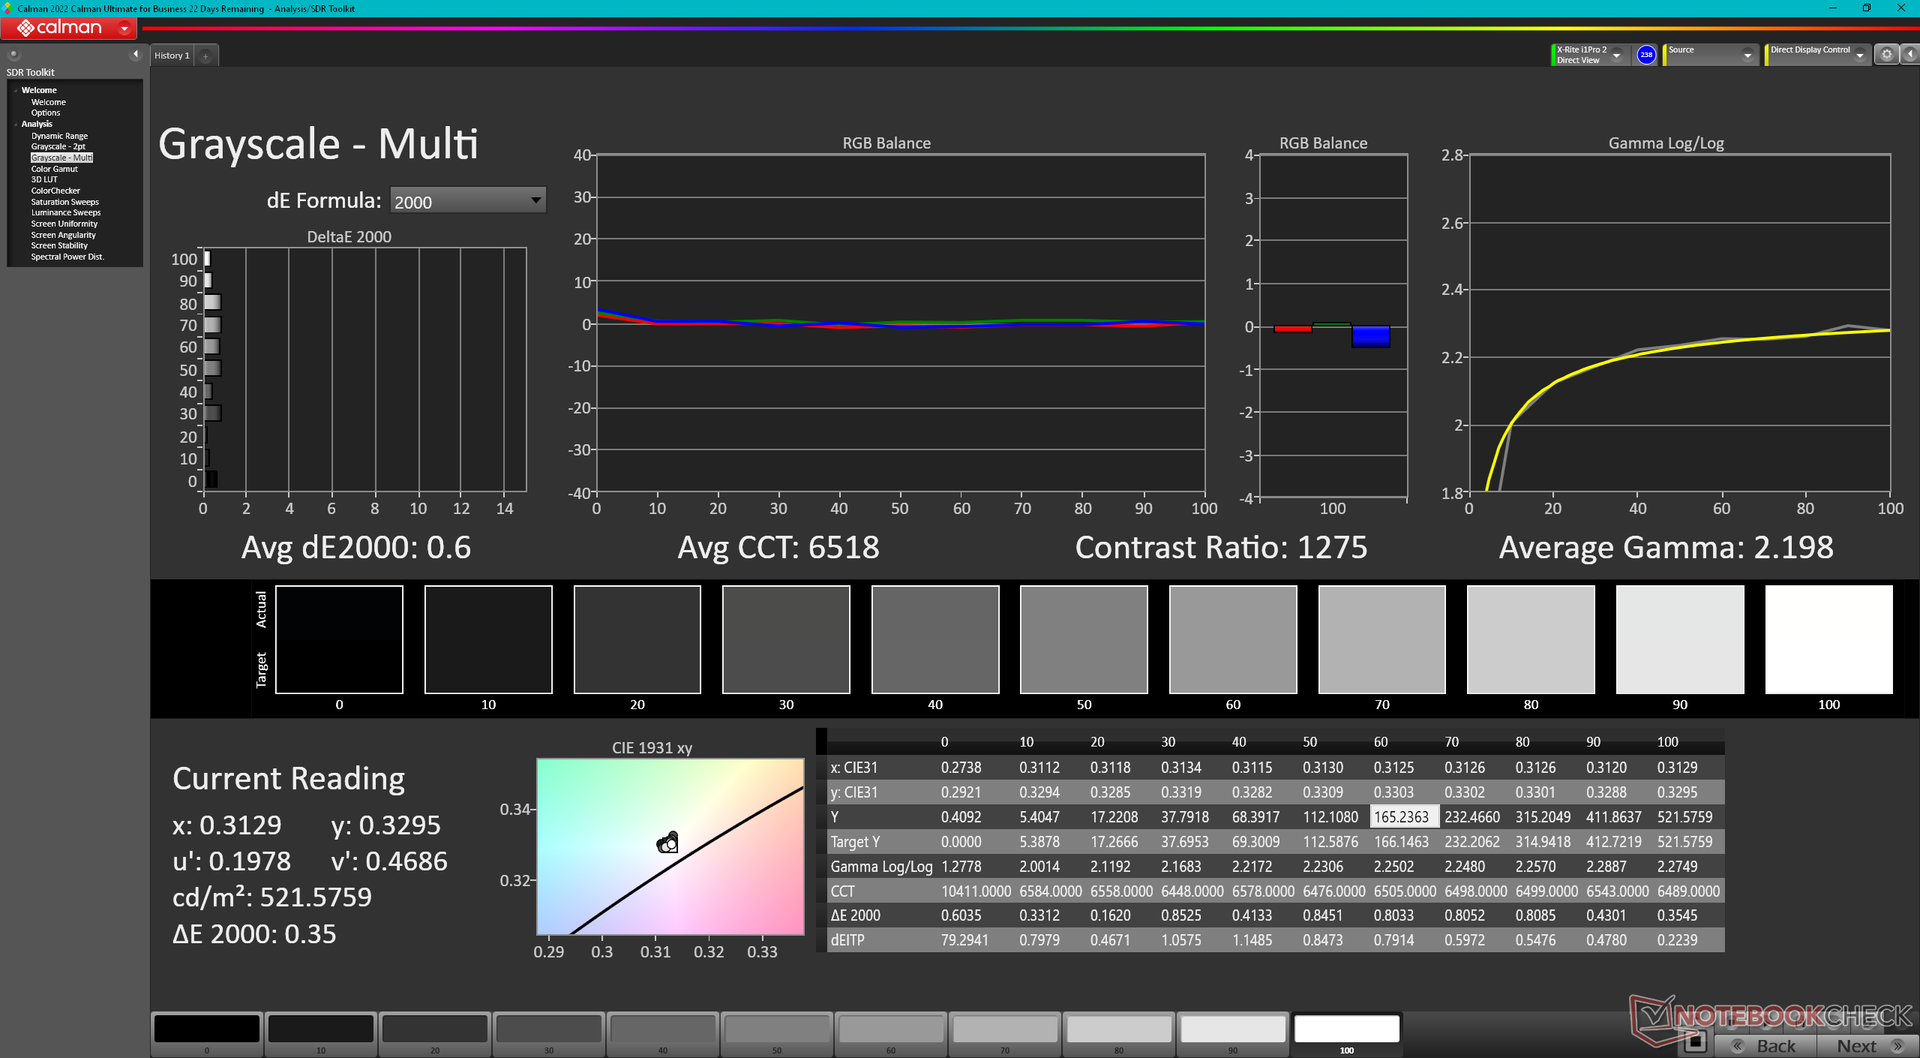
calibrated: 0.4
ΔE Greyscale Calman: 1 | ∀{0.09-98 Ø4.97}
86.2% AdobeRGB 1998 (Argyll 3D)
99.9% sRGB (Argyll 3D)
98% Display P3 (Argyll 3D)
Gamma: 2.3
CCT: 6553 K
| HP ZBook Fury 16 G10 AUO87A8, IPS, 3840x2400, 16" | HP ZBook Fury 16 G9 BOE0A52, IPS, 3840x2400, 16" | Dell Precision 5000 5680 Samsung 160YV03, OLED, 3840x2400, 16" | Lenovo ThinkPad P16 G1 RTX A5500 LP160UQ1-SPB1, IPS, 3840x2400, 16" | MSI CreatorPro Z16P B12UKST B160QAN02.N, IPS, 2560x1600, 16" | Asus ProArt StudioBook 16 W7600H5A-2BL2 ATNA60YV02-0, OLED, 3840x2400, 16" | |
|---|---|---|---|---|---|---|
| Display | -0% | 5% | -2% | 0% | 5% | |
| Display P3 Coverage (%) | 98 | 97.4 -1% | 99.9 2% | 82.9 -15% | 97.6 0% | 99.9 2% |
| sRGB Coverage (%) | 99.9 | 99.9 0% | 100 0% | 98.9 -1% | 99.9 0% | 100 0% |
| AdobeRGB 1998 Coverage (%) | 86.2 | 86.3 0% | 97.5 13% | 95.9 11% | 87.4 1% | 98.6 14% |
| Response Times | -3% | 84% | -283% | 8% | 81% | |
| Response Time Grey 50% / Grey 80% * (ms) | 11.9 ? | 13.7 ? -15% | 1.68 ? 86% | 45.6 ? -283% | 12.8 ? -8% | 2 ? 83% |
| Response Time Black / White * (ms) | 9.6 ? | 8.6 ? 10% | 1.77 ? 82% | 36.8 ? -283% | 7.4 ? 23% | 2 ? 79% |
| PWM Frequency (Hz) | 60 ? | 240 ? | ||||
| Bildschirm | -141% | -72% | -16% | -12% | -102% | |
| Helligkeit Bildmitte (cd/m²) | 514.6 | 530.5 3% | 345.7 -33% | 601.9 17% | 407 -21% | 353 -31% |
| Brightness (cd/m²) | 495 | 476 -4% | 349 -29% | 569 15% | 388 -22% | 360 -27% |
| Brightness Distribution (%) | 90 | 83 -8% | 98 9% | 77 -14% | 88 -2% | 96 7% |
| Schwarzwert * (cd/m²) | 0.46 | 0.57 -24% | 0.47 -2% | 0.36 22% | ||
| Kontrast (:1) | 1119 | 931 -17% | 1281 14% | 1131 1% | ||
| Delta E Colorchecker * | 2.4 | 2.26 6% | 3.59 -50% | 2.45 -2% | 1.3 46% | 2.45 -2% |
| Colorchecker dE 2000 max. * | 4.86 | 7.02 -44% | 4.46 8% | 2.5 49% | 3.75 23% | |
| Colorchecker dE 2000 calibrated * | 0.4 | 4.73 -1083% | 0.99 -147% | 0.7 -75% | 2.77 -593% | |
| Delta E Graustufen * | 1 | 1 -0% | 3.1 -210% | 2.6 -160% | 2.1 -110% | 1.88 -88% |
| Gamma | 2.3 96% | 2.28 96% | 2.13 103% | 2.3 96% | 2.26 97% | 2.31 95% |
| CCT | 6553 99% | 6543 99% | 6448 101% | 6805 96% | 6437 101% | 6441 101% |
| Durchschnitt gesamt (Programm / Settings) | -48% /
-87% | 6% /
-27% | -100% /
-53% | -1% /
-7% | -5% /
-44% |
* ... kleinere Werte sind besser
Das Display wird gut kalibriert ab Werk geliefert, so dass eine Endbenutzerkalibrierung nicht so notwendig ist.
Reaktionszeiten (Response Times) des Displays
| ↔ Reaktionszeiten Schwarz zu Weiß | ||
|---|---|---|
| 9.6 ms ... steigend ↗ und fallend ↘ kombiniert | ↗ 5.1 ms steigend | 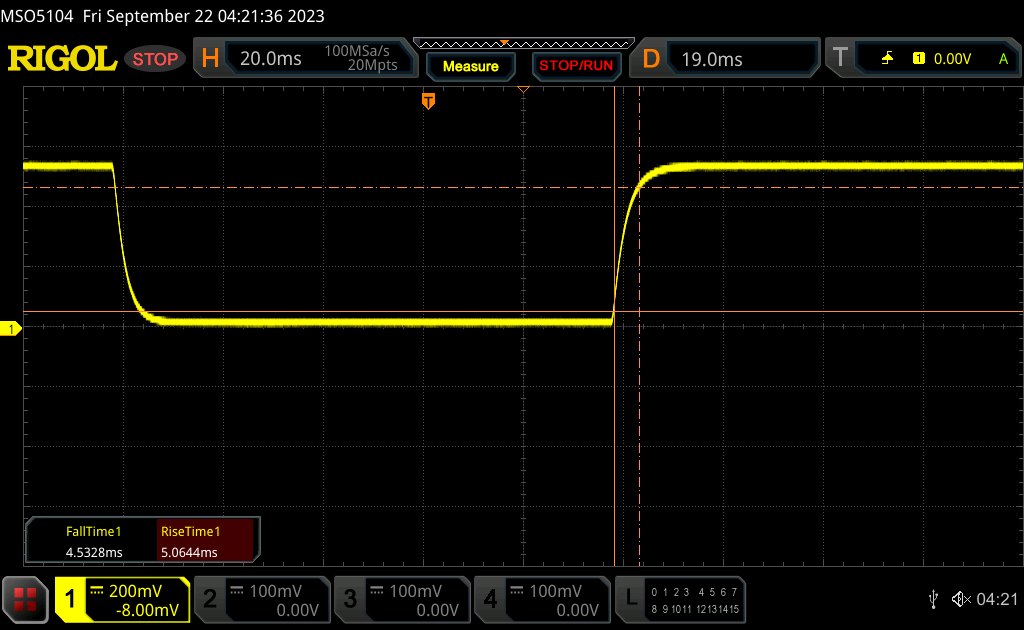 |
| ↘ 4.5 ms fallend | ||
| Die gemessenen Reaktionszeiten sind kurz wodurch sich der Bildschirm auch für Spiele gut eignen sollte. Im Vergleich rangierten die bei uns getesteten Geräte von 0.1 (Minimum) zu 240 (Maximum) ms. » 26 % aller Screens waren schneller als der getestete. Daher sind die gemessenen Reaktionszeiten besser als der Durchschnitt aller vermessenen Geräte (19.8 ms). | ||
| ↔ Reaktionszeiten 50% Grau zu 80% Grau | ||
| 11.9 ms ... steigend ↗ und fallend ↘ kombiniert | ↗ 5.9 ms steigend | 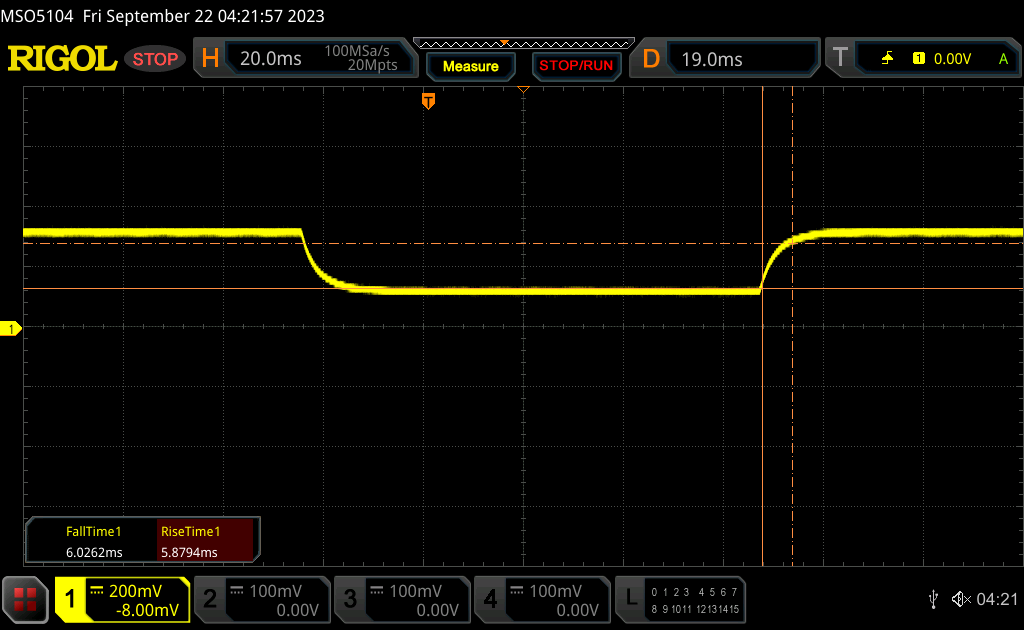 |
| ↘ 6 ms fallend | ||
| Die gemessenen Reaktionszeiten sind gut, für anspruchsvolle Spieler könnten der Bildschirm jedoch zu langsam sein. Im Vergleich rangierten die bei uns getesteten Geräte von 0.165 (Minimum) zu 636 (Maximum) ms. » 25 % aller Screens waren schneller als der getestete. Daher sind die gemessenen Reaktionszeiten besser als der Durchschnitt aller vermessenen Geräte (31 ms). | ||
Bildschirm-Flackern / PWM (Pulse-Width Modulation)
| Flackern / PWM nicht festgestellt | 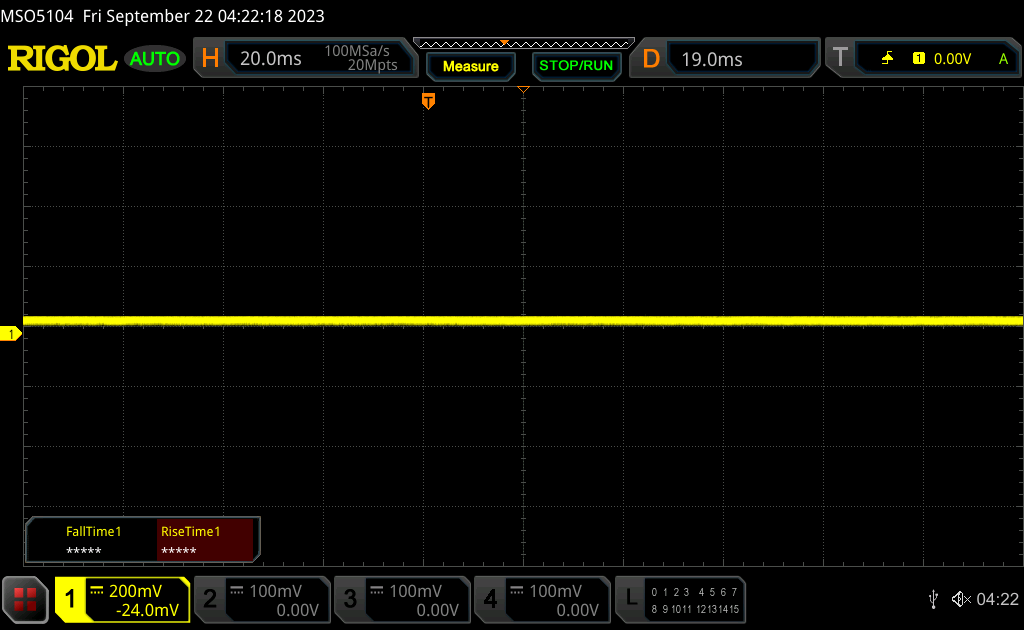 | ||
Im Vergleich: 52 % aller getesteten Geräte nutzten kein PWM um die Helligkeit zu reduzieren. Wenn PWM eingesetzt wurde, dann bei einer Frequenz von durchschnittlich 7763 (Minimum 5, Maximum 343500) Hz. | |||


Performance
Testbedingungen
Wir haben Windows im Modus Performance eingestellt, bevor wir die folgenden Benchmarks durchgeführt haben.
Advanced Optimus, MUX und Intel Xeon CPUs werden nicht unterstützt. Es ist jedoch erwähnenswert, dass das Modell trotz fehlender Xeon-Optionen offiziell DDR5-ECC-RAM unterstützt, eine Funktion, die bei den meisten anderen mobilen Workstations nicht zu finden ist.
Der ECC-VRAM-Modus kann ein- und ausgeschaltet werden, ähnlich wie bei anderen Ada-Lovelace-GPUs für Workstations. Durch die Aktivierung wird der maximal nutzbare VRAM von 16 GB auf 15 GB reduziert.
Prozessor
Die CPU-Leistung ist durchwachsen. Einerseits ist die Multi-Thread-Leistung etwa 25 bis 30 Prozent schneller als die des Core i9-12950HX im letztjährigen Fury 16 G9. Andererseits ist sie im Durchschnitt etwa 15 % langsamer als bei anderen Laptops mit dem gleichen Core i9-13950HX. Die exakt gleiche CPU im größeren Razer Blade 18 und MSI GE78HX läuft zum Beispiel durchweg schneller als unser HP. Das soll nicht heißen, dass das Fury 16 G10 langsam ist, aber doch etwas langsamer als erwartet.
Cinebench R15 Multi Loop
Cinebench R23: Multi Core | Single Core
Cinebench R20: CPU (Multi Core) | CPU (Single Core)
Cinebench R15: CPU Multi 64Bit | CPU Single 64Bit
Blender: v2.79 BMW27 CPU
7-Zip 18.03: 7z b 4 | 7z b 4 -mmt1
Geekbench 5.5: Multi-Core | Single-Core
HWBOT x265 Benchmark v2.2: 4k Preset
LibreOffice : 20 Documents To PDF
R Benchmark 2.5: Overall mean
| Cinebench R23 / Multi Core | |
| Durchschnittliche Intel Core i9-13950HX (24560 - 33277, n=7) | |
| HP ZBook Fury 16 G10 | |
| Lenovo ThinkPad P16 G1 RTX A5500 | |
| HP ZBook Fury 16 G9 | |
| Dell Precision 5000 5680 | |
| Lenovo ThinkPad P16 G1 21D6001DMB | |
| MSI CreatorPro Z16P B12UKST | |
| HP ZBook Studio 16 G9 62U04EA | |
| Lenovo ThinkPad P1 G4-20Y4Z9DVUS | |
| Asus ProArt StudioBook 16 W7600H5A-2BL2 | |
| Cinebench R23 / Single Core | |
| HP ZBook Fury 16 G10 | |
| Durchschnittliche Intel Core i9-13950HX (1952 - 2113, n=7) | |
| Dell Precision 5000 5680 | |
| HP ZBook Fury 16 G9 | |
| Lenovo ThinkPad P16 G1 RTX A5500 | |
| HP ZBook Studio 16 G9 62U04EA | |
| Lenovo ThinkPad P16 G1 21D6001DMB | |
| MSI CreatorPro Z16P B12UKST | |
| Lenovo ThinkPad P1 G4-20Y4Z9DVUS | |
| Asus ProArt StudioBook 16 W7600H5A-2BL2 | |
| Cinebench R20 / CPU (Multi Core) | |
| Durchschnittliche Intel Core i9-13950HX (8697 - 12648, n=7) | |
| HP ZBook Fury 16 G10 | |
| Lenovo ThinkPad P16 G1 RTX A5500 | |
| HP ZBook Fury 16 G9 | |
| Dell Precision 5000 5680 | |
| Lenovo ThinkPad P16 G1 21D6001DMB | |
| MSI CreatorPro Z16P B12UKST | |
| HP ZBook Studio 16 G9 62U04EA | |
| Lenovo ThinkPad P1 G4-20Y4Z9DVUS | |
| Asus ProArt StudioBook 16 W7600H5A-2BL2 | |
| Cinebench R20 / CPU (Single Core) | |
| HP ZBook Fury 16 G10 | |
| Durchschnittliche Intel Core i9-13950HX (742 - 816, n=7) | |
| Dell Precision 5000 5680 | |
| HP ZBook Fury 16 G9 | |
| Lenovo ThinkPad P16 G1 RTX A5500 | |
| HP ZBook Studio 16 G9 62U04EA | |
| Lenovo ThinkPad P16 G1 21D6001DMB | |
| MSI CreatorPro Z16P B12UKST | |
| Lenovo ThinkPad P1 G4-20Y4Z9DVUS | |
| Asus ProArt StudioBook 16 W7600H5A-2BL2 | |
| Cinebench R15 / CPU Multi 64Bit | |
| Durchschnittliche Intel Core i9-13950HX (3625 - 5227, n=7) | |
| HP ZBook Fury 16 G10 | |
| Lenovo ThinkPad P16 G1 RTX A5500 | |
| Lenovo ThinkPad P16 G1 21D6001DMB | |
| HP ZBook Studio 16 G9 62U04EA | |
| HP ZBook Fury 16 G9 | |
| Dell Precision 5000 5680 | |
| MSI CreatorPro Z16P B12UKST | |
| Lenovo ThinkPad P1 G4-20Y4Z9DVUS | |
| Asus ProArt StudioBook 16 W7600H5A-2BL2 | |
| Cinebench R15 / CPU Single 64Bit | |
| HP ZBook Fury 16 G10 | |
| Durchschnittliche Intel Core i9-13950HX (274 - 303, n=7) | |
| Dell Precision 5000 5680 | |
| Lenovo ThinkPad P16 G1 RTX A5500 | |
| HP ZBook Studio 16 G9 62U04EA | |
| Lenovo ThinkPad P16 G1 21D6001DMB | |
| MSI CreatorPro Z16P B12UKST | |
| Lenovo ThinkPad P1 G4-20Y4Z9DVUS | |
| Asus ProArt StudioBook 16 W7600H5A-2BL2 | |
| HP ZBook Fury 16 G9 | |
| Blender / v2.79 BMW27 CPU | |
| Asus ProArt StudioBook 16 W7600H5A-2BL2 | |
| Lenovo ThinkPad P1 G4-20Y4Z9DVUS | |
| MSI CreatorPro Z16P B12UKST | |
| Dell Precision 5000 5680 | |
| HP ZBook Studio 16 G9 62U04EA | |
| Lenovo ThinkPad P16 G1 21D6001DMB | |
| HP ZBook Fury 16 G9 | |
| Lenovo ThinkPad P16 G1 RTX A5500 | |
| HP ZBook Fury 16 G10 | |
| Durchschnittliche Intel Core i9-13950HX (100 - 137, n=7) | |
| 7-Zip 18.03 / 7z b 4 -mmt1 | |
| Durchschnittliche Intel Core i9-13950HX (6445 - 7064, n=7) | |
| HP ZBook Fury 16 G10 | |
| Dell Precision 5000 5680 | |
| Lenovo ThinkPad P16 G1 RTX A5500 | |
| HP ZBook Fury 16 G9 | |
| HP ZBook Studio 16 G9 62U04EA | |
| Lenovo ThinkPad P16 G1 21D6001DMB | |
| MSI CreatorPro Z16P B12UKST | |
| Lenovo ThinkPad P1 G4-20Y4Z9DVUS | |
| Asus ProArt StudioBook 16 W7600H5A-2BL2 | |
| Geekbench 5.5 / Multi-Core | |
| Durchschnittliche Intel Core i9-13950HX (16776 - 21853, n=7) | |
| HP ZBook Fury 16 G10 | |
| Lenovo ThinkPad P16 G1 RTX A5500 | |
| Dell Precision 5000 5680 | |
| HP ZBook Fury 16 G9 | |
| Lenovo ThinkPad P16 G1 21D6001DMB | |
| HP ZBook Studio 16 G9 62U04EA | |
| MSI CreatorPro Z16P B12UKST | |
| Asus ProArt StudioBook 16 W7600H5A-2BL2 | |
| Lenovo ThinkPad P1 G4-20Y4Z9DVUS | |
| Geekbench 5.5 / Single-Core | |
| HP ZBook Fury 16 G10 | |
| Dell Precision 5000 5680 | |
| Durchschnittliche Intel Core i9-13950HX (1805 - 2097, n=7) | |
| HP ZBook Fury 16 G9 | |
| Lenovo ThinkPad P16 G1 RTX A5500 | |
| HP ZBook Studio 16 G9 62U04EA | |
| MSI CreatorPro Z16P B12UKST | |
| Lenovo ThinkPad P16 G1 21D6001DMB | |
| Lenovo ThinkPad P1 G4-20Y4Z9DVUS | |
| Asus ProArt StudioBook 16 W7600H5A-2BL2 | |
| HWBOT x265 Benchmark v2.2 / 4k Preset | |
| Durchschnittliche Intel Core i9-13950HX (26 - 34.5, n=7) | |
| HP ZBook Fury 16 G10 | |
| Lenovo ThinkPad P16 G1 RTX A5500 | |
| Dell Precision 5000 5680 | |
| HP ZBook Fury 16 G9 | |
| HP ZBook Studio 16 G9 62U04EA | |
| MSI CreatorPro Z16P B12UKST | |
| Lenovo ThinkPad P16 G1 21D6001DMB | |
| Lenovo ThinkPad P1 G4-20Y4Z9DVUS | |
| Asus ProArt StudioBook 16 W7600H5A-2BL2 | |
| LibreOffice / 20 Documents To PDF | |
| Lenovo ThinkPad P1 G4-20Y4Z9DVUS | |
| Lenovo ThinkPad P16 G1 21D6001DMB | |
| Durchschnittliche Intel Core i9-13950HX (32.8 - 52.1, n=7) | |
| HP ZBook Fury 16 G10 | |
| HP ZBook Studio 16 G9 62U04EA | |
| Dell Precision 5000 5680 | |
| Lenovo ThinkPad P16 G1 RTX A5500 | |
| MSI CreatorPro Z16P B12UKST | |
| HP ZBook Fury 16 G9 | |
| Asus ProArt StudioBook 16 W7600H5A-2BL2 | |
| R Benchmark 2.5 / Overall mean | |
| Asus ProArt StudioBook 16 W7600H5A-2BL2 | |
| Lenovo ThinkPad P1 G4-20Y4Z9DVUS | |
| MSI CreatorPro Z16P B12UKST | |
| Lenovo ThinkPad P16 G1 21D6001DMB | |
| HP ZBook Studio 16 G9 62U04EA | |
| Lenovo ThinkPad P16 G1 RTX A5500 | |
| HP ZBook Fury 16 G9 | |
| Dell Precision 5000 5680 | |
| Durchschnittliche Intel Core i9-13950HX (0.3823 - 0.4121, n=7) | |
| HP ZBook Fury 16 G10 | |
* ... kleinere Werte sind besser
AIDA64: FP32 Ray-Trace | FPU Julia | CPU SHA3 | CPU Queen | FPU SinJulia | FPU Mandel | CPU AES | CPU ZLib | FP64 Ray-Trace | CPU PhotoWorxx
| Performance Rating | |
| Durchschnittliche Intel Core i9-13950HX | |
| HP ZBook Fury 16 G10 | |
| Lenovo ThinkPad P16 G1 RTX A5500 | |
| HP ZBook Fury 16 G9 | |
| Dell Precision 5000 5680 | |
| MSI CreatorPro Z16P B12UKST | |
| AIDA64 / FP32 Ray-Trace | |
| Durchschnittliche Intel Core i9-13950HX (17993 - 28957, n=9) | |
| HP ZBook Fury 16 G10 | |
| Lenovo ThinkPad P16 G1 RTX A5500 | |
| HP ZBook Fury 16 G9 | |
| Dell Precision 5000 5680 | |
| MSI CreatorPro Z16P B12UKST | |
| AIDA64 / FPU Julia | |
| Durchschnittliche Intel Core i9-13950HX (89362 - 144303, n=9) | |
| HP ZBook Fury 16 G10 | |
| HP ZBook Fury 16 G9 | |
| Lenovo ThinkPad P16 G1 RTX A5500 | |
| Dell Precision 5000 5680 | |
| MSI CreatorPro Z16P B12UKST | |
| AIDA64 / CPU SHA3 | |
| Durchschnittliche Intel Core i9-13950HX (4518 - 7093, n=9) | |
| HP ZBook Fury 16 G10 | |
| Lenovo ThinkPad P16 G1 RTX A5500 | |
| HP ZBook Fury 16 G9 | |
| MSI CreatorPro Z16P B12UKST | |
| Dell Precision 5000 5680 | |
| AIDA64 / CPU Queen | |
| Durchschnittliche Intel Core i9-13950HX (131931 - 140103, n=8) | |
| HP ZBook Fury 16 G10 | |
| Dell Precision 5000 5680 | |
| Lenovo ThinkPad P16 G1 RTX A5500 | |
| HP ZBook Fury 16 G9 | |
| MSI CreatorPro Z16P B12UKST | |
| AIDA64 / FPU SinJulia | |
| Durchschnittliche Intel Core i9-13950HX (12318 - 17057, n=9) | |
| HP ZBook Fury 16 G10 | |
| Lenovo ThinkPad P16 G1 RTX A5500 | |
| HP ZBook Fury 16 G9 | |
| Dell Precision 5000 5680 | |
| MSI CreatorPro Z16P B12UKST | |
| AIDA64 / FPU Mandel | |
| Durchschnittliche Intel Core i9-13950HX (44372 - 71038, n=9) | |
| HP ZBook Fury 16 G10 | |
| HP ZBook Fury 16 G9 | |
| Lenovo ThinkPad P16 G1 RTX A5500 | |
| Dell Precision 5000 5680 | |
| MSI CreatorPro Z16P B12UKST | |
| AIDA64 / CPU AES | |
| Durchschnittliche Intel Core i9-13950HX (99981 - 204491, n=9) | |
| MSI CreatorPro Z16P B12UKST | |
| HP ZBook Fury 16 G10 | |
| HP ZBook Fury 16 G9 | |
| Lenovo ThinkPad P16 G1 RTX A5500 | |
| Dell Precision 5000 5680 | |
| AIDA64 / CPU ZLib | |
| Durchschnittliche Intel Core i9-13950HX (1263 - 2069, n=9) | |
| HP ZBook Fury 16 G10 | |
| Lenovo ThinkPad P16 G1 RTX A5500 | |
| HP ZBook Fury 16 G9 | |
| MSI CreatorPro Z16P B12UKST | |
| Dell Precision 5000 5680 | |
| AIDA64 / FP64 Ray-Trace | |
| Durchschnittliche Intel Core i9-13950HX (9649 - 15573, n=9) | |
| HP ZBook Fury 16 G10 | |
| Lenovo ThinkPad P16 G1 RTX A5500 | |
| HP ZBook Fury 16 G9 | |
| Dell Precision 5000 5680 | |
| MSI CreatorPro Z16P B12UKST | |
| AIDA64 / CPU PhotoWorxx | |
| Dell Precision 5000 5680 | |
| Durchschnittliche Intel Core i9-13950HX (40233 - 50864, n=9) | |
| MSI CreatorPro Z16P B12UKST | |
| Lenovo ThinkPad P16 G1 RTX A5500 | |
| HP ZBook Fury 16 G10 | |
| HP ZBook Fury 16 G9 | |
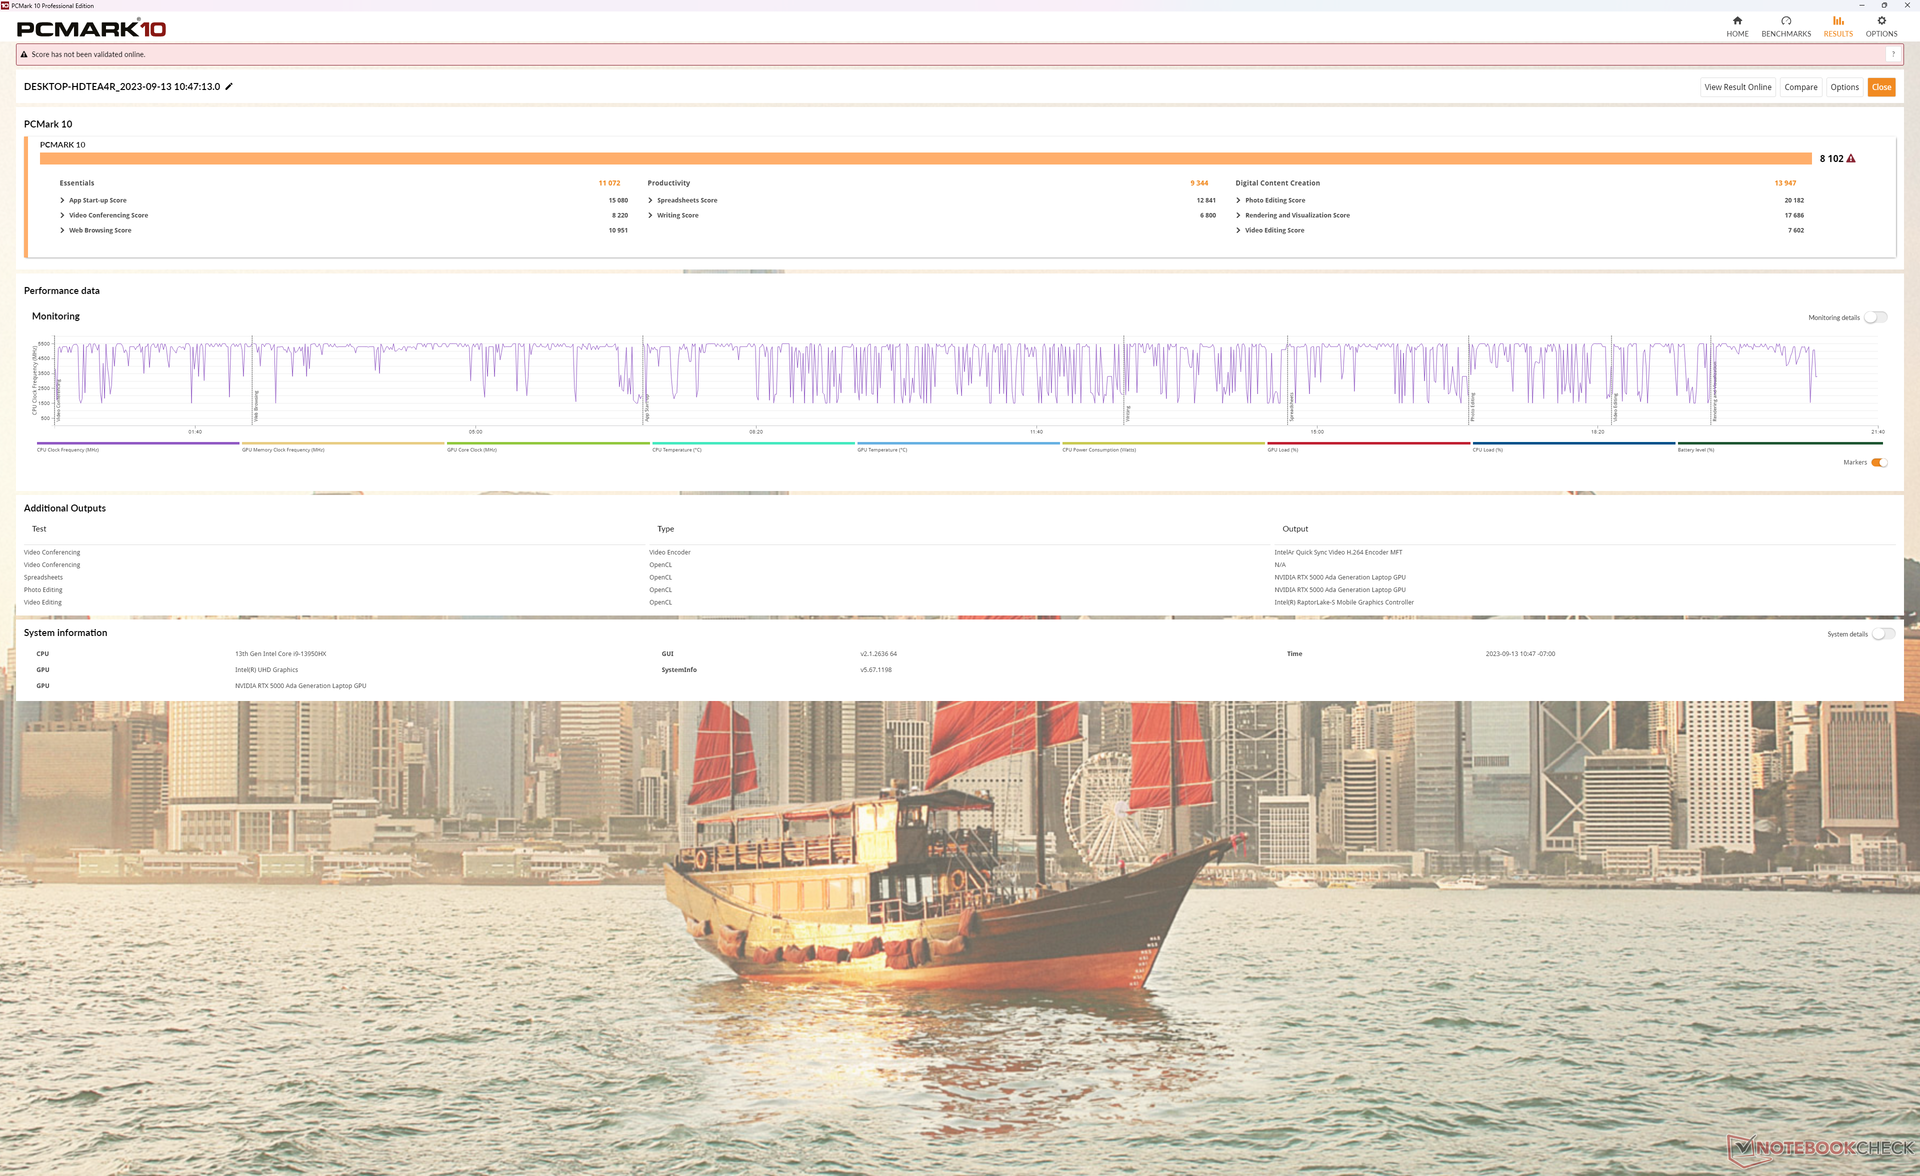
System Performance
Die PCMark-Scores liegen vor allem im Subtest Digital Content Creation über denen der letztjährigen Fury 16 G9, was auf den deutlichen Leistungssprung der GPU zurückzuführen ist. Das Precision 5680 schneidet aufgrund seiner RAID-0-SSDs bei der Produktivität besser ab. Natürlich kann unser HP auch mit RAID konfiguriert werden, falls gewünscht.
CrossMark: Overall | Productivity | Creativity | Responsiveness
| PCMark 10 / Score | |
| Dell Precision 5000 5680 | |
| HP ZBook Fury 16 G10 | |
| Durchschnittliche Intel Core i9-13950HX, NVIDIA RTX 5000 Ada Generation Laptop (n=1) | |
| Lenovo ThinkPad P16 G1 RTX A5500 | |
| MSI CreatorPro Z16P B12UKST | |
| Asus ProArt StudioBook 16 W7600H5A-2BL2 | |
| HP ZBook Fury 16 G9 | |
| PCMark 10 / Essentials | |
| Dell Precision 5000 5680 | |
| HP ZBook Fury 16 G10 | |
| Durchschnittliche Intel Core i9-13950HX, NVIDIA RTX 5000 Ada Generation Laptop (n=1) | |
| HP ZBook Fury 16 G9 | |
| Lenovo ThinkPad P16 G1 RTX A5500 | |
| MSI CreatorPro Z16P B12UKST | |
| Asus ProArt StudioBook 16 W7600H5A-2BL2 | |
| PCMark 10 / Productivity | |
| Dell Precision 5000 5680 | |
| Lenovo ThinkPad P16 G1 RTX A5500 | |
| MSI CreatorPro Z16P B12UKST | |
| HP ZBook Fury 16 G10 | |
| Durchschnittliche Intel Core i9-13950HX, NVIDIA RTX 5000 Ada Generation Laptop (n=1) | |
| Asus ProArt StudioBook 16 W7600H5A-2BL2 | |
| HP ZBook Fury 16 G9 | |
| PCMark 10 / Digital Content Creation | |
| HP ZBook Fury 16 G10 | |
| Durchschnittliche Intel Core i9-13950HX, NVIDIA RTX 5000 Ada Generation Laptop (n=1) | |
| Dell Precision 5000 5680 | |
| Asus ProArt StudioBook 16 W7600H5A-2BL2 | |
| Lenovo ThinkPad P16 G1 RTX A5500 | |
| MSI CreatorPro Z16P B12UKST | |
| HP ZBook Fury 16 G9 | |
| CrossMark / Overall | |
| MSI CreatorPro Z16P B12UKST | |
| Dell Precision 5000 5680 | |
| HP ZBook Fury 16 G10 | |
| Durchschnittliche Intel Core i9-13950HX, NVIDIA RTX 5000 Ada Generation Laptop (n=1) | |
| HP ZBook Fury 16 G9 | |
| Lenovo ThinkPad P16 G1 RTX A5500 | |
| CrossMark / Productivity | |
| HP ZBook Fury 16 G10 | |
| Durchschnittliche Intel Core i9-13950HX, NVIDIA RTX 5000 Ada Generation Laptop (n=1) | |
| MSI CreatorPro Z16P B12UKST | |
| Dell Precision 5000 5680 | |
| HP ZBook Fury 16 G9 | |
| Lenovo ThinkPad P16 G1 RTX A5500 | |
| CrossMark / Creativity | |
| Lenovo ThinkPad P16 G1 RTX A5500 | |
| Dell Precision 5000 5680 | |
| HP ZBook Fury 16 G9 | |
| HP ZBook Fury 16 G10 | |
| Durchschnittliche Intel Core i9-13950HX, NVIDIA RTX 5000 Ada Generation Laptop (n=1) | |
| MSI CreatorPro Z16P B12UKST | |
| CrossMark / Responsiveness | |
| MSI CreatorPro Z16P B12UKST | |
| HP ZBook Fury 16 G10 | |
| Durchschnittliche Intel Core i9-13950HX, NVIDIA RTX 5000 Ada Generation Laptop (n=1) | |
| HP ZBook Fury 16 G9 | |
| Dell Precision 5000 5680 | |
| Lenovo ThinkPad P16 G1 RTX A5500 | |
| PCMark 10 Score | 8102 Punkte | |
Hilfe | ||
| AIDA64 / Memory Copy | |
| Dell Precision 5000 5680 | |
| Lenovo ThinkPad P16 G1 RTX A5500 | |
| MSI CreatorPro Z16P B12UKST | |
| HP ZBook Fury 16 G10 | |
| HP ZBook Fury 16 G9 | |
| AIDA64 / Memory Read | |
| Dell Precision 5000 5680 | |
| MSI CreatorPro Z16P B12UKST | |
| Lenovo ThinkPad P16 G1 RTX A5500 | |
| HP ZBook Fury 16 G10 | |
| HP ZBook Fury 16 G9 | |
| AIDA64 / Memory Write | |
| Dell Precision 5000 5680 | |
| MSI CreatorPro Z16P B12UKST | |
| Lenovo ThinkPad P16 G1 RTX A5500 | |
| HP ZBook Fury 16 G10 | |
| HP ZBook Fury 16 G9 | |
* ... kleinere Werte sind besser
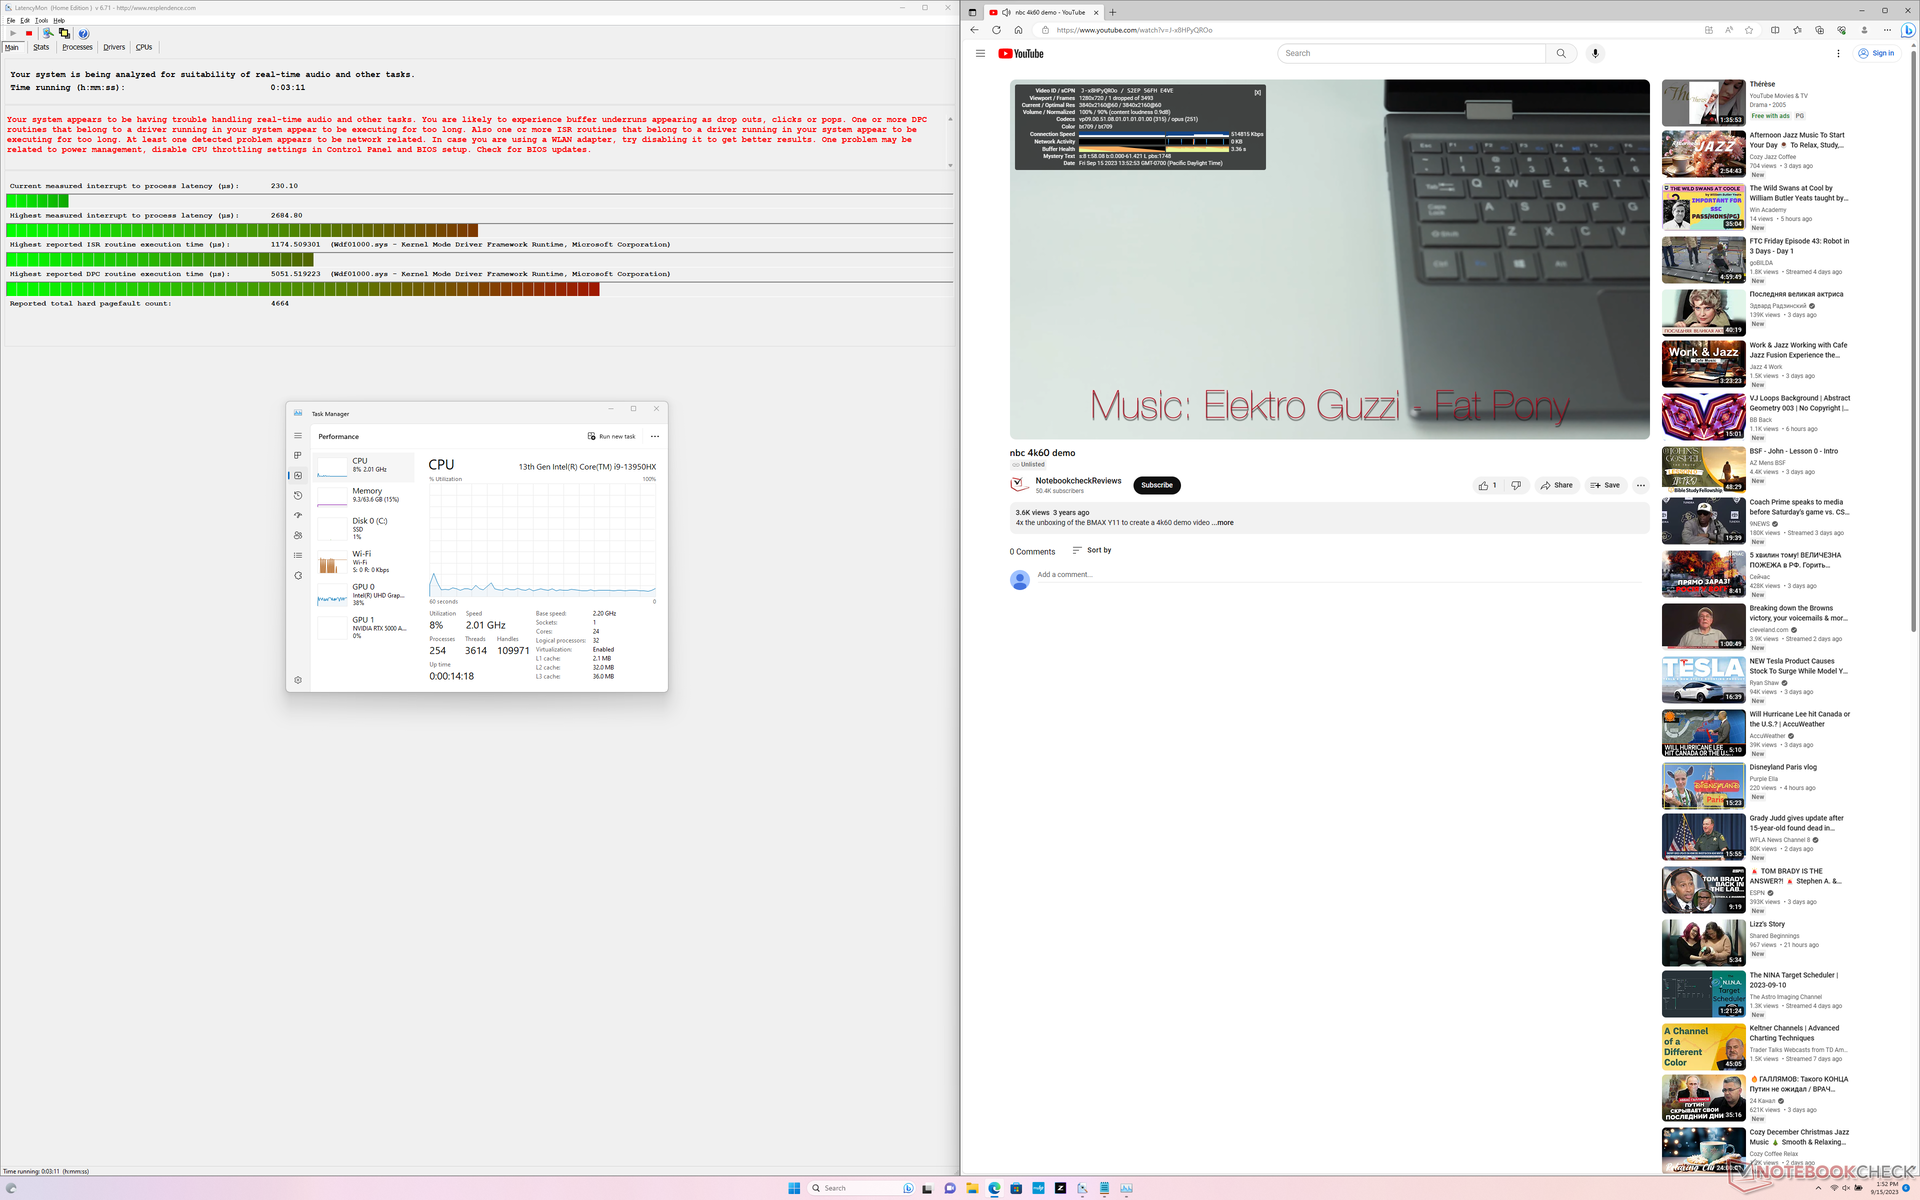
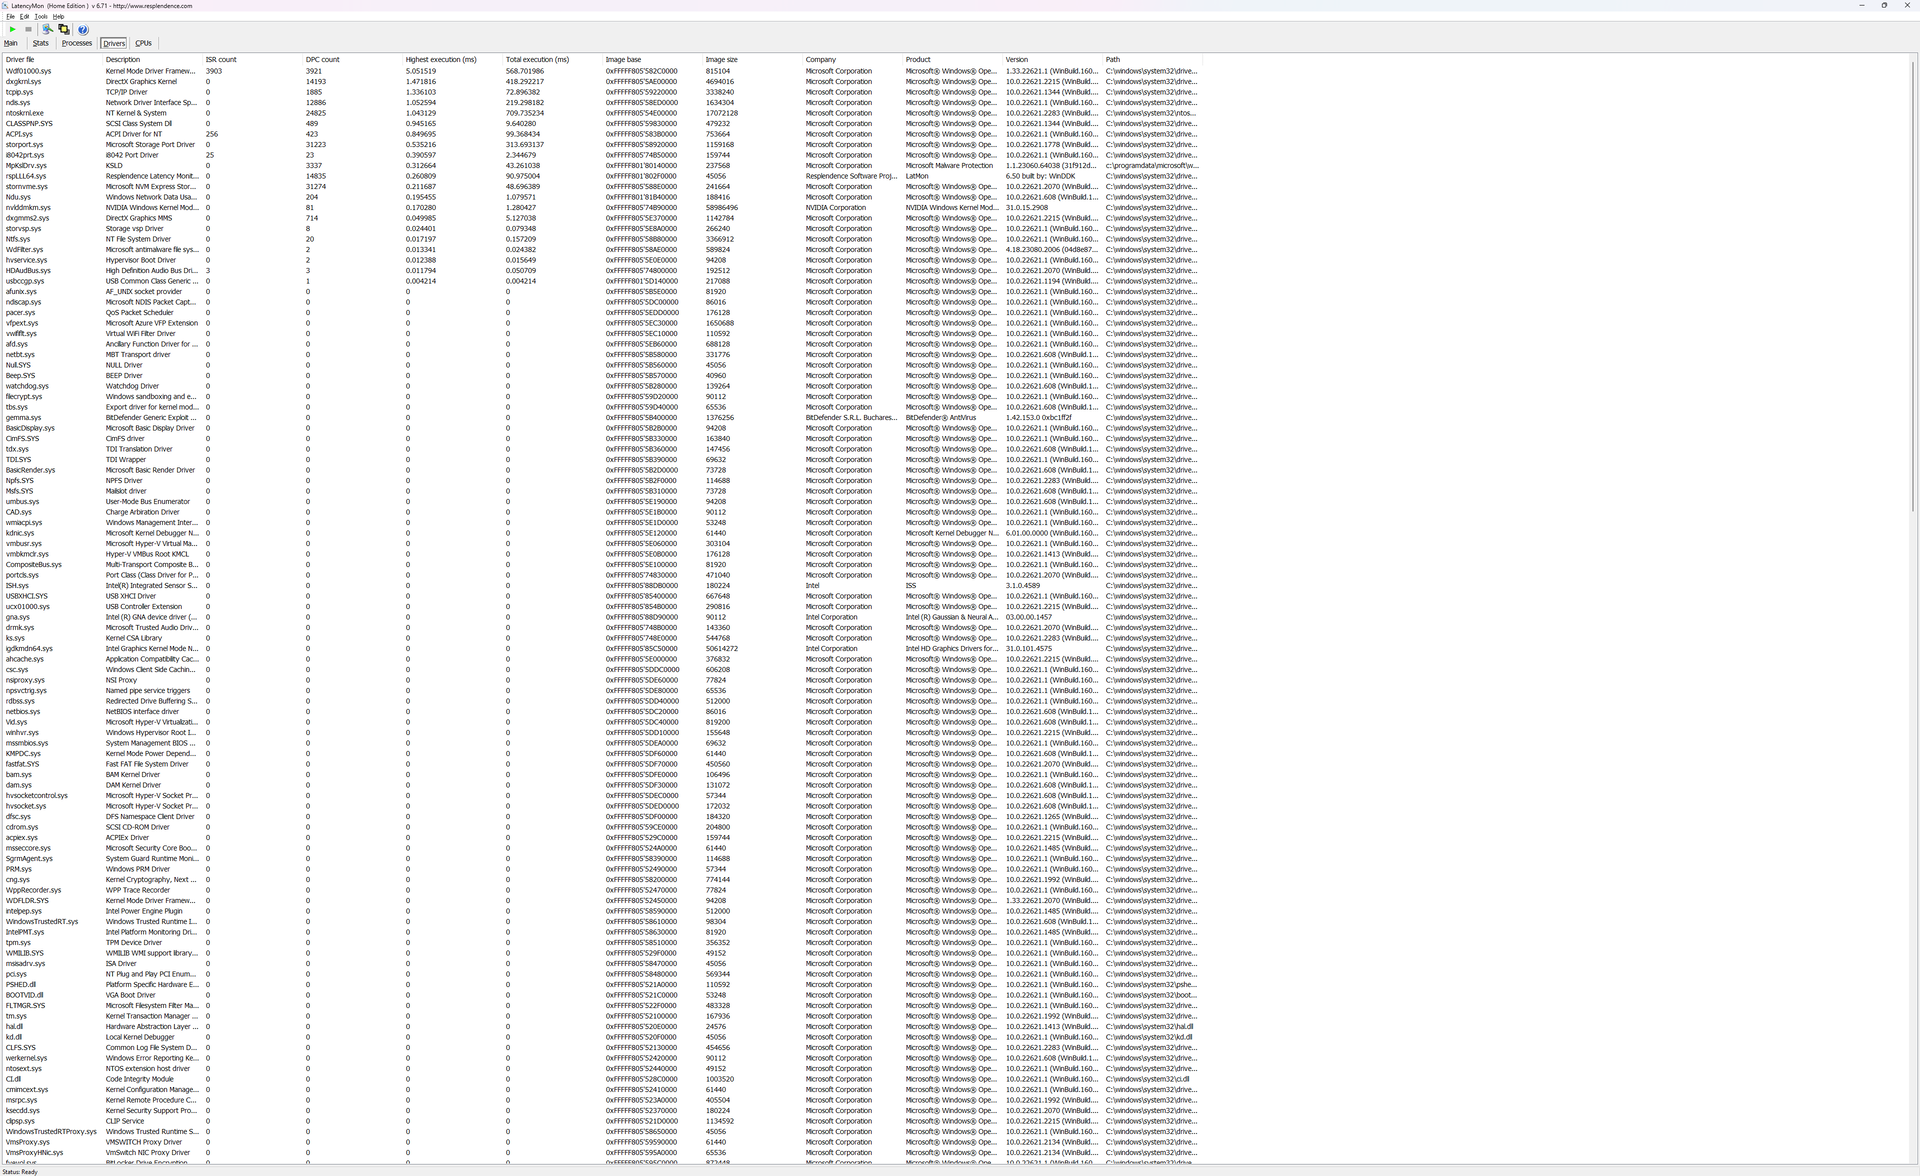
DPC-Latenzzeit
LatencyMon zeigt DPC-Probleme beim Öffnen mehrerer Tabs unserer Homepage. Die 4K-Videowiedergabe bei 60 FPS ist nahezu perfekt, nur ein einziger Frame wurde während eines 60-Sekunden-Intervalls abgebrochen.
| DPC Latencies / LatencyMon - interrupt to process latency (max), Web, Youtube, Prime95 | |
| HP ZBook Fury 16 G10 | |
| HP ZBook Fury 16 G9 | |
| Dell Precision 5000 5680 | |
| Lenovo ThinkPad P16 G1 RTX A5500 | |
| Asus ProArt StudioBook 16 W7600H5A-2BL2 | |
| MSI CreatorPro Z16P B12UKST | |
* ... kleinere Werte sind besser
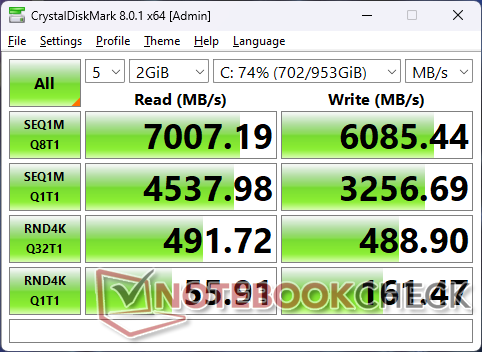
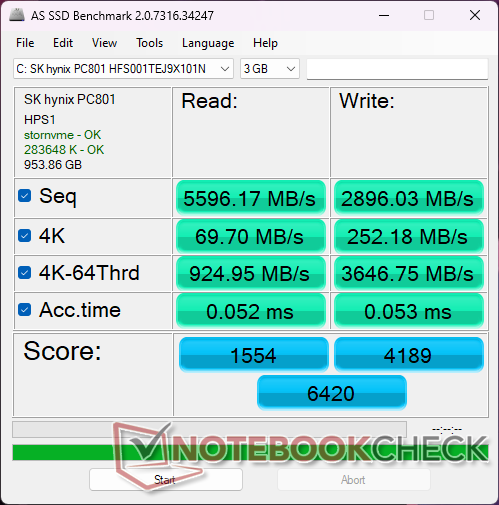
Speichergeräte
Unser Testgerät kommt mit einer SK hynix PC801 PCIe4 x4 NVMe SSD, während unser älteres Fury G16 G9 mit einer Micron 3400 ausgeliefert wurde. Leider wurde die Leistung nach etwa einer Minute in unserem Test auf bis zu 3400 MB/s gedrosselt, wie die Grafik unten zeigt. Die vier M.2-SSD-Steckplätze könnten wirklich etwas mehr Kühlung gebrauchen, um die Leistungskonsistenz zu verbessern.

* ... kleinere Werte sind besser
Disk Throttling: DiskSpd Read Loop, Queue Depth 8
GPU Performance - Mobile Monster
Die RTX 5000 Ada in unserem HP-System ist 10 bis 20 Prozent schneller als die gleiche GPU im Dell Precision 5680. Die leichten, aber konstanten Leistungsvorteile lassen sich auf die höhere TGP-Obergrenze zurückführen, während der Grafikprozessor im erwähnten Dell mit einer niedrigeren Leistungsaufnahme arbeitet. Unser Testabschnitt unten beschreibt unsere Beobachtungen im Detail.
Die Gesamtleistung liegt deutlich vor der der RTX A5500 im Fury 16 G9 aus dem letzten Jahr um bis zu 40 Prozent oder sogar 80 Prozent, je nach Anwendung.
| 3DMark 11 Performance | 39530 Punkte | |
| 3DMark Fire Strike Score | 28837 Punkte | |
| 3DMark Time Spy Score | 15989 Punkte | |
Hilfe | ||
* ... kleinere Werte sind besser
Witcher 3 FPS Chart
| min. | mittel | hoch | max. | QHD | 4K | |
|---|---|---|---|---|---|---|
| The Witcher 3 (2015) | 510.5 | 430.3 | 298.1 | 156.5 | 105.2 | |
| Dota 2 Reborn (2015) | 211 | 191.7 | 188.2 | 166.7 | 157.3 | |
| Final Fantasy XV Benchmark (2018) | 196.9 | 179.9 | 149.1 | 120 | 68.7 | |
| X-Plane 11.11 (2018) | 175.5 | 153.9 | 122.4 | 102.6 | ||
| Far Cry 5 (2018) | 158 | 144 | 138 | 131 | 129 | |
| Strange Brigade (2018) | 411 | 337 | 306 | 283 | 216 | 105.1 |
| Cyberpunk 2077 1.6 (2022) | 110.5 | 106.8 | 104.9 | 103.8 | 74.7 | 37 |
| Tiny Tina's Wonderlands (2022) | 267.5 | 227.7 | 171.7 | 139.4 | 99.4 | 53.9 |
| F1 22 (2022) | 249 | 246 | 211 | 86.2 | 64.4 | 33.4 |
| Ratchet & Clank Rift Apart (2023) | 118 | 93.9 | 69.4 | 54.5 | 43.4 | 33.3 |
Emissionen
Systemrauschen
Das maximale Lüftergeräusch ist leiser als beim letztjährigen Modell. Zumindest dauert es länger, bis die Lüfter des Fury 16 G10 die gleiche Lautstärke erreichen wie die Lüfter des Fury 16 G9. Das Lüftergeräusch ist ansonsten bei niedriger bis mittlerer Last leise, mit einem gelegentlichen Pulsieren auf 29 dB(A) vor einem leisen Hintergrund von 23 dB(A).
Wir können ein leichtes Spulenfiepen oder elektronisches Rauschen bei unserem Gerät feststellen, wenn wir anspruchsvollere Lasten wie Spiele starten. Das hochfrequente Geräusch sollte hoffentlich mit der Zeit verschwinden.
Lautstärkediagramm
| Idle |
| 22.9 / 22.9 / 28.5 dB(A) |
| Last |
| 40.6 / 45.8 dB(A) |
 | ||
30 dB leise 40 dB(A) deutlich hörbar 50 dB(A) störend |
||
min: | ||
| HP ZBook Fury 16 G10 RTX 5000 Ada Generation Laptop, i9-13950HX, SK hynix PC801 HFS001TEJ9X101N | HP ZBook Fury 16 G9 RTX A5500 Laptop GPU, i9-12950HX, Micron 3400 1TB MTFDKBA1T0TFH | Dell Precision 5000 5680 RTX 5000 Ada Generation Laptop, i9-13900H, 2x SK hynix PC801 HFS512GEJ9X101N RAID 0 | Lenovo ThinkPad P16 G1 RTX A5500 RTX A5500 Laptop GPU, i9-12950HX, WDC PC SN810 2TB | MSI CreatorPro Z16P B12UKST RTX A3000 Laptop GPU, i7-12700H, Samsung PM9A1 MZVL21T0HCLR | Asus ProArt StudioBook 16 W7600H5A-2BL2 RTX A5000 Laptop GPU, W-11955M, 2x Micron 2300 2TB MTFDHBA2T0TDV (RAID 0) | |
|---|---|---|---|---|---|---|
| Geräuschentwicklung | -1% | 0% | 2% | -6% | -5% | |
| aus / Umgebung * (dB) | 22.9 | 22.6 1% | 22.8 -0% | 23.1 -1% | 24.1 -5% | 26 -14% |
| Idle min * (dB) | 22.9 | 22.7 1% | 23 -0% | 23.1 -1% | 27.1 -18% | 26 -14% |
| Idle avg * (dB) | 22.9 | 22.7 1% | 23 -0% | 23.1 -1% | 27.1 -18% | 26 -14% |
| Idle max * (dB) | 28.5 | 28.8 -1% | 23 19% | 23.1 19% | 27.1 5% | 26.5 7% |
| Last avg * (dB) | 40.6 | 36.2 11% | 37.2 8% | 28.9 29% | 42.9 -6% | 42 -3% |
| Witcher 3 ultra * (dB) | 44.1 | 49.5 -12% | 51 -16% | 51.6 -17% | 44 -0% | |
| Last max * (dB) | 45.8 | 49.3 -8% | 51 -11% | 51.4 -12% | 47 -3% | 43 6% |
* ... kleinere Werte sind besser
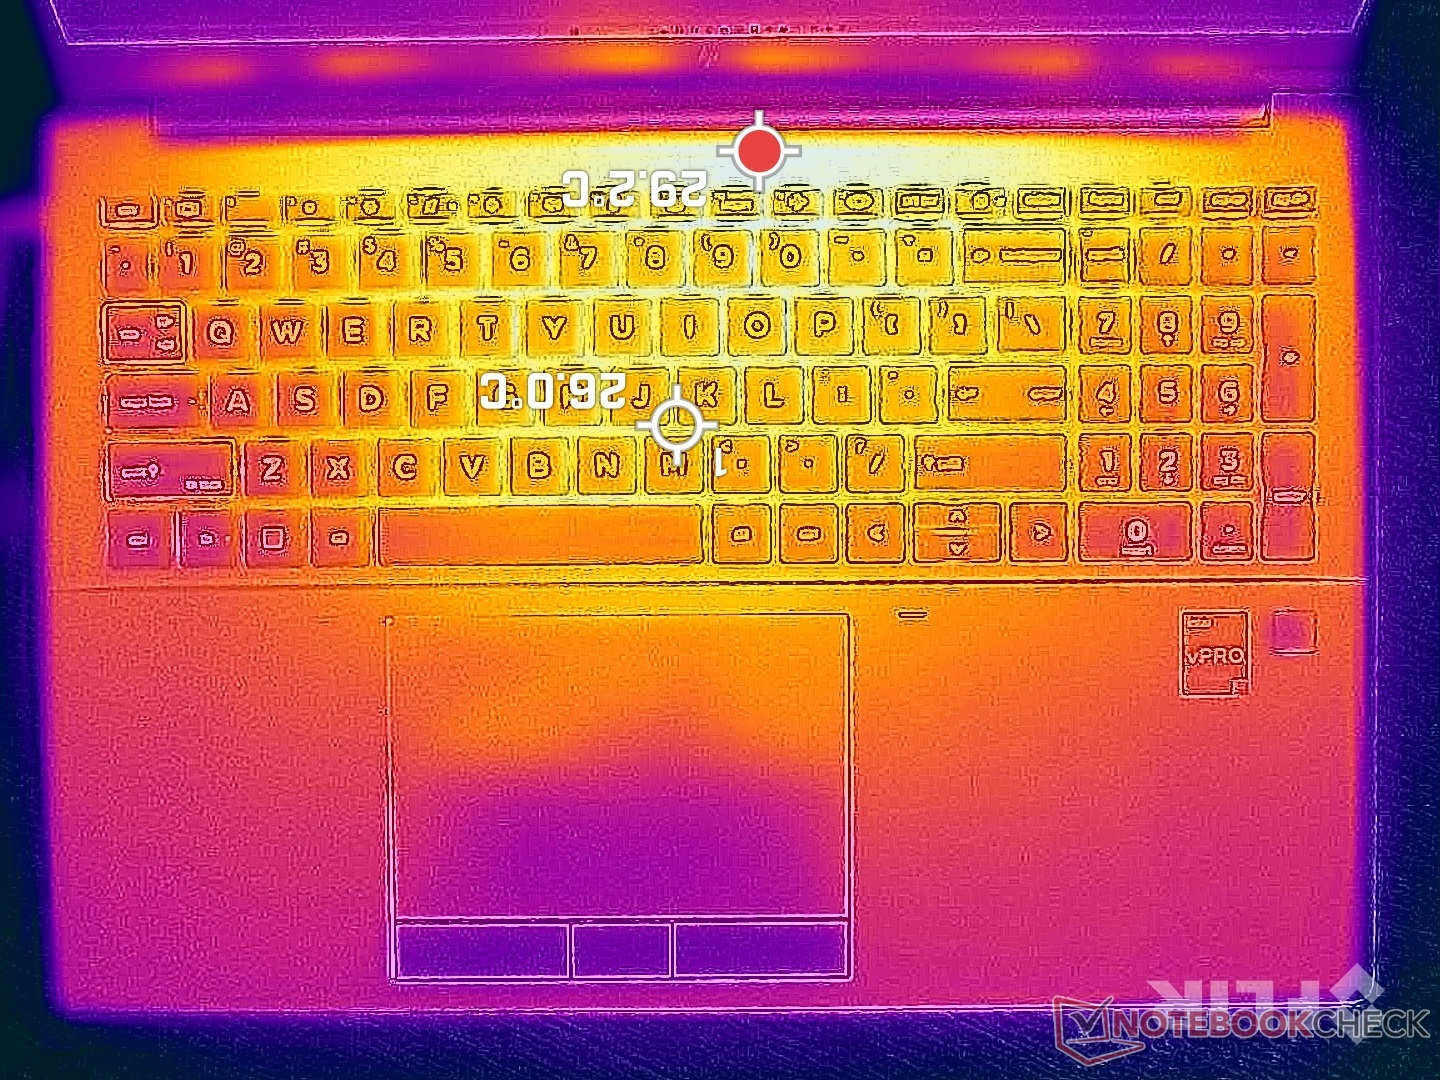
Temperatur
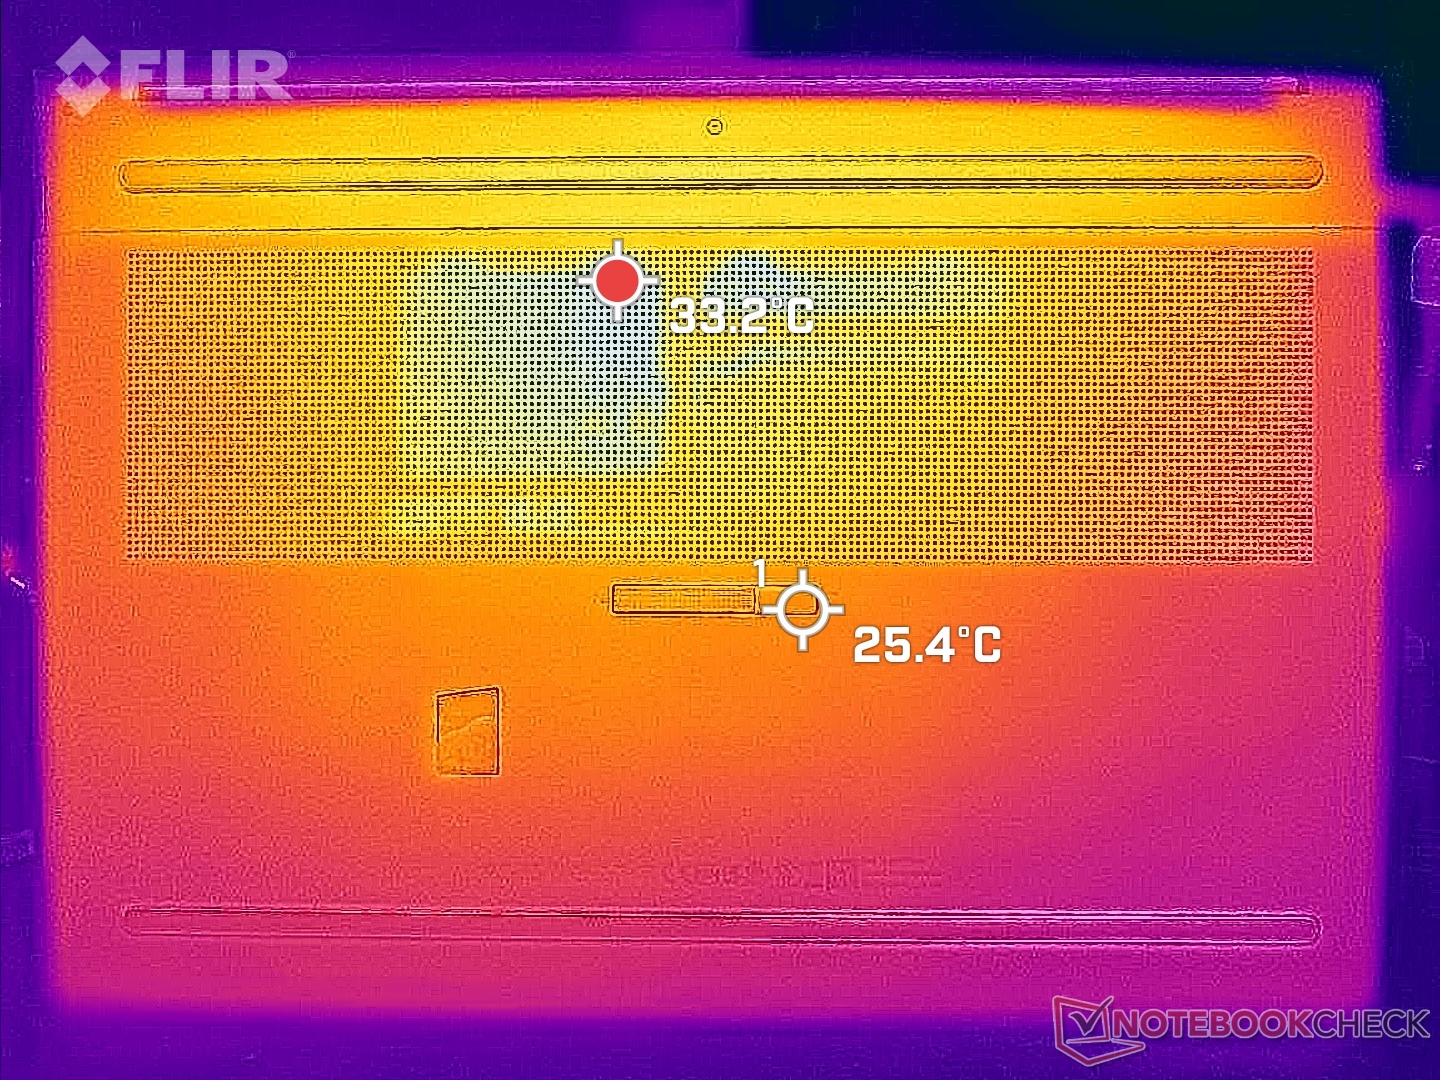
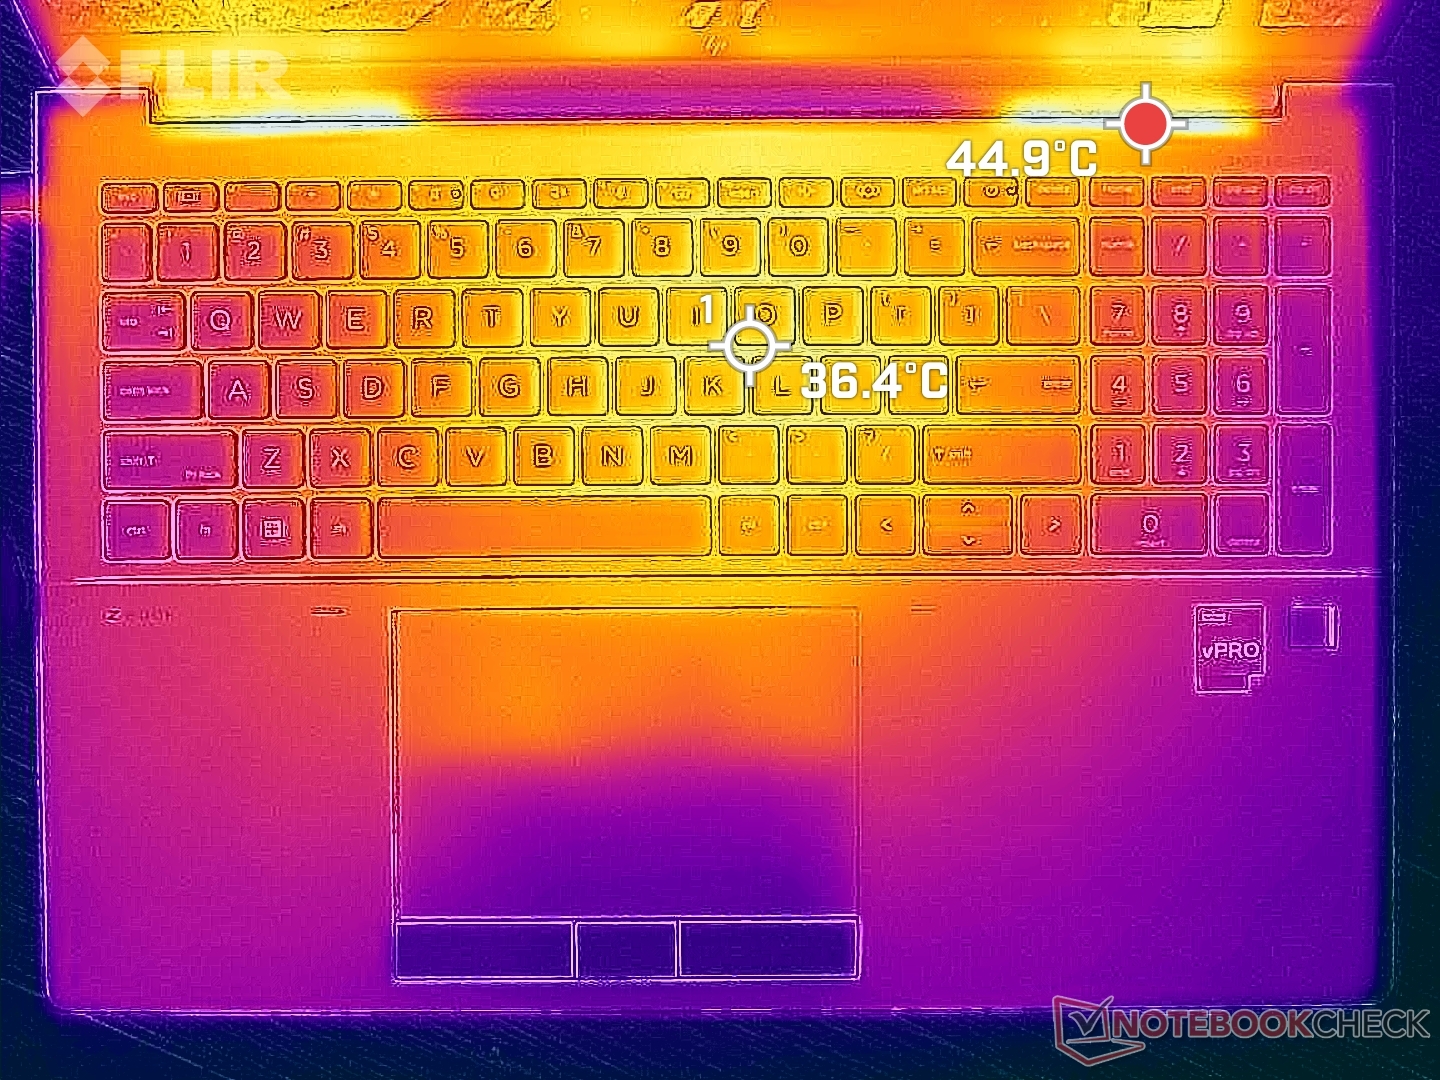
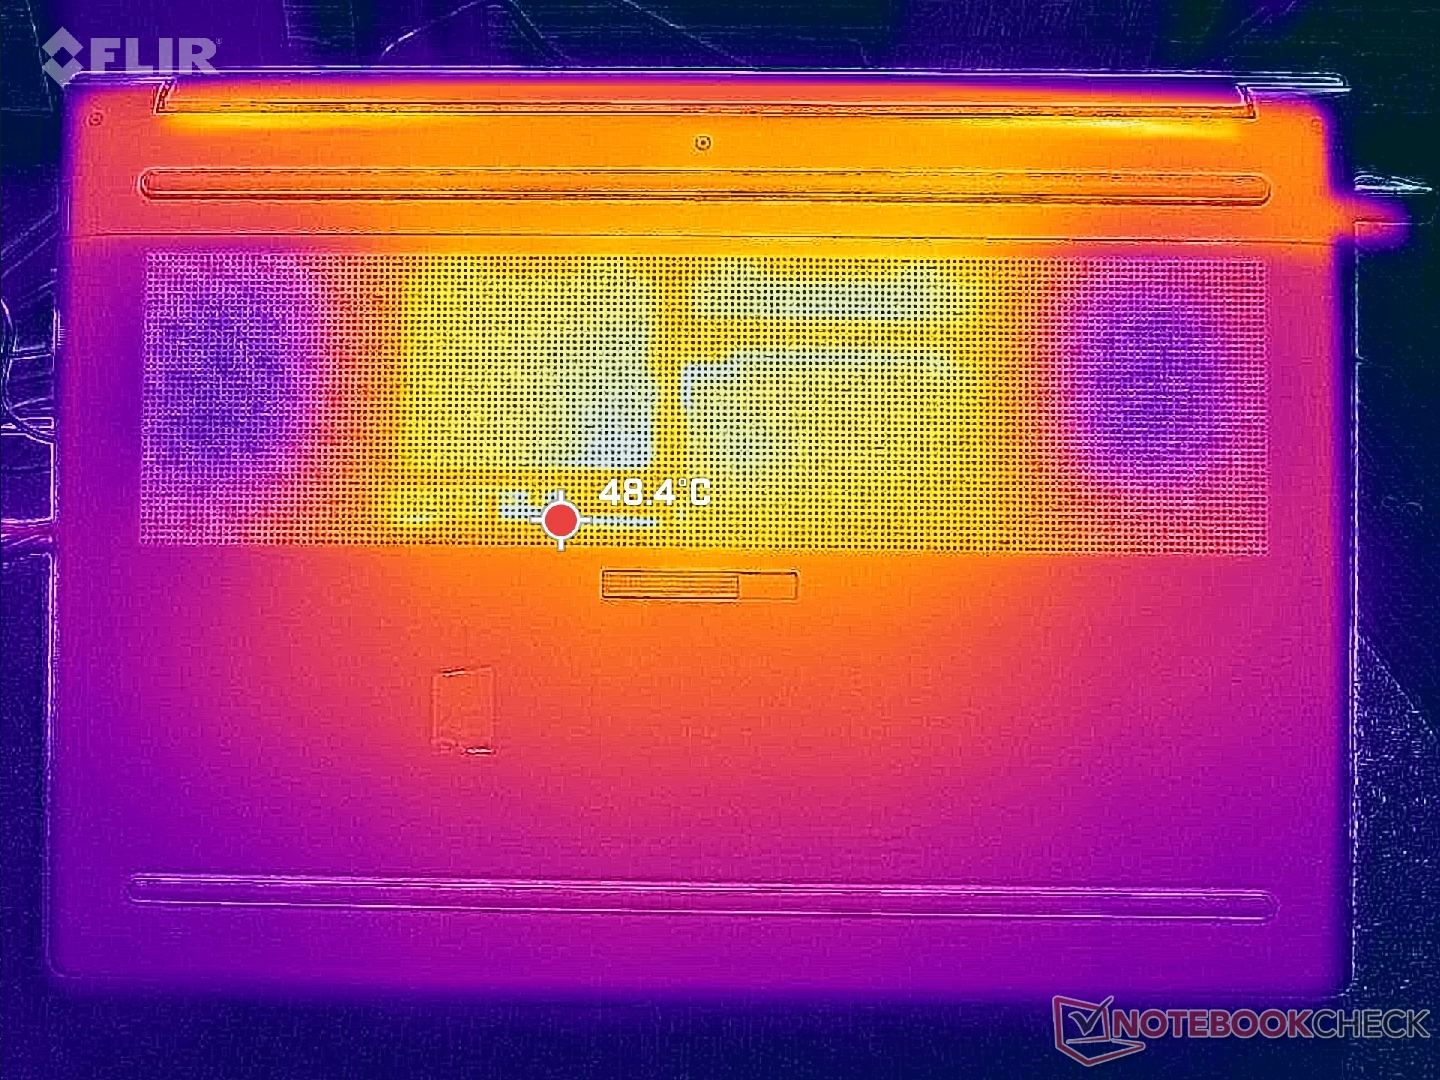
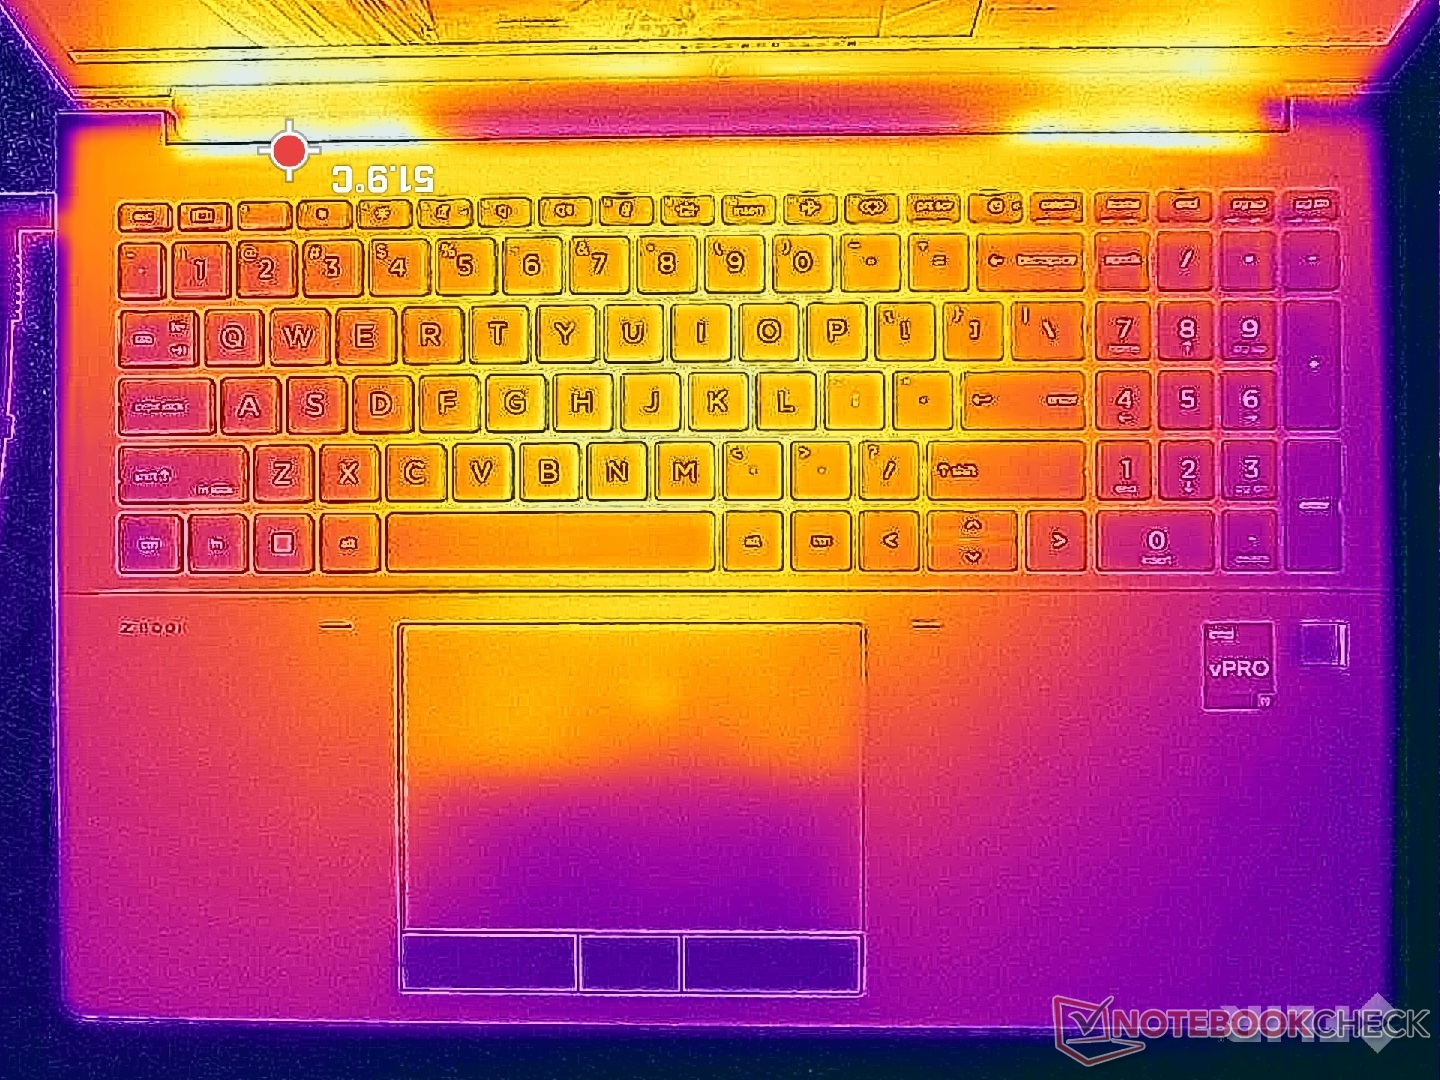
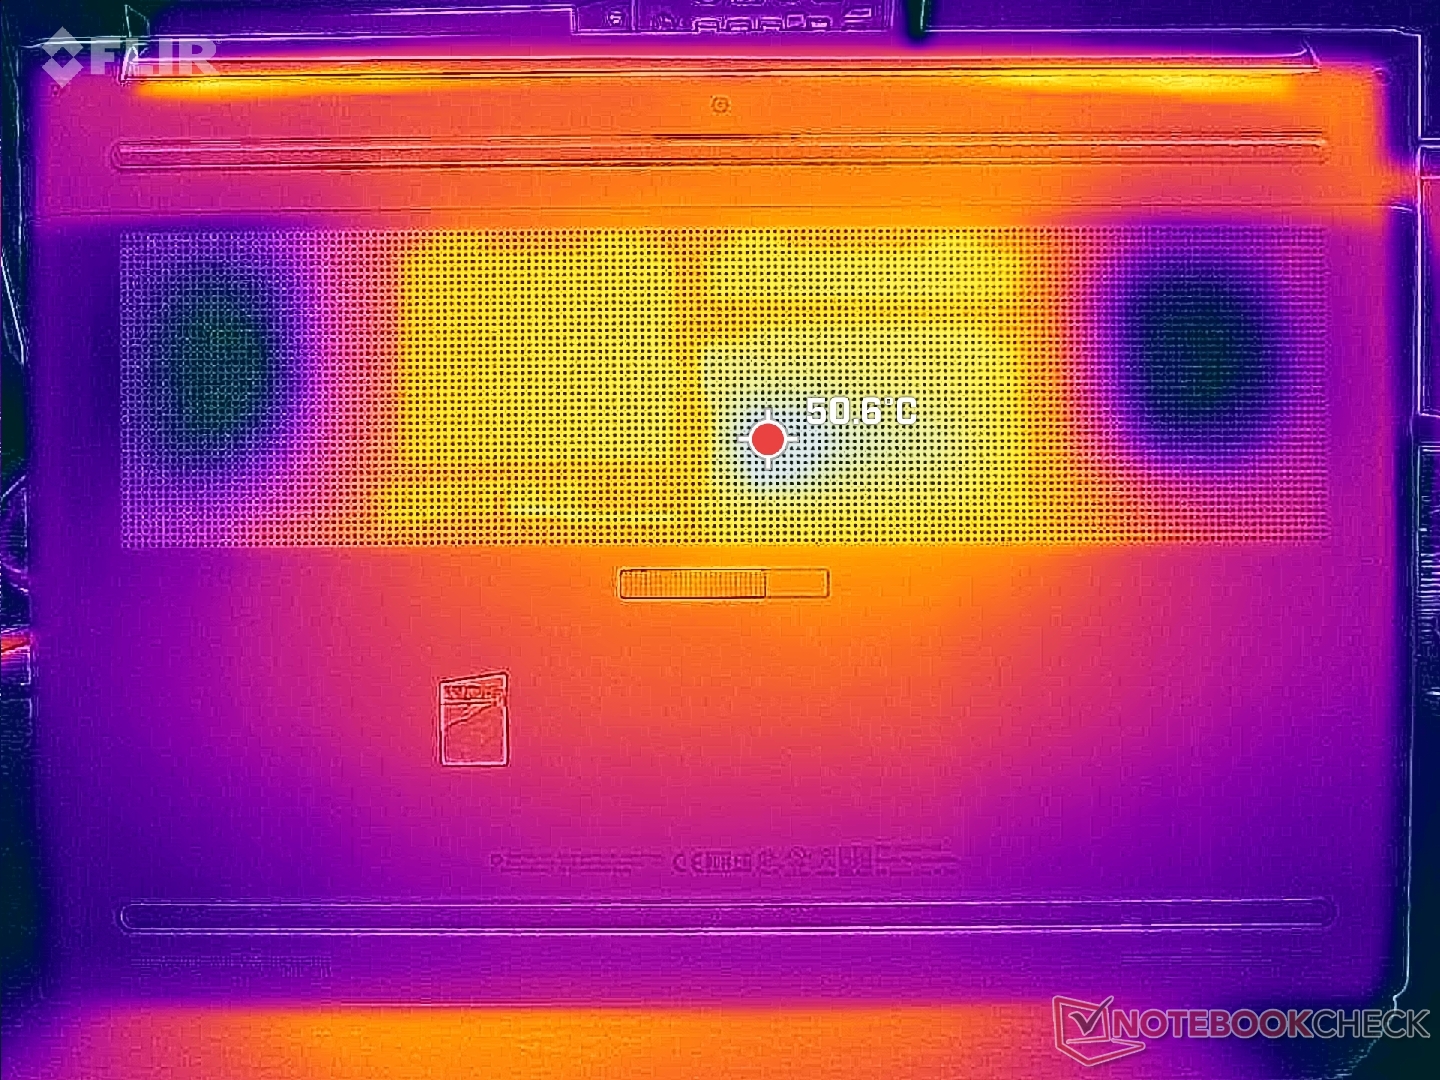
Die Oberflächentemperaturen können bei hoher Last über 36 °C in der Mitte der Tastatur und 45 °C auf der Rückseite erreichen. Interessanterweise ist das System kühler als das Precision 5680 auf der Tastatur, aber das Gegenteil trifft auf die Unterseite zu.
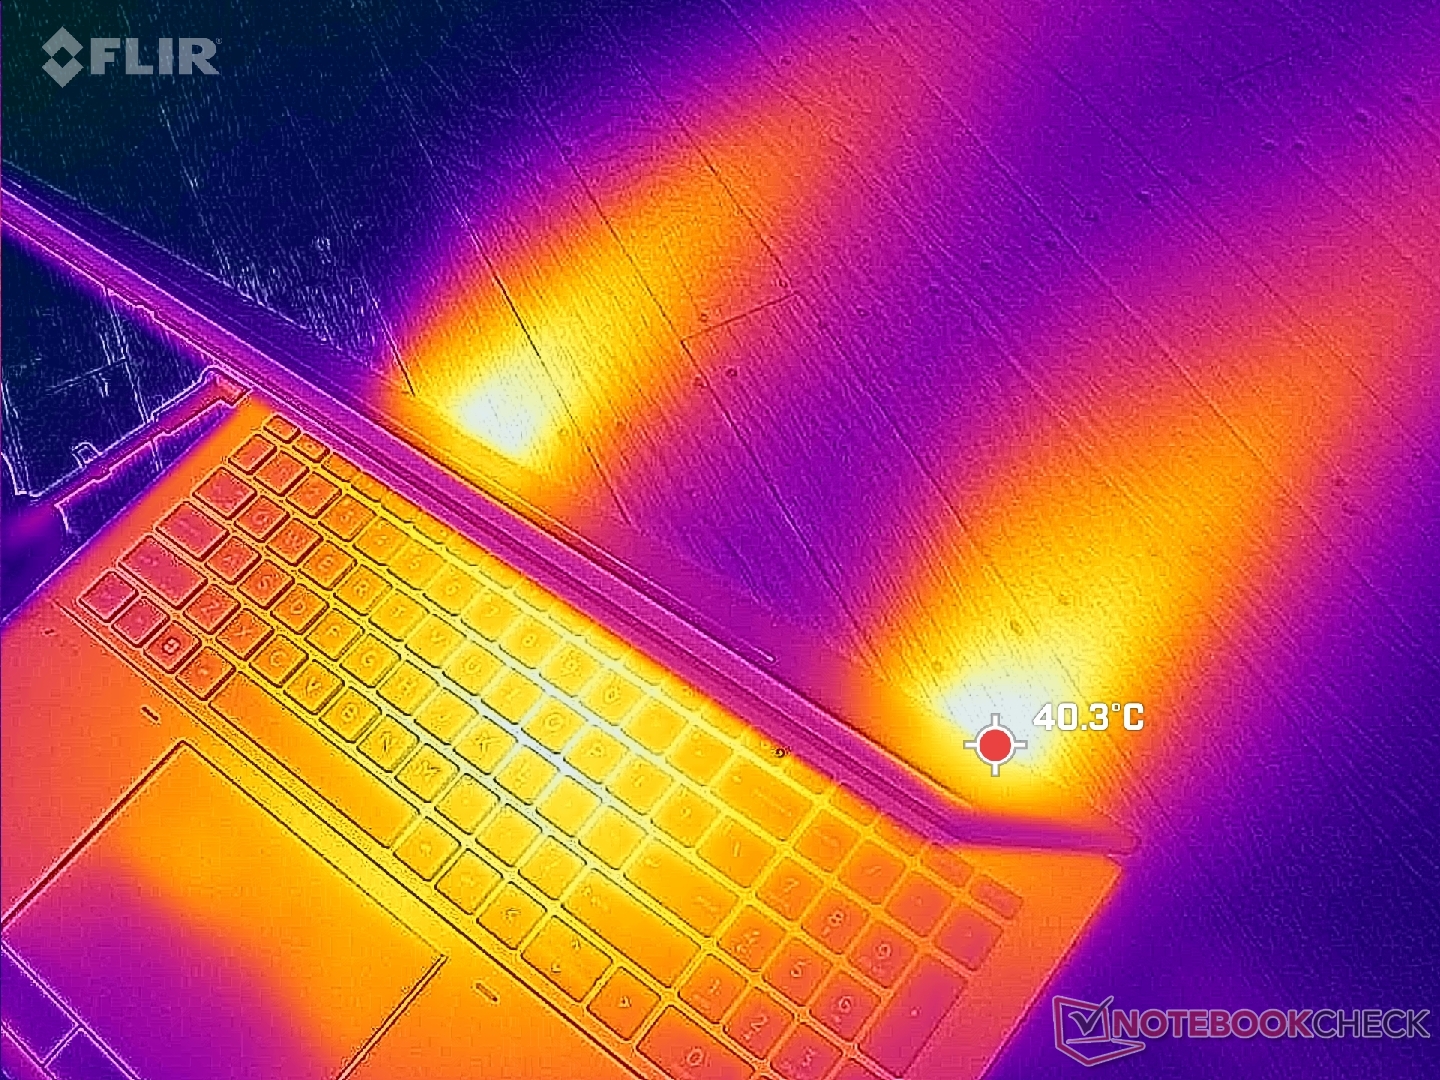
(±) Die maximale Temperatur auf der Oberseite ist 44.8 °C. Im Vergleich liegt der Klassendurchschnitt bei 38.2 °C (von 22.2 bis 69.8 °C für die Klasse Workstation).
(-) Auf der Unterseite messen wir eine maximalen Wert von 50 °C (im Vergleich zum Durchschnitt von 41.1 °C).
(+) Ohne Last messen wir eine durchschnittliche Temperatur von 30.6 °C auf der Oberseite. Der Klassendurchschnitt erreicht 32 °C.
(±) Beim längeren Spielen von The Witcher 3 erhitzt sich das Gerät durchschnittlich auf 34.7 °C. Der Durchschnitt der Klasse ist derzeit 32 °C.
(±) Die Handballen und der Touchpad-Bereich können sehr heiß werden mit maximal 39.2 °C.
(-) Die durchschnittliche Handballen-Temperatur anderer getesteter Geräte war 27.8 °C (-11.4 °C).
| HP ZBook Fury 16 G10 Intel Core i9-13950HX, NVIDIA RTX 5000 Ada Generation Laptop | HP ZBook Fury 16 G9 Intel Core i9-12950HX, NVIDIA RTX A5500 Laptop GPU | Dell Precision 5000 5680 Intel Core i9-13900H, NVIDIA RTX 5000 Ada Generation Laptop | Lenovo ThinkPad P16 G1 RTX A5500 Intel Core i9-12950HX, NVIDIA RTX A5500 Laptop GPU | MSI CreatorPro Z16P B12UKST Intel Core i7-12700H, NVIDIA RTX A3000 Laptop GPU | Asus ProArt StudioBook 16 W7600H5A-2BL2 Intel Xeon W-11955M, NVIDIA RTX A5000 Laptop GPU | |
|---|---|---|---|---|---|---|
| Hitze | 8% | 4% | -3% | -4% | -3% | |
| Last oben max * (°C) | 44.8 | 43.2 4% | 50.2 -12% | 44.8 -0% | 56.3 -26% | 45.7 -2% |
| Last unten max * (°C) | 50 | 50.4 -1% | 32 36% | 49.8 -0% | 68.3 -37% | 48.3 3% |
| Idle oben max * (°C) | 34.4 | 28.6 17% | 37.4 -9% | 30.6 11% | 25.2 27% | 35.3 -3% |
| Idle unten max * (°C) | 31.8 | 28.2 11% | 31.2 2% | 38.6 -21% | 25.9 19% | 34.4 -8% |
* ... kleinere Werte sind besser
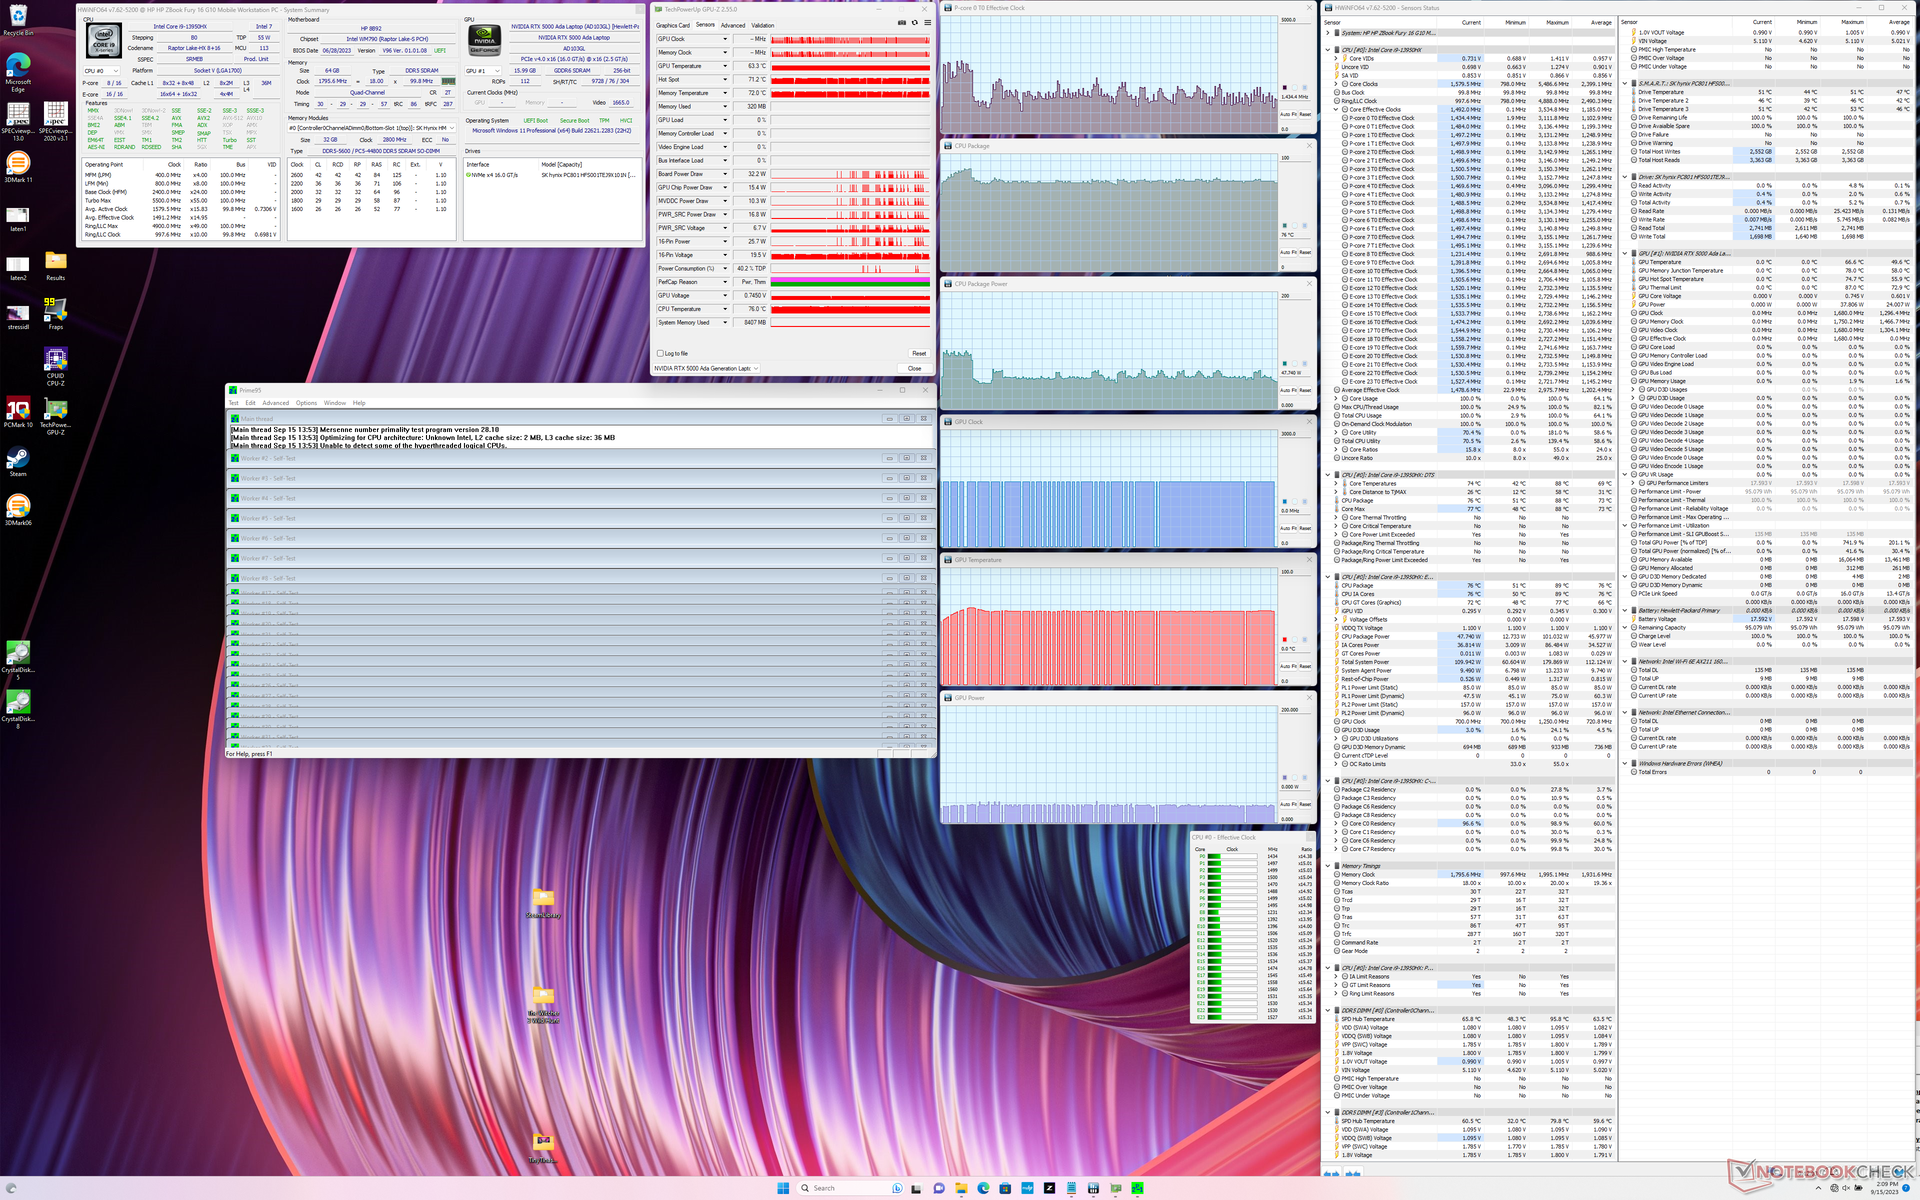
Stresstest
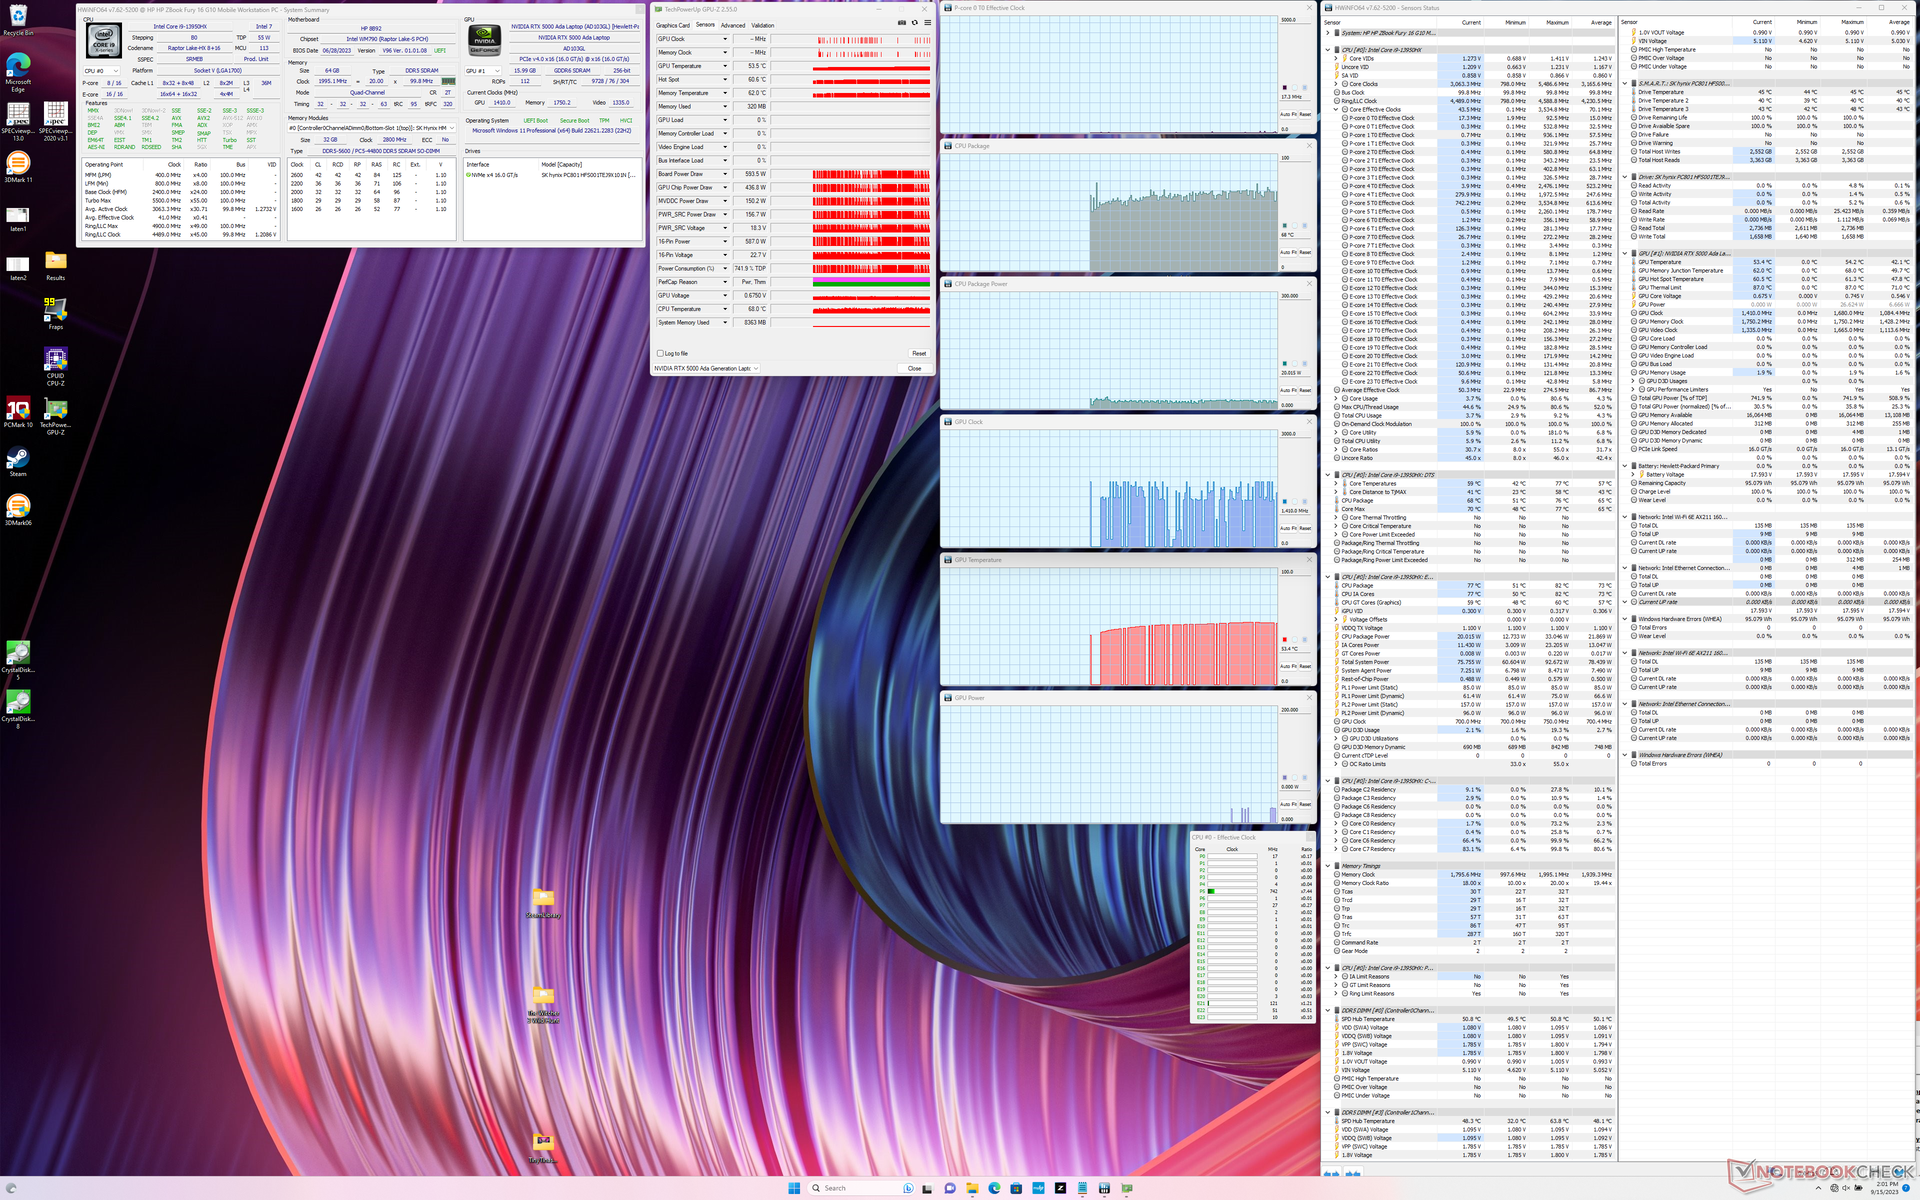
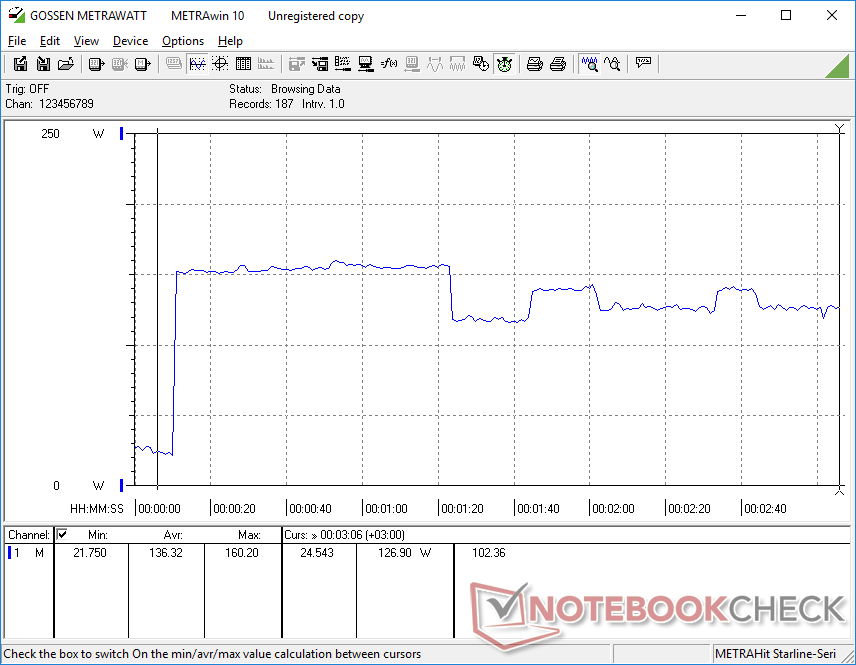
Die durchschnittlichen CPU-Taktraten und die Leistungsaufnahme des Boards bei der Ausführung von Prime95 stabilisieren sich bei 1,5 GHz bzw. 48 W, verglichen mit 2,9 GHz und 115 W beim Razer Blade 18, das mit der gleichen Core-i9-13950HX-CPU ausgestattet ist. Die Kerntemperatur ist beim HP um etwa 8 °C kühler, was darauf hindeutet, dass das Fury 16 G10 der Temperaturkontrolle Vorrang vor schnellerer Leistung einräumt.
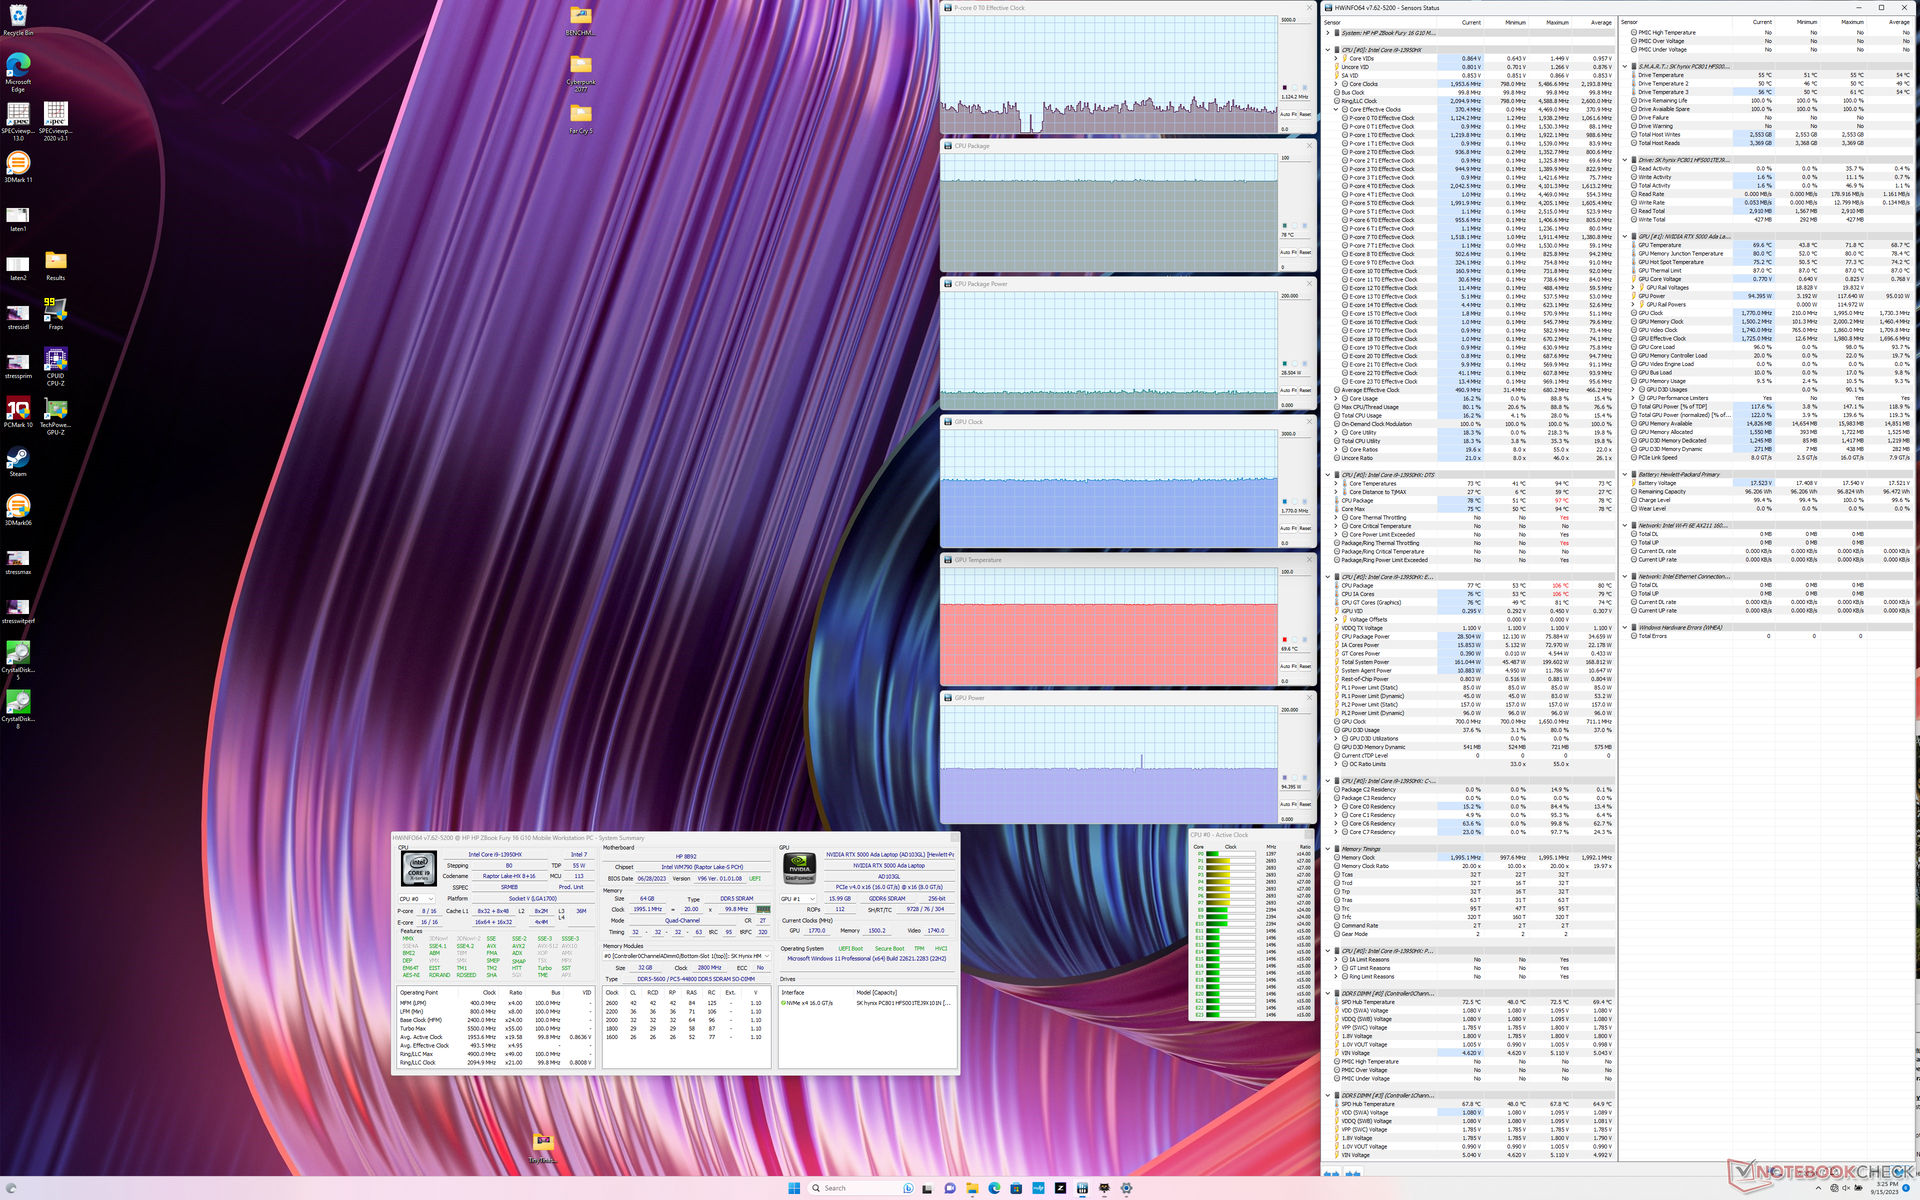
Im Modus "Ausbalanciert" wird die Grafikleistung reduziert. Beispielsweise stabilisieren sich die GPU-Taktraten und die Leistungsaufnahme bei Witcher 3 bei 1845 MHz bzw. 102 W, verglichen mit 1770 MHz und 94 W im Balanced-Modus. In jedem Fall erreicht das HP-System höhere reale TGP-Werte als die gleiche GPU im Precision 5680 wo es nur 72 W beträgt.
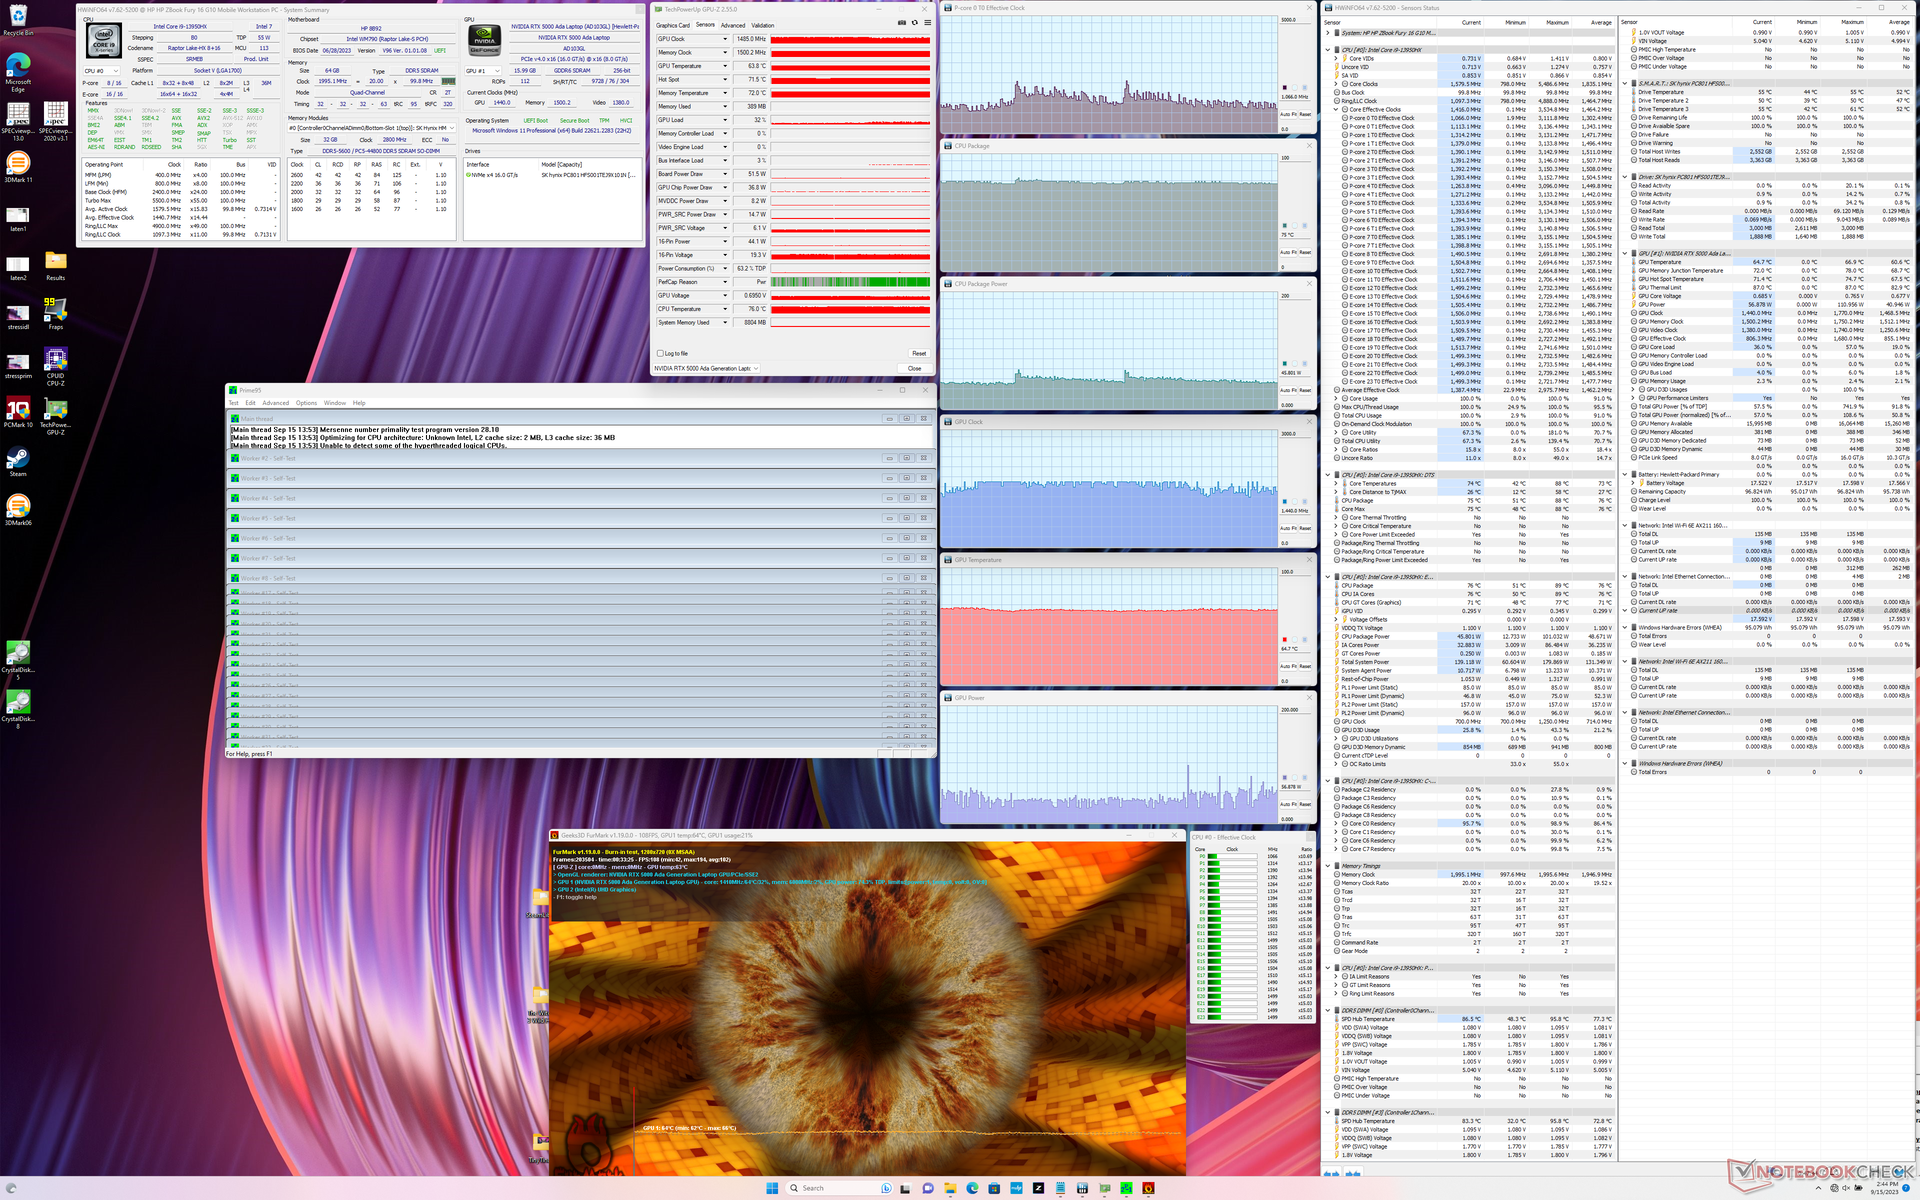

| CPU-Takt (GHz) | GPU-Takt (MHz) | Durchschnittliche CPU-Temperatur (°C) | Durchschnittliche GPU-Temperatur (°C) | |
| System Leerlauf | -- | -- | 68 | 54 |
| Prime95 Stress | ~1.7 | -- | 76 | 63 |
| Prime95 + FurMark Stress | ~1.1 | 1440 | 75 | 65 |
| Witcher 3 Stress (Ausgewogener Modus) | ~1.1 | 1770 | 78 | 70 |
| Witcher 3 Stress (Performance Modus) | ~1.1 | 1845 | 79 | 70 |
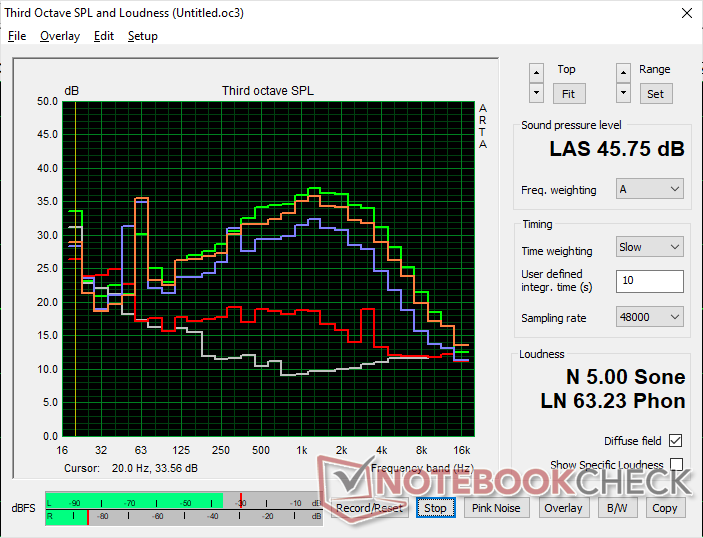
Lautsprecher
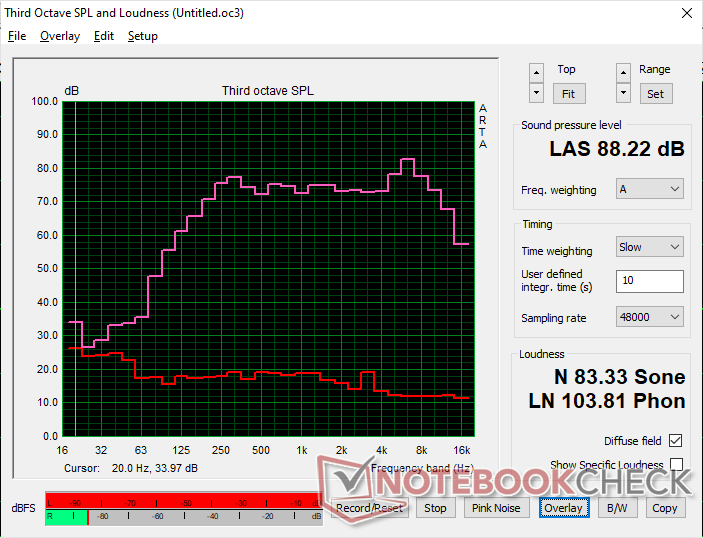
HP ZBook Fury 16 G10 Audio Analyse
(+) | Die Lautsprecher können relativ laut spielen (88.2 dB)
Bass 100 - 315 Hz
(±) | abgesenkter Bass - 7.7% geringer als der Median
(±) | durchschnittlich lineare Bass-Wiedergabe (8.7% Delta zum Vorgänger)
Mitteltöne 400 - 2000 Hz
(+) | ausgeglichene Mitten, vom Median nur 1.2% abweichend
(+) | lineare Mitten (3.3% Delta zum Vorgänger)
Hochtöne 2 - 16 kHz
(+) | ausgeglichene Hochtöne, vom Median nur 2.8% abweichend
(+) | sehr lineare Hochtöne (5.2% Delta zum Vorgänger)
Gesamt im hörbaren Bereich 100 - 16.000 Hz
(+) | hörbarer Bereich ist sehr linear (8.6% Abstand zum Median
Im Vergleich zu allen Geräten derselben Klasse
» 2% aller getesteten Geräte dieser Klasse waren besser, 1% vergleichbar, 96% schlechter
» Das beste Gerät hat einen Delta-Wert von 7%, durchschnittlich ist 17%, das schlechteste Gerät hat 35%
Im Vergleich zu allen Geräten im Test
» 2% aller getesteten Geräte waren besser, 1% vergleichbar, 97% schlechter
» Das beste Gerät hat einen Delta-Wert von 4%, durchschnittlich ist 23%, das schlechteste Gerät hat 134%
Apple MacBook Pro 16 2021 M1 Pro Audio Analyse
(+) | Die Lautsprecher können relativ laut spielen (84.7 dB)
Bass 100 - 315 Hz
(+) | guter Bass - nur 3.8% Abweichung vom Median
(+) | lineare Bass-Wiedergabe (5.2% Delta zum Vorgänger)
Mitteltöne 400 - 2000 Hz
(+) | ausgeglichene Mitten, vom Median nur 1.3% abweichend
(+) | lineare Mitten (2.1% Delta zum Vorgänger)
Hochtöne 2 - 16 kHz
(+) | ausgeglichene Hochtöne, vom Median nur 1.9% abweichend
(+) | sehr lineare Hochtöne (2.7% Delta zum Vorgänger)
Gesamt im hörbaren Bereich 100 - 16.000 Hz
(+) | hörbarer Bereich ist sehr linear (4.6% Abstand zum Median
Im Vergleich zu allen Geräten derselben Klasse
» 0% aller getesteten Geräte dieser Klasse waren besser, 0% vergleichbar, 100% schlechter
» Das beste Gerät hat einen Delta-Wert von 5%, durchschnittlich ist 17%, das schlechteste Gerät hat 45%
Im Vergleich zu allen Geräten im Test
» 0% aller getesteten Geräte waren besser, 0% vergleichbar, 100% schlechter
» Das beste Gerät hat einen Delta-Wert von 4%, durchschnittlich ist 23%, das schlechteste Gerät hat 134%
Energieverwaltung
Stromverbrauch
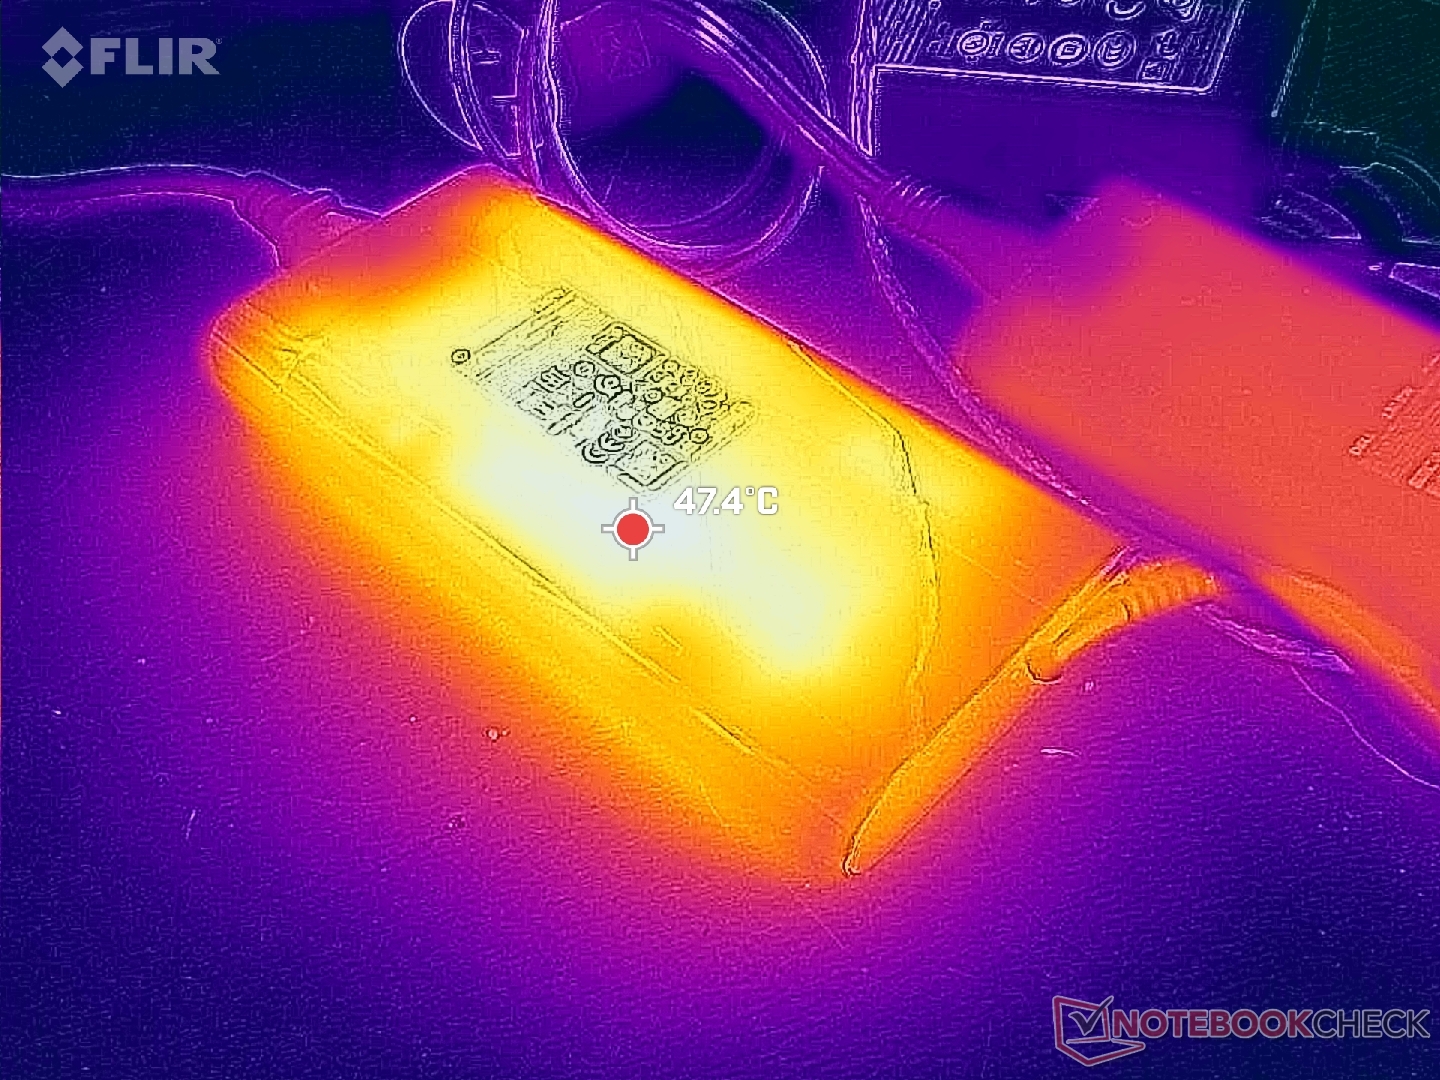
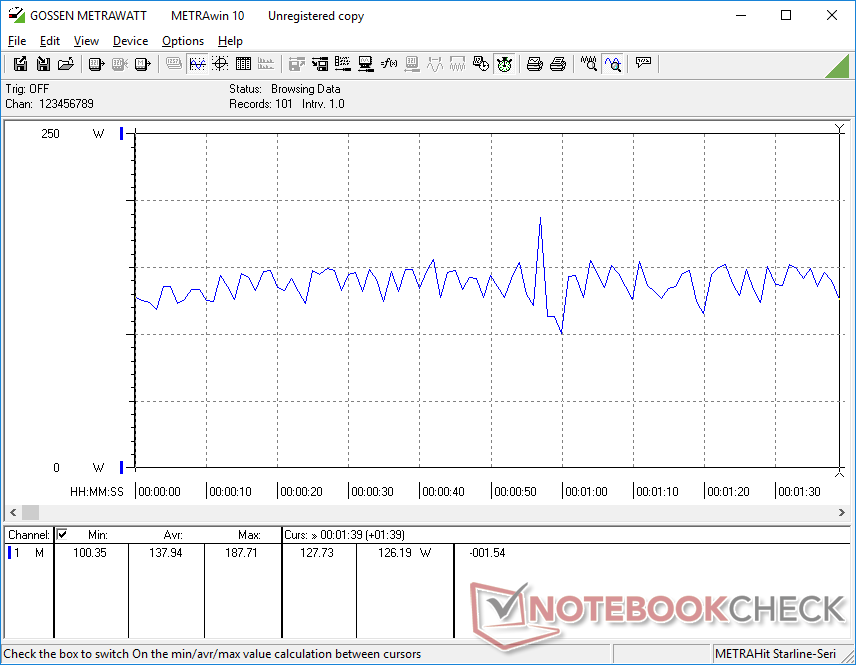
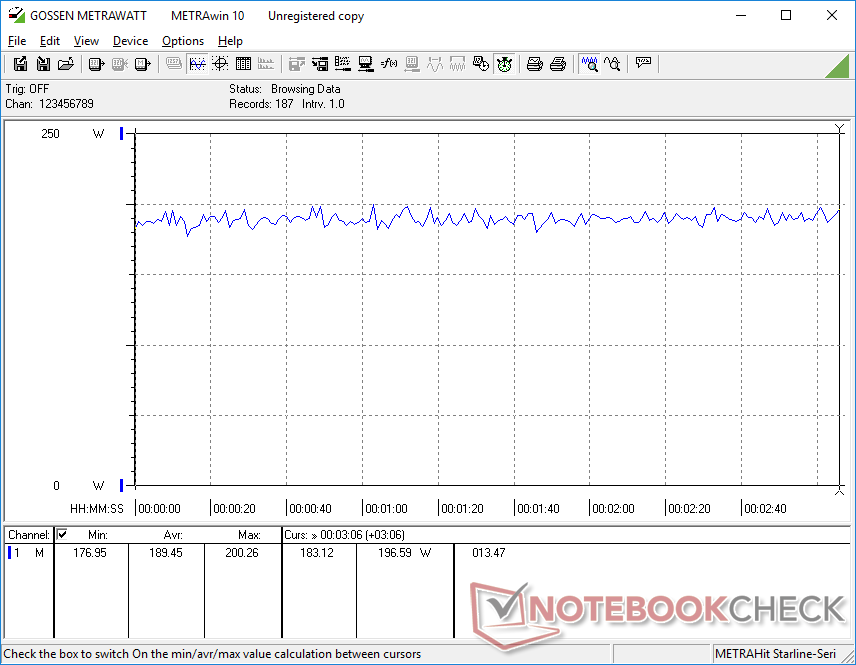
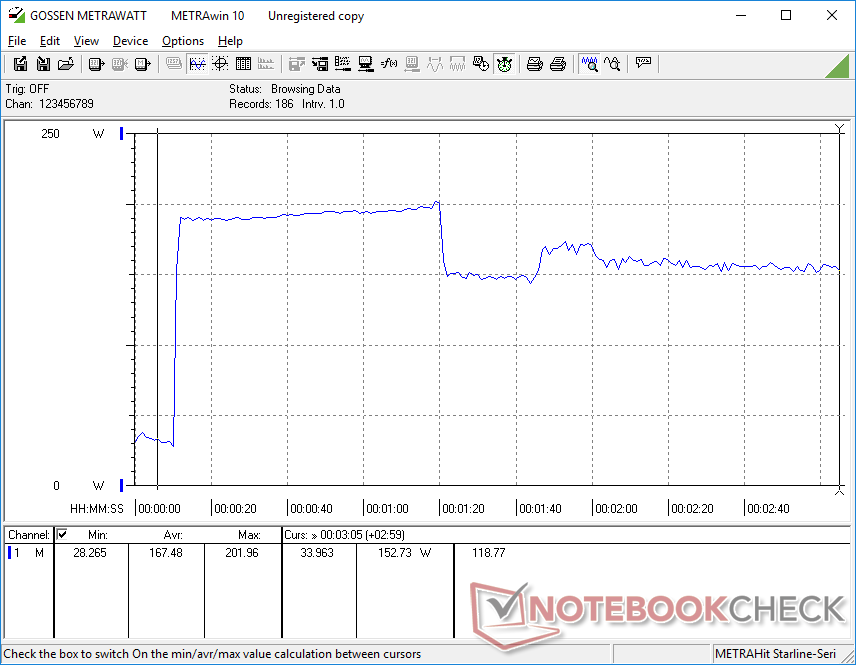
Der Stromverbrauch unter Last bleibt trotz der CPU- und GPU-Verbesserungen für eine viel höhere Leistung pro Watt ungefähr gleich wie beim letztjährigen Modell. Aufgrund der höheren TGP-Ziele des HP-Modells ist er auch generell höher als beim Precision 5680.
Beachten Sie, dass unsere Fury 16 G10 bei hoher Last, wie z. B. Spielen, deutlich mehr Strom verbraucht als die ähnlich konfigurierte Precision 5680, was vor allem an den höheren Leistungszielen des HP liegt. Das HP wird mit einem 230-Watt-, das Dell mit einem kleineren 165-Watt-USB-C-Netzteil ausgeliefert.
| Aus / Standby | |
| Idle | |
| Last |
|
Legende:
min: | |
| HP ZBook Fury 16 G10 i9-13950HX, RTX 5000 Ada Generation Laptop, SK hynix PC801 HFS001TEJ9X101N, IPS, 3840x2400, 16" | HP ZBook Fury 16 G9 i9-12950HX, RTX A5500 Laptop GPU, Micron 3400 1TB MTFDKBA1T0TFH, IPS, 3840x2400, 16" | Dell Precision 5000 5680 i9-13900H, RTX 5000 Ada Generation Laptop, 2x SK hynix PC801 HFS512GEJ9X101N RAID 0, OLED, 3840x2400, 16" | Lenovo ThinkPad P16 G1 RTX A5500 i9-12950HX, RTX A5500 Laptop GPU, WDC PC SN810 2TB, IPS, 3840x2400, 16" | MSI CreatorPro Z16P B12UKST i7-12700H, RTX A3000 Laptop GPU, Samsung PM9A1 MZVL21T0HCLR, IPS, 2560x1600, 16" | Asus ProArt StudioBook 16 W7600H5A-2BL2 W-11955M, RTX A5000 Laptop GPU, 2x Micron 2300 2TB MTFDHBA2T0TDV (RAID 0), OLED, 3840x2400, 16" | |
|---|---|---|---|---|---|---|
| Stromverbrauch | -24% | 28% | -9% | 22% | 18% | |
| Idle min * (Watt) | 15.3 | 19.5 -27% | 8 48% | 7.5 51% | 10.8 29% | 12.4 19% |
| Idle avg * (Watt) | 18.2 | 29 -59% | 10.4 43% | 20.1 -10% | 16.3 10% | 16.5 9% |
| Idle max * (Watt) | 28 | 40.7 -45% | 30.5 -9% | 40 -43% | 16.9 40% | 25 11% |
| Last avg * (Watt) | 137.9 | 142.1 -3% | 75.4 45% | 137 1% | 111.7 19% | 132 4% |
| Witcher 3 ultra * (Watt) | 189.4 | 188.6 -0% | 134 29% | 208 -10% | 152.1 20% | 132 30% |
| Last max * (Watt) | 202 | 224.4 -11% | 175 13% | 285.9 -42% | 177.4 12% | 134 34% |
* ... kleinere Werte sind besser
Power Consumption Witcher 3 / Stresstest
Power Consumption external Monitor
Akkulaufzeit
Die allgemeinen Laufzeiten sind nicht kürzer als beim letztjährigen Modell, trotz der gestiegenen CPU- und GPU-Leistung sowie der Bildwiederholrate. Wir konnten knapp über 7 Stunden WLAN-Surfen im Modus "Ausbalanciert" aufzeichnen, also fast eine Stunde länger als beim letztjährigen Fury 16 G9.
Das Aufladen von der leeren bis zur vollen Kapazität mit dem mitgelieferten Netzadapter dauert knapp 90 Minuten. Das System kann auch über USB-C-Adapter von Drittanbietern geladen werden, wenn auch langsamer.
| HP ZBook Fury 16 G10 i9-13950HX, RTX 5000 Ada Generation Laptop, 95 Wh | HP ZBook Fury 16 G9 i9-12950HX, RTX A5500 Laptop GPU, 95 Wh | Dell Precision 5000 5680 i9-13900H, RTX 5000 Ada Generation Laptop, 98 Wh | Lenovo ThinkPad P16 G1 RTX A5500 i9-12950HX, RTX A5500 Laptop GPU, 94 Wh | MSI CreatorPro Z16P B12UKST i7-12700H, RTX A3000 Laptop GPU, 90 Wh | Asus ProArt StudioBook 16 W7600H5A-2BL2 W-11955M, RTX A5000 Laptop GPU, 90 Wh | |
|---|---|---|---|---|---|---|
| Akkulaufzeit | -18% | 36% | -21% | -21% | -32% | |
| WLAN (h) | 7.3 | 6 -18% | 9.9 36% | 5.8 -21% | 5.8 -21% | 5 -32% |
| Idle (h) | 5.3 | 17.9 | ||||
| Last (h) | 1.2 | 1.7 | ||||
| H.264 (h) | 1.8 | |||||
| Witcher 3 ultra (h) | 1.6 |
Pro
Contra
Fazit - Die richtige HP-Workstation für hohe Grafikanspruche
Manchmal sind die Aktualisierungen gegenüber dem Vorjahr Prozessor relativ gering. In anderen Fällen können sie aber auch ganz erheblich sein. Das ZBook Fury 16 G10 fällt in die letztere Kategorie, da seine 13th-Gen-CPU- und Nvidia RTX Ada-GPU-Optionen im Vergleich zum ZBook Fury 16 G9 beträchtliche Leistungssteigerungen bieten, vor allem im Bereich der Grafik. Wenn Sie Wert auf ECC-RAM und die Maximierung der GPU-Leistung mit höheren TGP-Limits legen, dann ist das Fury 16 G10 auf jeden Fall einen Vergleich mit anderen 16-Zoll-Workstations, die es derzeit gibt, einschließlich dem Precision 5680 das mit denselben GPU-Optionen, aber mit niedrigeren TGP-Zielen ausgestattet ist, Wert.
Das ZBook Fury 16 G10 maximiert die GPU-Leistung und ist damit eine der schnellsten mobilen Workstations, wenn es um Grafik geht. Allerdings scheint dies auf Kosten der SSD- und CPU-Leistung zu gehen.
Einige Probleme verhindern, dass das HP "perfekt" ist. Die SSD wird immer noch gedrosselt und die CPU ist langsamer als erwartet, selbst wenn der Performance Modus aktiviert ist. Diese Probleme wären bei schlankeren oder kleineren Workstations leichter zu verzeihen, aber das Fury 16 G10 ist alles andere als dünn und leicht.
Preis und Verfügbarkeit
Das HP ZBook Fury 16 G10 ist ab 2.800 Euro in der Basis- bis hin zu 3.800 Euro bei High-End-Konfiguration (derzeit Ada 4000, Core i9) in Deutschland erhältlich.
HP ZBook Fury 16 G10
- 23.09.2023 v7 (old)
Allen Ngo
Transparenz
Die Auswahl der zu testenden Geräte erfolgt innerhalb der Redaktion. Das vorliegende Testmuster wurde dem Autor vom Hersteller oder einem Shop zu Testzwecken leihweise zur Verfügung gestellt. Eine Einflussnahme des Leihstellers auf den Testbericht gab es nicht, der Hersteller erhielt keine Version des Reviews vor der Veröffentlichung. Es bestand keine Verpflichtung zur Publikation. Als eigenständiges, unabhängiges Unternehmen unterliegt Notebookcheck keiner Diktion von Herstellern, Shops und Verlagen.
So testet Notebookcheck
Pro Jahr werden von Notebookcheck hunderte Laptops und Smartphones unabhängig in von uns standardisierten technischen Verfahren getestet, um eine Vergleichbarkeit aller Testergebnisse zu gewährleisten. Seit rund 20 Jahren entwickeln wir diese Testmethoden kontinuierlich weiter und setzen damit Branchenstandards. In unseren Testlaboren kommt ausschließlich hochwertiges Messequipment in die Hände erfahrener Techniker und Redakteure. Die Tests unterliegen einer mehrstufigen Kontrolle. Unsere komplexe Gesamtbewertung basiert auf hunderten fundierten Messergebnissen und Benchmarks, womit Ihnen Objektivität garantiert ist. Weitere Informationen zu unseren Testmethoden gibt es hier.
Preisvergleich

