Razer Blade 18 im Laptop-Test: Kleiner als viele 17-Zoll-Gaming-Laptops
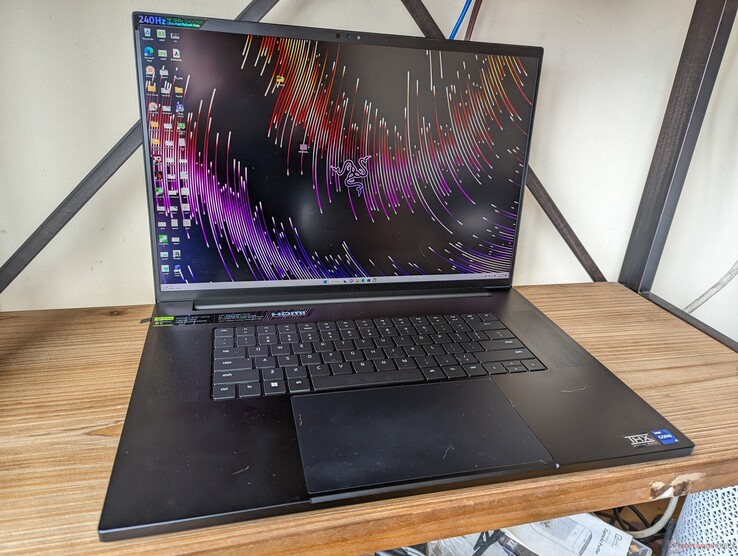
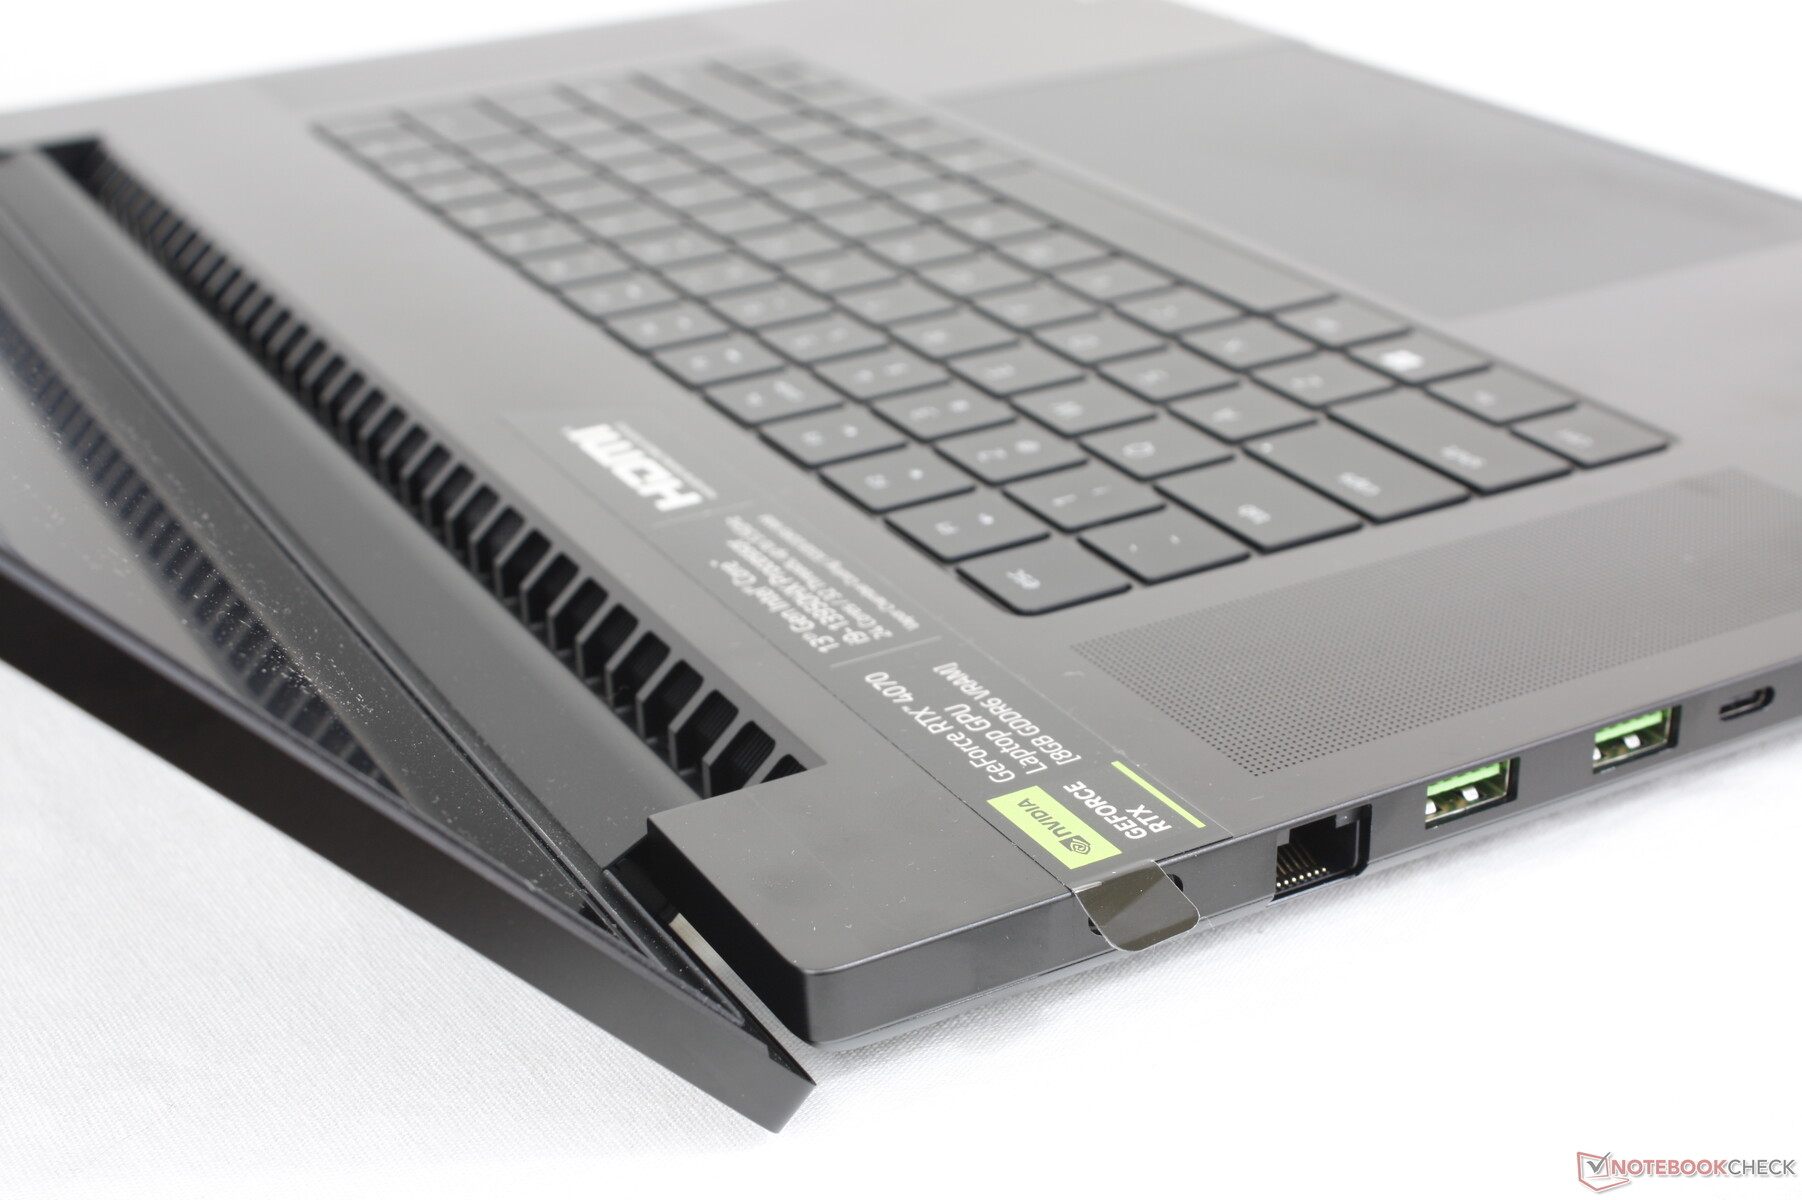
Gerade erst auf der CES 2023 vorgestellt, bietet das Blade 18 den bislang größten Bildschirm innerhalb der Blade-Serie und setzt dabei auf das gleiche Razer-typische gehäusedesign. Der Start des Laptops markiert gleichzeitig auch den Start von Intels Core Gen13-Serie sowie der mobilen Nvidia-GeForce-40-Ada-Lovelace-Serie, die wir bereits vor Kurzem im Blade 16 testen konnten.
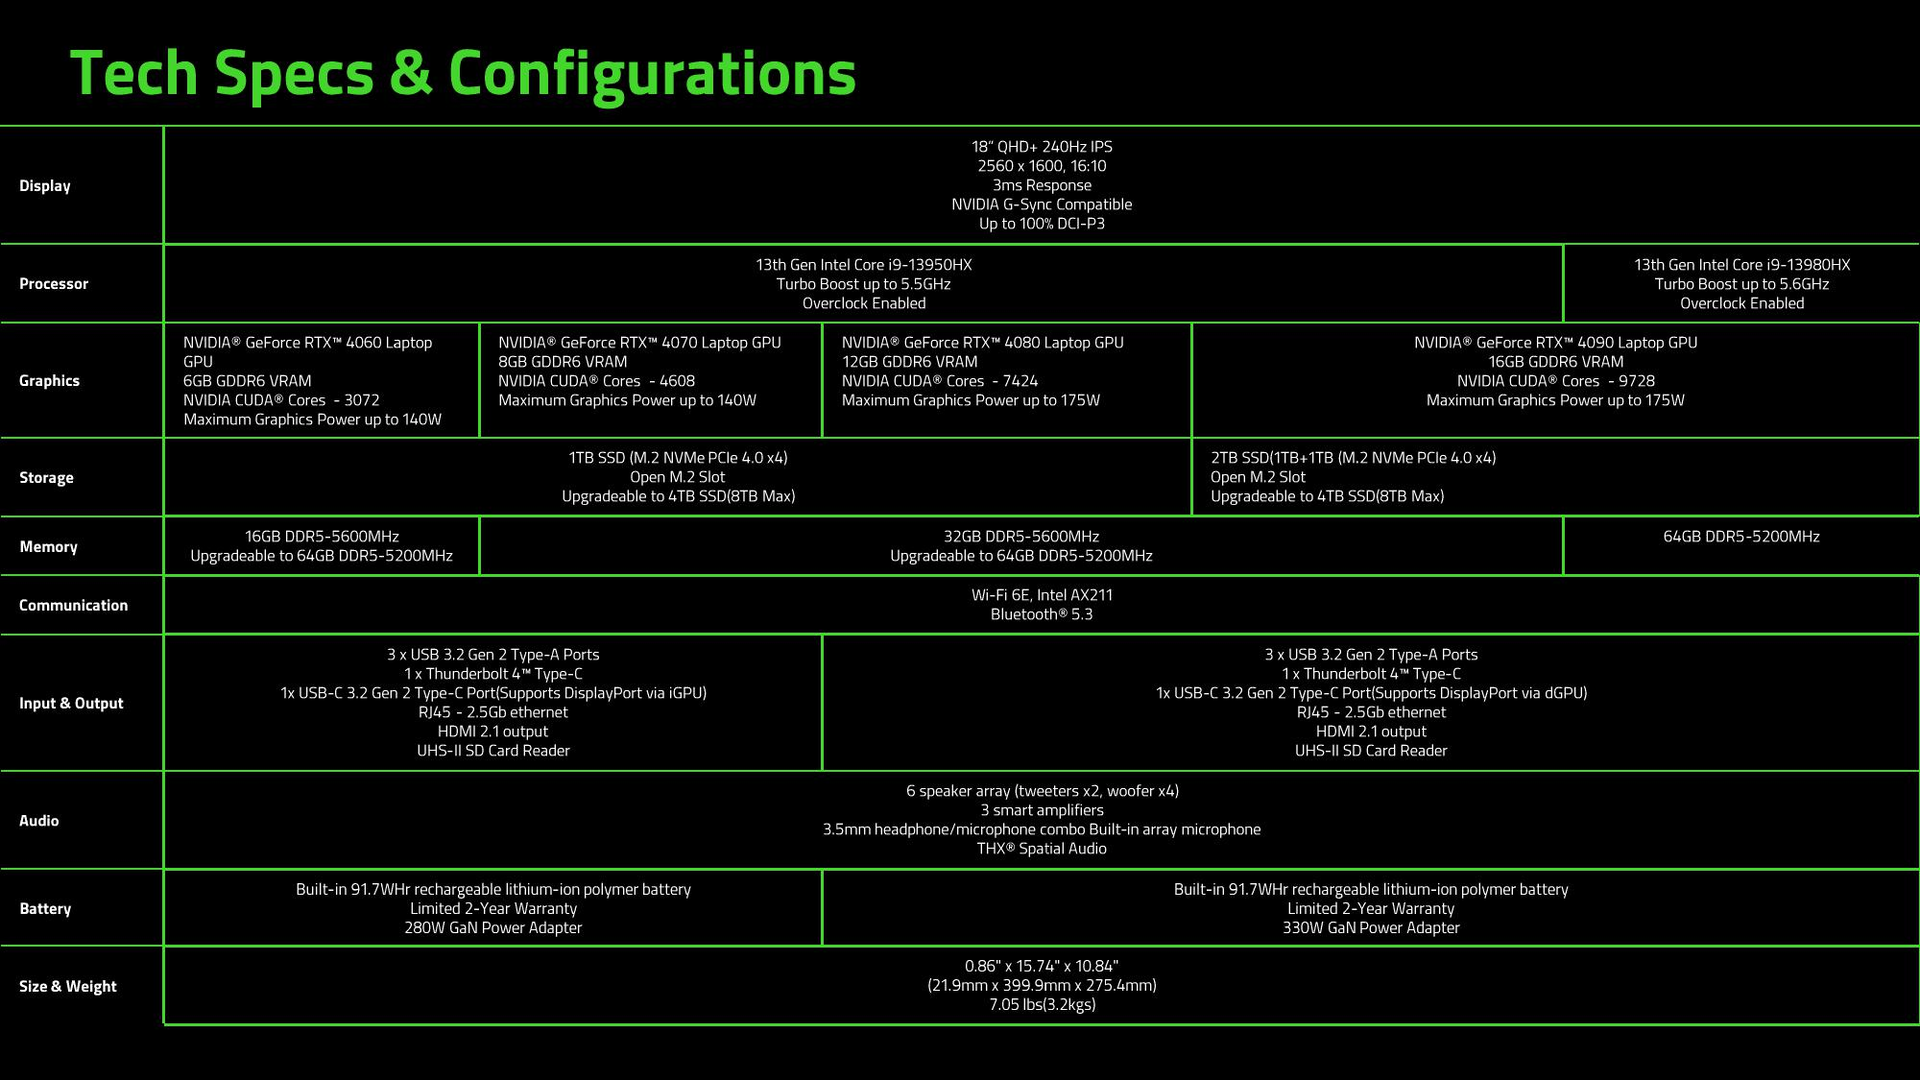
Konfigurationen starten beim Core i9-13950HX plus GeForce RTX 4060 mit 140 W und gehen hoch bis zu einem Core i9-13980HX plus RTX 4090 mit 175 W. Allen Modellen gemeinsam ist das 16:10-QHD+-IPS-Panel mit 240 Hz. Unser Testmodell stellt die mittlere Konfiguration dar, in ihr rechnet eine RTX 4070 mit 140 W. Angeboten wird das Paket zu einem Preis von rund 3.700 Euro.
18-Zoll-Laptops sind nach wie vor eher ungewöhnlich, das 6 Jahre alte MSI GT83 Titan ist ein Beispiel. Von Asus und Dell werden in Kürze jedoch Alternativen erwartet, darunter das ROG Strix Scar 18 sowie das Alienware m18.
Weitere Razer-Tests:
Potentielle Konkurrenten im Vergleich
Bew. | Datum | Modell | Gewicht | Dicke | Größe | Auflösung | Preis ab |
|---|---|---|---|---|---|---|---|
| 91.4 % v7 (old) | 02 / 2023 | Razer Blade 18 RTX 4070 i9-13950HX, GeForce RTX 4070 Laptop GPU | 3 kg | 21.9 mm | 18.00" | 2560x1600 | |
| 89.9 % v7 (old) | 07 / 2022 | Razer Blade 17 Early 2022 i9-12900H, GeForce RTX 3080 Ti Laptop GPU | 2.8 kg | 19.9 mm | 17.30" | 3840x2160 | |
| 89 % v7 (old) | 02 / 2023 | MSI Titan GT77 HX 13VI i9-13950HX, GeForce RTX 4090 Laptop GPU | 3.5 kg | 23 mm | 17.30" | 3840x2160 | |
| 83.3 % v7 (old) | 01 / 2023 | Gigabyte G7 KE i5-12500H, GeForce RTX 3060 Laptop GPU | 2.6 kg | 25 mm | 17.30" | 1920x1080 | |
| 86.1 % v7 (old) | 01 / 2023 | Alienware m17 R5 (R9 6900HX, RX 6850M XT) R9 6900HX, Radeon RX 6850M XT | 3.4 kg | 26.7 mm | 17.00" | 3840x2160 | |
| 86.9 % v7 (old) | 11 / 2022 | Asus ROG Strix Scar 17 SE G733CX-LL014W i9-12950HX, GeForce RTX 3080 Ti Laptop GPU | 2.9 kg | 28.3 mm | 17.30" | 2560x1440 |
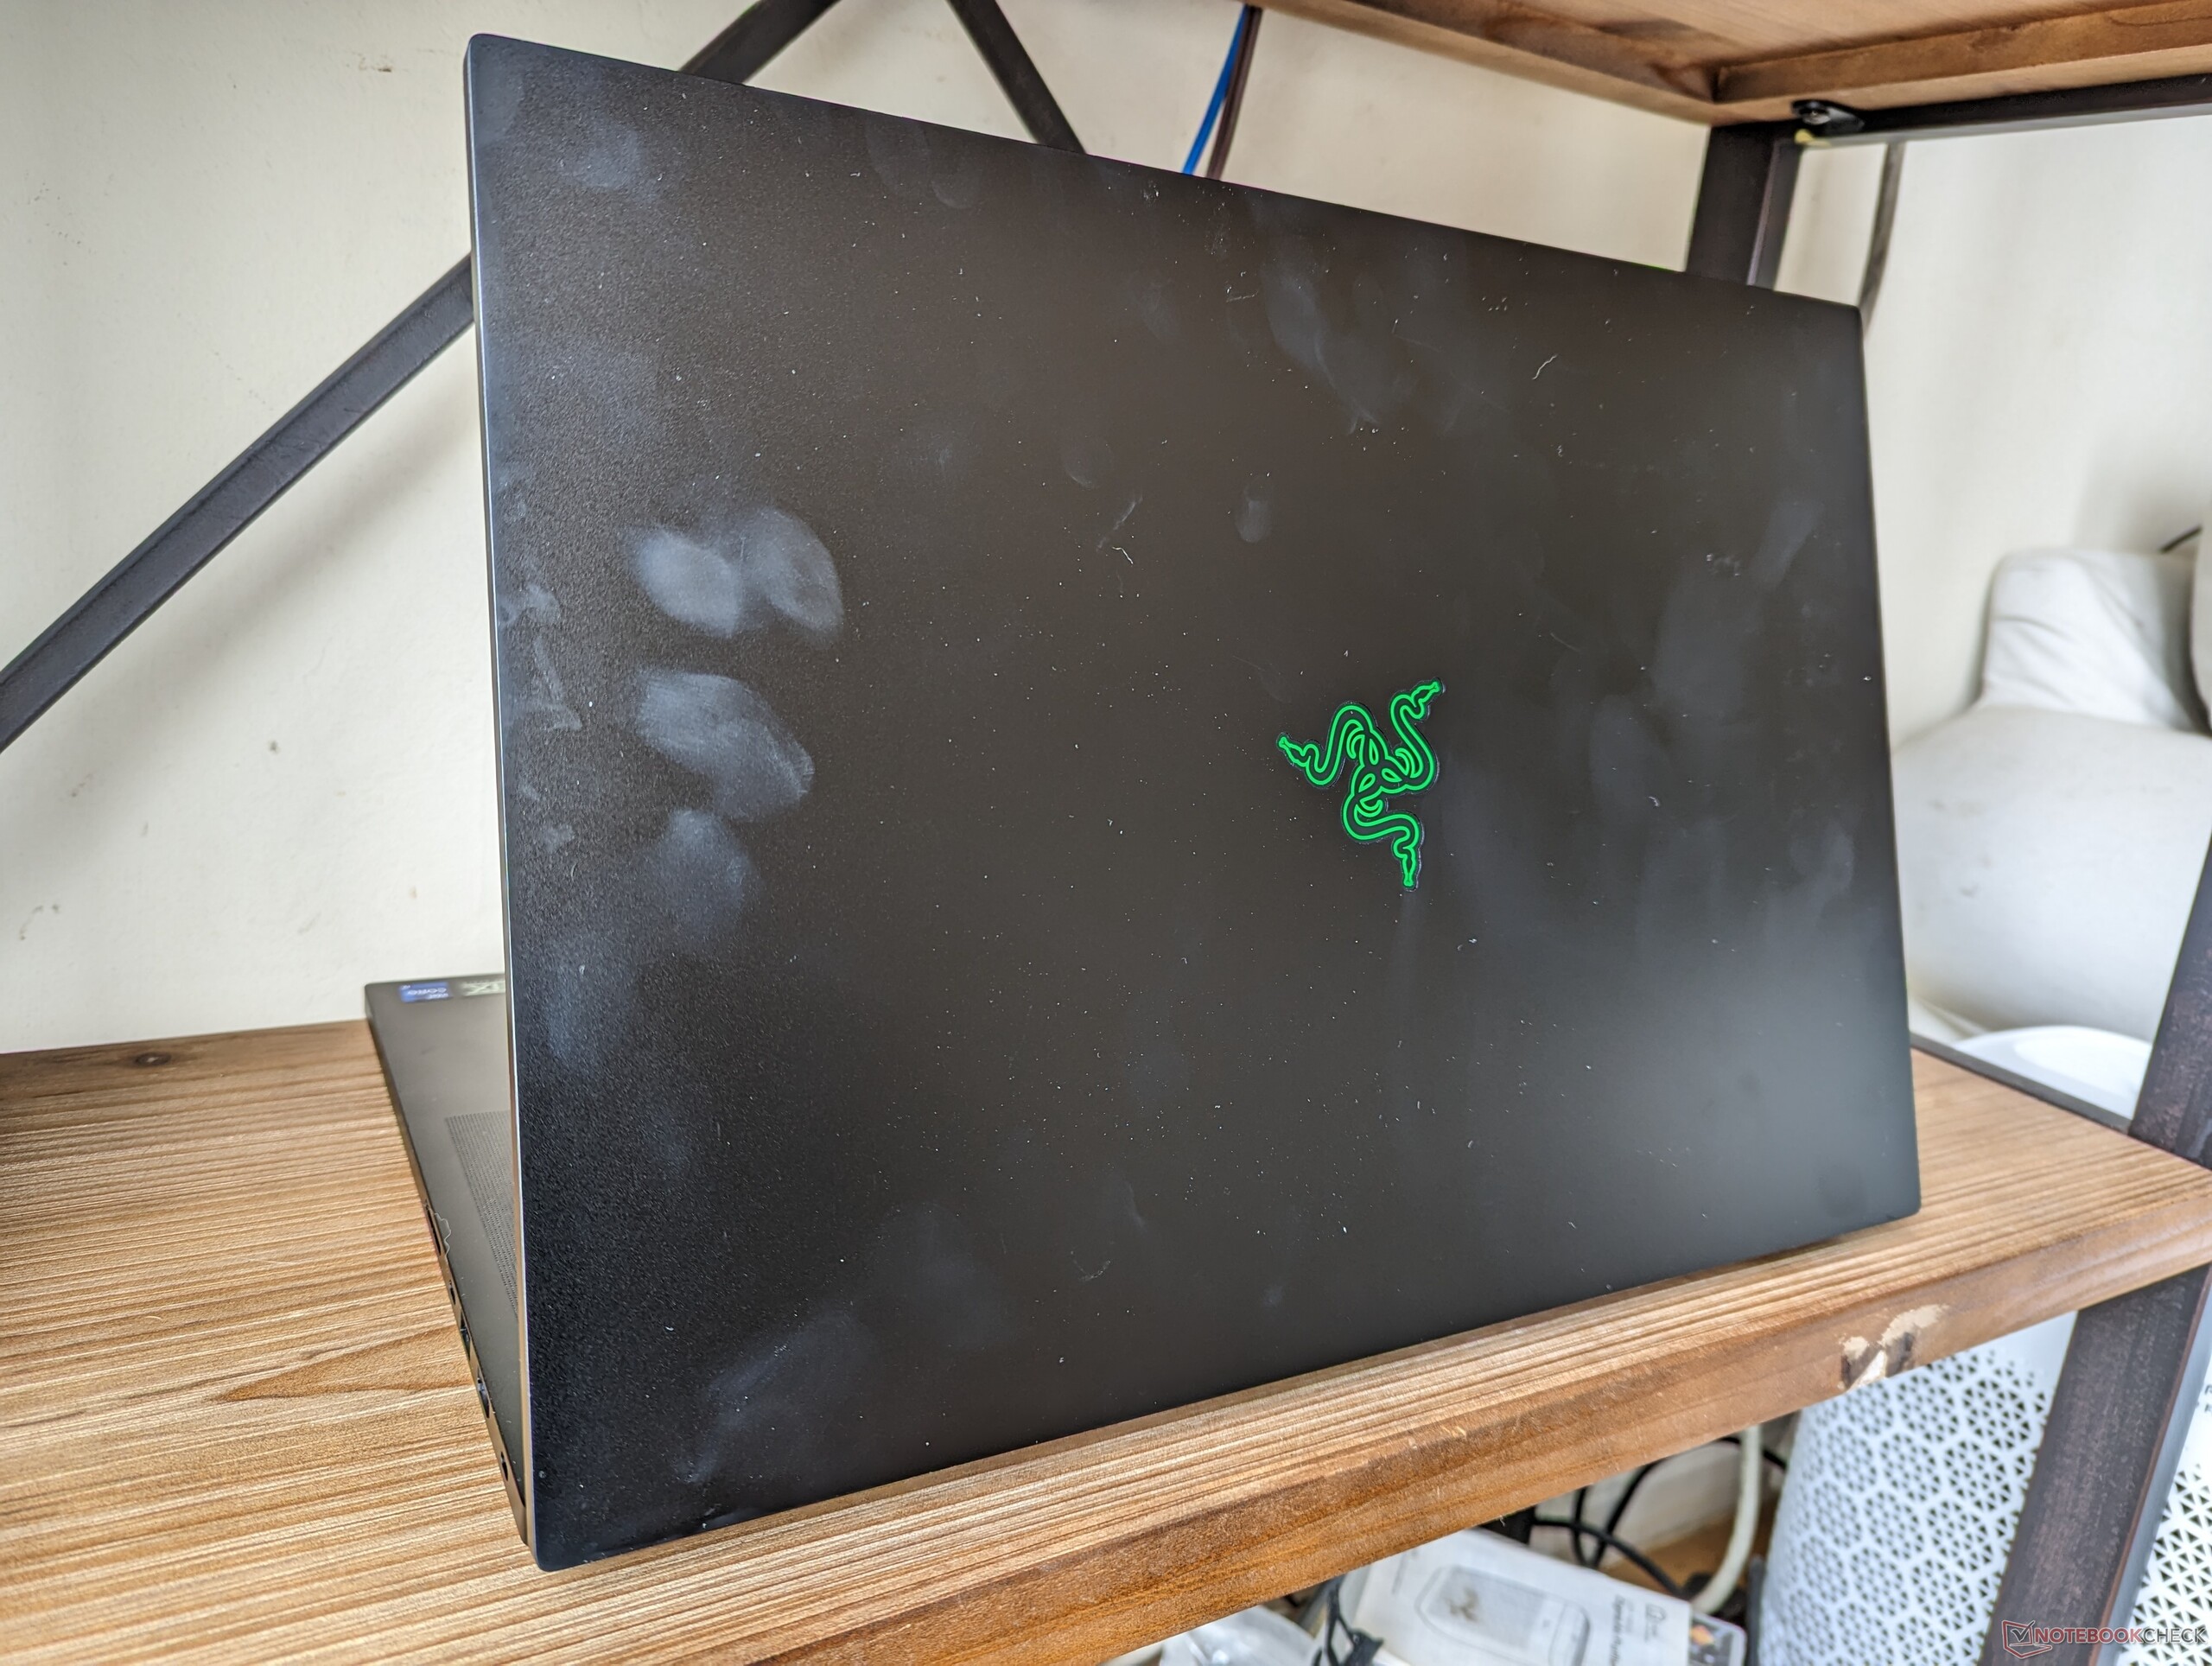
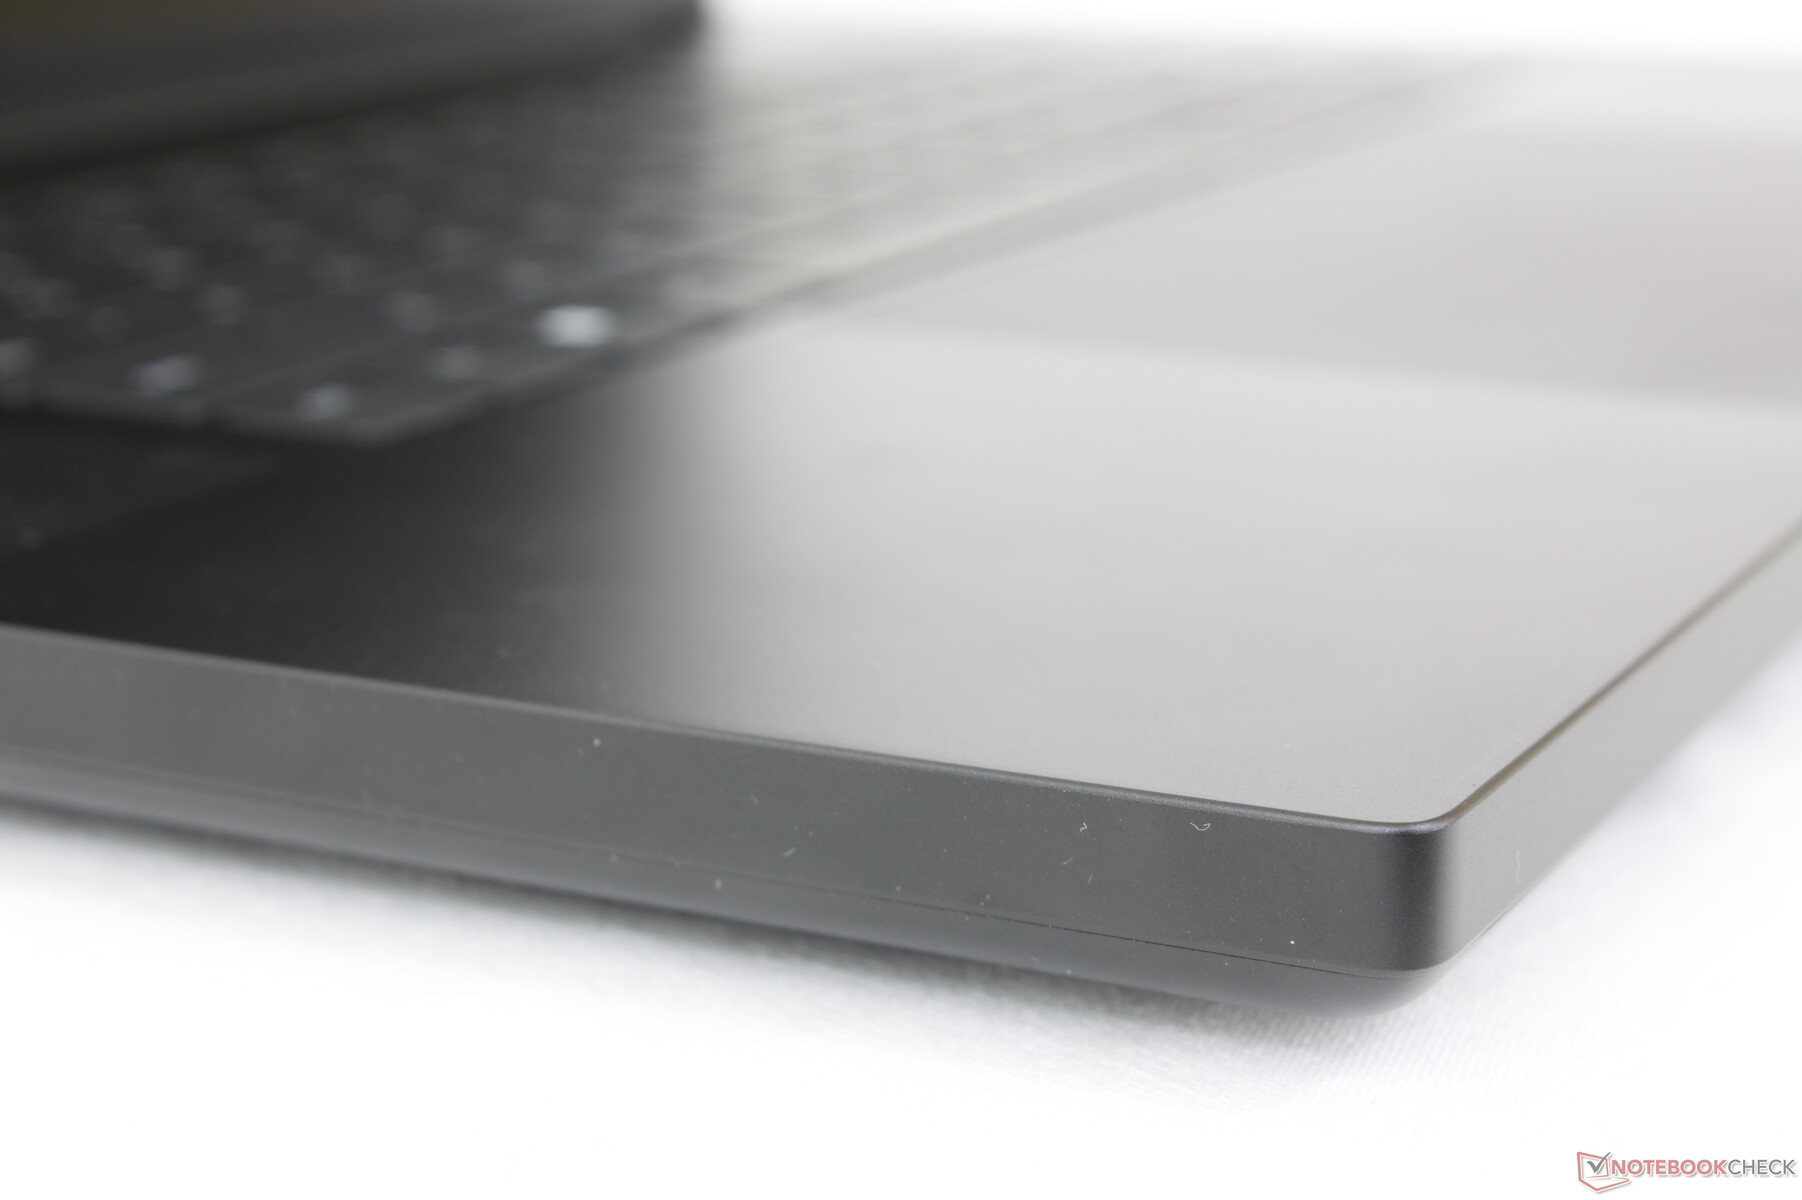
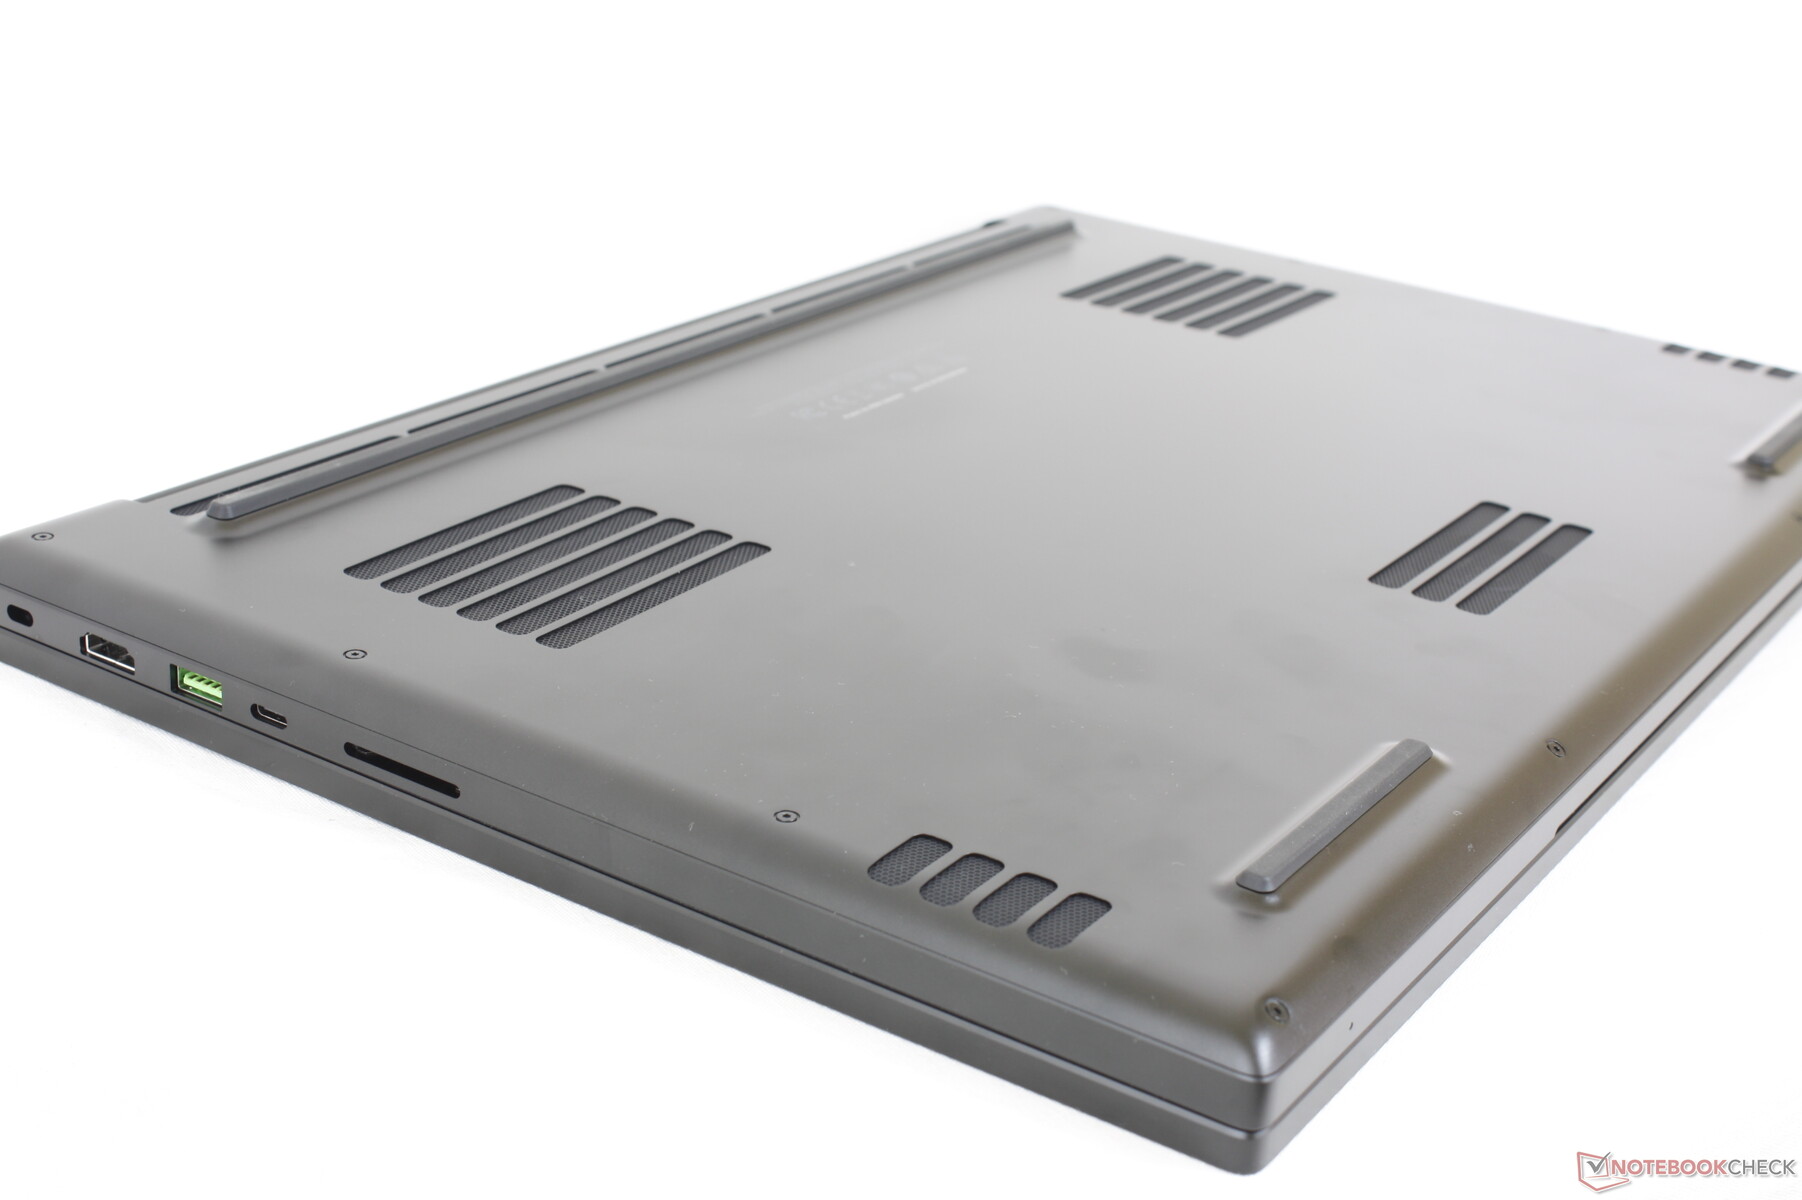
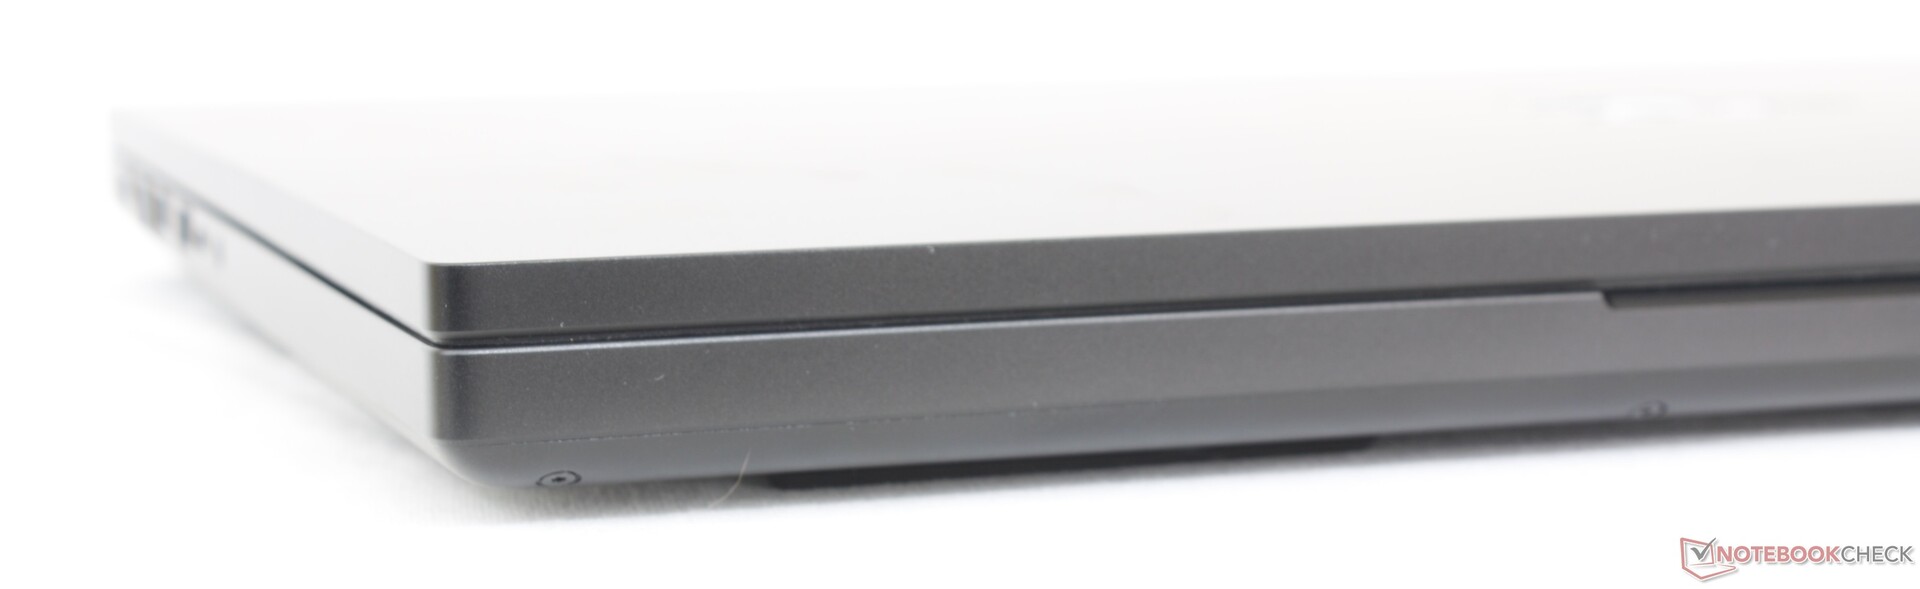
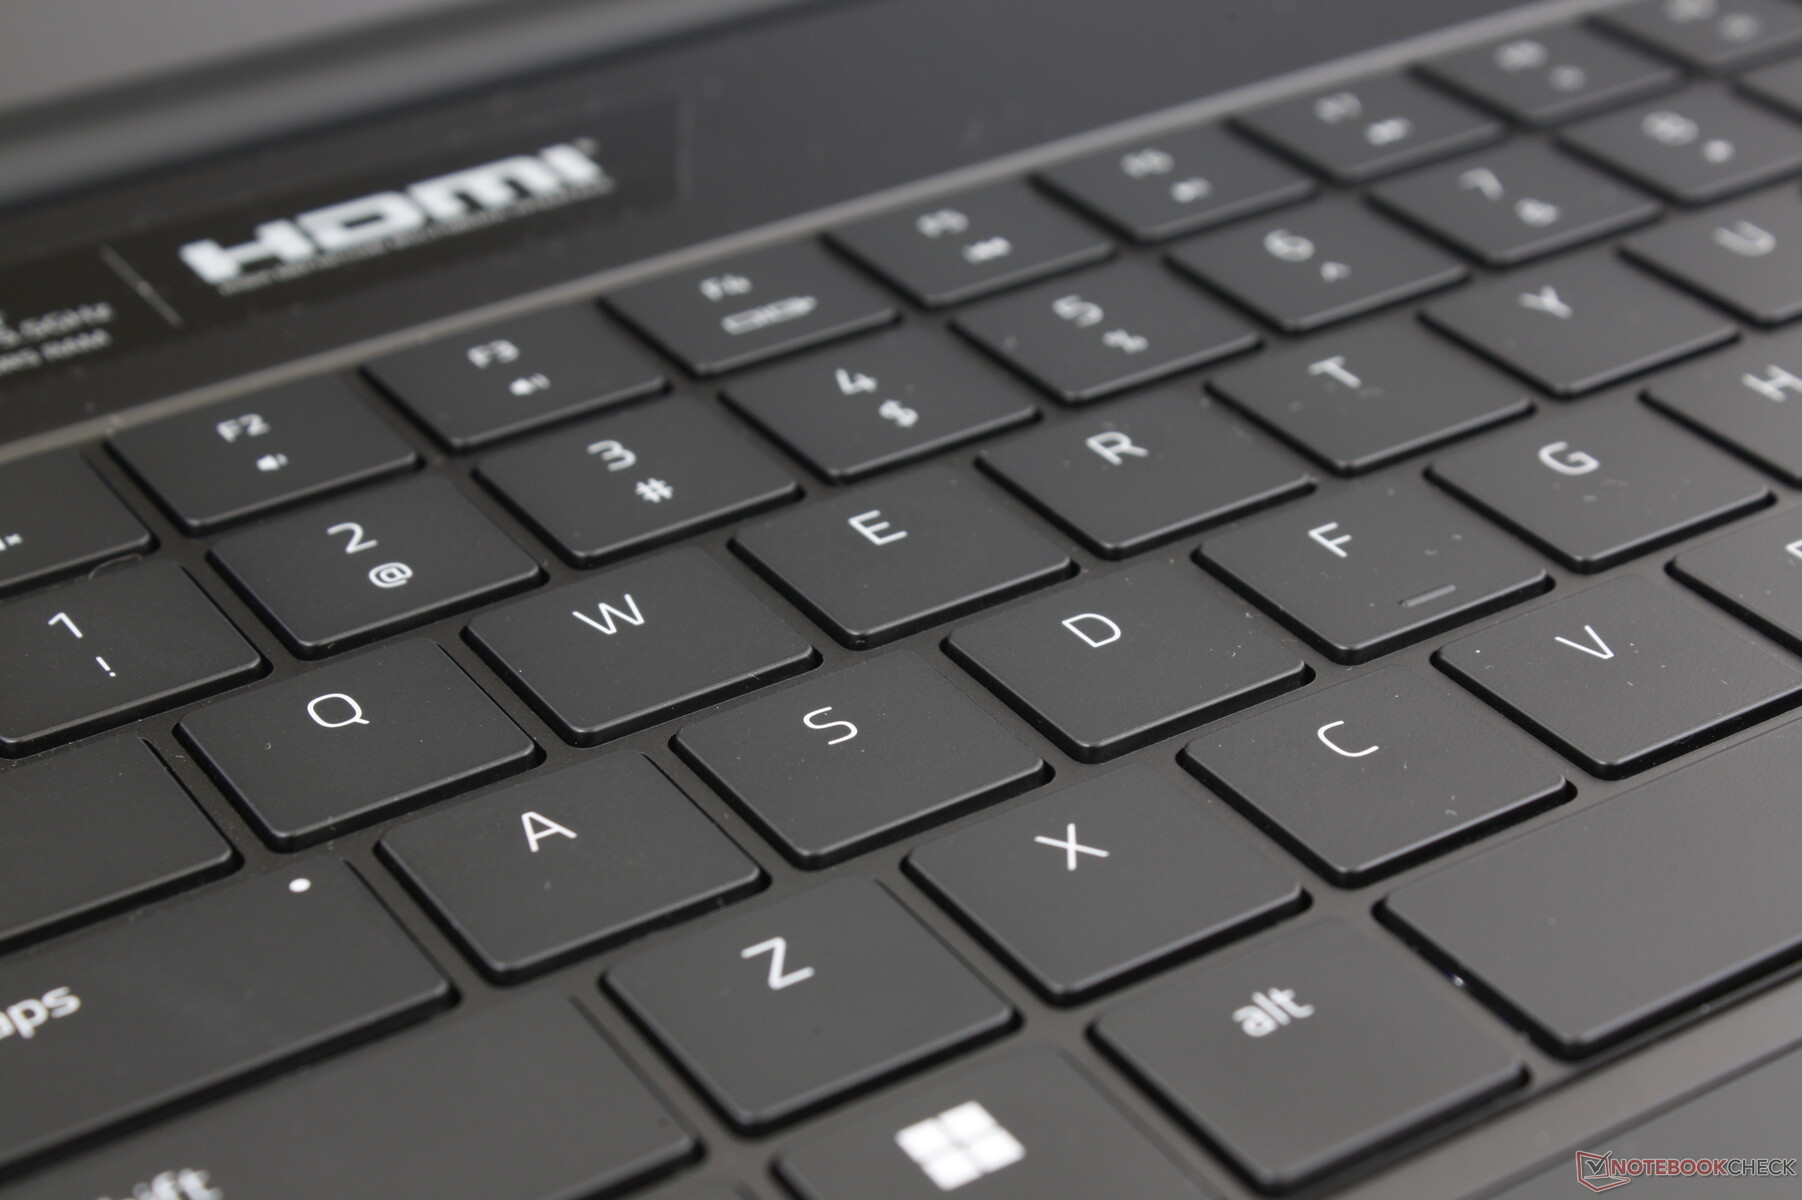
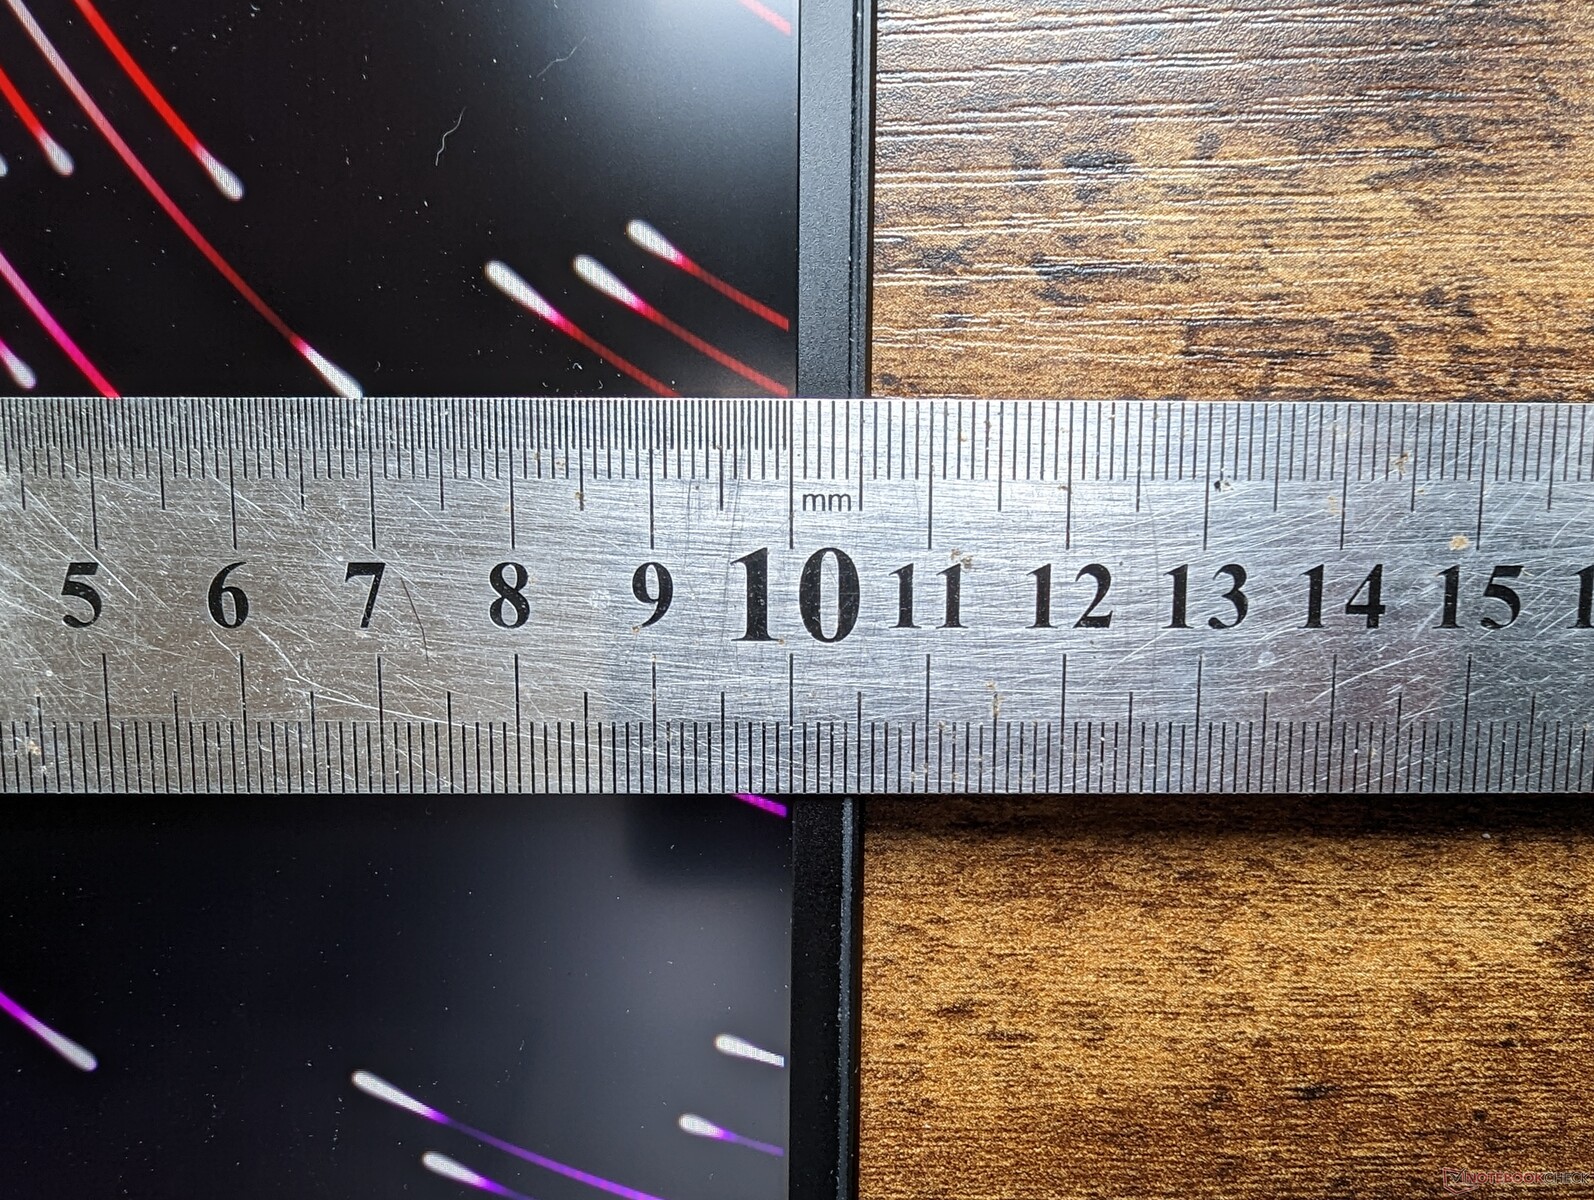
Gehäuse — Nur wenig größer als das Blade 17
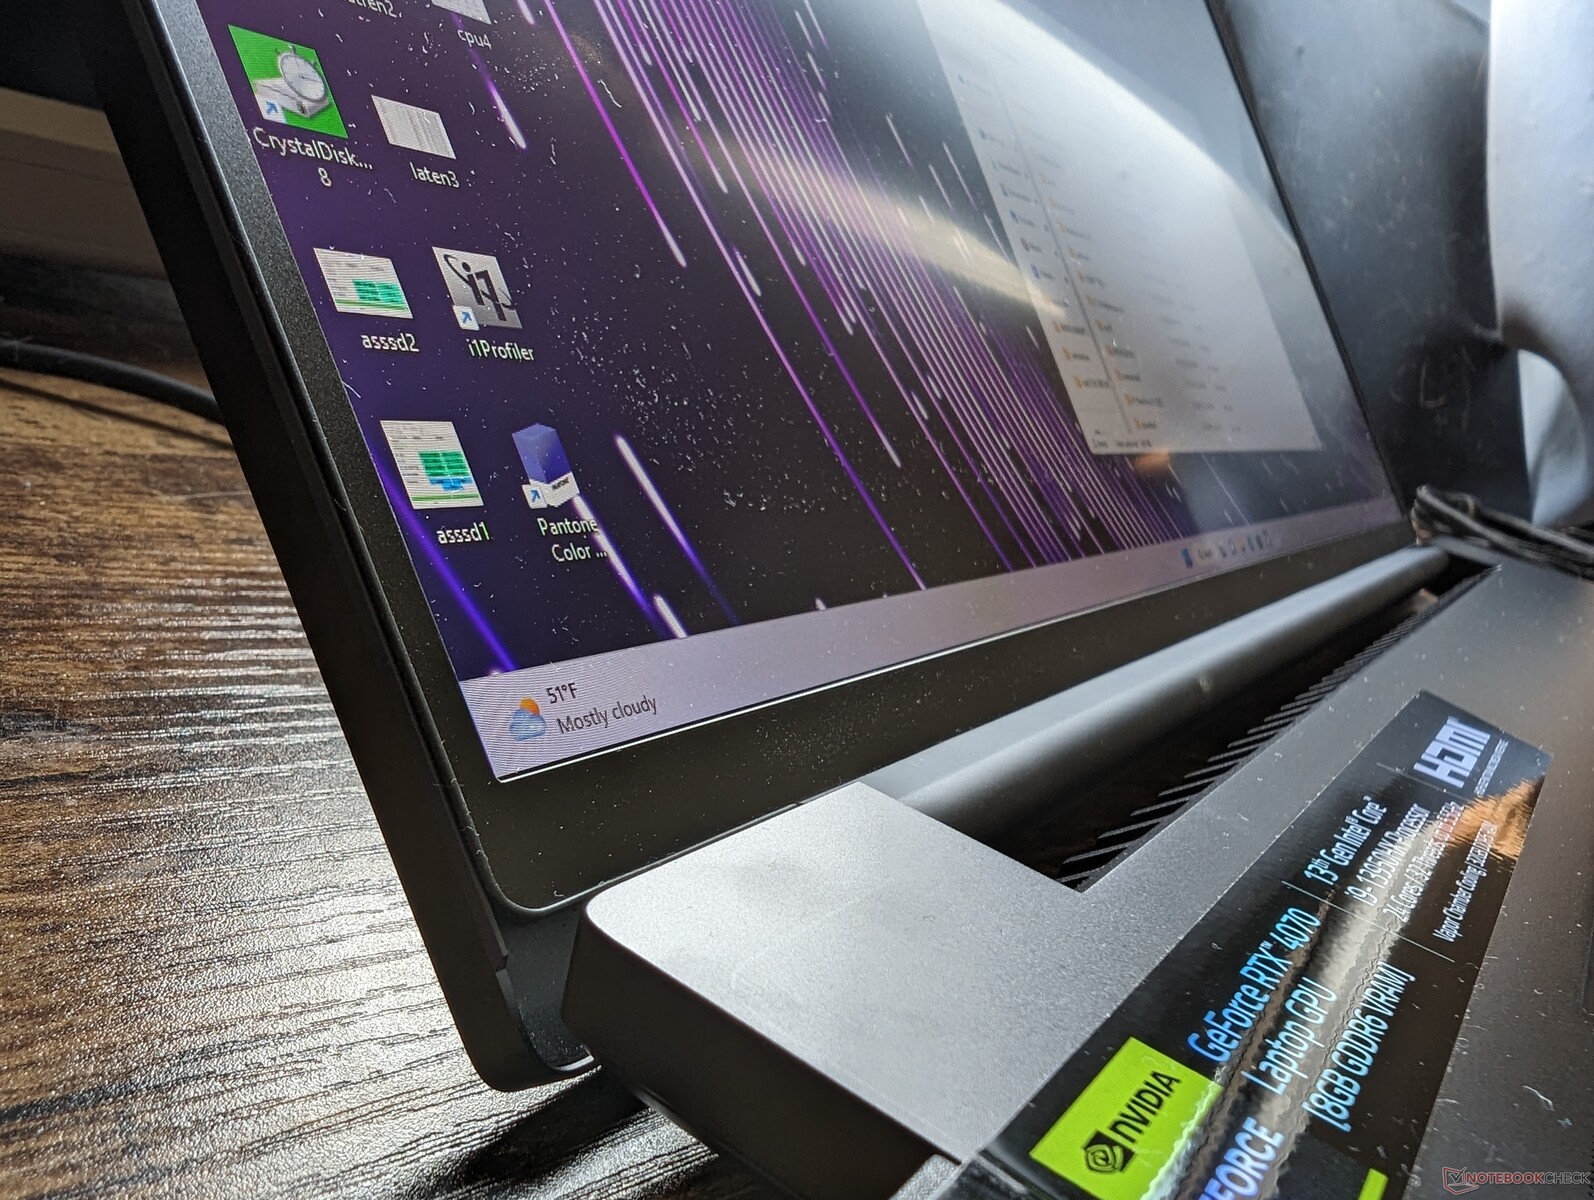
Zwar hat das Blade 18 eine neue Bildschirmgröße, beim Design gibt es hingegen keine Überraschungen. Das Modell erinnert von unten bis oben stark an das Blade 17. Der größte optische Unterschied besteht in dem deutlich dünneren unteren Displayrand des Blade 18, was ein besseres Screen-to-Body-Verhältnis bedeutet.
Glücklicherweise beeinträchtigt der größere 18-Zoll-Formfaktor nicht die Stabilität des Gehäuses. Sowohl die Basis als auch der Deckel sind genauso stabil wie beim Blade 17 und geben einen nahezu MacBook-Pro-ähnlichen Eindruck. Insbesondere die Scharniere halten das große Display gut fest, allerdings bleibt der maximale Öffnungswinkel deutlich unterhalb von 180 Grad. Der größte Schwachpunkt ist wohl das Zentrum des Displaydeckels, hier biegt sich die Oberfläche durch ausgeübten Druck noch am meisten durch.
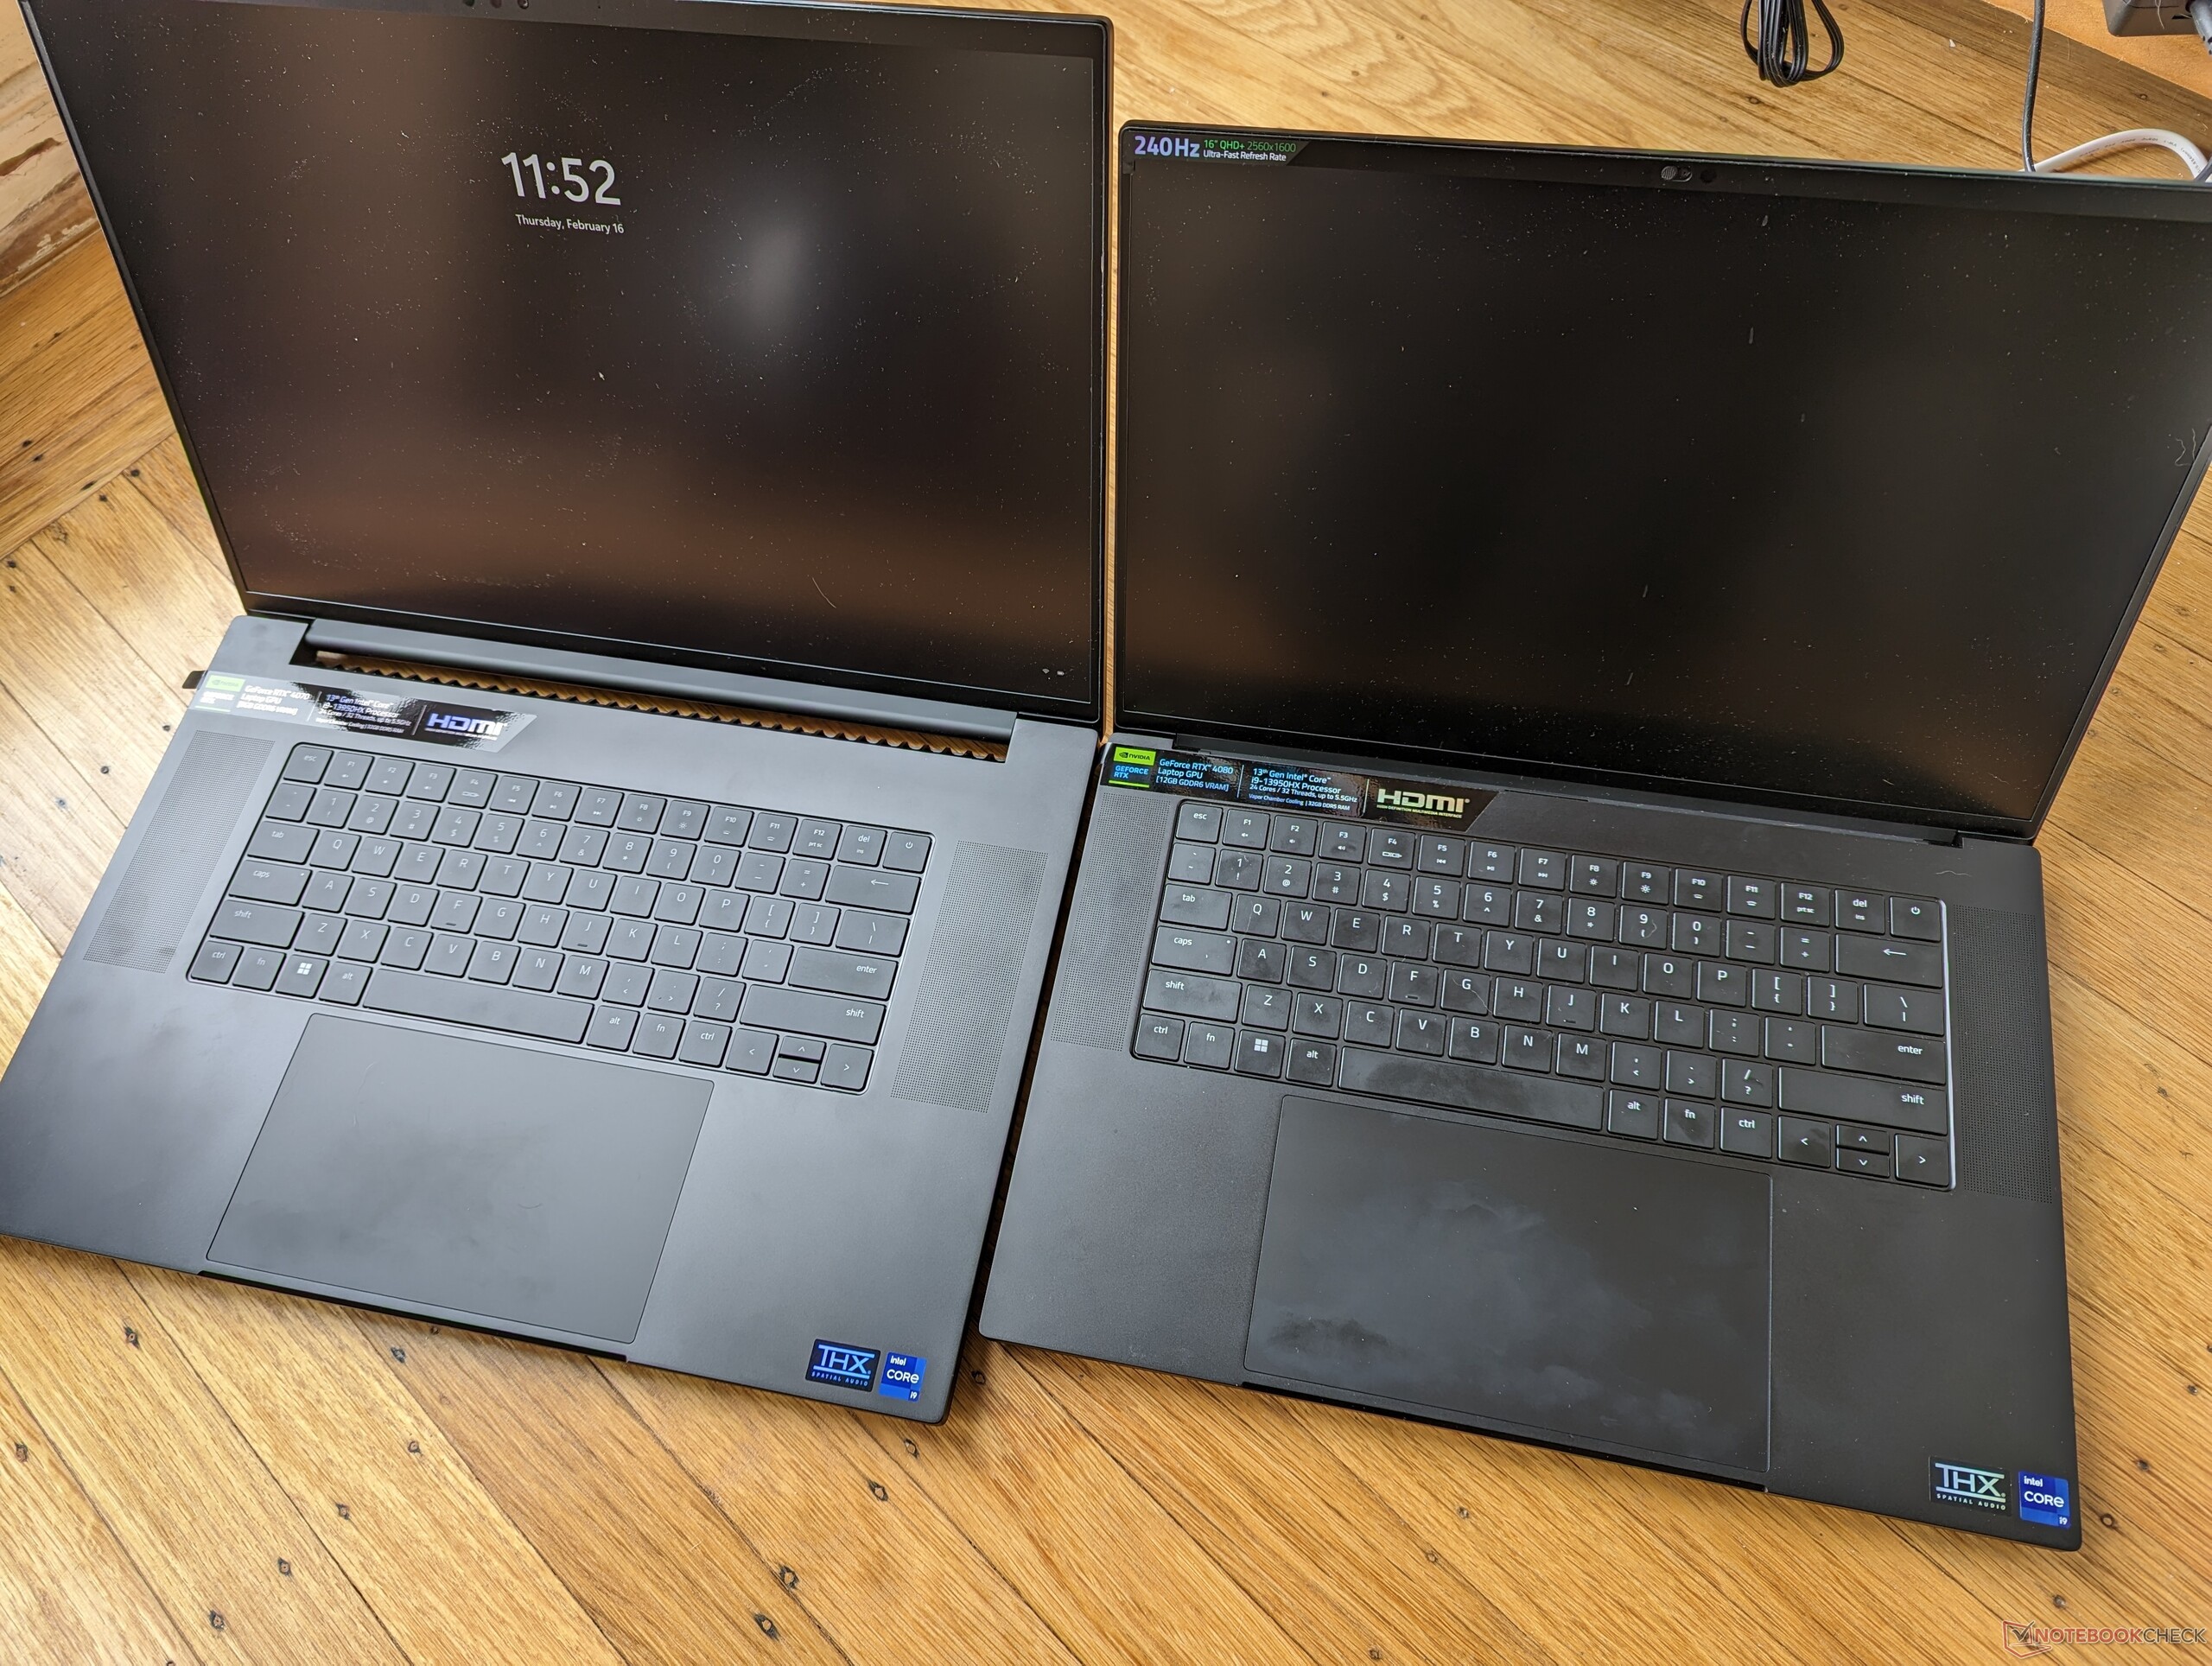
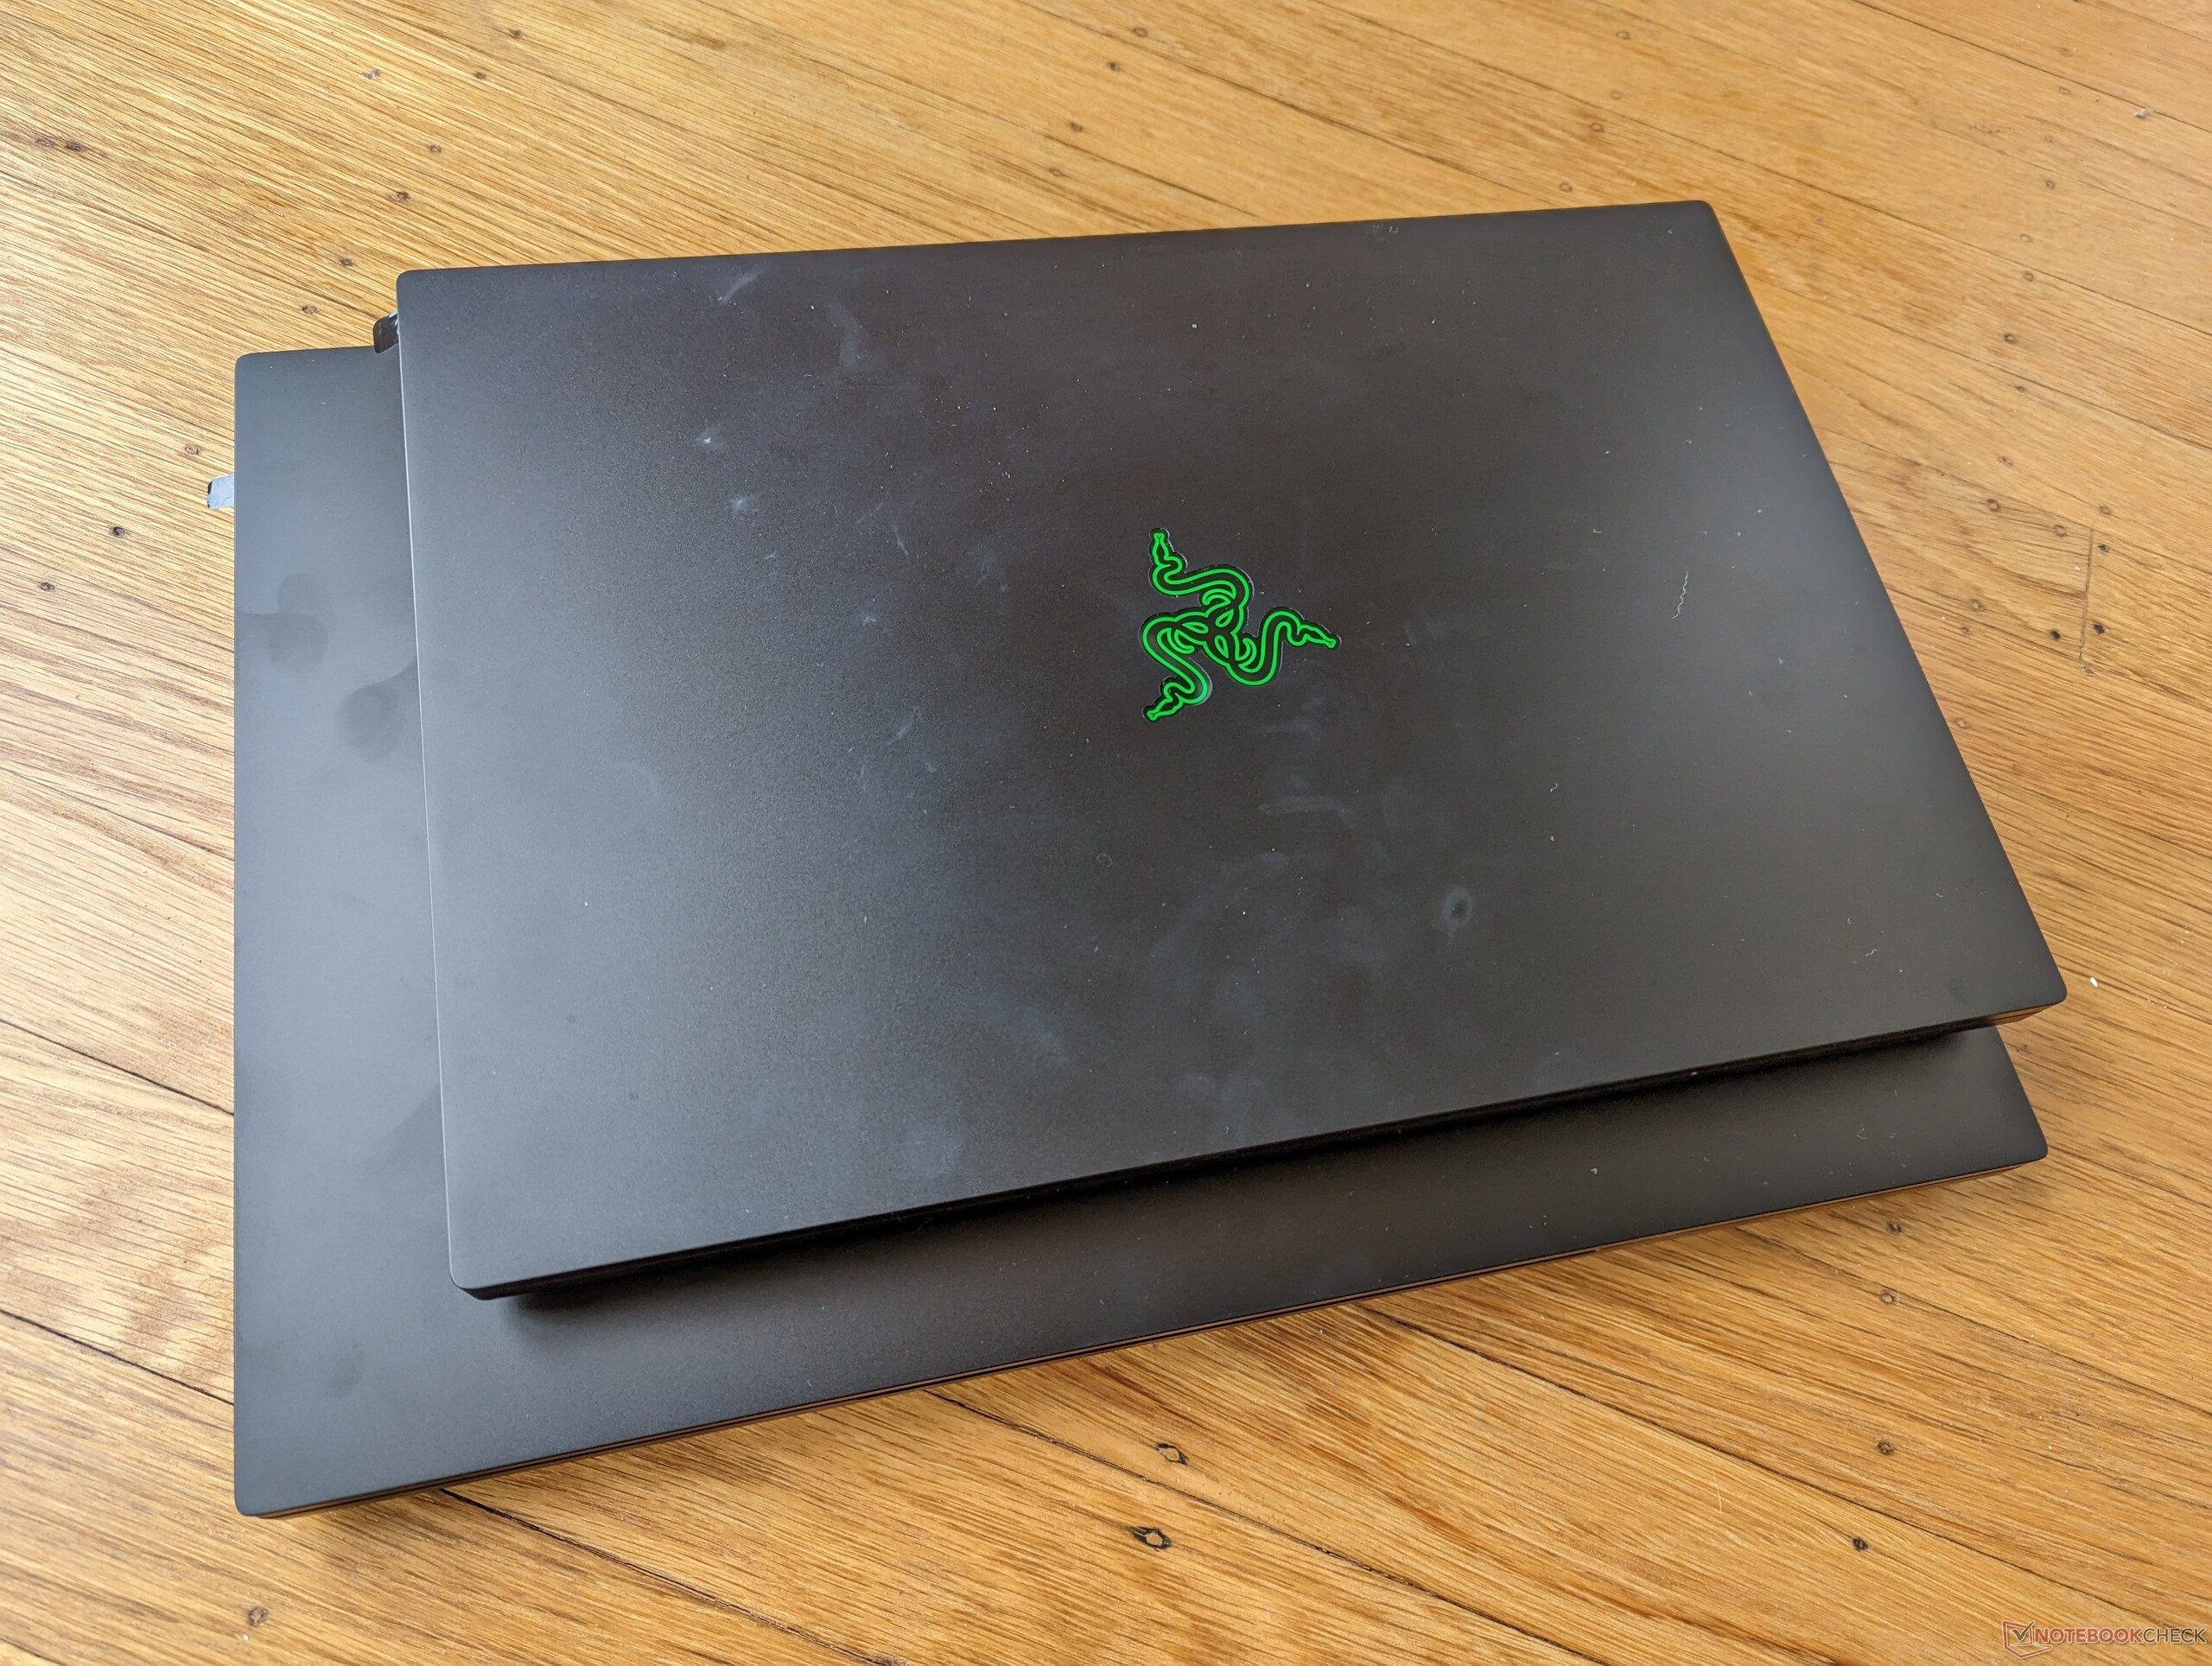
Razer wird nicht müde stolz zu betonen, dass das Blade 18 nur 18 Prozent größer und 7 Prozent schwerer ist als das 2022er Blade 17, trotz der unterschiedlichen Bildschirmgrößen. Folglich fühlt sich das 18-Zoll-Modell weniger klobig an als erwartet. Tatsächlich gibt es einige 17,3 Zoll großen Gaming-Laptops, die sowohl größer als auch schwerer sind als das neue Blade 18, darunter das Asus ROG Strix Scar 17 SE oder das Alienware m17 R5.
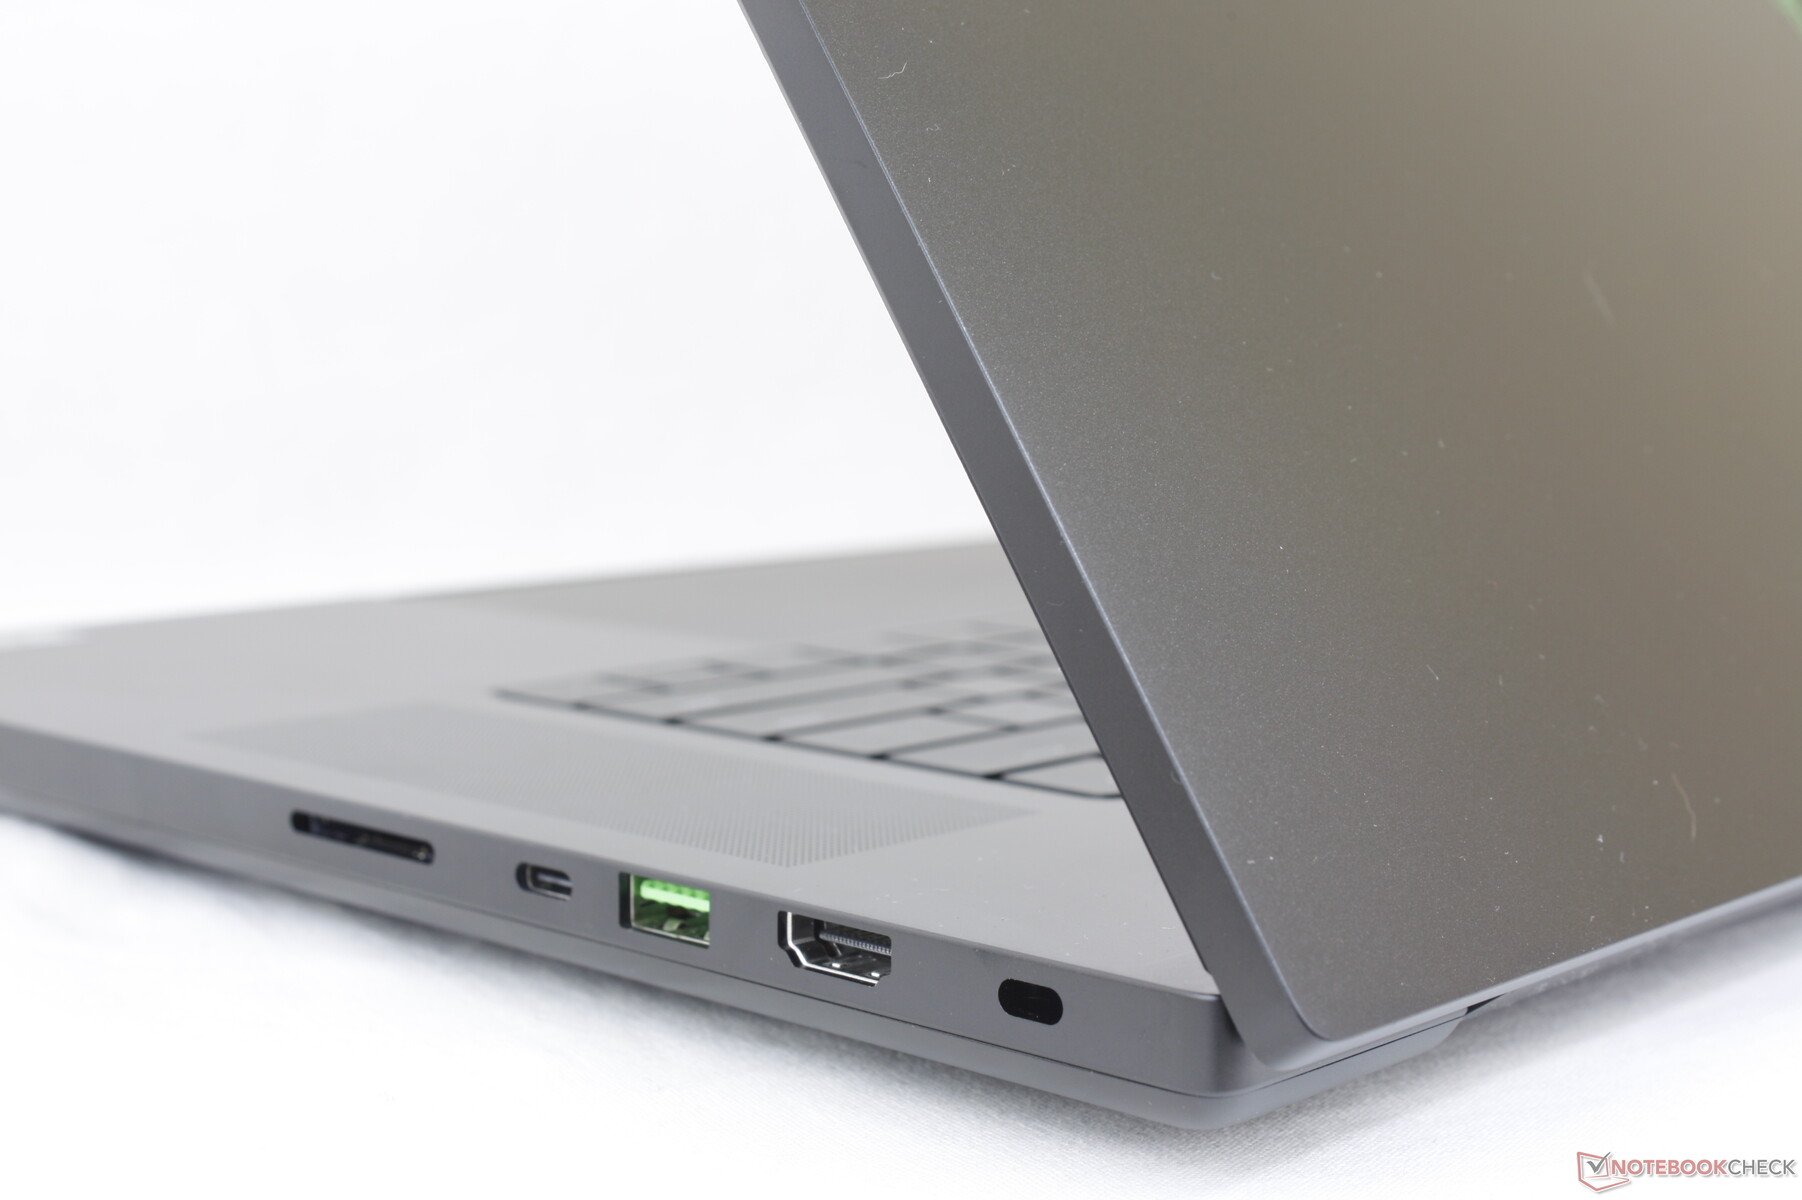
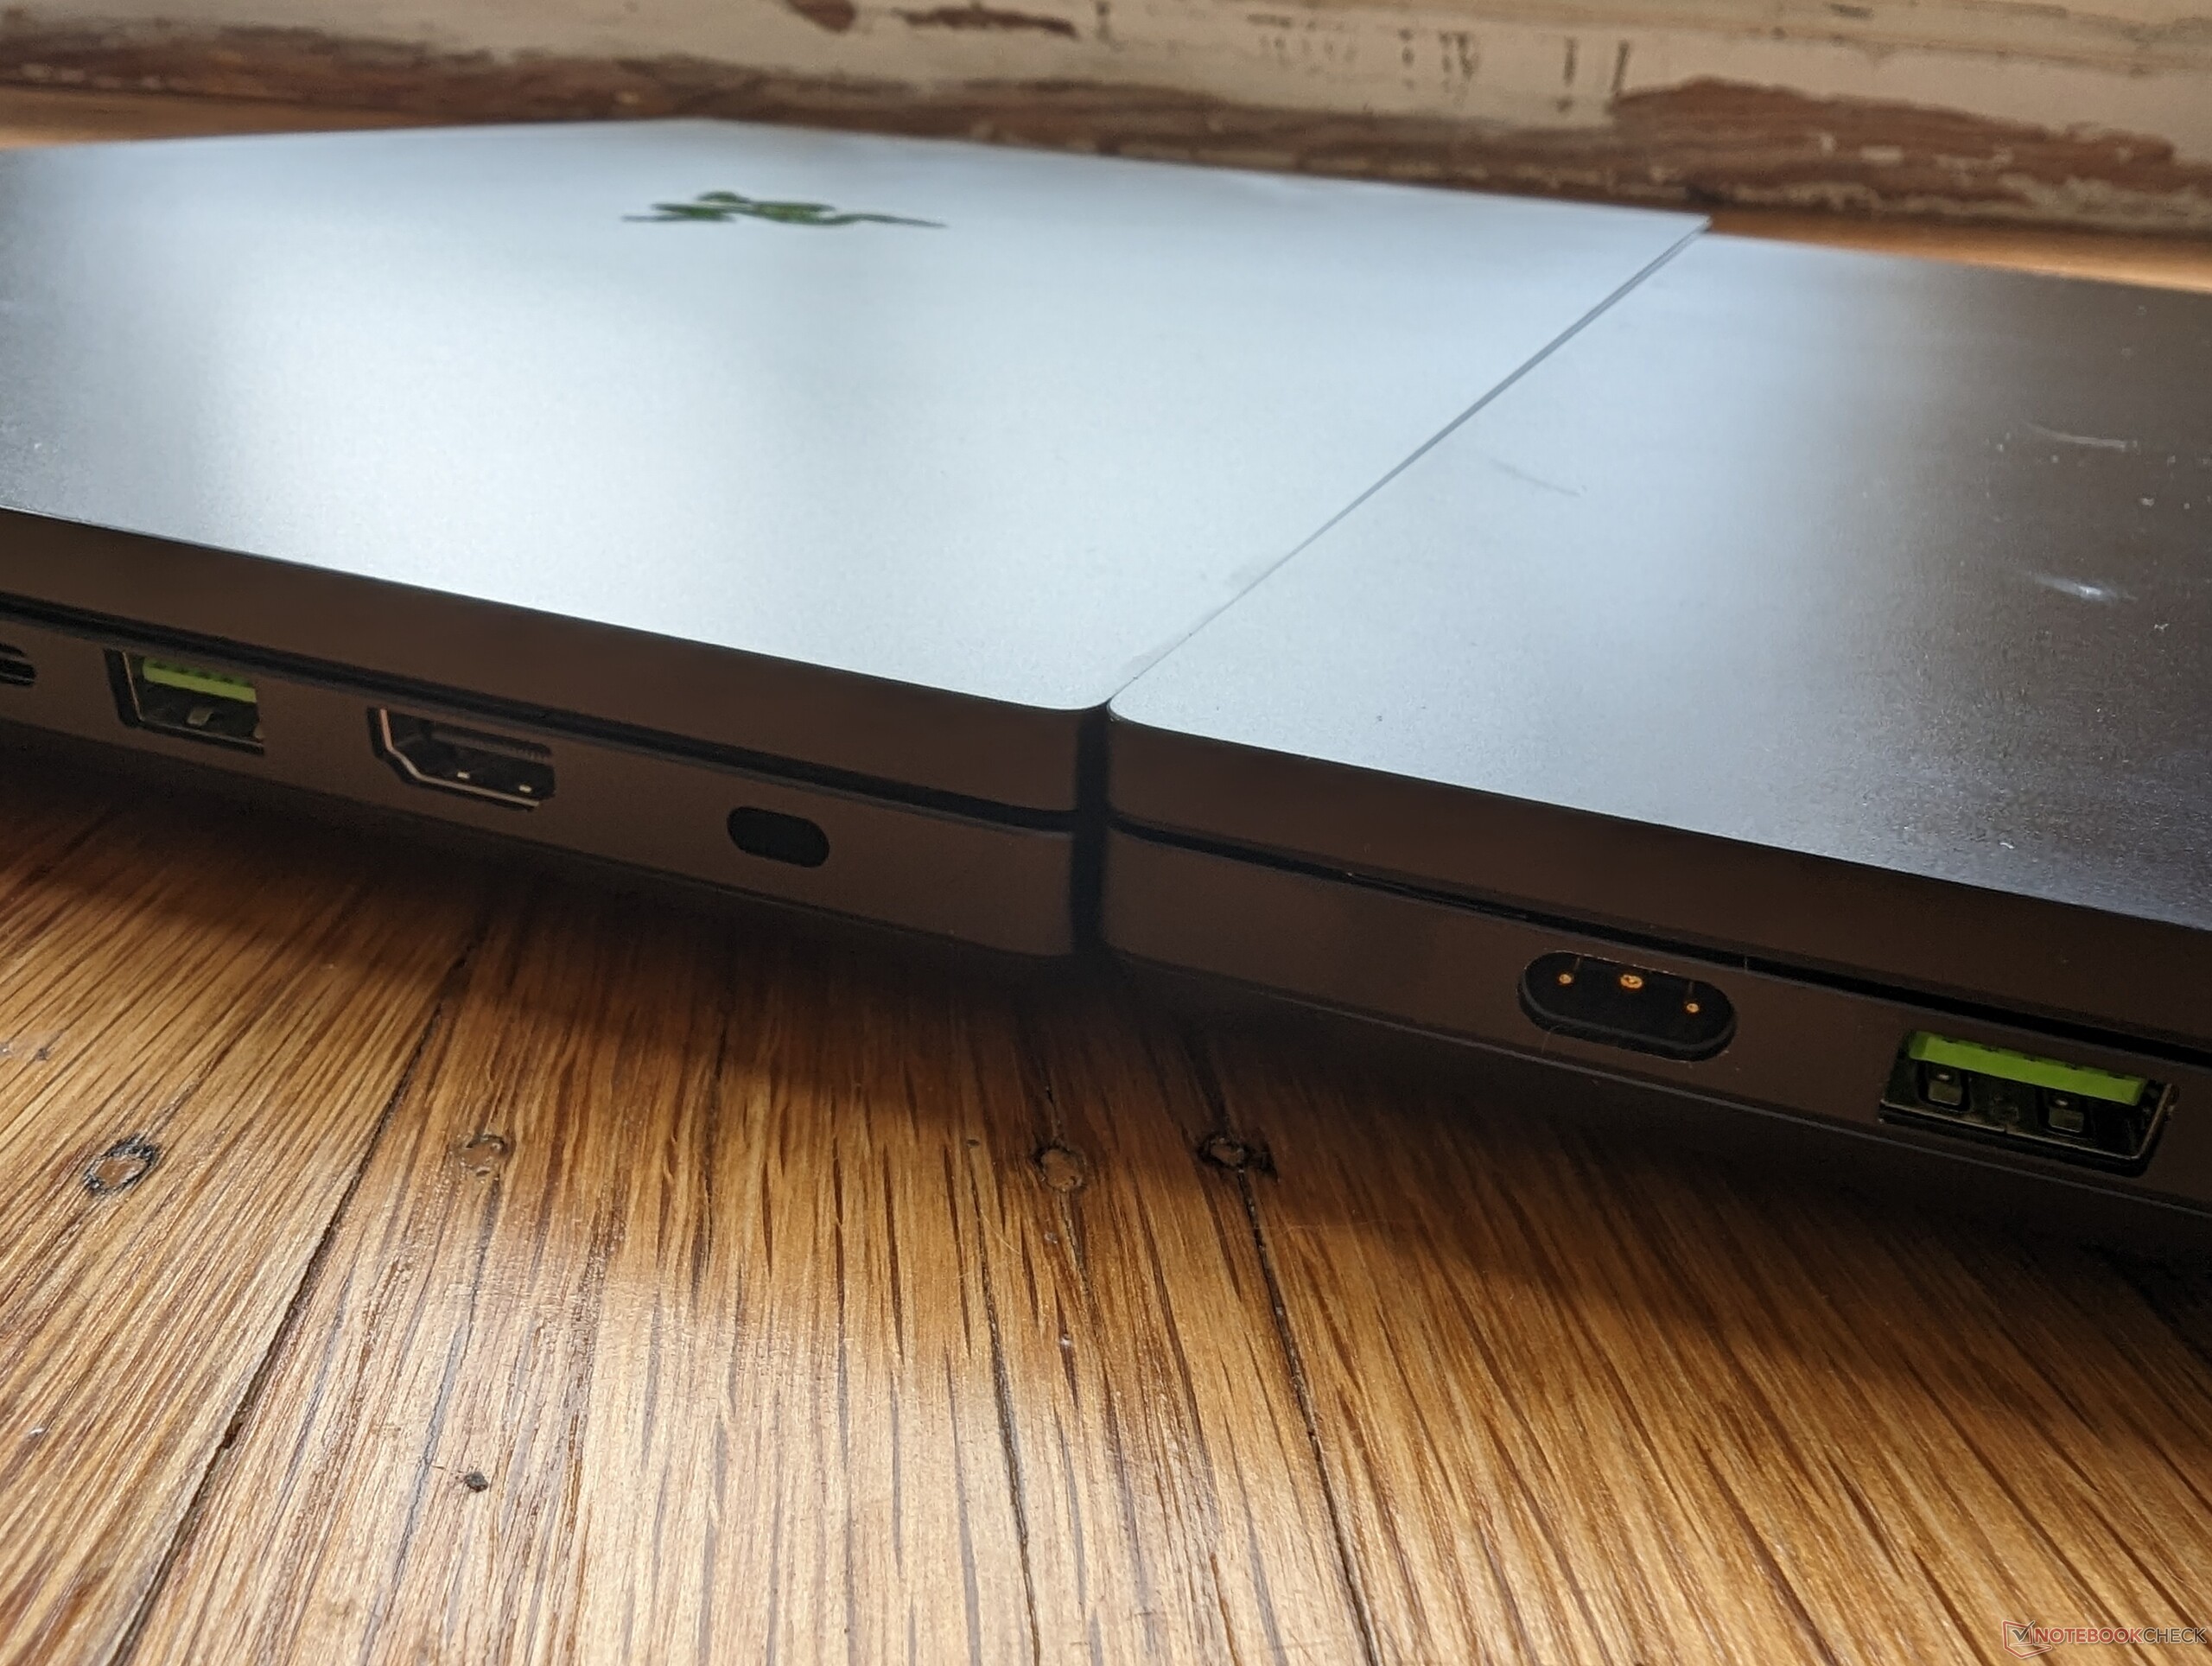
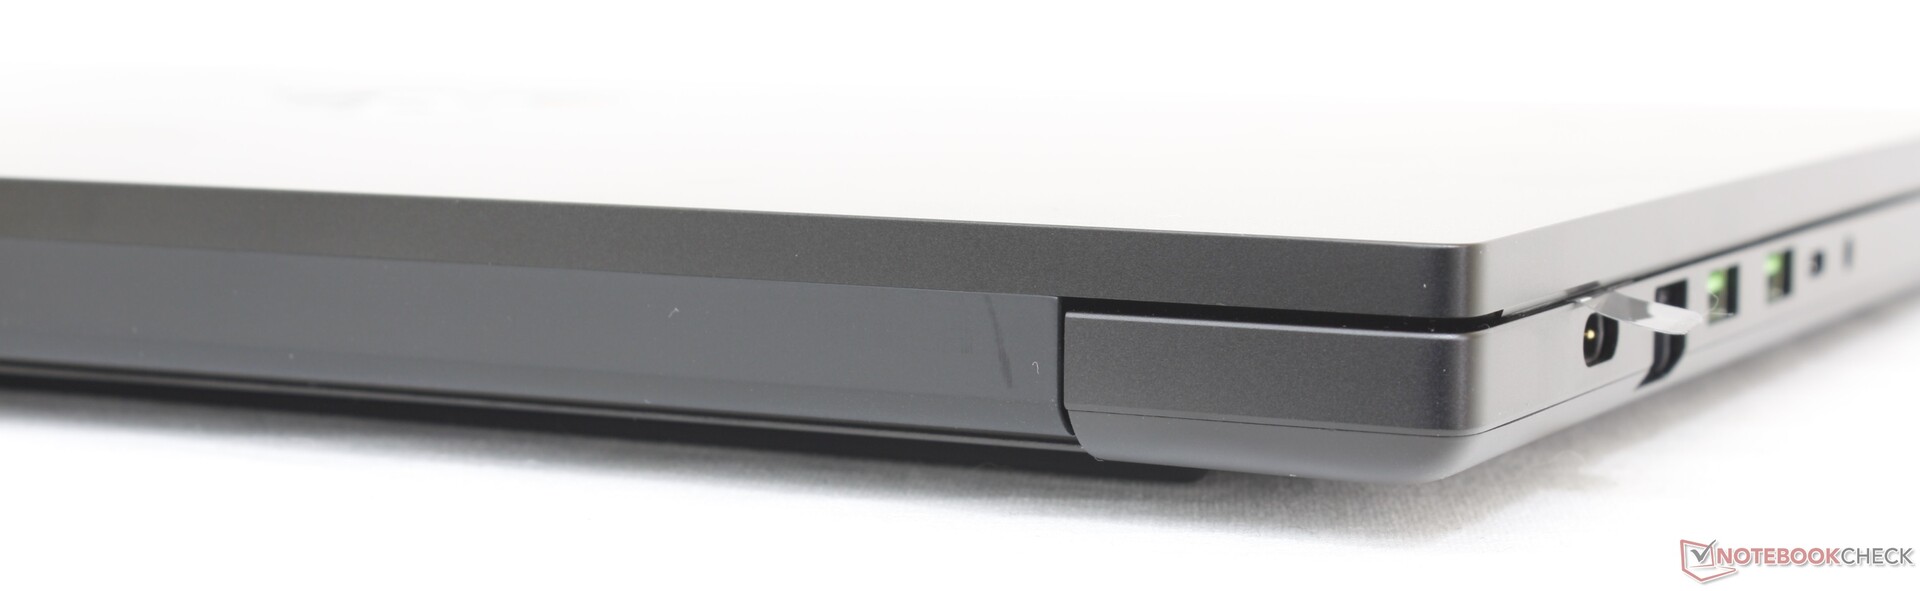
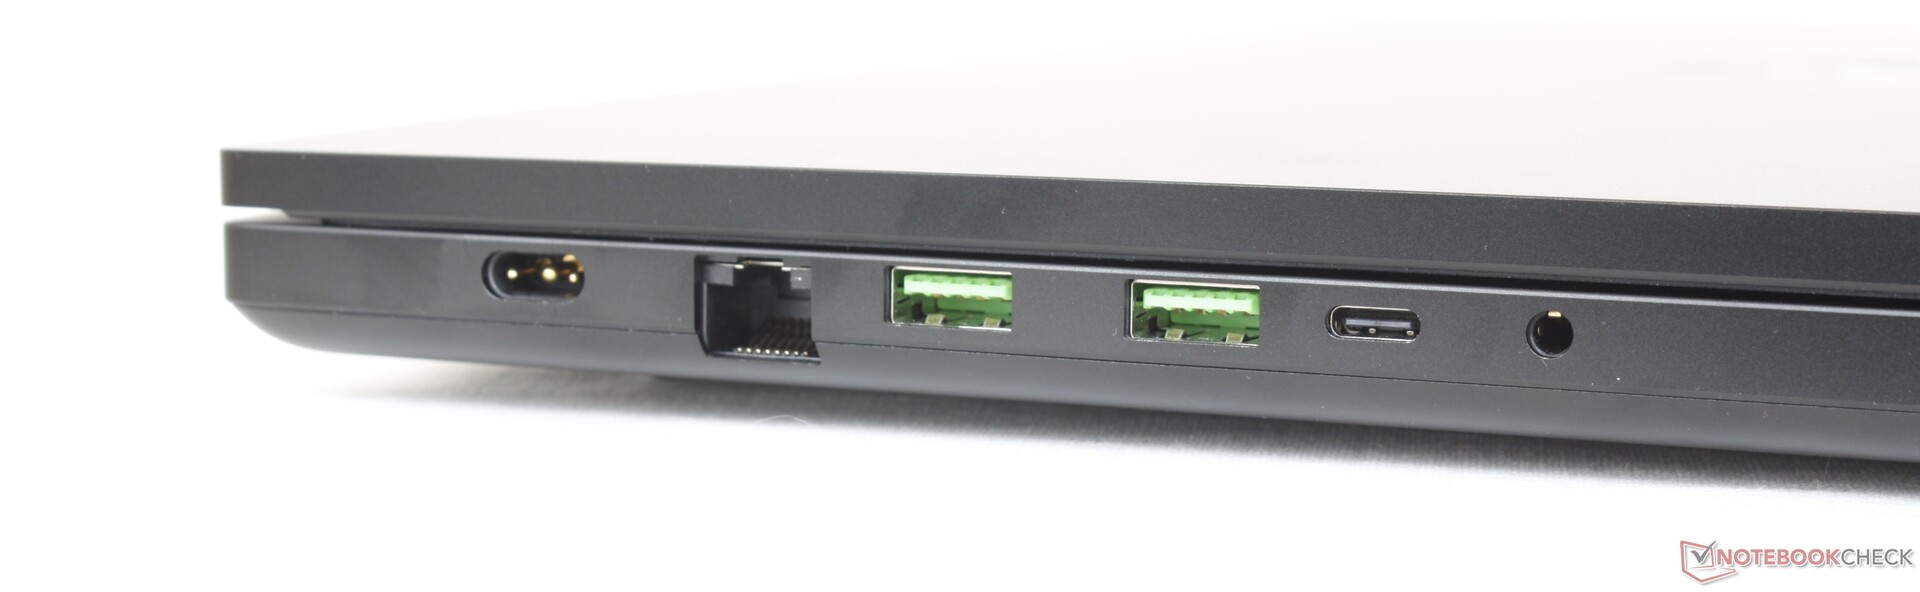
Ausstattung — Nur Standard
Das neue Modell erbt alle Anschlüsse des Blade 17, was eine gesunde Mischung an Optionen beinhaltet. Dennoch hätten wir uns ein paar wenige Anschlussoptionen mehr gewünscht, auch damit es sich positiv vom kleineren Schwestermodell abhebt. Beispielsweise hätte ein HDMI-In mehr Flexibilität für das großflächige 18-Zoll-Display bedeutet.
Zu beachten ist, dass nur einer der beiden USB-C-Ports Thunderbolt unterstützt.

SD-Kartenleser
Das Kopieren von 1 GB an Bildmaterial von unserer UHS-II-Testkarte auf den Desktop gelingt in nur 5 Sekunden. Das MSI Titan GT77 benötigt dafür rund 13 Sekunden.
| SD Card Reader | |
| average JPG Copy Test (av. of 3 runs) | |
| Razer Blade 18 RTX 4070 (Angelibird AV Pro V60) | |
| Razer Blade 17 Early 2022 (AV PRO microSD 128 GB V60) | |
| Razer Blade 16 Early 2023 (AV PRO microSD 128 GB V60) | |
| MSI Titan GT77 HX 13VI (Angelibird AV Pro V60) | |
| maximum AS SSD Seq Read Test (1GB) | |
| Razer Blade 18 RTX 4070 (Angelibird AV Pro V60) | |
| Razer Blade 16 Early 2023 (AV PRO microSD 128 GB V60) | |
| Gigabyte G7 KE (AV PRO microSD 128 GB V60) | |
| MSI Titan GT77 HX 13VI (Angelibird AV Pro V60) | |
Kommunikation
Ein Intel AX211 sorgt für Wi-Fi 6E und Bluetooth 5.3, im Vergleich dazu wird das Blade 17 mit dem Modul Killer AX1690i ausgeliefert. Letzteres ist ein speziell an Gaming-Laptops angepasstes Derivat des Intel AX211, sodass Nutzer kaum Unterschiede bemerken dürften.
| Networking | |
| iperf3 transmit AXE11000 6GHz | |
| Asus ROG Strix Scar 17 SE G733CX-LL014W | |
| Razer Blade 18 RTX 4070 | |
| iperf3 receive AXE11000 6GHz | |
| Asus ROG Strix Scar 17 SE G733CX-LL014W | |
| Razer Blade 18 RTX 4070 | |
| iperf3 receive AXE11000 | |
| Razer Blade 17 Early 2022 | |
| Gigabyte G7 KE | |
| MSI Titan GT77 HX 13VI | |
| Razer Blade 18 RTX 4070 | |
| Alienware m17 R5 (R9 6900HX, RX 6850M XT) | |
| iperf3 transmit AXE11000 | |
| Gigabyte G7 KE | |
| MSI Titan GT77 HX 13VI | |
| Razer Blade 18 RTX 4070 | |
| Alienware m17 R5 (R9 6900HX, RX 6850M XT) | |
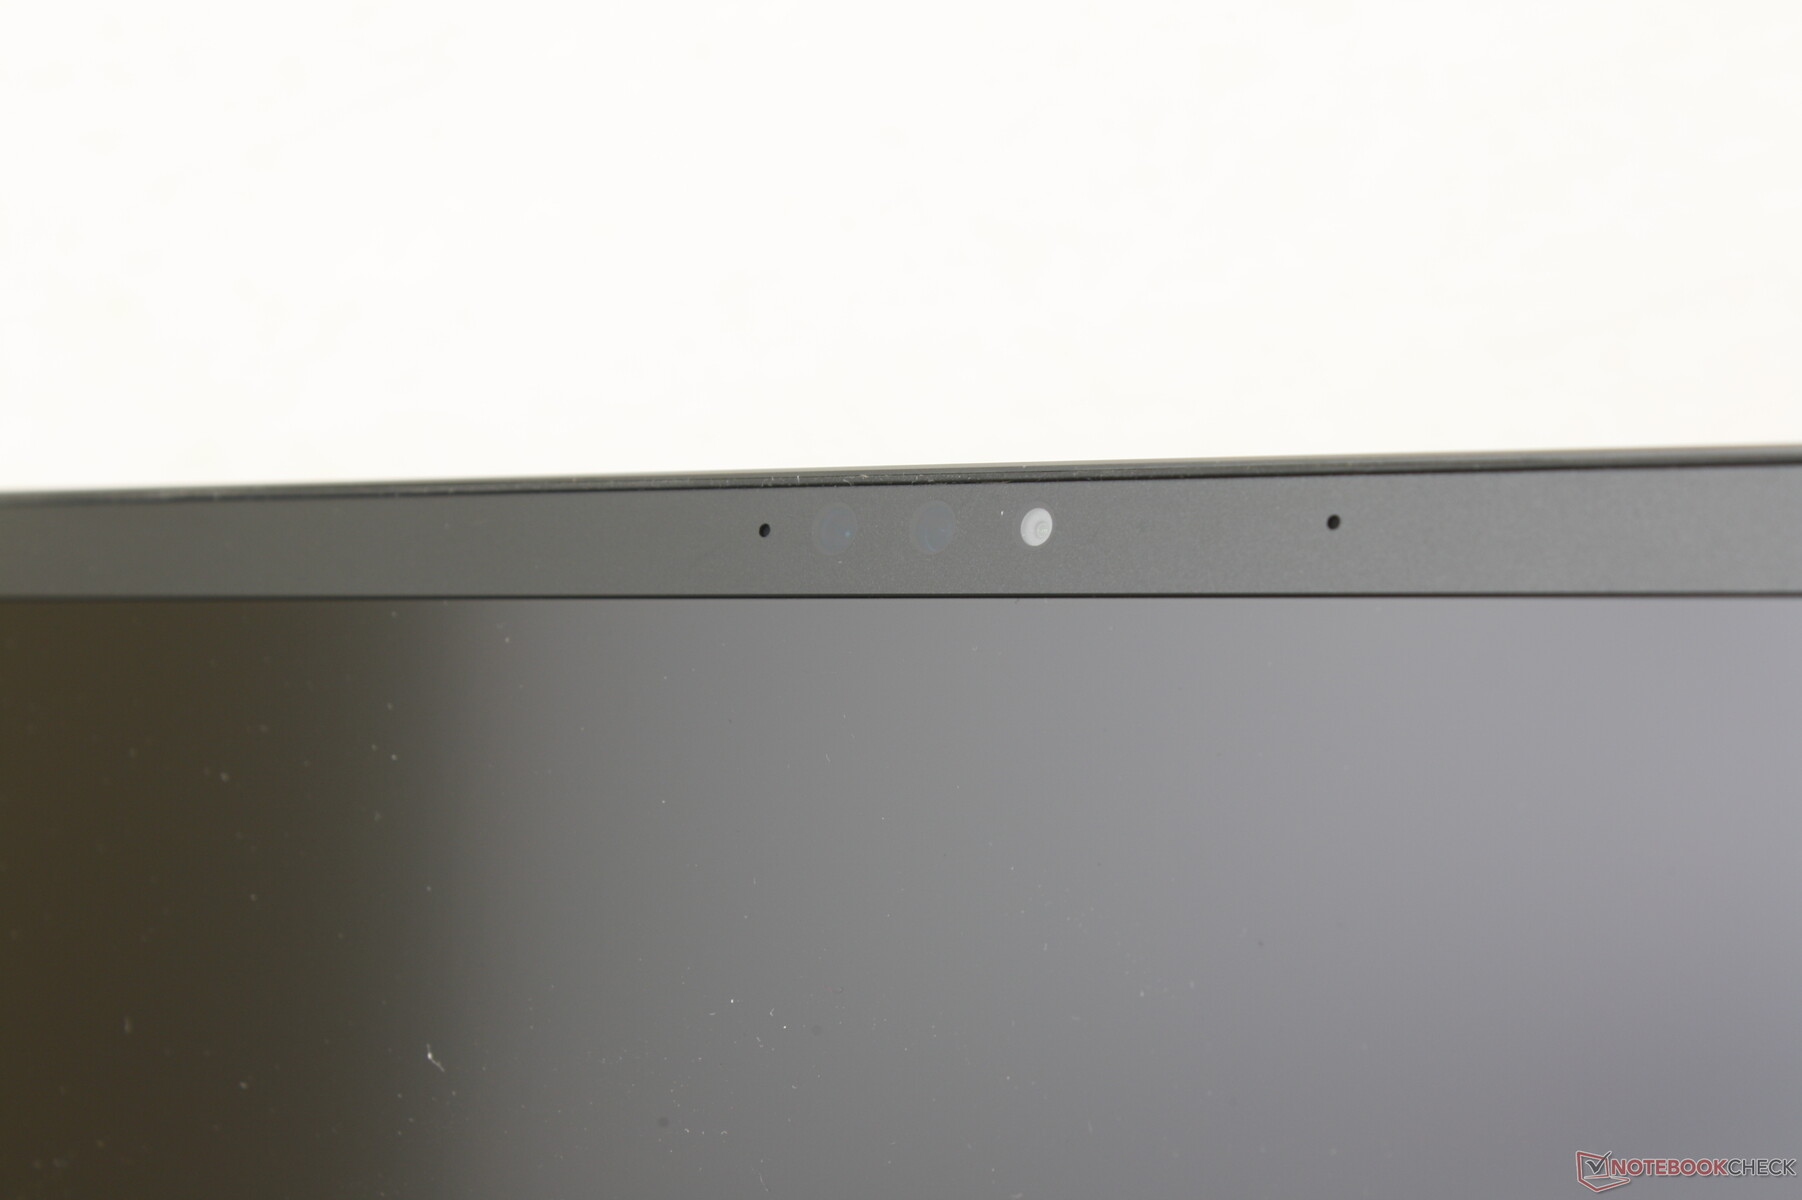
Webcam — Jetzt mit 5 MP
Razer hat seiner Webcam ein Update spendiert, von 2 MP im Blade 17 geht es hoch auf 5 MP im Blade 18. Wir gehen davon aus, dass auch die kleineren Blade-Modelle in Kürze mit dem gleichen 5-MP-Sensor ausgestattet werden. Die Bilder fallen dadurch nun schärfer aus, während sich bei den Farben kaum etwas geändert hat. IR ist standardmäßig dabei, Windows Hello wird unterstützt.
Seltsamerweise gibt es keinen physischen Shutter und das obwohl beispielsweise das Blade 16 einen besitzt. Alternativ gibt es noch nicht einmal einen digitalen Ausschalter oder gar Sondertaste.


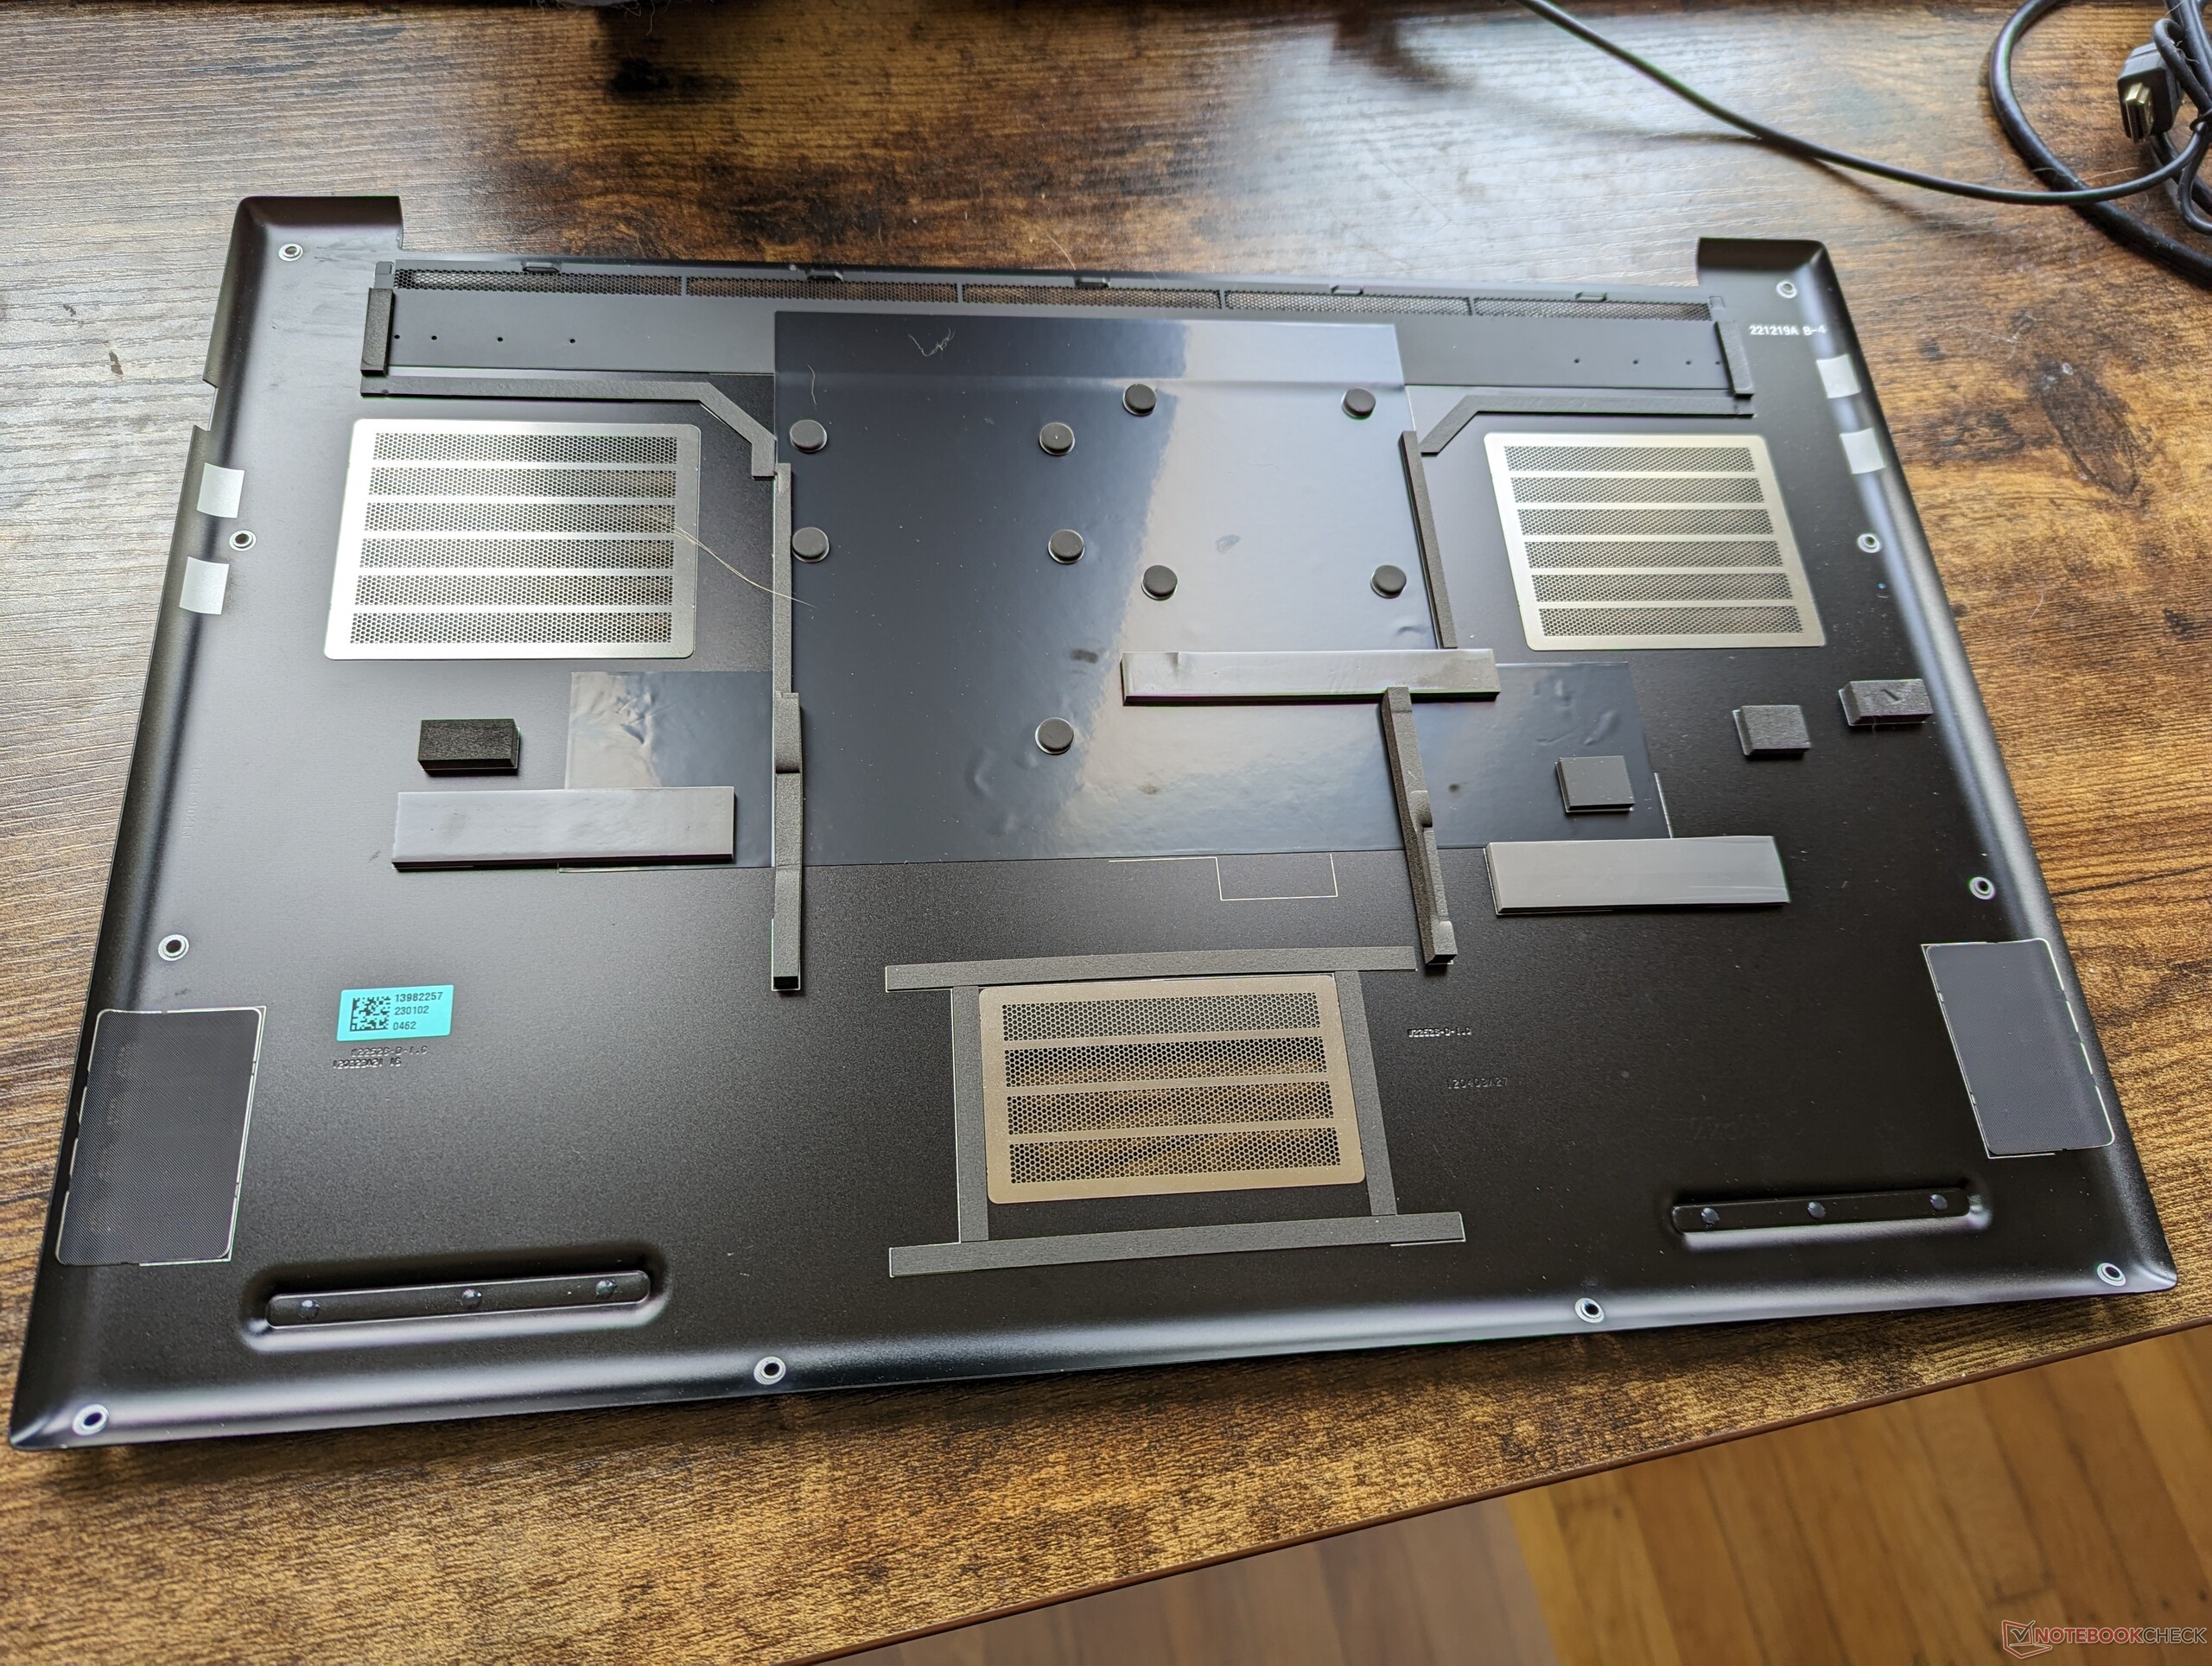
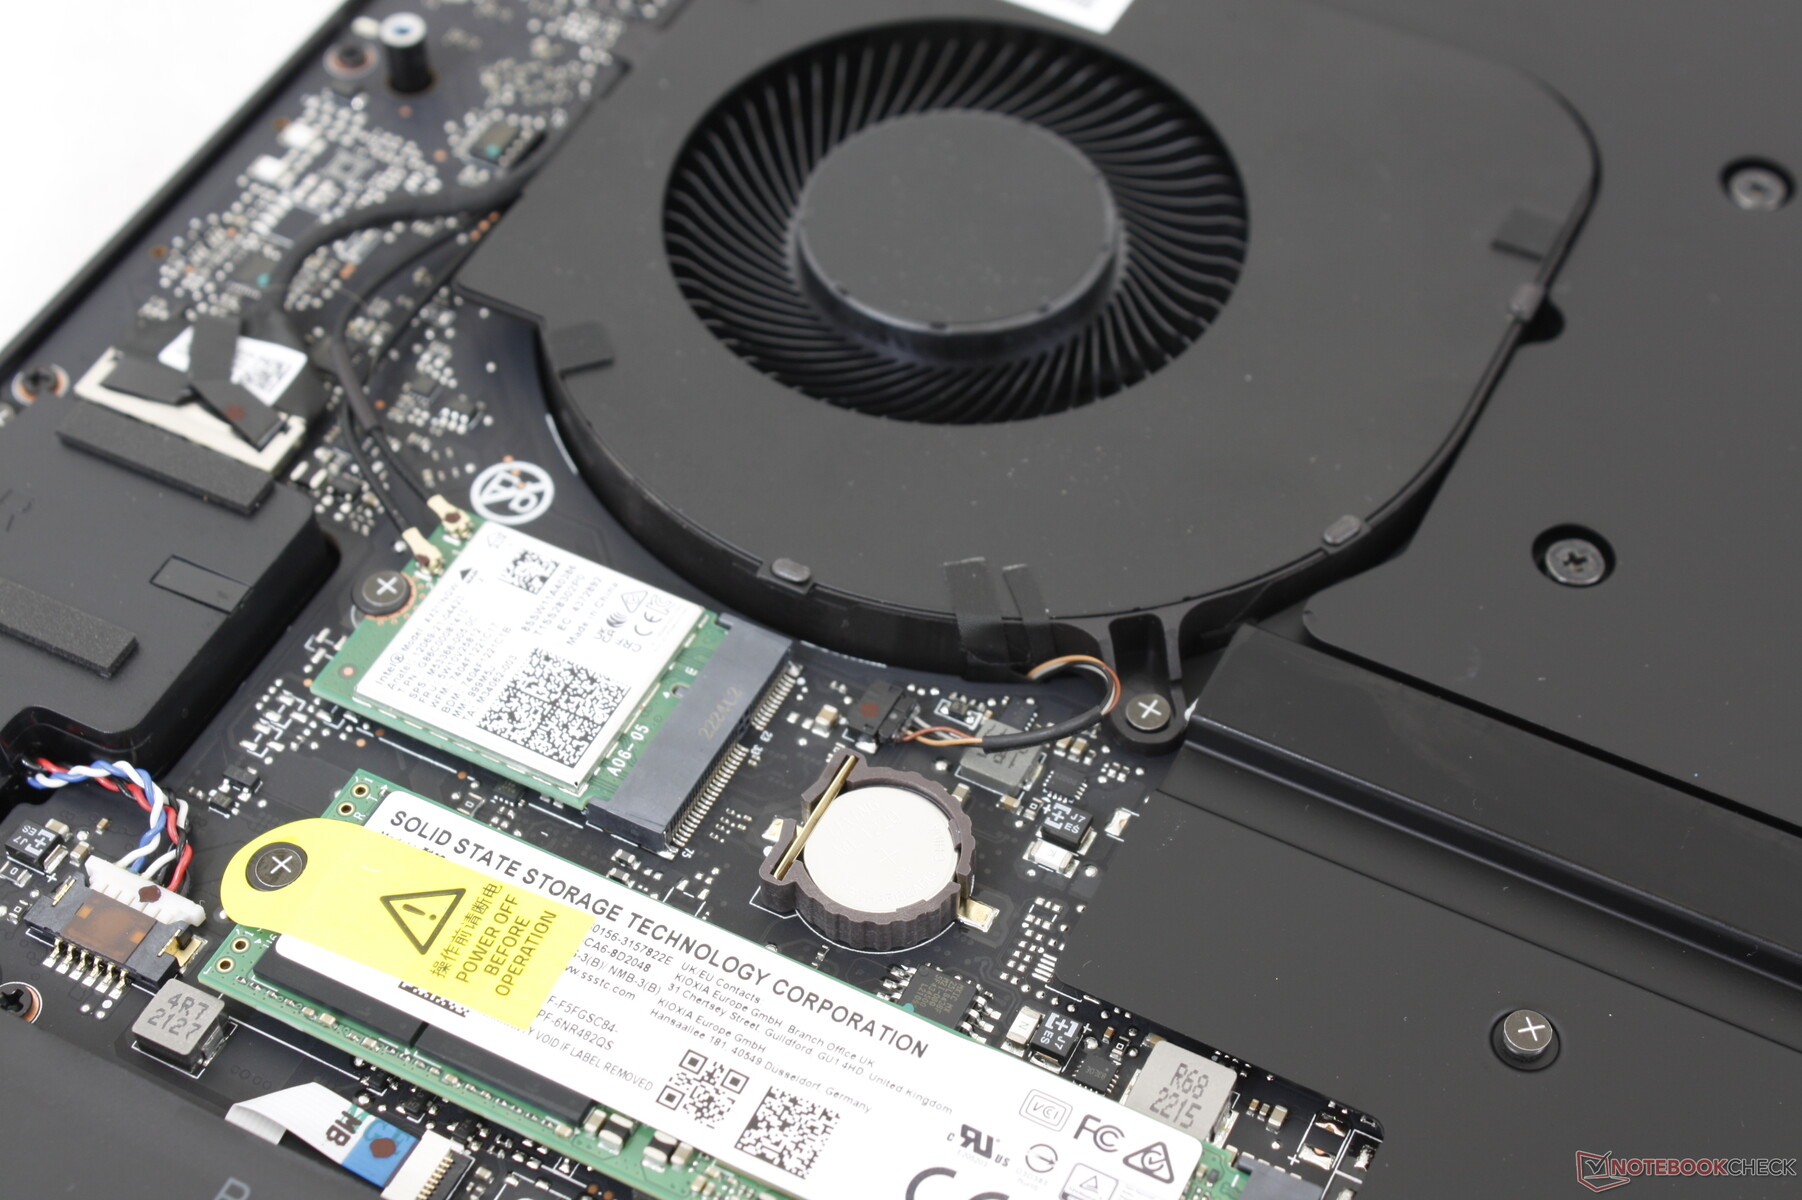
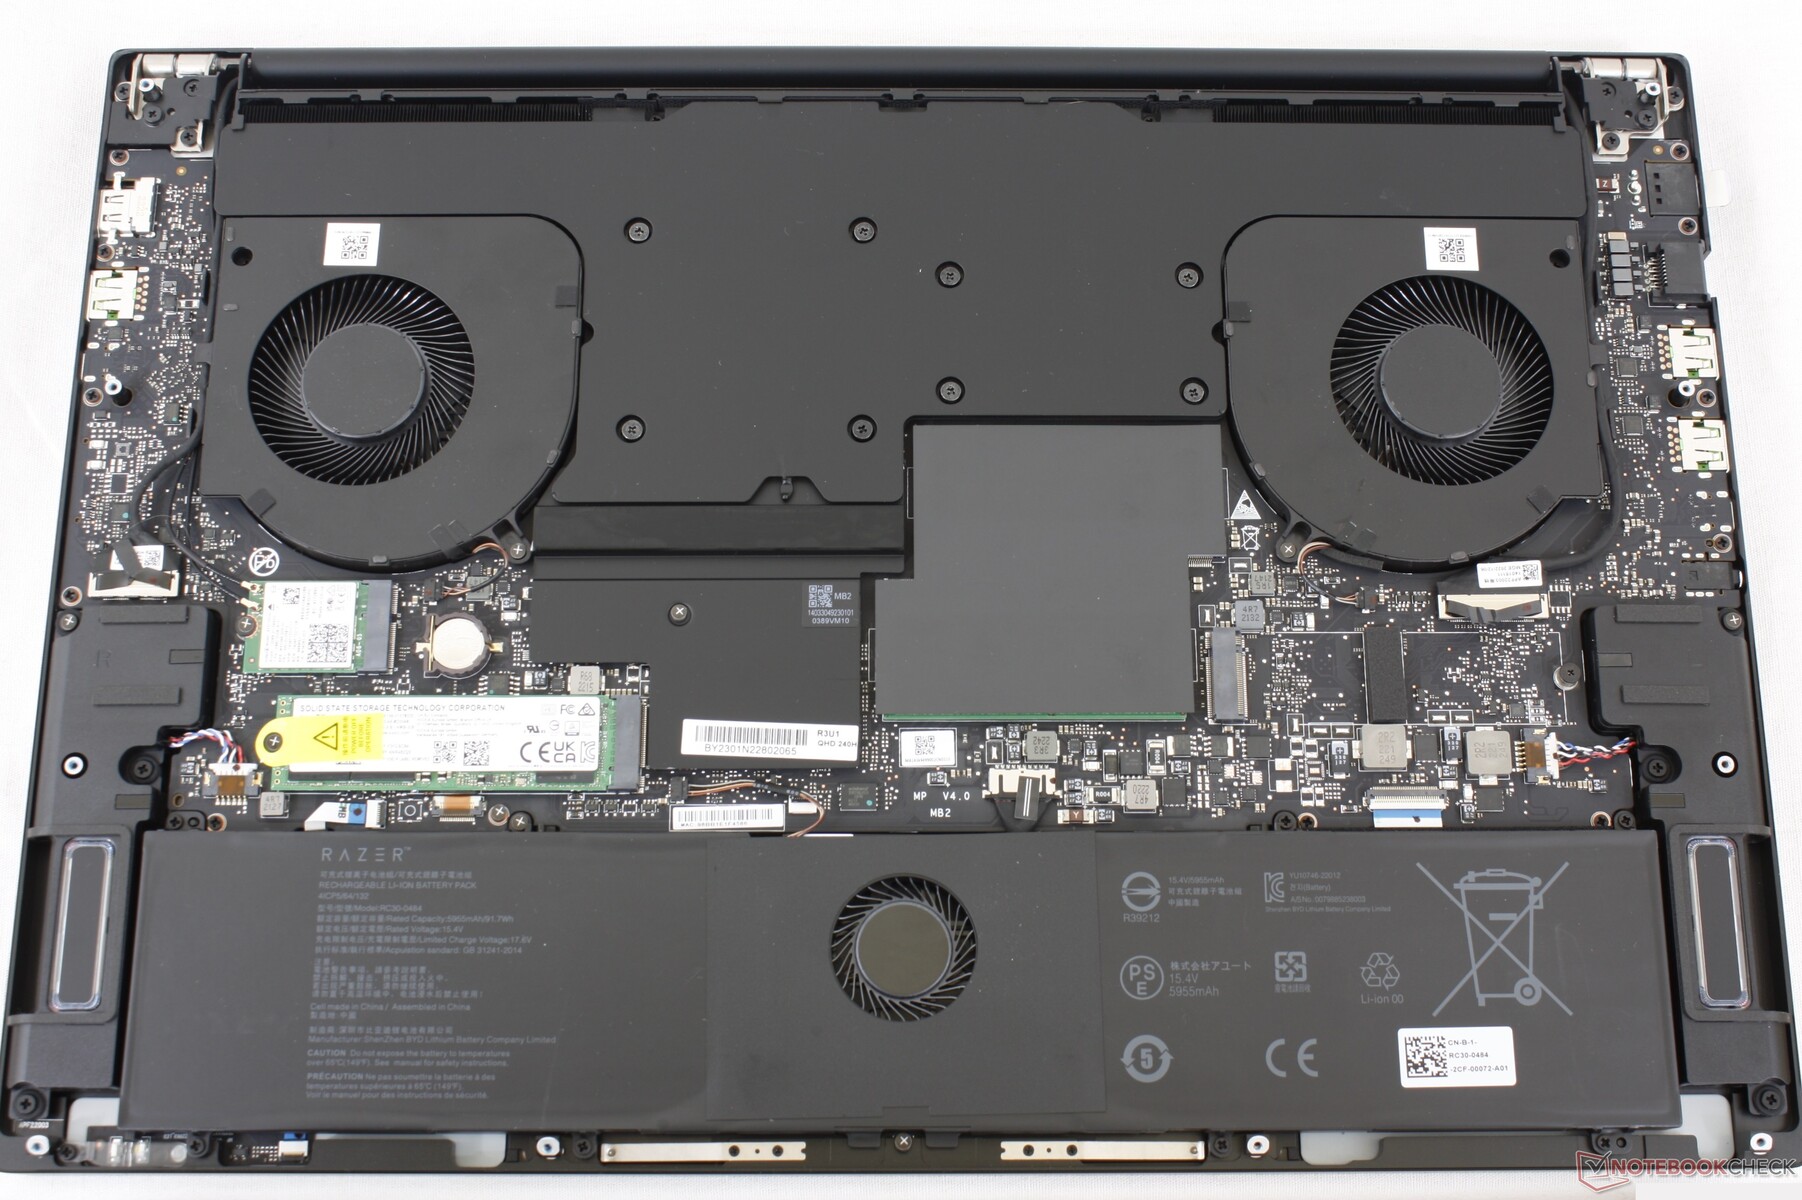
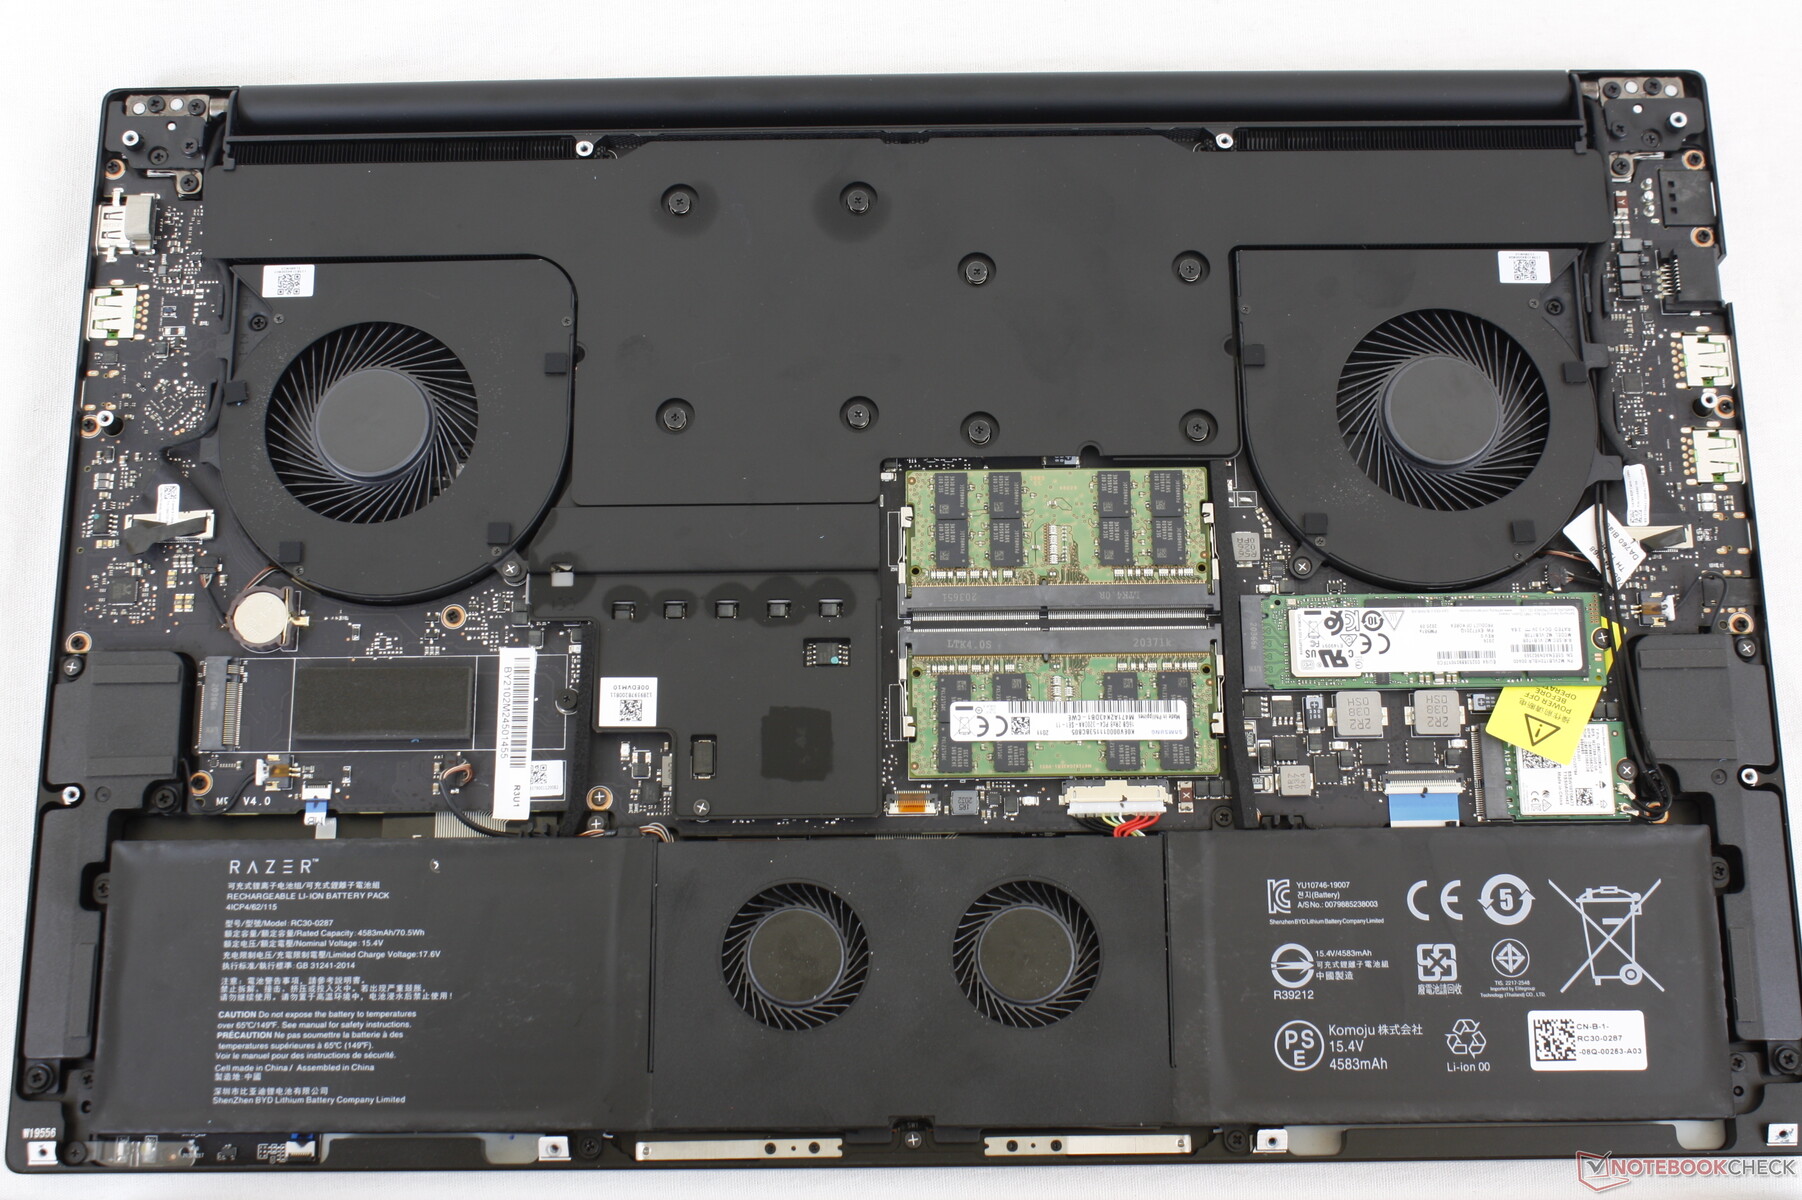
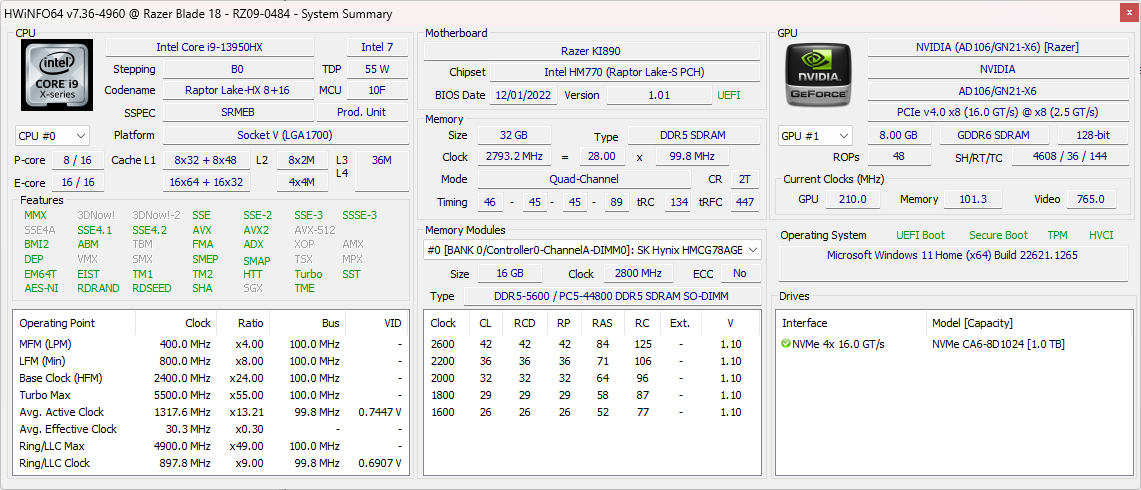
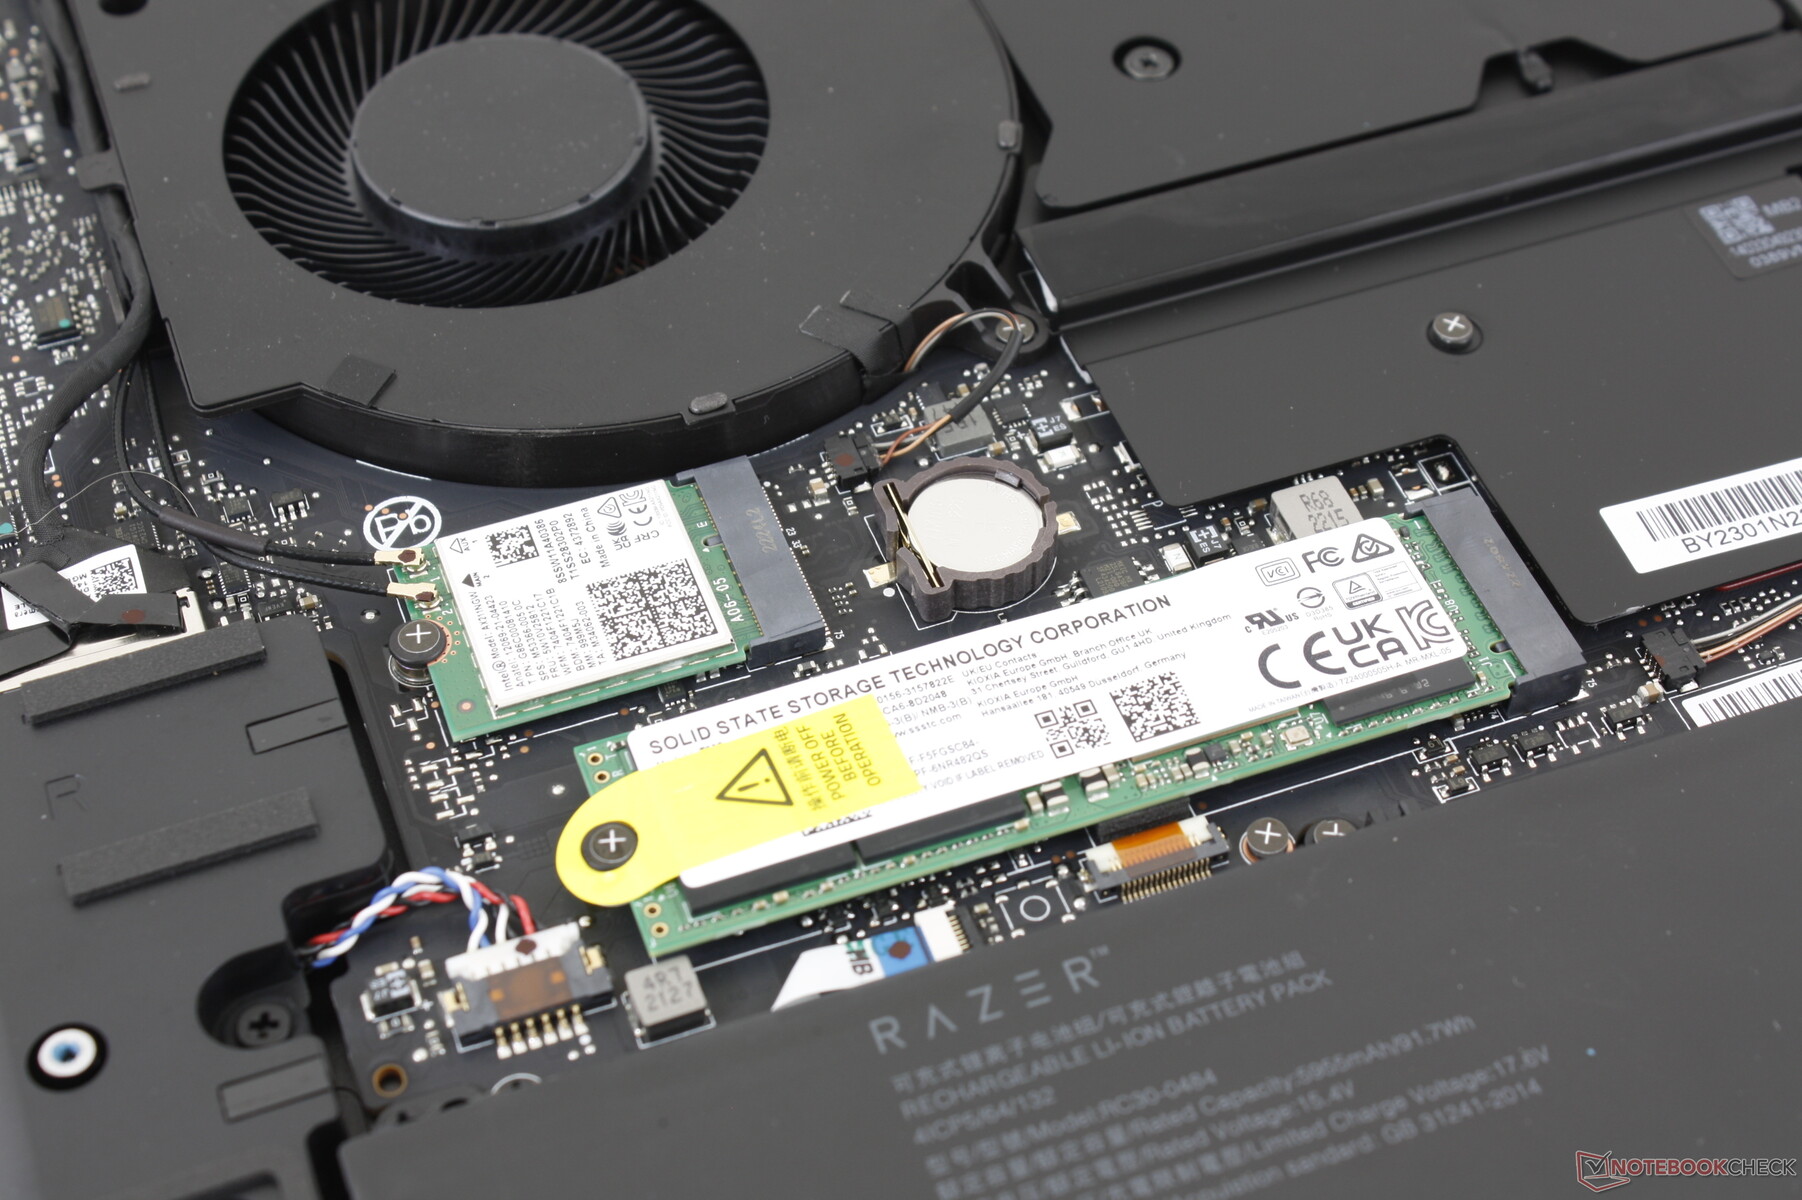
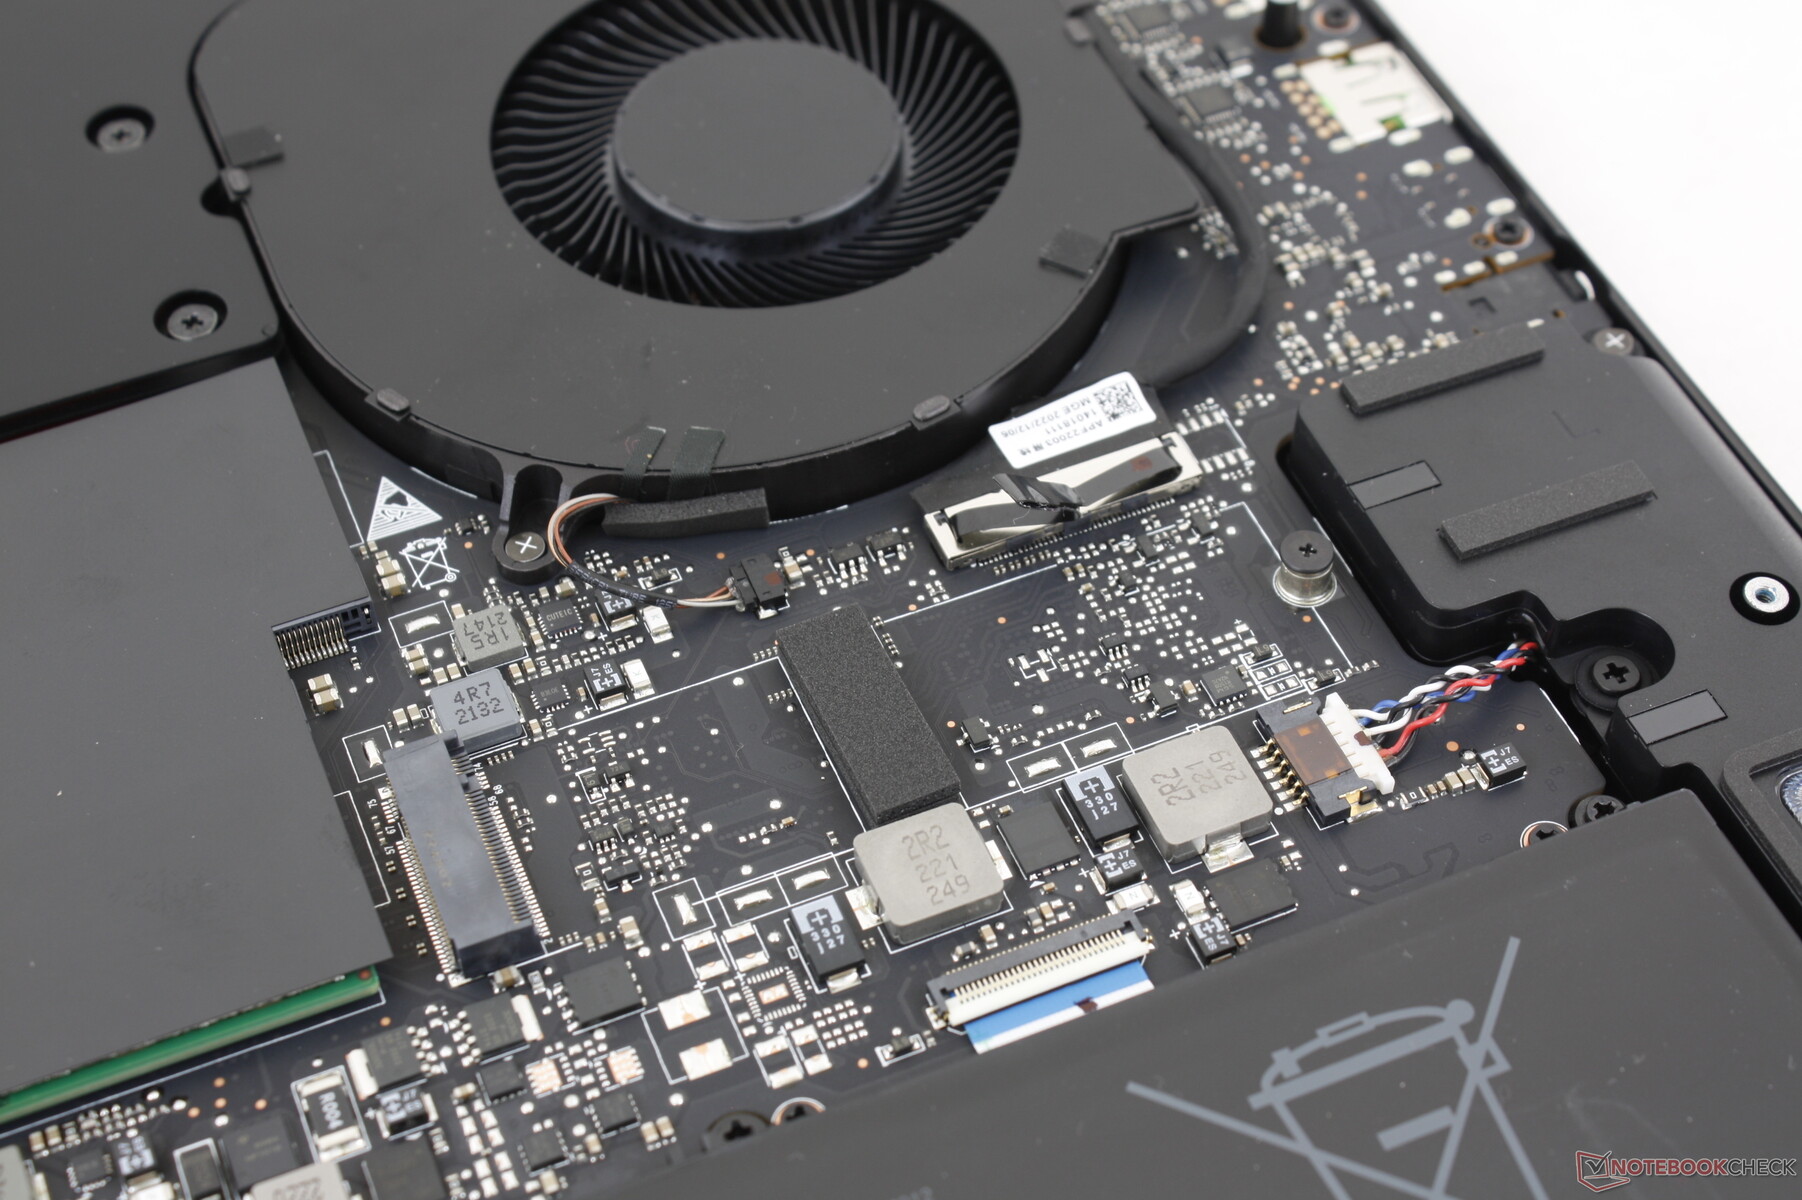
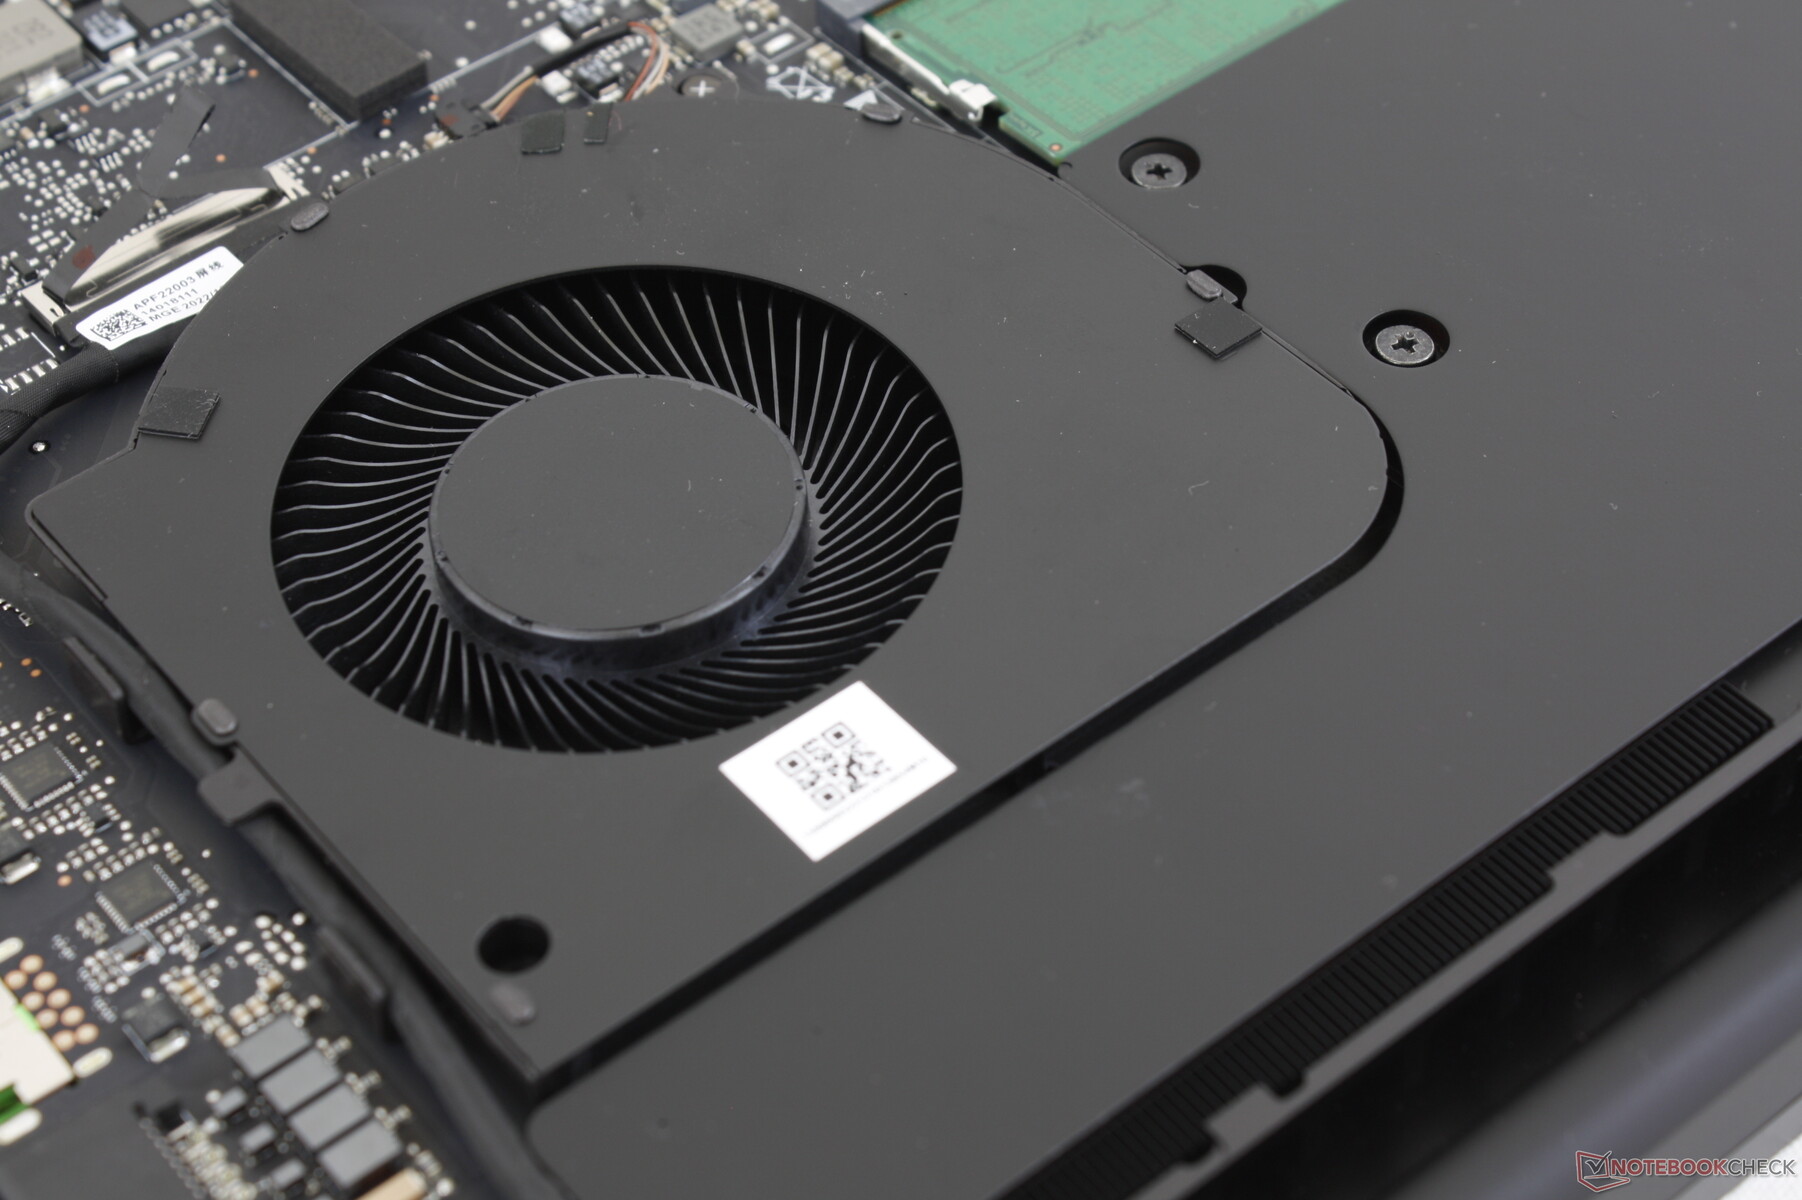
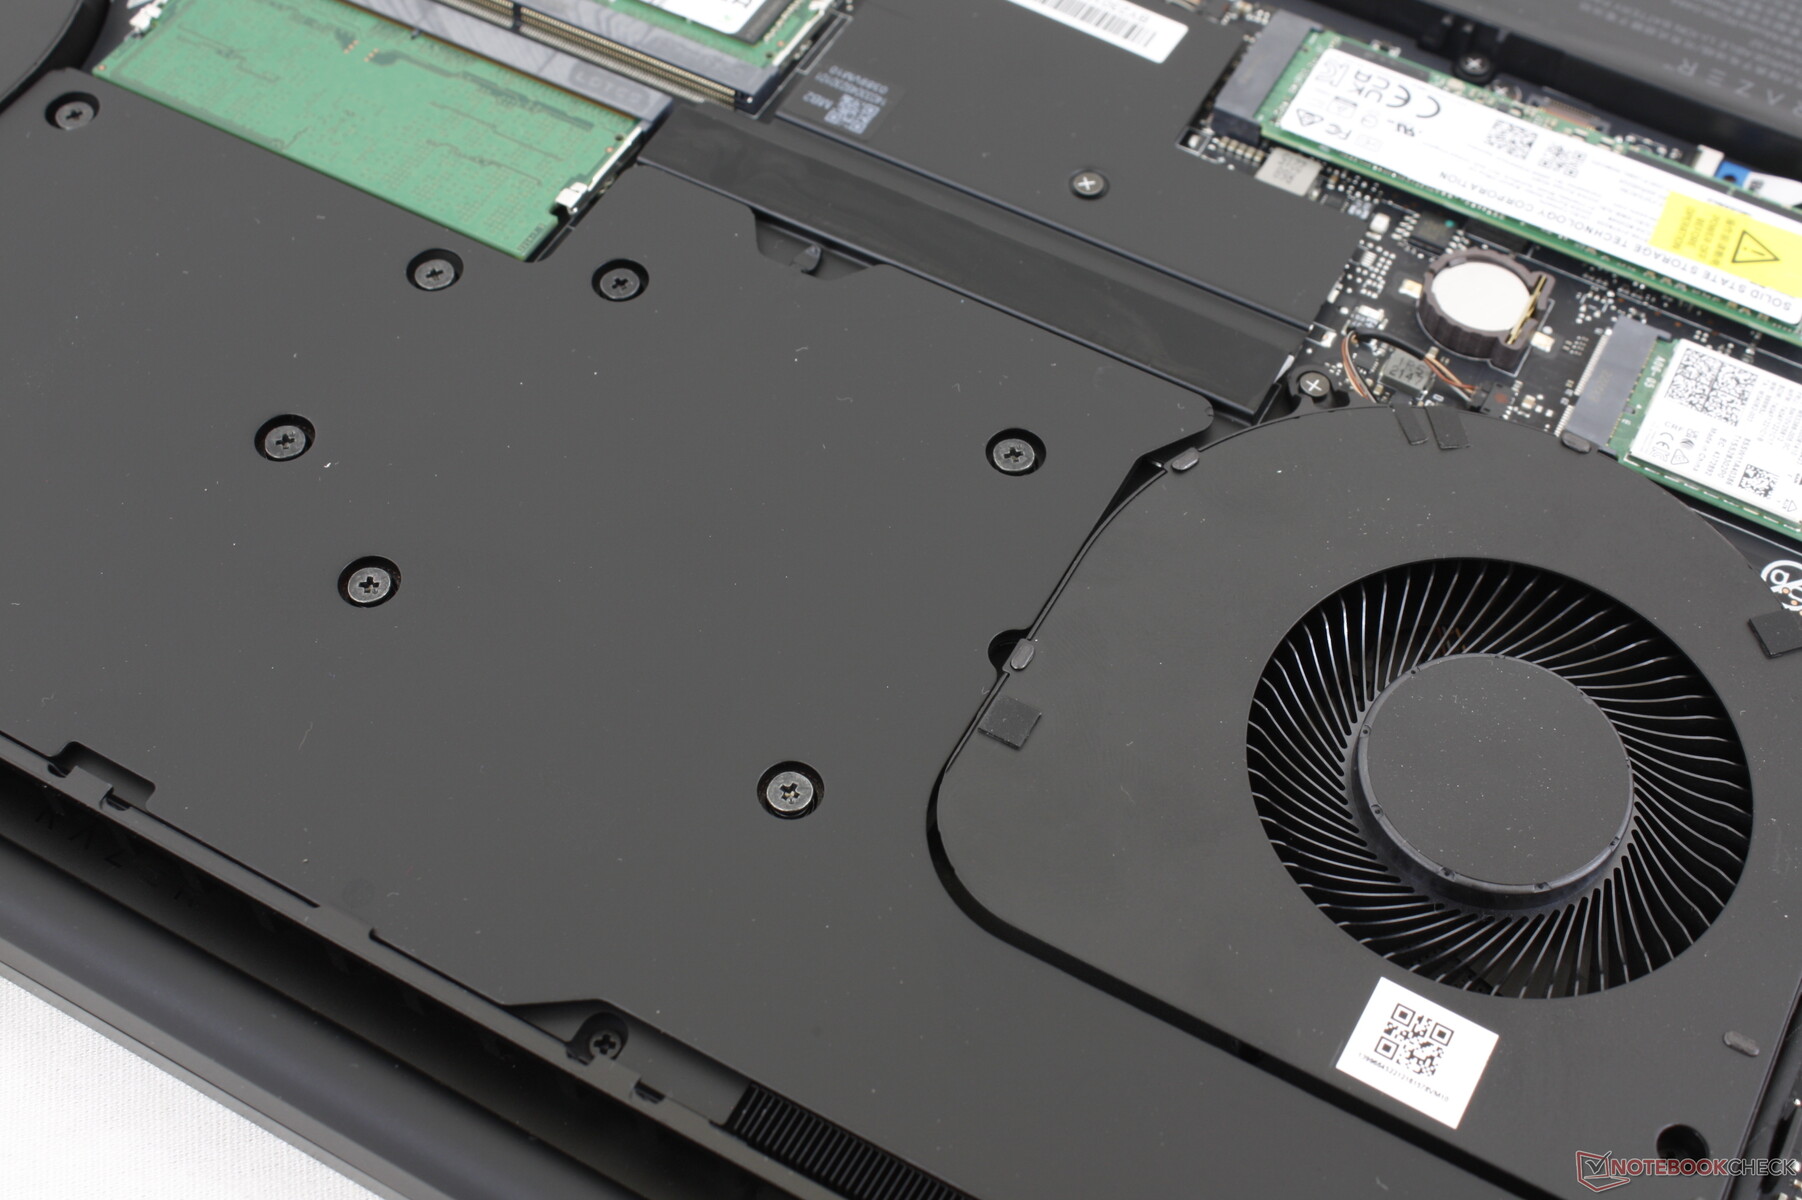
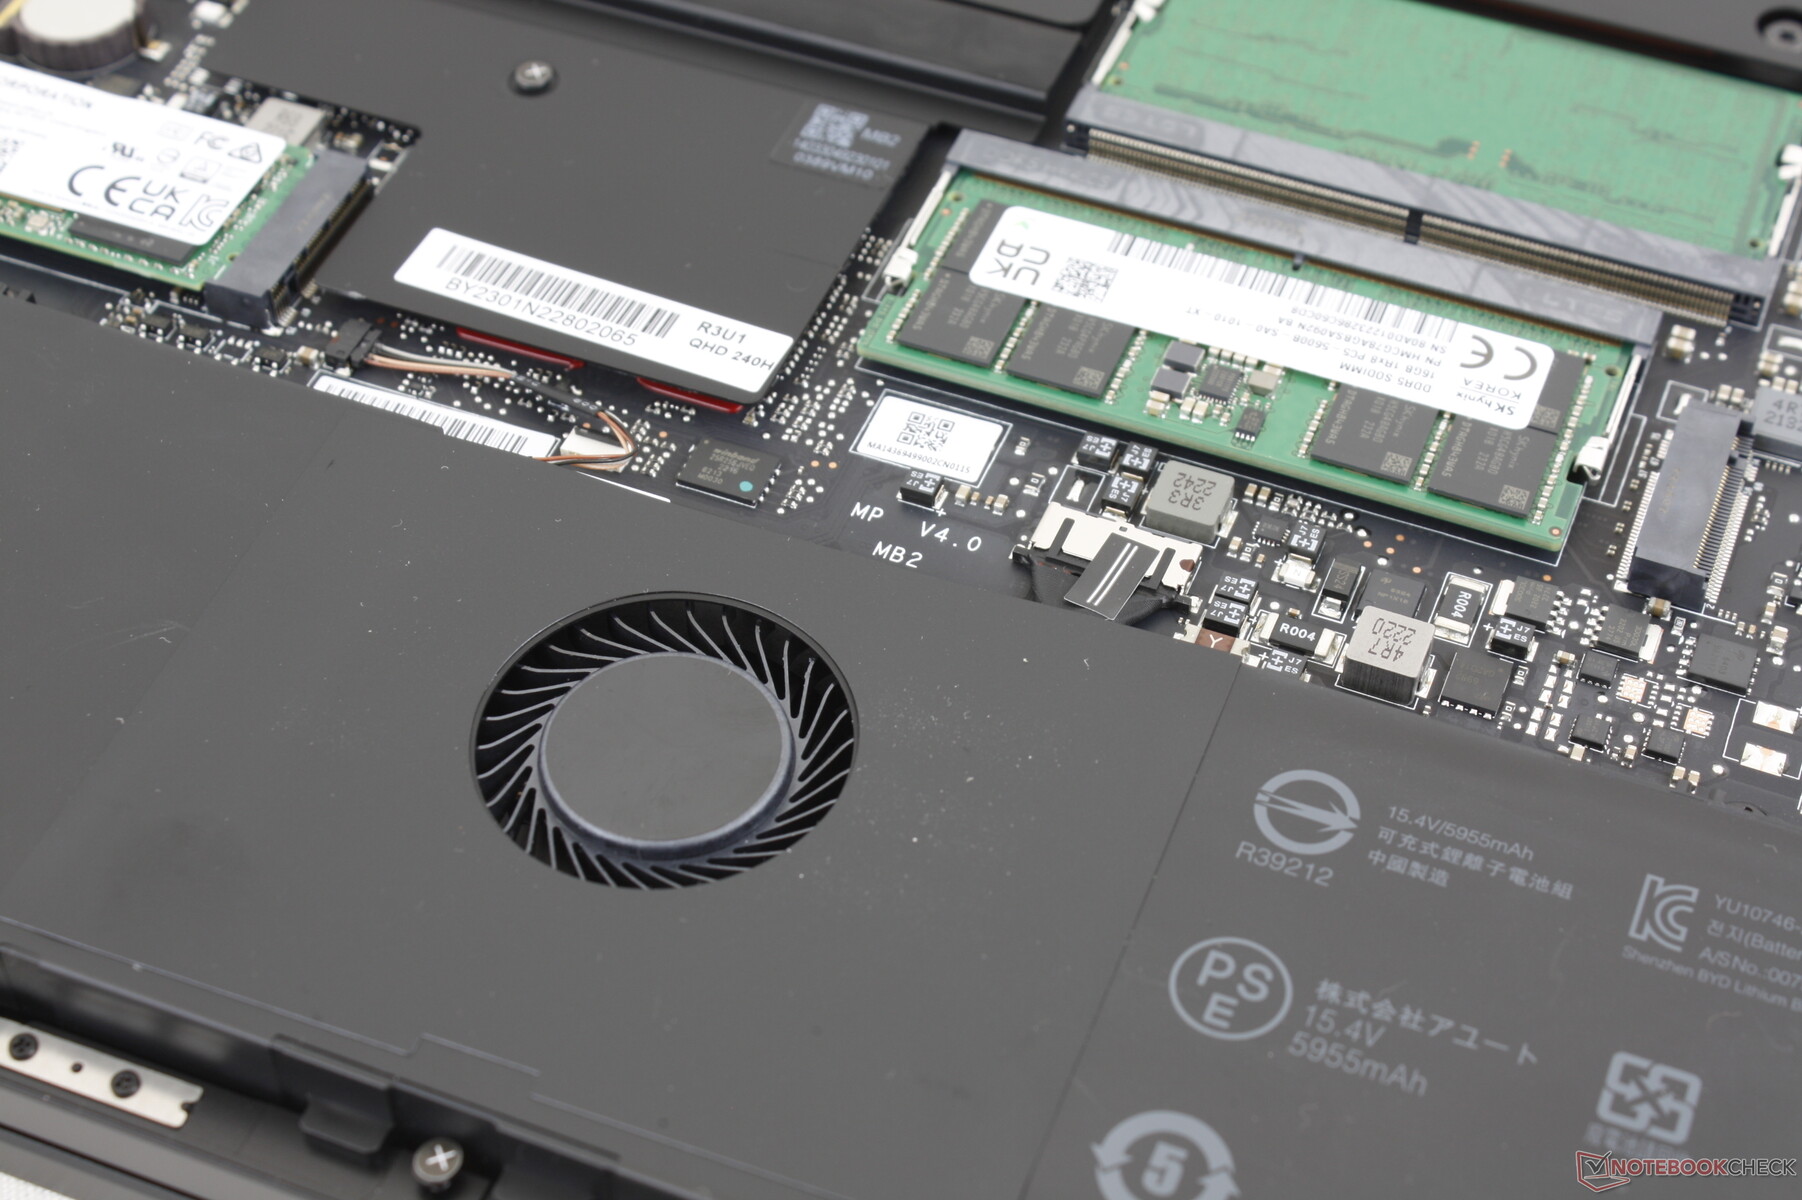
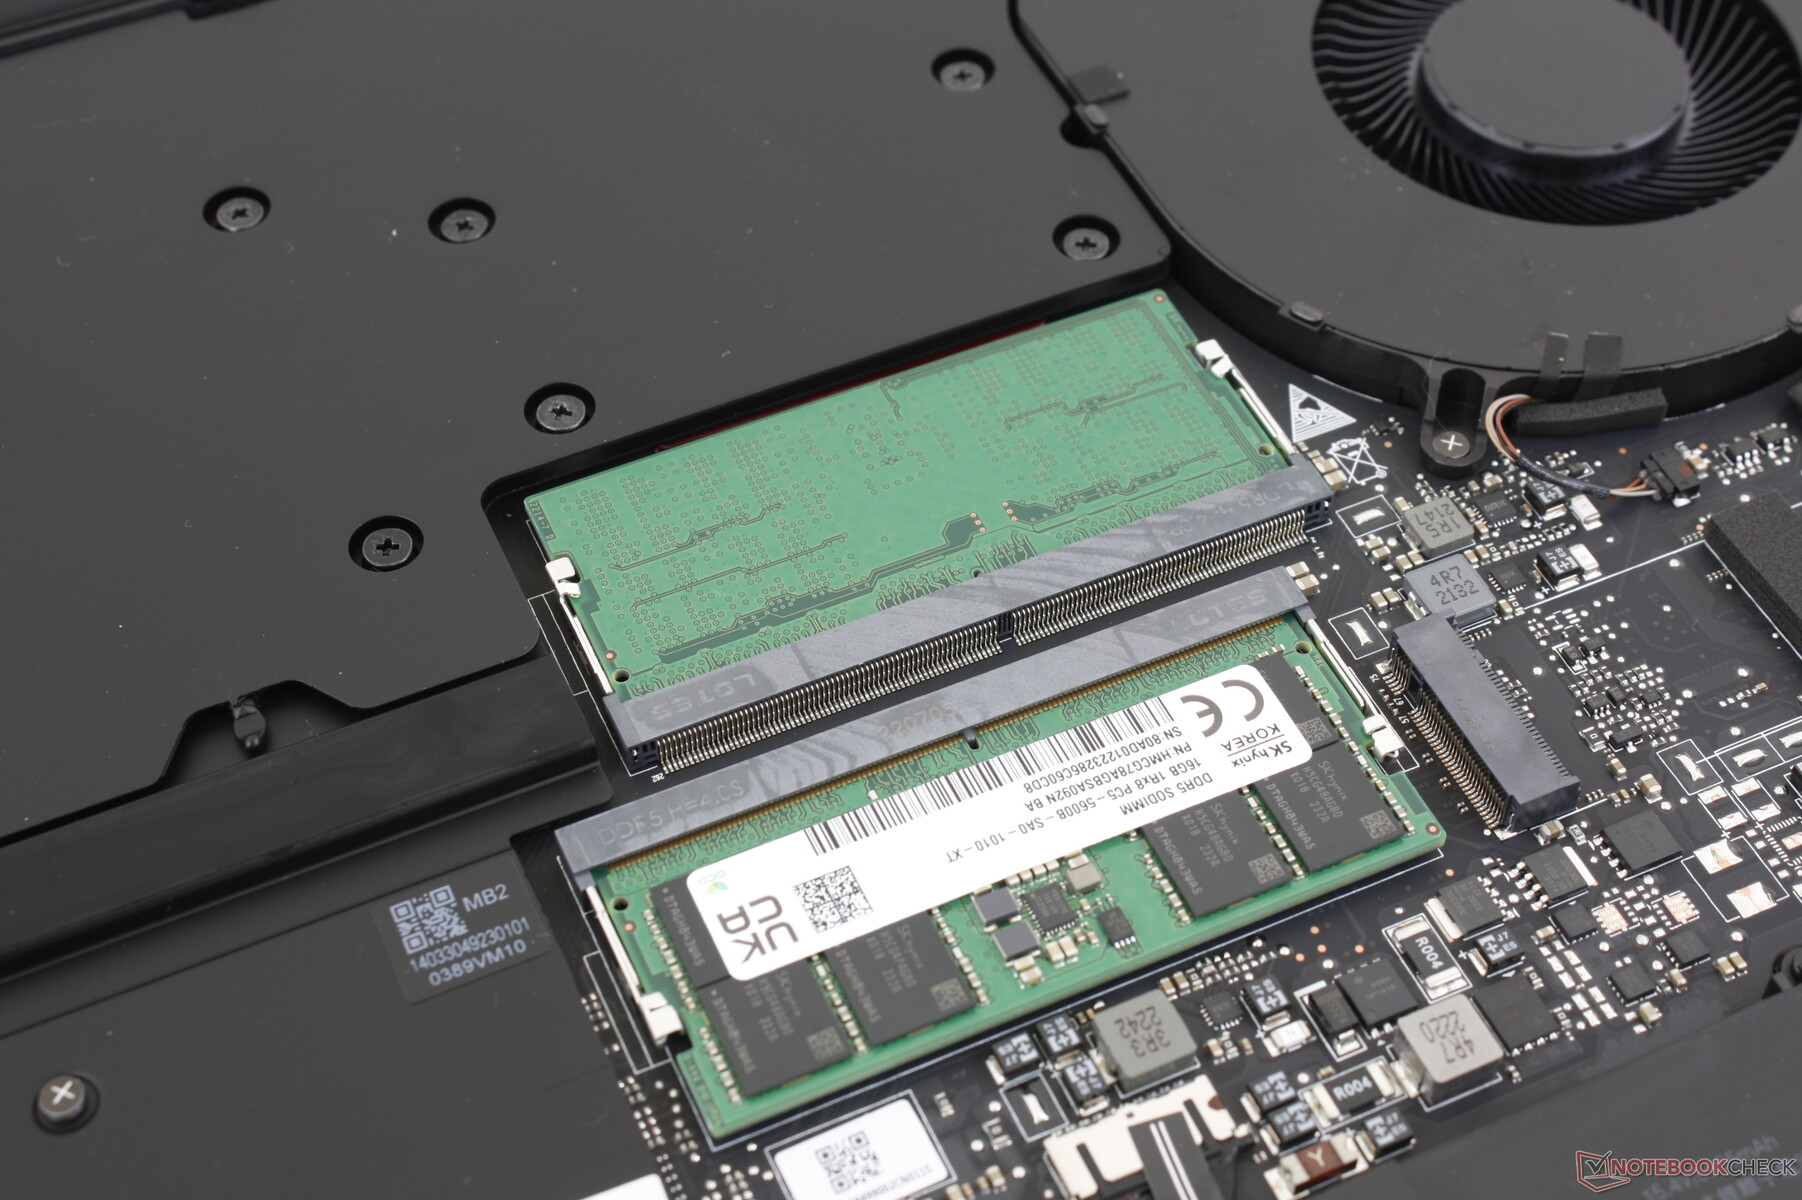
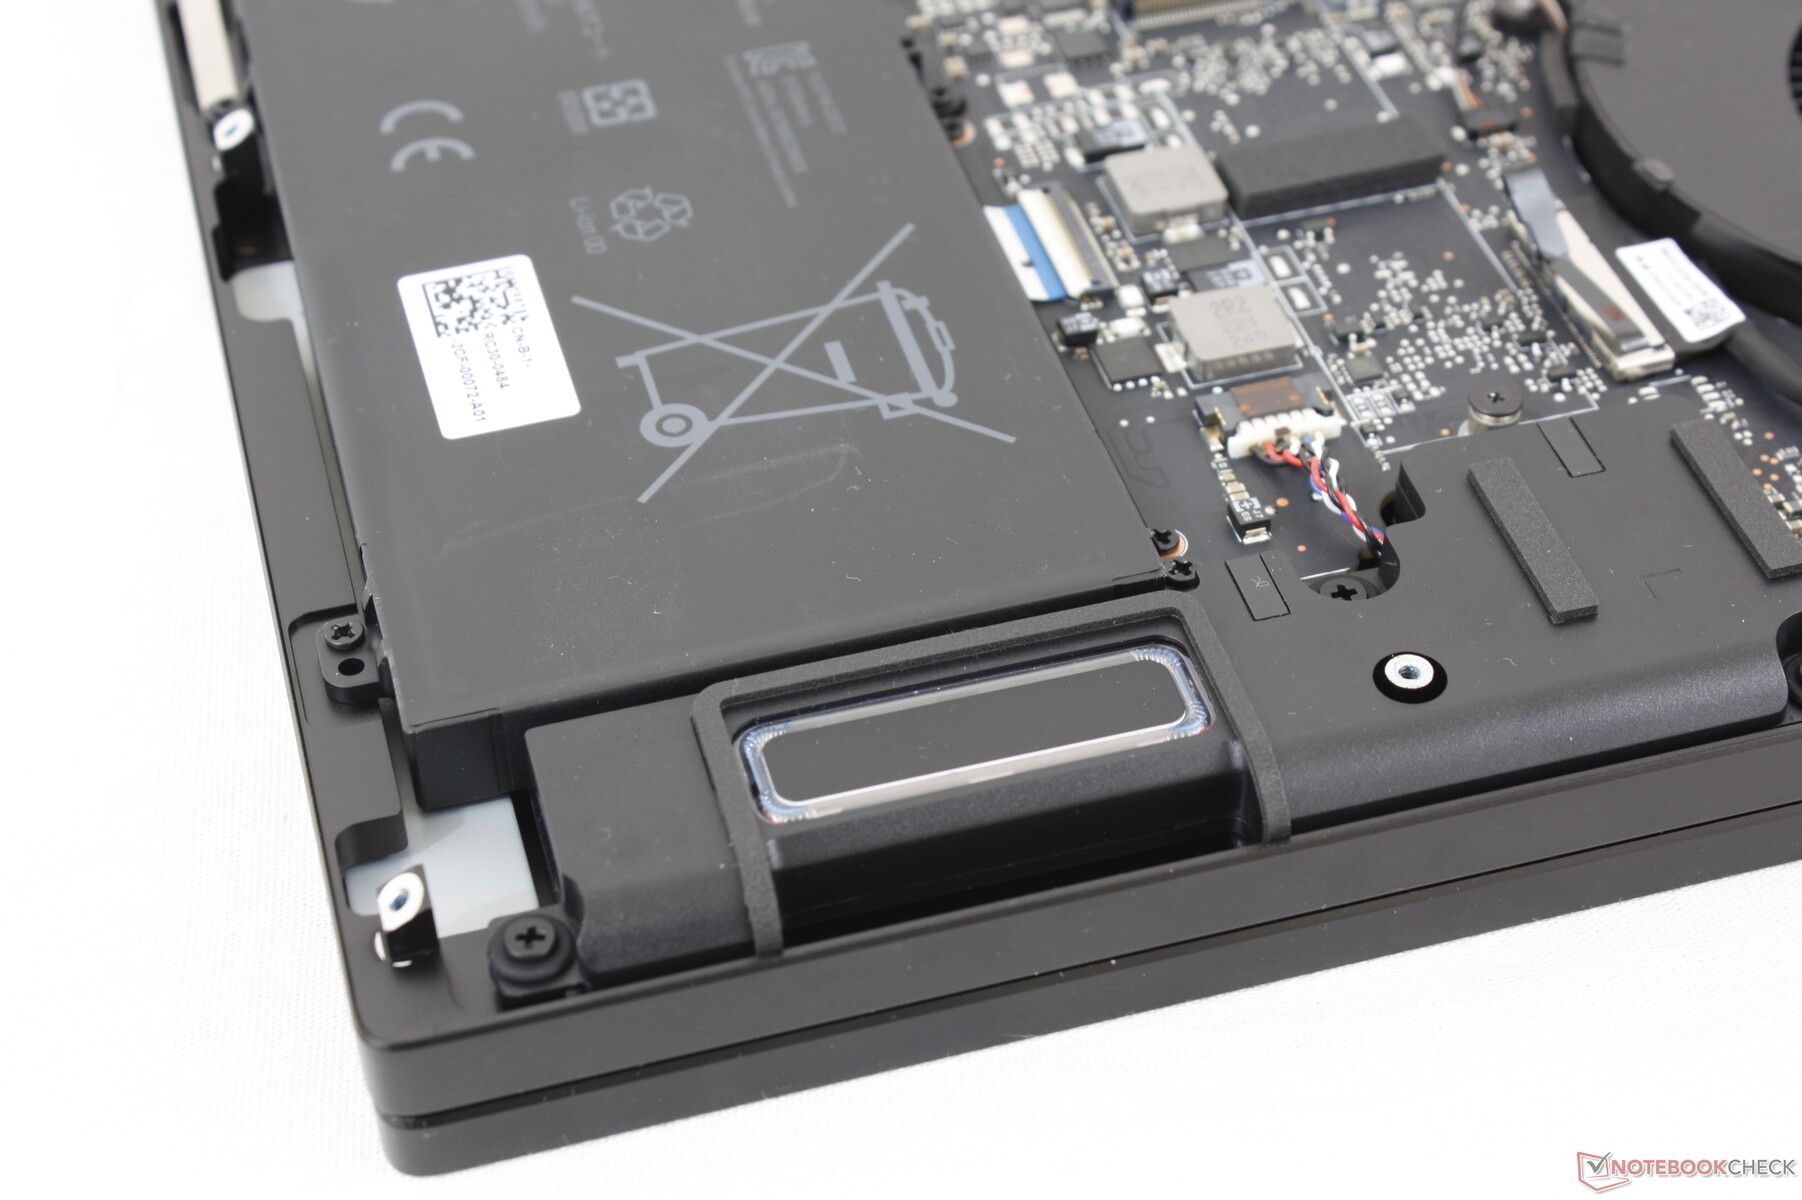
Wartung
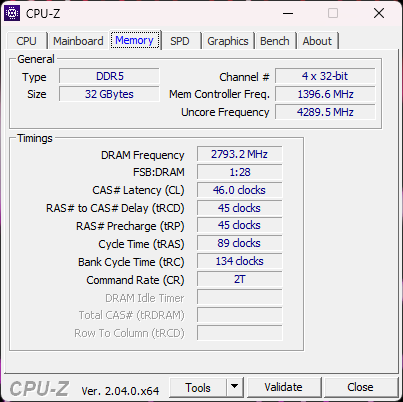
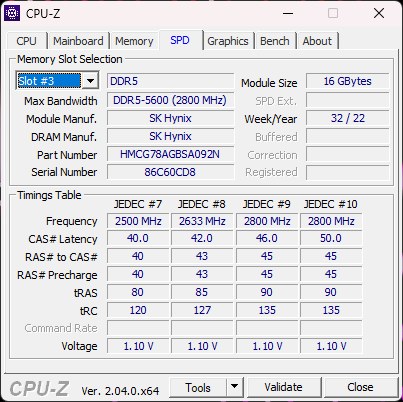
Die Unterseite ist durch 10 T5-Torx-Schrauben gesichert und lässt sich leicht abnehmen. Nutzer erhalten Zugang zu den beiden M.2-2280-SSD-Slots, den zwei RAM-Slots mit bis zu 32 GB DDR5-5600 oder 64 GB DDR5-5200 sowie dem austauschbaren WLAN-Modul. Interessant ist, dass das aktuelle Blade-18-Design einen zusätzlichen Lüfter direkt unter dem Touchpad platziert, ähnlich wie bei älteren Blade-17-Designs.
Zubehör und Garantie
In der Verpackung liegen keine Extras. Auch in Deutschland greift eine 1-Jahres-Garantie, nur der Akku erhält eine limitierte, zweijährige Garantiezeit.
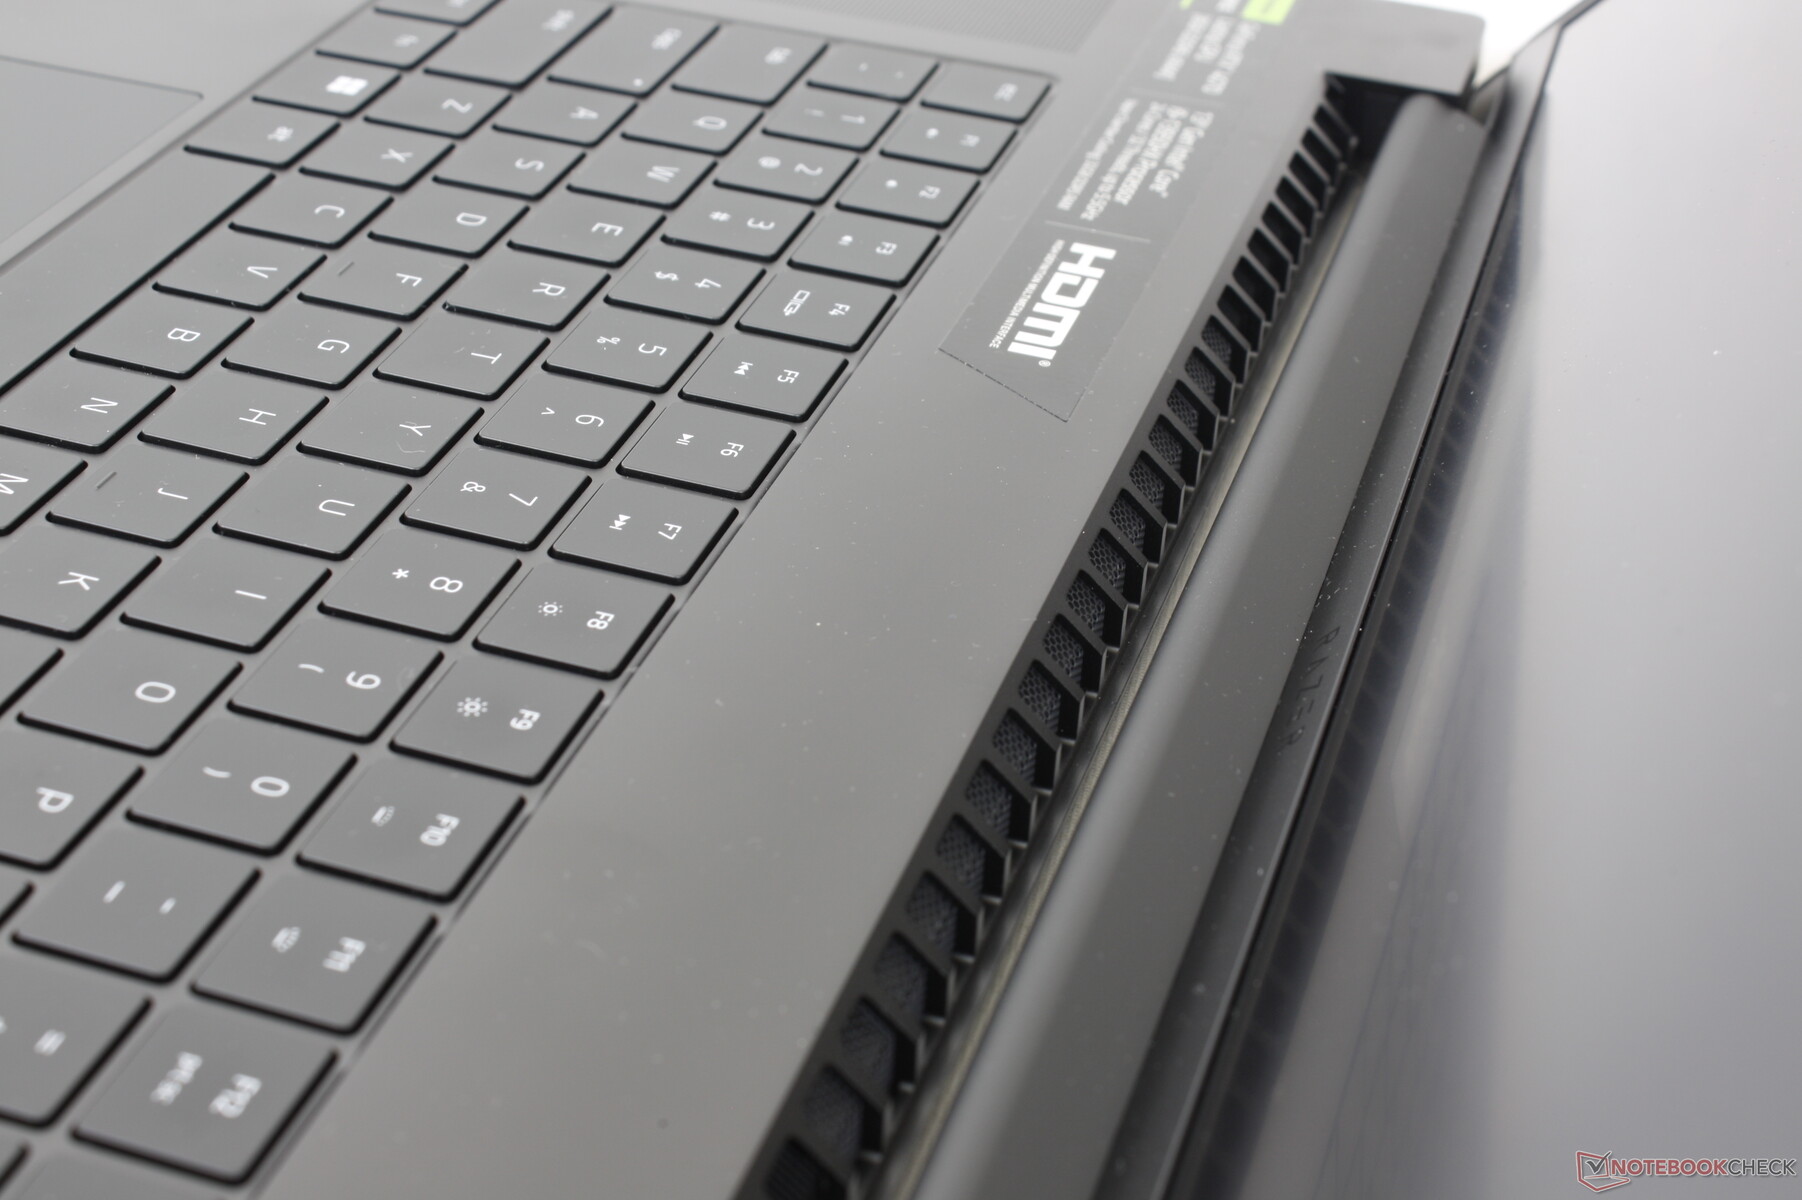
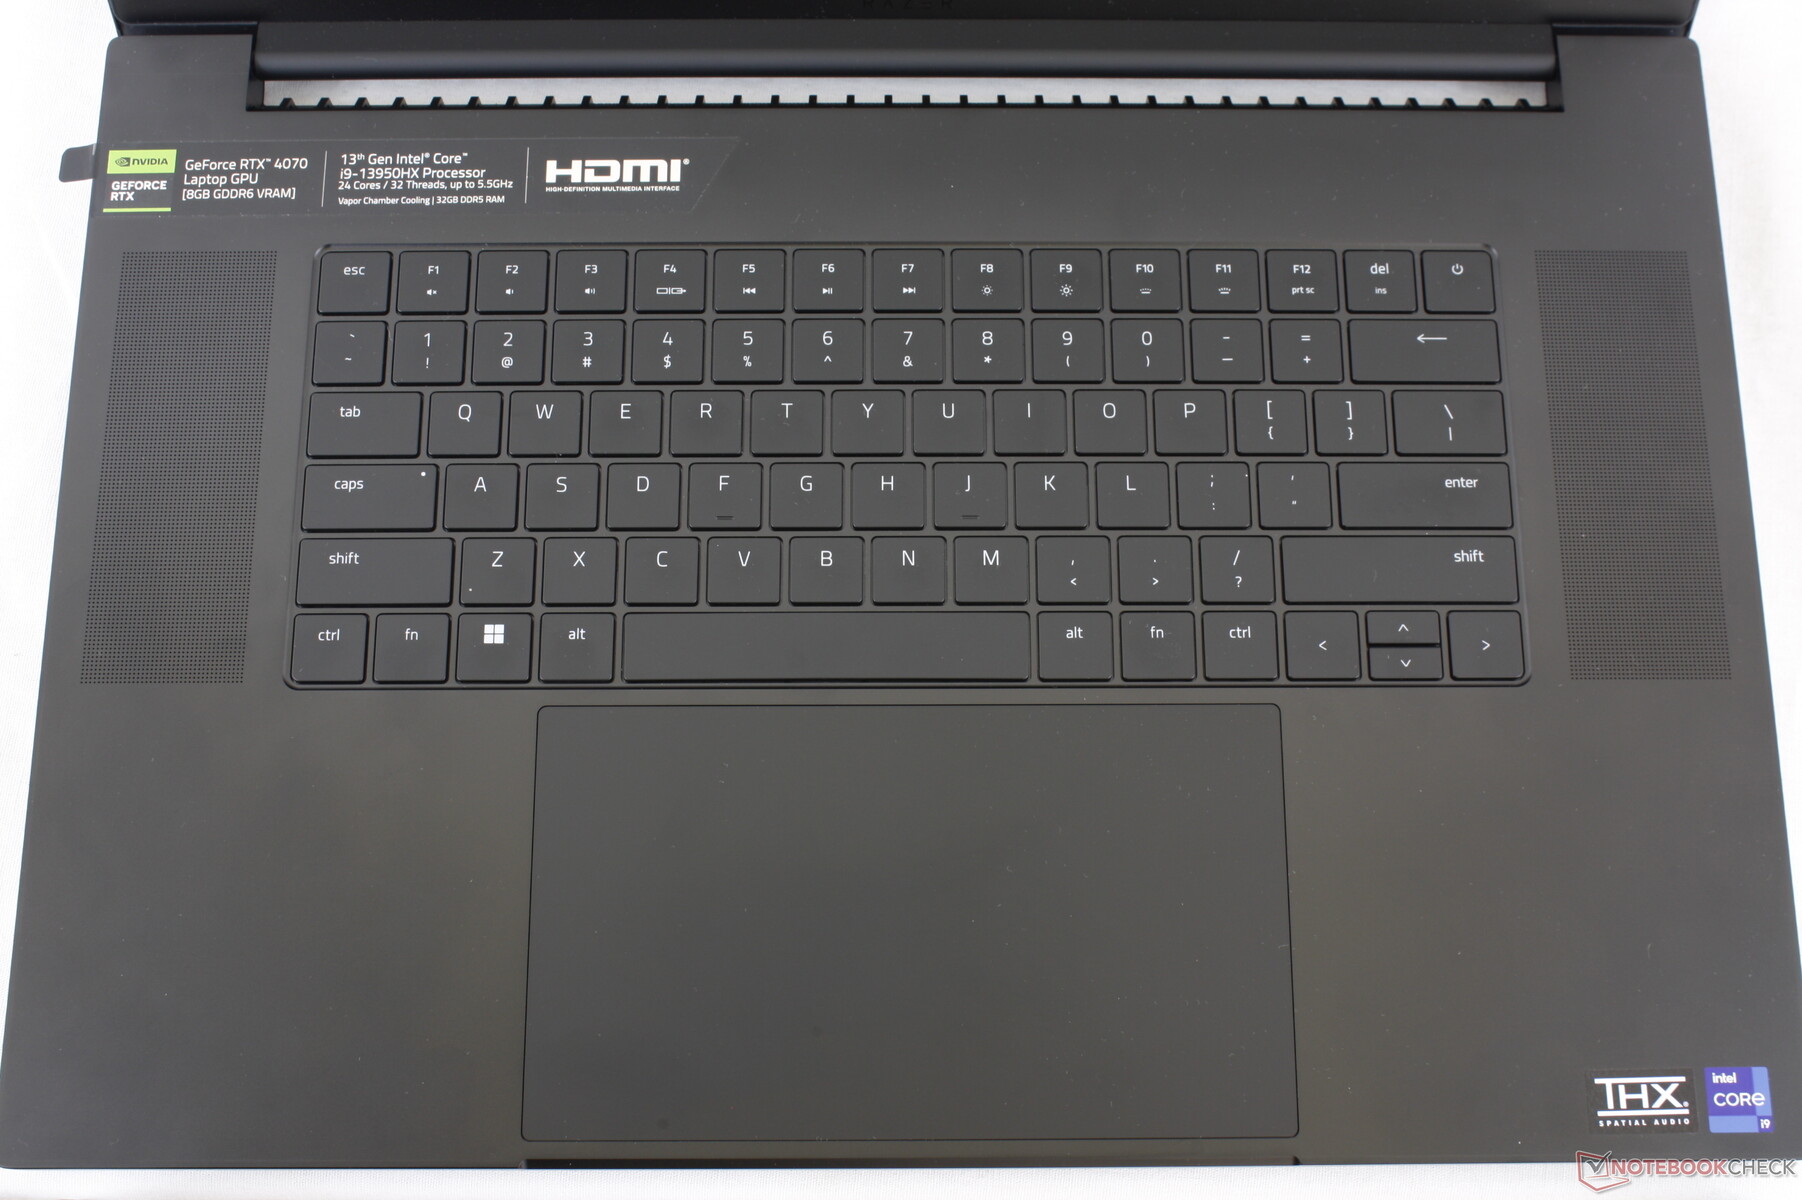
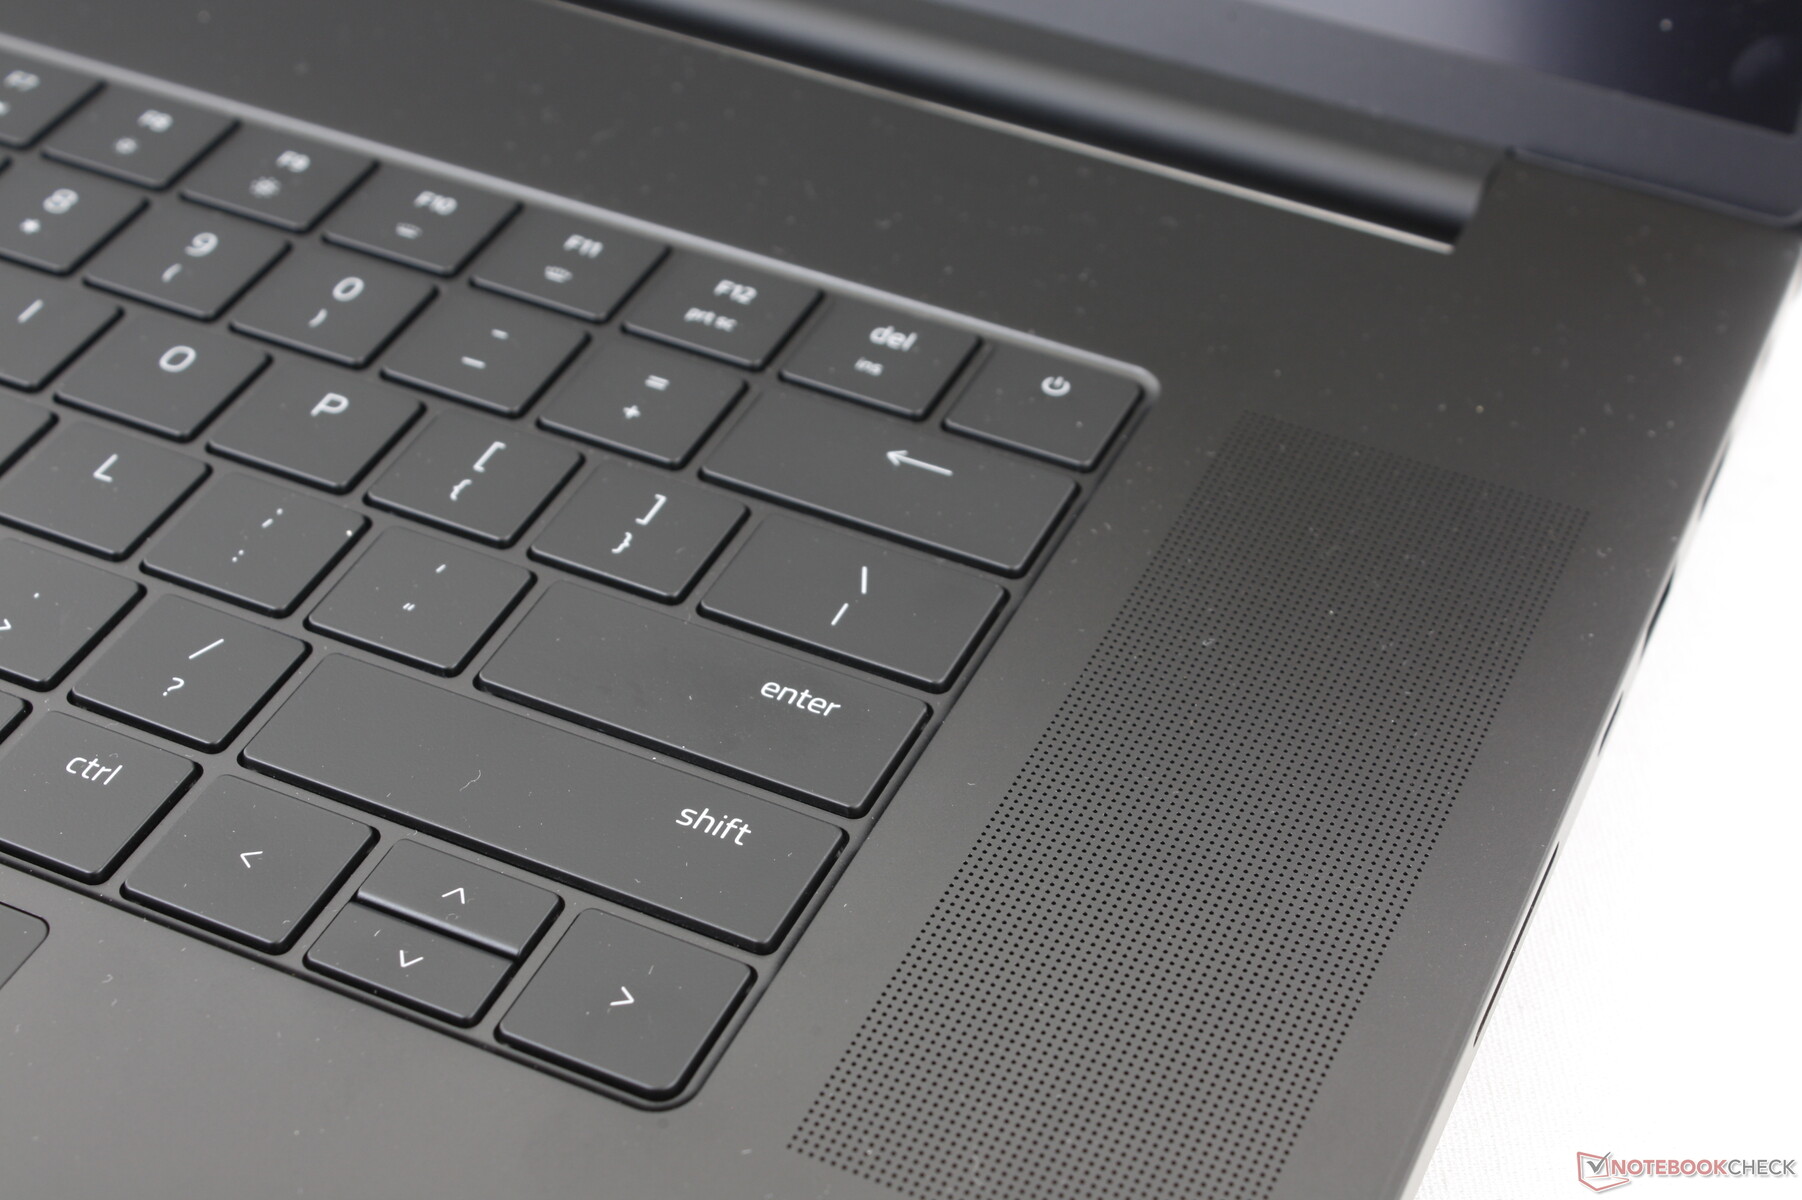
Eingabegeräte — Identisch zum Blade 16
Tastatur und Touchpad
Sowohl die Tastatur als auch das Touchpad sind die gleichen wie im Blade 16, trotz der unterschiedlichen Bildschirmgrößen. Selbst die Abmaße des Touchpads (17 x 9,7 cm) sowie der Tastatur haben sich nicht verändert, sodass unser Erfahrungsbericht beim Blade 16 hinsichtlich beiden auch für das Blade 18 gelten. Es ist schade, dass Razer den zusätzlichen Platz nicht für größere Pfeiltasten oder einen Ziffernblock nutzt.
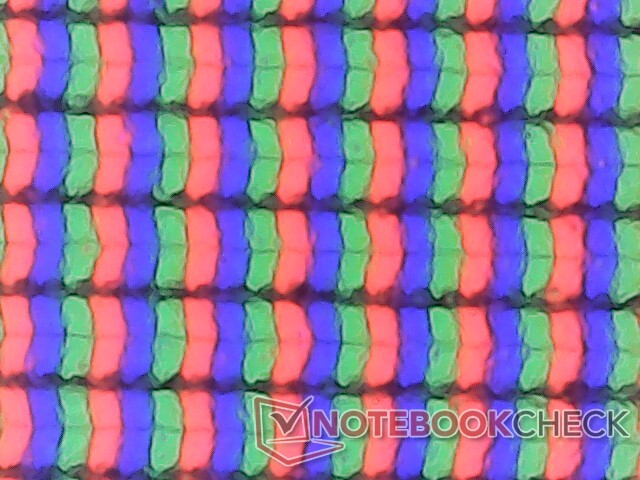
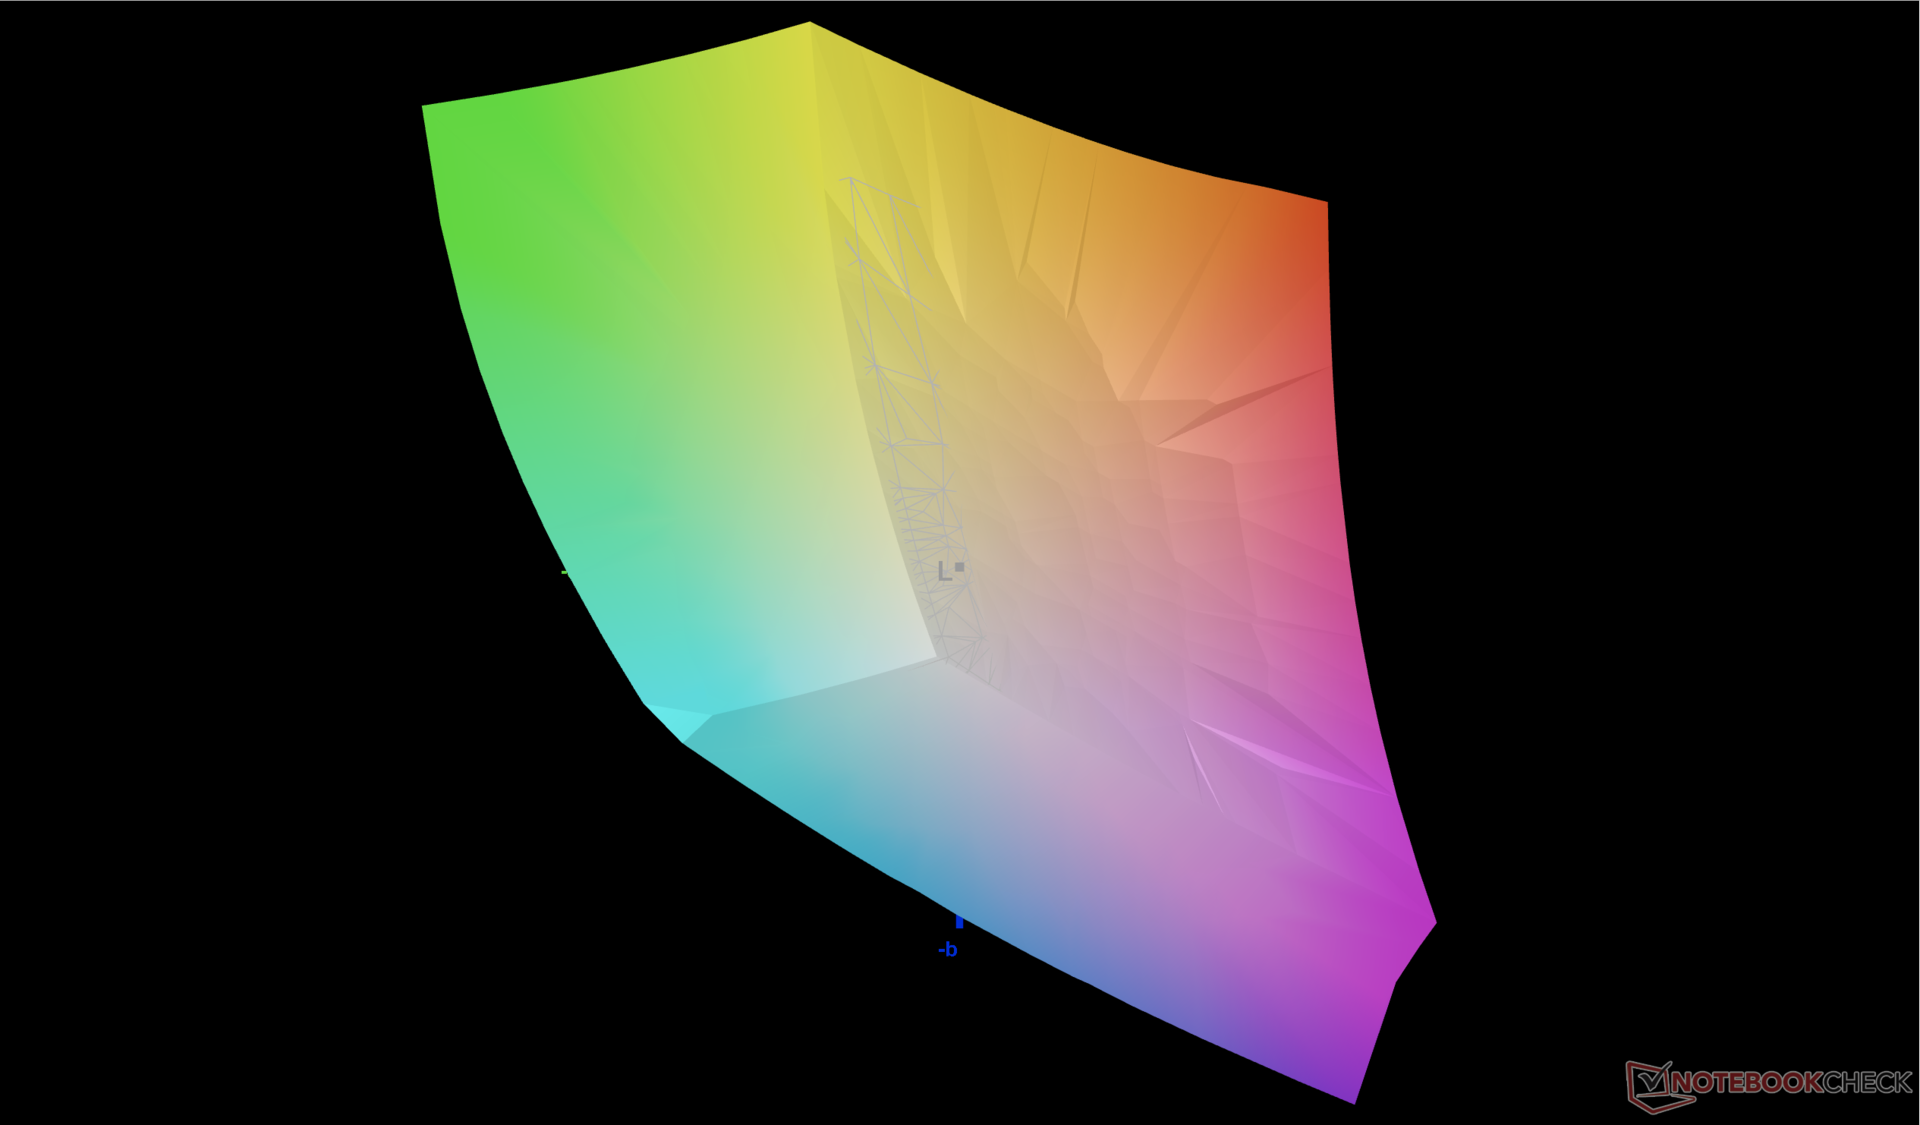
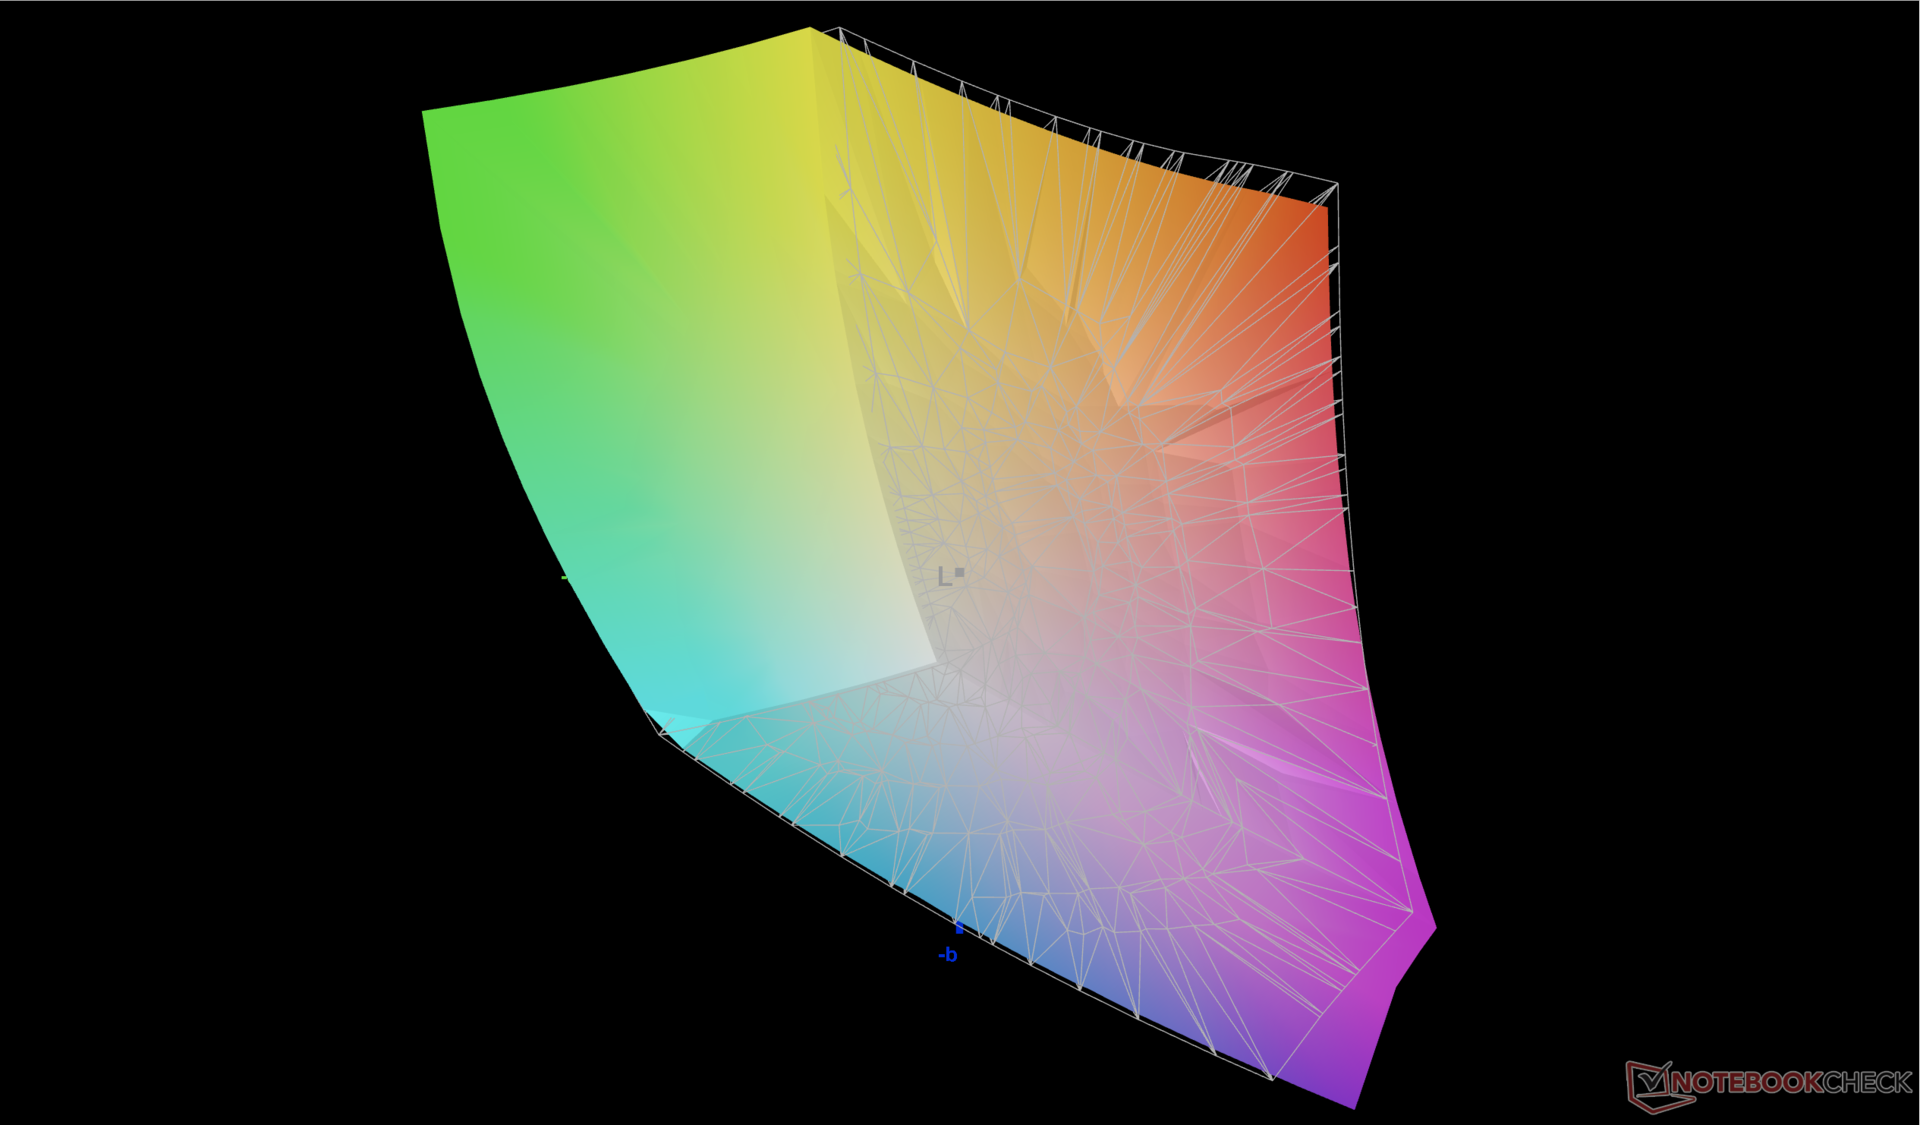
Display — Sehr geräumig
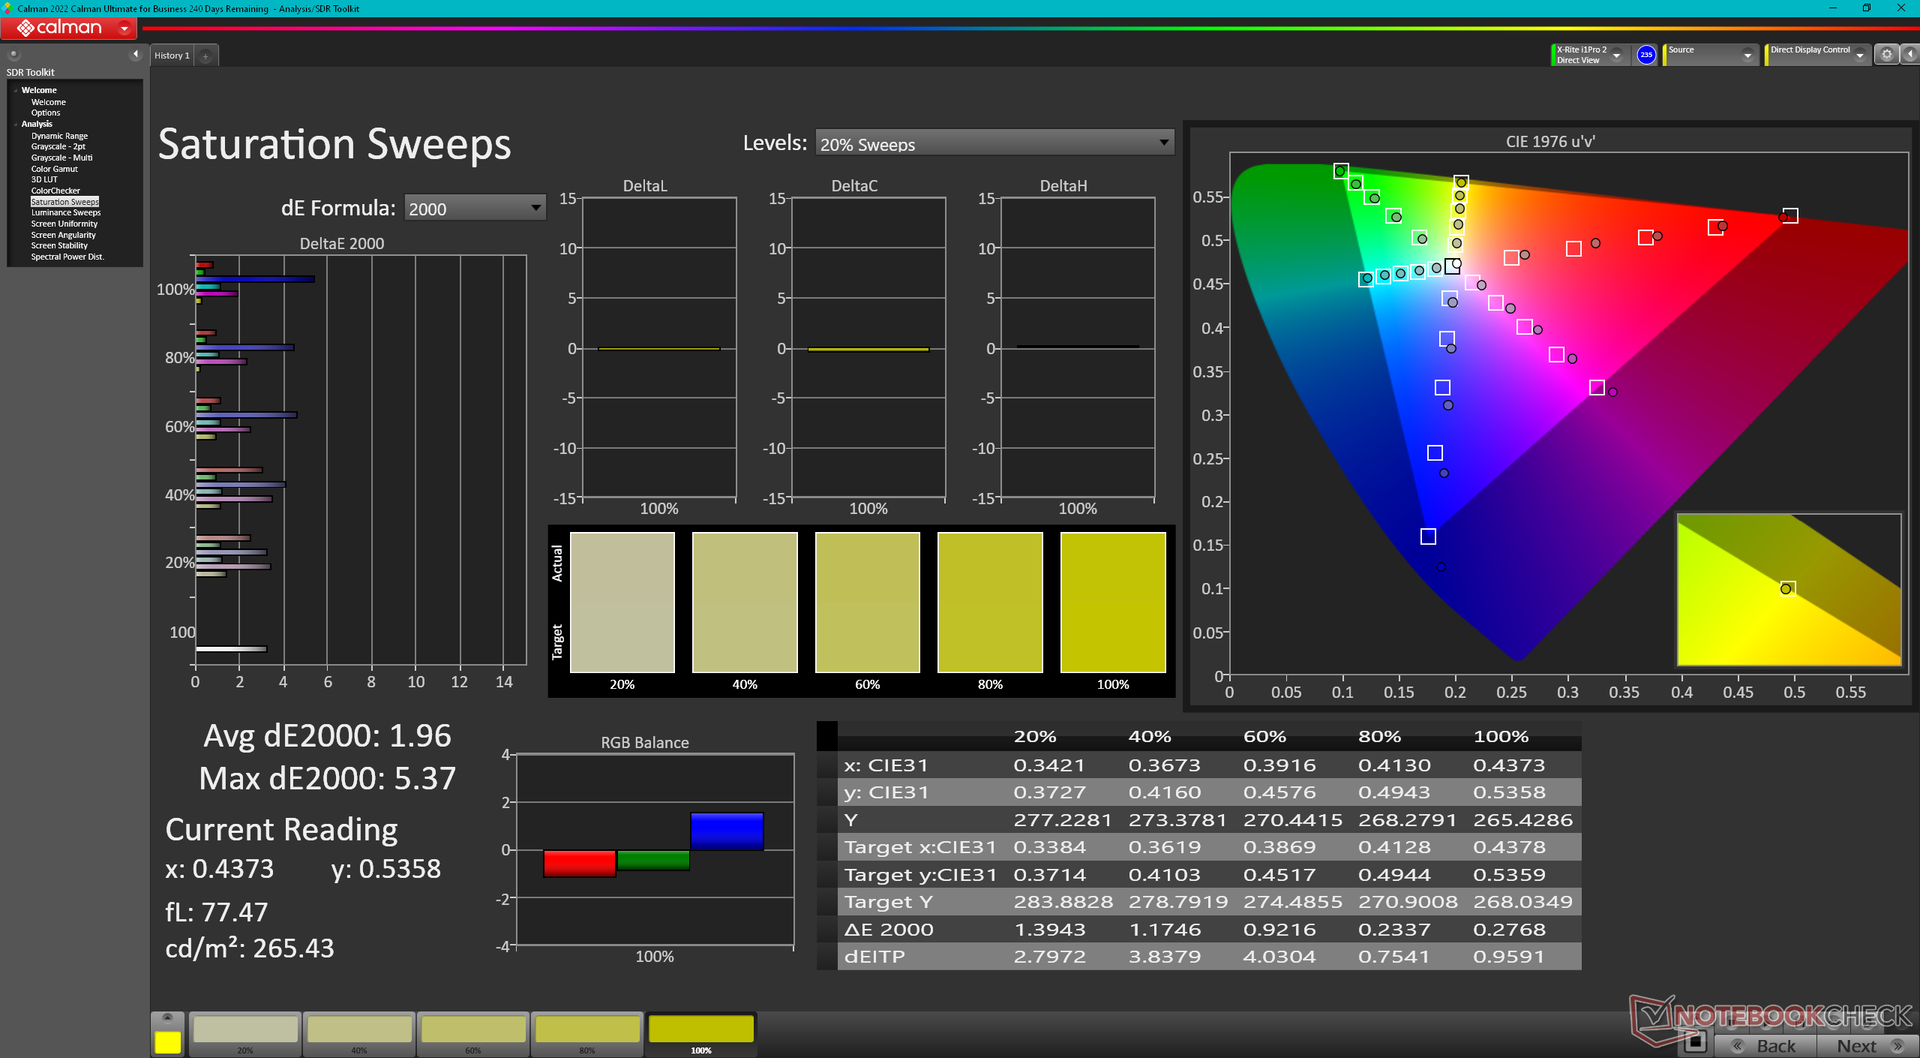
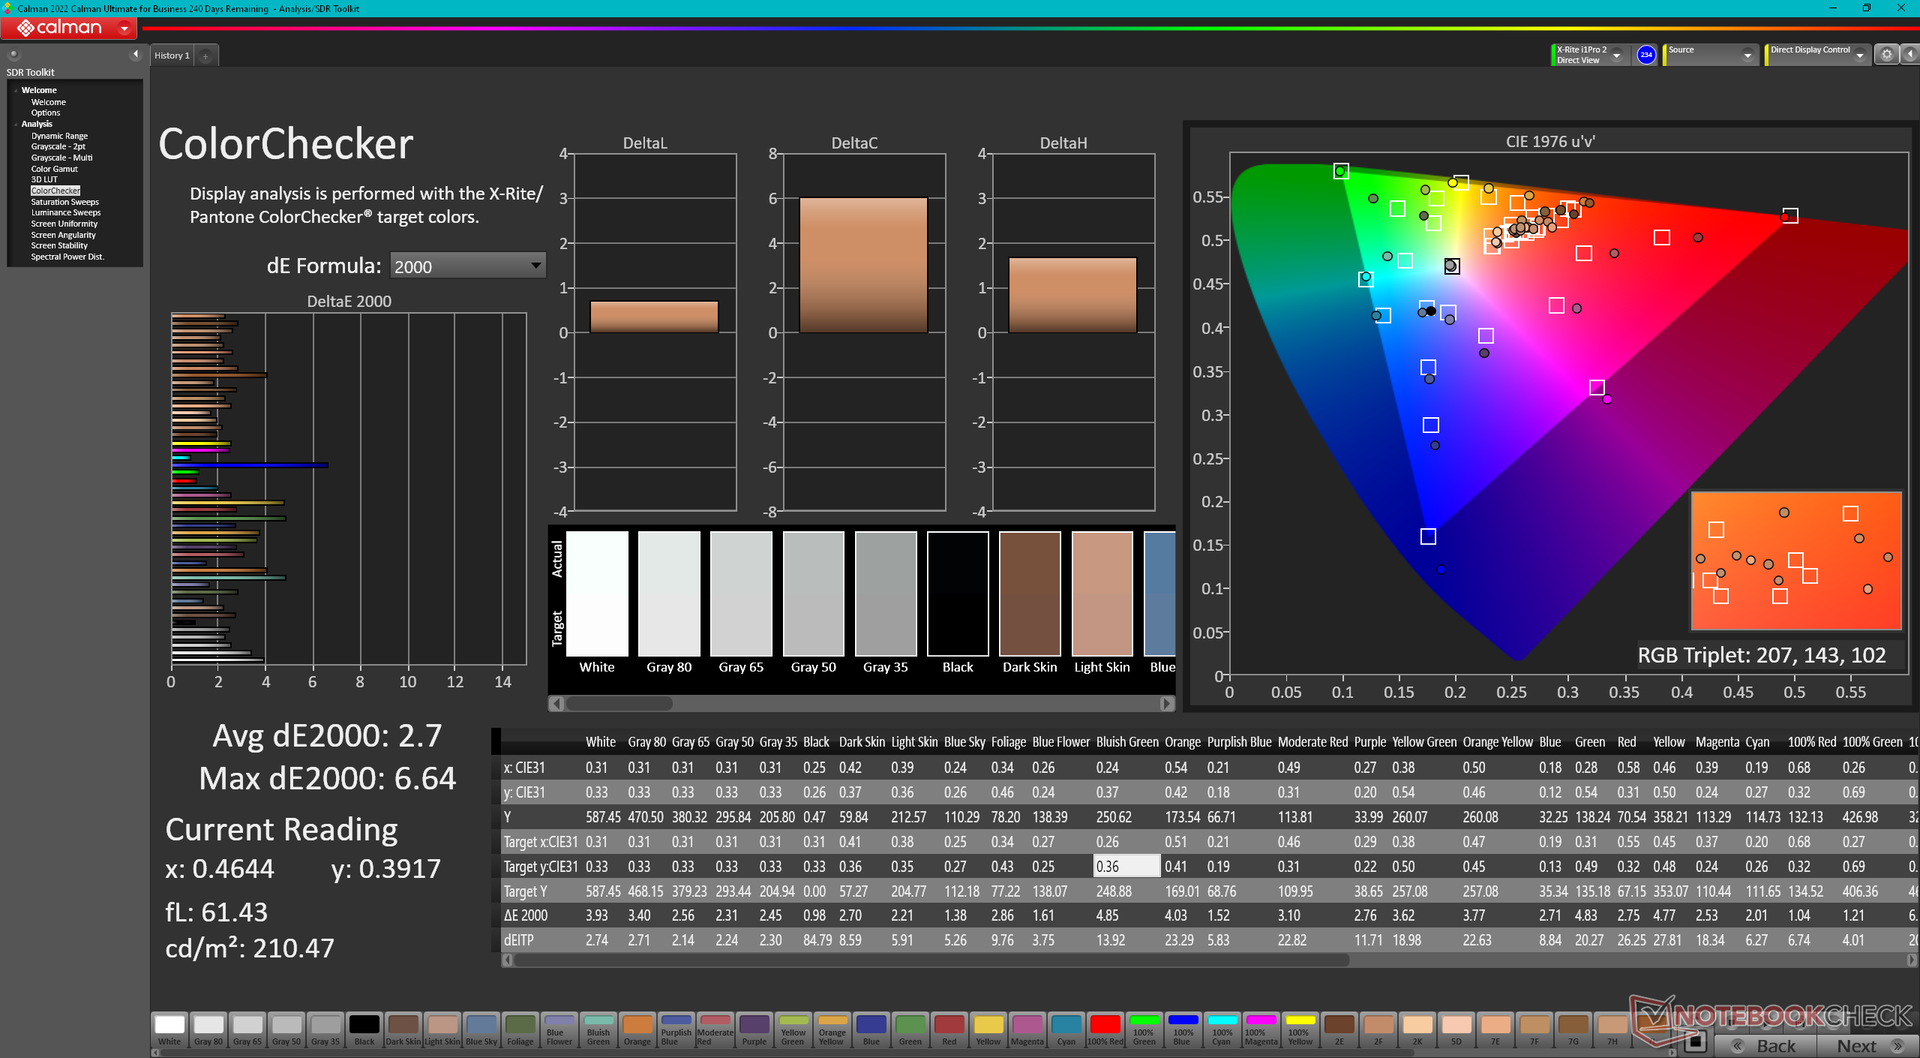
Für das Blade 18 gibt es nur die eine Displayoption, vermutlich durch die aktuell schwierigen Lieferketten. Tatsächlich wird das 18.0 Zoll große Asus ROG Strix Scar 18 wohl das gleiche AU-Optronics-B180QAN01.0-IPS-P verwenden wir unser Blade 18. Ungeachtet dessen handelt es sich um ein qualitativ hochwertiges Panel mit den üblichen Funktionen eines High-End-Gaming-Laptops, inklusive der 240 Hz schnellen Bildwiederholrate, der flinken Reaktionszeit von nur 3 ms, der vollen Abdeckung des DCI-P3-Farbraums, 500 Nits Helligkeit sowie der Kalibrierung ab Werk. Unsere unabhängigen Messungen mittels X-Rite-Farbmessgerät und Oszilloskop bestätigen die Versprechen.
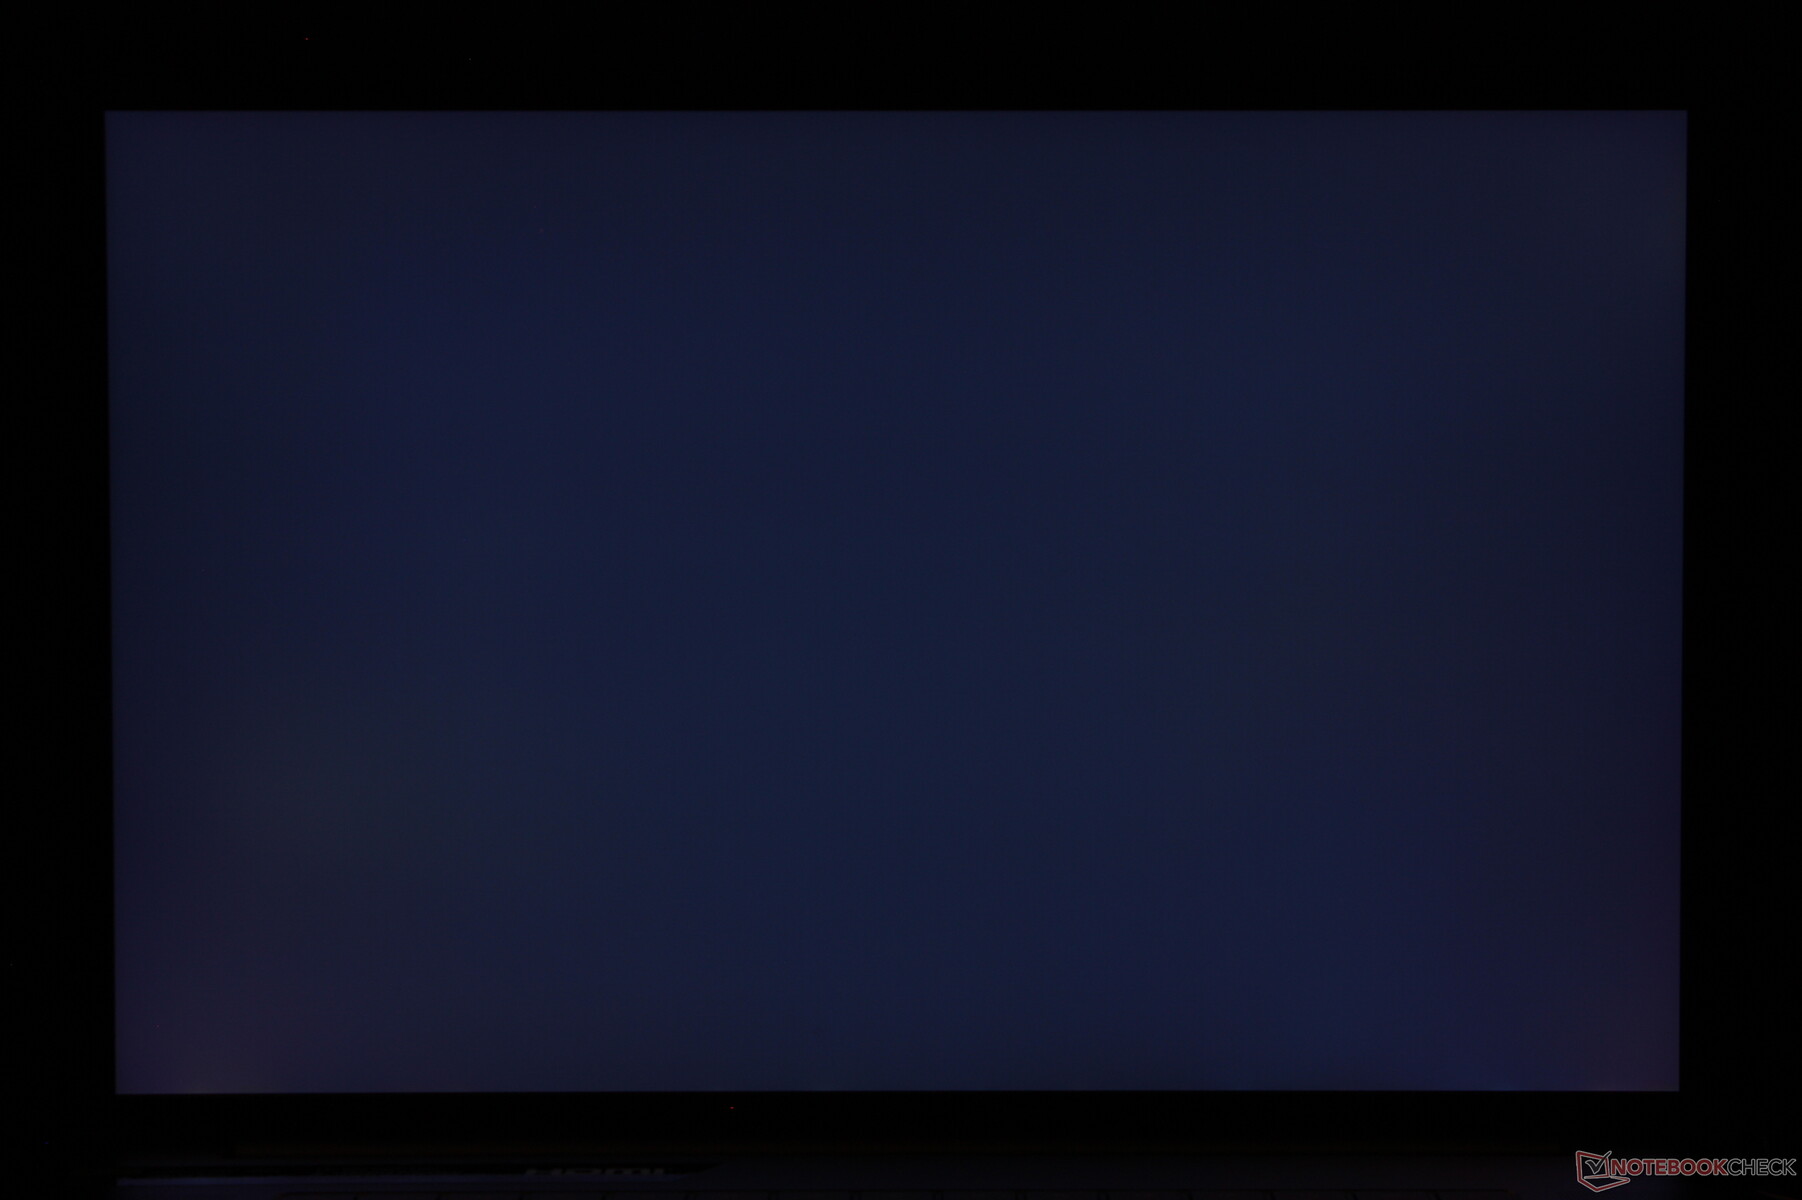
Leider flackert das Display in unserer Einheit gelegentlich ohne erkennbaren Grund zwischen verschiedenen Helligkeitsstufen. Das Flackern hat dabei nichts mit PWM zu tun, da das Panel kein PWM zur Helligkeitsregulierung verwendet. Sehr wahrscheinlich liegt ein Fehler des Displays vor, bislang können wir aber noch nicht bestätigen, ob es an einem Soft- oder Hardwarefehler liegt. Angeblich kämpfen einige Kunden, die sich das Blade 18 bereits zugelegt haben, mit ähnlichen Flackerproblemen. Wir updaten diese Sektion, sobald uns nähere Informationen und ein offizielles Statement seitens Razer vorliegen.
| |||||||||||||||||||||||||
Ausleuchtung: 89 %
Helligkeit Akku: 549.6 cd/m²
Kontrast: 1037:1 (Schwarzwert: 0.53 cd/m²)
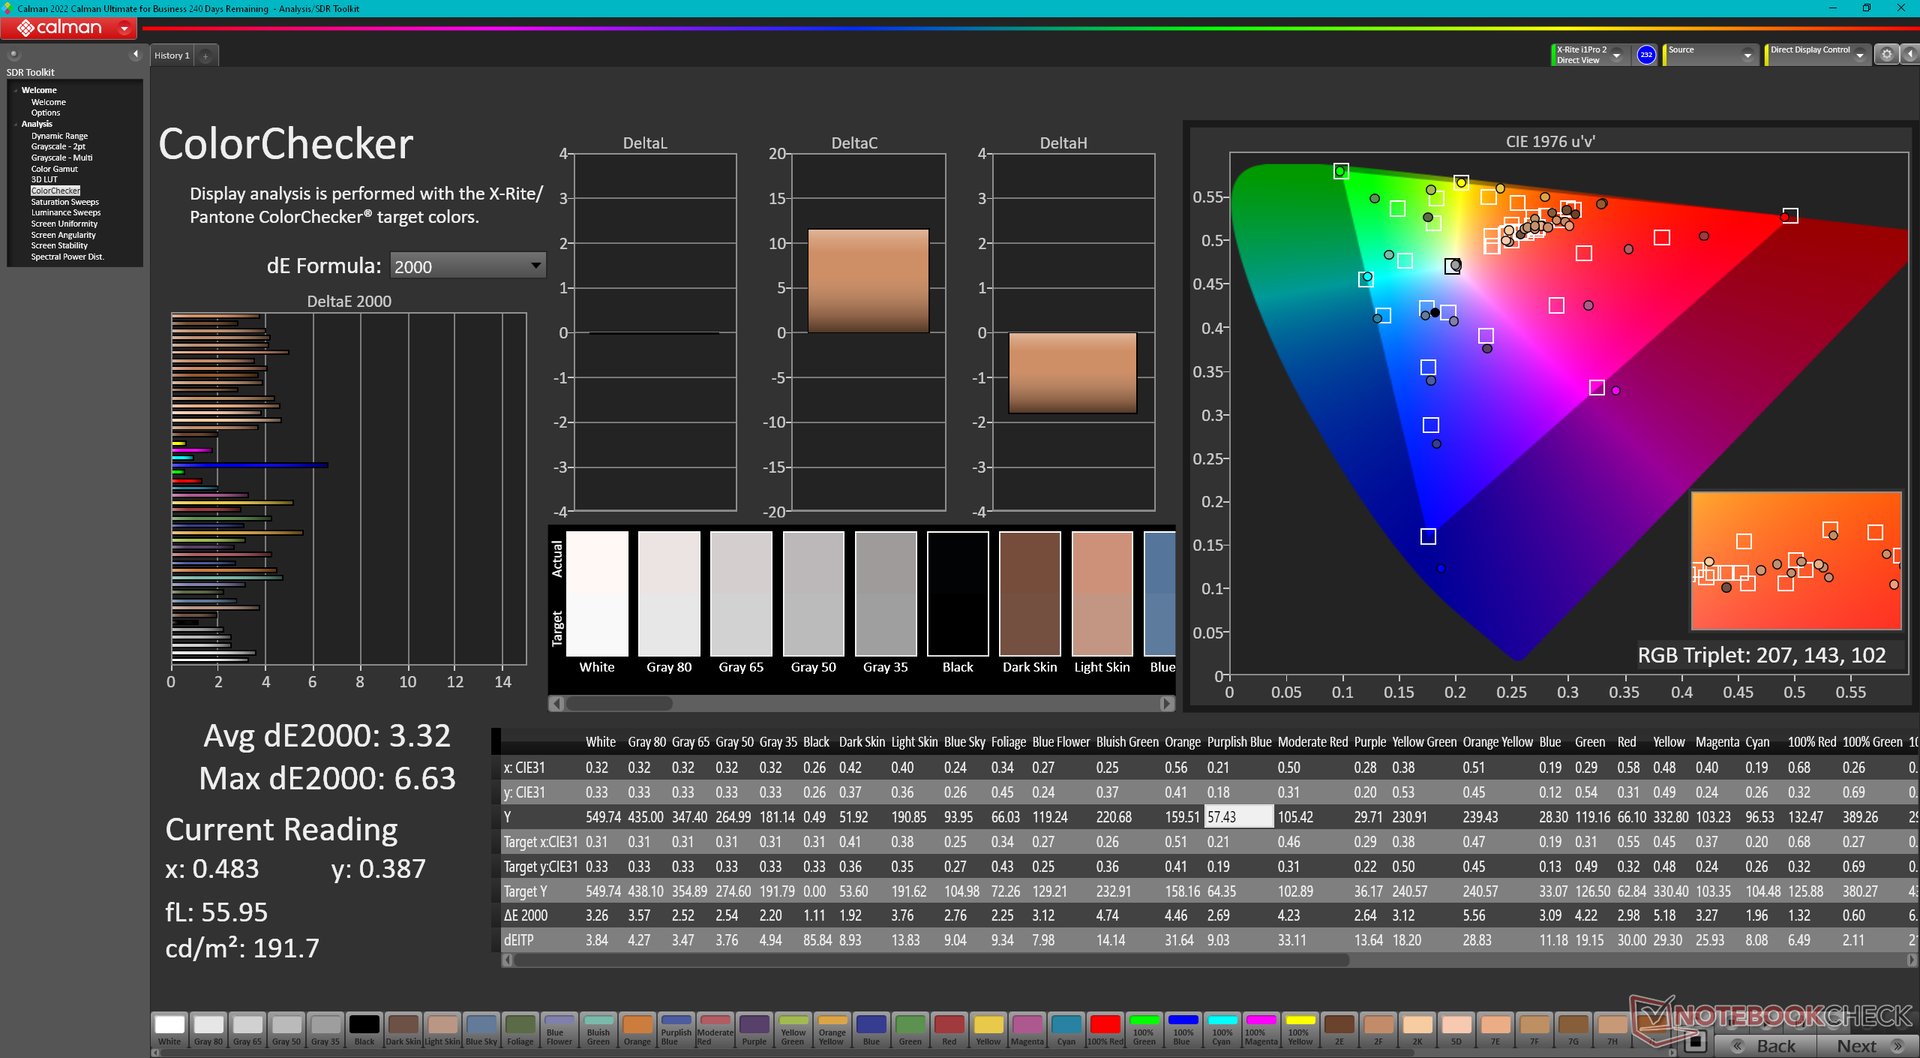
ΔE ColorChecker Calman: 3.32 | ∀{0.5-29.43 Ø4.72}
calibrated: 2.7
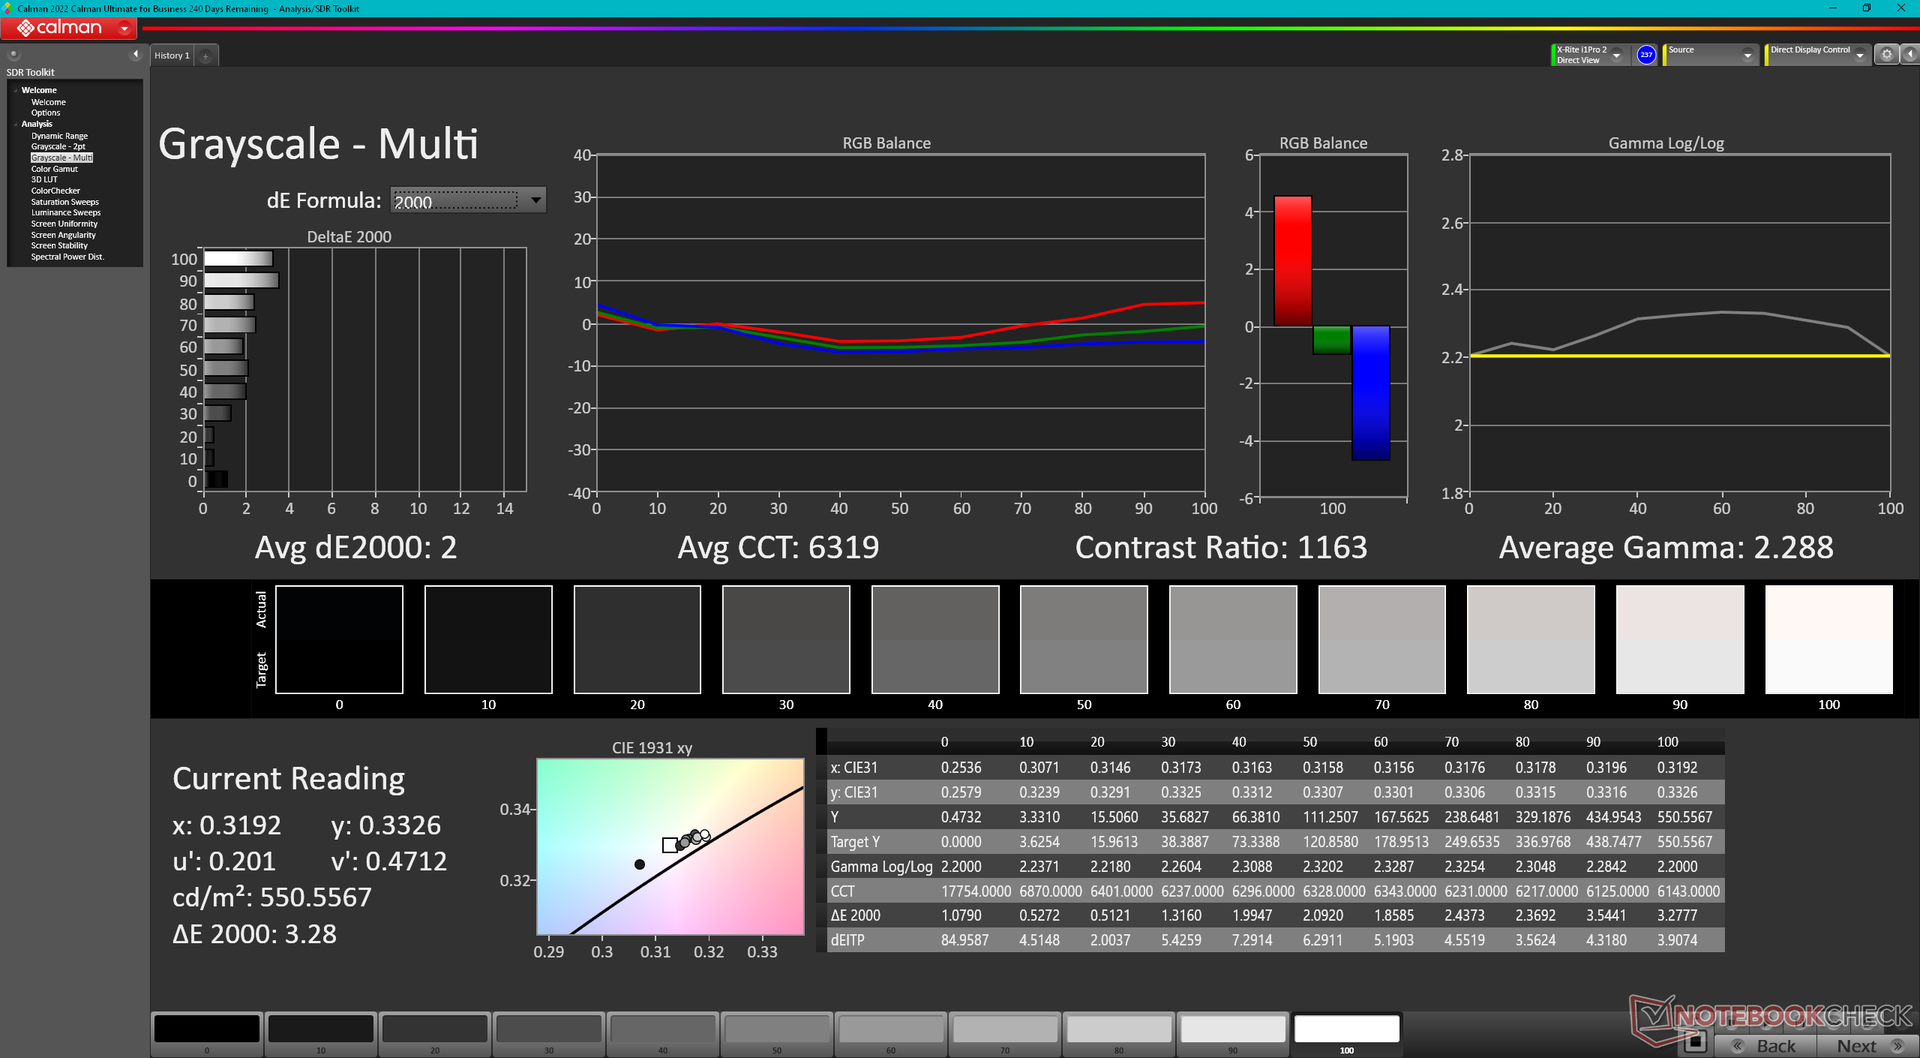
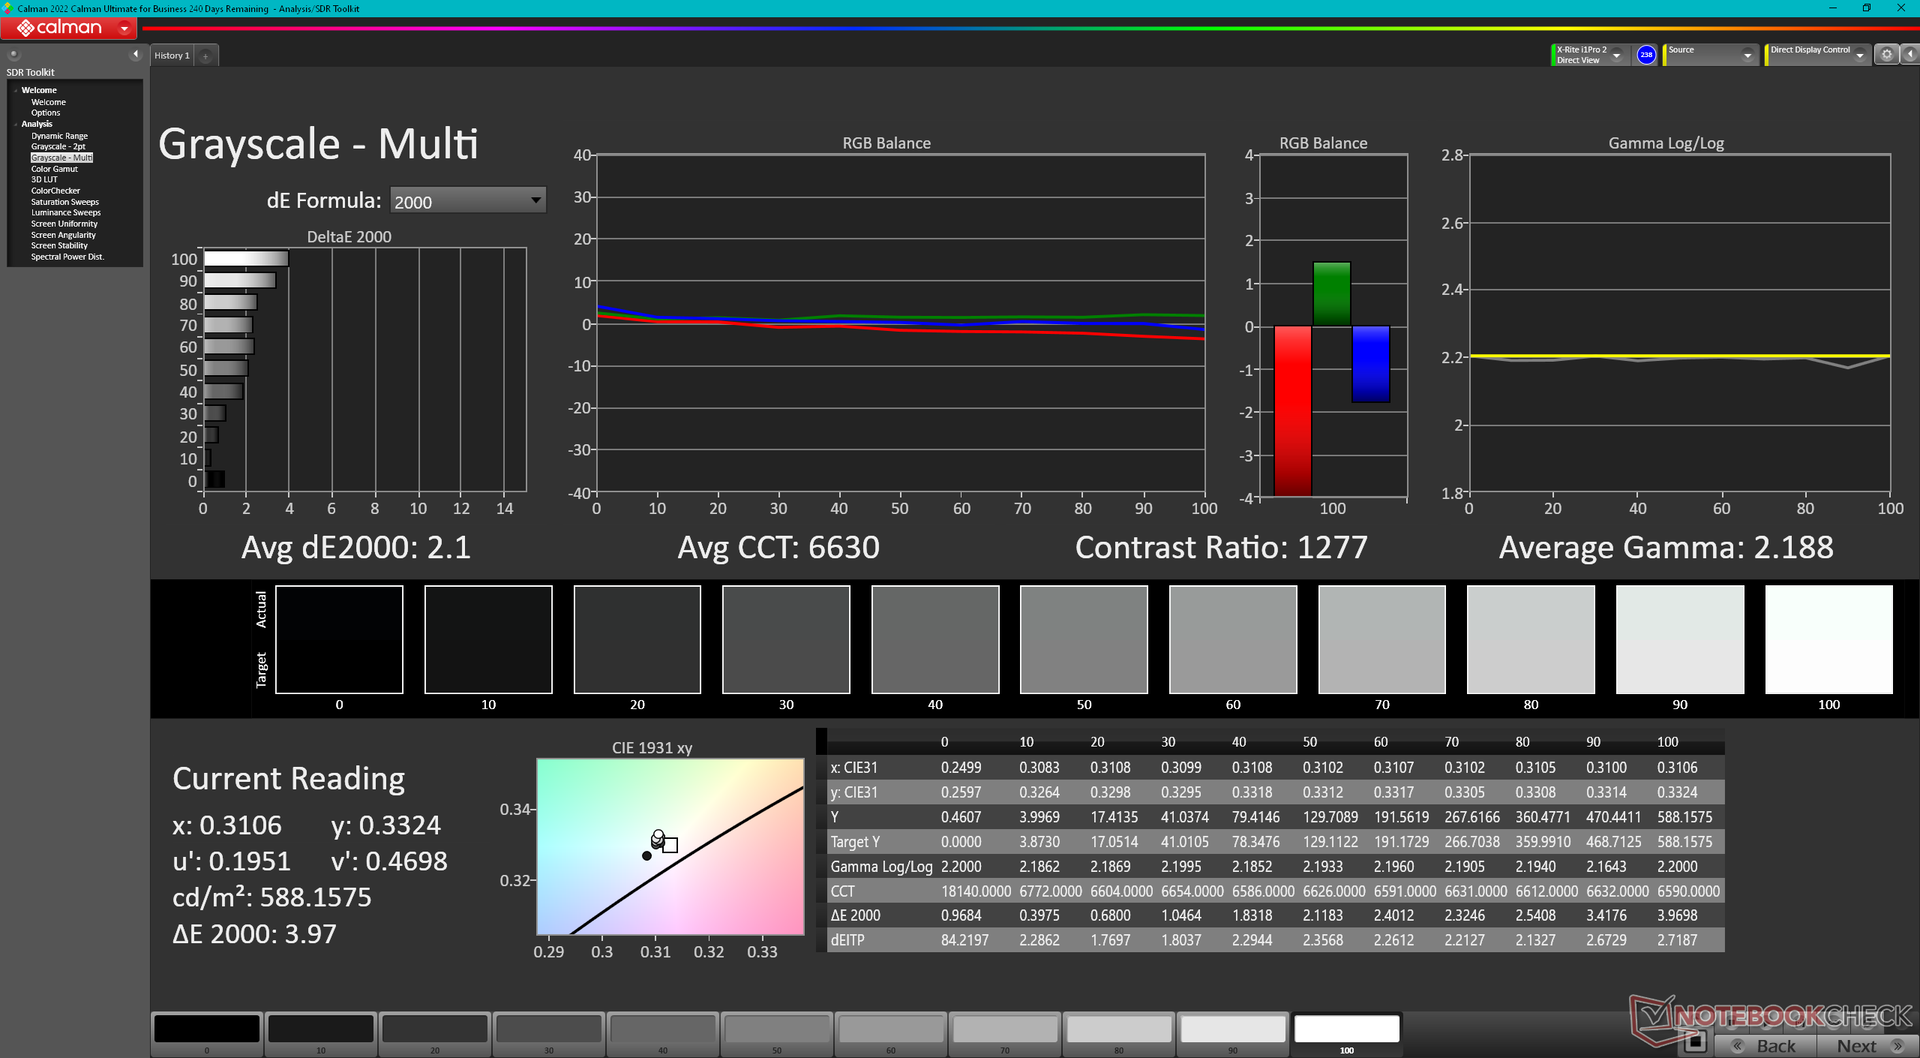
ΔE Greyscale Calman: 2 | ∀{0.09-98 Ø4.97}
85.3% AdobeRGB 1998 (Argyll 3D)
99.8% sRGB (Argyll 3D)
96.9% Display P3 (Argyll 3D)
Gamma: 2.29
CCT: 6319 K
| Razer Blade 18 RTX 4070 AU Optronics B180QAN01.0, IPS, 2560x1600, 18" | Razer Blade 17 Early 2022 AU Optronics B173ZAN06.9, IPS, 3840x2160, 17.3" | MSI Titan GT77 HX 13VI B173ZAN06.C, Mini-LED, 3840x2160, 17.3" | Gigabyte G7 KE AU Optronics B173HAN05.1, IPS, 1920x1080, 17.3" | Alienware m17 R5 (R9 6900HX, RX 6850M XT) AU Optronics AUODBA3, IPS, 3840x2160, 17" | Asus ROG Strix Scar 17 SE G733CX-LL014W NE173QHM-NZ2, IPS, 2560x1440, 17.3" | |
|---|---|---|---|---|---|---|
| Display | 2% | 2% | -14% | 1% | -0% | |
| Display P3 Coverage (%) | 96.9 | 99.4 3% | 94.9 -2% | 70.4 -27% | 97.2 0% | 97.1 0% |
| sRGB Coverage (%) | 99.8 | 100 0% | 99.9 0% | 99.8 0% | 99.6 0% | 99.9 0% |
| AdobeRGB 1998 Coverage (%) | 85.3 | 87.3 2% | 92.4 8% | 71.7 -16% | 88.4 4% | 84.8 -1% |
| Response Times | -25% | -524% | -12% | -168% | -31% | |
| Response Time Grey 50% / Grey 80% * (ms) | 4.2 ? | 7.5 ? -79% | 38.4 ? -814% | 5 ? -19% | 16.4 ? -290% | 5.7 ? -36% |
| Response Time Black / White * (ms) | 8 ? | 5.6 ? 30% | 26.6 ? -233% | 8.3 ? -4% | 11.6 ? -45% | 10.1 ? -26% |
| PWM Frequency (Hz) | 2380 ? | |||||
| Bildschirm | 24% | 64905% | 19% | -40% | 16% | |
| Helligkeit Bildmitte (cd/m²) | 549.6 | 503 -8% | 606 10% | 307 -44% | 484 -12% | 320 -42% |
| Brightness (cd/m²) | 524 | 486 -7% | 602 15% | 301 -43% | 449 -14% | 303 -42% |
| Brightness Distribution (%) | 89 | 84 -6% | 93 4% | 93 4% | 87 -2% | 87 -2% |
| Schwarzwert * (cd/m²) | 0.53 | 0.44 17% | 0.0001 100% | 0.2 62% | 0.55 -4% | 0.3 43% |
| Kontrast (:1) | 1037 | 1143 10% | 6060000 584278% | 1535 48% | 880 -15% | 1067 3% |
| Delta E Colorchecker * | 3.32 | 1.08 67% | 4.8 -45% | 1.32 60% | 4.8 -45% | 1.1 67% |
| Colorchecker dE 2000 max. * | 6.63 | 4.54 32% | 8.2 -24% | 4.6 31% | 7.48 -13% | 2.7 59% |
| Colorchecker dE 2000 calibrated * | 2.7 | 0.6 78% | 1.8 33% | 1.03 62% | 4.74 -76% | |
| Delta E Graustufen * | 2 | 1.3 35% | 6.5 -225% | 2.1 -5% | 5.5 -175% | 1.1 45% |
| Gamma | 2.29 96% | 2.151 102% | 2.63 84% | 2.247 98% | 2.42 91% | 2.13 103% |
| CCT | 6319 103% | 6541 99% | 6596 99% | 6815 95% | 6148 106% | 6599 98% |
| Durchschnitt gesamt (Programm / Settings) | 0% /
12% | 21461% /
41650% | -2% /
8% | -69% /
-49% | -5% /
5% |
* ... kleinere Werte sind besser
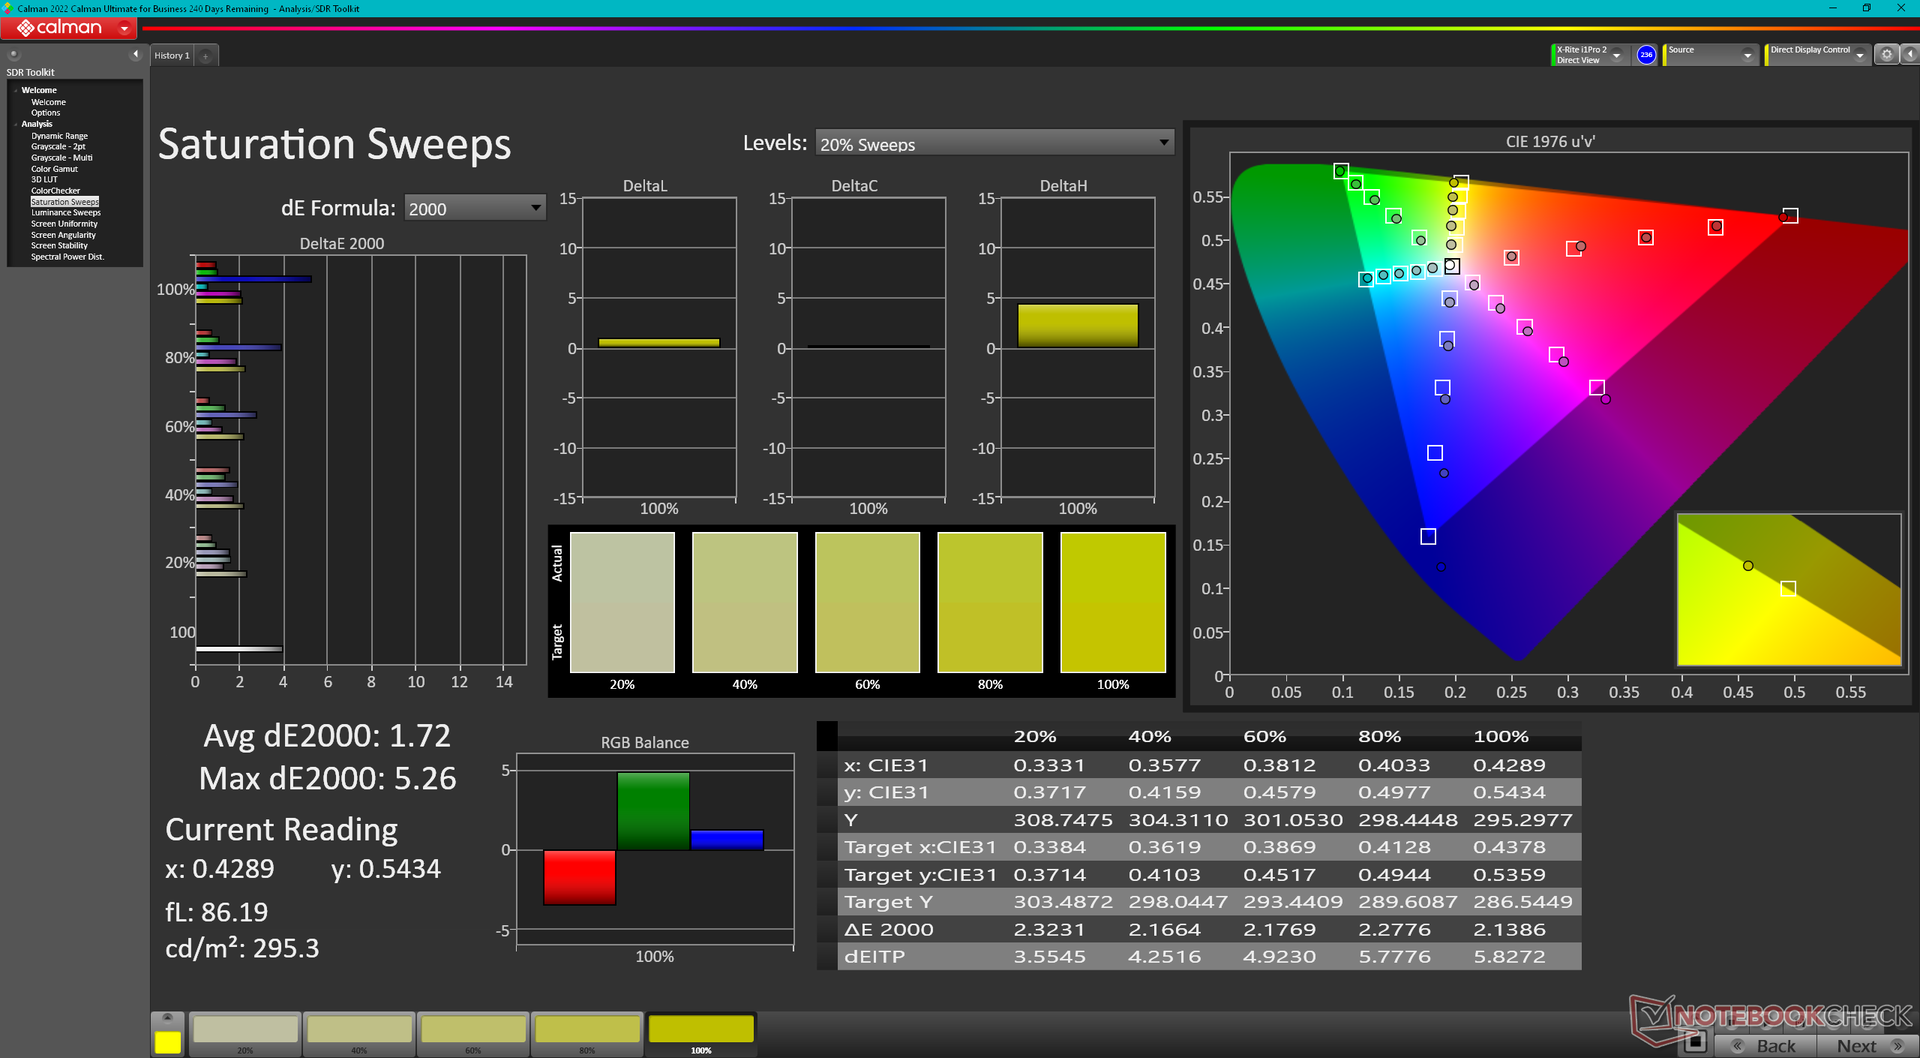
Die durchschnittlichen Graustufen- und Farb-DeltaE-Werte liegen ab Werk bei nur 2,0 und 3,32, immerhin kommt das Panel gegen den P3-Standard vorkalibriert. Unser Versuch einer erneuten Kalibrierung bringt keine signifikanten Verbesserungen mehr. Die Farbe Blau scheint allerdings etwas ungenauer wiedergegeben zu werden als die anderen Farben.
Reaktionszeiten (Response Times) des Displays
| ↔ Reaktionszeiten Schwarz zu Weiß | ||
|---|---|---|
| 8 ms ... steigend ↗ und fallend ↘ kombiniert | ↗ 3.8 ms steigend | 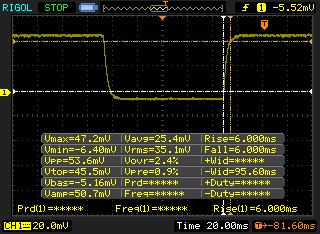 |
| ↘ 4.2 ms fallend | ||
| Die gemessenen Reaktionszeiten sind kurz wodurch sich der Bildschirm auch für Spiele gut eignen sollte. Im Vergleich rangierten die bei uns getesteten Geräte von 0.1 (Minimum) zu 240 (Maximum) ms. » 22 % aller Screens waren schneller als der getestete. Daher sind die gemessenen Reaktionszeiten besser als der Durchschnitt aller vermessenen Geräte (19.8 ms). | ||
| ↔ Reaktionszeiten 50% Grau zu 80% Grau | ||
| 4.2 ms ... steigend ↗ und fallend ↘ kombiniert | ↗ 2.1 ms steigend | 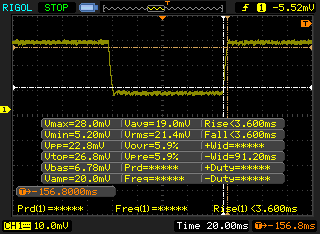 |
| ↘ 2.1 ms fallend | ||
| Die gemessenen Reaktionszeiten sind sehr kurz, wodurch sich der Bildschirm auch für schnelle 3D Spiele eignen sollte. Im Vergleich rangierten die bei uns getesteten Geräte von 0.165 (Minimum) zu 636 (Maximum) ms. » 16 % aller Screens waren schneller als der getestete. Daher sind die gemessenen Reaktionszeiten besser als der Durchschnitt aller vermessenen Geräte (31 ms). | ||
Bildschirm-Flackern / PWM (Pulse-Width Modulation)
| Flackern / PWM nicht festgestellt | 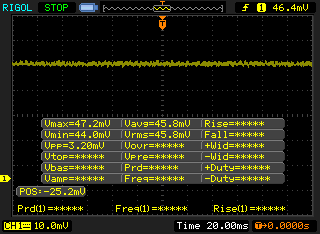 | ||
Im Vergleich: 52 % aller getesteten Geräte nutzten kein PWM um die Helligkeit zu reduzieren. Wenn PWM eingesetzt wurde, dann bei einer Frequenz von durchschnittlich 7772 (Minimum 5, Maximum 343500) Hz. | |||
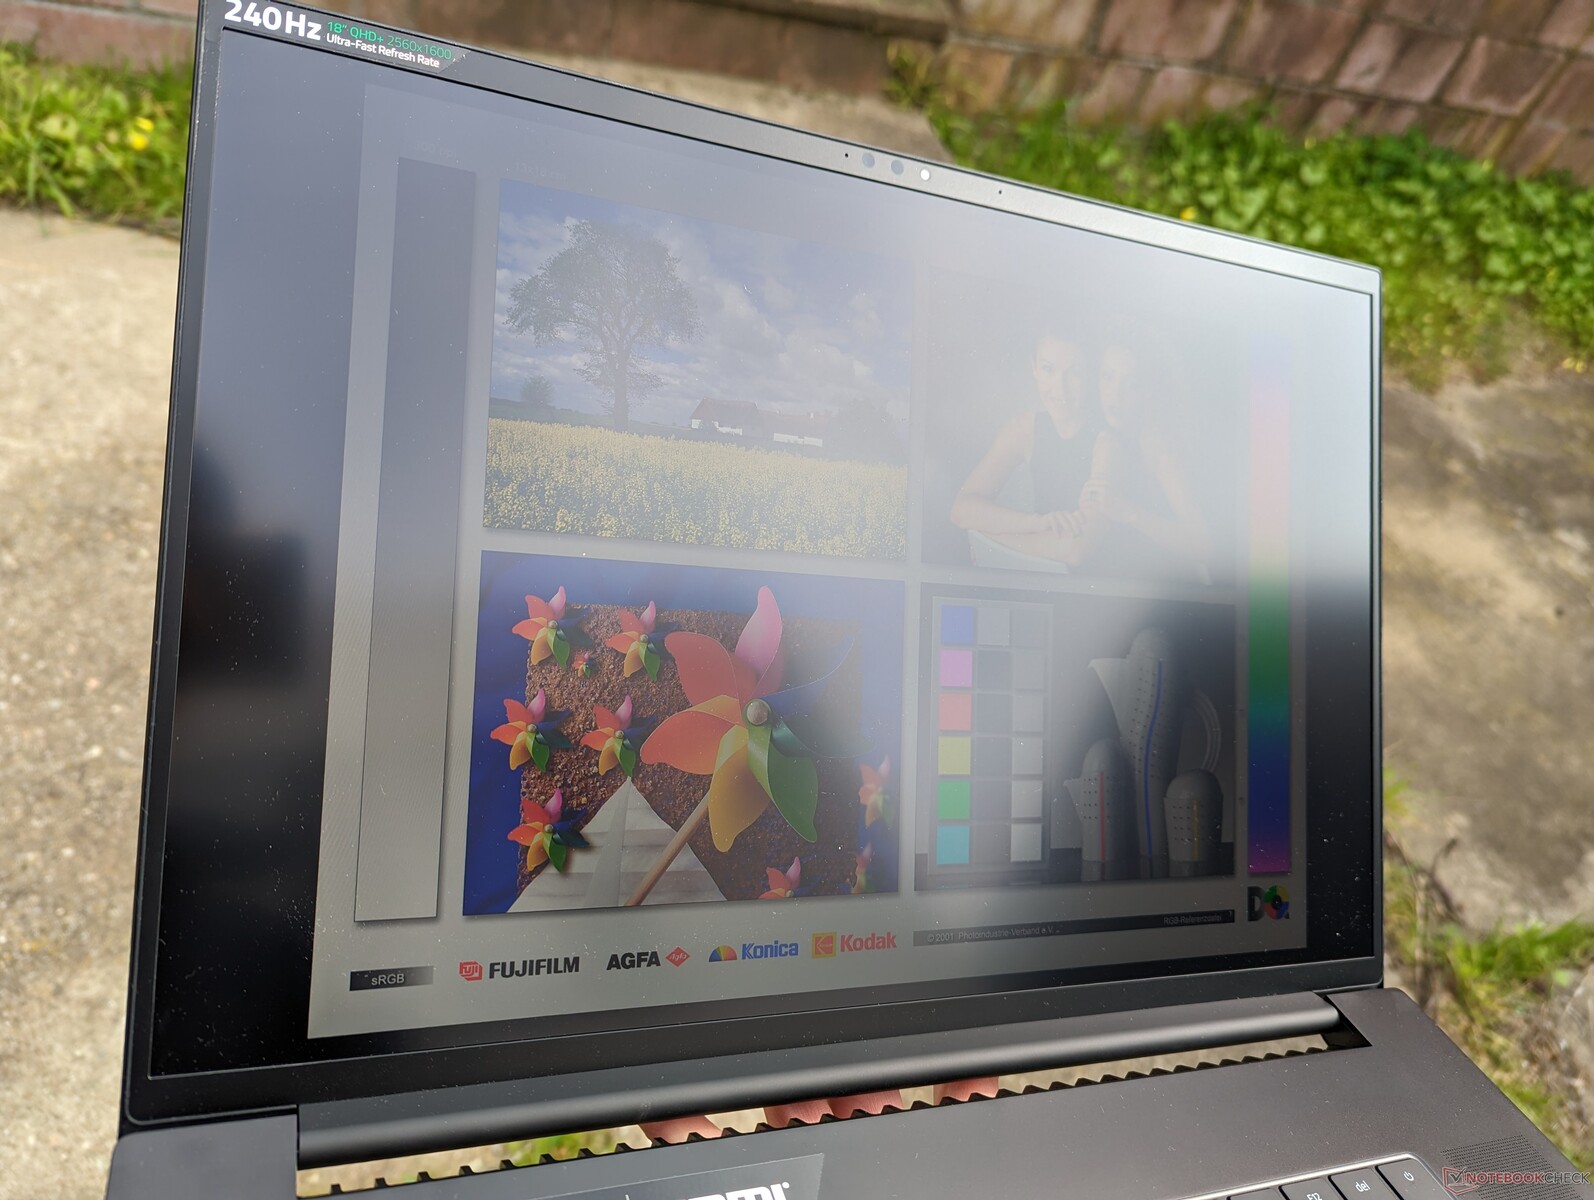
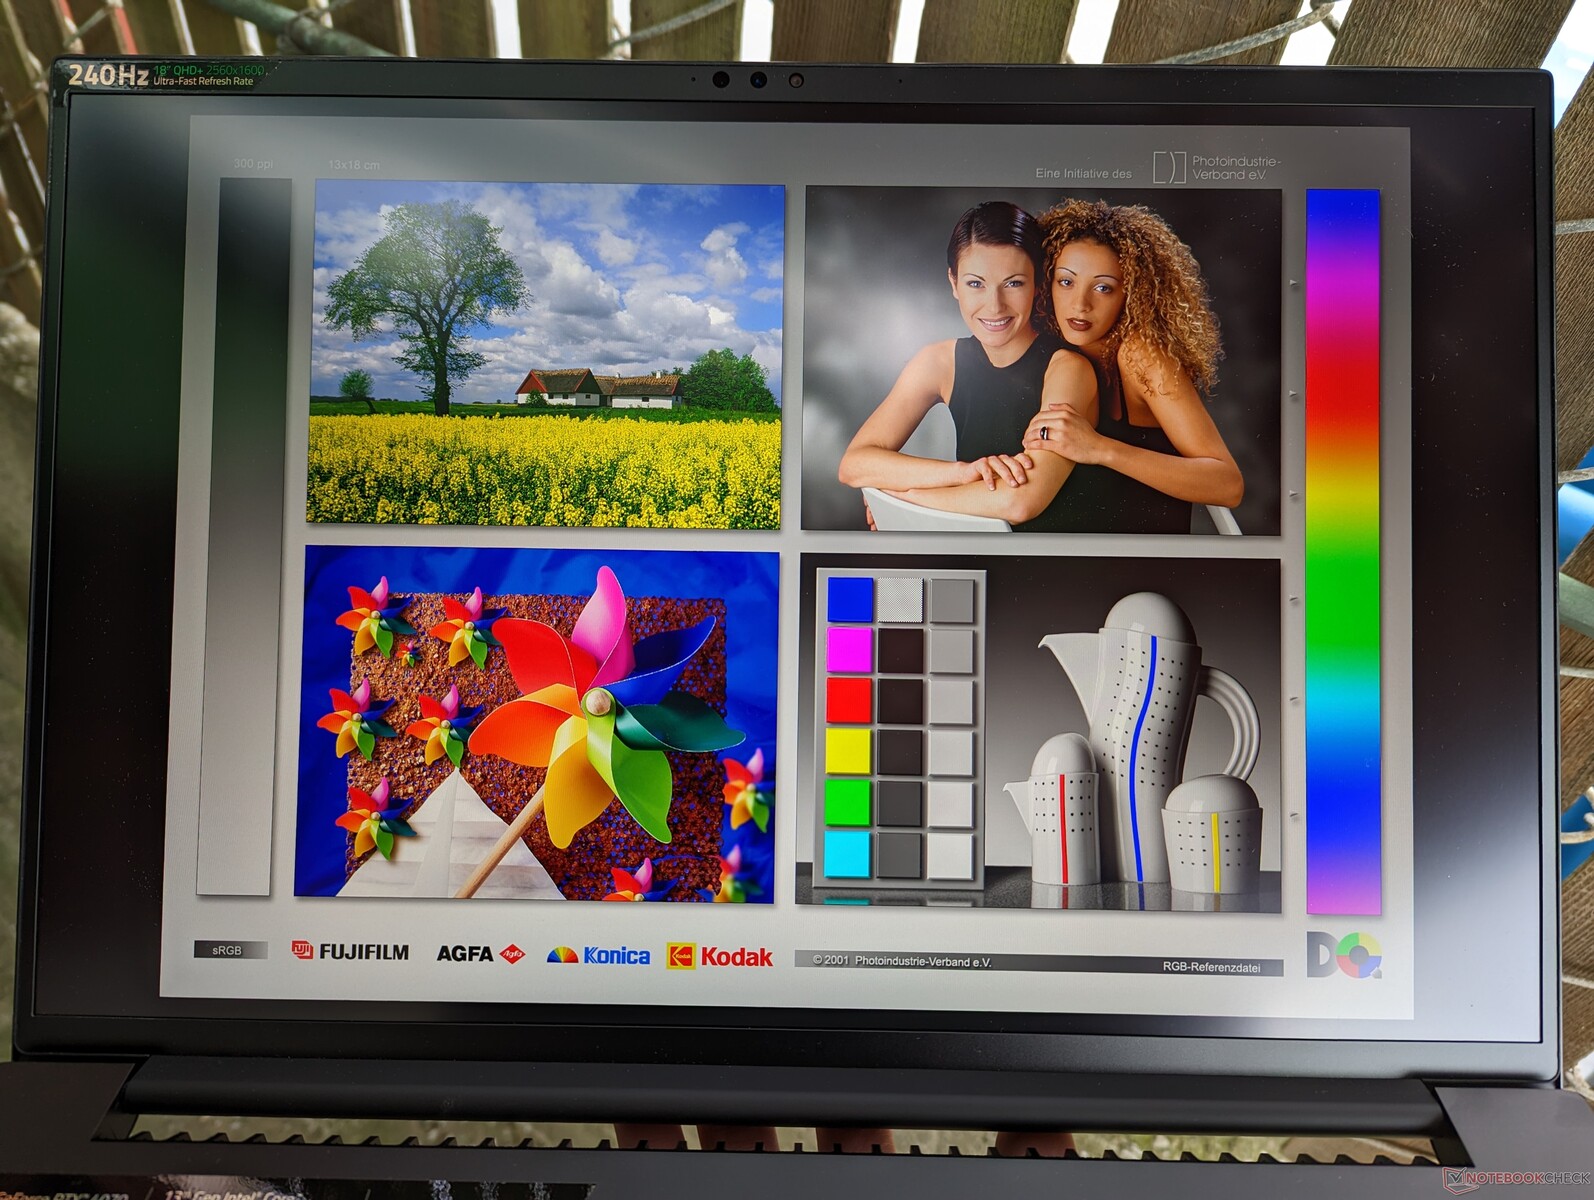
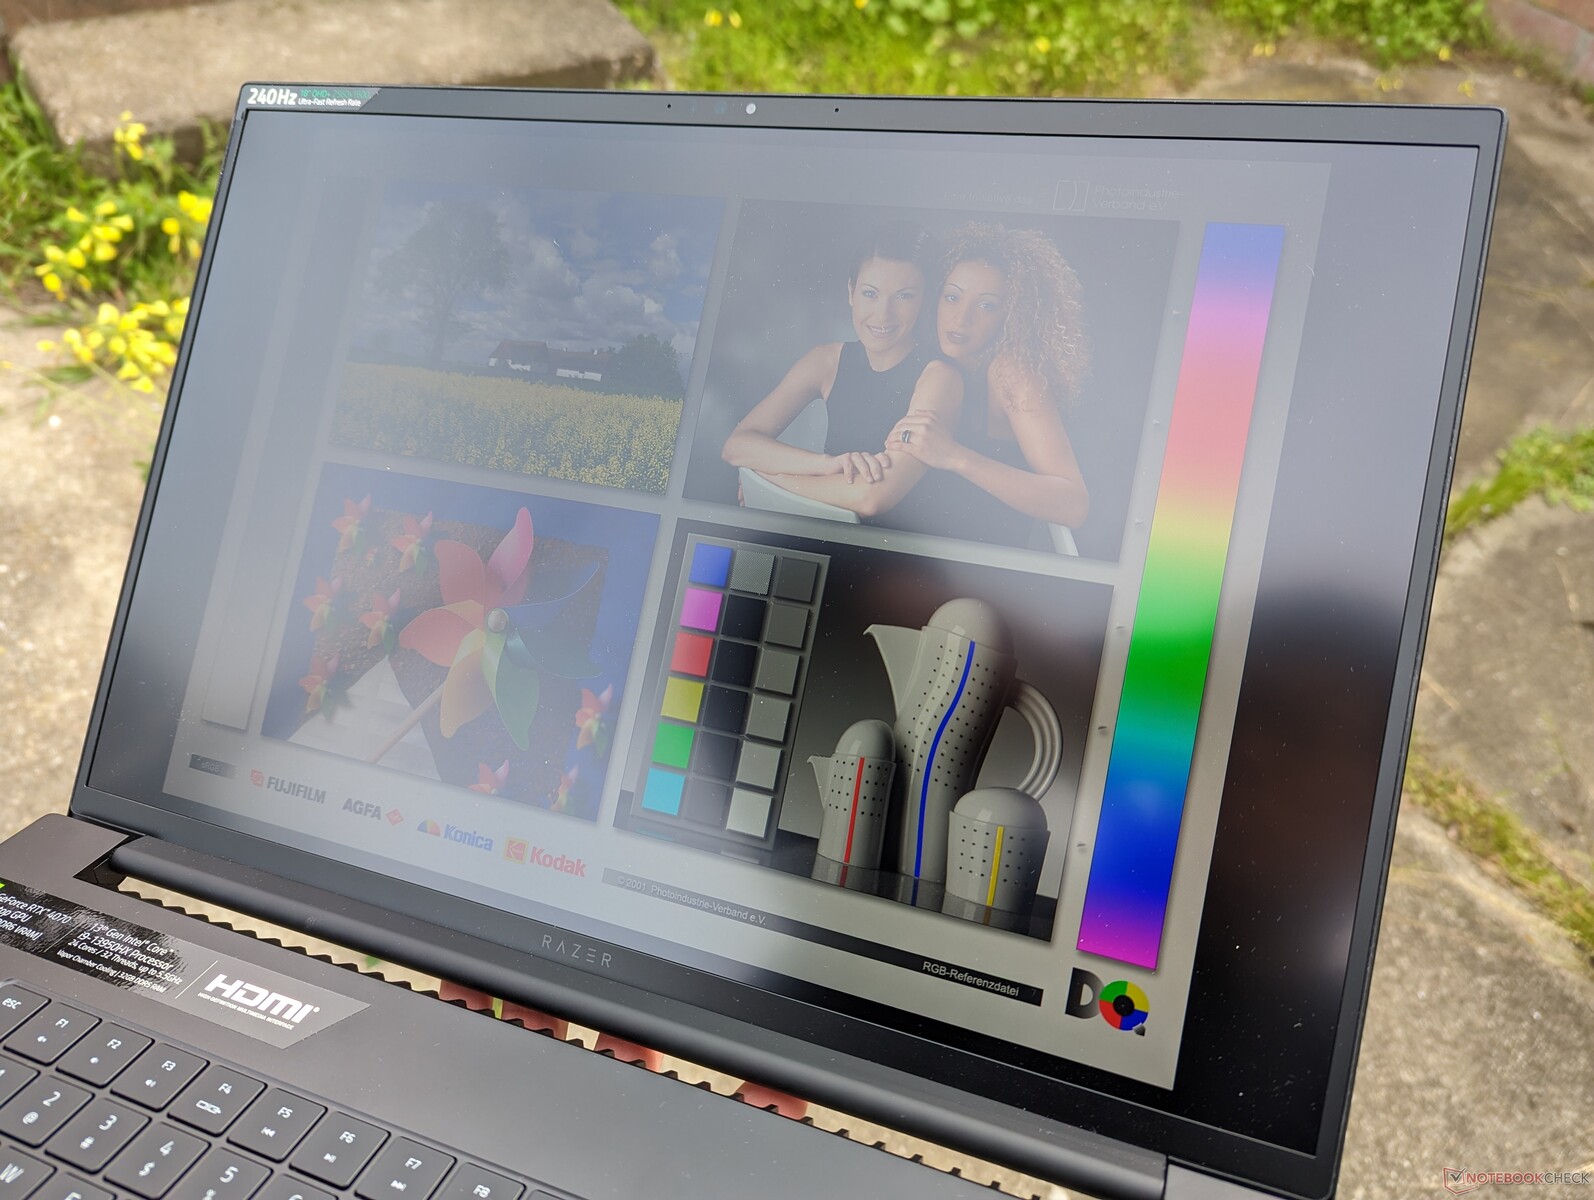
Im Freien ist die Sichtbarkeit ähnlich wie beim Blade 17, da beide Displays eine maximale Helligkeit von 500 Nits anvisieren. Um Spiegelungen zu vermeiden und die Farben zur Geltung kommen zu lassen, sind schattige Plätze empfehlenswert.
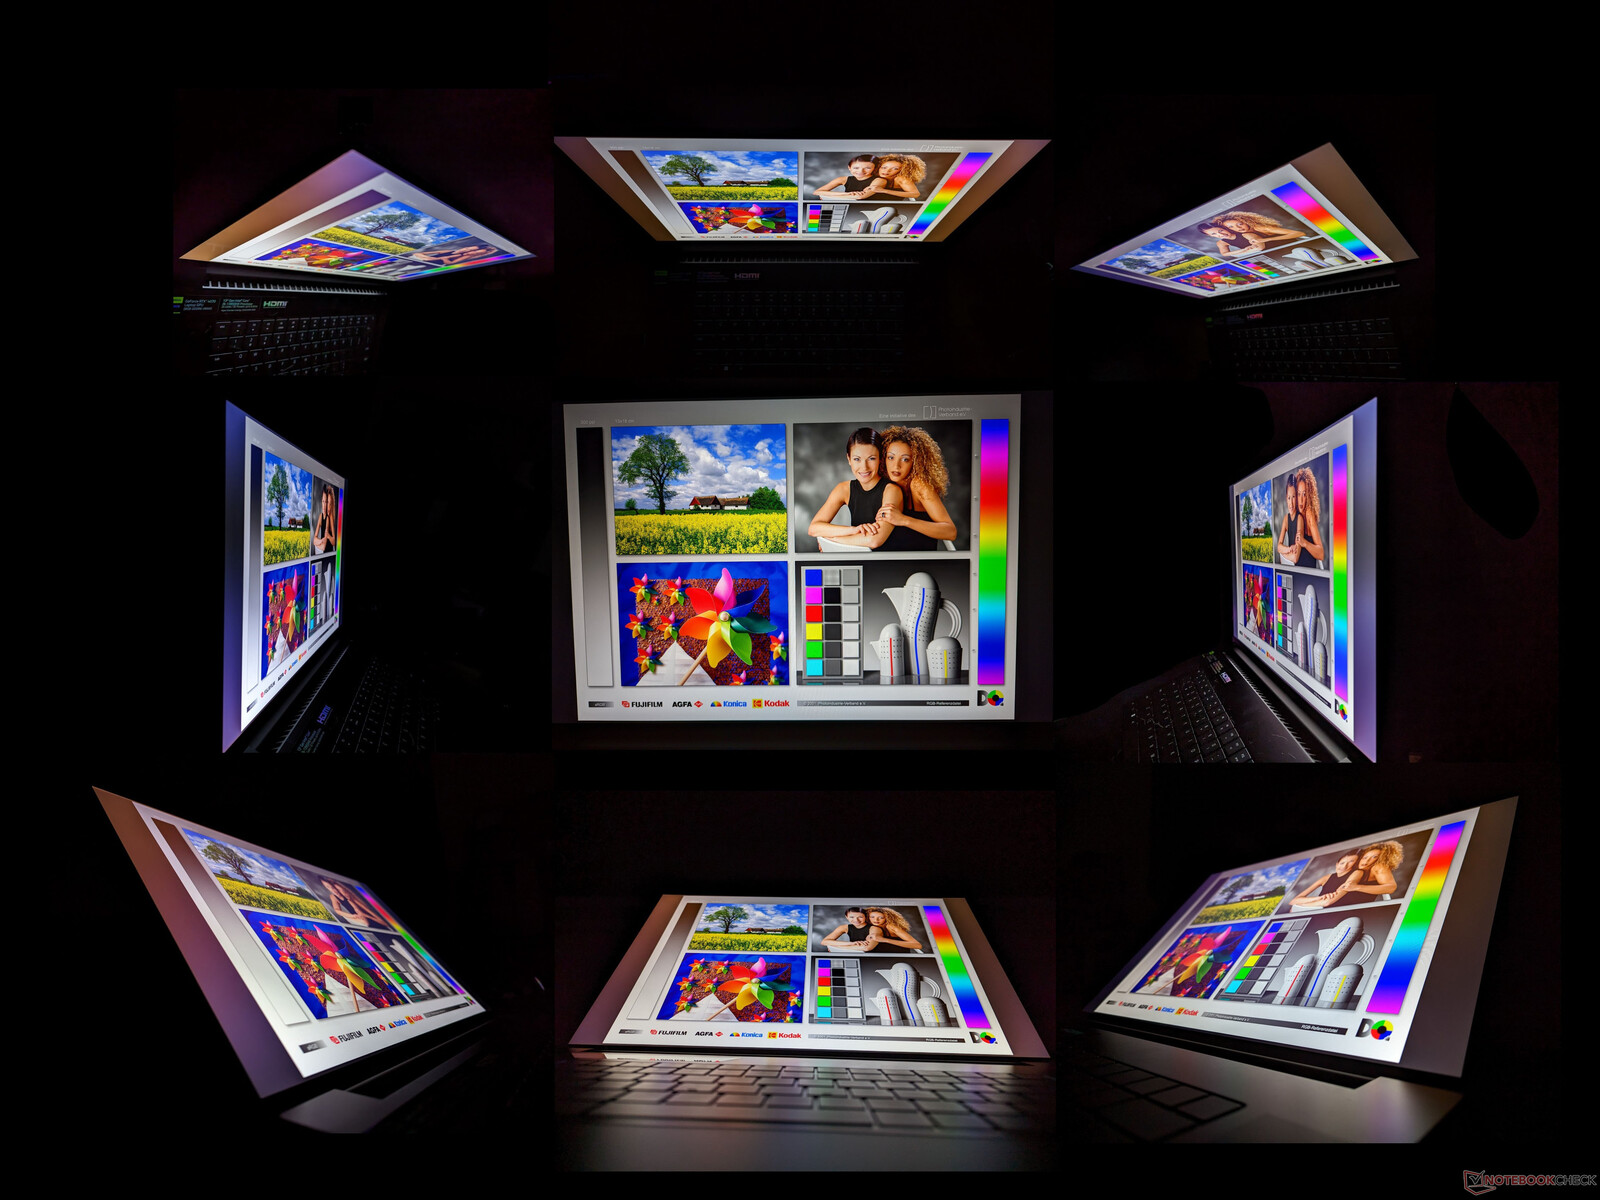
Wie von einem IPS-Panel zu erwarten, ist die Blickwinkelstabilität sehr gut. Farben und Kontraste verändern sich nur beim Blick aus extremen Winkeln.
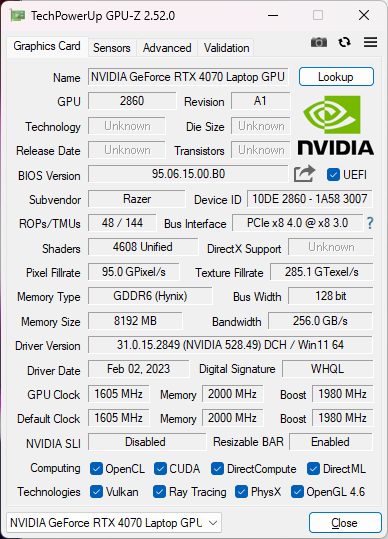
Leistung — Intel Raptor Lake + Nvidia Ada Lovelace
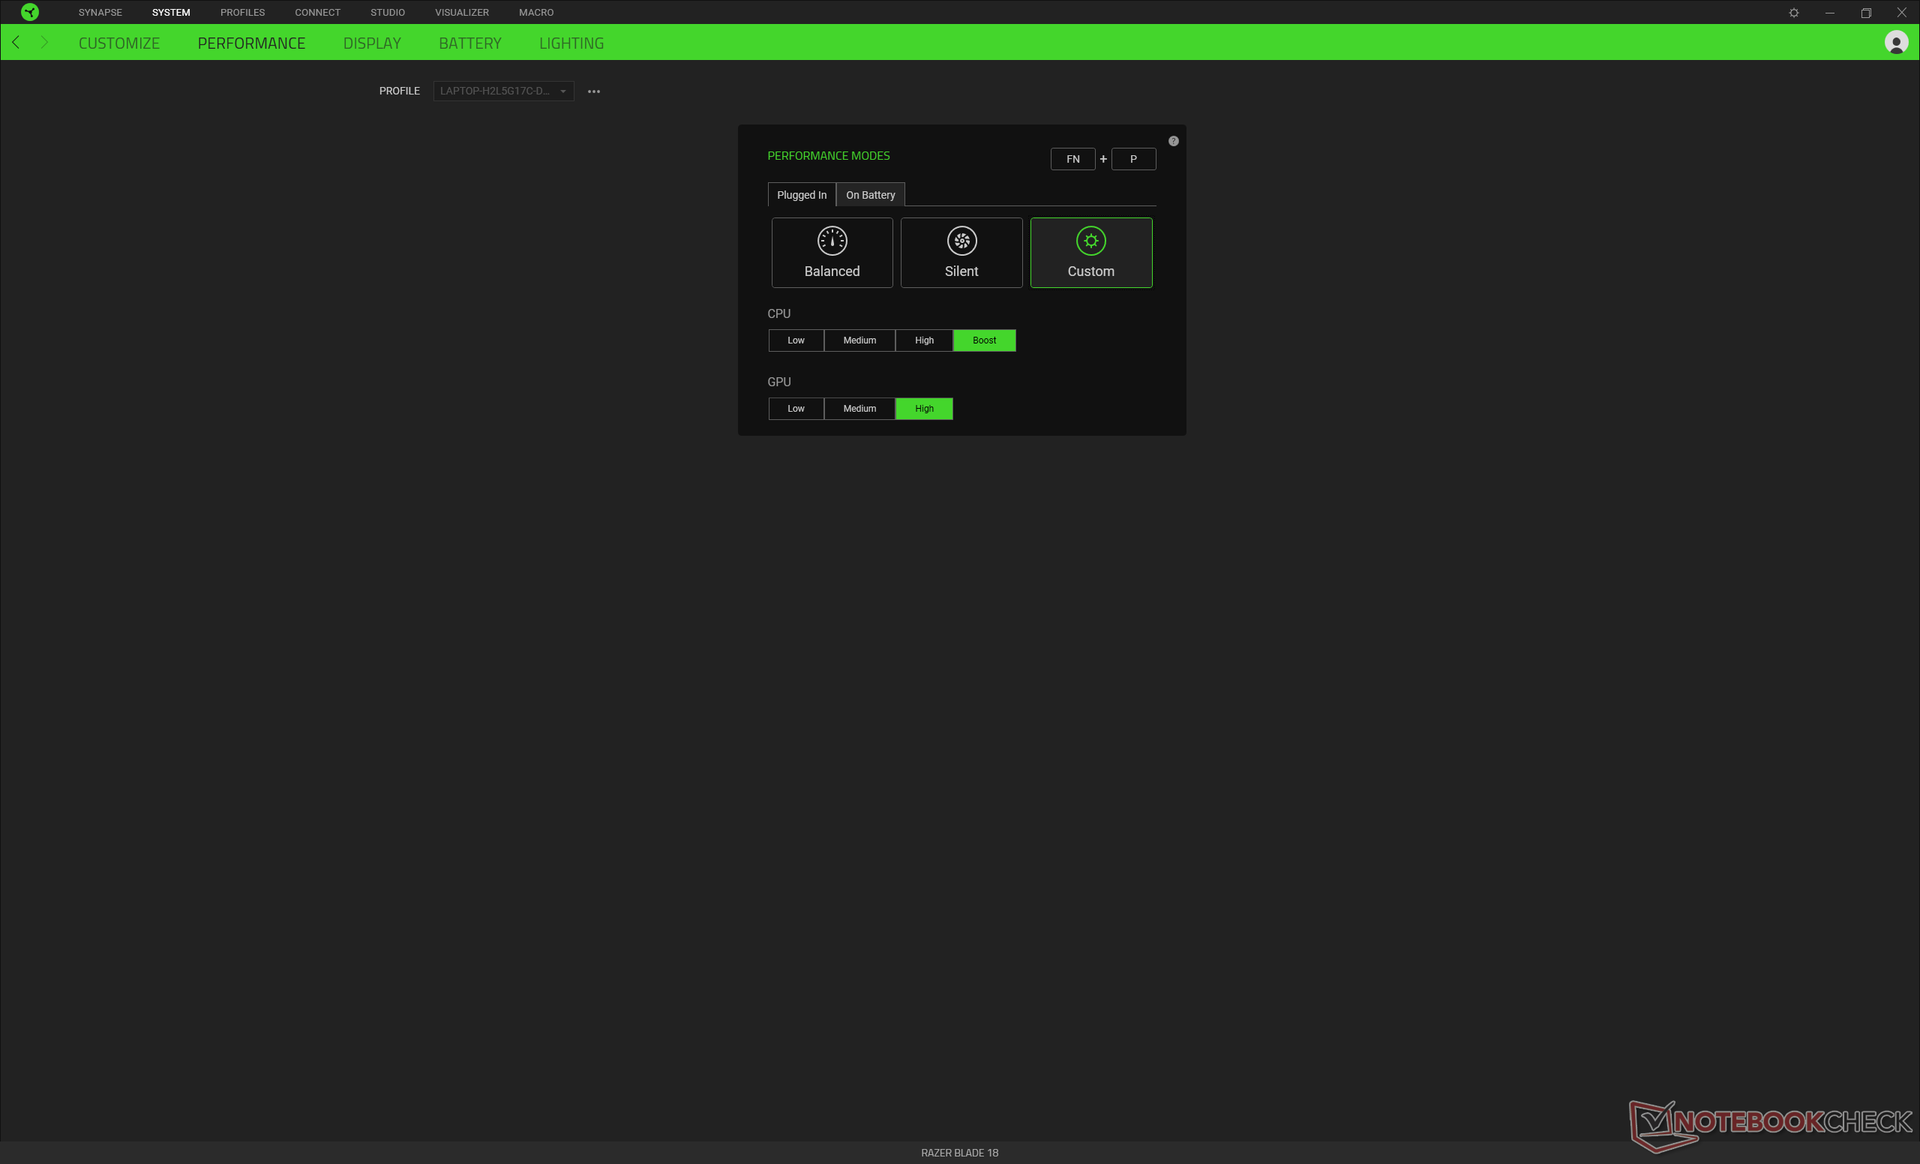
Testbedingungen
Wie unten aufgeführt, versetzen wir den Laptop via Windows in den Leistungsmodus und stellen die CPU und die GPU in der Razer-Synapse-Software auf Boost und High. Nutzer sollten sich mit Razer Synapse auseinandersetzen, sie ist der Hub zum Anpassen von RGB-Effekten, dem Einstellen der Leistungsprofile, dem Erstellen von Makros und andere wichtige Funktionen. Leider ist die Software nicht immer zuverlässig, manchmal hängt sie und reagiert nicht mehr, gelegentlich verweigert sie den Start, wenn keine Internetverbindung anliegt.
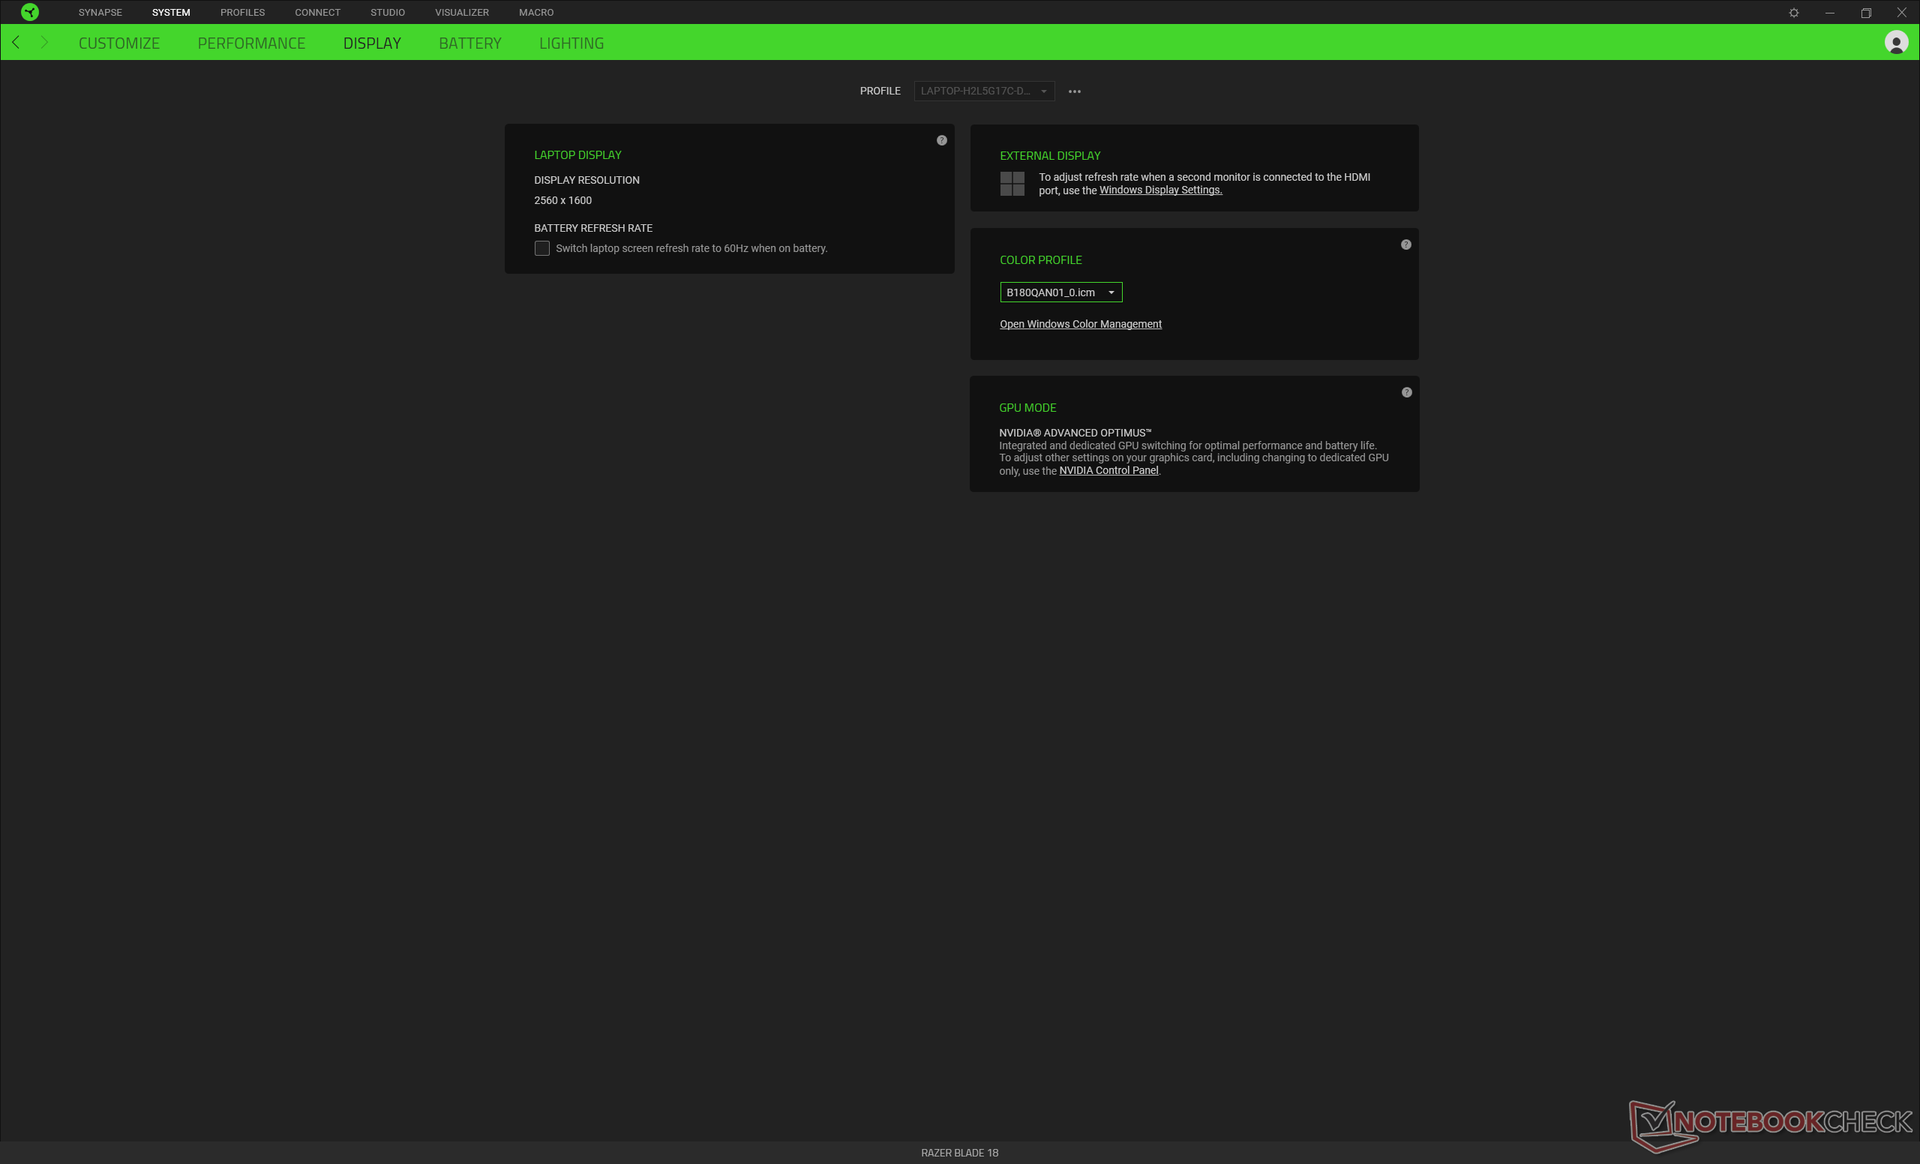
Anders als das Blade 16 unterstützt das Blade 18 weder MUX noch Advanced Optimus. Im Gegensatz zu den Werbeversprechen unterstützt unser Modell auch kein G-Sync. Auch hierfür haben wir Razer kontaktiert und werden bei einer Antwort diese Sektion überarbeiten.
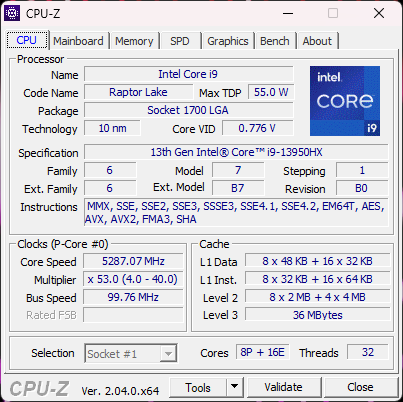
Prozessor
Die CPU-Leistung unterscheidet sich nur um wenige Prozentpunkte von der des Blade 16 oder GT77, beide verwenden den gleichen Core i9-13950HX. Demnach liegen keine erkennbaren Drosselungen beim Blade 18 vor. Die Multi-Thread-Leistung ist grob 45 Prozent schneller als die der Vorgängergeneration rund um den Core i9-12950HX und quasi auf einem Level mit der Desktop-CPU Core i9-12900K. Der generationsübergreifende Leistungssprung ist durchaus beachtlich.
Die Ergebnisse unseres sonst üblichen CineBench-R15-xT-Loop sind unten nicht vermerkt, da diese ungewöhnlich niedrig ausgefallen sind und für die Leistung der CPU nicht repräsentativ sind. Beim Starten von CineBench R15 werden sowohl CPU als auch dGPU aktiviert, was die Leistung des Prozessors CPU durch das dann geteilte Powerlimit mit der GPU limitiert. Das Problem kann auch auf einigen anderen Laptops beobachtet werden. CineBench R23 funktioniert hingegen als purer CPU-Benchmark und aktiviert die dGPU nicht, sodass wir stattdessen diese Ergebnisse unten darstellen.
Cinebench R23 Multi Loop
Cinebench R23: Multi Core | Single Core
Cinebench R20: CPU (Multi Core) | CPU (Single Core)
Cinebench R15: CPU Multi 64Bit | CPU Single 64Bit
Blender: v2.79 BMW27 CPU
7-Zip 18.03: 7z b 4 | 7z b 4 -mmt1
Geekbench 5.5: Multi-Core | Single-Core
HWBOT x265 Benchmark v2.2: 4k Preset
LibreOffice : 20 Documents To PDF
R Benchmark 2.5: Overall mean
* ... kleinere Werte sind besser
AIDA64: FP32 Ray-Trace | FPU Julia | CPU SHA3 | CPU Queen | FPU SinJulia | FPU Mandel | CPU AES | CPU ZLib | FP64 Ray-Trace | CPU PhotoWorxx
| Performance Rating | |
| MSI Titan GT77 HX 13VI | |
| Razer Blade 18 RTX 4070 | |
| Durchschnittliche Intel Core i9-13950HX | |
| Asus ROG Strix Scar 17 SE G733CX-LL014W | |
| Alienware m17 R5 (R9 6900HX, RX 6850M XT) | |
| Gigabyte G7 KE | |
| Razer Blade 17 Early 2022 | |
| AIDA64 / FP32 Ray-Trace | |
| MSI Titan GT77 HX 13VI | |
| Razer Blade 18 RTX 4070 | |
| Durchschnittliche Intel Core i9-13950HX (17993 - 28957, n=9) | |
| Asus ROG Strix Scar 17 SE G733CX-LL014W | |
| Alienware m17 R5 (R9 6900HX, RX 6850M XT) | |
| Gigabyte G7 KE | |
| Razer Blade 17 Early 2022 | |
| AIDA64 / FPU Julia | |
| MSI Titan GT77 HX 13VI | |
| Razer Blade 18 RTX 4070 | |
| Durchschnittliche Intel Core i9-13950HX (89362 - 144303, n=9) | |
| Alienware m17 R5 (R9 6900HX, RX 6850M XT) | |
| Asus ROG Strix Scar 17 SE G733CX-LL014W | |
| Gigabyte G7 KE | |
| Razer Blade 17 Early 2022 | |
| AIDA64 / CPU SHA3 | |
| MSI Titan GT77 HX 13VI | |
| Razer Blade 18 RTX 4070 | |
| Durchschnittliche Intel Core i9-13950HX (4518 - 7093, n=9) | |
| Asus ROG Strix Scar 17 SE G733CX-LL014W | |
| Alienware m17 R5 (R9 6900HX, RX 6850M XT) | |
| Gigabyte G7 KE | |
| Razer Blade 17 Early 2022 | |
| AIDA64 / CPU Queen | |
| MSI Titan GT77 HX 13VI | |
| Razer Blade 18 RTX 4070 | |
| Durchschnittliche Intel Core i9-13950HX (131931 - 140103, n=8) | |
| Alienware m17 R5 (R9 6900HX, RX 6850M XT) | |
| Asus ROG Strix Scar 17 SE G733CX-LL014W | |
| Razer Blade 17 Early 2022 | |
| Gigabyte G7 KE | |
| AIDA64 / FPU SinJulia | |
| MSI Titan GT77 HX 13VI | |
| Razer Blade 18 RTX 4070 | |
| Durchschnittliche Intel Core i9-13950HX (12318 - 17057, n=9) | |
| Alienware m17 R5 (R9 6900HX, RX 6850M XT) | |
| Asus ROG Strix Scar 17 SE G733CX-LL014W | |
| Gigabyte G7 KE | |
| Razer Blade 17 Early 2022 | |
| AIDA64 / FPU Mandel | |
| MSI Titan GT77 HX 13VI | |
| Razer Blade 18 RTX 4070 | |
| Durchschnittliche Intel Core i9-13950HX (44372 - 71038, n=9) | |
| Alienware m17 R5 (R9 6900HX, RX 6850M XT) | |
| Asus ROG Strix Scar 17 SE G733CX-LL014W | |
| Gigabyte G7 KE | |
| Razer Blade 17 Early 2022 | |
| AIDA64 / CPU AES | |
| Asus ROG Strix Scar 17 SE G733CX-LL014W | |
| Durchschnittliche Intel Core i9-13950HX (99981 - 204491, n=9) | |
| MSI Titan GT77 HX 13VI | |
| Razer Blade 18 RTX 4070 | |
| Gigabyte G7 KE | |
| Alienware m17 R5 (R9 6900HX, RX 6850M XT) | |
| Razer Blade 17 Early 2022 | |
| AIDA64 / CPU ZLib | |
| MSI Titan GT77 HX 13VI | |
| Razer Blade 18 RTX 4070 | |
| Durchschnittliche Intel Core i9-13950HX (1263 - 2069, n=9) | |
| Asus ROG Strix Scar 17 SE G733CX-LL014W | |
| Gigabyte G7 KE | |
| Alienware m17 R5 (R9 6900HX, RX 6850M XT) | |
| Razer Blade 17 Early 2022 | |
| AIDA64 / FP64 Ray-Trace | |
| MSI Titan GT77 HX 13VI | |
| Razer Blade 18 RTX 4070 | |
| Durchschnittliche Intel Core i9-13950HX (9649 - 15573, n=9) | |
| Asus ROG Strix Scar 17 SE G733CX-LL014W | |
| Alienware m17 R5 (R9 6900HX, RX 6850M XT) | |
| Gigabyte G7 KE | |
| Razer Blade 17 Early 2022 | |
| AIDA64 / CPU PhotoWorxx | |
| Razer Blade 18 RTX 4070 | |
| Durchschnittliche Intel Core i9-13950HX (40233 - 50864, n=9) | |
| Asus ROG Strix Scar 17 SE G733CX-LL014W | |
| MSI Titan GT77 HX 13VI | |
| Razer Blade 17 Early 2022 | |
| Alienware m17 R5 (R9 6900HX, RX 6850M XT) | |
| Gigabyte G7 KE | |
Systemleistung
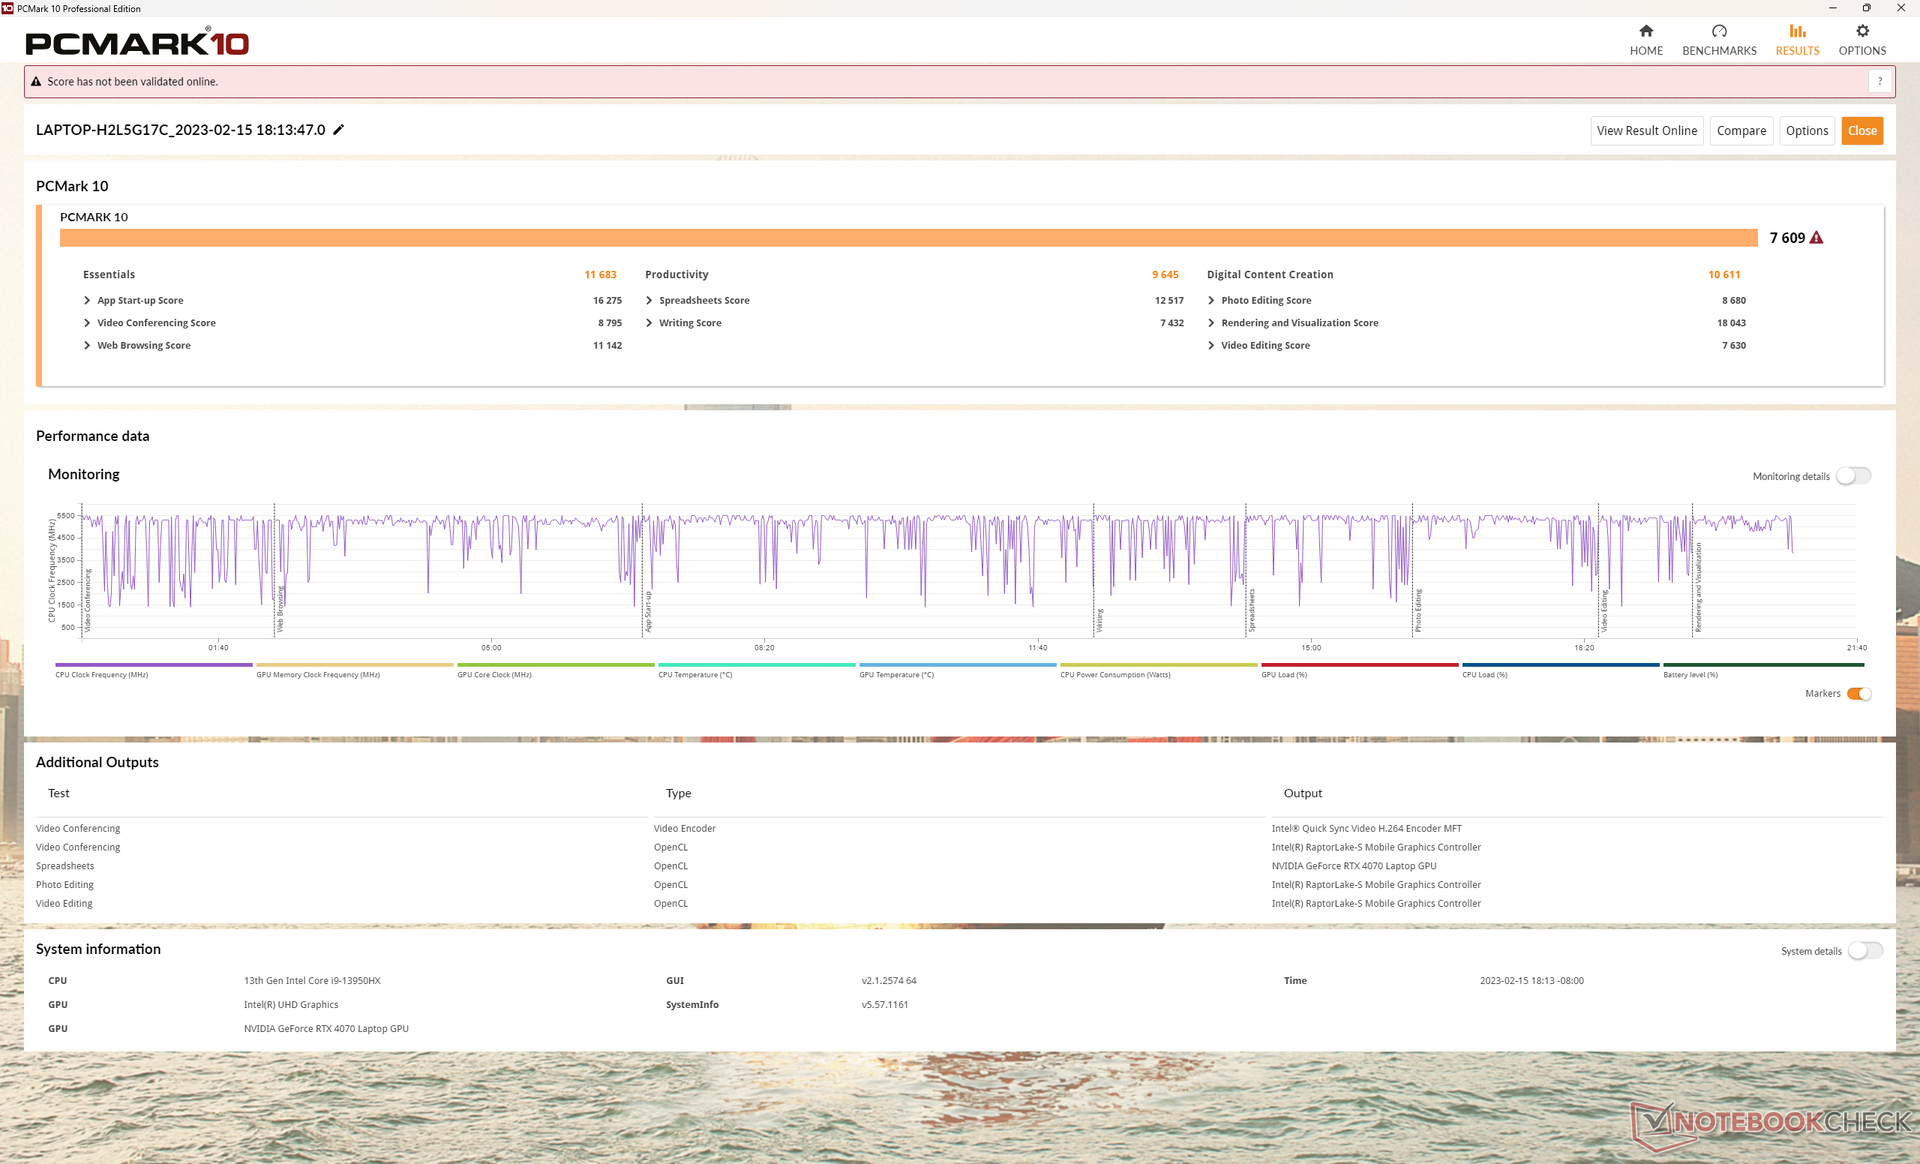
Die Ergebnisse im PCMark 10 sind konsistent höher als beim 2022er Blade 17, auch wenn die Unterschiede eher gering ausfallen. Sowohl das Blade 16 als auch das MSI GT77 schneiden hier besser ab, was an den schnelleren GPUs RTX 4080 und RTX 4090 liegt.
CrossMark: Overall | Productivity | Creativity | Responsiveness
| PCMark 10 / Score | |
| MSI Titan GT77 HX 13VI | |
| Razer Blade 18 RTX 4070 | |
| Durchschnittliche Intel Core i9-13950HX, NVIDIA GeForce RTX 4070 Laptop GPU (n=1) | |
| Alienware m17 R5 (R9 6900HX, RX 6850M XT) | |
| Asus ROG Strix Scar 17 SE G733CX-LL014W | |
| Razer Blade 17 Early 2022 | |
| Gigabyte G7 KE | |
| PCMark 10 / Essentials | |
| MSI Titan GT77 HX 13VI | |
| Razer Blade 18 RTX 4070 | |
| Durchschnittliche Intel Core i9-13950HX, NVIDIA GeForce RTX 4070 Laptop GPU (n=1) | |
| Asus ROG Strix Scar 17 SE G733CX-LL014W | |
| Gigabyte G7 KE | |
| Razer Blade 17 Early 2022 | |
| Alienware m17 R5 (R9 6900HX, RX 6850M XT) | |
| PCMark 10 / Productivity | |
| Asus ROG Strix Scar 17 SE G733CX-LL014W | |
| MSI Titan GT77 HX 13VI | |
| Razer Blade 18 RTX 4070 | |
| Durchschnittliche Intel Core i9-13950HX, NVIDIA GeForce RTX 4070 Laptop GPU (n=1) | |
| Razer Blade 17 Early 2022 | |
| Alienware m17 R5 (R9 6900HX, RX 6850M XT) | |
| Gigabyte G7 KE | |
| PCMark 10 / Digital Content Creation | |
| MSI Titan GT77 HX 13VI | |
| Alienware m17 R5 (R9 6900HX, RX 6850M XT) | |
| Razer Blade 18 RTX 4070 | |
| Durchschnittliche Intel Core i9-13950HX, NVIDIA GeForce RTX 4070 Laptop GPU (n=1) | |
| Razer Blade 17 Early 2022 | |
| Asus ROG Strix Scar 17 SE G733CX-LL014W | |
| Gigabyte G7 KE | |
| CrossMark / Overall | |
| MSI Titan GT77 HX 13VI | |
| Razer Blade 18 RTX 4070 | |
| Durchschnittliche Intel Core i9-13950HX, NVIDIA GeForce RTX 4070 Laptop GPU (n=1) | |
| Asus ROG Strix Scar 17 SE G733CX-LL014W | |
| Gigabyte G7 KE | |
| Razer Blade 17 Early 2022 | |
| Alienware m17 R5 (R9 6900HX, RX 6850M XT) | |
| CrossMark / Productivity | |
| MSI Titan GT77 HX 13VI | |
| Razer Blade 18 RTX 4070 | |
| Durchschnittliche Intel Core i9-13950HX, NVIDIA GeForce RTX 4070 Laptop GPU (n=1) | |
| Asus ROG Strix Scar 17 SE G733CX-LL014W | |
| Gigabyte G7 KE | |
| Razer Blade 17 Early 2022 | |
| Alienware m17 R5 (R9 6900HX, RX 6850M XT) | |
| CrossMark / Creativity | |
| MSI Titan GT77 HX 13VI | |
| Razer Blade 18 RTX 4070 | |
| Durchschnittliche Intel Core i9-13950HX, NVIDIA GeForce RTX 4070 Laptop GPU (n=1) | |
| Asus ROG Strix Scar 17 SE G733CX-LL014W | |
| Razer Blade 17 Early 2022 | |
| Gigabyte G7 KE | |
| Alienware m17 R5 (R9 6900HX, RX 6850M XT) | |
| CrossMark / Responsiveness | |
| Gigabyte G7 KE | |
| Asus ROG Strix Scar 17 SE G733CX-LL014W | |
| Razer Blade 18 RTX 4070 | |
| Durchschnittliche Intel Core i9-13950HX, NVIDIA GeForce RTX 4070 Laptop GPU (n=1) | |
| MSI Titan GT77 HX 13VI | |
| Razer Blade 17 Early 2022 | |
| Alienware m17 R5 (R9 6900HX, RX 6850M XT) | |
| PCMark 10 Score | 7609 Punkte | |
Hilfe | ||
| AIDA64 / Memory Copy | |
| Razer Blade 18 RTX 4070 | |
| Durchschnittliche Intel Core i9-13950HX (61938 - 78813, n=9) | |
| MSI Titan GT77 HX 13VI | |
| Asus ROG Strix Scar 17 SE G733CX-LL014W | |
| Razer Blade 17 Early 2022 | |
| Alienware m17 R5 (R9 6900HX, RX 6850M XT) | |
| Gigabyte G7 KE | |
| AIDA64 / Memory Read | |
| Razer Blade 18 RTX 4070 | |
| Durchschnittliche Intel Core i9-13950HX (62368 - 86831, n=9) | |
| Asus ROG Strix Scar 17 SE G733CX-LL014W | |
| MSI Titan GT77 HX 13VI | |
| Razer Blade 17 Early 2022 | |
| Alienware m17 R5 (R9 6900HX, RX 6850M XT) | |
| Gigabyte G7 KE | |
| AIDA64 / Memory Write | |
| Razer Blade 18 RTX 4070 | |
| Durchschnittliche Intel Core i9-13950HX (59501 - 80441, n=9) | |
| Asus ROG Strix Scar 17 SE G733CX-LL014W | |
| MSI Titan GT77 HX 13VI | |
| Razer Blade 17 Early 2022 | |
| Alienware m17 R5 (R9 6900HX, RX 6850M XT) | |
| Gigabyte G7 KE | |
| AIDA64 / Memory Latency | |
| Alienware m17 R5 (R9 6900HX, RX 6850M XT) | |
| MSI Titan GT77 HX 13VI | |
| Gigabyte G7 KE | |
| Durchschnittliche Intel Core i9-13950HX (84.4 - 99.5, n=9) | |
| Asus ROG Strix Scar 17 SE G733CX-LL014W | |
| Razer Blade 18 RTX 4070 | |
* ... kleinere Werte sind besser
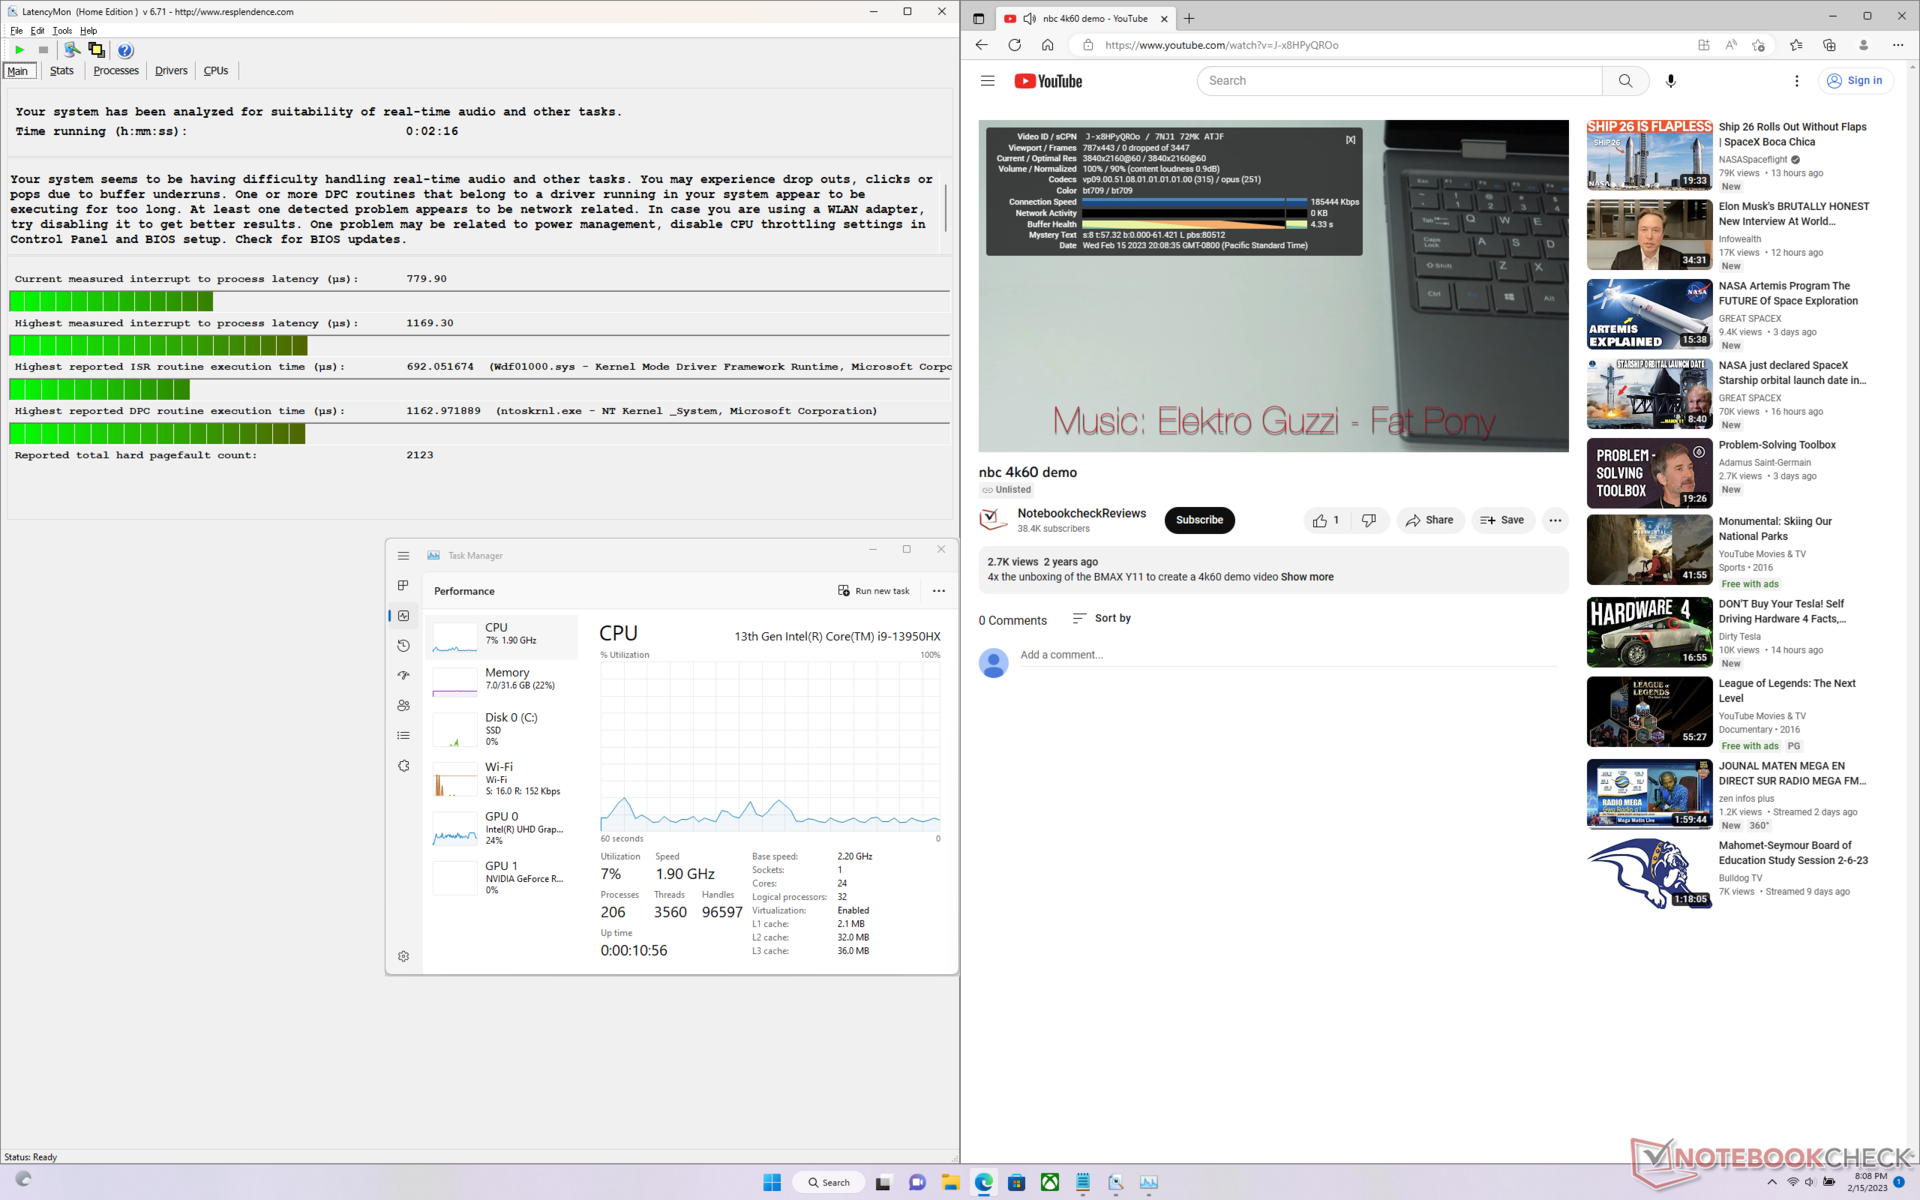
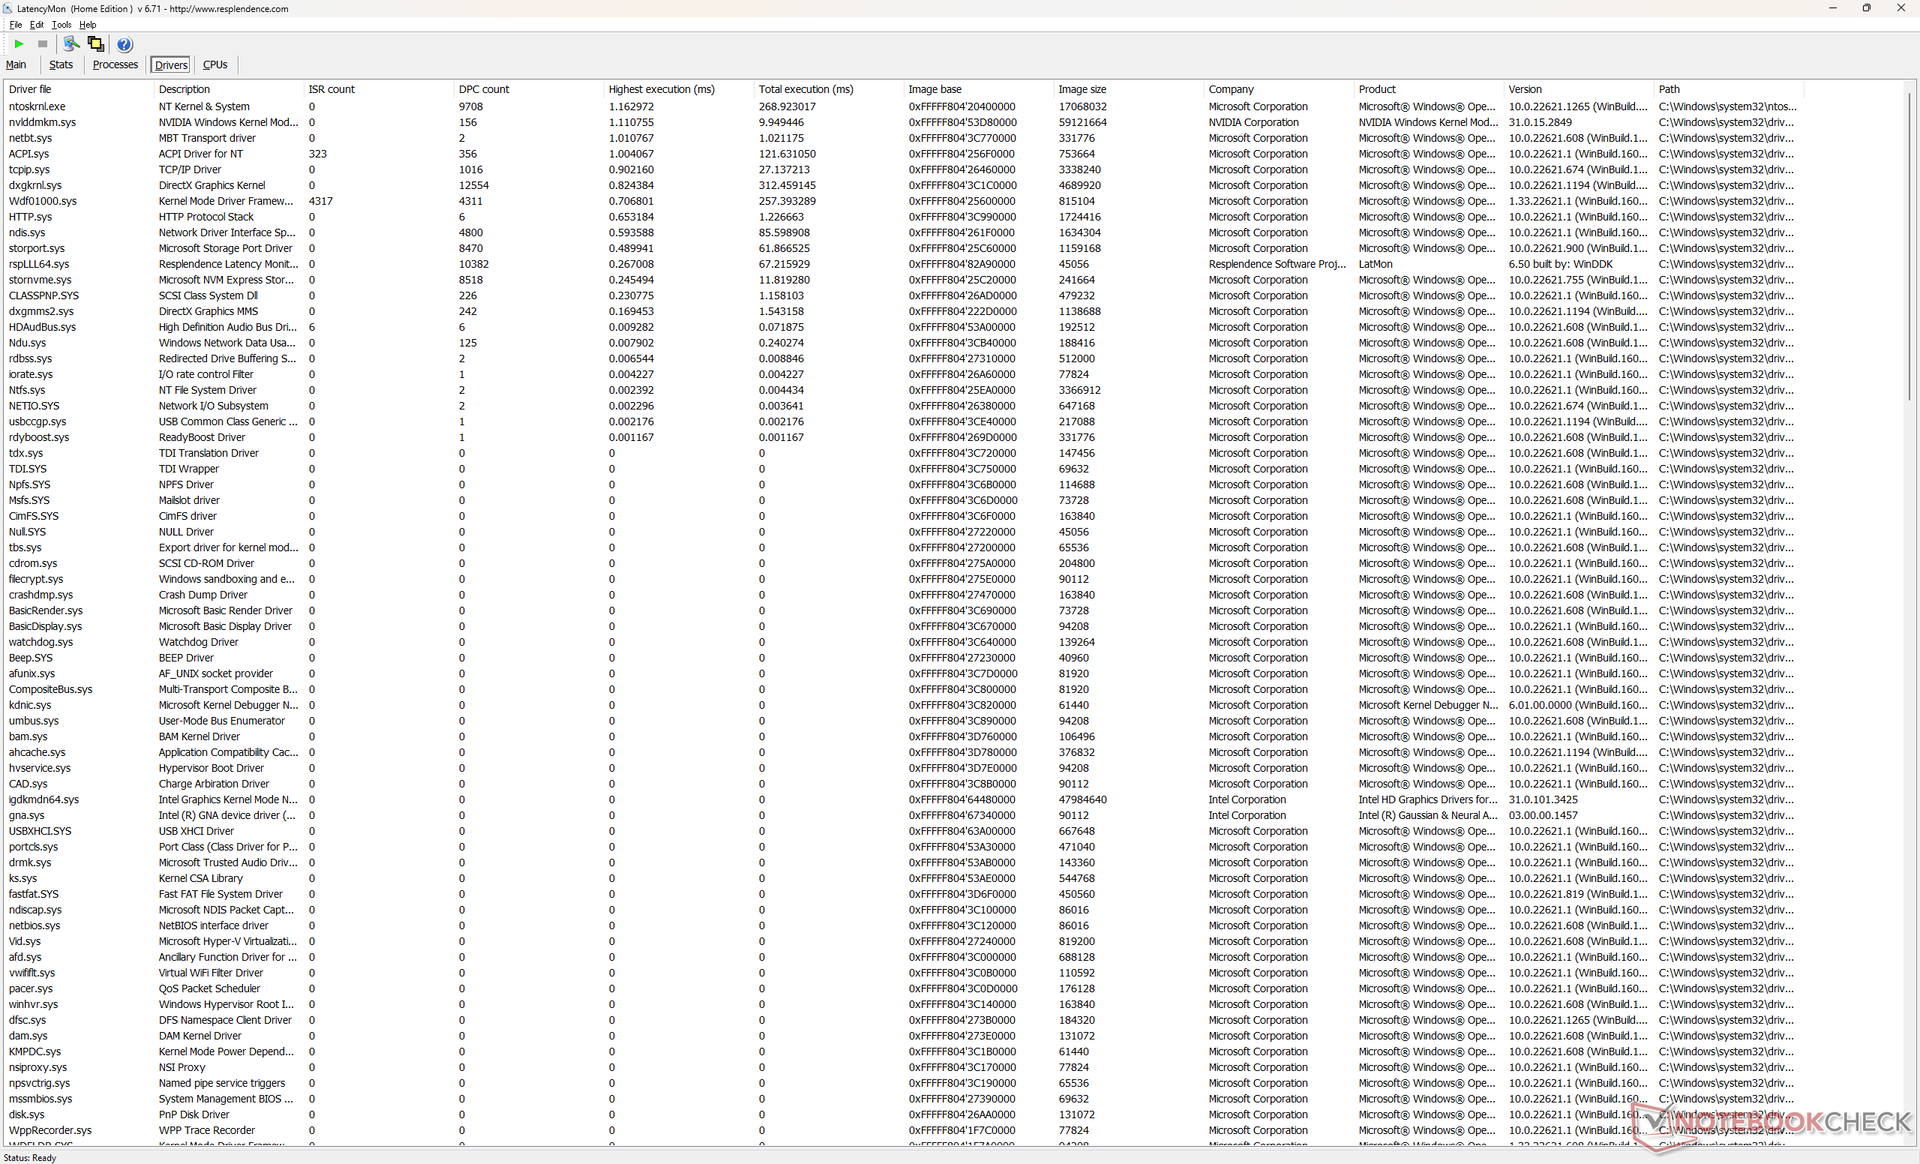
DPC Latency
LatencyMon deckt leichte DPC-Probleme beim Öffnen mehrerer Browsertabs auf. Unser 4K/60-fps-YouTubevideo wird hingegen flüssig und mit niedrigen Auslastungen für CPU und GPU abgespielt.
| DPC Latencies / LatencyMon - interrupt to process latency (max), Web, Youtube, Prime95 | |
| MSI Titan GT77 HX 13VI | |
| Asus ROG Strix Scar 17 SE G733CX-LL014W | |
| Gigabyte G7 KE | |
| Alienware m17 R5 (R9 6900HX, RX 6850M XT) | |
| Razer Blade 18 RTX 4070 | |
| Razer Blade 17 Early 2022 | |
* ... kleinere Werte sind besser
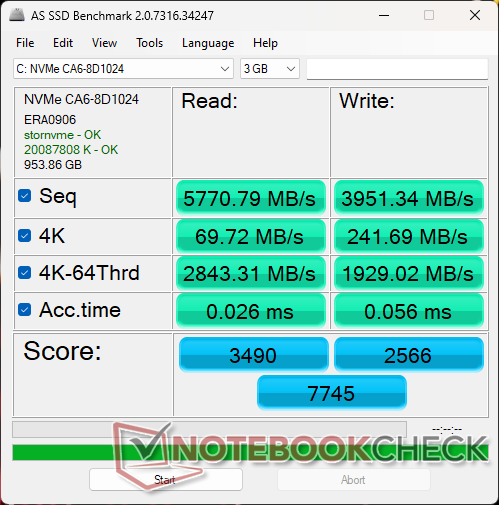
Massenspeicher — Bis zu zwei SSDs
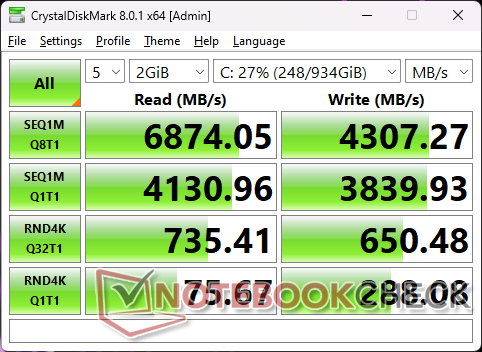
Unsere Testeinheit ist mit der gleichen 1 TB großen PCIe4-x4-NVMe-SSD SSSTC CA6-8D1024 ausgestattet wie das Alienware m17 R5. Die Transferraten sind vergleichbar mit denen der beliebten Samsung PM9A1, es werden stabile sequentielle Lese- und Schreibraten von 6.900 MB/s und 4.300 MB/s erreicht. Razer spendiert beiden SSD-Slots ein Kühlpad, welches die Hitze an das Metallgehäuse abgibt.

| Drive Performance Rating - Percent | |
| Asus ROG Strix Scar 17 SE G733CX-LL014W | |
| Gigabyte G7 KE | |
| Razer Blade 17 Early 2022 | |
| MSI Titan GT77 HX 13VI | |
| Razer Blade 18 RTX 4070 | |
| Alienware m17 R5 (R9 6900HX, RX 6850M XT) | |
* ... kleinere Werte sind besser
Disk Throttling: DiskSpd Read Loop, Queue Depth 8
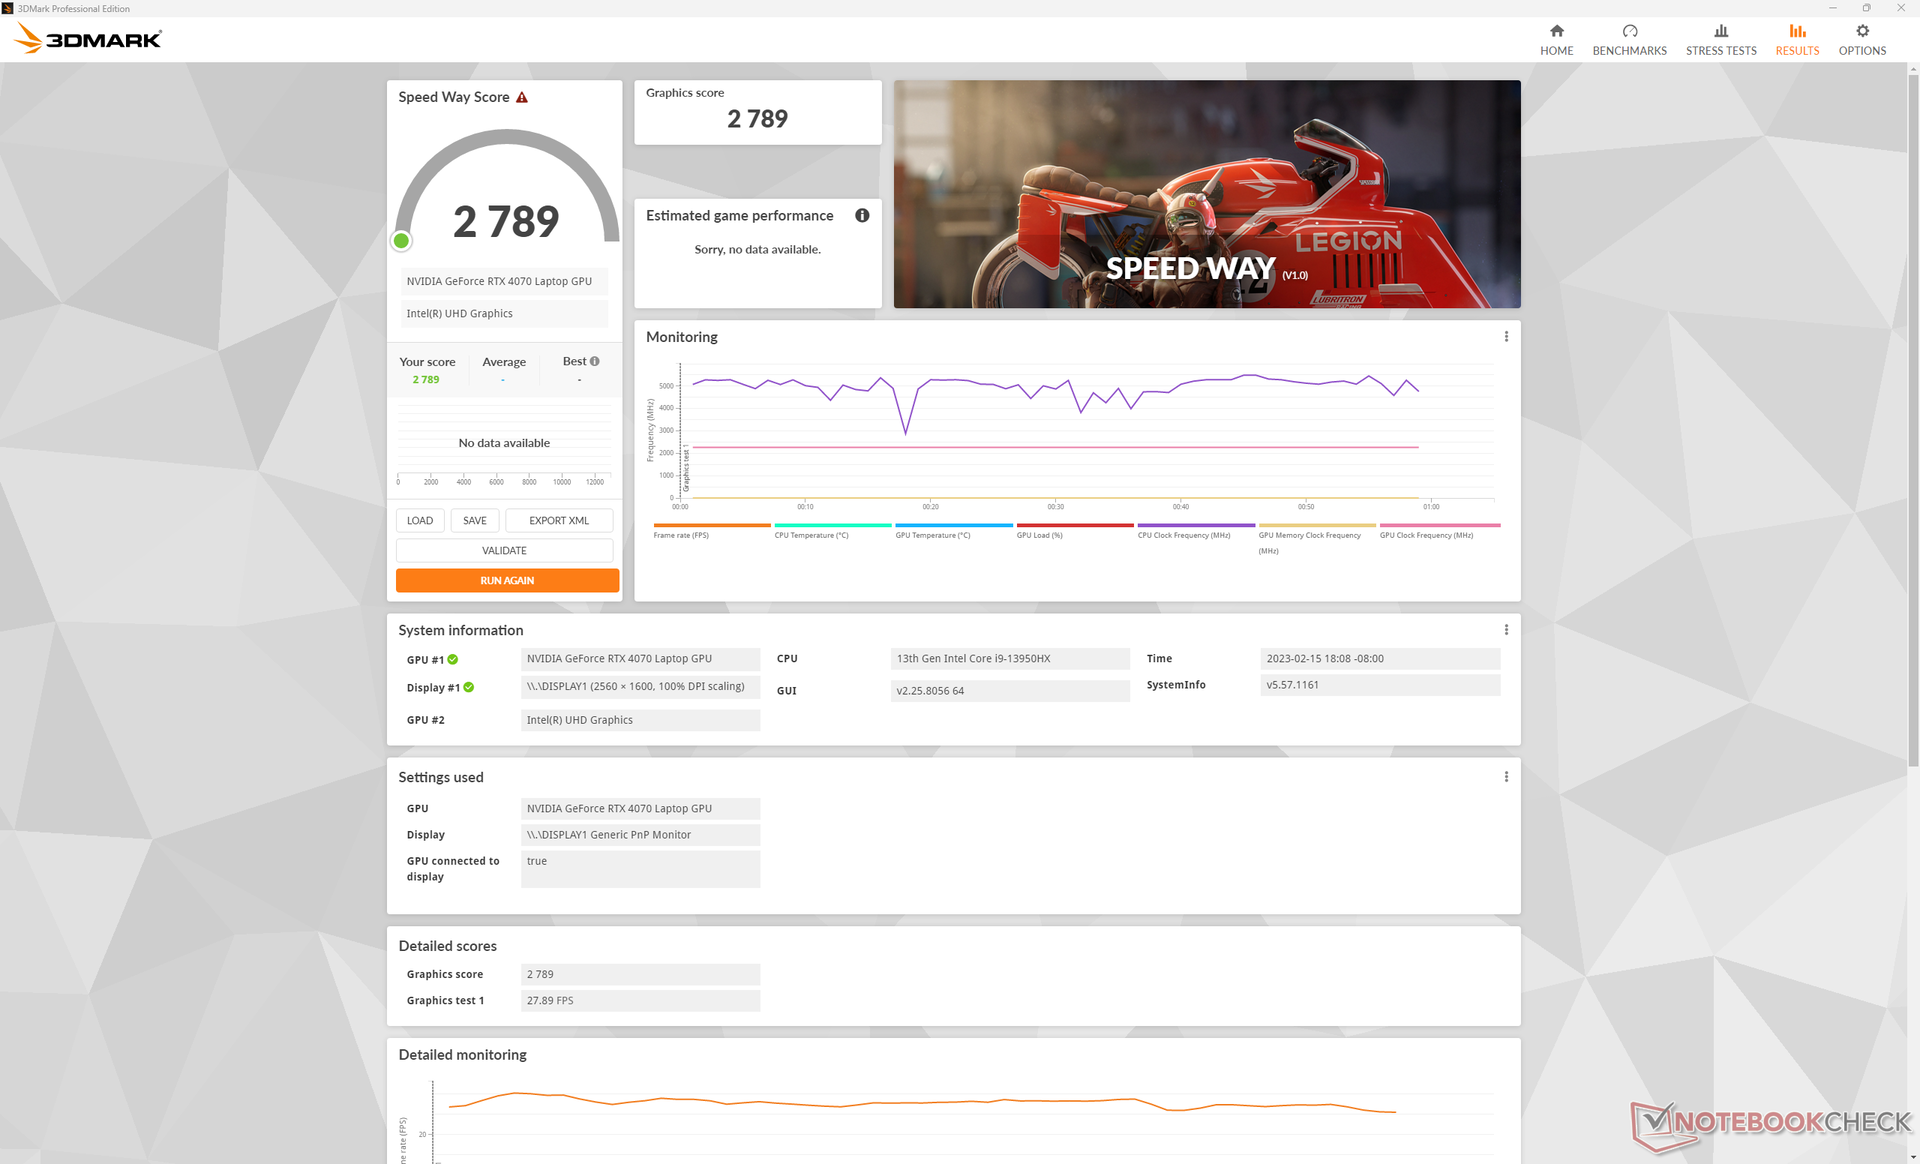
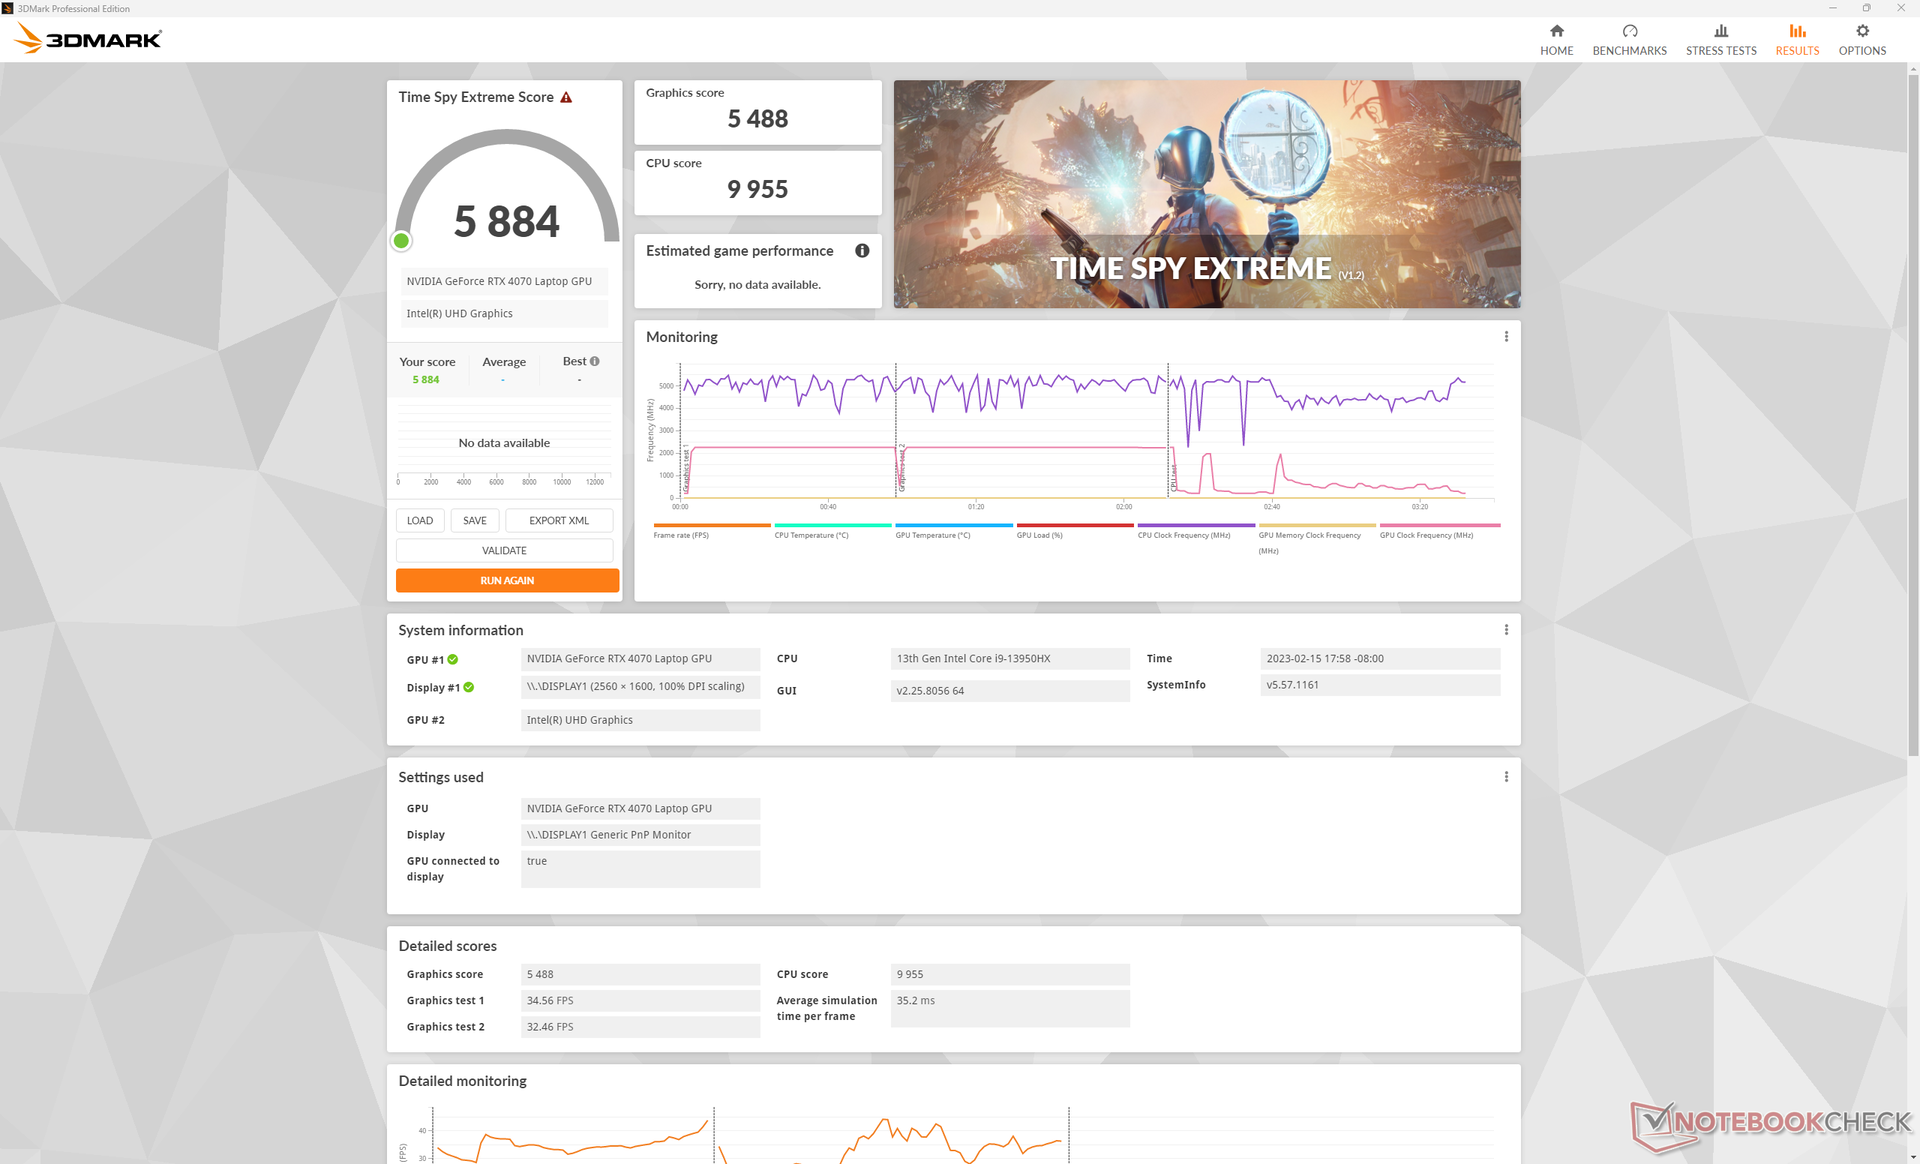
Grafikleistung — Ähnliche Leistung wie die Desktop-GPU GeForce RTX 3070
Die rohe Leistung der mobilen GeForce RTX 4070 mit 140 W rangiert zwischen der einer mobilen RTX 3080 und einer mobilen RTX 3080 Ti. Sie ist nur etwa 10 bis 20 Prozent schneller als eine mobile RTX 3070, was irgendwie enttäuscht, immerhin ist die mobile RTX 4080 etwa 40 bis 50 Prozent schneller als eine mobile RTX 3080. Das bedeutet auch, dass der Leistungsunterschied zwischen einer mobilen RTX 4070 und einer mobilen RTX 4080 größer ist und zwischen 40 bis 60 Prozent liegt.
Verglichen mit Desktop-GPUs ist die mobile RTX 4070 etwa 5 bis 10 Prozent langsamer als die Desktop-RTX-3070, welche bereits drei Jahren alt ist.
Eines der großen Verkaufsargumente für die GeForce 40 ist die Unterstützung von Frame Generation oder DLSS 3. Leider kommt es in unserem Blade 18 zu Problemen beim Starten von Games mit DLSS-3-Support, wenn ein externer 4K-Monitor per HDMI oder USB-C angeschlossen ist. Die Frameraten sinken dann scheinbar grundlos bei allen getesteten Titeln unter 30 FPS, während das Blade 16 mit RTX 4080 keinerlei Probleme hat. Auf dem internen Display laufen die DLSS-3-Titel seltsamerweise wieder ohne Probleme. Auch hierfür haben wir Razer kontaktiert und um eine Lösung gebeten, die wir an dieser Stelle bekannt geben werden. In der Zwischenzeit sollten Nutzer für DLSS-3-Titel lieber nur das interne Display nutzen.
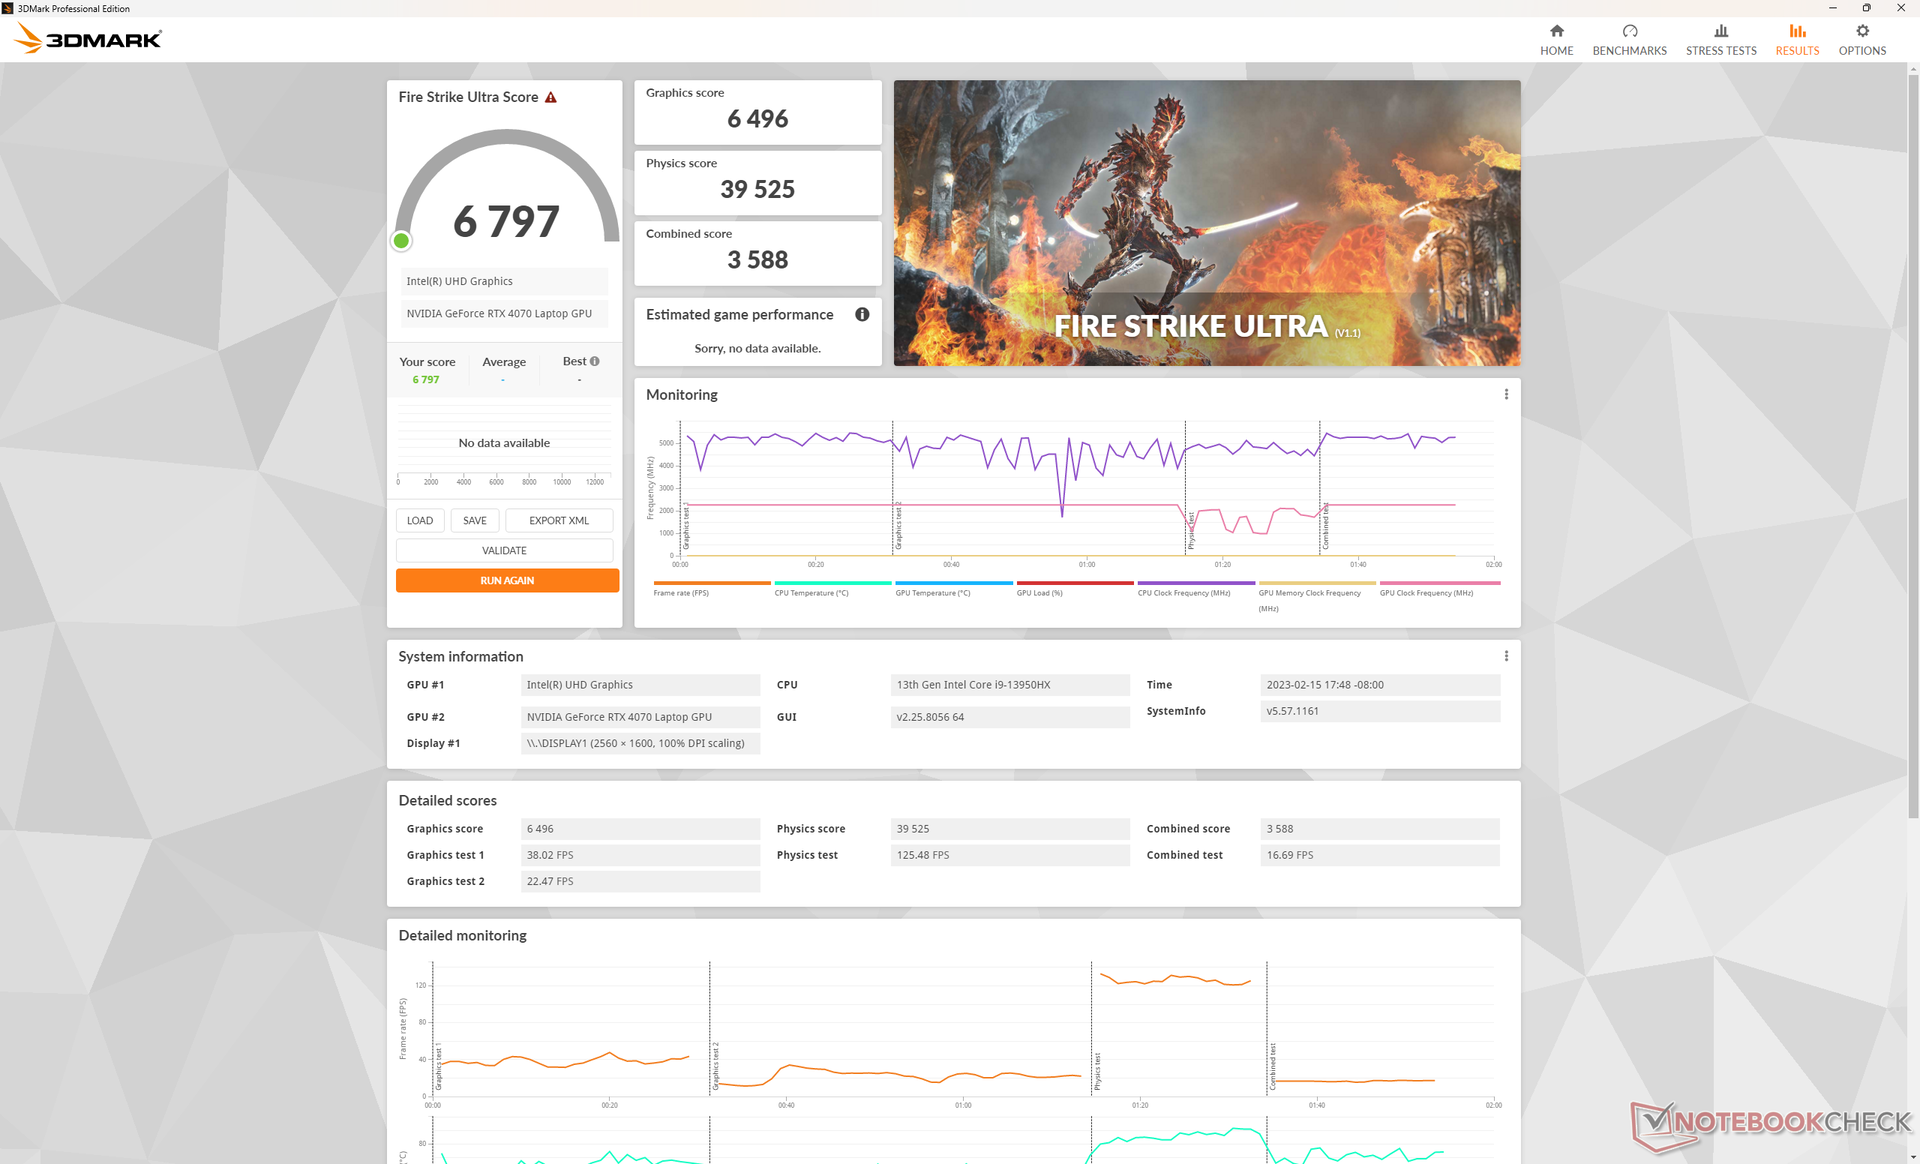
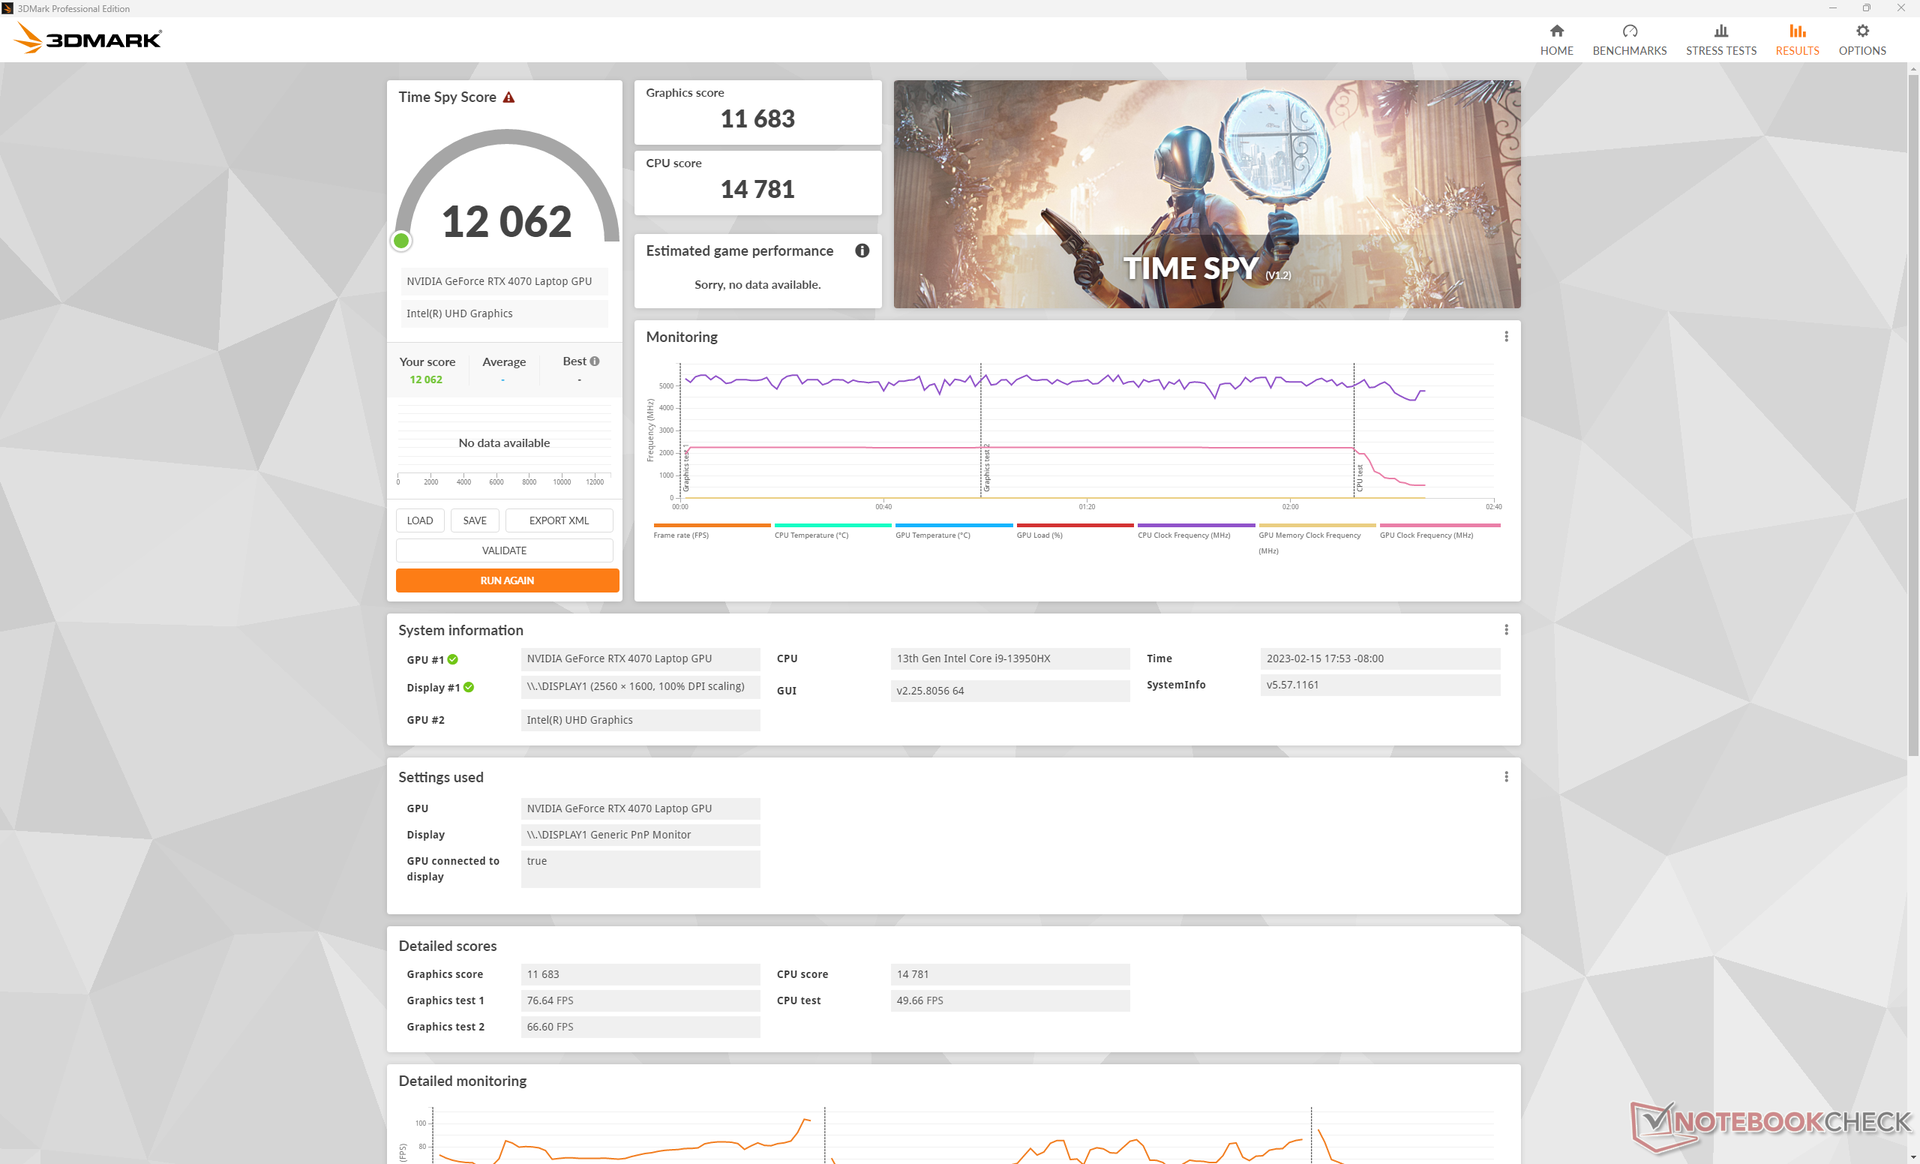

| 3DMark 11 Performance | 34754 Punkte | |
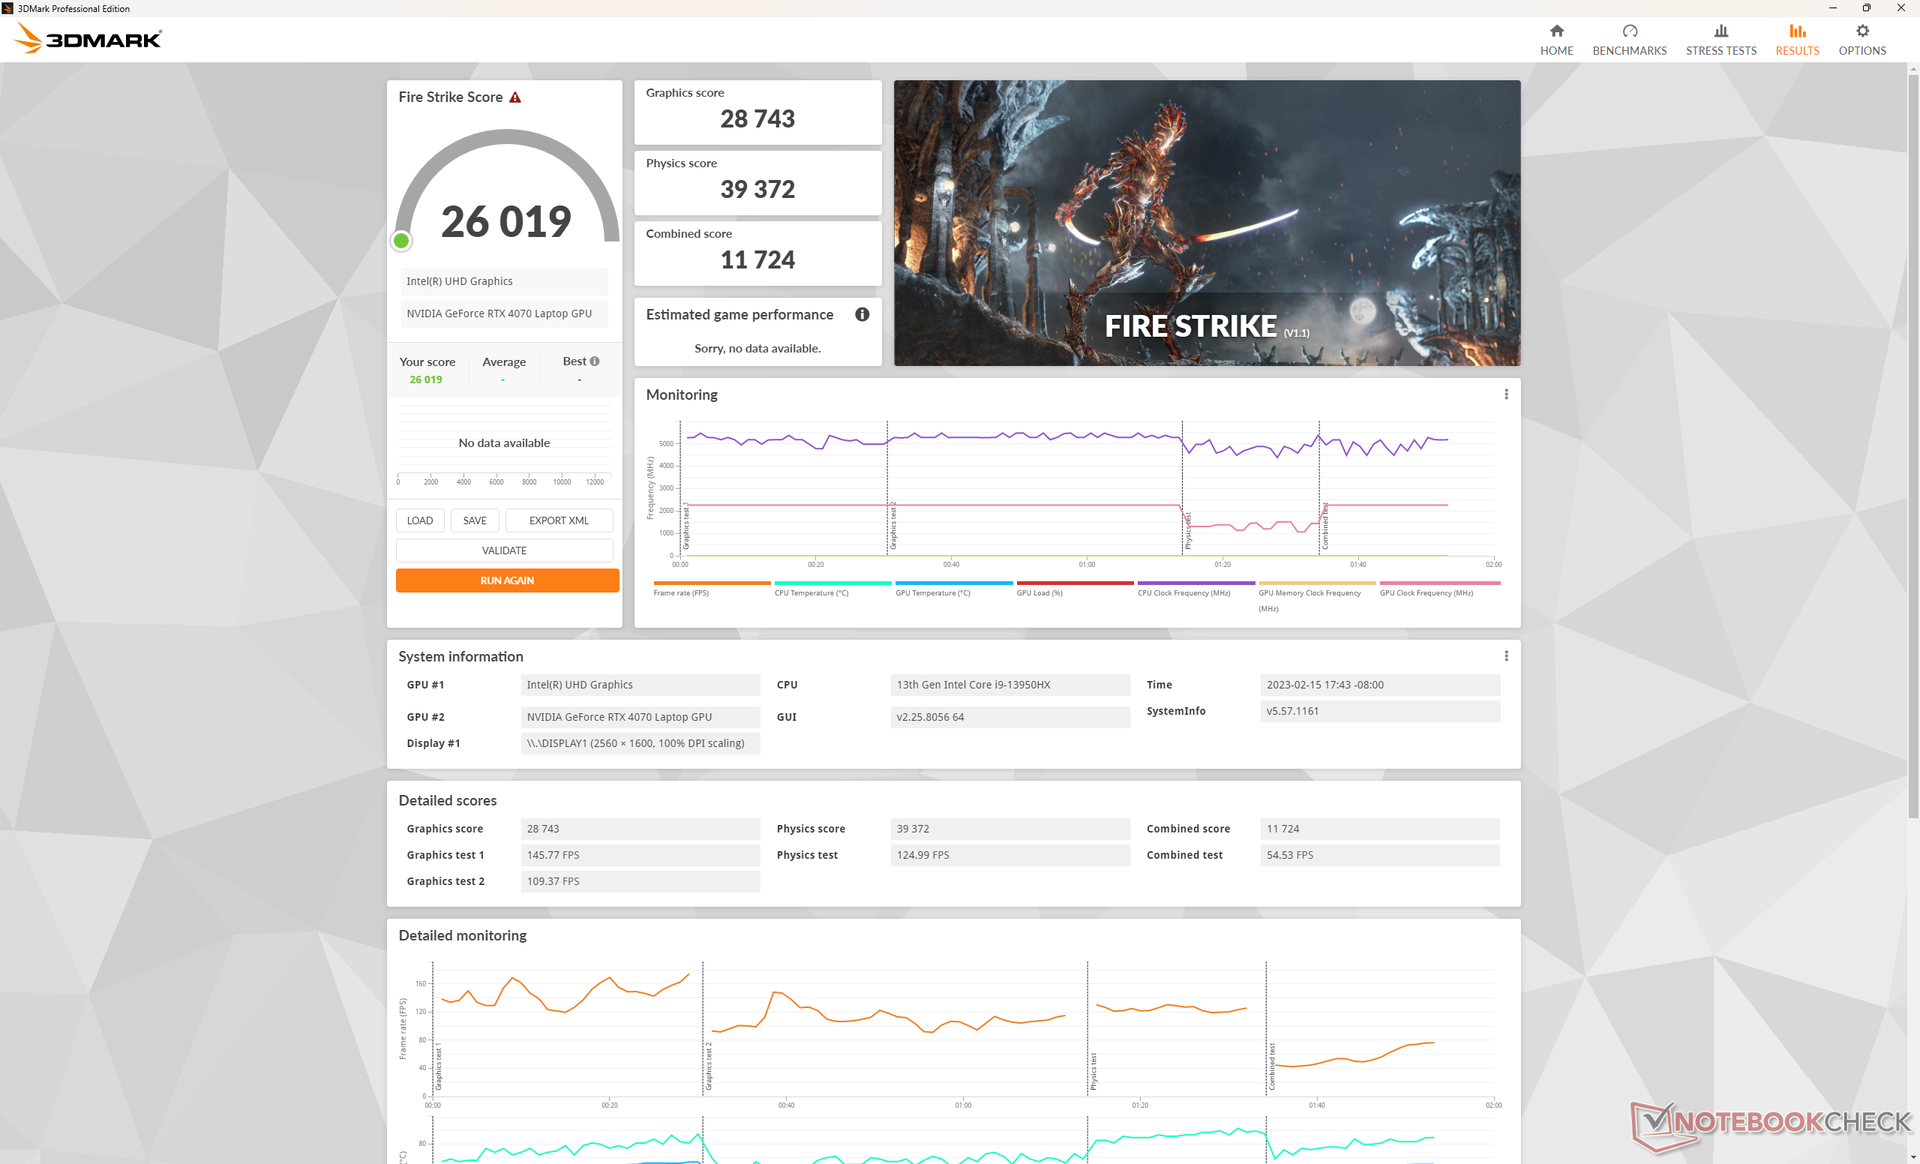
| 3DMark Fire Strike Score | 26019 Punkte | |
| 3DMark Time Spy Score | 12062 Punkte | |
Hilfe | ||
* ... kleinere Werte sind besser
Witcher 3 im Leerlauf produziert eine sehr stabile Framerate ohne Leistungseinbrüche, störenden Hintergrundprozessen oder erkennbarer Drosselung.
Witcher 3 FPS Chart
| min. | mittel | hoch | max. | QHD | 4K | |
|---|---|---|---|---|---|---|
| GTA V (2015) | 186.1 | 184.7 | 181.6 | 121.4 | 87.6 | 88.5 |
| The Witcher 3 (2015) | 617 | 405.9 | 240.9 | 113.9 | 72.5 | |
| Dota 2 Reborn (2015) | 225 | 200 | 191 | 178.6 | 145.5 | |
| Final Fantasy XV Benchmark (2018) | 231 | 166.9 | 115.2 | 82 | 46.6 | |
| X-Plane 11.11 (2018) | 203 | 178.9 | 137.9 | 117.7 | ||
| Strange Brigade (2018) | 464 | 315 | 243 | 208 | 136.7 | 71.9 |
| Metro Exodus (2019) | 208.9 | 139.8 | 109.7 | 86.8 | 69 | 44 |
| Borderlands 3 (2019) | 258.5 | 200.1 | 131.8 | 100.3 | 68.7 | 35.7 |
| Hitman 3 (2021) | 294.3 | 234 | 208.4 | 197.4 | 129.9 | 68.5 |
| Cyberpunk 2077 1.6 (2022) | 147.8 | 125.7 | 111.5 | 92.1 | 54 | 23.3 |
Emissionen - Ruhiger und kühler RTX-4070-Gamer
Systemlautstärke — Abseits vom Gaming leise
Wenn nur mäßig anspruchsvolle Lasten anliegen, beispielsweise Videostreaming oder Browsen, bleiben die internen Lüfter ruhig. Die Lüfterlautstärke beträgt in diesen Fällen knapp unter 27 dB(A) gegen eine Hintergrundlautstärke von 23,5 dB(A), was praktisch kaum hörbar ist. Angesichts der Größe und vor allem der potenten Hardware im Inneren ist dies überraschend leise.
Anspruchsvollere Lasten wie Games erhöhen die Lautstärke langsam aber stetig, bis sich die Lüfter bei rund 48 dB(A) stabilisieren. Bei 100-prozentiger Auslastung erreicht die Lüfterlautstärke aber auch bis zu 54 dB(A). Die meisten Gaming-Laptops bewegen sich im unteren 50-dB(A)-Bereich, so auch das GT77 oder Razers eigenem Blade 17. Trotz der Größenunterschiede ist das Blade 18 beim Gaming ungefähr so laut wie sein kleineres Schwestermodell.
Lautstärkediagramm
| Idle |
| 23.8 / 23.8 / 26.8 dB(A) |
| Last |
| 37.3 / 53.5 dB(A) |
 | ||
30 dB leise 40 dB(A) deutlich hörbar 50 dB(A) störend |
||
min: | ||
| Razer Blade 18 RTX 4070 GeForce RTX 4070 Laptop GPU, i9-13950HX, SSSTC CA6-8D1024 | Razer Blade 17 Early 2022 GeForce RTX 3080 Ti Laptop GPU, i9-12900H, Samsung PM9A1 MZVL21T0HCLR | MSI Titan GT77 HX 13VI GeForce RTX 4090 Laptop GPU, i9-13950HX, Samsung PM9A1 MZVL22T0HBLB | Gigabyte G7 KE GeForce RTX 3060 Laptop GPU, i5-12500H, Gigabyte AG470S1TB-SI B10 | Alienware m17 R5 (R9 6900HX, RX 6850M XT) Radeon RX 6850M XT, R9 6900HX, SSSTC CA6-8D1024 | Asus ROG Strix Scar 17 SE G733CX-LL014W GeForce RTX 3080 Ti Laptop GPU, i9-12950HX, Samsung PM9A1 MZVL22T0HBLB | |
|---|---|---|---|---|---|---|
| Geräuschentwicklung | -12% | -17% | -26% | 0% | 5% | |
| aus / Umgebung * (dB) | 23.5 | 26 -11% | 24.6 -5% | 27 -15% | 23 2% | 23.9 -2% |
| Idle min * (dB) | 23.8 | 26 -9% | 29.2 -23% | 27 -13% | 23 3% | 23.9 -0% |
| Idle avg * (dB) | 23.8 | 27 -13% | 29.2 -23% | 35 -47% | 28.11 -18% | 23.9 -0% |
| Idle max * (dB) | 26.8 | 32 -19% | 29.2 -9% | 38 -42% | 28.11 -5% | 23.9 11% |
| Last avg * (dB) | 37.3 | 50 -34% | 50.7 -36% | 52 -39% | 30.62 18% | 34.3 8% |
| Witcher 3 ultra * (dB) | 48 | 51 -6% | 53.3 -11% | 56 -17% | 49.75 -4% | |
| Last max * (dB) | 53.5 | 51 5% | 61 -14% | 59 -10% | 50.17 6% | 45.9 14% |
* ... kleinere Werte sind besser
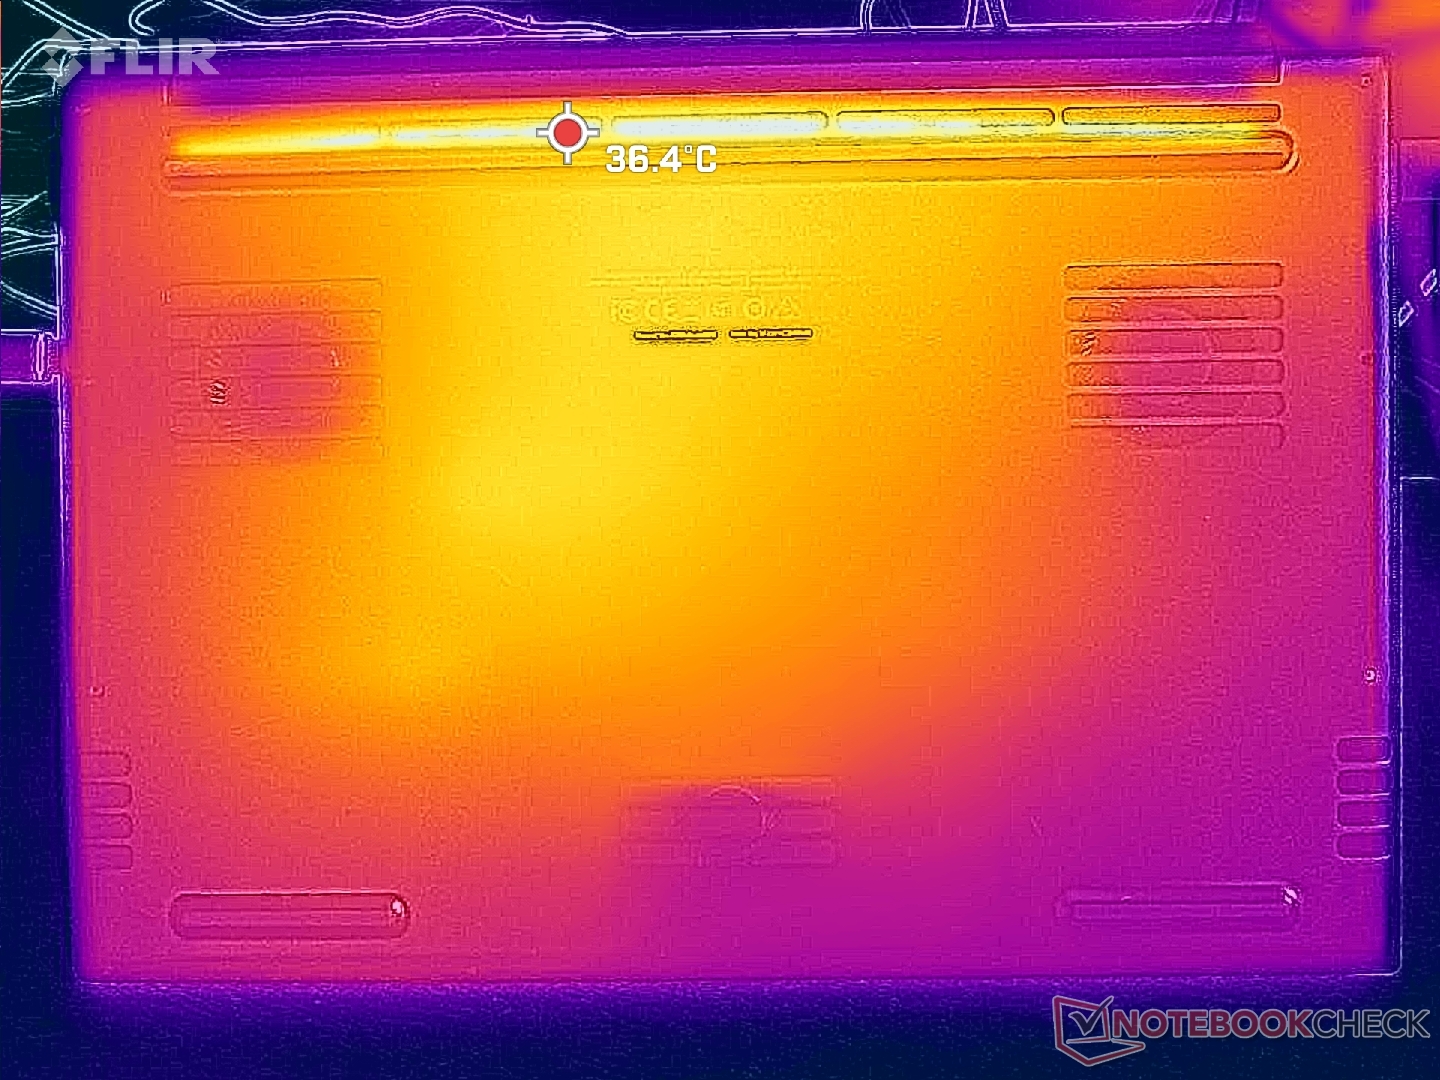
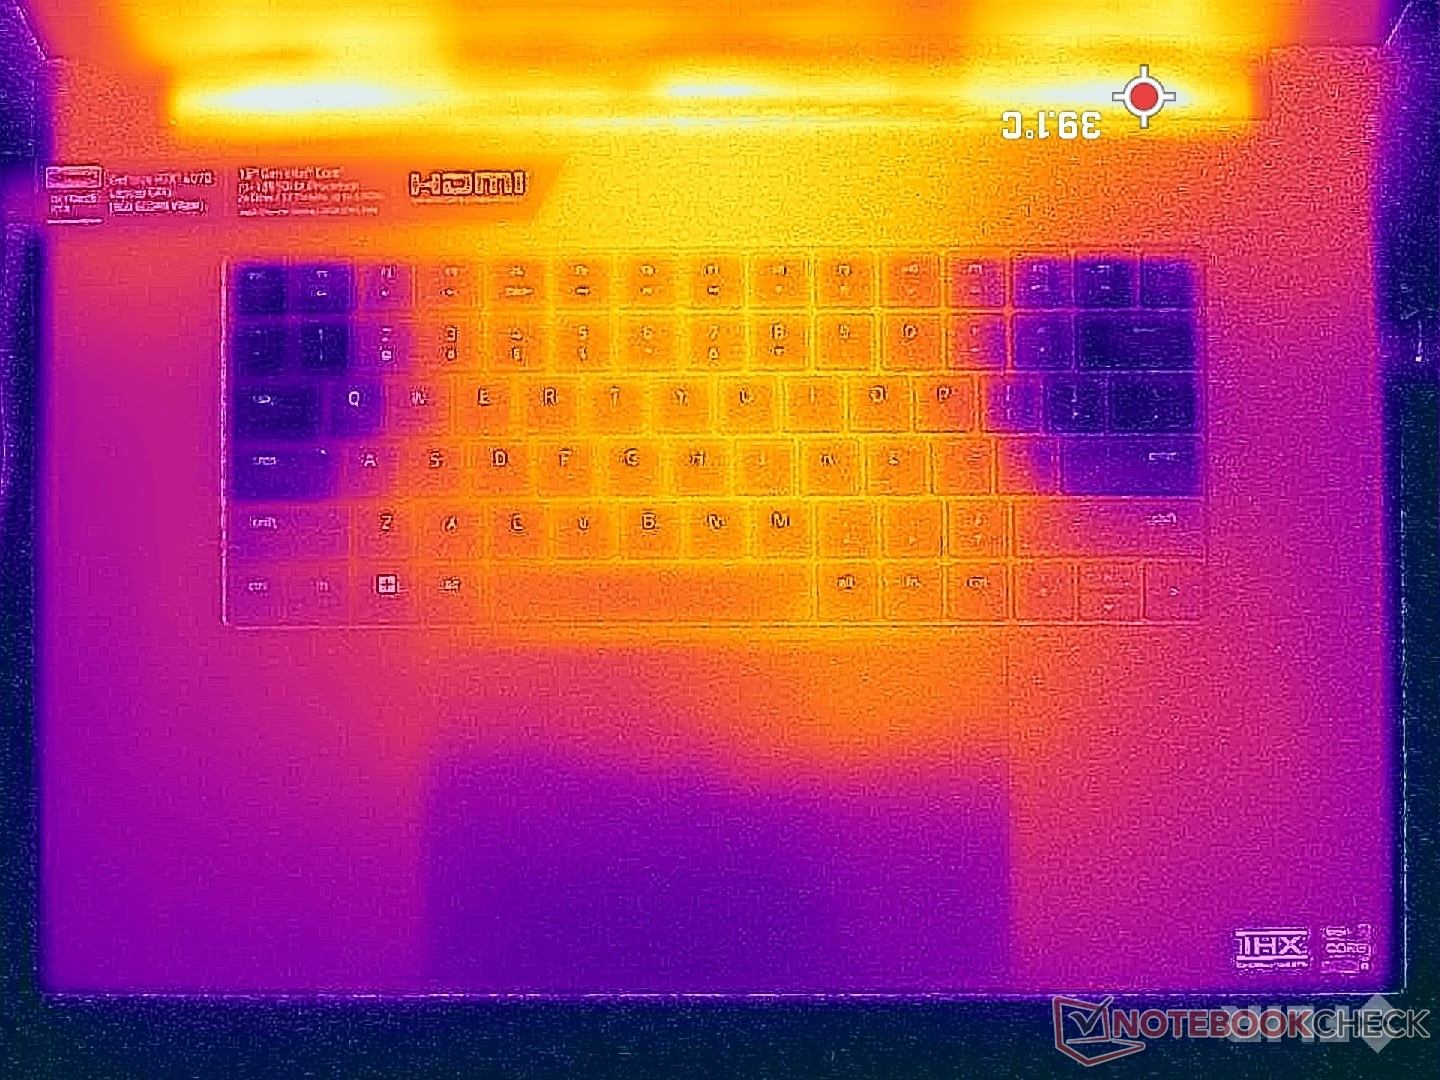
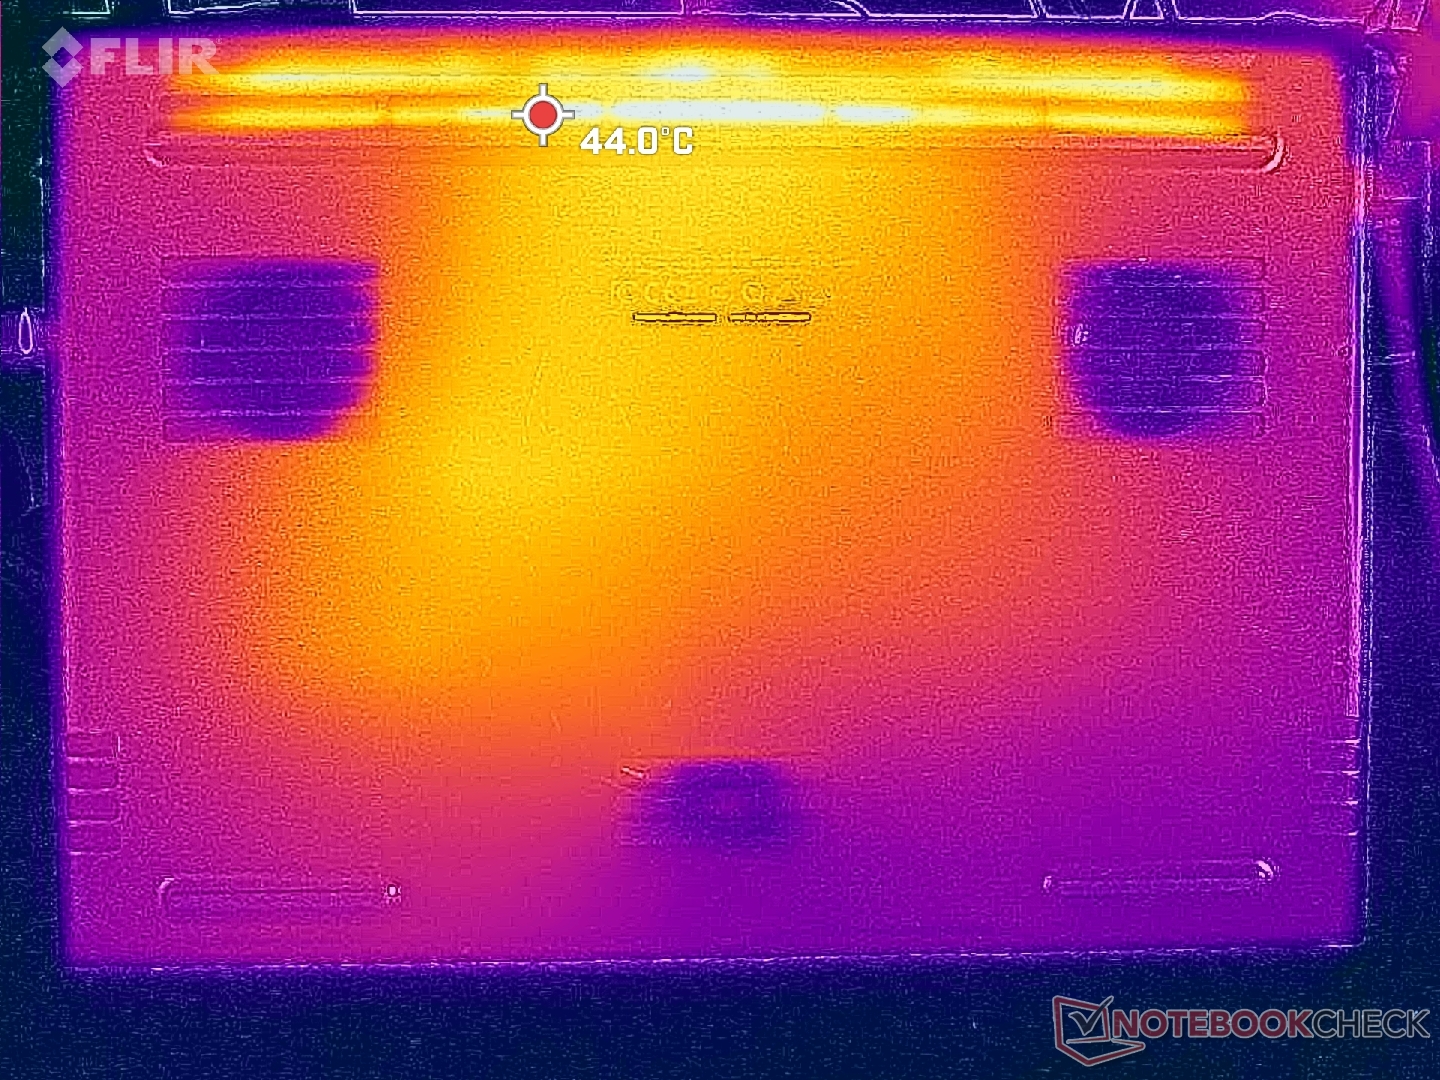
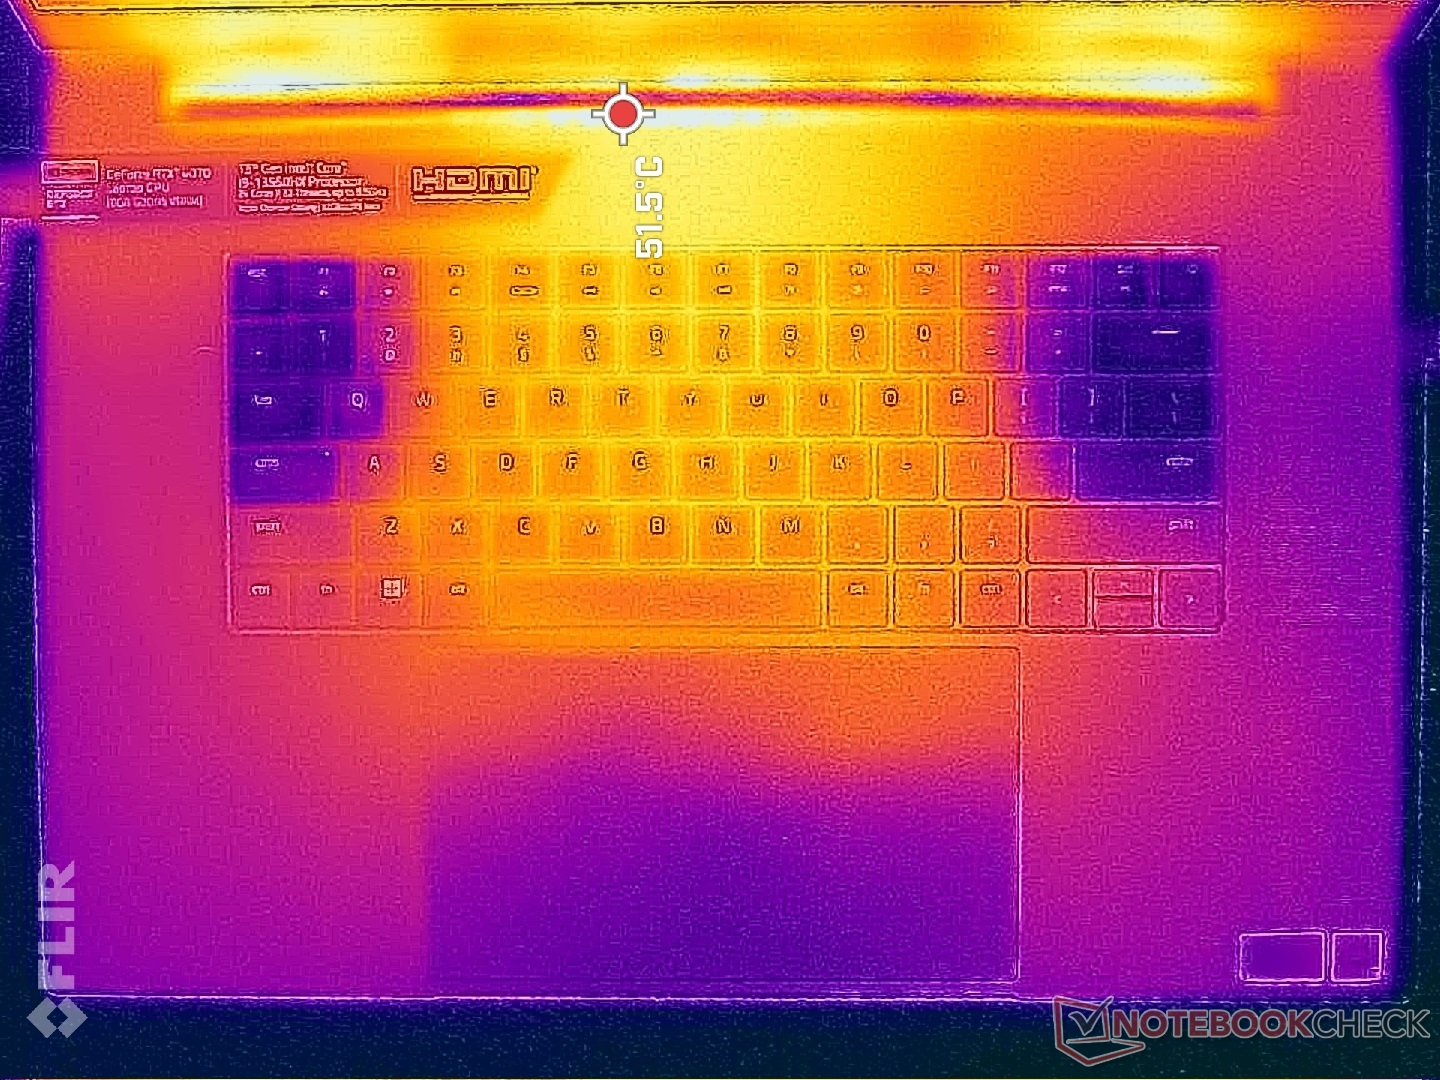
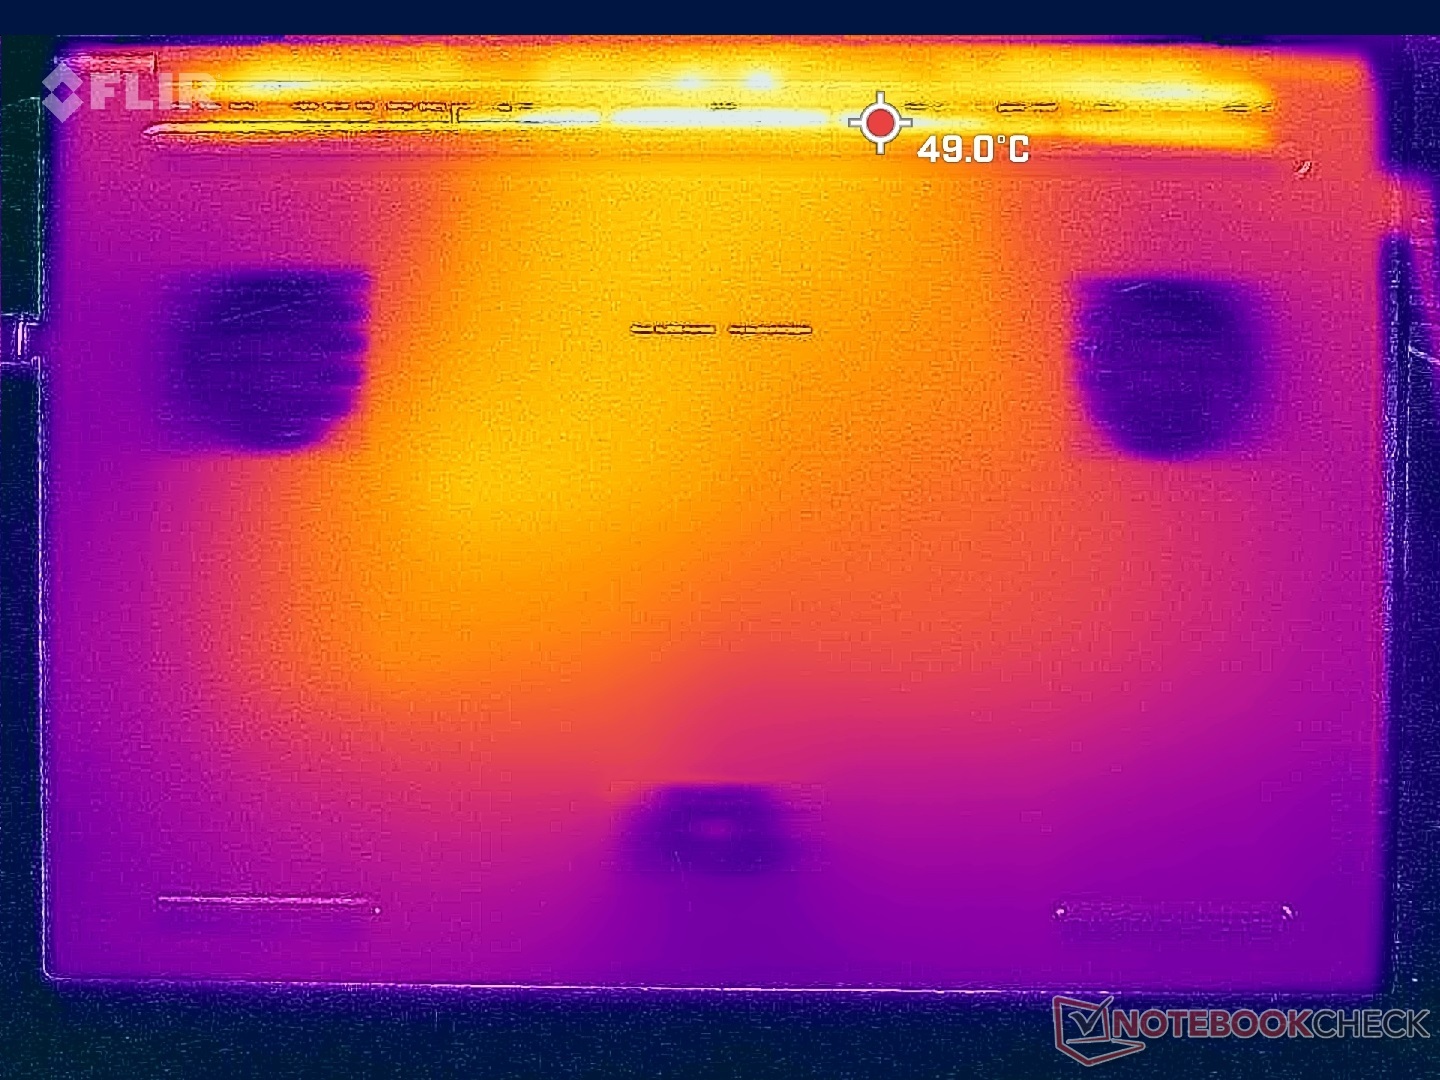
Temperatur
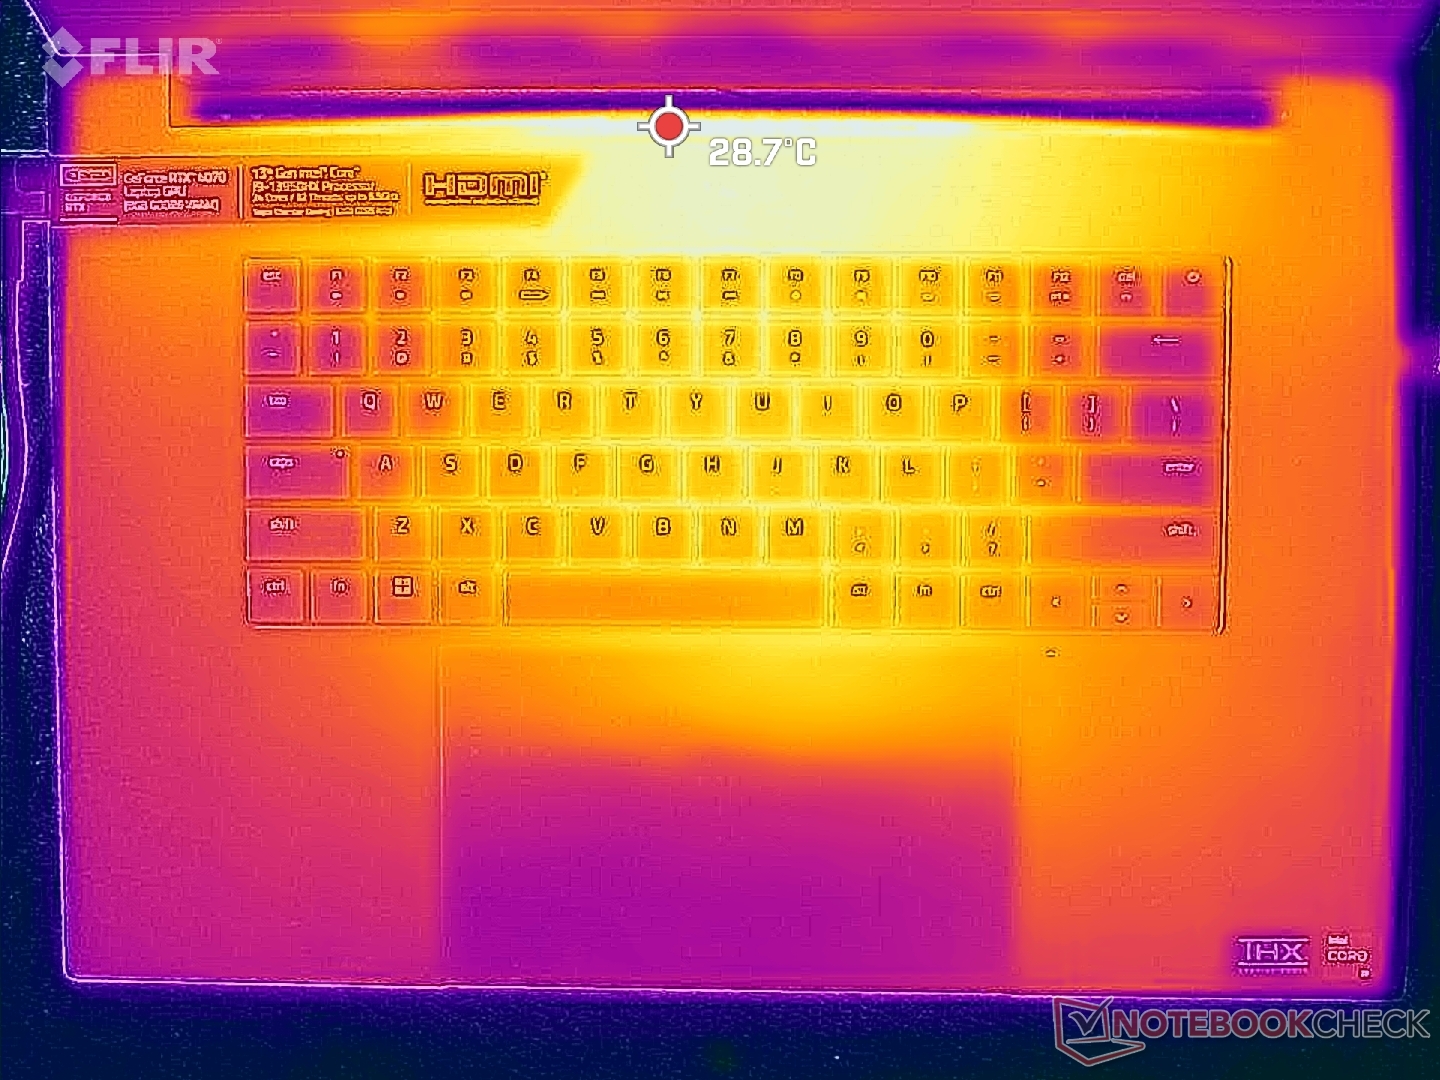
Für einen Gaming-Laptop sind die Oberflächentemperaturen relativ kühl. Dafür sorgen der große 18-Zoll-Formfaktor, die Vapor Chamber mit gleich drei Lüftern sowie die GPU mit nur 140 W TGP. Schnellere Konfigurationen mit RTX 4080 oder RTX 4090 dürften wärmer werden, alleine weil sie eine höhere TGP von bis zu 175 W aufrufen.
Hot Spots beim Spielen von Witcher 3 liegen an der Oberseite bei 36 °C und unten bei 33 °C, verglichen mit den 50 bis 57 °C am Alienware m17 R5. Damit ist das Blade 18 mit RTX 4070 eines der kühlsten Gaming-Laptops den wir bislang getestet haben. Klar wird auch, dass das Gehäuse dazu konzipiert ist noch schnellere Hardware zu beherbergen als unsere RTX 4070.
Im Leerlauf sind die Oberflächentemperaturen hingegen etwas höher als erwartet, da auch die Lüfter bei niedrigen Lasten aussetzen. Insgesamt wird das Blade 18 niemals unangenehm warm, so lange die lange Rückseite gut belüftet werden kann.
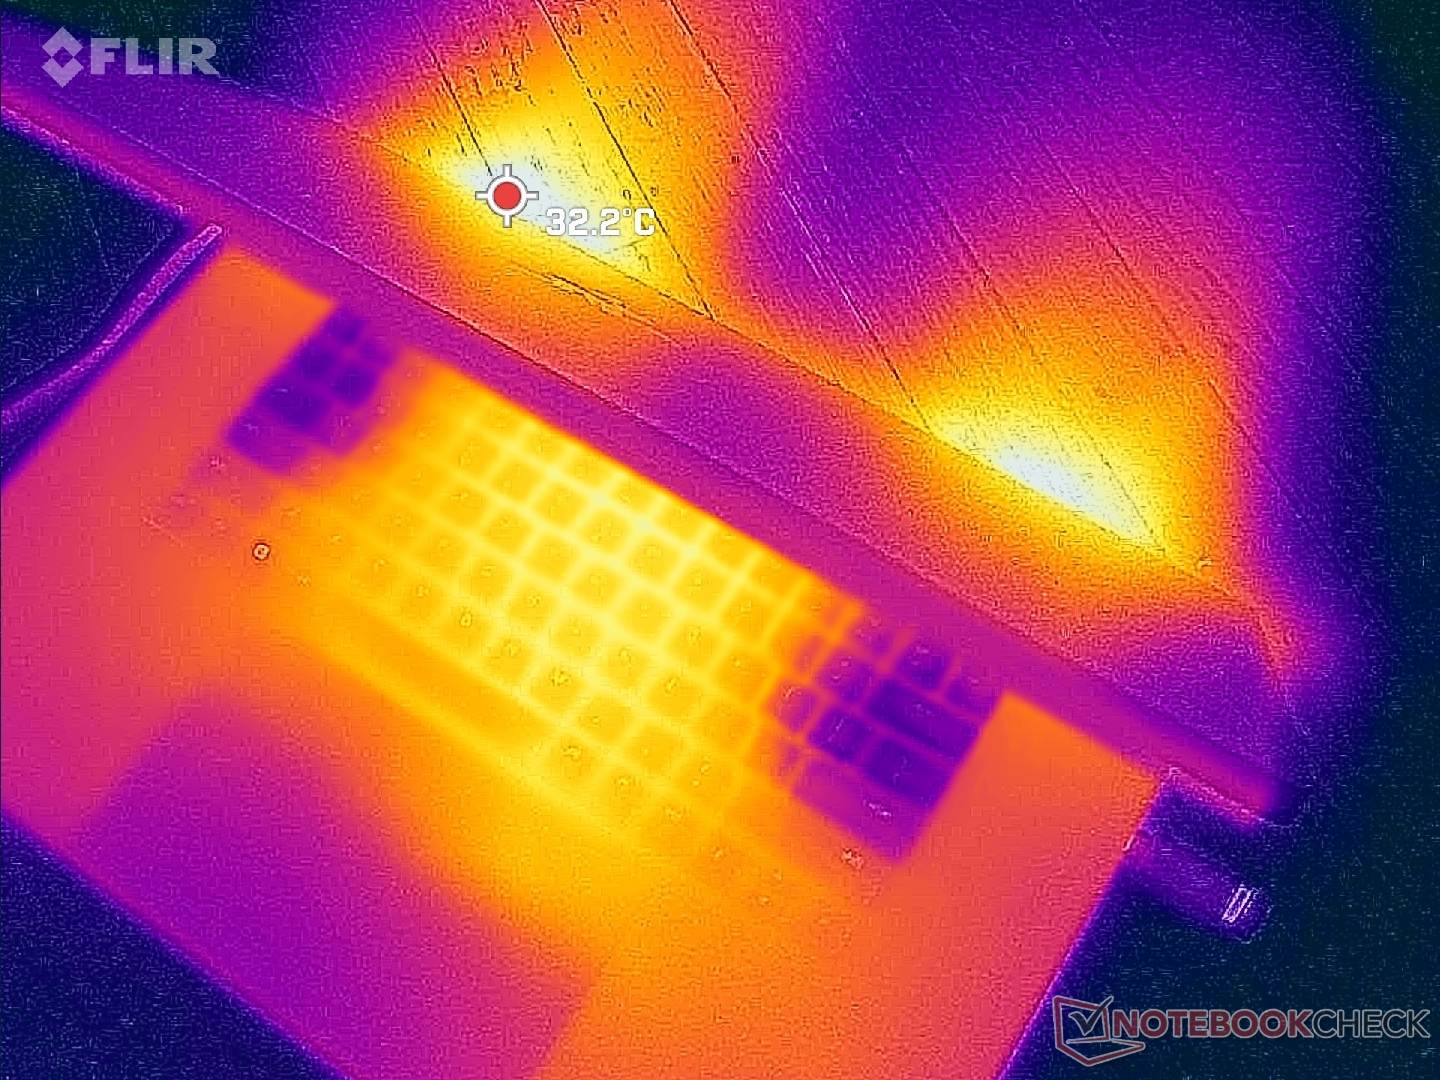
(+) Die maximale Temperatur auf der Oberseite ist 39.2 °C. Im Vergleich liegt der Klassendurchschnitt bei 40.4 °C (von 21.2 bis 68.8 °C für die Klasse Gaming).
(+) Auf der Unterseite messen wir eine maximalen Wert von 35.6 °C (im Vergleich zum Durchschnitt von 43.2 °C).
(+) Ohne Last messen wir eine durchschnittliche Temperatur von 28.1 °C auf der Oberseite. Der Klassendurchschnitt erreicht 33.9 °C.
(+) Beim längeren Spielen von The Witcher 3 erhitzt sich das Gerät durchschnittlich auf 28.9 °C. Der Durchschnitt der Klasse ist derzeit 33.9 °C.
(+) Die Handballen und der Touchpad-Bereich sind mit gemessenen 26 °C kühler als die typische Hauttemperatur und fühlen sich dadurch kühl an.
(+) Die durchschnittliche Handballen-Temperatur anderer getesteter Geräte war 28.8 °C (+2.8 °C).
| Razer Blade 18 RTX 4070 Intel Core i9-13950HX, NVIDIA GeForce RTX 4070 Laptop GPU | Razer Blade 17 Early 2022 Intel Core i9-12900H, NVIDIA GeForce RTX 3080 Ti Laptop GPU | MSI Titan GT77 HX 13VI Intel Core i9-13950HX, NVIDIA GeForce RTX 4090 Laptop GPU | Gigabyte G7 KE Intel Core i5-12500H, NVIDIA GeForce RTX 3060 Laptop GPU | Alienware m17 R5 (R9 6900HX, RX 6850M XT) AMD Ryzen 9 6900HX, AMD Radeon RX 6850M XT | Asus ROG Strix Scar 17 SE G733CX-LL014W Intel Core i9-12950HX, NVIDIA GeForce RTX 3080 Ti Laptop GPU | |
|---|---|---|---|---|---|---|
| Hitze | -28% | 2% | -17% | -18% | -18% | |
| Last oben max * (°C) | 39.2 | 50 -28% | 40.6 -4% | 52 -33% | 53 -35% | 48.8 -24% |
| Last unten max * (°C) | 35.6 | 56 -57% | 41.1 -15% | 54 -52% | 56 -57% | 52.4 -47% |
| Idle oben max * (°C) | 31.8 | 36 -13% | 26.2 18% | 28 12% | 30 6% | 30.4 4% |
| Idle unten max * (°C) | 33.2 | 38 -14% | 30.3 9% | 32 4% | 29 13% | 34.1 -3% |
* ... kleinere Werte sind besser
Stresstest
Wenn Prime95 läuft, um die CPU zu stressen, dann boosten die Taktraten und Leistungsaufnahme kurz auf 3,8 GHz und 140 W hoch, etwa 70 Sekunden später fallen die Werte auf 3,1 GHz und zwischen 110 bis 120 W. Die Kerntemperaturen pegeln sich auf 87 °C ein, verglichen mit den 82 °C beim Blade 16 mit der gleichen CPU.
GPU-Takt, Temperatur und Leistungsaufnahme stabilisieren sich unter Witcher 3 bei 2.265 MHz, 64 °C und 80 bis 90 W. Da die GPU eigentlich mit einer TGP von 140 W angegeben ist, überrascht der deutliche niedrigere Wert von nur 80 W im Performancemodus. Selbst beim anspruchsvollen Cyberpunk 2077 messen wir einen Peak von nur 100 W für die GPU. Dagegen stabilisiert sich die RTX 4080 im Blade 16 im gleichen Witcher-3-Test bei etwa 160 W bei einer Ziel-TGP von 175 W.
Im Akkumodus wird die Leistung limitiert. Ein erneuter 3DMark-11-Test ergibt Physics- und Graphics-Scores von 10.336 und 18.043 Punkten anstelle der 25.874 und 39.733 Punkte am Stromnetz.
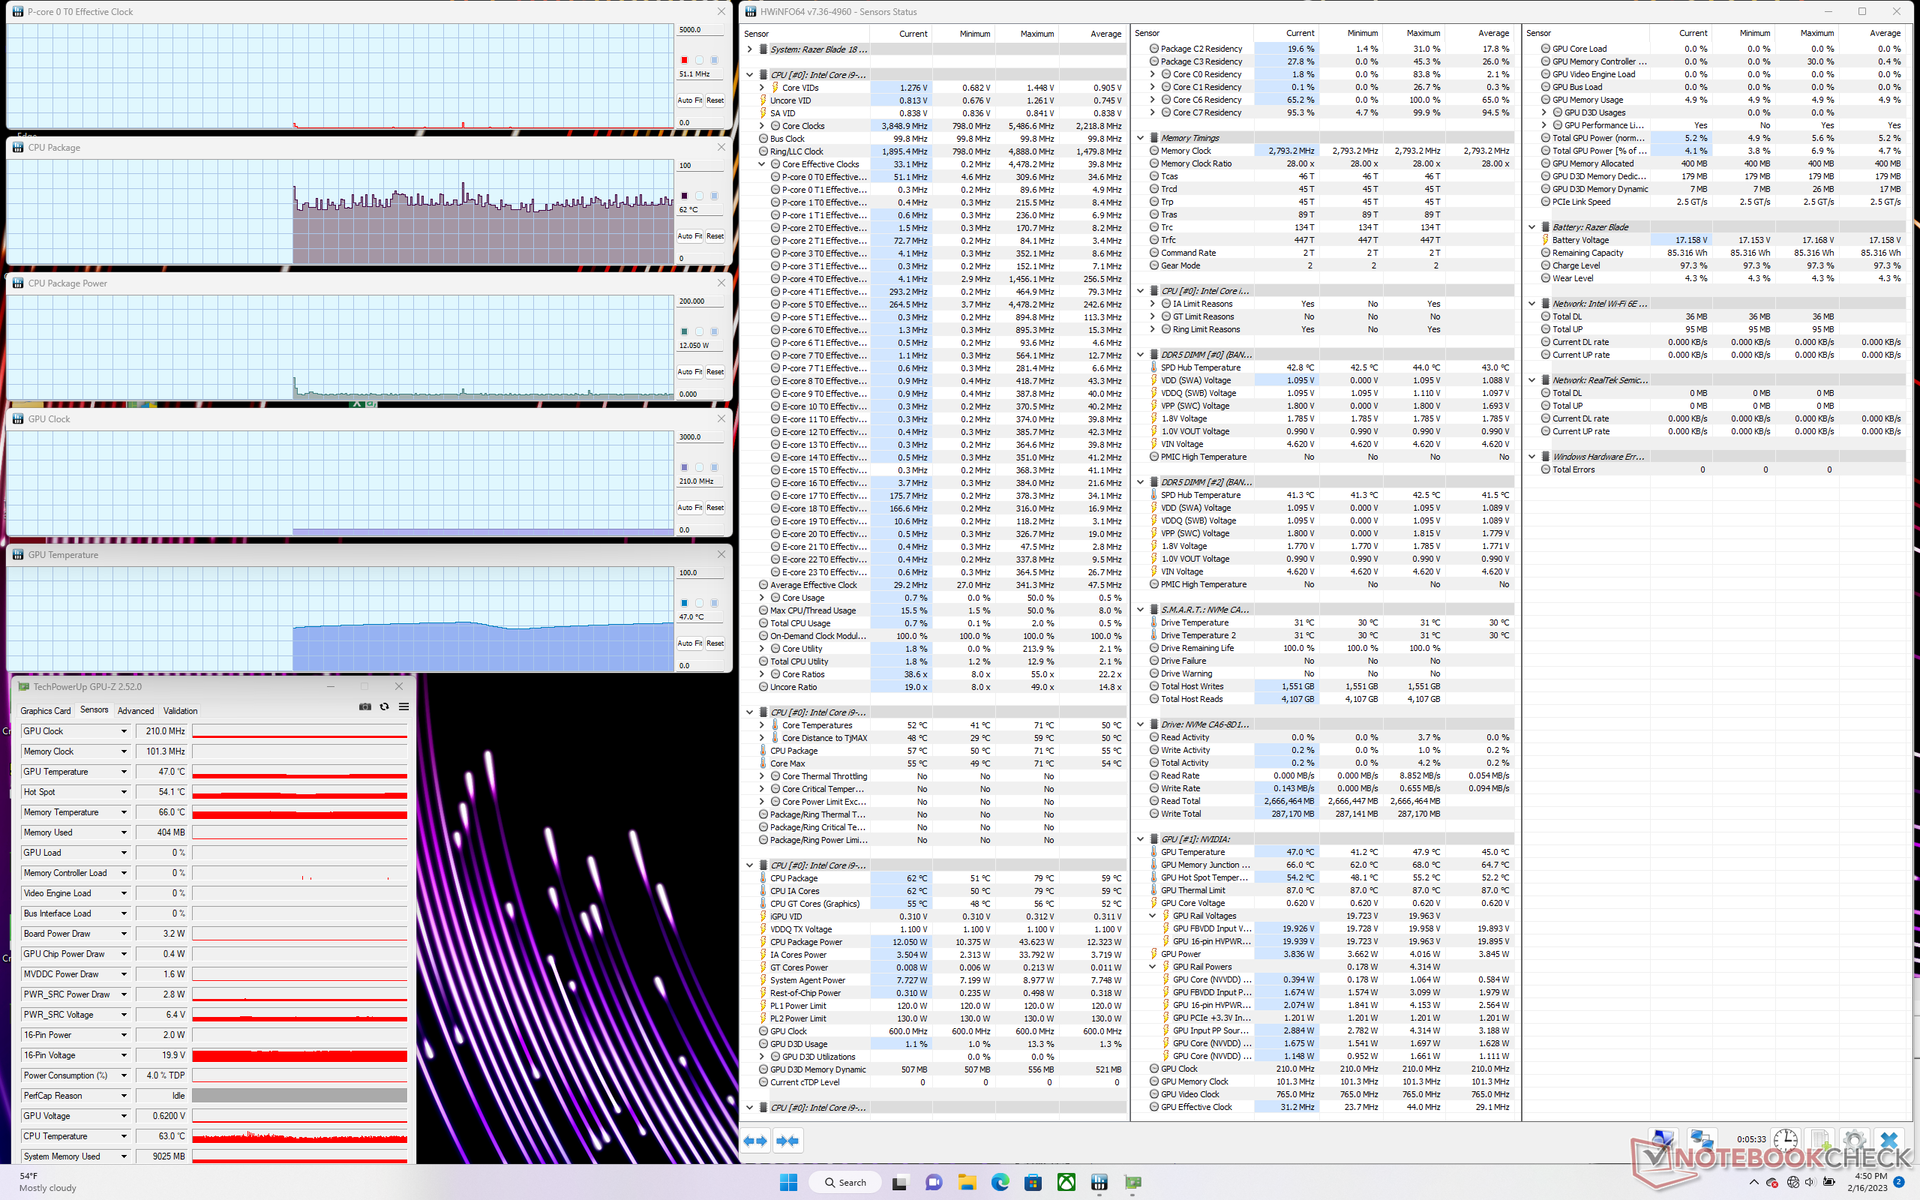
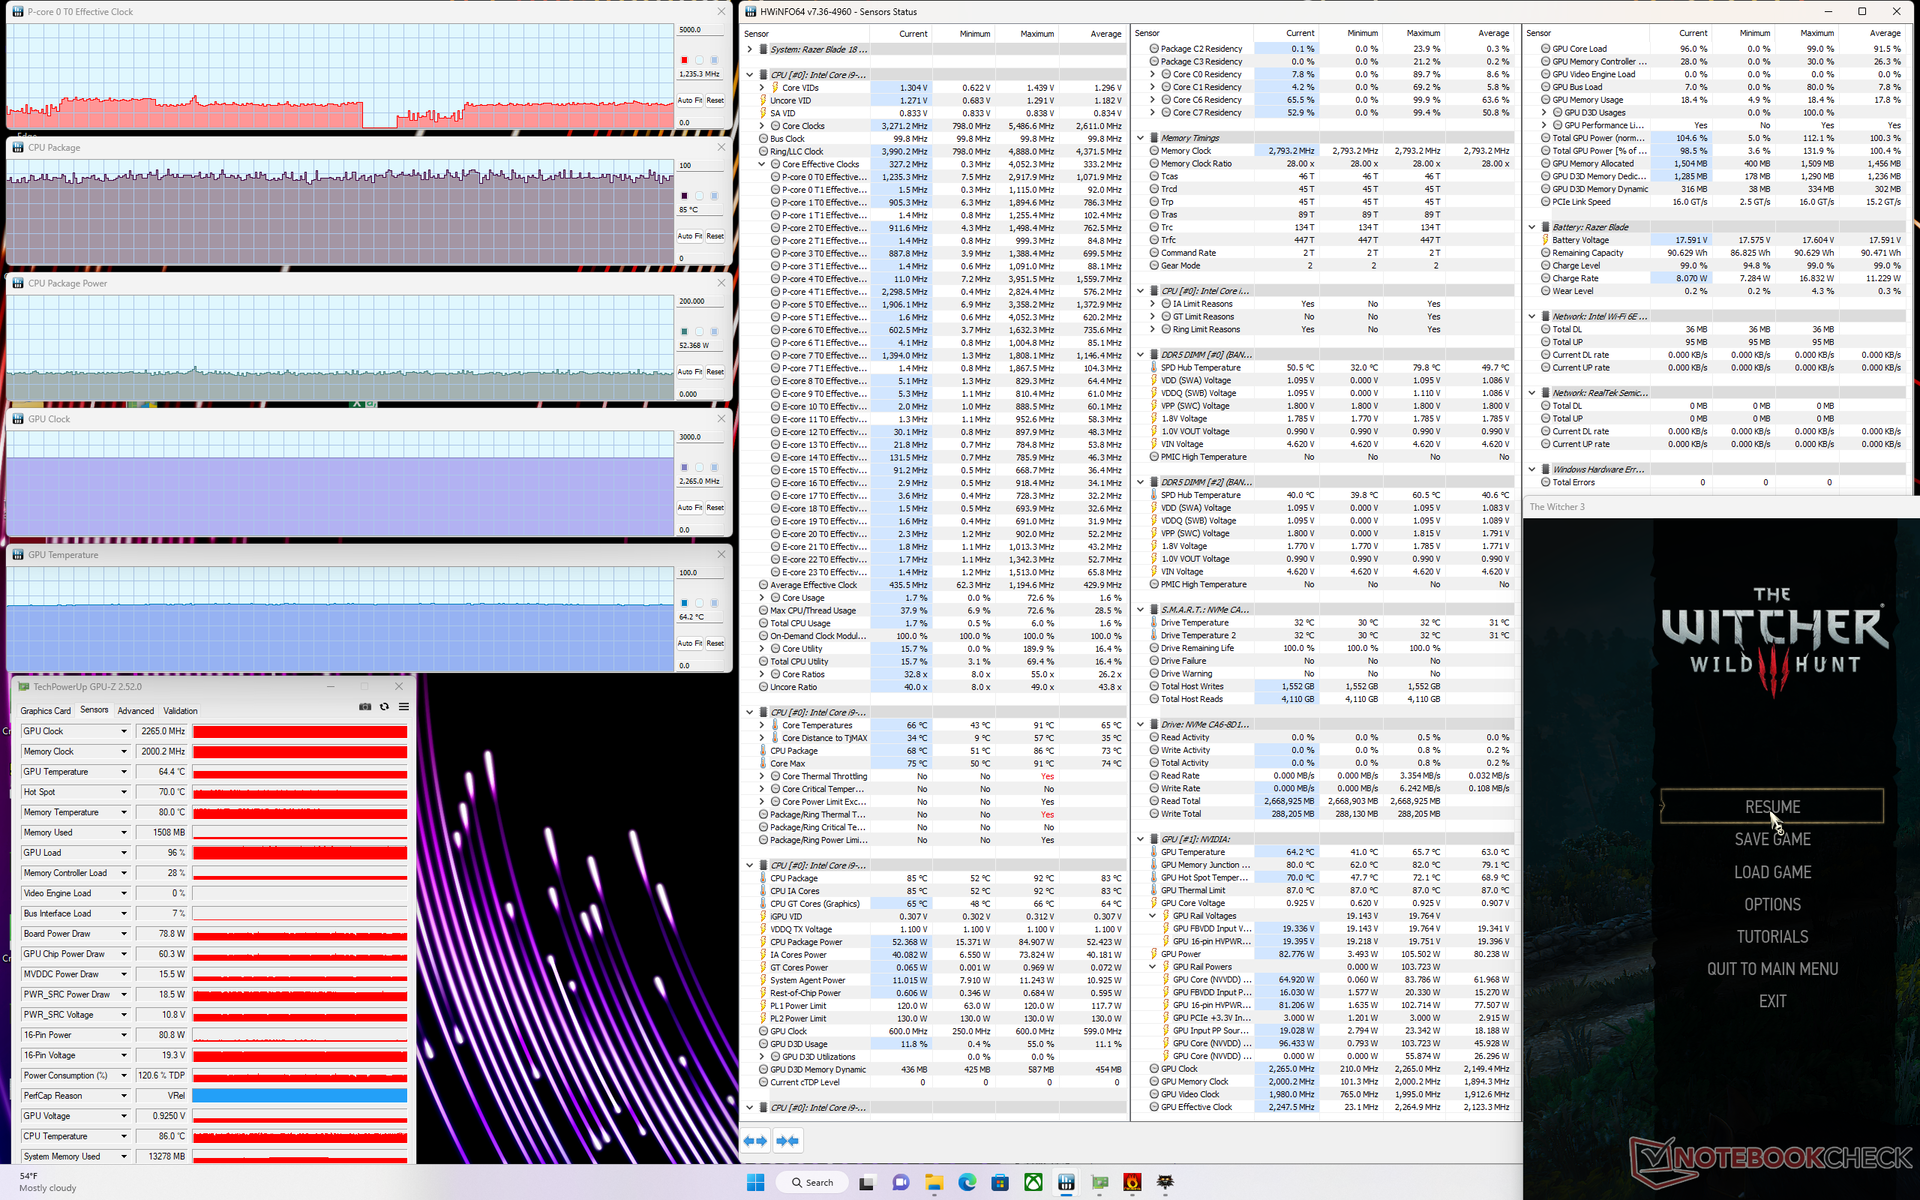

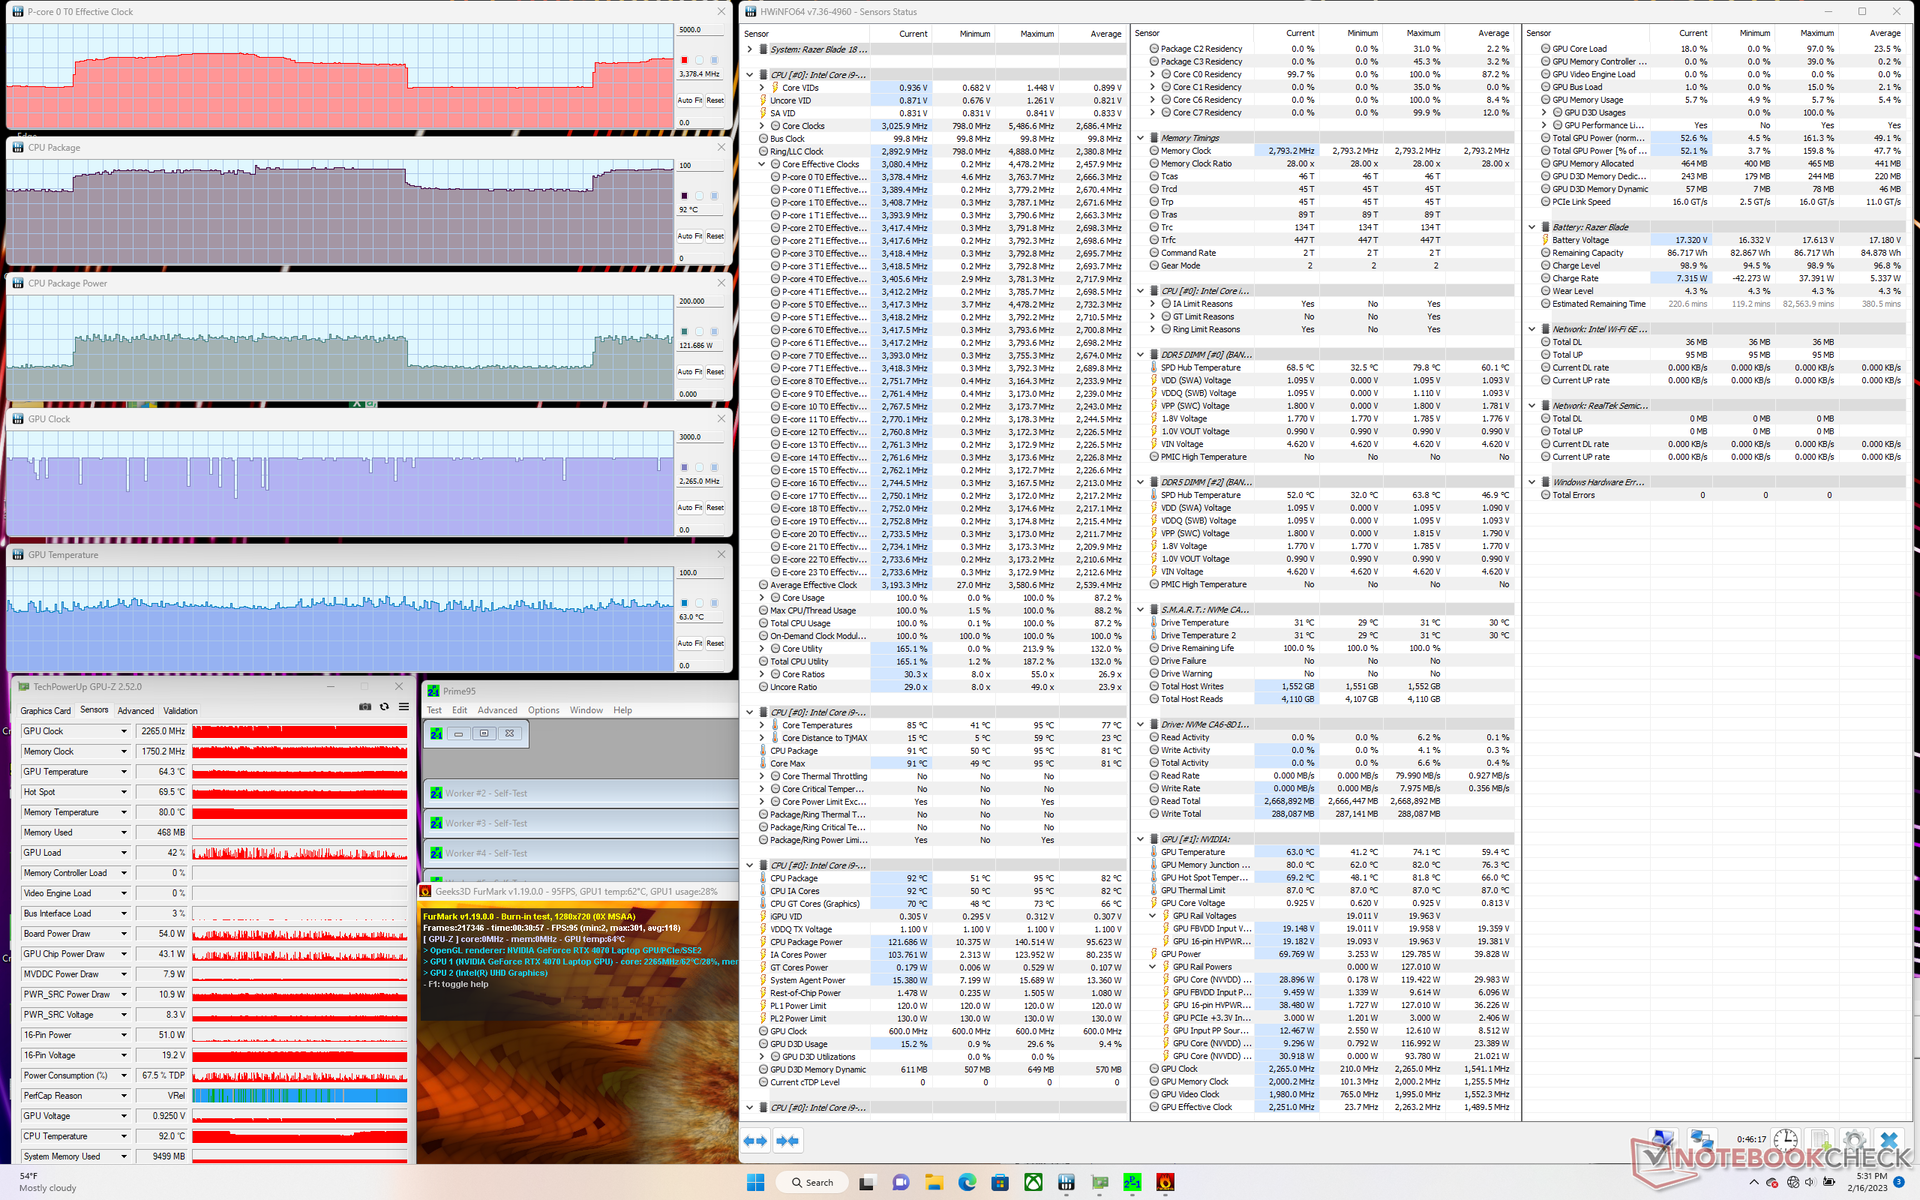
| CPU Clock (GHz) | GPU Clock (MHz) | Average CPU Temperature (°C) | Average GPU Temperature (°C) | |
| System Idle | -- | -- | 62 | 47 |
| Prime95 Stress | 3,2 | -- | 84 | 53 |
| Prime95 + FurMark Stress | 2,0 - 3,7 | 2265 | 70 - 91 | 63 |
| Witcher 3 Stress | ~1,2 | 2265 | 85 | 64 |
Lautsprecher
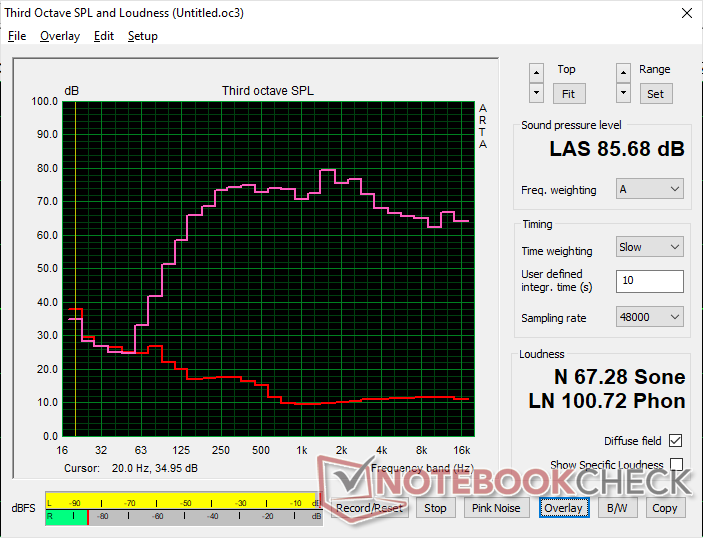
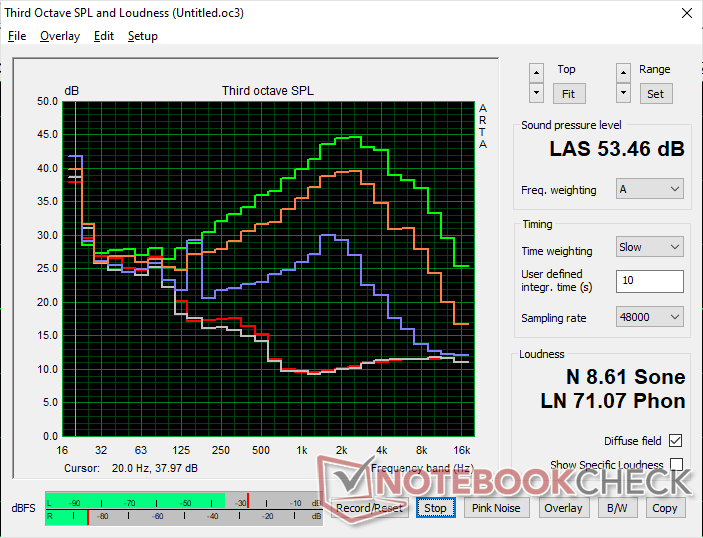
Razer Blade 18 RTX 4070 Audio Analyse
(+) | Die Lautsprecher können relativ laut spielen (85.7 dB)
Bass 100 - 315 Hz
(±) | abgesenkter Bass - 7.5% geringer als der Median
(±) | durchschnittlich lineare Bass-Wiedergabe (9.2% Delta zum Vorgänger)
Mitteltöne 400 - 2000 Hz
(+) | ausgeglichene Mitten, vom Median nur 3.5% abweichend
(+) | lineare Mitten (4.1% Delta zum Vorgänger)
Hochtöne 2 - 16 kHz
(+) | ausgeglichene Hochtöne, vom Median nur 4.8% abweichend
(+) | sehr lineare Hochtöne (3.8% Delta zum Vorgänger)
Gesamt im hörbaren Bereich 100 - 16.000 Hz
(+) | hörbarer Bereich ist sehr linear (9.2% Abstand zum Median
Im Vergleich zu allen Geräten derselben Klasse
» 3% aller getesteten Geräte dieser Klasse waren besser, 1% vergleichbar, 96% schlechter
» Das beste Gerät hat einen Delta-Wert von 6%, durchschnittlich ist 18%, das schlechteste Gerät hat 132%
Im Vergleich zu allen Geräten im Test
» 3% aller getesteten Geräte waren besser, 1% vergleichbar, 96% schlechter
» Das beste Gerät hat einen Delta-Wert von 4%, durchschnittlich ist 24%, das schlechteste Gerät hat 134%
Apple MacBook Pro 16 2021 M1 Pro Audio Analyse
(+) | Die Lautsprecher können relativ laut spielen (84.7 dB)
Bass 100 - 315 Hz
(+) | guter Bass - nur 3.8% Abweichung vom Median
(+) | lineare Bass-Wiedergabe (5.2% Delta zum Vorgänger)
Mitteltöne 400 - 2000 Hz
(+) | ausgeglichene Mitten, vom Median nur 1.3% abweichend
(+) | lineare Mitten (2.1% Delta zum Vorgänger)
Hochtöne 2 - 16 kHz
(+) | ausgeglichene Hochtöne, vom Median nur 1.9% abweichend
(+) | sehr lineare Hochtöne (2.7% Delta zum Vorgänger)
Gesamt im hörbaren Bereich 100 - 16.000 Hz
(+) | hörbarer Bereich ist sehr linear (4.6% Abstand zum Median
Im Vergleich zu allen Geräten derselben Klasse
» 0% aller getesteten Geräte dieser Klasse waren besser, 0% vergleichbar, 100% schlechter
» Das beste Gerät hat einen Delta-Wert von 5%, durchschnittlich ist 17%, das schlechteste Gerät hat 45%
Im Vergleich zu allen Geräten im Test
» 0% aller getesteten Geräte waren besser, 0% vergleichbar, 100% schlechter
» Das beste Gerät hat einen Delta-Wert von 4%, durchschnittlich ist 24%, das schlechteste Gerät hat 134%
Energiemanagement — Großes Display, hoher Verbrauch
Energieverbrauch
Im Leerlauf rangiert der Verbrauch zwischen 24 und 48 W, je nach Helligkeit und Leistungsmodus. Der Unterschied zwischen der minimalen und der maximalen Helligkeitseinstellung beträgt recht hohe 10 W. Diese Spanne ist spürbar höher als auf kleineren Laptops, was die eher mauen Laufzeiten, beschrieben im nächsten Abschnitt, erklärt.
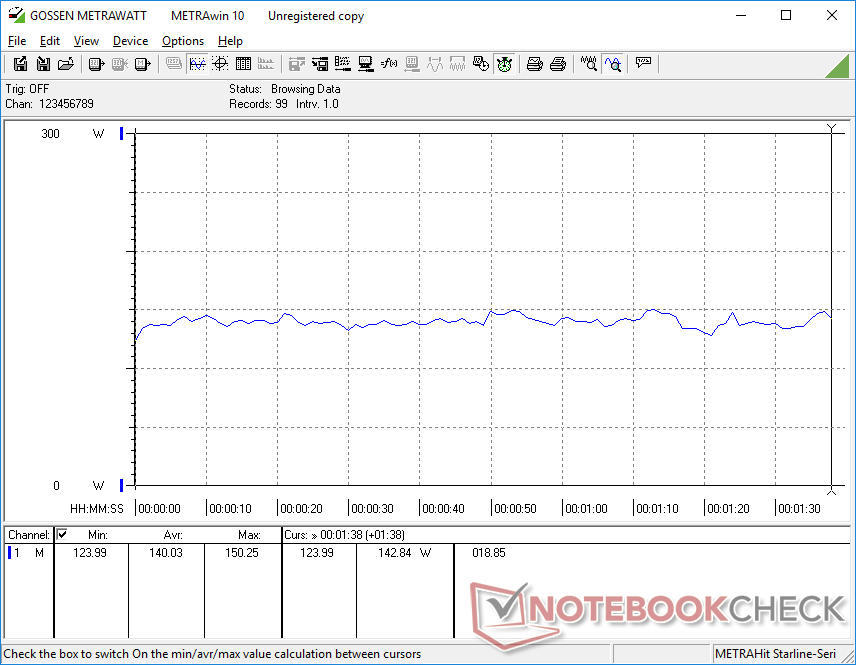
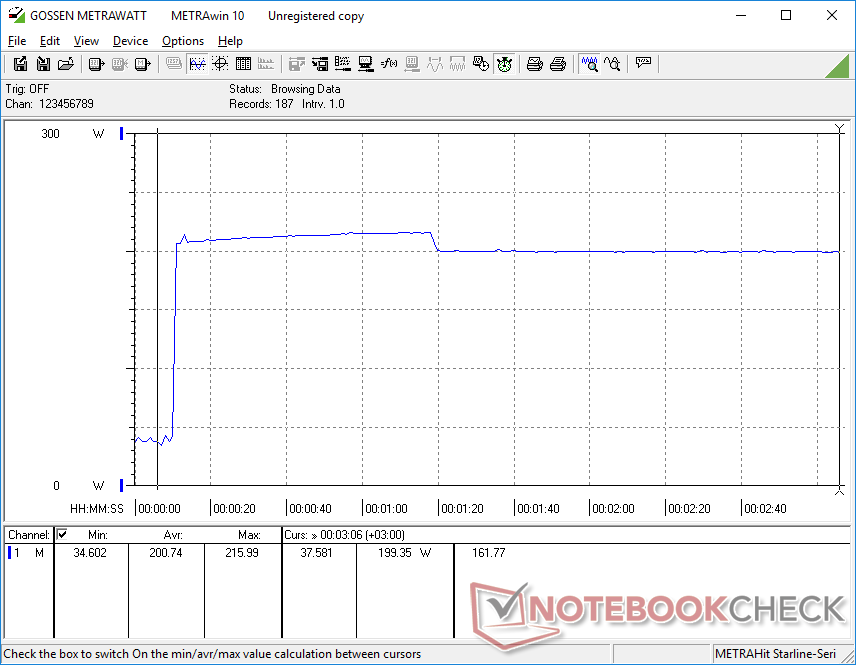
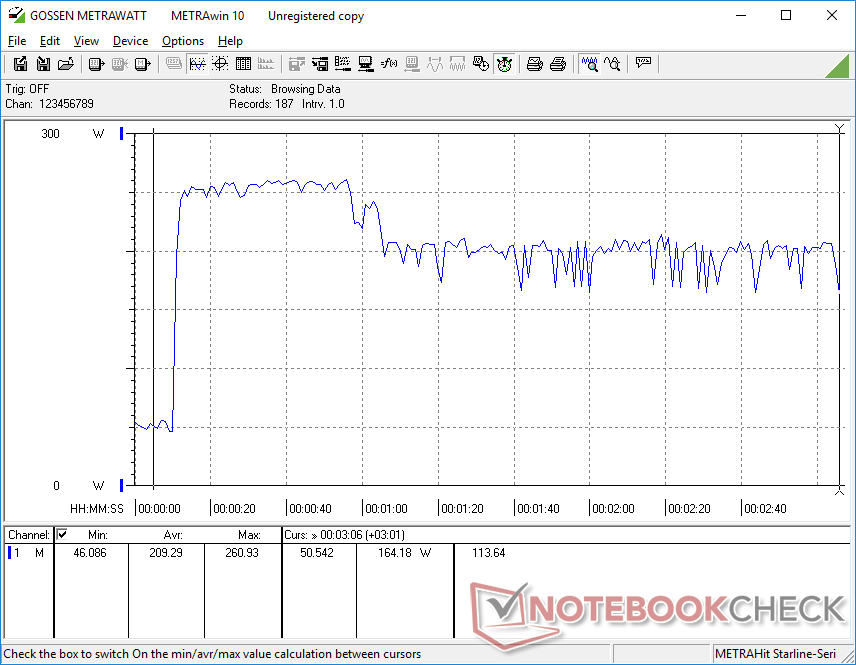
Beim Gaming unter Witcher 3 verbraucht das System 202 W, verglichen mit 229 W bzw. 225 W des Blade 17 mit RTX 3080 Ti bzw. des Asus ROG Strix Scar 17 SE. Folglich zieht unser 18-Zoll-RTX-4070-Gamer etwa 10 Prozent weniger Strom aus dem Netzteil als die mobile RTX 3080 Ti der letzten Generation und das bei etwa gleicher Grafikleistung. Die Ausstattung mit schnellerer RTX 4080 oder RTX 4090 dürfte ca. 40 bis 50 W mehr verbrauchen, ähnlich dem, was wir beim Blade 16 gemessen haben.
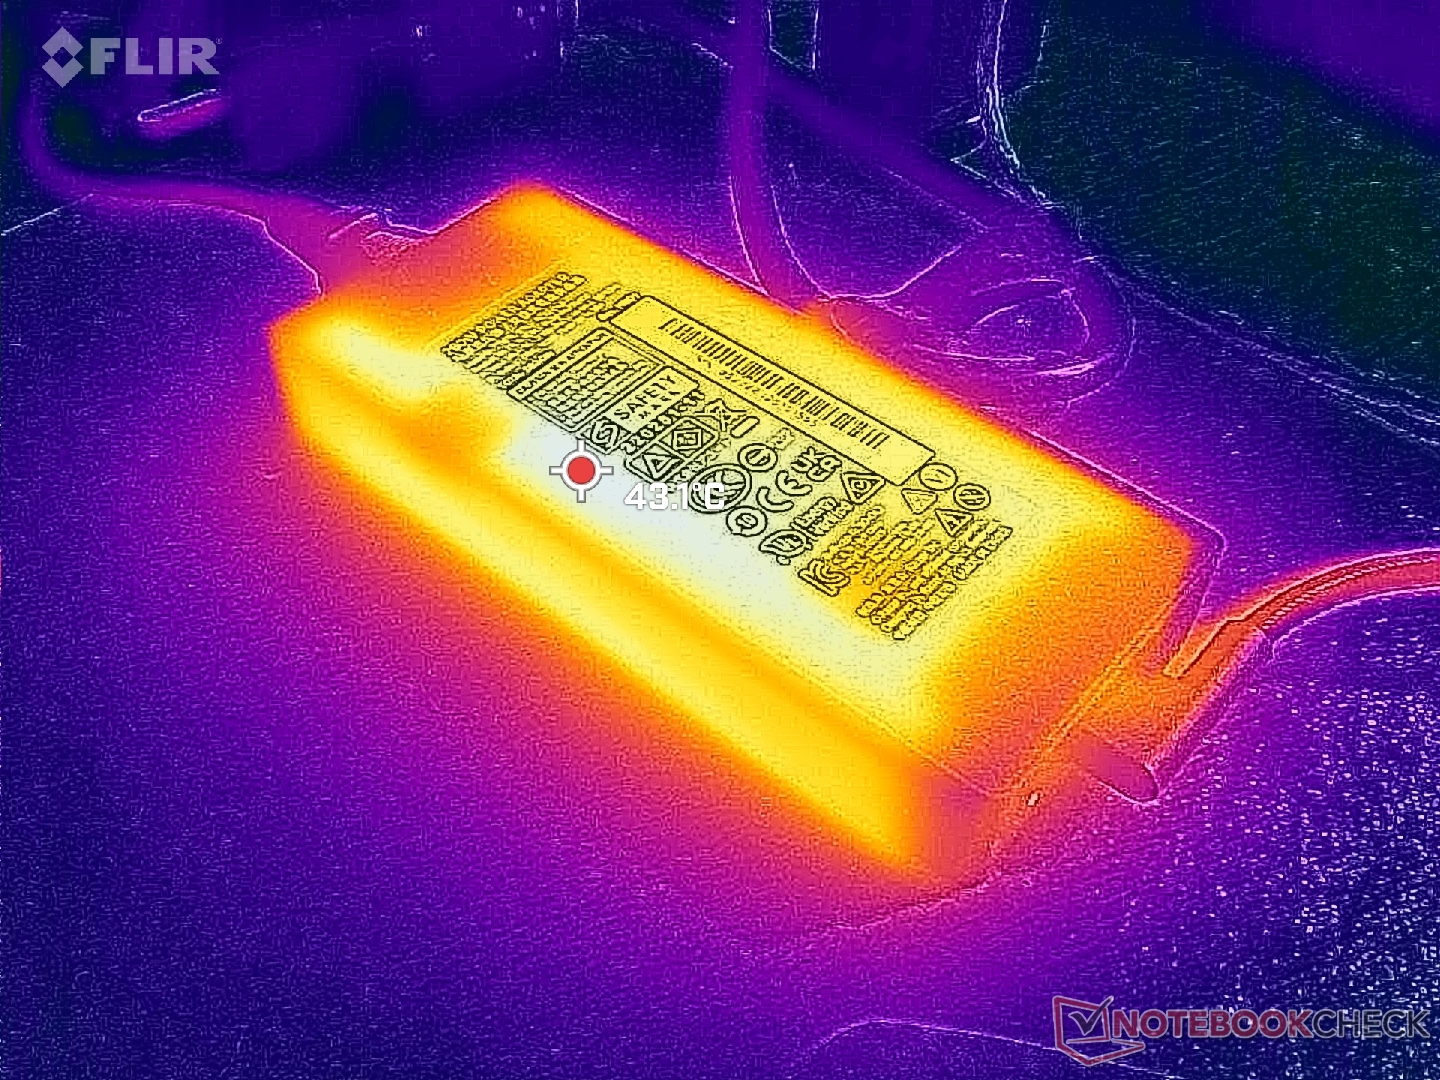
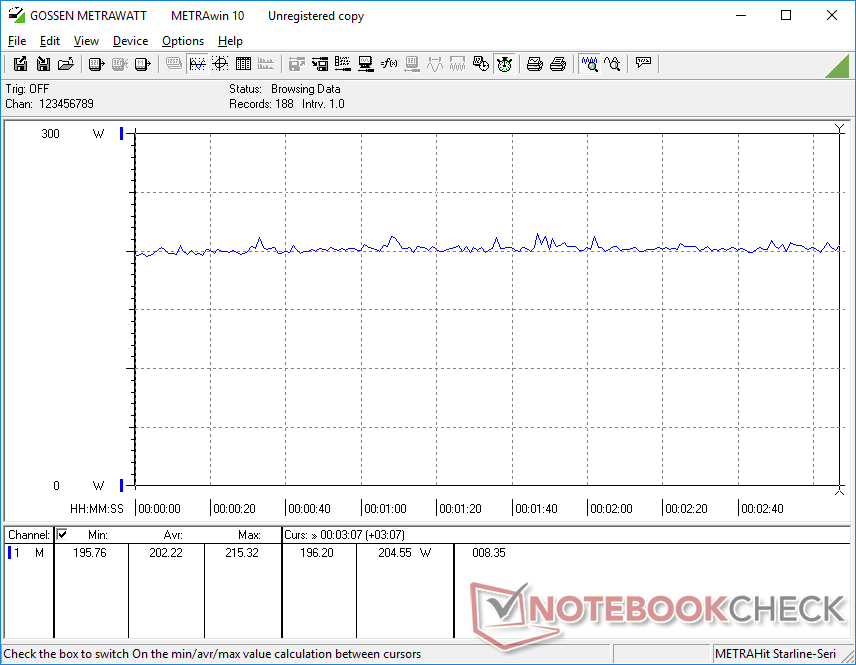
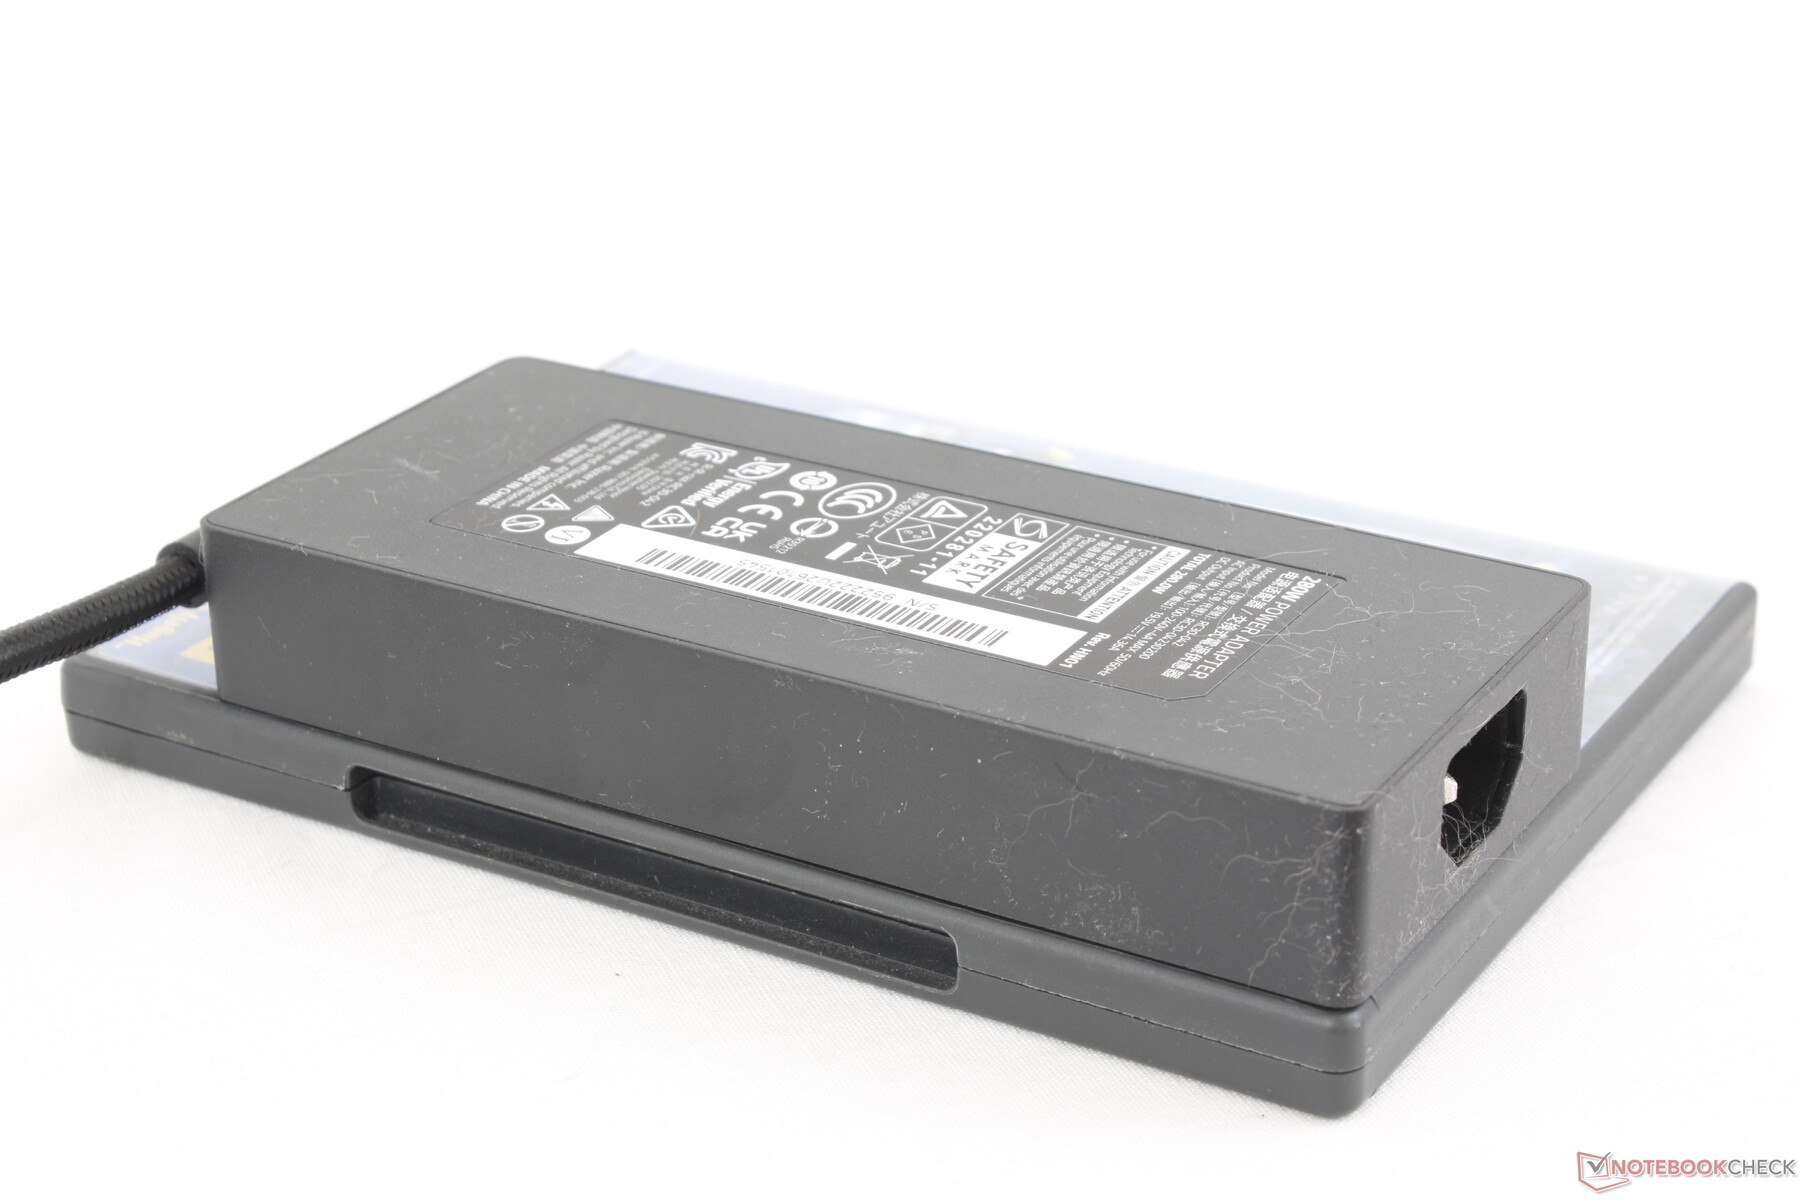
Wir messen ein temporäres Maximum von 261 W aus dem kleinen bis mittelgroßen (~16,3 x 7 x 2,5 cm) 280-W-GaN-Netzteil, wenn Prime95 und FurMark gleichzeitig laufen. Achtung: Je nach Konfiguration gibt es zwei verschiedene Netzteile - ein kleineres 280-W-Netzteil für die Systeme mit RTX 4060 und RTX 4070, sowie ein größeres 330-W-Netzteil für die Konfigurationen mit RTX 4080 und RTX 4090.
| Aus / Standby | |
| Idle | |
| Last |
|
Legende:
min: | |
| Razer Blade 18 RTX 4070 i9-13950HX, GeForce RTX 4070 Laptop GPU, SSSTC CA6-8D1024, IPS, 2560x1600, 18" | Razer Blade 17 Early 2022 i9-12900H, GeForce RTX 3080 Ti Laptop GPU, Samsung PM9A1 MZVL21T0HCLR, IPS, 3840x2160, 17.3" | MSI Titan GT77 HX 13VI i9-13950HX, GeForce RTX 4090 Laptop GPU, Samsung PM9A1 MZVL22T0HBLB, Mini-LED, 3840x2160, 17.3" | Gigabyte G7 KE i5-12500H, GeForce RTX 3060 Laptop GPU, Gigabyte AG470S1TB-SI B10, IPS, 1920x1080, 17.3" | Alienware m17 R5 (R9 6900HX, RX 6850M XT) R9 6900HX, Radeon RX 6850M XT, SSSTC CA6-8D1024, IPS, 3840x2160, 17" | Asus ROG Strix Scar 17 SE G733CX-LL014W i9-12950HX, GeForce RTX 3080 Ti Laptop GPU, Samsung PM9A1 MZVL22T0HBLB, IPS, 2560x1440, 17.3" | |
|---|---|---|---|---|---|---|
| Stromverbrauch | 17% | 8% | 32% | 31% | 9% | |
| Idle min * (Watt) | 24.5 | 17 31% | 14 43% | 15 39% | 13 47% | 19.3 21% |
| Idle avg * (Watt) | 34.1 | 23 33% | 21.6 37% | 17 50% | 16.5 52% | 26.5 22% |
| Idle max * (Watt) | 47.7 | 34 29% | 24.8 48% | 24 50% | 17 64% | 27.1 43% |
| Last avg * (Watt) | 140 | 120 14% | 122.5 12% | 111 21% | 93 34% | 141 -1% |
| Witcher 3 ultra * (Watt) | 202 | 229 -13% | 265 -31% | 174.1 14% | 239 -18% | 225 -11% |
| Last max * (Watt) | 261 | 243 7% | 418 -60% | 208 20% | 251 4% | 307.9 -18% |
* ... kleinere Werte sind besser
Energieverbrauch Witcher 3 / Stresstest
Energieverbrauch mit externem Monitor
Aukkulaufzeit
Es ist kein Zufall, dass das größte Blade-Modell auch den größten Akku beherbergt. Aber auch die üppigen 91,7 Wh verlängern die Laufzeit nicht unbedingt, tatsächlich ist sie in mehreren Szenarien eher kürzer. Das Surfen im Netz kann im Ausbalancierten Profil für 4 Stunden angesetzt werden. Das ist fast eine Stunde kürzer als das Blade 15 vom letzten Jahr. Das Verringern der Bildwiederholrate von 240 auf 60 Hz kann die Laufzeit nur marginal verbessern.
Das leere Blade 18 ist in etwa 90 Minuten wieder komplett aufgeladen. Nutzer können das System auch über USB-C aufladen, dann allerdings sinkt die Ladegeschwindigkeit.
| Razer Blade 18 RTX 4070 i9-13950HX, GeForce RTX 4070 Laptop GPU, 91.7 Wh | Razer Blade 17 Early 2022 i9-12900H, GeForce RTX 3080 Ti Laptop GPU, 82 Wh | MSI Titan GT77 HX 13VI i9-13950HX, GeForce RTX 4090 Laptop GPU, 99.9 Wh | Gigabyte G7 KE i5-12500H, GeForce RTX 3060 Laptop GPU, 54 Wh | Alienware m17 R5 (R9 6900HX, RX 6850M XT) R9 6900HX, Radeon RX 6850M XT, 97 Wh | Asus ROG Strix Scar 17 SE G733CX-LL014W i9-12950HX, GeForce RTX 3080 Ti Laptop GPU, 90 Wh | |
|---|---|---|---|---|---|---|
| Akkulaufzeit | 9% | 21% | 11% | 29% | 5% | |
| Idle (h) | 7 | 7.1 1% | 7.1 1% | |||
| WLAN (h) | 4 | 3.8 -5% | 5.3 33% | 5.3 33% | 4.8 20% | 4.2 5% |
| Last (h) | 1.3 | 1.7 31% | 1.4 8% | 1.3 0% | 1.8 38% | |
| H.264 (h) | 4.8 | 6 | 2.2 | 4.9 |
Pro
Contra
Fazit — Hardware zum Verlieben, Bugs zum Hassen
Nach dem Test des Blade 16 waren wir beeindruckt, aber beim Blade 18 können wir das leider nicht sagen. Dafür hatte unsere Testeinheit zu viele Probleme, angefangen bei der fehlerhaften DLSS-3-Leistung mit externem Monitor, über die fehlende G-Sync-Unterstützung obwohl diese eigentlich dabei sein sollte bis hin zum vermutlich fehlerhaft flackernden Display. Wir haben in Betracht gezogen mit der Veröffentlichung dieses Tests noch zu warten bis sich Razer um die Fehler kümmert, aber das Blade 18 wird inzwischen schon an Kunden ausgeliefert. Daher sehen wir es als unsere Pflicht an unsere Leser rechtzeitig über die Probleme des Blade 18 zu informieren, insbesondere wenn sie gerade einen Kauf erwägen. Wir überarbeiten diesen Test sobald der Hersteller etwaige Lösungen anbietet.
Schaut man hinter die aktuellen Probleme, so zeigt das Blade 18 eindeutig das Potential ein weiterer exzellenter Spross der Blade-Familie werden zu können. Das 18-Zoll-Display ist einfach gigantisch, ohne jedoch den Fußabdruck oder das Gewicht nachhaltig zu erhöhen. Allein der Fakt, dass das System nicht wesentlich größer oder schwerer ist als das Blade 17 dürfte Interesse bei all jenen wecken, die schon mit dem Kauf eines Blade 17 oder anderen 17-Zoll-Gaming-Laptop liebäugeln. Sein relativ kleines Netzteil unterstreicht den hybriden Ansatz dieses mobilen Desktop-Ersatzes.
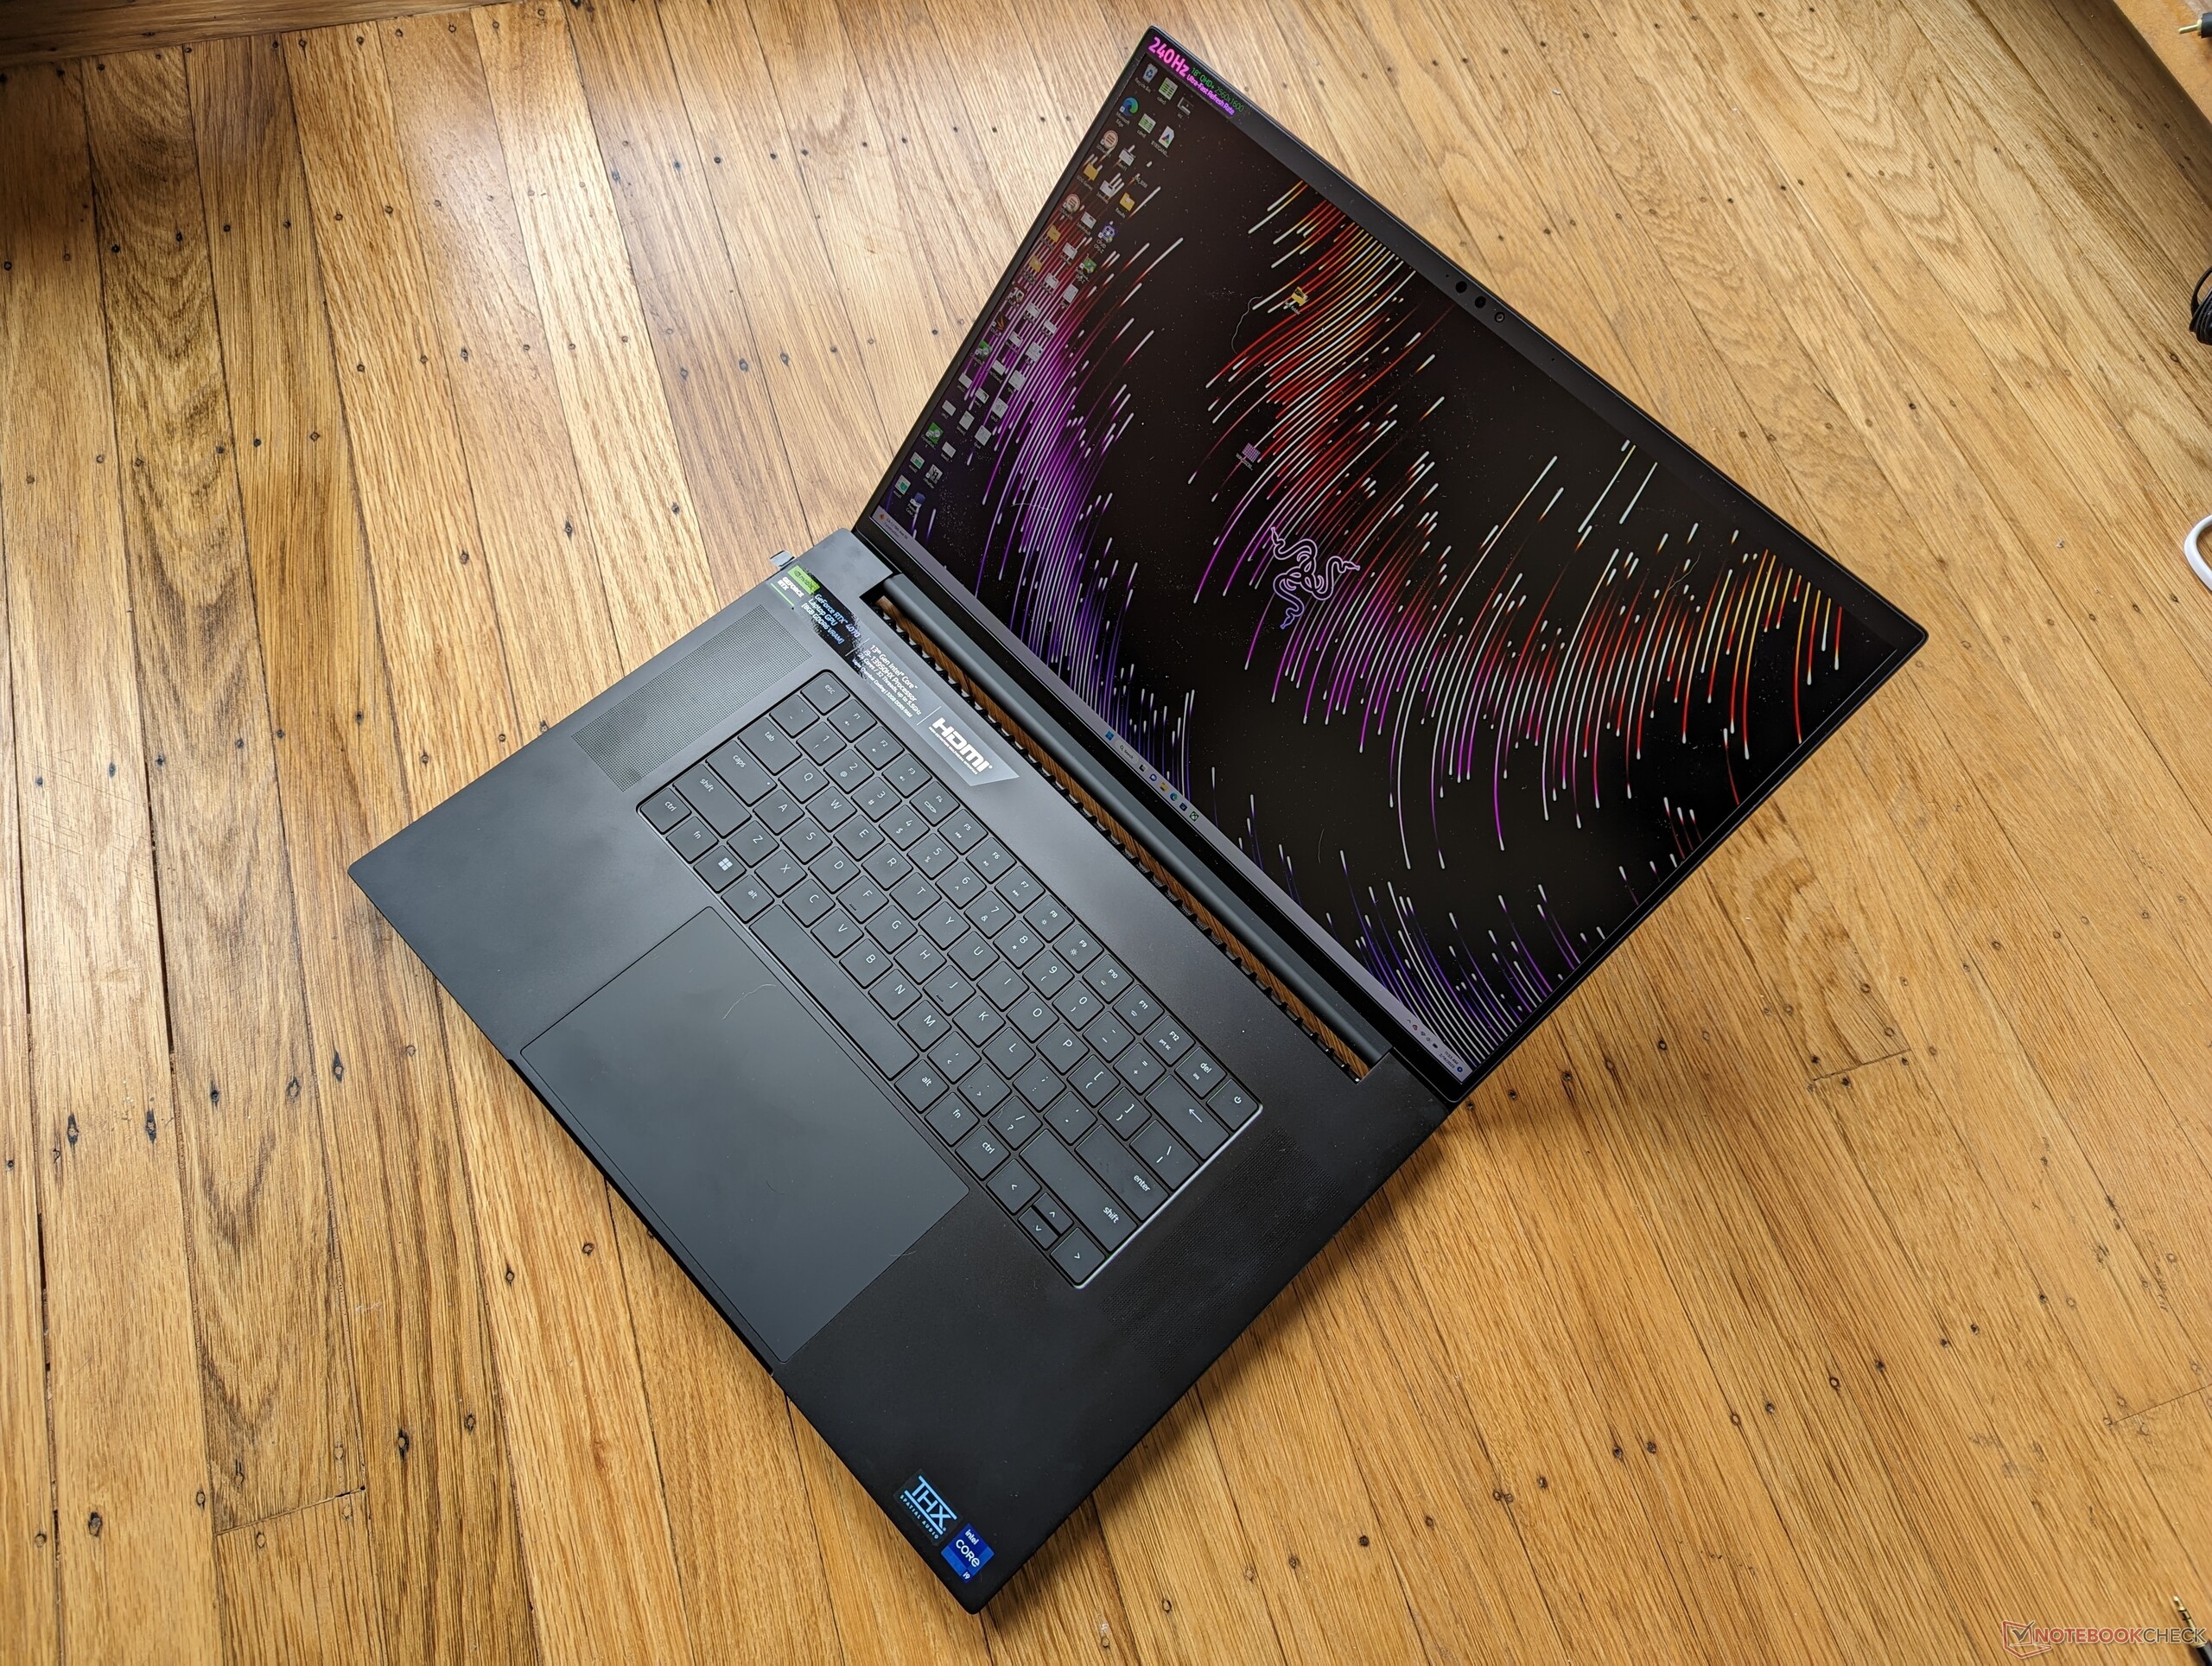
Im ersten Moment klingt ein Blade 18 gigantisch, tatsächlich jedoch ist es kaum größer oder schwerer als ein Blade 17. Sein großer Bildschirm und dessen hohes Screen-to-Body-Verhältnis sind beeindruckend.
Was die mobile RTX 4070 anbelangt, so kann ihre Leistung je nach Spiel etwas enttäuschend ausfallen. Titel mit DLSS-3-Support laufen wie Butter auf der mobilen RTX 4070. Abgesehen davon ist die allgemeine Leistung nicht höher als die einer mobilen RTX 3080 oder der Desktop-RTX-3070. Zum Glück erweitert sich die Liste der Games mit DLSS-3-Support stetig.
Insgesamt erlebt das 18-Zoll-Blade einen starken Start,d er allerdings durch ein paar Probleme zum Launch getrübt wird. Die kommenden Asus ROG Strix Scar 18 und Dell Alienware m18 könnten dem Blade 18 Probleme bereiten, sofern Razer einige der Schlüsselschwachstellen nicht in den Griff bekommt.
Hinweis: Aufgrund der im Test geschilderten Probleme haben wir das Rating des Blade 18 vorerst ausgesetzt. Sobald die offenen Punkte geklärt wurden werden wir eine finale Bewertung des Gerätes ergänzen.
Preise und Verfügbarkeit
Transparenz
Die Auswahl der zu testenden Geräte erfolgt innerhalb der Redaktion. Das vorliegende Testmuster wurde dem Autor vom Hersteller oder einem Shop zu Testzwecken leihweise zur Verfügung gestellt. Eine Einflussnahme des Leihstellers auf den Testbericht gab es nicht, der Hersteller erhielt keine Version des Reviews vor der Veröffentlichung. Es bestand keine Verpflichtung zur Publikation. Als eigenständiges, unabhängiges Unternehmen unterliegt Notebookcheck keiner Diktion von Herstellern, Shops und Verlagen.
So testet Notebookcheck
Pro Jahr werden von Notebookcheck hunderte Laptops und Smartphones unabhängig in von uns standardisierten technischen Verfahren getestet, um eine Vergleichbarkeit aller Testergebnisse zu gewährleisten. Seit rund 20 Jahren entwickeln wir diese Testmethoden kontinuierlich weiter und setzen damit Branchenstandards. In unseren Testlaboren kommt ausschließlich hochwertiges Messequipment in die Hände erfahrener Techniker und Redakteure. Die Tests unterliegen einer mehrstufigen Kontrolle. Unsere komplexe Gesamtbewertung basiert auf hunderten fundierten Messergebnissen und Benchmarks, womit Ihnen Objektivität garantiert ist. Weitere Informationen zu unseren Testmethoden gibt es hier.
Preisvergleich

