HP ZBook Fury 16 G9 Workstation im Test: Alternative zum Dell Precision 7670 und ThinkPad P16 G1

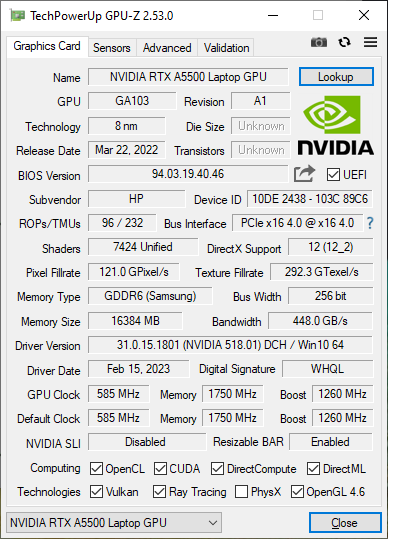
Die ZBook-Fury-Serie von HP stellt im Vergleich zur Mid-Range-ZBook-Studio-Serie und zur ZBook-Firefly-Serie die High-End-Serie des Produzenten dar. Angetrieben wird unser Testgerät von einem Alder-Lake-i9-12950HX, einer RTX-A5500-Ampere-GPU, 64-GB-RAM und einem 3.840x2.400-IPS-Display. Diese Version ist in Österreich bzw. Deutschland noch nicht erhältlich, würde aber umgerechnet geschätzt ca. 3.715 Euro (4.000 US-Dollar) kosten. Weiters gibt es optional Konfigurationen mit LTE, 5G oder sogar OLED-Panels. Außerdem wird das ZBook-Fury-G10 mit einer Intel-CPU der 13. Generation angeboten, wobei dieses das gleiche Case wie das G9 besitzt.
Alternativen zum Fury 16 G9 sind andere 16-Zoll-Workstations wie das Dell Precision 7670, das MSI CreatorPro Z16P, das Asus ProArt StudioBook 16 oder das Lenovo ThinkPad P16 G1.
Weitere HP Reviews:
Potentielle Mitstreiter im Vergleich
Bew. | Datum | Modell | Gewicht | Dicke | Größe | Auflösung | Preis ab |
|---|---|---|---|---|---|---|---|
| 91 % v7 (old) | 06 / 2023 | HP ZBook Fury 16 G9 i9-12950HX, RTX A5500 Laptop GPU | 2.6 kg | 28.5 mm | 16.00" | 3840x2400 | |
| 90.1 % v7 (old) | 11 / 2022 | HP ZBook Studio 16 G9 62U04EA i7-12800H, RTX A2000 Laptop GPU | 1.8 kg | 19 mm | 16.00" | 3840x2400 | |
| 82.9 % v7 (old) | 10 / 2022 | HP ZBook Firefly 16 G9-6B897EA i7-1265U, T550 Laptop GPU | 2 kg | 19.2 mm | 16.00" | 1920x1200 | |
| 91 % v7 (old) | 02 / 2023 | Lenovo ThinkPad P16 G1 RTX A5500 i9-12950HX, RTX A5500 Laptop GPU | 3 kg | 30.23 mm | 16.00" | 3840x2400 | |
| 89.1 % v7 (old) | 12 / 2022 | Dell Precision 7000 7670 Performance i9-12950HX, RTX A5500 Laptop GPU | 2.8 kg | 25.95 mm | 16.00" | 3840x2400 | |
| 84.3 % v7 (old) | 11 / 2022 | MSI CreatorPro Z16P B12UKST i7-12700H, RTX A3000 Laptop GPU | 2.4 kg | 19 mm | 16.00" | 2560x1600 |
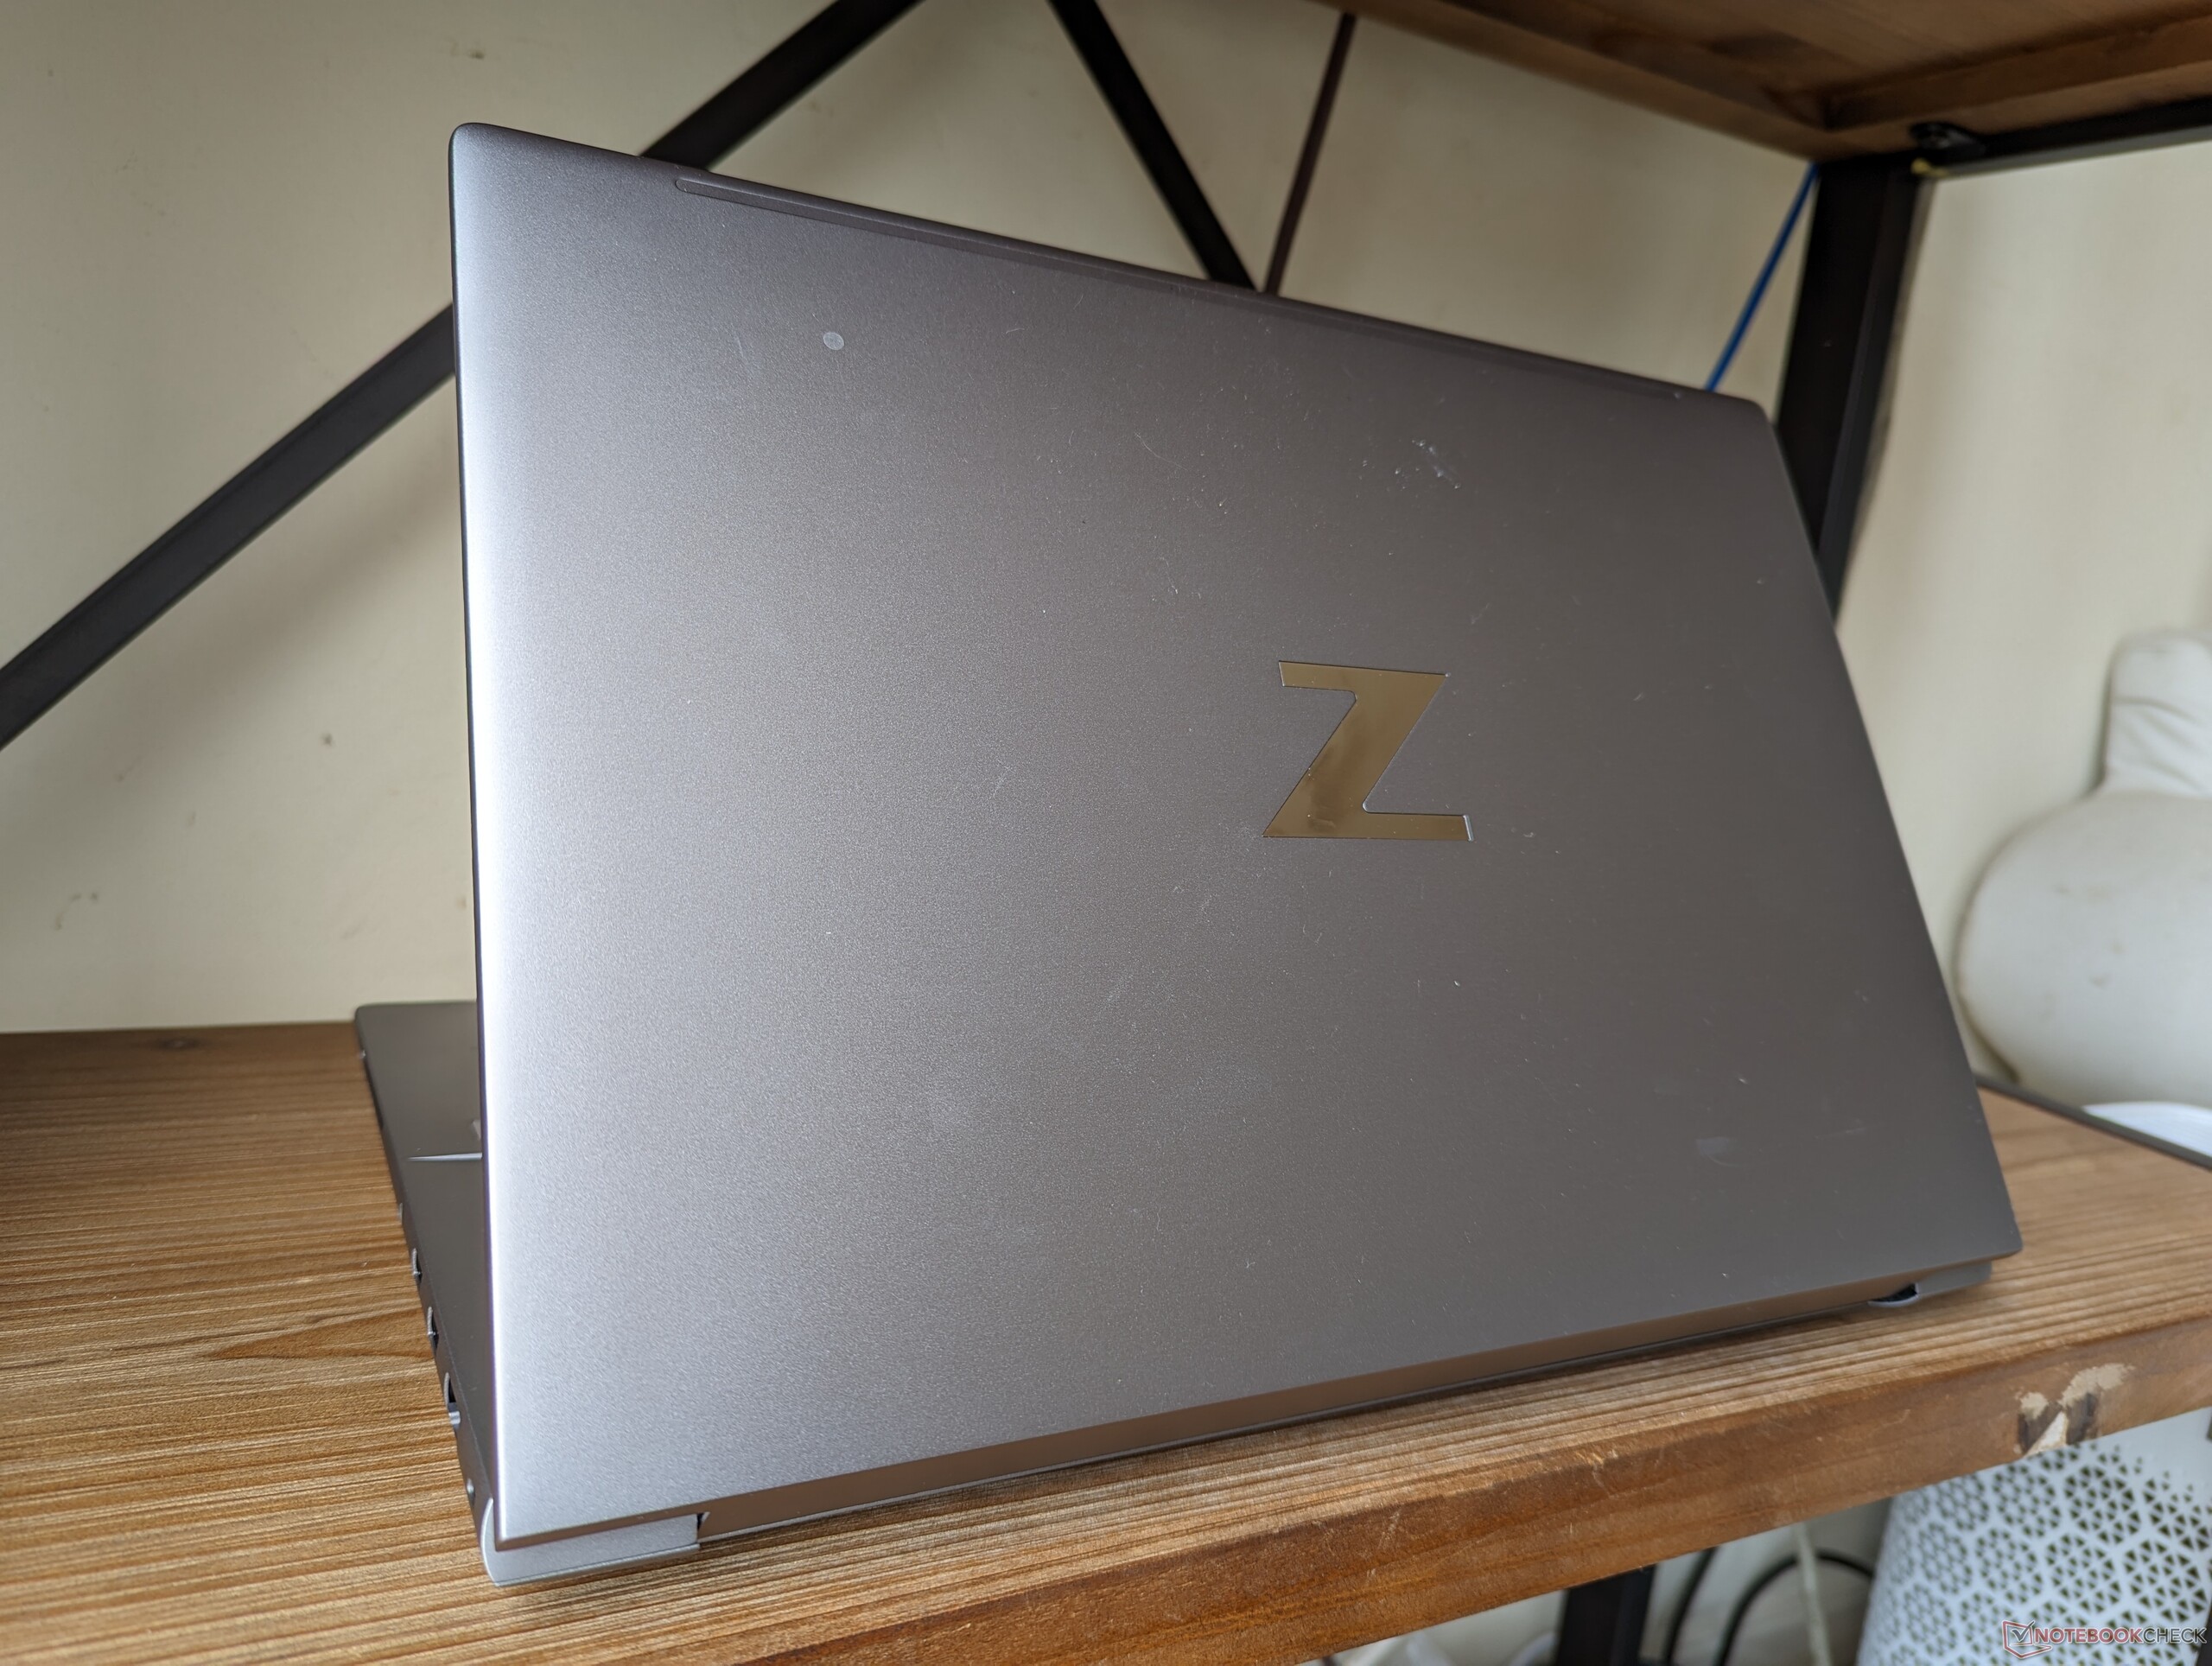
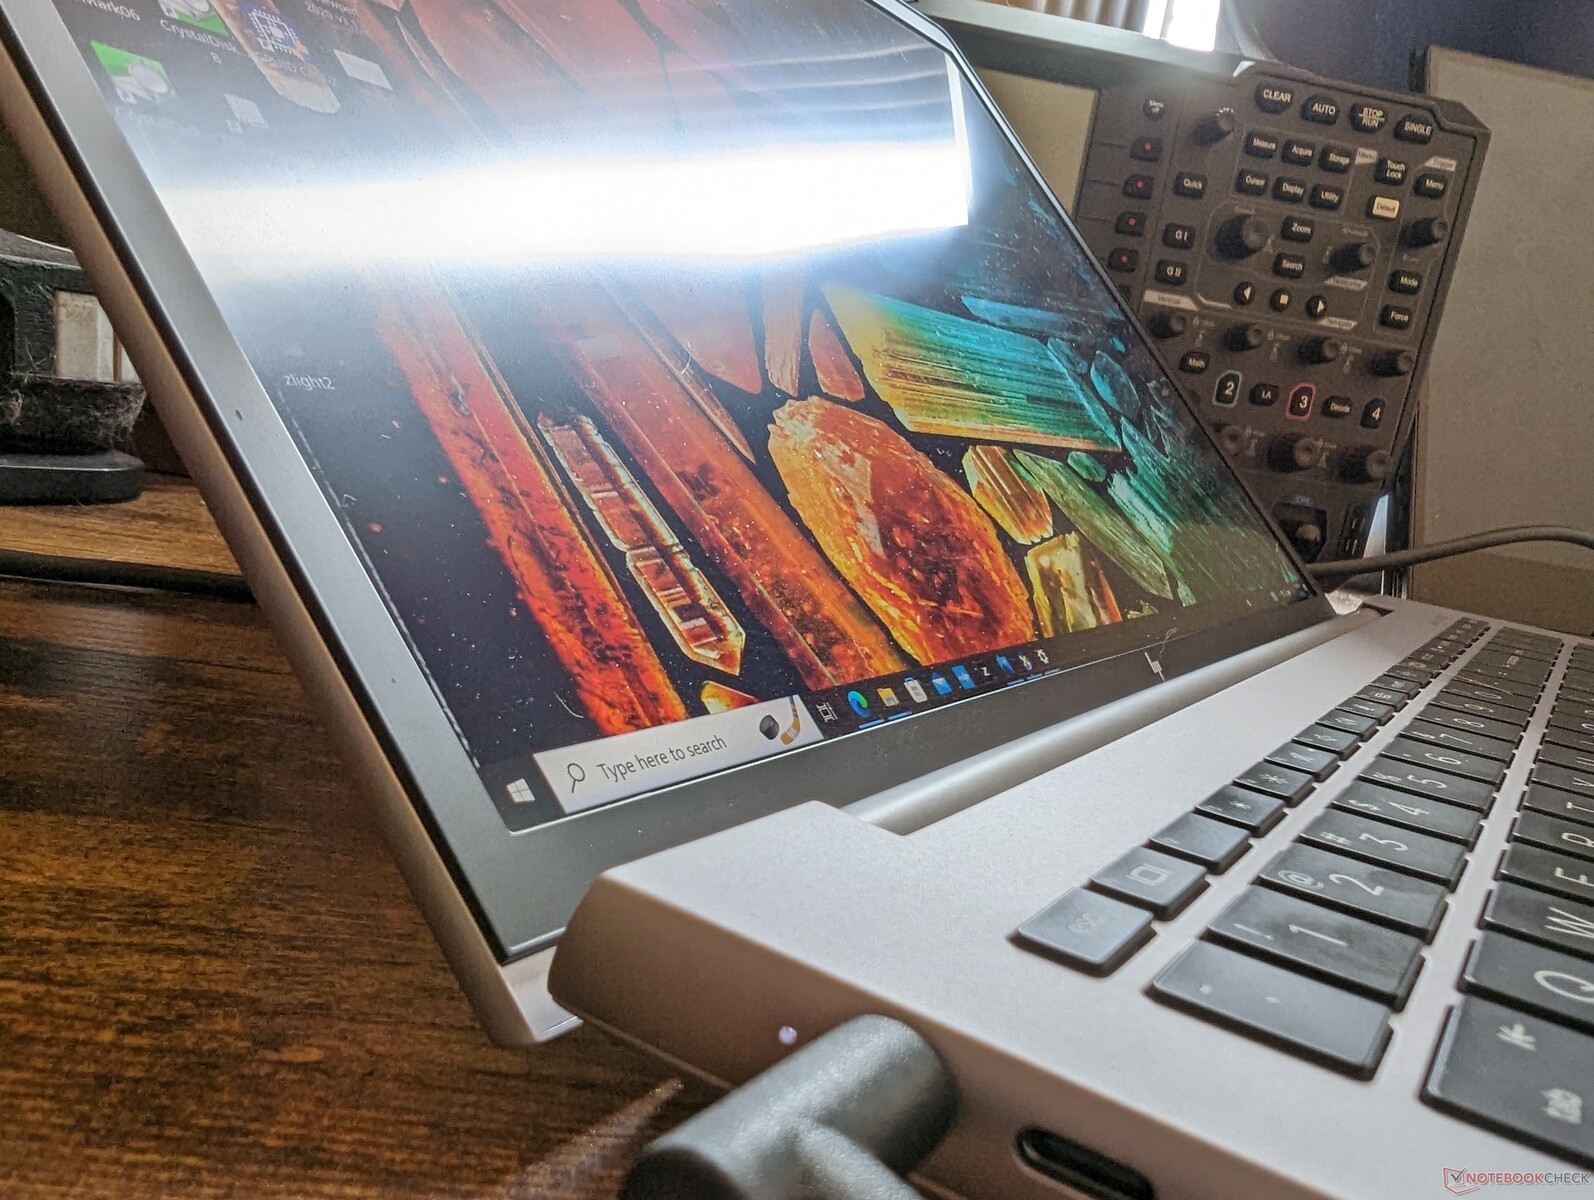
Gehäuse — Klassisches ZBook
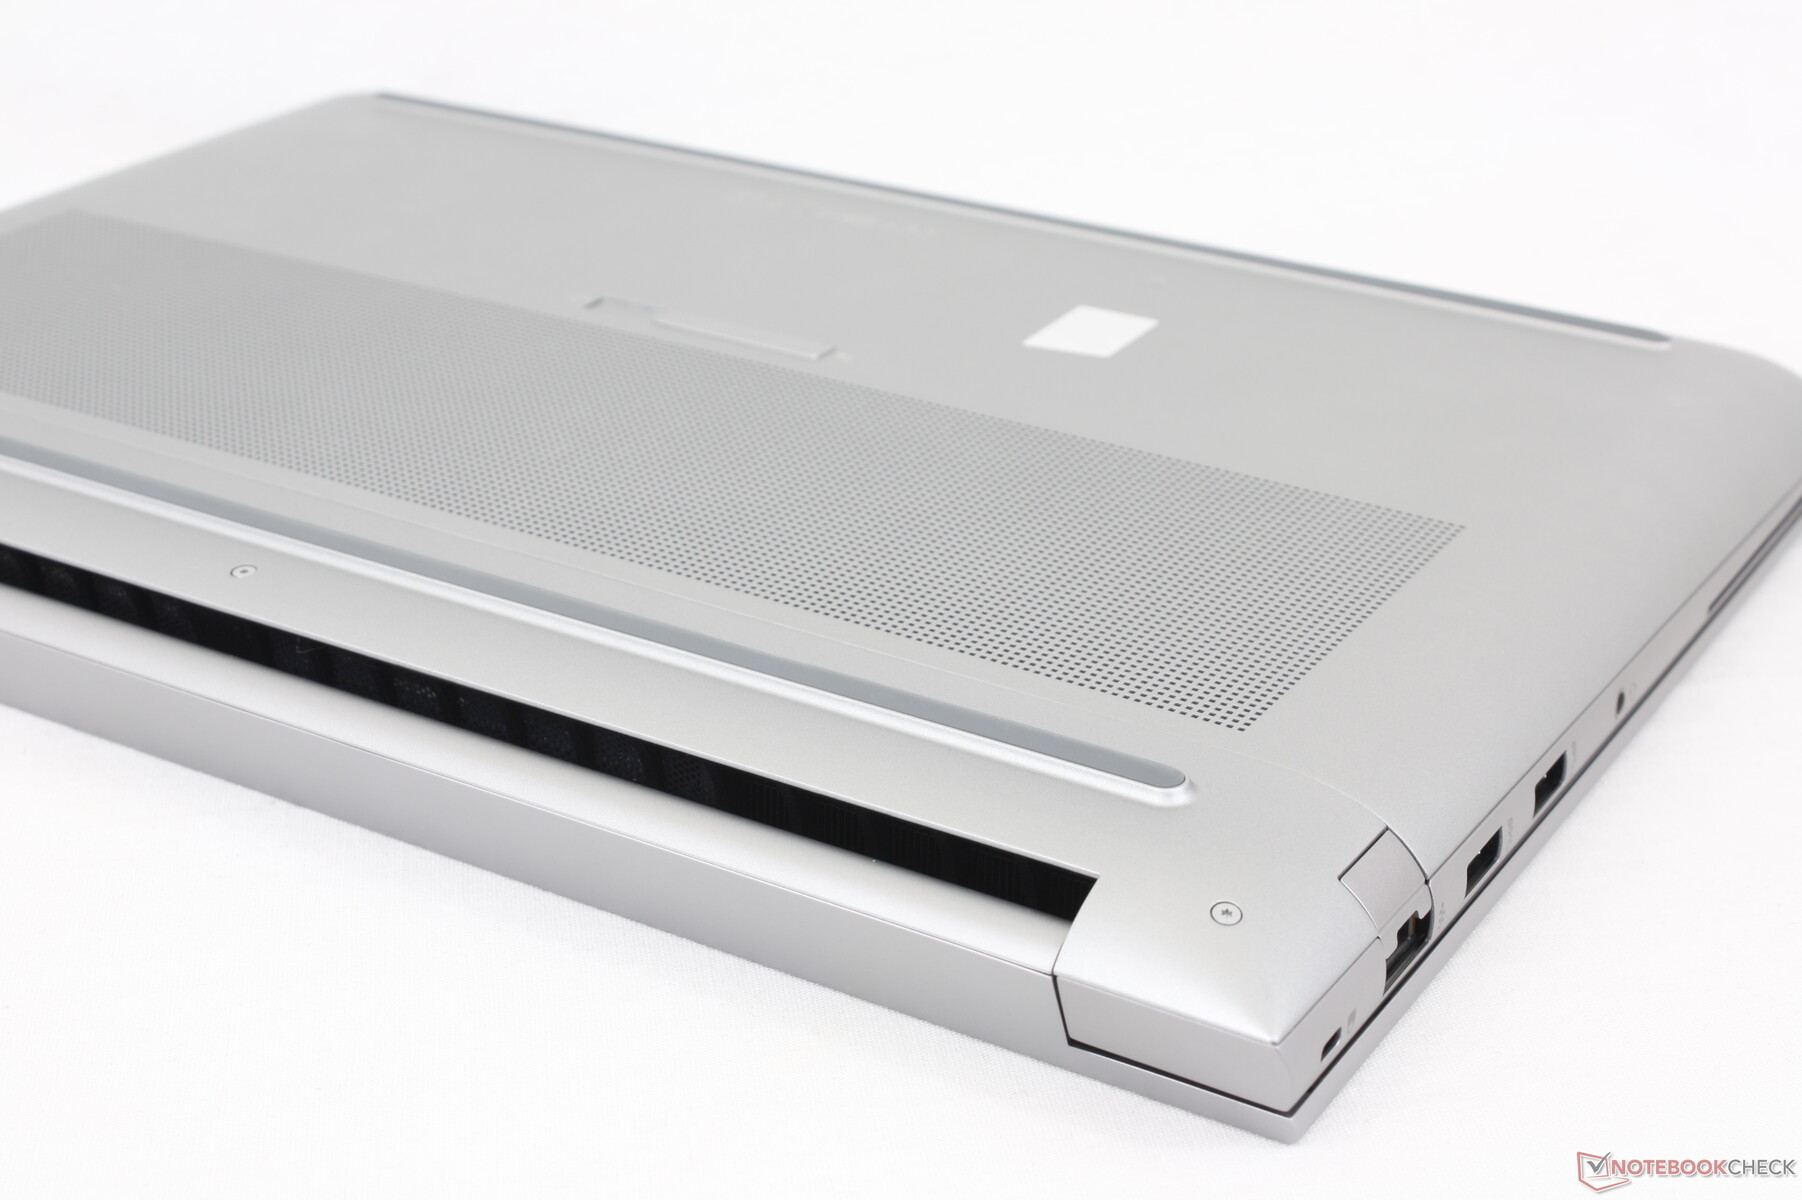
Das Gehäuse besteht aus jenem Aluminium, das wir schon von anderen ZBook Modellen kennen. Ein Knacken oder Verdrehungen sind dabei kaum bis gar nicht vorhanden, und von der Haptik ist das verarbeitete Material relativ gleich dem des Precision 7670. Ein kleiner Schwachpunkt wäre, dass der Deckel bei Druckausübung auf die Mitte leicht nachgibt, was aber auf lange Zeit gesehen keine Probleme geben sollte.
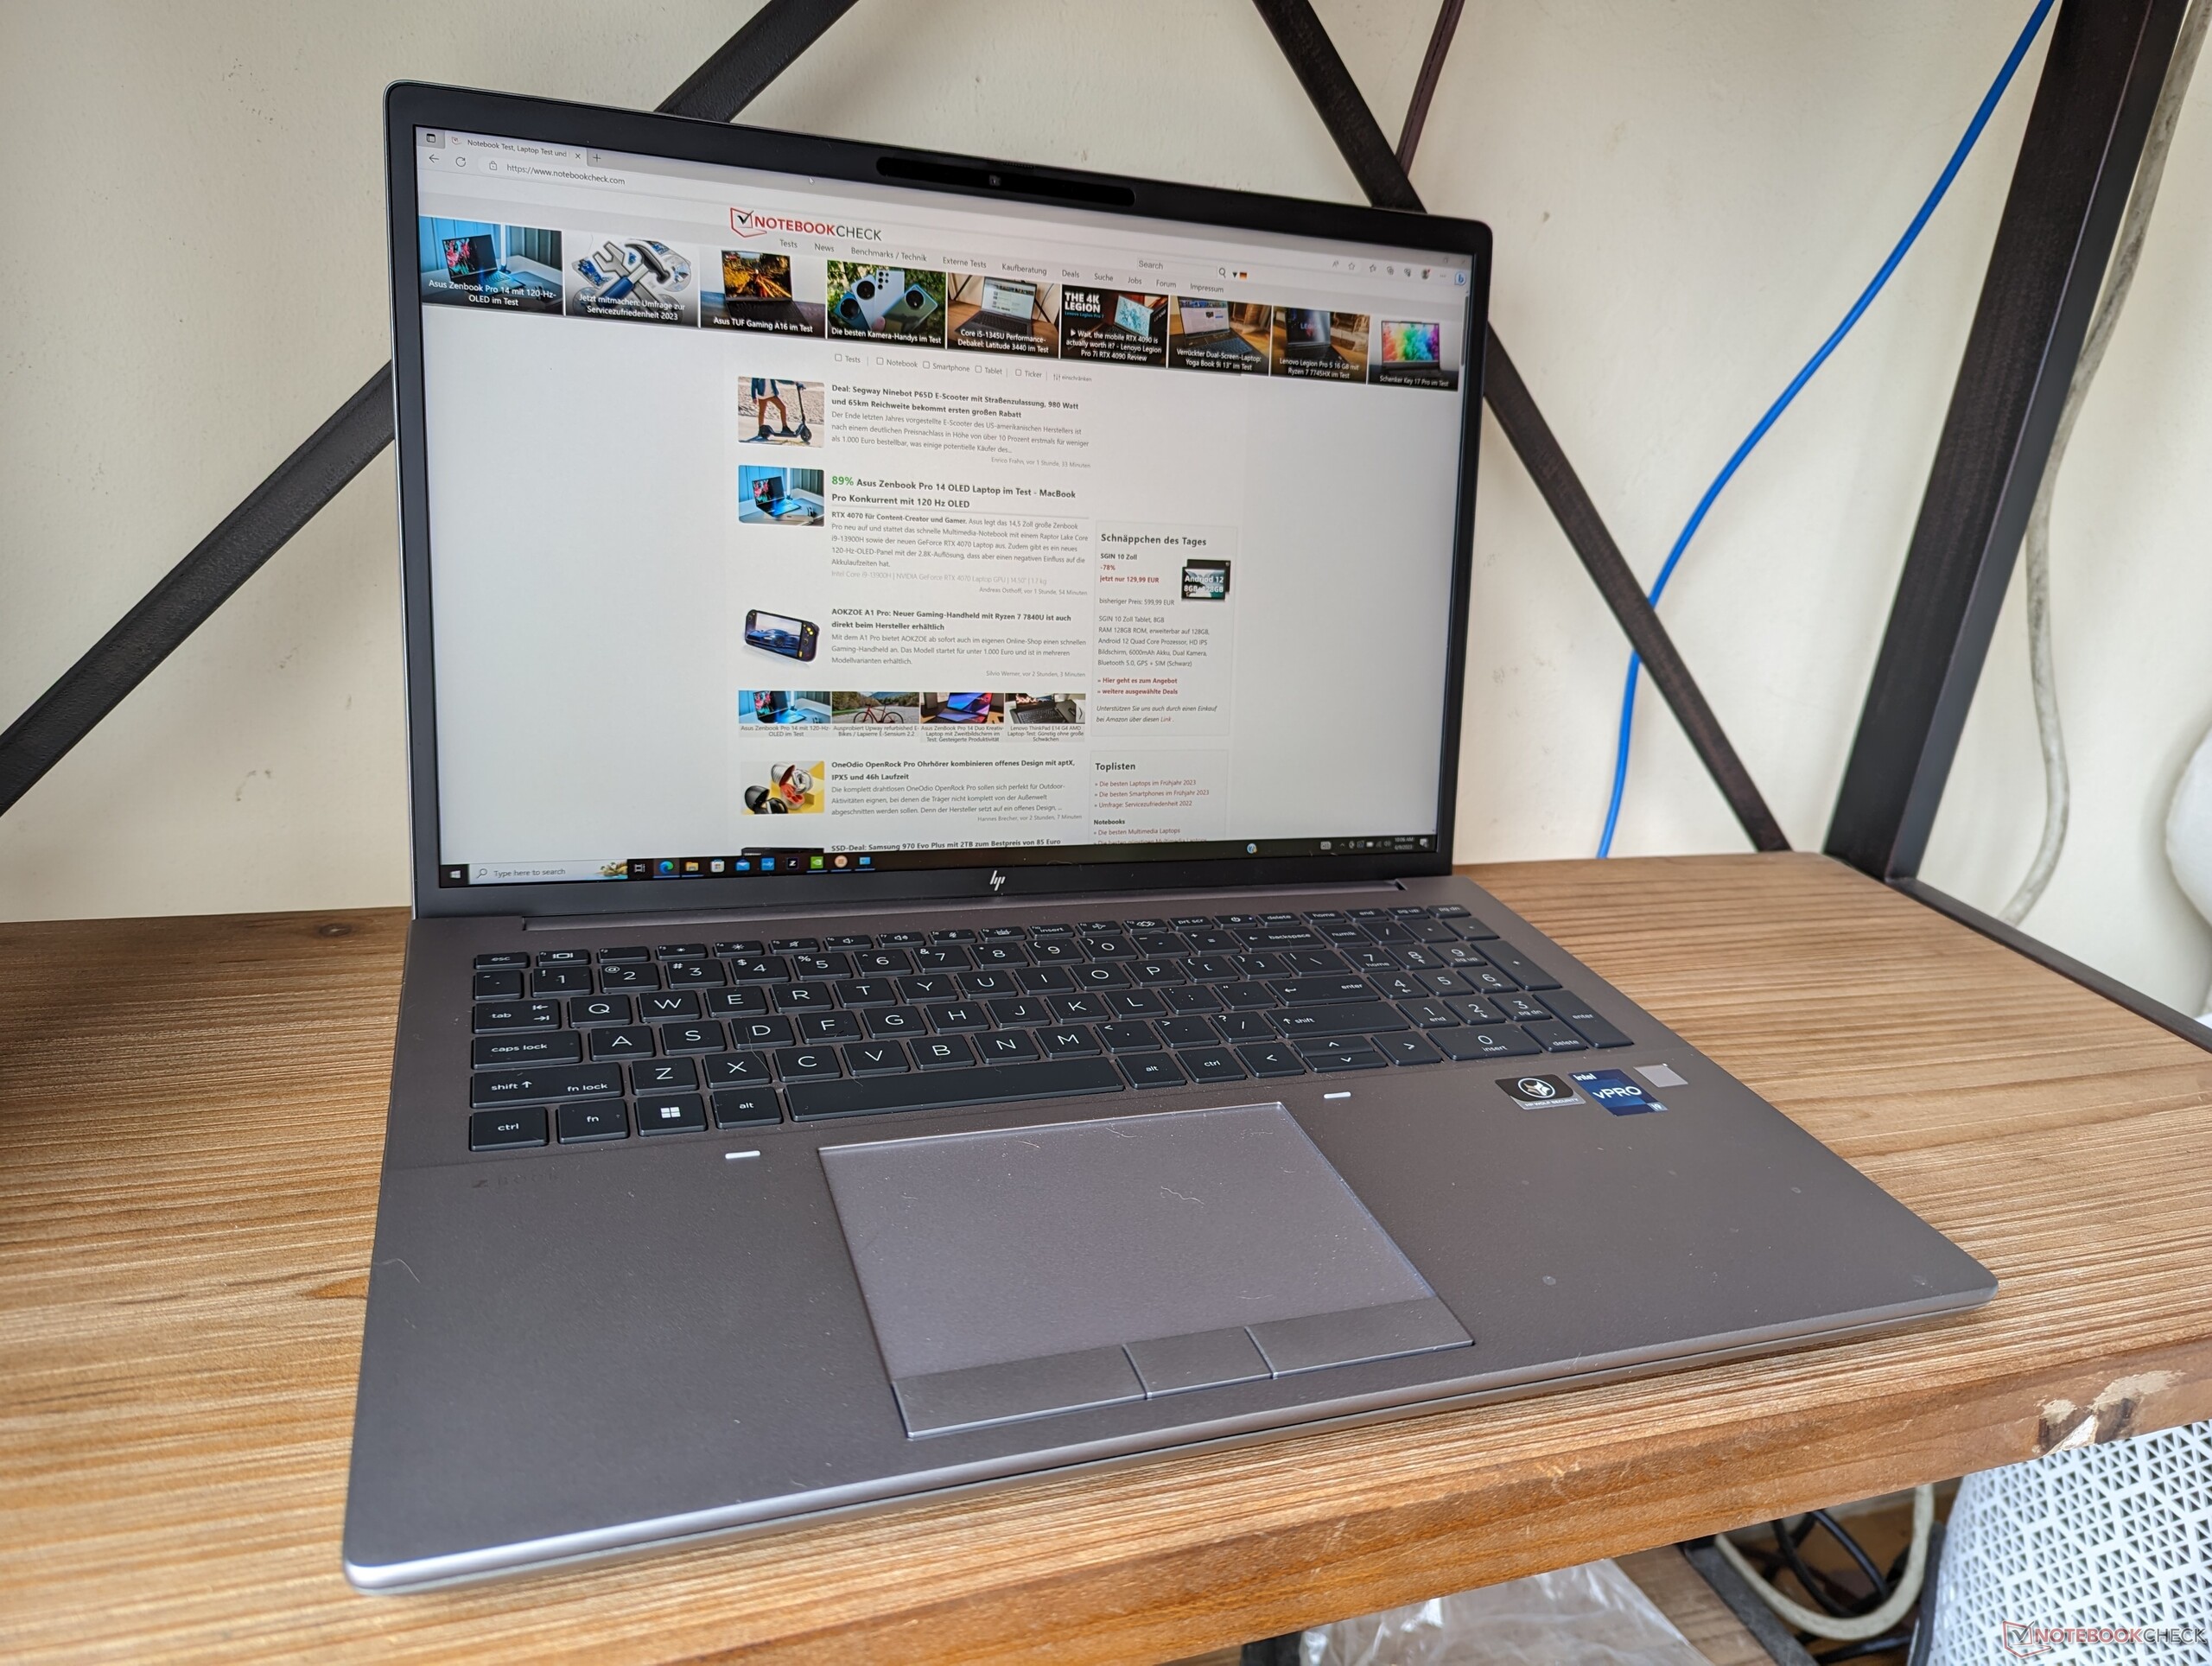
Das diesjährige HP Modell ist merkbar leichter geworden und bringt nun weniger auf die Waage als beispielsweise das ThinkPad P16 G1 oder das Precision 7670, auch wenn alle diese Laptops ähnliche Konfigurationen besitzen. Diese Anpassungen haben jedoch zur Folge, dass bei der Performance einiges eingespart werden musste, was auch unsere Benchmark-Tests weiter unten zeigen. Sollte man also etwas sehr Portables suchen, wäre das deutlich dünnere und leichtere ZBook Firefly 16 G9 oder das ZBook Studio 16 G9 eine Überlegung wert.
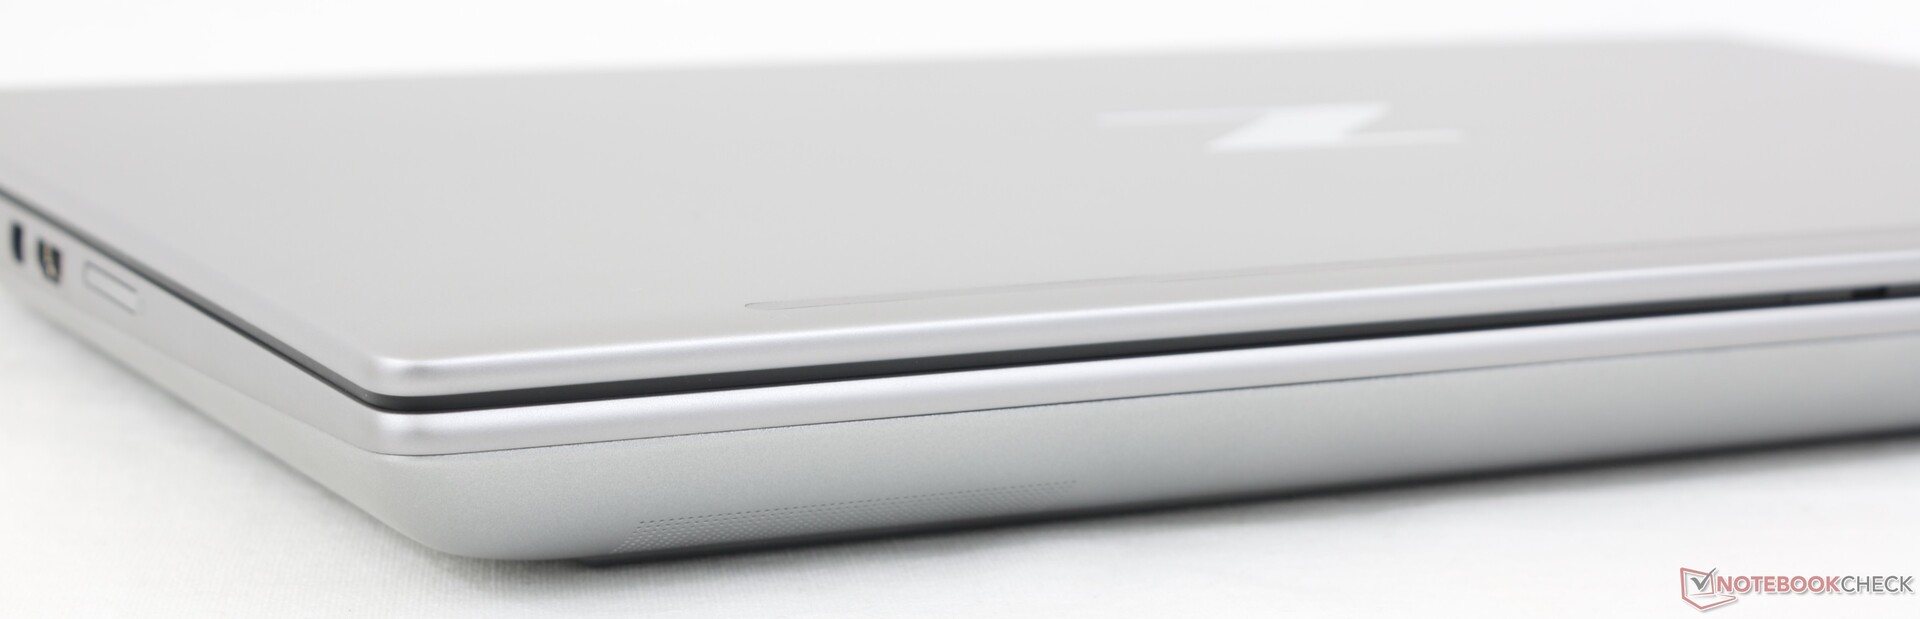
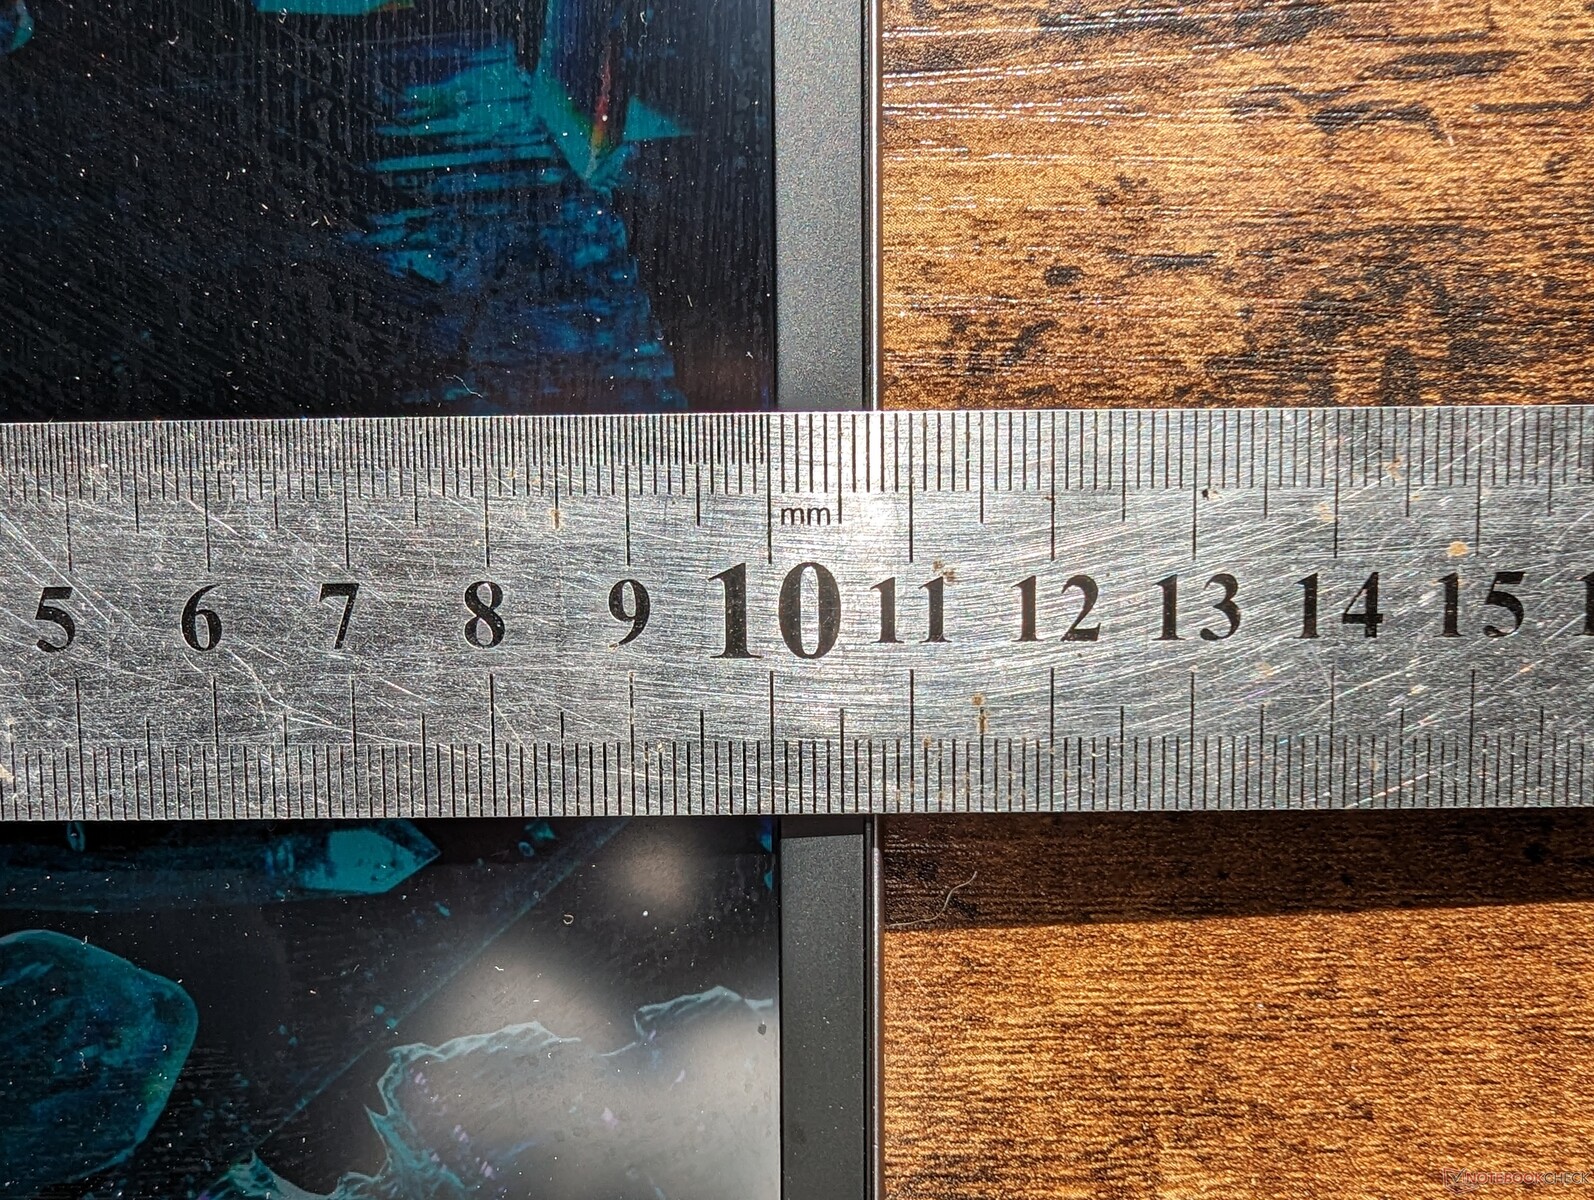
Der untere Rand des Fury G9 ist überraschend dünn für eine Workstation dieses Formfaktors, was auch in geringeren Gesamtabmessungen resultiert.

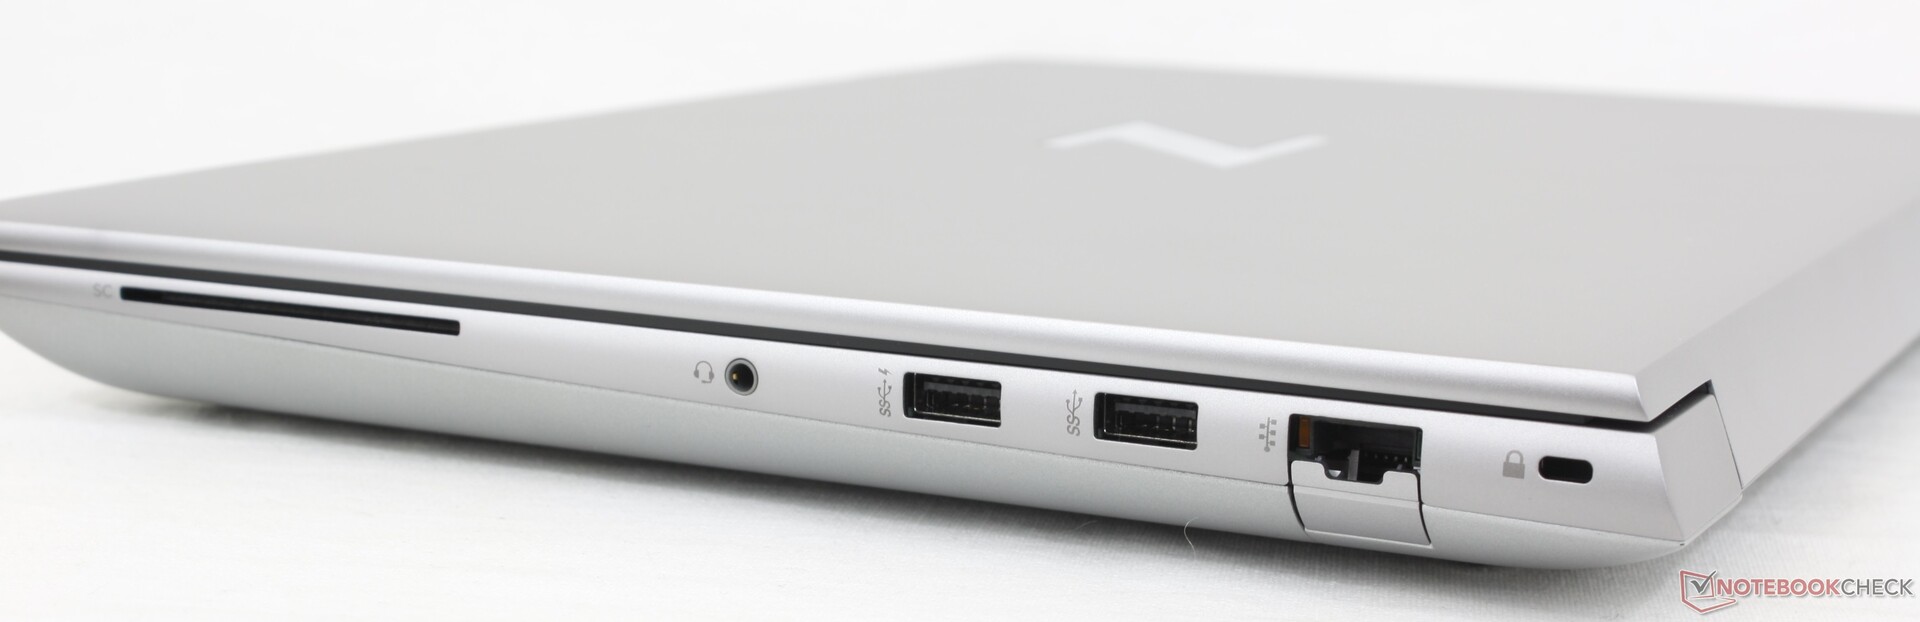
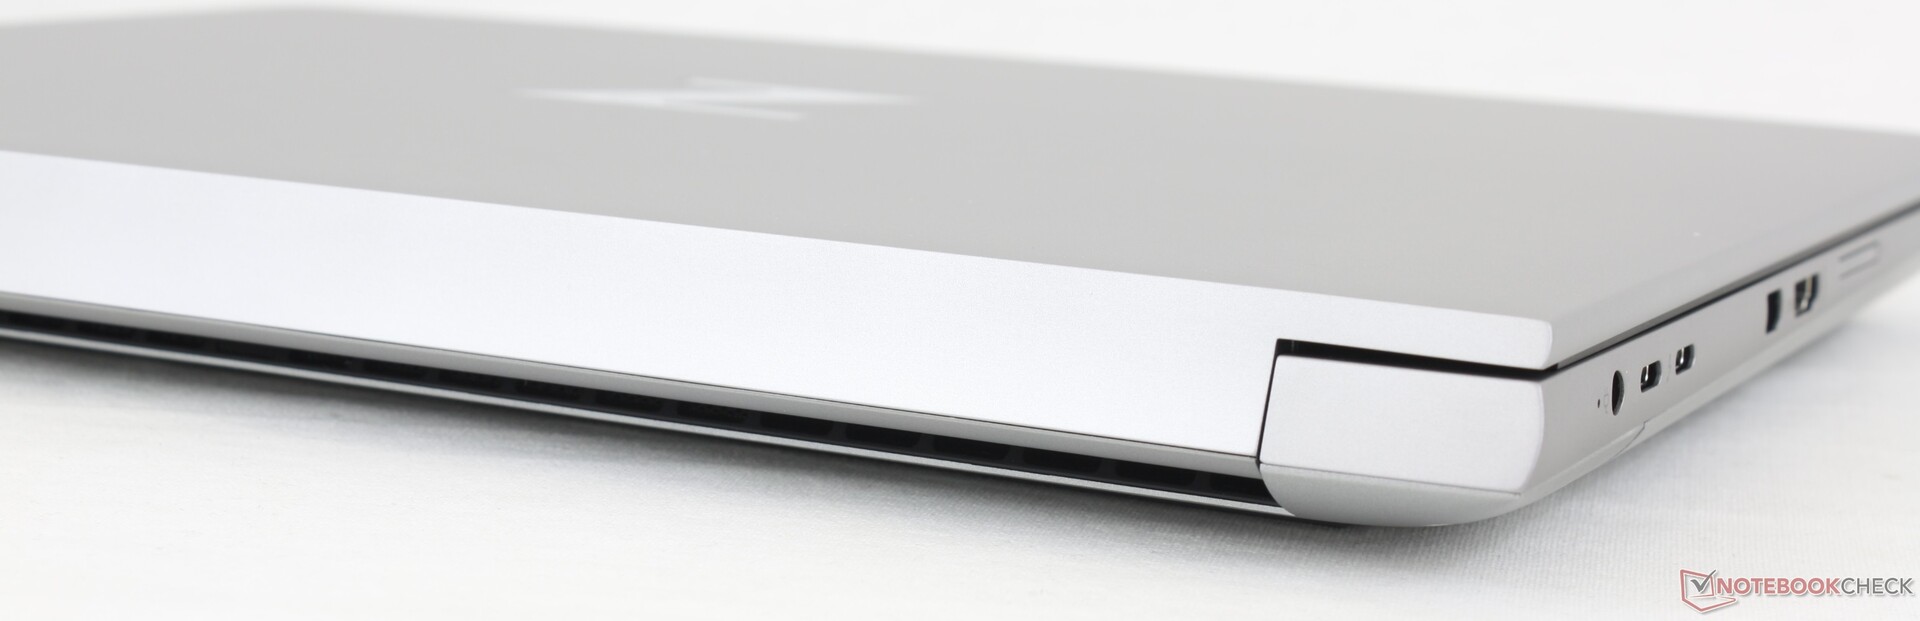
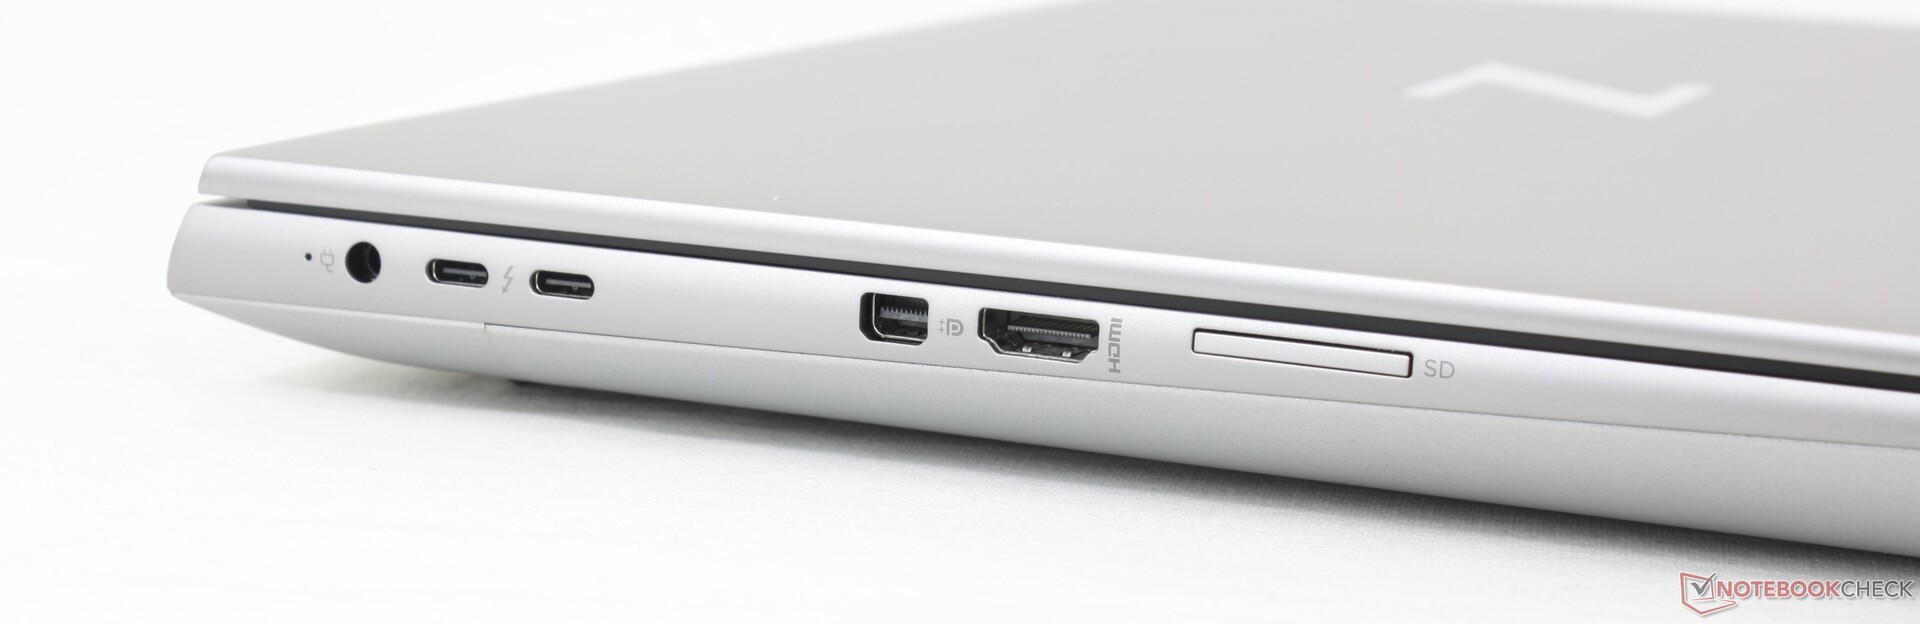
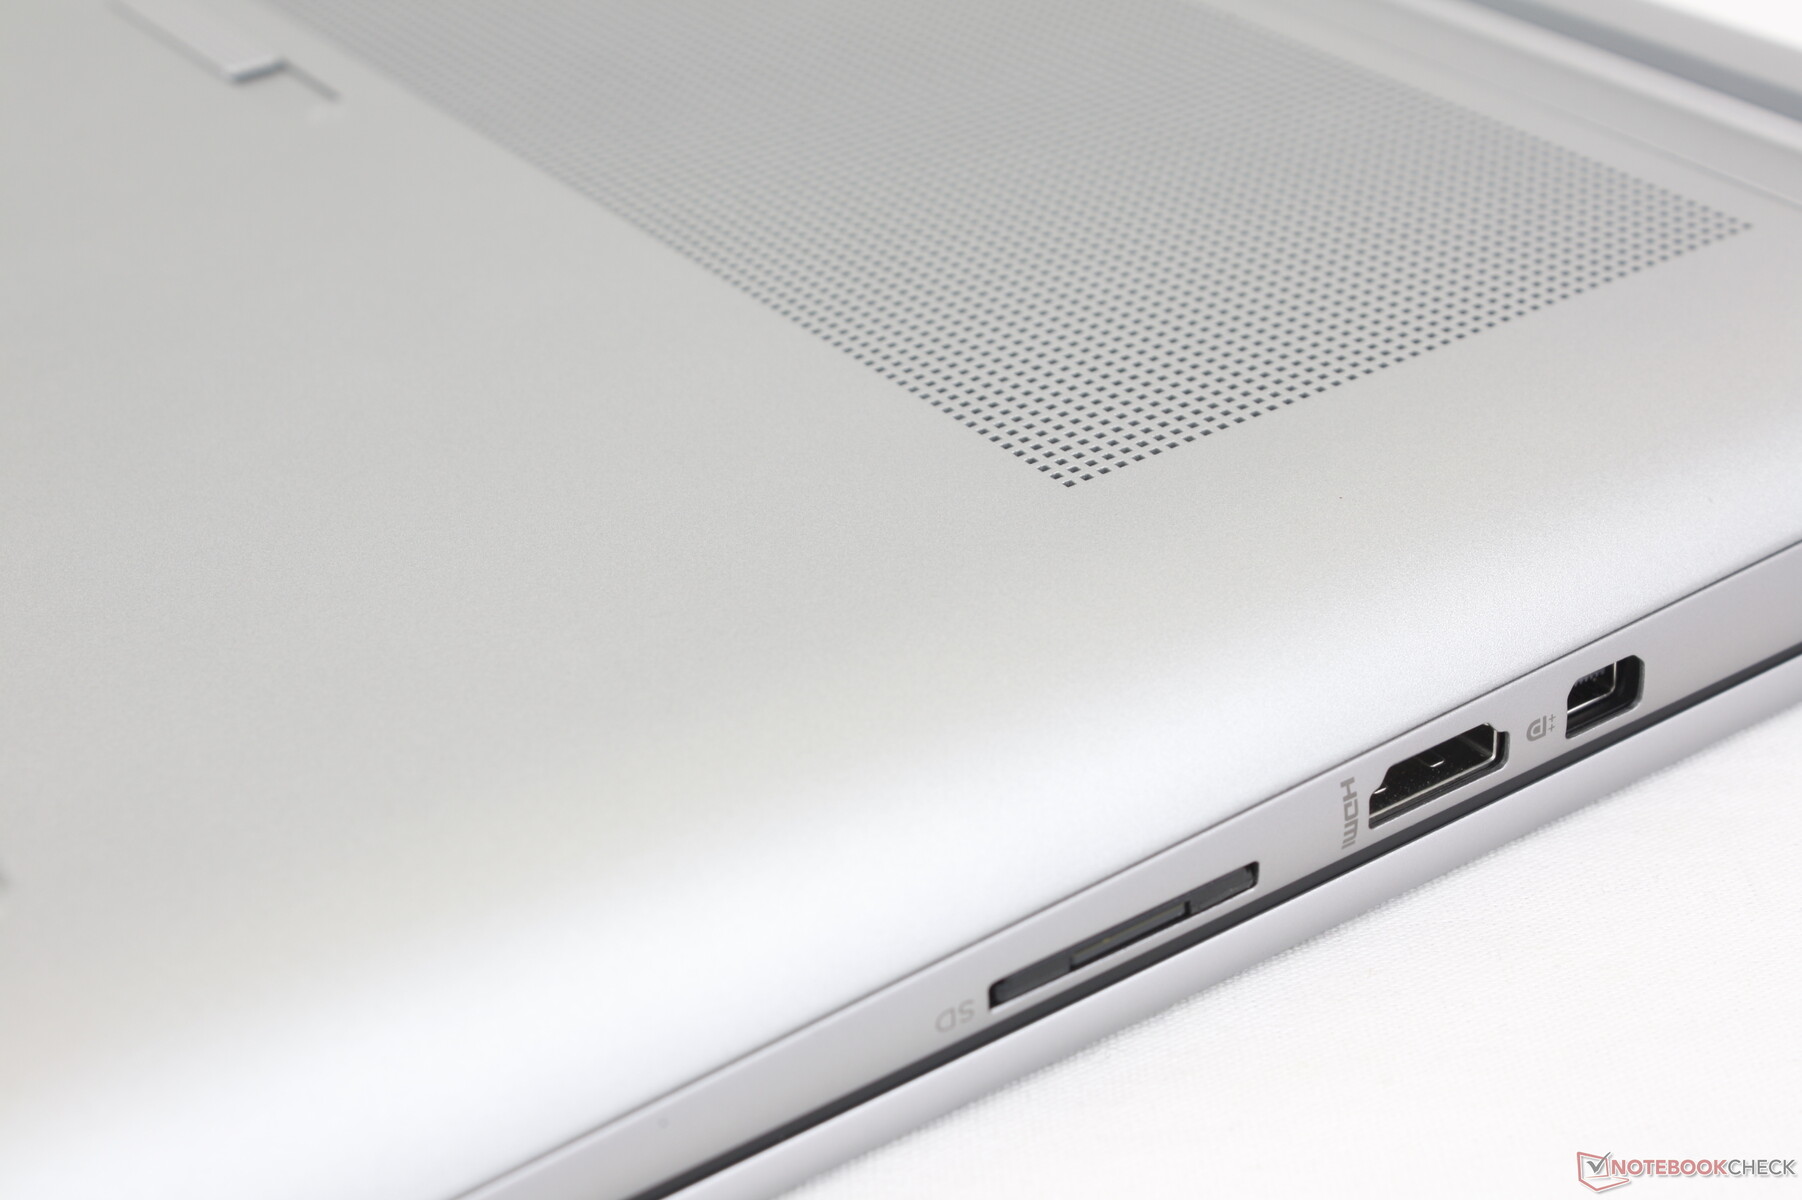
Anschlüsse
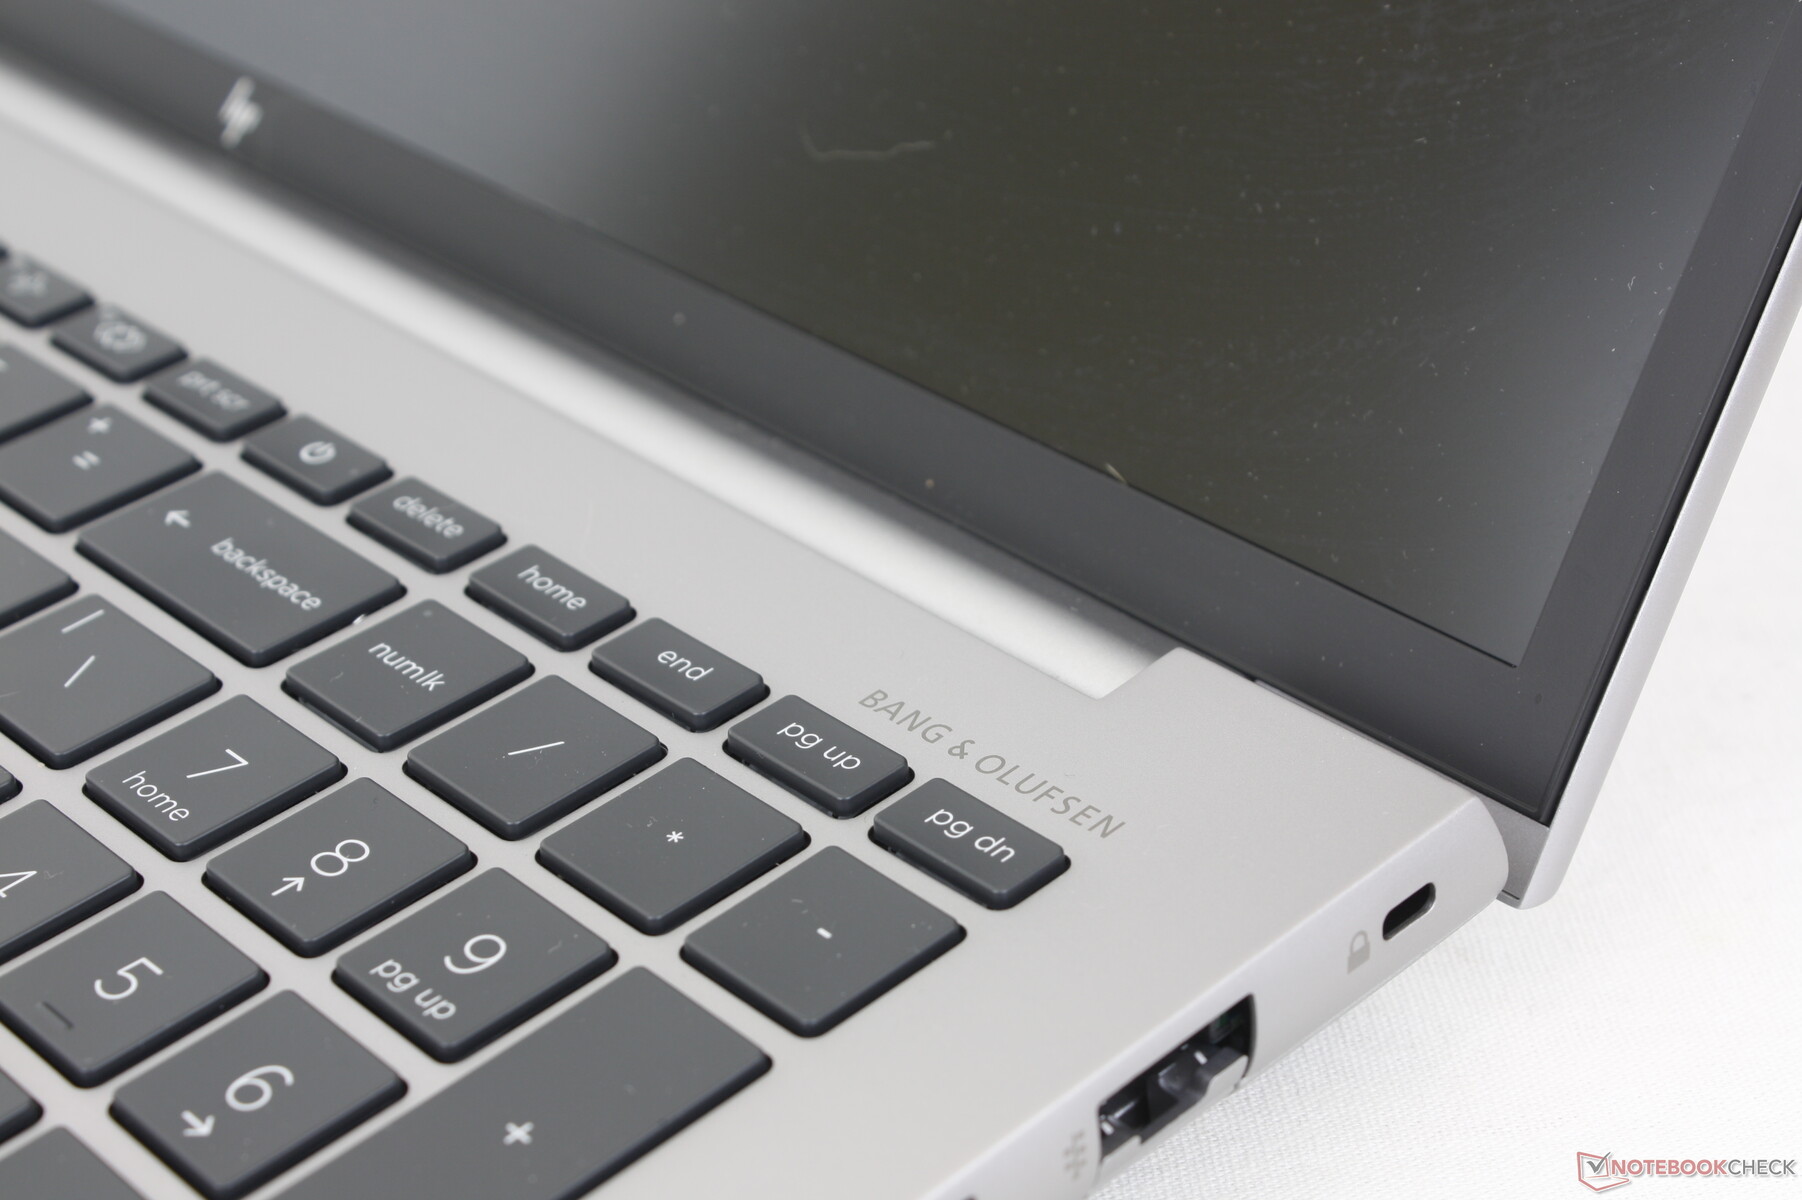
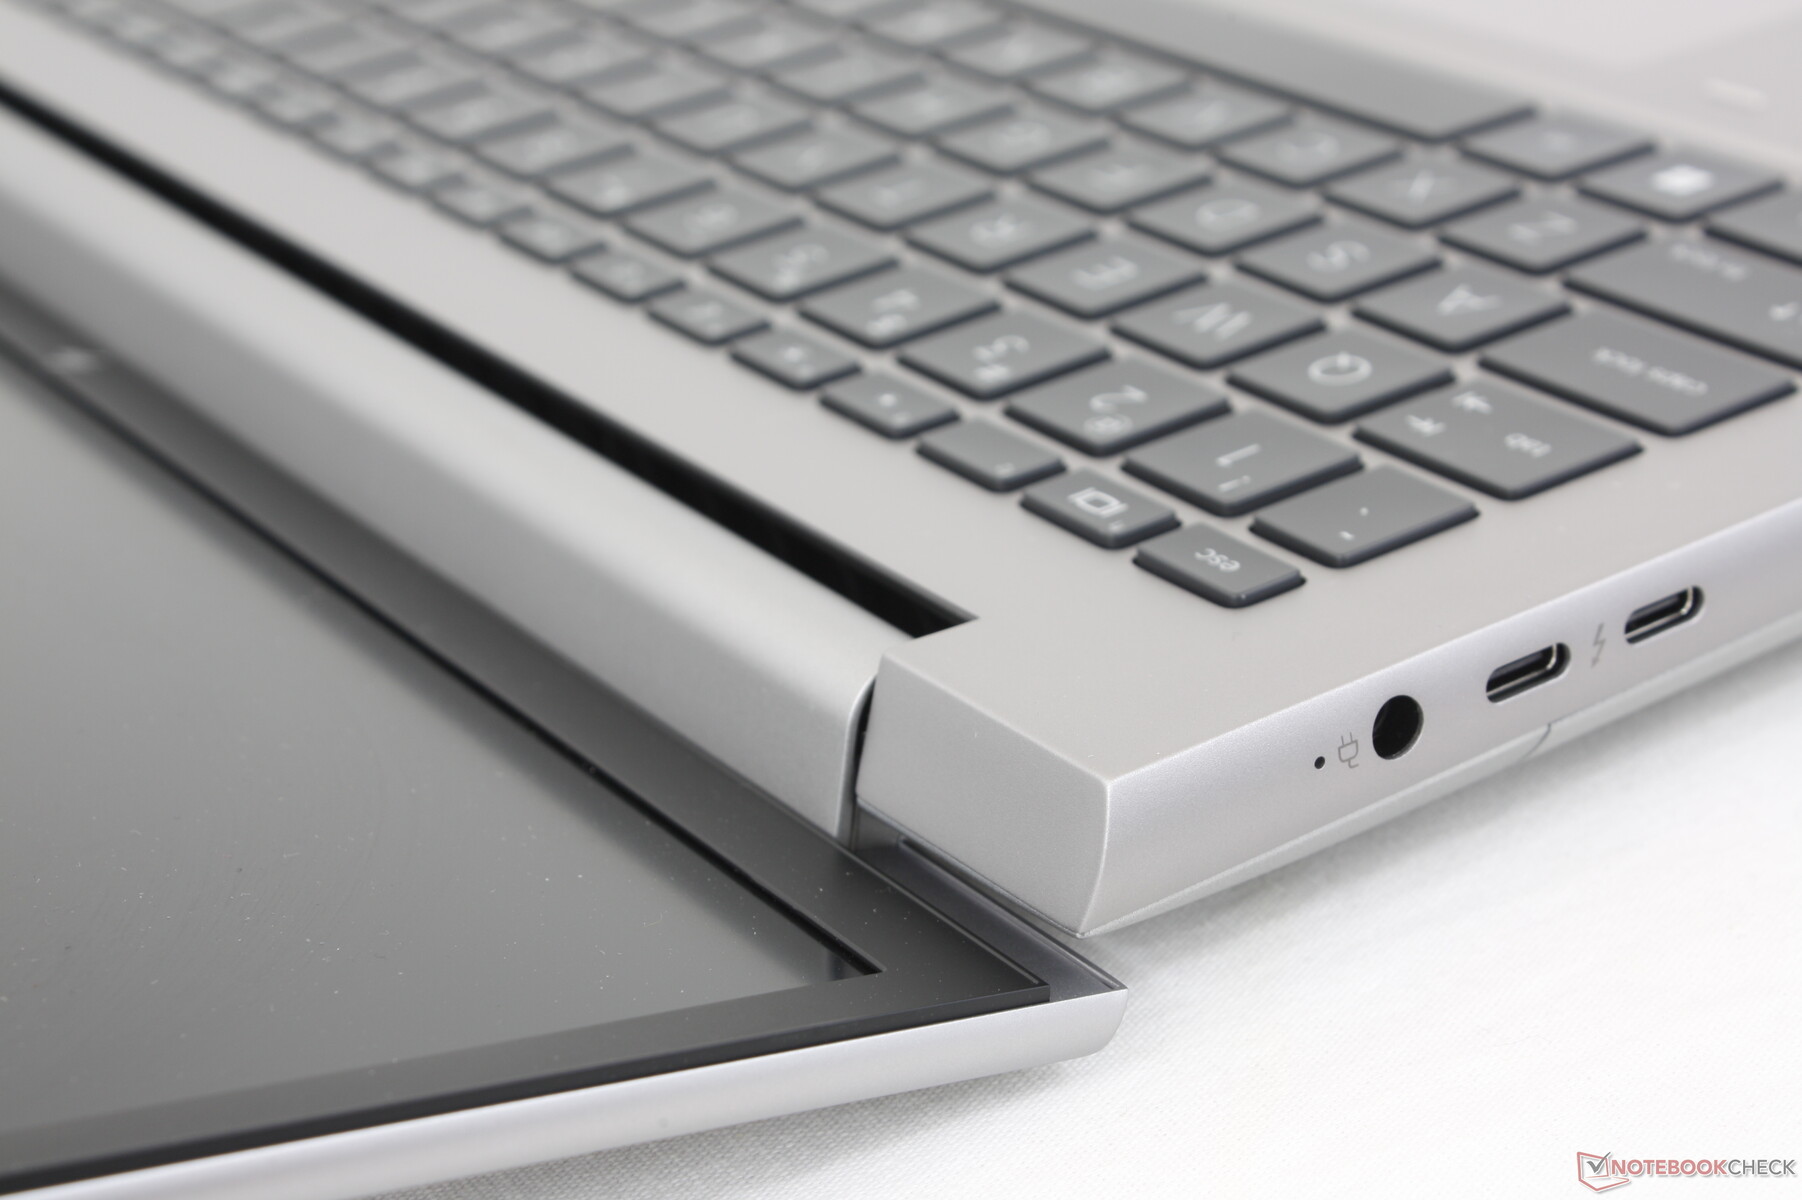
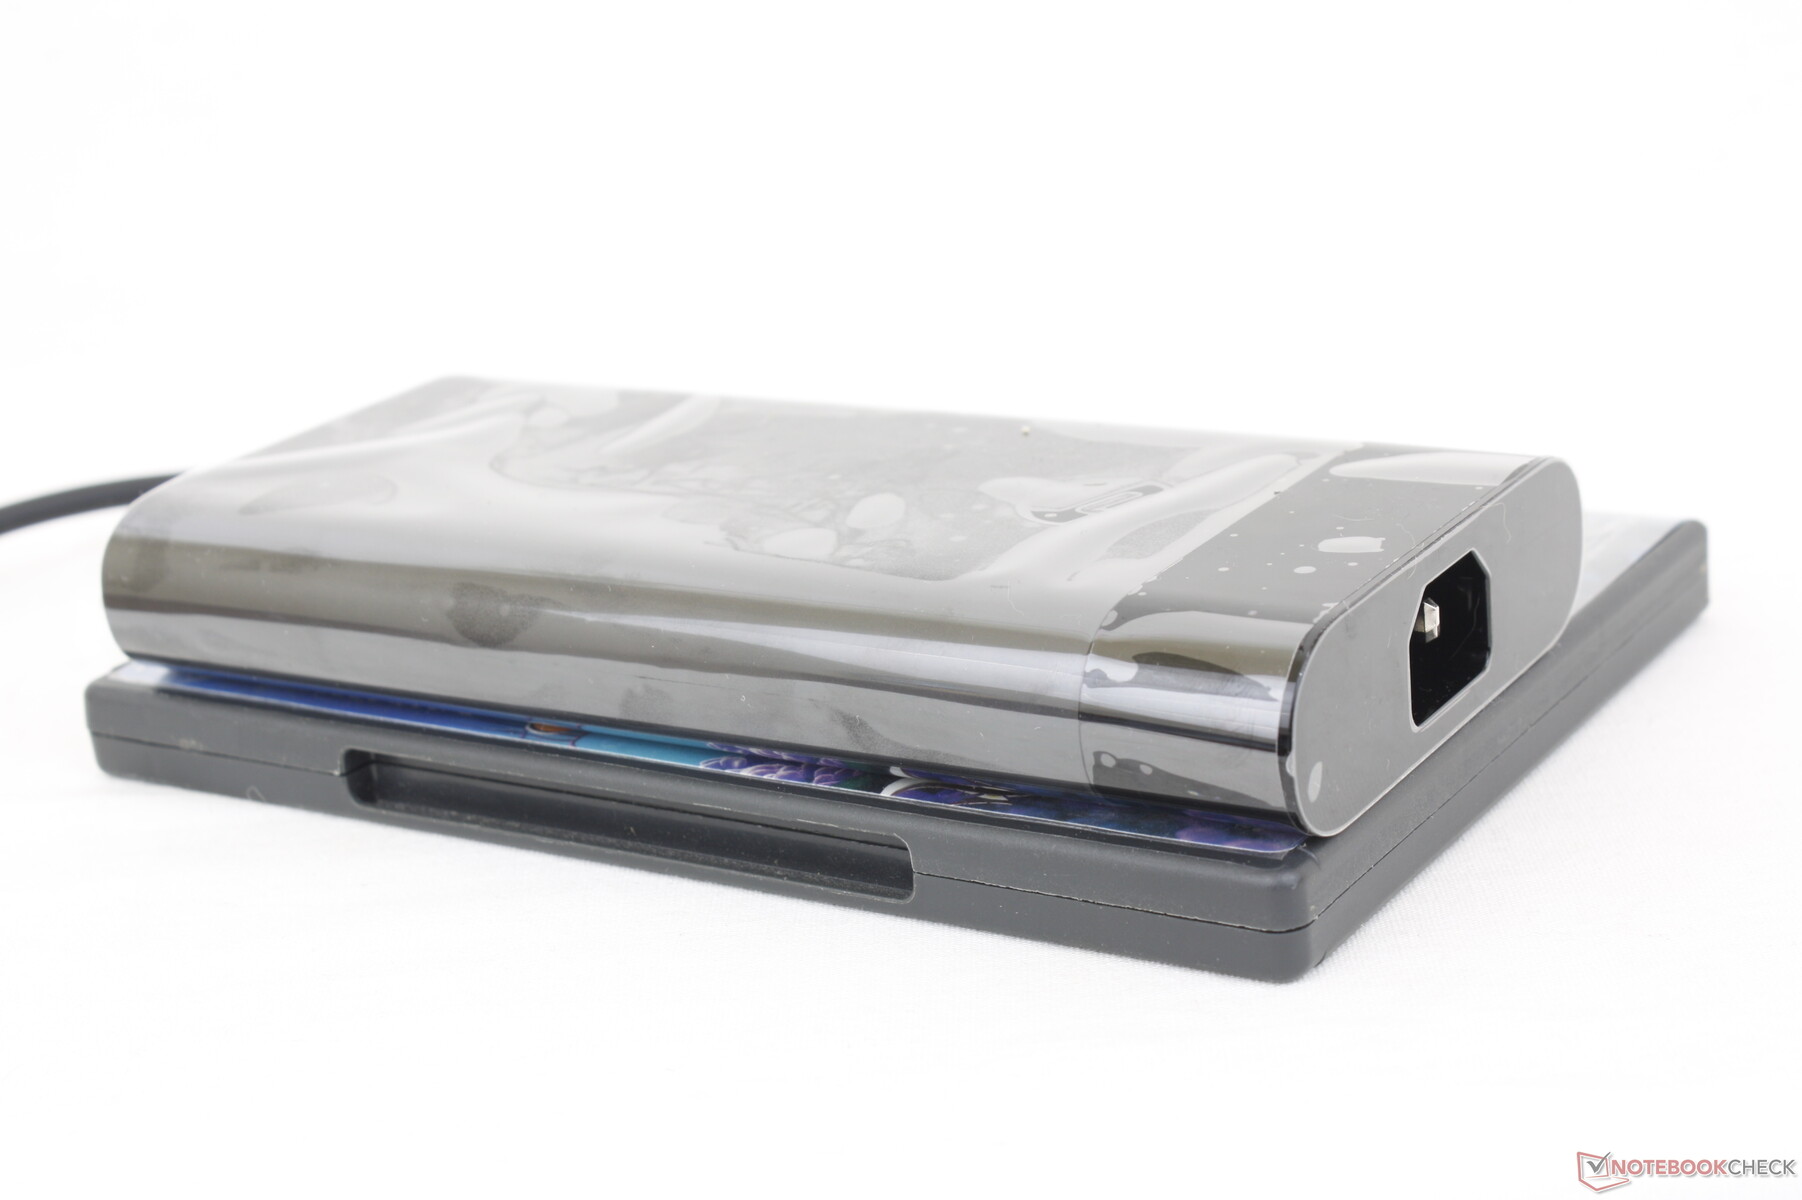
Unser Testgerät besitzt nahezu identische Ports wie das Precision 7670, nur findet man statt einem dritten USB-C-Port einen integrierten Mini-DisplayPort-Anschluss. Dies macht das ZBook Fury 16 G9 zu einer der wenigen Workstations, die mit Mini-DisplayPort daherkommen.
Die Verteilung der gesamten Anschlüsse hätte aber wiederum besser gewählt werden können: Die beiden USB-C-Anschlüsse liegen ziemlich dicht aneinander, direkt neben dem AC-Stromanschluss. So könnte es beispielsweise passieren, dass man mit diversen Adaptern oder ähnlichem die übrigen Anschlüsse verdeckt.
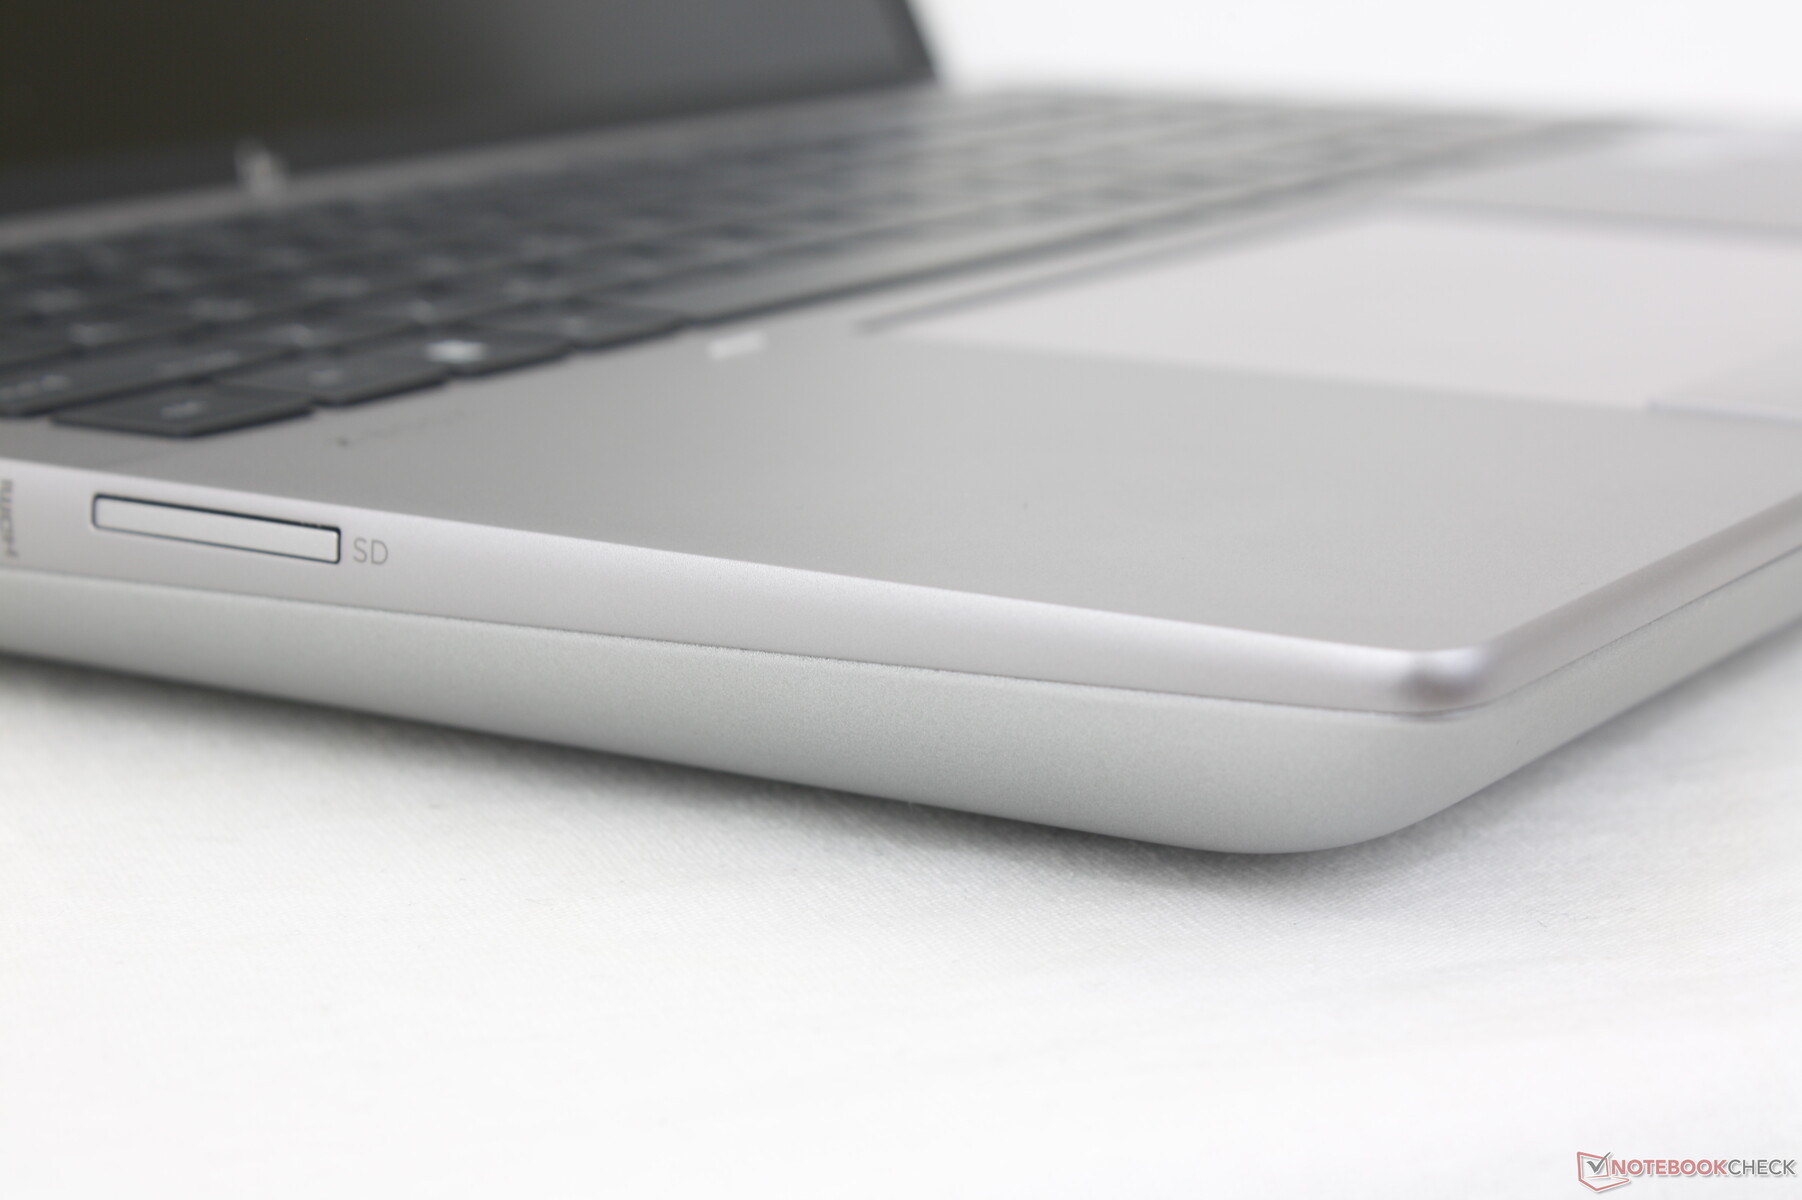
SD-Kartenleser
In unserem Test mit einer PNY EliteX-PRO60, welche maximale Lese- und Schreibgeschwindigkeiten von 280 MB/s besitzt, erreichten wir Transferraten von bis zu 80 MB/s. Im Vergleich dazu ist der SD-Kartenleser im Precision 7670 mehr als doppelt so schnell. User, die sehr viel Wert auf einen schnellen und zuverlässigen SD-Kartenleser legen, könnten daher beim Fury 16 G9 eher etwas enttäuscht werden.
| SD Card Reader | |
| average JPG Copy Test (av. of 3 runs) | |
| Dell Precision 7000 7670 Performance (Toshiba Exceria Pro SDXC 64 GB UHS-II) | |
| MSI CreatorPro Z16P B12UKST (AV Pro V60) | |
| HP ZBook Fury 16 G9 (PNY EliteX-PRO60) | |
| Lenovo ThinkPad P16 G1 RTX A5500 (Toshiba Exceria Pro SDXC 64 GB UHS-II) | |
| HP ZBook Studio 16 G9 62U04EA (Angelbird AV PRO V60) | |
| maximum AS SSD Seq Read Test (1GB) | |
| Dell Precision 7000 7670 Performance (Toshiba Exceria Pro SDXC 64 GB UHS-II) | |
| HP ZBook Fury 16 G9 (PNY EliteX-PRO60) | |
| MSI CreatorPro Z16P B12UKST (AV Pro V60) | |
| Lenovo ThinkPad P16 G1 RTX A5500 (Toshiba Exceria Pro SDXC 64 GB UHS-II) | |
| HP ZBook Studio 16 G9 62U04EA (Angelbird AV PRO V60) | |
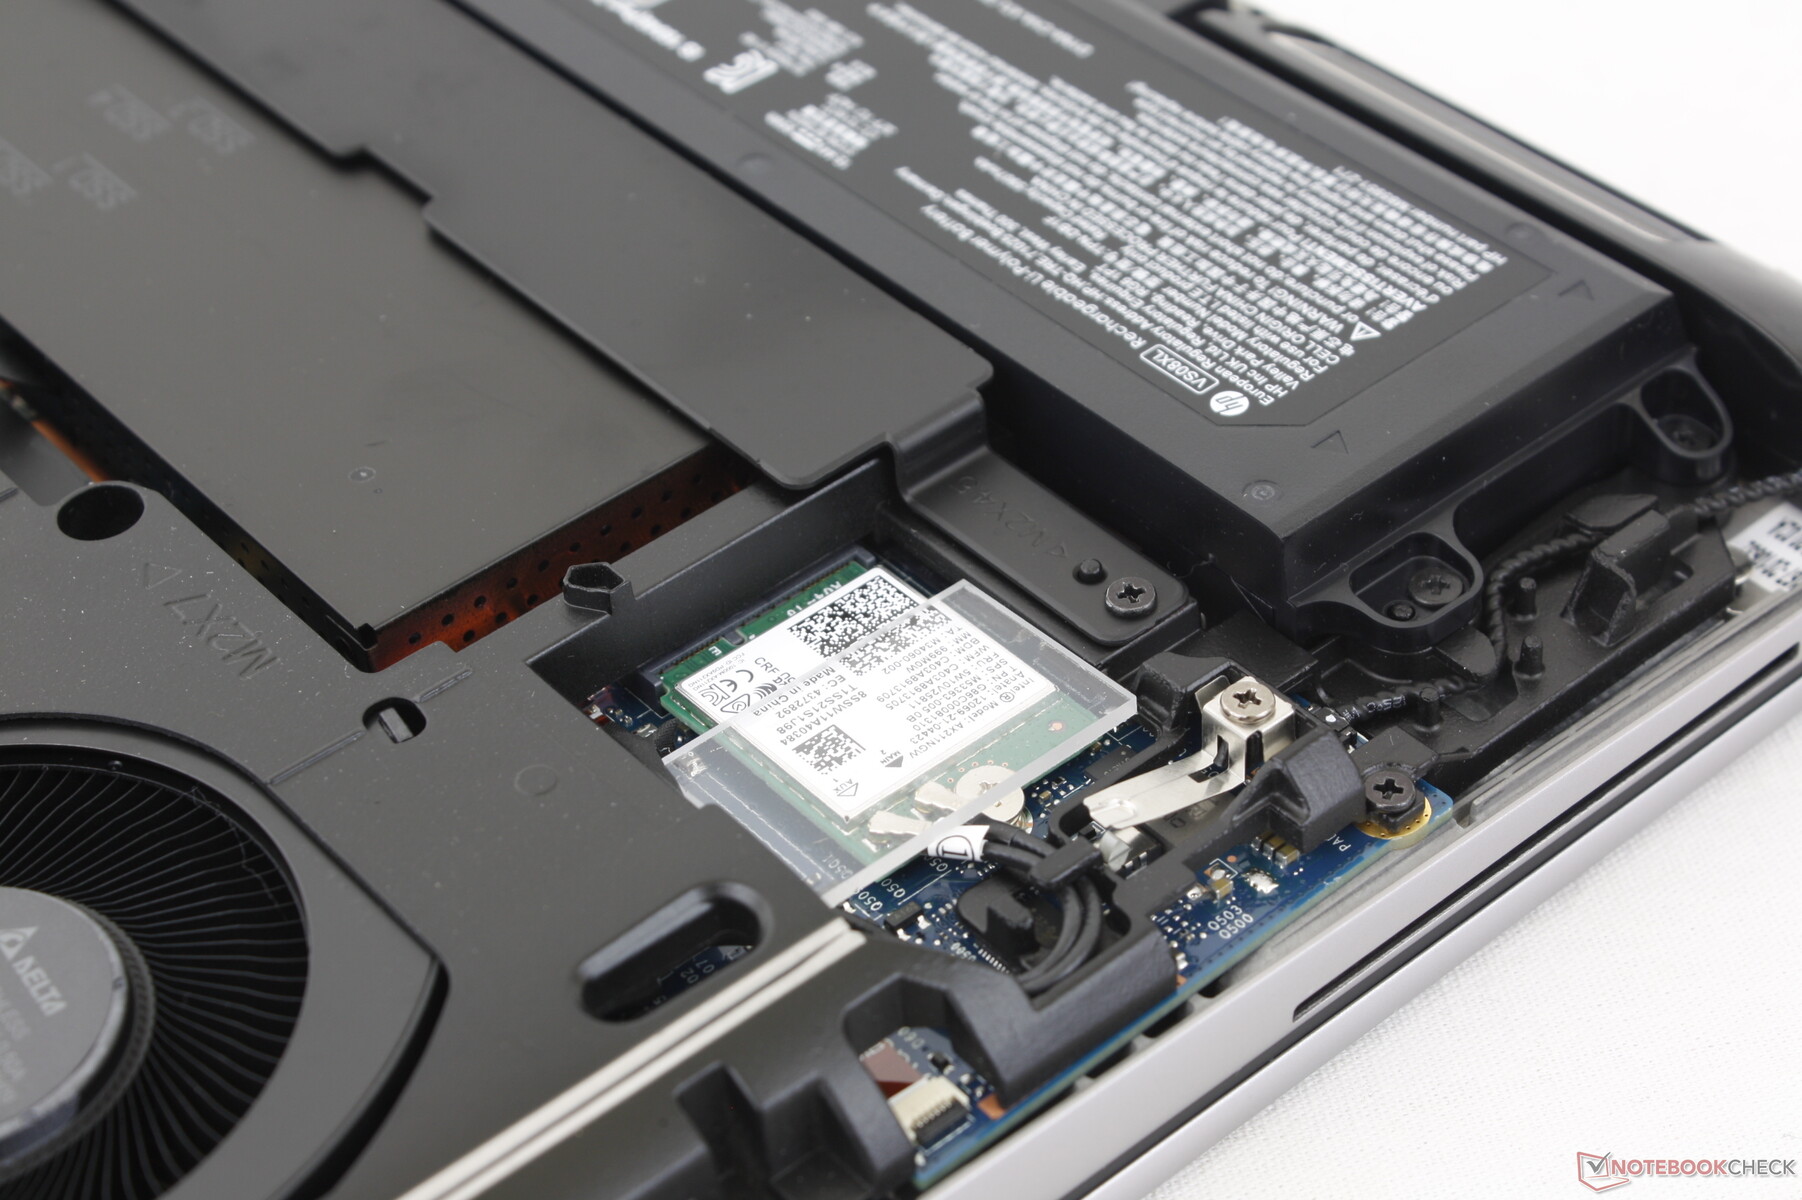
Kommunikation
Unsere Windows-10-Version ist mit einem Intel-AY211-Chip für WiFi-6E und Bluetooth 5.2 ausgestattet. Ersteres ist nur leider unter Windows 10 nicht nutzbar, da Microsoft diese Funktion ausschließlich für Windows 11 bereitstellt. Sollte man sich also mit 6-GHz-Netzwerken verbinden wollen, ist ein Upgrade auf Windows 11 essentiell. Ansonsten stellten wir keinerlei Performance-Probleme bei regulären WiFi-6-Verbindungen fest.
Webcam
HP verbaut beim ZBook Fury 16 G9 eine 5-MP-Webcam, weshalb die Qualität auch merkbar besser als bei Laptops mit einer 1-MP- oder 2-MP-Kamera ist. Diese sind nämlich immer noch der Standard, wie auch beim ThinkPad P16 oder beim Precision 7670. Außerdem darf man sich an einem IR-Sensor für den Windows-Hello-Support und einer Kameraverdeckung erfreuen.


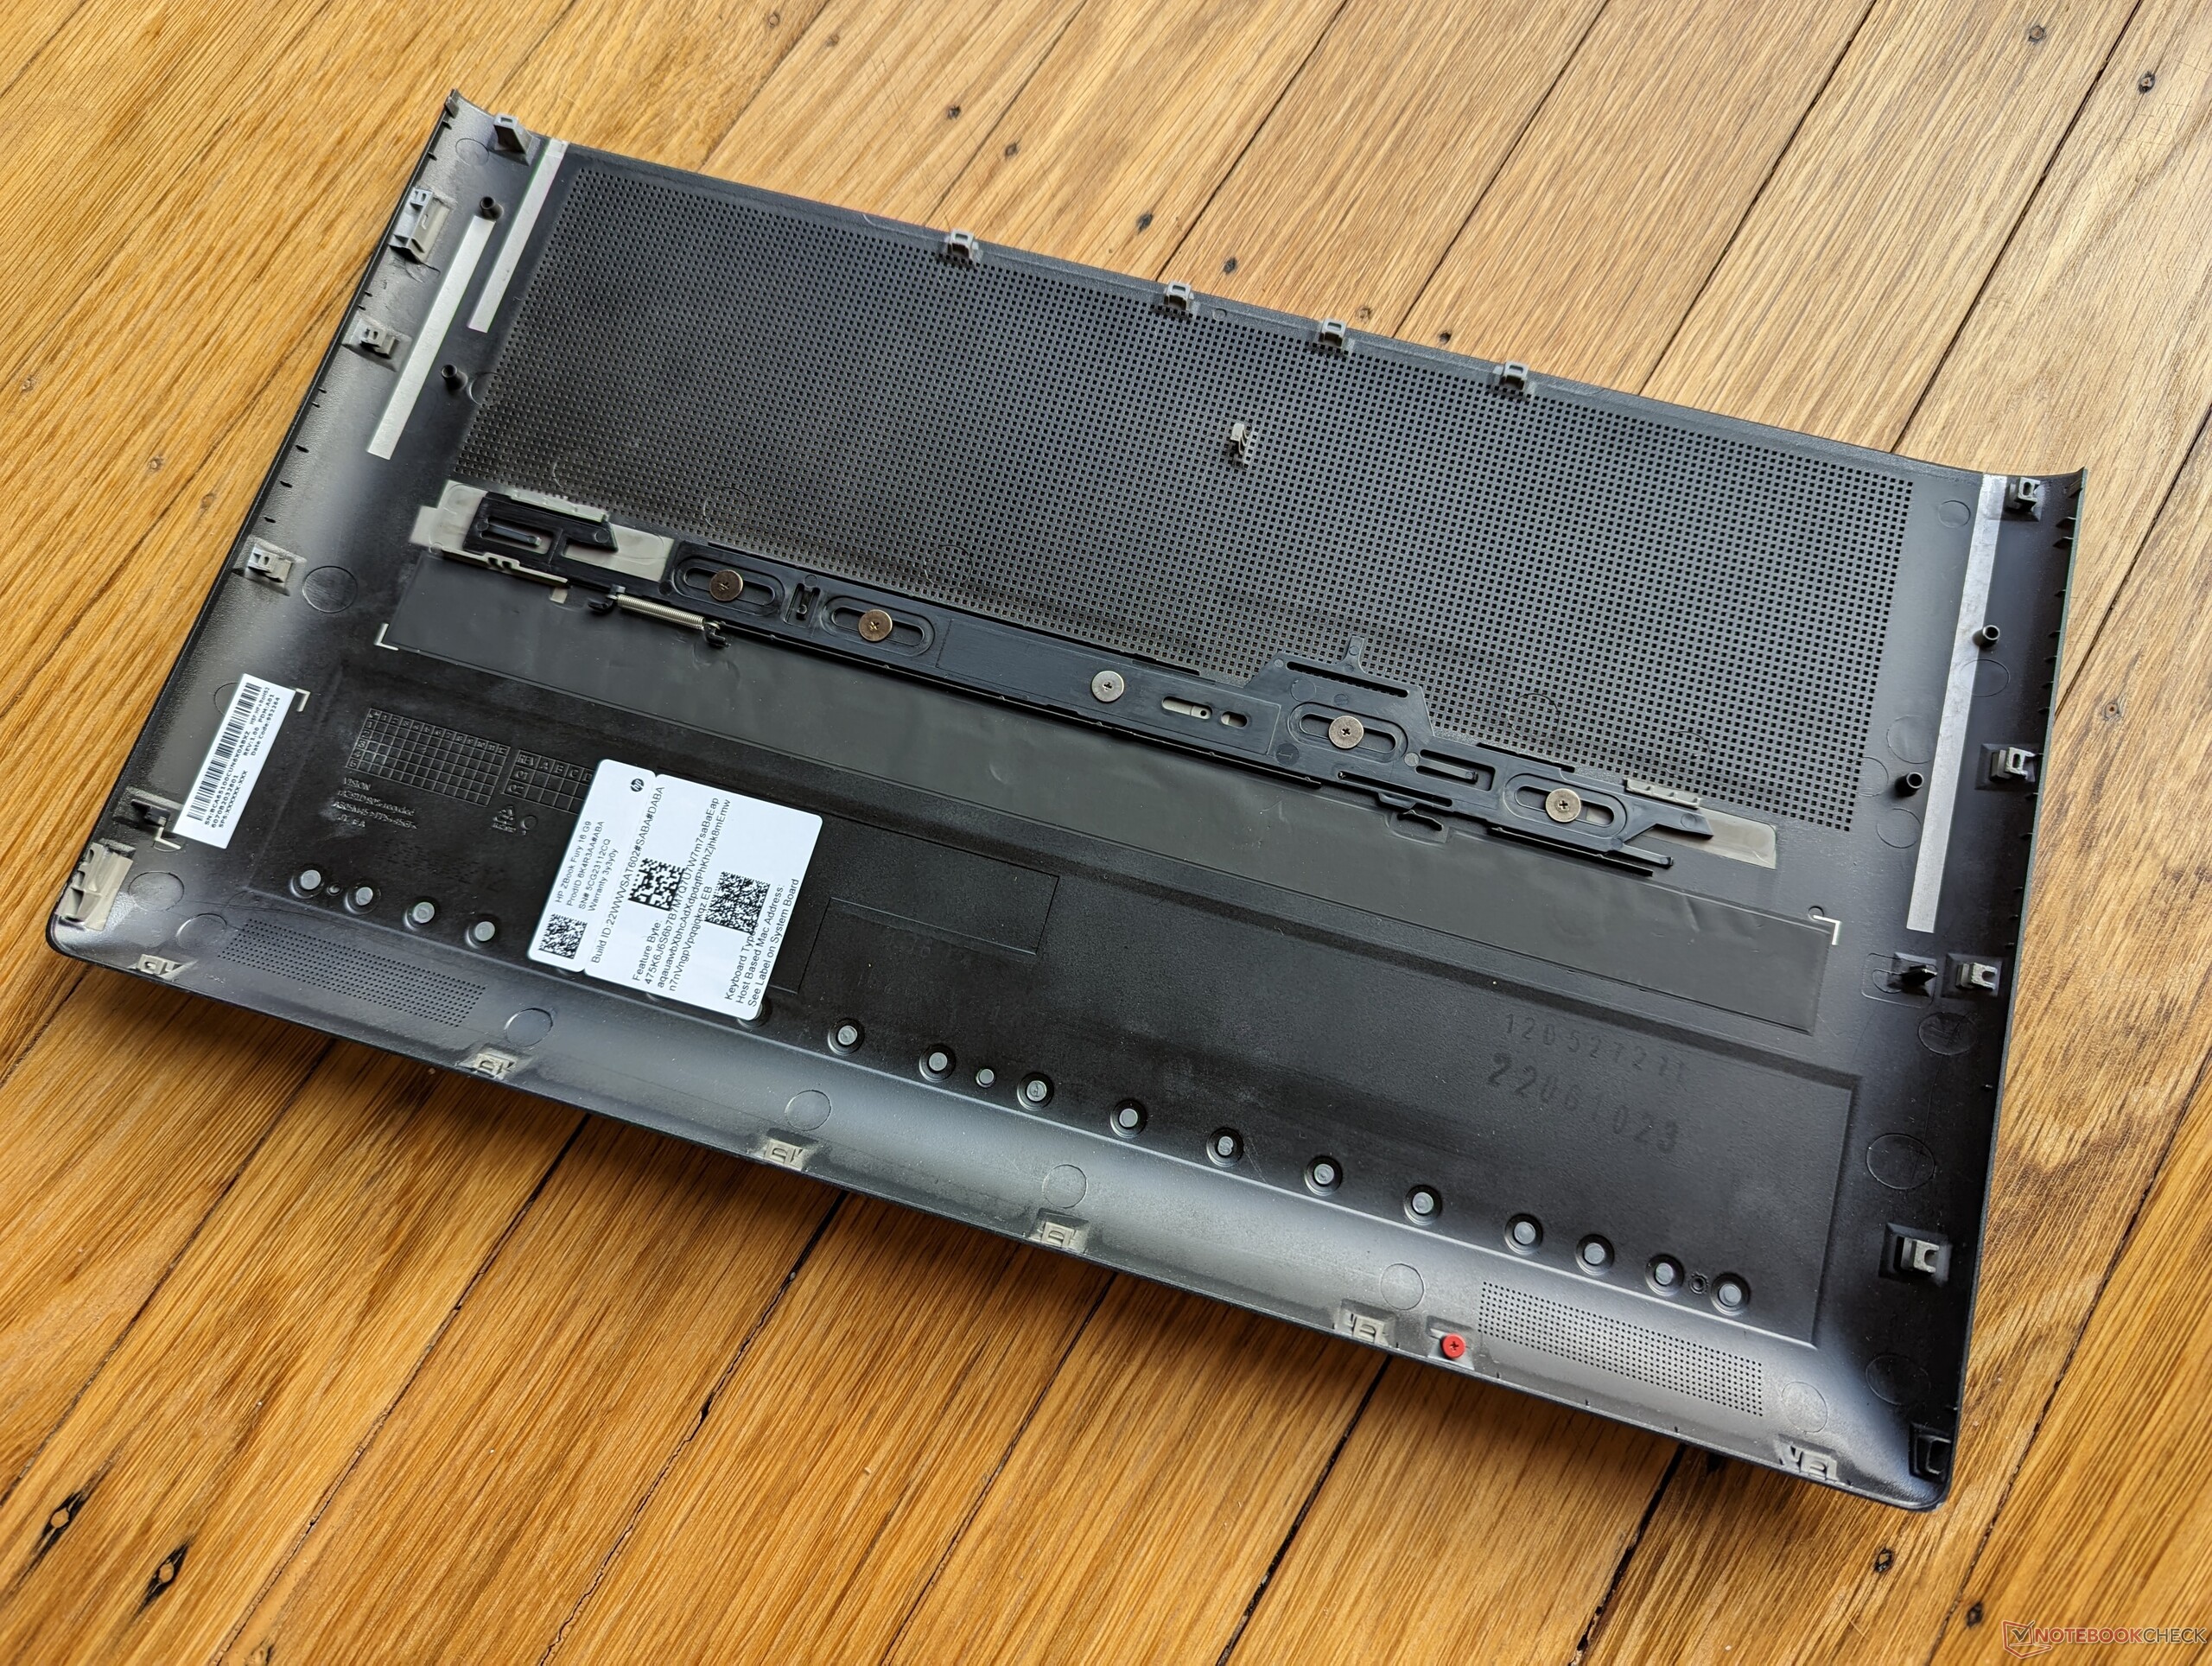
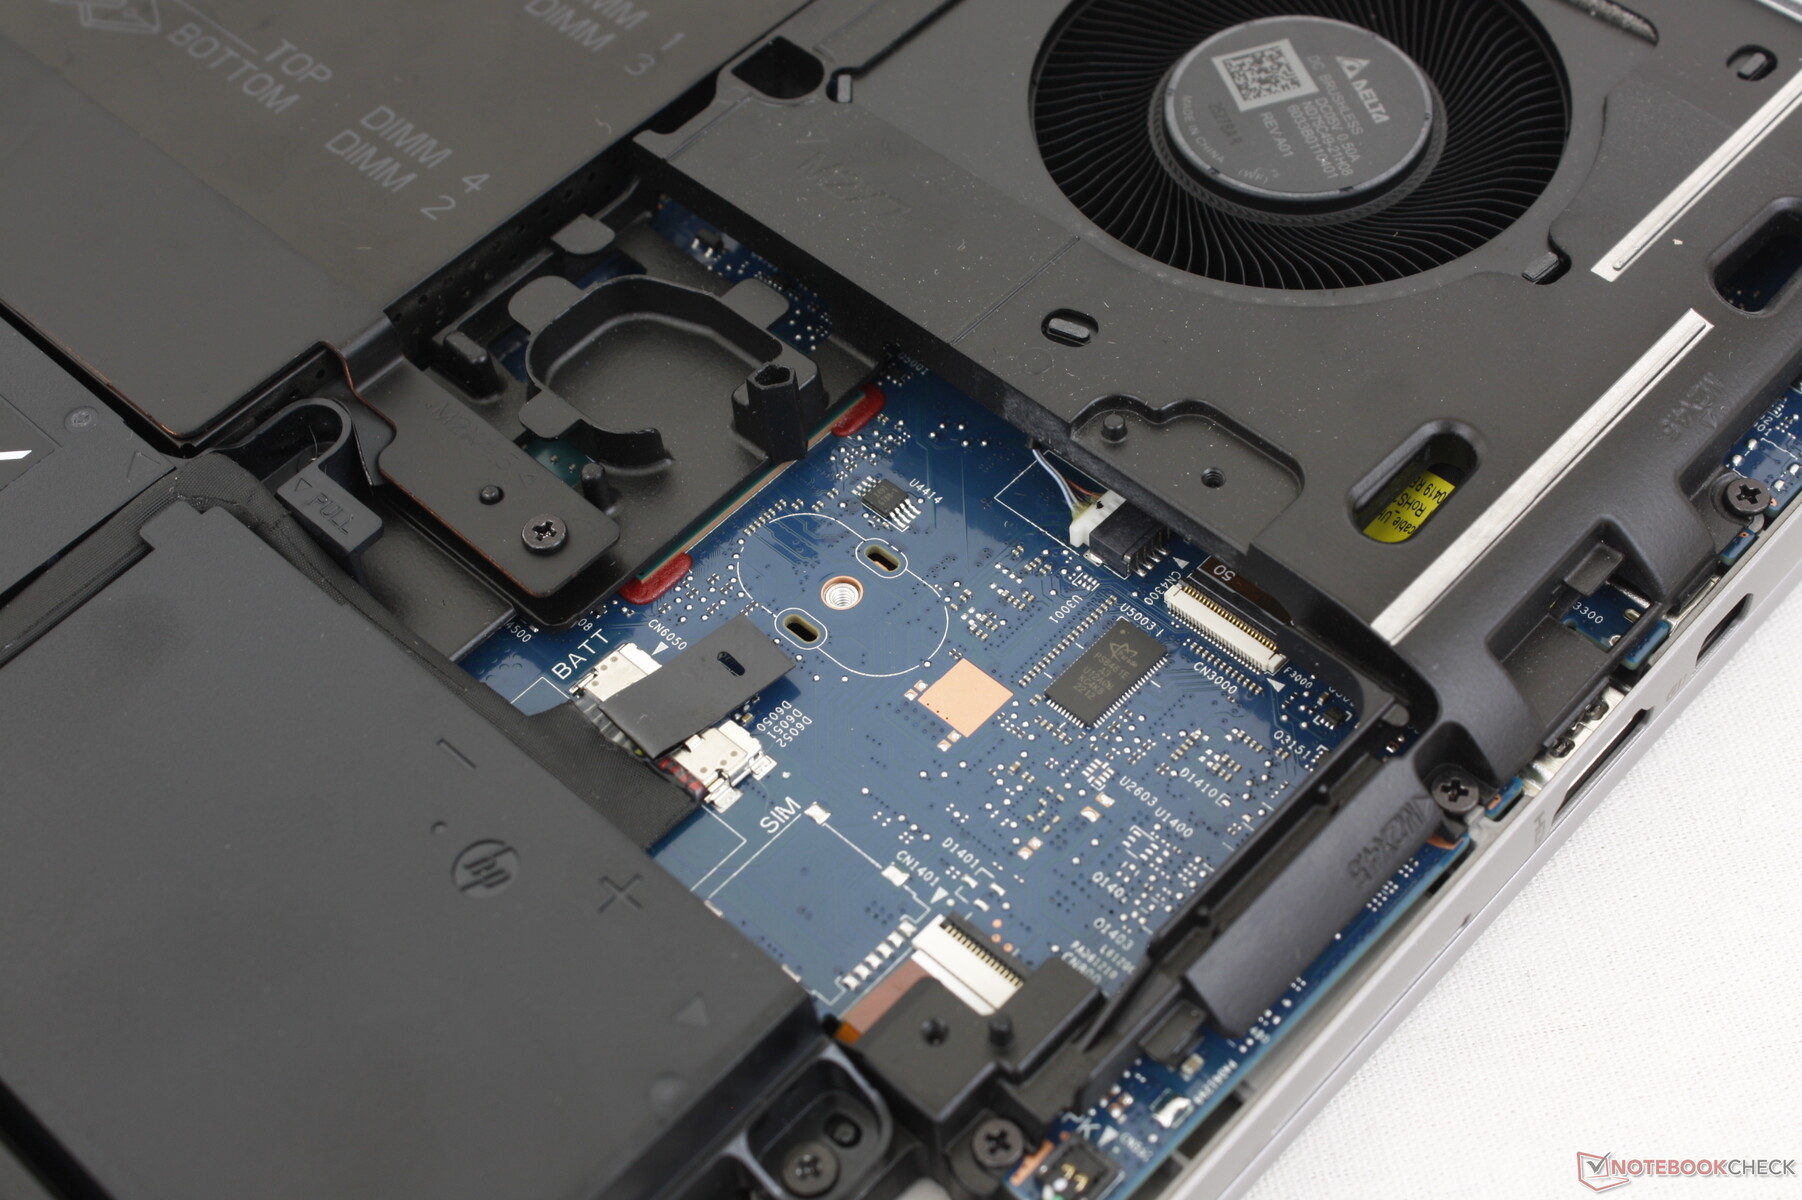
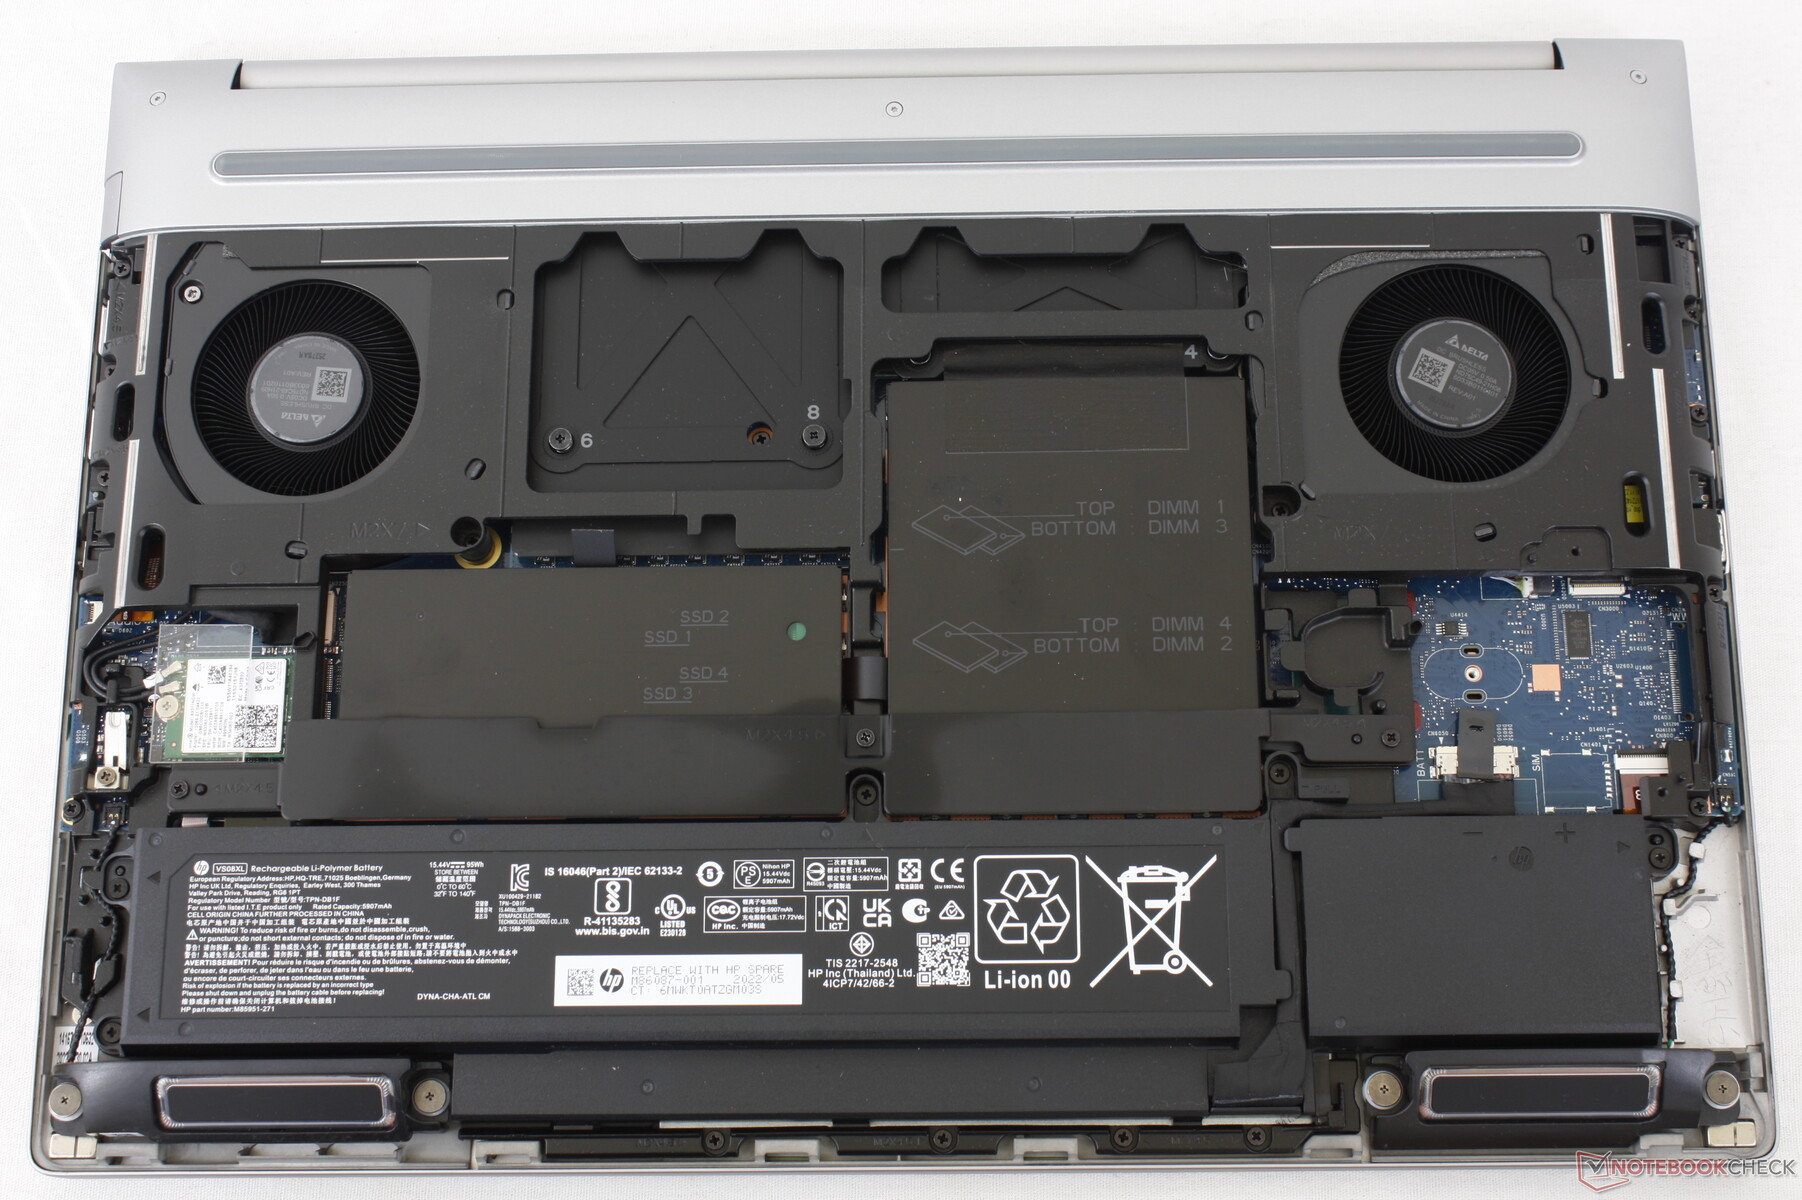
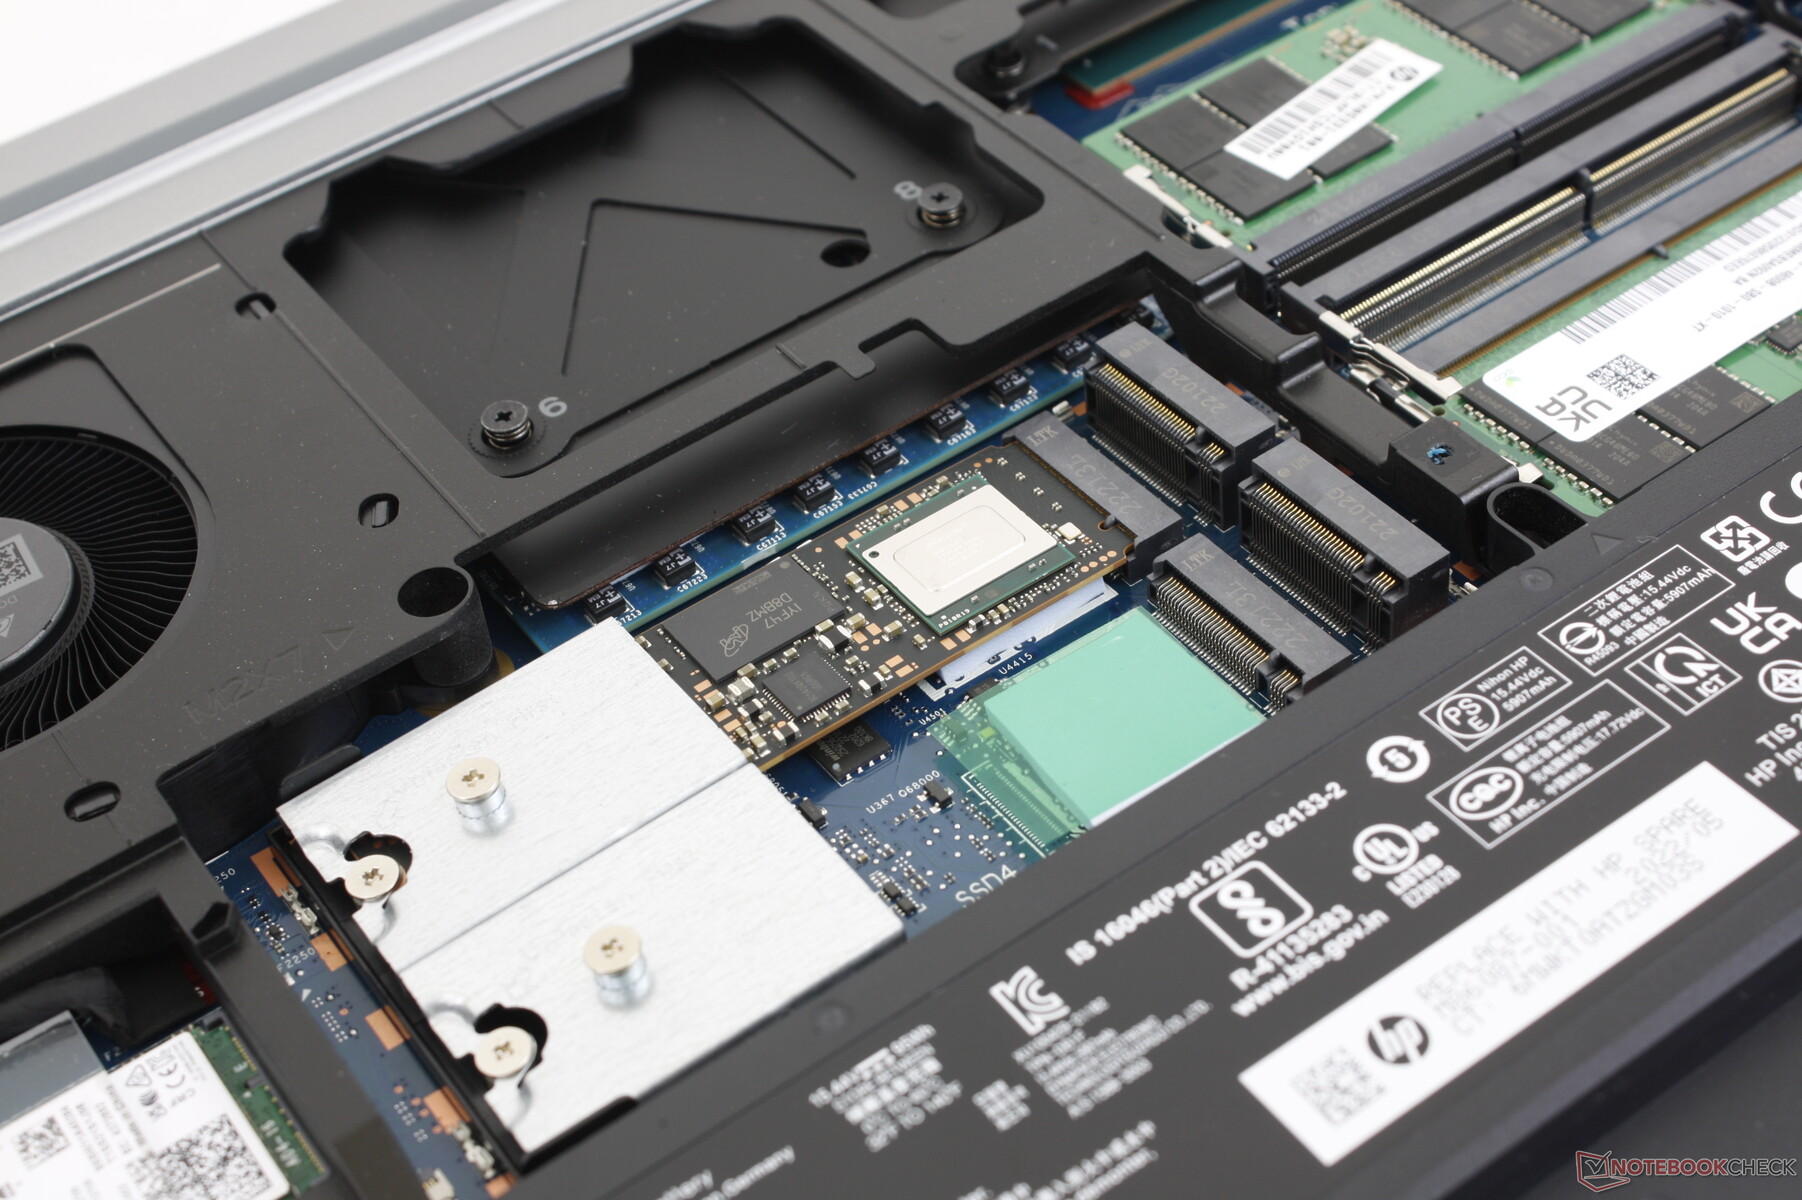
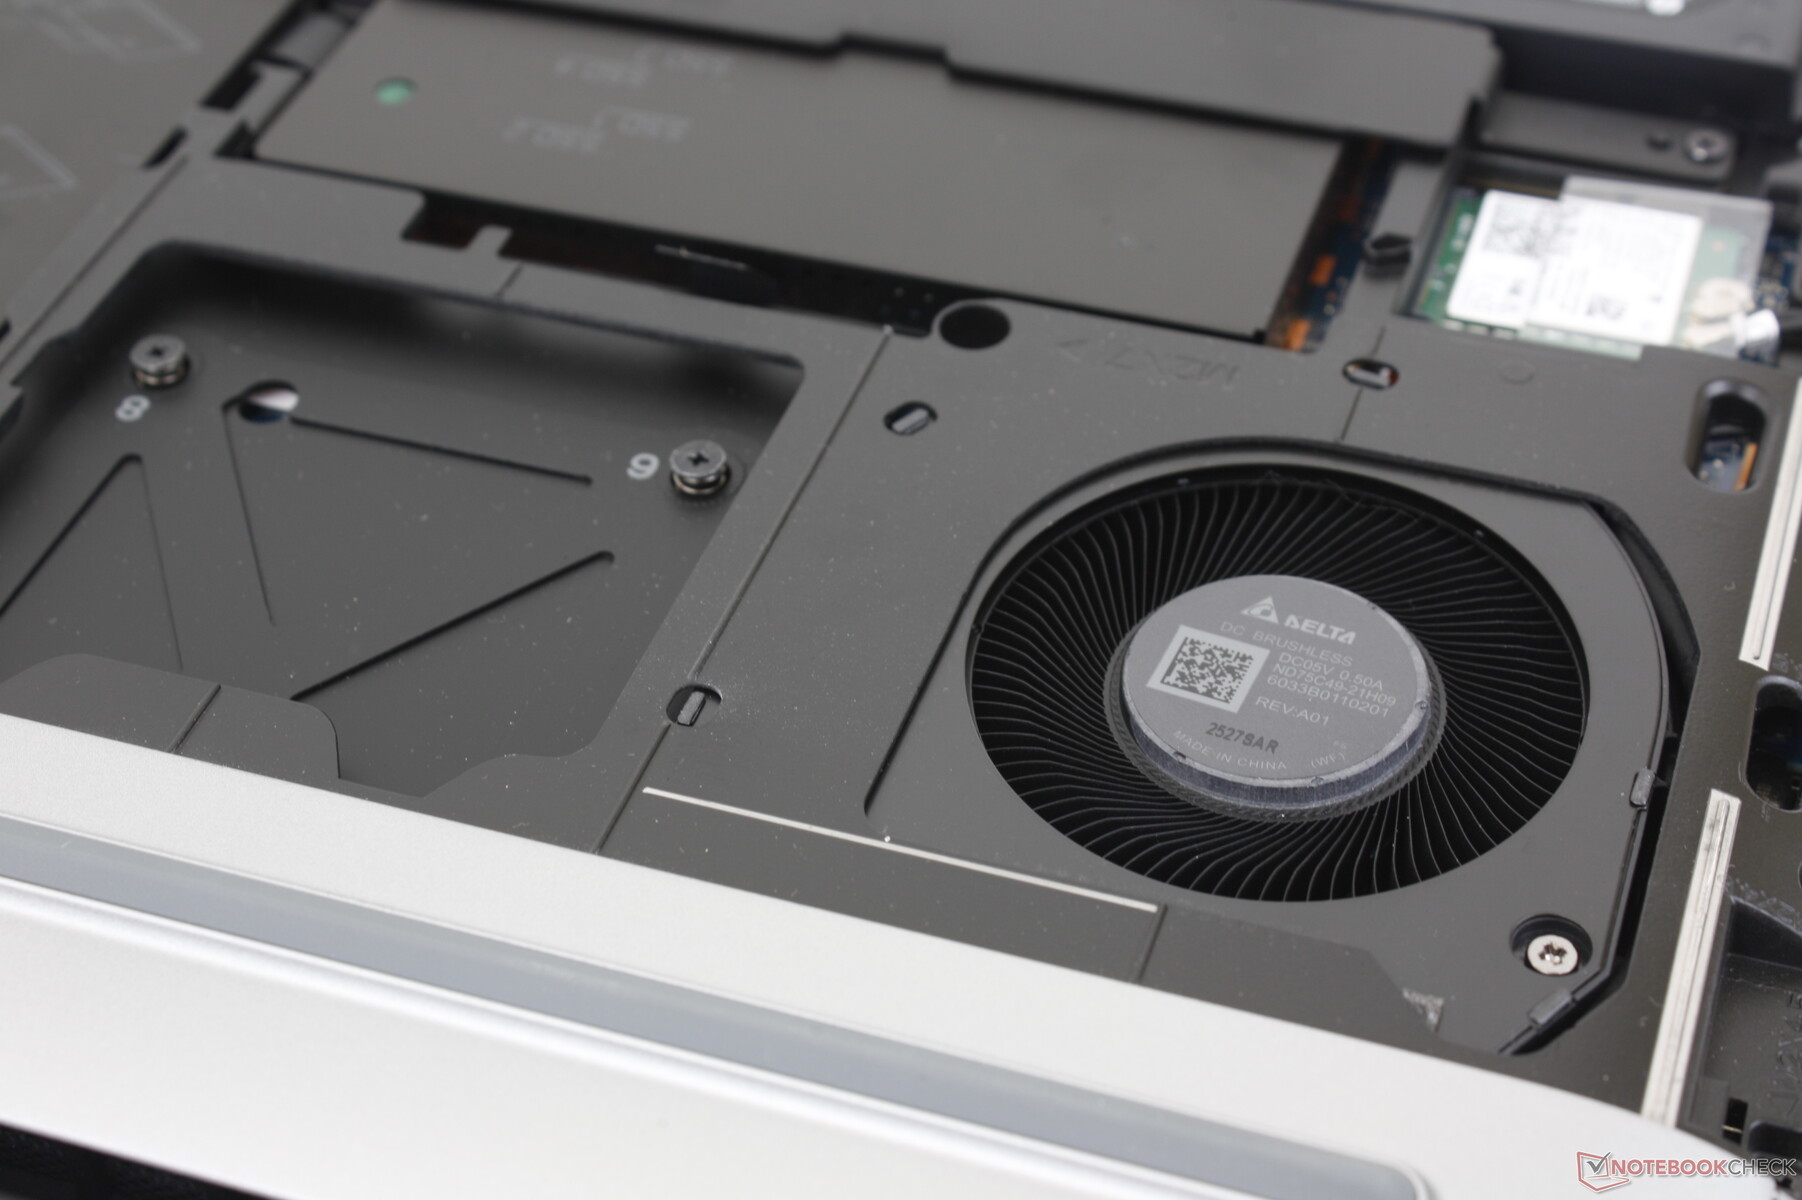
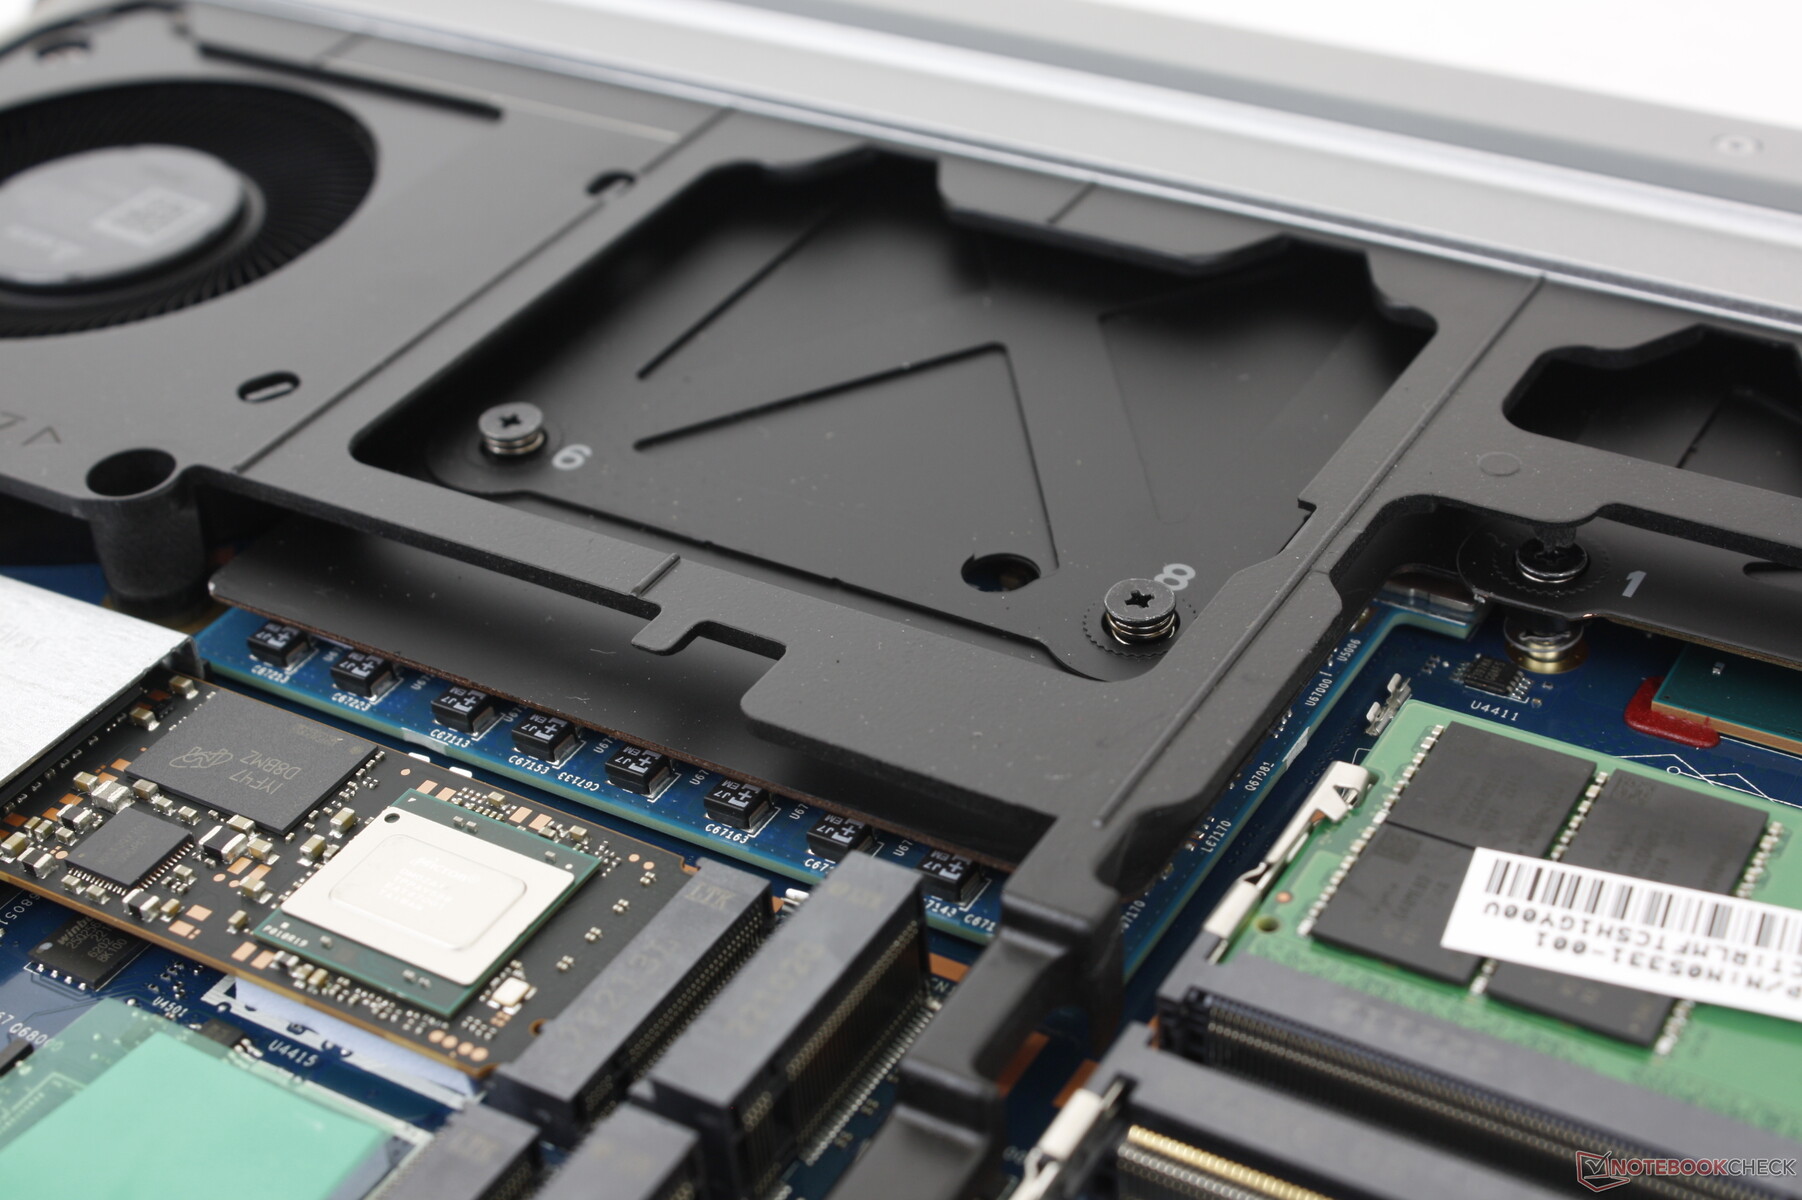
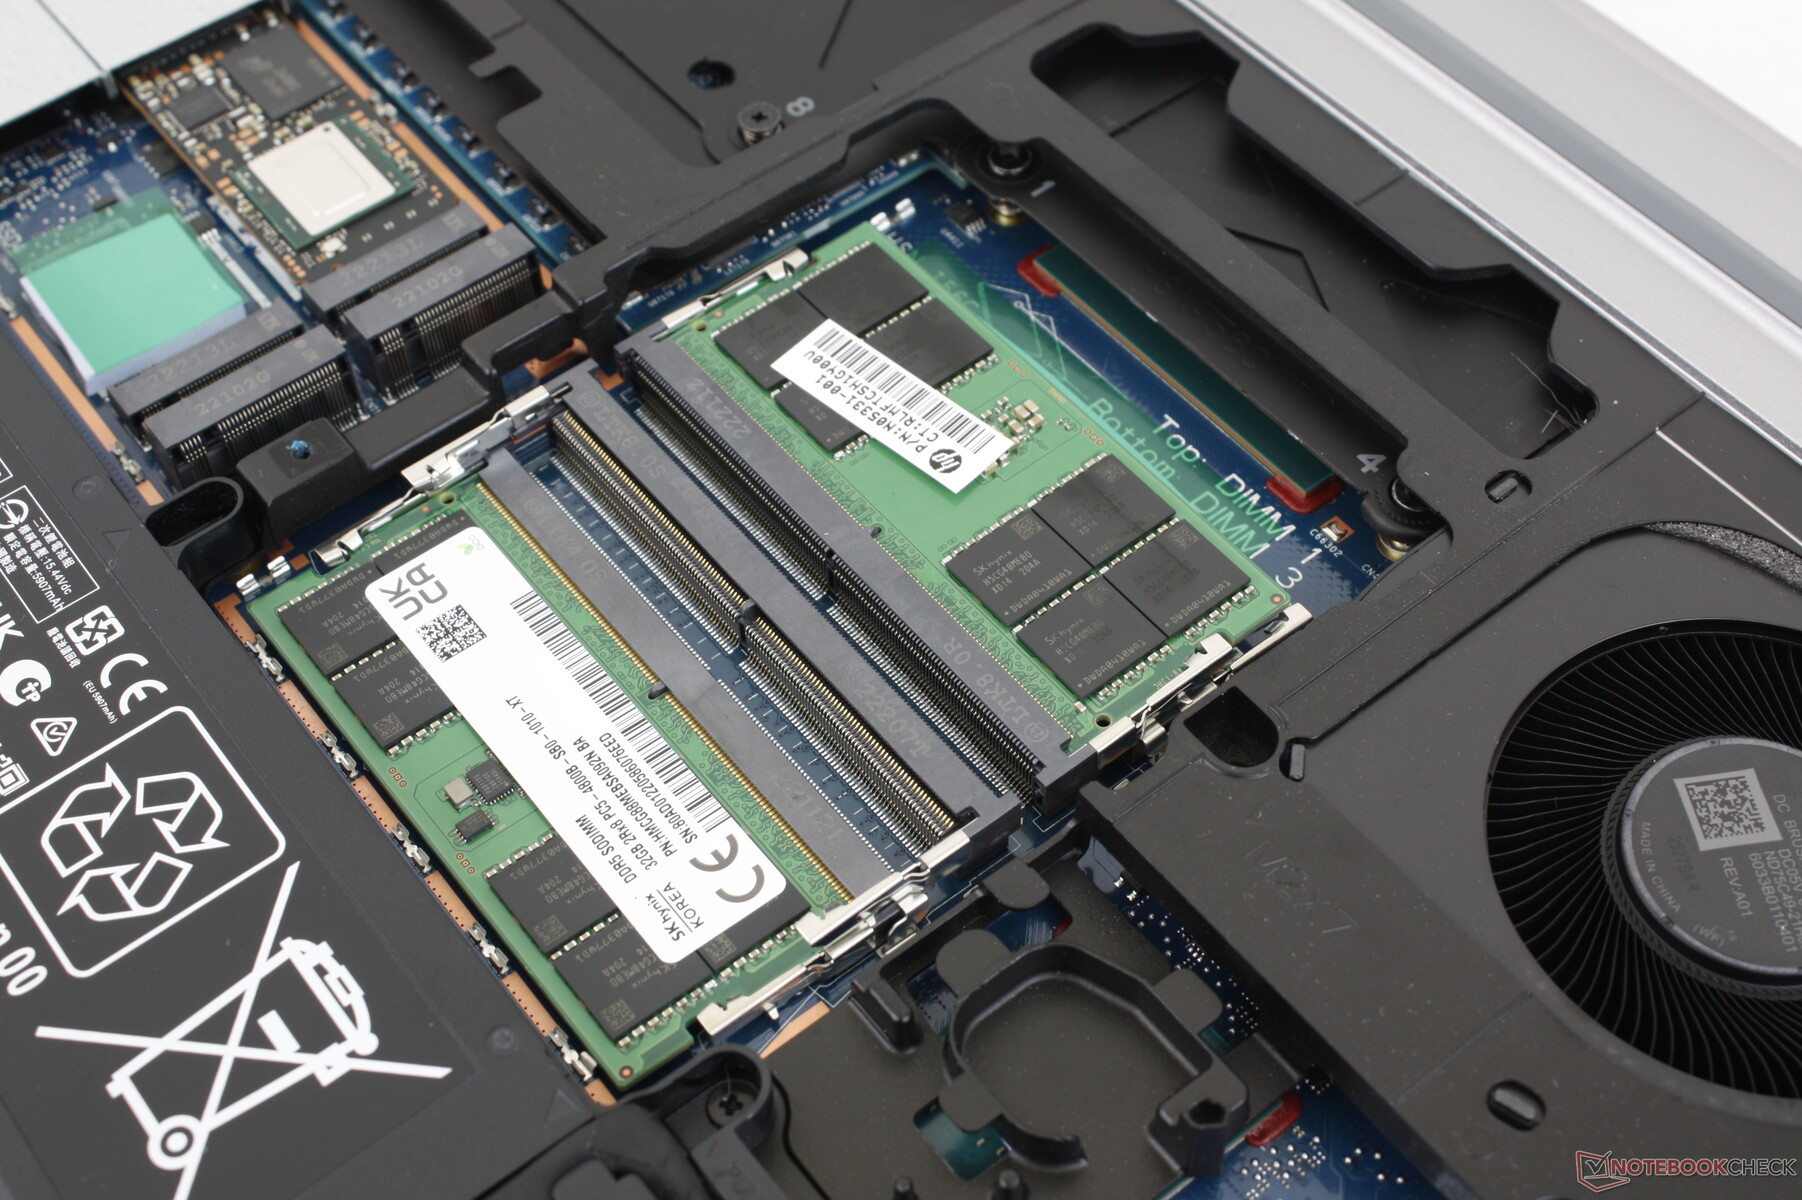
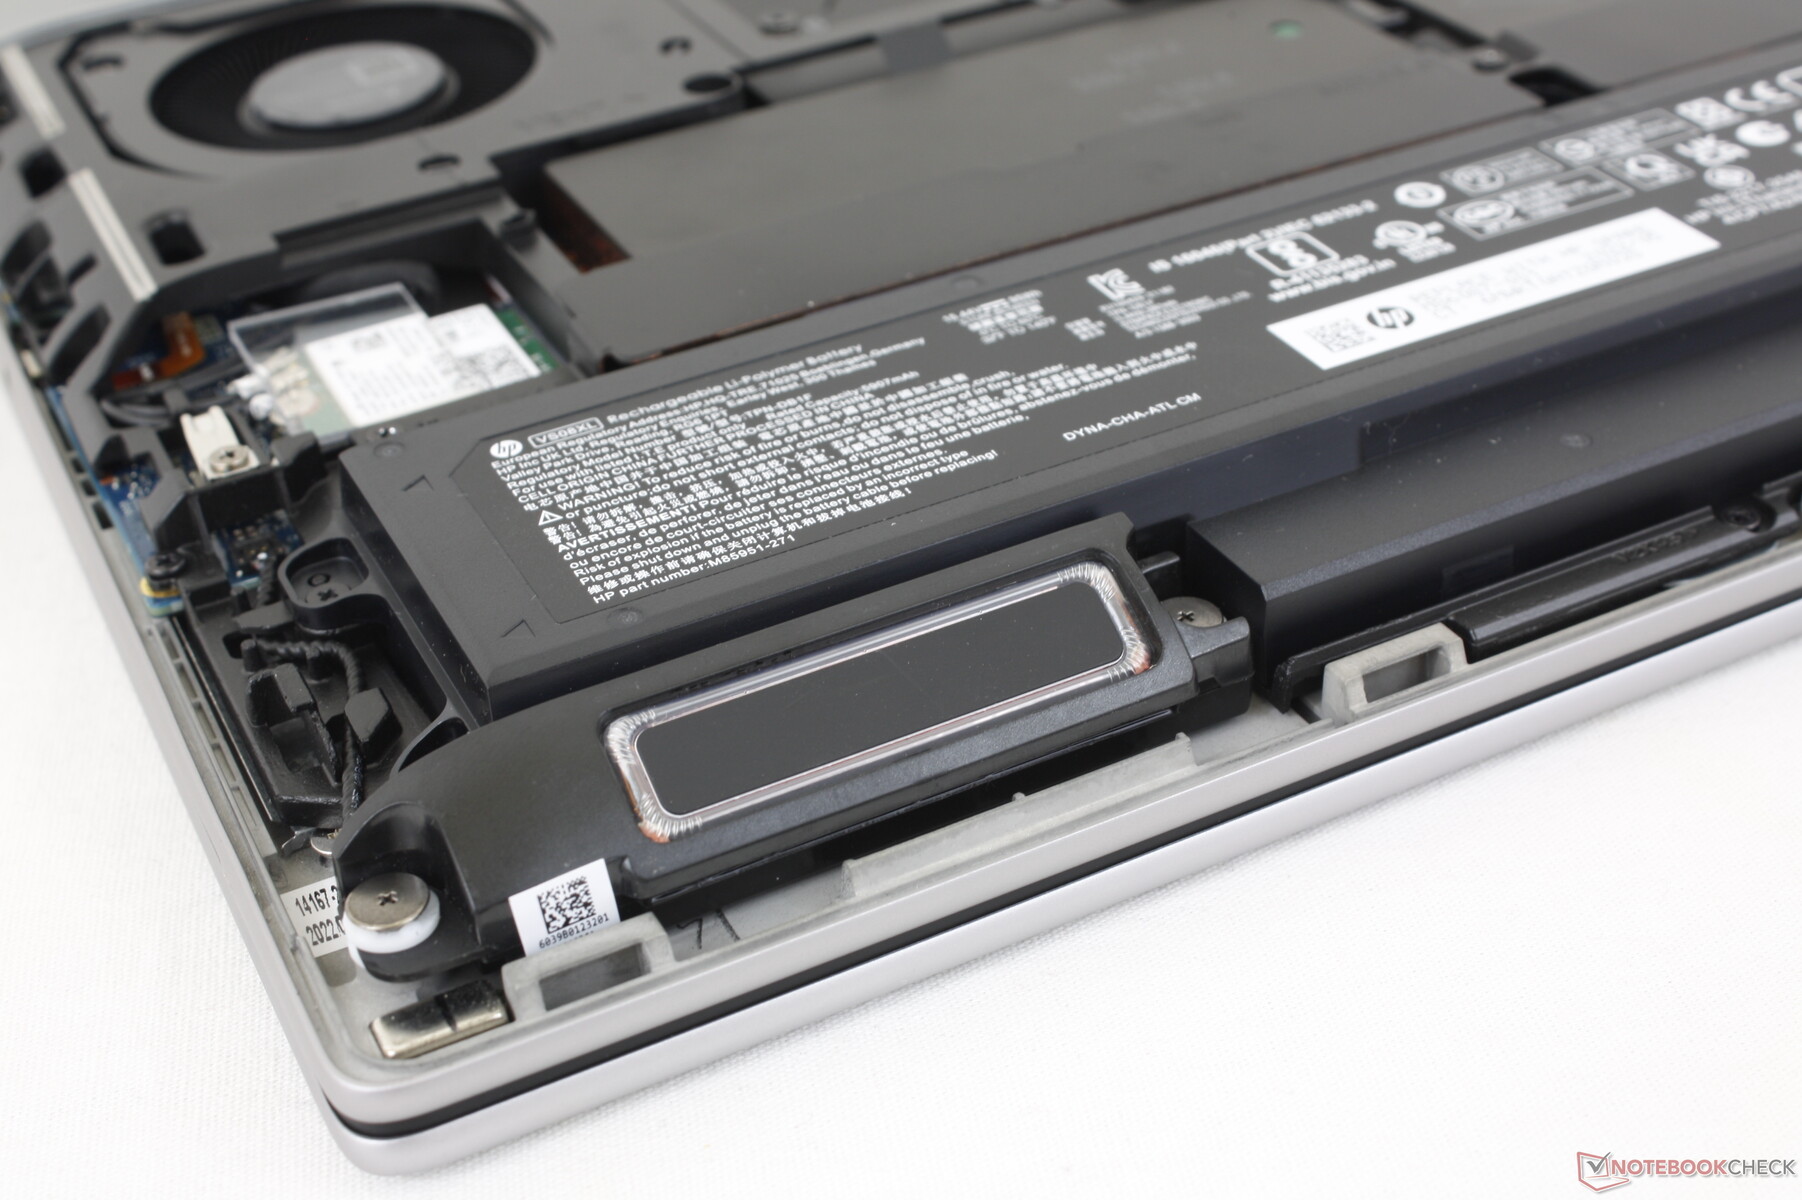
Wartung
Die Abdeckung auf der Unterseite ist „toolless“, was bedeutet, dass sie ganz einfach ohne jegliches Werkzeug durch Schieben entfernt werden kann. Spätestens danach ist jedoch trotzdem ein Schraubenzieher notwendig, um die Aluminiumplatten der SO-DIMM-Slots zu entfernen. Das Fury 16 G9 unterstützt bis zu vier M.2-2280-SSDs und vier DDR5-RAM-Module. Dies ist ebenfalls mehr als beim Precision 7670 oder beim ThinkPad P16.
Zubehör und Garantie
In der Verpackung gibt es bis auf einen AC-Adapter keinerlei Zusätze. Wird das Gerät online gekauft, erhält man drei Jahre Garantie, vorausgesetzt man kauft es in Österreich oder Deutschland. Im Offline-Store sind es dann aber nur zwei Jahre.
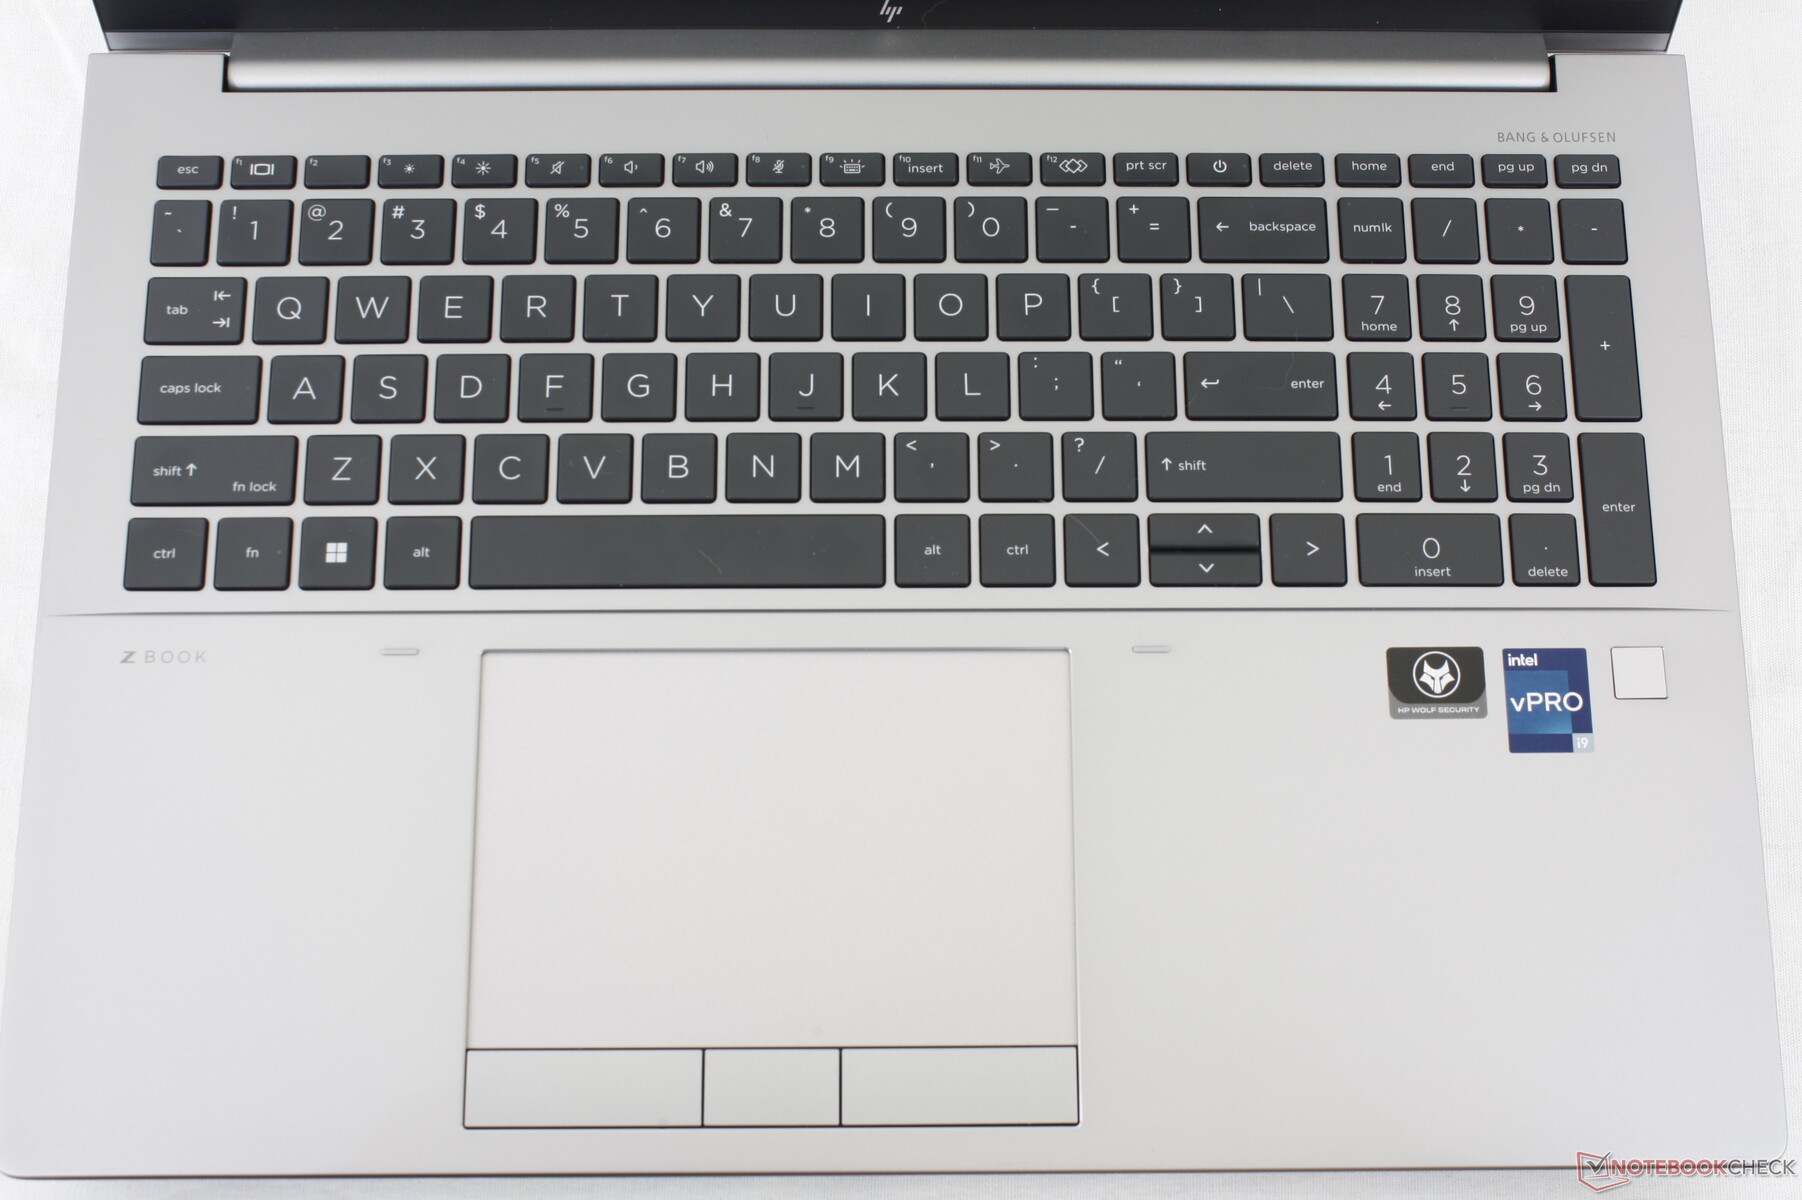
Eingabegeräte — Geräumig und komfortabel
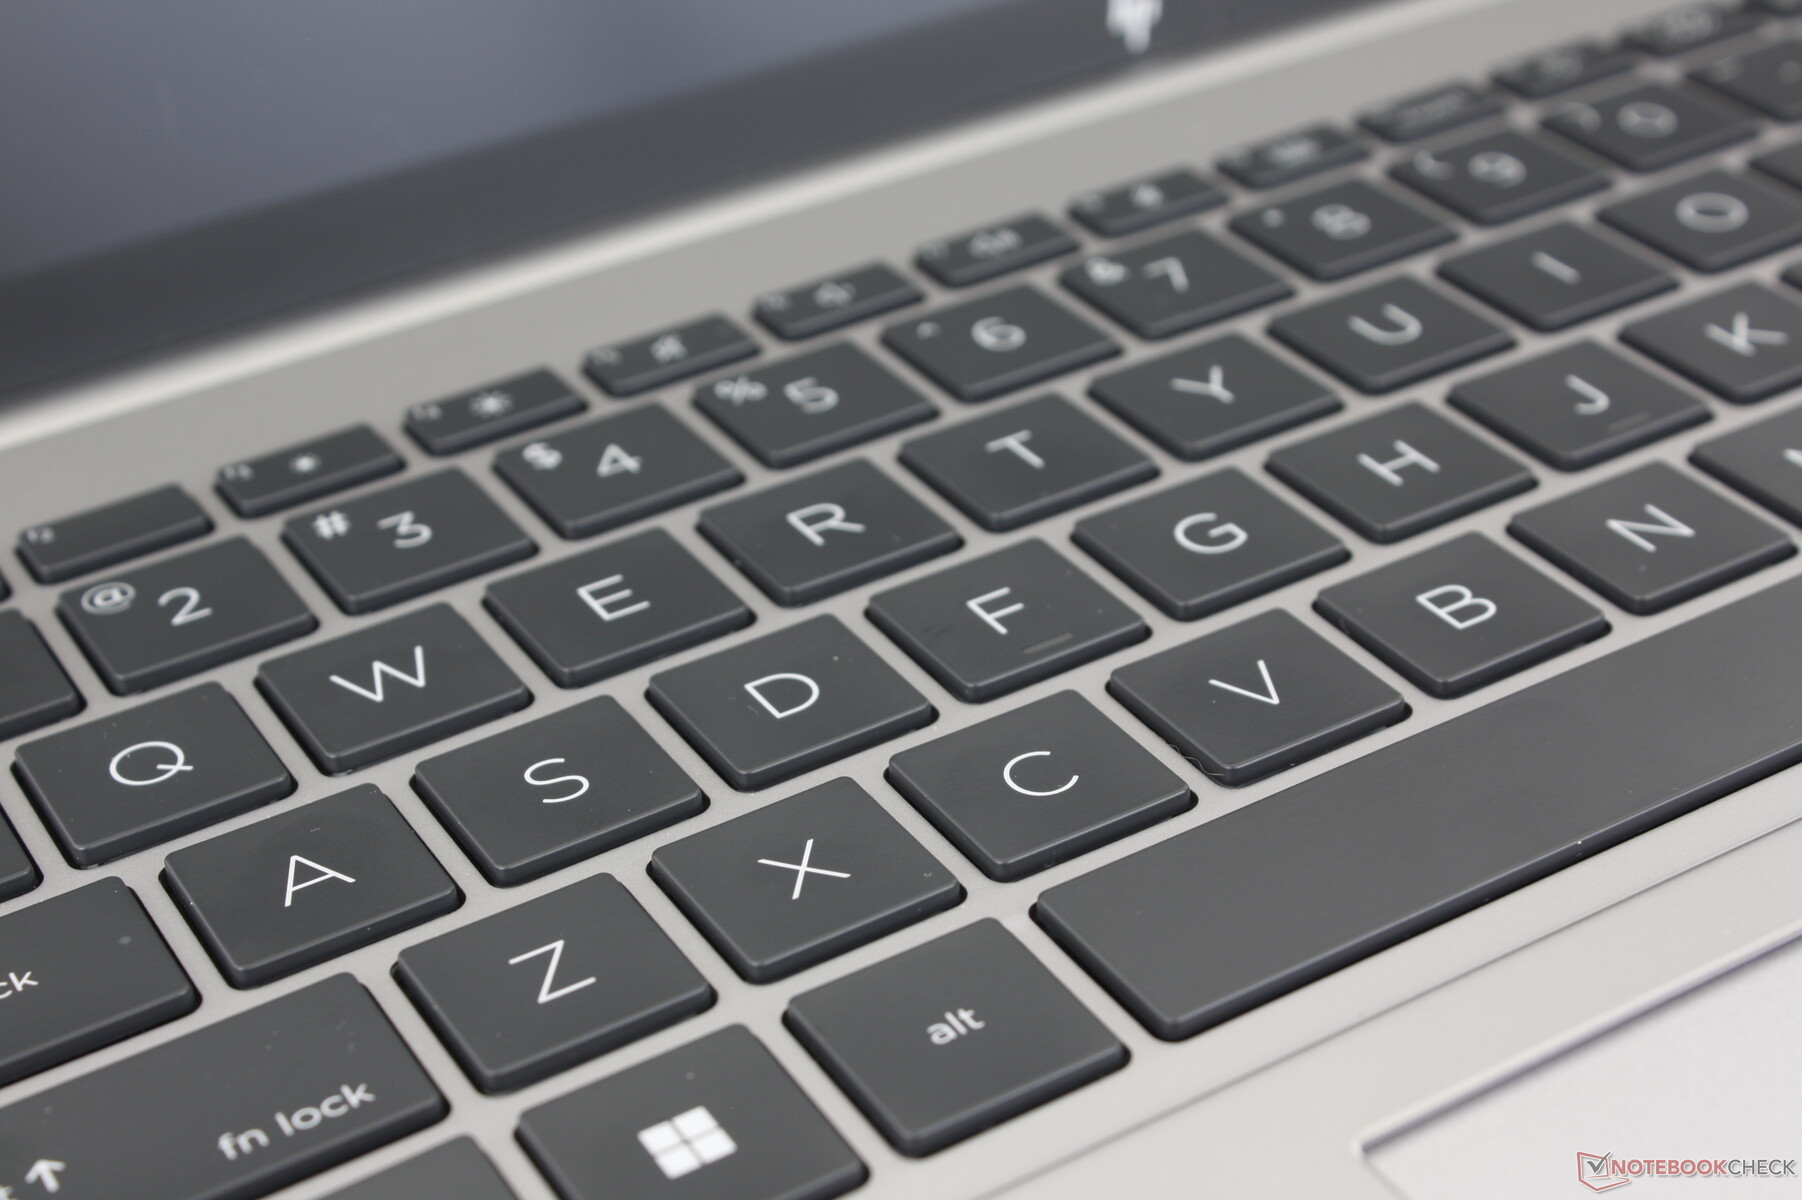
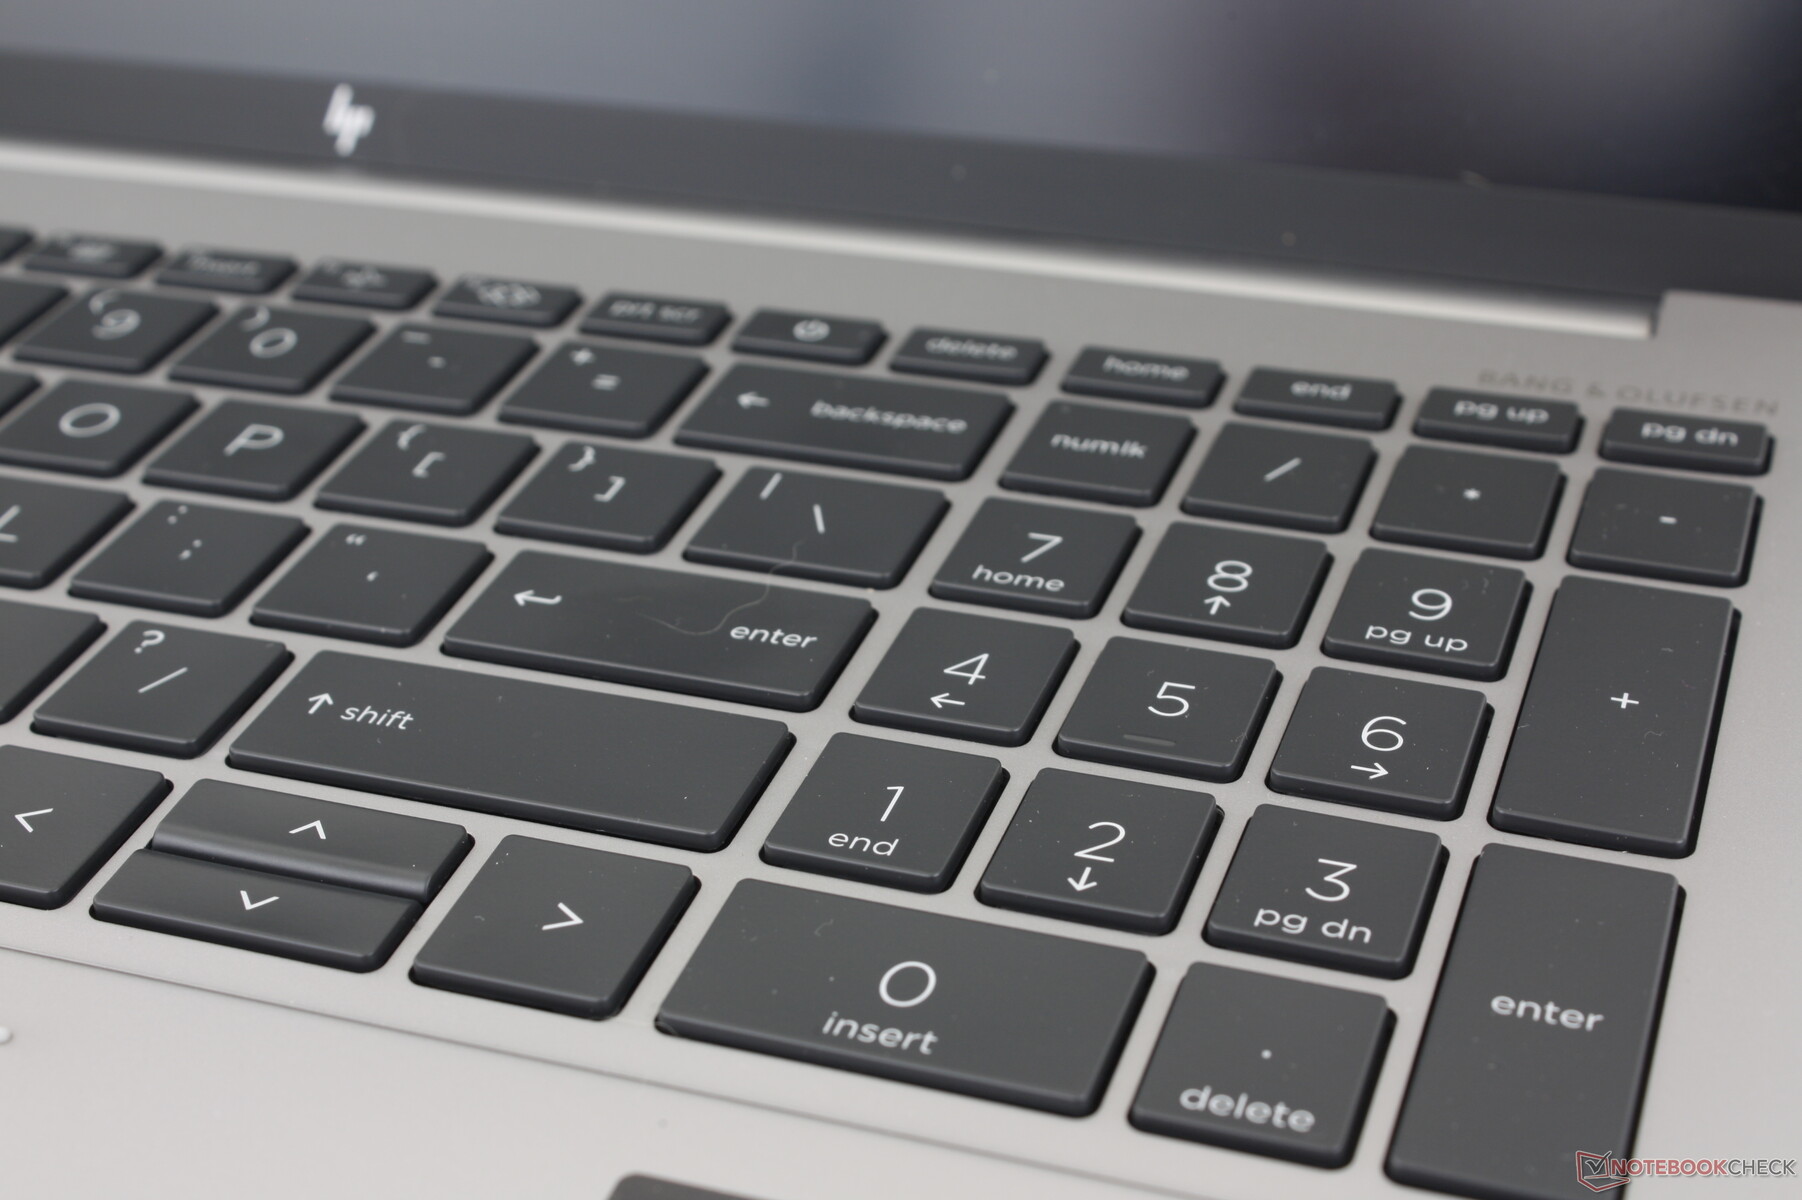
Tastatur
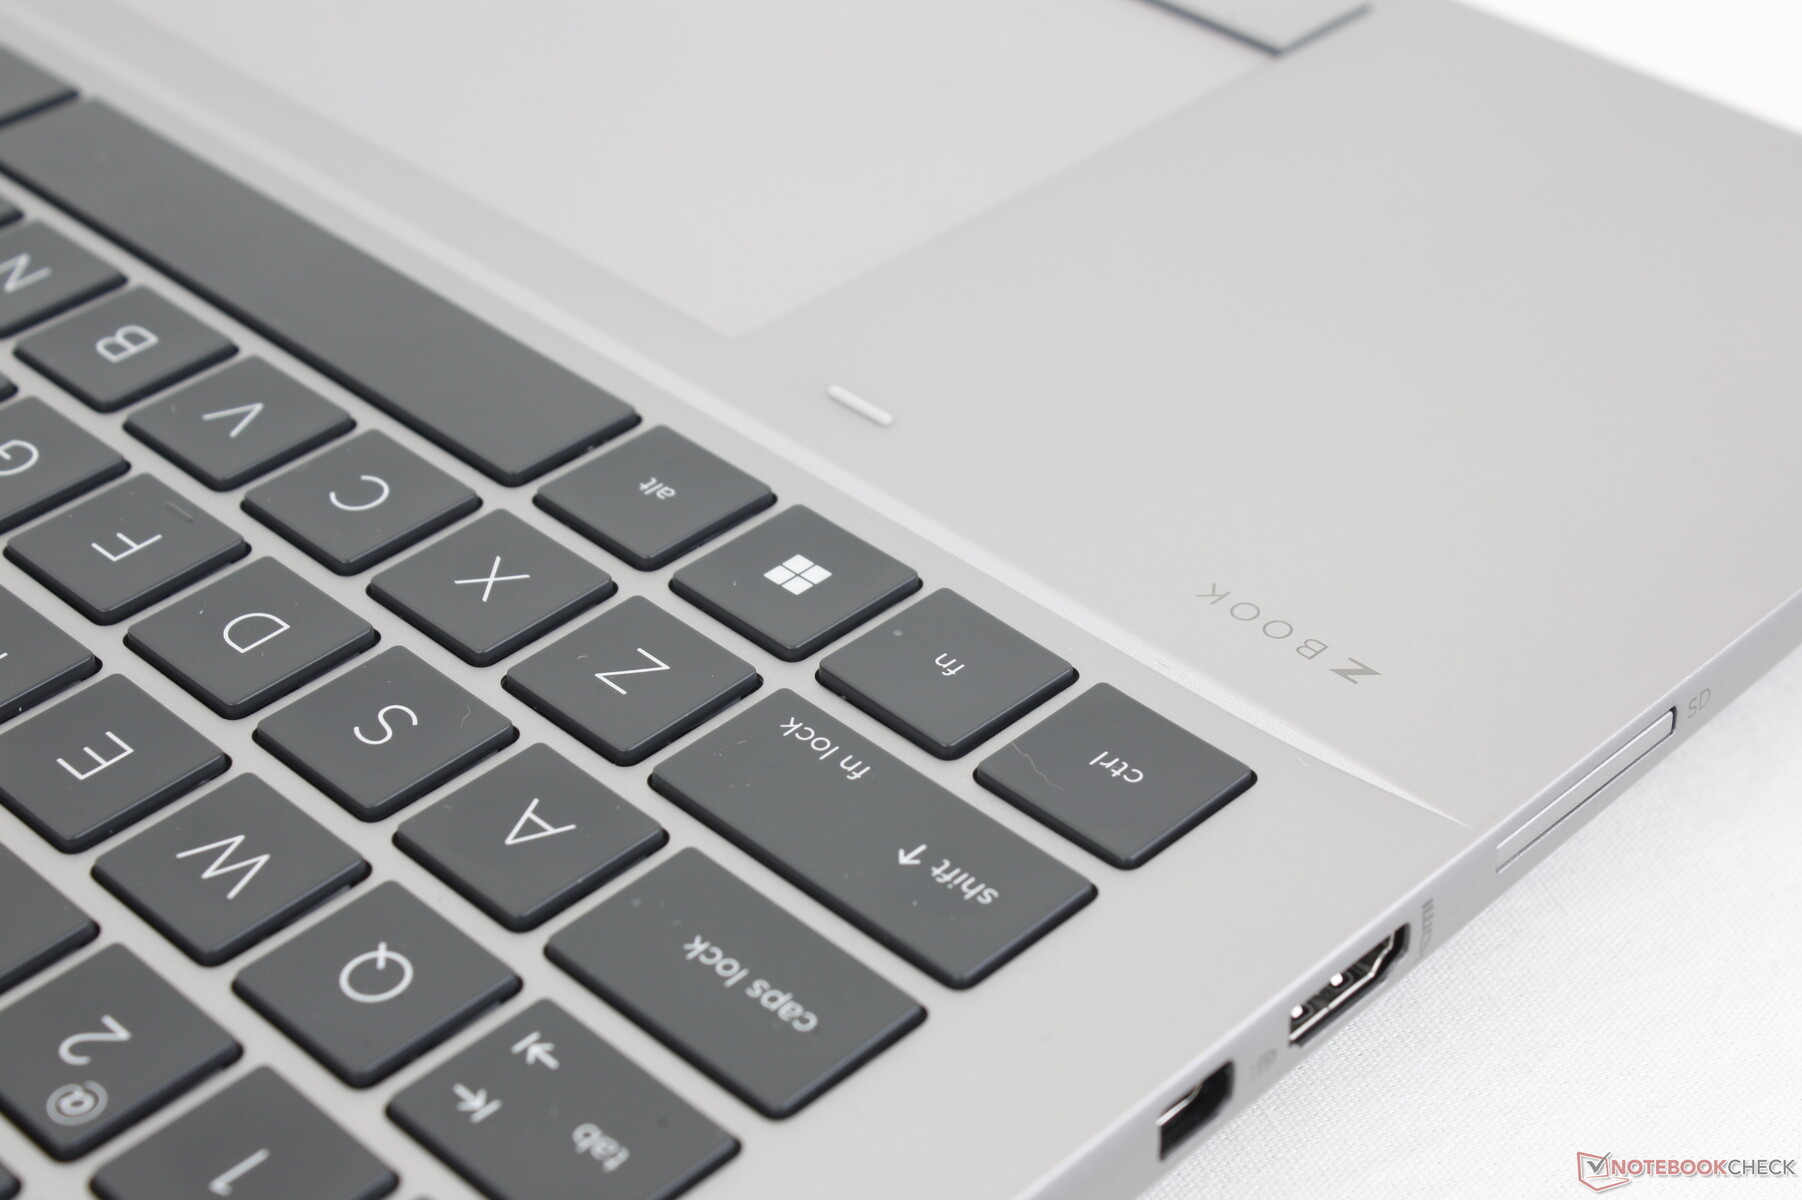
Die Spectre-, EliteBook- und ZBook Modelle von HP besitzen alle sehr gute Tastaturen in Bezug auf das Feedback und den Tastendruck. Die Tasten weisen alle dieselbe hochwertige Verarbeitung auf, was das Arbeiten mit dieser sehr angenehm macht. Das Tastengeräusch ist aber deutlich hörbarer als beim ThinkPad P16 G1 oder beim Precision 7670, vor allem wenn man die Space- oder Enter-Taste betätigt. Sollte man also eher leisere Keyboards bevorzugen, ist es ratsam, das ZBook vorab zu testen.
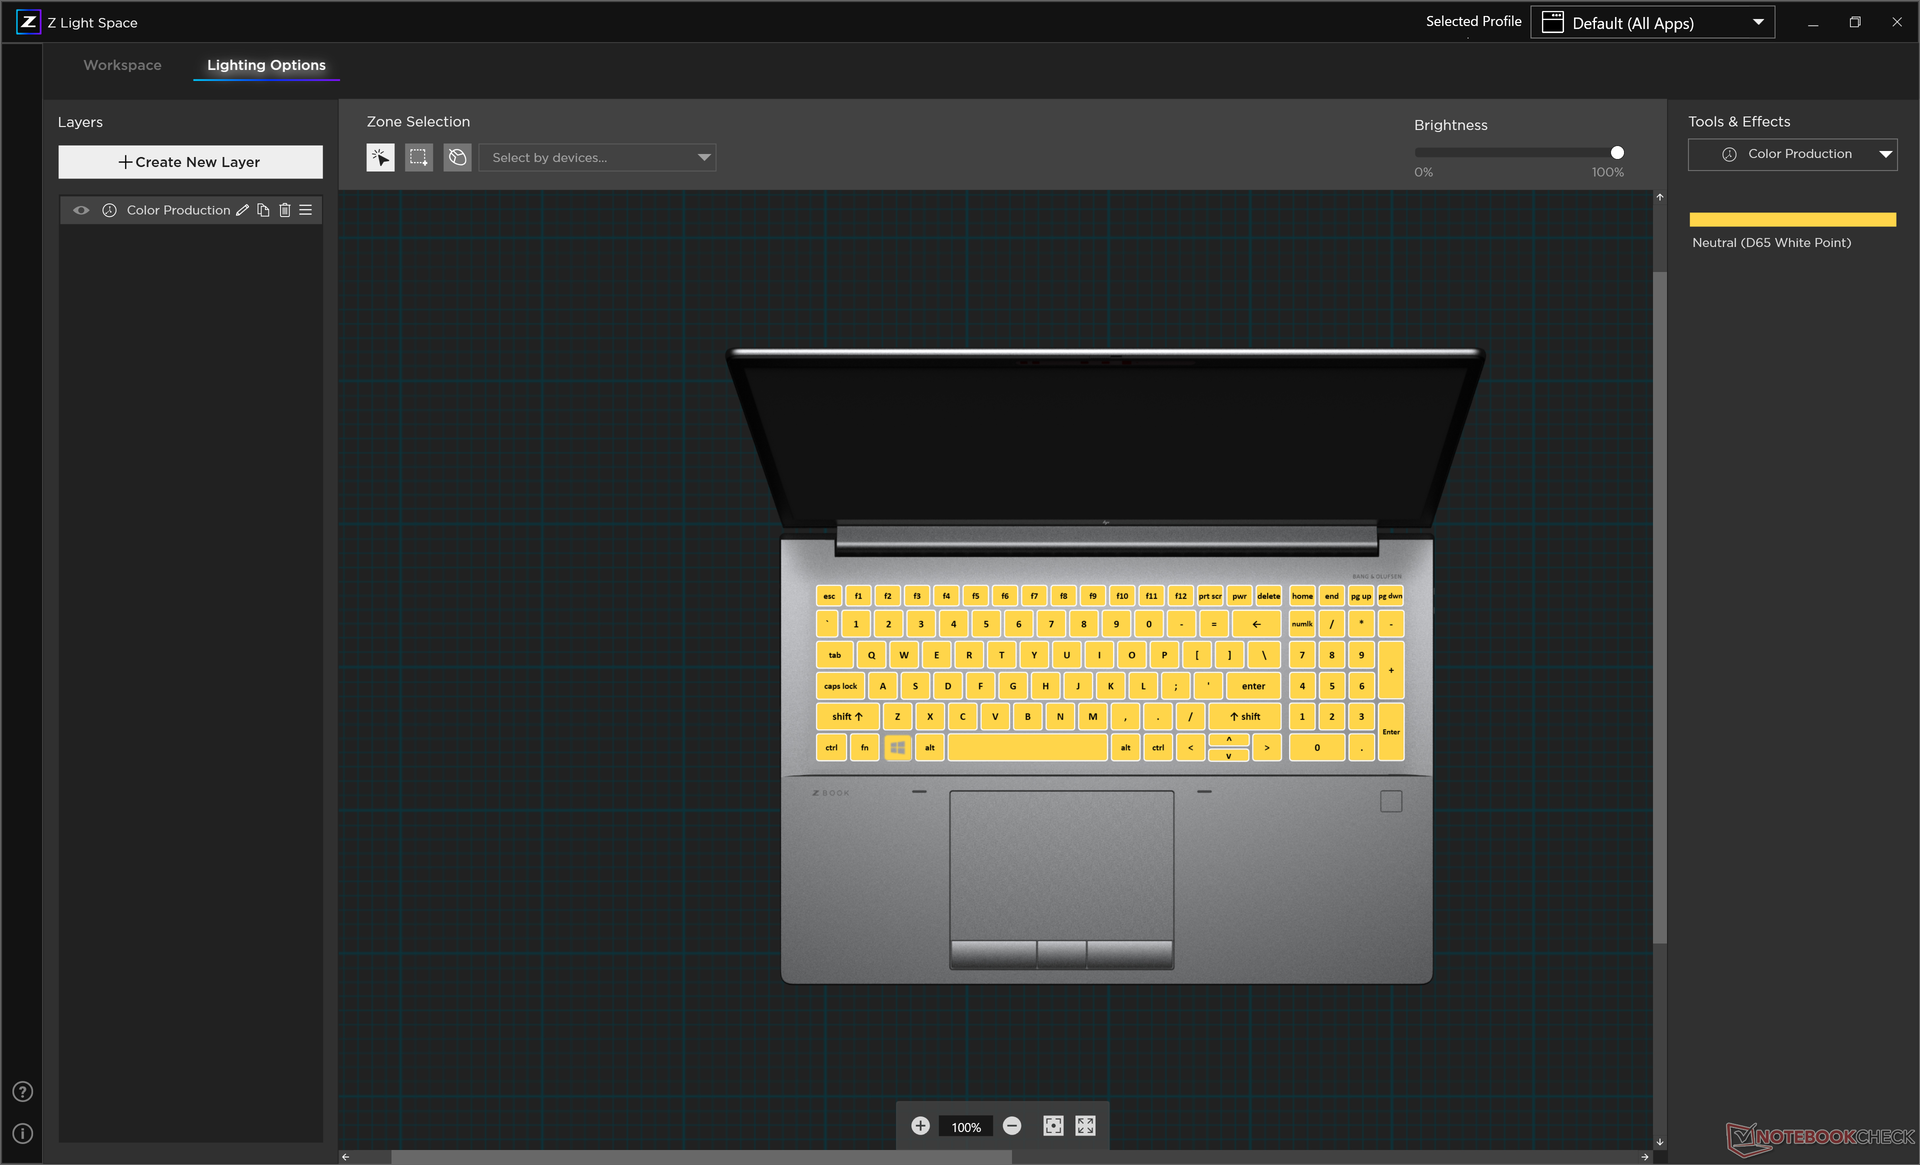
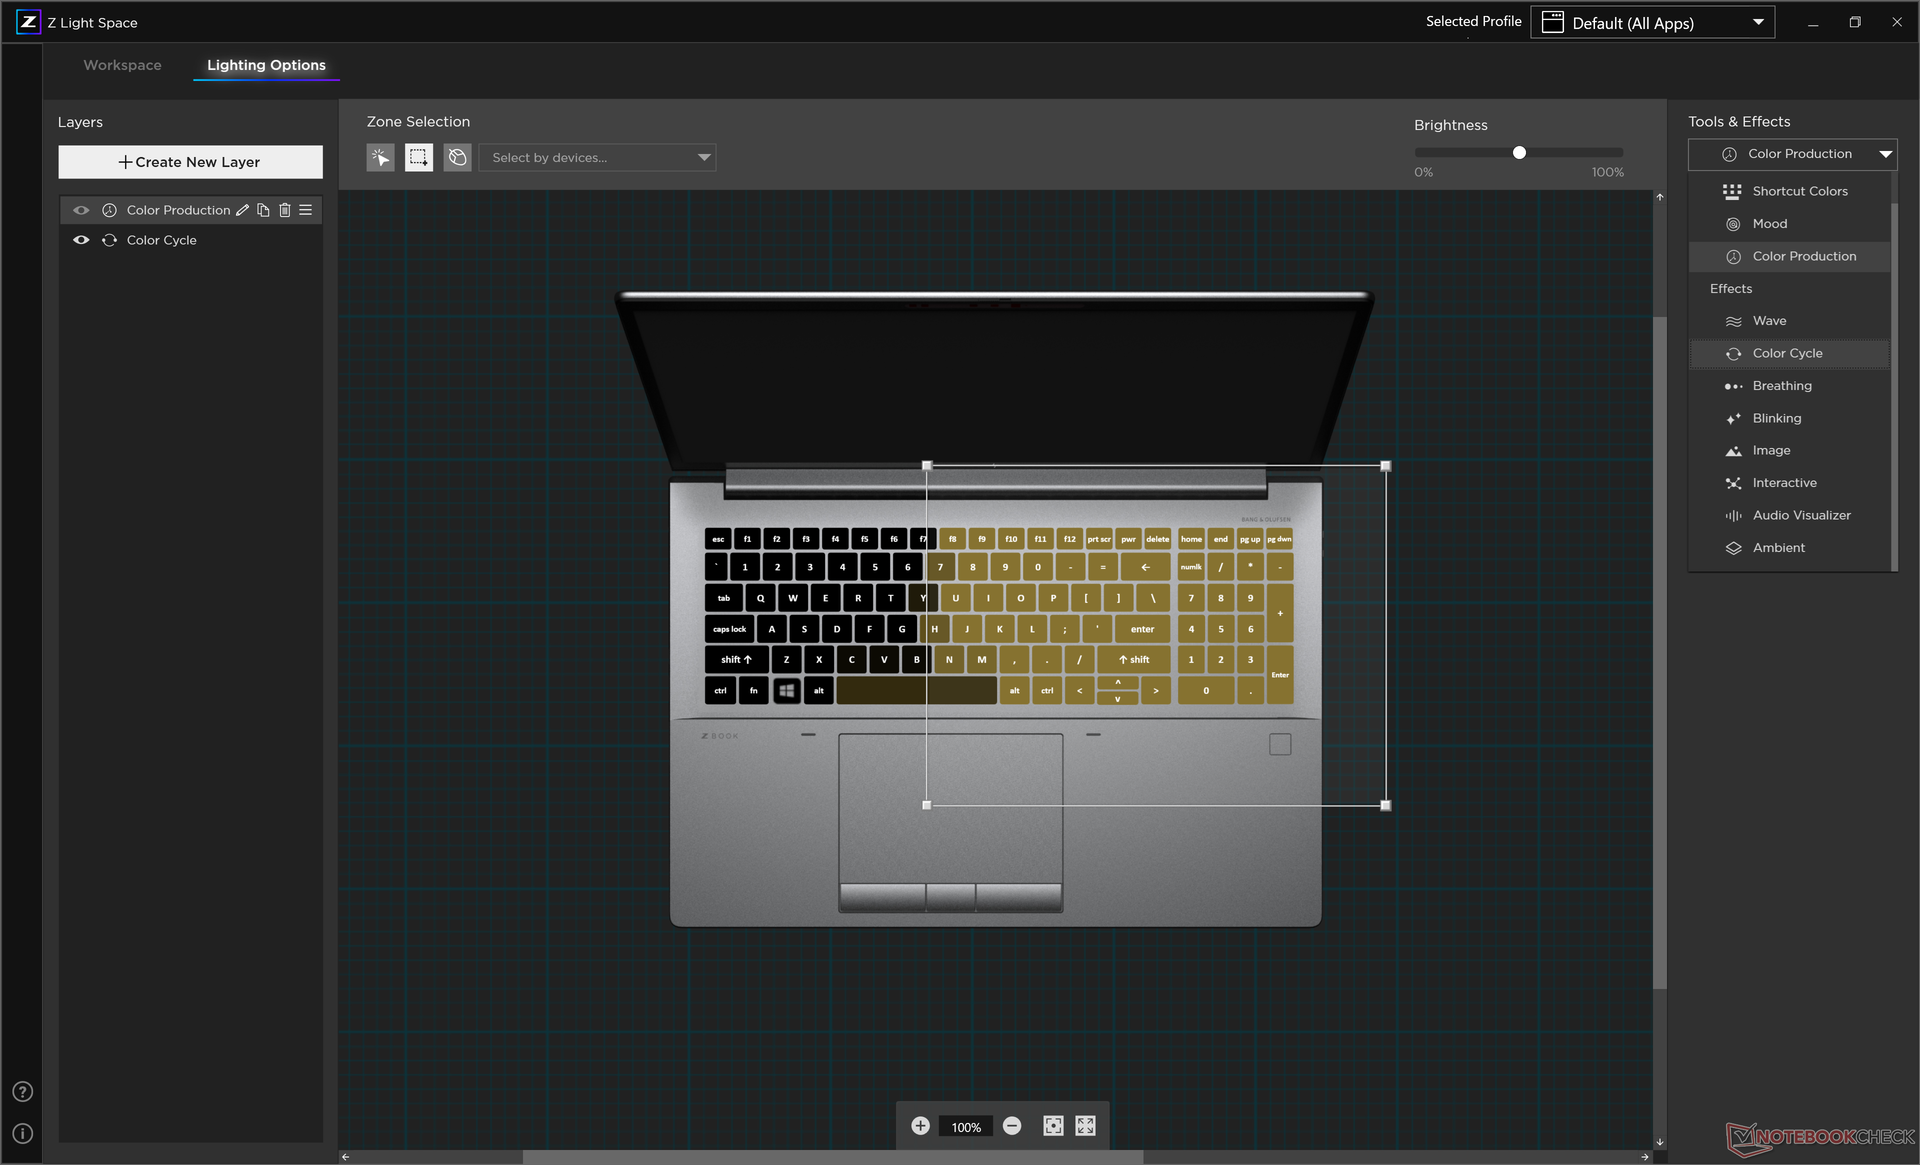
Eine weitere Besonderheit der Tastatur ist die RGB-Beleuchtung. Diese wurde bei jeder Taste einzeln verbaut, was auch ein Personalisieren jeder einzelnen Taste möglich macht. Die meisten anderen Workstations besitzen diese Funktionen beispielsweise nicht.
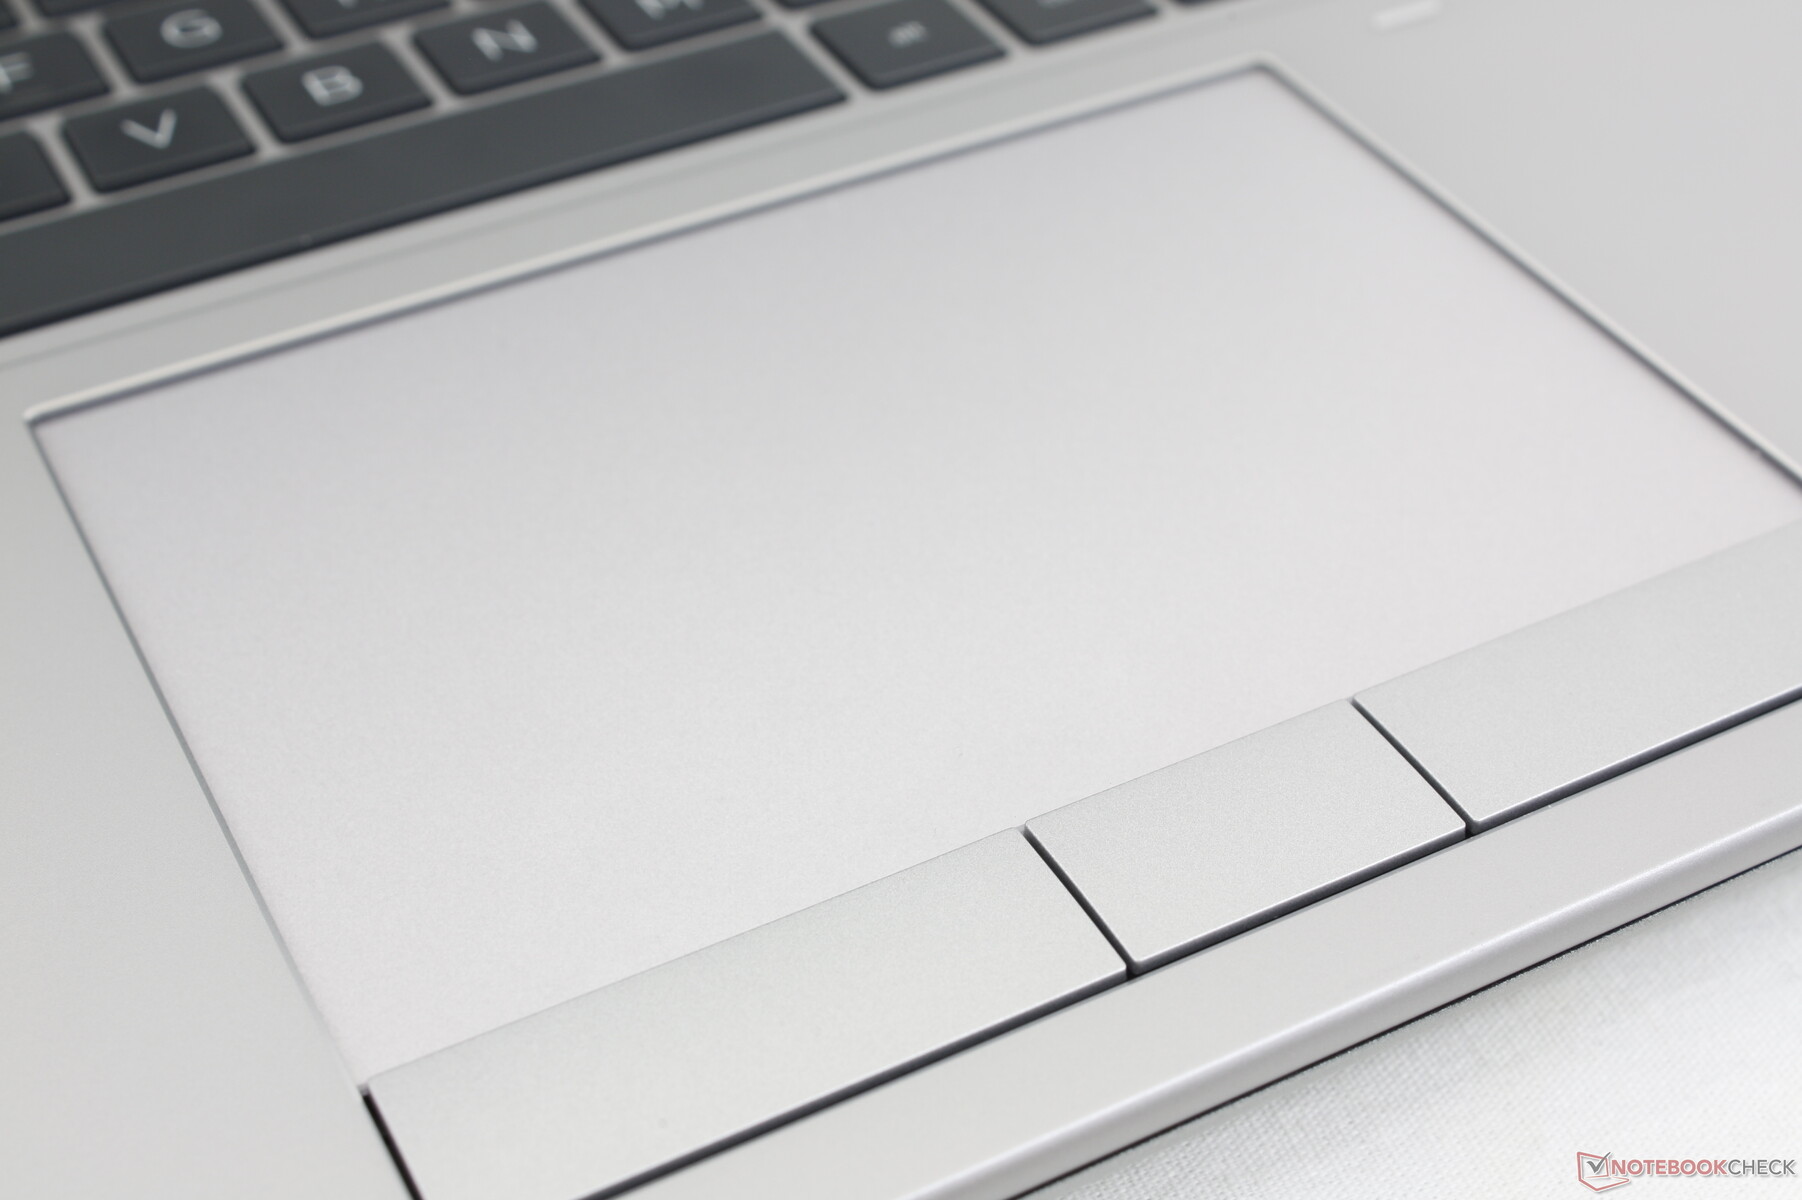
Touchpad
Das hier verbaute Touchpad ist das Beste, das wir jemals testen durften, sei es auf einer Workstation oder einem anderen Gerät. Nicht nur ist es mit 12,4 x 8,3 cm etwas größer geworden als jenes beim ThinkPad P16 G1 (11,5 x 6,9 cm) oder beim Precision 7670 (11,5 x 8 cm), sondern kann auch mit seiner Beschaffenheit und einem verlässlichen Cursor überzeugen. Die Maustasten haben einen relativ tiefen Druckpunkt, und das Geräusch beim Klicken ist ebenfalls gut wahrnehmbar. Im Vergleich dazu bietet das Precision 7670 zum Beispiel keine dedizierten Buttons an, was am verbauten Clickpad liegt.
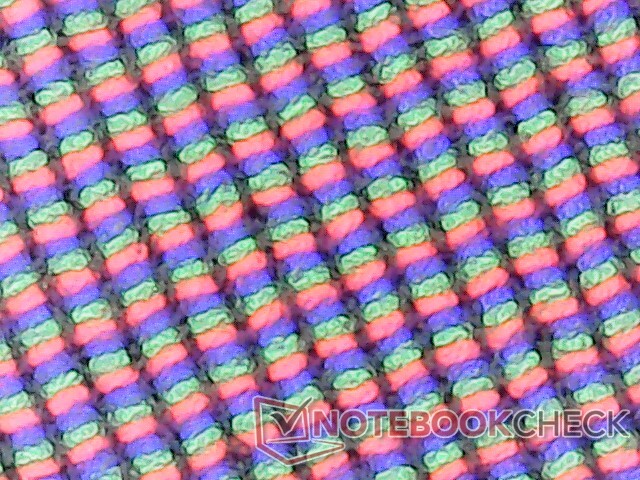
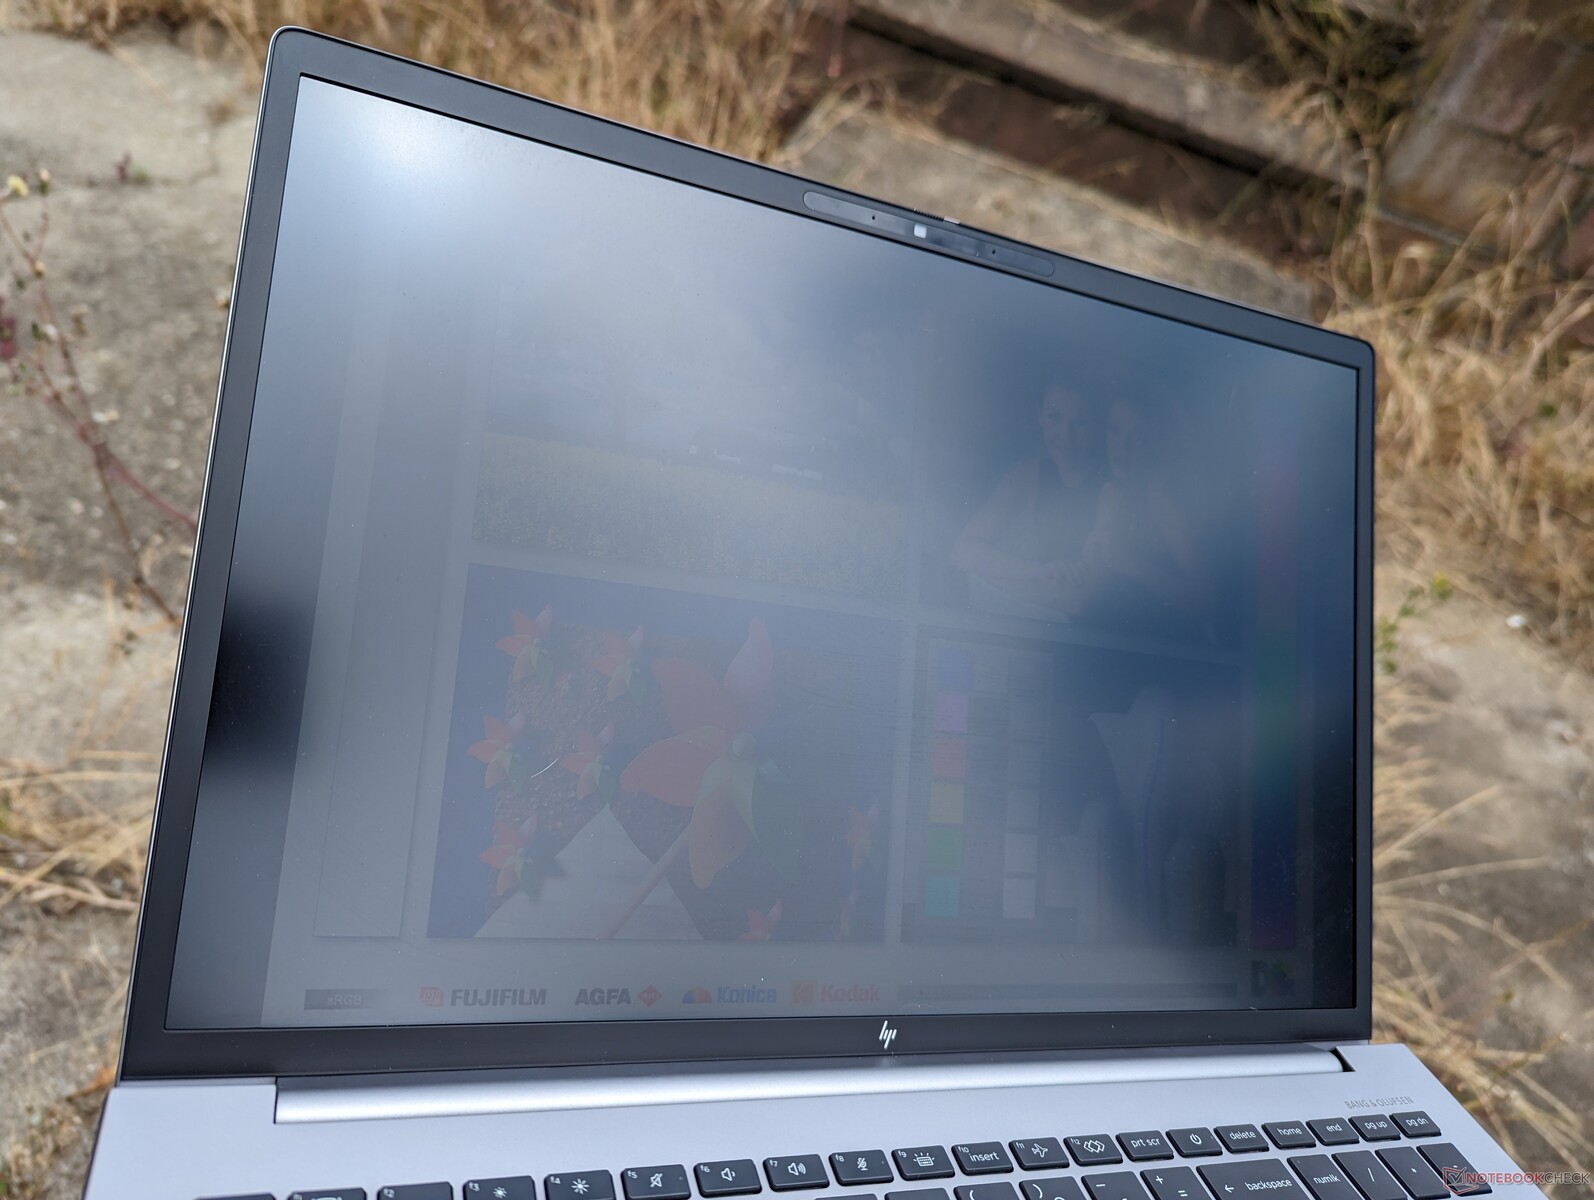
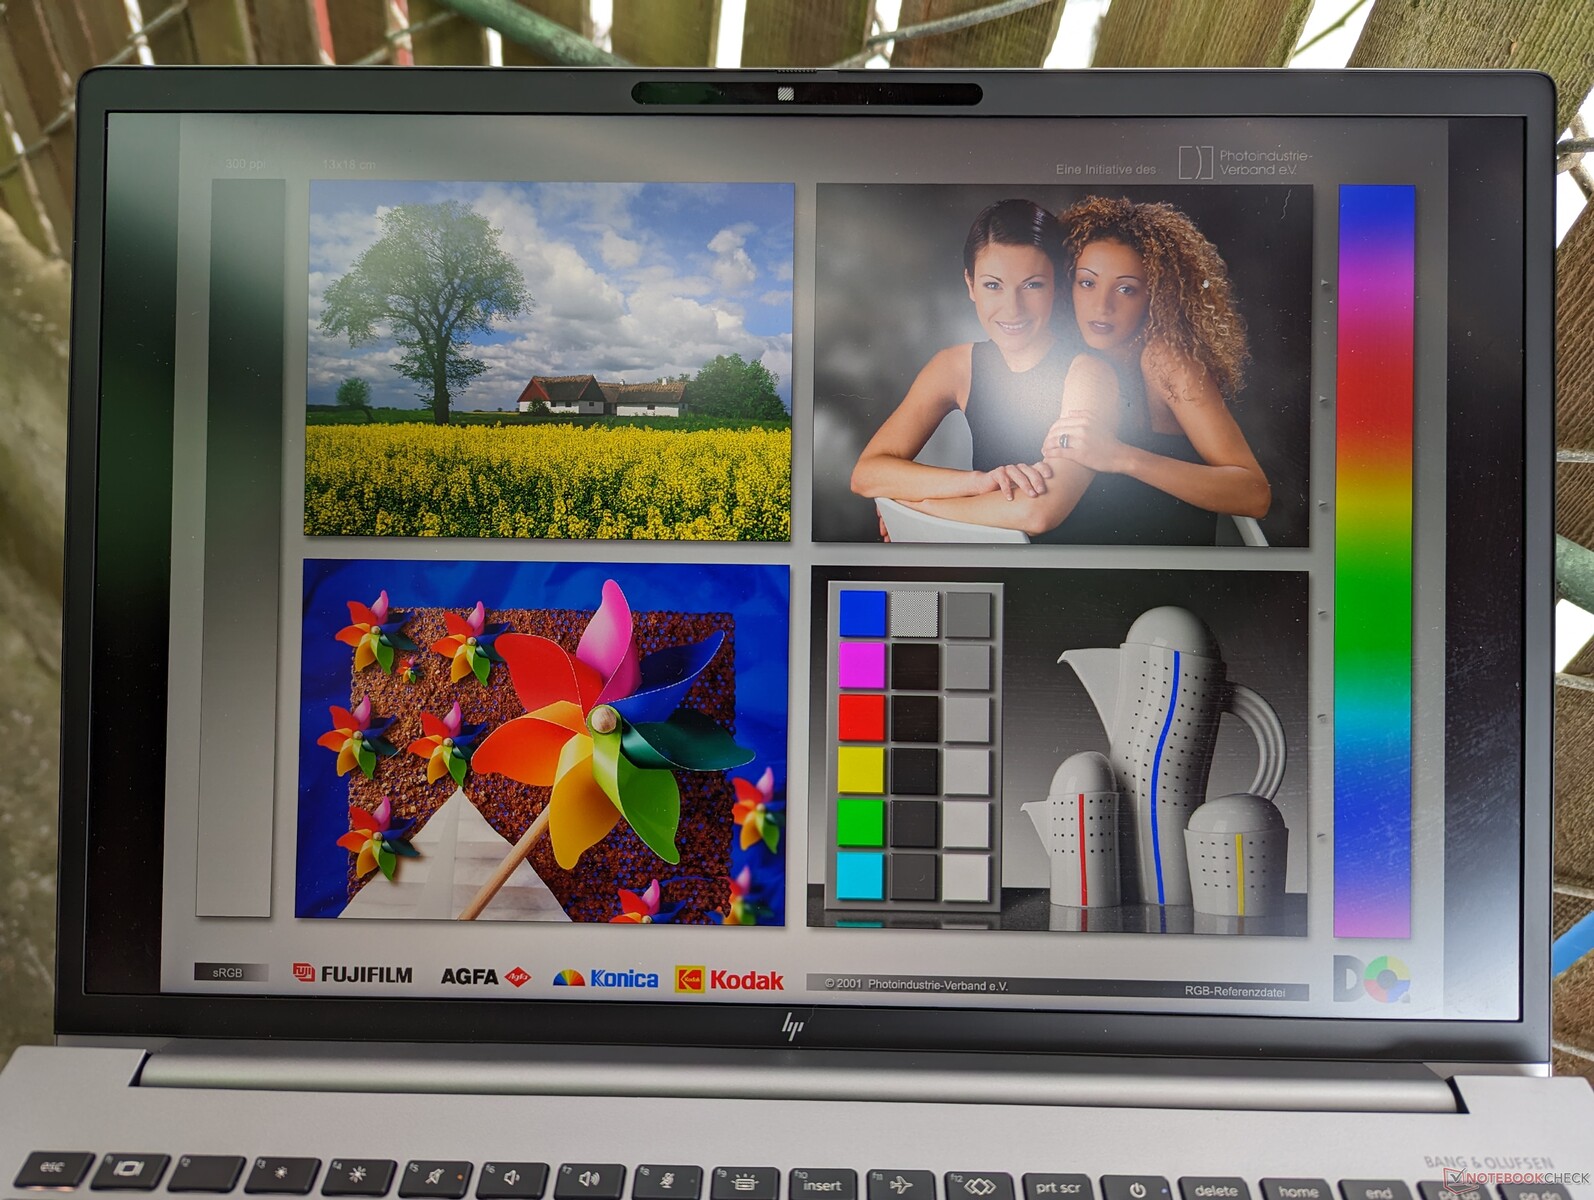
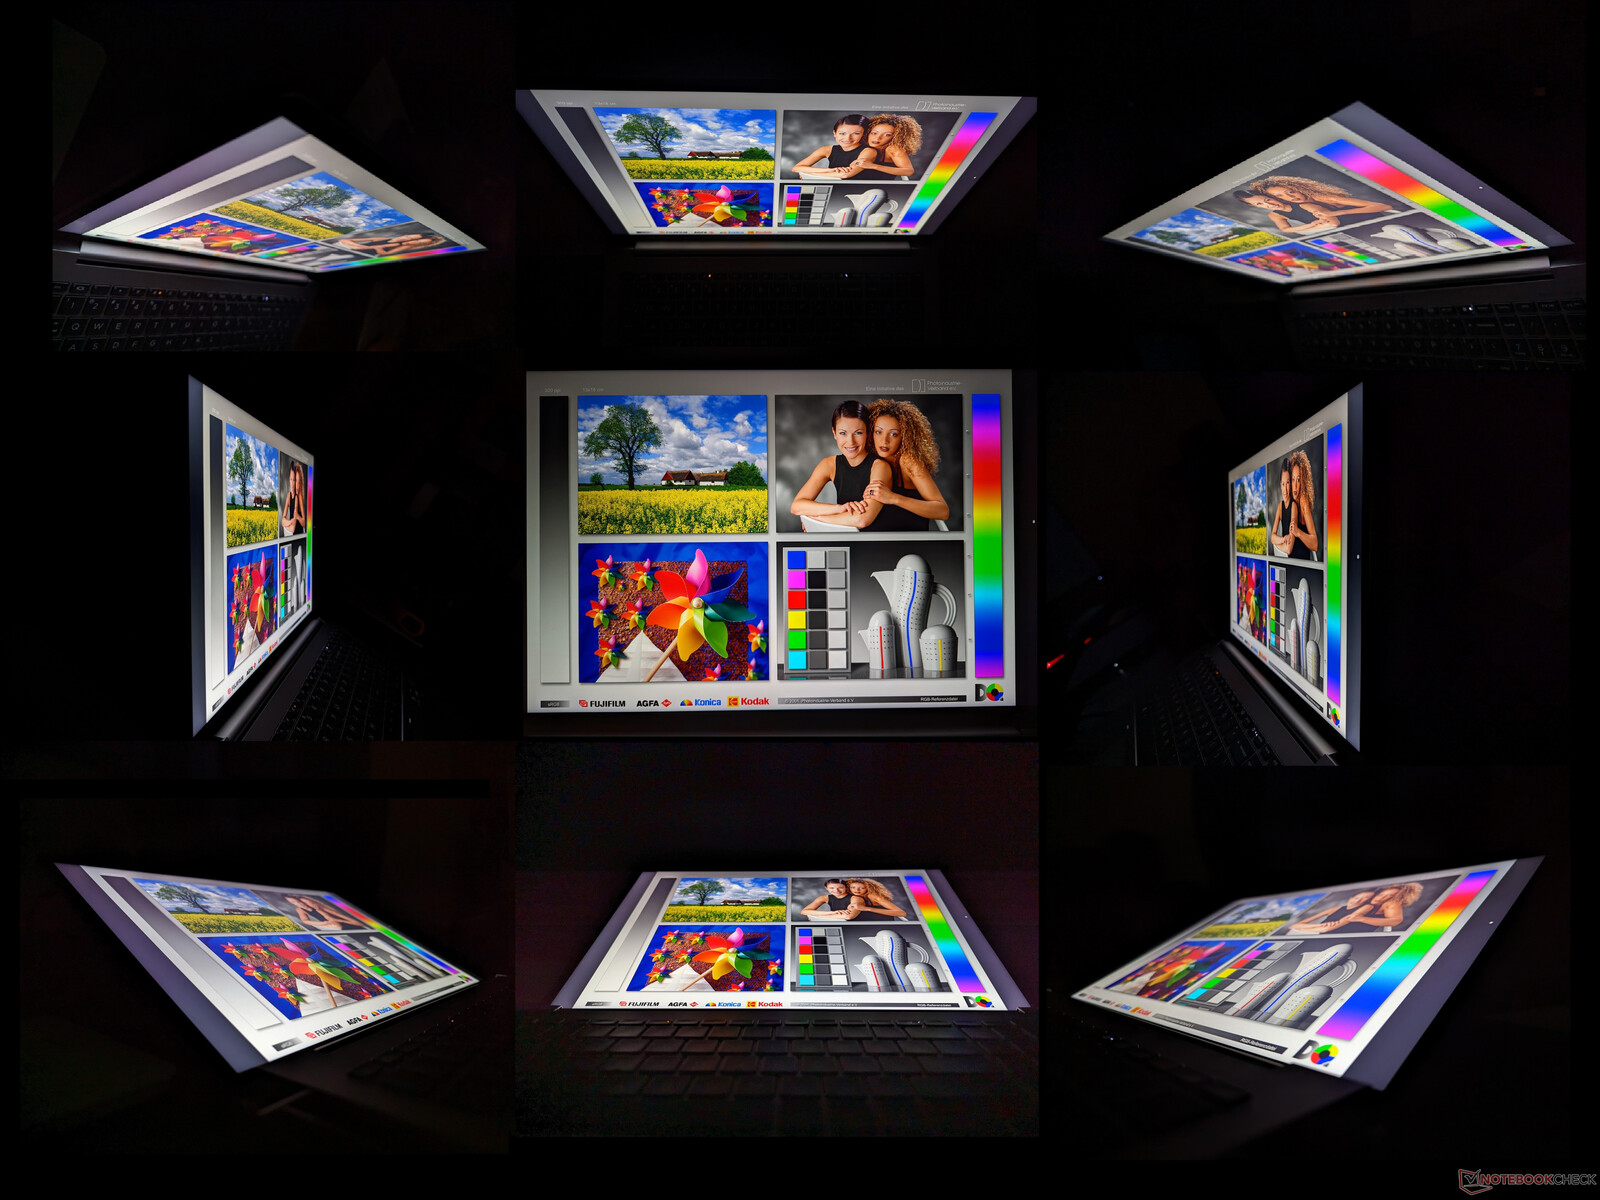
Display — sehr farbenfroh mit guten Reaktionszeiten
HP verbaut hier das gleiche BOE-Panel, das man ebenfalls bei vielen 16-Zoll-Modellen des Herstellers findet. So auch beim ZBook Studio 16 G9 beispielsweise, wo ein 16:10-4K-Panel zum Einsatz kommt.
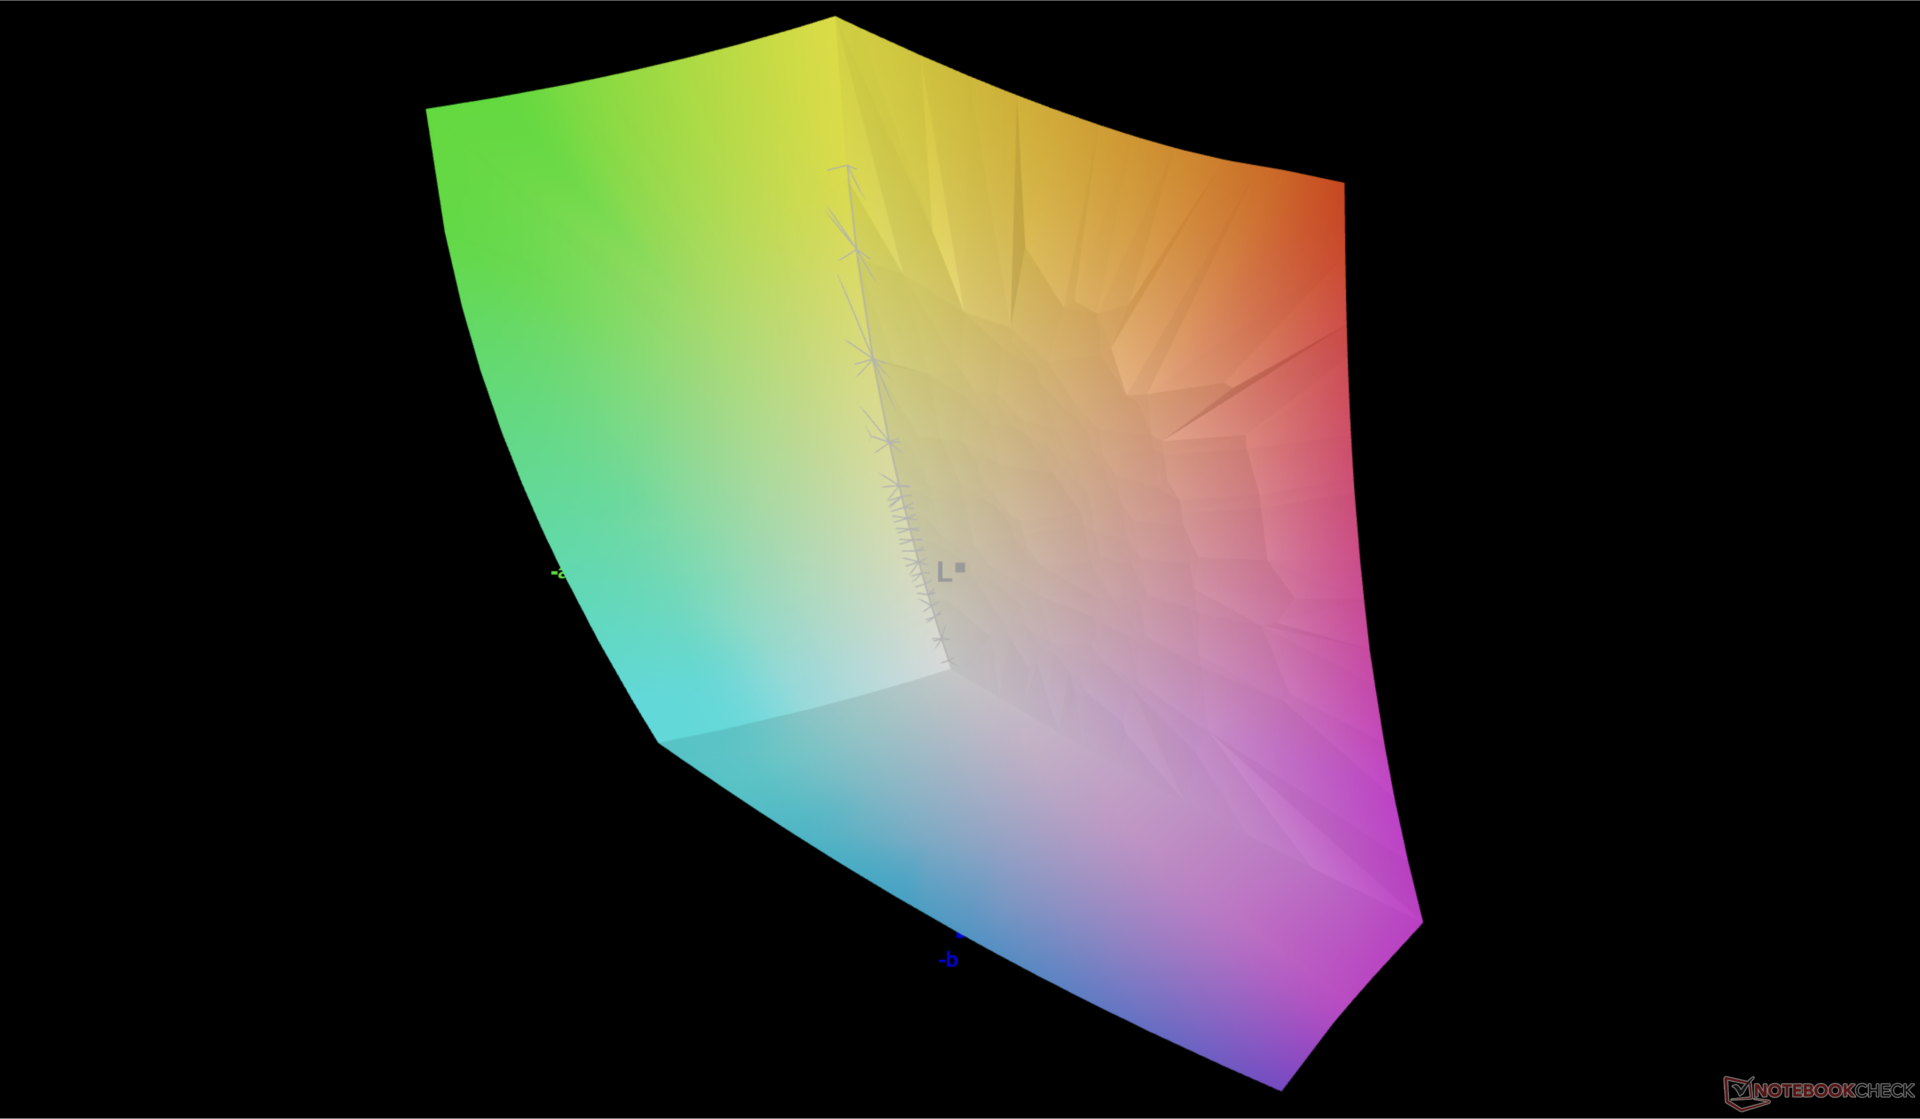
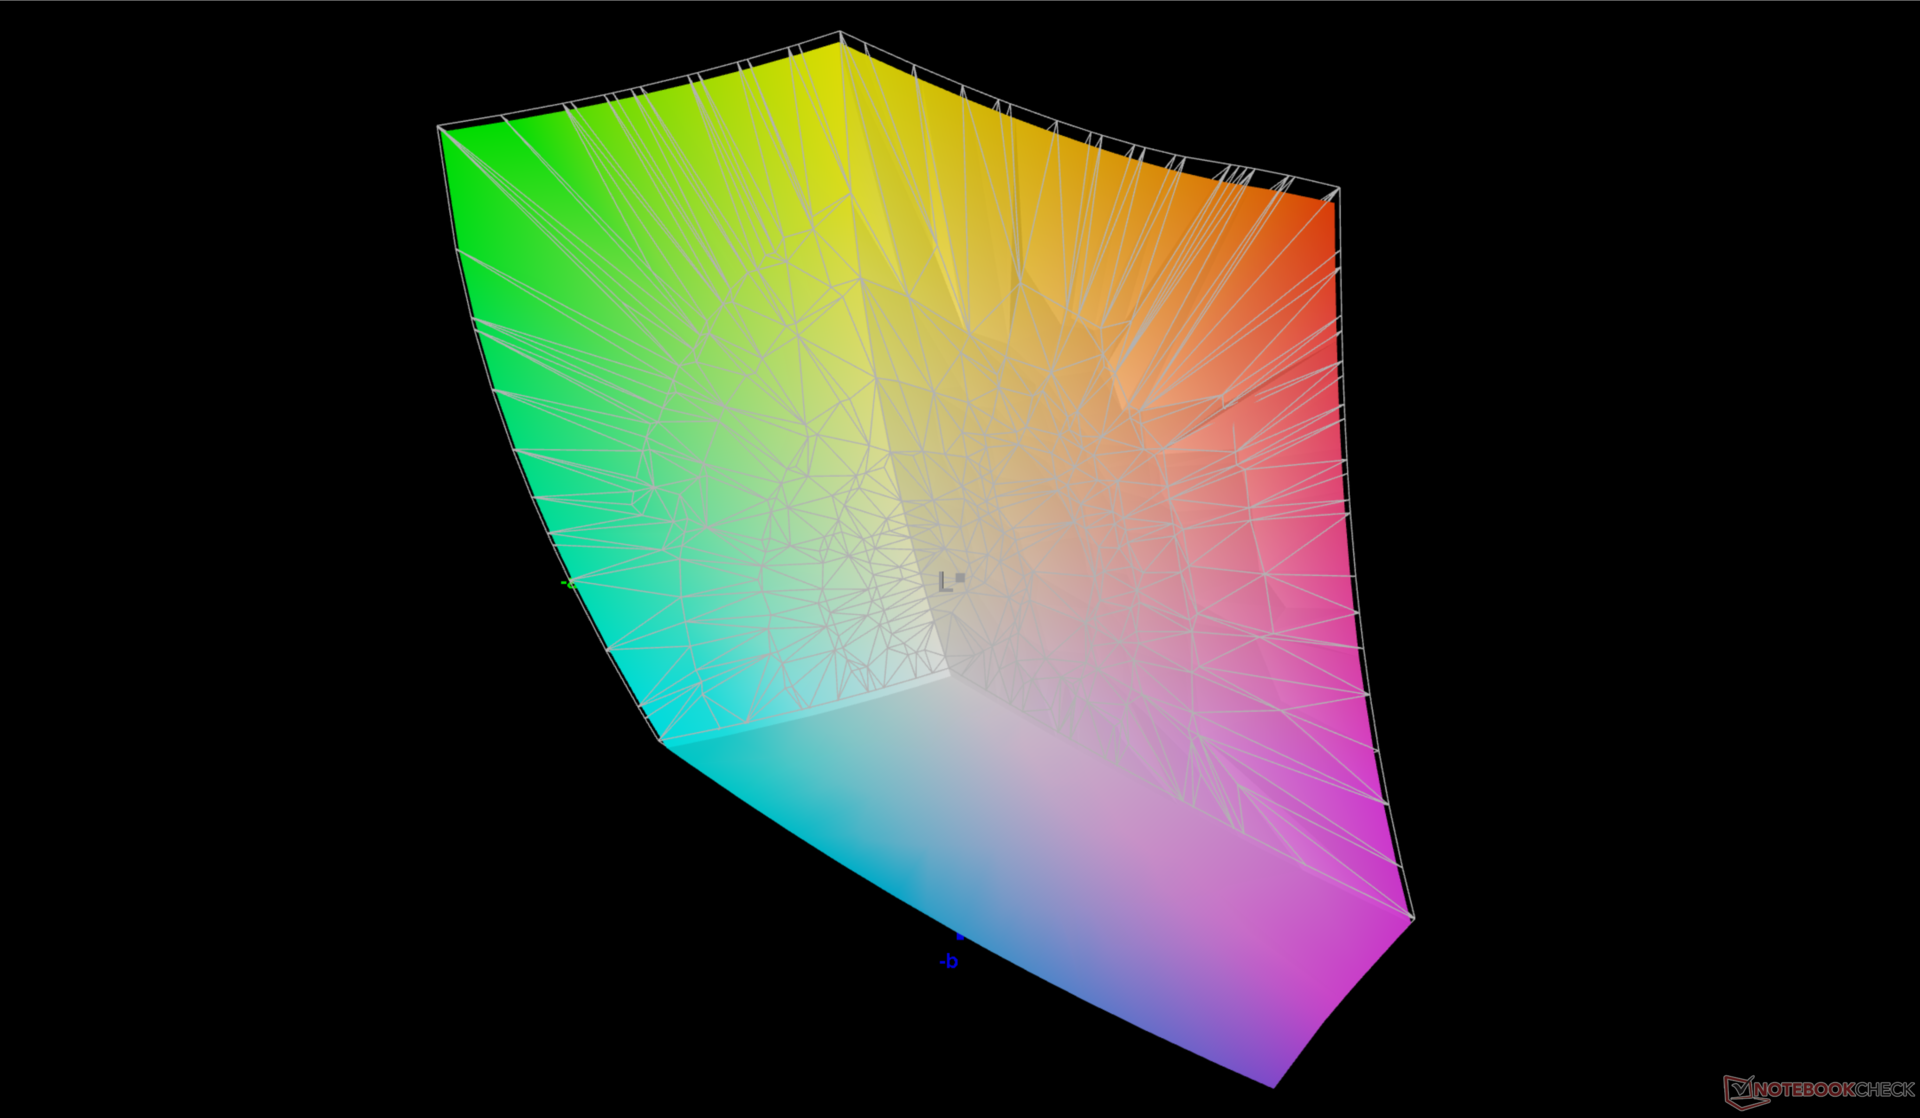
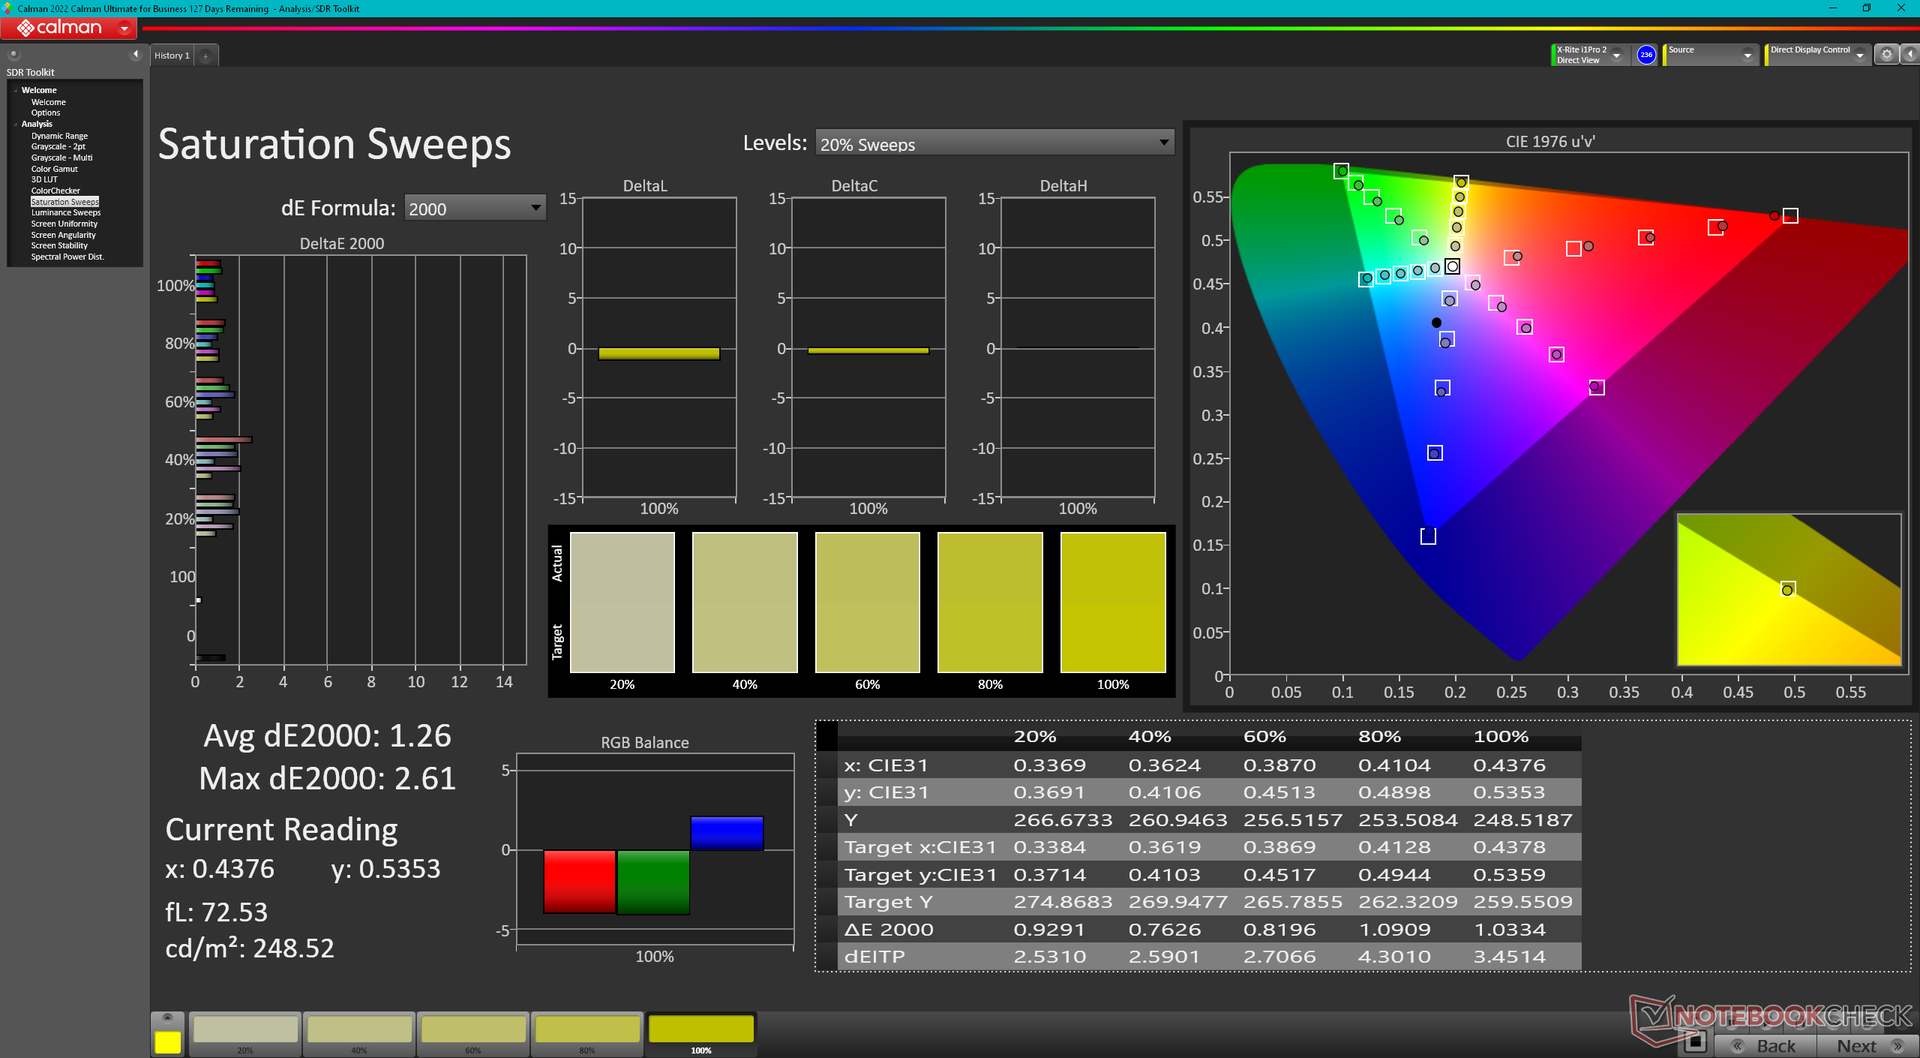
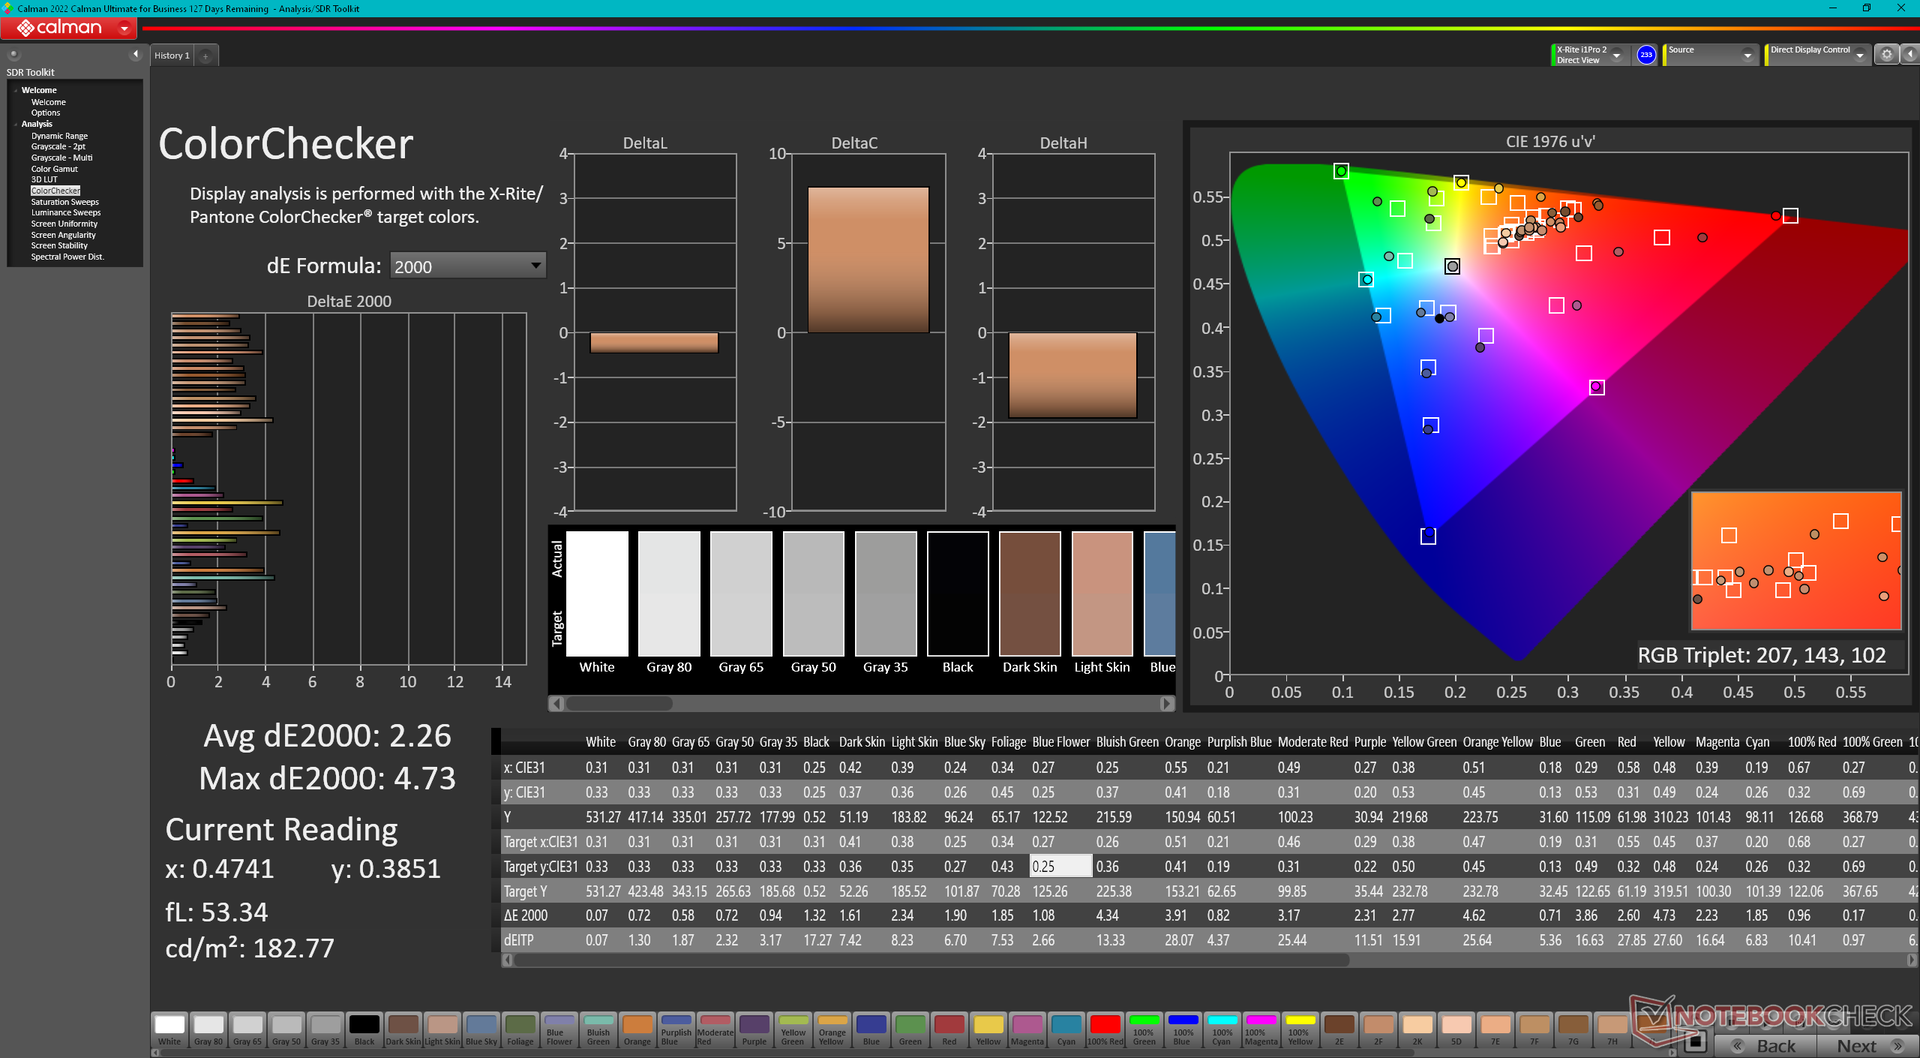
In unserem Fall kann das High-End-4K-IPS-Panel mit seinen sehr reichen P3-Farben und guten Schwarz-Weiß-Werten überzeugen. Auch die Reaktionszeiten der Graustufen kommt beim ZBook Fury 16 G9 zur Geltung. Aus diesen Gründen können wir es sowohl für diverse Games als auch für Content Creation empfehlen. Nichtsdestotrotz sollte erwähnt werden, dass man bei diesem matten Display ein etwas unschärferes Bild erhält als bei glänzenden Varianten und der Kontrast auf 1.000:1 limitiert ist. Wir hoffen auf jeden Fall, dass HP bald eine OLED-Version nachliefert, um diese Makel ausbessern zu können.
| |||||||||||||||||||||||||
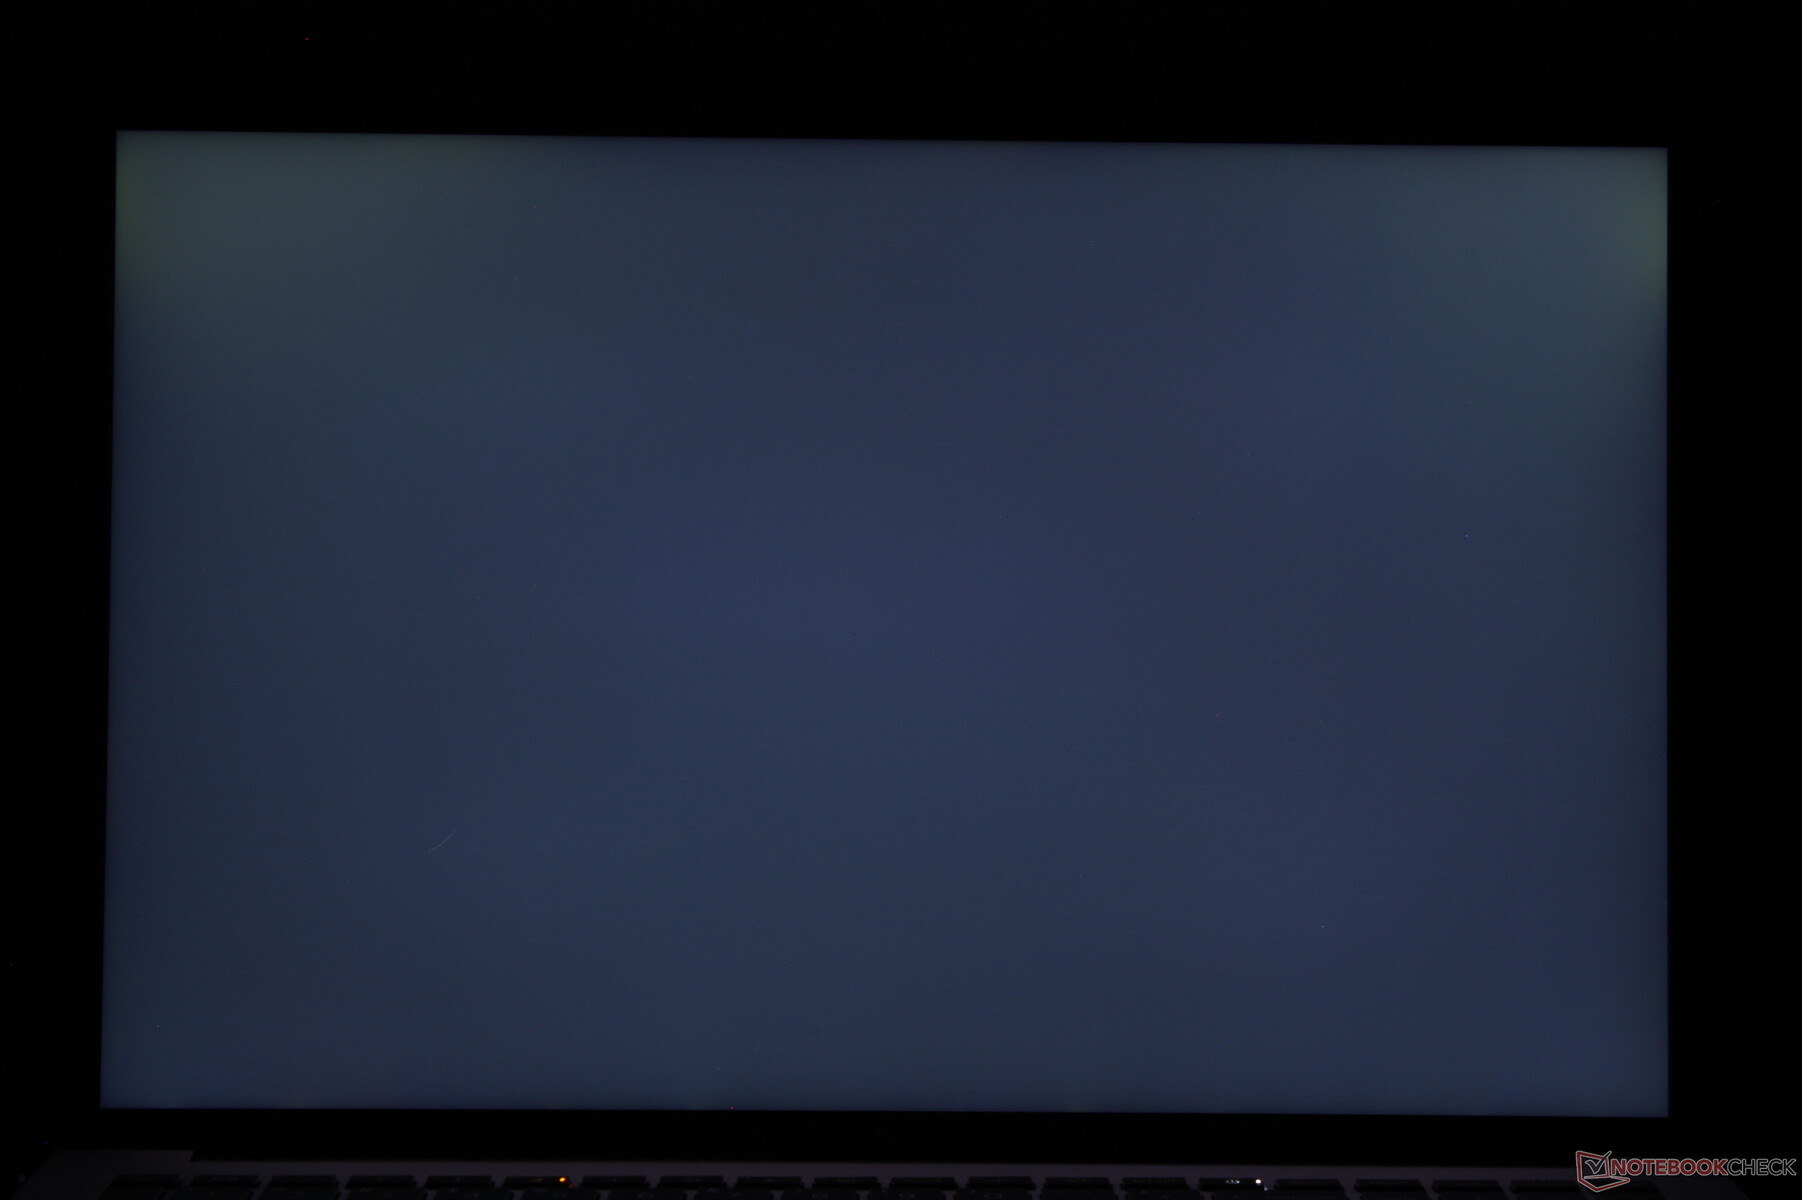
Ausleuchtung: 83 %
Helligkeit Akku: 451.7 cd/m²
Kontrast: 931:1 (Schwarzwert: 0.57 cd/m²)
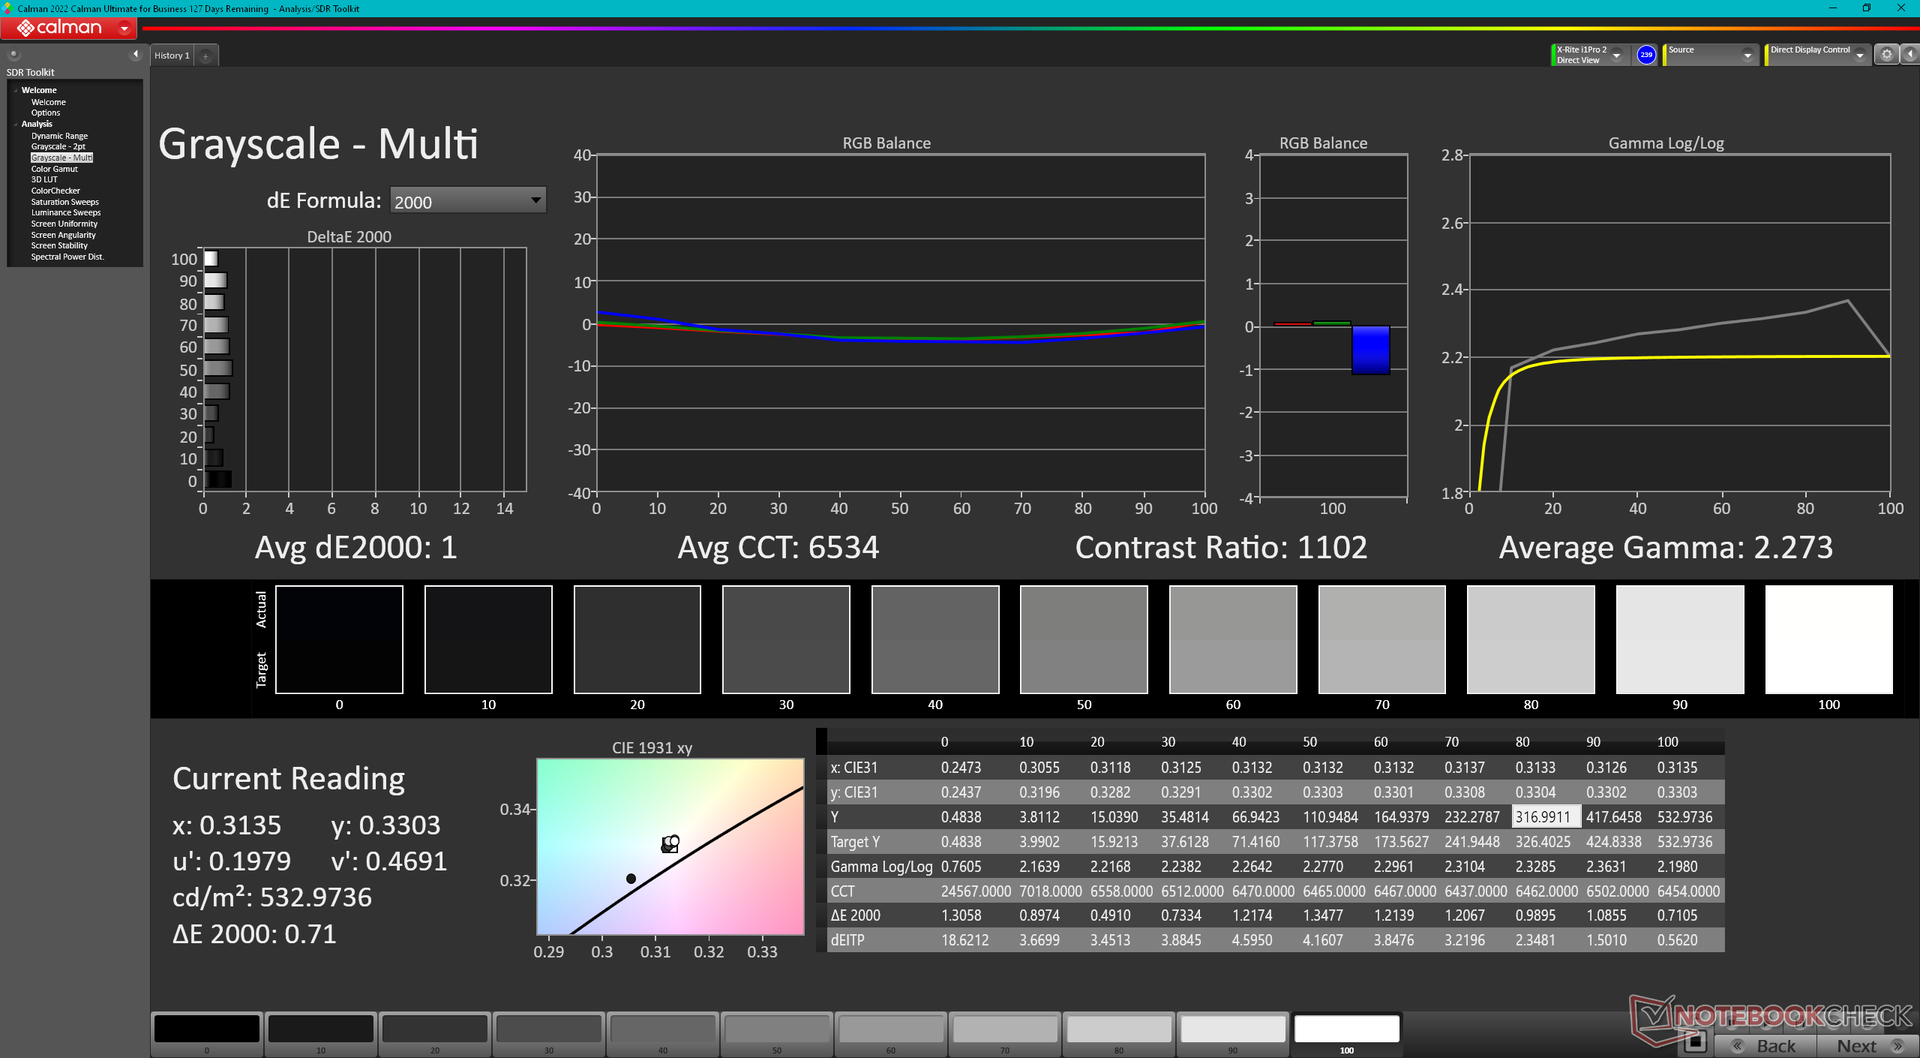
ΔE ColorChecker Calman: 2.26 | ∀{0.5-29.43 Ø4.72}
calibrated: 4.73
ΔE Greyscale Calman: 1 | ∀{0.09-98 Ø4.97}
86.3% AdobeRGB 1998 (Argyll 3D)
99.9% sRGB (Argyll 3D)
97.4% Display P3 (Argyll 3D)
Gamma: 2.28
CCT: 6543 K
| HP ZBook Fury 16 G9 BOE0A52, IPS, 3840x2400, 16" | HP ZBook Studio 16 G9 62U04EA BOE0A52, IPS, 3840x2400, 16" | HP ZBook Firefly 16 G9-6B897EA BOE0A02, IPS, 1920x1200, 16" | Lenovo ThinkPad P16 G1 RTX A5500 LP160UQ1-SPB1, IPS, 3840x2400, 16" | Dell Precision 7000 7670 Performance Samsung 160YV03, OLED, 3840x2400, 16" | MSI CreatorPro Z16P B12UKST B160QAN02.N, IPS, 2560x1600, 16" | |
|---|---|---|---|---|---|---|
| Display | 0% | -18% | -2% | 6% | 0% | |
| Display P3 Coverage (%) | 97.4 | 97.5 0% | 68.1 -30% | 82.9 -15% | 99.9 3% | 97.6 0% |
| sRGB Coverage (%) | 99.9 | 99.9 0% | 96.1 -4% | 98.9 -1% | 100 0% | 99.9 0% |
| AdobeRGB 1998 Coverage (%) | 86.3 | 86.3 0% | 70 -19% | 95.9 11% | 98.1 14% | 87.4 1% |
| Response Times | 9% | -206% | -281% | 83% | 11% | |
| Response Time Grey 50% / Grey 80% * (ms) | 13.7 ? | 15.3 ? -12% | 52.8 ? -285% | 45.6 ? -233% | 1.84 ? 87% | 12.8 ? 7% |
| Response Time Black / White * (ms) | 8.6 ? | 6.1 ? 29% | 19.5 ? -127% | 36.8 ? -328% | 1.92 ? 78% | 7.4 ? 14% |
| PWM Frequency (Hz) | 59.52 ? | |||||
| Bildschirm | 18% | -40% | -12% | -61% | 5% | |
| Helligkeit Bildmitte (cd/m²) | 530.5 | 554 4% | 526 -1% | 601.9 13% | 325.2 -39% | 407 -23% |
| Brightness (cd/m²) | 476 | 516 8% | 499 5% | 569 20% | 328 -31% | 388 -18% |
| Brightness Distribution (%) | 83 | 84 1% | 93 12% | 77 -7% | 97 17% | 88 6% |
| Schwarzwert * (cd/m²) | 0.57 | 0.47 18% | 0.31 46% | 0.47 18% | 0.36 37% | |
| Kontrast (:1) | 931 | 1179 27% | 1697 82% | 1281 38% | 1131 21% | |
| Delta E Colorchecker * | 2.26 | 1 56% | 3.6 -59% | 2.45 -8% | 4.59 -103% | 1.3 42% |
| Colorchecker dE 2000 calibrated * | 4.73 | 0.6 87% | 2.6 45% | 0.7 85% | ||
| Delta E Graustufen * | 1 | 1.6 -60% | 5.5 -450% | 2.6 -160% | 2.5 -150% | 2.1 -110% |
| Gamma | 2.28 96% | 2.29 96% | 2.02 109% | 2.3 96% | 2.1 105% | 2.26 97% |
| CCT | 6543 99% | 6458 101% | 6527 100% | 6805 96% | 6541 99% | 6437 101% |
| Colorchecker dE 2000 max. * | 2.4 | 6.6 | 4.46 | 7.65 | 2.5 | |
| Durchschnitt gesamt (Programm / Settings) | 9% /
12% | -88% /
-60% | -98% /
-54% | 9% /
-12% | 5% /
5% |
* ... kleinere Werte sind besser
Das Display ist standardmäßig auf den P3-Standard mit durchschnittlichen Graustufen und DeltaE-Farben (1,0 und 2,26) kalibriert.
Reaktionszeiten (Response Times) des Displays
| ↔ Reaktionszeiten Schwarz zu Weiß | ||
|---|---|---|
| 8.6 ms ... steigend ↗ und fallend ↘ kombiniert | ↗ 4.7 ms steigend | 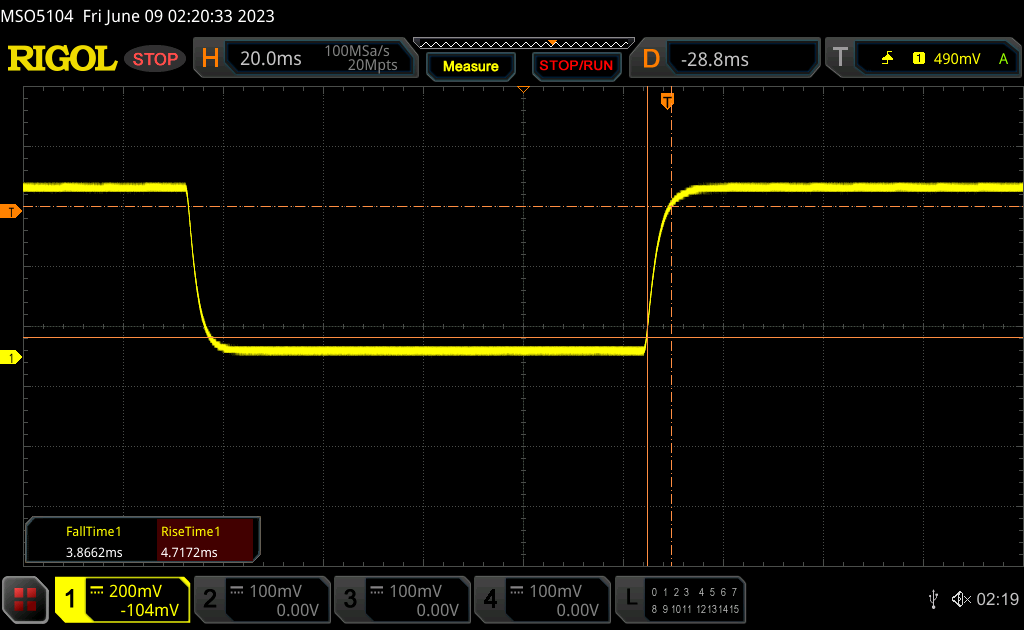 |
| ↘ 3.9 ms fallend | ||
| Die gemessenen Reaktionszeiten sind kurz wodurch sich der Bildschirm auch für Spiele gut eignen sollte. Im Vergleich rangierten die bei uns getesteten Geräte von 0.1 (Minimum) zu 240 (Maximum) ms. » 24 % aller Screens waren schneller als der getestete. Daher sind die gemessenen Reaktionszeiten besser als der Durchschnitt aller vermessenen Geräte (19.8 ms). | ||
| ↔ Reaktionszeiten 50% Grau zu 80% Grau | ||
| 13.7 ms ... steigend ↗ und fallend ↘ kombiniert | ↗ 6.6 ms steigend | 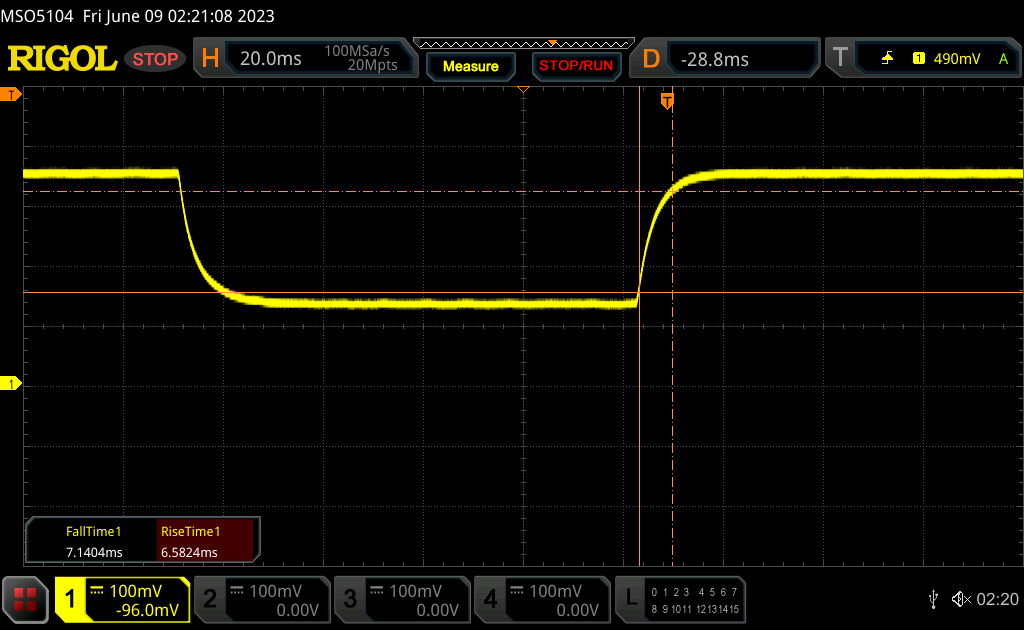 |
| ↘ 7.1 ms fallend | ||
| Die gemessenen Reaktionszeiten sind gut, für anspruchsvolle Spieler könnten der Bildschirm jedoch zu langsam sein. Im Vergleich rangierten die bei uns getesteten Geräte von 0.165 (Minimum) zu 636 (Maximum) ms. » 27 % aller Screens waren schneller als der getestete. Daher sind die gemessenen Reaktionszeiten besser als der Durchschnitt aller vermessenen Geräte (31 ms). | ||
Bildschirm-Flackern / PWM (Pulse-Width Modulation)
| Flackern / PWM nicht festgestellt | 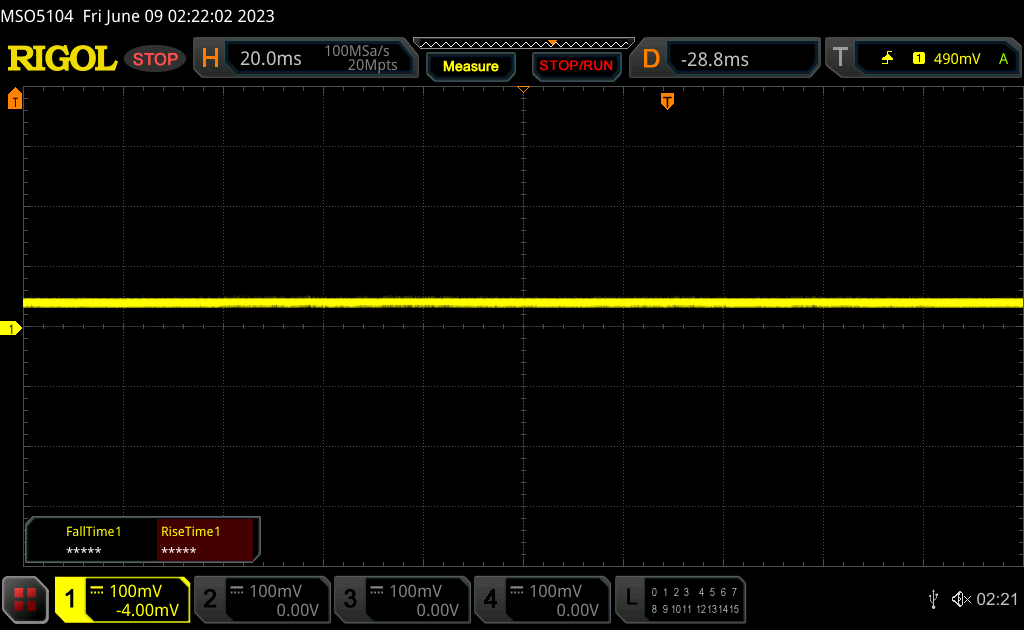 | ||
Im Vergleich: 52 % aller getesteten Geräte nutzten kein PWM um die Helligkeit zu reduzieren. Wenn PWM eingesetzt wurde, dann bei einer Frequenz von durchschnittlich 7769 (Minimum 5, Maximum 343500) Hz. | |||
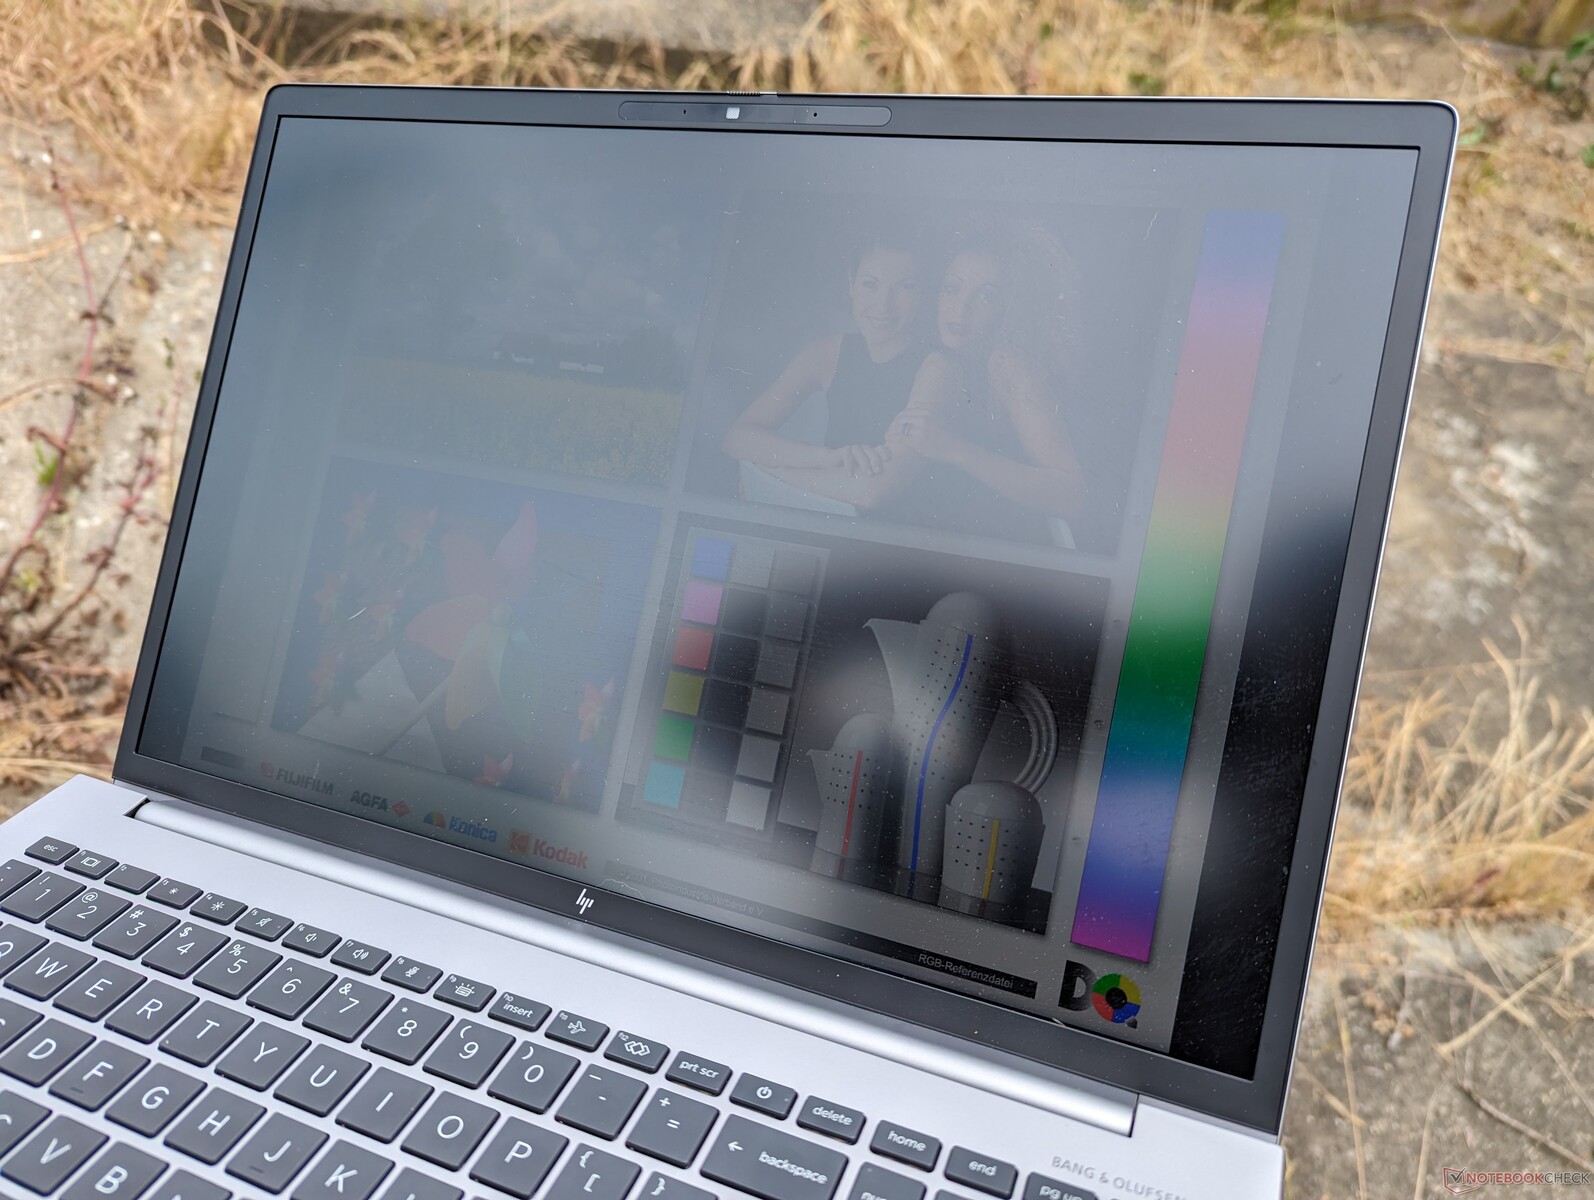
Das Display draußen im Schatten ist nichts Besonderes, da auch hier ein 400-Nits-Display zum Einsatz kommt. Dies ist für Ultrabooks dieser Preisklasse nicht außergewöhnlich. Es ist zwar auch ein Panel mit 1.000-Nits in Planung, erhältlich ist aber momentan nur das Modell mit einem 1.920x1.200-p-IPS-Panel.
Außerdem sollte erwähnt werden, dass ab Werk der Display-Energiesparmodus aktiviert ist, was bedeutet, dass es ohne externe Stromversorgung rund 80 Nits dunkler wird. Um diesen Modus zu deaktivieren, muss man das Programm Intel-Graphics-Command-Center starten und in das System- und Energie-Sub-Menü wechseln, um dort den Display-Energiesparmodus zu deaktivieren.
Performance — Intel der 12. Generation gepaart mit Nvidia RTX Ampere

Testszenario
Bevor wir jegliche Benchmarks durchgeführt haben, haben wir den Performance-Modus aktiviert. HP bietet keine hauseigenen Einstellungen zur Performance-Anpassung an. Stattdessen werden die normalen Windows Einstellungen verwendet. Dies schließt auch ein, dass diverse Features, wie Optimus 2.0 oder MUX, nicht unterstützt werden.
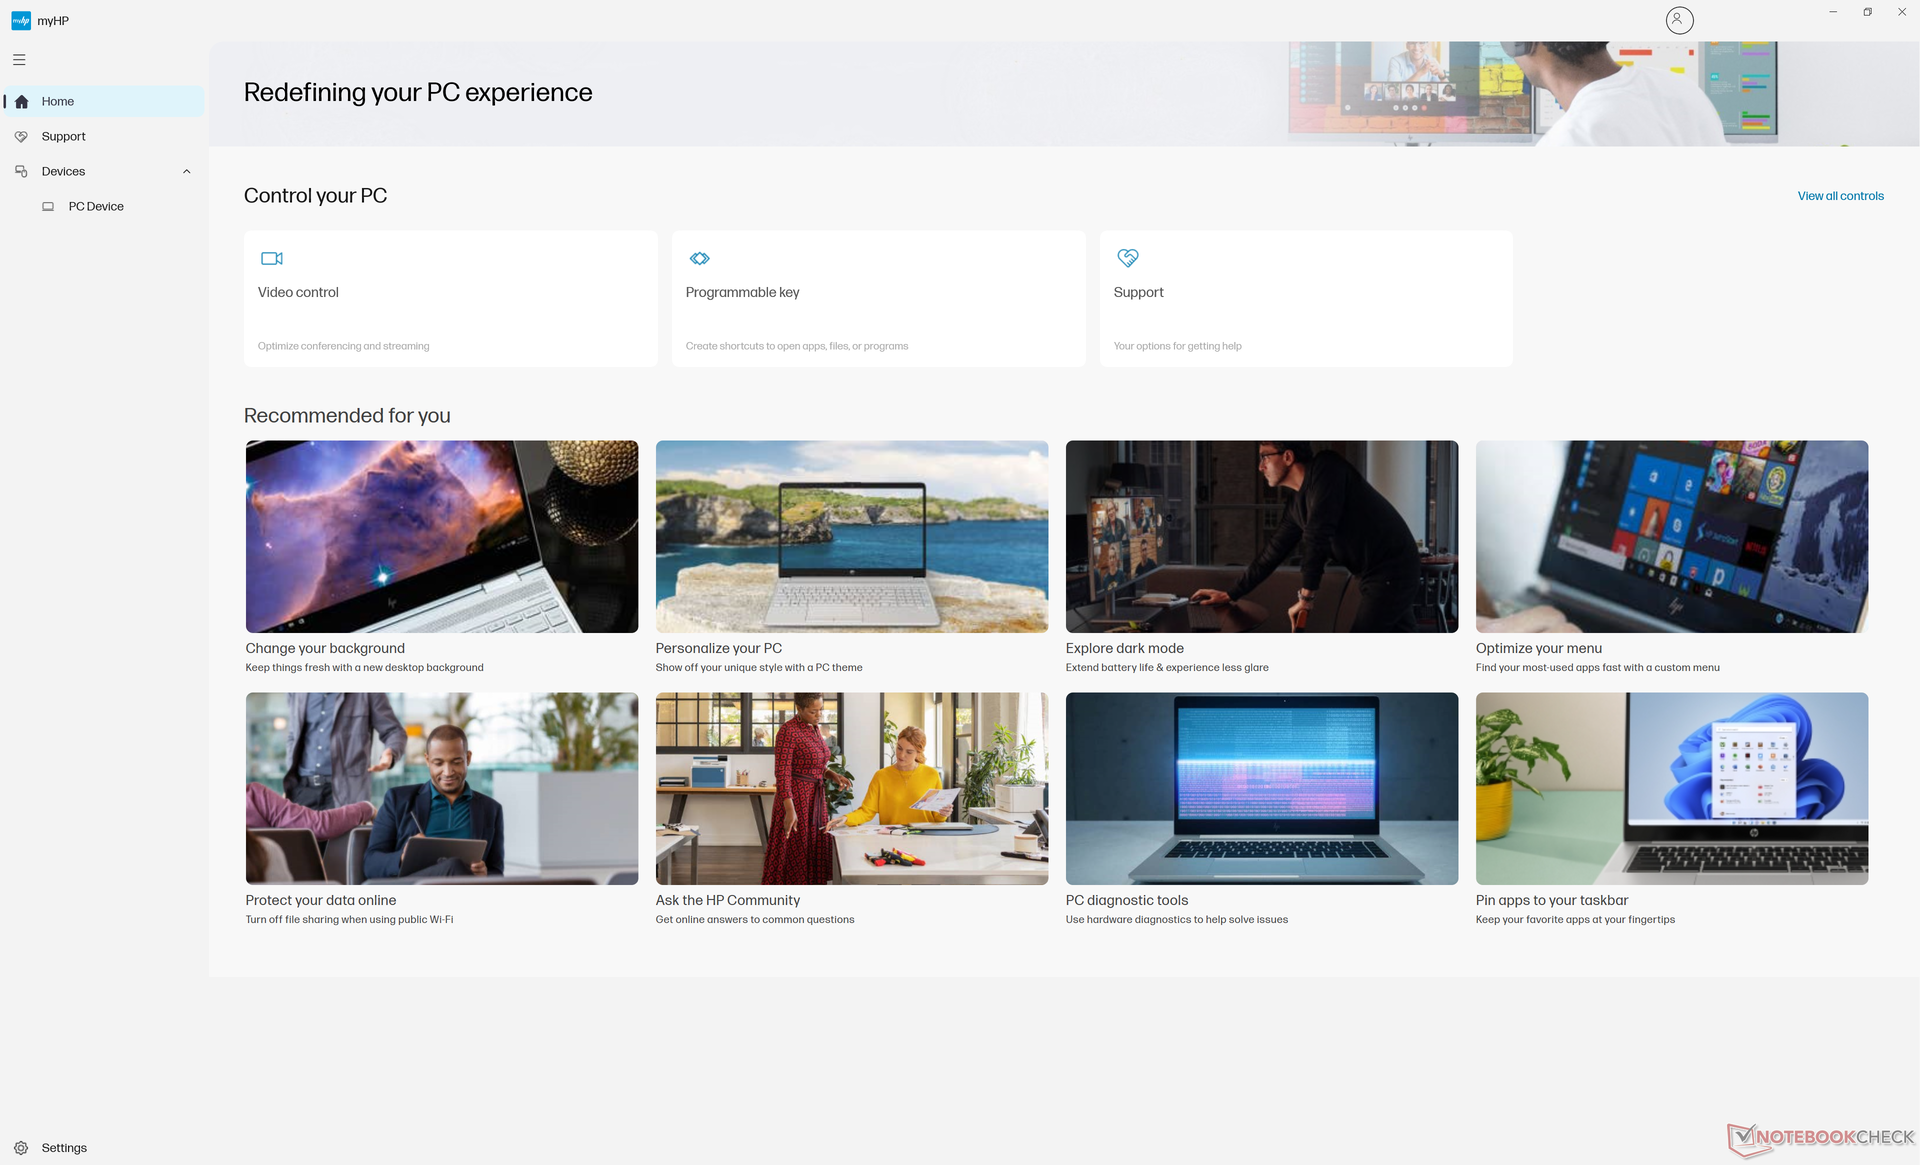
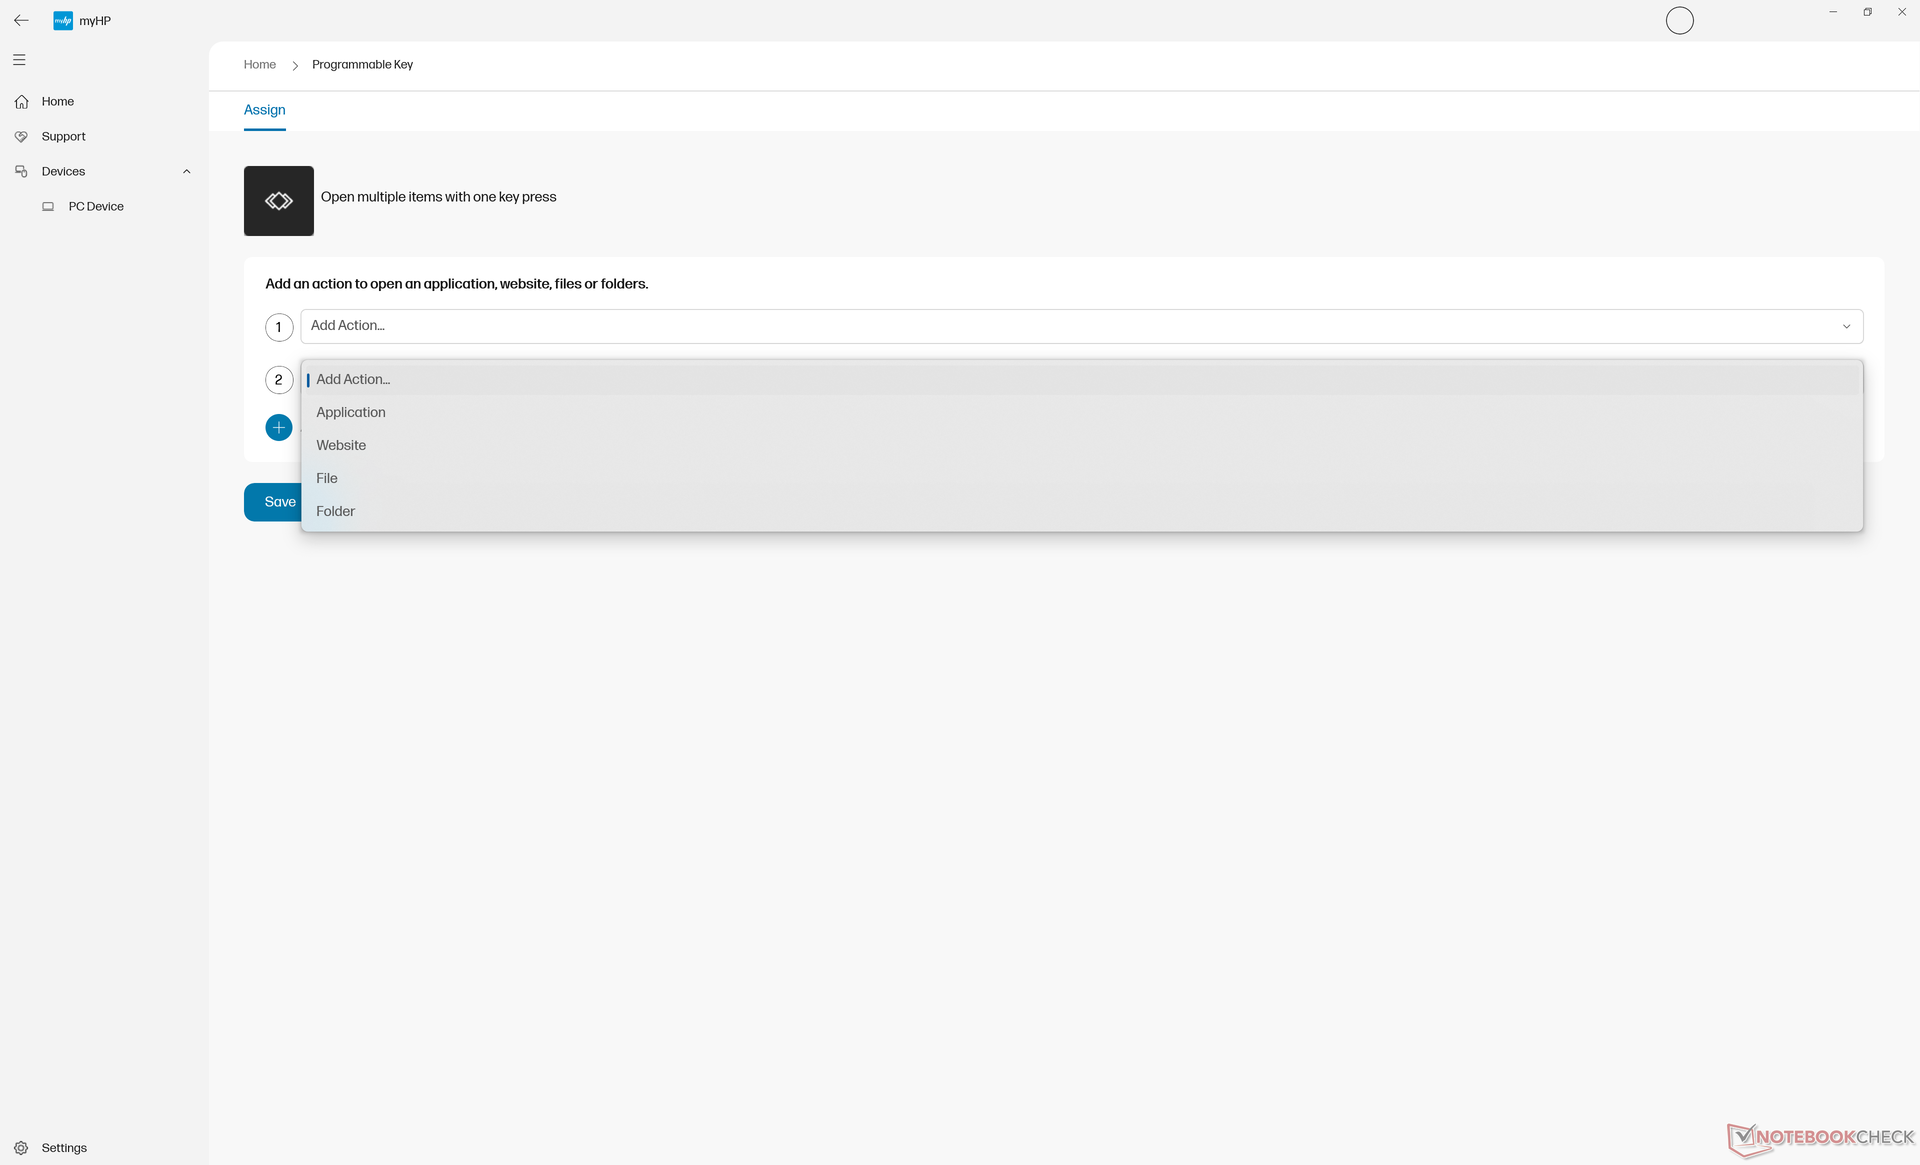
Wir empfehlen jedem Nutzer, sich vorab mit MyHP und Z-Light-Space vertraut zu machen, da über diese Apps auf HP spezifische Software und die Einstellungen für die RGB-Farben des Keyboards zugegriffen werden kann.
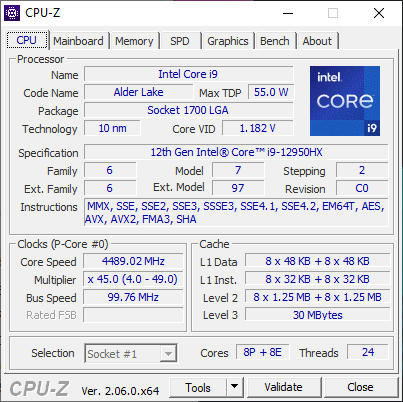
Prozessor
Der i9-12950HX war bis zum Launch vom i9-13950HX die stärkste mobile CPU mit vPro- und ECC-Support. Modelle mit Prozessoren der 13. Generation, wie das Fury 16 G10, sind aber auch bereits in den Startlöchern.
Unser Modell performt um ca. fünf Prozent schlechter als der Durchschnitts-Laptop mit dergleichen CPU. Ebenfalls neigt sie dazu, bei andauernder Volllast die Leistung ziemlich stark zu drosseln. Beispielsweise verliert sie bei CineBench R15 xT in Dauerschleife nach der 7. oder 8. Runde bereits 20 Prozent an Leistung. Beim THinkPad P16 G1 war dieses Drosseln weitaus geringer festzustellen.
Entscheidet man sich für die i7-12850HX-Variante, muss man mit einer Performance-Minimierung von 15 bis 20 Prozent rechnen, sowohl beim Single- als auch im Multi-Thread.
Cinebench R15 Multi-Loop
Cinebench R23: Multi Core | Single Core
Cinebench R20: CPU (Multi Core) | CPU (Single Core)
Cinebench R15: CPU Multi 64Bit | CPU Single 64Bit
Blender: v2.79 BMW27 CPU
7-Zip 18.03: 7z b 4 | 7z b 4 -mmt1
Geekbench 5.5: Multi-Core | Single-Core
HWBOT x265 Benchmark v2.2: 4k Preset
LibreOffice : 20 Documents To PDF
R Benchmark 2.5: Overall mean
* ... kleinere Werte sind besser
AIDA64: FP32 Ray-Trace | FPU Julia | CPU SHA3 | CPU Queen | FPU SinJulia | FPU Mandel | CPU AES | CPU ZLib | FP64 Ray-Trace | CPU PhotoWorxx
| Performance Rating | |
| Durchschnittliche Intel Core i9-12950HX | |
| Lenovo ThinkPad P16 G1 RTX A5500 | |
| HP ZBook Fury 16 G9 | |
| MSI CreatorPro Z16P B12UKST | |
| HP ZBook Studio 16 G9 62U04EA | |
| Dell Precision 7000 7670 Performance | |
| HP ZBook Firefly 16 G9-6B897EA | |
| AIDA64 / FP32 Ray-Trace | |
| Lenovo ThinkPad P16 G1 RTX A5500 | |
| Durchschnittliche Intel Core i9-12950HX (15499 - 22868, n=7) | |
| HP ZBook Fury 16 G9 | |
| Dell Precision 7000 7670 Performance | |
| HP ZBook Studio 16 G9 62U04EA | |
| MSI CreatorPro Z16P B12UKST | |
| HP ZBook Firefly 16 G9-6B897EA | |
| AIDA64 / FPU Julia | |
| HP ZBook Fury 16 G9 | |
| Lenovo ThinkPad P16 G1 RTX A5500 | |
| Durchschnittliche Intel Core i9-12950HX (77846 - 115907, n=7) | |
| HP ZBook Studio 16 G9 62U04EA | |
| Dell Precision 7000 7670 Performance | |
| MSI CreatorPro Z16P B12UKST | |
| HP ZBook Firefly 16 G9-6B897EA | |
| AIDA64 / CPU SHA3 | |
| Lenovo ThinkPad P16 G1 RTX A5500 | |
| Durchschnittliche Intel Core i9-12950HX (3426 - 5069, n=7) | |
| HP ZBook Fury 16 G9 | |
| HP ZBook Studio 16 G9 62U04EA | |
| MSI CreatorPro Z16P B12UKST | |
| Dell Precision 7000 7670 Performance | |
| HP ZBook Firefly 16 G9-6B897EA | |
| AIDA64 / CPU Queen | |
| HP ZBook Studio 16 G9 62U04EA | |
| Durchschnittliche Intel Core i9-12950HX (102752 - 104726, n=7) | |
| Lenovo ThinkPad P16 G1 RTX A5500 | |
| Dell Precision 7000 7670 Performance | |
| HP ZBook Fury 16 G9 | |
| MSI CreatorPro Z16P B12UKST | |
| HP ZBook Firefly 16 G9-6B897EA | |
| AIDA64 / FPU SinJulia | |
| Lenovo ThinkPad P16 G1 RTX A5500 | |
| HP ZBook Fury 16 G9 | |
| Durchschnittliche Intel Core i9-12950HX (10134 - 12823, n=7) | |
| Dell Precision 7000 7670 Performance | |
| HP ZBook Studio 16 G9 62U04EA | |
| MSI CreatorPro Z16P B12UKST | |
| HP ZBook Firefly 16 G9-6B897EA | |
| AIDA64 / FPU Mandel | |
| HP ZBook Fury 16 G9 | |
| Lenovo ThinkPad P16 G1 RTX A5500 | |
| Durchschnittliche Intel Core i9-12950HX (37146 - 57340, n=7) | |
| HP ZBook Studio 16 G9 62U04EA | |
| Dell Precision 7000 7670 Performance | |
| MSI CreatorPro Z16P B12UKST | |
| HP ZBook Firefly 16 G9-6B897EA | |
| AIDA64 / CPU AES | |
| MSI CreatorPro Z16P B12UKST | |
| Durchschnittliche Intel Core i9-12950HX (72599 - 181128, n=7) | |
| HP ZBook Fury 16 G9 | |
| Lenovo ThinkPad P16 G1 RTX A5500 | |
| HP ZBook Studio 16 G9 62U04EA | |
| Dell Precision 7000 7670 Performance | |
| HP ZBook Firefly 16 G9-6B897EA | |
| AIDA64 / CPU ZLib | |
| Lenovo ThinkPad P16 G1 RTX A5500 | |
| HP ZBook Fury 16 G9 | |
| Durchschnittliche Intel Core i9-12950HX (996 - 1417, n=7) | |
| HP ZBook Studio 16 G9 62U04EA | |
| MSI CreatorPro Z16P B12UKST | |
| Dell Precision 7000 7670 Performance | |
| HP ZBook Firefly 16 G9-6B897EA | |
| AIDA64 / FP64 Ray-Trace | |
| Lenovo ThinkPad P16 G1 RTX A5500 | |
| Durchschnittliche Intel Core i9-12950HX (8455 - 12432, n=7) | |
| HP ZBook Fury 16 G9 | |
| HP ZBook Studio 16 G9 62U04EA | |
| Dell Precision 7000 7670 Performance | |
| MSI CreatorPro Z16P B12UKST | |
| HP ZBook Firefly 16 G9-6B897EA | |
| AIDA64 / CPU PhotoWorxx | |
| MSI CreatorPro Z16P B12UKST | |
| Dell Precision 7000 7670 Performance | |
| Durchschnittliche Intel Core i9-12950HX (35479 - 42655, n=7) | |
| Lenovo ThinkPad P16 G1 RTX A5500 | |
| HP ZBook Fury 16 G9 | |
| HP ZBook Studio 16 G9 62U04EA | |
| HP ZBook Firefly 16 G9-6B897EA | |
System-Performance
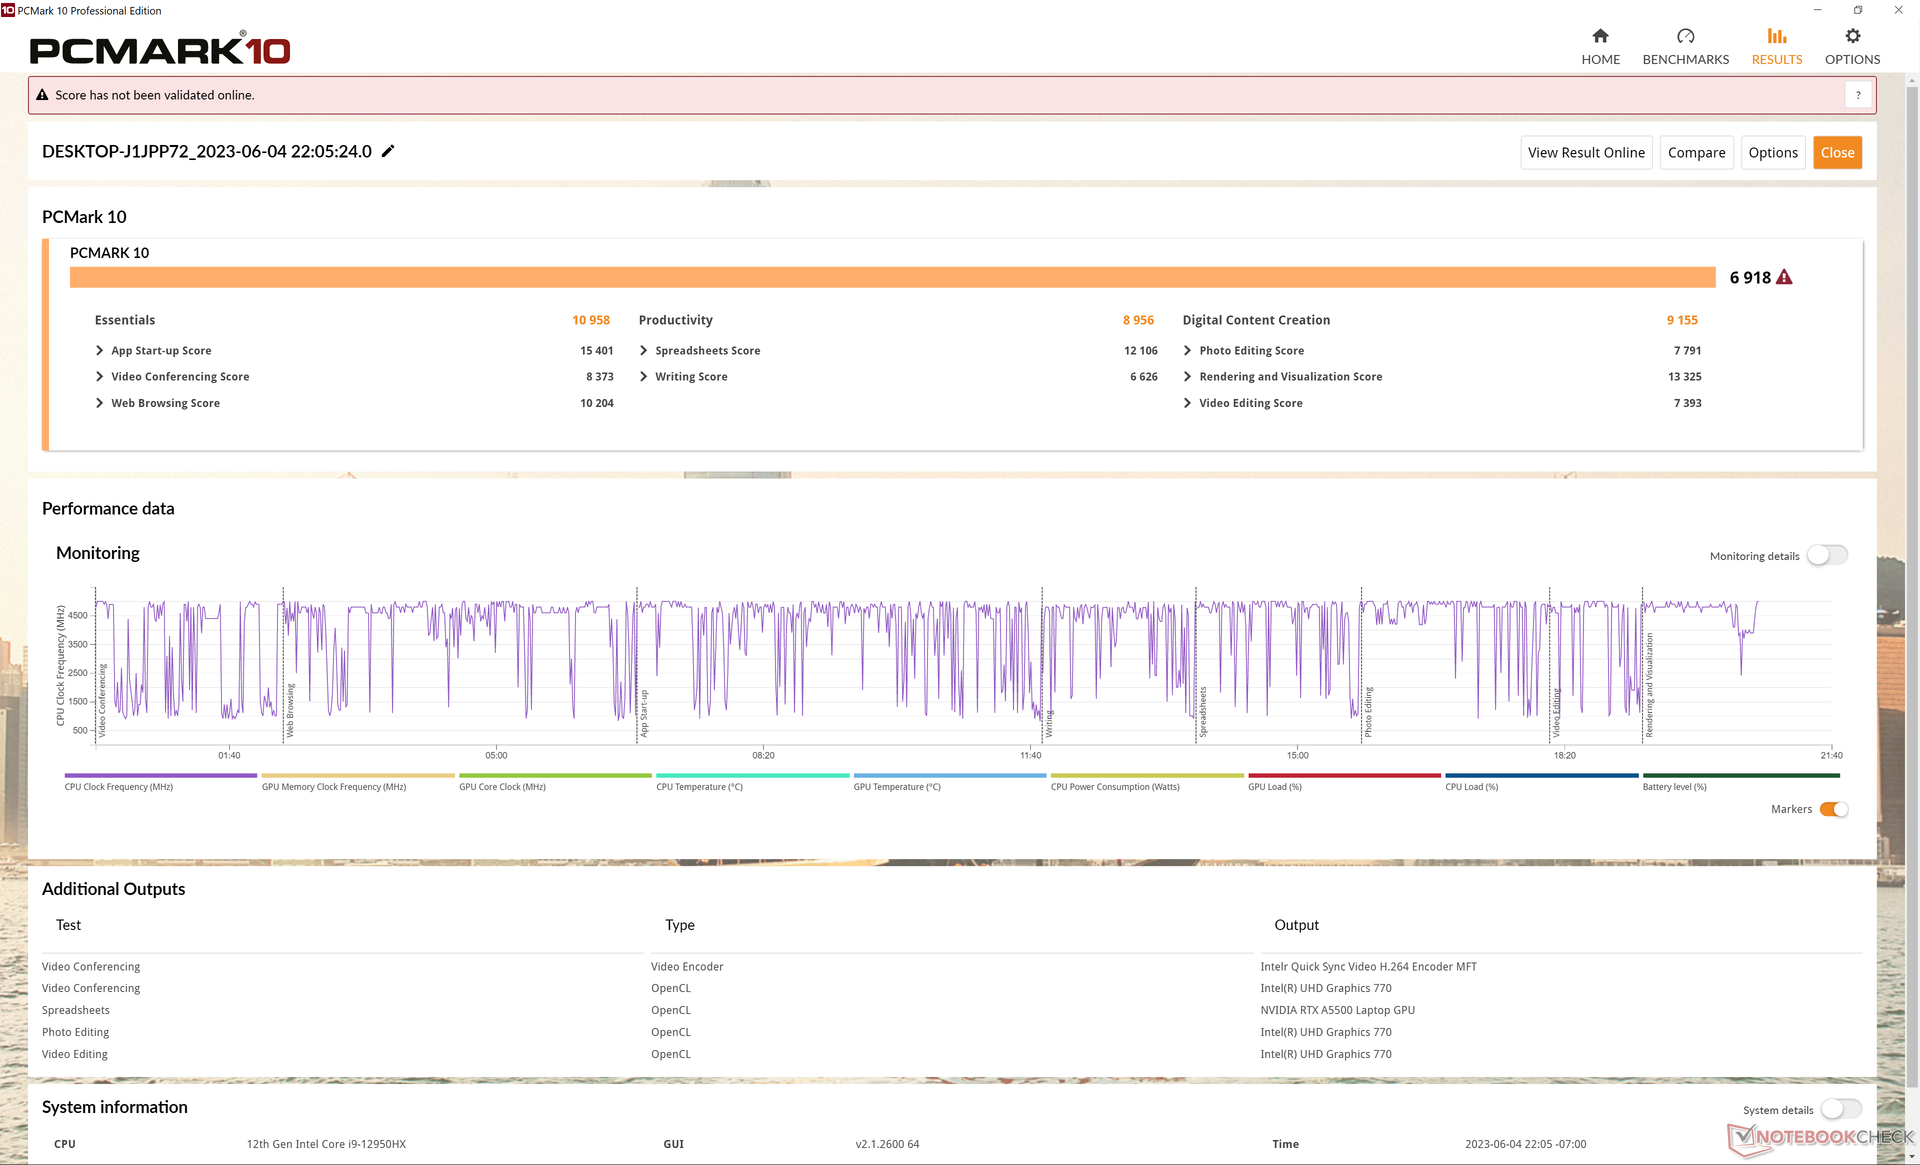
Unsere PCMark Ergebnisse sind ähnlich zu jenen des Dell Precision 7670 und des Lenovo ThinkPad P16 G1. Man beachte auch den erstaunlichen Vorteil im Bereich „Digital Content Creation“ gegenüber dem ZBook Firefly 16 G9, was vor allem an der RTX-A5500-GPU liegt.
CrossMark: Overall | Productivity | Creativity | Responsiveness
| PCMark 10 / Score | |
| Lenovo ThinkPad P16 G1 RTX A5500 | |
| MSI CreatorPro Z16P B12UKST | |
| Durchschnittliche Intel Core i9-12950HX, NVIDIA RTX A5500 Laptop GPU (6883 - 7236, n=3) | |
| HP ZBook Fury 16 G9 | |
| Dell Precision 7000 7670 Performance | |
| HP ZBook Studio 16 G9 62U04EA | |
| HP ZBook Firefly 16 G9-6B897EA | |
| PCMark 10 / Essentials | |
| Dell Precision 7000 7670 Performance | |
| Durchschnittliche Intel Core i9-12950HX, NVIDIA RTX A5500 Laptop GPU (10898 - 11465, n=3) | |
| HP ZBook Fury 16 G9 | |
| Lenovo ThinkPad P16 G1 RTX A5500 | |
| MSI CreatorPro Z16P B12UKST | |
| HP ZBook Firefly 16 G9-6B897EA | |
| HP ZBook Studio 16 G9 62U04EA | |
| PCMark 10 / Productivity | |
| Lenovo ThinkPad P16 G1 RTX A5500 | |
| MSI CreatorPro Z16P B12UKST | |
| HP ZBook Fury 16 G9 | |
| Durchschnittliche Intel Core i9-12950HX, NVIDIA RTX A5500 Laptop GPU (8054 - 9489, n=3) | |
| HP ZBook Firefly 16 G9-6B897EA | |
| Dell Precision 7000 7670 Performance | |
| HP ZBook Studio 16 G9 62U04EA | |
| PCMark 10 / Digital Content Creation | |
| Lenovo ThinkPad P16 G1 RTX A5500 | |
| MSI CreatorPro Z16P B12UKST | |
| Dell Precision 7000 7670 Performance | |
| Durchschnittliche Intel Core i9-12950HX, NVIDIA RTX A5500 Laptop GPU (9155 - 9944, n=3) | |
| HP ZBook Studio 16 G9 62U04EA | |
| HP ZBook Fury 16 G9 | |
| HP ZBook Firefly 16 G9-6B897EA | |
| CrossMark / Overall | |
| MSI CreatorPro Z16P B12UKST | |
| HP ZBook Fury 16 G9 | |
| Lenovo ThinkPad P16 G1 RTX A5500 | |
| Durchschnittliche Intel Core i9-12950HX, NVIDIA RTX A5500 Laptop GPU (1801 - 1889, n=3) | |
| HP ZBook Studio 16 G9 62U04EA | |
| Dell Precision 7000 7670 Performance | |
| HP ZBook Firefly 16 G9-6B897EA | |
| CrossMark / Productivity | |
| MSI CreatorPro Z16P B12UKST | |
| HP ZBook Fury 16 G9 | |
| Lenovo ThinkPad P16 G1 RTX A5500 | |
| Durchschnittliche Intel Core i9-12950HX, NVIDIA RTX A5500 Laptop GPU (1684 - 1785, n=3) | |
| HP ZBook Studio 16 G9 62U04EA | |
| Dell Precision 7000 7670 Performance | |
| HP ZBook Firefly 16 G9-6B897EA | |
| CrossMark / Creativity | |
| Lenovo ThinkPad P16 G1 RTX A5500 | |
| HP ZBook Fury 16 G9 | |
| Durchschnittliche Intel Core i9-12950HX, NVIDIA RTX A5500 Laptop GPU (2042 - 2192, n=3) | |
| HP ZBook Studio 16 G9 62U04EA | |
| MSI CreatorPro Z16P B12UKST | |
| Dell Precision 7000 7670 Performance | |
| HP ZBook Firefly 16 G9-6B897EA | |
| CrossMark / Responsiveness | |
| MSI CreatorPro Z16P B12UKST | |
| HP ZBook Fury 16 G9 | |
| HP ZBook Studio 16 G9 62U04EA | |
| Durchschnittliche Intel Core i9-12950HX, NVIDIA RTX A5500 Laptop GPU (1501 - 1585, n=3) | |
| Dell Precision 7000 7670 Performance | |
| Lenovo ThinkPad P16 G1 RTX A5500 | |
| HP ZBook Firefly 16 G9-6B897EA | |
| PCMark 10 Score | 6918 Punkte | |
Hilfe | ||
| AIDA64 / Memory Copy | |
| Dell Precision 7000 7670 Performance | |
| Durchschnittliche Intel Core i9-12950HX (59731 - 64732, n=7) | |
| Lenovo ThinkPad P16 G1 RTX A5500 | |
| MSI CreatorPro Z16P B12UKST | |
| HP ZBook Studio 16 G9 62U04EA | |
| HP ZBook Fury 16 G9 | |
| HP ZBook Firefly 16 G9-6B897EA | |
| AIDA64 / Memory Read | |
| Dell Precision 7000 7670 Performance | |
| Durchschnittliche Intel Core i9-12950HX (59744 - 70359, n=7) | |
| MSI CreatorPro Z16P B12UKST | |
| HP ZBook Studio 16 G9 62U04EA | |
| Lenovo ThinkPad P16 G1 RTX A5500 | |
| HP ZBook Fury 16 G9 | |
| HP ZBook Firefly 16 G9-6B897EA | |
| AIDA64 / Memory Write | |
| MSI CreatorPro Z16P B12UKST | |
| Dell Precision 7000 7670 Performance | |
| HP ZBook Studio 16 G9 62U04EA | |
| Durchschnittliche Intel Core i9-12950HX (57750 - 67899, n=7) | |
| HP ZBook Firefly 16 G9-6B897EA | |
| Lenovo ThinkPad P16 G1 RTX A5500 | |
| HP ZBook Fury 16 G9 | |
| AIDA64 / Memory Latency | |
| MSI CreatorPro Z16P B12UKST | |
| HP ZBook Fury 16 G9 | |
| Lenovo ThinkPad P16 G1 RTX A5500 | |
| HP ZBook Firefly 16 G9-6B897EA | |
| HP ZBook Studio 16 G9 62U04EA | |
| Durchschnittliche Intel Core i9-12950HX (84.5 - 92.2, n=7) | |
| Dell Precision 7000 7670 Performance | |
* ... kleinere Werte sind besser
DPC-Latenz
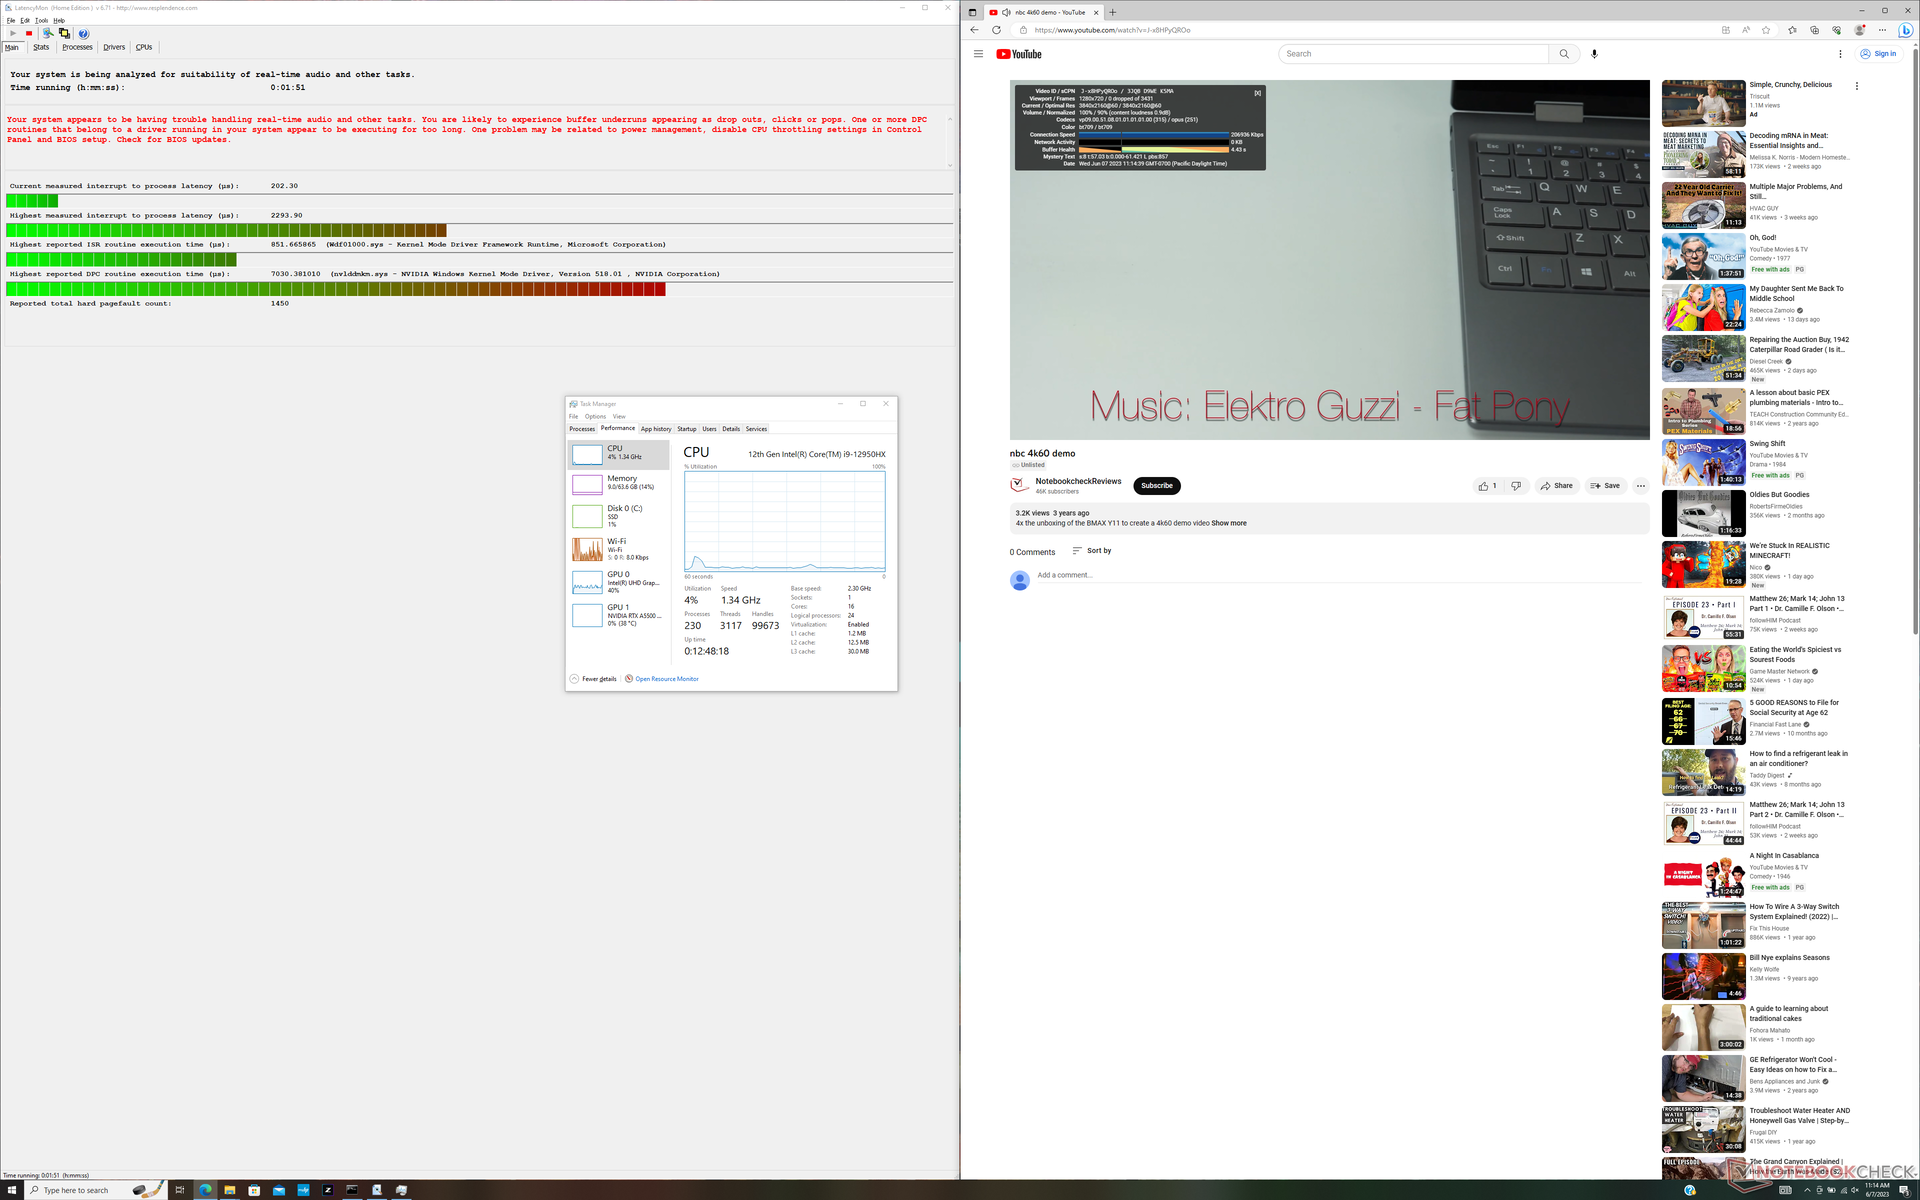
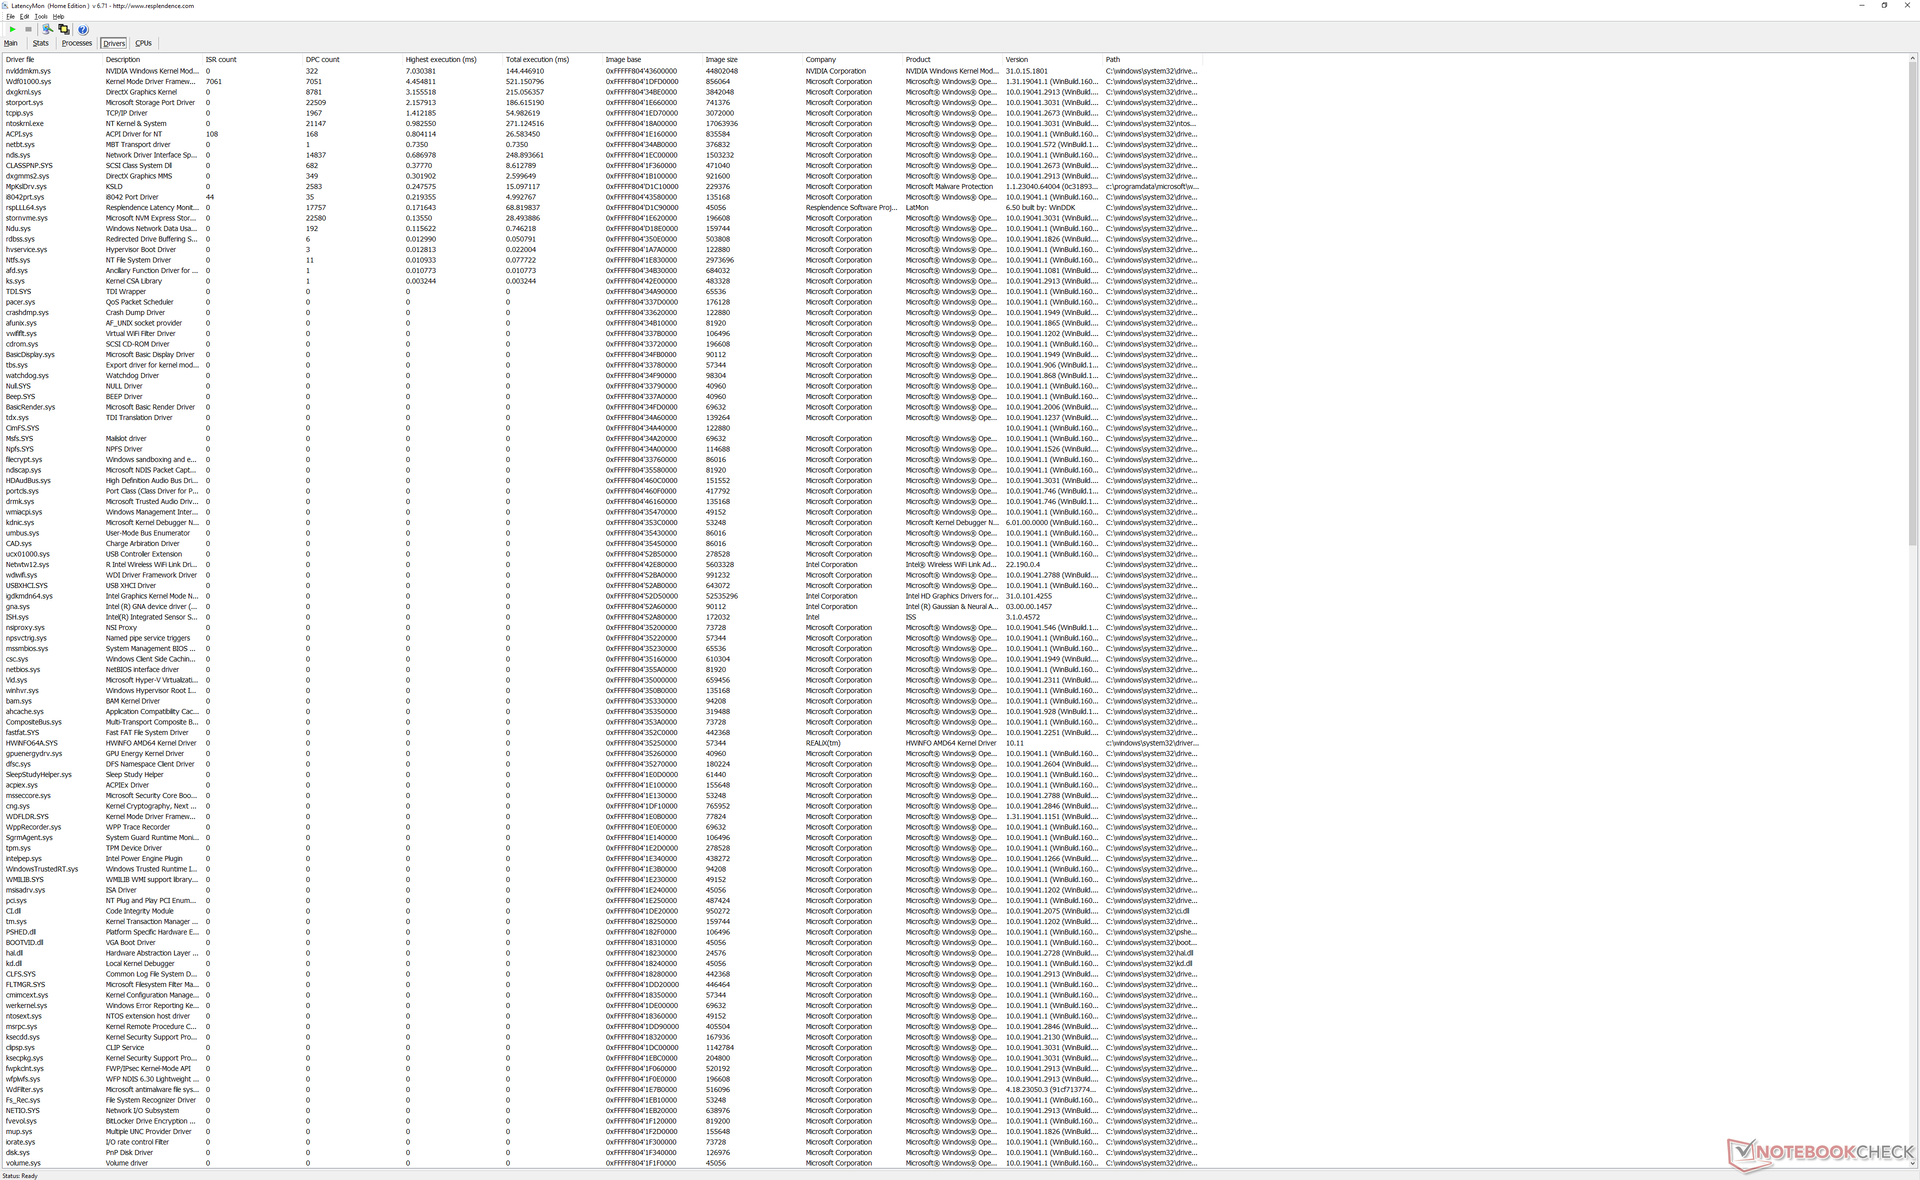
LatencyMon zeigt, dass es DPC-Latenz-Probleme beim Öffnen mehrerer Browser-Tabs gibt. 4K-Videowiedergabe bei 60 fps ist aber ohne Qualitäts- oder Bildverlust möglich.
| DPC Latencies / LatencyMon - interrupt to process latency (max), Web, Youtube, Prime95 | |
| HP ZBook Fury 16 G9 | |
| Dell Precision 7000 7670 Performance | |
| Lenovo ThinkPad P16 G1 RTX A5500 | |
| HP ZBook Studio 16 G9 62U04EA | |
| HP ZBook Firefly 16 G9-6B897EA | |
| MSI CreatorPro Z16P B12UKST | |
* ... kleinere Werte sind besser
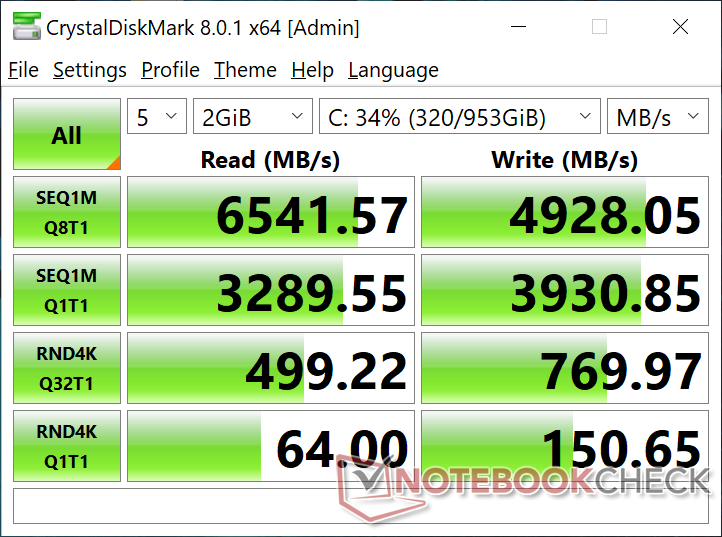
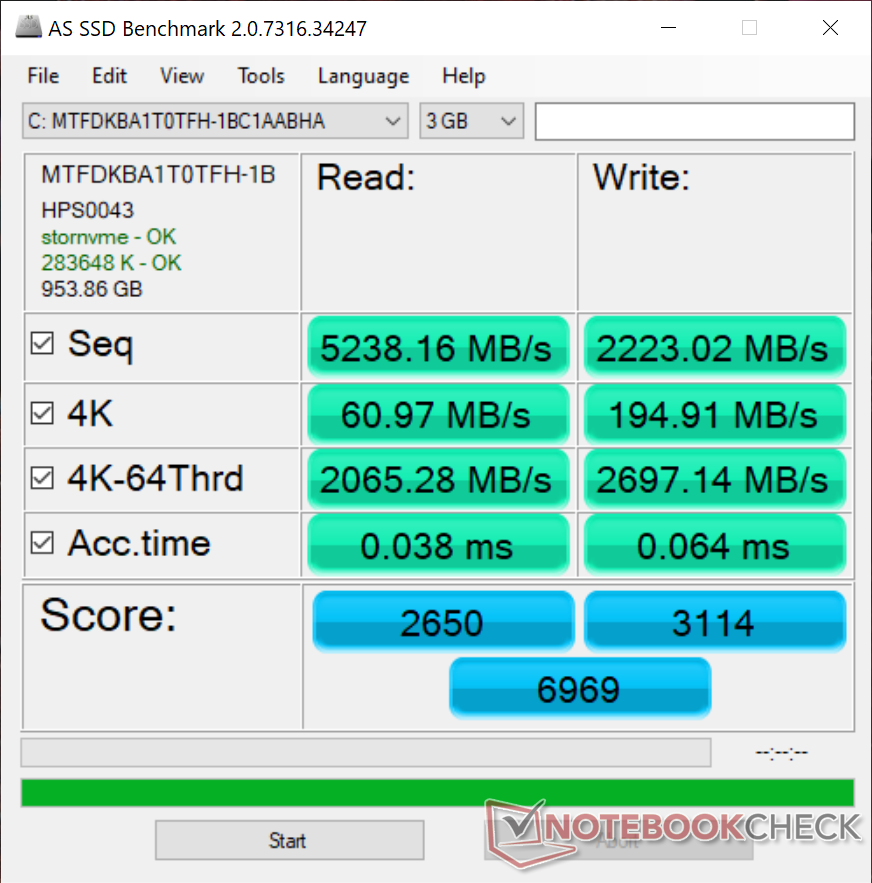
Speicher — Mögliches Drosseln der Performance
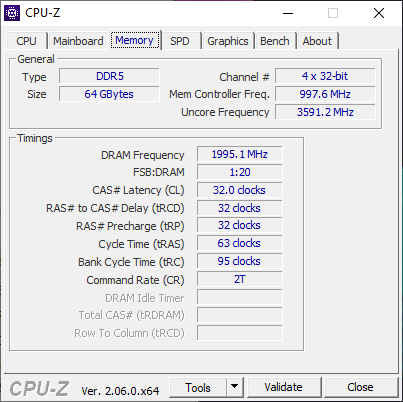
Unser Testgerät wird mit einer 1-TB-Micron-3400-MTFDKBA1T0TFH-SSD ausgeliefert, welche man ebenfalls beim Lenovo ThinkPad X1 Extreme G5 findet. Leider beginnt die SSD bei uns relativ schnell an Leistung zu verlieren, wie auch in der unten stehenden Abbildung zu sehen ist. Bei DiskSpd in einer Schleife drosselt sie beispielsweise von 6.500 MB/s auf ernüchternde 1.700 MB/s. Bei einem Lenovo Gerät wiederum bleiben die Transferraten bei konstanten 6.500 MB/s. Dies lässt vermuten, dass das Fury 16 Probleme beim Kühlen der Speichereinheit hat. Auch nach mehreren Versuchen konnten wie jenes Throttling immer wieder feststellen.

* ... kleinere Werte sind besser
Performance-Drosselung: DiskSpd Read Loop, Queue Depth 8
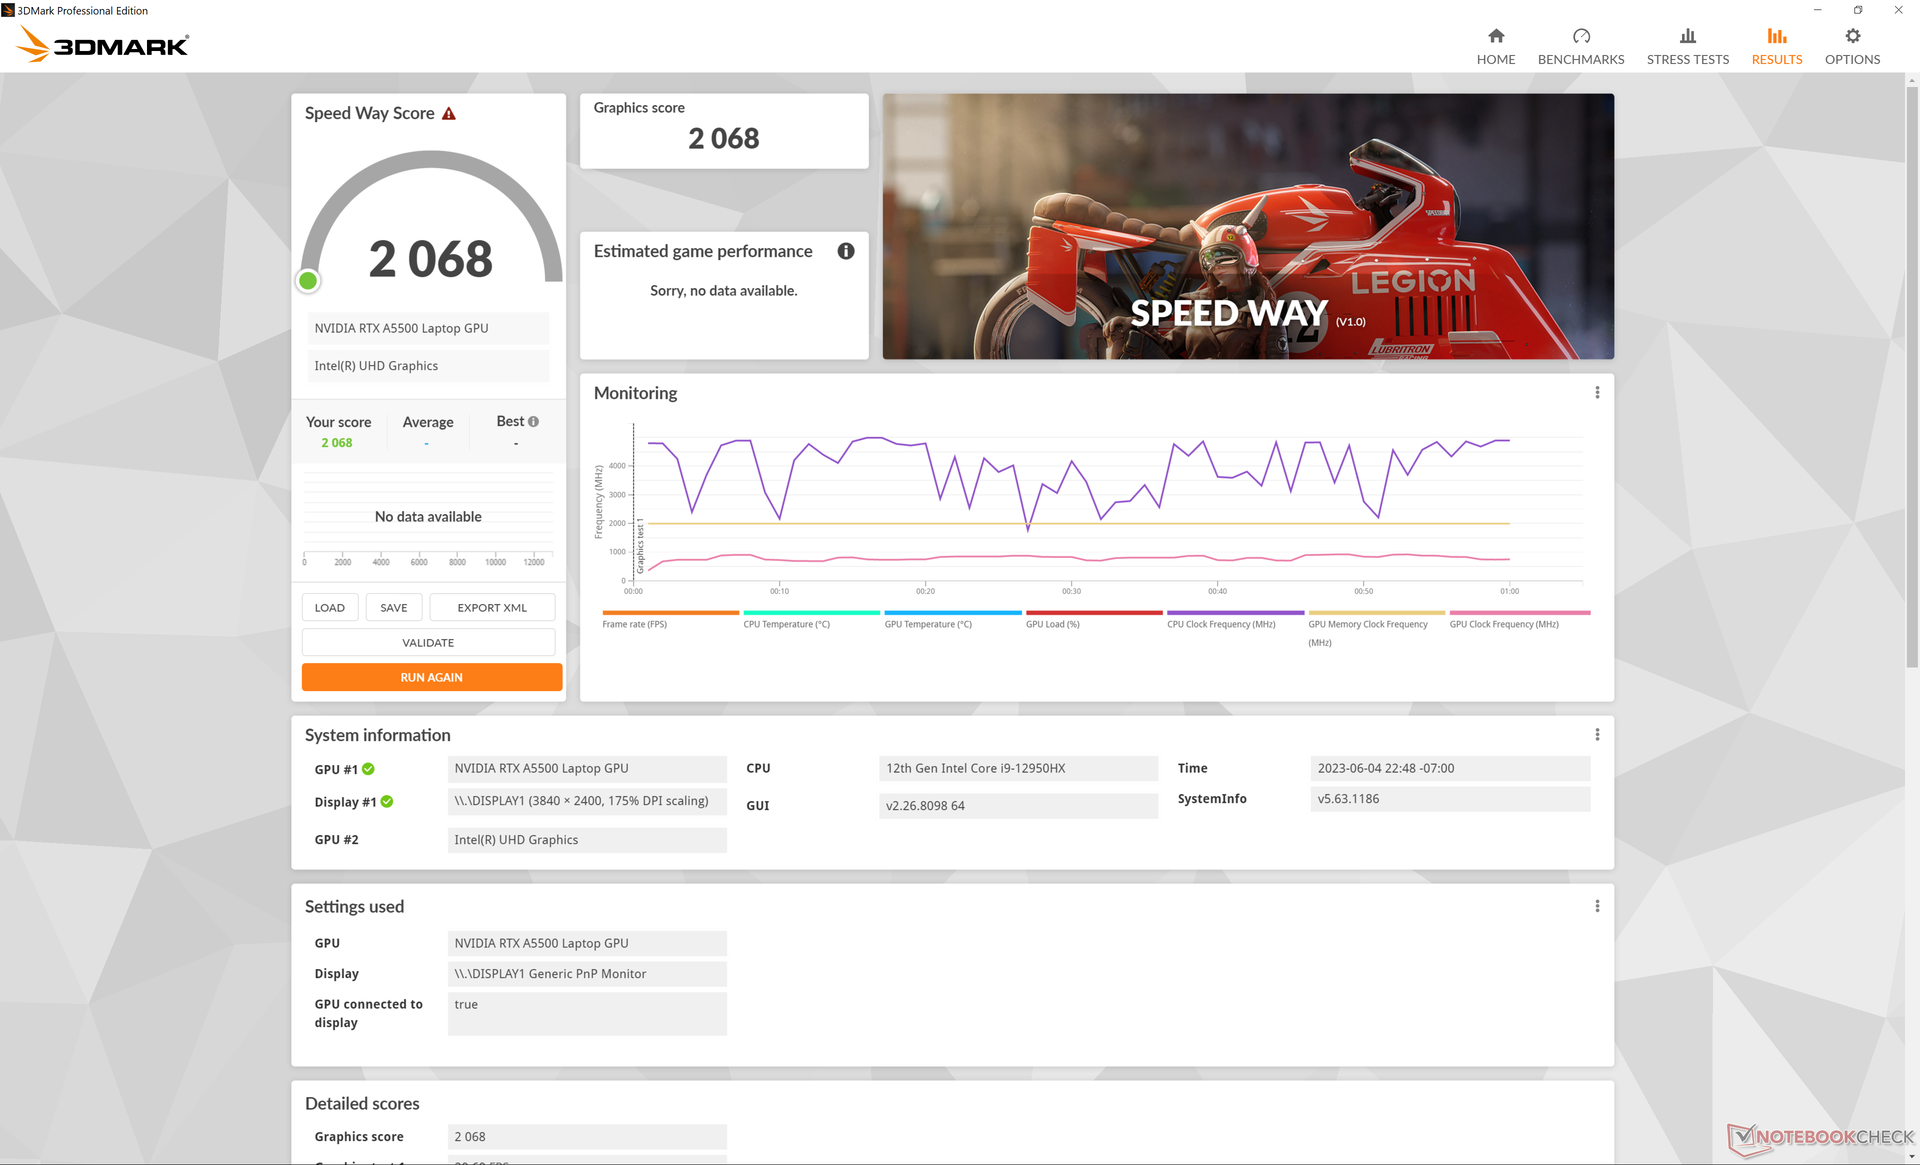
GPU-Performance — 100 W Verbrauch
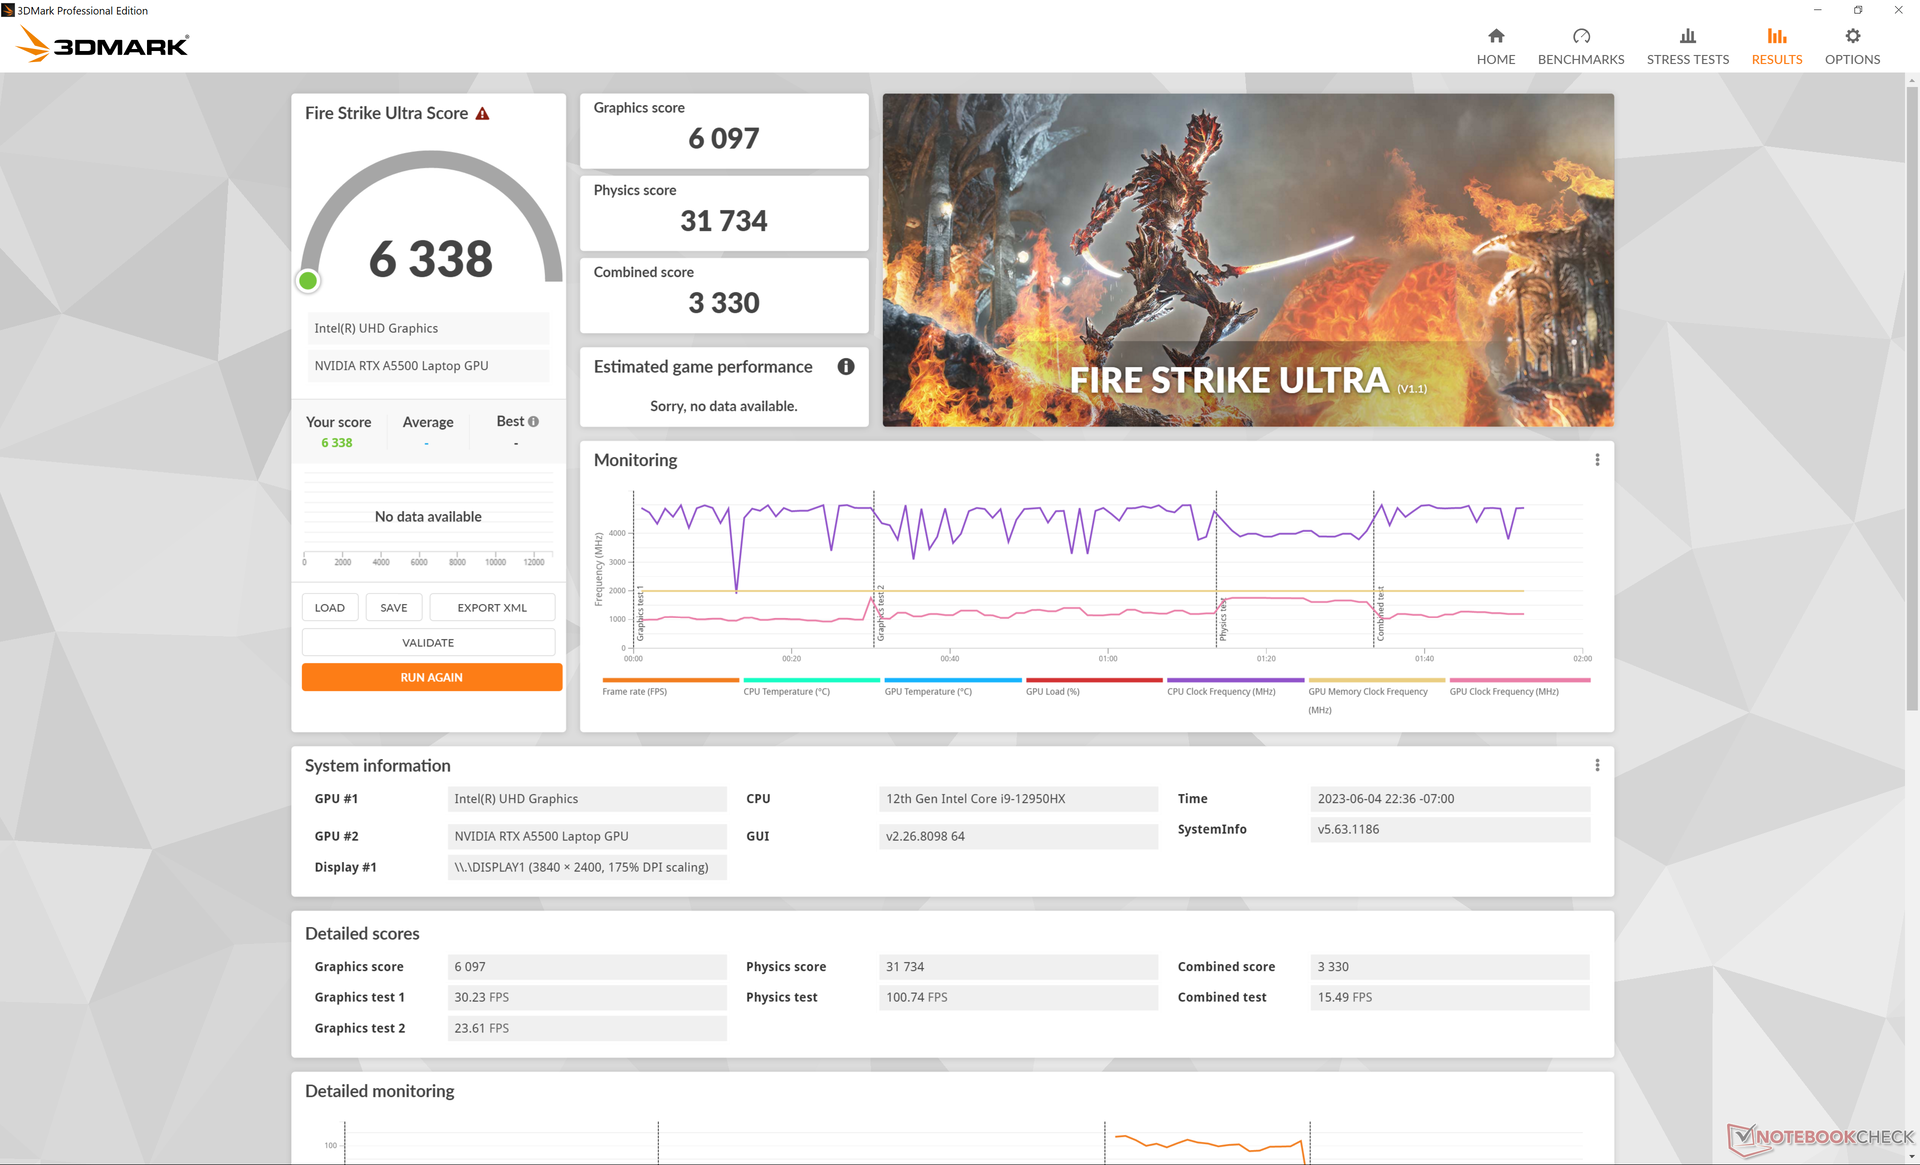
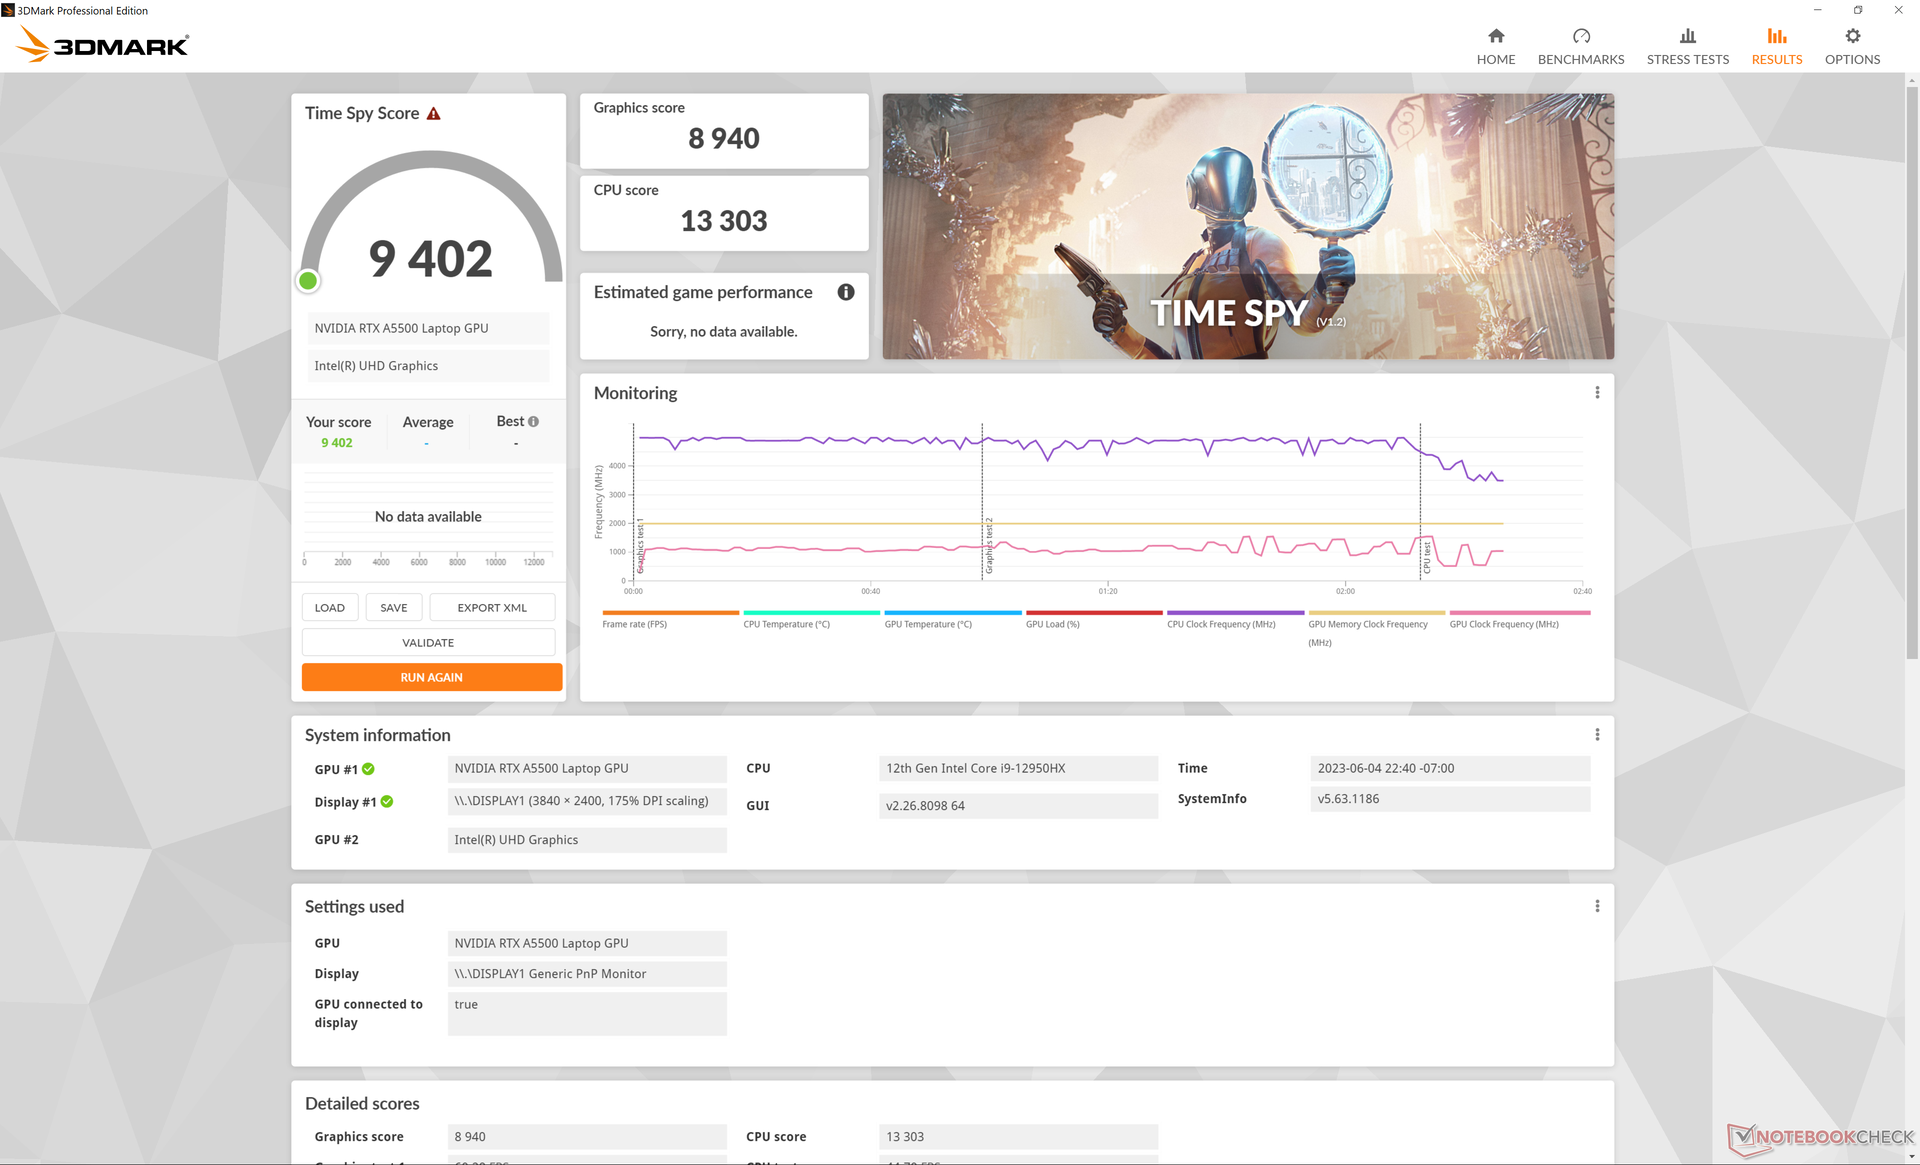
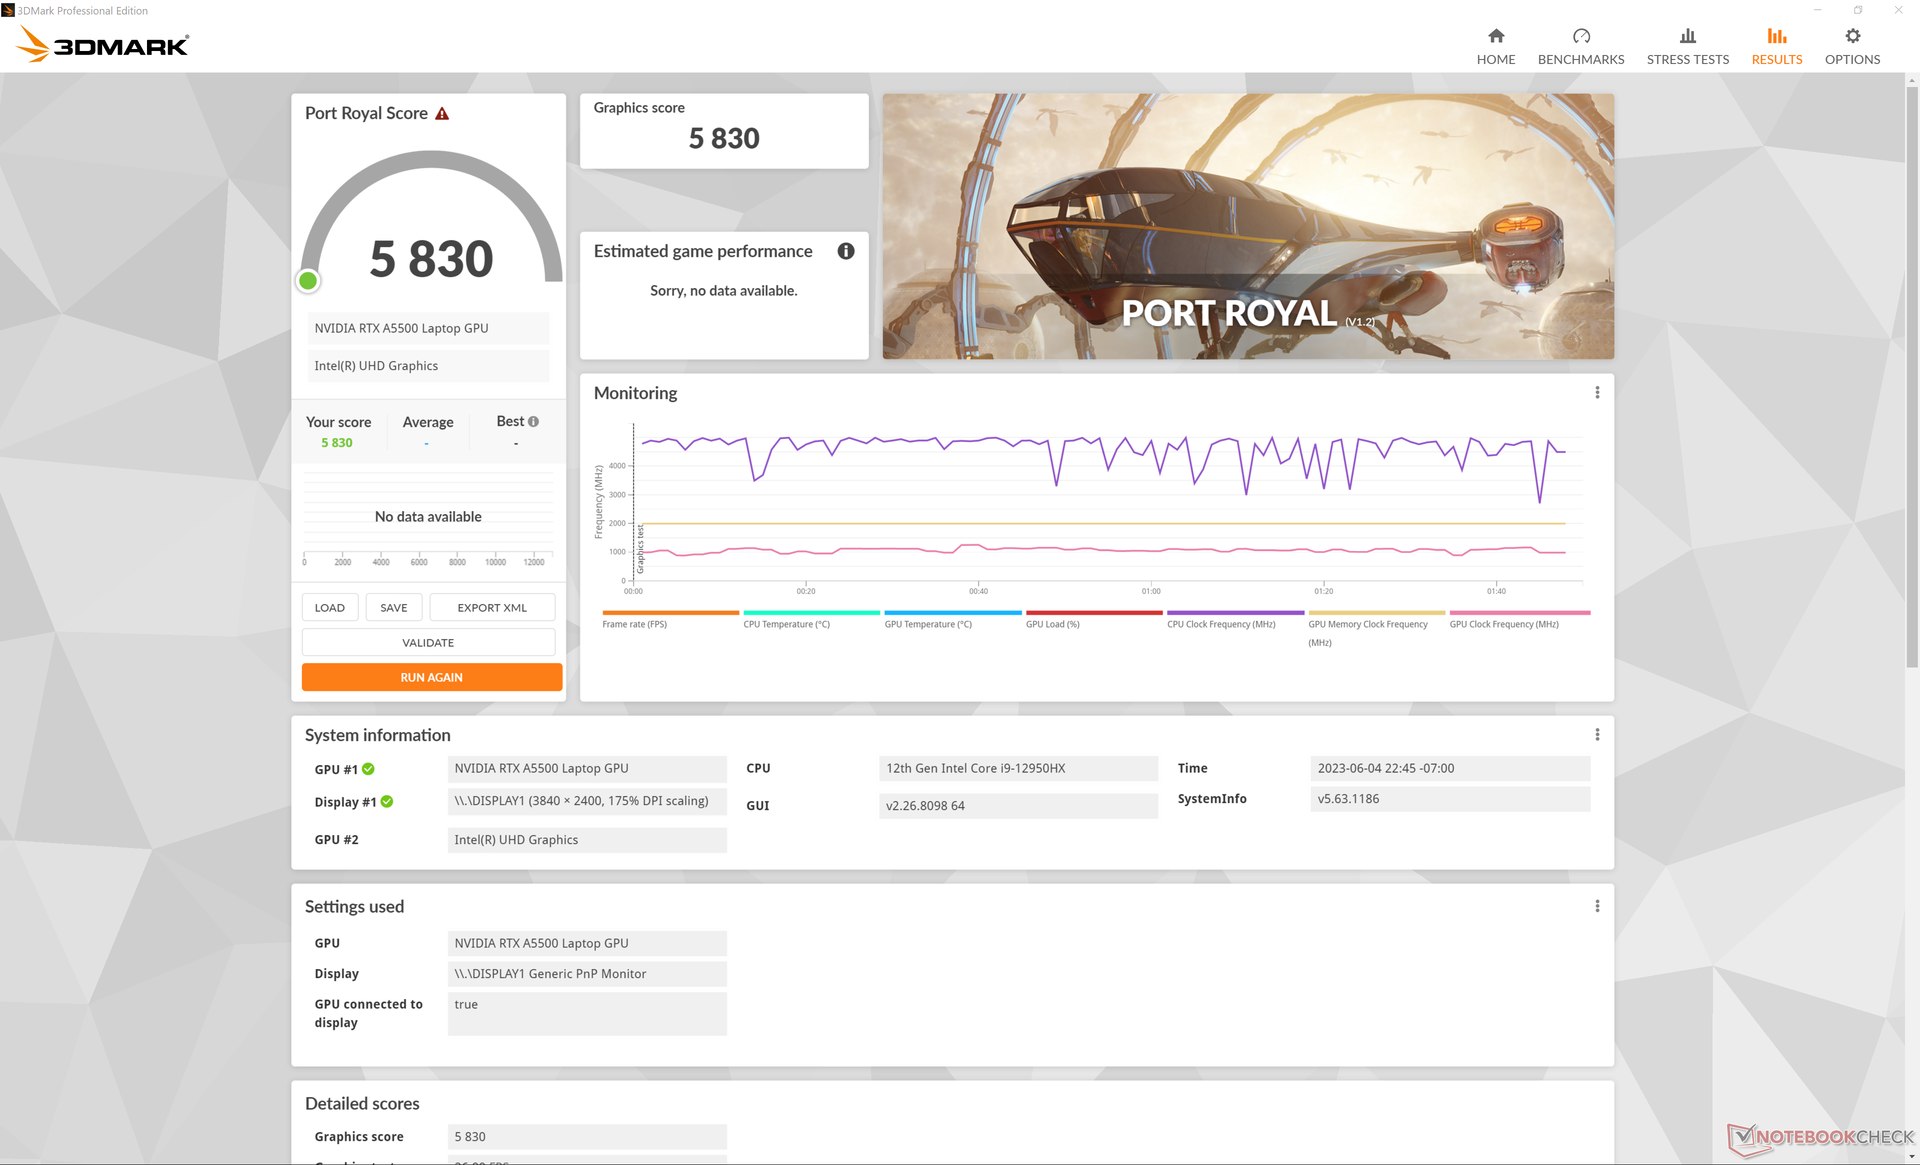
Die hier verbaute RTX A5500 weist einen Verbrauch von knapp 100 W auf, was etwas weniger als im ThinkPad P16 G1 (130 W) und im Precision 7670 (135 W) ist. Aus diesem Grund müsste die Grafik-Performance auf unserem Fury 16 etwas geringer sein, auch wenn in allen drei Geräten die gleiche GPU verbaut ist. 3DMark bestätigt diese Vermutung: Der Laptop von HP liegt knapp 15 Prozent hinter den anderen beiden Referenzmodellen. Nichtsdestotrotz ist es immer noch eine pfeilschnelle Workstation, auch wenn es nicht die schnellste ist.
Wir schätzen, dass ein Downgrading zur RTX A3000 die maximale Leistung um ungefähr 20 bis 30 Prozent senken wird.
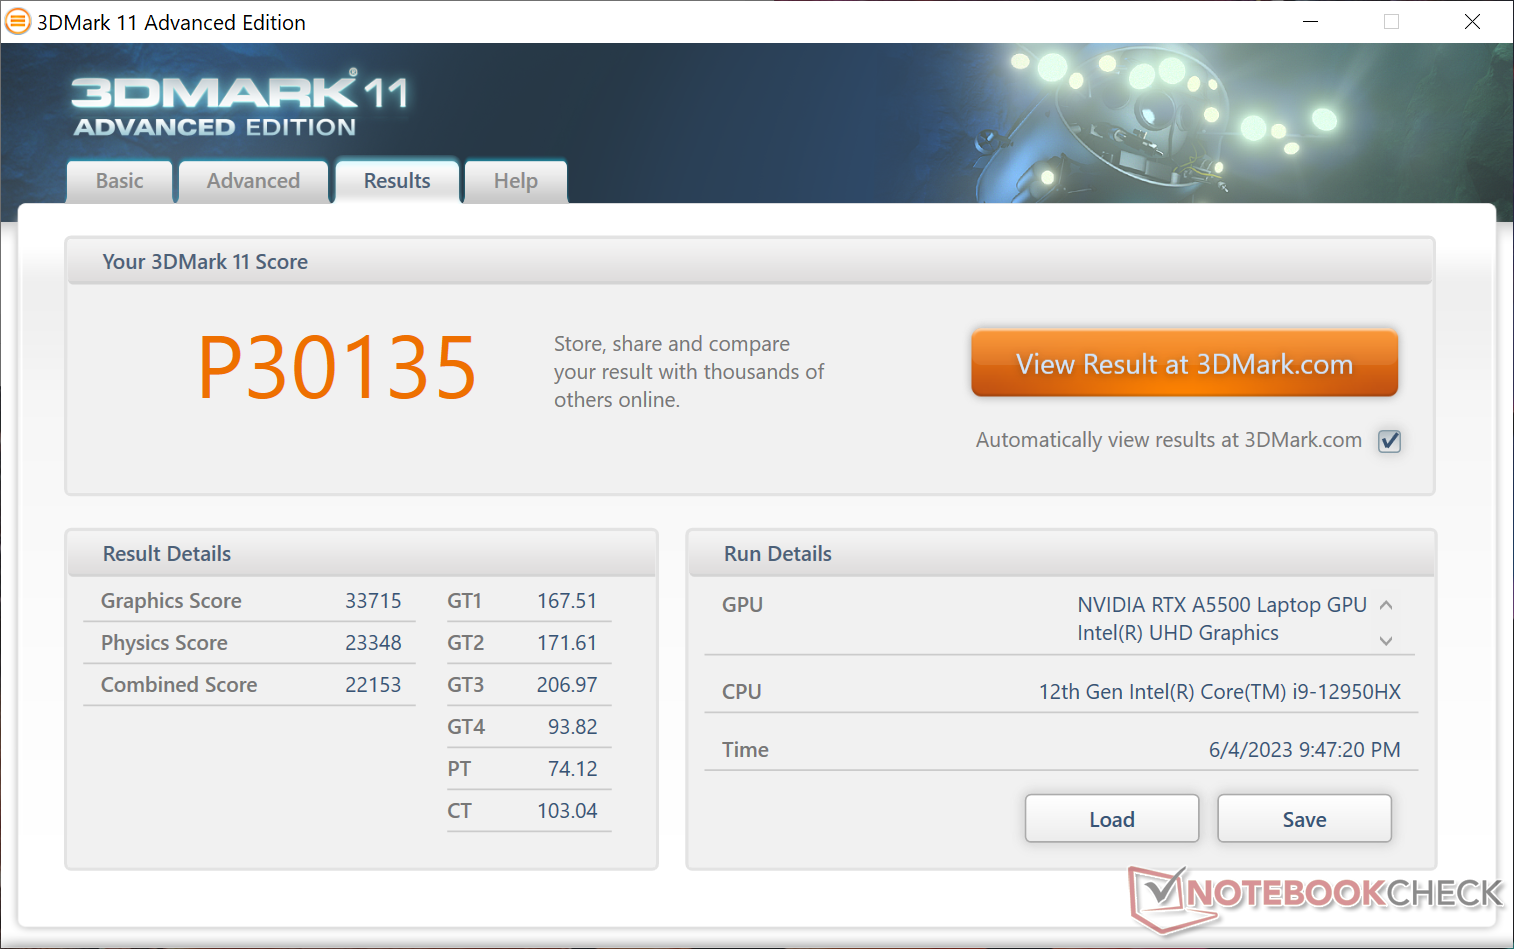
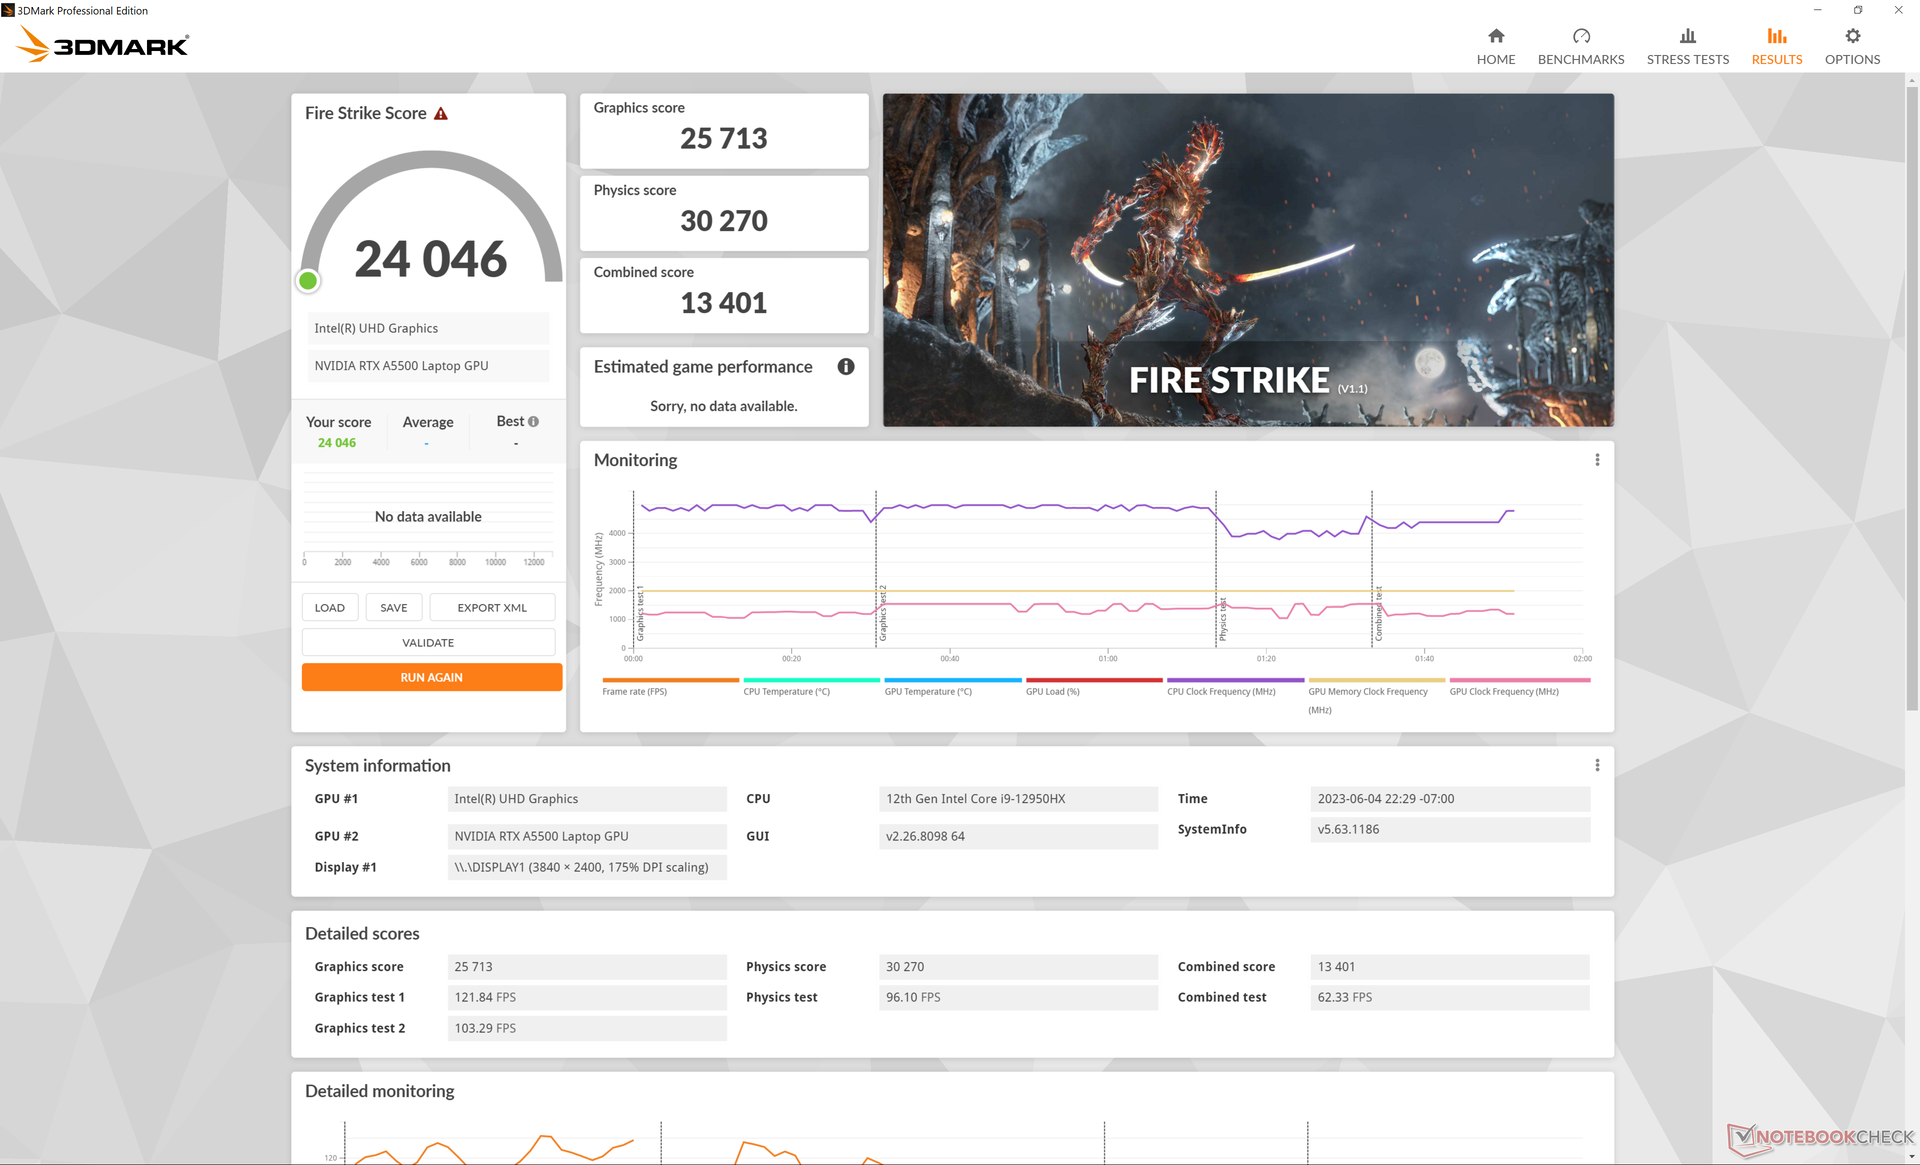
| 3DMark 11 Performance | 30135 Punkte | |
| 3DMark Fire Strike Score | 24046 Punkte | |
| 3DMark Time Spy Score | 9402 Punkte | |
Hilfe | ||
* ... kleinere Werte sind besser
Gaming Performance
Obwohl das ZBook Fury 16 G9 mit der RTX A5500 nicht für Gaming ausgelegt ist, kann man die meisten Spiele mit hohen Einstellungen und Auflösungen spielen. Die Performance ist dabei relativ ähnlich zur mobilen GeForce RTX 4070.
| Tiny Tina's Wonderlands | |
| 1920x1080 Low Preset (DX12) | |
| Lenovo Legion Pro 5 16IRX8 | |
| HP ZBook Fury 16 G9 | |
| Durchschnittliche NVIDIA RTX A5500 Laptop GPU (n=1) | |
| Dell XPS 17 9730 RTX 4070 | |
| 1920x1080 Medium Preset (DX12) | |
| Lenovo Legion Pro 5 16IRX8 | |
| HP ZBook Fury 16 G9 | |
| Durchschnittliche NVIDIA RTX A5500 Laptop GPU (n=1) | |
| Dell XPS 17 9730 RTX 4070 | |
| 1920x1080 High Preset (DX12) | |
| Lenovo Legion Pro 5 16IRX8 | |
| HP ZBook Fury 16 G9 | |
| Durchschnittliche NVIDIA RTX A5500 Laptop GPU (n=1) | |
| Dell XPS 17 9730 RTX 4070 | |
| 1920x1080 Badass Preset (DX12) | |
| Asus Zephyrus Duo 16 GX650PY-NM006W | |
| Lenovo Legion Pro 5 16IRX8 | |
| HP ZBook Fury 16 G9 | |
| Durchschnittliche NVIDIA RTX A5500 Laptop GPU (n=1) | |
| Dell XPS 17 9730 RTX 4070 | |
| 2560x1440 Badass Preset (DX12) | |
| Asus Zephyrus Duo 16 GX650PY-NM006W | |
| Lenovo Legion Pro 5 16IRX8 | |
| HP ZBook Fury 16 G9 | |
| Durchschnittliche NVIDIA RTX A5500 Laptop GPU (n=1) | |
| Dell XPS 17 9730 RTX 4070 | |
| 3840x2160 Badass Preset (DX12) | |
| Lenovo Legion Pro 5 16IRX8 | |
| HP ZBook Fury 16 G9 | |
| Durchschnittliche NVIDIA RTX A5500 Laptop GPU (n=1) | |
| Dell XPS 17 9730 RTX 4070 | |
Witcher 3 FPS
| min. | mittel | hoch | max. | QHD | 4K | |
|---|---|---|---|---|---|---|
| GTA V (2015) | 185.4 | 182.7 | 170.7 | 118.5 | 97.5 | 97.1 |
| The Witcher 3 (2015) | 447 | 308.5 | 169.3 | 92.8 | 62.2 | |
| Dota 2 Reborn (2015) | 191.3 | 173.1 | 162.4 | 150.7 | 116.1 | |
| Final Fantasy XV Benchmark (2018) | 180.1 | 131.6 | 103.5 | 75.1 | 39.4 | |
| X-Plane 11.11 (2018) | 151.3 | 130.9 | 103.6 | 81.9 | ||
| Strange Brigade (2018) | 447 | 235 | 190.2 | 168.6 | 122 | 67.6 |
| Cyberpunk 2077 1.6 (2022) | 128.7 | 114.4 | 87.6 | 69.8 | 41.4 | 18.1 |
| Tiny Tina's Wonderlands (2022) | 193.7 | 158.6 | 109.5 | 87.5 | 57.9 | 29.6 |
| F1 22 (2022) | 224 | 209 | 170.2 | 60.9 | 37.2 | 17.6 |
| Returnal (2023) | 70 | 68 | 64 | 59 | 42 | 20 |
Emissionen — Leise bei wenig Leistung
Systemlautstärke
Die Lüfter sind bei nicht besonders fordernden Aufgaben mit Werten zwischen 29 dB(A) und 35 dB(A) meist kaum zu hören. Bei anspruchsvolleren Dingen wie Gaming erreichen sie Werte von bis zu 50 dB(A), was auch relativ typisch ist. Trotzdem schafft es das ThinkPad P16 G1 beispielsweise, bei höherer Last längere Zeit leiser zu bleiben. Bei unserem 3DMark-06-Test stellten wir fest, dass unser HP Laptop einen Spitzenwert von 36 db(A) erreicht, das Lenovo Gerät jedoch nur 29 db(A).

Lautstärkediagramm
| Idle |
| 22.7 / 22.7 / 28.8 dB(A) |
| Last |
| 36.2 / 49.3 dB(A) |
 | ||
30 dB leise 40 dB(A) deutlich hörbar 50 dB(A) störend |
||
min: | ||
| HP ZBook Fury 16 G9 RTX A5500 Laptop GPU, i9-12950HX, Micron 3400 1TB MTFDKBA1T0TFH | HP ZBook Studio 16 G9 62U04EA RTX A2000 Laptop GPU, i7-12800H, Micron 3400 1TB MTFDKBA1T0TFH | HP ZBook Firefly 16 G9-6B897EA T550 Laptop GPU, i7-1265U, Samsung PM9A1 MZVL21T0HCLR | Lenovo ThinkPad P16 G1 RTX A5500 RTX A5500 Laptop GPU, i9-12950HX, WDC PC SN810 2TB | Dell Precision 7000 7670 Performance RTX A5500 Laptop GPU, i9-12950HX | MSI CreatorPro Z16P B12UKST RTX A3000 Laptop GPU, i7-12700H, Samsung PM9A1 MZVL21T0HCLR | |
|---|---|---|---|---|---|---|
| Geräuschentwicklung | -4% | 4% | 4% | -9% | -6% | |
| aus / Umgebung * (dB) | 22.6 | 24 -6% | 23.8 -5% | 23.1 -2% | 23.9 -6% | 24.1 -7% |
| Idle min * (dB) | 22.7 | 24 -6% | 23.8 -5% | 23.1 -2% | 24 -6% | 27.1 -19% |
| Idle avg * (dB) | 22.7 | 27.7 -22% | 23.8 -5% | 23.1 -2% | 24 -6% | 27.1 -19% |
| Idle max * (dB) | 28.8 | 27.7 4% | 23.8 17% | 23.1 20% | 38 -32% | 27.1 6% |
| Last avg * (dB) | 36.2 | 39.8 -10% | 39.4 -9% | 28.9 20% | 46.3 -28% | 42.9 -19% |
| Witcher 3 ultra * (dB) | 49.5 | 44.3 11% | 40.5 18% | 51.6 -4% | 41.9 15% | 44 11% |
| Last max * (dB) | 49.3 | 47.7 3% | 41.4 16% | 51.4 -4% | 47.9 3% | 47 5% |
* ... kleinere Werte sind besser
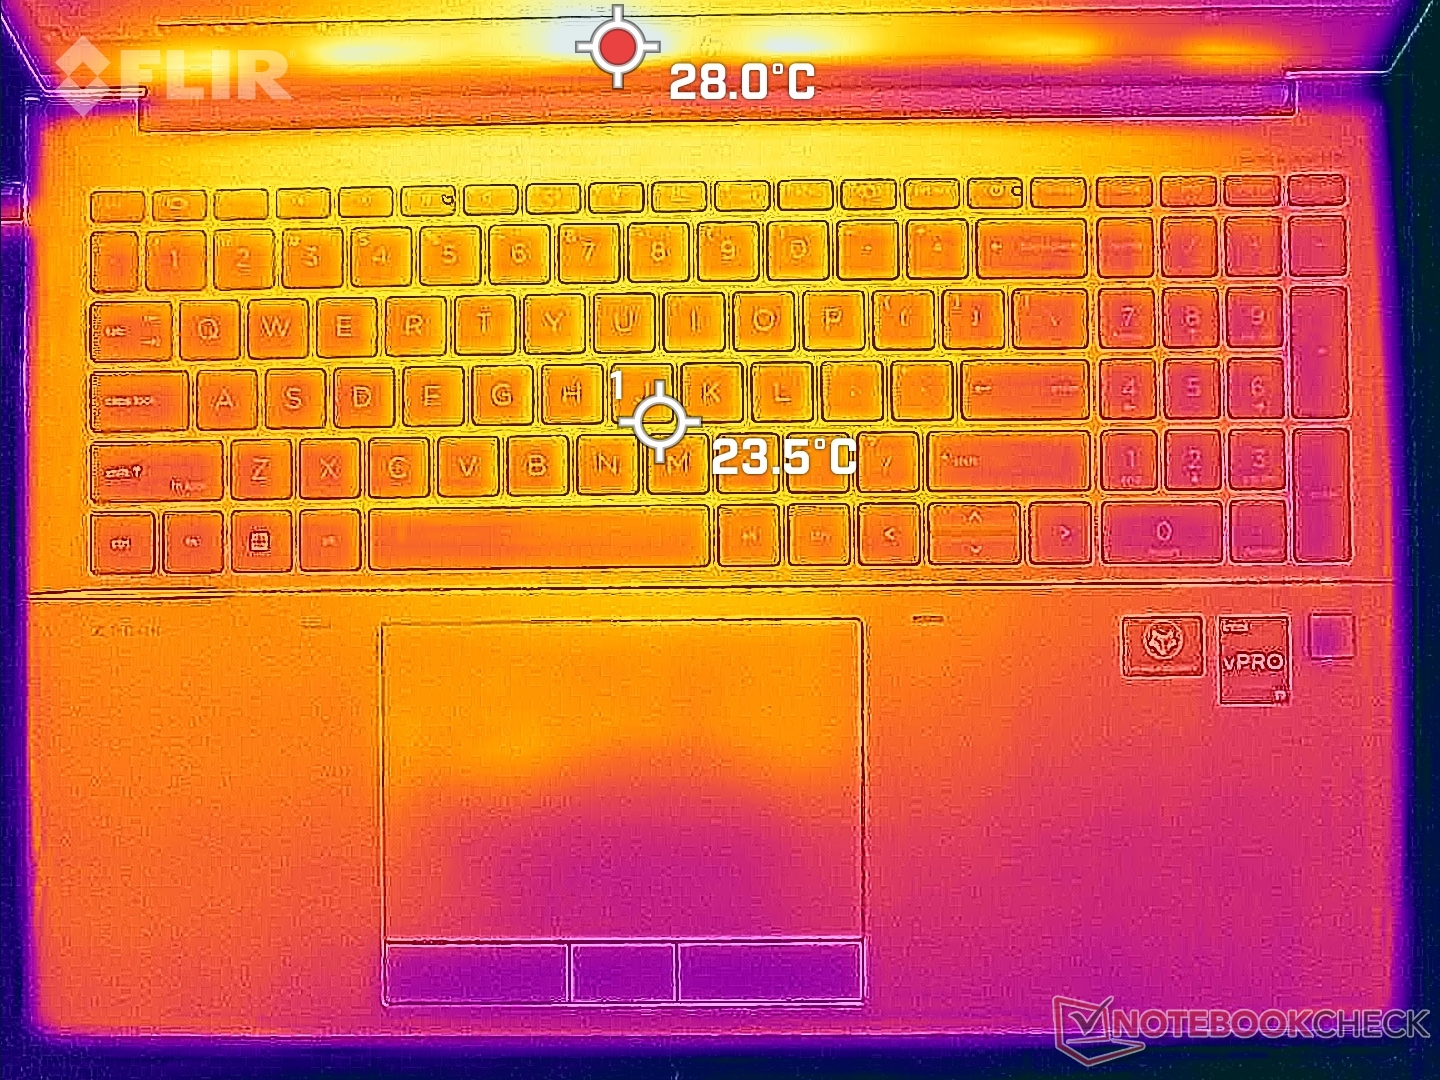
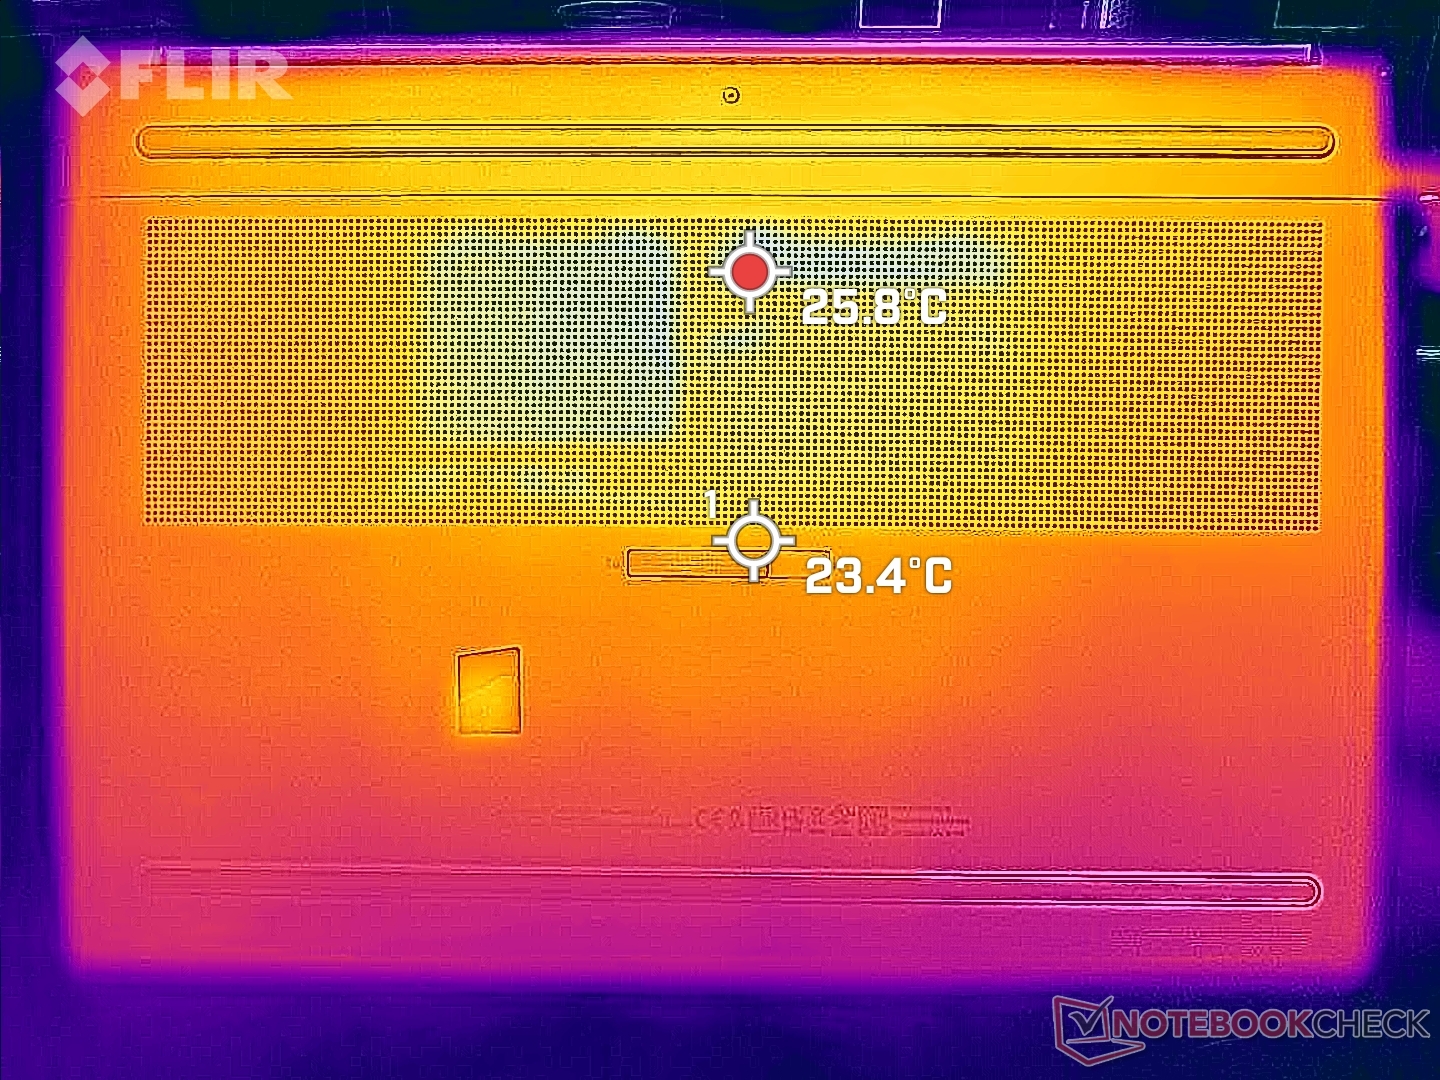
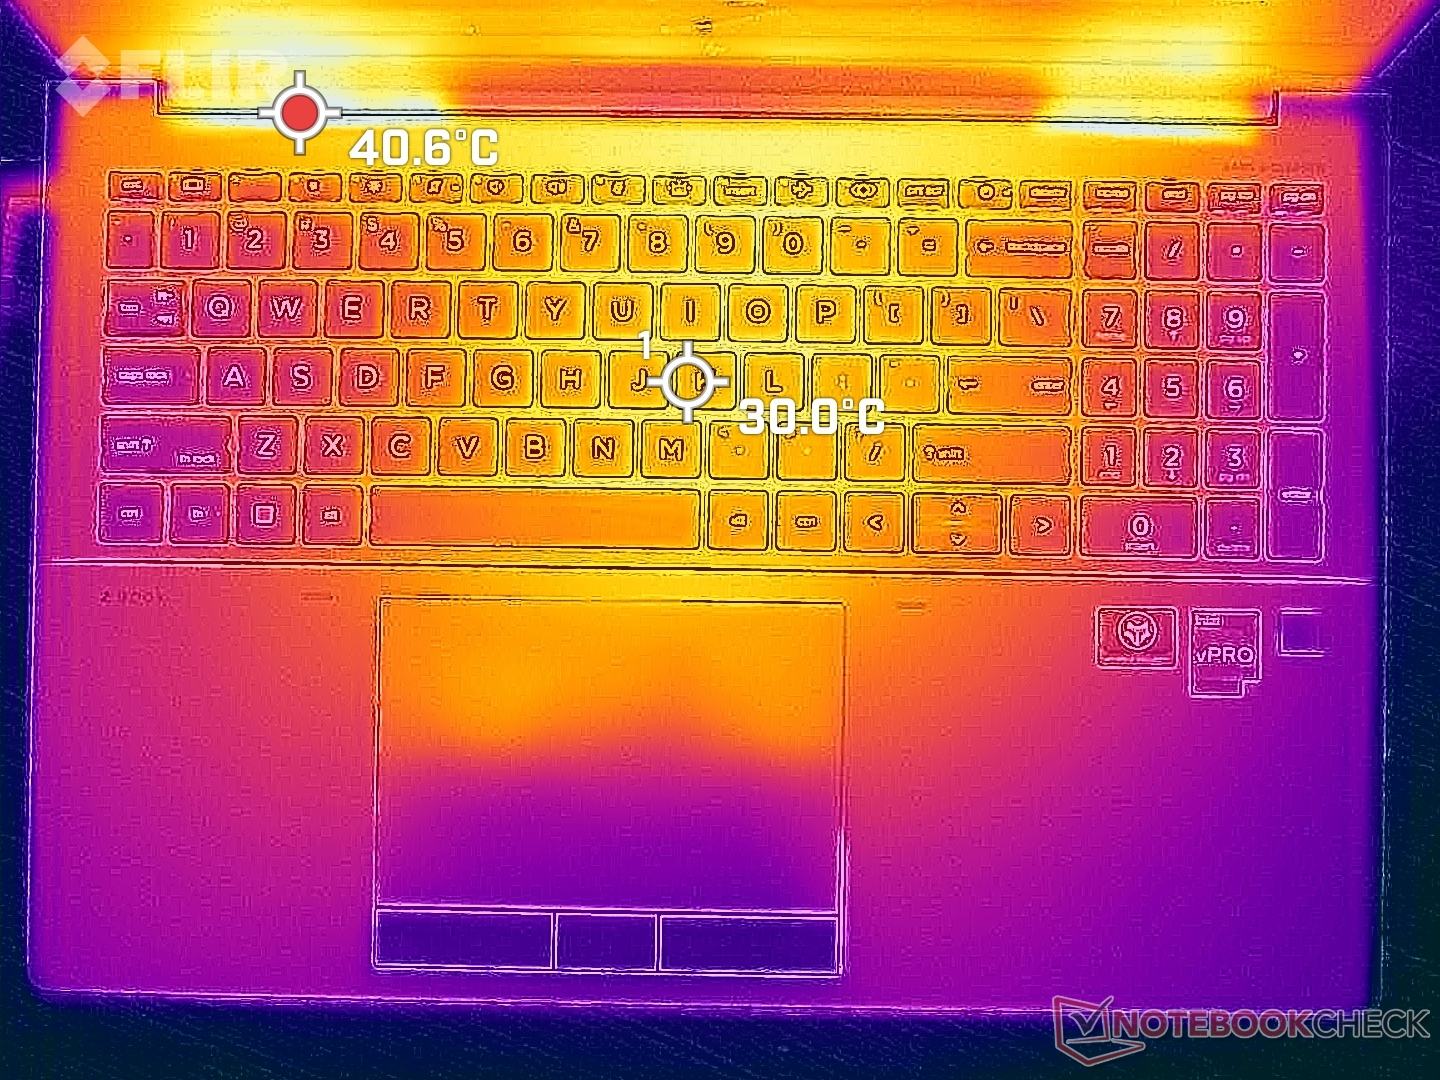
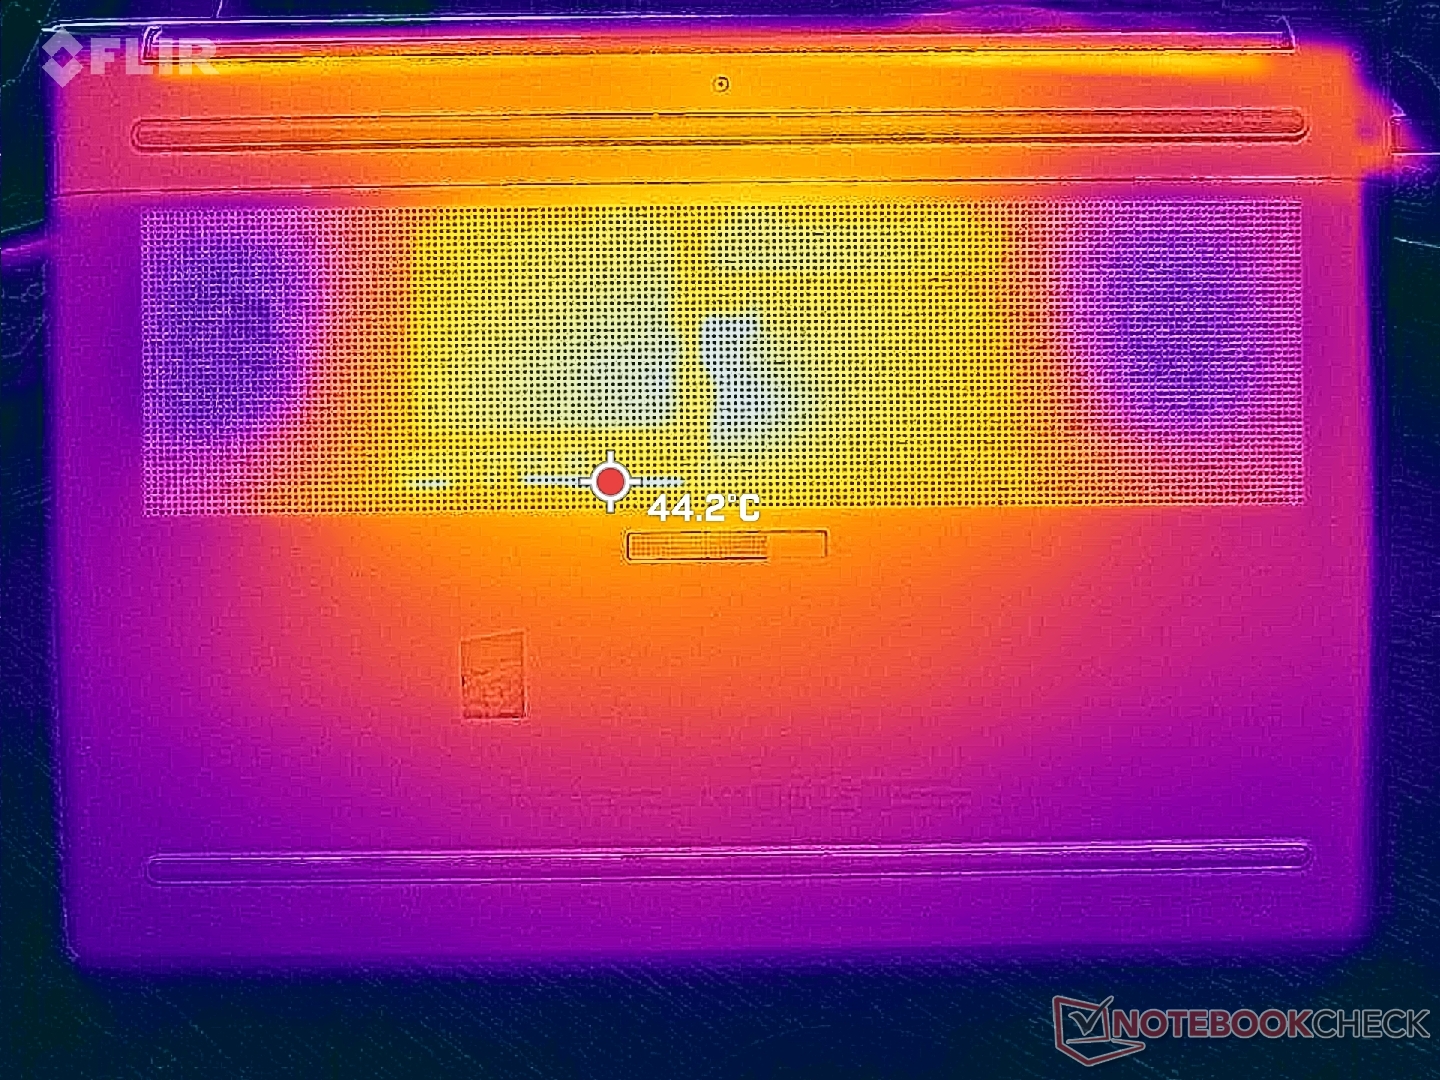
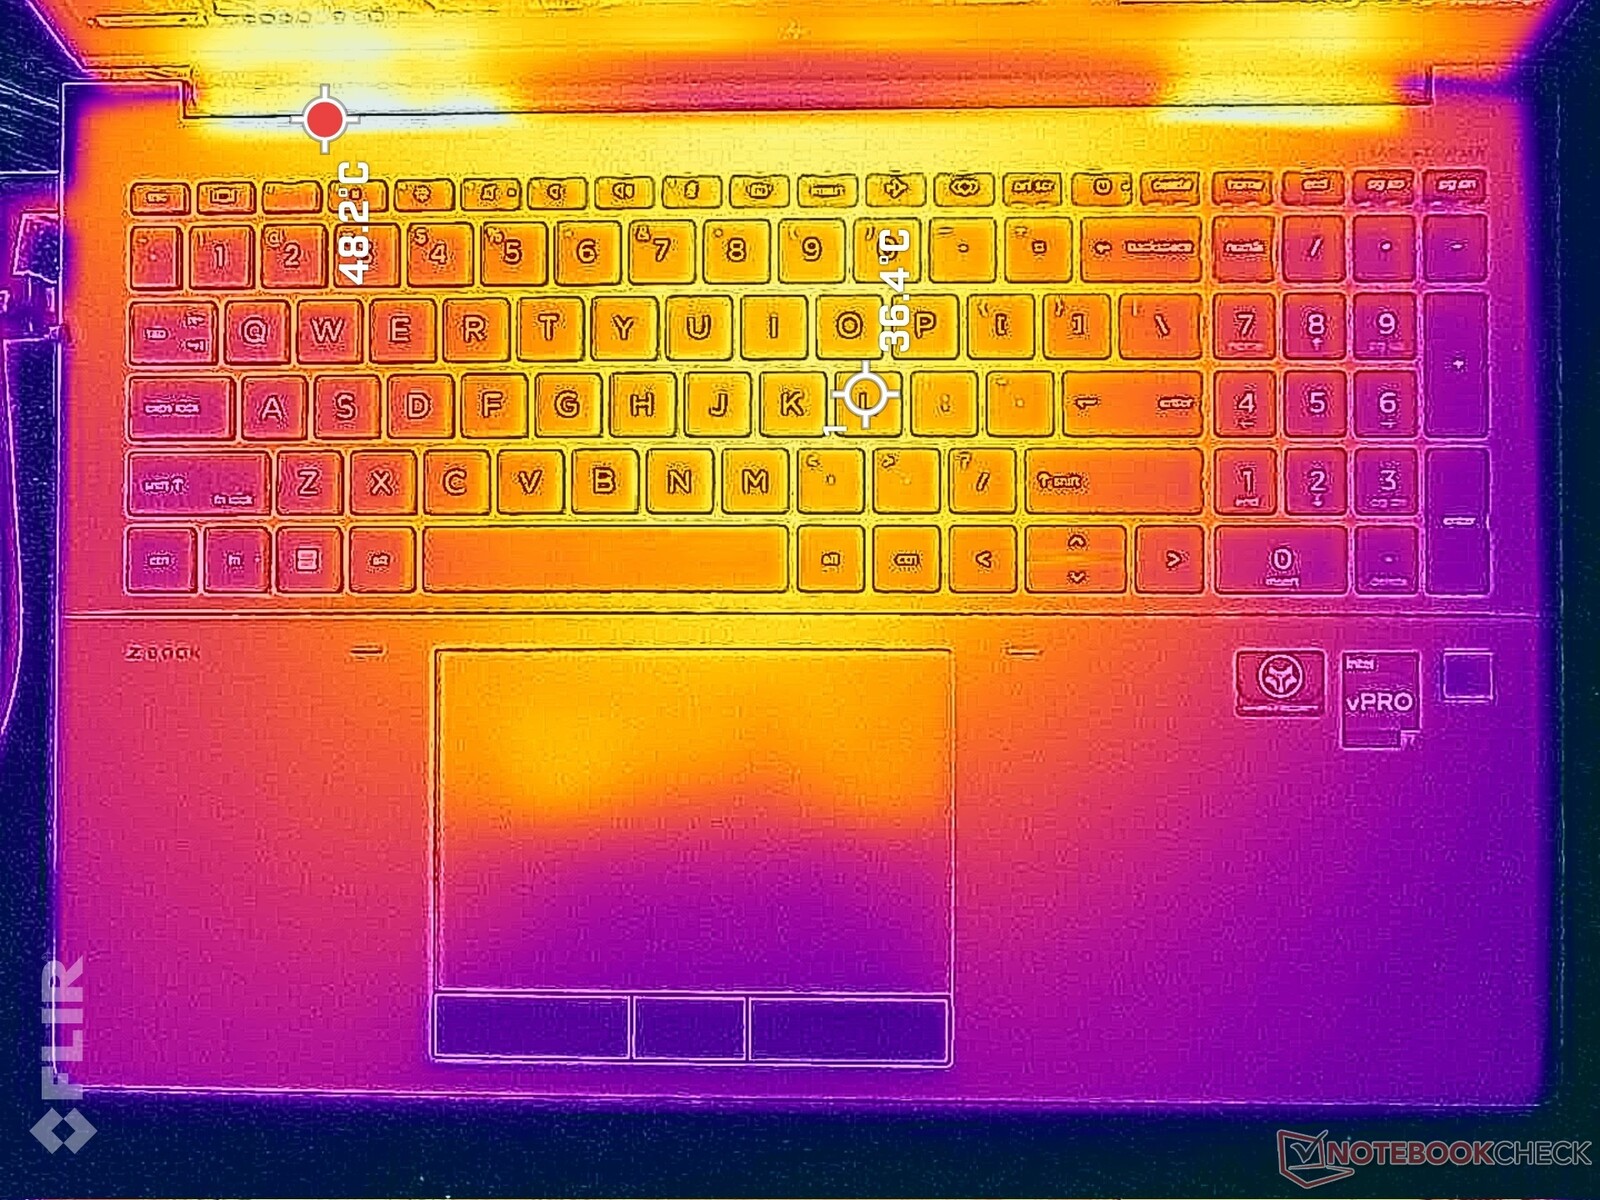
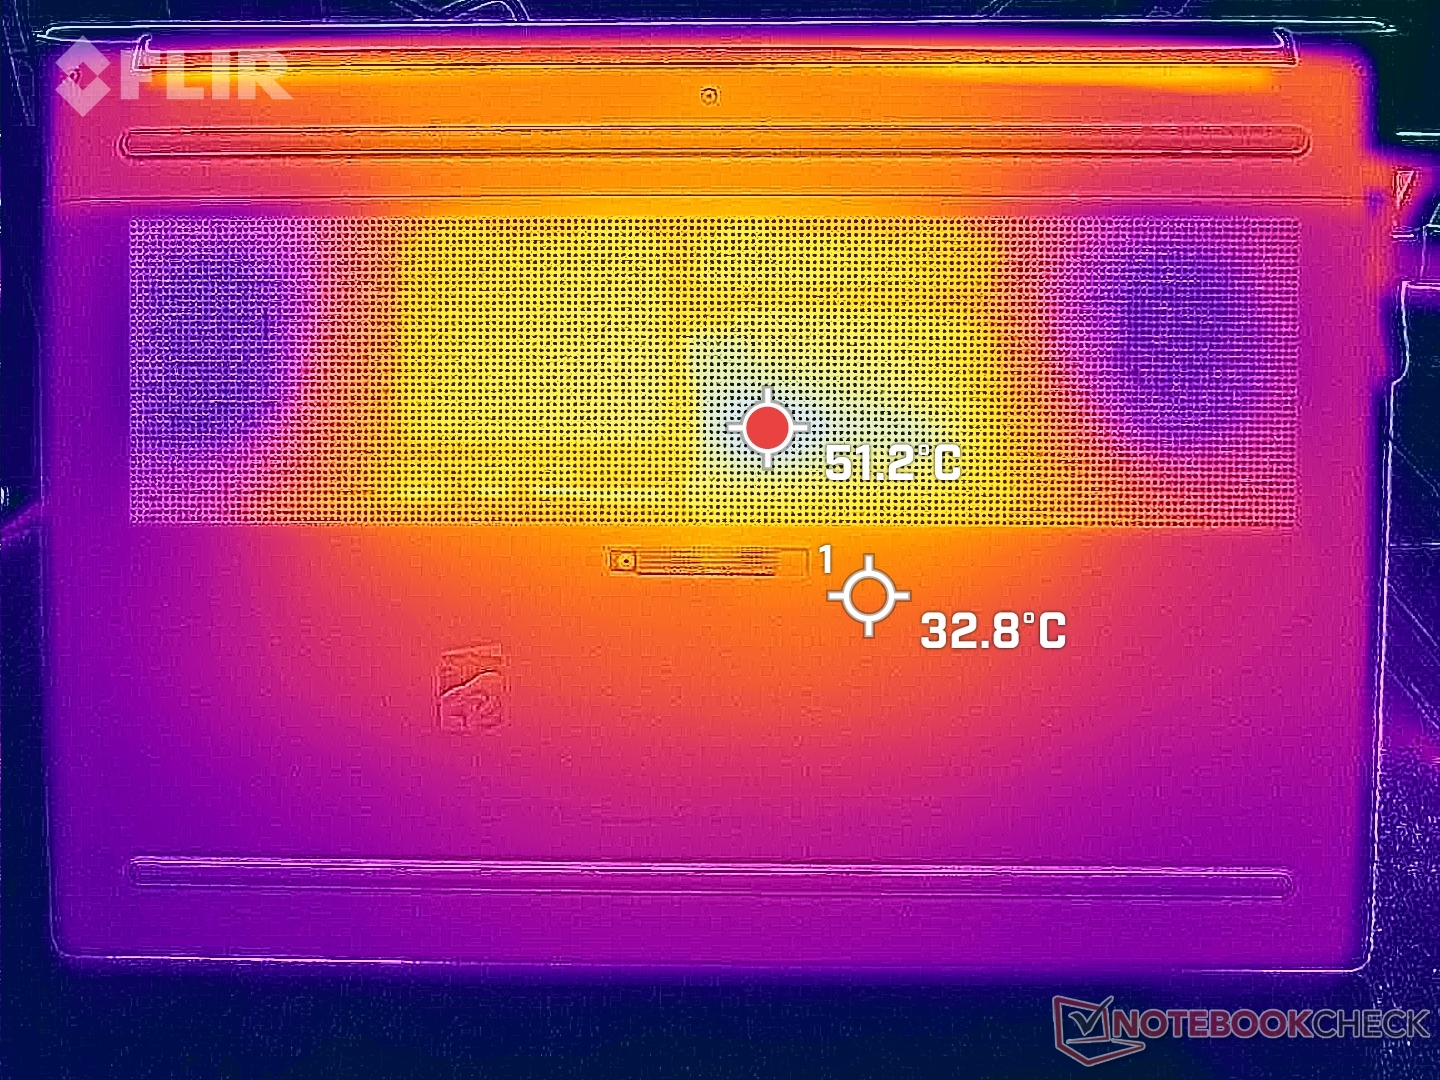
Temperaturen — Keine kühlen Hände unter Volllast
Am wärmsten wird der Laptop bei Volllast in der Mitte des Keyboards, welche ca. 36 °C oder noch mehr erreichen kann. Ansonsten sind die Temperaturen relativ gleichmäßig verteilt, außer auf der Handballenauflage, die unseres Empfindens nach eher unangenehm heiß wird. Das Touchpad weist leider ein ähnliches Problem auf: Es erreicht nämlich bis zu 35 °C, im Vergleich zu den 30 °C bei Lenovo- oder Dell Alternativen.
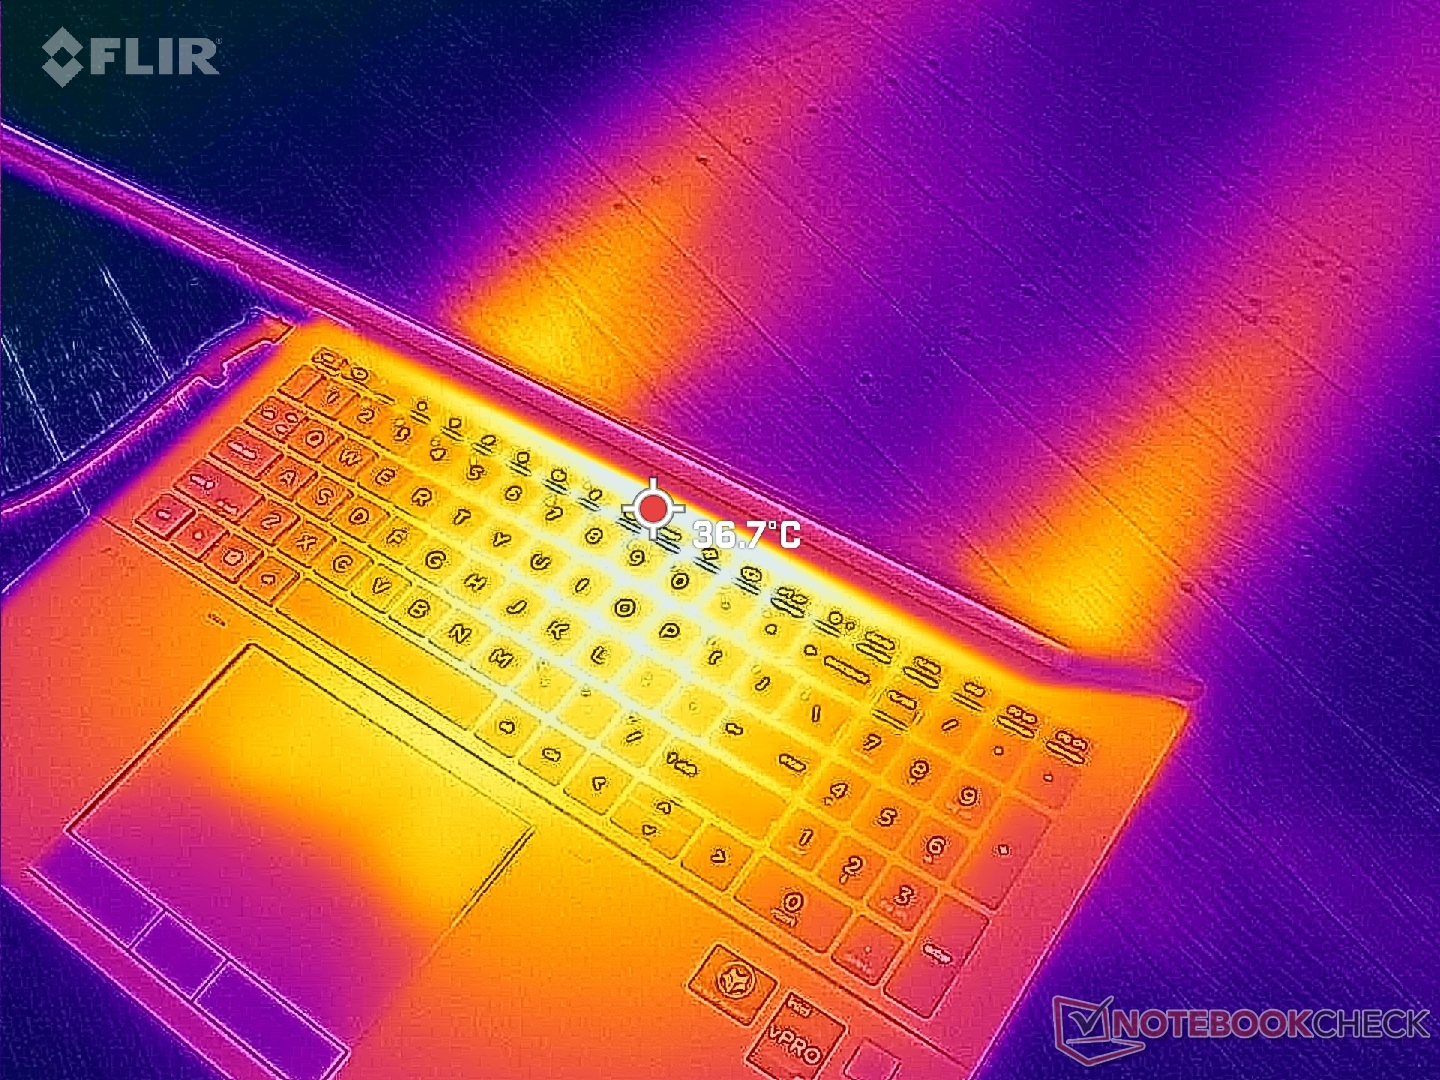
(±) Die maximale Temperatur auf der Oberseite ist 43.2 °C. Im Vergleich liegt der Klassendurchschnitt bei 38.2 °C (von 22.2 bis 69.8 °C für die Klasse Workstation).
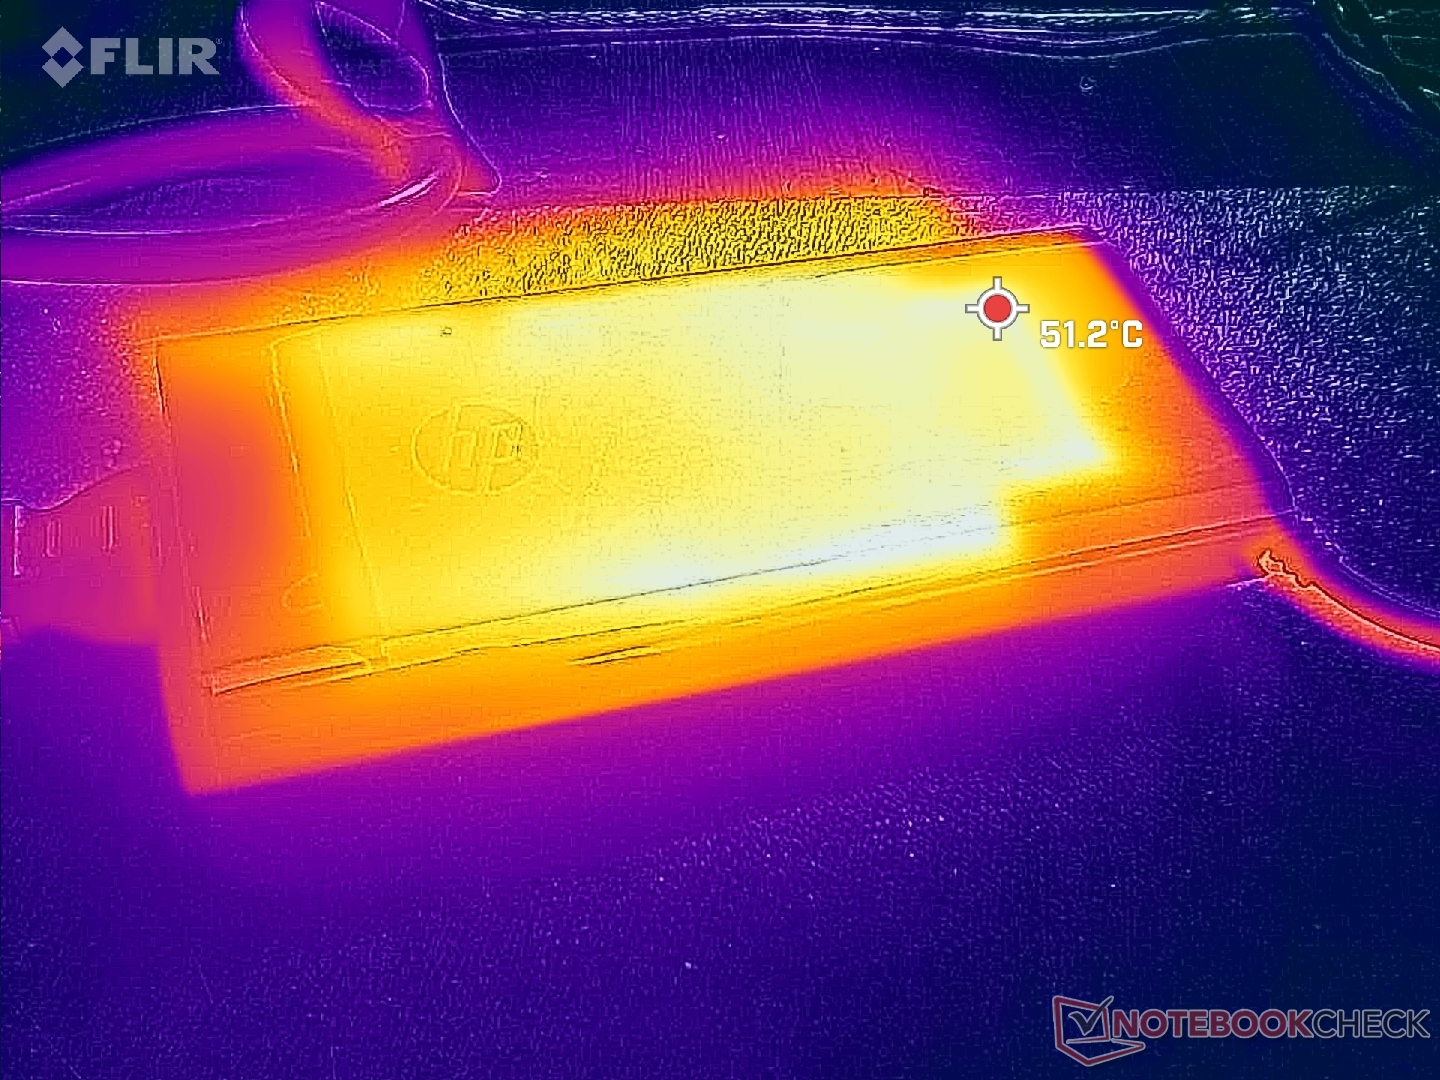
(-) Auf der Unterseite messen wir eine maximalen Wert von 50.4 °C (im Vergleich zum Durchschnitt von 41.1 °C).
(+) Ohne Last messen wir eine durchschnittliche Temperatur von 27.1 °C auf der Oberseite. Der Klassendurchschnitt erreicht 32 °C.
(±) Beim längeren Spielen von The Witcher 3 erhitzt sich das Gerät durchschnittlich auf 34 °C. Der Durchschnitt der Klasse ist derzeit 32 °C.
(+) Die Handballen und der Touchpad-Bereich erreichen maximal 35.6 °C und damit die typische Hauttemperatur und fühlen sich daher nicht heiß an.
(-) Die durchschnittliche Handballen-Temperatur anderer getesteter Geräte war 27.8 °C (-7.8 °C).
| HP ZBook Fury 16 G9 Intel Core i9-12950HX, NVIDIA RTX A5500 Laptop GPU | HP ZBook Studio 16 G9 62U04EA Intel Core i7-12800H, NVIDIA RTX A2000 Laptop GPU | HP ZBook Firefly 16 G9-6B897EA Intel Core i7-1265U, NVIDIA T550 Laptop GPU | Lenovo ThinkPad P16 G1 RTX A5500 Intel Core i9-12950HX, NVIDIA RTX A5500 Laptop GPU | Dell Precision 7000 7670 Performance Intel Core i9-12950HX, NVIDIA RTX A5500 Laptop GPU | MSI CreatorPro Z16P B12UKST Intel Core i7-12700H, NVIDIA RTX A3000 Laptop GPU | |
|---|---|---|---|---|---|---|
| Hitze | -1% | -4% | -12% | -15% | -12% | |
| Last oben max * (°C) | 43.2 | 38.7 10% | 42.1 3% | 44.8 -4% | 53 -23% | 56.3 -30% |
| Last unten max * (°C) | 50.4 | 53.4 -6% | 48 5% | 49.8 1% | 43.2 14% | 68.3 -36% |
| Idle oben max * (°C) | 28.6 | 27.3 5% | 29.9 -5% | 30.6 -7% | 36.8 -29% | 25.2 12% |
| Idle unten max * (°C) | 28.2 | 31.6 -12% | 32.9 -17% | 38.6 -37% | 33.8 -20% | 25.9 8% |
* ... kleinere Werte sind besser
Stresstest
Bei unserem Prime95-Stresstest erreichten wir eine maximale CPU-Taktrate von 3,1 GHz bei einem Verbrauch von 96 W. Dieser Wert konnte sich auch für ein paar Minuten halten, ehe sich die CPU auf 2,4 GHz heruntertaktete und bei konstanten 2,4 GHz (76 °C) einpendelte. Dabei hat sie dann einen Verbrauch von 71 W. Führen wir besagten Test auf dem ThinkPad P16 G1 mit exakt dem gleichen i9-12950HX durch, stellt sich heraus, dass sich der Prozessor hier bei 3,0 GHz (bei 81 W) einpendelt, aber auch mit 100 °C deutlich wärmer wird. HP bleibt hier also eher zurückhaltend, jedoch auf Kosten der Taktrate.
Bei unserem Witcher-3-Stresstest wies die CPU eine Taktrate von 1.297 MHz bei einem Verbrauch von 92 W und einer Temperatur von relativ kühlen 70 °C auf. Beim ThinkPad P16 G1 besitzt sie vergleichsweise 1.477 MHz (bei 129 W und 79 °C). Auch die Taktrate des Speichers der GPU ist beim ThinkPad merkbar höher.
Beim Gaming ohne externe Stromversorgung merkt man allerdings die Limitierung der Hardware, auch bei eingesetztem Performance-Modus. Ohne jene Stromversorgung erreichten wir physische Punkte von 22.837 und grafische von 5.625, mit angeschlossenem Adapter sind es dann 30.270 bzw. 25.713.
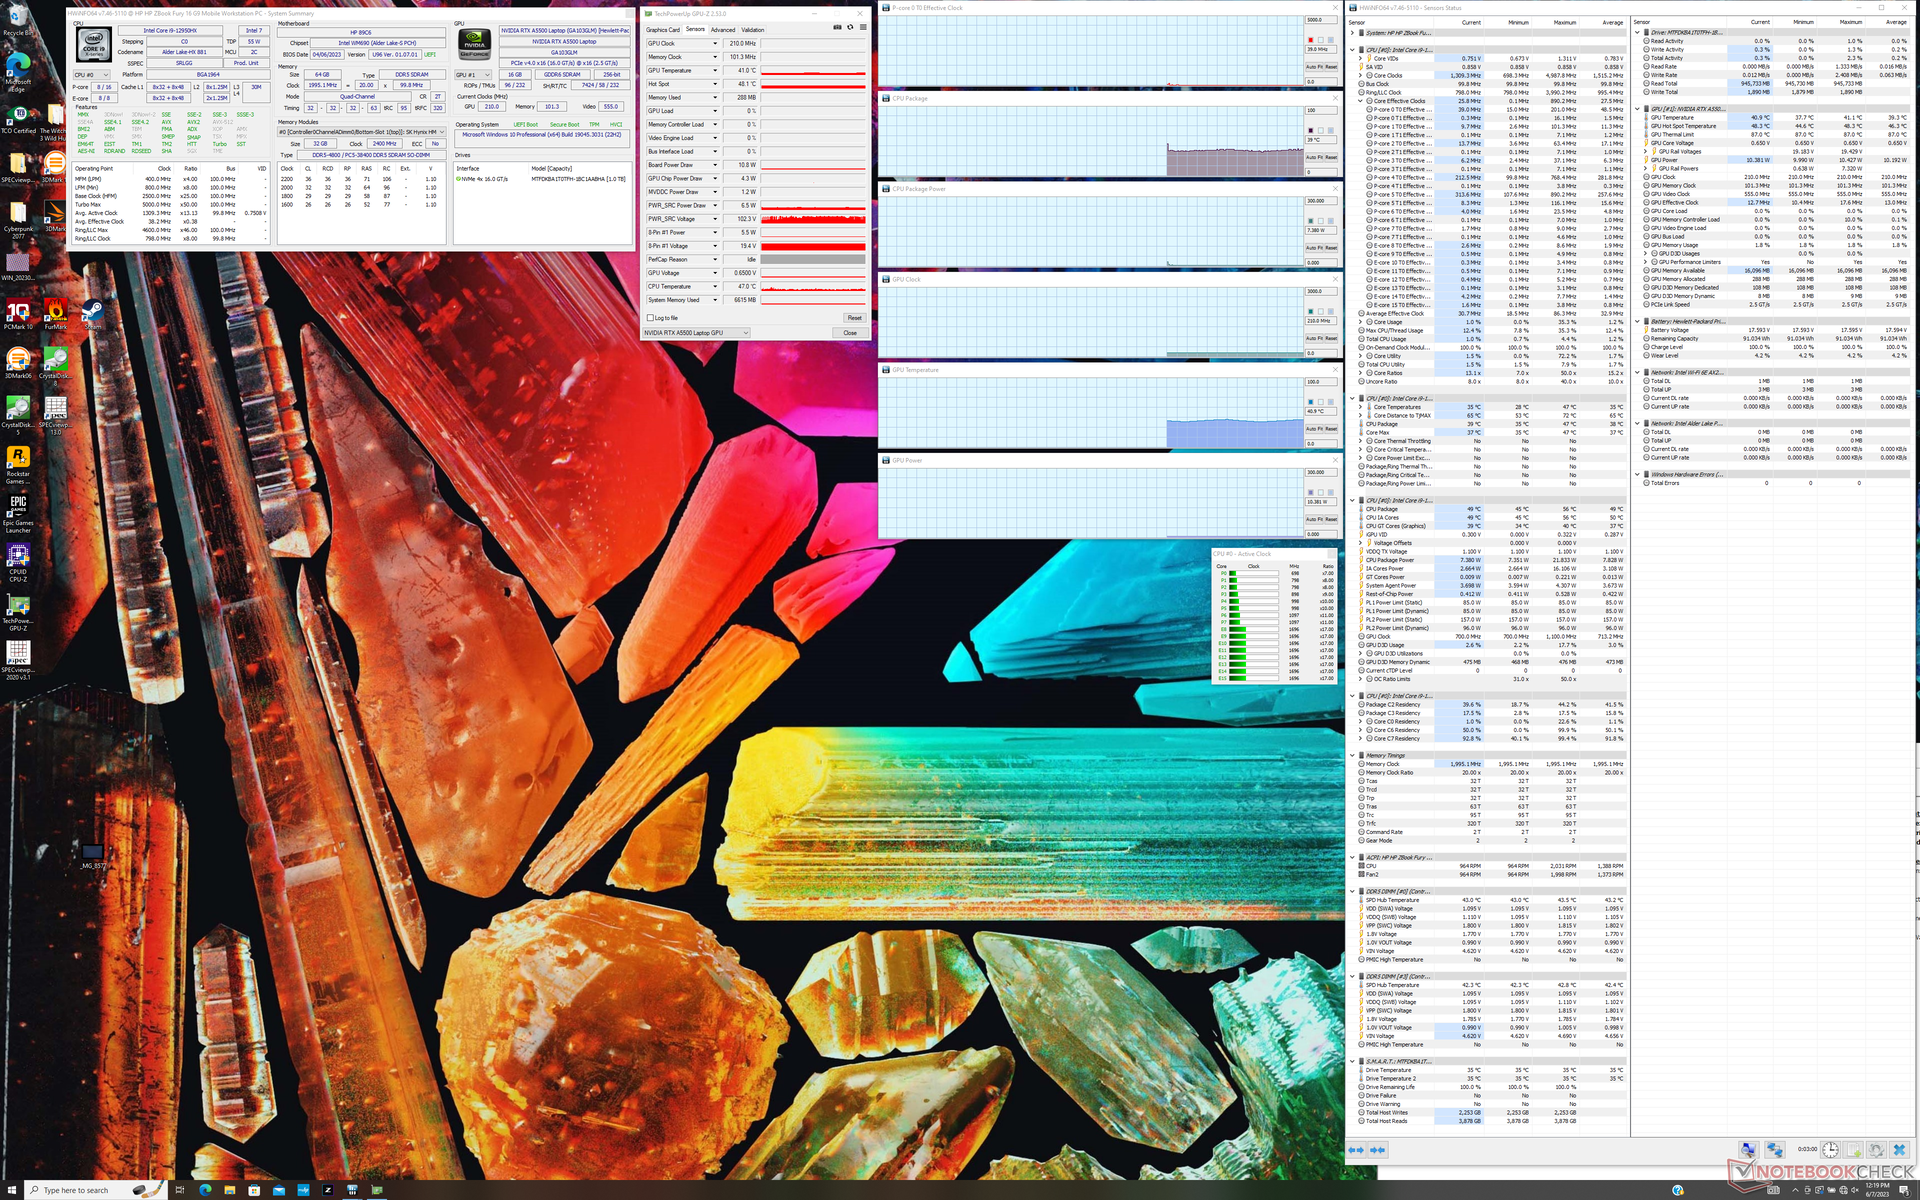
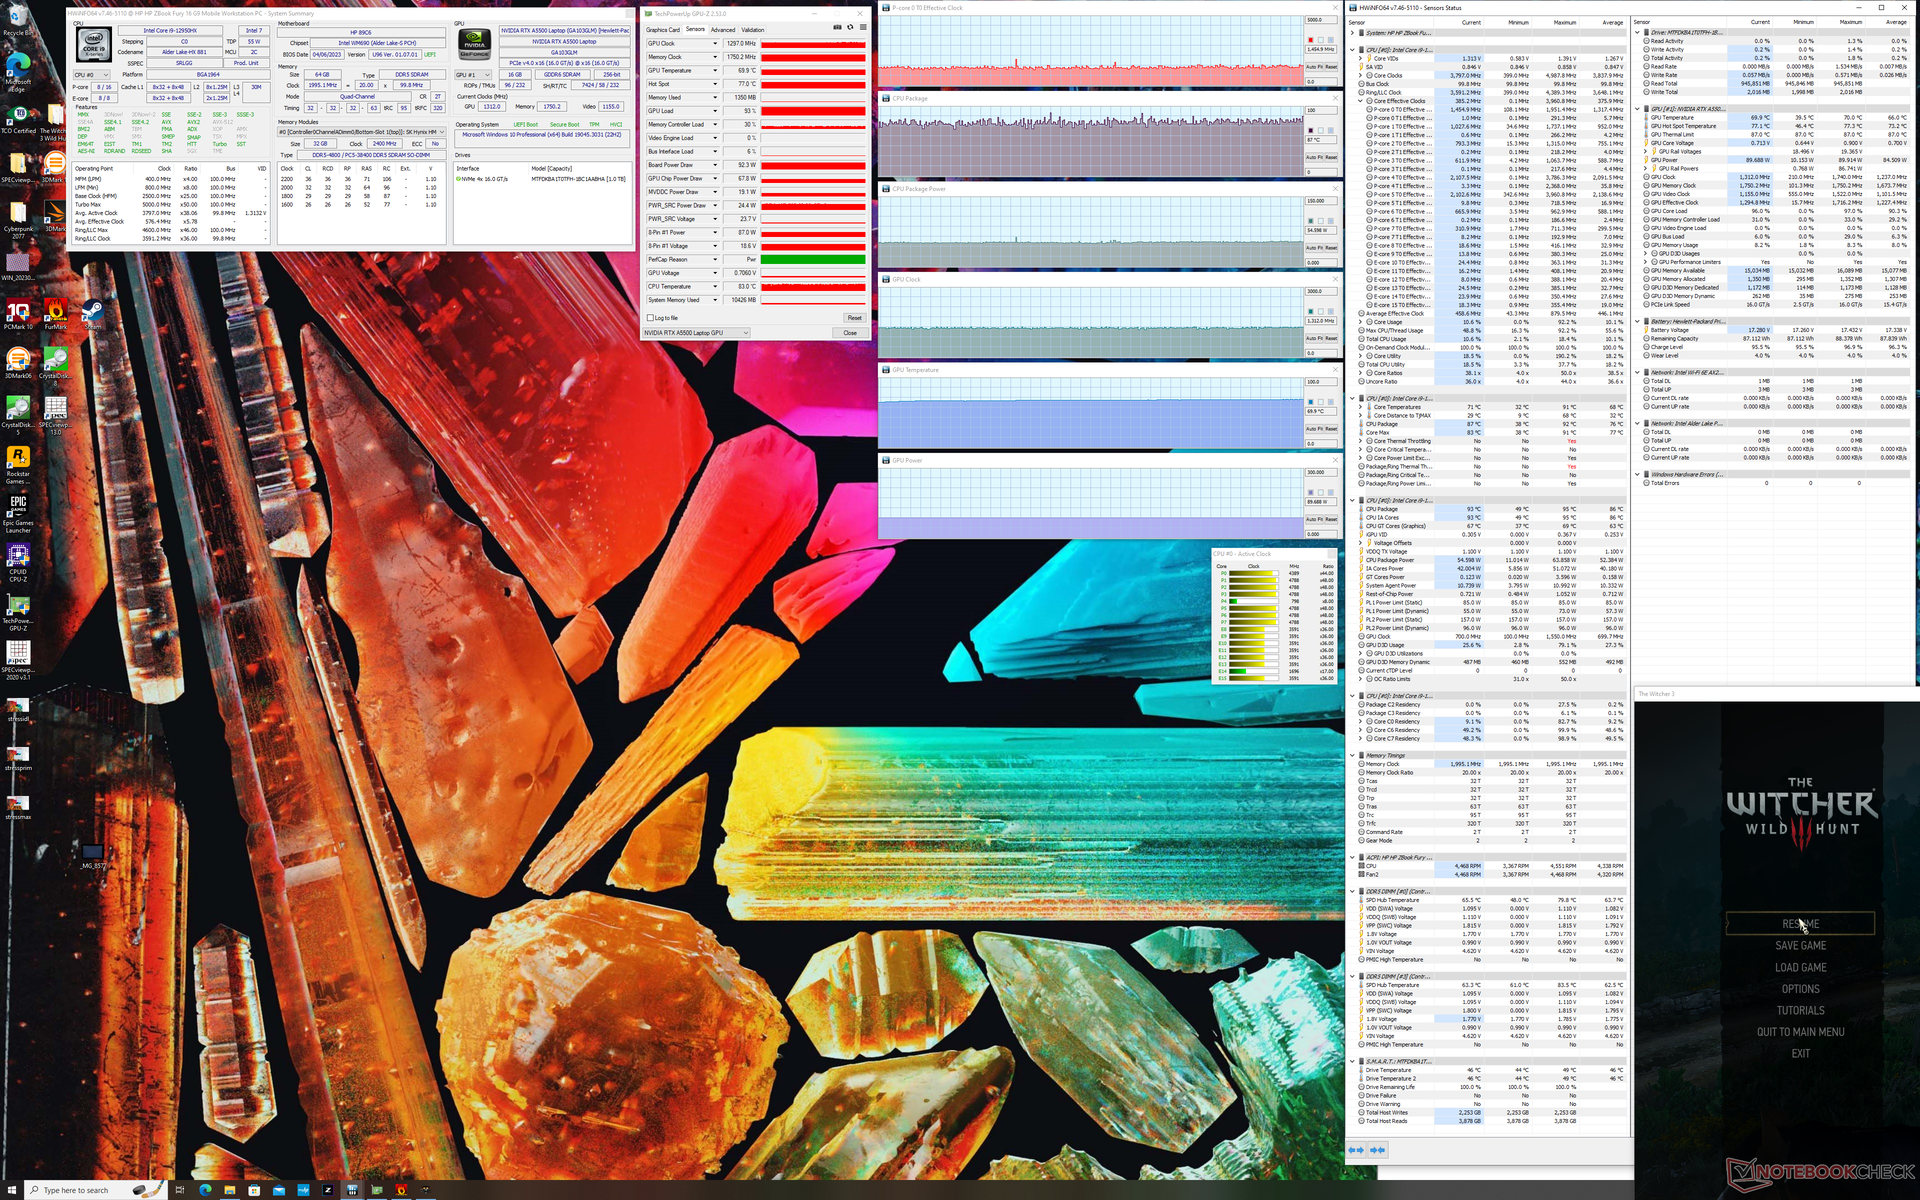
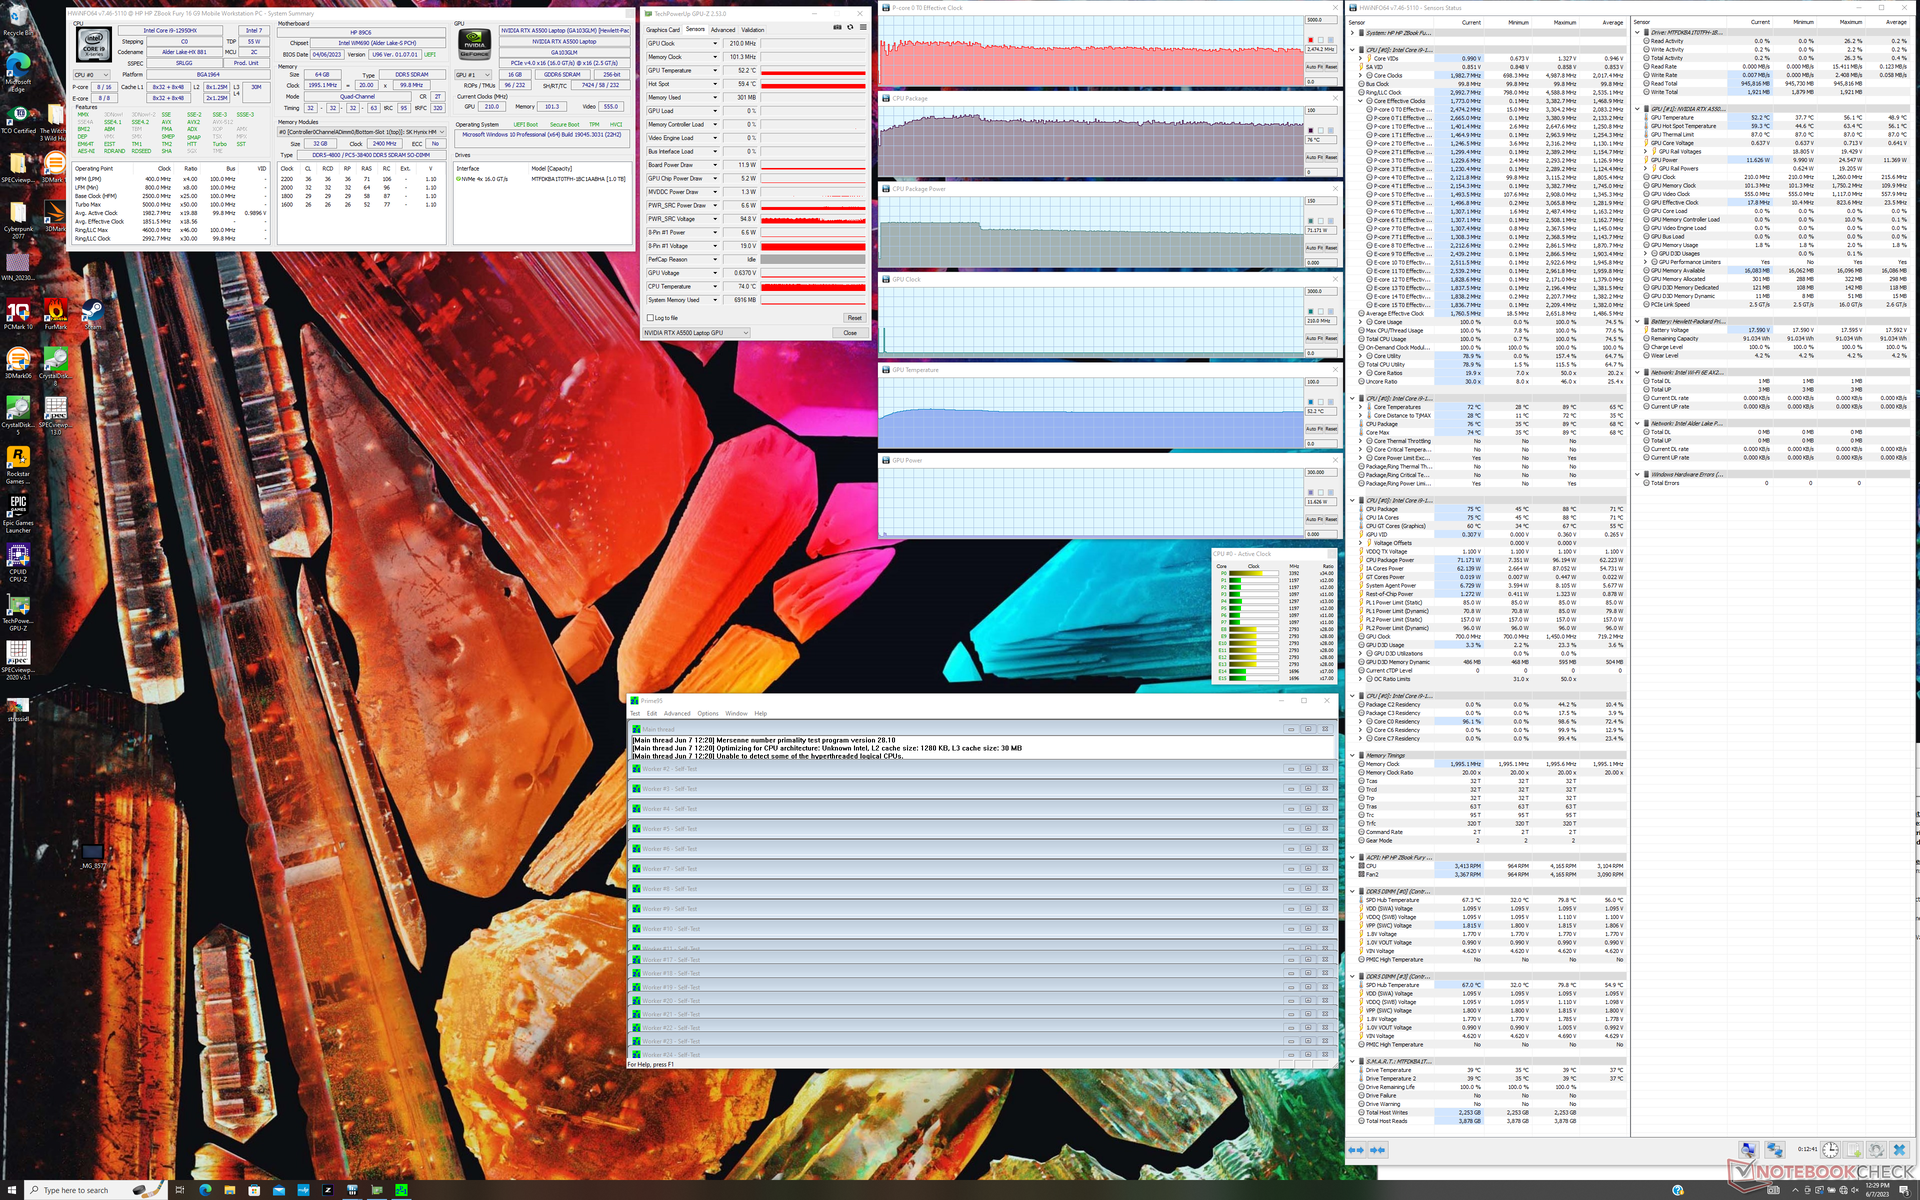
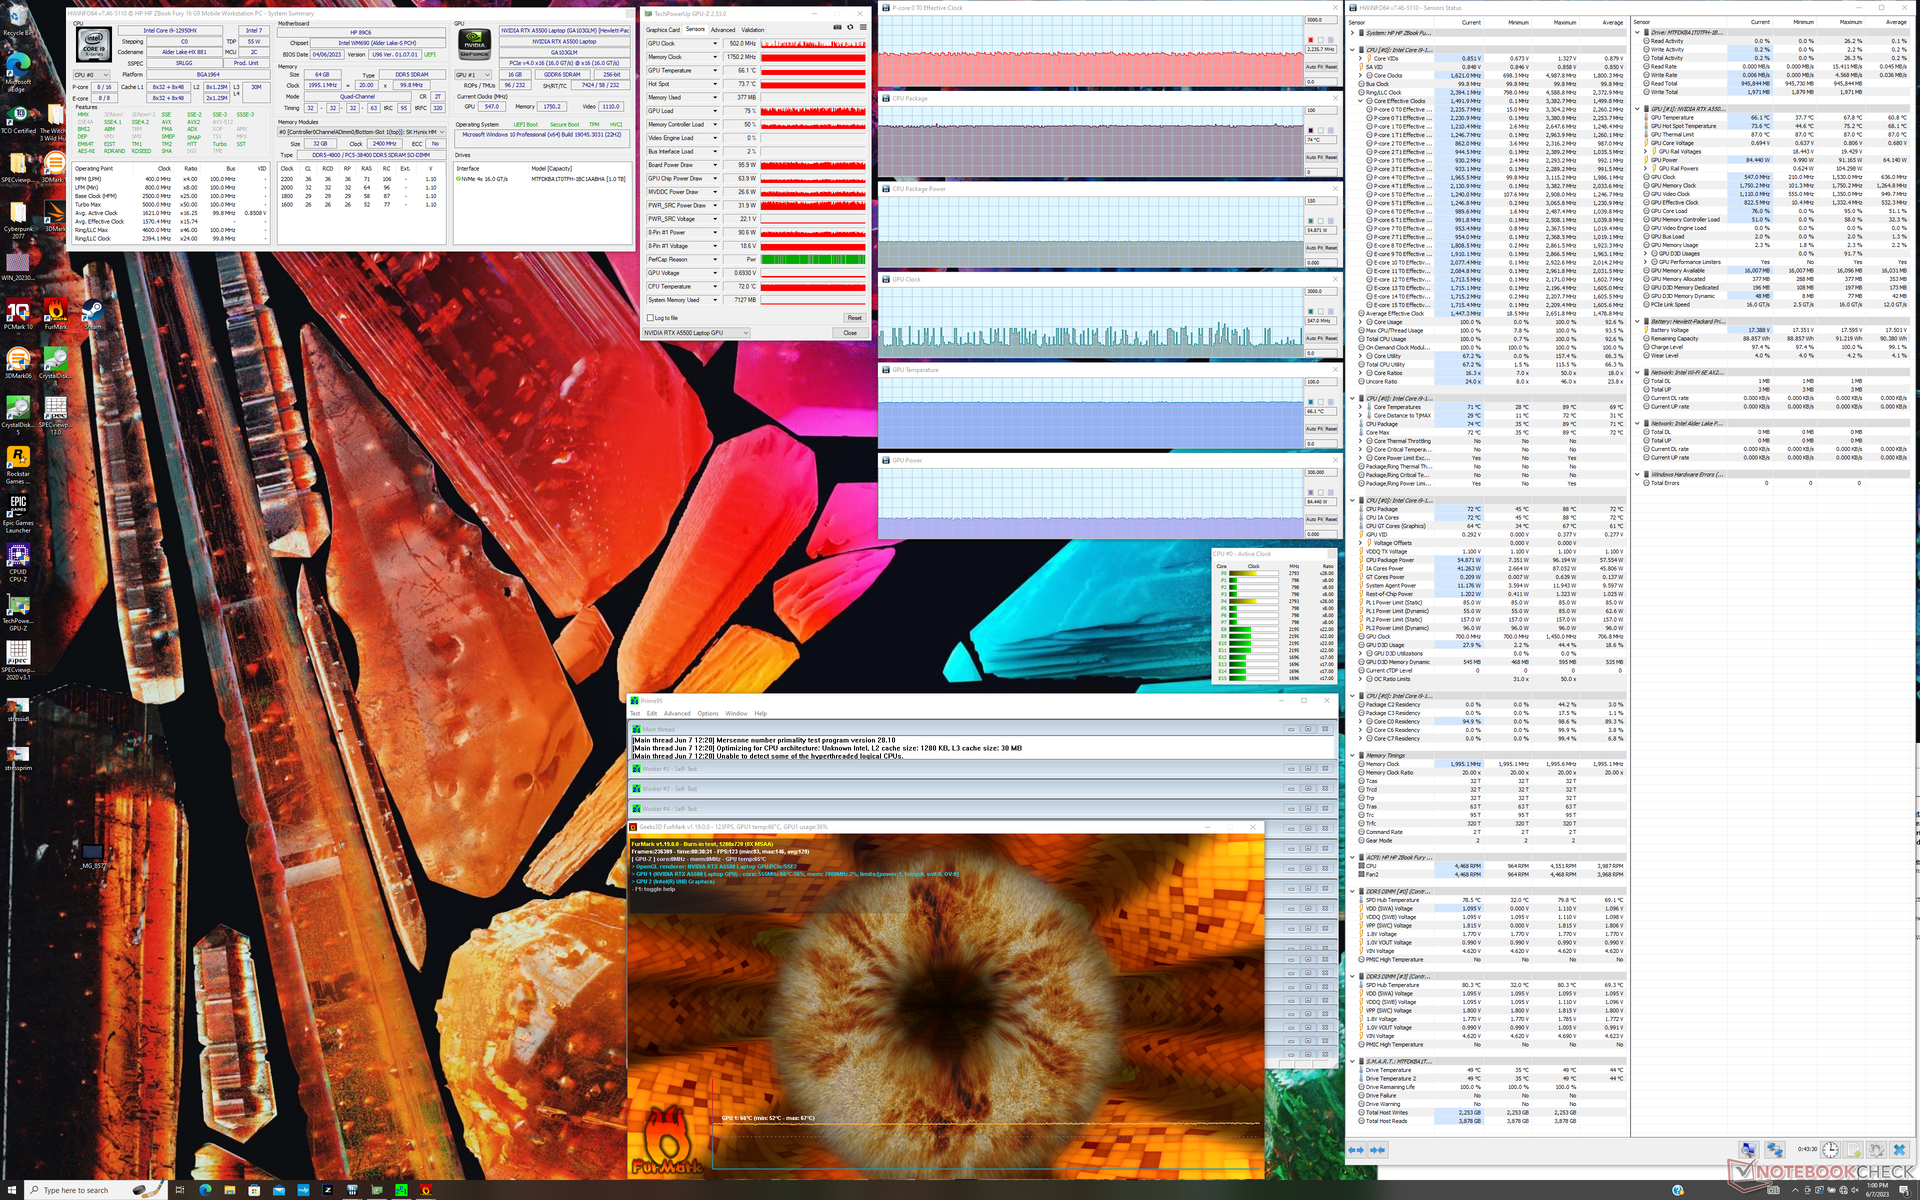
| CPU Clock (GHz) | GPU Clock (MHz) | Average CPU Temperature (°C) | Average GPU Temperature (°C) | |
| System Idle | -- | -- | 39 | 41 |
| Prime95, Stress | 2.5 - 2.7 | -- | 76 | 52 |
| Prime95 + FurMark, Stress | 2,2-2,3 | 547 - 1.200 | 74 | 66 |
| Witcher 3 Stress | ~1.4 | 1.297 | 87 | 70 |
Lautsprecher
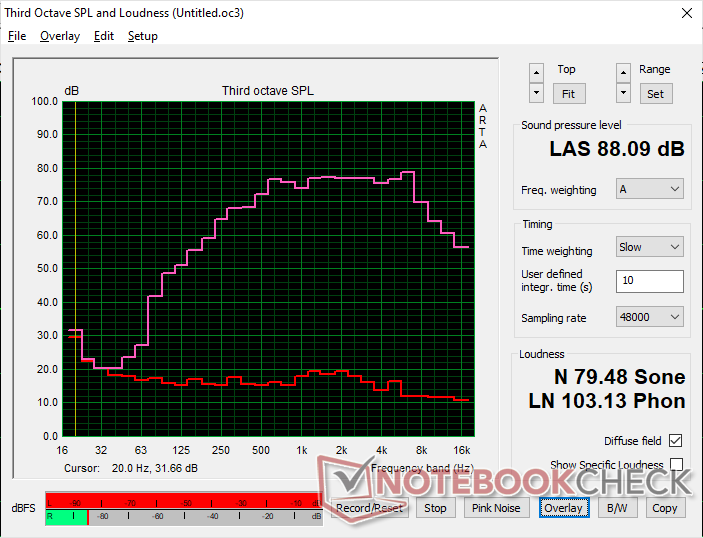
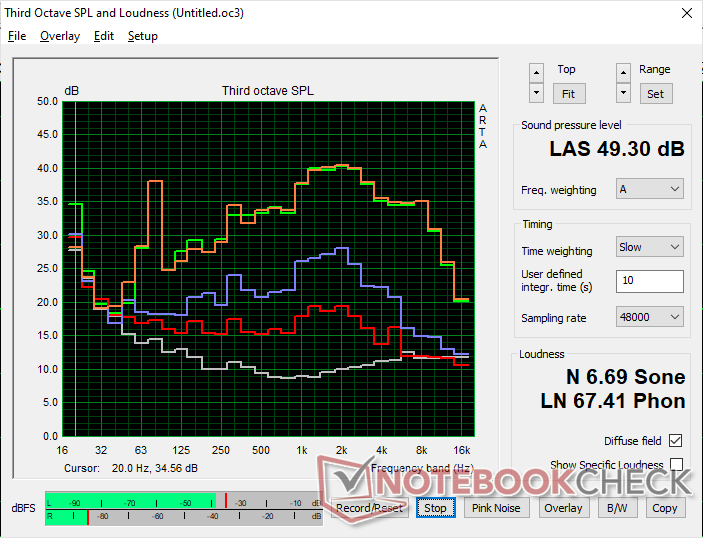
HP ZBook Fury 16 G9 Audio Analyse
(+) | Die Lautsprecher können relativ laut spielen (88.1 dB)
Bass 100 - 315 Hz
(-) | kaum Bass - 16.1% niedriger als der Median
(±) | durchschnittlich lineare Bass-Wiedergabe (7.5% Delta zum Vorgänger)
Mitteltöne 400 - 2000 Hz
(+) | ausgeglichene Mitten, vom Median nur 2.7% abweichend
(+) | lineare Mitten (3.2% Delta zum Vorgänger)
Hochtöne 2 - 16 kHz
(+) | ausgeglichene Hochtöne, vom Median nur 4.2% abweichend
(+) | sehr lineare Hochtöne (4.9% Delta zum Vorgänger)
Gesamt im hörbaren Bereich 100 - 16.000 Hz
(+) | hörbarer Bereich ist sehr linear (13.5% Abstand zum Median
Im Vergleich zu allen Geräten derselben Klasse
» 26% aller getesteten Geräte dieser Klasse waren besser, 5% vergleichbar, 70% schlechter
» Das beste Gerät hat einen Delta-Wert von 7%, durchschnittlich ist 17%, das schlechteste Gerät hat 35%
Im Vergleich zu allen Geräten im Test
» 14% aller getesteten Geräte waren besser, 4% vergleichbar, 82% schlechter
» Das beste Gerät hat einen Delta-Wert von 4%, durchschnittlich ist 24%, das schlechteste Gerät hat 134%
Apple MacBook Pro 16 2021 M1 Pro Audio Analyse
(+) | Die Lautsprecher können relativ laut spielen (84.7 dB)
Bass 100 - 315 Hz
(+) | guter Bass - nur 3.8% Abweichung vom Median
(+) | lineare Bass-Wiedergabe (5.2% Delta zum Vorgänger)
Mitteltöne 400 - 2000 Hz
(+) | ausgeglichene Mitten, vom Median nur 1.3% abweichend
(+) | lineare Mitten (2.1% Delta zum Vorgänger)
Hochtöne 2 - 16 kHz
(+) | ausgeglichene Hochtöne, vom Median nur 1.9% abweichend
(+) | sehr lineare Hochtöne (2.7% Delta zum Vorgänger)
Gesamt im hörbaren Bereich 100 - 16.000 Hz
(+) | hörbarer Bereich ist sehr linear (4.6% Abstand zum Median
Im Vergleich zu allen Geräten derselben Klasse
» 0% aller getesteten Geräte dieser Klasse waren besser, 0% vergleichbar, 100% schlechter
» Das beste Gerät hat einen Delta-Wert von 5%, durchschnittlich ist 17%, das schlechteste Gerät hat 45%
Im Vergleich zu allen Geräten im Test
» 0% aller getesteten Geräte waren besser, 0% vergleichbar, 100% schlechter
» Das beste Gerät hat einen Delta-Wert von 4%, durchschnittlich ist 24%, das schlechteste Gerät hat 134%
Energiemanagement
Energieverbrauch
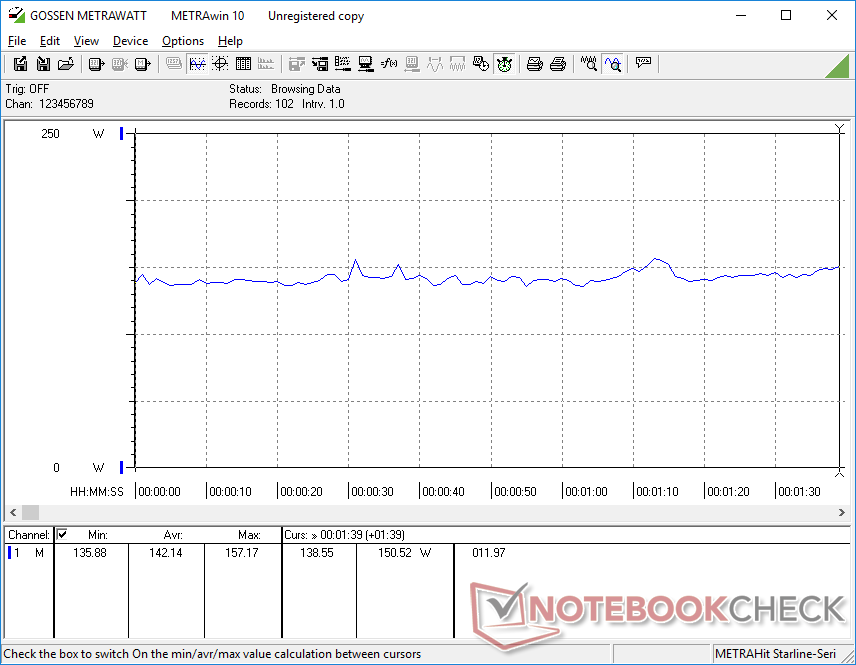
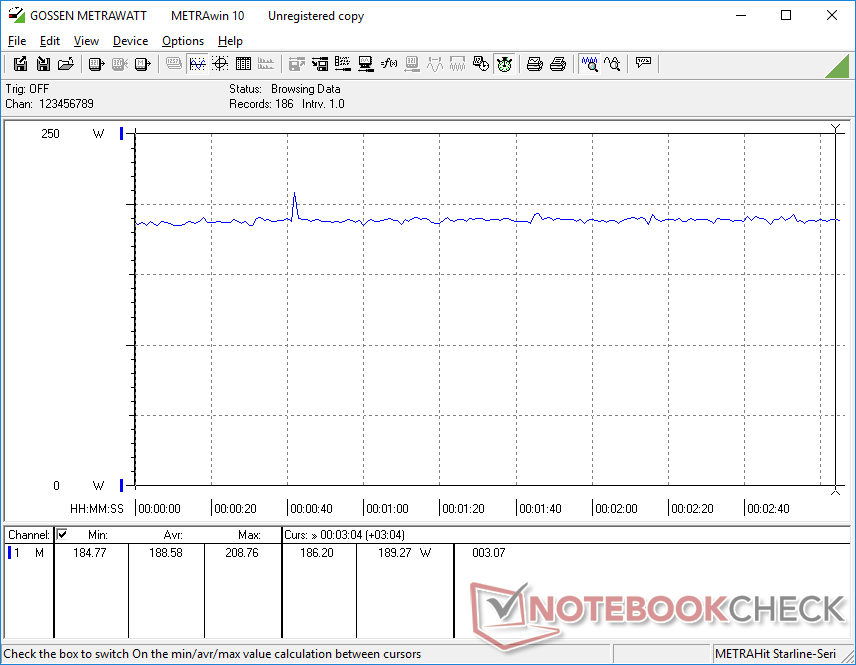
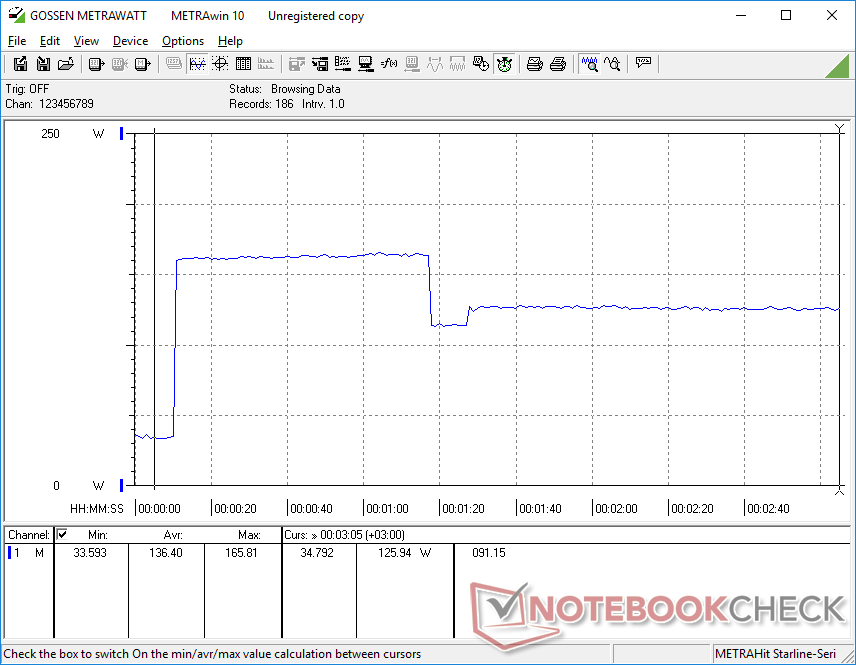
Der Stromverbrauch ist für die verbaute Hardware bei jeglicher Leistung relativ hoch. Beispielsweise konnten wir beim Desktop-Idle (trotz Energiesparmodus und niedrigster Helligkeit) 19 W messen, was verglichen mit den 7 W beim ThinkPad P16 G1 oder den 16 W beim Precision 7670 ziemlich viel ist. Bei Witcher 3 sieht man dies noch extremer: Unser Fury 16 G9 verbraucht hier 189 W, also fast 30 W mehr als das Precision 7670.
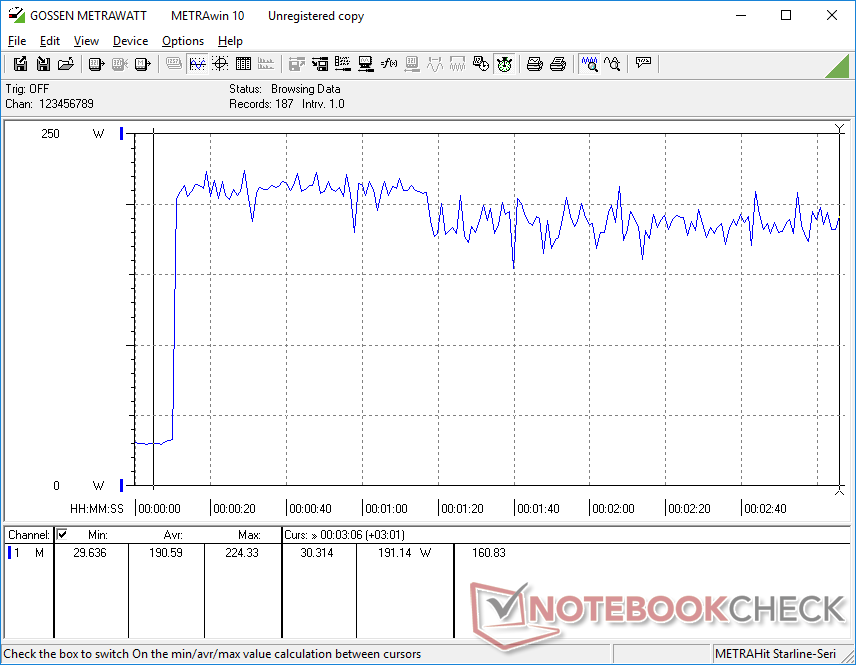
Ebenfalls konnten wir feststellen, dass der Laptop für kurze Zeit einen Verbrauch von 224 W hat (bei 100-prozentiger CPU- und GPU-Auslastung), was ein Laden mit dem 230-W-AC-Adapter zur Herausforderung macht. Ein und derselbe Test führt beim ThinkPad P16 G1 oder beim Precision 7670 zu 300 W, was aber auch am höheren Turbo-Boost und der generell höheren Taktrate liegt.
| Aus / Standby | |
| Idle | |
| Last |
|
Legende:
min: | |
| HP ZBook Fury 16 G9 i9-12950HX, RTX A5500 Laptop GPU, Micron 3400 1TB MTFDKBA1T0TFH, IPS, 3840x2400, 16" | HP ZBook Studio 16 G9 62U04EA i7-12800H, RTX A2000 Laptop GPU, Micron 3400 1TB MTFDKBA1T0TFH, IPS, 3840x2400, 16" | HP ZBook Firefly 16 G9-6B897EA i7-1265U, T550 Laptop GPU, Samsung PM9A1 MZVL21T0HCLR, IPS, 1920x1200, 16" | Lenovo ThinkPad P16 G1 RTX A5500 i9-12950HX, RTX A5500 Laptop GPU, WDC PC SN810 2TB, IPS, 3840x2400, 16" | Dell Precision 7000 7670 Performance i9-12950HX, RTX A5500 Laptop GPU, , OLED, 3840x2400, 16" | MSI CreatorPro Z16P B12UKST i7-12700H, RTX A3000 Laptop GPU, Samsung PM9A1 MZVL21T0HCLR, IPS, 2560x1600, 16" | |
|---|---|---|---|---|---|---|
| Stromverbrauch | 40% | 71% | 10% | -8% | 35% | |
| Idle min * (Watt) | 19.5 | 7.2 63% | 4.5 77% | 7.5 62% | 16.4 16% | 10.8 45% |
| Idle avg * (Watt) | 29 | 18.1 38% | 8 72% | 20.1 31% | 35.9 -24% | 16.3 44% |
| Idle max * (Watt) | 40.7 | 18.5 55% | 8.7 79% | 40 2% | 47 -15% | 16.9 58% |
| Last avg * (Watt) | 142.1 | 112.8 21% | 48.3 66% | 137 4% | 147.1 -4% | 111.7 21% |
| Witcher 3 ultra * (Watt) | 188.6 | 106.7 43% | 45.3 76% | 208 -10% | 158.8 16% | 152.1 19% |
| Last max * (Watt) | 224.4 | 186 17% | 94.7 58% | 285.9 -27% | 311 -39% | 177.4 21% |
* ... kleinere Werte sind besser
Power Consumption Witcher 3 / Stresstest
Energieverbrauch bei einem externen Monitor
Akkulaufzeit — etwas verbuggt
Die gemessene Akkulaufzeit von ca. 6 Stunden bei WLAN-Nutzung ist ähnlich wie beim ZBook Studio 16 G9 oder beim ThinkPad P16 G1, jedoch eine ganze Stunde länger als beim Precision 7670. Das weitaus dünnere ZBook Firefly 16 G9 hingegen schafft fast die doppelte Zeit, was vor allem an der langsameren CPU liegt.
Um den komplett leeren Akku auf 100 Prozent zu laden, ist nur etwas über eine Stunde nötig. Dabei kann man das Gerät zwar auch mittels USB-C-Adaptern von Drittherstellern laden, wobei hier die Kompatibilität nicht garantiert werden kann. Der 65-W-USB-C-Adapter des Fury 16 G9 beispielsweise führt unter Windows andauernd zu Fehlermeldungen, was ein Laden unmöglich macht. Lädt man das Fury 16 G9 außerdem über den USB-C-Port, muss man mit einer geringeren Ladegeschwindigkeit rechnen.
Seltsamerweise erreichten wir bei einem Desktop-Idle-Test mit der niedrigsten Helligkeit und dem Energiesparmodus eine kürzere Akkulaufzeit als unter normaler WLAN-Nutzung. Dies dürfte wahrscheinlich an einem Bug liegen, der ein schlechtes Background-Ressource-Management verursacht oder durch die Windows Energieeinstellungen hervorgerufen wird.
| HP ZBook Fury 16 G9 i9-12950HX, RTX A5500 Laptop GPU, 95 Wh | HP ZBook Studio 16 G9 62U04EA i7-12800H, RTX A2000 Laptop GPU, 86 Wh | HP ZBook Firefly 16 G9-6B897EA i7-1265U, T550 Laptop GPU, 76 Wh | Lenovo ThinkPad P16 G1 RTX A5500 i9-12950HX, RTX A5500 Laptop GPU, 94 Wh | Dell Precision 7000 7670 Performance i9-12950HX, RTX A5500 Laptop GPU, 93 Wh | MSI CreatorPro Z16P B12UKST i7-12700H, RTX A3000 Laptop GPU, 90 Wh | |
|---|---|---|---|---|---|---|
| Akkulaufzeit | -2% | 92% | -3% | -22% | -3% | |
| Idle (h) | 5.3 | |||||
| WLAN (h) | 6 | 6.3 5% | 13 117% | 5.8 -3% | 4.7 -22% | 5.8 -3% |
| Last (h) | 1.2 | 1.1 -8% | 2 67% | |||
| H.264 (h) | 8.5 | 18.4 |
Pro
Contra
Fazit — Gute Performance, aber Lenovo und Dell können es schneller
Das ZBook Fury 16 G9 bietet Funktionen, die nicht jede herkömmliche Workstation besitzt: Das extrem helle 1.000-Nits-Display, OLED-Varianten, die RGB-Beleuchtung und Platz für 4 SO-DIMM bzw. SSD-Module sind nur einige Beispiele, was der Laptop von HP bieten kann. Ebenfalls sind das Keyboard und das Touchpad Features, die sich andere Hersteller von HP noch abschauen könnten.
Der größte Kritikpunkt am Ganzen aber ist die Performance-Drosselung im Vergleich zum Lenovo ThinkPad P16 G1 oder zum Dell Precision 7670. Auch wenn das Fury 16 G9 Platz für vier Speichereinheiten anbieten kann, sind diese Performance-technisch unter Volllast eher eine Enttäuschung. Außerdem ist es schade, dass die RTX A5500 auf 100 W limitiert ist im Vergleich zu den 130 W beim Lenovo- bzw. Dell Modell, was leider zu einer geringeren Performance führt. Auch die CPU leidet unter diesem Problem, verglichen mit der identischen CPU in anderen Geräten.
Das HP ZBook Fury 16 G9 ist deutlich leichter und bietet mehr Features als die meisten anderen 16-Zoll-Workstations. Die Performance hinkt jedoch etwas hinterher, was an einem limitierten Stromverbrauch und einer insuffizienten Kühlung liegt.
Falls man die oben genannten Einschränkungen jedoch verkraften kann, empfehlen wir eher, sich das ThinkPad P16 G1 oder das Precision 7670 näher anzusehen. Möchte man aber die besonderen Eigenschaften einer leichten und trotzdem starken Workstation, dann ist das HP ZBook Fury 16 G9 auch auf jeden Fall eine Überlegung wert.
Preis und Verfügbarkeit
Momentan sind noch nicht alle Versionen des ZBook Fury 16 G9 in Österreich verfügbar. Das günstigste Modell startet im Online-Shop von HP bei 2.259 Euro. Es empfiehlt sich aber, auch immer wieder beispielsweise bei Amazon zu schauen, ob es mittlerweile bessere Angebote gibt.
HP ZBook Fury 16 G9
- 09.06.2023 v7 (old)
Allen Ngo
Transparenz
Die Auswahl der zu testenden Geräte erfolgt innerhalb der Redaktion. Das vorliegende Testmuster wurde dem Autor vom Hersteller oder einem Shop zu Testzwecken leihweise zur Verfügung gestellt. Eine Einflussnahme des Leihstellers auf den Testbericht gab es nicht, der Hersteller erhielt keine Version des Reviews vor der Veröffentlichung. Es bestand keine Verpflichtung zur Publikation. Als eigenständiges, unabhängiges Unternehmen unterliegt Notebookcheck keiner Diktion von Herstellern, Shops und Verlagen.
So testet Notebookcheck
Pro Jahr werden von Notebookcheck hunderte Laptops und Smartphones unabhängig in von uns standardisierten technischen Verfahren getestet, um eine Vergleichbarkeit aller Testergebnisse zu gewährleisten. Seit rund 20 Jahren entwickeln wir diese Testmethoden kontinuierlich weiter und setzen damit Branchenstandards. In unseren Testlaboren kommt ausschließlich hochwertiges Messequipment in die Hände erfahrener Techniker und Redakteure. Die Tests unterliegen einer mehrstufigen Kontrolle. Unsere komplexe Gesamtbewertung basiert auf hunderten fundierten Messergebnissen und Benchmarks, womit Ihnen Objektivität garantiert ist. Weitere Informationen zu unseren Testmethoden gibt es hier.
Preisvergleich
