Notebookcheck Logo

HP ZBook Firefly 14 G9 Laptop im Test - Mobile Workstation nach Updates mit mehr Leistung

BIOS-Updates verbessern die Leistung. Nach unserem Test des ZBook Firefly 14 G9 hat HP Updates veröffentlicht, um die Leistung zu verbessern. Allerdings wurden kurze Zeit später weitere Updates veröffentlicht, bei denen die CPU-Leistung wieder etwas reduziert wurde. Wir überprüfen daher noch einmal die Leistung der kompakten Workstation.

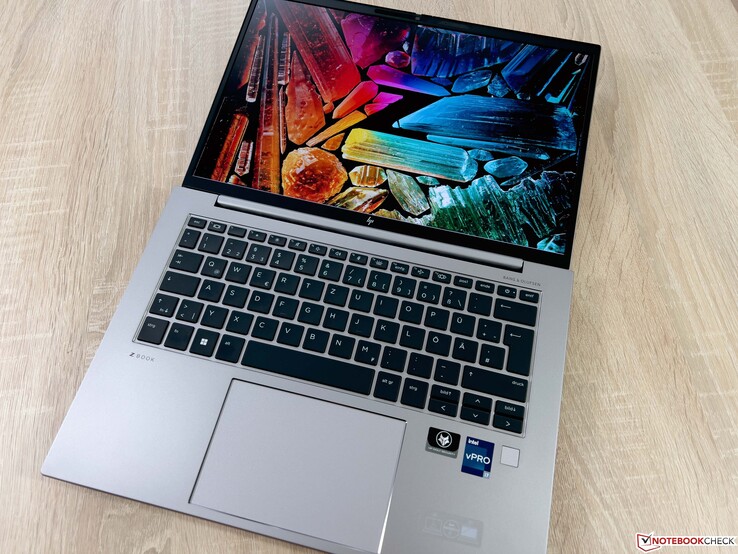
Nach unserem ursprünglichen Test des aktuellen HP ZBook Firefly 14 G9 mit den enttäuschenden Leistungswerten hat der Hersteller die Leistung durch Updates verbessert. Allerdings kamen dann noch weitere Updates inklusive dem BIOS-Update auf Version 01.04.10, welches die CPU-Leistung wieder etwas verschlechtert hat. Das bedeutet für uns einen erheblichen Mehraufwand beim Testen und auch für Kunden ist diese Situation problematisch, denn man weiß nie, wie die Leistung nach dem nächsten Update ausfallen wird.

Im folgenden Artikel konzentrieren wir uns auf die Auswirkungen der Updates auf die CPU- sowie die GPU-Leistung und wie sich die Leistungssteigerung auf die Oberflächentemperaturen unter Last sowie das Lüfterverhalten auswirkt. Alle anderen Informationen stehen in unserem ursprünglichen Test des ZBook Firefly 14 G9 zur Verfügung.

HP ZBook Firefly 14 G9-6B8A2EA (ZBook Firefly 14 G9 Serie)
Prozessor
Intel Core i7-1265U 10 x 1.3 - 4.8 GHz, 51 W PL2 / Short Burst, 33 W PL1 / Sustained, Alder Lake-U
Grafikkarte
NVIDIA T550 Laptop GPU - 4 GB VRAM, Speichertakt: 1500 MHz, 30 W TDP, GDDR6, 527.37, Optimus
Hauptspeicher
32 GB 
, DDR5-4800, Dual-Channel, 2 Slots, max. 64 GB
Bildschirm
14.00 Zoll 16:10, 1920 x 1200 Pixel 162 PPI, CMN1435, IPS, spiegelnd: nein, 60 Hz
Mainboard
Intel Alder Lake-P PCH
Massenspeicher
Micron 3400 1TB MTFDKBA1T0TFH, 1024 GB 
, 885 GB verfügbar
Soundkarte
Intel Alder Lake-P PCH - cAVS (Audio, Voice, Speech)
Anschlüsse
2 USB 3.0 / 3.1 Gen1, 2 USB 4.0 40 Gbps, 2 Thunderbolt, USB-C Power Delivery (PD), 1 HDMI, 2 DisplayPort, 1 Kensington Lock, Audio Anschlüsse: 3.5-mm-Stereo, 1 Fingerprint Reader, Helligkeitssensor
Netzwerk
Intel Wi-Fi 6E AX211 (a/b/g/h/n = Wi-Fi 4/ac = Wi-Fi 5/ax = Wi-Fi 6/ Wi-Fi 6E 6 GHz), Bluetooth 5.2
Abmessungen
Höhe x Breite x Tiefe (in mm): 19.9 x 315.6 x 224.3
Akku
51 Wh, 4240 mAh Lithium-Polymer
Betriebssystem
Microsoft Windows 11 Pro
Kamera
Webcam: 5 MP IR with Shutter
Primary Camera: 5 MPix
Sonstiges
Lautsprecher: Stereo, Tastatur: Chiclet, Tastatur-Beleuchtung: ja, 65W PSU, 36 Monate Garantie
Gewicht
1.517 kg, Netzteil: 311 g
Preis
2200 Euro
Hinweis: Der Hersteller kann abweichende Bauteile wie Bildschirme, Laufwerke und Speicherriegel mit ähnlichen Spezifikationen unter dem gleichen Modellnamen einsetzen.


Leistung - CPU und GPU jetzt schneller

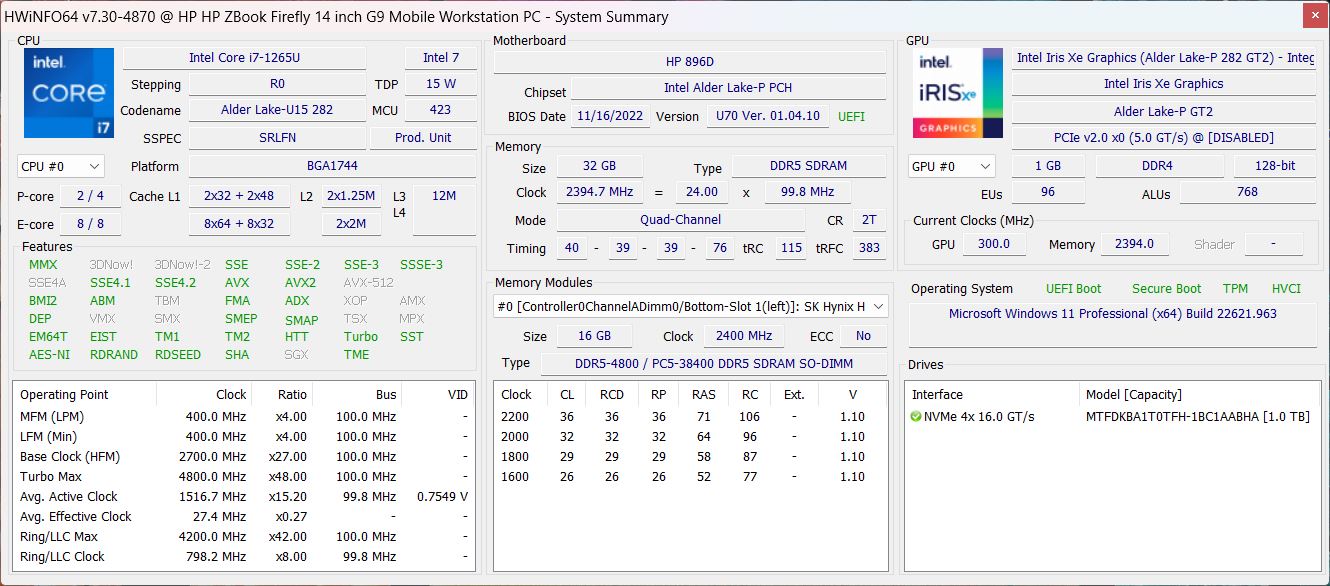
Bei unserem ursprünglichen Test des ZBook Firefly 14 G9 (und auch des größeren ZBook Firefly 16 G9 mit der identischen Kühlung) waren wir über die geringen Power Limits der Komponenten überrascht, denn der Core i7-1265U durfte nach einem kurzen Peak von 25 Watt nur 12 Watt verbrauchen und die Nvidia T550 gerade einmal 20 Watt. Das hatte natürlich massive Auswirkungen auf die Leistung und auch HP selbst war von den Ergebnissen überrascht, was dann zu einigen Updates führte.

Die Grafikkarte darf nun 30 anstatt 20 Watt verbrauchen und die Power Limits für den Prozessor wurden auf 33/51 Watt angehoben. Diese Werte wurden auch erreicht, allerdings hat HP die Leistung mit weiteren Updates wieder minimal verringert. Theoretisch haben die Werte 33/51 Watt noch Bestand, doch stabil wird der Wert nicht mehr gehalten.

Prozessor - Core i7-1265U

Durch die erhöhten Power Limits ist der Core i7-1265U im ZBook jetzt vor allem bei kurzzeitiger Belastung deutlich konkurrenzfähiger als mit den alten Einstellungen und es gibt nun auch einen deutlichen Vorteil gegenüber dem alten Modell. Durch die gesteigerten Power Limits kann das Firefly 14 nun auch die volle Single-Core-Leistung der Performance-Kerne abrufen, was im Fall des Core i7-1265U bei 4,6-4,7 GHz rund 21 Watt erfordert. Wirklich ausgereift wirkt die Situation aber nicht, denn die Takte schwanken bei der Multi-Core-Last und wir hätten uns hier lieber ein konstantes Level gewünscht. Hier muss man einfach sagen, dass die hohen Power Limits schnell zu sehr hohen Chip-Temperaturen führen, womit die Kühlung erst einmal klarkommen muss. Nur weil Intel einen maximalen Verbrauch von 51 Watt bei den U-Serie-CPUs erlaubt, ist es nicht immer sinnvoll.

Cinebench R15 Multi Dauertest

08517025534042551059568076585093510201105119012751360144515301615Tooltip
HP ZBook Firefly 14 G9-6B8A2EA Intel Core i7-1265U: Ø1242 (1060.05-1543.33)
HP ZBook Firefly 14 G9-6B8A2EA Intel Core i7-1265U: Ø676 (667.96-706.38)
HP ZBook Firefly 14 G8 2C9Q2EA Intel Core i7-1165G7: Ø710 (671.68-843.29)
HP EliteBook 865 G9 AMD Ryzen 7 PRO 6850U: Ø1606 (1590.77-1665.14)
CPU-Daten Cinebench R15 Multi-Schleife

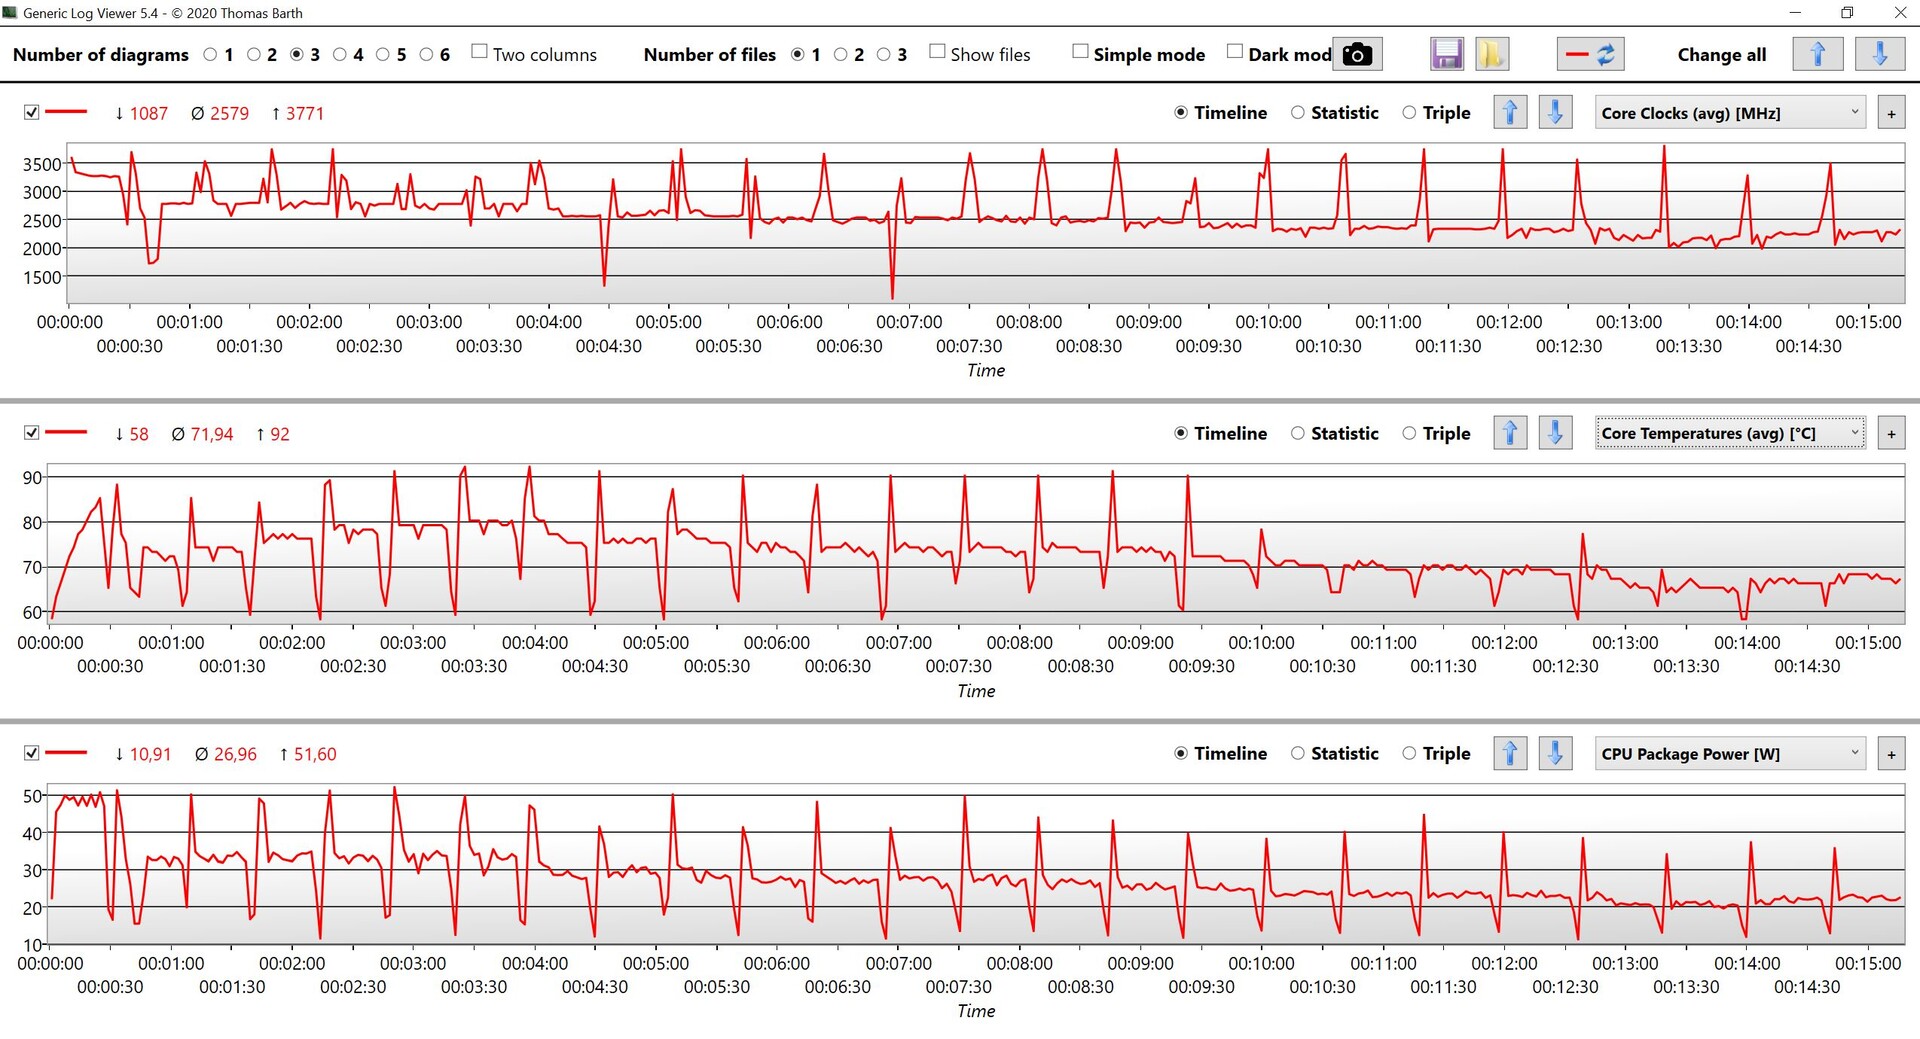
Gleichzeitig muss man aber auch klar sagen, dass die aktuellen AMD-CPUs wie der Ryzen 7 Pro 6850U im HP EliteBook 865 G9 bei 25 Watt deutlich konstantere und auch bessere Ergebnisse im Multi-Core-Bereich bieten. Im Single-Core-Betrieb hat Intel mit den Performance-Kernen einen Vorteil, benötigt aber auch mehr Strom.

Im Akkubetrieb darf der Prozessor in Multi-Core-Tests für die ersten 10 Sekunden 30 Watt verbrauchen und fällt dann auf 15 Watt ab. Im Single-Core-Betrieb sind es 17 Watt und später nur noch 15 Watt, auch hier steht also nicht die volle Leistung zur Verfügung. Weitere CPU-Benchmarks stehen in unserer Techniksektion zur Verfügung.

CPU Performance Rating: Percent
Cinebench R23: Multi Core | Single Core
Cinebench R20: CPU (Multi Core) | CPU (Single Core)
Cinebench R15: CPU Multi 64Bit | CPU Single 64Bit
Blender: v2.79 BMW27 CPU
7-Zip 18.03: 7z b 4 | 7z b 4 -mmt1
Geekbench 5.5: Multi-Core | Single-Core
HWBOT x265 Benchmark v2.2: 4k Preset
LibreOffice : 20 Documents To PDF
R Benchmark 2.5: Overall mean
CPU Performance Rating
Durchschnitt der Klasse Workstation
 
84.7 pt
Dell Precision 5000 5470
Intel Core i9-12900H
79 pt
Apple MacBook Pro 14 2021 M1 Pro Entry -8!
Apple M1 Pro 8-Core
77.4 pt
HP ZBook Firefly 14 G9-6B8A2EA
Intel Core i7-1265U
65.2 pt
HP EliteBook 865 G9
AMD Ryzen 7 PRO 6850U
63.6 pt
Durchschnittliche Intel Core i7-1265U
 
58.2 pt
Lenovo ThinkPad P14s Gen2-20VX000GGE
Intel Core i7-1185G7
49.7 pt
HP ZBook Firefly 14 G9-6B8A2EA
Intel Core i7-1265U
45.8 pt
HP ZBook Firefly 14 G8 2C9Q2EA -2!
Intel Core i7-1165G7
45.8 pt
Cinebench R23 / Multi Core
Durchschnitt der Klasse Workstation
  (4332 - 24560, n=28, der letzten 2 Jahre)
15342 Points +76%
Dell Precision 5000 5470
Intel Core i9-12900H
13077 (12213.6min - 13076.7max) Points +50%
HP EliteBook 865 G9
AMD Ryzen 7 PRO 6850U
10047 Points +15%
Apple MacBook Pro 14 2021 M1 Pro Entry
Apple M1 Pro 8-Core
9581 Points +10%
HP ZBook Firefly 14 G9-6B8A2EA
Intel Core i7-1265U
8740 Points
Durchschnittliche Intel Core i7-1265U
  (4332 - 9219, n=10)
7486 Points -14%
Lenovo ThinkPad P14s Gen2-20VX000GGE
Intel Core i7-1185G7
5876 Points -33%
HP ZBook Firefly 14 G9-6B8A2EA
Intel Core i7-1265U
4332 Points -50%
Cinebench R23 / Single Core
Dell Precision 5000 5470
Intel Core i9-12900H
1777 Points +3%
Durchschnitt der Klasse Workstation
  (1144 - 2106, n=28, der letzten 2 Jahre)
1758 Points +2%
HP ZBook Firefly 14 G9-6B8A2EA
Intel Core i7-1265U
1726 Points
Durchschnittliche Intel Core i7-1265U
  (1144 - 1820, n=10)
1595 Points -8%
Apple MacBook Pro 14 2021 M1 Pro Entry
Apple M1 Pro 8-Core
1531 Points -11%
Lenovo ThinkPad P14s Gen2-20VX000GGE
Intel Core i7-1185G7
1493 Points -13%
HP ZBook Firefly 14 G9-6B8A2EA
Intel Core i7-1265U
1415 Points -18%
HP EliteBook 865 G9
AMD Ryzen 7 PRO 6850U
1409 Points -18%
Cinebench R20 / CPU (Multi Core)
Durchschnitt der Klasse Workstation
  (1669 - 9329, n=29, der letzten 2 Jahre)
5824 Points +74%
Dell Precision 5000 5470
Intel Core i9-12900H
4594 Points +37%
HP EliteBook 865 G9
AMD Ryzen 7 PRO 6850U
3886 Points +16%
HP ZBook Firefly 14 G9-6B8A2EA
Intel Core i7-1265U
3344 Points
Durchschnittliche Intel Core i7-1265U
  (1669 - 3584, n=10)
2884 Points -14%
Lenovo ThinkPad P14s Gen2-20VX000GGE
Intel Core i7-1185G7
2269 Points -32%
HP ZBook Firefly 14 G8 2C9Q2EA
Intel Core i7-1165G7
2036 Points -39%
HP ZBook Firefly 14 G9-6B8A2EA
Intel Core i7-1265U
1681 Points -50%
Cinebench R20 / CPU (Single Core)
Dell Precision 5000 5470
Intel Core i9-12900H
685 Points +3%
Durchschnitt der Klasse Workstation
  (528 - 816, n=29, der letzten 2 Jahre)
684 Points +3%
HP ZBook Firefly 14 G9-6B8A2EA
Intel Core i7-1265U
665 Points
Durchschnittliche Intel Core i7-1265U
  (528 - 701, n=10)
619 Points -7%
HP EliteBook 865 G9
AMD Ryzen 7 PRO 6850U
587 Points -12%
HP ZBook Firefly 14 G8 2C9Q2EA
Intel Core i7-1165G7
581 Points -13%
Lenovo ThinkPad P14s Gen2-20VX000GGE
Intel Core i7-1185G7
529 Points -20%
HP ZBook Firefly 14 G9-6B8A2EA
Intel Core i7-1265U
528 Points -21%
Cinebench R15 / CPU Multi 64Bit
Durchschnitt der Klasse Workstation
  (706 - 3625, n=28, der letzten 2 Jahre)
2384 Points +55%
Dell Precision 5000 5470
Intel Core i9-12900H
2313 (1355.47min - 2312.54max) Points +50%
HP EliteBook 865 G9
AMD Ryzen 7 PRO 6850U
1665 (1590.77min - 1665.14max) Points +8%
HP ZBook Firefly 14 G9-6B8A2EA
Intel Core i7-1265U
1543 (1060.05min - 1543.33max) Points
Apple MacBook Pro 14 2021 M1 Pro Entry
Apple M1 Pro 8-Core
1320 (1307min - 1320max) Points -14%
Durchschnittliche Intel Core i7-1265U
  (706 - 1572, n=10)
1244 Points -19%
Lenovo ThinkPad P14s Gen2-20VX000GGE
Intel Core i7-1185G7
902 (538.67min - 901.88max) Points -42%
HP ZBook Firefly 14 G8 2C9Q2EA
Intel Core i7-1165G7
843 (671.68min - 843.29max) Points -45%
HP ZBook Firefly 14 G9-6B8A2EA
Intel Core i7-1265U
706 (667.96min - 706.38max) Points -54%
Cinebench R15 / CPU Single 64Bit
Durchschnitt der Klasse Workstation
  (166.2 - 301, n=28, der letzten 2 Jahre)
255 Points +1%
HP ZBook Firefly 14 G9-6B8A2EA
Intel Core i7-1265U
252 Points
Dell Precision 5000 5470
Intel Core i9-12900H
248 Points -2%
HP EliteBook 865 G9
AMD Ryzen 7 PRO 6850U
232 Points -8%
Durchschnittliche Intel Core i7-1265U
  (165.3 - 260, n=10)
230 Points -9%
HP ZBook Firefly 14 G8 2C9Q2EA
Intel Core i7-1165G7
225 Points -11%
HP ZBook Firefly 14 G9-6B8A2EA
Intel Core i7-1265U
215 Points -15%
Lenovo ThinkPad P14s Gen2-20VX000GGE
Intel Core i7-1185G7
213 Points -15%
Apple MacBook Pro 14 2021 M1 Pro Entry
Apple M1 Pro 8-Core
210 Points -17%
Blender / v2.79 BMW27 CPU
HP ZBook Firefly 14 G9-6B8A2EA
Intel Core i7-1265U
667 Seconds * -55%
Lenovo ThinkPad P14s Gen2-20VX000GGE
Intel Core i7-1185G7
630 Seconds * -47%
HP ZBook Firefly 14 G8 2C9Q2EA
Intel Core i7-1165G7
580 Seconds * -35%
Durchschnittliche Intel Core i7-1265U
  (364 - 684, n=10)
466 Seconds * -8%
HP ZBook Firefly 14 G9-6B8A2EA
Intel Core i7-1265U
430 Seconds *
HP EliteBook 865 G9
AMD Ryzen 7 PRO 6850U
303 Seconds * +30%
Durchschnitt der Klasse Workstation
  (137 - 684, n=28, der letzten 2 Jahre)
249 Seconds * +42%
Dell Precision 5000 5470
Intel Core i9-12900H
248 Seconds * +42%
7-Zip 18.03 / 7z b 4
Durchschnitt der Klasse Workstation
  (20087 - 99351, n=28, der letzten 2 Jahre)
61552 MIPS +77%
Dell Precision 5000 5470
Intel Core i9-12900H
51968 MIPS +50%
HP EliteBook 865 G9
AMD Ryzen 7 PRO 6850U
44011 MIPS +27%
HP ZBook Firefly 14 G9-6B8A2EA
Intel Core i7-1265U
34692 MIPS
Durchschnittliche Intel Core i7-1265U
  (20087 - 38715, n=10)
32344 MIPS -7%
HP ZBook Firefly 14 G8 2C9Q2EA
Intel Core i7-1165G7
22854 MIPS -34%
HP ZBook Firefly 14 G9-6B8A2EA
Intel Core i7-1265U
21897 MIPS -37%
Lenovo ThinkPad P14s Gen2-20VX000GGE
Intel Core i7-1185G7
21244 MIPS -39%
7-Zip 18.03 / 7z b 4 -mmt1
Durchschnitt der Klasse Workstation
  (4777 - 6670, n=28, der letzten 2 Jahre)
5910 MIPS +5%
HP ZBook Firefly 14 G9-6B8A2EA
Intel Core i7-1265U
5617 MIPS
HP EliteBook 865 G9
AMD Ryzen 7 PRO 6850U
5542 MIPS -1%
Lenovo ThinkPad P14s Gen2-20VX000GGE
Intel Core i7-1185G7
5507 MIPS -2%
Dell Precision 5000 5470
Intel Core i9-12900H
5505 MIPS -2%
HP ZBook Firefly 14 G8 2C9Q2EA
Intel Core i7-1165G7
5352 MIPS -5%
Durchschnittliche Intel Core i7-1265U
  (4614 - 5617, n=10)
5198 MIPS -7%
HP ZBook Firefly 14 G9-6B8A2EA
Intel Core i7-1265U
4777 MIPS -15%
Geekbench 5.5 / Multi-Core
Dell Precision 5000 5470
Intel Core i9-12900H
12252 Points +41%
Durchschnitt der Klasse Workstation
  (5022 - 17487, n=28, der letzten 2 Jahre)
11750 Points +35%
Apple MacBook Pro 14 2021 M1 Pro Entry
Apple M1 Pro 8-Core
9942 Points +15%
HP ZBook Firefly 14 G9-6B8A2EA
Intel Core i7-1265U
8679 Points
Durchschnittliche Intel Core i7-1265U
  (5022 - 8981, n=10)
7709 Points -11%
HP EliteBook 865 G9
AMD Ryzen 7 PRO 6850U
7044 Points -19%
HP ZBook Firefly 14 G9-6B8A2EA
Intel Core i7-1265U
5718 Points -34%
Lenovo ThinkPad P14s Gen2-20VX000GGE
Intel Core i7-1185G7
5692 Points -34%
HP ZBook Firefly 14 G8 2C9Q2EA
Intel Core i7-1165G7
4999 Points -42%
Geekbench 5.5 / Single-Core
Durchschnitt der Klasse Workstation
  (1474 - 2095, n=28, der letzten 2 Jahre)
1827 Points +6%
HP ZBook Firefly 14 G9-6B8A2EA
Intel Core i7-1265U
1806 Points +5%
Dell Precision 5000 5470
Intel Core i9-12900H
1805 Points +5%
Apple MacBook Pro 14 2021 M1 Pro Entry
Apple M1 Pro 8-Core
1769 Points +3%
HP ZBook Firefly 14 G9-6B8A2EA
Intel Core i7-1265U
1721 Points
Durchschnittliche Intel Core i7-1265U
  (1429 - 1806, n=10)
1697 Points -1%
Lenovo ThinkPad P14s Gen2-20VX000GGE
Intel Core i7-1185G7
1626 Points -6%
HP ZBook Firefly 14 G8 2C9Q2EA
Intel Core i7-1165G7
1551 Points -10%
HP EliteBook 865 G9
AMD Ryzen 7 PRO 6850U
1433 Points -17%
HWBOT x265 Benchmark v2.2 / 4k Preset
Durchschnitt der Klasse Workstation
  (5.09 - 26, n=28, der letzten 2 Jahre)
17 fps +78%
Dell Precision 5000 5470
Intel Core i9-12900H
13.4 fps +40%
HP EliteBook 865 G9
AMD Ryzen 7 PRO 6850U
11.7 fps +22%
HP ZBook Firefly 14 G9-6B8A2EA
Intel Core i7-1265U
9.56 fps
Durchschnittliche Intel Core i7-1265U
  (5.09 - 10.6, n=10)
8.57 fps -10%
Lenovo ThinkPad P14s Gen2-20VX000GGE
Intel Core i7-1185G7
7.18 fps -25%
HP ZBook Firefly 14 G8 2C9Q2EA
Intel Core i7-1165G7
6.7 fps -30%
HP ZBook Firefly 14 G9-6B8A2EA
Intel Core i7-1265U
5.43 fps -43%
LibreOffice / 20 Documents To PDF
HP EliteBook 865 G9
AMD Ryzen 7 PRO 6850U
53.1 s * -21%
HP ZBook Firefly 14 G8 2C9Q2EA
Intel Core i7-1165G7
52.8 s * -20%
Durchschnittliche Intel Core i7-1265U
  (44 - 61.6, n=10)
49.9 s * -13%
Durchschnitt der Klasse Workstation
  (36.5 - 95.2, n=28, der letzten 2 Jahre)
47.9 s * -9%
HP ZBook Firefly 14 G9-6B8A2EA
Intel Core i7-1265U
46.5 s * -6%
Dell Precision 5000 5470
Intel Core i9-12900H
45.8 s * -4%
HP ZBook Firefly 14 G9-6B8A2EA
Intel Core i7-1265U
44 s *
Lenovo ThinkPad P14s Gen2-20VX000GGE
Intel Core i7-1185G7
41.3 s * +6%
R Benchmark 2.5 / Overall mean
HP ZBook Firefly 14 G8 2C9Q2EA
Intel Core i7-1165G7
0.567 sec * -18%
Lenovo ThinkPad P14s Gen2-20VX000GGE
Intel Core i7-1185G7
0.55 sec * -15%
HP ZBook Firefly 14 G9-6B8A2EA
Intel Core i7-1265U
0.525 sec * -10%
HP EliteBook 865 G9
AMD Ryzen 7 PRO 6850U
0.519 sec * -8%
Durchschnittliche Intel Core i7-1265U
  (0.4666 - 0.578, n=10)
0.507 sec * -6%
HP ZBook Firefly 14 G9-6B8A2EA
Intel Core i7-1265U
0.4787 sec *
Dell Precision 5000 5470
Intel Core i9-12900H
0.4771 sec * -0%
Durchschnitt der Klasse Workstation
  (0.3876 - 0.544, n=28, der letzten 2 Jahre)
0.4611 sec * +4%

* ... kleinere Werte sind besser

Cinebench R15 CPU Multi 64Bit
1543 Points
Cinebench R15 OpenGL 64Bit
205 fps
Cinebench R15 Ref. Match 64Bit
99.6 %
Cinebench R15 CPU Single 64Bit
252 Points
Hilfe
Performance Rating
Durchschnitt der Klasse Workstation
 
95.8 pt
Dell Precision 5000 5470
Intel Core i9-12900H, RTX A1000 Laptop GPU
78.7 pt
HP EliteBook 865 G9
AMD Ryzen 7 PRO 6850U, Radeon 680M
77.5 pt
HP ZBook Firefly 14 G9-6B8A2EA
Intel Core i7-1265U, T550 Laptop GPU
55.2 pt
HP ZBook Firefly 14 G8 2C9Q2EA
Intel Core i7-1165G7, T500 Laptop GPU
49.5 pt
Durchschnittliche Intel Core i7-1265U
 
49 pt
HP ZBook Firefly 14 G9-6B8A2EA
Intel Core i7-1265U, T550 Laptop GPU
36.3 pt
AIDA64 / FP32 Ray-Trace
Durchschnitt der Klasse Workstation
  (2619 - 25776, n=28, der letzten 2 Jahre)
15617 KRay/s +115%
Dell Precision 5000 5470
Intel Core i9-12900H, RTX A1000 Laptop GPU
12918 KRay/s +78%
HP EliteBook 865 G9
AMD Ryzen 7 PRO 6850U, Radeon 680M
11668 KRay/s +61%
HP ZBook Firefly 14 G9-6B8A2EA
Intel Core i7-1265U, T550 Laptop GPU
7249 KRay/s
HP ZBook Firefly 14 G8 2C9Q2EA
Intel Core i7-1165G7, T500 Laptop GPU
6909 KRay/s -5%
Durchschnittliche Intel Core i7-1265U
  (2619 - 8178, n=10)
6278 KRay/s -13%
HP ZBook Firefly 14 G9-6B8A2EA
Intel Core i7-1265U, T550 Laptop GPU
4277 KRay/s -41%
AIDA64 / FPU Julia
Durchschnitt der Klasse Workstation
  (12909 - 109059, n=28, der letzten 2 Jahre)
77889 Points +108%
HP EliteBook 865 G9
AMD Ryzen 7 PRO 6850U, Radeon 680M
73770 Points +97%
Dell Precision 5000 5470
Intel Core i9-12900H, RTX A1000 Laptop GPU
65170 Points +74%
HP ZBook Firefly 14 G9-6B8A2EA
Intel Core i7-1265U, T550 Laptop GPU
37511 Points
Durchschnittliche Intel Core i7-1265U
  (12909 - 41649, n=10)
32723 Points -13%
HP ZBook Firefly 14 G8 2C9Q2EA
Intel Core i7-1165G7, T500 Laptop GPU
29814 Points -21%
HP ZBook Firefly 14 G9-6B8A2EA
Intel Core i7-1265U, T550 Laptop GPU
22111 Points -41%
AIDA64 / CPU SHA3
Durchschnitt der Klasse Workstation
  (824 - 4981, n=28, der letzten 2 Jahre)
3458 MB/s +76%
Dell Precision 5000 5470
Intel Core i9-12900H, RTX A1000 Laptop GPU
2950 MB/s +50%
HP EliteBook 865 G9
AMD Ryzen 7 PRO 6850U, Radeon 680M
2475 MB/s +26%
HP ZBook Firefly 14 G9-6B8A2EA
Intel Core i7-1265U, T550 Laptop GPU
1961 MB/s
HP ZBook Firefly 14 G8 2C9Q2EA
Intel Core i7-1165G7, T500 Laptop GPU
1921 MB/s -2%
Durchschnittliche Intel Core i7-1265U
  (824 - 2183, n=10)
1731 MB/s -12%
HP ZBook Firefly 14 G9-6B8A2EA
Intel Core i7-1265U, T550 Laptop GPU
1143 MB/s -42%
AIDA64 / CPU Queen
Dell Precision 5000 5470
Intel Core i9-12900H, RTX A1000 Laptop GPU
109214 Points +64%
Durchschnitt der Klasse Workstation
  (26716 - 131931, n=28, der letzten 2 Jahre)
98109 Points +47%
HP EliteBook 865 G9
AMD Ryzen 7 PRO 6850U, Radeon 680M
87176 Points +31%
HP ZBook Firefly 14 G9-6B8A2EA
Intel Core i7-1265U, T550 Laptop GPU
67065 Points 0%
HP ZBook Firefly 14 G9-6B8A2EA
Intel Core i7-1265U, T550 Laptop GPU
66757 Points
Durchschnittliche Intel Core i7-1265U
  (63615 - 67065, n=10)
65614 Points -2%
HP ZBook Firefly 14 G8 2C9Q2EA
Intel Core i7-1165G7, T500 Laptop GPU
49352 Points -26%
AIDA64 / FPU SinJulia
HP EliteBook 865 G9
AMD Ryzen 7 PRO 6850U, Radeon 680M
11123 Points +133%
Durchschnitt der Klasse Workstation
  (3105 - 14742, n=28, der letzten 2 Jahre)
10336 Points +116%
Dell Precision 5000 5470
Intel Core i9-12900H, RTX A1000 Laptop GPU
8599 Points +80%
HP ZBook Firefly 14 G9-6B8A2EA
Intel Core i7-1265U, T550 Laptop GPU
4779 Points
HP ZBook Firefly 14 G8 2C9Q2EA
Intel Core i7-1165G7, T500 Laptop GPU
4749 Points -1%
Durchschnittliche Intel Core i7-1265U
  (3105 - 5135, n=10)
4331 Points -9%
HP ZBook Firefly 14 G9-6B8A2EA
Intel Core i7-1265U, T550 Laptop GPU
3289 Points -31%
AIDA64 / FPU Mandel
HP EliteBook 865 G9
AMD Ryzen 7 PRO 6850U, Radeon 680M
40693 Points +119%
Durchschnitt der Klasse Workstation
  (6967 - 58181, n=28, der letzten 2 Jahre)
39044 Points +110%
Dell Precision 5000 5470
Intel Core i9-12900H, RTX A1000 Laptop GPU
31638 Points +70%
HP ZBook Firefly 14 G9-6B8A2EA
Intel Core i7-1265U, T550 Laptop GPU
18622 Points
HP ZBook Firefly 14 G8 2C9Q2EA
Intel Core i7-1165G7, T500 Laptop GPU
17895 Points -4%
Durchschnittliche Intel Core i7-1265U
  (6967 - 20804, n=10)
16054 Points -14%
HP ZBook Firefly 14 G9-6B8A2EA
Intel Core i7-1265U, T550 Laptop GPU
10541 Points -43%
AIDA64 / CPU AES
Durchschnitt der Klasse Workstation
  (19489 - 132156, n=28, der letzten 2 Jahre)
72740 MB/s +90%
HP ZBook Firefly 14 G8 2C9Q2EA
Intel Core i7-1165G7, T500 Laptop GPU
67771 MB/s +77%
HP EliteBook 865 G9
AMD Ryzen 7 PRO 6850U, Radeon 680M
50118 MB/s +31%
HP ZBook Firefly 14 G9-6B8A2EA
Intel Core i7-1265U, T550 Laptop GPU
38355 MB/s
Dell Precision 5000 5470
Intel Core i9-12900H, RTX A1000 Laptop GPU
34721 MB/s -9%
Durchschnittliche Intel Core i7-1265U
  (19489 - 42966, n=10)
34526 MB/s -10%
HP ZBook Firefly 14 G9-6B8A2EA
Intel Core i7-1265U, T550 Laptop GPU
24543 MB/s -36%
AIDA64 / CPU ZLib
Durchschnitt der Klasse Workstation
  (314 - 1472, n=28, der letzten 2 Jahre)
929 MB/s +62%
HP EliteBook 865 G9
AMD Ryzen 7 PRO 6850U, Radeon 680M
655 MB/s +14%
HP ZBook Firefly 14 G9-6B8A2EA
Intel Core i7-1265U, T550 Laptop GPU
574 MB/s
Durchschnittliche Intel Core i7-1265U
  (314 - 632, n=10)
514 MB/s -10%
Dell Precision 5000 5470
Intel Core i9-12900H, RTX A1000 Laptop GPU
449 MB/s -22%
HP ZBook Firefly 14 G8 2C9Q2EA
Intel Core i7-1165G7, T500 Laptop GPU
379 MB/s -34%
HP ZBook Firefly 14 G9-6B8A2EA
Intel Core i7-1265U, T550 Laptop GPU
341 MB/s -41%
AIDA64 / FP64 Ray-Trace
Durchschnitt der Klasse Workstation
  (1473 - 13800, n=28, der letzten 2 Jahre)
8397 KRay/s +115%
Dell Precision 5000 5470
Intel Core i9-12900H, RTX A1000 Laptop GPU
7085 KRay/s +82%
HP EliteBook 865 G9
AMD Ryzen 7 PRO 6850U, Radeon 680M
6091 KRay/s +56%
HP ZBook Firefly 14 G9-6B8A2EA
Intel Core i7-1265U, T550 Laptop GPU
3902 KRay/s
HP ZBook Firefly 14 G8 2C9Q2EA
Intel Core i7-1165G7, T500 Laptop GPU
3724 KRay/s -5%
Durchschnittliche Intel Core i7-1265U
  (1473 - 4376, n=10)
3339 KRay/s -14%
HP ZBook Firefly 14 G9-6B8A2EA
Intel Core i7-1265U, T550 Laptop GPU
2262 KRay/s -42%
AIDA64 / CPU PhotoWorxx
Dell Precision 5000 5470
Intel Core i9-12900H, RTX A1000 Laptop GPU
46123 MPixel/s +11%
HP ZBook Firefly 14 G9-6B8A2EA
Intel Core i7-1265U, T550 Laptop GPU
41462 MPixel/s
Durchschnitt der Klasse Workstation
  (18157 - 51637, n=28, der letzten 2 Jahre)
36625 MPixel/s -12%
Durchschnittliche Intel Core i7-1265U
  (20213 - 47031, n=10)
35509 MPixel/s -14%
HP ZBook Firefly 14 G9-6B8A2EA
Intel Core i7-1265U, T550 Laptop GPU
27493 MPixel/s -34%
HP ZBook Firefly 14 G8 2C9Q2EA
Intel Core i7-1165G7, T500 Laptop GPU
21725 MPixel/s -48%
HP EliteBook 865 G9
AMD Ryzen 7 PRO 6850U, Radeon 680M
19707 MPixel/s -52%

System Performance

Subjektiv bemerkt man die höhere Leistung bei alltäglichen Dingen nicht, im synthetischen Benchmark PCMark 10 ist die Leistung nun aber 13 % besser.

PCMark 10 / Score
Durchschnitt der Klasse Workstation
  (5488 - 8587, n=27, der letzten 2 Jahre)
6898 Points +12%
Dell Precision 5000 5470
RTX A1000 Laptop GPU, i9-12900H, Samsung PM9A1 MZVL21T0HCLR
6870 Points +11%
HP ZBook Firefly 14 G9-6B8A2EA
T550 Laptop GPU, i7-1265U, Micron 3400 1TB MTFDKBA1T0TFH
6181 Points
HP EliteBook 865 G9
Radeon 680M, R7 PRO 6850U, Samsung PM991 MZVLQ512HBLU
5873 Points -5%
Durchschnittliche Intel Core i7-1265U, NVIDIA T550 Laptop GPU
  (5488 - 6181, n=3)
5768 Points -7%
Lenovo ThinkPad P14s Gen2-20VX000GGE
T500 Laptop GPU, i7-1185G7, Toshiba XG6 KXG6AZNV1T02
5634 Points -9%
HP ZBook Firefly 14 G9-6B8A2EA
T550 Laptop GPU, i7-1265U, Micron 3400 1TB MTFDKBA1T0TFH
5488 Points -11%
HP ZBook Firefly 14 G8 2C9Q2EA
T500 Laptop GPU, i7-1165G7, Toshiba XG6 KXG60ZNV1T02
5282 Points -15%
PCMark 10 / Essentials
Dell Precision 5000 5470
RTX A1000 Laptop GPU, i9-12900H, Samsung PM9A1 MZVL21T0HCLR
10876 Points +9%
Durchschnitt der Klasse Workstation
  (9151 - 12197, n=27, der letzten 2 Jahre)
10563 Points +6%
Durchschnittliche Intel Core i7-1265U, NVIDIA T550 Laptop GPU
  (9960 - 10250, n=3)
10068 Points +1%
HP ZBook Firefly 14 G9-6B8A2EA
T550 Laptop GPU, i7-1265U, Micron 3400 1TB MTFDKBA1T0TFH
9994 Points 0%
HP ZBook Firefly 14 G9-6B8A2EA
T550 Laptop GPU, i7-1265U, Micron 3400 1TB MTFDKBA1T0TFH
9960 Points
Lenovo ThinkPad P14s Gen2-20VX000GGE
T500 Laptop GPU, i7-1185G7, Toshiba XG6 KXG6AZNV1T02
9609 Points -4%
HP EliteBook 865 G9
Radeon 680M, R7 PRO 6850U, Samsung PM991 MZVLQ512HBLU
9289 Points -7%
HP ZBook Firefly 14 G8 2C9Q2EA
T500 Laptop GPU, i7-1165G7, Toshiba XG6 KXG60ZNV1T02
8765 Points -12%
PCMark 10 / Productivity
HP ZBook Firefly 14 G9-6B8A2EA
T550 Laptop GPU, i7-1265U, Micron 3400 1TB MTFDKBA1T0TFH
9474 Points
Durchschnitt der Klasse Workstation
  (7846 - 10820, n=27, der letzten 2 Jahre)
9145 Points -3%
Lenovo ThinkPad P14s Gen2-20VX000GGE
T500 Laptop GPU, i7-1185G7, Toshiba XG6 KXG6AZNV1T02
8982 Points -5%
Durchschnittliche Intel Core i7-1265U, NVIDIA T550 Laptop GPU
  (8315 - 9474, n=3)
8784 Points -7%
HP EliteBook 865 G9
Radeon 680M, R7 PRO 6850U, Samsung PM991 MZVLQ512HBLU
8587 Points -9%
Dell Precision 5000 5470
RTX A1000 Laptop GPU, i9-12900H, Samsung PM9A1 MZVL21T0HCLR
8522 Points -10%
HP ZBook Firefly 14 G8 2C9Q2EA
T500 Laptop GPU, i7-1165G7, Toshiba XG6 KXG60ZNV1T02
8337 Points -12%
HP ZBook Firefly 14 G9-6B8A2EA
T550 Laptop GPU, i7-1265U, Micron 3400 1TB MTFDKBA1T0TFH
8315 Points -12%
PCMark 10 / Digital Content Creation
Dell Precision 5000 5470
RTX A1000 Laptop GPU, i9-12900H, Samsung PM9A1 MZVL21T0HCLR
9494 Points +40%
Durchschnitt der Klasse Workstation
  (5399 - 13947, n=27, der letzten 2 Jahre)
9339 Points +37%
HP EliteBook 865 G9
Radeon 680M, R7 PRO 6850U, Samsung PM991 MZVLQ512HBLU
6894 Points +1%
HP ZBook Firefly 14 G9-6B8A2EA
T550 Laptop GPU, i7-1265U, Micron 3400 1TB MTFDKBA1T0TFH
6793 Points
Durchschnittliche Intel Core i7-1265U, NVIDIA T550 Laptop GPU
  (5399 - 6793, n=3)
5907 Points -13%
Lenovo ThinkPad P14s Gen2-20VX000GGE
T500 Laptop GPU, i7-1185G7, Toshiba XG6 KXG6AZNV1T02
5625 Points -17%
HP ZBook Firefly 14 G8 2C9Q2EA
T500 Laptop GPU, i7-1165G7, Toshiba XG6 KXG60ZNV1T02
5476 Points -19%
HP ZBook Firefly 14 G9-6B8A2EA
T550 Laptop GPU, i7-1265U, Micron 3400 1TB MTFDKBA1T0TFH
5399 Points -21%
CrossMark / Overall
Dell Precision 5000 5470
RTX A1000 Laptop GPU, i9-12900H, Samsung PM9A1 MZVL21T0HCLR
1801 Points +13%
Durchschnitt der Klasse Workstation
  (1154 - 1972, n=27, der letzten 2 Jahre)
1728 Points +9%
HP ZBook Firefly 14 G9-6B8A2EA
T550 Laptop GPU, i7-1265U, Micron 3400 1TB MTFDKBA1T0TFH
1617 Points +2%
Durchschnittliche Intel Core i7-1265U, NVIDIA T550 Laptop GPU
  (1591 - 1623, n=3)
1610 Points +1%
HP ZBook Firefly 14 G9-6B8A2EA
T550 Laptop GPU, i7-1265U, Micron 3400 1TB MTFDKBA1T0TFH
1591 Points
Apple MacBook Pro 14 2021 M1 Pro Entry
M1 Pro 14-Core GPU, M1 Pro 8-Core, Apple SSD AP0512
1490 Points -6%
HP EliteBook 865 G9
Radeon 680M, R7 PRO 6850U, Samsung PM991 MZVLQ512HBLU
1329 Points -16%
CrossMark / Productivity
Dell Precision 5000 5470
RTX A1000 Laptop GPU, i9-12900H, Samsung PM9A1 MZVL21T0HCLR
1679 Points +8%
Durchschnitt der Klasse Workstation
  (1188 - 1842, n=27, der letzten 2 Jahre)
1650 Points +6%
HP ZBook Firefly 14 G9-6B8A2EA
T550 Laptop GPU, i7-1265U, Micron 3400 1TB MTFDKBA1T0TFH
1582 Points +2%
Durchschnittliche Intel Core i7-1265U, NVIDIA T550 Laptop GPU
  (1553 - 1592, n=3)
1576 Points +1%
HP ZBook Firefly 14 G9-6B8A2EA
T550 Laptop GPU, i7-1265U, Micron 3400 1TB MTFDKBA1T0TFH
1553 Points
HP EliteBook 865 G9
Radeon 680M, R7 PRO 6850U, Samsung PM991 MZVLQ512HBLU
1373 Points -12%
Apple MacBook Pro 14 2021 M1 Pro Entry
M1 Pro 14-Core GPU, M1 Pro 8-Core, Apple SSD AP0512
1305 Points -16%
CrossMark / Creativity
Dell Precision 5000 5470
RTX A1000 Laptop GPU, i9-12900H, Samsung PM9A1 MZVL21T0HCLR
2060 Points +20%
Durchschnitt der Klasse Workstation
  (1180 - 2248, n=27, der letzten 2 Jahre)
1916 Points +11%
Apple MacBook Pro 14 2021 M1 Pro Entry
M1 Pro 14-Core GPU, M1 Pro 8-Core, Apple SSD AP0512
1915 Points +11%
HP ZBook Firefly 14 G9-6B8A2EA
T550 Laptop GPU, i7-1265U, Micron 3400 1TB MTFDKBA1T0TFH
1744 Points +1%
Durchschnittliche Intel Core i7-1265U, NVIDIA T550 Laptop GPU
  (1723 - 1751, n=3)
1739 Points +1%
HP ZBook Firefly 14 G9-6B8A2EA
T550 Laptop GPU, i7-1265U, Micron 3400 1TB MTFDKBA1T0TFH
1723 Points
HP EliteBook 865 G9
Radeon 680M, R7 PRO 6850U, Samsung PM991 MZVLQ512HBLU
1363 Points -21%
CrossMark / Responsiveness
Dell Precision 5000 5470
RTX A1000 Laptop GPU, i9-12900H, Samsung PM9A1 MZVL21T0HCLR
1488 Points +11%
Durchschnitt der Klasse Workstation
  (990 - 1865, n=27, der letzten 2 Jahre)
1463 Points +9%
HP ZBook Firefly 14 G9-6B8A2EA
T550 Laptop GPU, i7-1265U, Micron 3400 1TB MTFDKBA1T0TFH
1376 Points +2%
Durchschnittliche Intel Core i7-1265U, NVIDIA T550 Laptop GPU
  (1344 - 1376, n=3)
1362 Points +1%
HP ZBook Firefly 14 G9-6B8A2EA
T550 Laptop GPU, i7-1265U, Micron 3400 1TB MTFDKBA1T0TFH
1344 Points
HP EliteBook 865 G9
Radeon 680M, R7 PRO 6850U, Samsung PM991 MZVLQ512HBLU
1118 Points -17%
Apple MacBook Pro 14 2021 M1 Pro Entry
M1 Pro 14-Core GPU, M1 Pro 8-Core, Apple SSD AP0512
1044 Points -22%
PCMark 10 Score
6181 Punkte
Hilfe

Grafikkarte

Nach den Updates darf die dedizierte T550-GPU von Nvidia nun 30 anstatt 20 Watt verbrauchen und in den GPU-Benchmarks liegt der Vorsprung bei 10-20 %. Damit gibt es nun auch einen klaren Vorsprung gegenüber der alten Nvidia T500. Allerdings gilt auch hier, dass die Leistung nach den letzten Updates nicht komplett stabil ist und die Ergebnisse einige Prozentpunkte niedriger ausfallen, beispielsweise wird auch der 3DMark Time-Spy-Stresstest knapp nicht bestanden.

Die höhere Leistung macht sich auch in den Gaming-Benchmarks bemerkbar, denn auch hier sehen wir je nach Titel und Einstellungen einen Vorteil von 10-20 % gegenüber unserem ursprünglichen Test.

Im Akkubetrieb wird die GPU auf 20 Watt begrenzt, hier fällt das ZBook also wieder auf den alten Stand zurück. Weitere GPU-Benchmarks sind hier gelistet.

3DMark
1920x1080 Fire Strike Graphics
Durchschnitt der Klasse Workstation
  (4816 - 35868, n=28, der letzten 2 Jahre)
16713 Points +199%
Dell Precision 5000 5470
NVIDIA RTX A1000 Laptop GPU, Intel Core i9-12900H
10914 Points +95%
HP ZBook Firefly 14 G9-6B8A2EA
NVIDIA T550 Laptop GPU, Intel Core i7-1265U
5593 Points
Durchschnittliche NVIDIA T550 Laptop GPU
  (4816 - 5593, n=3)
5100 Points -9%
HP ZBook Firefly 14 G9-6B8A2EA
NVIDIA T550 Laptop GPU, Intel Core i7-1265U
4816 Points -14%
HP ZBook Firefly 14 G8 2C9Q2EA
NVIDIA T500 Laptop GPU, Intel Core i7-1165G7
4635 Points -17%
HP EliteBook 865 G9
AMD Radeon 680M, AMD Ryzen 7 PRO 6850U
4015 Points -28%
Lenovo ThinkPad P14s Gen2-20VX000GGE
NVIDIA T500 Laptop GPU, Intel Core i7-1185G7
3814 Points -32%
2560x1440 Time Spy Graphics
Durchschnitt der Klasse Workstation
  (1882 - 16218, n=28, der letzten 2 Jahre)
6558 Points +191%
Dell Precision 5000 5470
NVIDIA RTX A1000 Laptop GPU, Intel Core i9-12900H
4101 Points +82%
HP ZBook Firefly 14 G9-6B8A2EA
NVIDIA T550 Laptop GPU, Intel Core i7-1265U
2252 Points
Durchschnittliche NVIDIA T550 Laptop GPU
  (1882 - 2252, n=3)
2021 Points -10%
HP ZBook Firefly 14 G8 2C9Q2EA
NVIDIA T500 Laptop GPU, Intel Core i7-1165G7
1939 Points -14%
HP ZBook Firefly 14 G9-6B8A2EA
NVIDIA T550 Laptop GPU, Intel Core i7-1265U
1882 Points -16%
Lenovo ThinkPad P14s Gen2-20VX000GGE
NVIDIA T500 Laptop GPU, Intel Core i7-1185G7
1636 Points -27%
HP EliteBook 865 G9
AMD Radeon 680M, AMD Ryzen 7 PRO 6850U
1399 Points -38%
Geekbench 5.5 - OpenCL Score
Durchschnitt der Klasse Workstation
  (4201 - 174402, n=28, der letzten 2 Jahre)
79044 Points +116%
Dell Precision 5000 5470
NVIDIA RTX A1000 Laptop GPU, Intel Core i9-12900H
52380 Points +43%
HP ZBook Firefly 14 G9-6B8A2EA
NVIDIA T550 Laptop GPU, Intel Core i7-1265U
36536 Points
Apple MacBook Pro 14 2021 M1 Pro Entry
Apple M1 Pro 14-Core GPU, Apple M1 Pro 8-Core
35173 Points -4%
Durchschnittliche NVIDIA T550 Laptop GPU
  (32530 - 36536, n=3)
34129 Points -7%
HP ZBook Firefly 14 G9-6B8A2EA
NVIDIA T550 Laptop GPU, Intel Core i7-1265U
32530 Points -11%
HP ZBook Firefly 14 G8 2C9Q2EA
NVIDIA T500 Laptop GPU, Intel Core i7-1165G7
30811 Points -16%
Lenovo ThinkPad P14s Gen2-20VX000GGE
NVIDIA T500 Laptop GPU, Intel Core i7-1185G7
30428 Points -17%
HP EliteBook 865 G9
AMD Radeon 680M, AMD Ryzen 7 PRO 6850U
21874 Points -40%
SPECviewperf 13
Solidworks (sw-04)
Durchschnitt der Klasse Workstation
  (91.8 - 227, n=27, der letzten 2 Jahre)
152.5 fps +44%
Dell Precision 5000 5470
NVIDIA RTX A1000 Laptop GPU, Intel Core i9-12900H
134.89 fps +28%
HP ZBook Firefly 14 G9-6B8A2EA
NVIDIA T550 Laptop GPU, Intel Core i7-1265U
105.68 fps
Durchschnittliche NVIDIA T550 Laptop GPU
  (95 - 105.7, n=3)
98.8 fps -7%
HP ZBook Firefly 14 G9-6B8A2EA
NVIDIA T550 Laptop GPU, Intel Core i7-1265U
95 fps -10%
HP ZBook Firefly 14 G8 2C9Q2EA
NVIDIA T500 Laptop GPU, Intel Core i7-1165G7
83.8 fps -21%
Lenovo ThinkPad P14s Gen2-20VX000GGE
NVIDIA T500 Laptop GPU, Intel Core i7-1185G7
64.9 fps -39%
Siemens NX (snx-03)
Durchschnitt der Klasse Workstation
  (48.9 - 551, n=27, der letzten 2 Jahre)
245 fps +123%
Dell Precision 5000 5470
NVIDIA RTX A1000 Laptop GPU, Intel Core i9-12900H
185.06 fps +69%
HP ZBook Firefly 14 G9-6B8A2EA
NVIDIA T550 Laptop GPU, Intel Core i7-1265U
109.67 fps
Durchschnittliche NVIDIA T550 Laptop GPU
  (95.8 - 109.7, n=3)
101.7 fps -7%
HP ZBook Firefly 14 G9-6B8A2EA
NVIDIA T550 Laptop GPU, Intel Core i7-1265U
95.8 fps -13%
HP ZBook Firefly 14 G8 2C9Q2EA
NVIDIA T500 Laptop GPU, Intel Core i7-1165G7
82.7 fps -25%
Lenovo ThinkPad P14s Gen2-20VX000GGE
NVIDIA T500 Laptop GPU, Intel Core i7-1185G7
72.2 fps -34%
Showcase (showcase-02)
Durchschnitt der Klasse Workstation
  (24.8 - 190.3, n=27, der letzten 2 Jahre)
82.4 fps +194%
Dell Precision 5000 5470
NVIDIA RTX A1000 Laptop GPU, Intel Core i9-12900H
57.85 fps +106%
HP ZBook Firefly 14 G9-6B8A2EA
NVIDIA T550 Laptop GPU, Intel Core i7-1265U
28.06 fps
Durchschnittliche NVIDIA T550 Laptop GPU
  (24.8 - 28.1, n=3)
26.1 fps -7%
HP ZBook Firefly 14 G9-6B8A2EA
NVIDIA T550 Laptop GPU, Intel Core i7-1265U
24.8 fps -12%
HP ZBook Firefly 14 G8 2C9Q2EA
NVIDIA T500 Laptop GPU, Intel Core i7-1165G7
16.01 fps -43%
Medical (medical-02)
Durchschnitt der Klasse Workstation
  (34.5 - 176.2, n=27, der letzten 2 Jahre)
93.9 fps +130%
Dell Precision 5000 5470
NVIDIA RTX A1000 Laptop GPU, Intel Core i9-12900H
62.13 fps +53%
HP ZBook Firefly 14 G9-6B8A2EA
NVIDIA T550 Laptop GPU, Intel Core i7-1265U
40.74 fps
Durchschnittliche NVIDIA T550 Laptop GPU
  (34.5 - 40.7, n=3)
37.1 fps -9%
HP ZBook Firefly 14 G9-6B8A2EA
NVIDIA T550 Laptop GPU, Intel Core i7-1265U
34.5 fps -15%
HP ZBook Firefly 14 G8 2C9Q2EA
NVIDIA T500 Laptop GPU, Intel Core i7-1165G7
31.08 fps -24%
Lenovo ThinkPad P14s Gen2-20VX000GGE
NVIDIA T500 Laptop GPU, Intel Core i7-1185G7
24.84 fps -39%
Maya (maya-05)
Durchschnitt der Klasse Workstation
  (77.5 - 449, n=27, der letzten 2 Jahre)
221 fps +152%
Dell Precision 5000 5470
NVIDIA RTX A1000 Laptop GPU, Intel Core i9-12900H
161.74 fps +85%
HP ZBook Firefly 14 G9-6B8A2EA
NVIDIA T550 Laptop GPU, Intel Core i7-1265U
87.57 fps
Durchschnittliche NVIDIA T550 Laptop GPU
  (77.5 - 87.6, n=3)
82 fps -6%
HP ZBook Firefly 14 G9-6B8A2EA
NVIDIA T550 Laptop GPU, Intel Core i7-1265U
77.5 fps -11%
HP ZBook Firefly 14 G8 2C9Q2EA
NVIDIA T500 Laptop GPU, Intel Core i7-1165G7
53.5 fps -39%
Lenovo ThinkPad P14s Gen2-20VX000GGE
NVIDIA T500 Laptop GPU, Intel Core i7-1185G7
48.47 fps -45%
Energy (energy-02)
Durchschnitt der Klasse Workstation
  (7.71 - 109.7, n=27, der letzten 2 Jahre)
41.9 fps +213%
Dell Precision 5000 5470
NVIDIA RTX A1000 Laptop GPU, Intel Core i9-12900H
25.13 fps +88%
HP ZBook Firefly 14 G9-6B8A2EA
NVIDIA T550 Laptop GPU, Intel Core i7-1265U
13.37 fps
Durchschnittliche NVIDIA T550 Laptop GPU
  (11.7 - 13.4, n=3)
12.4 fps -7%
HP ZBook Firefly 14 G9-6B8A2EA
NVIDIA T550 Laptop GPU, Intel Core i7-1265U
11.7 fps -12%
HP ZBook Firefly 14 G8 2C9Q2EA
NVIDIA T500 Laptop GPU, Intel Core i7-1165G7
8.82 fps -34%
Lenovo ThinkPad P14s Gen2-20VX000GGE
NVIDIA T500 Laptop GPU, Intel Core i7-1185G7
8.57 fps -36%
Creo (creo-02)
Durchschnitt der Klasse Workstation
  (76.8 - 398, n=26, der letzten 2 Jahre)
207 fps +128%
Dell Precision 5000 5470
NVIDIA RTX A1000 Laptop GPU, Intel Core i9-12900H
155.73 fps +72%
HP ZBook Firefly 14 G9-6B8A2EA
NVIDIA T550 Laptop GPU, Intel Core i7-1265U
90.66 fps
Durchschnittliche NVIDIA T550 Laptop GPU
  (82.4 - 90.7, n=3)
86.2 fps -5%
HP ZBook Firefly 14 G9-6B8A2EA
NVIDIA T550 Laptop GPU, Intel Core i7-1265U
82.4 fps -9%
HP ZBook Firefly 14 G8 2C9Q2EA
NVIDIA T500 Laptop GPU, Intel Core i7-1165G7
61.3 fps -32%
Lenovo ThinkPad P14s Gen2-20VX000GGE
NVIDIA T500 Laptop GPU, Intel Core i7-1185G7
55.8 fps -38%
Catia (catia-05)
Durchschnitt der Klasse Workstation
  (99.5 - 409, n=27, der letzten 2 Jahre)
232 fps +96%
Dell Precision 5000 5470
NVIDIA RTX A1000 Laptop GPU, Intel Core i9-12900H
184.4 fps +56%
HP ZBook Firefly 14 G9-6B8A2EA
NVIDIA T550 Laptop GPU, Intel Core i7-1265U
118.22 fps
Durchschnittliche NVIDIA T550 Laptop GPU
  (104 - 118.2, n=3)
110.4 fps -7%
HP ZBook Firefly 14 G9-6B8A2EA
NVIDIA T550 Laptop GPU, Intel Core i7-1265U
104 fps -12%
HP ZBook Firefly 14 G8 2C9Q2EA
NVIDIA T500 Laptop GPU, Intel Core i7-1165G7
92.7 fps -22%
Lenovo ThinkPad P14s Gen2-20VX000GGE
NVIDIA T500 Laptop GPU, Intel Core i7-1185G7
81.9 fps -31%
3ds Max (3dsmax-06)
Durchschnitt der Klasse Workstation
  (61.6 - 284, n=26, der letzten 2 Jahre)
156.9 fps +136%
Dell Precision 5000 5470
NVIDIA RTX A1000 Laptop GPU, Intel Core i9-12900H
123.69 fps +86%
HP ZBook Firefly 14 G9-6B8A2EA
NVIDIA T550 Laptop GPU, Intel Core i7-1265U
66.38 fps
Durchschnittliche NVIDIA T550 Laptop GPU
  (61.6 - 66.4, n=3)
63.7 fps -4%
HP ZBook Firefly 14 G9-6B8A2EA
NVIDIA T550 Laptop GPU, Intel Core i7-1265U
61.6 fps -7%
HP ZBook Firefly 14 G8 2C9Q2EA
NVIDIA T500 Laptop GPU, Intel Core i7-1165G7
52.6 fps -21%
Lenovo ThinkPad P14s Gen2-20VX000GGE
NVIDIA T500 Laptop GPU, Intel Core i7-1185G7
45.15 fps -32%
SPECviewperf 2020
1920x1080 Solidworks (solidworks-05)
Durchschnitt der Klasse Workstation
  (46.3 - 347, n=27, der letzten 2 Jahre)
156 fps +154%
Dell Precision 5000 5470
NVIDIA RTX A1000 Laptop GPU, Intel Core i9-12900H
108.5 fps +77%
HP ZBook Firefly 14 G9-6B8A2EA
NVIDIA T550 Laptop GPU, Intel Core i7-1265U
61.38 fps
Durchschnittliche NVIDIA T550 Laptop GPU
  (46.3 - 61.4, n=3)
54 fps -12%
HP ZBook Firefly 14 G9-6B8A2EA
NVIDIA T550 Laptop GPU, Intel Core i7-1265U
46.3 fps -25%
Lenovo ThinkPad P14s Gen2-20VX000GGE
NVIDIA T500 Laptop GPU, Intel Core i7-1185G7
37.82 fps -38%
1920x1080 Siemens NX (snx-04)
Durchschnitt der Klasse Workstation
  (48.5 - 554, n=28, der letzten 2 Jahre)
239 fps +108%
Dell Precision 5000 5470
NVIDIA RTX A1000 Laptop GPU, Intel Core i9-12900H
174.1 fps +52%
HP ZBook Firefly 14 G9-6B8A2EA
NVIDIA T550 Laptop GPU, Intel Core i7-1265U
114.82 fps
Durchschnittliche NVIDIA T550 Laptop GPU
  (84 - 114.8, n=3)
99.4 fps -13%
HP ZBook Firefly 14 G9-6B8A2EA
NVIDIA T550 Laptop GPU, Intel Core i7-1265U
84 fps -27%
Lenovo ThinkPad P14s Gen2-20VX000GGE
NVIDIA T500 Laptop GPU, Intel Core i7-1185G7
66.2 fps -42%
1920x1080 Medical (medical-03)
Durchschnitt der Klasse Workstation
  (13.5 - 97, n=28, der letzten 2 Jahre)
45.5 fps +155%
Dell Precision 5000 5470
NVIDIA RTX A1000 Laptop GPU, Intel Core i9-12900H
30.29 fps +70%
HP ZBook Firefly 14 G9-6B8A2EA
NVIDIA T550 Laptop GPU, Intel Core i7-1265U
17.87 fps
Durchschnittliche NVIDIA T550 Laptop GPU
  (13.5 - 17.9, n=3)
15.6 fps -13%
HP ZBook Firefly 14 G9-6B8A2EA
NVIDIA T550 Laptop GPU, Intel Core i7-1265U
13.5 fps -24%
Lenovo ThinkPad P14s Gen2-20VX000GGE
NVIDIA T500 Laptop GPU, Intel Core i7-1185G7
10.73 fps -40%
1920x1080 Maya (maya-06)
Durchschnitt der Klasse Workstation
  (86.9 - 460, n=28, der letzten 2 Jahre)
248 fps +126%
Dell Precision 5000 5470
NVIDIA RTX A1000 Laptop GPU, Intel Core i9-12900H
189.59 fps +73%
HP ZBook Firefly 14 G9-6B8A2EA
NVIDIA T550 Laptop GPU, Intel Core i7-1265U
109.68 fps
Durchschnittliche NVIDIA T550 Laptop GPU
  (86.9 - 109.7, n=3)
98.2 fps -10%
HP ZBook Firefly 14 G9-6B8A2EA
NVIDIA T550 Laptop GPU, Intel Core i7-1265U
86.9 fps -21%
Lenovo ThinkPad P14s Gen2-20VX000GGE
NVIDIA T500 Laptop GPU, Intel Core i7-1185G7
59.3 fps -46%
1920x1080 Energy (energy-03)
Durchschnitt der Klasse Workstation
  (6.72 - 109.7, n=28, der letzten 2 Jahre)
41.5 fps +206%
Dell Precision 5000 5470
NVIDIA RTX A1000 Laptop GPU, Intel Core i9-12900H
23.77 fps +75%
HP ZBook Firefly 14 G9-6B8A2EA
NVIDIA T550 Laptop GPU, Intel Core i7-1265U
13.56 fps
Durchschnittliche NVIDIA T550 Laptop GPU
  (10.6 - 13.6, n=3)
12.1 fps -11%
HP ZBook Firefly 14 G9-6B8A2EA
NVIDIA T550 Laptop GPU, Intel Core i7-1265U
10.6 fps -22%
Lenovo ThinkPad P14s Gen2-20VX000GGE
NVIDIA T500 Laptop GPU, Intel Core i7-1185G7
8.62 fps -36%
1920x1080 Creo (creo-03)
Durchschnitt der Klasse Workstation
  (44.5 - 169.5, n=28, der letzten 2 Jahre)
99.6 fps +118%
Dell Precision 5000 5470
NVIDIA RTX A1000 Laptop GPU, Intel Core i9-12900H
87.16 fps +91%
Durchschnittliche NVIDIA T550 Laptop GPU
  (44.5 - 48.5, n=3)
46.2 fps +1%
HP ZBook Firefly 14 G9-6B8A2EA
NVIDIA T550 Laptop GPU, Intel Core i7-1265U
45.73 fps
HP ZBook Firefly 14 G9-6B8A2EA
NVIDIA T550 Laptop GPU, Intel Core i7-1265U
44.5 fps -3%
Lenovo ThinkPad P14s Gen2-20VX000GGE
NVIDIA T500 Laptop GPU, Intel Core i7-1185G7
32.72 fps -28%
1920x1080 CATIA (catia-06)
Durchschnitt der Klasse Workstation
  (21 - 130, n=28, der letzten 2 Jahre)
66.4 fps +124%
Dell Precision 5000 5470
NVIDIA RTX A1000 Laptop GPU, Intel Core i9-12900H
47.4 fps +60%
HP ZBook Firefly 14 G9-6B8A2EA
NVIDIA T550 Laptop GPU, Intel Core i7-1265U
29.58 fps
Durchschnittliche NVIDIA T550 Laptop GPU
  (22.4 - 29.6, n=3)
25.6 fps -13%
HP ZBook Firefly 14 G9-6B8A2EA
NVIDIA T550 Laptop GPU, Intel Core i7-1265U
22.4 fps -24%
Lenovo ThinkPad P14s Gen2-20VX000GGE
NVIDIA T500 Laptop GPU, Intel Core i7-1185G7
16.48 fps -44%
1920x1080 3ds Max (3dsmax-07)
Durchschnitt der Klasse Workstation
  (28.3 - 174.7, n=28, der letzten 2 Jahre)
78.6 fps +145%
Dell Precision 5000 5470
NVIDIA RTX A1000 Laptop GPU, Intel Core i9-12900H
54.35 fps +70%
HP ZBook Firefly 14 G9-6B8A2EA
NVIDIA T550 Laptop GPU, Intel Core i7-1265U
32.03 fps
Durchschnittliche NVIDIA T550 Laptop GPU
  (28.3 - 32, n=3)
30 fps -6%
HP ZBook Firefly 14 G9-6B8A2EA
NVIDIA T550 Laptop GPU, Intel Core i7-1265U
28.3 fps -12%
Lenovo ThinkPad P14s Gen2-20VX000GGE
NVIDIA T500 Laptop GPU, Intel Core i7-1185G7
19.56 fps -39%
Blender / v3.3 Classroom HIP/AMD
HP EliteBook 865 G9
AMD Radeon 680M, AMD Ryzen 7 PRO 6850U
555 Seconds *
Durchschnitt der Klasse Workstation
  (330 - 474, n=3, der letzten 2 Jahre)
379 Seconds *
Blender / v3.3 Classroom OPTIX/RTX
HP ZBook Firefly 14 G9-6B8A2EA
NVIDIA T550 Laptop GPU, Intel Core i7-1265U
265 Seconds * -4%
Durchschnittliche NVIDIA T550 Laptop GPU
  (256 - 269, n=3)
263 Seconds * -3%
HP ZBook Firefly 14 G9-6B8A2EA
NVIDIA T550 Laptop GPU, Intel Core i7-1265U
256 Seconds *
Durchschnitt der Klasse Workstation
  (15 - 269, n=25, der letzten 2 Jahre)
65.4 Seconds * +74%
Dell Precision 5000 5470
NVIDIA RTX A1000 Laptop GPU, Intel Core i9-12900H
61 Seconds * +76%
Blender / v3.3 Classroom CUDA
HP ZBook Firefly 14 G9-6B8A2EA
NVIDIA T550 Laptop GPU, Intel Core i7-1265U
283 Seconds * -2%
Durchschnittliche NVIDIA T550 Laptop GPU
  (278 - 285, n=3)
282 Seconds * -1%
HP ZBook Firefly 14 G9-6B8A2EA
NVIDIA T550 Laptop GPU, Intel Core i7-1265U
278 Seconds *
Dell Precision 5000 5470
NVIDIA RTX A1000 Laptop GPU, Intel Core i9-12900H
112 Seconds * +60%
Durchschnitt der Klasse Workstation
  (21 - 285, n=26, der letzten 2 Jahre)
98.8 Seconds * +64%
Blender / v3.3 Classroom CPU
HP ZBook Firefly 14 G9-6B8A2EA
NVIDIA T550 Laptop GPU, Intel Core i7-1265U
1202 Seconds * -65%
Durchschnittliche NVIDIA T550 Laptop GPU
  (728 - 1326, n=3)
1085 Seconds * -49%
HP ZBook Firefly 14 G9-6B8A2EA
NVIDIA T550 Laptop GPU, Intel Core i7-1265U
728 Seconds *
HP EliteBook 865 G9
AMD Radeon 680M, AMD Ryzen 7 PRO 6850U
516 Seconds * +29%
Dell Precision 5000 5470
NVIDIA RTX A1000 Laptop GPU, Intel Core i9-12900H
448 Seconds * +38%
Durchschnitt der Klasse Workstation
  (254 - 1326, n=29, der letzten 2 Jahre)
430 Seconds * +41%

* ... kleinere Werte sind besser

Performance Rating - Percent
Durchschnitt der Klasse Workstation
 
98.8 pt
Dell Precision 5000 5470
Intel Core i9-12900H, NVIDIA RTX A1000 Laptop GPU
80.7 pt
HP ZBook Firefly 14 G9-6B8A2EA
Intel Core i7-1265U, NVIDIA T550 Laptop GPU
48.7 pt
HP ZBook Firefly 14 G8 2C9Q2EA -2!
Intel Core i7-1165G7, NVIDIA T500 Laptop GPU
47.6 pt
HP ZBook Firefly 14 G9-6B8A2EA
Intel Core i7-1265U, NVIDIA T550 Laptop GPU
46 pt
Lenovo ThinkPad P14s Gen2-20VX000GGE
Intel Core i7-1185G7, NVIDIA T500 Laptop GPU
34.3 pt
HP EliteBook 865 G9
AMD Ryzen 7 PRO 6850U, AMD Radeon 680M
26 pt
The Witcher 3 - 1920x1080 Ultra Graphics & Postprocessing (HBAO+)
Durchschnitt der Klasse Workstation
  (19.6 - 156.5, n=29, der letzten 2 Jahre)
63.4 fps +173%
Dell Precision 5000 5470
Intel Core i9-12900H, NVIDIA RTX A1000 Laptop GPU
42.7 (40min) fps +84%
HP ZBook Firefly 14 G9-6B8A2EA
Intel Core i7-1265U, NVIDIA T550 Laptop GPU
23.2 (20min, 21P1) fps
HP ZBook Firefly 14 G8 2C9Q2EA
Intel Core i7-1165G7, NVIDIA T500 Laptop GPU
21.9 fps -6%
HP ZBook Firefly 14 G9-6B8A2EA
Intel Core i7-1265U, NVIDIA T550 Laptop GPU
19.6 (18min, 18P1) fps -16%
Lenovo ThinkPad P14s Gen2-20VX000GGE
Intel Core i7-1185G7, NVIDIA T500 Laptop GPU
17 fps -27%
HP EliteBook 865 G9
AMD Ryzen 7 PRO 6850U, AMD Radeon 680M
14.3 (12min, 13P1) fps -38%
GTA V - 1920x1080 Highest Settings possible AA:4xMSAA + FX AF:16x
Durchschnitt der Klasse Workstation
  (18.3 - 124.4, n=26, der letzten 2 Jahre)
70.9 fps +140%
Dell Precision 5000 5470
Intel Core i9-12900H, NVIDIA RTX A1000 Laptop GPU
58.9 (9.57min, 38.5P1) fps +99%
HP ZBook Firefly 14 G9-6B8A2EA
Intel Core i7-1265U, NVIDIA T550 Laptop GPU
29.6 (14.9min, 17.9P1) fps
HP ZBook Firefly 14 G9-6B8A2EA
Intel Core i7-1265U, NVIDIA T550 Laptop GPU
29 (5.96min, 18.9P1) fps -2%
Lenovo ThinkPad P14s Gen2-20VX000GGE
Intel Core i7-1185G7, NVIDIA T500 Laptop GPU
19 (8.26min, 11.4P1) fps -36%
HP EliteBook 865 G9
AMD Ryzen 7 PRO 6850U, AMD Radeon 680M
11.3 (1.23min, 7.87P1) fps -62%
Final Fantasy XV Benchmark - 1920x1080 High Quality
Durchschnitt der Klasse Workstation
  (21.2 - 149.1, n=29, der letzten 2 Jahre)
63.9 fps +188%
Dell Precision 5000 5470
Intel Core i9-12900H, NVIDIA RTX A1000 Laptop GPU
43 fps +94%
HP ZBook Firefly 14 G9-6B8A2EA
Intel Core i7-1265U, NVIDIA T550 Laptop GPU
22.2 fps
HP ZBook Firefly 14 G9-6B8A2EA
Intel Core i7-1265U, NVIDIA T550 Laptop GPU
22 fps -1%
HP ZBook Firefly 14 G8 2C9Q2EA
Intel Core i7-1165G7, NVIDIA T500 Laptop GPU
16.7 fps -25%
Lenovo ThinkPad P14s Gen2-20VX000GGE
Intel Core i7-1185G7, NVIDIA T500 Laptop GPU
16.7 fps -25%
HP EliteBook 865 G9
AMD Ryzen 7 PRO 6850U, AMD Radeon 680M
14.8 fps -33%
Strange Brigade - 1920x1080 ultra AA:ultra AF:16
Durchschnitt der Klasse Workstation
  (33.2 - 283, n=27, der letzten 2 Jahre)
103.1 fps +171%
Dell Precision 5000 5470
Intel Core i9-12900H, NVIDIA RTX A1000 Laptop GPU
72.8 (53.2min, 56.3P1) fps +92%
HP ZBook Firefly 14 G9-6B8A2EA
Intel Core i7-1265U, NVIDIA T550 Laptop GPU
38 fps
HP ZBook Firefly 14 G9-6B8A2EA
Intel Core i7-1265U, NVIDIA T550 Laptop GPU
33.2 (26.1min, 27.1P1) fps -13%
Lenovo ThinkPad P14s Gen2-20VX000GGE
Intel Core i7-1185G7, NVIDIA T500 Laptop GPU
24.5 (19.1min, 20.9P1) fps -36%
HP EliteBook 865 G9
AMD Ryzen 7 PRO 6850U, AMD Radeon 680M
22 (14min, 15.9P1) fps -42%
Dota 2 Reborn - 1920x1080 ultra (3/3) best looking
Dell Precision 5000 5470
Intel Core i9-12900H, NVIDIA RTX A1000 Laptop GPU
132.1 (114.8min) fps +41%
Durchschnitt der Klasse Workstation
  (57.8 - 166.7, n=29, der letzten 2 Jahre)
122.9 fps +32%
HP ZBook Firefly 14 G9-6B8A2EA
Intel Core i7-1265U, NVIDIA T550 Laptop GPU
93.4 (82min) fps
HP ZBook Firefly 14 G9-6B8A2EA
Intel Core i7-1265U, NVIDIA T550 Laptop GPU
84 (72.5min) fps -10%
HP ZBook Firefly 14 G8 2C9Q2EA
Intel Core i7-1165G7, NVIDIA T500 Laptop GPU
77.8 (68.4min) fps -17%
Lenovo ThinkPad P14s Gen2-20VX000GGE
Intel Core i7-1185G7, NVIDIA T500 Laptop GPU
71.4 (60.6min) fps -24%
HP EliteBook 865 G9
AMD Ryzen 7 PRO 6850U, AMD Radeon 680M
48 (42.4min) fps -49%
X-Plane 11.11 - 1920x1080 high (fps_test=3)
Durchschnitt der Klasse Workstation
  (27.7 - 122.4, n=30, der letzten 2 Jahre)
79.6 fps +40%
Dell Precision 5000 5470
Intel Core i9-12900H, NVIDIA RTX A1000 Laptop GPU
76.3 fps +34%
HP ZBook Firefly 14 G9-6B8A2EA
Intel Core i7-1265U, NVIDIA T550 Laptop GPU
58.8 fps +3%
HP ZBook Firefly 14 G9-6B8A2EA
Intel Core i7-1265U, NVIDIA T550 Laptop GPU
57 fps
HP ZBook Firefly 14 G8 2C9Q2EA
Intel Core i7-1165G7, NVIDIA T500 Laptop GPU
56.4 fps -1%
Lenovo ThinkPad P14s Gen2-20VX000GGE
Intel Core i7-1185G7, NVIDIA T500 Laptop GPU
38.6 fps -32%
HP EliteBook 865 G9
AMD Ryzen 7 PRO 6850U, AMD Radeon 680M
29.3 fps -49%

Witcher 3 FPS-Diagramm

0510152025Tooltip
HP ZBook Firefly 14 G9-6B8A2EA i7-1265U, T550 Laptop GPU: Ø23.2 (20-25)
HP ZBook Firefly 14 G9-6B8A2EA i7-1265U, T550 Laptop GPU: Ø19.6 (18-21)
min. mittel hoch max.
GTA V (2015) 127.2 120.6 63.9 29.6
The Witcher 3 (2015) 139 78 43 23.2
Dota 2 Reborn (2015) 126 110.1 101.2 93.4
Final Fantasy XV Benchmark (2018) 65.7 30.5 22.2
X-Plane 11.11 (2018) 77.4 65.4 57
Strange Brigade (2018) 139 56 44 38
F1 2021 (2021) 156.6 75.4 59.9 36.8
F1 22 (2022) 69.9 63 44.6 33.4

Emissionen - ZBook jetzt mit aktiverem Lüfter

Der Lüfter ist nach dem Update etwas lauter und aktiver geworden. Hierfür sind die hohen Power Limits verantwortlich, da schon bei kurzen Lastspitzen hohe Chiptemperaturen erreicht werden. Auch im Alltag kann es daher öfter passieren, dass der Lüfter anfängt zu arbeiten. Bei reiner CPU-Last (sowohl Single- als auch Multi-Core) sind das 33 dB(A), sobald die Grafikkarte mit belastet wird, sind es mehr als 40 dB(A).

Lautstärkediagramm

Idle
23.6 / 23.6 / 23.6 dB(A)
Last
42.5 / 42.5 dB(A)
  red to green bar
 
 
30 dB
leise
40 dB(A)
deutlich hörbar
50 dB(A)
störend
 
min: dark, med: mid, max: light   Earthworks M23R, Arta (aus 15 cm gemessen)   Umgebungsgeräusche: 23.6 dB(A)
dB(A) 0102030405060708090Deep BassMiddle BassHigh BassLower RangeMidsHigher MidsLower HighsMid HighsUpper HighsSuper Highs2032.832.831.329.529.62529.831.528.630.826.93124.725.323.323.223.34030.42829.230.930.55026.723.925.125.224.86323.622.723.922.122.48020.123.224.319.218.610018.821.421.118.922.61252020.521.717.918.816017.419.92016.216.12001922.321.816.818.725018.922.523.116.617.731518.923.22415.117.440018.324.62512.116.15001925.927.510.316.763020.526.627.610.516.780020.528.929.29.318.1100021.728.728.89.418.7125021.129.130.59.320.3160022.328.731.29.919.5200021.729.130.210.118.1250022.530.53310.219.4315020.829.431.910.817400021.630.33211.218.6500020.529.331.111.616.2630018.428.33111.813.9800014.425.127.912.912.31000013.221.824.711.813.31250014.11921.212.3121600012.515.316.613.211.8SPL32.740.642.523.329.8N1.73.540.51.2median 19median 25.9median 27.6median 11.8median 17.4Delta1.83.94.51.91.7hearing rangehide median Fan NoiseHP ZBook Firefly 14 G9-6B8A2EA
HP ZBook Firefly 14 G9-6B8A2EA
T550 Laptop GPU, i7-1265U, Micron 3400 1TB MTFDKBA1T0TFH
HP ZBook Firefly 14 G9-6B8A2EA
T550 Laptop GPU, i7-1265U, Micron 3400 1TB MTFDKBA1T0TFH
HP ZBook Firefly 14 G8 2C9Q2EA
T500 Laptop GPU, i7-1165G7, Toshiba XG6 KXG60ZNV1T02
HP EliteBook 865 G9
Radeon 680M, R7 PRO 6850U, Samsung PM991 MZVLQ512HBLU
Apple MacBook Pro 14 2021 M1 Pro Entry
M1 Pro 14-Core GPU, M1 Pro 8-Core, Apple SSD AP0512
Dell Precision 5000 5470
RTX A1000 Laptop GPU, i9-12900H, Samsung PM9A1 MZVL21T0HCLR
Lenovo ThinkPad P14s Gen2-20VX000GGE
T500 Laptop GPU, i7-1185G7, Toshiba XG6 KXG6AZNV1T02
Geräuschentwicklung
3%
-8%
14%
5%
-6%
0%
aus / Umgebung *
23.6
24.3
-3%
28.7
-22%
23
3%
24.8
-5%
23
3%
24.6
-4%
Idle min *
23.6
24.3
-3%
28.7
-22%
23
3%
24.8
-5%
23.3
1%
24.6
-4%
Idle avg *
23.6
24.3
-3%
28.7
-22%
23
3%
24.8
-5%
23.3
1%
24.6
-4%
Idle max *
23.6
24.3
-3%
28.7
-22%
23
3%
24.8
-5%
23.3
1%
24.6
-4%
Last avg *
42.5
35.6
16%
34
20%
29.1
32%
27.8
35%
48.5
-14%
38.9
8%
Witcher 3 ultra *
42.5
38.2
10%
40.1
6%
29.1
32%
27.8
35%
48.6
-14%
Last max *
42.5
41
4%
40.1
6%
32.9
23%
49.5
-16%
50.4
-19%
38.9
8%

* ... kleinere Werte sind besser

Temperatur

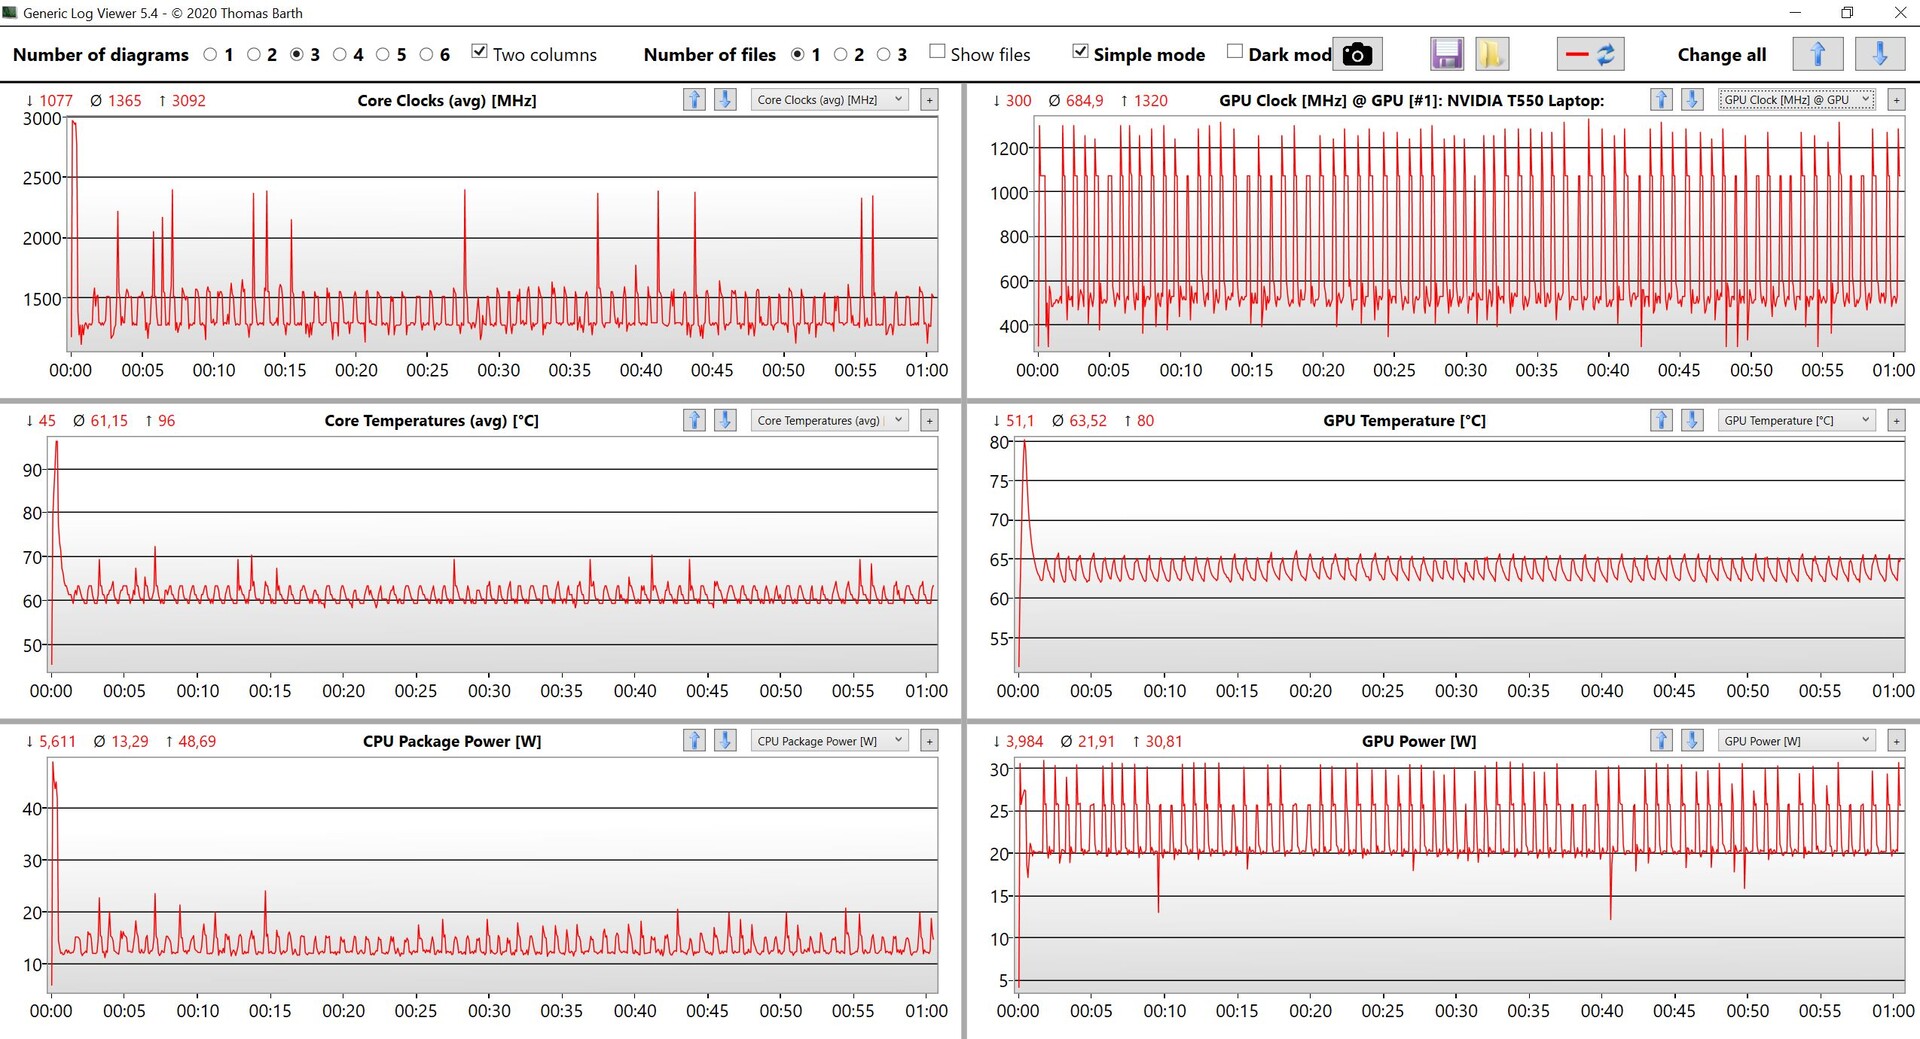
Die Oberflächentemperaturen unter Last sind praktisch gleichgeblieben, die etwas gestiegene Leistung wird also durch die höhere Lüfterdrehzahl kompensiert. Die Analyse der Leistungsdaten in unserem Stresstest zeigt aber ganz klar, dass die Leistung der beiden Komponenten keineswegs konstant, sondern schwankend ist. Hier besteht also noch Optimierungsbedarf. Im Akkubetrieb ist die Leistung mit 15 Watt für den Prozessor und 20 Watt für die GPU etwas niedriger, aber zumindest konstant.

CPU- & GPU-Daten Stresstest

Pro

+ gesteigerte Leistung nach Updates
+ hochwertiges Metallgehäuse
+ heller IPS-Bildschirm ohne PWM
+ sehr gute Eingabegeräte
+ Thunderbolt 4 & Wi-Fi 6E
+ optional mit LTE/5G
+ 2x SO-DIMM

Contra

- Leistung kann immer noch etwas schwankend sein, vor allem bei kombinierter Last
- WWAN nicht nachrüstbar
- Leistungsreduzierung im Akkubetrieb

Fazit - BIOS-Updates helfen, es besteht aber noch mehr Optimierungsbedarf

Im Test: HP ZBook Firefly 14 G9. Testgerät zur Verfügung gestellt von HP Deutschland.

Zunächst einmal ist es positiv, dass sich HP unsere Kritik im ursprünglichen Test zu Herzen genommen und daraufhin Updates veröffentlicht hat, um die Leistung zu verbessern. Allerdings sind dann im Nachgang noch weitere Updates gekommen, mit denen die CPU- und auch die GPU-Leistung wieder etwas reduziert wurden. Insgesamt hinterlässt die kompakte mobile Workstation nun aber einen deutlich besseren Gesamteindruck. Wir gehen davon aus, dass auch das größere ZBook Firefly 16 G9 mit der identischen Kühlung gleichermaßen von den Updates profitiert.

Mit den Updates hinterlässt das ZBook Firefly 14 G9 nun einen besseren Gesamteindruck und sowohl die CPU als auch die GPU können den Vorgänger jetzt distanzieren.

Neben den positiven Aspekten muss man aber auch sagen, dass die Leistung der beiden Komponenten immer noch etwas schwankend sein kann, vor allem bei gleichzeitiger Belastung der CPU und GPU. Hier besteht also weiterhin Optimierungsbedarf. Bei den anderen Vor- und Nachteilen gibt es keine Veränderungen gibt es keine Änderungen und insgesamt ist das ZBook Firefly 14 G9 jetzt eine gute kompakte Workstation.

Preis und Verfügbarkeit

Unsere Testkonfiguration des ZBook Firefly 14 G9 ist beispielsweise beim Online-Händler Cyberport für rund 2.030 Euro sofort verfügbar.

HP ZBook Firefly 14 G9-6B8A2EA - 08.01.2023 v7
Andreas Osthoff

Gehäuse
88 / 98 → 90%
Tastatur
91%
Pointing Device
96%
Konnektivität
68 / 80 → 85%
Gewicht
69 / 10-66 → 100%
Akkulaufzeit
84 / 95 → 89%
Display
89%
Leistung Spiele
76%
Leistung Anwendungen
85%
Temperatur
89 / 95 → 93%
Lautstärke
90 / 90 → 100%
Audio
83%
Kamera
43 / 85 → 51%
Durchschnitt
81%
87%
Workstation - gewichteter Durchschnitt
Weitere Informationen über unsere Bewertung finden Sie hier.

Preisvergleich

Alle 1 Beträge lesen / Antworten
static version load dynamic
Loading Comments
Diesen Artikel kommentieren / Antworten
Teilen Sie diesen Artikel, um uns zu unterstützen. Jeder Link hilft!
> Notebook Test, Laptop Test und News > Tests > Notebook Testberichte > HP ZBook Firefly 14 G9 Laptop im Test - Mobile Workstation nach Updates mit mehr Leistung
Autor: Andreas Osthoff,  8.01.2023 (Update:  8.01.2023)