Lenovo ThinkPad P16 G1 RTX A5500 Workstation Test: Schneller als der Dell Precision 7670
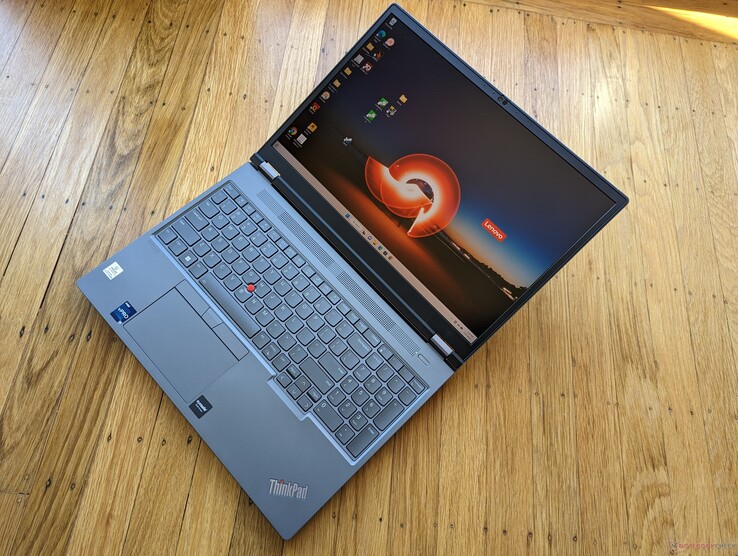
Das ThinkPad P16 G1 ist eine neue Generation von 16-Zoll-ThinkPad-Workstations, welche die bestehende 16-Zoll-Serie ThinkPad P1 übertreffen soll. Es ist mit einigen der schnellsten mobilen CPUs und Workstation-GPUs ausgestattet, die derzeit verfügbar sind, bis hin zum Core i9-12950HX bzw. RTX A5500, um eine der schnellsten mobilen Workstations auf dem Markt zu sein. Unser Gerät kostet in dieser Konfiguration etwa 9.000 US-Dollar. Natürlich sind auch niedrigere SKUs mit langsamerer integrierter UHD-Grafik oder der Intel ARC Pro A30M erhältlich, deren Startpreise bei 3.400 US-Dollar liegen.
Das Modell konkurriert direkt mit anderen mobilen High-End-Workstations und einigen Nvidia-Studio-Notebooks wie dem Dell Precision 7670, Asus ProArt StudioBook Pro 16, MSI CreatorPro Z16P oder dem HP ZBook Studio 16 G9. Lesen Sie unseren vollständigen Test der ThinkPad P16 G1 RTX A2000 Konfiguration, um mehr über die Gehäuse und andere physische Merkmale des Modells zu erfahren. Der vorliegende Test konzentriert sich darauf, was die Nutzer vom ThinkPad P16 G1 in Bezug auf die Leistung erwarten können, wenn sie es mit den höchsten CPU- und GPU-Optionen konfigurieren.
Weitere Lenovo Testberichte:
Mögliche Konkurrenten im Vergleich
Bew. | Datum | Modell | Gewicht | Dicke | Größe | Auflösung | Preis ab |
|---|---|---|---|---|---|---|---|
| 91 % v7 (old) | 02 / 2023 | Lenovo ThinkPad P16 G1 RTX A5500 i9-12950HX, RTX A5500 Laptop GPU | 3 kg | 30.23 mm | 16.00" | 3840x2400 | |
v (old) | 11 / 2021 | Asus ProArt StudioBook 16 W7600H5A-2BL2 W-11955M, RTX A5000 Laptop GPU | 2.4 kg | 21.4 mm | 16.00" | 3840x2400 | |
| 89.1 % v7 (old) | 12 / 2022 | Dell Precision 7000 7670 Performance i9-12950HX, RTX A5500 Laptop GPU | 2.8 kg | 25.95 mm | 16.00" | 3840x2400 | |
| 88.2 % v7 (old) | 01 / 2023 | Lenovo ThinkPad P16 G1 21D6001DMB i7-12850HX, RTX A2000 Laptop GPU | 3 kg | 30.23 mm | 16.00" | 2560x1600 | |
| 84.3 % v7 (old) | 11 / 2022 | MSI CreatorPro Z16P B12UKST i7-12700H, RTX A3000 Laptop GPU | 2.4 kg | 19 mm | 16.00" | 2560x1600 | |
| 90.1 % v7 (old) | 11 / 2022 | HP ZBook Studio 16 G9 62U04EA i7-12800H, RTX A2000 Laptop GPU | 1.8 kg | 19 mm | 16.00" | 3840x2400 |
Gehäuse
SD-Kartenleser
Der integrierte Kartenleser bietet nur durchschnittliche Übertragungsraten. Die Übertragung von 1 GB Bildern von unserer UHS-II-Testkarte auf den Desktop dauert etwa 14 Sekunden, während es beim Precision 7670 weniger als die Hälfte ist. Bei einer mobile High-End-Workstation wie unser ThinkPad P1 haben wir ein wenig mehr erwartet.
| SD Card Reader | |
| average JPG Copy Test (av. of 3 runs) | |
| Dell Precision 7000 7670 Performance (Toshiba Exceria Pro SDXC 64 GB UHS-II) | |
| MSI CreatorPro Z16P B12UKST (AV Pro V60) | |
| Lenovo ThinkPad P16 G1 RTX A5500 (Toshiba Exceria Pro SDXC 64 GB UHS-II) | |
| HP ZBook Studio 16 G9 62U04EA (Angelbird AV PRO V60) | |
| Asus ProArt StudioBook 16 W7600H5A-2BL2 (AV Pro SD microSD 128 GB V60) | |
| Lenovo ThinkPad P16 G1 21D6001DMB (AV Pro V60) | |
| maximum AS SSD Seq Read Test (1GB) | |
| Dell Precision 7000 7670 Performance (Toshiba Exceria Pro SDXC 64 GB UHS-II) | |
| Asus ProArt StudioBook 16 W7600H5A-2BL2 (AV Pro SD microSD 128 GB V60) | |
| MSI CreatorPro Z16P B12UKST (AV Pro V60) | |
| Lenovo ThinkPad P16 G1 RTX A5500 (Toshiba Exceria Pro SDXC 64 GB UHS-II) | |
| HP ZBook Studio 16 G9 62U04EA (Angelbird AV PRO V60) | |
| Lenovo ThinkPad P16 G1 21D6001DMB (AV Pro V60) | |
Kommunikation
| Networking | |
| iperf3 transmit AX12 | |
| Asus ProArt StudioBook 16 W7600H5A-2BL2 | |
| iperf3 receive AX12 | |
| Asus ProArt StudioBook 16 W7600H5A-2BL2 | |
| iperf3 receive AXE11000 6GHz | |
| MSI CreatorPro Z16P B12UKST | |
| HP ZBook Studio 16 G9 62U04EA | |
| Dell Precision 7000 7670 Performance | |
| Lenovo ThinkPad P16 G1 RTX A5500 | |
| iperf3 receive AXE11000 | |
| Lenovo ThinkPad P16 G1 21D6001DMB | |
| Lenovo ThinkPad P16 G1 RTX A5500 | |
| Dell Precision 7000 7670 Performance | |
| iperf3 transmit AXE11000 | |
| Lenovo ThinkPad P16 G1 RTX A5500 | |
| Lenovo ThinkPad P16 G1 21D6001DMB | |
| Dell Precision 7000 7670 Performance | |
| iperf3 transmit AXE11000 6GHz | |
| MSI CreatorPro Z16P B12UKST | |
| HP ZBook Studio 16 G9 62U04EA | |
| Lenovo ThinkPad P16 G1 RTX A5500 | |
| Dell Precision 7000 7670 Performance | |
Webcam


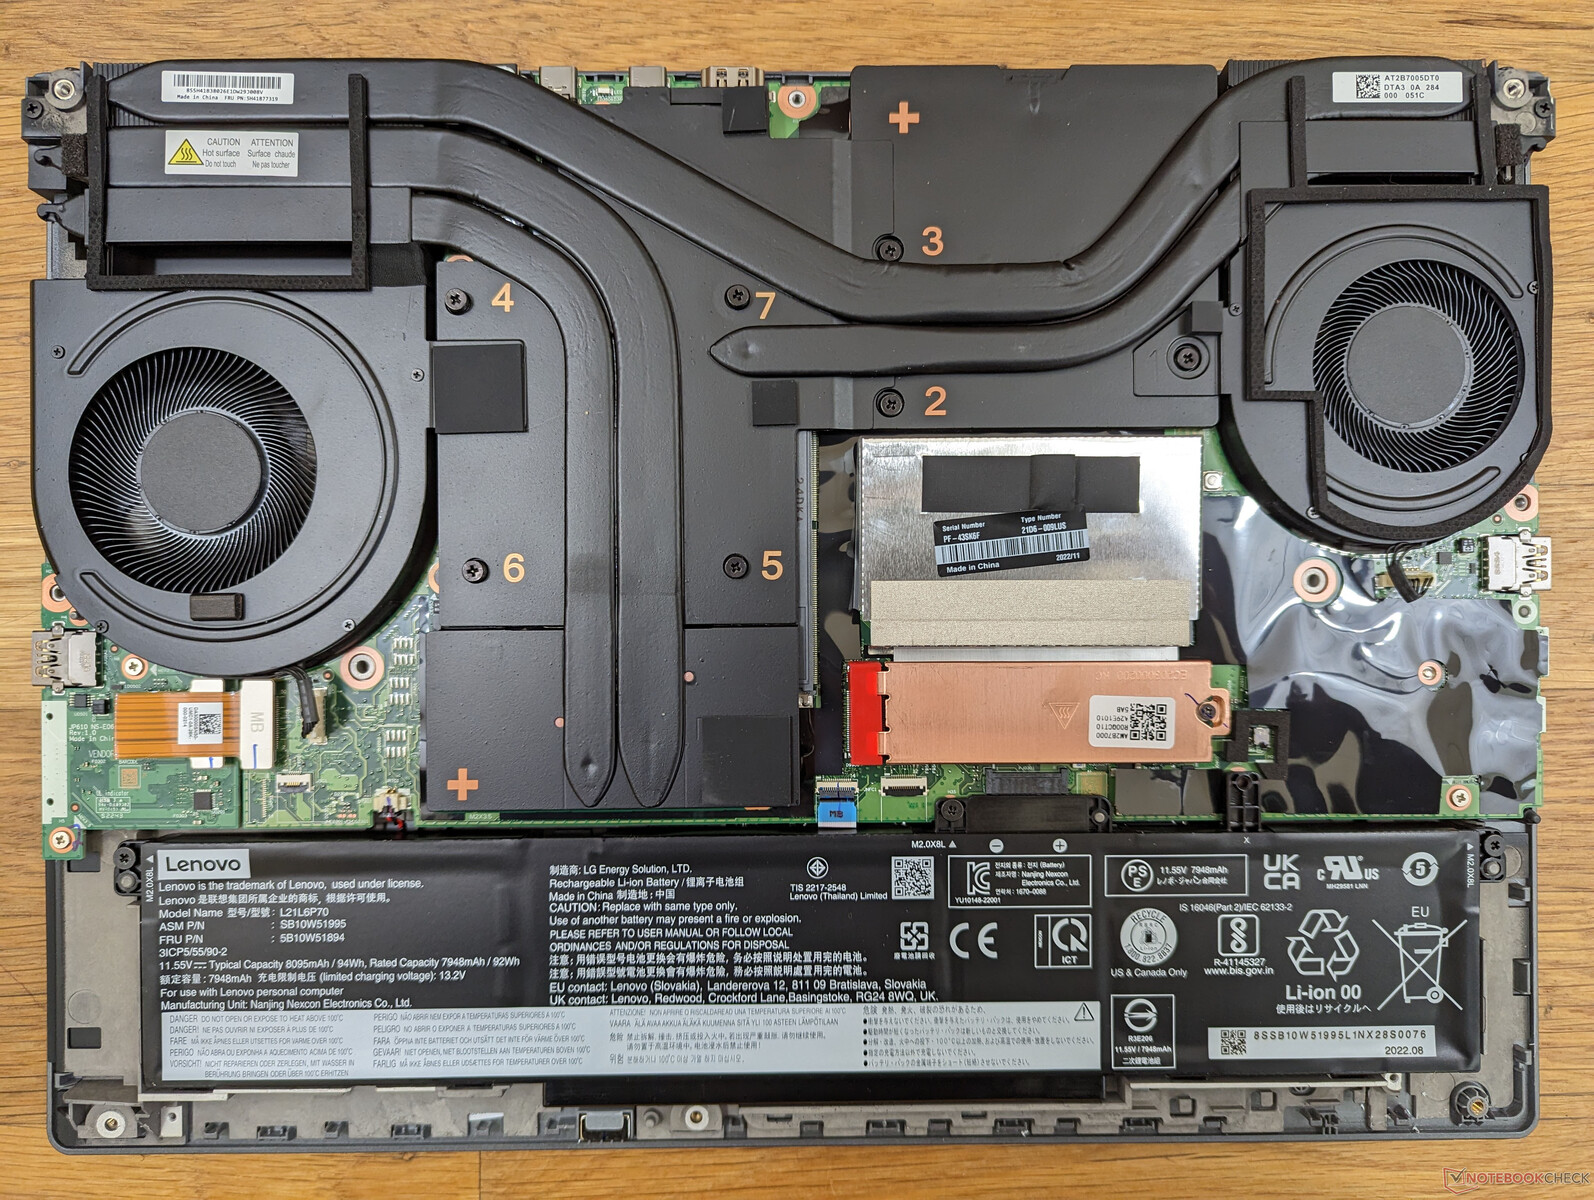
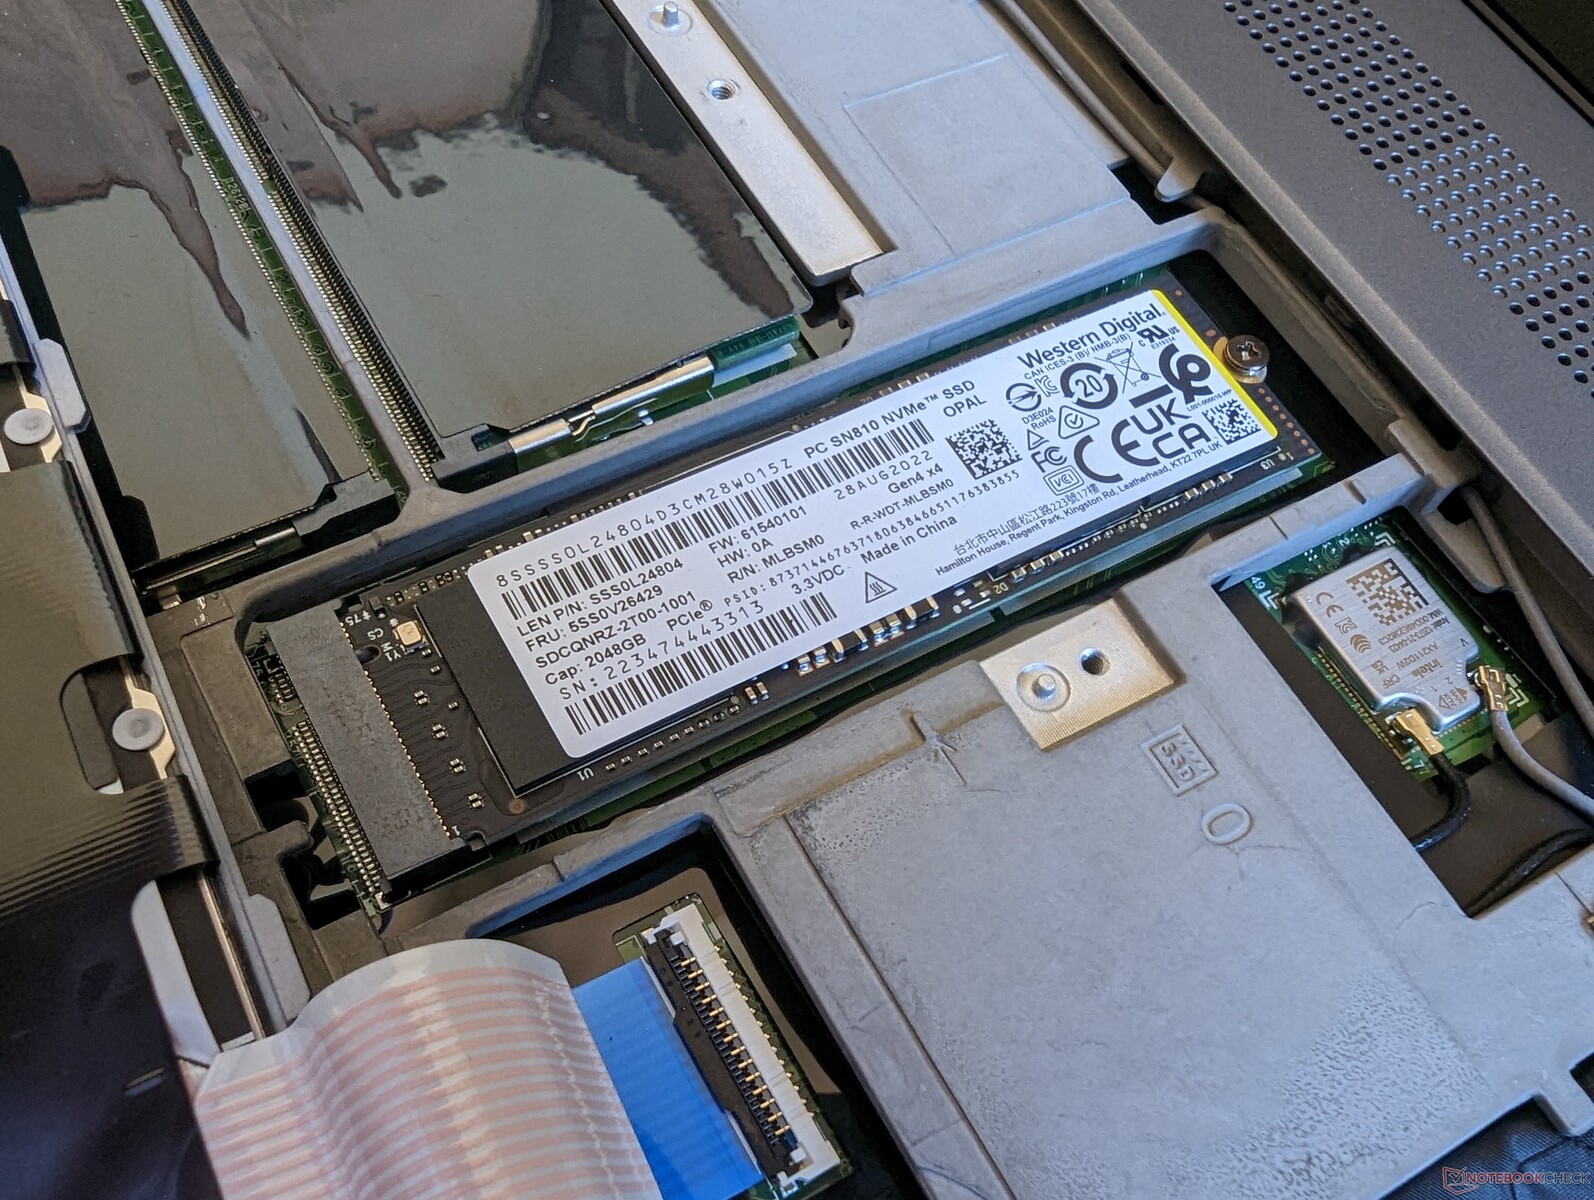
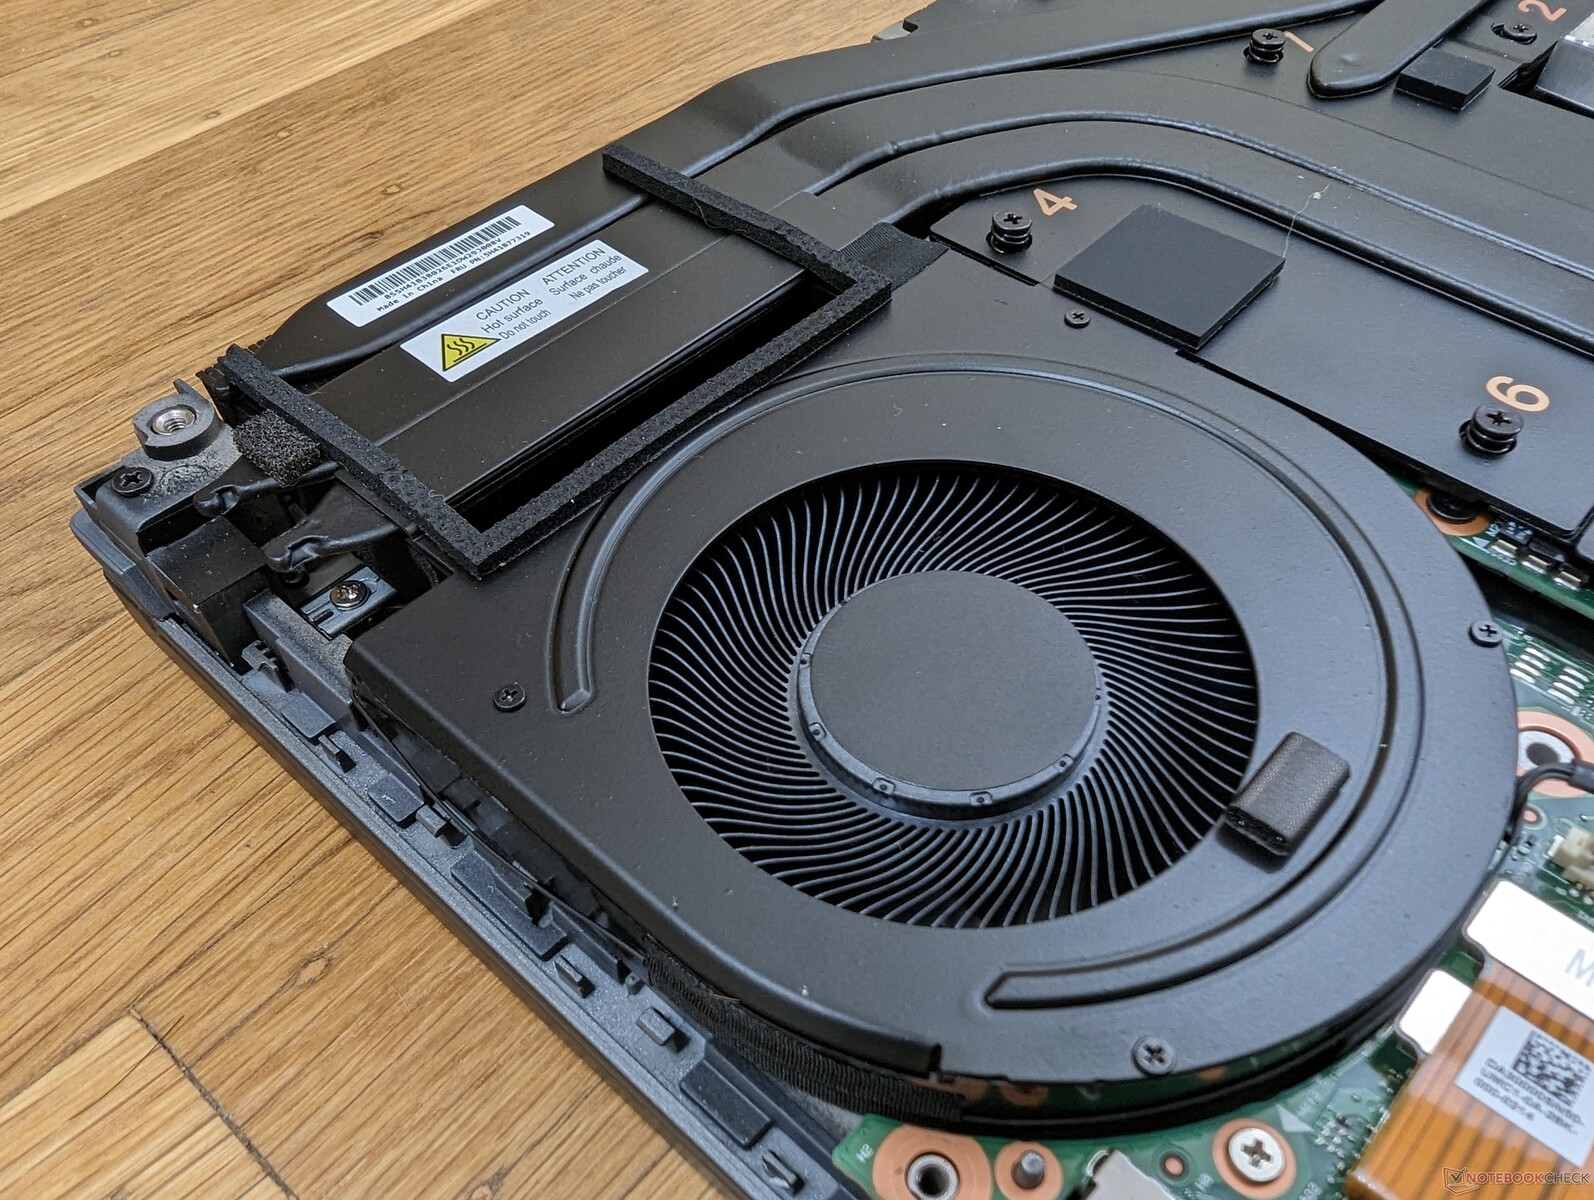
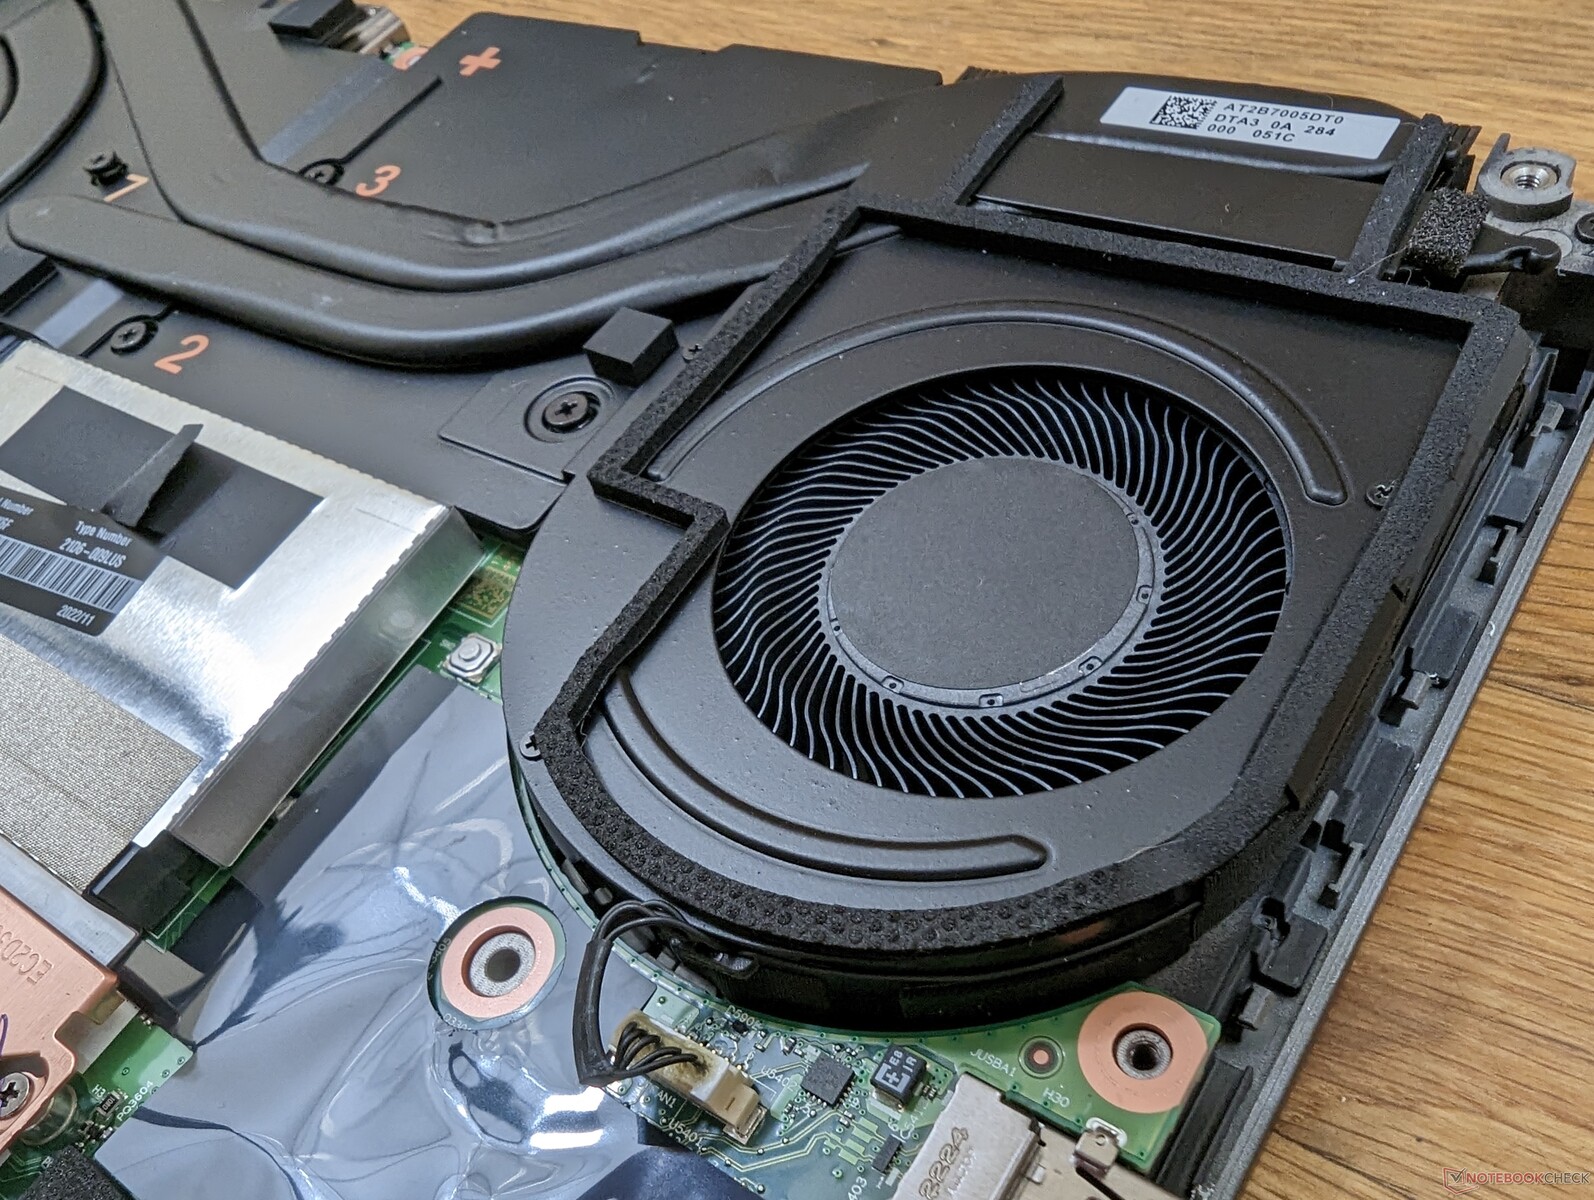
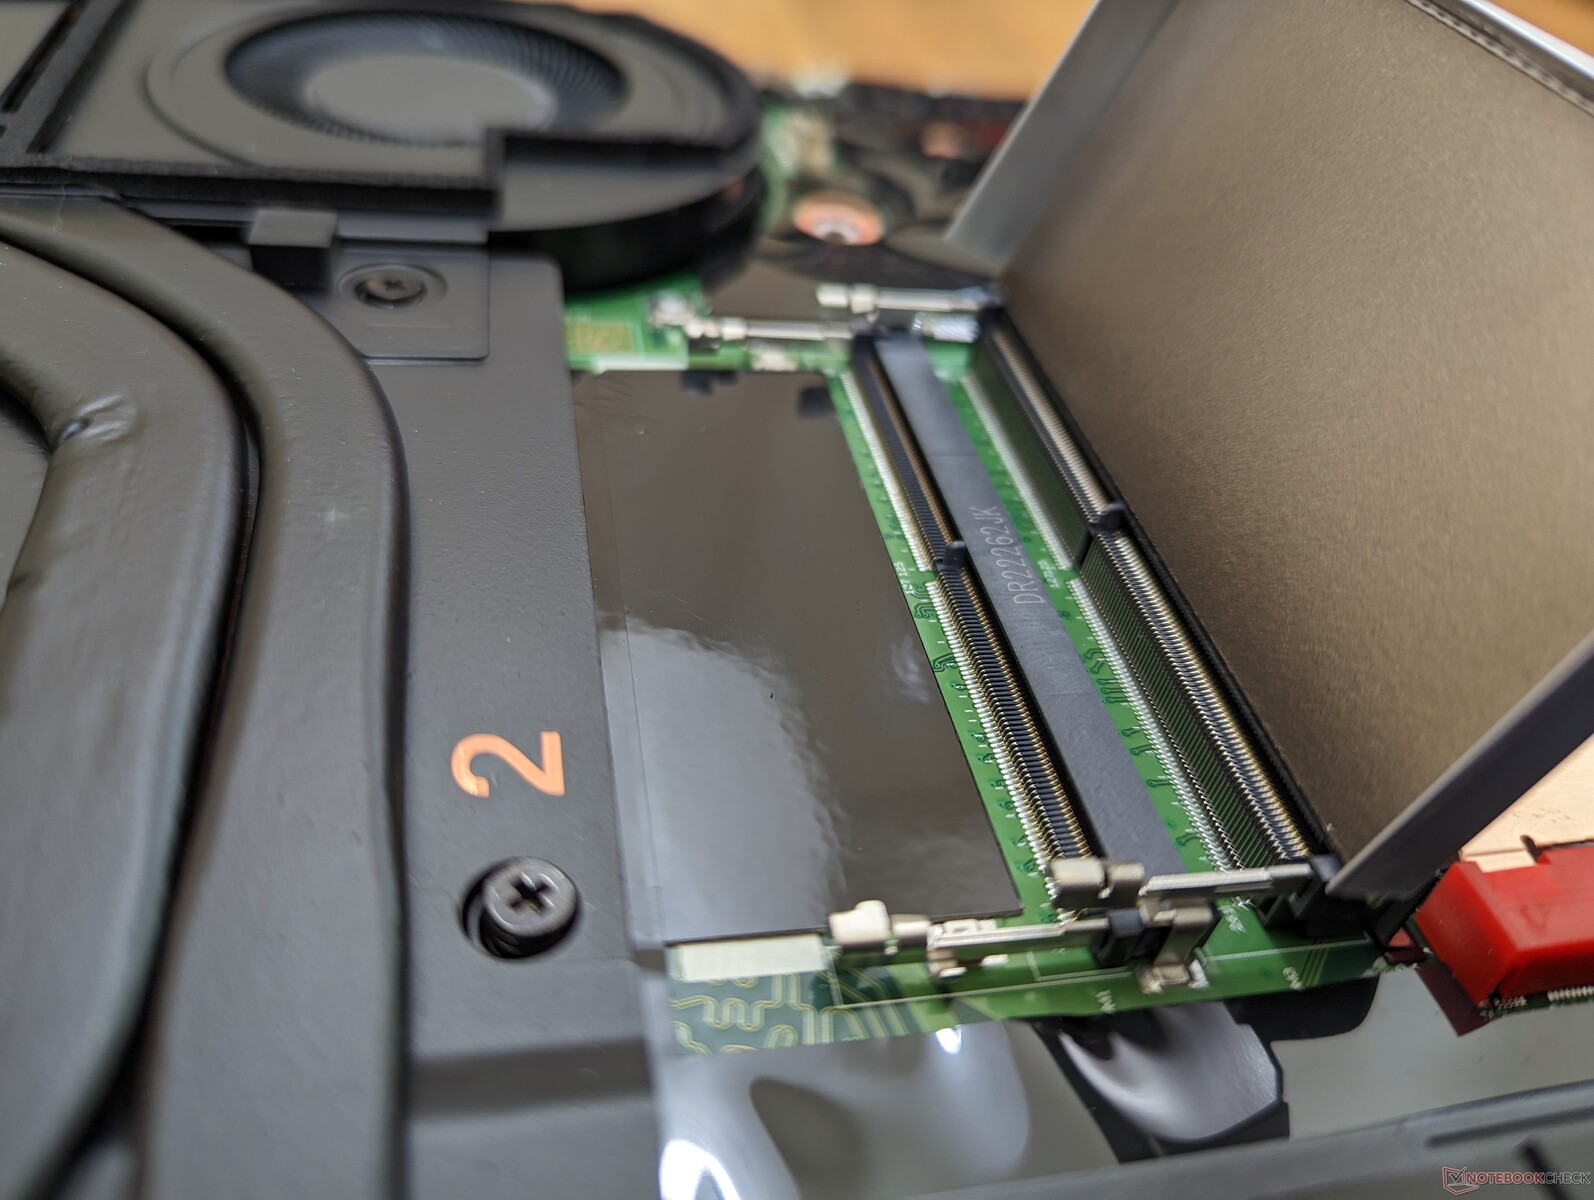
Wartung
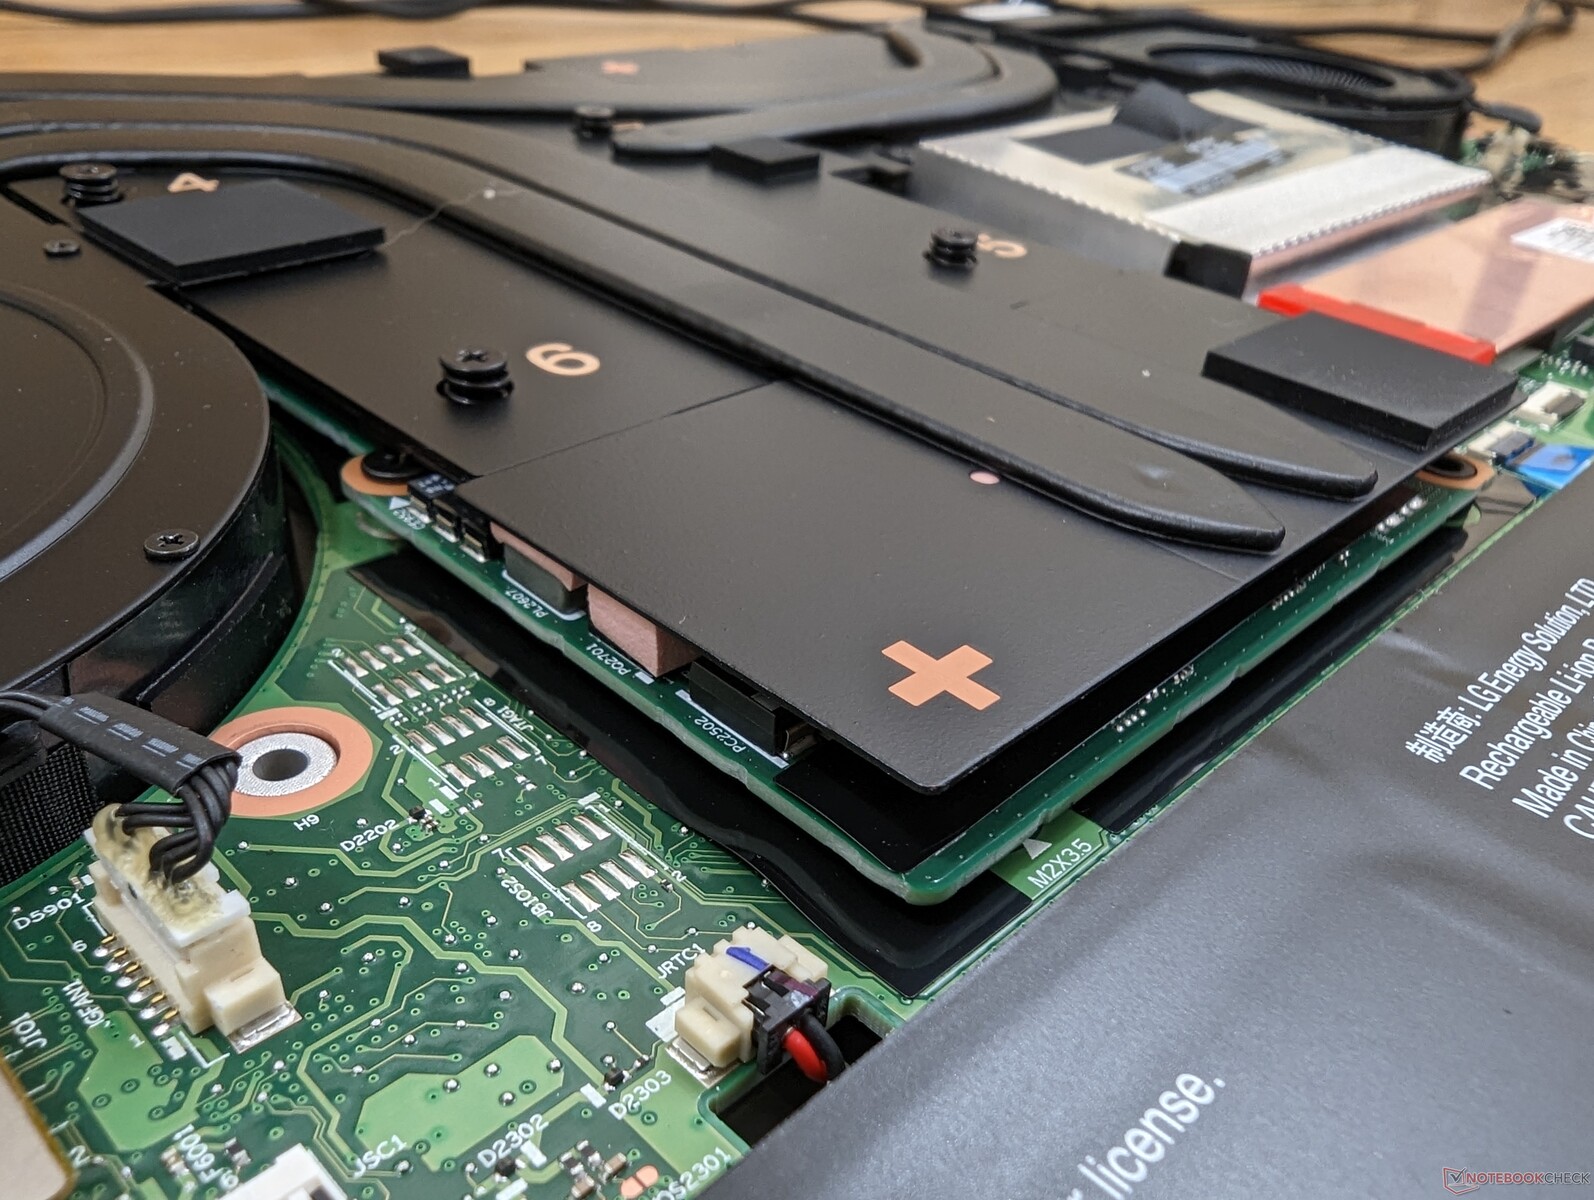
Die Bodenplatte ist mit zwölf Kreuzschlitzschrauben befestigt. Die Tastatur muss entfernt werden, um Zugriff auf das WAN-Modul, den primären M.2-SSD-Steckplatz und zwei der vier SODIMM-Steckplätze zu erhalten. Lenovo hat ein offizielles Wartungshandbuch https://download.lenovo.com/pccbbs/mobiles_pdf/p16_gen1_hmm_en.pdf für Endbenutzer zur Verfügung.
Interessanterweise ist das ThinkPad P16 G1 einer der wenigen Laptops, die mit einer herausnehmbaren GPU ausgeliefert werden. Der Austausch einer Notebook-Grafikkarte wird in der Regel nicht empfohlen, es sei denn, es handelt sich um eine Wartung oder einen Austausch.
Zubehör und Garantie
In der Verpackung befinden sich außer dem Netzteil und den Unterlagen keine weiteren Extras.
Die Garantie ist auf ein Jahr beschränkt, während das Dell Precision 7670 mit einer dreijährigen Garantie ausgeliefert wird. Lenovo bietet jedoch während der einjährigen Laufzeit bei Bedarf einen Vor-Ort-Service an.
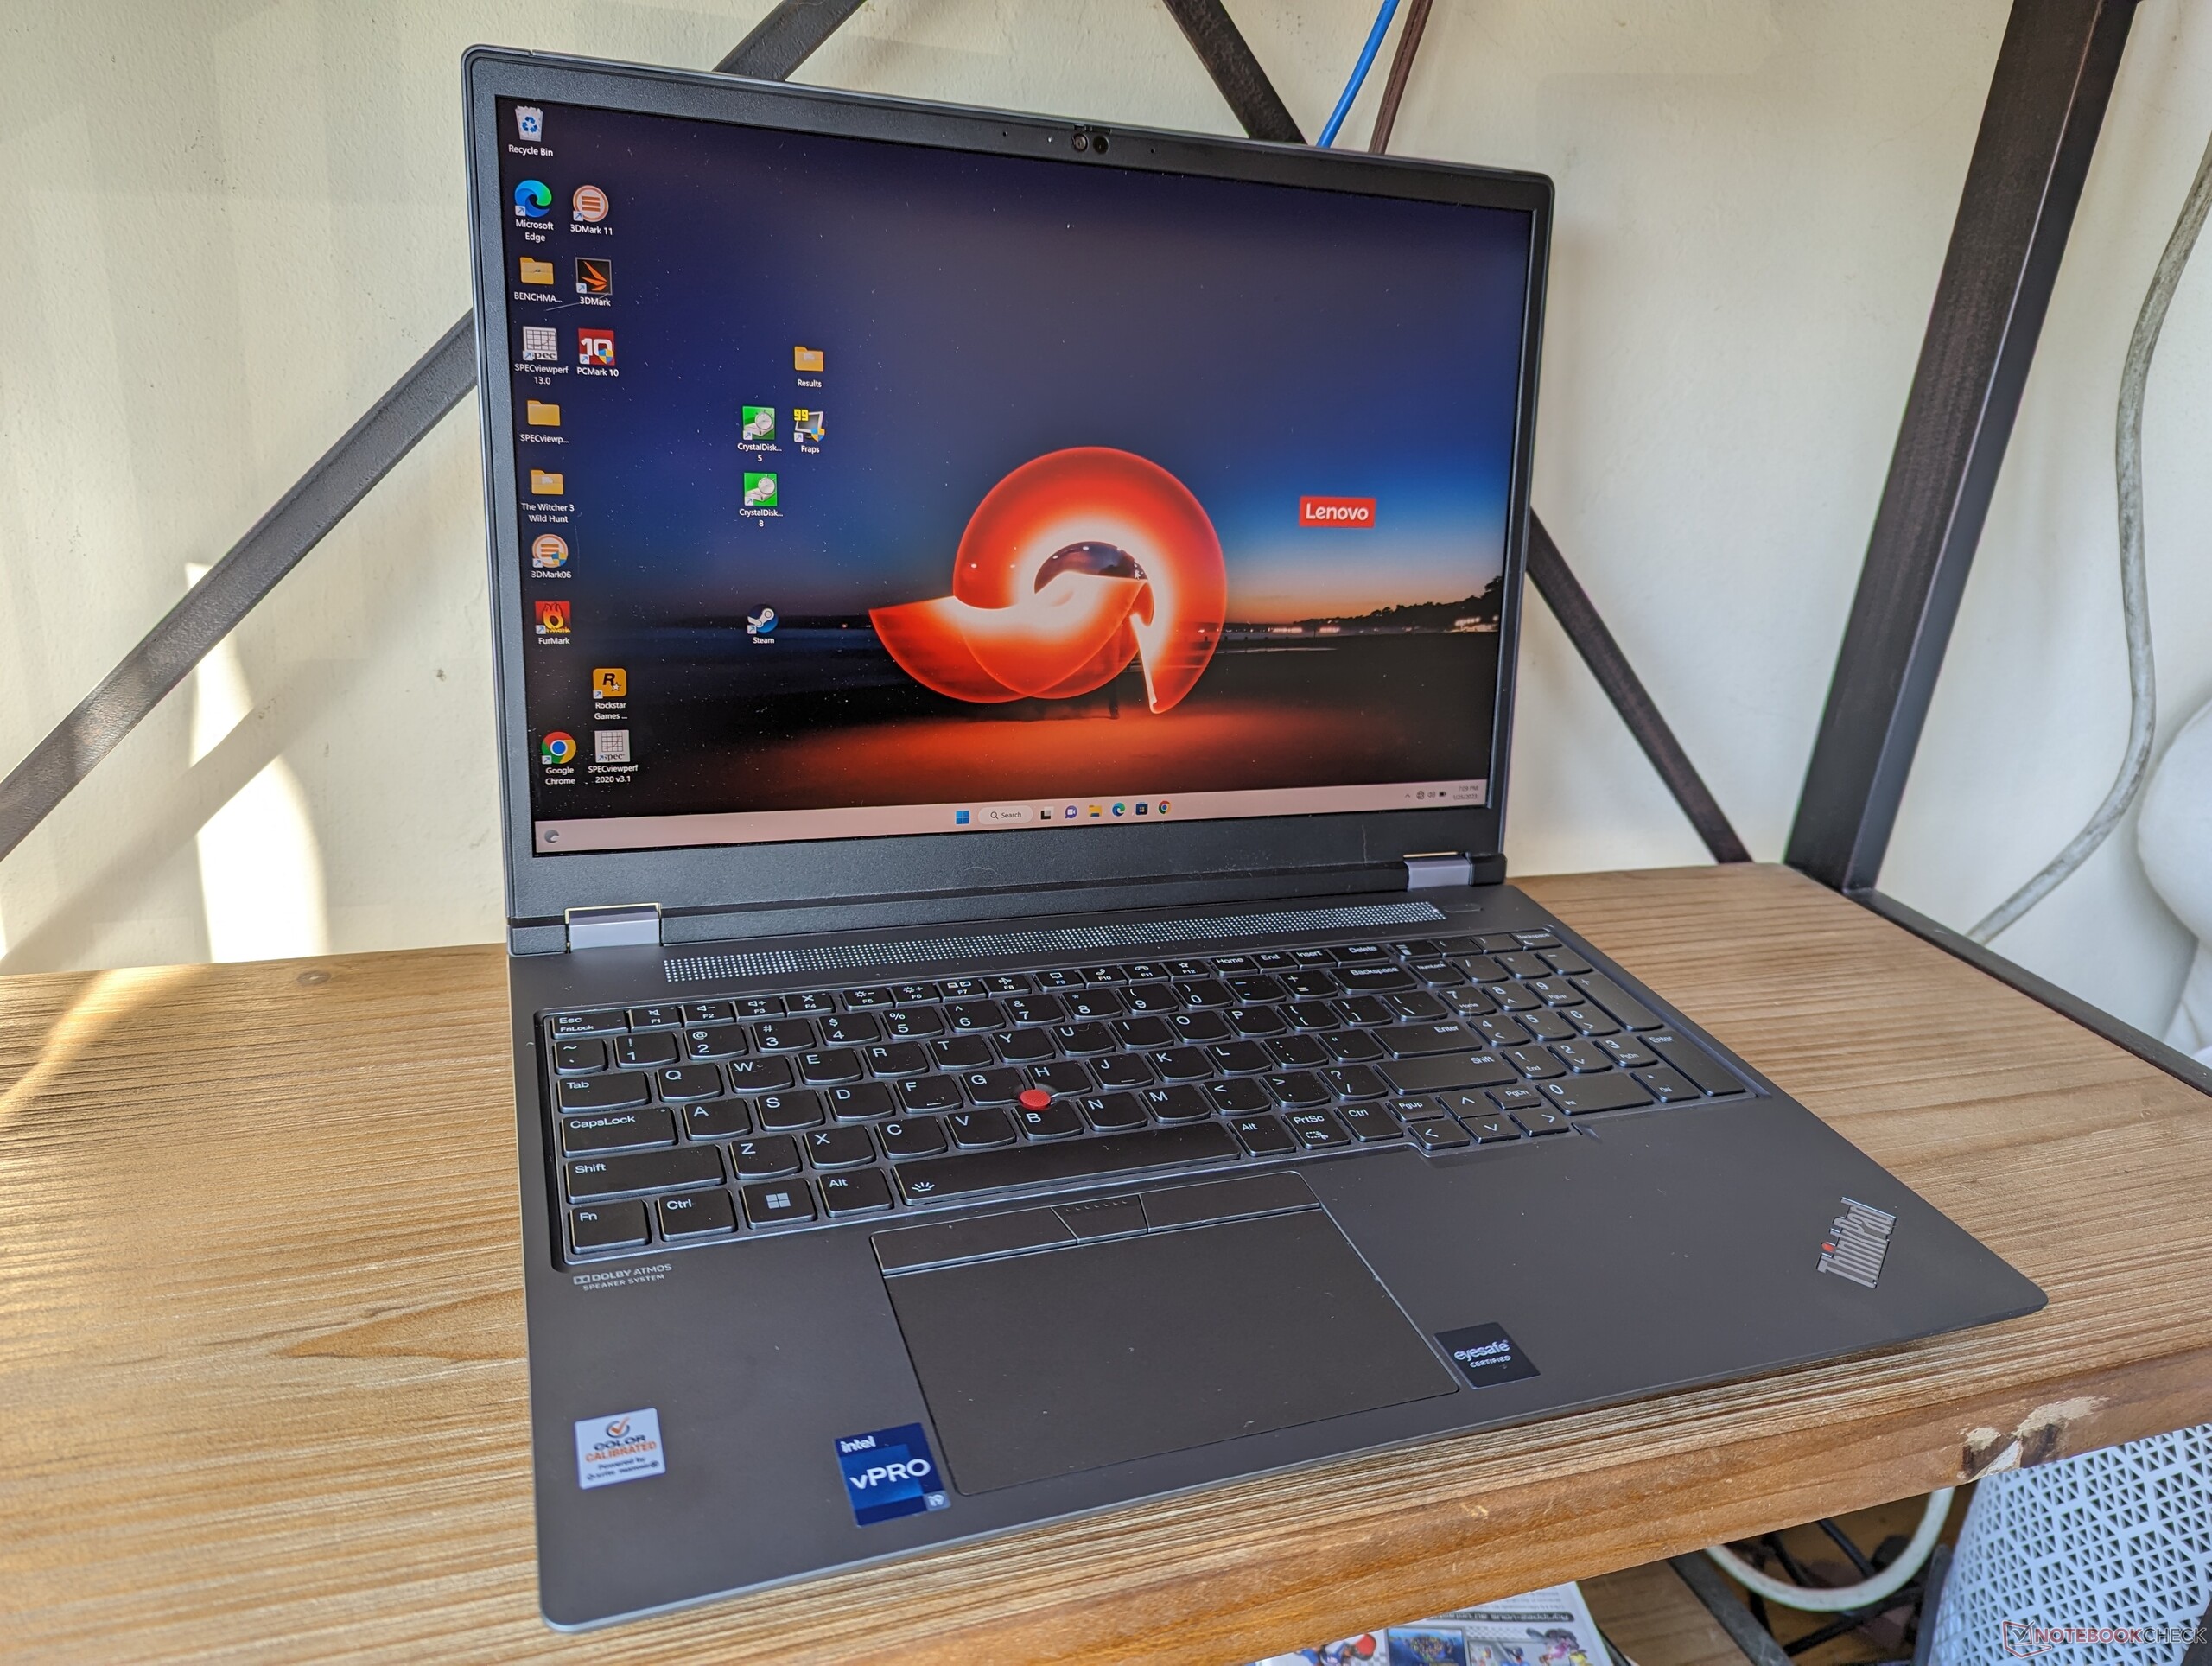
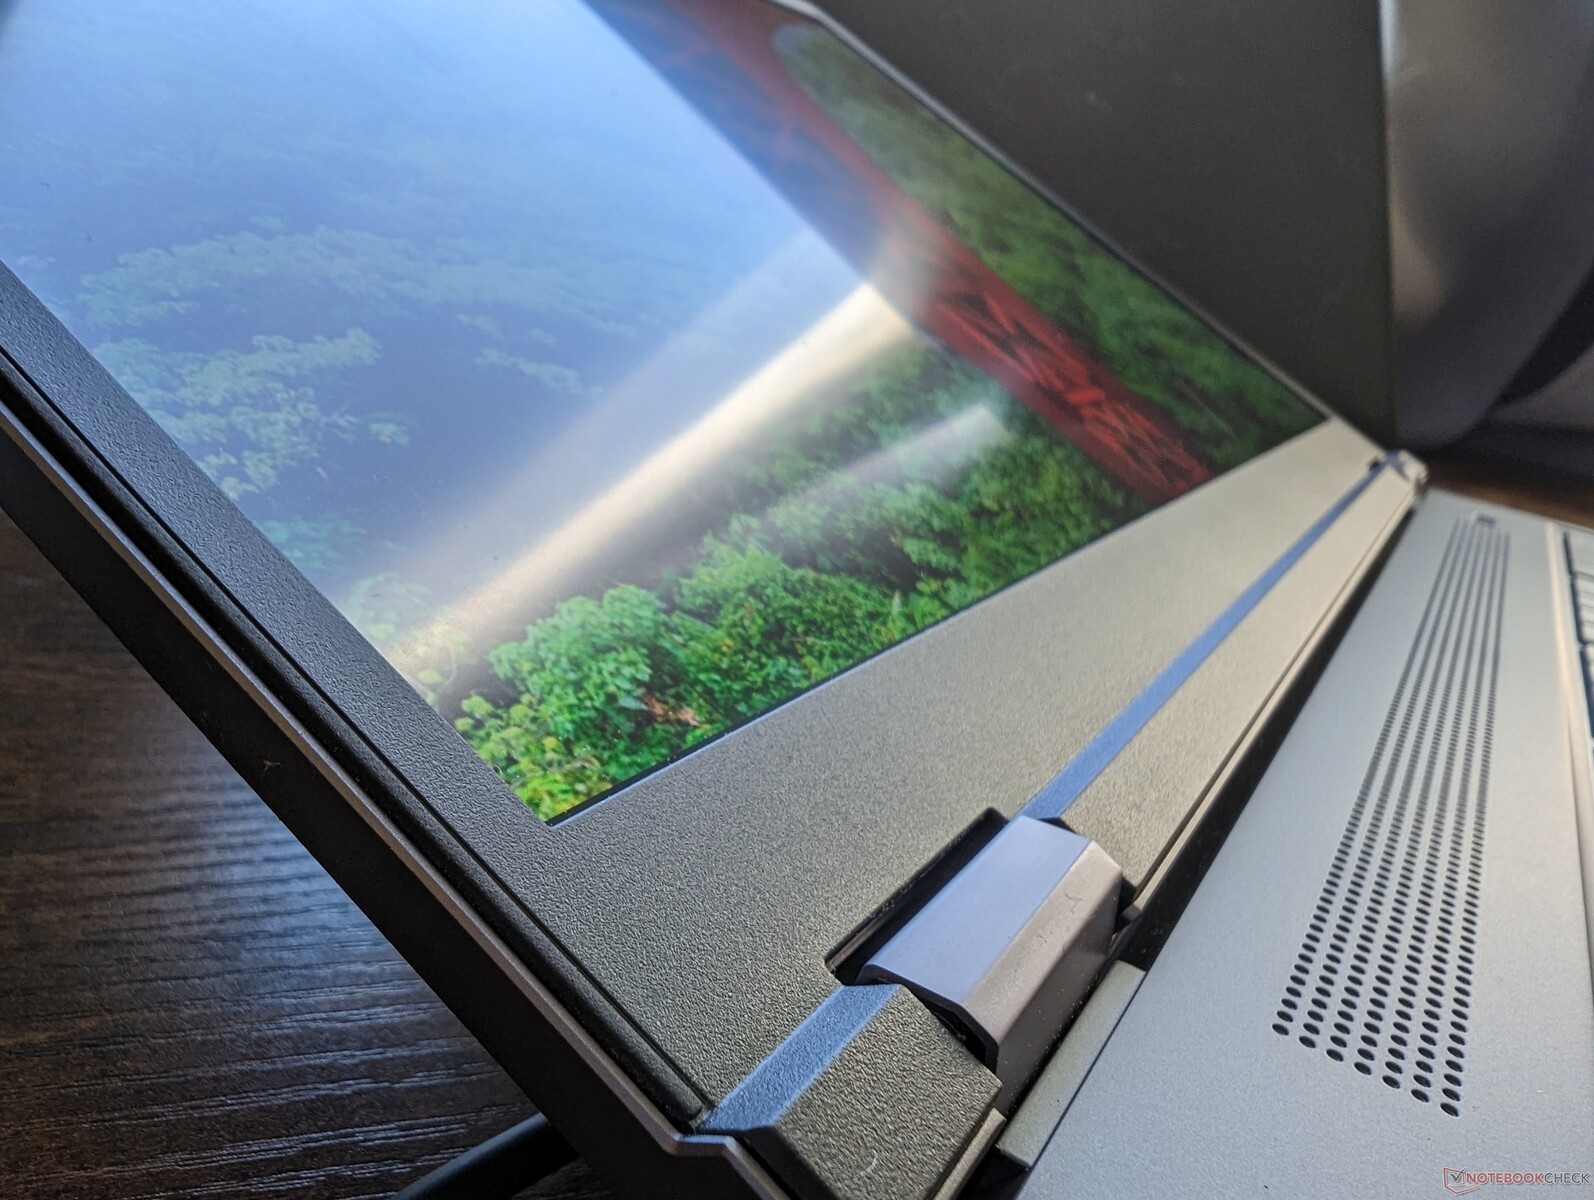
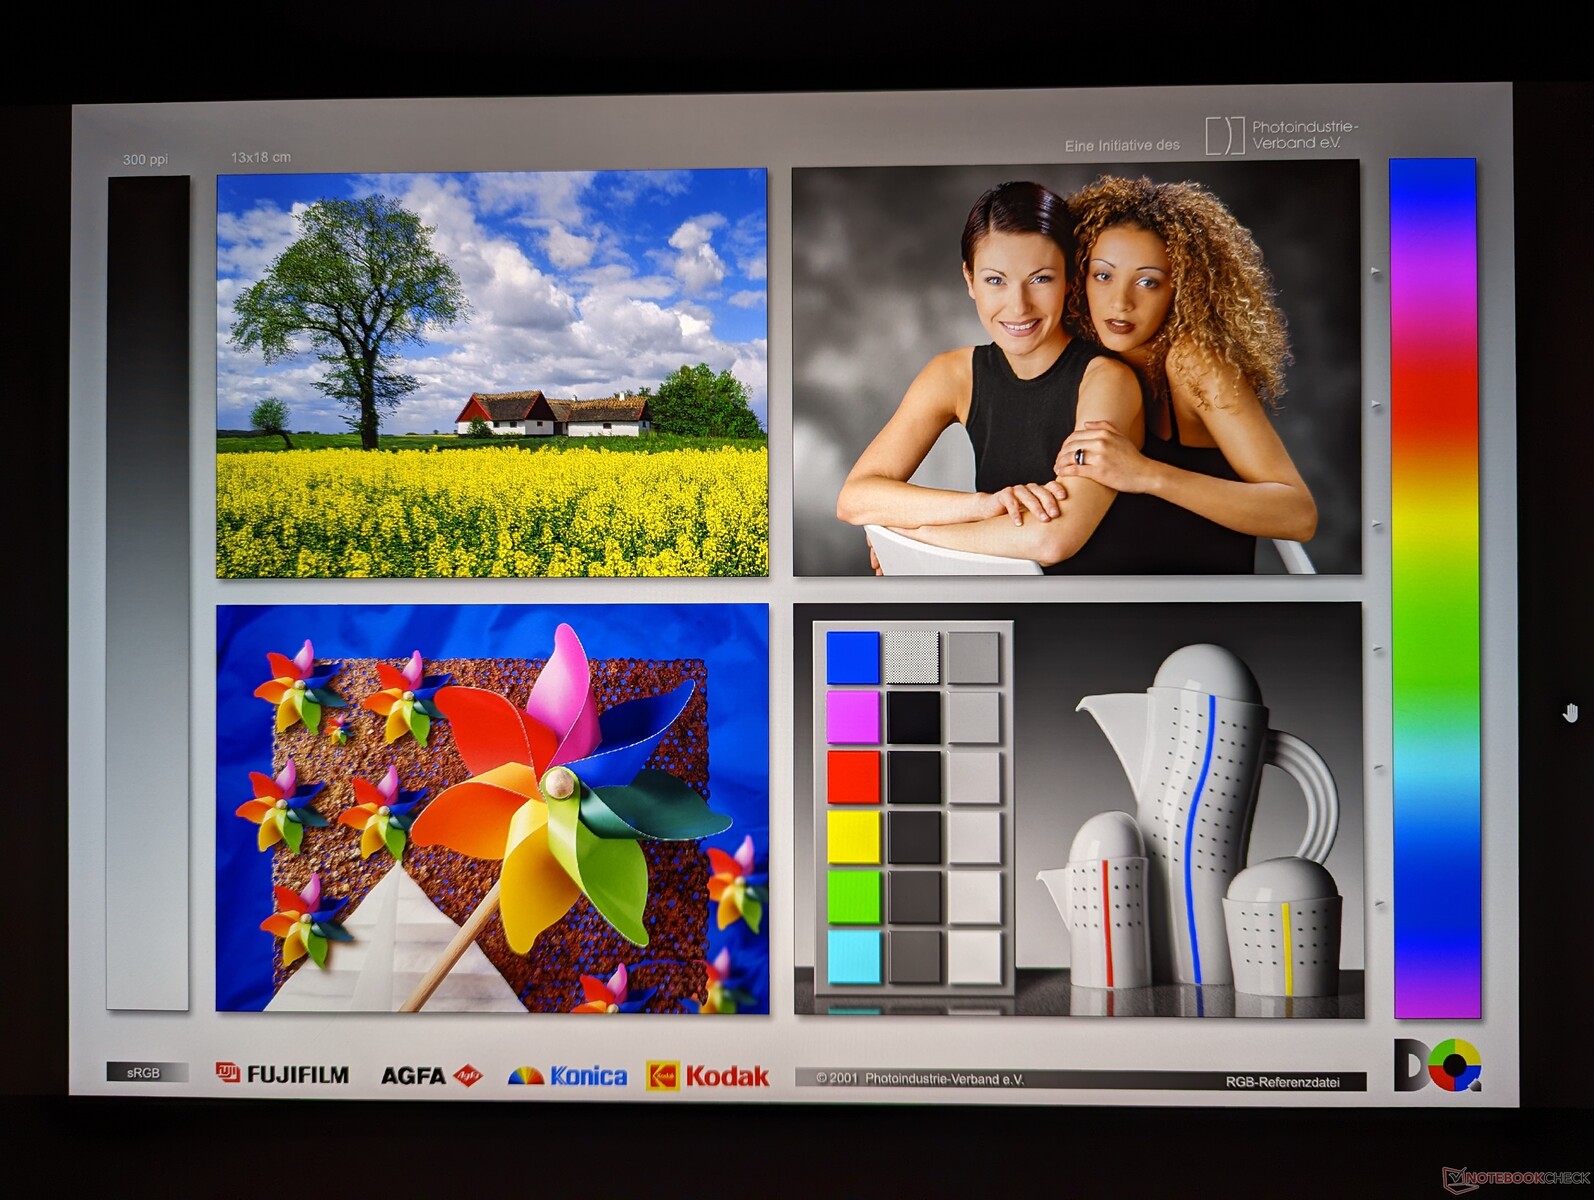
Display
Lenovo stellt vier verschiedene 60-Hz-Display-Optionen zur Wahl, die alle werkseitig nach Pantone kalibriert sind und über DC-Dimming verfügen. Unsere Messungen unten spiegeln nur die fettgedruckte Option wider, während unser zweites Gerät mit RTX-A2000-GPU mit der 1.600p-Option ausgestattet ist.
- 1.920 x 1.200, ohne Touchscreen, IPS, 300 Nits, matt, 100 % sRGB
- 2.560 x 1.600, ohne Touchscreen, IPS, 400 Nits, matt, 100 % sRGB
- 3.840 x 2.400, ohne Touchscreen, IPS, 600 Nits, matt, 100 % AdobeRGB
- 3.840 x 2.400, ohne Touchscreen, OLED, 400 Nits, glänzend, 100 % DCI-P3
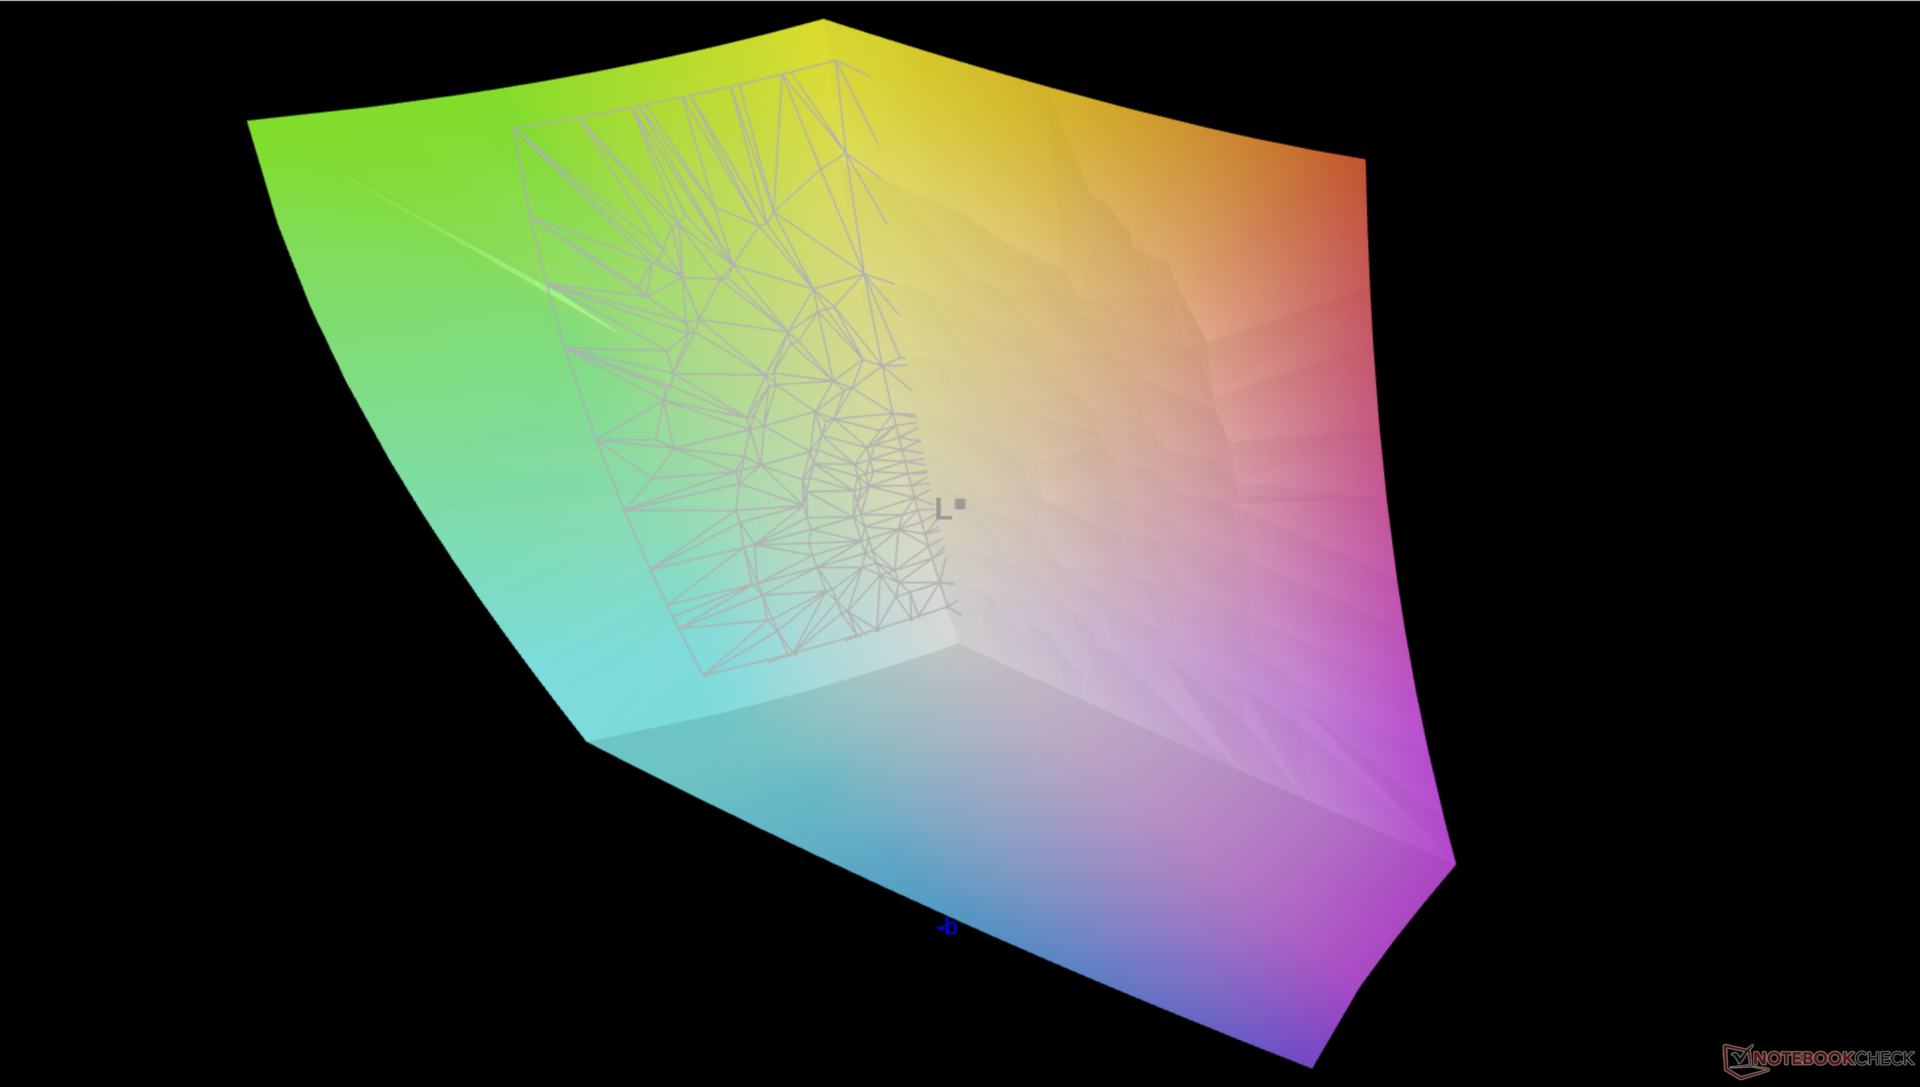
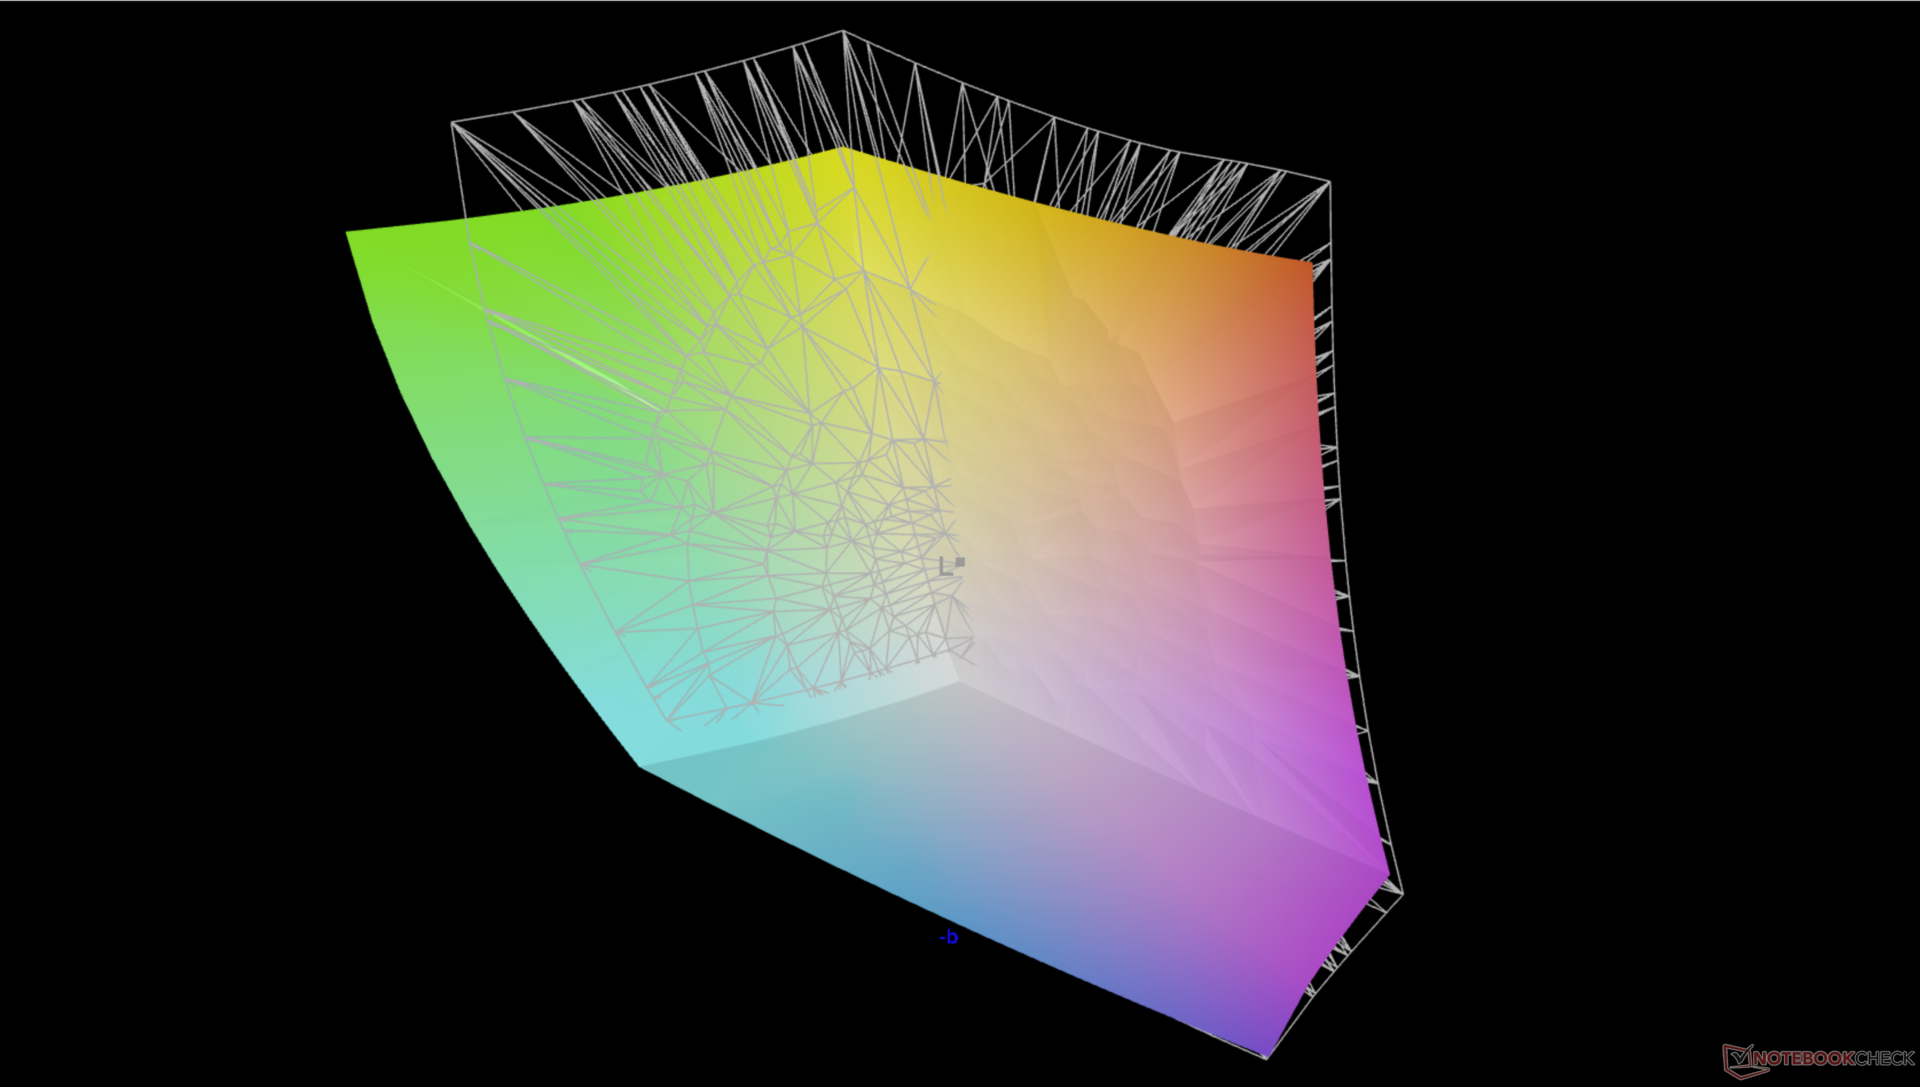
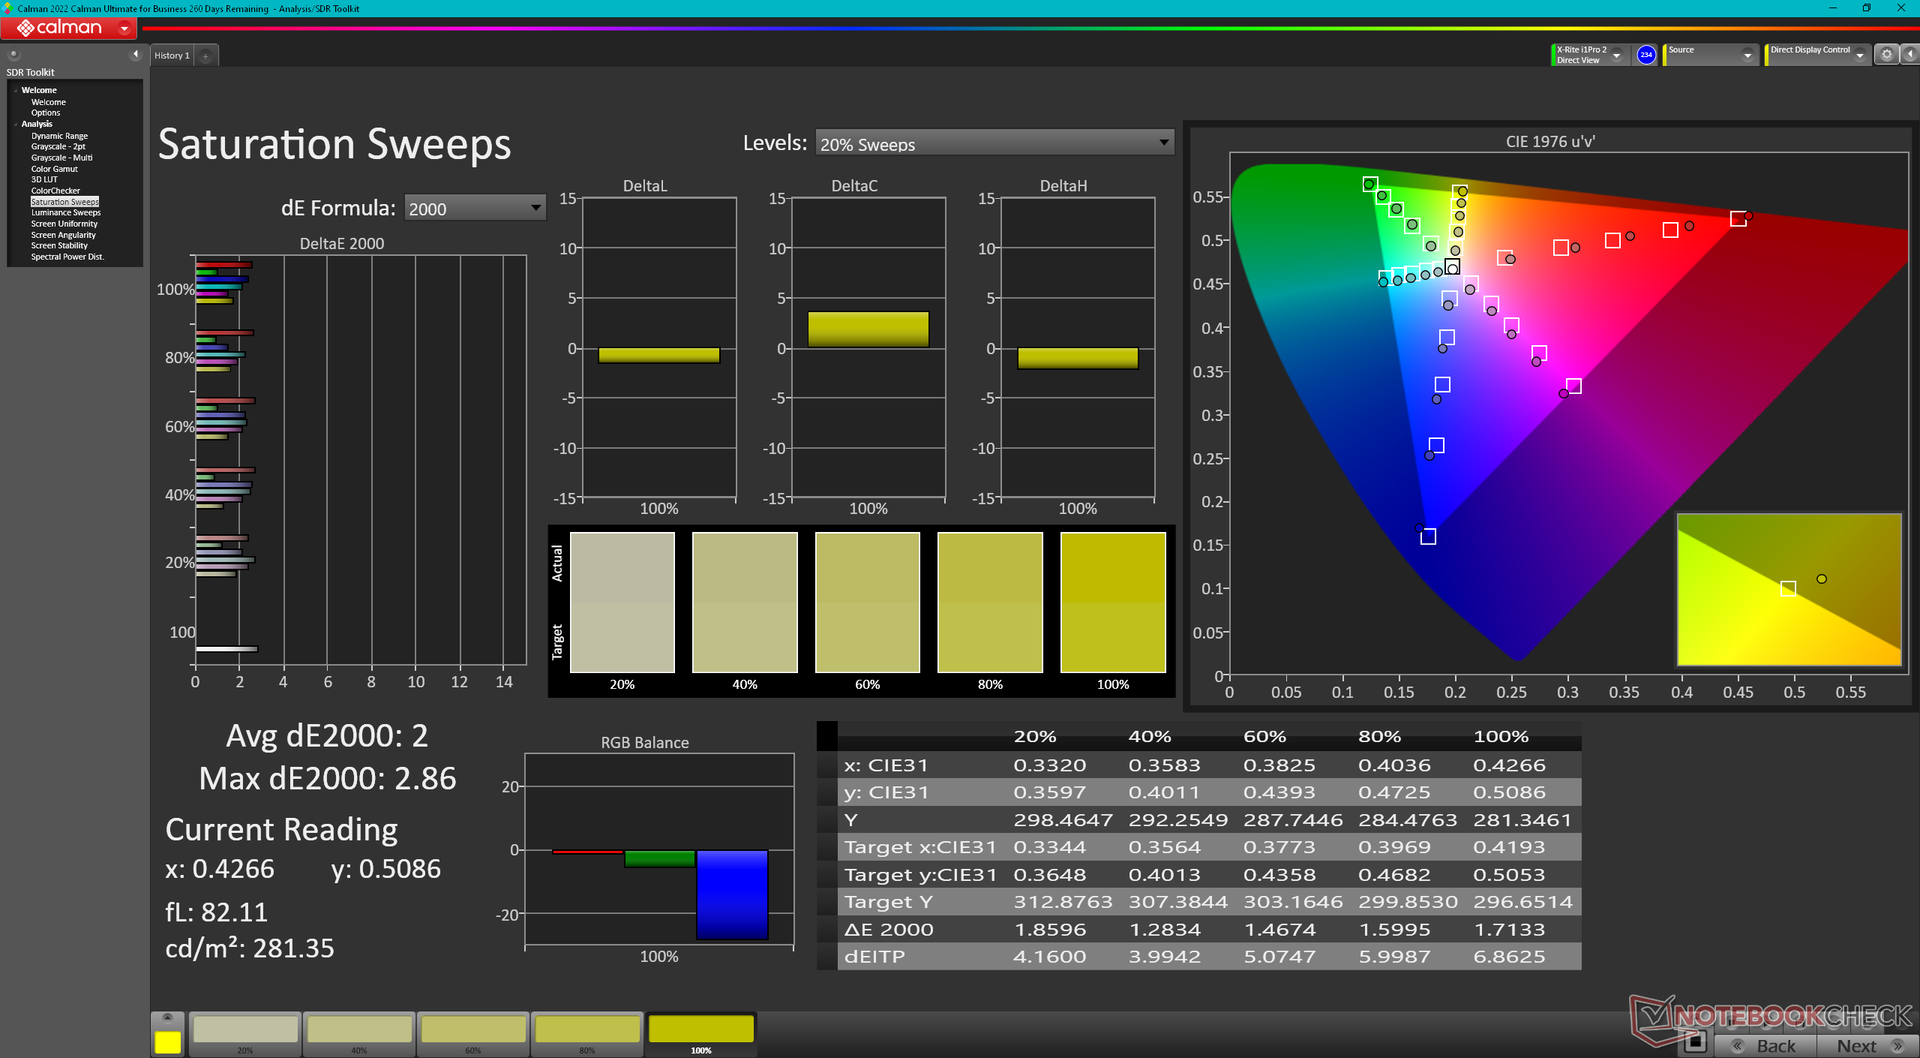
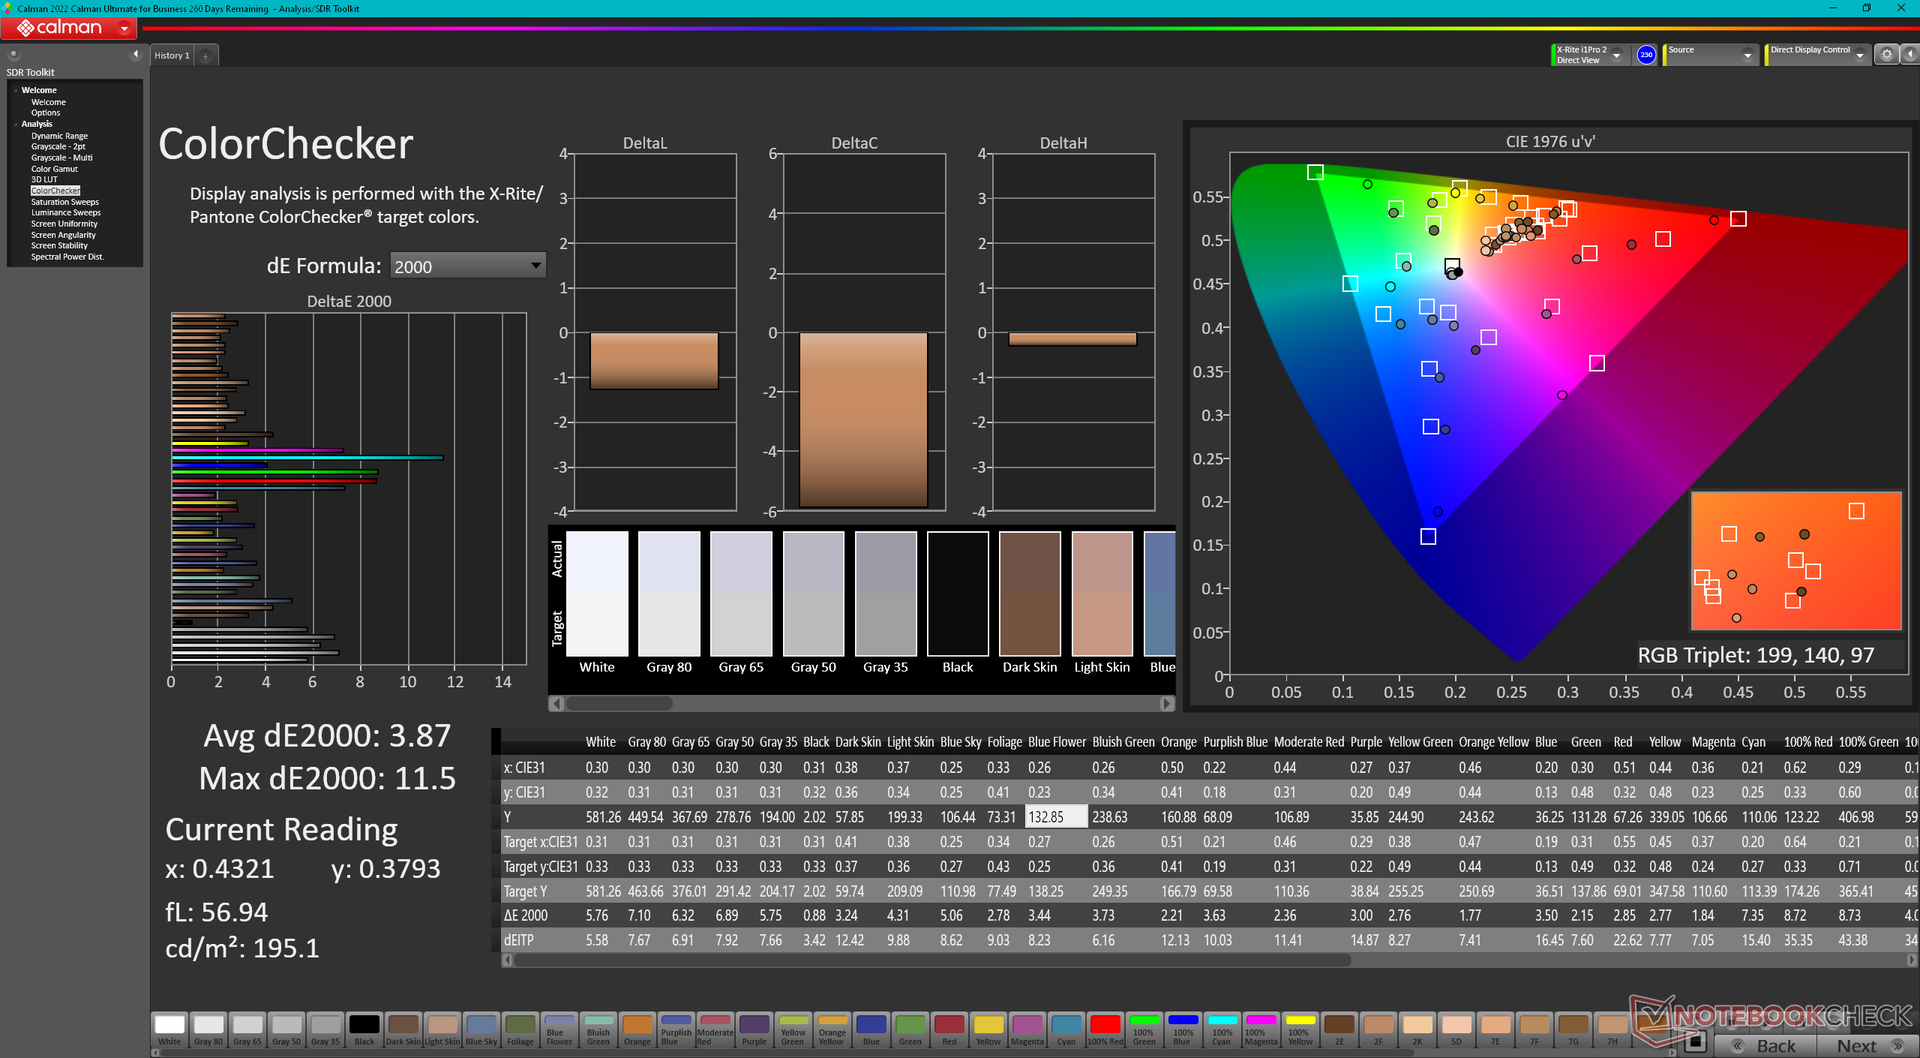
Unsere unabhängigen Messungen können die volle AdobeRGB-Abdeckung und 600-Nit-Helligkeit bestätigen. Die Helligkeitsverteilung ist jedoch trotz des 600-Nit-Ziels nur durchschnittlich. Der obere linke Quadrant unseres Displays ist beispielsweise 29 Prozent heller als der untere rechte Quadrant (642 Nits vs. 497 Nits). Die Entscheidung für ein OLED-Panel würde die Helligkeitsverteilung verbessern, aber angesichts des Preises des ThinkPad P1 G1 haben wir von unserem IPS-Panel mehr erwartet.
Es ist erwähnenswert, dass Lenovo das gleiche LP160UQ1-SPB1-IPS-Panel auf dem ThinkPad P1 G1 für seine anderen 16-Zoll-ThinkPad-Modelle verwendet, darunter dasThinkPad P1 G4 und ThinkPad X1 Extreme G4.


| |||||||||||||||||||||||||
Ausleuchtung: 77 %
Helligkeit Akku: 601.9 cd/m²
Kontrast: 1281:1 (Schwarzwert: 0.47 cd/m²)
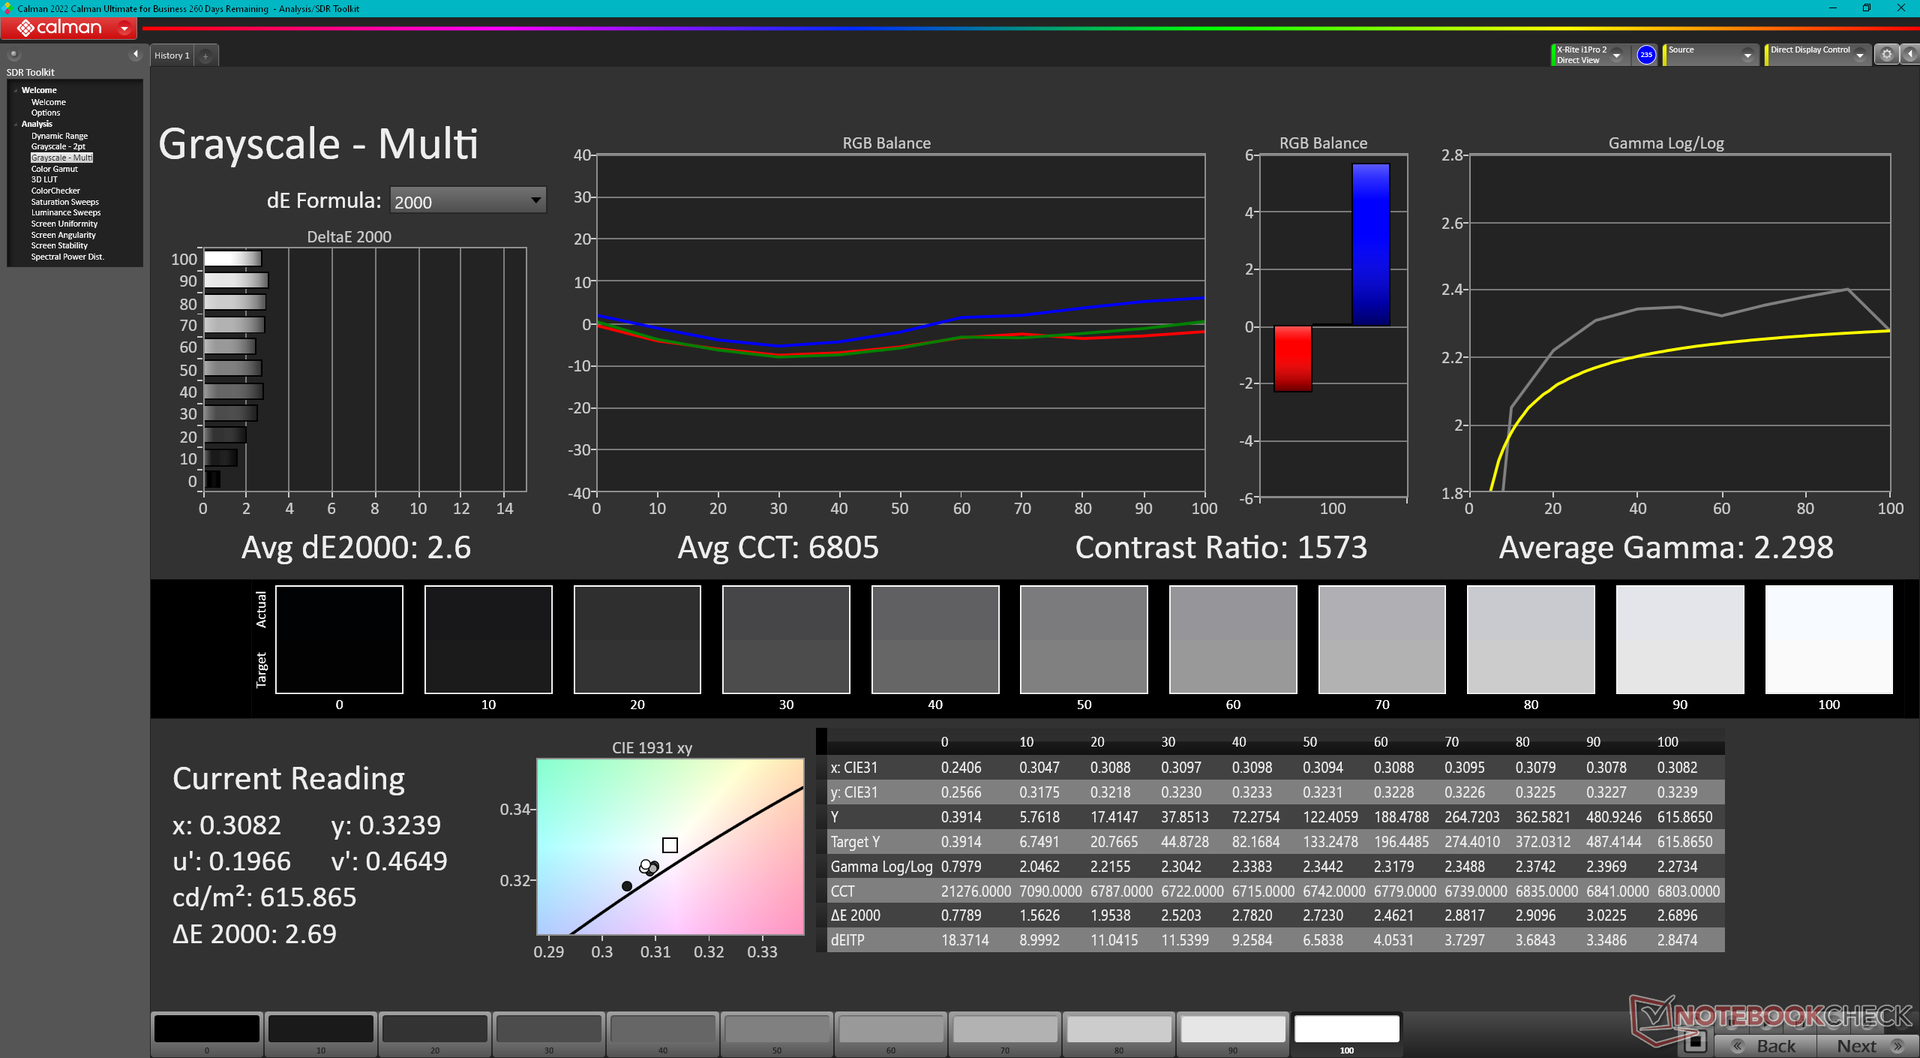
ΔE ColorChecker Calman: 2.45 | ∀{0.5-29.43 Ø4.72}
ΔE Greyscale Calman: 2.6 | ∀{0.09-98 Ø4.97}
95.9% AdobeRGB 1998 (Argyll 3D)
98.9% sRGB (Argyll 3D)
82.9% Display P3 (Argyll 3D)
Gamma: 2.3
CCT: 6805 K
| Lenovo ThinkPad P16 G1 RTX A5500 LP160UQ1-SPB1, IPS, 3840x2400, 16" | Asus ProArt StudioBook 16 W7600H5A-2BL2 ATNA60YV02-0, OLED, 3840x2400, 16" | Dell Precision 7000 7670 Performance Samsung 160YV03, OLED, 3840x2400, 16" | Lenovo ThinkPad P16 G1 21D6001DMB NE160QDM-N63 , IPS LED, 2560x1600, 16" | MSI CreatorPro Z16P B12UKST B160QAN02.N, IPS, 2560x1600, 16" | HP ZBook Studio 16 G9 62U04EA BOE0A52, IPS, 3840x2400, 16" | |
|---|---|---|---|---|---|---|
| Display | 8% | 8% | -12% | 3% | 3% | |
| Display P3 Coverage (%) | 82.9 | 99.9 21% | 99.9 21% | 71.5 -14% | 97.6 18% | 97.5 18% |
| sRGB Coverage (%) | 98.9 | 100 1% | 100 1% | 100 1% | 99.9 1% | 99.9 1% |
| AdobeRGB 1998 Coverage (%) | 95.9 | 98.6 3% | 98.1 2% | 73.3 -24% | 87.4 -9% | 86.3 -10% |
| Response Times | 96% | 96% | 23% | 76% | 75% | |
| Response Time Grey 50% / Grey 80% * (ms) | 45.6 ? | 2 ? 96% | 1.84 ? 96% | 37.7 ? 17% | 12.8 ? 72% | 15.3 ? 66% |
| Response Time Black / White * (ms) | 36.8 ? | 2 ? 95% | 1.92 ? 95% | 26.3 ? 29% | 7.4 ? 80% | 6.1 ? 83% |
| PWM Frequency (Hz) | 240 ? | 59.52 ? | ||||
| Bildschirm | -2% | -36% | -4% | 9% | 16% | |
| Helligkeit Bildmitte (cd/m²) | 601.9 | 353 -41% | 325.2 -46% | 424 -30% | 407 -32% | 554 -8% |
| Brightness (cd/m²) | 569 | 360 -37% | 328 -42% | 398 -30% | 388 -32% | 516 -9% |
| Brightness Distribution (%) | 77 | 96 25% | 97 26% | 90 17% | 88 14% | 84 9% |
| Schwarzwert * (cd/m²) | 0.47 | 0.24 49% | 0.36 23% | 0.47 -0% | ||
| Kontrast (:1) | 1281 | 1767 38% | 1131 -12% | 1179 -8% | ||
| Delta E Colorchecker * | 2.45 | 2.45 -0% | 4.59 -87% | 2.6 -6% | 1.3 47% | 1 59% |
| Colorchecker dE 2000 max. * | 4.46 | 3.75 16% | 7.65 -72% | 4.9 -10% | 2.5 44% | 2.4 46% |
| Delta E Graustufen * | 2.6 | 1.88 28% | 2.5 4% | 4.1 -58% | 2.1 19% | 1.6 38% |
| Gamma | 2.3 96% | 2.31 95% | 2.1 105% | 2.13 103% | 2.26 97% | 2.29 96% |
| CCT | 6805 96% | 6441 101% | 6541 99% | 7252 90% | 6437 101% | 6458 101% |
| Colorchecker dE 2000 calibrated * | 2.77 | 0.8 | 0.7 | 0.6 | ||
| Durchschnitt gesamt (Programm / Settings) | 34% /
19% | 23% /
-0% | 2% /
-2% | 29% /
18% | 31% /
22% |
* ... kleinere Werte sind besser
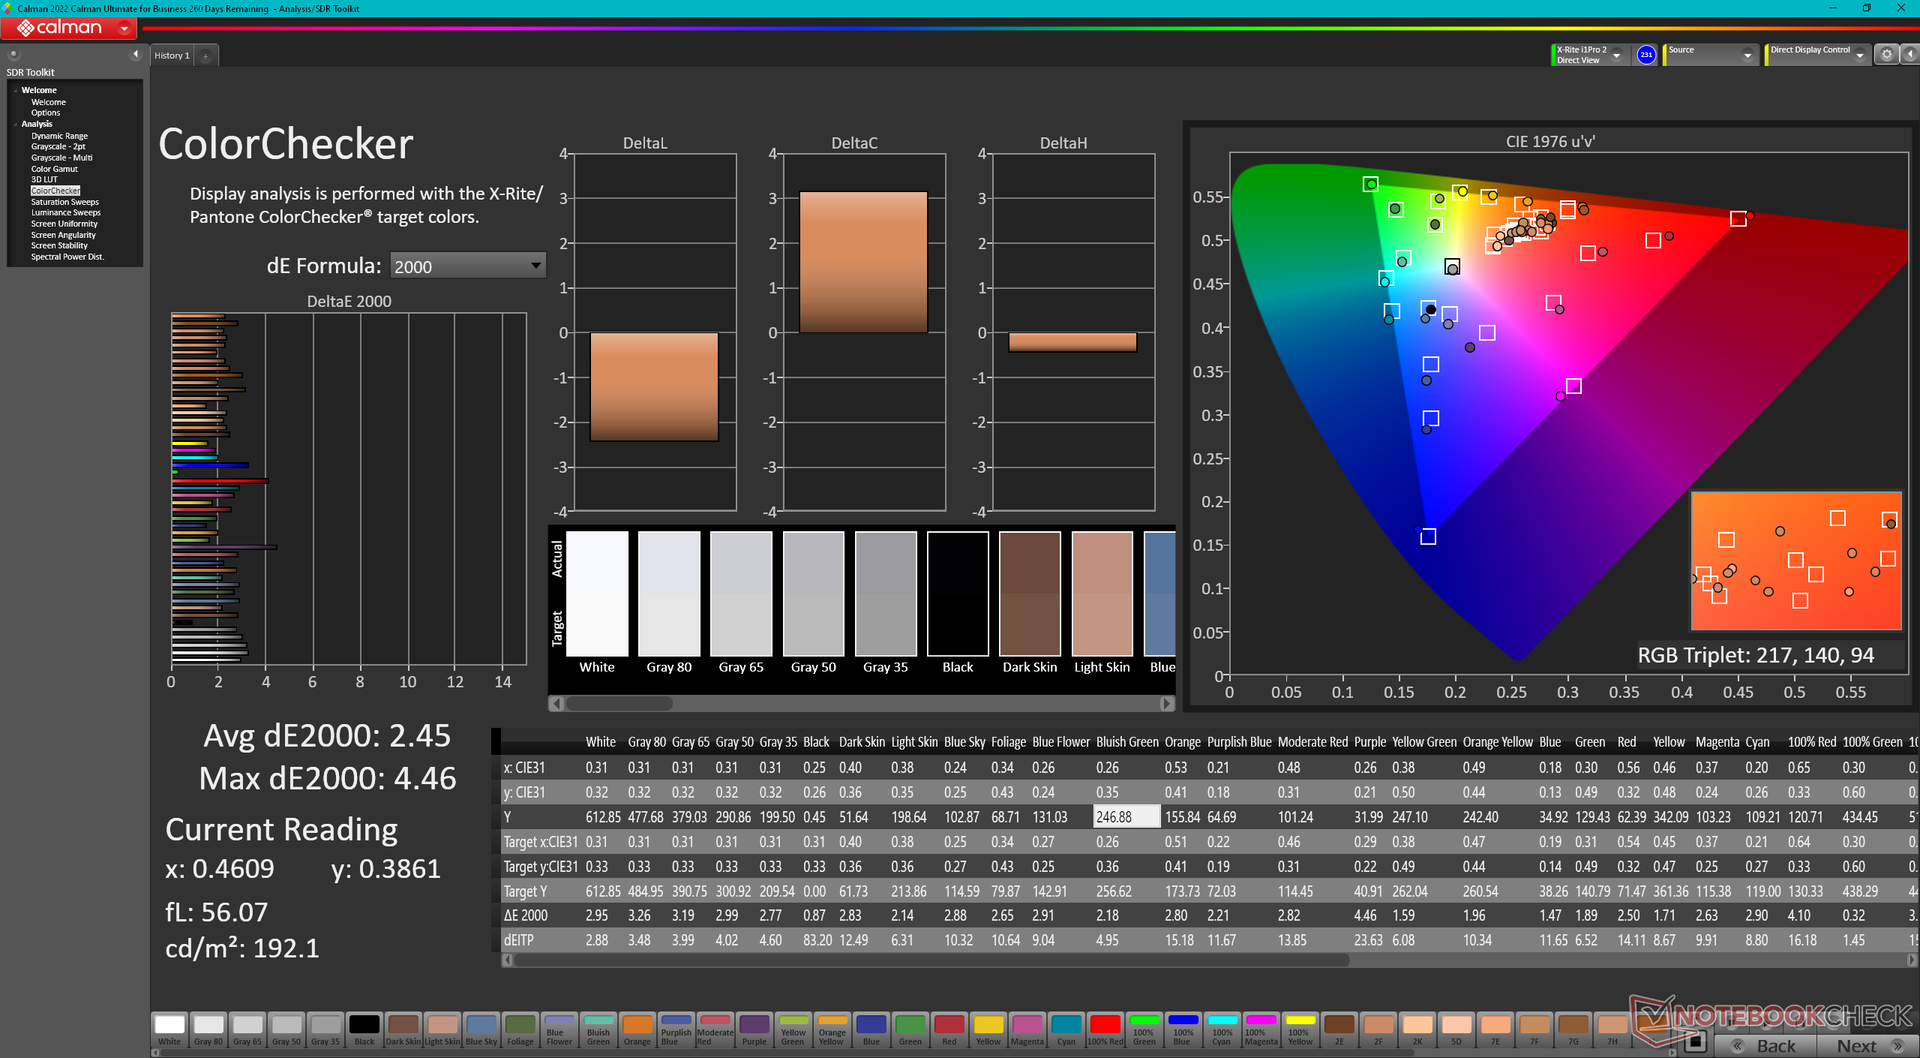
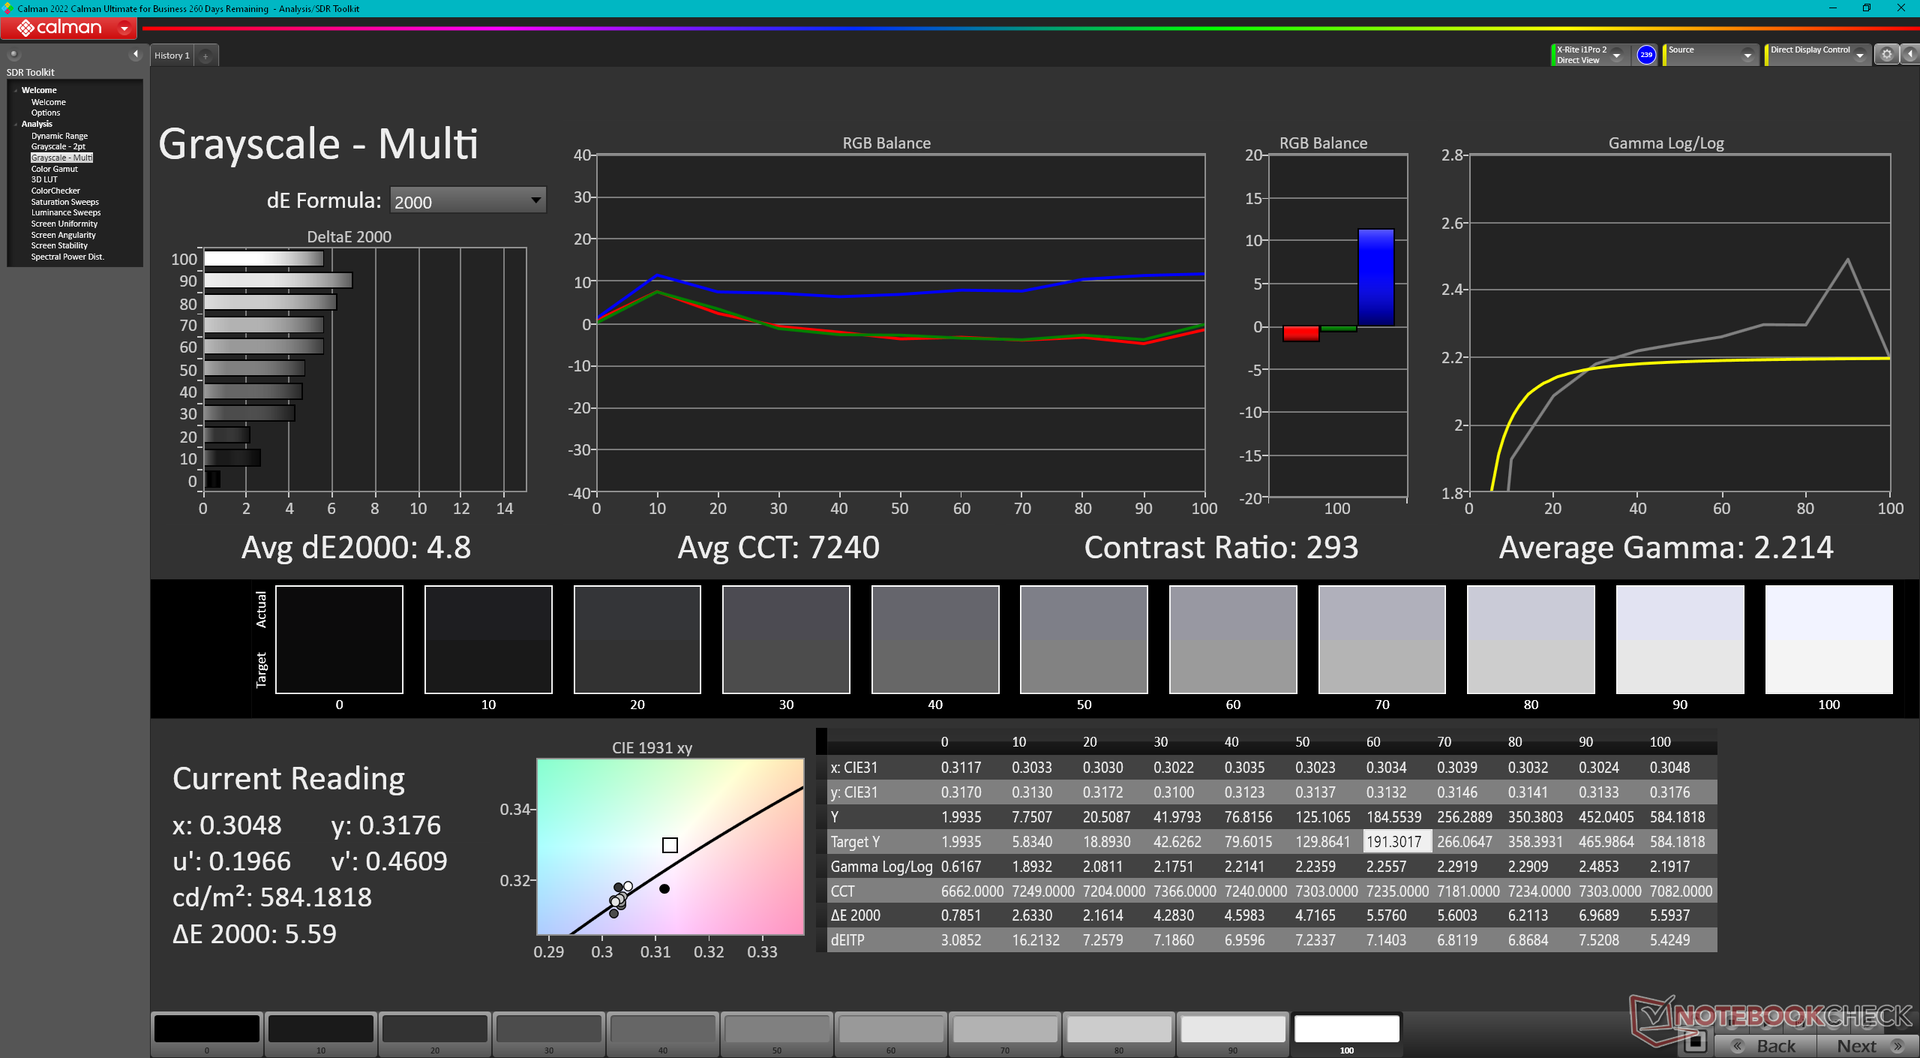
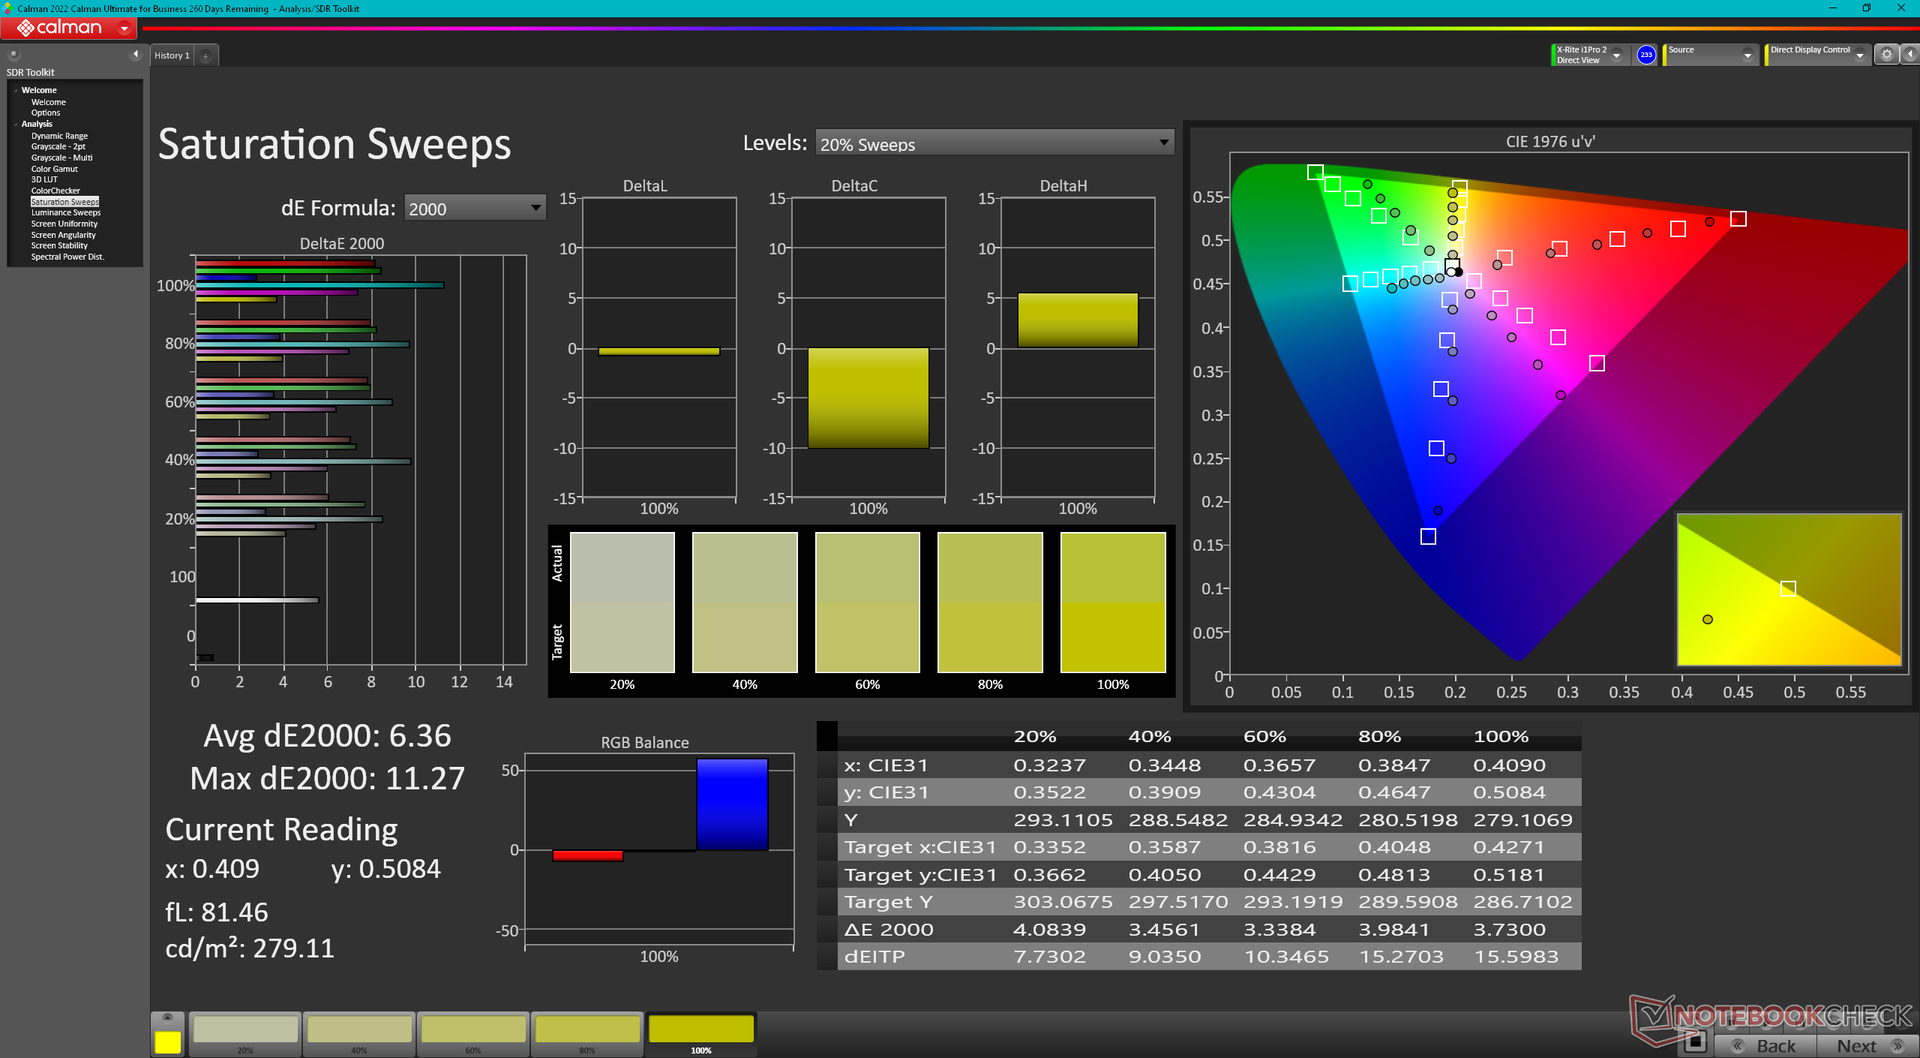
Das Farbprofil kann über die vorinstallierte Software X-Rite Color Assistant geändert werden. Die Software scheint im Moment noch fehlerhaft zu sein, da die Farben trotz der vollständigen AdobeRGB-Abdeckung unseres Panels nicht so genau sind, wie sie sein sollten. Im sRGB-Modus betragen die durchschnittlichen Graustufen- und Farb-DeltaE-Werte beispielsweise nur 2,6 bzw. 2,45, während sie im AdobeRGB-Modus 4,8 bzw. 3,87 betragen.

Reaktionszeiten (Response Times) des Displays
| ↔ Reaktionszeiten Schwarz zu Weiß | ||
|---|---|---|
| 36.8 ms ... steigend ↗ und fallend ↘ kombiniert | ↗ 19.6 ms steigend | 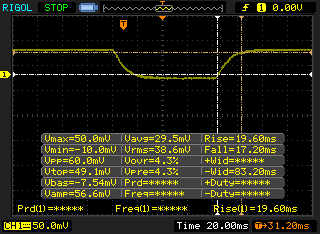 |
| ↘ 17.2 ms fallend | ||
| Die gemessenen Reaktionszeiten sind langsam und dadurch für viele Spieler wahrscheinlich zu langsam. Im Vergleich rangierten die bei uns getesteten Geräte von 0.1 (Minimum) zu 240 (Maximum) ms. » 95 % aller Screens waren schneller als der getestete. Daher sind die gemessenen Reaktionszeiten schlechter als der Durchschnitt aller vermessenen Geräte (19.8 ms). | ||
| ↔ Reaktionszeiten 50% Grau zu 80% Grau | ||
| 45.6 ms ... steigend ↗ und fallend ↘ kombiniert | ↗ 21.2 ms steigend | 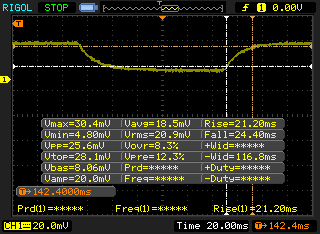 |
| ↘ 24.4 ms fallend | ||
| Die gemessenen Reaktionszeiten sind langsam und dadurch für viele Spieler wahrscheinlich zu langsam. Im Vergleich rangierten die bei uns getesteten Geräte von 0.165 (Minimum) zu 636 (Maximum) ms. » 78 % aller Screens waren schneller als der getestete. Daher sind die gemessenen Reaktionszeiten schlechter als der Durchschnitt aller vermessenen Geräte (31 ms). | ||
Bildschirm-Flackern / PWM (Pulse-Width Modulation)
| Flackern / PWM nicht festgestellt | 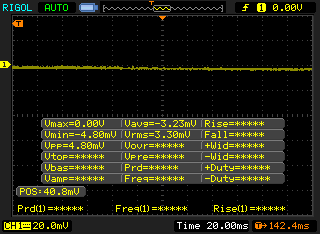 | ||
Im Vergleich: 52 % aller getesteten Geräte nutzten kein PWM um die Helligkeit zu reduzieren. Wenn PWM eingesetzt wurde, dann bei einer Frequenz von durchschnittlich 7781 (Minimum 5, Maximum 343500) Hz. | |||
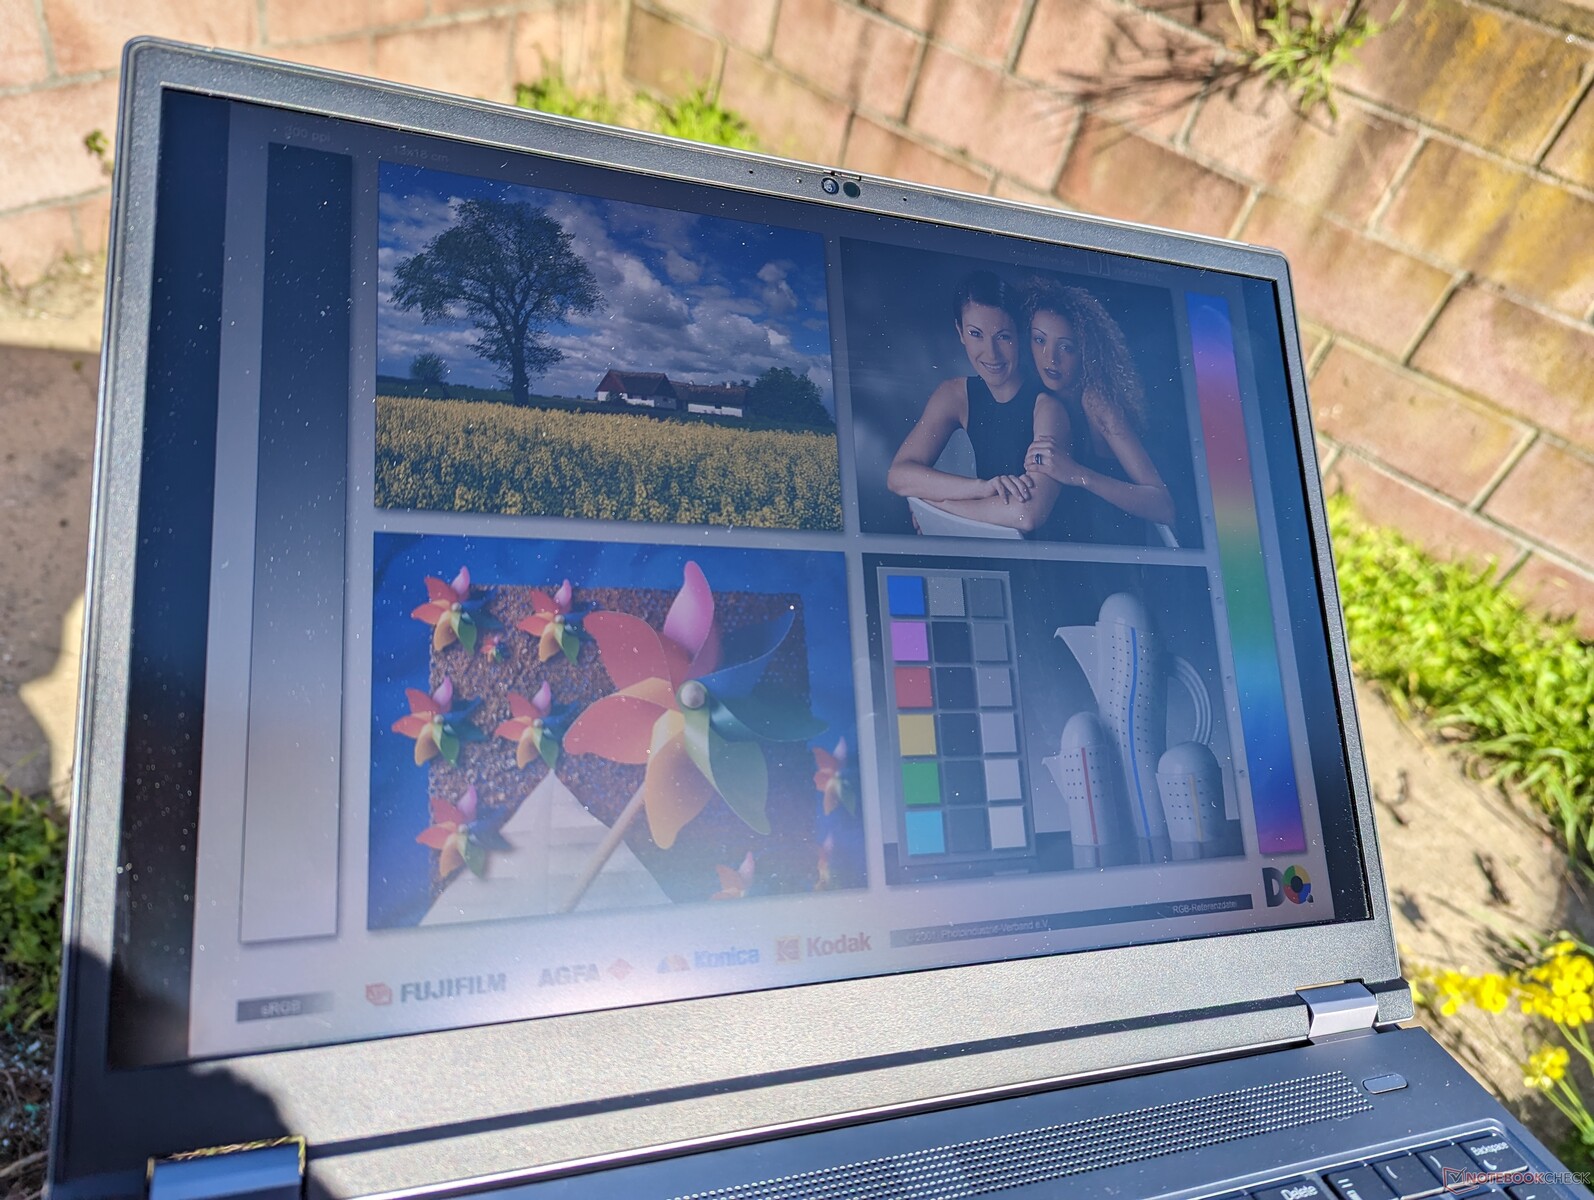
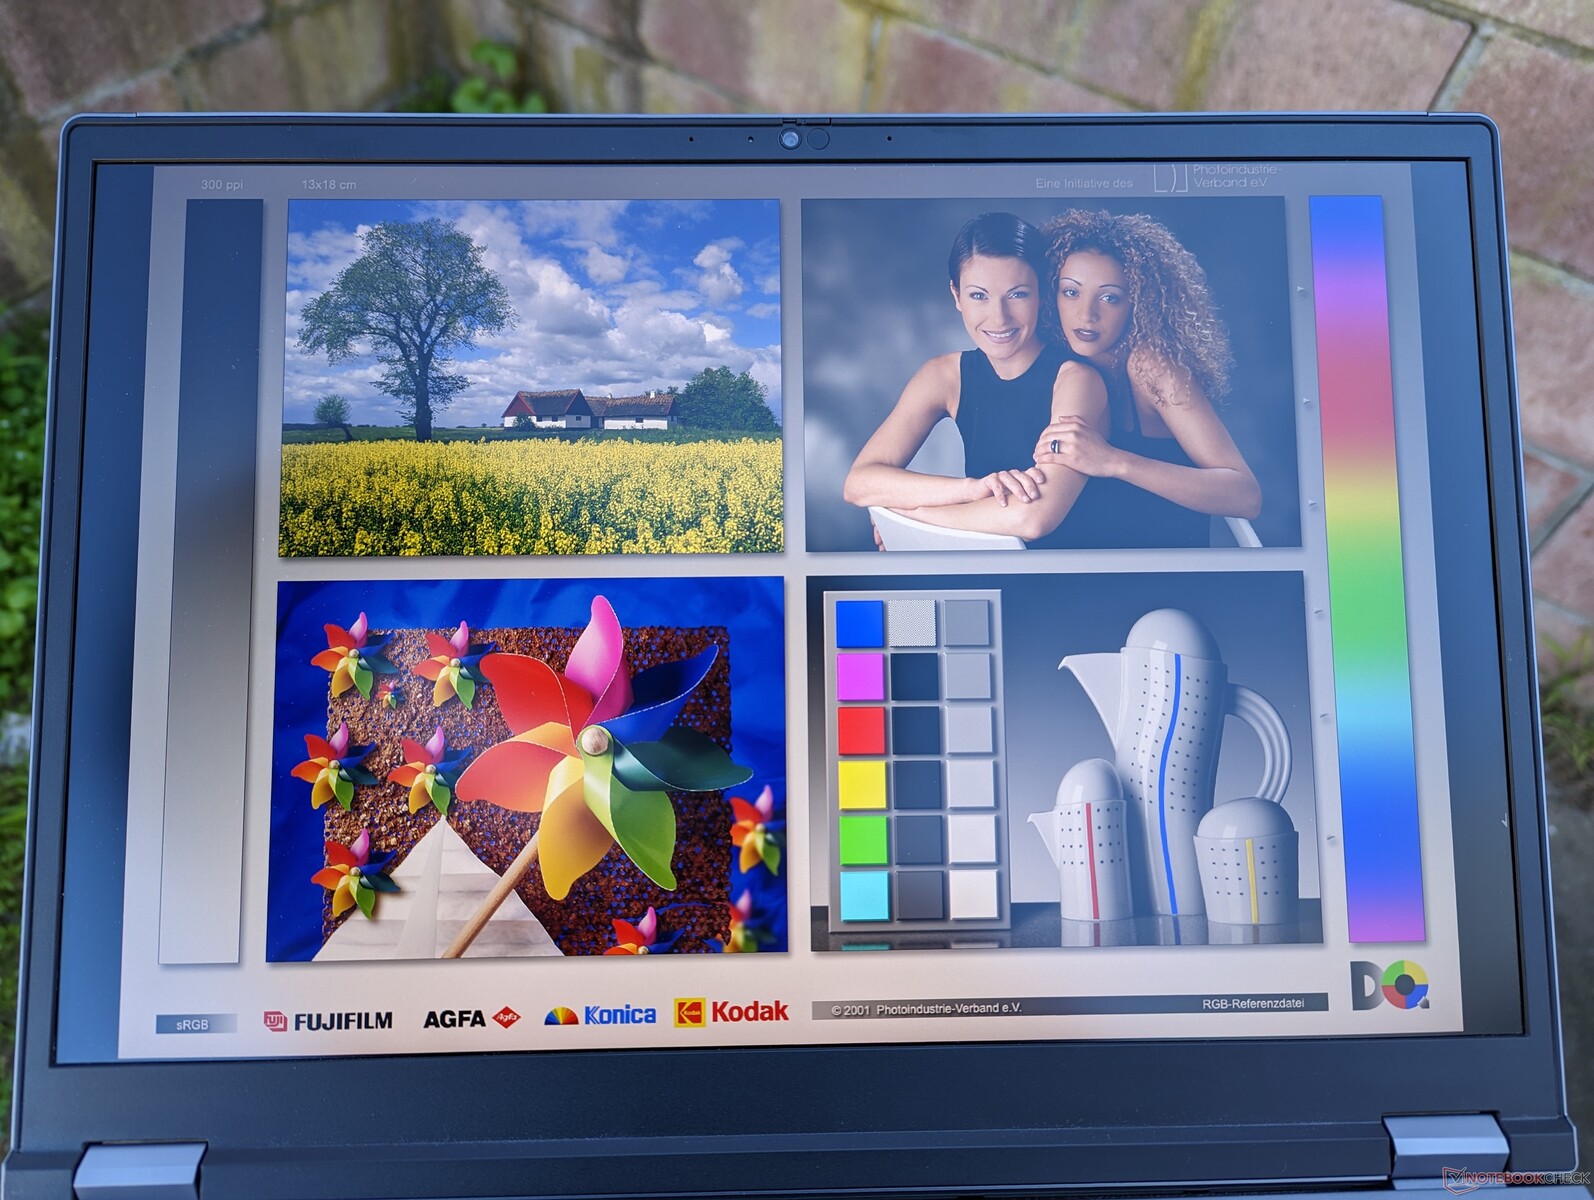
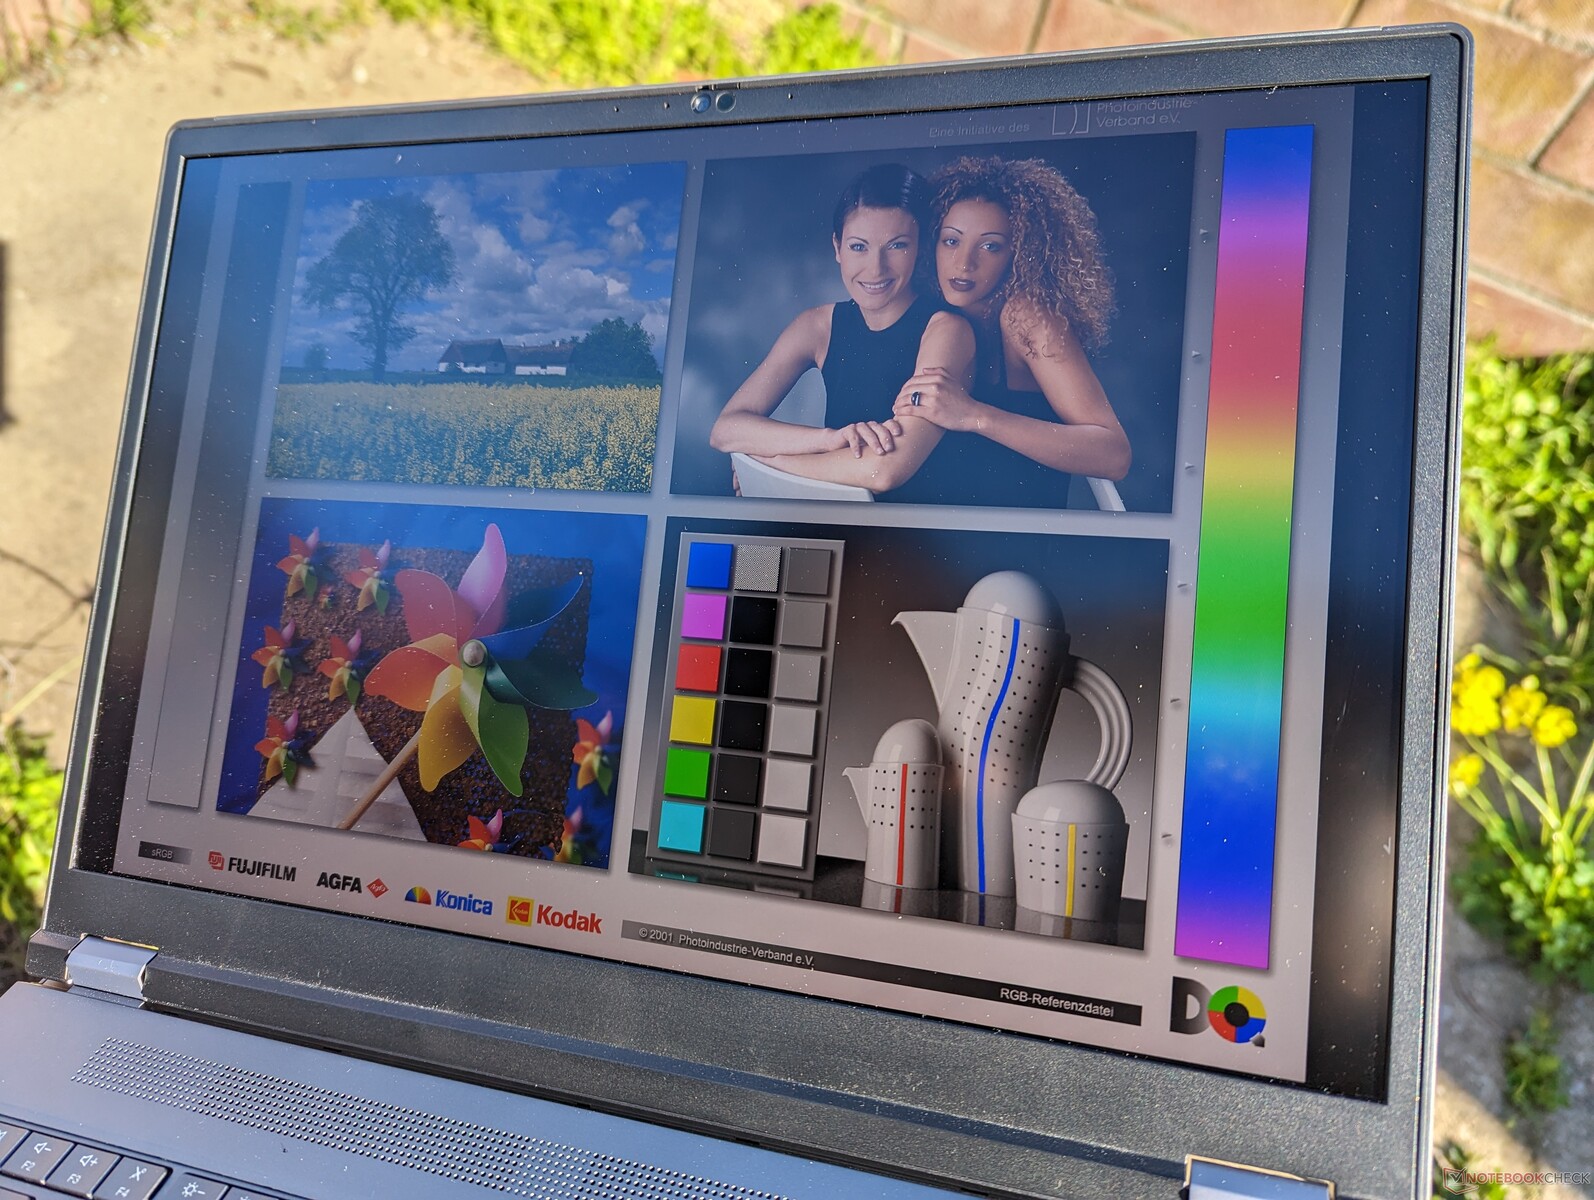
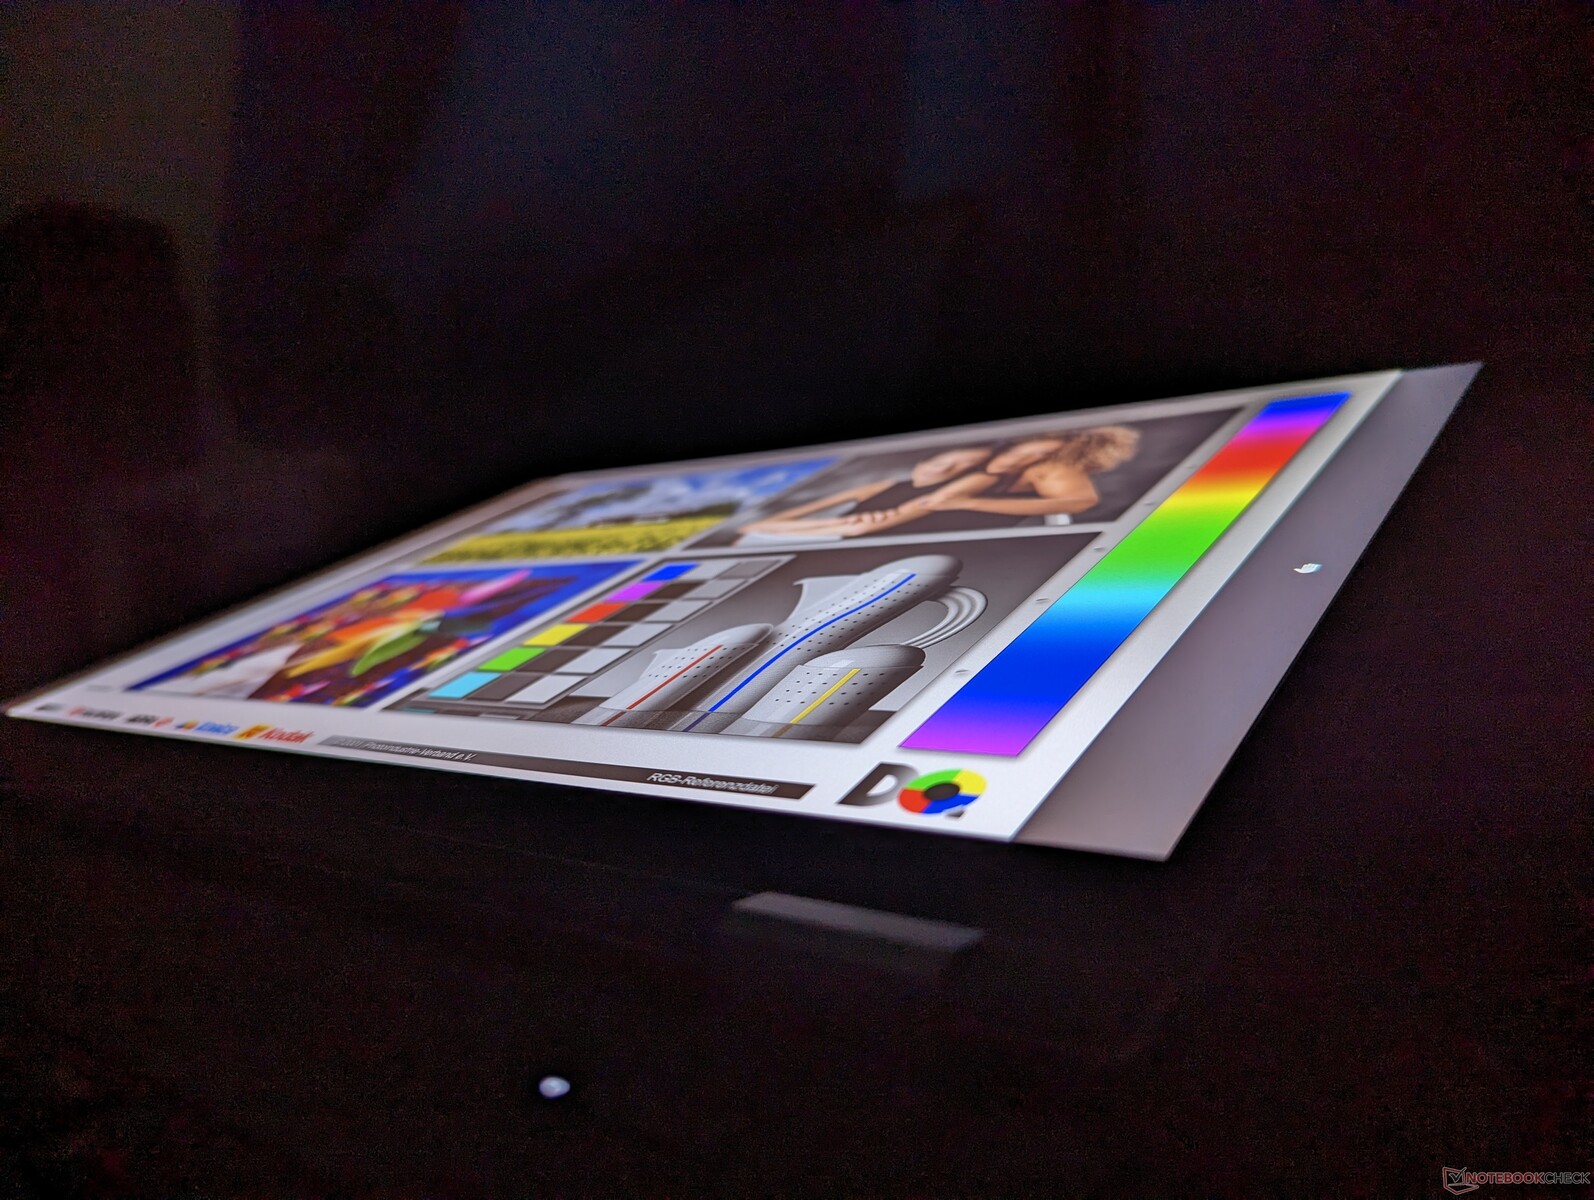
Die Sichtbarkeit im Freien ist gut, da das Display heller ist als bei den meisten anderen Laptops, bei denen der Bereich von 300 bis 400 Nit üblich ist. Es wird jedoch immer noch empfohlen, wenn möglich im Schatten zu arbeiten, da direktes Sonnenlicht die Bildqualität und die Farben beeinträchtigt.
Performance
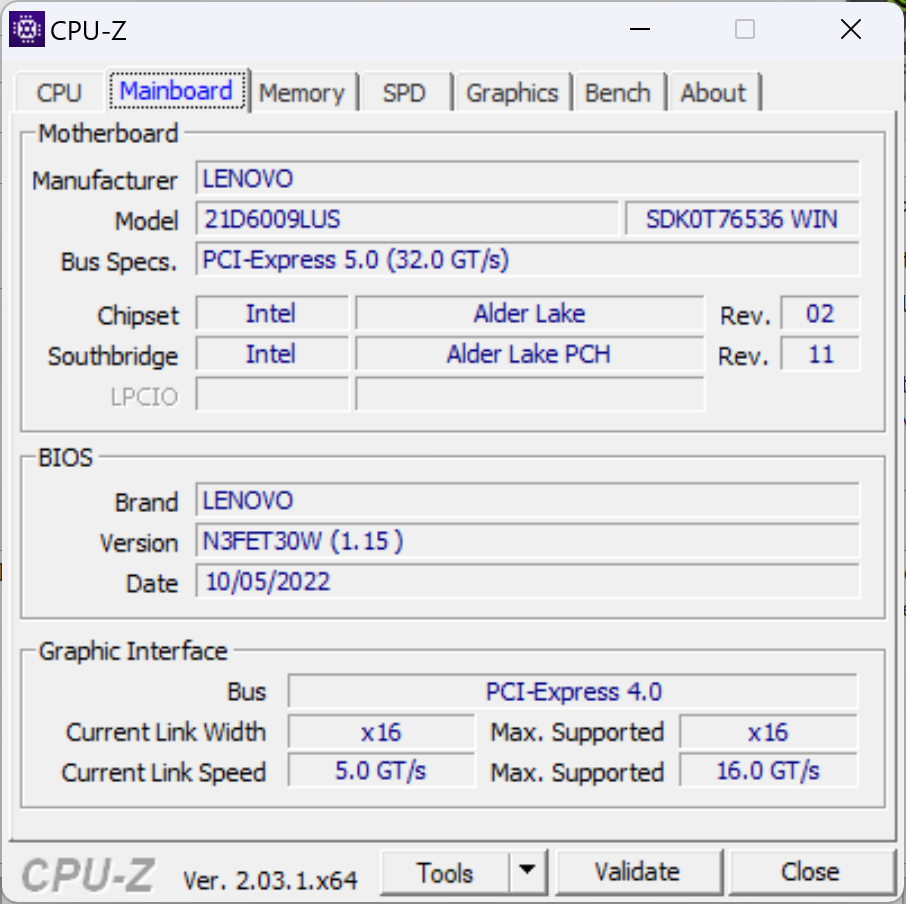
Testbedingungen
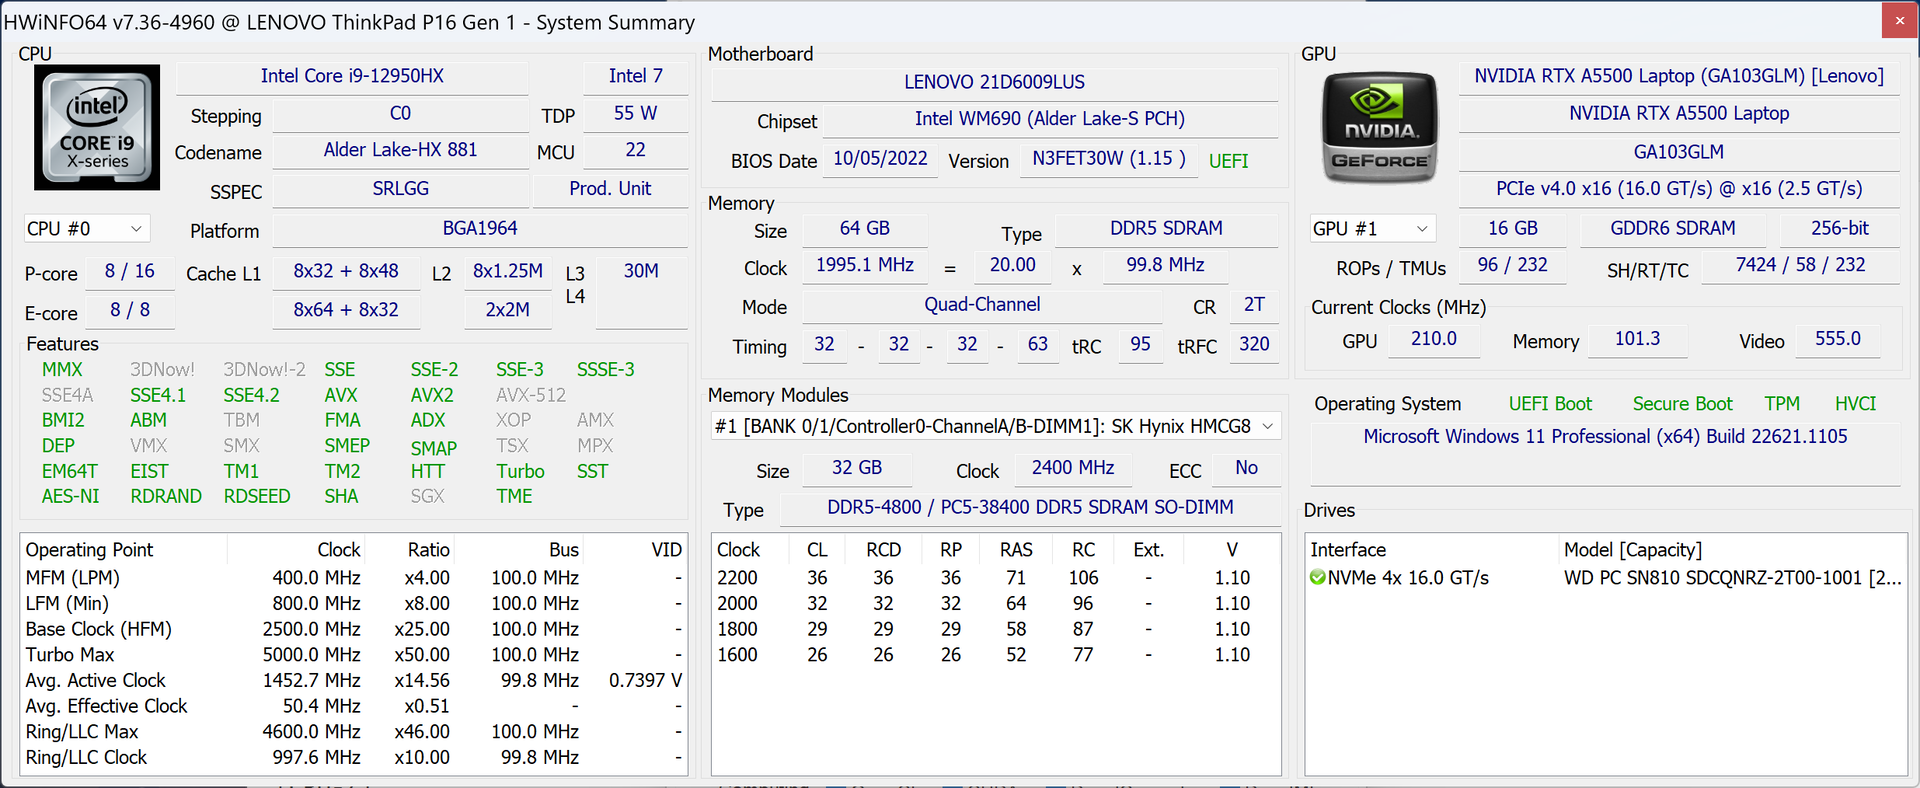
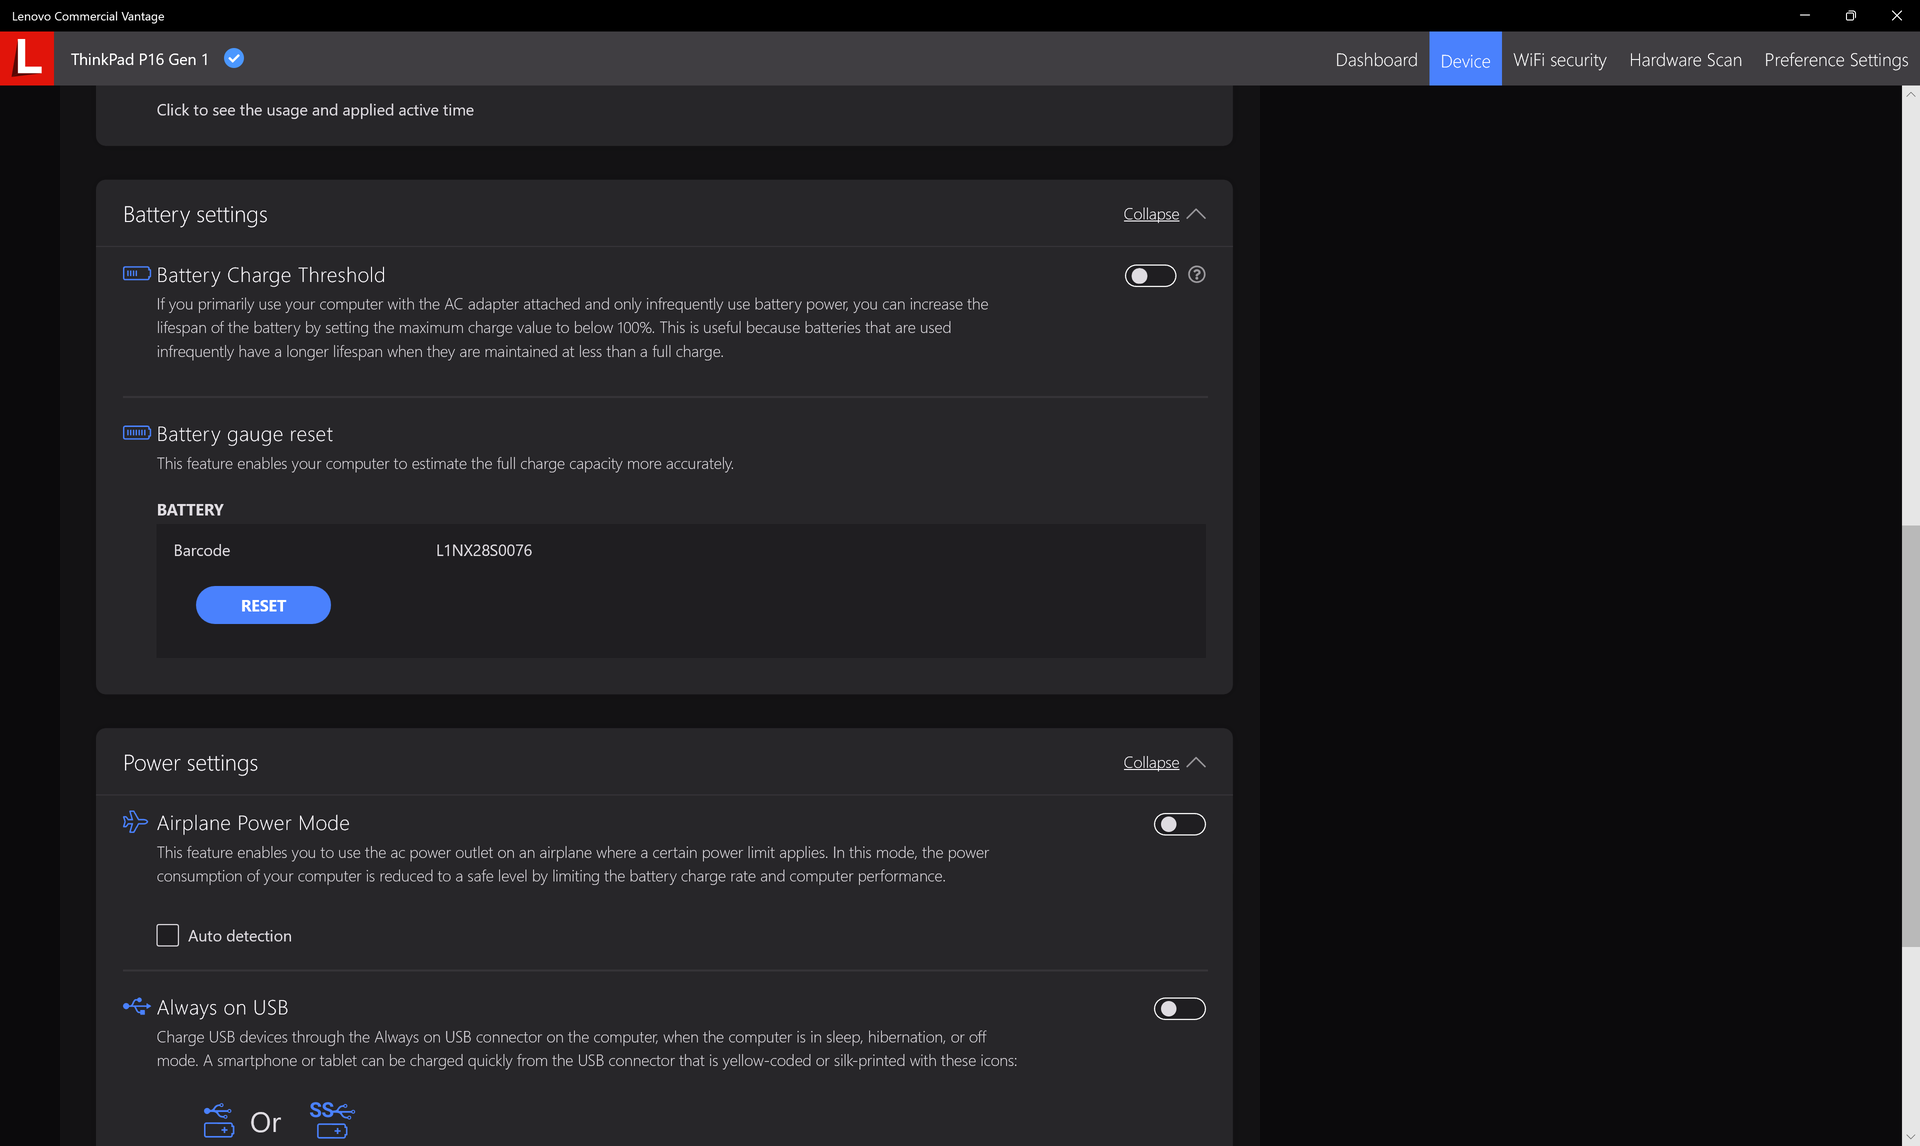
Wir haben unser Gerät über Windows und die Nvidia Systemsteuerung in den Performance Modus bzw. den dGPU-Modus versetzt, bevor wir die folgenden Leistungsbenchmarks durchgeführt haben. Es wird empfohlen, sich mit der vorinstallierten Lenovo Vantage Software vertraut zu machen, da sie die zentrale Anlaufstelle für Lenovo spezifische BIOS-Updates, Funktionen, Garantiestatus und mehr ist.
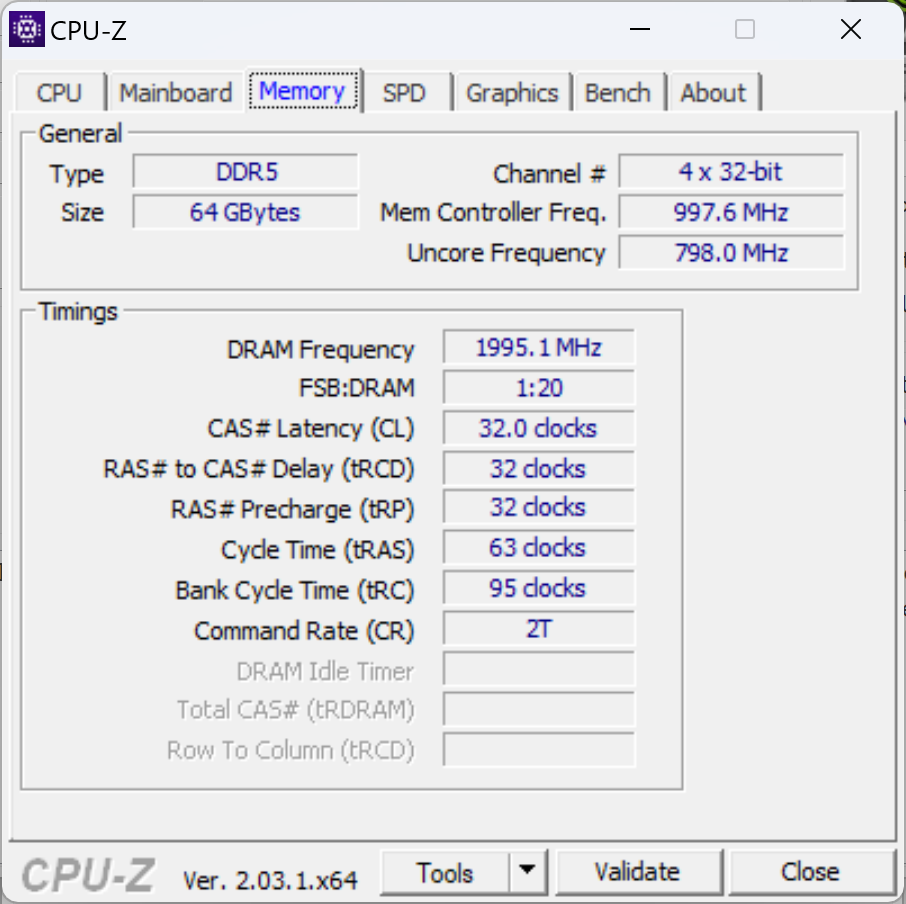
Es gibt keine Xeon-CPU-Optionen, daher wird ECC-RAM nicht unterstützt. Allerdings kann der ECC-Status für die GPU über das Nvidia Kontrollfeld ein- oder ausgeschaltet werden.
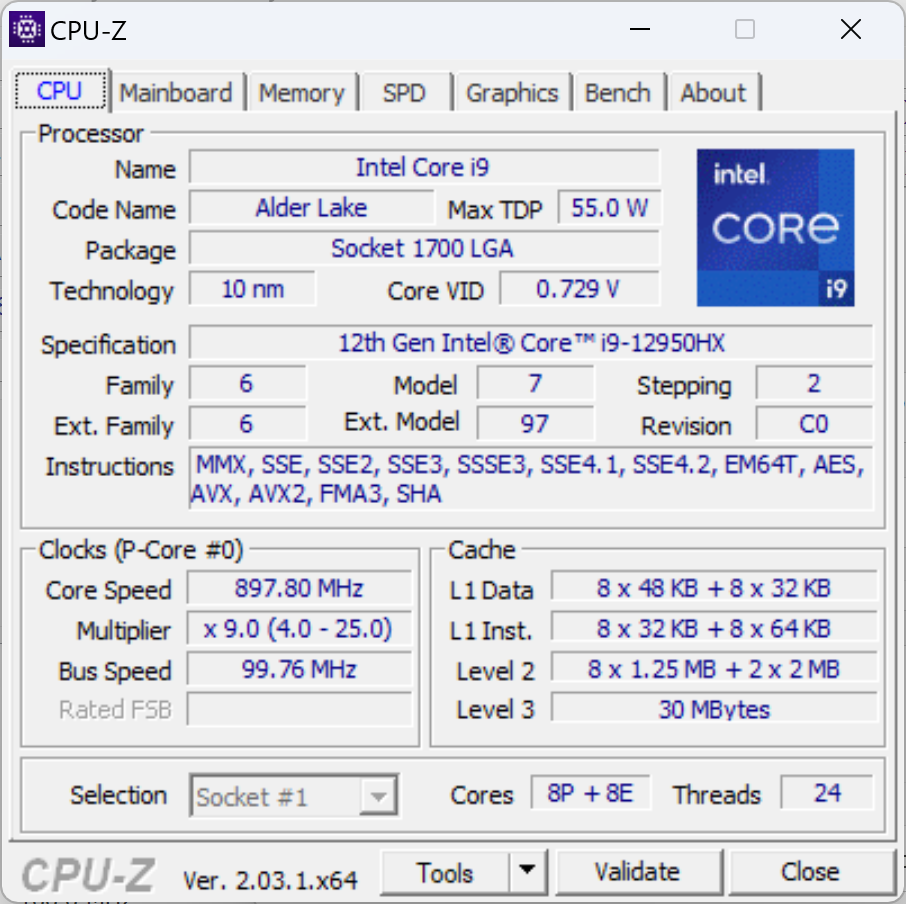
Prozessor
Die Multi-Thread-Rohleistung ist etwa zehn Prozent schneller als die des Core i9-12900H im konkurrierenden MSI CreatorPro Z16P. Ein Upgrade von Core i7-12850HX auf unser Core i9-12950HX steigert die Leistung um 15 Prozent. Am bemerkenswertesten ist vielleicht, dass das Precision 7670 etwa 15 bis 20 Prozent langsamer ist, obwohl es mit der gleichen Core i9-12950HX CPU wie unser Lenovo ausgeliefert wird.
Die Turbo-Boost-Nachhaltigkeit ist gut, aber nicht perfekt. Wenn wir beispielsweise den CineBench R15 xT in einer Schleife laufen lassen, sinkt der ursprüngliche Wert von 3.141 Punkten im Laufe der Zeit auf ~2.830 Punkte, was einem Leistungsabfall von 10 % entspricht.
Cinebench R15 Multi Loop
Cinebench R23: Multi Core | Single Core
Cinebench R20: CPU (Multi Core) | CPU (Single Core)
Cinebench R15: CPU Multi 64Bit | CPU Single 64Bit
Blender: v2.79 BMW27 CPU
7-Zip 18.03: 7z b 4 | 7z b 4 -mmt1
Geekbench 5.5: Multi-Core | Single-Core
HWBOT x265 Benchmark v2.2: 4k Preset
LibreOffice : 20 Documents To PDF
R Benchmark 2.5: Overall mean
* ... kleinere Werte sind besser
AIDA64: FP32 Ray-Trace | FPU Julia | CPU SHA3 | CPU Queen | FPU SinJulia | FPU Mandel | CPU AES | CPU ZLib | FP64 Ray-Trace | CPU PhotoWorxx
| Performance Rating | |
| Durchschnittliche Intel Core i9-12950HX | |
| Lenovo ThinkPad P16 G1 RTX A5500 | |
| Lenovo ThinkPad P16 G1 21D6001DMB | |
| MSI CreatorPro Z16P B12UKST | |
| HP ZBook Studio 16 G9 62U04EA | |
| Dell Precision 7000 7670 Performance | |
| Asus ProArt StudioBook 16 W7600H5A-2BL2 -9! | |
| AIDA64 / FP32 Ray-Trace | |
| Lenovo ThinkPad P16 G1 RTX A5500 | |
| Durchschnittliche Intel Core i9-12950HX (15499 - 22868, n=7) | |
| Lenovo ThinkPad P16 G1 21D6001DMB | |
| Dell Precision 7000 7670 Performance | |
| HP ZBook Studio 16 G9 62U04EA | |
| MSI CreatorPro Z16P B12UKST | |
| AIDA64 / FPU Julia | |
| Lenovo ThinkPad P16 G1 RTX A5500 | |
| Durchschnittliche Intel Core i9-12950HX (77846 - 115907, n=7) | |
| Lenovo ThinkPad P16 G1 21D6001DMB | |
| HP ZBook Studio 16 G9 62U04EA | |
| Dell Precision 7000 7670 Performance | |
| MSI CreatorPro Z16P B12UKST | |
| AIDA64 / CPU SHA3 | |
| Lenovo ThinkPad P16 G1 RTX A5500 | |
| Durchschnittliche Intel Core i9-12950HX (3426 - 5069, n=7) | |
| Lenovo ThinkPad P16 G1 21D6001DMB | |
| HP ZBook Studio 16 G9 62U04EA | |
| MSI CreatorPro Z16P B12UKST | |
| Dell Precision 7000 7670 Performance | |
| AIDA64 / CPU Queen | |
| HP ZBook Studio 16 G9 62U04EA | |
| Durchschnittliche Intel Core i9-12950HX (102752 - 104726, n=7) | |
| Lenovo ThinkPad P16 G1 RTX A5500 | |
| Dell Precision 7000 7670 Performance | |
| MSI CreatorPro Z16P B12UKST | |
| Lenovo ThinkPad P16 G1 21D6001DMB | |
| AIDA64 / FPU SinJulia | |
| Lenovo ThinkPad P16 G1 RTX A5500 | |
| Durchschnittliche Intel Core i9-12950HX (10134 - 12823, n=7) | |
| Lenovo ThinkPad P16 G1 21D6001DMB | |
| Dell Precision 7000 7670 Performance | |
| HP ZBook Studio 16 G9 62U04EA | |
| MSI CreatorPro Z16P B12UKST | |
| AIDA64 / FPU Mandel | |
| Lenovo ThinkPad P16 G1 RTX A5500 | |
| Durchschnittliche Intel Core i9-12950HX (37146 - 57340, n=7) | |
| Lenovo ThinkPad P16 G1 21D6001DMB | |
| HP ZBook Studio 16 G9 62U04EA | |
| Dell Precision 7000 7670 Performance | |
| MSI CreatorPro Z16P B12UKST | |
| AIDA64 / CPU AES | |
| MSI CreatorPro Z16P B12UKST | |
| Durchschnittliche Intel Core i9-12950HX (72599 - 181128, n=7) | |
| Lenovo ThinkPad P16 G1 RTX A5500 | |
| Lenovo ThinkPad P16 G1 21D6001DMB | |
| HP ZBook Studio 16 G9 62U04EA | |
| Dell Precision 7000 7670 Performance | |
| AIDA64 / FP64 Ray-Trace | |
| Lenovo ThinkPad P16 G1 RTX A5500 | |
| Durchschnittliche Intel Core i9-12950HX (8455 - 12432, n=7) | |
| Lenovo ThinkPad P16 G1 21D6001DMB | |
| HP ZBook Studio 16 G9 62U04EA | |
| Dell Precision 7000 7670 Performance | |
| MSI CreatorPro Z16P B12UKST | |
| AIDA64 / CPU PhotoWorxx | |
| MSI CreatorPro Z16P B12UKST | |
| Dell Precision 7000 7670 Performance | |
| Durchschnittliche Intel Core i9-12950HX (35479 - 42655, n=7) | |
| Lenovo ThinkPad P16 G1 RTX A5500 | |
| HP ZBook Studio 16 G9 62U04EA | |
| Lenovo ThinkPad P16 G1 21D6001DMB | |
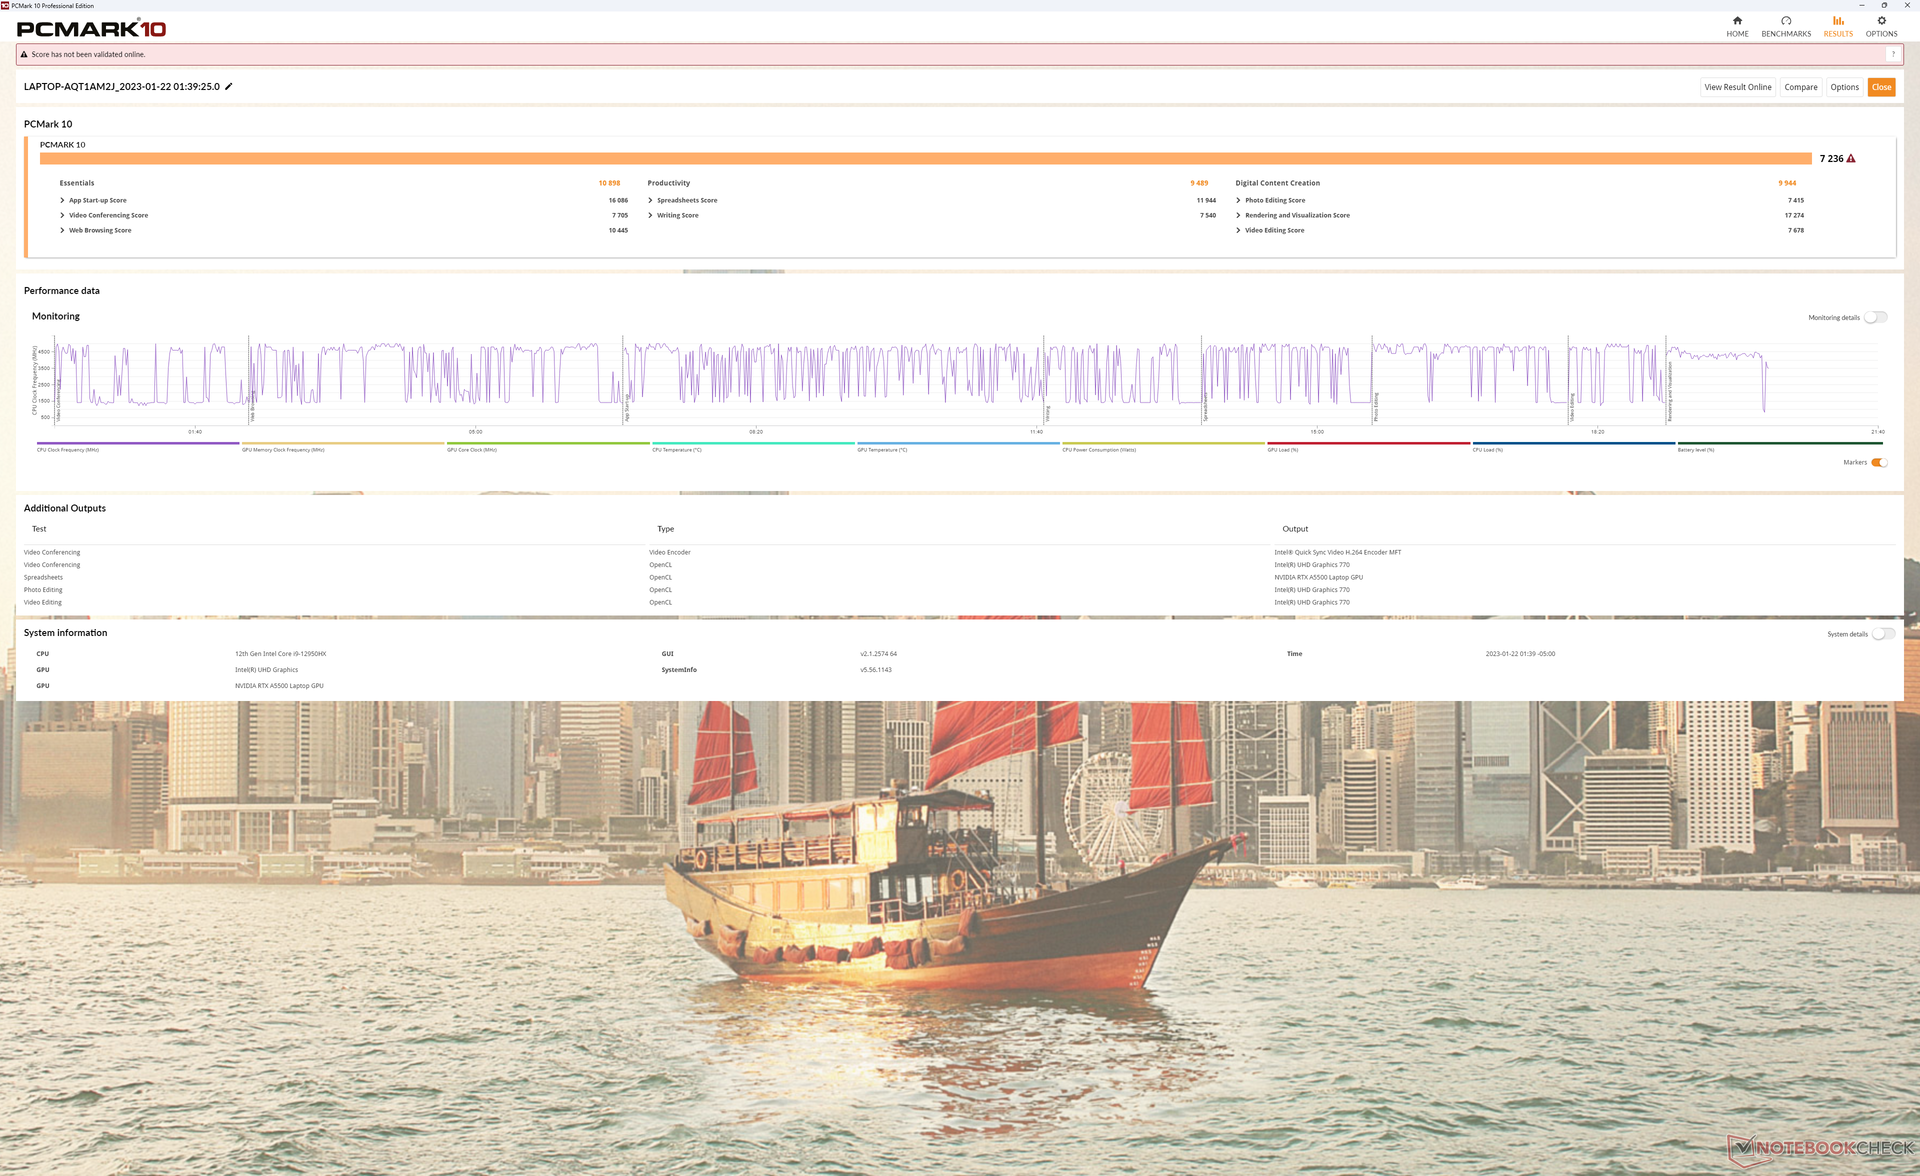
System Performance
Die PCMark-Ergebnisse gehören zu den besten, die wir je bei einer mobilen Workstation gesehen haben. Unser System übertrifft sogar das Dell Precision 7670, welches mit den gleichen CPU- und GPU-Optionen ausgestattet ist wie das ThinkPad P16 G1.
CrossMark: Overall | Productivity | Creativity | Responsiveness
| PCMark 10 / Score | |
| Lenovo ThinkPad P16 G1 RTX A5500 | |
| MSI CreatorPro Z16P B12UKST | |
| Durchschnittliche Intel Core i9-12950HX, NVIDIA RTX A5500 Laptop GPU (6883 - 7236, n=3) | |
| Asus ProArt StudioBook 16 W7600H5A-2BL2 | |
| Dell Precision 7000 7670 Performance | |
| HP ZBook Studio 16 G9 62U04EA | |
| Lenovo ThinkPad P16 G1 21D6001DMB | |
| PCMark 10 / Essentials | |
| Dell Precision 7000 7670 Performance | |
| Durchschnittliche Intel Core i9-12950HX, NVIDIA RTX A5500 Laptop GPU (10898 - 11465, n=3) | |
| Lenovo ThinkPad P16 G1 RTX A5500 | |
| MSI CreatorPro Z16P B12UKST | |
| Asus ProArt StudioBook 16 W7600H5A-2BL2 | |
| Lenovo ThinkPad P16 G1 21D6001DMB | |
| HP ZBook Studio 16 G9 62U04EA | |
| PCMark 10 / Productivity | |
| Lenovo ThinkPad P16 G1 RTX A5500 | |
| MSI CreatorPro Z16P B12UKST | |
| Lenovo ThinkPad P16 G1 21D6001DMB | |
| Asus ProArt StudioBook 16 W7600H5A-2BL2 | |
| Durchschnittliche Intel Core i9-12950HX, NVIDIA RTX A5500 Laptop GPU (8054 - 9489, n=3) | |
| Dell Precision 7000 7670 Performance | |
| HP ZBook Studio 16 G9 62U04EA | |
| PCMark 10 / Digital Content Creation | |
| Asus ProArt StudioBook 16 W7600H5A-2BL2 | |
| Lenovo ThinkPad P16 G1 RTX A5500 | |
| MSI CreatorPro Z16P B12UKST | |
| Dell Precision 7000 7670 Performance | |
| Durchschnittliche Intel Core i9-12950HX, NVIDIA RTX A5500 Laptop GPU (9155 - 9944, n=3) | |
| HP ZBook Studio 16 G9 62U04EA | |
| Lenovo ThinkPad P16 G1 21D6001DMB | |
| CrossMark / Overall | |
| MSI CreatorPro Z16P B12UKST | |
| Lenovo ThinkPad P16 G1 RTX A5500 | |
| Durchschnittliche Intel Core i9-12950HX, NVIDIA RTX A5500 Laptop GPU (1801 - 1889, n=3) | |
| HP ZBook Studio 16 G9 62U04EA | |
| Dell Precision 7000 7670 Performance | |
| Lenovo ThinkPad P16 G1 21D6001DMB | |
| CrossMark / Productivity | |
| MSI CreatorPro Z16P B12UKST | |
| Lenovo ThinkPad P16 G1 RTX A5500 | |
| Durchschnittliche Intel Core i9-12950HX, NVIDIA RTX A5500 Laptop GPU (1684 - 1785, n=3) | |
| HP ZBook Studio 16 G9 62U04EA | |
| Dell Precision 7000 7670 Performance | |
| Lenovo ThinkPad P16 G1 21D6001DMB | |
| CrossMark / Creativity | |
| Lenovo ThinkPad P16 G1 RTX A5500 | |
| Durchschnittliche Intel Core i9-12950HX, NVIDIA RTX A5500 Laptop GPU (2042 - 2192, n=3) | |
| HP ZBook Studio 16 G9 62U04EA | |
| MSI CreatorPro Z16P B12UKST | |
| Dell Precision 7000 7670 Performance | |
| Lenovo ThinkPad P16 G1 21D6001DMB | |
| CrossMark / Responsiveness | |
| MSI CreatorPro Z16P B12UKST | |
| HP ZBook Studio 16 G9 62U04EA | |
| Durchschnittliche Intel Core i9-12950HX, NVIDIA RTX A5500 Laptop GPU (1501 - 1585, n=3) | |
| Dell Precision 7000 7670 Performance | |
| Lenovo ThinkPad P16 G1 RTX A5500 | |
| Lenovo ThinkPad P16 G1 21D6001DMB | |
| PCMark 10 Score | 7236 Punkte | |
Hilfe | ||
| AIDA64 / Memory Copy | |
| Dell Precision 7000 7670 Performance | |
| Durchschnittliche Intel Core i9-12950HX (59731 - 64732, n=7) | |
| Lenovo ThinkPad P16 G1 RTX A5500 | |
| MSI CreatorPro Z16P B12UKST | |
| HP ZBook Studio 16 G9 62U04EA | |
| Lenovo ThinkPad P16 G1 21D6001DMB | |
| AIDA64 / Memory Read | |
| Dell Precision 7000 7670 Performance | |
| Durchschnittliche Intel Core i9-12950HX (59744 - 70359, n=7) | |
| MSI CreatorPro Z16P B12UKST | |
| HP ZBook Studio 16 G9 62U04EA | |
| Lenovo ThinkPad P16 G1 RTX A5500 | |
| Lenovo ThinkPad P16 G1 21D6001DMB | |
| AIDA64 / Memory Write | |
| MSI CreatorPro Z16P B12UKST | |
| Dell Precision 7000 7670 Performance | |
| HP ZBook Studio 16 G9 62U04EA | |
| Durchschnittliche Intel Core i9-12950HX (57750 - 67899, n=7) | |
| Lenovo ThinkPad P16 G1 RTX A5500 | |
| Lenovo ThinkPad P16 G1 21D6001DMB | |
| AIDA64 / Memory Latency | |
| Lenovo ThinkPad P16 G1 21D6001DMB | |
| MSI CreatorPro Z16P B12UKST | |
| Lenovo ThinkPad P16 G1 RTX A5500 | |
| HP ZBook Studio 16 G9 62U04EA | |
| Durchschnittliche Intel Core i9-12950HX (84.5 - 92.2, n=7) | |
| Dell Precision 7000 7670 Performance | |
| Asus ProArt StudioBook 16 W7600H5A-2BL2 | |
| Asus ProArt StudioBook 16 W7600H5A-2BL2 | |
* ... kleinere Werte sind besser
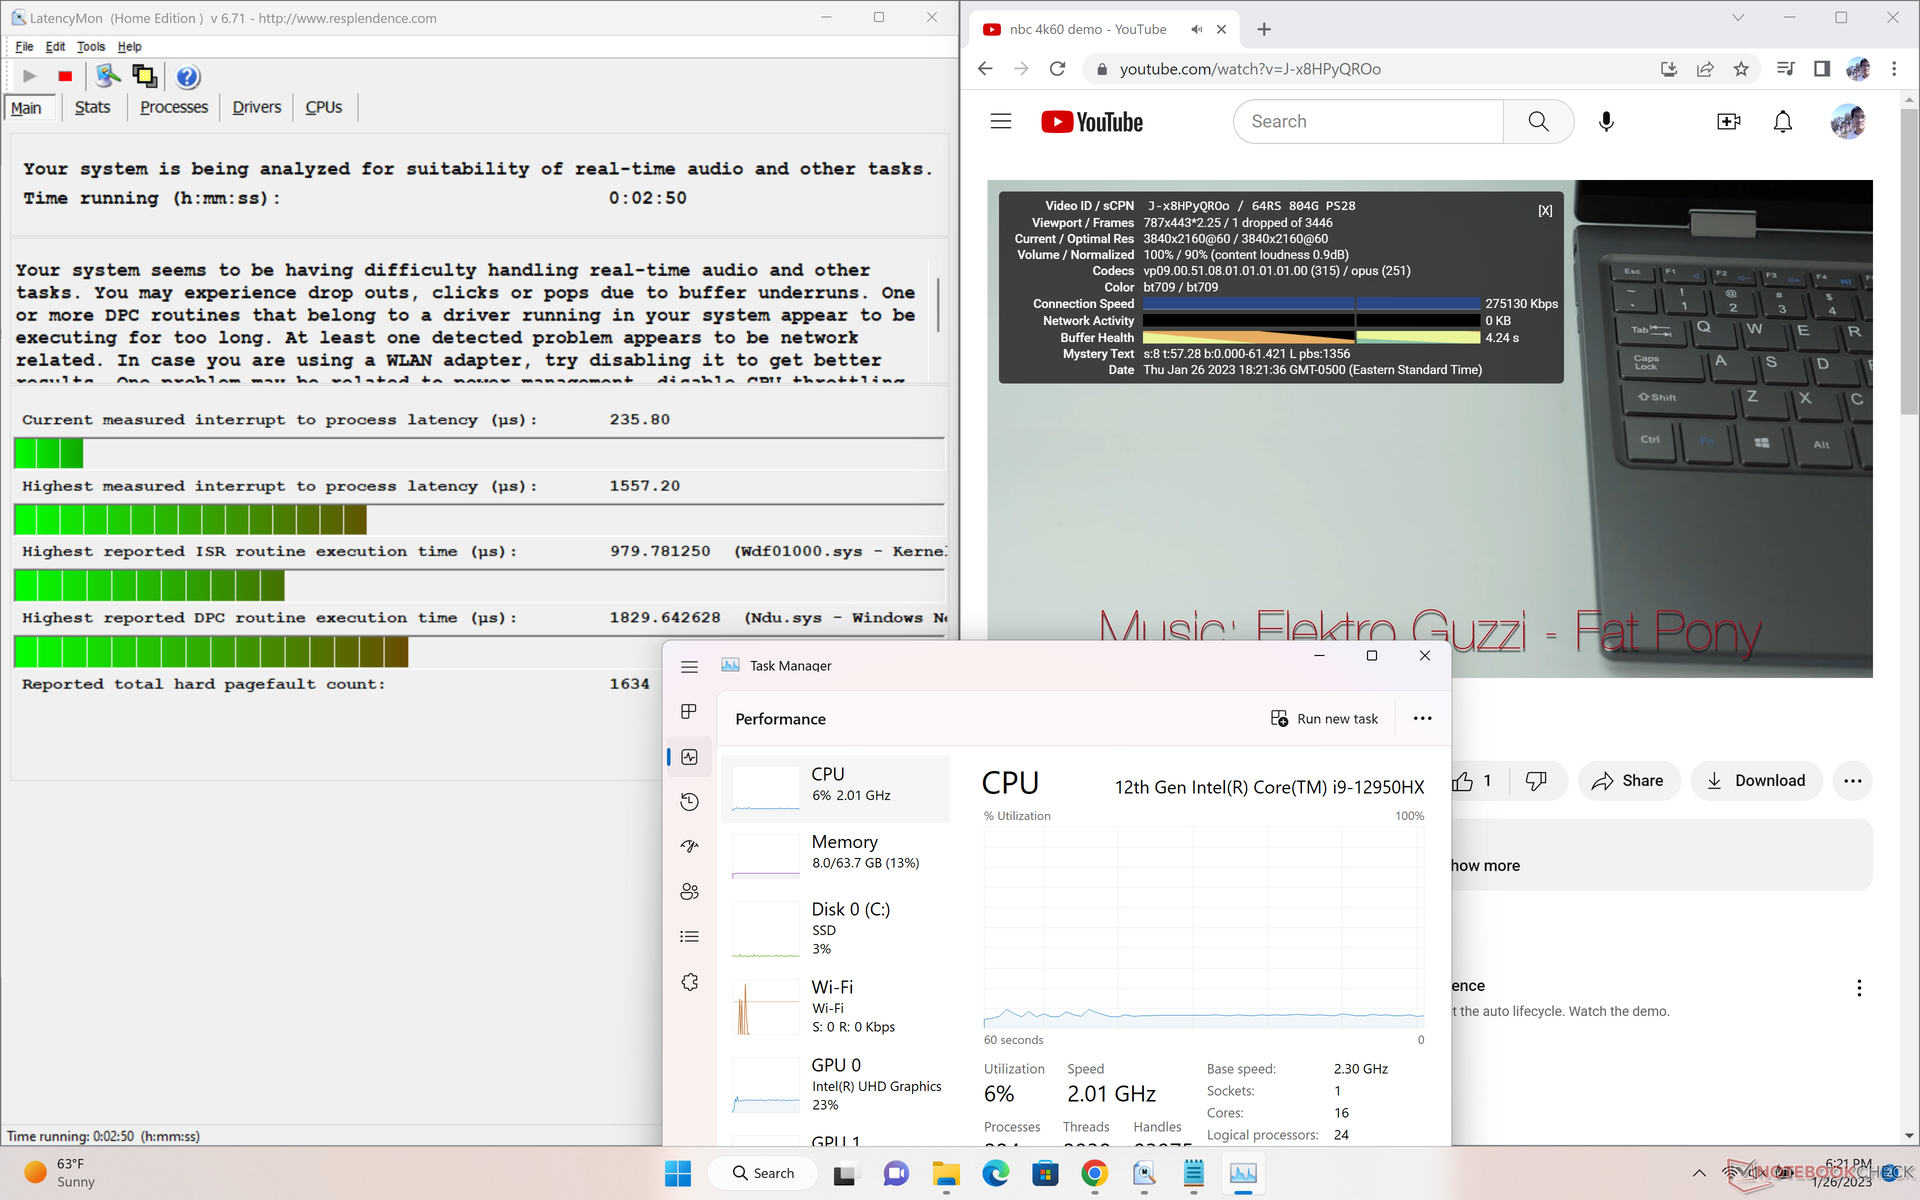
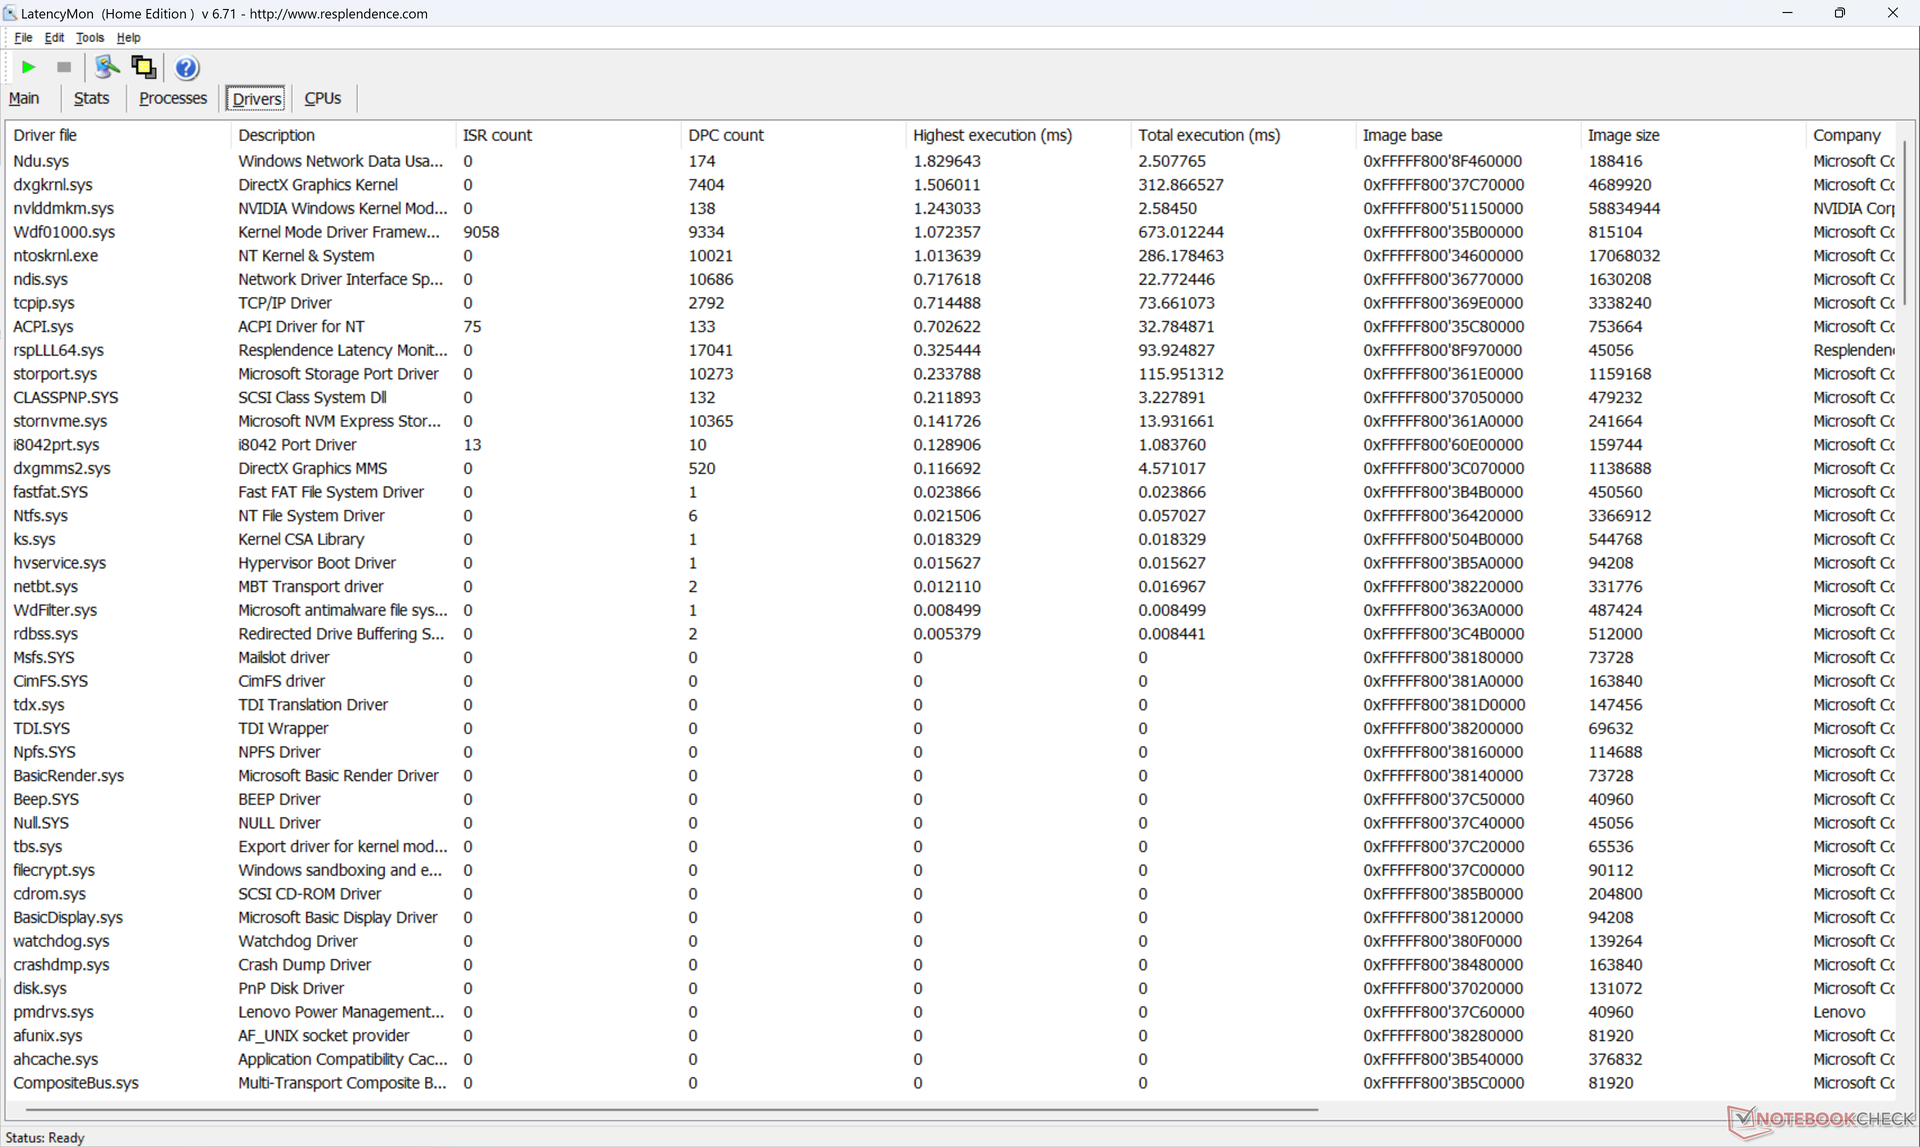
DPC-Latenzzeit
LatencyMon zeigt kleinere DPC-Probleme beim Öffnen mehrerer Browser Tabs unserer Homepage, was für eine Workstation enttäuschend ist. Die 4K-Videowiedergabe bei 60 fps ist ansonsten exzellent mit nur einem einzigen Frame-Abbruch während unseres Testvideos.
| DPC Latencies / LatencyMon - interrupt to process latency (max), Web, Youtube, Prime95 | |
| Dell Precision 7000 7670 Performance | |
| Lenovo ThinkPad P16 G1 RTX A5500 | |
| Asus ProArt StudioBook 16 W7600H5A-2BL2 | |
| Lenovo ThinkPad P16 G1 21D6001DMB | |
| HP ZBook Studio 16 G9 62U04EA | |
| MSI CreatorPro Z16P B12UKST | |
* ... kleinere Werte sind besser
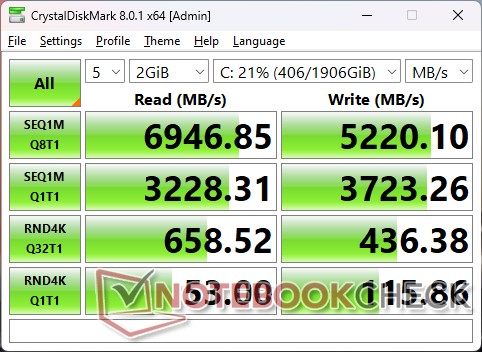
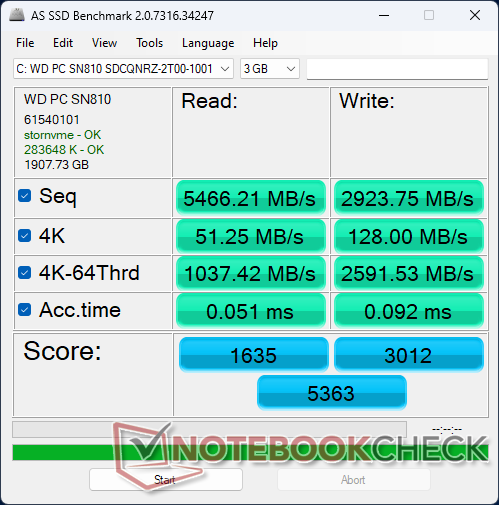
Speichergeräte
Während unsere A2000-Konfiguration mit einer Micron-3400-SSD ausgeliefert wird, kommt unsere A5500-Konfiguration mit einer WD SN810 OPAL SSD. Die sequenziellen Lese- und Schreibgeschwindigkeiten sind vergleichbar, aber unser WD Laufwerk scheint Probleme zu haben, die maximalen Übertragungsraten nach etwa fünf Minuten Stress, wie unser Vergleichsdiagramm unten zeigt.

* ... kleinere Werte sind besser
Disk Throttling: DiskSpd Read Loop, Queue Depth 8
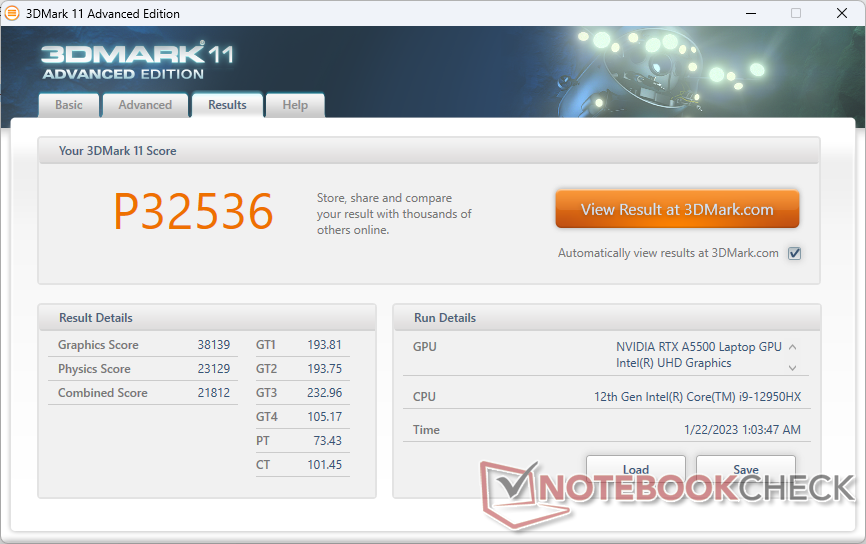
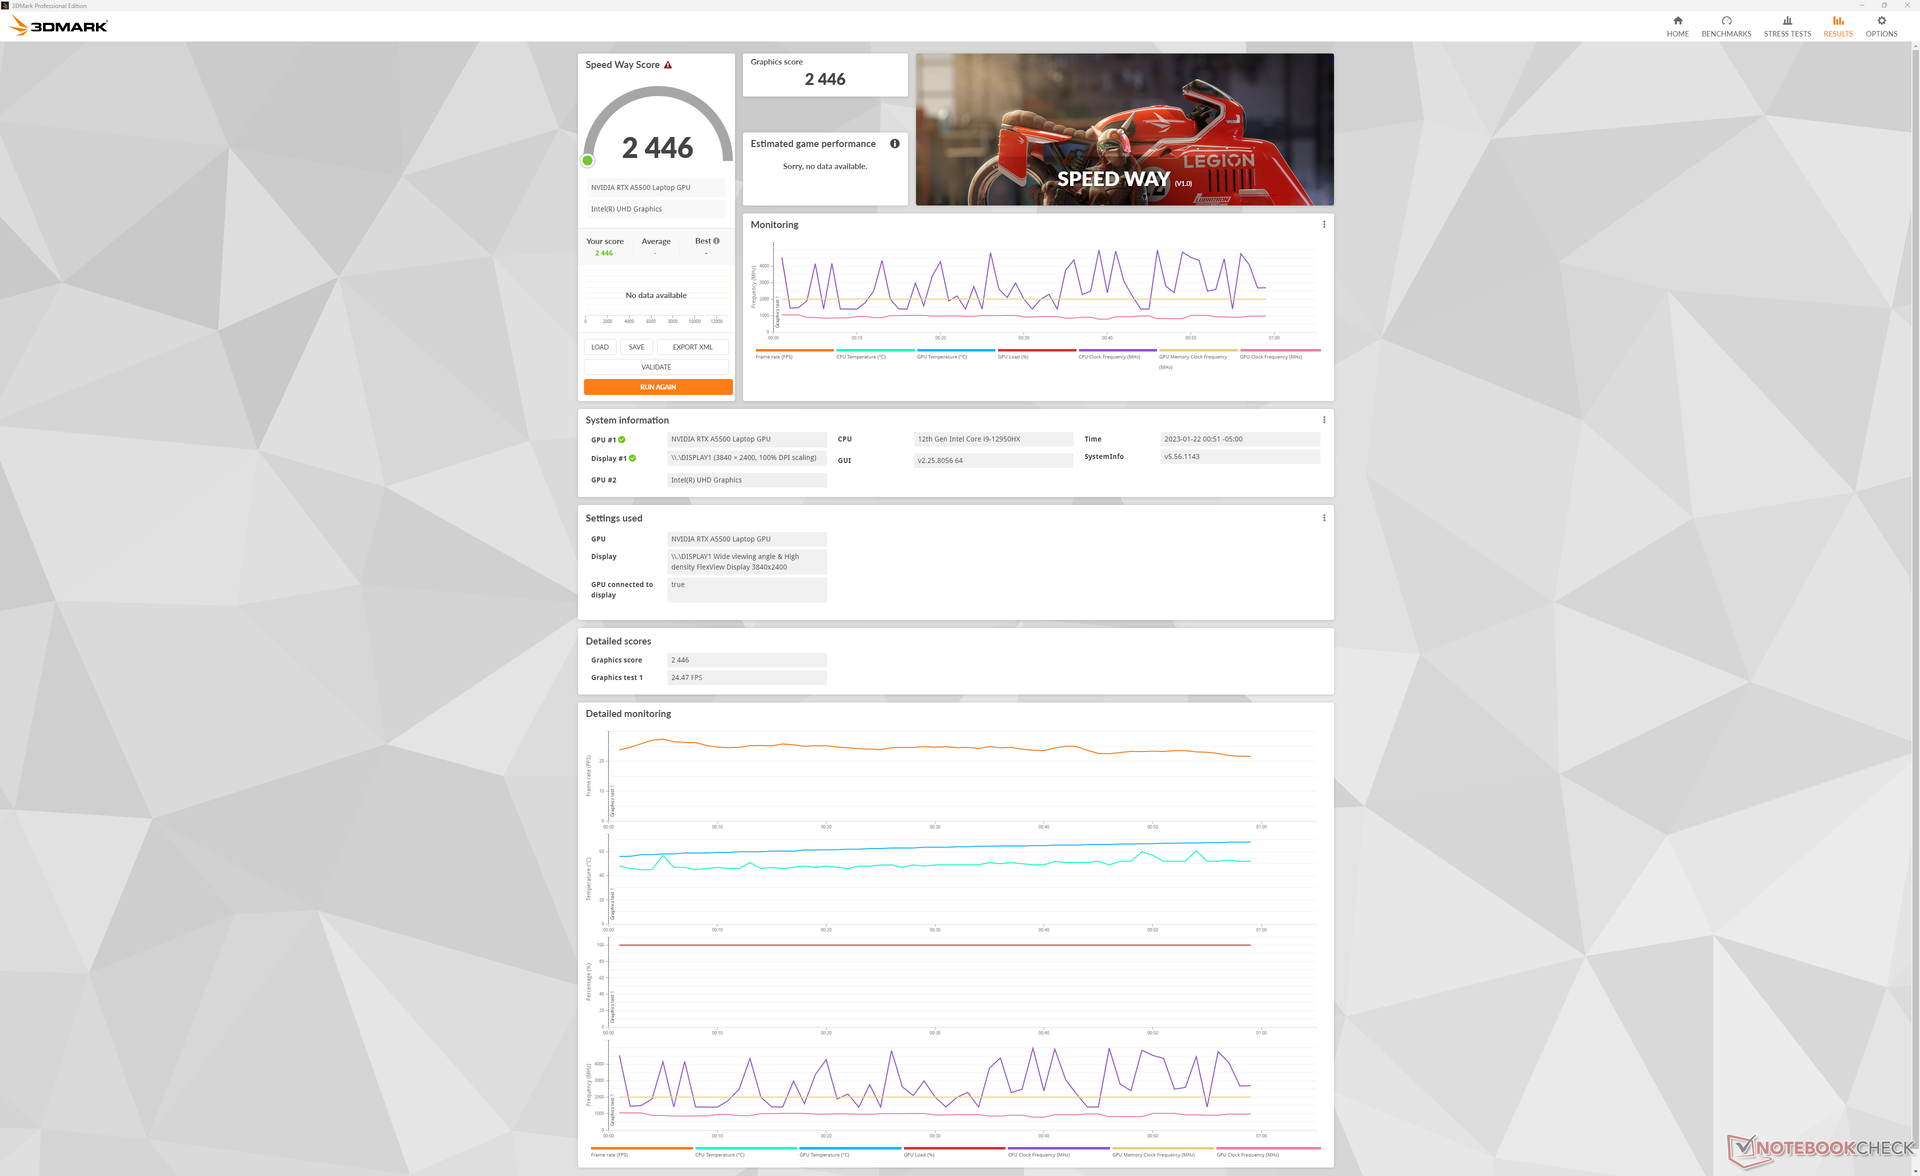
GPU Performance
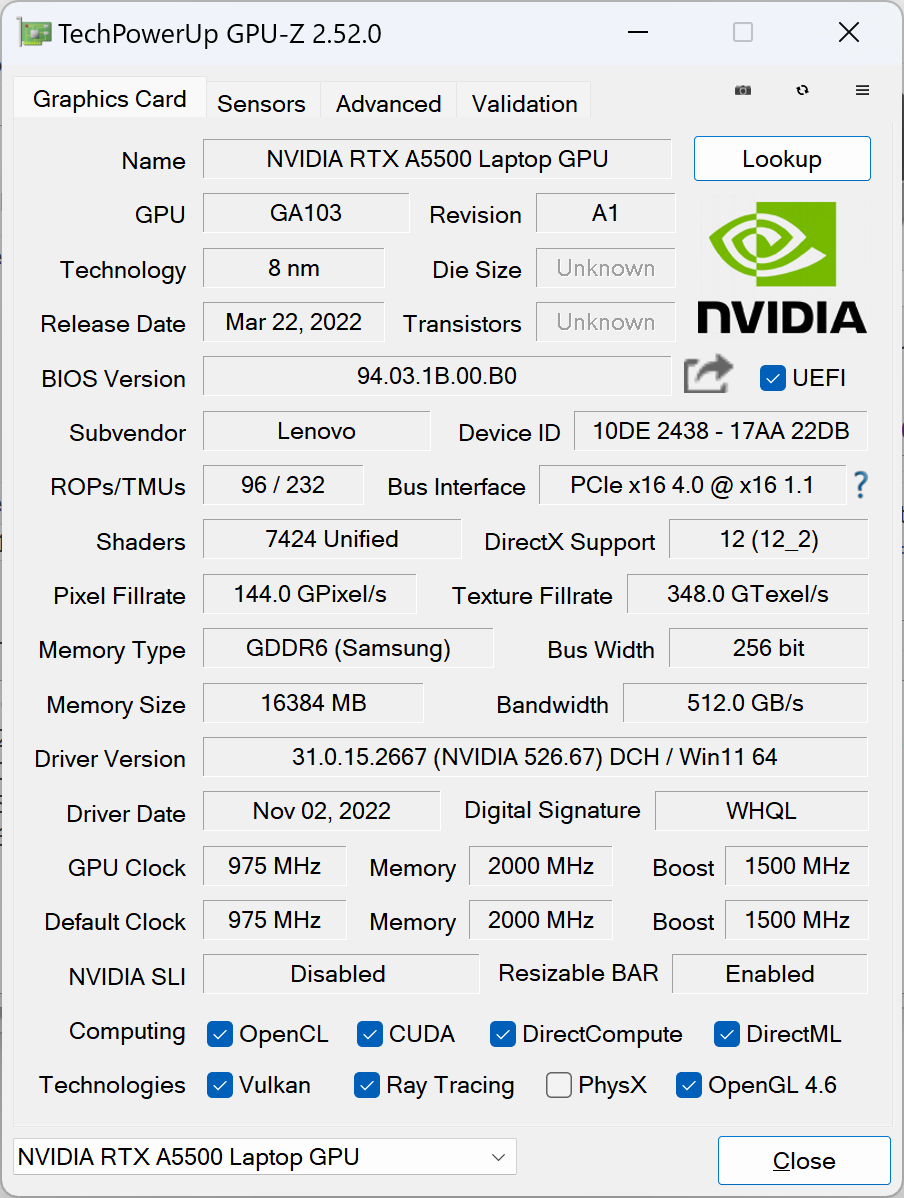
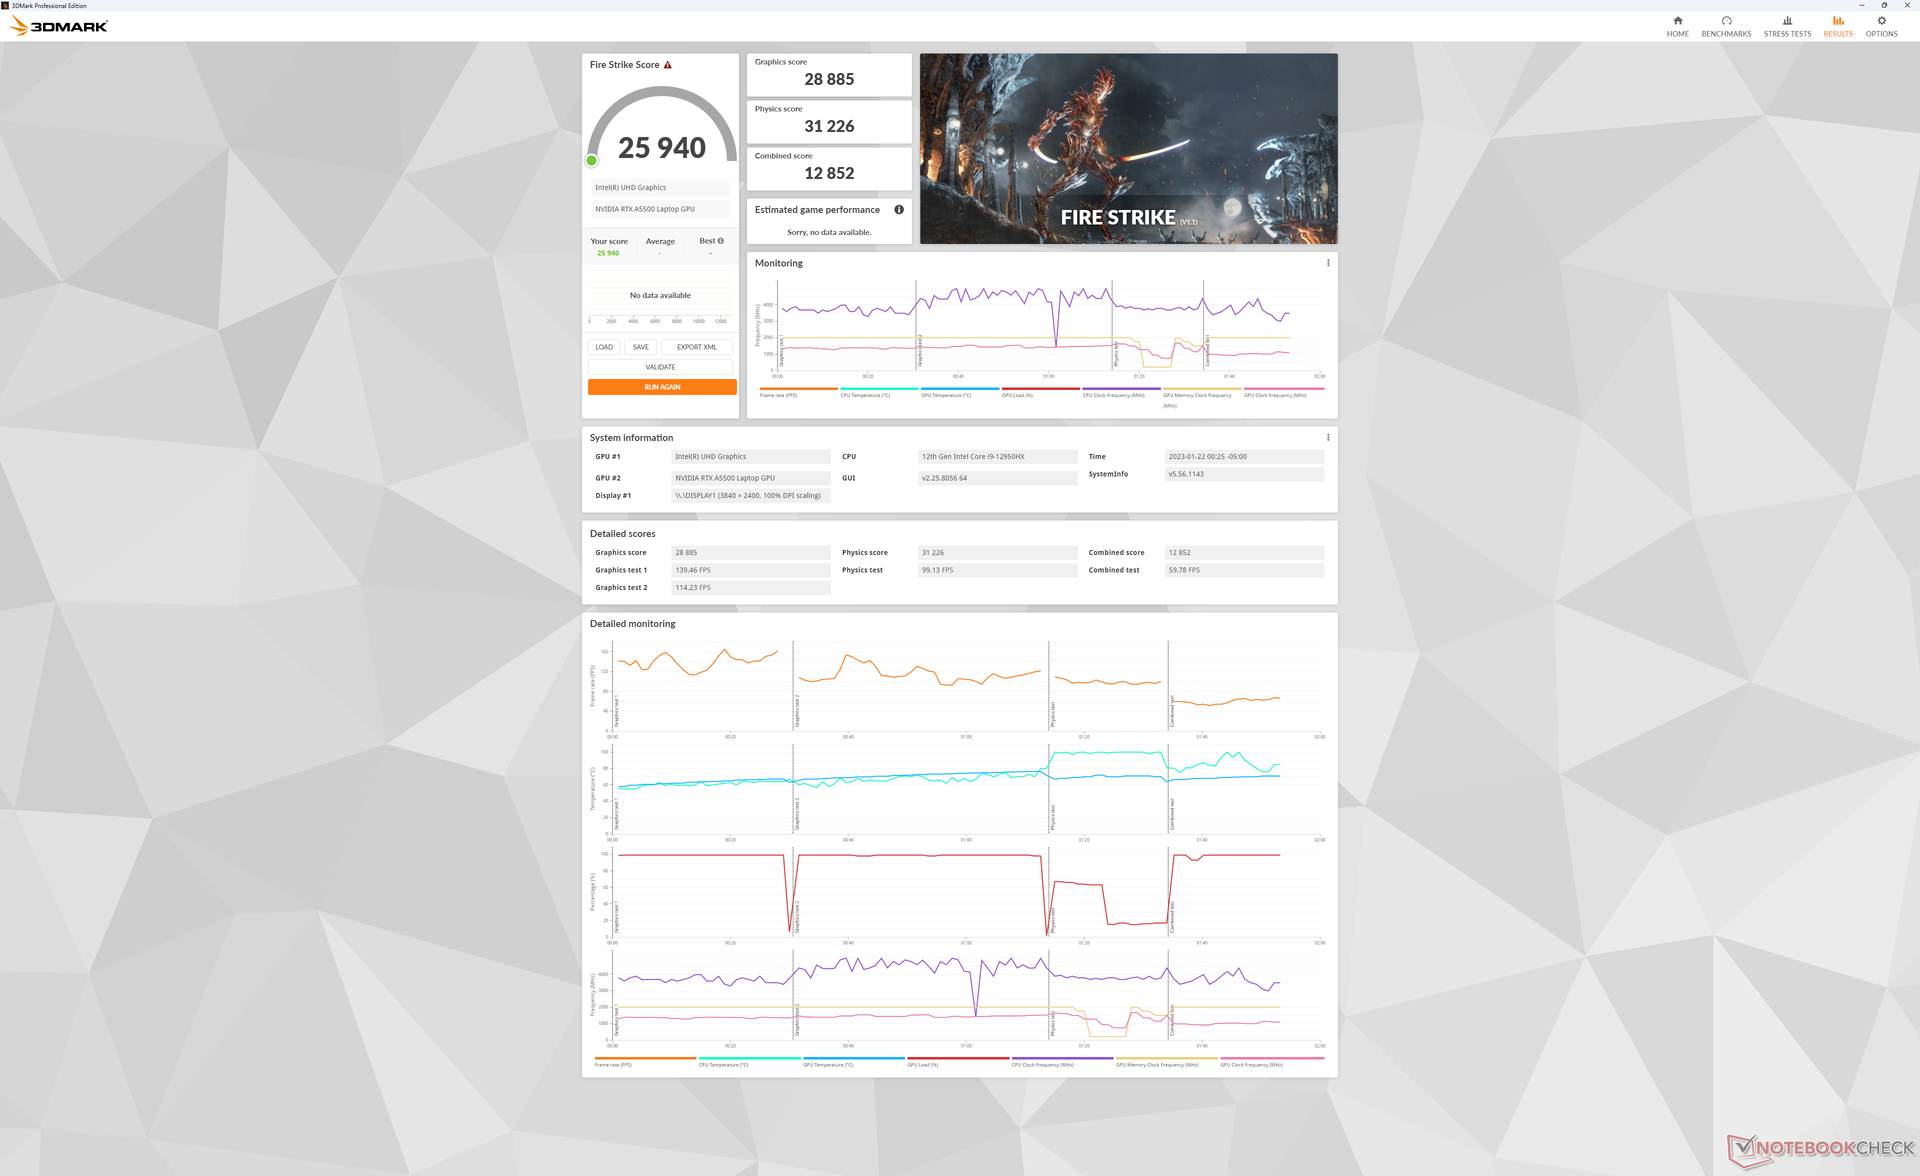
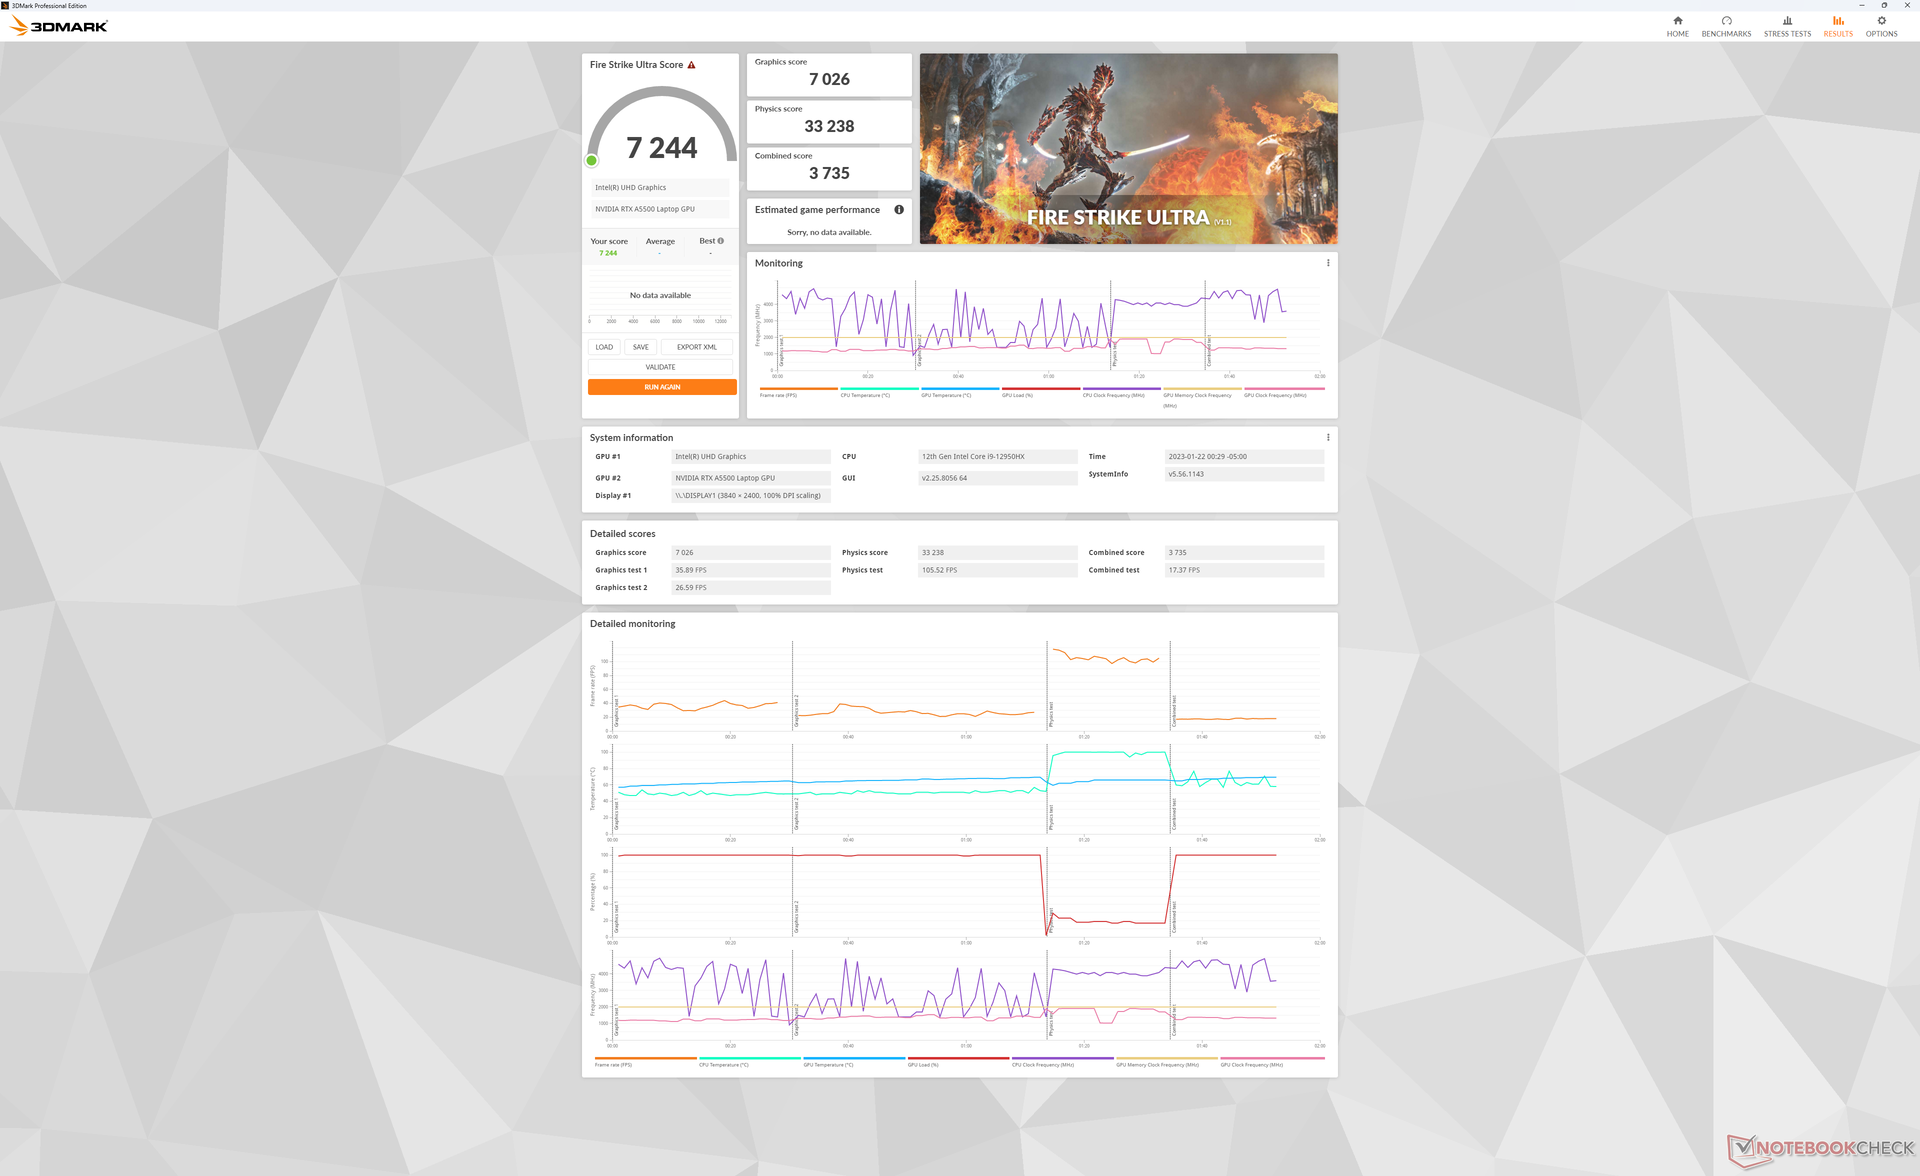
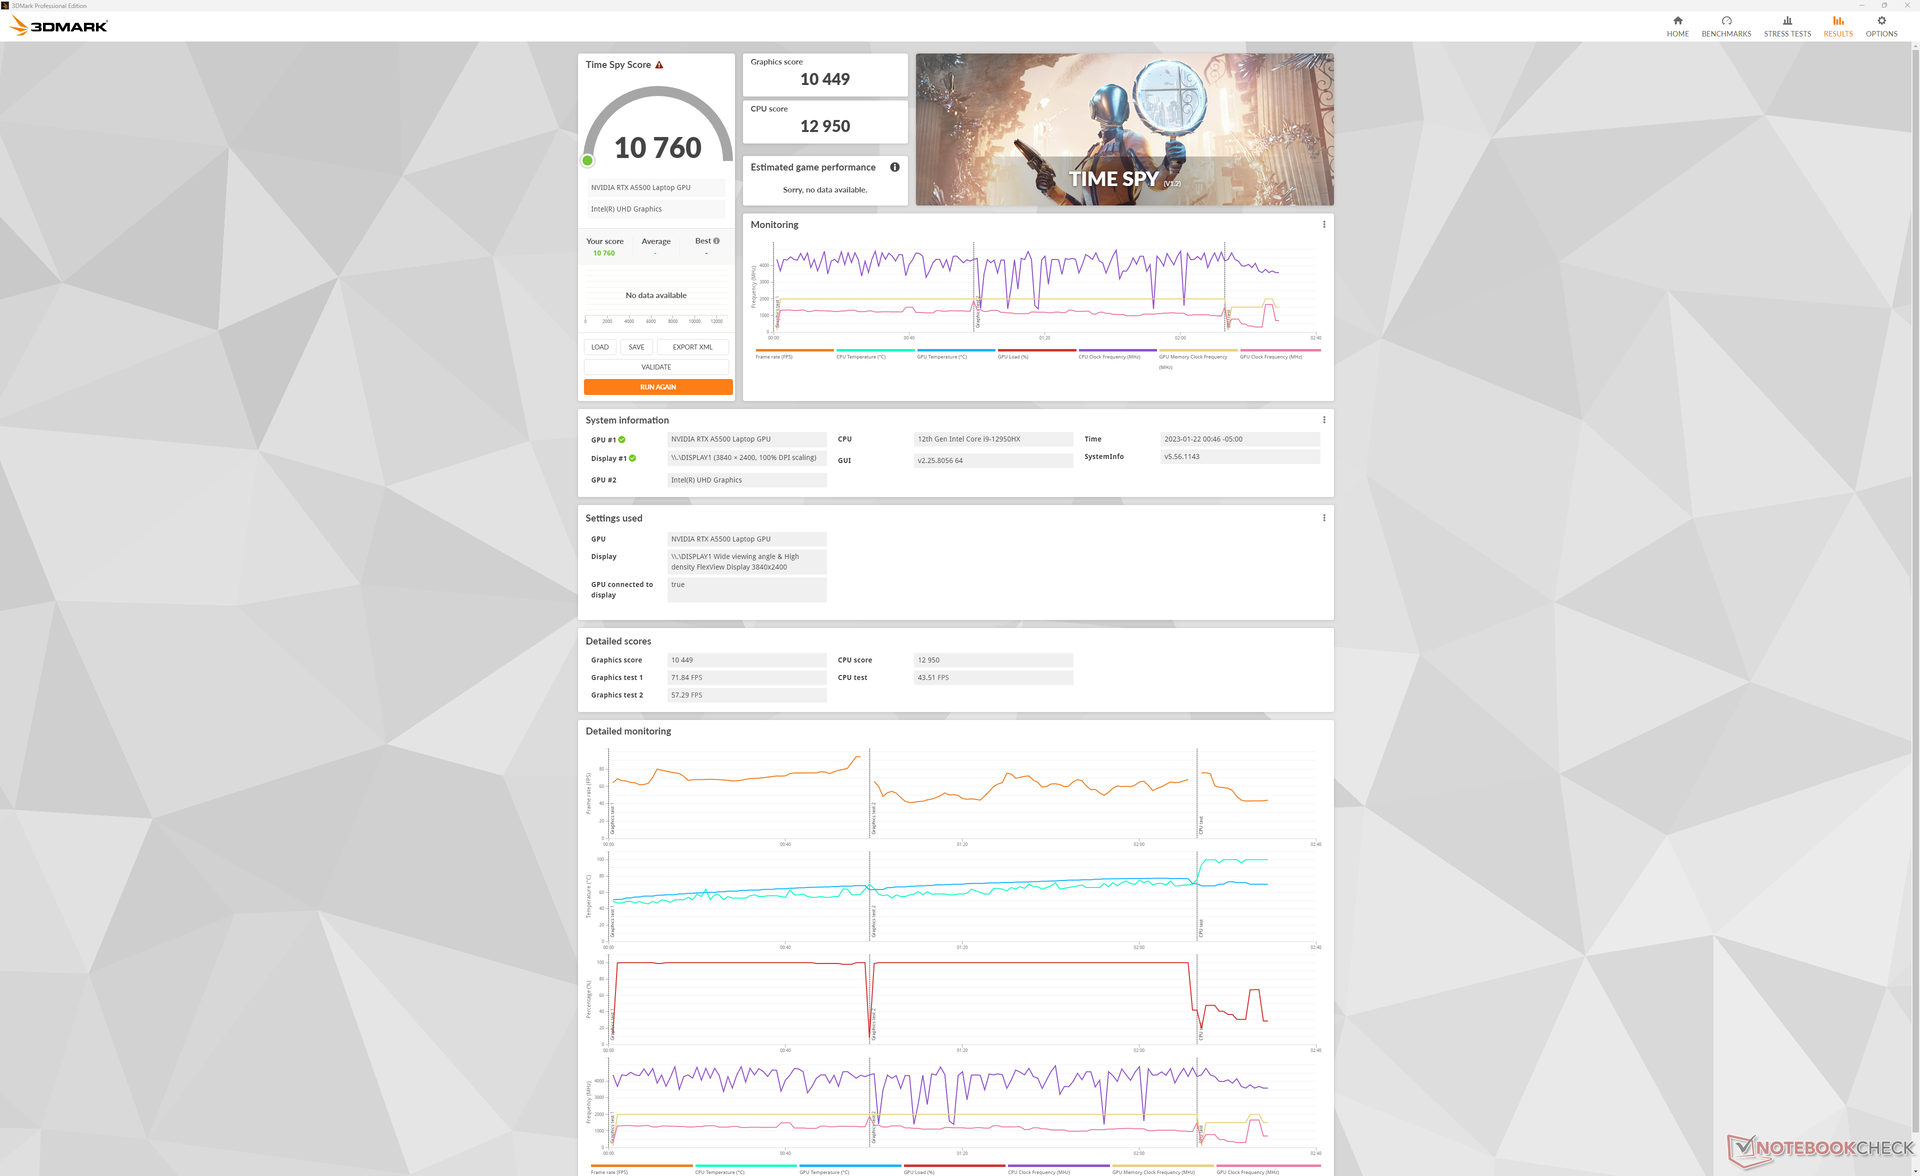
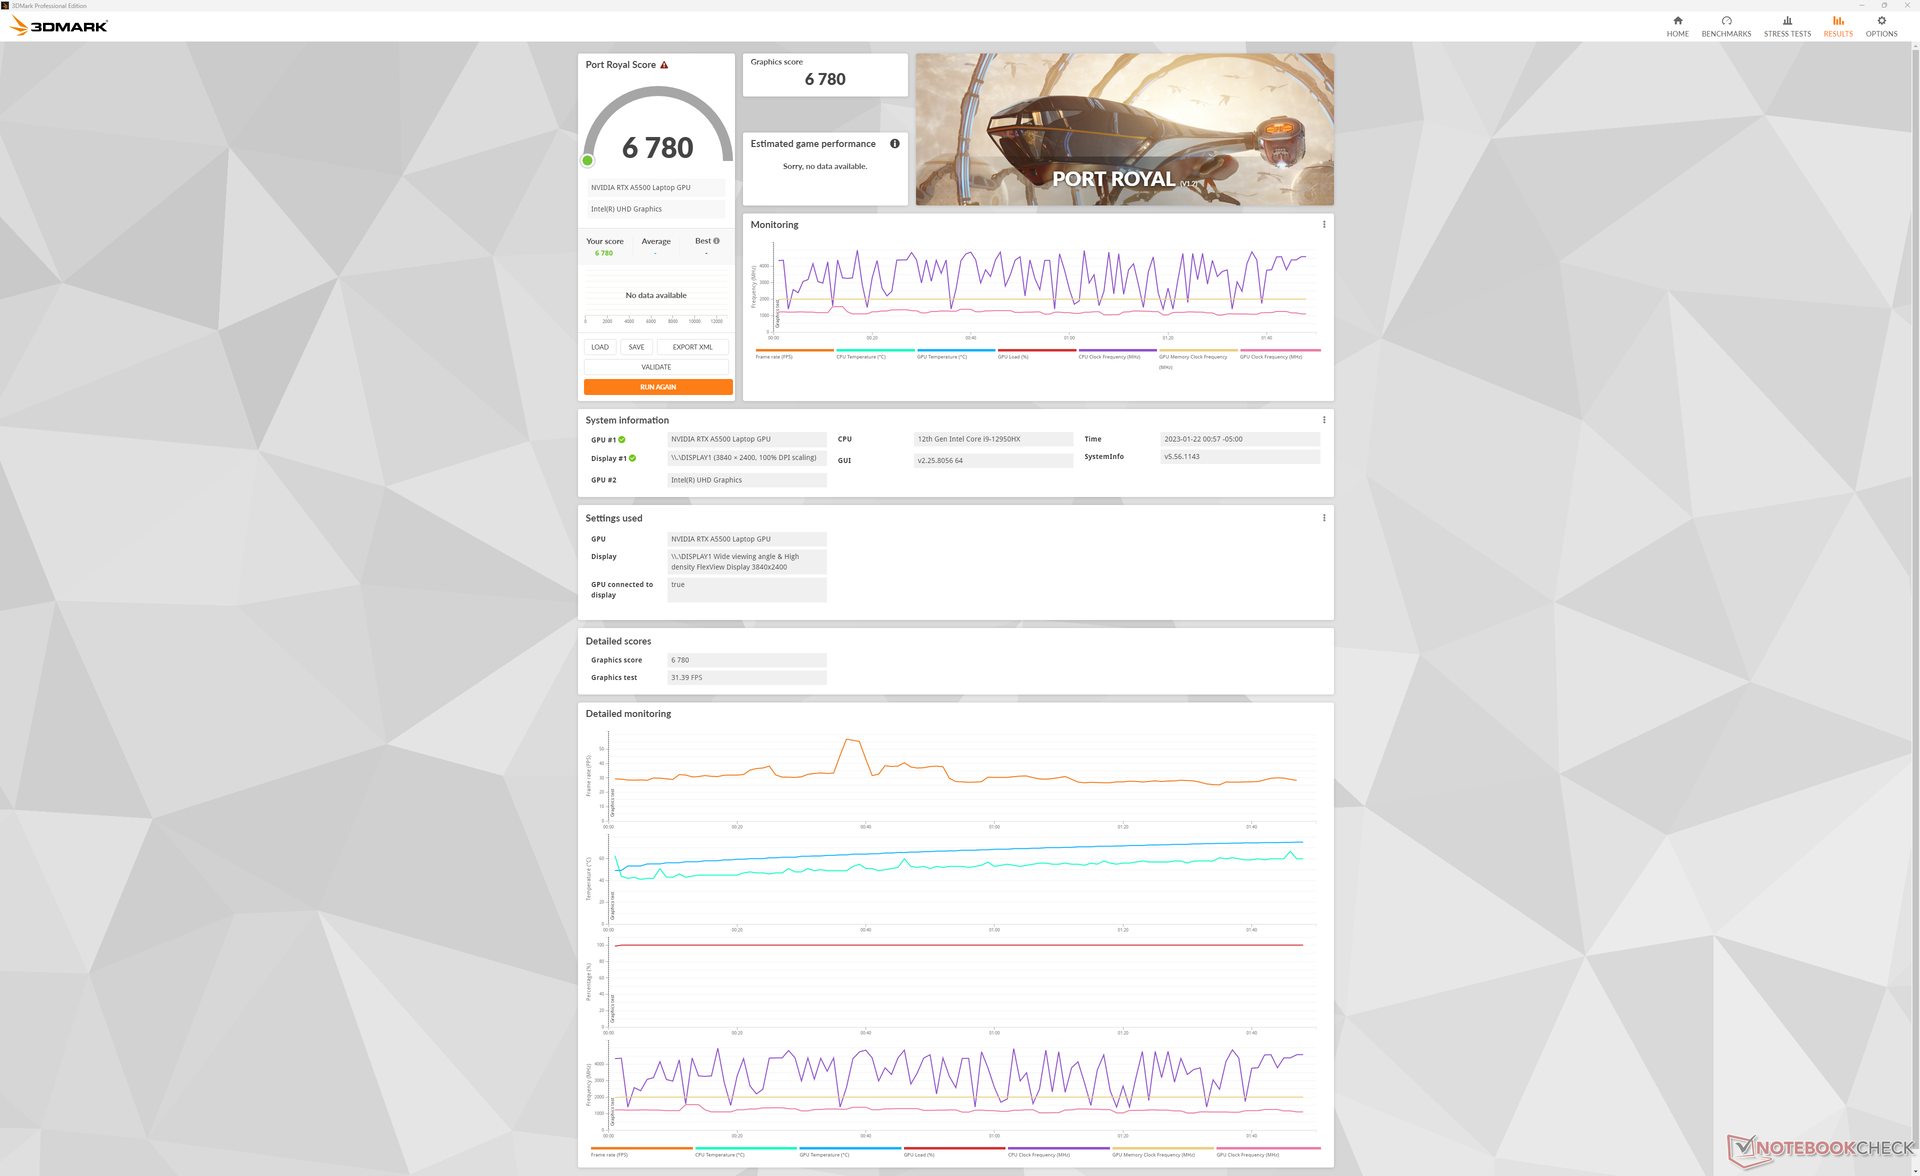
Die RTX A5500 in unserem Lenovo ist etwa 10 % schneller als die gleiche GPU im konkurrierenden Precision 7670. Und das, obwohl die GPU im Dell laut Nvidia Kontrollpanel für 135 W TGP im Vergleich zu den 130 W TGP in unserem Lenovo ausgelegt ist. Weiter runter zum unteren Ende mit RTX A2000 SKU wird die Grafikleistung um 50 bis 65 Prozent reduziert.
| 3DMark Performance Rating - Percent | |
| Lenovo Legion 7 16IAX7-82TD004SGE -34! | |
| Lenovo ThinkPad P16 G1 RTX A5500 | |
| Dell Precision 7000 7670 Performance -1! | |
| Durchschnittliche NVIDIA RTX A5500 Laptop GPU | |
| Asus ProArt StudioBook 16 W7600H5A-2BL2 -19! | |
| MSI WE76 11UM-456 -9! | |
| HP ZBook Fury 15 G8 -1! | |
| MSI CreatorPro Z16P B12UKST -17! | |
| HP ZBook Studio 15 G8 -17! | |
| HP ZBook Studio G7 -17! | |
| HP ZBook Studio 16 G9 62U04EA -9! | |
| Dell Precision 5000 5470 -9! | |
| Lenovo ThinkPad P16 G1 21D6001DMB -17! | |
| 3DMark 11 Performance | 32536 Punkte | |
| 3DMark Cloud Gate Standard Score | 54323 Punkte | |
| 3DMark Fire Strike Score | 25940 Punkte | |
| 3DMark Time Spy Score | 10760 Punkte | |
Hilfe | ||
* ... kleinere Werte sind besser
Witcher 3 FPS Chart
| min. | mittel | hoch | max. | QHD | 4K | |
|---|---|---|---|---|---|---|
| GTA V (2015) | 185.9 | 183.4 | 177.7 | 124.4 | 103.5 | |
| The Witcher 3 (2015) | 489.4 | 329.9 | 211.8 | 110.4 | 63.7 | |
| Dota 2 Reborn (2015) | 194.3 | 174.5 | 166.1 | 156.3 | 132.8 | |
| Final Fantasy XV Benchmark (2018) | 212 | 142.5 | 113.1 | 83.5 | 45.4 | |
| X-Plane 11.11 (2018) | 155.8 | 137.6 | 108.8 | 93.7 | ||
| Strange Brigade (2018) | 442 | 264 | 223 | 197.7 | 138.6 | |
| Cyberpunk 2077 1.6 (2022) | 132.3 | 117.7 | 96.1 | 80.7 | 47 | 20.4 |
Emissionen
Systemrauschen
Im Standardmodus "Ausbalanciert" blieben die Lüfter trotz der leistungsstarken Prozessoren im Inneren länger als erwartet leise. Beim 3DMark 06 zum Beispiel erreichte die Lüfterlautstärke am Ende der ersten Benchmark-Szene nur 28 dB(A). Erst nach mehreren Durchläufen kamen die Lüfter auf lautere Drehzahlen von bis zu 40 dB(A).
Die Lüftergeräusche bei anspruchsvolleren Lasten im Performance-Modus steigen auf knapp über 50 dB(A) und sind damit deutlich lauter als die der konkurrierenden Workstations, einschließlich des Precision 7670, wie die Tabelle unten zeigt. Natürlich sind diese Alternativen auch langsamer als unsere Lenovo Konfiguration.
Lautstärkediagramm
| Idle |
| 23.1 / 23.1 / 23.1 dB(A) |
| Last |
| 28.9 / 51.4 dB(A) |
 | ||
30 dB leise 40 dB(A) deutlich hörbar 50 dB(A) störend |
||
min: | ||
| Lenovo ThinkPad P16 G1 RTX A5500 RTX A5500 Laptop GPU, i9-12950HX, WDC PC SN810 2TB | Asus ProArt StudioBook 16 W7600H5A-2BL2 RTX A5000 Laptop GPU, W-11955M, 2x Micron 2300 2TB MTFDHBA2T0TDV (RAID 0) | Dell Precision 7000 7670 Performance RTX A5500 Laptop GPU, i9-12950HX | Lenovo ThinkPad P16 G1 21D6001DMB RTX A2000 Laptop GPU, i7-12850HX, Micron 3400 1TB MTFDKBA1T0TFH | MSI CreatorPro Z16P B12UKST RTX A3000 Laptop GPU, i7-12700H, Samsung PM9A1 MZVL21T0HCLR | HP ZBook Studio 16 G9 62U04EA RTX A2000 Laptop GPU, i7-12800H, Micron 3400 1TB MTFDKBA1T0TFH | |
|---|---|---|---|---|---|---|
| Geräuschentwicklung | -14% | -16% | -6% | -11% | -9% | |
| aus / Umgebung * (dB) | 23.1 | 26 -13% | 23.9 -3% | 23.2 -0% | 24.1 -4% | 24 -4% |
| Idle min * (dB) | 23.1 | 26 -13% | 24 -4% | 23.2 -0% | 27.1 -17% | 24 -4% |
| Idle avg * (dB) | 23.1 | 26 -13% | 24 -4% | 23.2 -0% | 27.1 -17% | 27.7 -20% |
| Idle max * (dB) | 23.1 | 26.5 -15% | 38 -65% | 23.2 -0% | 27.1 -17% | 27.7 -20% |
| Last avg * (dB) | 28.9 | 42 -45% | 46.3 -60% | 47.8 -65% | 42.9 -48% | 39.8 -38% |
| Witcher 3 ultra * (dB) | 51.6 | 41.9 19% | 34.1 34% | 44 15% | 44.3 14% | |
| Last max * (dB) | 51.4 | 43 16% | 47.9 7% | 56.3 -10% | 47 9% | 47.7 7% |
* ... kleinere Werte sind besser
Temperatur
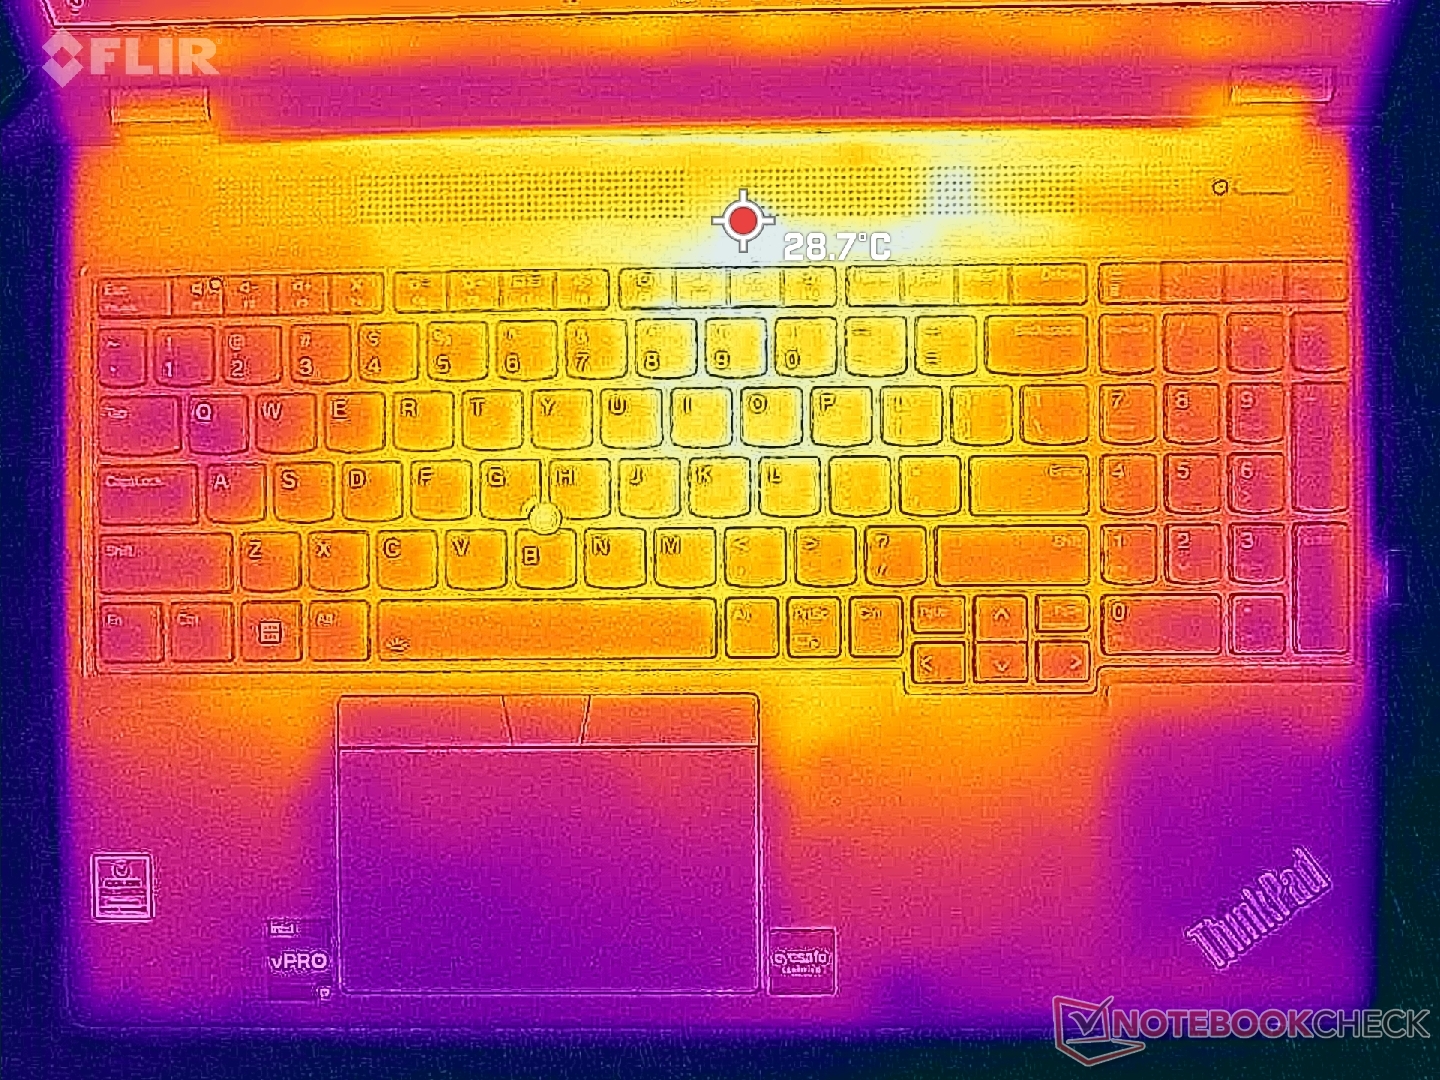
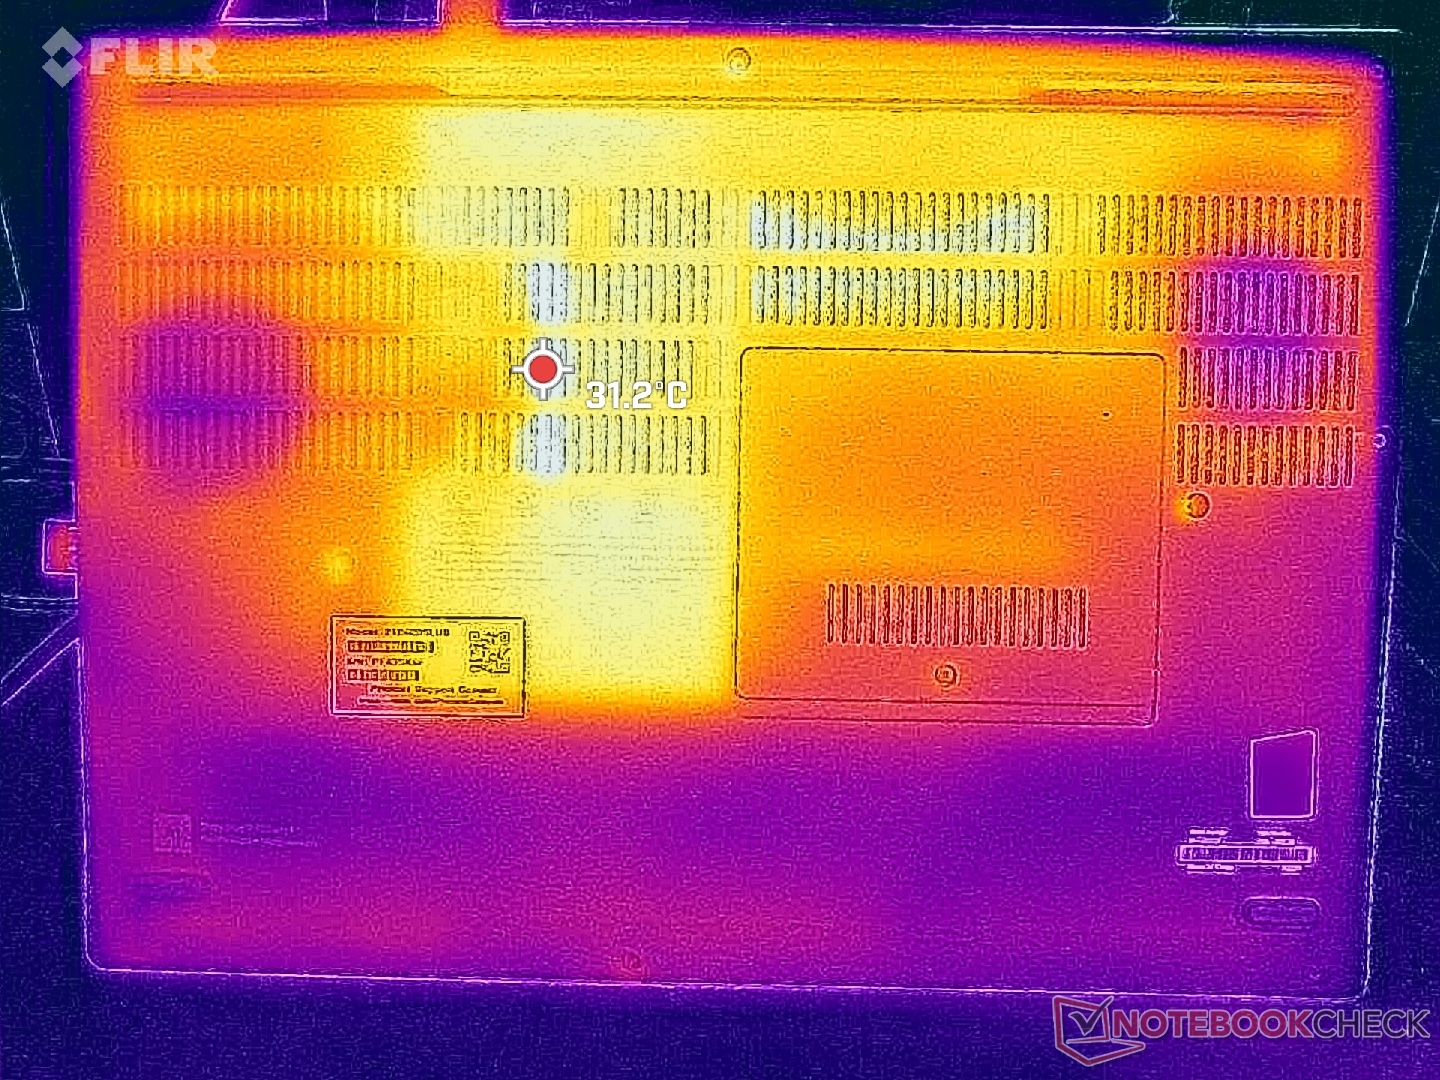
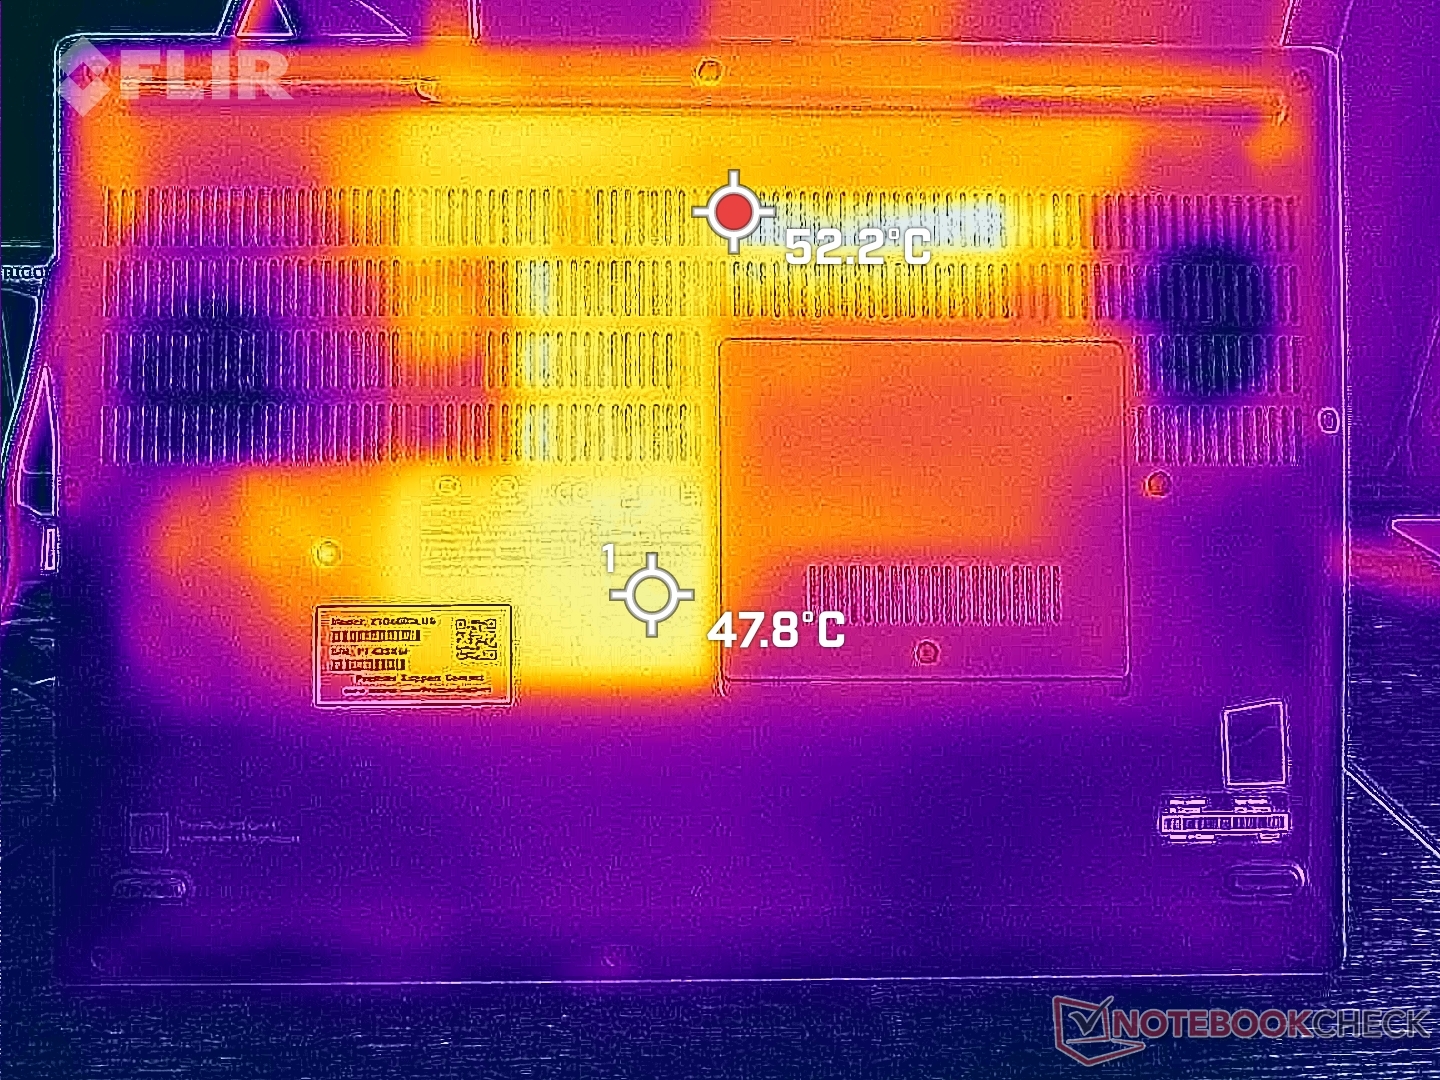
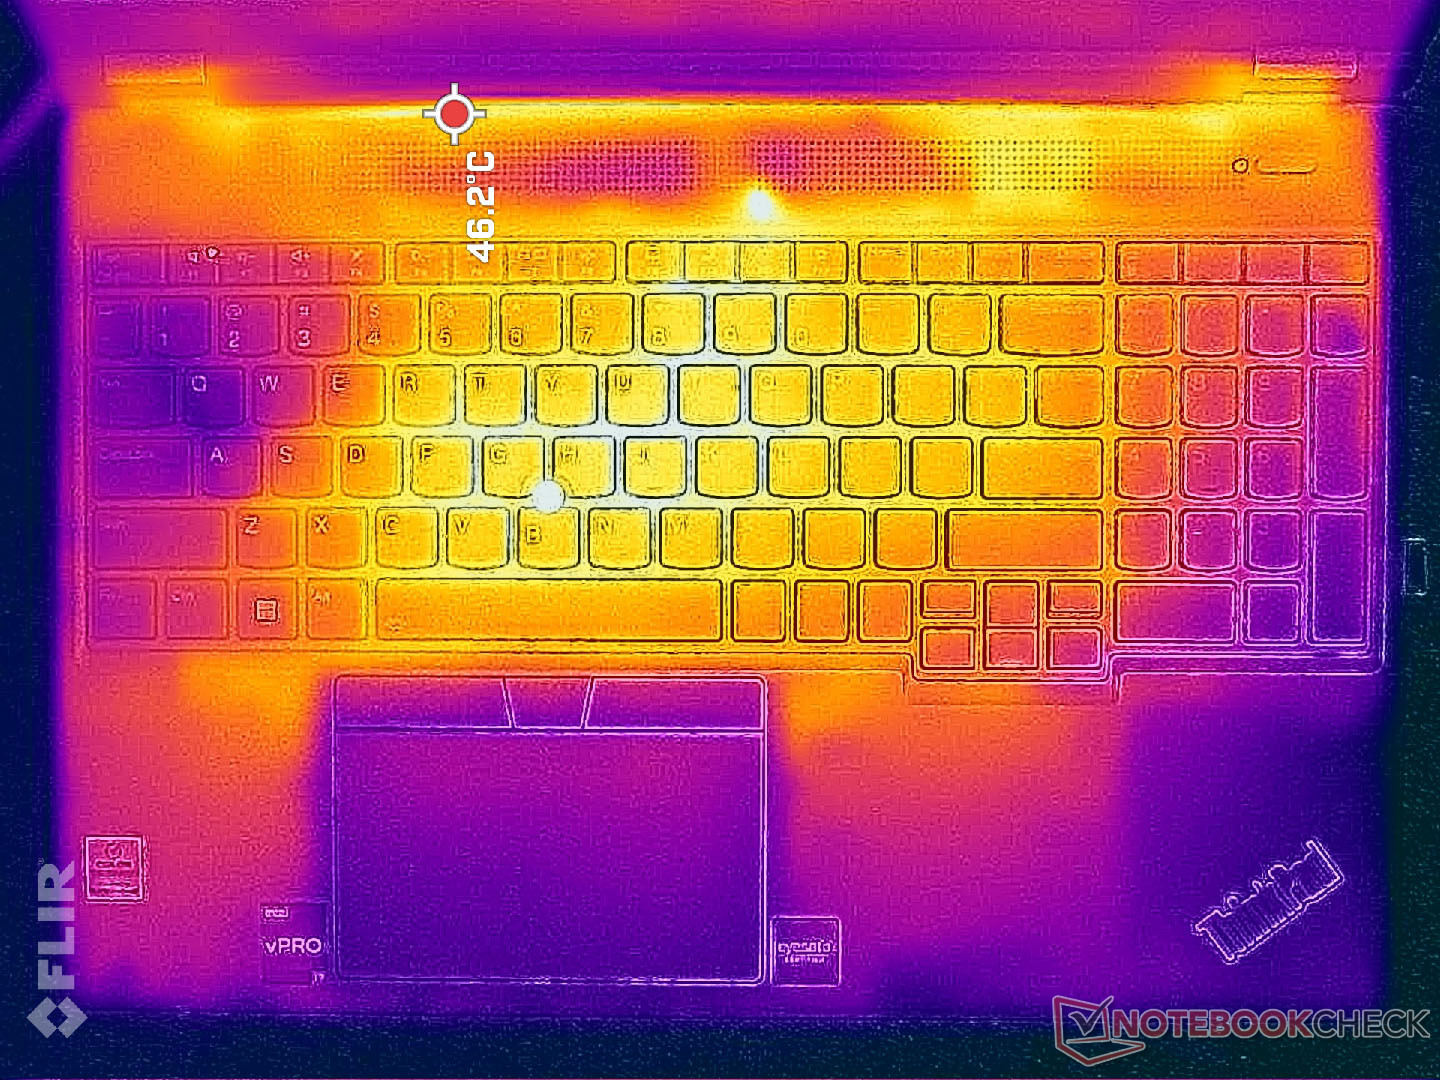
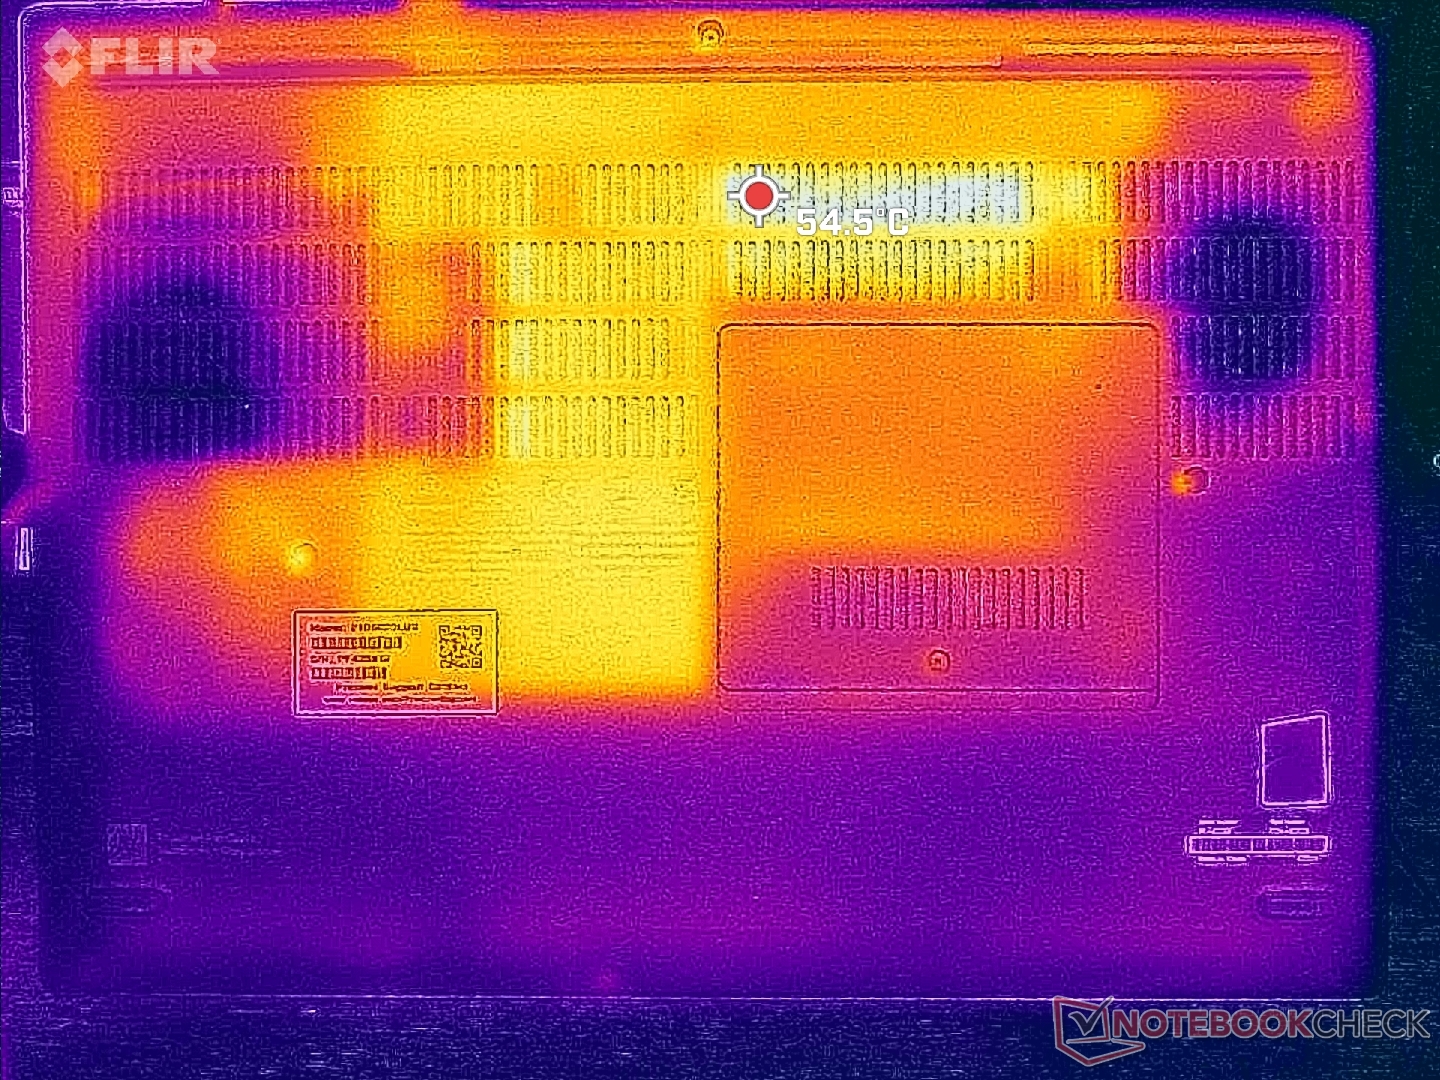
Die Oberflächentemperaturen sind wärmer als erwartet, selbst im Leerlauf auf dem Desktop ohne laufende Anwendungen. Die Unterseite zum Beispiel kann bis zu 37 °C warm werden, verglichen mit nur 31 °C beim Precision 7670. Bei höherer Last können dieselben heißen Stellen des Lenovo 49 °C oder wärmer werden, während die Tastaturmitte 40 °C erreichen kann. Die Temperaturen auf der Haut können sich unangenehm anfühlen, wenn das Notebook auf dem Schoß statt auf einem Tisch steht.
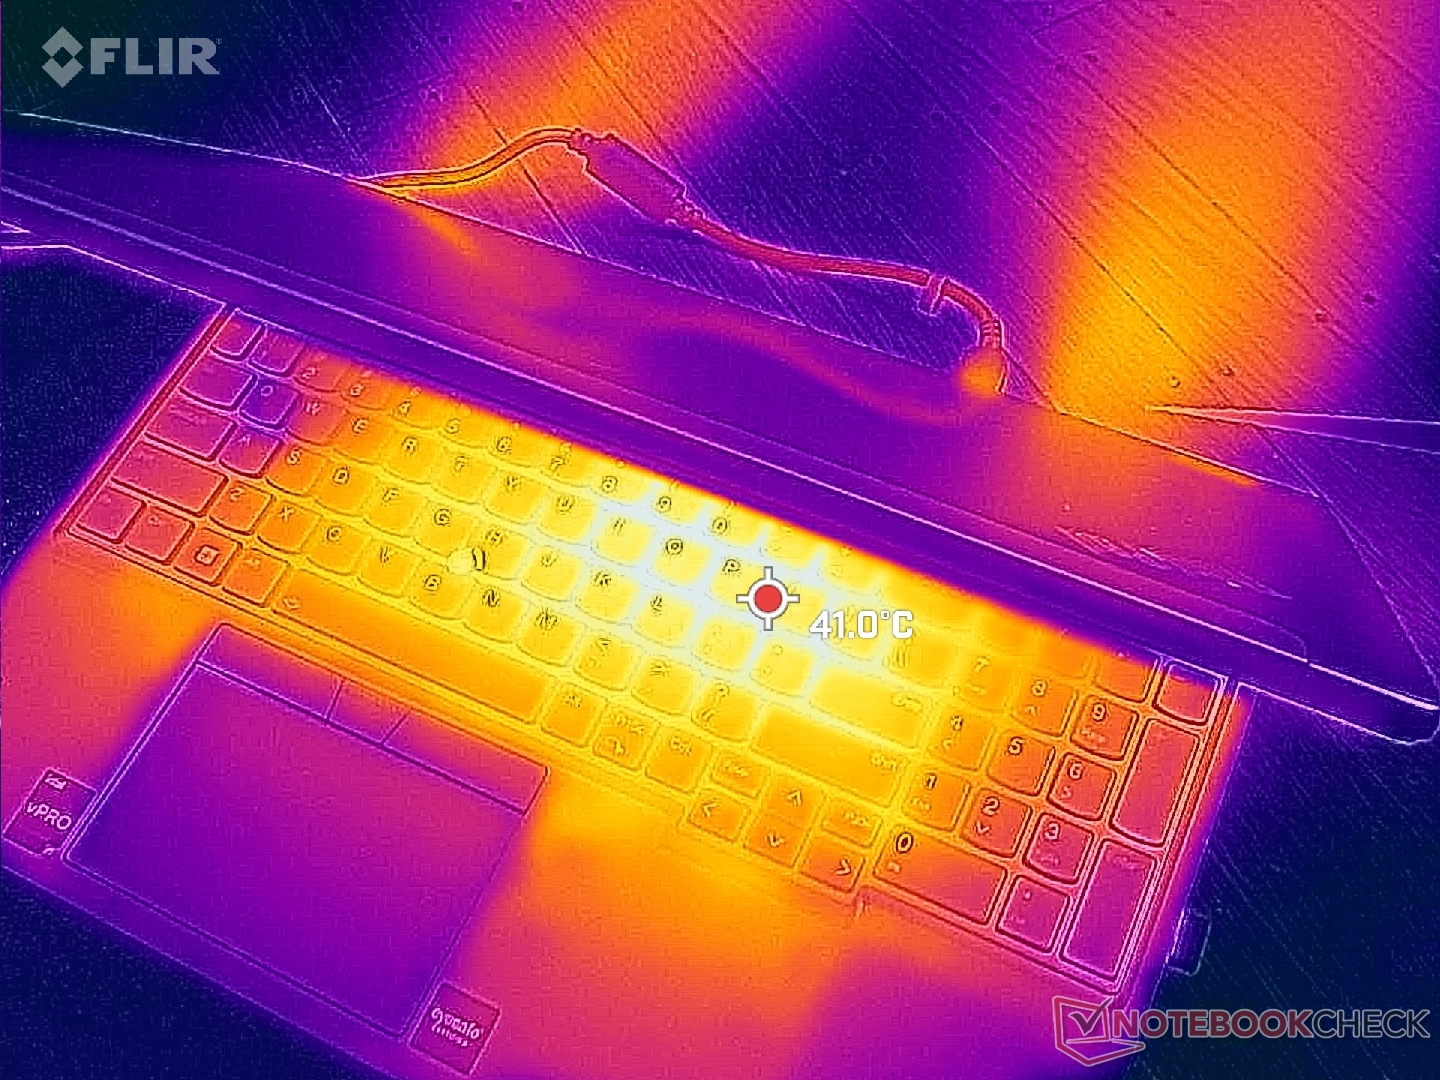
(±) Die maximale Temperatur auf der Oberseite ist 44.8 °C. Im Vergleich liegt der Klassendurchschnitt bei 38.2 °C (von 22.2 bis 69.8 °C für die Klasse Workstation).
(-) Auf der Unterseite messen wir eine maximalen Wert von 49.8 °C (im Vergleich zum Durchschnitt von 41.1 °C).
(+) Ohne Last messen wir eine durchschnittliche Temperatur von 28.6 °C auf der Oberseite. Der Klassendurchschnitt erreicht 32 °C.
(±) Beim längeren Spielen von The Witcher 3 erhitzt sich das Gerät durchschnittlich auf 36.4 °C. Der Durchschnitt der Klasse ist derzeit 32 °C.
(+) Die Handballen und der Touchpad-Bereich erreichen maximal 32.4 °C und damit die typische Hauttemperatur und fühlen sich daher nicht heiß an.
(-) Die durchschnittliche Handballen-Temperatur anderer getesteter Geräte war 27.8 °C (-4.6 °C).

| Lenovo ThinkPad P16 G1 RTX A5500 Intel Core i9-12950HX, NVIDIA RTX A5500 Laptop GPU | Asus ProArt StudioBook 16 W7600H5A-2BL2 Intel Xeon W-11955M, NVIDIA RTX A5000 Laptop GPU | Dell Precision 7000 7670 Performance Intel Core i9-12950HX, NVIDIA RTX A5500 Laptop GPU | Lenovo ThinkPad P16 G1 21D6001DMB Intel Core i7-12850HX, NVIDIA RTX A2000 Laptop GPU | MSI CreatorPro Z16P B12UKST Intel Core i7-12700H, NVIDIA RTX A3000 Laptop GPU | HP ZBook Studio 16 G9 62U04EA Intel Core i7-12800H, NVIDIA RTX A2000 Laptop GPU | |
|---|---|---|---|---|---|---|
| Hitze | -1% | -3% | 17% | -3% | 9% | |
| Last oben max * (°C) | 44.8 | 45.7 -2% | 53 -18% | 43.1 4% | 56.3 -26% | 38.7 14% |
| Last unten max * (°C) | 49.8 | 48.3 3% | 43.2 13% | 39.9 20% | 68.3 -37% | 53.4 -7% |
| Idle oben max * (°C) | 30.6 | 35.3 -15% | 36.8 -20% | 26 15% | 25.2 18% | 27.3 11% |
| Idle unten max * (°C) | 38.6 | 34.4 11% | 33.8 12% | 27.6 28% | 25.9 33% | 31.6 18% |
* ... kleinere Werte sind besser
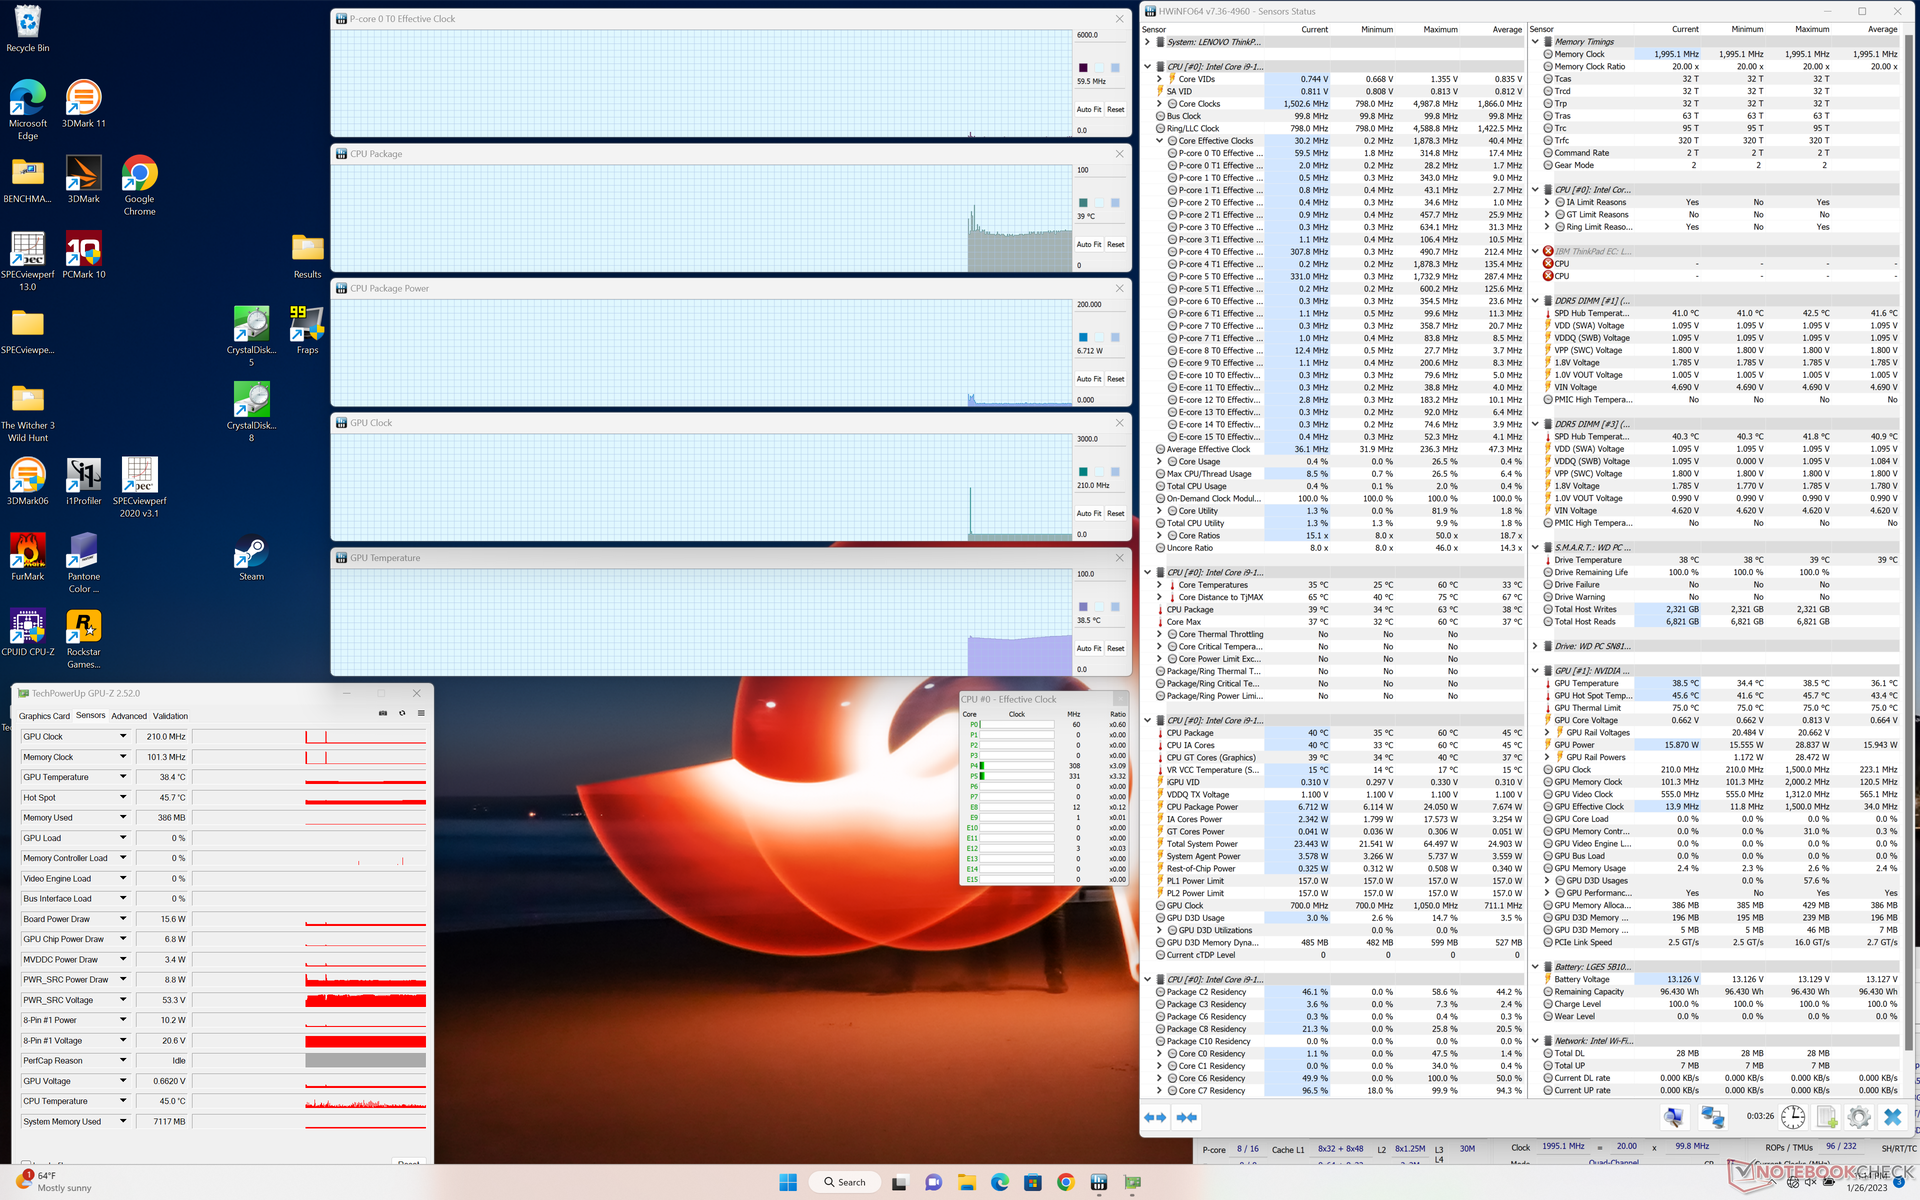
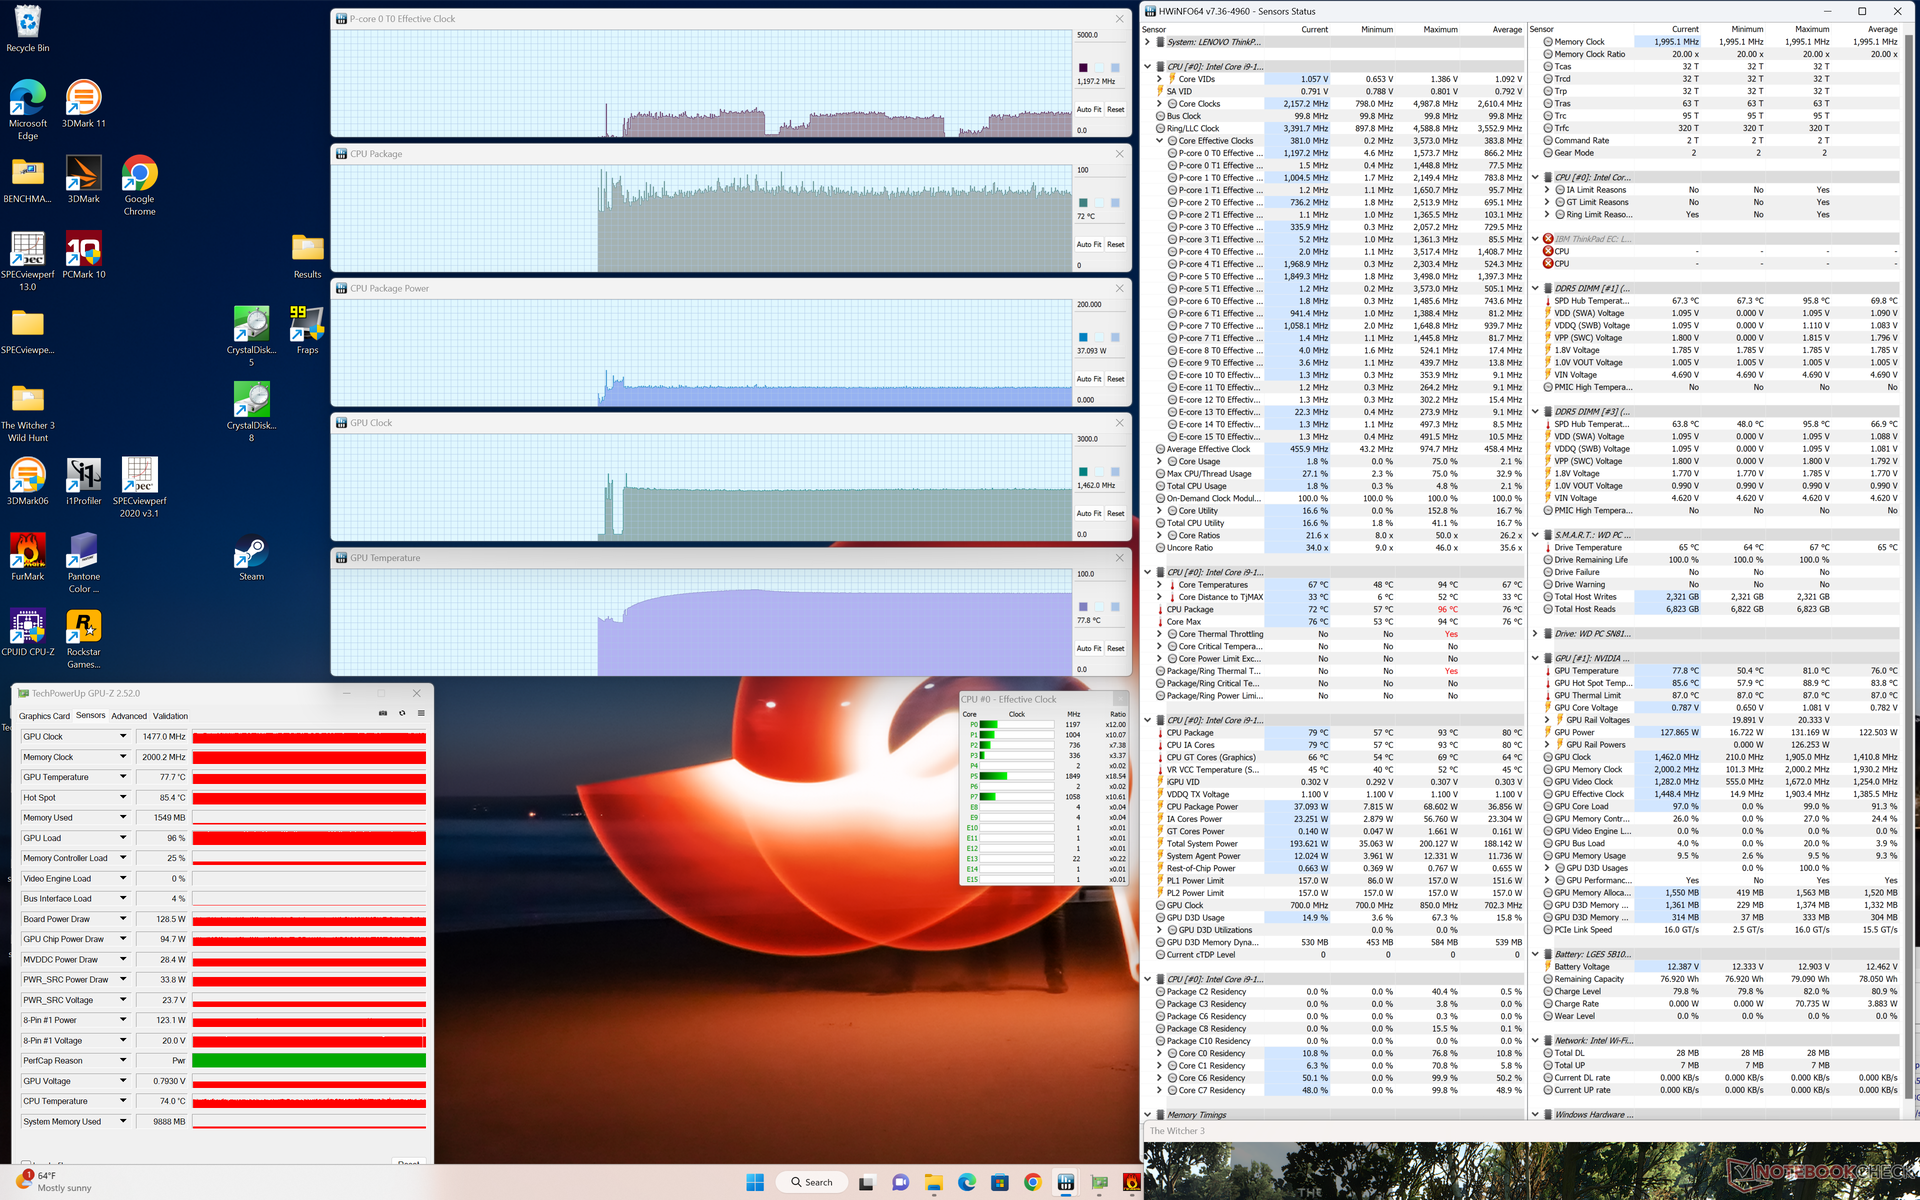
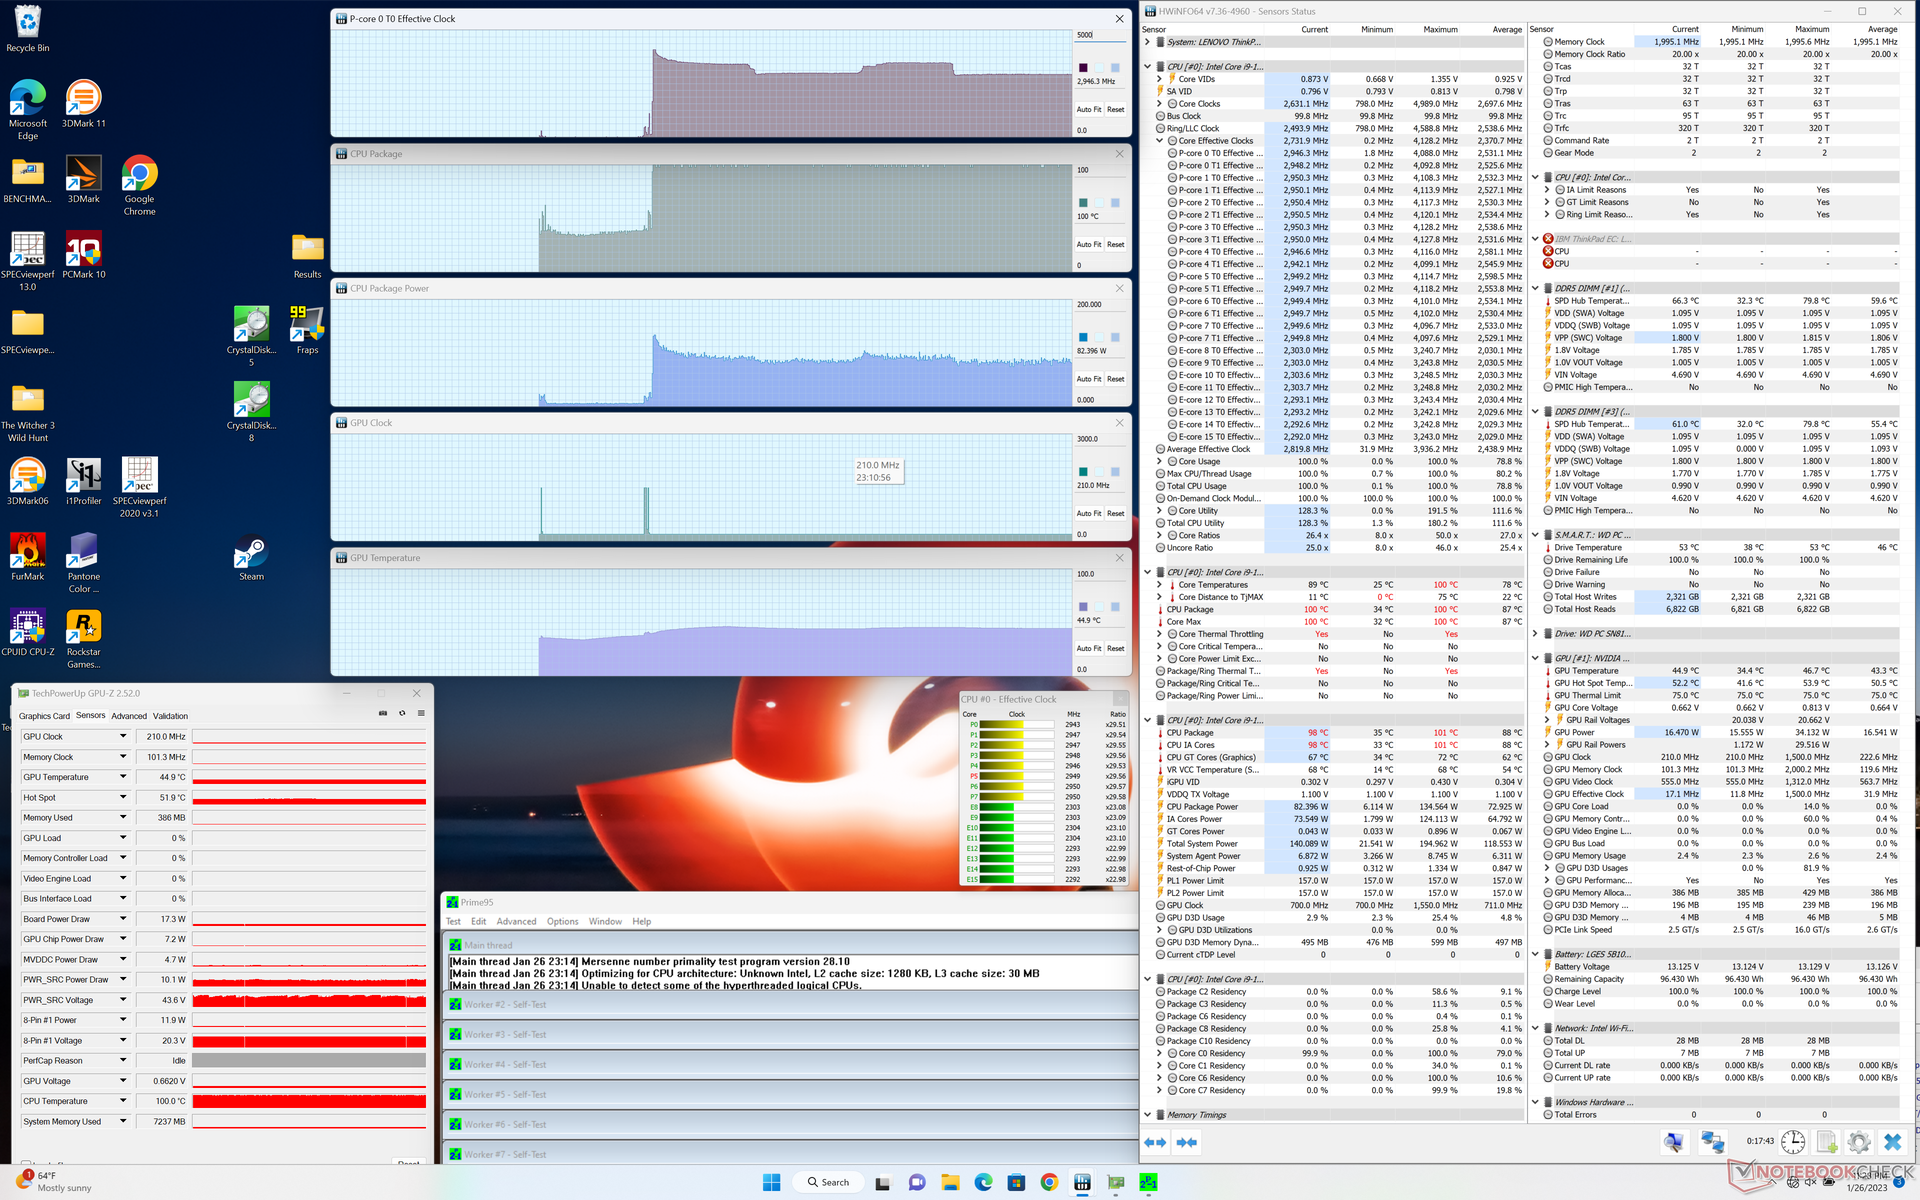
Stresstest
Das System ist definitiv heftig beansprucht, wenn die Prozessoren stark belastet werden. Bei der Ausführung von Prime95 beispielsweise stiegen die CPU-Taktraten und die Leistungsaufnahme des Boards auf 4,1 GHz bzw. 135 W. Leider stieg die Kerntemperatur fast sofort auf 100 °C an, so dass die Taktraten schnell sanken, um noch wärmere Temperaturen zu vermeiden. Der Prozessor stabilisierte sich schließlich bei 3 GHz, 82 W und 100 °C, was bedeutet, dass er an die Grenzen der ThinkPad-P16-G1-Kühllösung stößt. Eine Wiederholung dieses Tests mit dem Precision 7670, das mit dem gleichen Prozessor ausgestattet ist, führt zu einer niedrigeren stabilen Taktrate von 2,3 GHz und einer kühleren Kerntemperatur von 78 °C.
Bei der Ausführung von Witcher 3, um hohe Lasten darzustellen, stabilisieren sich GPU-Takt, Speichertakt und Temperatur bei 1.477 MHz, 2.000 MHz bzw. 78 °C, verglichen mit 1.417 MHz, 1.750 MHz und 82 °C auf dem Precision 7670 unter ähnlichen Bedingungen. Auch die Leistungsaufnahme des Boards ist bei unserem Lenovo mit 129 W höher als bei dem Dell mit nur 100 W, was die oben erwähnten GPU-Leistungsvorteile erklären würde.
Der Akkubetrieb schränkt die Leistung ein. Ein Fire-Strike-Test im Akkubetrieb liefert Physik- und Grafik-Scores von 18.903 bzw. 12.395 Punkten, verglichen mit 31.226 und 28.885 Punkten im Netzbetrieb.
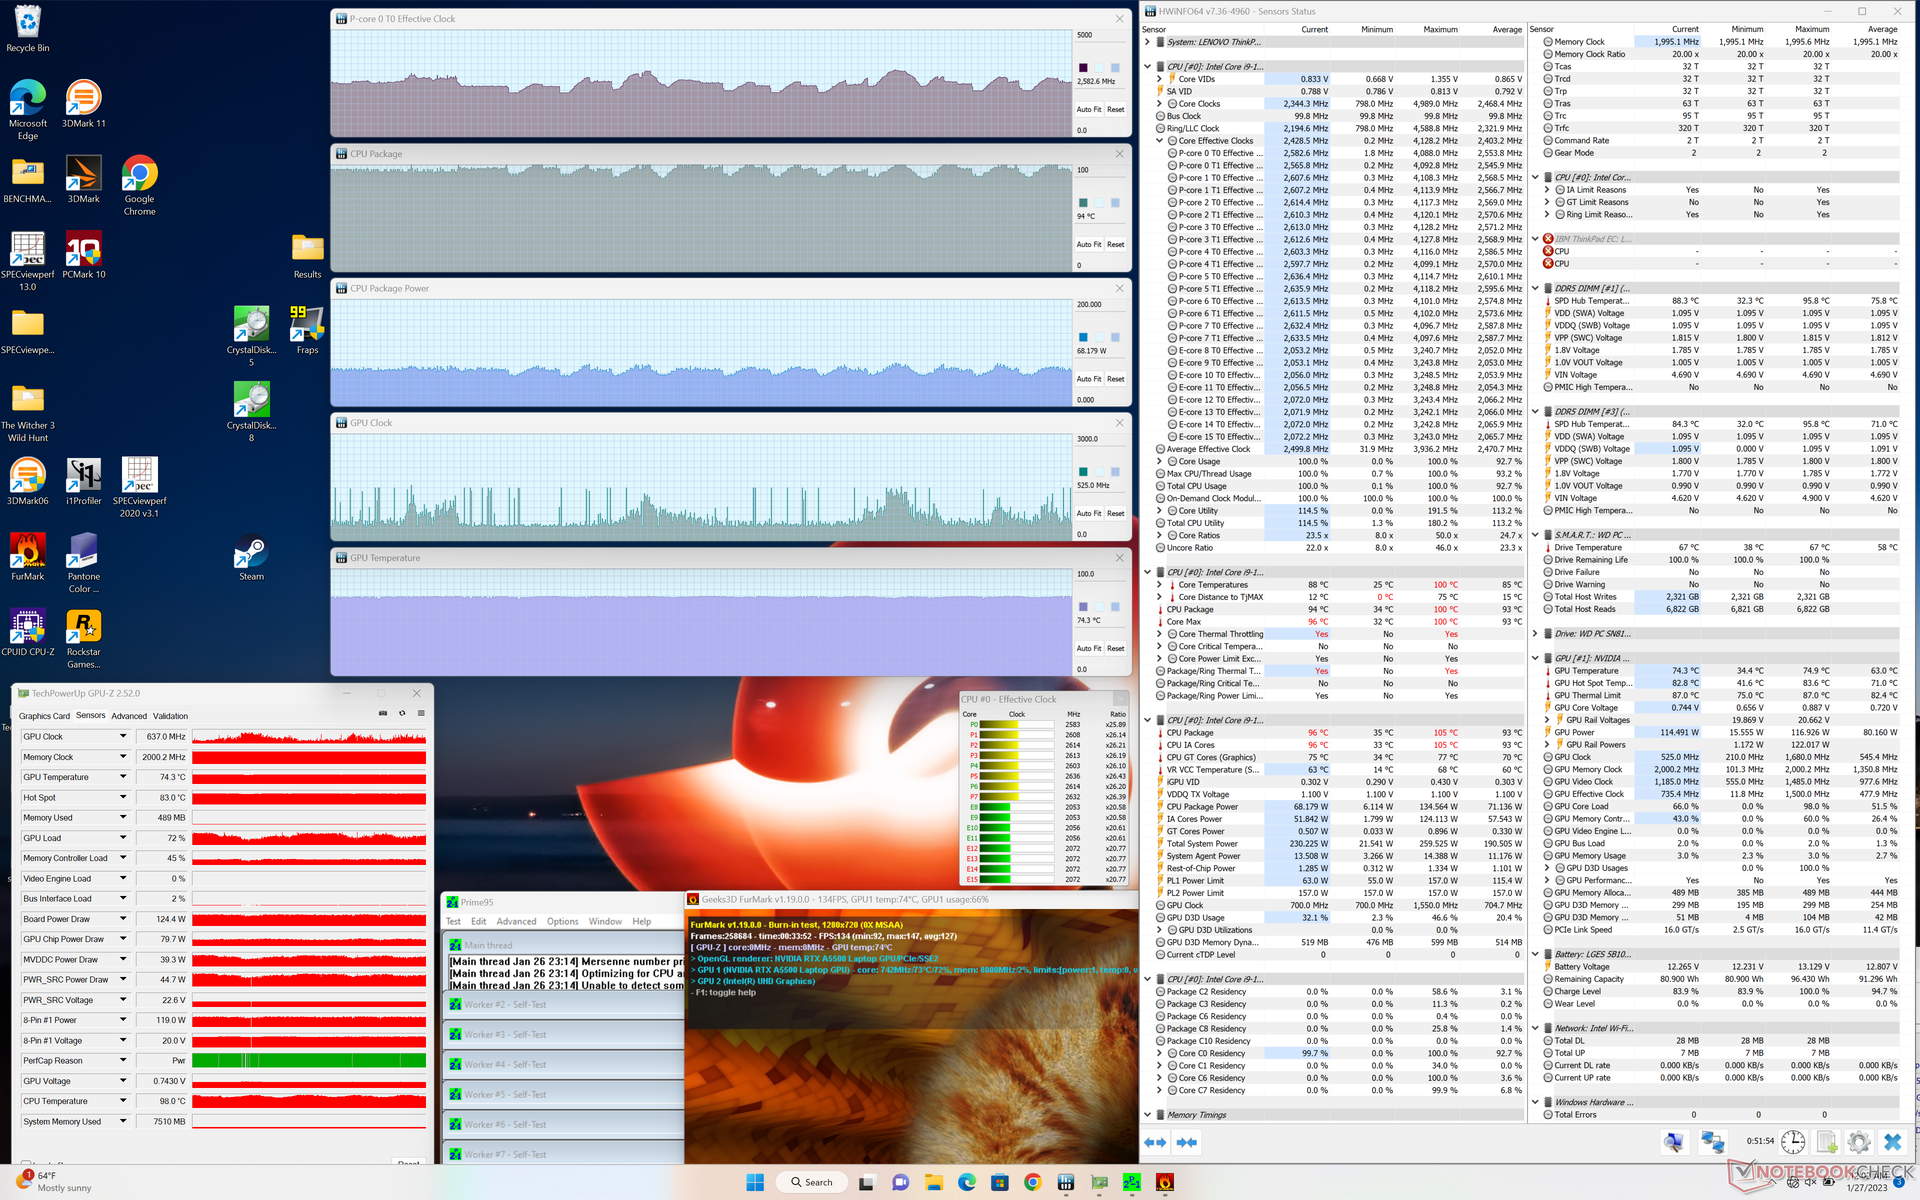
| CPU-Takt (GHz) | GPU-Takt (MHz) | durchschnittliche CPU-Temperatur (°C) | durchschnittliche GPU-Temperatur (°C) | |
| System Leerlauf | -- | -- | 39 | 39 |
| Prime95, Stress | 3,0 | -- | 100 | 45 |
| Prime95 + FurMark, Stress | 2,1-2,8 | ~500-1.550 | 88-100 | 75 |
| Witcher 3, Stress | ~1,2 | 1.477 | 72 | 78 |
Lautsprecher

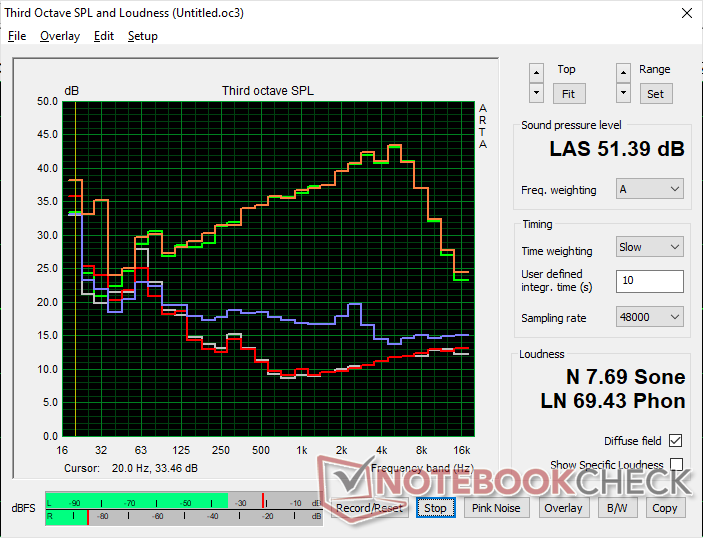
Lenovo ThinkPad P16 G1 RTX A5500 Audio Analyse
(±) | Mittelmäßig laut spielende Lautsprecher (80.8 dB)
Bass 100 - 315 Hz
(±) | abgesenkter Bass - 11.1% geringer als der Median
(±) | durchschnittlich lineare Bass-Wiedergabe (9.7% Delta zum Vorgänger)
Mitteltöne 400 - 2000 Hz
(+) | ausgeglichene Mitten, vom Median nur 4.1% abweichend
(+) | lineare Mitten (3.3% Delta zum Vorgänger)
Hochtöne 2 - 16 kHz
(+) | ausgeglichene Hochtöne, vom Median nur 2.9% abweichend
(+) | sehr lineare Hochtöne (5.2% Delta zum Vorgänger)
Gesamt im hörbaren Bereich 100 - 16.000 Hz
(+) | hörbarer Bereich ist sehr linear (13.2% Abstand zum Median
Im Vergleich zu allen Geräten derselben Klasse
» 23% aller getesteten Geräte dieser Klasse waren besser, 6% vergleichbar, 71% schlechter
» Das beste Gerät hat einen Delta-Wert von 7%, durchschnittlich ist 17%, das schlechteste Gerät hat 35%
Im Vergleich zu allen Geräten im Test
» 13% aller getesteten Geräte waren besser, 3% vergleichbar, 84% schlechter
» Das beste Gerät hat einen Delta-Wert von 4%, durchschnittlich ist 24%, das schlechteste Gerät hat 134%
Apple MacBook Pro 16 2021 M1 Pro Audio Analyse
(+) | Die Lautsprecher können relativ laut spielen (84.7 dB)
Bass 100 - 315 Hz
(+) | guter Bass - nur 3.8% Abweichung vom Median
(+) | lineare Bass-Wiedergabe (5.2% Delta zum Vorgänger)
Mitteltöne 400 - 2000 Hz
(+) | ausgeglichene Mitten, vom Median nur 1.3% abweichend
(+) | lineare Mitten (2.1% Delta zum Vorgänger)
Hochtöne 2 - 16 kHz
(+) | ausgeglichene Hochtöne, vom Median nur 1.9% abweichend
(+) | sehr lineare Hochtöne (2.7% Delta zum Vorgänger)
Gesamt im hörbaren Bereich 100 - 16.000 Hz
(+) | hörbarer Bereich ist sehr linear (4.6% Abstand zum Median
Im Vergleich zu allen Geräten derselben Klasse
» 0% aller getesteten Geräte dieser Klasse waren besser, 0% vergleichbar, 100% schlechter
» Das beste Gerät hat einen Delta-Wert von 5%, durchschnittlich ist 17%, das schlechteste Gerät hat 45%
Im Vergleich zu allen Geräten im Test
» 0% aller getesteten Geräte waren besser, 0% vergleichbar, 100% schlechter
» Das beste Gerät hat einen Delta-Wert von 4%, durchschnittlich ist 24%, das schlechteste Gerät hat 134%
Energieverwaltung
Stromverbrauch
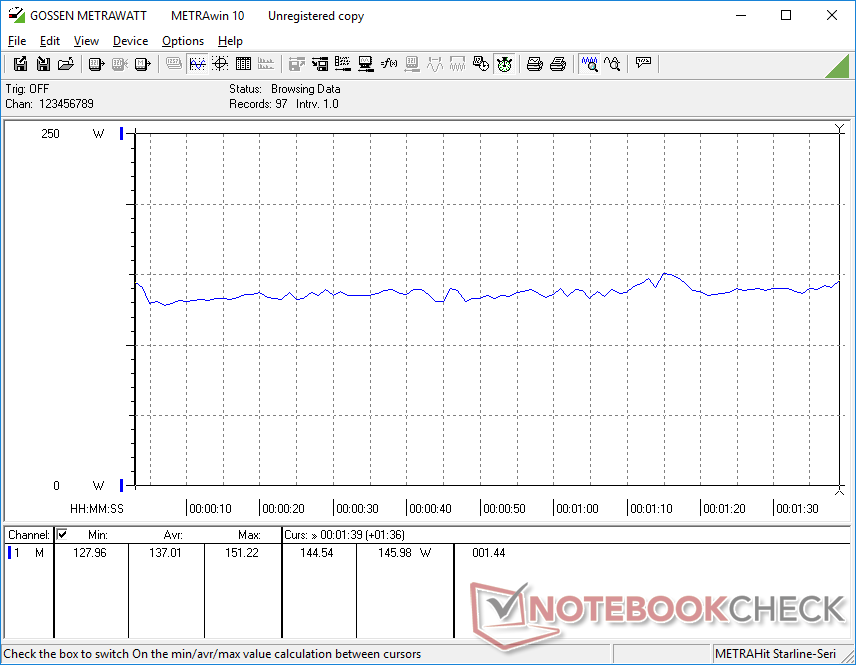
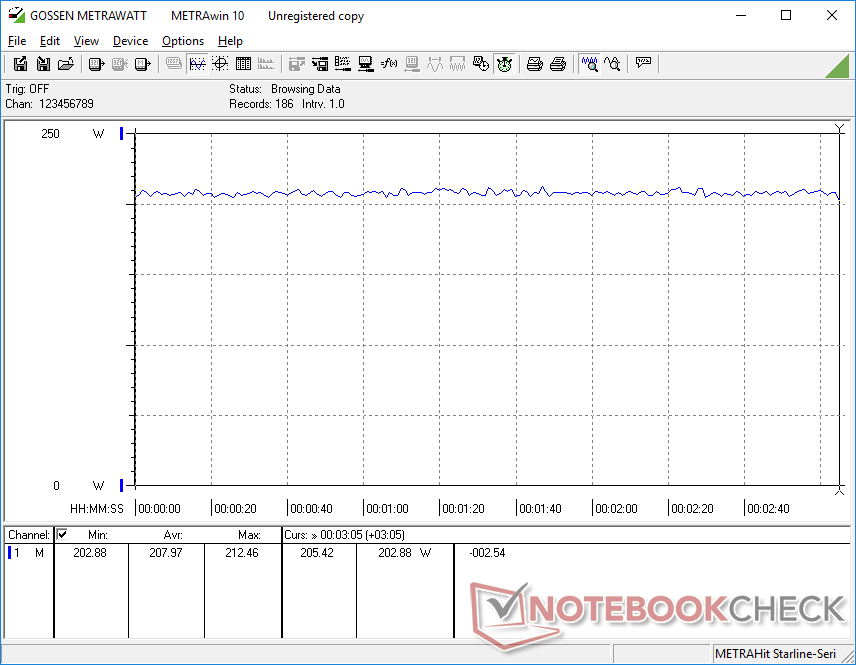
Die Leistungsaufnahme im Leerlauf ist um einige Watt niedriger als beim Precision 7670, was wahrscheinlich auf das anspruchsvollere OLED-Panel von Letzterem zurückzuführen ist. Bei höherer Last wie Witcher 3, ist der Verbrauch beim Lenovo jedoch deutlich höher als beim Dell (208 vs. 159 W). Die höhere Leistungsaufnahme fällt mit der schnelleren CPU- und GPU-Leistung des Dell Konkurrenzmodells zusammen, wie unsere Benchmarks oben zeigen.
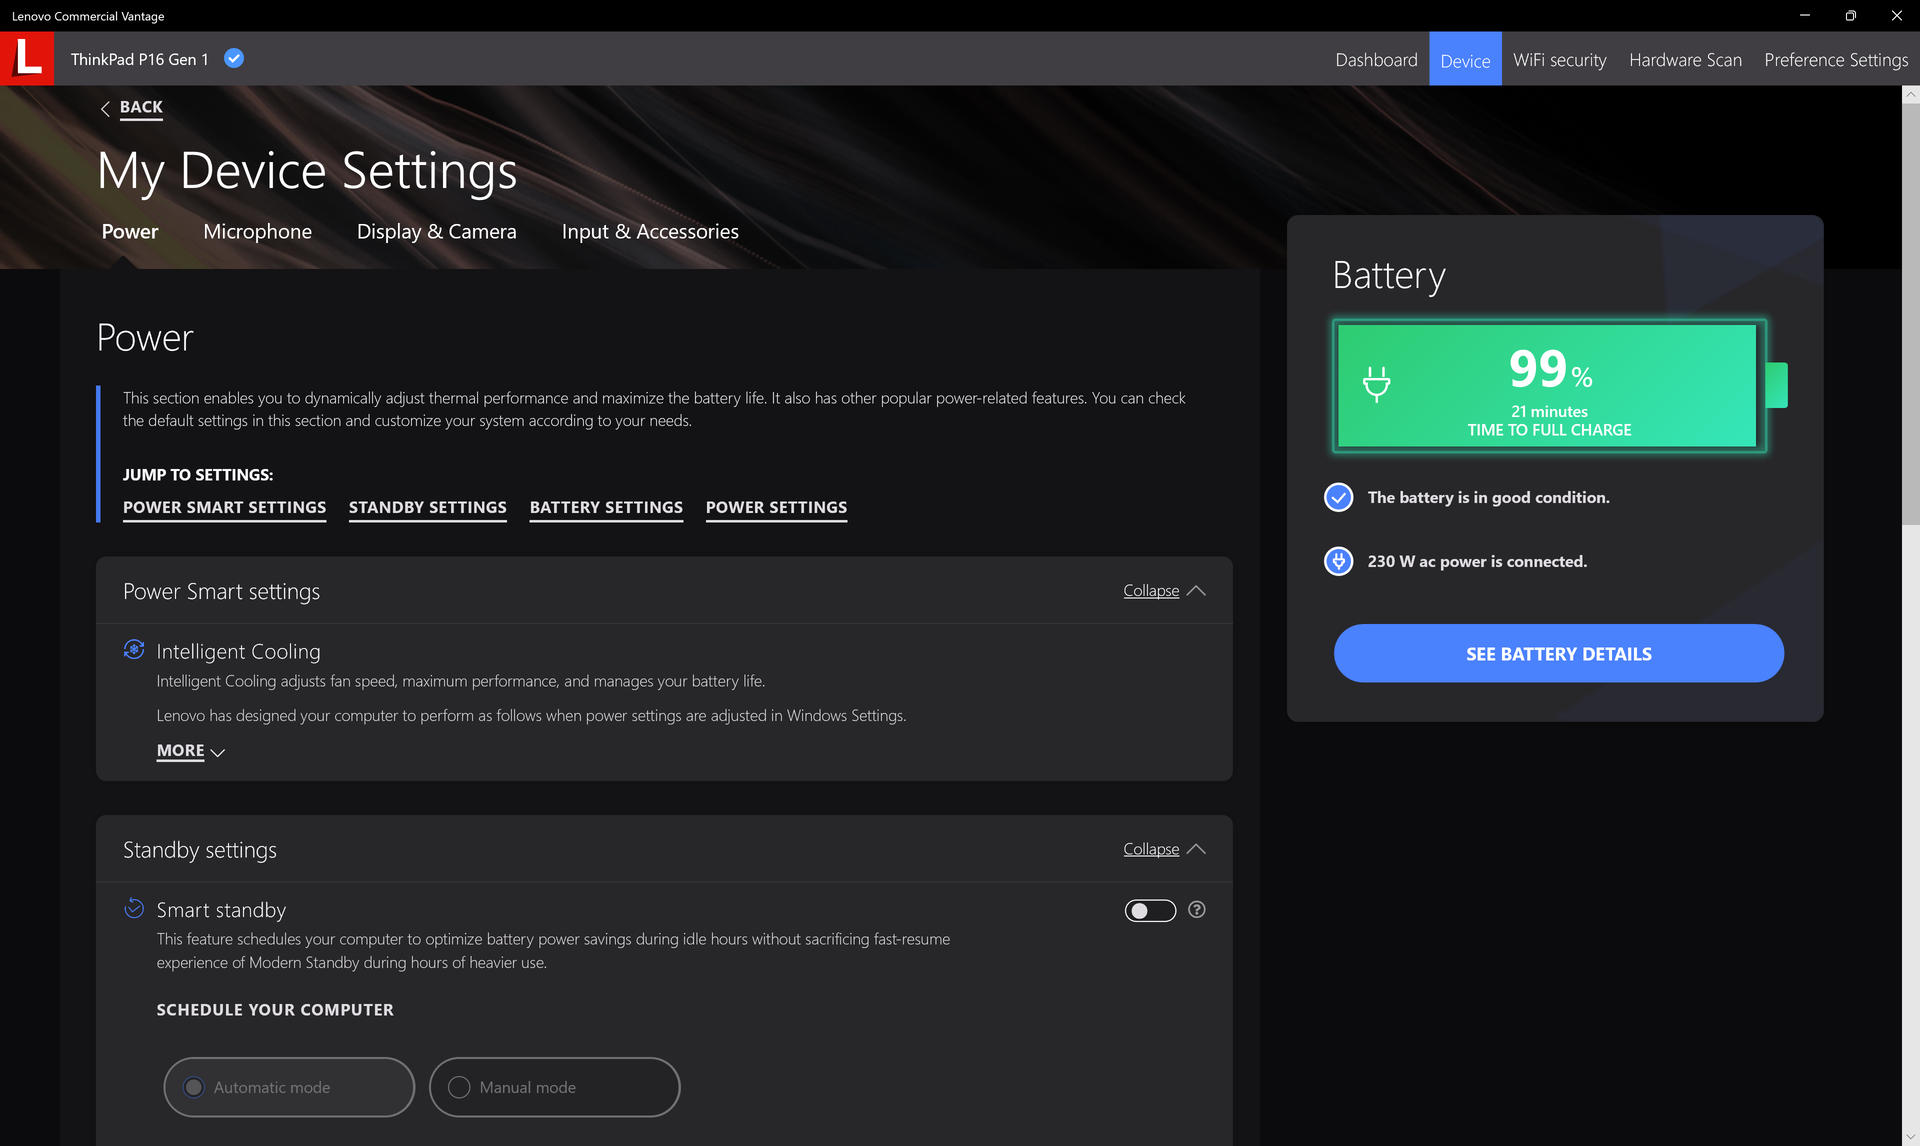
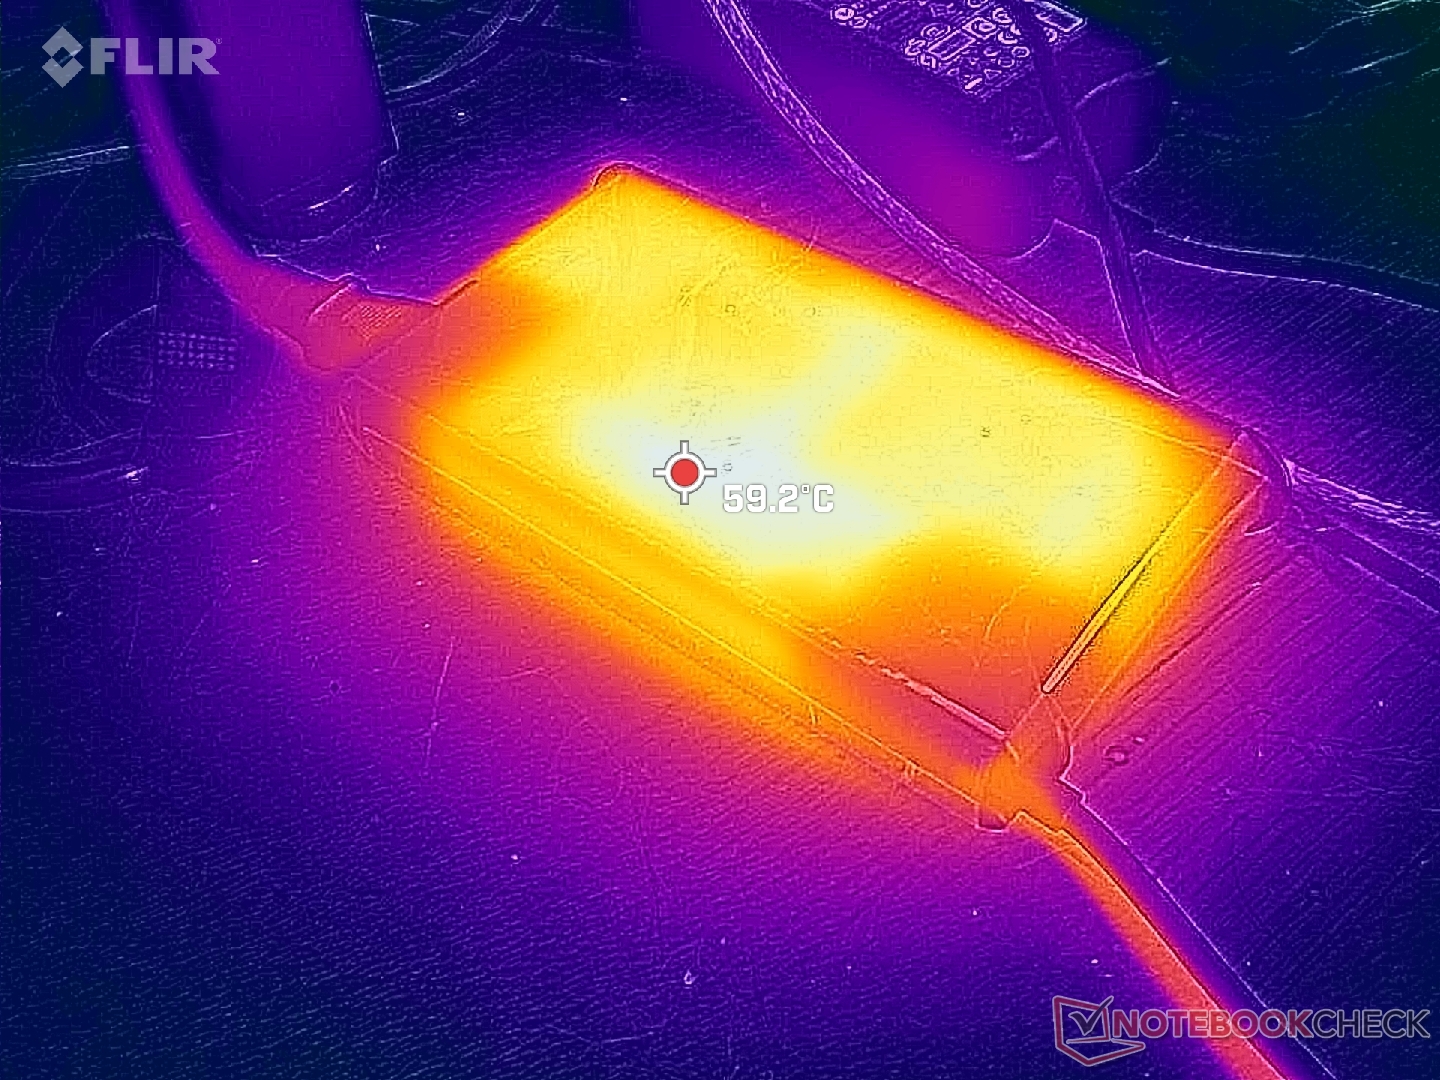
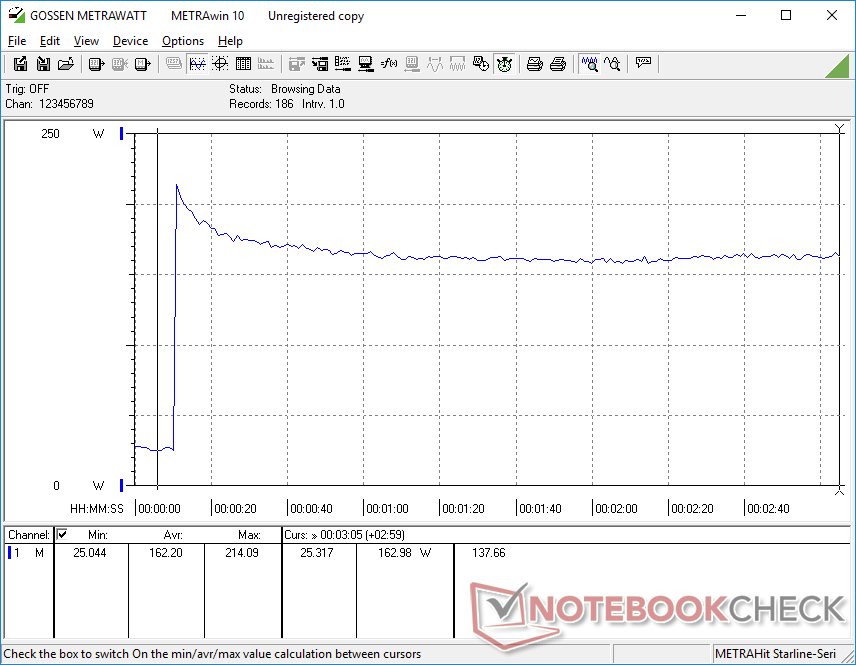
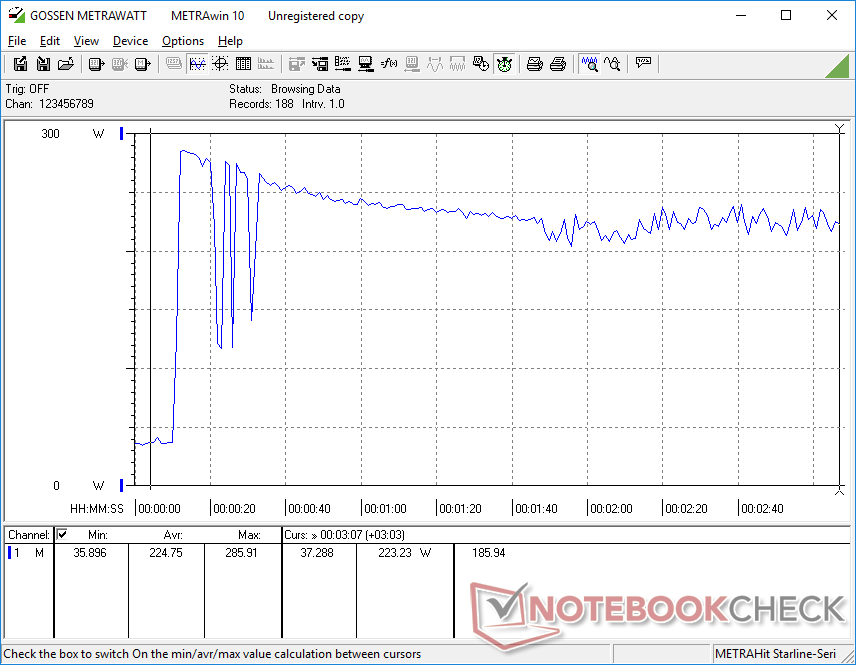
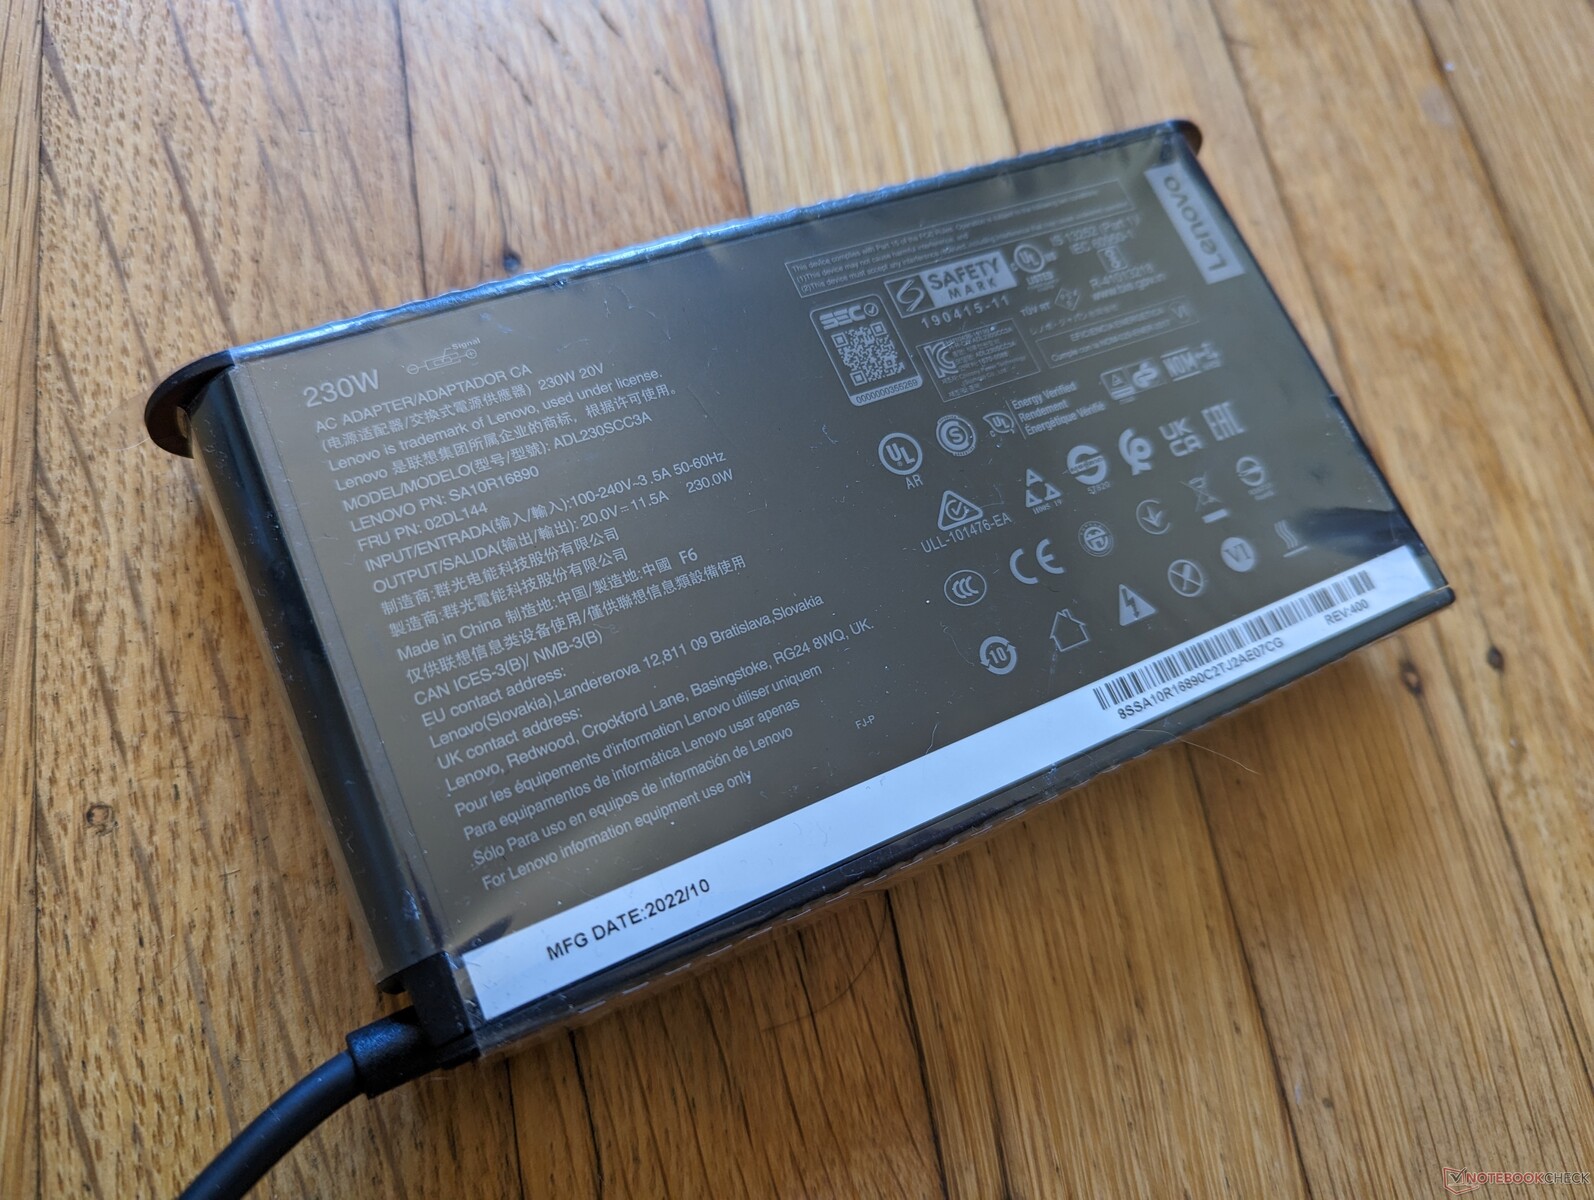
Auch wenn Power-User die zusätzliche Leistung zu schätzen wissen, ist unser voll ausgelastetes Lenovo deutlich anspruchsvoller als die meisten anderen mobilen Workstations. Tatsächlich reicht das mittelgroße (~15 x 8,6 x 2,6 cm) 230-W-Netzteil möglicherweise nicht aus, um das Gerät mit Strom zu versorgen, wenn CPU und GPU stark ausgelastet sind. Wir konnten eine vorübergehende maximale Leistungsaufnahme von 286 W aus dem 230-W-Netzteil messen, bevor sie schließlich sinkt und sich bei etwa 223 W stabilisiert. Bei einem Betrieb von Witcher 3 für 90 Minuten am Stück fiel der Akkuladestand von 100 auf 87 Prozent. Ein ähnliches Verhalten konnten wir bei dem älteren XPS 17 oder Precision 5750 beobachten. Es ist schade, dass Lenovo an der Kasse keine Netzteile mit mehr als 230 W anbietet.
Eine Konfiguration mit der günstigeren RTX A2000 würde den Verbrauch um etwa die Hälfte senken. In diesem Fall würde das 230-W-Netzteil ausreichen.
| Aus / Standby | |
| Idle | |
| Last |
|
Legende:
min: | |
| Lenovo ThinkPad P16 G1 RTX A5500 i9-12950HX, RTX A5500 Laptop GPU, WDC PC SN810 2TB, IPS, 3840x2400, 16" | Asus ProArt StudioBook 16 W7600H5A-2BL2 W-11955M, RTX A5000 Laptop GPU, 2x Micron 2300 2TB MTFDHBA2T0TDV (RAID 0), OLED, 3840x2400, 16" | Dell Precision 7000 7670 Performance i9-12950HX, RTX A5500 Laptop GPU, , OLED, 3840x2400, 16" | Lenovo ThinkPad P16 G1 21D6001DMB i7-12850HX, RTX A2000 Laptop GPU, Micron 3400 1TB MTFDKBA1T0TFH, IPS LED, 2560x1600, 16" | MSI CreatorPro Z16P B12UKST i7-12700H, RTX A3000 Laptop GPU, Samsung PM9A1 MZVL21T0HCLR, IPS, 2560x1600, 16" | HP ZBook Studio 16 G9 62U04EA i7-12800H, RTX A2000 Laptop GPU, Micron 3400 1TB MTFDKBA1T0TFH, IPS, 3840x2400, 16" | |
|---|---|---|---|---|---|---|
| Stromverbrauch | 14% | -35% | 45% | 19% | 28% | |
| Idle min * (Watt) | 7.5 | 12.4 -65% | 16.4 -119% | 5.1 32% | 10.8 -44% | 7.2 4% |
| Idle avg * (Watt) | 20.1 | 16.5 18% | 35.9 -79% | 9.2 54% | 16.3 19% | 18.1 10% |
| Idle max * (Watt) | 40 | 25 37% | 47 -18% | 9.9 75% | 16.9 58% | 18.5 54% |
| Last avg * (Watt) | 137 | 132 4% | 147.1 -7% | 124.1 9% | 111.7 18% | 112.8 18% |
| Witcher 3 ultra * (Watt) | 208 | 132 37% | 158.8 24% | 87.7 58% | 152.1 27% | 106.7 49% |
| Last max * (Watt) | 285.9 | 134 53% | 311 -9% | 168.9 41% | 177.4 38% | 186 35% |
* ... kleinere Werte sind besser
Power Consumption Witcher 3 / Stresstest
Power Consumption external Monitor
Akkulaufzeit
Die Laufzeit ist einige Stunden kürzer als bei unserer kleineren RTX-A2000-SKU und beträgt insgesamt knapp sechs Stunden, wenn das Profil "Ausgewogene Leistung" eingestellt ist.
Das Aufladen von leer auf voll dauert etwa zwei Stunden. Lenovos geschätzte Ladezeit ist jedoch nicht so genau, da Vantage zunächst bis zu vier Stunden anzeigen kann, bevor es sich automatisch neu kalibriert. Denken Sie daran, dass sich die Ladegeschwindigkeit erheblich verlangsamt, wenn Sie anspruchsvolle Anwendungen ausführen (siehe oben).
Das System kann nicht über USB-C wieder aufgeladen werden.
| Lenovo ThinkPad P16 G1 RTX A5500 i9-12950HX, RTX A5500 Laptop GPU, 94 Wh | Asus ProArt StudioBook 16 W7600H5A-2BL2 W-11955M, RTX A5000 Laptop GPU, 90 Wh | Dell Precision 7000 7670 Performance i9-12950HX, RTX A5500 Laptop GPU, 93 Wh | Lenovo ThinkPad P16 G1 21D6001DMB i7-12850HX, RTX A2000 Laptop GPU, 94 Wh | MSI CreatorPro Z16P B12UKST i7-12700H, RTX A3000 Laptop GPU, 90 Wh | HP ZBook Studio 16 G9 62U04EA i7-12800H, RTX A2000 Laptop GPU, 86 Wh | |
|---|---|---|---|---|---|---|
| Akkulaufzeit | -14% | -19% | 62% | 0% | 9% | |
| WLAN (h) | 5.8 | 5 -14% | 4.7 -19% | 9.4 62% | 5.8 0% | 6.3 9% |
| H.264 (h) | 1.8 | 8.5 | ||||
| Witcher 3 ultra (h) | 1.6 | |||||
| Last (h) | 1.8 | 1.1 |
Pro
Contra
Fazit - Der 230-W-AC-Adapter ist nicht genug
Aus reiner Leistungsperspektive ist das ThinkPad P16 G1 eine der schnellsten mobilen Workstations, die derzeit unabhängig von der Bildschirmgröße erhältlich sind. Die Core i9-12950HX CPU und die RTX-A5500-GPU übertreffen leicht, aber konstant die Precision 7670, obwohl das Dell Modell mit ähnlichen Prozessoroptionen ausgestattet ist.
Es gibt zwei wesentliche Nachteile, von denen wir hoffen, dass Lenovo sie bei zukünftigen Versionen beheben kann. Erstens sind die CPU-Temperaturen bei anspruchsvoller Last viel wärmer als der Durchschnitt. Hohe Temperaturen sind natürlich nicht unerwartet, aber ein Plateau von 100 °C ist einfach zu warm, wenn die gleiche CPU im oben erwähnten Dell Modell unter ähnlichen Bedingungen kaum die 80-°C-Marke knackt. Die hohe Temperatur ist vielleicht der Preis, den man für die etwas schnellere Leistung zahlen muss.
Zweitens kommt das 230-Watt-Netzteil beim Versuch, eine 100-Watt-CPU und eine 130-Watt-GPU mit Strom zu versorgen, ganz schön ins Schwitzen. Der Kampf ist bei anspruchsvollen Lasten zu beobachten, da sich die Systemladerate deutlich verlangsamt oder sogar beginnt, den Akku in bestimmten Szenarien zu entladen. Wenn wir mit einem Netzteil, das nur für 230 W ausgelegt ist, einen Spitzenverbrauch von 285 W messen können, dann gibt es hier eindeutig einen Engpass. Ein größeres 280-W- oder 330-W-Netzteil wäre für unsere Konfiguration besser geeignet gewesen.
Das ThinkPad P16 Gen 1 maximiert die Leistung, auch wenn dies einen höheren Stromverbrauch und höhere Kerntemperaturen bedeutet. Das 230-W-Netzteil könnte jedoch angesichts der sehr anspruchsvollen Prozessoren unserer Top-End-Konfiguration zu konservativ sein.
Die insgesamt hohe Systemleistung ist trotz der hohen Temperaturen und des unzureichenden 230-Watt-Netzteils unbestreitbar. Achten Sie darauf, alle anspruchsvollen Anwendungen zu beenden, um eine angemessene Ladegeschwindigkeit zu erreichen.
Preis und Verfügbarkeit
Das ThinkPad P16 G1 ist in der vollständig konfigurierten Variante für 6.952 Euro bei Amazon verfügbar. In niedrigeren Ausstattungsvarianten ist es bereits ab 2.239 Euro bei Klarsicht erhältlich. Wir empfehlen, das Gerät direkt bei Lenovo zu kaufen, da dort die meisten konfigurierbaren Optionen auf Lager sind.
Lenovo ThinkPad P16 G1 RTX A5500
- 06.02.2023 v7 (old)
Allen Ngo
Transparenz
Die Auswahl der zu testenden Geräte erfolgt innerhalb der Redaktion. Das vorliegende Testmuster wurde dem Autor vom Hersteller oder einem Shop zu Testzwecken leihweise zur Verfügung gestellt. Eine Einflussnahme des Leihstellers auf den Testbericht gab es nicht, der Hersteller erhielt keine Version des Reviews vor der Veröffentlichung. Es bestand keine Verpflichtung zur Publikation. Als eigenständiges, unabhängiges Unternehmen unterliegt Notebookcheck keiner Diktion von Herstellern, Shops und Verlagen.
So testet Notebookcheck
Pro Jahr werden von Notebookcheck hunderte Laptops und Smartphones unabhängig in von uns standardisierten technischen Verfahren getestet, um eine Vergleichbarkeit aller Testergebnisse zu gewährleisten. Seit rund 20 Jahren entwickeln wir diese Testmethoden kontinuierlich weiter und setzen damit Branchenstandards. In unseren Testlaboren kommt ausschließlich hochwertiges Messequipment in die Hände erfahrener Techniker und Redakteure. Die Tests unterliegen einer mehrstufigen Kontrolle. Unsere komplexe Gesamtbewertung basiert auf hunderten fundierten Messergebnissen und Benchmarks, womit Ihnen Objektivität garantiert ist. Weitere Informationen zu unseren Testmethoden gibt es hier.
Preisvergleich

