Intel NUC 13 Extreme Raptor Canyon Mini-PC mit Core i9-13900K und GeForce RTX 3080 Ti im Test
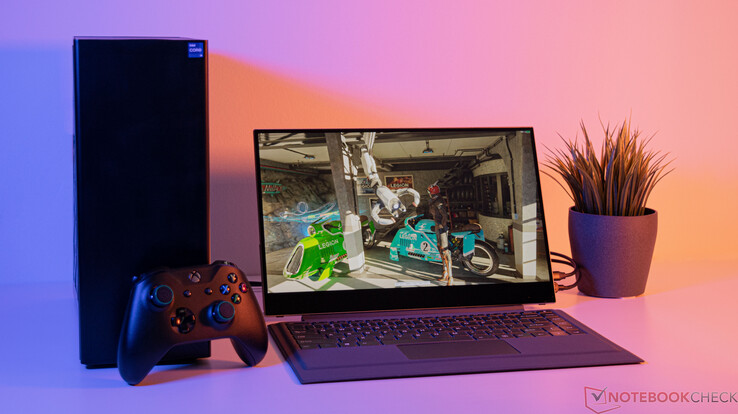
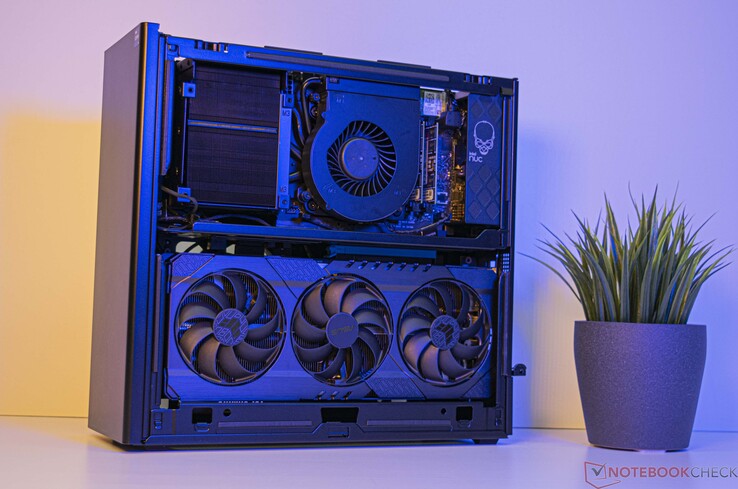
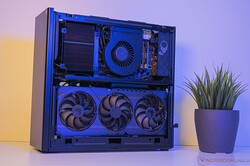
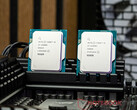
Auf Beast Canyon und Dragon Canyon folgt nun mit Raptor Canyon eine Neuauflage des Intel NUC Extreme Kit, welche sich optisch deutlich von seinen Vorgängern unterscheidet. Dennoch verfolgt Intel den Ansatz eines sehr kompakten PCs, der kaum Wünsche offen lässt. Weiterhin gibt es die Möglichkeit, eine vollwertige Grafikkarte zu installieren. Als CPUs kommen Intels aktuelle Raptor-Lake-Prozessoren zum Einsatz. Gleichwohl kann man hier selbst wählen, denn die verbauten CPUs sind nicht fest verlötet. Für diesen Test kommt im NUC 13 Extreme Raptor Canyon ein Intel Core i9-13900K zum Einsatz. Für ausreichend 3D-Performance gibt es mit der Nvidia GeForce RTX 3080 Ti ein gutes Modell für den anspruchsvollen Gamer.
Bei Kauf des Intel NUC 13 Extreme Kit muss bedacht werden, dass es sich um ein Barebone-System handelt, welches ohne SSD, RAM und Grafikkarte ausgeliefert wird. Die Preise staffeln sich hierbei nach der verbauten CPU. Die UVP der kleinsten Konfiguration mit Intel Core i5-13600K liegt bei 1.179 US-Dollar, wenngleich für die Topausstattung 1.549 US-Dollar fällig werden.
Als dedizierte Grafikkarten lassen sich Modelle mit einer Länge von bis zu 31 Zentimetern einbauen. Das 750-Watt-SFX-Netzteil bietet genügend Leistung, um auch aktuelle High-End-Modelle zu betreiben. Rein theoretisch kann sogar eine Nvidia GeForce RTX 4090 FE verbaut werden. Problematisch wird es hingegen mit dem 12VHPWR-Anschluss, welcher nur maximal 300 Watt bereitstellen kann. Mehr als 450 Watt kann man dem Netzteil eh nicht entlocken, denn es bietet nur drei 6+2-Stecker für die Grafikkarte.
Intel NUC 13 Extreme Compute-Element im Detail
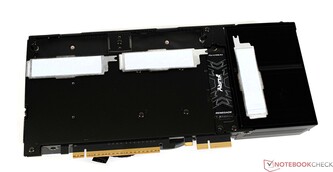
Der Intel NUC 13 Extreme bietet mit dem Intel Core i9-13900K in unserer Testausstattung die derzeit schnellste Gaming-CPU. 24 Kerne und insgesamt 32 Threads stehen dem Nutzer zur Seite. Wie bereits bekannt vertraut die Raptor-Lake-Generation auf ein hybrides Design, welches E- und P-Kerne miteinander vereint. Wie auch schon beim Intel NUC 12 Extreme wird ein herkömmlicher Desktop-Prozessor verbaut. Zudem bringt das Compute-Element alle Anschlüsse mit. So befinden sich auf der Unterseite der Platine drei Aufnahmen für NVMe-SSDs, und rückwärtig finden wir alle nötigen externen Schnittstellen.
WLAN-Performance
Im Intel NUC 13 Extreme Raptor Canyon steckt ein Killer Wi-Fi 6E AX1690i Wi-Fi-Modul. Im Test dokumentieren wir in Verbindung mit unserem Testrouter Asus ROG Rapture GT-AXE11000 eine gute Leistung beim Senden und Empfangen von Daten. Das WLAN-Modul ist als Steckkarte auf dem Compute-Element installiert und lässt sich gegebenenfalls auch austauschen. Für eine drahtgebundene Netzwerkverbindung stehen einmal 10G und einmal 2.5G zur Verfügung.
Hinweis:
Eine stabile WiFi-6G-Verbindung ließ sich mit unserer Testausstattung nicht realisieren. Ein Update der Komponenten mit aktuellsten Treibern sowie Firmwareupdates für den Intel NUC 13 Extreme Raptor Canyon sowie bei unserem Testrouter brachten keinen Erfolg. Sollte sich in den nächsten Tagen diesbezüglich noch etwas ergeben, bevor wir das Gerät wieder abgeben müssen, werden wir den Test an dieser Stelle überarbeiten.
Prozessor-Benchmarks
Mit dem Intel Core i9-13900K werkelt Intels schnellste Gaming-CPU in dem Intel NUC 13 Extreme Raptor Canyon. Dementsprechend gut fallen auch unsere ermittelten Ergebnisse aus. Trotz der verhältnismäßig kleinen Kühleinheit beträgt der Rückstand auf ein alternatives Desktop-System mit guter Wasserkühlung nur sieben Prozent.
Bei den Power-Limits gibt es mit 150 Watt respektive 250 Watt eine kleine Einschränkung, welche den geringen Rückstand erklären. Doch bei den wenigsten Anwendungen werden die vollen 250 Watt benötigt. Wer den Intel NUC 13 Extreme Raptor Canyon mit dem kleineren Intel Core i5-13600K kombiniert, sollte etwa die Leistung erreichen, die man auch in der Vergleichstabelle sehen kann. Mit dem geringeren PL2 (181 Watt) müßte der Nachteil unter Vollast etwas geringer ausfallen.
Weitere Benchmarks zu den Prozessoren finden Sie hier.
| Performance Rating - Percent | |
| Intel Core i9-13900K | |
| AMD Ryzen 9 7950X | |
| Intel Core i9-13900K | |
| AMD Ryzen 9 7900X | |
| Intel Core i9-12900K | |
| Intel Core i5-13600K | |
| AMD Ryzen 5 7600X | |
| Intel Core i5-12600K | |
| Cinebench R15 | |
| CPU Single 64Bit | |
| AMD Ryzen 9 7950X | |
| Intel Core i9-13900K | |
| AMD Ryzen 9 7900X | |
| Intel Core i9-13900K | |
| AMD Ryzen 5 7600X | |
| Intel Core i5-13600K | |
| Intel Core i9-12900K | |
| Intel Core i5-12600K | |
| CPU Multi 64Bit | |
| AMD Ryzen 9 7950X | |
| Intel Core i9-13900K | |
| Intel Core i9-13900K | |
| AMD Ryzen 9 7900X | |
| Intel Core i9-12900K | |
| Intel Core i5-13600K | |
| Intel Core i5-12600K | |
| AMD Ryzen 5 7600X | |
| Cinebench R20 | |
| CPU (Single Core) | |
| Intel Core i9-13900K | |
| Intel Core i9-13900K | |
| AMD Ryzen 9 7950X | |
| AMD Ryzen 9 7900X | |
| Intel Core i5-13600K | |
| Intel Core i9-12900K | |
| AMD Ryzen 5 7600X | |
| Intel Core i5-12600K | |
| CPU (Multi Core) | |
| Intel Core i9-13900K | |
| AMD Ryzen 9 7950X | |
| Intel Core i9-13900K | |
| AMD Ryzen 9 7900X | |
| Intel Core i9-12900K | |
| Intel Core i5-13600K | |
| Intel Core i5-12600K | |
| AMD Ryzen 5 7600X | |
| Cinebench R23 | |
| Single Core | |
| Intel Core i9-13900K | |
| Intel Core i9-13900K | |
| AMD Ryzen 9 7950X | |
| AMD Ryzen 9 7900X | |
| Intel Core i5-13600K | |
| Intel Core i9-12900K | |
| AMD Ryzen 5 7600X | |
| Intel Core i5-12600K | |
| Multi Core | |
| Intel Core i9-13900K | |
| AMD Ryzen 9 7950X | |
| Intel Core i9-13900K | |
| AMD Ryzen 9 7900X | |
| Intel Core i9-12900K | |
| Intel Core i5-13600K | |
| Intel Core i5-12600K | |
| AMD Ryzen 5 7600X | |
| Cinebench R11.5 | |
| CPU Single 64Bit | |
| Intel Core i9-13900K | |
| AMD Ryzen 9 7950X | |
| AMD Ryzen 9 7900X | |
| Intel Core i9-13900K | |
| AMD Ryzen 5 7600X | |
| Intel Core i9-12900K | |
| Intel Core i5-13600K | |
| Intel Core i5-12600K | |
| CPU Multi 64Bit | |
| Intel Core i9-13900K | |
| AMD Ryzen 9 7950X | |
| Intel Core i9-13900K | |
| AMD Ryzen 9 7900X | |
| Intel Core i9-12900K | |
| Intel Core i5-13600K | |
| Intel Core i5-12600K | |
| AMD Ryzen 5 7600X | |
| Cinebench R10 | |
| Rendering Single CPUs 64Bit | |
| Intel Core i9-13900K | |
| Intel Core i9-13900K | |
| AMD Ryzen 9 7900X | |
| AMD Ryzen 9 7950X | |
| Intel Core i5-13600K | |
| Intel Core i9-12900K | |
| AMD Ryzen 5 7600X | |
| Intel Core i5-12600K | |
| Rendering Multiple CPUs 64Bit | |
| Intel Core i9-13900K | |
| Intel Core i9-13900K | |
| AMD Ryzen 9 7950X | |
| AMD Ryzen 9 7900X | |
| Intel Core i9-12900K | |
| Intel Core i5-13600K | |
| AMD Ryzen 5 7600X | |
| Intel Core i5-12600K | |
| Blender - v2.79 BMW27 CPU | |
| AMD Ryzen 5 7600X | |
| Intel Core i5-12600K | |
| Intel Core i5-13600K | |
| Intel Core i9-12900K | |
| AMD Ryzen 9 7900X | |
| Intel Core i9-13900K | |
| AMD Ryzen 9 7950X | |
| Intel Core i9-13900K | |
| X264 HD Benchmark 4.0 | |
| Pass 1 | |
| Intel Core i9-13900K | |
| Intel Core i9-13900K | |
| Intel Core i5-13600K | |
| AMD Ryzen 9 7950X | |
| AMD Ryzen 9 7900X | |
| Intel Core i9-12900K | |
| AMD Ryzen 5 7600X | |
| Intel Core i5-12600K | |
| Pass 2 | |
| Intel Core i9-13900K | |
| AMD Ryzen 9 7950X | |
| Intel Core i9-13900K | |
| AMD Ryzen 9 7900X | |
| Intel Core i9-12900K | |
| Intel Core i5-13600K | |
| Intel Core i5-12600K | |
| AMD Ryzen 5 7600X | |
| WinRAR - Result | |
| AMD Ryzen 9 7900X | |
| AMD Ryzen 9 7950X | |
| AMD Ryzen 5 7600X | |
| Intel Core i9-13900K | |
| Intel Core i9-13900K | |
| Intel Core i5-13600K | |
| Intel Core i9-12900K | |
| Intel Core i5-12600K | |
| TrueCrypt | |
| AES Mean 100MB | |
| AMD Ryzen 9 7950X | |
| Intel Core i9-13900K | |
| Intel Core i9-13900K | |
| Intel Core i5-13600K | |
| Intel Core i9-12900K | |
| AMD Ryzen 9 7900X | |
| AMD Ryzen 5 7600X | |
| Intel Core i5-12600K | |
| Twofish Mean 100MB | |
| Intel Core i9-13900K | |
| Intel Core i9-13900K | |
| AMD Ryzen 9 7950X | |
| Intel Core i9-12900K | |
| Intel Core i5-13600K | |
| AMD Ryzen 9 7900X | |
| Intel Core i5-12600K | |
| AMD Ryzen 5 7600X | |
| Serpent Mean 100MB | |
| Intel Core i9-13900K | |
| AMD Ryzen 9 7950X | |
| Intel Core i9-13900K | |
| Intel Core i9-12900K | |
| Intel Core i5-13600K | |
| AMD Ryzen 9 7900X | |
| Intel Core i5-12600K | |
| AMD Ryzen 5 7600X | |
| Geekbench 5.5 | |
| Multi-Core | |
| AMD Ryzen 9 7950X | |
| Intel Core i9-13900K | |
| Intel Core i9-13900K | |
| AMD Ryzen 9 7900X | |
| Intel Core i9-12900K | |
| Intel Core i5-13600K | |
| Intel Core i5-12600K | |
| AMD Ryzen 5 7600X | |
| Single-Core | |
| AMD Ryzen 9 7950X | |
| Intel Core i9-13900K | |
| AMD Ryzen 9 7900X | |
| AMD Ryzen 5 7600X | |
| Intel Core i9-13900K | |
| Intel Core i9-12900K | |
| Intel Core i5-13600K | |
| Intel Core i5-12600K | |
| Geekbench 5.0 | |
| 5.0 Multi-Core | |
| AMD Ryzen 9 7950X | |
| Intel Core i9-13900K | |
| Intel Core i9-13900K | |
| AMD Ryzen 9 7900X | |
| Intel Core i9-12900K | |
| Intel Core i5-13600K | |
| Intel Core i5-12600K | |
| AMD Ryzen 5 7600X | |
| 5.0 Single-Core | |
| AMD Ryzen 9 7950X | |
| Intel Core i9-13900K | |
| AMD Ryzen 9 7900X | |
| Intel Core i9-13900K | |
| AMD Ryzen 5 7600X | |
| Intel Core i9-12900K | |
| Intel Core i5-13600K | |
| Intel Core i5-12600K | |
| Geekbench 4.4 | |
| 64 Bit Single-Core Score | |
| Intel Core i9-13900K | |
| AMD Ryzen 9 7950X | |
| Intel Core i9-13900K | |
| AMD Ryzen 9 7900X | |
| AMD Ryzen 5 7600X | |
| Intel Core i9-12900K | |
| Intel Core i5-13600K | |
| Intel Core i5-12600K | |
| 64 Bit Multi-Core Score | |
| AMD Ryzen 9 7950X | |
| Intel Core i9-13900K | |
| Intel Core i9-13900K | |
| AMD Ryzen 9 7900X | |
| Intel Core i9-12900K | |
| Intel Core i5-13600K | |
| AMD Ryzen 5 7600X | |
| Intel Core i5-12600K | |
| 3DMark 11 - 1280x720 Performance Physics | |
| Intel Core i9-13900K | |
| Intel Core i5-13600K | |
| Intel Core i9-13900K | |
| AMD Ryzen 9 7900X | |
| AMD Ryzen 9 7950X | |
| Intel Core i9-12900K | |
| AMD Ryzen 5 7600X | |
| Intel Core i5-12600K | |
| HWBOT x265 Benchmark v2.2 - 4k Preset | |
| AMD Ryzen 9 7950X | |
| Intel Core i9-13900K | |
| AMD Ryzen 9 7900X | |
| Intel Core i9-13900K | |
| Intel Core i5-12600K | |
| Intel Core i9-12900K | |
| Intel Core i5-13600K | |
| AMD Ryzen 5 7600X | |
| R Benchmark 2.5 - Overall mean | |
| Intel Core i5-12600K | |
| Intel Core i9-12900K | |
| Intel Core i5-13600K | |
| Intel Core i9-13900K | |
| AMD Ryzen 5 7600X | |
| AMD Ryzen 9 7900X | |
| AMD Ryzen 9 7950X | |
| Intel Core i9-13900K | |
| LibreOffice - 20 Documents To PDF | |
| Intel Core i5-12600K | |
| Intel Core i9-13900K | |
| Intel Core i9-12900K | |
| AMD Ryzen 5 7600X | |
| Intel Core i9-13900K | |
| AMD Ryzen 9 7950X | |
| Intel Core i5-13600K | |
| AMD Ryzen 9 7900X | |
| WebXPRT 3 - Overall | |
| AMD Ryzen 9 7900X | |
| AMD Ryzen 9 7950X | |
| AMD Ryzen 5 7600X | |
| Intel Core i9-13900K | |
| Intel Core i9-13900K | |
| Intel Core i5-13600K | |
| Intel Core i9-12900K | |
| Intel Core i5-12600K | |
| Mozilla Kraken 1.1 - Total | |
| Intel Core i5-12600K | |
| Intel Core i9-12900K | |
| Intel Core i5-13600K | |
| AMD Ryzen 5 7600X | |
| Intel Core i9-13900K | |
| AMD Ryzen 9 7950X | |
| Intel Core i9-13900K | |
| AMD Ryzen 9 7900X | |
| 3DMark | |
| 3840x2160 Fire Strike Ultra Physics | |
| Intel Core i9-13900K | |
| Intel Core i9-13900K | |
| AMD Ryzen 9 7900X | |
| AMD Ryzen 9 7950X | |
| Intel Core i9-12900K | |
| Intel Core i5-13600K | |
| AMD Ryzen 5 7600X | |
| Intel Core i5-12600K | |
| 1920x1080 Fire Strike Physics | |
| Intel Core i9-13900K | |
| Intel Core i9-13900K | |
| AMD Ryzen 9 7900X | |
| AMD Ryzen 9 7950X | |
| Intel Core i9-12900K | |
| Intel Core i5-13600K | |
| AMD Ryzen 5 7600X | |
| Intel Core i5-12600K | |
| 2560x1440 Time Spy CPU | |
| Intel Core i9-13900K | |
| Intel Core i9-12900K | |
| Intel Core i5-13600K | |
| AMD Ryzen 9 7900X | |
| AMD Ryzen 9 7950X | |
| Intel Core i9-13900K | |
| Intel Core i5-12600K | |
| AMD Ryzen 5 7600X | |
* ... kleinere Werte sind besser
AIDA64: FP32 Ray-Trace | FPU Julia | CPU SHA3 | CPU Queen | FPU SinJulia | FPU Mandel | CPU AES | CPU ZLib | FP64 Ray-Trace | CPU PhotoWorxx
| Performance Rating | |
| AMD Ryzen 9 7950X | |
| Intel Core i9-13900K | |
| AMD Ryzen 9 7900X | |
| Durchschnitt der Klasse Desktop | |
| Intel Core i9-13900K | |
| Intel Core i5-13600K | |
| Intel Core i9-12900K | |
| AMD Ryzen 5 7600X | |
| AMD Ryzen 9 5900HX | |
| Intel Core i5-12600K | |
| Intel Core i7-11800H | |
| AIDA64 / FP32 Ray-Trace | |
| AMD Ryzen 9 7950X | |
| Durchschnitt der Klasse Desktop (12248 - 84577, n=15, der letzten 2 Jahre) | |
| Intel Core i9-13900K | |
| AMD Ryzen 9 7900X | |
| Intel Core i9-13900K | |
| Intel Core i5-13600K | |
| AMD Ryzen 5 7600X | |
| AMD Ryzen 9 5900HX | |
| Intel Core i9-12900K | |
| Intel Core i7-11800H | |
| Intel Core i5-12600K | |
| AIDA64 / FPU Julia | |
| AMD Ryzen 9 7950X | |
| AMD Ryzen 9 7900X | |
| Intel Core i9-13900K | |
| Durchschnitt der Klasse Desktop (65152 - 246125, n=15, der letzten 2 Jahre) | |
| Intel Core i9-13900K | |
| Intel Core i5-13600K | |
| AMD Ryzen 5 7600X | |
| AMD Ryzen 9 5900HX | |
| Intel Core i9-12900K | |
| Intel Core i7-11800H | |
| Intel Core i5-12600K | |
| AIDA64 / CPU SHA3 | |
| AMD Ryzen 9 7950X | |
| Intel Core i9-13900K | |
| AMD Ryzen 9 7900X | |
| Intel Core i9-13900K | |
| Durchschnitt der Klasse Desktop (2982 - 10804, n=15, der letzten 2 Jahre) | |
| Intel Core i5-13600K | |
| Intel Core i9-12900K | |
| Intel Core i7-11800H | |
| AMD Ryzen 5 7600X | |
| AMD Ryzen 9 5900HX | |
| Intel Core i5-12600K | |
| AIDA64 / CPU Queen | |
| AMD Ryzen 9 7950X | |
| AMD Ryzen 9 7900X | |
| Intel Core i9-13900K | |
| Intel Core i9-13900K | |
| Durchschnitt der Klasse Desktop (76512 - 187912, n=15, der letzten 2 Jahre) | |
| Intel Core i5-13600K | |
| Intel Core i9-12900K | |
| AMD Ryzen 5 7600X | |
| AMD Ryzen 9 5900HX | |
| Intel Core i7-11800H | |
| Intel Core i5-12600K | |
| AIDA64 / FPU SinJulia | |
| AMD Ryzen 9 7950X | |
| AMD Ryzen 9 7900X | |
| Intel Core i9-13900K | |
| Durchschnitt der Klasse Desktop (6443 - 35251, n=15, der letzten 2 Jahre) | |
| Intel Core i9-13900K | |
| Intel Core i9-12900K | |
| AMD Ryzen 5 7600X | |
| AMD Ryzen 9 5900HX | |
| Intel Core i5-13600K | |
| Intel Core i7-11800H | |
| Intel Core i5-12600K | |
| AIDA64 / FPU Mandel | |
| AMD Ryzen 9 7950X | |
| AMD Ryzen 9 7900X | |
| Intel Core i9-13900K | |
| Durchschnitt der Klasse Desktop (31697 - 129745, n=15, der letzten 2 Jahre) | |
| Intel Core i9-13900K | |
| Intel Core i5-13600K | |
| AMD Ryzen 9 5900HX | |
| AMD Ryzen 5 7600X | |
| Intel Core i9-12900K | |
| Intel Core i7-11800H | |
| Intel Core i5-12600K | |
| AIDA64 / CPU AES | |
| AMD Ryzen 9 7950X | |
| Intel Core i9-13900K | |
| AMD Ryzen 9 7900X | |
| Intel Core i5-13600K | |
| Durchschnitt der Klasse Desktop (57777 - 513073, n=15, der letzten 2 Jahre) | |
| AMD Ryzen 5 7600X | |
| AMD Ryzen 9 5900HX | |
| Intel Core i9-13900K | |
| Intel Core i7-11800H | |
| Intel Core i9-12900K | |
| Intel Core i5-12600K | |
| AIDA64 / CPU ZLib | |
| Intel Core i9-13900K | |
| AMD Ryzen 9 7950X | |
| Intel Core i9-13900K | |
| AMD Ryzen 9 7900X | |
| Durchschnitt der Klasse Desktop (887 - 2674, n=15, der letzten 2 Jahre) | |
| Intel Core i9-12900K | |
| Intel Core i5-13600K | |
| Intel Core i5-12600K | |
| AMD Ryzen 5 7600X | |
| AMD Ryzen 9 5900HX | |
| Intel Core i7-11800H | |
| AIDA64 / FP64 Ray-Trace | |
| AMD Ryzen 9 7950X | |
| Durchschnitt der Klasse Desktop (6471 - 44013, n=15, der letzten 2 Jahre) | |
| Intel Core i9-13900K | |
| AMD Ryzen 9 7900X | |
| Intel Core i9-13900K | |
| Intel Core i5-13600K | |
| AMD Ryzen 5 7600X | |
| Intel Core i9-12900K | |
| AMD Ryzen 9 5900HX | |
| Intel Core i7-11800H | |
| Intel Core i5-12600K | |
| AIDA64 / CPU PhotoWorxx | |
| Intel Core i9-13900K | |
| Intel Core i5-12600K | |
| Intel Core i5-13600K | |
| Intel Core i9-12900K | |
| Durchschnitt der Klasse Desktop (38071 - 55966, n=15, der letzten 2 Jahre) | |
| Intel Core i9-13900K | |
| AMD Ryzen 9 7950X | |
| AMD Ryzen 9 7900X | |
| AMD Ryzen 5 7600X | |
| Intel Core i7-11800H | |
| AMD Ryzen 9 5900HX | |
Intel NUC 13 Extreme Kit in der Cinebench-R15-Multi-Schleife
Der Lasttest mit der Cinebench-R15-Mult-Schleife zeigt nach dem ersten Durchlauf einen deutlichen Leistungsverlust. Aufgrund der kompakten Kühlung und der Power Limits fällt die hier dokumentierte Leistung, im Vergleich zu einem Intel Core i9-13900K in einem alternativen Desktop-System unter Dauerleistung des Prozessors etwas schlechter aus. Mit durchschnittlich 4.779 Punkten zeigt sich das Ergebnis aber dennoch deutlich besser als beim Intel Dragon Canyon NUC.
System Performance
Bei den synthetischen Benchmarks kann der Intel NUC 13 Extreme Raptor Canyon mit einem sehr hohen Arbeitstempo punkten. Aber auch hier sehen wir wieder einen leichten Rückstand zu einem Intel Core i9-13900K mit besserer Kühlung. Die Konkurrenz in Form von Minisforum und den direkten Vorgängern der NUC-Serie kann aber in Schach gehalten werden. Subjektiv bewertet arbeitet das Testsample zu jeder Zeit sehr schnell und ohne merkliche Latenzen.
Massenspeicher
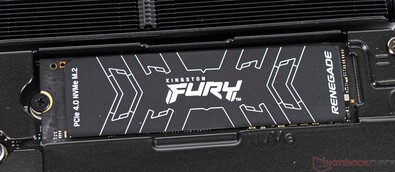
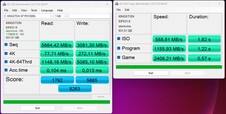
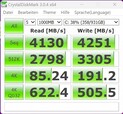
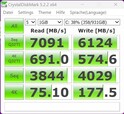
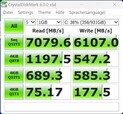
Als Massenspeicher finden wir in unserem Testsample eine sehr schnelle NVMe-SSD aus dem Hause Kingston. Sowohl in AS SSD als auch in DiskSpd kann das Modell mit sehr flinken Transferraten überzeugen. Da es sich beim Intel NUC 13 Extreme Raptor Canyon um ein Barebone-System handelt, kann hier jeder selbst entscheiden, welche SSD zum Einsatz kommen soll. Insgesamt kann das Compute-Element mit drei M.2 SSDs bestückt werden. Der Einbau gestaltet sich allerdings etwas schwierig, denn das Compute-Element muss für dieses Vorhaben komplett aus dem NUC 13 ausgebaut werden.
Für weitere Vergleiche und Benchmarks verweisen wir auf unsere Vergleichstabelle.
* ... kleinere Werte sind besser
Dauerleistung Lesen: DiskSpd Read Loop, Queue Depth 8
Grafikkarte
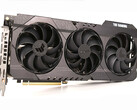
Intel stattet unser Testmuster mit einer Nvidia GeForce RTX 3080 Ti aus. Das Modell bietet eine tolle Leistung und ist nahezu genauso schnell wie eine Nvidia GeForce RTX 3090. Mit 12 GB VRAM gibt es jedoch nur halb soviel VRAM, was aber in den meisten Fällen ausreichend ist. Mit 350 Watt arbeitet das verbaute Modell durchaus an der maximal zumutbaren Grenze, und wir empfehlen es nicht, noch leistungsstärkere Grafikkarten in dem kompakten System zu betreiben. Damit beziehen wir uns jedoch voll und ganz auf die Leistungsaufnahme, denn physikalisch kann auch eine Nvidia GeForce RTX 4090 verbaut werden. Wer also unbedingt eine GeForce RTX der 4000er-Generation verbauen möchte, sollte lieber mit einer Nvidia GeForce RTX 4080 liebäugeln. Diese ist mit einer TDP von bis zu 320 Watt sogar noch sparsamer und deutlich schneller als die verbaute GeForce RTX 3080 Ti aus dem Hause Asus.
Mehr Vergleiche und Benchmarks finden Sie in unserer GPU-Vergleichstabelle.
| 3DMark 05 Standard | 82816 Punkte | |
| 3DMark 06 Standard Score | 71555 Punkte | |
| 3DMark Vantage P Result | 118753 Punkte | |
| 3DMark 11 Performance | 46806 Punkte | |
| 3DMark Ice Storm Standard Score | 288716 Punkte | |
| 3DMark Cloud Gate Standard Score | 76027 Punkte | |
| 3DMark Fire Strike Score | 37178 Punkte | |
| 3DMark Fire Strike Extreme Score | 23232 Punkte | |
| 3DMark Time Spy Score | 18822 Punkte | |
Hilfe | ||
Gaming Performance
Mit der Nvidia GeForce RTX 3080 Ti greift man sicherlich zu keiner schlechten Grafikkarte, auch wenn das Modell inzwischen nicht mehr zu den neuesten Grafikkarten zählt. Dennoch ergibt die Kombination aus Intel Core i9-13900K und der GeForce RTX 3080 Ti durchaus Sinn, denn selbst aktuelle Spiele meistert diese Konfiguration mit maximalen Details. Der Rückstand auf die schnellere Nvidia GeForce RTX 3090 ist verschwindend gering. In einem anderen Vergleichssystem auf Basis eines AMD Ryzen 9 7950X kann die gleiche Nvidia GeForce RTX 3080 Ti nur einen sehr geringen Vorteil erzielen, denn mit zunehmender Last auf der Grafikkarte spielt die Leistung des Prozessors nur noch eine untergeordnete Rolle.
Bei der Wahl der Grafikkarte sollte jedoch unbedingt auf die Kompatibilität geachtet werden, da der Platz in der Länge begrenzt ist. Mehr als 31,3 Zentimeter darf der Pixelbeschleuniger in der Länge nicht überschreiten. Die Dicke des Kühlers ist hingegen mit maximal drei Slots angegeben.
| The Witcher 3 | |
| 1920x1080 Ultra Graphics & Postprocessing (HBAO+) | |
| ASUS TUF Gaming GeForce RTX 3080 Ti OC | |
| Corsair One i300 | |
| Intel Core i9-13900K | |
| Intel NUC13 Raptor Canyon | |
| Minisforum NUCX i7 | |
| Intel Dragon Canyon NUC - RTX 3060 | |
| Minisforum Neptune Series HX90G | |
| 3840x2160 High Graphics & Postprocessing (Nvidia HairWorks Off) | |
| Intel NUC13 Raptor Canyon | |
| ASUS TUF Gaming GeForce RTX 3080 Ti OC | |
| Intel Core i9-13900K | |
| Corsair One i300 | |
| Minisforum NUCX i7 | |
| Intel Dragon Canyon NUC - RTX 3060 | |
| Minisforum Neptune Series HX90G | |
| Far Cry 6 | |
| 1920x1080 Ultra Graphics Quality + HD Textures AA:T | |
| ASUS TUF Gaming GeForce RTX 3080 Ti OC | |
| Intel Core i9-13900K | |
| Corsair One i300 | |
| Intel NUC13 Raptor Canyon | |
| Minisforum NUCX i7 | |
| Intel Dragon Canyon NUC - RTX 3060 | |
| Intel Beast Canyon NUC | |
| Minisforum Neptune Series HX90G | |
| 3840x2160 Ultra Graphics Quality + HD Textures AA:T | |
| ASUS TUF Gaming GeForce RTX 3080 Ti OC | |
| Intel NUC13 Raptor Canyon | |
| Intel Core i9-13900K | |
| Corsair One i300 | |
| Intel Dragon Canyon NUC - RTX 3060 | |
| Intel Beast Canyon NUC | |
| Minisforum Neptune Series HX90G | |
| F1 2021 | |
| 1920x1080 Ultra High Preset + Raytracing AA:T AF:16x | |
| ASUS TUF Gaming GeForce RTX 3080 Ti OC | |
| Intel NUC13 Raptor Canyon | |
| Intel Core i9-13900K | |
| Corsair One i300 | |
| Minisforum NUCX i7 | |
| Intel Beast Canyon NUC | |
| Intel Dragon Canyon NUC - RTX 3060 | |
| Minisforum Neptune Series HX90G | |
| 3840x2160 Ultra High Preset + Raytracing AA:T AF:16x | |
| ASUS TUF Gaming GeForce RTX 3080 Ti OC | |
| Intel Core i9-13900K | |
| Intel NUC13 Raptor Canyon | |
| Corsair One i300 | |
| Minisforum NUCX i7 | |
| Intel Beast Canyon NUC | |
| Intel Dragon Canyon NUC - RTX 3060 | |
| Minisforum Neptune Series HX90G | |
| min. | mittel | hoch | max. | QHD | 4K | |
|---|---|---|---|---|---|---|
| GTA V (2015) | 187.6 | 187.4 | 187 | 161.5 | 152.8 | 182 |
| The Witcher 3 (2015) | 702 | 564 | 374 | 179.1 | 156.8 | |
| Dota 2 Reborn (2015) | 278.9 | 242.4 | 234.1 | 216.6 | 211.1 | |
| Final Fantasy XV Benchmark (2018) | 234 | 229 | 180.6 | 141 | 84.2 | |
| X-Plane 11.11 (2018) | 232 | 202 | 148.8 | 127.3 | ||
| Far Cry 5 (2018) | 239 | 208 | 198 | 186 | 176 | 109 |
| Strange Brigade (2018) | 613 | 489 | 407 | 359 | 269 | 161 |
| Far Cry New Dawn (2019) | 200 | 174 | 167 | 150 | 144 | 109 |
| Metro Exodus (2019) | 241 | 200 | 165.8 | 134 | 115 | 76.5 |
| Borderlands 3 (2019) | 229 | 195.3 | 179.7 | 160 | 128.7 | 74 |
| F1 2020 (2020) | 520 | 448 | 419 | 310 | 240 | 145.2 |
| F1 2021 (2021) | 615 | 525 | 428 | 225 | 174.3 | 103.2 |
| Far Cry 6 (2021) | 211 | 180.4 | 160.6 | 120.7 | 136 | 86 |
| Forza Horizon 5 (2021) | 256 | 191 | 182 | 129 | 117 | 87 |
| God of War (2022) | 229 | 200 | 166.6 | 119.6 | 105.8 | 77.5 |
| Tiny Tina's Wonderlands (2022) | 355 | 291 | 211 | 168.5 | 123.1 | 70 |
| F1 22 (2022) | 367 | 342 | 321 | 128.8 | 85.6 | 43 |
Emissionen
Temperaturen und Geräuschemission
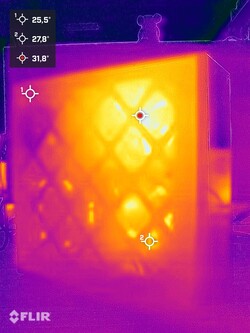
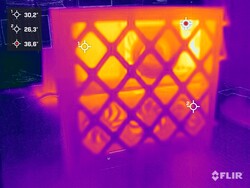
Das Gehäuse des Intel NUC 13 Extreme Raptor Canyon ist in zwei Kammern aufgeteilt. Zum einen befindet sich im oberen Bereich das Compute-Element mit CPU, RAM und SSD sowie das Netzteil, und zum anderen ist der untere Bereich komplett für eine dedizierte Grafikkarte vorgesehen. Das Konzept funktioniert in der Praxis recht gut, wenngleich das PL2 des Intel Core i9-13900K nur kurzfristig erreicht werden kann. Die 100 °C können unter Last auf der CPU nicht verhindert werden. Gleichwohl wird diese hohe Temperatur nur selten und wenn, dann nur für eine sehr kurze Dauer erreicht. Im Mittel pendelt sich die CPU-Temperatur aber je nach Szenario zwischen 60 und 90 °C ein.
Bei der Lautstärke bleibt das System, so wie wir es im Test hatten, relativ leise. Mit 39 dB(A) unter Volllast ist das System hörbar, aber von einem störendem Lärmpegel noch weit entfernt. Beim Spielen notieren wir mit knapp über 38 dB(A) einen ähnlichen Wert. Demzufolge ist die verbaute Grafikkarte maßgeblich für die Lautstärke unter Last verantwortlich. Wer hier auf ein leiseres Modell setzt, kann ein sehr leises System zusammenstellen.
Lautstärkediagramm
| Idle |
| 32.1 / 32.1 / 32.1 dB(A) |
| Last |
| 33.4 / 39 dB(A) |
 | ||
30 dB leise 40 dB(A) deutlich hörbar 50 dB(A) störend |
||
min: | ||
Energieaufnahme
Die Stromversorgung regelt ein 750-Watt-Netzteil im SFX-Format. Mit diesem ist man auch unter Vollast auf der sicheren Seite, denn im Schnitt werden beim Spielen 499 Watt an der Steckdose für das System gemessen. In Spitzen sehen wir auch mal 544 Watt, was im Test zu keinen Problemen führte. Mit 350 Watt sorgt die Grafikkarte für den meisten Energiebedarf beim Zocken. Von einer Grafikkarte mit einer noch höheren Leistungsaufnahme raten wir jedoch ab. Der neue 12VHPWR-Anschluss kann ohnehin nur maximal 300 Watt zur Verfügung stellen. Das besagt jedenfalls die Aufschrift am Stecker selbst. Alternativ gibt es noch drei 6+2-PCIe-Stecker
| Intel NUC13 Raptor Canyon i9-13900K, GeForce RTX 3080 Ti | Minisforum Neptune Series HX90G R9 5900HX, Radeon RX 6600M | Minisforum NUCX i7 i7-11800H, GeForce RTX 3070 Laptop GPU | Durchschnittliche NVIDIA GeForce RTX 3080 Ti | Durchschnitt der Klasse Desktop | |
|---|---|---|---|---|---|
| Stromverbrauch | 51% | 36% | 0% | 40% | |
| Idle min * (Watt) | 39 | 17.8 54% | 28.2 28% | 39 ? -0% | 17.9 ? 54% |
| Idle avg * (Watt) | 42 | 17.9 57% | 29.9 29% | 42 ? -0% | 37.2 ? 11% |
| Idle max * (Watt) | 52 | 18.1 65% | 36.2 30% | 52 ? -0% | 41.3 ? 21% |
| Last avg * (Watt) | 228 | 82.1 64% | 83.2 64% | 228 ? -0% | 96.7 ? 58% |
| Last max * (Watt) | 308 | 262 15% | 215.7 30% | 308 ? -0% | 141.6 ? 54% |
| Witcher 3 ultra * (Watt) | 167 | ||||
| Cyberpunk 2077 ultra external monitor * (Watt) | 177 |
* ... kleinere Werte sind besser
| Aus / Standby | |
| Idle | |
| Last |
|
Legende:
min: | |
Energieaufnahme mit externem Monitor
Pro
Contra
Fazit - Viele Verbesserungen und deutlich mehr Leistung
Mit dem NUC 13 Extreme Raptor Canyon macht Intel vieles richtig. Mit der aktuellen Raptor-Lake-Serie betreibt der Hersteller nicht nur einfache Produktpflege, sondern überarbeitet vor allem das Gehäuse. Dieses ist nun deutlich größer als zuvor. Somit würden wir dieses System nicht mehr im Bereich der Mini-PCs ansiedeln, auch wenn Intel das vielleicht anders sieht. Mit dem Gehäusevolumen von nunmehr 14 Litern duelliert sich der Intel NUC 13 Extreme Raptor Canyon mit der Corsair-One-i300-Serie, welche mit 12 Litern noch etwas kompakter ist.
In der von uns getesteten Version verfügt das System über genügend Leistung, um alle aktuellen Spiele in 2.160p zu zocken. Aufgrund der Tatsache, dass es sich beim NUC 13 Extreme Raptor Canyon um ein Barebone-System handelt, kann sich hier jeder das Gerät passend auf seine Bedürfnisse zusammenstellen. Der Intel Core i9-13900K performt überaus gut, was wir im Vorfeld nicht so erwartet hätten. Und trotzdem bleibt das Gerät auch unter Last relativ leise.
Der Intel NUC 13 Extreme Kit bietet auf Basis eines Intel Core i9-13900K eine hervorragende Leistung. Mit der richtigen GPU lässt sich hier ein tolles Gaming-System oder eine hochwertige Workstation zusammenstellen.
Der Kaufpreis liegt derzeit bei 1.550 US-Dollar für das System inklusive CPU. Weitere Komponenten wie RAM, SSD oder GPU treiben den Preis schnell in ungeahnte Höhen. Vergleichbare Komplettsysteme wie der schon erwähnte Corsair One i300 schlagen aber auch mit teilweise 5.000 Euro zu Buche.
Das neue Gehäuse gefällt und ist dank der hochwertigen Materialien stabil. Zudem ist es funktional aufgebaut, wovon auch die Kühlung der Komponenten profitiert. Dennoch gibt es einige unschöne Aspekte, wie zum Beispiel die Erreichbarkeit der SSDs oder das Fehlen eines Kartenlesers. Beim Vorgänger gab es diesen noch mit dem schnellen UHS-II-Standard.
Preise und Verfügbarkeit
Der Intel NUC 13 Extreme Raptor Canyon kommt in China im vierten Quartal 2022 auf den Markt. Der Launch im Rest der Welt folgt im ersten Quartal 2023. Je nach Konfiguration kostet der NUC 13 Extreme 1.179 bis 1.549 US-Dollar, wobei dieser Preis wie bei NUCs üblich ohne Grafikkarte, Arbeitsspeicher oder SSD gilt. Das zugehörige Compute Element wird auch ohne PC-Gehäuse für 760 bis 1.100 US-Dollar angeboten.
Notebookcheck wurde der Intel NUC 13 Extreme Raptor Canyon leihweise von Intel zum Testen zur Verfügung gestellt.


