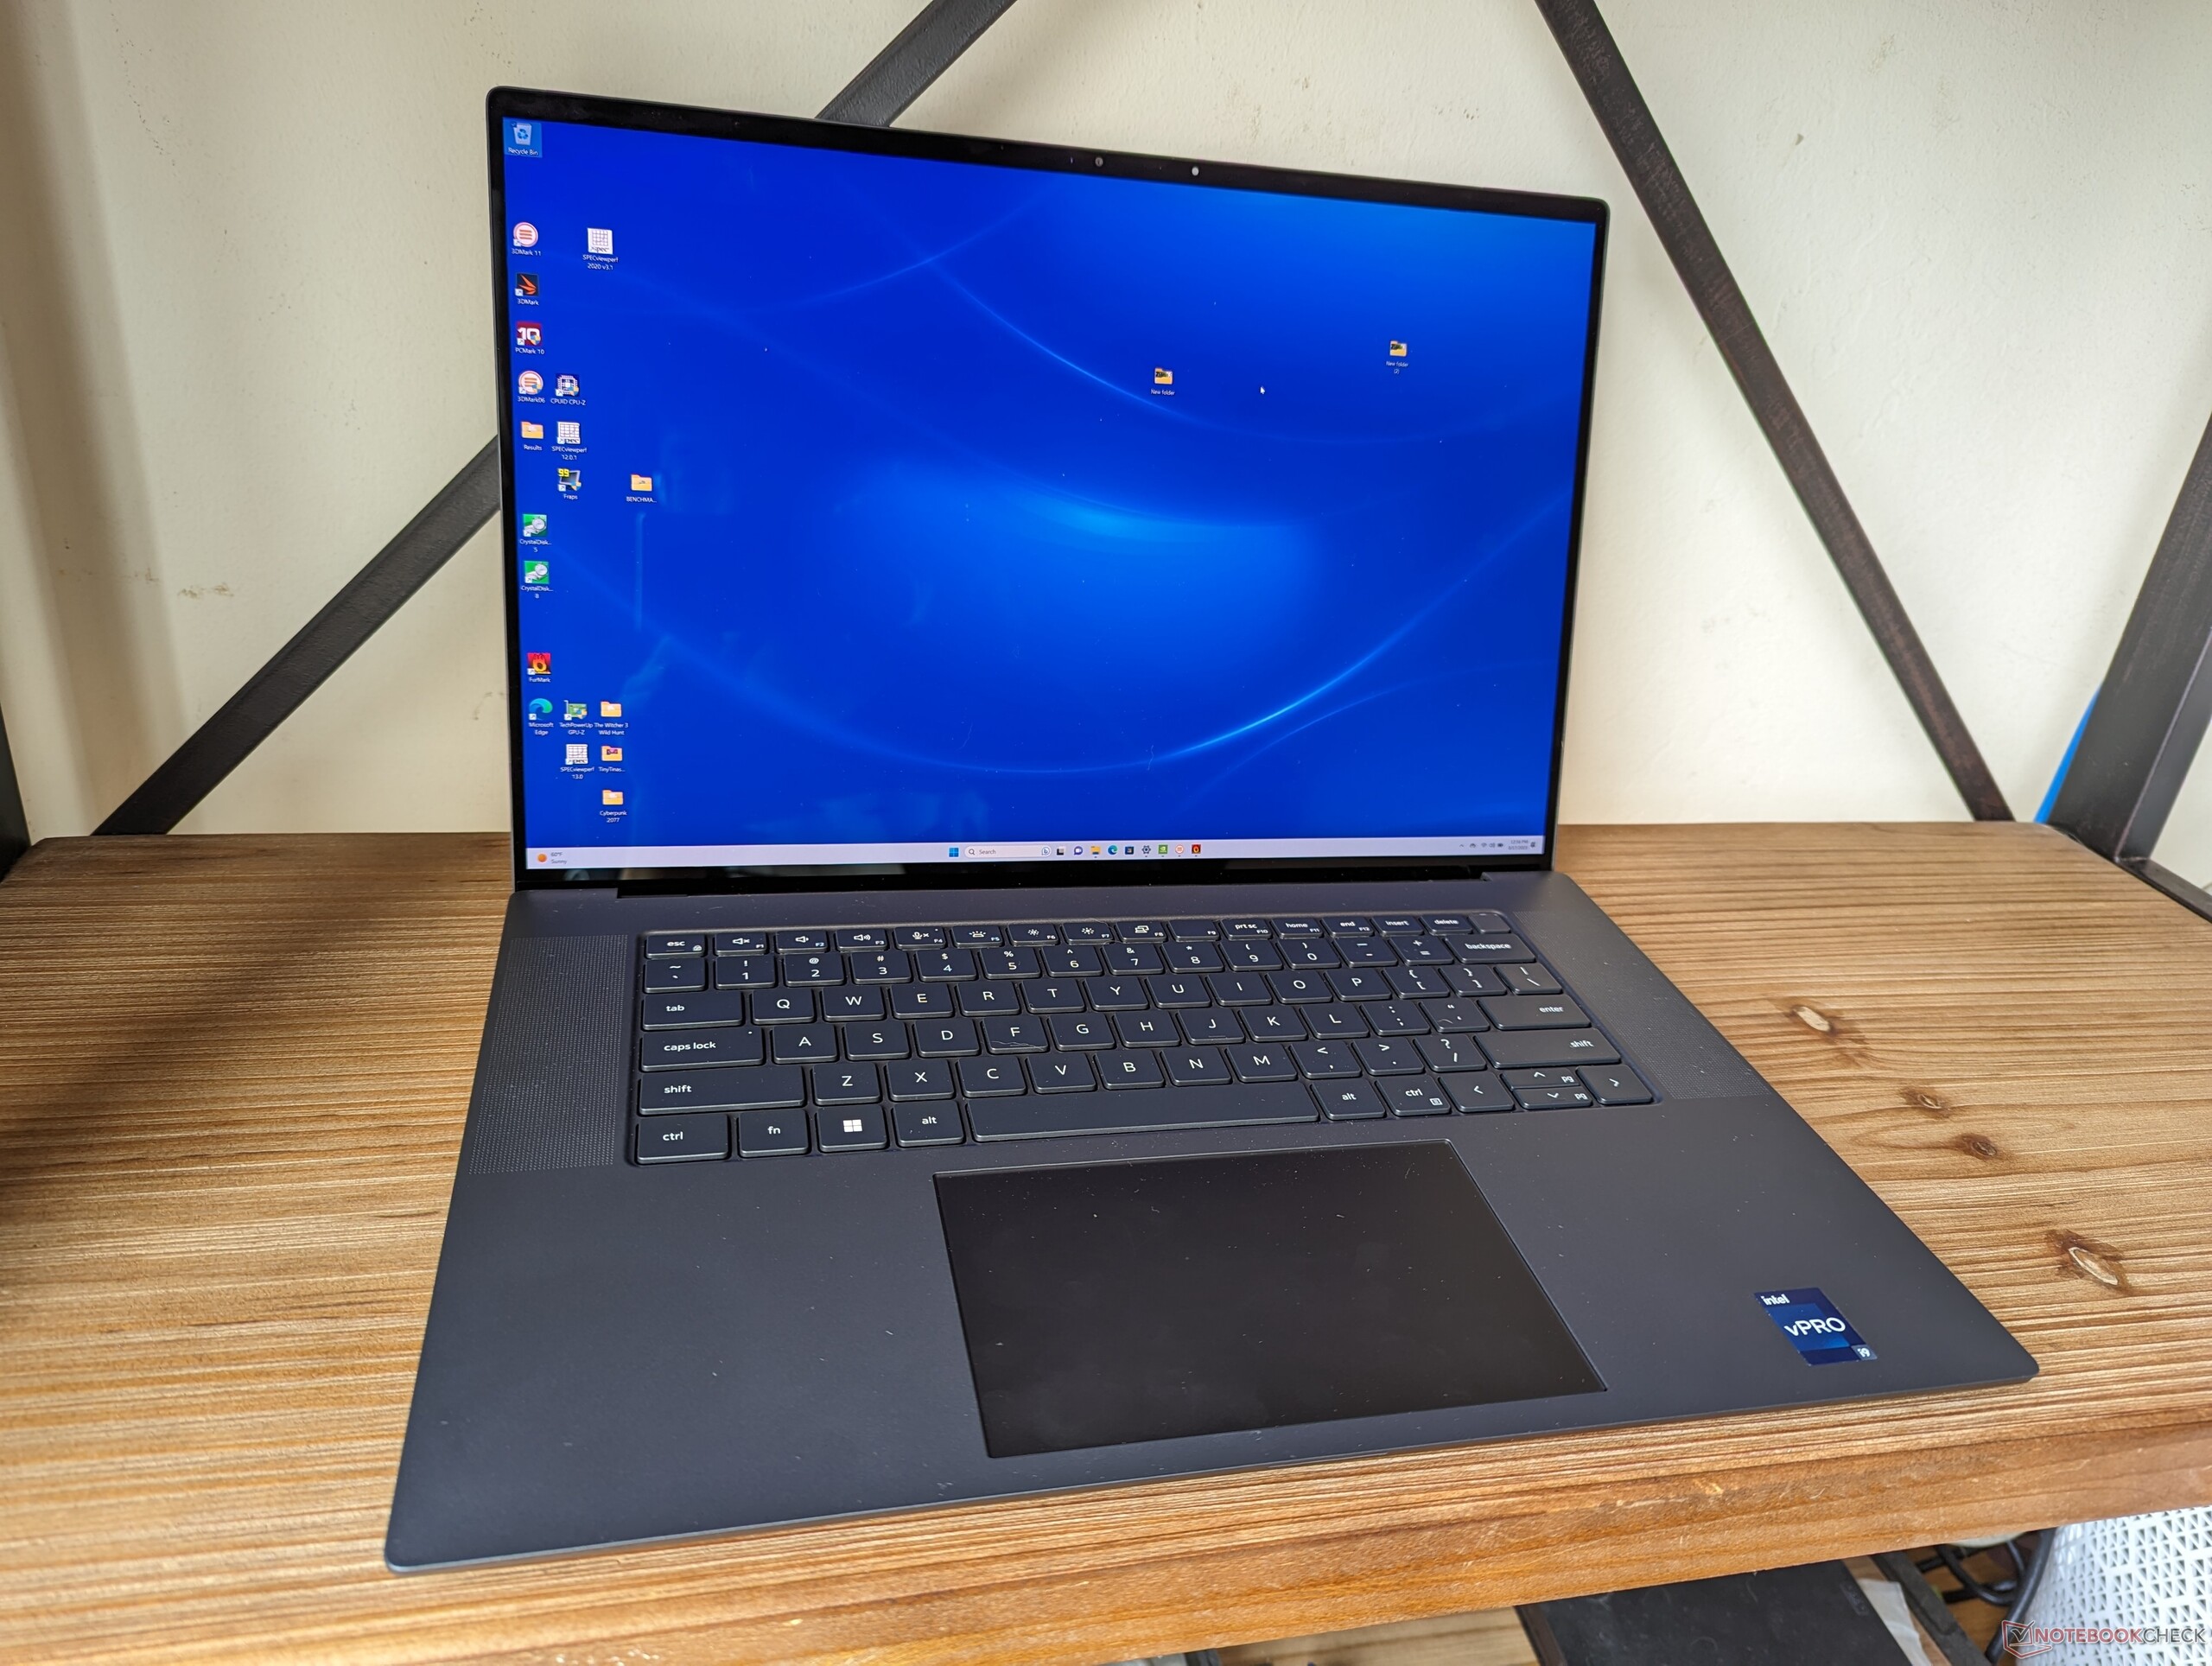
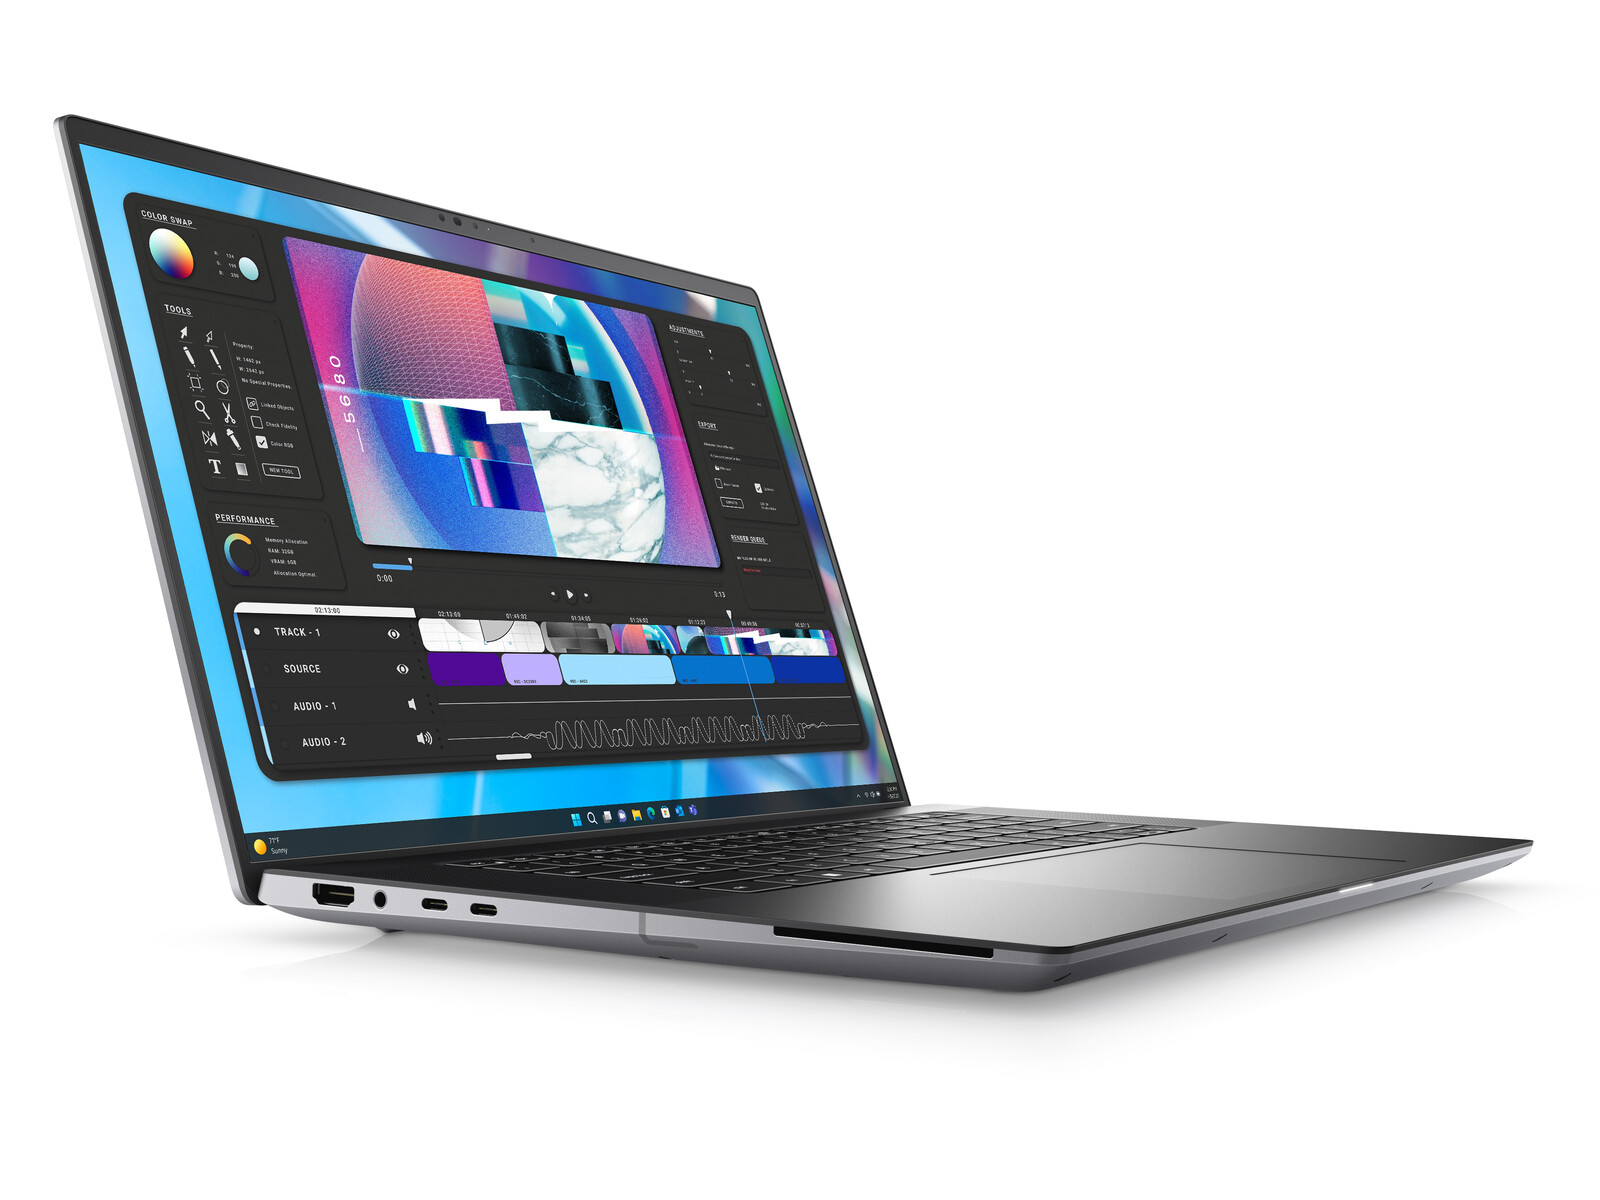
Dell Precision 5680 im Test: Ada Lovelace dominiert auf Workstations

Das Precision 5680 ist das erste 16-Zoll-Modell in der Precision-5000-Serie und vervollständigt die existierenden Modelle um das 14-Zoll-Precision 5470, das 15-Zoll-Precision 5560 sowie das 17-Zoll-Precision 5750. Sie ist eine High-End-Workstation, die sogar dünner und leichter ist als ein Precision-7000-Modell, wenngleich dafür ein paar Zusatzfunktionen gestrichen wurden.
Unsere Testeinheit bildet eine der höheren Konfigurationen nach, in ihr rechnen die Gen13-Raptor-Lake-H-CPU Core i9-13900H und eine Nvidia RTX 5000 mit 75 W, darüber hinaus bietet sie einen 2.400p OLED-Touchscreen für einen Preis von umgerechnet $6.500 (ca. €6.000). Schwächere Konfigurationen mit Core i5-13600H, ausschließlich integrierter GPU und einem 1.200p IPS-Display starten zu einem Preis von $2490 (ca. €2.300).
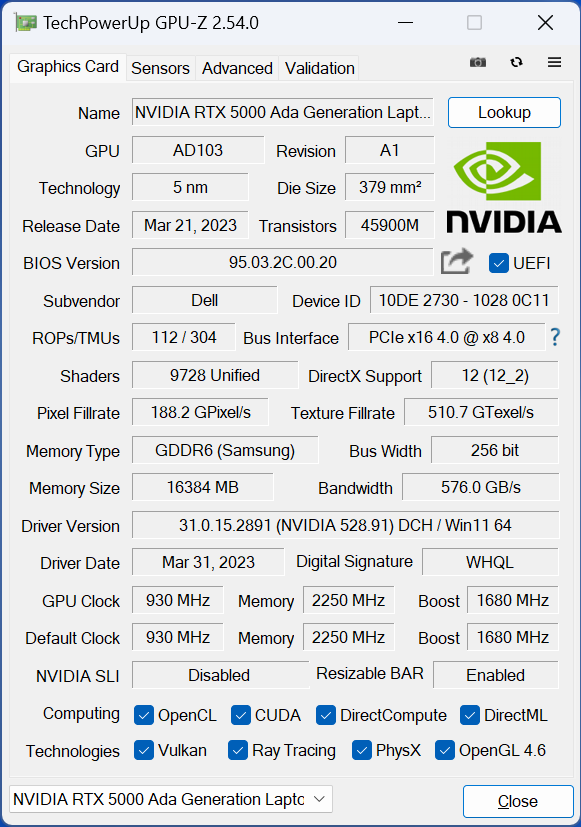
Gleichzeitig ist unser Testgerät eine der ersten Workstations, die mit einer RTX 5000 Ada Lovelace ausgestattet sind, nicht zu verwechseln mit der Turing-basierten Quadro RTX 5000 oder der Ampere-basierten RTX A5000.
Konkurrenz findet sich in anderen 16-Zoll-Workstations wie der HP ZBook Fury 16 G9, der Lenovo ThinkPad P16 G1, der MSI CreatorPro Z16P oder der Asus ProArt StudioBook 16.
Weitere Dell-Tests:
Potentielle Konkurrenten im Vergleich
Bew. | Datum | Modell | Gewicht | Dicke | Größe | Auflösung | Preis ab |
|---|---|---|---|---|---|---|---|
| 89 % v7 (old) | 08 / 2023 | Dell Precision 5000 5680 i9-13900H, RTX 5000 Ada Generation Laptop | 2.3 kg | 22.17 mm | 16.00" | 3840x2400 | |
| 89.1 % v7 (old) | 12 / 2022 | Dell Precision 7000 7670 Performance i9-12950HX, RTX A5500 Laptop GPU | 2.8 kg | 25.95 mm | 16.00" | 3840x2400 | |
| 91 % v7 (old) | 06 / 2023 | HP ZBook Fury 16 G9 i9-12950HX, RTX A5500 Laptop GPU | 2.6 kg | 28.5 mm | 16.00" | 3840x2400 | |
| 91 % v7 (old) | 02 / 2023 | Lenovo ThinkPad P16 G1 RTX A5500 i9-12950HX, RTX A5500 Laptop GPU | 3 kg | 30.23 mm | 16.00" | 3840x2400 | |
| 84.3 % v7 (old) | 11 / 2022 | MSI CreatorPro Z16P B12UKST i7-12700H, RTX A3000 Laptop GPU | 2.4 kg | 19 mm | 16.00" | 2560x1600 | |
| 89.6 % v7 (old) | 01 / 2023 | Asus ExpertBook B6 Flip B6602FC2 i9-12950HX, RTX A2000 Laptop GPU | 2.8 kg | 27.2 mm | 16.00" | 2560x1600 |
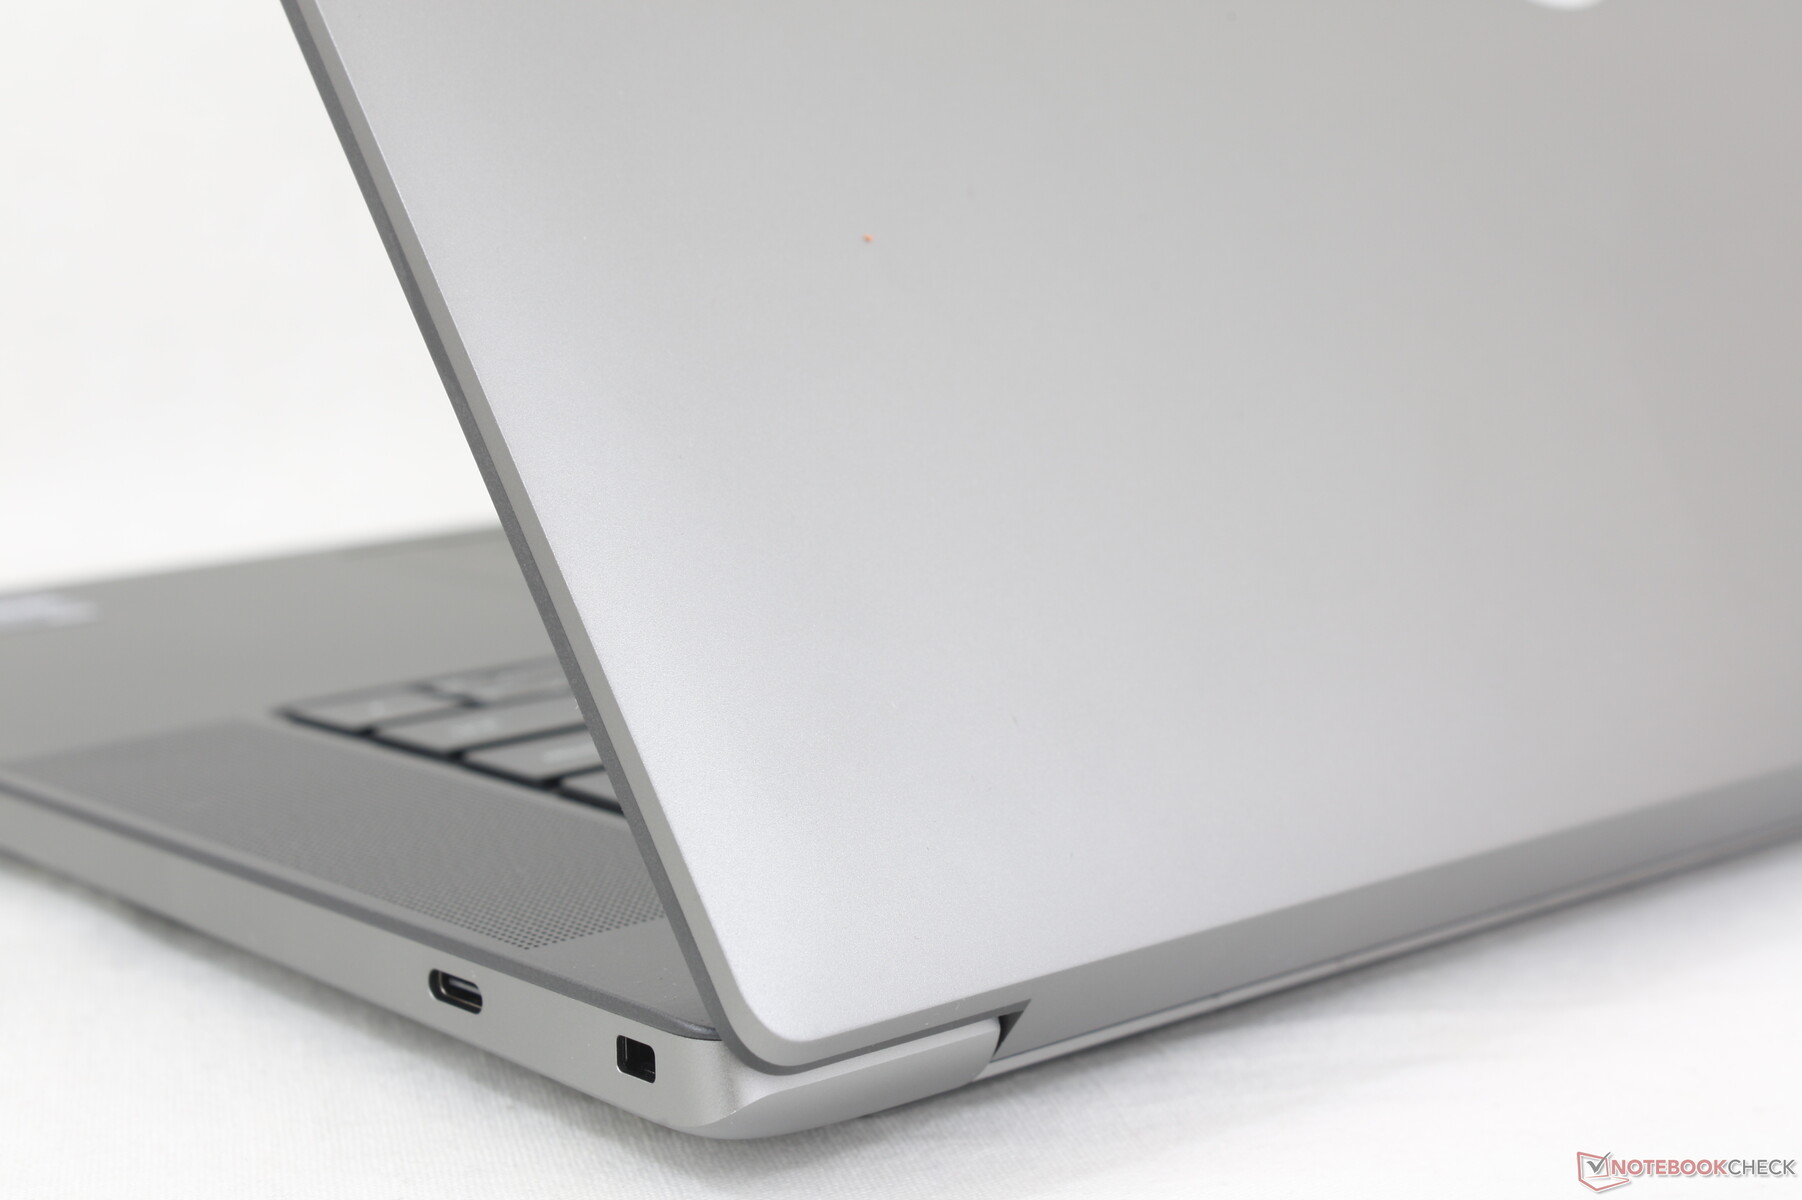
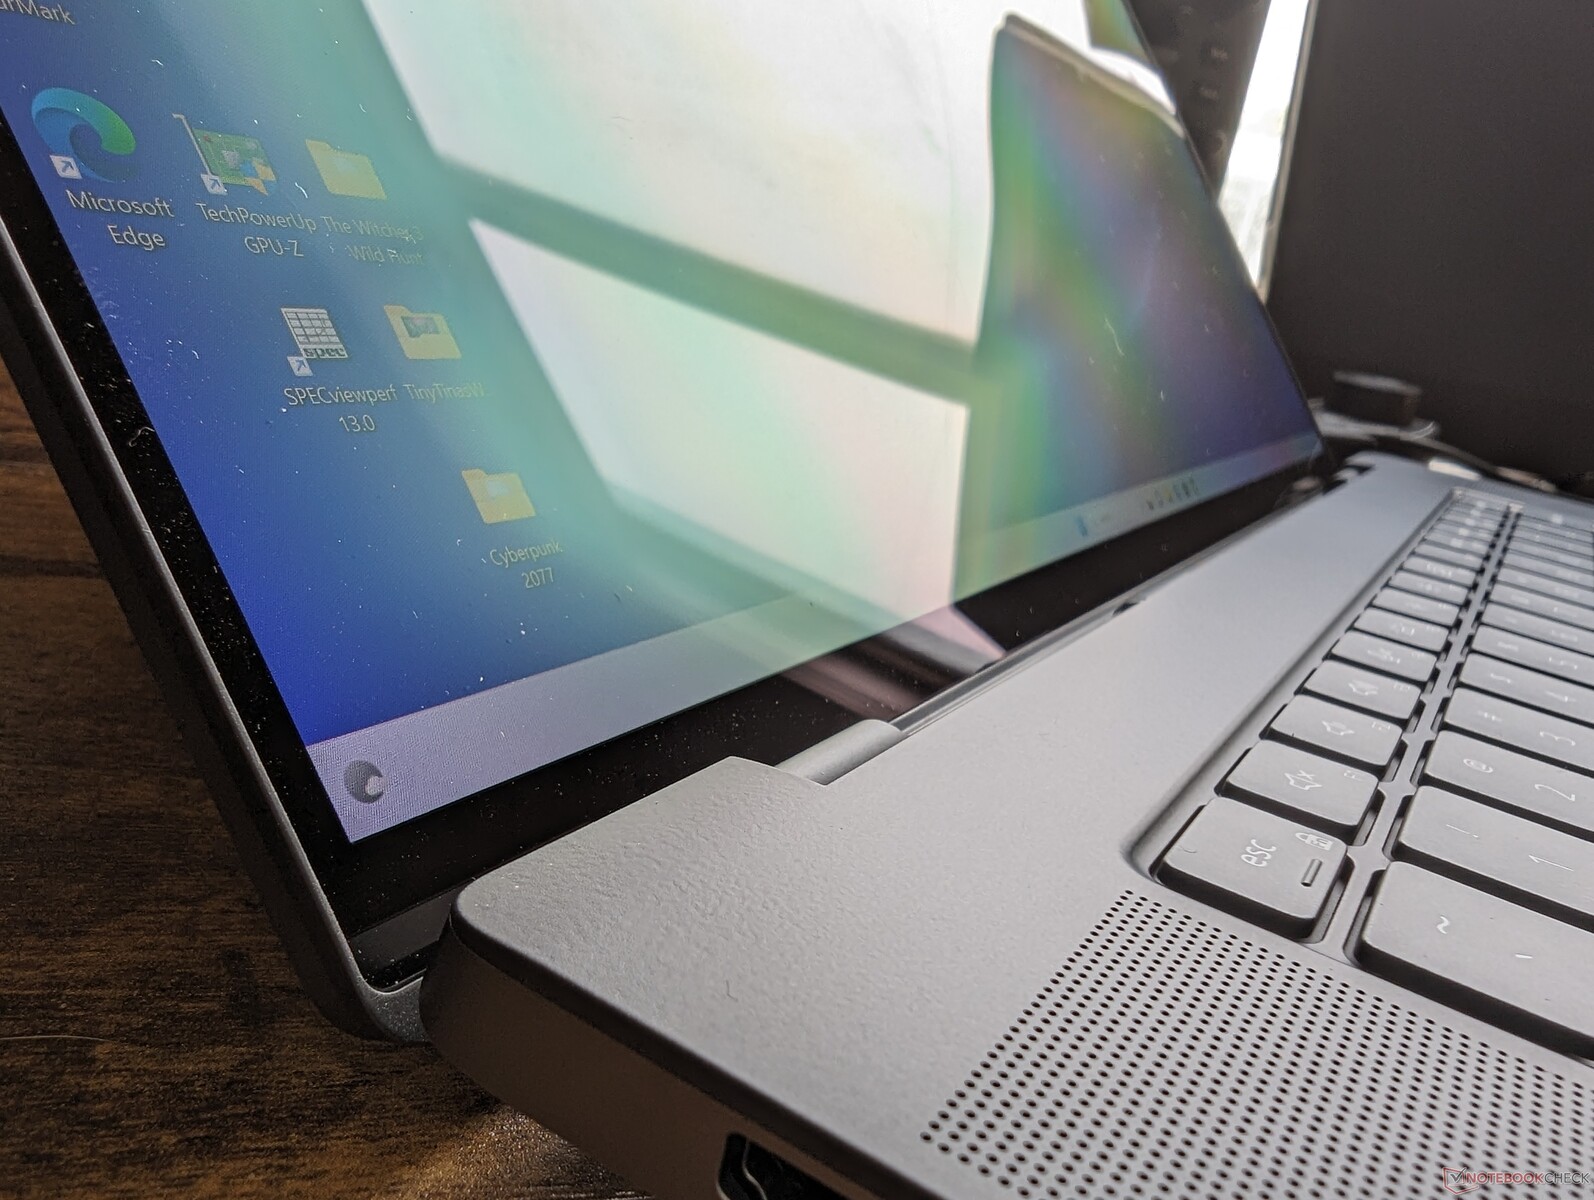
Gehäuse — XPS-Wurzeln
Die Inspiration für das Design der Precision 5680 ist recht offensichtlich, es wirkt wie eine 16-Zoll-Version eines XPS 15 oder XPS 17. Wer bereits Erfahrungen mit einem XPS-Modell hat, dürfte sich mit der Precision 5680 sofort heimisch fühlen. Es nimmt quasi ein "XPS 16" vorweg, wir wären nicht überrascht, wenn Dell in naher Zukunft ein solches Modell auf Basis des Gehäuses der Precision 5680 vorstellt.
Die Verarbeitungsqualität fällt im Vergleich zu Alternativen wie dem ZBook Fury 16 G9 oder dem CreatorPro Z16P positiv aus, auch wenn diese ebenfalls auf Metallverbindungen setzen und so für einen guten Ersteindruck sorgen.
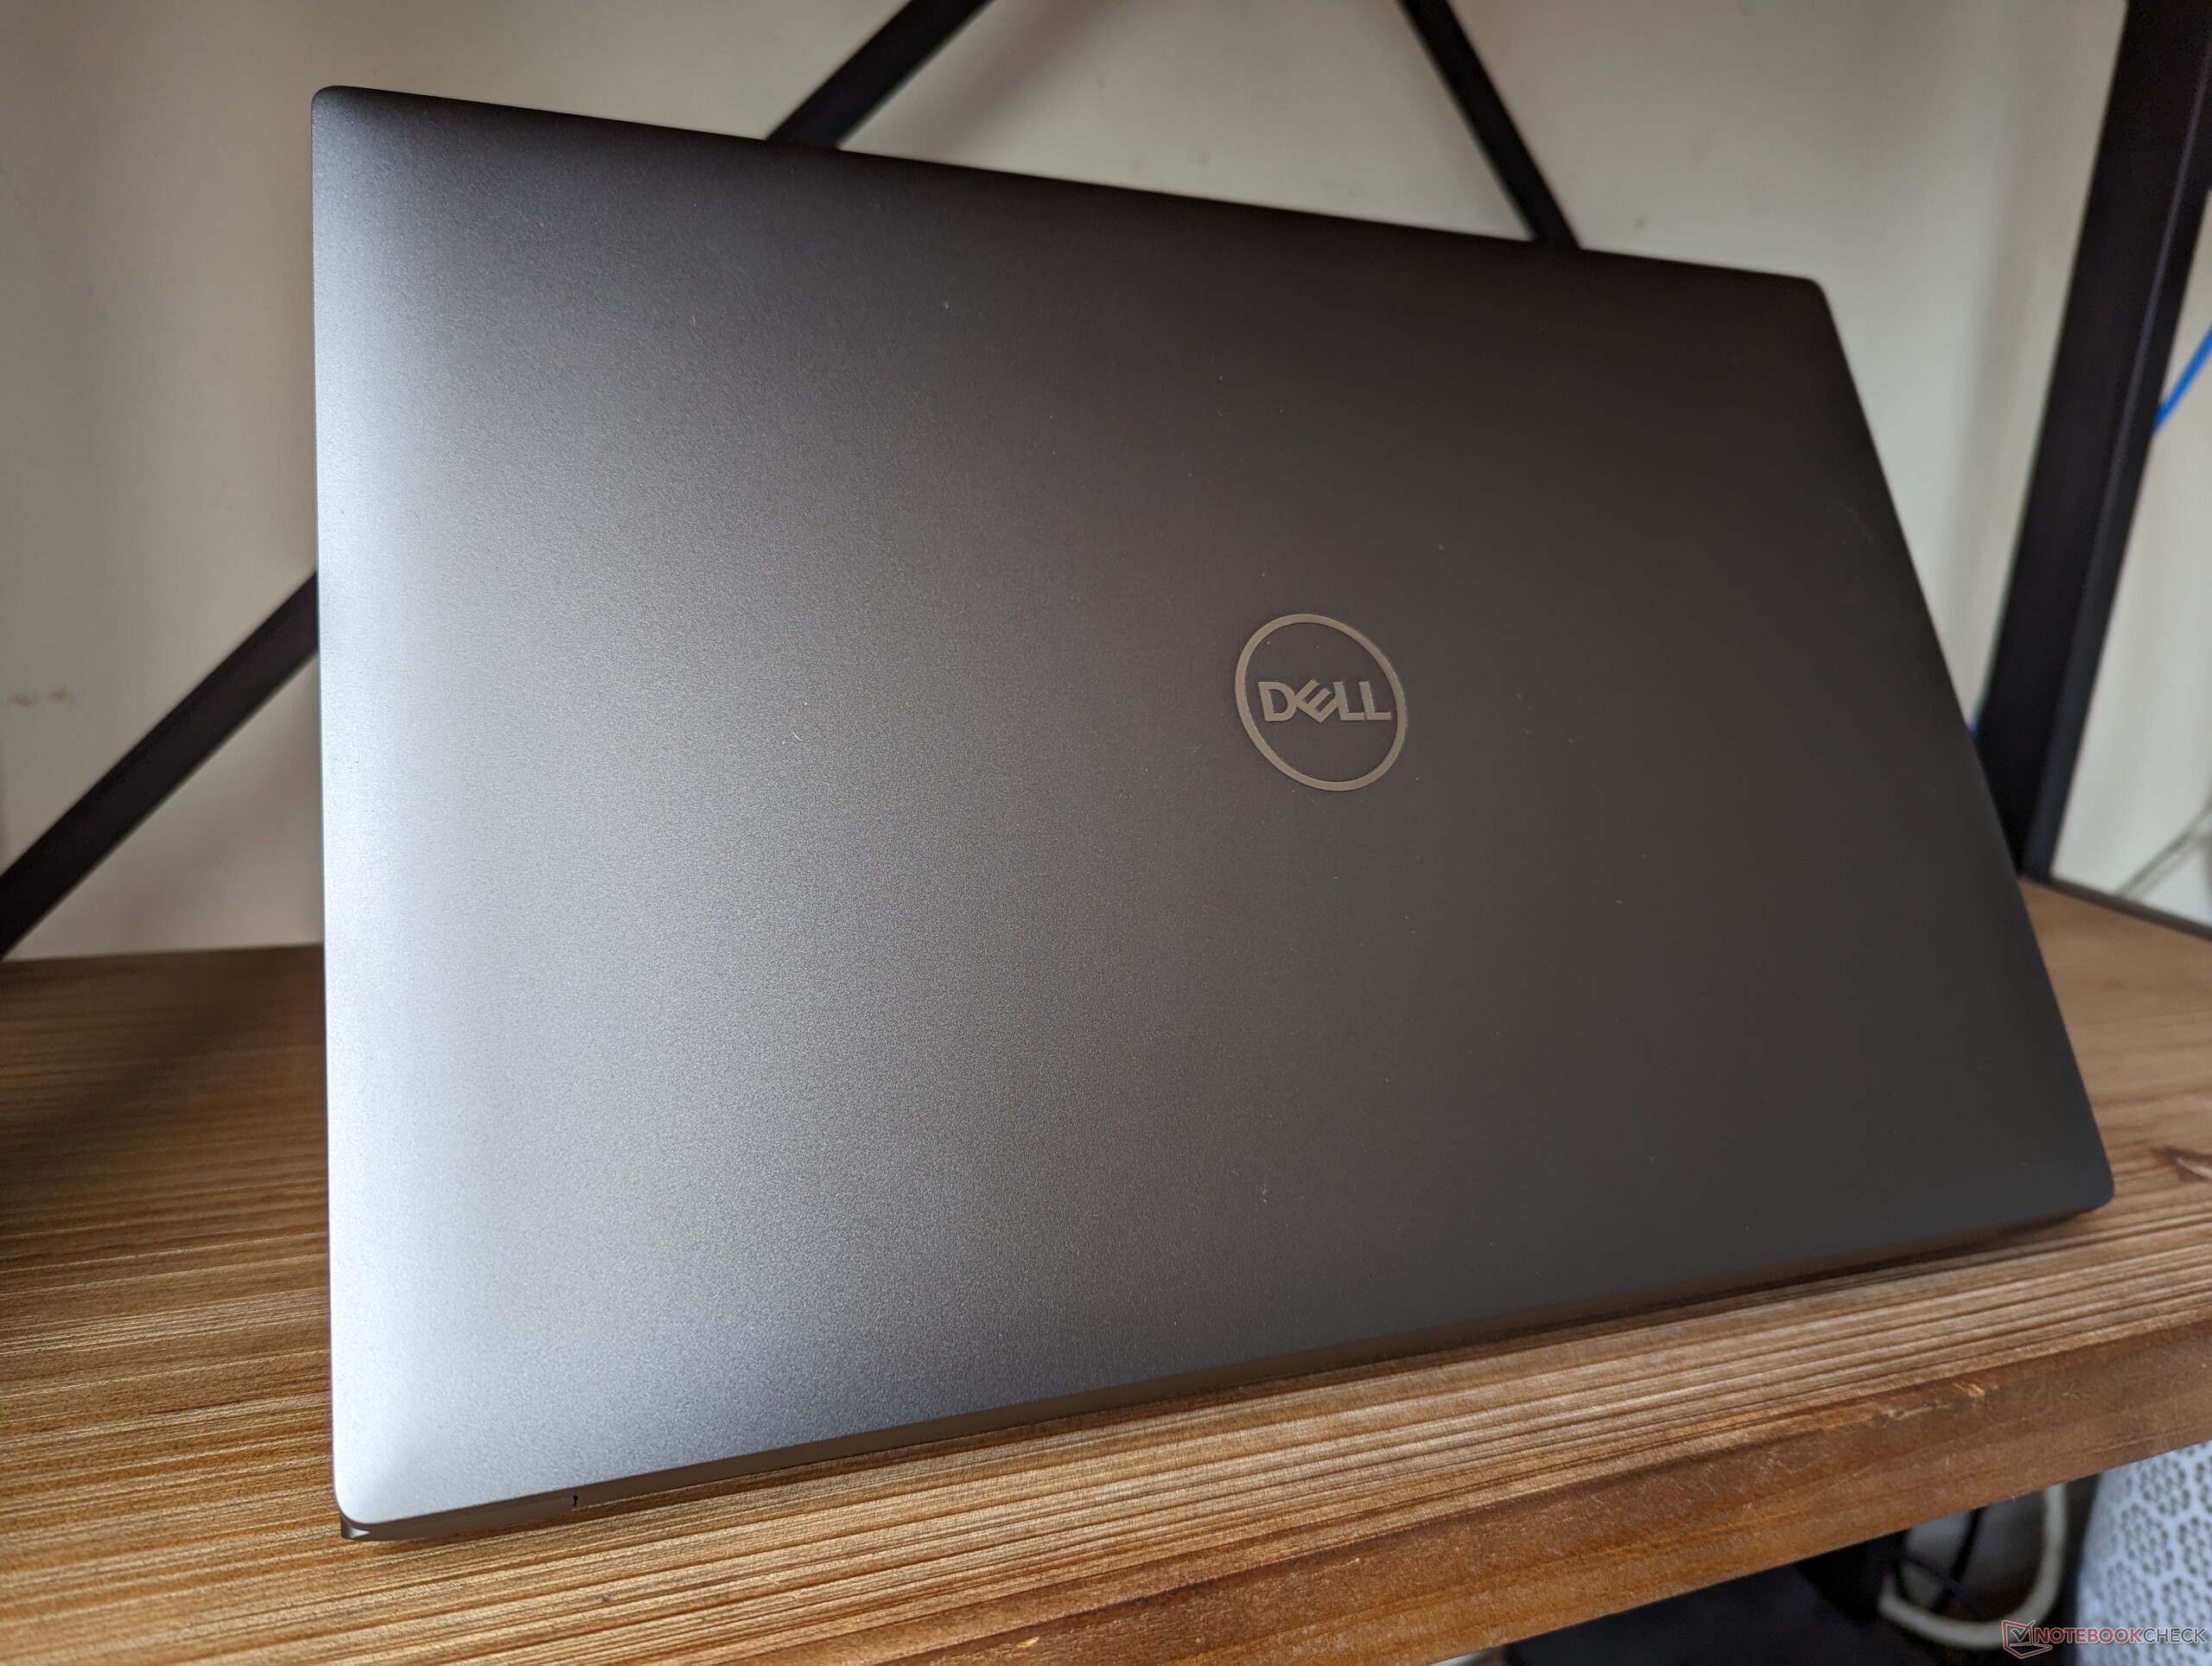
Mit nur 2,3 kg ist die Precision 5680 knapp eine der aktuell leichtesten 16-Zoll-Workstations auf dem Markt. Das CreatorPro Z16P und das HP ZBook Fury 16 G9 sind beispielsweise 100 beziehungsweise 300 g schwerer und übrigens auch größer als unser Dell. Angesichts der Leistung ist die Precision 5680 überraschend mobil.
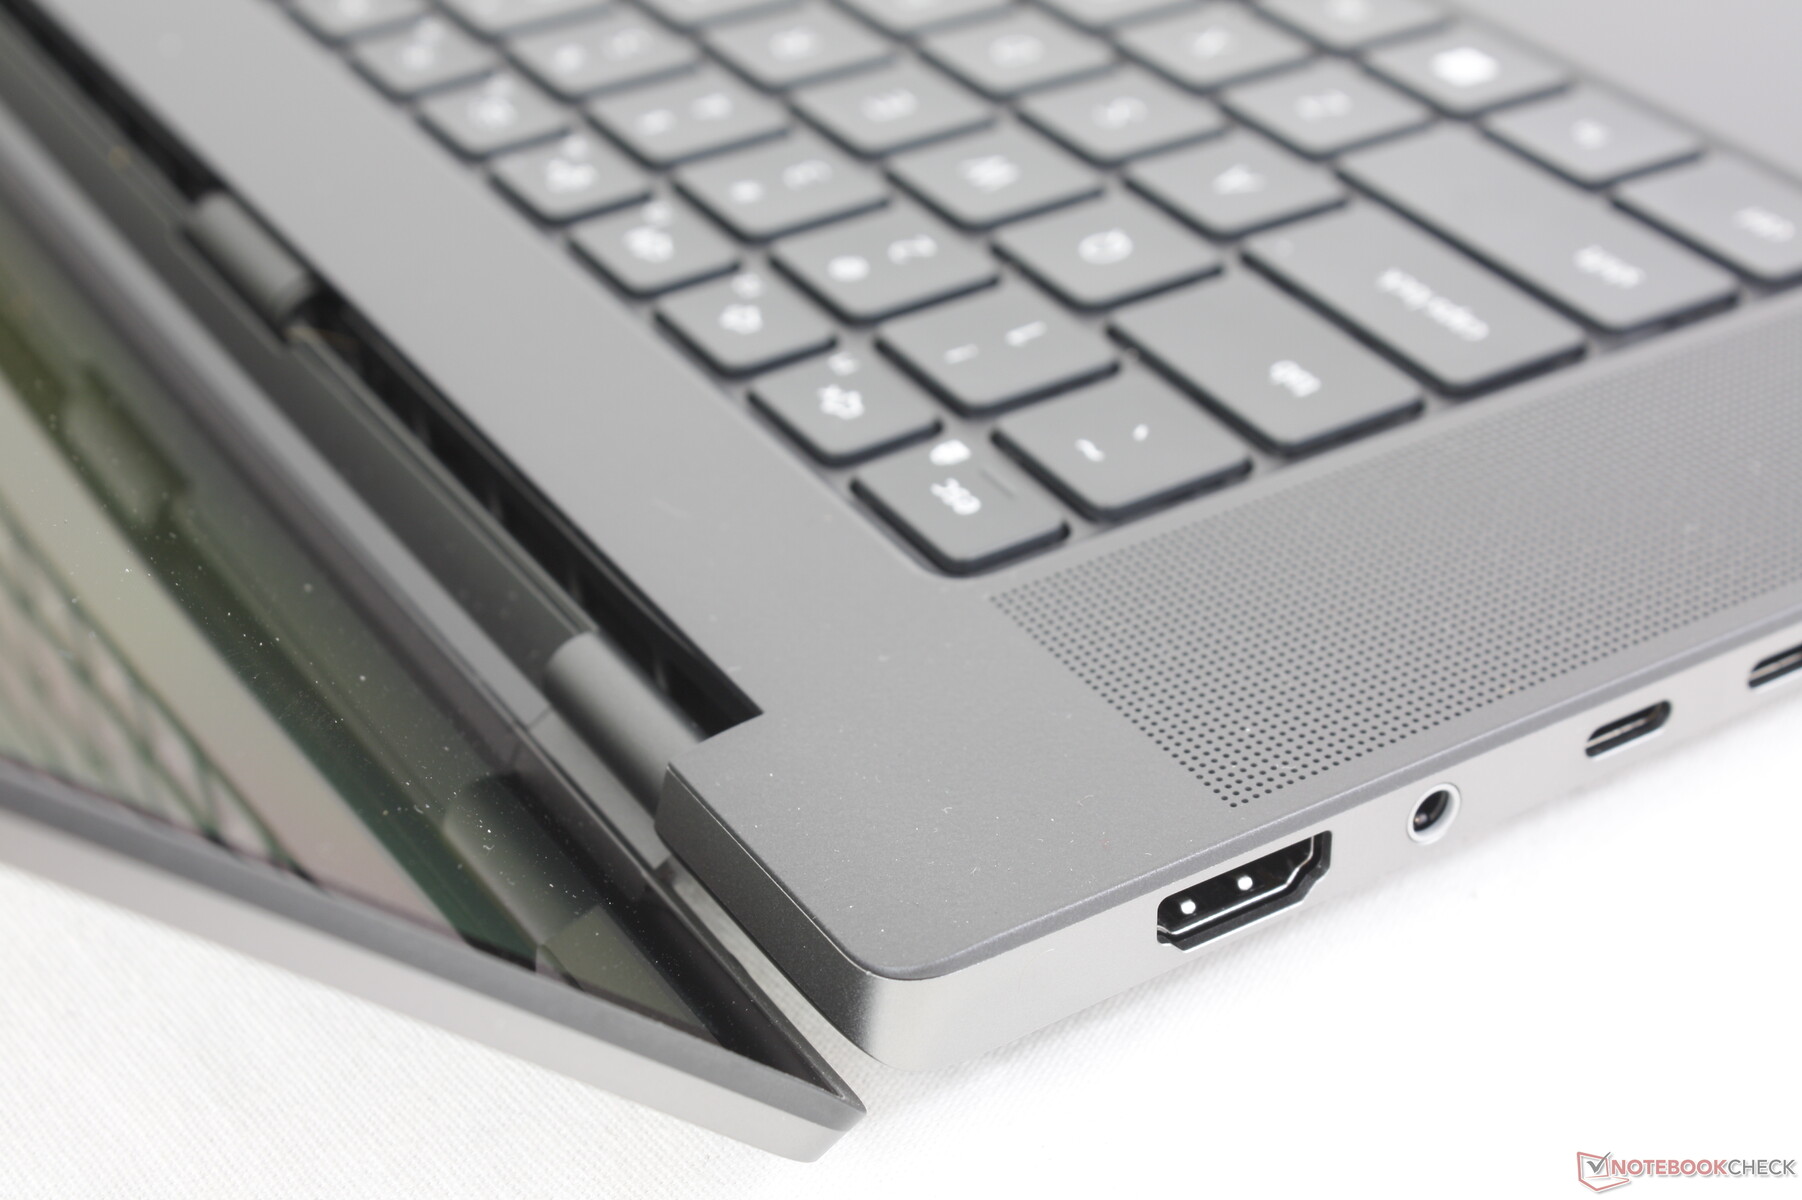
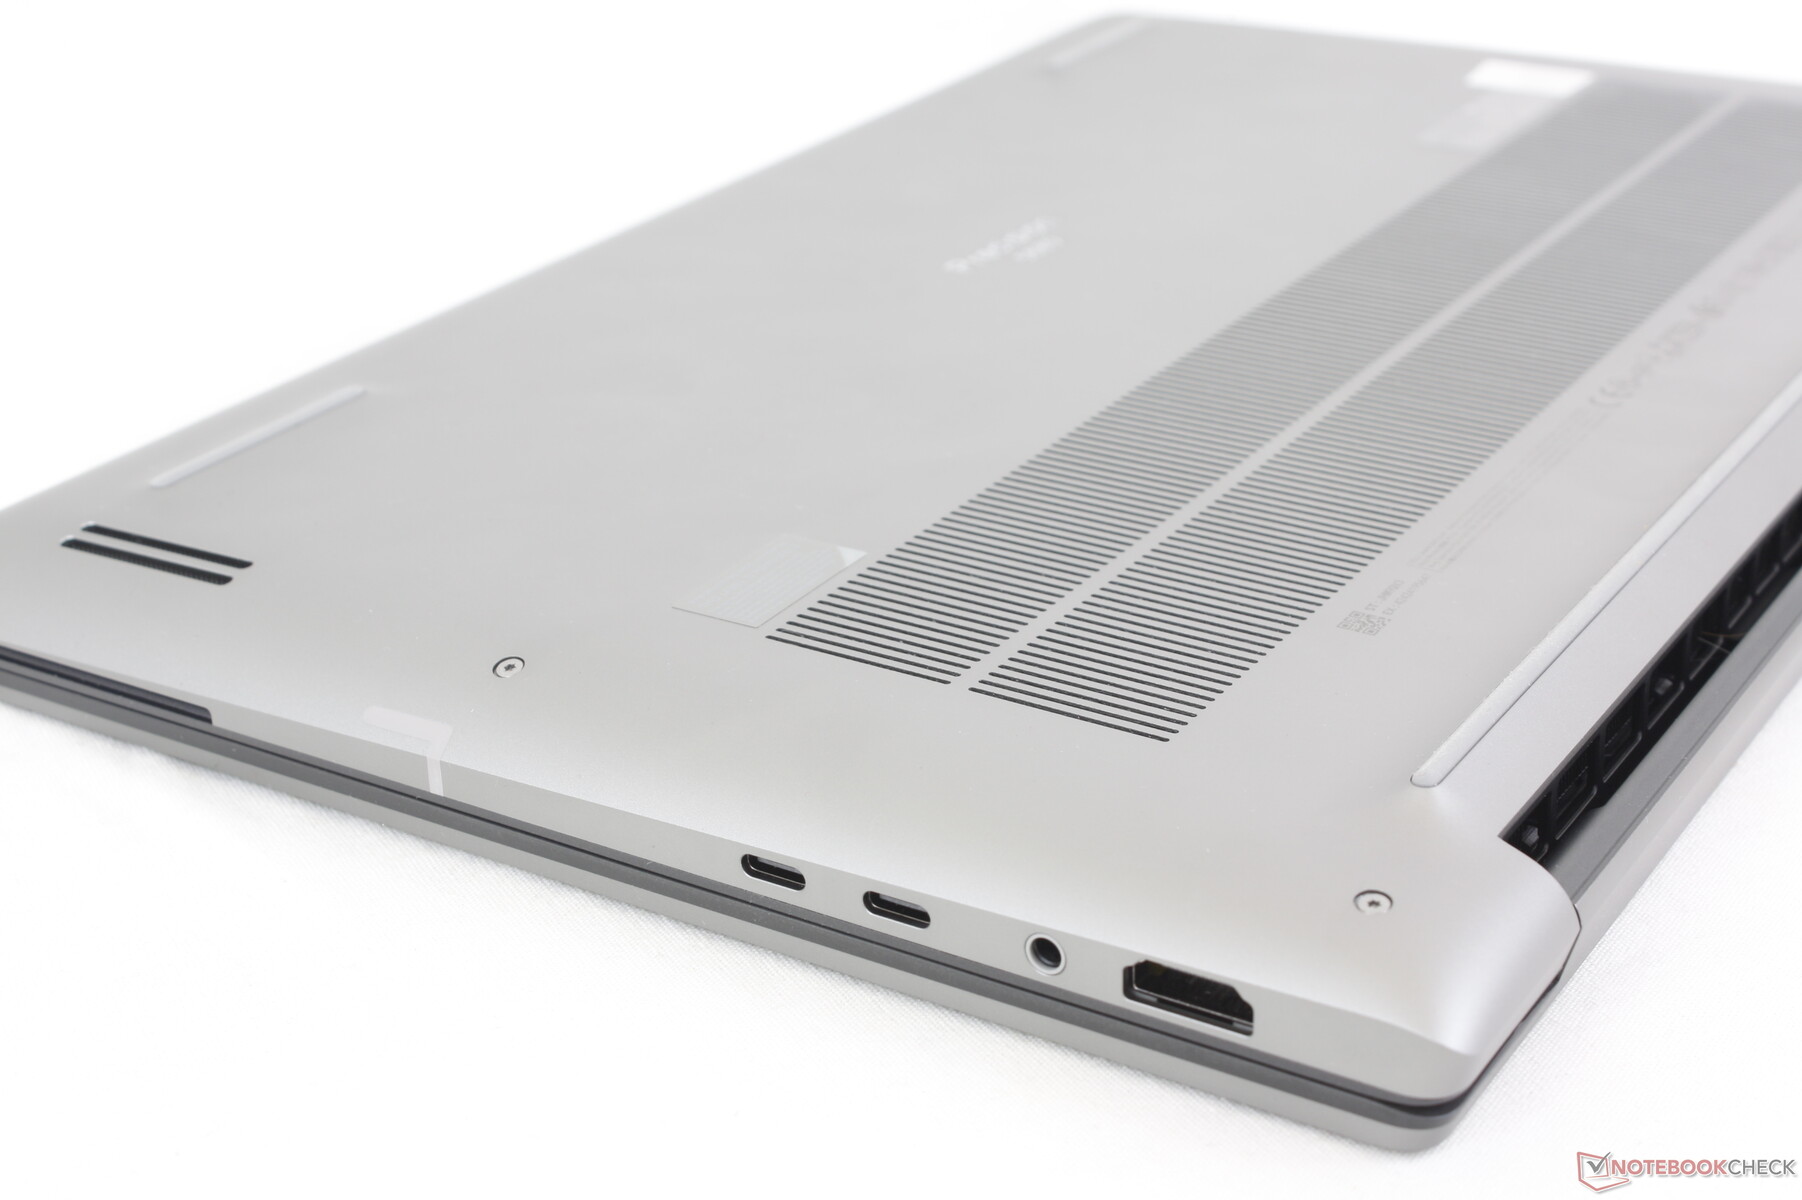

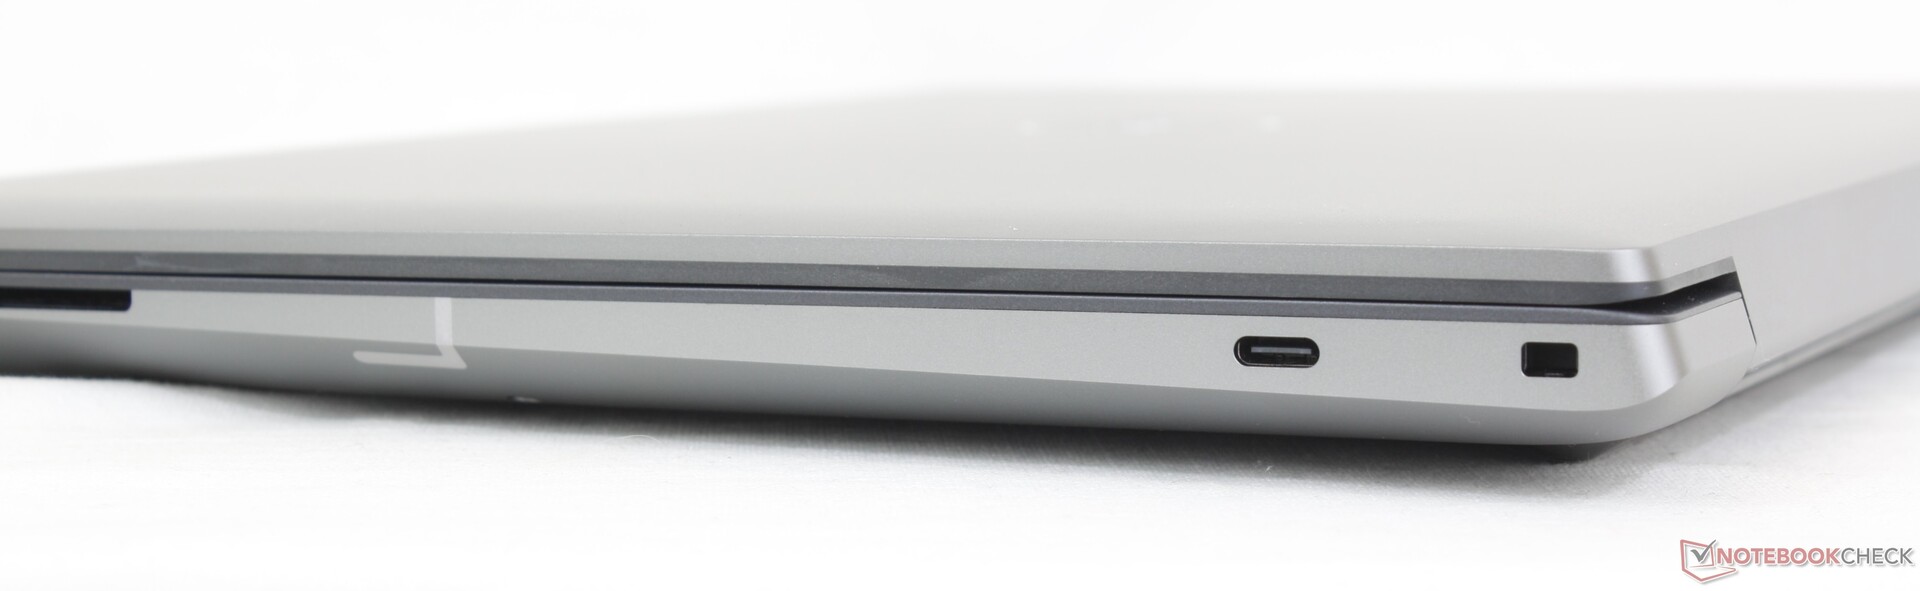
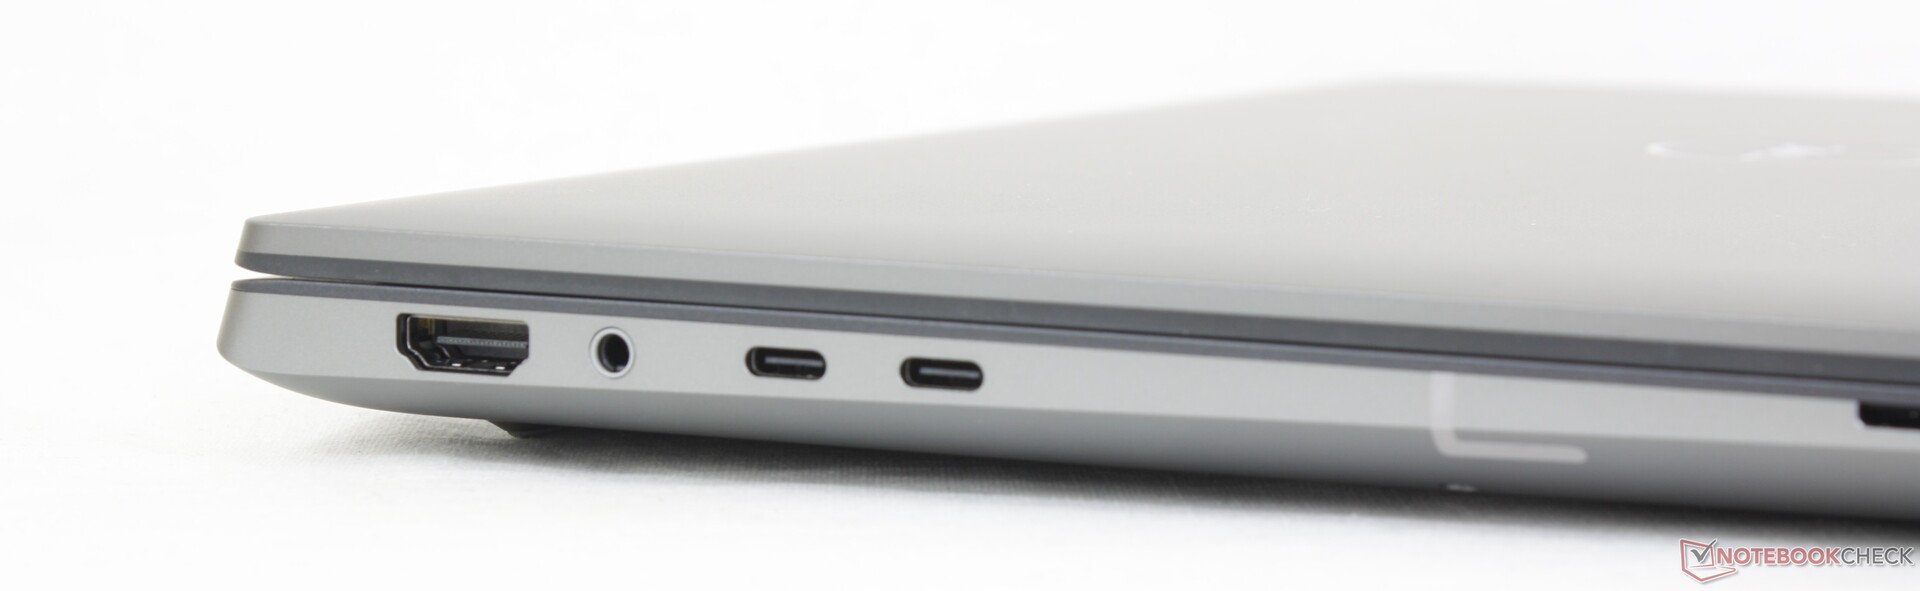
Anschlüsse — Nicht viel für eine Workstation
Die Anschlussoptionen sind zukunftsorientiert - um es positiv auszudrücken. Jeder Port ist vielseitig wenn es um Adapter und Peripheriegeräte geht, aber ohne Adapter gibt es wenig direkt nutzbare Ports wie einen USB-A- oder LAN-Anschluss. Alternativen wie das ThinkPad P1 G4 oder das ExpertBook B6 Flip bieten jeweils ein deutlich breiteres Spektrum an Verbindungsmöglichkeiten an. Man sollte sich darauf einstellen Adapter oder Docking Stations zusammen mit der Precision 5680 zu verwenden.
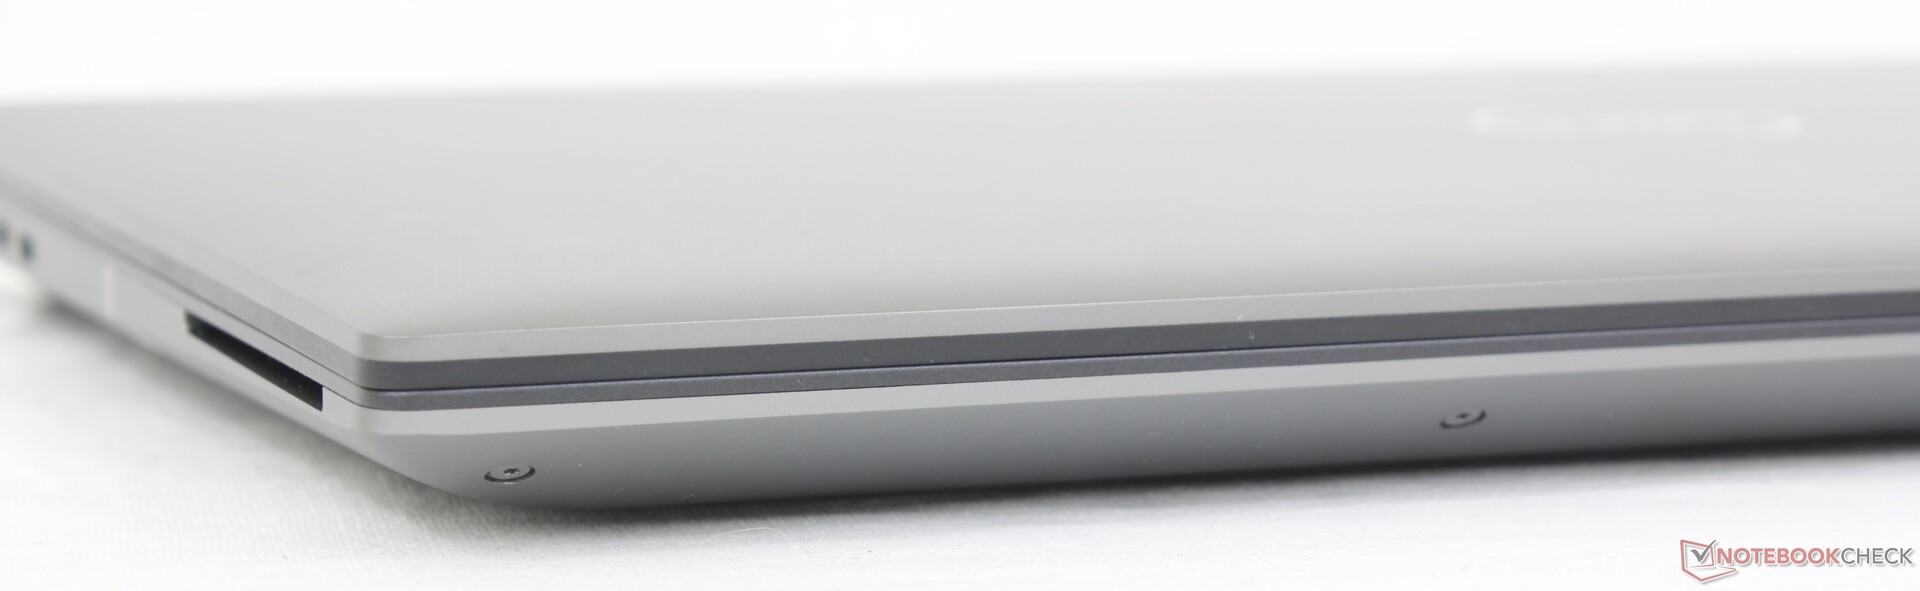
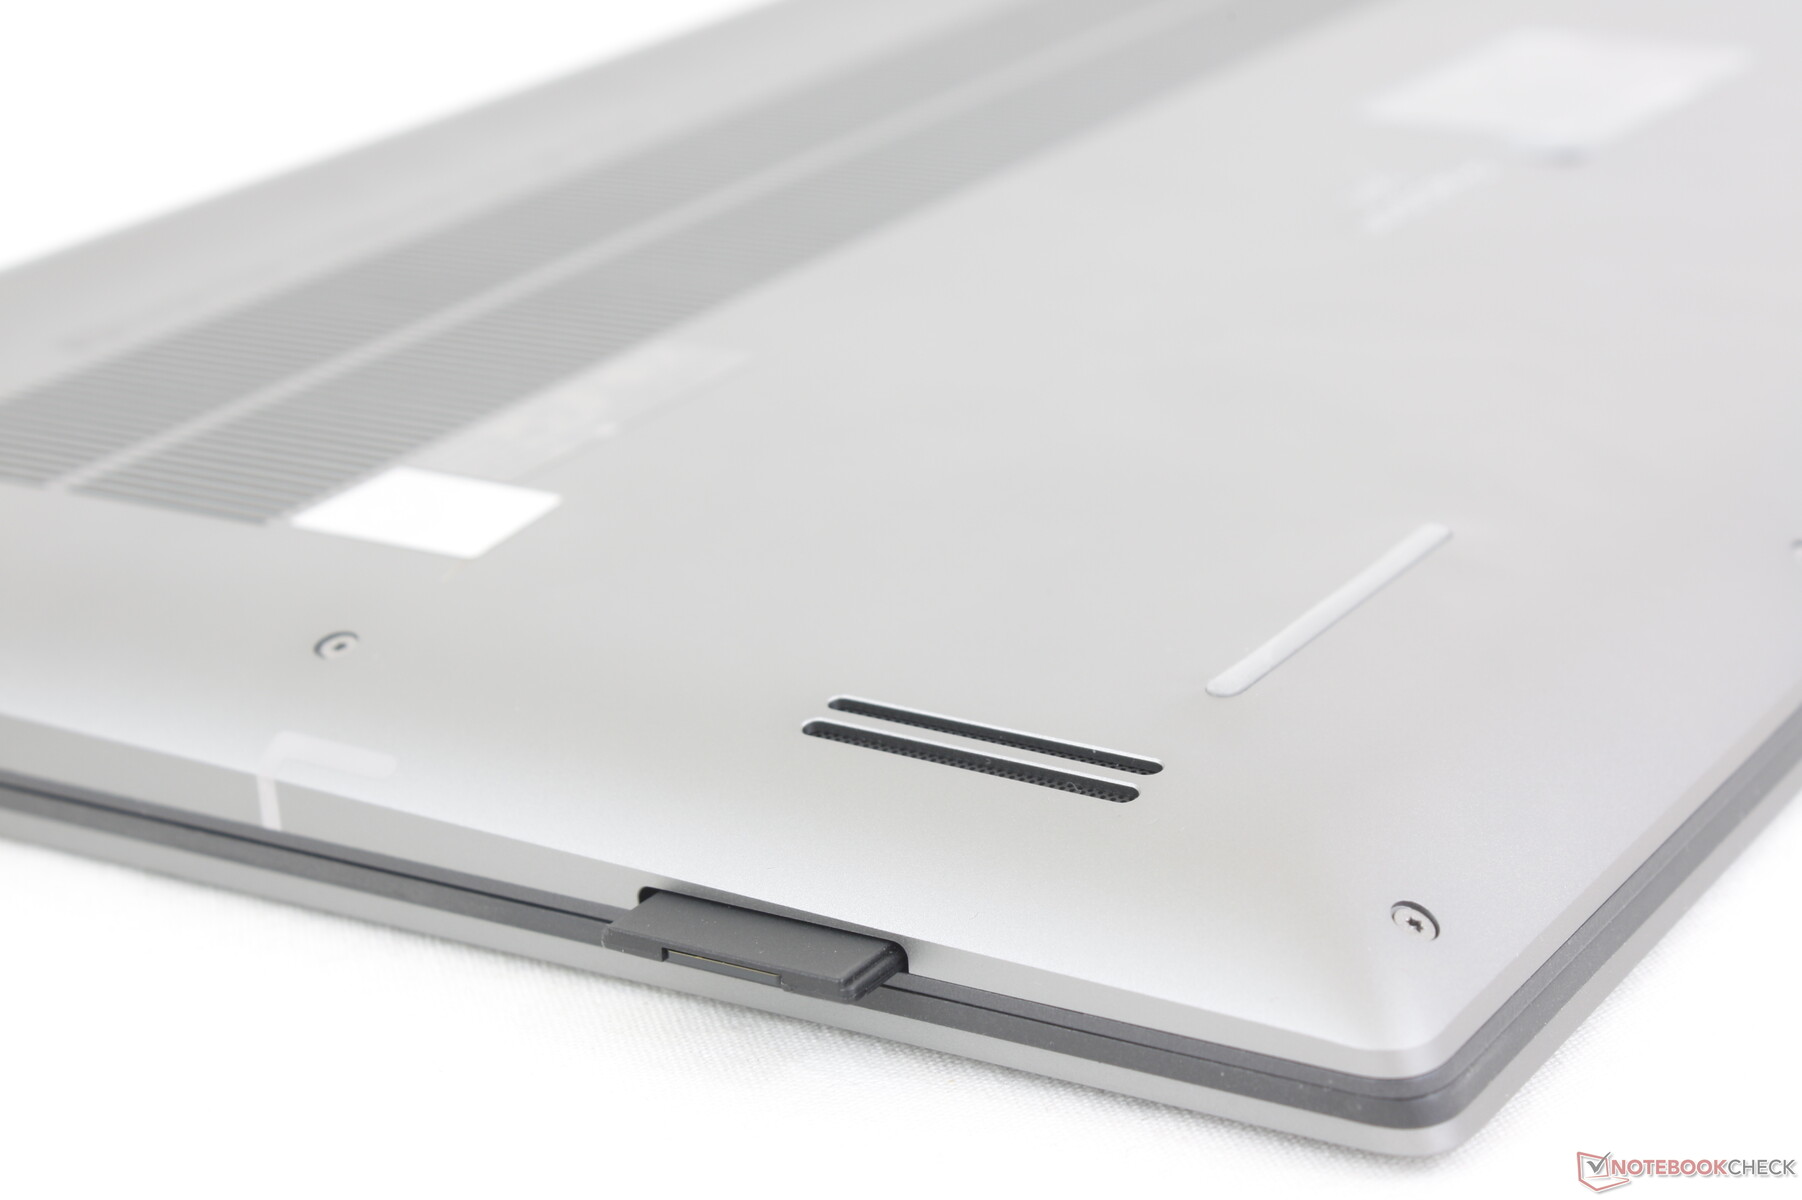
SD Card Reader
XPS- und Precision-Modelle haben mit die schnellsten integrierten SD-Kartenleser ihrer Klasse und das setzt sich glücklicherweise auch bei der Precision 5680 fort. Die Leseraten sind zweimal schneller als beim ZBook Fury 16 G9 oder ThinkPad P16 G1, sodass es nur 5 bis 6 Sekunden braucht, um 1 GB an Bilddaten von unserer UHS-II-Testkarte auf den Desktop zu kopieren.
| SD Card Reader | |
| average JPG Copy Test (av. of 3 runs) | |
| Dell Precision 5000 5680 (Toshiba Exceria Pro SDXC 64 GB UHS-II) | |
| Dell Precision 7000 7670 Performance (Toshiba Exceria Pro SDXC 64 GB UHS-II) | |
| MSI CreatorPro Z16P B12UKST (AV Pro V60) | |
| HP ZBook Fury 16 G9 (PNY EliteX-PRO60) | |
| Lenovo ThinkPad P16 G1 RTX A5500 (Toshiba Exceria Pro SDXC 64 GB UHS-II) | |
| maximum AS SSD Seq Read Test (1GB) | |
| Dell Precision 7000 7670 Performance (Toshiba Exceria Pro SDXC 64 GB UHS-II) | |
| Dell Precision 5000 5680 (Toshiba Exceria Pro SDXC 64 GB UHS-II) | |
| HP ZBook Fury 16 G9 (PNY EliteX-PRO60) | |
| MSI CreatorPro Z16P B12UKST (AV Pro V60) | |
| Lenovo ThinkPad P16 G1 RTX A5500 (Toshiba Exceria Pro SDXC 64 GB UHS-II) | |
Kommunikation
Das Wifi-Modul Intel AX211 sorgt für Wi-Fi 6E und Bluetooth 5.3. Verbunden mit unserem Asus-AXE11000-6-GHz-Netzwerk erweisen sich die Übertragungsraten als sehr stabil.
Leider wird keine WAN-Option angeboten, anders als beim konkurrierenden ZBook Fury 16 G9.
Webcam
Dell hat der Kamera ein Update verpasst, statt 1 MP wie bei der Precision 5550 schießt sie nun Fotos mit 2 MP. Leider gibt es noch immer keinen Schließmechanismus für mehr Privatsphäre.


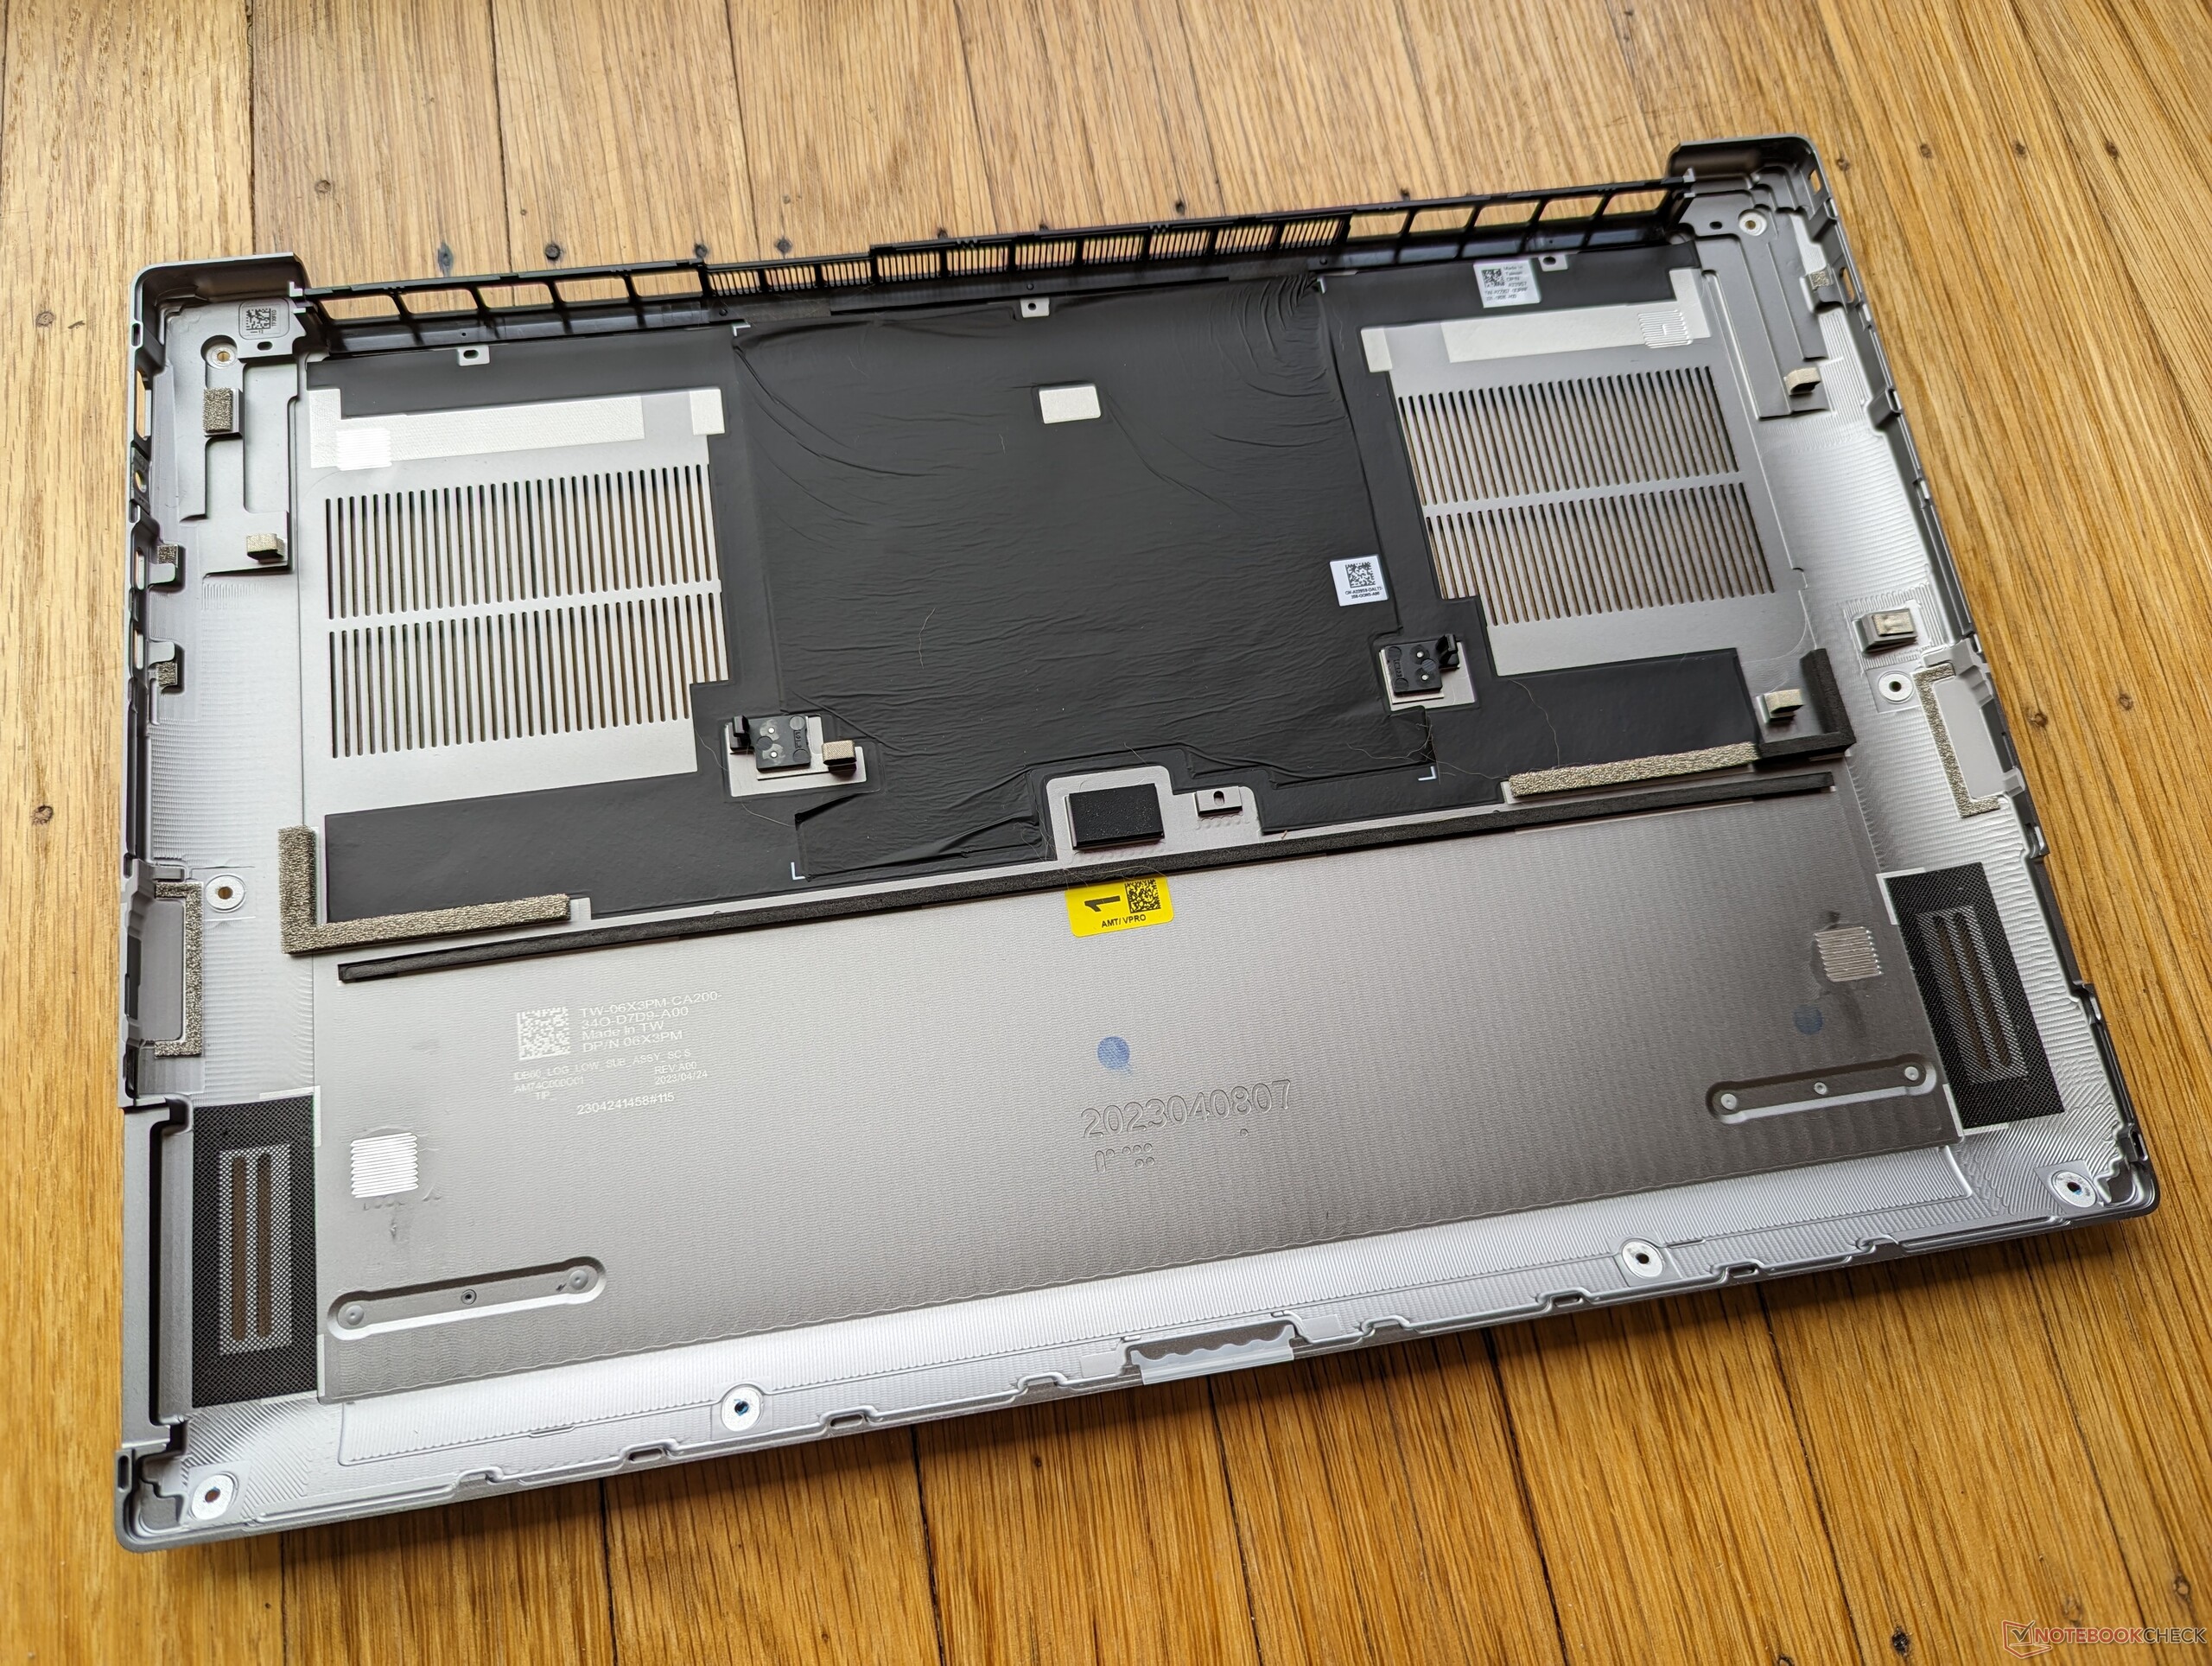
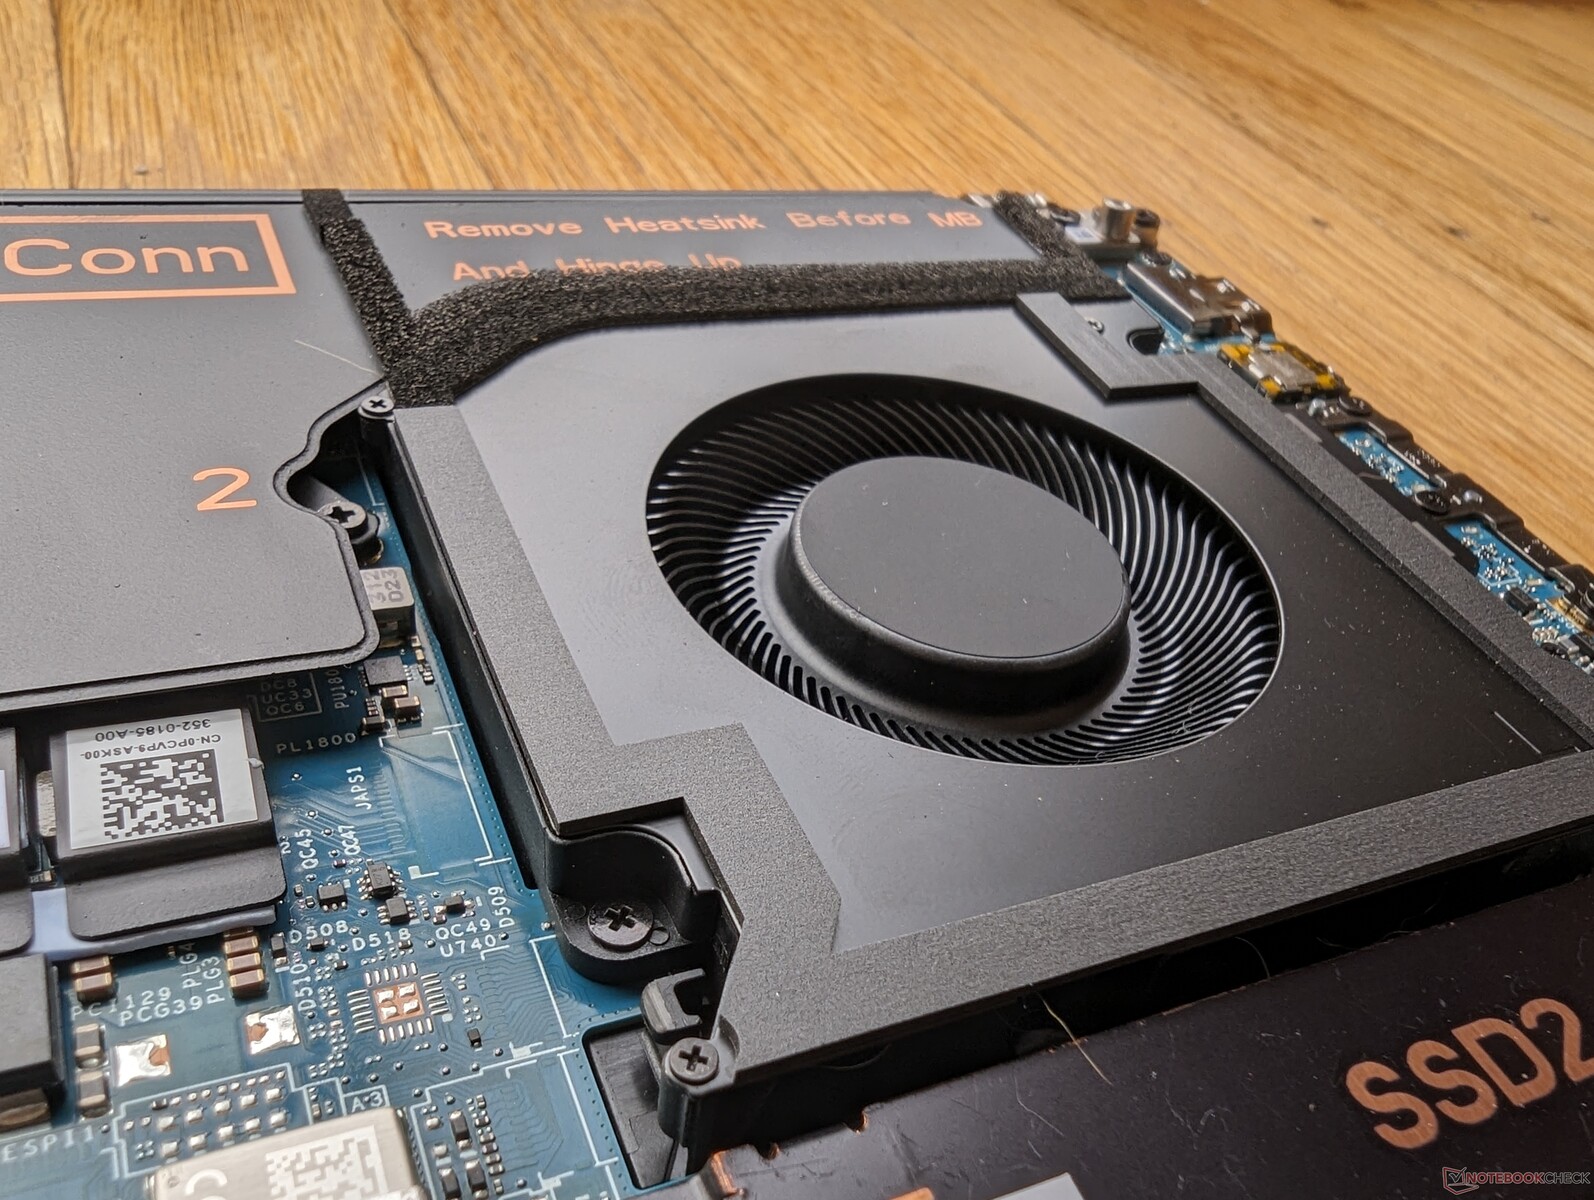
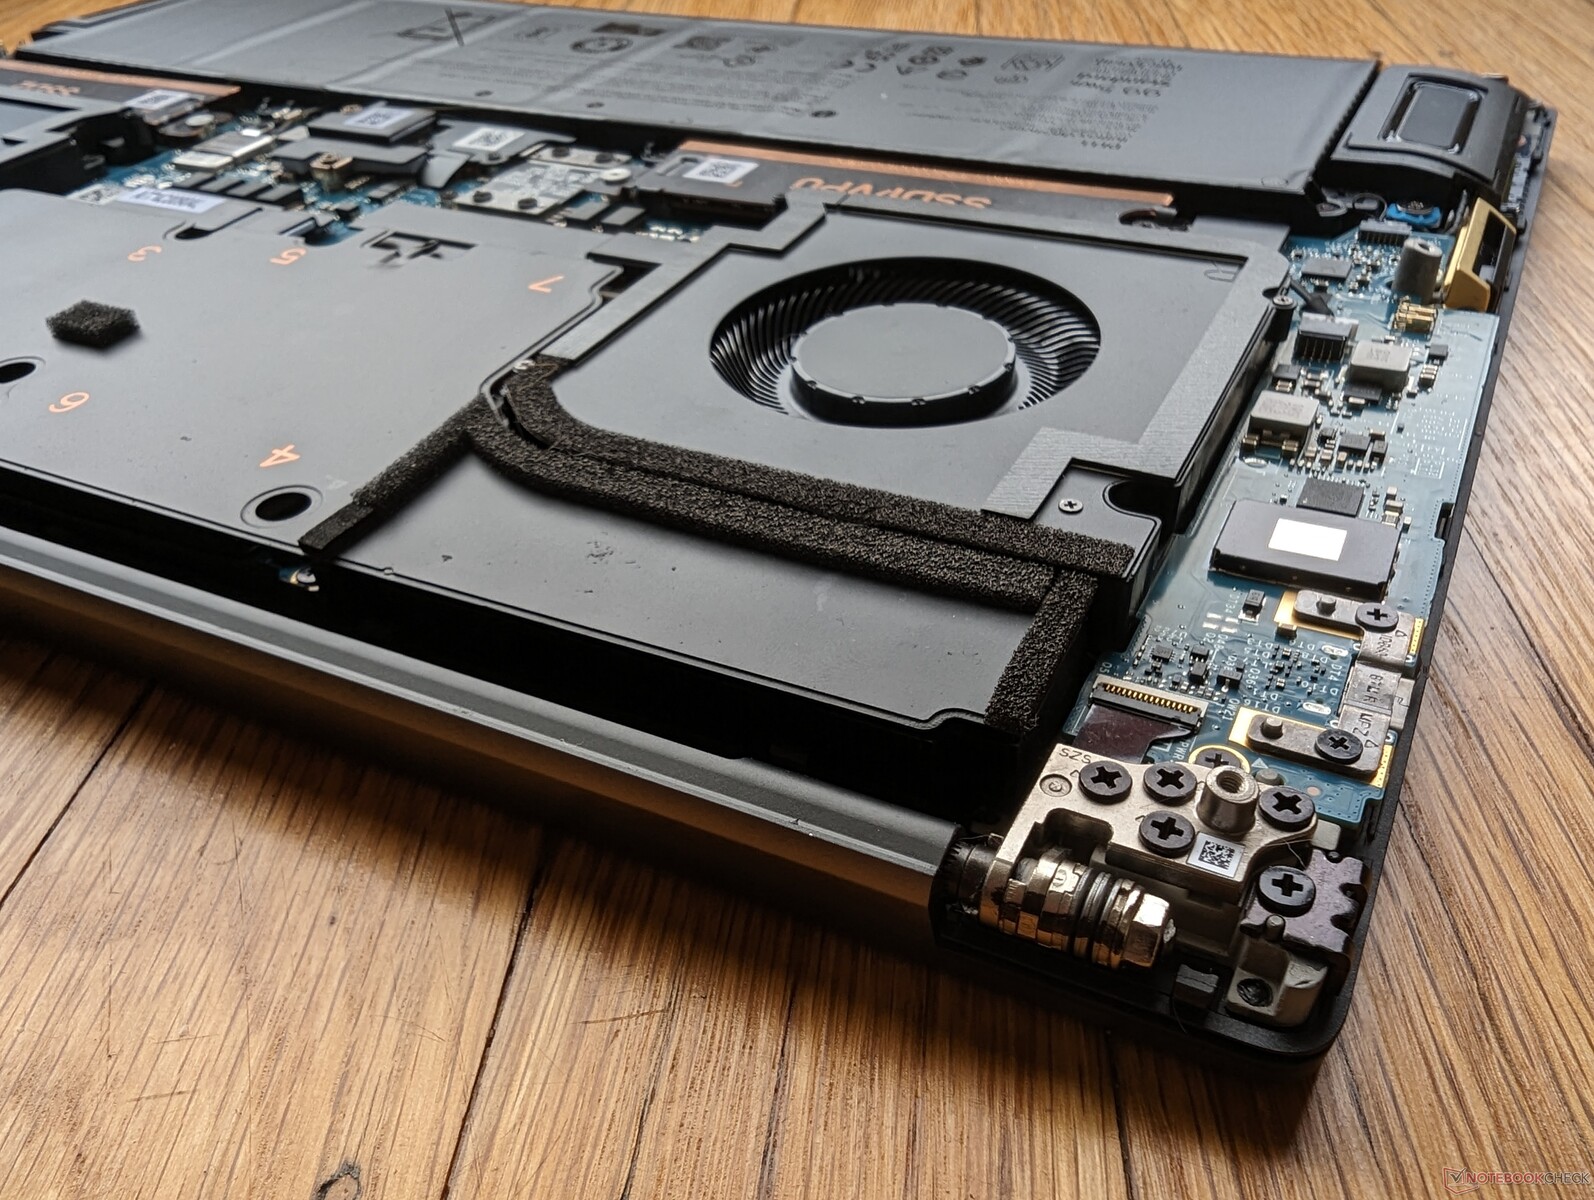
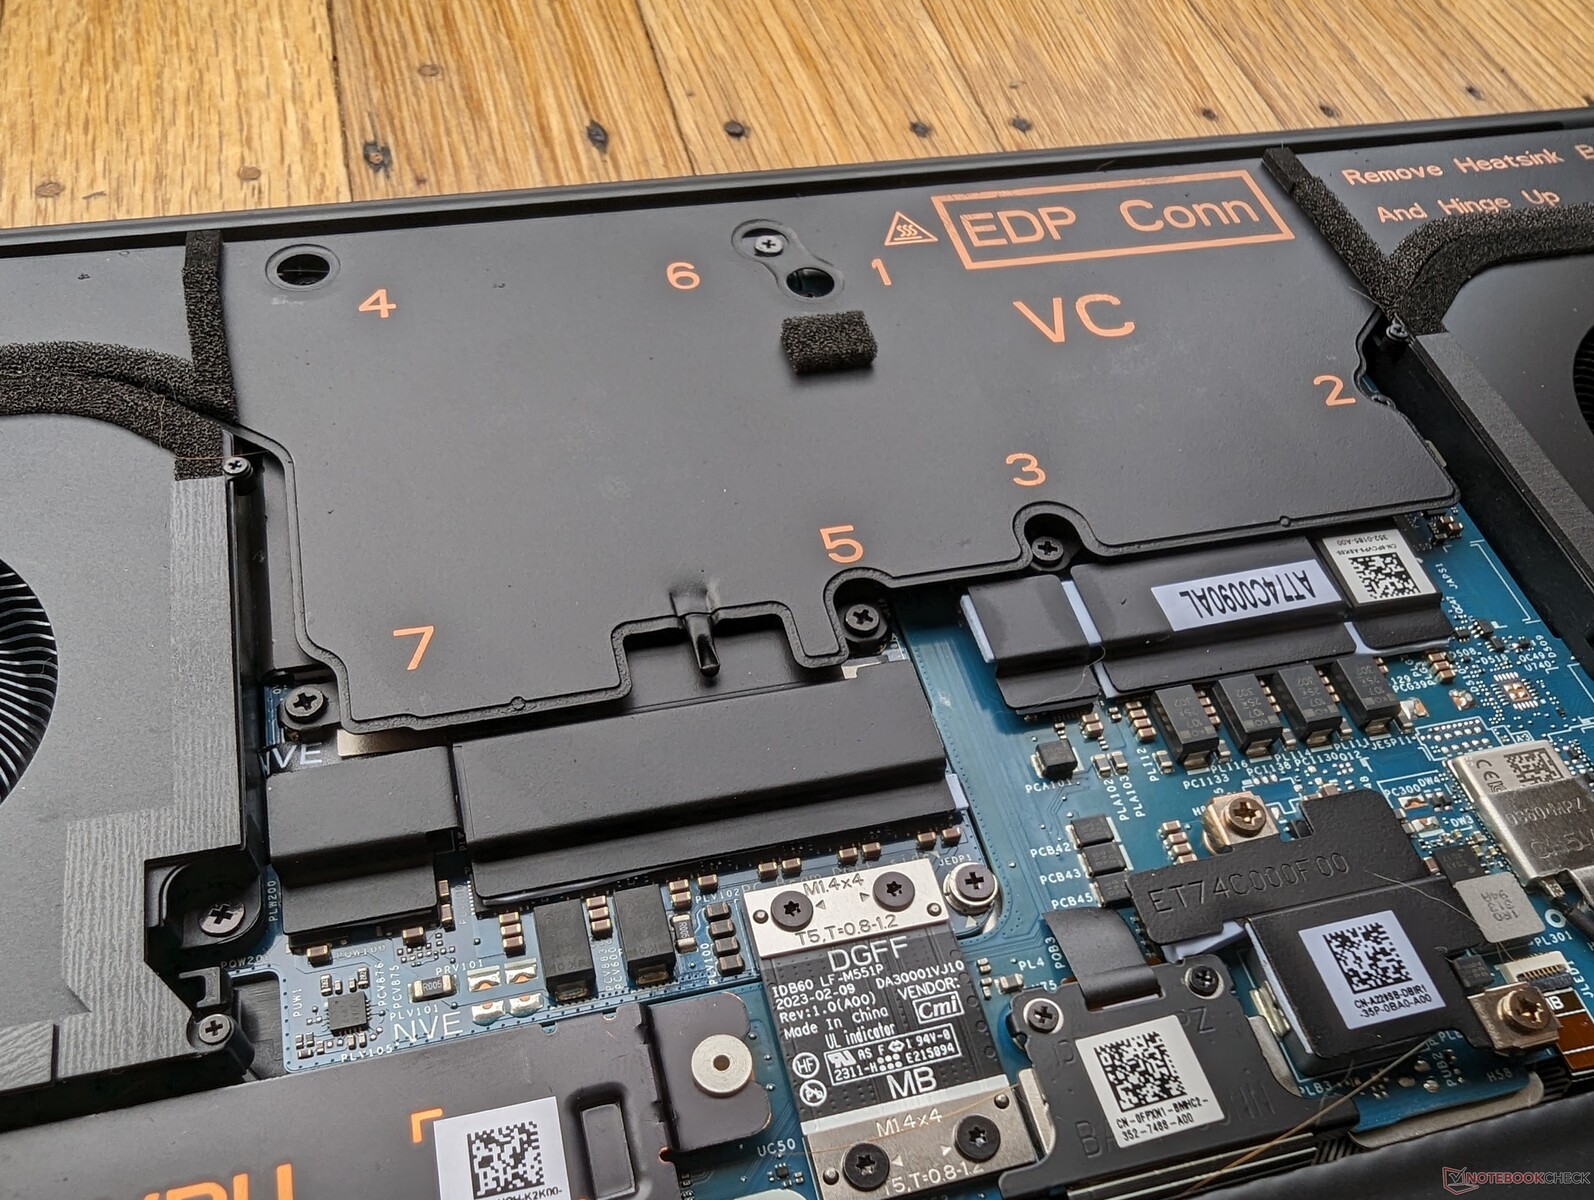
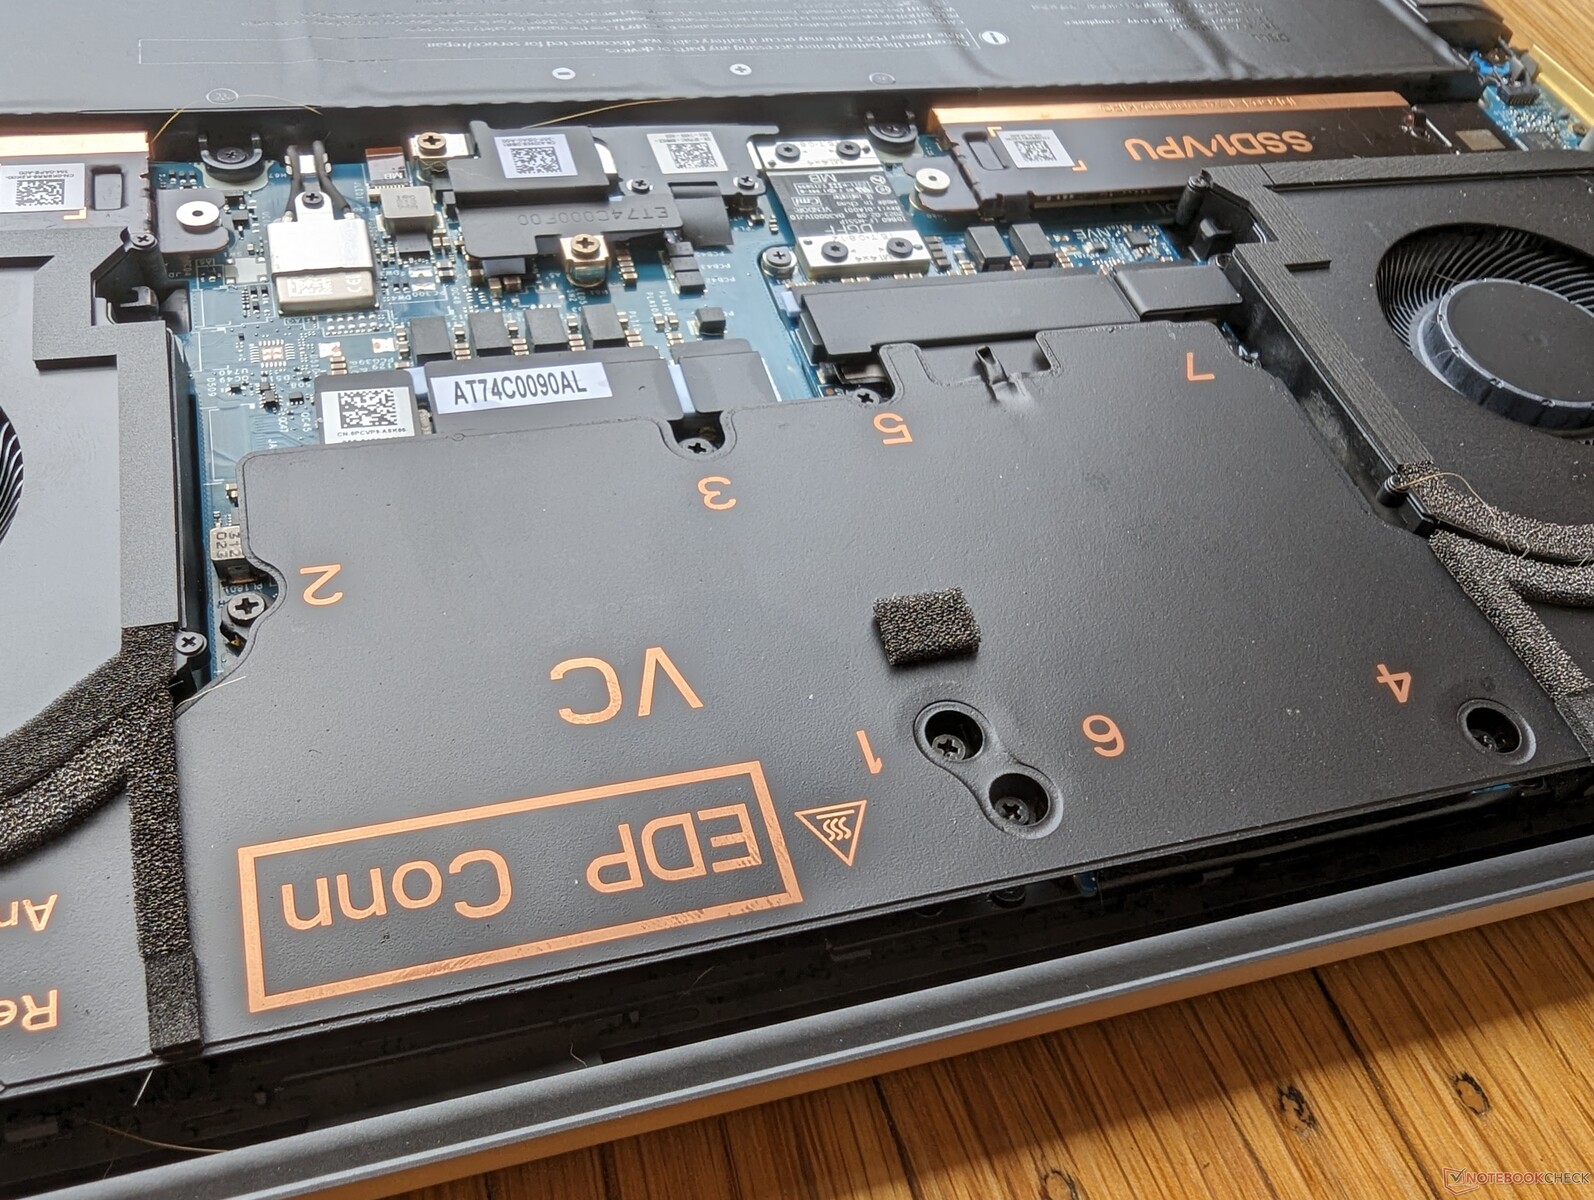
Wartung
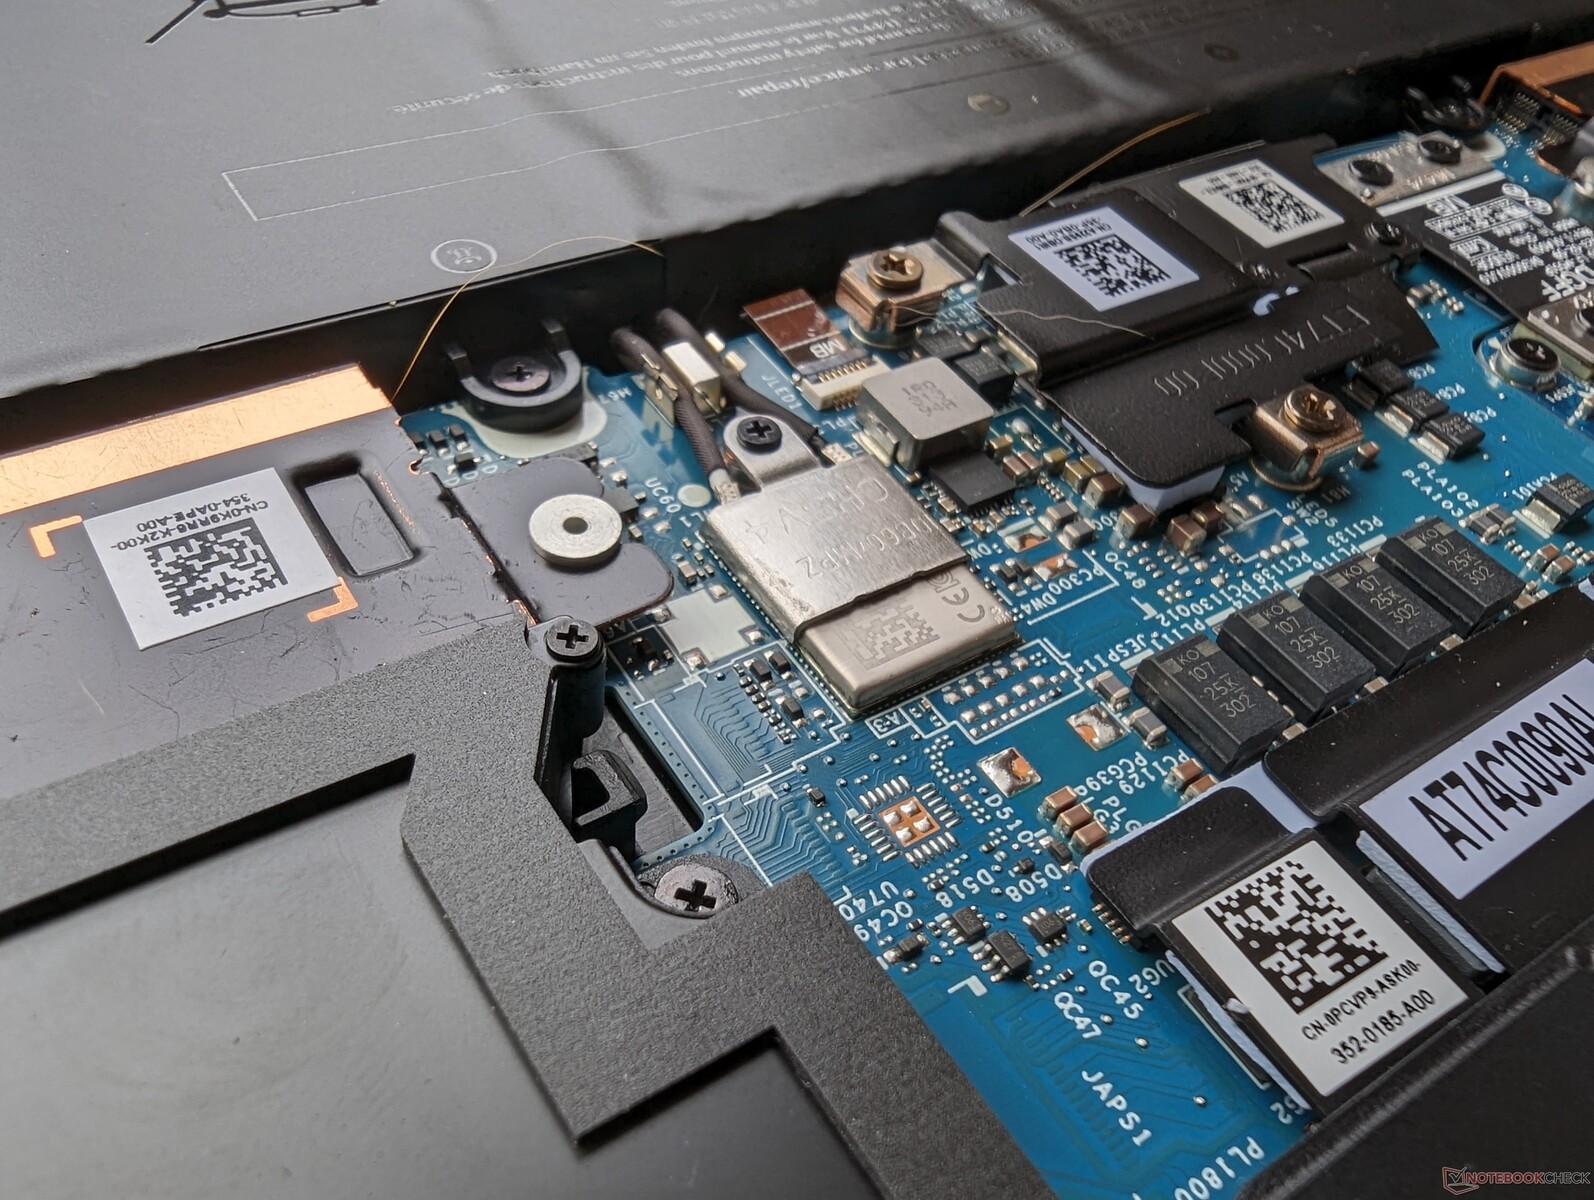
Das Entfernen der Bodenplatte erweist sich als etwas komplizierter als erwartet, was daran liegt, dass die Metallplatte einerseits sehr scharfkantig und andererseits wie beim XPS 15 oder XPS 17 auch noch stark festgeklammert ist. Wer hier Hand anlegt, sollte sich mit einem Torx-Schraubendreher und flachem Hebelwerkzeug bewaffnen.
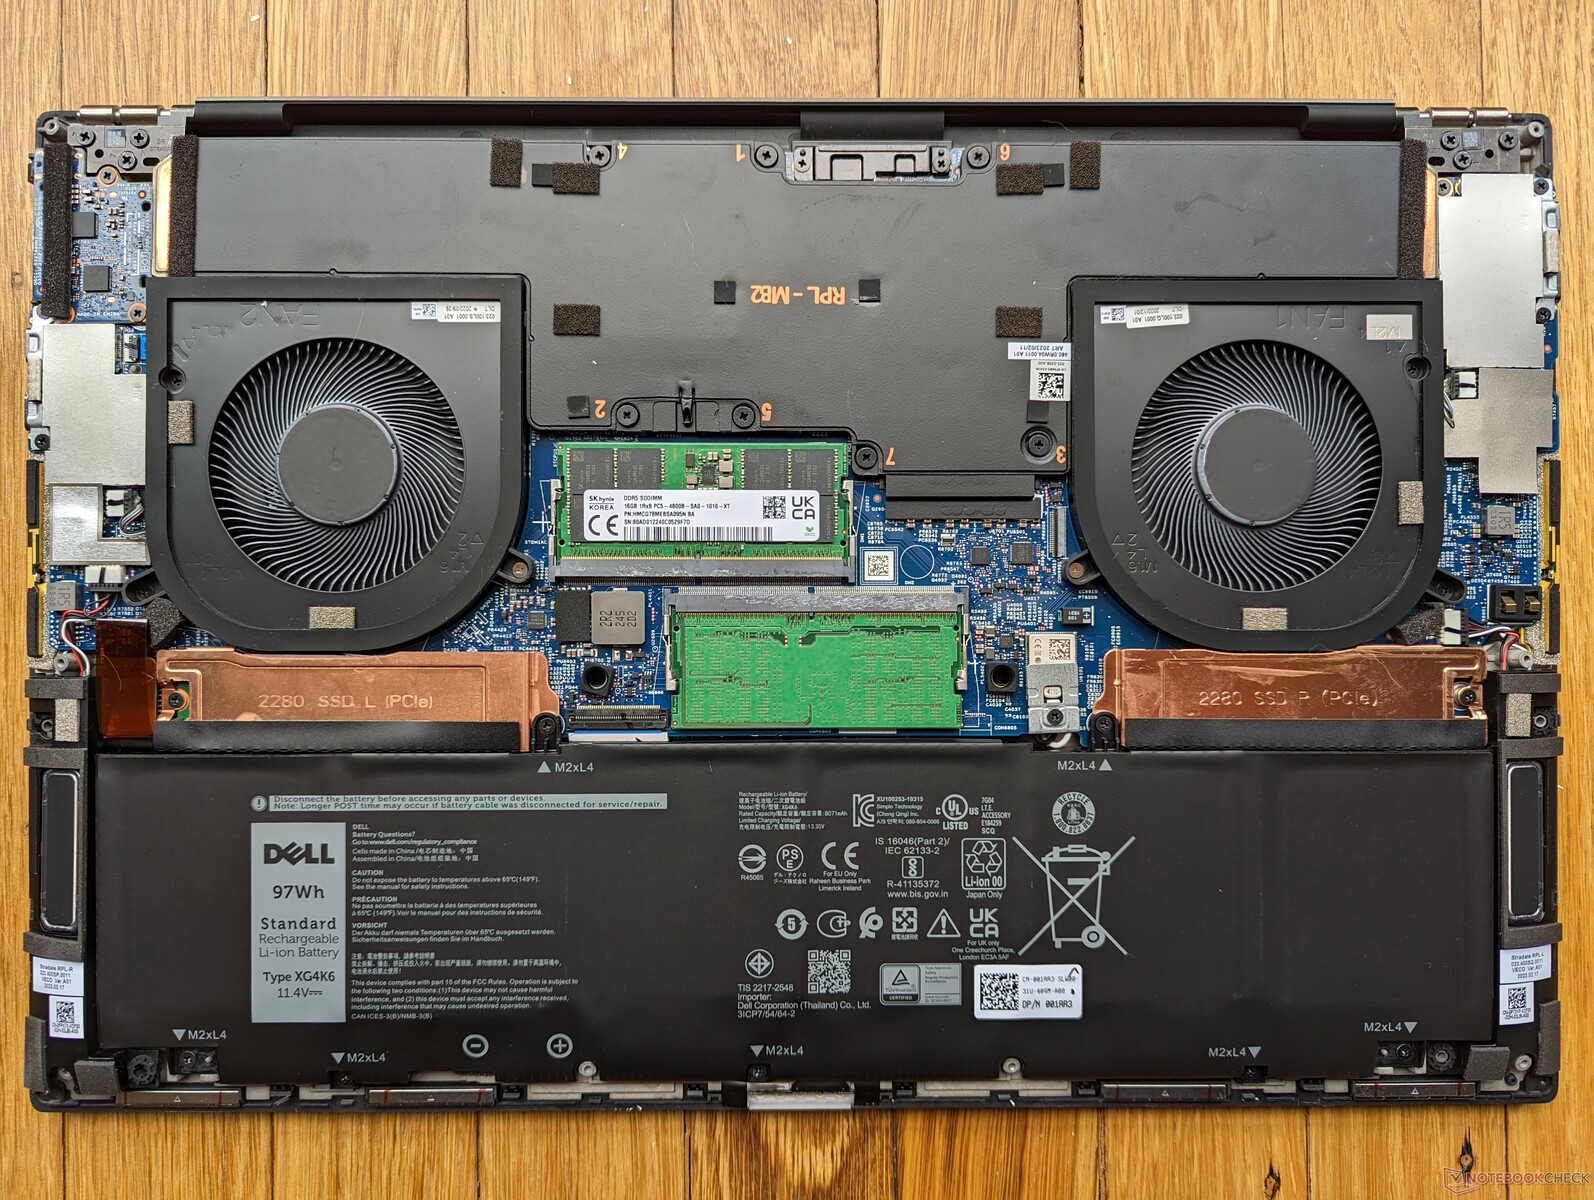
Sowohl WLAN- als auch RAM-Module sind, anders als bei den meisten anderen Workstation dieser Displaygröße, fest verlötet. Die verlöteten Module plus die wenigen Anschlussmöglichkeiten sind die Nachteile des dünnen Designs und des geringen Gewichtes.
Zubehör und Garantie
Die Verpackung enthält noch einen kleinen USB-A-zu-USB-C-Adapter, um das Fehlen eines nativen USB-A-Ports zu kompensieren.
Es greift standardmäßig eine limitierte drei-Jahres-Garantie des Herstellers.
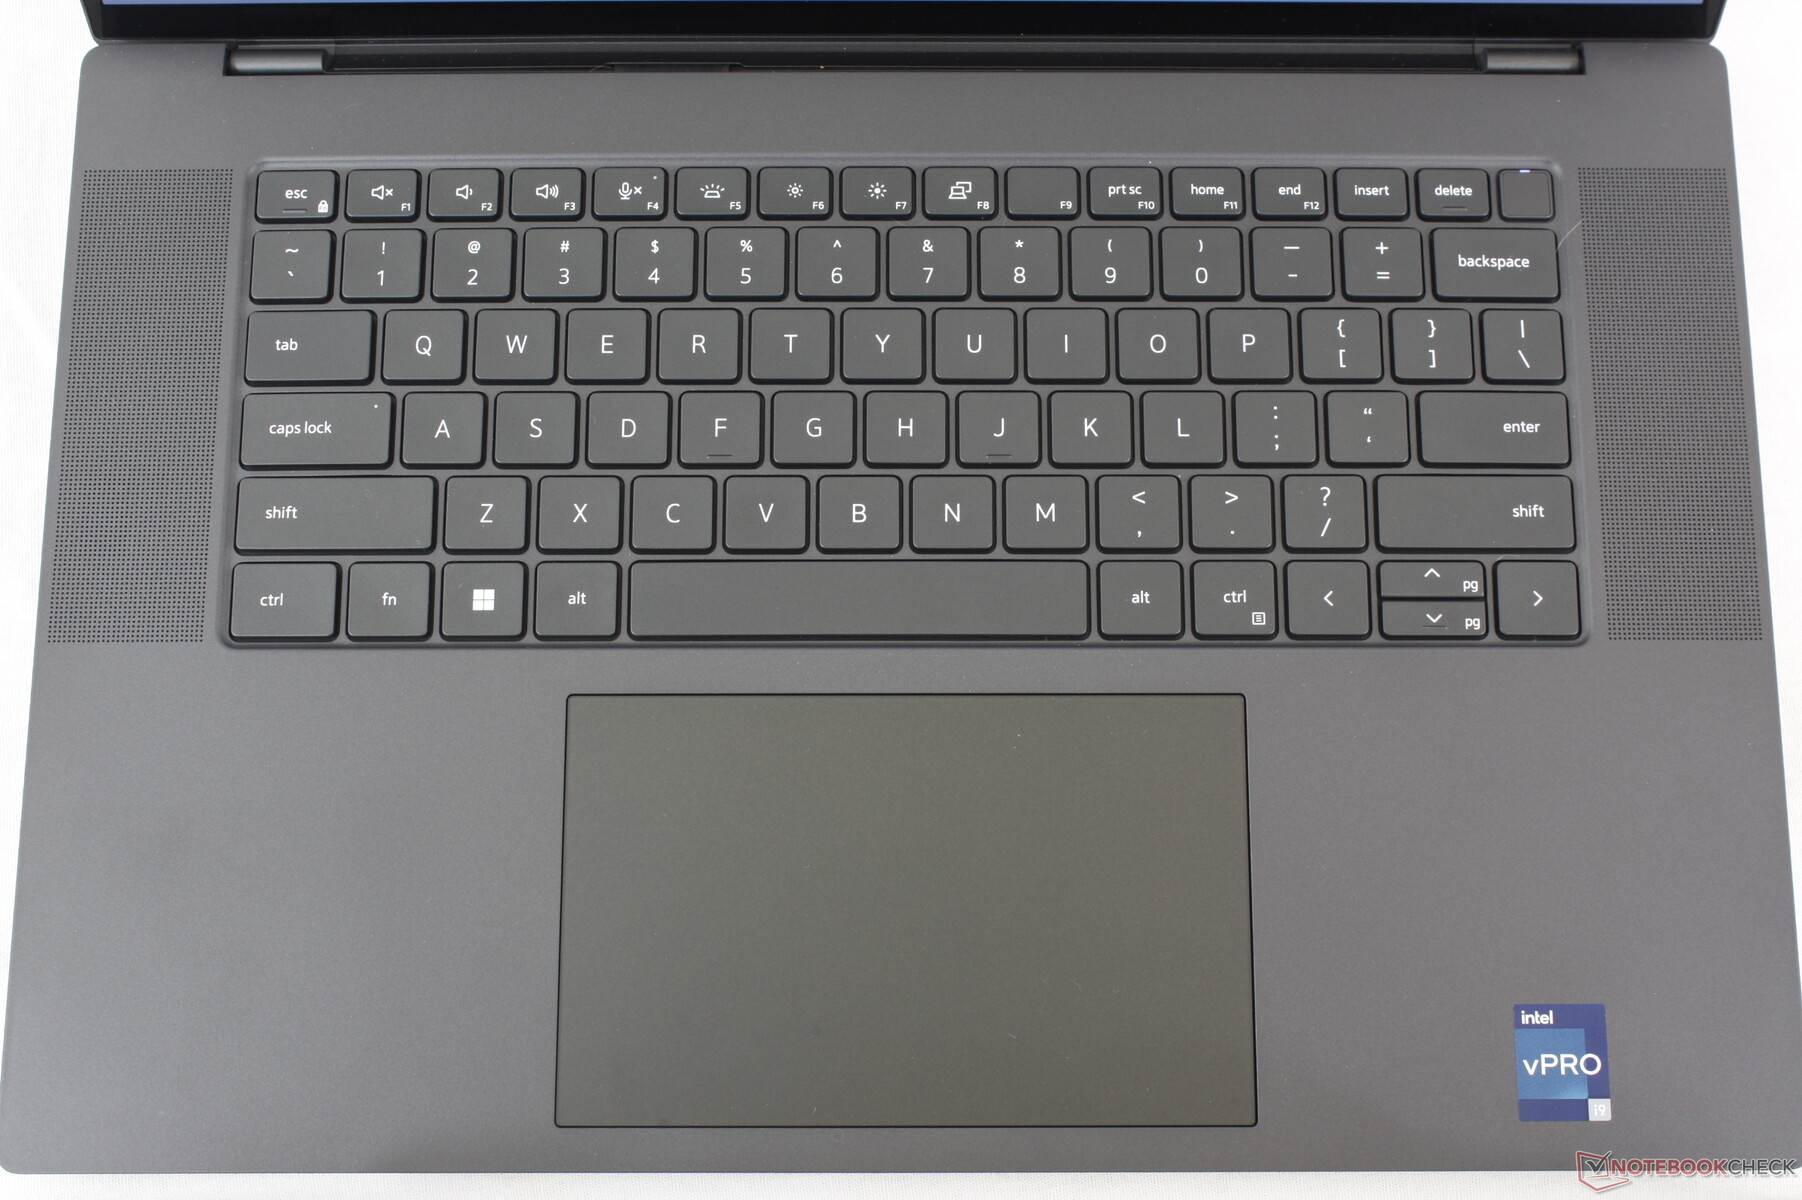
Eingabegeräte — Kleiner Unterschied zum XPS
Tastatur
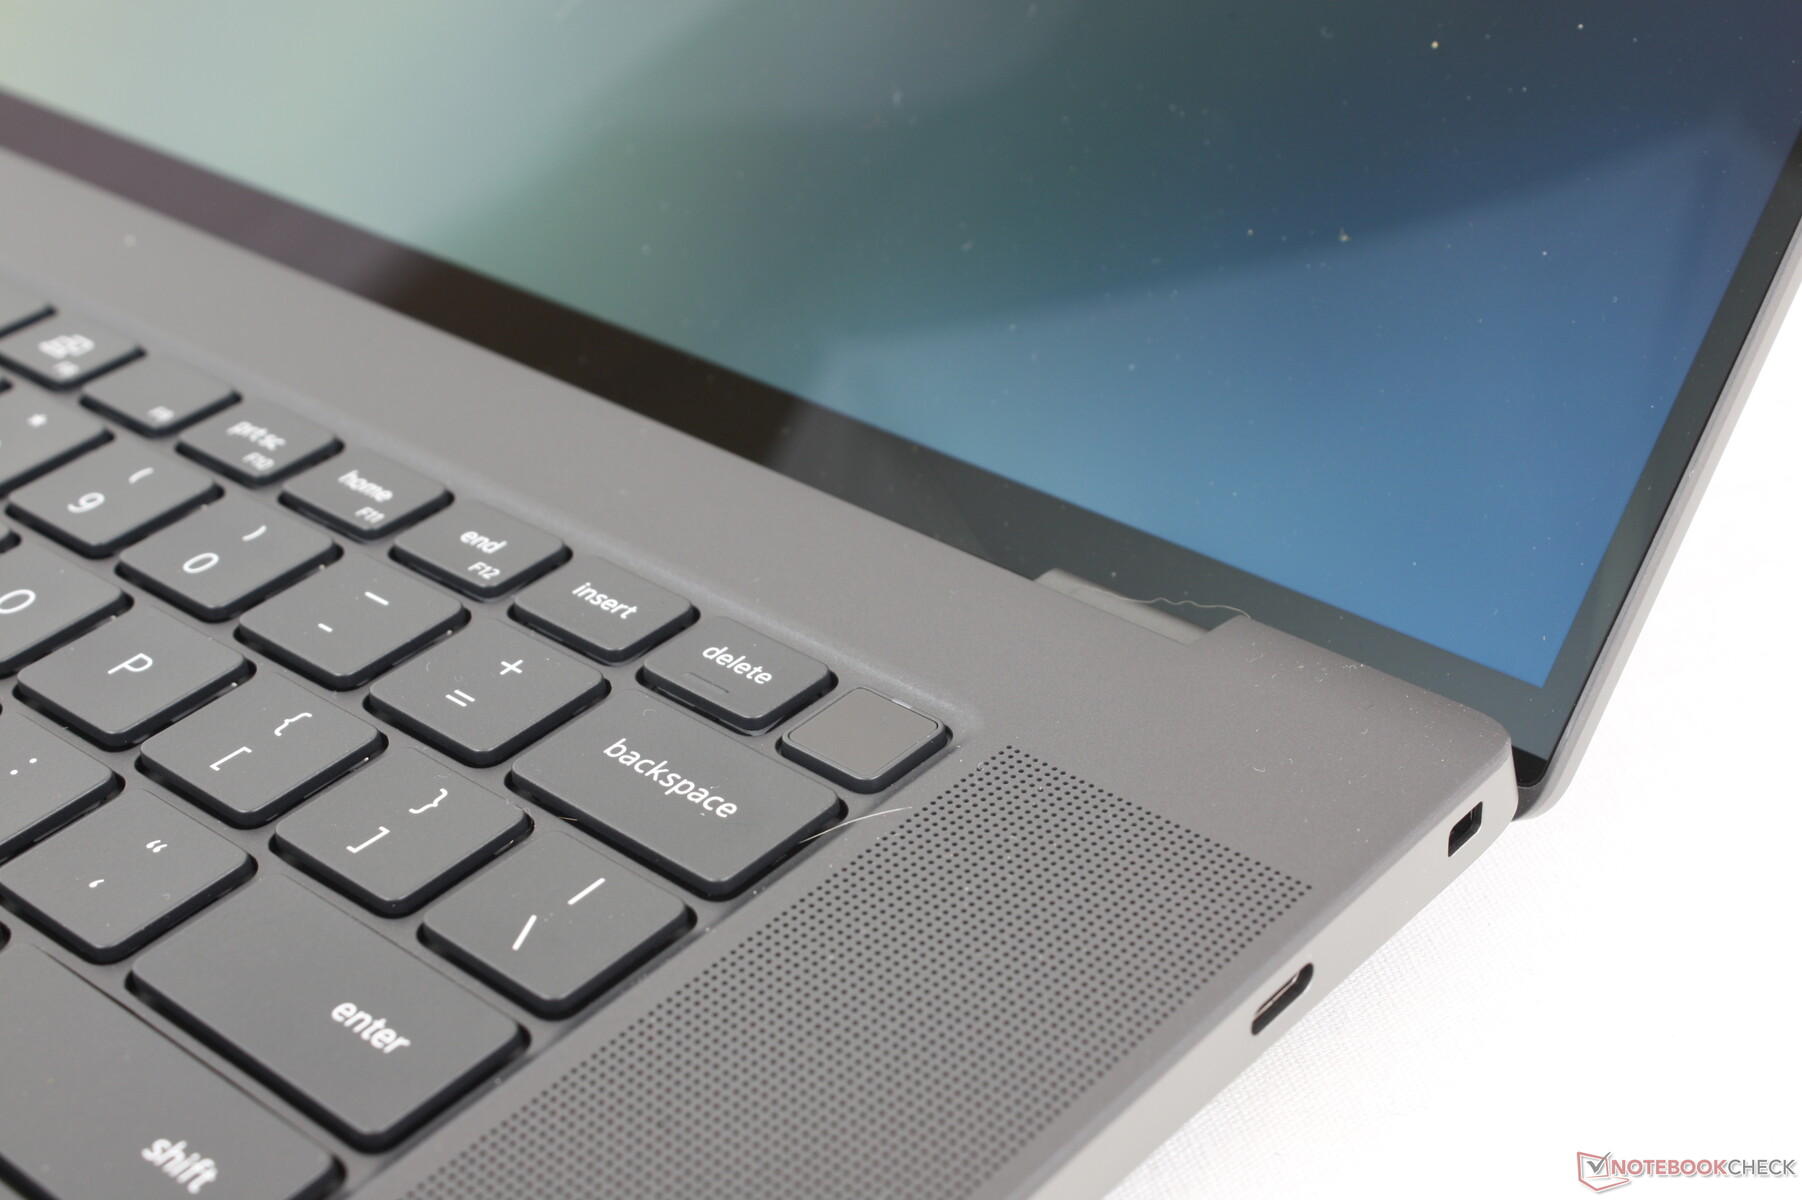
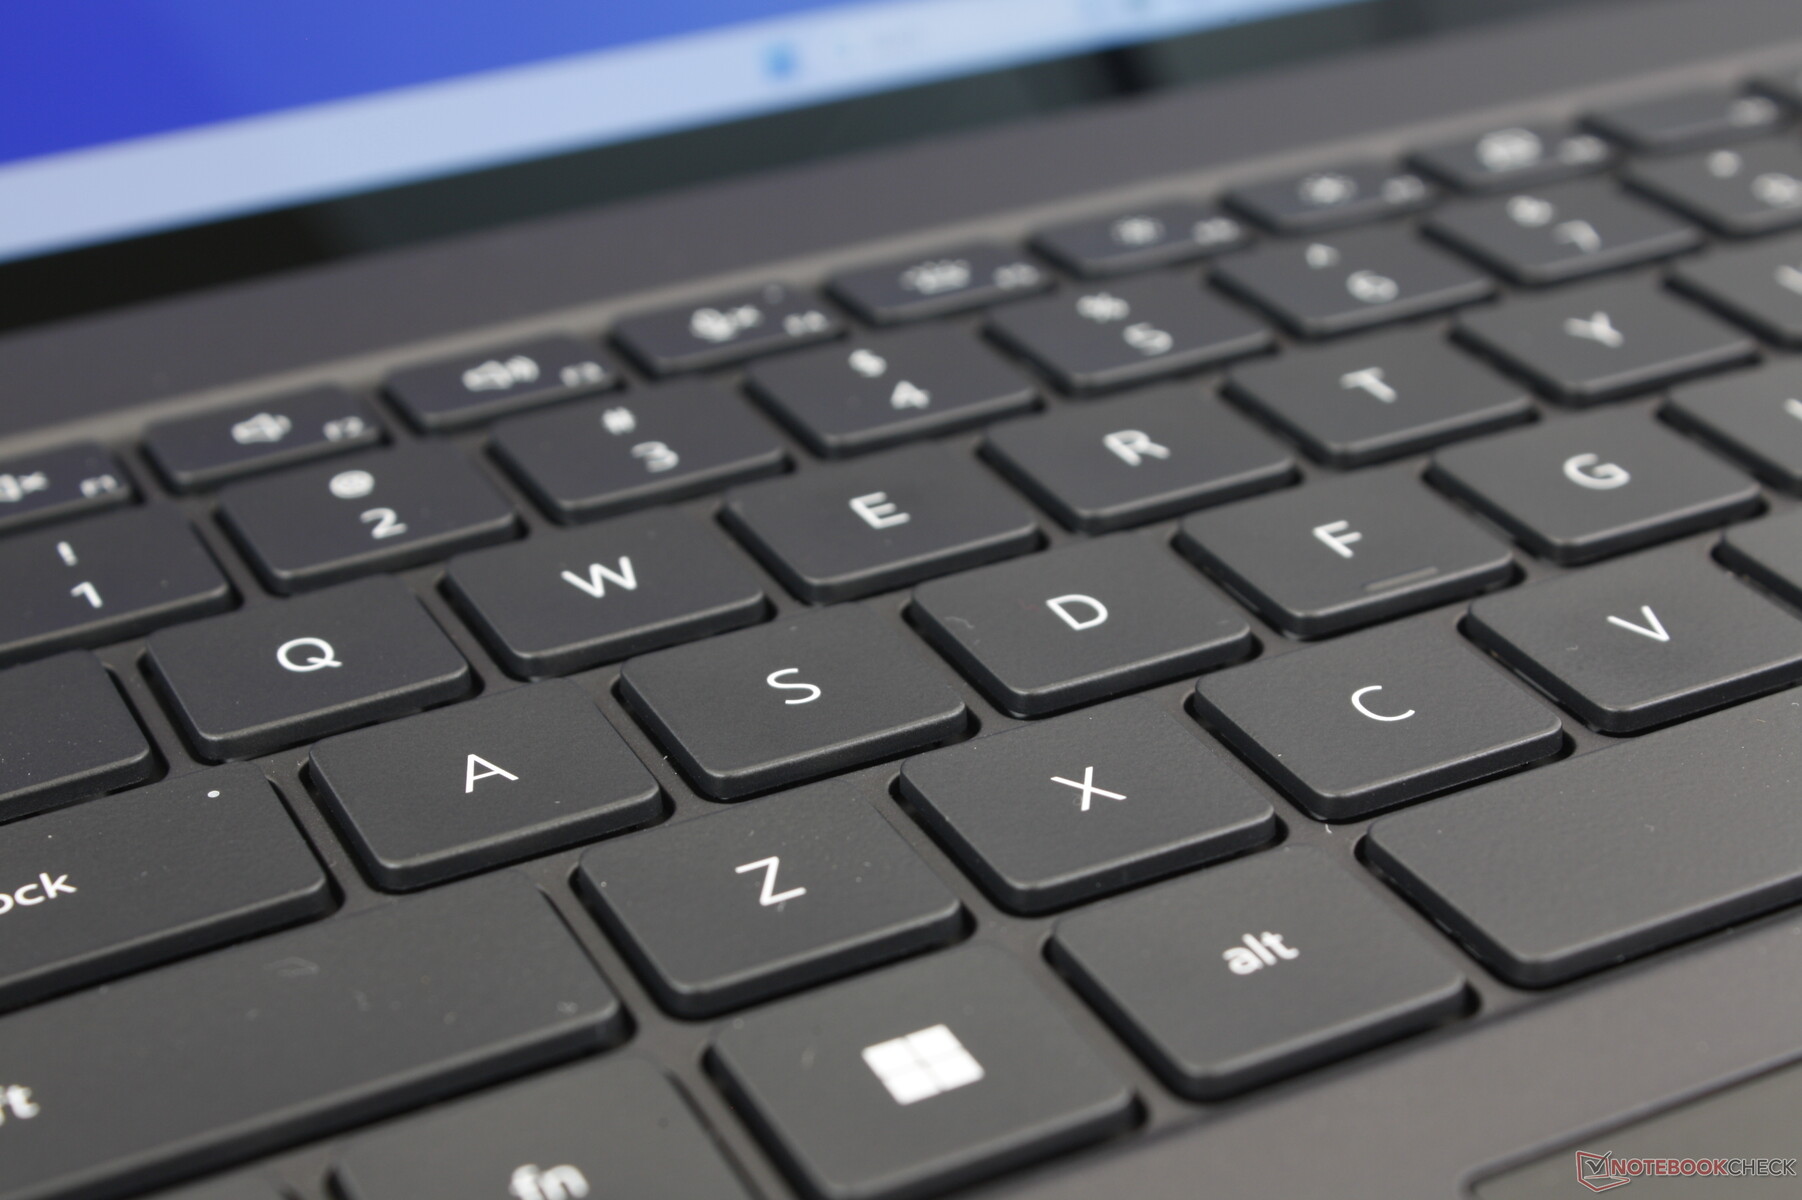
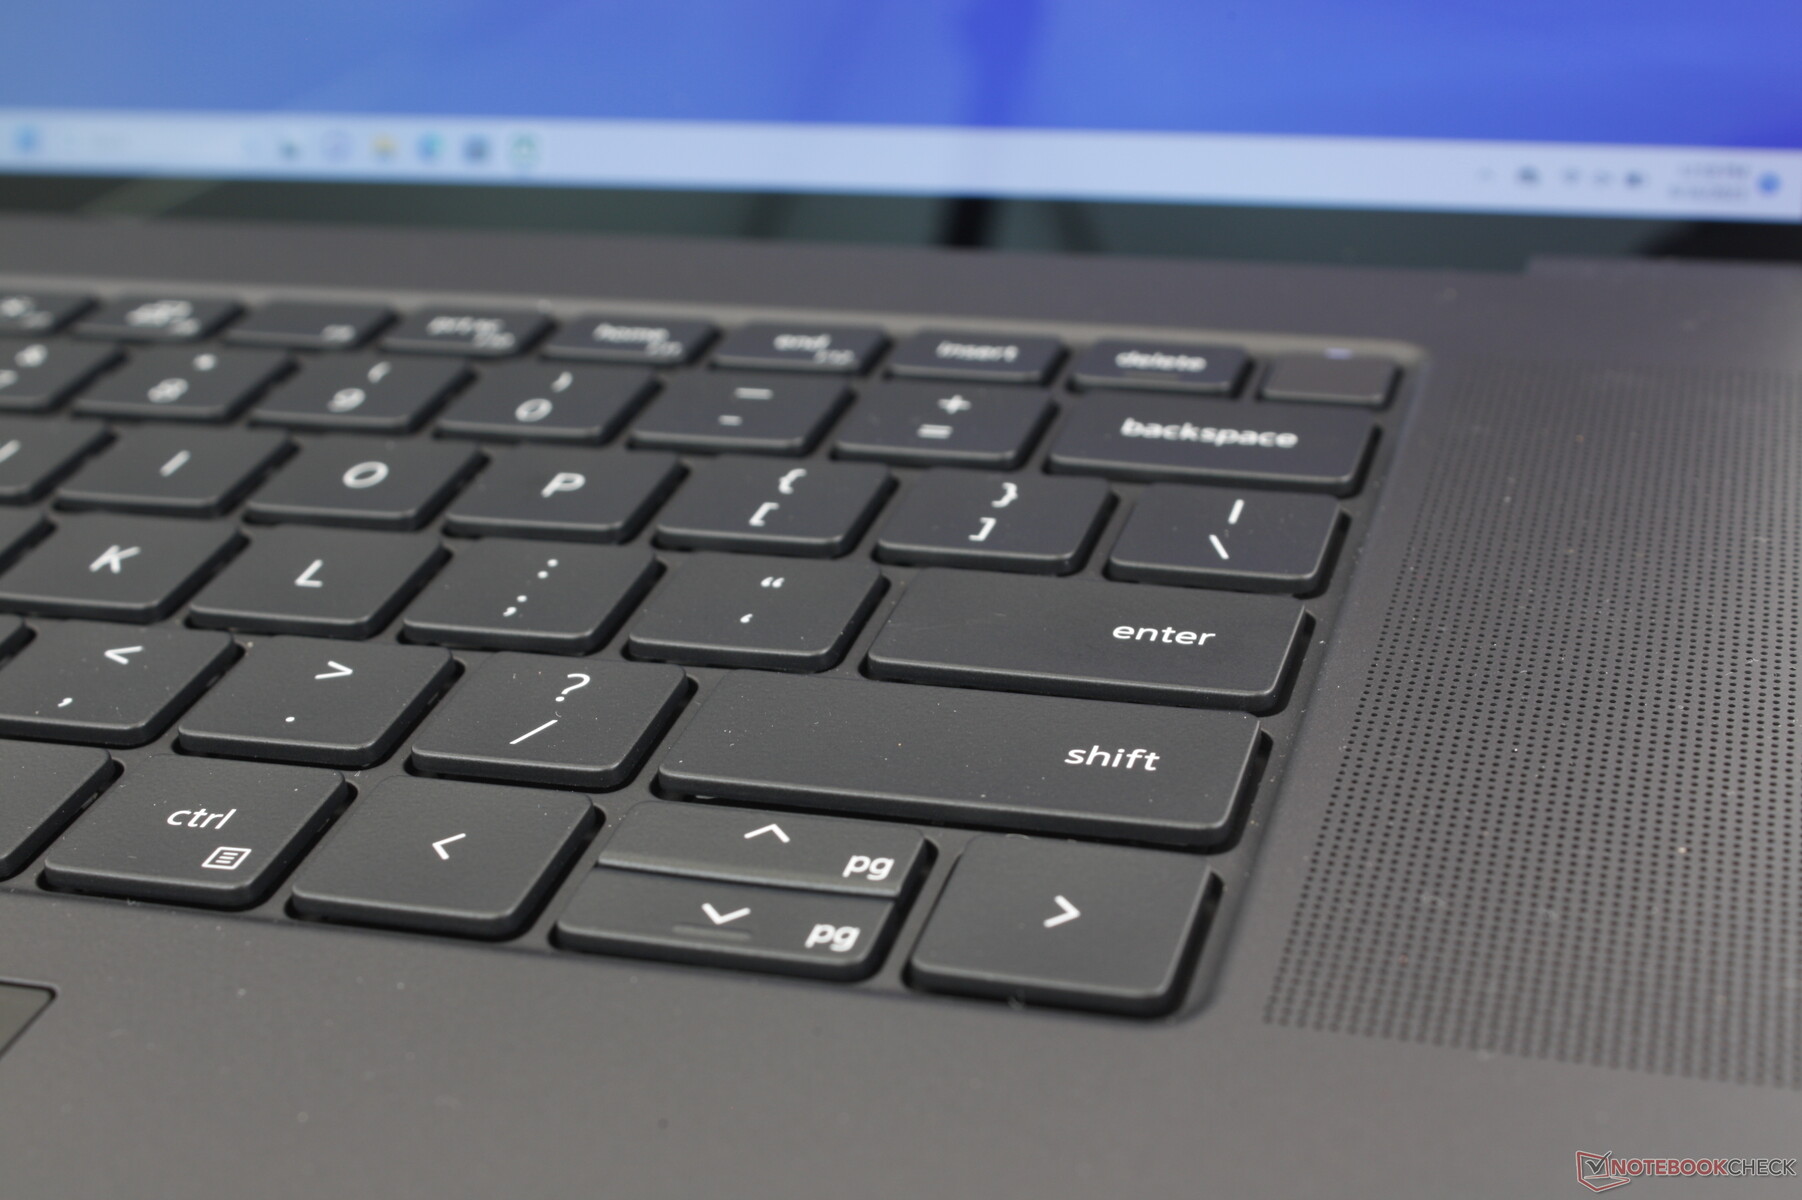
Auf den ersten Blick sieht die Tastatur genauso aus wie beim XPS 15 oder der Precision 5550, allerdings gibt es ein paar wichtige Änderungen. Erstens ist die Reihe der Funktionstasten nun endlich größer, einige XPS-15-Nutzer hatten sich darüber beschwert, dass diese besonders schmal geraten war. Zweitens sind einige Tasten am Rand nun leicht verkürzt worden, darunter die Lösch-taste, aber auch Enter, Tab, Strg und die Shift-Tasten. Ansonsten bleibt die Schreiberfahrung aber beim typischen XPS-Gefühl.
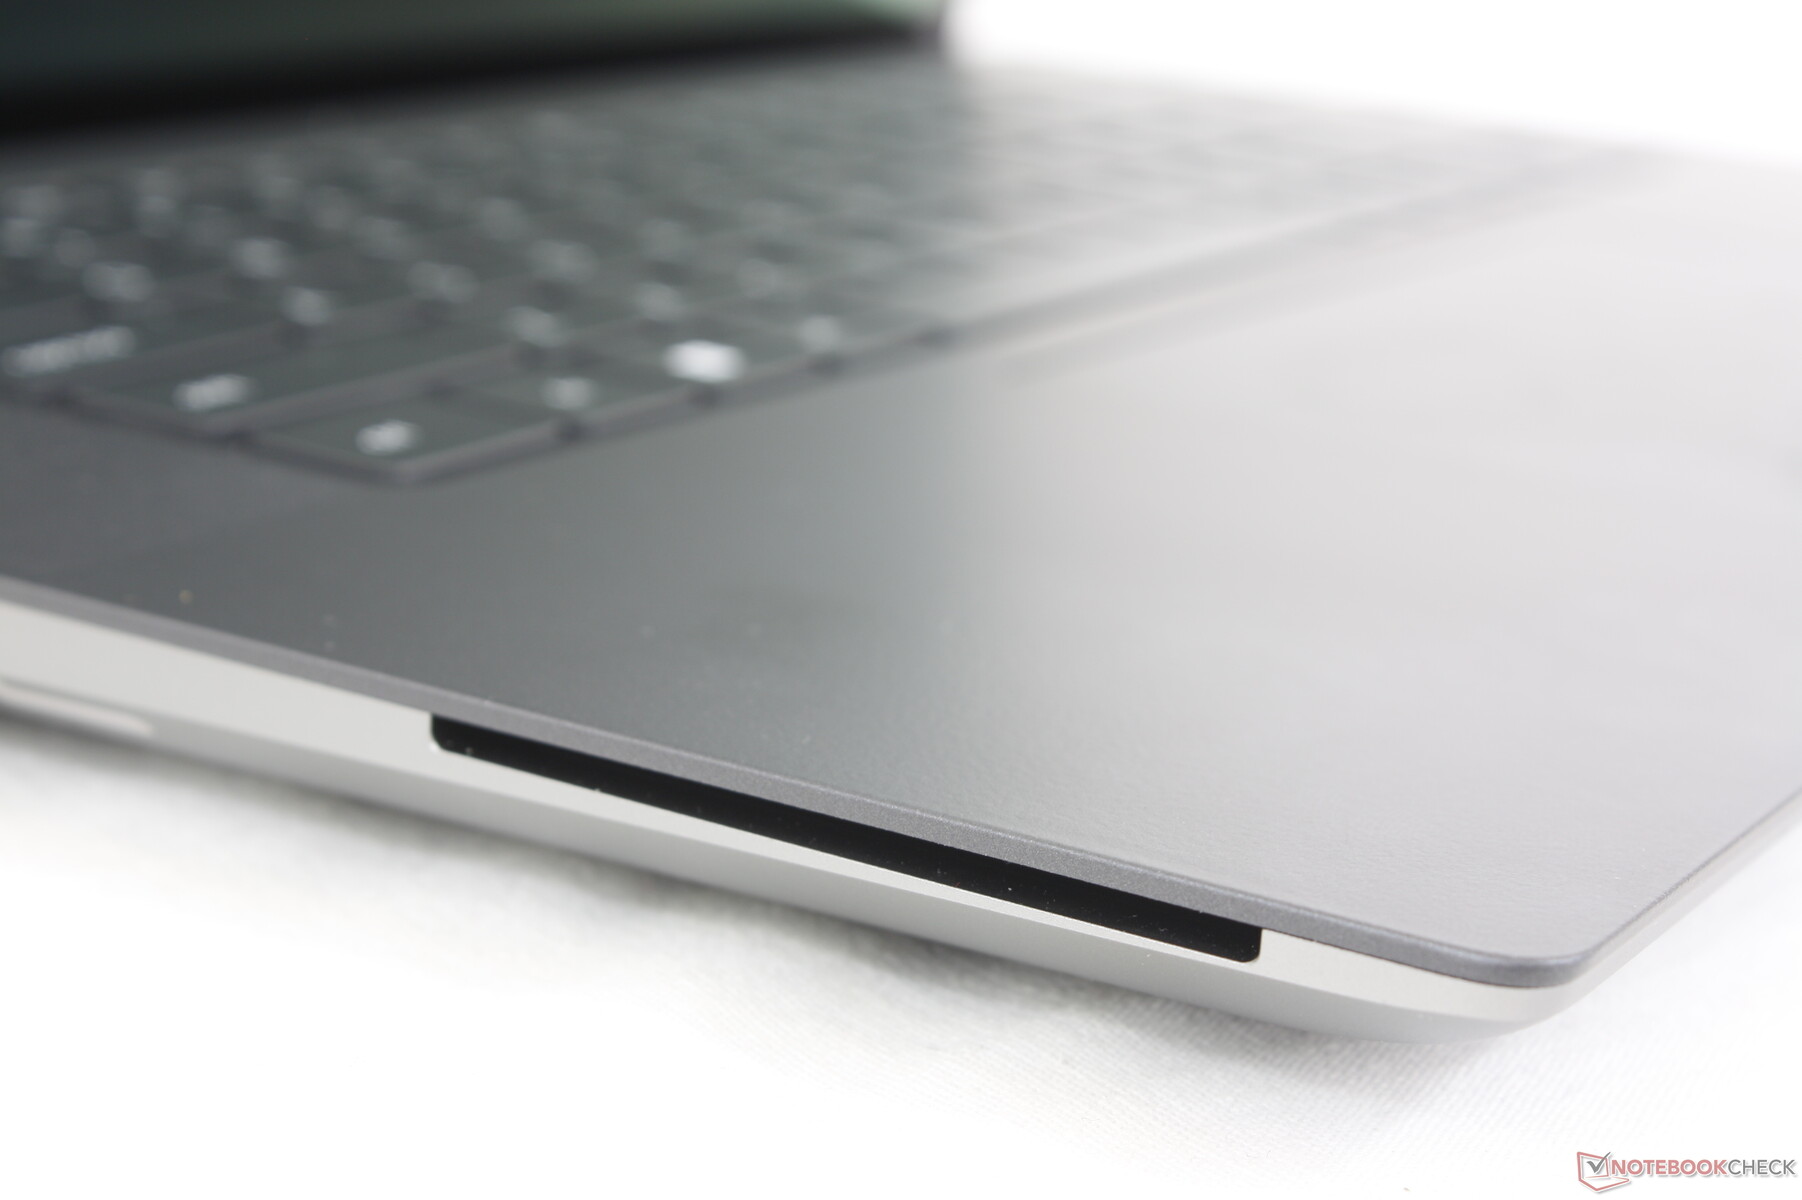
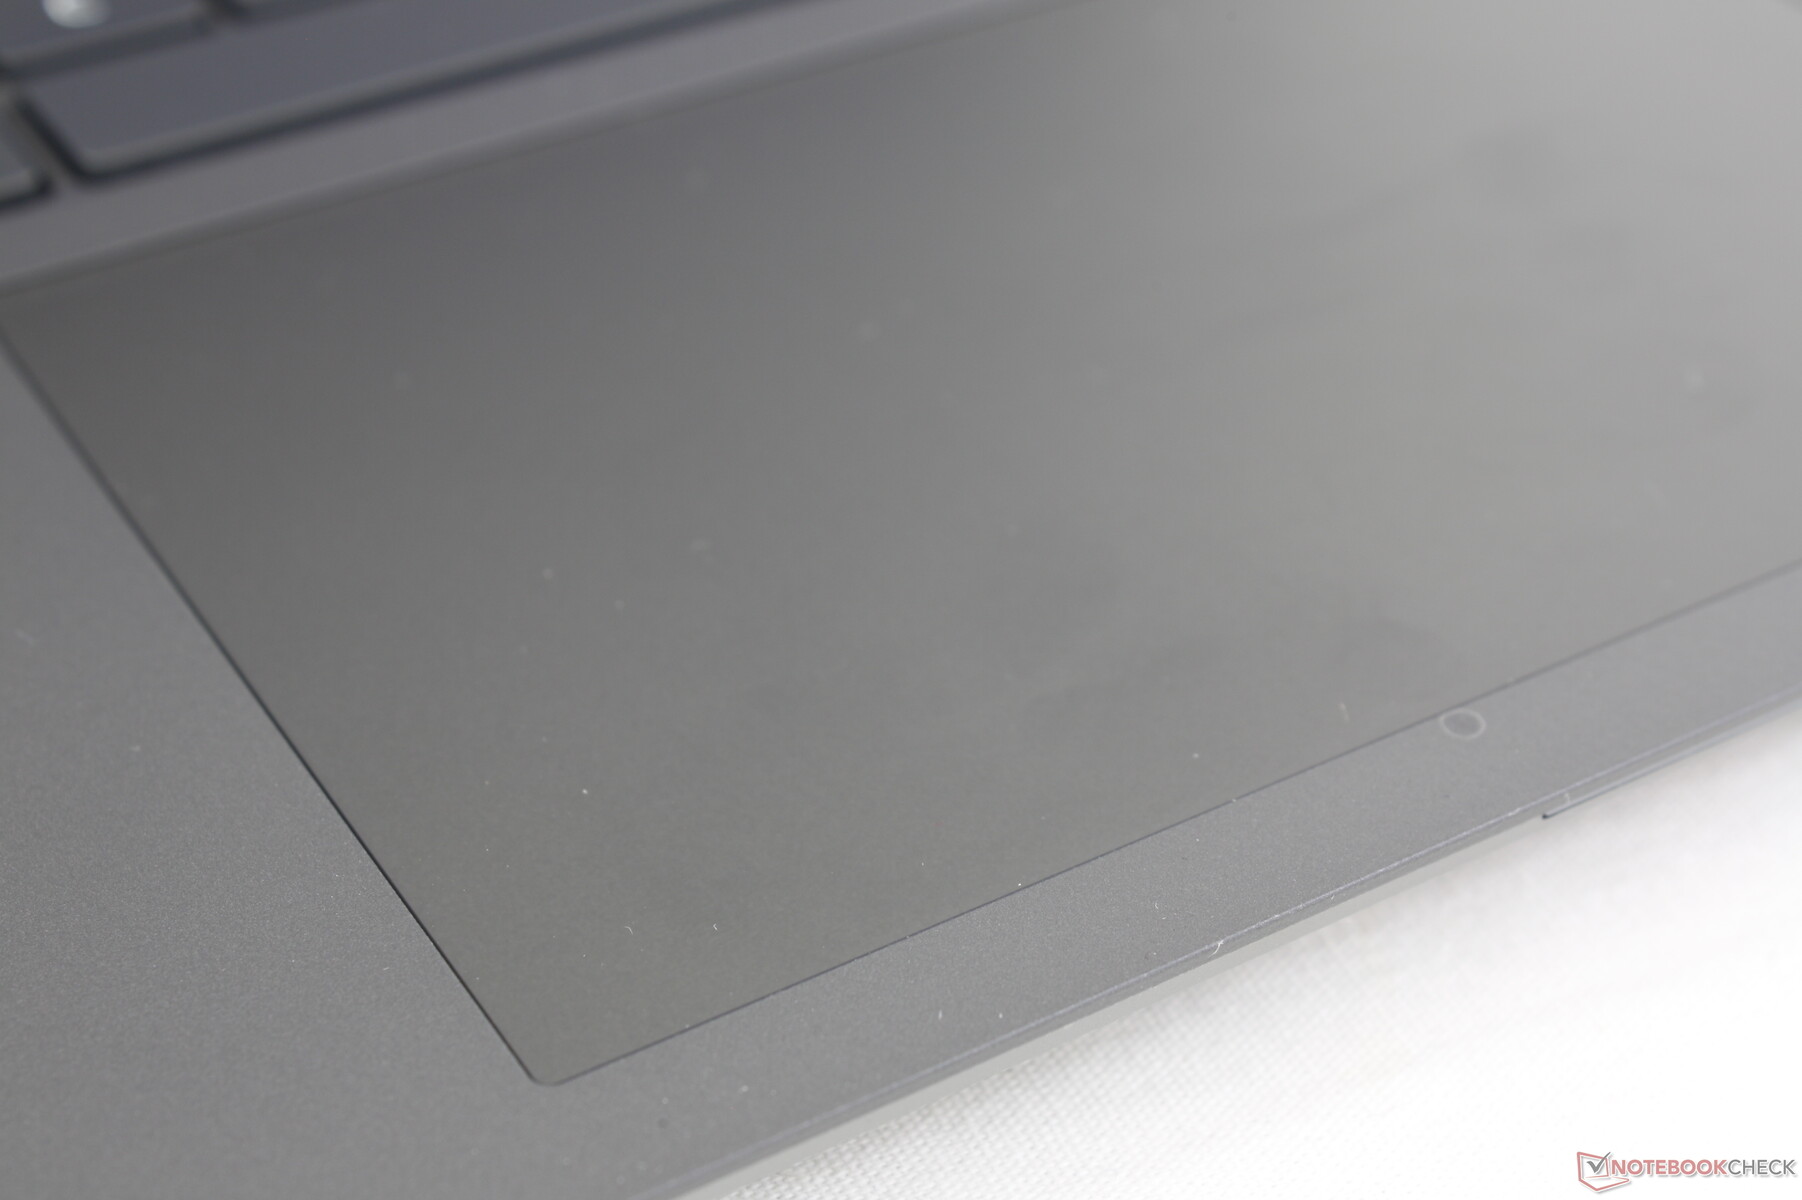
Touchpad
Tatsächlich ist das Touchpad nun kleiner als bei der 15-Zoll großen Precision 5550 (13,7 x 8,5 cm vs. 15,1 x 9 cm), trotz der größeren Bildschirmdiagonale. Dennoch fühlt es sich geräumig genug an und es bietet ebenso gute Gleiteigenschaften wie beim XPS 15.
Unglücklicherweise ist das haptische Feedback beim Klicken kaum noch vorhanden. Tatsächlich gibt es beinahe überhaupt keinen Hub oder wenigstens auditives Feedback. Daher wird der Anschluss einer externen Maus dringend zur Nutzung empfohlen.
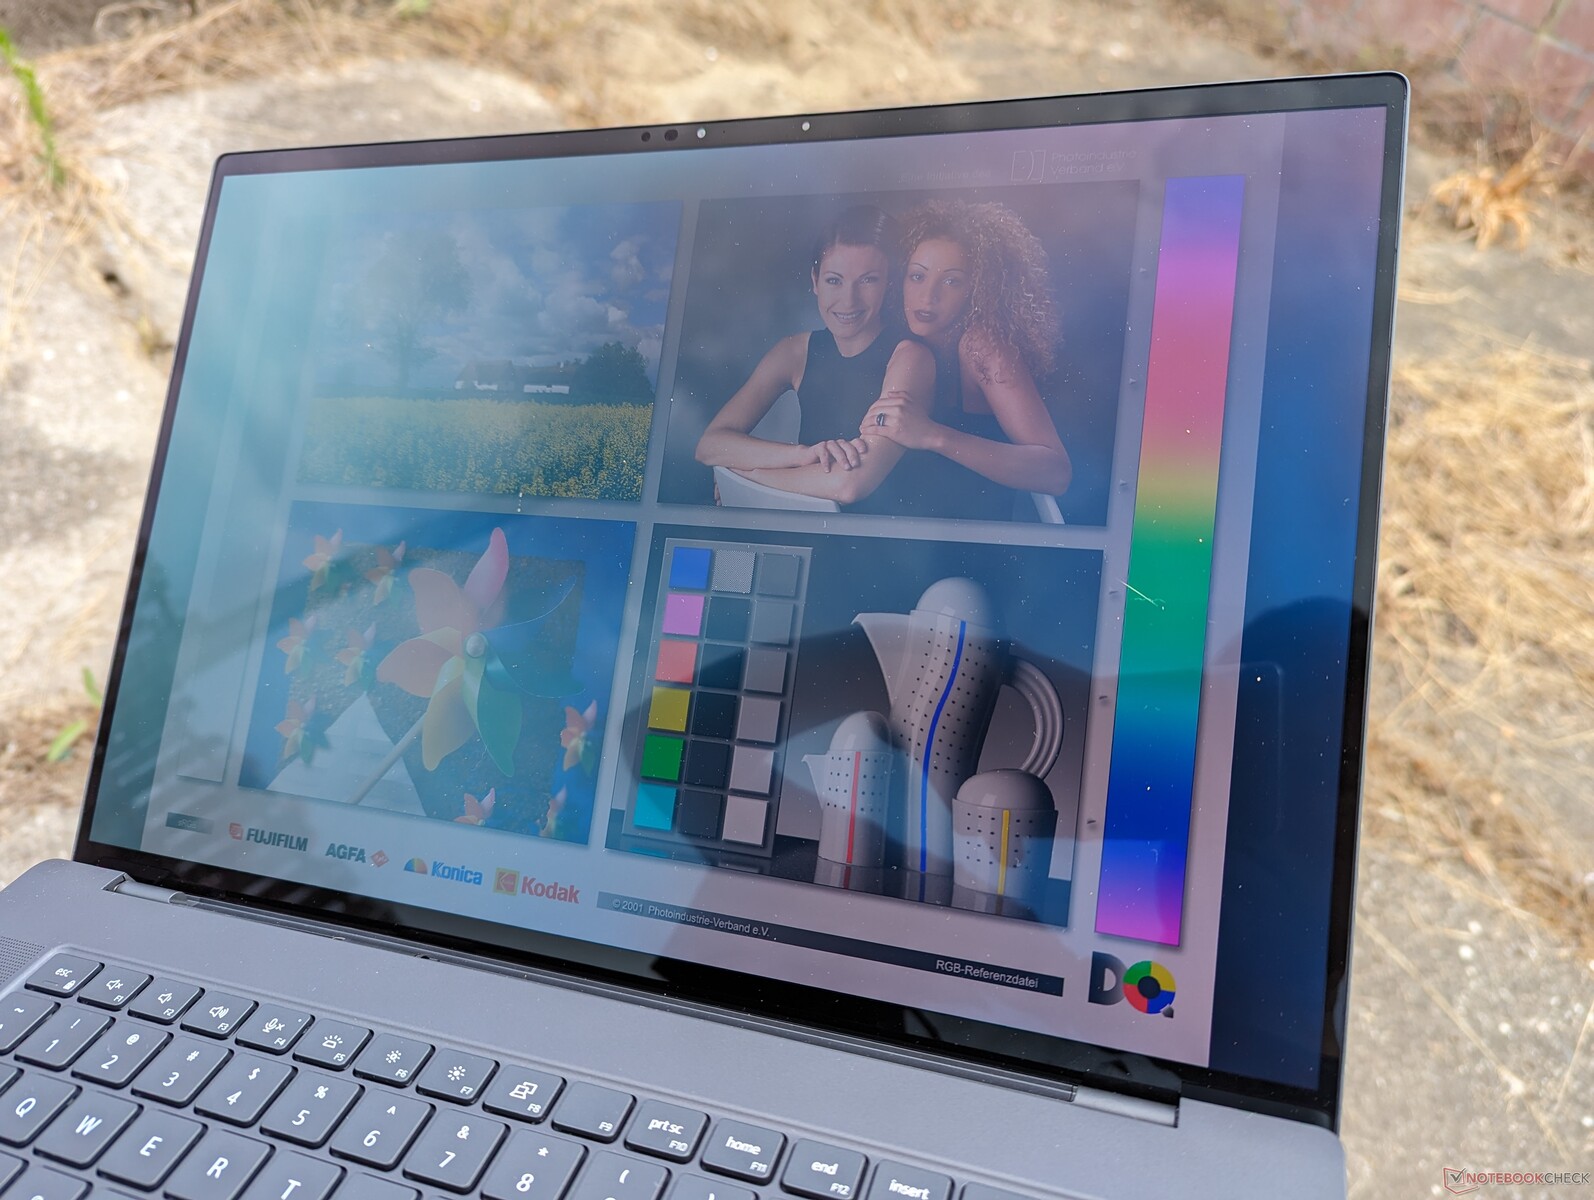
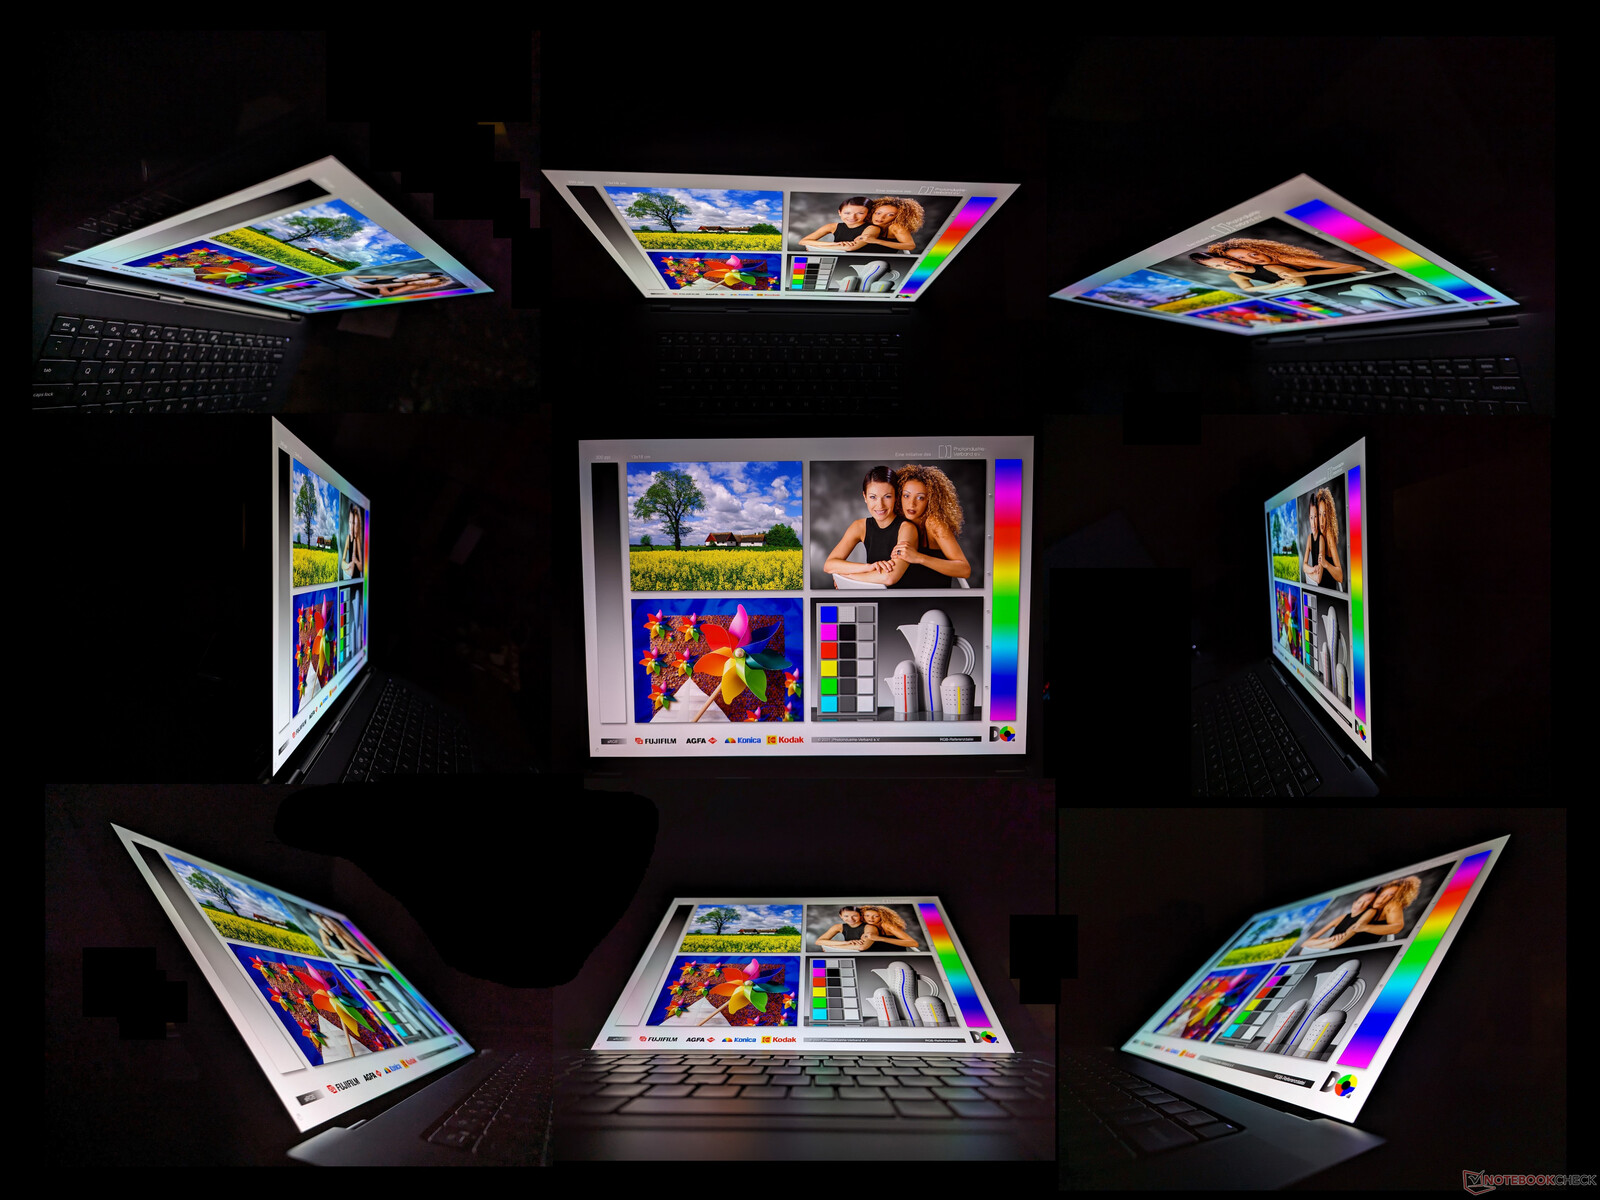
Display - Präziser 4K-OLED
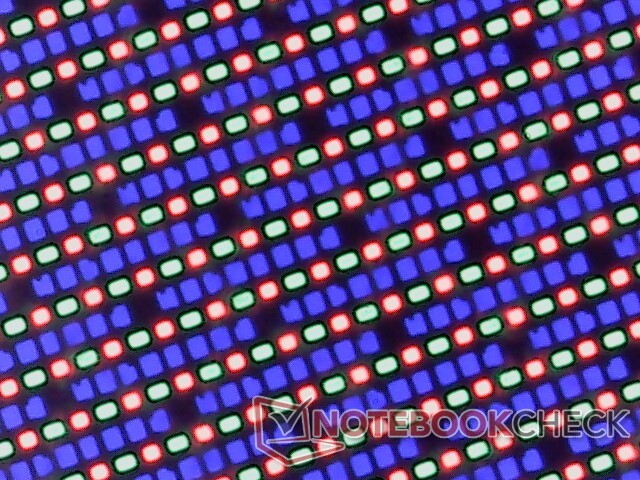
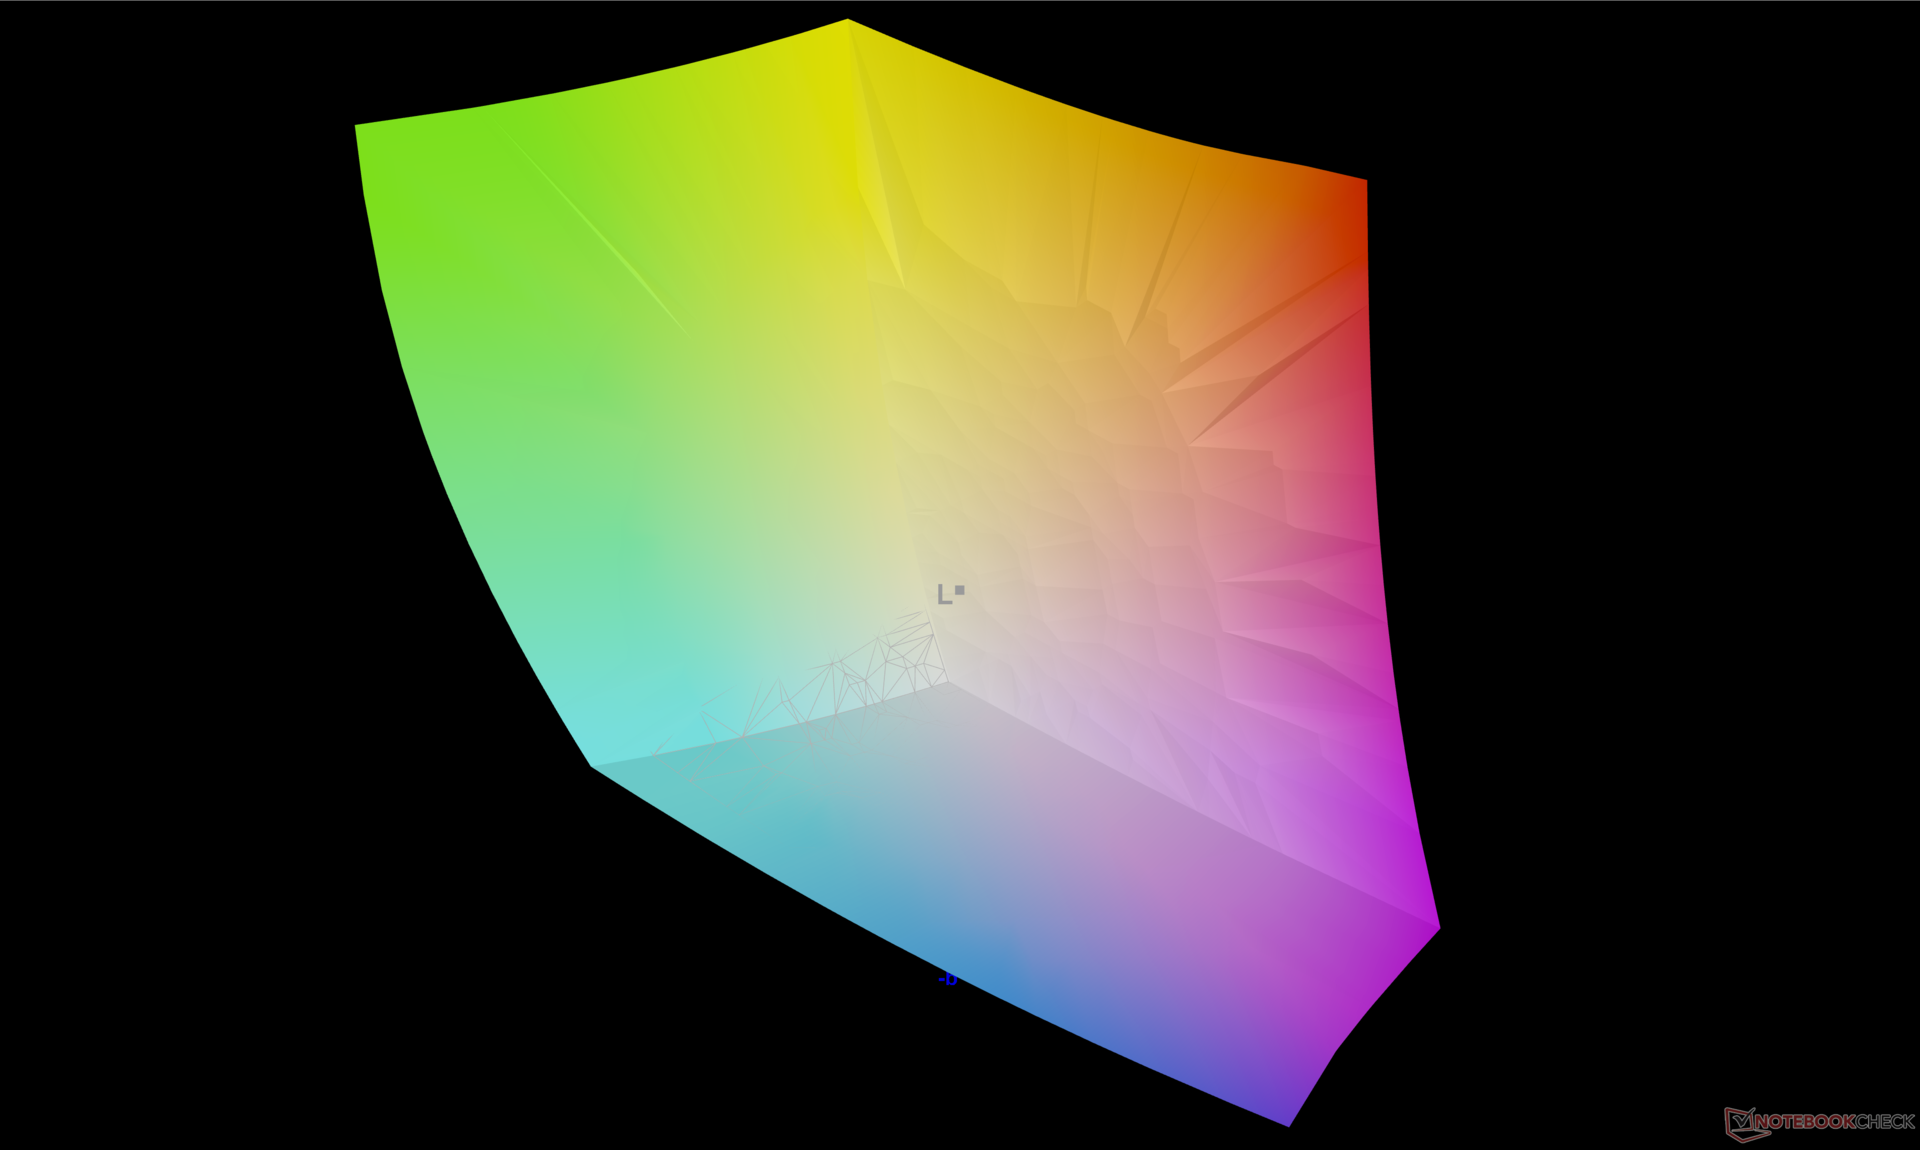
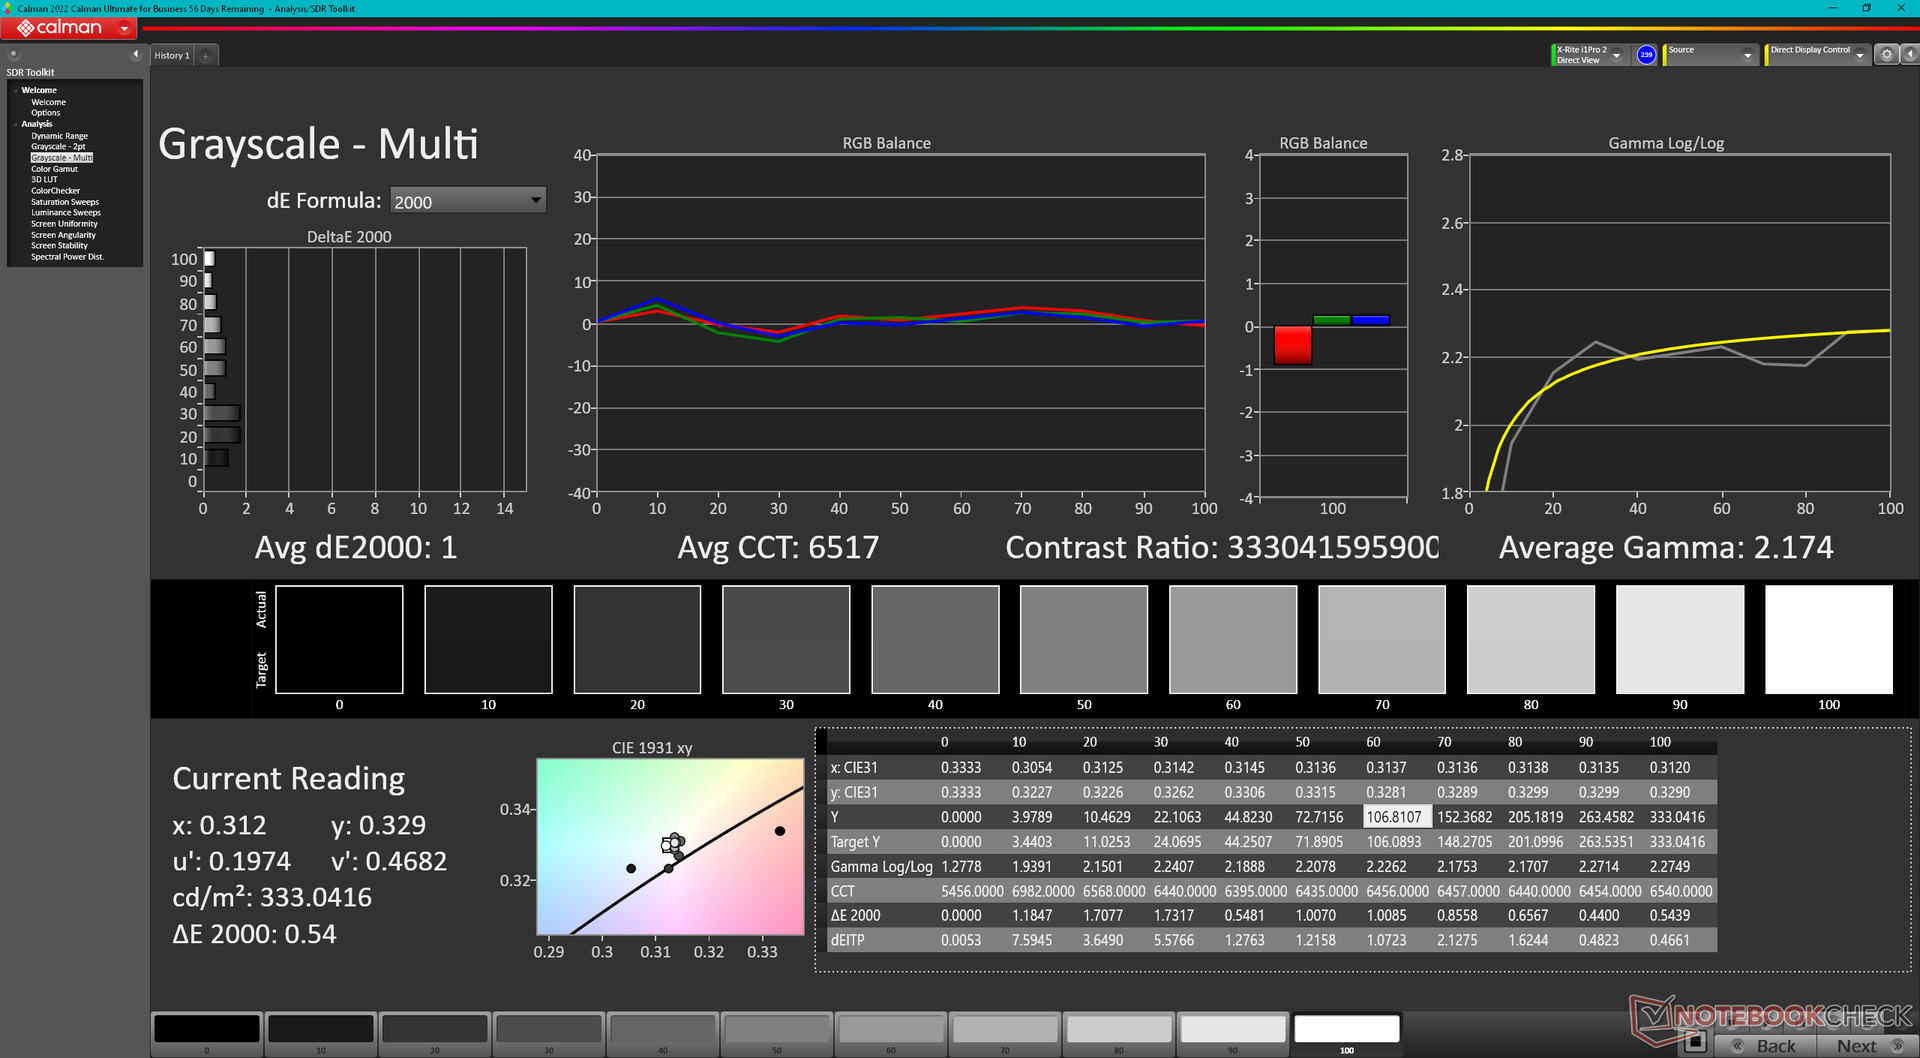
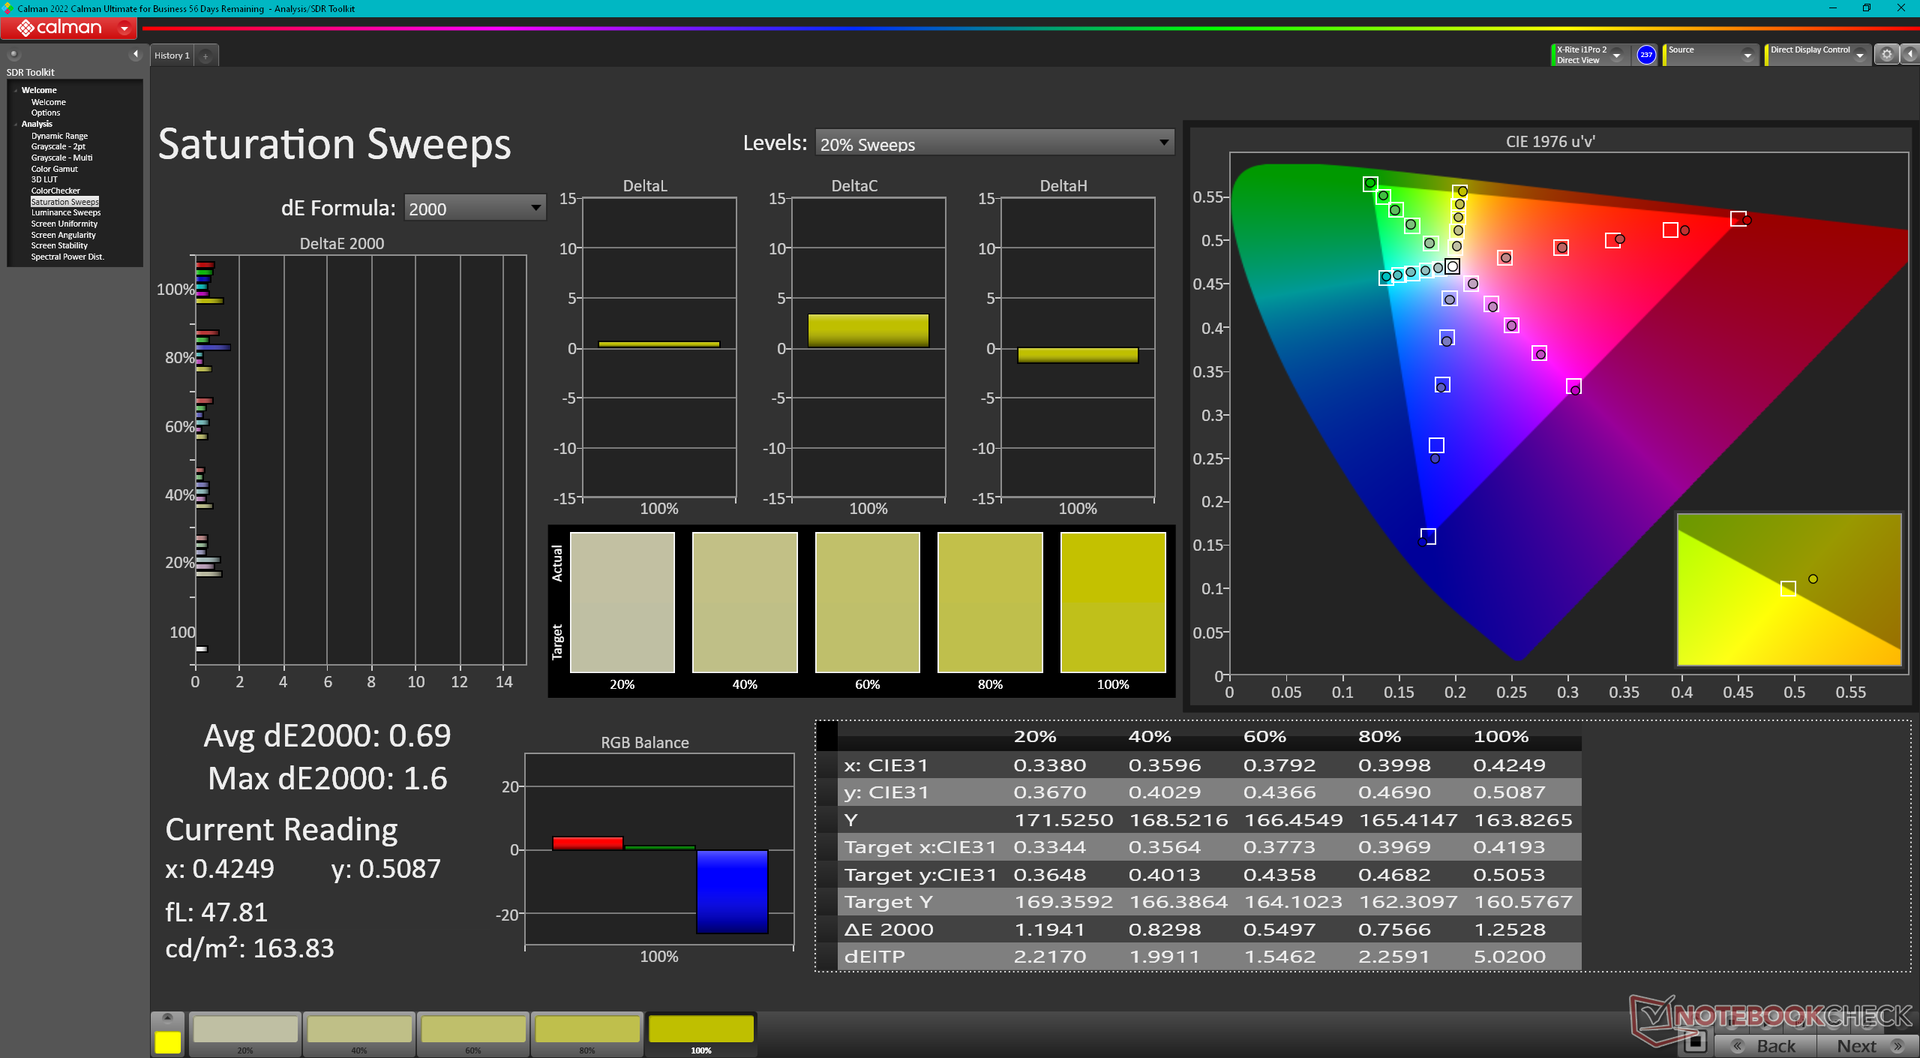
Dell vertraut dem gleichen Samsung 160YV03 OLED Panel in der 16 Zoll großen Precision 5680 und der ebenfalls 16 Zoll großen Precision 7670. Dementsprechend kommen beide auf ähnliche visuelle Werte und Nutzererfahrung, was Reaktionszeiten, volle DCI-P3-Abdeckung, die gute Helligkeitsverteilung mit einschließt. Jetzt hoffen wir für die nahe Zukunft nur noch auf höhere Bildwiederholraten.
| |||||||||||||||||||||||||
Ausleuchtung: 98 %
Helligkeit Akku: 345.7 cd/m²
Kontrast: ∞:1 (Schwarzwert: 0 cd/m²)
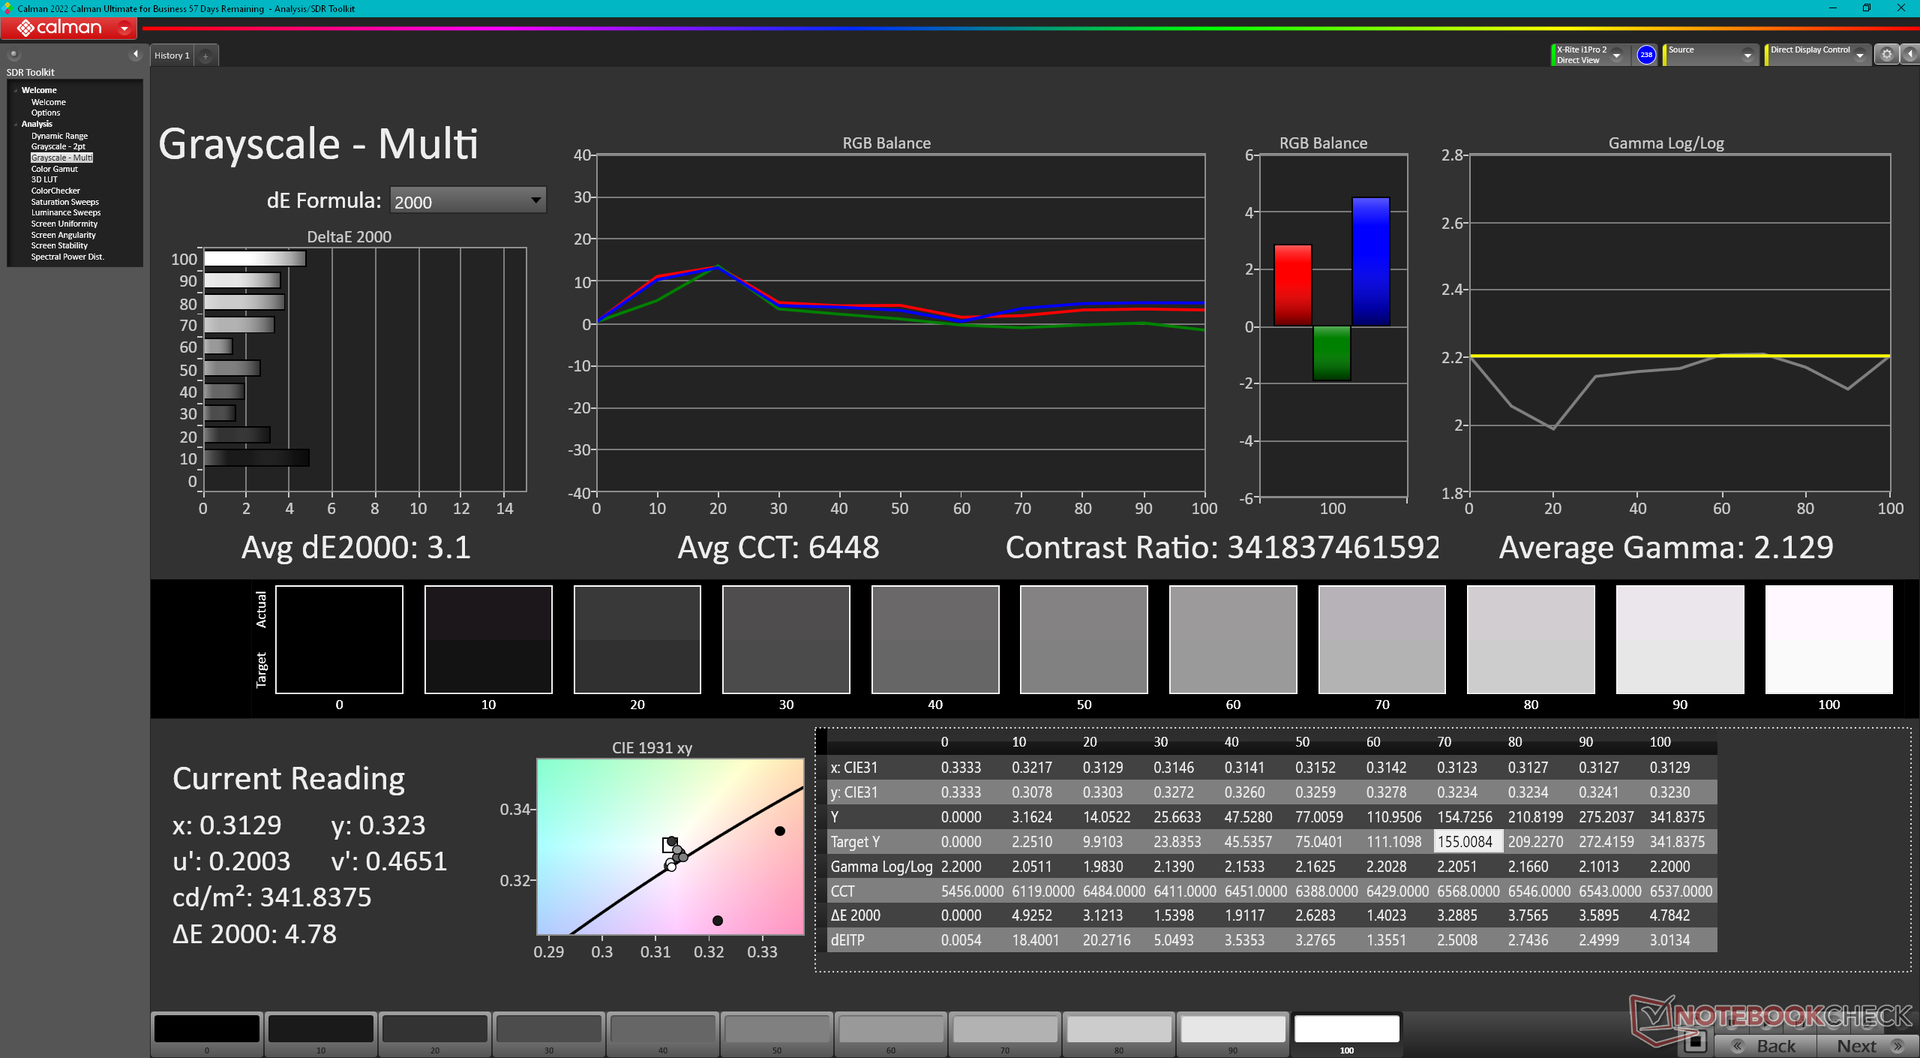
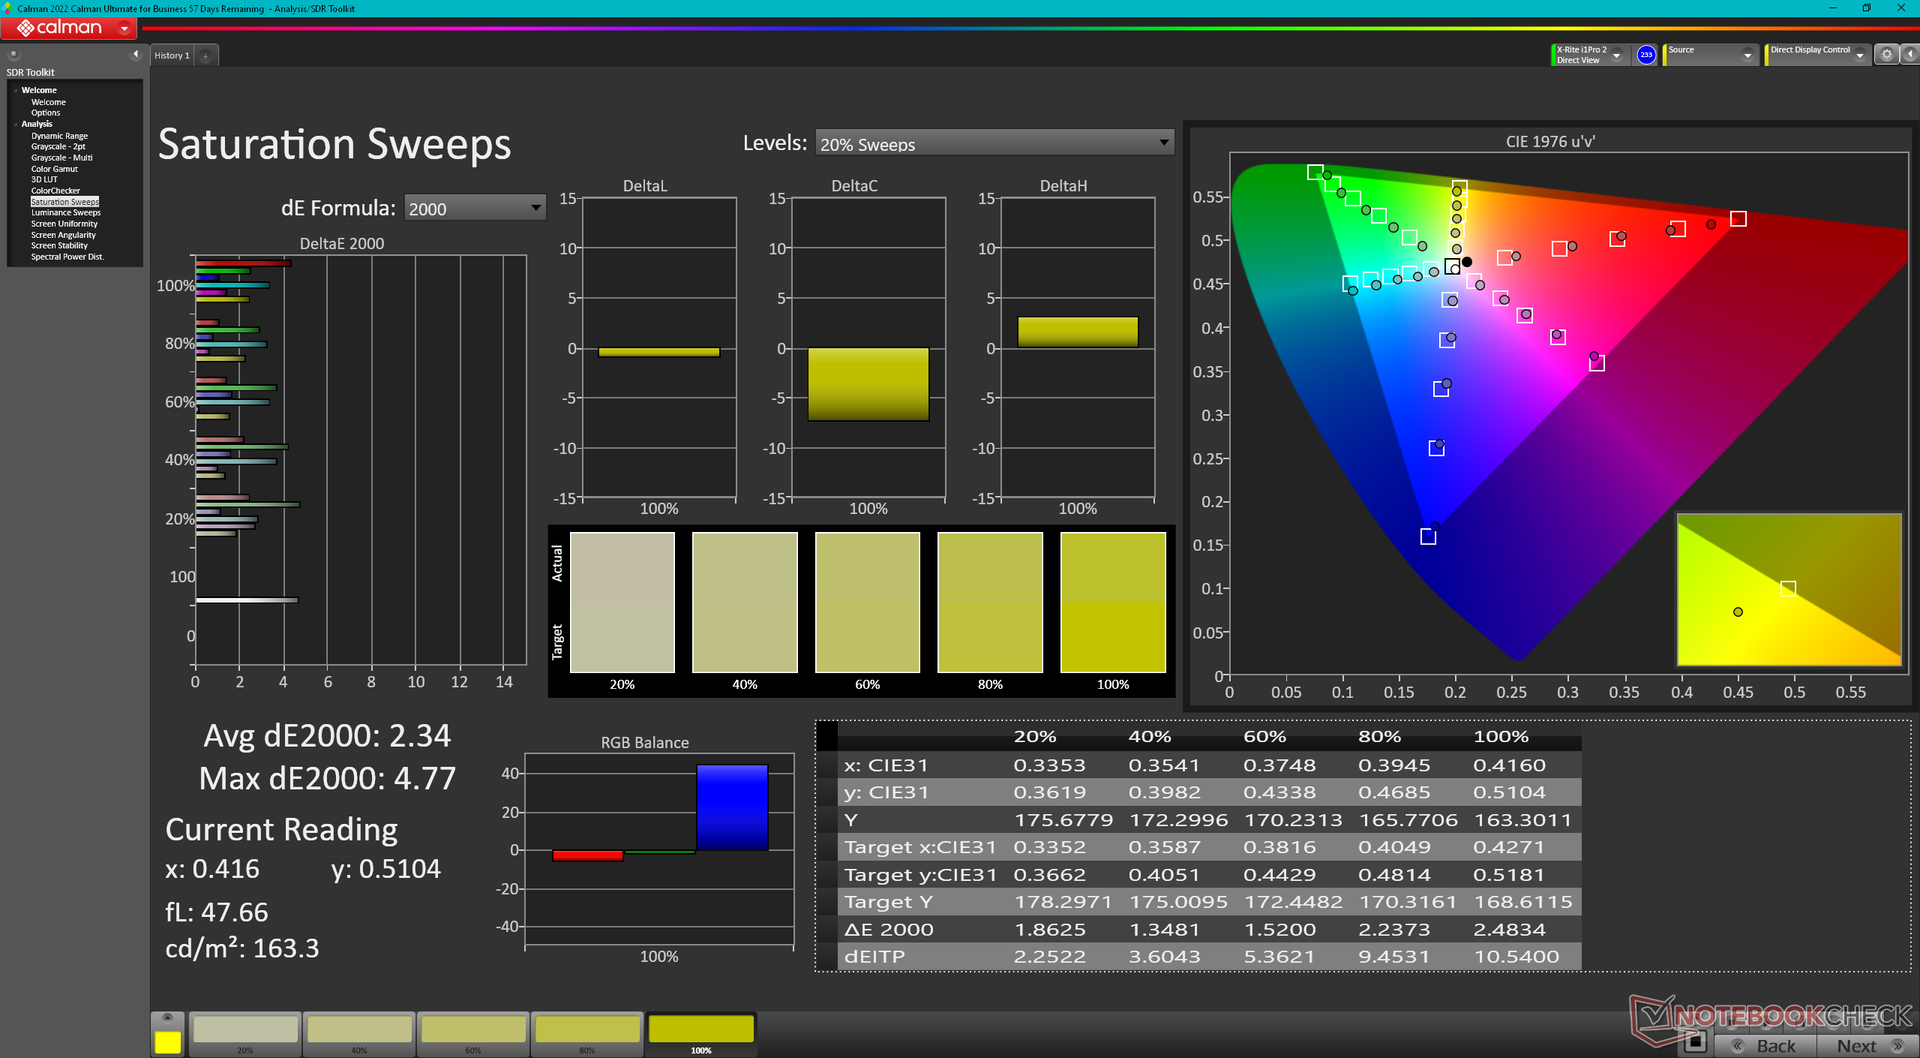
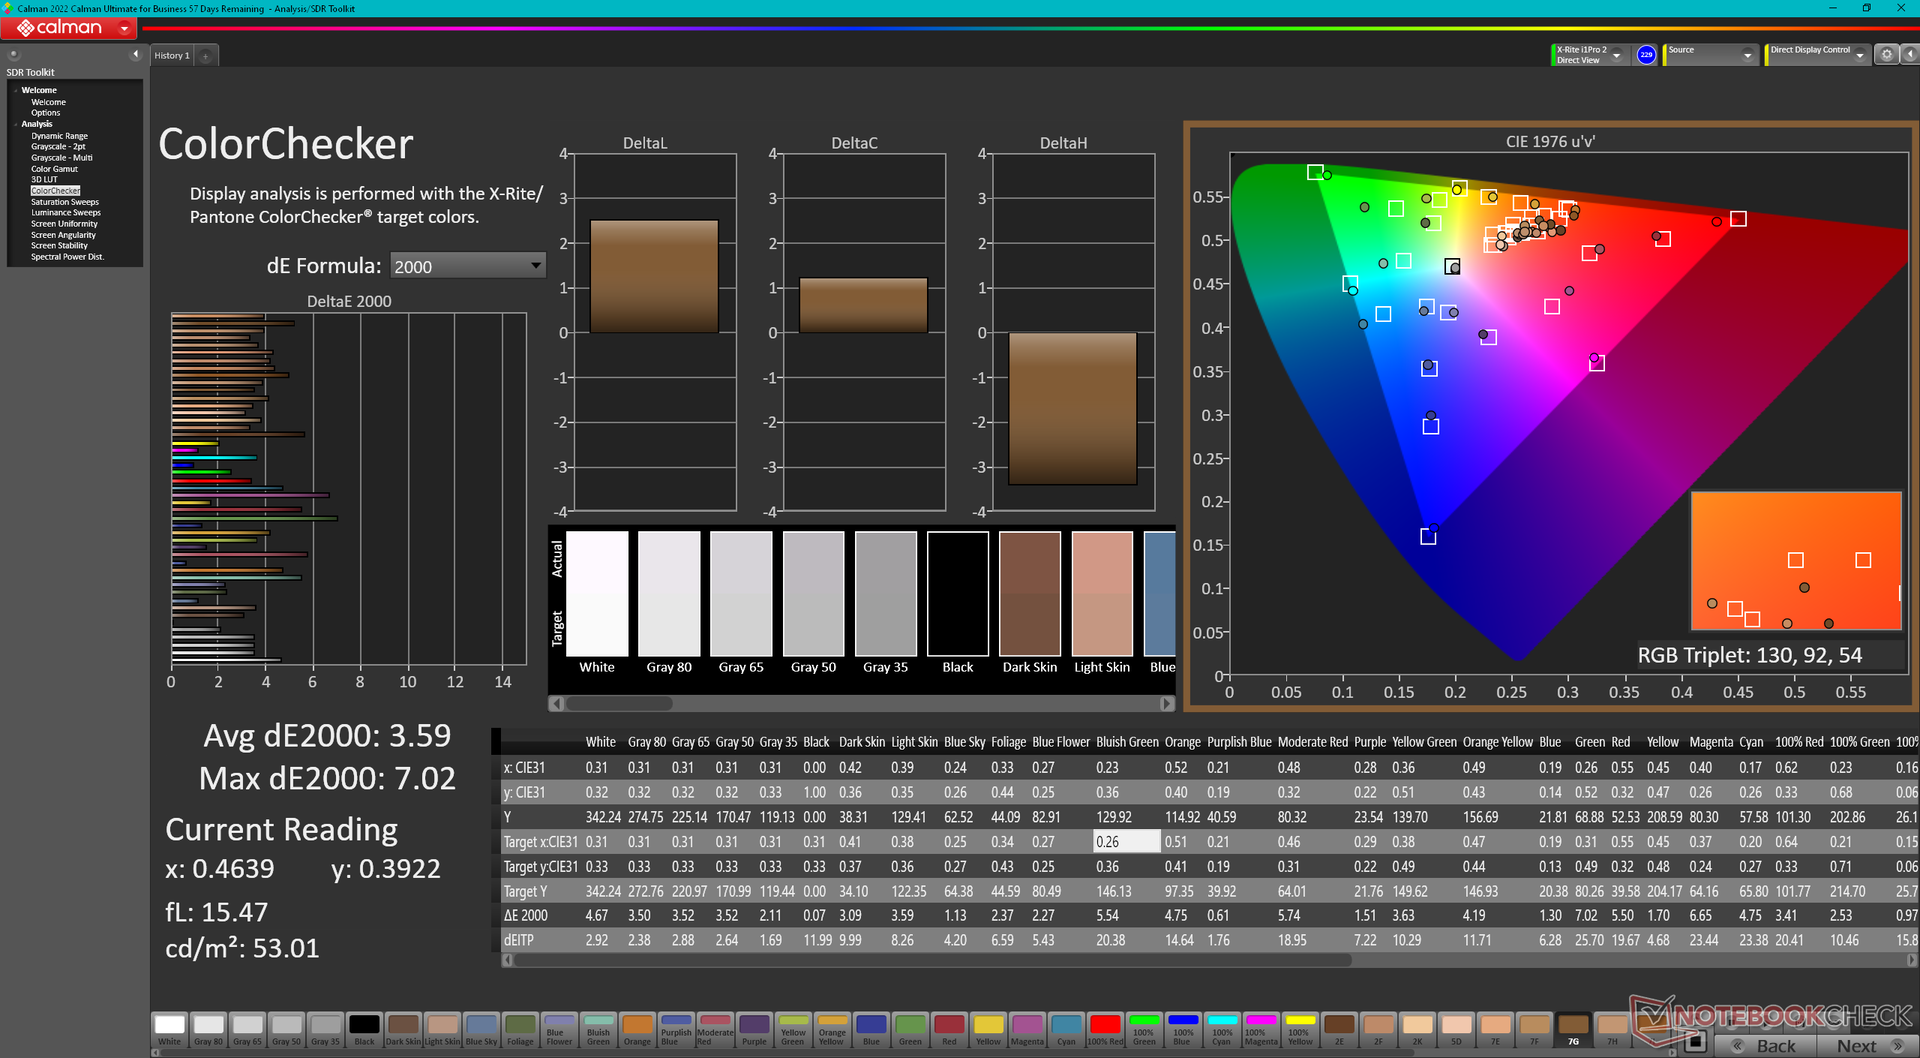
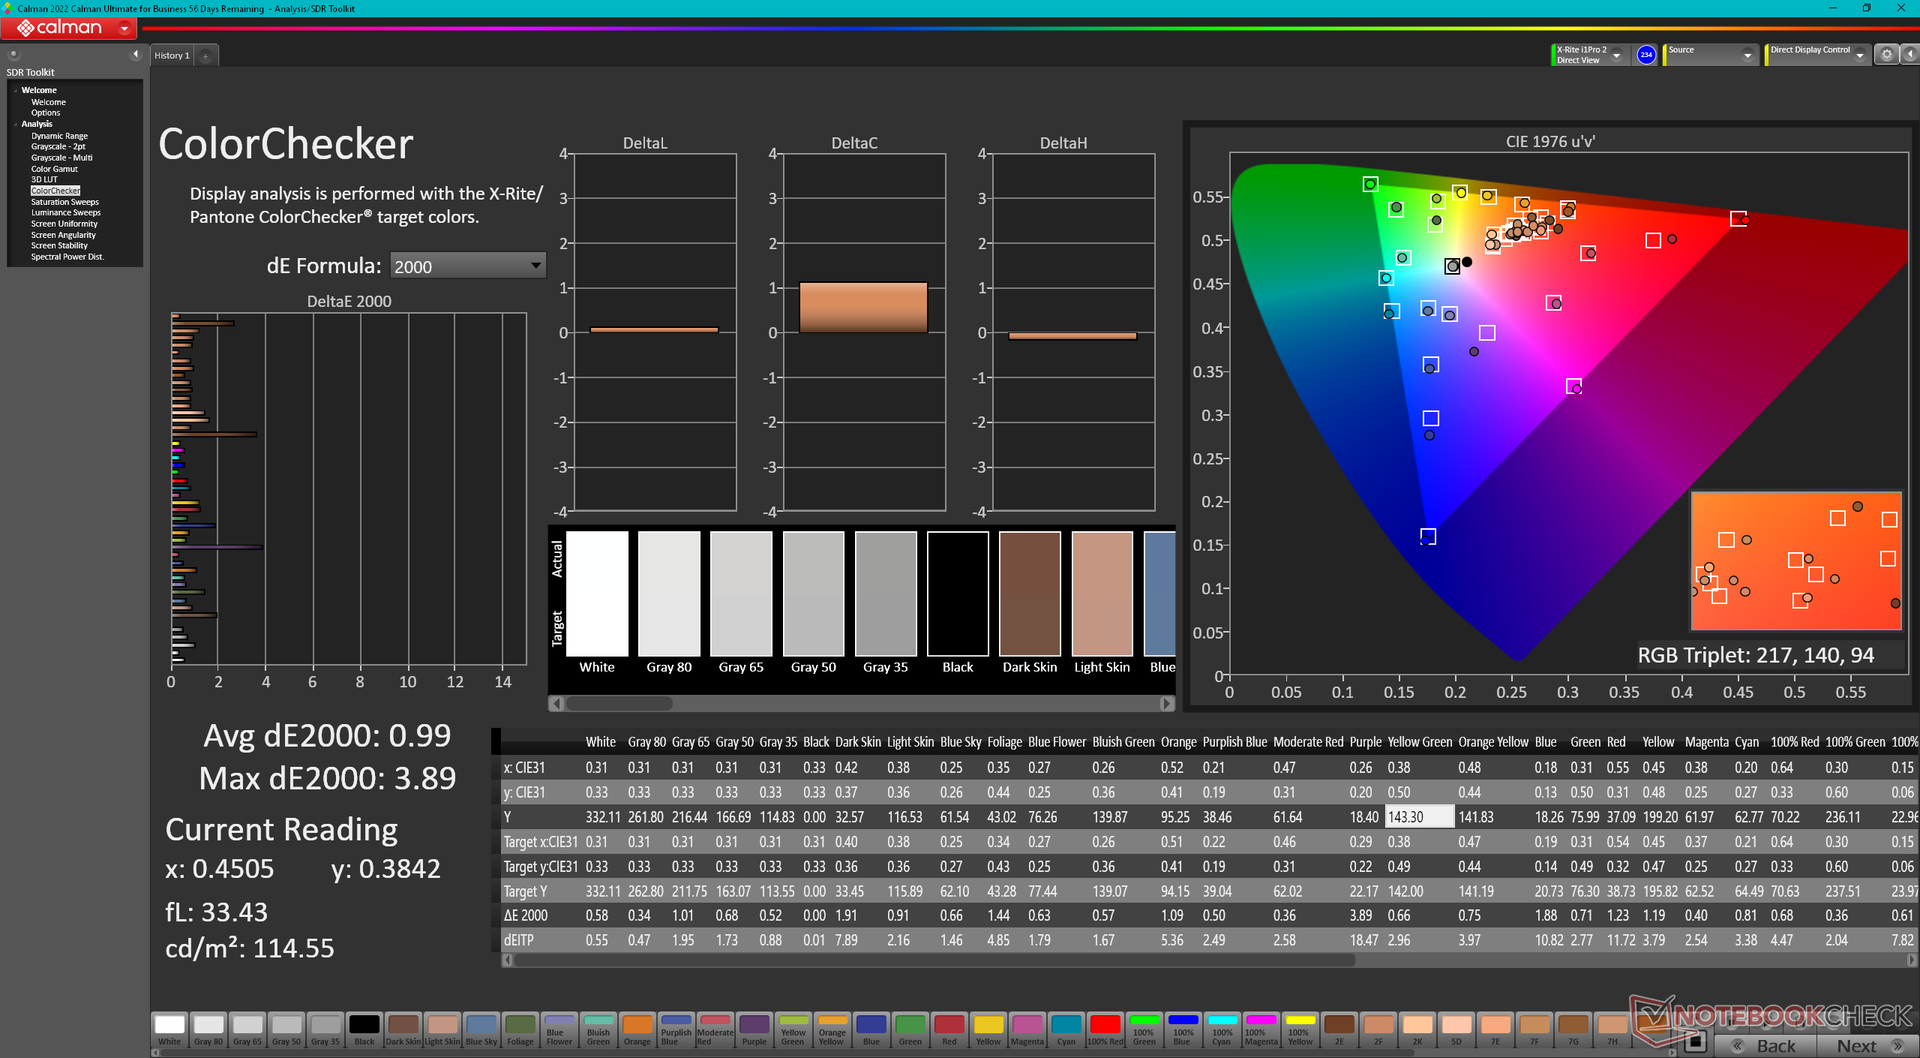
ΔE ColorChecker Calman: 3.59 | ∀{0.5-29.43 Ø4.73}
calibrated: 0.99
ΔE Greyscale Calman: 3.1 | ∀{0.09-98 Ø4.97}
97.5% AdobeRGB 1998 (Argyll 3D)
100% sRGB (Argyll 3D)
99.9% Display P3 (Argyll 3D)
Gamma: 2.13
CCT: 6448 K
| Dell Precision 5000 5680 Samsung 160YV03, OLED, 3840x2400, 16" | Dell Precision 7000 7670 Performance Samsung 160YV03, OLED, 3840x2400, 16" | HP ZBook Fury 16 G9 BOE0A52, IPS, 3840x2400, 16" | Lenovo ThinkPad P16 G1 RTX A5500 LP160UQ1-SPB1, IPS, 3840x2400, 16" | MSI CreatorPro Z16P B12UKST B160QAN02.N, IPS, 2560x1600, 16" | Asus ExpertBook B6 Flip B6602FC2 AU Optronics Model: AUOE495, IPS, 2560x1600, 16" | |
|---|---|---|---|---|---|---|
| Display | 0% | -5% | -7% | -4% | -5% | |
| Display P3 Coverage (%) | 99.9 | 99.9 0% | 97.4 -3% | 82.9 -17% | 97.6 -2% | 97.9 -2% |
| sRGB Coverage (%) | 100 | 100 0% | 99.9 0% | 98.9 -1% | 99.9 0% | 99.89 0% |
| AdobeRGB 1998 Coverage (%) | 97.5 | 98.1 1% | 86.3 -11% | 95.9 -2% | 87.4 -10% | 85.52 -12% |
| Response Times | -9% | -551% | -2297% | -490% | -1452% | |
| Response Time Grey 50% / Grey 80% * (ms) | 1.68 ? | 1.84 ? -10% | 13.7 ? -715% | 45.6 ? -2614% | 12.8 ? -662% | 36 ? -2043% |
| Response Time Black / White * (ms) | 1.77 ? | 1.92 ? -8% | 8.6 ? -386% | 36.8 ? -1979% | 7.4 ? -318% | 17 ? -860% |
| PWM Frequency (Hz) | 60 ? | 59.52 ? | ||||
| Bildschirm | -5% | -33% | 33% | 30% | -6% | |
| Helligkeit Bildmitte (cd/m²) | 345.7 | 325.2 -6% | 530.5 53% | 601.9 74% | 407 18% | 440 27% |
| Brightness (cd/m²) | 349 | 328 -6% | 476 36% | 569 63% | 388 11% | 418 20% |
| Brightness Distribution (%) | 98 | 97 -1% | 83 -15% | 77 -21% | 88 -10% | 82 -16% |
| Schwarzwert * (cd/m²) | 0.57 | 0.47 | 0.36 | 0.3 | ||
| Delta E Colorchecker * | 3.59 | 4.59 -28% | 2.26 37% | 2.45 32% | 1.3 64% | 2.81 22% |
| Colorchecker dE 2000 max. * | 7.02 | 7.65 -9% | 4.46 36% | 2.5 64% | 4.62 34% | |
| Colorchecker dE 2000 calibrated * | 0.99 | 4.73 -378% | 0.7 29% | 2.99 -202% | ||
| Delta E Graustufen * | 3.1 | 2.5 19% | 1 68% | 2.6 16% | 2.1 32% | 0.91 71% |
| Gamma | 2.13 103% | 2.1 105% | 2.28 96% | 2.3 96% | 2.26 97% | 2.2 100% |
| CCT | 6448 101% | 6541 99% | 6543 99% | 6805 96% | 6437 101% | 6600 98% |
| Kontrast (:1) | 931 | 1281 | 1131 | 1467 | ||
| Durchschnitt gesamt (Programm / Settings) | -5% /
-4% | -196% /
-119% | -757% /
-401% | -155% /
-65% | -488% /
-247% |
* ... kleinere Werte sind besser
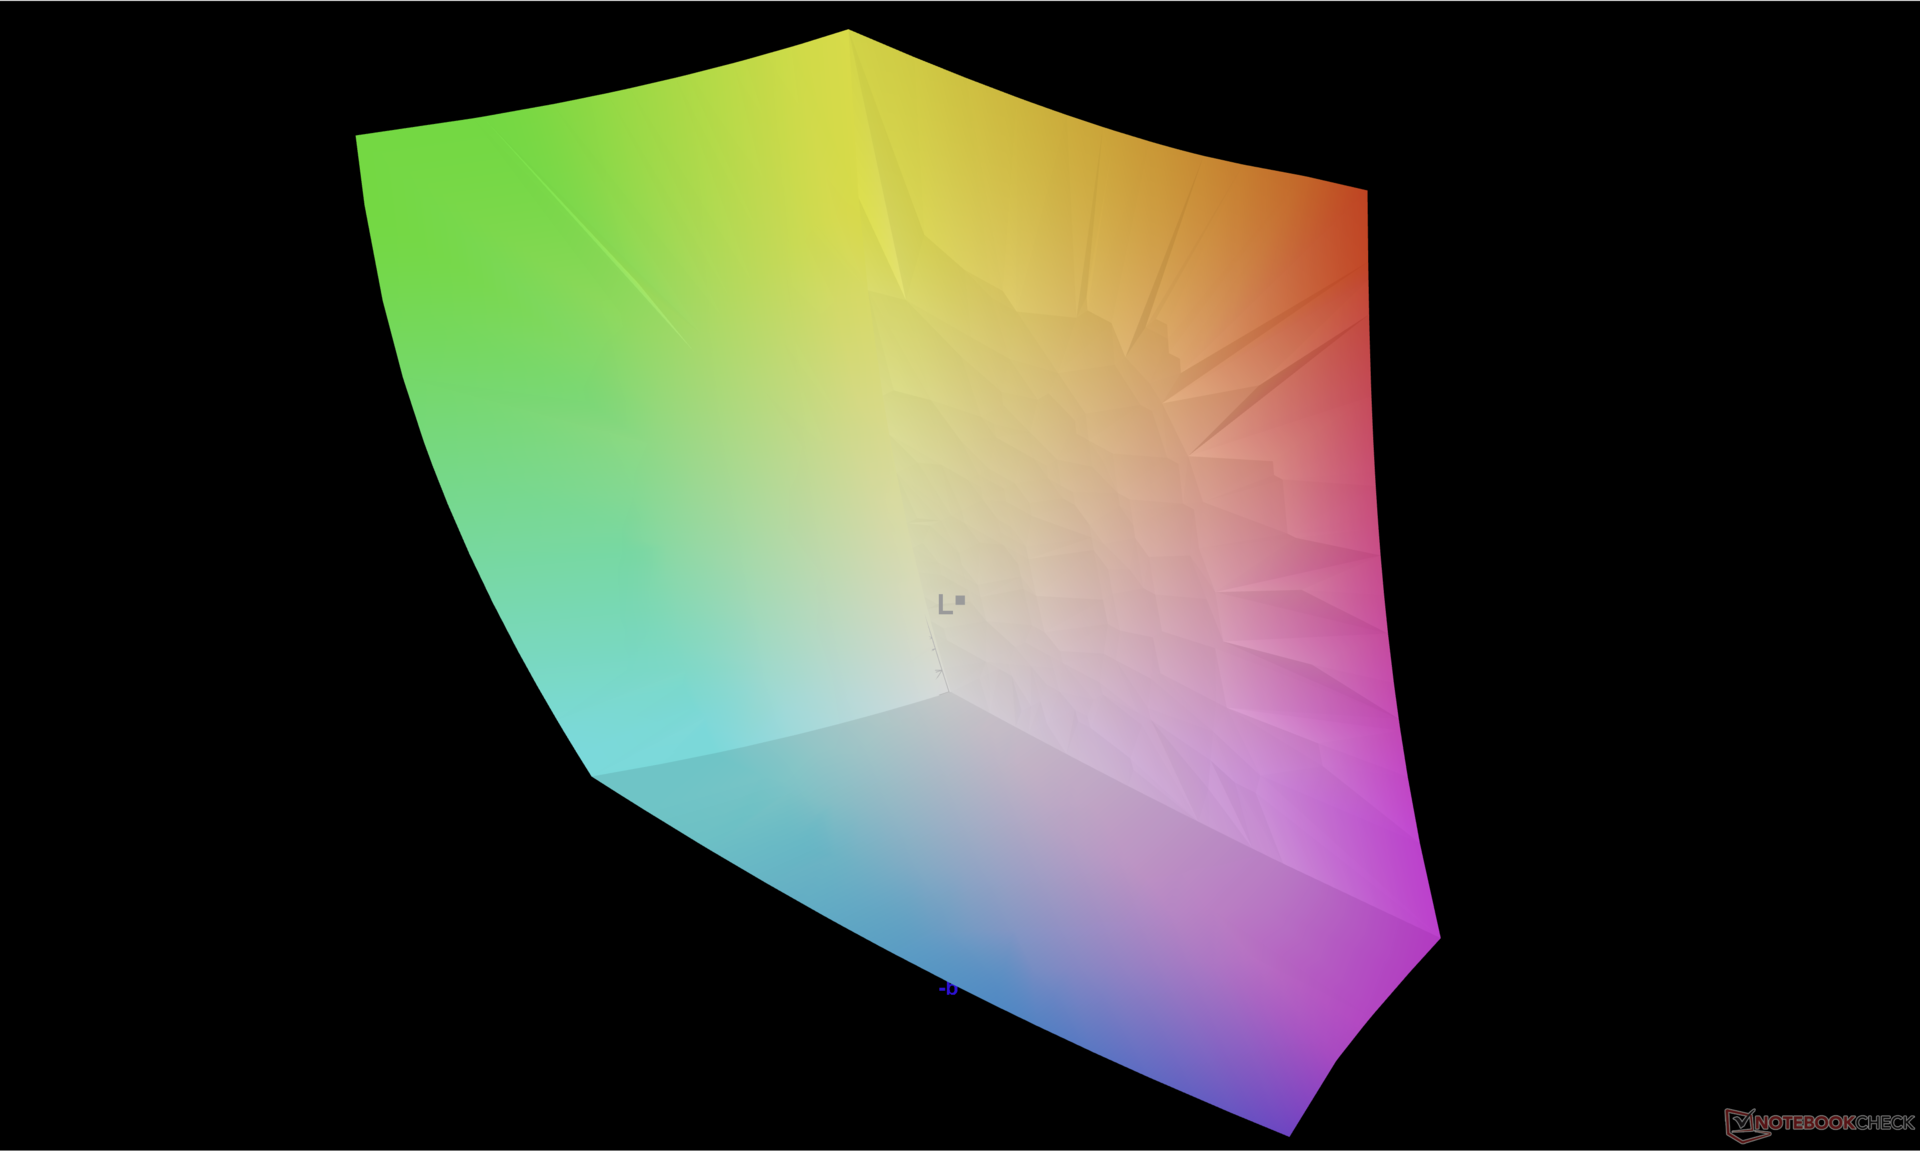
Ab Werk ist das Display ordentlich kalibriert, wir messen DeltaE-Werte zwischen 3 und 4. Unser eigens kalibriertes ICM-Profil kann weiter oben kostenlos heruntergeladen werden.
Reaktionszeiten (Response Times) des Displays
| ↔ Reaktionszeiten Schwarz zu Weiß | ||
|---|---|---|
| 1.77 ms ... steigend ↗ und fallend ↘ kombiniert | ↗ 0.8 ms steigend |  |
| ↘ 0.97 ms fallend | ||
| Die gemessenen Reaktionszeiten sind sehr kurz, wodurch sich der Bildschirm auch für schnelle 3D Spiele eignen sollte. Im Vergleich rangierten die bei uns getesteten Geräte von 0.1 (Minimum) zu 240 (Maximum) ms. » 10 % aller Screens waren schneller als der getestete. Daher sind die gemessenen Reaktionszeiten besser als der Durchschnitt aller vermessenen Geräte (19.9 ms). | ||
| ↔ Reaktionszeiten 50% Grau zu 80% Grau | ||
| 1.68 ms ... steigend ↗ und fallend ↘ kombiniert | ↗ 0.97 ms steigend | 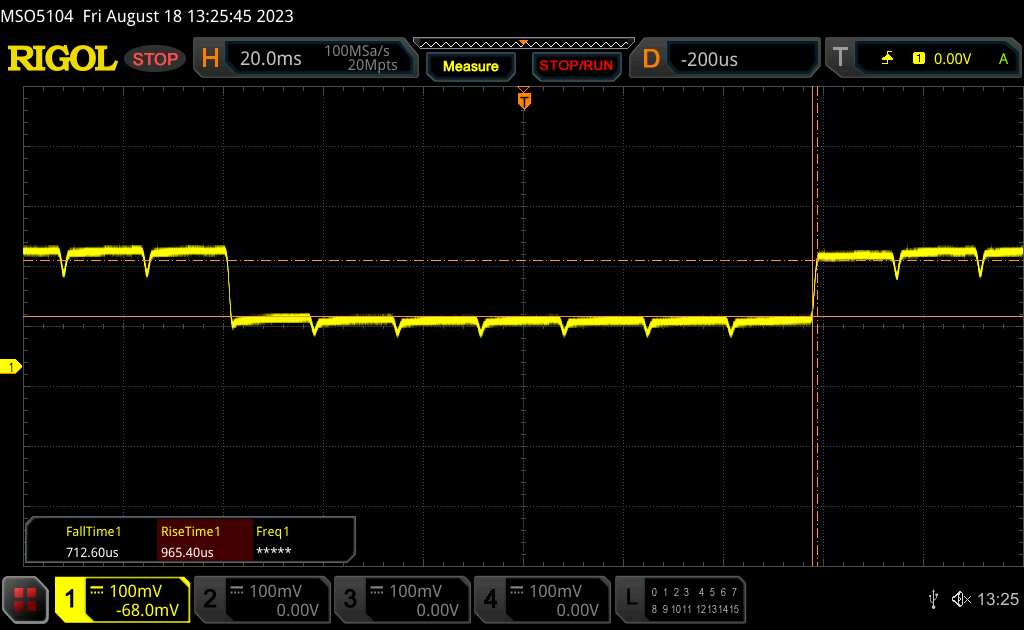 |
| ↘ 0.71 ms fallend | ||
| Die gemessenen Reaktionszeiten sind sehr kurz, wodurch sich der Bildschirm auch für schnelle 3D Spiele eignen sollte. Im Vergleich rangierten die bei uns getesteten Geräte von 0.165 (Minimum) zu 636 (Maximum) ms. » 8 % aller Screens waren schneller als der getestete. Daher sind die gemessenen Reaktionszeiten besser als der Durchschnitt aller vermessenen Geräte (31.1 ms). | ||
Bildschirm-Flackern / PWM (Pulse-Width Modulation)
| Flackern / PWM festgestellt | 60 Hz | ≤ 100 % Helligkeit |  |
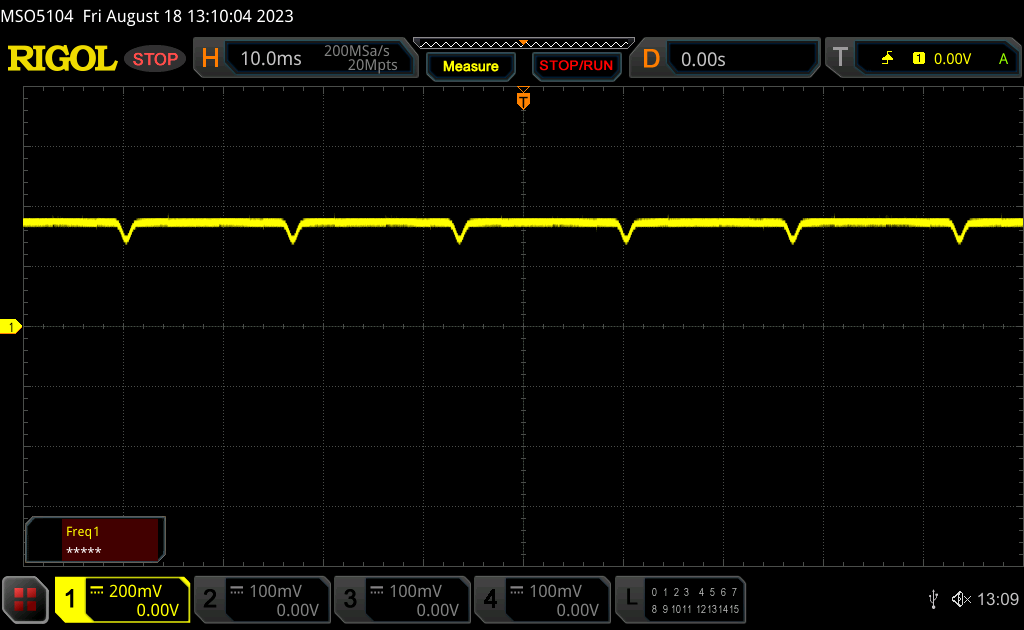
Das Display flackert mit 60 Hz (im schlimmsten Fall, eventuell durch Pulsweitenmodulation PWM) bei einer eingestellten Helligkeit von 100 % und darunter. Darüber sollte es zu keinem Flackern kommen. Die Frequenz von 60 Hz ist sehr gering und daher kann es bei allen Usern zu sichtbaren Flackern, brennenden Augen oder Kopfweh kommen. Im Vergleich: 52 % aller getesteten Geräte nutzten kein PWM um die Helligkeit zu reduzieren. Wenn PWM eingesetzt wurde, dann bei einer Frequenz von durchschnittlich 7791 (Minimum 5, Maximum 343500) Hz. | |||
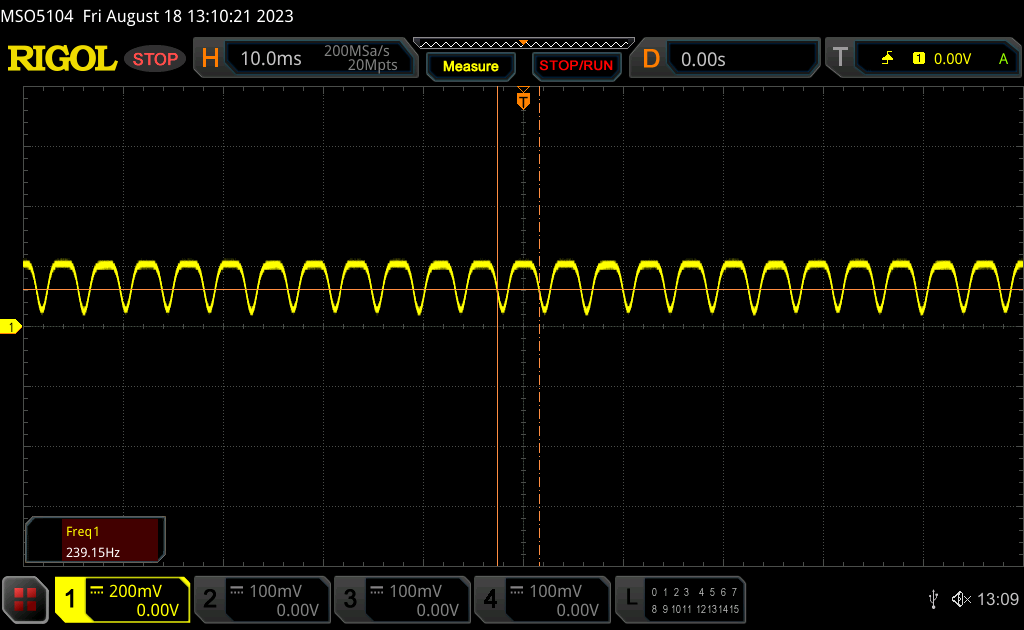
Flackern ist auf allen Helligkeitsstufen nachweisbar, ähnlich wie bei Smartphones und anderen Laptops mit OLED-Panels. Zwischen 0 und 54 Prozent Helligkeit ist die Frequenz stabil bei 239 Hz. Darüber liegt sie bei 60 Hz.
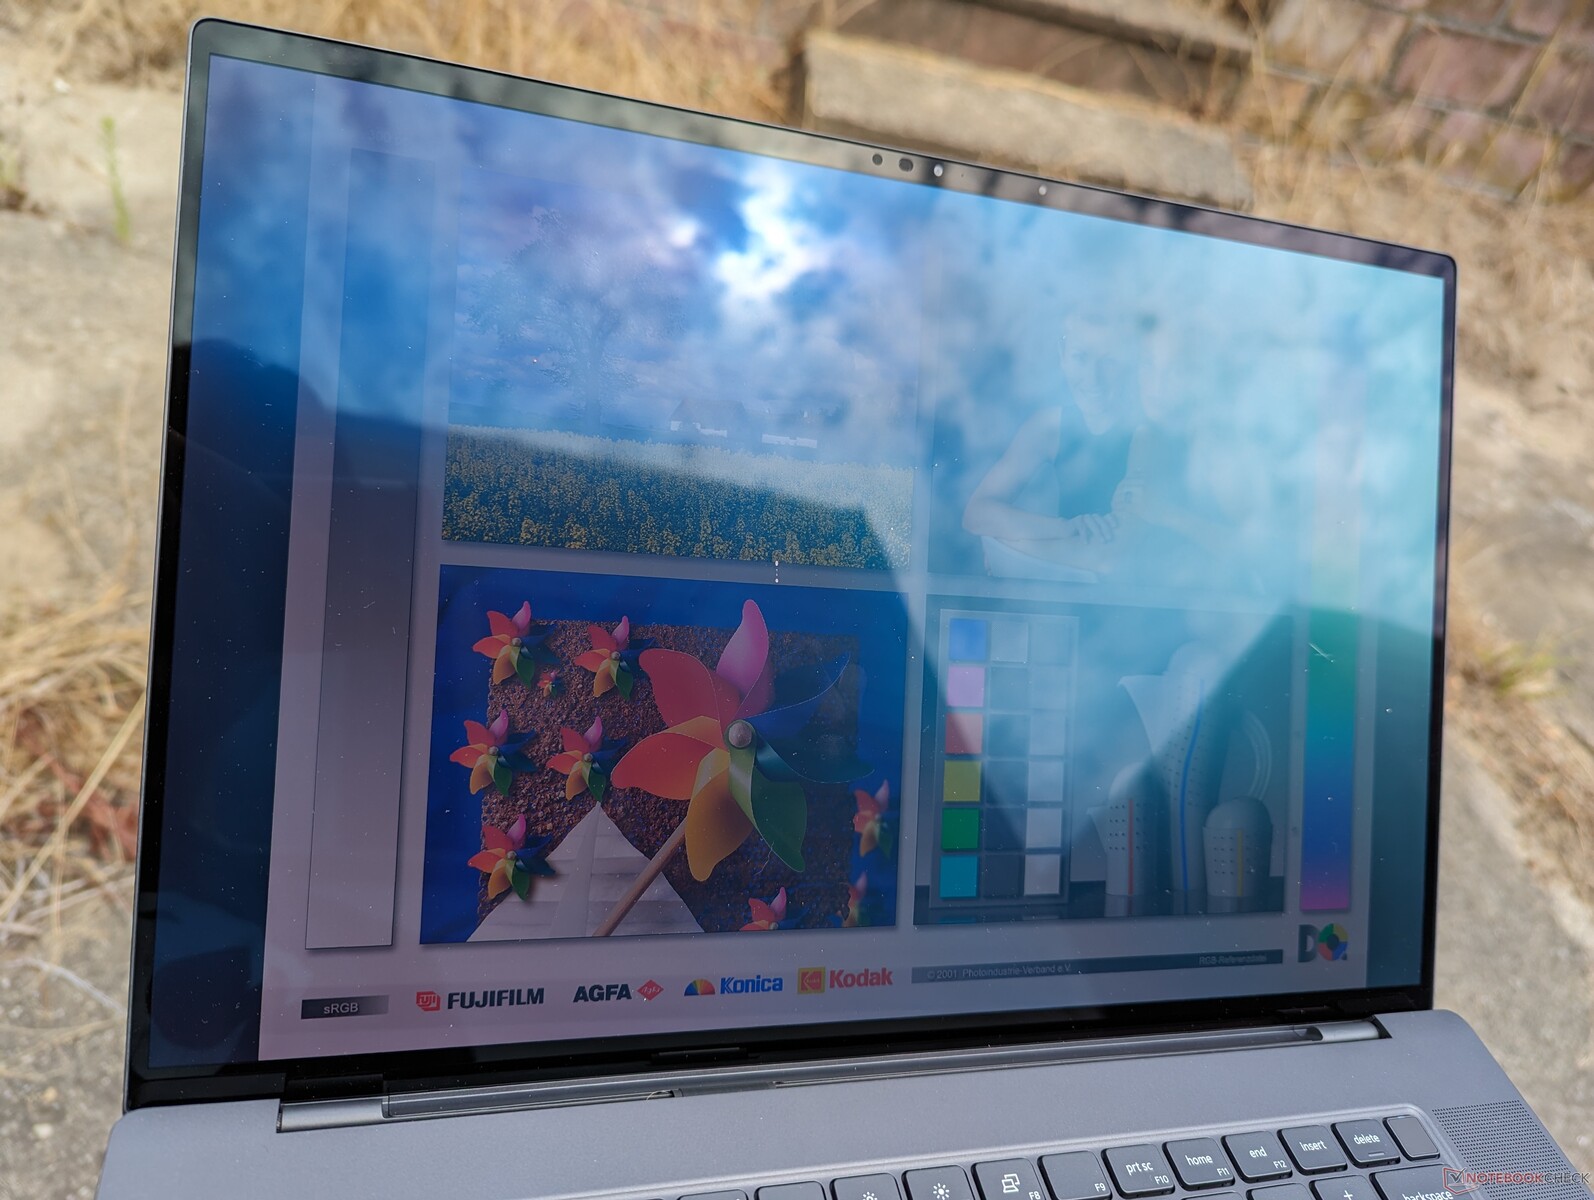
Im Freien ist die Sichtbarkeit der Bildschirminhalte durch den spiegelnden 350-Nits-Touchscreen bestenfalls durchschnittlich. Der OLED ist nicht annähernd so hell wie das IPS-Displays im ZBook Fury 16 G9 oder im ThinkPad P16 G1, welche 500 bis 600 Nits hell leuchten.
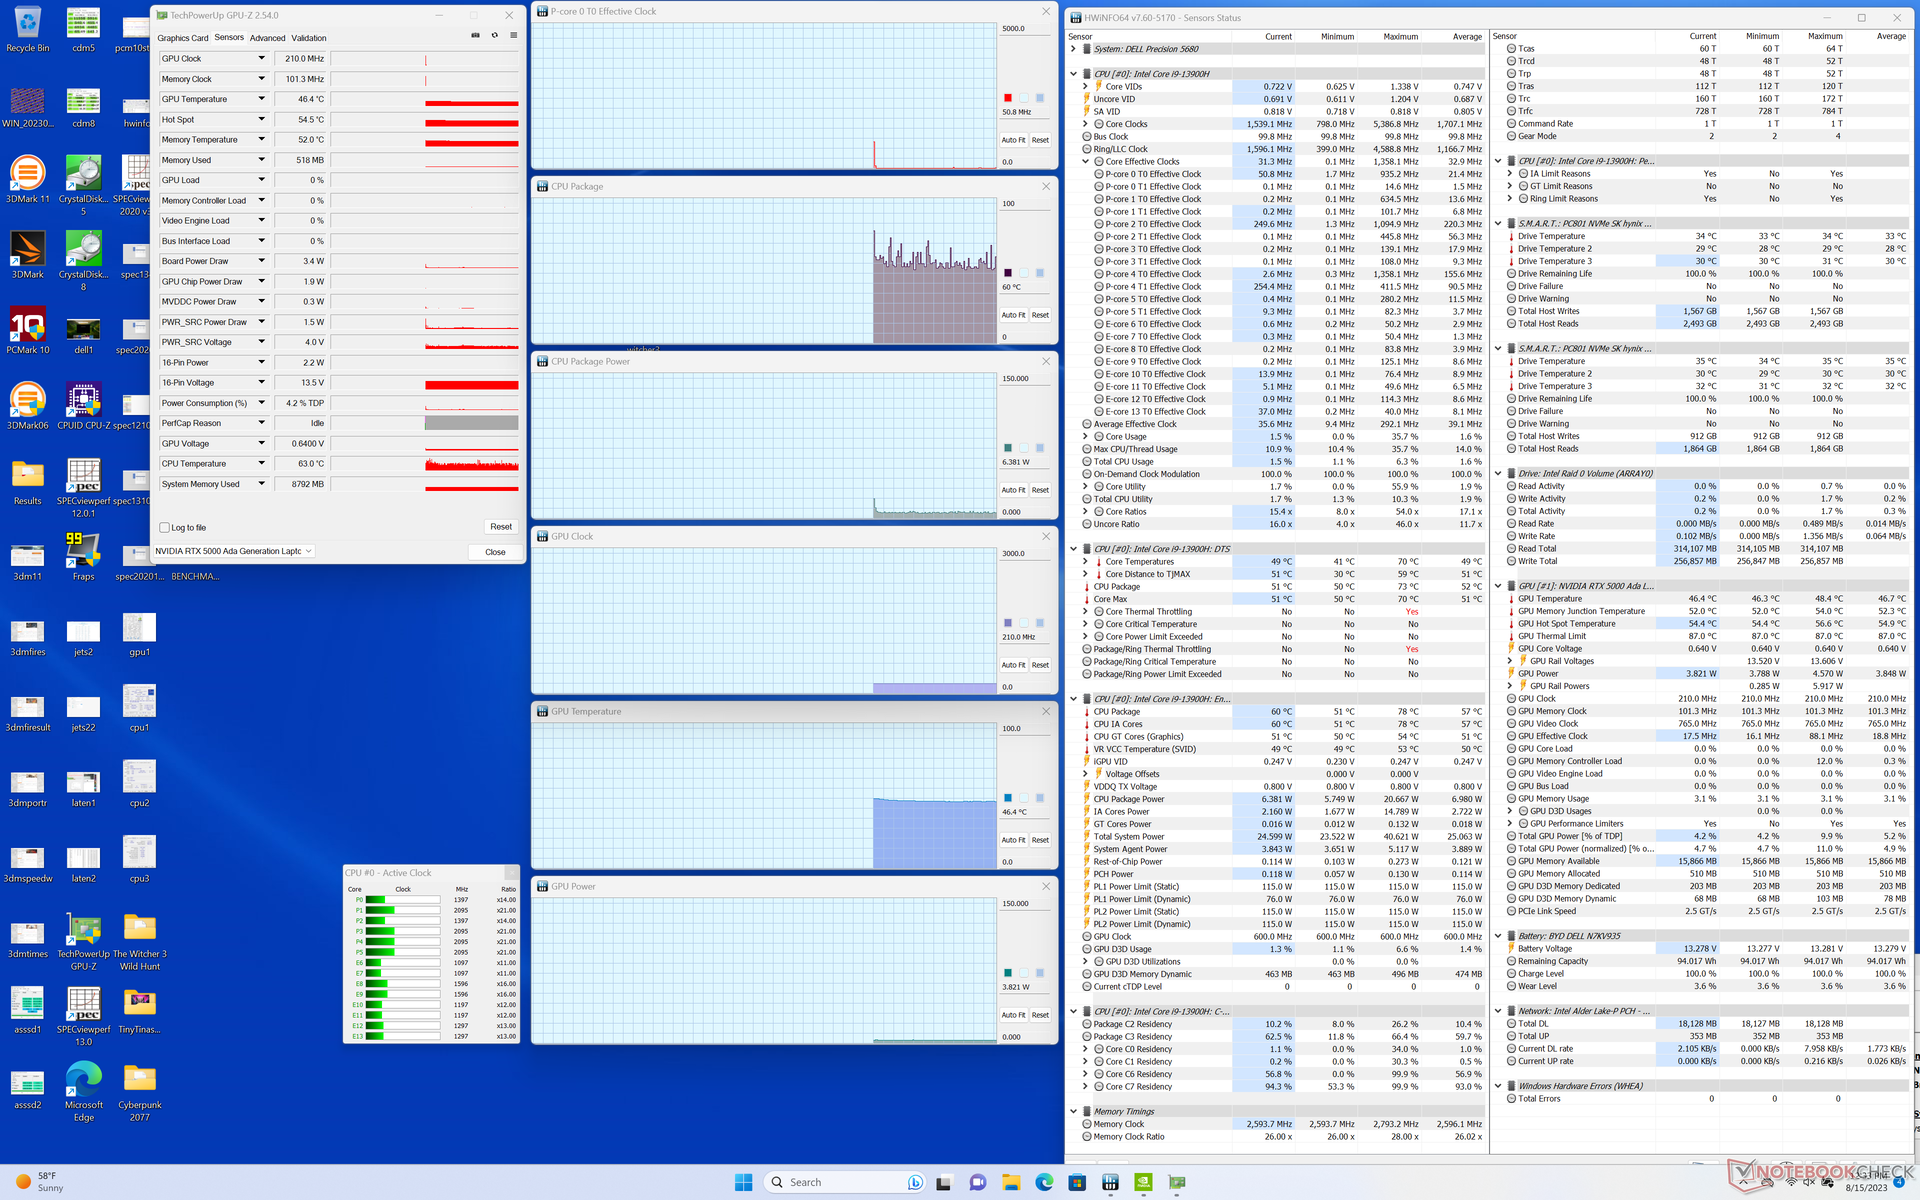
Leistung — Intel Gen13 Raptor Lake-H
Testbedingungen
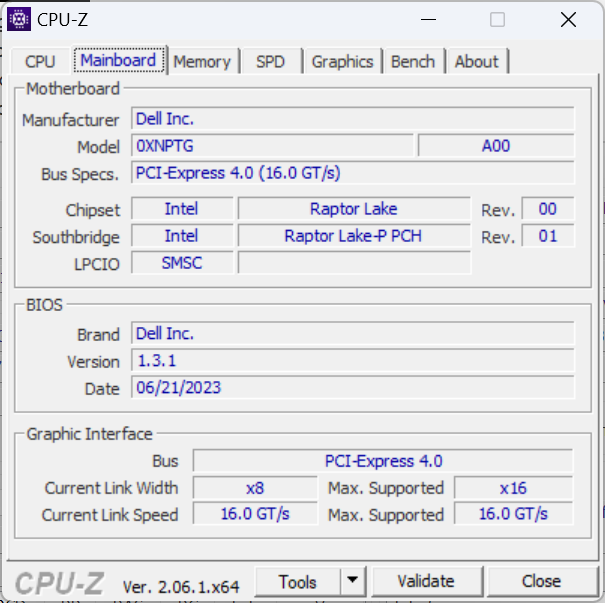
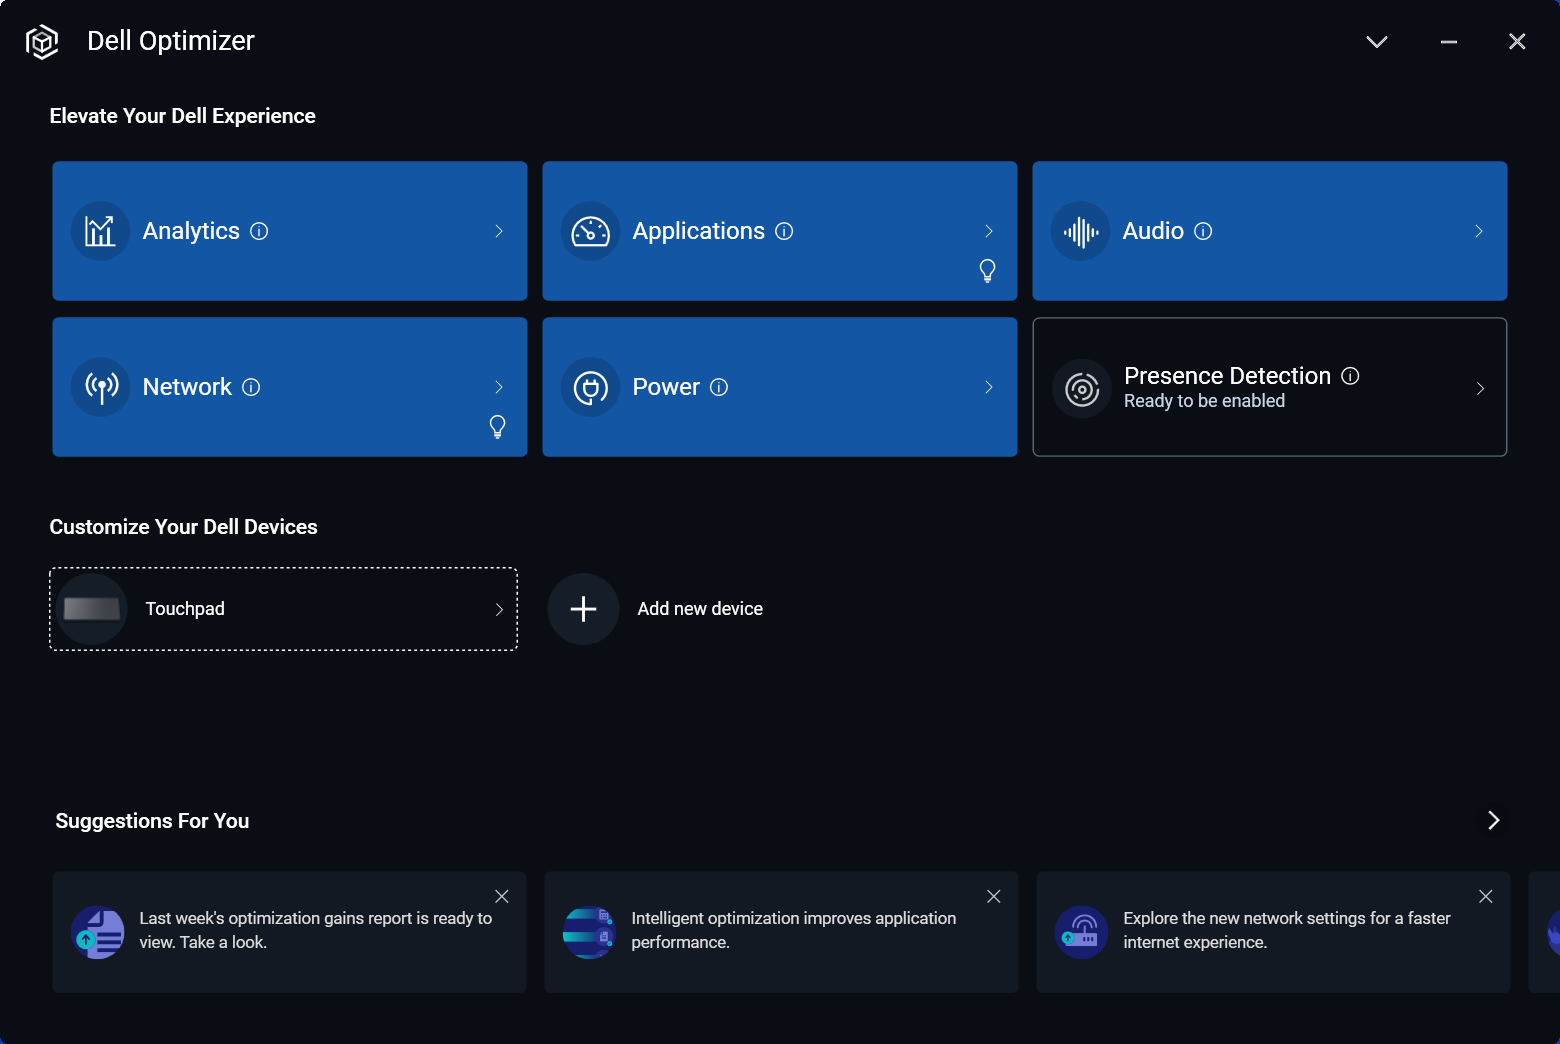
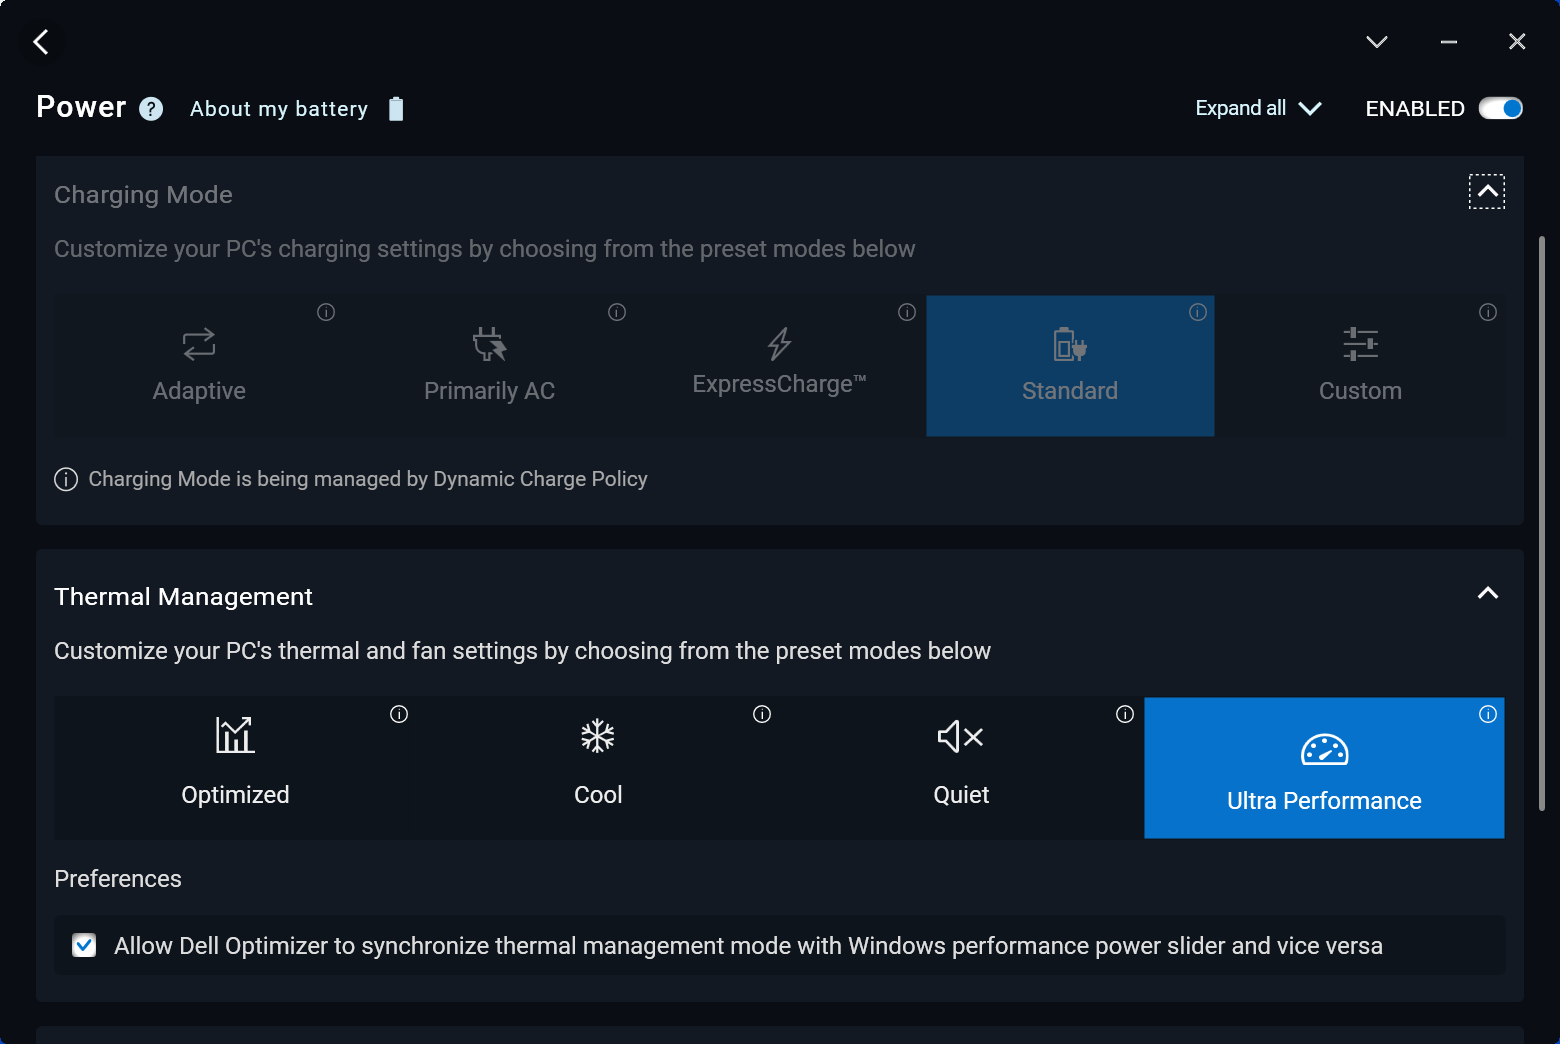
Über den Dell Optimizer haben wir unsere Testeinheit in den "Ultra Performance Modus" versetzt. Im Gegensatz zu den Leistungsprofilen vieler anderer Hersteller, sind die Profile im Optimizer mit den Windows-Energieprofilen synchronisiert.
Advanced Optimus oder Optimus 2.0 wird nicht unterstützt. Allerdings gibt es mit Ada Lovelace eine neue GPU-Funktion für Workstations, den ECC VRAM Mode, welcher über die Nvidia Systemsteuerung an- und ausgeschaltet werden kann. Ein Neustart ist bei einer Änderung erforderlich.
Prozessor
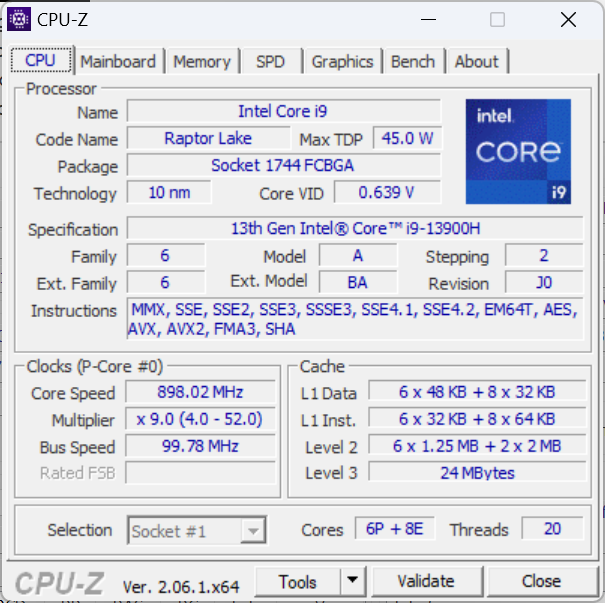
Intels Gen13-CPU Core i9-13900H ist insofern enttäuschend, als dass es keinen nennenswerten Leistungssprung zum letztjährigen Core i9-12900H gibt. Beispielsweise ist die Leistung fast identisch zum Asus ProArt StudioBook 16 mit älterem Core i9-12900H, nur bei Single-Thread-Lasten trennen die beiden etwa 5 bis 10 mickrige Prozent. Es ist schade, dass man die Precision 5680 nicht auch mit Core i9-13900HX erhält, die HX-CPUs bieten dann doch eine signifikante Leistungssteigerung zu den mobilen Prozessoren der Alder-Lake-H-Serie.
Es gibt auch keine Xeon- W-Prozessoren zur Auswahl, was bedeutet, dass ECC RAM auf der Precision 5680 nicht unterstützt wird.
Ein Downgrade auf den Core i7-13700H dürfte die Multi-Thread-Leistung um etwa 20 Prozent absinken lassen, wenn wir vom Test des Schenker Vision 16 Pro ausgehen.
Cinebench R15 Multi Loop
Cinebench R23: Multi Core | Single Core
Cinebench R20: CPU (Multi Core) | CPU (Single Core)
Cinebench R15: CPU Multi 64Bit | CPU Single 64Bit
Blender: v2.79 BMW27 CPU
7-Zip 18.03: 7z b 4 | 7z b 4 -mmt1
Geekbench 5.5: Multi-Core | Single-Core
HWBOT x265 Benchmark v2.2: 4k Preset
LibreOffice : 20 Documents To PDF
R Benchmark 2.5: Overall mean
* ... kleinere Werte sind besser
AIDA64: FP32 Ray-Trace | FPU Julia | CPU SHA3 | CPU Queen | FPU SinJulia | FPU Mandel | CPU AES | CPU ZLib | FP64 Ray-Trace | CPU PhotoWorxx
| Performance Rating | |
| Lenovo ThinkPad P16 G1 RTX A5500 | |
| HP ZBook Fury 16 G9 | |
| Dell Precision 5000 5680 | |
| MSI CreatorPro Z16P B12UKST | |
| Asus ExpertBook B6 Flip B6602FC2 | |
| Durchschnittliche Intel Core i9-13900H | |
| Dell Precision 7000 7670 Performance | |
| AIDA64 / FP32 Ray-Trace | |
| Lenovo ThinkPad P16 G1 RTX A5500 | |
| HP ZBook Fury 16 G9 | |
| Asus ExpertBook B6 Flip B6602FC2 | |
| Dell Precision 5000 5680 | |
| Dell Precision 7000 7670 Performance | |
| Durchschnittliche Intel Core i9-13900H (6788 - 19557, n=25) | |
| MSI CreatorPro Z16P B12UKST | |
| AIDA64 / FPU Julia | |
| HP ZBook Fury 16 G9 | |
| Lenovo ThinkPad P16 G1 RTX A5500 | |
| Asus ExpertBook B6 Flip B6602FC2 | |
| Dell Precision 5000 5680 | |
| Dell Precision 7000 7670 Performance | |
| Durchschnittliche Intel Core i9-13900H (22551 - 95579, n=25) | |
| MSI CreatorPro Z16P B12UKST | |
| AIDA64 / CPU SHA3 | |
| Lenovo ThinkPad P16 G1 RTX A5500 | |
| HP ZBook Fury 16 G9 | |
| MSI CreatorPro Z16P B12UKST | |
| Durchschnittliche Intel Core i9-13900H (2491 - 4270, n=25) | |
| Dell Precision 5000 5680 | |
| Asus ExpertBook B6 Flip B6602FC2 | |
| Dell Precision 7000 7670 Performance | |
| AIDA64 / CPU Queen | |
| Dell Precision 5000 5680 | |
| Durchschnittliche Intel Core i9-13900H (65121 - 120936, n=25) | |
| Lenovo ThinkPad P16 G1 RTX A5500 | |
| Dell Precision 7000 7670 Performance | |
| Asus ExpertBook B6 Flip B6602FC2 | |
| HP ZBook Fury 16 G9 | |
| MSI CreatorPro Z16P B12UKST | |
| AIDA64 / FPU SinJulia | |
| Lenovo ThinkPad P16 G1 RTX A5500 | |
| HP ZBook Fury 16 G9 | |
| Asus ExpertBook B6 Flip B6602FC2 | |
| Dell Precision 7000 7670 Performance | |
| Dell Precision 5000 5680 | |
| Durchschnittliche Intel Core i9-13900H (6108 - 11631, n=25) | |
| MSI CreatorPro Z16P B12UKST | |
| AIDA64 / FPU Mandel | |
| HP ZBook Fury 16 G9 | |
| Lenovo ThinkPad P16 G1 RTX A5500 | |
| Asus ExpertBook B6 Flip B6602FC2 | |
| Dell Precision 5000 5680 | |
| Durchschnittliche Intel Core i9-13900H (11283 - 48474, n=25) | |
| Dell Precision 7000 7670 Performance | |
| MSI CreatorPro Z16P B12UKST | |
| AIDA64 / CPU AES | |
| MSI CreatorPro Z16P B12UKST | |
| HP ZBook Fury 16 G9 | |
| Lenovo ThinkPad P16 G1 RTX A5500 | |
| Durchschnittliche Intel Core i9-13900H (3691 - 149377, n=25) | |
| Asus ExpertBook B6 Flip B6602FC2 | |
| Dell Precision 7000 7670 Performance | |
| Dell Precision 5000 5680 | |
| AIDA64 / CPU ZLib | |
| Lenovo ThinkPad P16 G1 RTX A5500 | |
| HP ZBook Fury 16 G9 | |
| Durchschnittliche Intel Core i9-13900H (789 - 1254, n=25) | |
| Asus ExpertBook B6 Flip B6602FC2 | |
| MSI CreatorPro Z16P B12UKST | |
| Dell Precision 5000 5680 | |
| Dell Precision 7000 7670 Performance | |
| AIDA64 / FP64 Ray-Trace | |
| Lenovo ThinkPad P16 G1 RTX A5500 | |
| HP ZBook Fury 16 G9 | |
| Asus ExpertBook B6 Flip B6602FC2 | |
| Dell Precision 5000 5680 | |
| Dell Precision 7000 7670 Performance | |
| Durchschnittliche Intel Core i9-13900H (3655 - 10716, n=25) | |
| MSI CreatorPro Z16P B12UKST | |
| AIDA64 / CPU PhotoWorxx | |
| Dell Precision 5000 5680 | |
| MSI CreatorPro Z16P B12UKST | |
| Dell Precision 7000 7670 Performance | |
| Lenovo ThinkPad P16 G1 RTX A5500 | |
| Durchschnittliche Intel Core i9-13900H (10871 - 50488, n=25) | |
| HP ZBook Fury 16 G9 | |
| Asus ExpertBook B6 Flip B6602FC2 | |
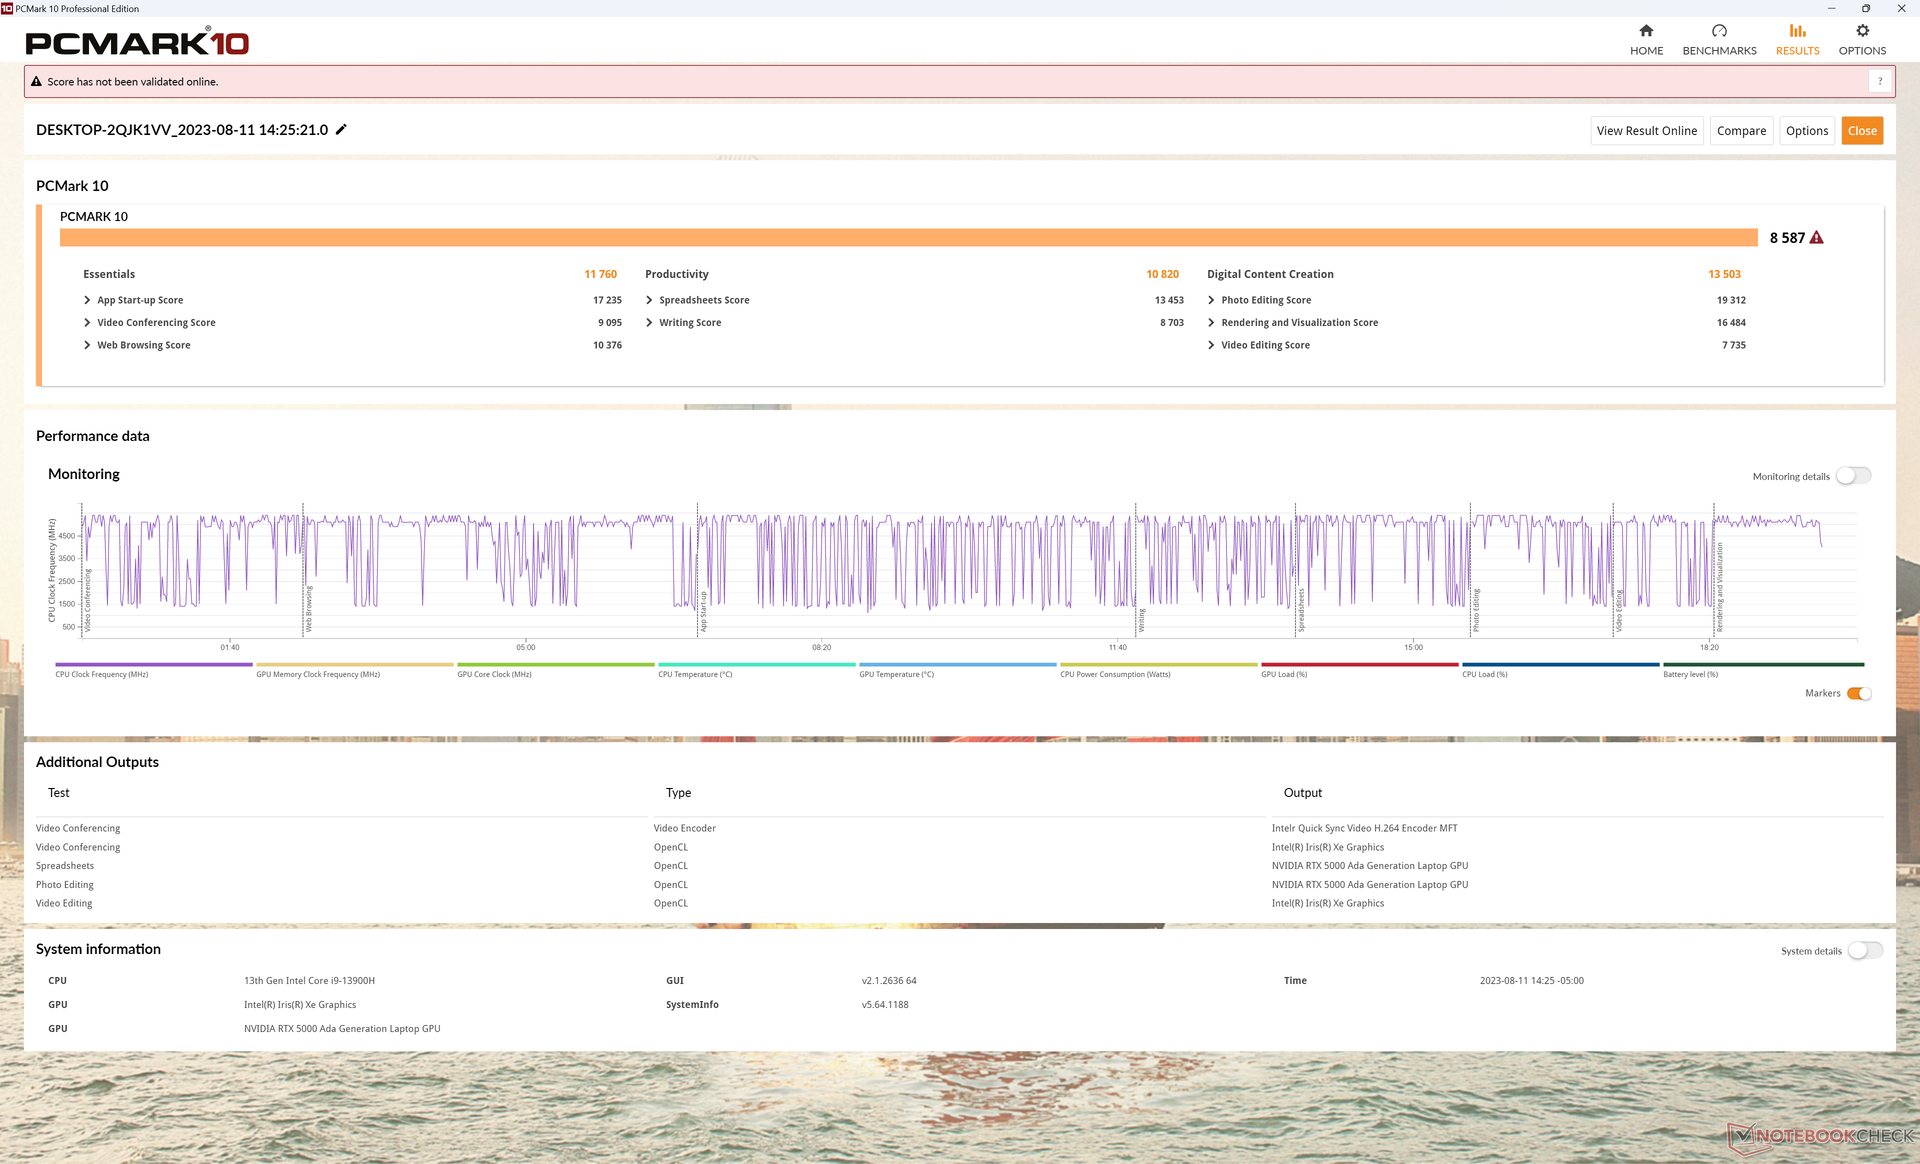
Systemleistung
PCMark-Scores rangieren höher als bei den meisten anderen Workstations, selbst im Vergleich zu starken Vertretern wie dem HP ZBook Fury 16 G9 oder der Precision 7670 Performance. Das liegt zu großen Teilen an der RAID-0-SSD-Konfiguration und der RTX 5000, andere Workstations vertrauen meist auf eine Single-SSD und ältere GPUs.
CrossMark: Overall | Productivity | Creativity | Responsiveness
| PCMark 10 / Score | |
| Dell Precision 5000 5680 | |
| Durchschnittliche Intel Core i9-13900H, NVIDIA RTX 5000 Ada Generation Laptop (n=1) | |
| Asus ExpertBook B6 Flip B6602FC2 | |
| Lenovo ThinkPad P16 G1 RTX A5500 | |
| MSI CreatorPro Z16P B12UKST | |
| HP ZBook Fury 16 G9 | |
| Dell Precision 7000 7670 Performance | |
| PCMark 10 / Essentials | |
| Dell Precision 5000 5680 | |
| Durchschnittliche Intel Core i9-13900H, NVIDIA RTX 5000 Ada Generation Laptop (n=1) | |
| Dell Precision 7000 7670 Performance | |
| HP ZBook Fury 16 G9 | |
| Lenovo ThinkPad P16 G1 RTX A5500 | |
| Asus ExpertBook B6 Flip B6602FC2 | |
| MSI CreatorPro Z16P B12UKST | |
| PCMark 10 / Productivity | |
| Dell Precision 5000 5680 | |
| Durchschnittliche Intel Core i9-13900H, NVIDIA RTX 5000 Ada Generation Laptop (n=1) | |
| Asus ExpertBook B6 Flip B6602FC2 | |
| Lenovo ThinkPad P16 G1 RTX A5500 | |
| MSI CreatorPro Z16P B12UKST | |
| HP ZBook Fury 16 G9 | |
| Dell Precision 7000 7670 Performance | |
| PCMark 10 / Digital Content Creation | |
| Dell Precision 5000 5680 | |
| Durchschnittliche Intel Core i9-13900H, NVIDIA RTX 5000 Ada Generation Laptop (n=1) | |
| Lenovo ThinkPad P16 G1 RTX A5500 | |
| MSI CreatorPro Z16P B12UKST | |
| Dell Precision 7000 7670 Performance | |
| HP ZBook Fury 16 G9 | |
| Asus ExpertBook B6 Flip B6602FC2 | |
| CrossMark / Overall | |
| Asus ExpertBook B6 Flip B6602FC2 | |
| MSI CreatorPro Z16P B12UKST | |
| Dell Precision 5000 5680 | |
| Durchschnittliche Intel Core i9-13900H, NVIDIA RTX 5000 Ada Generation Laptop (n=1) | |
| HP ZBook Fury 16 G9 | |
| Lenovo ThinkPad P16 G1 RTX A5500 | |
| Dell Precision 7000 7670 Performance | |
| CrossMark / Productivity | |
| Asus ExpertBook B6 Flip B6602FC2 | |
| MSI CreatorPro Z16P B12UKST | |
| Dell Precision 5000 5680 | |
| Durchschnittliche Intel Core i9-13900H, NVIDIA RTX 5000 Ada Generation Laptop (n=1) | |
| HP ZBook Fury 16 G9 | |
| Lenovo ThinkPad P16 G1 RTX A5500 | |
| Dell Precision 7000 7670 Performance | |
| CrossMark / Creativity | |
| Lenovo ThinkPad P16 G1 RTX A5500 | |
| Dell Precision 5000 5680 | |
| Durchschnittliche Intel Core i9-13900H, NVIDIA RTX 5000 Ada Generation Laptop (n=1) | |
| Asus ExpertBook B6 Flip B6602FC2 | |
| HP ZBook Fury 16 G9 | |
| MSI CreatorPro Z16P B12UKST | |
| Dell Precision 7000 7670 Performance | |
| CrossMark / Responsiveness | |
| MSI CreatorPro Z16P B12UKST | |
| Asus ExpertBook B6 Flip B6602FC2 | |
| HP ZBook Fury 16 G9 | |
| Dell Precision 5000 5680 | |
| Durchschnittliche Intel Core i9-13900H, NVIDIA RTX 5000 Ada Generation Laptop (n=1) | |
| Dell Precision 7000 7670 Performance | |
| Lenovo ThinkPad P16 G1 RTX A5500 | |
| PCMark 10 Score | 8587 Punkte | |
Hilfe | ||
| AIDA64 / Memory Copy | |
| Dell Precision 5000 5680 | |
| Dell Precision 7000 7670 Performance | |
| Lenovo ThinkPad P16 G1 RTX A5500 | |
| MSI CreatorPro Z16P B12UKST | |
| Durchschnittliche Intel Core i9-13900H (37448 - 74486, n=25) | |
| HP ZBook Fury 16 G9 | |
| Asus ExpertBook B6 Flip B6602FC2 | |
| AIDA64 / Memory Read | |
| Dell Precision 7000 7670 Performance | |
| Dell Precision 5000 5680 | |
| MSI CreatorPro Z16P B12UKST | |
| Lenovo ThinkPad P16 G1 RTX A5500 | |
| Durchschnittliche Intel Core i9-13900H (41599 - 75433, n=25) | |
| Asus ExpertBook B6 Flip B6602FC2 | |
| HP ZBook Fury 16 G9 | |
| AIDA64 / Memory Write | |
| Dell Precision 5000 5680 | |
| MSI CreatorPro Z16P B12UKST | |
| Dell Precision 7000 7670 Performance | |
| Durchschnittliche Intel Core i9-13900H (36152 - 88505, n=25) | |
| Lenovo ThinkPad P16 G1 RTX A5500 | |
| Asus ExpertBook B6 Flip B6602FC2 | |
| HP ZBook Fury 16 G9 | |
| AIDA64 / Memory Latency | |
| MSI CreatorPro Z16P B12UKST | |
| Asus ExpertBook B6 Flip B6602FC2 | |
| Dell Precision 5000 5680 | |
| HP ZBook Fury 16 G9 | |
| Lenovo ThinkPad P16 G1 RTX A5500 | |
| Durchschnittliche Intel Core i9-13900H (75.8 - 102.3, n=25) | |
| Dell Precision 7000 7670 Performance | |
* ... kleinere Werte sind besser
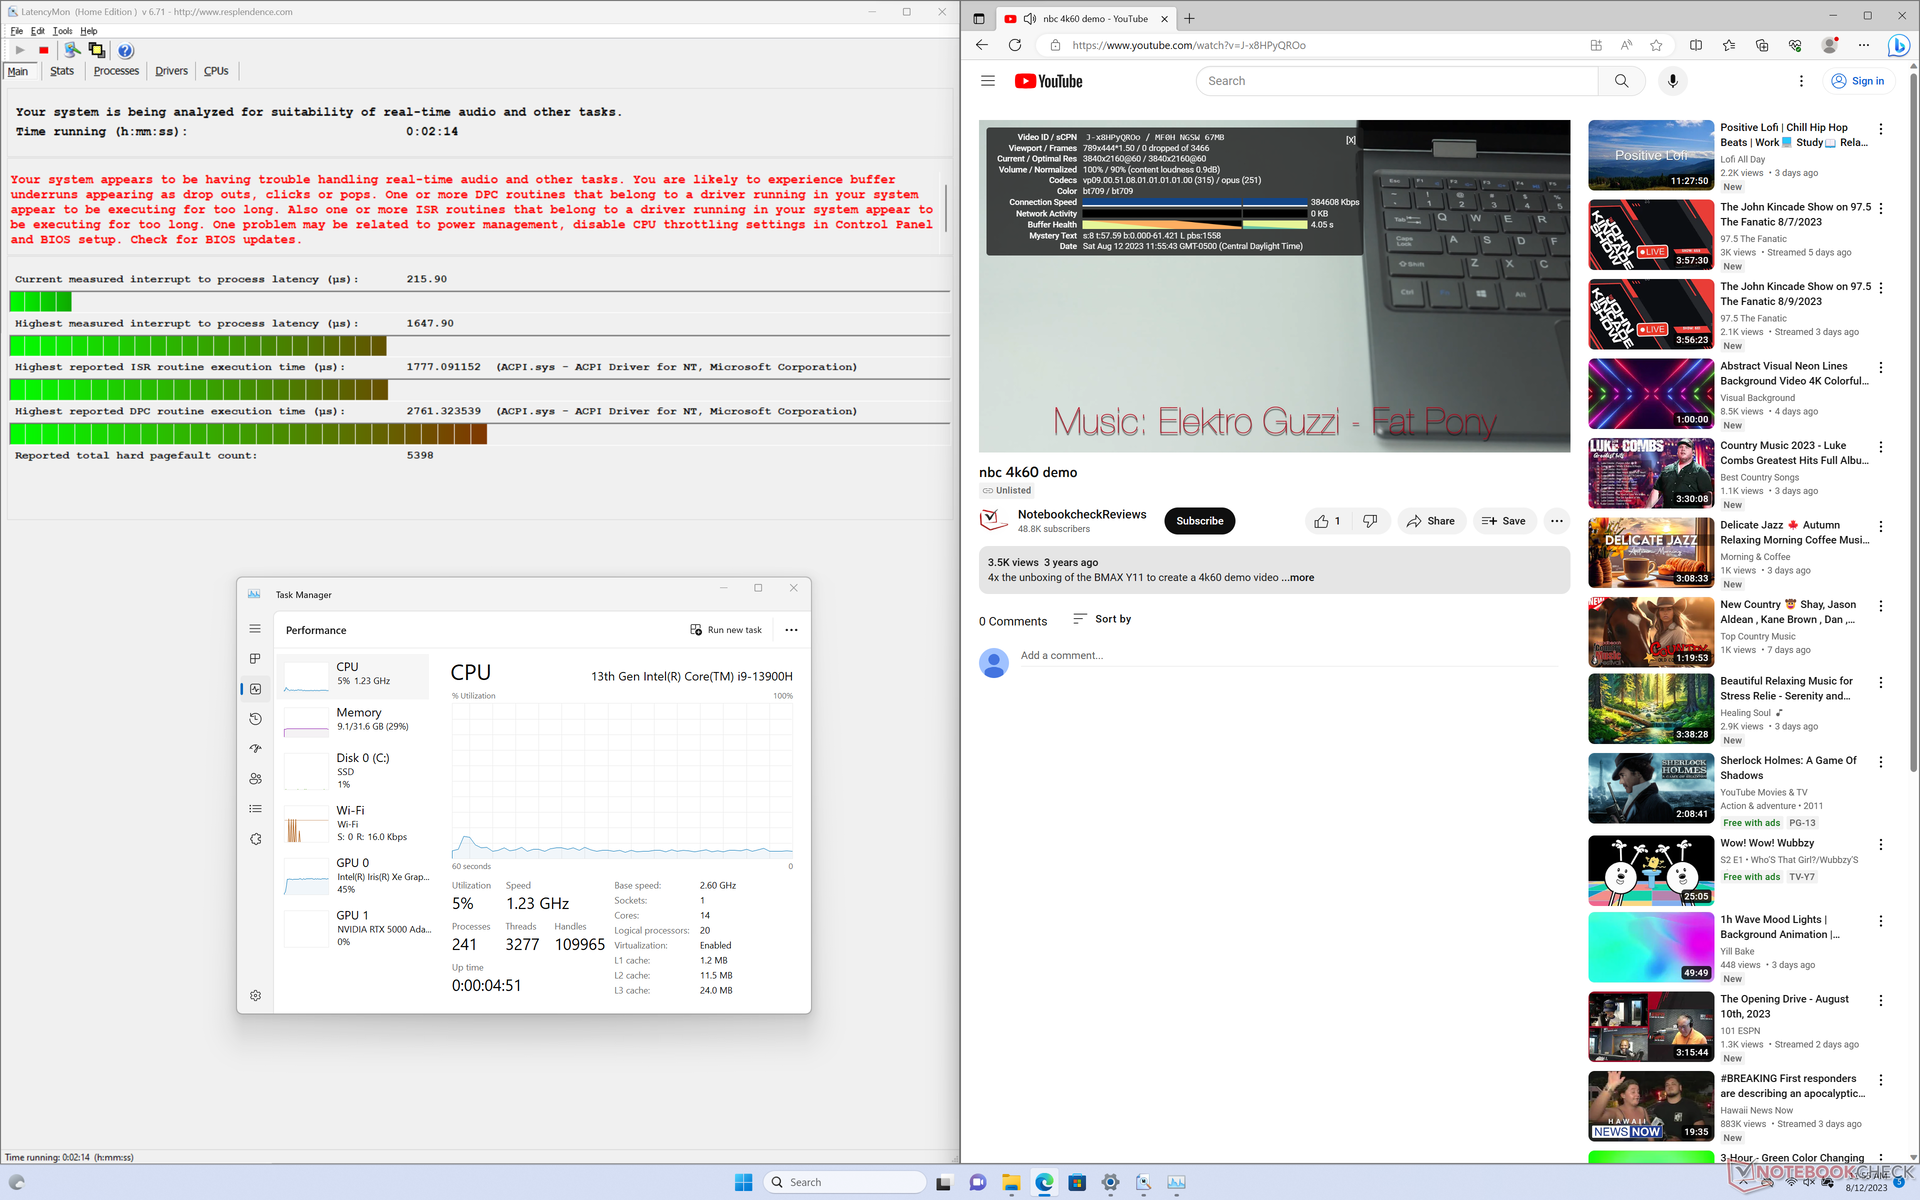
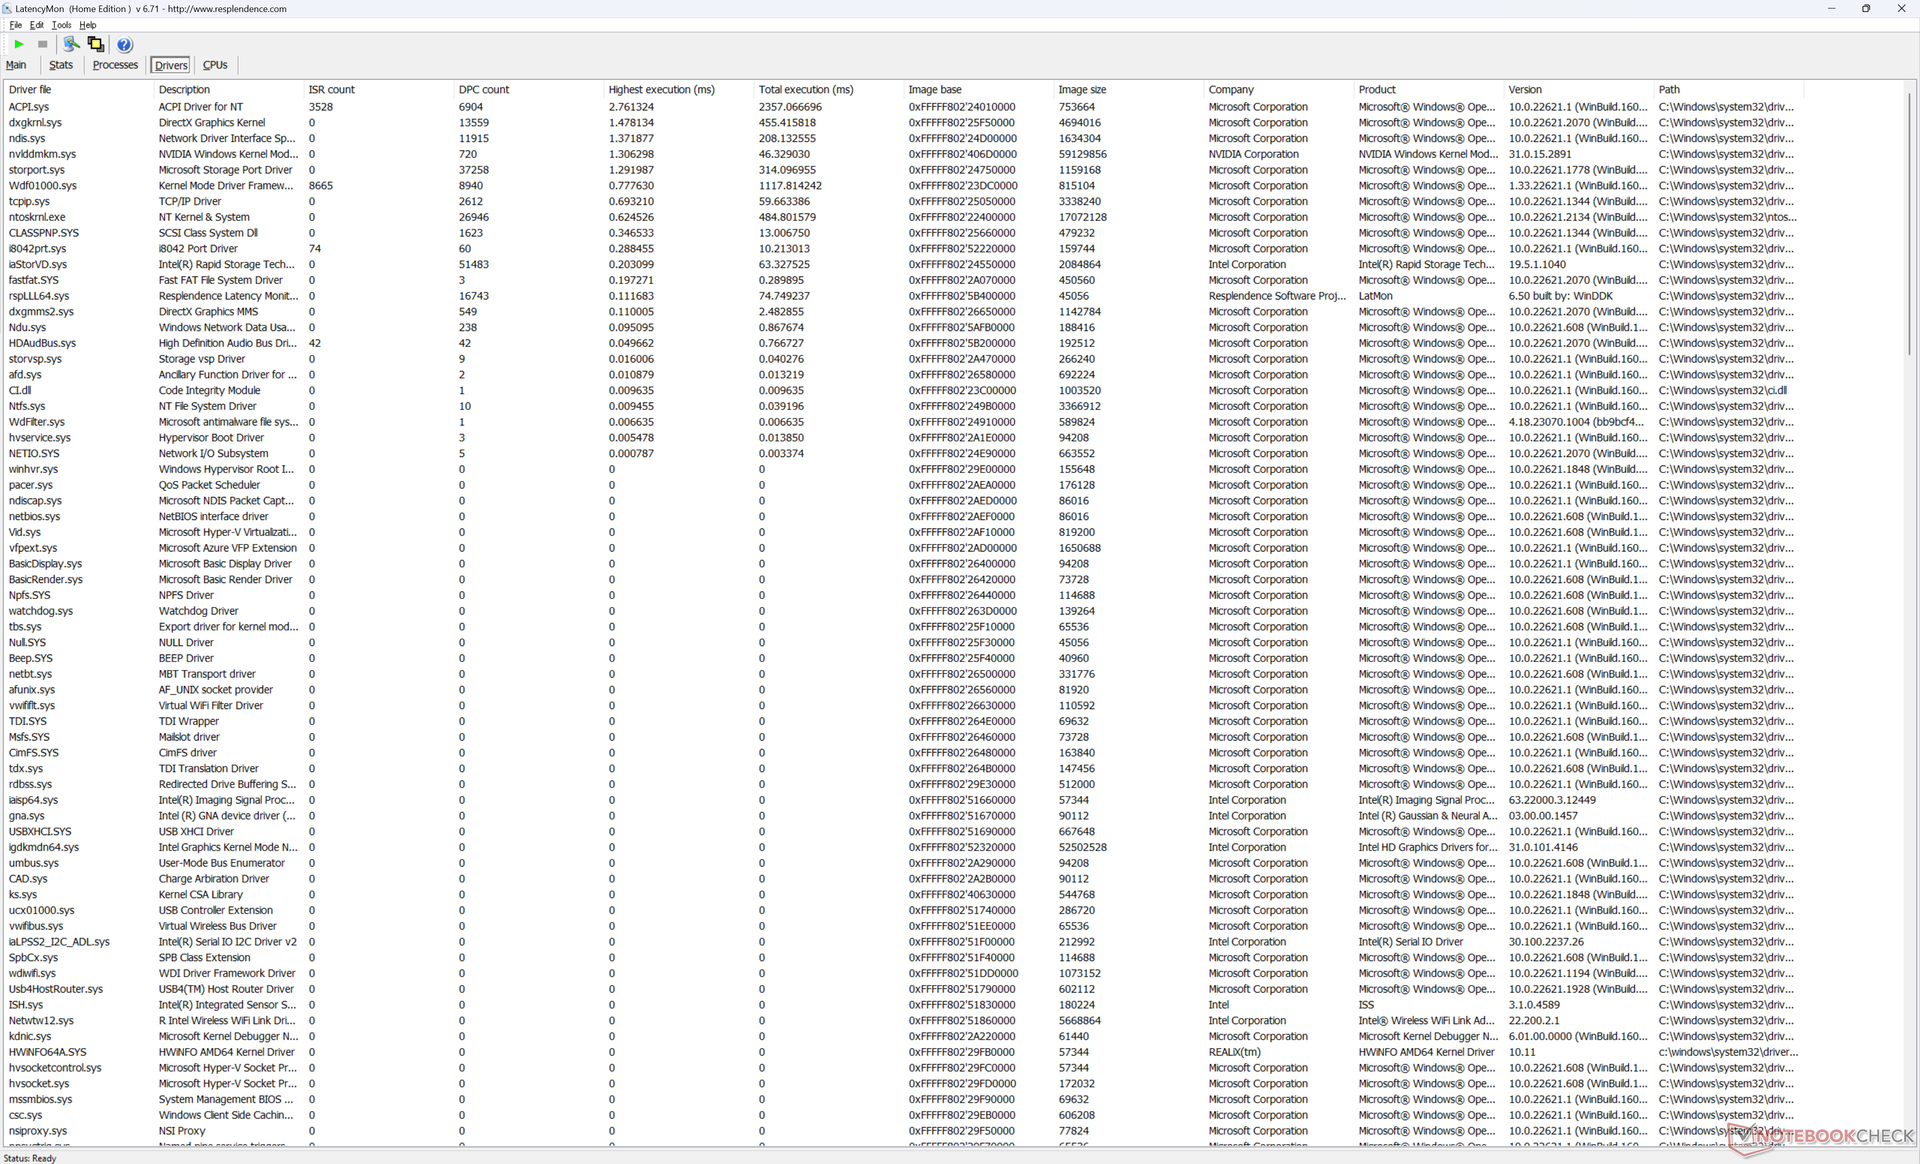
DPC Latency
LatencyMon enthüllt leichte Latenzprobleme beim Öffnen mehrerer Browsertabs auf unserer Homepage, ähnlich wie beim Precision 7670. Die Wiedergabe unseres 4K/60-fps-YouTubevideos läuft hingegen flüssig und ohne ausgelassene Frames ab.
| DPC Latencies / LatencyMon - interrupt to process latency (max), Web, Youtube, Prime95 | |
| HP ZBook Fury 16 G9 | |
| Asus ExpertBook B6 Flip B6602FC2 | |
| Dell Precision 7000 7670 Performance | |
| Dell Precision 5000 5680 | |
| Lenovo ThinkPad P16 G1 RTX A5500 | |
| MSI CreatorPro Z16P B12UKST | |
* ... kleinere Werte sind besser
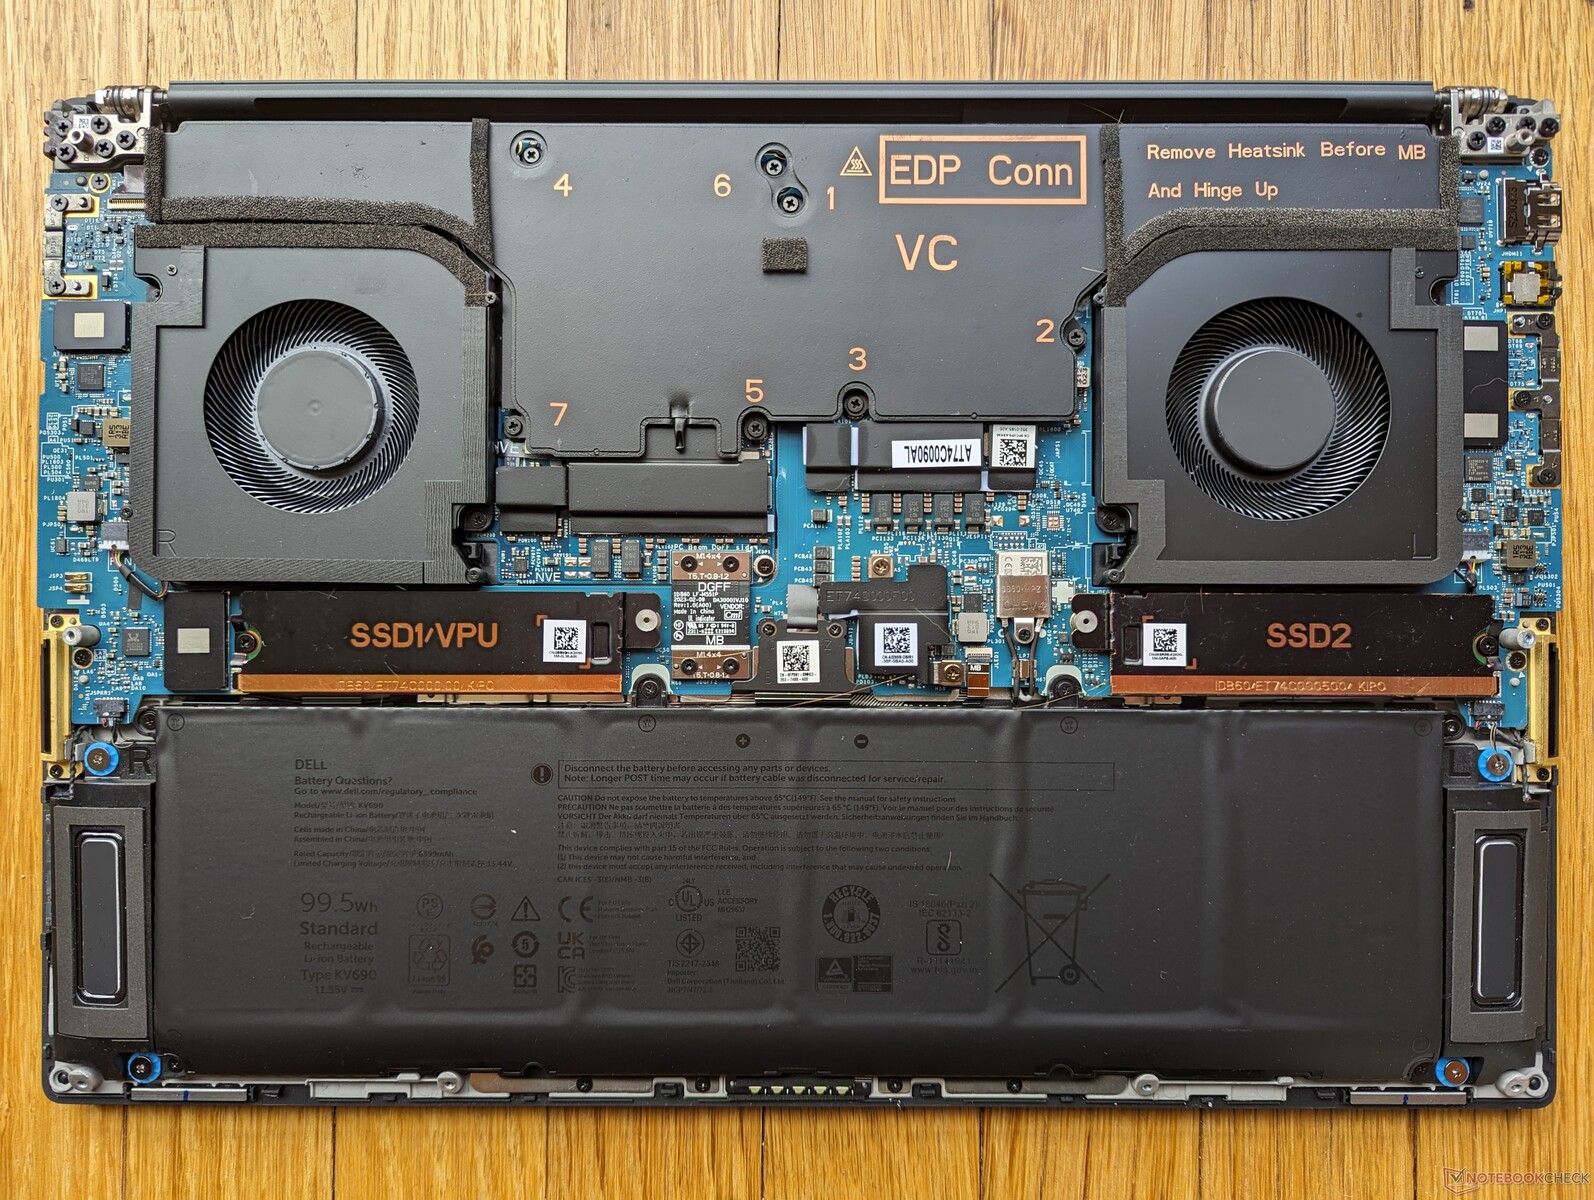
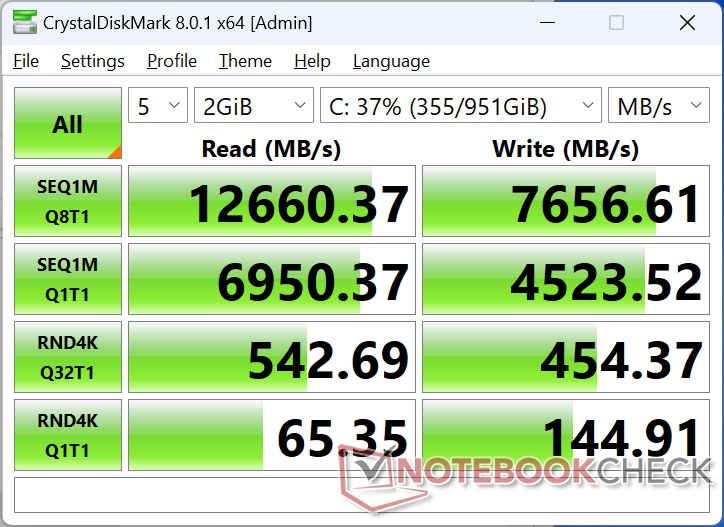
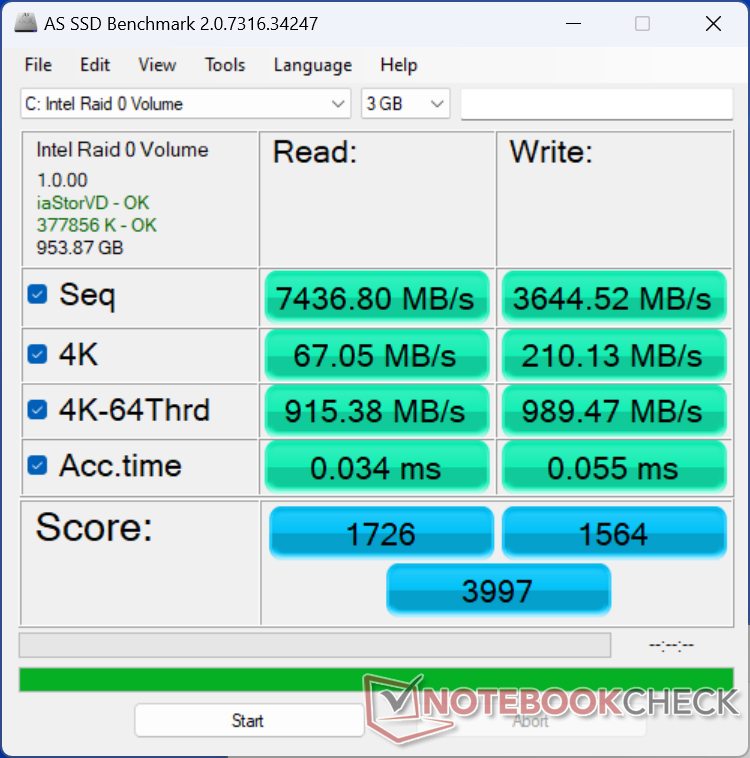
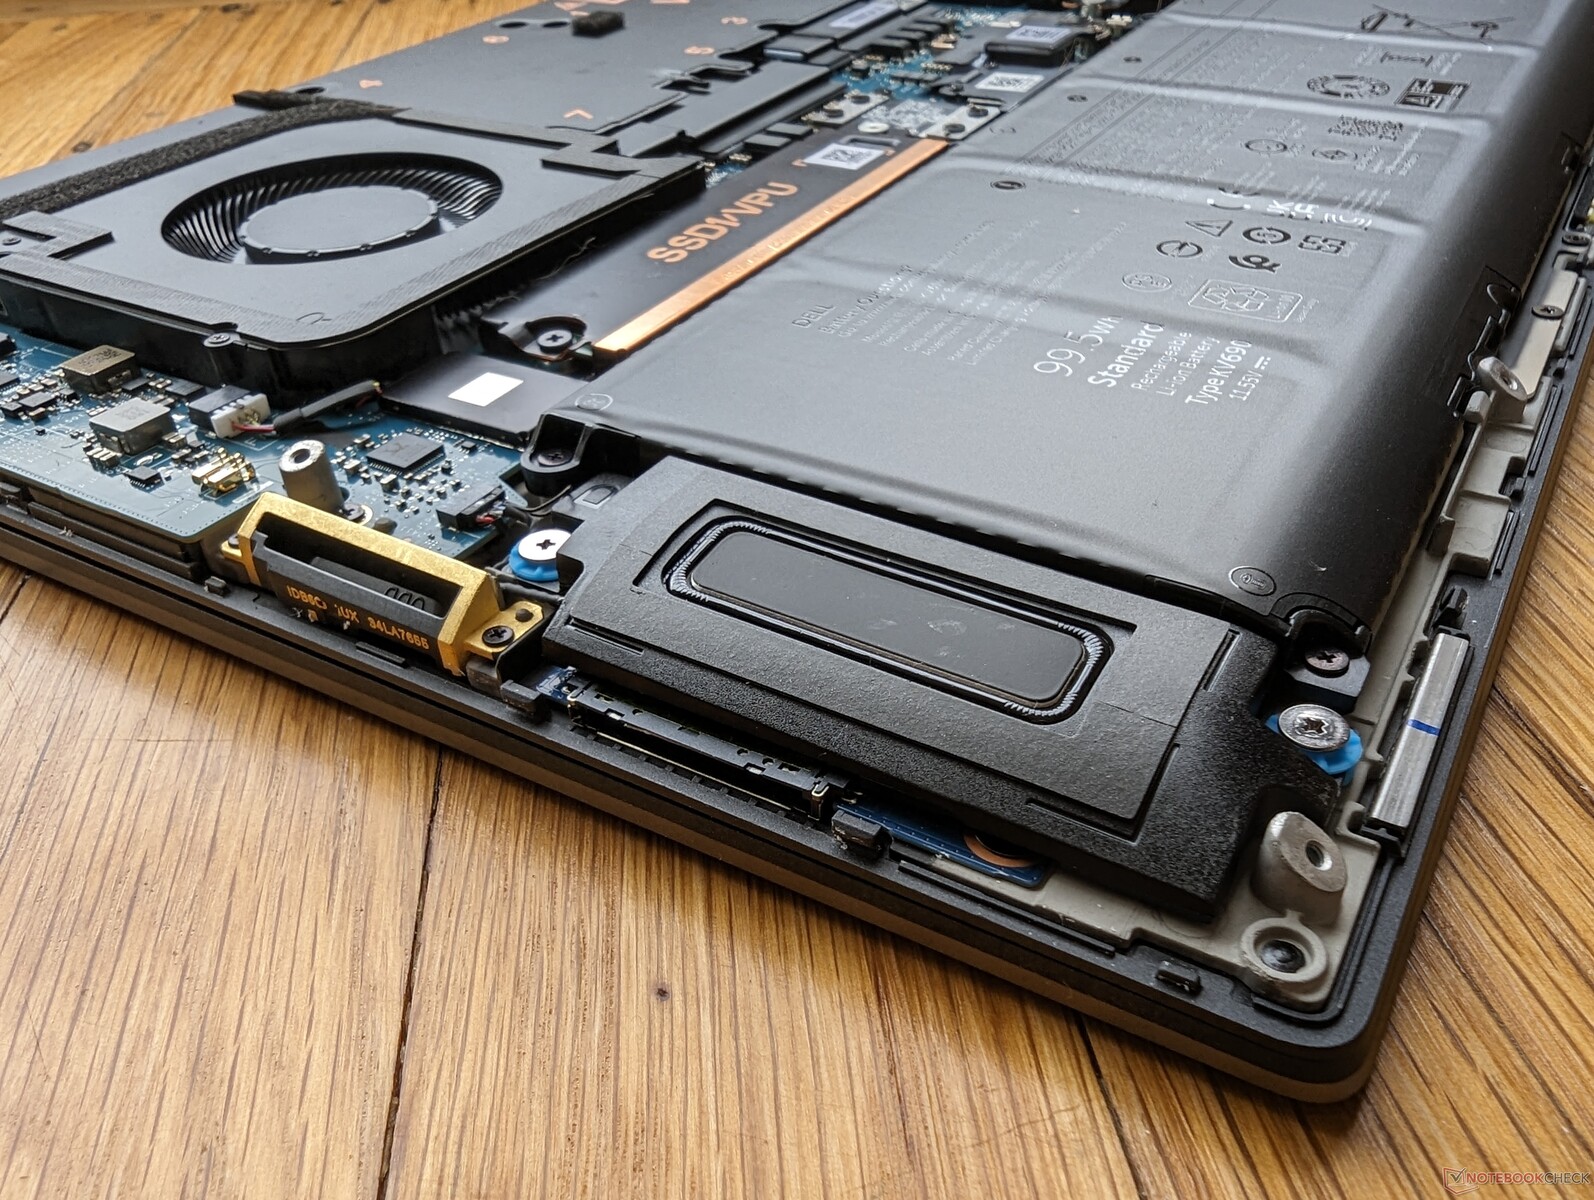
Massenspeicher — Bis zu zwei PCIe4-x4-NVMe-SSDs
Unser Testgerät kommt mir den gleichen SK hynix PC801 PCIe4-x4-NVMe-SSDs im RAID-0-Verbund wie die Precision 7670. Natürlich wäre PCIe5-Support wie in einigen Gaming Laptops ein nettes Feature gewesen, allerdings spielt das bei den kaum verfügbaren PCIe5-SSDs bislang kaum eine Rolle. Dafür bietet Dell Self-Encrypting-SSD-Optionen für eine erhöhte Sicherheit an.
Jeder M.2-SSD-Slot ist mit einem eigenen Kupfer-Heat-Spreader ausgestattet, was positiv für die Kühlung ist. Daher hat kein Laufwerk in unserem Testgerät irgendwelche Probleme damit die hohen Transferraten von ~5.400 MB/s auch über längere Zeiträume aufrecht zu halten.

* ... kleinere Werte sind besser
Disk Throttling: DiskSpd Read Loop, Queue Depth 8
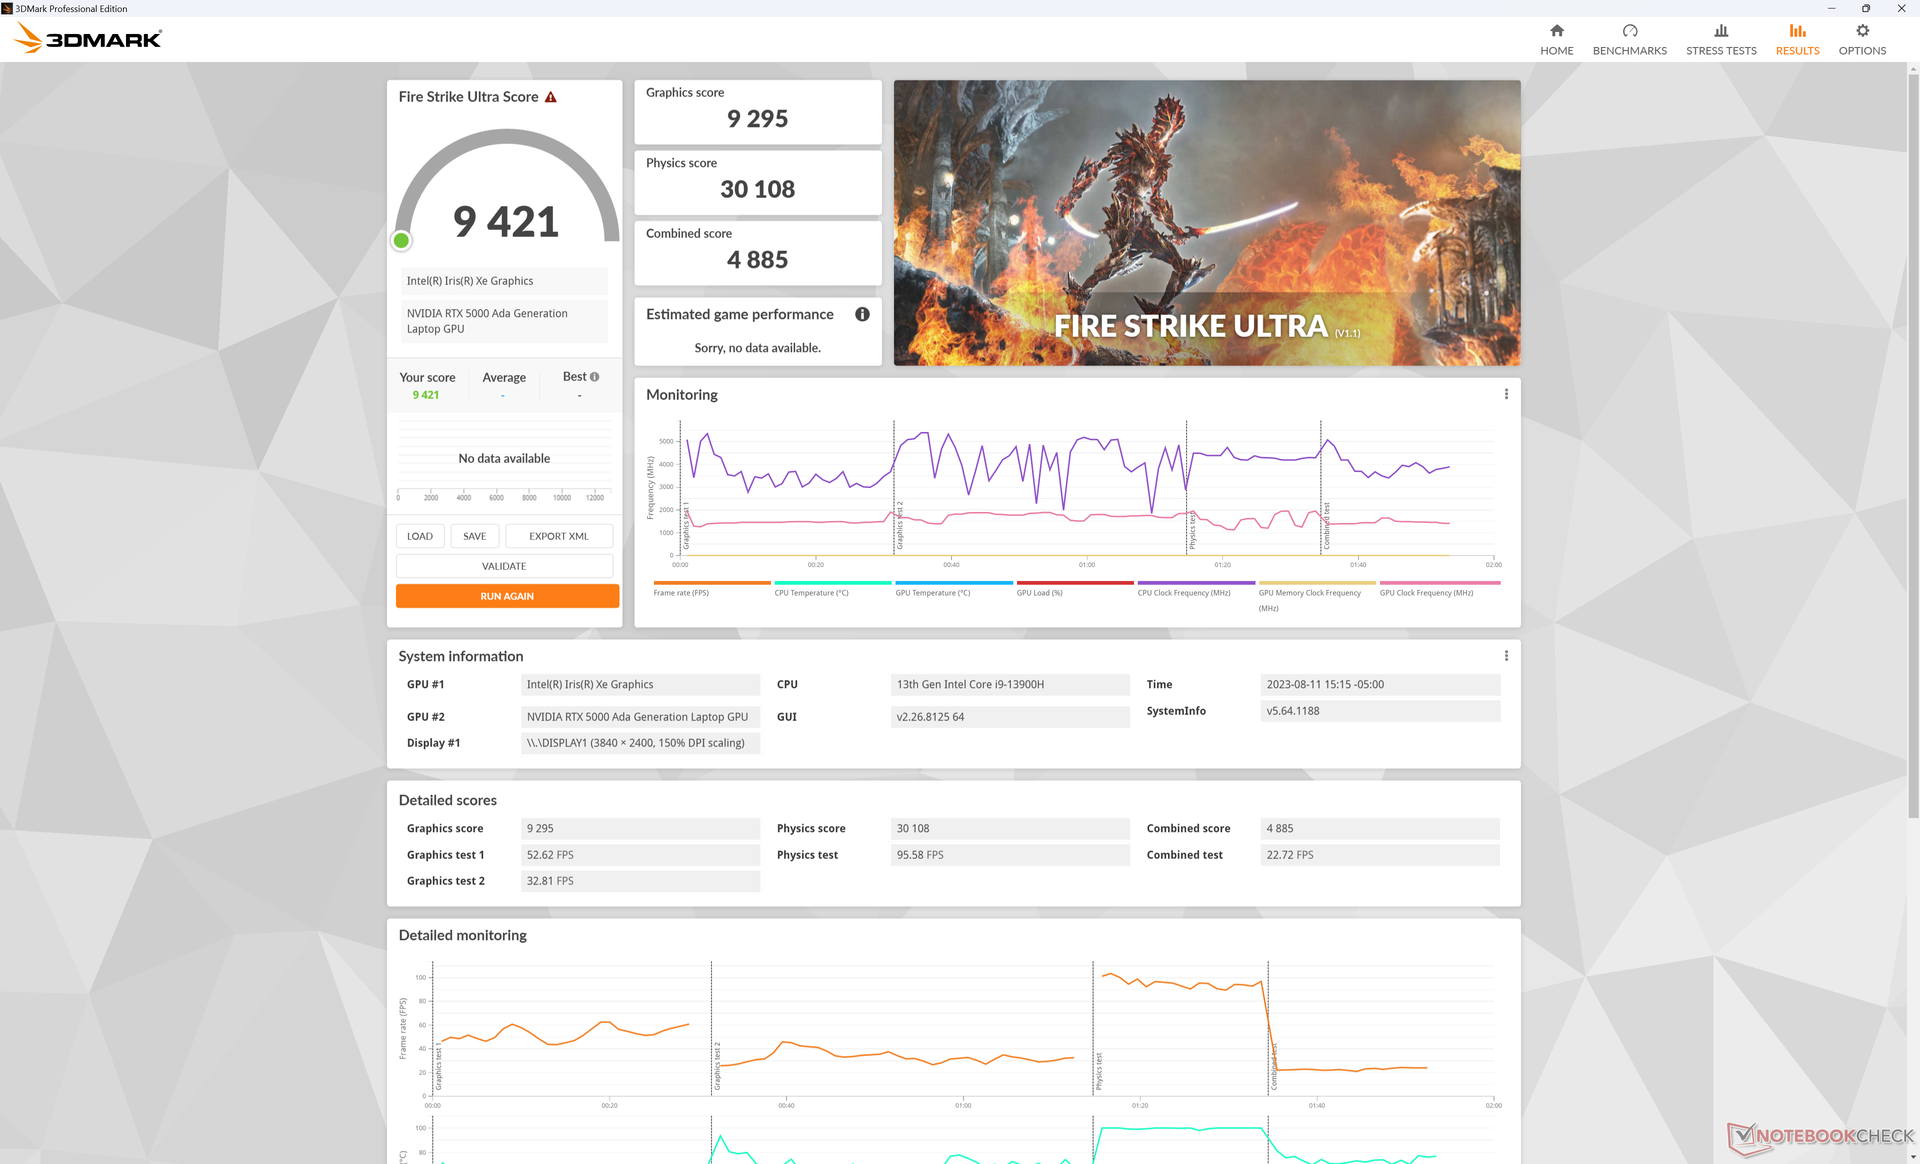
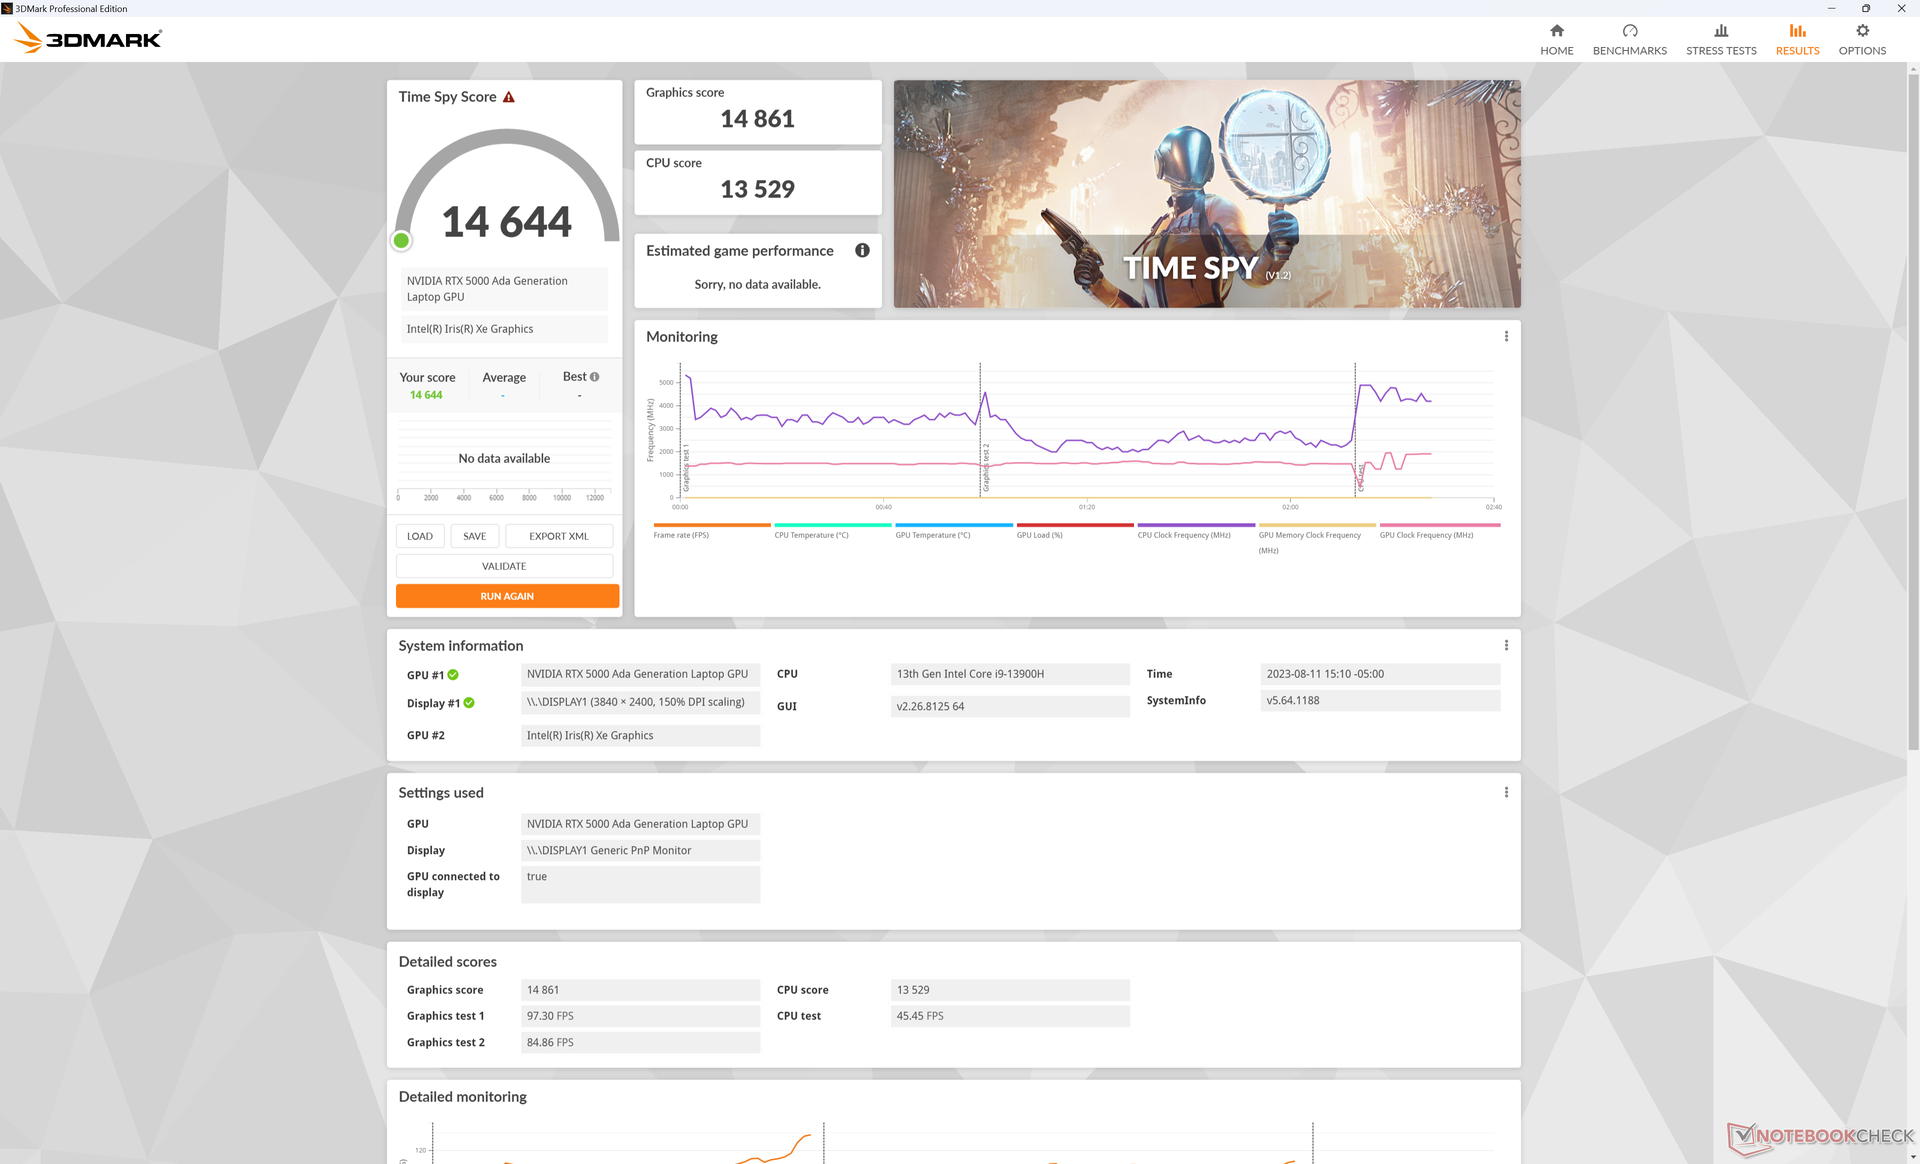
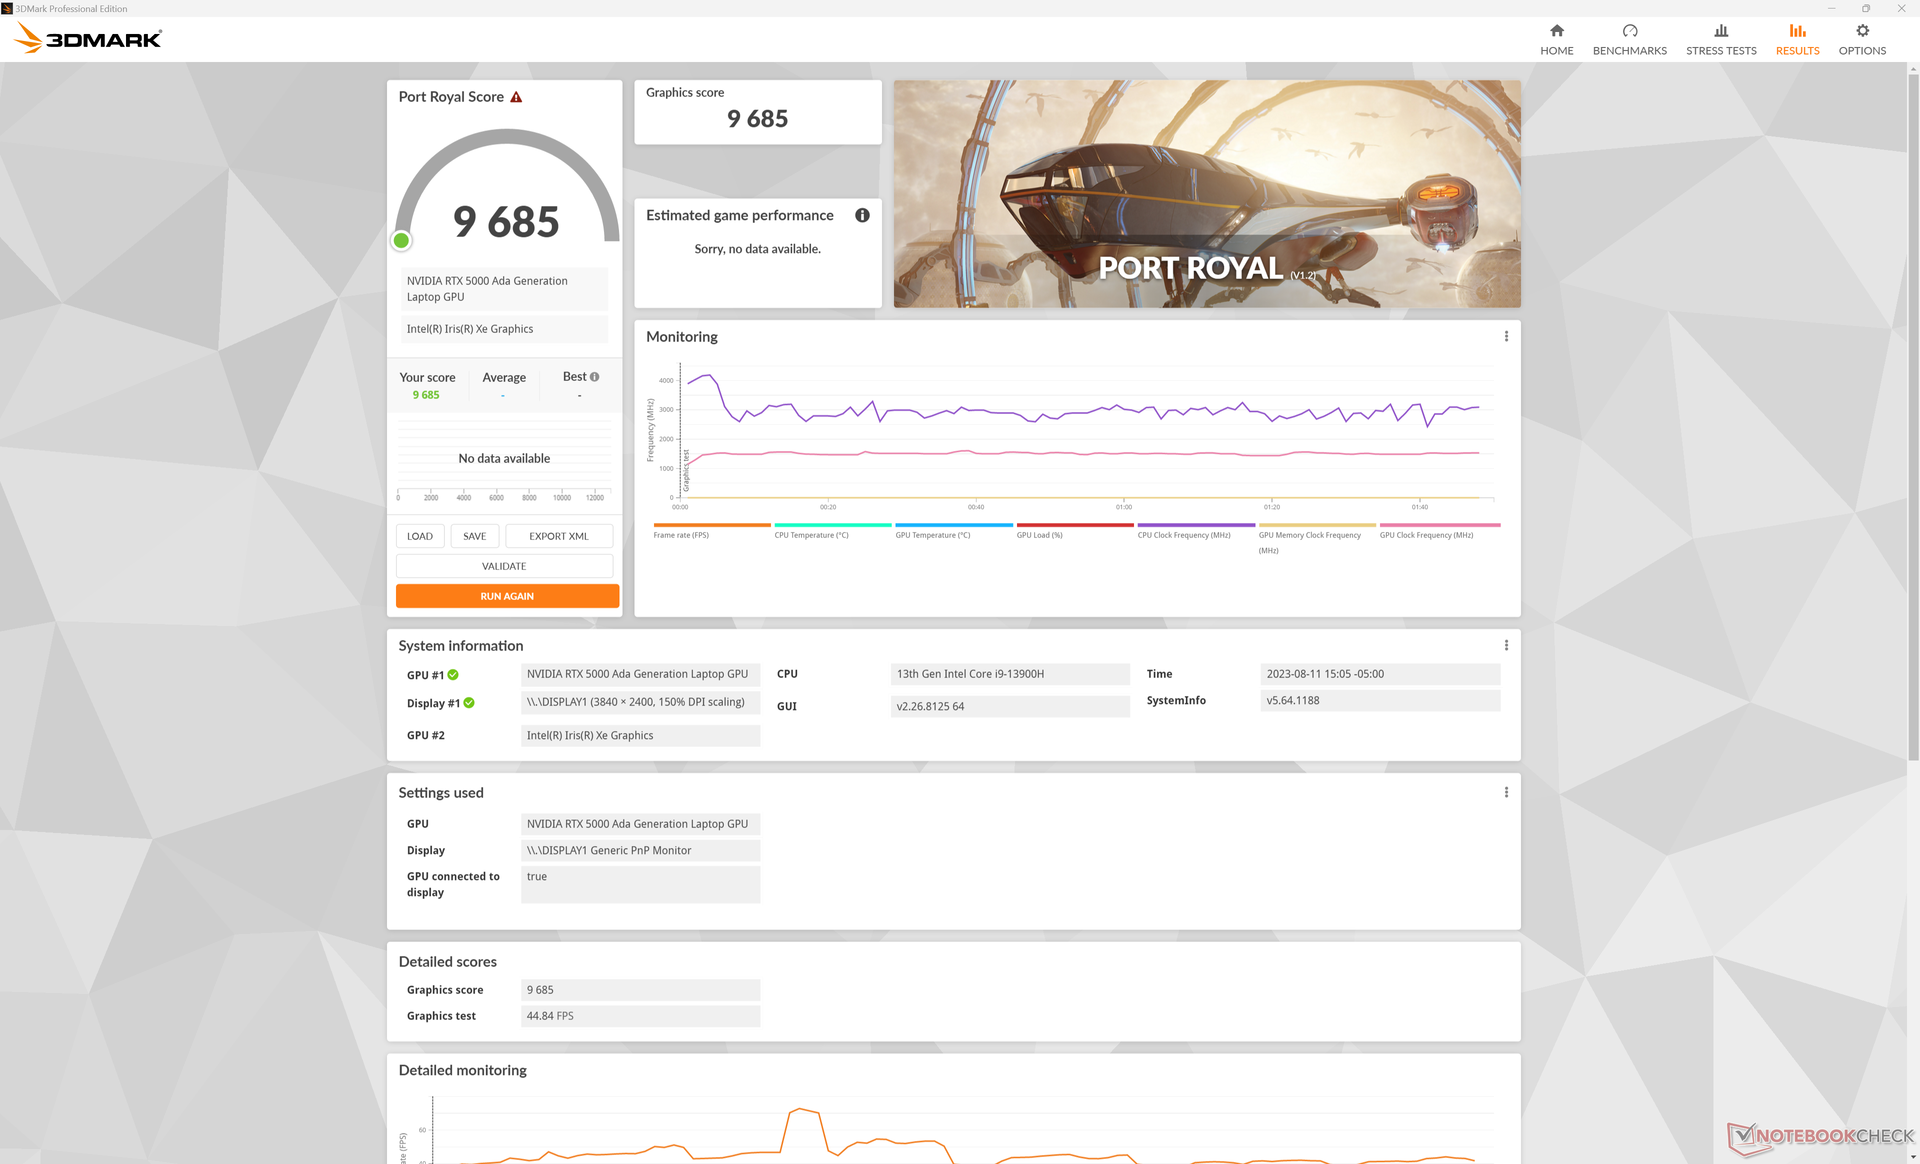
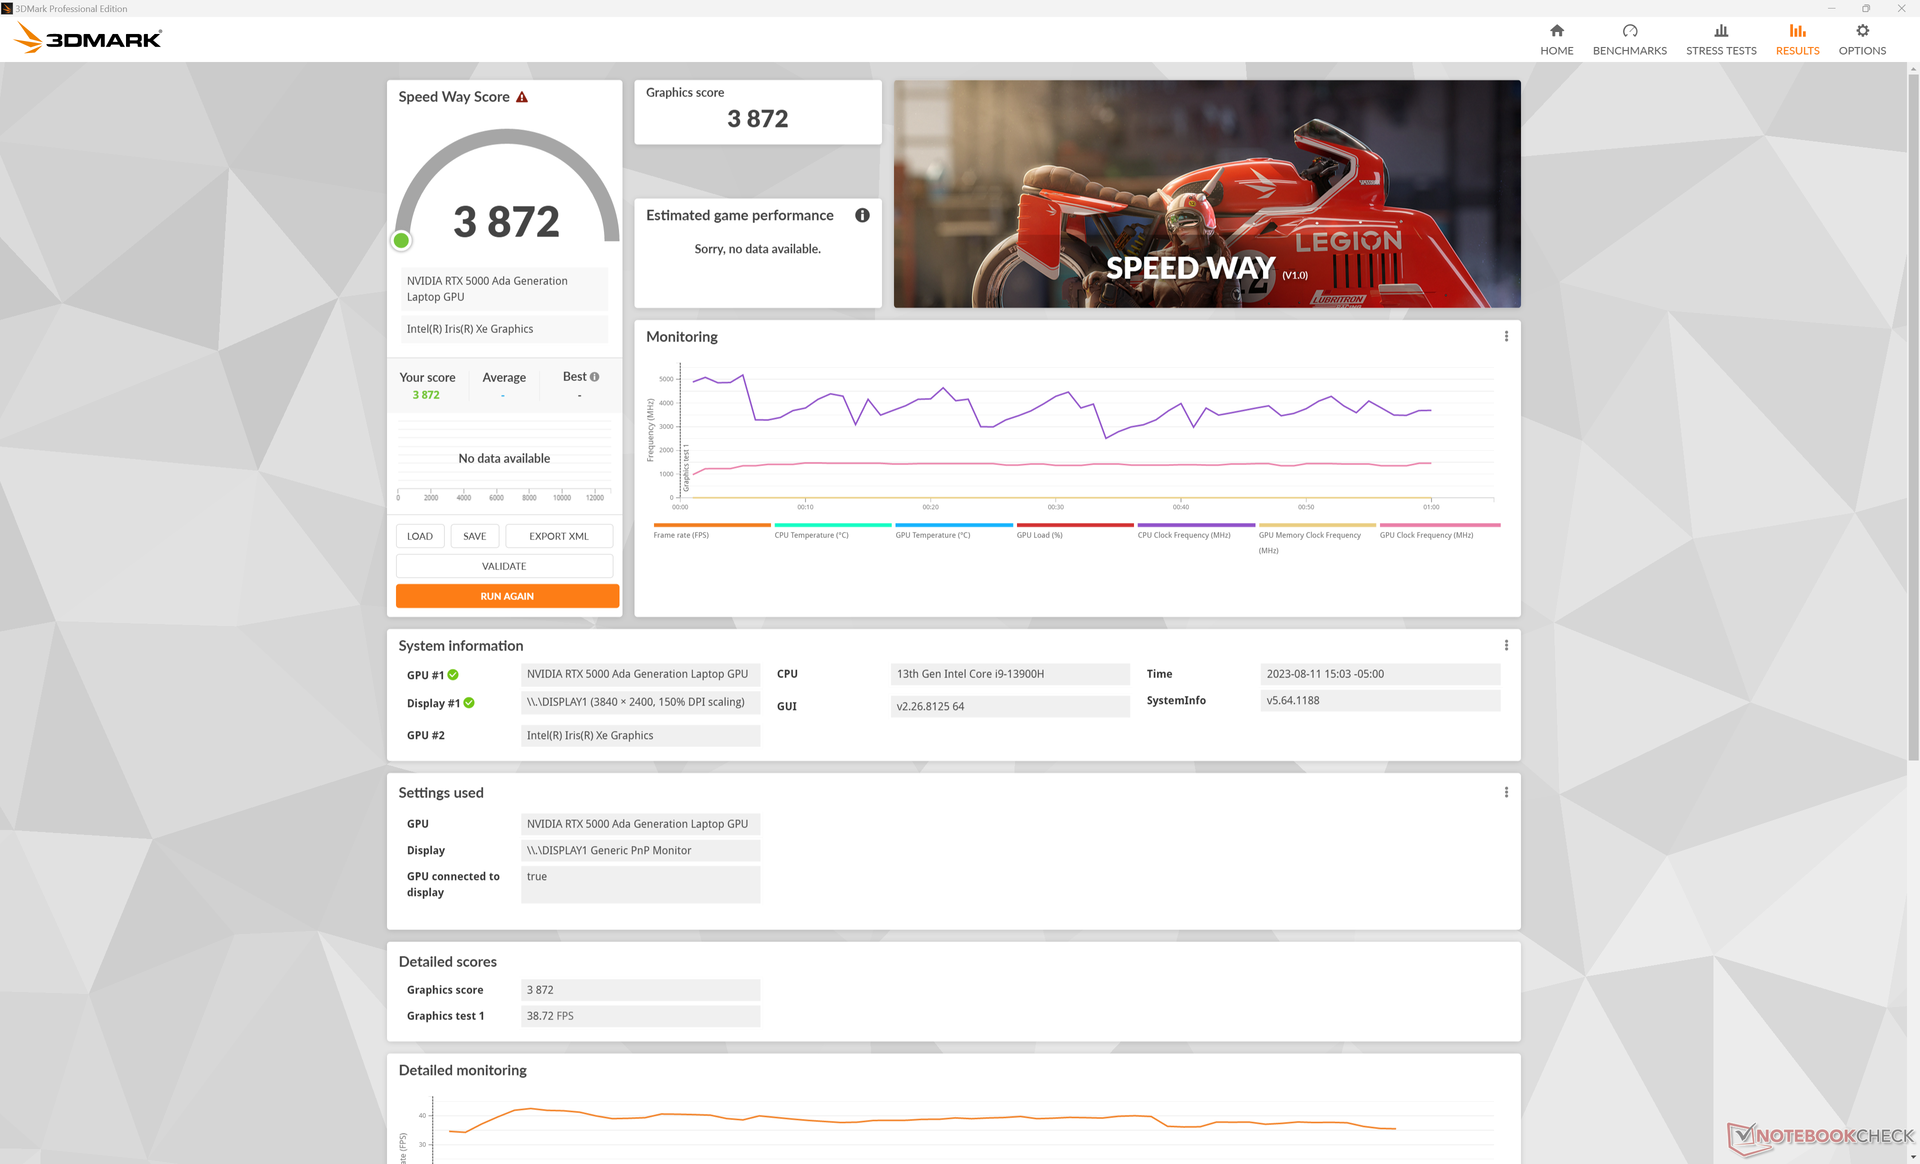
Grafikleistung — Nvidia Ada Lovelace mit 70 W
Die neue RTX 5000 bietet merkliche Leistungsvorteile gegenüber der letztjährigen RTX A5000 und A5500, insbesondere in DX12-Anwendungen und der Blender-CUDA-Beschleunigung. Time Spy, beispielsweise, produziert 30 bis 40 Prozent höhere Scores auf unserer Precision als auf dem MSI WE76 oder dem Lenovo ThinkPad P16 G1, welche beide noch mit GPUs auf Basis von Ampere laufen. Die Vorteile sind auch in den meisten Specviewperf-Subtests sichtbar.
Ein Aktivieren des ECC VRAM Mode scheint die Speichertaktraten nicht zu beeinflussen, dafür sinkt laut GPU-Z der maximal verfügbare VRAM von 16.384 MB auf 15.360 MB.
Im Fire-Strike-Test gibt es keine bedeutenden Leistungsunterschiede, wenn man vom Leistungsmodus auf den Ausbalancierten Modus umschaltet. Stattdessen wird nur die CPU-Leistung eingeschränkt.
| Leistungsprofil | Physics Score | Graphics Score | Combined Score |
| Battery Power | 20.938 (-31%) | 27.514 (-10%) | 8.910 (-31%) |
| Balanced Mode | 24.828 (-18%) | 30.588 (-0%) | 11.365 (-12%) |
| Performance Mode | 30.237 | 30.422 | 12.907 |
| 3DMark 11 Performance | 39574 Punkte | |
| 3DMark Fire Strike Score | 26765 Punkte | |
| 3DMark Time Spy Score | 14644 Punkte | |
Hilfe | ||
* ... kleinere Werte sind besser
Gaming Performance
Auch wenn die Precision 5680 kein Gaming-Laptop ist, kann sie auch fordernde, aktuelle Spiele ohne Kompatibilitätsprobleme bewältigen. Die allgemeine Leistung sortiert sich vom Niveau zwischen einer mobilen GeForce RTX 4060 und einer mobilen RTX 4070 ein. Das entspricht in etwa einem Gaming-Laptop wie dem HP Omen Transcend 16.
Witcher 3 FPS Chart
| min. | mittel | hoch | max. | QHD | 4K | |
|---|---|---|---|---|---|---|
| GTA V (2015) | 185.4 | 179.7 | 175.3 | 117.1 | 106.6 | 108 |
| The Witcher 3 (2015) | 412.7 | 329.6 | 256 | 137 | 97 | |
| Dota 2 Reborn (2015) | 178 | 161.7 | 154 | 144 | 142.5 | |
| Final Fantasy XV Benchmark (2018) | 196.3 | 165.6 | 127.4 | 100.8 | 60.4 | |
| X-Plane 11.11 (2018) | 155.3 | 133 | 102.4 | 86.2 | ||
| Far Cry 5 (2018) | 145 | 132 | 129 | 132 | 114 | 70 |
| Cyberpunk 2077 1.6 (2022) | 124.9 | 122.7 | 107.7 | 100 | 66.2 | 32.2 |
| Tiny Tina's Wonderlands (2022) | 220 | 202.3 | 152.6 | 125 | 90.1 | 50.9 |
| F1 22 (2022) | 232 | 218 | 202 | 84.5 | 56.1 | 28.8 |
| Returnal (2023) | 98 | 94 | 90 | 81 | 60 | 34 |
Emissions — Quiet Most Of The Time
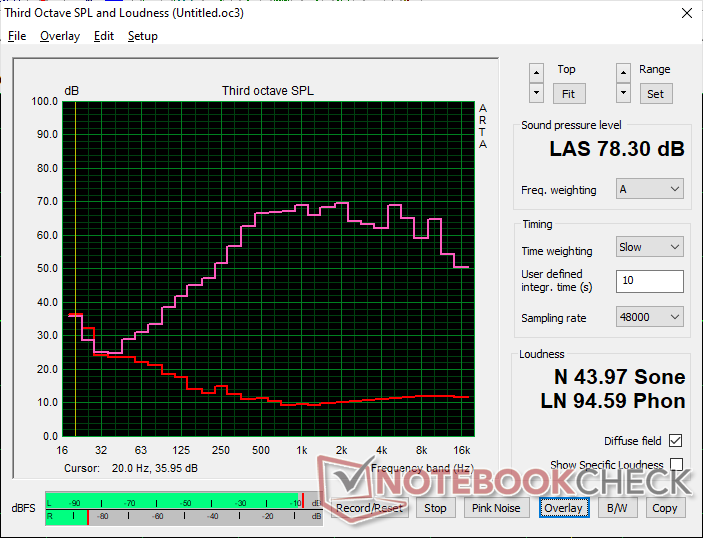
Systemlautstärke
Die Lautstärke orientiert sich an der Precision 5550, auch wenn unsere Precision 5680 über eine signifikant schnellere GPU verfügt. Bei schwachen Lasten wie Web Browsing rauschen die Lüfter mit um die 20 dB(A) vor sich hin, anspruchsvollere Lasten haben eine konstante Geräuschkulisse von etwa 51 dB(A) zur Folge.
Interessanterweise ist der maximale Lautstärkepegel im Ausbalancierten Modus der gleiche wie im Leistungsmodus.
Lautstärkediagramm
| Idle |
| 23 / 23 / 23 dB(A) |
| Last |
| 37.2 / 51 dB(A) |
 | ||
30 dB leise 40 dB(A) deutlich hörbar 50 dB(A) störend |
||
min: | ||
| Dell Precision 5000 5680 RTX 5000 Ada Generation Laptop, i9-13900H, 2x SK hynix PC801 HFS512GEJ9X101N RAID 0 | Dell Precision 7000 7670 Performance RTX A5500 Laptop GPU, i9-12950HX | HP ZBook Fury 16 G9 RTX A5500 Laptop GPU, i9-12950HX, Micron 3400 1TB MTFDKBA1T0TFH | Lenovo ThinkPad P16 G1 RTX A5500 RTX A5500 Laptop GPU, i9-12950HX, WDC PC SN810 2TB | MSI CreatorPro Z16P B12UKST RTX A3000 Laptop GPU, i7-12700H, Samsung PM9A1 MZVL21T0HCLR | Asus ExpertBook B6 Flip B6602FC2 RTX A2000 Laptop GPU, i9-12950HX, Samsung PM9A1 MZVL21T0HCLR | |
|---|---|---|---|---|---|---|
| Geräuschentwicklung | -11% | -2% | 3% | -8% | -30% | |
| aus / Umgebung * (dB) | 22.8 | 23.9 -5% | 22.6 1% | 23.1 -1% | 24.1 -6% | 26 -14% |
| Idle min * (dB) | 23 | 24 -4% | 22.7 1% | 23.1 -0% | 27.1 -18% | 32.4 -41% |
| Idle avg * (dB) | 23 | 24 -4% | 22.7 1% | 23.1 -0% | 27.1 -18% | 32.4 -41% |
| Idle max * (dB) | 23 | 38 -65% | 28.8 -25% | 23.1 -0% | 27.1 -18% | 32.4 -41% |
| Last avg * (dB) | 37.2 | 46.3 -24% | 36.2 3% | 28.9 22% | 42.9 -15% | 51.9 -40% |
| Witcher 3 ultra * (dB) | 51 | 41.9 18% | 49.5 3% | 51.6 -1% | 44 14% | |
| Last max * (dB) | 51 | 47.9 6% | 49.3 3% | 51.4 -1% | 47 8% | 52.1 -2% |
* ... kleinere Werte sind besser
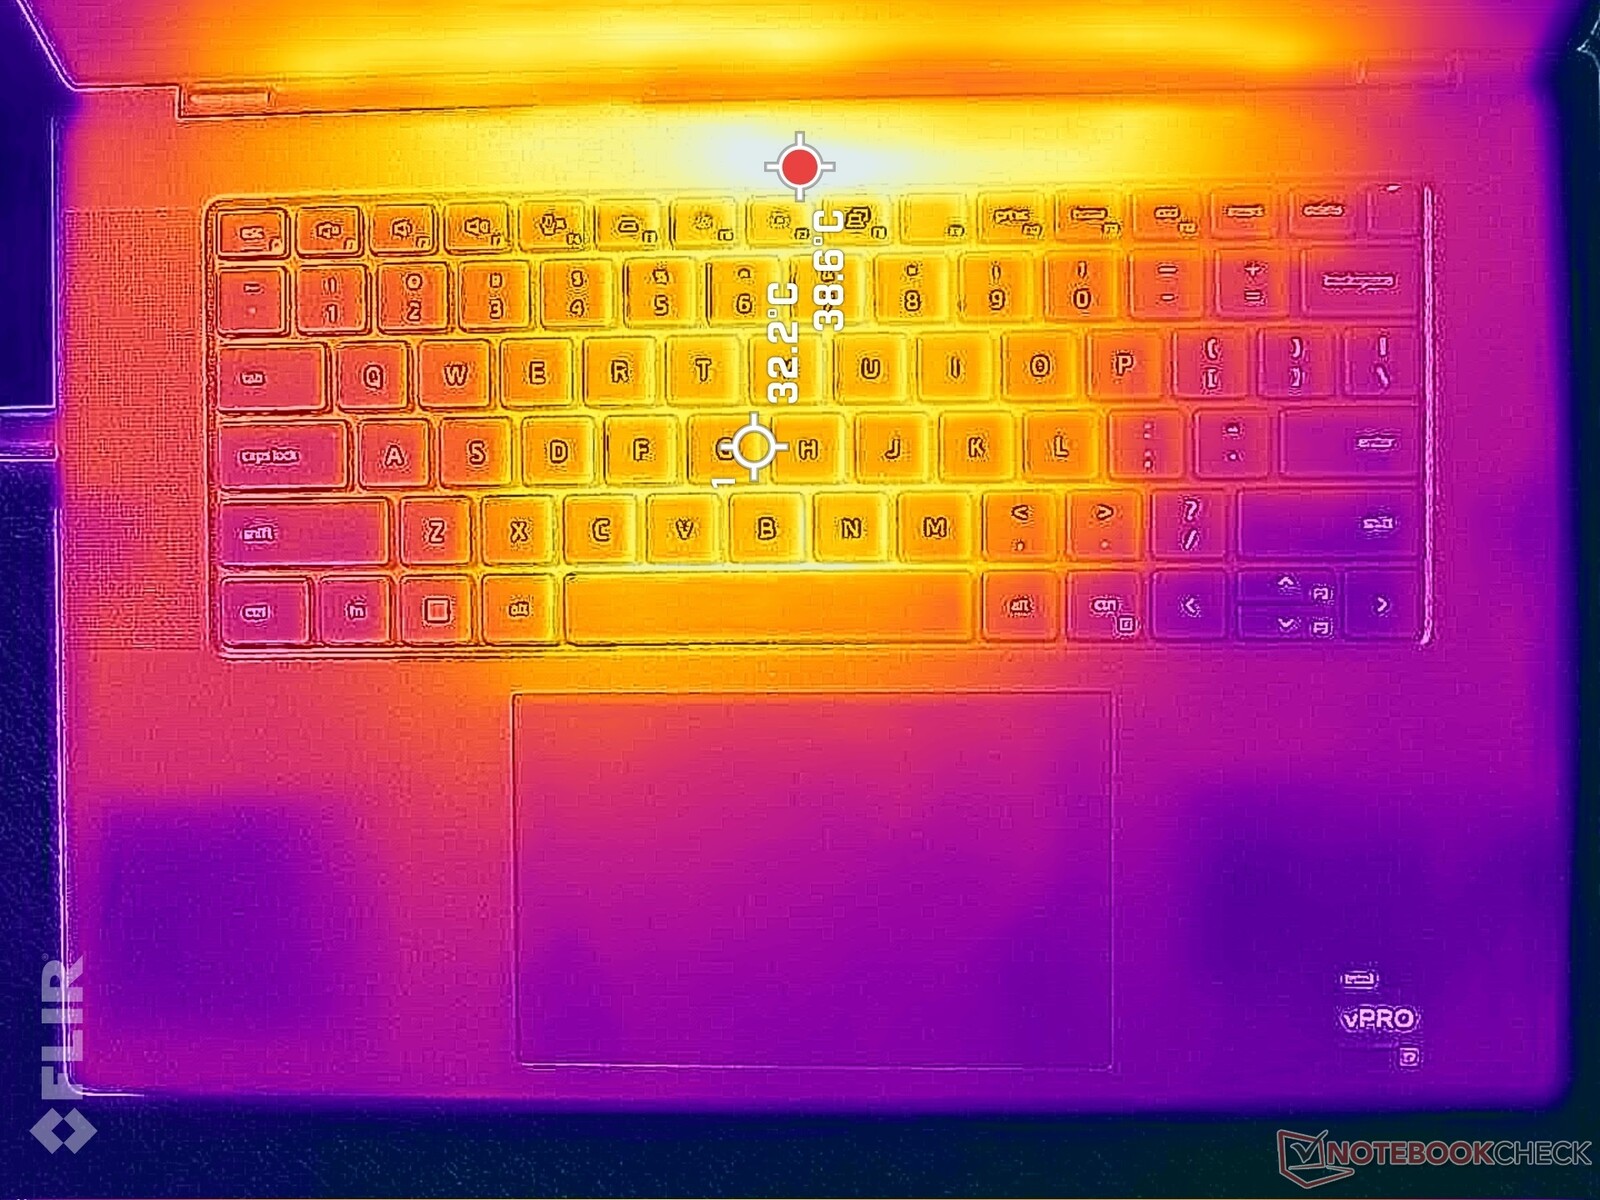
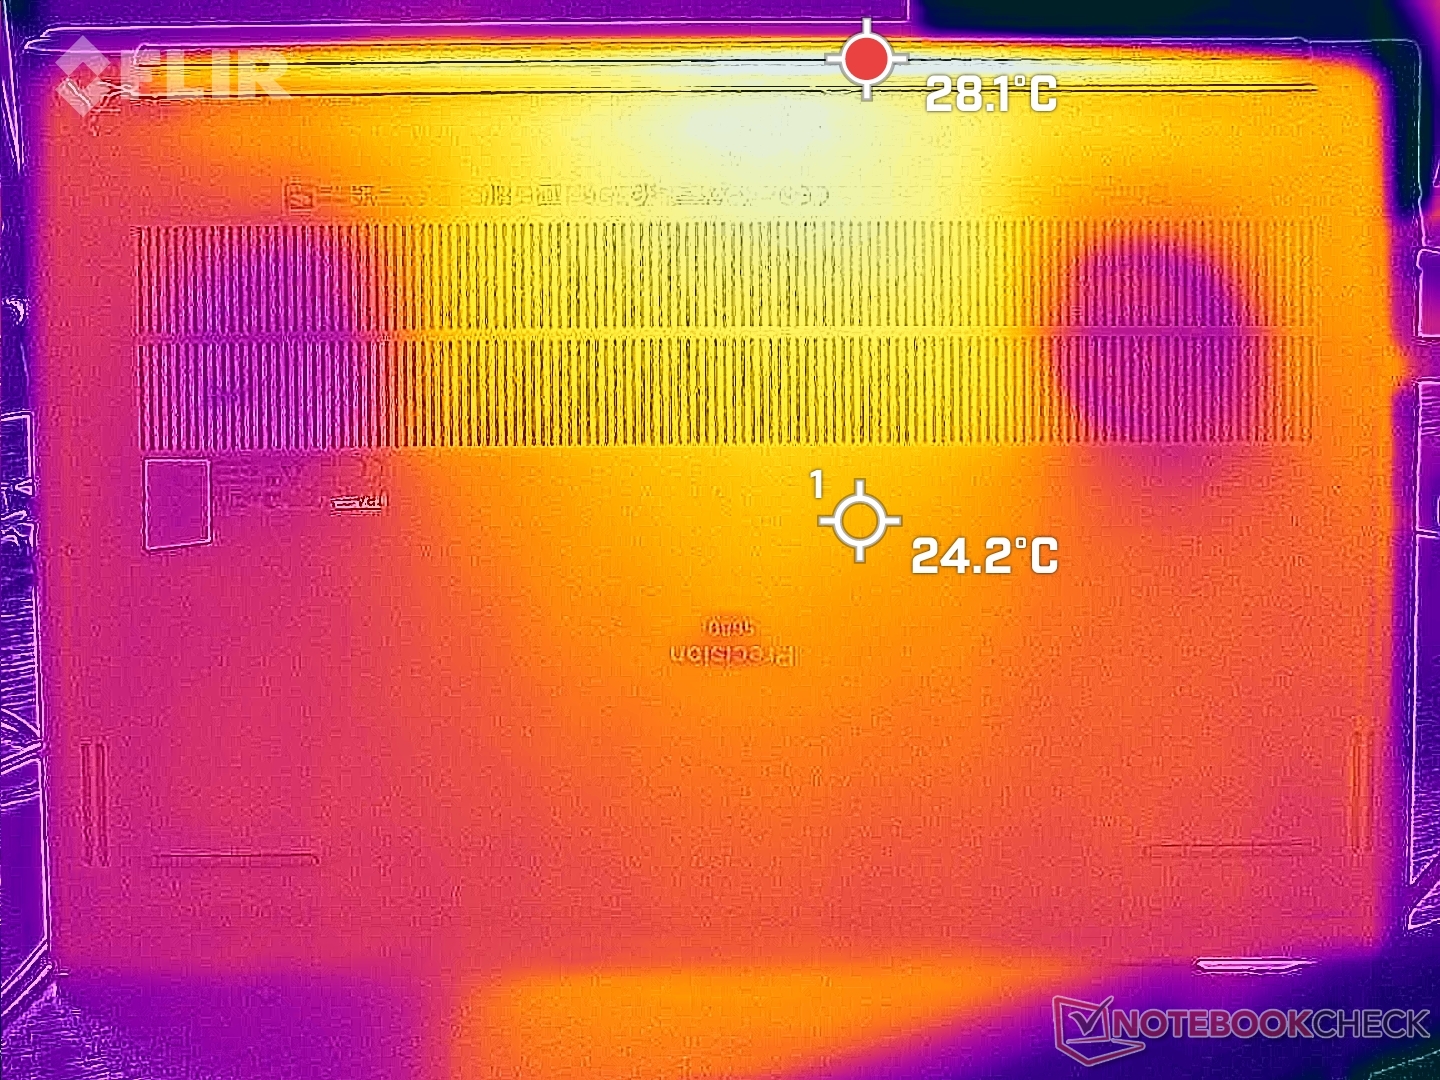
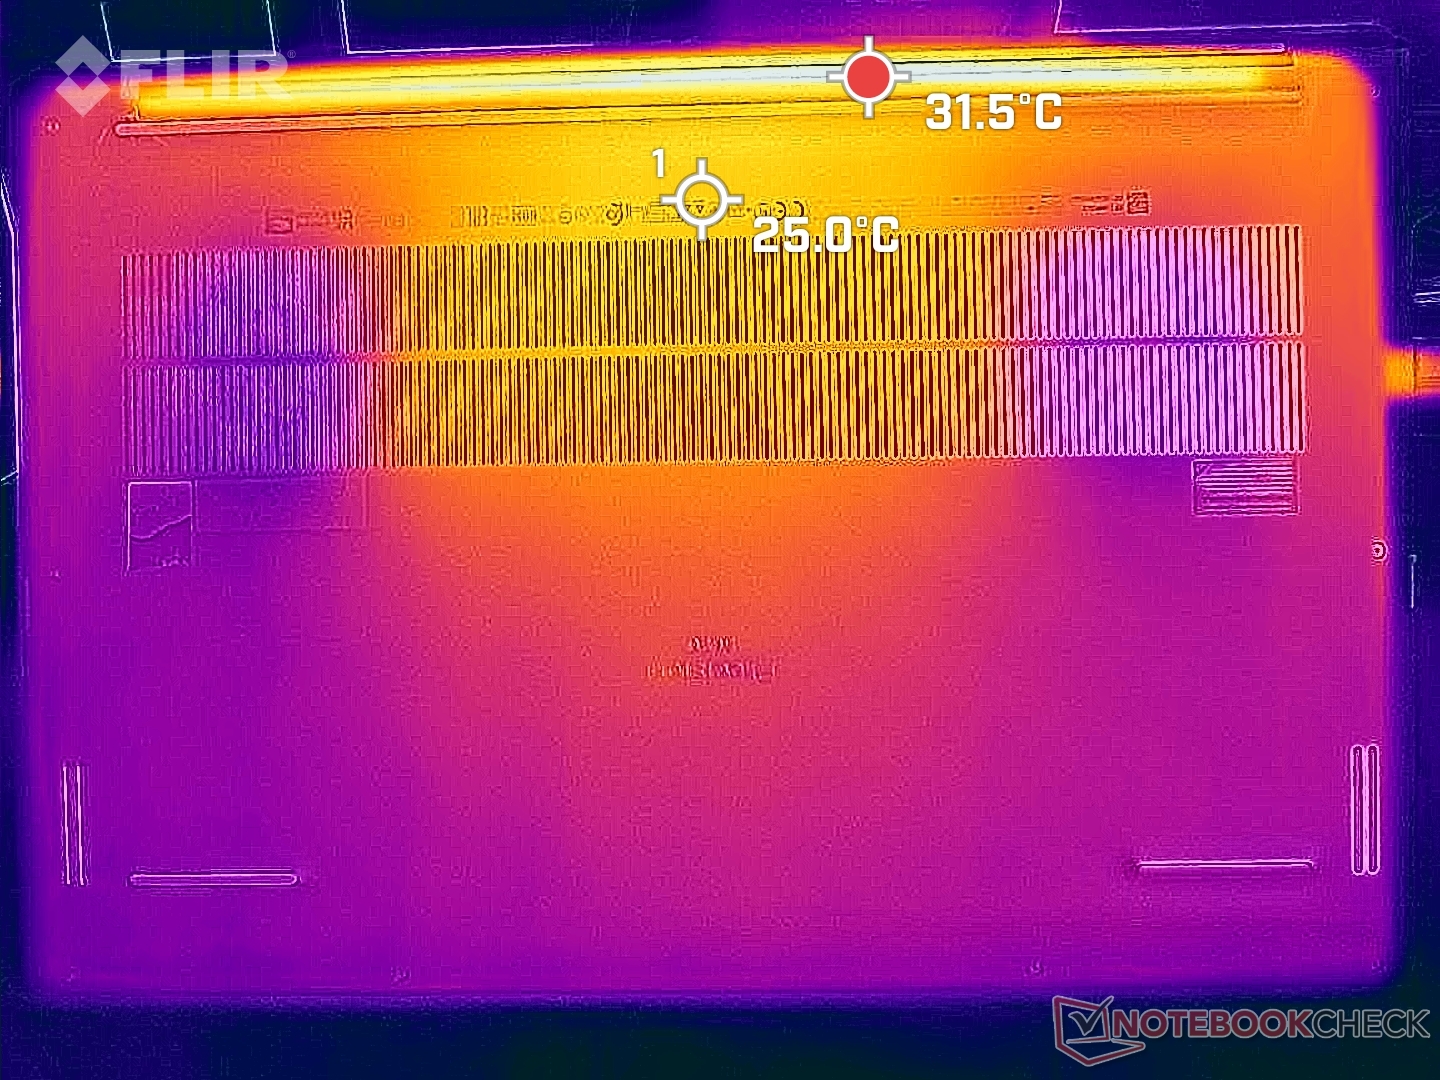
Temperatur
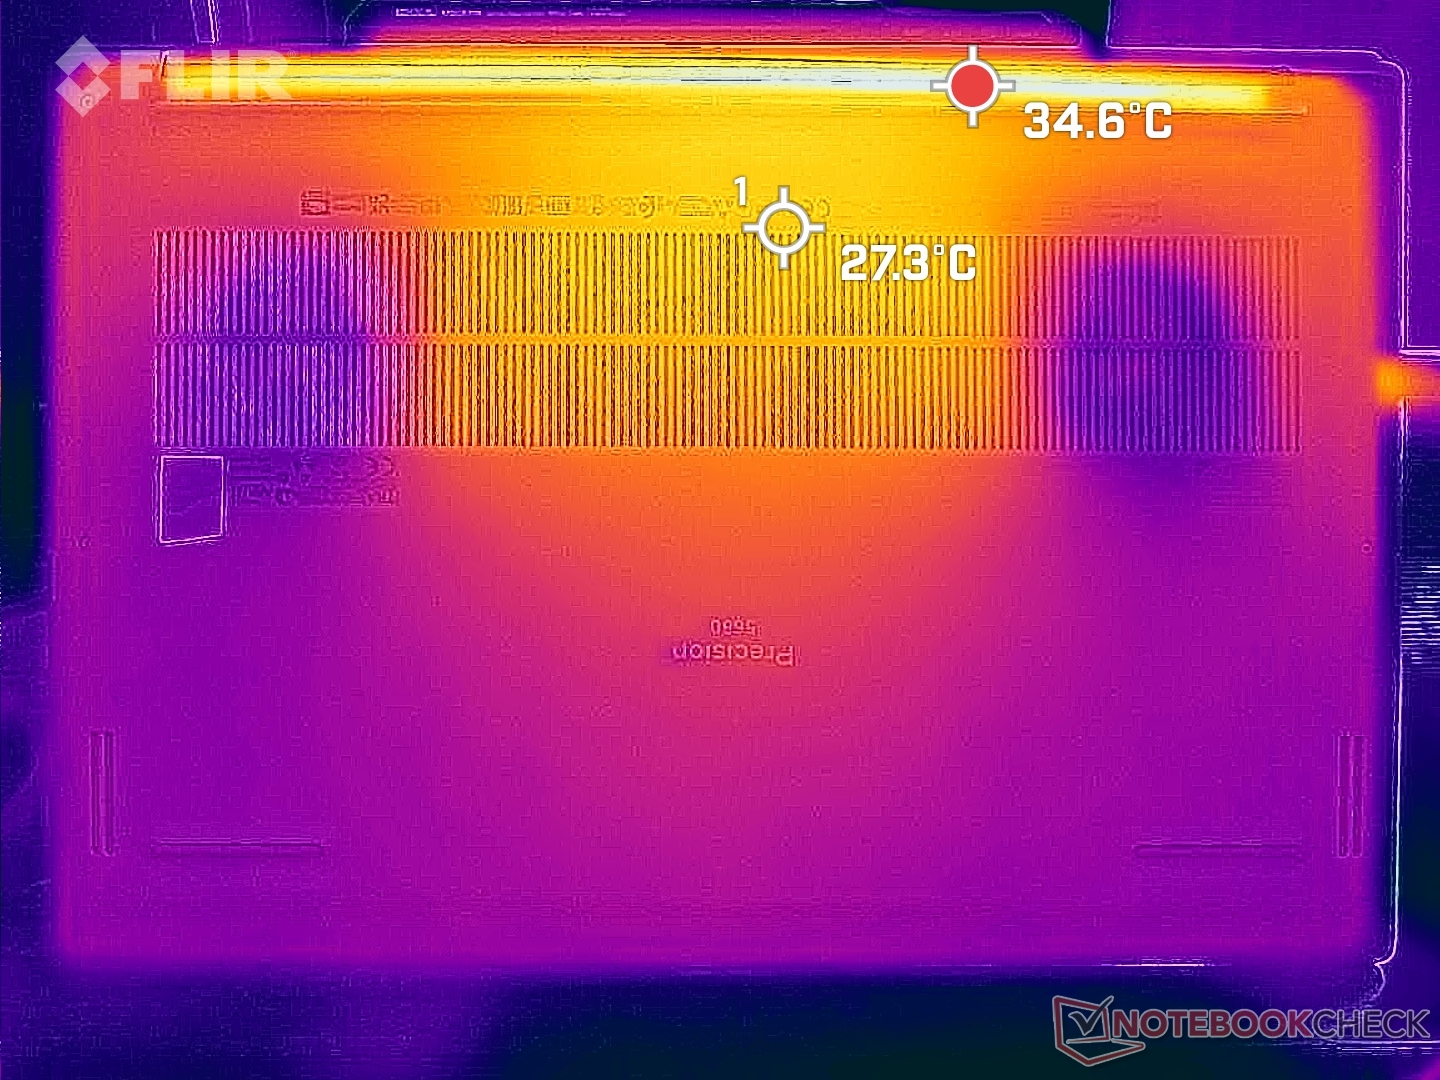
Im Leerlauf sind die Oberflächentemperaturen höher als erwartet, da die Lüfter hier so lange ausbleiben bis sie wirklich benötigt werden. Hot Spots erreichen 37 °C auf der Ober- und 32 °C auf der Unterseite, verglichen mit den unter 30 °C beim ExpertBook B6 Flip.
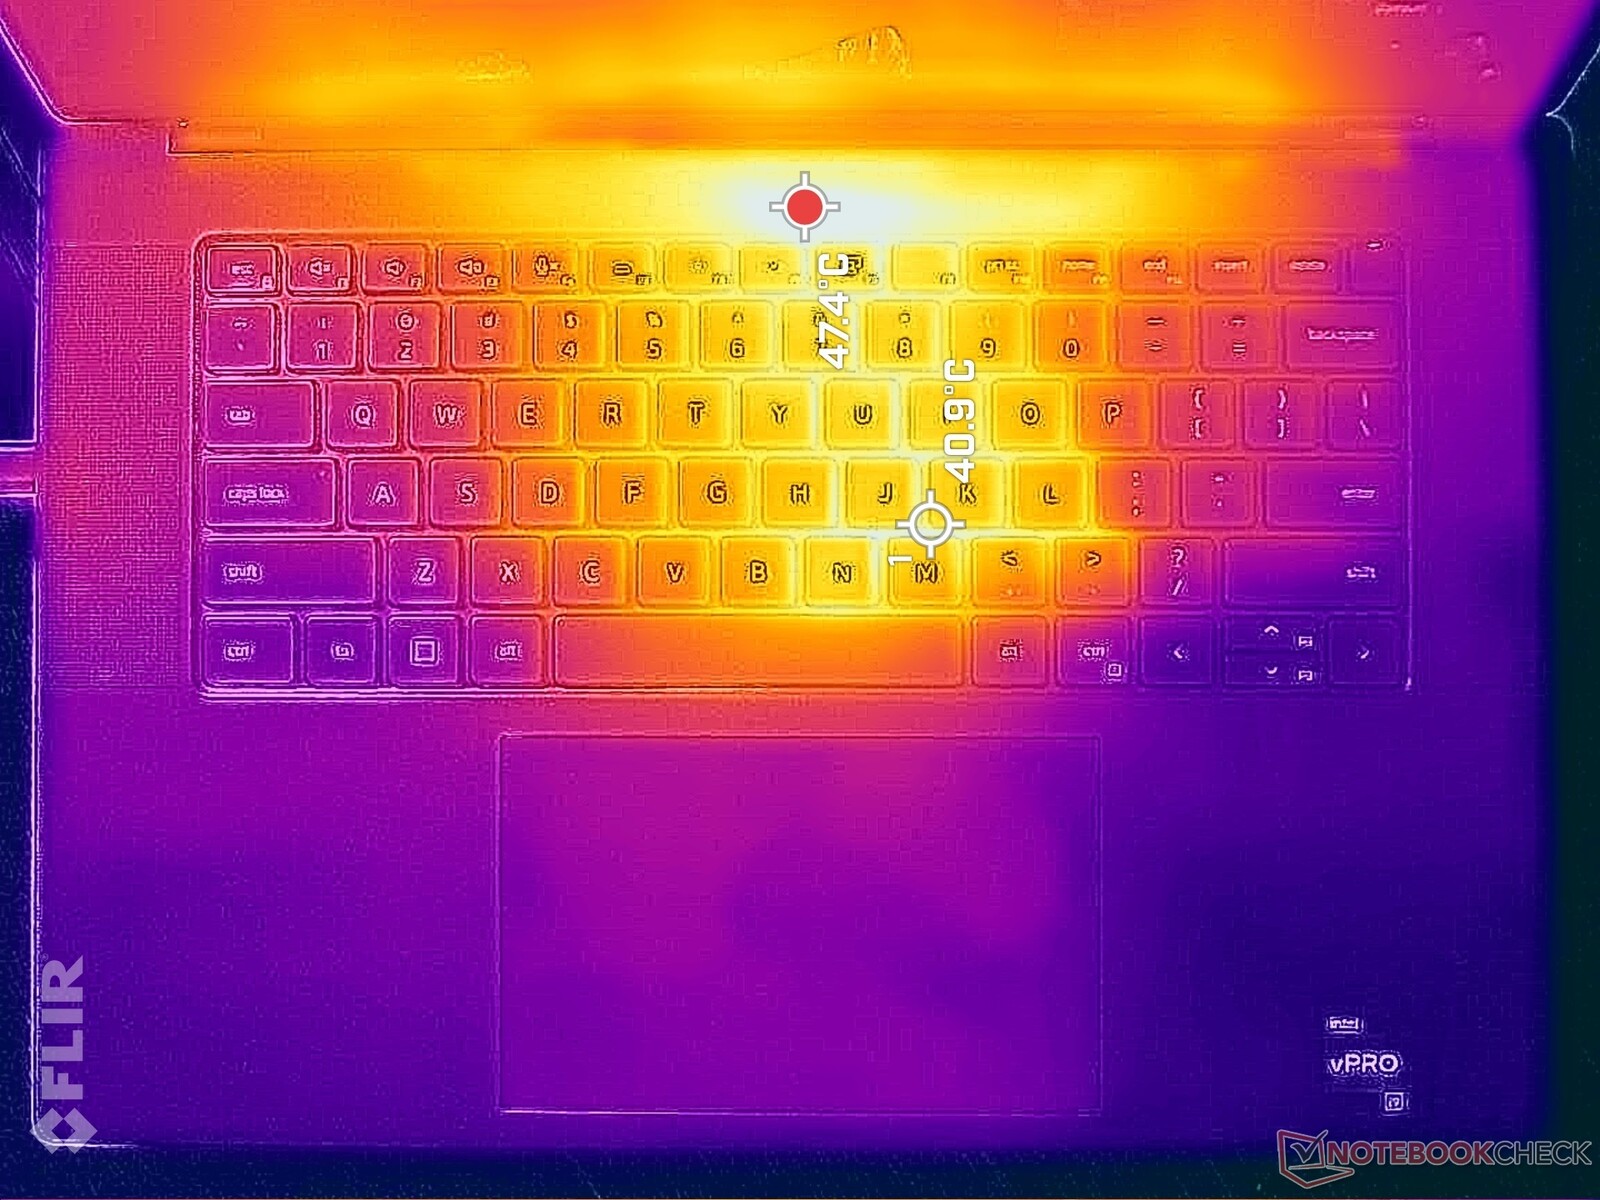
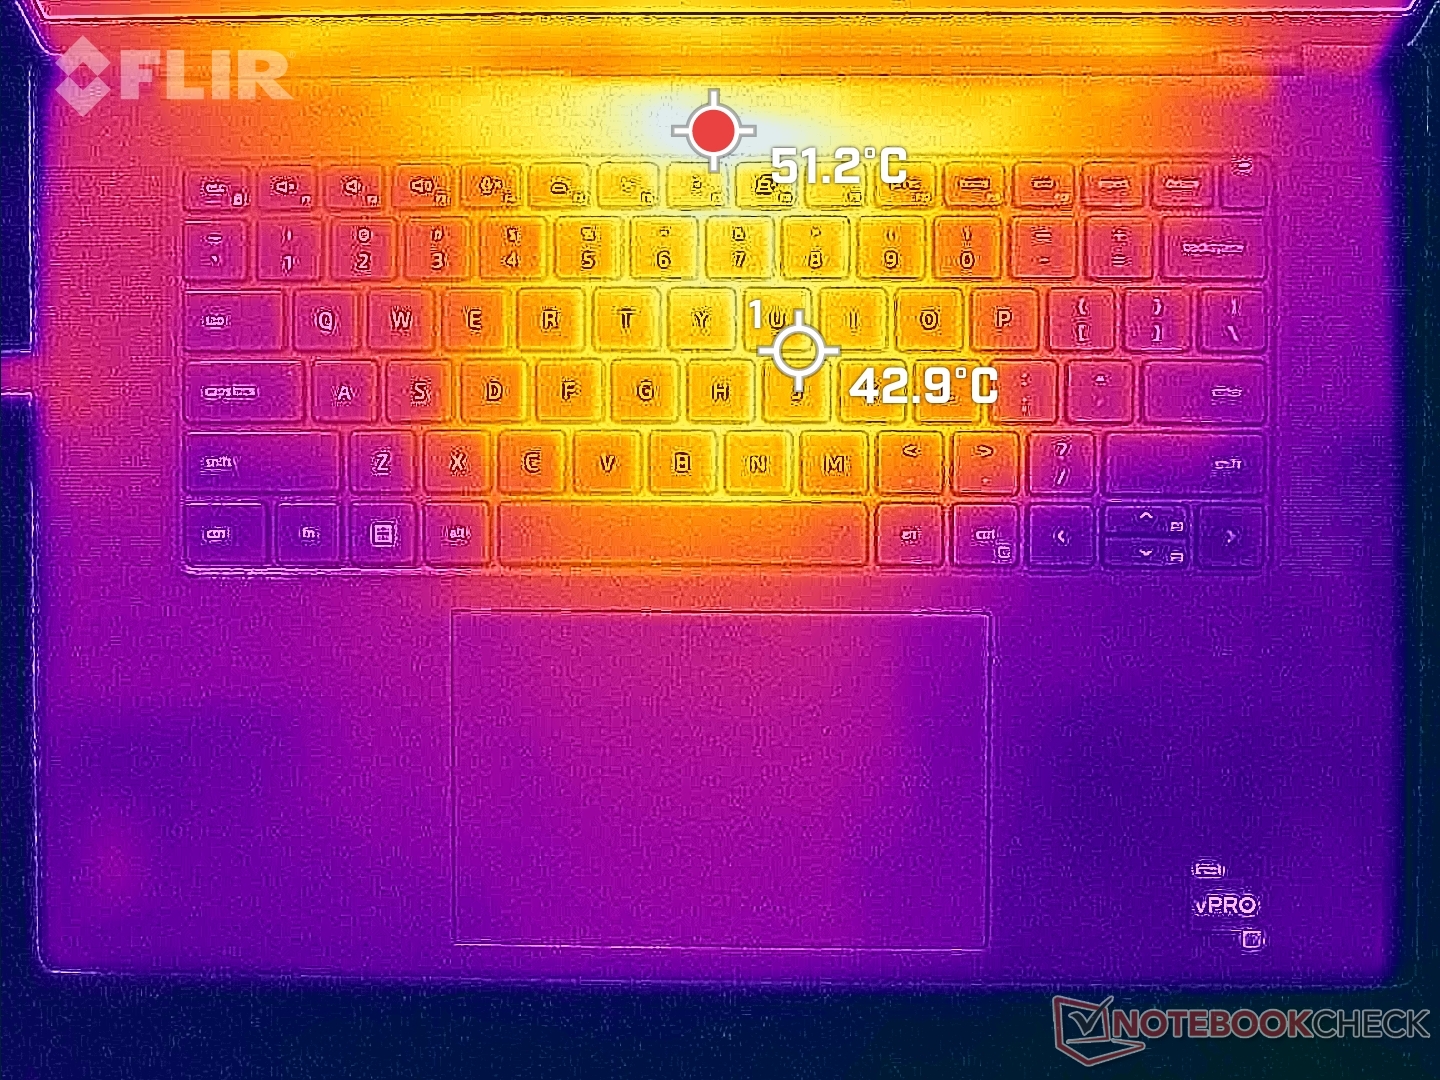
Laufen anspruchsvolle Lasten, so erhitzt sich die Tastaturmitte auf über 50 °C, während sich die Unterseite kaum weiter erhitzt, was an den Gore-Isolatoren liegt. Finger und Handballen kommen mit der Tastaturmitte nur sehr kurz und unregelmäßig in Berührung, sodass die Hot Spots eher nicht den Komfort beeinträchtigen.
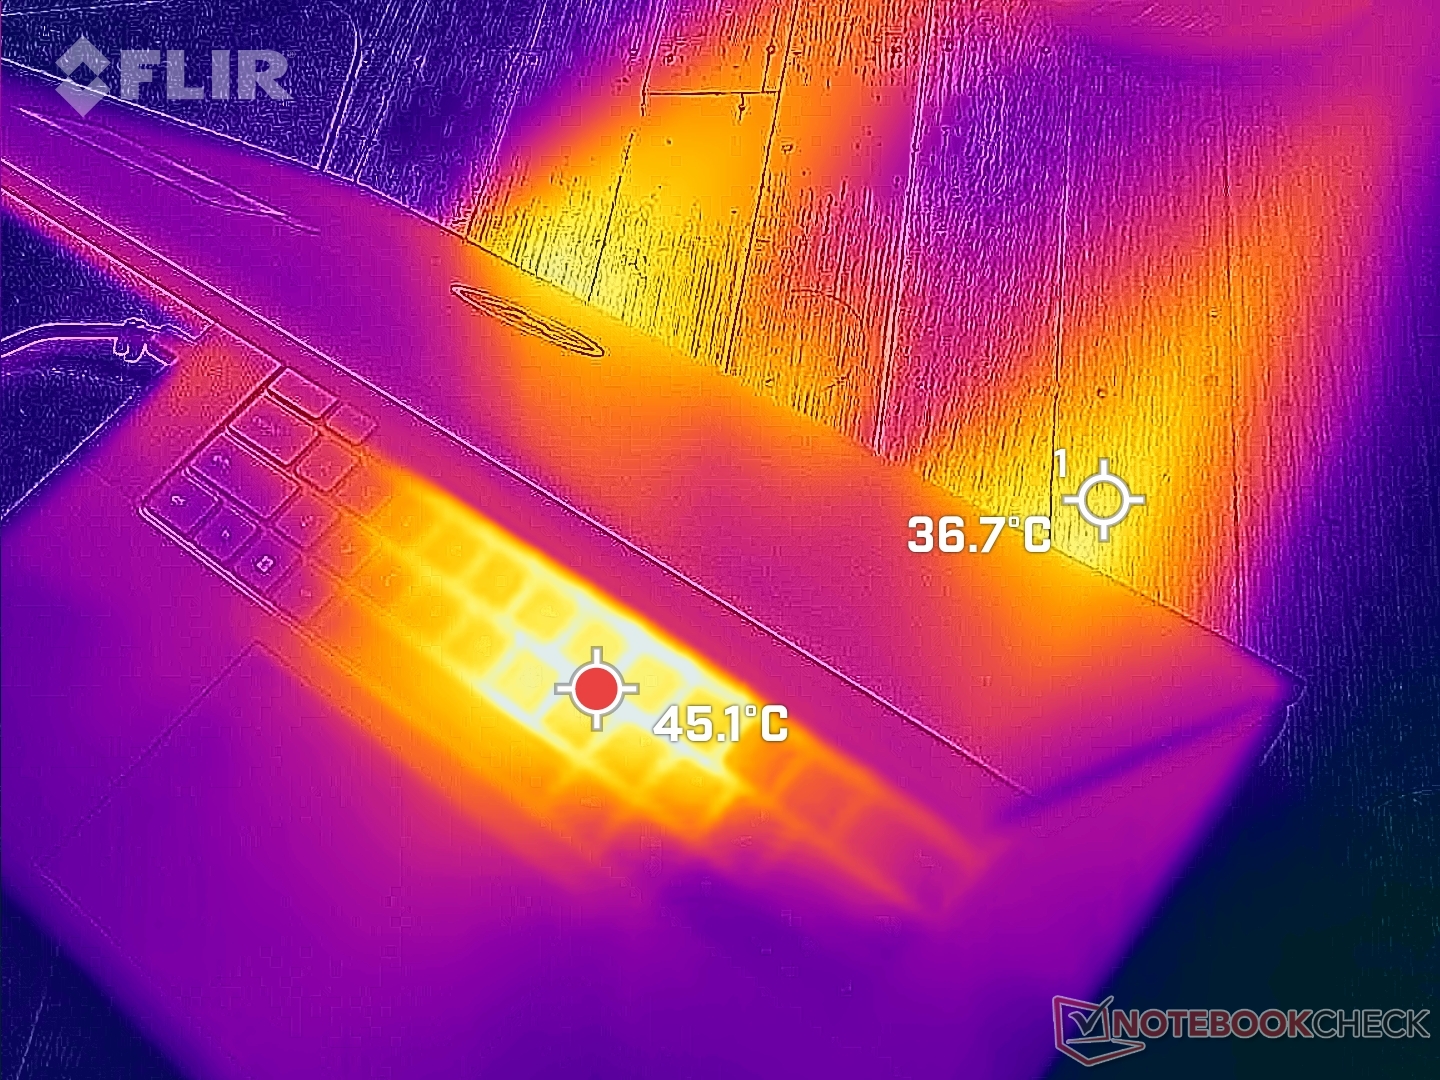
(-) Die maximale Temperatur auf der Oberseite ist 50.2 °C. Im Vergleich liegt der Klassendurchschnitt bei 38.2 °C (von 22.2 bis 69.8 °C für die Klasse Workstation).
(+) Auf der Unterseite messen wir eine maximalen Wert von 32 °C (im Vergleich zum Durchschnitt von 41.1 °C).
(+) Ohne Last messen wir eine durchschnittliche Temperatur von 30.1 °C auf der Oberseite. Der Klassendurchschnitt erreicht 32 °C.
(±) Beim längeren Spielen von The Witcher 3 erhitzt sich das Gerät durchschnittlich auf 34.6 °C. Der Durchschnitt der Klasse ist derzeit 32 °C.
(+) Die Handballen und der Touchpad-Bereich sind mit gemessenen 27.6 °C kühler als die typische Hauttemperatur und fühlen sich dadurch kühl an.
(±) Die durchschnittliche Handballen-Temperatur anderer getesteter Geräte war 27.8 °C (+0.2 °C).
| Dell Precision 5000 5680 Intel Core i9-13900H, NVIDIA RTX 5000 Ada Generation Laptop | Dell Precision 7000 7670 Performance Intel Core i9-12950HX, NVIDIA RTX A5500 Laptop GPU | HP ZBook Fury 16 G9 Intel Core i9-12950HX, NVIDIA RTX A5500 Laptop GPU | Lenovo ThinkPad P16 G1 RTX A5500 Intel Core i9-12950HX, NVIDIA RTX A5500 Laptop GPU | MSI CreatorPro Z16P B12UKST Intel Core i7-12700H, NVIDIA RTX A3000 Laptop GPU | Asus ExpertBook B6 Flip B6602FC2 Intel Core i9-12950HX, NVIDIA RTX A2000 Laptop GPU | |
|---|---|---|---|---|---|---|
| Hitze | -12% | -3% | -13% | -19% | -8% | |
| Last oben max * (°C) | 50.2 | 53 -6% | 43.2 14% | 44.8 11% | 56.3 -12% | 48.4 4% |
| Last unten max * (°C) | 32 | 43.2 -35% | 50.4 -58% | 49.8 -56% | 68.3 -113% | 52.3 -63% |
| Idle oben max * (°C) | 37.4 | 36.8 2% | 28.6 24% | 30.6 18% | 25.2 33% | 27.8 26% |
| Idle unten max * (°C) | 31.2 | 33.8 -8% | 28.2 10% | 38.6 -24% | 25.9 17% | 30.3 3% |
* ... kleinere Werte sind besser
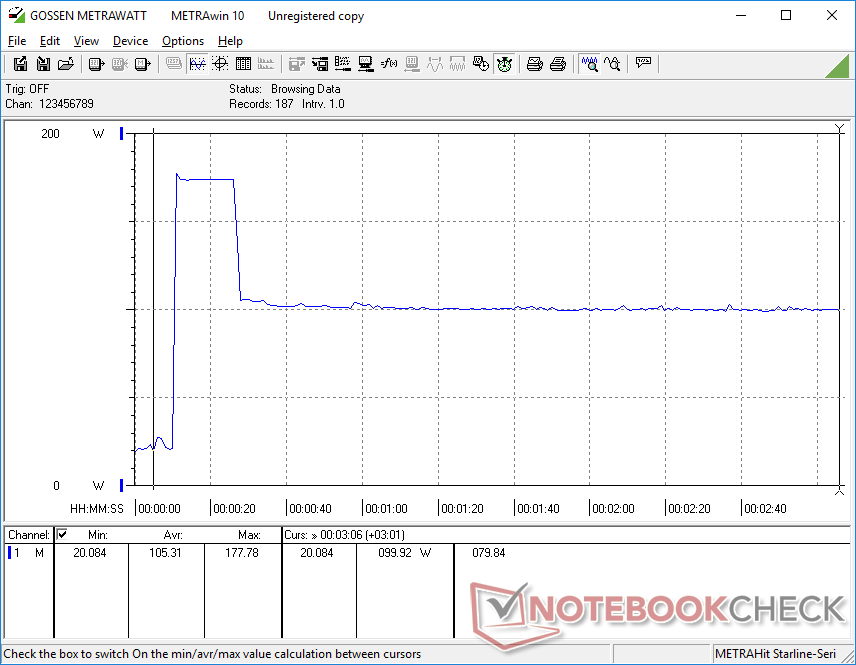
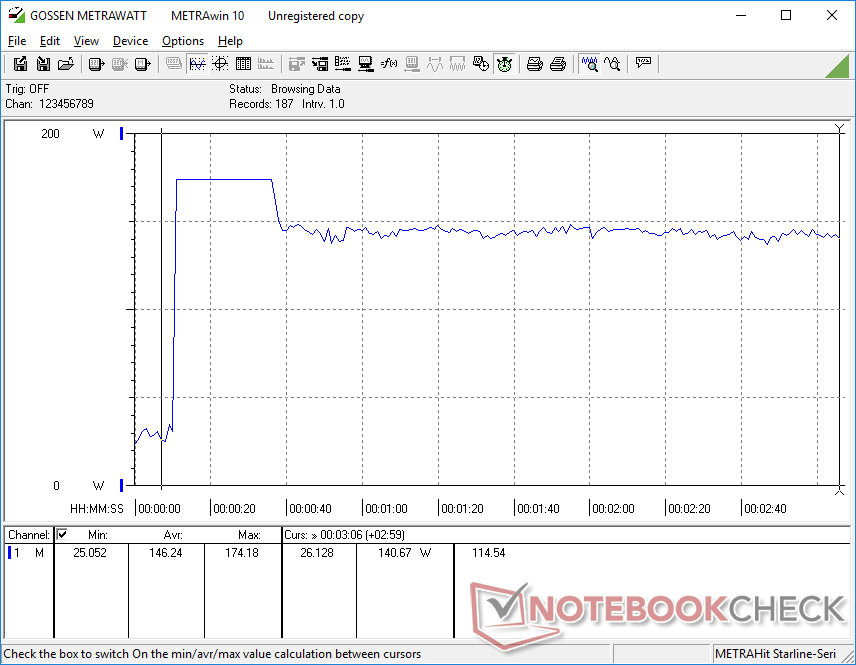
Stresstest
Unter Prime95-Stress boostet die CPU auf 3,9 GHz hoch und verbraucht 117 W, dabei erhitzt sie sich innerhalb von 15 Sekunden auf 100 °C. Danach sinkt der Turbo Boost, die Werte stabilisieren sich schließlich bei 2,8 GHz und 56 W bei gleichzeitig deutlich akzeptableren Kerntemperaturen von 75 °C. Der maximale Turbo Boost ist also auf der Precision 5680 nicht von Dauer, selbst im Leistungsmodus nicht.
Wie bereits erwähnt beeinflusst das Umschalten auf den Ausbalancierten Modus nicht die GPU-Leistung. GPU-Takt, Temperatur und Leistungsaufnahme stabilisieren sich im Leistungsmodus unter Witcher 3 bei 1.560 MHz, 72 °C und 63 W, verglichen mit 1.665 MHz, 65 °C und 69 W im Ausbalancierten Modus. Der größte Unterschied beider Modi scheint in der CPU-Temperatur zu liegen, welche im Leistungsmodus über 100 °C erreichen kann, im Ausbalancierten Modus jedoch nur etwa 80 °C. Das sorgt im Leistungsmodus für mehr Turbo-Boost-Potential.
Obwohl die TGP laut Nvidia Systemsteuerung 95 W beträgt, messen wir eine maximale Leistungsaufnahme von nur 75 W.
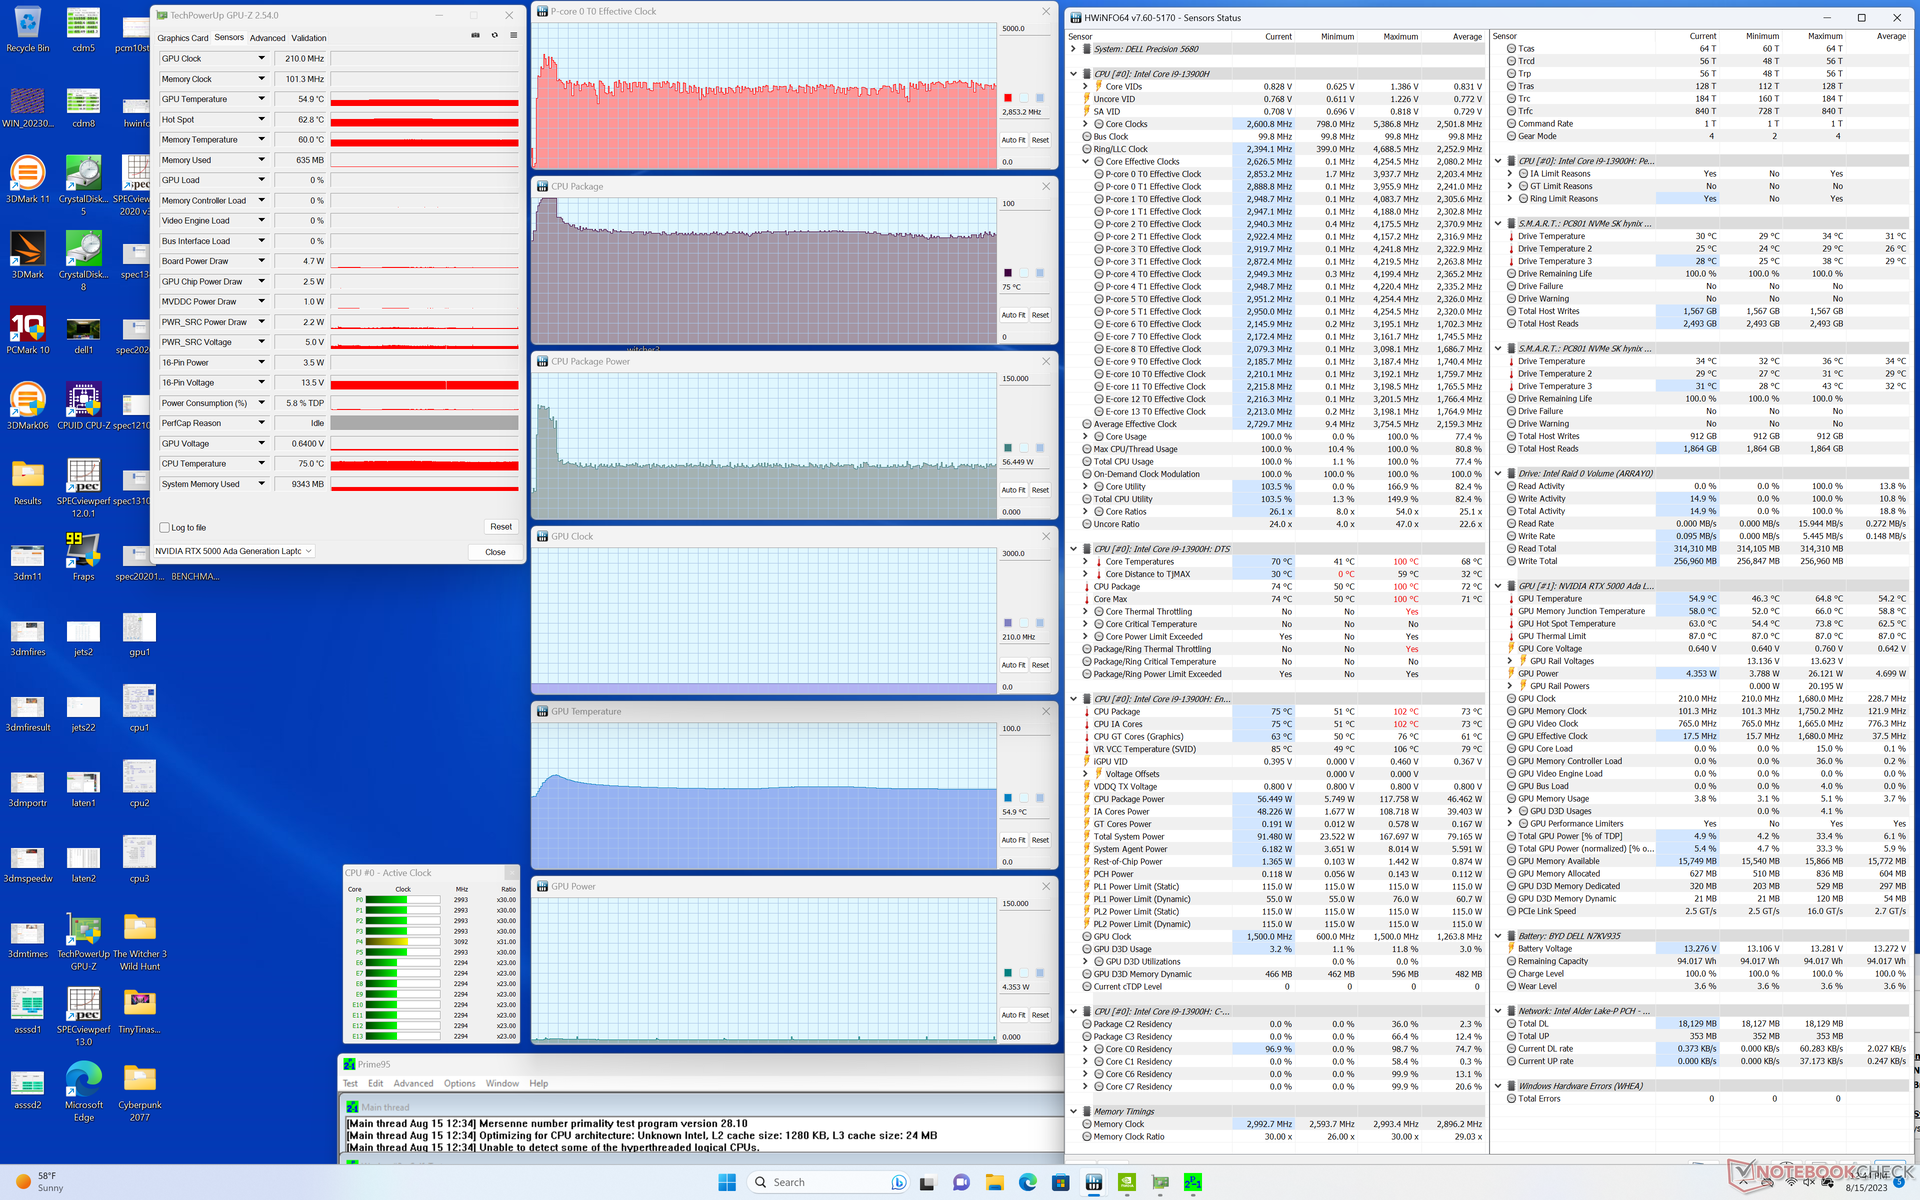

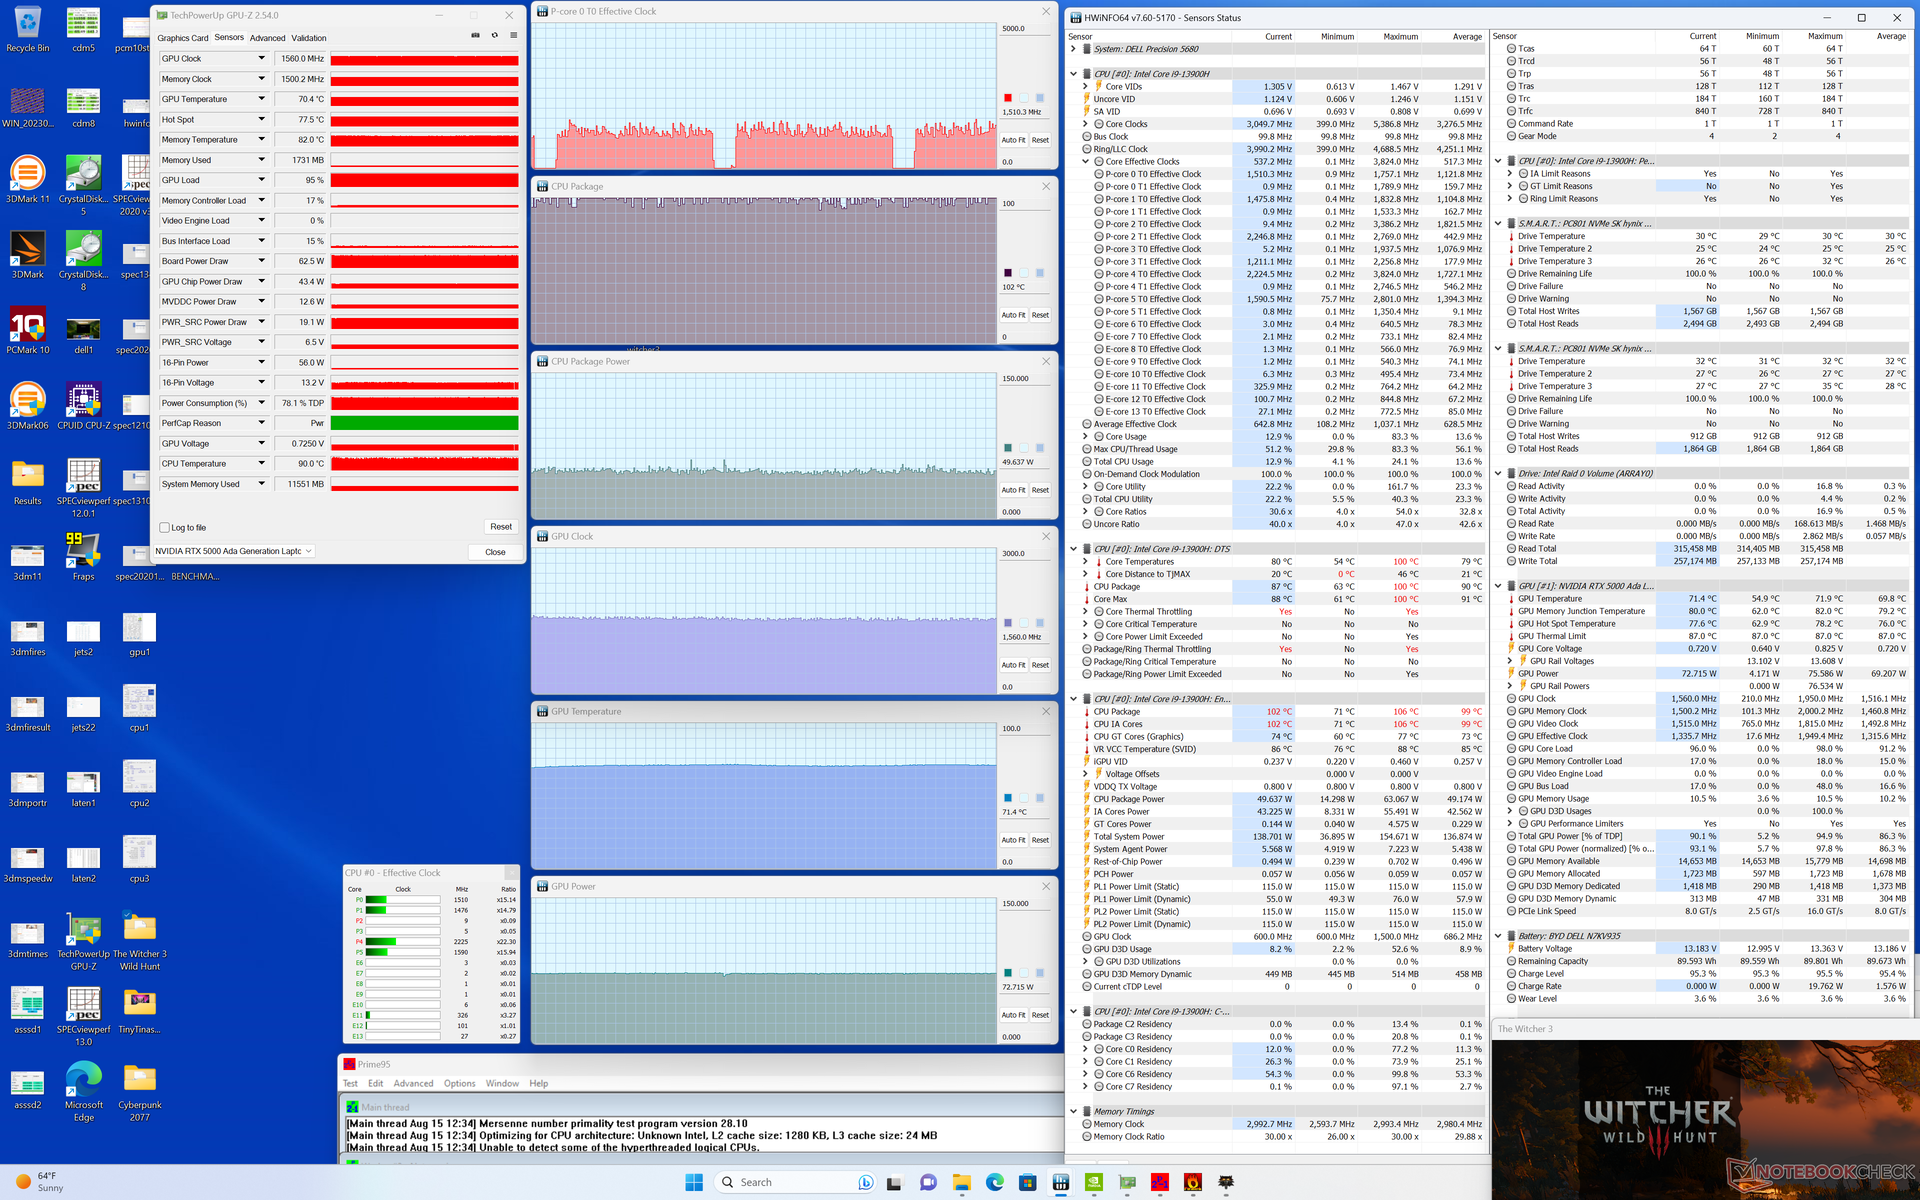
| CPU Clock (GHz) | GPU Clock (MHz) | Average CPU Temperature (°C) | Average GPU Temperature (°C) | |
| System Idle | -- | -- | 60 | 46 |
| Prime95 Stress | ~2.8 | -- | 75 | 55 |
| Prime95 + FurMark Stress | ~2.6 | 1365 | 85 | 67 |
| Witcher 3 Stress (Performance mode) | ~1.5 | 1560 | 100 | 72 |
| Witcher 3 Stress (Balanced mode) | ~1.3 | 1665 | 80 | 65 |
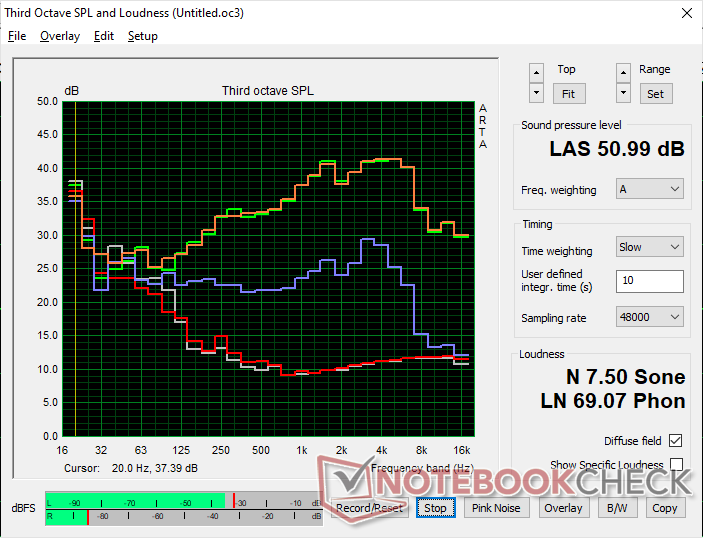
Lautsprecher
Dell Precision 5000 5680 Audio Analyse
(±) | Mittelmäßig laut spielende Lautsprecher (78.3 dB)
Bass 100 - 315 Hz
(-) | kaum Bass - 16.4% niedriger als der Median
(±) | durchschnittlich lineare Bass-Wiedergabe (7.5% Delta zum Vorgänger)
Mitteltöne 400 - 2000 Hz
(+) | ausgeglichene Mitten, vom Median nur 3.9% abweichend
(+) | lineare Mitten (4.5% Delta zum Vorgänger)
Hochtöne 2 - 16 kHz
(+) | ausgeglichene Hochtöne, vom Median nur 2.2% abweichend
(±) | durchschnittlich lineare Hochtöne (8.3% Delta zum Vorgänger)
Gesamt im hörbaren Bereich 100 - 16.000 Hz
(±) | hörbarer Bereich ist durchschnittlich linear (15.5% Abstand zum Median)
Im Vergleich zu allen Geräten derselben Klasse
» 35% aller getesteten Geräte dieser Klasse waren besser, 10% vergleichbar, 55% schlechter
» Das beste Gerät hat einen Delta-Wert von 7%, durchschnittlich ist 17%, das schlechteste Gerät hat 35%
Im Vergleich zu allen Geräten im Test
» 23% aller getesteten Geräte waren besser, 4% vergleichbar, 73% schlechter
» Das beste Gerät hat einen Delta-Wert von 4%, durchschnittlich ist 24%, das schlechteste Gerät hat 134%
Apple MacBook Pro 16 2021 M1 Pro Audio Analyse
(+) | Die Lautsprecher können relativ laut spielen (84.7 dB)
Bass 100 - 315 Hz
(+) | guter Bass - nur 3.8% Abweichung vom Median
(+) | lineare Bass-Wiedergabe (5.2% Delta zum Vorgänger)
Mitteltöne 400 - 2000 Hz
(+) | ausgeglichene Mitten, vom Median nur 1.3% abweichend
(+) | lineare Mitten (2.1% Delta zum Vorgänger)
Hochtöne 2 - 16 kHz
(+) | ausgeglichene Hochtöne, vom Median nur 1.9% abweichend
(+) | sehr lineare Hochtöne (2.7% Delta zum Vorgänger)
Gesamt im hörbaren Bereich 100 - 16.000 Hz
(+) | hörbarer Bereich ist sehr linear (4.6% Abstand zum Median
Im Vergleich zu allen Geräten derselben Klasse
» 0% aller getesteten Geräte dieser Klasse waren besser, 0% vergleichbar, 100% schlechter
» Das beste Gerät hat einen Delta-Wert von 5%, durchschnittlich ist 17%, das schlechteste Gerät hat 45%
Im Vergleich zu allen Geräten im Test
» 0% aller getesteten Geräte waren besser, 0% vergleichbar, 100% schlechter
» Das beste Gerät hat einen Delta-Wert von 4%, durchschnittlich ist 24%, das schlechteste Gerät hat 134%
Energiemanagement — Ada Lovelace brilliert
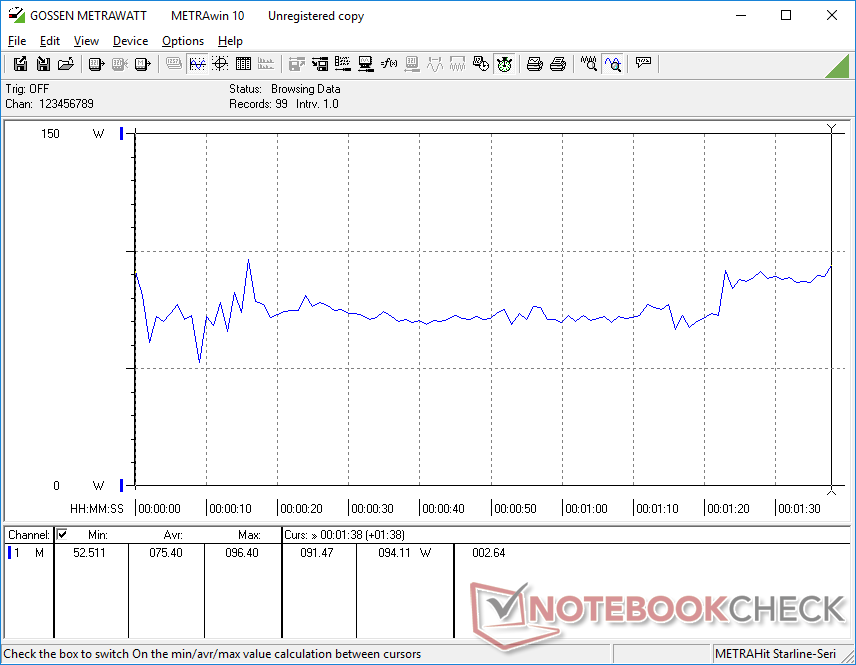
Energieverbrauch
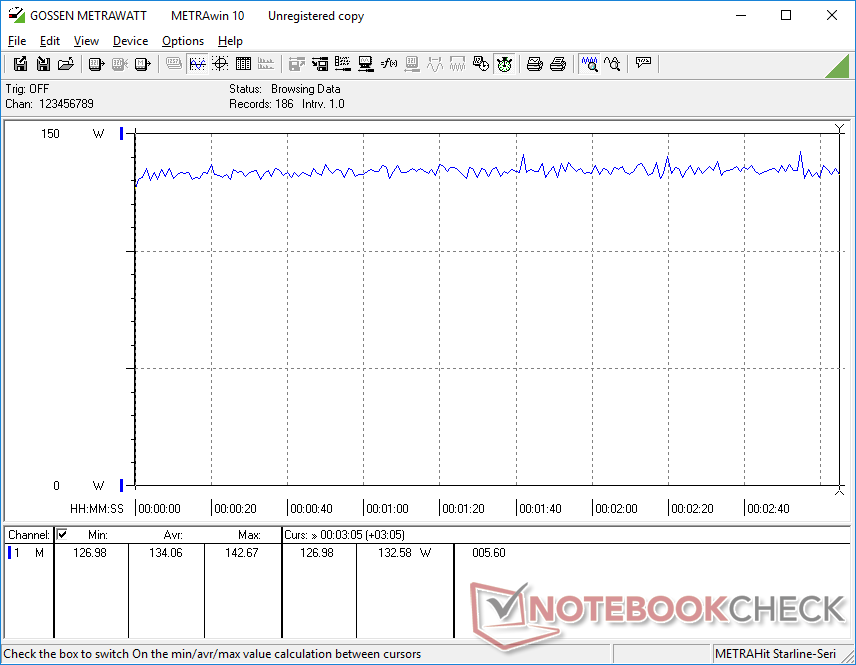
Die Leistung-pro-Watt ist den meisten anderen Workstations deutlich überlegen, da unsere Precision die neue GPU-Generation rund um Ada Lovelace verwendet. Unter Witcher 3 verbraucht das System nur 134 W, verglichen mit den 159 W und 189 W der Precision 7670 Performance und des HP ZBook Fury 16 G9, zumal die RTX 5000 deren RTX A5500 leistungstechnisch deutlich schlägt.
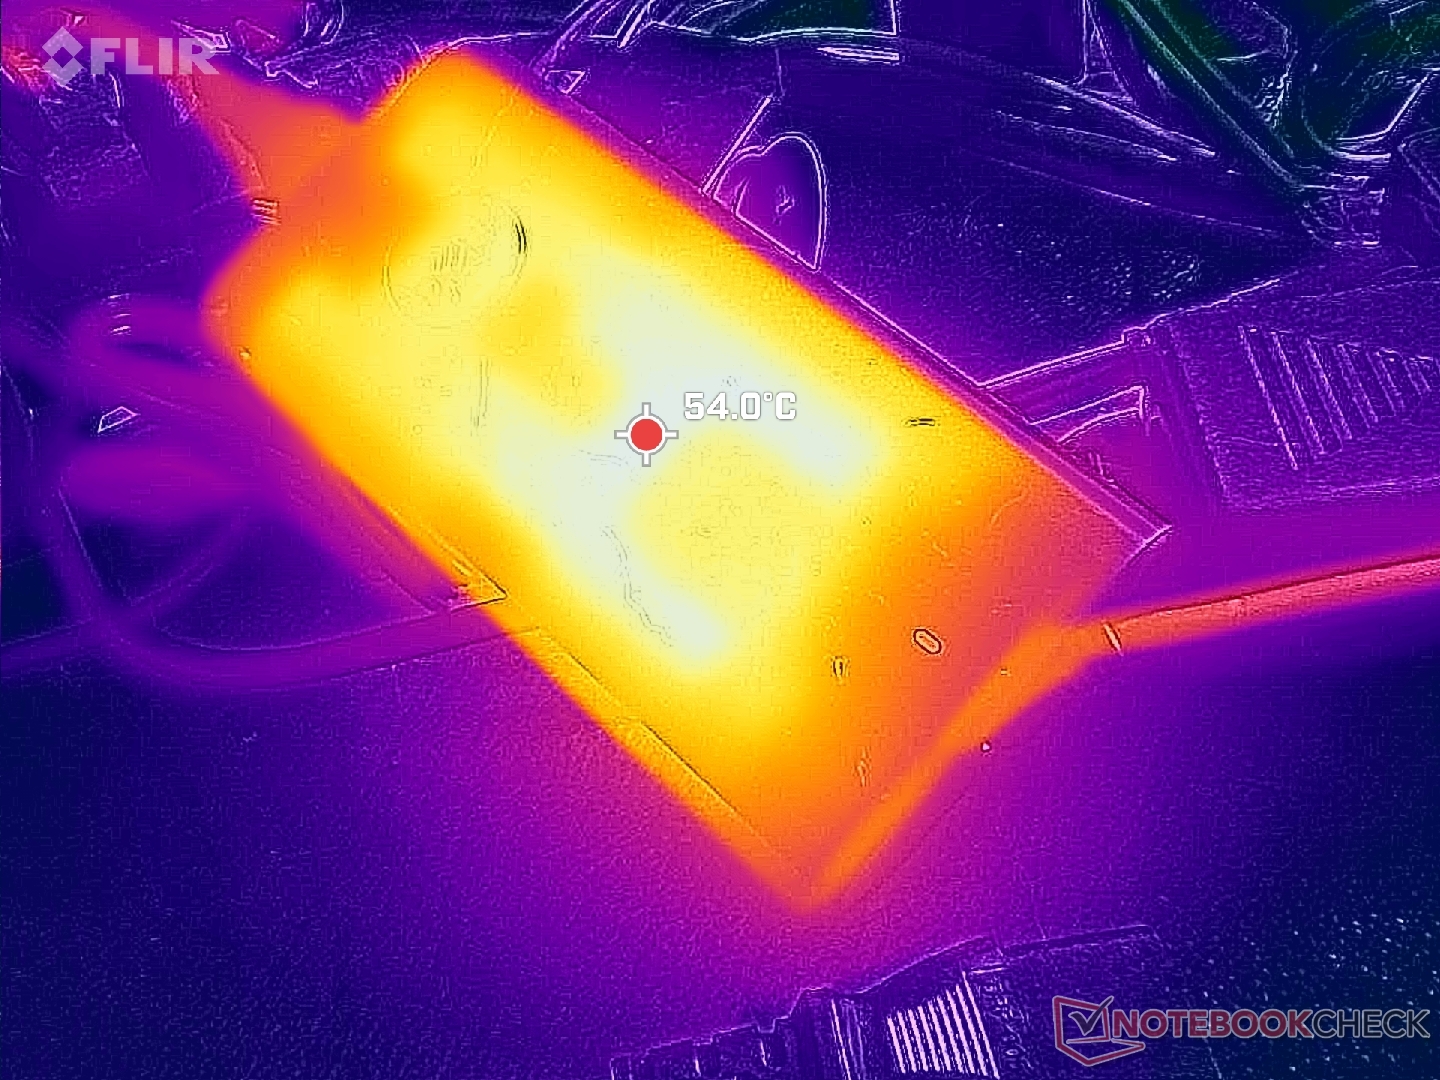
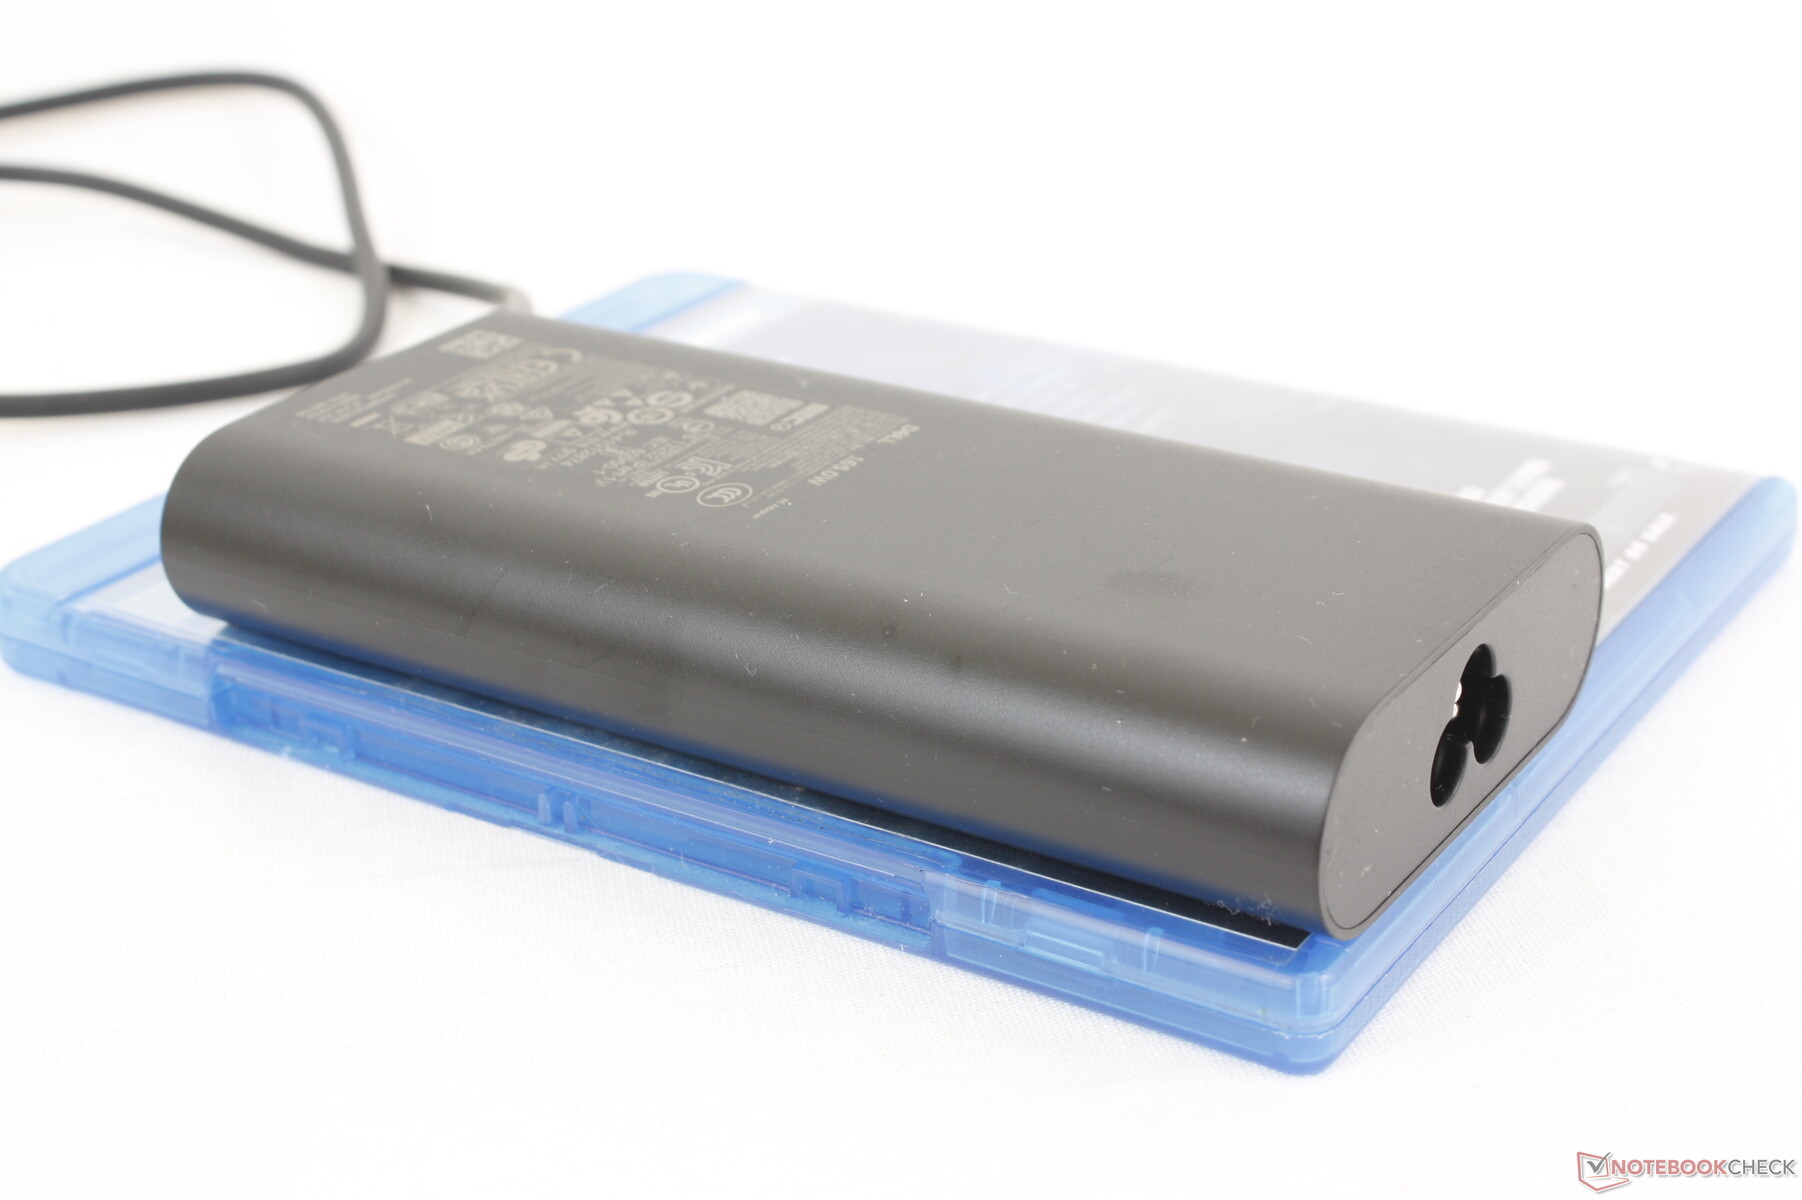
Das recht kleine (~13,5 x 6,5 x 2,2 cm) 165-W-USB-C-Netzteil verdient eine gesonderte Anerkennung für seinen hohen Energie-Output. Die meisten existierenden USB-C-Adapter limitieren die Leistung auf nur 100 W bis 140 W. Das macht unser 165-W-Netzteil deutlich vielseitiger in der Verwendung. Beispielsweise entledigt sich das neue Netzteil dem Akku-Ladeproblem, das wir auf der älteren Precision 7000 mit schwächerem 130-W-USB-C-Netzteil beobachtet haben.
| Aus / Standby | |
| Idle | |
| Last |
|
Legende:
min: | |
| Dell Precision 5000 5680 i9-13900H, RTX 5000 Ada Generation Laptop, 2x SK hynix PC801 HFS512GEJ9X101N RAID 0, OLED, 3840x2400, 16" | Dell Precision 7000 7670 Performance i9-12950HX, RTX A5500 Laptop GPU, , OLED, 3840x2400, 16" | HP ZBook Fury 16 G9 i9-12950HX, RTX A5500 Laptop GPU, Micron 3400 1TB MTFDKBA1T0TFH, IPS, 3840x2400, 16" | Lenovo ThinkPad P16 G1 RTX A5500 i9-12950HX, RTX A5500 Laptop GPU, WDC PC SN810 2TB, IPS, 3840x2400, 16" | MSI CreatorPro Z16P B12UKST i7-12700H, RTX A3000 Laptop GPU, Samsung PM9A1 MZVL21T0HCLR, IPS, 2560x1600, 16" | Asus ExpertBook B6 Flip B6602FC2 i9-12950HX, RTX A2000 Laptop GPU, Samsung PM9A1 MZVL21T0HCLR, IPS, 2560x1600, 16" | |
|---|---|---|---|---|---|---|
| Stromverbrauch | -99% | -86% | -53% | -18% | -35% | |
| Idle min * (Watt) | 8 | 16.4 -105% | 19.5 -144% | 7.5 6% | 10.8 -35% | 10.5 -31% |
| Idle avg * (Watt) | 10.4 | 35.9 -245% | 29 -179% | 20.1 -93% | 16.3 -57% | 11.9 -14% |
| Idle max * (Watt) | 30.5 | 47 -54% | 40.7 -33% | 40 -31% | 16.9 45% | 18 41% |
| Last avg * (Watt) | 75.4 | 147.1 -95% | 142.1 -88% | 137 -82% | 111.7 -48% | 182 -141% |
| Witcher 3 ultra * (Watt) | 134 | 158.8 -19% | 188.6 -41% | 208 -55% | 152.1 -14% | 177.5 -32% |
| Last max * (Watt) | 175 | 311 -78% | 224.4 -28% | 285.9 -63% | 177.4 -1% | 229 -31% |
* ... kleinere Werte sind besser
Energieverbrauch unter Witcher 3 / Stresstest
Energieverbrauch mit externem Monitor
Akkulaufzeit
Angesichts der hohen Leistung und des anspruchsvollen OLED-Panels sind die Laufzeiten beeindruckend. Im Ausbalancierten Modus kommen wir auf beinahe 10 Stunden in unserem praxisnahen WLAN-Test. Alternativen wie das Lenovo ThinkPad P16 G1 oder das MSI CreatorPro Z16P schaffen hier gerade einmal die Hälfte.
Eine komplette Aufladung von 0 auf 100 Prozent dauert etwa zwei Stunden mit dem beiliegenden 165-W-Netzteil. Auch mit unserem Drittanbieter-USB-C-Netzteil mit 65 W ließ sich die Workstation laden, dann natürlich nur mit einer geringeren Rate.
| Dell Precision 5000 5680 i9-13900H, RTX 5000 Ada Generation Laptop, 98 Wh | Dell Precision 7000 7670 Performance i9-12950HX, RTX A5500 Laptop GPU, 93 Wh | HP ZBook Fury 16 G9 i9-12950HX, RTX A5500 Laptop GPU, 95 Wh | Lenovo ThinkPad P16 G1 RTX A5500 i9-12950HX, RTX A5500 Laptop GPU, 94 Wh | MSI CreatorPro Z16P B12UKST i7-12700H, RTX A3000 Laptop GPU, 90 Wh | Asus ExpertBook B6 Flip B6602FC2 i9-12950HX, RTX A2000 Laptop GPU, 90 Wh | |
|---|---|---|---|---|---|---|
| Akkulaufzeit | -53% | -46% | -41% | -41% | -14% | |
| Idle (h) | 17.9 | 5.3 -70% | 12.5 -30% | |||
| WLAN (h) | 9.9 | 4.7 -53% | 6 -39% | 5.8 -41% | 5.8 -41% | 8.7 -12% |
| Last (h) | 1.7 | 1.2 -29% | 1.7 0% | |||
| H.264 (h) | 5.8 |
Pro
Contra
Fazit — Stärker als es aussieht
Die Precision 5680 ist eindeutig eine der schlanksten und schnellsten mobilen Workstations in Dells Sortiment. Das portable Design, das 165-W-USB-C-Netzteil, das exzellente 4K-OLED-Display und die starke RTX 5000 erweisen sich allesamt als die stärksten Punkte dieses Modells. Vor allem Letztere zeichnet sich für einen erheblichen Leistungssprung sowie eine längere Akkulaufzeit gegenüber anderen Workstations verantwortlich, daraus resultiert eine hohe Leistung-pro-Watt.
Die Precision 5680 bietet eine der besten Leistung-pro-Watt-Verhältnisse in der wachsenden Kategorie der dünnen und leichten Workstations.
Hardcore-Nutzer von Workstations bevorzugen womöglich auch weiterhin größere und dickere Modelle wie das HP ZBook Fury 16 oder das Precision 7670, auch weil das dünne Precision-5680-Design einige Schlüsselfunktionen wie austauschbaren RAM, WAN, ECC RAM und mehr Anschlussmöglichkeiten vermissen lässt. Ihr furchtbares Klickpad ist zudem nicht annähernd so genau wie das Touchpad auf dem HP oder dem Lenovo ThinkPad P16, welches physische Maustasten für eine bessere Steuerung bietet.
Preise und Verfügbarkeit
In den USA liefert Dell die Precision 5680 für ab $2490 USD bis über $6500 aus. In Deutschland ist das Modell bislang noch nicht erhältlich, selbst die Dell-Webseite listet das Modell bislang nicht auf.
Dell Precision 5000 5680
- 18.08.2023 v7 (old)
Allen Ngo
Transparenz
Die Auswahl der zu testenden Geräte erfolgt innerhalb der Redaktion. Das vorliegende Testmuster wurde dem Autor vom Hersteller oder einem Shop zu Testzwecken leihweise zur Verfügung gestellt. Eine Einflussnahme des Leihstellers auf den Testbericht gab es nicht, der Hersteller erhielt keine Version des Reviews vor der Veröffentlichung. Es bestand keine Verpflichtung zur Publikation. Als eigenständiges, unabhängiges Unternehmen unterliegt Notebookcheck keiner Diktion von Herstellern, Shops und Verlagen.
So testet Notebookcheck
Pro Jahr werden von Notebookcheck hunderte Laptops und Smartphones unabhängig in von uns standardisierten technischen Verfahren getestet, um eine Vergleichbarkeit aller Testergebnisse zu gewährleisten. Seit rund 20 Jahren entwickeln wir diese Testmethoden kontinuierlich weiter und setzen damit Branchenstandards. In unseren Testlaboren kommt ausschließlich hochwertiges Messequipment in die Hände erfahrener Techniker und Redakteure. Die Tests unterliegen einer mehrstufigen Kontrolle. Unsere komplexe Gesamtbewertung basiert auf hunderten fundierten Messergebnissen und Benchmarks, womit Ihnen Objektivität garantiert ist. Weitere Informationen zu unseren Testmethoden gibt es hier.
Preisvergleich

