Dell Precision 5490 Workstation im Test: Jetzt mit Intel Meteor Lake-H vPro

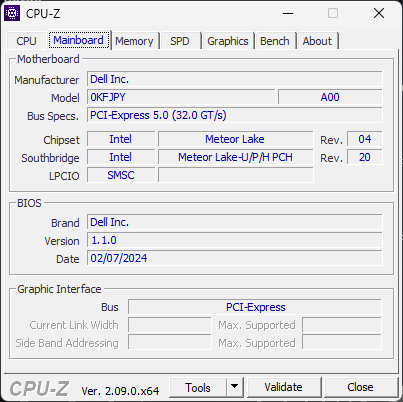
Das 2024 Precision 5490 ist ein Update des Precision 5480 aus dem letzten Jahr. Das neueste Modell nutzt das gleiche Gehäusedesign wie die Precision 5480 und 5470, was bedeutet, dass alle unsere bisherigen Kommentare zu den physischen Eigenschaften der Precision 5470 auch für die 5490 gelten.
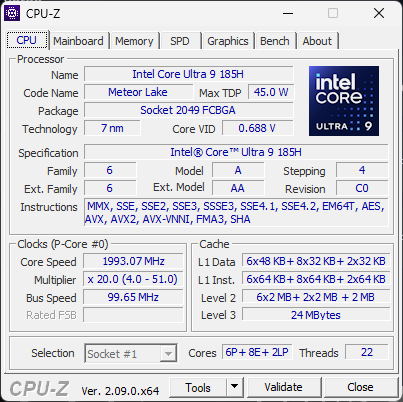
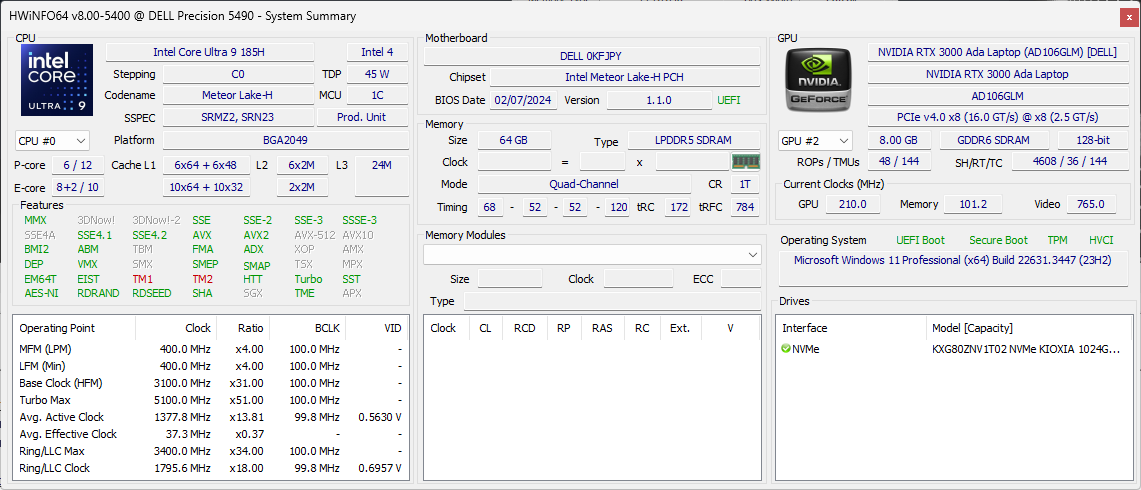
Unser Testgerät ist die Top-End-Konfiguration mit der Meteor Lake-H Core Ultra 9 185H CPU, die die Raptor Lake-H Optionen des letzten Jahres ersetzt. Ansonsten bleibt alles beim Alten, einschließlich des QHD+ 2560 x 1600 IPS-Touchscreens und der 50 W Nvidia RTX 3000 Ada GPU. Kleinere SKUs können stattdessen mit dem Core Ultra 5 135H, FHD+ 1920 x 1200 Display und nur integrierter Arc-Grafik ausgeliefert werden.
Zu den direkten Konkurrenten des Precision 5490 gehören andere ultraportable 14-Zoll-Workstations wie das Lenovo ThinkPad P14s oder das HP ZBook Firefly 14 G10.
Weitere Dell Bewertungen:
Mögliche Konkurrenten im Vergleich
Bew. | Datum | Modell | Gewicht | Dicke | Größe | Auflösung | Preis ab |
|---|---|---|---|---|---|---|---|
| 89.3 % v7 (old) | 04 / 2024 | Dell Precision 5000 5490 Ultra 9 185H, RTX 3000 Ada Generation Laptop | 1.6 kg | 18.95 mm | 14.00" | 2560x1600 | |
| 81 % | 06 / 2024 | Lenovo ThinkPad P14s G4 21HF0017GE i7-1370P, RTX A500 Laptop GPU | 1.5 kg | 22.7 mm | 14.00" | 2880x1800 | |
| 87.4 % v7 (old) | 10 / 2023 | HP ZBook Firefly 14 G10 A R5 PRO 7640HS, Radeon 760M | 1.5 kg | 20 mm | 14.00" | 1920x1200 | |
| 87.4 % v7 (old) | 01 / 2023 | HP ZBook Firefly 14 G9-6B8A2EA i7-1265U, T550 Laptop GPU | 1.5 kg | 19.9 mm | 14.00" | 1920x1200 | |
| 89.6 % v7 (old) | 09 / 2023 | Dell Precision 5480 i9-13900H, RTX 3000 Ada Generation Laptop | 1.6 kg | 18.95 mm | 14.00" | 2560x1600 | |
| 87.6 % v7 (old) | 09 / 2022 | Dell Precision 5000 5470 i9-12900H, RTX A1000 Laptop GPU | 1.6 kg | 18.95 mm | 14.00" | 2560x1600 |
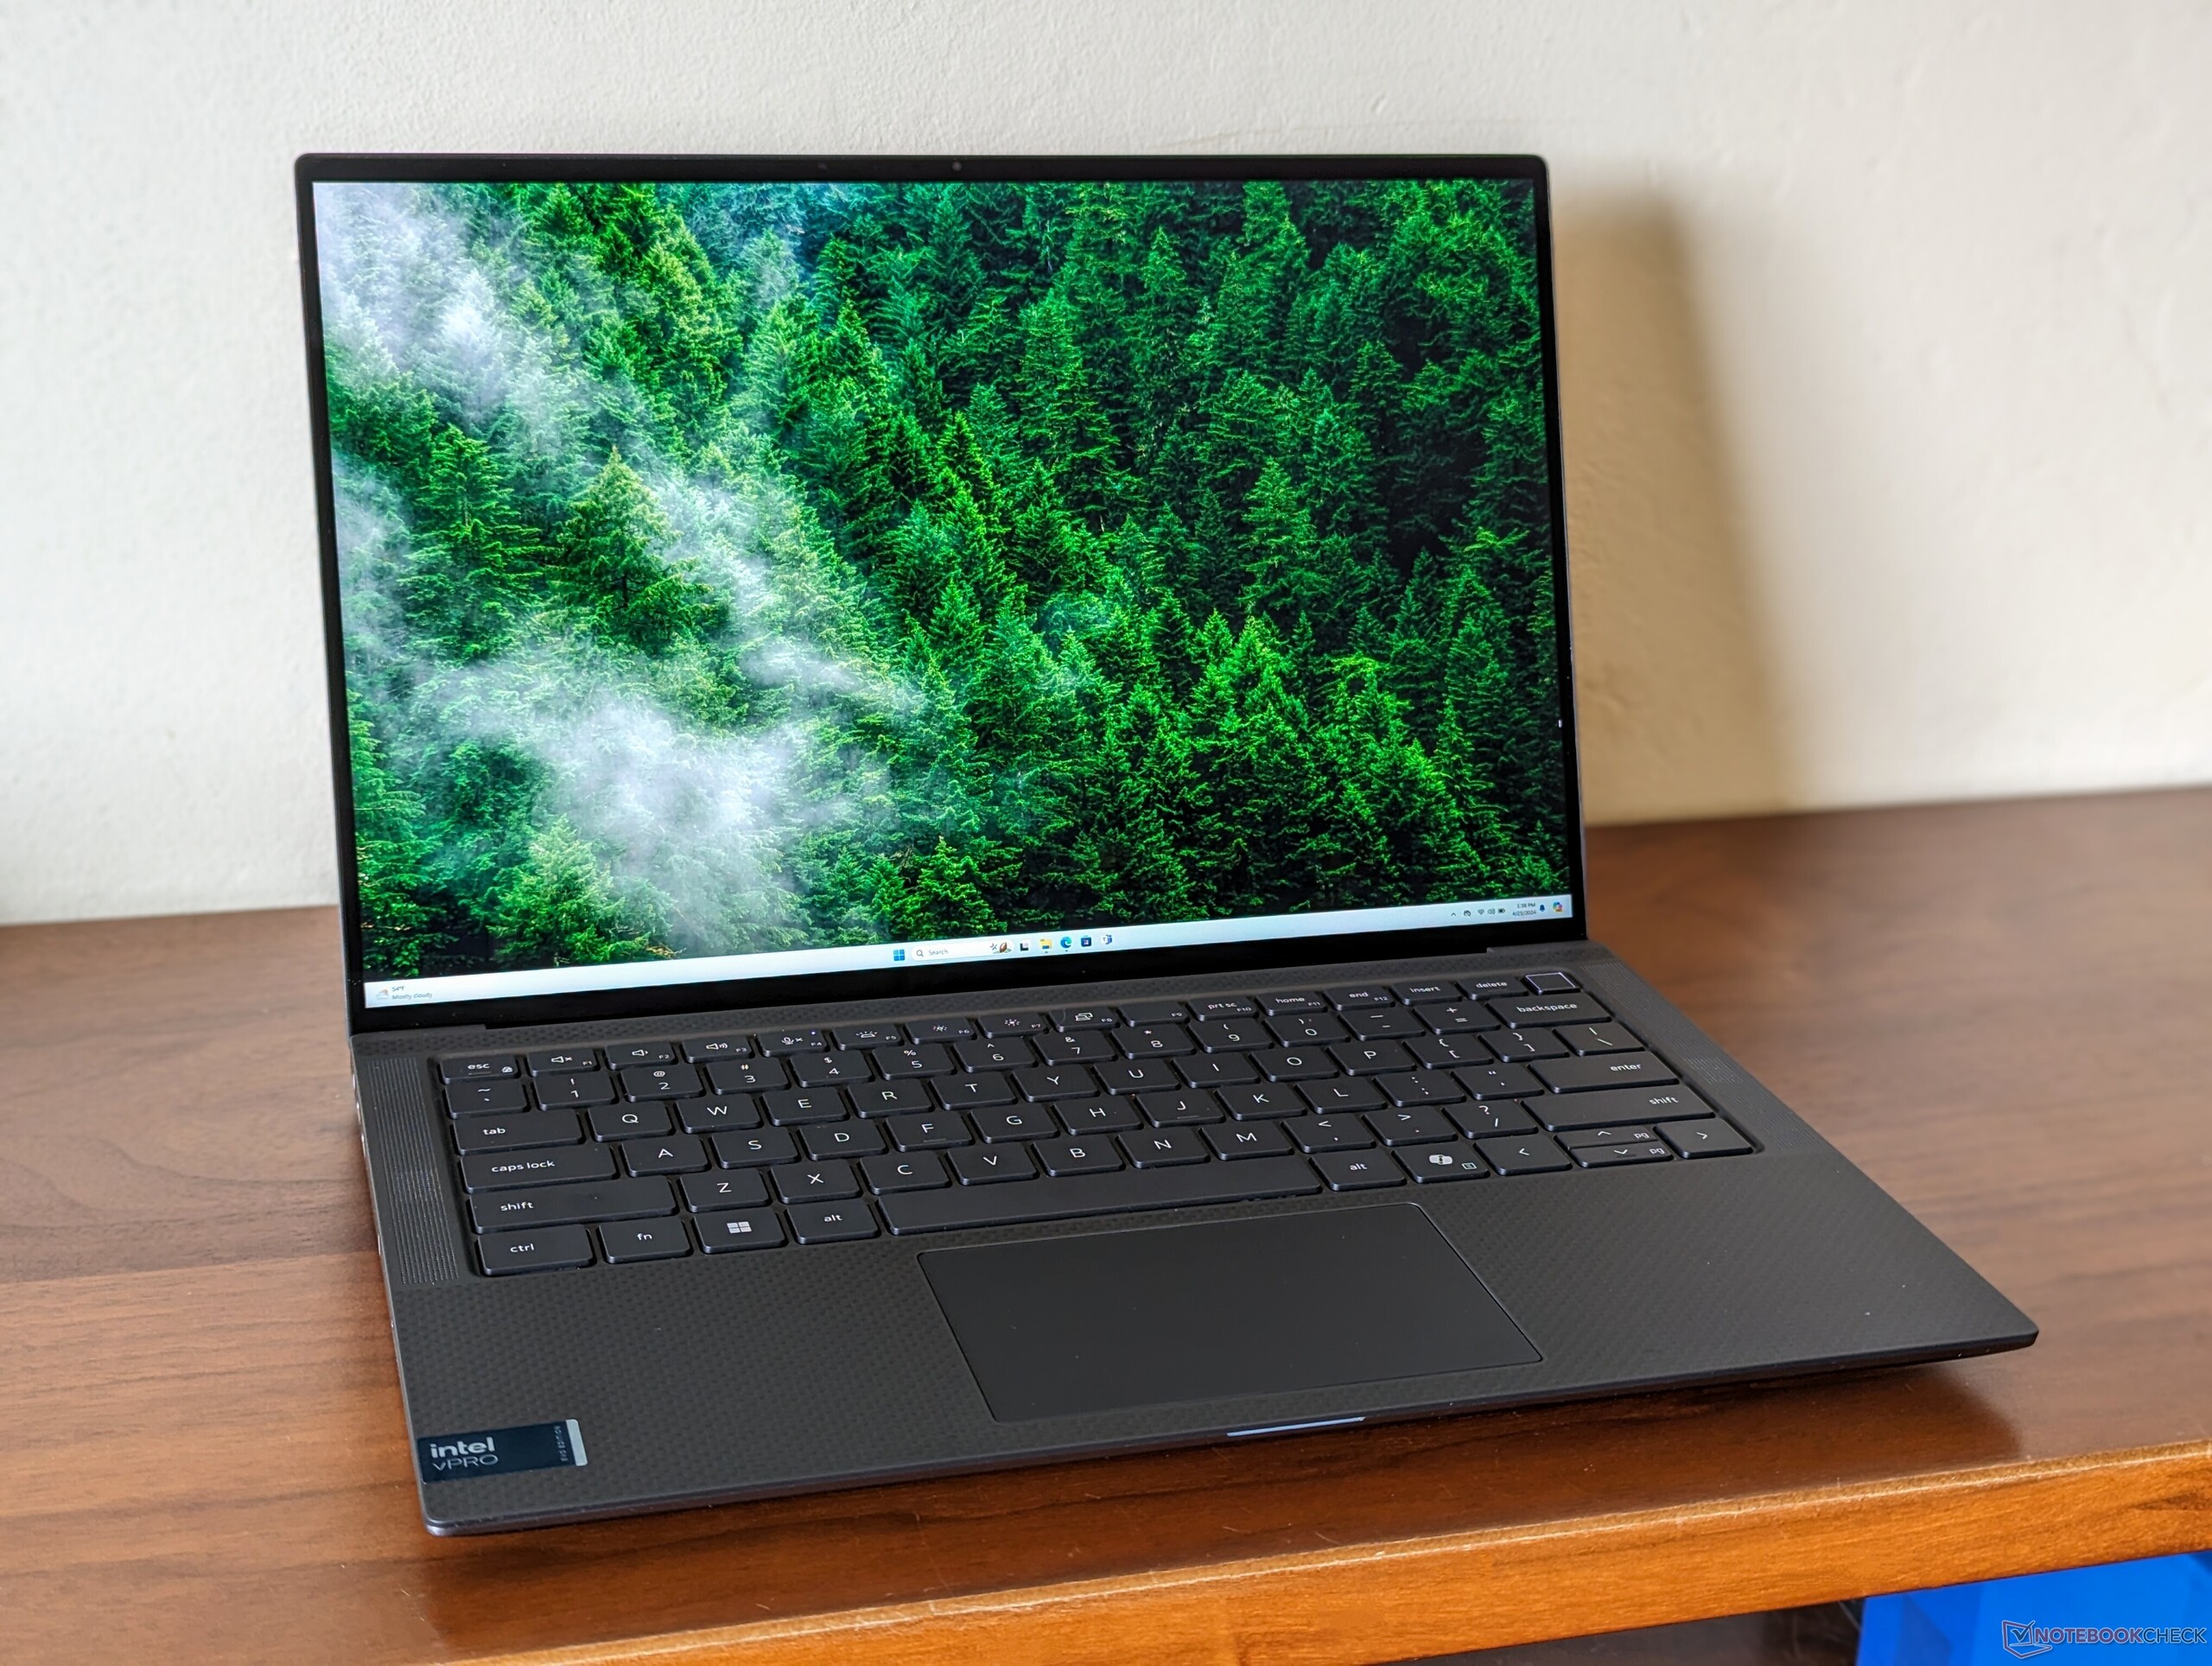
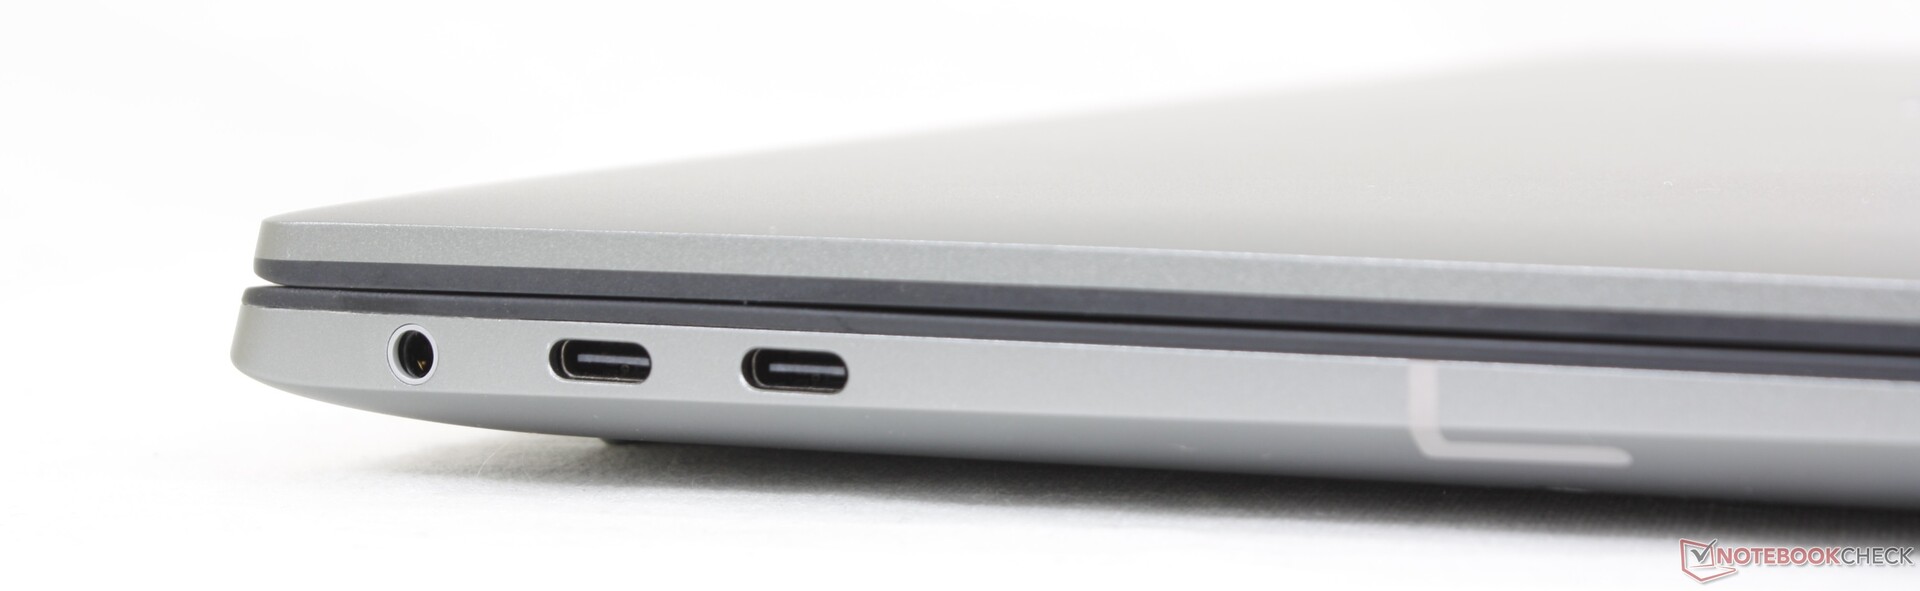
Gehäuse — Inspiriert von XPS
Der einfachste Weg, die Precision 5490 von der Precision 5480 oder 5470 optisch zu unterscheiden, ist die neue Co-Pilot-Taste auf der Tastatur. Microsoft verlangt diese spezielle Taste von allen großen Herstellern, um kommende Windows AI-Funktionen besser zu unterstützen. Ansonsten gibt es keine anderen Änderungen am Gehäuse. Weitere Informationen finden Sie in unserem Testbericht über das Precision 5470.
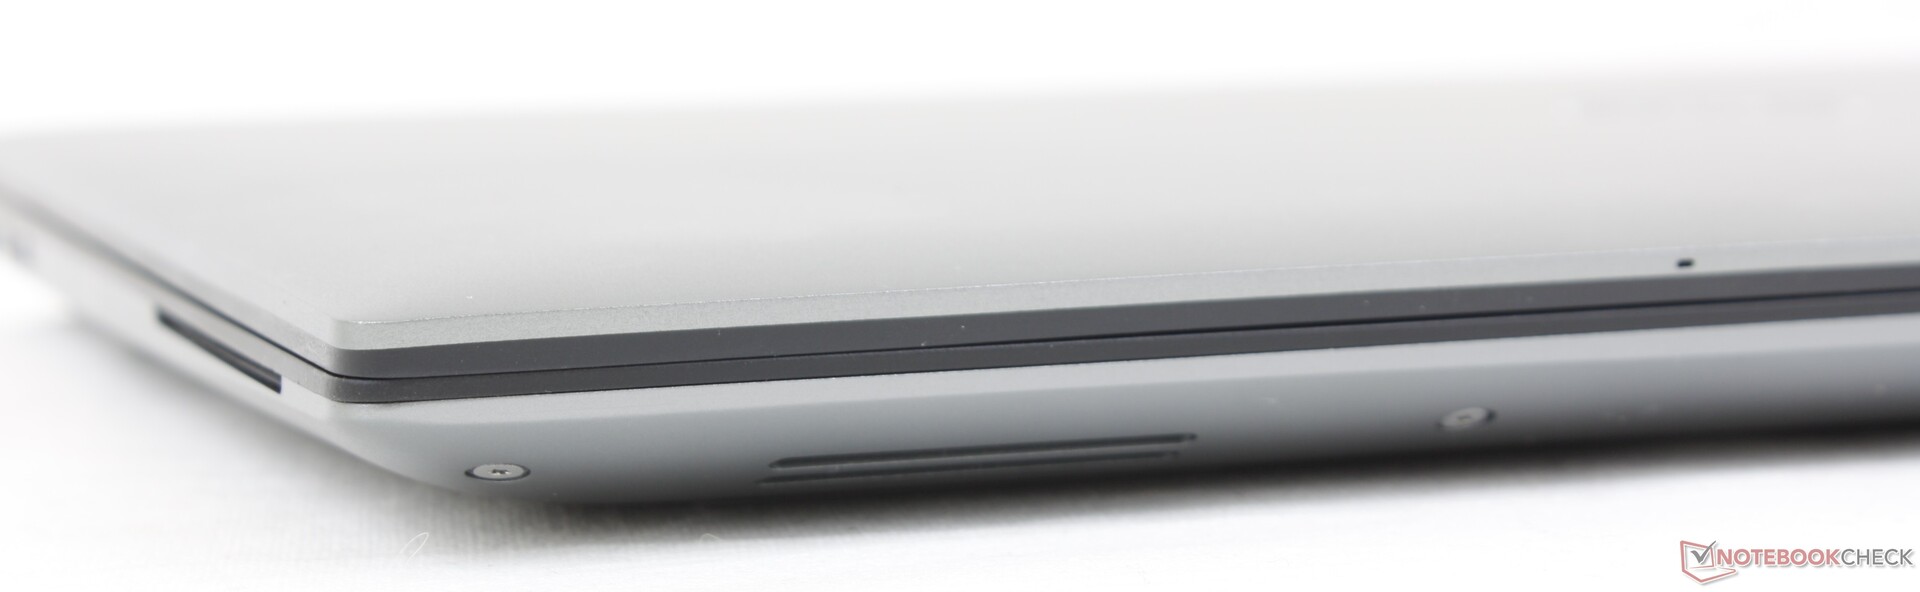
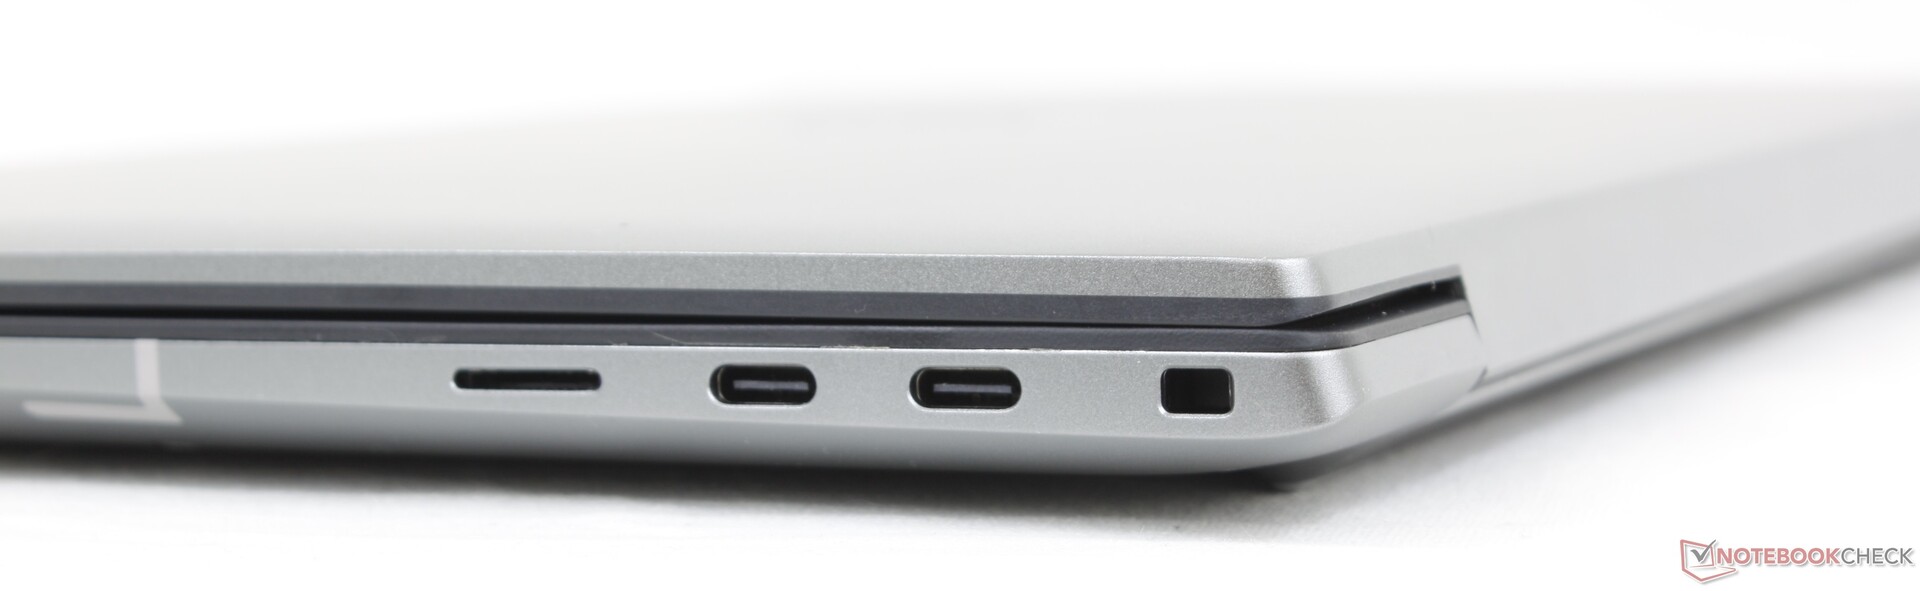
Beachten Sie, dass der MicroSD-Kartenleser optional bleibt
Ausstattung
Kommunikation
Der Intel BE200, der für Wi-Fi 7 geeignet ist, ist in diesem Jahr im Modell vorhanden.
| Networking | |
| iperf3 transmit AXE11000 | |
| Dell Precision 5480 | |
| Dell Precision 5000 5490 | |
| HP ZBook Firefly 14 G10 A | |
| Lenovo ThinkPad P14s G4 21HF0017GE | |
| iperf3 receive AXE11000 | |
| HP ZBook Firefly 14 G10 A | |
| Lenovo ThinkPad P14s G4 21HF0017GE | |
| Dell Precision 5480 | |
| Dell Precision 5000 5490 | |
| iperf3 transmit AXE11000 6GHz | |
| Dell Precision 5000 5490 | |
| Dell Precision 5480 | |
| Dell Precision 5000 5470 | |
| Lenovo ThinkPad P14s G4 21HF0017GE | |
| iperf3 receive AXE11000 6GHz | |
| Lenovo ThinkPad P14s G4 21HF0017GE | |
| Dell Precision 5000 5490 | |
| Dell Precision 5480 | |
| Dell Precision 5000 5470 | |
Webcam


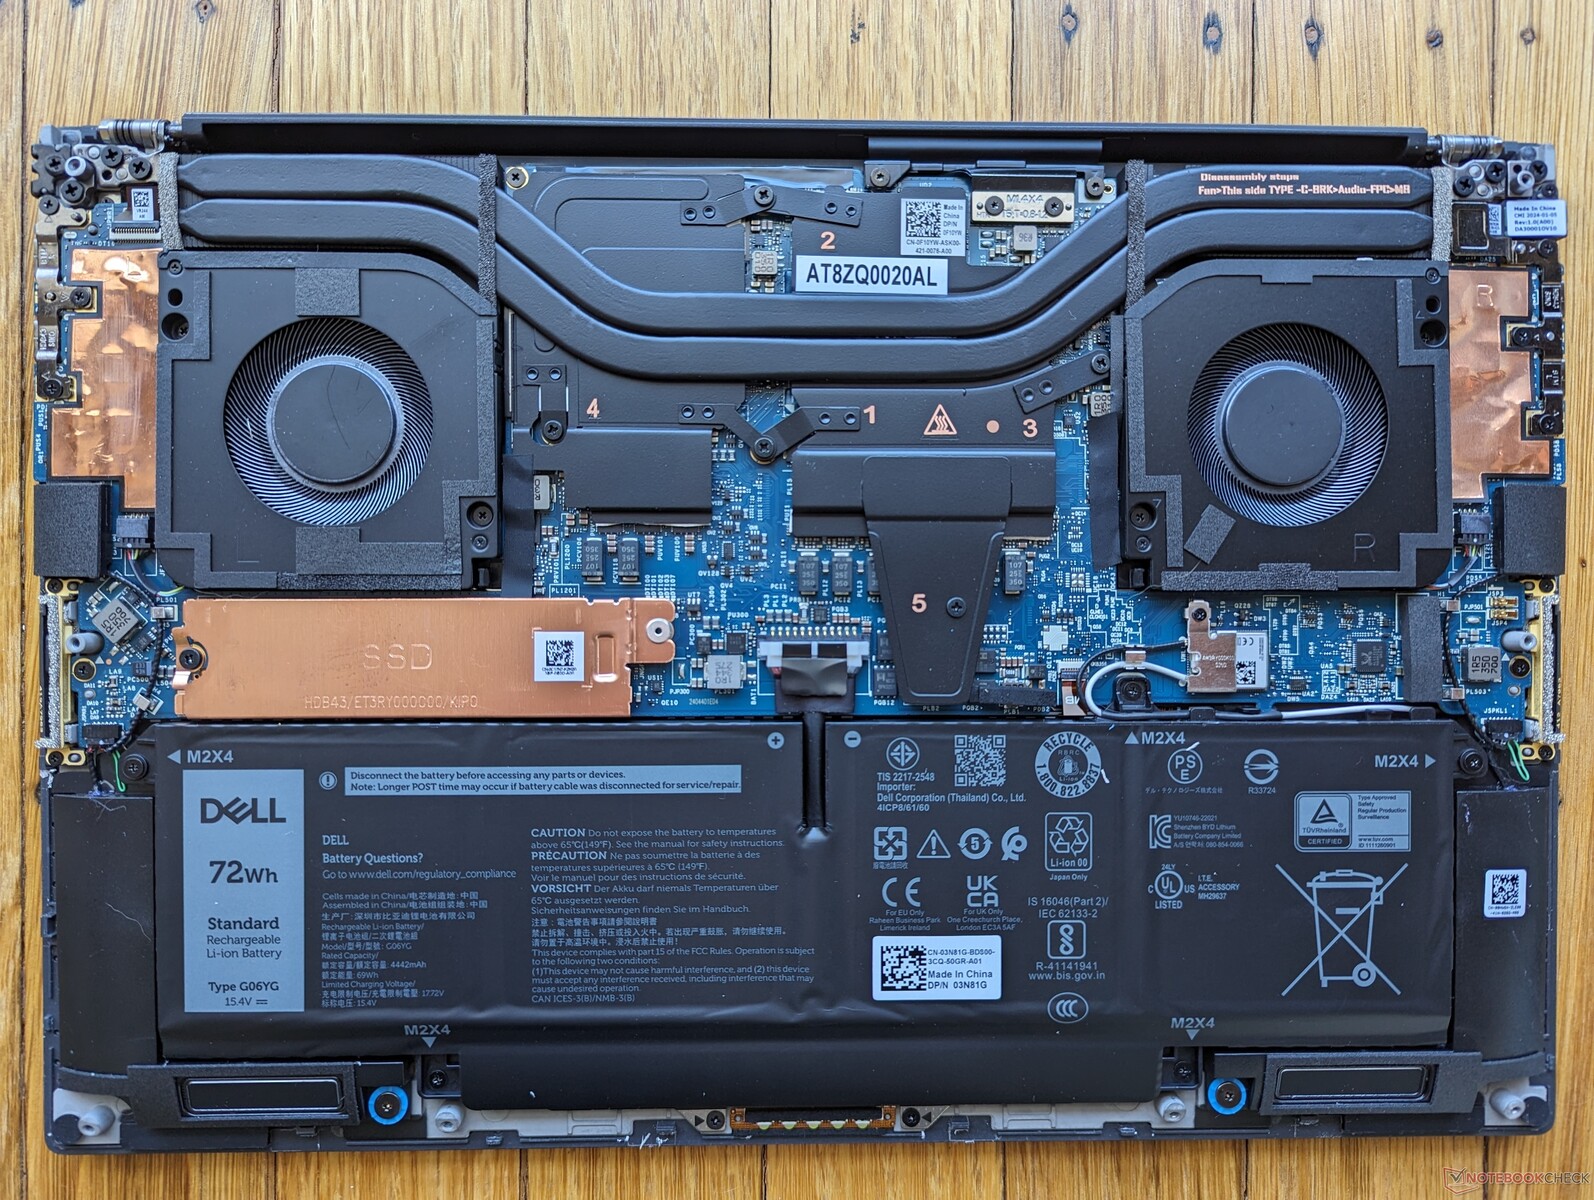
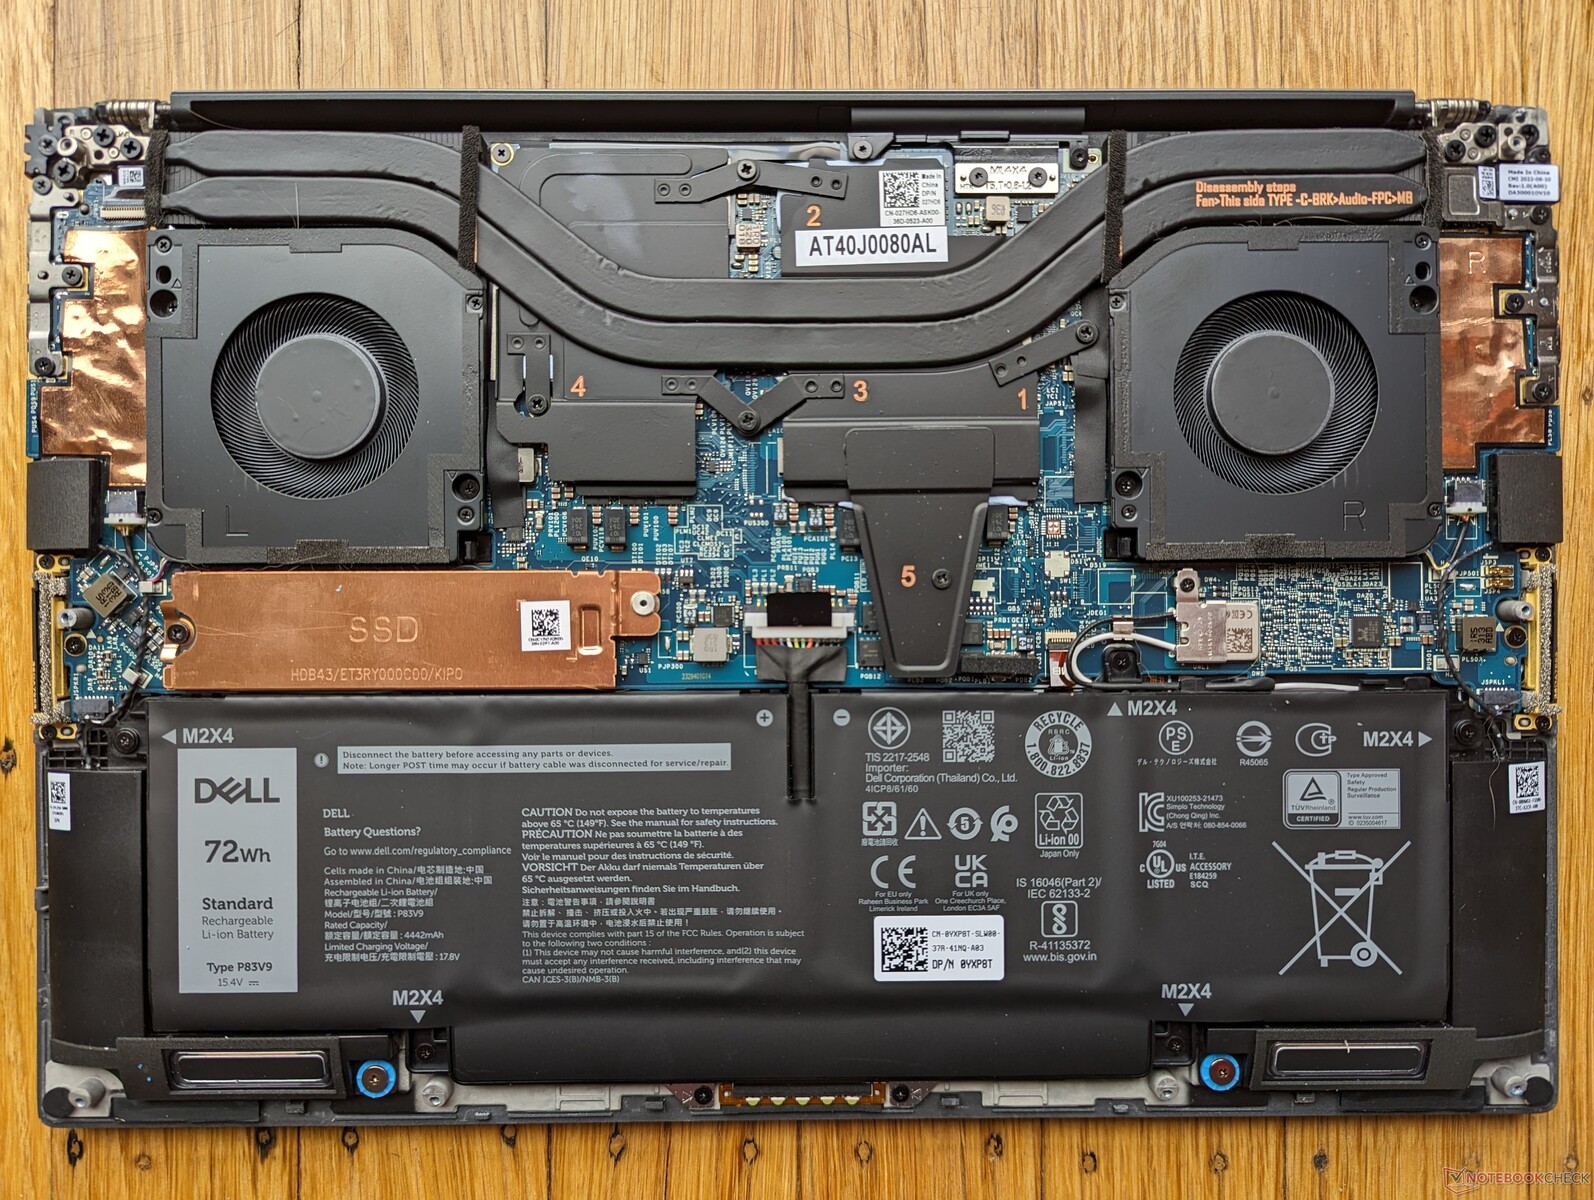
Wartung
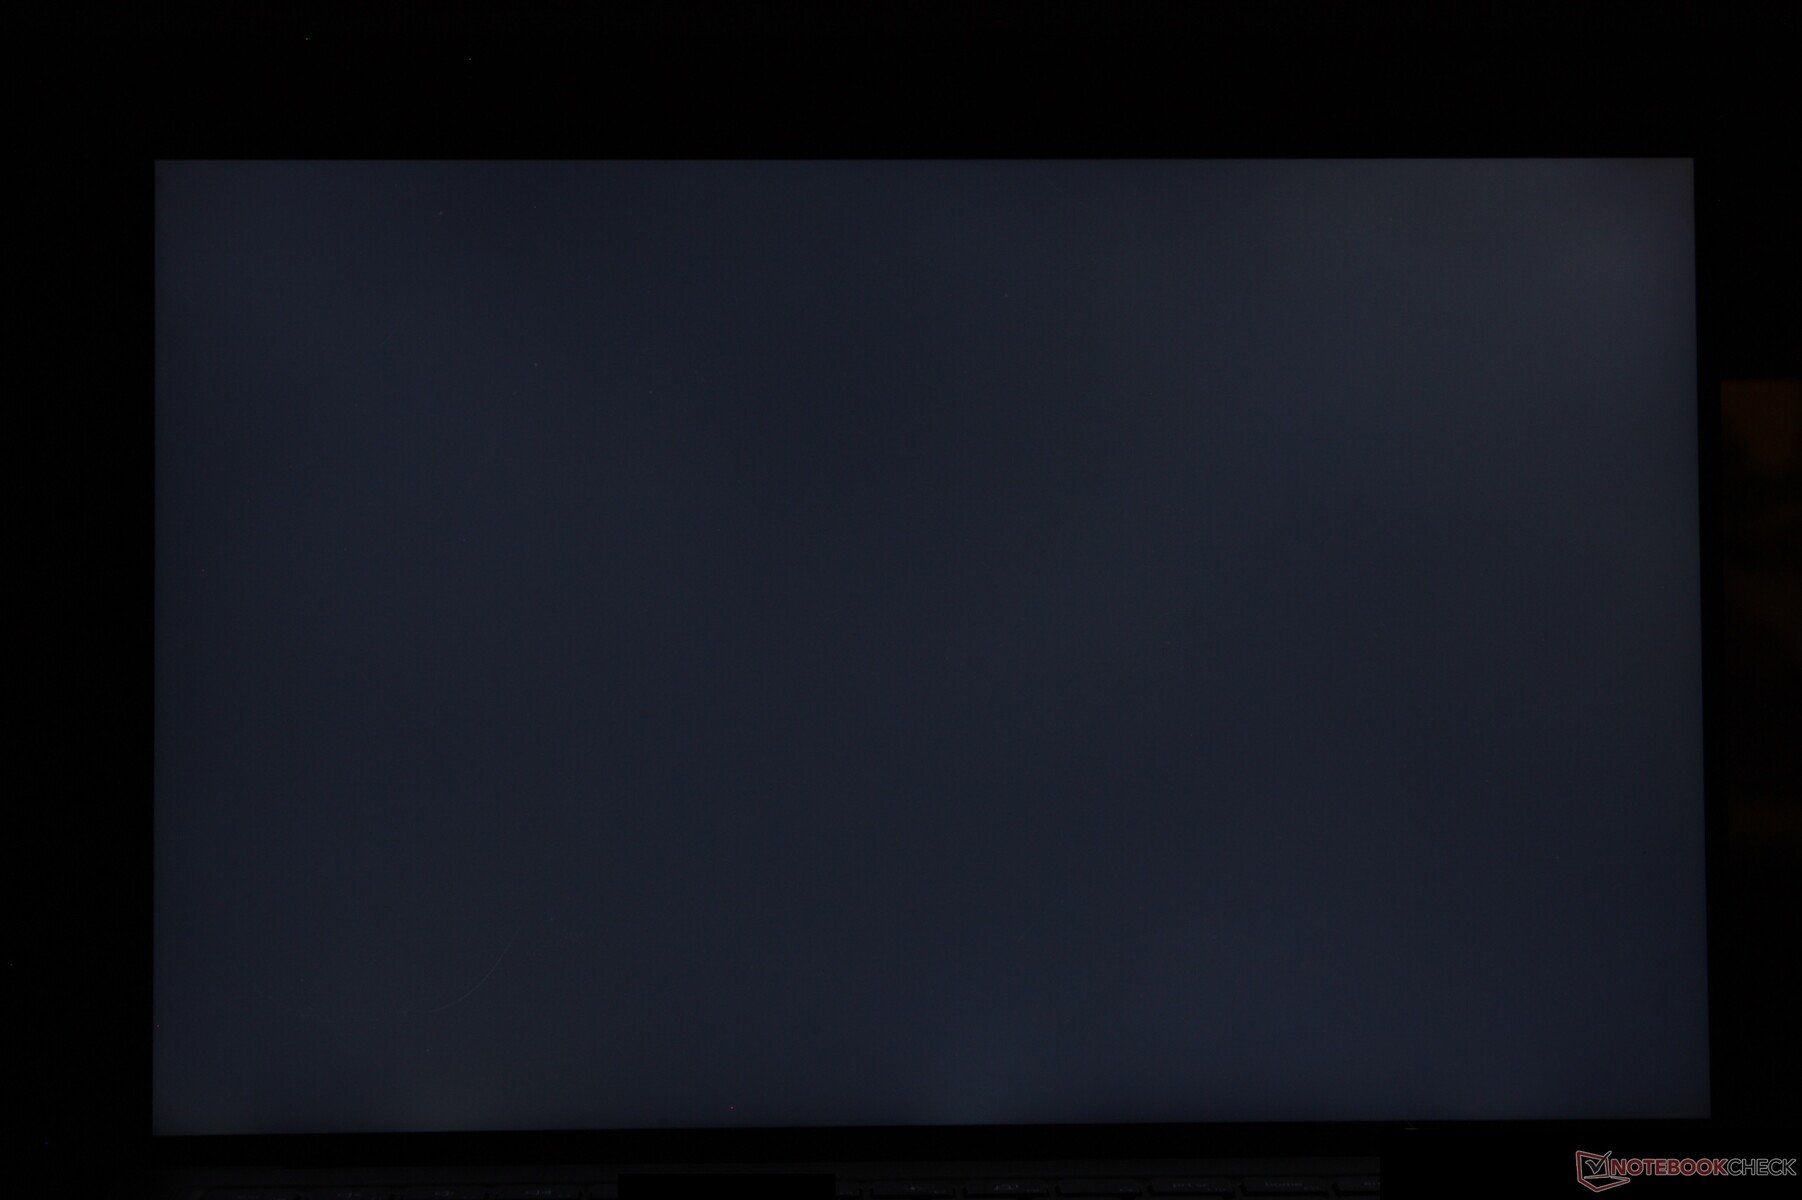
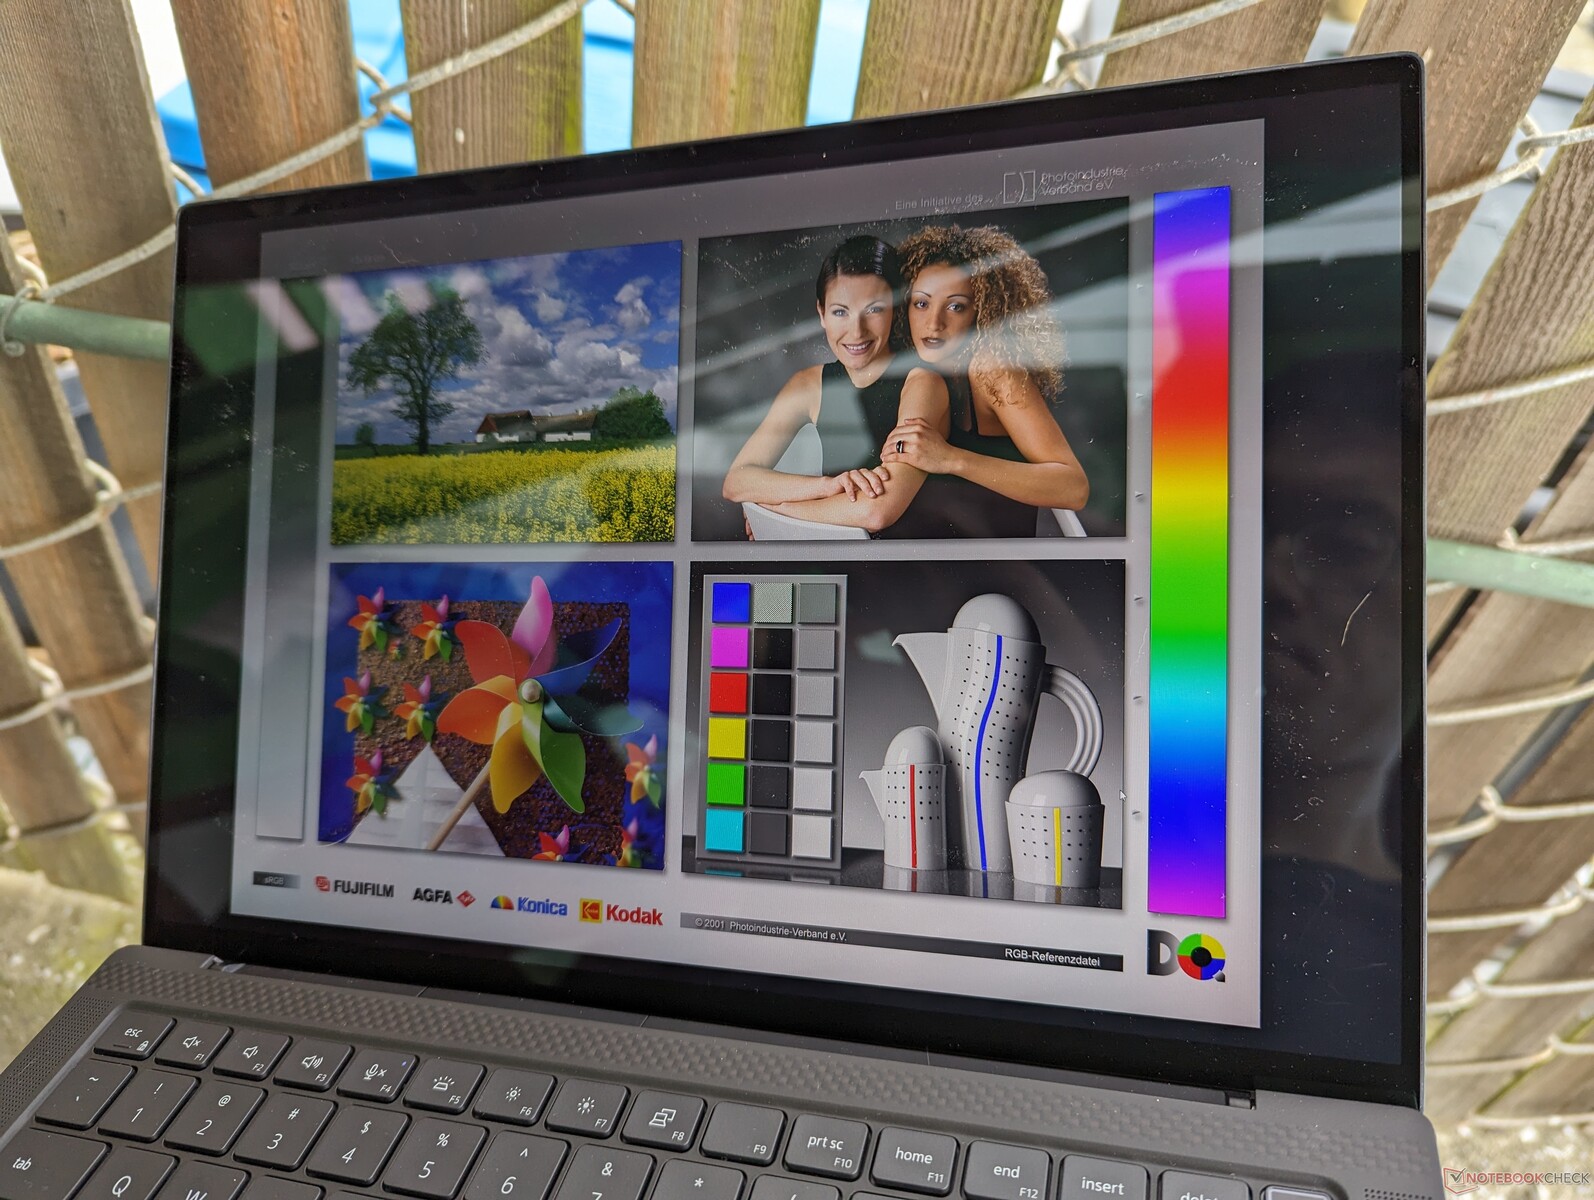
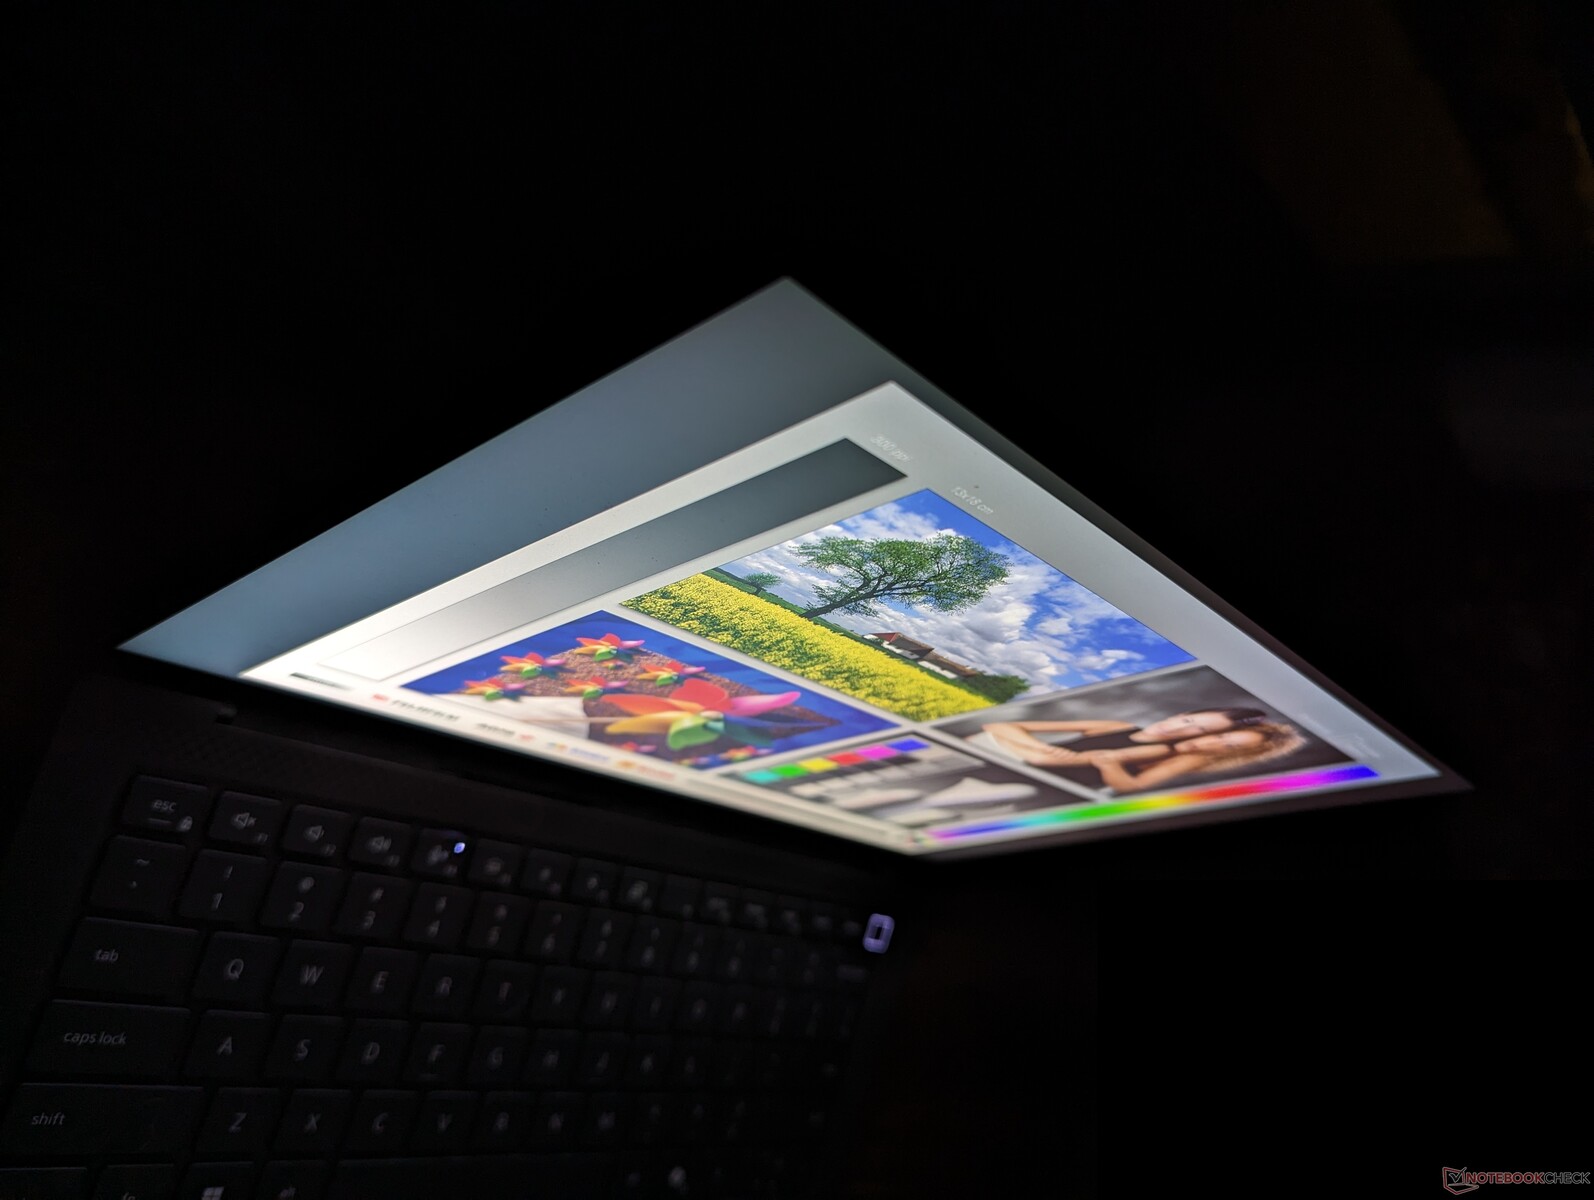
Display — Das gute alte IPS
AU Optronics ist nun schon das dritte Jahr in Folge der Lieferant für das QHD+-Panel. Während es bei seiner Einführung für das Precision 5470 hervorragend war, ist das Panel angesichts neuerer OLED- und höherer Bildwiederholraten in die Jahre gekommen. Das Lenovo ThinkPad P14s G4 wird beispielsweise mit einer 1800p OLED-Option ausgeliefert, die beim Precision 5490 nicht verfügbar ist

| |||||||||||||||||||||||||
Ausleuchtung: 90 %
Helligkeit Akku: 485.1 cd/m²
Kontrast: 1277:1 (Schwarzwert: 0.38 cd/m²)
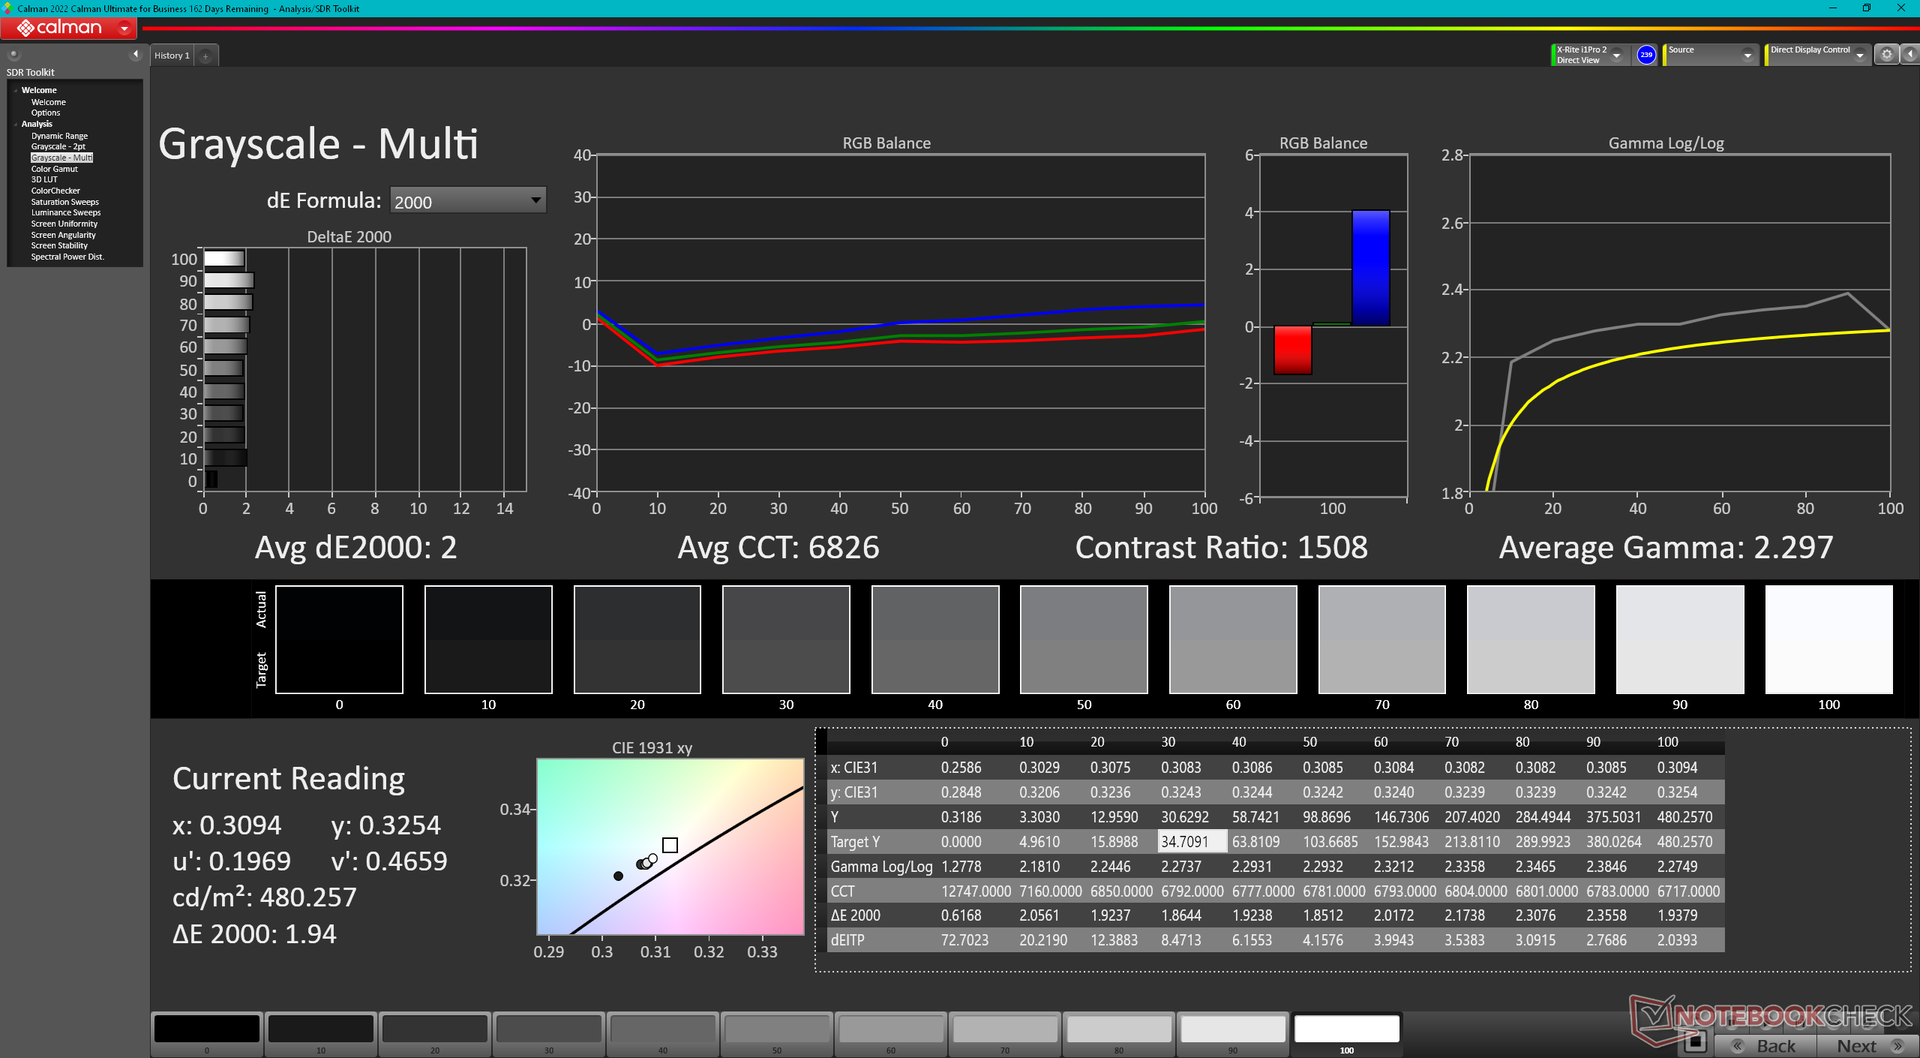
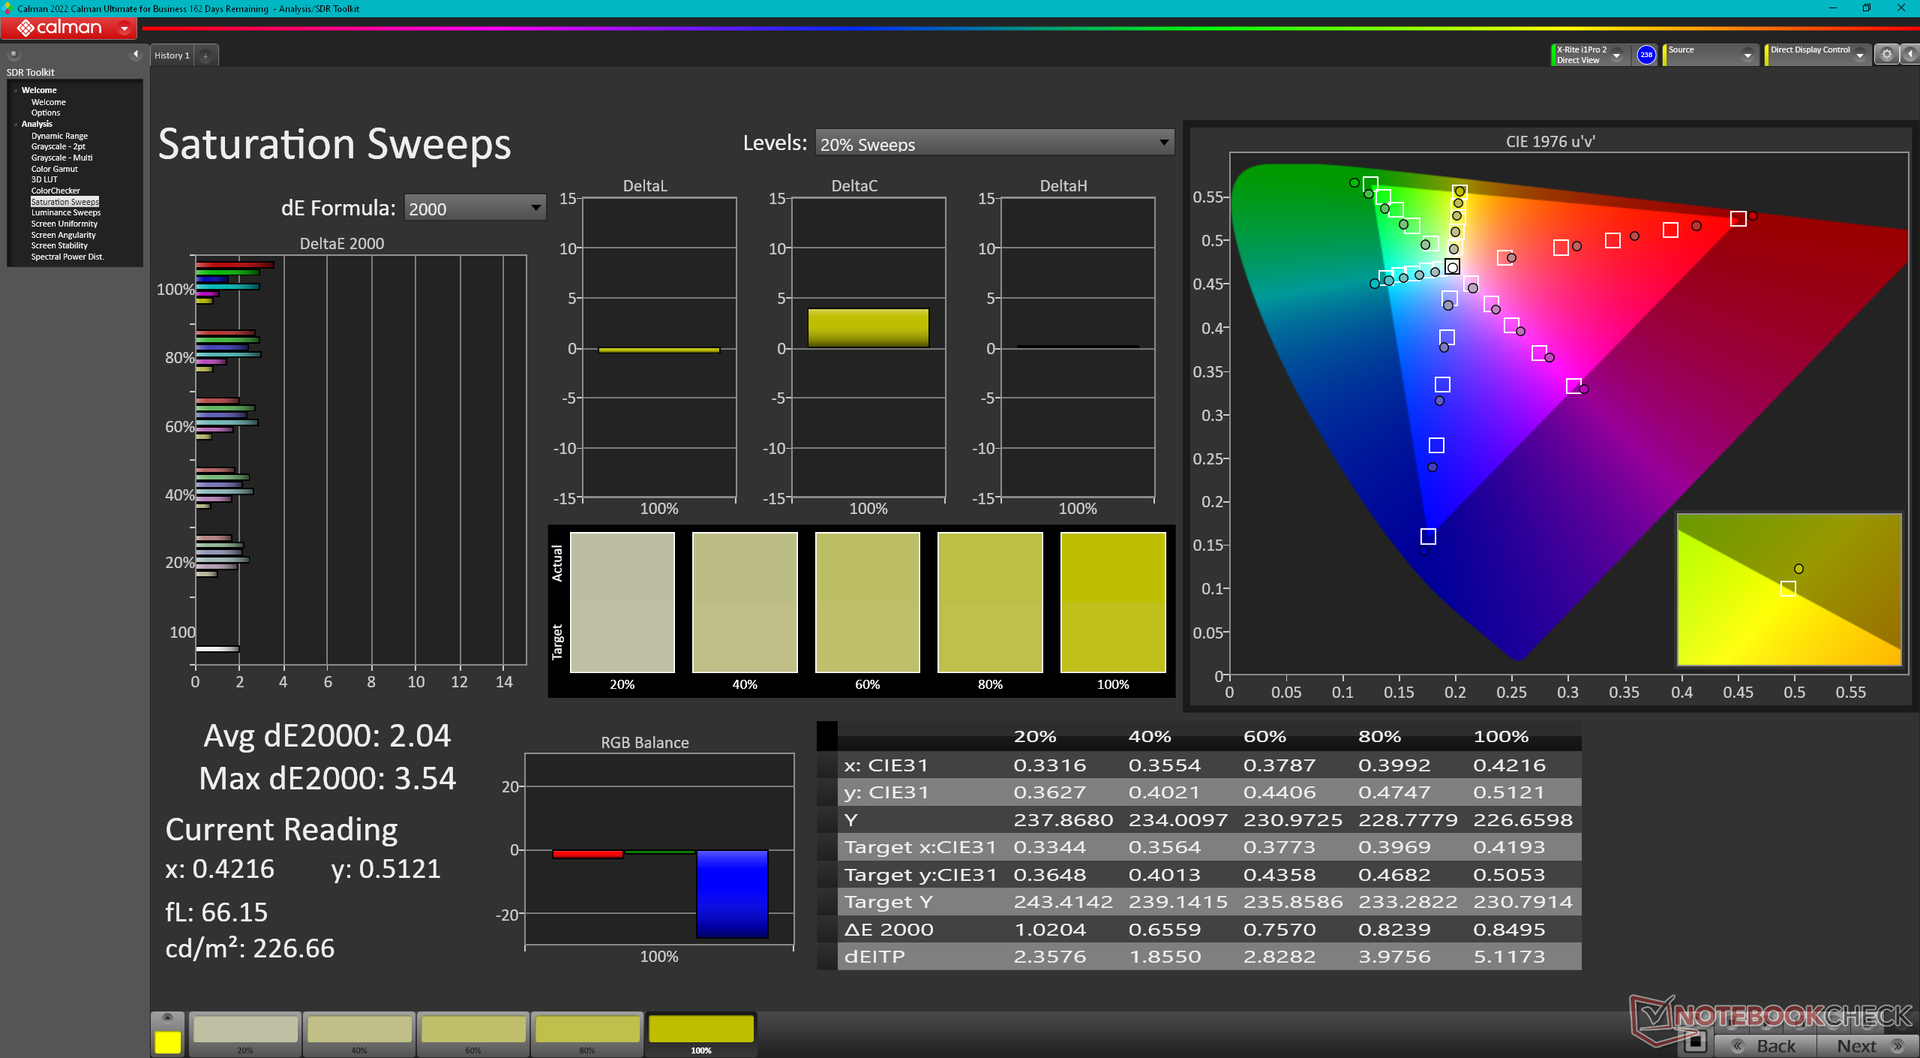
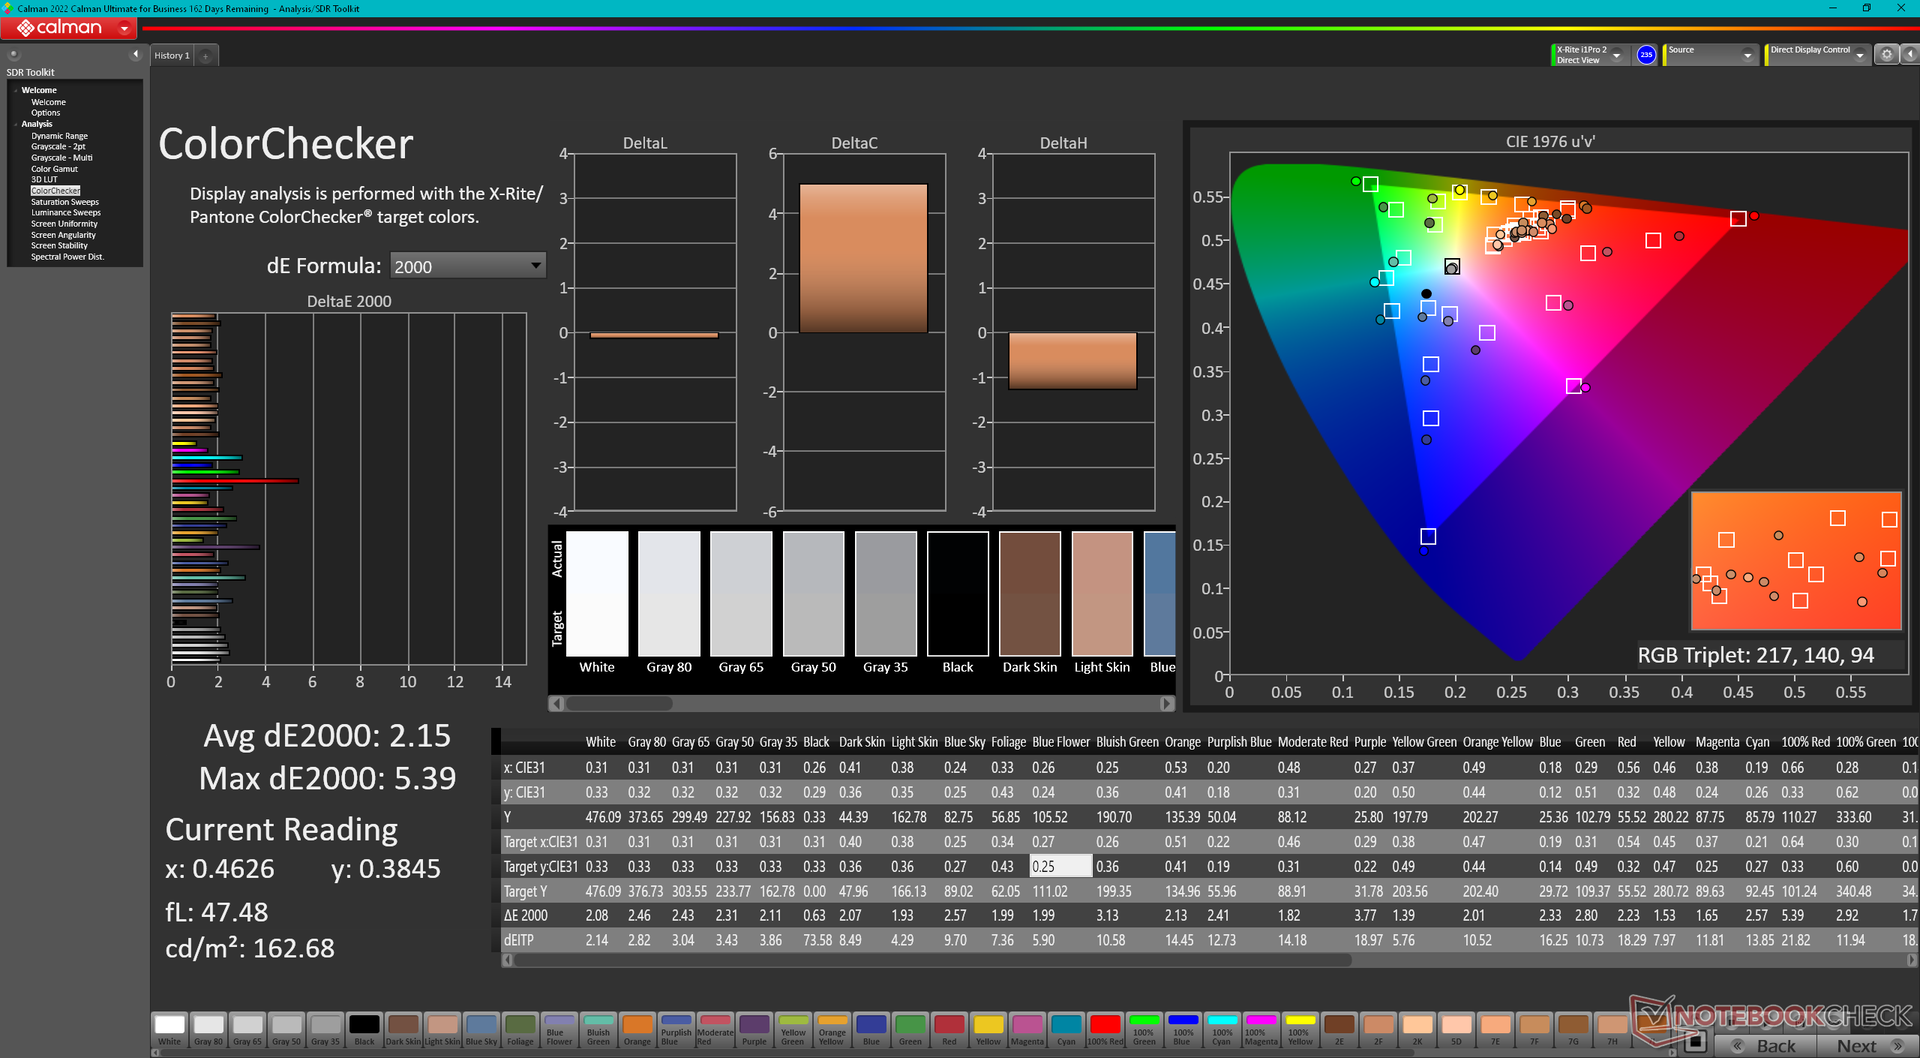
ΔE ColorChecker Calman: 2.15 | ∀{0.5-29.43 Ø4.73}
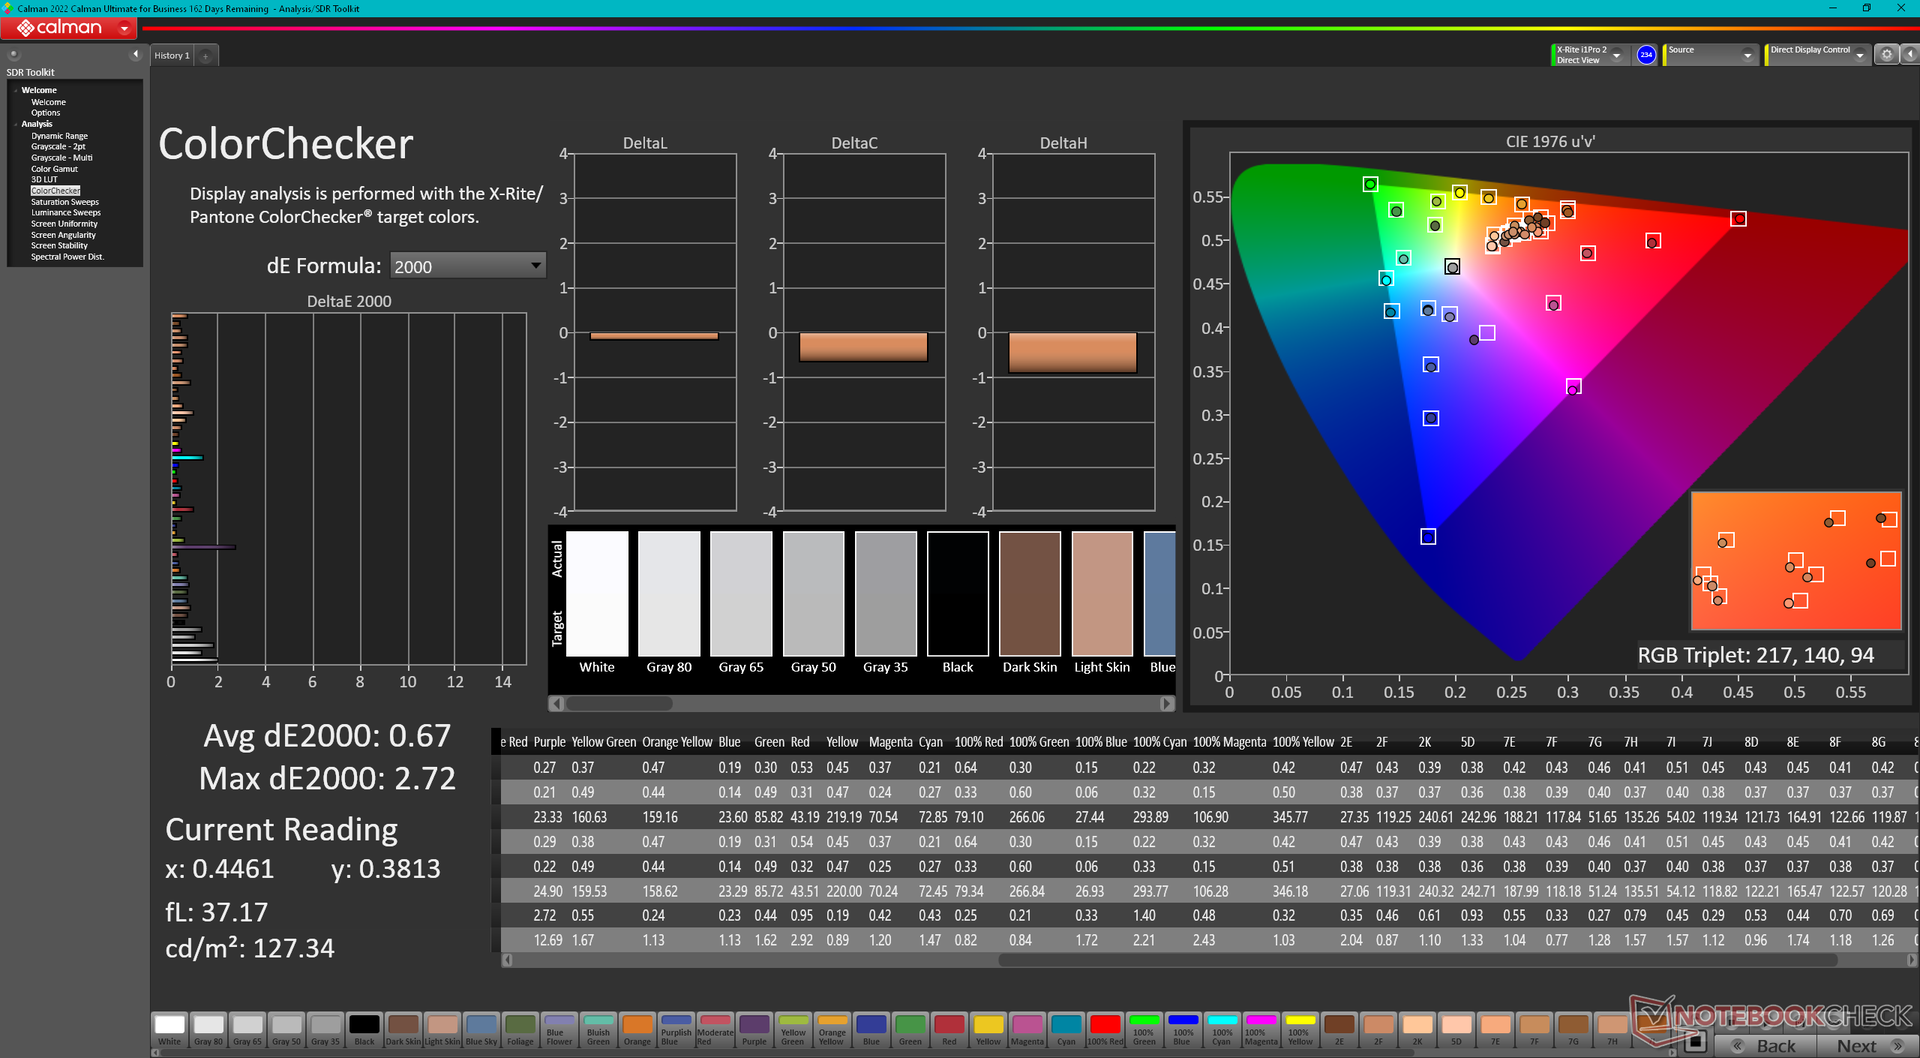
calibrated: 0.67
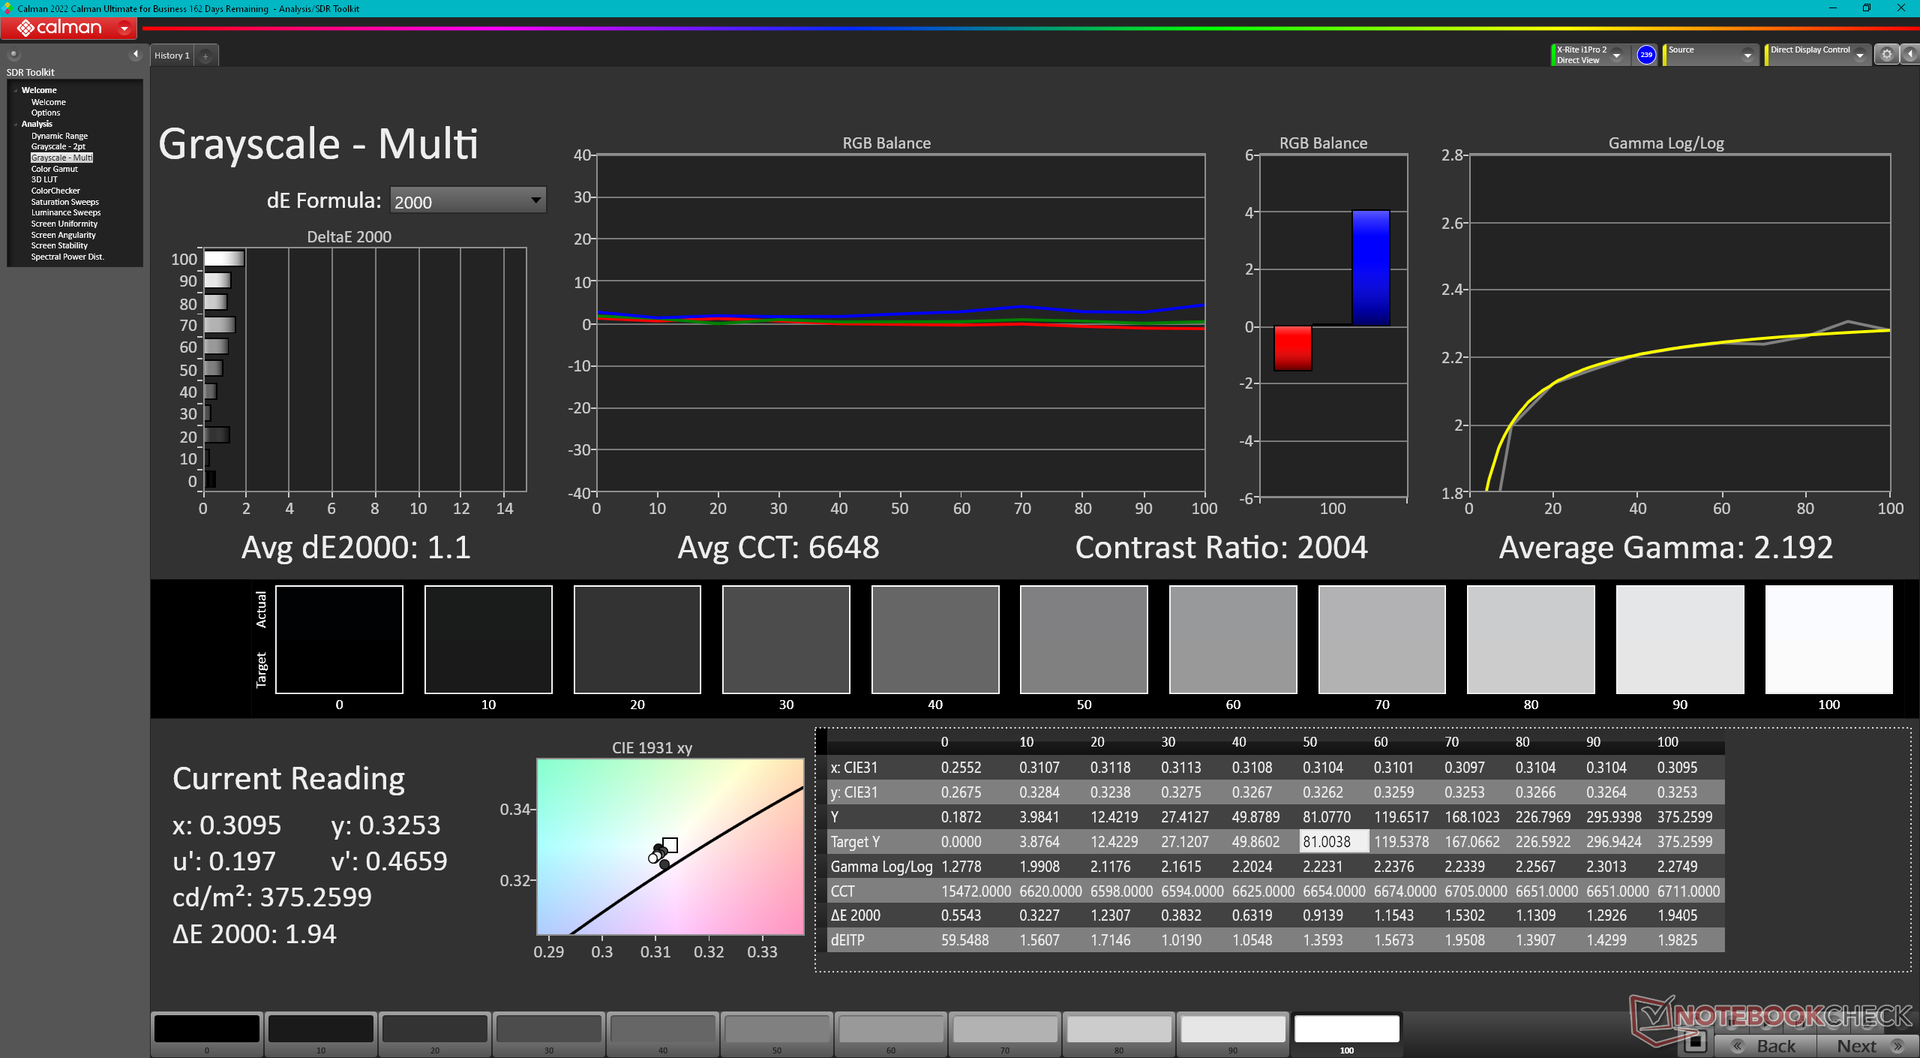
ΔE Greyscale Calman: 2 | ∀{0.09-98 Ø4.97}
79.5% AdobeRGB 1998 (Argyll 3D)
100% sRGB (Argyll 3D)
79.7% Display P3 (Argyll 3D)
Gamma: 2.3
CCT: 6826 K
| Dell Precision 5000 5490 AU Optronics B140QAN, IPS, 2560x1600, 14" | Lenovo ThinkPad P14s G4 21HF0017GE ATNA40YK15-0, OLED, 2880x1800, 14" | HP ZBook Firefly 14 G10 A CMN1435, IPS, 1920x1200, 14" | HP ZBook Firefly 14 G9-6B8A2EA CMN1435, IPS, 1920x1200, 14" | Dell Precision 5480 AU Optronics B140QAN, IPS, 2560x1600, 14" | Dell Precision 5000 5470 AU Optronics B140QAN, IPS, 2560x1600, 14" | |
|---|---|---|---|---|---|---|
| Display | 16% | -9% | -8% | -2% | -1% | |
| Display P3 Coverage (%) | 79.7 | 99.9 25% | 68.7 -14% | 69.6 -13% | 77.6 -3% | 79.3 -1% |
| sRGB Coverage (%) | 100 | 100 0% | 98.2 -2% | 99.9 0% | 99.8 0% | 100 0% |
| AdobeRGB 1998 Coverage (%) | 79.5 | 97 22% | 70.8 -11% | 71.1 -11% | 78 -2% | 78.7 -1% |
| Response Times | 94% | 9% | 7% | 20% | 2% | |
| Response Time Grey 50% / Grey 80% * (ms) | 52.3 ? | 3 ? 94% | 56.2 ? -7% | 56.3 ? -8% | 43.9 ? 16% | 52.4 ? -0% |
| Response Time Black / White * (ms) | 33.3 ? | 2.2 ? 93% | 25.2 ? 24% | 26.2 ? 21% | 25.3 ? 24% | 32.4 ? 3% |
| PWM Frequency (Hz) | 360 ? | |||||
| PWM Amplitude * (%) | 25 | |||||
| Bildschirm | -121% | -8% | -19% | 4% | -3% | |
| Helligkeit Bildmitte (cd/m²) | 485.1 | 432 -11% | 397 -18% | 432 -11% | 472.8 -3% | 537 11% |
| Brightness (cd/m²) | 471 | 432 -8% | 367 -22% | 407 -14% | 469 0% | 518 10% |
| Brightness Distribution (%) | 90 | 98 9% | 86 -4% | 91 1% | 87 -3% | 94 4% |
| Schwarzwert * (cd/m²) | 0.38 | 0.25 34% | 0.28 26% | 0.35 8% | 0.33 13% | |
| Kontrast (:1) | 1277 | 1588 24% | 1543 21% | 1351 6% | 1627 27% | |
| Delta E Colorchecker * | 2.15 | 4.8 -123% | 2.35 -9% | 3.1 -44% | 2.1 2% | 2.97 -38% |
| Colorchecker dE 2000 max. * | 5.39 | 9.2 -71% | 4.68 13% | 5.6 -4% | 5.54 -3% | 5.33 1% |
| Colorchecker dE 2000 calibrated * | 0.67 | 4.9 -631% | 1.15 -72% | 0.8 -19% | 0.59 12% | 0.88 -31% |
| Delta E Graustufen * | 2 | 2.3 -15% | 2.4 -20% | 4.5 -125% | 1.7 15% | 2.4 -20% |
| Gamma | 2.3 96% | 2.23 99% | 2.067 106% | 2 110% | 2.26 97% | 2.06 107% |
| CCT | 6826 95% | 6391 102% | 6409 101% | 6528 100% | 6493 100% | 6668 97% |
| Durchschnitt gesamt (Programm / Settings) | -4% /
-51% | -3% /
-6% | -7% /
-13% | 7% /
5% | -1% /
-2% |
* ... kleinere Werte sind besser
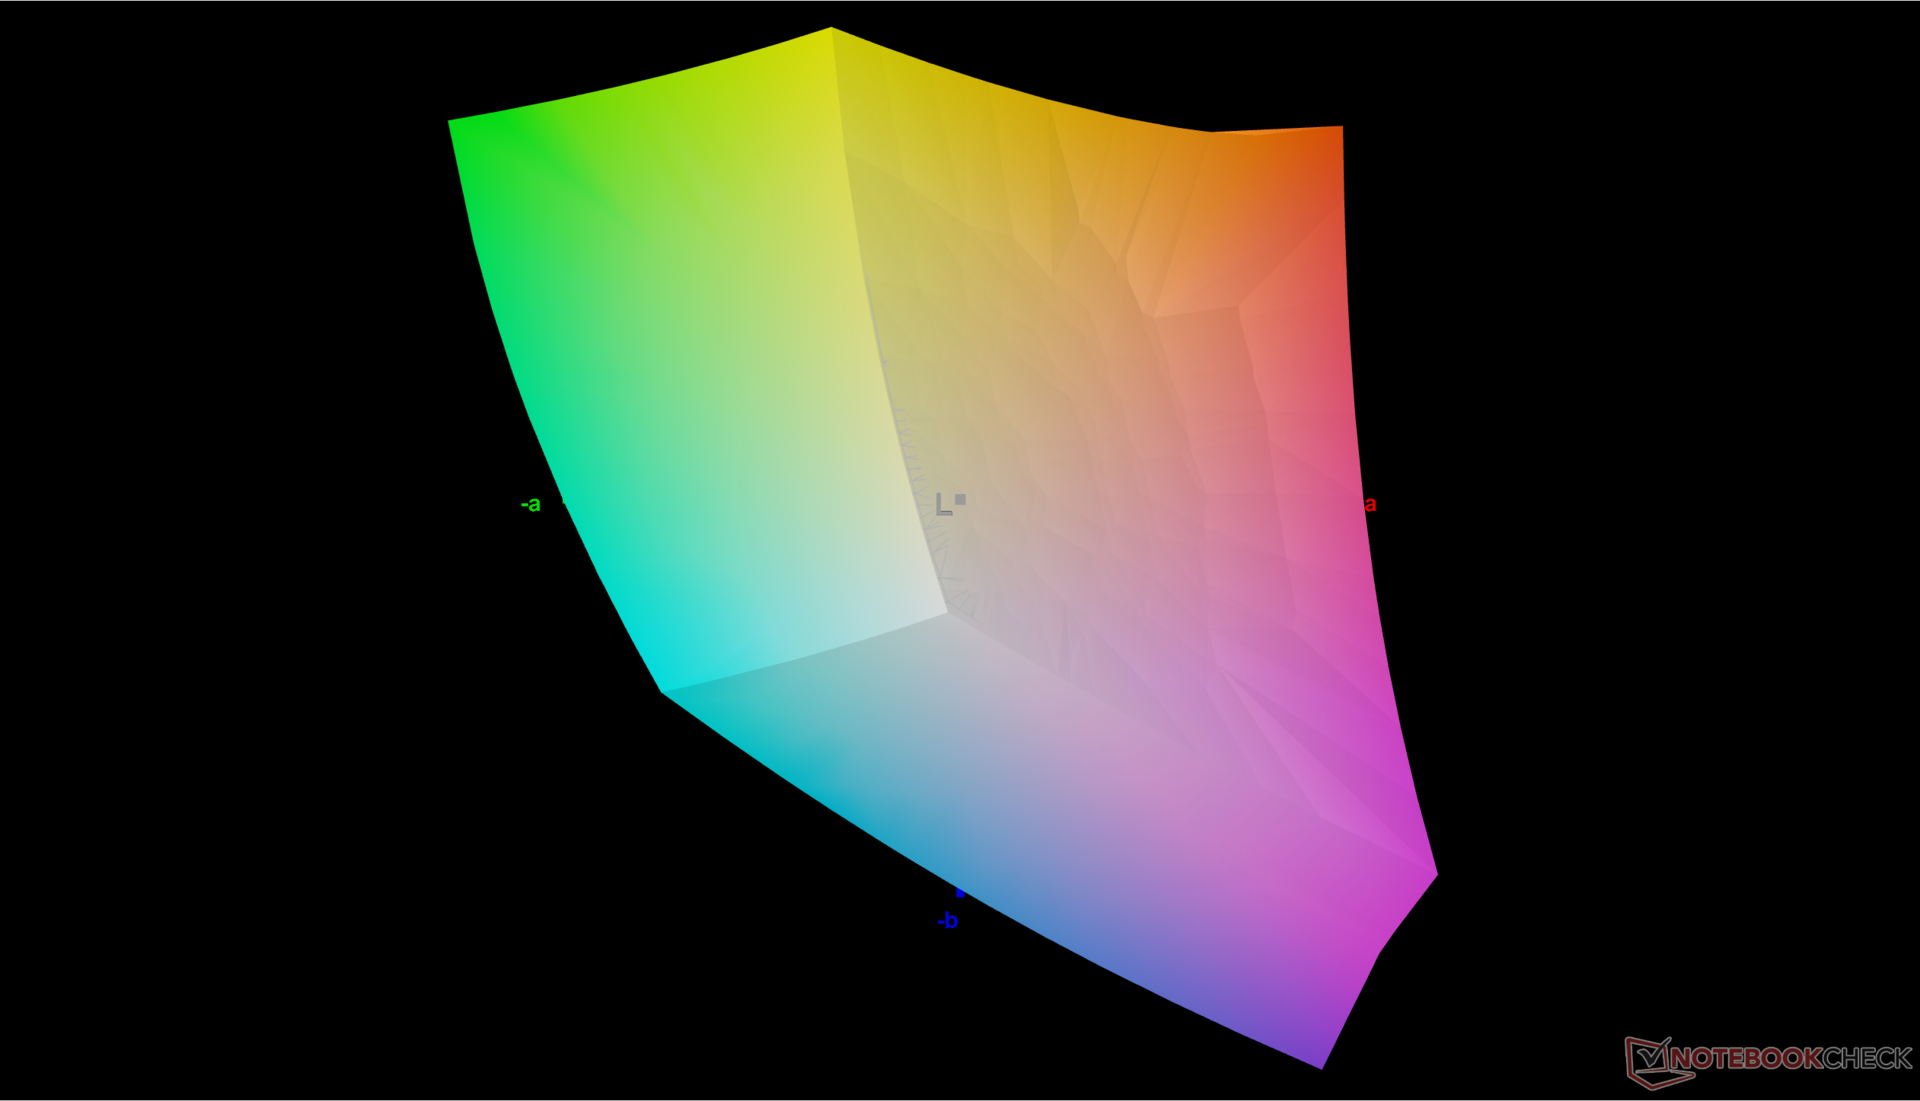
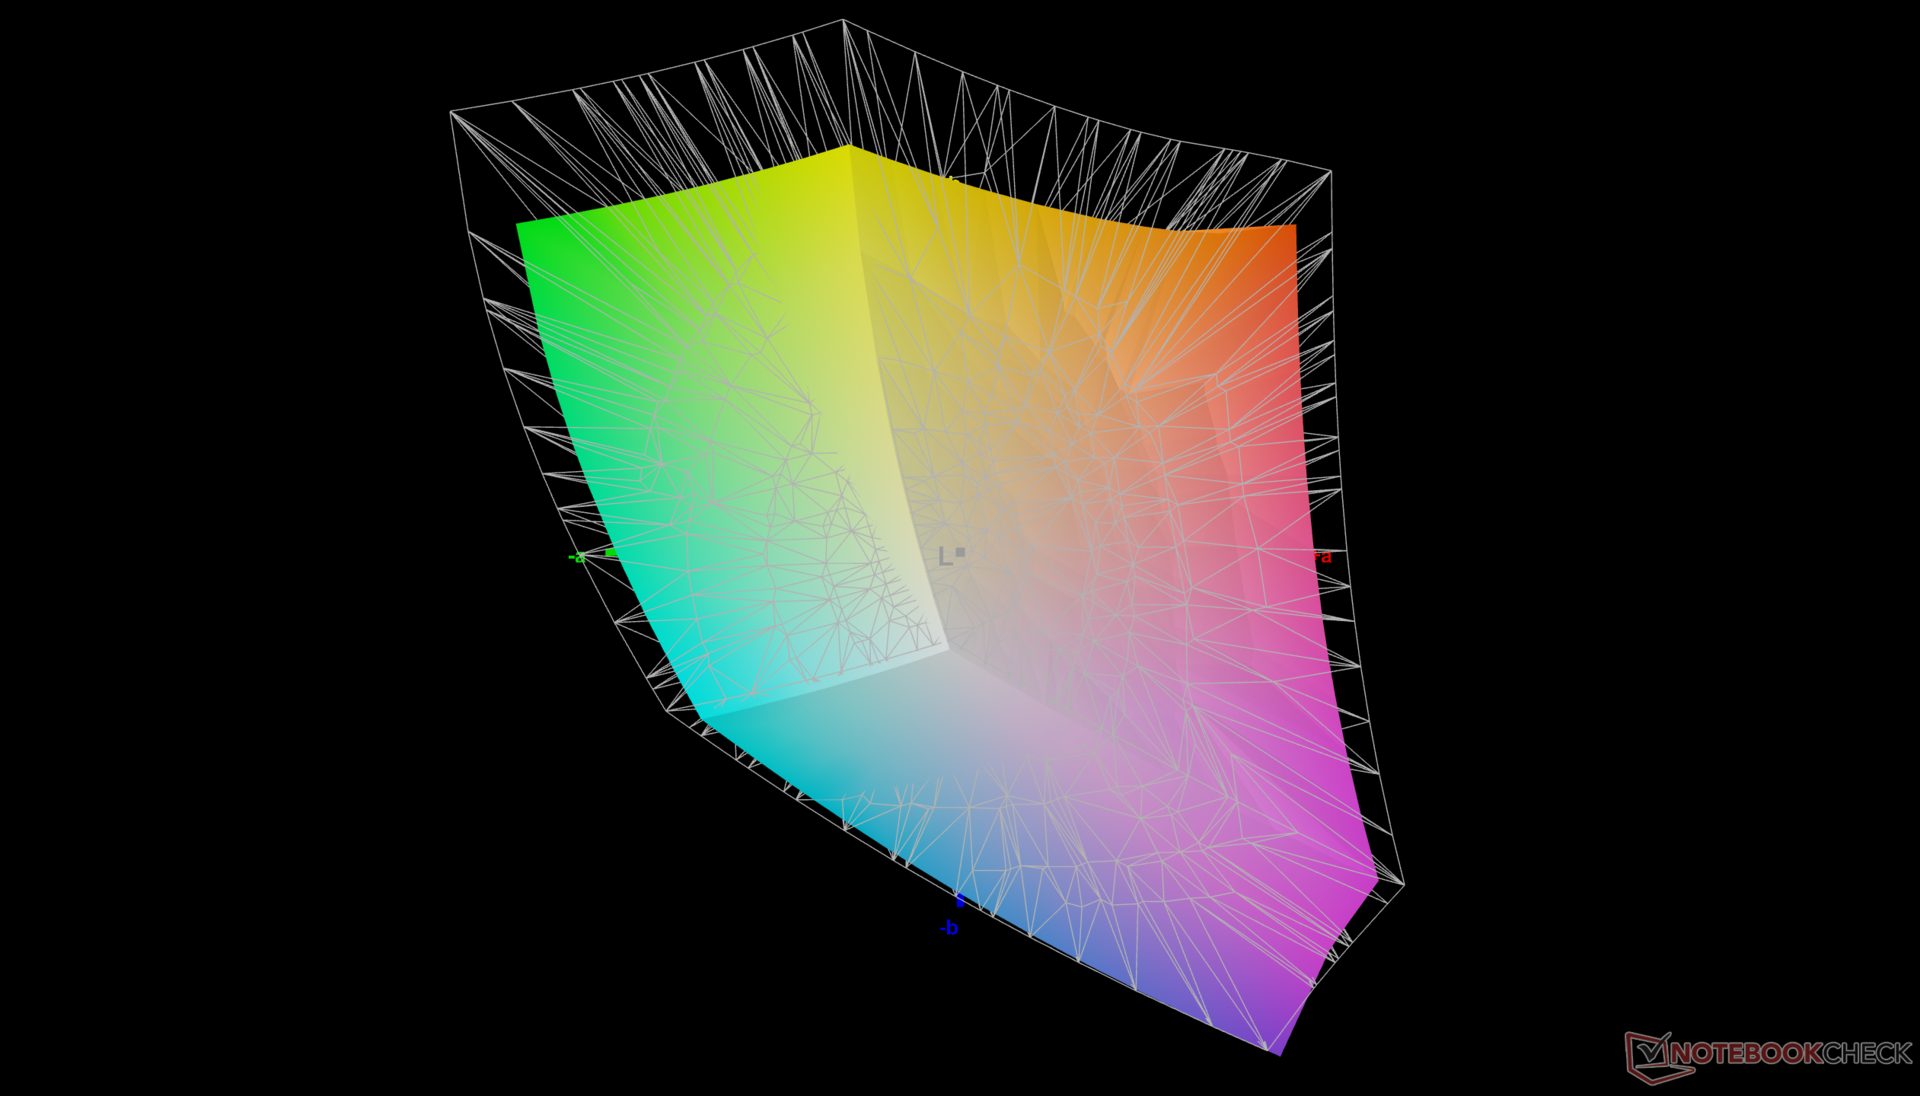
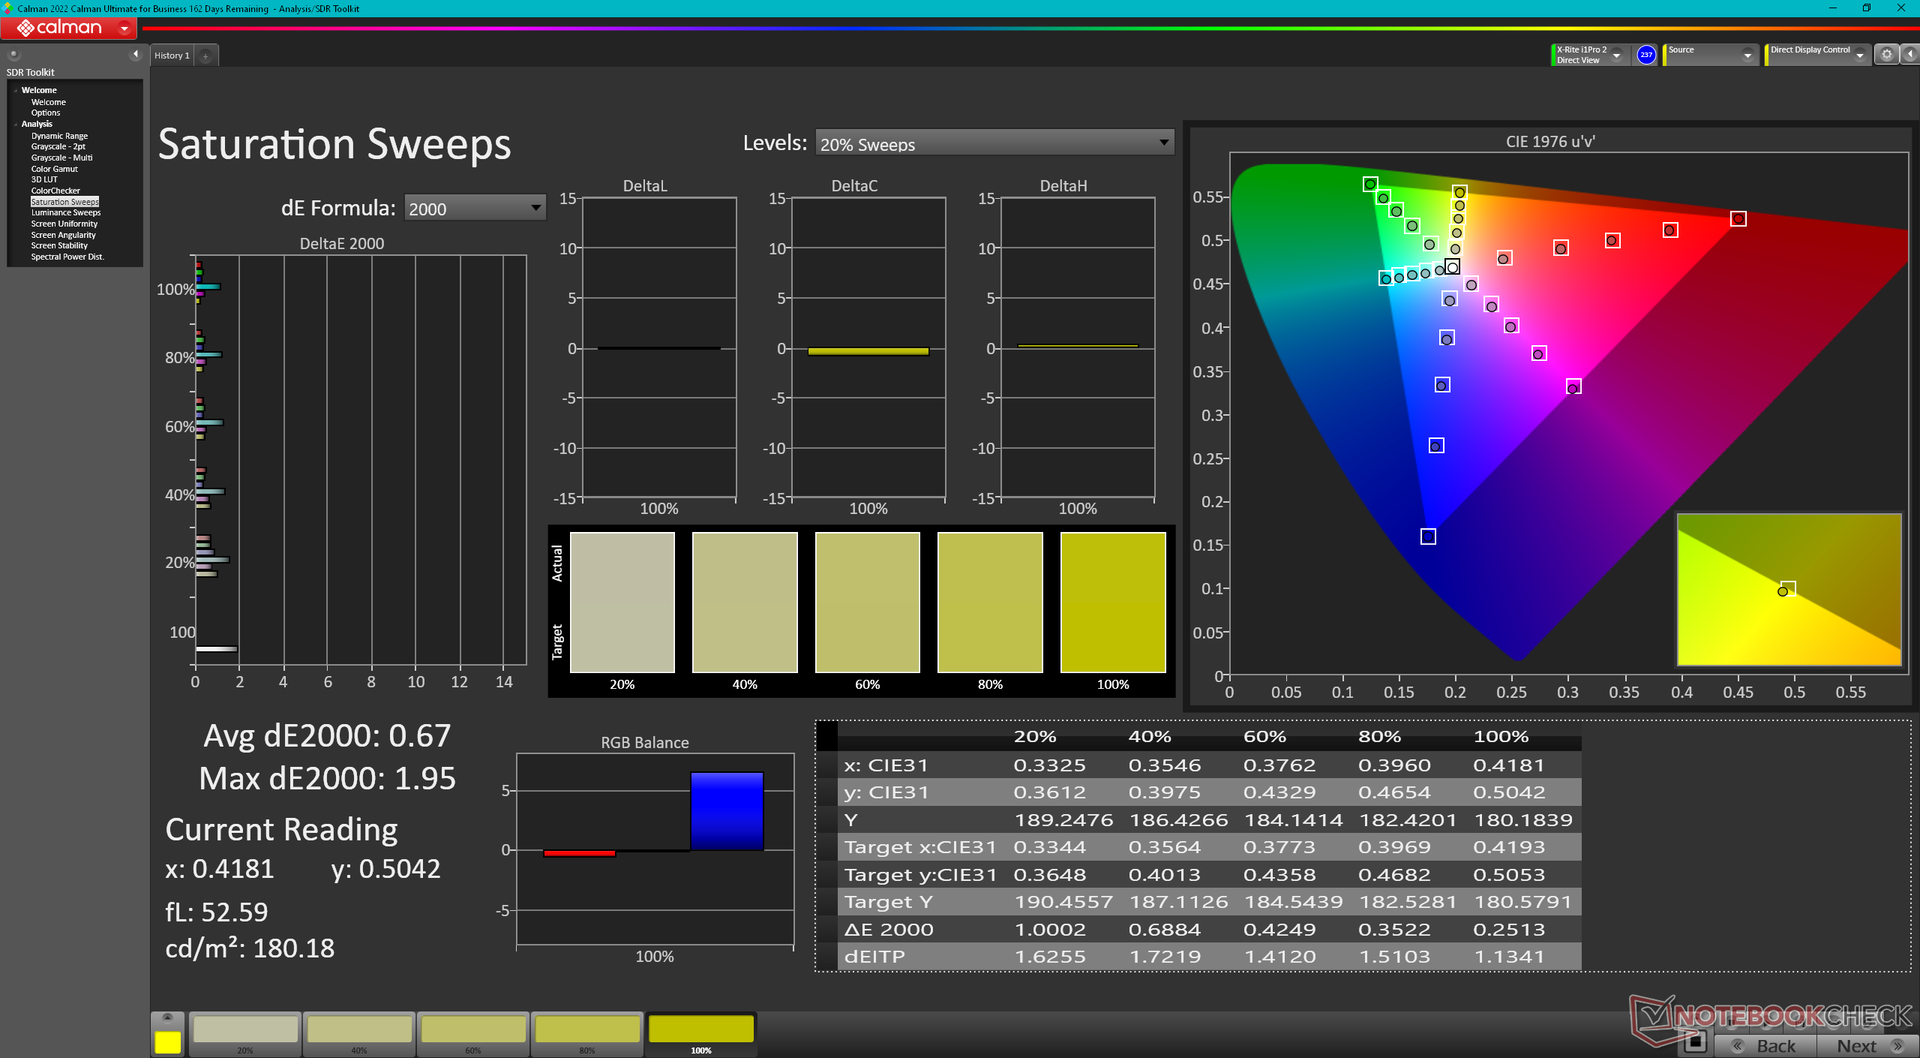
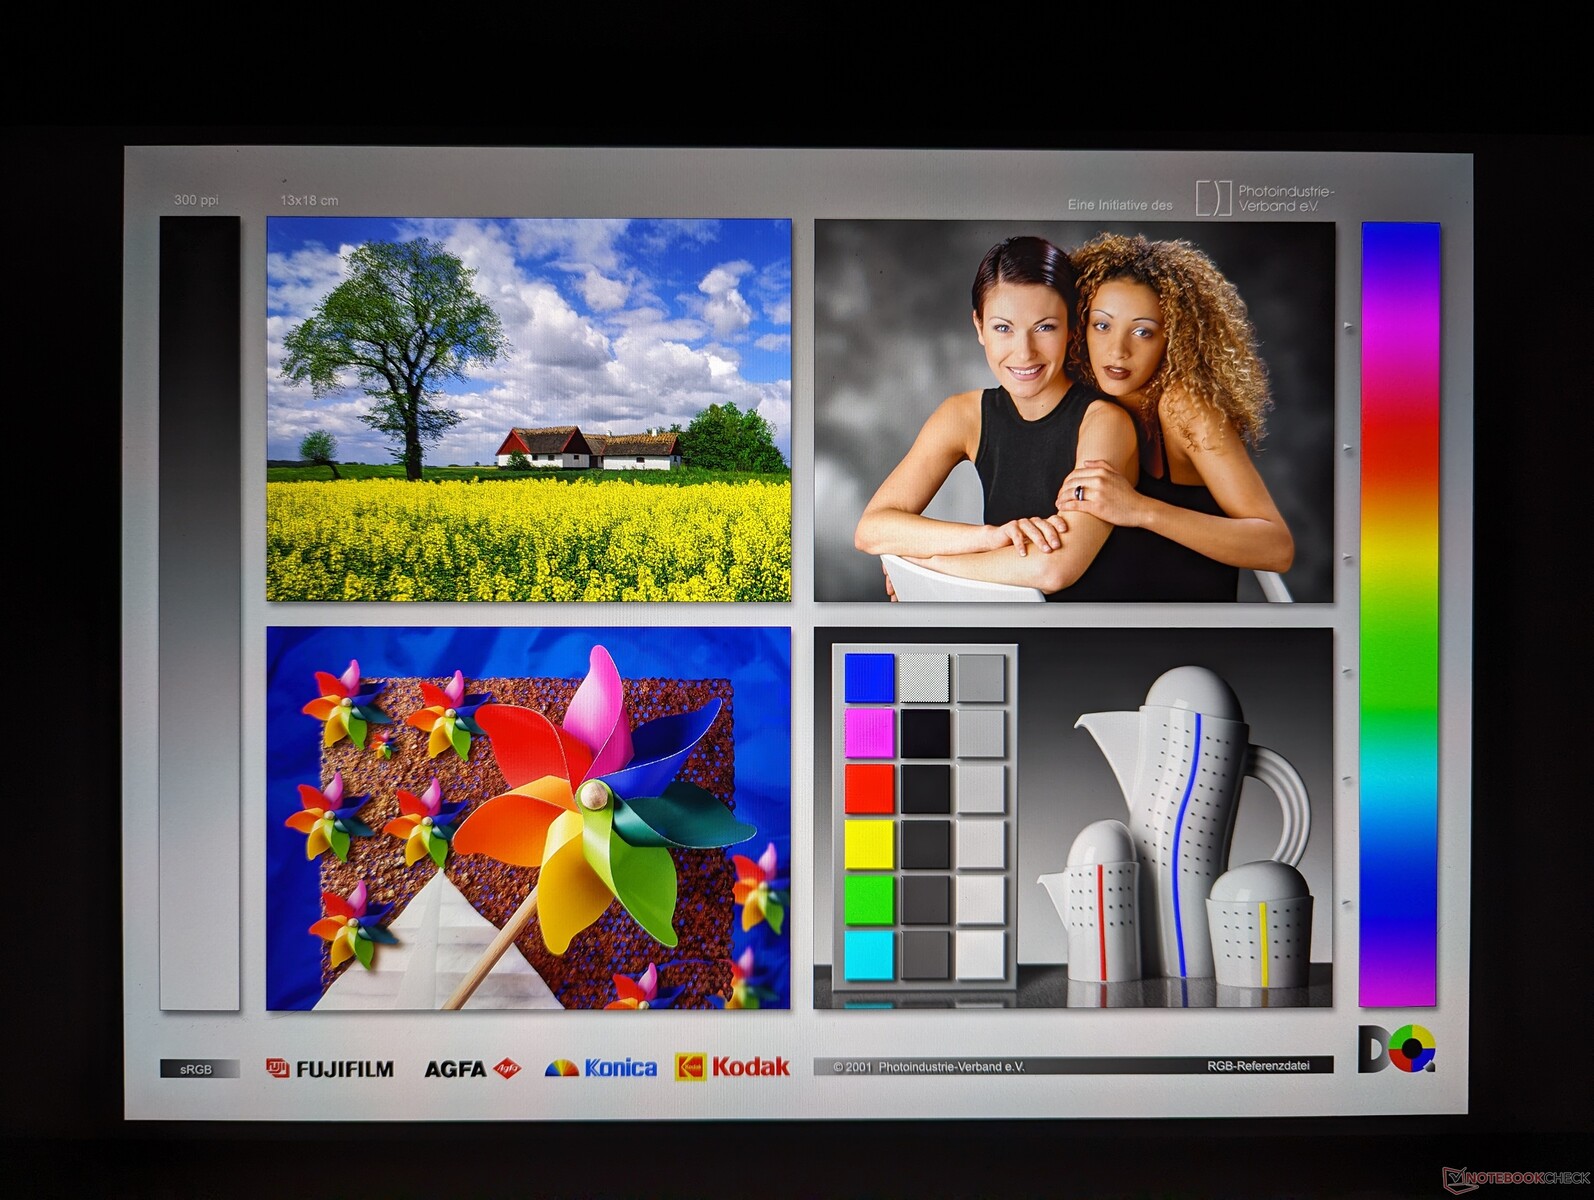
Das Display ist werksseitig gut kalibriert, mit durchschnittlichen Graustufen- und Farb-DeltaE-Werten von nur 2 bzw. 2,15. Nur sRGB wird bei allen Konfigurationen vollständig unterstützt.
Reaktionszeiten (Response Times) des Displays
| ↔ Reaktionszeiten Schwarz zu Weiß | ||
|---|---|---|
| 33.3 ms ... steigend ↗ und fallend ↘ kombiniert | ↗ 16.2 ms steigend | 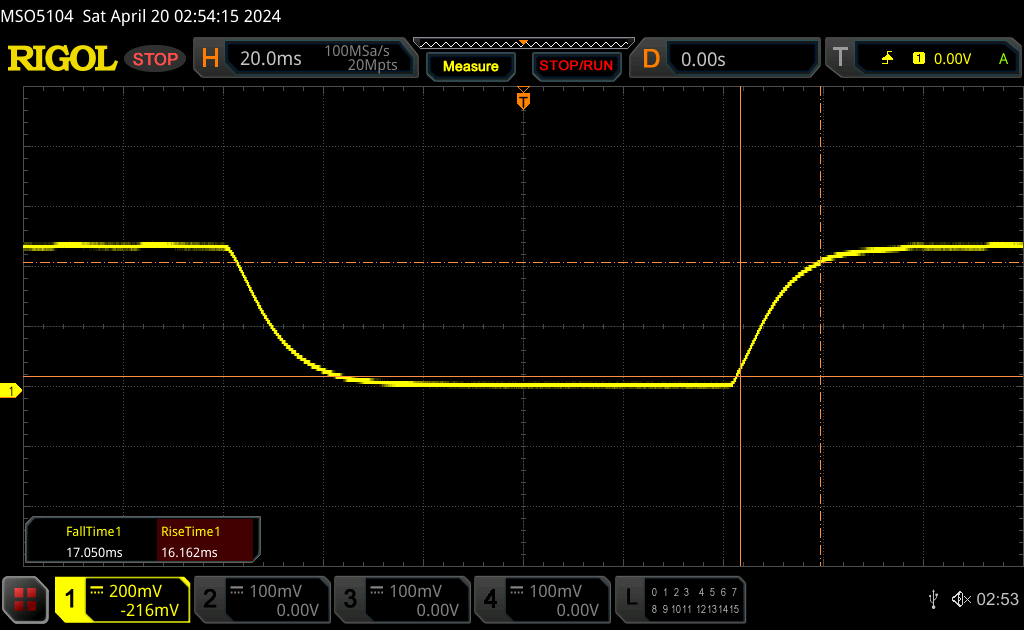 |
| ↘ 17.1 ms fallend | ||
| Die gemessenen Reaktionszeiten sind langsam und dadurch für viele Spieler wahrscheinlich zu langsam. Im Vergleich rangierten die bei uns getesteten Geräte von 0.1 (Minimum) zu 240 (Maximum) ms. » 90 % aller Screens waren schneller als der getestete. Daher sind die gemessenen Reaktionszeiten schlechter als der Durchschnitt aller vermessenen Geräte (19.9 ms). | ||
| ↔ Reaktionszeiten 50% Grau zu 80% Grau | ||
| 52.3 ms ... steigend ↗ und fallend ↘ kombiniert | ↗ 23.6 ms steigend | 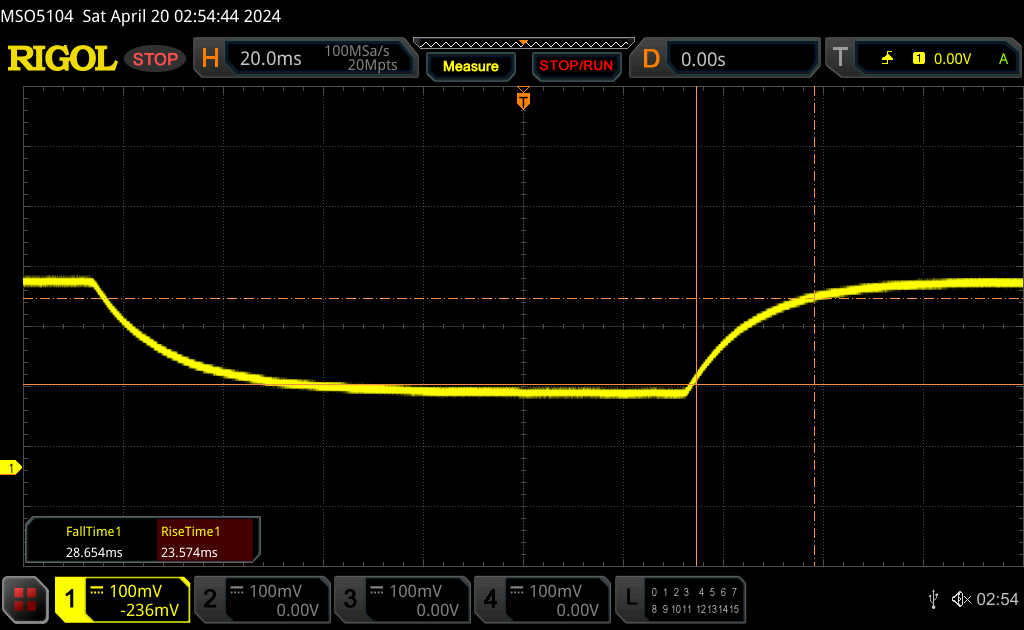 |
| ↘ 28.7 ms fallend | ||
| Die gemessenen Reaktionszeiten sind langsam und dadurch für viele Spieler wahrscheinlich zu langsam. Im Vergleich rangierten die bei uns getesteten Geräte von 0.165 (Minimum) zu 636 (Maximum) ms. » 89 % aller Screens waren schneller als der getestete. Daher sind die gemessenen Reaktionszeiten schlechter als der Durchschnitt aller vermessenen Geräte (31.1 ms). | ||
Bildschirm-Flackern / PWM (Pulse-Width Modulation)
| Flackern / PWM nicht festgestellt | 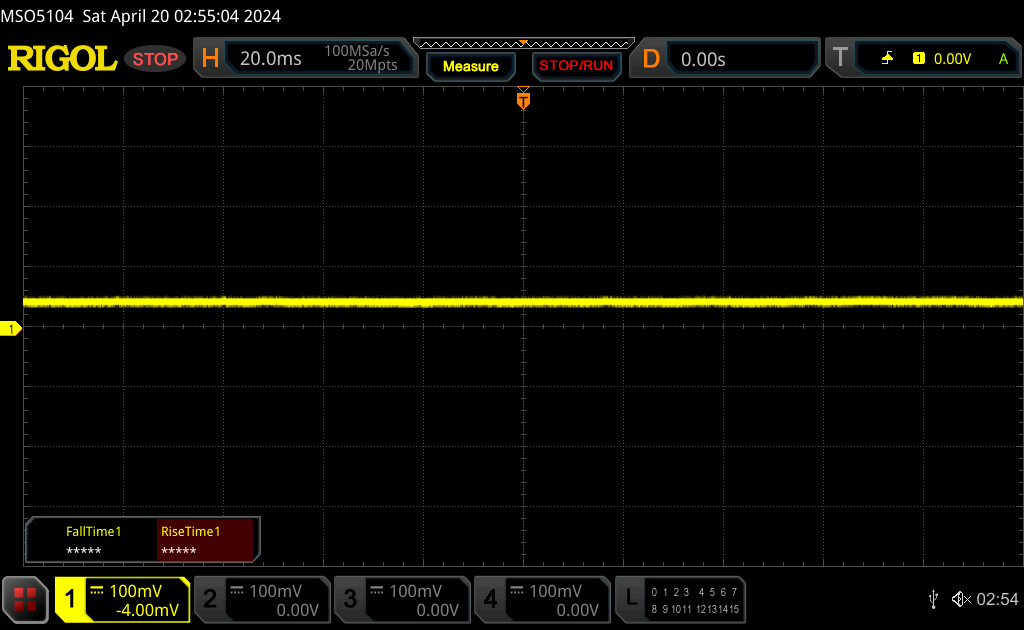 | ||
Im Vergleich: 52 % aller getesteten Geräte nutzten kein PWM um die Helligkeit zu reduzieren. Wenn PWM eingesetzt wurde, dann bei einer Frequenz von durchschnittlich 7784 (Minimum 5, Maximum 343500) Hz. | |||


Performance — Rund um KI
Testbedingungen
Vor der Durchführung der nachfolgenden Tests haben wir den Dell Optimizer auf den Ultra-Performance-Modus und die GPU auf Nvidia gesetzt.

Prozessor
Die CPU-Rohleistung des Precision 5490 bleibt im Vergleich zum Core i9-13900H im Precision 5480 des letzten Jahres unverändert. Selbst wenn es Verbesserungen gibt, sind diese marginal und können durch Turbo-Boost-Beschränkungen weiter minimiert werden, wie unsere CineBench R15 xT-Schleifenbenchmarks zeigen.
Wenn die integrierten KI-Funktionen nicht entscheidend sind, könnte der preiswertere Ryzen 7 Pro 7840HS in Konkurrenzmodellen wie dem HP Firefly 14 eine ähnliche Leistung wie der neuere Core Ultra 9 185H bieten.
Ein Downgrade auf die Core Ultra 5 135H-Konfiguration könnte die Prozessorleistung um 15 bis 20 Prozent beeinträchtigen, basierend auf unseren Erfahrungen mit Core i5-13500H-Notebooks.
Cinebench R15 Multi Dauertest
Cinebench R23: Multi Core | Single Core
Cinebench R20: CPU (Multi Core) | CPU (Single Core)
Cinebench R15: CPU Multi 64Bit | CPU Single 64Bit
Blender: v2.79 BMW27 CPU
7-Zip 18.03: 7z b 4 | 7z b 4 -mmt1
Geekbench 6.7: Multi-Core | Single-Core
Geekbench 5.5: Multi-Core | Single-Core
HWBOT x265 Benchmark v2.2: 4k Preset
LibreOffice : 20 Documents To PDF
R Benchmark 2.5: Overall mean
| CPU Performance Rating | |
| Dell Precision 5480 | |
| HP ZBook Power 15 G10 | |
| Durchschnittliche Intel Core Ultra 9 185H | |
| Dell Precision 5000 5490 | |
| Lenovo ThinkPad P14s G4 21HF0017GE | |
| Lenovo ThinkPad P14s G4 21K5000LGE | |
| HP ZBook Power 15 G9 6B8C4EA -2! | |
| Dell Precision 5000 5470 -2! | |
| Asus VivoBook 14X K3405 -2! | |
| HP ZBook Firefly 14 G10 A | |
| Lenovo ThinkPad P14s G3 AMD 21J6S05000 -2! | |
| HP ZBook Firefly 14 G9-6B8A2EA -2! | |
| Lenovo ThinkPad P15v G3 21EM001AGE -2! | |
| Dell Precision 5000 5560 -4! | |
| Lenovo ThinkPad P15v G2 21A9000XGE -3! | |
| Lenovo ThinkPad P14s Gen1-20Y10002GE -2! | |
| Geekbench 6.7 / Multi-Core | |
| Dell Precision 5480 | |
| Dell Precision 5000 5490 | |
| Durchschnittliche Intel Core Ultra 9 185H (9140 - 14540, n=20) | |
| HP ZBook Power 15 G10 | |
| Lenovo ThinkPad P14s G4 21HF0017GE | |
| Lenovo ThinkPad P14s G4 21K5000LGE | |
| HP ZBook Firefly 14 G10 A | |
| Geekbench 6.7 / Single-Core | |
| Dell Precision 5480 | |
| Lenovo ThinkPad P14s G4 21HF0017GE | |
| HP ZBook Power 15 G10 | |
| Lenovo ThinkPad P14s G4 21K5000LGE | |
| Durchschnittliche Intel Core Ultra 9 185H (1490 - 2573, n=20) | |
| Dell Precision 5000 5490 | |
| HP ZBook Firefly 14 G10 A | |
Cinebench R23: Multi Core | Single Core
Cinebench R20: CPU (Multi Core) | CPU (Single Core)
Cinebench R15: CPU Multi 64Bit | CPU Single 64Bit
Blender: v2.79 BMW27 CPU
7-Zip 18.03: 7z b 4 | 7z b 4 -mmt1
Geekbench 6.7: Multi-Core | Single-Core
Geekbench 5.5: Multi-Core | Single-Core
HWBOT x265 Benchmark v2.2: 4k Preset
LibreOffice : 20 Documents To PDF
R Benchmark 2.5: Overall mean
* ... kleinere Werte sind besser
AIDA64: FP32 Ray-Trace | FPU Julia | CPU SHA3 | CPU Queen | FPU SinJulia | FPU Mandel | CPU AES | CPU ZLib | FP64 Ray-Trace | CPU PhotoWorxx
| Performance Rating | |
| Durchschnittliche Intel Core Ultra 9 185H | |
| Dell Precision 5480 | |
| Dell Precision 5000 5490 | |
| HP ZBook Firefly 14 G10 A | |
| Dell Precision 5000 5470 | |
| Lenovo ThinkPad P14s G4 21HF0017GE | |
| HP ZBook Firefly 14 G9-6B8A2EA | |
| AIDA64 / FP32 Ray-Trace | |
| HP ZBook Firefly 14 G10 A | |
| Durchschnittliche Intel Core Ultra 9 185H (9220 - 18676, n=20) | |
| Dell Precision 5480 | |
| Dell Precision 5000 5490 | |
| Dell Precision 5000 5470 | |
| Lenovo ThinkPad P14s G4 21HF0017GE | |
| HP ZBook Firefly 14 G9-6B8A2EA | |
| AIDA64 / FPU Julia | |
| Durchschnittliche Intel Core Ultra 9 185H (48865 - 96463, n=20) | |
| HP ZBook Firefly 14 G10 A | |
| Dell Precision 5000 5490 | |
| Dell Precision 5480 | |
| Dell Precision 5000 5470 | |
| Lenovo ThinkPad P14s G4 21HF0017GE | |
| HP ZBook Firefly 14 G9-6B8A2EA | |
| AIDA64 / CPU SHA3 | |
| Durchschnittliche Intel Core Ultra 9 185H (2394 - 4534, n=20) | |
| Dell Precision 5000 5490 | |
| Dell Precision 5480 | |
| HP ZBook Firefly 14 G10 A | |
| Dell Precision 5000 5470 | |
| Lenovo ThinkPad P14s G4 21HF0017GE | |
| HP ZBook Firefly 14 G9-6B8A2EA | |
| AIDA64 / CPU Queen | |
| Dell Precision 5480 | |
| Dell Precision 5000 5470 | |
| Lenovo ThinkPad P14s G4 21HF0017GE | |
| Dell Precision 5000 5490 | |
| Durchschnittliche Intel Core Ultra 9 185H (66785 - 95241, n=20) | |
| HP ZBook Firefly 14 G10 A | |
| HP ZBook Firefly 14 G9-6B8A2EA | |
| AIDA64 / FPU SinJulia | |
| HP ZBook Firefly 14 G10 A | |
| Durchschnittliche Intel Core Ultra 9 185H (7255 - 11392, n=20) | |
| Dell Precision 5000 5490 | |
| Dell Precision 5480 | |
| Dell Precision 5000 5470 | |
| Lenovo ThinkPad P14s G4 21HF0017GE | |
| HP ZBook Firefly 14 G9-6B8A2EA | |
| AIDA64 / FPU Mandel | |
| HP ZBook Firefly 14 G10 A | |
| Durchschnittliche Intel Core Ultra 9 185H (24004 - 48020, n=20) | |
| Dell Precision 5480 | |
| Dell Precision 5000 5490 | |
| Dell Precision 5000 5470 | |
| Lenovo ThinkPad P14s G4 21HF0017GE | |
| HP ZBook Firefly 14 G9-6B8A2EA | |
| AIDA64 / CPU AES | |
| Durchschnittliche Intel Core Ultra 9 185H (53116 - 154066, n=20) | |
| Dell Precision 5000 5490 | |
| Dell Precision 5480 | |
| HP ZBook Firefly 14 G10 A | |
| Lenovo ThinkPad P14s G4 21HF0017GE | |
| HP ZBook Firefly 14 G9-6B8A2EA | |
| Dell Precision 5000 5470 | |
| AIDA64 / CPU ZLib | |
| Durchschnittliche Intel Core Ultra 9 185H (678 - 1341, n=20) | |
| Dell Precision 5000 5490 | |
| Dell Precision 5480 | |
| Lenovo ThinkPad P14s G4 21HF0017GE | |
| HP ZBook Firefly 14 G10 A | |
| HP ZBook Firefly 14 G9-6B8A2EA | |
| Dell Precision 5000 5470 | |
| AIDA64 / FP64 Ray-Trace | |
| HP ZBook Firefly 14 G10 A | |
| Durchschnittliche Intel Core Ultra 9 185H (4428 - 10078, n=20) | |
| Dell Precision 5480 | |
| Dell Precision 5000 5490 | |
| Dell Precision 5000 5470 | |
| Lenovo ThinkPad P14s G4 21HF0017GE | |
| HP ZBook Firefly 14 G9-6B8A2EA | |
| AIDA64 / CPU PhotoWorxx | |
| Dell Precision 5000 5490 | |
| Durchschnittliche Intel Core Ultra 9 185H (44547 - 53918, n=20) | |
| Dell Precision 5480 | |
| Dell Precision 5000 5470 | |
| HP ZBook Firefly 14 G9-6B8A2EA | |
| Lenovo ThinkPad P14s G4 21HF0017GE | |
| HP ZBook Firefly 14 G10 A | |
Stresstest
Die Kerntaktrate und die Leistungsaufnahme des Prozessors stiegen auf bis zu 3,3 GHz bzw. 92 W, als wir Prime95-Stresstests durchführten. Diese Werte sanken jedoch schnell auf durchschnittlich 2,2 GHz und 55 W, um eine sehr hohe Kerntemperatur von 101 °C aufrechtzuerhalten. Diese Ergebnisse ähneln denen, die wir beim Precision 5480 des letzten Jahres gemessen haben, wenn auch etwas wärmer.
Interessanterweise stabilisierte sich die Leistungsaufnahme der Grafikkarte beim Ausführen von Witcher 3 bei 35 W, während die GPU im Precision 5480 des letzten Jahres selbst im Ultra-Performance-Modus stabil bei 45 W blieb. Die Leistungsaufnahme der Grafikkarte könnte teilweise die etwas langsamere Grafikleistung in unserem Abschnitt zur GPU-Leistung unten erklären.
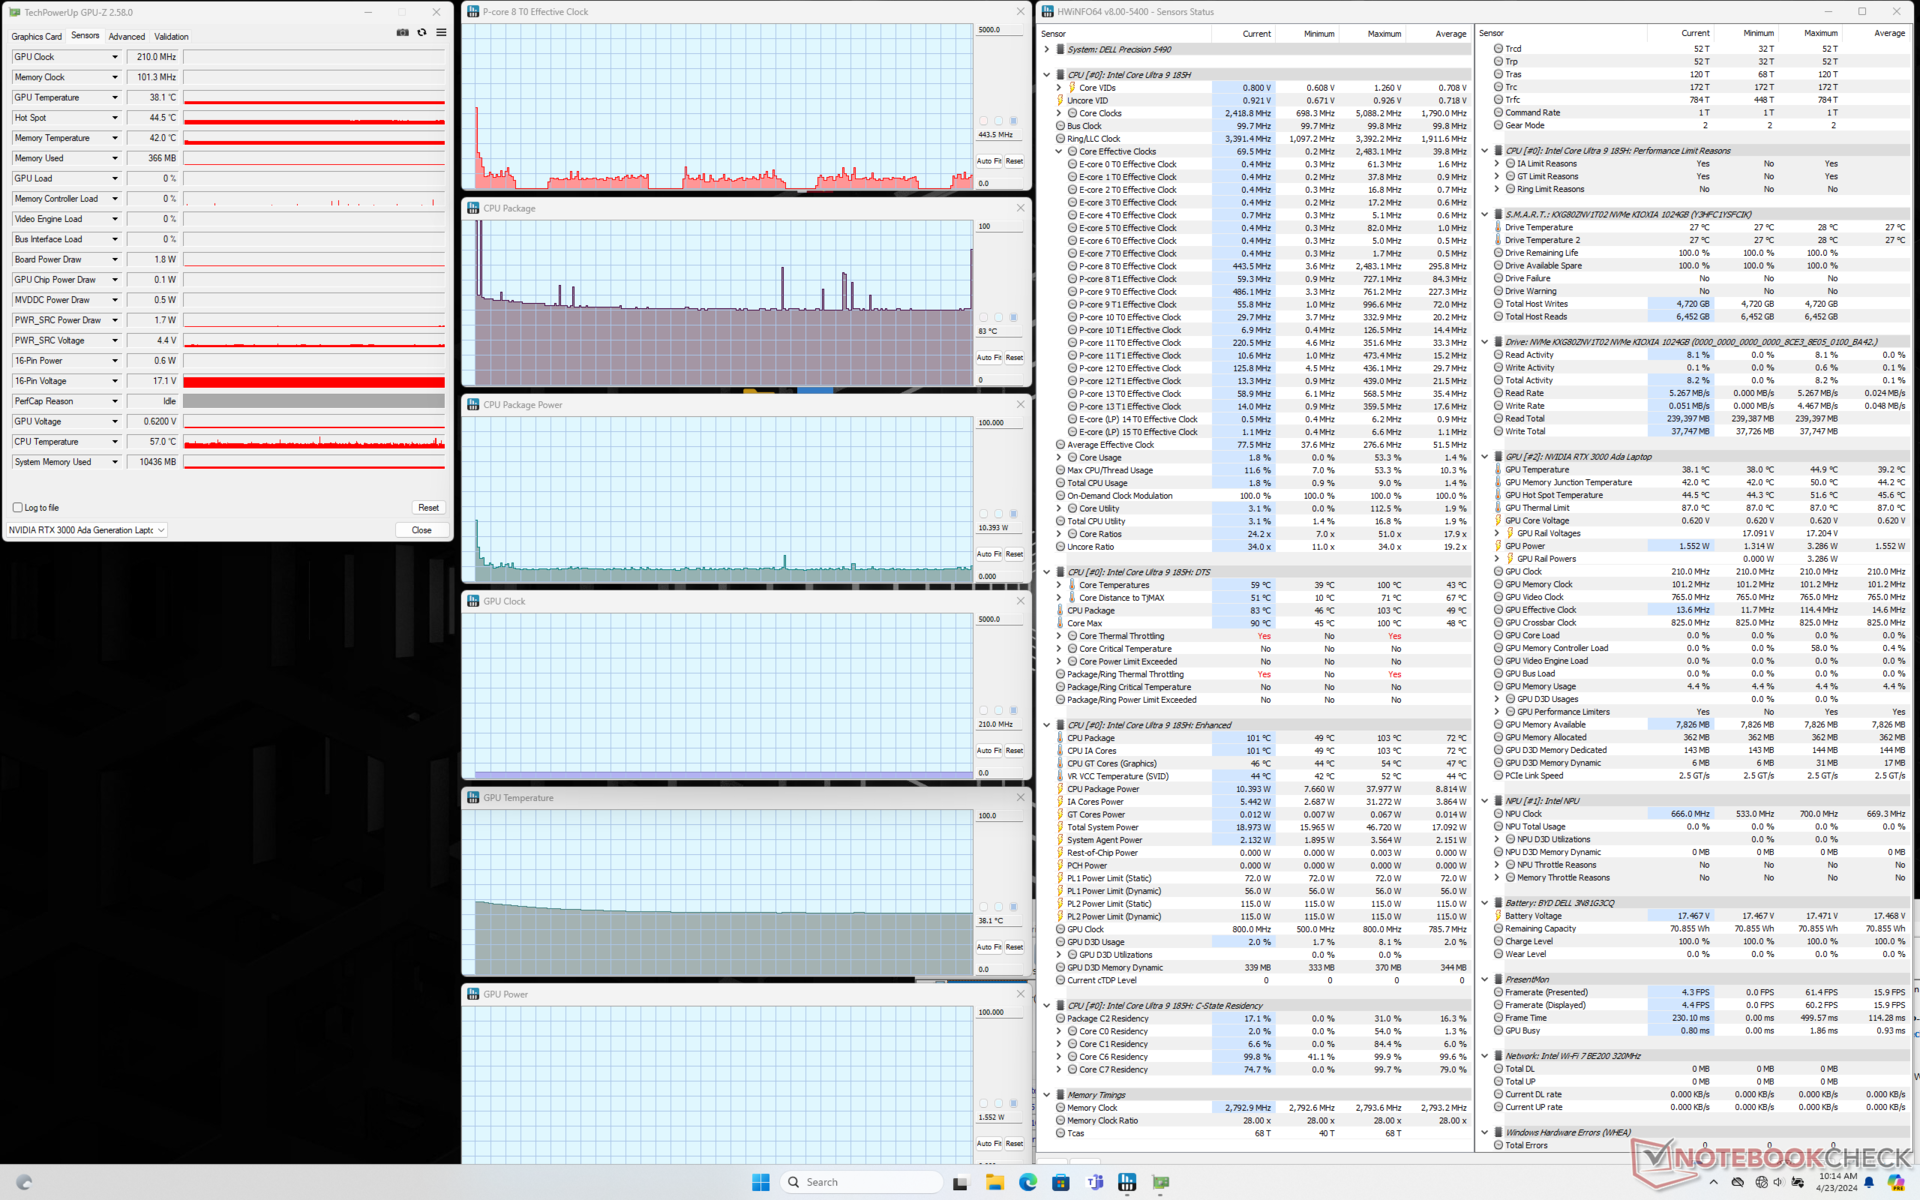
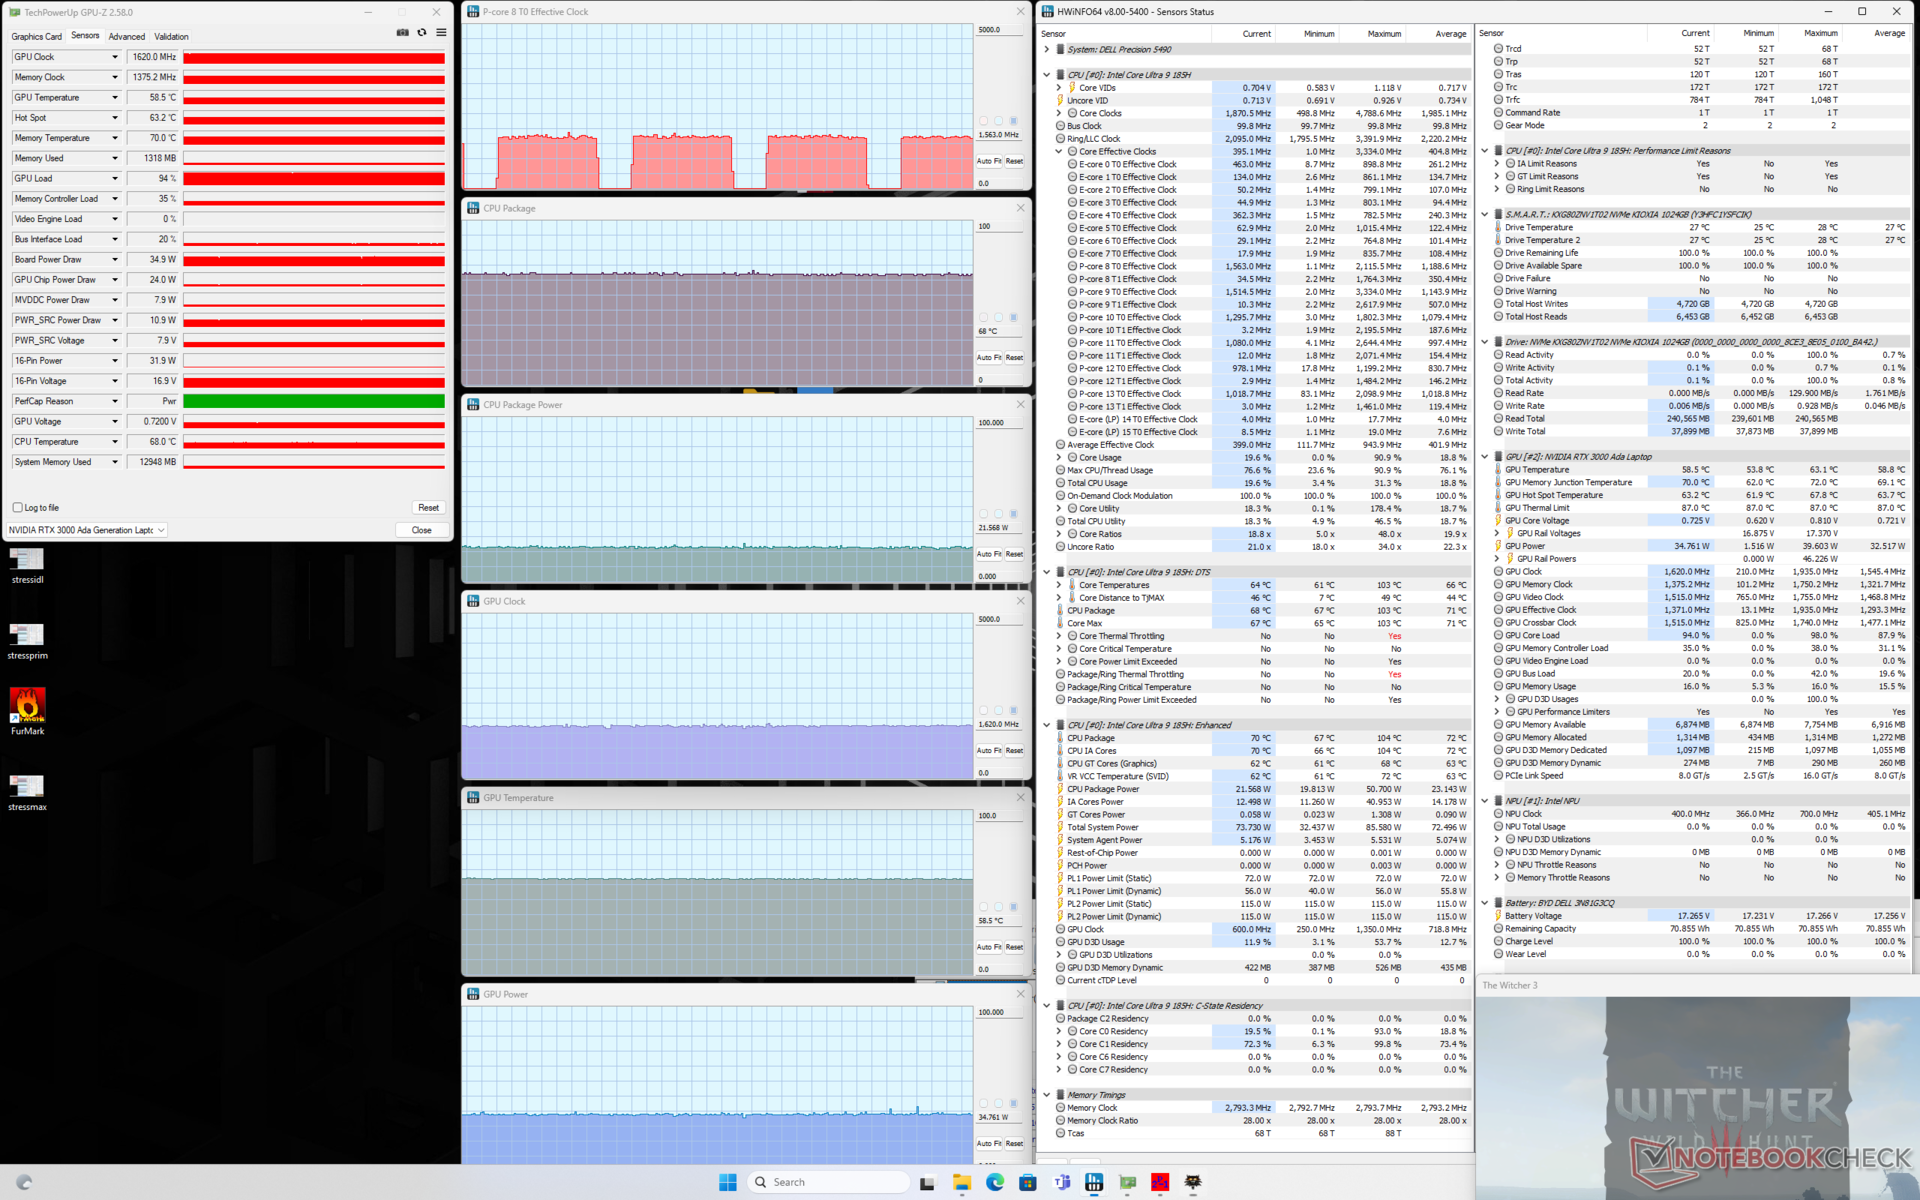
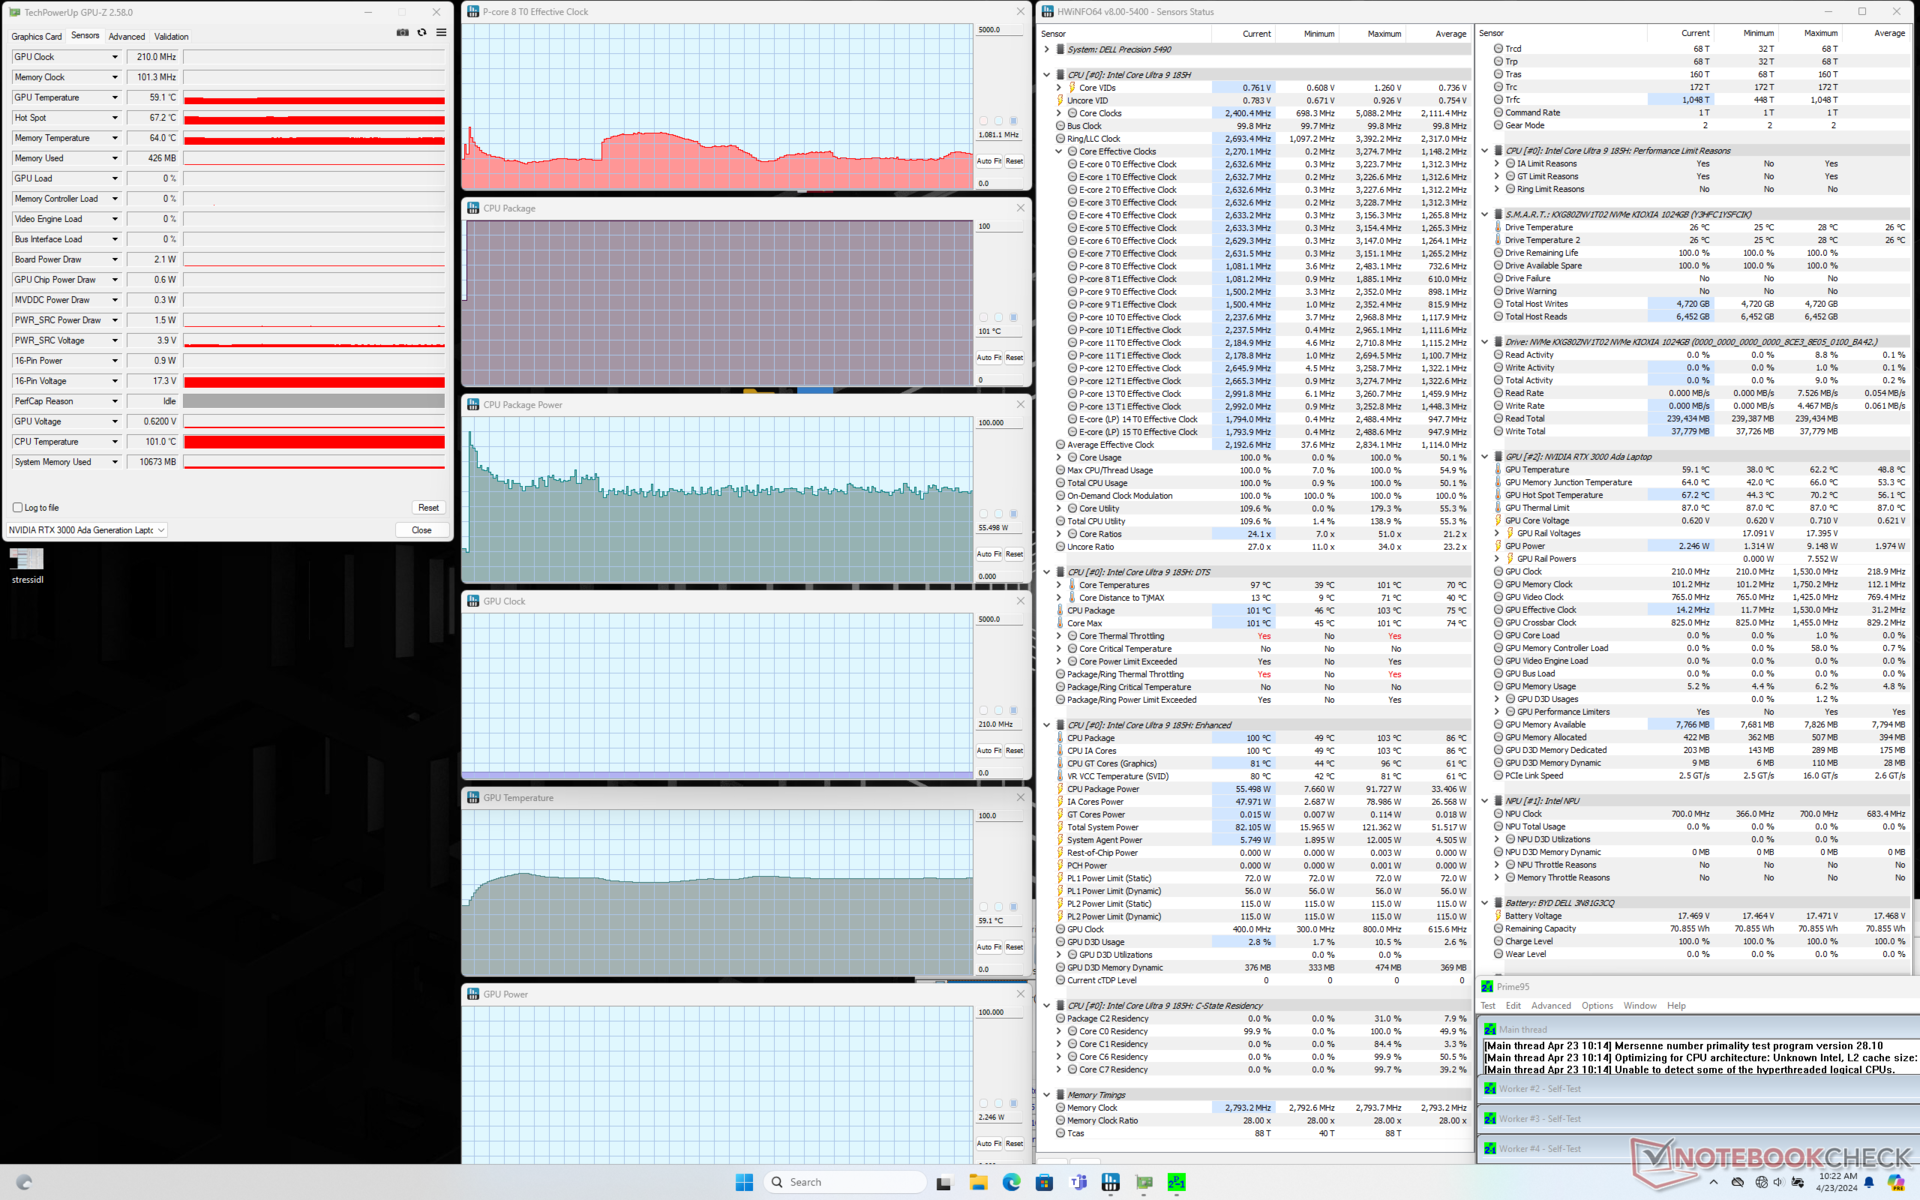
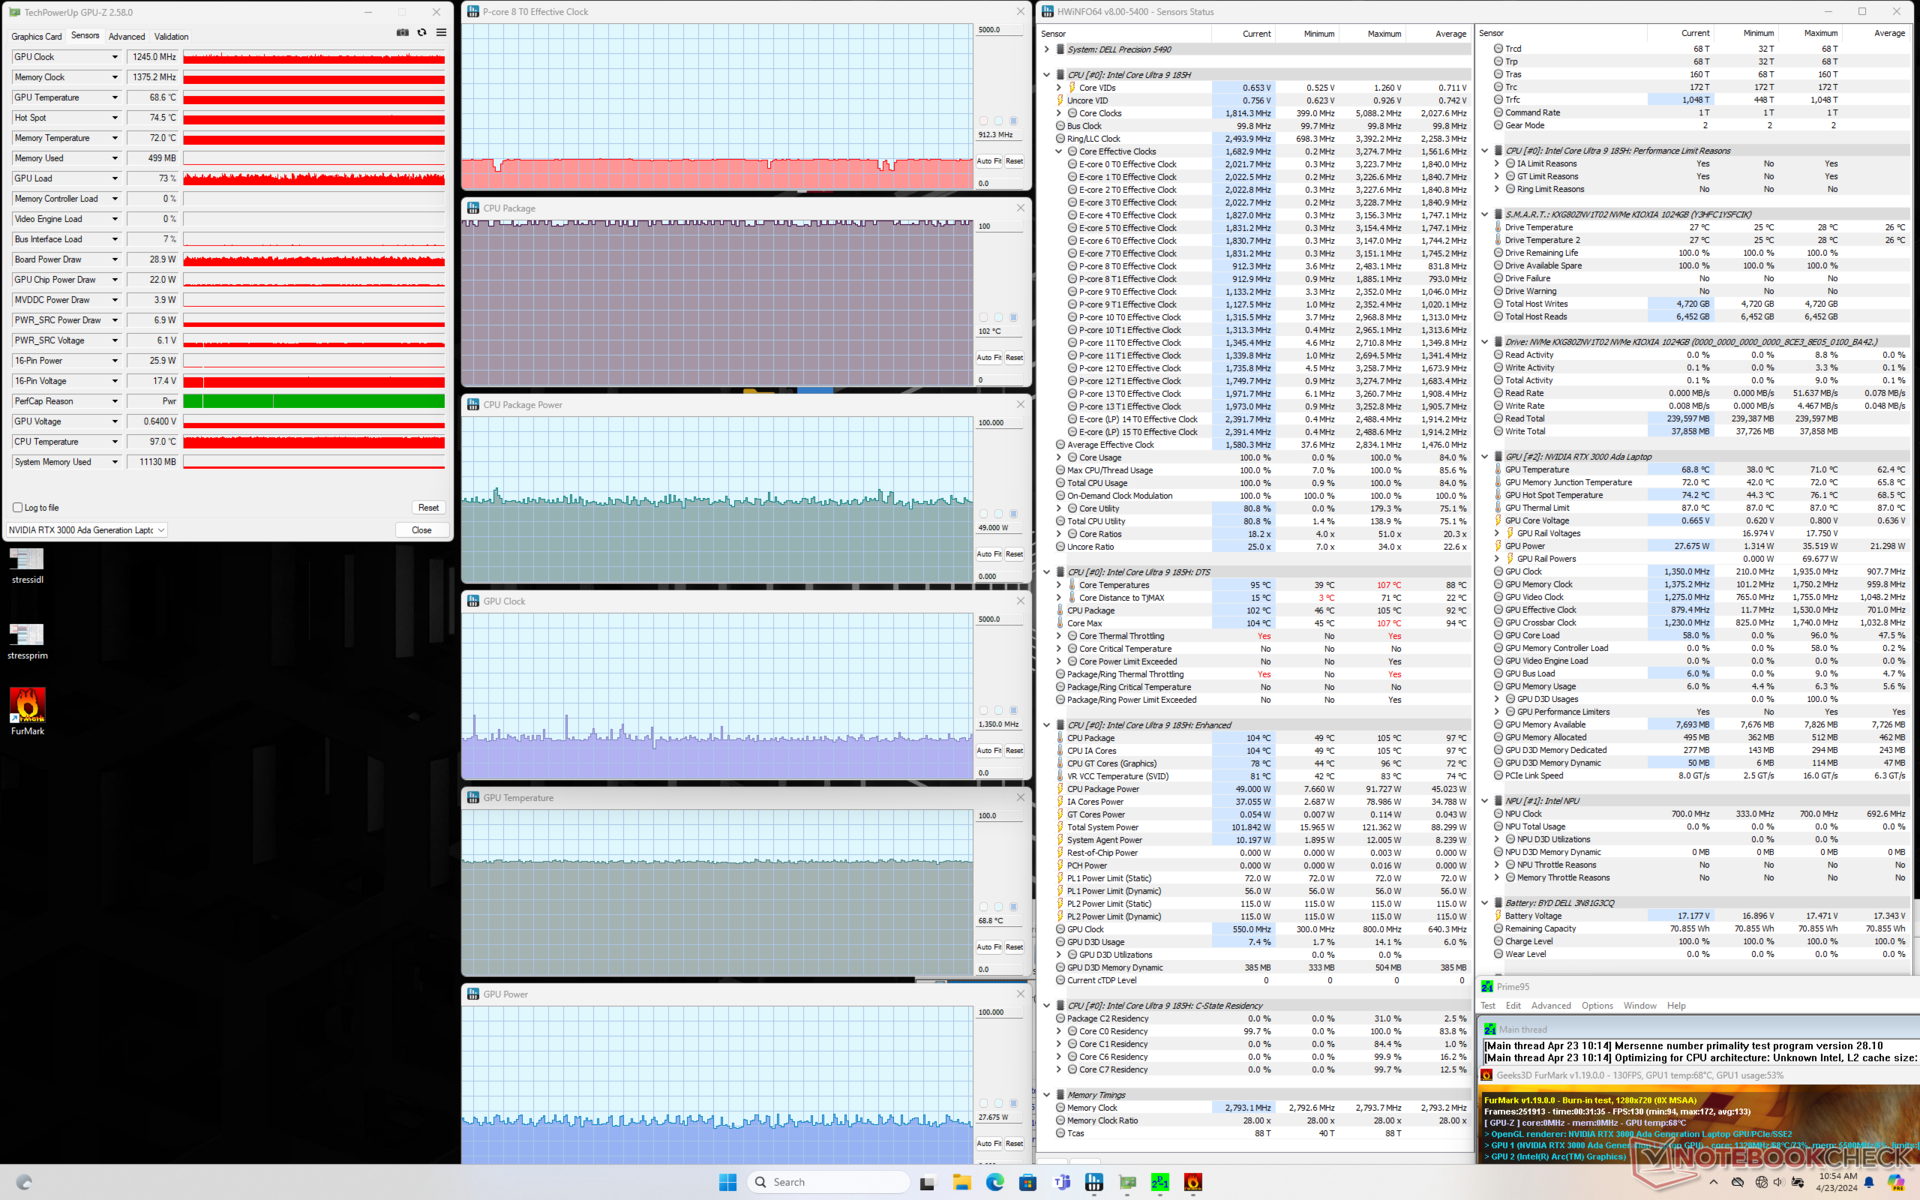
| CPU-Takt (GHz) | GPU-Takt (MHz) | Durchschnittliche CPU-Temperatur (°C) | Durchschnittliche GPU-Temperatur (°C) | |
| System im Leerlauf | -- | -- | 45 | 38 |
| Prime95 Stress | 2.2 | -- | 101 | 59 |
| Prime95 + FurMark Stresstest | 1.6 | ~1350 | 101 | 69 |
| Witcher 3 Stresstest | 0.4 | 1620 | 68 | 59 |
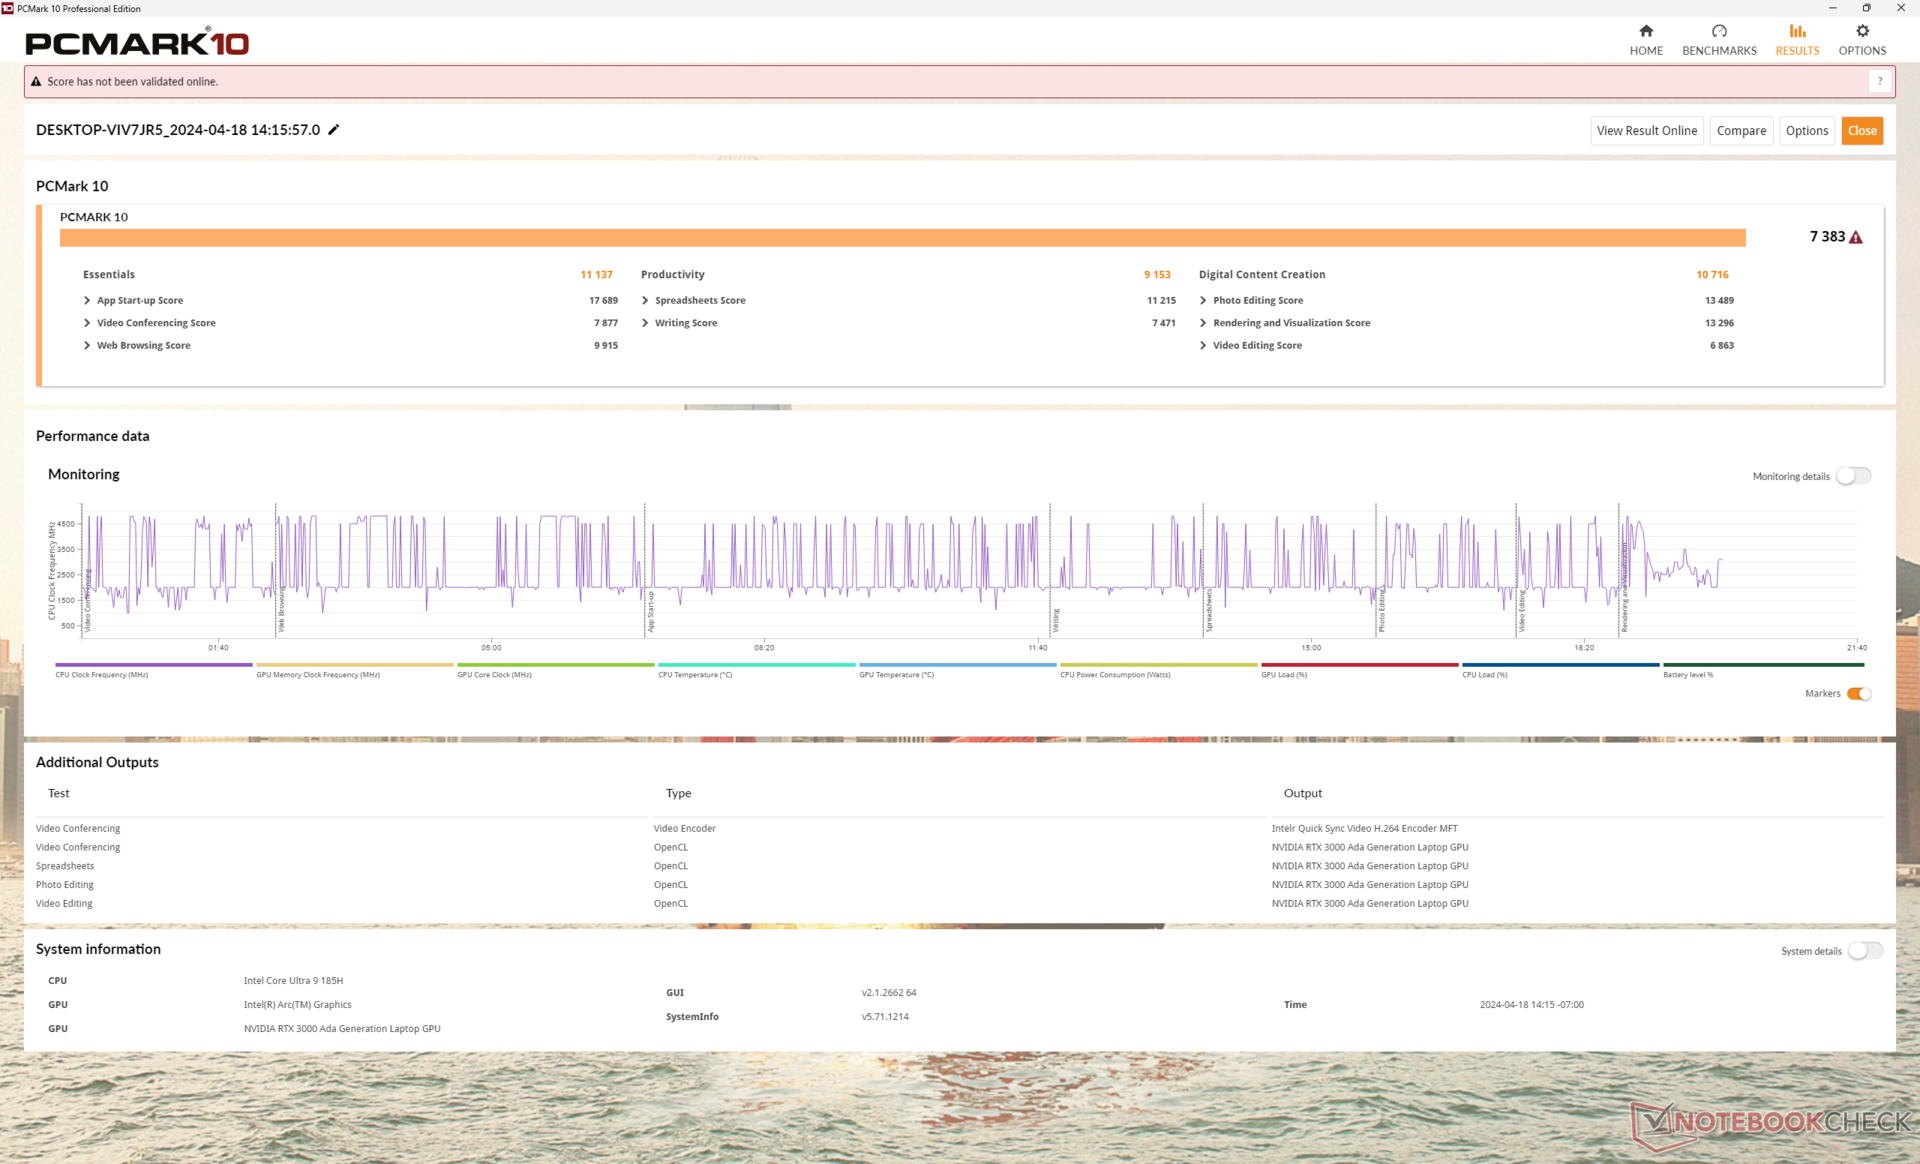
System Performance
Die PCMark-Ergebnisse sind nahezu identisch mit denen des Precision 5480 aus dem letzten Jahr und deuten nicht auf bedeutende Leistungsvorteile bei allgemeinen Multitasking- oder Videobearbeitungsaufgaben hin. Die PCMark AI-Benchmarks, die wir noch nicht durchgeführt haben, könnten Laptops mit integrierten NPUs wie unserem Precision 5490 besser von älteren Modellen unterscheiden.
CrossMark: Overall | Productivity | Creativity | Responsiveness
WebXPRT 3: Overall
WebXPRT 4: Overall
Mozilla Kraken 1.1: Total
| PCMark 10 / Score | |
| Dell Precision 5480 | |
| Durchschnittliche Intel Core Ultra 9 185H, NVIDIA RTX 3000 Ada Generation Laptop (7383 - 7537, n=2) | |
| Dell Precision 5000 5490 | |
| Lenovo ThinkPad P14s G4 21HF0017GE | |
| Dell Precision 5000 5470 | |
| HP ZBook Firefly 14 G10 A | |
| HP ZBook Firefly 14 G9-6B8A2EA | |
| PCMark 10 / Essentials | |
| Dell Precision 5480 | |
| Dell Precision 5000 5490 | |
| Dell Precision 5000 5470 | |
| Durchschnittliche Intel Core Ultra 9 185H, NVIDIA RTX 3000 Ada Generation Laptop (10514 - 11137, n=2) | |
| Lenovo ThinkPad P14s G4 21HF0017GE | |
| HP ZBook Firefly 14 G9-6B8A2EA | |
| HP ZBook Firefly 14 G10 A | |
| PCMark 10 / Productivity | |
| Lenovo ThinkPad P14s G4 21HF0017GE | |
| HP ZBook Firefly 14 G9-6B8A2EA | |
| Dell Precision 5480 | |
| Durchschnittliche Intel Core Ultra 9 185H, NVIDIA RTX 3000 Ada Generation Laptop (9153 - 9356, n=2) | |
| HP ZBook Firefly 14 G10 A | |
| Dell Precision 5000 5490 | |
| Dell Precision 5000 5470 | |
| PCMark 10 / Digital Content Creation | |
| Dell Precision 5480 | |
| Durchschnittliche Intel Core Ultra 9 185H, NVIDIA RTX 3000 Ada Generation Laptop (10716 - 11811, n=2) | |
| Dell Precision 5000 5490 | |
| Dell Precision 5000 5470 | |
| Lenovo ThinkPad P14s G4 21HF0017GE | |
| HP ZBook Firefly 14 G10 A | |
| HP ZBook Firefly 14 G9-6B8A2EA | |
| CrossMark / Overall | |
| Dell Precision 5480 | |
| Lenovo ThinkPad P14s G4 21HF0017GE | |
| Dell Precision 5000 5470 | |
| Durchschnittliche Intel Core Ultra 9 185H, NVIDIA RTX 3000 Ada Generation Laptop (1754 - 1770, n=2) | |
| Dell Precision 5000 5490 | |
| HP ZBook Firefly 14 G9-6B8A2EA | |
| CrossMark / Productivity | |
| Dell Precision 5480 | |
| Lenovo ThinkPad P14s G4 21HF0017GE | |
| Dell Precision 5000 5470 | |
| Durchschnittliche Intel Core Ultra 9 185H, NVIDIA RTX 3000 Ada Generation Laptop (1643 - 1686, n=2) | |
| Dell Precision 5000 5490 | |
| HP ZBook Firefly 14 G9-6B8A2EA | |
| CrossMark / Creativity | |
| Dell Precision 5480 | |
| Dell Precision 5000 5470 | |
| Lenovo ThinkPad P14s G4 21HF0017GE | |
| Dell Precision 5000 5490 | |
| Durchschnittliche Intel Core Ultra 9 185H, NVIDIA RTX 3000 Ada Generation Laptop (1981 - 2001, n=2) | |
| HP ZBook Firefly 14 G9-6B8A2EA | |
| CrossMark / Responsiveness | |
| Dell Precision 5480 | |
| Lenovo ThinkPad P14s G4 21HF0017GE | |
| Dell Precision 5000 5470 | |
| Durchschnittliche Intel Core Ultra 9 185H, NVIDIA RTX 3000 Ada Generation Laptop (1438 - 1458, n=2) | |
| Dell Precision 5000 5490 | |
| HP ZBook Firefly 14 G9-6B8A2EA | |
| WebXPRT 3 / Overall | |
| Dell Precision 5480 | |
| Dell Precision 5000 5470 | |
| Lenovo ThinkPad P14s G4 21HF0017GE | |
| Durchschnittliche Intel Core Ultra 9 185H, NVIDIA RTX 3000 Ada Generation Laptop (286 - 295, n=2) | |
| Dell Precision 5000 5490 | |
| HP ZBook Firefly 14 G9-6B8A2EA | |
| HP ZBook Firefly 14 G10 A | |
| HP ZBook Firefly 14 G10 A | |
| WebXPRT 4 / Overall | |
| Dell Precision 5480 | |
| Lenovo ThinkPad P14s G4 21HF0017GE | |
| Lenovo ThinkPad P14s G4 21HF0017GE | |
| Dell Precision 5000 5470 | |
| Dell Precision 5000 5490 | |
| Durchschnittliche Intel Core Ultra 9 185H, NVIDIA RTX 3000 Ada Generation Laptop (261 - 268, n=2) | |
| HP ZBook Firefly 14 G9-6B8A2EA | |
| Mozilla Kraken 1.1 / Total | |
| HP ZBook Firefly 14 G10 A | |
| HP ZBook Firefly 14 G10 A | |
| HP ZBook Firefly 14 G9-6B8A2EA | |
| Dell Precision 5000 5470 | |
| Dell Precision 5000 5490 | |
| Durchschnittliche Intel Core Ultra 9 185H, NVIDIA RTX 3000 Ada Generation Laptop (515 - 522, n=2) | |
| Dell Precision 5480 | |
| Lenovo ThinkPad P14s G4 21HF0017GE | |
* ... kleinere Werte sind besser
| PCMark 10 Score | 7383 Punkte | |
Hilfe | ||
| AIDA64 / Memory Copy | |
| Dell Precision 5000 5490 | |
| Durchschnittliche Intel Core Ultra 9 185H (69929 - 95718, n=20) | |
| Dell Precision 5480 | |
| Dell Precision 5000 5470 | |
| HP ZBook Firefly 14 G10 A | |
| Lenovo ThinkPad P14s G4 21HF0017GE | |
| HP ZBook Firefly 14 G9-6B8A2EA | |
| AIDA64 / Memory Read | |
| Dell Precision 5000 5490 | |
| Durchschnittliche Intel Core Ultra 9 185H (64619 - 87768, n=20) | |
| Dell Precision 5000 5470 | |
| Dell Precision 5480 | |
| HP ZBook Firefly 14 G9-6B8A2EA | |
| HP ZBook Firefly 14 G10 A | |
| Lenovo ThinkPad P14s G4 21HF0017GE | |
| AIDA64 / Memory Write | |
| Dell Precision 5000 5490 | |
| Dell Precision 5480 | |
| HP ZBook Firefly 14 G10 A | |
| Durchschnittliche Intel Core Ultra 9 185H (51114 - 93871, n=20) | |
| Lenovo ThinkPad P14s G4 21HF0017GE | |
| HP ZBook Firefly 14 G9-6B8A2EA | |
| Dell Precision 5000 5470 | |
| AIDA64 / Memory Latency | |
| Durchschnittliche Intel Core Ultra 9 185H (121.4 - 259, n=20) | |
| Dell Precision 5000 5490 | |
| Dell Precision 5000 5470 | |
| HP ZBook Firefly 14 G10 A | |
| Lenovo ThinkPad P14s G4 21HF0017GE | |
| Dell Precision 5480 | |
| HP ZBook Firefly 14 G9-6B8A2EA | |
* ... kleinere Werte sind besser
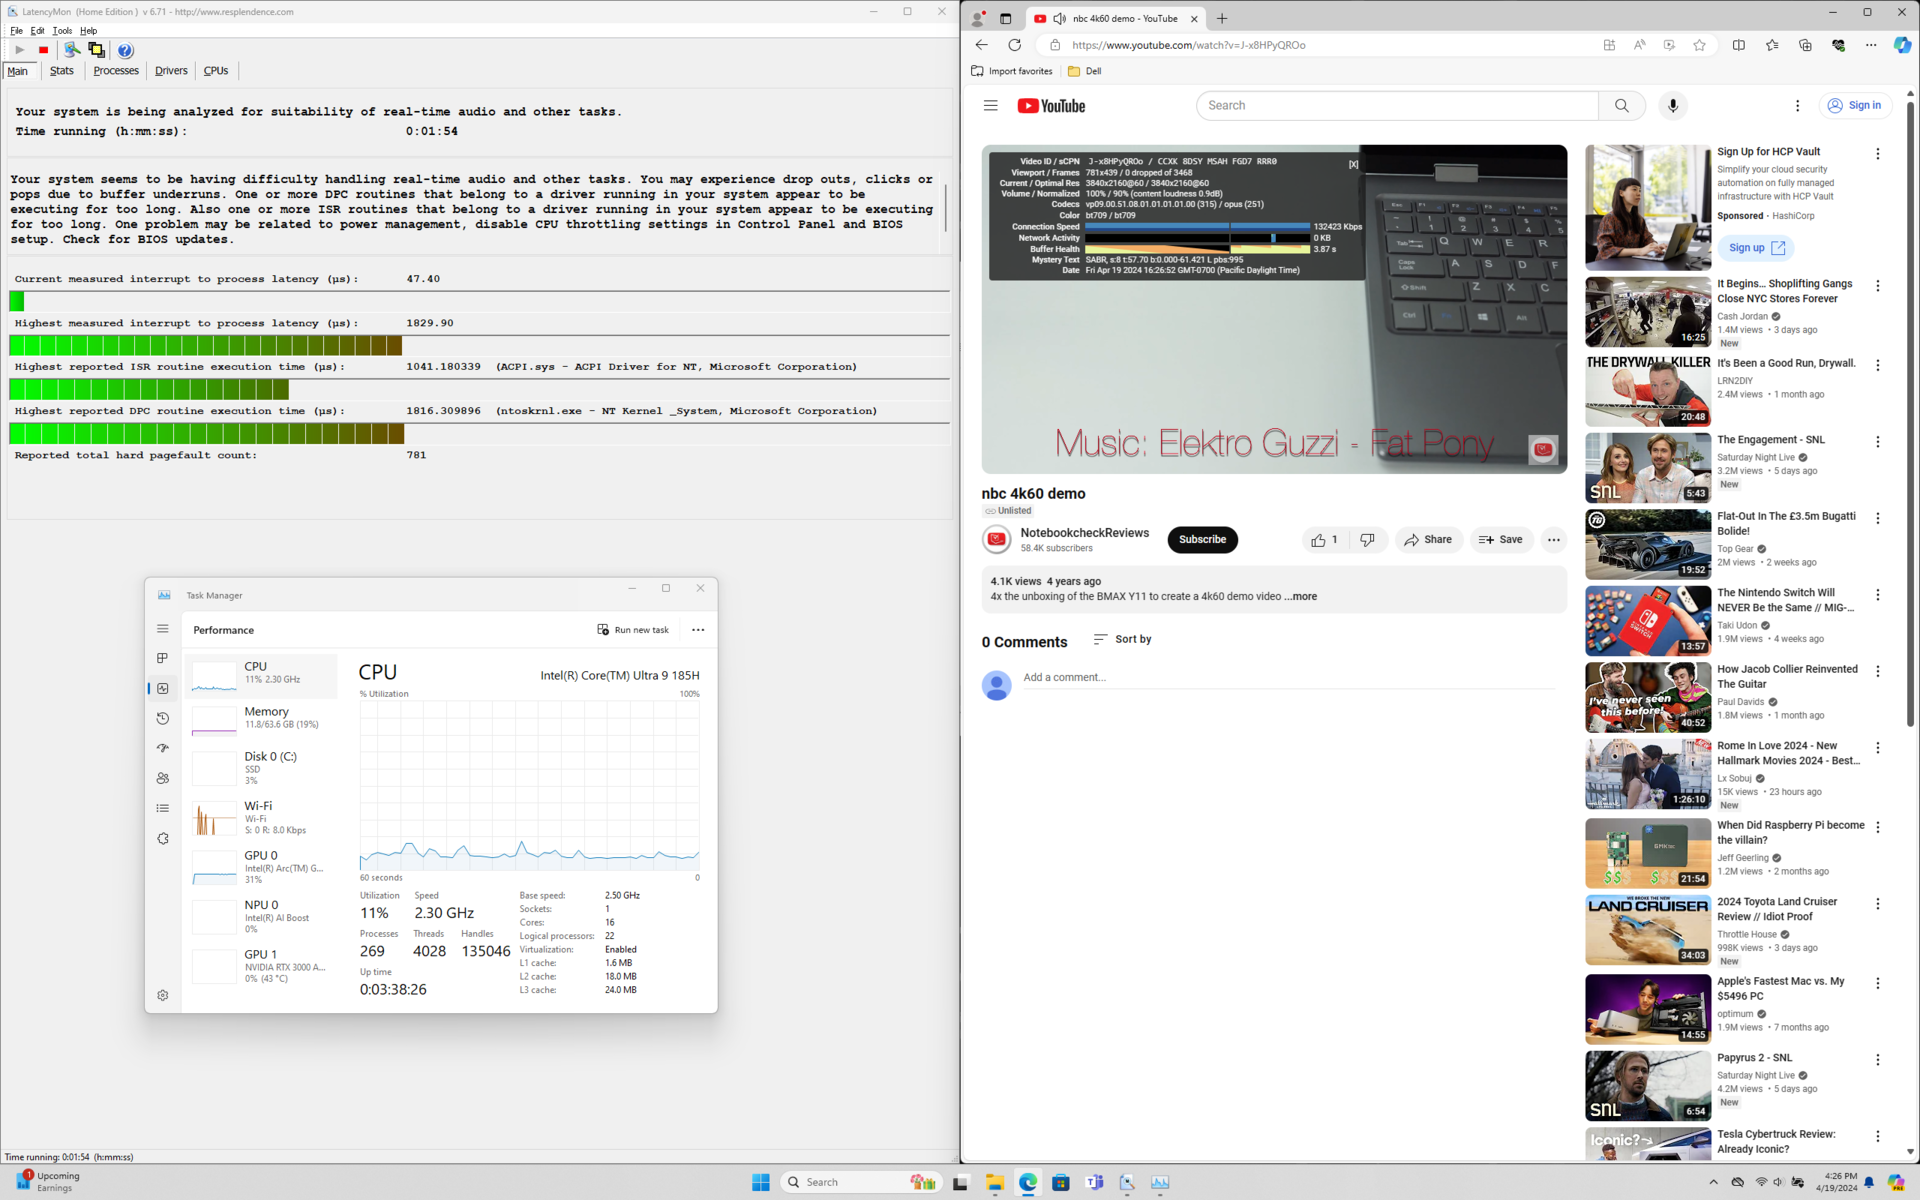
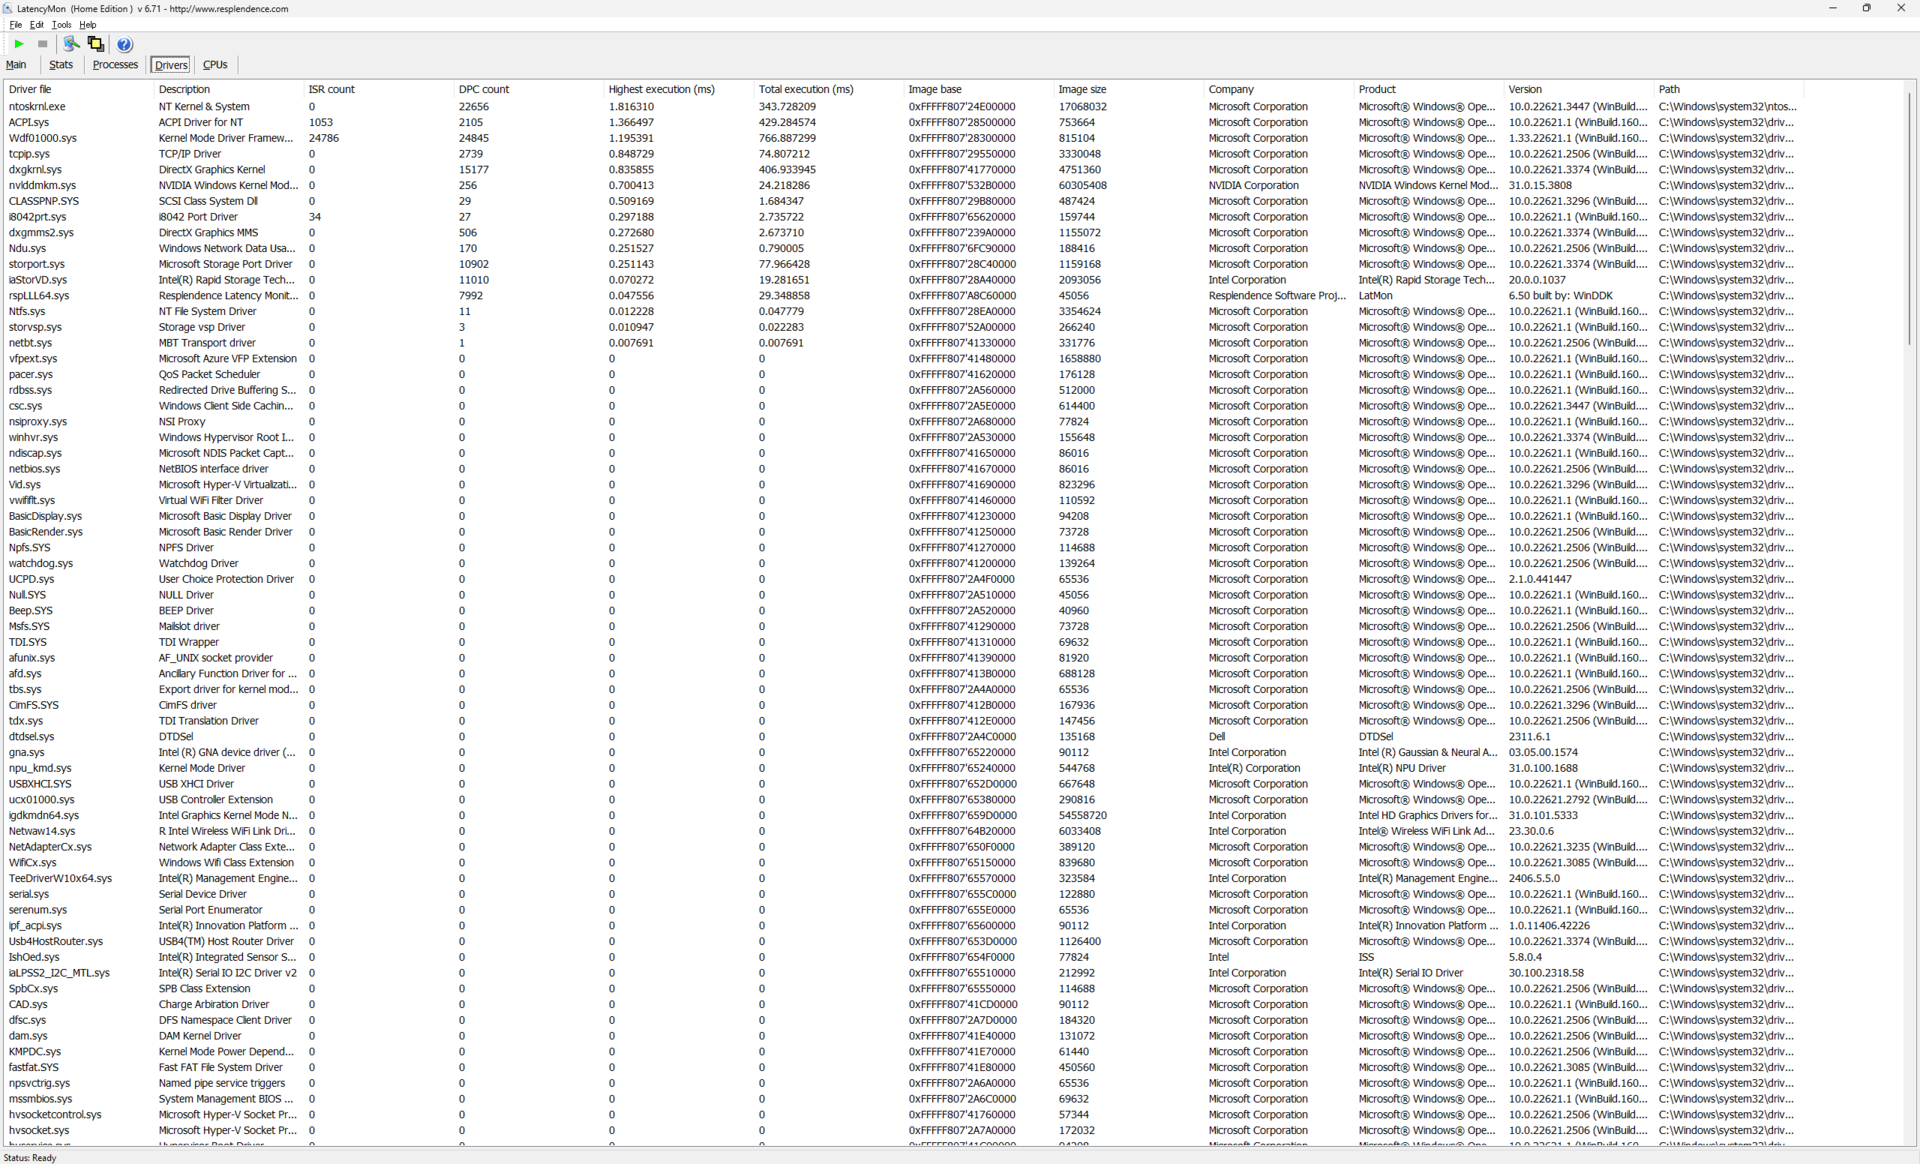
DPC-Latenzen
Es scheint, dass LatencyMon wieder nur geringfügige DPC-Probleme beim Öffnen mehrerer Tabs unserer Homepage zeigt. Die Wiedergabe von 4K-Videos mit 60 FPS verläuft ansonsten einwandfrei, ohne dass Frames verloren gehen.
| DPC Latencies / LatencyMon - interrupt to process latency (max), Web, Youtube, Prime95 | |
| Dell Precision 5000 5490 | |
| Lenovo ThinkPad P14s G4 21HF0017GE | |
| Dell Precision 5480 | |
| HP ZBook Firefly 14 G10 A | |
| Dell Precision 5000 5470 | |
* ... kleinere Werte sind besser
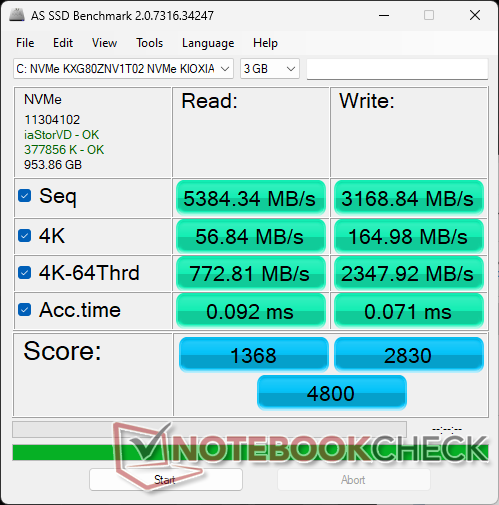
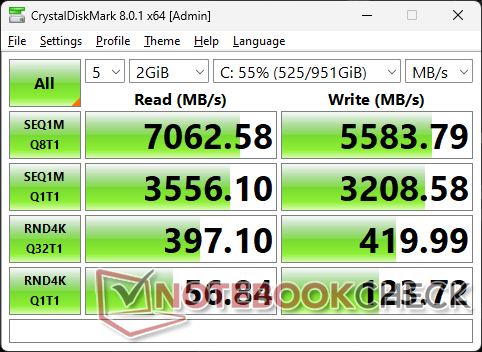
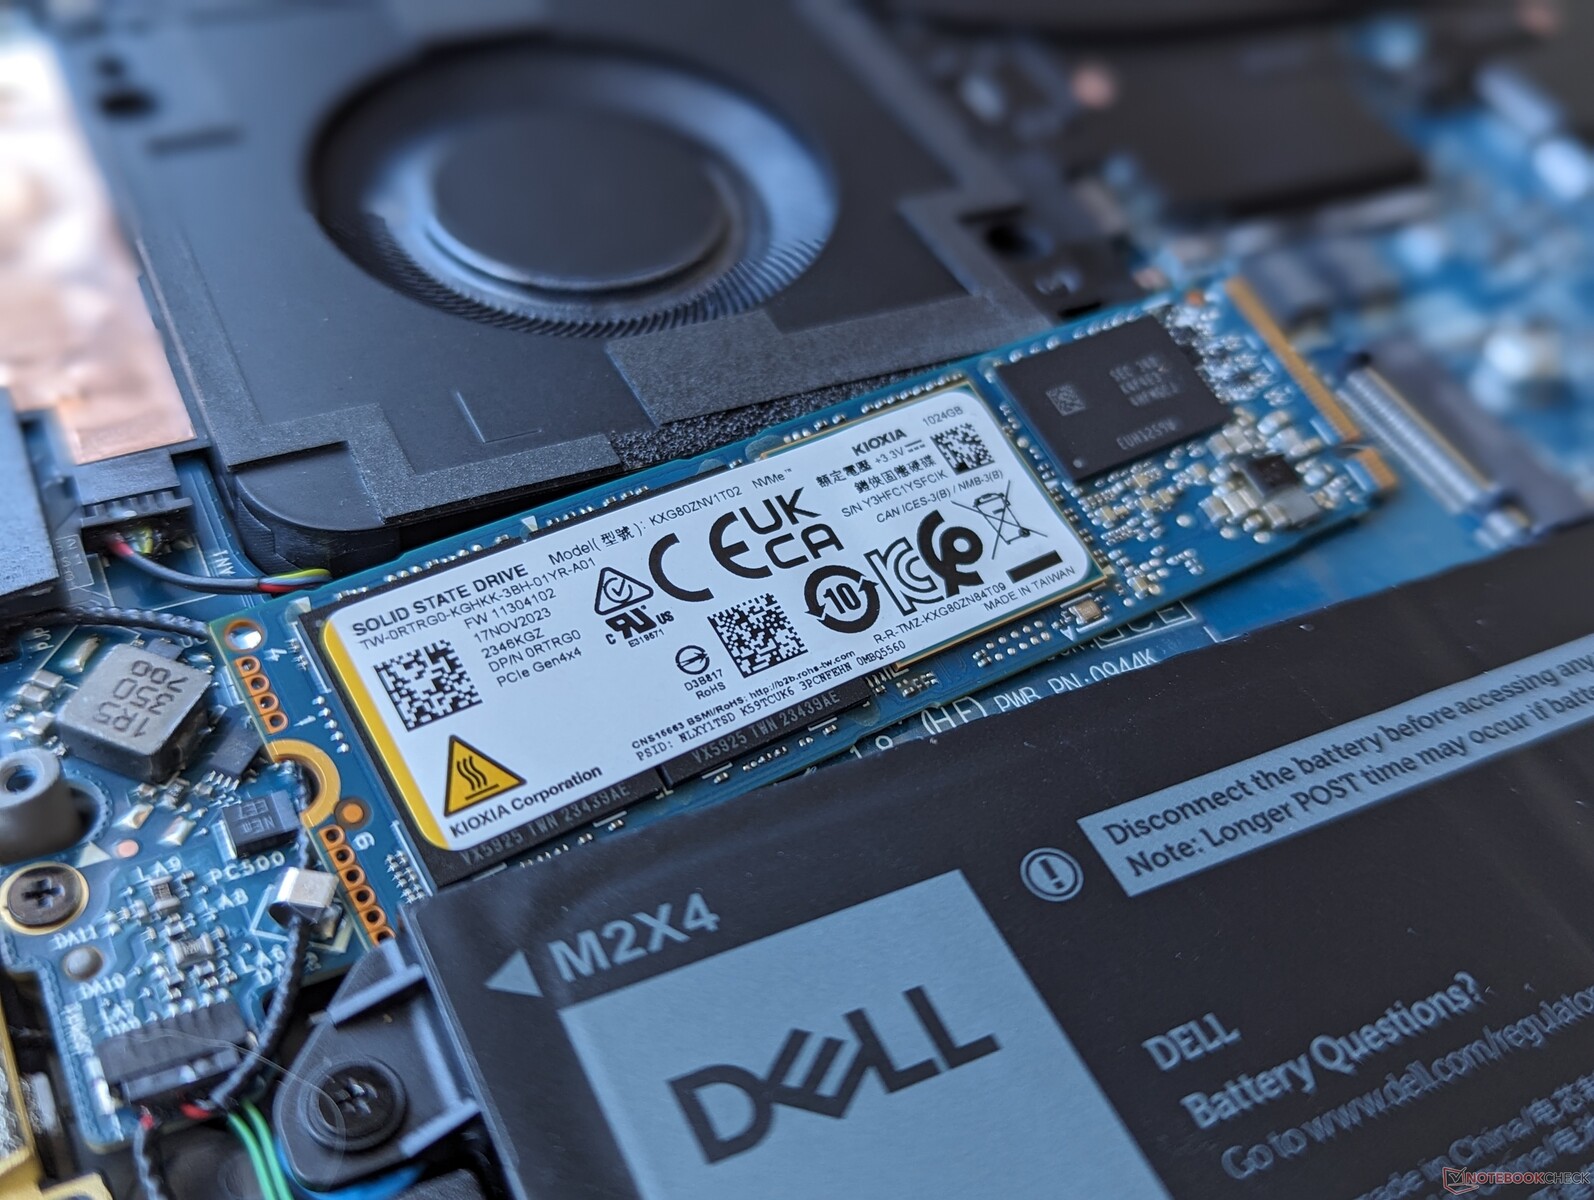
Massenspeicher
Unser Gerät wird mit der Kioxia KXG80ZNV1T02 anstelle der Samsung PM9A1 des letztjährigen Modells ausgeliefert. Die Gesamtleistung ist in etwa gleich, wenn auch mit etwas langsameren Leseraten bei kleineren 4K-Blöcken.

| Drive Performance Rating - Percent | |
| Lenovo ThinkPad P14s G4 21HF0017GE | |
| Dell Precision 5480 | |
| Dell Precision 5000 5470 | |
| HP ZBook Firefly 14 G9-6B8A2EA | |
| Dell Precision 5000 5490 | |
| HP ZBook Firefly 14 G10 A | |
* ... kleinere Werte sind besser
Dauerleistung Lesen: DiskSpd Read Loop, Queue Depth 8
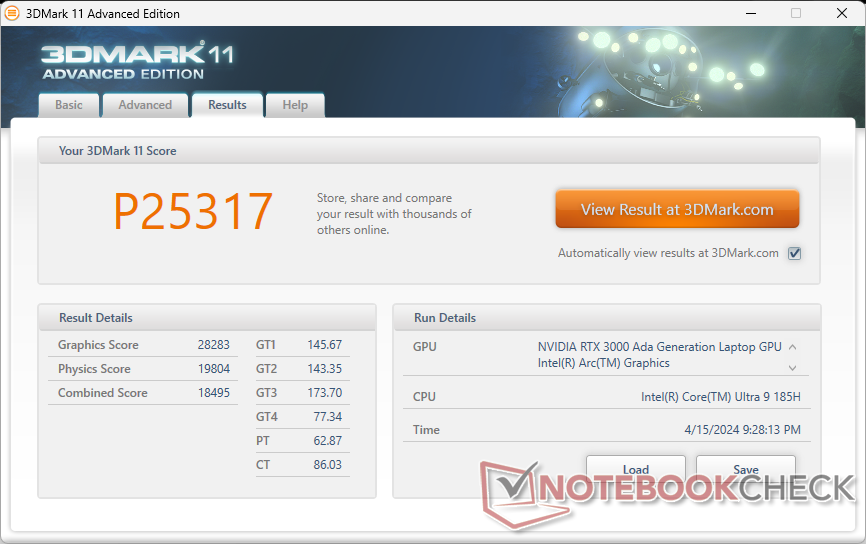
GPU Performance — RTX 3000 Ada
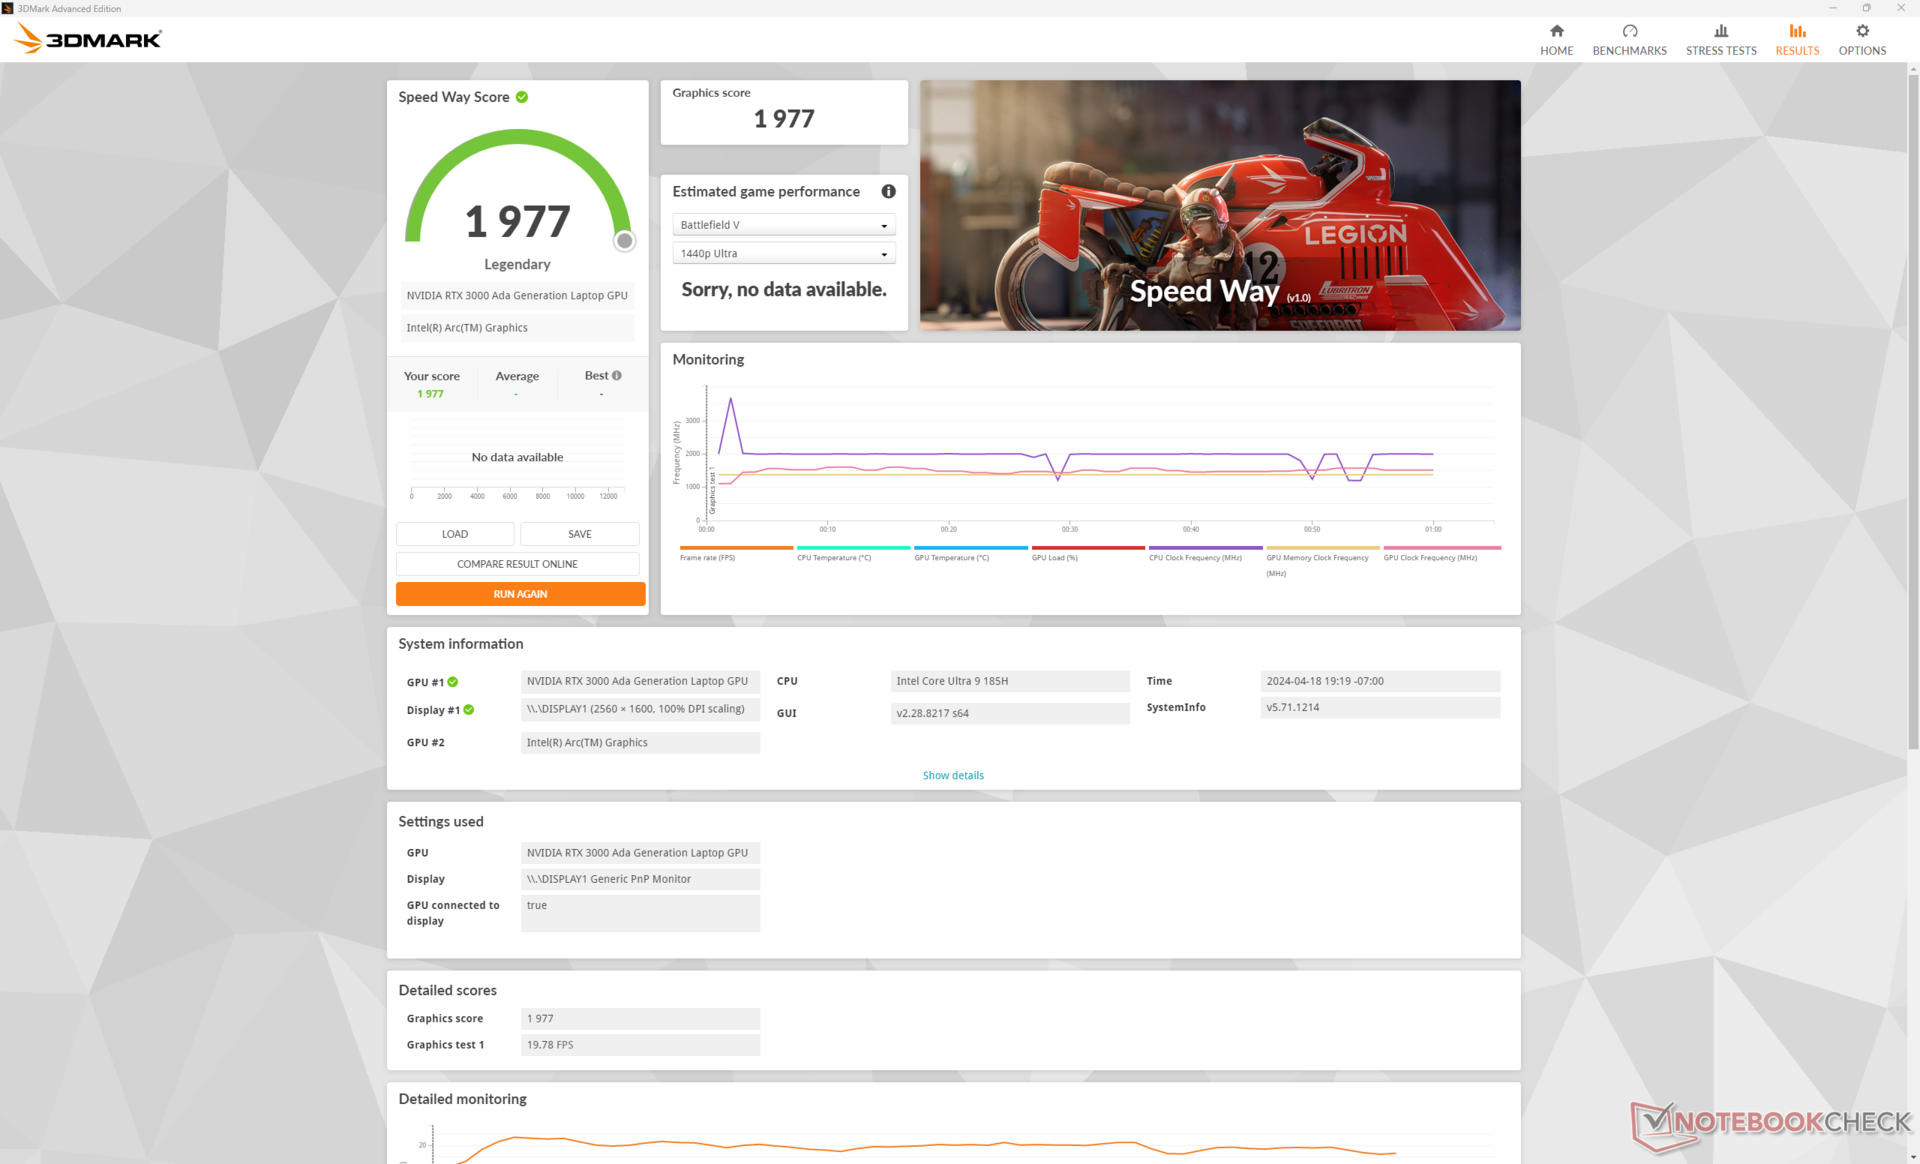
Die RTX 3000 Ada ist ohne Änderungen und ohne Leistungsvorteile im Vergleich zum Precision 5480 zurückgekehrt. Tatsächlich kann die durchschnittliche Leistung in vielen Fällen, einschließlich bestimmter Spiele und 3DMark-Benchmarks, etwas langsamer sein. Trotzdem bleibt das Precision 5490 eine der schnellsten 14-Zoll-Workstations.
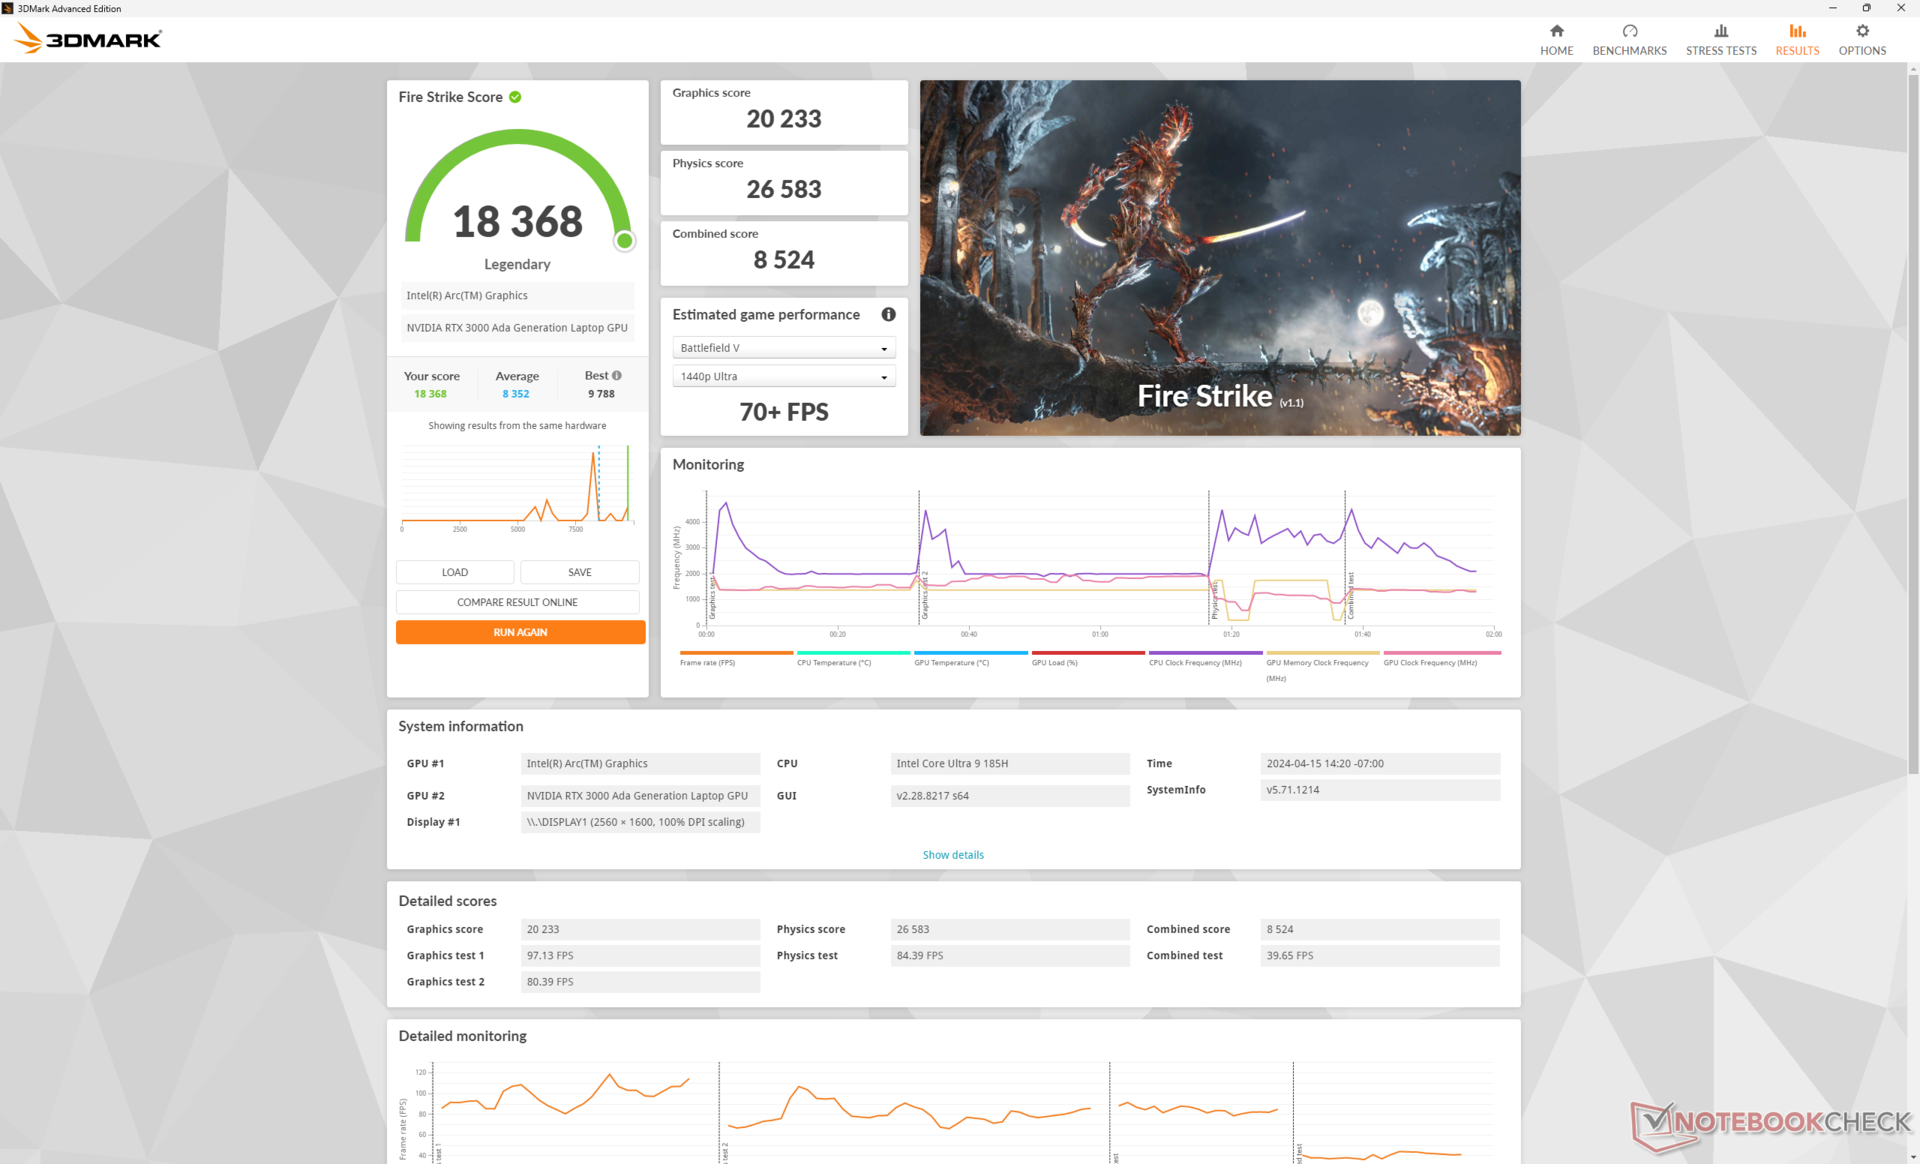
| Energieprofile | Grafikleistung | CPU-Leistung | Gesamtwert |
| Performance-Modus | 20233 | 26583 | 8524 |
| Balanced-Modus | 19308 (-5%) | 25981 (-2%) | 7568 (-11%) |
| Battery Power | 19040 (-6%) | 20532 (-23%) | 7331 (-14%) |
Die Verwendung des Balanced-Modus anstelle des Performance-Modus wirkt sich nur geringfügig auf die Leistung aus, wie unsere obigen Fire-Strike-Ergebnisse zeigen. Die Akkuleistung reduziert die Prozessorleistung deutlicher als die Grafikleistung.
| 3DMark Performance Rating - Percent | |
| Durchschnittliche NVIDIA RTX 3000 Ada Generation Laptop -1! | |
| Dell Precision 5000 5490 -3! | |
| Dell Precision 5480 -5! | |
| HP ZBook Power 15 G10 -11! | |
| HP ZBook Power 15 G9 6B8C4EA -18! | |
| Dell Precision 5000 5560 -4! | |
| Dell Precision 5000 5470 -11! | |
| Lenovo ThinkPad P15v G3 21EM001AGE -12! | |
| Lenovo ThinkPad P15v G2 21A9000XGE -19! | |
| Lenovo ThinkPad P14s G4 21HF0017GE -19! | |
| Lenovo ThinkPad P14s G4 21K5000LGE -21! | |
| Lenovo ThinkPad P14s G3 AMD 21J6S05000 -19! | |
| HP ZBook Firefly 14 G9-6B8A2EA -19! | |
| HP ZBook Firefly 14 G10 A -35! | |
| Lenovo ThinkPad P14s Gen1-20Y10002GE -19! | |
| 3DMark 11 Performance | 25317 Punkte | |
| 3DMark Cloud Gate Standard Score | 45774 Punkte | |
| 3DMark Fire Strike Score | 18368 Punkte | |
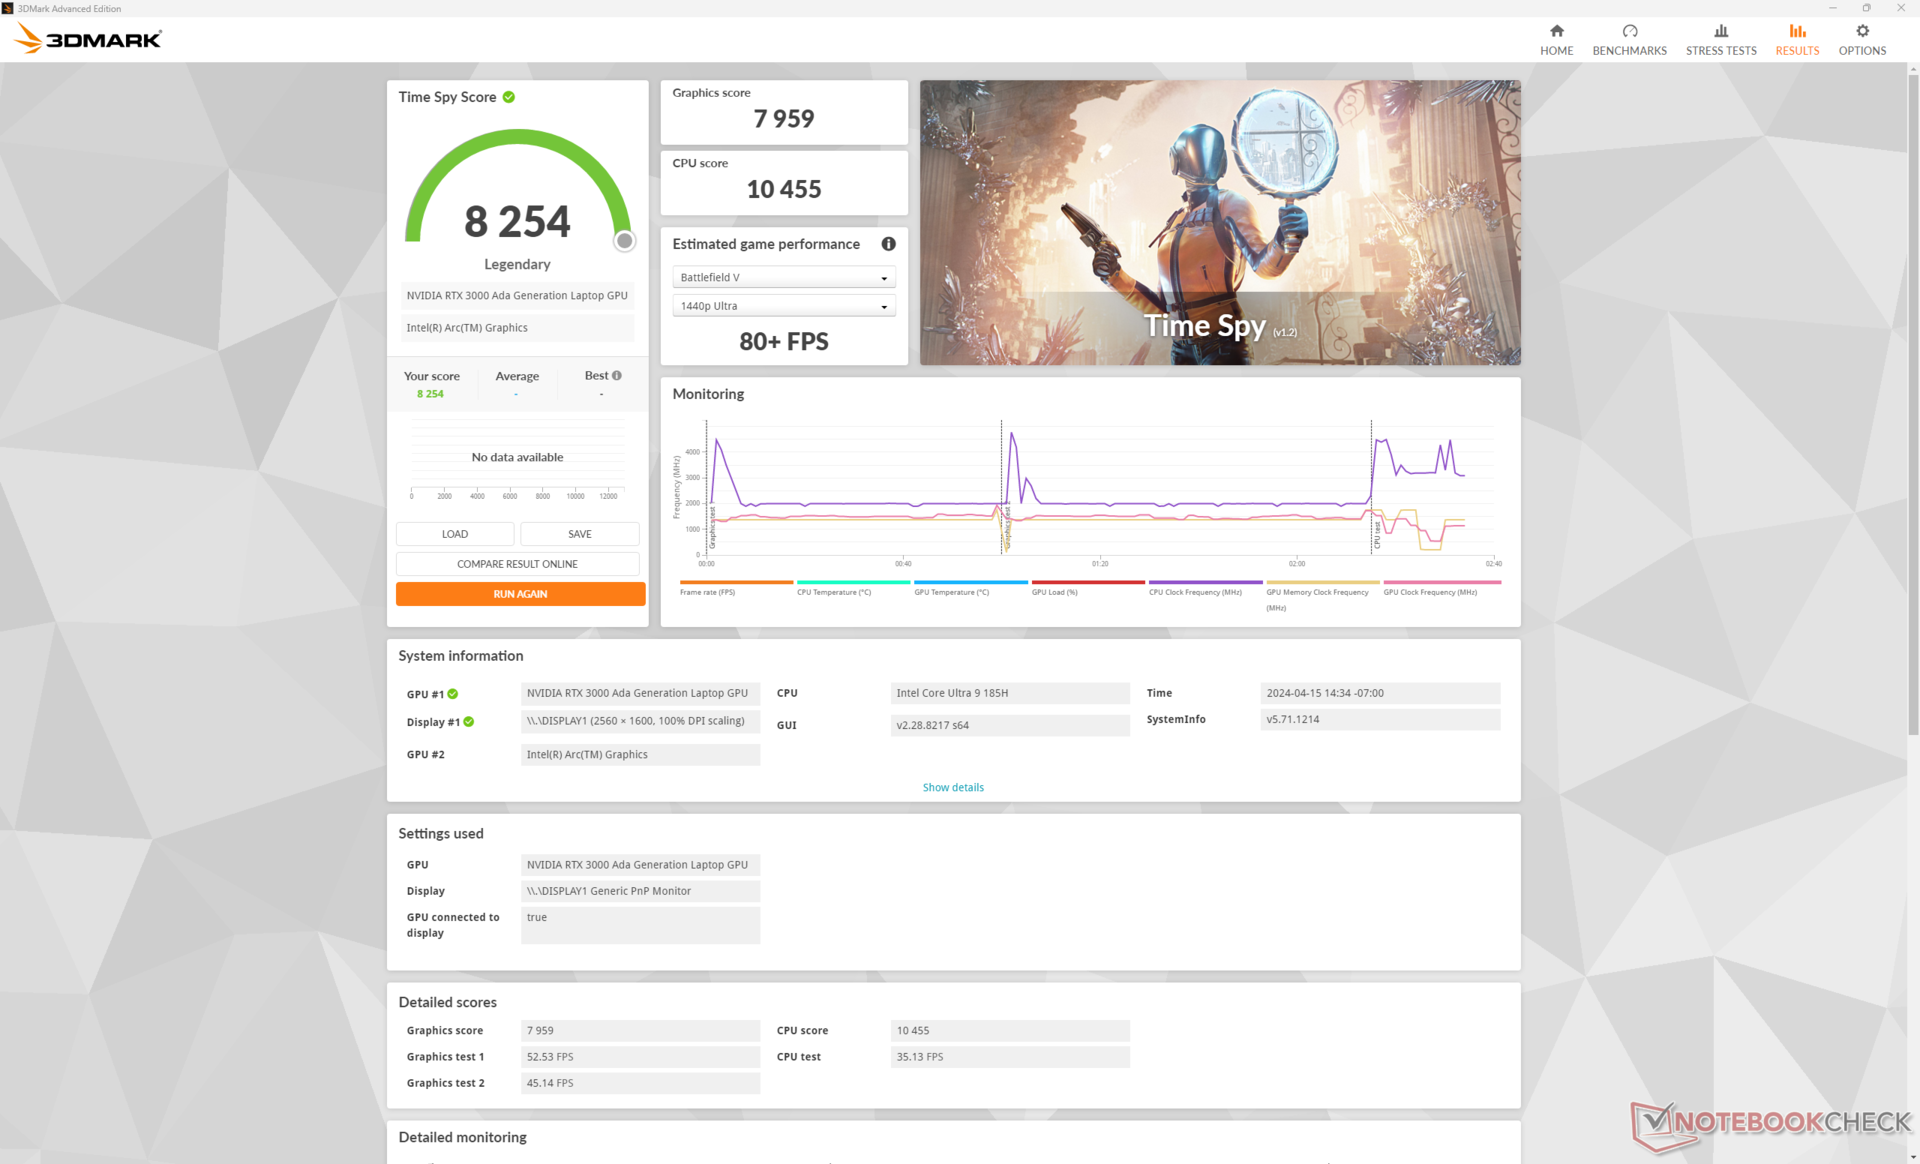
| 3DMark Time Spy Score | 8254 Punkte | |
Hilfe | ||
* ... kleinere Werte sind besser
| Cyberpunk 2077 | |
| 1920x1080 Low Preset (FSR off) | |
| Durchschnittliche NVIDIA RTX 3000 Ada Generation Laptop (87.2 - 104.6, n=2) | |
| Dell Precision 5000 5490 | |
| HP ZBook Power 15 G10 | |
| Lenovo ThinkPad P14s G4 21HF0017GE | |
| 1920x1080 Medium Preset (FSR off) | |
| Durchschnittliche NVIDIA RTX 3000 Ada Generation Laptop (72.7 - 87.9, n=2) | |
| Dell Precision 5000 5490 | |
| HP ZBook Power 15 G10 | |
| Lenovo ThinkPad P14s G4 21HF0017GE | |
| 1920x1080 High Preset (FSR off) | |
| Durchschnittliche NVIDIA RTX 3000 Ada Generation Laptop (60.7 - 74.2, n=2) | |
| Dell Precision 5000 5490 | |
| HP ZBook Power 15 G10 | |
| Lenovo ThinkPad P14s G4 21HF0017GE | |
| 1920x1080 Ultra Preset (FSR off) | |
| Durchschnittliche NVIDIA RTX 3000 Ada Generation Laptop (52.1 - 64.3, n=2) | |
| Dell Precision 5000 5490 | |
| HP ZBook Power 15 G10 | |
| Lenovo ThinkPad P14s G4 21HF0017GE | |
| 1920x1080 Ray Tracing Ultra Preset (DLSS off) | |
| Durchschnittliche NVIDIA RTX 3000 Ada Generation Laptop (26.2 - 33.2, n=2) | |
| Dell Precision 5000 5490 | |
| HP ZBook Power 15 G10 | |
| Lenovo ThinkPad P14s G4 21HF0017GE | |
| Tiny Tina's Wonderlands | |
| 1920x1080 Low Preset (DX12) | |
| Durchschnittliche NVIDIA RTX 3000 Ada Generation Laptop (153.9 - 194, n=3) | |
| Dell Precision 5480 | |
| Dell Precision 5000 5490 | |
| HP ZBook Power 15 G10 | |
| 1920x1080 Medium Preset (DX12) | |
| Durchschnittliche NVIDIA RTX 3000 Ada Generation Laptop (125.4 - 157.7, n=3) | |
| Dell Precision 5480 | |
| Dell Precision 5000 5490 | |
| HP ZBook Power 15 G10 | |
| 1920x1080 High Preset (DX12) | |
| Durchschnittliche NVIDIA RTX 3000 Ada Generation Laptop (88 - 110, n=3) | |
| Dell Precision 5000 5490 | |
| Dell Precision 5480 | |
| HP ZBook Power 15 G10 | |
| 1920x1080 Badass Preset (DX12) | |
| Durchschnittliche NVIDIA RTX 3000 Ada Generation Laptop (69 - 87.9, n=3) | |
| Dell Precision 5000 5490 | |
| Dell Precision 5480 | |
| HP ZBook Power 15 G10 | |
Witcher 3 FPS-Diagramm
| min. | mittel | hoch | max. | |
|---|---|---|---|---|
| The Witcher 3 (2015) | 344 | 249.5 | 145.8 | 79.5 |
| Dota 2 Reborn (2015) | 168 | 151.3 | 136 | 123.3 |
| Final Fantasy XV Benchmark (2018) | 128.8 | 91.9 | 72.9 | |
| X-Plane 11.11 (2018) | 109.9 | 102.1 | 76.7 | |
| Far Cry 5 (2018) | 115 | 105 | 104 | 96 |
| Strange Brigade (2018) | 282 | 182.4 | 151.4 | 132.5 |
| Tiny Tina's Wonderlands (2022) | 153.9 | 125.4 | 88.5 | 70.2 |
| F1 22 (2022) | 183.6 | 168 | 127.5 | 50.4 |
| Baldur's Gate 3 (2023) | 92 | 78.8 | 70.1 | 68.8 |
| Cyberpunk 2077 (2023) | 87.2 | 72.7 | 60.7 | 52.1 |
Emissionen
Geräuschemissionen
Die Untergrenze und die Obergrenze des Lüftergeräuschs sind im Wesentlichen identisch mit dem, was wir bei der Precision 5480 gemessen haben. Insbesondere die Lautstärke ist weiterhin höher oder lauter als bei anderen 14-Zoll-Workstations, was hauptsächlich auf die schnellere GPU im Dell-System zurückzuführen ist. In diesem Jahr kann die Precision 5490 zumindest für längere Zeit leiser laufen, bevor die Lüfter anspringen.
Lautstärkediagramm
| Idle |
| 23.8 / 23.8 / 24.7 dB(A) |
| Last |
| 38.9 / 51.4 dB(A) |
 | ||
30 dB leise 40 dB(A) deutlich hörbar 50 dB(A) störend |
||
min: | ||
| Dell Precision 5000 5490 RTX 3000 Ada Generation Laptop, Ultra 9 185H, Kioxia XG8 KXG80ZNV1T02 | Lenovo ThinkPad P14s G4 21HF0017GE RTX A500 Laptop GPU, i7-1370P, SK Hynix HFS002TEJ9X162N | HP ZBook Firefly 14 G10 A Radeon 760M, R5 PRO 7640HS, Samsung PM9B1 512GB MZVL4512HBLU | HP ZBook Firefly 14 G9-6B8A2EA T550 Laptop GPU, i7-1265U, Micron 3400 1TB MTFDKBA1T0TFH | Dell Precision 5480 RTX 3000 Ada Generation Laptop, i9-13900H, Samsung PM9A1 MZVL21T0HCLR | Dell Precision 5000 5470 RTX A1000 Laptop GPU, i9-12900H, Samsung PM9A1 MZVL21T0HCLR | |
|---|---|---|---|---|---|---|
| Geräuschentwicklung | -1% | -4% | 4% | 0% | -2% | |
| aus / Umgebung * (dB) | 22.8 | 24.6 -8% | 25 -10% | 23.6 -4% | 23.5 -3% | 23 -1% |
| Idle min * (dB) | 23.8 | 24.6 -3% | 25 -5% | 23.6 1% | 23.5 1% | 23.3 2% |
| Idle avg * (dB) | 23.8 | 24.6 -3% | 26 -9% | 23.6 1% | 23.5 1% | 23.3 2% |
| Idle max * (dB) | 24.7 | 25.9 -5% | 27 -9% | 23.6 4% | 23.5 5% | 23.3 6% |
| Last avg * (dB) | 38.9 | 41.3 -6% | 45 -16% | 42.5 -9% | 39.9 -3% | 48.5 -25% |
| Witcher 3 ultra * (dB) | 49.9 | 46 8% | 45 10% | 42.5 15% | 50.1 -0% | 48.6 3% |
| Last max * (dB) | 51.4 | 46.2 10% | 46 11% | 42.5 17% | 51 1% | 50.4 2% |
| Cyberpunk 2077 ultra * (dB) | 44.2 |
* ... kleinere Werte sind besser
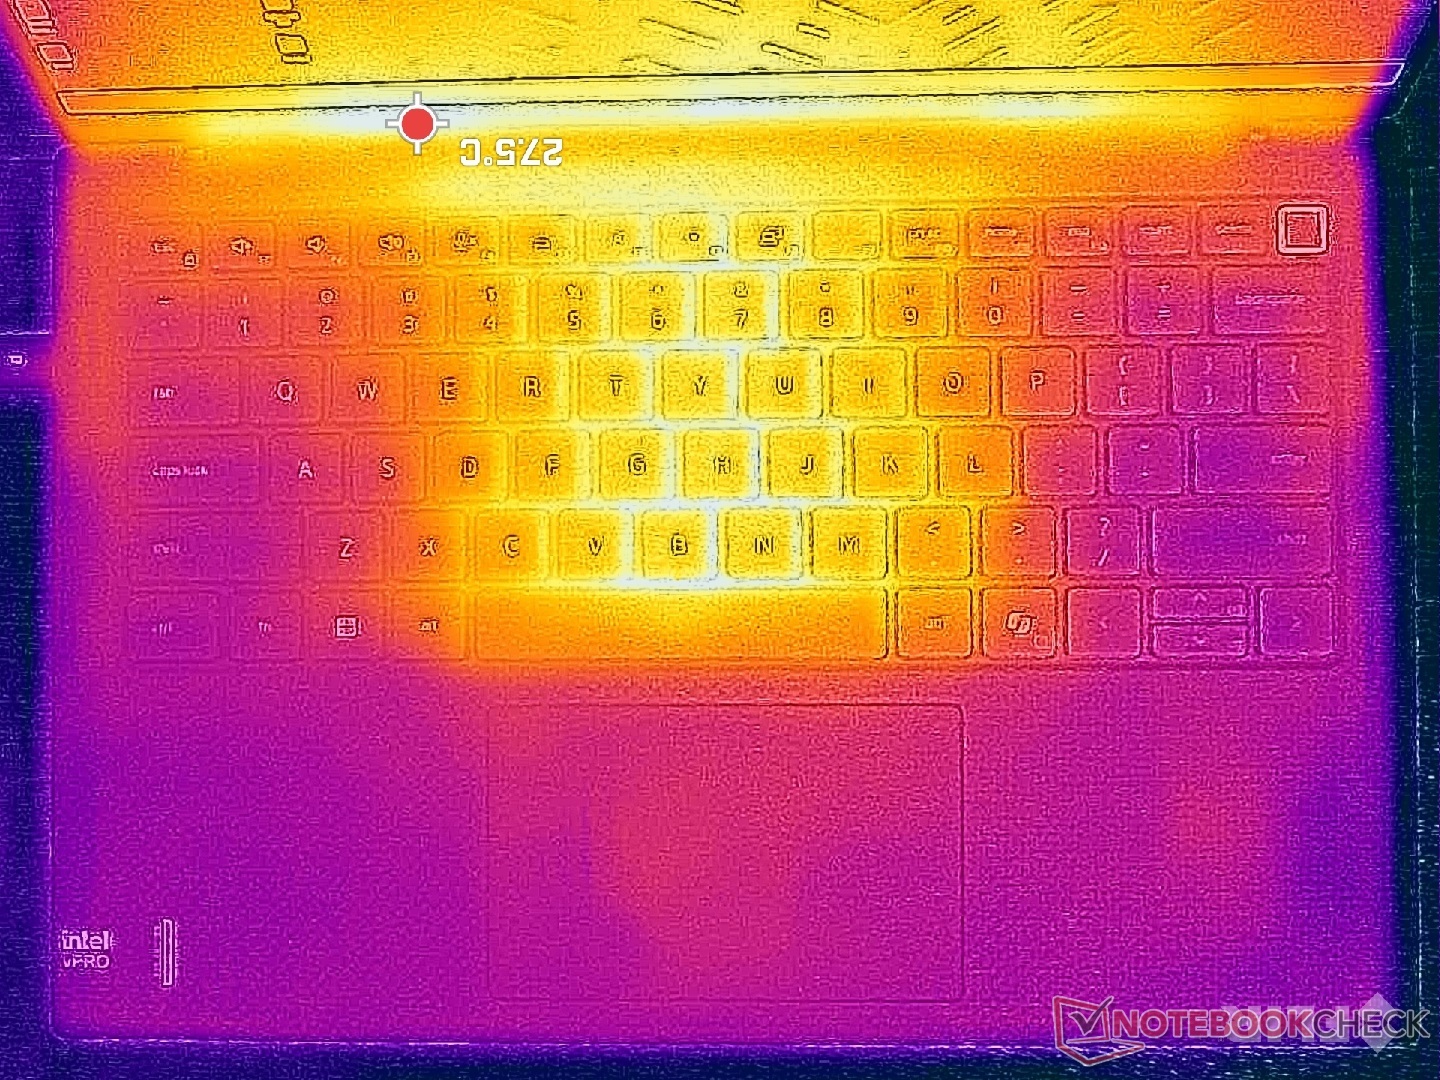
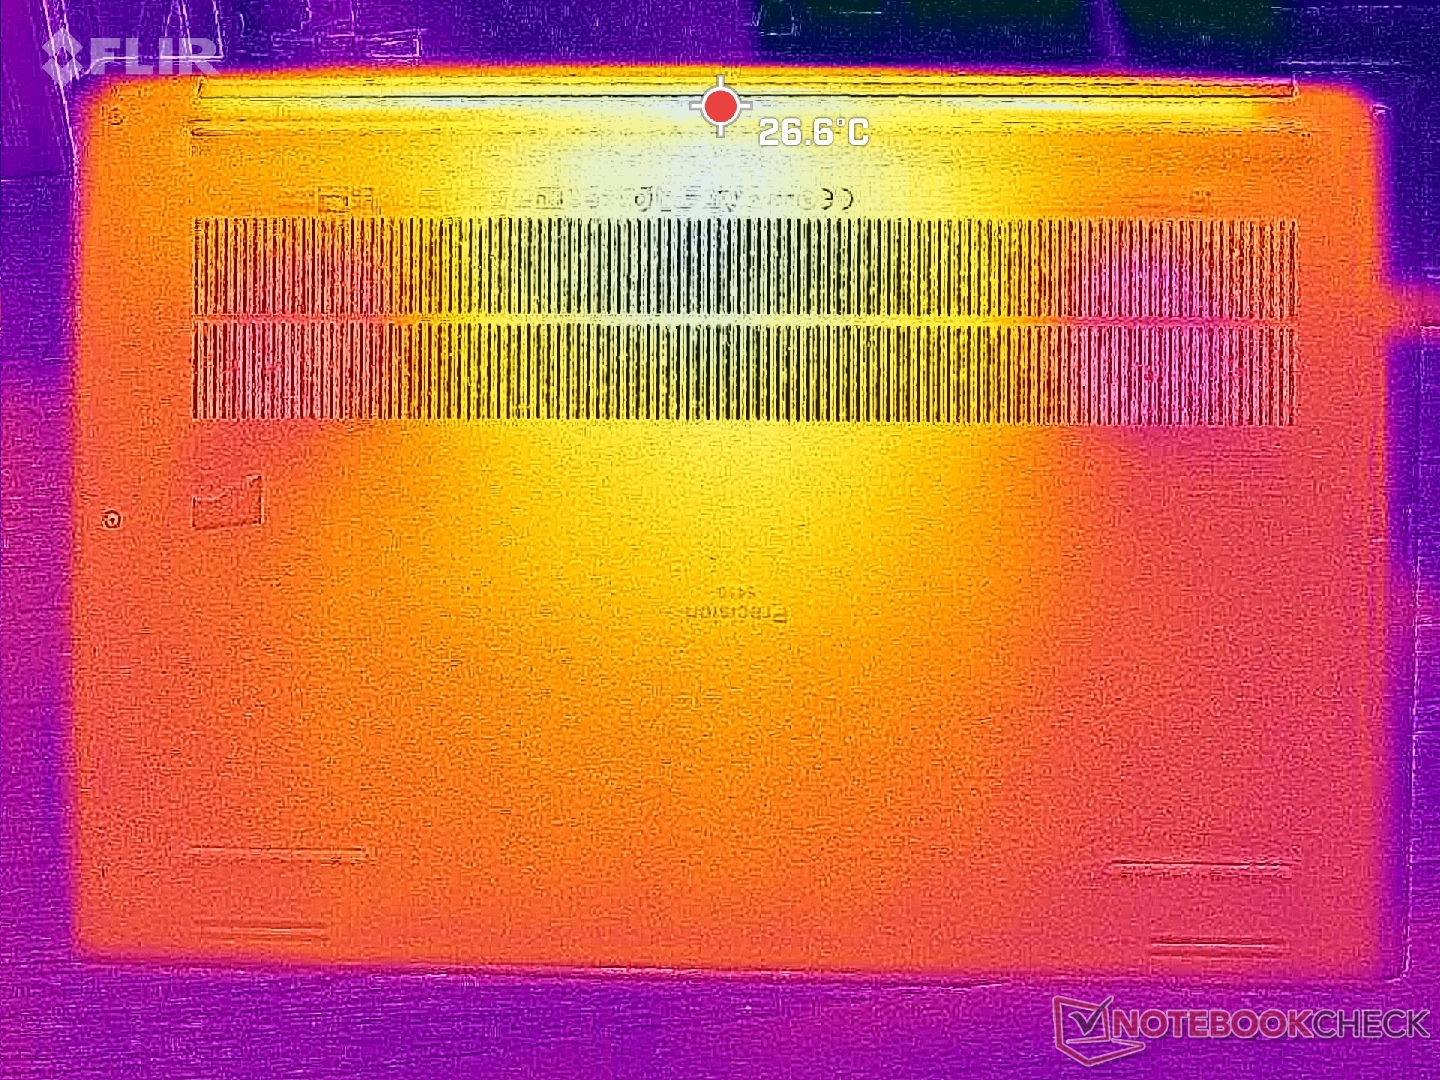
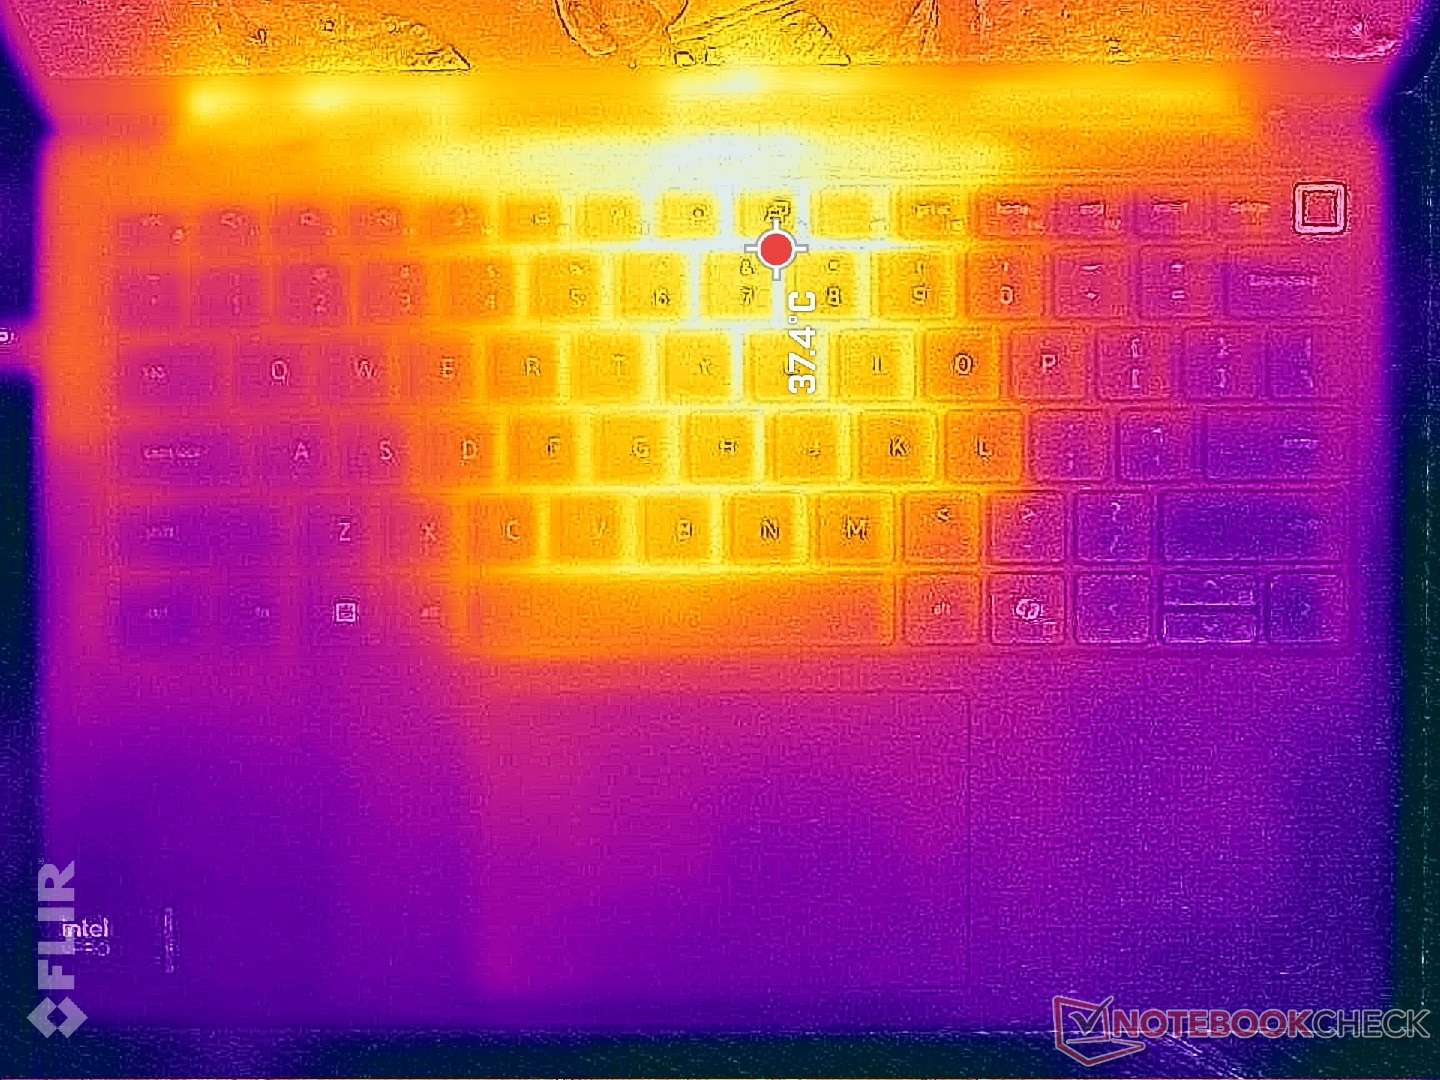
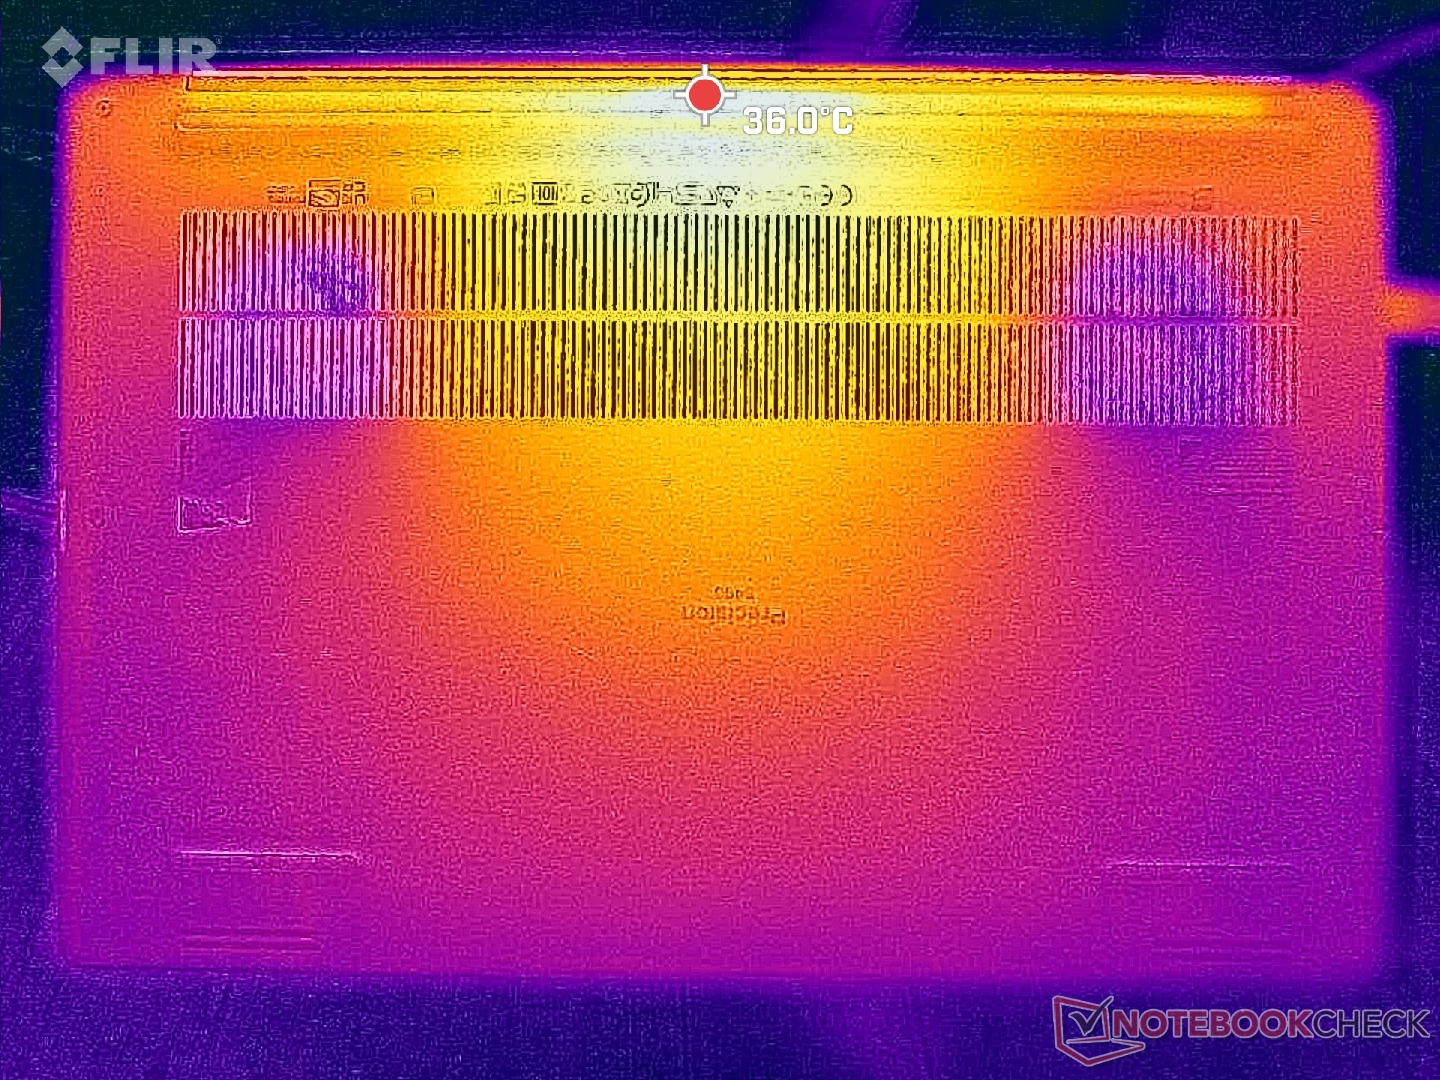
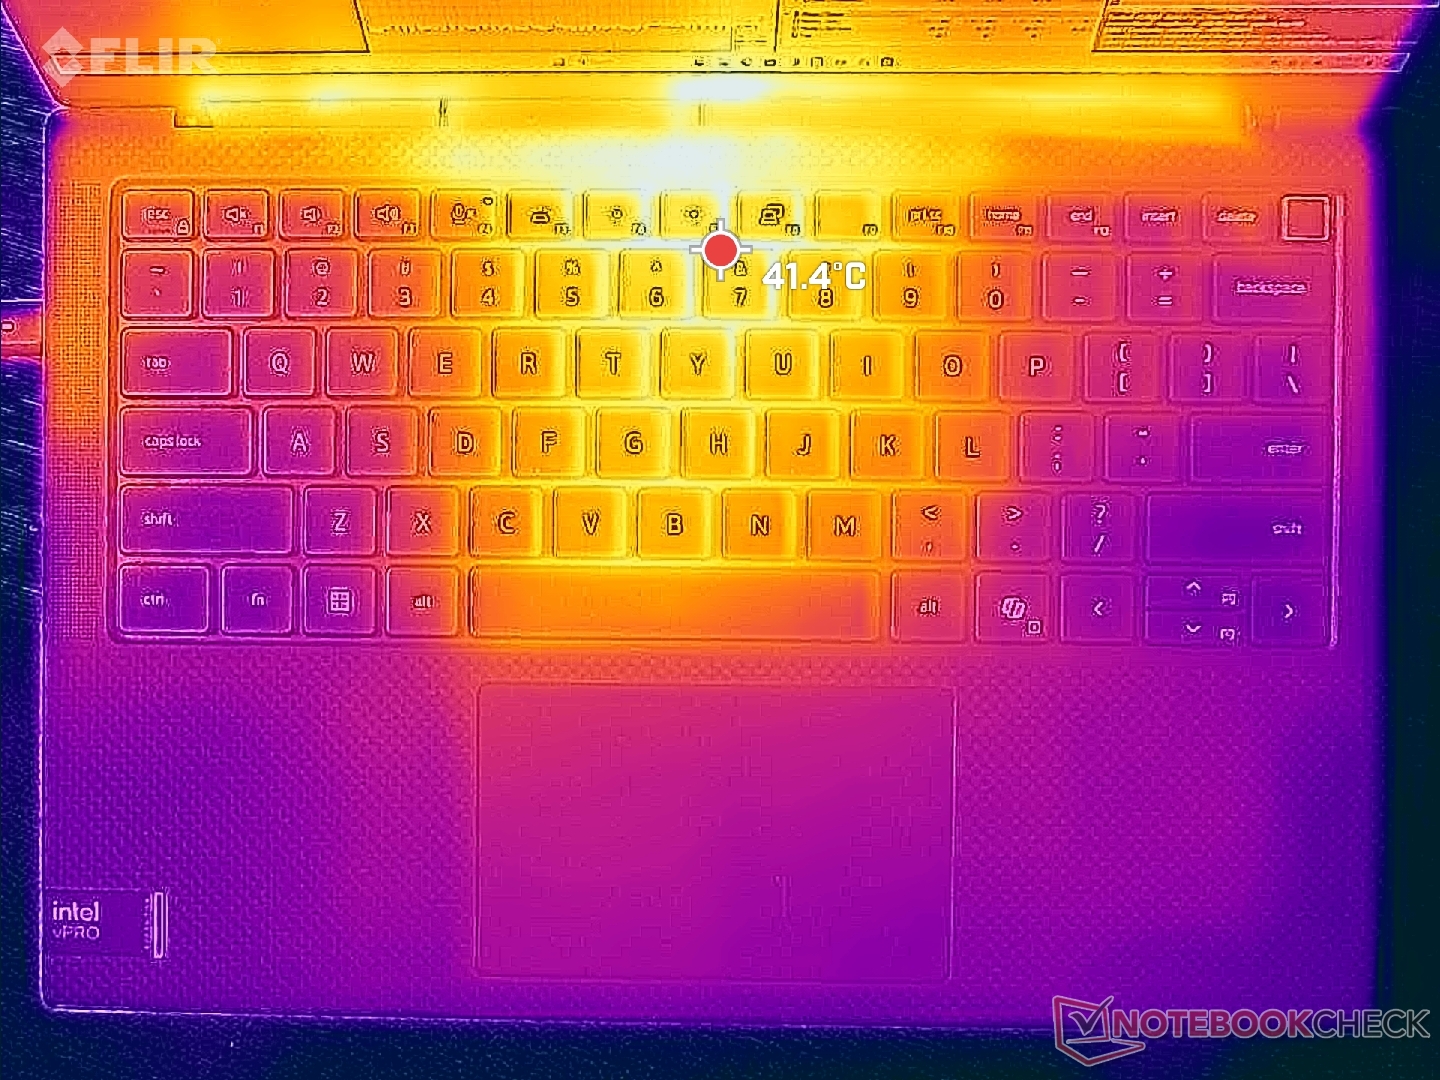
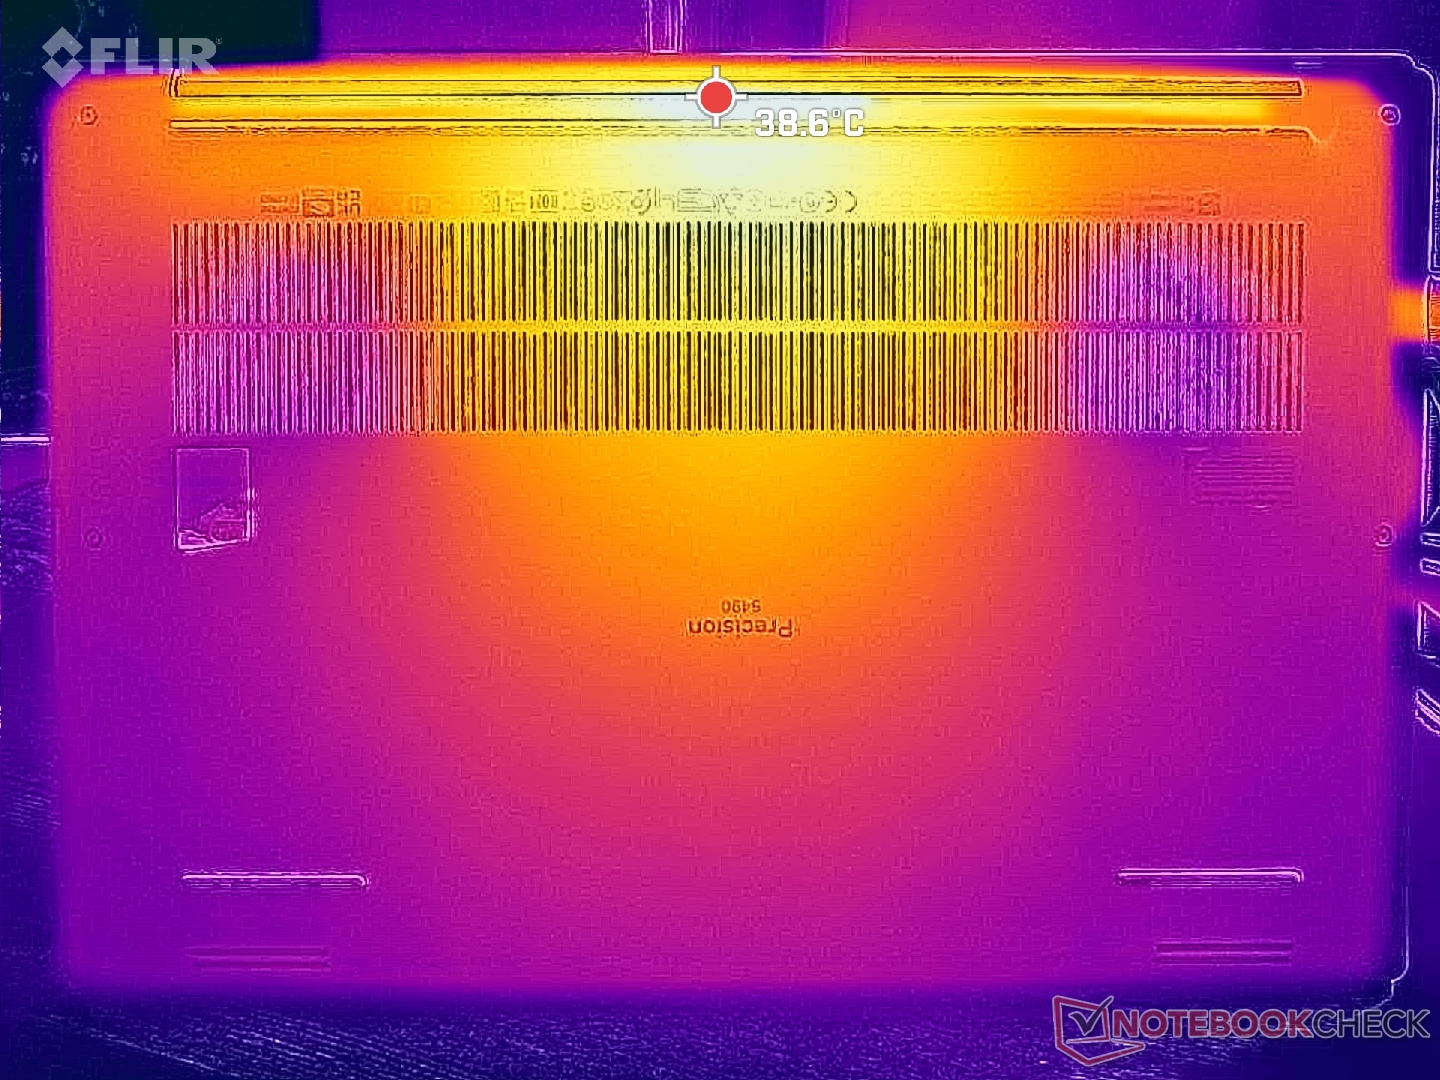
Temperatur
Die Temperaturentwicklung ist symmetrisch, d. h. die Hotspots befinden sich am ehesten in der Mitte der Tastatur, während die Seiten und Handballenablagen deutlich kühler sind. Dennoch sind die Hotspots deutlich kühler als beim HP ZBook Firefly 14 G10, und zwar um einige Grad Celsius.
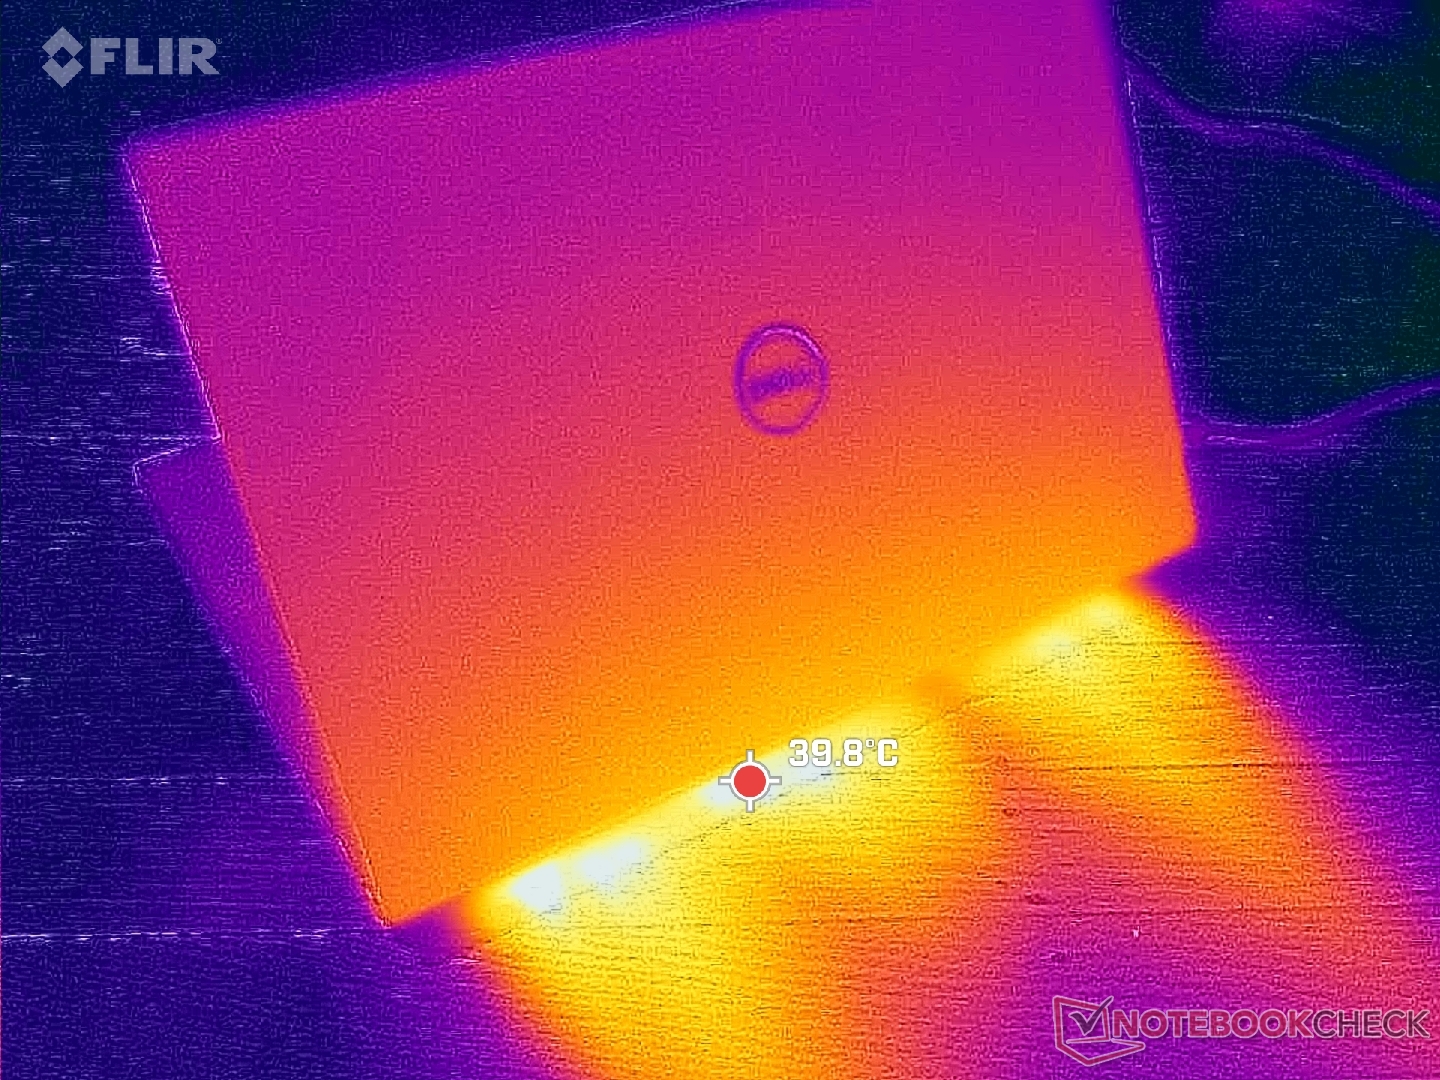

(±) Die maximale Temperatur auf der Oberseite ist 43.2 °C. Im Vergleich liegt der Klassendurchschnitt bei 38.2 °C (von 22.2 bis 69.8 °C für die Klasse Workstation).
(+) Auf der Unterseite messen wir eine maximalen Wert von 38.4 °C (im Vergleich zum Durchschnitt von 41.1 °C).
(+) Ohne Last messen wir eine durchschnittliche Temperatur von 29 °C auf der Oberseite. Der Klassendurchschnitt erreicht 32 °C.
(+) Beim längeren Spielen von The Witcher 3 erhitzt sich das Gerät durchschnittlich auf 31.7 °C. Der Durchschnitt der Klasse ist derzeit 32 °C.
(+) Die Handballen und der Touchpad-Bereich sind mit gemessenen 27.6 °C kühler als die typische Hauttemperatur und fühlen sich dadurch kühl an.
(±) Die durchschnittliche Handballen-Temperatur anderer getesteter Geräte war 27.8 °C (+0.2 °C).
| Dell Precision 5000 5490 Intel Core Ultra 9 185H, NVIDIA RTX 3000 Ada Generation Laptop | Lenovo ThinkPad P14s G4 21HF0017GE Intel Core i7-1370P, NVIDIA RTX A500 Laptop GPU | HP ZBook Firefly 14 G10 A AMD Ryzen 5 PRO 7640HS, AMD Radeon 760M | HP ZBook Firefly 14 G9-6B8A2EA Intel Core i7-1265U, NVIDIA T550 Laptop GPU | Dell Precision 5480 Intel Core i9-13900H, NVIDIA RTX 3000 Ada Generation Laptop | Dell Precision 5000 5470 Intel Core i9-12900H, NVIDIA RTX A1000 Laptop GPU | |
|---|---|---|---|---|---|---|
| Hitze | -13% | -4% | 2% | -13% | -3% | |
| Last oben max * (°C) | 43.2 | 55.3 -28% | 50 -16% | 41.2 5% | 44 -2% | 41.8 3% |
| Last unten max * (°C) | 38.4 | 48.7 -27% | 51 -33% | 47.9 -25% | 38.2 1% | 36 6% |
| Idle oben max * (°C) | 31.6 | 31 2% | 25 21% | 26.5 16% | 38.8 -23% | 34.6 -9% |
| Idle unten max * (°C) | 30.6 | 29.9 2% | 27 12% | 27 12% | 38.6 -26% | 33.6 -10% |
* ... kleinere Werte sind besser
Lautsprecher
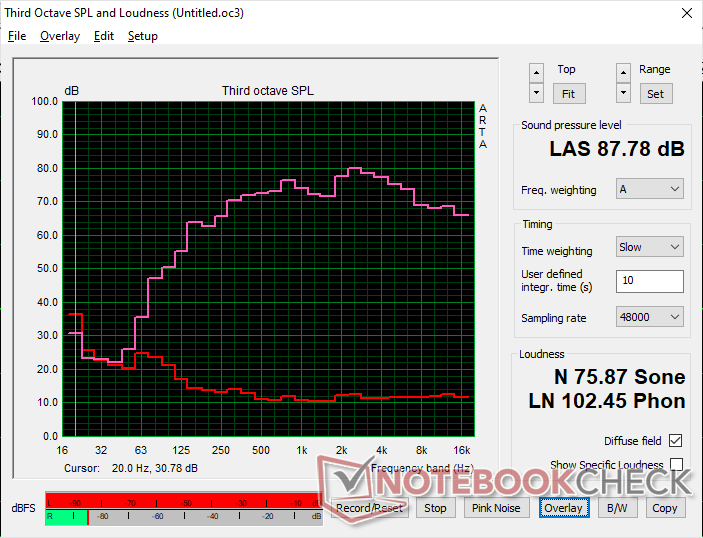
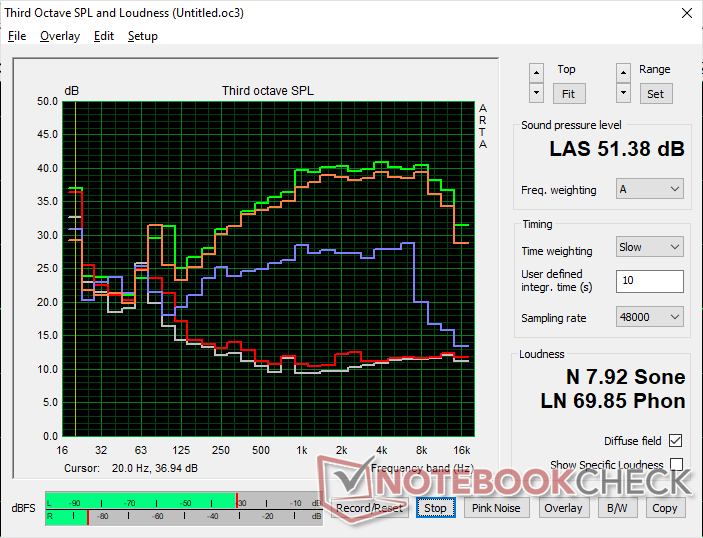
Dell Precision 5000 5490 Audio Analyse
(+) | Die Lautsprecher können relativ laut spielen (87.8 dB)
Bass 100 - 315 Hz
(±) | abgesenkter Bass - 10.9% geringer als der Median
(±) | durchschnittlich lineare Bass-Wiedergabe (7.2% Delta zum Vorgänger)
Mitteltöne 400 - 2000 Hz
(+) | ausgeglichene Mitten, vom Median nur 1.7% abweichend
(+) | lineare Mitten (3.5% Delta zum Vorgänger)
Hochtöne 2 - 16 kHz
(+) | ausgeglichene Hochtöne, vom Median nur 4.4% abweichend
(+) | sehr lineare Hochtöne (3.4% Delta zum Vorgänger)
Gesamt im hörbaren Bereich 100 - 16.000 Hz
(+) | hörbarer Bereich ist sehr linear (9.2% Abstand zum Median
Im Vergleich zu allen Geräten derselben Klasse
» 4% aller getesteten Geräte dieser Klasse waren besser, 2% vergleichbar, 94% schlechter
» Das beste Gerät hat einen Delta-Wert von 7%, durchschnittlich ist 17%, das schlechteste Gerät hat 35%
Im Vergleich zu allen Geräten im Test
» 3% aller getesteten Geräte waren besser, 1% vergleichbar, 96% schlechter
» Das beste Gerät hat einen Delta-Wert von 4%, durchschnittlich ist 24%, das schlechteste Gerät hat 134%
Apple MacBook Pro 16 2021 M1 Pro Audio Analyse
(+) | Die Lautsprecher können relativ laut spielen (84.7 dB)
Bass 100 - 315 Hz
(+) | guter Bass - nur 3.8% Abweichung vom Median
(+) | lineare Bass-Wiedergabe (5.2% Delta zum Vorgänger)
Mitteltöne 400 - 2000 Hz
(+) | ausgeglichene Mitten, vom Median nur 1.3% abweichend
(+) | lineare Mitten (2.1% Delta zum Vorgänger)
Hochtöne 2 - 16 kHz
(+) | ausgeglichene Hochtöne, vom Median nur 1.9% abweichend
(+) | sehr lineare Hochtöne (2.7% Delta zum Vorgänger)
Gesamt im hörbaren Bereich 100 - 16.000 Hz
(+) | hörbarer Bereich ist sehr linear (4.6% Abstand zum Median
Im Vergleich zu allen Geräten derselben Klasse
» 0% aller getesteten Geräte dieser Klasse waren besser, 0% vergleichbar, 100% schlechter
» Das beste Gerät hat einen Delta-Wert von 5%, durchschnittlich ist 17%, das schlechteste Gerät hat 45%
Im Vergleich zu allen Geräten im Test
» 0% aller getesteten Geräte waren besser, 0% vergleichbar, 100% schlechter
» Das beste Gerät hat einen Delta-Wert von 4%, durchschnittlich ist 24%, das schlechteste Gerät hat 134%
Energieverwaltung
Energieaufnahme
Die Ausführung von Witcher 3 erfordert durchschnittlich 88 W, was trotz der CPU-Unterschiede nahe an den Werten des Precision 5480 liegt. Im Vergleich zu anderen 14-Zoll-Workstations ist das Precision 5490 eines der anspruchsvollsten, was mit seiner relativ schnellen Leistung übereinstimmt.
Ein kleineres 100-W-USB-Netzteil wird mit Konfigurationen ausgeliefert, die keine diskrete Grafik verwenden. Ansonsten ist ein 130-W-USB-C-Adapter im Lieferumfang enthalten.
(Anmerkung der Redaktion: Dieser Abschnitt wird aktualisiert, wenn die Reparaturen an unserem Metrahit Energy-Multimeter im Laufe dieses Monats abgeschlossen sind. Wir entschuldigen uns für die Unannehmlichkeiten).
| Aus / Standby | |
| Idle | |
| Last |
|
Legende:
min: | |
| Dell Precision 5000 5490 Ultra 9 185H, RTX 3000 Ada Generation Laptop, Kioxia XG8 KXG80ZNV1T02, IPS, 2560x1600, 14" | Lenovo ThinkPad P14s G4 21HF0017GE i7-1370P, RTX A500 Laptop GPU, SK Hynix HFS002TEJ9X162N, OLED, 2880x1800, 14" | HP ZBook Firefly 14 G10 A R5 PRO 7640HS, Radeon 760M, Samsung PM9B1 512GB MZVL4512HBLU, IPS, 1920x1200, 14" | HP ZBook Firefly 14 G9-6B8A2EA i7-1265U, T550 Laptop GPU, Micron 3400 1TB MTFDKBA1T0TFH, IPS, 1920x1200, 14" | Dell Precision 5480 i9-13900H, RTX 3000 Ada Generation Laptop, Samsung PM9A1 MZVL21T0HCLR, IPS, 2560x1600, 14" | Dell Precision 5000 5470 i9-12900H, RTX A1000 Laptop GPU, Samsung PM9A1 MZVL21T0HCLR, IPS, 2560x1600, 14" | |
|---|---|---|---|---|---|---|
| Stromverbrauch | 32% | 51% | 52% | -24% | 11% | |
| Idle min * (Watt) | 11.1 | 6.3 43% | 3 73% | 4.2 62% | 14.9 -34% | 4.3 61% |
| Idle avg * (Watt) | 14.8 | 7 53% | 4 73% | 6.5 56% | 19.5 -32% | 8.9 40% |
| Idle max * (Watt) | 16.5 | 8.1 51% | 8 52% | 7.2 56% | 27.2 -65% | 18.9 -15% |
| Last avg * (Watt) | 70.1 | 84.6 -21% | 56 20% | 47.7 32% | 81.6 -16% | 94 -34% |
| Witcher 3 ultra * (Watt) | 93.1 | 56.5 39% | 58.2 37% | 42.9 54% | 90.4 3% | 83.2 11% |
| Last max * (Watt) | 137.5 | 98.3 29% | 66 52% | 68.2 50% | 137.8 -0% | 137.5 -0% |
* ... kleinere Werte sind besser
Power Consumption Witcher 3 / Stresstest
Energieverbrauch externer Monitor
Akkulaufzeit
Die Akkulaufzeit ist nahezu identisch mit der des Precision 5480, da die beiden Modelle ähnliche Komponenten und Leistungsstufen aufweisen.
| Dell Precision 5000 5490 Ultra 9 185H, RTX 3000 Ada Generation Laptop, 72 Wh | Lenovo ThinkPad P14s G4 21HF0017GE i7-1370P, RTX A500 Laptop GPU, 52.5 Wh | HP ZBook Firefly 14 G10 A R5 PRO 7640HS, Radeon 760M, 51 Wh | HP ZBook Firefly 14 G9-6B8A2EA i7-1265U, T550 Laptop GPU, 51 Wh | Dell Precision 5480 i9-13900H, RTX 3000 Ada Generation Laptop, 72 Wh | Dell Precision 5000 5470 i9-12900H, RTX A1000 Laptop GPU, 72 Wh | |
|---|---|---|---|---|---|---|
| Akkulaufzeit | -45% | 18% | -20% | -1% | -13% | |
| WLAN (h) | 11 | 6.1 -45% | 13 18% | 8.8 -20% | 10.9 -1% | 9.6 -13% |
| Last (h) | 1 | 0.9 | 1.1 | |||
| Idle (h) | 14.7 |
Pro
Contra
Fazit — Fast nicht von der Precision 5480 unterscheidbar
Die Precision 5480 bietet dank eines GPU-Boosts im Vergleich zur Precision 5470 eine spürbare Steigerung der Grafikleistung, obwohl beide Gehäuse identisch sind. Beim Precision 5490 gibt es jedoch keine neuen GPU-Optionen, sodass die RTX 3000 Ada die Top-End-Konfiguration bleibt. In Bezug auf die GPU-Leistung läuft das Precision 5490 also ähnlich wie das Precision 5480.
Die CPU-Leistung und die Grafikleistung stagnieren zwischen dem Precision 5490 und dem Precision 5480. Das neueste Modell konzentriert sich stattdessen auf die KI-Beschleunigung, die zum Zeitpunkt der Veröffentlichung noch in den Kinderschuhen steckt.
Abgesehen von der GPU bietet der Wechsel von Raptor Lake-H zu Meteor Lake-H keine wesentlichen Leistungsvorteile. Die integrierte NPU, das Hauptverkaufsargument des Precision 5490, hat zum Zeitpunkt des Schreibens nur wenige Anwendungen. Wer also heute das Precision 5490 kauft, investiert in lokale KI-Beschleunigung und zukünftige Windows-KI-Funktionen.
Für zukünftige Modelle würden zusätzliche Display-Optionen begrüßt, insbesondere für Anwendungen, die P3-Farben und schnellere Schwarz-Weiß-Reaktionszeiten erfordern. Alternativen wie das ThinkPad P14s bieten OLED-Displays, während unser Precision nur mit IPS-Displays ausgestattet ist.
Preis und Verfügbarkeit
Dell bietet das Precision 5490 ab sofort zu Preisen ab 3640 Euro für die Basiskonfiguration mit Core Ultra 5, RTX 1000 Ada und einem 1200p-Display an. Die Preise können je nach gewählter Ausstattung variieren für die High-End-Konfiguration mit Core Ultra 9, RTX 3000 Ada und einem 1600p-Display.
Dell Precision 5000 5490
- 25.04.2024 v7 (old)
Allen Ngo
Transparenz
Die Auswahl der zu testenden Geräte erfolgt innerhalb der Redaktion. Das vorliegende Testmuster wurde dem Autor vom Hersteller oder einem Shop zu Testzwecken leihweise zur Verfügung gestellt. Eine Einflussnahme des Leihstellers auf den Testbericht gab es nicht, der Hersteller erhielt keine Version des Reviews vor der Veröffentlichung. Es bestand keine Verpflichtung zur Publikation. Als eigenständiges, unabhängiges Unternehmen unterliegt Notebookcheck keiner Diktion von Herstellern, Shops und Verlagen.
So testet Notebookcheck
Pro Jahr werden von Notebookcheck hunderte Laptops und Smartphones unabhängig in von uns standardisierten technischen Verfahren getestet, um eine Vergleichbarkeit aller Testergebnisse zu gewährleisten. Seit rund 20 Jahren entwickeln wir diese Testmethoden kontinuierlich weiter und setzen damit Branchenstandards. In unseren Testlaboren kommt ausschließlich hochwertiges Messequipment in die Hände erfahrener Techniker und Redakteure. Die Tests unterliegen einer mehrstufigen Kontrolle. Unsere komplexe Gesamtbewertung basiert auf hunderten fundierten Messergebnissen und Benchmarks, womit Ihnen Objektivität garantiert ist. Weitere Informationen zu unseren Testmethoden gibt es hier.
Preisvergleich

