Alienware m18 R2 Laptop im Test: Der Wechsel vom Core i9-13980HX zum i9-14900HX

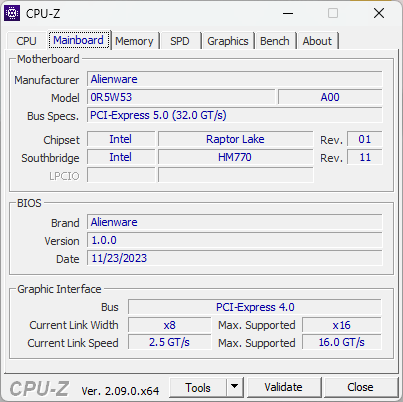
Dell hat seine Alienware m18-Serie dieses Jahr mit dem neuen m18 R2 aktualisiert. Im Gegensatz zum Sprung vom m16 R1 zum m16 R2 verwendet das m18 R2 jedoch das gleiche Gehäusedesign wie sein Vorgänger, jedoch mit neuen Raptor Lake-HX Core i9-14000HX CPUs, die die älteren Core i9-13000HX Optionen ersetzen. Nahezu alles andere bleibt unverändert, weshalb wir empfehlen, einen Blick auf unsere bestehenden Testberichte zu den m18 R1- und m18 R1 AMD-Konfigurationen zu werfen, um mehr über die physischen Eigenschaften des m18 R2 zu erfahren.
Unser Testgerät ist die High-End-Konfiguration mit Core i9-14900HX CPU, 175 W GeForce RTX 4090 GPU, 1600p 165 Hz IPS-Display und mechanischer CherryMX Ultra Low-Profile-Tastatur für ca. 3.949 Euro. Andere SKUs können den Core i7-14650HX, RTX 4060, einen 1200p 480 Hz Bildschirm und eine Standard-Membrantastatur beinhalten, die ab 2.199 Euro beginnen.
Weitere Alienware Bewertungen:
Mögliche Konkurrenten im Vergleich
Bew. | Datum | Modell | Gewicht | Dicke | Größe | Auflösung | Preis ab |
|---|---|---|---|---|---|---|---|
| 89.5 % v7 (old) | 03 / 2024 | Alienware m18 R2 i9-14900HX, GeForce RTX 4090 Laptop GPU | 4 kg | 26.7 mm | 18.00" | 2560x1600 | |
| 89.2 % v7 (old) | 11 / 2023 | Alienware m18 R1 AMD R9 7945HX, Radeon RX 7900M | 3.9 kg | 26.7 mm | 18.00" | 1920x1200 | |
| 90.7 % v7 (old) | 04 / 2023 | Alienware m18 R1 i9-13980HX, GeForce RTX 4090 Laptop GPU | 3.9 kg | 26.7 mm | 18.00" | 1920x1200 | |
| 88.8 % v7 (old) | 01 / 2024 | MSI Titan 18 HX A14VIG i9-14900HX, GeForce RTX 4090 Laptop GPU | 3.6 kg | 32.1 mm | 18.00" | 3840x2400 | |
| 87.4 % v7 (old) | 03 / 2023 | Asus ROG Strix G18 G814JI i7-13650HX, GeForce RTX 4070 Laptop GPU | 3 kg | 31 mm | 18.00" | 2560x1600 | |
| 88.3 % v7 (old) | 10 / 2023 | Acer Predator Helios 18 N23Q2 i9-13900HX, GeForce RTX 4080 Laptop GPU | 3.2 kg | 29.15 mm | 18.00" | 2560x1600 |
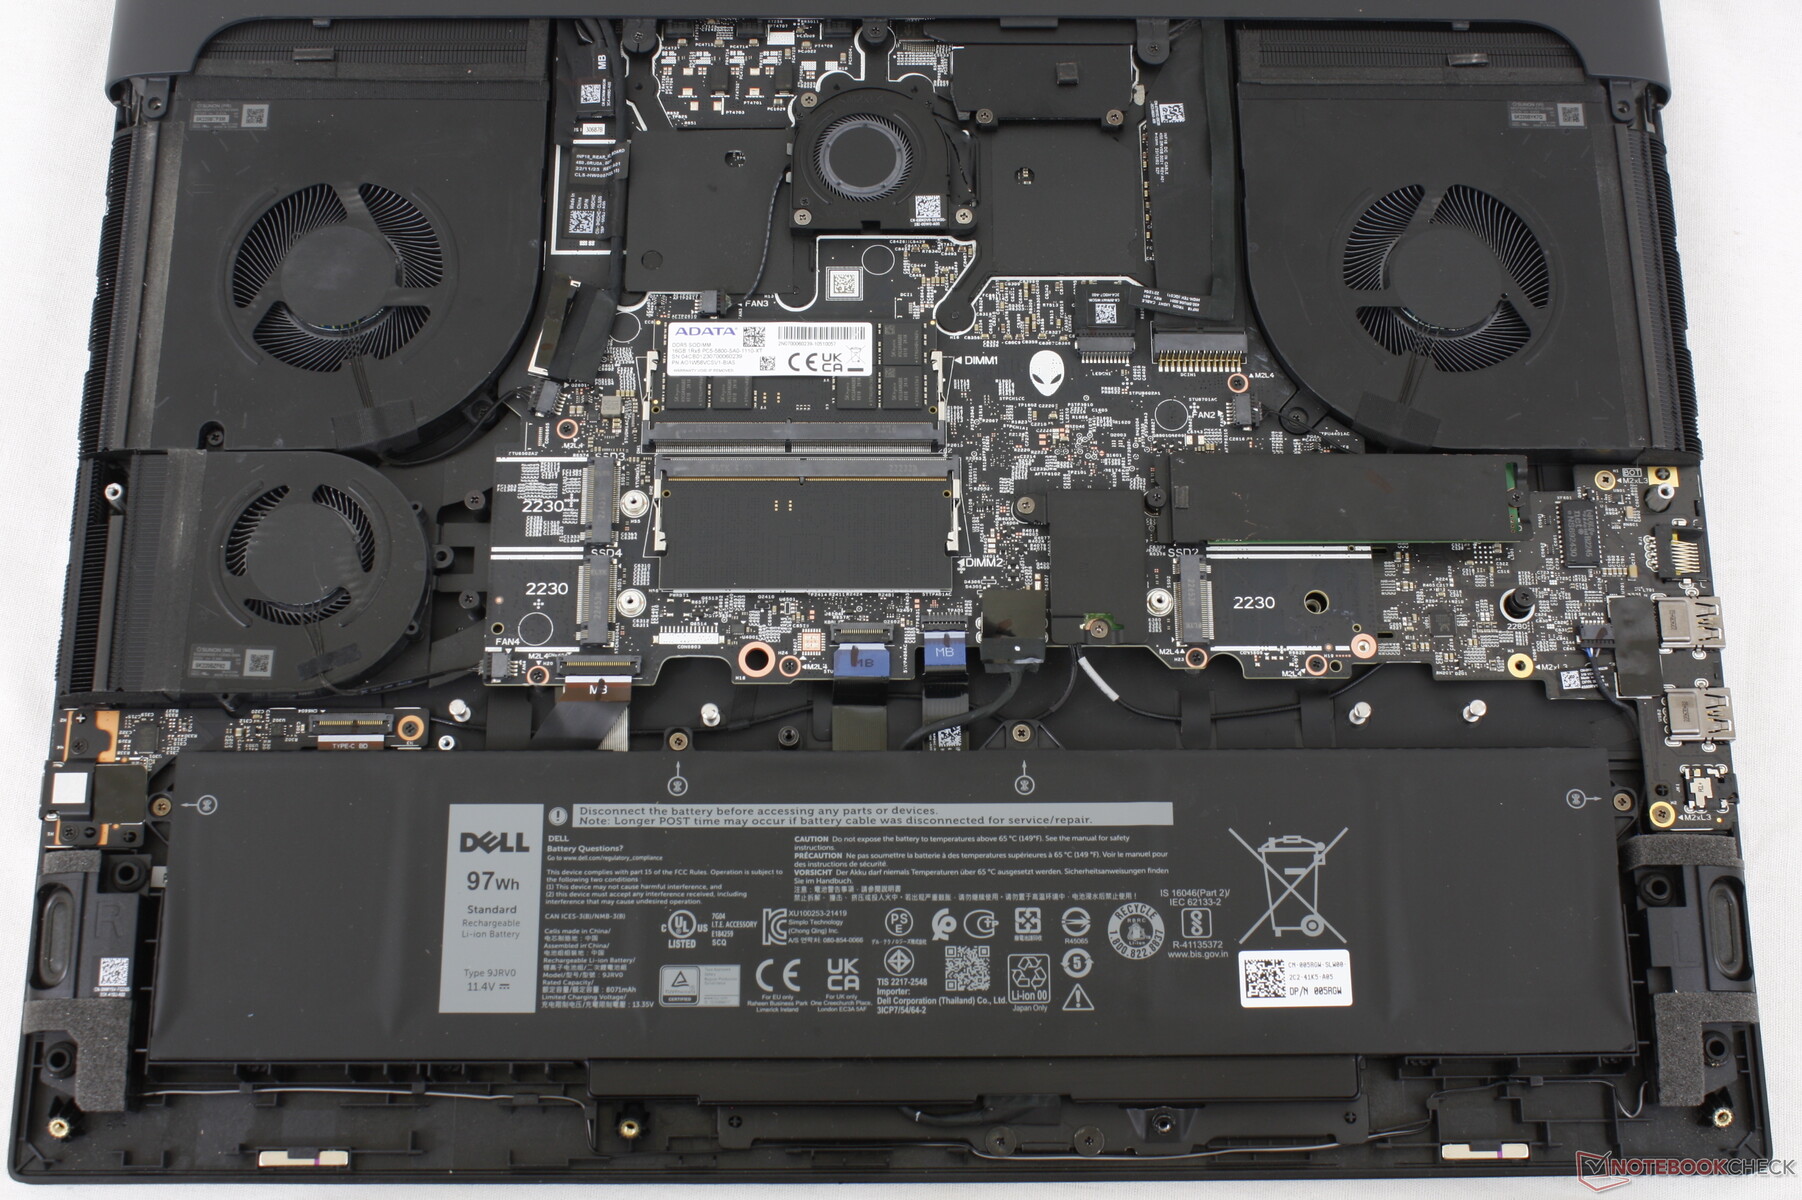
Gehäuse - Immer noch groß mit rückseitigem Wärmedeck
Der RJ-45-Anschluss wurde dieses Jahr von der Killer E3000 auf die Killer E5000 aufgerüstet, um den doppelten Durchsatz zu erreichen (2,5 Gbit/s im Vergleich zu 5 Gbit/s). Ansonsten ist das äußere Design gleich geblieben.

SD Card Reader
| SD Card Reader | |
| average JPG Copy Test (av. of 3 runs) | |
| Alienware m18 R1 (Angelibird AV Pro V60) | |
| Alienware m18 R2 (Toshiba Exceria Pro SDXC 64 GB UHS-II) | |
| Alienware m18 R1 AMD (Toshiba Exceria Pro SDXC 64 GB UHS-II) | |
| MSI Titan 18 HX A14VIG (Toshiba Exceria Pro SDXC 64 GB UHS-II) | |
| Acer Predator Helios 18 N23Q2 | |
| maximum AS SSD Seq Read Test (1GB) | |
| Alienware m18 R1 AMD (Toshiba Exceria Pro SDXC 64 GB UHS-II) | |
| Alienware m18 R2 (Toshiba Exceria Pro SDXC 64 GB UHS-II) | |
| Alienware m18 R1 (Angelibird AV Pro V60) | |
| MSI Titan 18 HX A14VIG (Toshiba Exceria Pro SDXC 64 GB UHS-II) | |
| Acer Predator Helios 18 N23Q2 | |
Kommunikation
| Networking | |
| iperf3 transmit AXE11000 | |
| Asus ROG Strix G18 G814JI | |
| Alienware m18 R1 AMD | |
| Alienware m18 R1 | |
| MSI Titan 18 HX A14VIG | |
| Acer Predator Helios 18 N23Q2 | |
| Alienware m18 R2 | |
| iperf3 receive AXE11000 | |
| Asus ROG Strix G18 G814JI | |
| Alienware m18 R1 AMD | |
| Alienware m18 R2 | |
| Alienware m18 R1 | |
| MSI Titan 18 HX A14VIG | |
| Acer Predator Helios 18 N23Q2 | |
| iperf3 transmit AXE11000 6GHz | |
| Alienware m18 R1 AMD | |
| Acer Predator Helios 18 N23Q2 | |
| Alienware m18 R1 | |
| MSI Titan 18 HX A14VIG | |
| Alienware m18 R2 | |
| iperf3 receive AXE11000 6GHz | |
| Alienware m18 R1 AMD | |
| Acer Predator Helios 18 N23Q2 | |
| MSI Titan 18 HX A14VIG | |
| Alienware m18 R1 | |
| Alienware m18 R2 | |
Webcam


Wartung

Display — 1200p oder 1600p?
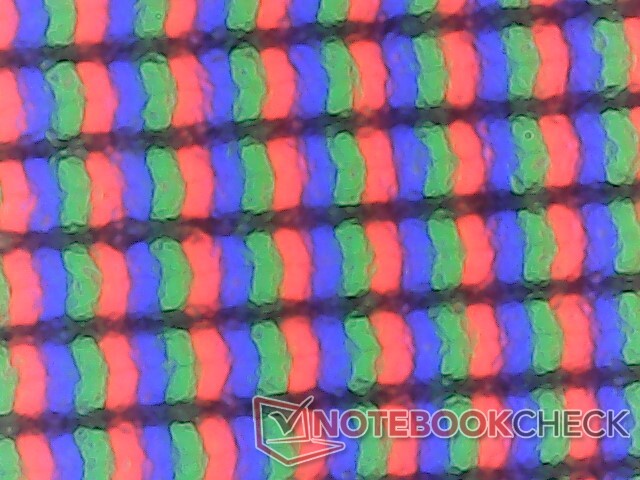
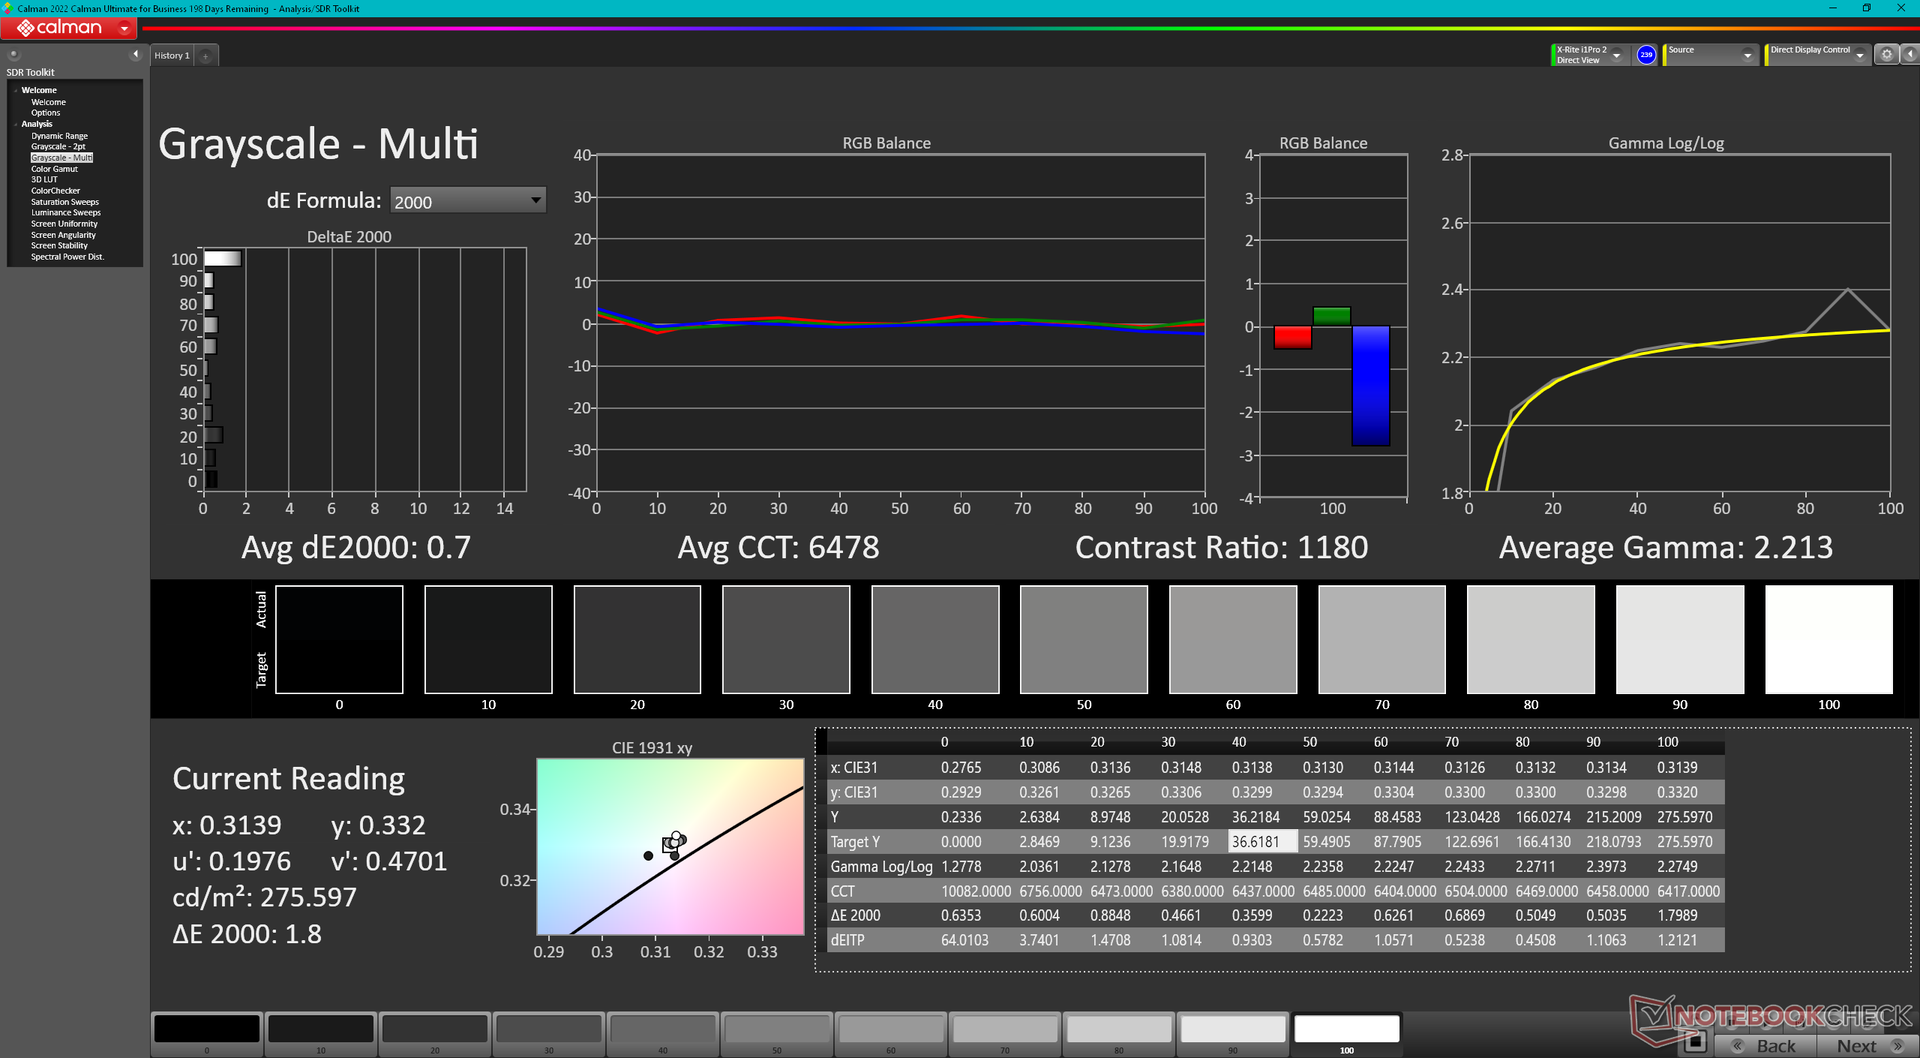
Interessanterweise trägt das Panel unserer m18 R2-Konfiguration denselben Namen wie das Panel unserer m18 R1-Konfiguration, obwohl sie unterschiedliche native Auflösungen (1600p vs. 1200p) und Bildwiederholraten (165 Hz vs. 480 Hz) aufweisen. Dennoch bieten beide Panels ähnliche P3-Farben, schnelle Reaktionszeiten und ein ordentliches Kontrastverhältnis von etwa 1000:1.
Nachdem wir beide Panels betrachtet haben, empfehlen wir die 1600p-Option, da 1200p auf einem 18-Zoll-Bildschirm nicht sehr scharf ist, während die Bildwiederholfrequenz von 480 Hz nur geringfügige Vorteile gegenüber 165 Hz für die meisten Anwendungsfälle bietet.
Die dynamische Auflösung von Windows wird nicht unterstützt, sodass die Bildwiederholfrequenz im Betriebssystem entweder auf 165 Hz oder 60 Hz festgelegt ist. G-Sync wird jedoch weiterhin unterstützt, wenn Spiele im dGPU-Modus ausgeführt werden. HDR wird nicht unterstützt, da die Hintergrundbeleuchtung nicht hell genug ist, um die HDR-Anforderungen zu erfüllen. Tatsächlich ist unser 1600p-Display im Durchschnitt sogar etwas dunkler als die 1200p-Konfiguration.

| |||||||||||||||||||||||||
Ausleuchtung: 78 %
Helligkeit Akku: 271.8 cd/m²
Kontrast: 1007:1 (Schwarzwert: 0.27 cd/m²)
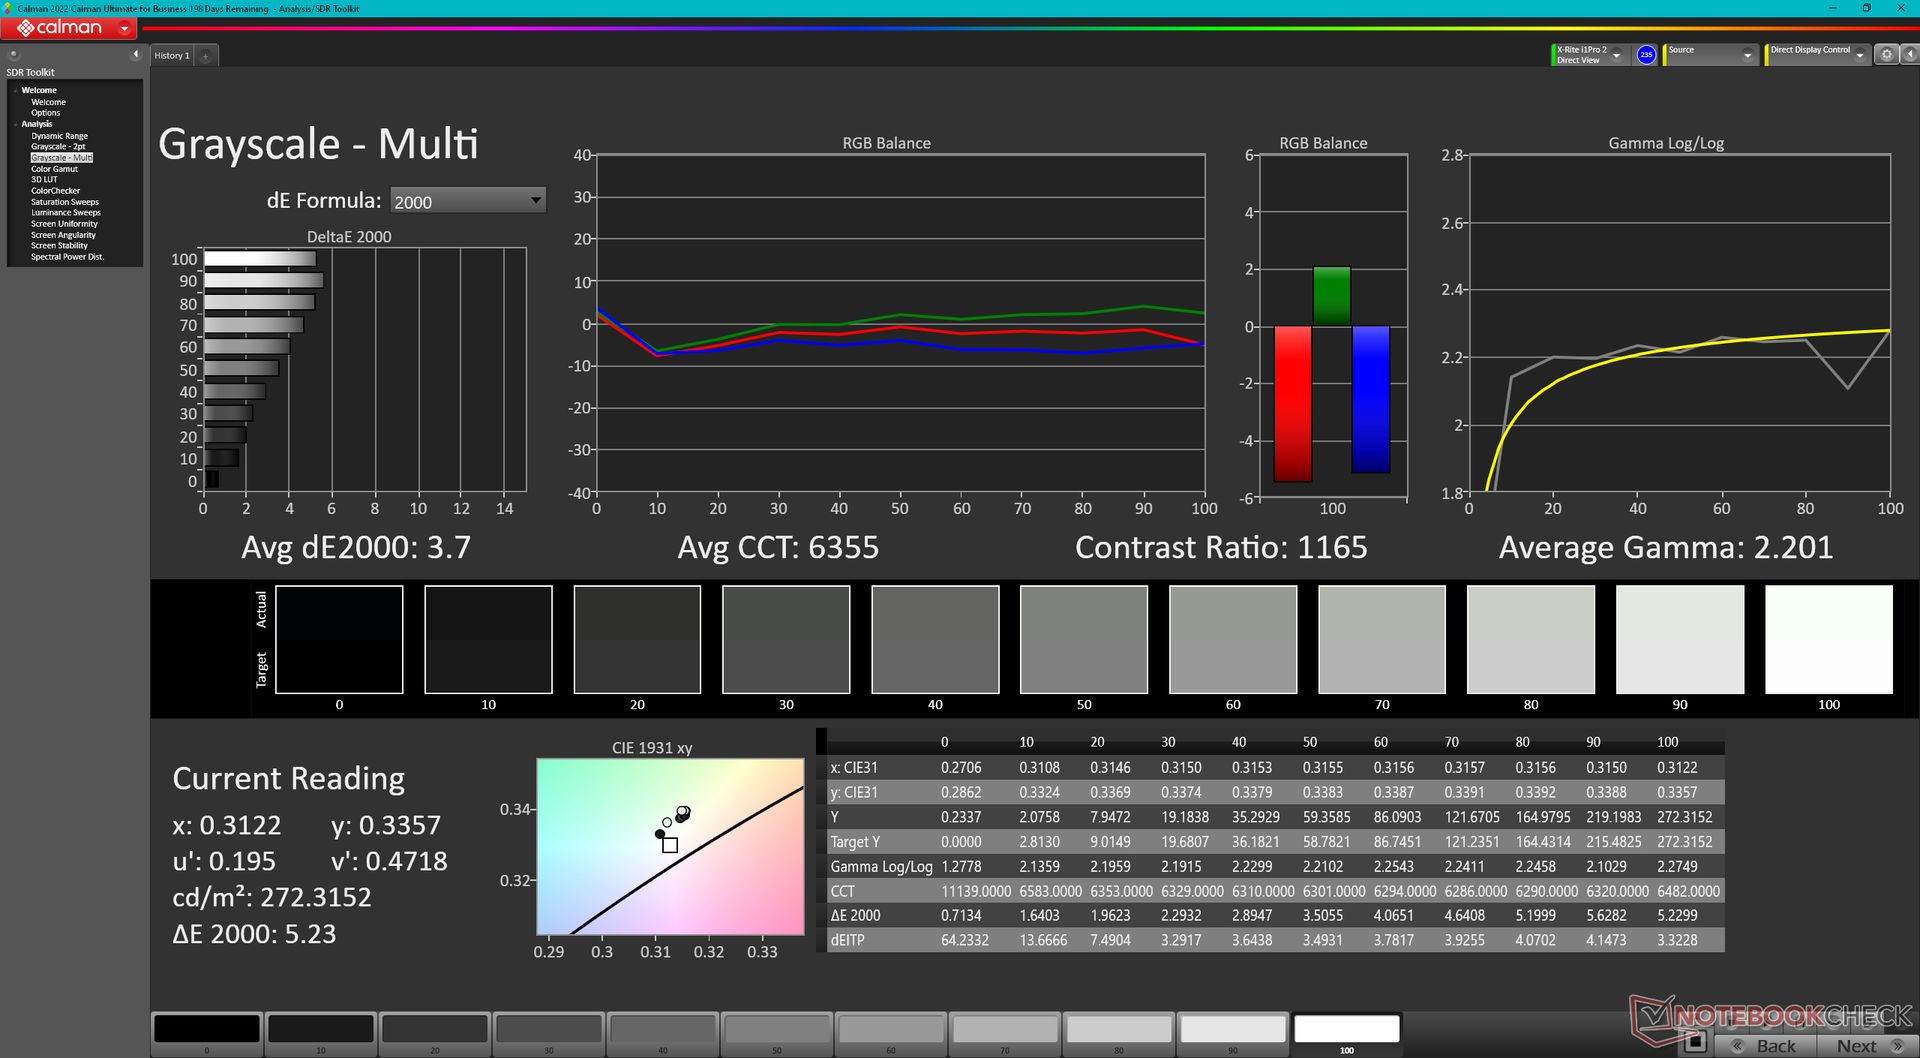
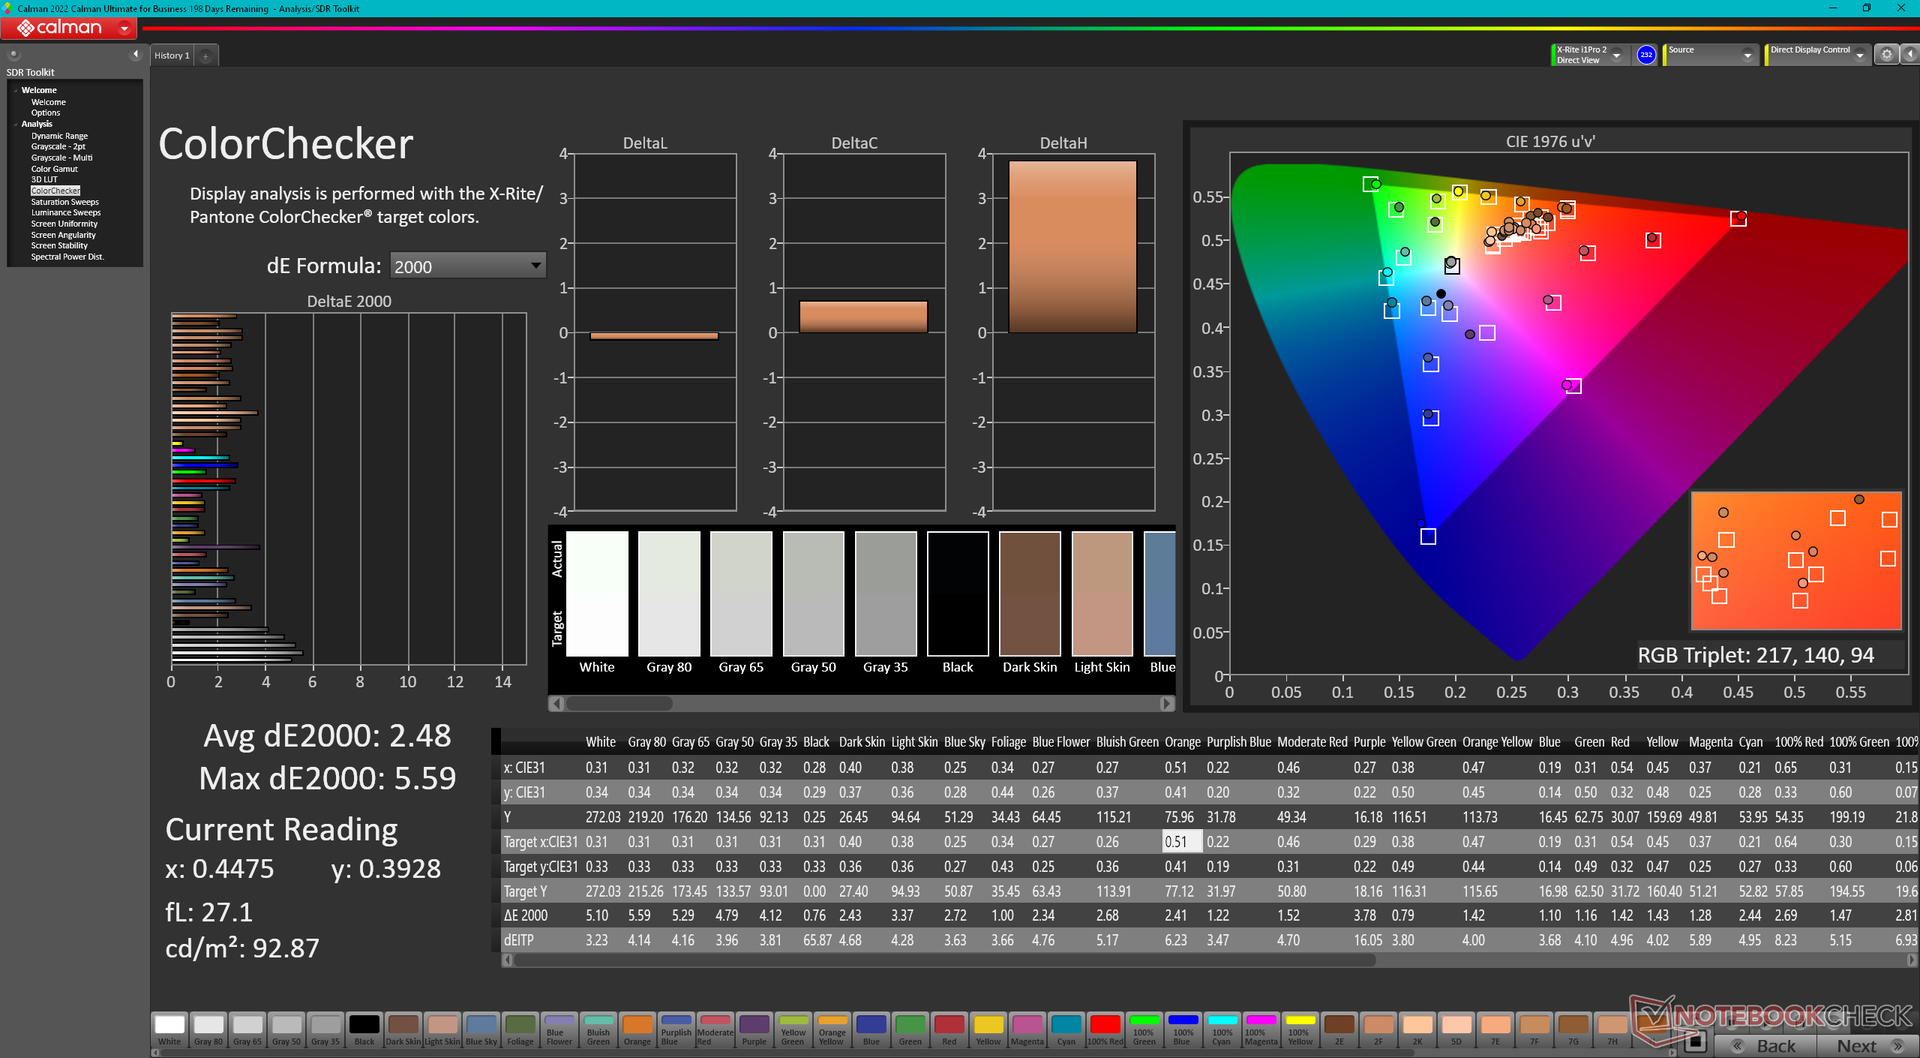
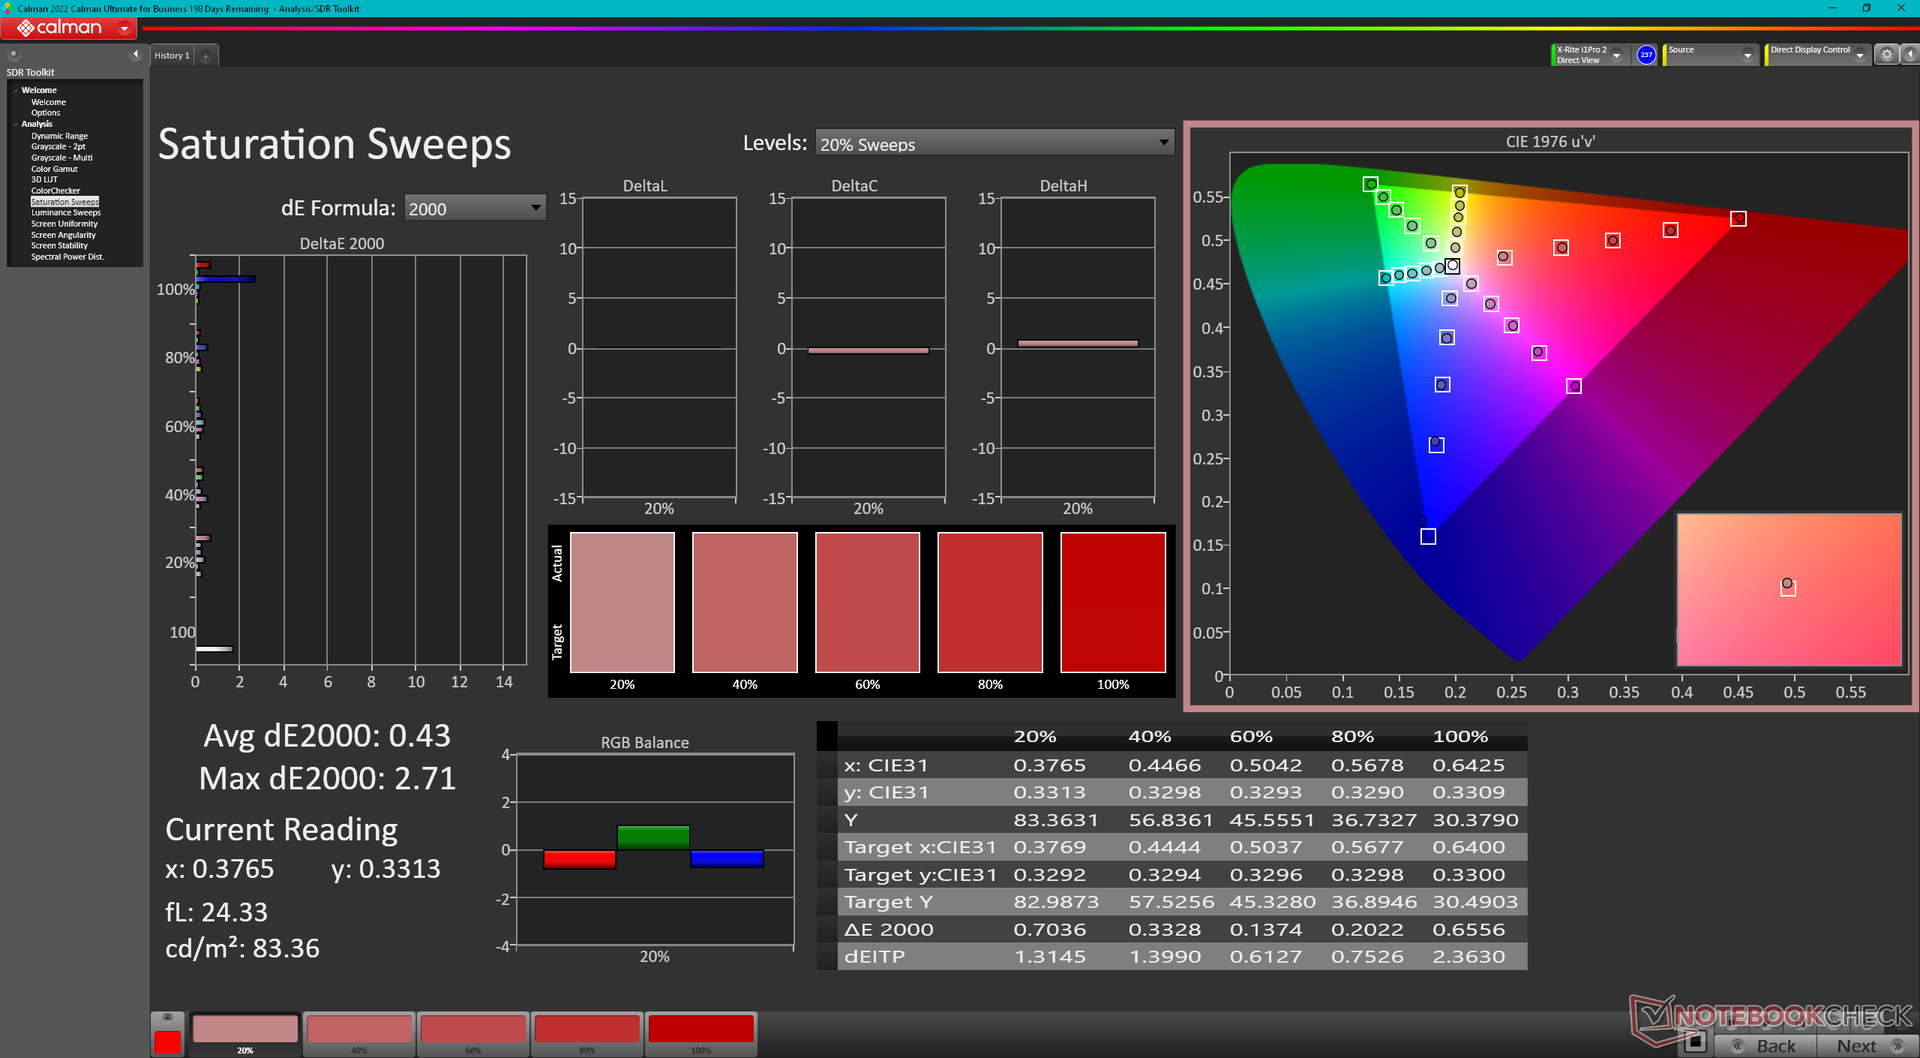
ΔE ColorChecker Calman: 2.48 | ∀{0.5-29.43 Ø4.73}
calibrated: 0.56
ΔE Greyscale Calman: 3.7 | ∀{0.09-98 Ø4.97}
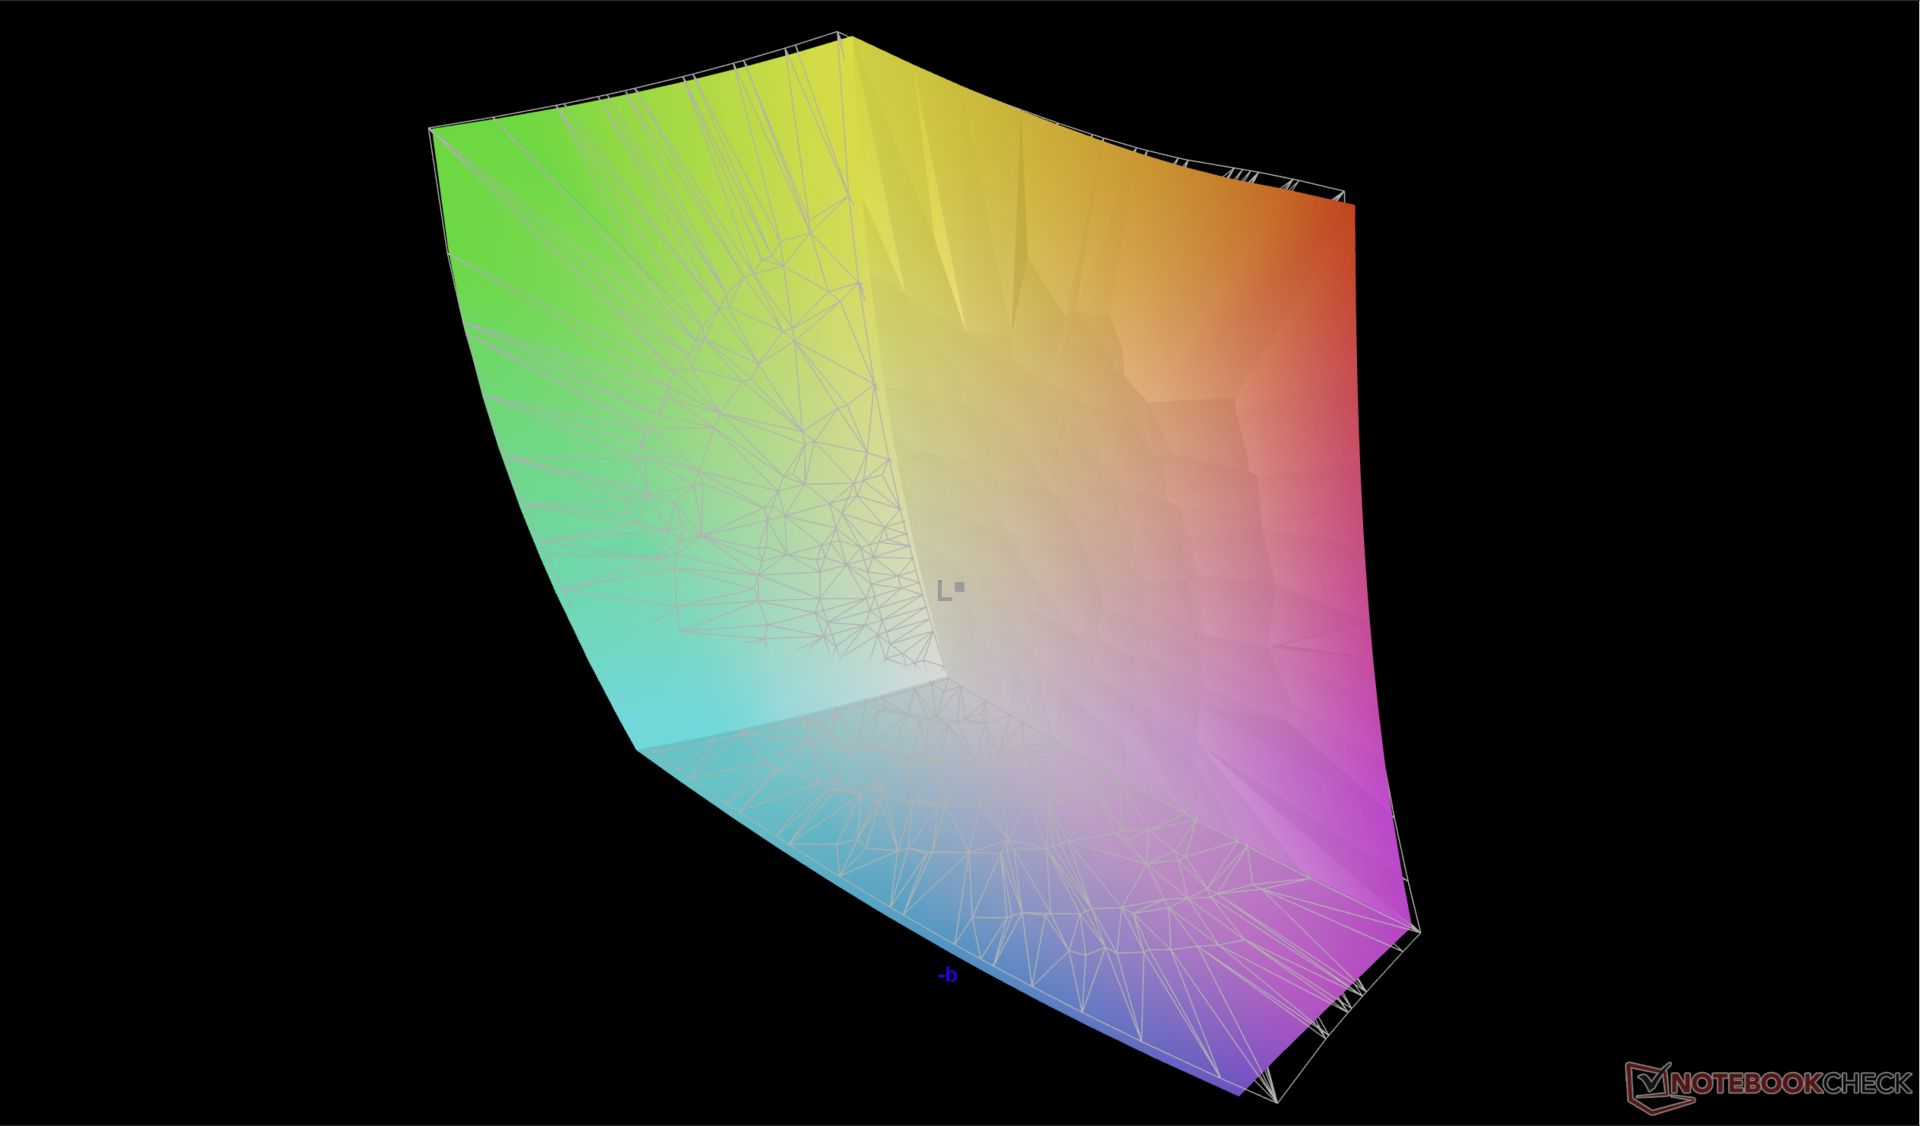
88.9% AdobeRGB 1998 (Argyll 3D)
99.5% sRGB (Argyll 3D)
97.8% Display P3 (Argyll 3D)
Gamma: 2.2
CCT: 6355 K
| Alienware m18 R2 BOE NE18NZ1, IPS, 2560x1600, 18" | Alienware m18 R1 AMD BOE NE18NZ1, IPS, 1920x1200, 18" | Alienware m18 R1 Chi Mei 180JME, IPS, 1920x1200, 18" | MSI Titan 18 HX A14VIG AU Optronics B180ZAN01.0, Mini-LED, 3840x2400, 18" | Asus ROG Strix G18 G814JI NE180QDM-NZ2 (BOE0B35), IPS, 2560x1600, 18" | Acer Predator Helios 18 N23Q2 AUO45A8 (B180QAN01.2), IPS, 2560x1600, 18" | |
|---|---|---|---|---|---|---|
| Display | 0% | 1% | -1% | -1% | 2% | |
| Display P3 Coverage (%) | 97.8 | 98.5 1% | 97.7 0% | 98.1 0% | 98.1 0% | 99.8 2% |
| sRGB Coverage (%) | 99.5 | 99.7 0% | 100 1% | 99.8 0% | 99.9 0% | 100 1% |
| AdobeRGB 1998 Coverage (%) | 88.9 | 88.7 0% | 89.8 1% | 86.2 -3% | 85.6 -4% | 91.8 3% |
| Response Times | 28% | 24% | -375% | 4% | -57% | |
| Response Time Grey 50% / Grey 80% * (ms) | 5.3 ? | 2.8 ? 47% | 3 ? 43% | 8.6 ? -62% | 5.6 ? -6% | 7.6 ? -43% |
| Response Time Black / White * (ms) | 10.4 ? | 9.6 ? 8% | 9.9 ? 5% | 81.8 ? -687% | 9 ? 13% | 17.8 ? -71% |
| PWM Frequency (Hz) | 2592 ? | 2509 | ||||
| Bildschirm | 29% | 24% | -45% | 9% | -28% | |
| Helligkeit Bildmitte (cd/m²) | 271.8 | 319.6 18% | 372.8 37% | 467.5 72% | 471 73% | 360 32% |
| Brightness (cd/m²) | 275 | 304 11% | 367 33% | 459 67% | 422 53% | 355 29% |
| Brightness Distribution (%) | 78 | 87 12% | 97 24% | 90 15% | 83 6% | 92 18% |
| Schwarzwert * (cd/m²) | 0.27 | 0.25 7% | 0.32 -19% | 0.47 -74% | 0.21 22% | |
| Kontrast (:1) | 1007 | 1278 27% | 1165 16% | 1002 0% | 1714 70% | |
| Delta E Colorchecker * | 2.48 | 1.22 51% | 1.92 23% | 3.77 -52% | 2.05 17% | 3.82 -54% |
| Colorchecker dE 2000 max. * | 5.59 | 3.1 45% | 3.65 35% | 6.12 -9% | 4.15 26% | 7.38 -32% |
| Colorchecker dE 2000 calibrated * | 0.56 | 0.47 16% | 0.51 9% | 2.94 -425% | 0.8 -43% | 2.24 -300% |
| Delta E Graustufen * | 3.7 | 0.8 78% | 1.5 59% | 3.2 14% | 2.8 24% | 5.06 -37% |
| Gamma | 2.2 100% | 2.23 99% | 2.34 94% | 2.43 91% | 2.204 100% | 2.52 87% |
| CCT | 6355 102% | 6471 100% | 6607 98% | 6478 100% | 7122 91% | 5657 115% |
| Durchschnitt gesamt (Programm / Settings) | 19% /
23% | 16% /
19% | -140% /
-89% | 4% /
6% | -28% /
-26% |
* ... kleinere Werte sind besser
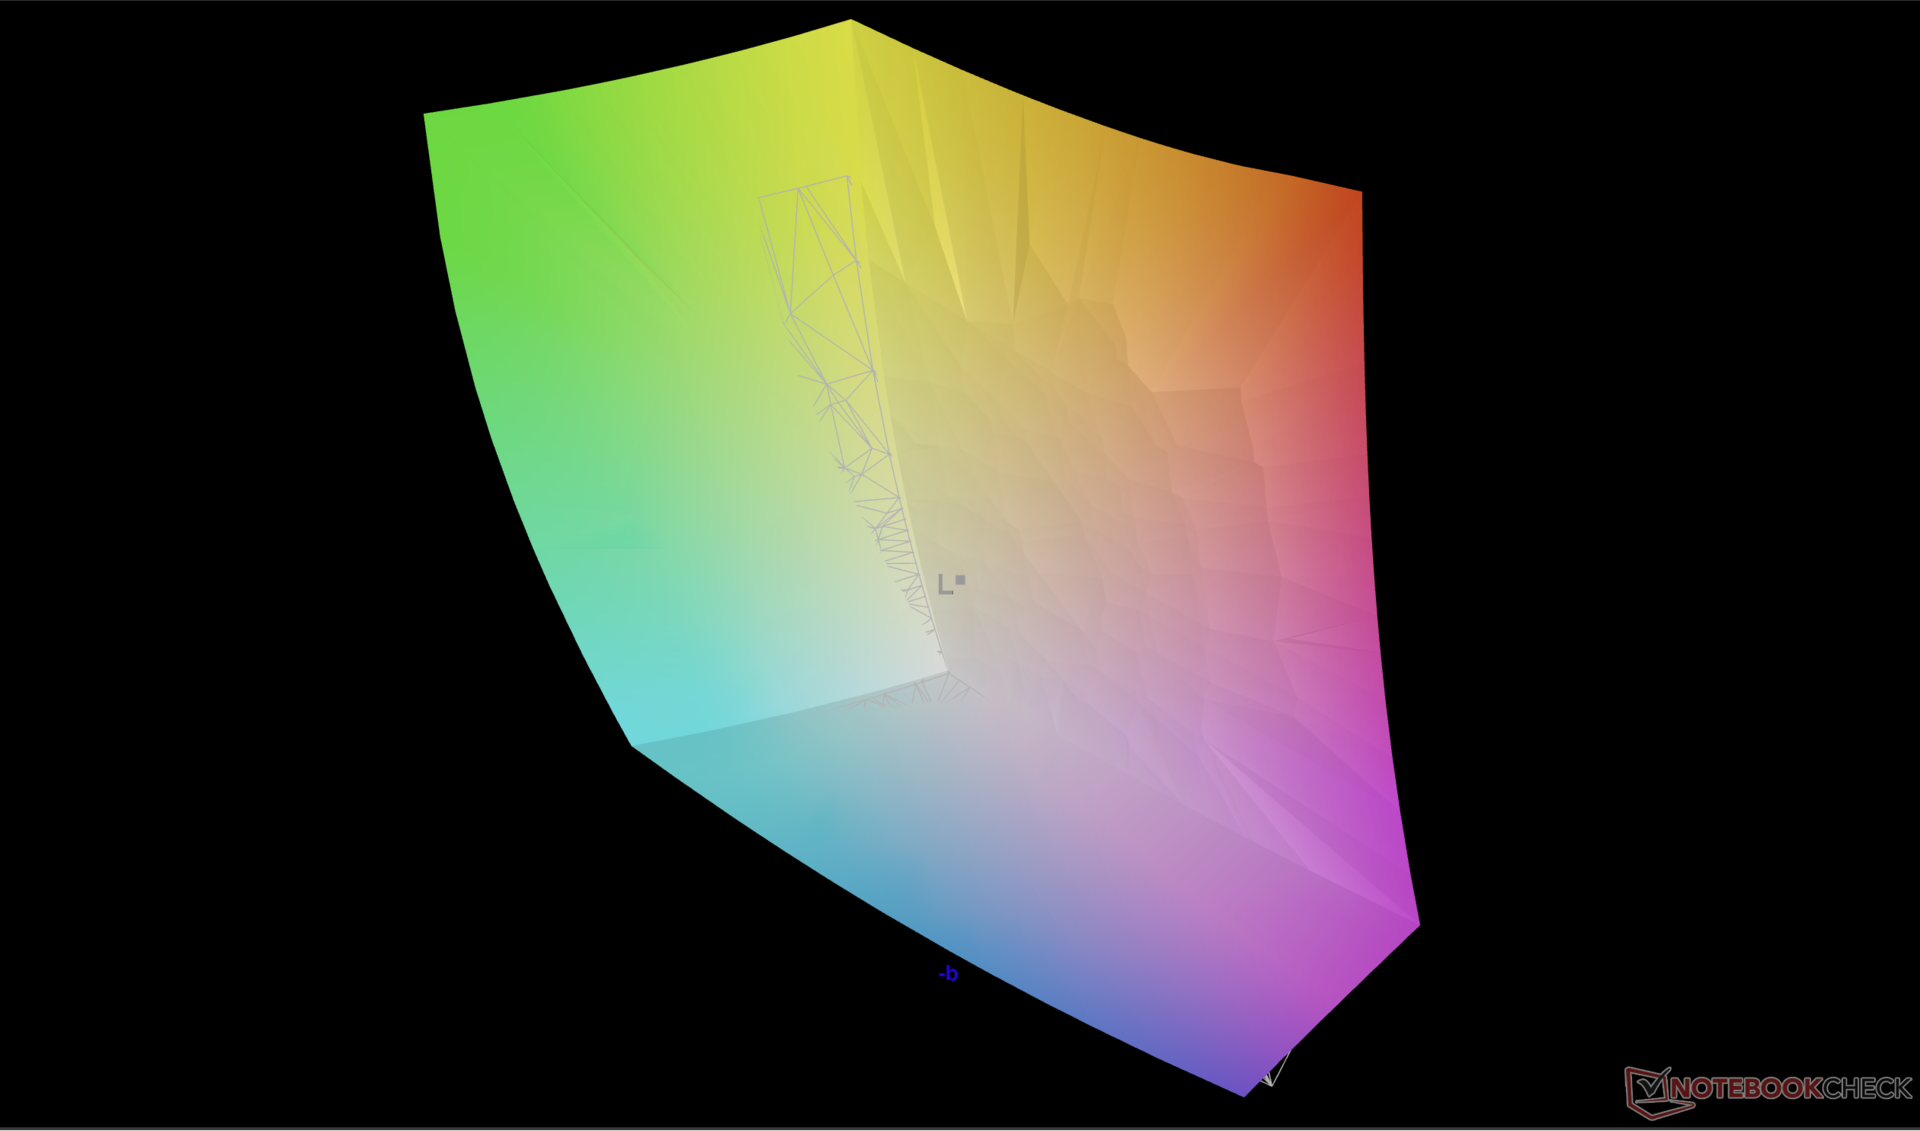
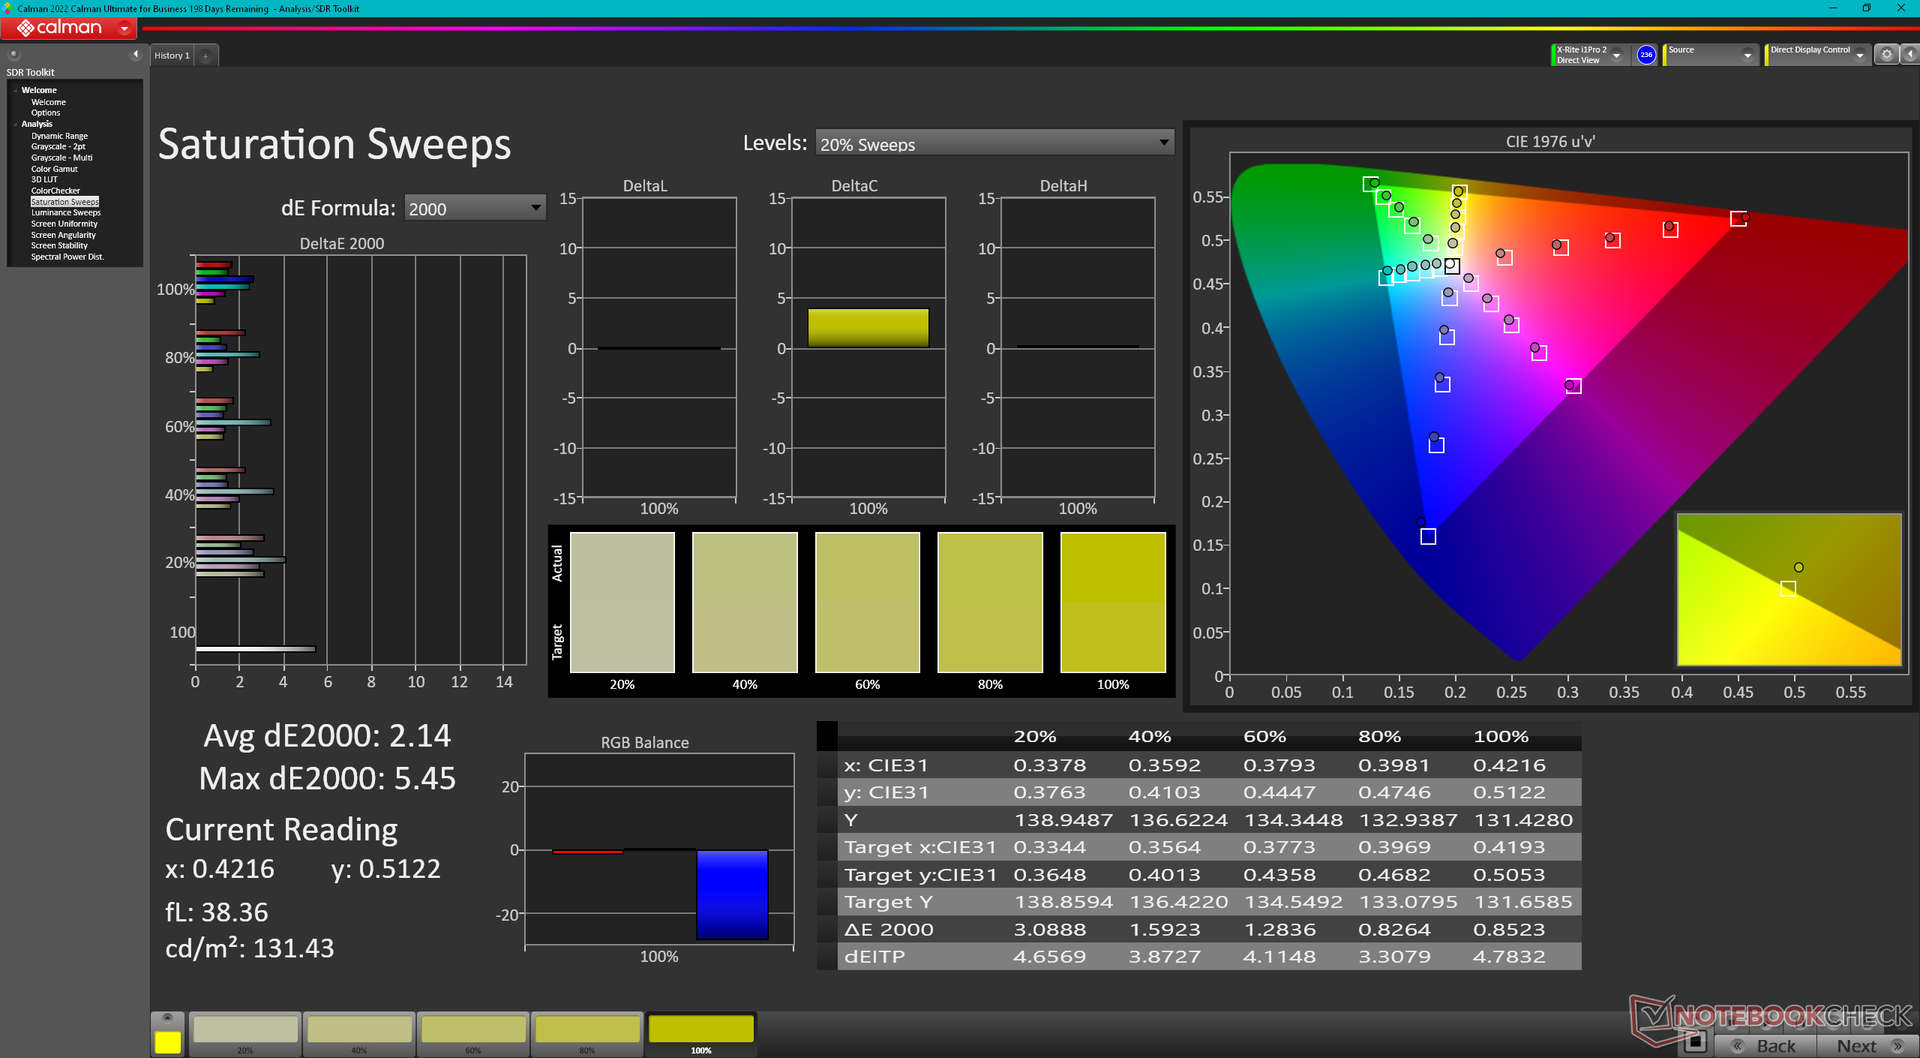
Die Graustufen und Farben sind ziemlich genau, obwohl das Display nicht werkseitig kalibriert ist. Durch eine Kalibrierung des Panels könnten die durchschnittlichen DeltaE-Werte auf unter 1 verbessert werden, um die volle Bandbreite der P3-Farben besser auszunutzen. Unser kalibriertes ICM-Profil steht oben zum kostenlosen Download bereit.

Reaktionszeiten (Response Times) des Displays
| ↔ Reaktionszeiten Schwarz zu Weiß | ||
|---|---|---|
| 10.4 ms ... steigend ↗ und fallend ↘ kombiniert | ↗ 4.8 ms steigend |  |
| ↘ 5.6 ms fallend | ||
| Die gemessenen Reaktionszeiten sind gut, für anspruchsvolle Spieler könnten der Bildschirm jedoch zu langsam sein. Im Vergleich rangierten die bei uns getesteten Geräte von 0.1 (Minimum) zu 240 (Maximum) ms. » 28 % aller Screens waren schneller als der getestete. Daher sind die gemessenen Reaktionszeiten besser als der Durchschnitt aller vermessenen Geräte (19.9 ms). | ||
| ↔ Reaktionszeiten 50% Grau zu 80% Grau | ||
| 5.3 ms ... steigend ↗ und fallend ↘ kombiniert | ↗ 2.2 ms steigend | 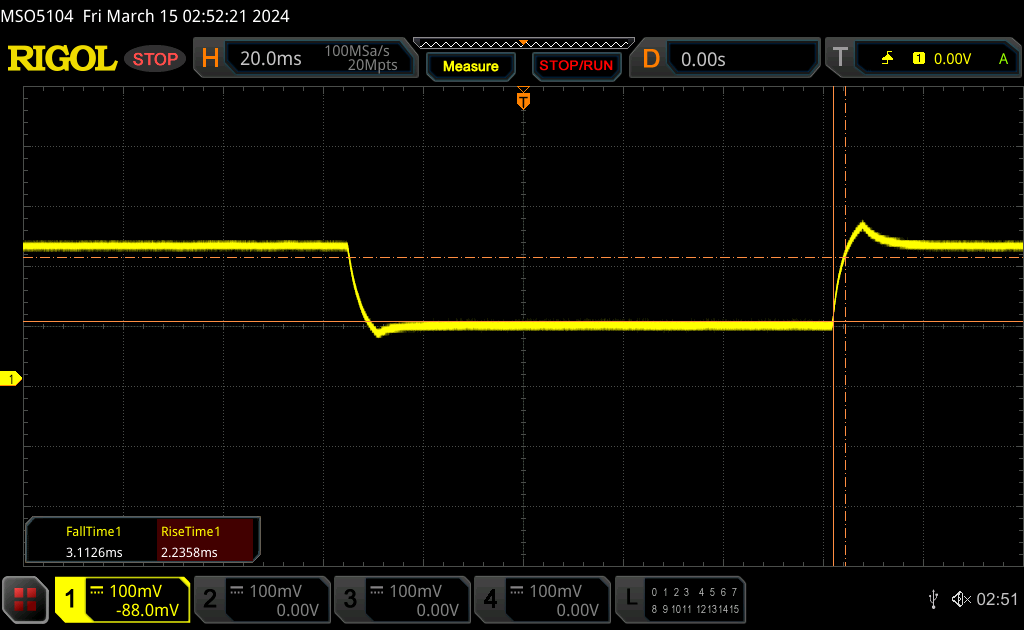 |
| ↘ 3.1 ms fallend | ||
| Die gemessenen Reaktionszeiten sind sehr kurz, wodurch sich der Bildschirm auch für schnelle 3D Spiele eignen sollte. Im Vergleich rangierten die bei uns getesteten Geräte von 0.165 (Minimum) zu 636 (Maximum) ms. » 17 % aller Screens waren schneller als der getestete. Daher sind die gemessenen Reaktionszeiten besser als der Durchschnitt aller vermessenen Geräte (31.1 ms). | ||
Bildschirm-Flackern / PWM (Pulse-Width Modulation)
| Flackern / PWM nicht festgestellt | 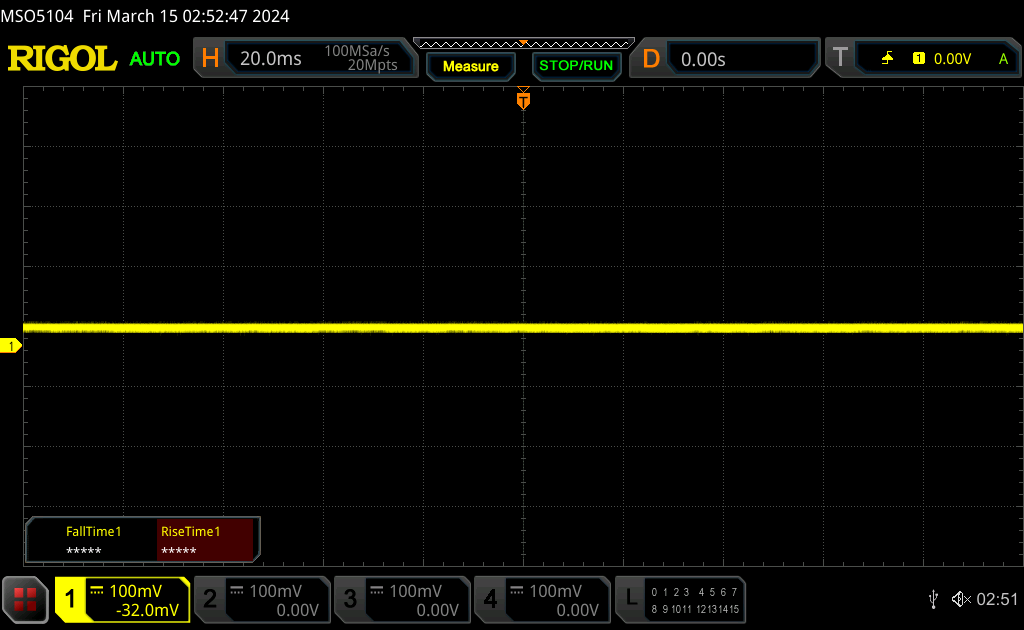 | ||
Im Vergleich: 52 % aller getesteten Geräte nutzten kein PWM um die Helligkeit zu reduzieren. Wenn PWM eingesetzt wurde, dann bei einer Frequenz von durchschnittlich 7791 (Minimum 5, Maximum 343500) Hz. | |||


Performance — Raptor Lake-HX-Refresh


Testbedingungen
Wir haben das Alienware Command Center auf den Overdrive-Modus und Windows auf den Performance-Modus eingestellt, bevor wir die folgenden Benchmarks durchgeführt haben. Außerdem haben wir das System über die Nvidia Systemsteuerung in den dGPU-Modus versetzt. Advanced Optimus und MUX werden unterstützt, was bedeutet, dass beim Wechsel zwischen iGPU und dGPU kein Neustart erforderlich ist.
Es ist erwähnenswert, dass wir bei unserem Gerät ein paar Fehler im Zusammenhang mit dem Ruhezustand festgestellt haben. Das System ging manchmal nicht korrekt in den Ruhezustand über, wenn der Deckel geschlossen wurde, und wurde dann grundlos sehr warm. Wenn dies auf Reisen auftritt, kann der Akku ohne Vorwarnung entladen werden. Außerdem friert der Bildschirm manchmal für einige Sekunden ein, wenn er aus dem Ruhezustand erwacht. Wir vermuten, dass dies ein Problem im Zusammenhang mit dem MUX oder der automatischen GPU-Umschaltung sein könnte.


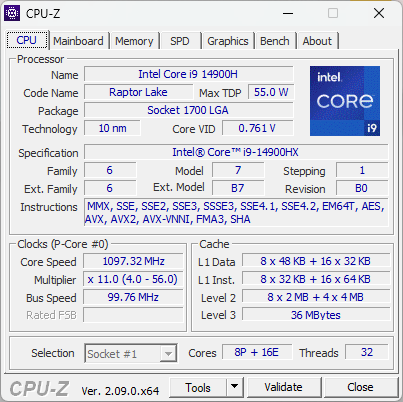
Prozessor
Der Core i9-14900HX ist im Wesentlichen eine Neubezeichnung des letztjährigen Core i9-13900HX, daher sind die Leistungsunterschiede zwischen ihnen minimal. Tatsächlich hat der Core i9-13980HX im letztjährigen m18 R1 unseren i9-14900HX bei Multi-Thread-Workloads stets leicht übertroffen.
Ein Wechsel zu den Prozessoren Core i7-14700HX oder Core i7-14650HX würde die Prozessorleistung um etwa 25 bis 30 Prozent bzw. 30 bis 35 Prozent reduzieren. Diese niedrigeren CPUs sind ebenfalls Neuauflagen der älteren Core i7-13700HX und Core i7-14750HX.
Cinebench R15 Multi Dauertest
Cinebench R23: Multi Core | Single Core
Cinebench R20: CPU (Multi Core) | CPU (Single Core)
Cinebench R15: CPU Multi 64Bit | CPU Single 64Bit
Blender: v2.79 BMW27 CPU
7-Zip 18.03: 7z b 4 | 7z b 4 -mmt1
Geekbench 6.7: Multi-Core | Single-Core
Geekbench 5.5: Multi-Core | Single-Core
HWBOT x265 Benchmark v2.2: 4k Preset
LibreOffice : 20 Documents To PDF
R Benchmark 2.5: Overall mean
| CPU Performance Rating | |
| Alienware m18 R1 AMD | |
| Alienware m18 R2 | |
| Alienware m18 R1 -2! | |
| MSI Titan 18 HX A14VIG | |
| Acer Predator Helios 18 N23Q2 | |
| Durchschnittliche Intel Core i9-14900HX | |
| Razer Blade 18 RTX 4070 -2! | |
| Asus TUF Gaming A17 FA707XI-NS94 | |
| Asus ROG Strix G18 G814JI -2! | |
| Schenker XMG Apex 17 (Late 23) | |
| Acer Nitro 17 AN17-51-71ER -2! | |
| Acer Nitro 17 AN17-41-R9LN | |
| Cinebench R20 / CPU (Multi Core) | |
| Alienware m18 R1 AMD | |
| Alienware m18 R1 | |
| MSI Titan 18 HX A14VIG | |
| Alienware m18 R2 | |
| Acer Predator Helios 18 N23Q2 | |
| Durchschnittliche Intel Core i9-14900HX (6579 - 13832, n=37) | |
| Razer Blade 18 RTX 4070 | |
| Asus ROG Strix G18 G814JI | |
| Acer Nitro 17 AN17-51-71ER | |
| Asus TUF Gaming A17 FA707XI-NS94 | |
| Schenker XMG Apex 17 (Late 23) | |
| Acer Nitro 17 AN17-41-R9LN | |
| Cinebench R20 / CPU (Single Core) | |
| Alienware m18 R2 | |
| Durchschnittliche Intel Core i9-14900HX (657 - 859, n=37) | |
| MSI Titan 18 HX A14VIG | |
| Alienware m18 R1 | |
| Acer Predator Helios 18 N23Q2 | |
| Razer Blade 18 RTX 4070 | |
| Alienware m18 R1 AMD | |
| Asus ROG Strix G18 G814JI | |
| Asus TUF Gaming A17 FA707XI-NS94 | |
| Schenker XMG Apex 17 (Late 23) | |
| Acer Nitro 17 AN17-41-R9LN | |
| Acer Nitro 17 AN17-51-71ER | |
| Cinebench R15 / CPU Multi 64Bit | |
| Alienware m18 R1 AMD | |
| Alienware m18 R1 | |
| Alienware m18 R2 | |
| MSI Titan 18 HX A14VIG | |
| Acer Predator Helios 18 N23Q2 | |
| Razer Blade 18 RTX 4070 | |
| Durchschnittliche Intel Core i9-14900HX (3263 - 5589, n=38) | |
| Asus ROG Strix G18 G814JI | |
| Acer Nitro 17 AN17-51-71ER | |
| Asus TUF Gaming A17 FA707XI-NS94 | |
| Schenker XMG Apex 17 (Late 23) | |
| Acer Nitro 17 AN17-41-R9LN | |
| Cinebench R15 / CPU Single 64Bit | |
| Alienware m18 R2 | |
| Alienware m18 R1 AMD | |
| Durchschnittliche Intel Core i9-14900HX (247 - 323, n=37) | |
| Alienware m18 R1 | |
| MSI Titan 18 HX A14VIG | |
| Razer Blade 18 RTX 4070 | |
| Acer Predator Helios 18 N23Q2 | |
| Asus TUF Gaming A17 FA707XI-NS94 | |
| Asus ROG Strix G18 G814JI | |
| Schenker XMG Apex 17 (Late 23) | |
| Acer Nitro 17 AN17-41-R9LN | |
| Acer Nitro 17 AN17-51-71ER | |
| Geekbench 6.7 / Multi-Core | |
| Alienware m18 R2 | |
| Acer Predator Helios 18 N23Q2 | |
| Durchschnittliche Intel Core i9-14900HX (13158 - 19665, n=37) | |
| MSI Titan 18 HX A14VIG | |
| Alienware m18 R1 AMD | |
| Schenker XMG Apex 17 (Late 23) | |
| Asus TUF Gaming A17 FA707XI-NS94 | |
| Acer Nitro 17 AN17-41-R9LN | |
| Geekbench 6.7 / Single-Core | |
| Alienware m18 R2 | |
| Durchschnittliche Intel Core i9-14900HX (2419 - 3129, n=37) | |
| Acer Predator Helios 18 N23Q2 | |
| Alienware m18 R1 AMD | |
| MSI Titan 18 HX A14VIG | |
| Asus TUF Gaming A17 FA707XI-NS94 | |
| Schenker XMG Apex 17 (Late 23) | |
| Acer Nitro 17 AN17-41-R9LN | |
| HWBOT x265 Benchmark v2.2 / 4k Preset | |
| Alienware m18 R1 AMD | |
| Alienware m18 R1 | |
| Alienware m18 R2 | |
| Razer Blade 18 RTX 4070 | |
| MSI Titan 18 HX A14VIG | |
| Acer Predator Helios 18 N23Q2 | |
| Durchschnittliche Intel Core i9-14900HX (16.8 - 38.9, n=37) | |
| Asus ROG Strix G18 G814JI | |
| Asus TUF Gaming A17 FA707XI-NS94 | |
| Schenker XMG Apex 17 (Late 23) | |
| Acer Nitro 17 AN17-51-71ER | |
| Acer Nitro 17 AN17-41-R9LN | |
| LibreOffice / 20 Documents To PDF | |
| Acer Nitro 17 AN17-41-R9LN | |
| Asus ROG Strix G18 G814JI | |
| Acer Nitro 17 AN17-51-71ER | |
| Acer Predator Helios 18 N23Q2 | |
| Asus TUF Gaming A17 FA707XI-NS94 | |
| Schenker XMG Apex 17 (Late 23) | |
| Alienware m18 R1 | |
| MSI Titan 18 HX A14VIG | |
| Alienware m18 R2 | |
| Razer Blade 18 RTX 4070 | |
| Durchschnittliche Intel Core i9-14900HX (19 - 85.1, n=37) | |
| Alienware m18 R1 AMD | |
| R Benchmark 2.5 / Overall mean | |
| Acer Nitro 17 AN17-51-71ER | |
| Acer Nitro 17 AN17-41-R9LN | |
| Asus ROG Strix G18 G814JI | |
| Schenker XMG Apex 17 (Late 23) | |
| Asus TUF Gaming A17 FA707XI-NS94 | |
| Alienware m18 R1 AMD | |
| Acer Predator Helios 18 N23Q2 | |
| Razer Blade 18 RTX 4070 | |
| Alienware m18 R1 | |
| MSI Titan 18 HX A14VIG | |
| Durchschnittliche Intel Core i9-14900HX (0.3604 - 0.4859, n=37) | |
| Alienware m18 R2 | |
* ... kleinere Werte sind besser
AIDA64: FP32 Ray-Trace | FPU Julia | CPU SHA3 | CPU Queen | FPU SinJulia | FPU Mandel | CPU AES | CPU ZLib | FP64 Ray-Trace | CPU PhotoWorxx
| Performance Rating | |
| Alienware m18 R1 AMD | |
| Acer Predator Helios 18 N23Q2 | |
| Alienware m18 R1 | |
| Alienware m18 R2 | |
| MSI Titan 18 HX A14VIG | |
| Durchschnittliche Intel Core i9-14900HX | |
| Asus ROG Strix G18 G814JI | |
| AIDA64 / FP32 Ray-Trace | |
| Alienware m18 R1 AMD | |
| Alienware m18 R1 | |
| MSI Titan 18 HX A14VIG | |
| Alienware m18 R2 | |
| Acer Predator Helios 18 N23Q2 | |
| Durchschnittliche Intel Core i9-14900HX (13098 - 33474, n=36) | |
| Asus ROG Strix G18 G814JI | |
| AIDA64 / FPU Julia | |
| Alienware m18 R1 AMD | |
| MSI Titan 18 HX A14VIG | |
| Alienware m18 R1 | |
| Alienware m18 R2 | |
| Acer Predator Helios 18 N23Q2 | |
| Durchschnittliche Intel Core i9-14900HX (67573 - 166040, n=36) | |
| Asus ROG Strix G18 G814JI | |
| AIDA64 / CPU SHA3 | |
| Alienware m18 R1 AMD | |
| MSI Titan 18 HX A14VIG | |
| Alienware m18 R1 | |
| Alienware m18 R2 | |
| Acer Predator Helios 18 N23Q2 | |
| Durchschnittliche Intel Core i9-14900HX (3589 - 7979, n=36) | |
| Asus ROG Strix G18 G814JI | |
| AIDA64 / CPU Queen | |
| Alienware m18 R1 AMD | |
| MSI Titan 18 HX A14VIG | |
| Alienware m18 R1 | |
| Alienware m18 R2 | |
| Durchschnittliche Intel Core i9-14900HX (118405 - 148966, n=36) | |
| Acer Predator Helios 18 N23Q2 | |
| Asus ROG Strix G18 G814JI | |
| AIDA64 / FPU SinJulia | |
| Alienware m18 R1 AMD | |
| MSI Titan 18 HX A14VIG | |
| Alienware m18 R1 | |
| Alienware m18 R2 | |
| Acer Predator Helios 18 N23Q2 | |
| Durchschnittliche Intel Core i9-14900HX (10475 - 18517, n=36) | |
| Asus ROG Strix G18 G814JI | |
| AIDA64 / FPU Mandel | |
| Alienware m18 R1 AMD | |
| Alienware m18 R1 | |
| Alienware m18 R2 | |
| MSI Titan 18 HX A14VIG | |
| Acer Predator Helios 18 N23Q2 | |
| Durchschnittliche Intel Core i9-14900HX (32543 - 83662, n=36) | |
| Asus ROG Strix G18 G814JI | |
| AIDA64 / CPU AES | |
| Acer Predator Helios 18 N23Q2 | |
| Alienware m18 R1 AMD | |
| Durchschnittliche Intel Core i9-14900HX (86964 - 241777, n=36) | |
| MSI Titan 18 HX A14VIG | |
| Alienware m18 R1 | |
| Alienware m18 R2 | |
| Asus ROG Strix G18 G814JI | |
| AIDA64 / CPU ZLib | |
| Alienware m18 R1 AMD | |
| MSI Titan 18 HX A14VIG | |
| Alienware m18 R2 | |
| Alienware m18 R1 | |
| Acer Predator Helios 18 N23Q2 | |
| Durchschnittliche Intel Core i9-14900HX (1054 - 2292, n=36) | |
| Asus ROG Strix G18 G814JI | |
| AIDA64 / FP64 Ray-Trace | |
| Alienware m18 R1 AMD | |
| Alienware m18 R1 | |
| Alienware m18 R2 | |
| MSI Titan 18 HX A14VIG | |
| Acer Predator Helios 18 N23Q2 | |
| Durchschnittliche Intel Core i9-14900HX (6809 - 18349, n=36) | |
| Asus ROG Strix G18 G814JI | |
| AIDA64 / CPU PhotoWorxx | |
| Alienware m18 R1 | |
| Acer Predator Helios 18 N23Q2 | |
| Alienware m18 R2 | |
| Durchschnittliche Intel Core i9-14900HX (23903 - 54702, n=36) | |
| Asus ROG Strix G18 G814JI | |
| Alienware m18 R1 AMD | |
| MSI Titan 18 HX A14VIG | |
Stresstest
Die Kerntemperatur unter Prime95-Stress stabilisiert sich bei 100 °C, ähnlich wie beim m18 R1 des letzten Jahres, trotz des Wechsels zu einem neueren Prozessor. Die Taktraten des i9-14900HX scheinen jedoch häufiger zu schwanken, was seine etwas langsamere Leistung im Vergleich zum i9-13980HX erklären könnte (siehe oben).
Die GPU-Taktraten und die Leistungsaufnahme des Boards ändern sich kaum, wenn man zwischen den Modi Balanced, Performance und Overdrive wechselt, was mit unseren Fire-Strike-Testergebnissen im Abschnitt zur GPU-Leistung unten übereinstimmt. Dieses Verhalten unterscheidet sich von den meisten anderen Gaming-Laptops, bei denen es einen größeren Leistungsunterschied zwischen den Modi Balanced und Performance gibt.


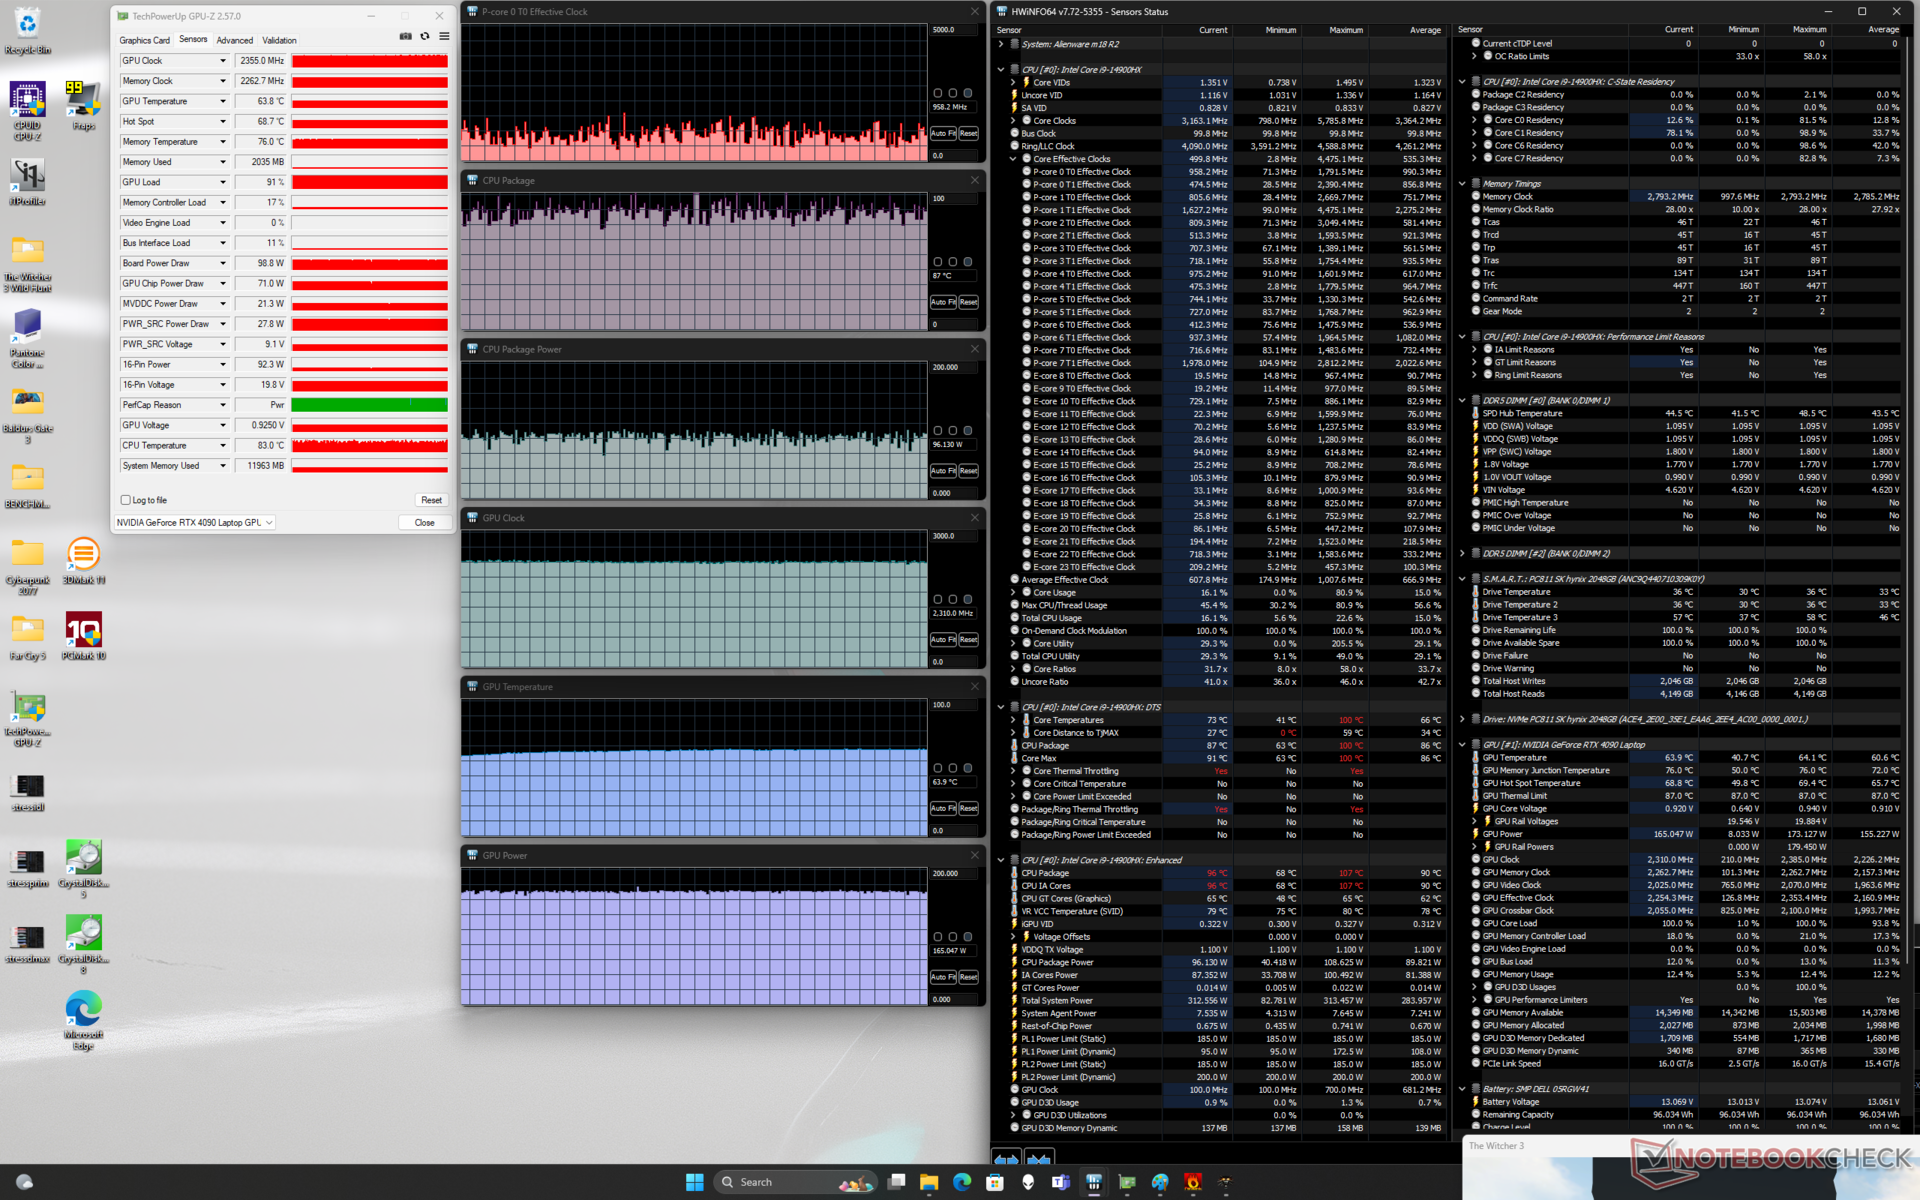
| CPU-Takt (GHz) | GPU-Takt (MHz) | Durchschnittliche CPU-Temperatur (°C) | Durchschnittliche GPU-Temperatur (°C) | |
| System im Leerlauf | -- | -- | 36 | 27 |
| Prime95 Stresstest | 2.1 - 3.3 | -- | 99 | 46 |
| Prime95 + FurMark Stresstest | 1.7 - 3.7 | 1350 - 2370 | 74 - 100 | 54 - 61 |
| Witcher 3 Stresstest (Balanced-Modus) | ~1.7 | 2295 | ~84 | 66 |
| Witcher 3 Stresstest (Performance-Modus) | ~1.4 | 2310 | ~82 | 65 |
| Witcher 3 Stresstest (Overdrive-Modus) | ~1.0 | 2310 | ~87 | 64 |
System Performance

CrossMark: Overall | Productivity | Creativity | Responsiveness
WebXPRT 3: Overall
WebXPRT 4: Overall
Mozilla Kraken 1.1: Total
| PCMark 10 / Score | |
| Alienware m18 R1 AMD | |
| Alienware m18 R2 | |
| MSI Titan 18 HX A14VIG | |
| Alienware m18 R1 | |
| Durchschnittliche Intel Core i9-14900HX, NVIDIA GeForce RTX 4090 Laptop GPU (8230 - 9234, n=13) | |
| Acer Predator Helios 18 N23Q2 | |
| Asus ROG Strix G18 G814JI | |
| PCMark 10 / Essentials | |
| Alienware m18 R1 AMD | |
| MSI Titan 18 HX A14VIG | |
| Alienware m18 R2 | |
| Alienware m18 R1 | |
| Durchschnittliche Intel Core i9-14900HX, NVIDIA GeForce RTX 4090 Laptop GPU (10778 - 11628, n=13) | |
| Acer Predator Helios 18 N23Q2 | |
| Asus ROG Strix G18 G814JI | |
| PCMark 10 / Productivity | |
| Alienware m18 R2 | |
| Alienware m18 R1 AMD | |
| Durchschnittliche Intel Core i9-14900HX, NVIDIA GeForce RTX 4090 Laptop GPU (9458 - 11759, n=13) | |
| Acer Predator Helios 18 N23Q2 | |
| MSI Titan 18 HX A14VIG | |
| Alienware m18 R1 | |
| Asus ROG Strix G18 G814JI | |
| PCMark 10 / Digital Content Creation | |
| Alienware m18 R1 AMD | |
| MSI Titan 18 HX A14VIG | |
| Alienware m18 R2 | |
| Alienware m18 R1 | |
| Durchschnittliche Intel Core i9-14900HX, NVIDIA GeForce RTX 4090 Laptop GPU (13219 - 16462, n=13) | |
| Acer Predator Helios 18 N23Q2 | |
| Asus ROG Strix G18 G814JI | |
| CrossMark / Overall | |
| Acer Predator Helios 18 N23Q2 | |
| Alienware m18 R1 | |
| Durchschnittliche Intel Core i9-14900HX, NVIDIA GeForce RTX 4090 Laptop GPU (1877 - 2344, n=10) | |
| Alienware m18 R2 | |
| Alienware m18 R1 AMD | |
| MSI Titan 18 HX A14VIG | |
| CrossMark / Productivity | |
| Acer Predator Helios 18 N23Q2 | |
| Alienware m18 R1 | |
| Durchschnittliche Intel Core i9-14900HX, NVIDIA GeForce RTX 4090 Laptop GPU (1738 - 2162, n=10) | |
| Alienware m18 R2 | |
| Alienware m18 R1 AMD | |
| MSI Titan 18 HX A14VIG | |
| CrossMark / Creativity | |
| Alienware m18 R1 | |
| Acer Predator Helios 18 N23Q2 | |
| Alienware m18 R2 | |
| Durchschnittliche Intel Core i9-14900HX, NVIDIA GeForce RTX 4090 Laptop GPU (2195 - 2660, n=10) | |
| Alienware m18 R1 AMD | |
| MSI Titan 18 HX A14VIG | |
| CrossMark / Responsiveness | |
| Acer Predator Helios 18 N23Q2 | |
| Alienware m18 R1 | |
| Durchschnittliche Intel Core i9-14900HX, NVIDIA GeForce RTX 4090 Laptop GPU (1478 - 2327, n=10) | |
| Alienware m18 R2 | |
| Alienware m18 R1 AMD | |
| MSI Titan 18 HX A14VIG | |
| WebXPRT 3 / Overall | |
| Alienware m18 R1 AMD | |
| Alienware m18 R1 | |
| MSI Titan 18 HX A14VIG | |
| Alienware m18 R2 | |
| Durchschnittliche Intel Core i9-14900HX, NVIDIA GeForce RTX 4090 Laptop GPU (279 - 339, n=10) | |
| Acer Predator Helios 18 N23Q2 | |
| Asus ROG Strix G18 G814JI | |
| Asus ROG Strix G18 G814JI | |
| WebXPRT 4 / Overall | |
| Alienware m18 R2 | |
| Alienware m18 R1 | |
| Alienware m18 R1 AMD | |
| Durchschnittliche Intel Core i9-14900HX, NVIDIA GeForce RTX 4090 Laptop GPU (246 - 309, n=8) | |
| MSI Titan 18 HX A14VIG | |
| Asus ROG Strix G18 G814JI | |
| Asus ROG Strix G18 G814JI | |
| Mozilla Kraken 1.1 / Total | |
| Asus ROG Strix G18 G814JI | |
| Asus ROG Strix G18 G814JI | |
| Alienware m18 R1 AMD | |
| Alienware m18 R1 | |
| Acer Predator Helios 18 N23Q2 | |
| Durchschnittliche Intel Core i9-14900HX, NVIDIA GeForce RTX 4090 Laptop GPU (428 - 535, n=11) | |
| MSI Titan 18 HX A14VIG | |
| Alienware m18 R2 | |
* ... kleinere Werte sind besser
| PCMark 10 Score | 9234 Punkte | |
Hilfe | ||
| AIDA64 / Memory Copy | |
| Alienware m18 R1 | |
| Alienware m18 R2 | |
| Acer Predator Helios 18 N23Q2 | |
| Durchschnittliche Intel Core i9-14900HX (38028 - 83392, n=36) | |
| Asus ROG Strix G18 G814JI | |
| MSI Titan 18 HX A14VIG | |
| Alienware m18 R1 AMD | |
| AIDA64 / Memory Read | |
| Alienware m18 R1 | |
| Acer Predator Helios 18 N23Q2 | |
| Alienware m18 R2 | |
| Durchschnittliche Intel Core i9-14900HX (43306 - 87568, n=36) | |
| Asus ROG Strix G18 G814JI | |
| Alienware m18 R1 AMD | |
| MSI Titan 18 HX A14VIG | |
| AIDA64 / Memory Write | |
| Alienware m18 R1 | |
| Alienware m18 R2 | |
| Acer Predator Helios 18 N23Q2 | |
| Durchschnittliche Intel Core i9-14900HX (37146 - 80589, n=36) | |
| Alienware m18 R1 AMD | |
| Asus ROG Strix G18 G814JI | |
| MSI Titan 18 HX A14VIG | |
| AIDA64 / Memory Latency | |
| MSI Titan 18 HX A14VIG | |
| Alienware m18 R1 AMD | |
| Alienware m18 R2 | |
| Durchschnittliche Intel Core i9-14900HX (76.1 - 105, n=36) | |
| Asus ROG Strix G18 G814JI | |
| Acer Predator Helios 18 N23Q2 | |
| Alienware m18 R1 | |
* ... kleinere Werte sind besser
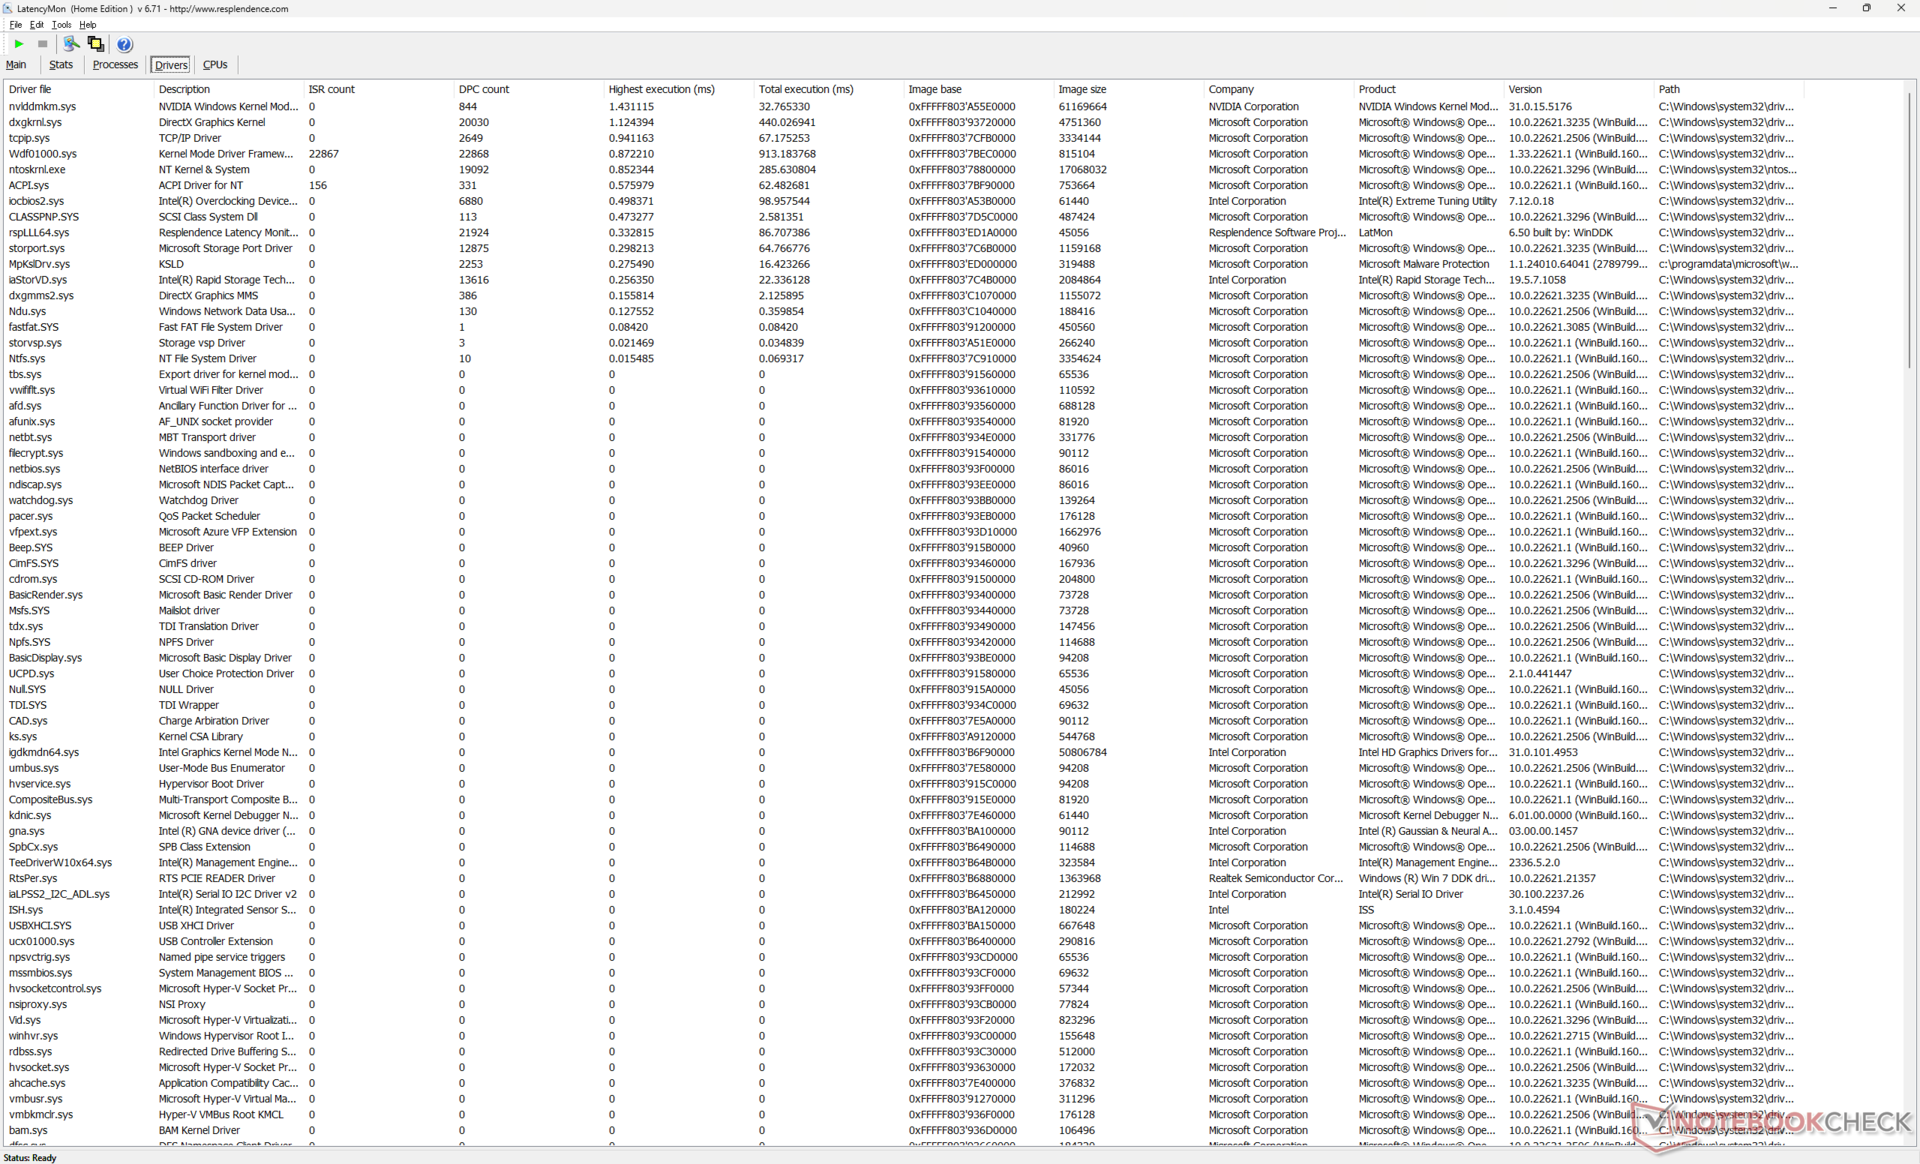
DPC-Latenzen

| DPC Latencies / LatencyMon - interrupt to process latency (max), Web, Youtube, Prime95 | |
| Acer Predator Helios 18 N23Q2 | |
| Alienware m18 R2 | |
| Alienware m18 R1 | |
| MSI Titan 18 HX A14VIG | |
| Alienware m18 R1 AMD | |
| Asus ROG Strix G18 G814JI | |
* ... kleinere Werte sind besser
Massenspeicher
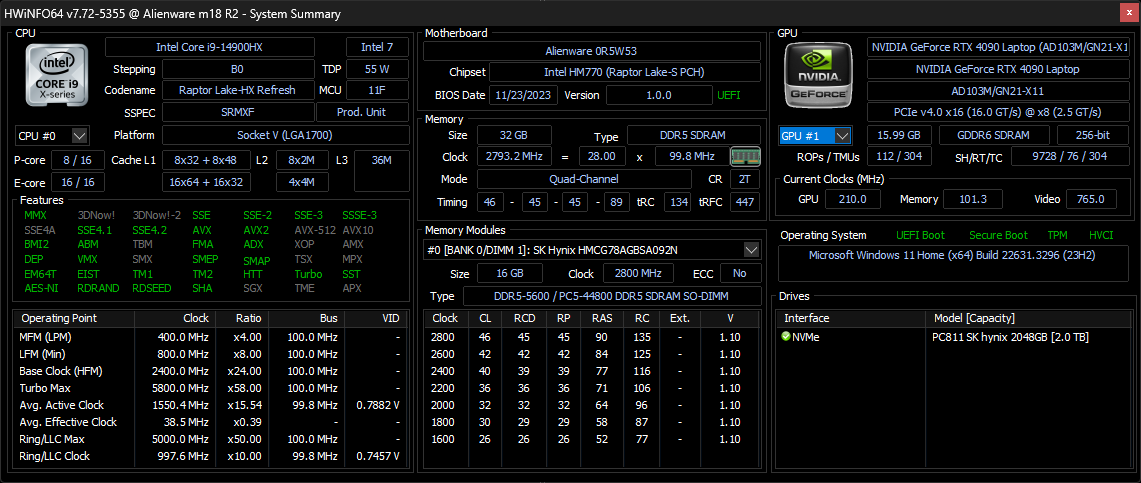
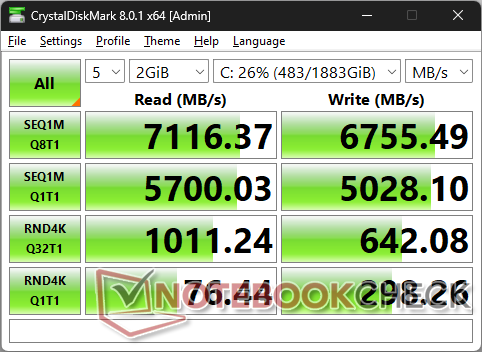
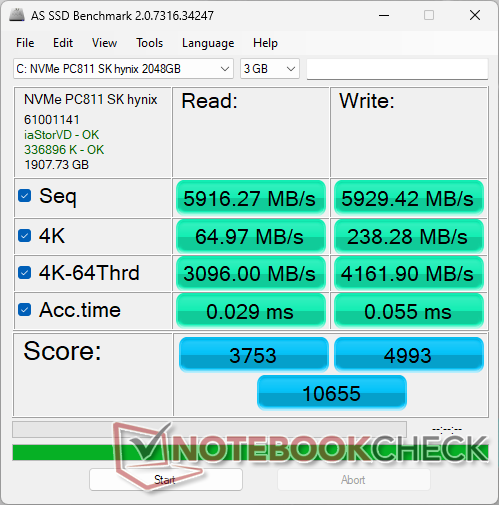
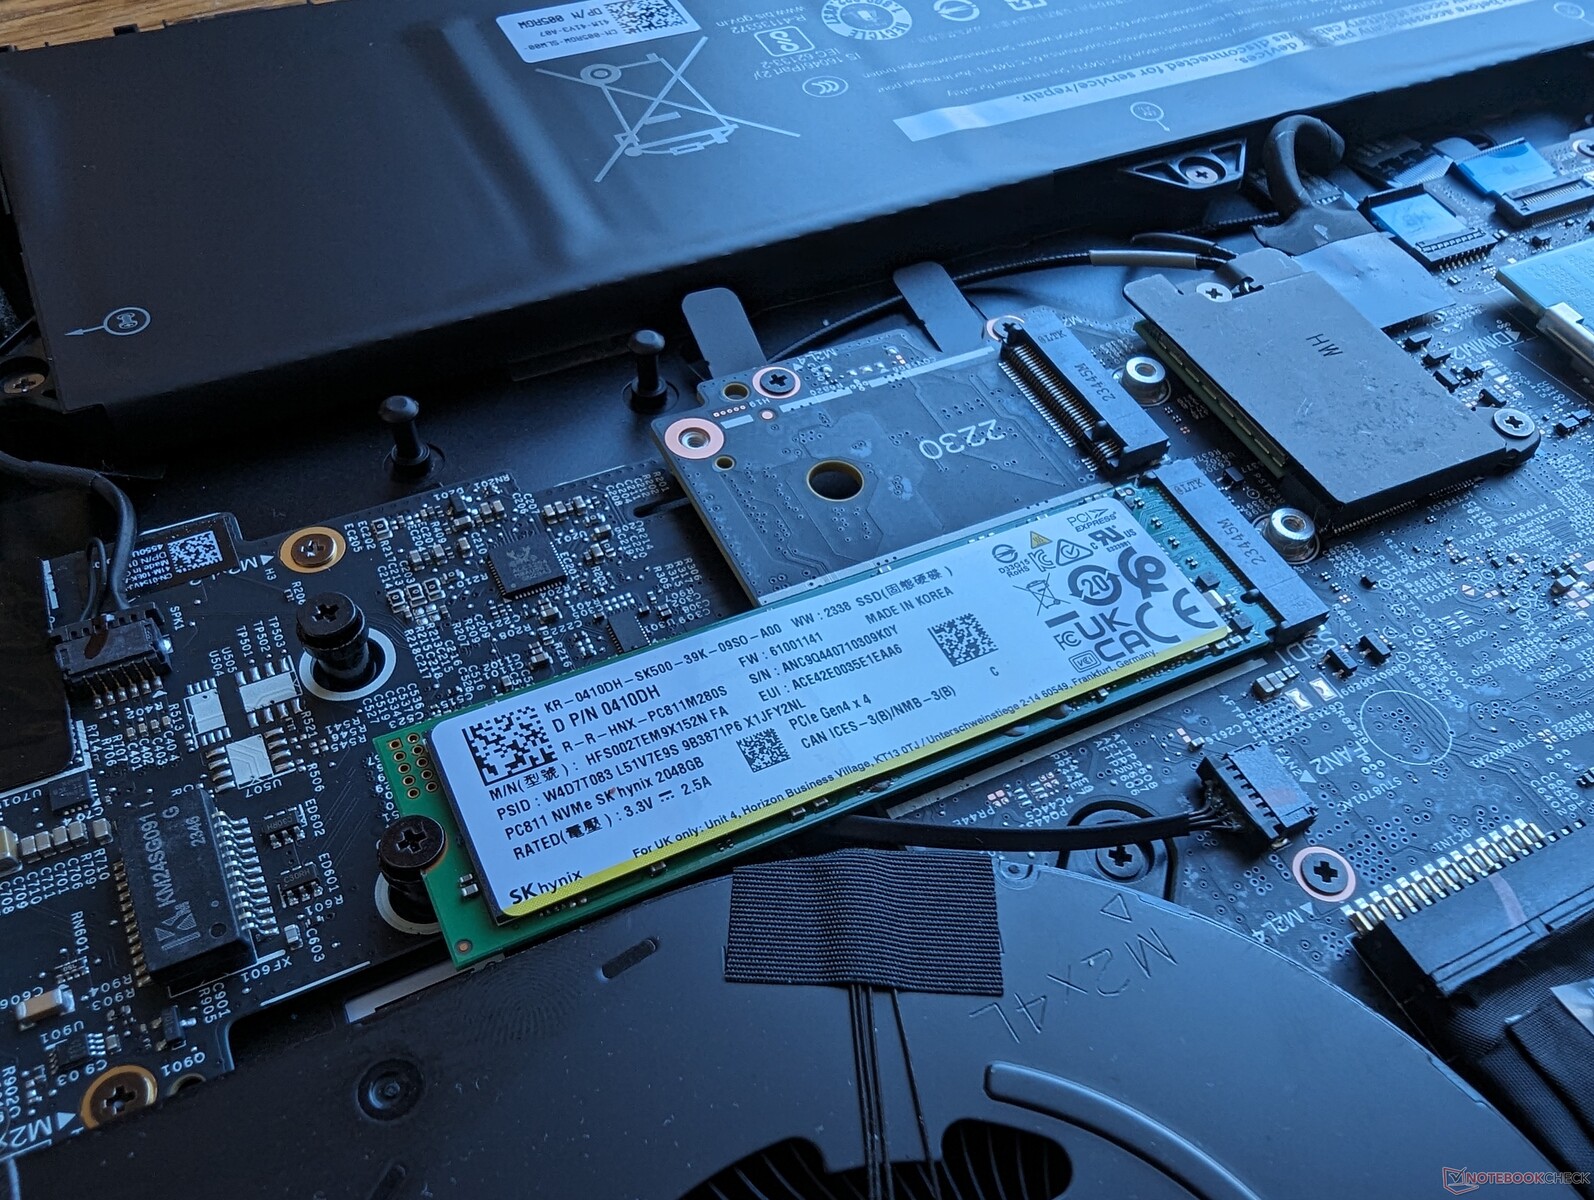
Das Alienware ist eines der ersten Modelle, das mit der 2 TB SK Hynix PC811 PCIe4 x4 NVMe SSD ausgeliefert wird. Im Vergleich zur PC801-Serie enthält die PC811-Serie 8D-NAND-Flash anstelle von 4D-NAND für eine insgesamt dichtere Speicherkapazität und verbesserte Energieeffizienz. Das Laufwerk ist in der Lage, bei Belastung maximale Übertragungsraten von etwa 7100 MB/s aufrechtzuerhalten, was im Wesentlichen die Leistungsgrenze für einzelne PCIe4 x4 SSDs darstellt.
Dell bietet auch die Möglichkeit, zwei 4-TB-Laufwerke zu konfigurieren, was eine Gesamtspeicherkapazität von 8 TB ergibt.

| Drive Performance Rating - Percent | |
| Alienware m18 R2 | |
| Alienware m18 R1 | |
| Acer Predator Helios 18 N23Q2 | |
| MSI Titan 18 HX A14VIG | |
| Alienware m18 R1 AMD | |
| Asus ROG Strix G18 G814JI | |
* ... kleinere Werte sind besser
Dauerleistung Lesen: DiskSpd Read Loop, Queue Depth 8
GPU Performance — 175 W TGP Graphics
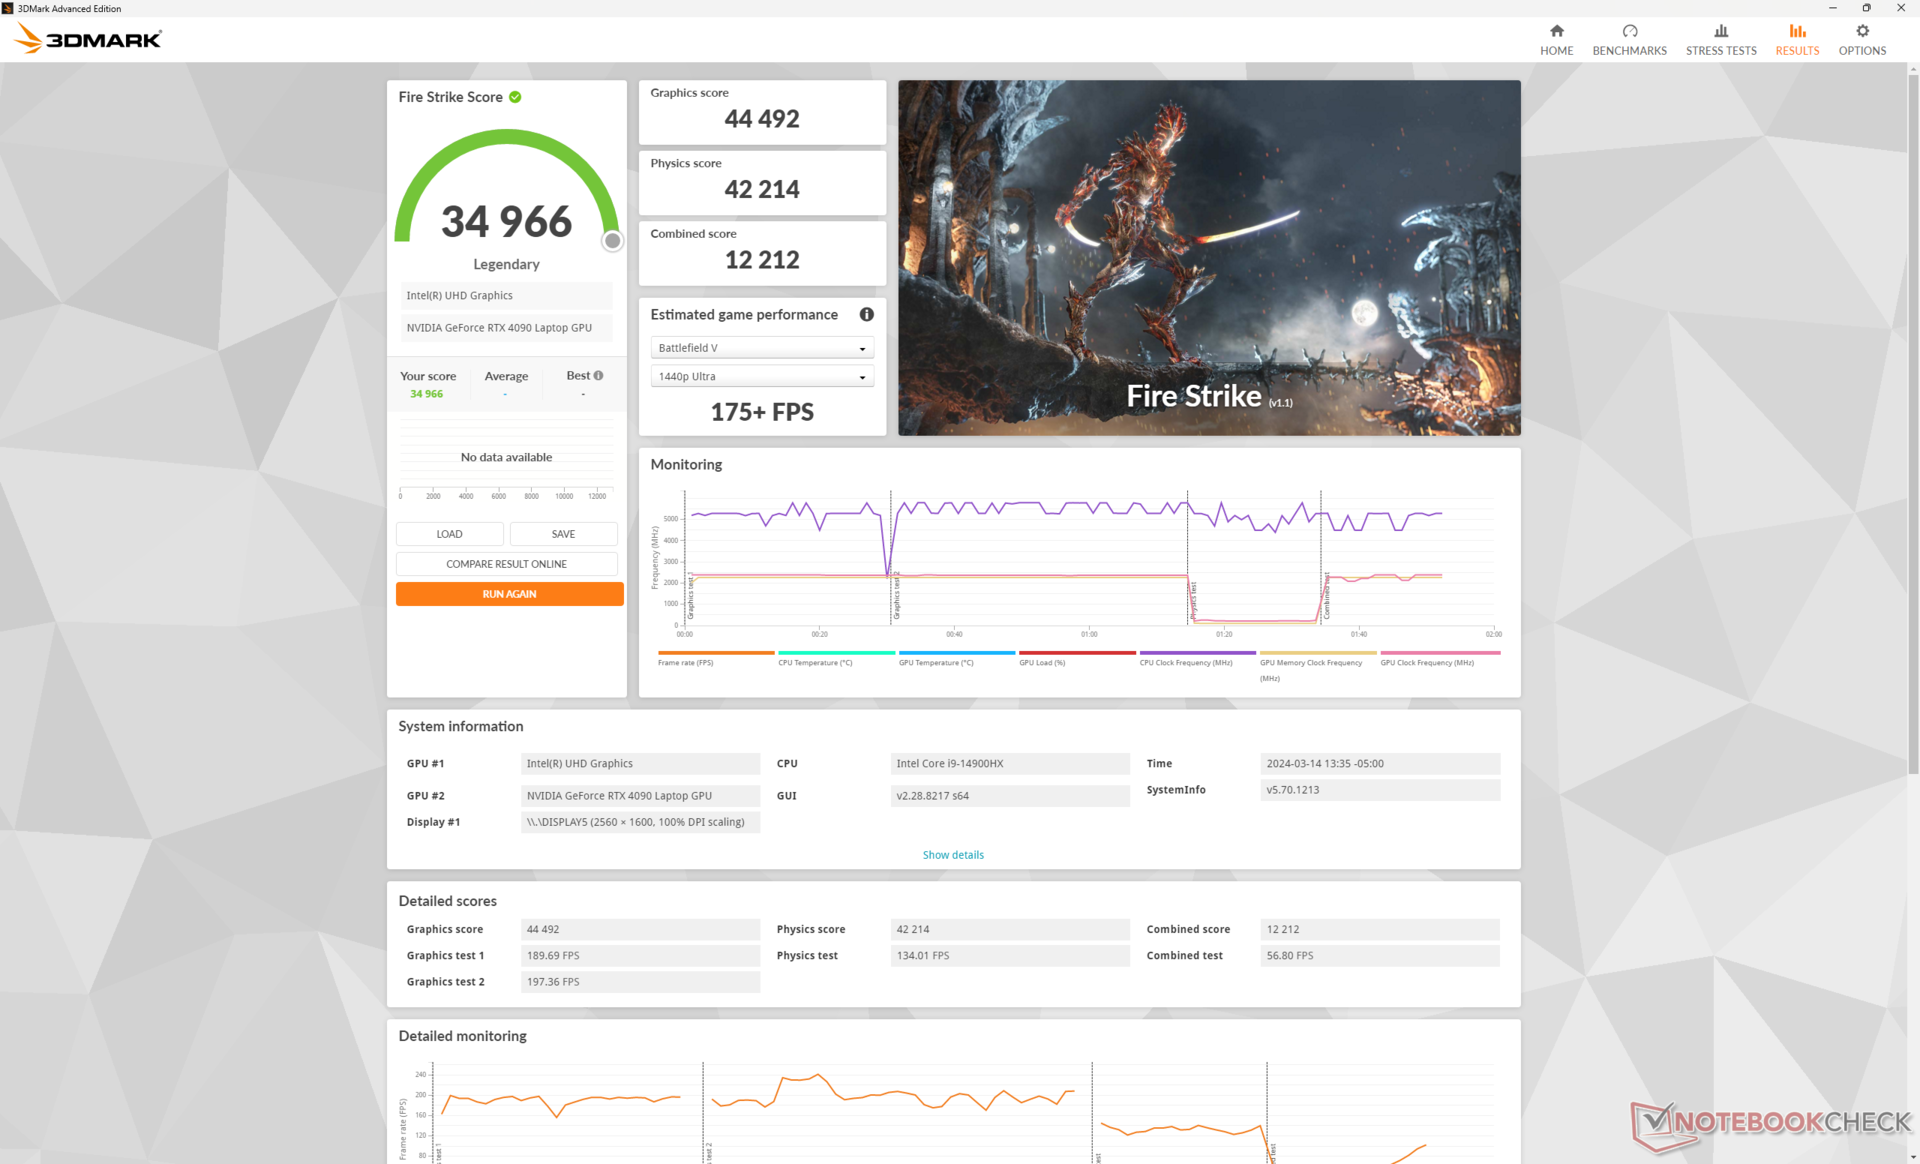
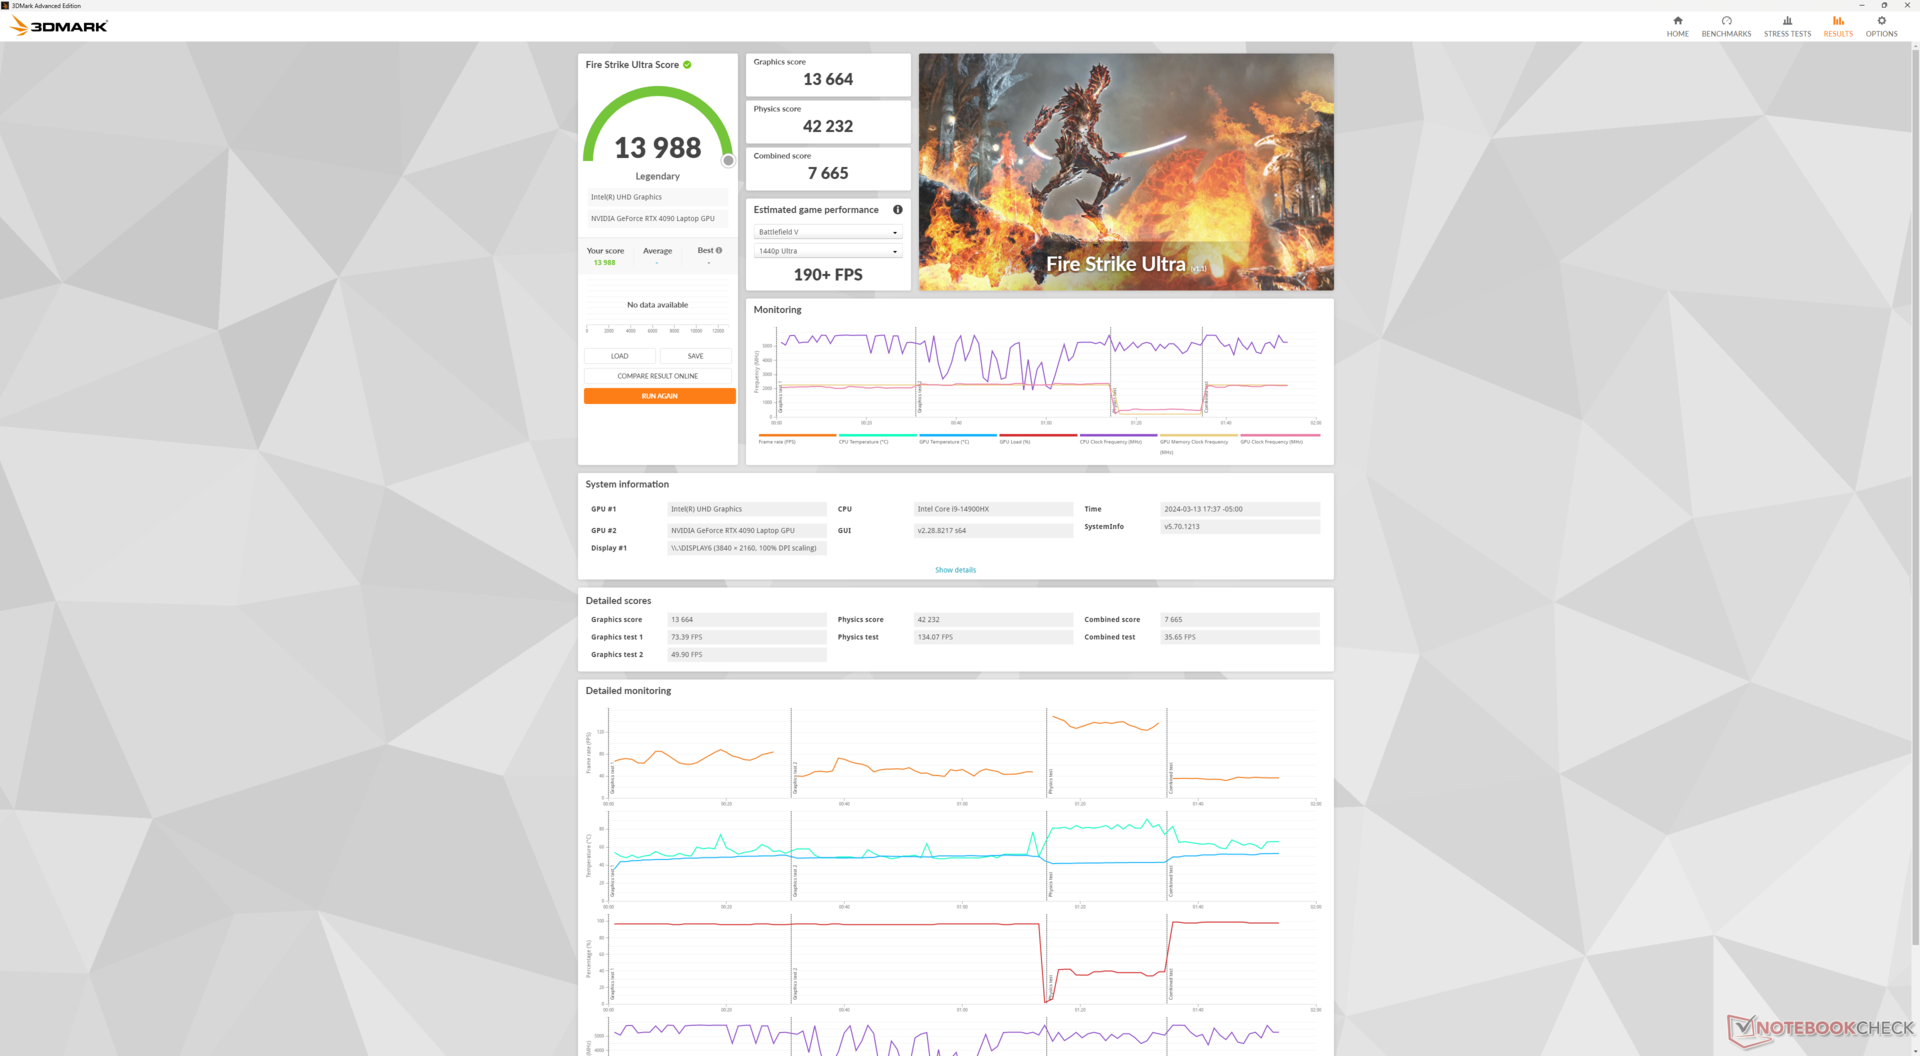
Die 175 W GeForce RTX 4090 ist in diesem Jahr ohne größere Änderungen zurück und bietet die gleiche Spieleleistung wie die m18 R1 des letzten Jahres. Am wichtigsten ist vielleicht, dass es wieder keine großen Leistungsunterschiede zwischen den Profilen Overdrive, Performance und Balanced gibt, wie unsere Fire Strike-Ergebnistabelle unten zeigt.
| Energieprofile | Grafikleistung | CPU-Leistung | Gesamtwert |
| Overdrive-Modus | 13664 | 42232 | 7665 |
| Performance-Modus | 13579 (-0%) | 42217 (-0%) | 7541 (-2%) |
| Balanced-Modus | 13449 (-1%) | 40978 (-3%) | 7592 (-1%) |
| Battery Power | 5116 (-63%) | 22857 (-46%) | 2102 (-73%) |
Ein Wechsel zu einer RTX 4080-, 4070- oder 4060-Konfiguration dürfte die Grafikleistung voraussichtlich um etwa 5 bis 10 Prozent, 30 bis 35 Prozent bzw. 45 bis 55 Prozent reduzieren. Der Leistungsabfall ist also am größten zwischen der RTX 4080 und der RTX 4070.
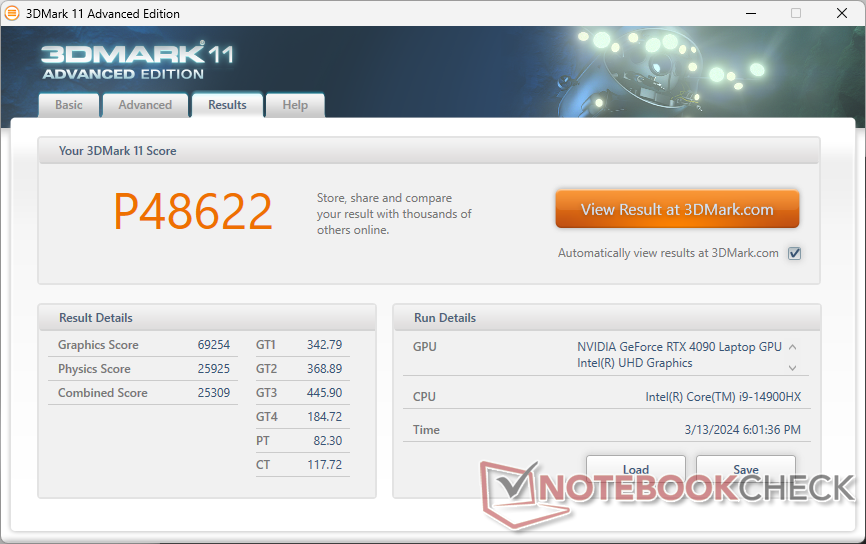
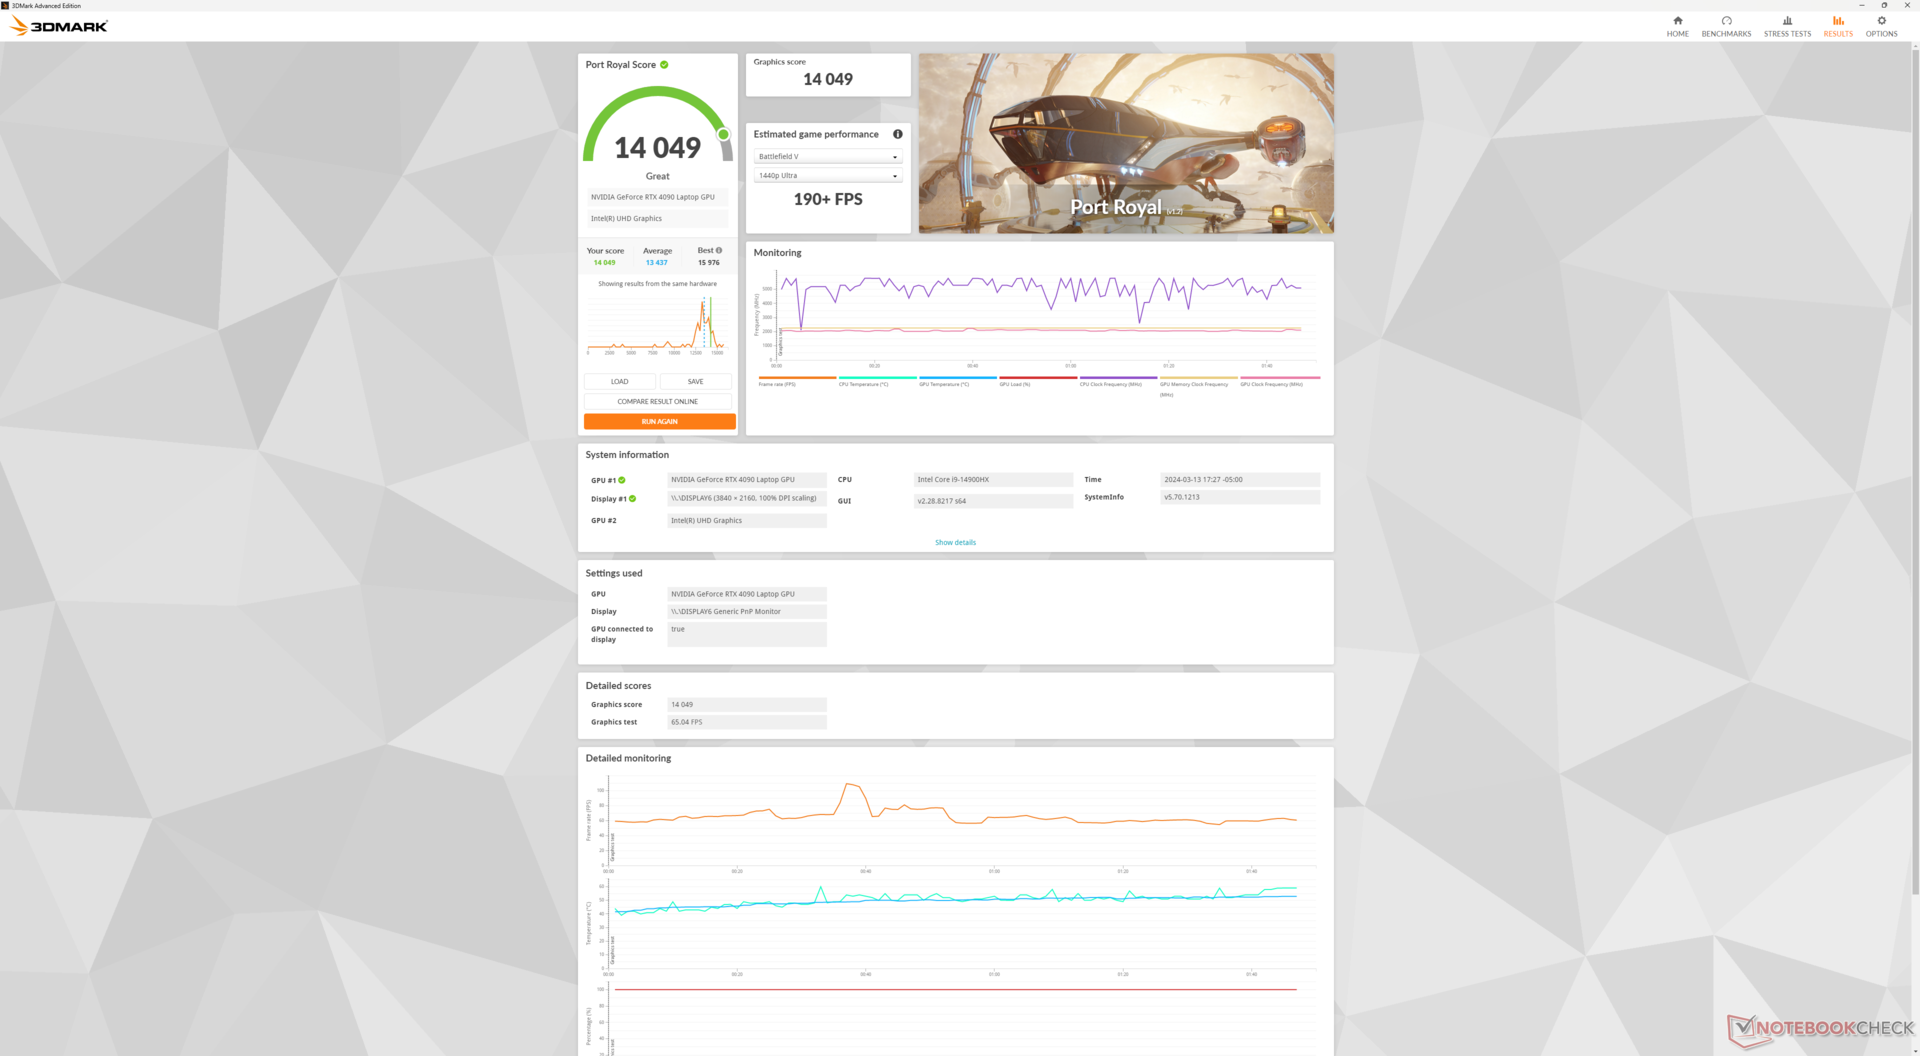

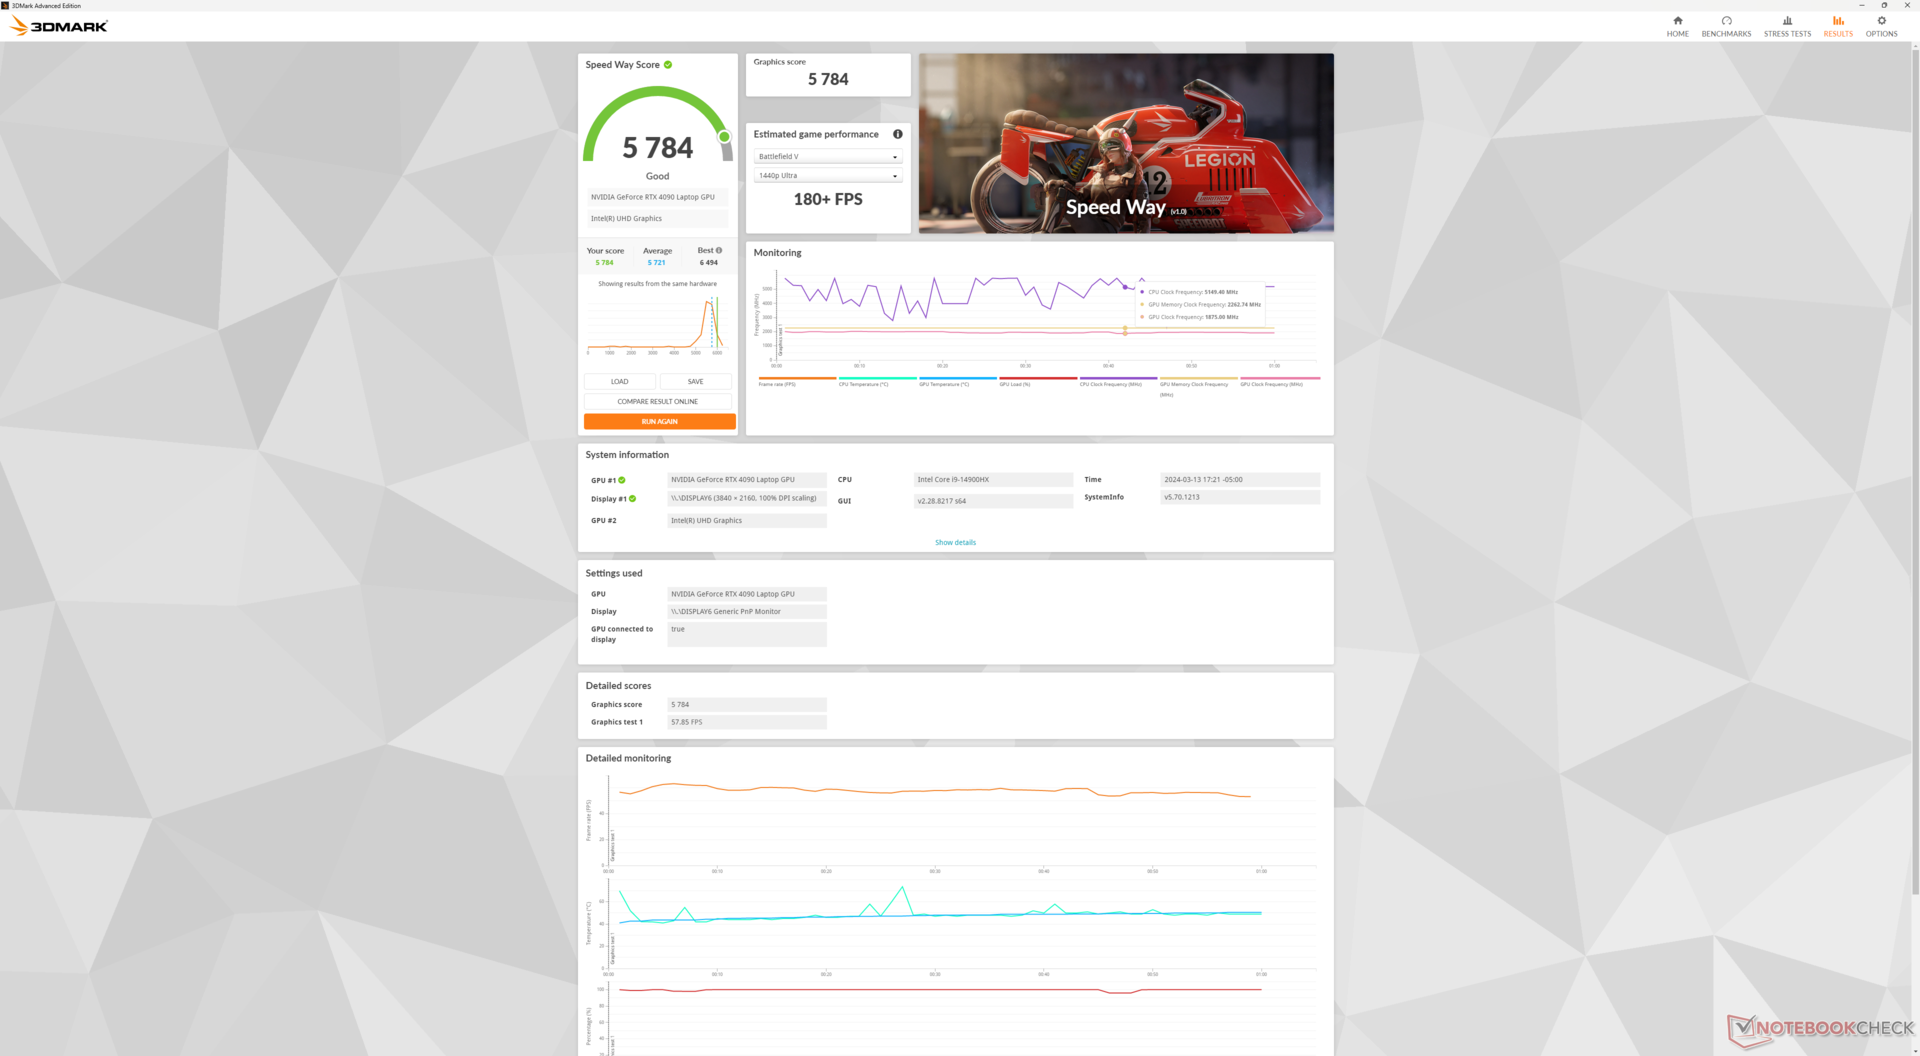
| 3DMark 11 Performance | 48622 Punkte | |
| 3DMark Fire Strike Score | 34966 Punkte | |
| 3DMark Time Spy Score | 21695 Punkte | |
Hilfe | ||
* ... kleinere Werte sind besser
Gaming Performance
Die Spieleleistung bleibt trotz des CPU-Tauschs die gleiche wie beim m18 R1. Die RTX 4090 harmoniert sehr gut mit dem 1600p-Display, wenn man Frameraten über 60 FPS anstrebt.
| Performance Rating - Percent | |
| Alienware m18 R1 | |
| Alienware m18 R2 | |
| MSI Titan 18 HX A14VIG | |
| Acer Predator Helios 18 N23Q2 | |
| Alienware m18 R1 AMD | |
| Asus ROG Strix G18 G814JI | |
| The Witcher 3 - 1920x1080 Ultra Graphics & Postprocessing (HBAO+) | |
| Alienware m18 R1 | |
| MSI Titan 18 HX A14VIG | |
| Alienware m18 R2 | |
| Acer Predator Helios 18 N23Q2 | |
| Alienware m18 R1 AMD | |
| Asus ROG Strix G18 G814JI | |
| GTA V - 1920x1080 Highest AA:4xMSAA + FX AF:16x | |
| Acer Predator Helios 18 N23Q2 | |
| Alienware m18 R1 | |
| MSI Titan 18 HX A14VIG | |
| Alienware m18 R2 | |
| Asus ROG Strix G18 G814JI | |
| Alienware m18 R1 AMD | |
| Final Fantasy XV Benchmark - 1920x1080 High Quality | |
| Alienware m18 R1 | |
| Alienware m18 R2 | |
| MSI Titan 18 HX A14VIG | |
| Acer Predator Helios 18 N23Q2 | |
| Alienware m18 R1 AMD | |
| Asus ROG Strix G18 G814JI | |
| Strange Brigade - 1920x1080 ultra AA:ultra AF:16 | |
| MSI Titan 18 HX A14VIG | |
| Alienware m18 R1 | |
| Alienware m18 R2 | |
| Alienware m18 R1 AMD | |
| Acer Predator Helios 18 N23Q2 | |
| Asus ROG Strix G18 G814JI | |
| Dota 2 Reborn - 1920x1080 ultra (3/3) best looking | |
| Alienware m18 R1 | |
| Acer Predator Helios 18 N23Q2 | |
| MSI Titan 18 HX A14VIG | |
| Alienware m18 R2 | |
| Asus ROG Strix G18 G814JI | |
| Alienware m18 R1 AMD | |
| X-Plane 11.11 - 1920x1080 high (fps_test=3) | |
| Alienware m18 R1 | |
| Alienware m18 R2 | |
| Acer Predator Helios 18 N23Q2 | |
| MSI Titan 18 HX A14VIG | |
| Asus ROG Strix G18 G814JI | |
| Alienware m18 R1 AMD | |
Witcher 3 FPS-Diagramm
| min. | mittel | hoch | max. | QHD DLSS | QHD | 4K DLSS | 4K | |
|---|---|---|---|---|---|---|---|---|
| GTA V (2015) | 185.2 | 181.6 | 179.6 | 137 | 134.7 | 174.9 | ||
| The Witcher 3 (2015) | 585.5 | 525.8 | 405.6 | 205.7 | 157.7 | |||
| Dota 2 Reborn (2015) | 217 | 190.1 | 181.5 | 171.8 | 160.8 | |||
| Final Fantasy XV Benchmark (2018) | 229 | 199.2 | 193.2 | 160.1 | 93.8 | |||
| X-Plane 11.11 (2018) | 201 | 180.1 | 140.6 | 120.4 | ||||
| Far Cry 5 (2018) | 181 | 171 | 160 | 154 | 112 | |||
| Strange Brigade (2018) | 471 | 387 | 383 | 369 | 309 | 160.2 | ||
| Tiny Tina's Wonderlands (2022) | 348.6 | 285.3 | 227.2 | 187.5 | 132.8 | 71.2 | ||
| F1 22 (2022) | 305 | 295 | 276 | 135.1 | 91.4 | 45.4 | ||
| Baldur's Gate 3 (2023) | 246.9 | 222.5 | 206.7 | 202 | 151.6 | 81.7 | ||
| Cyberpunk 2077 (2023) | 149.3 | 148.7 | 142.9 | 133.9 | 94.1 | 43.4 | ||
| Assassin's Creed Mirage (2023) | 230 | 215 | 205 | 160 | 135 | 110 | 81 | |
| Alan Wake 2 (2023) | 124.6 | 121.4 | 116.9 | 83.1 | 62.3 | 45.2 | ||
| Call of Duty Modern Warfare 3 2023 (2023) | 276 | 255 | 220 | 205 | 160 | 113 | 106 | |
| Avatar Frontiers of Pandora (2023) | 162 | 150 | 131 | 103 | 70 | 63 | 36 | |
| Black Myth: Wukong (2024) | 55 | 62 | 42 | 25 | ||||
| Indiana Jones and the Great Circle (2024) | 121.1 | 95.6 | 60.9 | |||||
| Monster Hunter Wilds (2025) | 78.54 | 76.96 | 66.98 | 42.01 | ||||
| Assassin's Creed Shadows (2025) | 100 | 90 | 77 | 57 | 59 | 50 |
Emissionen
Geräuschemissionen
Beim Lüftergeräusch gibt es keine wesentlichen Änderungen. Das Wichtigste ist, dass die Lüftergeräusche in den Modi Performance und Overdrive im Vergleich zum Balanced-Modus etwas lauter sind, obwohl die Gesamtleistung in allen drei Modi gleich ist. Das bedeutet, dass Sie im Modus Balanced oder Performance spielen können, um ein leiseres Erlebnis zu haben, ohne dass Sie auf eine höhere Spielleistung verzichten müssen. Der Overdrive-Modus sollte stattdessen für Übertaktungszwecke reserviert werden.
Lautstärkediagramm
| Idle |
| 23.8 / 26.1 / 31.5 dB(A) |
| Last |
| 31.5 / 56.6 dB(A) |
 | ||
30 dB leise 40 dB(A) deutlich hörbar 50 dB(A) störend |
||
min: | ||
| Alienware m18 R2 GeForce RTX 4090 Laptop GPU, i9-14900HX, SK Hynix PC811 HFS002TEM9X152N | Alienware m18 R1 AMD Radeon RX 7900M, R9 7945HX, Kioxia XG8 KXG80ZNV1T02 | Alienware m18 R1 GeForce RTX 4090 Laptop GPU, i9-13980HX, SK hynix PC801 HFS001TEJ9X101N | MSI Titan 18 HX A14VIG GeForce RTX 4090 Laptop GPU, i9-14900HX, 2x Samsung PM9A1a MZVL22T0HDLB (RAID 0) | Asus ROG Strix G18 G814JI GeForce RTX 4070 Laptop GPU, i7-13650HX, Micron 2400 MTFDKBA1T0QFM | Acer Predator Helios 18 N23Q2 GeForce RTX 4080 Laptop GPU, i9-13900HX, Samsung PM9A1 MZVL22T0HBLB | |
|---|---|---|---|---|---|---|
| Geräuschentwicklung | 1% | 5% | -3% | -1% | -3% | |
| aus / Umgebung * (dB) | 23.6 | 22.4 5% | 22.8 3% | 22.8 3% | 25 -6% | 23 3% |
| Idle min * (dB) | 23.8 | 23 3% | 23 3% | 23.8 -0% | 26 -9% | 23 3% |
| Idle avg * (dB) | 26.1 | 23.4 10% | 23 12% | 23.8 9% | 28 -7% | 23 12% |
| Idle max * (dB) | 31.5 | 33.5 -6% | 23 27% | 28 11% | 29 8% | 23 27% |
| Last avg * (dB) | 31.5 | 33.5 -6% | 35.6 -13% | 38 -21% | 41 -30% | 45.26 -44% |
| Witcher 3 ultra * (dB) | 52.1 | 53.6 -3% | 51.3 2% | 57.3 -10% | 44 16% | 59.82 -15% |
| Last max * (dB) | 56.6 | 53.6 5% | 56.7 -0% | 62.8 -11% | 46 19% | 59.94 -6% |
* ... kleinere Werte sind besser
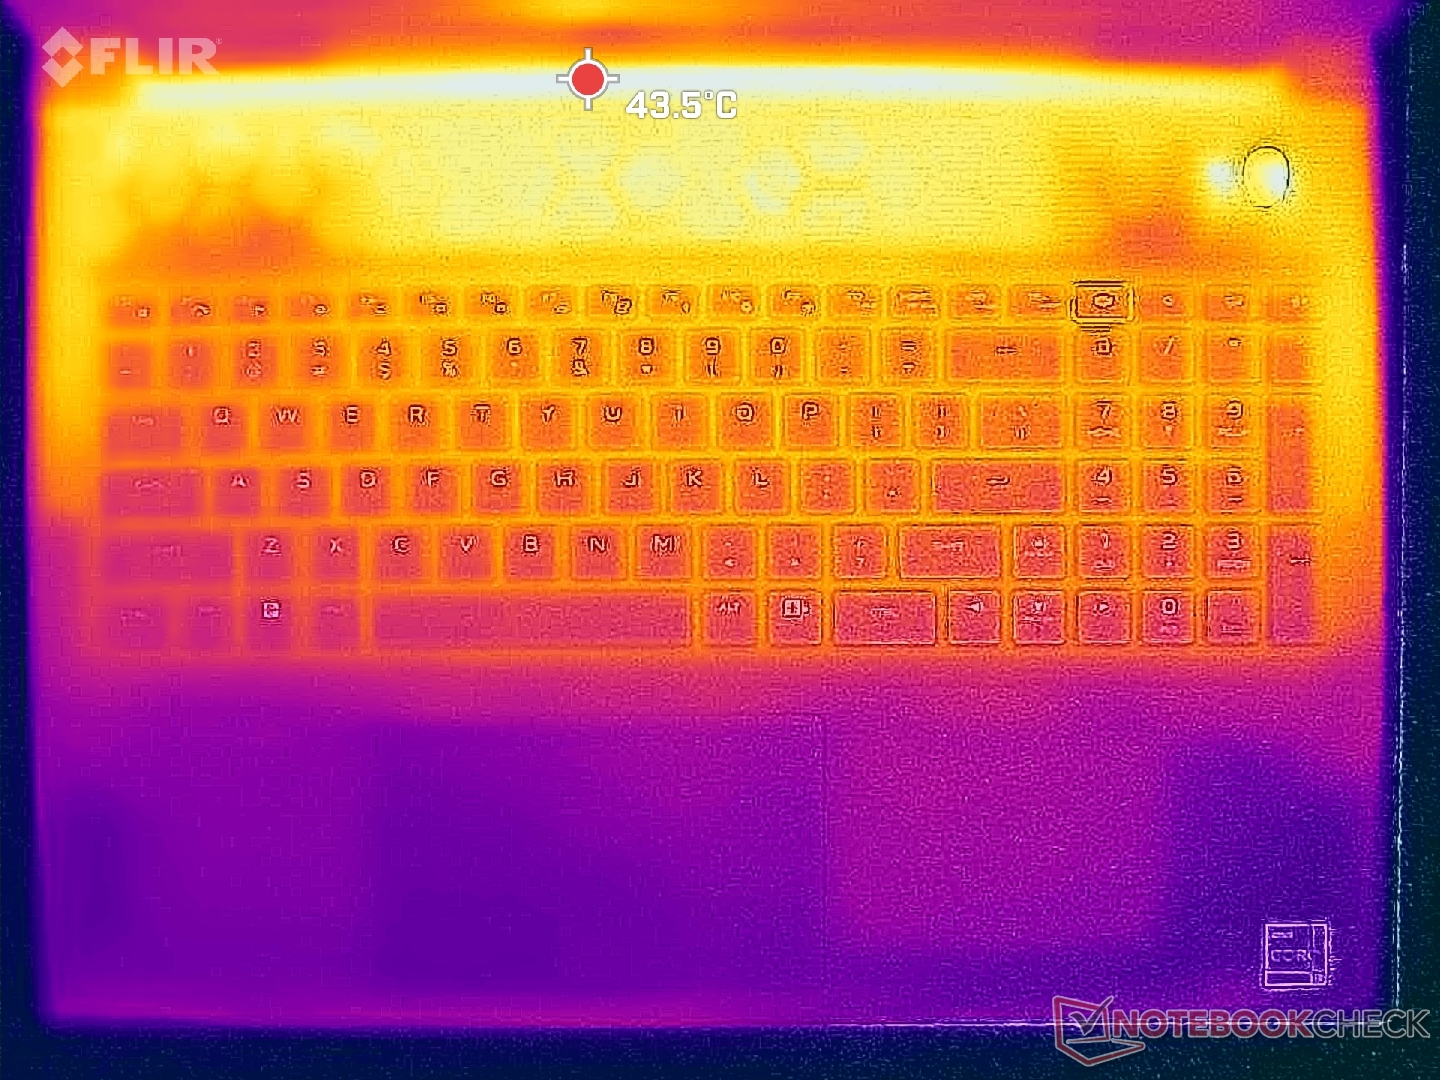
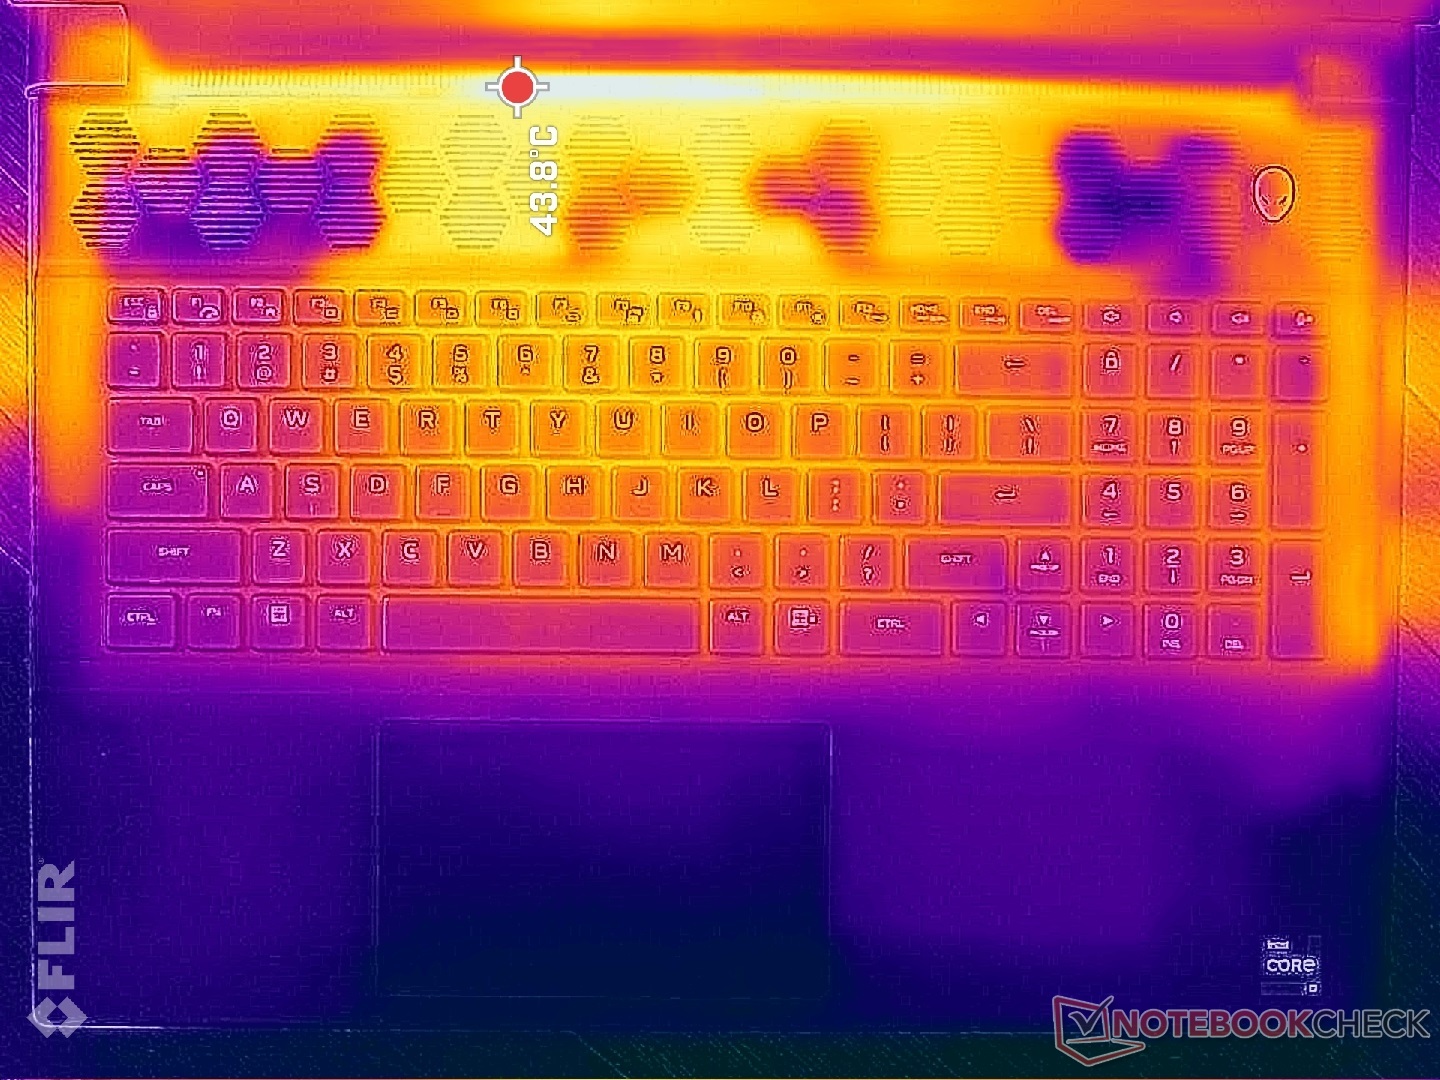
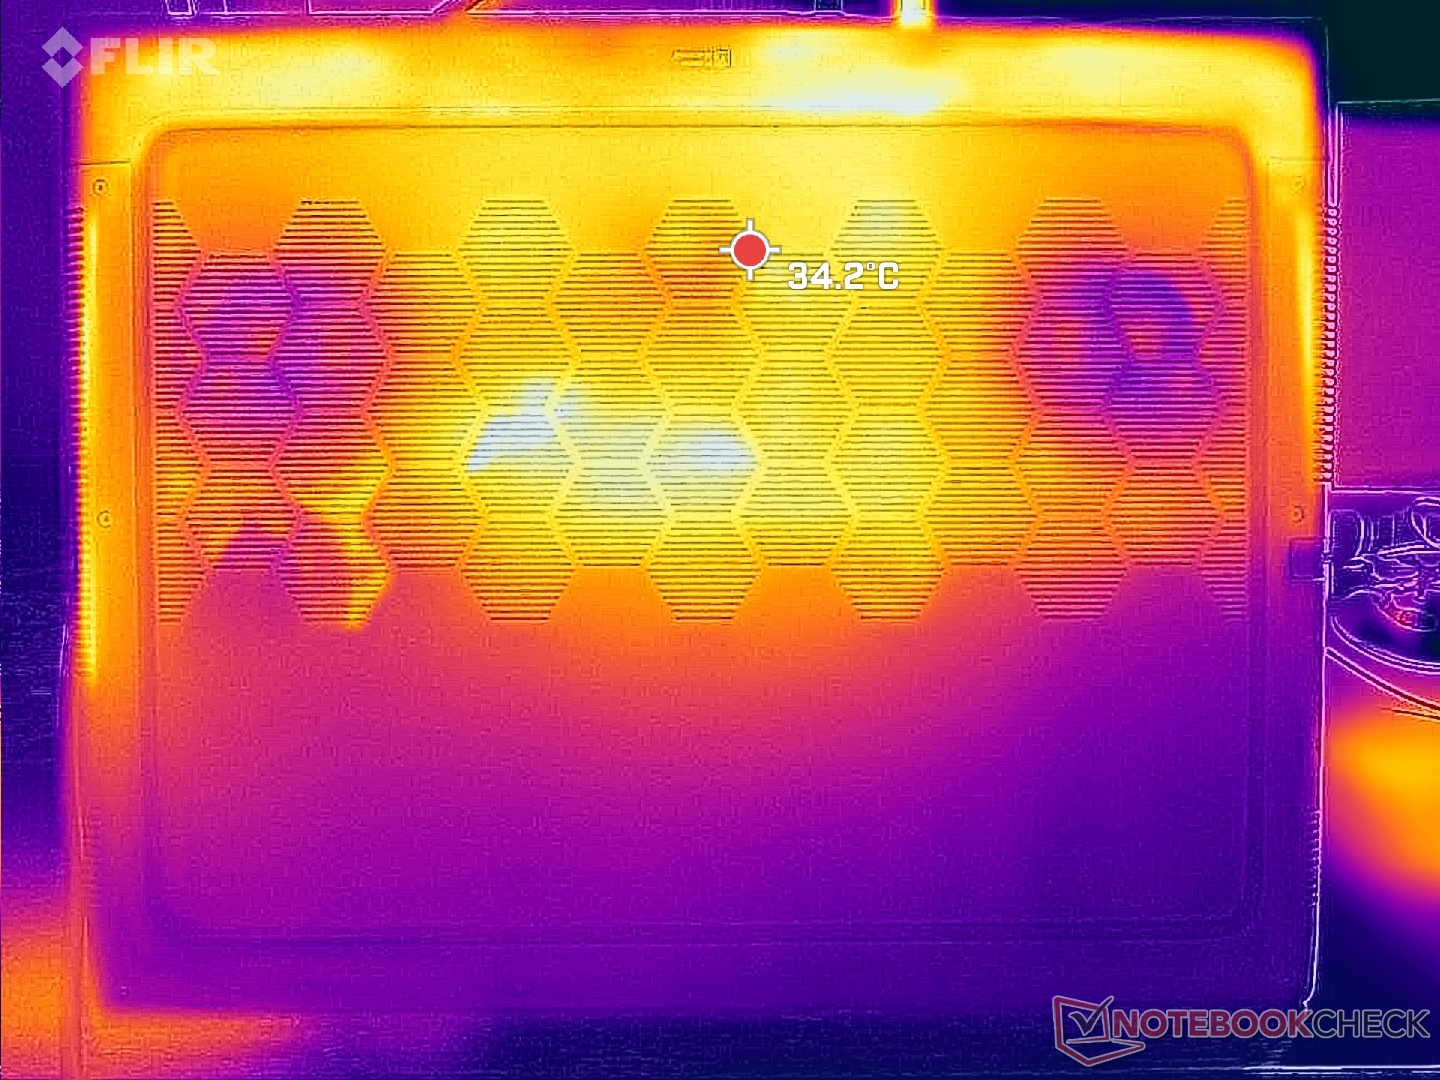
Temperatur
Die durchschnittlichen Oberflächentemperaturen sind im Allgemeinen kühler als die, die wir beim Asus ROG Strix G18 beobachtet haben. Heiße Stellen sind auf die Rückseite des Gehäuses verlagert, um den Hautkontakt zu minimieren.
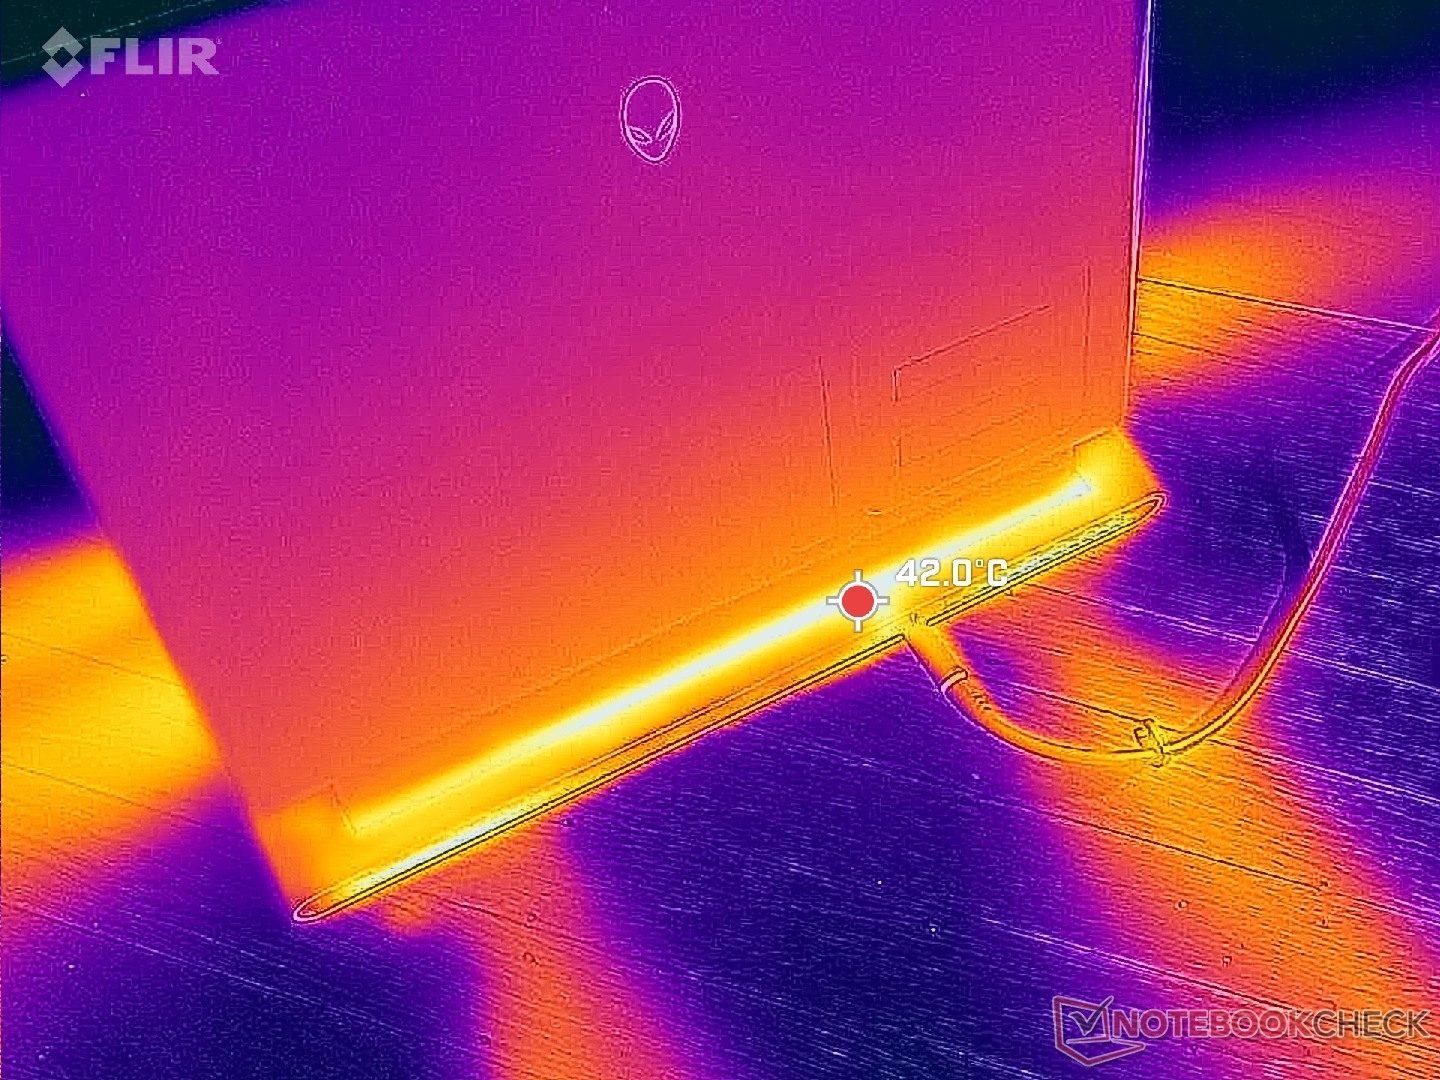
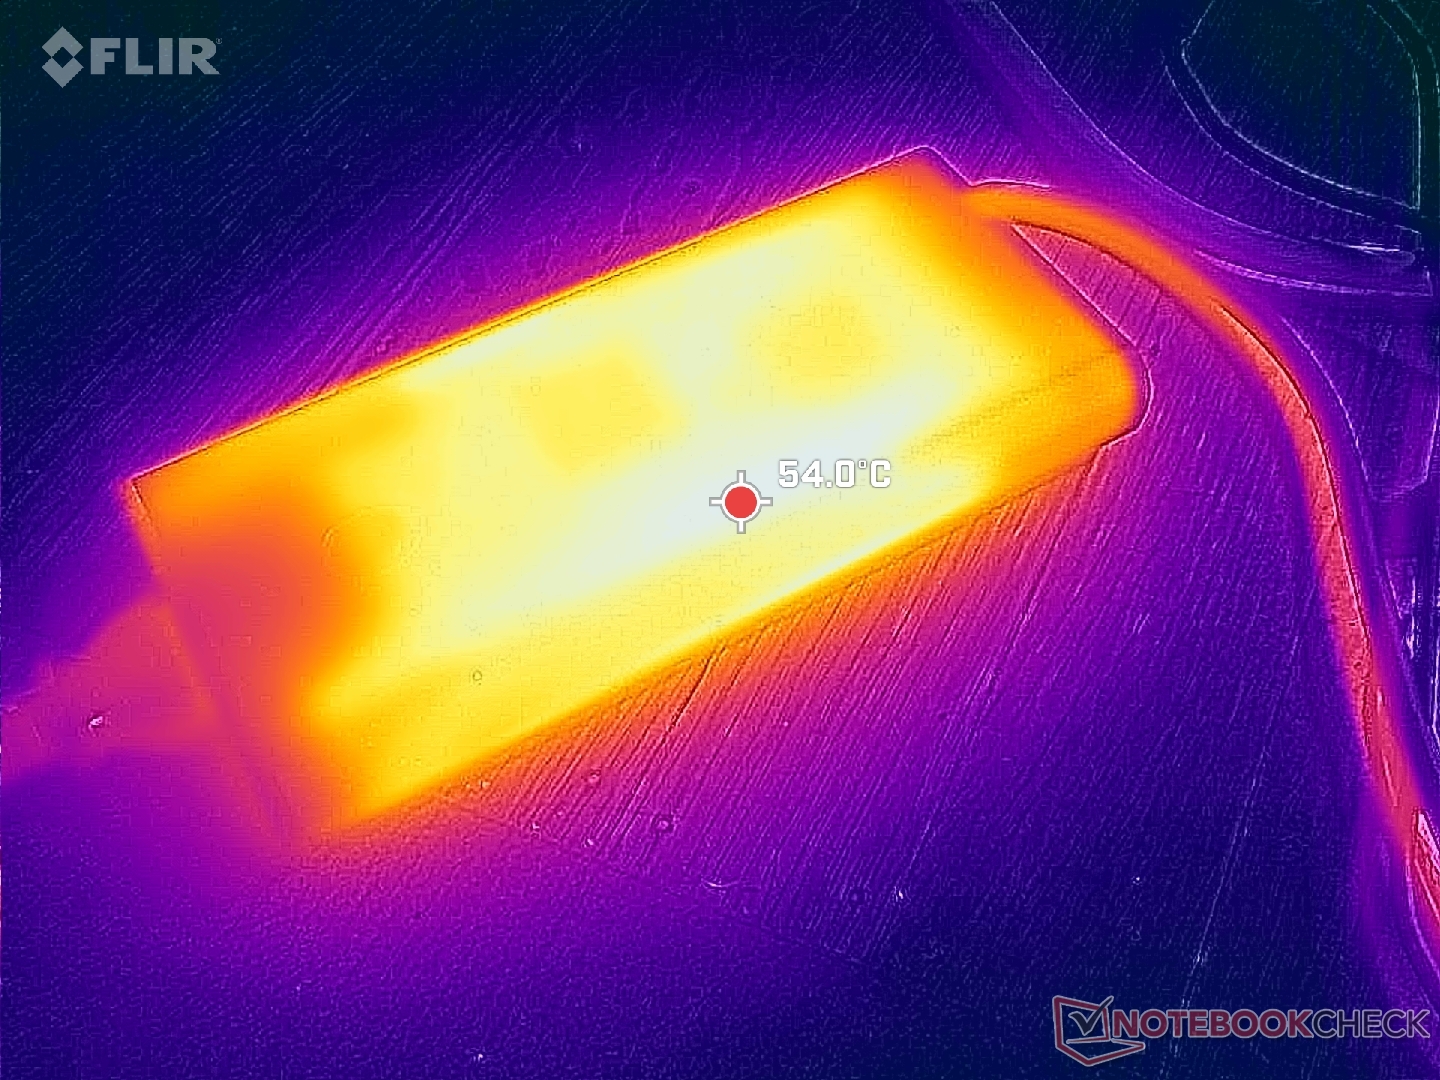
(±) Die maximale Temperatur auf der Oberseite ist 41.2 °C. Im Vergleich liegt der Klassendurchschnitt bei 40.4 °C (von 21.2 bis 68.8 °C für die Klasse Gaming).
(+) Auf der Unterseite messen wir eine maximalen Wert von 34.6 °C (im Vergleich zum Durchschnitt von 43.2 °C).
(±) Ohne Last messen wir eine durchschnittliche Temperatur von 34.9 °C auf der Oberseite. Der Klassendurchschnitt erreicht 33.9 °C.
(±) Beim längeren Spielen von The Witcher 3 erhitzt sich das Gerät durchschnittlich auf 32 °C. Der Durchschnitt der Klasse ist derzeit 33.9 °C.
(+) Die Handballen und der Touchpad-Bereich sind mit gemessenen 28.2 °C kühler als die typische Hauttemperatur und fühlen sich dadurch kühl an.
(±) Die durchschnittliche Handballen-Temperatur anderer getesteter Geräte war 28.8 °C (+0.6 °C).


| Alienware m18 R2 Intel Core i9-14900HX, NVIDIA GeForce RTX 4090 Laptop GPU | Alienware m18 R1 AMD AMD Ryzen 9 7945HX, AMD Radeon RX 7900M | Alienware m18 R1 Intel Core i9-13980HX, NVIDIA GeForce RTX 4090 Laptop GPU | MSI Titan 18 HX A14VIG Intel Core i9-14900HX, NVIDIA GeForce RTX 4090 Laptop GPU | Asus ROG Strix G18 G814JI Intel Core i7-13650HX, NVIDIA GeForce RTX 4070 Laptop GPU | Acer Predator Helios 18 N23Q2 Intel Core i9-13900HX, NVIDIA GeForce RTX 4080 Laptop GPU | |
|---|---|---|---|---|---|---|
| Hitze | 13% | 17% | 9% | 5% | -4% | |
| Last oben max * (°C) | 41.2 | 40.2 2% | 39 5% | 37.8 8% | 45 -9% | 35 15% |
| Last unten max * (°C) | 34.6 | 37.4 -8% | 36.4 -5% | 37.6 -9% | 47 -36% | 56 -62% |
| Idle oben max * (°C) | 42.8 | 31.6 26% | 29.2 32% | 34.8 19% | 28 35% | 34 21% |
| Idle unten max * (°C) | 43.6 | 30.6 30% | 27.8 36% | 36 17% | 31 29% | 39 11% |
* ... kleinere Werte sind besser
Lautsprecher

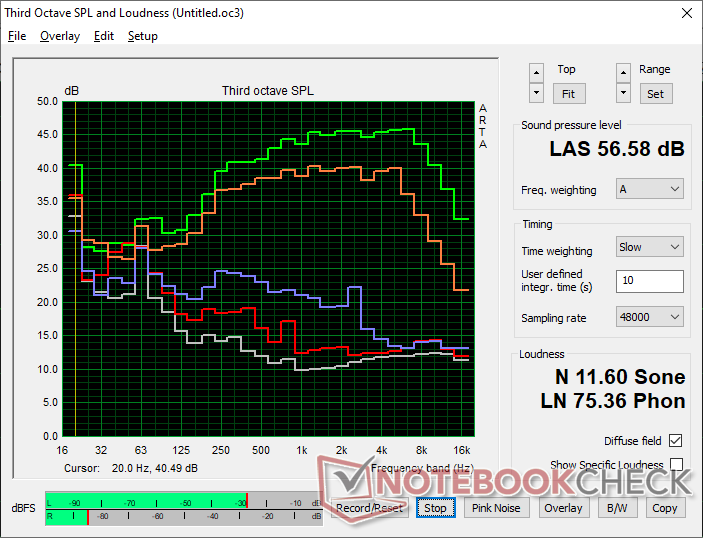
Alienware m18 R2 Audio Analyse
(+) | Die Lautsprecher können relativ laut spielen (82.5 dB)
Bass 100 - 315 Hz
(-) | kaum Bass - 22.1% niedriger als der Median
(±) | durchschnittlich lineare Bass-Wiedergabe (14% Delta zum Vorgänger)
Mitteltöne 400 - 2000 Hz
(+) | ausgeglichene Mitten, vom Median nur 4.1% abweichend
(+) | lineare Mitten (3.3% Delta zum Vorgänger)
Hochtöne 2 - 16 kHz
(+) | ausgeglichene Hochtöne, vom Median nur 4% abweichend
(+) | sehr lineare Hochtöne (6.1% Delta zum Vorgänger)
Gesamt im hörbaren Bereich 100 - 16.000 Hz
(±) | hörbarer Bereich ist durchschnittlich linear (17% Abstand zum Median)
Im Vergleich zu allen Geräten derselben Klasse
» 45% aller getesteten Geräte dieser Klasse waren besser, 12% vergleichbar, 43% schlechter
» Das beste Gerät hat einen Delta-Wert von 6%, durchschnittlich ist 18%, das schlechteste Gerät hat 132%
Im Vergleich zu allen Geräten im Test
» 30% aller getesteten Geräte waren besser, 8% vergleichbar, 62% schlechter
» Das beste Gerät hat einen Delta-Wert von 4%, durchschnittlich ist 24%, das schlechteste Gerät hat 134%
Apple MacBook Pro 16 2021 M1 Pro Audio Analyse
(+) | Die Lautsprecher können relativ laut spielen (84.7 dB)
Bass 100 - 315 Hz
(+) | guter Bass - nur 3.8% Abweichung vom Median
(+) | lineare Bass-Wiedergabe (5.2% Delta zum Vorgänger)
Mitteltöne 400 - 2000 Hz
(+) | ausgeglichene Mitten, vom Median nur 1.3% abweichend
(+) | lineare Mitten (2.1% Delta zum Vorgänger)
Hochtöne 2 - 16 kHz
(+) | ausgeglichene Hochtöne, vom Median nur 1.9% abweichend
(+) | sehr lineare Hochtöne (2.7% Delta zum Vorgänger)
Gesamt im hörbaren Bereich 100 - 16.000 Hz
(+) | hörbarer Bereich ist sehr linear (4.6% Abstand zum Median
Im Vergleich zu allen Geräten derselben Klasse
» 0% aller getesteten Geräte dieser Klasse waren besser, 0% vergleichbar, 100% schlechter
» Das beste Gerät hat einen Delta-Wert von 5%, durchschnittlich ist 17%, das schlechteste Gerät hat 45%
Im Vergleich zu allen Geräten im Test
» 0% aller getesteten Geräte waren besser, 0% vergleichbar, 100% schlechter
» Das beste Gerät hat einen Delta-Wert von 4%, durchschnittlich ist 24%, das schlechteste Gerät hat 134%
Energieverwaltung
Energieaufnahme
Die Ausführung von Witcher 3, die eine typische Spielelast darstellt, würde im Durchschnitt 328 W verbrauchen, was leicht über dem Wert liegt, den wir bei der letztjährigen m18 R1 Intel-Version gemessen haben. In Bezug auf die Leistung pro Watt gibt es also keine großen Fortschritte, da sich die zugrunde liegende Hardware nicht verändert hat.
Neu in diesem Jahr ist das leistungsstärkere 360-Watt-Netzteil, während der m18 R1 mit einem 330-Watt-Netzteil ausgeliefert wird. Das neue Netzteil ist aufgrund der Umstellung auf die GaN-Technologie auch kleiner (~18,9 x 8,6 x 2,6 cm gegenüber ~19,5 x 9,8 x 4 cm). Der Adapter mit höherer Kapazität verringert das Risiko einer Drosselung und ermöglicht ein schnelleres Aufladen bei gleichzeitigem Betrieb anspruchsvoller Lasten.
(Hinweis der Redaktion: Dieser Abschnitt wird aktualisiert, sobald die Reparaturen an unserem Metrahit Energy Multimeter abgeschlossen sind. Wir entschuldigen uns für etwaige Unannehmlichkeiten).
| Aus / Standby | |
| Idle | |
| Last |
|
Legende:
min: | |
| Alienware m18 R2 i9-14900HX, GeForce RTX 4090 Laptop GPU, SK Hynix PC811 HFS002TEM9X152N, IPS, 2560x1600, 18" | Alienware m18 R1 AMD R9 7945HX, Radeon RX 7900M, Kioxia XG8 KXG80ZNV1T02, IPS, 1920x1200, 18" | Alienware m18 R1 i9-13980HX, GeForce RTX 4090 Laptop GPU, SK hynix PC801 HFS001TEJ9X101N, IPS, 1920x1200, 18" | MSI Titan 18 HX A14VIG i9-14900HX, GeForce RTX 4090 Laptop GPU, 2x Samsung PM9A1a MZVL22T0HDLB (RAID 0), Mini-LED, 3840x2400, 18" | Asus ROG Strix G18 G814JI i7-13650HX, GeForce RTX 4070 Laptop GPU, Micron 2400 MTFDKBA1T0QFM, IPS, 2560x1600, 18" | Acer Predator Helios 18 N23Q2 i9-13900HX, GeForce RTX 4080 Laptop GPU, Samsung PM9A1 MZVL22T0HBLB, IPS, 2560x1600, 18" | |
|---|---|---|---|---|---|---|
| Stromverbrauch | -72% | -21% | -9% | 36% | 13% | |
| Idle min * (Watt) | 10.6 | 30.3 -186% | 21.6 -104% | 13.2 -25% | 8 25% | 16 -51% |
| Idle avg * (Watt) | 20.9 | 55.6 -166% | 25.2 -21% | 25.4 -22% | 15 28% | 19 9% |
| Idle max * (Watt) | 40 | 101.1 -153% | 56.7 -42% | 53.5 -34% | 26 35% | 21.3 47% |
| Last avg * (Watt) | 201.1 | 160.3 20% | 164.1 18% | 151.4 25% | 102 49% | 124 38% |
| Witcher 3 ultra * (Watt) | 358 | 216 40% | 311 13% | 336 6% | 178.6 50% | 289 19% |
| Last max * (Watt) | 378.9 | 332.1 12% | 338.9 11% | 395.2 -4% | 267 30% | 319 16% |
* ... kleinere Werte sind besser
Energieverbrauch Witcher 3 / Stresstest
Energieverbrauch externer Monitor
Akkulaufzeit
Die Laufzeiten bleiben in etwa gleich wie zuvor, wenn nicht sogar etwas länger, nämlich etwa eine halbe Stunde. Dies steht im Gegensatz zu unserer m18 R1 AMD-Konfiguration, die während des Tests Probleme mit der Akkuleistung aufwies.
Das Aufladen über USB-C ist weiterhin nicht möglich.
| Alienware m18 R2 i9-14900HX, GeForce RTX 4090 Laptop GPU, 97 Wh | Alienware m18 R1 AMD R9 7945HX, Radeon RX 7900M, 97 Wh | Alienware m18 R1 i9-13980HX, GeForce RTX 4090 Laptop GPU, 97 Wh | MSI Titan 18 HX A14VIG i9-14900HX, GeForce RTX 4090 Laptop GPU, 99.9 Wh | Asus ROG Strix G18 G814JI i7-13650HX, GeForce RTX 4070 Laptop GPU, 90 Wh | Acer Predator Helios 18 N23Q2 i9-13900HX, GeForce RTX 4080 Laptop GPU, 90 Wh | |
|---|---|---|---|---|---|---|
| Akkulaufzeit | -71% | -10% | -12% | 69% | -8% | |
| WLAN (h) | 4.8 | 1.4 -71% | 4.3 -10% | 4.2 -12% | 8.1 69% | 4.4 -8% |
| Idle (h) | 4.5 | 5.6 | 5.9 | 11.7 | ||
| Last (h) | 0.7 | 0.7 | 1.2 | 1.2 | 1.7 | |
| H.264 (h) | 4.8 |
Pro
Contra
Fazit — Eher wie ein Alienware m18 R1.1

Gaming-Laptops stehen dieses Jahr vor einer Herausforderung. Die Raptor Lake-HX-Refresh-CPUs ähneln ihren Pendants aus dem Jahr 2023 fast identisch, und es wurden keine neuen Ankündigungen gemacht, um die ein Jahr alte RTX 4090 zu ersetzen. Infolgedessen sind neue Gaming-Laptops wie das Alienware m18 R2 mehr oder weniger auf die gleichen Komponenten wie die Vorjahresmodelle angewiesen. Nutzer, die das Alienware m18 R2 interessieren, sollten daher eine ähnliche Leistung wie beim Alienware m18 R1 erwarten.
Das Alienware m18 R2 ist im Vergleich zum Alienware m18 R1 ein Rückschritt. Es bleibt eines der schnellsten Gaming-Notebooks auf dem Markt, aber die Verbesserungen gegenüber dem Vorjahr sind bestenfalls marginal.
Es gibt zwar ein paar kleinere Verbesserungen wie den schnelleren RJ-45-Anschluss, das kleinere Netzteil und die neuen SSD-Optionen, aber die Benutzererfahrung bleibt im Wesentlichen gleich. Wir empfehlen daher, das m18 R1 dem m18 R2 vorzuziehen, insbesondere da das m18 R1 jetzt zu einem günstigeren Preis erhältlich ist.
Preis und Verfügbarkeit
Dell is now shipping the Alienware m18 R2 starting at $1900 USD for the base Core i7-14650HX, GeForce RTX 4060, and 1600p165 display configuration up to over $3200 of configured with the Core i9-14900HX, RTX 4090, and 1200p480 display.
Dell liefert ab sofort das Alienware m18 R2 ab 2.199 Euro für die Basiskonfiguration mit Core i7-14650HX, GeForce RTX 4060 und 1600p165-Display bis zu über 3.949 Euro für die Konfiguration mit Core i9-14900HX, RTX 4090 und 1200p480-Display.
Alienware m18 R2
- 22.03.2024 v7 (old)
Allen Ngo
Transparenz
Die Auswahl der zu testenden Geräte erfolgt innerhalb der Redaktion. Das vorliegende Testmuster wurde dem Autor vom Hersteller oder einem Shop zu Testzwecken leihweise zur Verfügung gestellt. Eine Einflussnahme des Leihstellers auf den Testbericht gab es nicht, der Hersteller erhielt keine Version des Reviews vor der Veröffentlichung. Es bestand keine Verpflichtung zur Publikation. Als eigenständiges, unabhängiges Unternehmen unterliegt Notebookcheck keiner Diktion von Herstellern, Shops und Verlagen.
So testet Notebookcheck
Pro Jahr werden von Notebookcheck hunderte Laptops und Smartphones unabhängig in von uns standardisierten technischen Verfahren getestet, um eine Vergleichbarkeit aller Testergebnisse zu gewährleisten. Seit rund 20 Jahren entwickeln wir diese Testmethoden kontinuierlich weiter und setzen damit Branchenstandards. In unseren Testlaboren kommt ausschließlich hochwertiges Messequipment in die Hände erfahrener Techniker und Redakteure. Die Tests unterliegen einer mehrstufigen Kontrolle. Unsere komplexe Gesamtbewertung basiert auf hunderten fundierten Messergebnissen und Benchmarks, womit Ihnen Objektivität garantiert ist. Weitere Informationen zu unseren Testmethoden gibt es hier.
Preisvergleich

