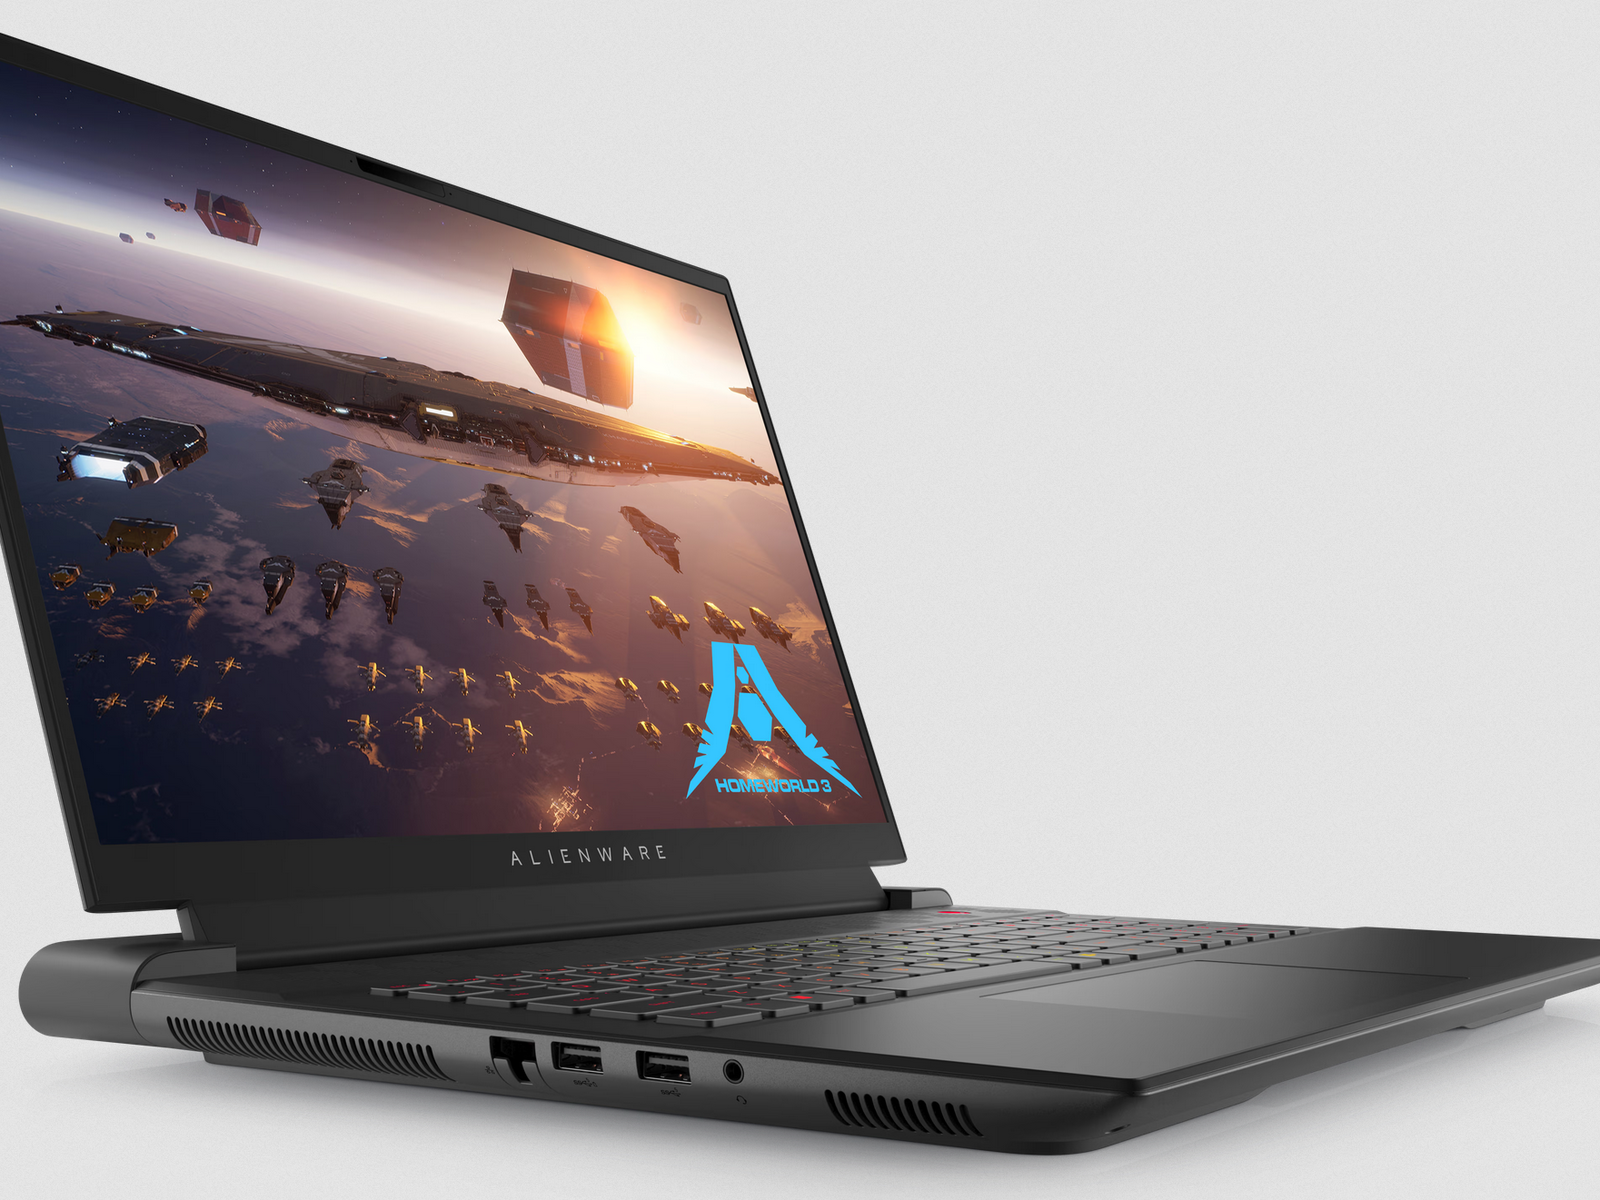
AMD Radeon RX 7900M gibt ihr Leistungsdebut: Alienware m18 R1 im Laptop-Test

Als erster 18-Zoll-Gaming-Laptop von Alienware in über einer Dekade bietet Dell für sein Alienware M18 R1 quasi alle möglichen Kombinationen von Intel, AMD und Nvidia an, um so viele Gamer anzusprechen wie möglich. Nutzer können daher Intel-Nvidia-, AMD-Nvidia- oder AMD-AMD-Optionen nach eigenen CPU-GPU-Wünschen mixen, was für einen Gaming-Laptop bislang eher ungewöhnlich ist.
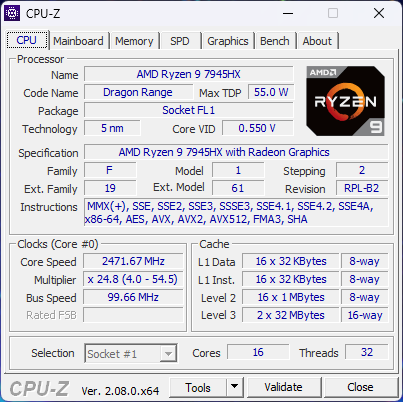
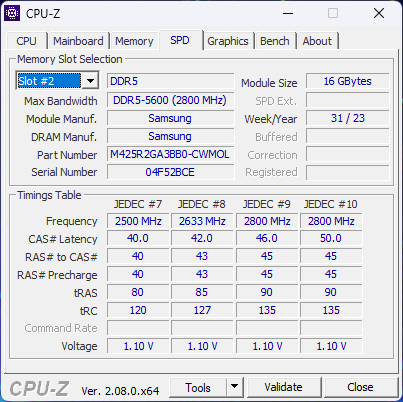
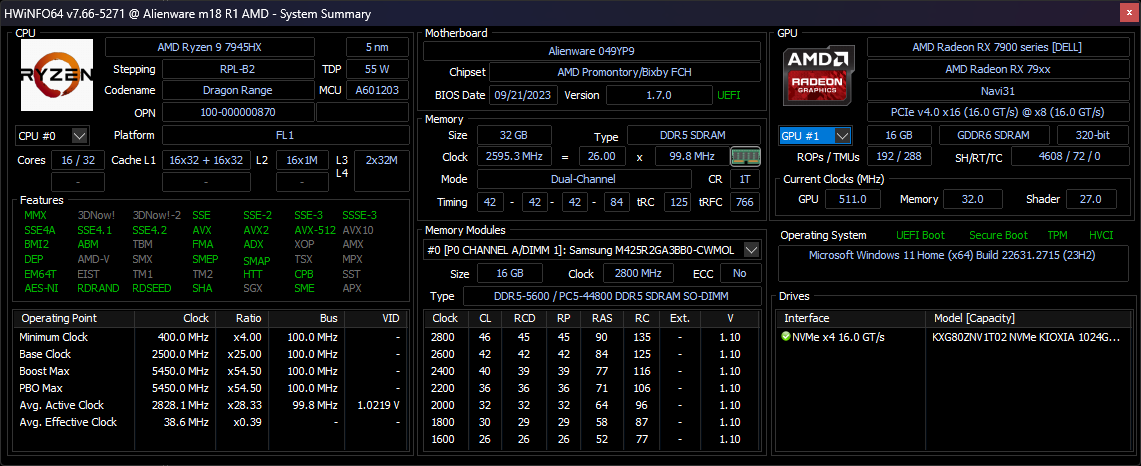
Unsere Testeinheit stellt die neueste AMD-AMD-Konfiguration dar und bietet als einer der ersten Laptops die brandneue 180-W-RNDA3-Radeon-RX-7900M als an Alternative zur bislang klar vorherrschenden mobilen GeForce RTX 4080. Dabei unterbietet die Version mit AMD-GPU den Preis der RTX-4090-Konfiguration um $1200 USD, während alle anderen Ausstattungsmerkmale gleich bleiben. Der Endpreis liegt bei $2300 USD (ca. 2.100 Euro).
Alternativen zum Alienware m18 R1 finden sich in anderen High-End-18-Zöllern wie dem Asus ROG Strix Scar 18, dem Razer Blade 18 oder dem Acer Predator Helios 18. MSI bietet momentan noch keine modernen 18-Zoll-Gaming-Laptops an.
Weitere Dell-Tests:
Potentielle Konkurrenten im Vergleich
Bew. | Datum | Modell | Gewicht | Dicke | Größe | Auflösung | Preis ab |
|---|---|---|---|---|---|---|---|
| 89.2 % v7 (old) | 11 / 2023 | Alienware m18 R1 AMD R9 7945HX, Radeon RX 7900M | 3.9 kg | 26.7 mm | 18.00" | 1920x1200 | |
| 90.7 % v7 (old) | 04 / 2023 | Alienware m18 R1 i9-13980HX, GeForce RTX 4090 Laptop GPU | 3.9 kg | 26.7 mm | 18.00" | 1920x1200 | |
| 88.3 % v7 (old) | 10 / 2023 | Acer Predator Helios 18 N23Q2 i9-13900HX, GeForce RTX 4080 Laptop GPU | 3.2 kg | 29.15 mm | 18.00" | 2560x1600 | |
| 91.4 % v7 (old) | 02 / 2023 | Razer Blade 18 RTX 4070 i9-13950HX, GeForce RTX 4070 Laptop GPU | 3 kg | 21.9 mm | 18.00" | 2560x1600 | |
| 86.6 % v7 (old) | 02 / 2023 | Asus ROG Strix Scar 18 2023 G834JY-N6005W i9-13980HX, GeForce RTX 4090 Laptop GPU | 3.1 kg | 30.8 mm | 18.00" | 2560x1600 | |
v (old) | MSI Raider GE78 HX 13VI i9-13980HX, GeForce RTX 4090 Laptop GPU | 17.30" | 2560x1600 |
Gehäuse - Genau wie das Intel/Nvidia-Pendant
Alle Intel- und AMD-Konfigurationen des Alienware m18 R1 stecken im gleichen Gehäusedesign mit den gleichen Farboptionen. Daher besteht die einzige optische Möglichkeit der Unterscheidung beider Modelle darin, nach den Thunderbolt-Logos neben den USB-C-Ports auf der Rückseite zu schauen. Ein Blick in unseren Test der Intel-Nvidia-Konfiguration verrät mehr über die physischen Merkmale des Alienware m18 R1.
Enttäuschend ist, dass USB4 nicht unterstützt wird.
SD Card Reader
| SD Card Reader | |
| average JPG Copy Test (av. of 3 runs) | |
| Razer Blade 18 RTX 4070 (Angelibird AV Pro V60) | |
| Alienware m18 R1 (Angelibird AV Pro V60) | |
| Alienware m18 R1 AMD (Toshiba Exceria Pro SDXC 64 GB UHS-II) | |
| Acer Predator Helios 18 N23Q2 | |
| MSI GE78HX 13VH-070US (Angelibird AV Pro V60) | |
| maximum AS SSD Seq Read Test (1GB) | |
| Alienware m18 R1 AMD (Toshiba Exceria Pro SDXC 64 GB UHS-II) | |
| Alienware m18 R1 (Angelibird AV Pro V60) | |
| Razer Blade 18 RTX 4070 (Angelibird AV Pro V60) | |
| MSI GE78HX 13VH-070US (Angelibird AV Pro V60) | |
| Acer Predator Helios 18 N23Q2 | |
Kommunikation
Webcam


Wartung
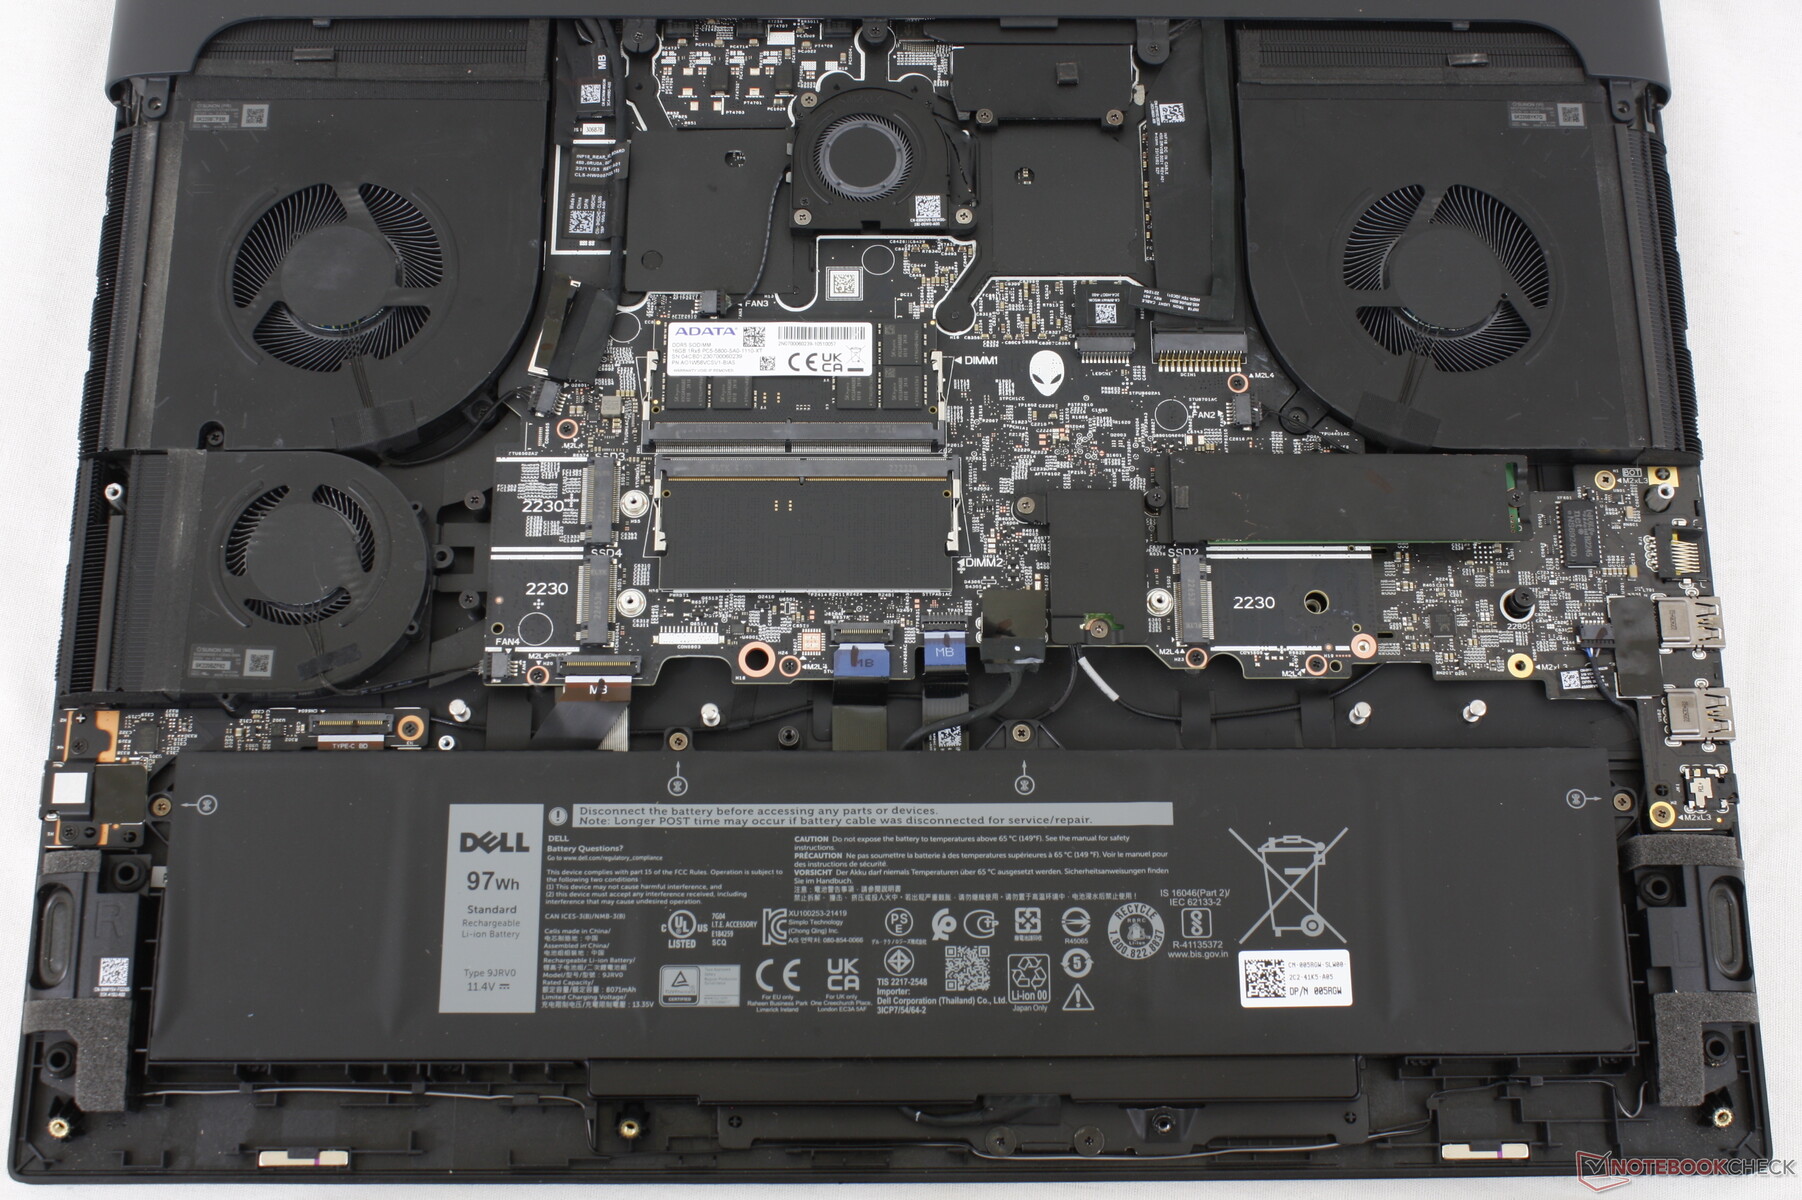
Die AMD-AMD-Konfiguration unterstützt "nur" bis zu drei M.2-NVMe-SSDs, während die Intel-Nvidia-SKUs bis zu vier Plätze bieten, wie unsere Vergleichsbilder unten zeigen. Ansonsten sind die internen Merkmale beider Versionen identisch.

Zubehör und Garantie
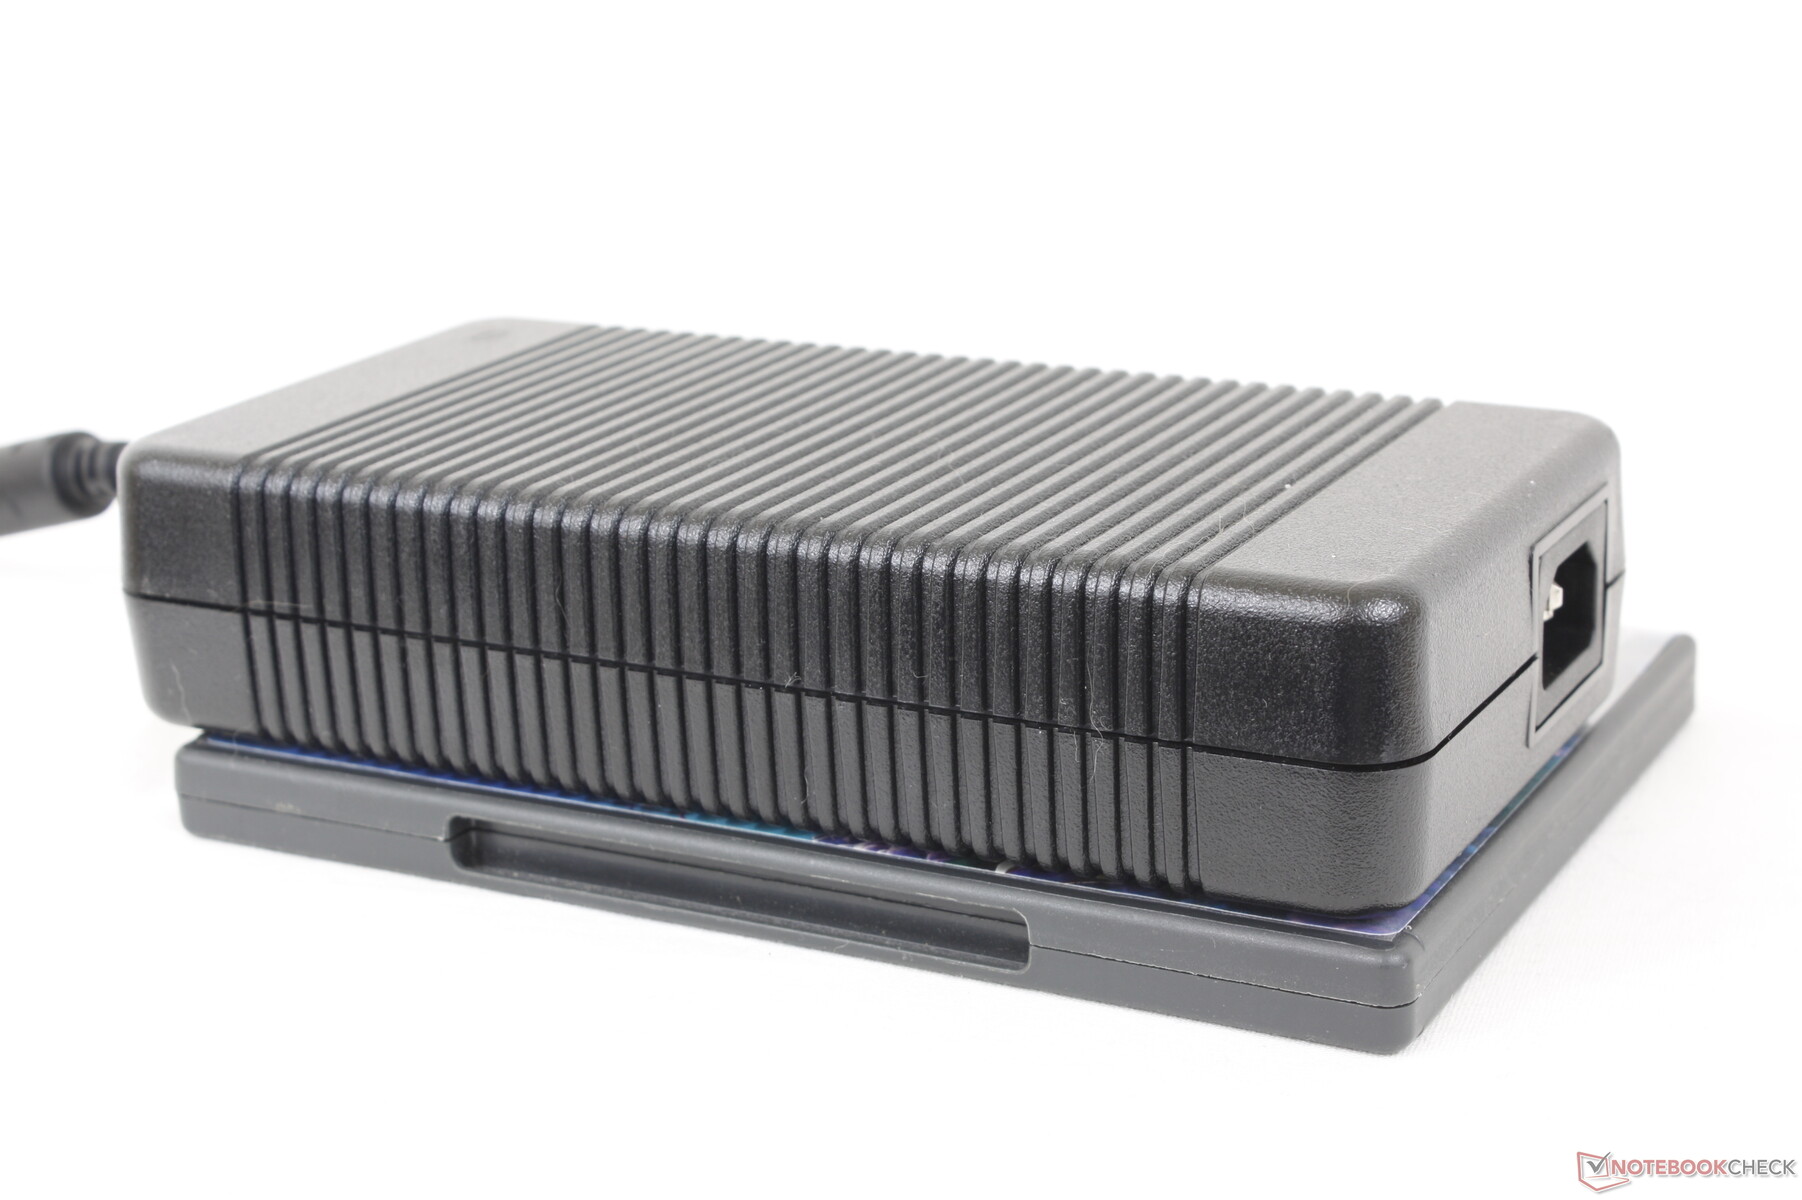
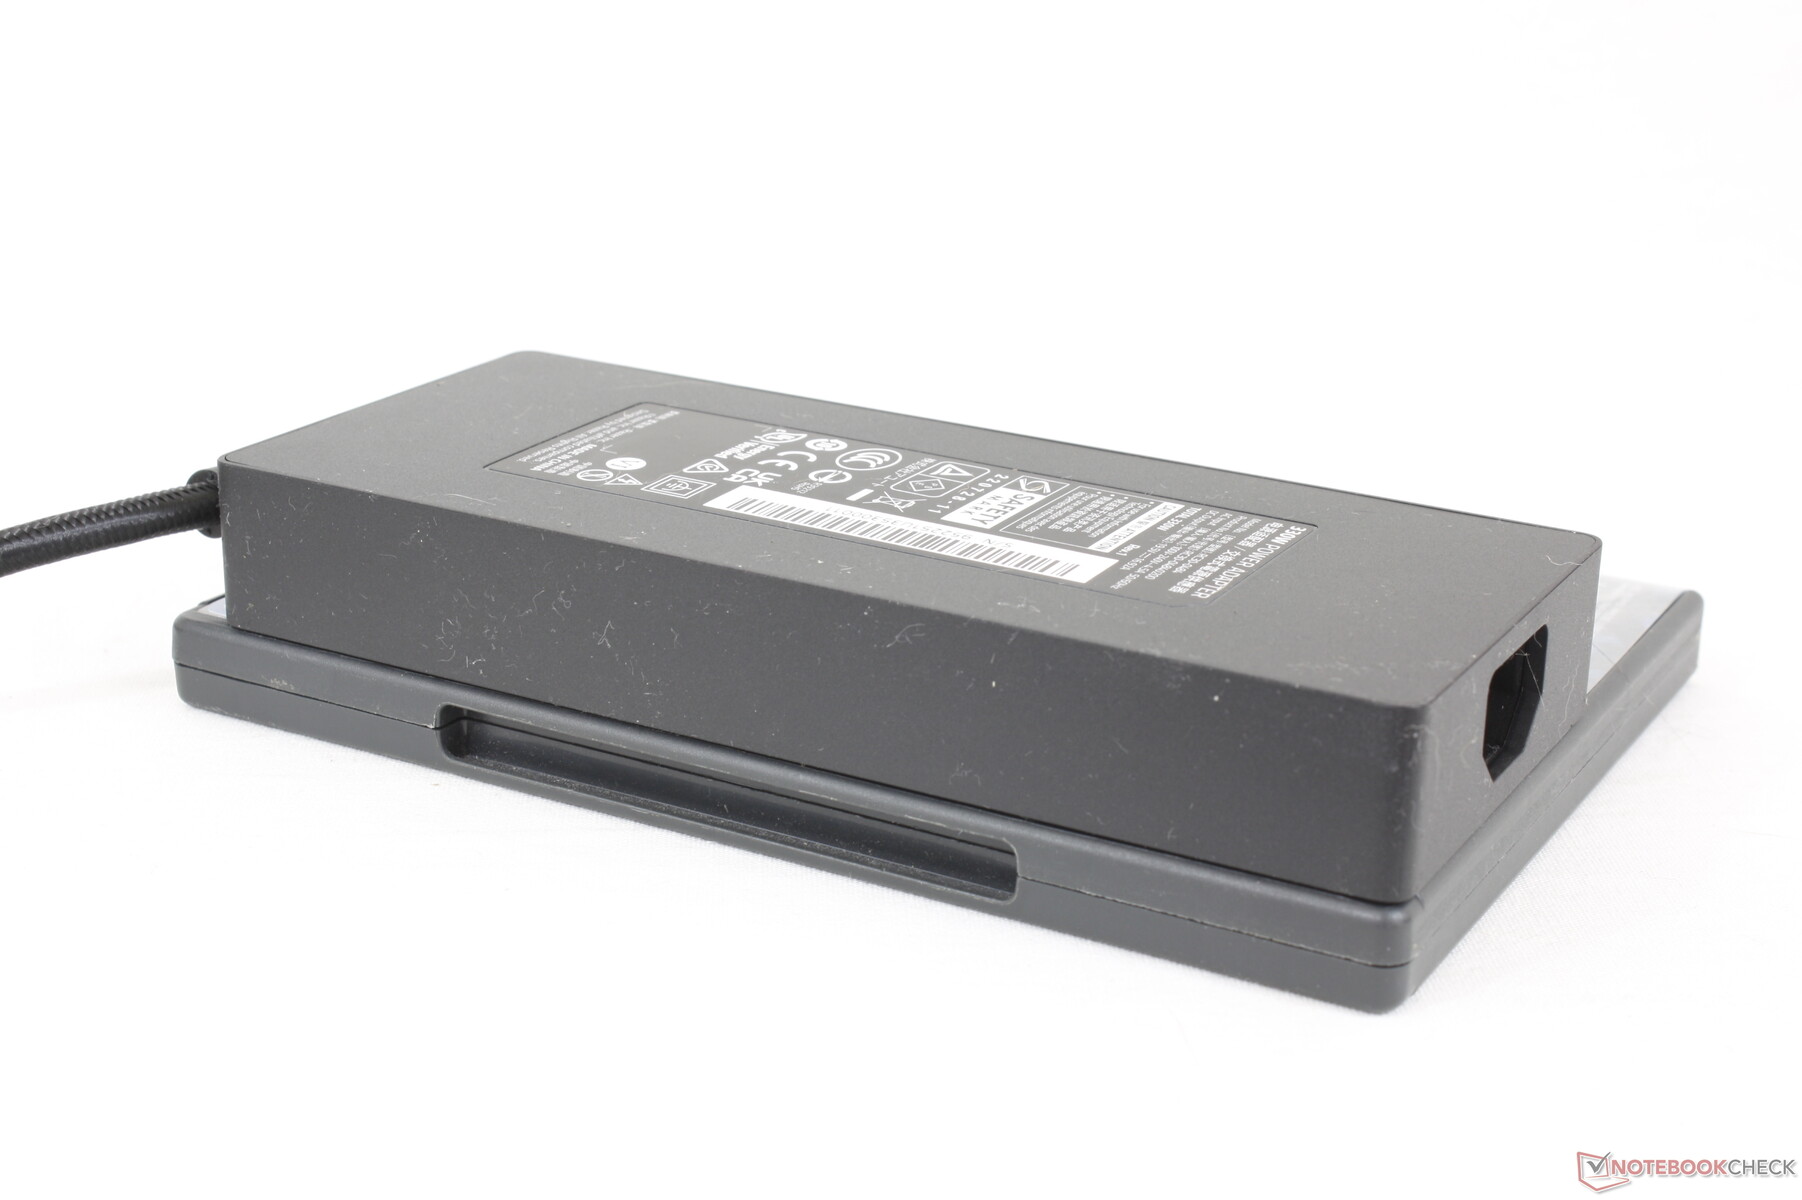
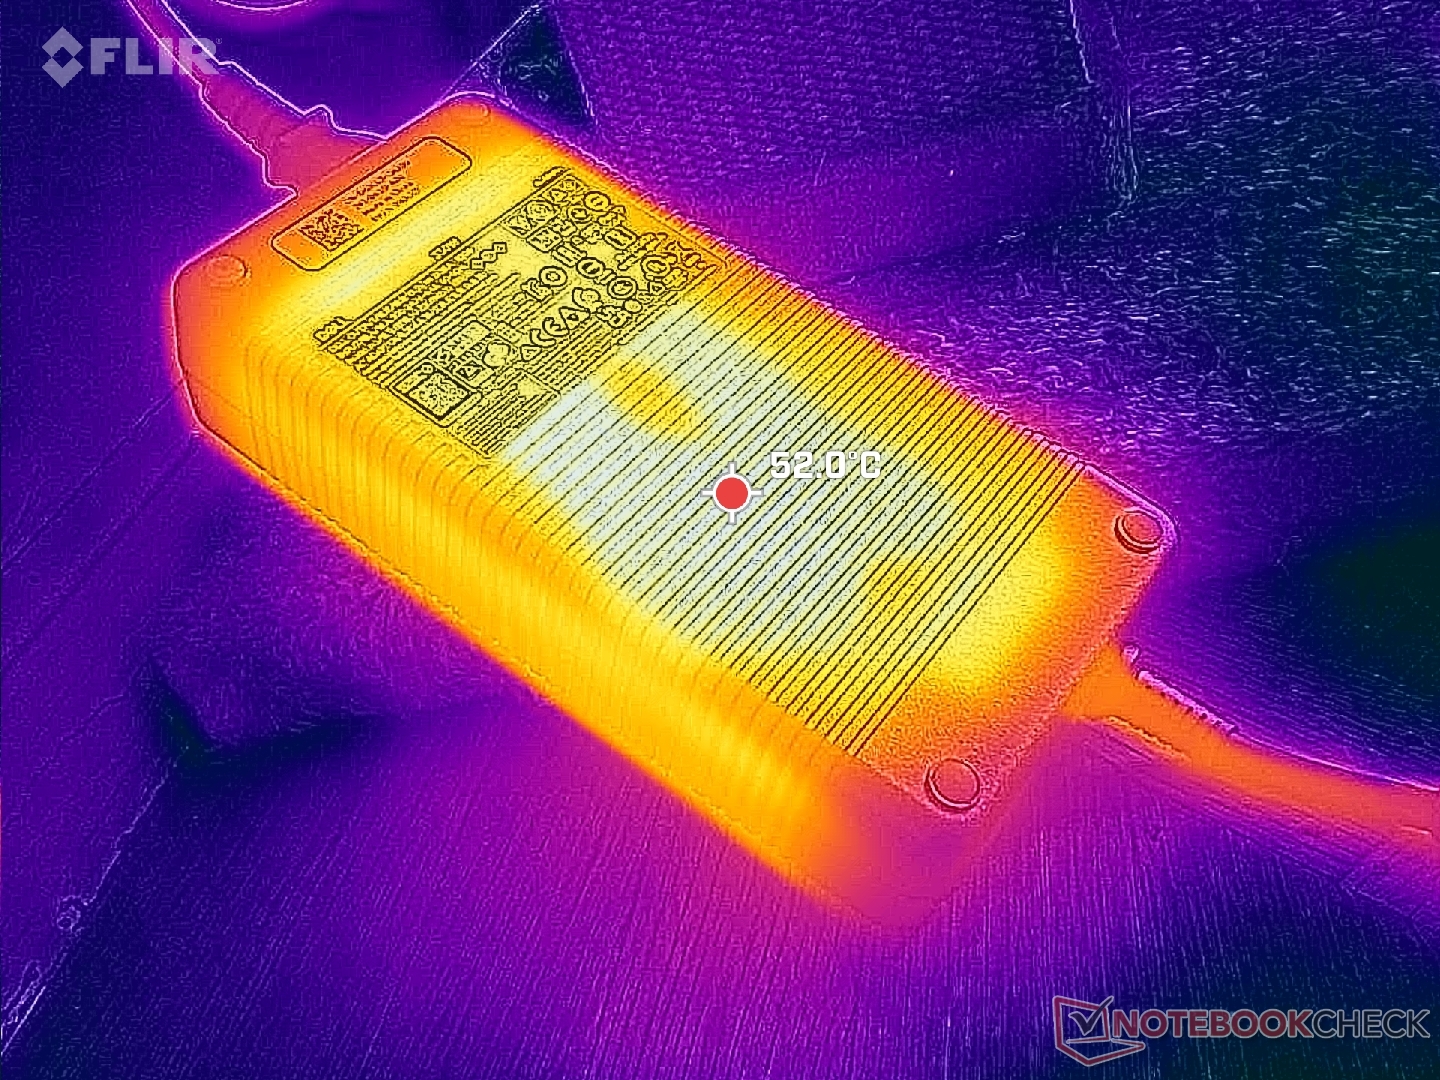
Dell hat den Umstieg von traditionellen auf GaN-Netzteilen noch vor sich. Daher ist das beiliegende 330-W-Netzteil noch sehr klobig im Vergleich zum 330-W-GaN-Netzteil der meisten Razer-Blade-Laptops.
In Deutschland gewährt Dell nur eine Garantie von 12 Monaten.
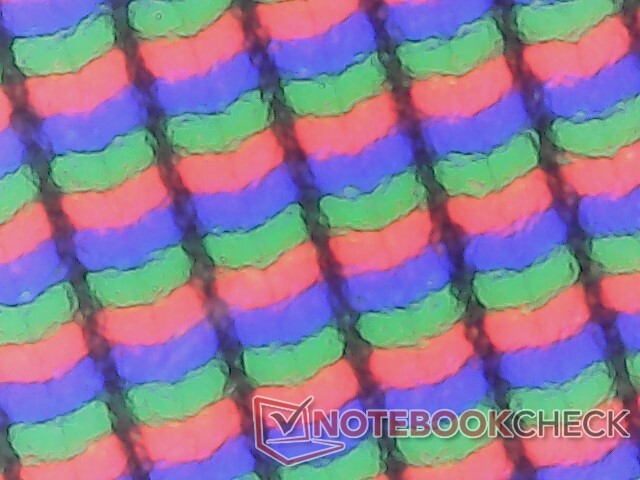
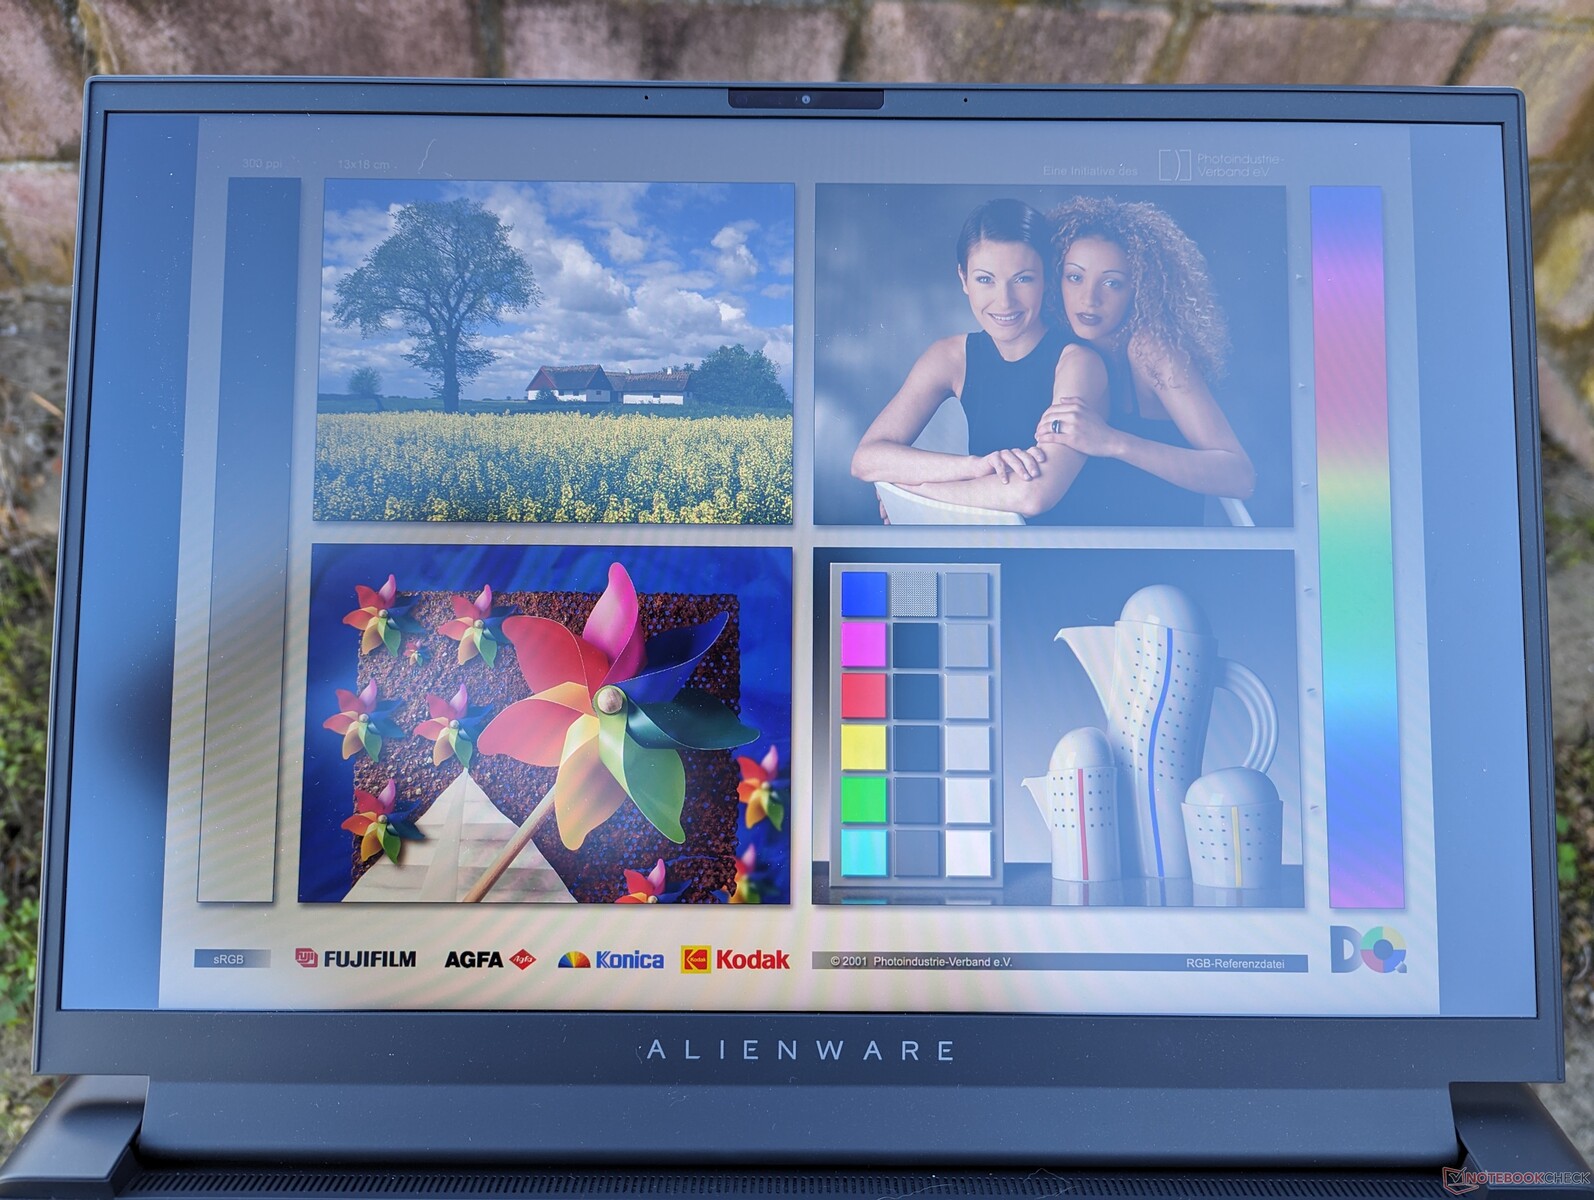
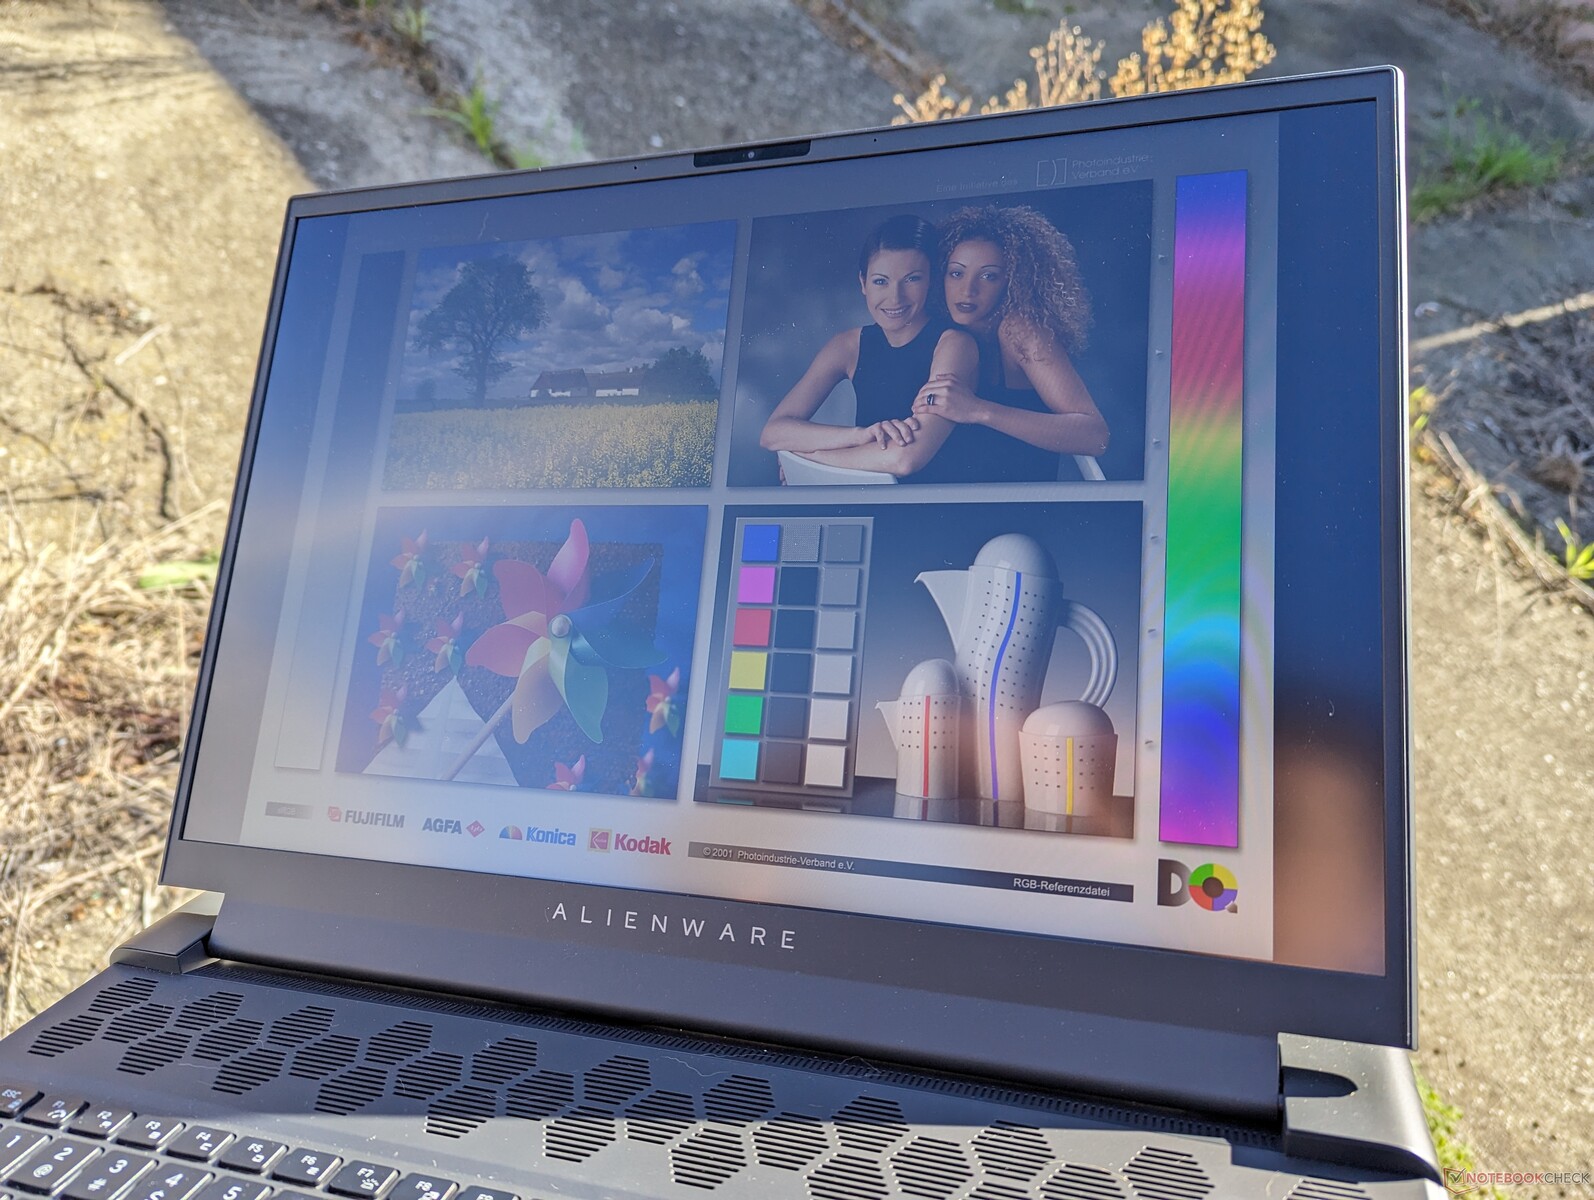
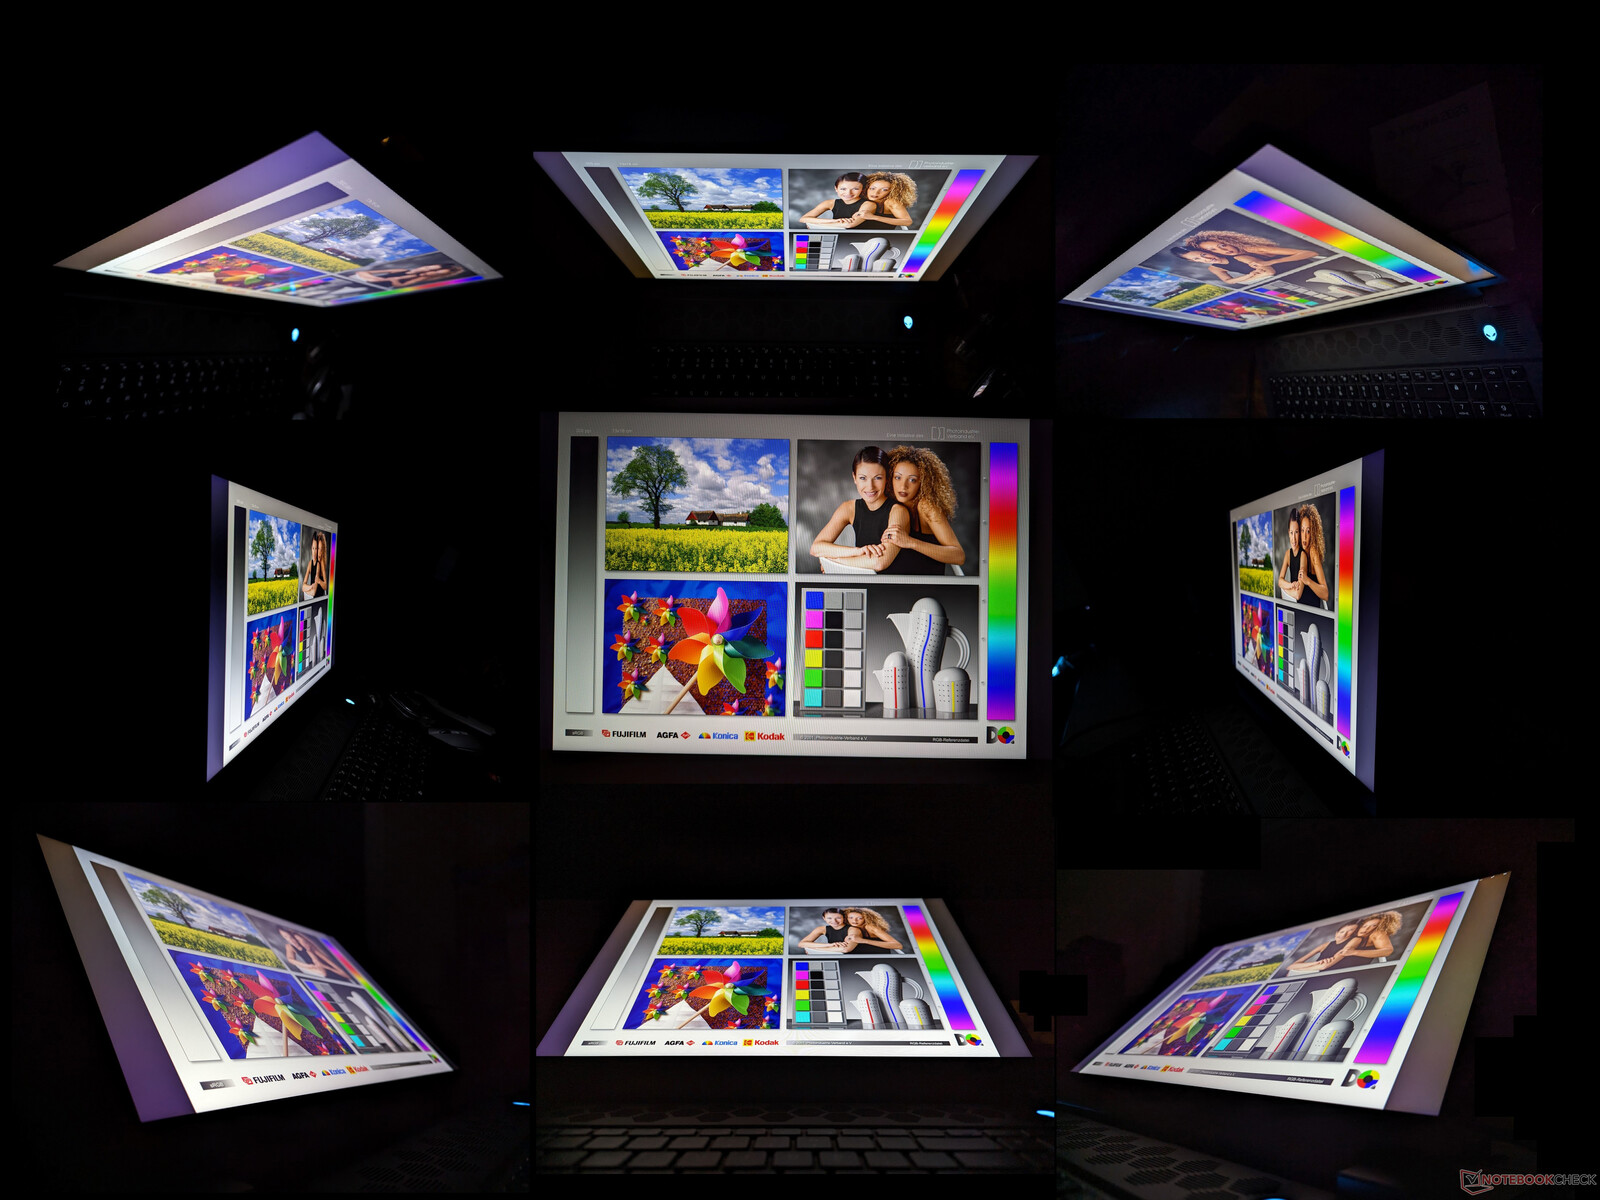
Display - 1.200p und 480 Hz
Die zwei folgenden Display-Optionen mit AMD FreeSync sind erhältlich, die fettgedruckte Variante ist in unserem Testgerät verbaut:
- 1920 x 1200, 480 Hz, 100% DCI-P3, IPS
- 2560 x 1600, 165 Hz, 100% DCI-P3, IPS
Unsere Full-HD-Option ähnelt der in der Intel-Nvidia-Konfiguration. Allerdings hat diesmal der Hersteller gewechselt (BOE vs. Chi Mei), ein Zeichen dafür, dass Dell seine 480-Hz-Panels für die Alienware-m18-Serie von verschiedenen Händlern ordert. Zum Glück gibt es zwischen den Panels kaum nennenswerte Unterschiede was die Punkte Farbraumabdeckung, Reaktionszeiten oder Kontrast angeht, sodass die resultierende Seherfahrung bei allen Modellen ähnlich ist.
Zum aktuellen Zeitpunkt ist die Bildwiederholrate von 480 Hz die schnellste, die momentan auf einem Laptop verfügbar ist. Das führt zu extrem weichen Bewegungen mit nur minimalem Ghosting. Dennoch verringern sich die Vorzüge schneller Bildwiederholraten je höher diese werden. Womöglich kann es deshalb von Vorteil sein gleich die höhere Auflösung von 1.600p zu wählen, deren langsamere 165 Hz bieten noch immer eine super flüssige Darstellung.
Zudem sei erwähnt, dass man die Wiederholrate in Windows auch auf 240 oder 120 Hz stellen kann, allerdings nicht darunter. Es ist wirklich schade, dass man keine 60-Hz-Option findet, vor allem, weil sich die Wiederholrate massiv auf den Verbrauch und somit auch auf die Laufzeit auswirkt, wie wir im Abschnitt Energiemanagement aufzeigen.
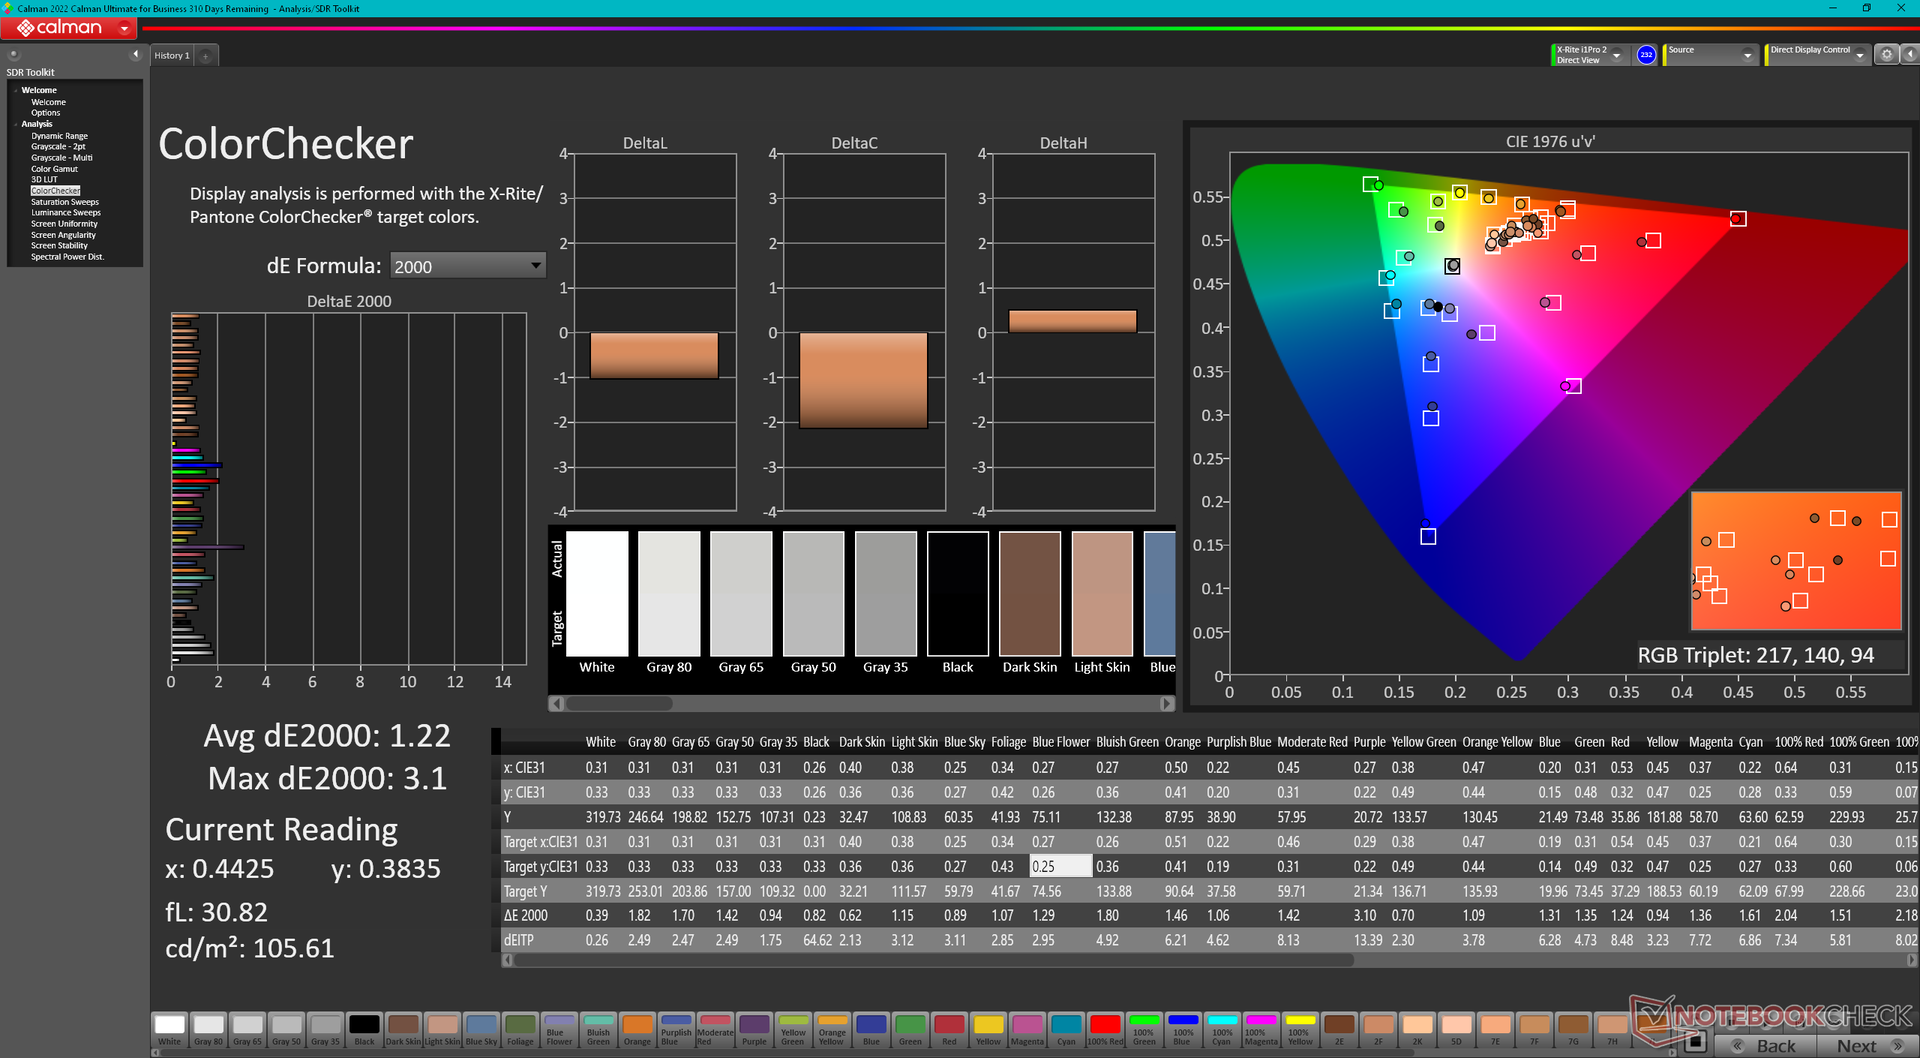
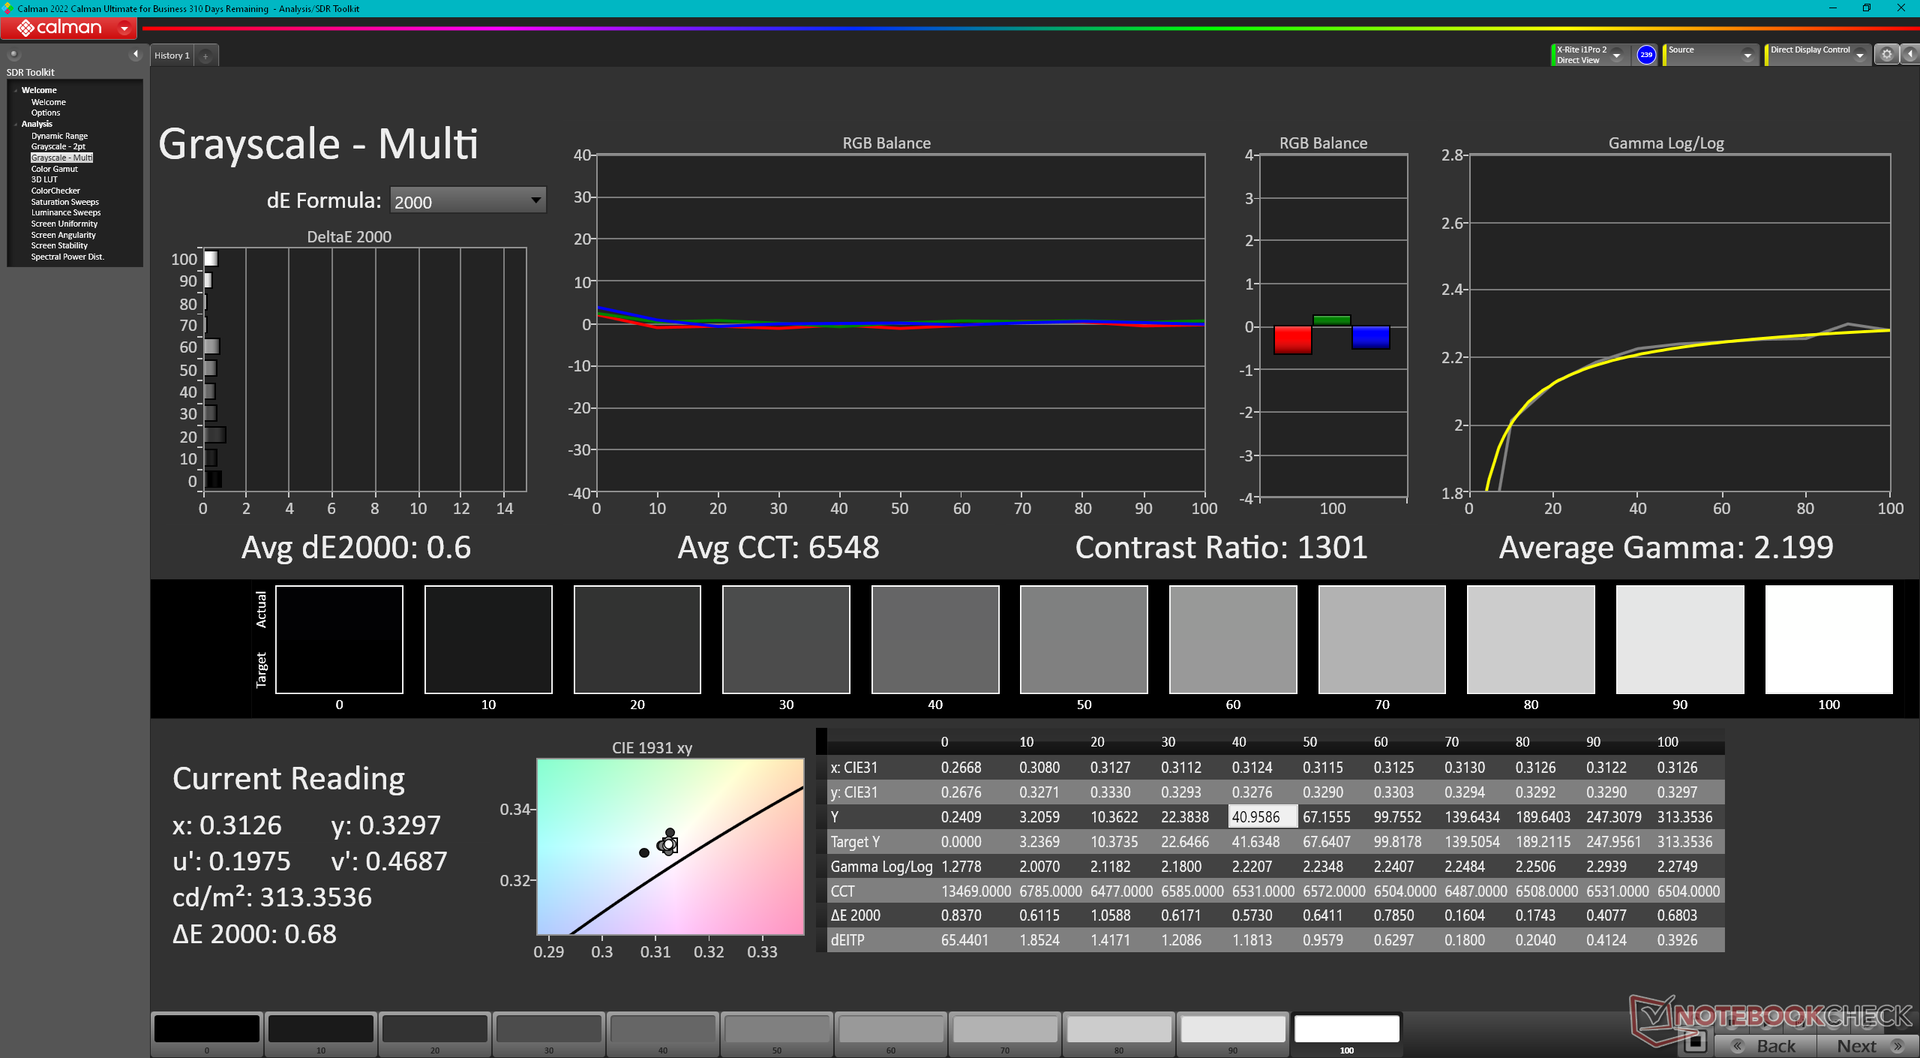
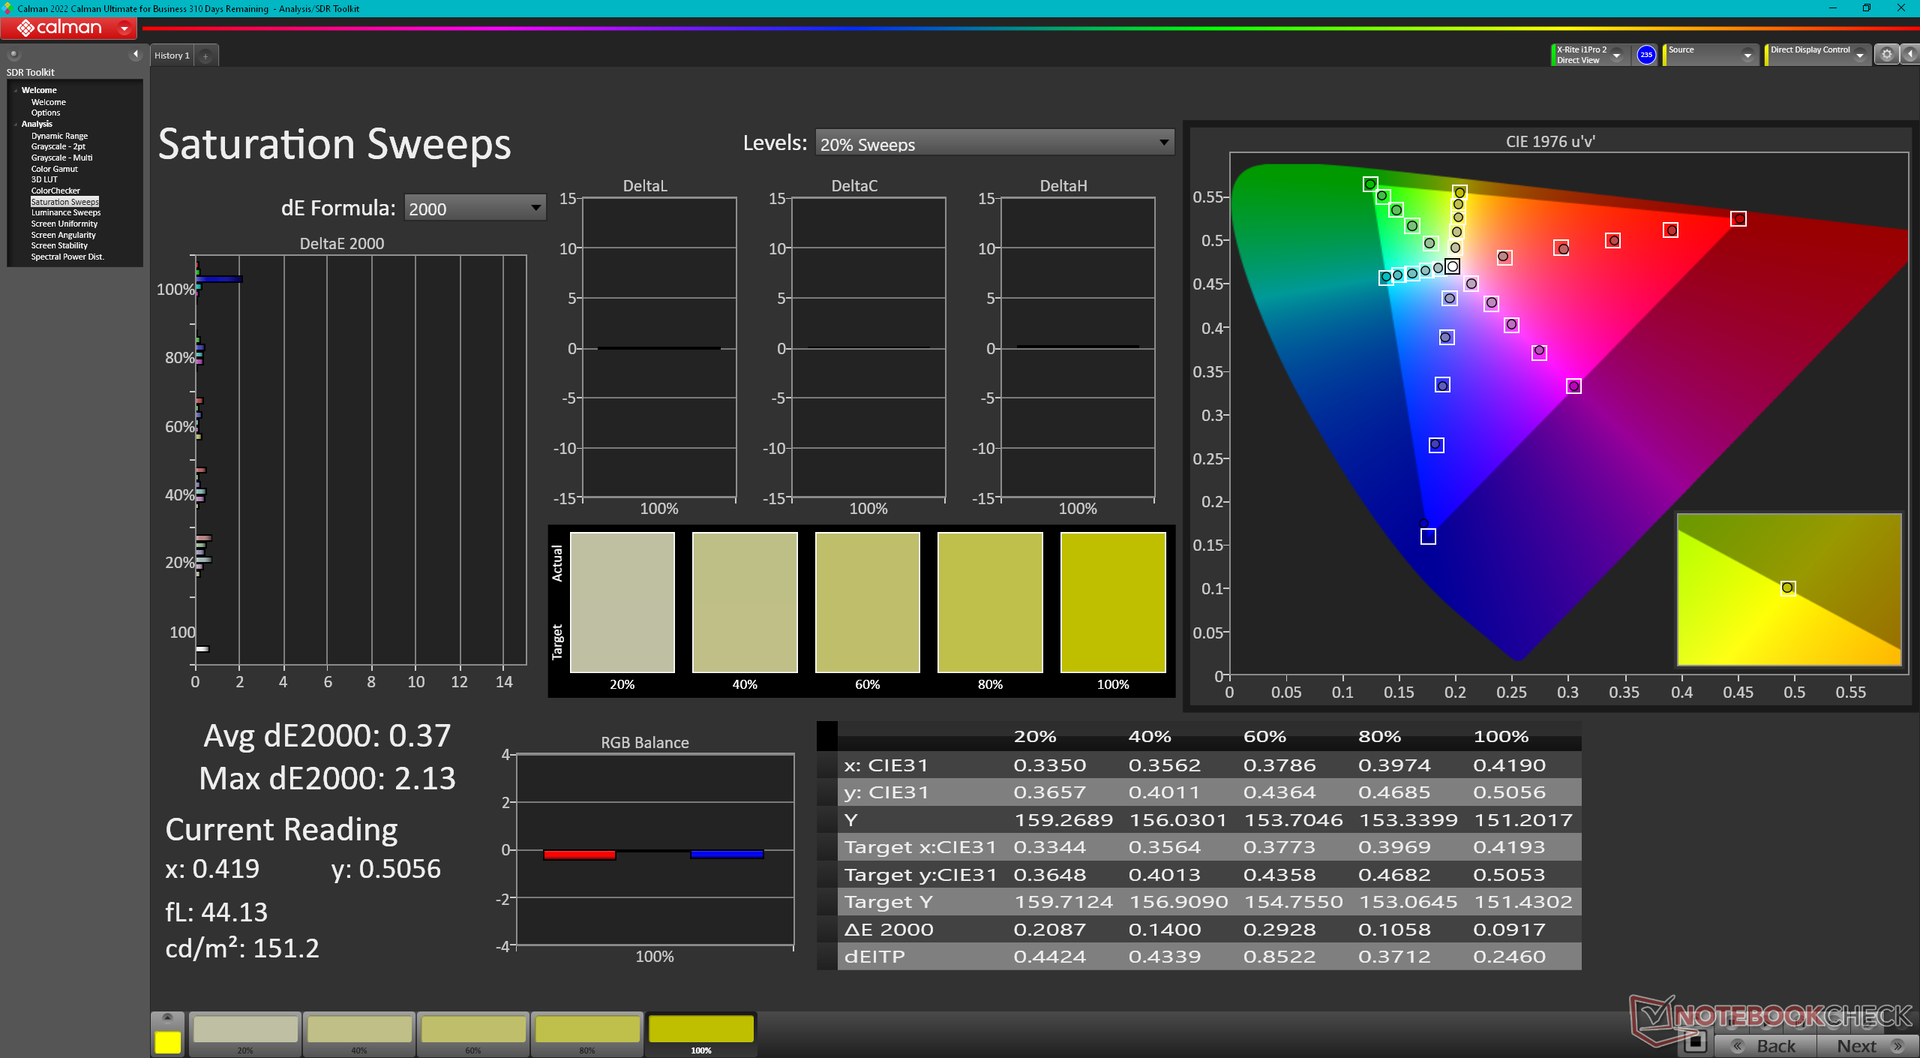
Seltsamerweise ist das Display ab Werk auf den kleineren sRGB-Farbraum kalibriert, obwohl das Panel volle DCI-P3-Farben unterstützt. Gleiches haben wir für die Intel-Nvidia-Konfiguration festgestellt.
| |||||||||||||||||||||||||
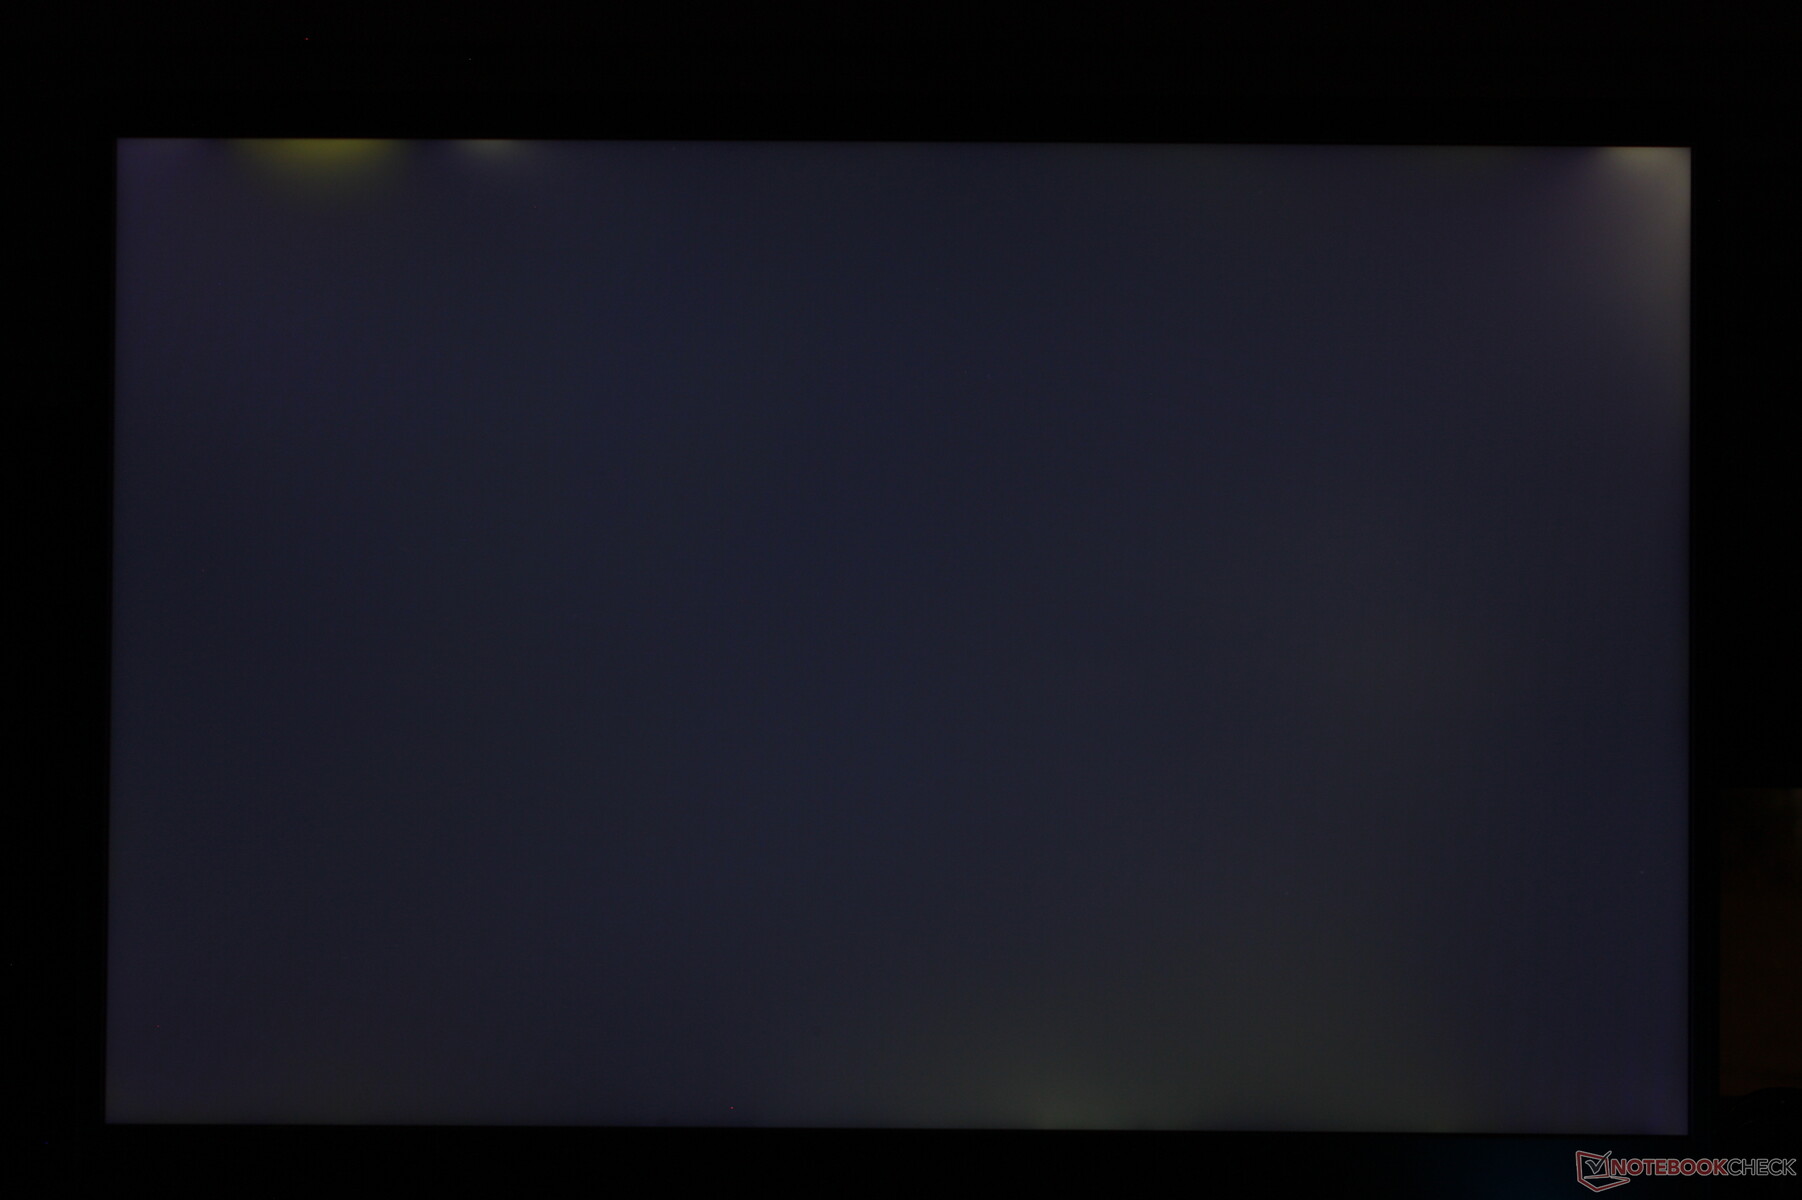
Ausleuchtung: 87 %
Helligkeit Akku: 319.6 cd/m²
Kontrast: 1278:1 (Schwarzwert: 0.25 cd/m²)
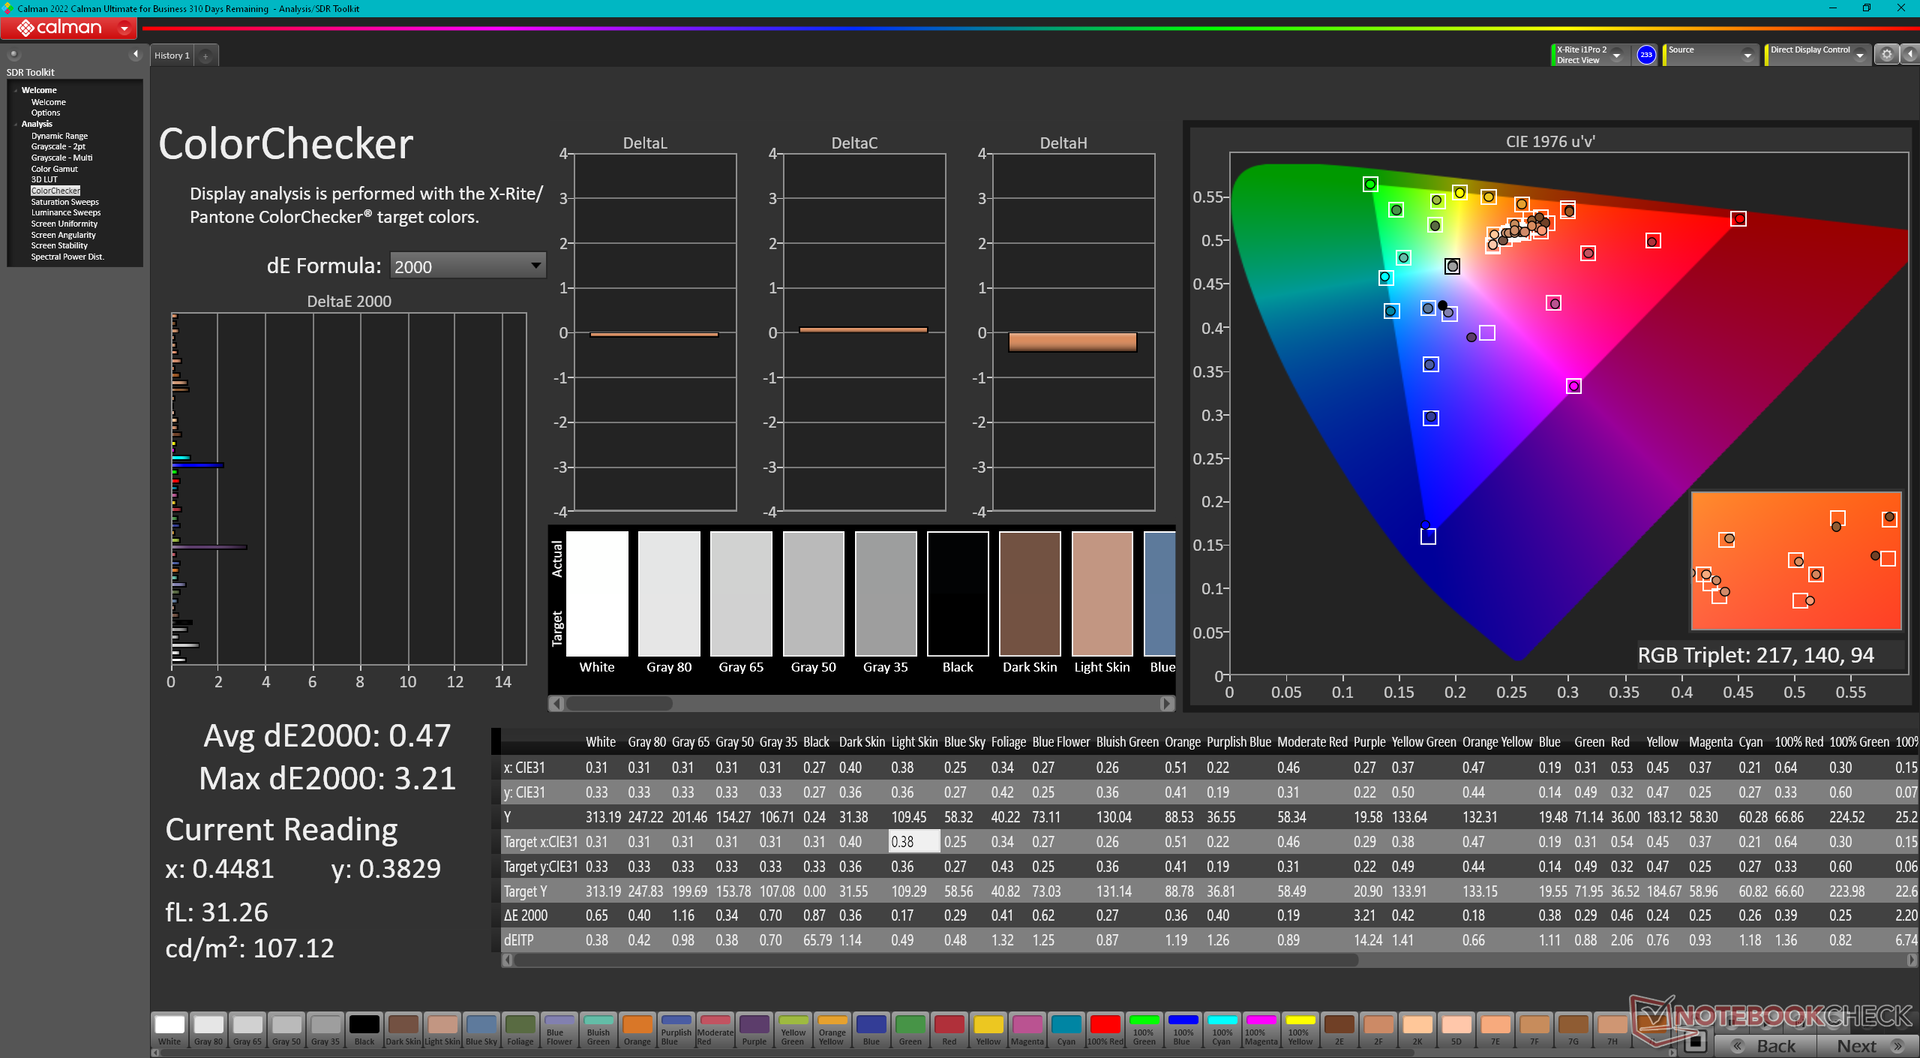
ΔE ColorChecker Calman: 1.22 | ∀{0.5-29.43 Ø4.72}
calibrated: 0.47
ΔE Greyscale Calman: 0.8 | ∀{0.09-98 Ø4.97}
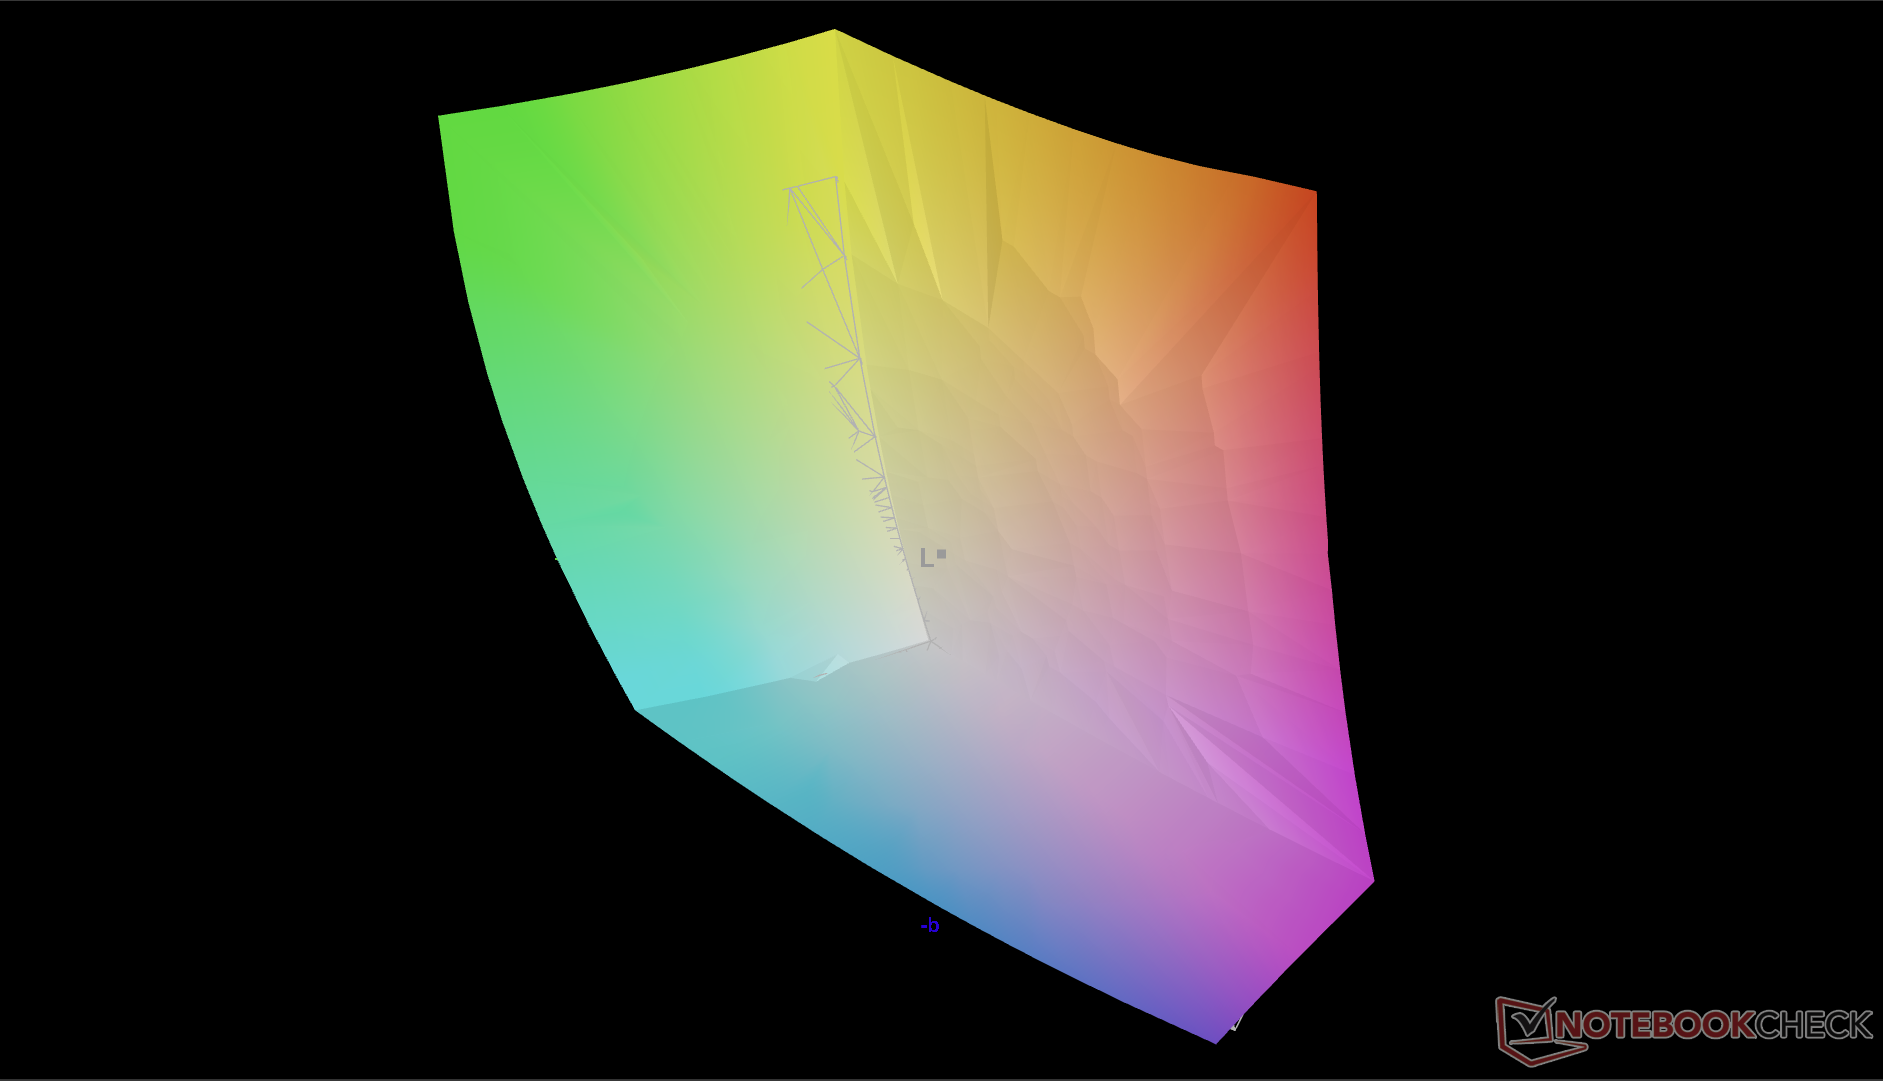
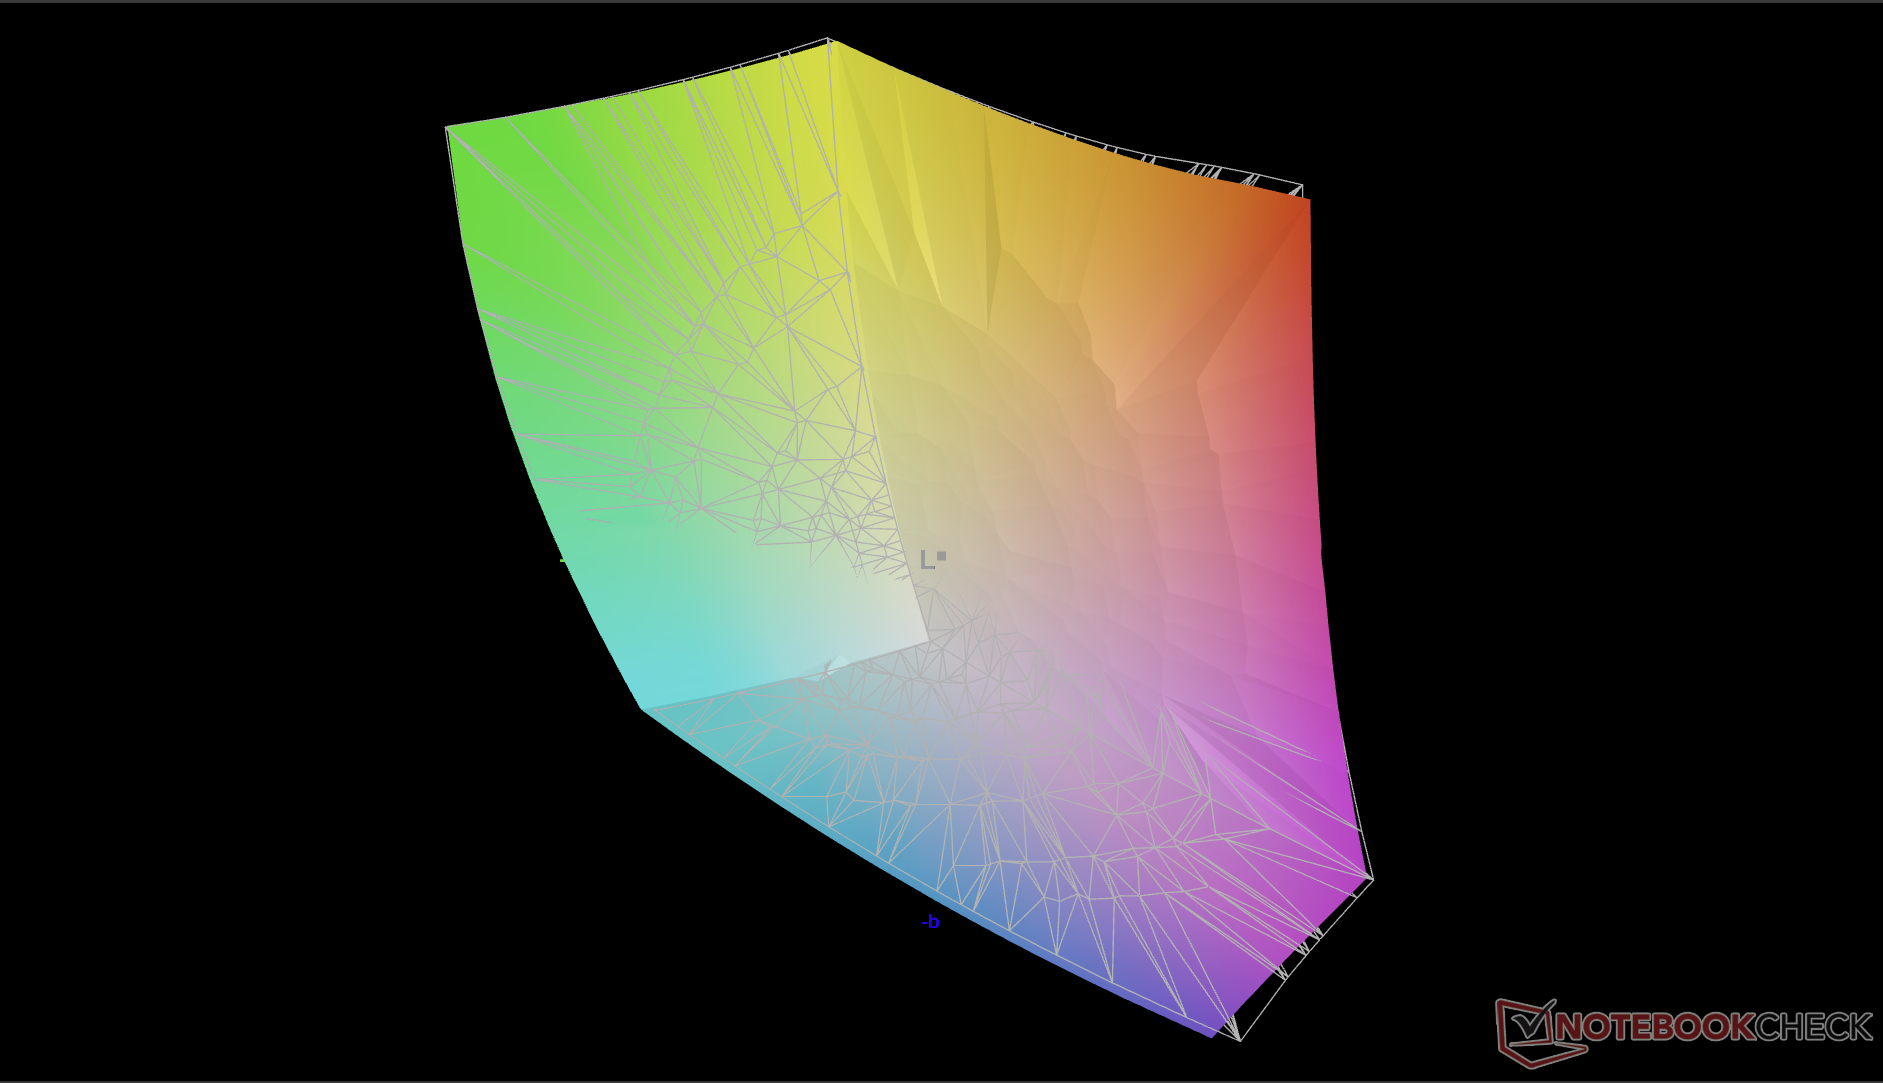
88.7% AdobeRGB 1998 (Argyll 3D)
99.7% sRGB (Argyll 3D)
98.5% Display P3 (Argyll 3D)
Gamma: 2.23
CCT: 6471 K
| Alienware m18 R1 AMD BOE NE18NZ1, IPS, 1920x1200, 18" | Alienware m18 R1 Chi Mei 180JME, IPS, 1920x1200, 18" | Acer Predator Helios 18 N23Q2 AUO45A8 (B180QAN01.2), IPS, 2560x1600, 18" | Razer Blade 18 RTX 4070 AU Optronics B180QAN01.0, IPS, 2560x1600, 18" | Asus ROG Strix Scar 18 2023 G834JY-N6005W NE180QDM-NZ2, IPS, 2560x1600, 18" | MSI GE78HX 13VH-070US AU Optronics B170QAN01.2, IPS, 2560x1600, 17" | |
|---|---|---|---|---|---|---|
| Display | 0% | 1% | -2% | -2% | -1% | |
| Display P3 Coverage (%) | 98.5 | 97.7 -1% | 99.8 1% | 96.9 -2% | 97.2 -1% | 97.6 -1% |
| sRGB Coverage (%) | 99.7 | 100 0% | 100 0% | 99.8 0% | 99.9 0% | 99.9 0% |
| AdobeRGB 1998 Coverage (%) | 88.7 | 89.8 1% | 91.8 3% | 85.3 -4% | 84.9 -4% | 86.5 -2% |
| Response Times | -5% | -128% | -17% | -42% | -9% | |
| Response Time Grey 50% / Grey 80% * (ms) | 2.8 ? | 3 ? -7% | 7.6 ? -171% | 4.2 ? -50% | 5.41 ? -93% | 4.2 ? -50% |
| Response Time Black / White * (ms) | 9.6 ? | 9.9 ? -3% | 17.8 ? -85% | 8 ? 17% | 8.62 ? 10% | 6.4 ? 33% |
| PWM Frequency (Hz) | 2509 | |||||
| Bildschirm | -18% | -130% | -99% | -215% | -145% | |
| Helligkeit Bildmitte (cd/m²) | 319.6 | 372.8 17% | 360 13% | 549.6 72% | 490 53% | 398.6 25% |
| Brightness (cd/m²) | 304 | 367 21% | 355 17% | 524 72% | 468 54% | 384 26% |
| Brightness Distribution (%) | 87 | 97 11% | 92 6% | 89 2% | 86 -1% | 89 2% |
| Schwarzwert * (cd/m²) | 0.25 | 0.32 -28% | 0.21 16% | 0.53 -112% | 0.54 -116% | 0.46 -84% |
| Kontrast (:1) | 1278 | 1165 -9% | 1714 34% | 1037 -19% | 907 -29% | 867 -32% |
| Delta E Colorchecker * | 1.22 | 1.92 -57% | 3.82 -213% | 3.32 -172% | 4.97 -307% | 4.05 -232% |
| Colorchecker dE 2000 max. * | 3.1 | 3.65 -18% | 7.38 -138% | 6.63 -114% | 11.02 -255% | 8.68 -180% |
| Colorchecker dE 2000 calibrated * | 0.47 | 0.51 -9% | 2.24 -377% | 2.7 -474% | 2.97 -532% | 1.02 -117% |
| Delta E Graustufen * | 0.8 | 1.5 -88% | 5.06 -532% | 2 -150% | 7.2 -800% | 6.5 -713% |
| Gamma | 2.23 99% | 2.34 94% | 2.52 87% | 2.29 96% | 2.161 102% | 2.11 104% |
| CCT | 6471 100% | 6607 98% | 5657 115% | 6319 103% | 6515 100% | 7518 86% |
| Durchschnitt gesamt (Programm / Settings) | -8% /
-12% | -86% /
-102% | -39% /
-67% | -86% /
-144% | -52% /
-95% |
* ... kleinere Werte sind besser
Die durchschnittlichen DeltaE-Werte liegen gut unterhalb von 2, sodass eine Nutzer-Kalibrierung für die meisten User nicht notwendig ist.


Reaktionszeiten (Response Times) des Displays
| ↔ Reaktionszeiten Schwarz zu Weiß | ||
|---|---|---|
| 9.6 ms ... steigend ↗ und fallend ↘ kombiniert | ↗ 4.9 ms steigend | 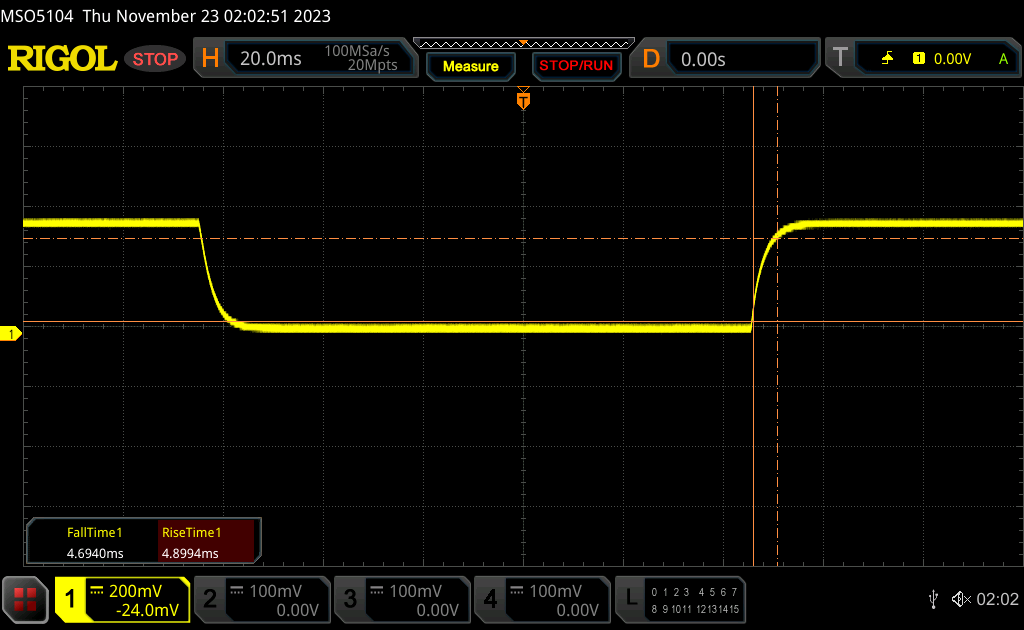 |
| ↘ 4.7 ms fallend | ||
| Die gemessenen Reaktionszeiten sind kurz wodurch sich der Bildschirm auch für Spiele gut eignen sollte. Im Vergleich rangierten die bei uns getesteten Geräte von 0.1 (Minimum) zu 240 (Maximum) ms. » 26 % aller Screens waren schneller als der getestete. Daher sind die gemessenen Reaktionszeiten besser als der Durchschnitt aller vermessenen Geräte (19.8 ms). | ||
| ↔ Reaktionszeiten 50% Grau zu 80% Grau | ||
| 2.8 ms ... steigend ↗ und fallend ↘ kombiniert | ↗ 1.2 ms steigend | 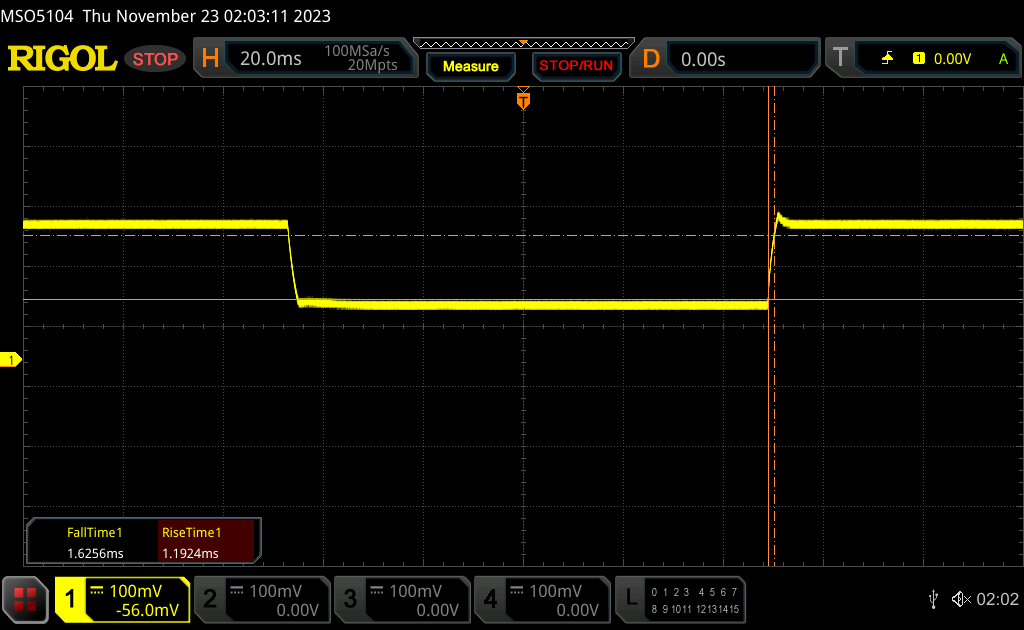 |
| ↘ 1.6 ms fallend | ||
| Die gemessenen Reaktionszeiten sind sehr kurz, wodurch sich der Bildschirm auch für schnelle 3D Spiele eignen sollte. Im Vergleich rangierten die bei uns getesteten Geräte von 0.165 (Minimum) zu 636 (Maximum) ms. » 12 % aller Screens waren schneller als der getestete. Daher sind die gemessenen Reaktionszeiten besser als der Durchschnitt aller vermessenen Geräte (31 ms). | ||
Bildschirm-Flackern / PWM (Pulse-Width Modulation)
| Flackern / PWM nicht festgestellt | 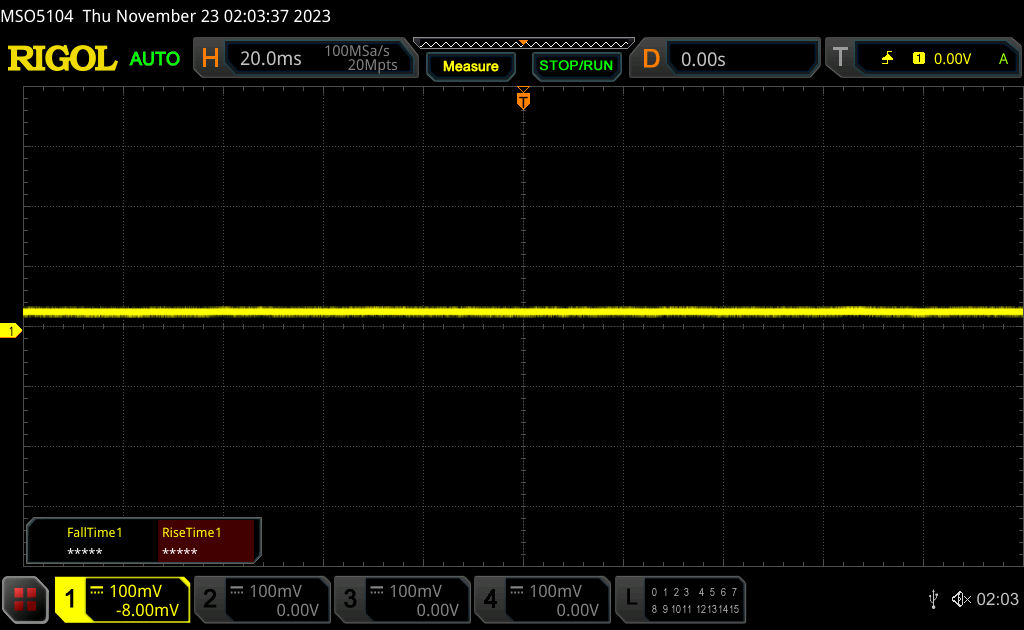 | ||
Im Vergleich: 52 % aller getesteten Geräte nutzten kein PWM um die Helligkeit zu reduzieren. Wenn PWM eingesetzt wurde, dann bei einer Frequenz von durchschnittlich 7750 (Minimum 5, Maximum 343500) Hz. | |||

Leistung - Starker AMD mit Bugs
Testbedingungen
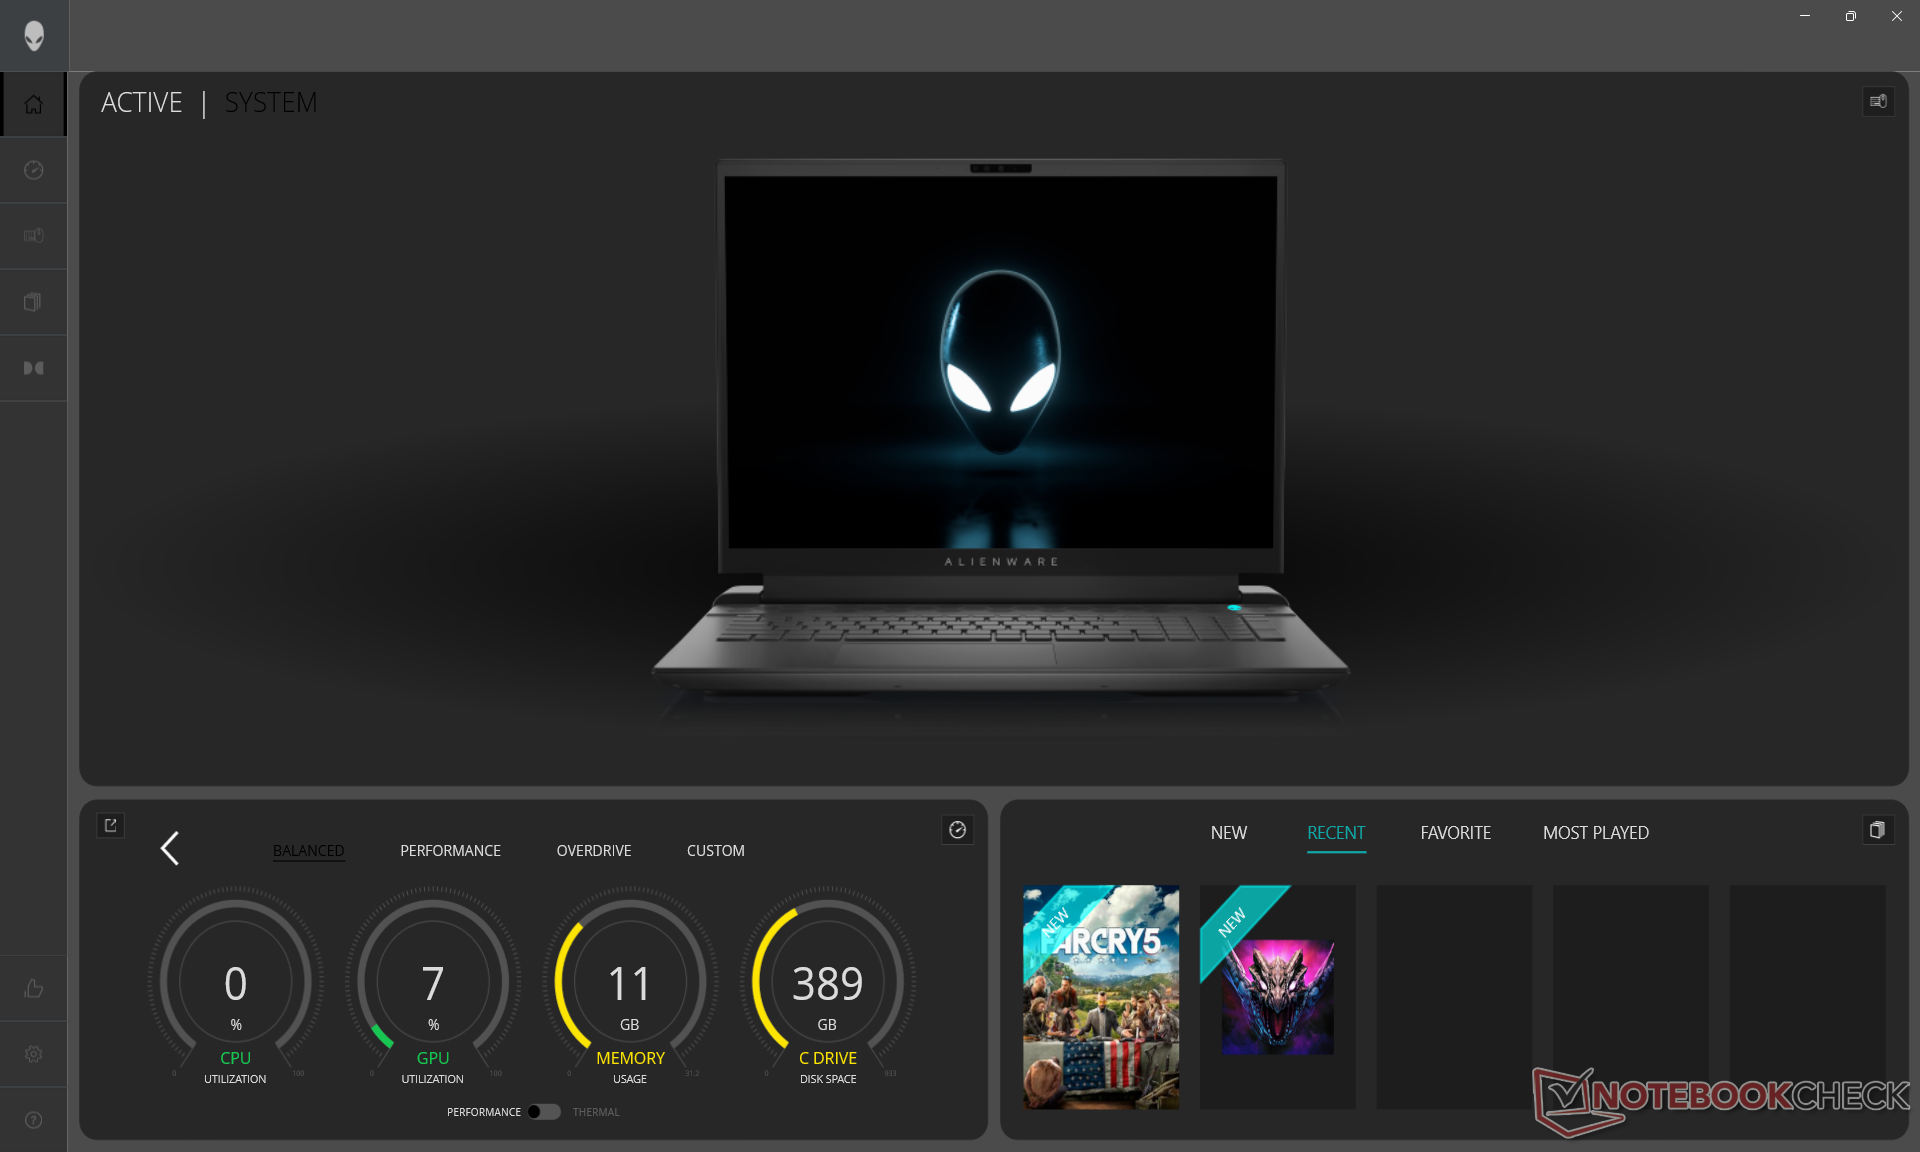
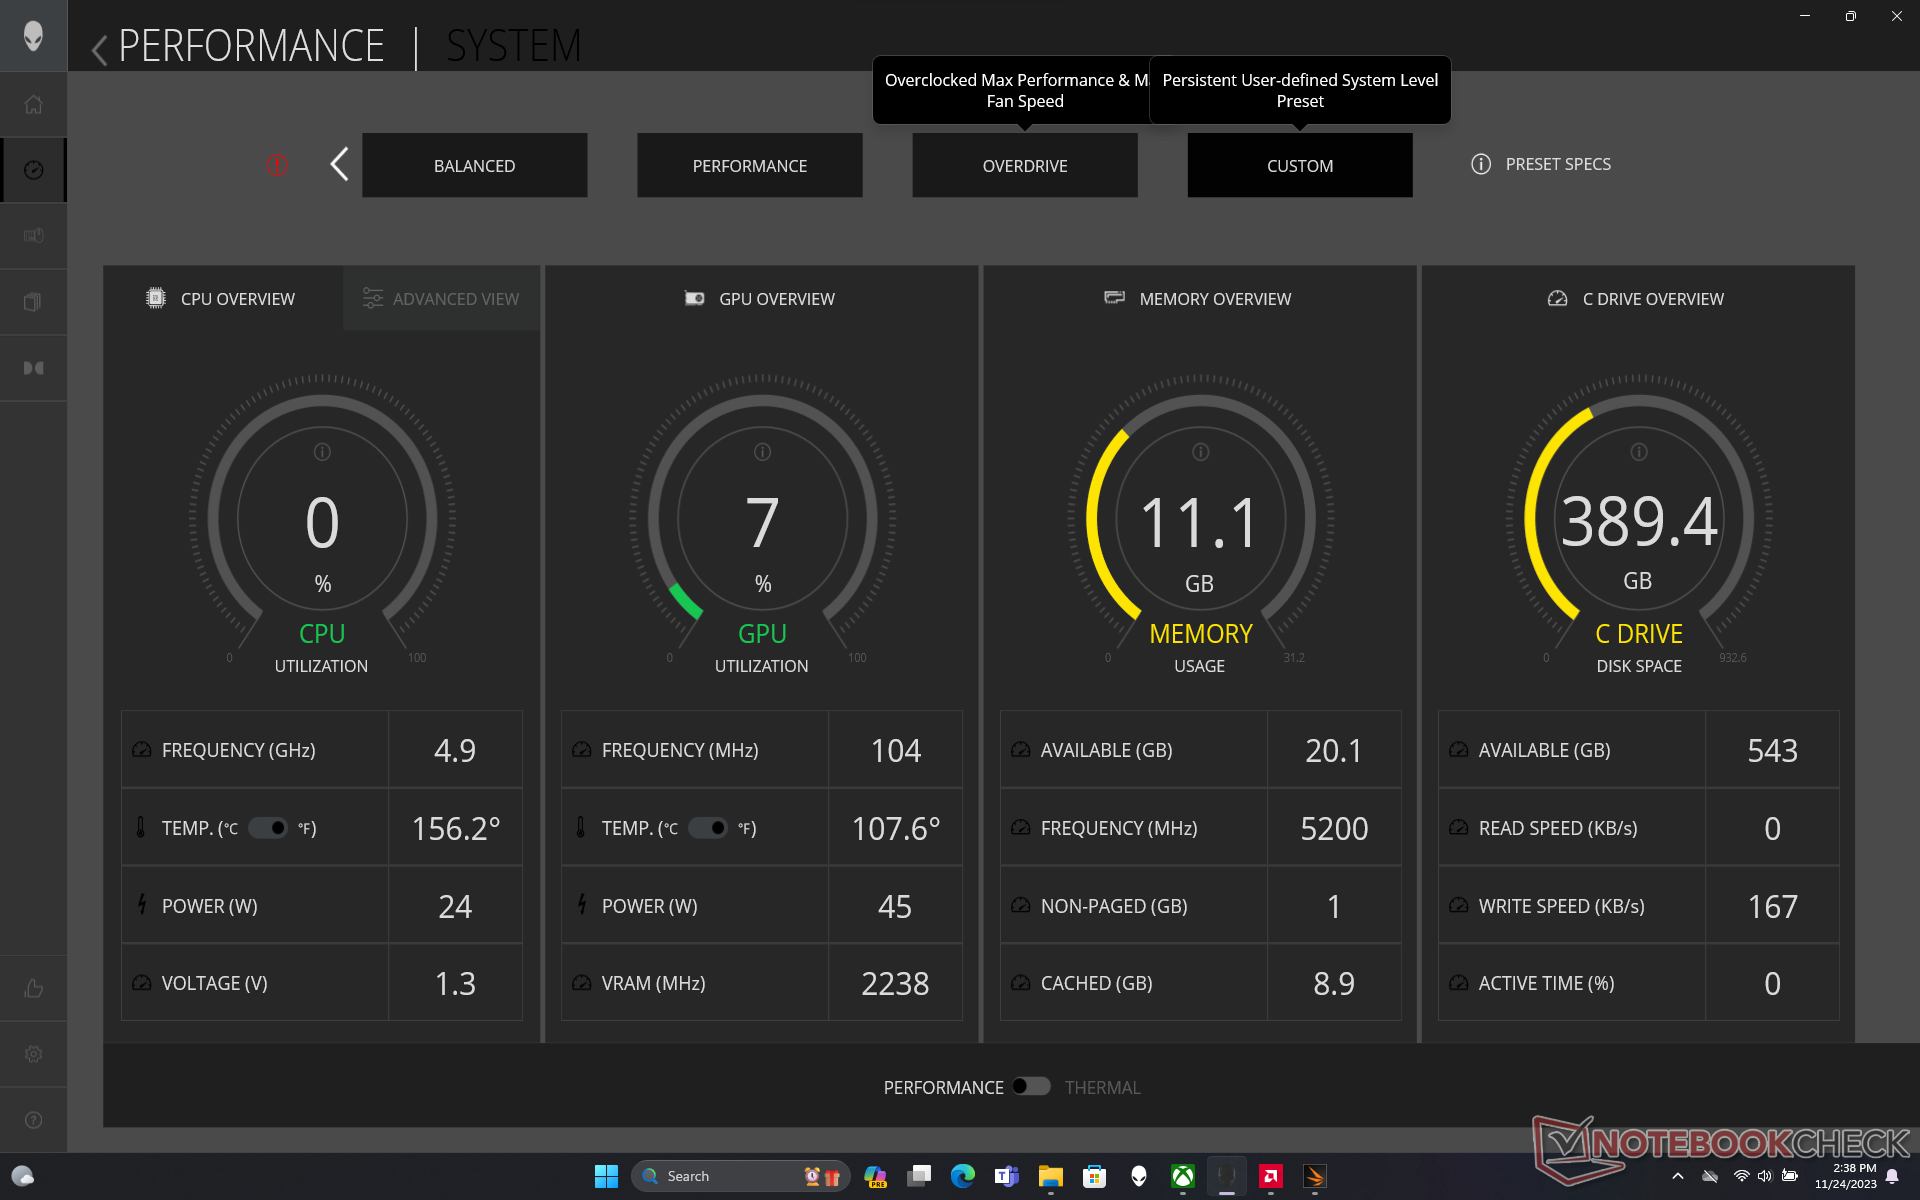
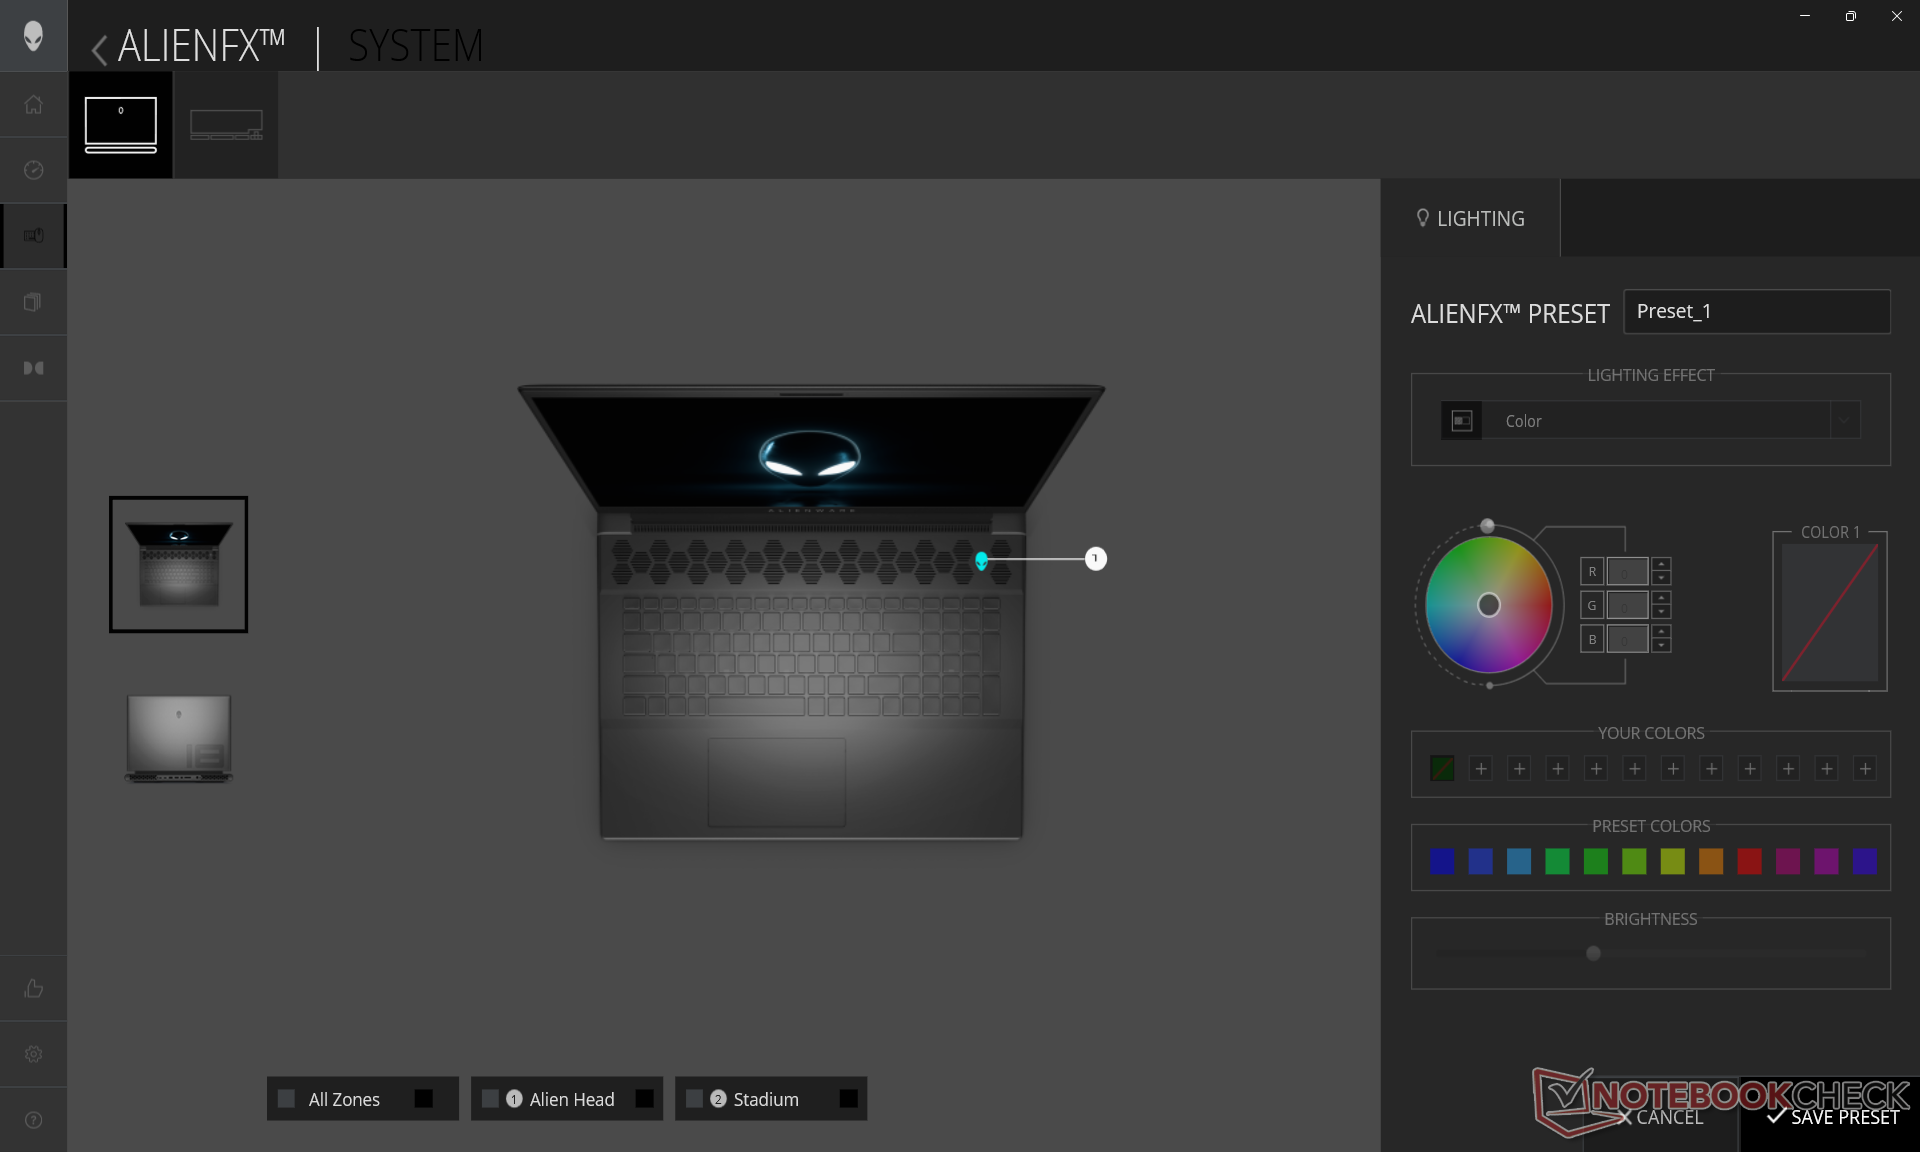
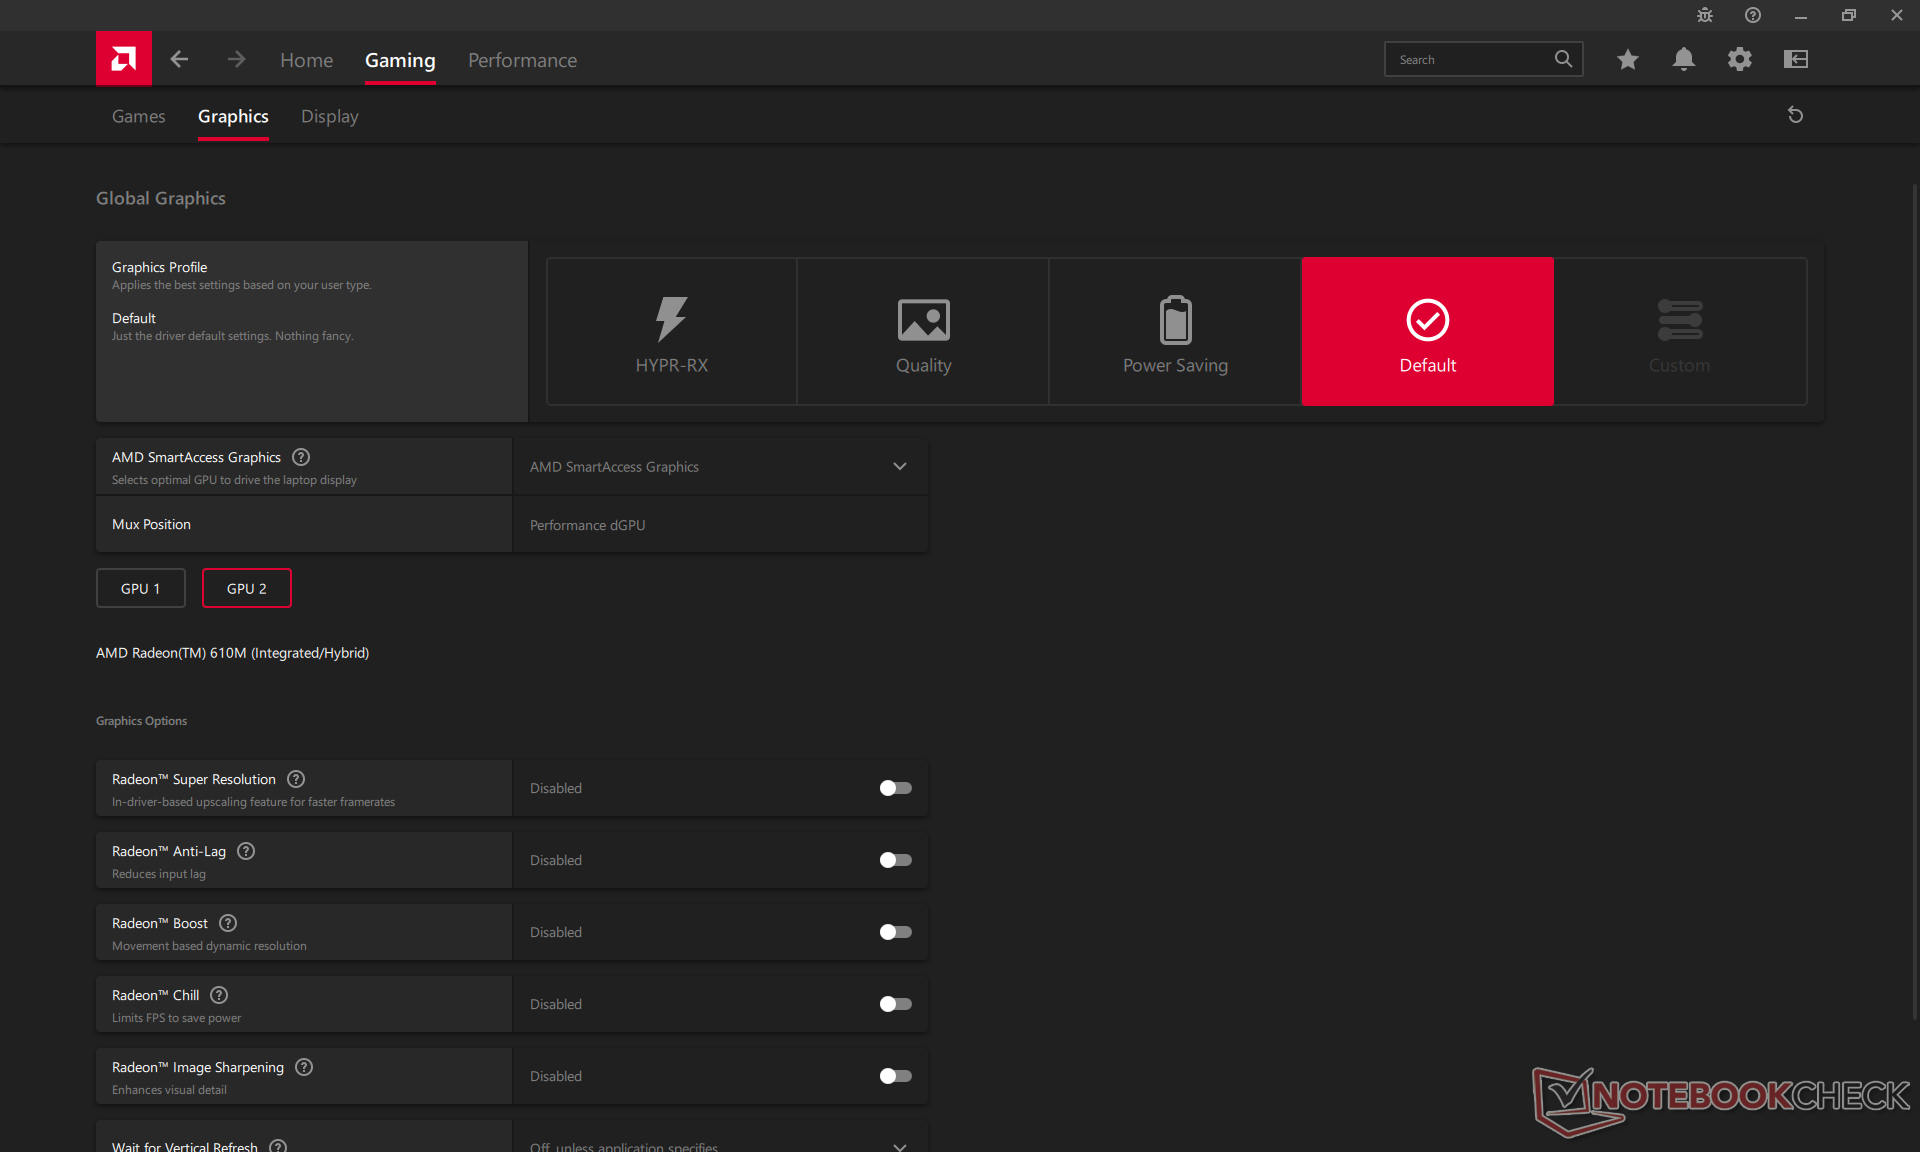
Im Alienware Command Center wählen wir den Overdrive-Modus vor der Durchführung aller Benchmarks aus. Man sollte sich mit dem Command Center gut auseinandersetzen, da sich hier alle wichtigen Einstellungen befinden, darunter für die RGB-Beleuchtung, die Leistungsprofile und Gaming-spezifische Profile.
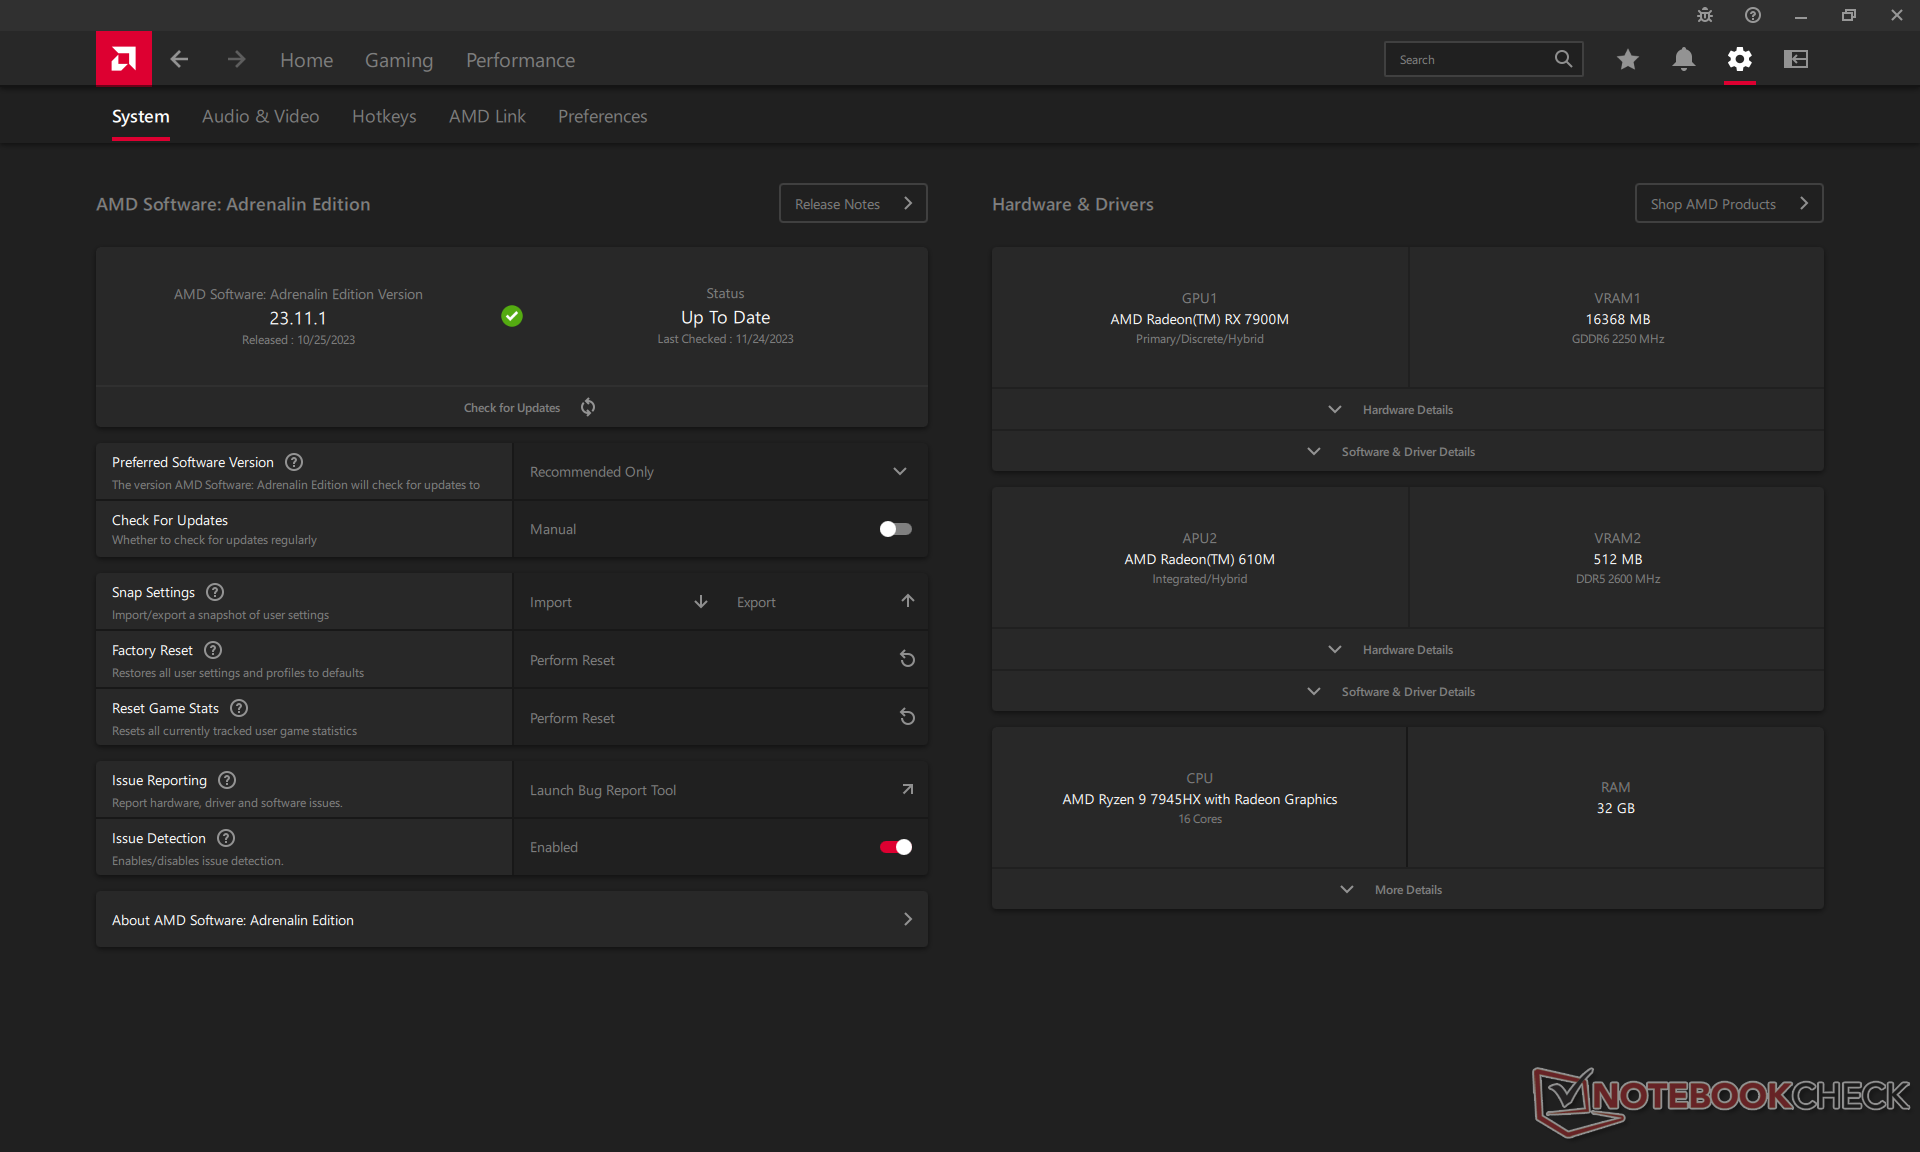
Empfehlenswert ist außerdem der Download von AMD Adrenalin, um bei den GPU-Treibern immer auf dem neuesten Stand zu sein und sämtliche Funktionen der GPU an- und ausschalten zu können.
Prozessor
Die CPU-Leistung ist der klassische AMD- vs. Intel-Wettstreit, bei dem unser Ryzen 9 7945HX eine 5 bis 10 Prozent schnellere Multi-Thread-Leistung gegenüber dem konkurrierenden Core i9-13980HX abruft. Gleichzeitig ist die AMD-CPU 5 bis 10 Prozent langsamer in der Single-Thread-Leistung. Sie liegt quasi auf einem Niveau mit dem Ryzen 9 7945HX3D und ist so einer der schnellsten mobilen Prozessoren überhaupt. Wählt man hingegen die schwächeren Ryzen 9 7845HX oder Ryzen 7 7745HX sollte die CPU-Leistung um etwa 20 bis 25 beziehungsweise 40 bis 50 Prozent sinken.
Die Stabilität der Leistung ist ausgezeichnet, wie die sehr stabilen Scores im CineBench-R15-xT-Loop verdeutlichen.
Cinebench R15 Multi Loop
Cinebench R23: Multi Core | Single Core
Cinebench R20: CPU (Multi Core) | CPU (Single Core)
Cinebench R15: CPU Multi 64Bit | CPU Single 64Bit
Blender: v2.79 BMW27 CPU
7-Zip 18.03: 7z b 4 | 7z b 4 -mmt1
Geekbench 5.5: Multi-Core | Single-Core
HWBOT x265 Benchmark v2.2: 4k Preset
LibreOffice : 20 Documents To PDF
R Benchmark 2.5: Overall mean
| CPU Performance Rating | |
| AMD Ryzen 9 7950X | |
| Alienware m18 R1 AMD | |
| Asus ROG Strix Scar 17 G733PY-XS96 | |
| Asus ROG Strix Scar 17 G733PYV-LL053X | |
| MSI GE78HX 13VH-070US | |
| Durchschnittliche AMD Ryzen 9 7945HX | |
| Alienware m18 R1 | |
| Acer Predator Helios 18 N23Q2 | |
| Razer Blade 18 RTX 4070 | |
| Alienware m16 R1 AMD | |
| MSI Titan GT77 12UHS | |
| Lenovo Legion Pro 5 16ARX8 | |
| MSI Stealth 17 Studio A13VH-014 | |
| Uniwell Technology GM7AG8N Liquid Cooling Box | |
| Schenker XMG Apex 17 (Late 23) | |
| Acer Nitro 17 AN17-41-R9LN | |
| Asus ROG Strix G17 G713QE-RB74 -2! | |
| Cinebench R23 / Multi Core | |
| AMD Ryzen 9 7950X | |
| Alienware m18 R1 AMD | |
| Asus ROG Strix Scar 17 G733PY-XS96 | |
| Durchschnittliche AMD Ryzen 9 7945HX (30783 - 34613, n=9) | |
| Asus ROG Strix Scar 17 G733PYV-LL053X | |
| MSI GE78HX 13VH-070US | |
| Alienware m18 R1 | |
| Acer Predator Helios 18 N23Q2 | |
| Razer Blade 18 RTX 4070 | |
| Alienware m16 R1 AMD | |
| MSI Titan GT77 12UHS | |
| MSI Stealth 17 Studio A13VH-014 | |
| Uniwell Technology GM7AG8N Liquid Cooling Box | |
| Lenovo Legion Pro 5 16ARX8 | |
| Schenker XMG Apex 17 (Late 23) | |
| Acer Nitro 17 AN17-41-R9LN | |
| Asus ROG Strix G17 G713QE-RB74 | |
| Cinebench R23 / Single Core | |
| MSI GE78HX 13VH-070US | |
| Alienware m18 R1 | |
| Acer Predator Helios 18 N23Q2 | |
| Razer Blade 18 RTX 4070 | |
| AMD Ryzen 9 7950X | |
| Alienware m18 R1 AMD | |
| Asus ROG Strix Scar 17 G733PYV-LL053X | |
| Durchschnittliche AMD Ryzen 9 7945HX (1861 - 1957, n=9) | |
| MSI Titan GT77 12UHS | |
| Asus ROG Strix Scar 17 G733PY-XS96 | |
| Alienware m16 R1 AMD | |
| Lenovo Legion Pro 5 16ARX8 | |
| Schenker XMG Apex 17 (Late 23) | |
| Uniwell Technology GM7AG8N Liquid Cooling Box | |
| MSI Stealth 17 Studio A13VH-014 | |
| Acer Nitro 17 AN17-41-R9LN | |
| Asus ROG Strix G17 G713QE-RB74 | |
| Cinebench R20 / CPU (Multi Core) | |
| AMD Ryzen 9 7950X | |
| Alienware m18 R1 AMD | |
| Asus ROG Strix Scar 17 G733PY-XS96 | |
| Asus ROG Strix Scar 17 G733PYV-LL053X | |
| Durchschnittliche AMD Ryzen 9 7945HX (10025 - 13769, n=9) | |
| MSI GE78HX 13VH-070US | |
| Alienware m18 R1 | |
| Acer Predator Helios 18 N23Q2 | |
| Razer Blade 18 RTX 4070 | |
| Alienware m16 R1 AMD | |
| MSI Titan GT77 12UHS | |
| MSI Stealth 17 Studio A13VH-014 | |
| Uniwell Technology GM7AG8N Liquid Cooling Box | |
| Lenovo Legion Pro 5 16ARX8 | |
| Schenker XMG Apex 17 (Late 23) | |
| Acer Nitro 17 AN17-41-R9LN | |
| Asus ROG Strix G17 G713QE-RB74 | |
| Cinebench R20 / CPU (Single Core) | |
| Alienware m18 R1 | |
| Acer Predator Helios 18 N23Q2 | |
| MSI GE78HX 13VH-070US | |
| Razer Blade 18 RTX 4070 | |
| AMD Ryzen 9 7950X | |
| Asus ROG Strix Scar 17 G733PYV-LL053X | |
| Alienware m18 R1 AMD | |
| Durchschnittliche AMD Ryzen 9 7945HX (712 - 760, n=9) | |
| MSI Titan GT77 12UHS | |
| Uniwell Technology GM7AG8N Liquid Cooling Box | |
| Asus ROG Strix Scar 17 G733PY-XS96 | |
| Alienware m16 R1 AMD | |
| Lenovo Legion Pro 5 16ARX8 | |
| Schenker XMG Apex 17 (Late 23) | |
| MSI Stealth 17 Studio A13VH-014 | |
| Acer Nitro 17 AN17-41-R9LN | |
| Asus ROG Strix G17 G713QE-RB74 | |
| Cinebench R15 / CPU Multi 64Bit | |
| AMD Ryzen 9 7950X | |
| Asus ROG Strix Scar 17 G733PYV-LL053X | |
| Alienware m18 R1 AMD | |
| Asus ROG Strix Scar 17 G733PY-XS96 | |
| Durchschnittliche AMD Ryzen 9 7945HX (4998 - 5663, n=10) | |
| MSI GE78HX 13VH-070US | |
| Alienware m18 R1 | |
| Acer Predator Helios 18 N23Q2 | |
| Razer Blade 18 RTX 4070 | |
| Alienware m16 R1 AMD | |
| MSI Titan GT77 12UHS | |
| MSI Stealth 17 Studio A13VH-014 | |
| Uniwell Technology GM7AG8N Liquid Cooling Box | |
| Lenovo Legion Pro 5 16ARX8 | |
| Schenker XMG Apex 17 (Late 23) | |
| Acer Nitro 17 AN17-41-R9LN | |
| Asus ROG Strix G17 G713QE-RB74 | |
| Cinebench R15 / CPU Single 64Bit | |
| AMD Ryzen 9 7950X | |
| Asus ROG Strix Scar 17 G733PYV-LL053X | |
| Alienware m18 R1 AMD | |
| Asus ROG Strix Scar 17 G733PY-XS96 | |
| Durchschnittliche AMD Ryzen 9 7945HX (290 - 311, n=10) | |
| MSI GE78HX 13VH-070US | |
| Alienware m18 R1 | |
| Razer Blade 18 RTX 4070 | |
| Alienware m16 R1 AMD | |
| Acer Predator Helios 18 N23Q2 | |
| Lenovo Legion Pro 5 16ARX8 | |
| MSI Stealth 17 Studio A13VH-014 | |
| MSI Titan GT77 12UHS | |
| Schenker XMG Apex 17 (Late 23) | |
| Uniwell Technology GM7AG8N Liquid Cooling Box | |
| Acer Nitro 17 AN17-41-R9LN | |
| Asus ROG Strix G17 G713QE-RB74 | |
| Blender / v2.79 BMW27 CPU | |
| Asus ROG Strix G17 G713QE-RB74 | |
| Acer Nitro 17 AN17-41-R9LN | |
| Schenker XMG Apex 17 (Late 23) | |
| Lenovo Legion Pro 5 16ARX8 | |
| MSI Stealth 17 Studio A13VH-014 | |
| Uniwell Technology GM7AG8N Liquid Cooling Box | |
| MSI Titan GT77 12UHS | |
| Alienware m16 R1 AMD | |
| Razer Blade 18 RTX 4070 | |
| Acer Predator Helios 18 N23Q2 | |
| MSI GE78HX 13VH-070US | |
| Alienware m18 R1 | |
| Asus ROG Strix Scar 17 G733PYV-LL053X | |
| Durchschnittliche AMD Ryzen 9 7945HX (87 - 100, n=9) | |
| Asus ROG Strix Scar 17 G733PY-XS96 | |
| Alienware m18 R1 AMD | |
| AMD Ryzen 9 7950X | |
| 7-Zip 18.03 / 7z b 4 | |
| AMD Ryzen 9 7950X | |
| Asus ROG Strix Scar 17 G733PY-XS96 | |
| Alienware m18 R1 AMD | |
| Asus ROG Strix Scar 17 G733PYV-LL053X | |
| Durchschnittliche AMD Ryzen 9 7945HX (123364 - 140932, n=9) | |
| Alienware m18 R1 | |
| MSI GE78HX 13VH-070US | |
| Acer Predator Helios 18 N23Q2 | |
| Razer Blade 18 RTX 4070 | |
| Alienware m16 R1 AMD | |
| MSI Titan GT77 12UHS | |
| MSI Stealth 17 Studio A13VH-014 | |
| Lenovo Legion Pro 5 16ARX8 | |
| Schenker XMG Apex 17 (Late 23) | |
| Uniwell Technology GM7AG8N Liquid Cooling Box | |
| Acer Nitro 17 AN17-41-R9LN | |
| Asus ROG Strix G17 G713QE-RB74 | |
| 7-Zip 18.03 / 7z b 4 -mmt1 | |
| AMD Ryzen 9 7950X | |
| Asus ROG Strix Scar 17 G733PY-XS96 | |
| Asus ROG Strix Scar 17 G733PYV-LL053X | |
| Durchschnittliche AMD Ryzen 9 7945HX (7319 - 7711, n=9) | |
| Alienware m18 R1 AMD | |
| Lenovo Legion Pro 5 16ARX8 | |
| MSI GE78HX 13VH-070US | |
| Alienware m16 R1 AMD | |
| Acer Predator Helios 18 N23Q2 | |
| Alienware m18 R1 | |
| Razer Blade 18 RTX 4070 | |
| Schenker XMG Apex 17 (Late 23) | |
| MSI Titan GT77 12UHS | |
| MSI Stealth 17 Studio A13VH-014 | |
| Uniwell Technology GM7AG8N Liquid Cooling Box | |
| Acer Nitro 17 AN17-41-R9LN | |
| Asus ROG Strix G17 G713QE-RB74 | |
| Geekbench 5.5 / Multi-Core | |
| AMD Ryzen 9 7950X | |
| Alienware m18 R1 | |
| MSI GE78HX 13VH-070US | |
| Acer Predator Helios 18 N23Q2 | |
| Razer Blade 18 RTX 4070 | |
| Asus ROG Strix Scar 17 G733PYV-LL053X | |
| Alienware m18 R1 AMD | |
| Durchschnittliche AMD Ryzen 9 7945HX (18372 - 20394, n=9) | |
| Asus ROG Strix Scar 17 G733PY-XS96 | |
| MSI Titan GT77 12UHS | |
| Alienware m16 R1 AMD | |
| MSI Stealth 17 Studio A13VH-014 | |
| Lenovo Legion Pro 5 16ARX8 | |
| Schenker XMG Apex 17 (Late 23) | |
| Uniwell Technology GM7AG8N Liquid Cooling Box | |
| Acer Nitro 17 AN17-41-R9LN | |
| Geekbench 5.5 / Single-Core | |
| AMD Ryzen 9 7950X | |
| Asus ROG Strix Scar 17 G733PYV-LL053X | |
| Alienware m18 R1 AMD | |
| MSI GE78HX 13VH-070US | |
| Durchschnittliche AMD Ryzen 9 7945HX (1960 - 2158, n=9) | |
| Alienware m18 R1 | |
| Acer Predator Helios 18 N23Q2 | |
| Asus ROG Strix Scar 17 G733PY-XS96 | |
| MSI Stealth 17 Studio A13VH-014 | |
| Lenovo Legion Pro 5 16ARX8 | |
| Razer Blade 18 RTX 4070 | |
| Alienware m16 R1 AMD | |
| Schenker XMG Apex 17 (Late 23) | |
| MSI Titan GT77 12UHS | |
| Uniwell Technology GM7AG8N Liquid Cooling Box | |
| Acer Nitro 17 AN17-41-R9LN | |
| HWBOT x265 Benchmark v2.2 / 4k Preset | |
| AMD Ryzen 9 7950X | |
| Asus ROG Strix Scar 17 G733PY-XS96 | |
| Alienware m18 R1 AMD | |
| Asus ROG Strix Scar 17 G733PYV-LL053X | |
| Durchschnittliche AMD Ryzen 9 7945HX (33.8 - 37.6, n=8) | |
| MSI GE78HX 13VH-070US | |
| Alienware m18 R1 | |
| Razer Blade 18 RTX 4070 | |
| Acer Predator Helios 18 N23Q2 | |
| Alienware m16 R1 AMD | |
| MSI Titan GT77 12UHS | |
| Lenovo Legion Pro 5 16ARX8 | |
| MSI Stealth 17 Studio A13VH-014 | |
| Uniwell Technology GM7AG8N Liquid Cooling Box | |
| Schenker XMG Apex 17 (Late 23) | |
| Acer Nitro 17 AN17-41-R9LN | |
| Asus ROG Strix G17 G713QE-RB74 | |
| LibreOffice / 20 Documents To PDF | |
| Acer Nitro 17 AN17-41-R9LN | |
| Asus ROG Strix G17 G713QE-RB74 | |
| MSI Stealth 17 Studio A13VH-014 | |
| Acer Predator Helios 18 N23Q2 | |
| Uniwell Technology GM7AG8N Liquid Cooling Box | |
| Schenker XMG Apex 17 (Late 23) | |
| MSI GE78HX 13VH-070US | |
| Alienware m18 R1 | |
| Durchschnittliche AMD Ryzen 9 7945HX (35.5 - 60.4, n=8) | |
| Razer Blade 18 RTX 4070 | |
| Alienware m18 R1 AMD | |
| Alienware m16 R1 AMD | |
| MSI Titan GT77 12UHS | |
| Asus ROG Strix Scar 17 G733PYV-LL053X | |
| Lenovo Legion Pro 5 16ARX8 | |
| Asus ROG Strix Scar 17 G733PY-XS96 | |
| AMD Ryzen 9 7950X | |
| R Benchmark 2.5 / Overall mean | |
| Asus ROG Strix G17 G713QE-RB74 | |
| Acer Nitro 17 AN17-41-R9LN | |
| Uniwell Technology GM7AG8N Liquid Cooling Box | |
| Schenker XMG Apex 17 (Late 23) | |
| MSI Stealth 17 Studio A13VH-014 | |
| Alienware m16 R1 AMD | |
| Lenovo Legion Pro 5 16ARX8 | |
| MSI Titan GT77 12UHS | |
| Alienware m18 R1 AMD | |
| Asus ROG Strix Scar 17 G733PYV-LL053X | |
| Durchschnittliche AMD Ryzen 9 7945HX (0.3884 - 0.4159, n=8) | |
| Asus ROG Strix Scar 17 G733PY-XS96 | |
| Acer Predator Helios 18 N23Q2 | |
| Razer Blade 18 RTX 4070 | |
| Alienware m18 R1 | |
| MSI GE78HX 13VH-070US | |
| AMD Ryzen 9 7950X | |
Cinebench R23: Multi Core | Single Core
Cinebench R20: CPU (Multi Core) | CPU (Single Core)
Cinebench R15: CPU Multi 64Bit | CPU Single 64Bit
Blender: v2.79 BMW27 CPU
7-Zip 18.03: 7z b 4 | 7z b 4 -mmt1
Geekbench 5.5: Multi-Core | Single-Core
HWBOT x265 Benchmark v2.2: 4k Preset
LibreOffice : 20 Documents To PDF
R Benchmark 2.5: Overall mean
* ... kleinere Werte sind besser
AIDA64: FP32 Ray-Trace | FPU Julia | CPU SHA3 | CPU Queen | FPU SinJulia | FPU Mandel | CPU AES | CPU ZLib | FP64 Ray-Trace | CPU PhotoWorxx
| Performance Rating | |
| Alienware m18 R1 AMD | |
| Durchschnittliche AMD Ryzen 9 7945HX | |
| Acer Predator Helios 18 N23Q2 | |
| Alienware m18 R1 | |
| MSI GE78HX 13VH-070US | |
| Asus ROG Strix Scar 18 2023 G834JY-N6005W | |
| Razer Blade 18 RTX 4070 | |
| AIDA64 / FP32 Ray-Trace | |
| Alienware m18 R1 AMD | |
| Durchschnittliche AMD Ryzen 9 7945HX (50388 - 60169, n=7) | |
| Alienware m18 R1 | |
| Asus ROG Strix Scar 18 2023 G834JY-N6005W | |
| MSI GE78HX 13VH-070US | |
| Acer Predator Helios 18 N23Q2 | |
| Razer Blade 18 RTX 4070 | |
| AIDA64 / FPU Julia | |
| Alienware m18 R1 AMD | |
| Durchschnittliche AMD Ryzen 9 7945HX (201874 - 252486, n=7) | |
| Alienware m18 R1 | |
| MSI GE78HX 13VH-070US | |
| Asus ROG Strix Scar 18 2023 G834JY-N6005W | |
| Acer Predator Helios 18 N23Q2 | |
| Razer Blade 18 RTX 4070 | |
| AIDA64 / CPU SHA3 | |
| Alienware m18 R1 AMD | |
| Durchschnittliche AMD Ryzen 9 7945HX (8525 - 10389, n=7) | |
| Alienware m18 R1 | |
| Asus ROG Strix Scar 18 2023 G834JY-N6005W | |
| MSI GE78HX 13VH-070US | |
| Acer Predator Helios 18 N23Q2 | |
| Razer Blade 18 RTX 4070 | |
| AIDA64 / CPU Queen | |
| Alienware m18 R1 AMD | |
| Durchschnittliche AMD Ryzen 9 7945HX (175041 - 200651, n=7) | |
| Alienware m18 R1 | |
| Asus ROG Strix Scar 18 2023 G834JY-N6005W | |
| MSI GE78HX 13VH-070US | |
| Razer Blade 18 RTX 4070 | |
| Acer Predator Helios 18 N23Q2 | |
| AIDA64 / FPU SinJulia | |
| Alienware m18 R1 AMD | |
| Durchschnittliche AMD Ryzen 9 7945HX (28794 - 32988, n=7) | |
| Asus ROG Strix Scar 18 2023 G834JY-N6005W | |
| MSI GE78HX 13VH-070US | |
| Alienware m18 R1 | |
| Razer Blade 18 RTX 4070 | |
| Acer Predator Helios 18 N23Q2 | |
| AIDA64 / FPU Mandel | |
| Alienware m18 R1 AMD | |
| Durchschnittliche AMD Ryzen 9 7945HX (105740 - 134044, n=7) | |
| Alienware m18 R1 | |
| Asus ROG Strix Scar 18 2023 G834JY-N6005W | |
| MSI GE78HX 13VH-070US | |
| Acer Predator Helios 18 N23Q2 | |
| Razer Blade 18 RTX 4070 | |
| AIDA64 / CPU AES | |
| Acer Predator Helios 18 N23Q2 | |
| Durchschnittliche AMD Ryzen 9 7945HX (126790 - 325960, n=7) | |
| Alienware m18 R1 AMD | |
| Alienware m18 R1 | |
| MSI GE78HX 13VH-070US | |
| Asus ROG Strix Scar 18 2023 G834JY-N6005W | |
| Razer Blade 18 RTX 4070 | |
| AIDA64 / CPU ZLib | |
| Alienware m18 R1 AMD | |
| Durchschnittliche AMD Ryzen 9 7945HX (2022 - 2409, n=7) | |
| MSI GE78HX 13VH-070US | |
| Asus ROG Strix Scar 18 2023 G834JY-N6005W | |
| Alienware m18 R1 | |
| Acer Predator Helios 18 N23Q2 | |
| Razer Blade 18 RTX 4070 | |
| AIDA64 / FP64 Ray-Trace | |
| Alienware m18 R1 AMD | |
| Durchschnittliche AMD Ryzen 9 7945HX (26875 - 31796, n=7) | |
| Alienware m18 R1 | |
| Asus ROG Strix Scar 18 2023 G834JY-N6005W | |
| MSI GE78HX 13VH-070US | |
| Acer Predator Helios 18 N23Q2 | |
| Razer Blade 18 RTX 4070 | |
| AIDA64 / CPU PhotoWorxx | |
| Alienware m18 R1 | |
| Acer Predator Helios 18 N23Q2 | |
| MSI GE78HX 13VH-070US | |
| Razer Blade 18 RTX 4070 | |
| Asus ROG Strix Scar 18 2023 G834JY-N6005W | |
| Durchschnittliche AMD Ryzen 9 7945HX (31421 - 40095, n=7) | |
| Alienware m18 R1 AMD | |
Systemleistung
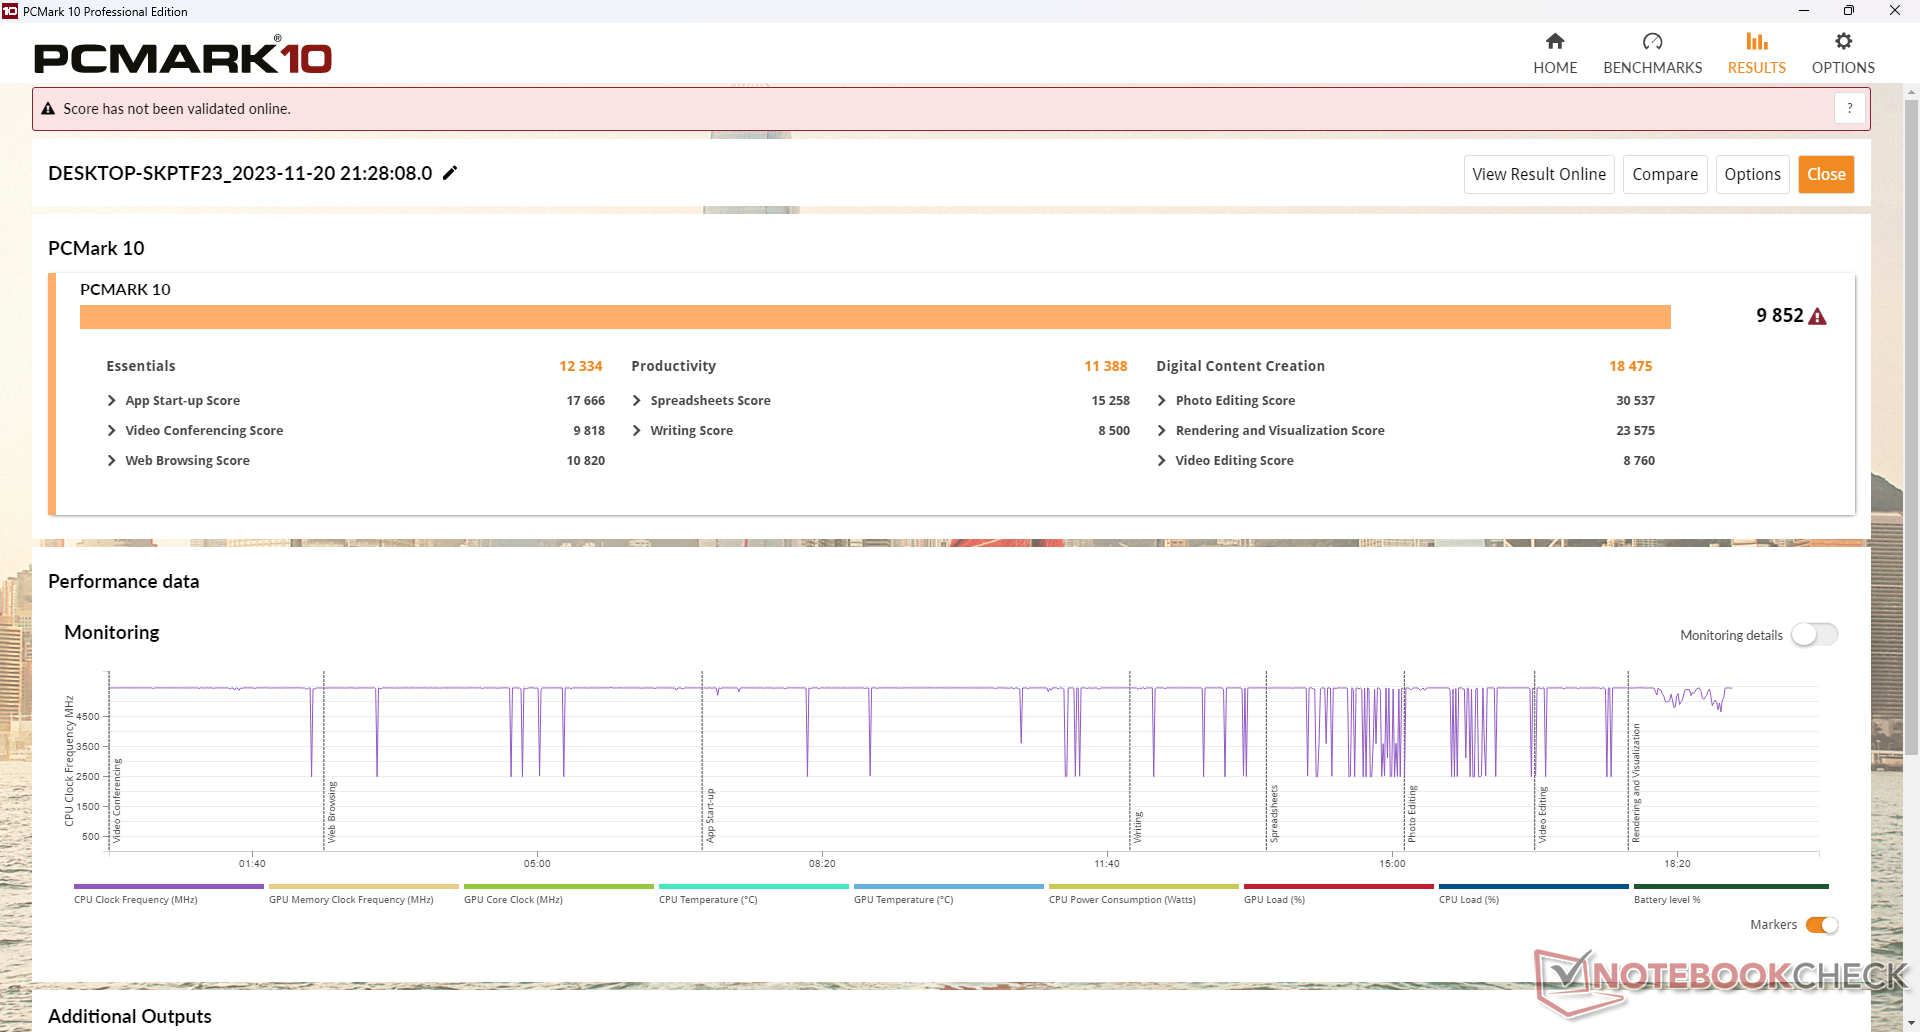
Unsere Ergebnisse im PCMark-10-Test gehören zu den höchsten, die je ein Gaming-Laptop bei uns erzielt hat, wodurch sich das Alienware m18 auf eine Stufe mit einigen der schnellsten Intel-Nvidia-Alternativen stellt. Leider ist die Nutzererfahrung in der Praxis weniger berauschend, was an all den Bugs liegt, die wir beobachtet haben. Einige davon sind:
- Das Hauptdisplay schaltete sich manchmal grundlos aus, ein Neustart war erforderlich
- System bootete nicht, wenn ein externer Monitor angeschlossen war
- 3DMark Speed Way und Blender Classroom HIP/AMD Benchmarks liefen nicht
- Ungewöhnlich hoher Verbrauch im Standby-Modus
Trotz aktueller Windows-Updates und AMD-Treiber (31.0.22023.1014) traten diese Fehler mehr als einmal auf.
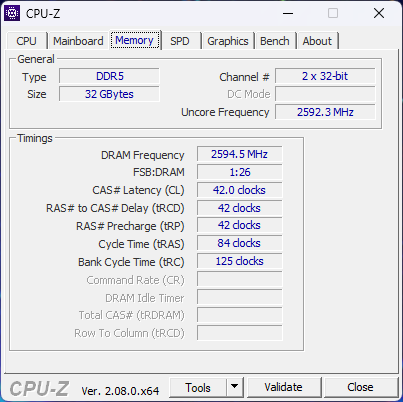
Auch die Speichergeschwindigkeit ist signifikant langsamer als auf vielen Intel-Gaming-Laptops. Das scheint kein Ausrutscher oder Zufall zu sein, denn das Asus ROG Strix Scar 17 mit der gleichen Ryzen-9-CPU wie in unserem Alienware produziert ähnlich niedrige Werte.
CrossMark: Overall | Productivity | Creativity | Responsiveness
| PCMark 10 / Score | |
| Alienware m18 R1 AMD | |
| Durchschnittliche AMD Ryzen 9 7945HX, AMD Radeon RX 7900M (n=1) | |
| MSI GE78HX 13VH-070US | |
| Asus ROG Strix Scar 18 2023 G834JY-N6005W | |
| Alienware m18 R1 | |
| Acer Predator Helios 18 N23Q2 | |
| Razer Blade 18 RTX 4070 | |
| PCMark 10 / Essentials | |
| Alienware m18 R1 AMD | |
| Durchschnittliche AMD Ryzen 9 7945HX, AMD Radeon RX 7900M (n=1) | |
| Razer Blade 18 RTX 4070 | |
| MSI GE78HX 13VH-070US | |
| Alienware m18 R1 | |
| Acer Predator Helios 18 N23Q2 | |
| PCMark 10 / Productivity | |
| Alienware m18 R1 AMD | |
| Durchschnittliche AMD Ryzen 9 7945HX, AMD Radeon RX 7900M (n=1) | |
| Acer Predator Helios 18 N23Q2 | |
| MSI GE78HX 13VH-070US | |
| Alienware m18 R1 | |
| Razer Blade 18 RTX 4070 | |
| PCMark 10 / Digital Content Creation | |
| Alienware m18 R1 AMD | |
| Durchschnittliche AMD Ryzen 9 7945HX, AMD Radeon RX 7900M (n=1) | |
| Alienware m18 R1 | |
| MSI GE78HX 13VH-070US | |
| Acer Predator Helios 18 N23Q2 | |
| Razer Blade 18 RTX 4070 | |
| CrossMark / Overall | |
| Acer Predator Helios 18 N23Q2 | |
| Alienware m18 R1 | |
| Razer Blade 18 RTX 4070 | |
| Asus ROG Strix Scar 18 2023 G834JY-N6005W | |
| Alienware m18 R1 AMD | |
| Durchschnittliche AMD Ryzen 9 7945HX, AMD Radeon RX 7900M (n=1) | |
| MSI GE78HX 13VH-070US | |
| CrossMark / Productivity | |
| Acer Predator Helios 18 N23Q2 | |
| Alienware m18 R1 | |
| Razer Blade 18 RTX 4070 | |
| Asus ROG Strix Scar 18 2023 G834JY-N6005W | |
| MSI GE78HX 13VH-070US | |
| Alienware m18 R1 AMD | |
| Durchschnittliche AMD Ryzen 9 7945HX, AMD Radeon RX 7900M (n=1) | |
| CrossMark / Creativity | |
| Alienware m18 R1 | |
| Asus ROG Strix Scar 18 2023 G834JY-N6005W | |
| Acer Predator Helios 18 N23Q2 | |
| Razer Blade 18 RTX 4070 | |
| Alienware m18 R1 AMD | |
| Durchschnittliche AMD Ryzen 9 7945HX, AMD Radeon RX 7900M (n=1) | |
| MSI GE78HX 13VH-070US | |
| CrossMark / Responsiveness | |
| Acer Predator Helios 18 N23Q2 | |
| Alienware m18 R1 | |
| Razer Blade 18 RTX 4070 | |
| MSI GE78HX 13VH-070US | |
| Asus ROG Strix Scar 18 2023 G834JY-N6005W | |
| Alienware m18 R1 AMD | |
| Durchschnittliche AMD Ryzen 9 7945HX, AMD Radeon RX 7900M (n=1) | |
| PCMark 10 Score | 9852 Punkte | |
Hilfe | ||
| AIDA64 / Memory Copy | |
| Alienware m18 R1 | |
| Acer Predator Helios 18 N23Q2 | |
| MSI GE78HX 13VH-070US | |
| Razer Blade 18 RTX 4070 | |
| Asus ROG Strix Scar 18 2023 G834JY-N6005W | |
| Durchschnittliche AMD Ryzen 9 7945HX (48948 - 57953, n=7) | |
| Alienware m18 R1 AMD | |
| Asus ROG Strix Scar 17 G733PYV-LL053X | |
| AIDA64 / Memory Read | |
| Alienware m18 R1 | |
| Acer Predator Helios 18 N23Q2 | |
| Razer Blade 18 RTX 4070 | |
| MSI GE78HX 13VH-070US | |
| Asus ROG Strix Scar 18 2023 G834JY-N6005W | |
| Alienware m18 R1 AMD | |
| Durchschnittliche AMD Ryzen 9 7945HX (56910 - 67753, n=7) | |
| Asus ROG Strix Scar 17 G733PYV-LL053X | |
| AIDA64 / Memory Write | |
| Alienware m18 R1 | |
| MSI GE78HX 13VH-070US | |
| Razer Blade 18 RTX 4070 | |
| Acer Predator Helios 18 N23Q2 | |
| Asus ROG Strix Scar 18 2023 G834JY-N6005W | |
| Durchschnittliche AMD Ryzen 9 7945HX (58602 - 70063, n=7) | |
| Alienware m18 R1 AMD | |
| Asus ROG Strix Scar 17 G733PYV-LL053X | |
| AIDA64 / Memory Latency | |
| Alienware m18 R1 AMD | |
| Asus ROG Strix Scar 18 2023 G834JY-N6005W | |
| Asus ROG Strix Scar 17 G733PYV-LL053X | |
| Razer Blade 18 RTX 4070 | |
| MSI GE78HX 13VH-070US | |
| Durchschnittliche AMD Ryzen 9 7945HX (77.1 - 91.3, n=7) | |
| Acer Predator Helios 18 N23Q2 | |
| Alienware m18 R1 | |
* ... kleinere Werte sind besser
DPC Latency
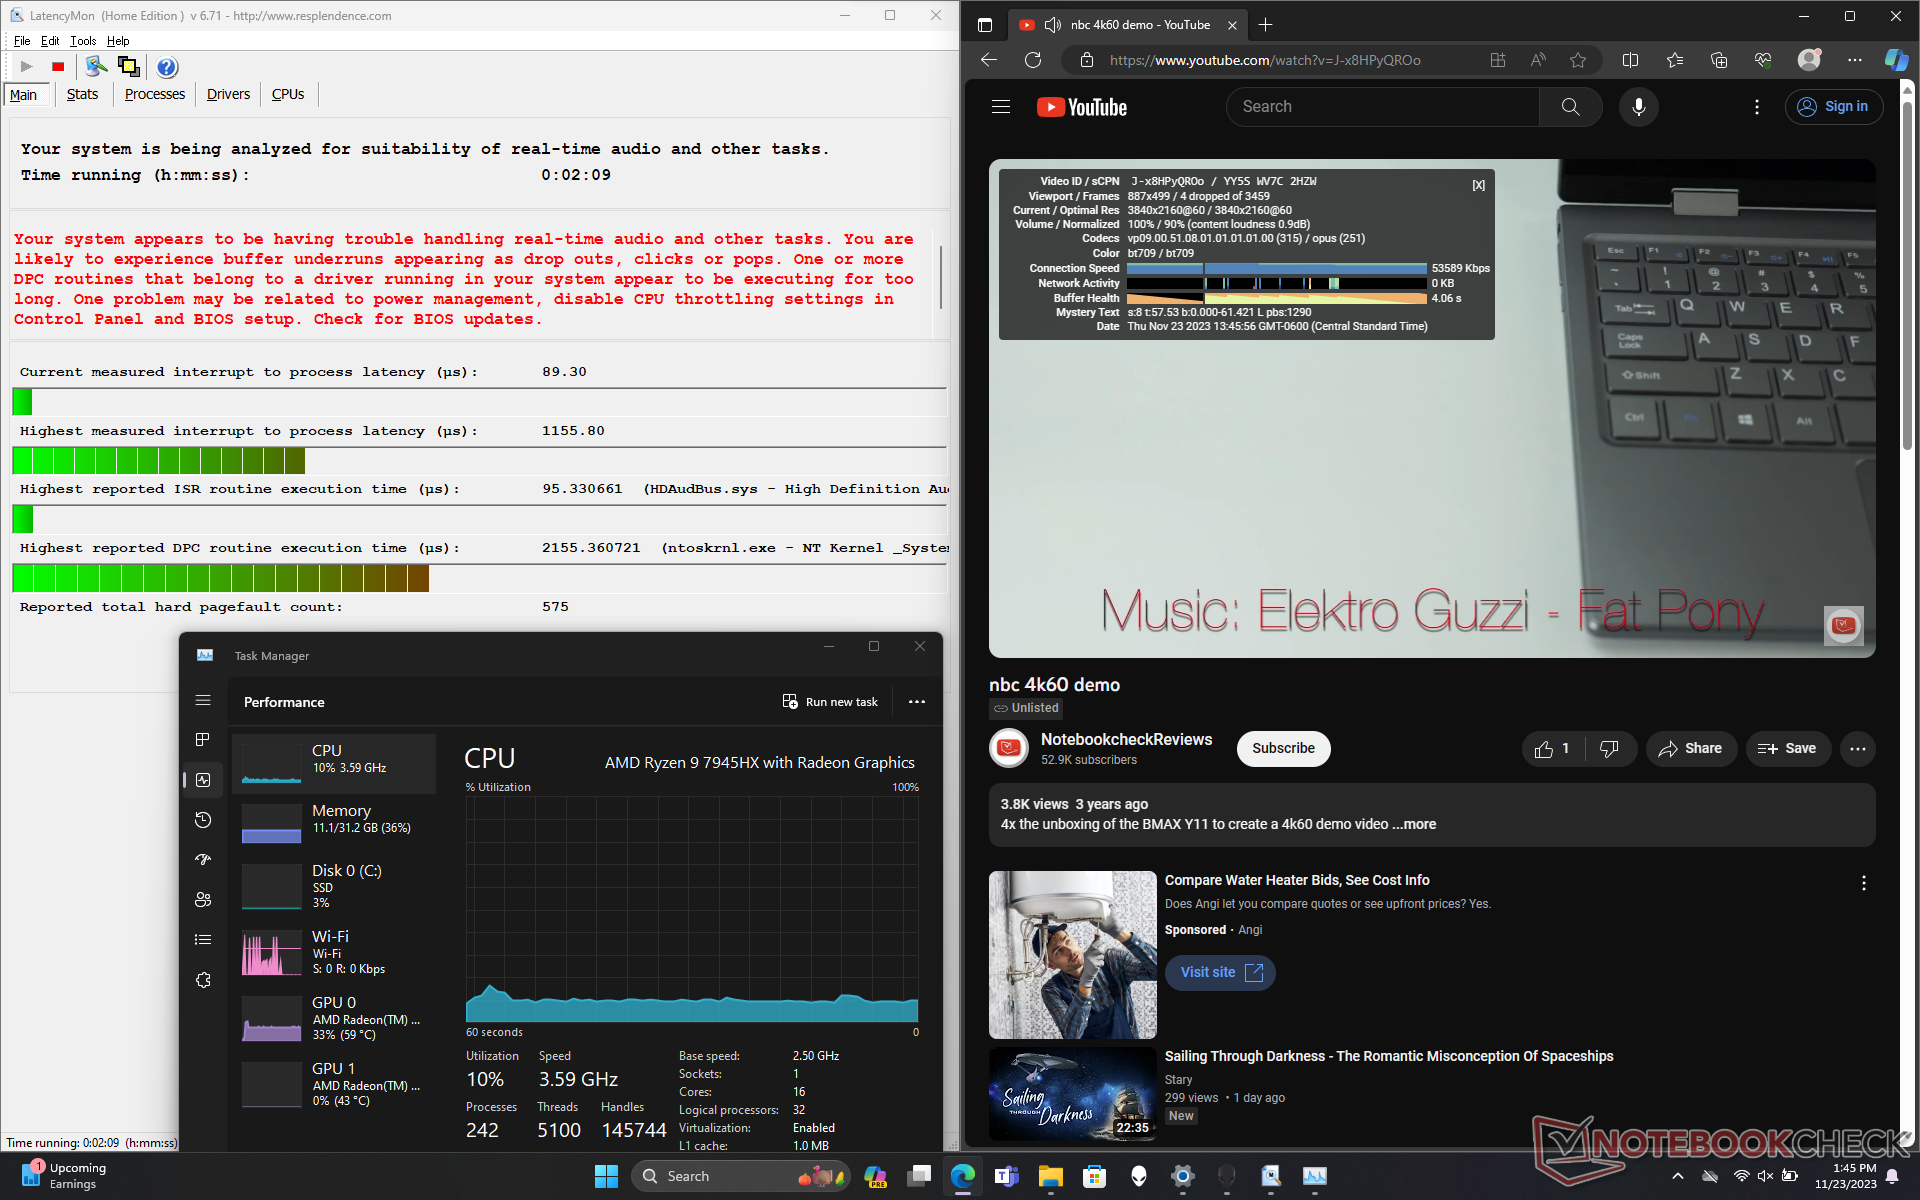
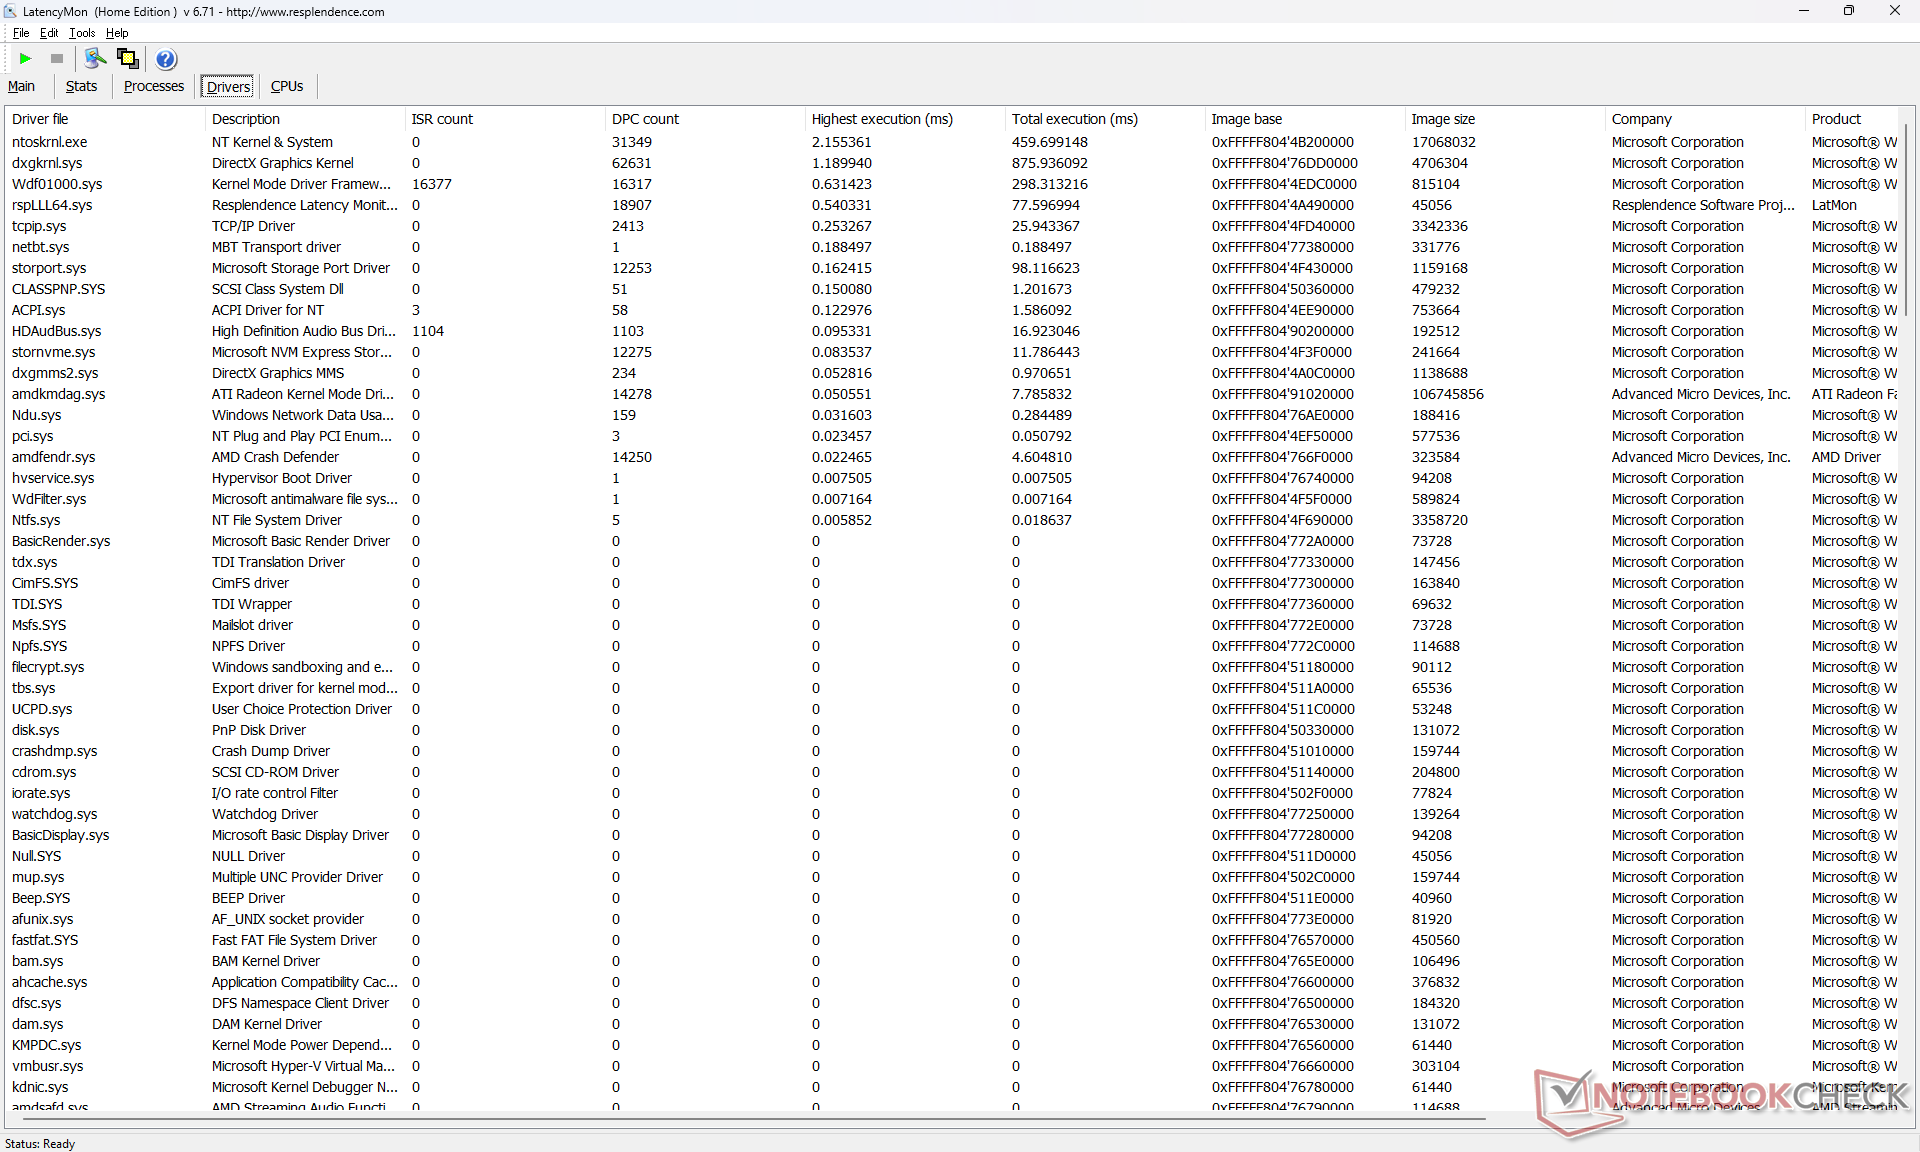
LatencyMon enthüllt leichte DPC-Probleme beim Öffnen mehrerer Browsertabs auf unserer Homepage, was nicht ungewöhnlich ist. Die Wiedergabe unseres 4K/60-FPS-YouTubevideos könnte allerdings besser sein, wir registrieren 4 ausgelassene Bilder in dem einminütigen Video, während beim Blade 18 keine zu beklagen sind.
| DPC Latencies / LatencyMon - interrupt to process latency (max), Web, Youtube, Prime95 | |
| Acer Predator Helios 18 N23Q2 | |
| MSI GE78HX 13VH-070US | |
| Alienware m18 R1 | |
| Razer Blade 18 RTX 4070 | |
| Alienware m18 R1 AMD | |
| Asus ROG Strix Scar 18 2023 G834JY-N6005W | |
* ... kleinere Werte sind besser
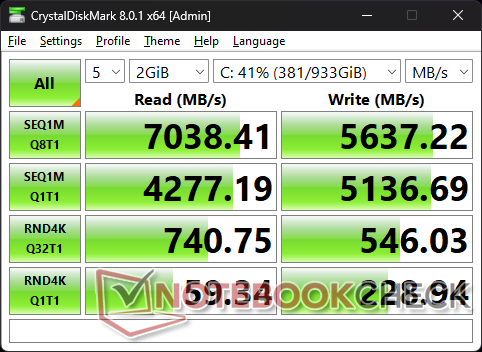
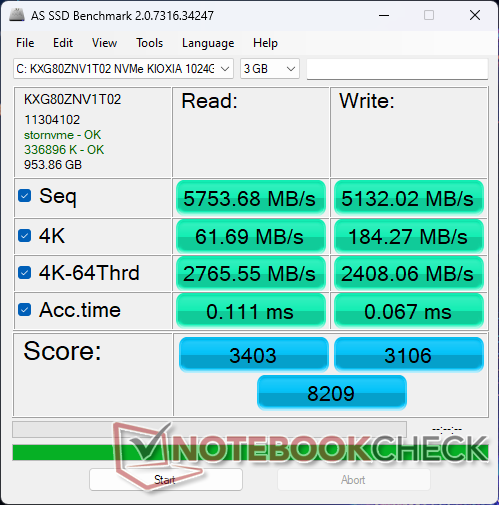
Massenspeicher
Die 1 TB große Kioxia XG8 KXG80ZNV1T02 ist eine Higher-End-PCIe4-x4-NVMe-SSD, ähnlich der Samsung-PM9A1-Serie. Unser Modell hat keine Drosselungsprobleme, sondern kommt auf stabile und hohe Transferraten von um die 6.300 MB/s, selbst bei längeren Testperioden.

| Drive Performance Rating - Percent | |
| Alienware m18 R1 | |
| Acer Predator Helios 18 N23Q2 | |
| MSI GE78HX 13VH-070US | |
| Razer Blade 18 RTX 4070 | |
| Alienware m18 R1 AMD | |
| Asus ROG Strix Scar 18 2023 G834JY-N6005W | |
* ... kleinere Werte sind besser
Disk Throttling: DiskSpd Read Loop, Queue Depth 8
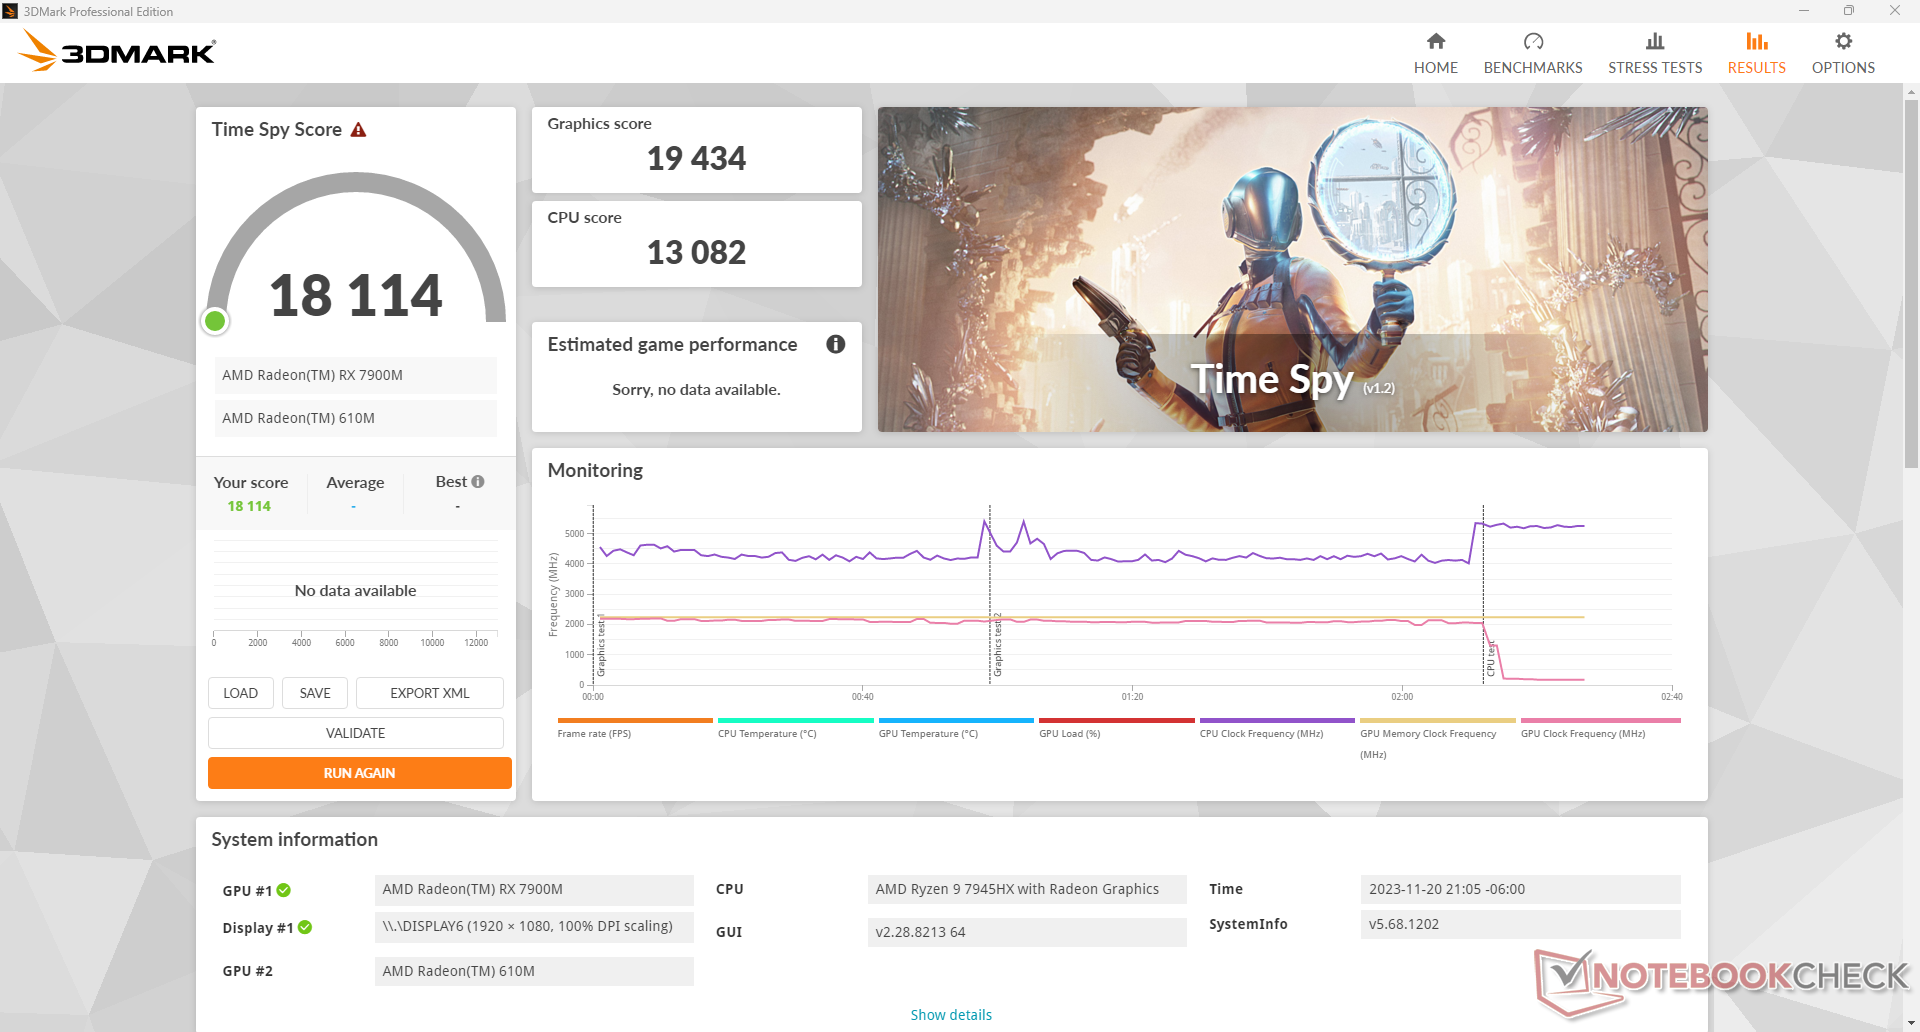
Grafikleistung
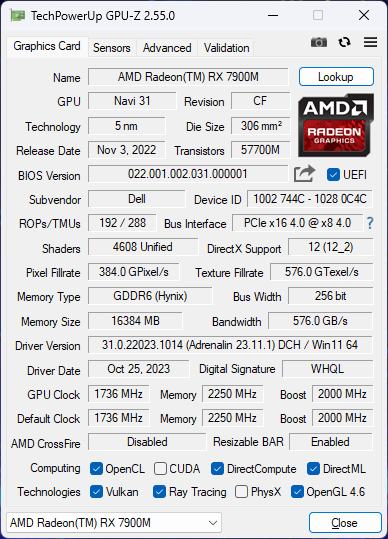
AMD bewirbt seine Radeon RX 7900M als direkten Konkurrenten zur mobilen GeForce RTX 4080 und unserer Meinung nach ist dies ein passender Vergleich. Im 3DMark liegen die Ergebnisse auf Augenhöhe mit der RTX 4080 im Alienware m16 R1, im DX11-basierten Fire Strike sind sie sogar leicht höher. Der reine Leistungsgewinn gegenüber der letztjährigen Radeon RX 6850M XT fällt mit 40 bis 60 Prozent signifikant aus. AMD hatte vor dem Launch der Radeon RX 7900M noch keine echte Antwort auf die mobilen RTX 4070, 4080 oder 4090.
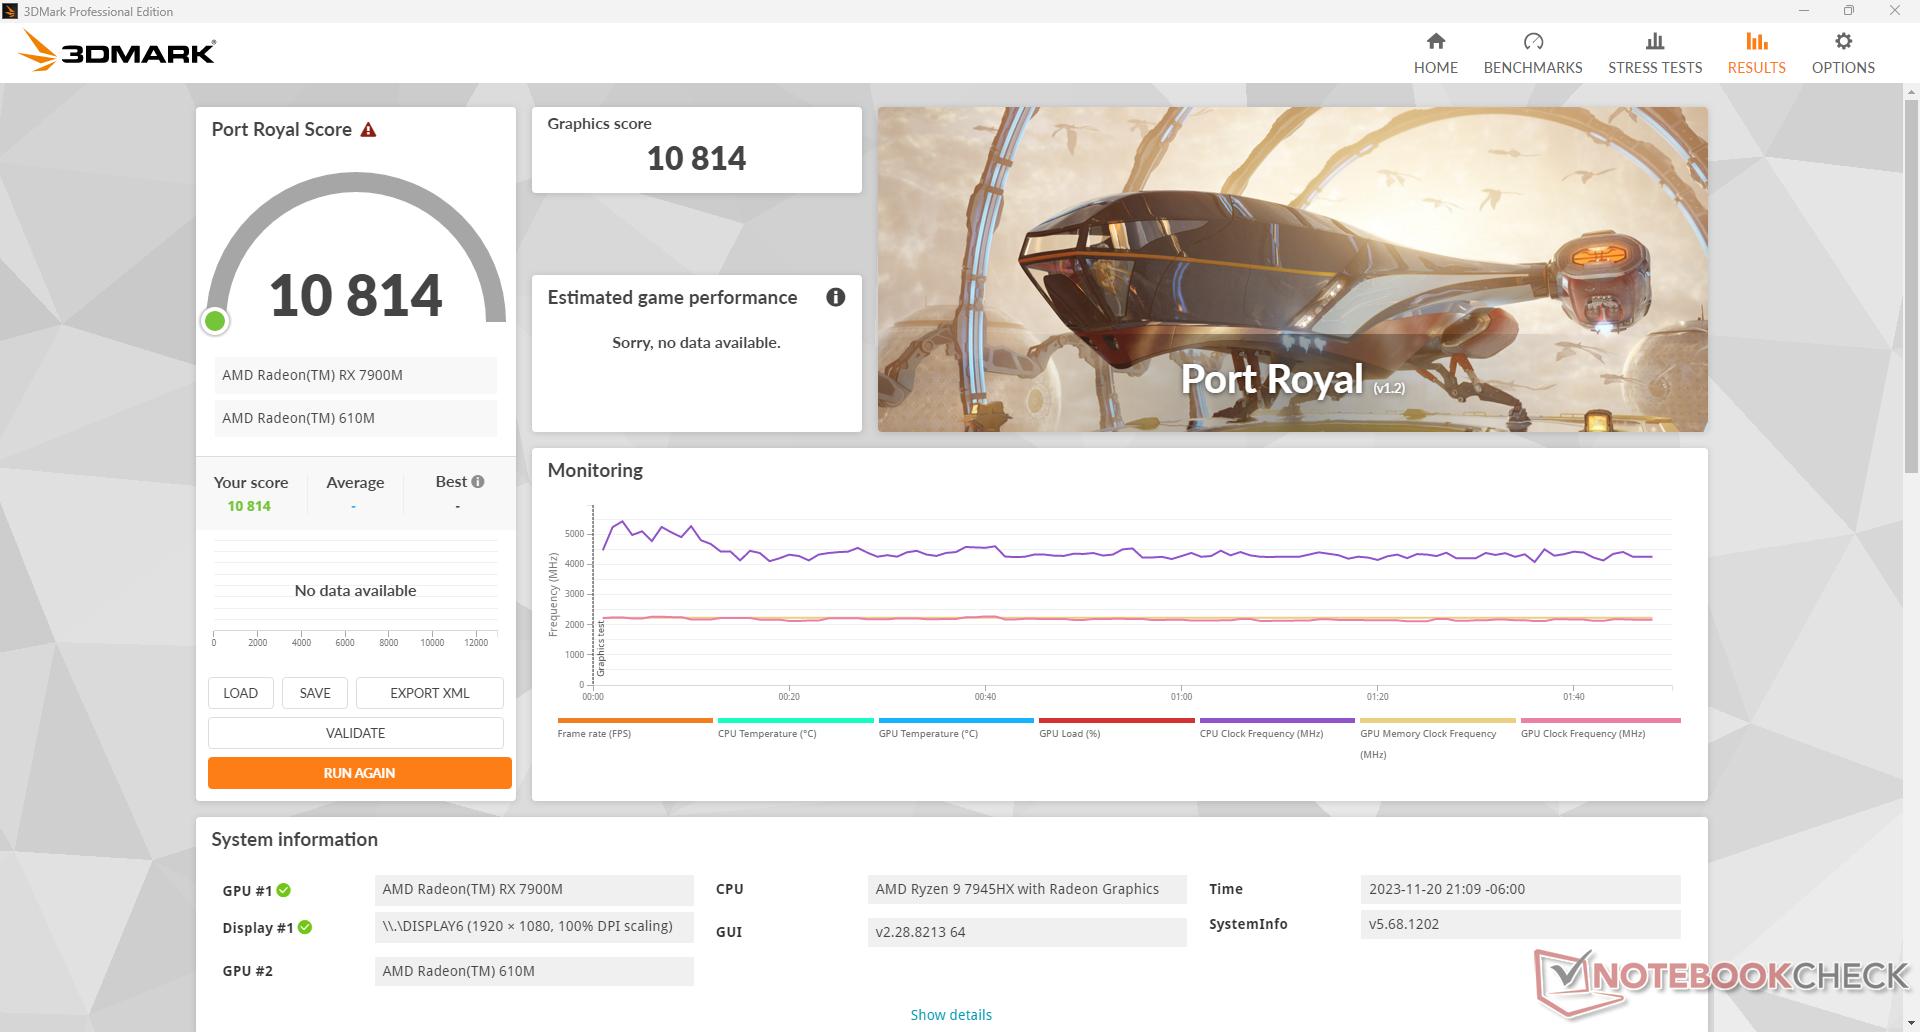
Die RT-Beschleunigung war bislang immer ein Schwachpunkt der Radeon-Serie, aber das hat sich mit der Radeon RX 7900M substanziell verbessert. Unser Port Royal Score liegt nur noch 10 Prozent hinter dem einer mobilen GeForce RTX 4080, was gleichzeitig einen Anstieg von 2x bis 2,5x gegenüber der letztjährigen Radeon RX 6800M bedeutet. Das Aktivieren von Ray Tracing war bislang auf Laptops mit Radeon-Karte durch den immensen Leistungsverlust kaum empfehlenswert, aber die Radeon RX 7900M markiert hier den Wendepunkt, auf den AMD-Fans gewartet haben.
Lässt man den Laptop statt auf dem Overdrive- im Performance- oder Balanced-Modus laufen, so sinkt die Leistung nur um wenige Prozentpunkte, wie unsere Ergebnisse im Fire Strike in der Tabelle unten zeigen. Die geringen Unterschiede sind erwähnenswert, da sich die Lüfterlautstärke zwischen diesen Modi erheblich unterscheidet, wie wir im Kapitel Geräuschemissionen aufzeigen.
| Power Profile | Physics Score | Graphics Score | Combined Score |
| Overdrive | 39027 | 50241 | 16256 |
| Performance | 37979 (-3%) | 47187 (-6%) | 16523 (-0%) |
| Balanced | 37590 (-4%) | 48170 (-4%) | 16382 (-0%) |
| Battery | 31494 (-19%) | 10735 (-79%) | 4174 (-74%) |
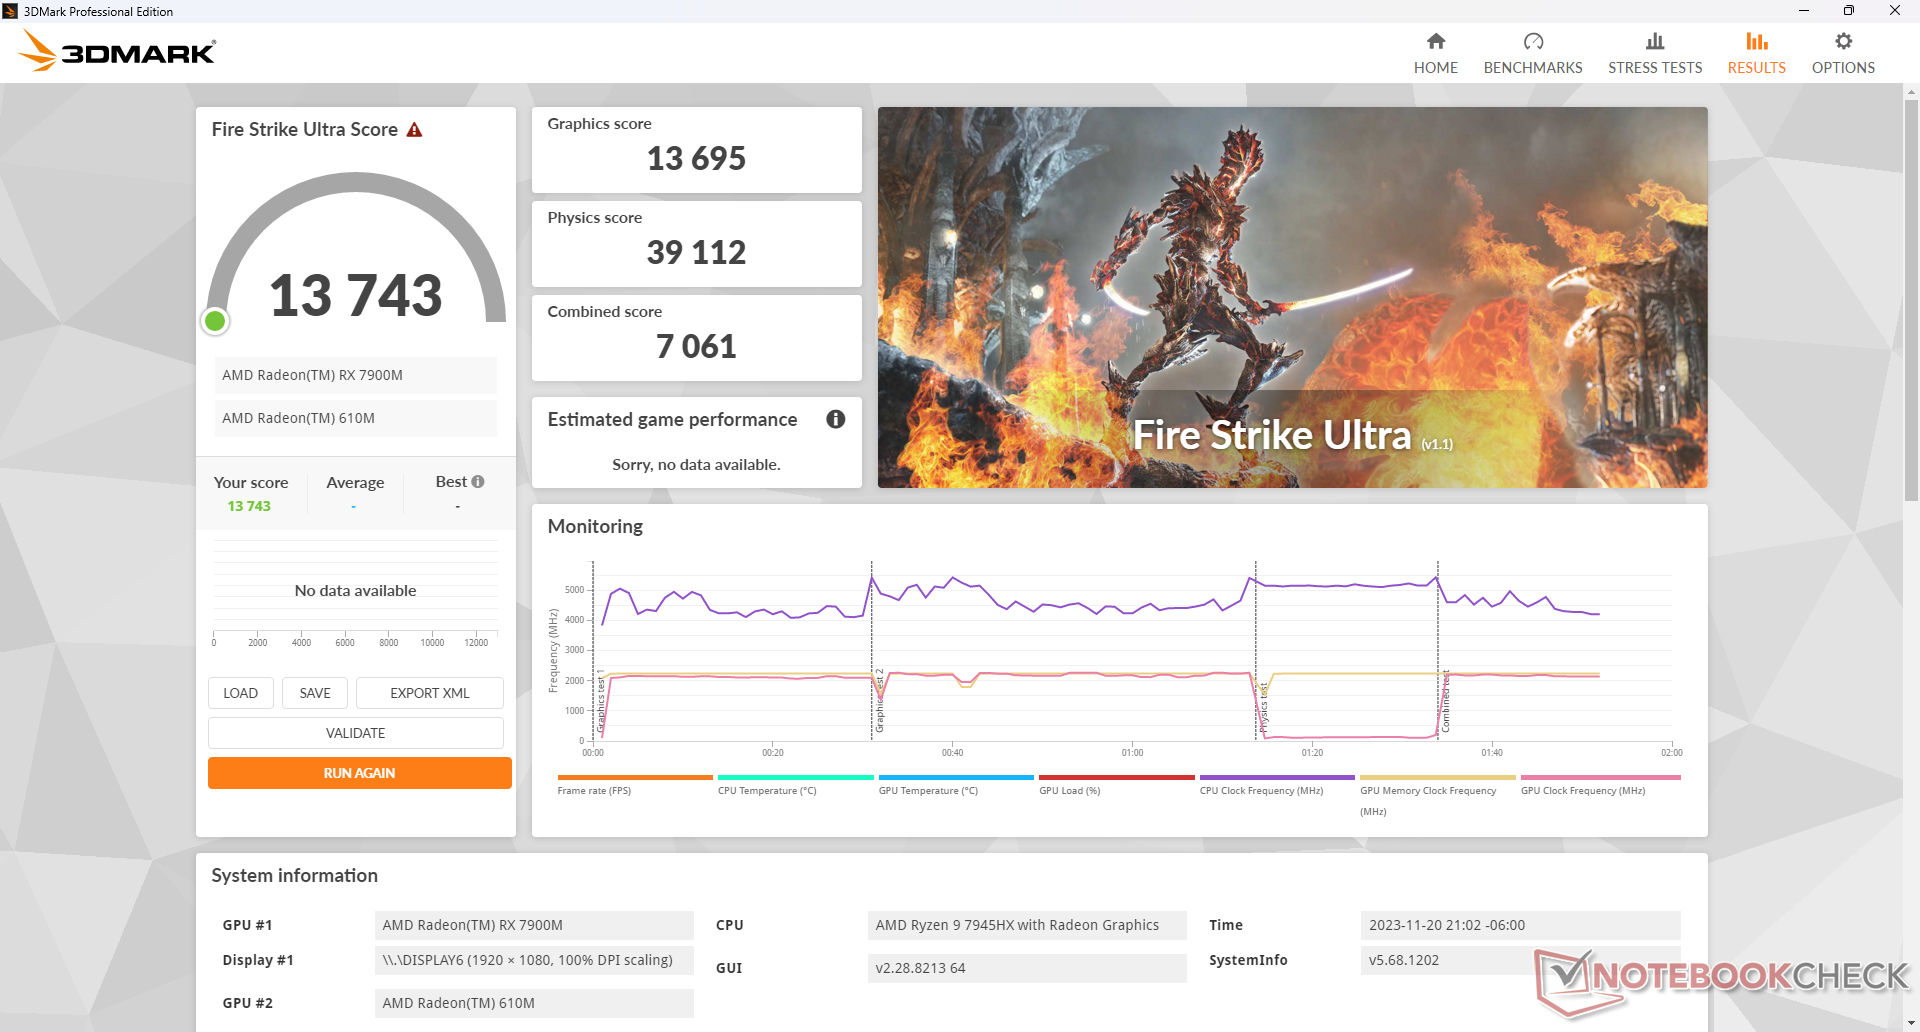
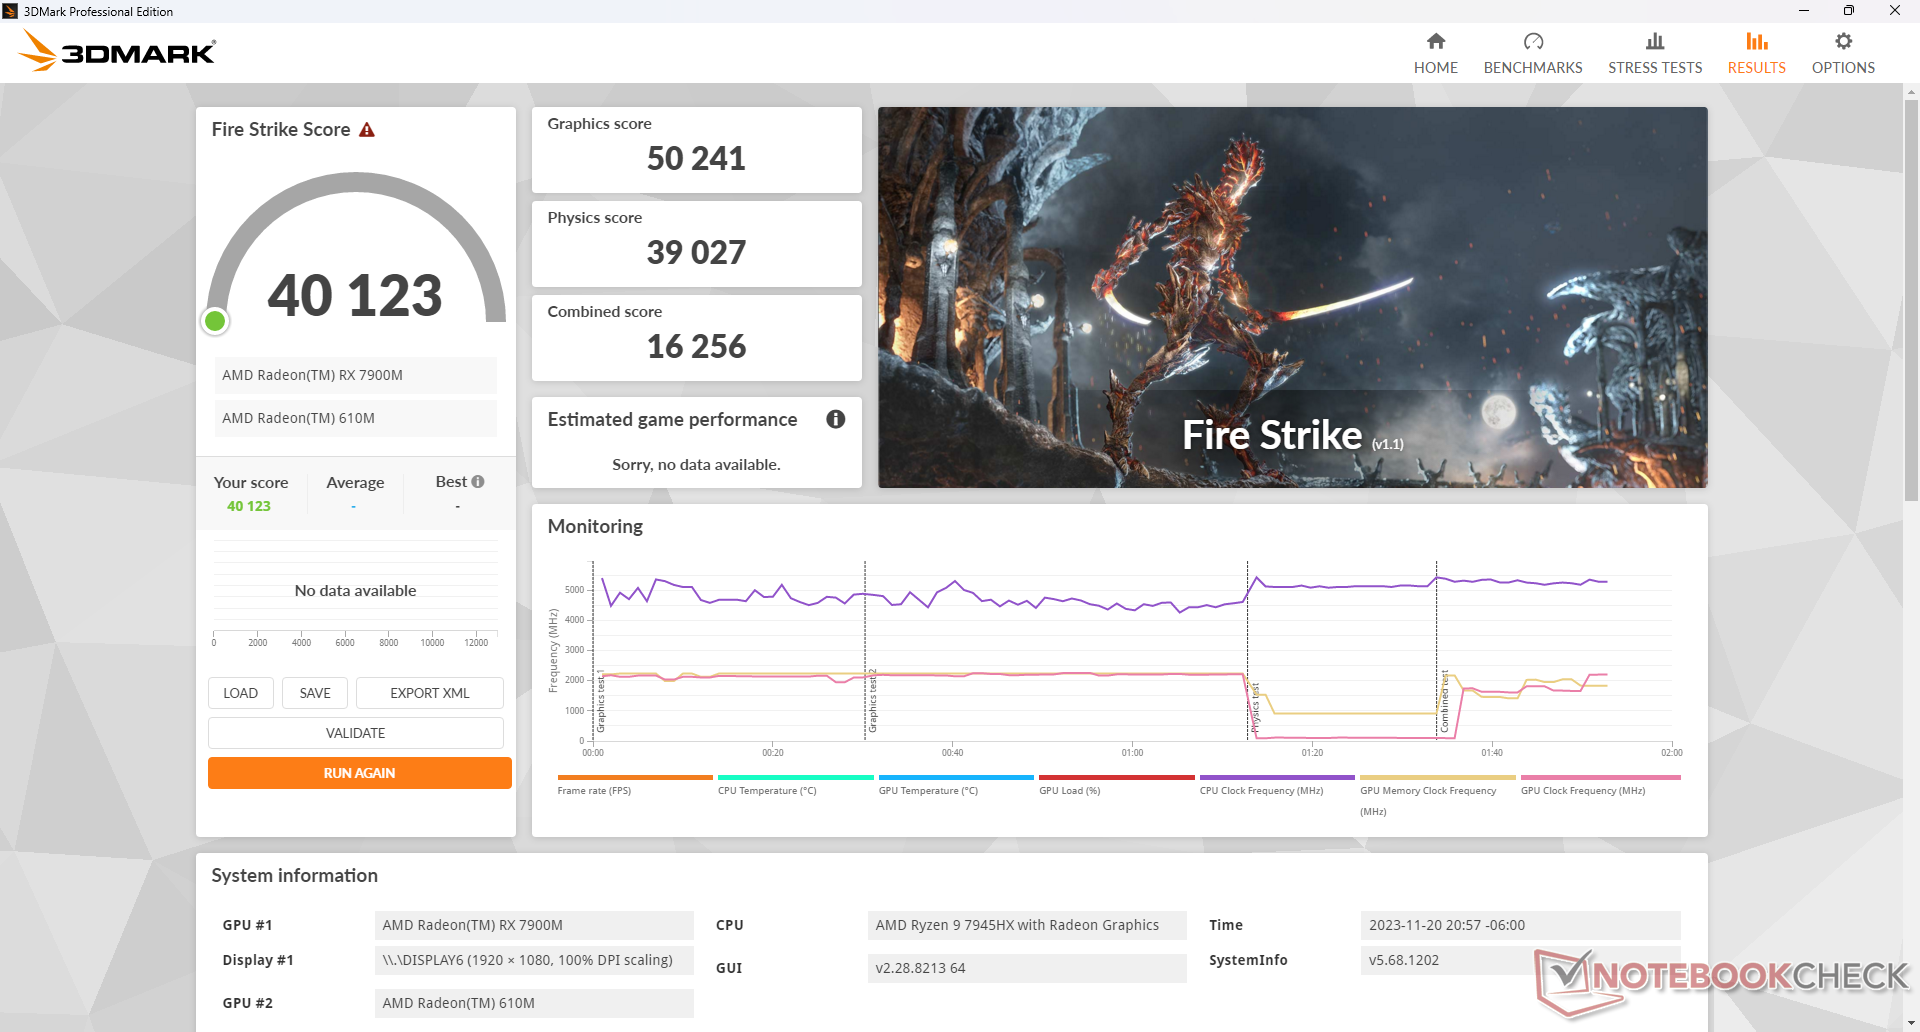
| 3DMark 11 Performance | 41670 Punkte | |
| 3DMark Fire Strike Score | 40123 Punkte | |
| 3DMark Time Spy Score | 18114 Punkte | |
Hilfe | ||
* ... kleinere Werte sind besser
Gaming Performance
Die 3DMark-Ergebnisse lassen sich gut auf die Gamingleistung transponieren. Unter Cyberpunk 2077 oder F1 22 liegen die Frameraten in den meisten Szenarien nur wenige Prozentpunkte innerhalb einer mobilen RTX 4080. Bei aktiviertem RT fällt der Leistungsabfall jedoch immer noch höher aus als bei der konkurrierenden Nvidia-GPU. Beispielsweise rechnet unser Alienware 15 und 35 Prozent langsamer als eine mobile RTX 4080 wenn man RT in den Titeln F1 22 und Cyberpunk 2077 aktiviert, auch wenn die beiden GPUs ohen RT sonst meist auf Augenhöhe liegen.
Zusammen mit dem Launch der Radeon RX 7900M hat AMD FSR 3 eingeführt, ihre Antwort auf DLSS 3. Ähnlich wie Nvidias Lösung bietet die Upscaling-Technik sowohl Frame Generation als auch Latency Reduction an, um dem Leistungsverlust mit aktiviertem RT zu begegnen. Leider steckt FSR 3 aktuell noch in den Kinderschuhen, sodass kaum ein Spiel das Feature unterstützt, während die Zahl der Games mit DLSS-3-Support in der letzten Zeit stark angewachsen ist. Nicht einmal Cyberpunk 2077 unterstützt FSR 3 aktuell. 2024 und in der weiteren Zukunft wird es aber mehr Spiele mit FSR 3 geben. In der Zwischenzeit müssen Nutzer sich mit dem älteren, aber weiter verbreiteten FSR 2 begnügen.
Erwähnt sei noch, dass wir trotz der allgemeinen, oben erwähnten Systembugs auf keine entscheidenden Fehler beim Spielen gestoßen sind. In Zukunft werden wir weitere Spiele testen und der Liste hinzufügen.
| Performance Rating - Percent | |
| Alienware m18 R1 | |
| Asus ROG Strix Scar 18 2023 G834JY-N6005W -1! | |
| Acer Predator Helios 18 N23Q2 | |
| Alienware m18 R1 AMD | |
| MSI GE78HX 13VH-070US | |
| Razer Blade 18 RTX 4070 | |
| The Witcher 3 - 1920x1080 Ultra Graphics & Postprocessing (HBAO+) | |
| Alienware m18 R1 | |
| MSI GE78HX 13VH-070US | |
| Acer Predator Helios 18 N23Q2 | |
| Alienware m18 R1 AMD | |
| Razer Blade 18 RTX 4070 | |
| GTA V - 1920x1080 Highest AA:4xMSAA + FX AF:16x | |
| Acer Predator Helios 18 N23Q2 | |
| Alienware m18 R1 | |
| Asus ROG Strix Scar 18 2023 G834JY-N6005W | |
| Razer Blade 18 RTX 4070 | |
| Alienware m18 R1 AMD | |
| MSI GE78HX 13VH-070US | |
| Final Fantasy XV Benchmark - 1920x1080 High Quality | |
| Alienware m18 R1 | |
| Acer Predator Helios 18 N23Q2 | |
| Asus ROG Strix Scar 18 2023 G834JY-N6005W | |
| Alienware m18 R1 AMD | |
| MSI GE78HX 13VH-070US | |
| Razer Blade 18 RTX 4070 | |
| Strange Brigade - 1920x1080 ultra AA:ultra AF:16 | |
| Alienware m18 R1 | |
| Asus ROG Strix Scar 18 2023 G834JY-N6005W | |
| Alienware m18 R1 AMD | |
| Acer Predator Helios 18 N23Q2 | |
| MSI GE78HX 13VH-070US | |
| Razer Blade 18 RTX 4070 | |
| Dota 2 Reborn - 1920x1080 ultra (3/3) best looking | |
| Alienware m18 R1 | |
| Asus ROG Strix Scar 18 2023 G834JY-N6005W | |
| Acer Predator Helios 18 N23Q2 | |
| Razer Blade 18 RTX 4070 | |
| Alienware m18 R1 AMD | |
| MSI GE78HX 13VH-070US | |
| Ratchet & Clank Rift Apart | |
| 1920x1080 Very High Preset AA:T | |
| AMD Radeon RX 7900 GRE | |
| Alienware m18 R1 AMD | |
| Durchschnittliche AMD Radeon RX 7900M (n=1) | |
| 2560x1440 Very High Preset AA:T | |
| AMD Radeon RX 7900 GRE | |
| Alienware m18 R1 AMD | |
| Durchschnittliche AMD Radeon RX 7900M (n=1) | |
| 3840x2160 Very High Preset AA:T | |
| AMD Radeon RX 7900 GRE | |
| Alienware m18 R1 AMD | |
| Durchschnittliche AMD Radeon RX 7900M (n=1) | |
| 1920x1080 Very High Preset + Very High Raytracing AA:T | |
| Alienware m18 R1 AMD | |
| Durchschnittliche AMD Radeon RX 7900M (n=1) | |
Gelegentlich fällt die Leistung in Witcher 3 (Idle) kurz auf niedrige 70 FPS gegenüber den hohen 180 FPS, wie der unten stehende Graph zeigt. Beim Gameplay äußern sich diese Leistungsabsacker als kurze Stotterer, selbst wenn die Spielfigur gar nicht bewegt wird. Das Phänomen tritt in einer bestimmten Frequenz auf, was auf einen störenden Hintergrundprozess hindeutet, dessen man sich annehmen sollte.
Dieser Leistungs-Bug tritt nicht auf, wenn man den gleichen Test auf der Intel-Nvidia-Konfiguration des ansonsten gleichen Alienware wiederholt.
Witcher 3 FPS Chart
| min. | mittel | hoch | max. | QHD | 4K | |
|---|---|---|---|---|---|---|
| GTA V (2015) | 172.9 | 105 | 105.6 | 146 | ||
| The Witcher 3 (2015) | 167.7 | 116 | ||||
| Dota 2 Reborn (2015) | 162.8 | 146.2 | 122.5 | |||
| Final Fantasy XV Benchmark (2018) | 152.8 | 114.6 | 69.3 | |||
| X-Plane 11.11 (2018) | 83.7 | 64.3 | ||||
| Far Cry 5 (2018) | 128 | 123 | 103 | |||
| Strange Brigade (2018) | 344 | 249 | 130.5 | |||
| Shadow of the Tomb Raider (2018) | 207 | 198 | 139 | 76 | ||
| Cyberpunk 2077 1.6 (2022) | 135 | 93.3 | 44.3 | |||
| Tiny Tina's Wonderlands (2022) | 150.2 | 106.8 | 56 | |||
| F1 22 (2022) | 296 | 102.8 | 69.3 | 36.1 | ||
| Ratchet & Clank Rift Apart (2023) | 86.2 | 83.6 | 54.8 | |||
| Baldur's Gate 3 (2023) | 152.4 | 152.6 | 118.5 | 65.8 | ||
| Cyberpunk 2077 (2023) | 130.7 | 129.6 | 85.2 | 37.7 | ||
| Alan Wake 2 (2023) | 104.8 | 71.7 | 37.3 |
Emissionen - Kühl, aber laut wie Intel-Nvidia
Systemlautstärke
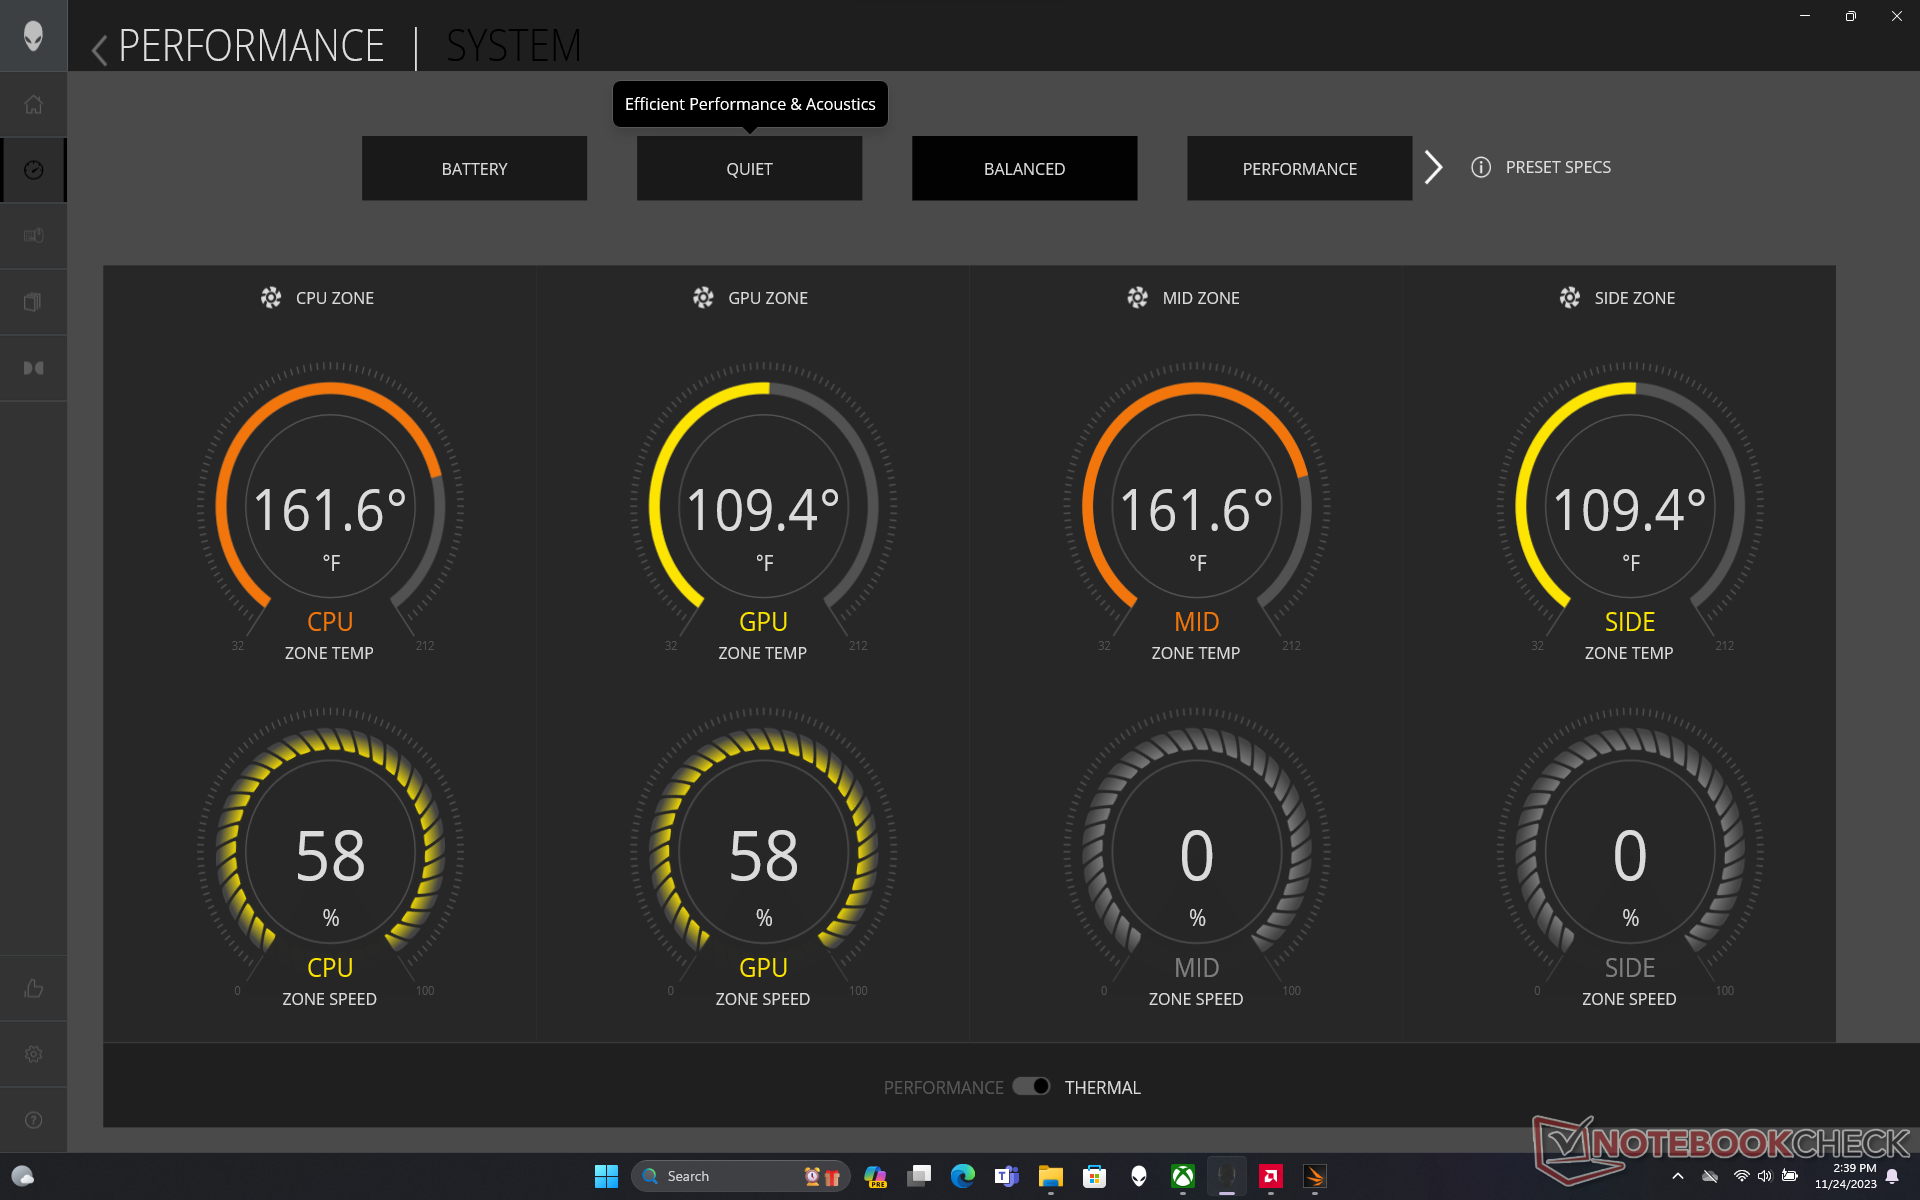
Es gibt quasi kaum Unterschiede zwischen der Intel- und der AMD-Konfiguration in Sachen Lüfterlautstärke. Das wiederum ist nicht unbedingt positiv gemeint, denn in unserer AMD-Einheit neigen die Lüfter immer wieder zum Pulsieren ohne offensichtlichen Grund, selbst beim Surfen oder Videostreaming. Erst läuft das System nahezu still mit 23 dB(A) und plötzlich setzen die Lüfter scharf ein und pulsieren auf bis zu 33,5 dB(A) hoch, auch im Lautlos- oder Akkumodus.
Interessanterweise gibt es keine Lautstärkeunterschiede zwischen dem Balanced- und dem Performance-Modus, wir messen jeweils ein Maximum von etwa 48 dB(A) beim Gamen mit beiden Profilen. Gaming im Overdrive-Modus geht hingegen deutlich lauter zu Werke, hier rotieren die Lüfter mit bis zu 54 dB(A). Nutzer sollten sich daher überlegen, ob sie nicht lieber im Performance-Modus spielen, da dieser signifikant leiser läuft und nur 5 bis 10 Prozent langsamer.
Man sollte nicht erwarten, dass das Alienware leiser läuft als andere 18-Zoll-Gamer, trotz der doppelten Anzahl an Lüftern im Inneren. Beim Gaming rauscht das System lauter als 50 dB(A), was Kopfhörer nahezu unverzichtbar macht.
Lautstärkediagramm
| Idle |
| 23 / 23.4 / 33.5 dB(A) |
| Last |
| 33.5 / 53.6 dB(A) |
 | ||
30 dB leise 40 dB(A) deutlich hörbar 50 dB(A) störend |
||
min: | ||
| Alienware m18 R1 AMD Radeon RX 7900M, R9 7945HX, Kioxia XG8 KXG80ZNV1T02 | Alienware m18 R1 GeForce RTX 4090 Laptop GPU, i9-13980HX, SK hynix PC801 HFS001TEJ9X101N | Acer Predator Helios 18 N23Q2 GeForce RTX 4080 Laptop GPU, i9-13900HX, Samsung PM9A1 MZVL22T0HBLB | Razer Blade 18 RTX 4070 GeForce RTX 4070 Laptop GPU, i9-13950HX, SSSTC CA6-8D1024 | Asus ROG Strix Scar 18 2023 G834JY-N6005W GeForce RTX 4090 Laptop GPU, i9-13980HX, 2x Samsung PM9A1 MZVL21T0HCLR (RAID 0) | MSI GE78HX 13VH-070US GeForce RTX 4080 Laptop GPU, i9-13950HX, Samsung PM9A1 MZVL22T0HBLB | |
|---|---|---|---|---|---|---|
| Geräuschentwicklung | 3% | -4% | 1% | -10% | -8% | |
| aus / Umgebung * (dB) | 22.4 | 22.8 -2% | 23 -3% | 23.5 -5% | 23.9 -7% | 23.4 -4% |
| Idle min * (dB) | 23 | 23 -0% | 23 -0% | 23.8 -3% | 23.9 -4% | 24.2 -5% |
| Idle avg * (dB) | 23.4 | 23 2% | 23 2% | 23.8 -2% | 32.6 -39% | 25.6 -9% |
| Idle max * (dB) | 33.5 | 23 31% | 23 31% | 26.8 20% | 32.6 3% | 31 7% |
| Last avg * (dB) | 33.5 | 35.6 -6% | 45.26 -35% | 37.3 -11% | 35.9 -7% | 43.3 -29% |
| Witcher 3 ultra * (dB) | 53.6 | 51.3 4% | 59.82 -12% | 48 10% | 56.3 -5% | |
| Last max * (dB) | 53.6 | 56.7 -6% | 59.94 -12% | 53.5 -0% | 55.8 -4% | 59.1 -10% |
* ... kleinere Werte sind besser
Temperatur
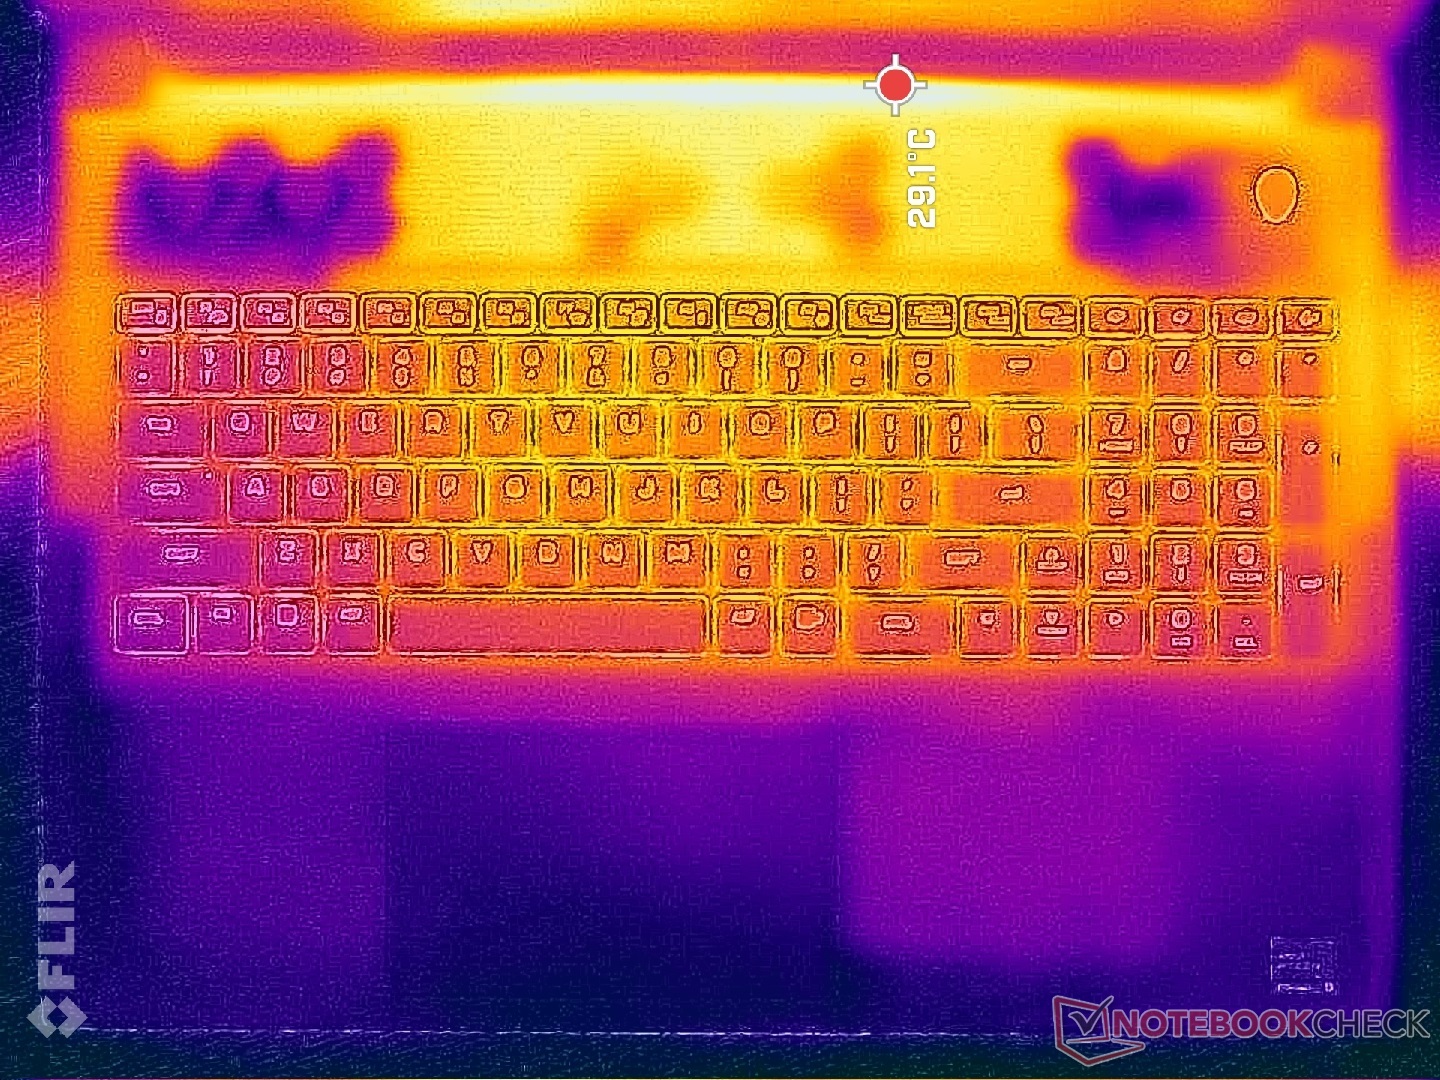
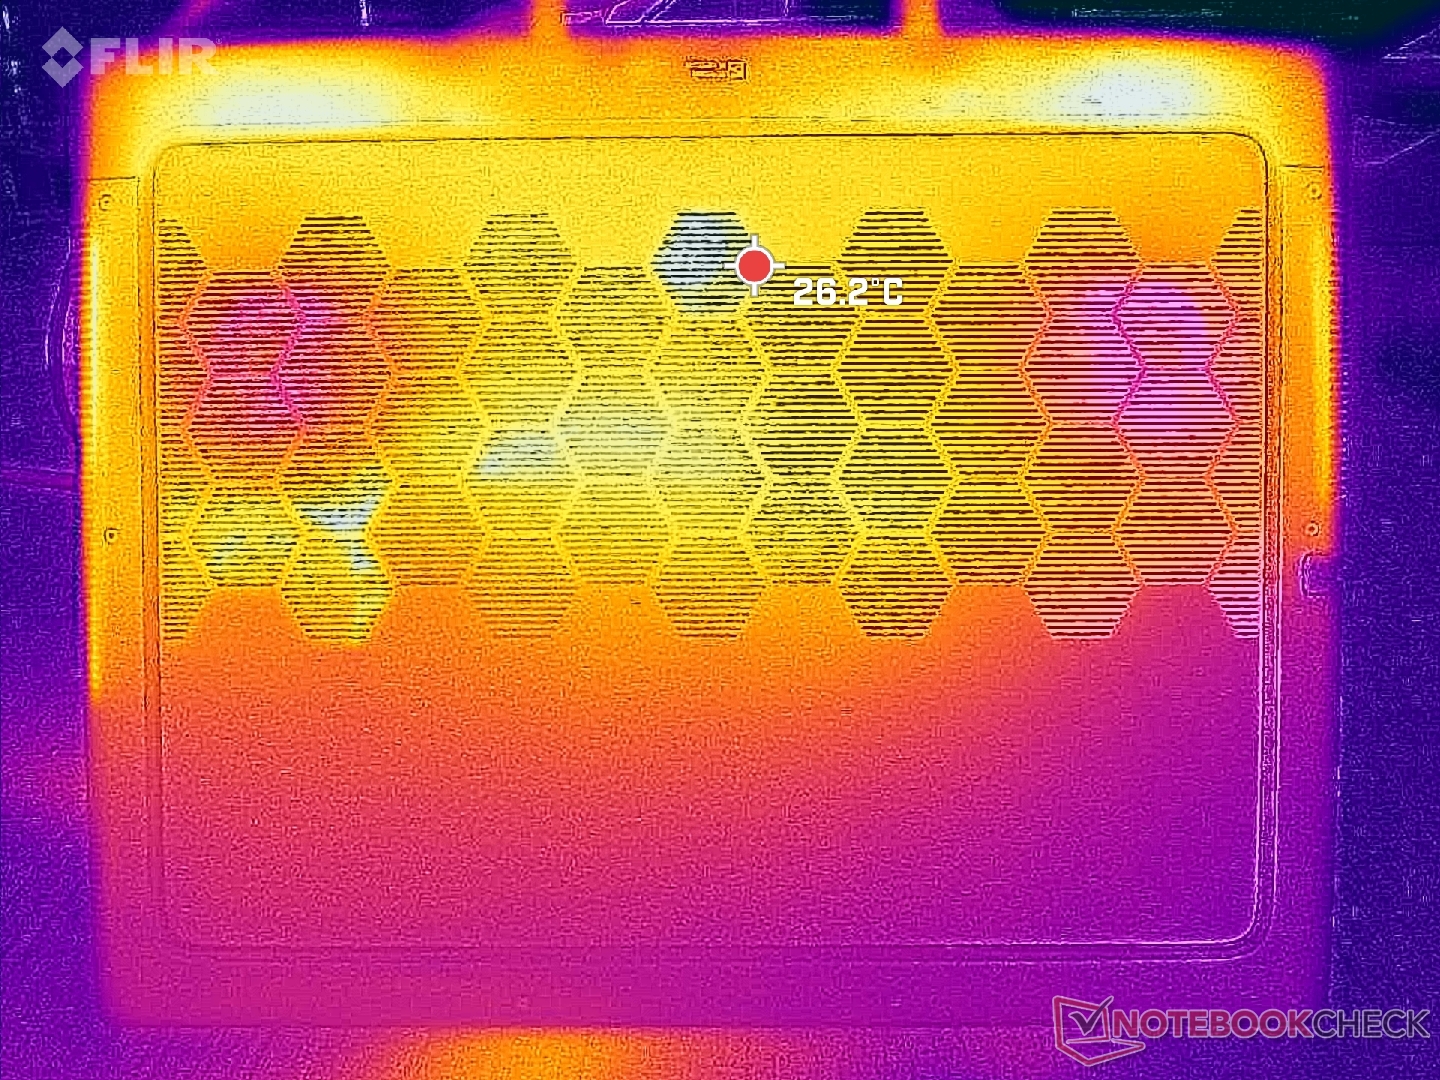
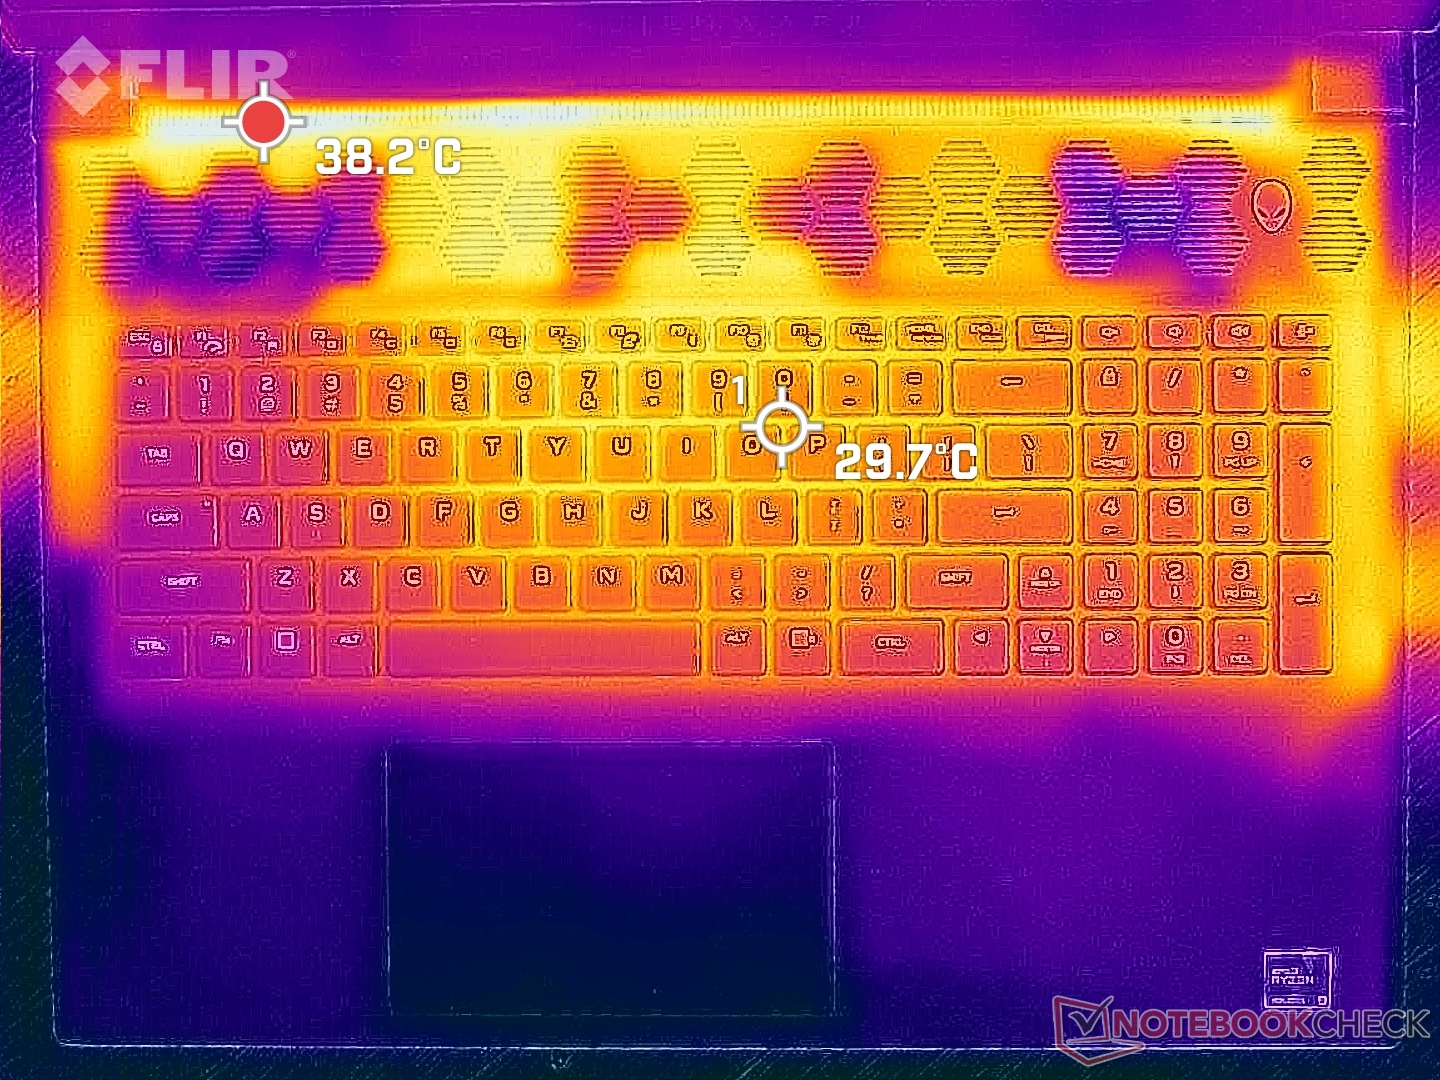
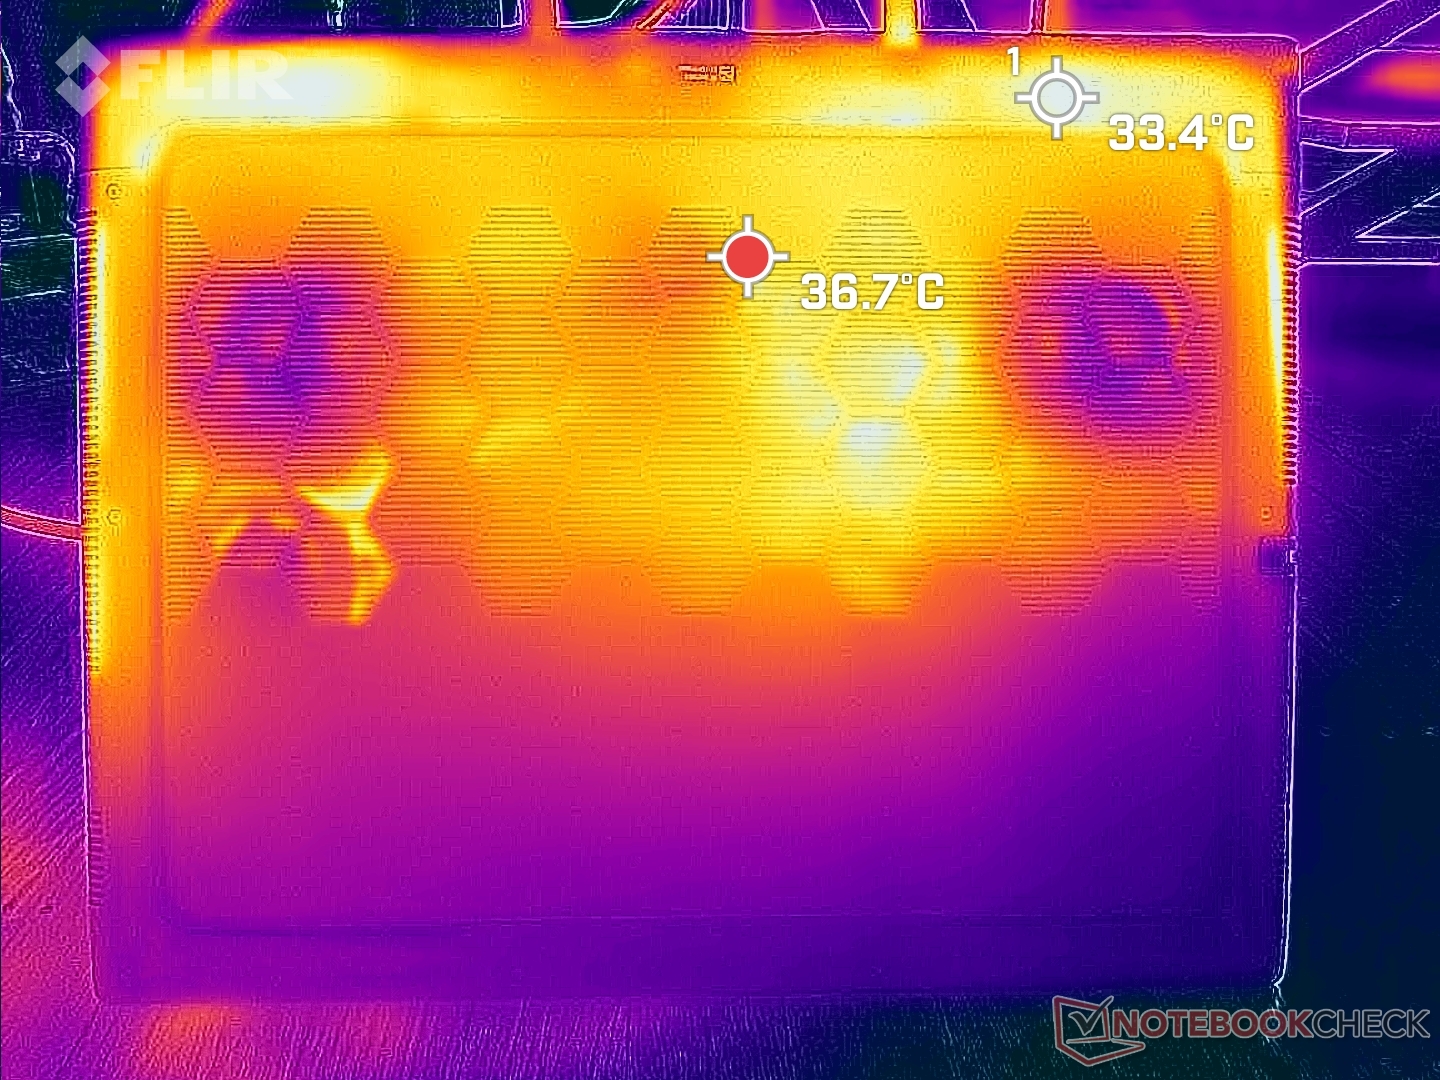
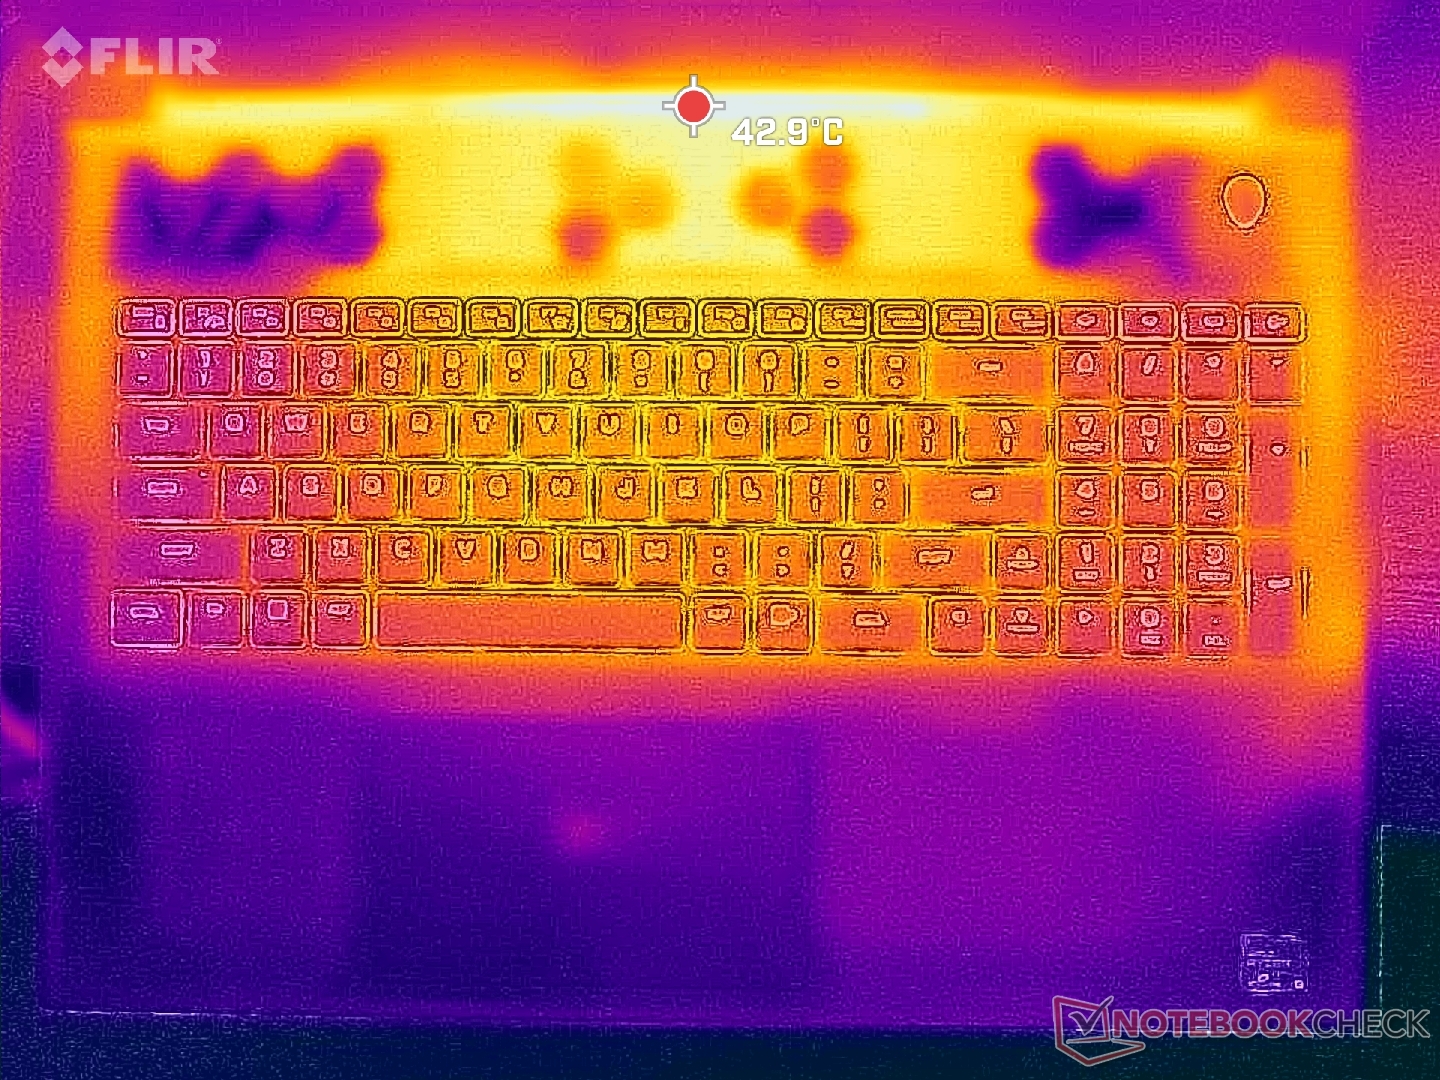
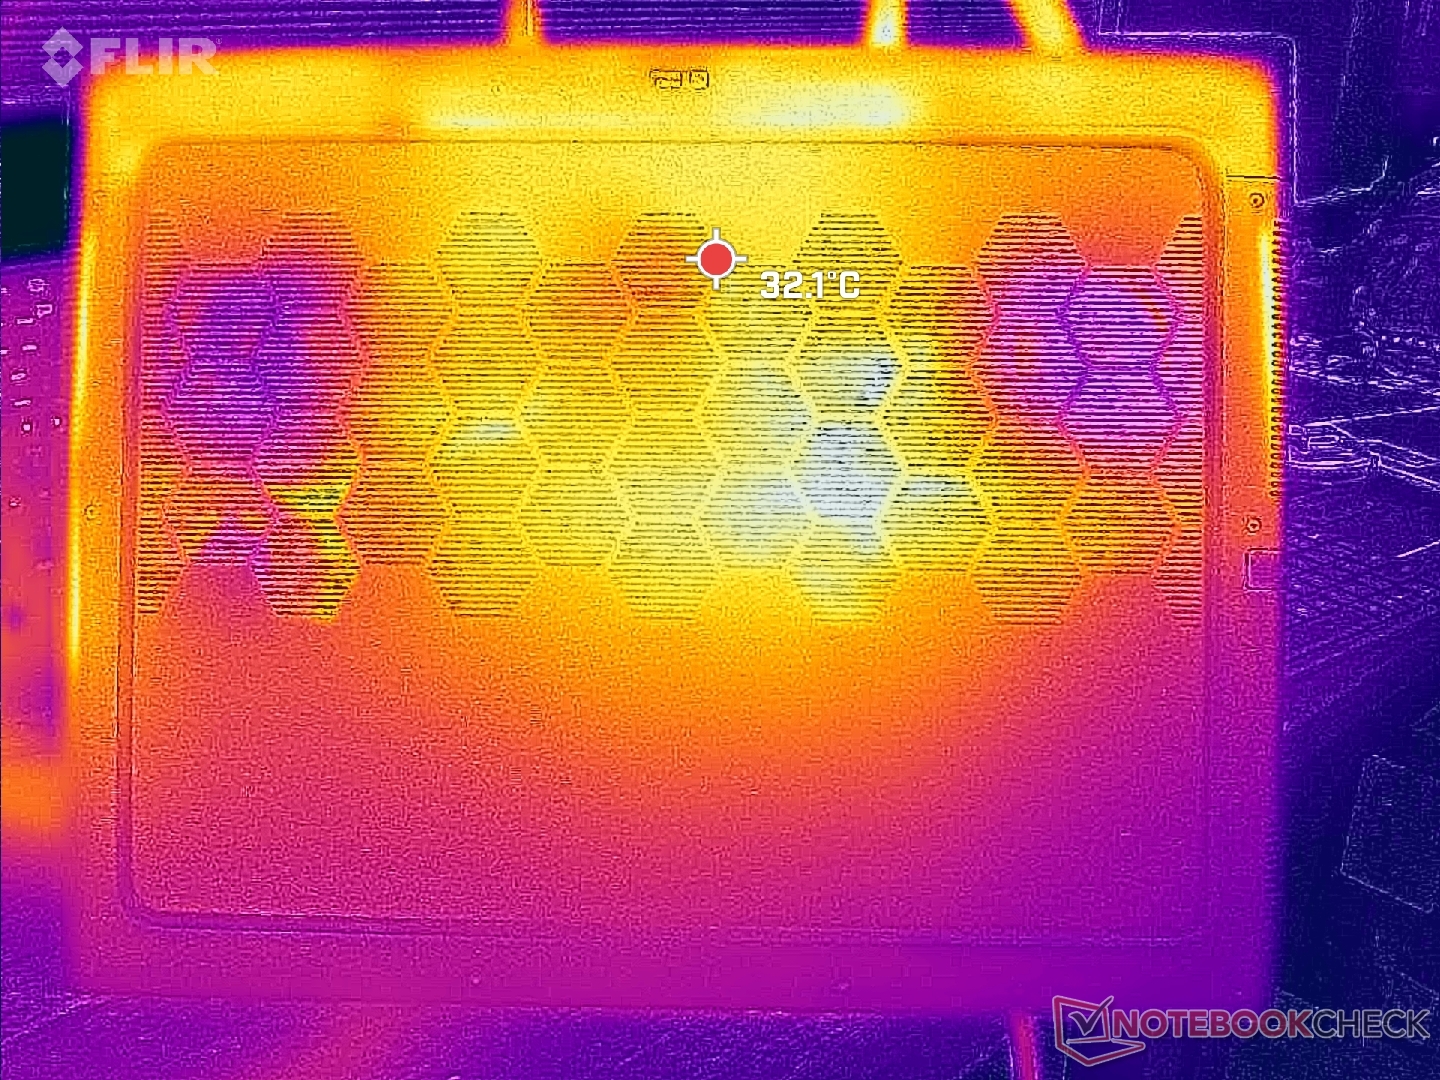
Die Oberflächentemperaturen sind mit denen auf der Intel-Nvidia-Konfiguration vergleichbar, sie bleiben kühler als man es angesichts der Displaygröße, der riesigen Luftgitter, das ausladende hintere Kühlsystem und der vielen Lüfter erwarten würde. Die Handballenauflagen sowie die Tastatur werden auch beim Gaming niemals ungemütlich heiß, ganz im Gegenteil zu kleineren Gaming-Laptops wie dem Razer Blade 16.
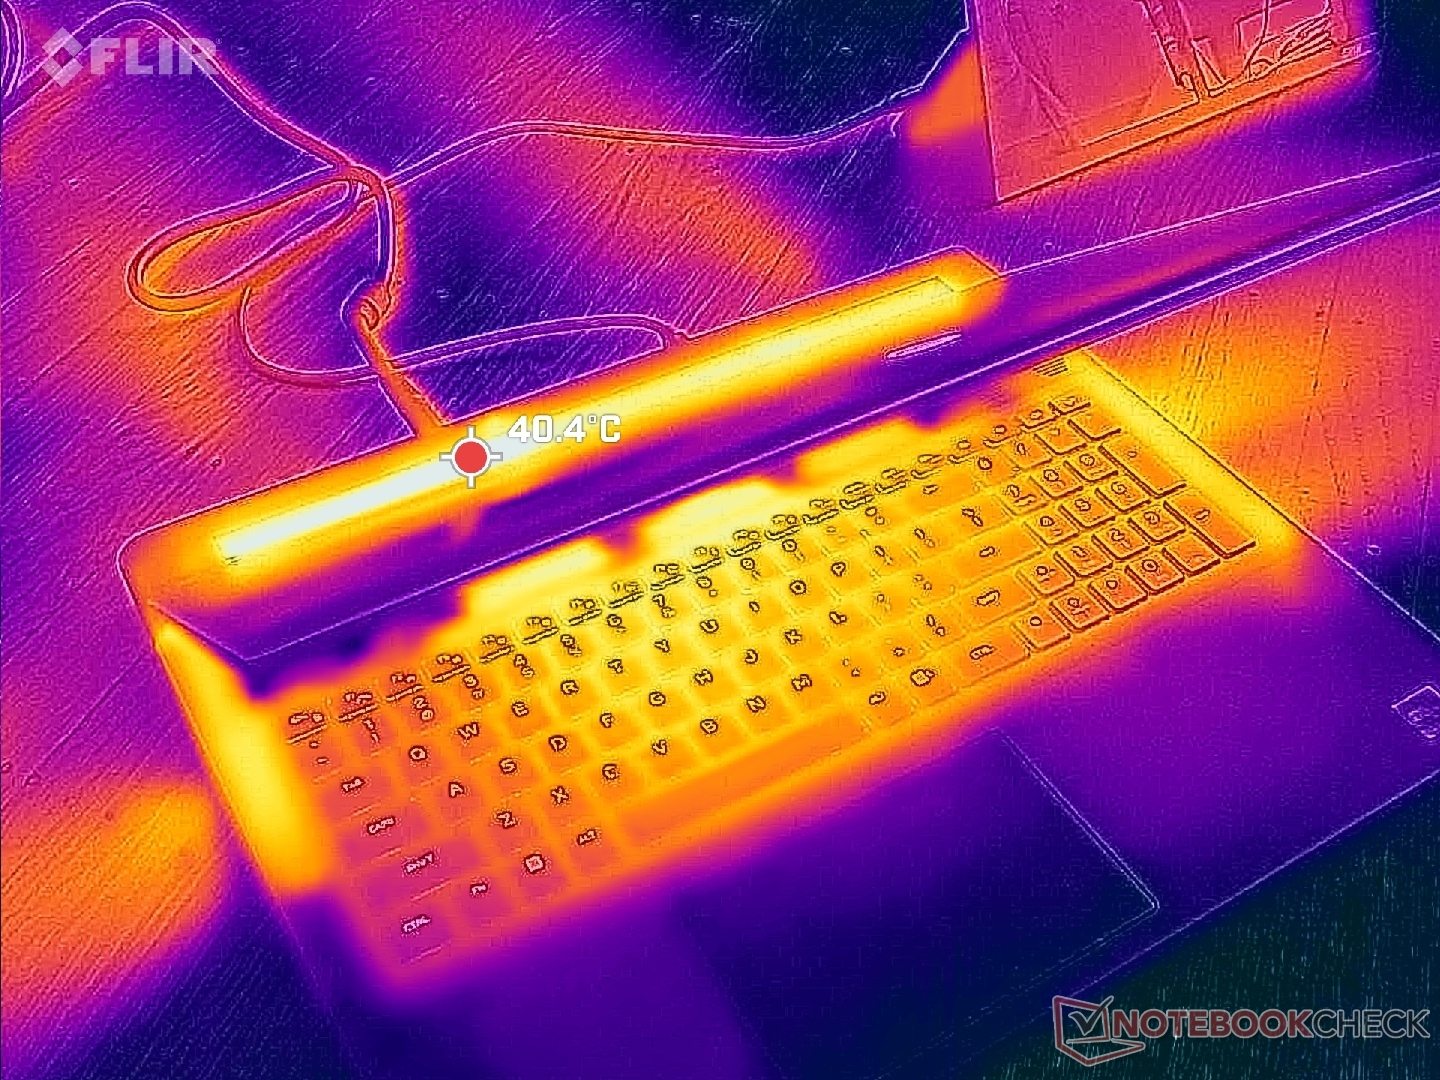
(±) Die maximale Temperatur auf der Oberseite ist 40.2 °C. Im Vergleich liegt der Klassendurchschnitt bei 40.4 °C (von 21.2 bis 68.8 °C für die Klasse Gaming).
(+) Auf der Unterseite messen wir eine maximalen Wert von 37.4 °C (im Vergleich zum Durchschnitt von 43.2 °C).
(+) Ohne Last messen wir eine durchschnittliche Temperatur von 26.6 °C auf der Oberseite. Der Klassendurchschnitt erreicht 33.9 °C.
(+) Beim längeren Spielen von The Witcher 3 erhitzt sich das Gerät durchschnittlich auf 30.6 °C. Der Durchschnitt der Klasse ist derzeit 33.9 °C.
(+) Die Handballen und der Touchpad-Bereich sind mit gemessenen 24.6 °C kühler als die typische Hauttemperatur und fühlen sich dadurch kühl an.
(+) Die durchschnittliche Handballen-Temperatur anderer getesteter Geräte war 28.8 °C (+4.2 °C).
| Alienware m18 R1 AMD AMD Ryzen 9 7945HX, AMD Radeon RX 7900M | Alienware m18 R1 Intel Core i9-13980HX, NVIDIA GeForce RTX 4090 Laptop GPU | Acer Predator Helios 18 N23Q2 Intel Core i9-13900HX, NVIDIA GeForce RTX 4080 Laptop GPU | Razer Blade 18 RTX 4070 Intel Core i9-13950HX, NVIDIA GeForce RTX 4070 Laptop GPU | Asus ROG Strix Scar 18 2023 G834JY-N6005W Intel Core i9-13980HX, NVIDIA GeForce RTX 4090 Laptop GPU | MSI GE78HX 13VH-070US Intel Core i9-13950HX, NVIDIA GeForce RTX 4080 Laptop GPU | |
|---|---|---|---|---|---|---|
| Hitze | 6% | -18% | -1% | -13% | -3% | |
| Last oben max * (°C) | 40.2 | 39 3% | 35 13% | 39.2 2% | 54 -34% | 37.4 7% |
| Last unten max * (°C) | 37.4 | 36.4 3% | 56 -50% | 35.6 5% | 46 -23% | 45 -20% |
| Idle oben max * (°C) | 31.6 | 29.2 8% | 34 -8% | 31.8 -1% | 30 5% | 29.8 6% |
| Idle unten max * (°C) | 30.6 | 27.8 9% | 39 -27% | 33.2 -8% | 31 -1% | 32.4 -6% |
* ... kleinere Werte sind besser
Stresstest
CPU-Temperatur und Leistungsaufnahme im Prime95-Stress pegeln sich bei etwa 97 °C und 145 W ein, was ungefähr auch den Werten der Intel-Konfiguration mit Core i9-13980HK entspricht. Dennoch ist der Turbo Boost zu Testbeginn höher und aggressiver als bei der Intel-CPU, wie unser Kapitel zum Energieverbrauch demonstriert.
AMD bewirbt eine TGP von 180 W, welche sich unter Witcher 3 im Overdrive-Modus einstellt. Im Balanced- oder Performance-Modus sinkt die TDP allerdings auf maximal 165 W, wie die Screenshots unten zeigen. Dadurch fallen die GPU-Taktraten etwas niedriger aus, was auch mit unseren Ergebnissen im Fire Strike übereinstimmt. Dies bedeutet, dass der laute Overdrive-Modus für die wirklich maximale Leistung unumgänglich ist.
Der gleiche Witcher-3-Test auf der Intel-Nvidia-Konfiguration mit RTX 4090 resultiert in einer etwas niedrigeren GPU-Leistungsaufnahme von 161 W, was eine bessere Leistung-pro-Watt gegenüber unserer Radeon RX 7900M demonstriert.
Beachtet werden sollte, dass die CPU- und GPU-Temperaturen beim Gaming im Overdrive-Modus etwas kühler ausfallen als unter Balanced oder Performance, immerhin laufen die Lüfter aber auch deutlich lauter.
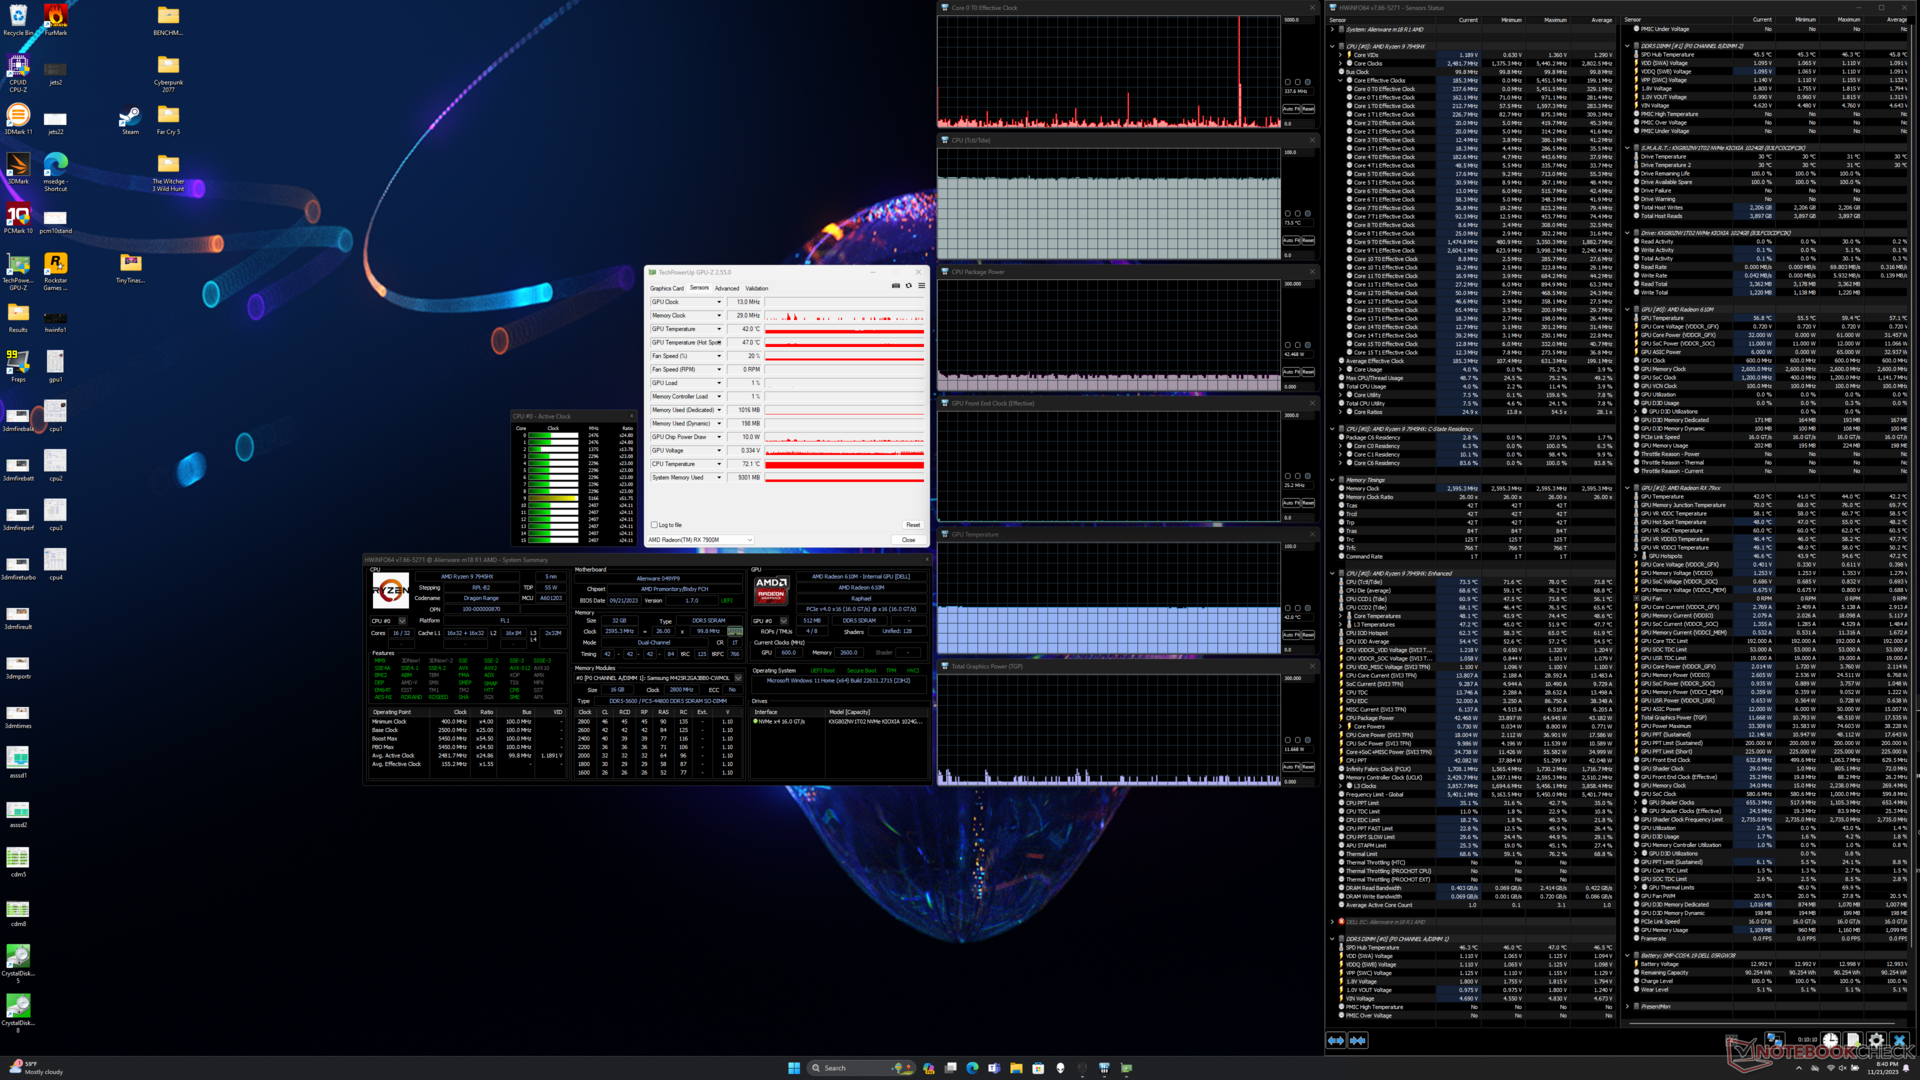
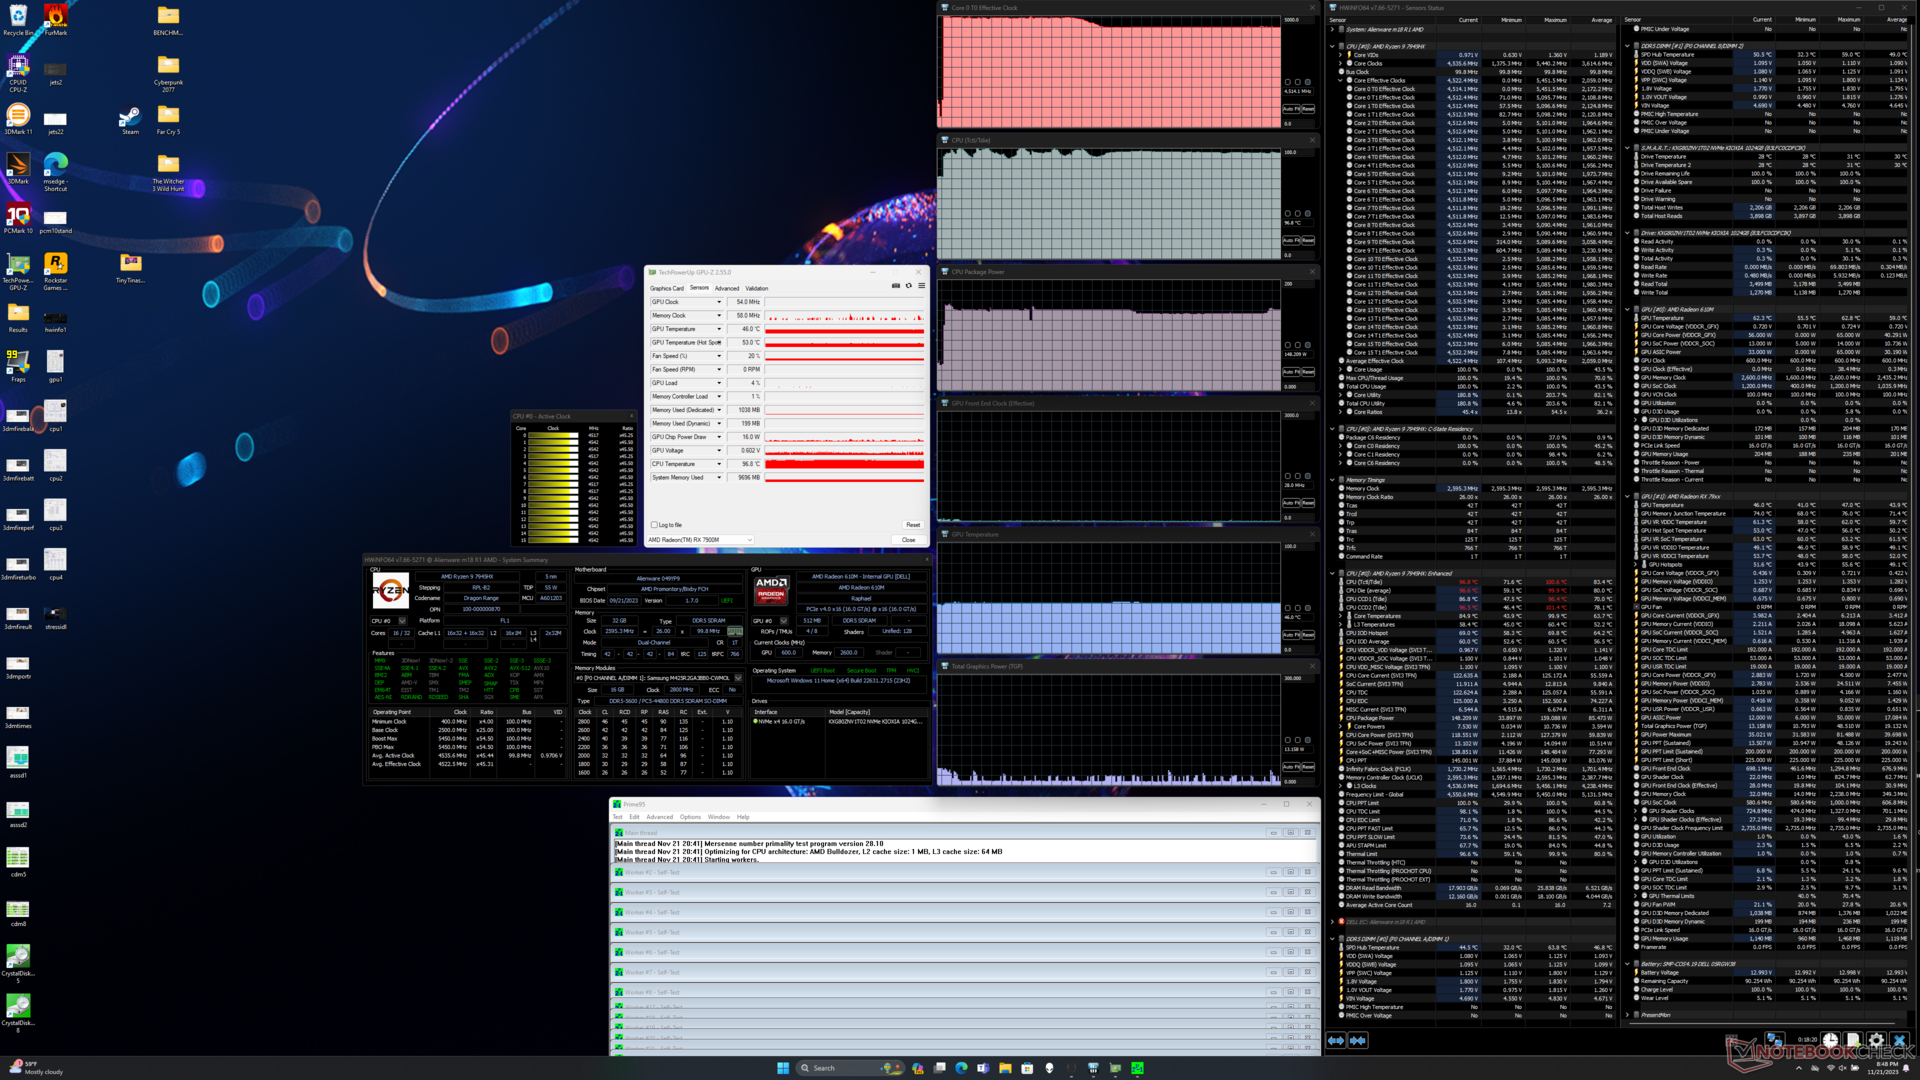
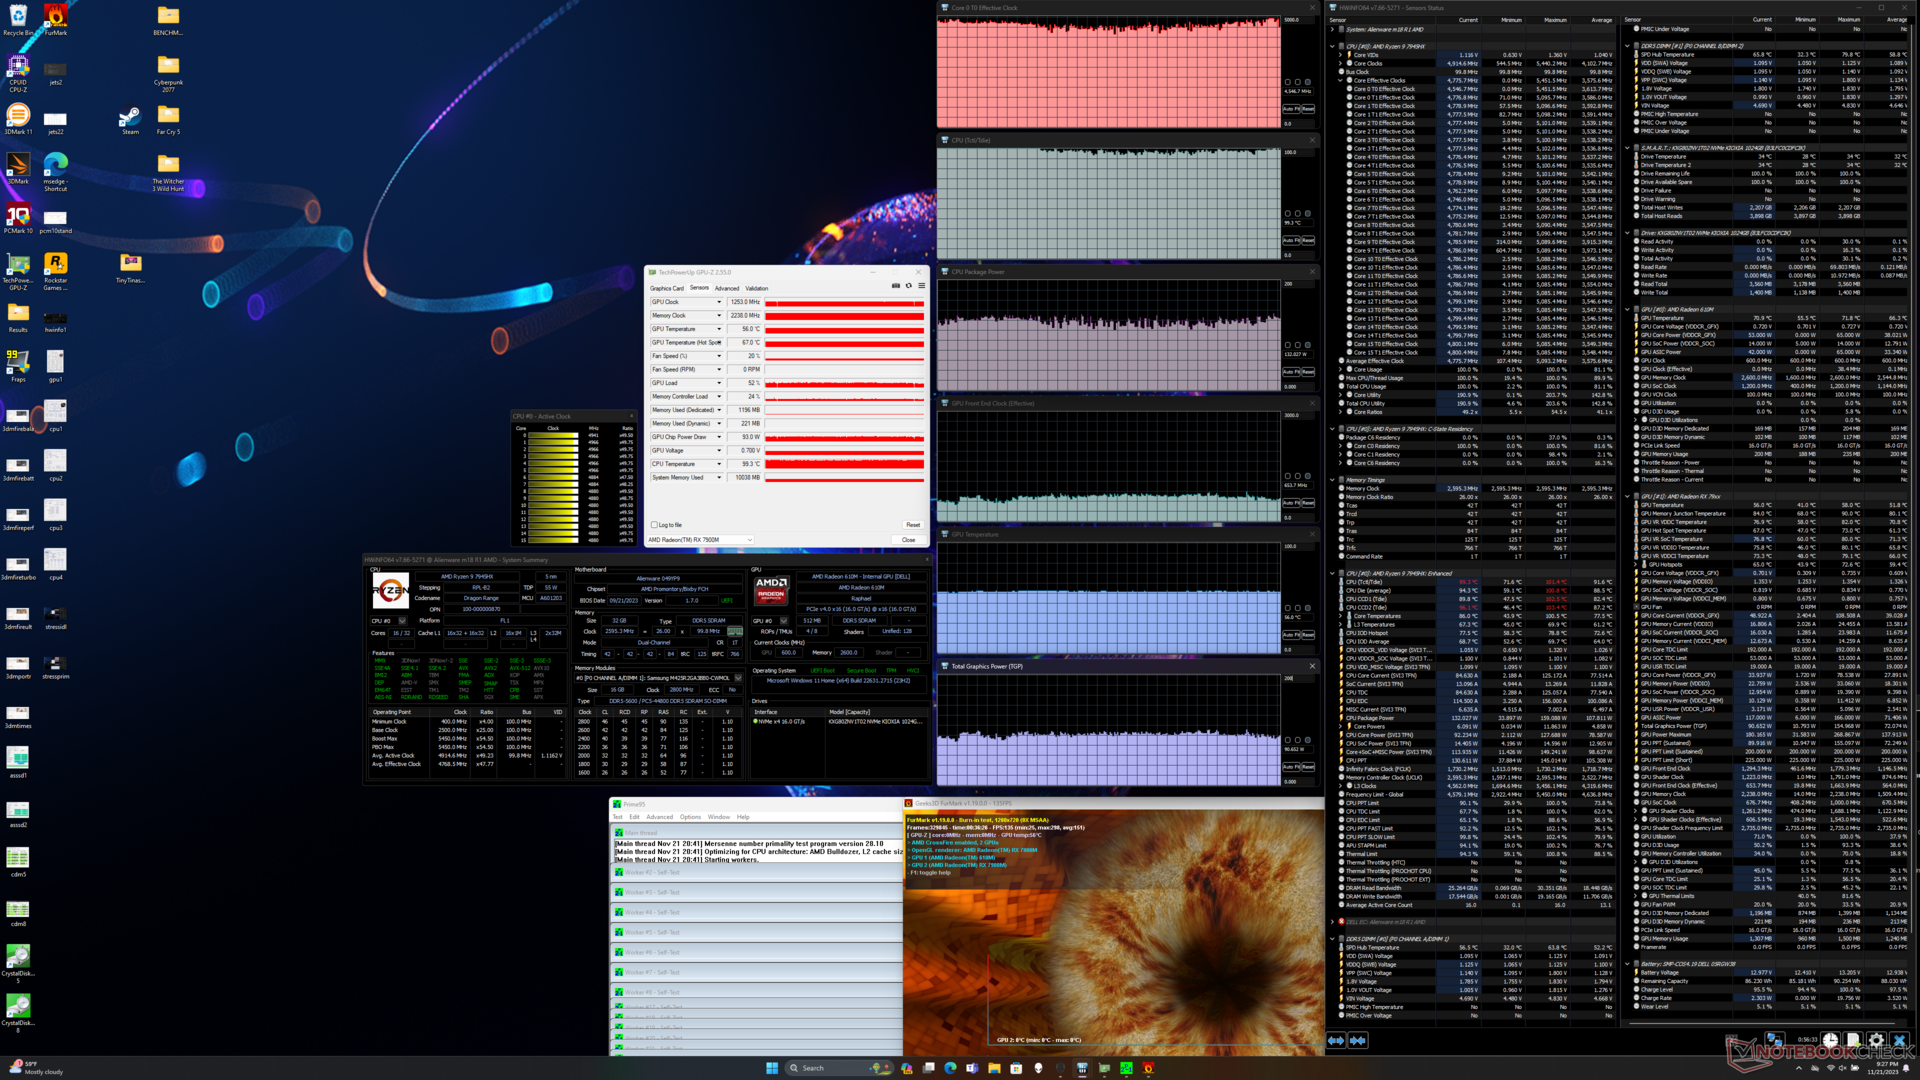
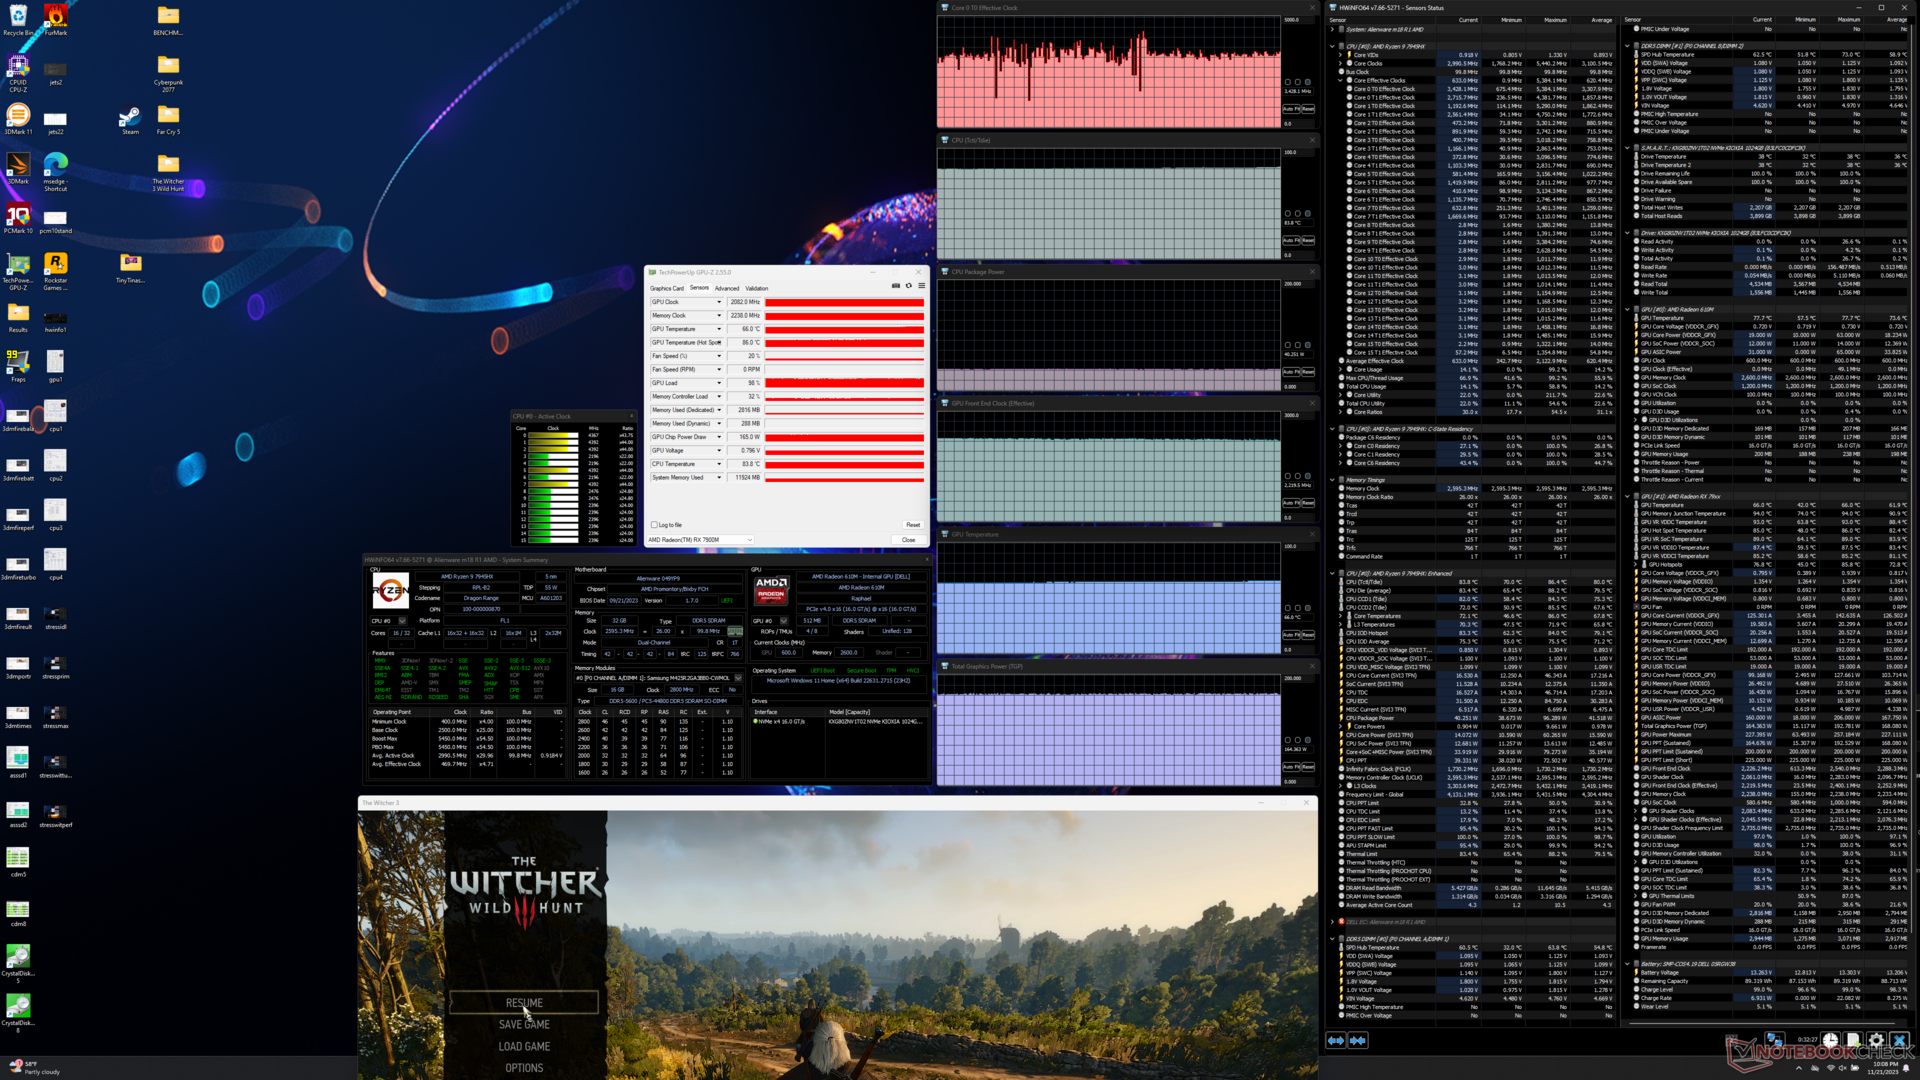
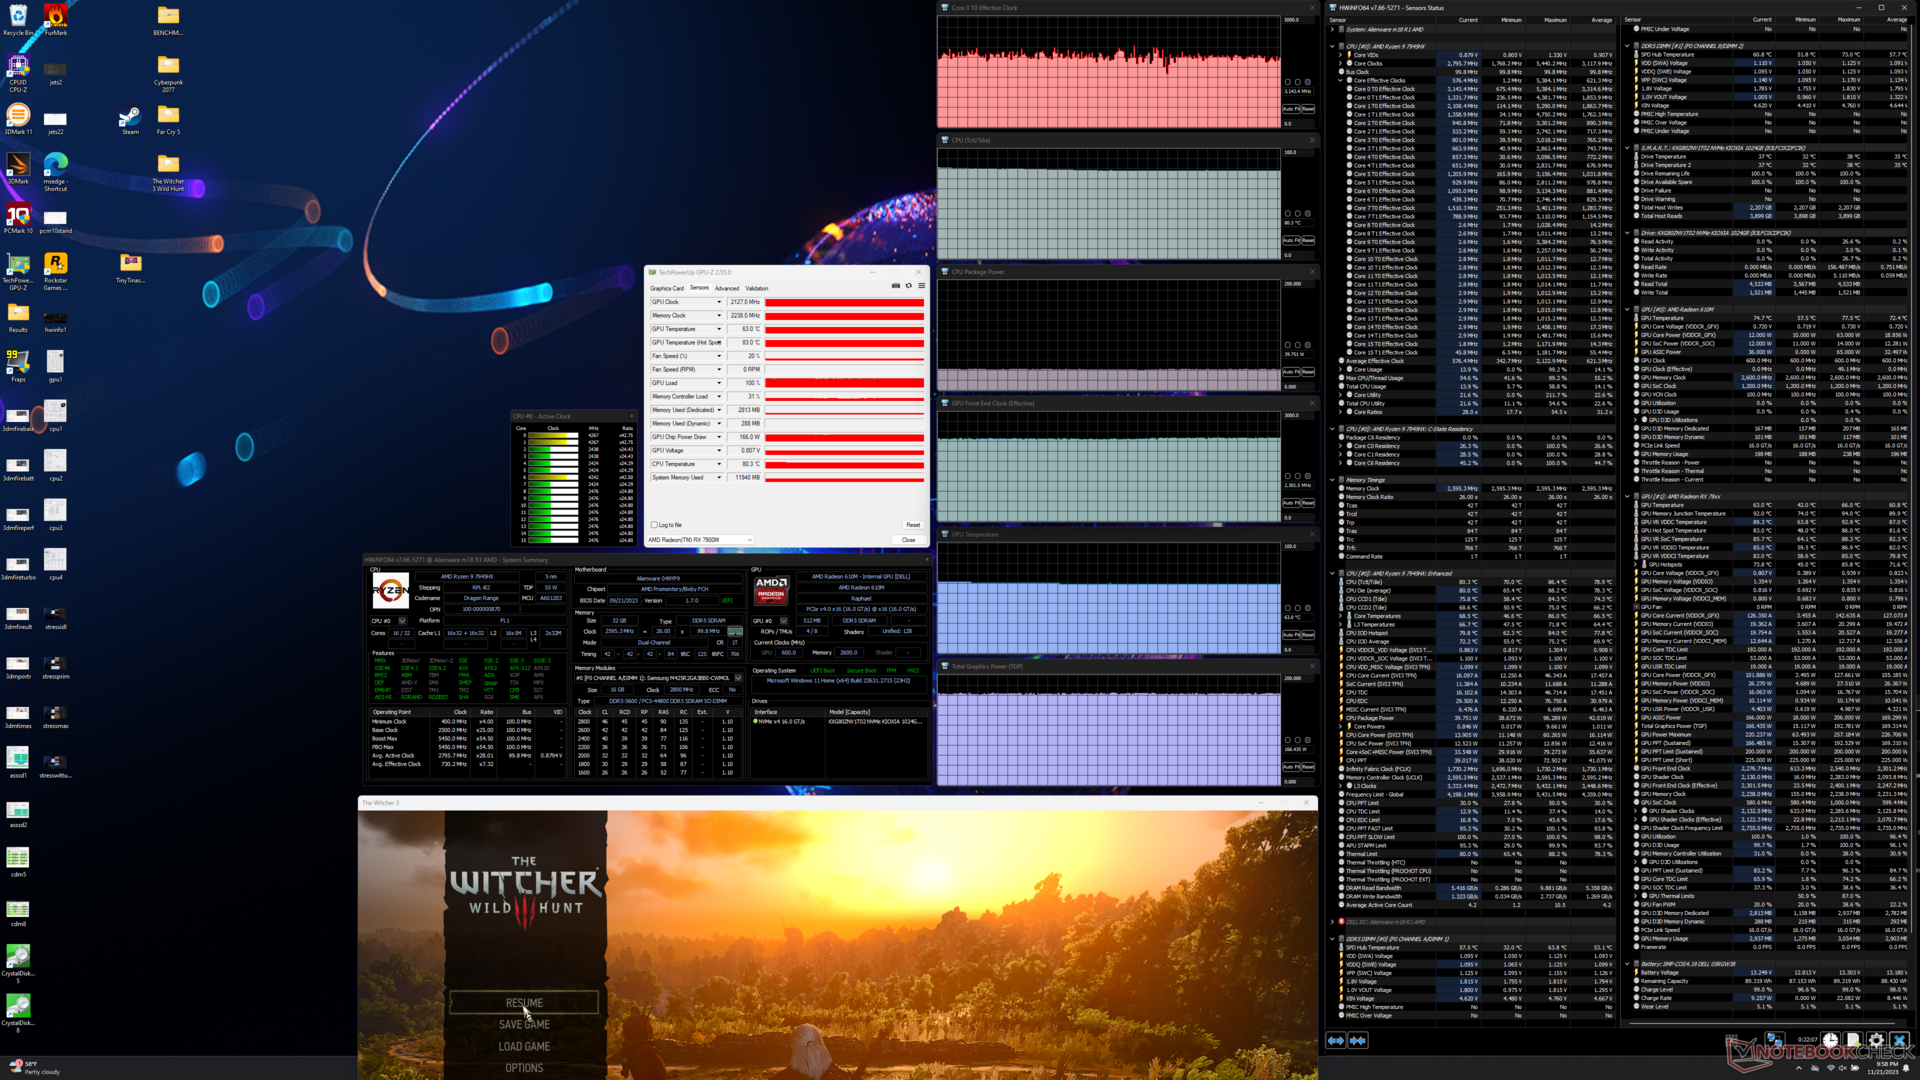
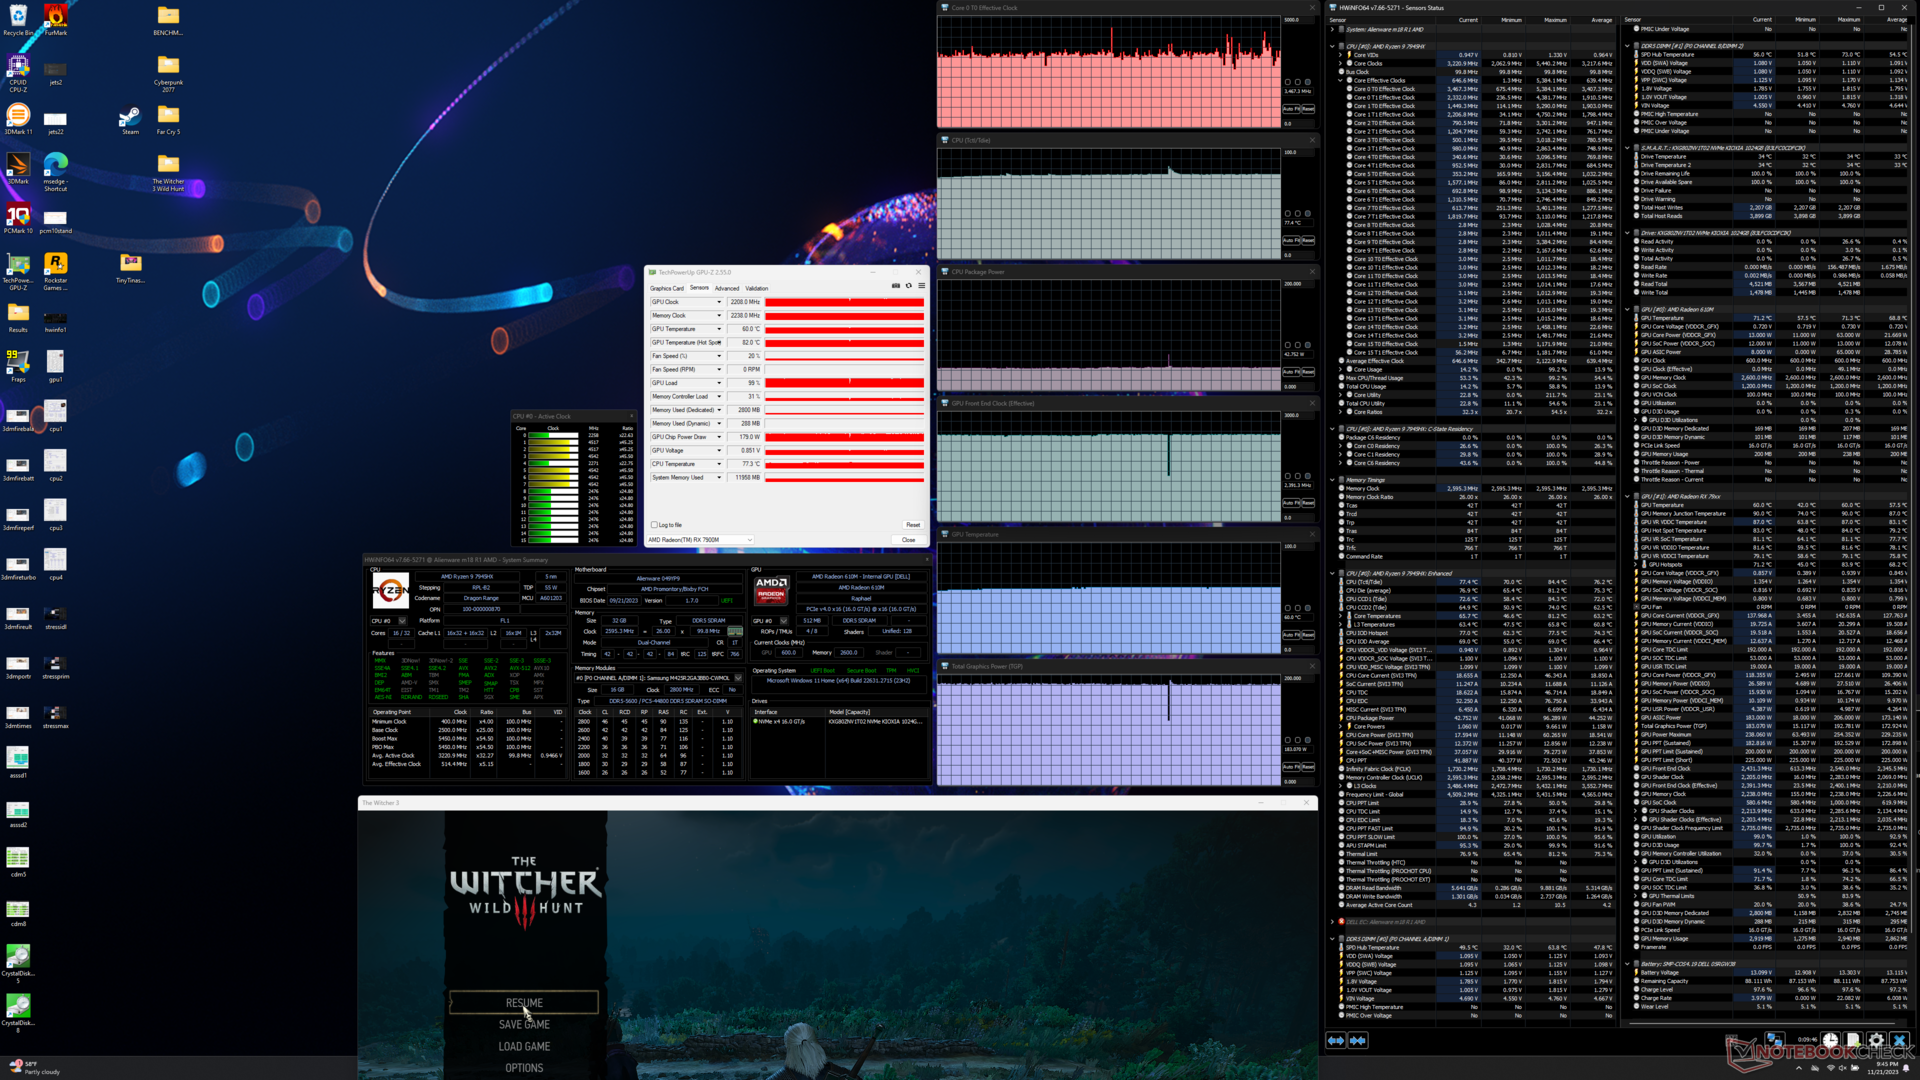
| CPU-Takt (GHz) | GPU-Takt (MHz) | Durchschnittliche CPU-Temperaturen (°C) | Durchschnittliche GPU-Temperaturen (°C) | |
| Idle | -- | -- | 74 | 47 |
| Prime95-Stress | 4,5 - 4,9 | -- | 97 | 53 |
| Prime95 + FurMark-Stress | ~4,6 | 1253 | 99 | 67 |
| Witcher-3-Stress (Overdrive) | ~3,5 | 2208 | 77 | 82 |
| Witcher-3-Stress (Performance) | ~3,2 | 2127 | 80 | 83 |
| Witcher-3-Stress (Balanced) | ~3,4 | 2082 | 84 | 86 |
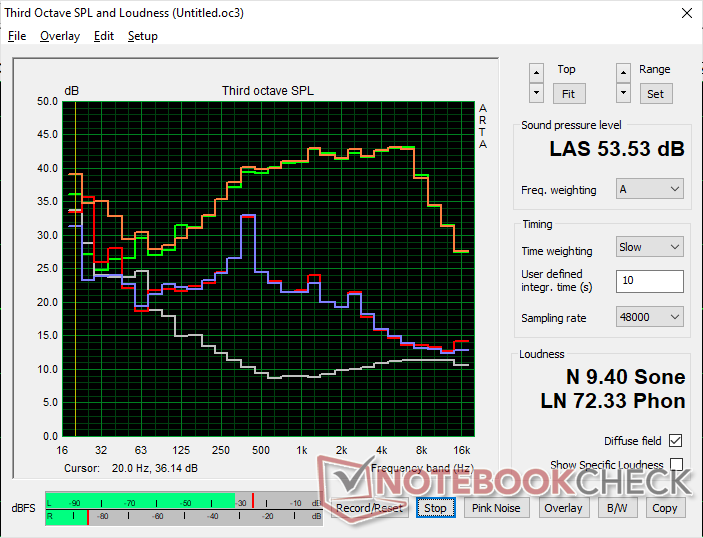
Lautsprecher
Alienware m18 R1 AMD Audio Analyse
(+) | Die Lautsprecher können relativ laut spielen (84.2 dB)
Bass 100 - 315 Hz
(-) | kaum Bass - 22.7% niedriger als der Median
(-) | keine lineare Bass-Wiedergabe (15.8% Delta zum Vorgänger)
Mitteltöne 400 - 2000 Hz
(+) | ausgeglichene Mitten, vom Median nur 1.5% abweichend
(+) | lineare Mitten (3.8% Delta zum Vorgänger)
Hochtöne 2 - 16 kHz
(+) | ausgeglichene Hochtöne, vom Median nur 3.6% abweichend
(+) | sehr lineare Hochtöne (5.5% Delta zum Vorgänger)
Gesamt im hörbaren Bereich 100 - 16.000 Hz
(±) | hörbarer Bereich ist durchschnittlich linear (16.5% Abstand zum Median)
Im Vergleich zu allen Geräten derselben Klasse
» 42% aller getesteten Geräte dieser Klasse waren besser, 7% vergleichbar, 51% schlechter
» Das beste Gerät hat einen Delta-Wert von 6%, durchschnittlich ist 18%, das schlechteste Gerät hat 132%
Im Vergleich zu allen Geräten im Test
» 28% aller getesteten Geräte waren besser, 6% vergleichbar, 66% schlechter
» Das beste Gerät hat einen Delta-Wert von 4%, durchschnittlich ist 23%, das schlechteste Gerät hat 134%
Apple MacBook Pro 16 2021 M1 Pro Audio Analyse
(+) | Die Lautsprecher können relativ laut spielen (84.7 dB)
Bass 100 - 315 Hz
(+) | guter Bass - nur 3.8% Abweichung vom Median
(+) | lineare Bass-Wiedergabe (5.2% Delta zum Vorgänger)
Mitteltöne 400 - 2000 Hz
(+) | ausgeglichene Mitten, vom Median nur 1.3% abweichend
(+) | lineare Mitten (2.1% Delta zum Vorgänger)
Hochtöne 2 - 16 kHz
(+) | ausgeglichene Hochtöne, vom Median nur 1.9% abweichend
(+) | sehr lineare Hochtöne (2.7% Delta zum Vorgänger)
Gesamt im hörbaren Bereich 100 - 16.000 Hz
(+) | hörbarer Bereich ist sehr linear (4.6% Abstand zum Median
Im Vergleich zu allen Geräten derselben Klasse
» 0% aller getesteten Geräte dieser Klasse waren besser, 0% vergleichbar, 100% schlechter
» Das beste Gerät hat einen Delta-Wert von 5%, durchschnittlich ist 17%, das schlechteste Gerät hat 45%
Im Vergleich zu allen Geräten im Test
» 0% aller getesteten Geräte waren besser, 0% vergleichbar, 100% schlechter
» Das beste Gerät hat einen Delta-Wert von 4%, durchschnittlich ist 23%, das schlechteste Gerät hat 134%
Energiemanagement - Effizienter Ryzen, weniger effiziente Grafik
Energieverbrauch
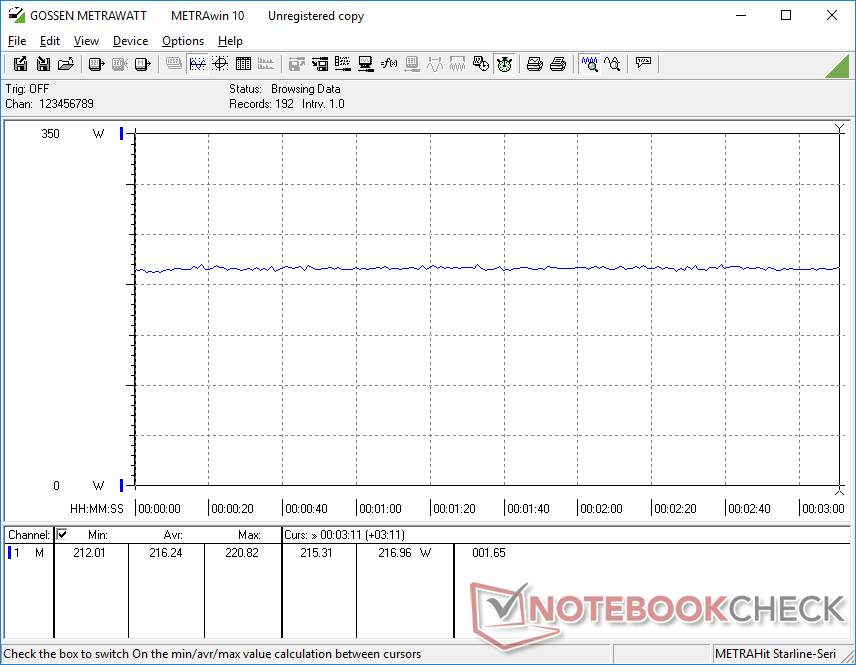
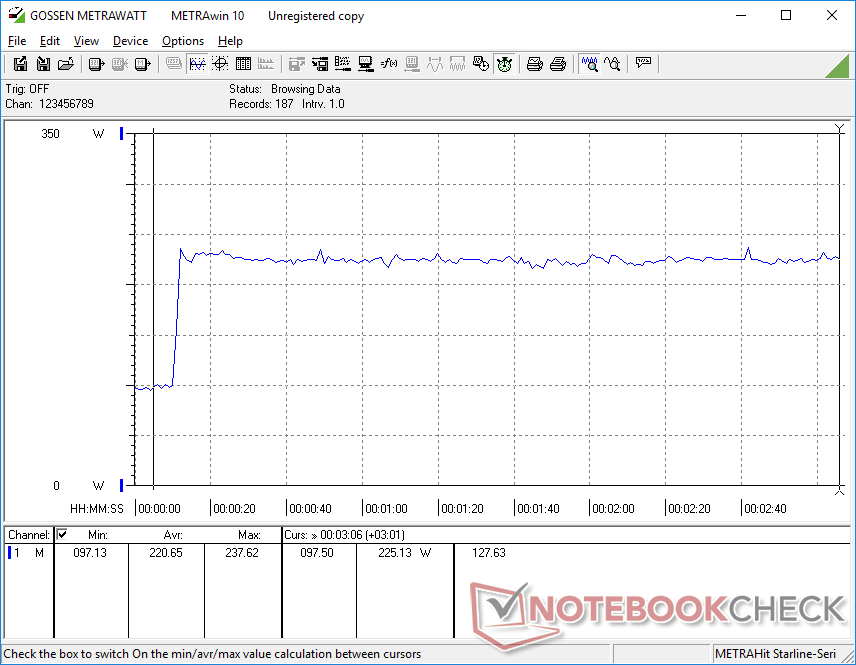
Beim Energieverbrauch geht es hin und her zwischen der AMD-AMD- und der Intel-Nvidia-Konfiguration des Alienware m18 R1. Einerseits präsentiert sich der Ryzen 7 7945HX als effizienter gegenüber dem Core i9-13980HX: Die AMD-CPU durchläuft den CineBench-R15-xT-Benchmark in etwa der gleichen Zeit wie der Core i9, zieht dabei jedoch 50 bis 60 W weniger aus dem Netzteil. Auf der anderen Seite ist die Radeon RX 7900M weniger effizient als eine GeForce RTX 4080 oder 4090: Beispielsweise benötigt unser AMD-Modell in FurMark ungefähr 50 W mehr. Die allgemeine Leistung-pro-Watt dürfte sich also danach ausrichten, wie CPU- oder GPU-lastig die Anwendungen des Nutzers ausfallen.
Sind CPU und GPU gleichzeitig zu 100 Prozent ausgelastet, so zieht die AMD-Konfiguration etwa 333 W aus dem großen 330-W-Netzteil, was in etwa dem Verbrauch der Intel-Nvidia-Version entspricht. Allerdings tendiert der Intel Core i9 dazu deutlich großzügiger mit dem Mehrverbrauch umzugehen, sodass der allgemeine Verbrauch beim Gaming insgesamt etwas höher ausfällt als bei unserer All-AMD-Einheit. Unsere Tabelle unten zeigt dieses Verhalten am Beispiel von Witcher 3.
Im Idle ist das Verbrauchsverhalten leider nicht optimiert, was entscheidend zur sehr kurzen Akkulaufzeit beiträgt. Selbst unter Balanced messen wir im Idle auf dem Desktop einen Verbrauch von teils 101 W, ohne dass aktive Anwendungen laufen. Auch der Verbrauch im Standby ist mit 25 W viel zu hoch, er sollte eher bei nur 1 bis 2 Watt liegen.
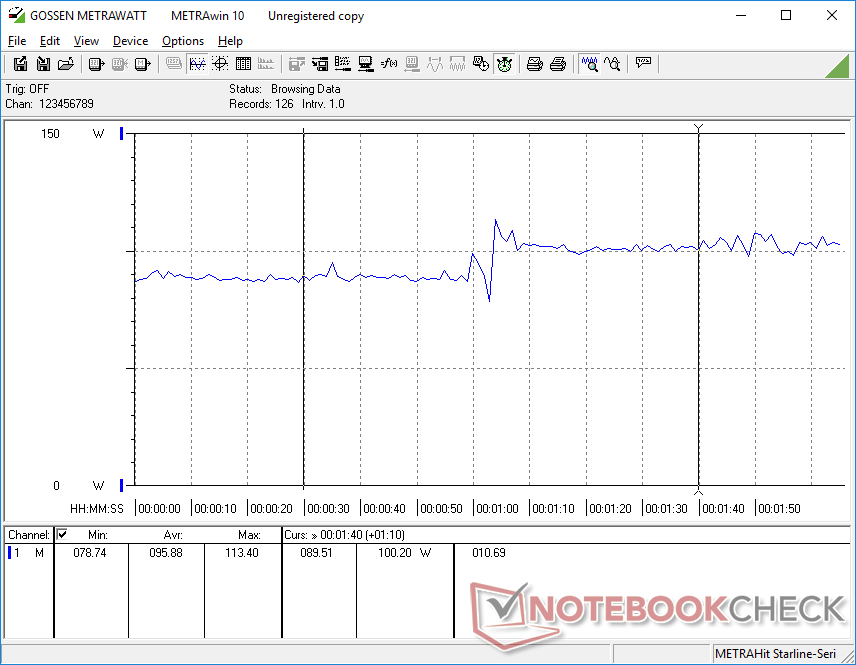
Wenn der Verbrauch eine starke Rolle spielt, empfehlen wir das Absenken der Bildwiederholrate von 480 Hz auf 120 Hz, das kann schon bis zu 11 W einsparen, wie unser Graph unten verdeutlicht. Es ist wirklich schade, dass das Panelmodell keine variable Bildwiederholrate bietet.

| Aus / Standby | |
| Idle | |
| Last |
|
Legende:
min: | |
| Alienware m18 R1 AMD R9 7945HX, Radeon RX 7900M, Kioxia XG8 KXG80ZNV1T02, IPS, 1920x1200, 18" | HP Omen 16-wf000 i7-13700HX, GeForce RTX 4080 Laptop GPU, SK hynix PC801 HFS002TEJ9X101N, IPS, 2560x1440, 16.1" | Alienware m18 R1 i9-13980HX, GeForce RTX 4090 Laptop GPU, SK hynix PC801 HFS001TEJ9X101N, IPS, 1920x1200, 18" | Acer Predator Helios 18 N23Q2 i9-13900HX, GeForce RTX 4080 Laptop GPU, Samsung PM9A1 MZVL22T0HBLB, IPS, 2560x1600, 18" | Razer Blade 18 RTX 4070 i9-13950HX, GeForce RTX 4070 Laptop GPU, SSSTC CA6-8D1024, IPS, 2560x1600, 18" | MSI GE78HX 13VH-070US i9-13950HX, GeForce RTX 4080 Laptop GPU, Samsung PM9A1 MZVL22T0HBLB, IPS, 2560x1600, 17" | |
|---|---|---|---|---|---|---|
| Stromverbrauch | 32% | 13% | 31% | 25% | 29% | |
| Idle min * (Watt) | 30.3 | 21.8 28% | 21.6 29% | 16 47% | 24.5 19% | 16.1 47% |
| Idle avg * (Watt) | 55.6 | 26 53% | 25.2 55% | 19 66% | 34.1 39% | 24 57% |
| Idle max * (Watt) | 101.1 | 36 64% | 56.7 44% | 21.3 79% | 47.7 53% | 34 66% |
| Last avg * (Watt) | 160.3 | 115.5 28% | 164.1 -2% | 124 23% | 140 13% | 123.6 23% |
| Witcher 3 ultra * (Watt) | 216 | 214 1% | 311 -44% | 289 -34% | 202 6% | 286 -32% |
| Last max * (Watt) | 332.1 | 269.7 19% | 338.9 -2% | 319 4% | 261 21% | 285.7 14% |
* ... kleinere Werte sind besser
Energieverbrauch unter Witcher 3 / Stresstest
Energieverbrauch mit externem Monitor
Akkulaufzeit
Die Laufzeiten sind selbst für einen großen Gaming-Laptop sehr schwach. Selbst im günstigsten Fall, wenn quasi alles ausgeschaltet oder minimiert ist (AlienFX aus, minimale Displayhelligkeit, 120 Hz, keine laufenden Anwendungen, Flugmodus, Battery-Saver-Modus), messen wir nur unter 4,5 Stunden vor dem automatischen Shutdown. Beim Surfen fällt dieser Wert auf nur noch 95 Minuten. Zum Vergleich: Das Acer Predator Helios 18 oder das Razer Blade 18 halten beide mehrere Stunden länger durch.
Eine komplette Aufladung dauert etwa 2 bis 2,5 Stunden. Anders als viele anderen modernen Gaming-Laptop unterstützt unser Modell kein Aufladen via USB-C, sodass man auch unterwegs immer auf das sperrige 330-W-Netzteil angebunden ist.
| Alienware m18 R1 AMD R9 7945HX, Radeon RX 7900M, 97 Wh | Alienware m18 R1 i9-13980HX, GeForce RTX 4090 Laptop GPU, 97 Wh | Acer Predator Helios 18 N23Q2 i9-13900HX, GeForce RTX 4080 Laptop GPU, 90 Wh | Razer Blade 18 RTX 4070 i9-13950HX, GeForce RTX 4070 Laptop GPU, 91.7 Wh | Asus ROG Strix Scar 18 2023 G834JY-N6005W i9-13980HX, GeForce RTX 4090 Laptop GPU, 90 Wh | MSI GE78HX 13VH-070US i9-13950HX, GeForce RTX 4080 Laptop GPU, 99 Wh | |
|---|---|---|---|---|---|---|
| Akkulaufzeit | 77% | 179% | 109% | 218% | 171% | |
| Idle (h) | 4.5 | 5.6 24% | 7 56% | 7.3 62% | ||
| WLAN (h) | 1.4 | 4.3 207% | 4.4 214% | 4 186% | 7.1 407% | 6.1 336% |
| Last (h) | 0.7 | 0.7 0% | 1.7 143% | 1.3 86% | 0.9 29% | 1.5 114% |
| H.264 (h) | 4.8 | 7 | ||||
| Witcher 3 ultra (h) | 0.9 |
Pro
Contra
Fazit — Der Herausforderer der mobilen GeForce RTX 4080 auf den wir gewartet haben
Zum Zeitpunkt des Verfassens dieses Artikels kostet die Konfiguration des Alienware m18 R1 mit Core i9-13900HX, RTX 4080, 32 GB RAM, 1 TB SSD und 1.200p-Display $2.950 USD (ca. 2.700 Euro). Im Gegensatz dazu kostet die Konfiguration mit Ryzen 9 7945HX und RX 7900M und ansonsten komplett gleicher Ausstattung nur $2.300 USD (ca. 2.010 Euro). Dabei bietet die All-AMD-Option eine schnellere CPU-Leistung und nahezu die gleiche GPU-Performance für ungefähr $700 (ca. 650 Euro) weniger. Da ist klar, dass das stärkste Argument der AMD-Variante ihr Leistung-pro-Dollar/Euro ist und damit auch der beste Grund mal auf Intel und Nvidia zu verzichten. Der Preisunterschied ist so groß, dass wir beinahe die vielen kleineren Probleme vergessen könnten, die wir im Test aufgespürt haben, immerhin sparen wir hier hunderte von Euros.
Gaming-Laptops mit einer GeForce RTX 4080 sind vom Preis her extrem aufgebläht. Die kosteneffizientere AMD Radeon RX 7900M ist daher der willkommene Herausforderer, um die GPU-Preise wieder auf den Boden der Tatsachen zurück zu holen.
Dennoch müssen wir auf die signifikanten Bugs hinweisen. Das Display schaltet sich aus, Bootprobleme, Ausgelassene Frames bei der Videowiedergabe, Frameeinbrüche und Stotterer beim Gaming und ein ungewöhnlich hoher Verbrauch im Idle sind die Baustellen, derer man sich unbedingt annehmen sollte. Als Ergebnis sollte man womöglich nicht jetzt schon vorpreschen und das All-AMD-Alienware-m18-R1 sofort kaufen, sondern lieber etwas warten bis die Probleme behoben und FSR 3 flächendeckender angeboten wird.
Darüber hinaus gibt weiterhin Gründe sich für die Intel-Nvidia- statt für die AMD-AMD-Option zu entscheiden, selbst wenn alle Bugs beseitigt sind. So beeindruckend die Radeon 7900M auch ist, die mobile RTX 4080 ist im Durchschnitt noch immer schneller, besonders wenn man RT aktiviert. Wer also unbedingt das Schnellste und Beste braucht, unabhängig von den Kosten, wird wohl vorerst weiter bei der GeForce-Serie bleiben. Für uns übrige Sterbliche mit schmalem Geldbeutel ist die Radeon 7900M eine solide Alternative zur kostspieligen RTX 4080, auf die viele gewartet haben. Das nährt die Hoffnung, dass die GPU zukünftig noch in vielen weiteren Gaming-Laptops eingesetzt werden wird und nicht nur in ein paar auserwählte.
Preise und Verfügbarkeit
In den USA liefert Dell das Alienware m18 R1 höchst selbst in allen Konfigurationen aus. In Deutschland gibt es zumindest aktuell noch keine Angebote für das Modell.
Alienware m18 R1 AMD
- 26.11.2023 v7 (old)
Allen Ngo
Transparenz
Die Auswahl der zu testenden Geräte erfolgt innerhalb der Redaktion. Das vorliegende Testmuster wurde dem Autor vom Hersteller oder einem Shop zu Testzwecken leihweise zur Verfügung gestellt. Eine Einflussnahme des Leihstellers auf den Testbericht gab es nicht, der Hersteller erhielt keine Version des Reviews vor der Veröffentlichung. Es bestand keine Verpflichtung zur Publikation. Als eigenständiges, unabhängiges Unternehmen unterliegt Notebookcheck keiner Diktion von Herstellern, Shops und Verlagen.
So testet Notebookcheck
Pro Jahr werden von Notebookcheck hunderte Laptops und Smartphones unabhängig in von uns standardisierten technischen Verfahren getestet, um eine Vergleichbarkeit aller Testergebnisse zu gewährleisten. Seit rund 20 Jahren entwickeln wir diese Testmethoden kontinuierlich weiter und setzen damit Branchenstandards. In unseren Testlaboren kommt ausschließlich hochwertiges Messequipment in die Hände erfahrener Techniker und Redakteure. Die Tests unterliegen einer mehrstufigen Kontrolle. Unsere komplexe Gesamtbewertung basiert auf hunderten fundierten Messergebnissen und Benchmarks, womit Ihnen Objektivität garantiert ist. Weitere Informationen zu unseren Testmethoden gibt es hier.
Preisvergleich

