Eurocom Nightsky TXi317 Laptop im Test: 125 W GeForce RTX 3080 Ti speedster
")
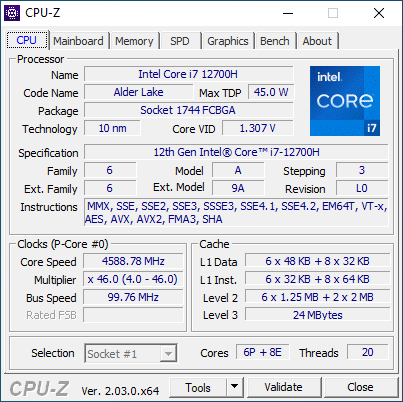
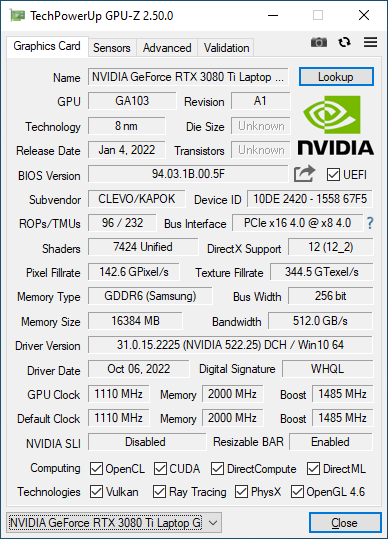
Das Nightsky TXi317 ist das neueste 17,3-Zoll-Gaming-Notebook von Eurocom, das Intels Alder Lake-H-CPUs der 12. Generation und eine bis zu 155 W starke TGP GeForce RTX 3080 Ti GPU nutzt, um eines der schnellsten derzeit erhältlichen Gaming-Notebooks zu sein. Es hat das gleiche Tongfang-Gehäuse wie das Schenker XMG Pro 17 E22, weshalb wir empfehlen, einen Blick auf unseren Testbericht zu werfen, um mehr Details über das Gehäuse und seine physikalischen Eigenschaften zu erfahren.
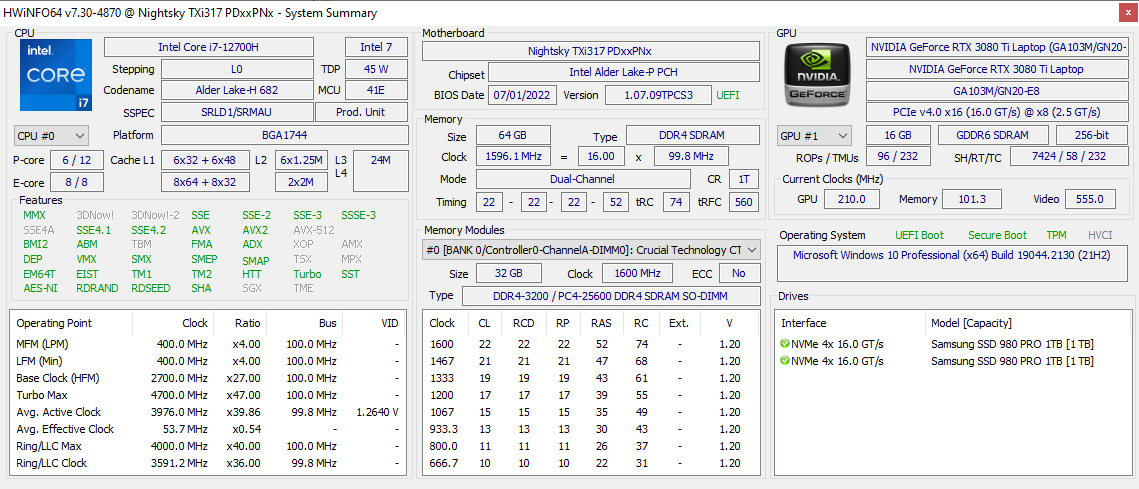
Unsere Testkonfiguration ist mit einer Core i7-12700H CPU, einem 144 Hz 1080p IPS-Display, einer GeForce RTX 3080 Ti GPU und 64 GB Arbeitsspeicher ausgestattet und kostet rund 4.000 Euro. Die niedrigste GPU-Option ist die GeForce RTX 3070 Ti, was das Nightsky TXi317 direkt in den Kreis der Enthusiasten-Gaming-Laptops bringt.
Zu den direkten Konkurrenten zählen andere leistungsstarke 17-Zoll-Gaming-Notebooks wie das Aorus 17X, MSI Raider GE77 oder das Alienware x17 R2.
Weitere Eurocom-Tests:
Potential Competitors in Comparison
Bew. | Datum | Modell | Gewicht | Dicke | Größe | Auflösung | Preis ab |
|---|---|---|---|---|---|---|---|
| 85.3 % v7 (old) | 11 / 2022 | Eurocom Nightsky TXi317 i7-12700H, GeForce RTX 3080 Ti Laptop GPU | 2.9 kg | 27 mm | 17.30" | 1920x1080 | |
| 85.4 % v7 (old) | 07 / 2022 | Schenker XMG Pro 17 E22 i9-12900H, GeForce RTX 3080 Ti Laptop GPU | 2.8 kg | 27 mm | 17.30" | 2560x1440 | |
| 83.7 % v7 (old) | 08 / 2022 | Aorus 17X XES i9-12900HX, GeForce RTX 3070 Ti Laptop GPU | 2.7 kg | 30 mm | 17.30" | 1920x1080 | |
| 86.8 % v7 (old) | 07 / 2022 | MSI Raider GE77 HX 12UHS i9-12900HX, GeForce RTX 3080 Ti Laptop GPU | 3.1 kg | 25.9 mm | 17.30" | 3840x2160 | |
| 89.9 % v7 (old) | 07 / 2022 | Razer Blade 17 Early 2022 i9-12900H, GeForce RTX 3080 Ti Laptop GPU | 2.8 kg | 19.9 mm | 17.30" | 3840x2160 | |
| 89.2 % v7 (old) | 05 / 2022 | Alienware x17 R2 P48E i9-12900HK, GeForce RTX 3080 Ti Laptop GPU | 3.1 kg | 20.9 mm | 17.30" | 1920x1080 |
Gehäuse
Es gibt einen oberflächlichen Unterschied zwischen dem Nightsky TXi317 und dem XMG Pro 17 E22: Die hinteren Ecken des Eurocom-Designs sind mit glänzenden bronzefarbenen Zierleisten versehen, während das Schenker-Design diese nicht hat. Ansonsten sind die Gehäuse der beiden Modelle identisch.
SD-Kartenleser
| SD Card Reader | |
| average JPG Copy Test (av. of 3 runs) | |
| Alienware x17 R2 P48E (AV Pro V60) | |
| Razer Blade 17 Early 2022 (AV PRO microSD 128 GB V60) | |
| Schenker XMG Pro 17 E22 (AV PRO microSD 128 GB V60) | |
| MSI Raider GE77 HX 12UHS (AV PRO microSD 128 GB V60) | |
| Eurocom Nightsky TXi317 (AV Pro V60) | |
| maximum AS SSD Seq Read Test (1GB) | |
| Alienware x17 R2 P48E (AV Pro V60) | |
| Eurocom Nightsky TXi317 (AV Pro V60) | |
| Schenker XMG Pro 17 E22 (AV PRO microSD 128 GB V60) | |
Kommunikation
Wi-Fi 6 gehört zur Standardausstattung, wobei der Hersteller trotz der hohen Preisklasse des Modells keine Wi-Fi 6E-Optionen anbietet. Die Übertragungsraten sind dennoch stabil und ohne Verbindungsprobleme.
| Networking | |
| iperf3 transmit AX12 | |
| Alienware x17 R2 P48E | |
| iperf3 receive AX12 | |
| Alienware x17 R2 P48E | |
| iperf3 receive AXE11000 6GHz | |
| Aorus 17X XES | |
| MSI Raider GE77 HX 12UHS | |
| iperf3 receive AXE11000 | |
| Schenker XMG Pro 17 E22 | |
| Razer Blade 17 Early 2022 | |
| Eurocom Nightsky TXi317 | |
| iperf3 transmit AXE11000 6GHz | |
| Aorus 17X XES | |
| iperf3 transmit AXE11000 | |
| Eurocom Nightsky TXi317 | |
Webcam
Die Kamera hat nur eine 1-MP- und keine 2 MP-Optionen, was angesichts des hohen Preises des Modells ebenfalls enttäuschend ist.


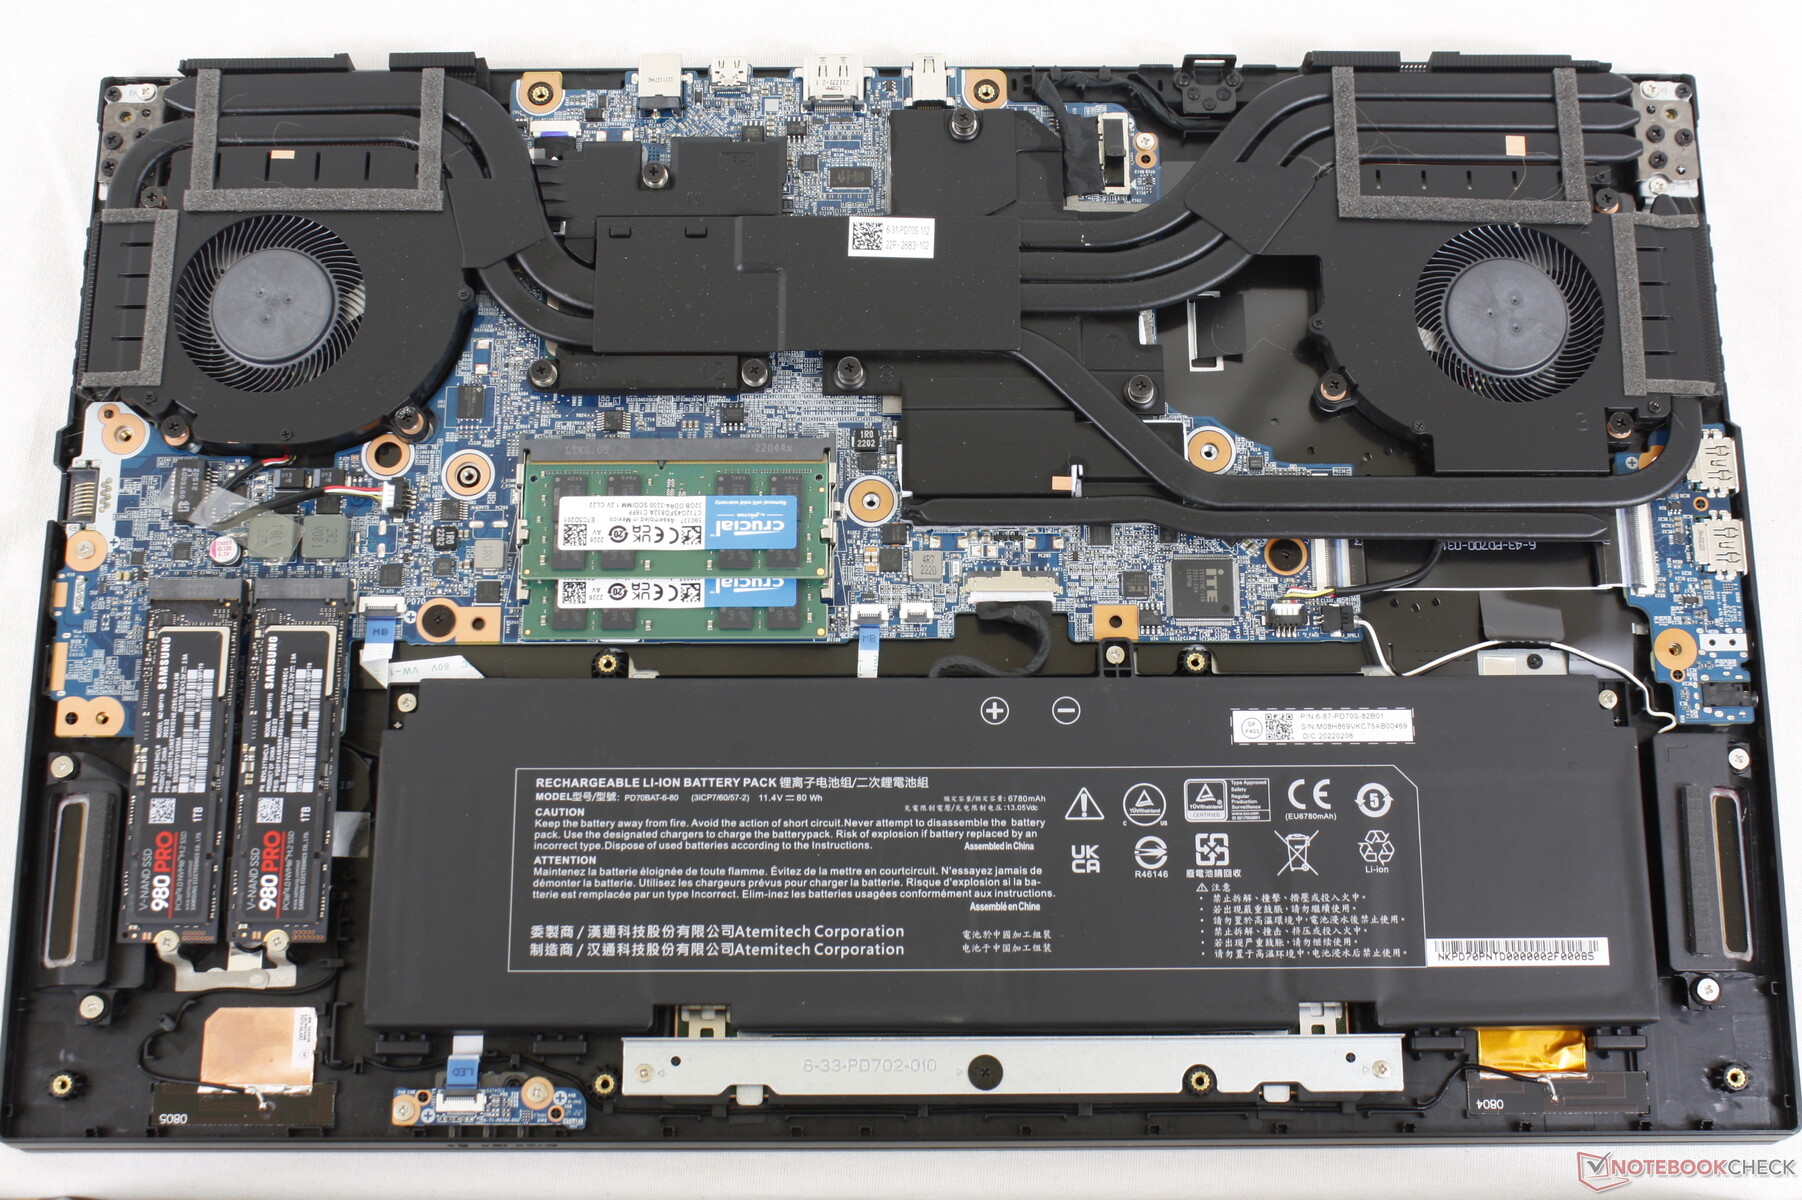
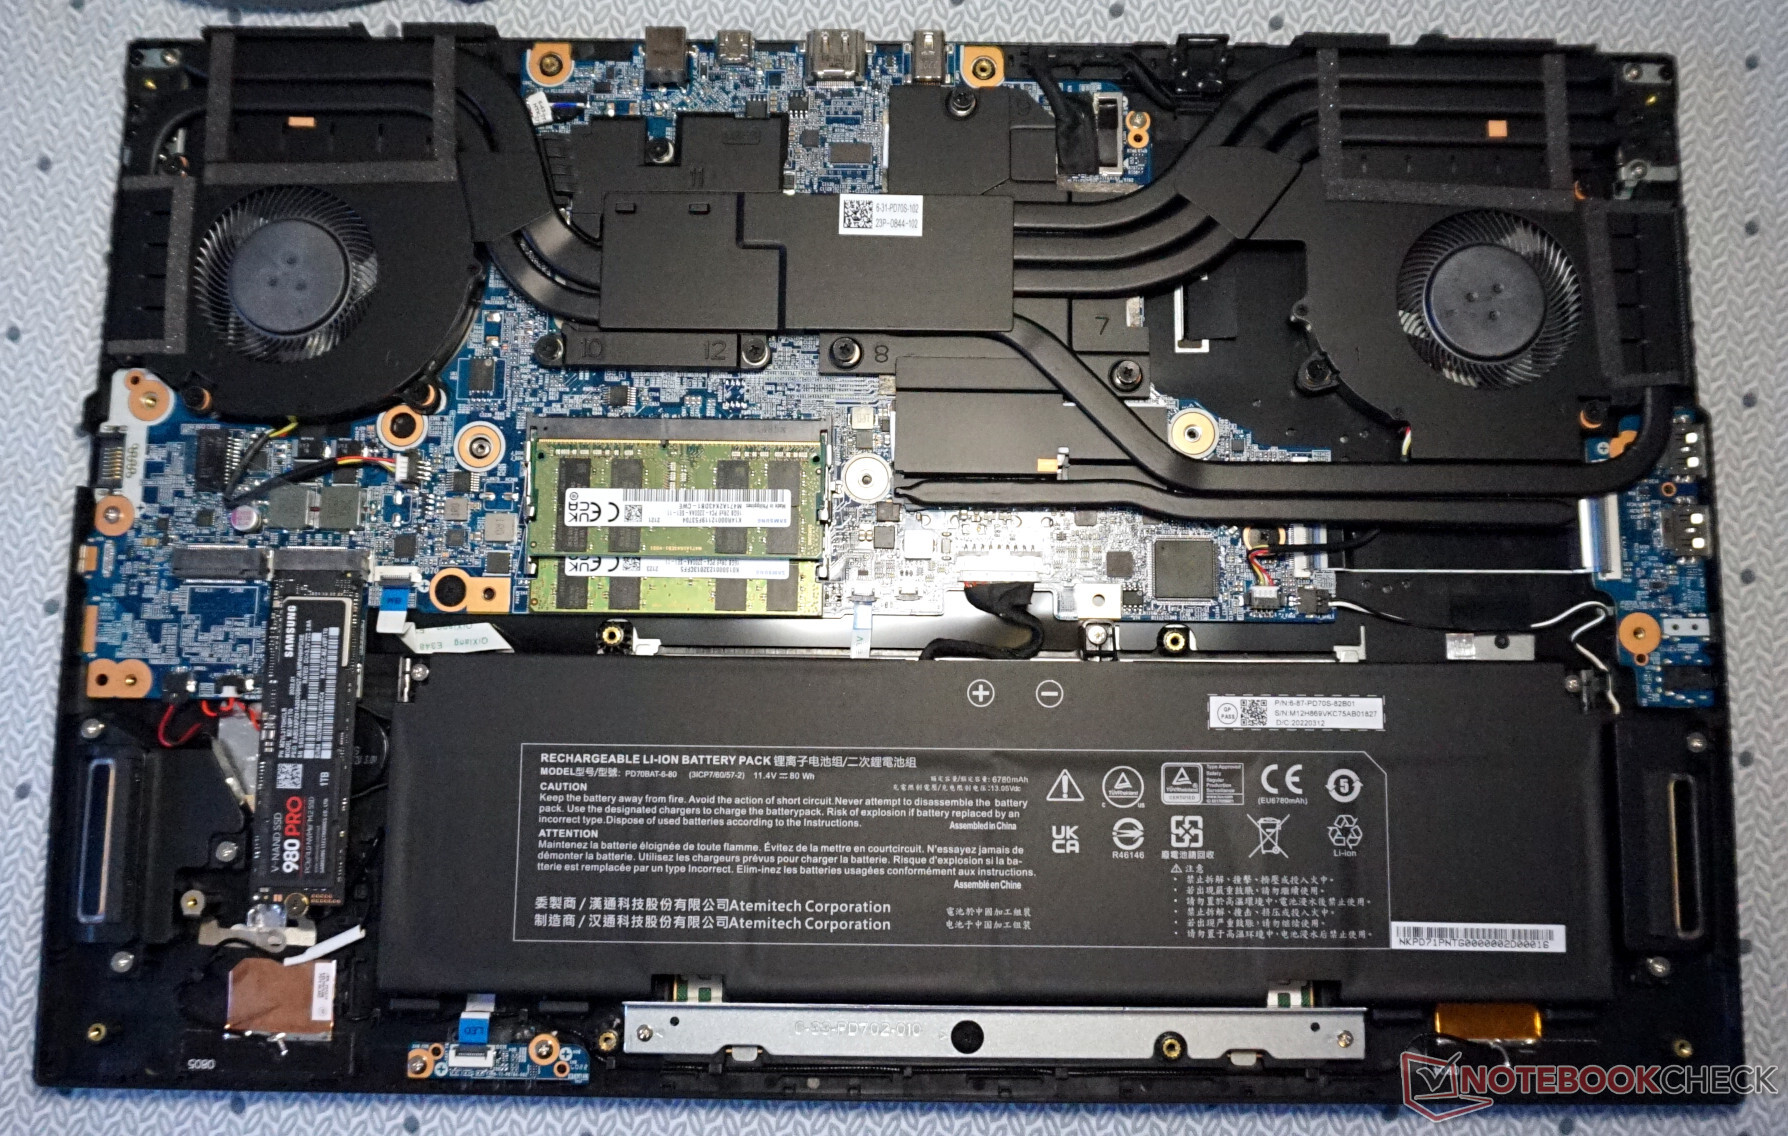
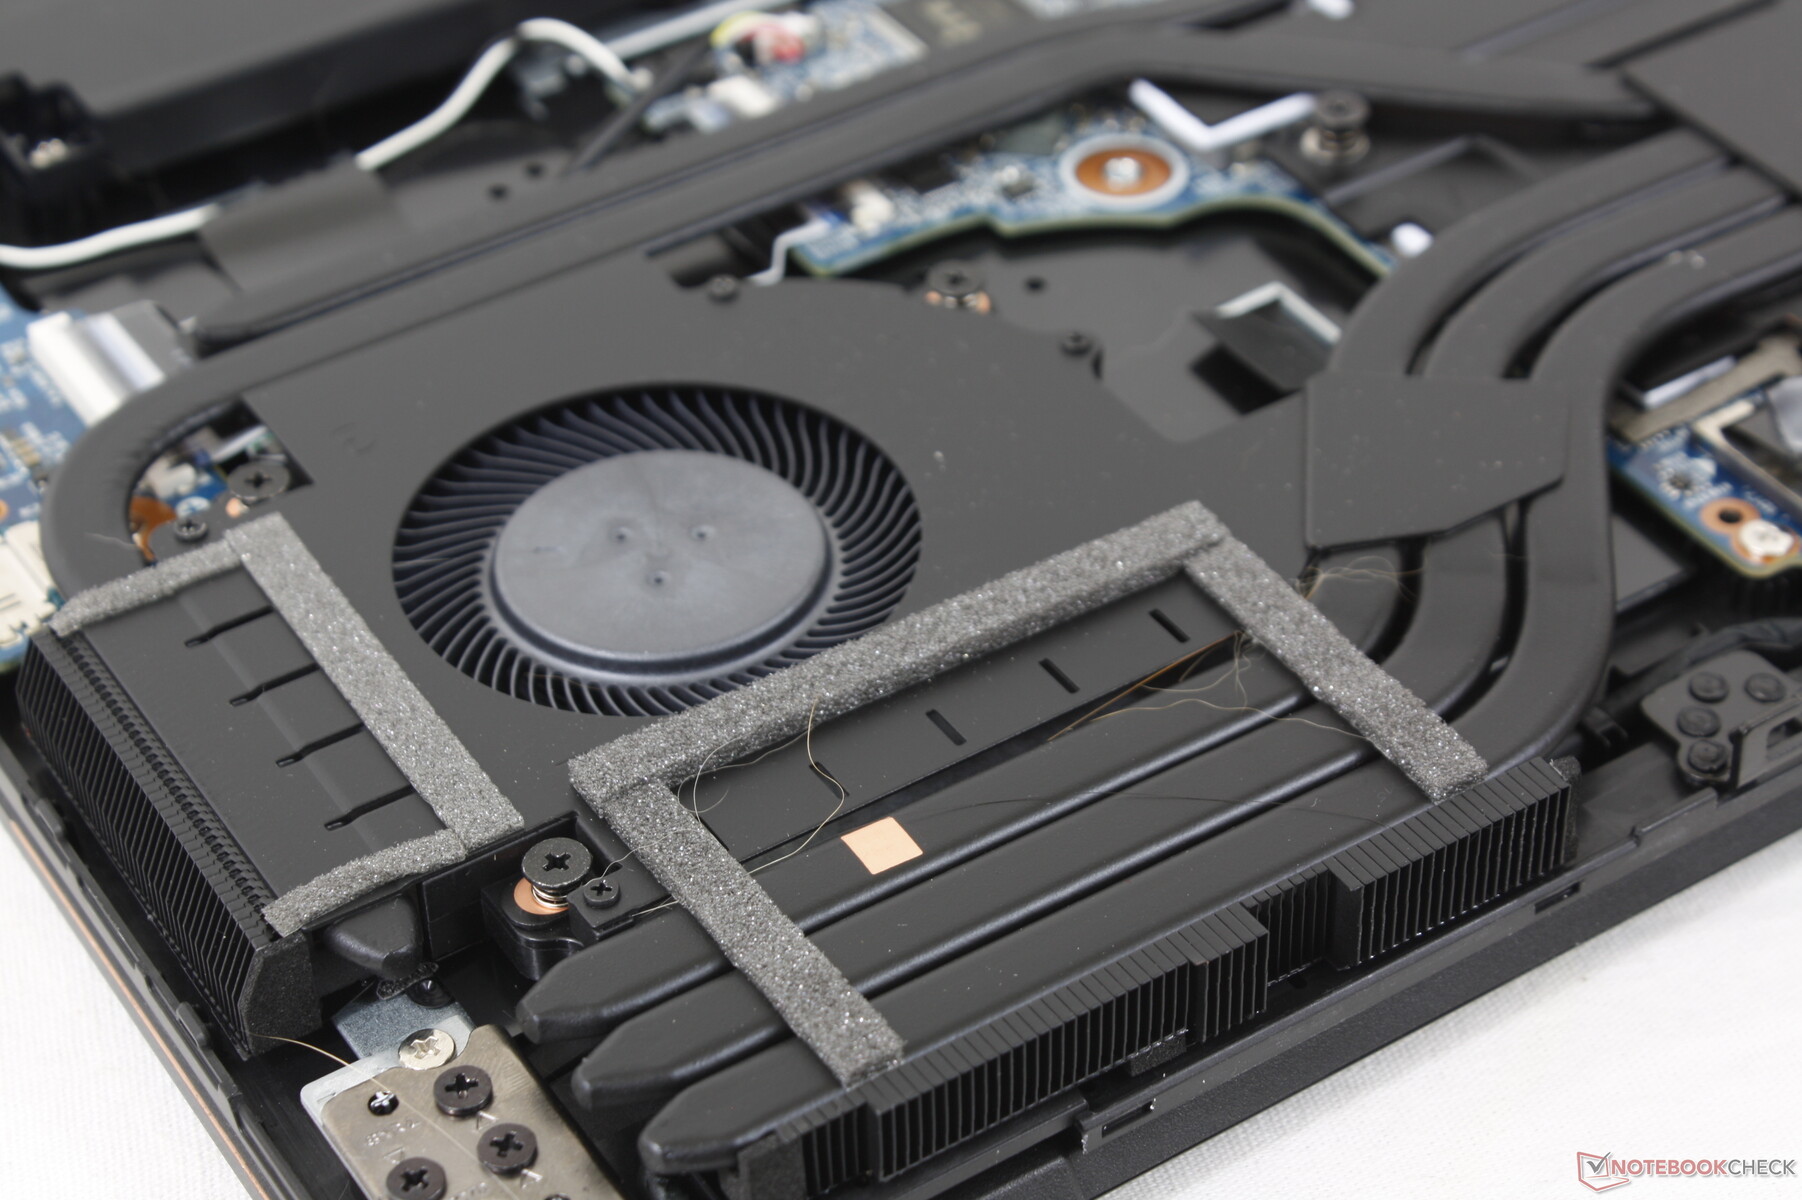
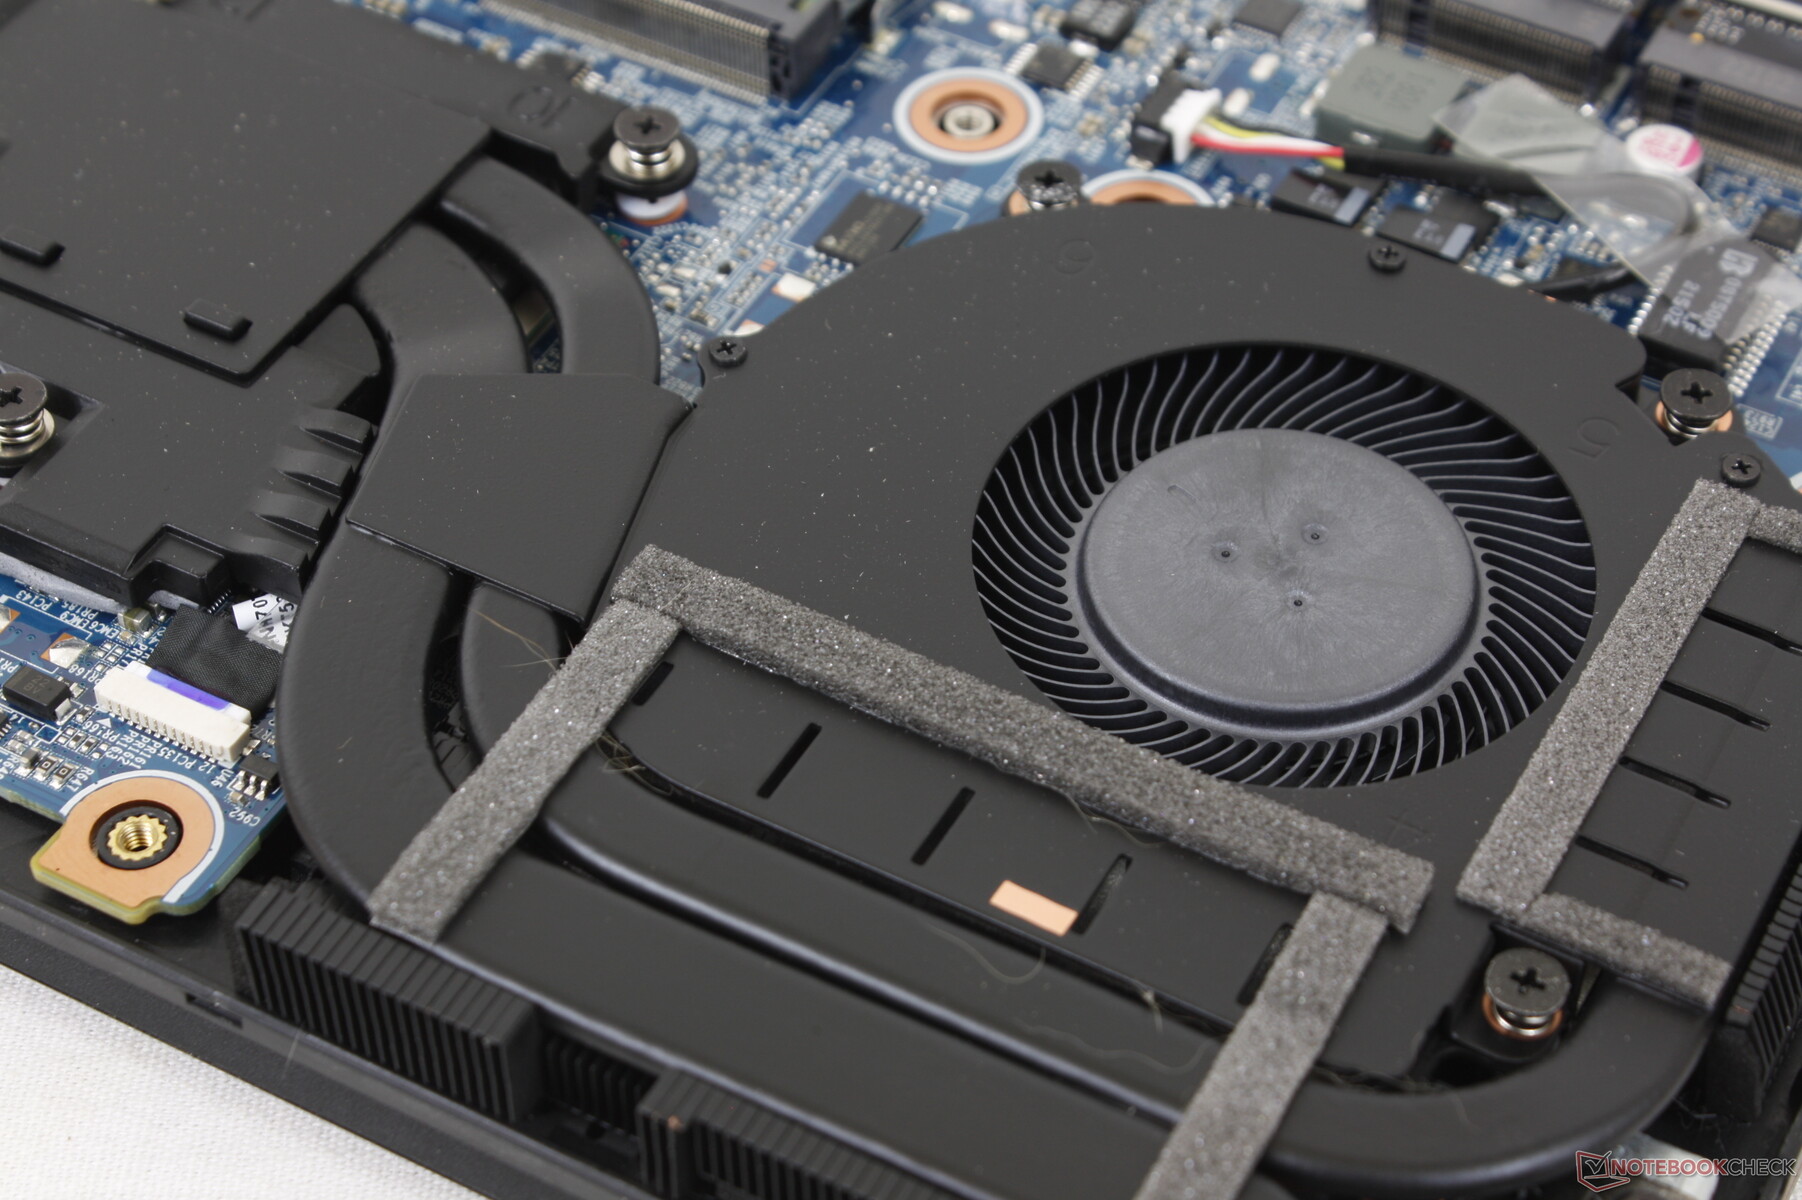
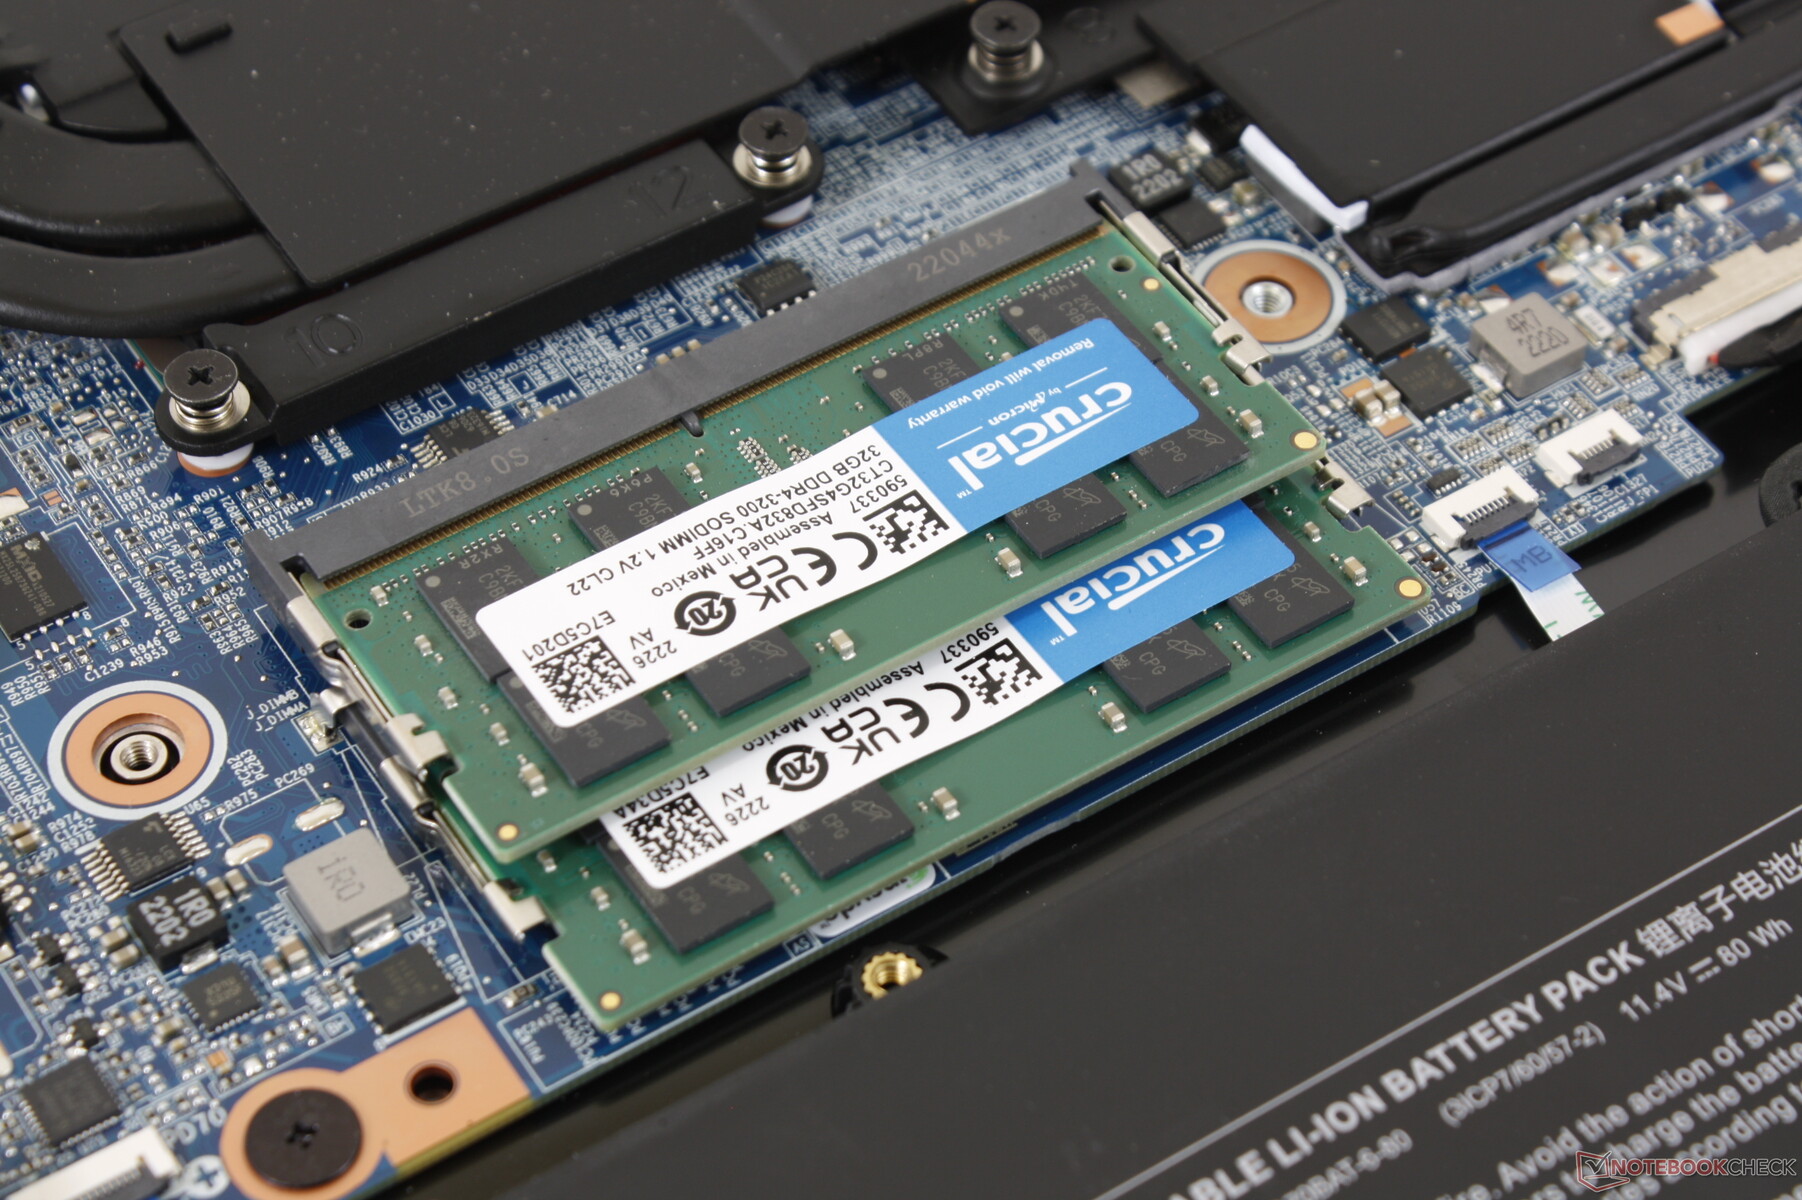
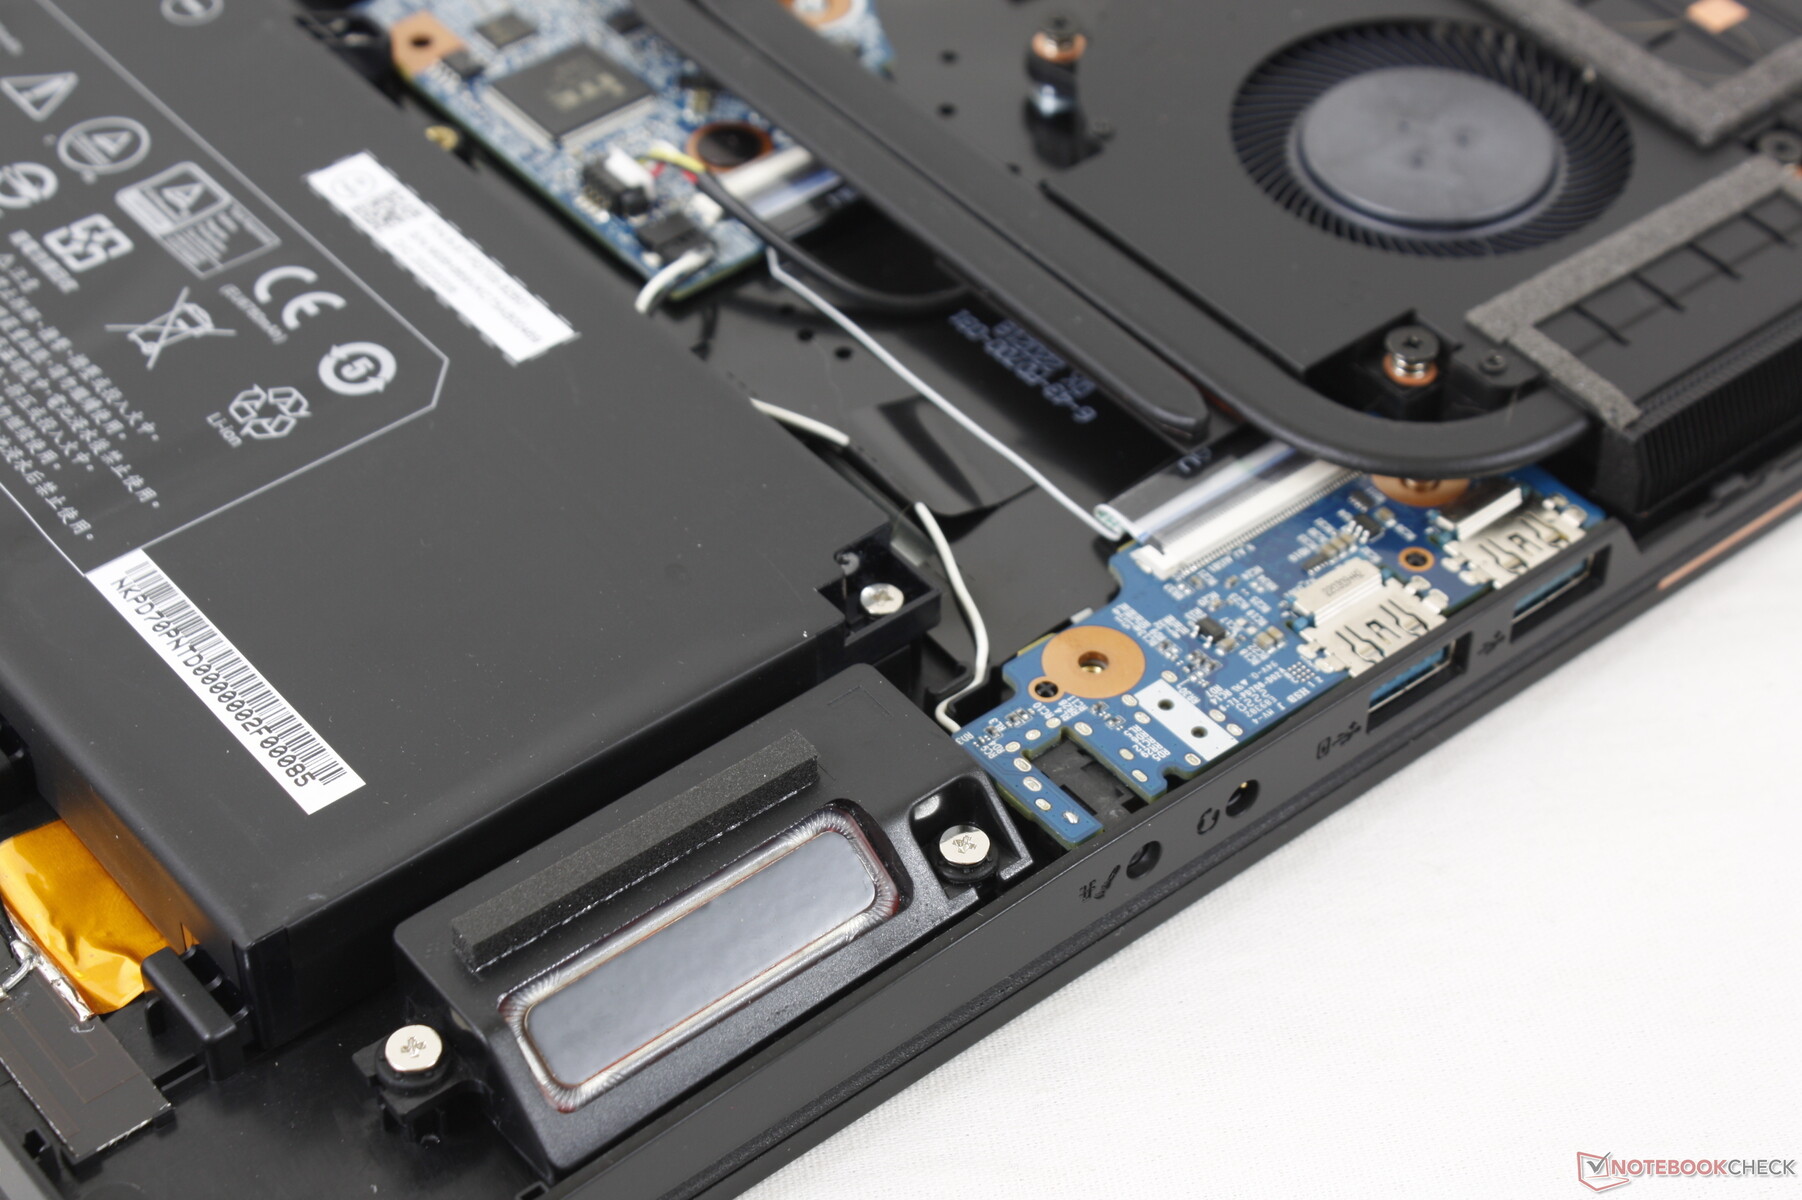
Wartung
Die Unterseite ist mit 16 Kreuzschlitzschrauben gesichert, was eine Wartung prinzipiell ermöglicht. Die meisten anderen Gaming-Laptops haben jedoch viel weniger Schrauben, sodass man etwas mehr Geduld braucht, um den Eurocom zu öffnen.
Zubehör und Garantie
Die Verpackung enthält außer dem Netzgerät und den Unterlagen keine weiteren Extras. Beim Kauf in den USA gilt die eingeschränkte Standard-Herstellergarantie von einem Jahr. Der Laptop kann für eine Gebühr auch in die EU geliefert werden.
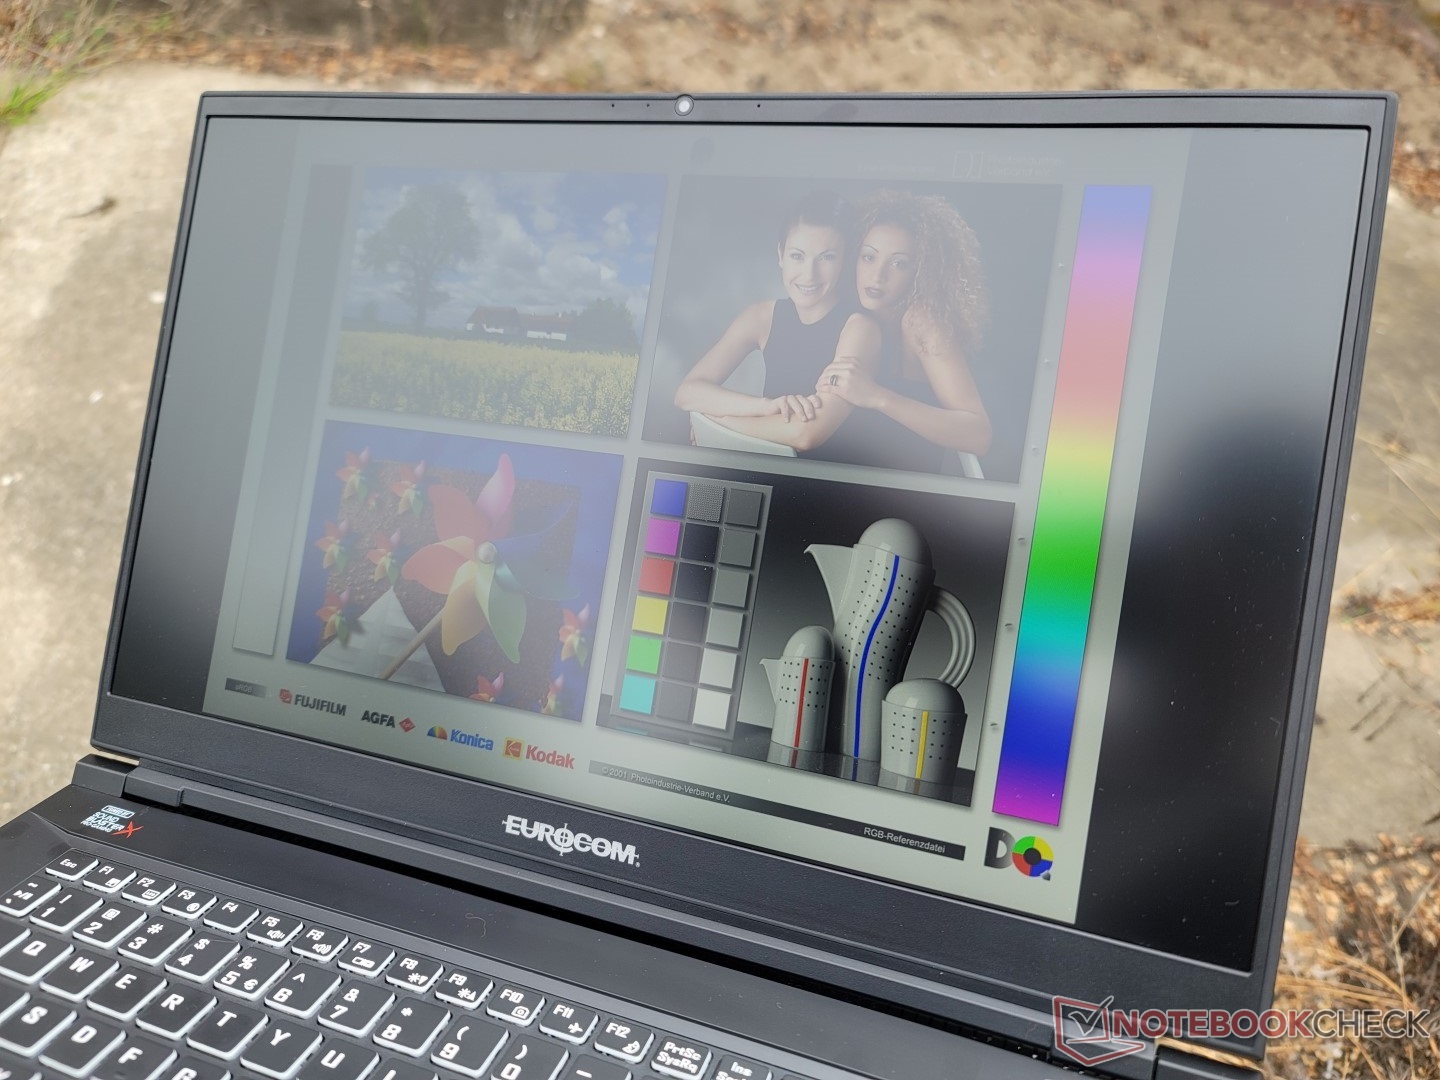
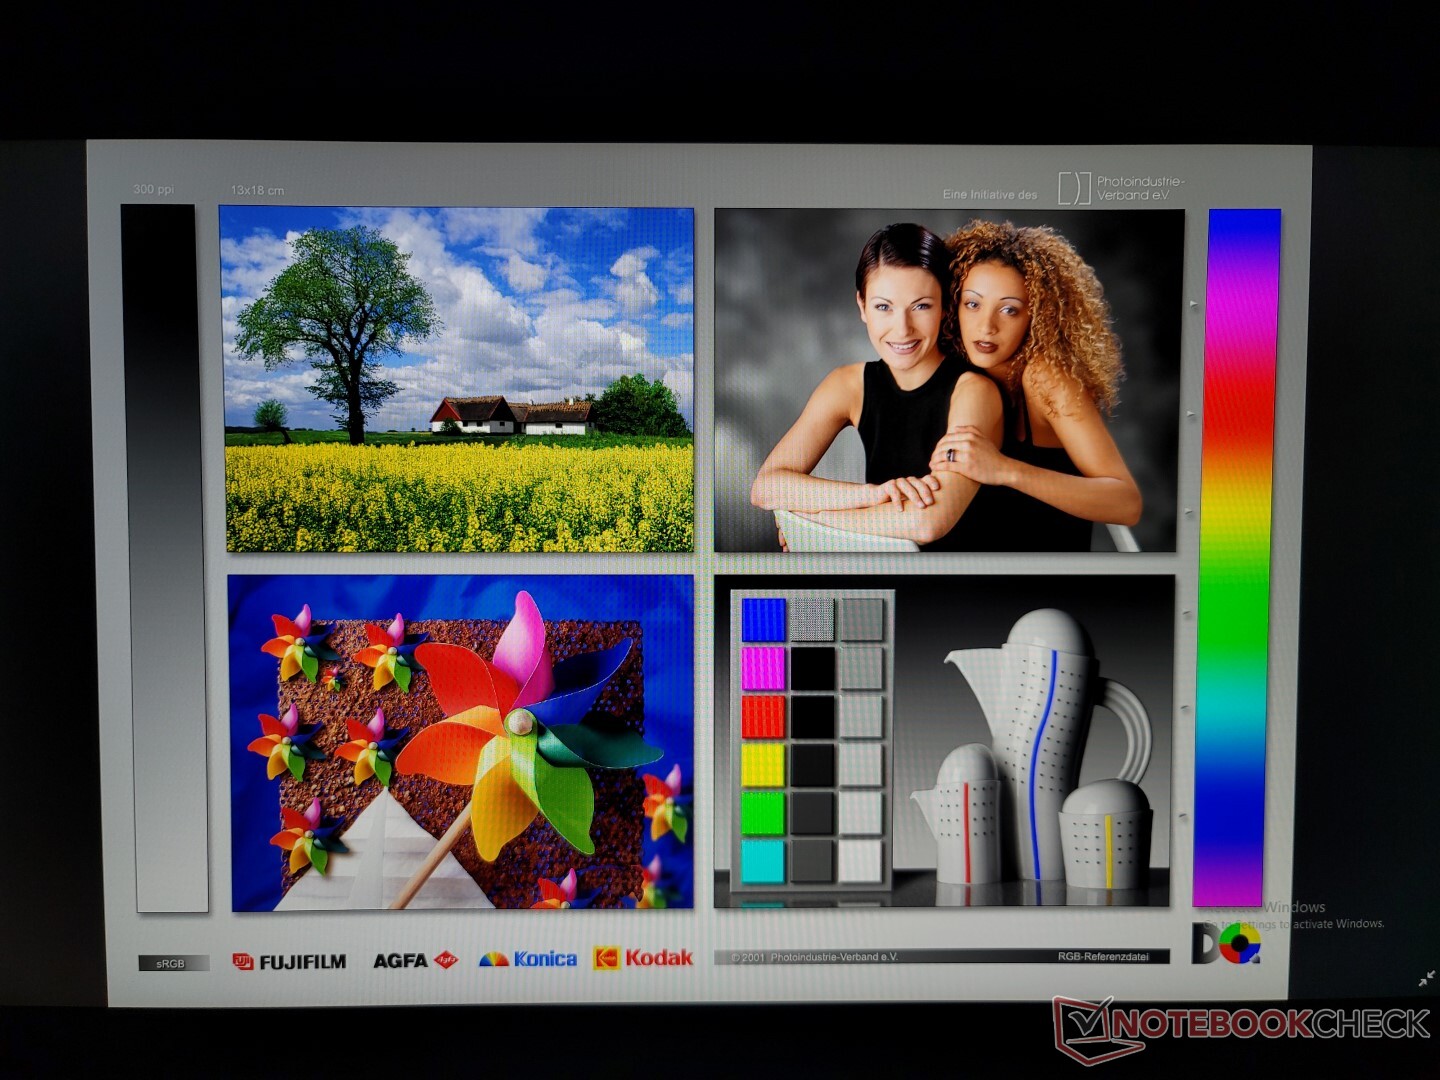
Display
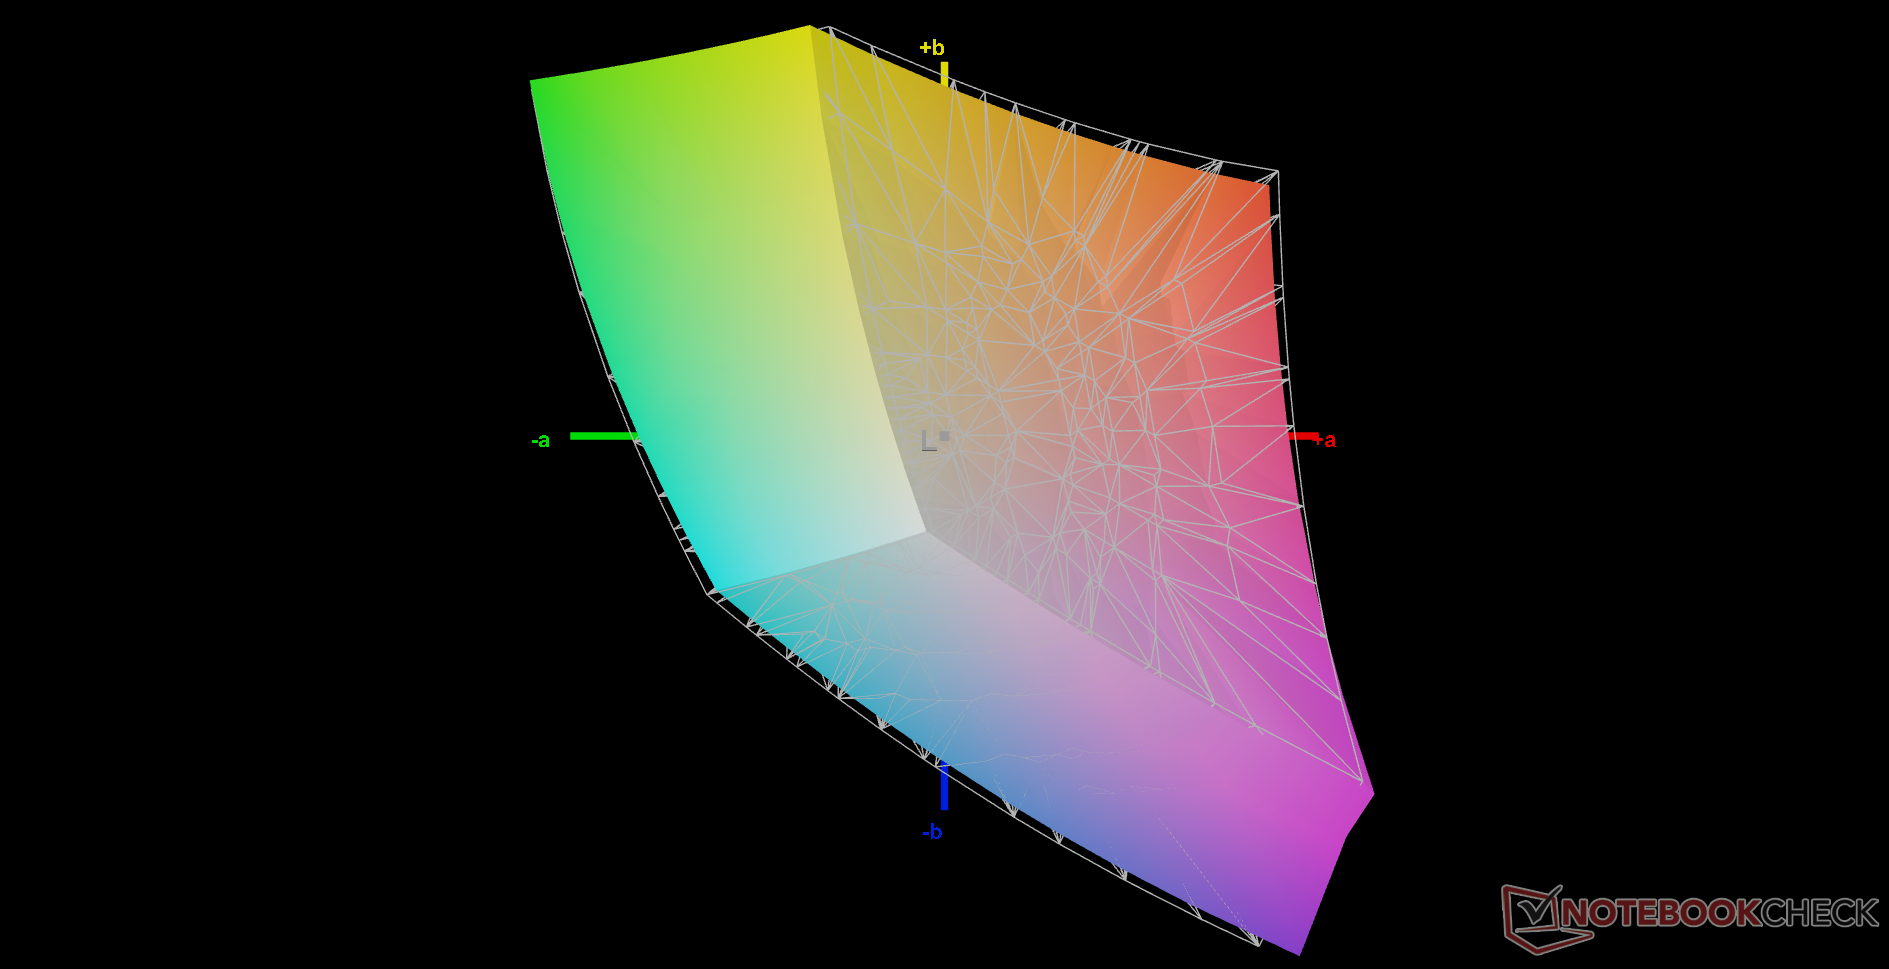
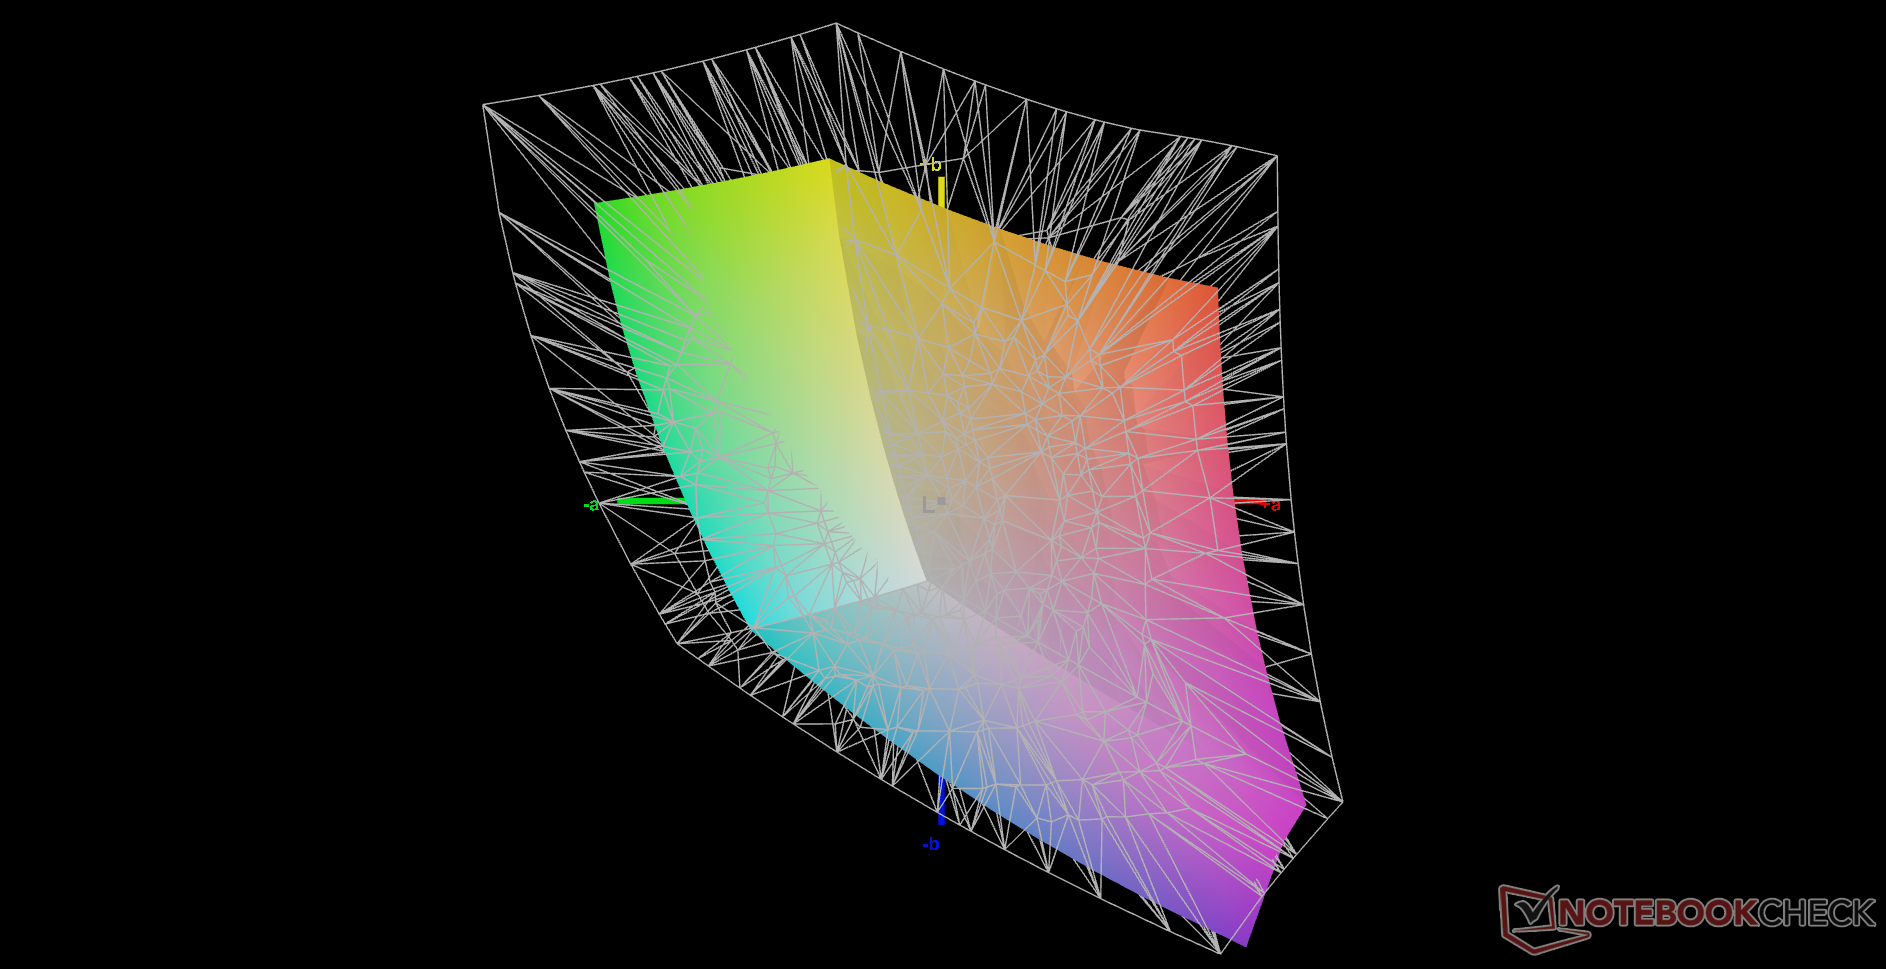
Unser Testgerät verwendet das gleiche LG Philips LP173WFG-SPB3 IPS-Panel, das auch im Schenker XMG Focus 17 zum Einsatz kommt. Im Vergleich zum 1440p BOE-Panel des XMG Pro 17 E22 bietet unser 1080p LG Philips-Panel weniger Farben, eine niedrigere Bildwiederholrate und eine langsamere Schwarz-Weiß-Reaktionszeit, was es eher zu einem Mittelklasse-Display als zu einem High-End-Display macht. Es ist aber immer noch sehr gut, aber 1440p ist definitiv eine bessere Wahl als 1080p für ein Notebook mit einer GeForce RTX 3080 Ti GPU.
Glücklicherweise bietet der TXi317 drei Panels zur Auswahl, die von 1080p bis 4K reichen. Man sollte bedenken, dass keines der Panels OLED ist und auch nicht die volle AdobeRGB-Abdeckung bietet.
- 1080p, 144 Hz, 100% sRGB, IPS
- 1440p, 165 Hz, 100% sRGB, IPS
- 2160p, 60 Hz, 100% sRGB, IPS


| |||||||||||||||||||||||||
Ausleuchtung: 88 %
Helligkeit Akku: 303.9 cd/m²
Kontrast: 1013:1 (Schwarzwert: 0.3 cd/m²)
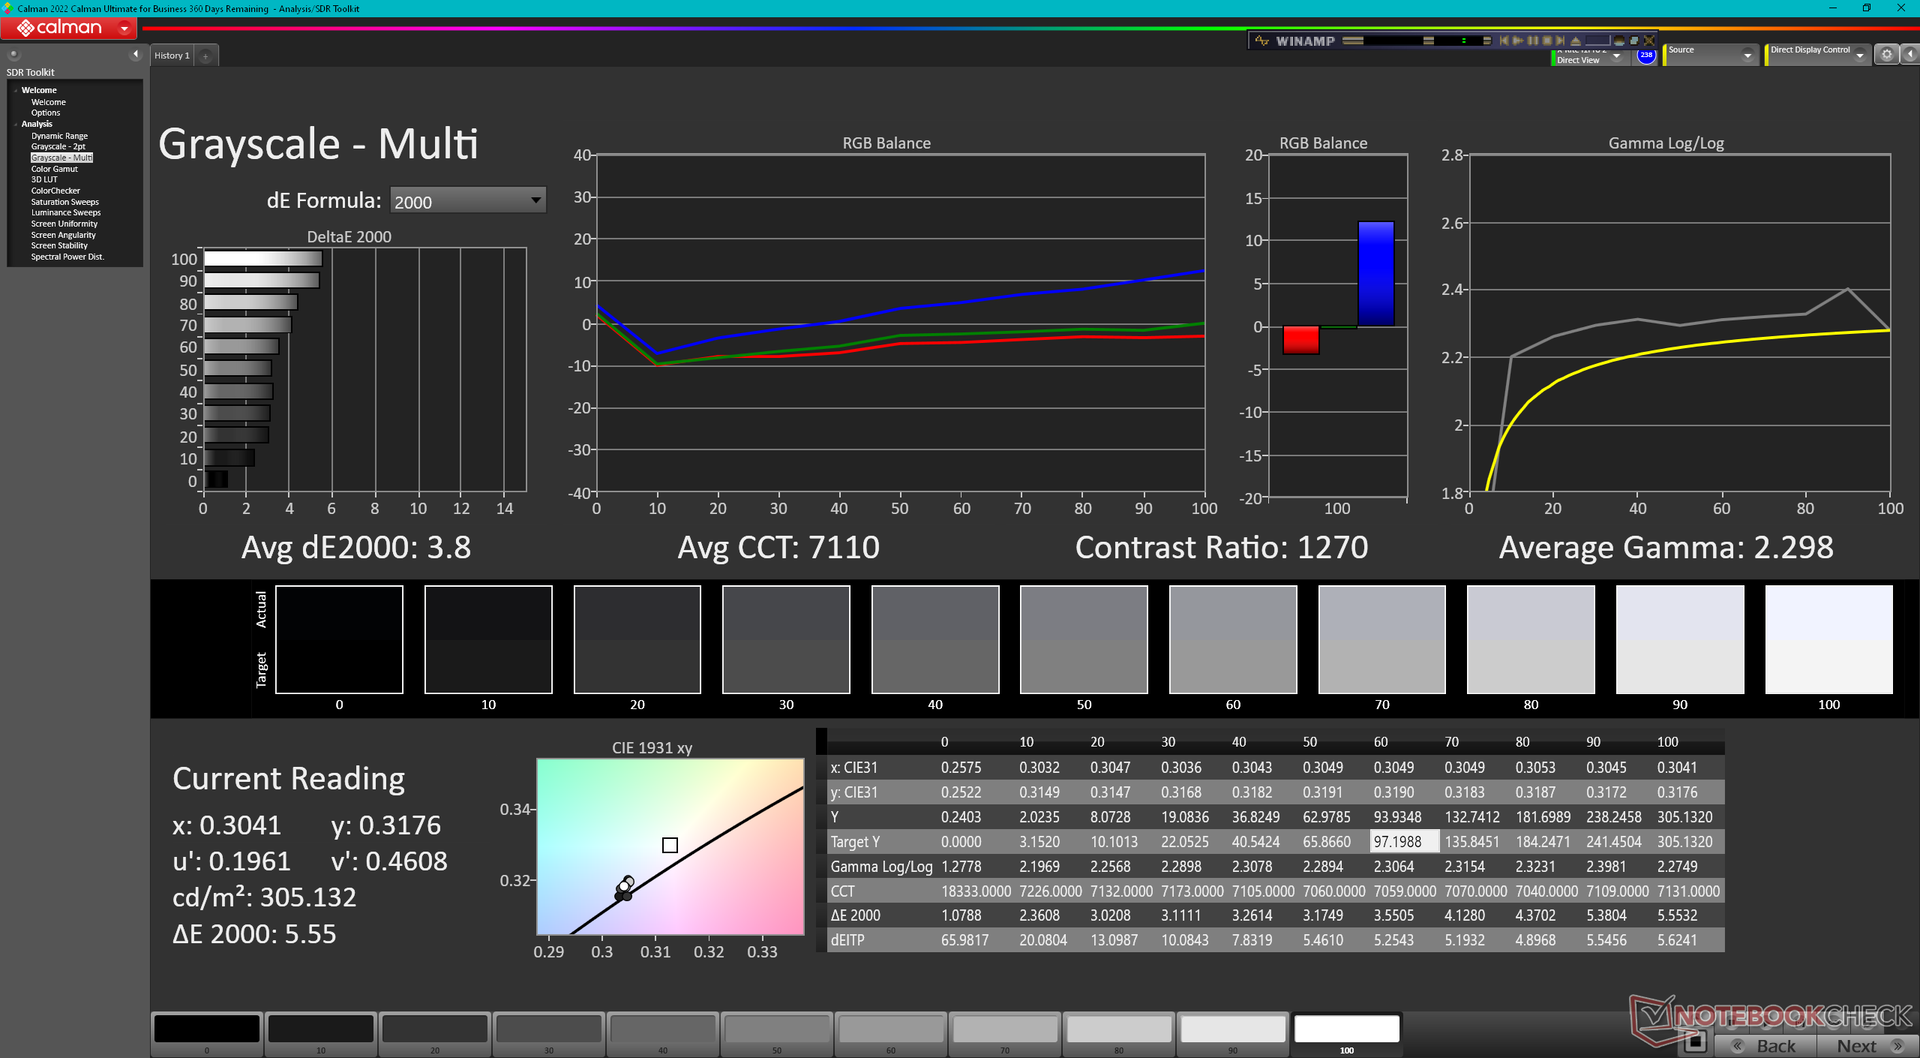
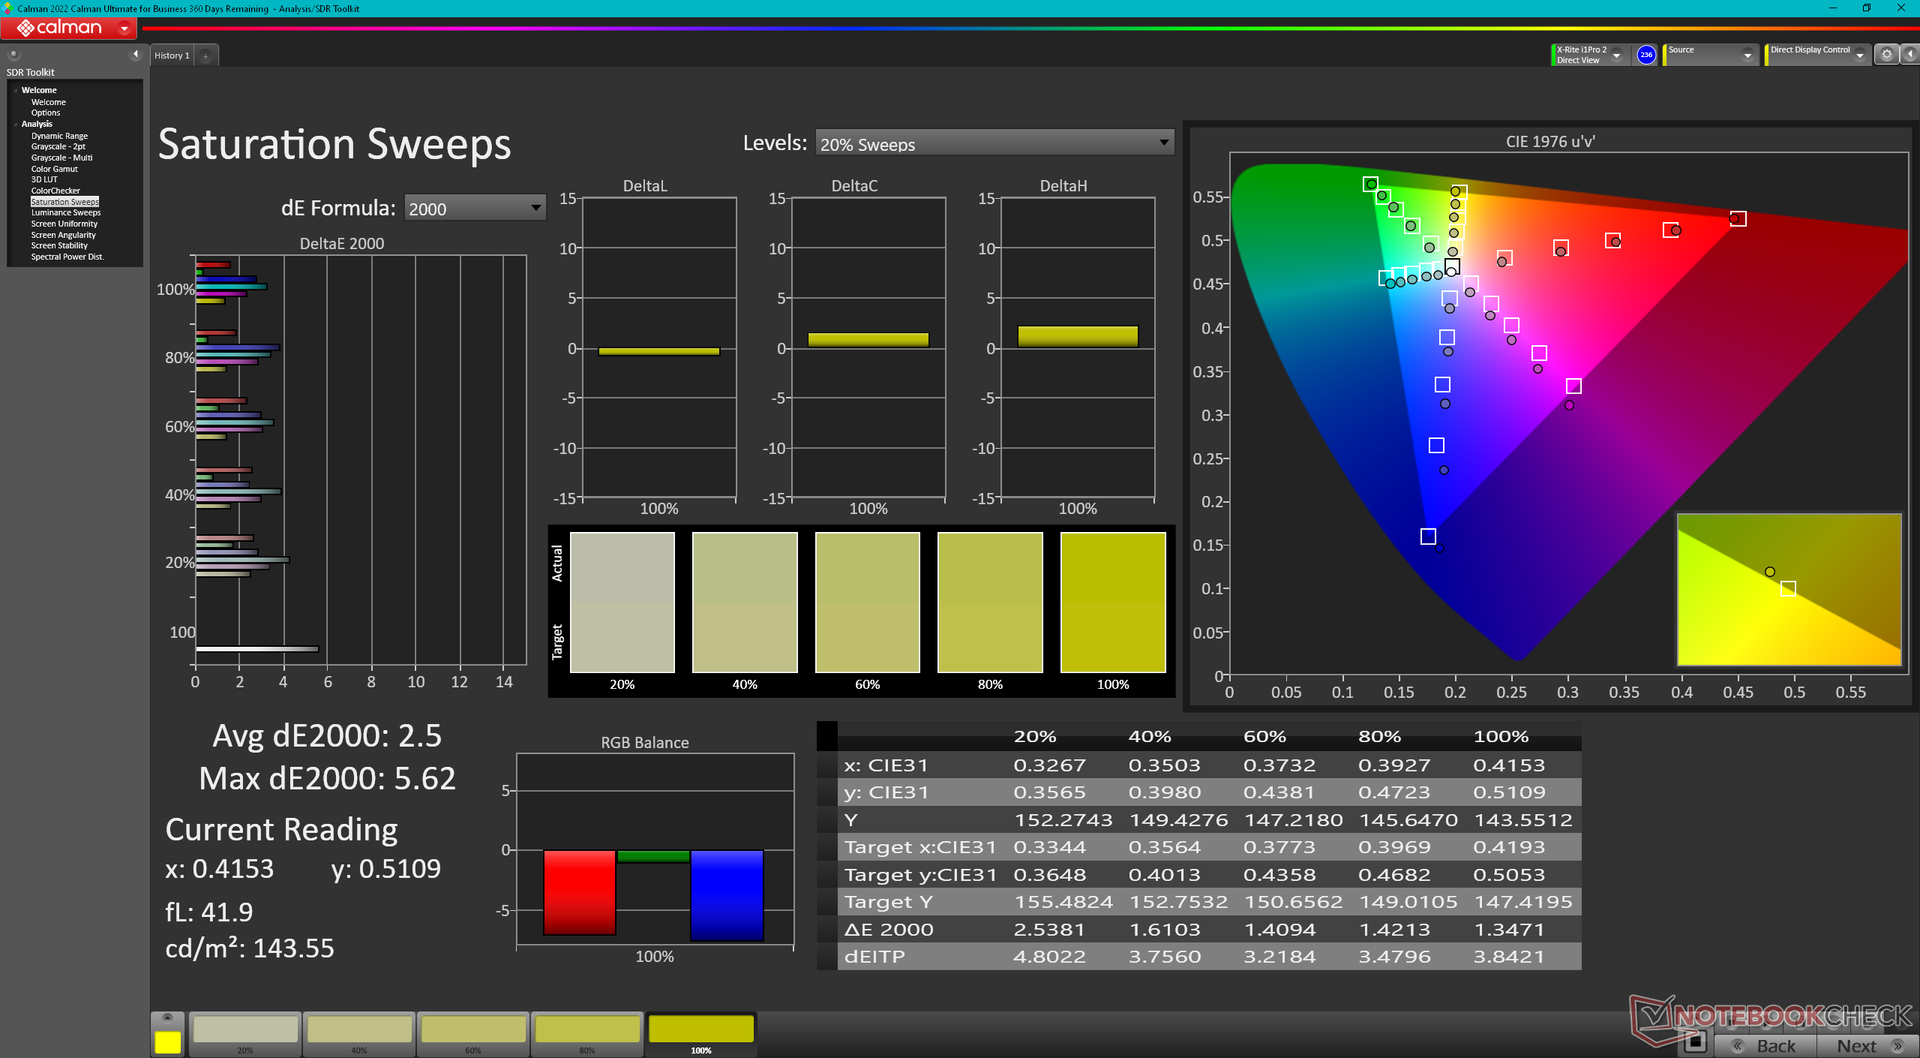
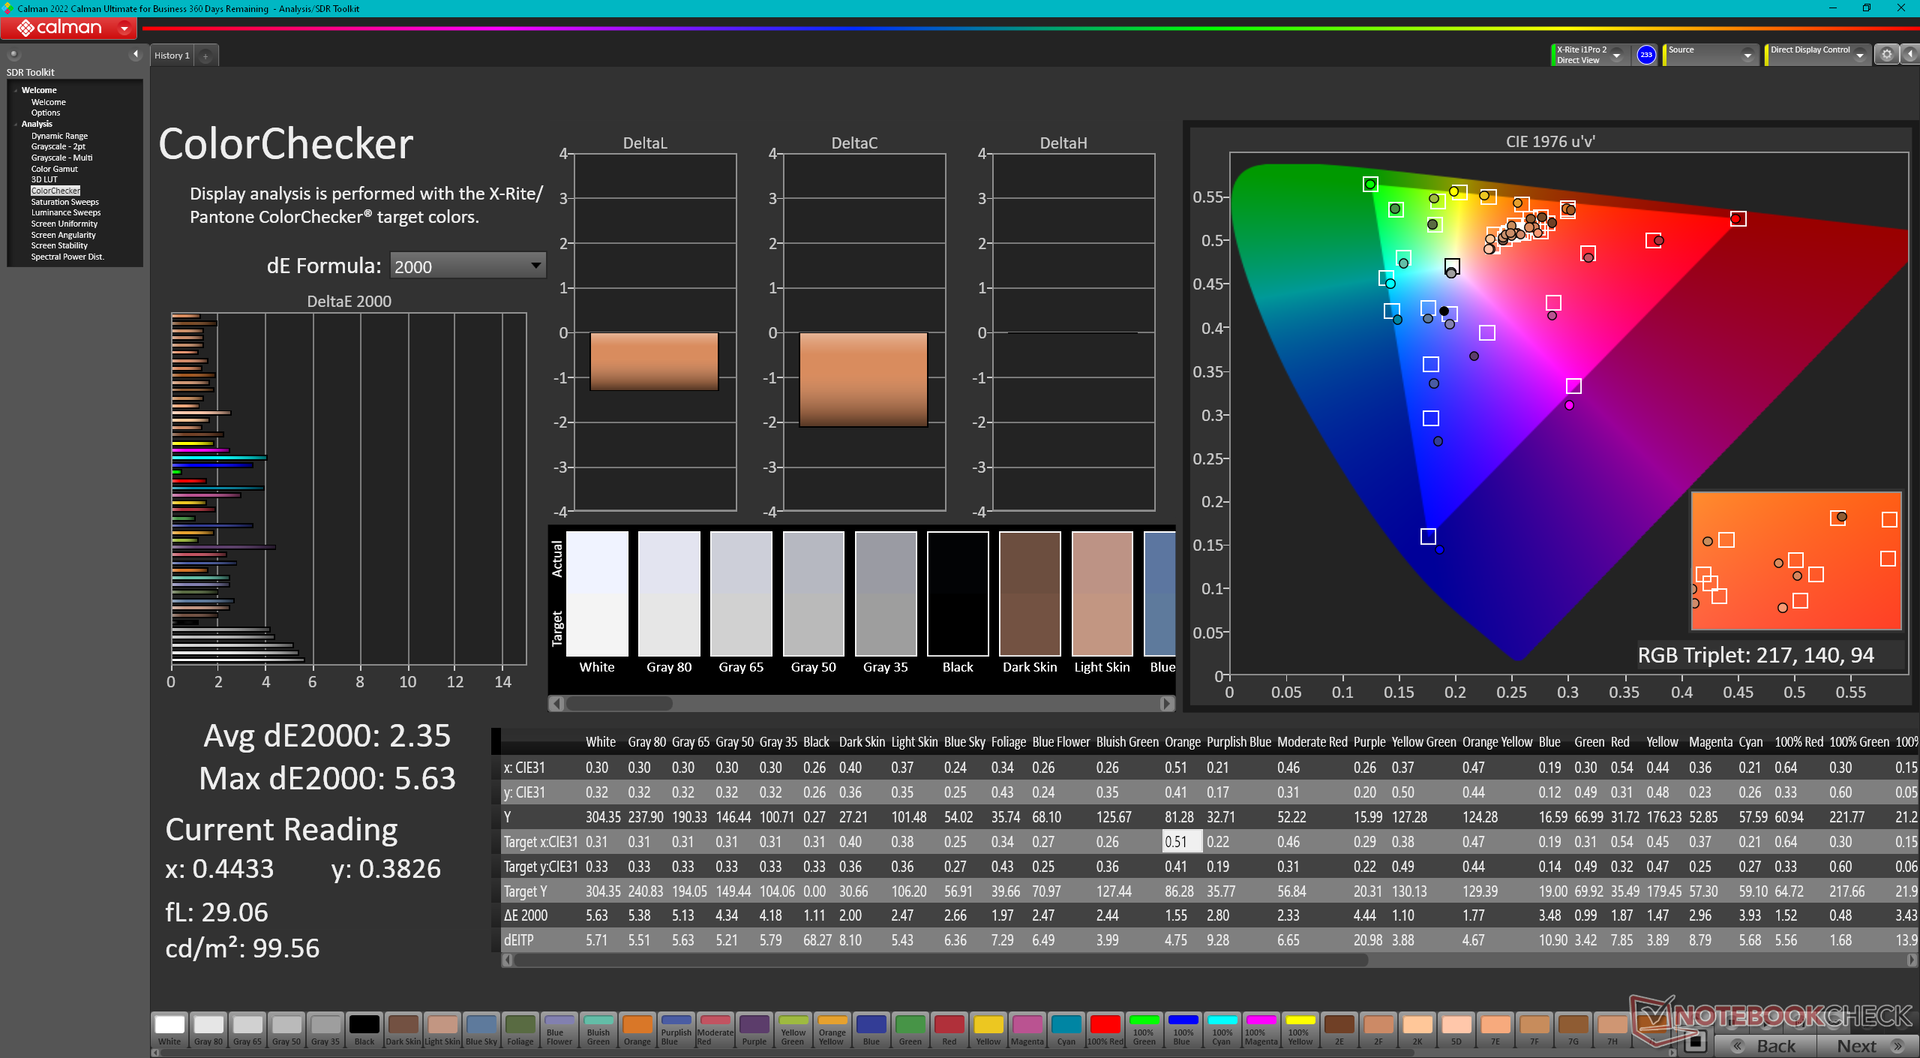
ΔE ColorChecker Calman: 2.35 | ∀{0.5-29.43 Ø4.72}
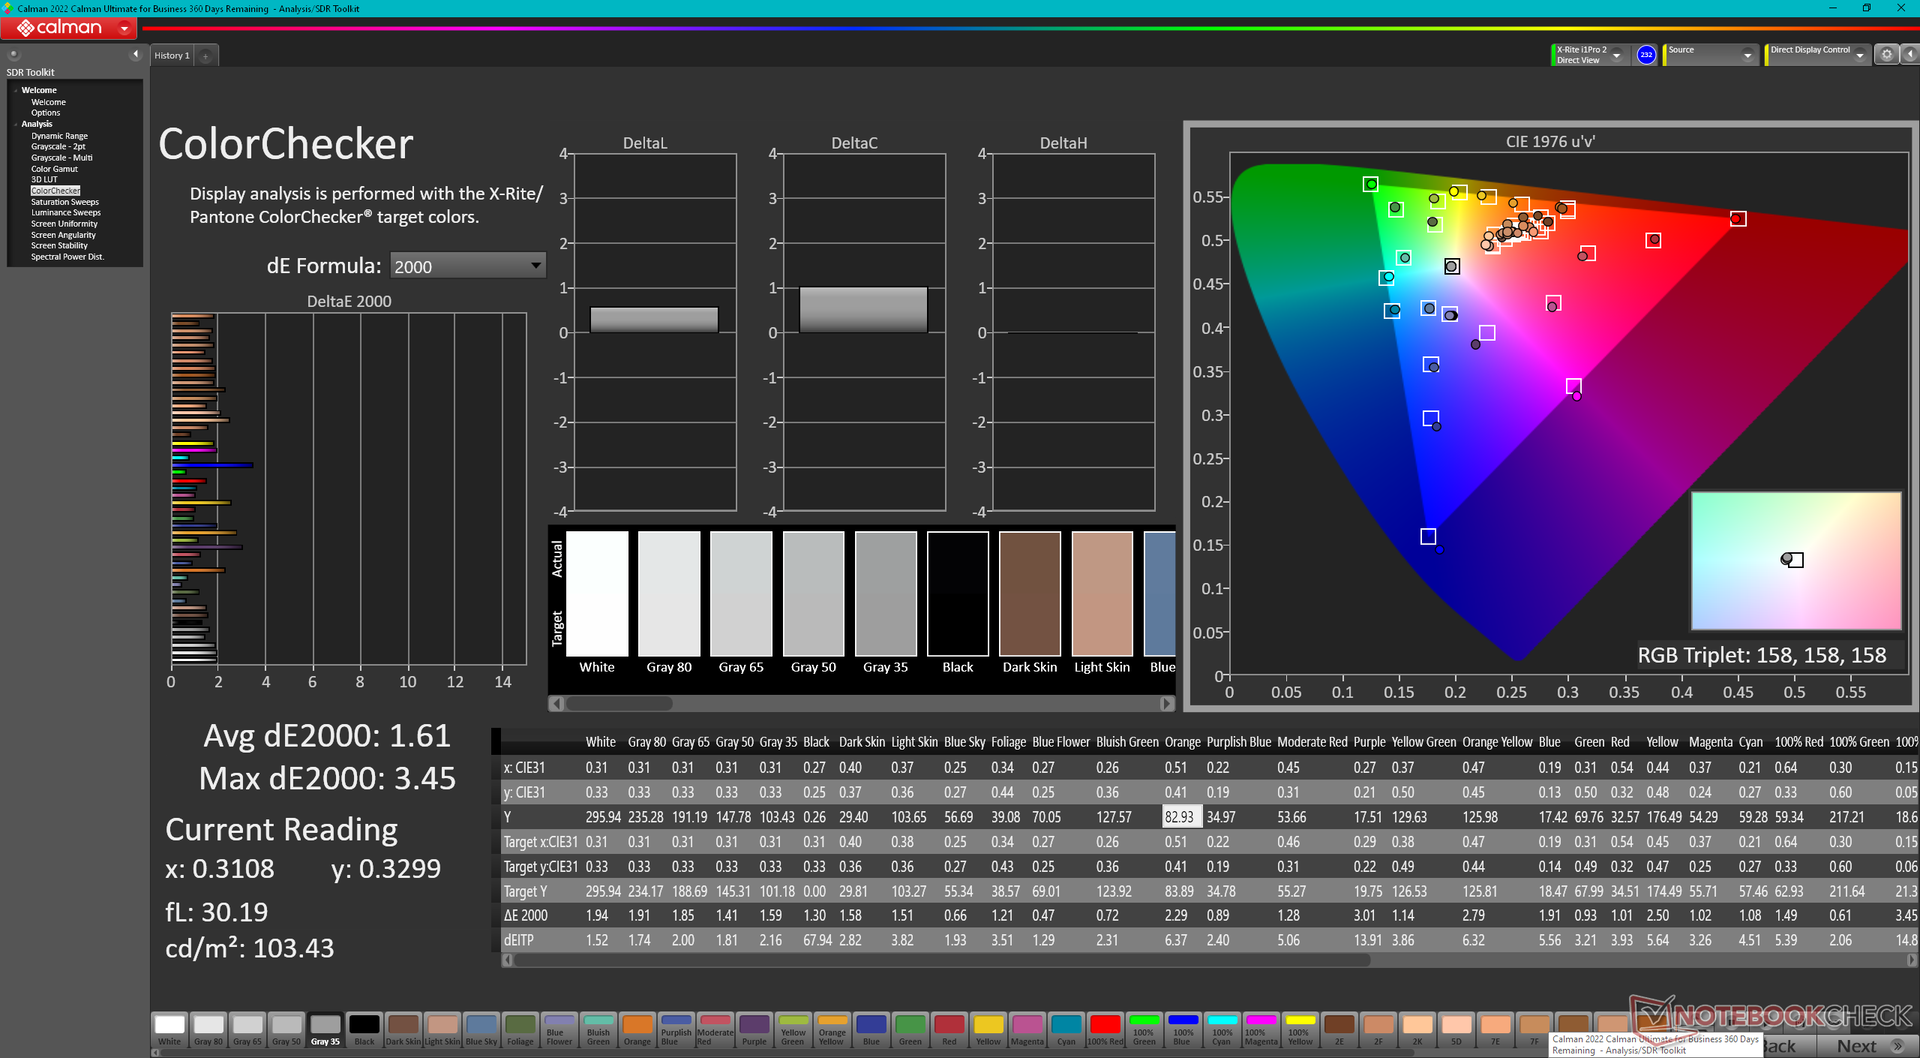
calibrated: 1.61
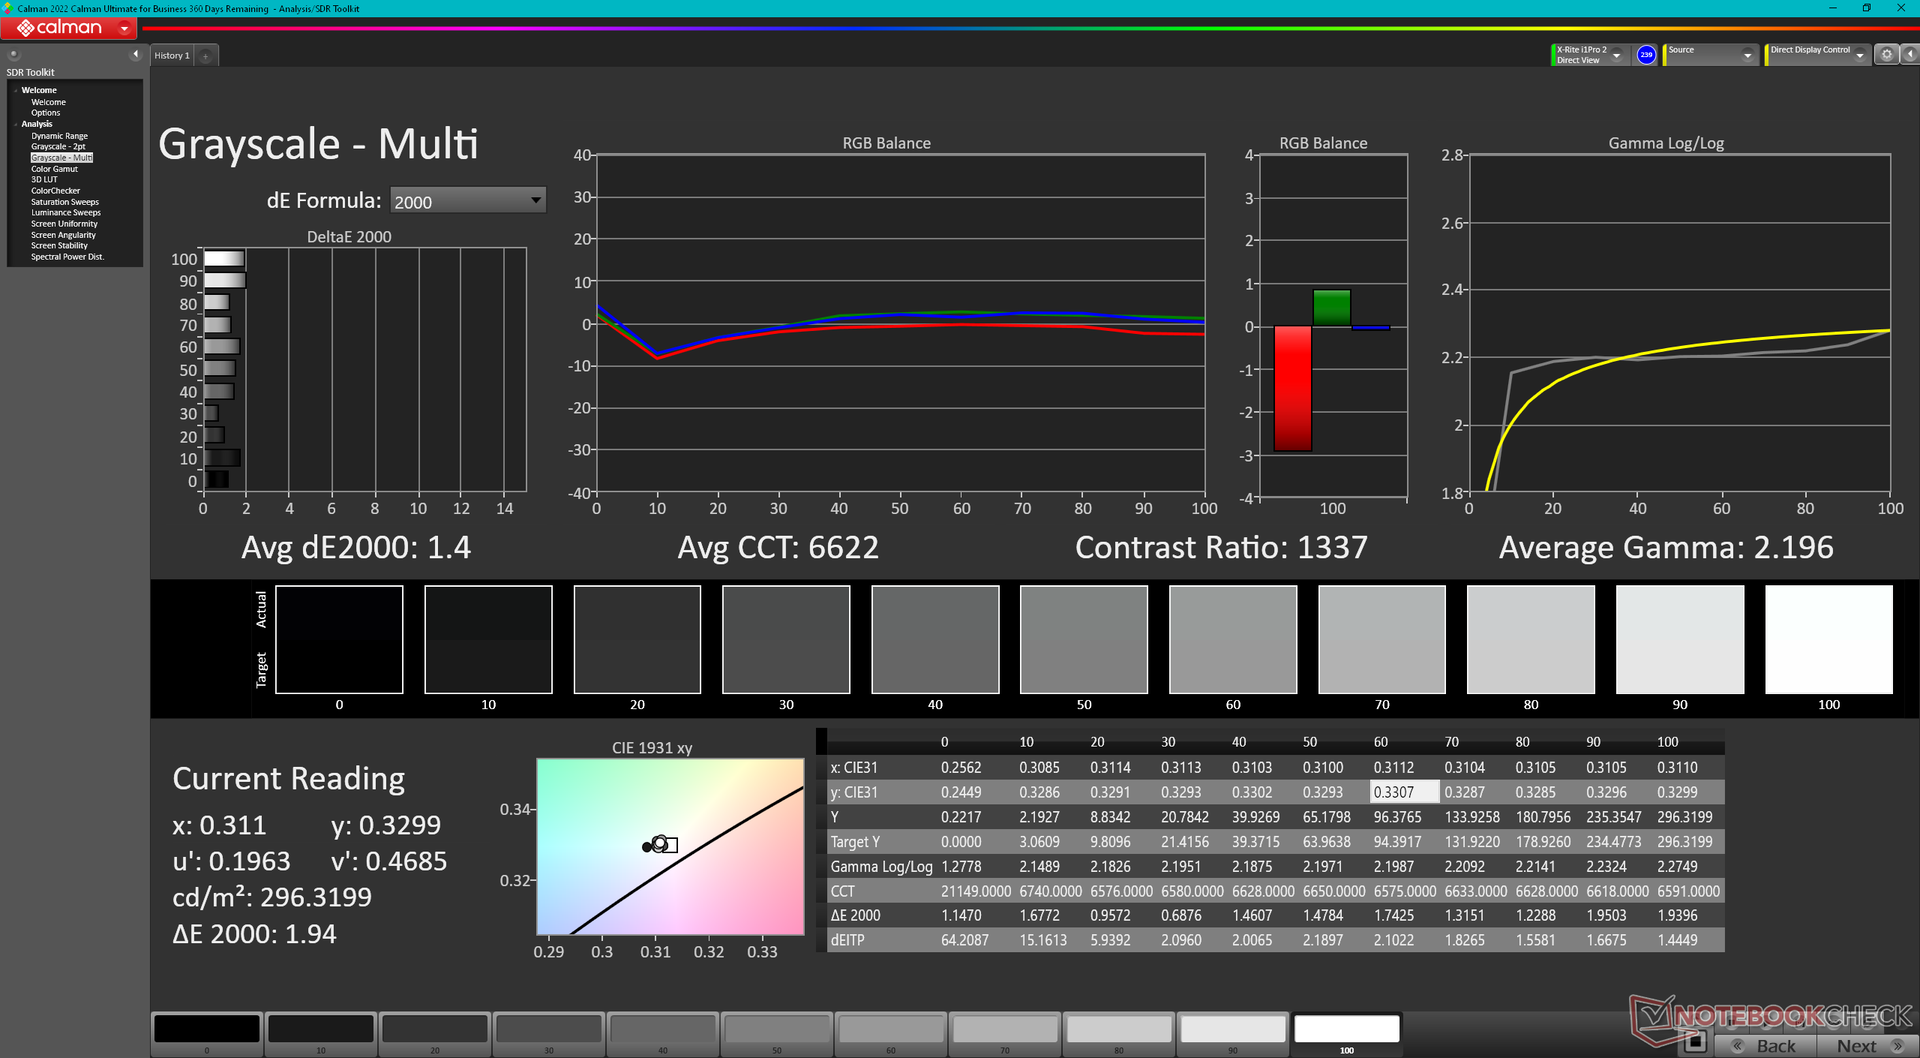
ΔE Greyscale Calman: 3.8 | ∀{0.09-98 Ø4.97}
65.4% AdobeRGB 1998 (Argyll 3D)
95.2% sRGB (Argyll 3D)
64.5% Display P3 (Argyll 3D)
Gamma: 2.3
CCT: 7110 K
| Eurocom Nightsky TXi317 LG Philips LP173WFG-SPB3, IPS, 1920x1080, 17.3" | Schenker XMG Pro 17 E22 BOE099D, IPS, 2560x1440, 17.3" | Aorus 17X XES Sharp SHP1563, IPS, 1920x1080, 17.3" | MSI Raider GE77 HX 12UHS AU Optronics B173ZAN06.1, IPS, 3840x2160, 17.3" | Razer Blade 17 Early 2022 AU Optronics B173ZAN06.9, IPS, 3840x2160, 17.3" | Alienware x17 R2 P48E AU Optronics B173HAN, IPS, 1920x1080, 17.3" | |
|---|---|---|---|---|---|---|
| Display | 29% | 8% | 29% | 31% | 17% | |
| Display P3 Coverage (%) | 64.5 | 97.5 51% | 70.1 9% | 96.6 50% | 99.4 54% | 79.2 23% |
| sRGB Coverage (%) | 95.2 | 99.9 5% | 99.9 5% | 99.8 5% | 100 5% | 99.8 5% |
| AdobeRGB 1998 Coverage (%) | 65.4 | 85.2 30% | 71.9 10% | 85.8 31% | 87.3 33% | 79.6 22% |
| Response Times | 44% | 58% | 47% | 39% | -1% | |
| Response Time Grey 50% / Grey 80% * (ms) | 10.4 ? | 5.4 ? 48% | 3.4 ? 67% | 5.8 ? 44% | 7.5 ? 28% | 12.4 ? -19% |
| Response Time Black / White * (ms) | 11.2 ? | 6.8 ? 39% | 5.8 ? 48% | 5.6 ? 50% | 5.6 ? 50% | 9.2 ? 18% |
| PWM Frequency (Hz) | ||||||
| Bildschirm | 5% | -24% | -19% | 33% | 2% | |
| Helligkeit Bildmitte (cd/m²) | 303.9 | 349 15% | 278 -9% | 381 25% | 503 66% | 365.4 20% |
| Brightness (cd/m²) | 292 | 319 9% | 273 -7% | 371 27% | 486 66% | 344 18% |
| Brightness Distribution (%) | 88 | 83 -6% | 79 -10% | 84 -5% | 84 -5% | 85 -3% |
| Schwarzwert * (cd/m²) | 0.3 | 0.32 -7% | 0.26 13% | 0.52 -73% | 0.44 -47% | 0.29 3% |
| Kontrast (:1) | 1013 | 1091 8% | 1069 6% | 733 -28% | 1143 13% | 1260 24% |
| Delta E Colorchecker * | 2.35 | 2.5 -6% | 3.96 -69% | 1.08 54% | 3.17 -35% | |
| Colorchecker dE 2000 max. * | 5.63 | 6.87 -22% | 10.78 -91% | 4.54 19% | 7.69 -37% | |
| Colorchecker dE 2000 calibrated * | 1.61 | 0.64 60% | 1.07 34% | 2.53 -57% | 0.6 63% | 0.51 68% |
| Delta E Graustufen * | 3.8 | 3.9 -3% | 6.8 -79% | 1.3 66% | 5.3 -39% | |
| Gamma | 2.3 96% | 2.09 105% | 2.224 99% | 2.151 102% | 2.18 101% | |
| CCT | 7110 91% | 7192 90% | 7651 85% | 6541 99% | 5879 111% | |
| Durchschnitt gesamt (Programm / Settings) | 26% /
16% | 14% /
-5% | 19% /
6% | 34% /
33% | 6% /
5% |
* ... kleinere Werte sind besser
Eurocom kalibriert den Bildschirm für eine Gebühr. Unser Testgerät kam unkalibriert mit durchschnittlichen Graustufen- und Farb-DeltaE-Werten von 3,8 bzw. 2,35, was eigentlich nicht schlecht ist. Wenn wir das Panel selbst kalibrieren würden, könnten diese Durchschnittswerte noch weiter auf 1,4 und 1,61 verbessert werden. Unser kalibriertes Profil steht oben zum kostenlosen Download bereit.

Reaktionszeiten (Response Times) des Displays
| ↔ Reaktionszeiten Schwarz zu Weiß | ||
|---|---|---|
| 11.2 ms ... steigend ↗ und fallend ↘ kombiniert | ↗ 6 ms steigend | 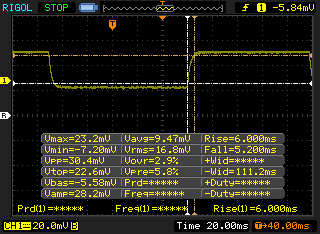 |
| ↘ 5.2 ms fallend | ||
| Die gemessenen Reaktionszeiten sind gut, für anspruchsvolle Spieler könnten der Bildschirm jedoch zu langsam sein. Im Vergleich rangierten die bei uns getesteten Geräte von 0.1 (Minimum) zu 240 (Maximum) ms. » 30 % aller Screens waren schneller als der getestete. Daher sind die gemessenen Reaktionszeiten besser als der Durchschnitt aller vermessenen Geräte (19.8 ms). | ||
| ↔ Reaktionszeiten 50% Grau zu 80% Grau | ||
| 10.4 ms ... steigend ↗ und fallend ↘ kombiniert | ↗ 6 ms steigend | 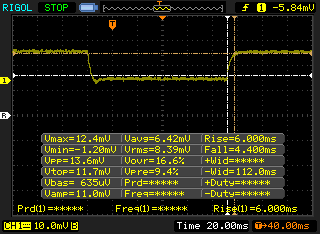 |
| ↘ 4.4 ms fallend | ||
| Die gemessenen Reaktionszeiten sind gut, für anspruchsvolle Spieler könnten der Bildschirm jedoch zu langsam sein. Im Vergleich rangierten die bei uns getesteten Geräte von 0.165 (Minimum) zu 636 (Maximum) ms. » 24 % aller Screens waren schneller als der getestete. Daher sind die gemessenen Reaktionszeiten besser als der Durchschnitt aller vermessenen Geräte (31 ms). | ||
Bildschirm-Flackern / PWM (Pulse-Width Modulation)
| Flackern / PWM nicht festgestellt | 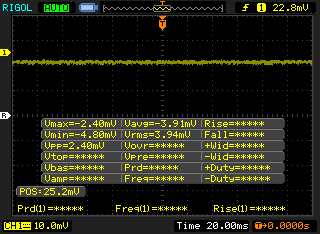 | ||
Im Vergleich: 52 % aller getesteten Geräte nutzten kein PWM um die Helligkeit zu reduzieren. Wenn PWM eingesetzt wurde, dann bei einer Frequenz von durchschnittlich 7772 (Minimum 5, Maximum 343500) Hz. | |||
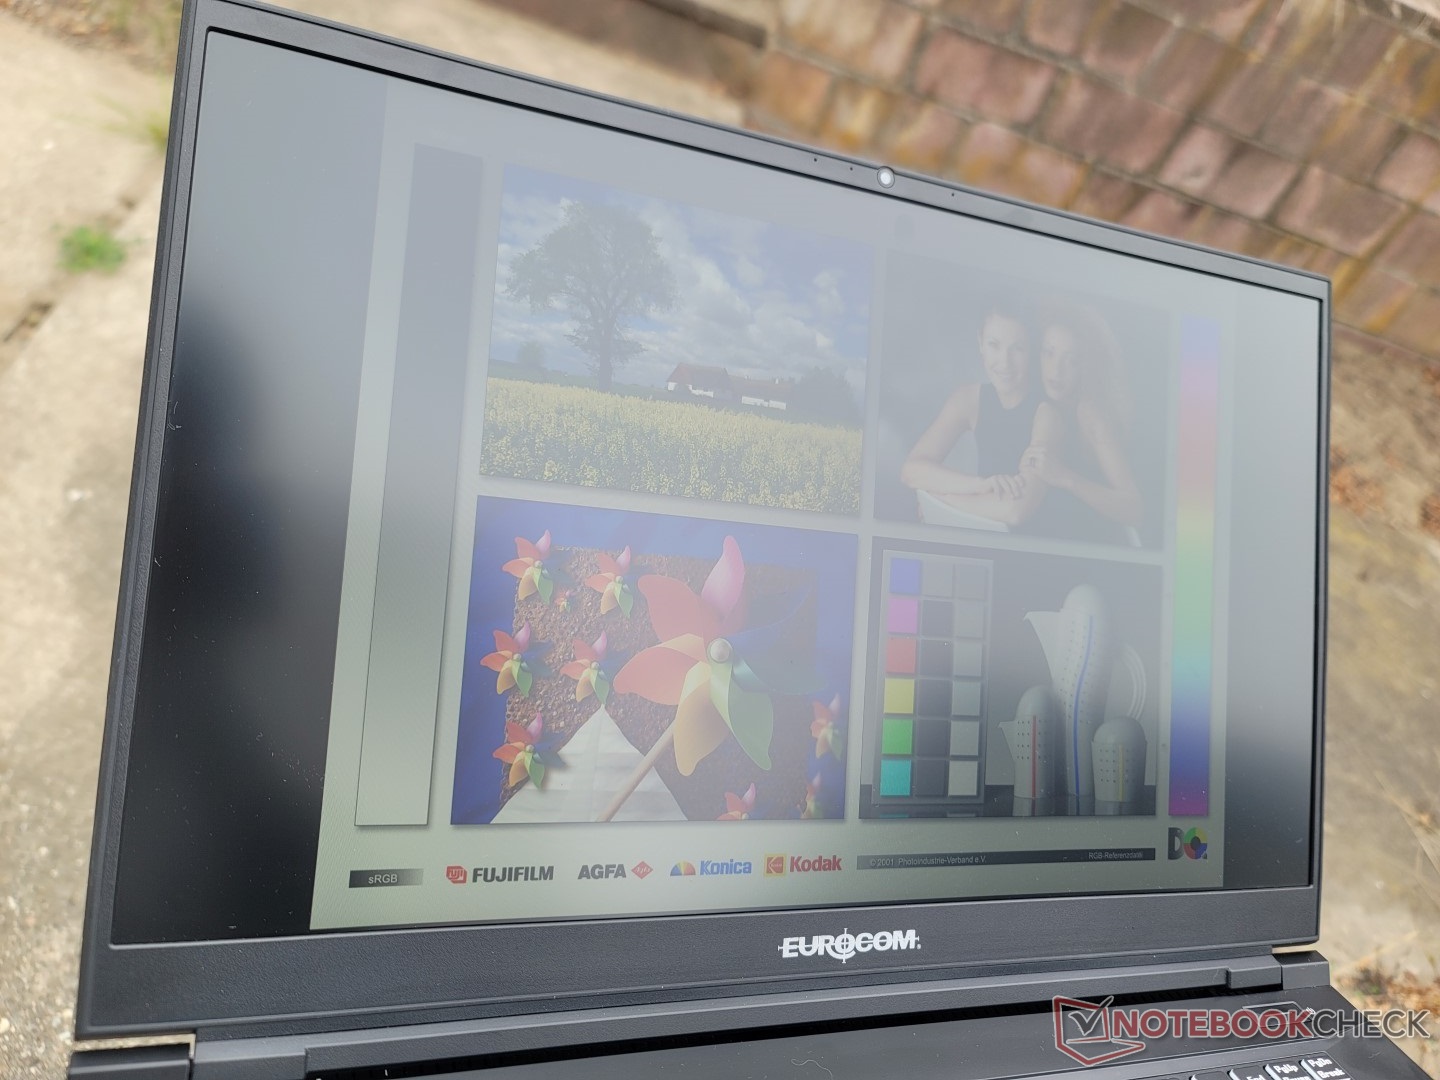
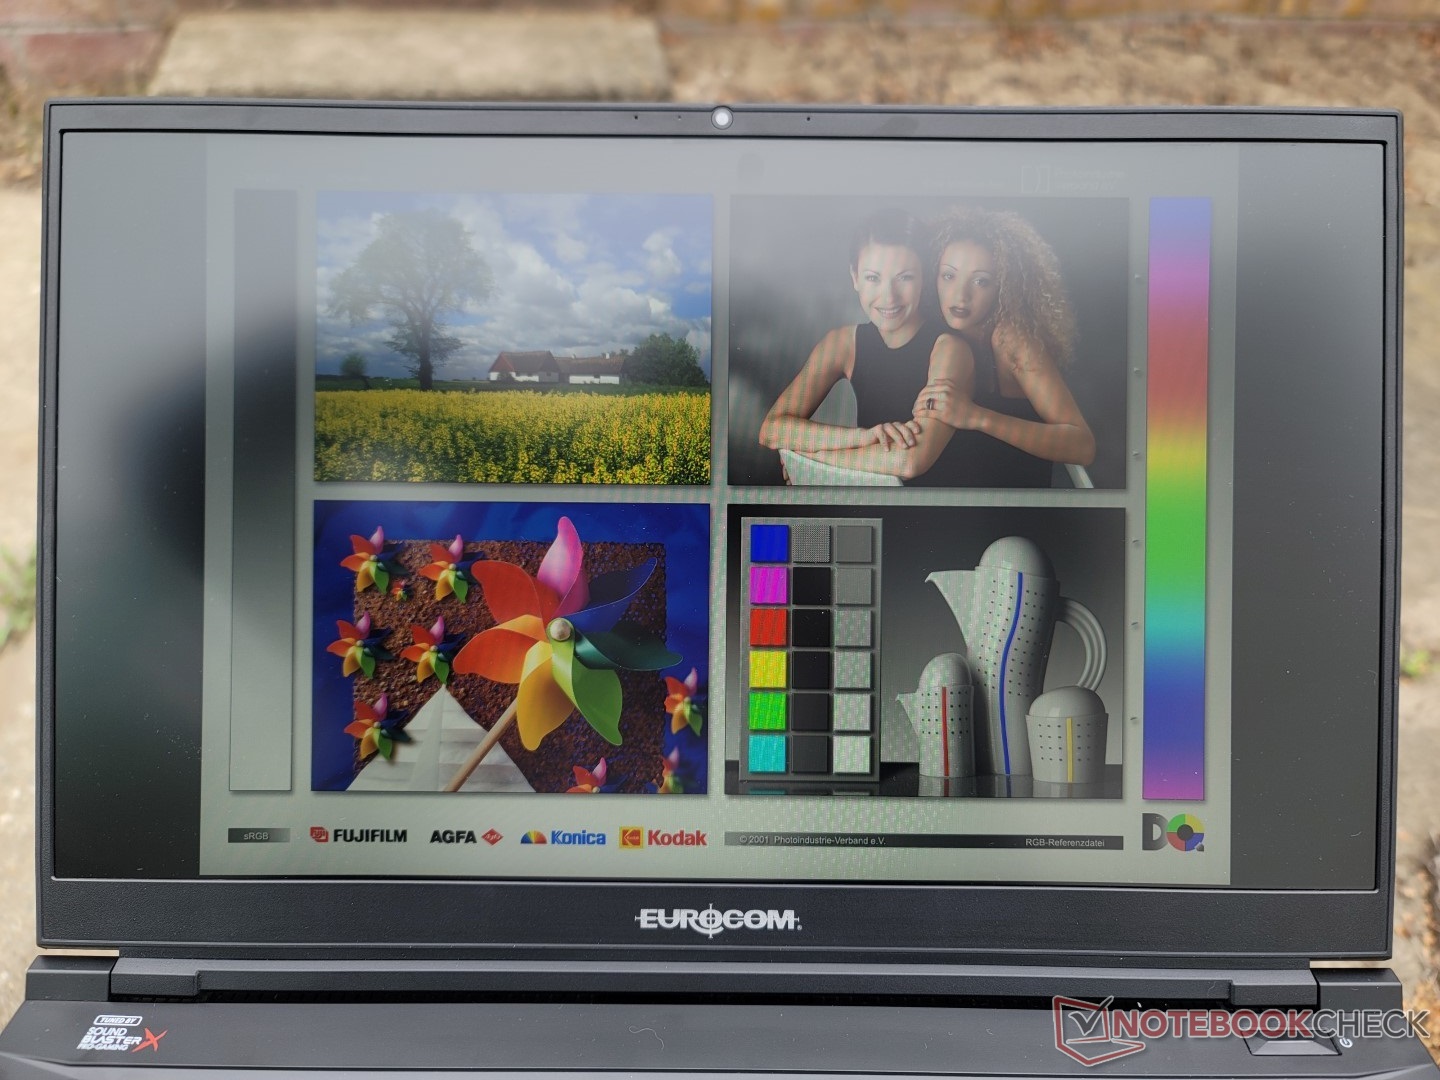
Mit maximal 300 cd/m² ist das Display im Vergleich zu anderen 17-Zoll-Gaming-Notebooks für die Sichtbarkeit im Freien nur durchschnittlich. Einige Alternativen, wie z. B. das Razer Blade 17, verfügen über deutlich hellere Displays mit über 500 nits, die im Freien besser ablesbar sind.
Leistung

Testbedingungen
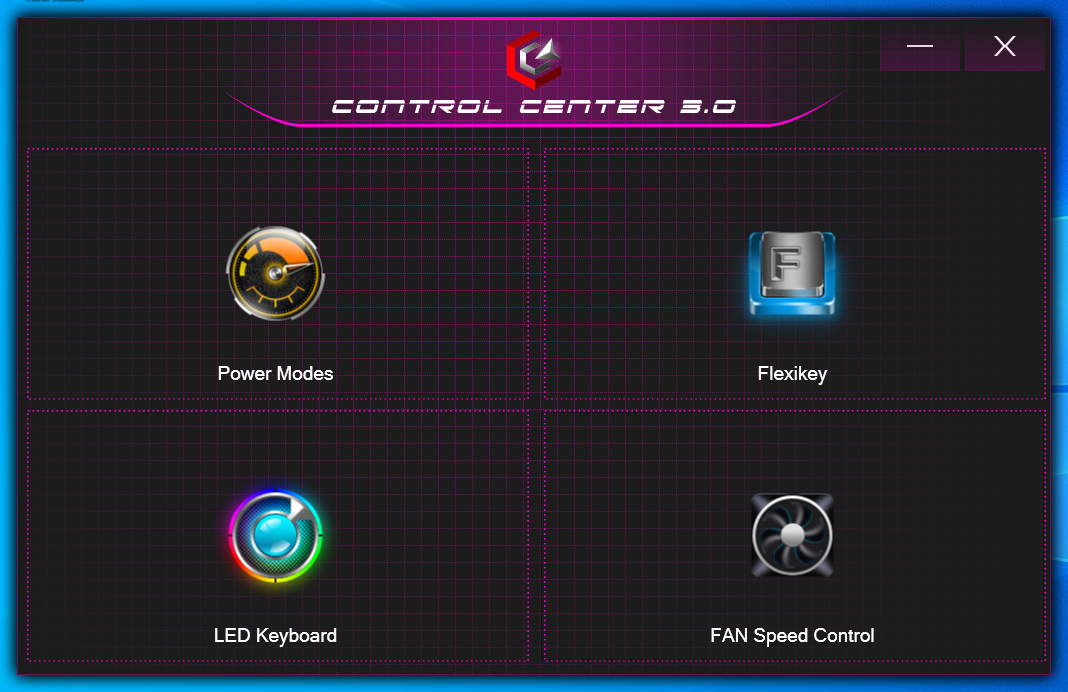
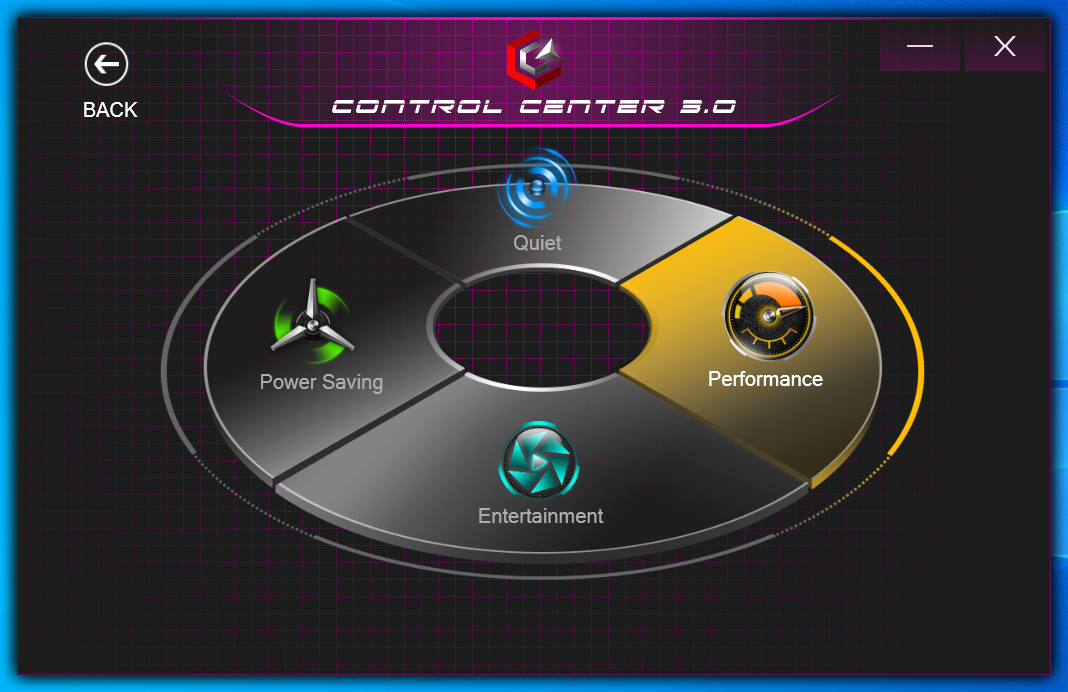
Unser Gerät wurde sowohl über Windows als auch über die vorinstallierte Control Center 3.0 Software in den Leistungsmodus gesetzt, bevor wir die folgenden Benchmarks durchgeführt haben, um die bestmöglichen Ergebnisse zu erzielen. Wir haben auch darauf geachtet, dass Nvidia Optimus auf dedizierte Grafik eingestellt ist; MUX wird hier leider nicht unterstützt.
Prozessor
Die rohe Multi-Thread-Leistung ist etwa 10 % schneller als die eines durchschnittlichen Notebooks in unserer Datenbank, das mit dem gleichen Core i7-12700H ausgestattet ist. Der Prozessor im HP Envy 16 beispielsweise ist selbst nach Berücksichtigung jeglicher Leistungsdrosselung deutlich langsamer als unser Eurocom.
Ein Upgrade auf den Core i9-12900H erhöht die Prozessorleistung nur geringfügig um etwa 5 bis 10 Prozent, basierend auf unseren Erfahrungen mit dem Alienware x15 R2 und dem Schenker XMG Pro 17 E22.
CineBench R15 wurde auf unserem Gerät nicht korrekt ausgeführt, ähnlich wie auf dem letzten Eurocom-System, das wir Anfang des Jahres getestet haben. Wir haben uns mit dem Hersteller in Verbindung gesetzt und sie konnten unsere Ergebnisse bestätigen. Der Benchmark wurde für diesen Test ausgelassen.
Cinebench R23 Multi Loop
Cinebench R23: Multi Core | Single Core
Cinebench R15: CPU Multi 64Bit | CPU Single 64Bit
Blender: v2.79 BMW27 CPU
7-Zip 18.03: 7z b 4 | 7z b 4 -mmt1
Geekbench 5.5: Multi-Core | Single-Core
HWBOT x265 Benchmark v2.2: 4k Preset
LibreOffice : 20 Documents To PDF
R Benchmark 2.5: Overall mean
Cinebench R23: Multi Core | Single Core
Cinebench R15: CPU Multi 64Bit | CPU Single 64Bit
Blender: v2.79 BMW27 CPU
7-Zip 18.03: 7z b 4 | 7z b 4 -mmt1
Geekbench 5.5: Multi-Core | Single-Core
HWBOT x265 Benchmark v2.2: 4k Preset
LibreOffice : 20 Documents To PDF
R Benchmark 2.5: Overall mean
* ... kleinere Werte sind besser
AIDA64: FP32 Ray-Trace | FPU Julia | CPU SHA3 | CPU Queen | FPU SinJulia | FPU Mandel | CPU AES | CPU ZLib | FP64 Ray-Trace | CPU PhotoWorxx
| Performance Rating | |
| MSI Raider GE77 HX 12UHS | |
| Aorus 17X XES | |
| Eurocom Nightsky TXi317 | |
| Alienware x17 R2 P48E | |
| Durchschnittliche Intel Core i7-12700H | |
| Schenker XMG Pro 17 E22 | |
| Razer Blade 17 Early 2022 | |
| AIDA64 / FP32 Ray-Trace | |
| MSI Raider GE77 HX 12UHS | |
| Eurocom Nightsky TXi317 | |
| Aorus 17X XES | |
| Durchschnittliche Intel Core i7-12700H (2585 - 17957, n=64) | |
| Alienware x17 R2 P48E | |
| Schenker XMG Pro 17 E22 | |
| Razer Blade 17 Early 2022 | |
| AIDA64 / FPU Julia | |
| MSI Raider GE77 HX 12UHS | |
| Eurocom Nightsky TXi317 | |
| Aorus 17X XES | |
| Durchschnittliche Intel Core i7-12700H (12439 - 90760, n=64) | |
| Alienware x17 R2 P48E | |
| Schenker XMG Pro 17 E22 | |
| Razer Blade 17 Early 2022 | |
| AIDA64 / CPU SHA3 | |
| MSI Raider GE77 HX 12UHS | |
| Eurocom Nightsky TXi317 | |
| Aorus 17X XES | |
| Alienware x17 R2 P48E | |
| Durchschnittliche Intel Core i7-12700H (833 - 4242, n=64) | |
| Schenker XMG Pro 17 E22 | |
| Razer Blade 17 Early 2022 | |
| AIDA64 / CPU Queen | |
| Alienware x17 R2 P48E | |
| Schenker XMG Pro 17 E22 | |
| Aorus 17X XES | |
| Eurocom Nightsky TXi317 | |
| MSI Raider GE77 HX 12UHS | |
| Durchschnittliche Intel Core i7-12700H (57923 - 103202, n=63) | |
| Razer Blade 17 Early 2022 | |
| AIDA64 / FPU SinJulia | |
| MSI Raider GE77 HX 12UHS | |
| Aorus 17X XES | |
| Alienware x17 R2 P48E | |
| Eurocom Nightsky TXi317 | |
| Schenker XMG Pro 17 E22 | |
| Durchschnittliche Intel Core i7-12700H (3249 - 9939, n=64) | |
| Razer Blade 17 Early 2022 | |
| AIDA64 / FPU Mandel | |
| MSI Raider GE77 HX 12UHS | |
| Aorus 17X XES | |
| Eurocom Nightsky TXi317 | |
| Durchschnittliche Intel Core i7-12700H (7135 - 44760, n=64) | |
| Alienware x17 R2 P48E | |
| Schenker XMG Pro 17 E22 | |
| Razer Blade 17 Early 2022 | |
| AIDA64 / CPU AES | |
| MSI Raider GE77 HX 12UHS | |
| Eurocom Nightsky TXi317 | |
| Aorus 17X XES | |
| Alienware x17 R2 P48E | |
| Schenker XMG Pro 17 E22 | |
| Durchschnittliche Intel Core i7-12700H (31839 - 144360, n=64) | |
| Razer Blade 17 Early 2022 | |
| AIDA64 / CPU ZLib | |
| MSI Raider GE77 HX 12UHS | |
| Alienware x17 R2 P48E | |
| Eurocom Nightsky TXi317 | |
| Schenker XMG Pro 17 E22 | |
| Aorus 17X XES | |
| Durchschnittliche Intel Core i7-12700H (305 - 1171, n=64) | |
| Razer Blade 17 Early 2022 | |
| AIDA64 / FP64 Ray-Trace | |
| MSI Raider GE77 HX 12UHS | |
| Aorus 17X XES | |
| Eurocom Nightsky TXi317 | |
| Durchschnittliche Intel Core i7-12700H (1437 - 9692, n=64) | |
| Alienware x17 R2 P48E | |
| Schenker XMG Pro 17 E22 | |
| Razer Blade 17 Early 2022 | |
| AIDA64 / CPU PhotoWorxx | |
| MSI Raider GE77 HX 12UHS | |
| Aorus 17X XES | |
| Razer Blade 17 Early 2022 | |
| Alienware x17 R2 P48E | |
| Durchschnittliche Intel Core i7-12700H (12863 - 52207, n=64) | |
| Eurocom Nightsky TXi317 | |
| Schenker XMG Pro 17 E22 | |
Systemleistung
CrossMark: Overall | Productivity | Creativity | Responsiveness
| PCMark 10 / Score | |
| Alienware x17 R2 P48E | |
| Aorus 17X XES | |
| Schenker XMG Pro 17 E22 | |
| Eurocom Nightsky TXi317 | |
| Durchschnittliche Intel Core i7-12700H, NVIDIA GeForce RTX 3080 Ti Laptop GPU (6868 - 7638, n=7) | |
| Razer Blade 17 Early 2022 | |
| MSI Raider GE77 HX 12UHS | |
| PCMark 10 / Essentials | |
| Eurocom Nightsky TXi317 | |
| Alienware x17 R2 P48E | |
| Schenker XMG Pro 17 E22 | |
| Aorus 17X XES | |
| Durchschnittliche Intel Core i7-12700H, NVIDIA GeForce RTX 3080 Ti Laptop GPU (9987 - 11318, n=7) | |
| Razer Blade 17 Early 2022 | |
| MSI Raider GE77 HX 12UHS | |
| PCMark 10 / Productivity | |
| Eurocom Nightsky TXi317 | |
| Aorus 17X XES | |
| Schenker XMG Pro 17 E22 | |
| Alienware x17 R2 P48E | |
| MSI Raider GE77 HX 12UHS | |
| Durchschnittliche Intel Core i7-12700H, NVIDIA GeForce RTX 3080 Ti Laptop GPU (8944 - 10726, n=7) | |
| Razer Blade 17 Early 2022 | |
| PCMark 10 / Digital Content Creation | |
| Alienware x17 R2 P48E | |
| Aorus 17X XES | |
| Schenker XMG Pro 17 E22 | |
| Durchschnittliche Intel Core i7-12700H, NVIDIA GeForce RTX 3080 Ti Laptop GPU (8956 - 12249, n=7) | |
| Razer Blade 17 Early 2022 | |
| Eurocom Nightsky TXi317 | |
| MSI Raider GE77 HX 12UHS | |
| CrossMark / Overall | |
| MSI Raider GE77 HX 12UHS | |
| Aorus 17X XES | |
| Alienware x17 R2 P48E | |
| Eurocom Nightsky TXi317 | |
| Durchschnittliche Intel Core i7-12700H, NVIDIA GeForce RTX 3080 Ti Laptop GPU (1761 - 1861, n=4) | |
| Razer Blade 17 Early 2022 | |
| CrossMark / Productivity | |
| MSI Raider GE77 HX 12UHS | |
| Aorus 17X XES | |
| Alienware x17 R2 P48E | |
| Eurocom Nightsky TXi317 | |
| Razer Blade 17 Early 2022 | |
| Durchschnittliche Intel Core i7-12700H, NVIDIA GeForce RTX 3080 Ti Laptop GPU (1645 - 1800, n=4) | |
| CrossMark / Creativity | |
| MSI Raider GE77 HX 12UHS | |
| Aorus 17X XES | |
| Alienware x17 R2 P48E | |
| Durchschnittliche Intel Core i7-12700H, NVIDIA GeForce RTX 3080 Ti Laptop GPU (1936 - 2041, n=4) | |
| Eurocom Nightsky TXi317 | |
| Razer Blade 17 Early 2022 | |
| CrossMark / Responsiveness | |
| Aorus 17X XES | |
| MSI Raider GE77 HX 12UHS | |
| Eurocom Nightsky TXi317 | |
| Alienware x17 R2 P48E | |
| Durchschnittliche Intel Core i7-12700H, NVIDIA GeForce RTX 3080 Ti Laptop GPU (1461 - 1868, n=4) | |
| Razer Blade 17 Early 2022 | |
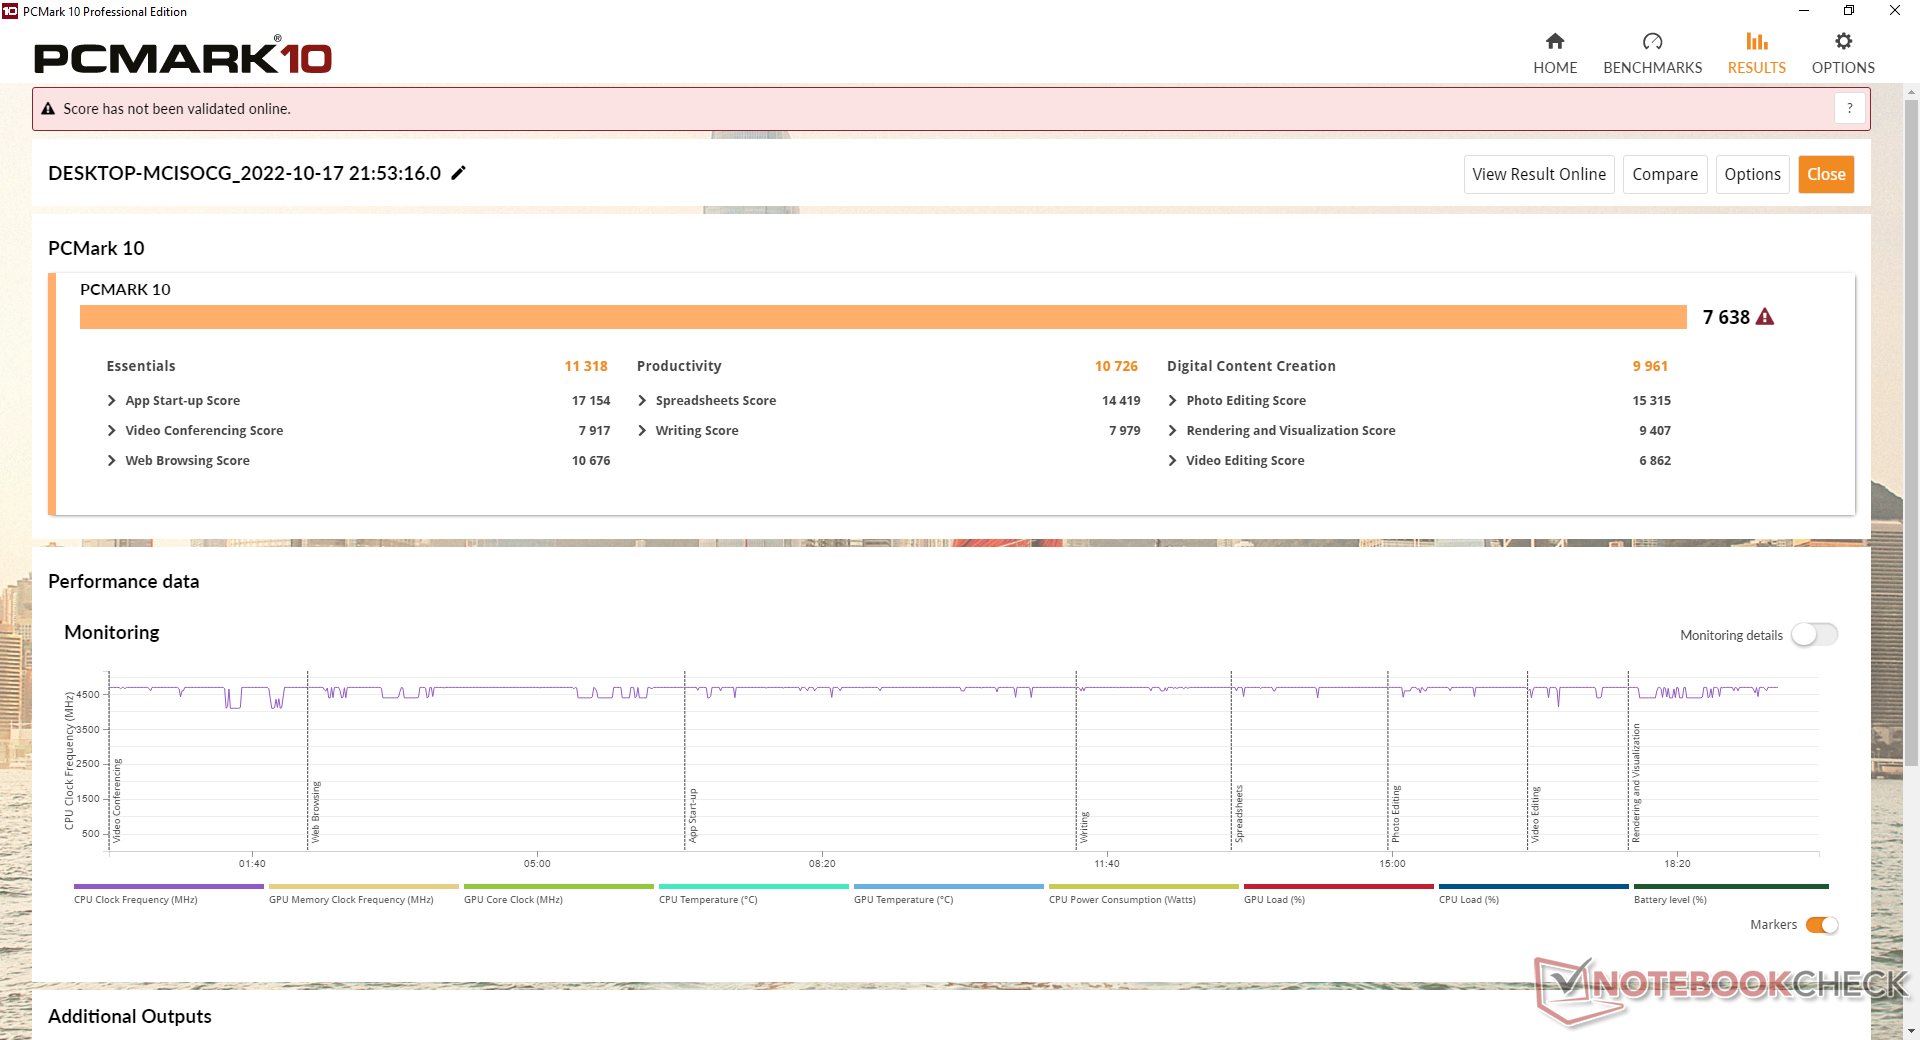
| PCMark 10 Score | 7638 Punkte | |
Hilfe | ||
| AIDA64 / Memory Copy | |
| MSI Raider GE77 HX 12UHS | |
| Aorus 17X XES | |
| Razer Blade 17 Early 2022 | |
| Alienware x17 R2 P48E | |
| Durchschnittliche Intel Core i7-12700H (25615 - 80511, n=64) | |
| Eurocom Nightsky TXi317 | |
| Schenker XMG Pro 17 E22 | |
| AIDA64 / Memory Read | |
| MSI Raider GE77 HX 12UHS | |
| Aorus 17X XES | |
| Razer Blade 17 Early 2022 | |
| Alienware x17 R2 P48E | |
| Durchschnittliche Intel Core i7-12700H (25586 - 79442, n=64) | |
| Eurocom Nightsky TXi317 | |
| Schenker XMG Pro 17 E22 | |
| AIDA64 / Memory Write | |
| MSI Raider GE77 HX 12UHS | |
| Aorus 17X XES | |
| Razer Blade 17 Early 2022 | |
| Durchschnittliche Intel Core i7-12700H (23679 - 88660, n=64) | |
| Alienware x17 R2 P48E | |
| Eurocom Nightsky TXi317 | |
| Schenker XMG Pro 17 E22 | |
| AIDA64 / Memory Latency | |
| Alienware x17 R2 P48E | |
| Schenker XMG Pro 17 E22 | |
| Eurocom Nightsky TXi317 | |
| Aorus 17X XES | |
| MSI Raider GE77 HX 12UHS | |
| Durchschnittliche Intel Core i7-12700H (76.2 - 133.9, n=62) | |
* ... kleinere Werte sind besser
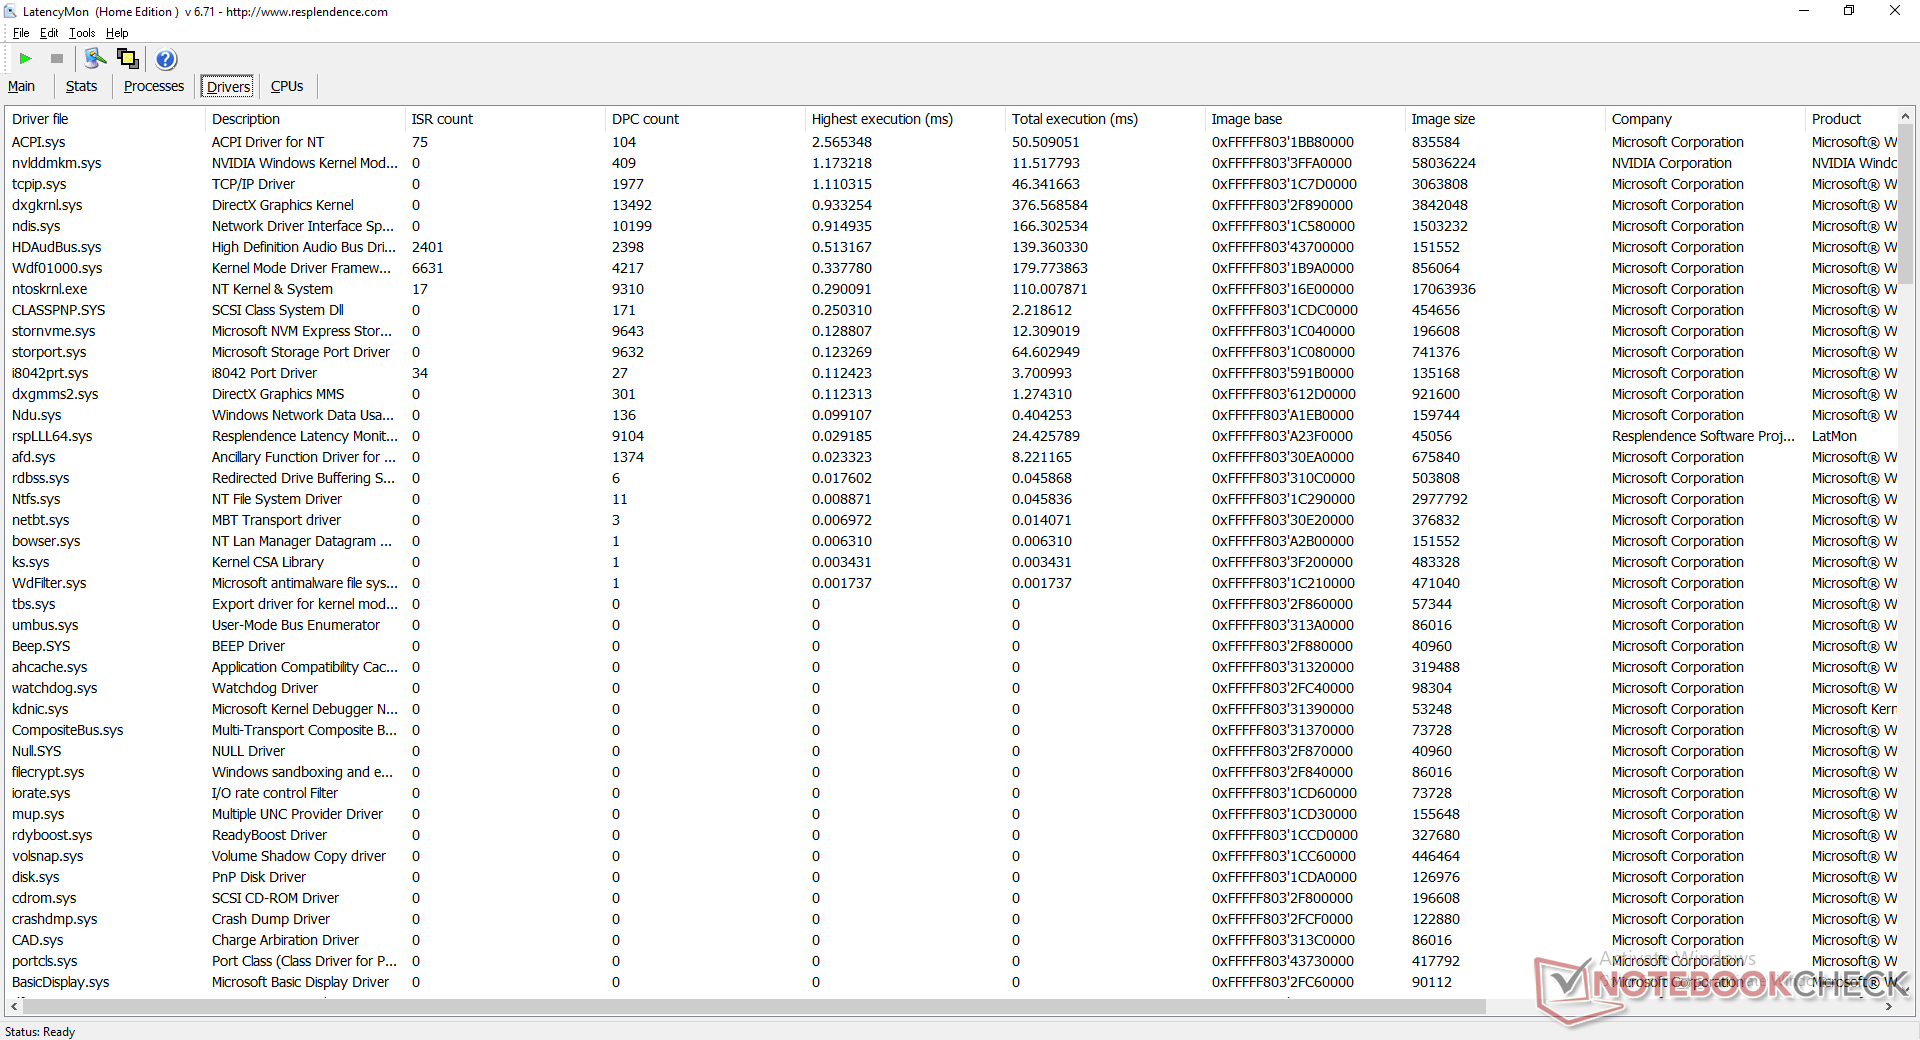
DPC-Latenz
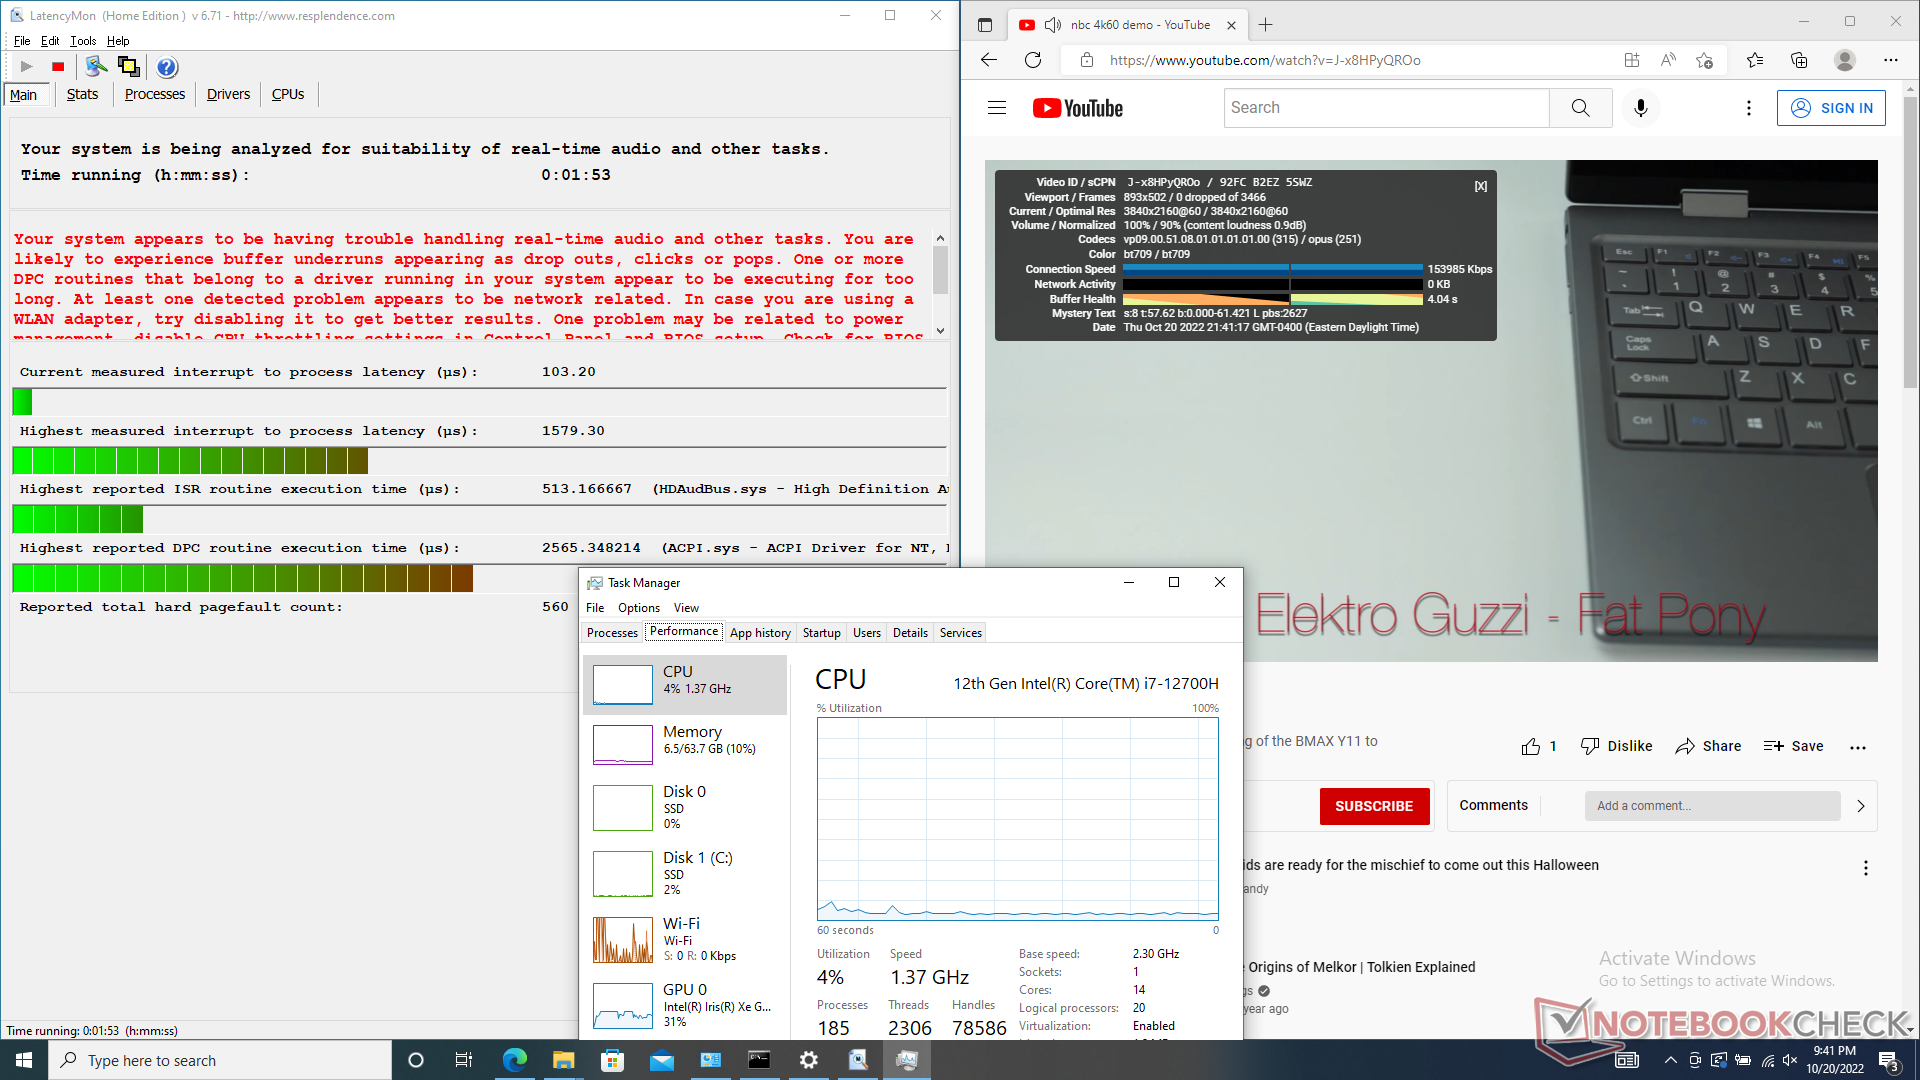
LatencyMon zeigt DPC-Probleme beim Öffnen mehrerer Browser-Tabs auf unserer Homepage. Die 4K-Videowiedergabe bei 60 FPS ist ansonsten perfekt, ohne Bildaussetzer.
| DPC Latencies / LatencyMon - interrupt to process latency (max), Web, Youtube, Prime95 | |
| MSI Raider GE77 HX 12UHS | |
| Eurocom Nightsky TXi317 | |
| Aorus 17X XES | |
| Alienware x17 R2 P48E | |
| Schenker XMG Pro 17 E22 | |
| Razer Blade 17 Early 2022 | |
* ... kleinere Werte sind besser
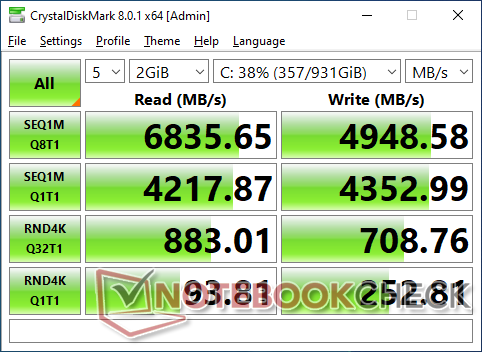
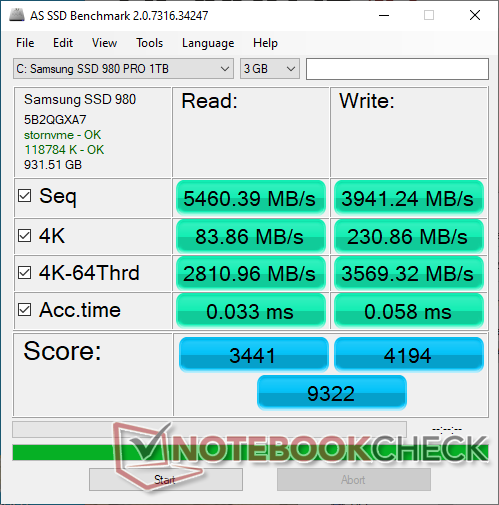
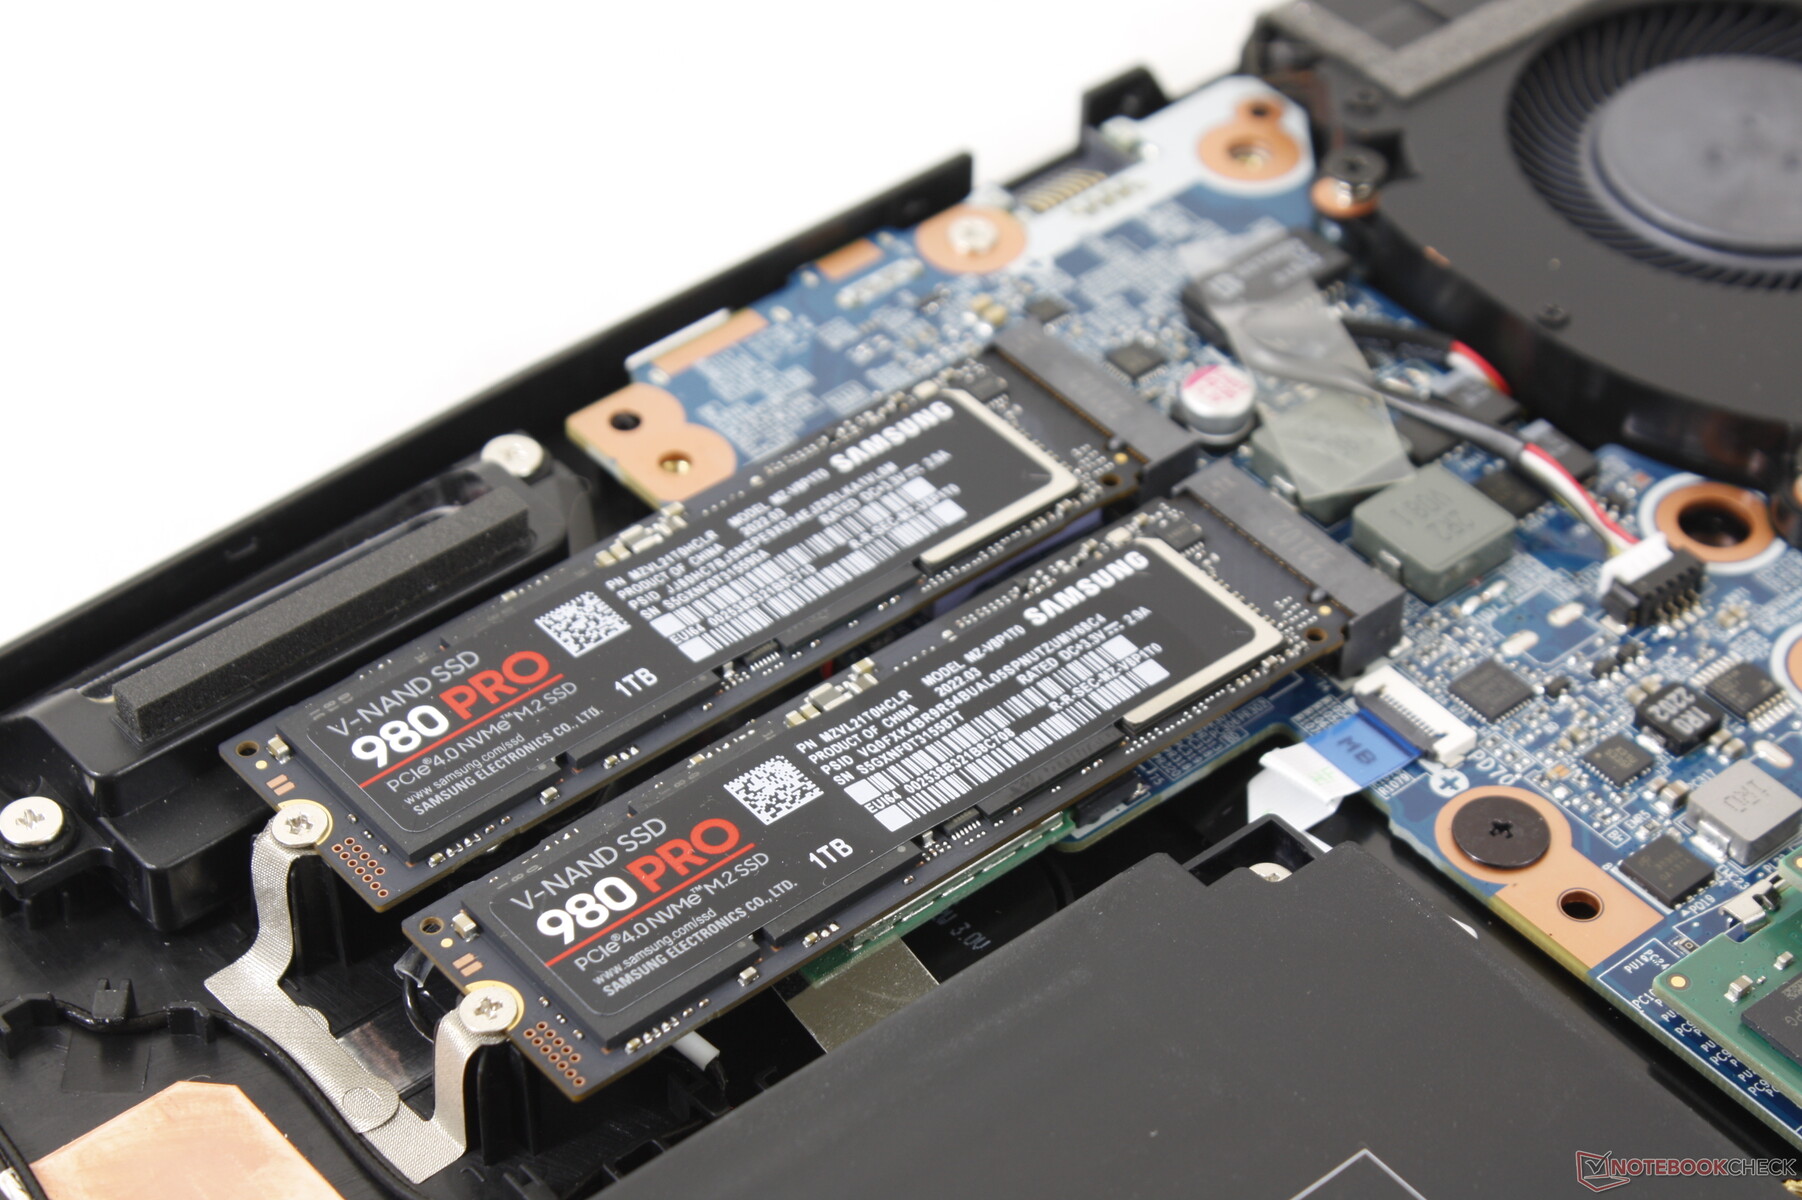
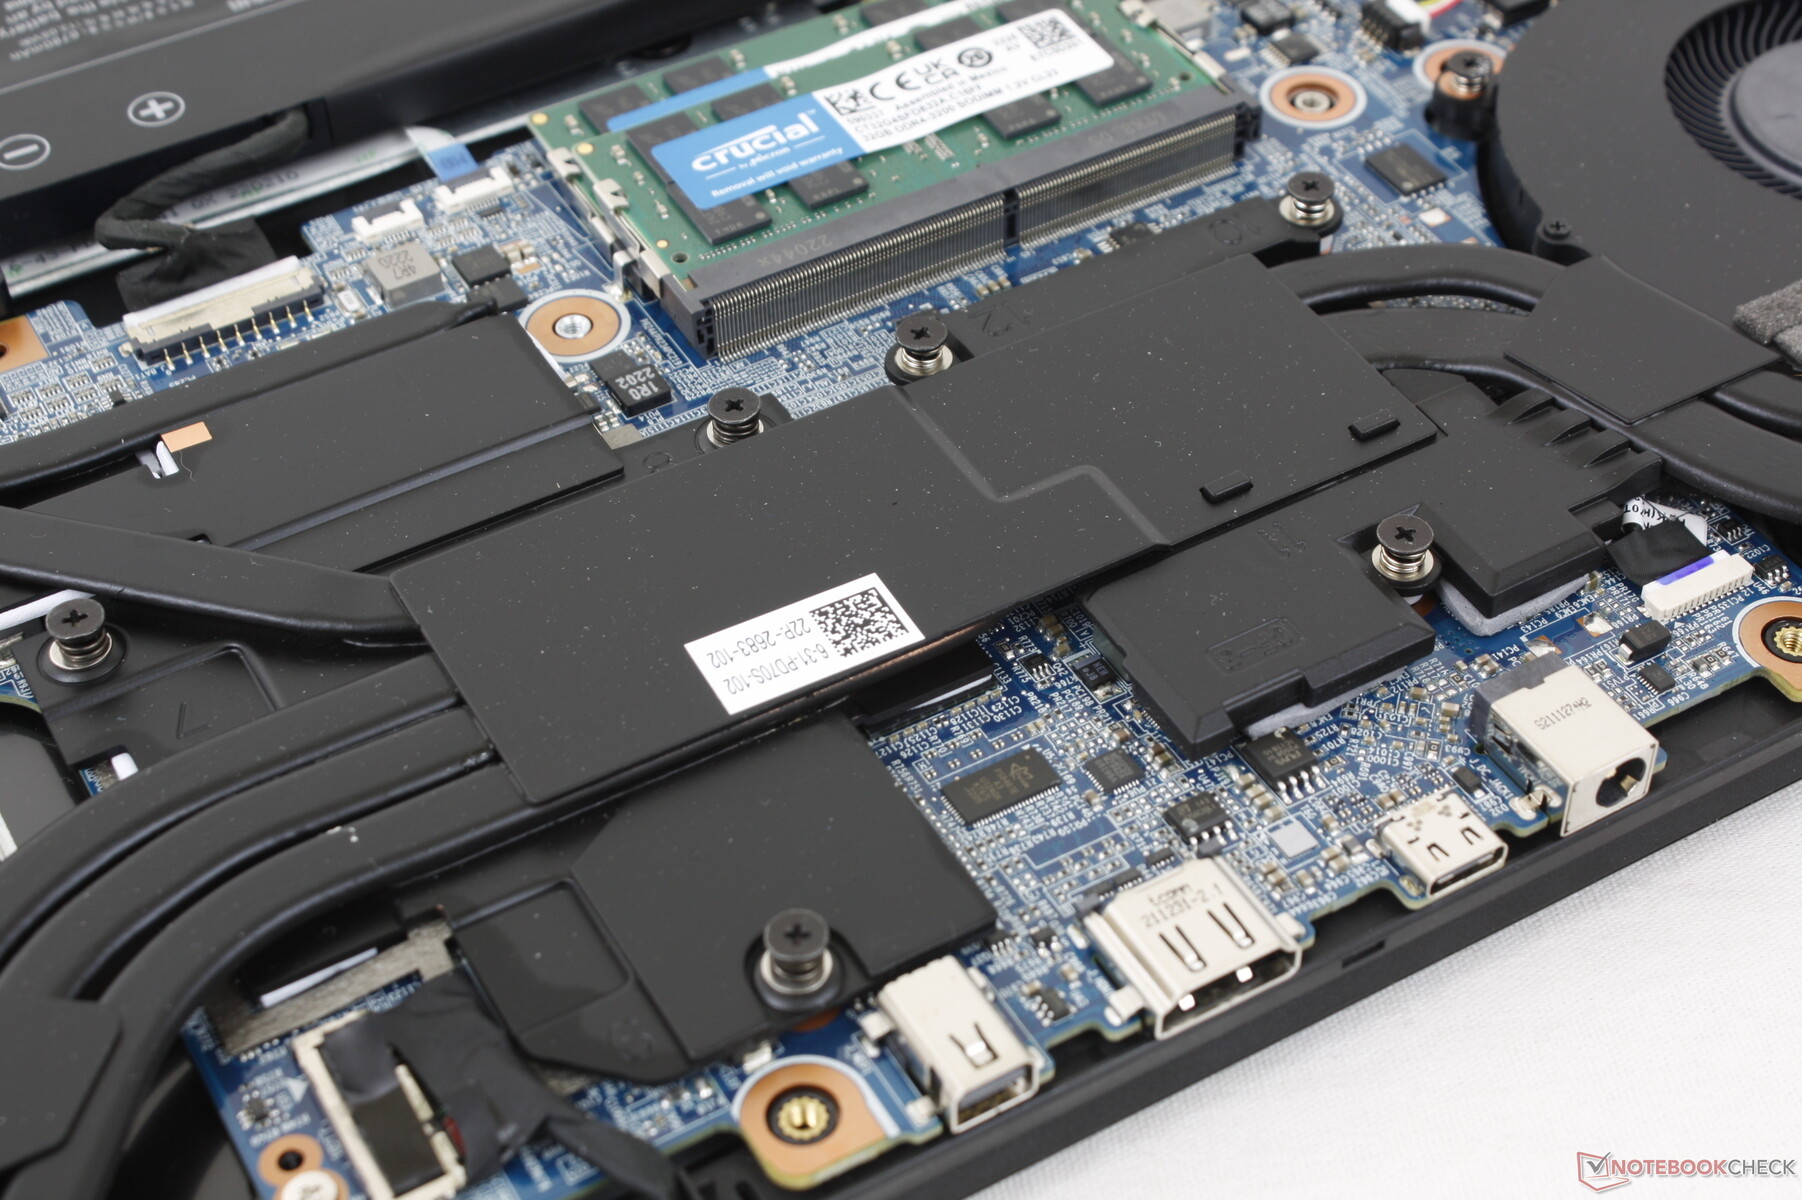
Speichergeräte
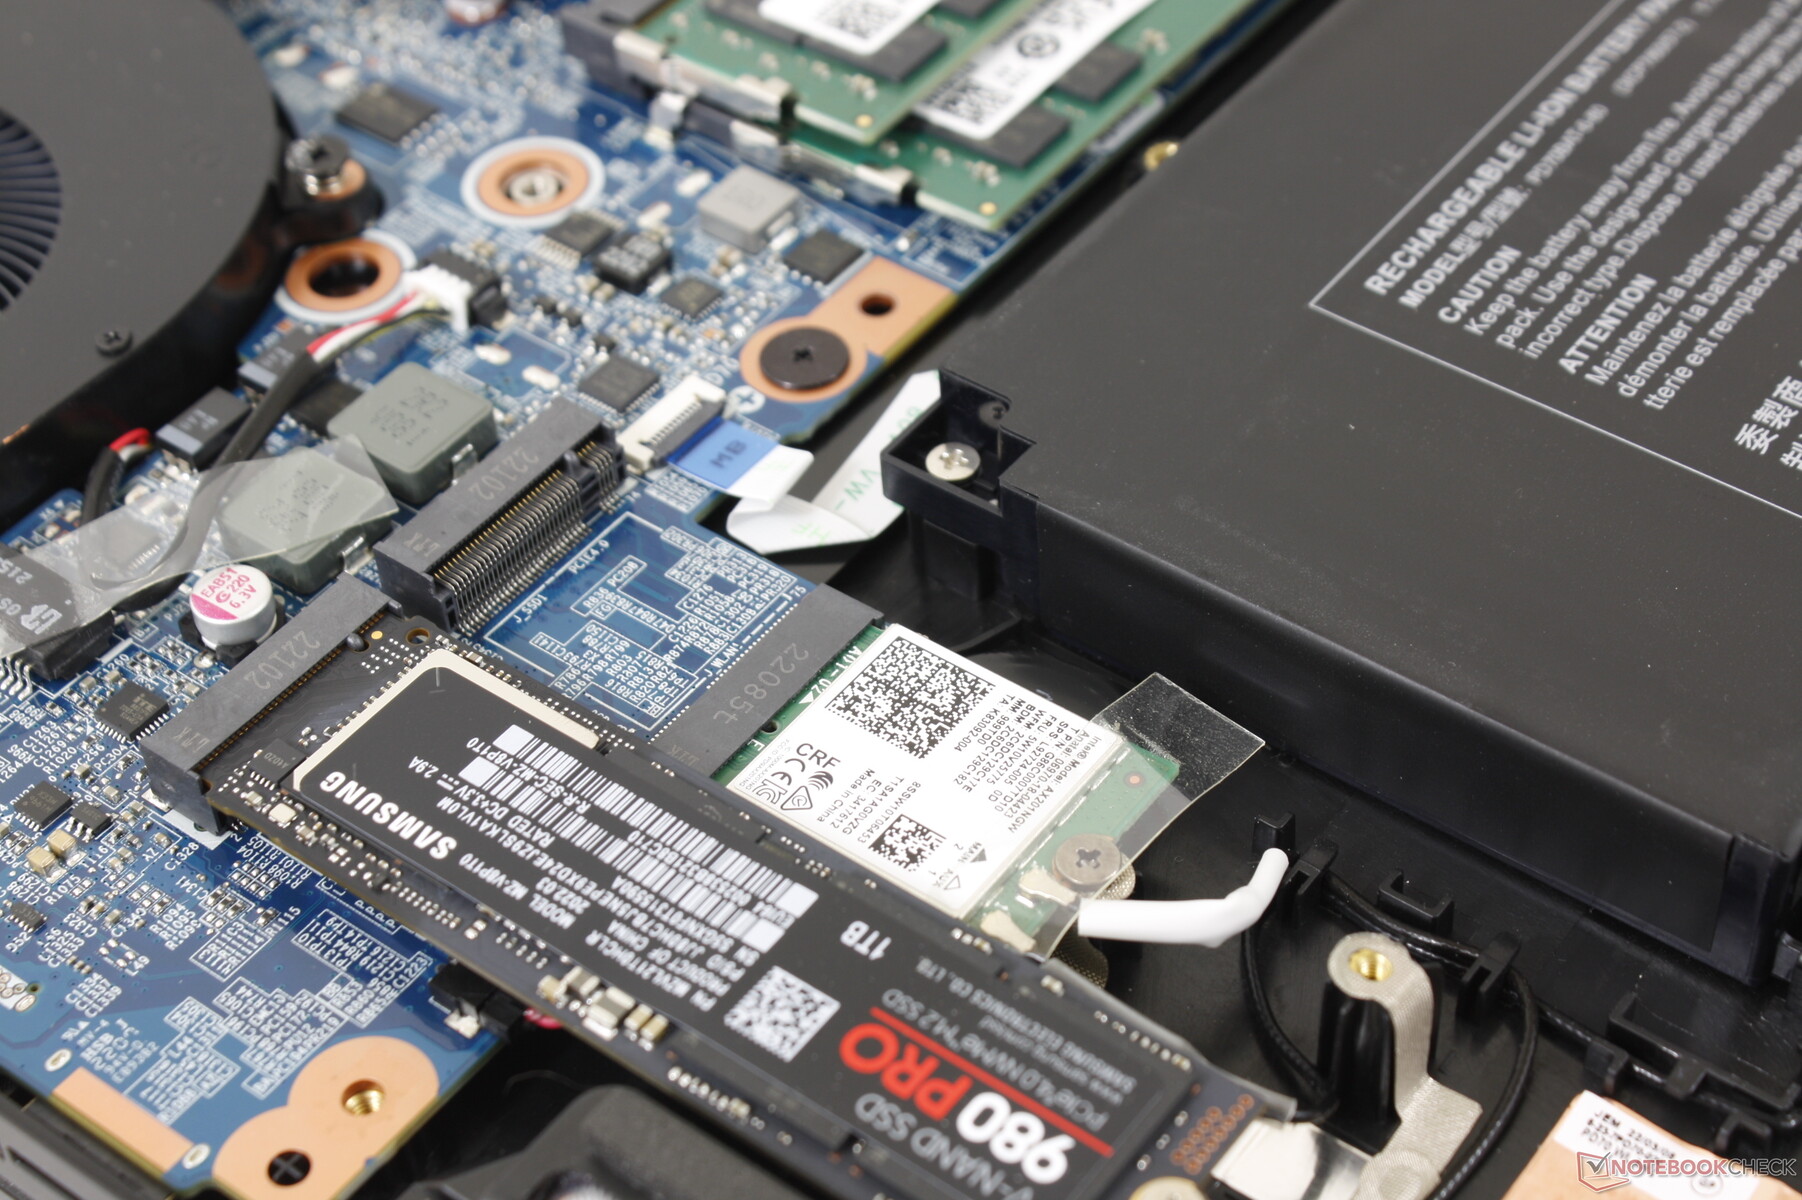
Die beiden internen M.2 2280-Steckplätze können jeweils PCIe4 x4-SSDs für wahnsinnige Geschwindigkeiten unterstützen, zumindest theoretisch. In der Realität werden die Laufwerke wahrscheinlich drosseln, da das Gehäuse keinen eingebauten Heatspreader für die SSDs hat. Die 1 TB Samsung 980 Pro PCIe4 x4 NVMe SSD in unserem Testgerät fiel von einem anfänglichen Höchstwert von 6800 MB/s auf 1400 MB/s, wenn DiskSpd in einer Schleife lief, wie unsere Grafik unten zeigt. Solche Ergebnisse sind im Allgemeinen akzeptabel für günstige Gaming-Laptops, aber sie sind enttäuschend, wenn man sie auf High-End-Geräten wie diesem sieht.

| Drive Performance Rating - Percent | |
| MSI Raider GE77 HX 12UHS | |
| Eurocom Nightsky TXi317 | |
| Aorus 17X XES | |
| Schenker XMG Pro 17 E22 | |
| Razer Blade 17 Early 2022 | |
| Alienware x17 R2 P48E | |
* ... kleinere Werte sind besser
Disk Throttling: DiskSpd Read Loop, Queue Depth 8
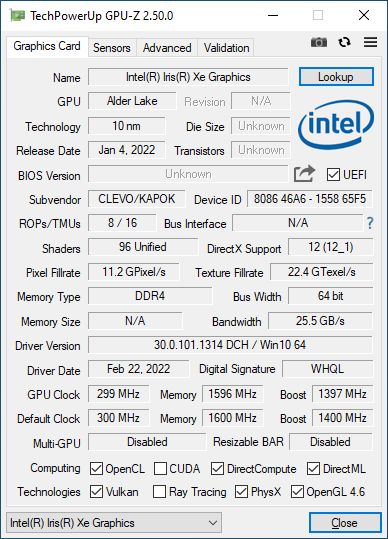
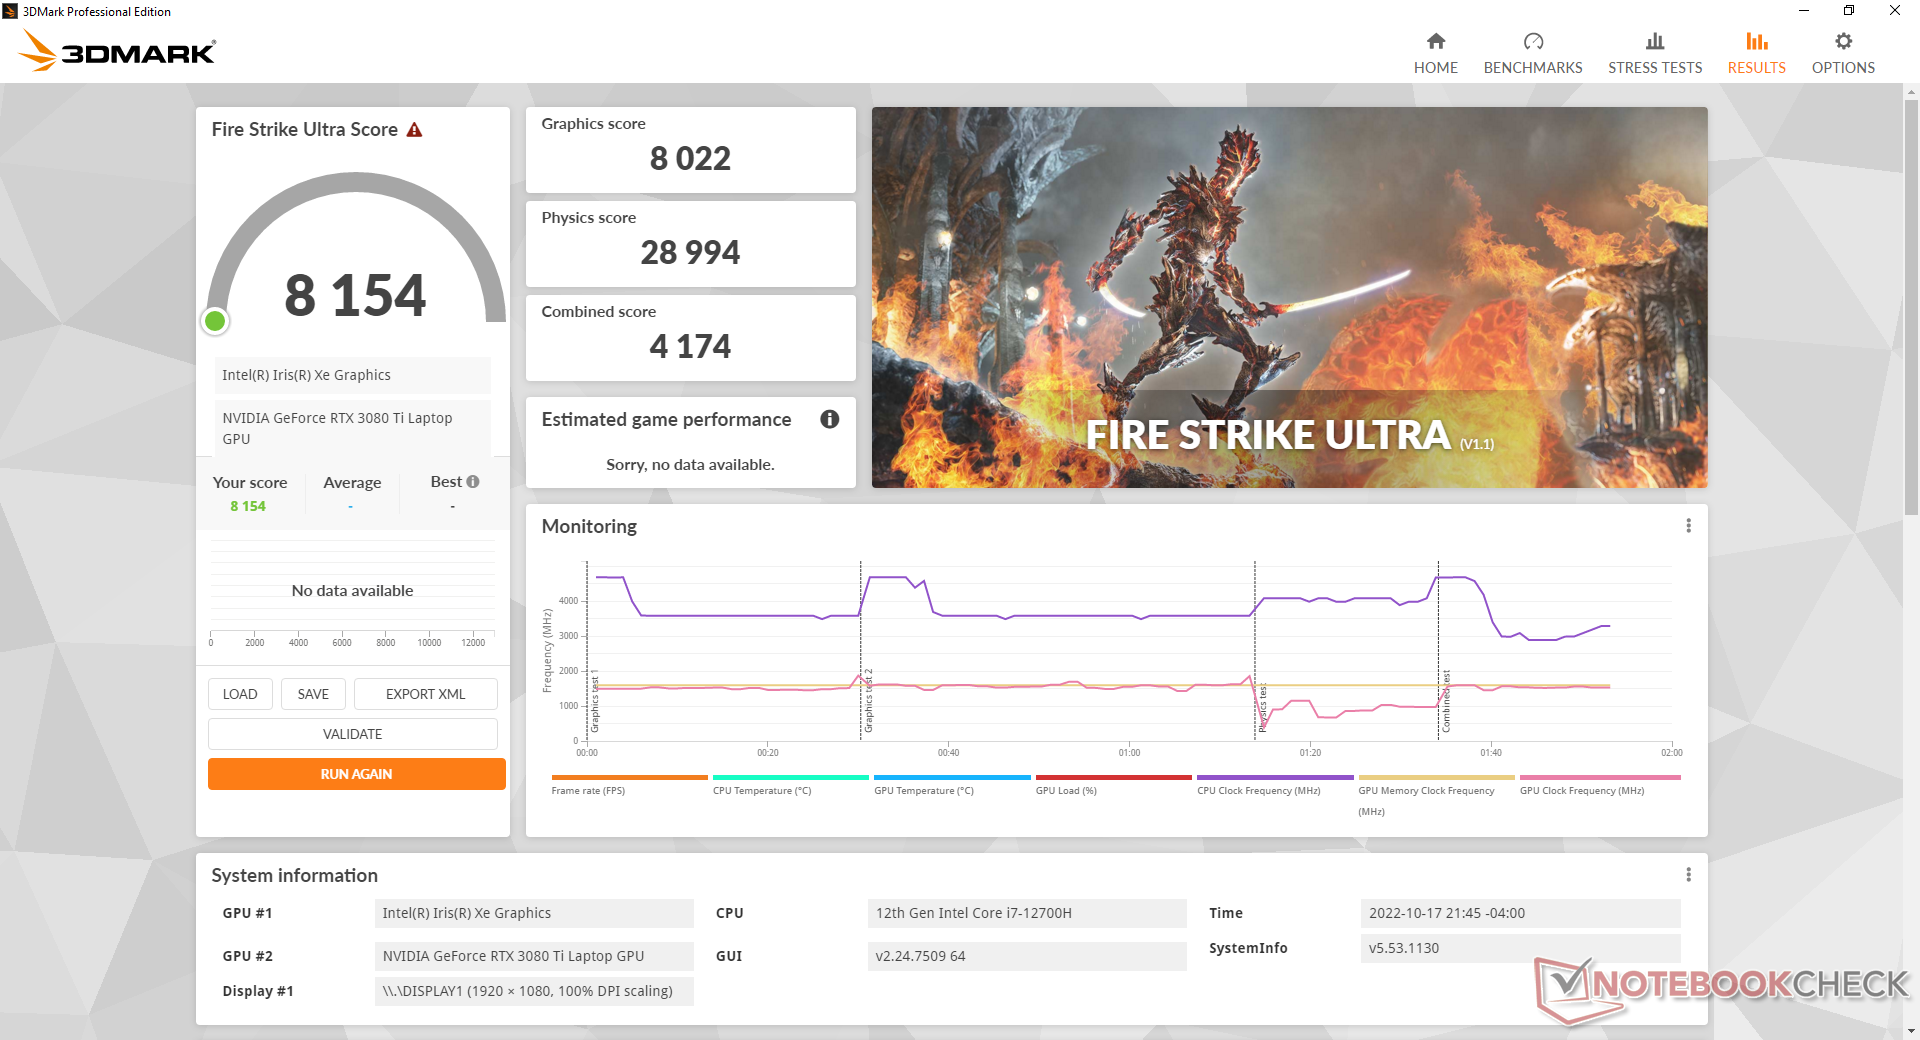
Grafikleistung
Die Grafikleistung ist ausgezeichnet und führt zu Ergebnissen, die leicht über denen der meisten anderen Laptops mit der gleichen GeForce RTX 3080 Ti GPU liegen. Der 125-W-TGP ist nicht der höchste, da das Alienware x17 R2 und sogar das Razer Blade 17 höhere Werte haben, aber er ist zumindest besser als bei vielen ultradünnen Laptops wie der MSI GS-Serie.
Interessanterweise gibt Nvidia Control Panel einen TGP von 155 W an, während Eurocom einen TGP von 125 W angibt. Die letztere Zahl scheint das genauere Ziel zu sein, wie unser Stresstest-Abschnitt unten zeigen wird.
Ein Downgrade auf die GeForce RTX 3070 Ti beeinträchtigt die Grafikleistung nur um etwa 10 Prozent. Die Gesamtleistung ist etwa 20 bis 30 Prozent langsamer als bei unserem desktop GeForce RTX 3080.
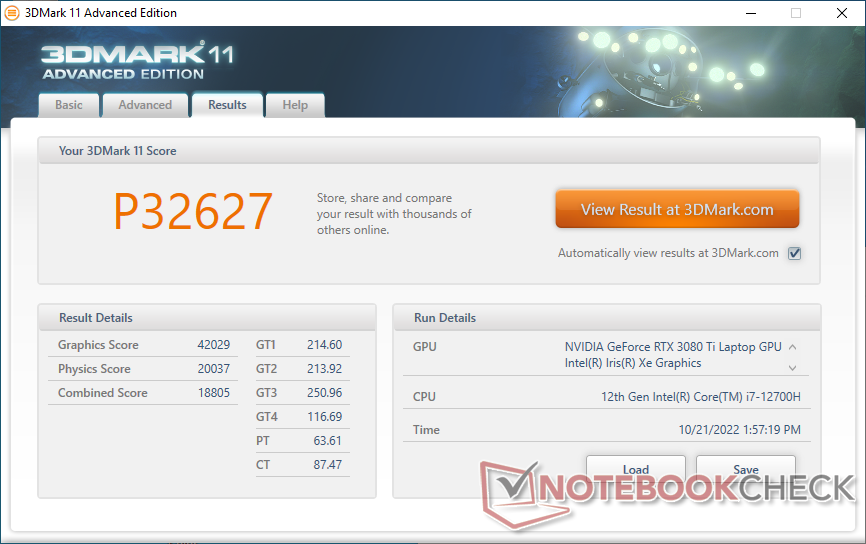
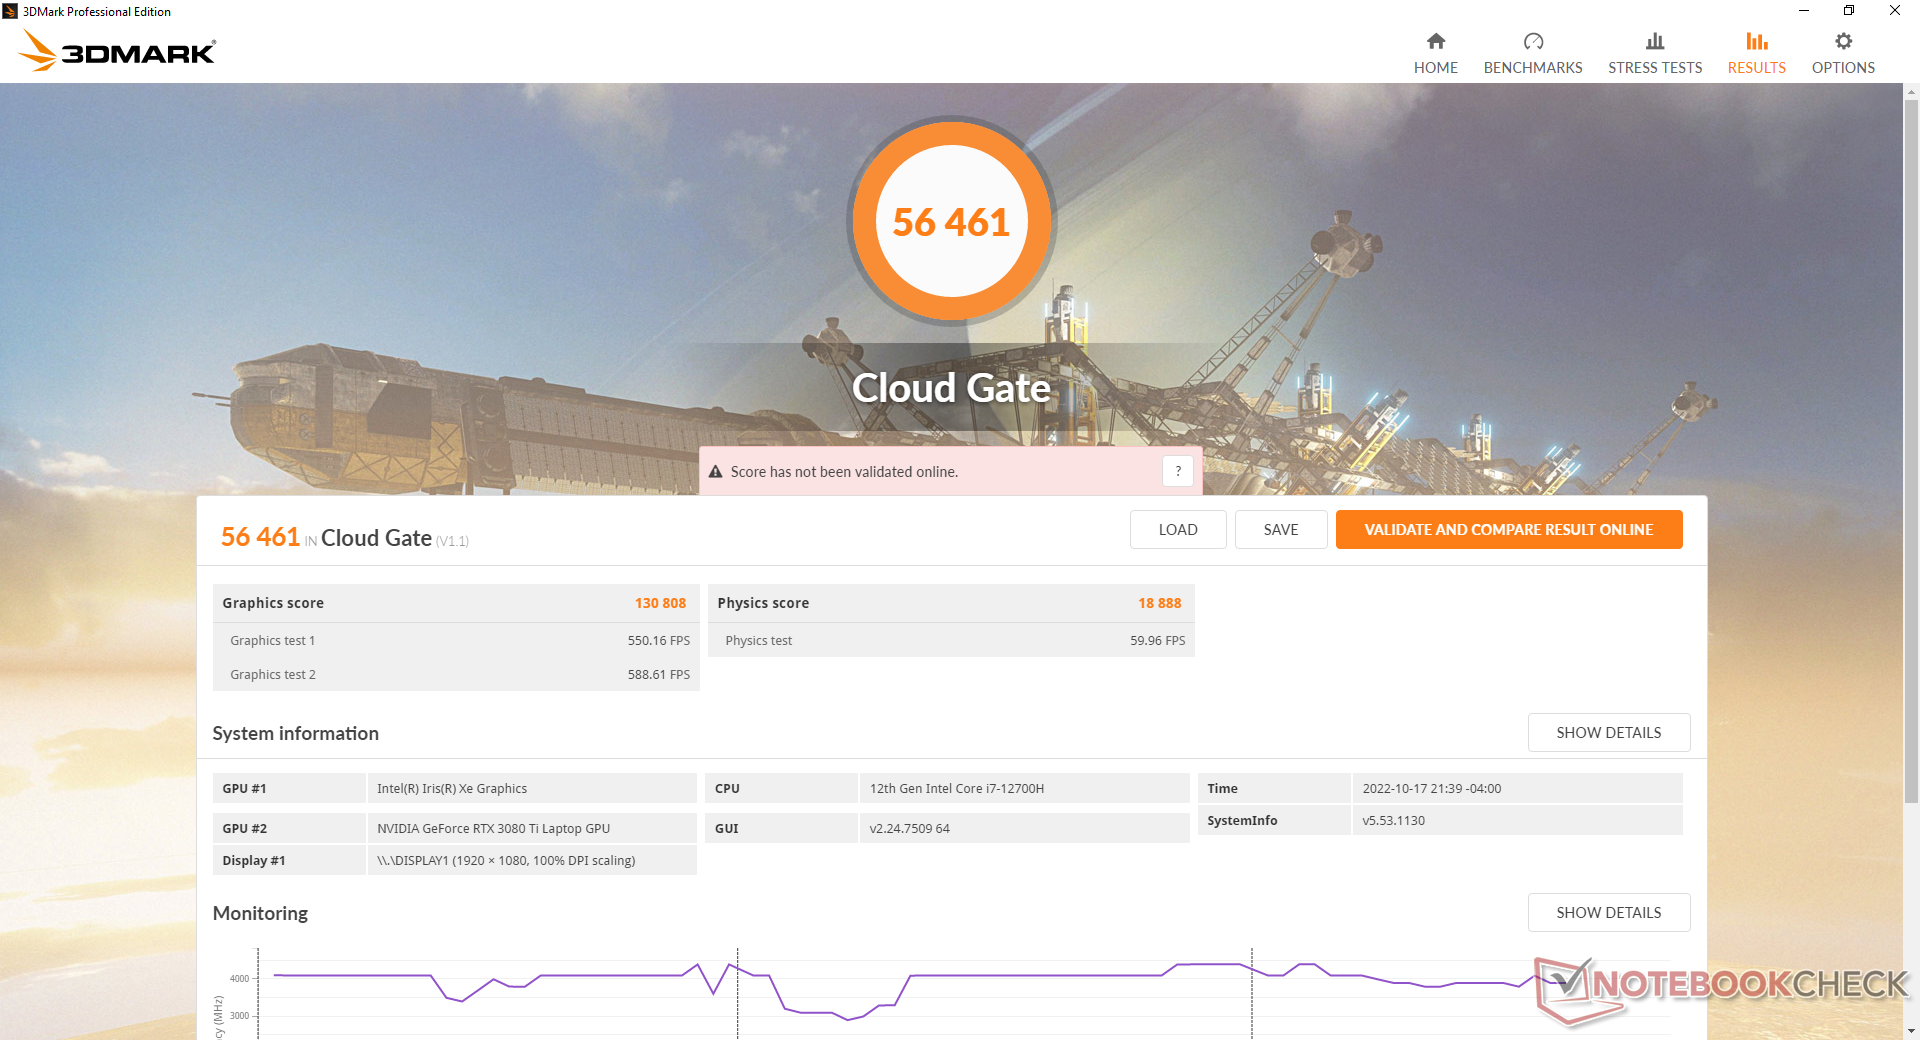
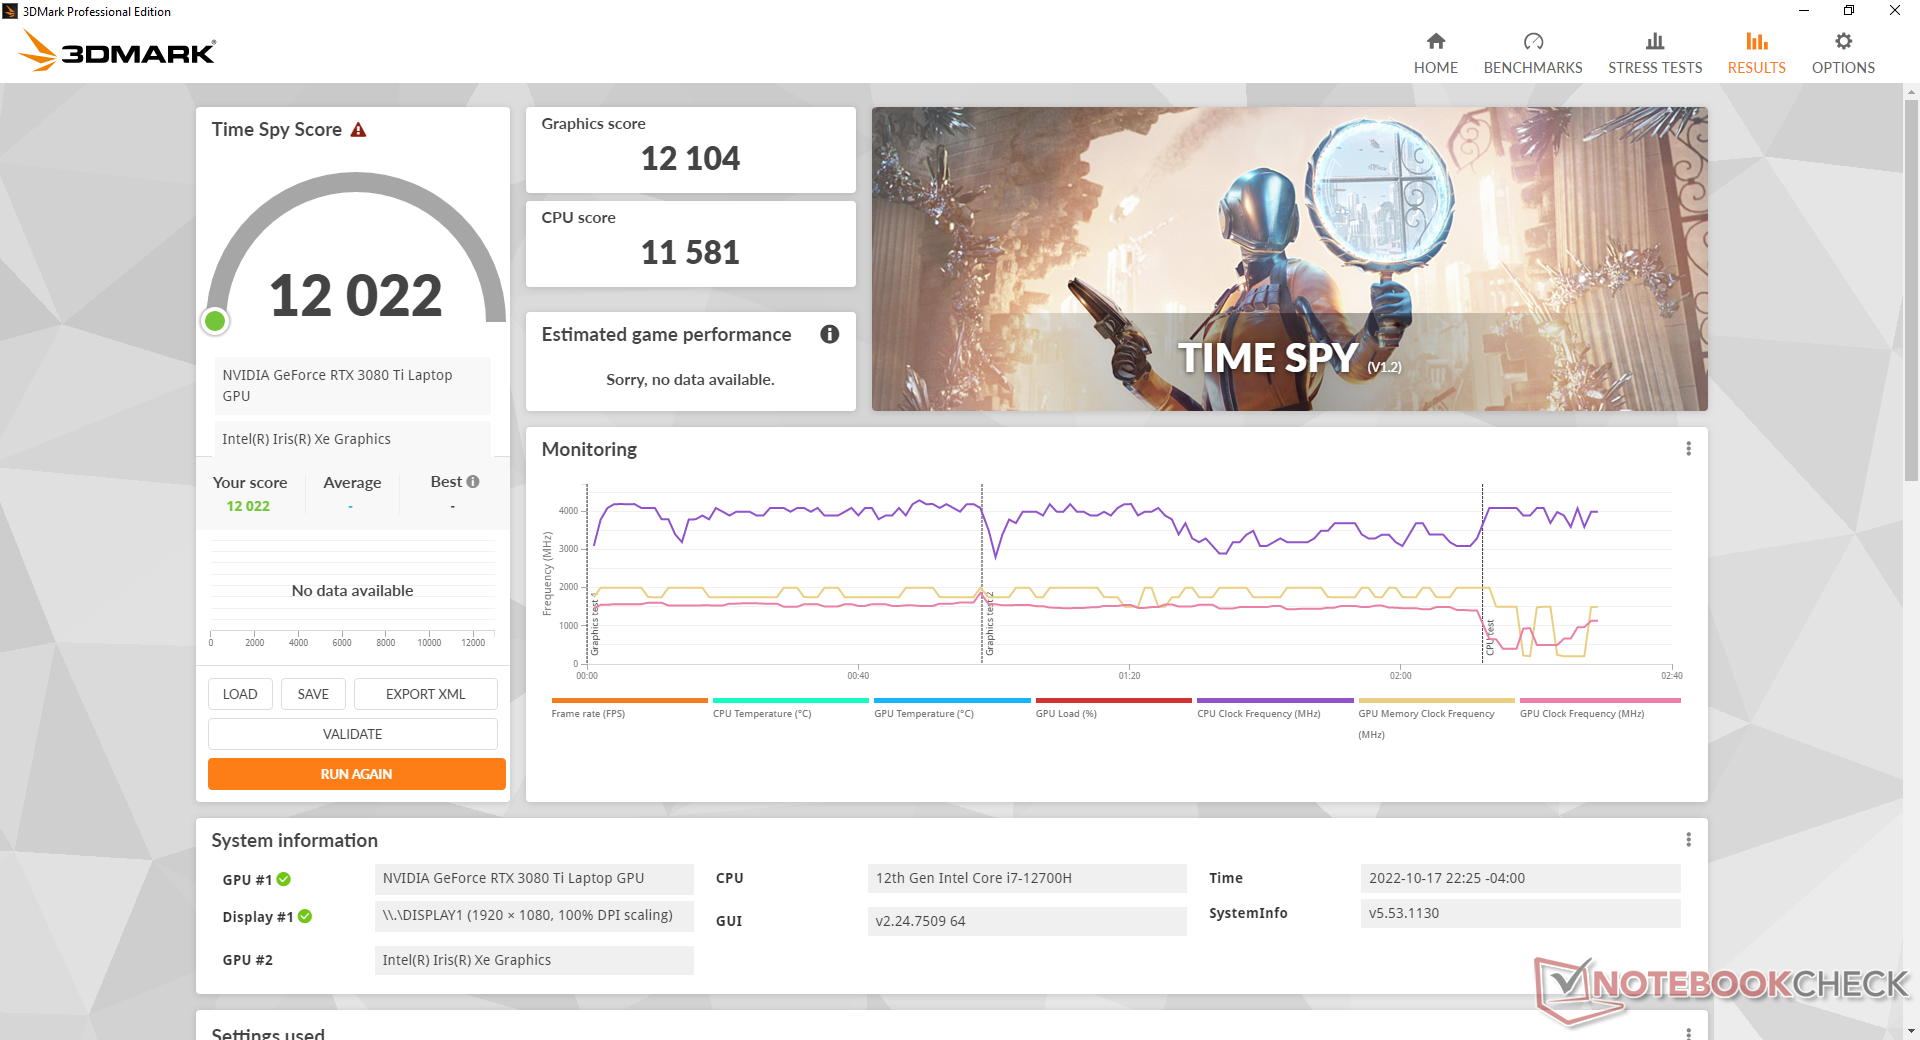
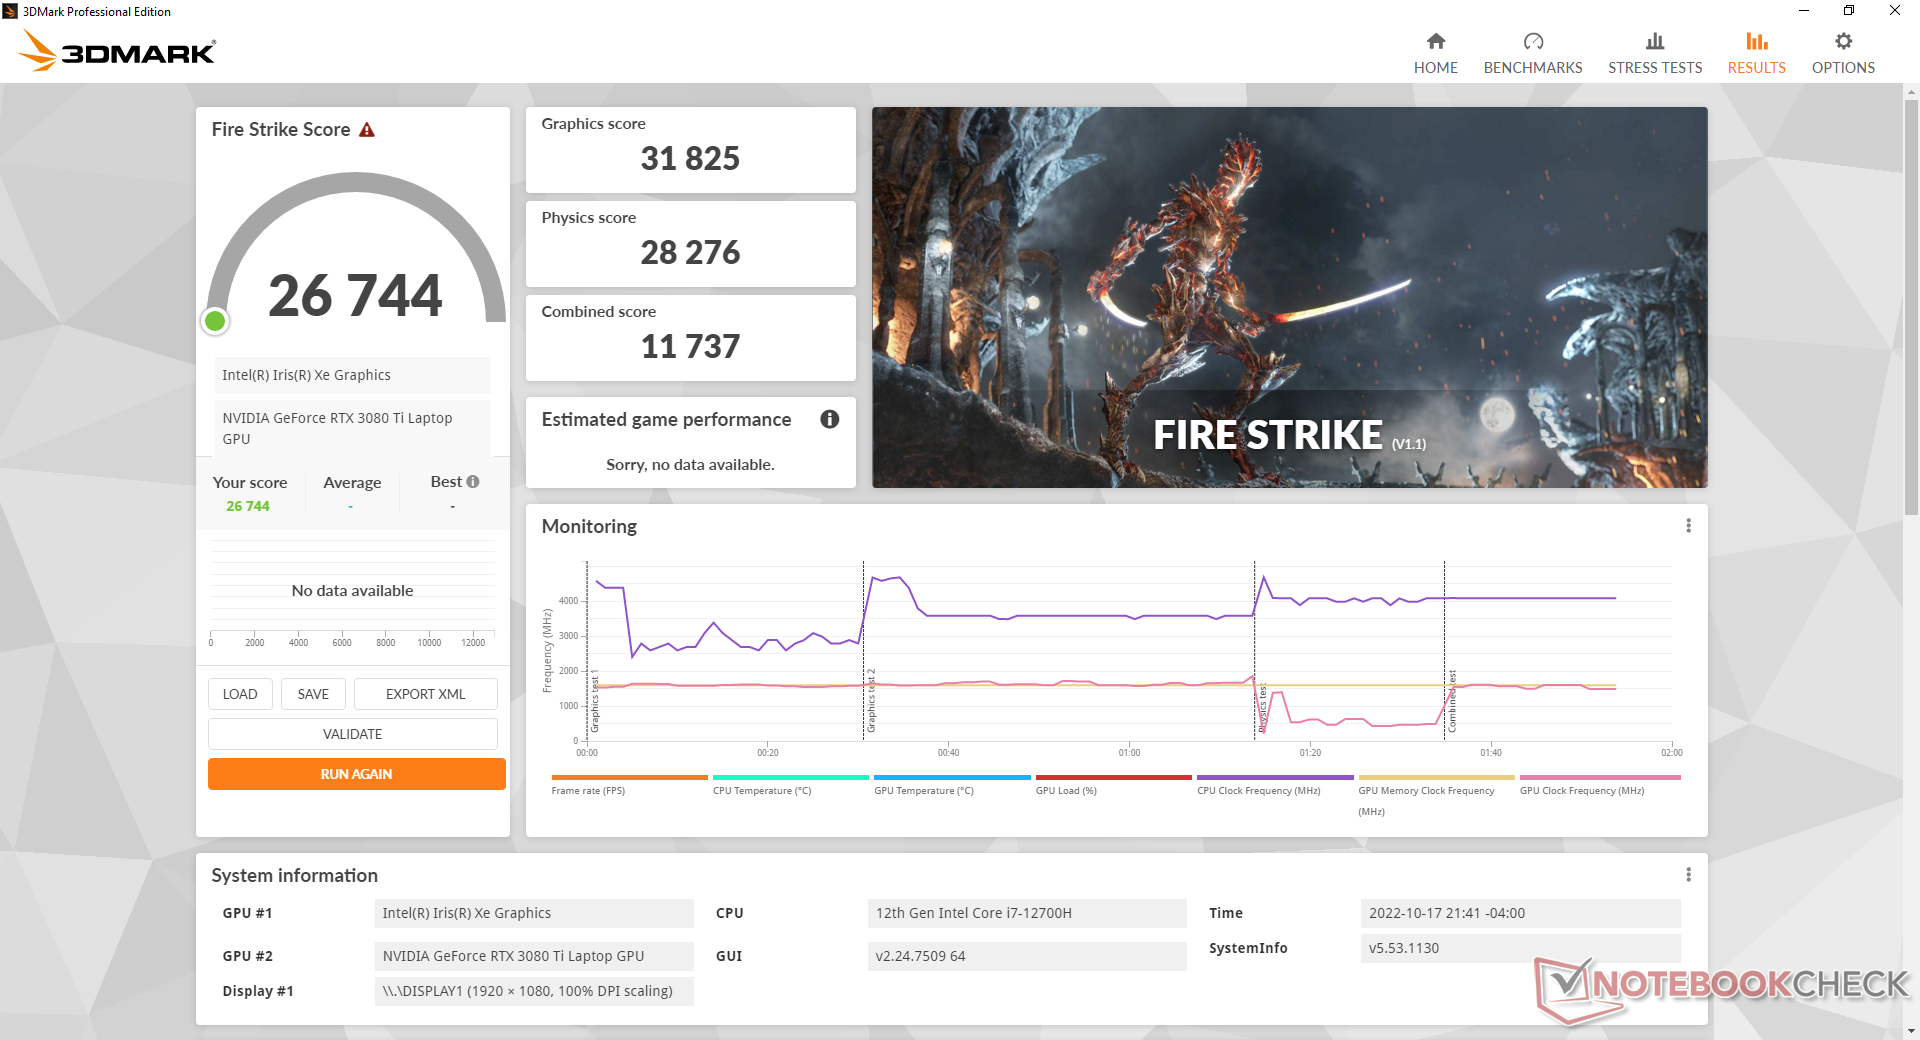
| 3DMark 11 Performance | 32627 Punkte | |
| 3DMark Cloud Gate Standard Score | 56461 Punkte | |
| 3DMark Fire Strike Score | 26744 Punkte | |
| 3DMark Time Spy Score | 12022 Punkte | |
Hilfe | ||
* ... kleinere Werte sind besser
Witcher 3 FPS-Diagramm
| min. | mittel | hoch | max. | |
|---|---|---|---|---|
| GTA V (2015) | 186.2 | 181.3 | 169.5 | 107.4 |
| The Witcher 3 (2015) | 391.9 | 313.9 | 212.5 | 109.4 |
| Dota 2 Reborn (2015) | 176.1 | 157.9 | 148.6 | 140.8 |
| Final Fantasy XV Benchmark (2018) | 200 | 147.4 | 115.1 | |
| X-Plane 11.11 (2018) | 124.3 | 106.6 | 96.4 | |
| Strange Brigade (2018) | 416 | 273 | 226 | 199.8 |
| Cyberpunk 2077 1.6 (2022) | 135.4 | 123.2 | 96.2 | 80 |
Emissionen
Systemgeräusche
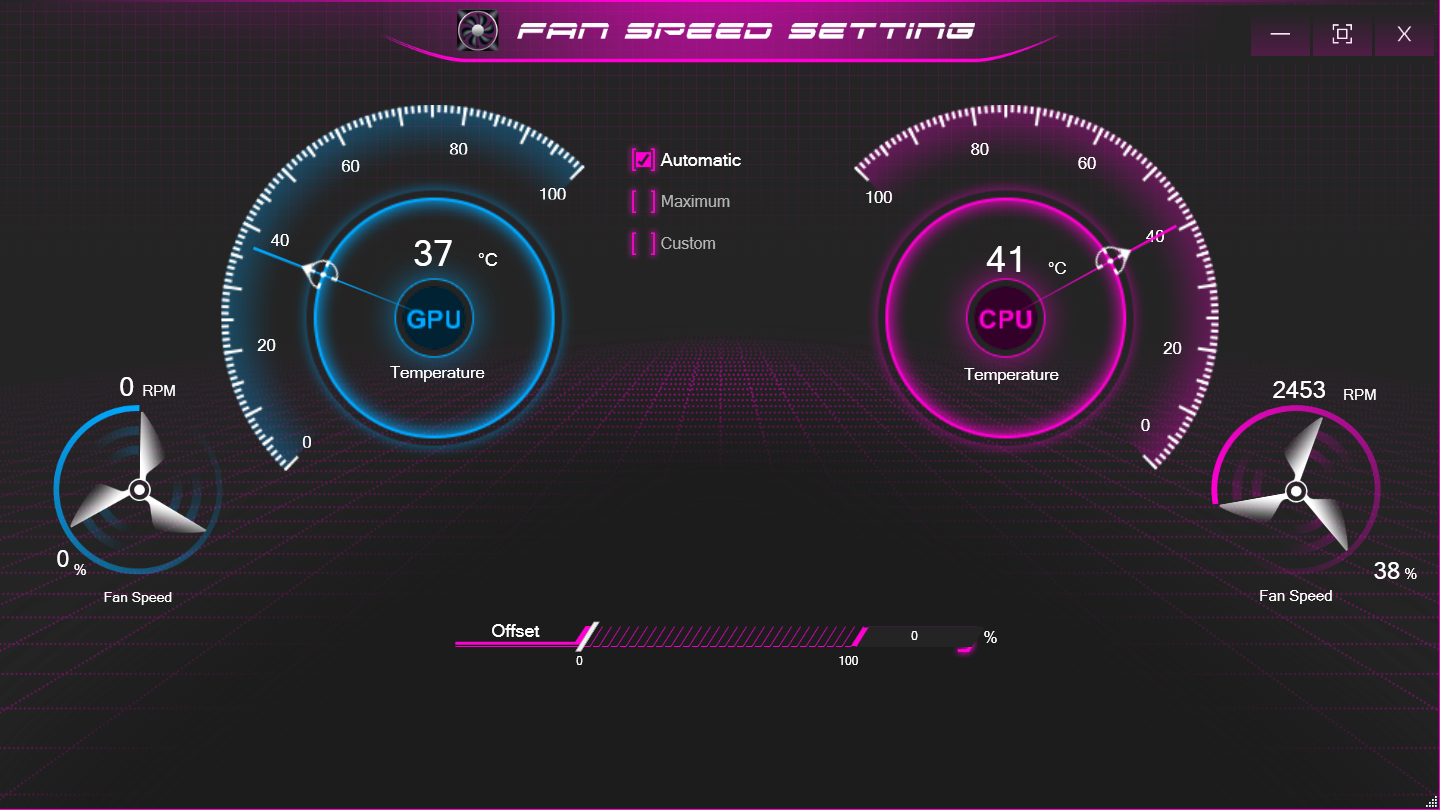
Das Gerät produziert fast immer ein gewisses Lüftergeräusch. Die Lüfter neigen dazu, im Leerlauf auf dem Desktop zu laufen, aber selbst die geringste Belastung wie Web-Browsing verursacht ein Lüftergeräusch von 30 dB(A) vor einem leisen Hintergrund von 23 dB(A). Bei anspruchsvolleren Aufgaben wie dem 3DMark 06 oder Spielen erreicht das Lüftergeräusch schnell seinen Höchstwert von 56 dB(A), selbst wenn das Profil "Ausbalanciert" eingestellt ist. Dies ist ein Gaming-Notebook, das sich nicht davor scheut, laut zu sein, egal welches Energieprofil eingestellt ist.
Die meisten anderen 17-Zoll-Gaming-Laptops erreichen unter ähnlichen Bedingungen ebenfalls den Bereich von 50 dB(A) oder lauter, sodass dieses Problem nicht nur bei Eurocom auftritt. Nichtsdestotrotz neigt das Eurocom-Gerät dazu, plötzlich und schneller lauter zu werden.
Lautstärkediagramm
| Idle |
| 23.3 / 30.7 / 30.7 dB(A) |
| Last |
| 56.2 / 55.9 dB(A) |
 | ||
30 dB leise 40 dB(A) deutlich hörbar 50 dB(A) störend |
||
min: | ||
| Eurocom Nightsky TXi317 GeForce RTX 3080 Ti Laptop GPU, i7-12700H, Samsung SSD 980 Pro 1TB MZ-V8P1T0BW | Schenker XMG Pro 17 E22 GeForce RTX 3080 Ti Laptop GPU, i9-12900H, Samsung SSD 980 Pro 1TB MZ-V8P1T0BW | Aorus 17X XES GeForce RTX 3070 Ti Laptop GPU, i9-12900HX, Gigabyte AG470S1TB-SI B10 | MSI Raider GE77 HX 12UHS GeForce RTX 3080 Ti Laptop GPU, i9-12900HX, Samsung PM9A1 MZVL22T0HBLB | Razer Blade 17 Early 2022 GeForce RTX 3080 Ti Laptop GPU, i9-12900H, Samsung PM9A1 MZVL21T0HCLR | Alienware x17 R2 P48E GeForce RTX 3080 Ti Laptop GPU, i9-12900HK, 2x Samsung PM9A1 1TB (RAID 0) | |
|---|---|---|---|---|---|---|
| Geräuschentwicklung | -12% | -7% | -11% | 2% | 16% | |
| aus / Umgebung * (dB) | 23.3 | 26 -12% | 26 -12% | 26 -12% | 26 -12% | 22.7 3% |
| Idle min * (dB) | 23.3 | 26 -12% | 28 -20% | 26 -12% | 26 -12% | 23.1 1% |
| Idle avg * (dB) | 30.7 | 34 -11% | 32 -4% | 34 -11% | 27 12% | 23.1 25% |
| Idle max * (dB) | 30.7 | 42 -37% | 38 -24% | 46 -50% | 32 -4% | 23.1 25% |
| Last avg * (dB) | 56.2 | 58 -3% | 53 6% | 50 11% | 50 11% | 31.9 43% |
| Witcher 3 ultra * (dB) | 56.1 | 57 -2% | 54 4% | 55 2% | 51 9% | 52.5 6% |
| Last max * (dB) | 55.9 | 58 -4% | 55 2% | 57 -2% | 51 9% | 52.5 6% |
* ... kleinere Werte sind besser
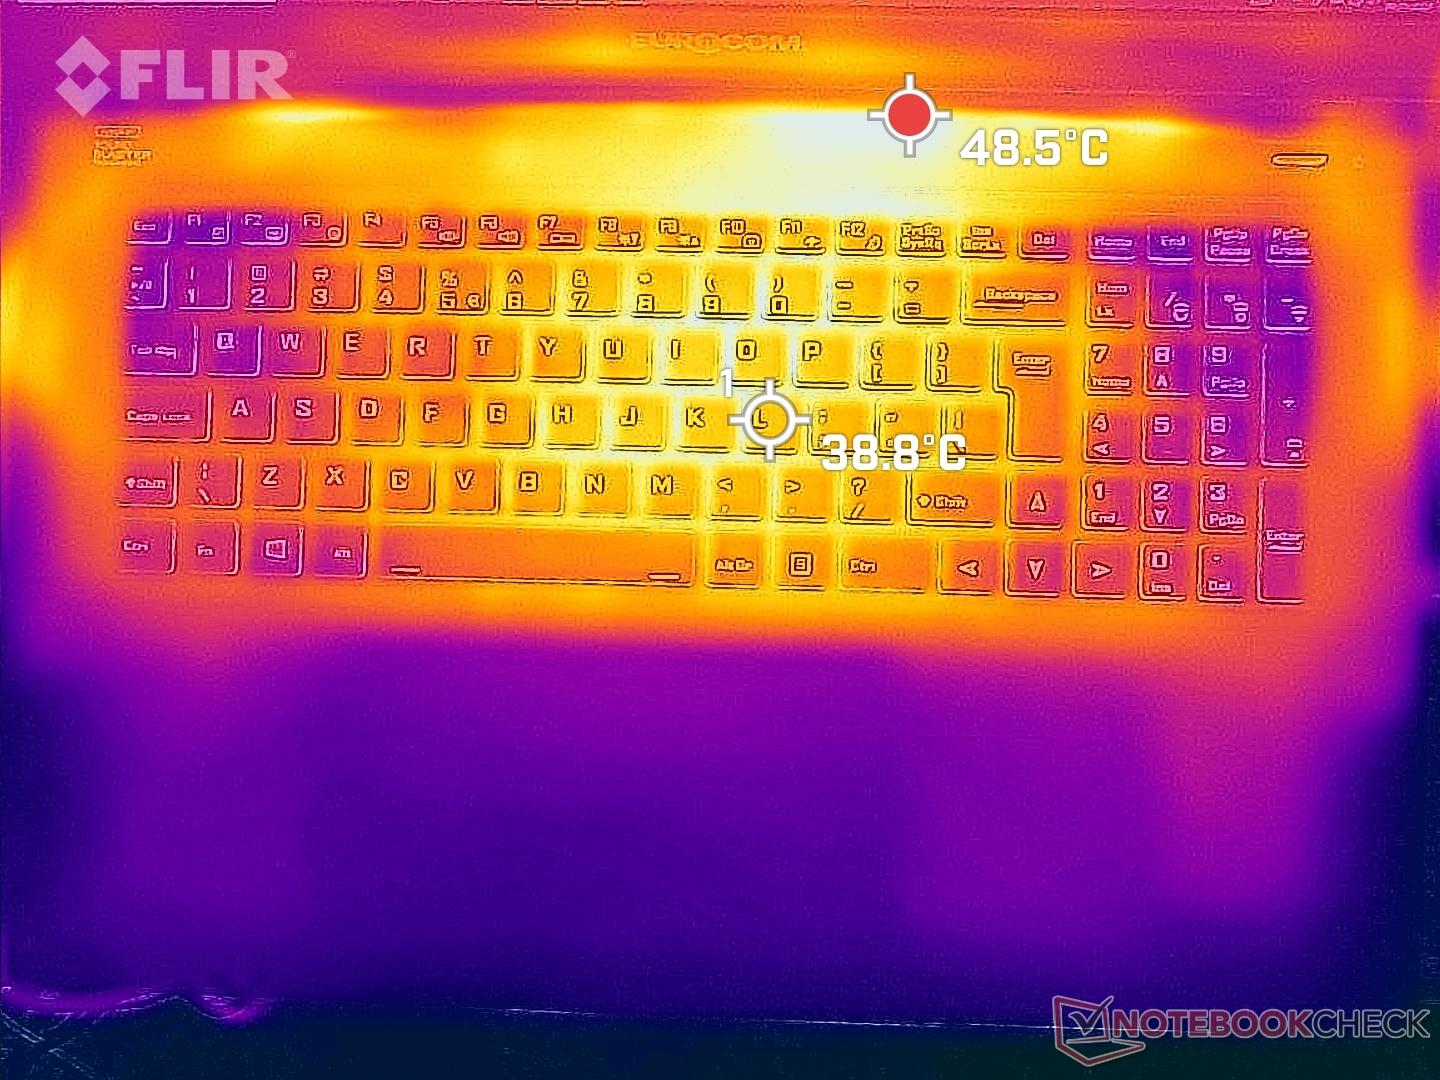
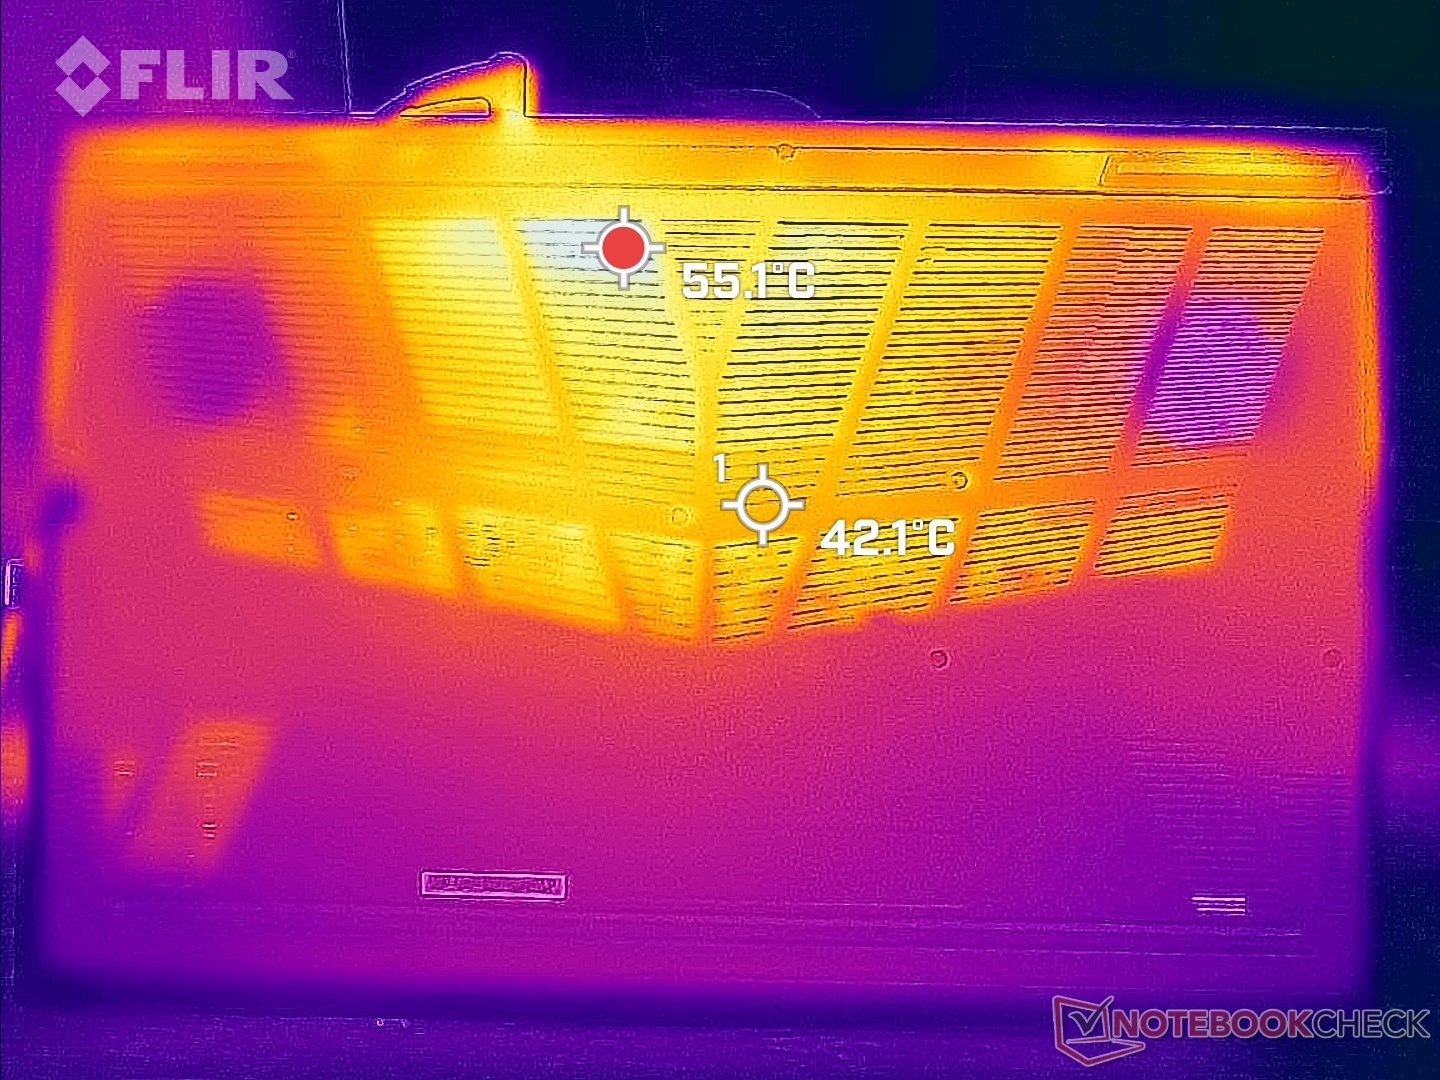
Temperatur
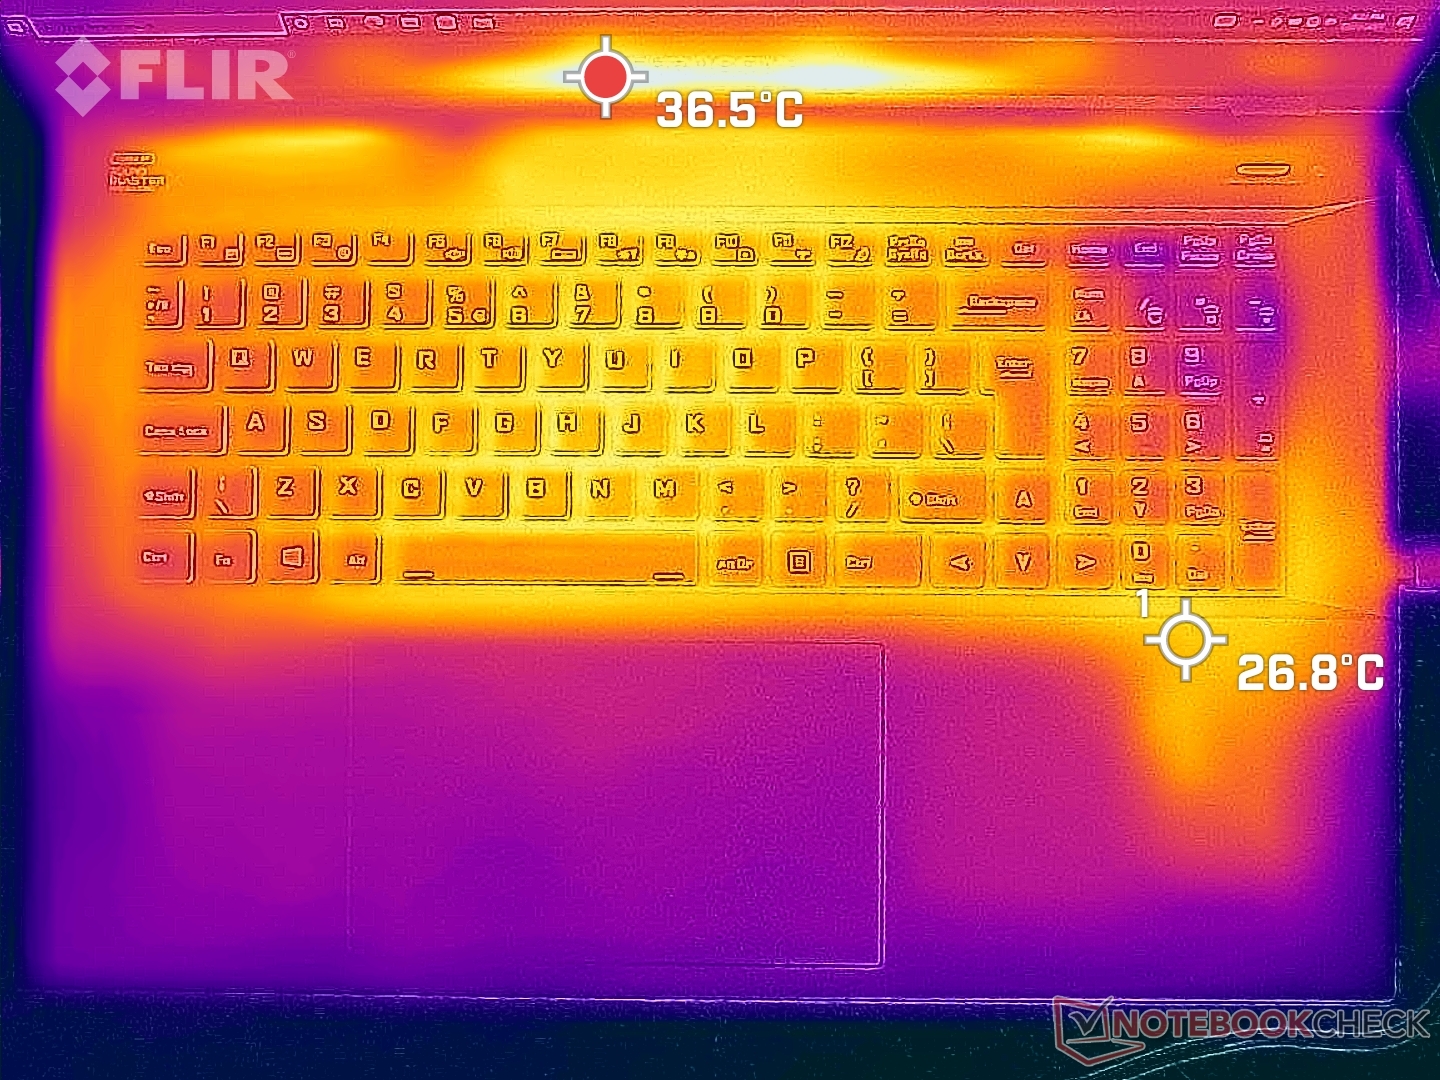
Die Oberflächentemperaturen sind in der Mitte der Tastatur am wärmsten, während die Handballenablagen viel kühler sind, um ein komfortables Spielen zu ermöglichen. Dünnere Laptops wie das Razer Blade 17 haben deutlich wärmere Handballenauflagen, die für die Hand unangenehmer sind.
Beim Nightsky TXi317 wird die rechte Handballenauflage immer etwas wärmer sein als die linke, da sich die M.2-SSDs unter der rechten Handballenauflage befinden.
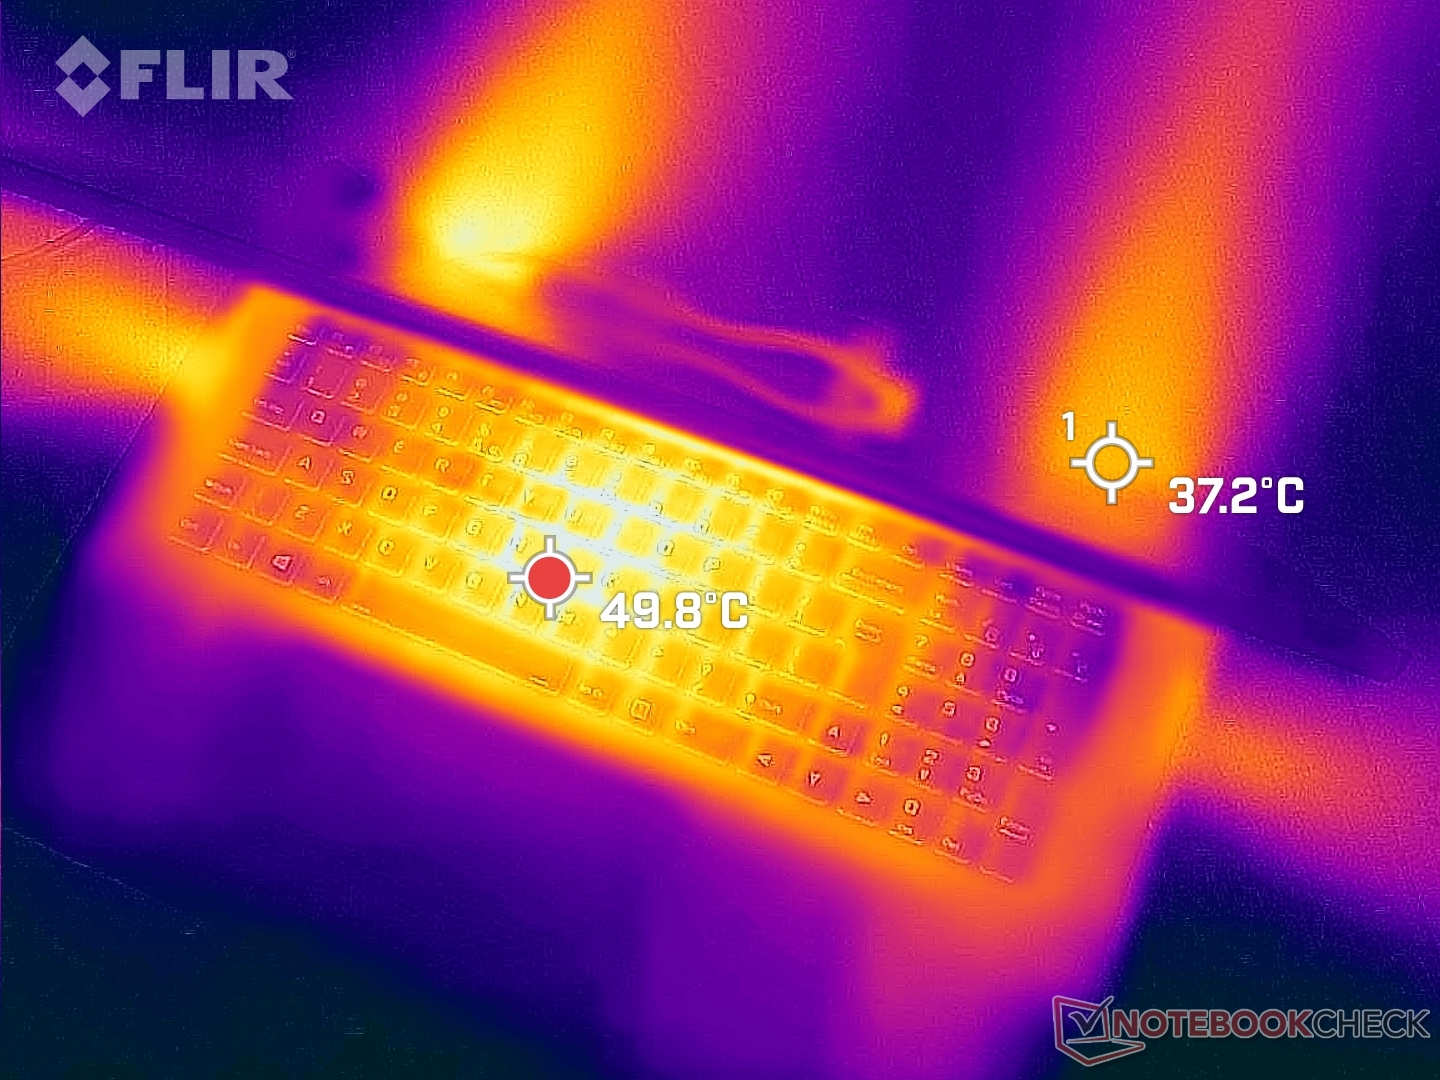
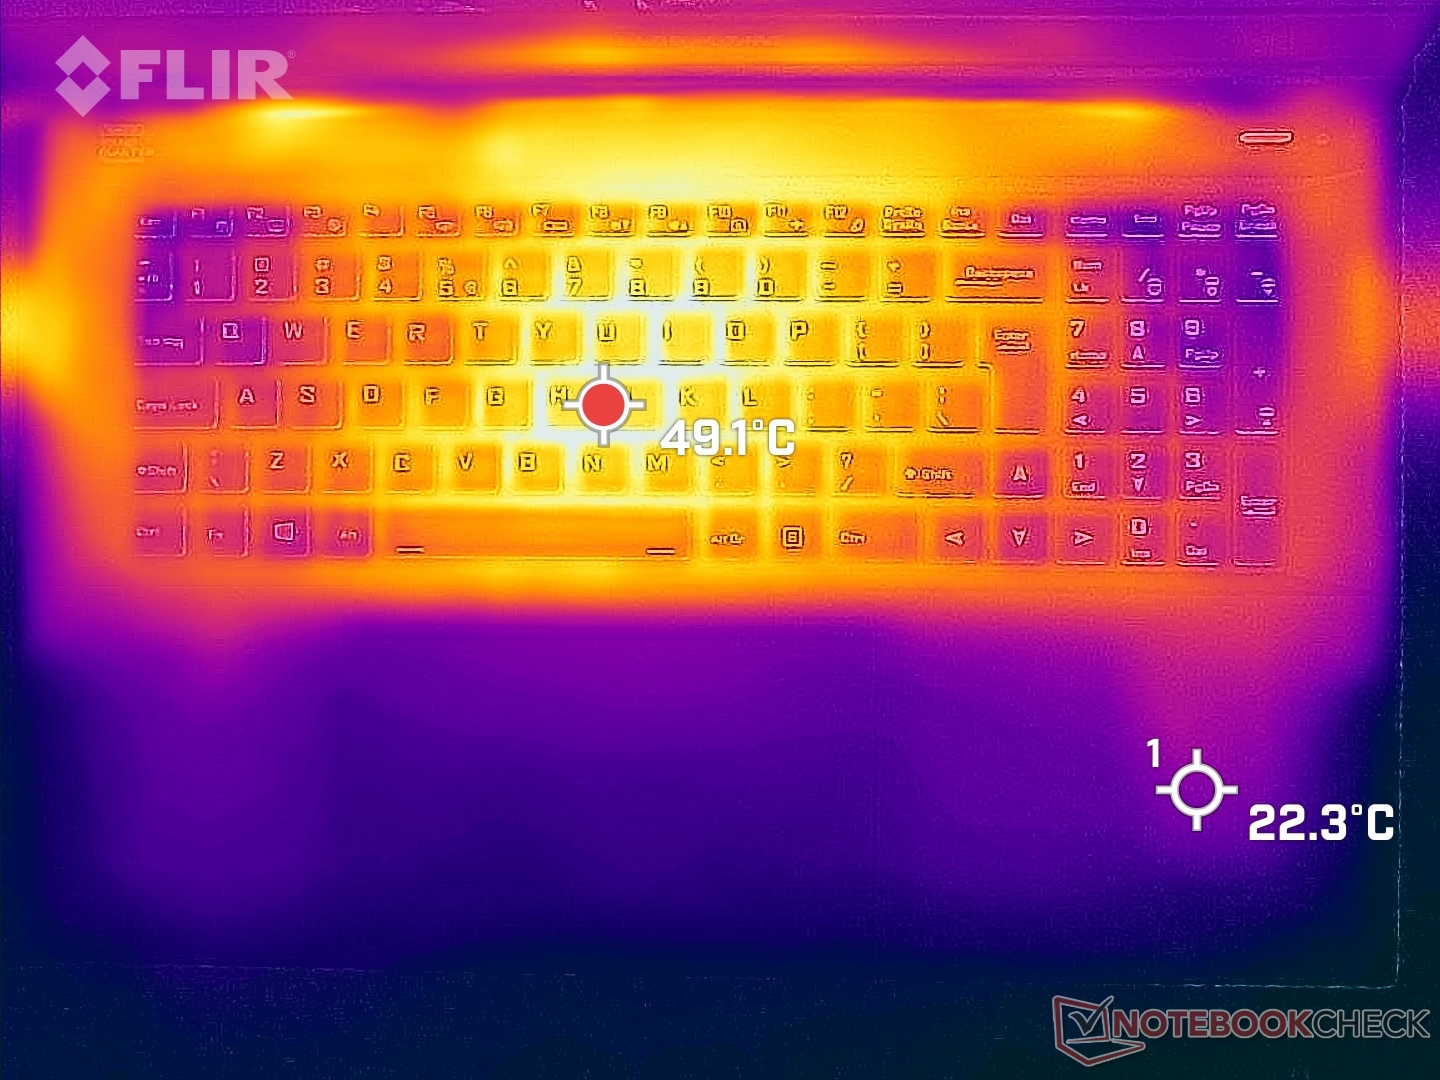
(-) Die maximale Temperatur auf der Oberseite ist 50.4 °C. Im Vergleich liegt der Klassendurchschnitt bei 40.4 °C (von 21.2 bis 68.8 °C für die Klasse Gaming).
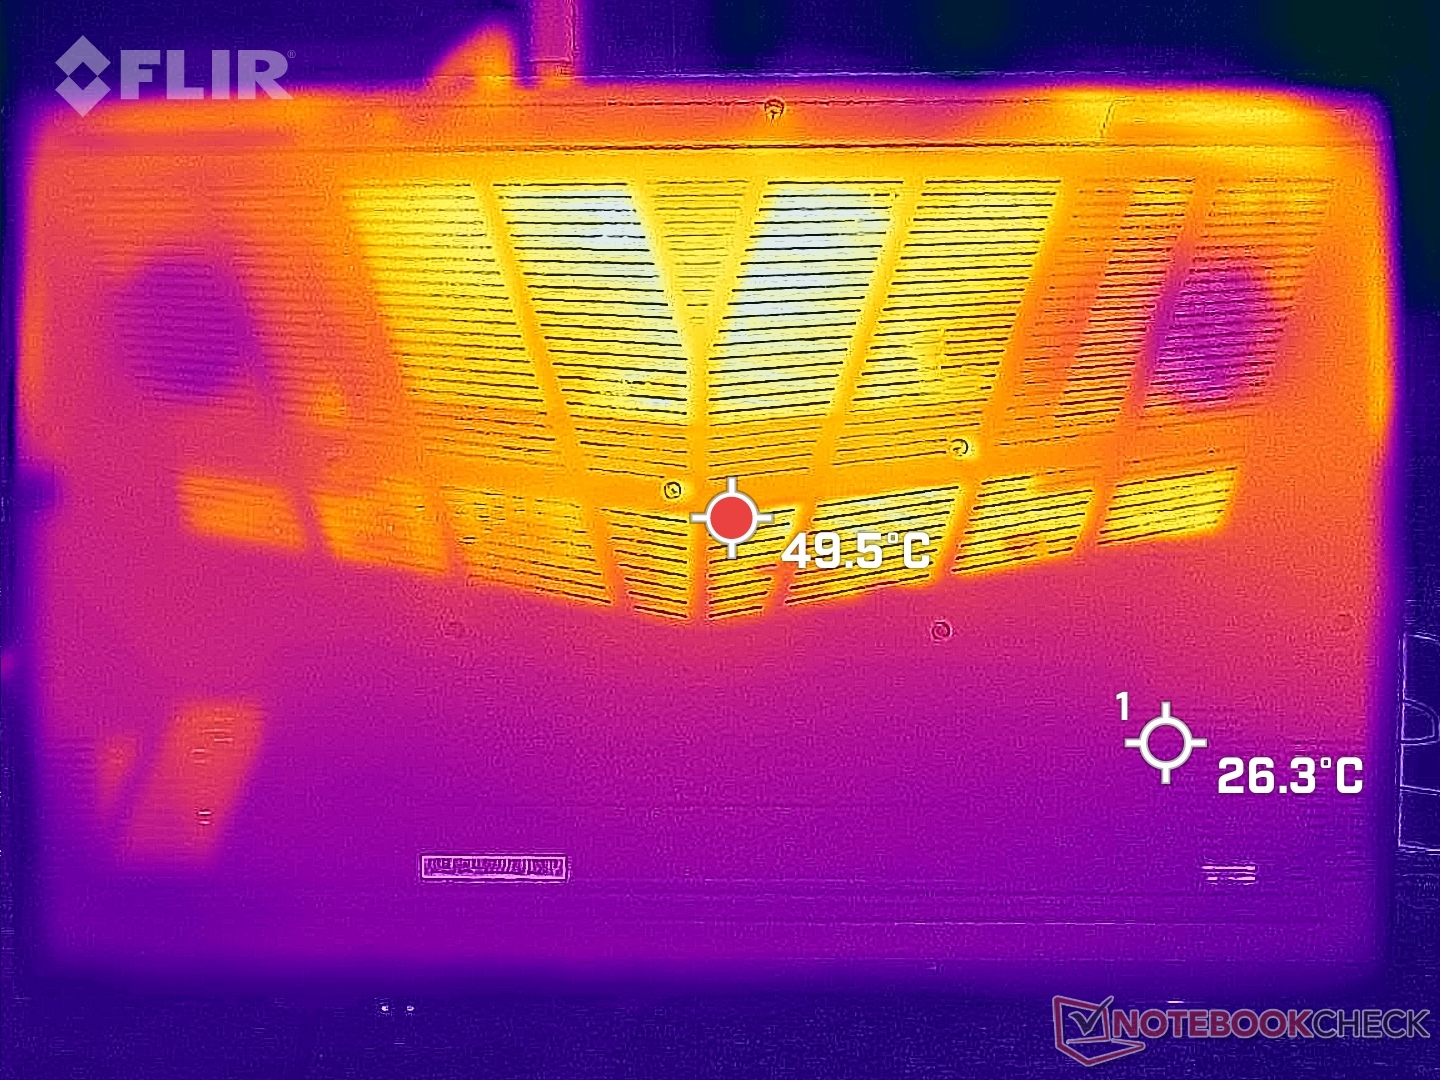
(-) Auf der Unterseite messen wir eine maximalen Wert von 47.6 °C (im Vergleich zum Durchschnitt von 43.2 °C).
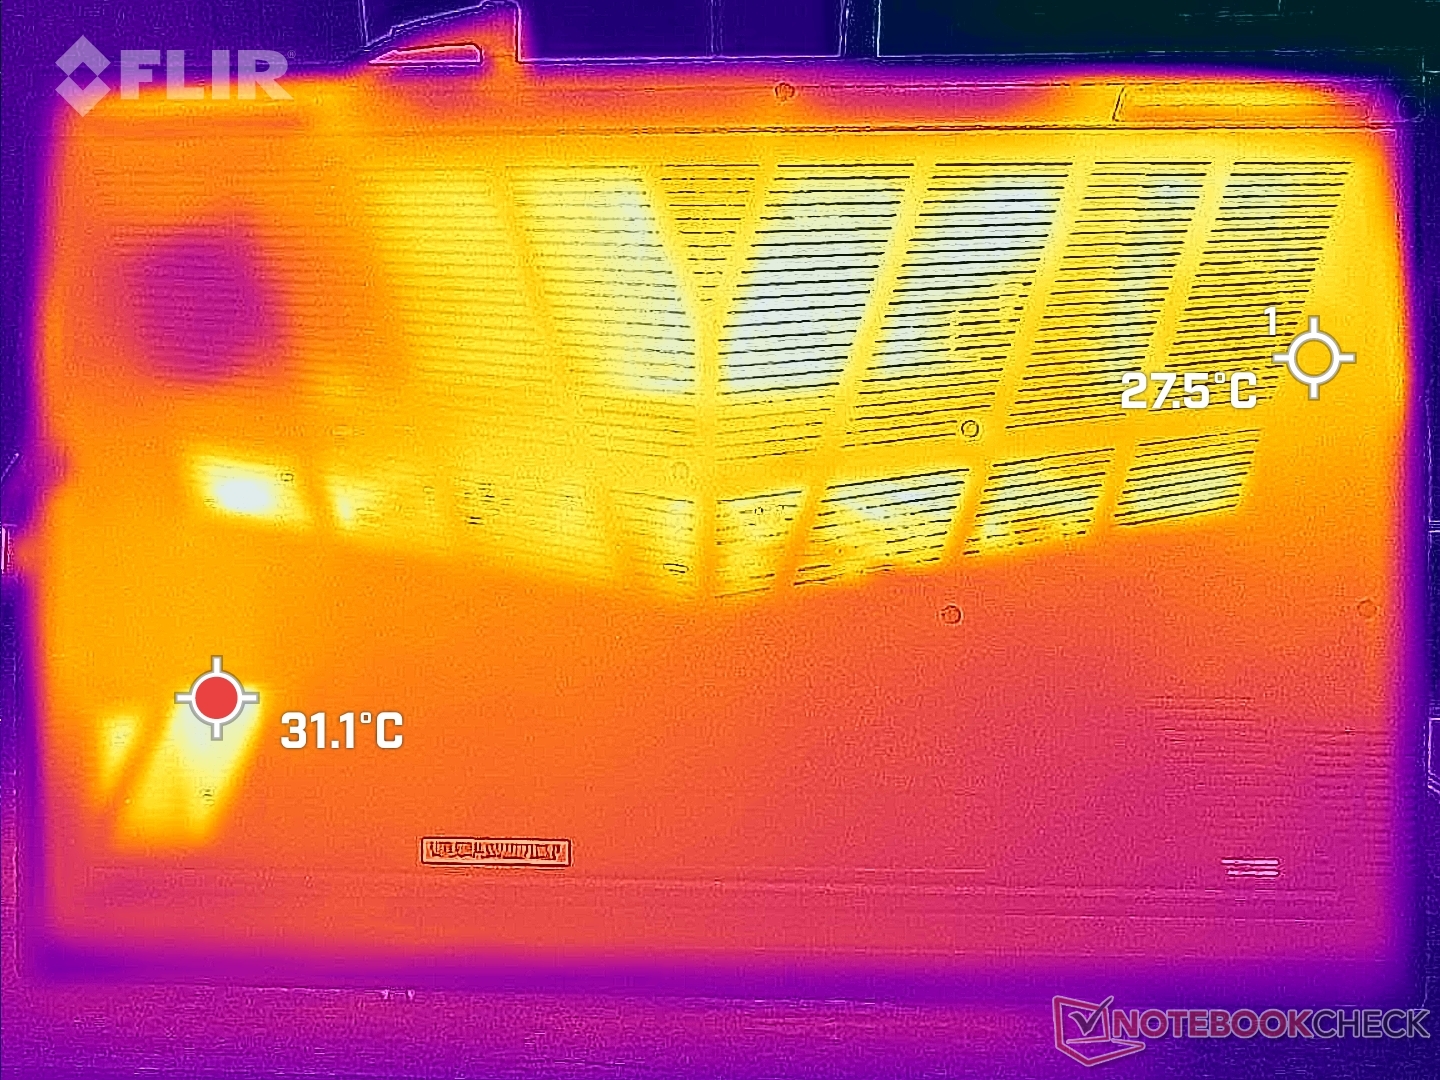
(+) Ohne Last messen wir eine durchschnittliche Temperatur von 29.4 °C auf der Oberseite. Der Klassendurchschnitt erreicht 33.9 °C.
(-) Beim längeren Spielen von The Witcher 3 erhitzt sich das Gerät durchschnittlich auf 39.2 °C. Der Durchschnitt der Klasse ist derzeit 33.9 °C.
(+) Die Handballen und der Touchpad-Bereich sind mit gemessenen 31.2 °C kühler als die typische Hauttemperatur und fühlen sich dadurch kühl an.
(-) Die durchschnittliche Handballen-Temperatur anderer getesteter Geräte war 28.8 °C (-2.4 °C).
| Eurocom Nightsky TXi317 Intel Core i7-12700H, NVIDIA GeForce RTX 3080 Ti Laptop GPU | Schenker XMG Pro 17 E22 Intel Core i9-12900H, NVIDIA GeForce RTX 3080 Ti Laptop GPU | Aorus 17X XES Intel Core i9-12900HX, NVIDIA GeForce RTX 3070 Ti Laptop GPU | MSI Raider GE77 HX 12UHS Intel Core i9-12900HX, NVIDIA GeForce RTX 3080 Ti Laptop GPU | Razer Blade 17 Early 2022 Intel Core i9-12900H, NVIDIA GeForce RTX 3080 Ti Laptop GPU | Alienware x17 R2 P48E Intel Core i9-12900HK, NVIDIA GeForce RTX 3080 Ti Laptop GPU | |
|---|---|---|---|---|---|---|
| Hitze | -12% | -15% | -19% | -10% | 7% | |
| Last oben max * (°C) | 50.4 | 56 -11% | 54 -7% | 53 -5% | 50 1% | 49.6 2% |
| Last unten max * (°C) | 47.6 | 60 -26% | 58 -22% | 58 -22% | 56 -18% | 42.4 11% |
| Idle oben max * (°C) | 32.6 | 34 -4% | 37 -13% | 38 -17% | 36 -10% | 29.2 10% |
| Idle unten max * (°C) | 33.2 | 36 -8% | 39 -17% | 43 -30% | 38 -14% | 32 4% |
* ... kleinere Werte sind besser
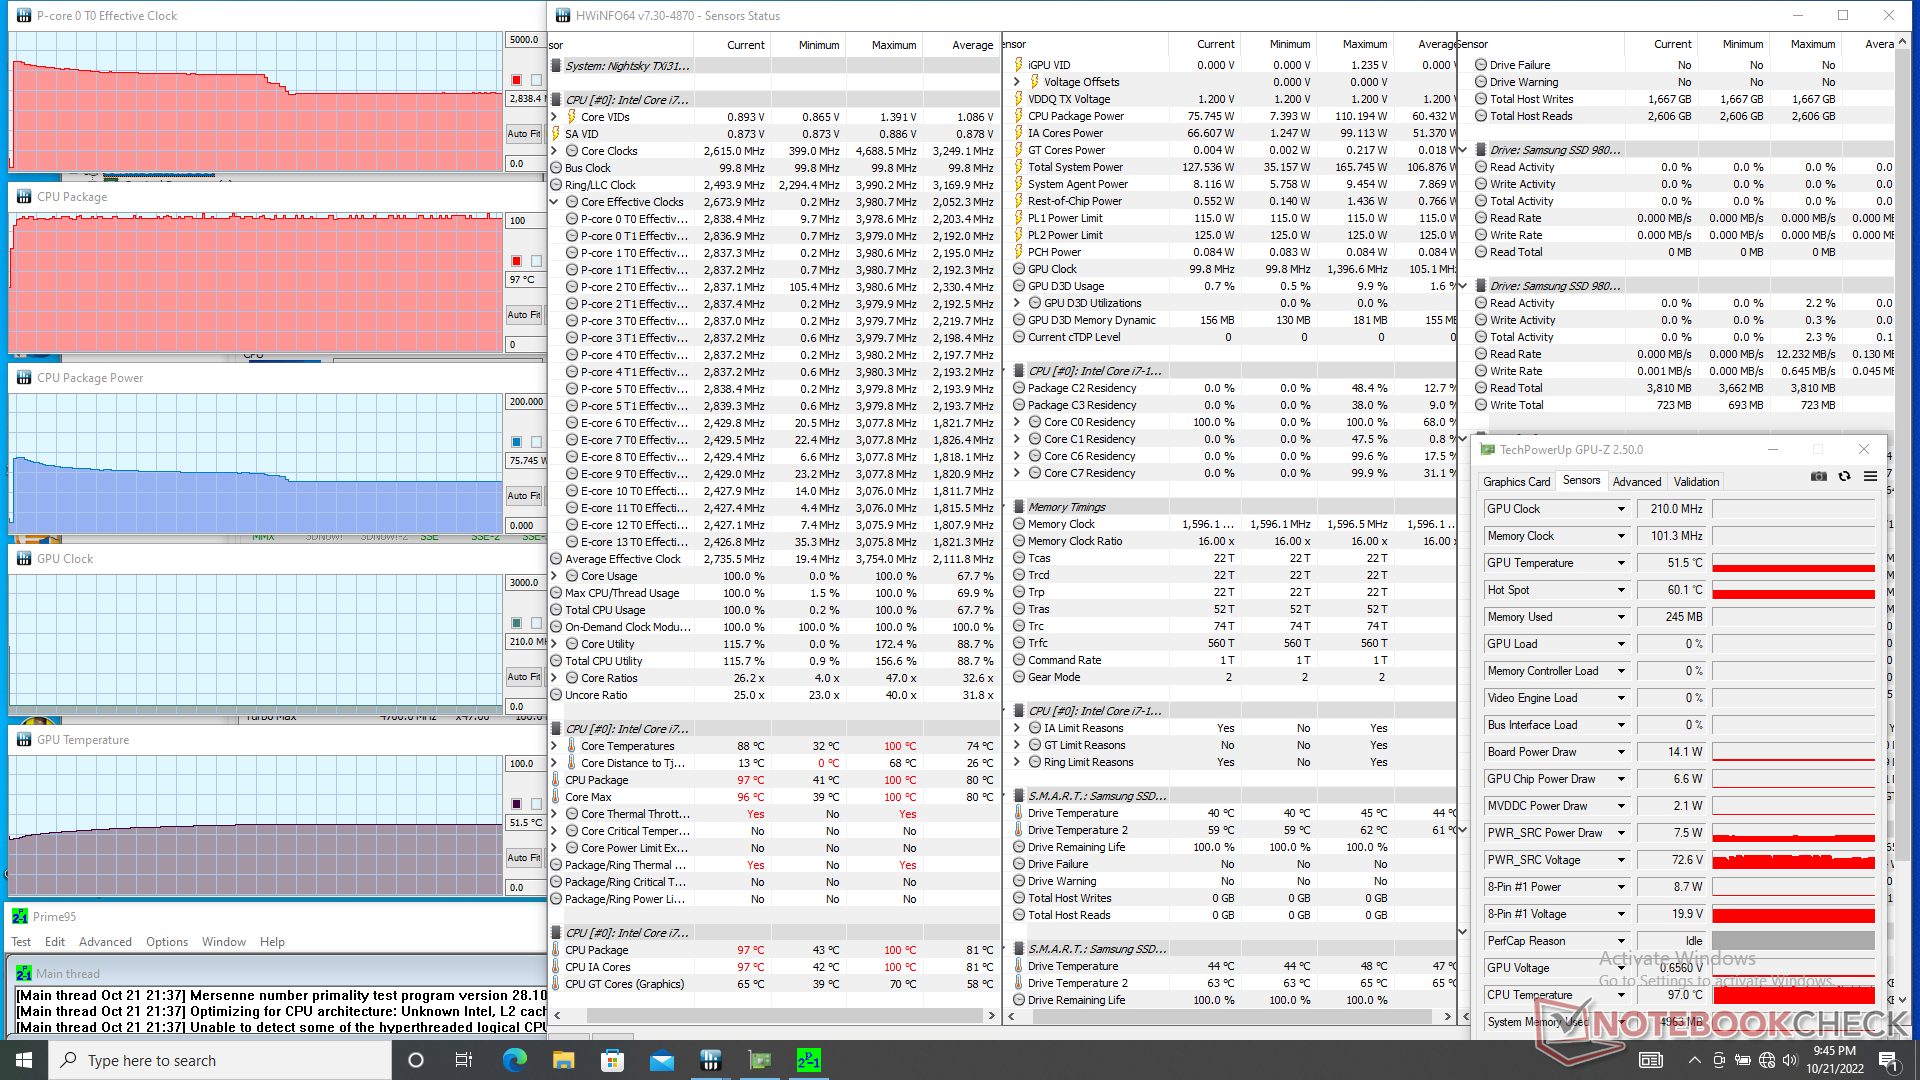
Stresstest
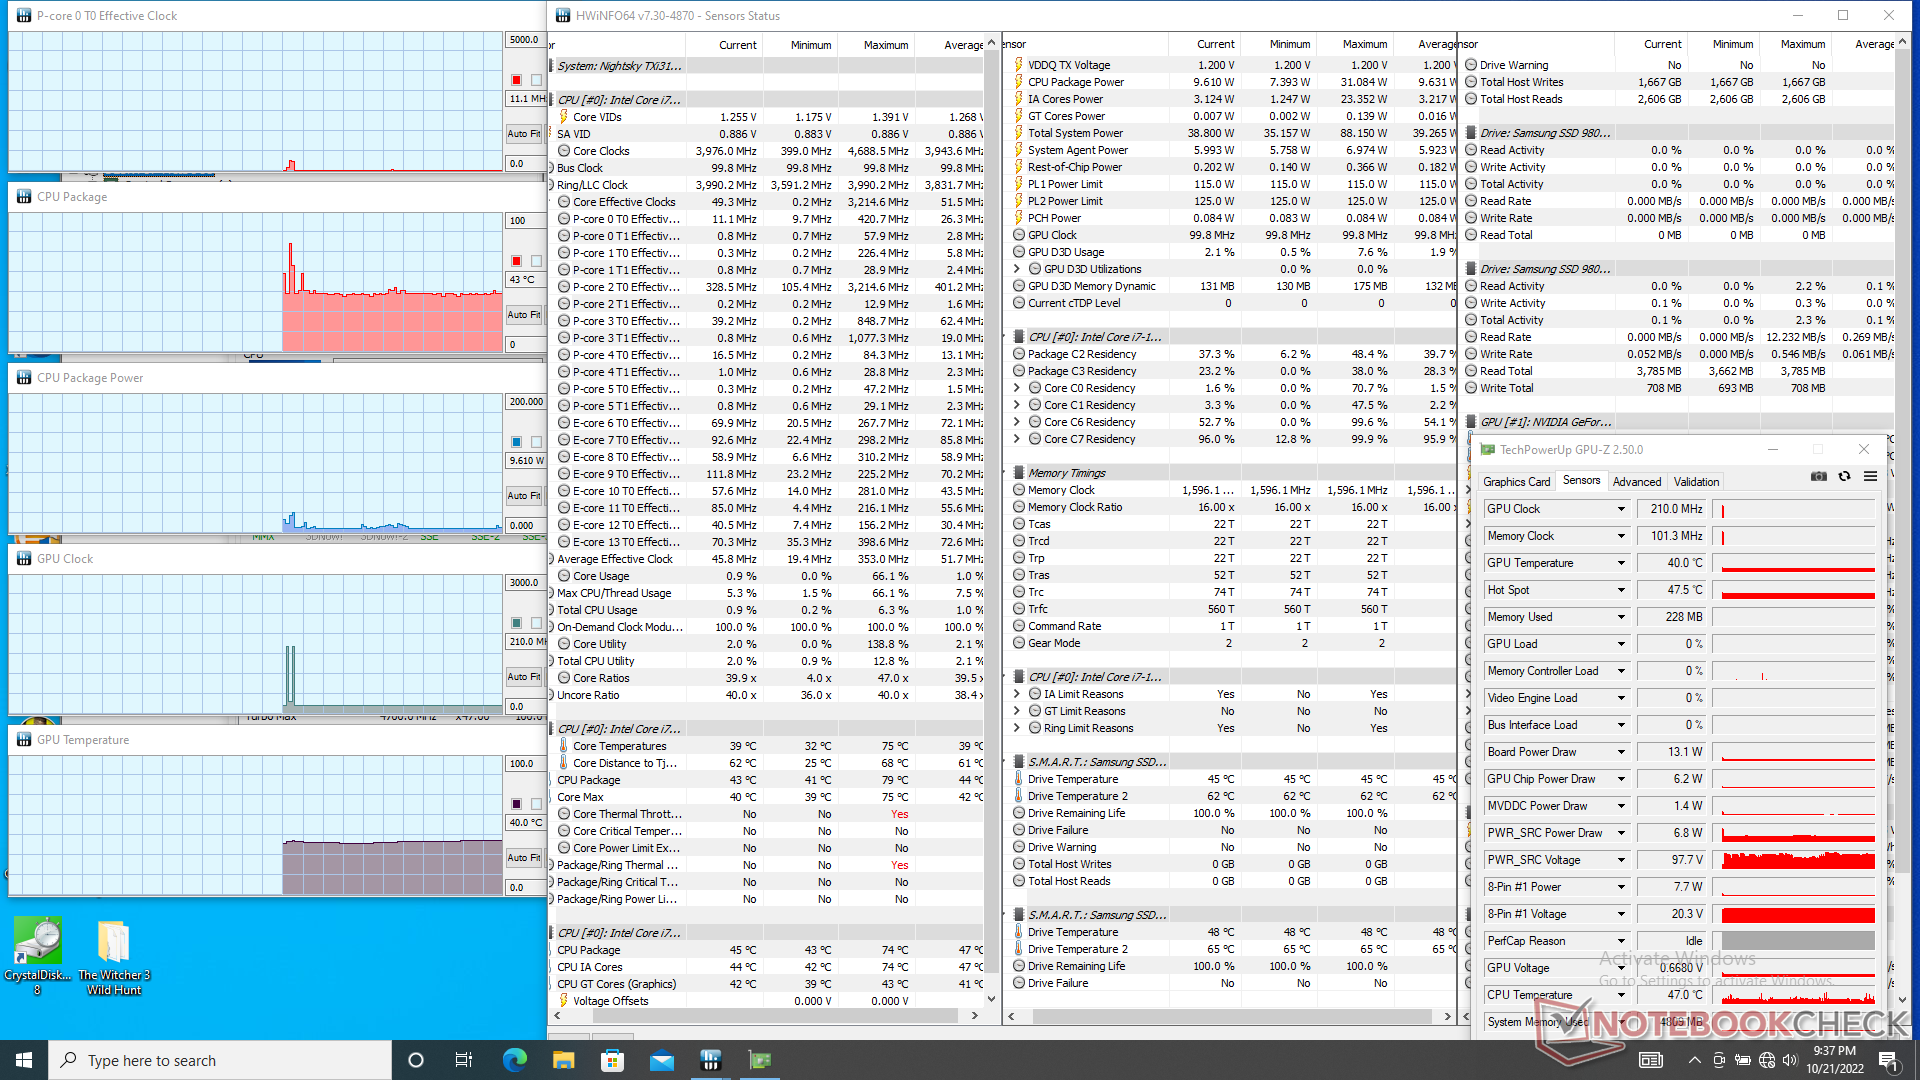
Die CPU-Taktraten, die Temperatur und die Leistungsaufnahme des Boards stiegen auf 4 GHz, 97 °C bzw. 110 W, wenn Prime95 gestartet wurde. Die Taktraten und die Leistungsaufnahme sinken dann kontinuierlich, bevor sie sich bei 2,8 GHz bzw. 76 W stabilisieren, ohne dass sich die Kerntemperatur ändert. Die Wiederholung desselben Tests auf dem Dell G16 7620 mit einem identischen Prozessor führt zu etwas schnelleren stabilen Taktraten von etwa 3,3 GHz, aber ähnlichen Kerntemperaturen von fast 100 °C.
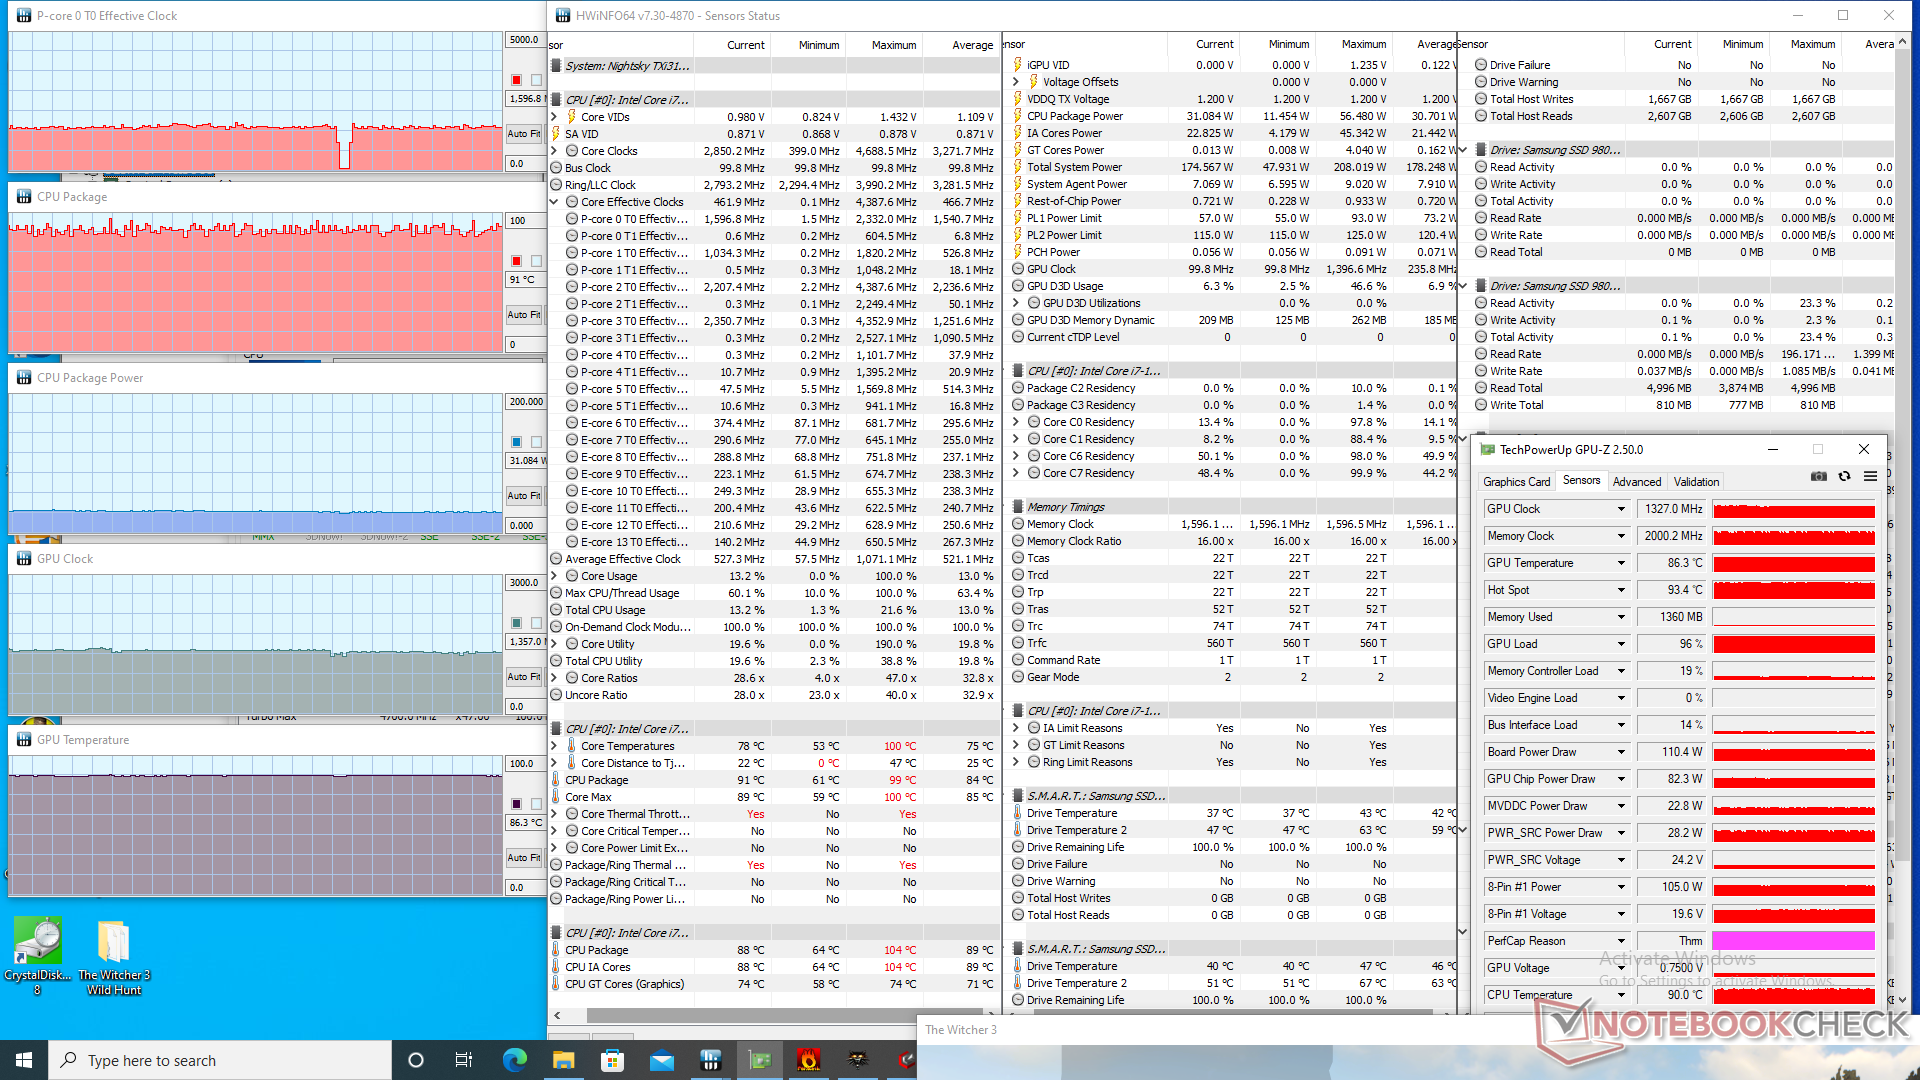
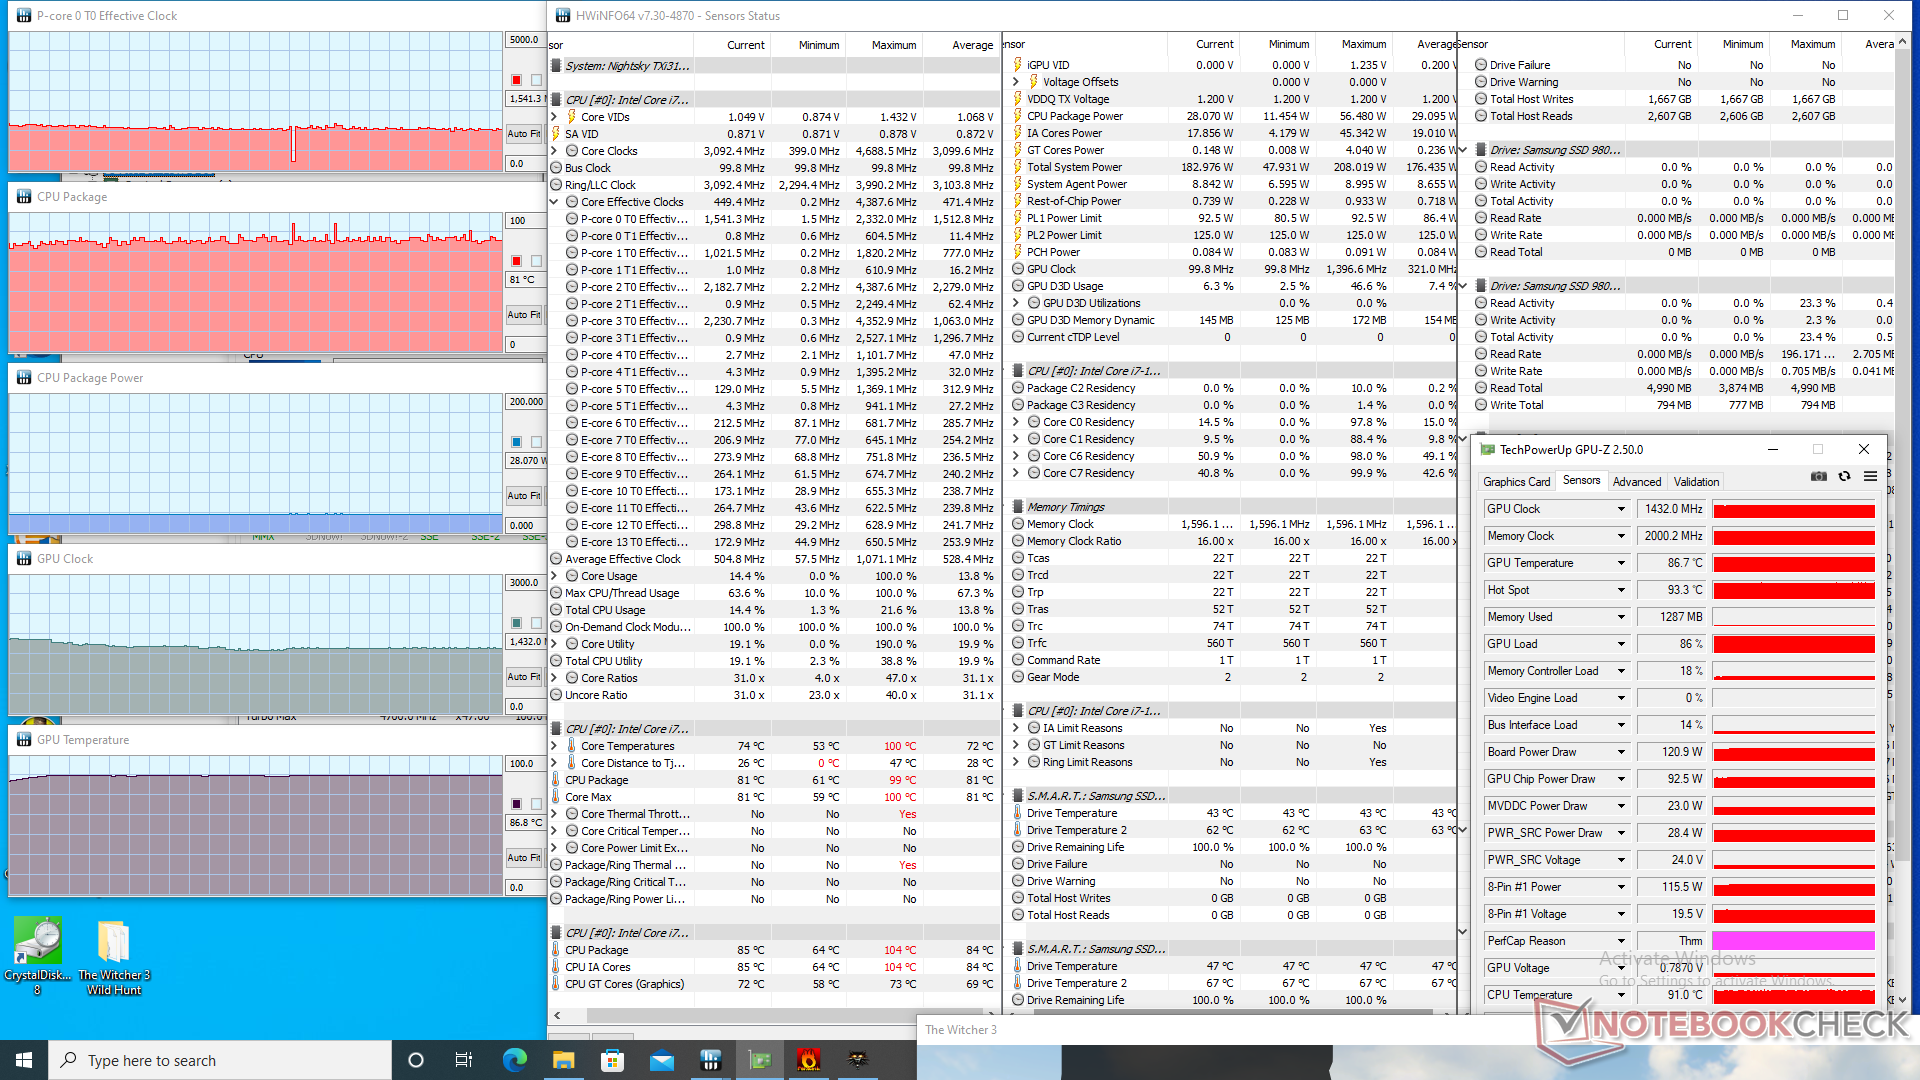
Die GPU-Taktraten, die Temperatur und die Leistungsaufnahme des Boards stabilisieren sich bei 1432 MHz, 87 °C bzw. 121 W, wenn Witcher 3 läuft. Eine Wiederholung dieses Tests mit dem Energieprofil "Unterhaltung" führt zu einer leicht verringerten GPU-Leistung: Taktrate und Leistungsaufnahme fallen auf 1327 MHz bzw. 110 W, ohne dass sich die Temperatur ändert. Es ist bedauerlich, dass wir nicht näher an das behauptete TGP-Ziel von 125 W bis 155 W herankommen können.
Die Ausführung von Witcher 3 auf dem MSI GS77 mit der gleichen RTX 3080 Ti GPU führt im Vergleich zu unserem Eurocom zu einem niedrigeren GPU-Takt, einer kühleren Kerntemperatur und einer geringeren Leistungsaufnahme des Boards von 1432 MHz, 75 °C bzw. 105 W.
Im Batteriebetrieb ist die Leistung begrenzt. Ein Fire-Strike-Test im Akkubetrieb ergibt Physik- und Grafikwerte von 12300 bzw. 5071 Punkten, im Netzbetrieb sind es 28276 bzw. 31825 Punkte.
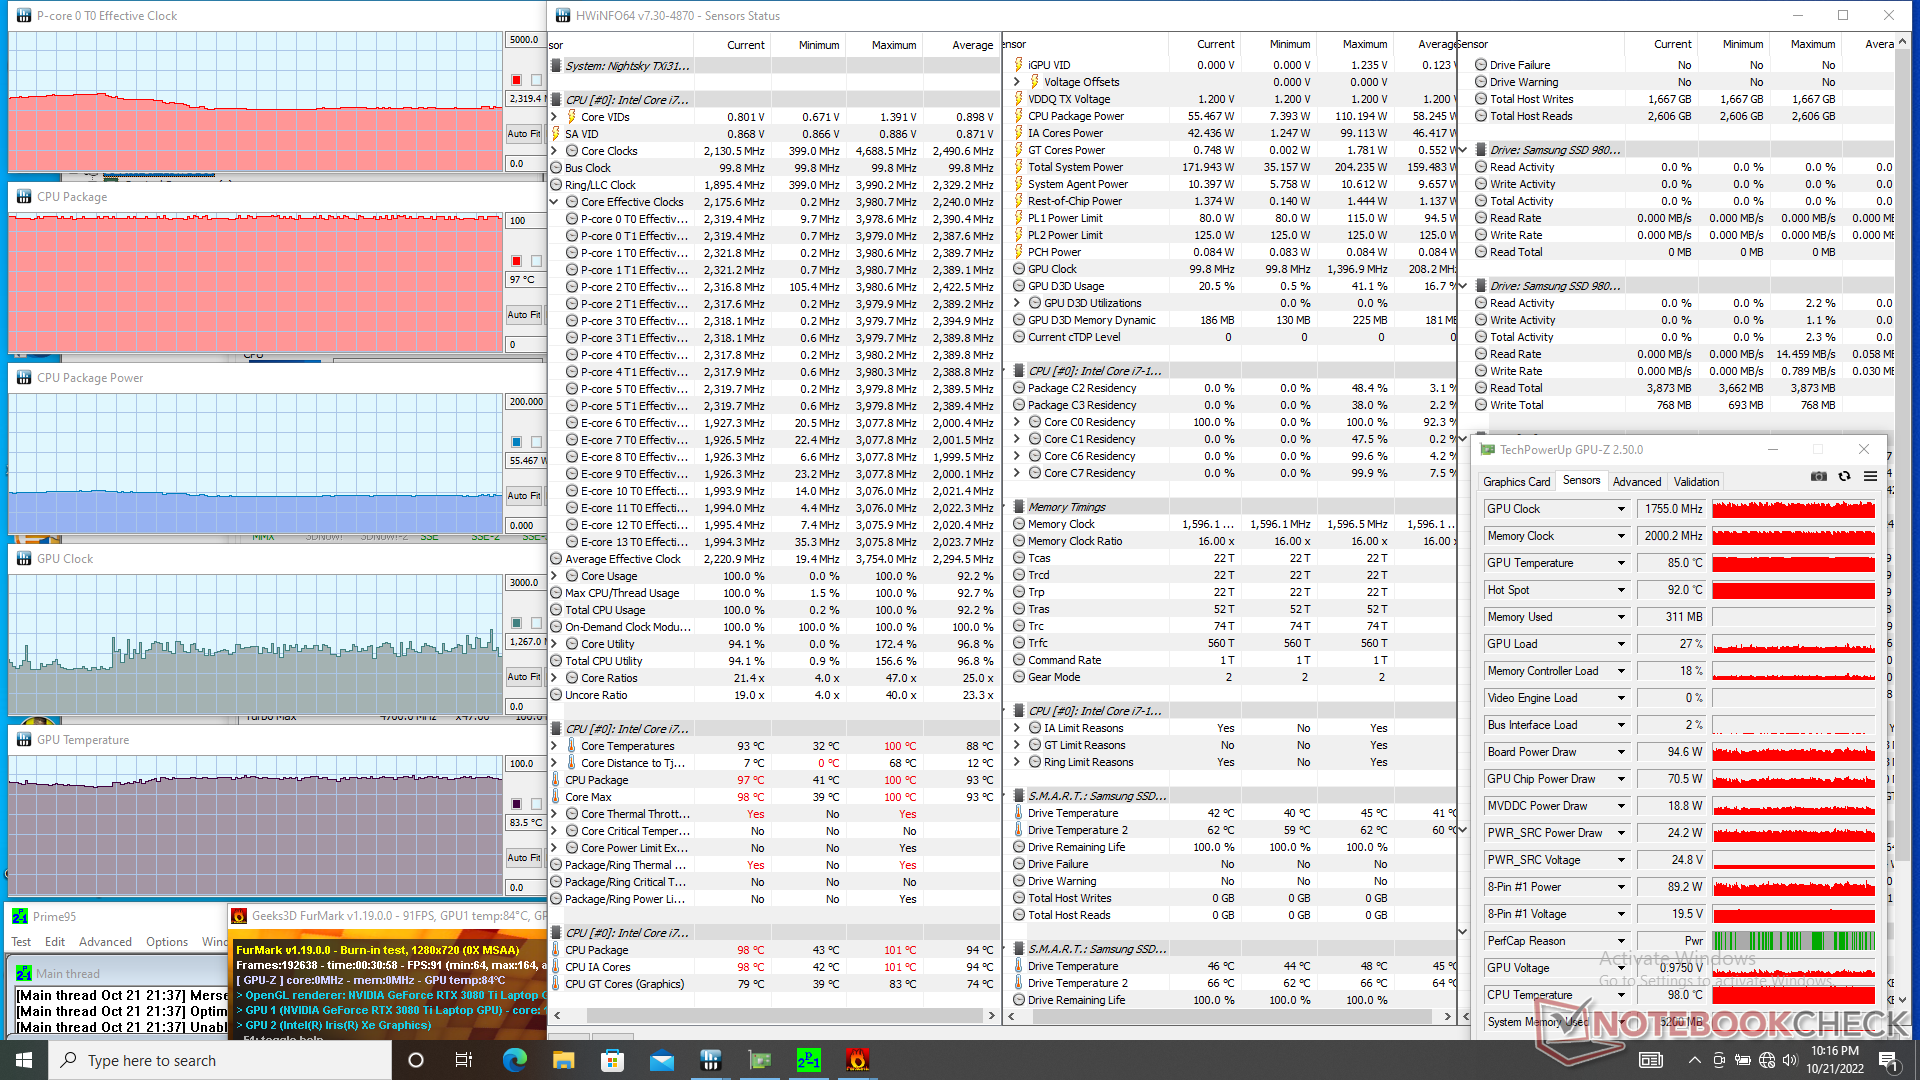
| CPU Clock (GHz) | GPU Clock (MHz) | Average CPU Temperature (°C) | Average GPU Temperature (°C) | |
| System Idle | -- | -- | 43 | 40 |
| Prime95 Stress | 2.8 | -- | 97 | 52 |
| Prime95 + FurMark Stress | 2.3 - 2.8 | 1267 - 1755 | 97 | 84 |
| Witcher 3 Stress | 1.5 | 1432 | 81 | 87 |
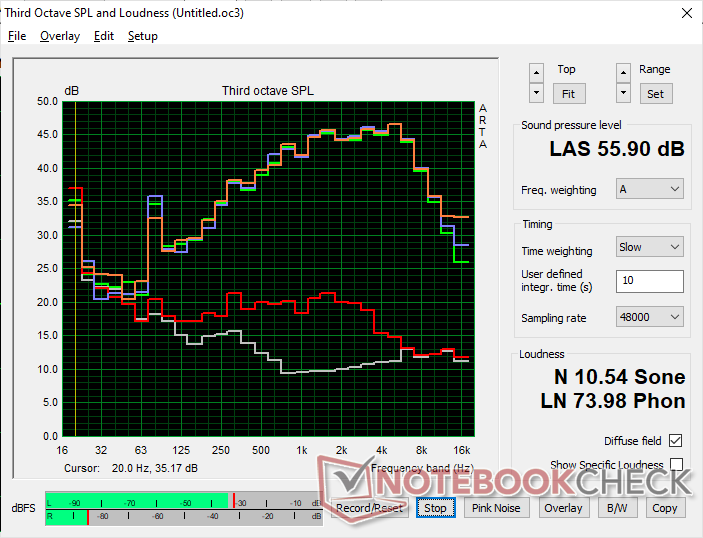
Lautsprecher
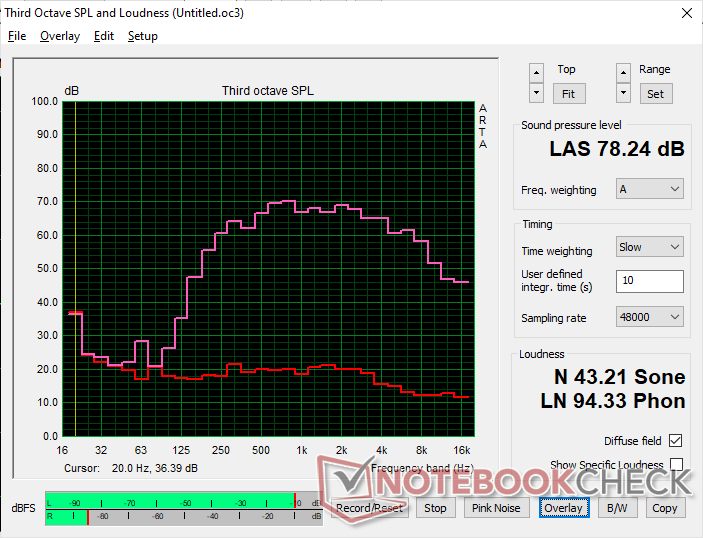
Eurocom Nightsky TXi317 Audio Analyse
(±) | Mittelmäßig laut spielende Lautsprecher (78.2 dB)
Bass 100 - 315 Hz
(±) | abgesenkter Bass - 14.6% geringer als der Median
(-) | keine lineare Bass-Wiedergabe (16.5% Delta zum Vorgänger)
Mitteltöne 400 - 2000 Hz
(±) | zu hohe Mitten, vom Median 5.1% abweichend
(+) | lineare Mitten (5% Delta zum Vorgänger)
Hochtöne 2 - 16 kHz
(+) | ausgeglichene Hochtöne, vom Median nur 4% abweichend
(+) | sehr lineare Hochtöne (6.2% Delta zum Vorgänger)
Gesamt im hörbaren Bereich 100 - 16.000 Hz
(±) | hörbarer Bereich ist durchschnittlich linear (20.4% Abstand zum Median)
Im Vergleich zu allen Geräten derselben Klasse
» 72% aller getesteten Geräte dieser Klasse waren besser, 6% vergleichbar, 22% schlechter
» Das beste Gerät hat einen Delta-Wert von 6%, durchschnittlich ist 18%, das schlechteste Gerät hat 132%
Im Vergleich zu allen Geräten im Test
» 53% aller getesteten Geräte waren besser, 8% vergleichbar, 39% schlechter
» Das beste Gerät hat einen Delta-Wert von 4%, durchschnittlich ist 24%, das schlechteste Gerät hat 134%
Apple MacBook Pro 16 2021 M1 Pro Audio Analyse
(+) | Die Lautsprecher können relativ laut spielen (84.7 dB)
Bass 100 - 315 Hz
(+) | guter Bass - nur 3.8% Abweichung vom Median
(+) | lineare Bass-Wiedergabe (5.2% Delta zum Vorgänger)
Mitteltöne 400 - 2000 Hz
(+) | ausgeglichene Mitten, vom Median nur 1.3% abweichend
(+) | lineare Mitten (2.1% Delta zum Vorgänger)
Hochtöne 2 - 16 kHz
(+) | ausgeglichene Hochtöne, vom Median nur 1.9% abweichend
(+) | sehr lineare Hochtöne (2.7% Delta zum Vorgänger)
Gesamt im hörbaren Bereich 100 - 16.000 Hz
(+) | hörbarer Bereich ist sehr linear (4.6% Abstand zum Median
Im Vergleich zu allen Geräten derselben Klasse
» 0% aller getesteten Geräte dieser Klasse waren besser, 0% vergleichbar, 100% schlechter
» Das beste Gerät hat einen Delta-Wert von 5%, durchschnittlich ist 17%, das schlechteste Gerät hat 45%
Im Vergleich zu allen Geräten im Test
» 0% aller getesteten Geräte waren besser, 0% vergleichbar, 100% schlechter
» Das beste Gerät hat einen Delta-Wert von 4%, durchschnittlich ist 24%, das schlechteste Gerät hat 134%
Energiemanagement
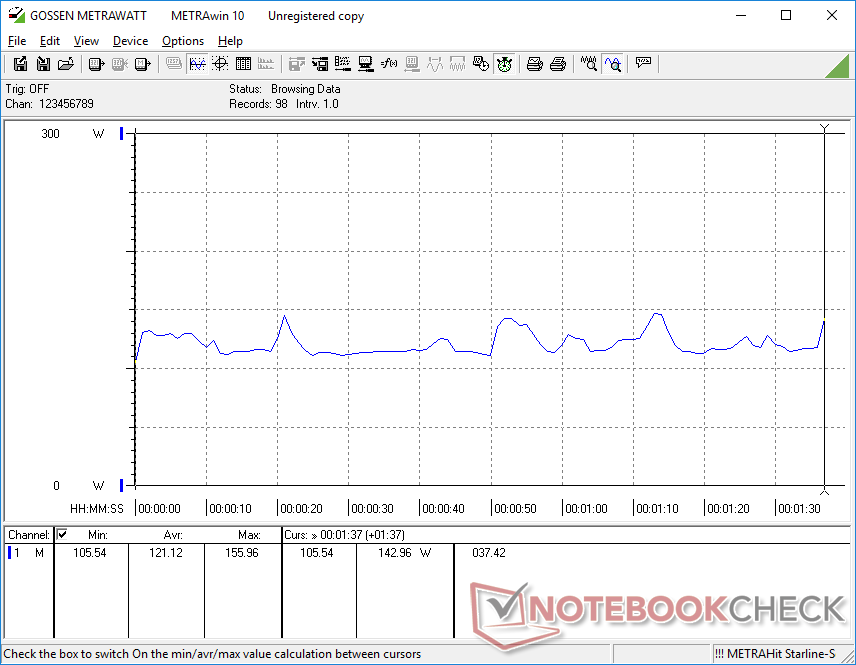
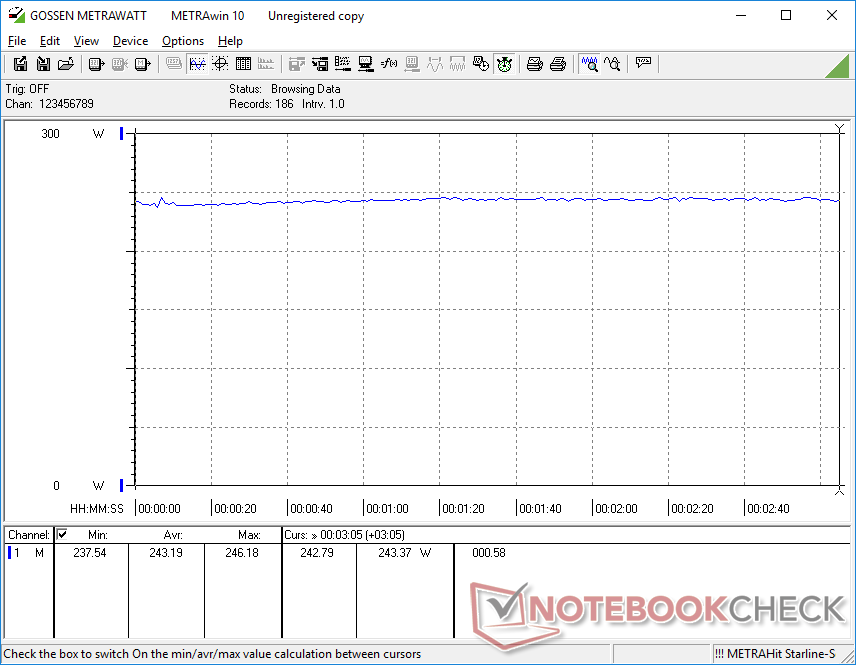
Leistungsaufnahme
Im Leerlauf bei niedrigster Helligkeit und niedrigstem Leistungsprofil benötigt es knapp 13 W, um mit dem XMG Pro 17 E22 vergleichbar zu sein. Bei maximaler Helligkeit und dem Leistungsprofil mit aktiver dedizierter Nvidia-GPU kann dieser Wert jedoch auf bis zu 40 W ansteigen. Wenn die zusätzliche Leistung nicht benötigt wird, empfiehlt es sich, wegen der erheblichen Energieeinsparungen mit niedrigeren Energieeinstellungen zu arbeiten.
Die Leistungsaufnahme bei der Ausführung von Witcher 3 ist fast identisch mit der des MSI Raider GE77, das mit der gleichen GPU ausgestattet ist. Das System ist deutlich anspruchsvoller als ältere Gaming-Notebooks mit GeForce RTX 2080, wie z. B. das Lenovo Legion 7 15 mit über 80 W.
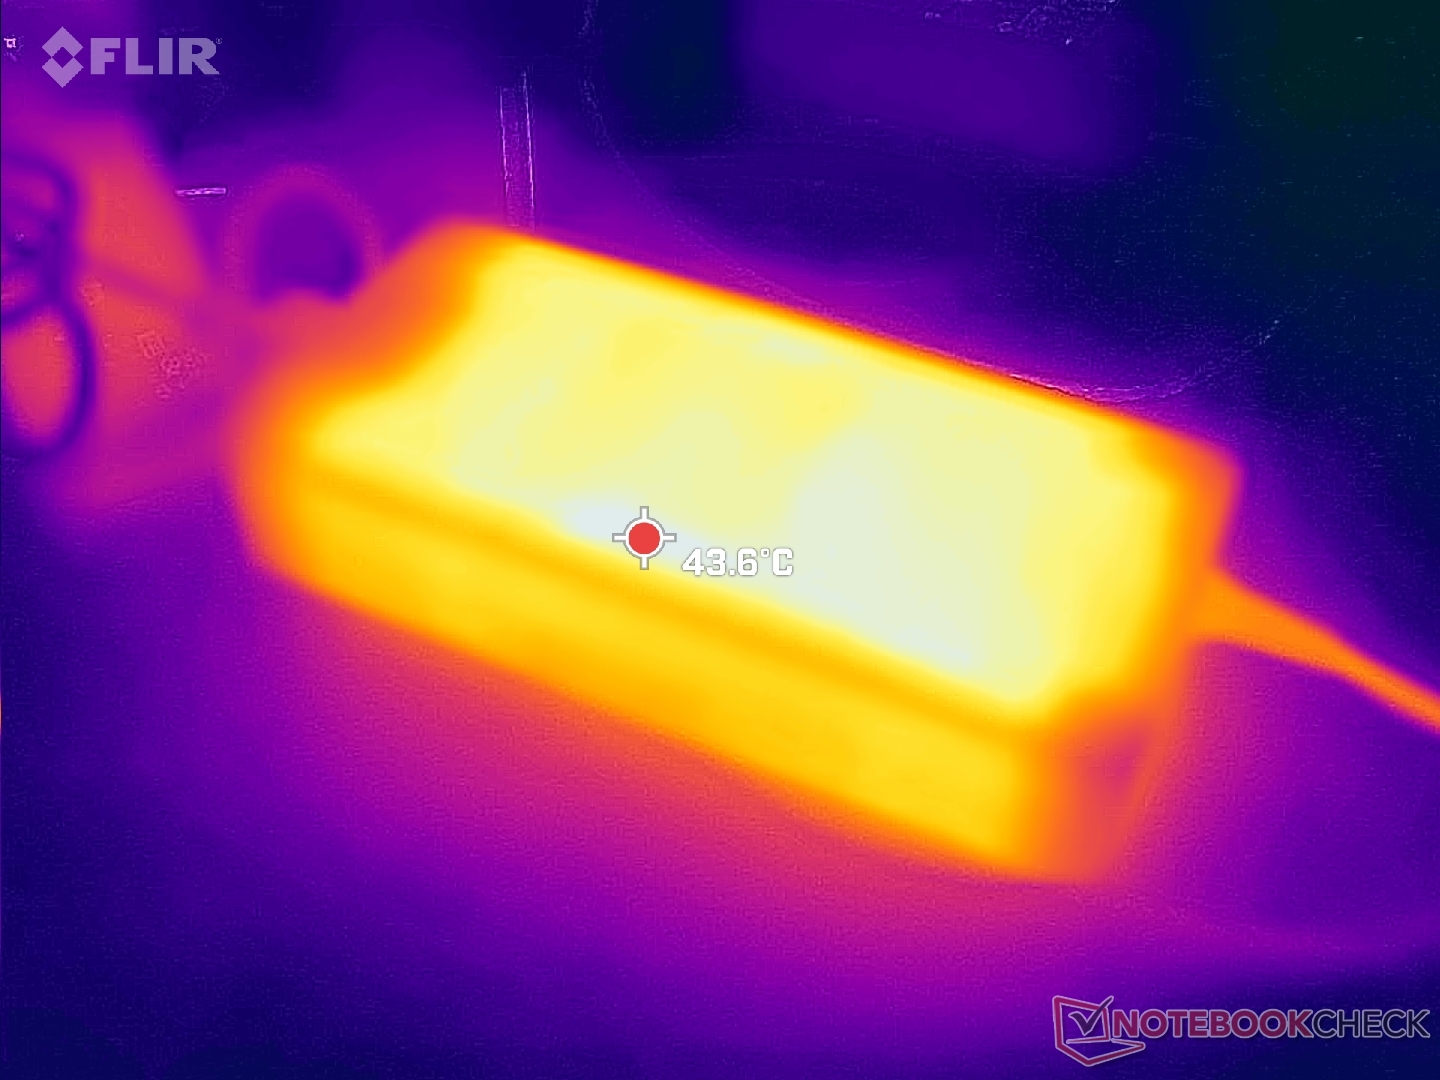
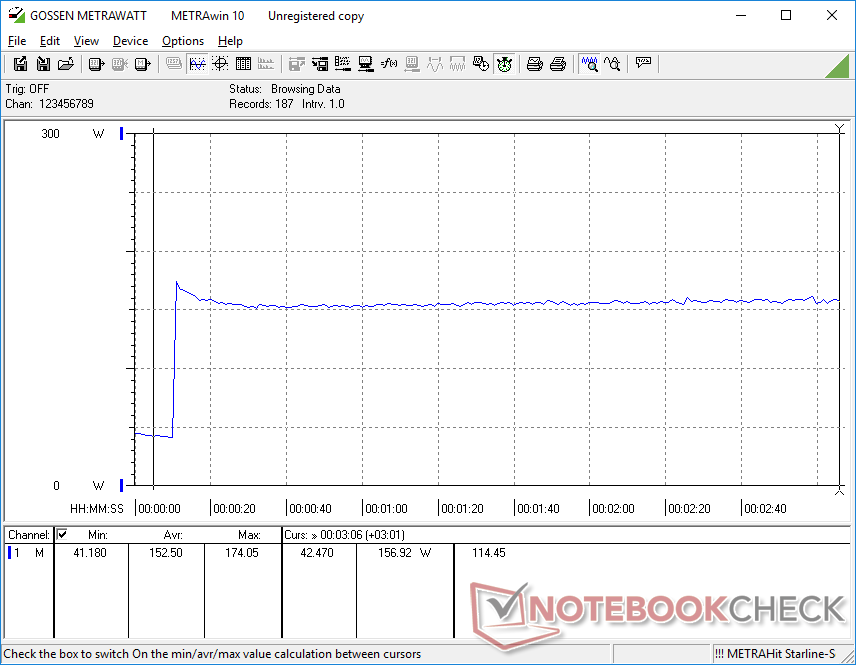
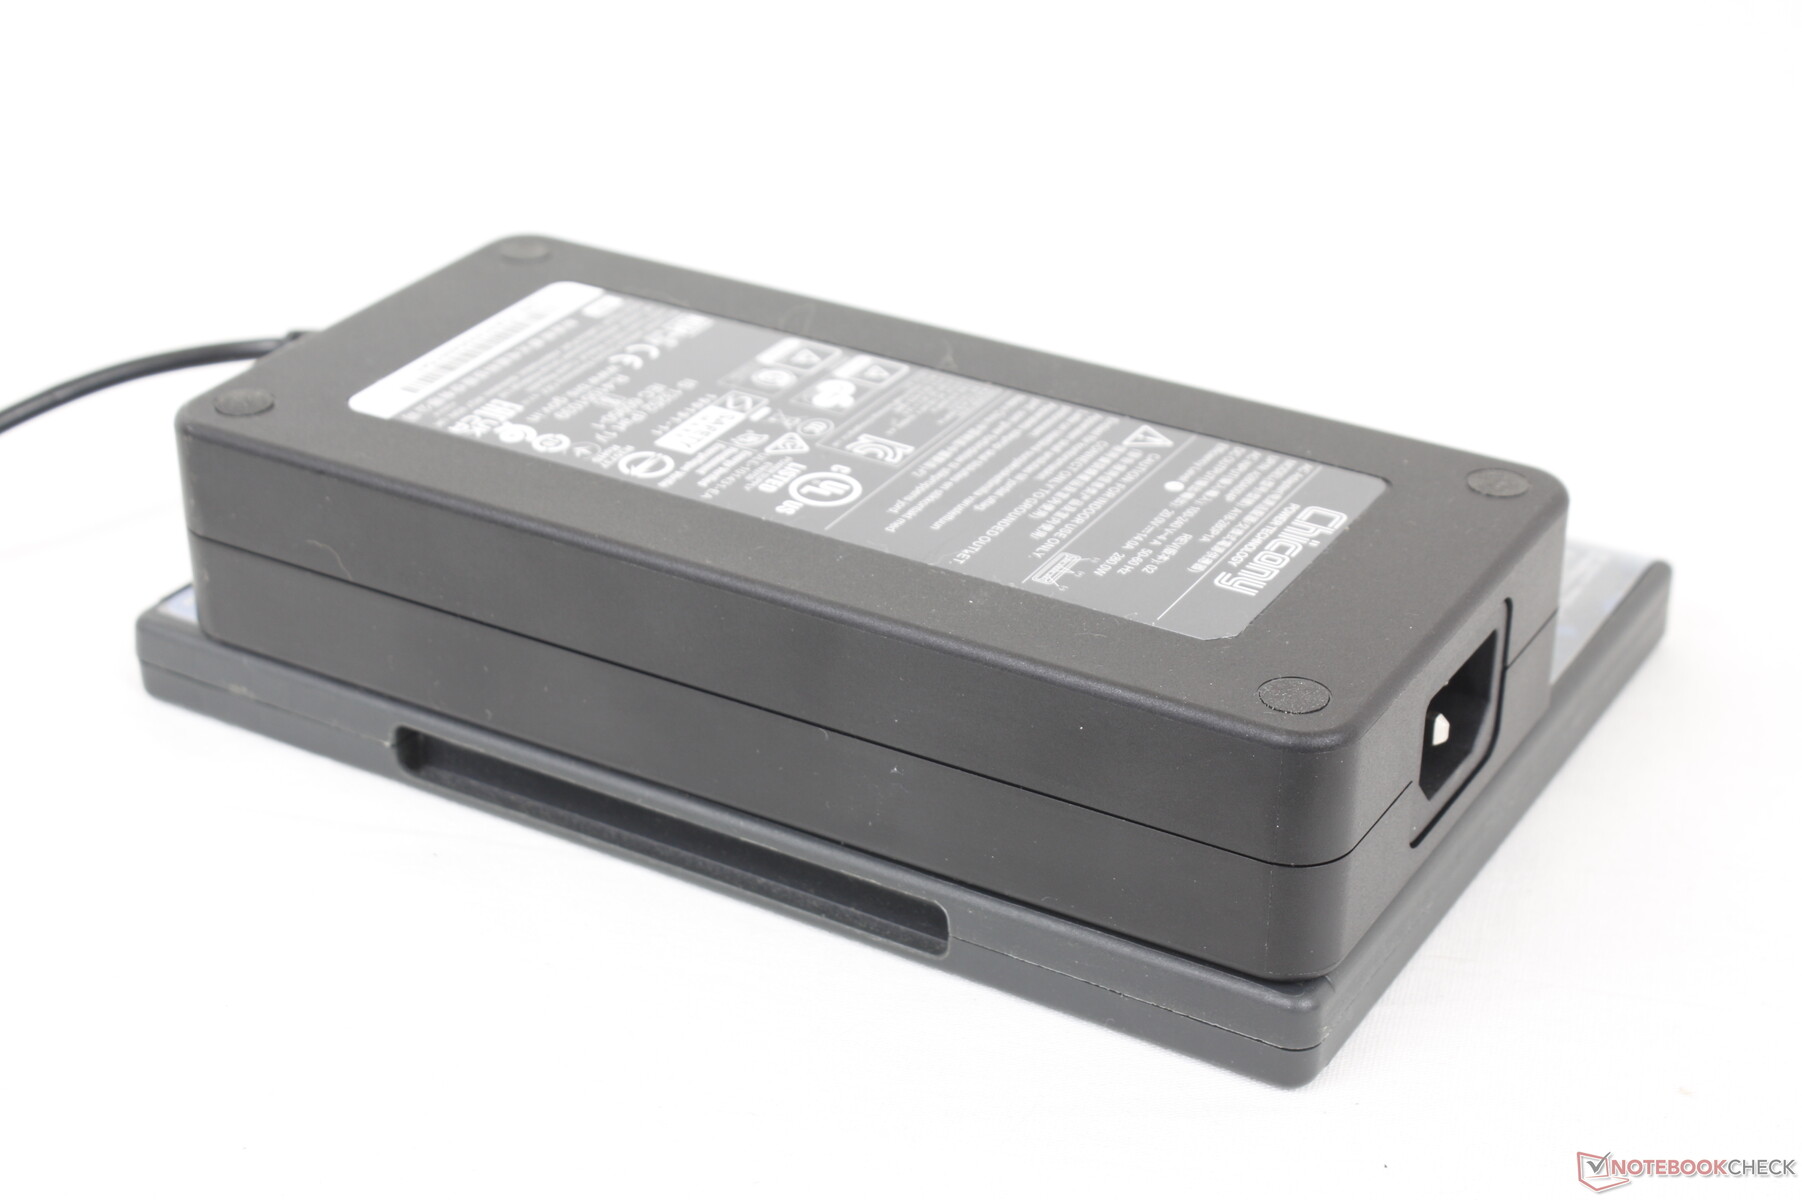
Wir konnten eine maximale Leistungsaufnahme von 285 W aus dem großen (~18 x 8,5 x 3,5 cm) 280-W-Netzteil aufzeichnen, wenn sowohl die CPU als auch die GPU zu 100 Prozent ausgelastet sind. Wie unser Diagramm unten zeigt, ist dieser Wert aufgrund von thermischen Beschränkungen nur vorübergehend. Das System ist immer fürs Gaming geeignet und kann gleichzeitig geladen werden.
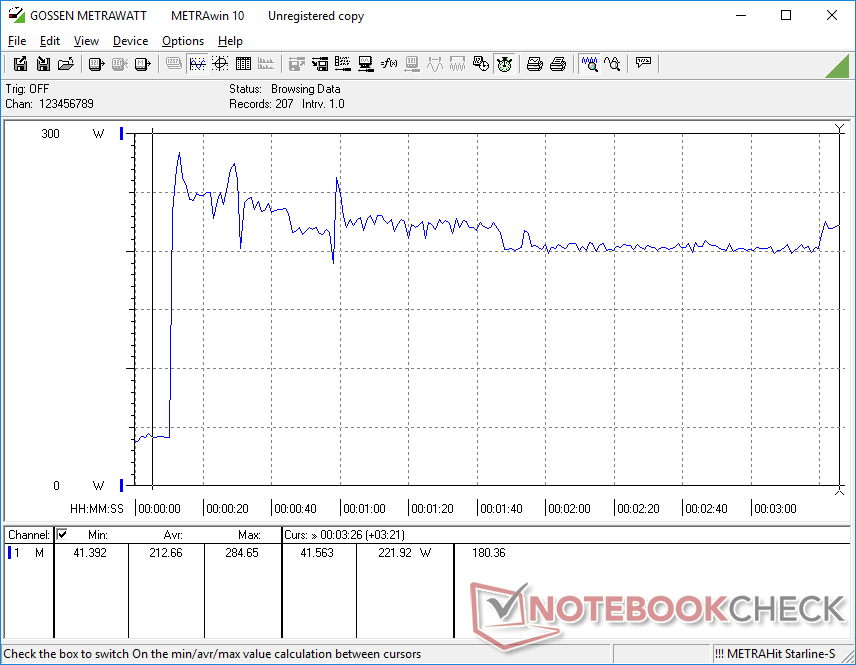
| Aus / Standby | |
| Idle | |
| Last |
|
Legende:
min: | |
| Eurocom Nightsky TXi317 i7-12700H, GeForce RTX 3080 Ti Laptop GPU, Samsung SSD 980 Pro 1TB MZ-V8P1T0BW, IPS, 1920x1080, 17.3" | Schenker XMG Pro 17 E22 i9-12900H, GeForce RTX 3080 Ti Laptop GPU, Samsung SSD 980 Pro 1TB MZ-V8P1T0BW, IPS, 2560x1440, 17.3" | Aorus 17X XES i9-12900HX, GeForce RTX 3070 Ti Laptop GPU, Gigabyte AG470S1TB-SI B10, IPS, 1920x1080, 17.3" | MSI Raider GE77 HX 12UHS i9-12900HX, GeForce RTX 3080 Ti Laptop GPU, Samsung PM9A1 MZVL22T0HBLB, IPS, 3840x2160, 17.3" | Razer Blade 17 Early 2022 i9-12900H, GeForce RTX 3080 Ti Laptop GPU, Samsung PM9A1 MZVL21T0HCLR, IPS, 3840x2160, 17.3" | Alienware x17 R2 P48E i9-12900HK, GeForce RTX 3080 Ti Laptop GPU, 2x Samsung PM9A1 1TB (RAID 0), IPS, 1920x1080, 17.3" | |
|---|---|---|---|---|---|---|
| Stromverbrauch | 17% | -6% | 4% | 6% | -25% | |
| Idle min * (Watt) | 12.8 | 13 -2% | 18 -41% | 13 -2% | 17 -33% | 24.1 -88% |
| Idle avg * (Watt) | 33.9 | 17 50% | 28 17% | 19 44% | 23 32% | 28.5 16% |
| Idle max * (Watt) | 39.1 | 26 34% | 36 8% | 29 26% | 34 13% | 60 -53% |
| Last avg * (Watt) | 121.1 | 120 1% | 153 -26% | 143 -18% | 120 1% | 128.7 -6% |
| Witcher 3 ultra * (Watt) | 243 | 221 9% | 221 9% | 247 -2% | 229 6% | 254 -5% |
| Last max * (Watt) | 284.7 | 266 7% | 290 -2% | 352 -24% | 243 15% | 323 -13% |
* ... kleinere Werte sind besser
Leistungsaufnahme Witcher 3 / Stresstest
Leistungsaufnahme externer Monitor
Batterielaufzeit
Die WLAN-Laufzeit beim Surfen beträgt etwas mehr als 4 Stunden, bevor der Akku wieder aufgeladen werden muss. Unser Gerät wurde vor dem Test der Akkulaufzeit auf das Energieprofil "Ausbalanciert" mit aktiver iGPU eingestellt. Die Ergebnisse sind ähnlich wie beim Razer Blade 17 oder dem Aorus 17X, aber immer noch über zwei Stunden kürzer als beim Schenker XMG Pro 17 E22.
Das Aufladen von der leeren zur vollen Kapazität ist mit etwa 2,5 Stunden sehr langsam. Die meisten Gaming-Laptops brauchen im Vergleich dazu nur 1,5 bis 2 Stunden. Das System kann nicht via USB-C wieder aufgeladen werden.
| Eurocom Nightsky TXi317 i7-12700H, GeForce RTX 3080 Ti Laptop GPU, 80 Wh | Schenker XMG Pro 17 E22 i9-12900H, GeForce RTX 3080 Ti Laptop GPU, 80 Wh | Aorus 17X XES i9-12900HX, GeForce RTX 3070 Ti Laptop GPU, 99 Wh | MSI Raider GE77 HX 12UHS i9-12900HX, GeForce RTX 3080 Ti Laptop GPU, 99.99 Wh | Razer Blade 17 Early 2022 i9-12900H, GeForce RTX 3080 Ti Laptop GPU, 82 Wh | Alienware x17 R2 P48E i9-12900HK, GeForce RTX 3080 Ti Laptop GPU, 87 Wh | |
|---|---|---|---|---|---|---|
| Akkulaufzeit | 62% | 5% | 29% | -10% | -52% | |
| WLAN (h) | 4.2 | 6.8 62% | 4.4 5% | 5.4 29% | 3.8 -10% | 2 -52% |
| H.264 (h) | 4.6 | 3.8 | 6.5 | 4.8 | ||
| Last (h) | 1.5 | 1.4 | 2 | 1.7 | 0.8 | |
| Idle (h) | 9.8 | 7.1 | 3.9 |
Pro
Contra
Fazit: Das Gehäuse braucht eine Auffrischung
Das Eurocom Nightsky TXi317 hat die CPU- und Grafikleistung eines großen Flaggschiff-Gaming-Laptops, jedoch ohne viele der Zusatzfunktionen, die wir von einem mittelgroßen Design erwarten. Vor allem ist das Modell nicht in der Lage, SSDs über längere Zeit zu betreiben, ohne die Übertragungsraten zu drosseln. Die Zielgruppe der Performance-Nutzer wird eher enttäuscht sein, dass sie ihre neuen PCIe4 x4-Laufwerke nicht voll ausnutzen können. Alternativen wie das Alienware x17 oder die MSI GE66-Serie haben genau aus diesem Grund Heatspreader über ihren internen SSDs.
Das Eurocom Nightsky TXi317 hat die Leistung eines teuren Gaming-Laptops, aber es fehlt ihm an vielen grundlegenden und fortgeschrittenen Zusatzfunktionen eines solchen.
Weitere kleinere Nachteile sind die sehr niedrig auflösende Webcam, der fehlende Privacy Shutter, die fehlende USB-C-PD-Unterstützung, das fehlende Advanced Optimus, die fehlenden Wi-Fi 6E-Optionen und die sehr warmen Kerntemperaturen, die beim Spielen fast 90 °C erreichen. Auch bei der Wartung hinkt das Gehäuse hinterher, da das Entfernen der Bodenplatte länger dauert als bei den meisten anderen Gaming-Notebooks heutzutage. Für 3.000 Euro und mehr bietet das Nightsky TXi317 einfach nicht annähernd so viel wie andere High-End-Konkurrenten.
Preis und Verfügbarkeit
In Europa kann der Nightsky TXi317 über die Eurocom-Website in verschiedenen Konfigurationen für 3.000 Euro aufwärts bestellt werden.
Eurocom Nightsky TXi317
- 26.10.2022 v7 (old)
Allen Ngo
Preisvergleich

