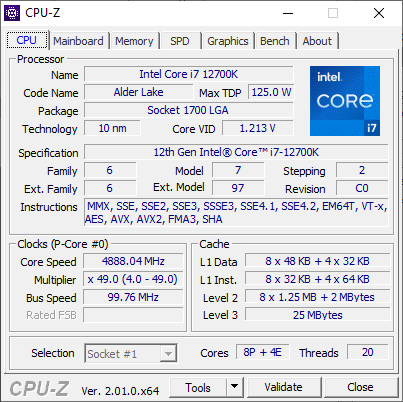
Eurocom Raptor X15 Test: LGA1700 Core i7-12700K in einem Laptop
Das Gehäuse des Raptor X15 ähnelt dem Clevo NH57AF1, das Schenker auch für sein XMG Apex 15 Notebook verwendet. Wir empfehlen daher einen Blick auf unsere Schenker Testseite, da unsere Anmerkungen zu den Anschlüssen und dem Gesamtdesign des Modells hier auf das Raptor X15 zutreffen. Diese Seite wird sich stattdessen auf die Leistung des Raptor X15 konzentrieren und darauf, was Nutzer von der 12. Generation der Core i7-12700K CPU erwarten können, wenn sie in einem Laptop-Formfaktor eingesetzt wird.
Das Raptor X15 konkurriert mit anderen 15,6-Zoll-Enthusiasten-Gaming-Notebooks wie dem MSI GE66, Gigabyte A5 X1, Asus TUF Gaming A15 oder dem Razer Blade 15. Ein wichtiges Unterscheidungsmerkmal ist jedoch die Verwendung einer Desktop-CPU mit Sockel LGA1700 anstelle eines typischen mobilen Prozessors der H-Serie.
(Update vom 14. Juni 2022: Der Hersteller hat uns gegenüber klargestellt, dass der Raptor X15 trotz der Gehäuseähnlichkeiten nicht auf dem Clevo NH57AF1-Modell basiert. Das Sckenker Modell basiert auf AMD, während der Raptor X15 auf Intel basiert. Schenker hat keine Verbindung zum Raptor X15.)
Weitere Eurocom Tests:
Potenzielle Mitbewerber im Vergleich
Bew. | Datum | Modell | Gewicht | Dicke | Größe | Auflösung | Preis ab |
|---|---|---|---|---|---|---|---|
| 86.1 % v7 (old) | 10 / 2022 | Eurocom Raptor X15 i7-12700K, GeForce RTX 3070 Ti Laptop GPU | 2.7 kg | 32.5 mm | 15.60" | 1920x1080 | |
| 87.4 % v7 (old) | 06 / 2022 | MSI Raider GE66 12UHS i9-12900HK, GeForce RTX 3080 Ti Laptop GPU | 2.4 kg | 23.4 mm | 15.60" | 3840x2160 | |
| 88.3 % v7 (old) | 05 / 2022 | Razer Blade 15 Advanced Model Early 2022 i7-12800H, GeForce RTX 3080 Ti Laptop GPU | 2.1 kg | 16.99 mm | 15.60" | 1920x1080 | |
| 85.2 % v7 (old) | Eurocom RX315 NH57AF1 i7-11800H, GeForce RTX 3070 Laptop GPU | 2 kg | 20 mm | 15.60" | 1920x1080 | ||
| 84.1 % v7 (old) | 01 / 2022 | Gigabyte A5 X1 R9 5900HX, GeForce RTX 3070 Laptop GPU | 2.2 kg | 25.3 mm | 15.60" | 1920x1080 | |
| 85 % v7 (old) | 07 / 2021 | Asus TUF Gaming A15 FA506QR-AZ061T R7 5800H, GeForce RTX 3070 Laptop GPU | 2.3 kg | 24 mm | 15.60" | 1920x1080 |
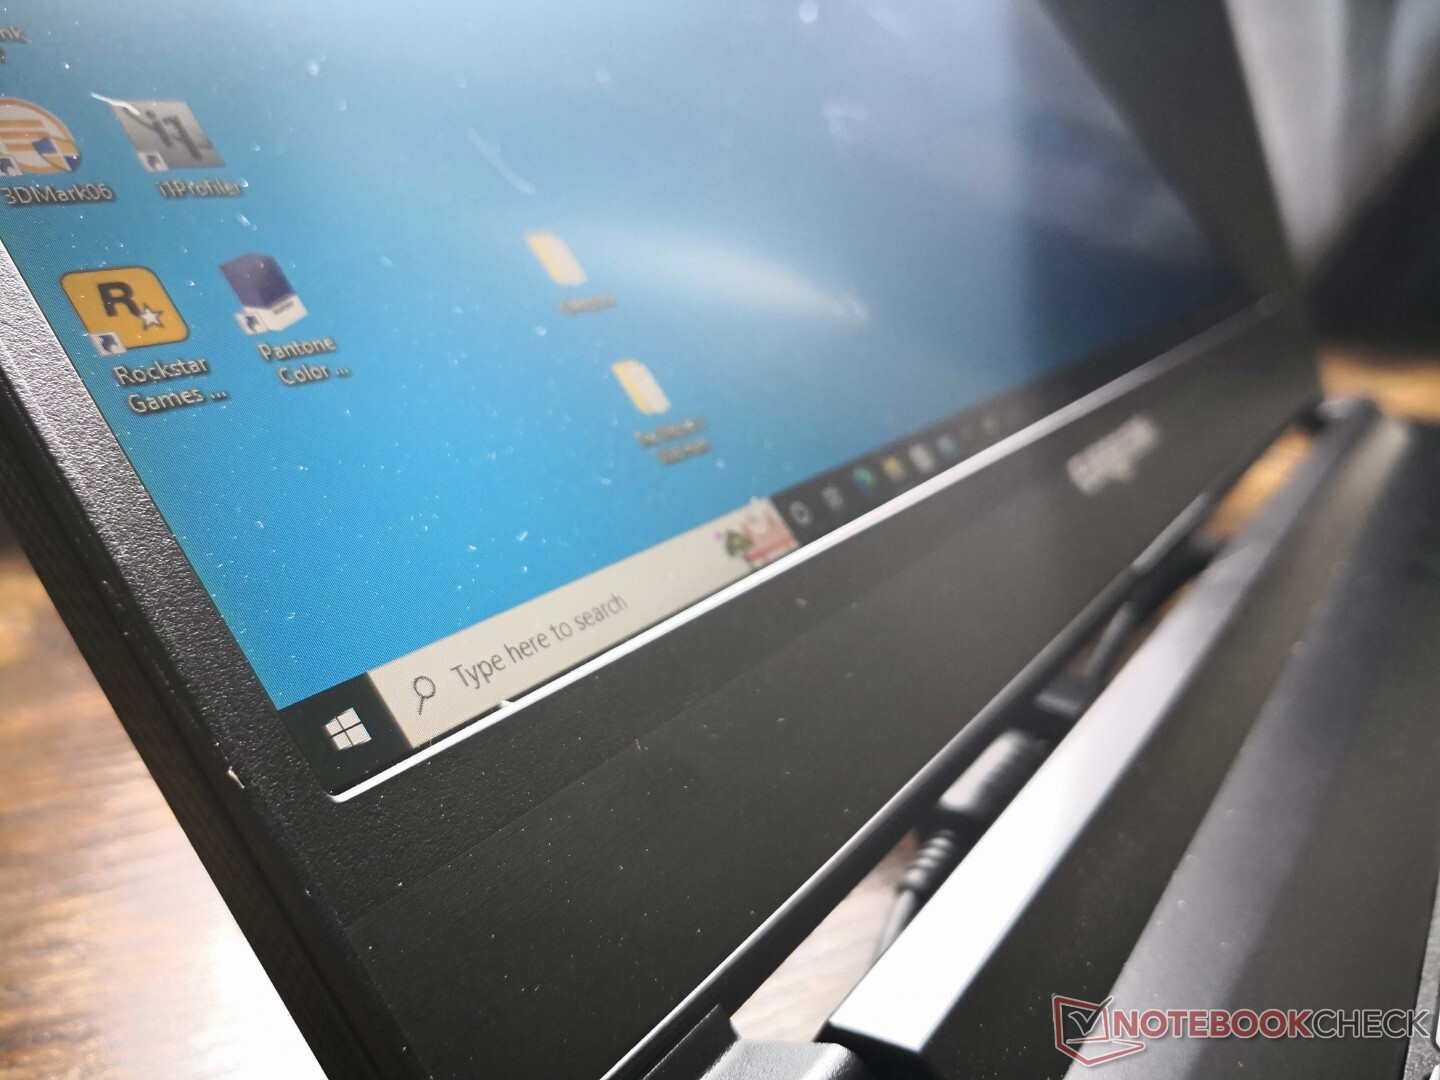
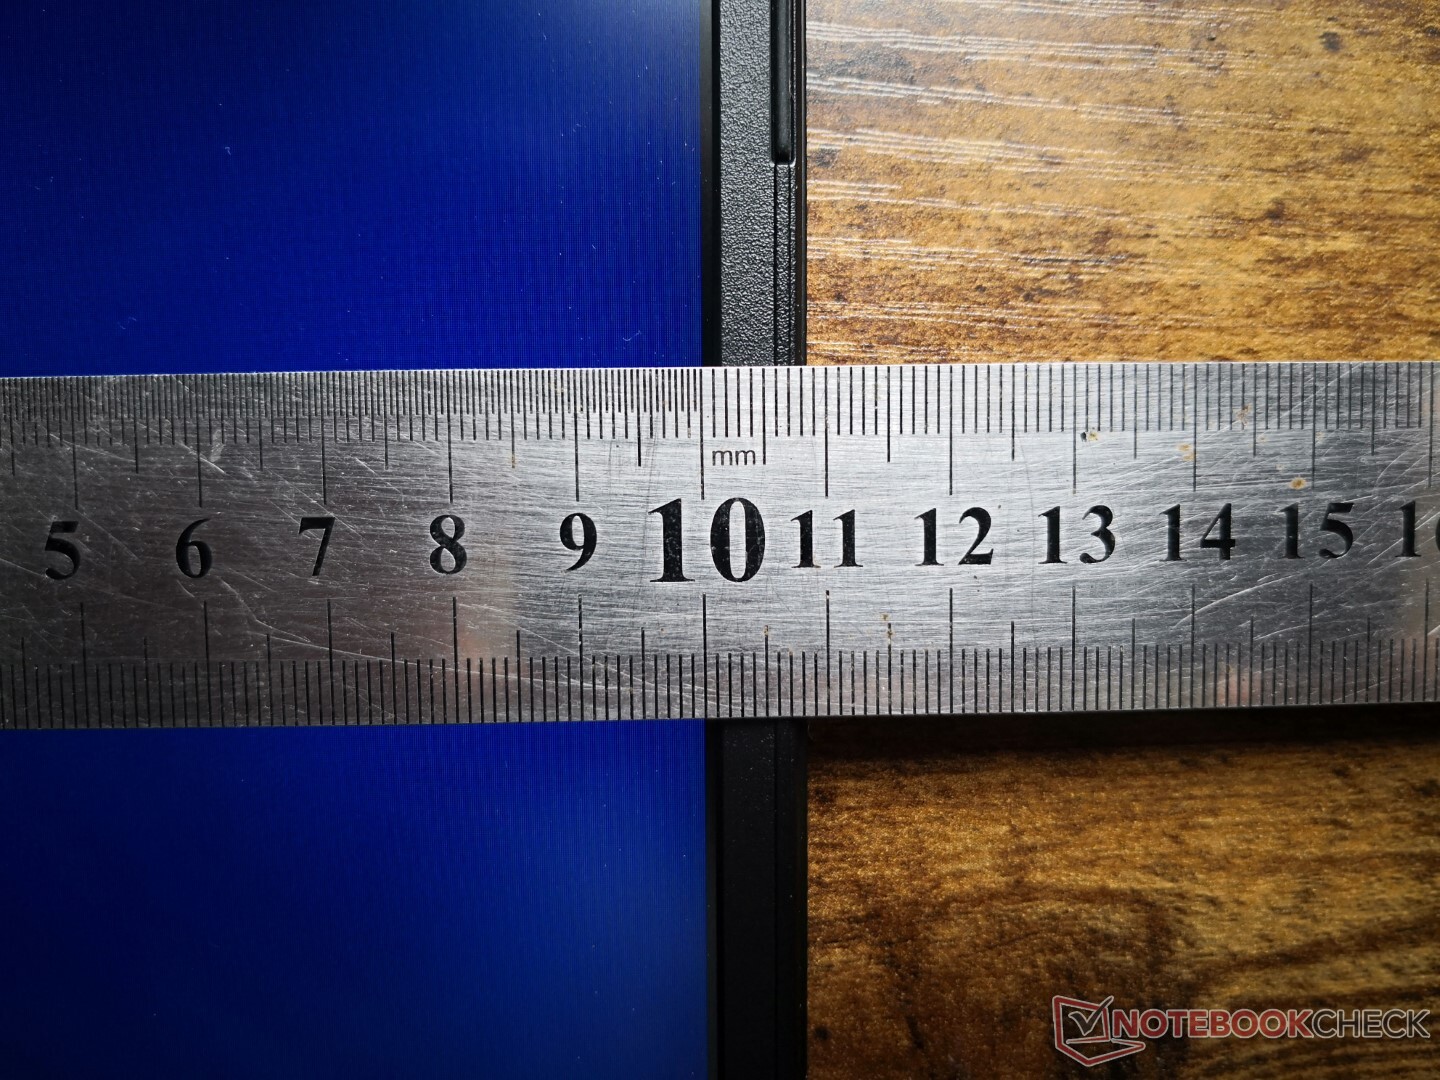
Gehäuse
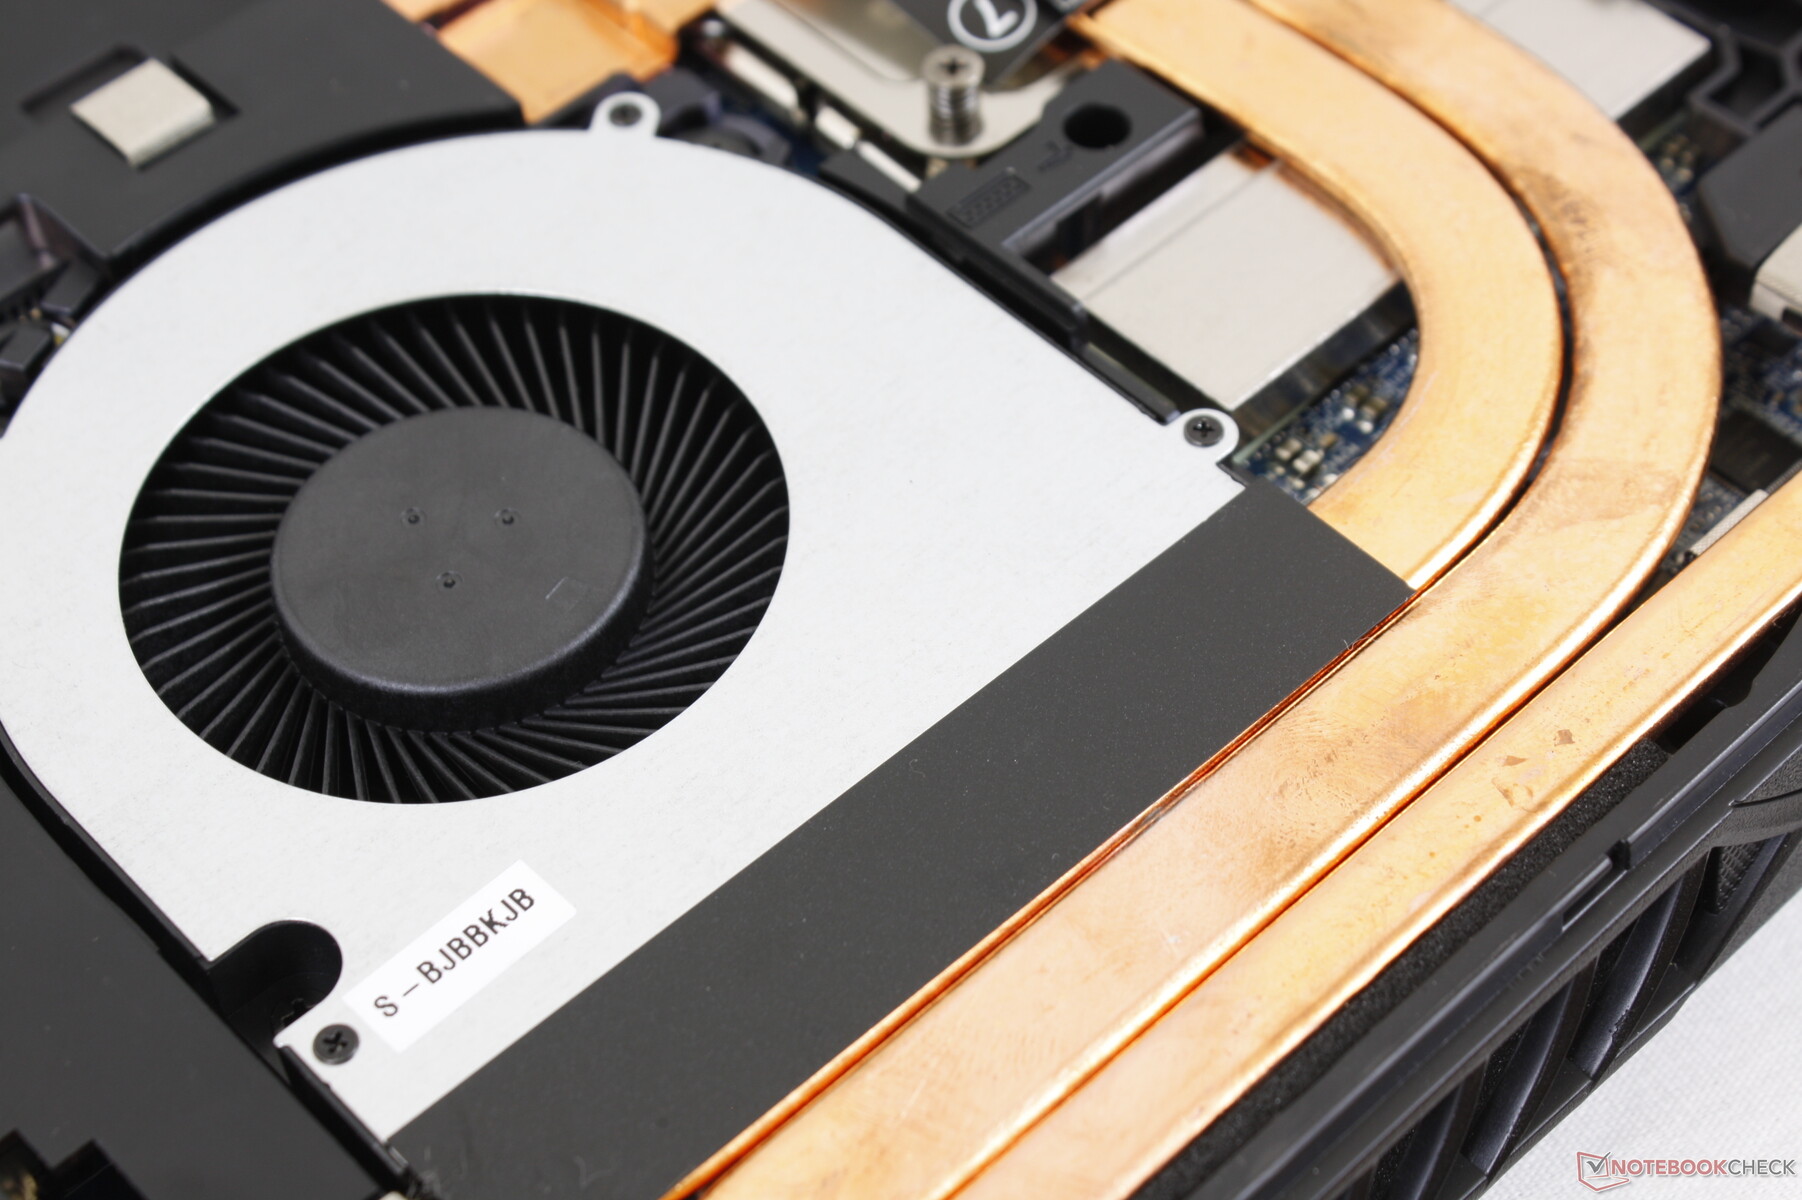
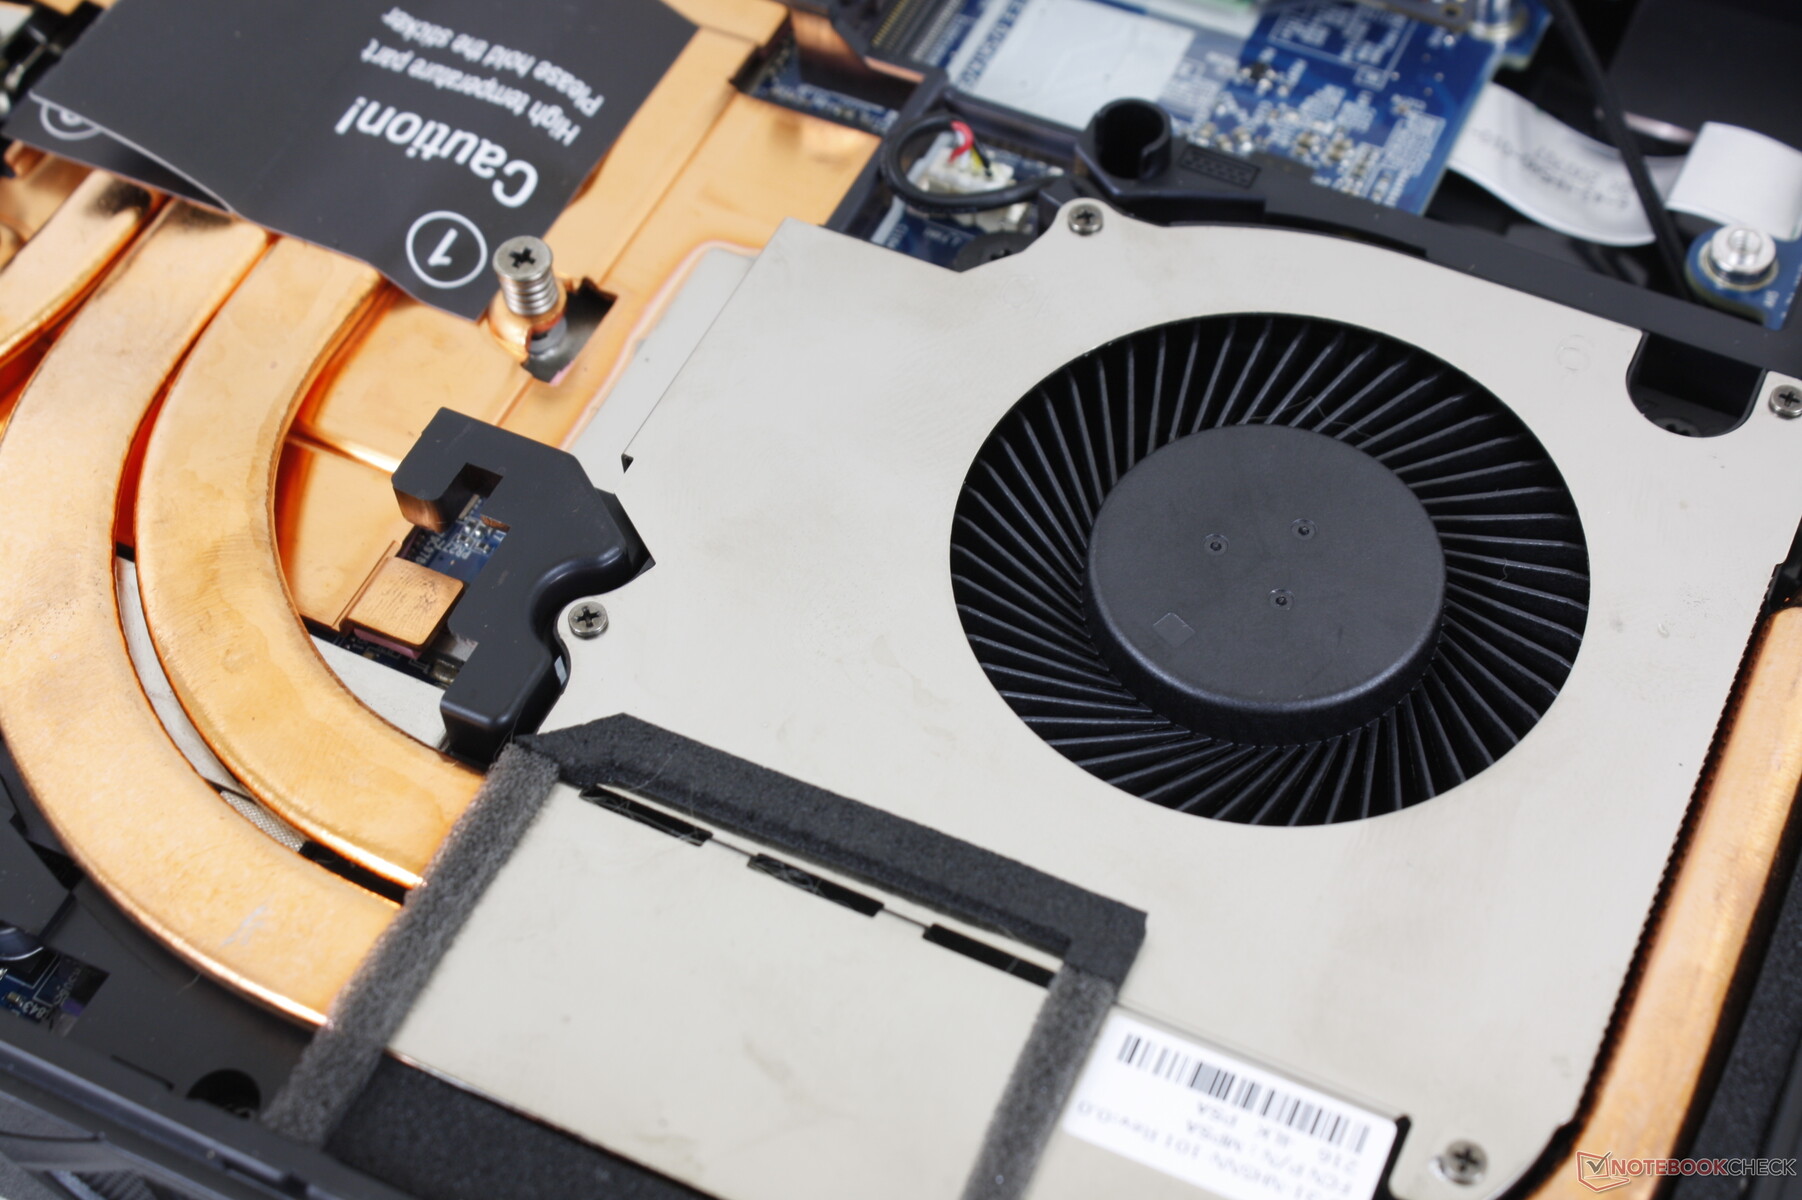
Mit 2,7 kg und 32,5 mm Dicke ist das Raptor X15 schwerer und dicker als die meisten anderen 15,6-Zoll-Gaming-Notebooks, darunter das MSI GE66 oder das Asus TUF Gaming A15. Das zusätzliche Gewicht kann teilweise auf die größere Kühlung zurückgeführt werden, die erforderlich ist, um den LGA1700-Sockel und den Prozessor entsprechend unterzubringen und zu kühlen.
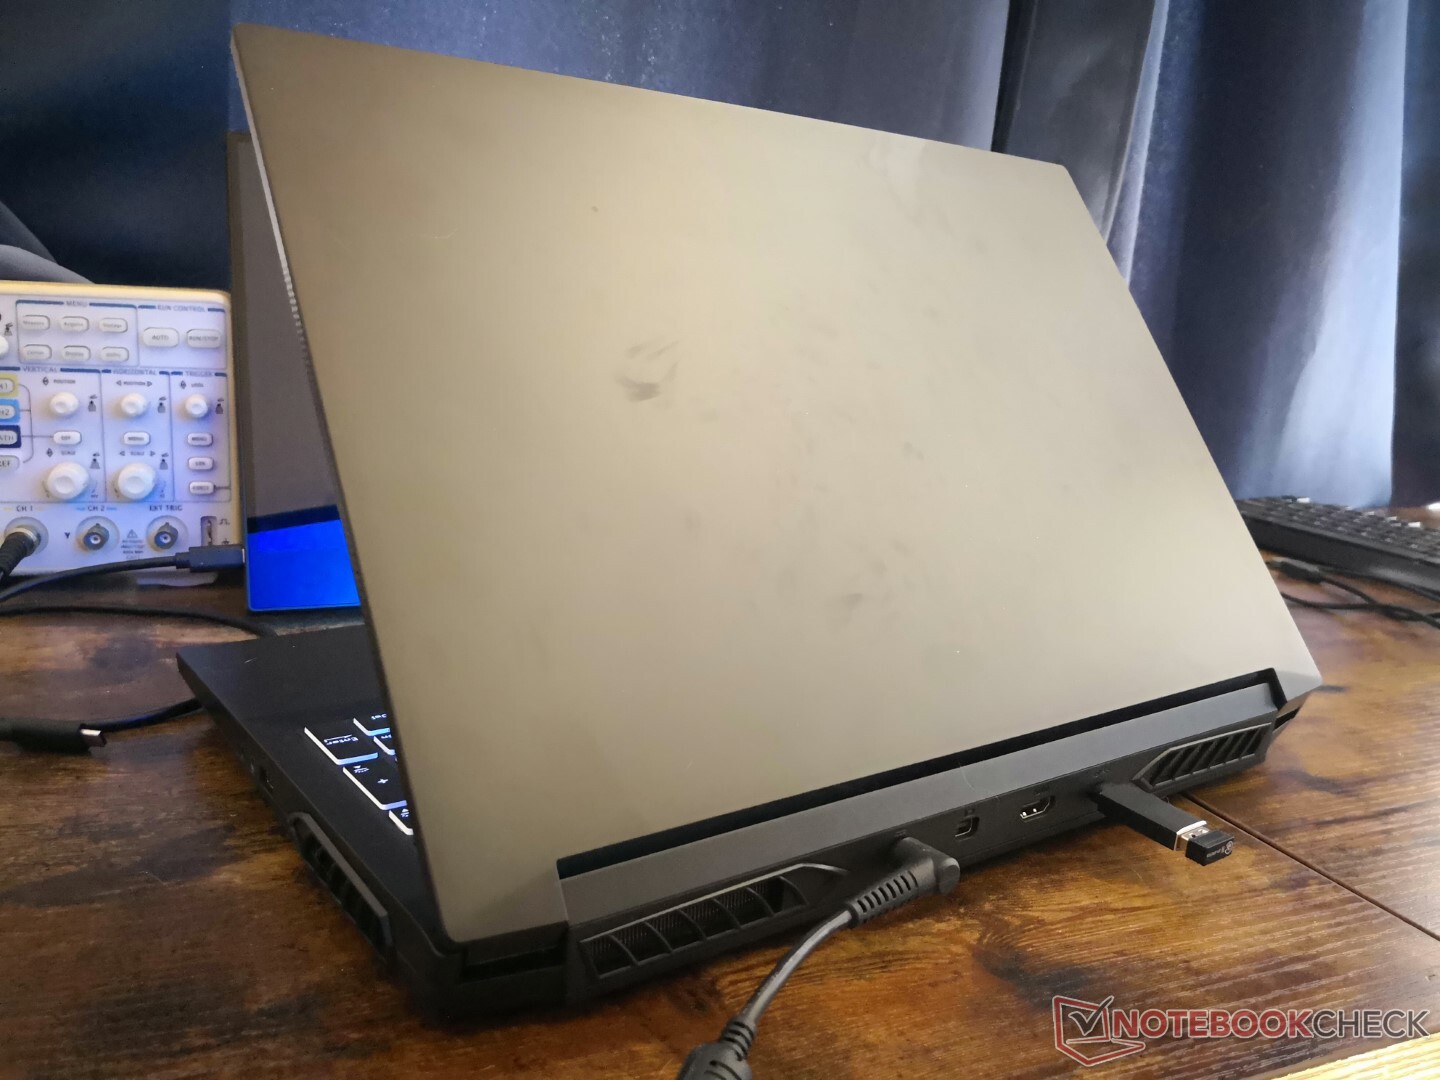
Anschlüsse
Die Anschlussoptionen sind vielfältig und identisch mit denen des Schenker XMG Apex 15. Man beachte, dass es nur einen USB-C-Anschluss mit Unterstützung für DisplayPort gibt, aber nicht Thunderbolt oder Power Delivery, anders als bei vielen anderen Intel betriebenen Gaming-Notebooks wie der Razer-Blade-Serie oder der MSI-GS-Serie.
SD-Kartenleser
Seltsamerweise hat das Modell trotz dem großen und relativ dicken Formfaktor einen microSD-Kartenleser anstelle eines Full-Size-Kartenlesers integriert. Die Übertragungsraten sind nur durchschnittlich und weniger als halb so schnell wie der Kartenleser des Dell XPS 15.
| SD Card Reader | |
| average JPG Copy Test (av. of 3 runs) | |
| Dell XPS 15 9510 i5 11400H FHD (AV Pro V60) | |
| Asus ZenBook Flip 14 UN5401QA-KN085W (AV Pro SD microSD 128 GB V60) | |
| Asus Zenbook Pro 15 OLED UM535Q (Toshiba Exceria Pro SDXC 64 GB UHS-II) | |
| Eurocom Raptor X15 (AV Pro V60) | |
| Asus ZenBook 14X OLED UX5400EA-L7154W | |
| maximum AS SSD Seq Read Test (1GB) | |
| Dell XPS 15 9510 i5 11400H FHD (AV Pro V60) | |
| Eurocom Raptor X15 (AV Pro V60) | |
| Asus ZenBook Flip 14 UN5401QA-KN085W (AV Pro SD microSD 128 GB V60) | |
| Asus Zenbook Pro 15 OLED UM535Q (Toshiba Exceria Pro SDXC 64 GB UHS-II) | |
| Asus ZenBook 14X OLED UX5400EA-L7154W | |
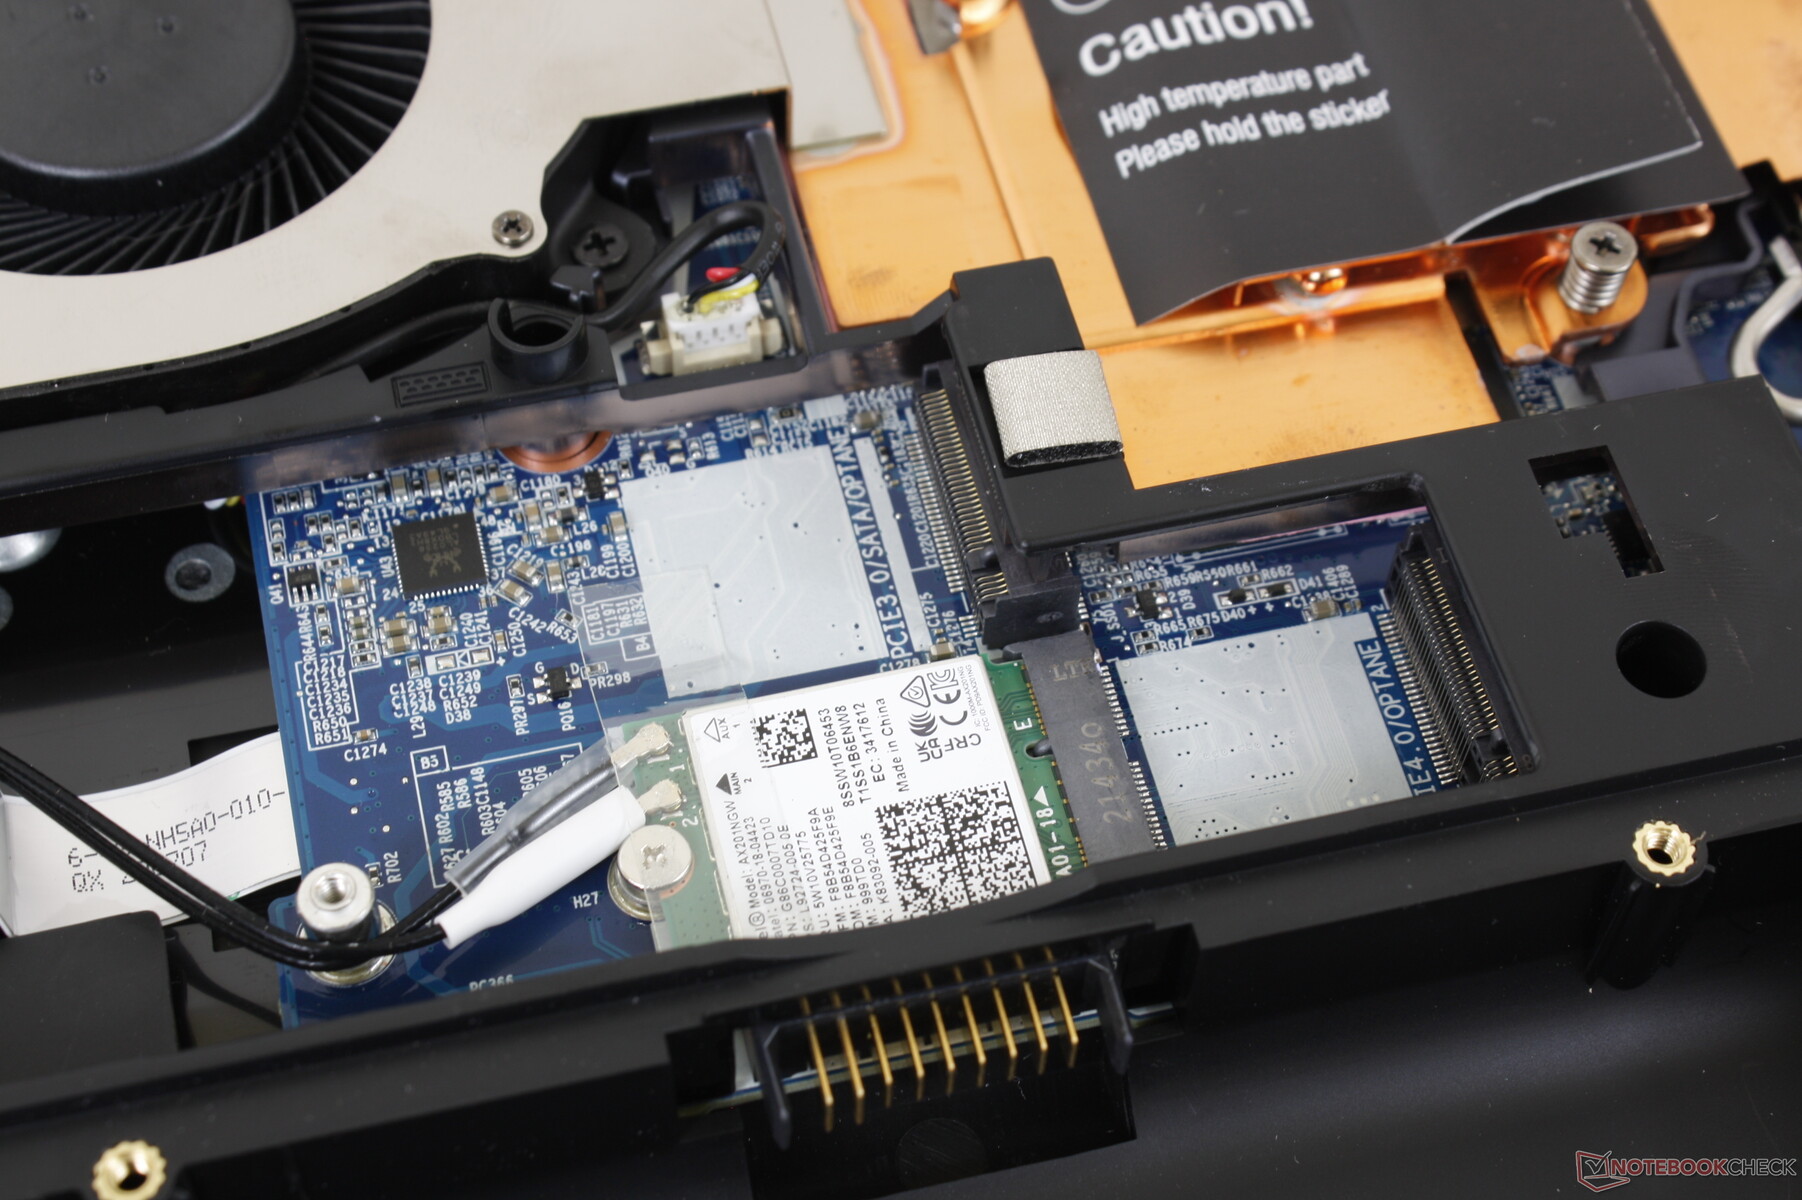
Kommunikation
Das Intel AX200/201 ist als High-End-Option für Wi-Fi 6 und Bluetooth-5.2-Konnektivität ausgestattet. Bei der Kopplung mit unserem Testrouter Asus GT-AXE11000 gab es keine Probleme.
Wi-Fi 6E ist leider nicht kompatibel.
| Networking | |
| iperf3 transmit AX12 | |
| Gigabyte A5 X1 | |
| Asus TUF Gaming A15 FA506QR-AZ061T | |
| Eurocom RX315 NH57AF1 | |
| iperf3 receive AX12 | |
| Asus TUF Gaming A15 FA506QR-AZ061T | |
| Gigabyte A5 X1 | |
| Eurocom RX315 NH57AF1 | |
| iperf3 receive AXE11000 | |
| Razer Blade 15 Advanced Model Early 2022 | |
| MSI Raider GE66 12UHS | |
| Eurocom Raptor X15 | |
| iperf3 transmit AXE11000 | |
| Razer Blade 15 Advanced Model Early 2022 | |
| MSI Raider GE66 12UHS | |
| Eurocom Raptor X15 | |
Webcam
Die Webcam ist mit 720p im Vergleich zu 1.080p bei einigen anderen Gaming-Laptops wie dem Razer Blade 15 sehr schwach. Es gibt auch keine Unterstützung für Windows Hello. Die Kamera kann elektronisch über die F10-Taste anstelle eines physischen Auslösers deaktiviert werden.


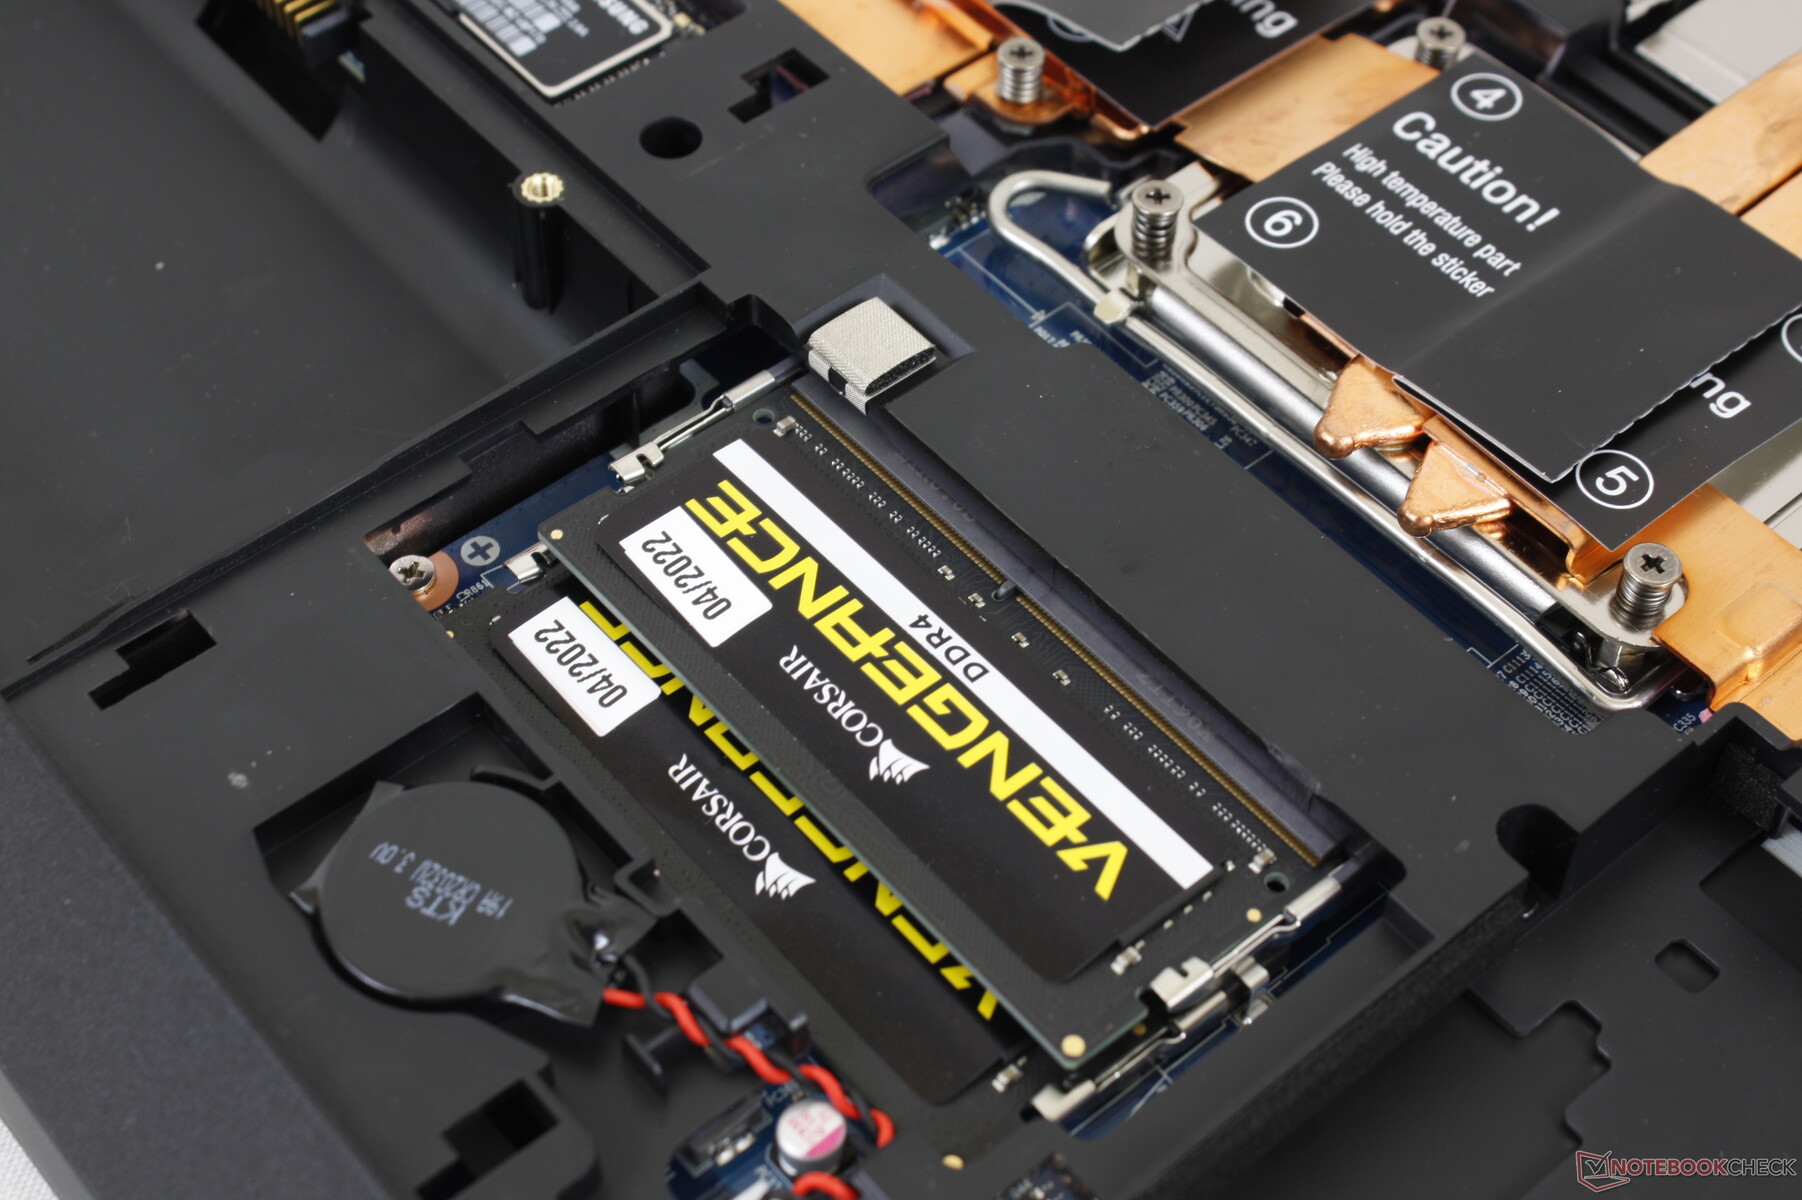
Wartung
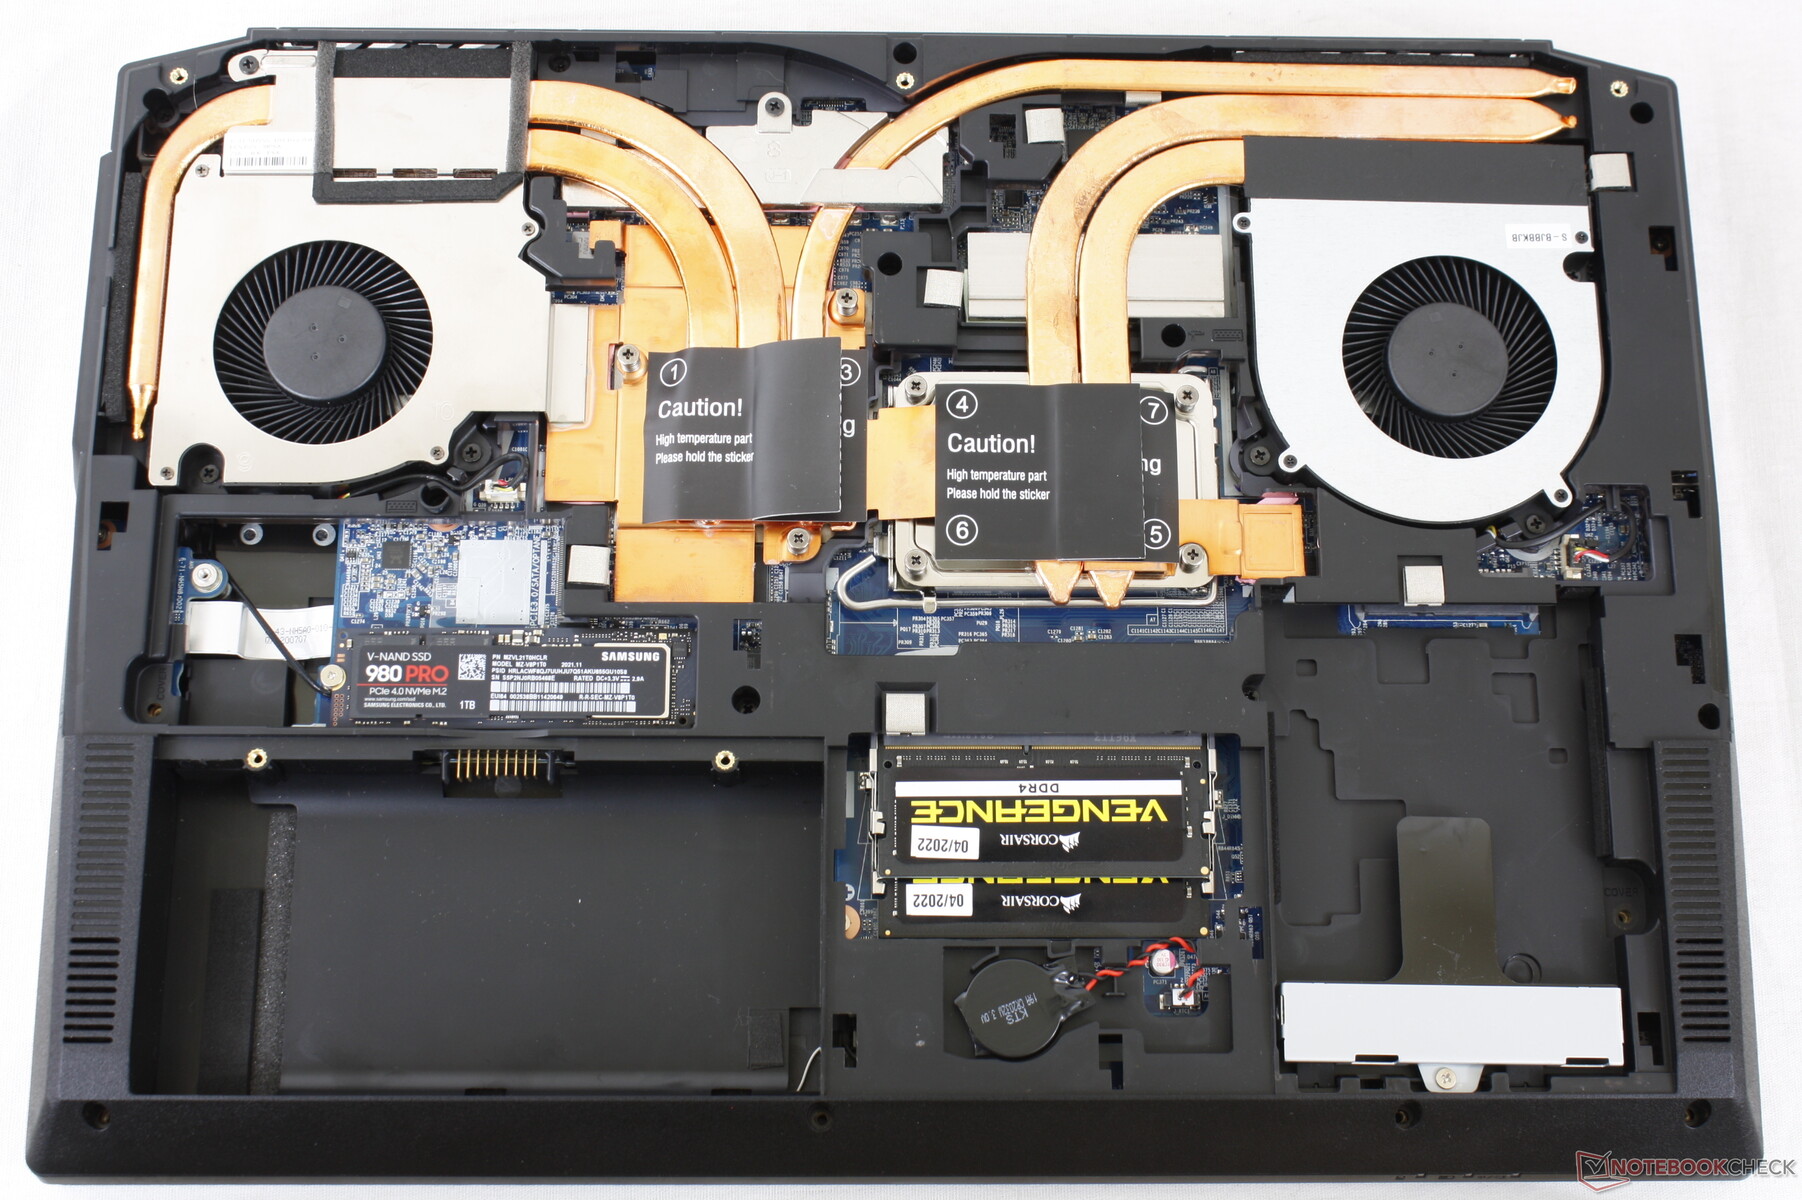
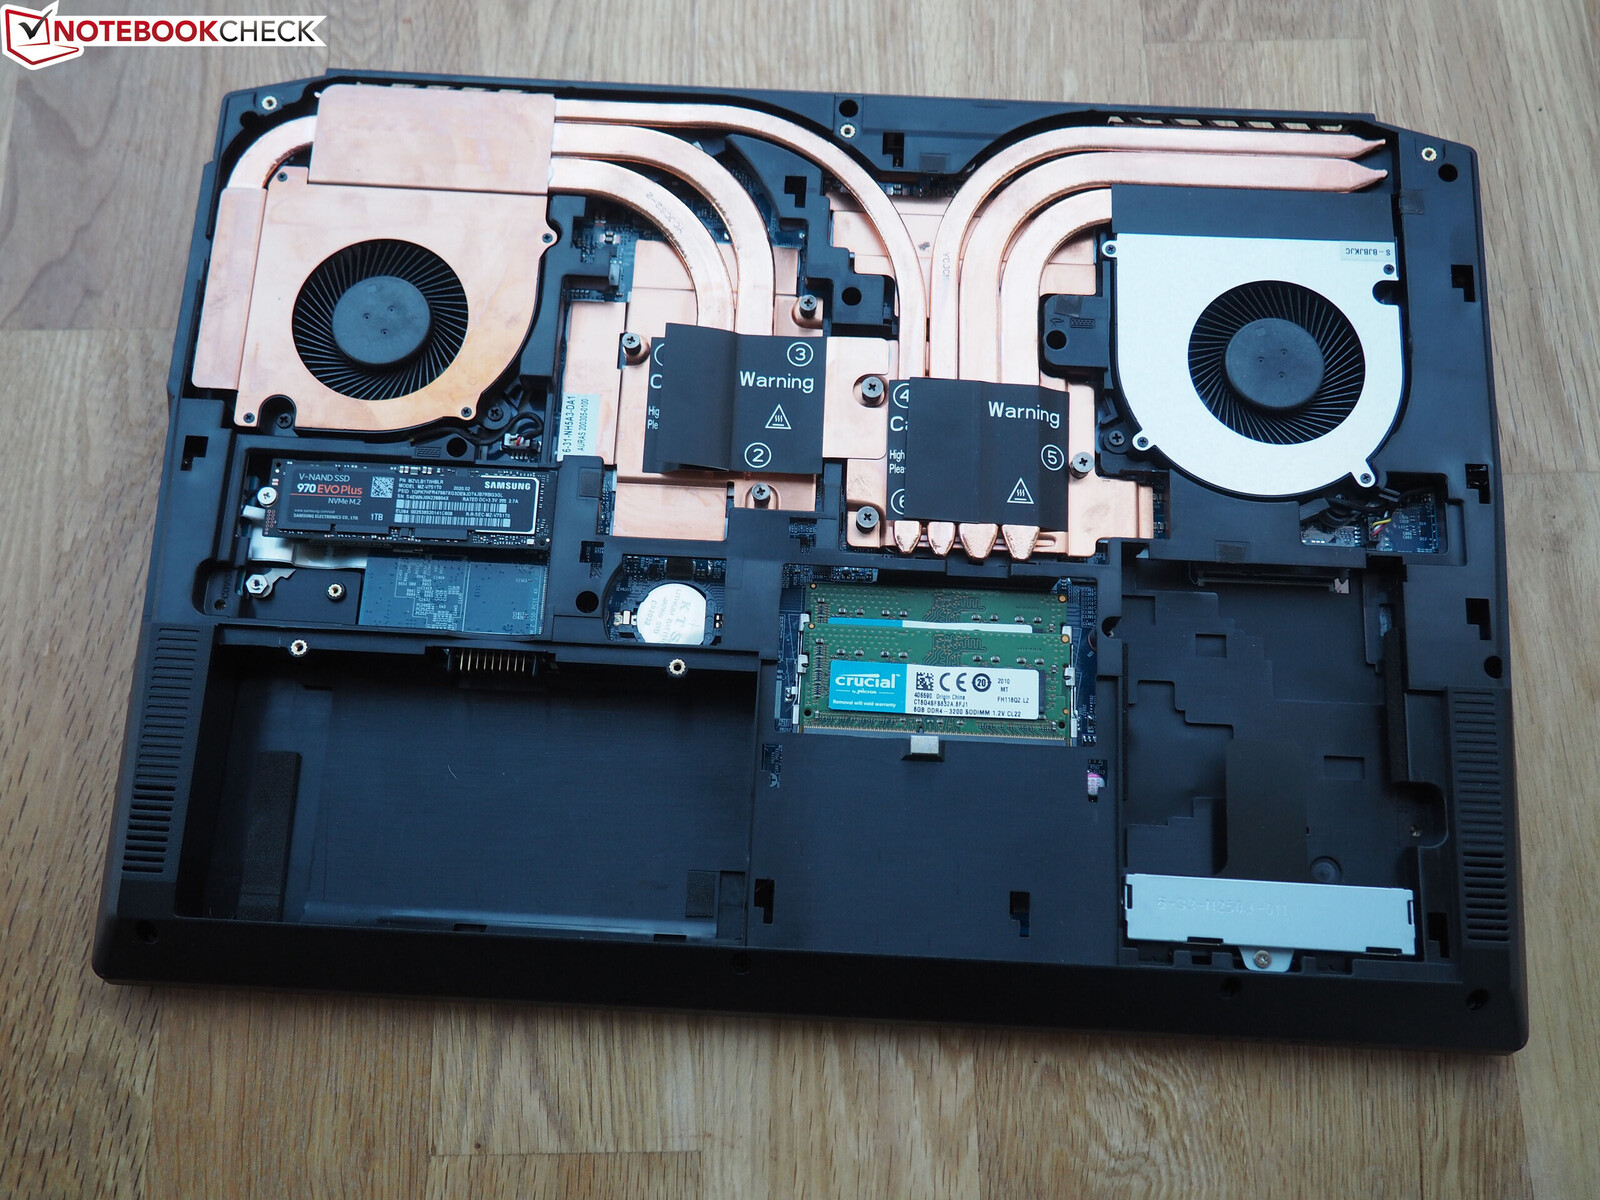
Zubehör und Garantie
Die Verkaufsverpackung enthält Schrauben und Pads für die Installation zusätzlicher SSDs sowie eine Treiberdiskette. Eine CPU-Wärmeleitpaste ist nicht enthalten.
Beim Kauf in den USA gilt die eingeschränkte Standardgarantie von einem Jahr, die optional um zwei und drei Jahre verlängert werden kann. Der Raptor X15 ist hierzulande in dieser Konfiguration nicht verfügbar.
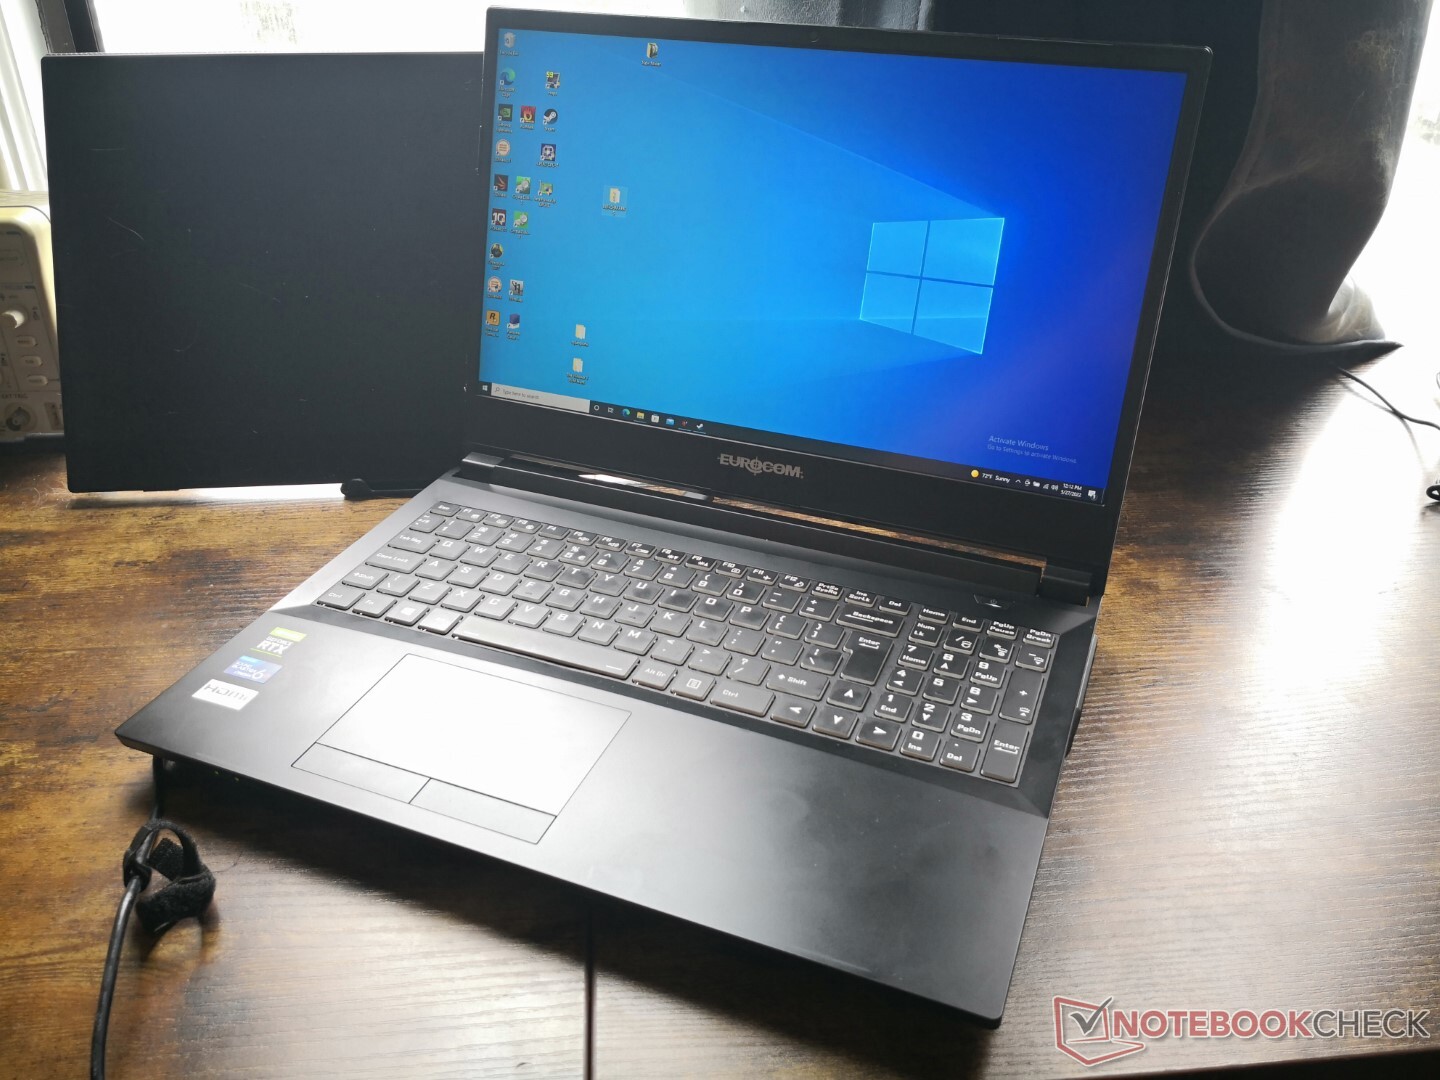
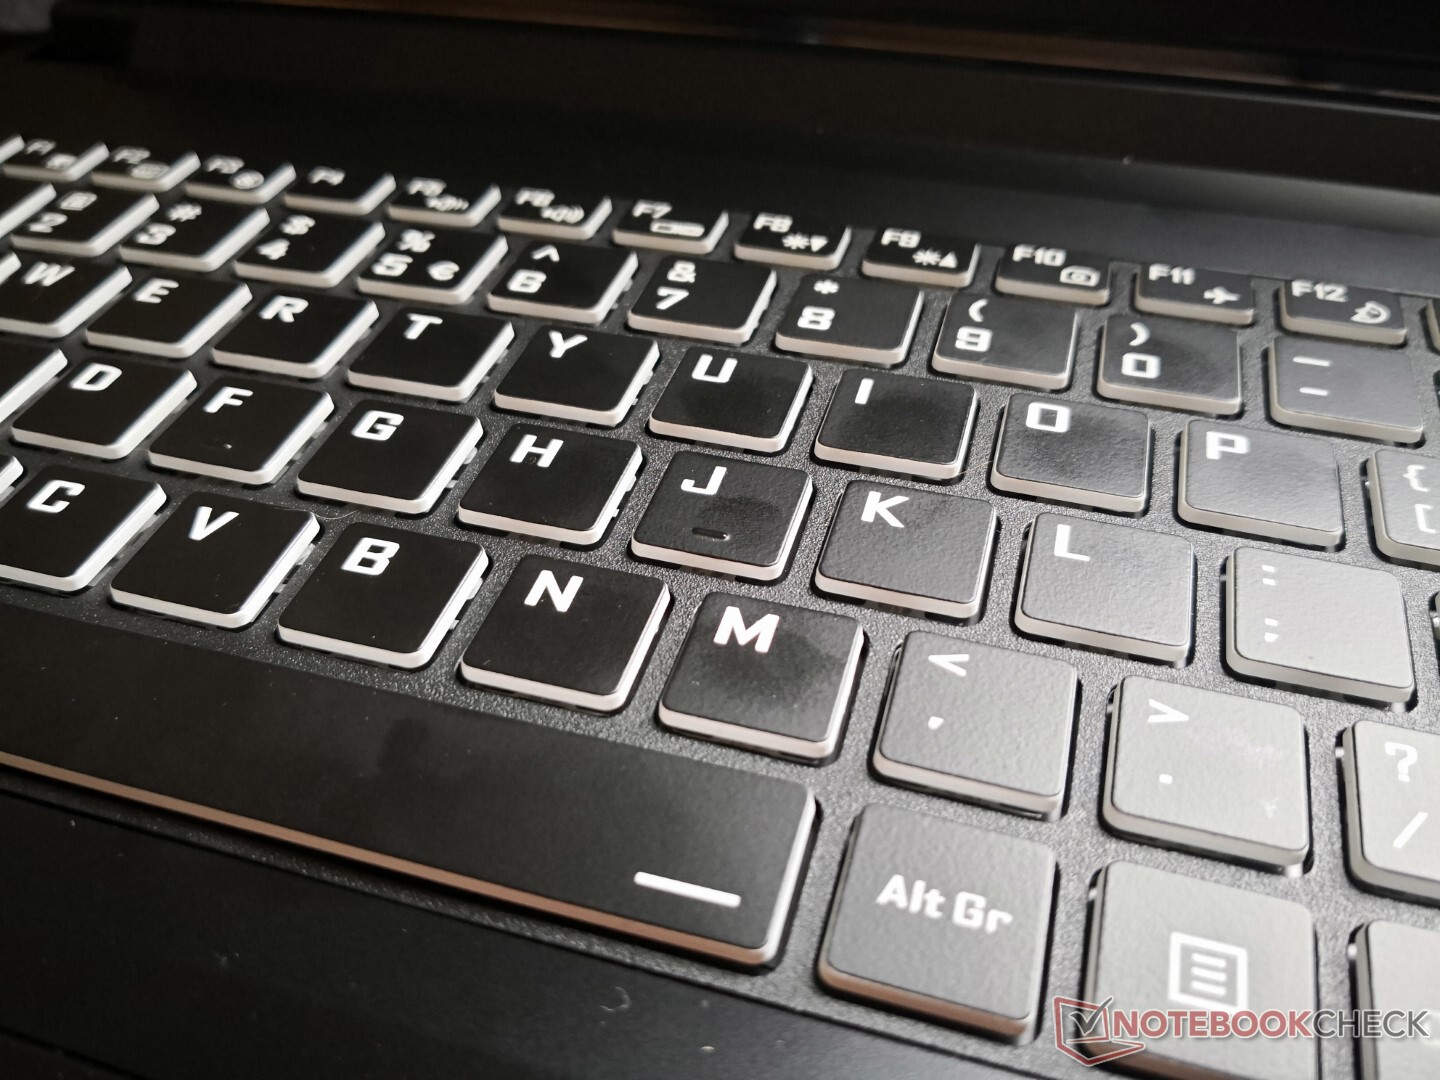
Eingabegeräte
Das Tippgefühl ist angenehm mit festerem Feedback, aber lauterem Klappern als wir es von anderen Gaming-Laptops gewohnt sind.
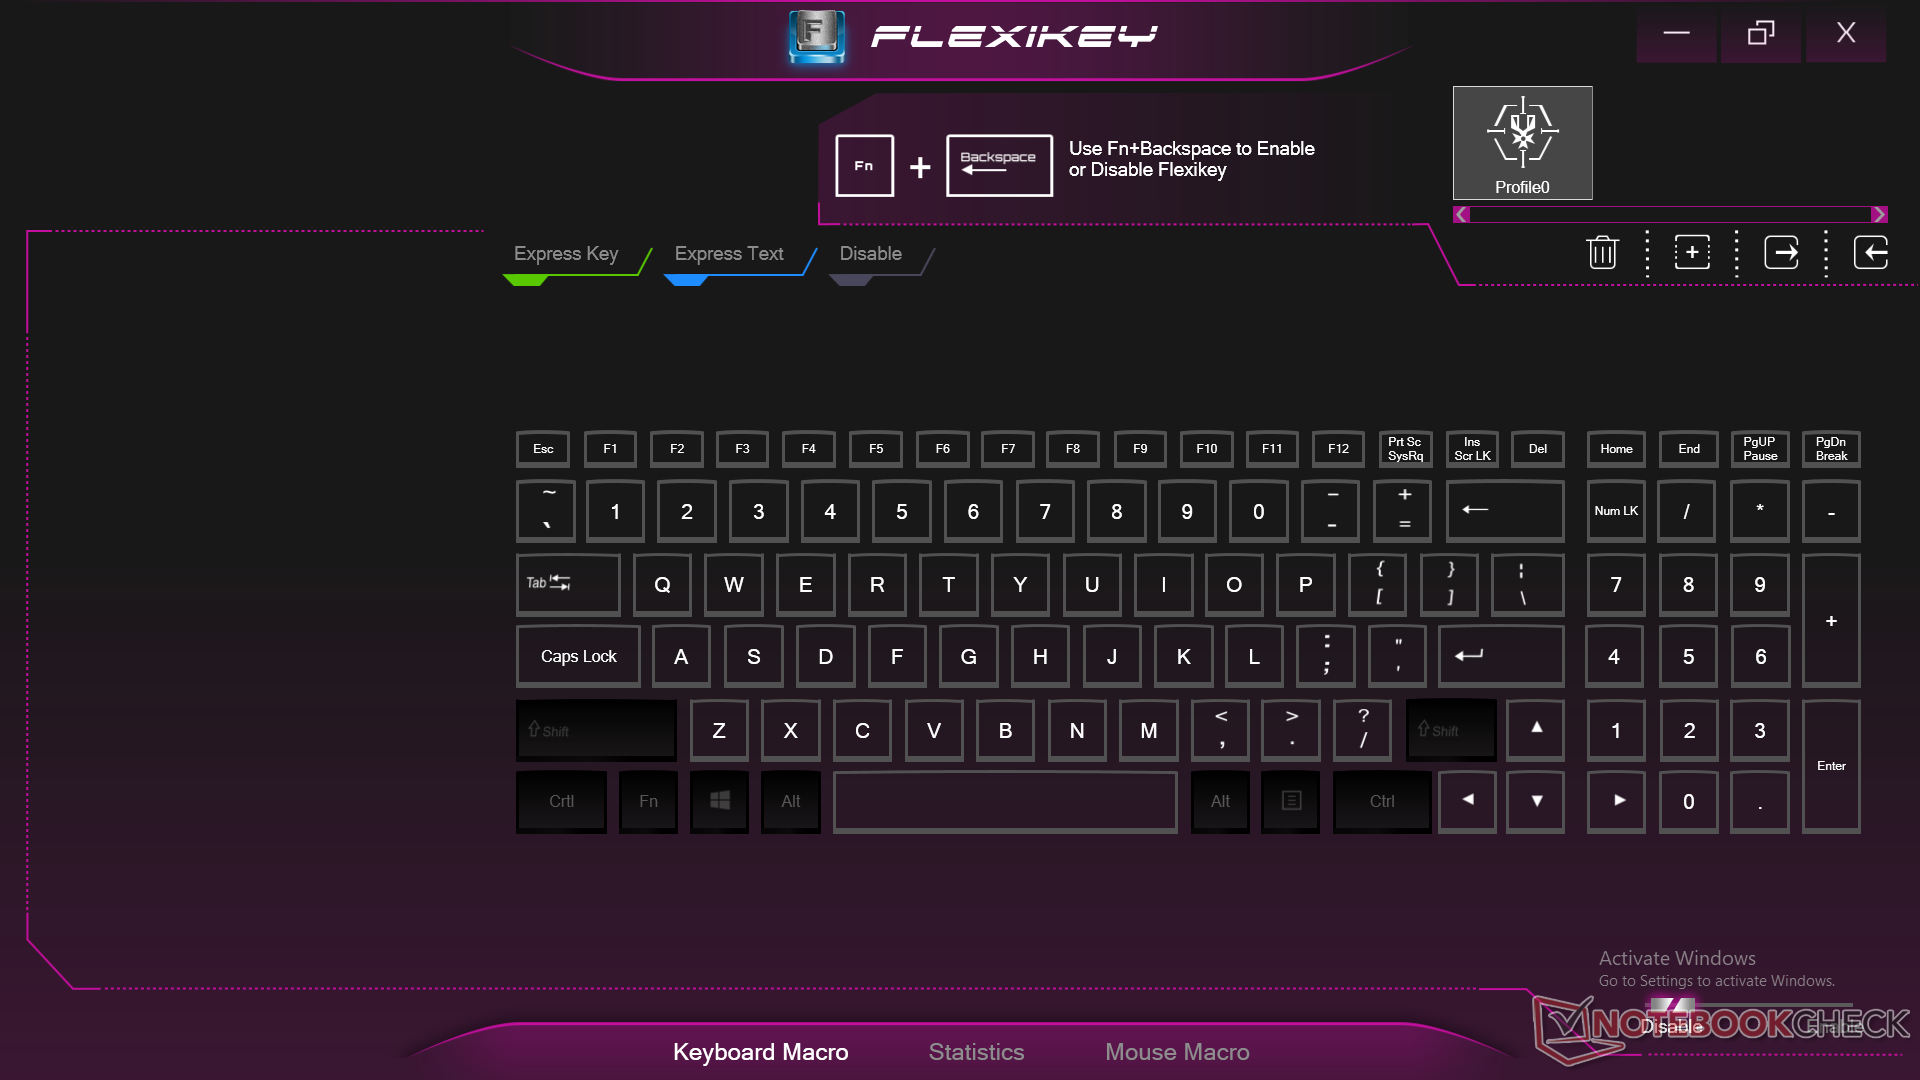
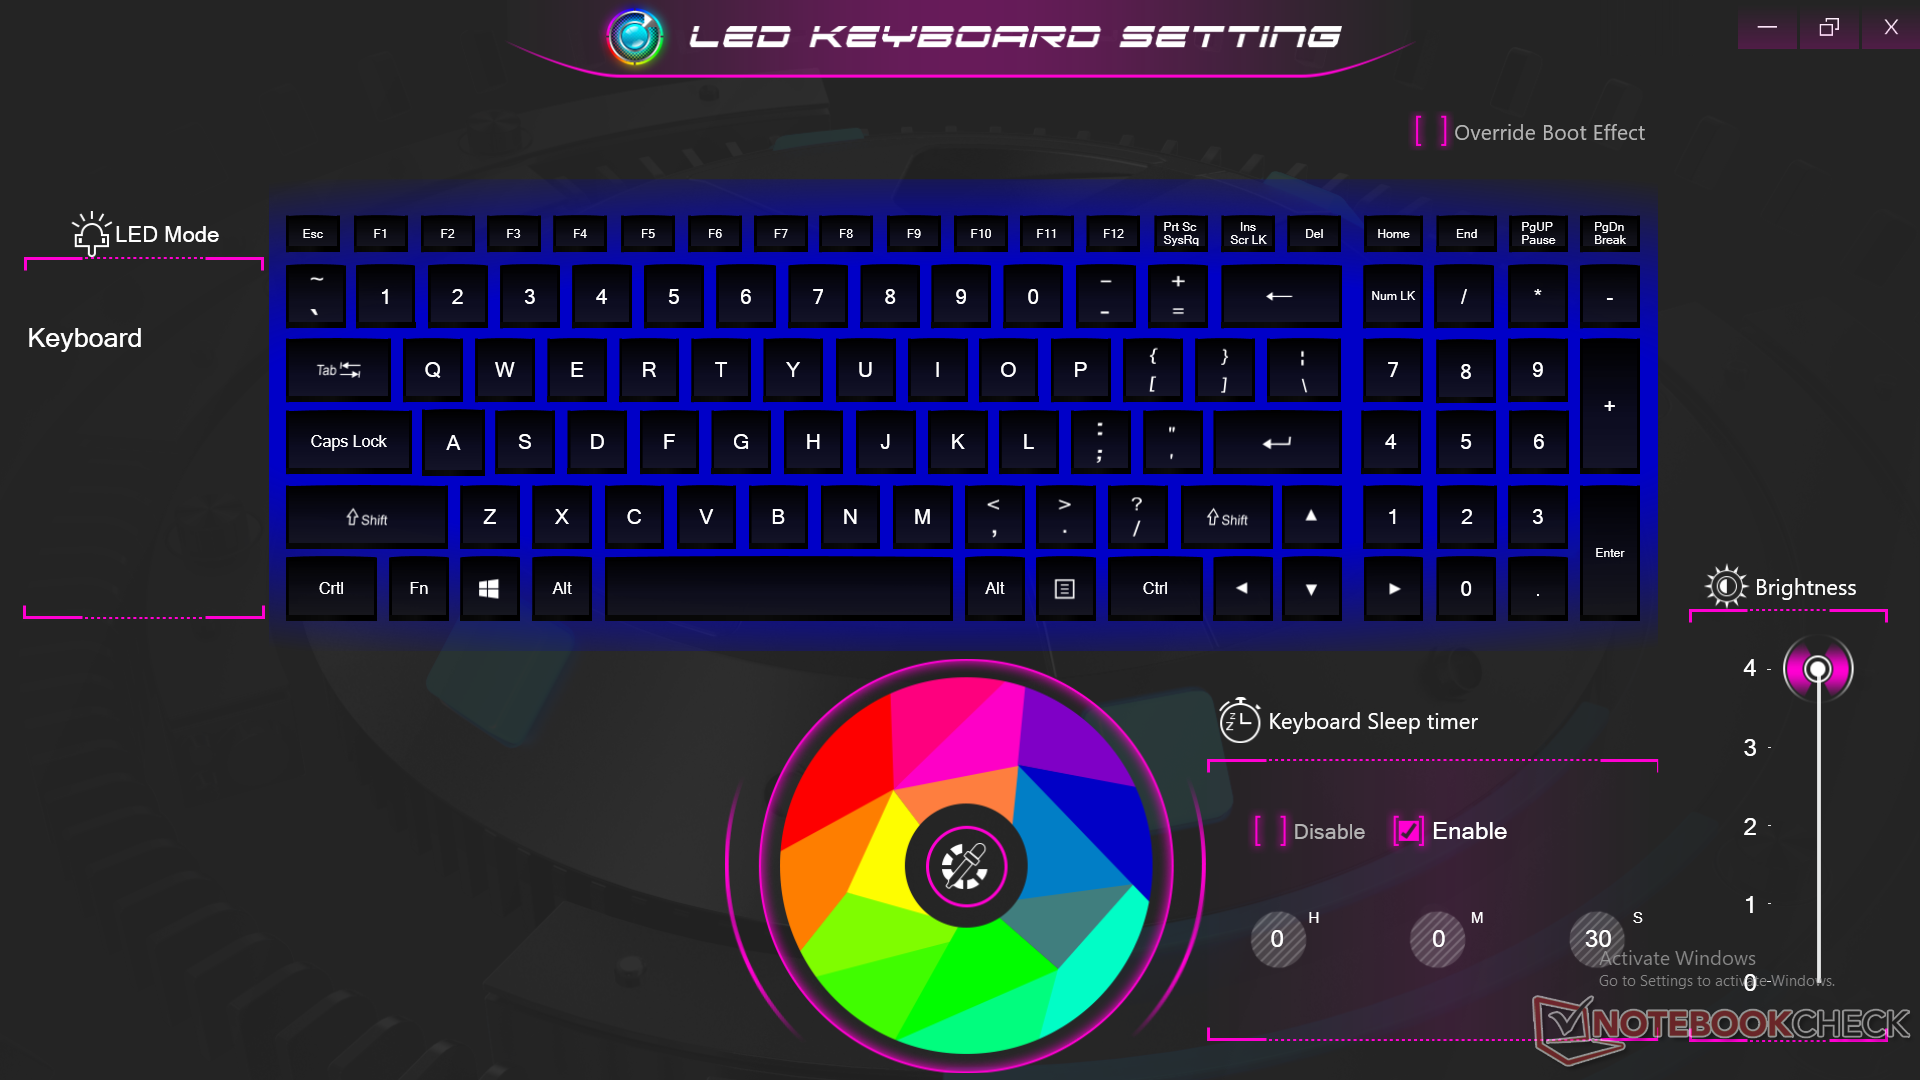
Die Tastaturbeleuchtung ist leider nur einzonig, im Vergleich zur Vierzonentechnik oder RGB-Beleuchtung pro Taste bei den meisten anderen Performance-Laptops. Wir schätzen jedoch die dedizierten Maustasten für einfachere Multi-Touch-Eingaben.
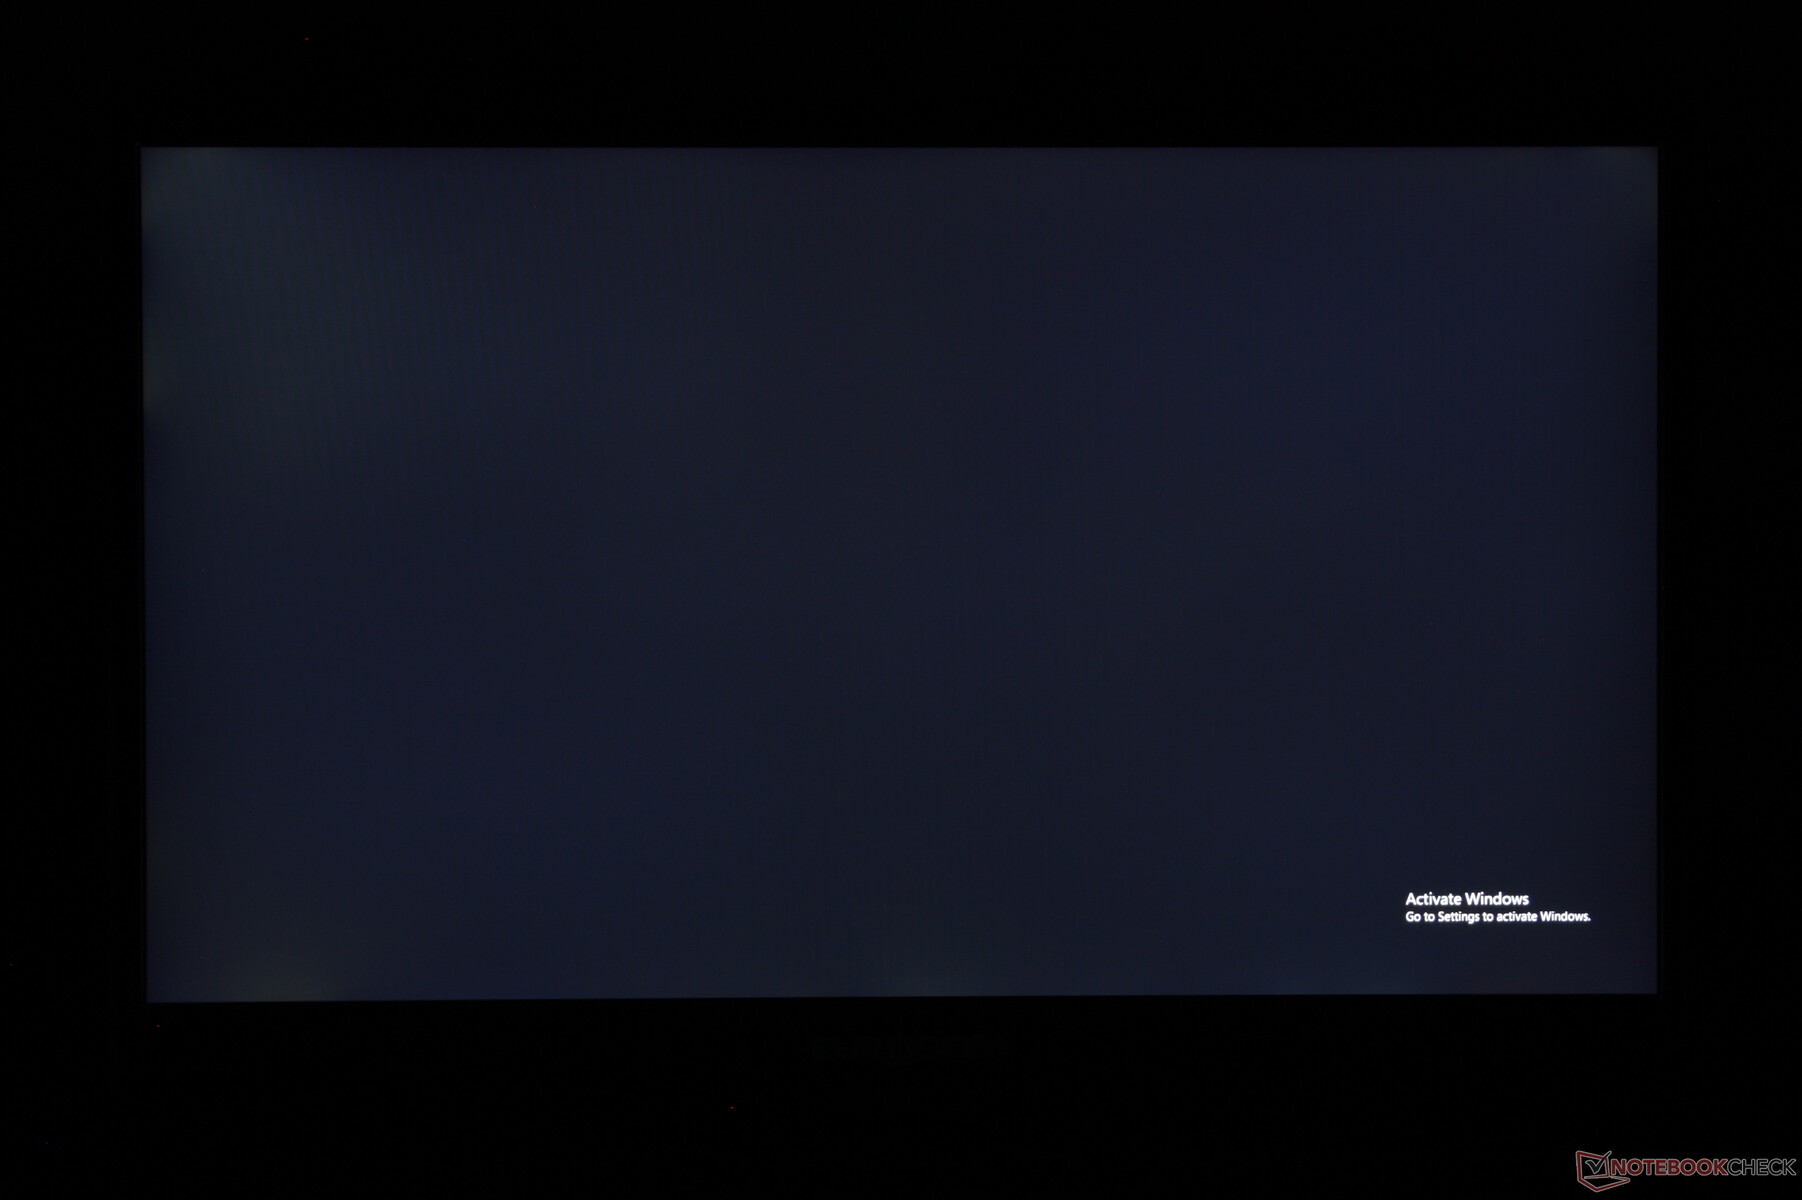
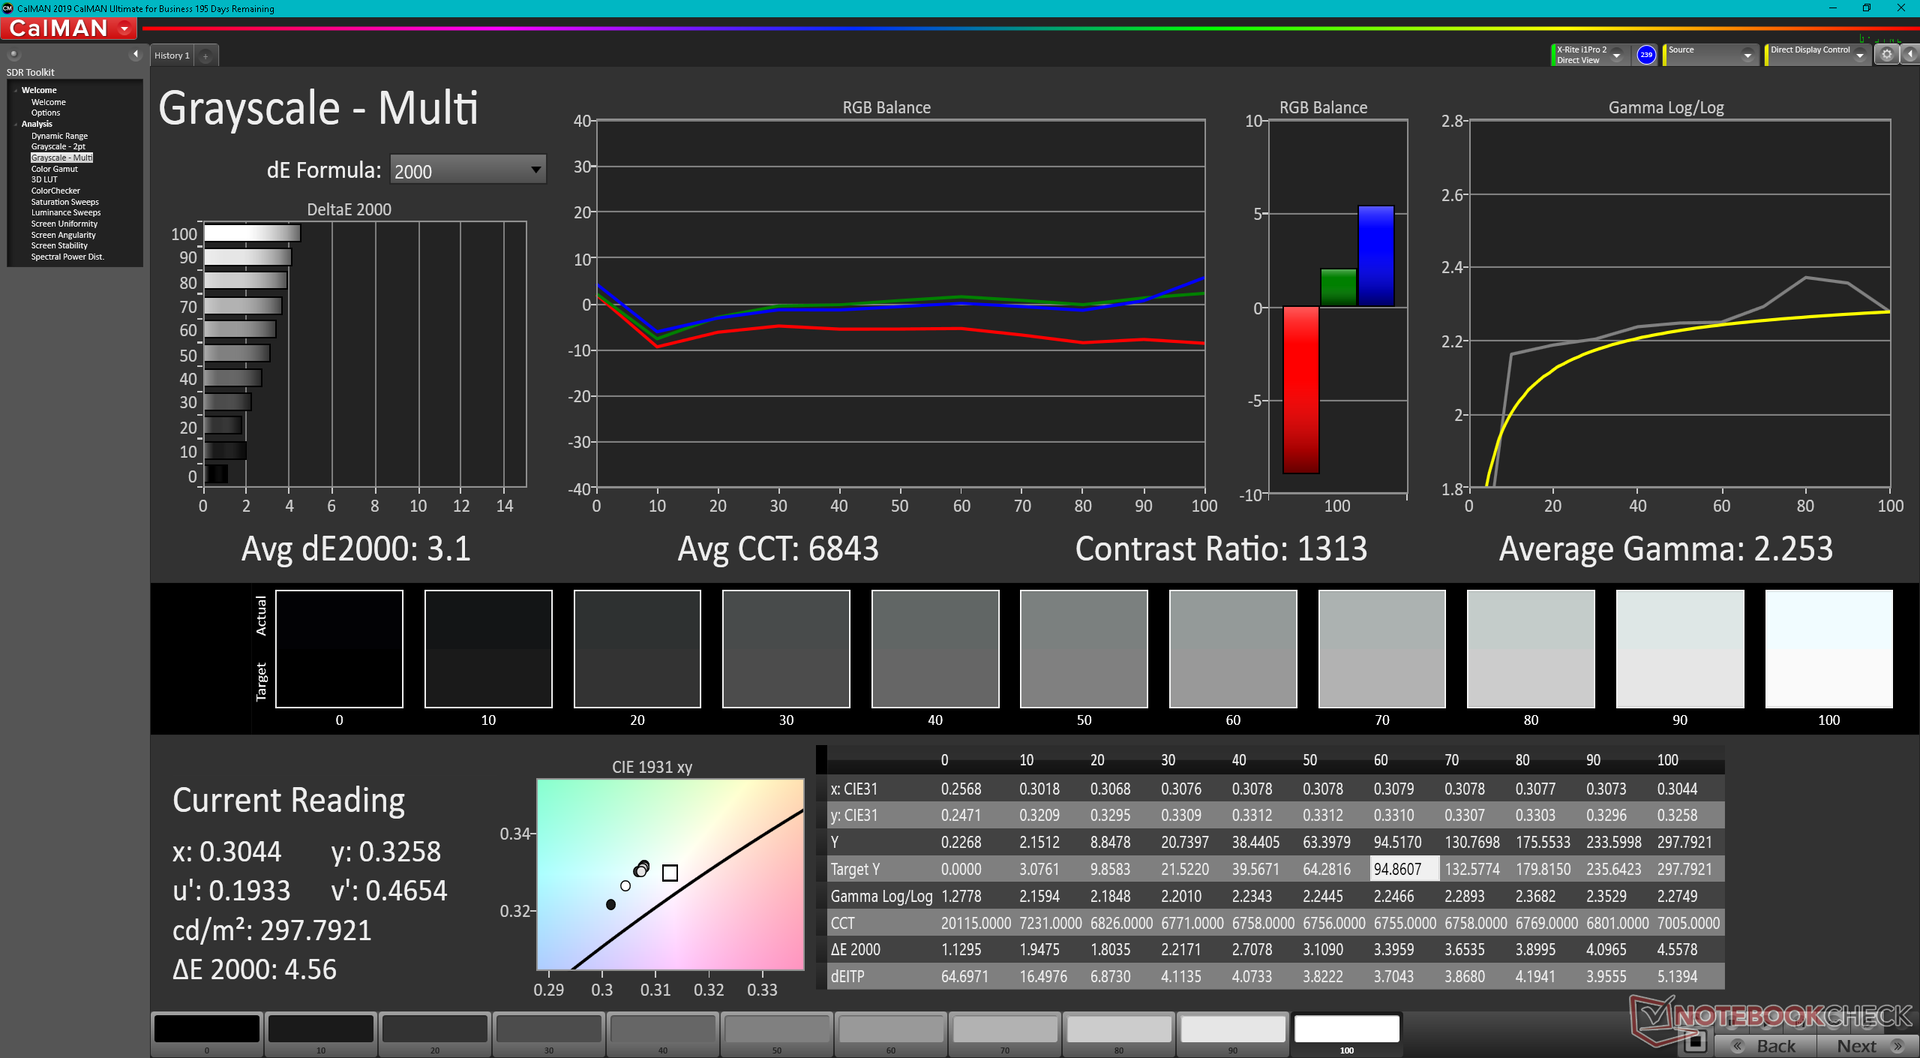
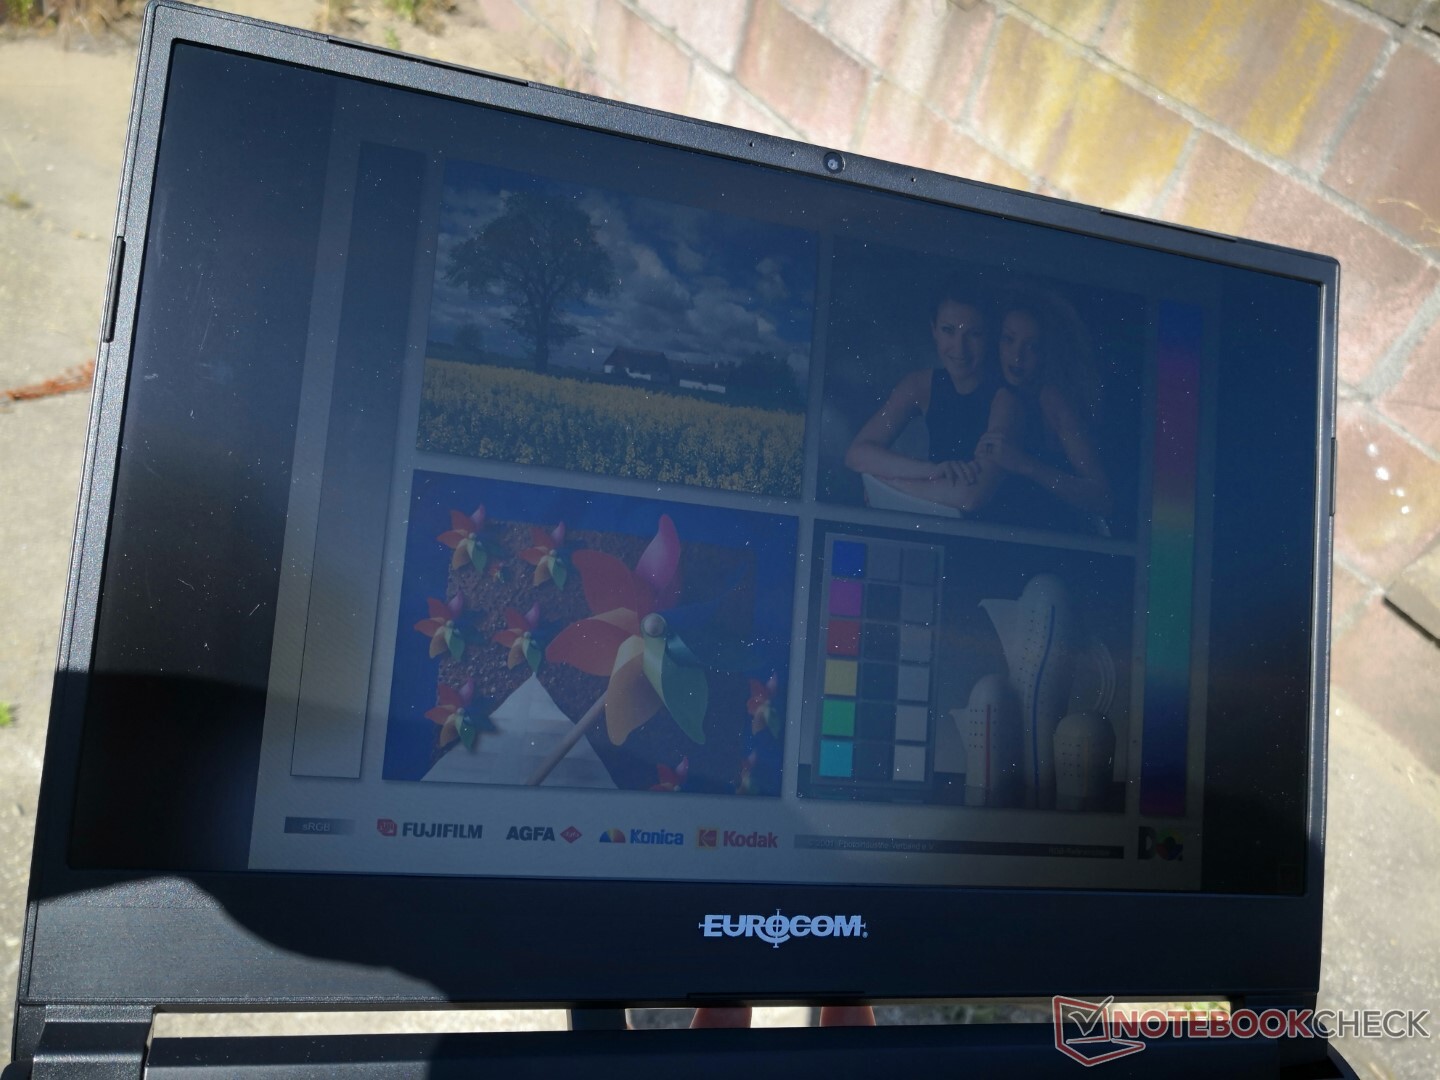
Display
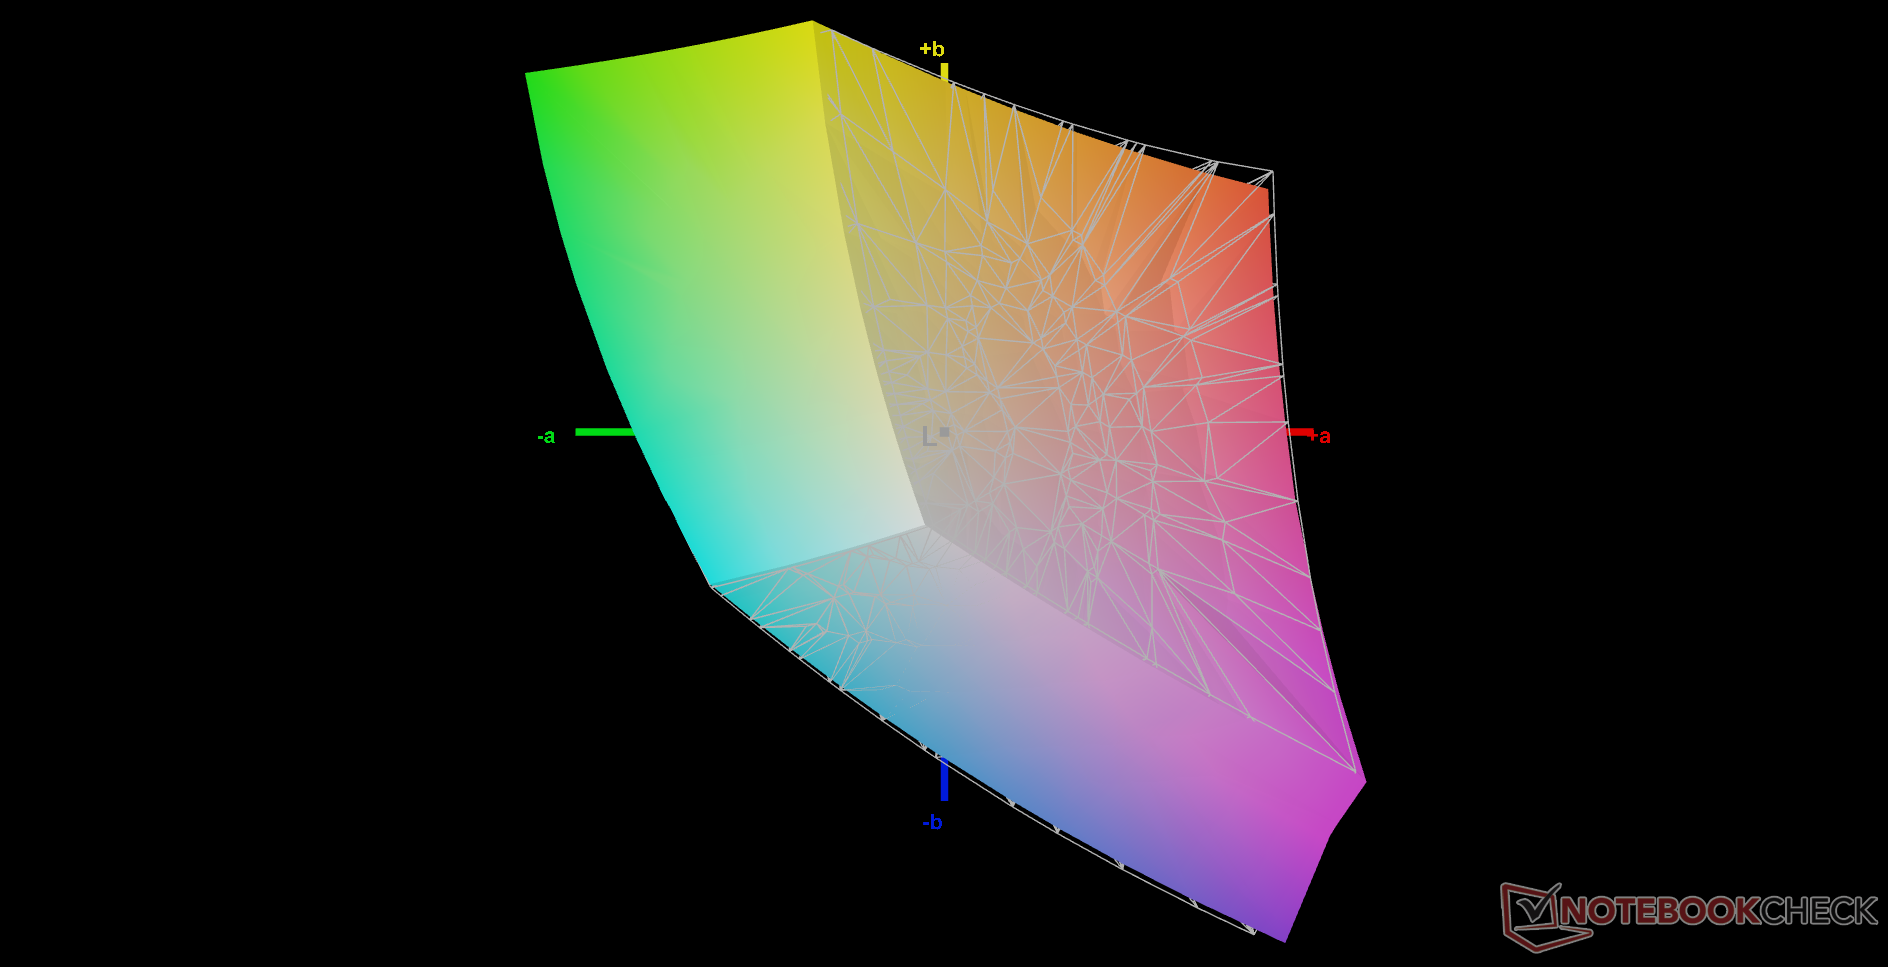
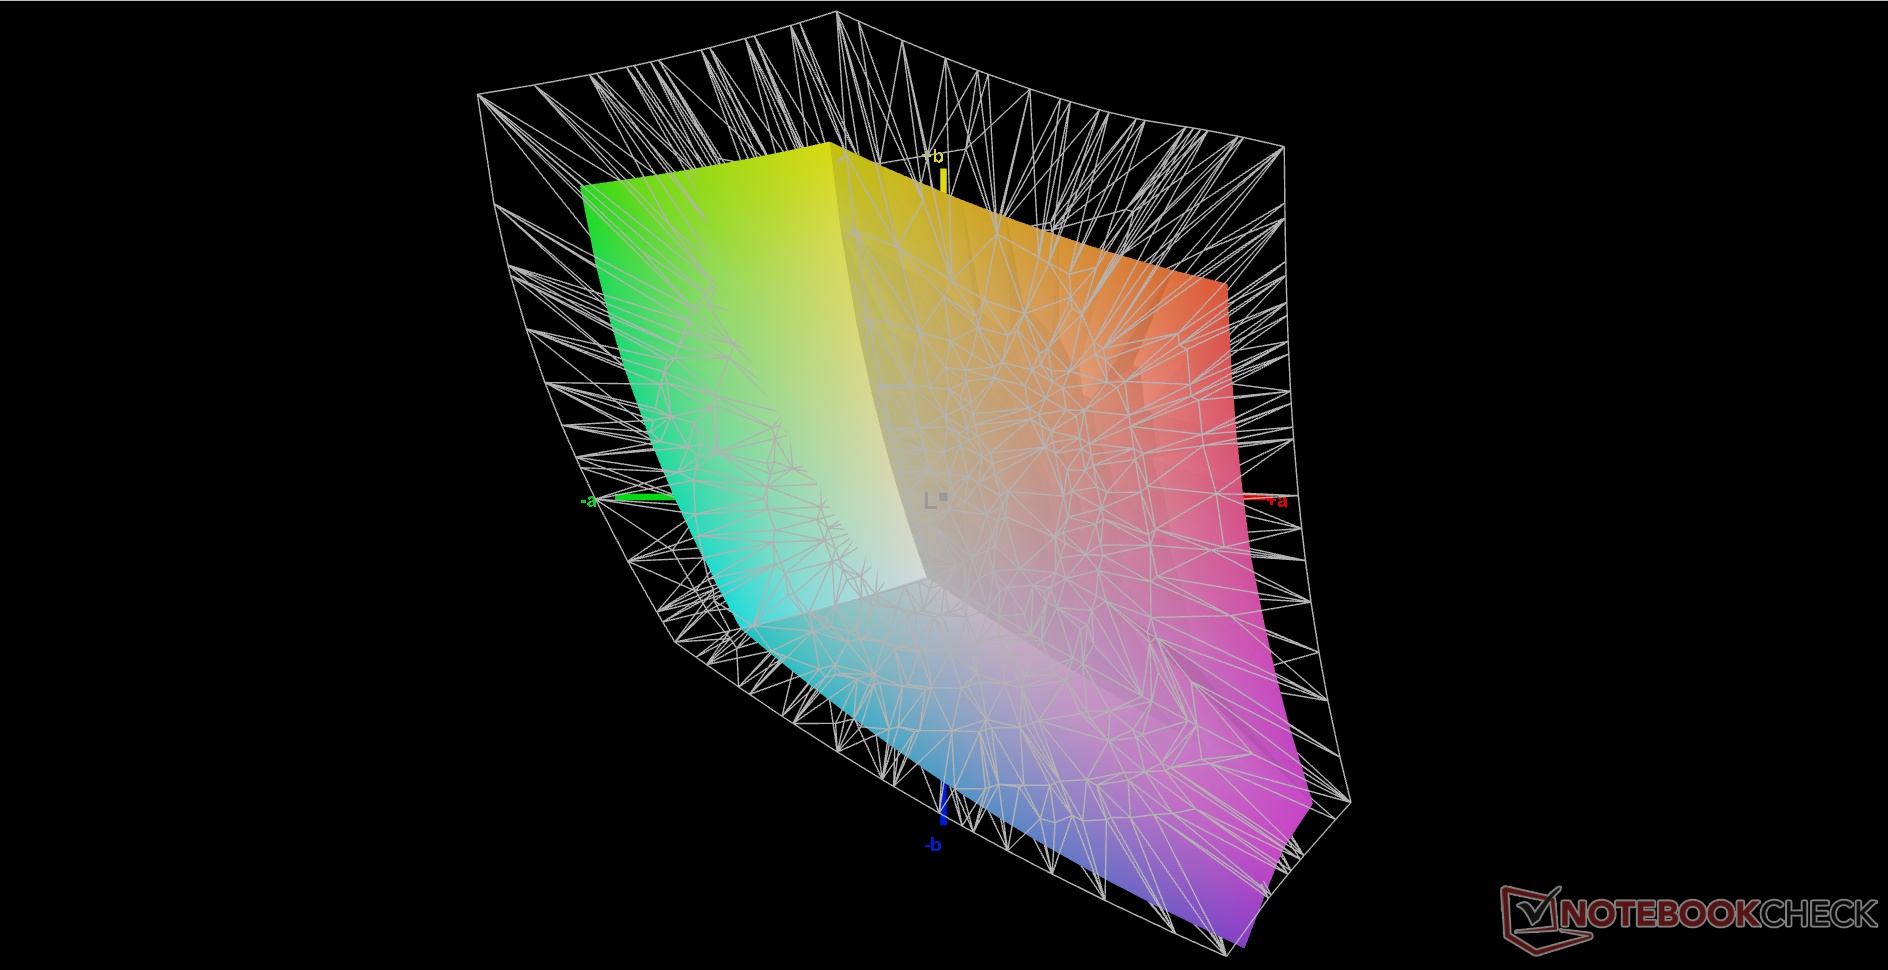
Unser Gerät ist mit dem gleichen Sharp-LQ156M1JW03-IPS-Panel ausgestattet, das auch im Eurocom RX315 (Englisch) zum Einsatz kommt. Dieses Panel zeichnet sich durch eine sehr schnelle Bildwiederholrate von 240 Hz, schnelle Reaktionszeiten und eine vollständige sRGB-Abdeckung aus, die sowohl für Spiele als auch für die meisten Grafikarbeiten geeignet ist. Es ist auch ein QHD-Panel mit höherer Auflösung erhältlich, das eine vollständige DCI-P3-Abdeckung verspricht, allerdings mit einer langsameren Bildwiederholfrequenz von 165 Hz.https://www.deepl.com/translator?utm_source=windows&utm_medium=app&utm_campaign=windows-share

| |||||||||||||||||||||||||
Ausleuchtung: 91 %
Helligkeit Akku: 299.2 cd/m²
Kontrast: 997:1 (Schwarzwert: 0.3 cd/m²)
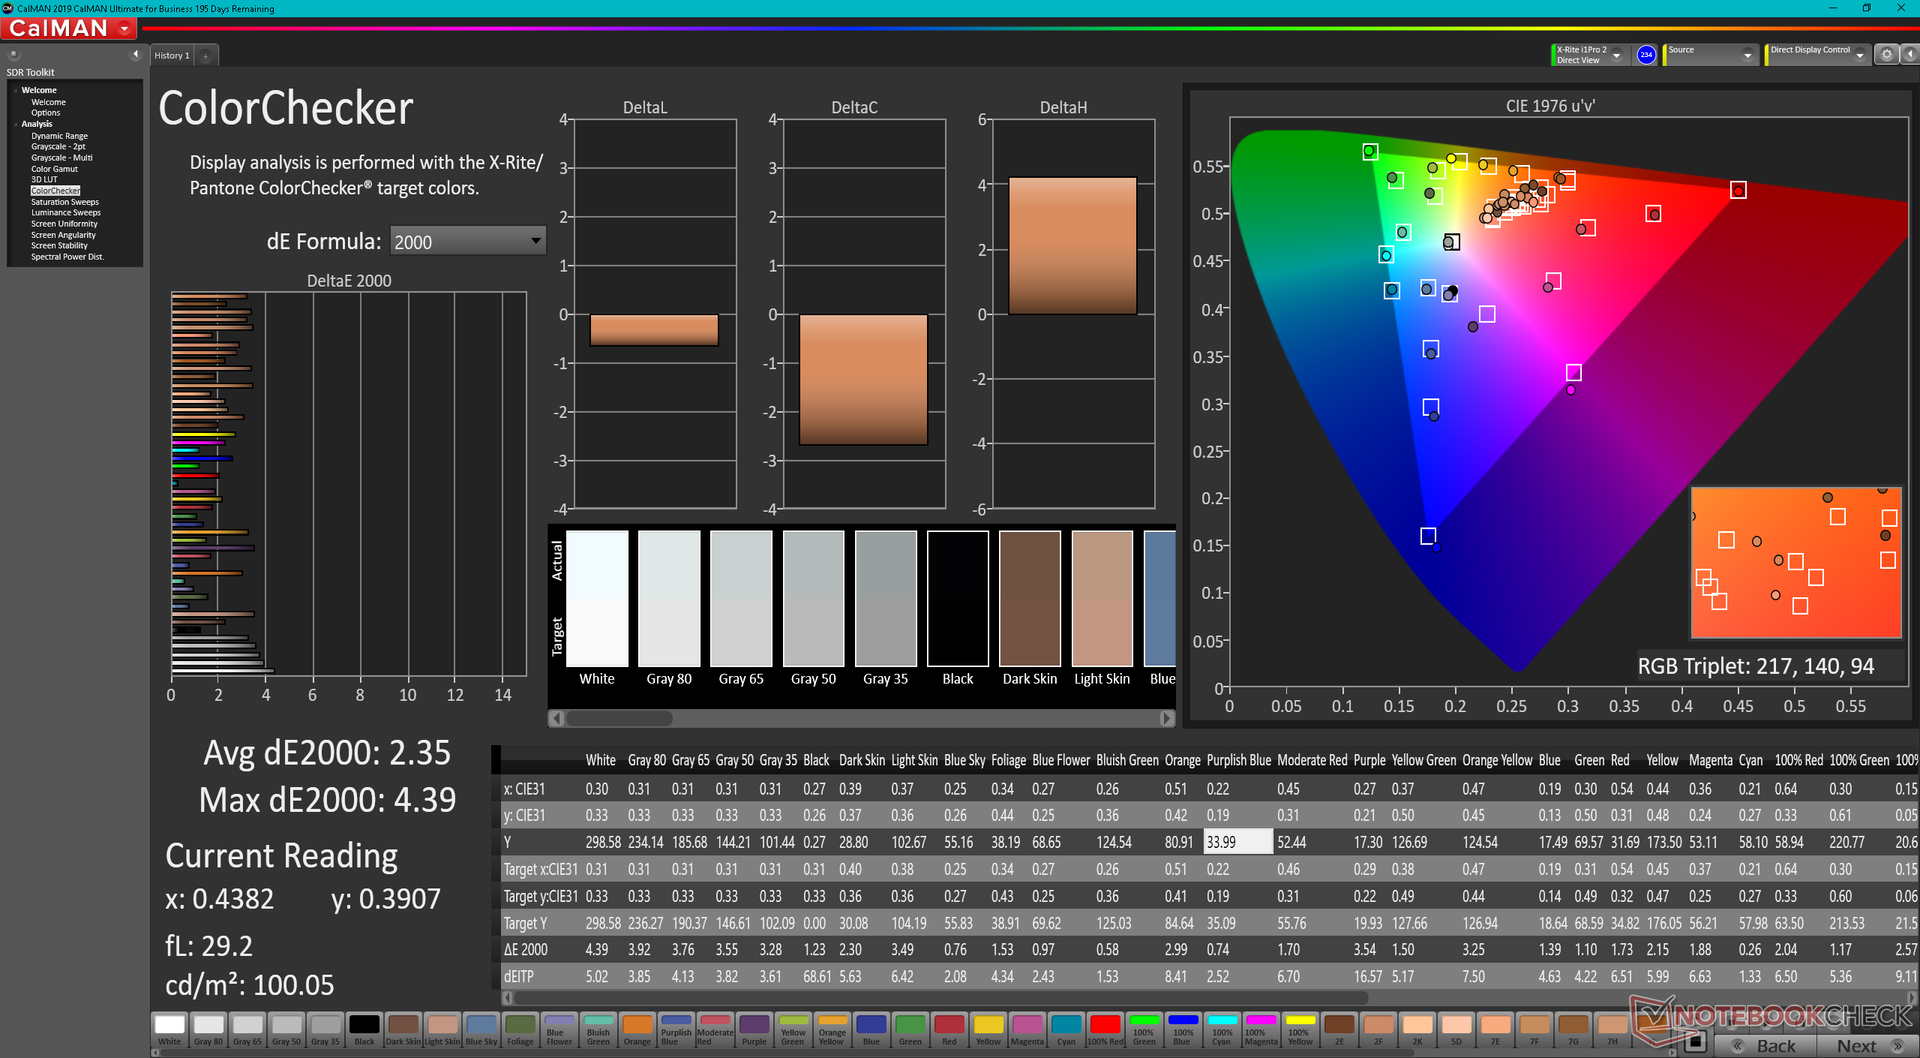
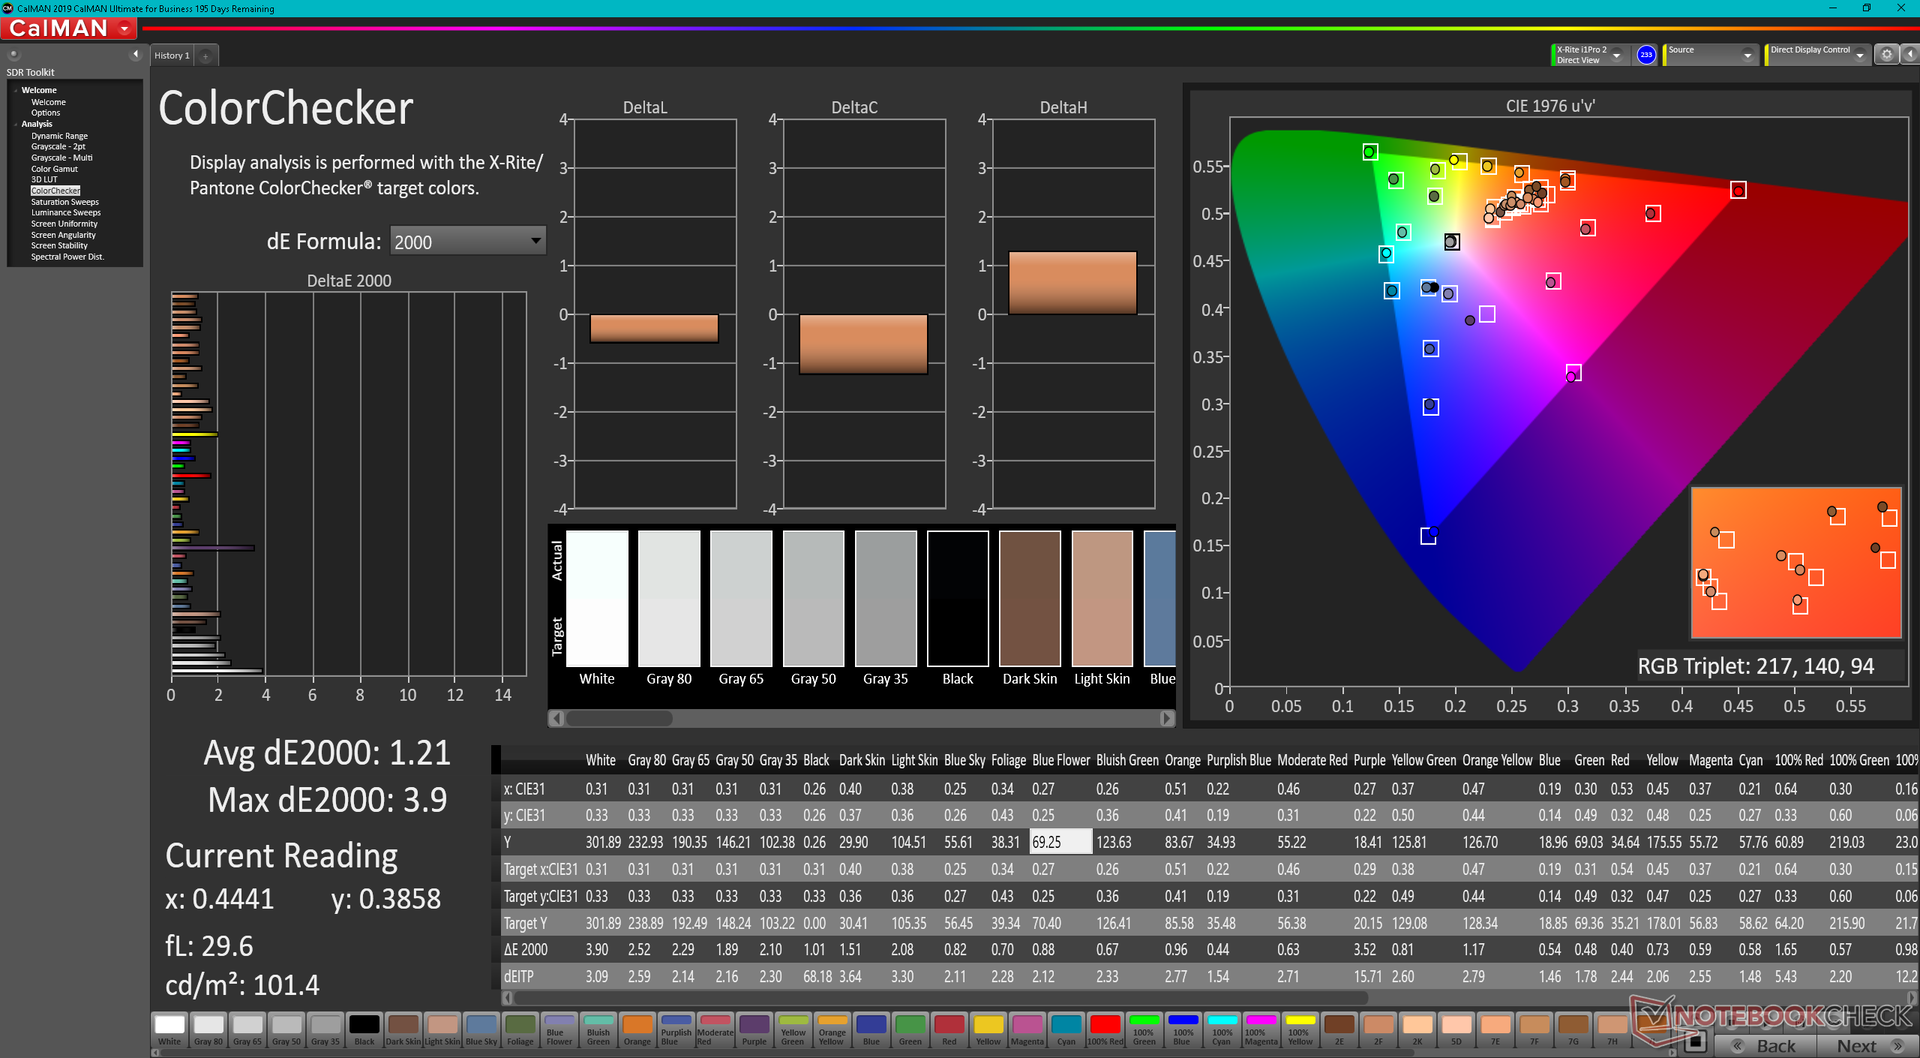
ΔE ColorChecker Calman: 2.35 | ∀{0.5-29.43 Ø4.73}
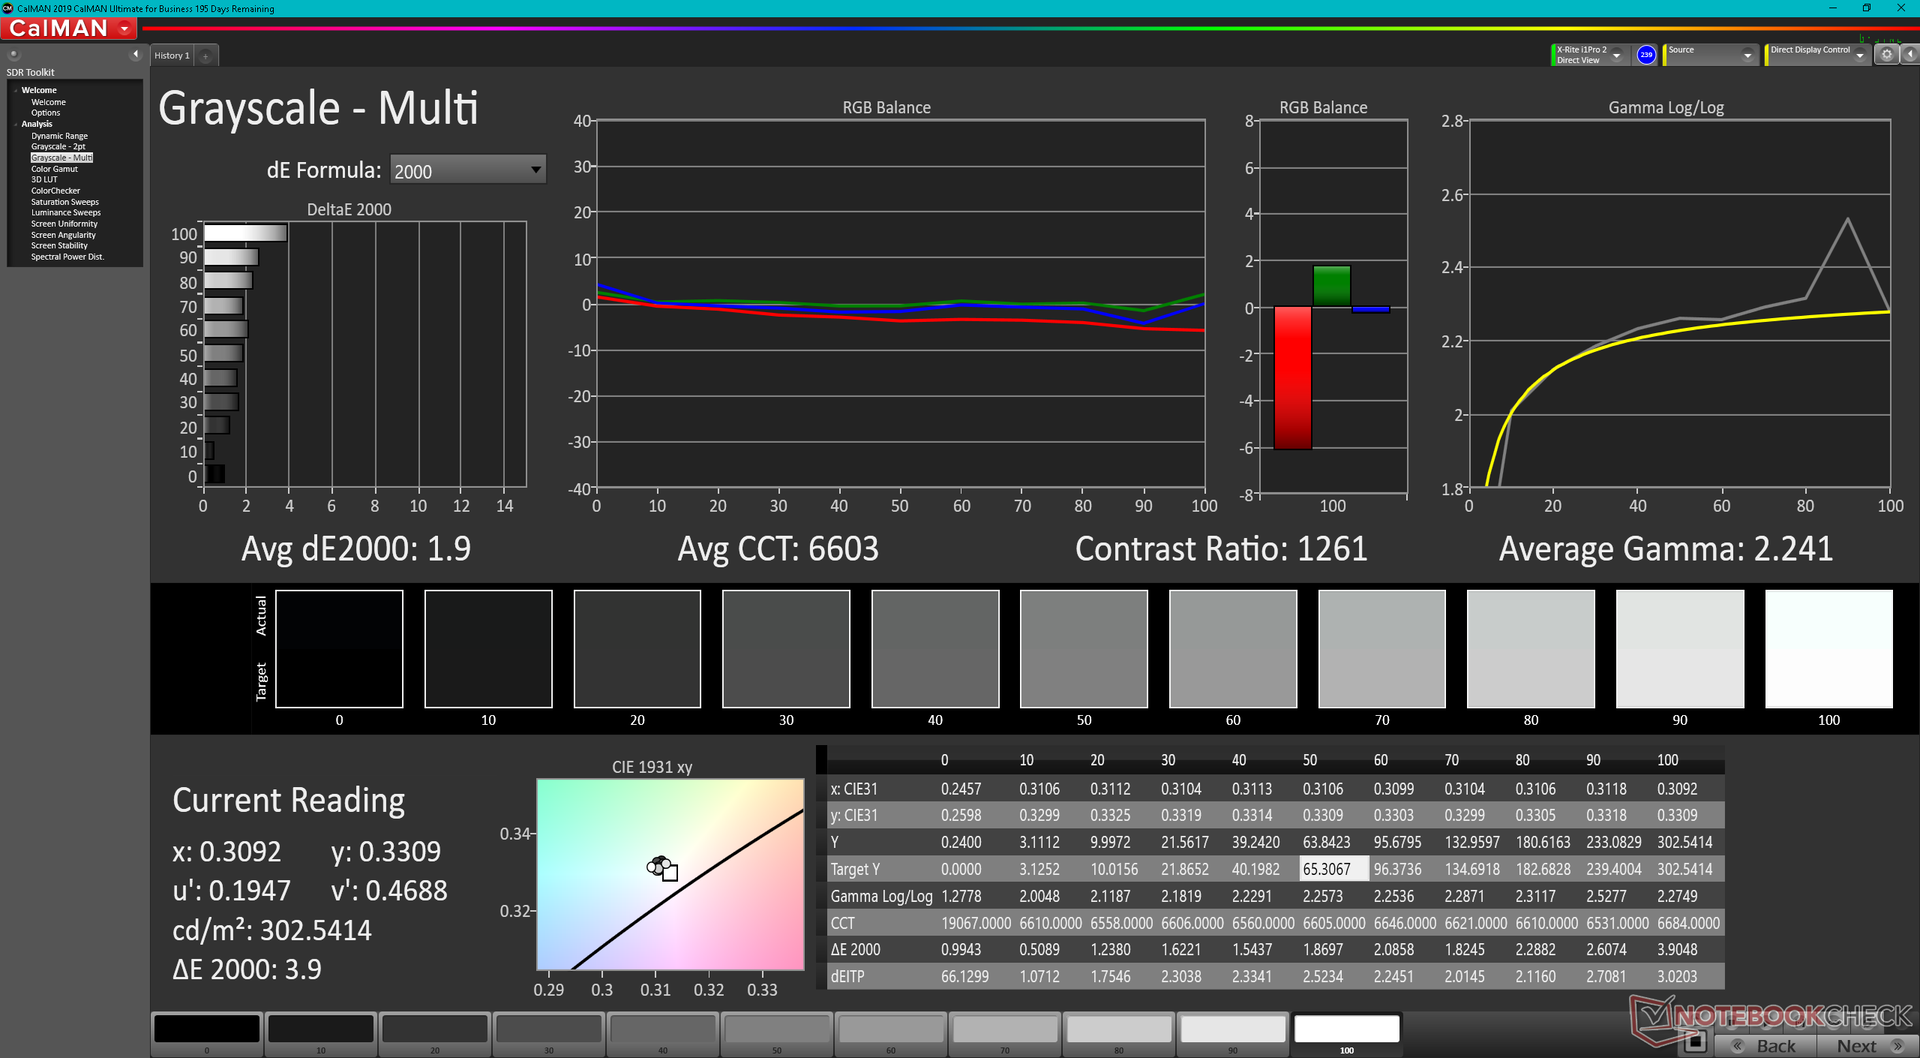
calibrated: 1.21
ΔE Greyscale Calman: 3.1 | ∀{0.09-98 Ø4.97}
67.7% AdobeRGB 1998 (Argyll 3D)
97.3% sRGB (Argyll 3D)
66.5% Display P3 (Argyll 3D)
Gamma: 2.25
CCT: 6843 K
| Eurocom Raptor X15 Sharp LQ156M1JW03, IPS, 1920x1080, 15.6" | MSI Raider GE66 12UHS AUO51EB, IPS, 3840x2160, 15.6" | Razer Blade 15 Advanced Model Early 2022 TL156VDXP02-0, IPS, 1920x1080, 15.6" | Eurocom RX315 NH57AF1 Sharp LQ156M1JW03, IPS, 1920x1080, 15.6" | Gigabyte A5 X1 AU Optronics B156HAN12.0, IPS, 1920x1080, 15.6" | Asus TUF Gaming A15 FA506QR-AZ061T Sharp SHP1532, IPS, 1920x1080, 15.6" | |
|---|---|---|---|---|---|---|
| Display | 21% | -5% | 1% | 4% | ||
| Display P3 Coverage (%) | 66.5 | 80.4 21% | 65.3 -2% | 67.5 2% | 69.6 5% | |
| sRGB Coverage (%) | 97.3 | 98.4 1% | 85.1 -13% | 98 1% | 98.6 1% | |
| AdobeRGB 1998 Coverage (%) | 67.7 | 94.7 40% | 67.4 0% | 68.5 1% | 70.8 5% | |
| Response Times | -35% | 33% | 4% | 28% | 15% | |
| Response Time Grey 50% / Grey 80% * (ms) | 12.8 ? | 18.8 ? -47% | 4.3 ? 66% | 10.4 ? 19% | 4.8 ? 63% | 12 ? 6% |
| Response Time Black / White * (ms) | 10.4 ? | 12.8 ? -23% | 10.5 ? -1% | 11.6 ? -12% | 11.2 ? -8% | 8 ? 23% |
| PWM Frequency (Hz) | 23810 ? | 22730 ? | 1250 ? | |||
| Bildschirm | -7% | 27% | -23% | -13% | 18% | |
| Helligkeit Bildmitte (cd/m²) | 299.2 | 351 17% | 330 10% | 291.3 -3% | 335 12% | 297 -1% |
| Brightness (cd/m²) | 282 | 347 23% | 315 12% | 273 -3% | 325 15% | 268 -5% |
| Brightness Distribution (%) | 91 | 90 -1% | 89 -2% | 91 0% | 90 -1% | 84 -8% |
| Schwarzwert * (cd/m²) | 0.3 | 0.35 -17% | 0.24 20% | 0.35 -17% | 0.4 -33% | 0.22 27% |
| Kontrast (:1) | 997 | 1003 1% | 1375 38% | 832 -17% | 838 -16% | 1350 35% |
| Delta E Colorchecker * | 2.35 | 2.54 -8% | 1.47 37% | 2.39 -2% | 2.63 -12% | 1.36 42% |
| Colorchecker dE 2000 max. * | 4.39 | 8.36 -90% | 2.73 38% | 8.05 -83% | 7.71 -76% | 3.82 13% |
| Colorchecker dE 2000 calibrated * | 1.21 | 0.67 45% | 0.63 48% | 1.49 -23% | 0.97 20% | |
| Delta E Graustufen * | 3.1 | 4.1 -32% | 1.8 42% | 4.8 -55% | 4 -29% | 1.88 39% |
| Gamma | 2.25 98% | 2.089 105% | 2.282 96% | 2.25 98% | 2.129 103% | 2.48 89% |
| CCT | 6843 95% | 7036 92% | 6499 100% | 7124 91% | 7434 87% | 6768 96% |
| Farbraum (Prozent von AdobeRGB 1998) (%) | 63 | |||||
| Color Space (Percent of sRGB) (%) | 99 | |||||
| Durchschnitt gesamt (Programm / Settings) | -7% /
-5% | 18% /
21% | -6% /
-14% | 6% /
-4% | 17% /
17% |
* ... kleinere Werte sind besser
Das Display ist mit durchschnittlichen Graustufen- und ColorChecker-DeltaE-Werten von nur 3,1 bzw. 2,35 bereits im Auslieferungszustand anständig kalibriert. Mit unserem X-Rite-Kolorimeter können wir den DeltaE-Wert sogar noch weiter verbessern, wie unsere Screenshots unten zeigen.

Reaktionszeiten (Response Times) des Displays
| ↔ Reaktionszeiten Schwarz zu Weiß | ||
|---|---|---|
| 10.4 ms ... steigend ↗ und fallend ↘ kombiniert | ↗ 5.2 ms steigend | 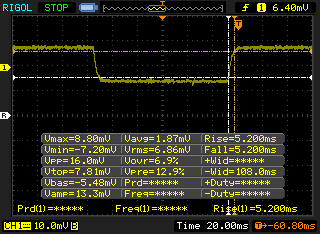 |
| ↘ 5.2 ms fallend | ||
| Die gemessenen Reaktionszeiten sind gut, für anspruchsvolle Spieler könnten der Bildschirm jedoch zu langsam sein. Im Vergleich rangierten die bei uns getesteten Geräte von 0.1 (Minimum) zu 240 (Maximum) ms. » 28 % aller Screens waren schneller als der getestete. Daher sind die gemessenen Reaktionszeiten besser als der Durchschnitt aller vermessenen Geräte (19.9 ms). | ||
| ↔ Reaktionszeiten 50% Grau zu 80% Grau | ||
| 12.8 ms ... steigend ↗ und fallend ↘ kombiniert | ↗ 4.8 ms steigend | 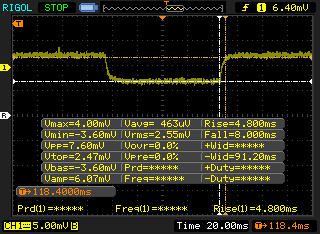 |
| ↘ 8 ms fallend | ||
| Die gemessenen Reaktionszeiten sind gut, für anspruchsvolle Spieler könnten der Bildschirm jedoch zu langsam sein. Im Vergleich rangierten die bei uns getesteten Geräte von 0.165 (Minimum) zu 636 (Maximum) ms. » 26 % aller Screens waren schneller als der getestete. Daher sind die gemessenen Reaktionszeiten besser als der Durchschnitt aller vermessenen Geräte (31.1 ms). | ||
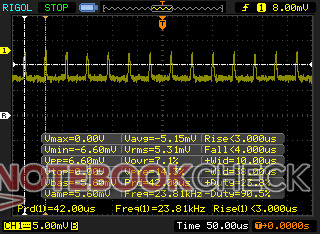
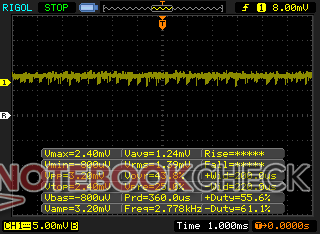
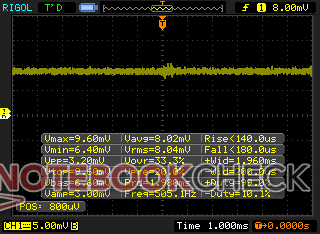
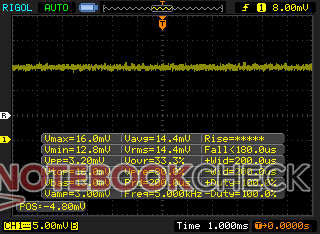
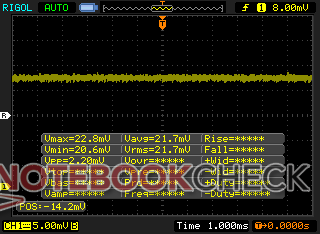
Bildschirm-Flackern / PWM (Pulse-Width Modulation)
| Flackern / PWM festgestellt | 23810 Hz | ≤ 25 % Helligkeit | 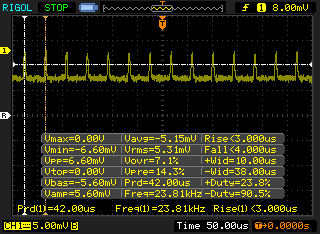 |
Das Display flackert mit 23810 Hz (im schlimmsten Fall, eventuell durch Pulsweitenmodulation PWM) bei einer eingestellten Helligkeit von 25 % und darunter. Darüber sollte es zu keinem Flackern kommen. Die Frequenz von 23810 Hz ist sehr hoch und sollte daher auch bei empfindlichen Personen zu keinen Problemen führen. Im Vergleich: 52 % aller getesteten Geräte nutzten kein PWM um die Helligkeit zu reduzieren. Wenn PWM eingesetzt wurde, dann bei einer Frequenz von durchschnittlich 7798 (Minimum 5, Maximum 343500) Hz. | |||


Leistung
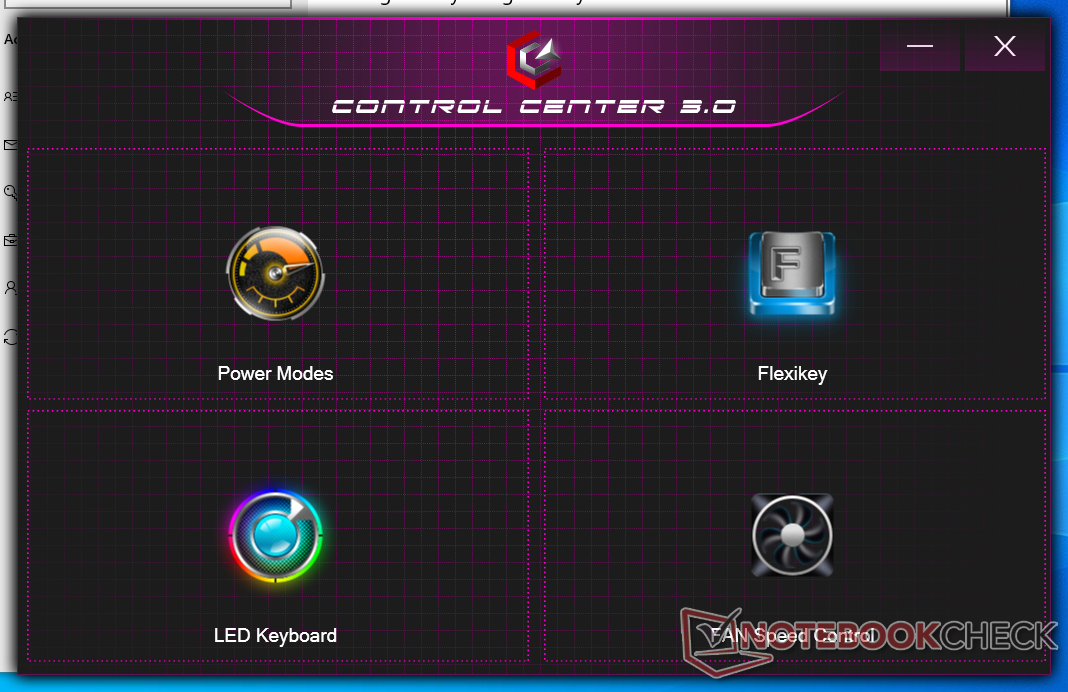
Testbedingungen
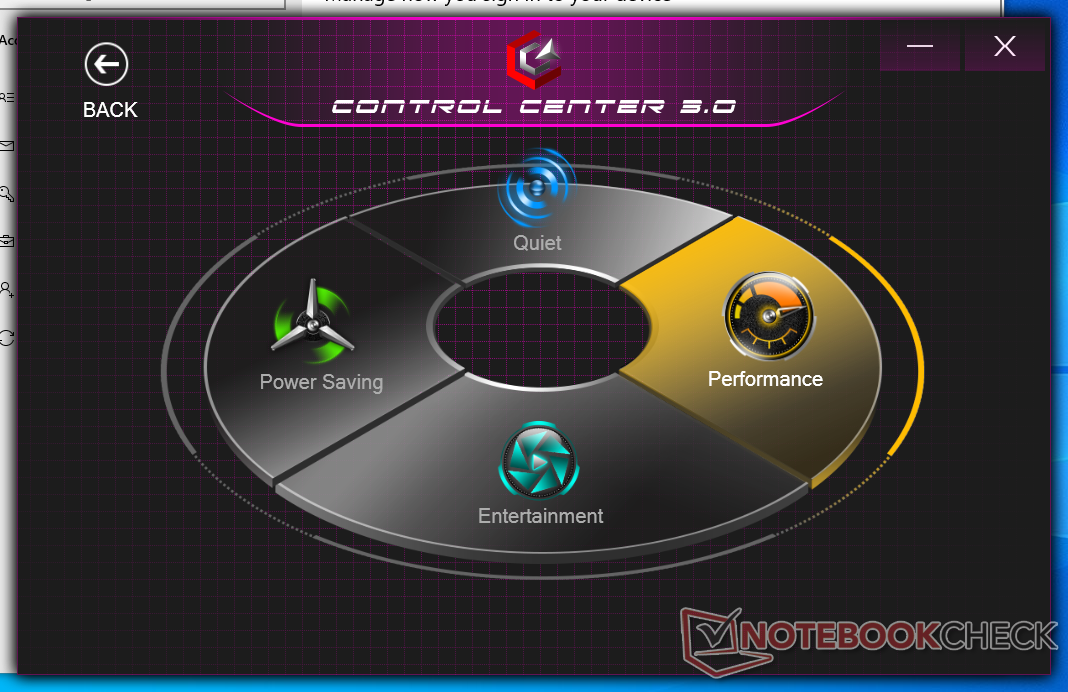
Unser Gerät wurde sowohl über Windows als auch über die Control Center 3.0 Software auf den Leistungsmodus eingestellt, bevor wir die folgenden Leistungsbenchmarks durchführten, um die höchstmöglichen Ergebnisse ohne Übertaktung durch den Endbenutzer zu erzielen. Es ist empfehlenswert, sich mit dem Control Center 3.0 vertraut zu machen, da hier die Lüftersteuerung, die Energiemodi und die LED-/Makrofunktionen umgeschaltet werden.
Es gibt keinen MUX-Schalter und somit nur Optimus-1.0-Unterstützung. Eurocom sagt, dass der Raptor X15 nicht mit einem MUX-Schalter im Hinterkopf entwickelt wurde.
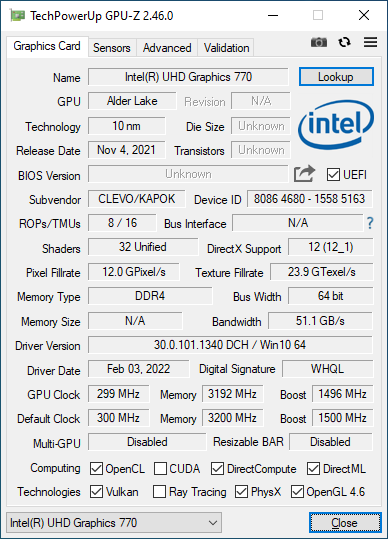
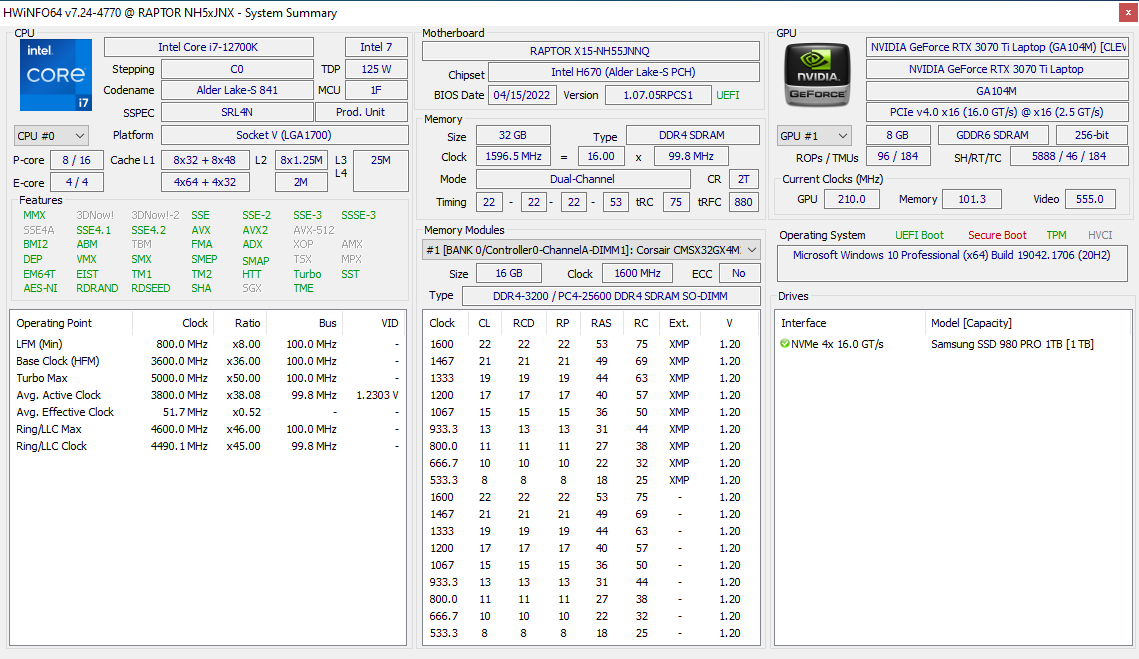
Prozessor
Leider wies unser Gerät bei der Ausführung von CineBench R15 Leistungsfehler auf, die uns daran hinderten, korrekte Ergebnisse mit dem Benchmark zu erzielen. Eurocom hat uns bestätigt, dass der Fehler bei mehreren Raptor-X15-Geräten reproduzierbar ist. Glücklicherweise liefen alle anderen Benchmarks ohne jegliche Probleme. Im Vergleich zu unserem Referenz-Desktop mit der gleichen Core i7-12700K-CPU ist der i7-12700K in unserem Eurocom bei Multi-Thread-Workloads 20 bis 25 Prozent langsamer, was einer Gesamtleistung entspricht, die der des mobilen Core i7-12700H am ähnlichsten ist.
Alle Details zur Alder-Lake-S-Plattform finden Sie auf unserer Übersichtsseite hier.
Cinebench R15 Multi Loop
Cinebench R23: Multi Core | Single Core
Cinebench R15: CPU Multi 64Bit | CPU Single 64Bit
Blender: v2.79 BMW27 CPU
7-Zip 18.03: 7z b 4 | 7z b 4 -mmt1
Geekbench 5.5: Multi-Core | Single-Core
HWBOT x265 Benchmark v2.2: 4k Preset
LibreOffice : 20 Documents To PDF
R Benchmark 2.5: Overall mean
| Cinebench R20 / CPU (Multi Core) | |
| Intel Core i7-12700K | |
| Durchschnittliche Intel Core i7-12700K (6953 - 8648, n=2) | |
| Eurocom Raptor X15 | |
| MSI Vector GP76 12UGS-434 | |
| Schenker XMG Apex 15 NH57AF1 | |
| MSI Raider GE66 12UHS | |
| Razer Blade 15 2022 | |
| Razer Blade 14 Ryzen 9 6900HX | |
| Gigabyte A5 X1 | |
| Eurocom Nightsky ARX315 | |
| Schenker XMG Apex 15 NH57E PS | |
| Eurocom RX315 NH57AF1 | |
| Aorus 15P XC | |
| Lenovo Legion C7 15IMH05 82EH0030GE | |
| Cinebench R20 / CPU (Single Core) | |
| Eurocom Raptor X15 | |
| Durchschnittliche Intel Core i7-12700K (731 - 740, n=2) | |
| Intel Core i7-12700K | |
| MSI Raider GE66 12UHS | |
| Razer Blade 15 2022 | |
| MSI Vector GP76 12UGS-434 | |
| Razer Blade 14 Ryzen 9 6900HX | |
| Eurocom Nightsky ARX315 | |
| Gigabyte A5 X1 | |
| Eurocom RX315 NH57AF1 | |
| Schenker XMG Apex 15 NH57E PS | |
| Schenker XMG Apex 15 NH57AF1 | |
| Lenovo Legion C7 15IMH05 82EH0030GE | |
| Aorus 15P XC | |
| Cinebench R23 / Multi Core | |
| Intel Core i7-12700K | |
| Durchschnittliche Intel Core i7-12700K (17003 - 22565, n=2) | |
| MSI Vector GP76 12UGS-434 | |
| Eurocom Raptor X15 | |
| MSI Raider GE66 12UHS | |
| Razer Blade 15 2022 | |
| Razer Blade 14 Ryzen 9 6900HX | |
| Gigabyte A5 X1 | |
| Eurocom Nightsky ARX315 | |
| Schenker XMG Apex 15 NH57E PS | |
| Eurocom RX315 NH57AF1 | |
| Aorus 15P XC | |
| Lenovo Legion C7 15IMH05 82EH0030GE | |
| Cinebench R23 / Single Core | |
| Intel Core i7-12700K | |
| MSI Raider GE66 12UHS | |
| Durchschnittliche Intel Core i7-12700K (1806 - 1895, n=2) | |
| Eurocom Raptor X15 | |
| Razer Blade 15 2022 | |
| MSI Vector GP76 12UGS-434 | |
| Eurocom Nightsky ARX315 | |
| Razer Blade 14 Ryzen 9 6900HX | |
| Eurocom RX315 NH57AF1 | |
| Gigabyte A5 X1 | |
| Schenker XMG Apex 15 NH57E PS | |
| Lenovo Legion C7 15IMH05 82EH0030GE | |
| Aorus 15P XC | |
| Cinebench R15 / CPU Multi 64Bit | |
| Intel Core i7-12700K | |
| Durchschnittliche Intel Core i7-12700K (n=1) | |
| MSI Vector GP76 12UGS-434 | |
| Schenker XMG Apex 15 NH57AF1 | |
| MSI Raider GE66 12UHS | |
| Razer Blade 14 Ryzen 9 6900HX | |
| Eurocom Nightsky ARX315 | |
| Razer Blade 15 2022 | |
| Gigabyte A5 X1 | |
| Schenker XMG Apex 15 NH57E PS | |
| Eurocom RX315 NH57AF1 | |
| Aorus 15P XC | |
| Lenovo Legion C7 15IMH05 82EH0030GE | |
| Cinebench R15 / CPU Single 64Bit | |
| Intel Core i7-12700K | |
| Durchschnittliche Intel Core i7-12700K (n=1) | |
| MSI Raider GE66 12UHS | |
| Razer Blade 15 2022 | |
| MSI Vector GP76 12UGS-434 | |
| Eurocom Nightsky ARX315 | |
| Razer Blade 14 Ryzen 9 6900HX | |
| Gigabyte A5 X1 | |
| Schenker XMG Apex 15 NH57E PS | |
| Eurocom RX315 NH57AF1 | |
| Lenovo Legion C7 15IMH05 82EH0030GE | |
| Aorus 15P XC | |
| Schenker XMG Apex 15 NH57AF1 | |
| Blender / v2.79 BMW27 CPU | |
| Lenovo Legion C7 15IMH05 82EH0030GE | |
| Aorus 15P XC | |
| Eurocom RX315 NH57AF1 | |
| Schenker XMG Apex 15 NH57E PS | |
| Gigabyte A5 X1 | |
| Razer Blade 15 2022 | |
| Razer Blade 14 Ryzen 9 6900HX | |
| Eurocom Nightsky ARX315 | |
| MSI Vector GP76 12UGS-434 | |
| MSI Raider GE66 12UHS | |
| Eurocom Raptor X15 | |
| Schenker XMG Apex 15 NH57AF1 | |
| Durchschnittliche Intel Core i7-12700K (152.3 - 193.9, n=2) | |
| Intel Core i7-12700K | |
| 7-Zip 18.03 / 7z b 4 | |
| Intel Core i7-12700K | |
| Eurocom Nightsky ARX315 | |
| Schenker XMG Apex 15 NH57AF1 | |
| Durchschnittliche Intel Core i7-12700K (65508 - 81369, n=2) | |
| MSI Raider GE66 12UHS | |
| Eurocom Raptor X15 | |
| MSI Vector GP76 12UGS-434 | |
| Razer Blade 14 Ryzen 9 6900HX | |
| Razer Blade 15 2022 | |
| Gigabyte A5 X1 | |
| Schenker XMG Apex 15 NH57E PS | |
| Aorus 15P XC | |
| Lenovo Legion C7 15IMH05 82EH0030GE | |
| Eurocom RX315 NH57AF1 | |
| 7-Zip 18.03 / 7z b 4 -mmt1 | |
| Eurocom Nightsky ARX315 | |
| Eurocom Raptor X15 | |
| Durchschnittliche Intel Core i7-12700K (6117 - 6422, n=2) | |
| Intel Core i7-12700K | |
| MSI Raider GE66 12UHS | |
| Razer Blade 14 Ryzen 9 6900HX | |
| Razer Blade 15 2022 | |
| Gigabyte A5 X1 | |
| Schenker XMG Apex 15 NH57E PS | |
| MSI Vector GP76 12UGS-434 | |
| Lenovo Legion C7 15IMH05 82EH0030GE | |
| Eurocom RX315 NH57AF1 | |
| Aorus 15P XC | |
| Schenker XMG Apex 15 NH57AF1 | |
| Geekbench 5.5 / Multi-Core | |
| Intel Core i7-12700K | |
| Durchschnittliche Intel Core i7-12700K (12475 - 15557, n=2) | |
| MSI Raider GE66 12UHS | |
| Eurocom Raptor X15 | |
| Razer Blade 15 2022 | |
| MSI Vector GP76 12UGS-434 | |
| Schenker XMG Apex 15 NH57AF1 | |
| Eurocom Nightsky ARX315 | |
| Razer Blade 14 Ryzen 9 6900HX | |
| Eurocom RX315 NH57AF1 | |
| Gigabyte A5 X1 | |
| Schenker XMG Apex 15 NH57E PS | |
| Lenovo Legion C7 15IMH05 82EH0030GE | |
| Aorus 15P XC | |
| Geekbench 5.5 / Single-Core | |
| Eurocom Raptor X15 | |
| Durchschnittliche Intel Core i7-12700K (1890 - 1933, n=2) | |
| Intel Core i7-12700K | |
| MSI Raider GE66 12UHS | |
| MSI Vector GP76 12UGS-434 | |
| Razer Blade 15 2022 | |
| Eurocom Nightsky ARX315 | |
| Razer Blade 14 Ryzen 9 6900HX | |
| Eurocom RX315 NH57AF1 | |
| Gigabyte A5 X1 | |
| Schenker XMG Apex 15 NH57E PS | |
| Lenovo Legion C7 15IMH05 82EH0030GE | |
| Aorus 15P XC | |
| Schenker XMG Apex 15 NH57AF1 | |
| HWBOT x265 Benchmark v2.2 / 4k Preset | |
| Intel Core i7-12700K | |
| Durchschnittliche Intel Core i7-12700K (14.9 - 26.1, n=2) | |
| MSI Vector GP76 12UGS-434 | |
| Schenker XMG Apex 15 NH57AF1 | |
| MSI Raider GE66 12UHS | |
| Razer Blade 14 Ryzen 9 6900HX | |
| Eurocom Nightsky ARX315 | |
| Razer Blade 15 2022 | |
| Gigabyte A5 X1 | |
| Schenker XMG Apex 15 NH57E PS | |
| Eurocom RX315 NH57AF1 | |
| Eurocom Raptor X15 | |
| Aorus 15P XC | |
| Lenovo Legion C7 15IMH05 82EH0030GE | |
| LibreOffice / 20 Documents To PDF | |
| Gigabyte A5 X1 | |
| Schenker XMG Apex 15 NH57AF1 | |
| Lenovo Legion C7 15IMH05 82EH0030GE | |
| Schenker XMG Apex 15 NH57E PS | |
| Aorus 15P XC | |
| Razer Blade 15 2022 | |
| Razer Blade 14 Ryzen 9 6900HX | |
| Eurocom RX315 NH57AF1 | |
| Eurocom Nightsky ARX315 | |
| MSI Vector GP76 12UGS-434 | |
| Intel Core i7-12700K | |
| Durchschnittliche Intel Core i7-12700K (37.8 - 39.8, n=2) | |
| Eurocom Raptor X15 | |
| MSI Raider GE66 12UHS | |
| R Benchmark 2.5 / Overall mean | |
| Aorus 15P XC | |
| Lenovo Legion C7 15IMH05 82EH0030GE | |
| Eurocom RX315 NH57AF1 | |
| Schenker XMG Apex 15 NH57AF1 | |
| Schenker XMG Apex 15 NH57E PS | |
| Gigabyte A5 X1 | |
| Eurocom Nightsky ARX315 | |
| Razer Blade 14 Ryzen 9 6900HX | |
| Razer Blade 15 2022 | |
| MSI Vector GP76 12UGS-434 | |
| MSI Raider GE66 12UHS | |
| Intel Core i7-12700K | |
| Durchschnittliche Intel Core i7-12700K (0.412 - 0.423, n=2) | |
| Eurocom Raptor X15 | |
Cinebench R23: Multi Core | Single Core
Cinebench R15: CPU Multi 64Bit | CPU Single 64Bit
Blender: v2.79 BMW27 CPU
7-Zip 18.03: 7z b 4 | 7z b 4 -mmt1
Geekbench 5.5: Multi-Core | Single-Core
HWBOT x265 Benchmark v2.2: 4k Preset
LibreOffice : 20 Documents To PDF
R Benchmark 2.5: Overall mean
* ... kleinere Werte sind besser
AIDA64: FP32 Ray-Trace | FPU Julia | CPU SHA3 | CPU Queen | FPU SinJulia | FPU Mandel | CPU AES | CPU ZLib | FP64 Ray-Trace | CPU PhotoWorxx
| Performance Rating | |
| Gigabyte A5 X1 | |
| Eurocom RX315 NH57AF1 | |
| Asus TUF Gaming A15 FA506QR-AZ061T | |
| MSI Raider GE66 12UHS | |
| Eurocom Raptor X15 | |
| Durchschnittliche Intel Core i7-12700K | |
| Razer Blade 15 Advanced Model Early 2022 | |
| AIDA64 / FP32 Ray-Trace | |
| Gigabyte A5 X1 | |
| Eurocom RX315 NH57AF1 | |
| Asus TUF Gaming A15 FA506QR-AZ061T | |
| MSI Raider GE66 12UHS | |
| Eurocom Raptor X15 | |
| Durchschnittliche Intel Core i7-12700K (n=1) | |
| Razer Blade 15 Advanced Model Early 2022 | |
| AIDA64 / FPU Julia | |
| Gigabyte A5 X1 | |
| Asus TUF Gaming A15 FA506QR-AZ061T | |
| Eurocom RX315 NH57AF1 | |
| Eurocom Raptor X15 | |
| Durchschnittliche Intel Core i7-12700K (n=1) | |
| MSI Raider GE66 12UHS | |
| Razer Blade 15 Advanced Model Early 2022 | |
| AIDA64 / CPU SHA3 | |
| Eurocom RX315 NH57AF1 | |
| Gigabyte A5 X1 | |
| Eurocom Raptor X15 | |
| Durchschnittliche Intel Core i7-12700K (n=1) | |
| MSI Raider GE66 12UHS | |
| Asus TUF Gaming A15 FA506QR-AZ061T | |
| Razer Blade 15 Advanced Model Early 2022 | |
| AIDA64 / CPU Queen | |
| MSI Raider GE66 12UHS | |
| Gigabyte A5 X1 | |
| Eurocom Raptor X15 | |
| Durchschnittliche Intel Core i7-12700K (n=1) | |
| Asus TUF Gaming A15 FA506QR-AZ061T | |
| Eurocom RX315 NH57AF1 | |
| Razer Blade 15 Advanced Model Early 2022 | |
| AIDA64 / FPU SinJulia | |
| Gigabyte A5 X1 | |
| Asus TUF Gaming A15 FA506QR-AZ061T | |
| Eurocom Raptor X15 | |
| Durchschnittliche Intel Core i7-12700K (n=1) | |
| Eurocom RX315 NH57AF1 | |
| MSI Raider GE66 12UHS | |
| Razer Blade 15 Advanced Model Early 2022 | |
| AIDA64 / FPU Mandel | |
| Gigabyte A5 X1 | |
| Eurocom RX315 NH57AF1 | |
| Asus TUF Gaming A15 FA506QR-AZ061T | |
| MSI Raider GE66 12UHS | |
| Eurocom Raptor X15 | |
| Durchschnittliche Intel Core i7-12700K (n=1) | |
| Razer Blade 15 Advanced Model Early 2022 | |
| AIDA64 / CPU AES | |
| Eurocom RX315 NH57AF1 | |
| Gigabyte A5 X1 | |
| MSI Raider GE66 12UHS | |
| Eurocom Raptor X15 | |
| Durchschnittliche Intel Core i7-12700K (n=1) | |
| Asus TUF Gaming A15 FA506QR-AZ061T | |
| Razer Blade 15 Advanced Model Early 2022 | |
| AIDA64 / CPU ZLib | |
| Eurocom Raptor X15 | |
| Durchschnittliche Intel Core i7-12700K (n=1) | |
| MSI Raider GE66 12UHS | |
| Gigabyte A5 X1 | |
| Eurocom RX315 NH57AF1 | |
| Asus TUF Gaming A15 FA506QR-AZ061T | |
| Razer Blade 15 Advanced Model Early 2022 | |
| AIDA64 / FP64 Ray-Trace | |
| Eurocom RX315 NH57AF1 | |
| Gigabyte A5 X1 | |
| Asus TUF Gaming A15 FA506QR-AZ061T | |
| MSI Raider GE66 12UHS | |
| Eurocom Raptor X15 | |
| Durchschnittliche Intel Core i7-12700K (n=1) | |
| Razer Blade 15 Advanced Model Early 2022 | |
| AIDA64 / CPU PhotoWorxx | |
| MSI Raider GE66 12UHS | |
| Razer Blade 15 Advanced Model Early 2022 | |
| Eurocom Raptor X15 | |
| Durchschnittliche Intel Core i7-12700K (n=1) | |
| Eurocom RX315 NH57AF1 | |
| Gigabyte A5 X1 | |
| Asus TUF Gaming A15 FA506QR-AZ061T | |
Systemleistung
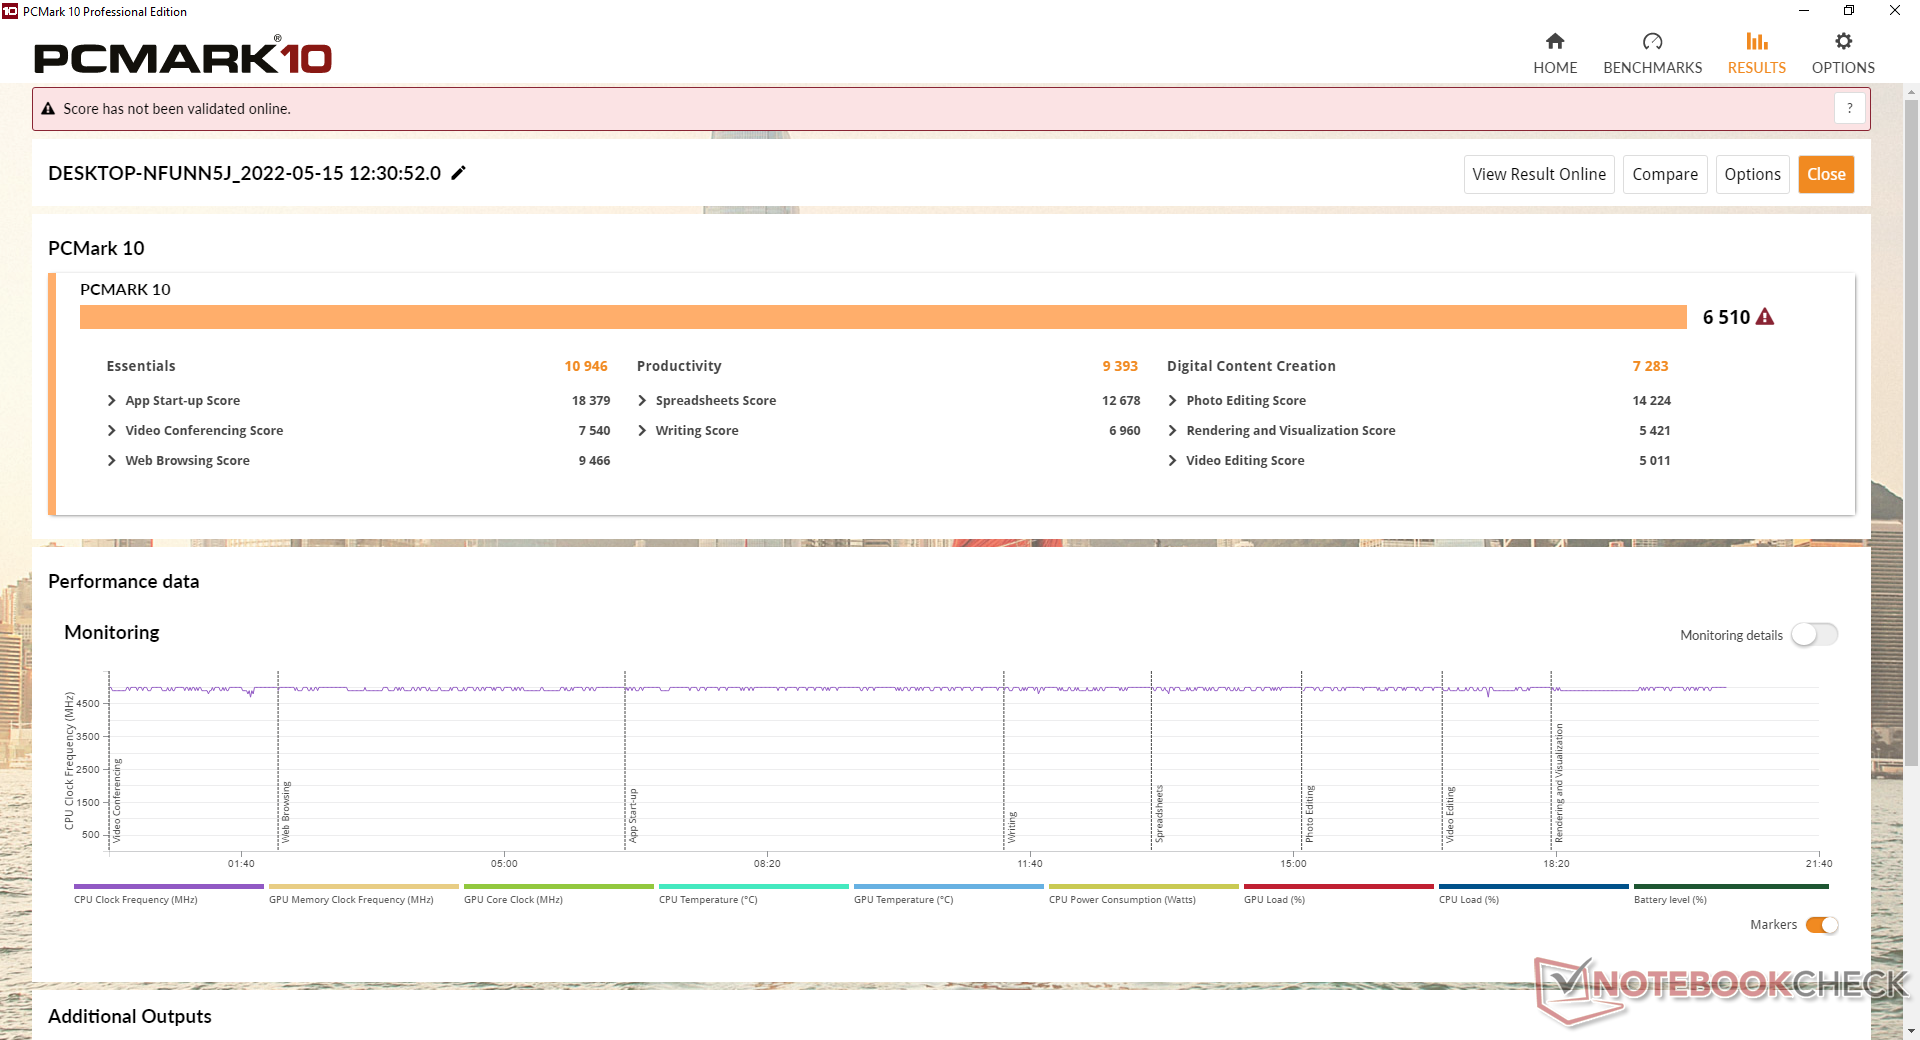
Die PCMark-10-Ergebnisse sind vergleichbar mit High-End-Gaming-Notebooks, die mit "normalen" mobilen CPUs wie dem MSI GE66 i9-12900HK oder dem Razer Blade 15 i7-12800H ausgestattet sind. Das Ergebnis des Subtests "Erstellung digitaler Inhalte" ist jedoch niedriger als erwartet.
CrossMark: Overall | Productivity | Creativity | Responsiveness
| PCMark 10 / Score | |
| MSI Raider GE66 12UHS | |
| Razer Blade 15 Advanced Model Early 2022 | |
| Eurocom RX315 NH57AF1 | |
| Asus TUF Gaming A15 FA506QR-AZ061T | |
| Gigabyte A5 X1 | |
| Eurocom Raptor X15 | |
| Durchschnittliche Intel Core i7-12700K, NVIDIA GeForce RTX 3070 Ti Laptop GPU (n=1) | |
| PCMark 10 / Essentials | |
| MSI Raider GE66 12UHS | |
| Eurocom Raptor X15 | |
| Durchschnittliche Intel Core i7-12700K, NVIDIA GeForce RTX 3070 Ti Laptop GPU (n=1) | |
| Razer Blade 15 Advanced Model Early 2022 | |
| Eurocom RX315 NH57AF1 | |
| Asus TUF Gaming A15 FA506QR-AZ061T | |
| Gigabyte A5 X1 | |
| PCMark 10 / Productivity | |
| MSI Raider GE66 12UHS | |
| Razer Blade 15 Advanced Model Early 2022 | |
| Asus TUF Gaming A15 FA506QR-AZ061T | |
| Eurocom Raptor X15 | |
| Durchschnittliche Intel Core i7-12700K, NVIDIA GeForce RTX 3070 Ti Laptop GPU (n=1) | |
| Gigabyte A5 X1 | |
| Eurocom RX315 NH57AF1 | |
| PCMark 10 / Digital Content Creation | |
| MSI Raider GE66 12UHS | |
| Razer Blade 15 Advanced Model Early 2022 | |
| Eurocom RX315 NH57AF1 | |
| Gigabyte A5 X1 | |
| Asus TUF Gaming A15 FA506QR-AZ061T | |
| Eurocom Raptor X15 | |
| Durchschnittliche Intel Core i7-12700K, NVIDIA GeForce RTX 3070 Ti Laptop GPU (n=1) | |
| CrossMark / Overall | |
| Eurocom Raptor X15 | |
| Durchschnittliche Intel Core i7-12700K, NVIDIA GeForce RTX 3070 Ti Laptop GPU (n=1) | |
| Razer Blade 15 Advanced Model Early 2022 | |
| CrossMark / Productivity | |
| Eurocom Raptor X15 | |
| Durchschnittliche Intel Core i7-12700K, NVIDIA GeForce RTX 3070 Ti Laptop GPU (n=1) | |
| Razer Blade 15 Advanced Model Early 2022 | |
| CrossMark / Creativity | |
| Eurocom Raptor X15 | |
| Durchschnittliche Intel Core i7-12700K, NVIDIA GeForce RTX 3070 Ti Laptop GPU (n=1) | |
| Razer Blade 15 Advanced Model Early 2022 | |
| CrossMark / Responsiveness | |
| Eurocom Raptor X15 | |
| Durchschnittliche Intel Core i7-12700K, NVIDIA GeForce RTX 3070 Ti Laptop GPU (n=1) | |
| Razer Blade 15 Advanced Model Early 2022 | |
| PCMark 10 Score | 6510 Punkte | |
Hilfe | ||
| AIDA64 / Memory Copy | |
| MSI Raider GE66 12UHS | |
| Razer Blade 15 Advanced Model Early 2022 | |
| Eurocom Raptor X15 | |
| Durchschnittliche Intel Core i7-12700K (n=1) | |
| Eurocom RX315 NH57AF1 | |
| Gigabyte A5 X1 | |
| Asus TUF Gaming A15 FA506QR-AZ061T | |
| AIDA64 / Memory Read | |
| MSI Raider GE66 12UHS | |
| Razer Blade 15 Advanced Model Early 2022 | |
| Eurocom Raptor X15 | |
| Durchschnittliche Intel Core i7-12700K (n=1) | |
| Eurocom RX315 NH57AF1 | |
| Gigabyte A5 X1 | |
| Asus TUF Gaming A15 FA506QR-AZ061T | |
| AIDA64 / Memory Write | |
| Razer Blade 15 Advanced Model Early 2022 | |
| MSI Raider GE66 12UHS | |
| Eurocom Raptor X15 | |
| Durchschnittliche Intel Core i7-12700K (n=1) | |
| Eurocom RX315 NH57AF1 | |
| Gigabyte A5 X1 | |
| Asus TUF Gaming A15 FA506QR-AZ061T | |
| AIDA64 / Memory Latency | |
| Razer Blade 15 Advanced Model Early 2022 | |
| MSI Raider GE66 12UHS | |
| Eurocom RX315 NH57AF1 | |
| Asus TUF Gaming A15 FA506QR-AZ061T | |
| Gigabyte A5 X1 | |
| Eurocom Raptor X15 | |
| Durchschnittliche Intel Core i7-12700K (n=1) | |
* ... kleinere Werte sind besser
DPC-Latenzzeit
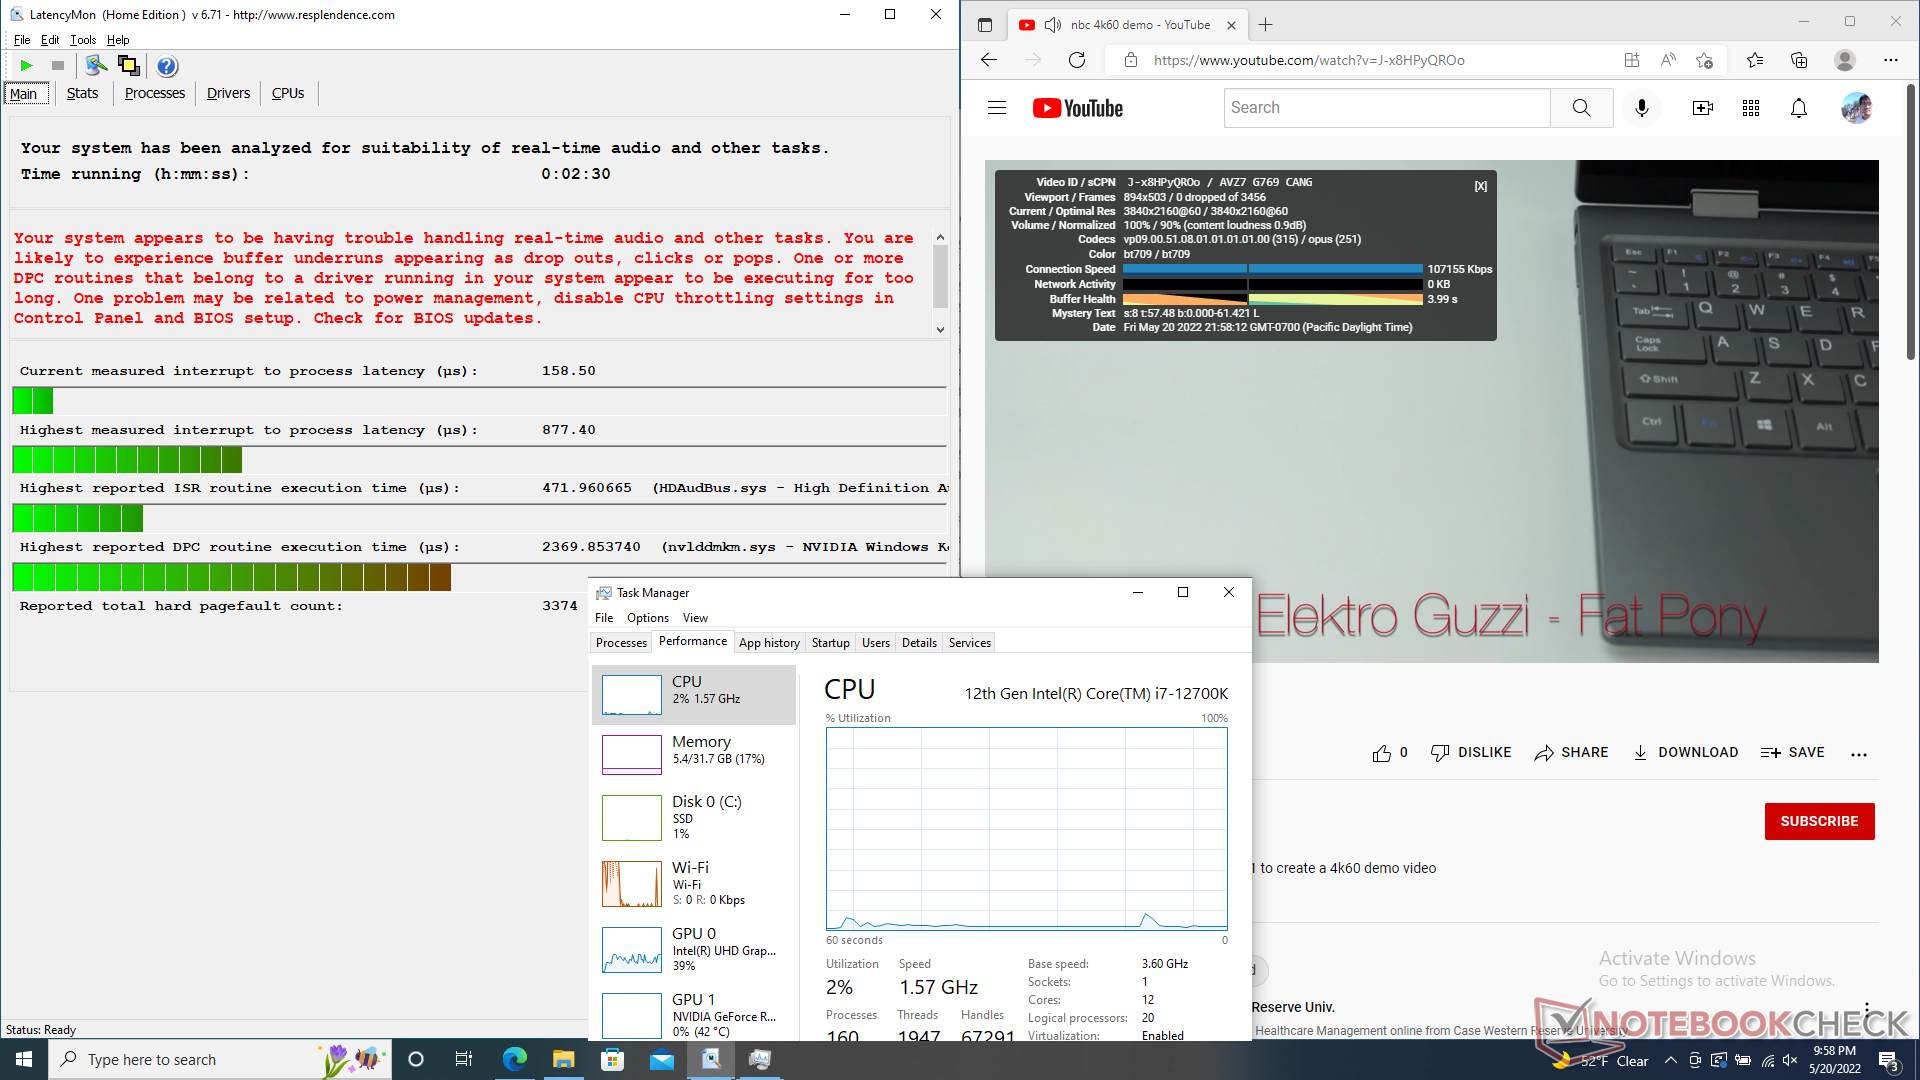
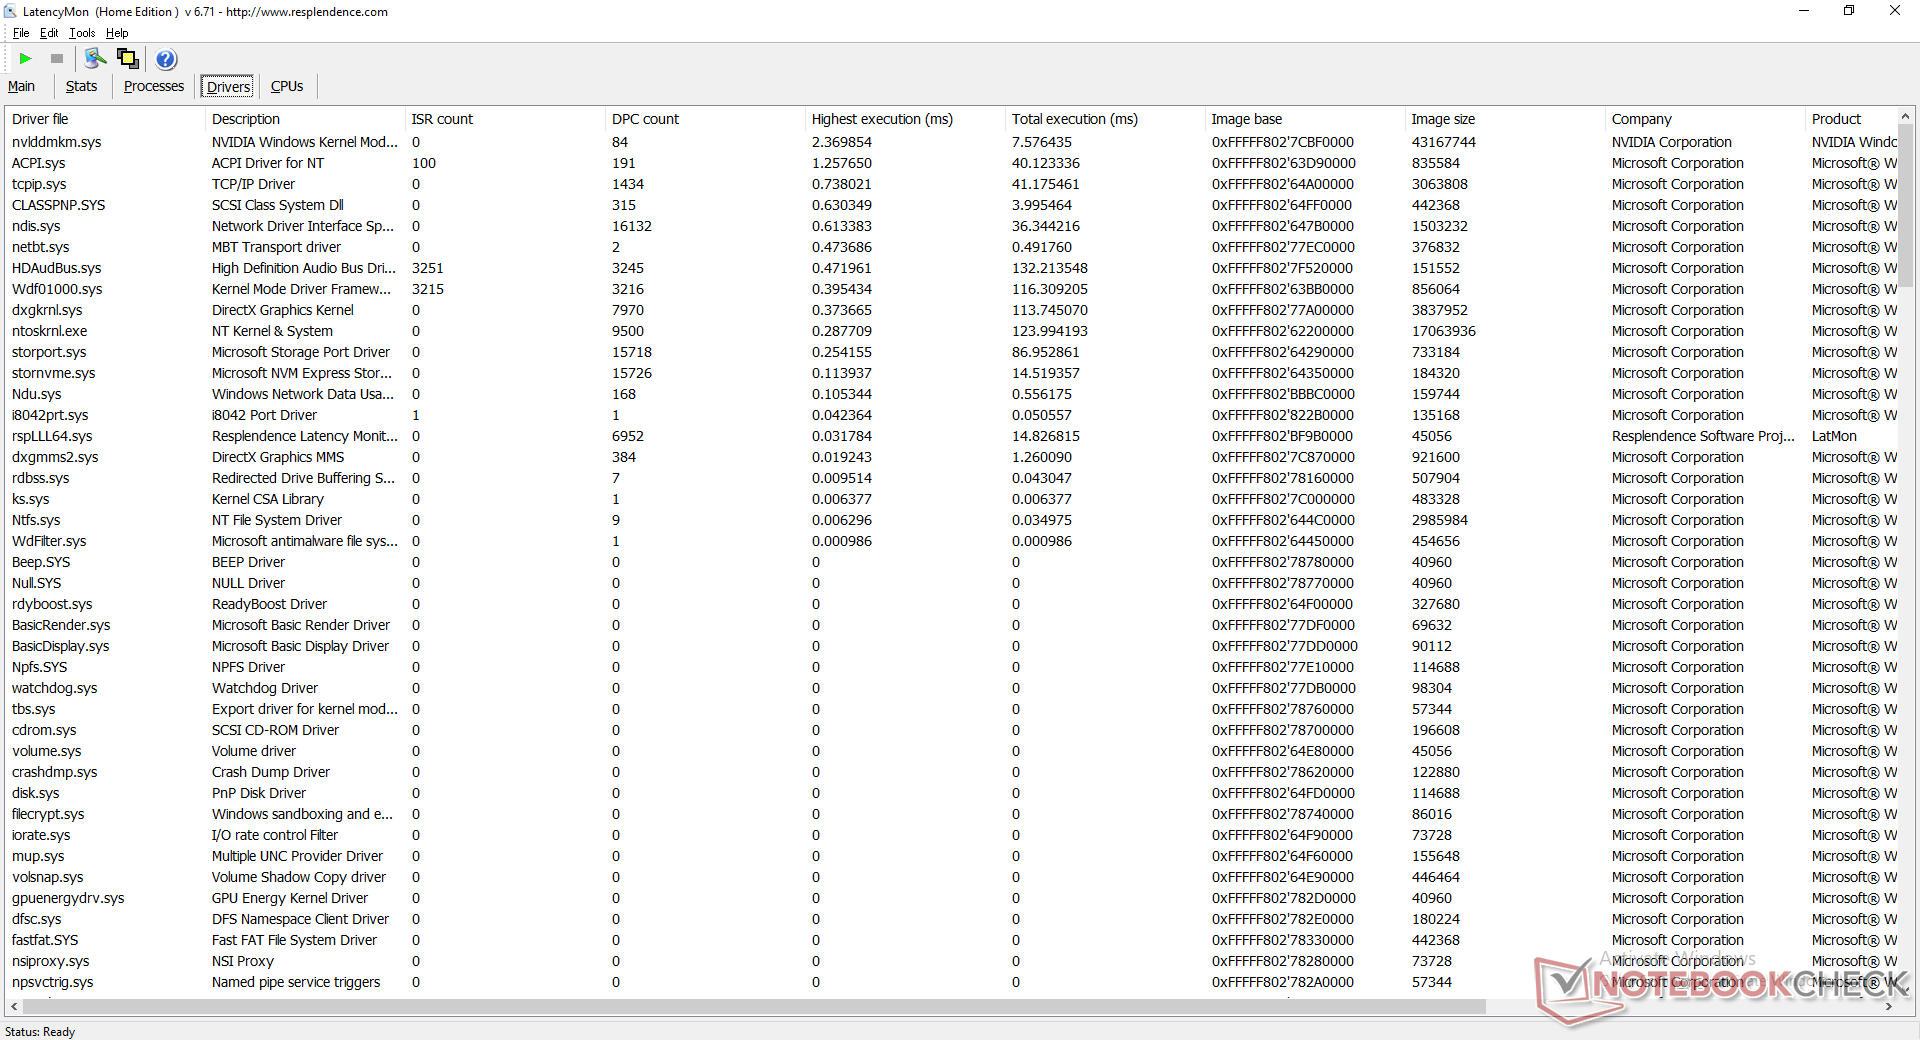
LatencyMon zeigt DPC-Probleme beim Öffnen mehrerer Browser-Tabs unserer Homepage. Die 4K-Videowiedergabe bei 60 fps ist ansonsten perfekt und ohne Bildaussetzer, wenn die integrierte GPU verwendet wird.
| DPC Latencies / LatencyMon - interrupt to process latency (max), Web, Youtube, Prime95 | |
| MSI Raider GE66 12UHS | |
| Razer Blade 15 Advanced Model Early 2022 | |
| Eurocom RX315 NH57AF1 | |
| Asus TUF Gaming A15 FA506QR-AZ061T | |
| Eurocom Raptor X15 | |
| Gigabyte A5 X1 | |
* ... kleinere Werte sind besser
Speichergeräte
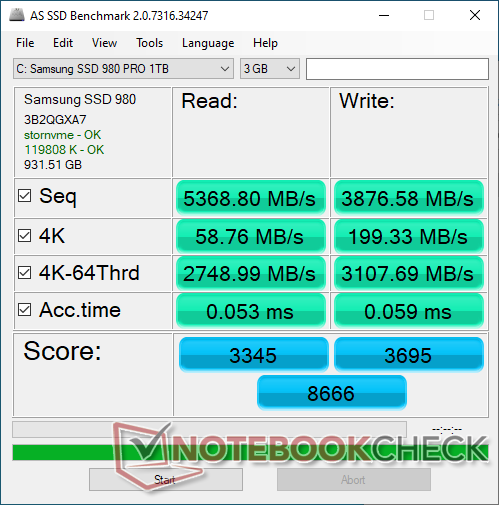
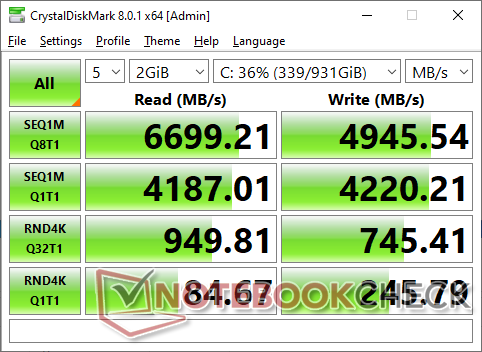
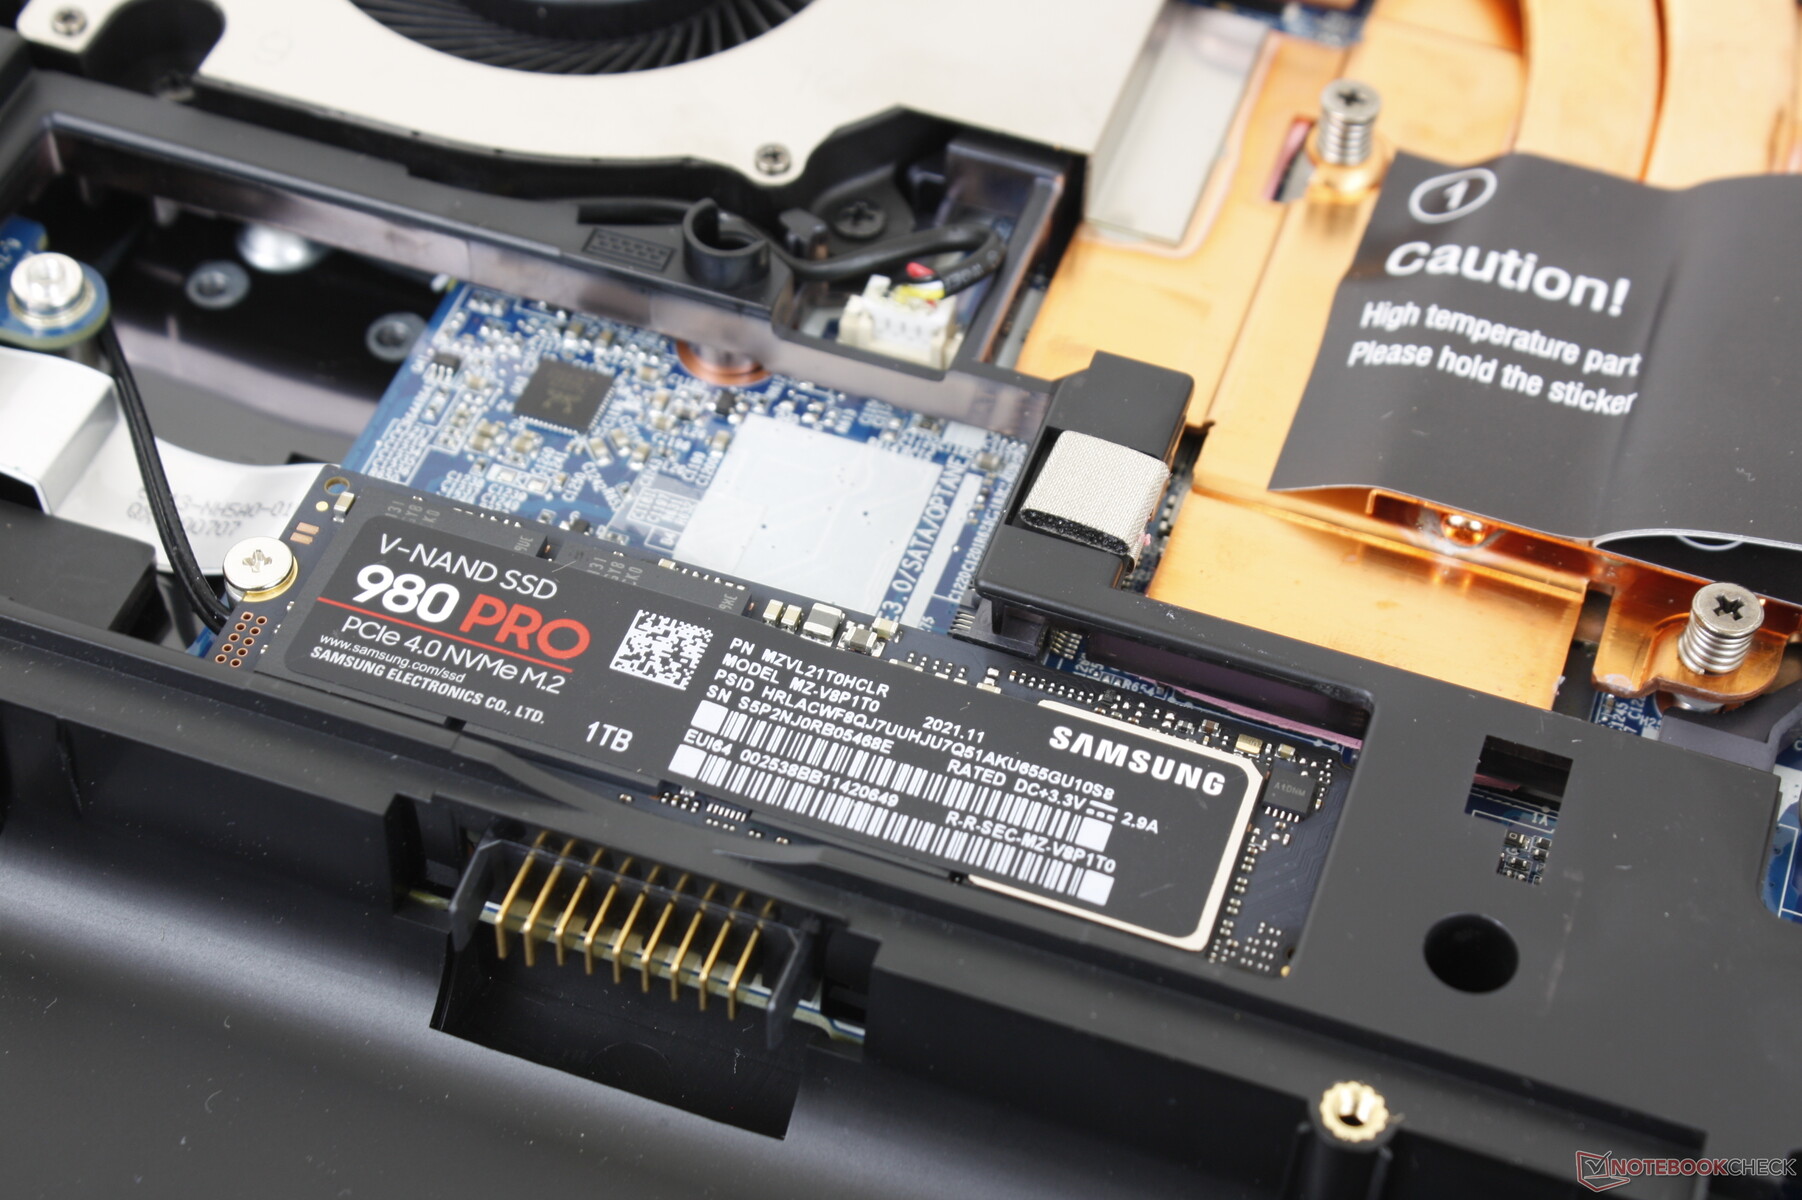
Die Nachhaltigkeit der Leistung ist schlecht, wenn ein PCIe4-Laufwerk installiert ist. Wie unsere Grafik unten zeigt, hat die Samsung SSD 980 Pro Probleme, ihre maximale Übertragungsrate auch nur für kurze Zeit aufrechtzuerhalten. Die Leistungsdrosselung setzt aufgrund der thermischen Einschränkungen, die sich aus dem Fehlen eines mitgelieferten Wärmeableiters ergeben, früh ein.

| Drive Performance Rating - Percent | |
| MSI Raider GE66 12UHS | |
| Razer Blade 15 Advanced Model Early 2022 | |
| Eurocom Raptor X15 | |
| Eurocom RX315 NH57AF1 | |
| Asus TUF Gaming A15 FA506QR-AZ061T | |
| Gigabyte A5 X1 | |
* ... kleinere Werte sind besser
Disk Throttling: DiskSpd Read Loop, Queue Depth 8
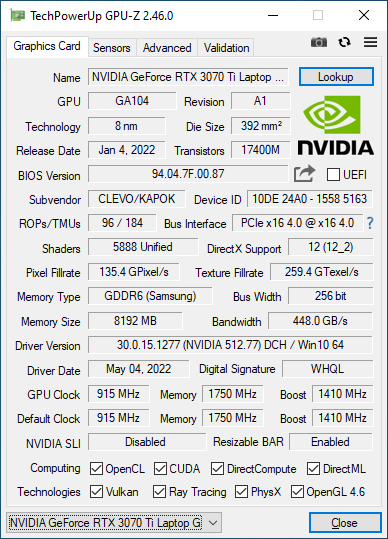
GPU-Leistung
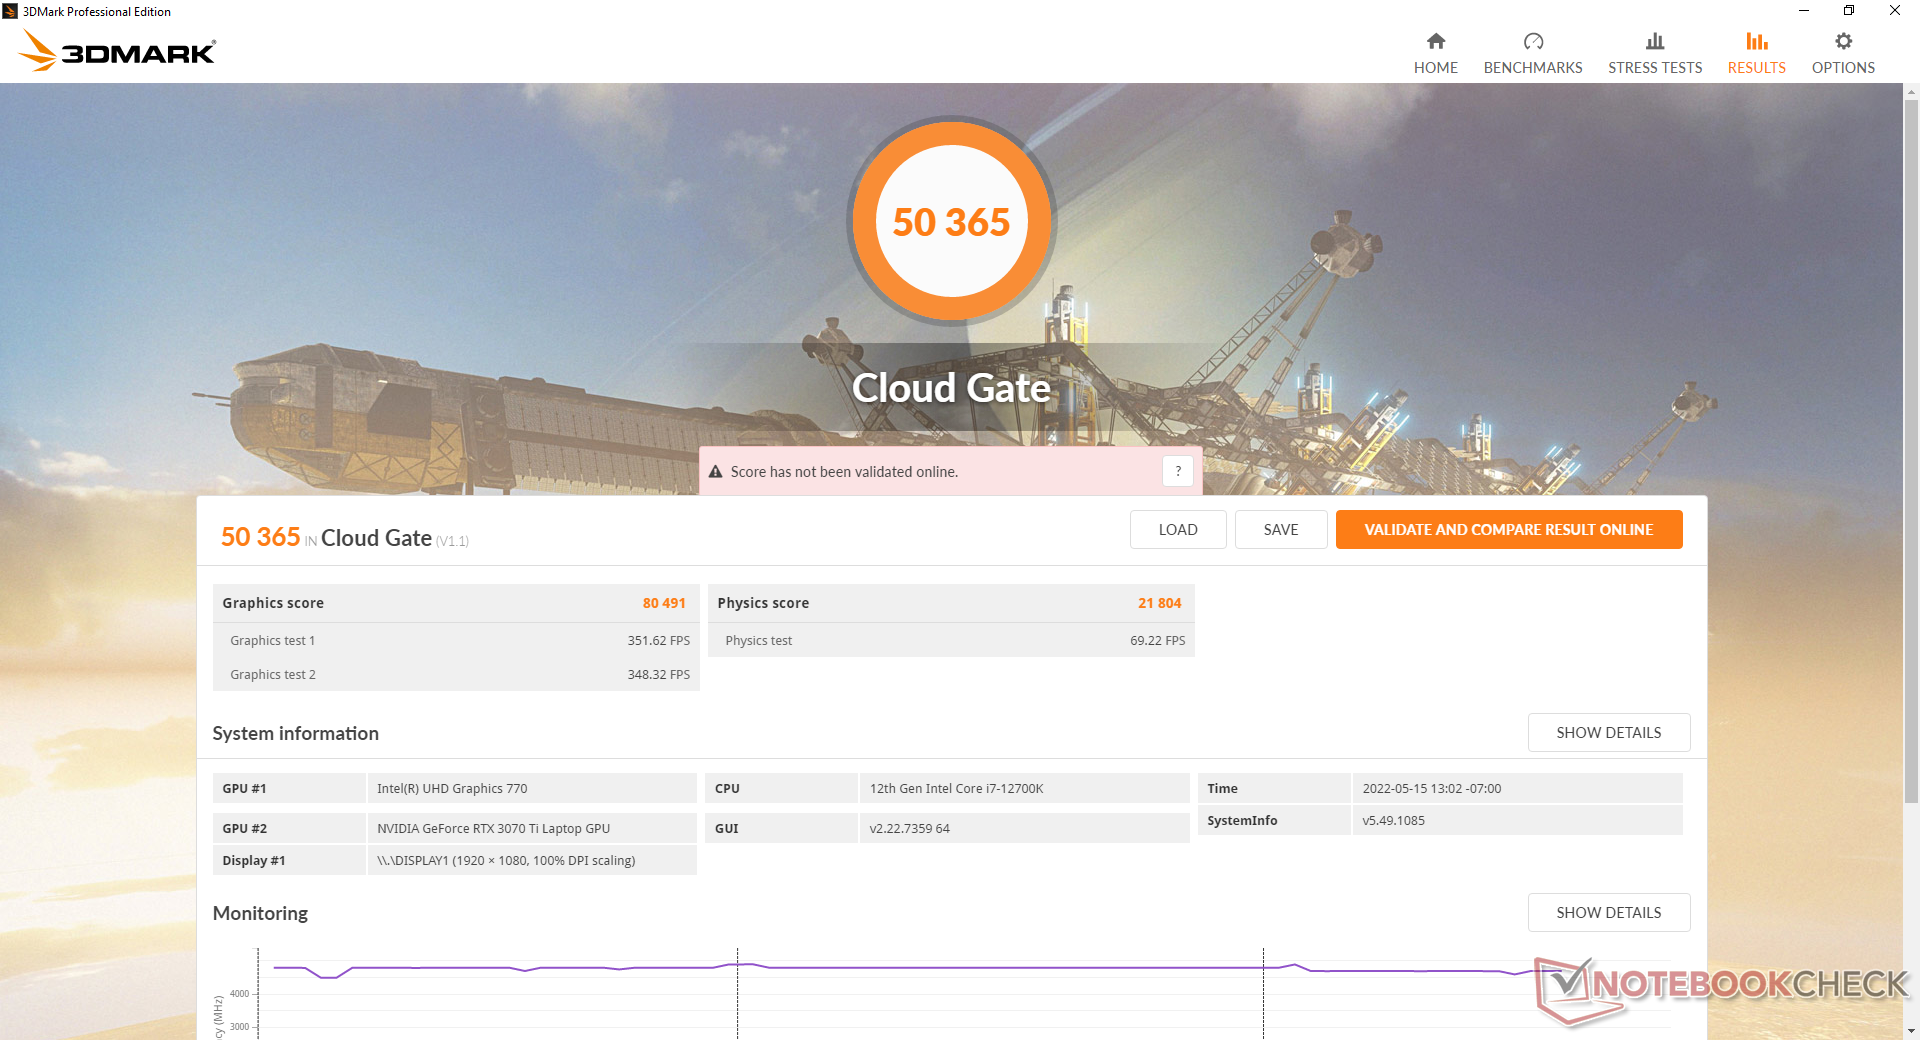
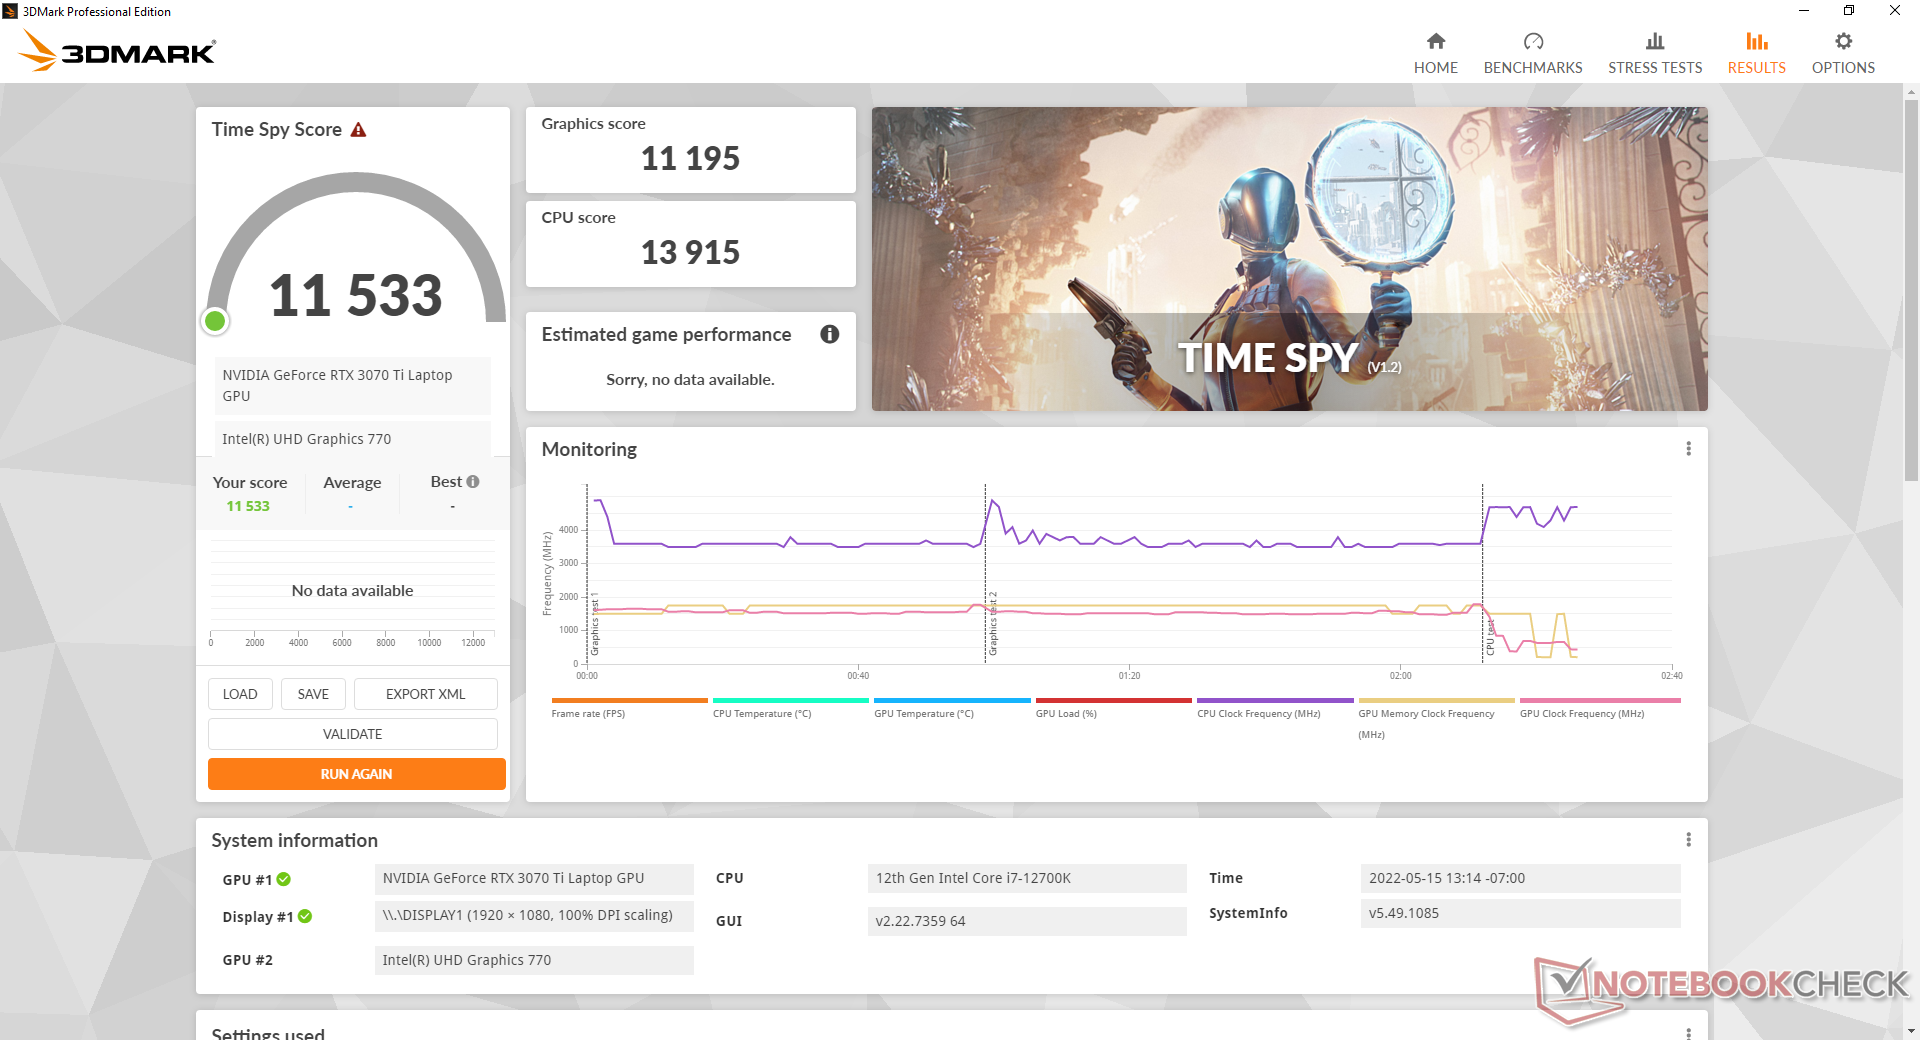
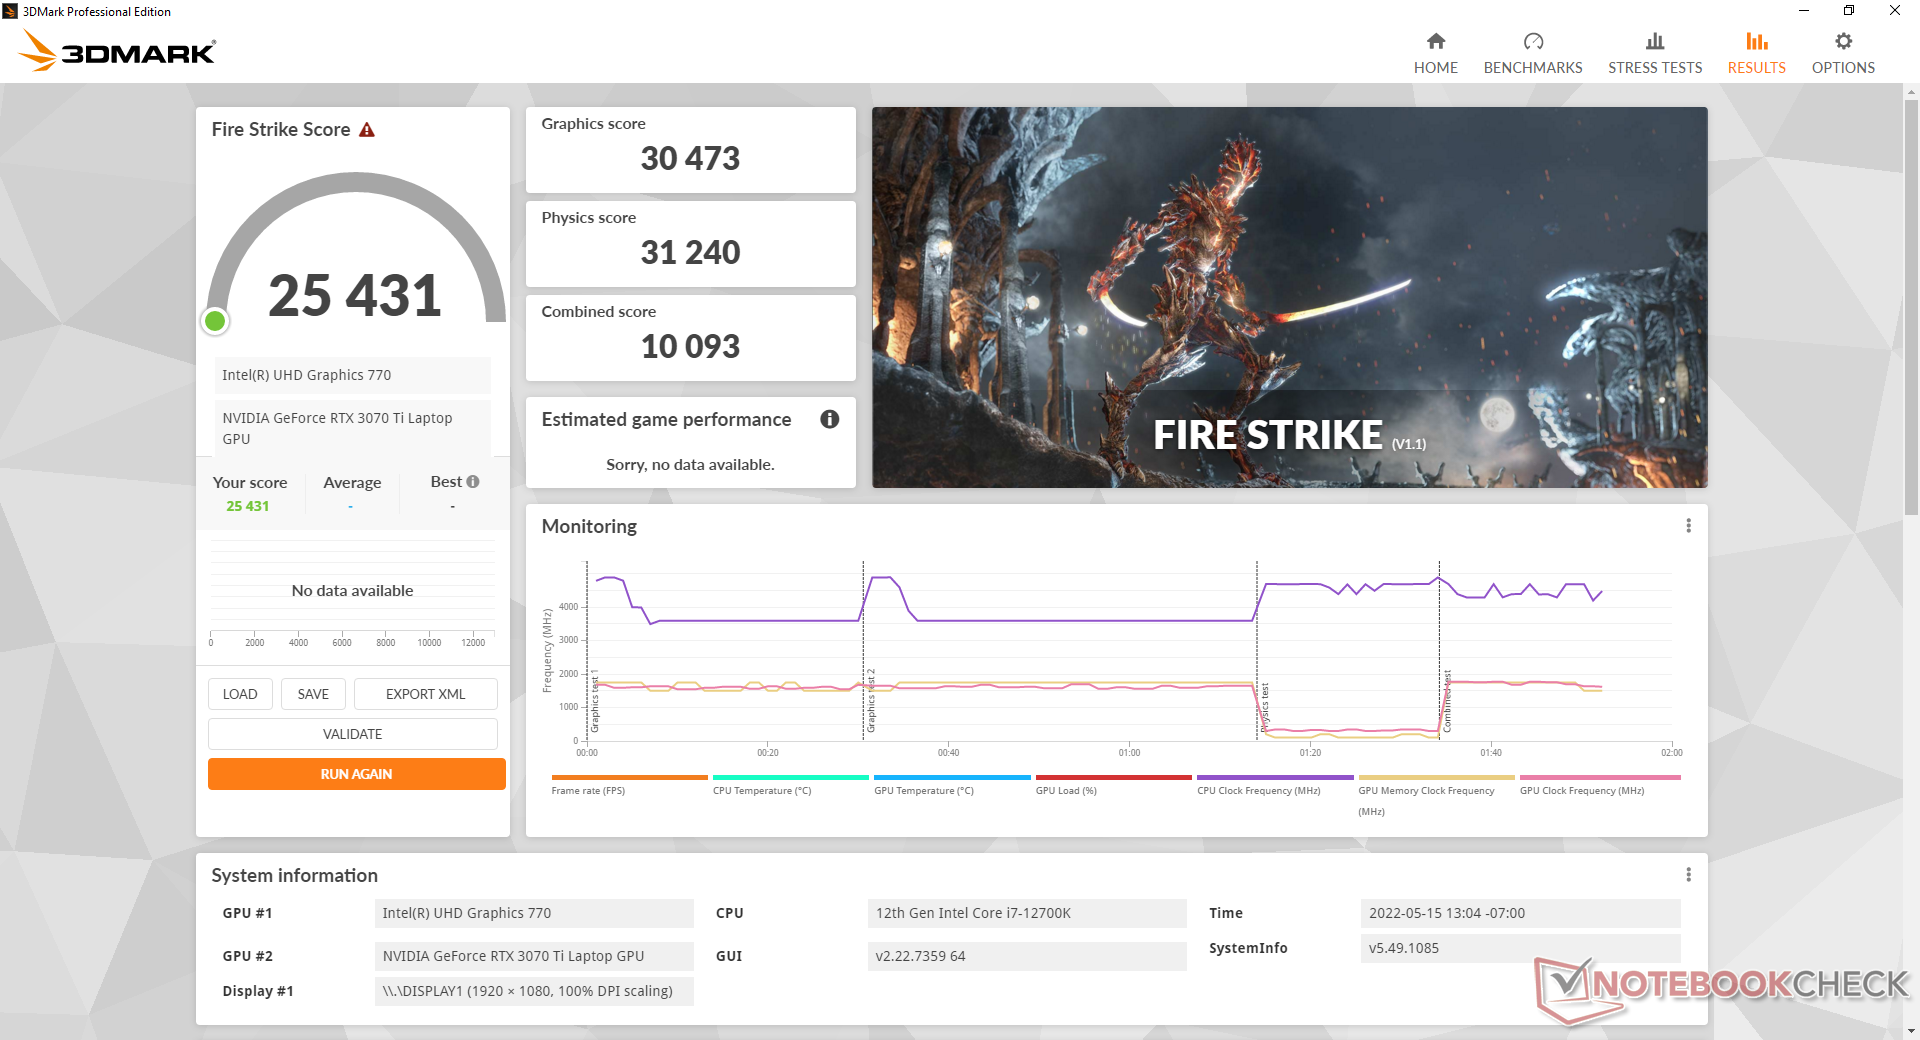
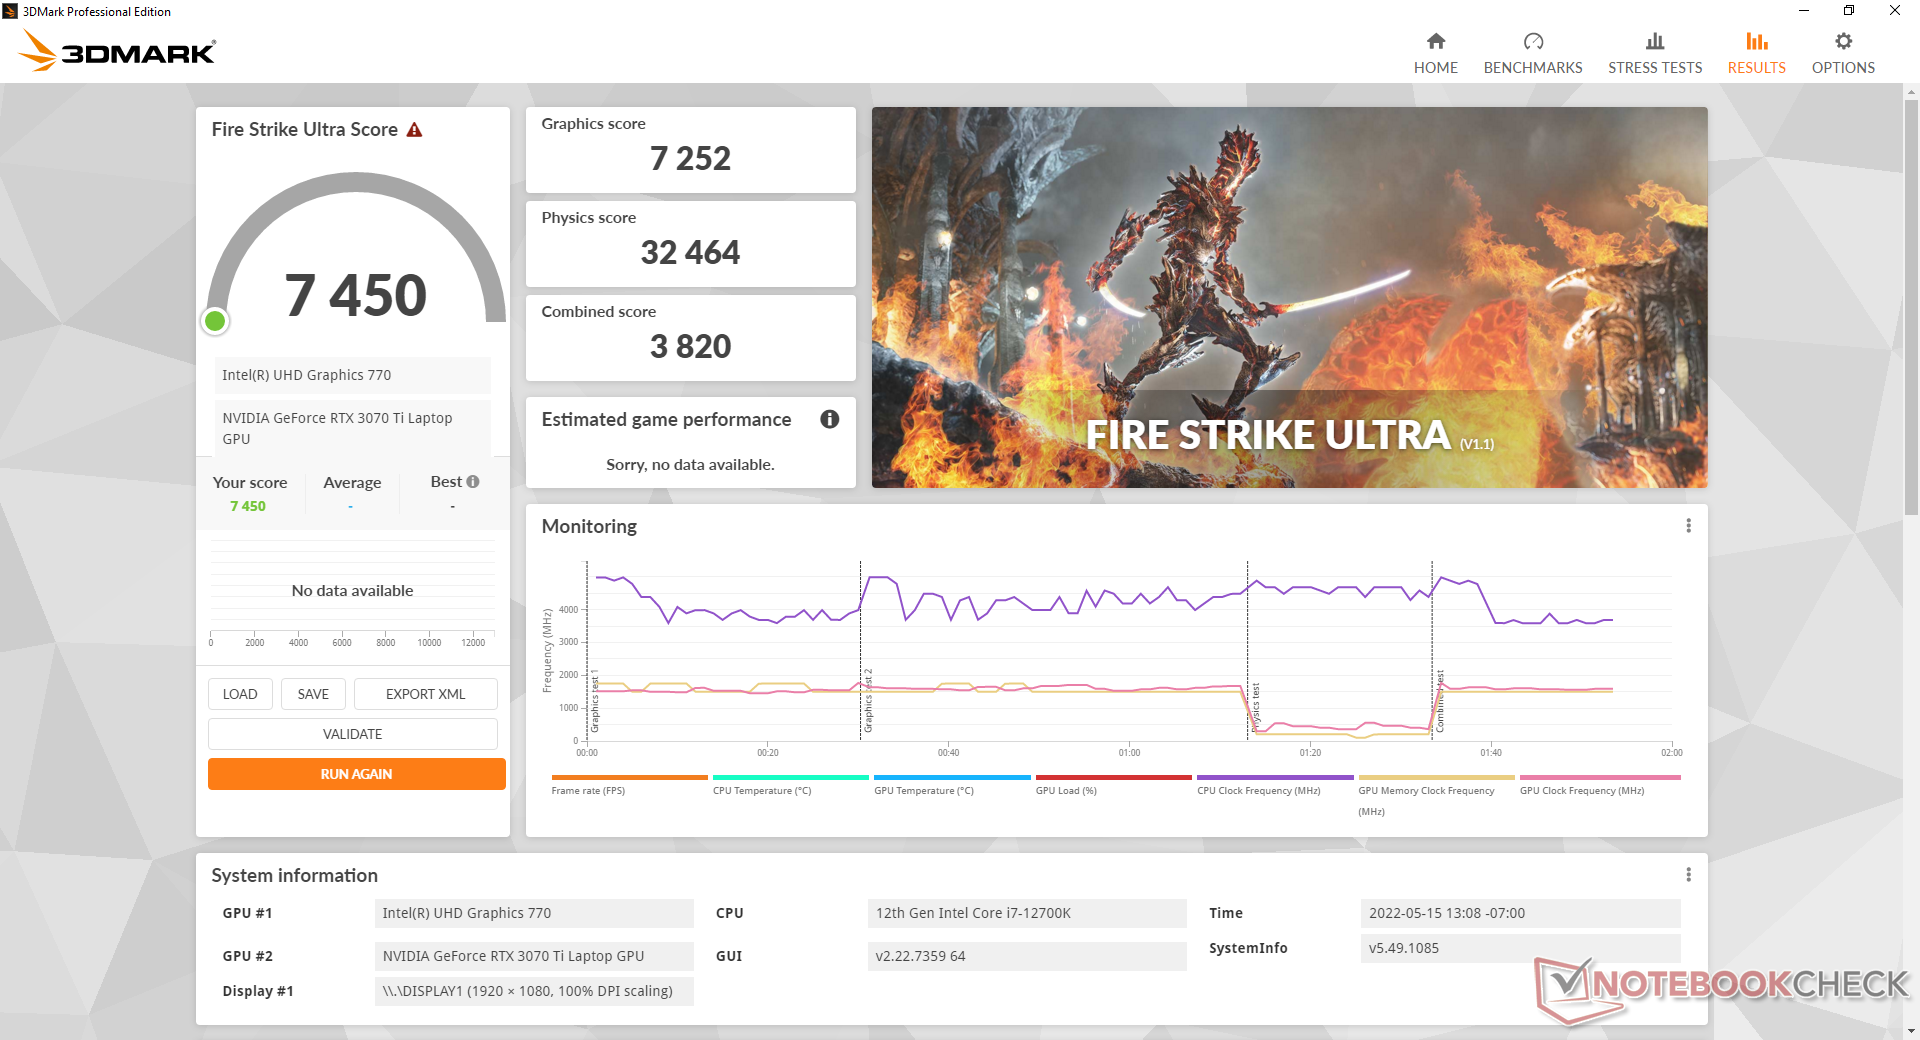
Die Grafikleistung ist hervorragend und bis zu 10 % schneller als der durchschnittliche Laptop in unserer Datenbank, der mit der gleichen GeForce RTX 3070 Ti GPU ausgestattet ist. Das relativ dicke Gehäuse ermöglicht einen überdurchschnittlich hohen TGP-Wert von 140 W im Vergleich zu nur 105 W oder weniger wie beim MSI GS66. Die Leistung liegt nur knapp unter der der GeForce RTX 3070 für Desktops.
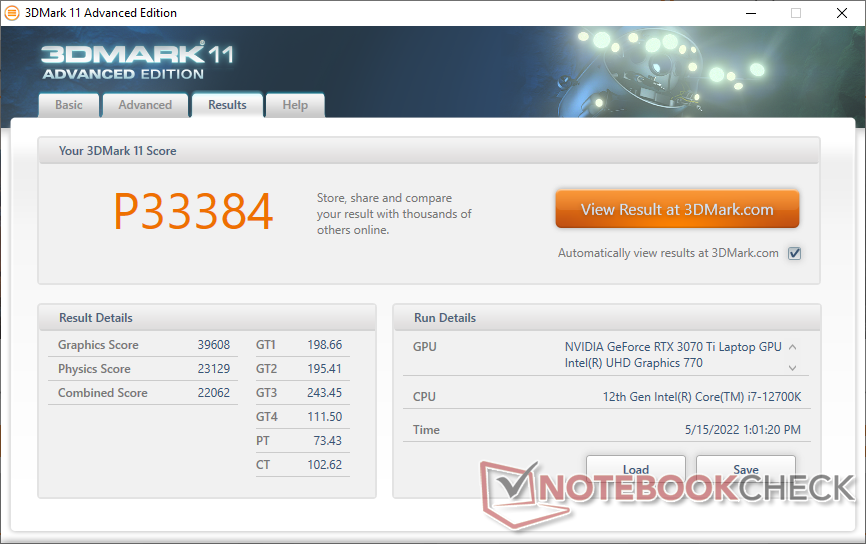
| 3DMark 11 Performance | 33384 Punkte | |
| 3DMark Cloud Gate Standard Score | 50365 Punkte | |
| 3DMark Fire Strike Score | 25431 Punkte | |
| 3DMark Time Spy Score | 11533 Punkte | |
Hilfe | ||
Witcher 3 FPS-Diagramm
| min. | mittel | hoch | max. | |
|---|---|---|---|---|
| GTA V (2015) | 186.6 | 182.8 | 174.6 | 116.5 |
| The Witcher 3 (2015) | 429 | 329.2 | 213.9 | 111.4 |
| Dota 2 Reborn (2015) | 199 | 178.4 | 166.3 | 155.6 |
| Final Fantasy XV Benchmark (2018) | 202 | 145.8 | 109.5 | |
| X-Plane 11.11 (2018) | 160.9 | 137.6 | 109.9 | |
| Strange Brigade (2018) | 490 | 271 | 223 | 194 |
| Cyberpunk 2077 1.6 (2022) | 140.4 | 124.6 | 132.3 | 81.8 |
Emissionen
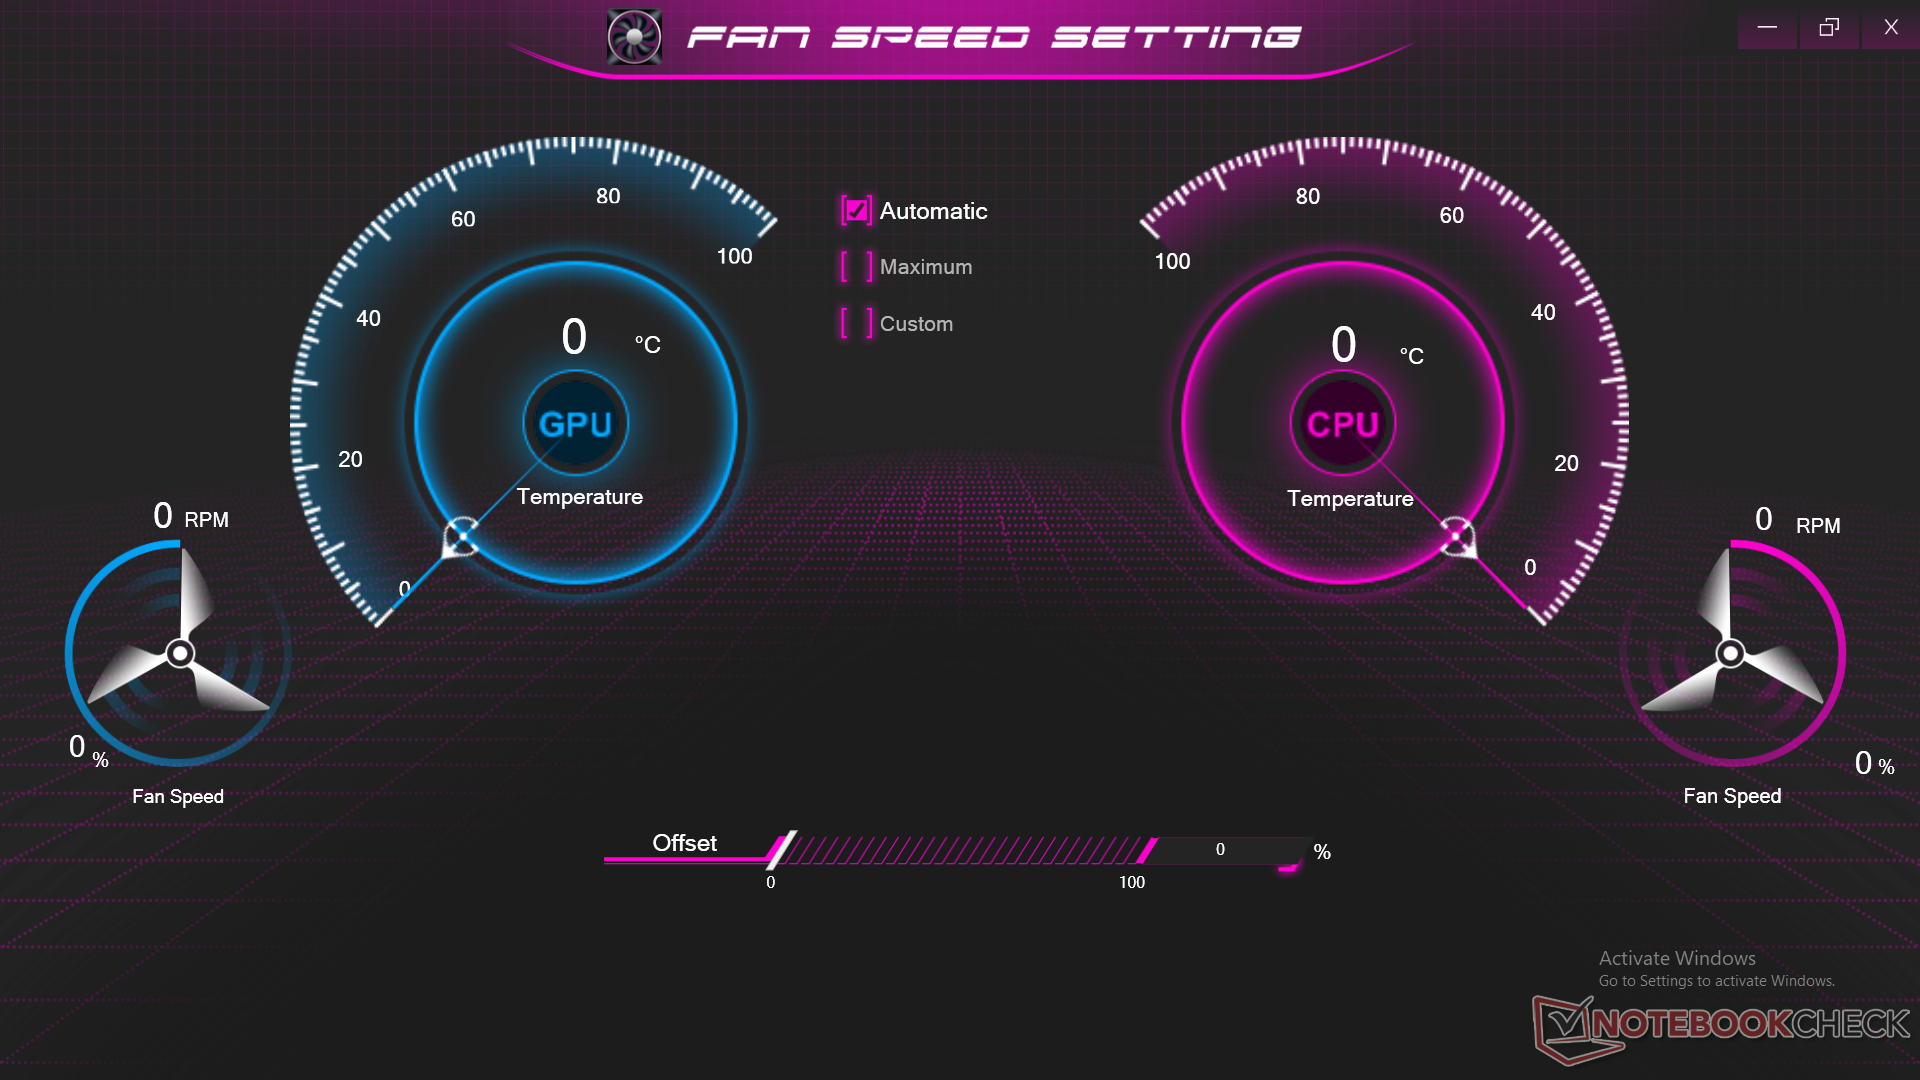
Das Lüftergeräusch hängt von den fünf Energiemodus-Einstellungen des Control Centers ab: Energiesparen, Leise, Unterhaltung, Leistung und Maximaler Lüftermodus. Der Modus "Leise" oder "Energiesparen" wird empfohlen, wenn man nur surft oder Videos streamt, um das Lüftergeräusch auf ein Minimum zu reduzieren. Andernfalls werden die Lüfter häufiger arbeiten, wenn Sie anspruchslose Anwendungen im Unterhaltungs- oder Leistungsmodus ausführen.
Zu erwarten ist ein Lüftergeräusch im niedrigen bis mittleren 50-dB(A)-Bereich beim Spielen, was lauter ist als bei vielen anderen Gaming-Laptops unter ähnlichen Bedingungen. Wenn sowohl der Leistungsmodus als auch der maximale Lüftermodus aktiviert sind, kann das Lüftergeräusch bis zu 55 dB(A) betragen.
Systemlautstärke

Lautstärkediagramm
| Idle |
| 23.8 / 23.8 / 30.1 dB(A) |
| Last |
| 31.1 / 55.1 dB(A) |
 | ||
30 dB leise 40 dB(A) deutlich hörbar 50 dB(A) störend |
||
min: | ||
| Eurocom Raptor X15 GeForce RTX 3070 Ti Laptop GPU, i7-12700K, Samsung SSD 980 Pro 1TB MZ-V8P1T0BW | MSI Raider GE66 12UHS GeForce RTX 3080 Ti Laptop GPU, i9-12900HK, Samsung PM9A1 MZVL22T0HBLB | Razer Blade 15 Advanced Model Early 2022 GeForce RTX 3080 Ti Laptop GPU, i7-12800H, Samsung PM9A1 MZVL21T0HCLR | Eurocom RX315 NH57AF1 GeForce RTX 3070 Laptop GPU, i7-11800H, Samsung SSD 980 Pro 1TB MZ-V8P1T0BW | Gigabyte A5 X1 GeForce RTX 3070 Laptop GPU, R9 5900HX, ADATA XPG SX8200 Pro (ASX8200PNP-512GT) | Asus TUF Gaming A15 FA506QR-AZ061T GeForce RTX 3070 Laptop GPU, R7 5800H, SK Hynix HFM001TD3JX013N | |
|---|---|---|---|---|---|---|
| Geräuschentwicklung | -14% | -2% | -18% | -21% | -10% | |
| aus / Umgebung * (dB) | 23.3 | 26 -12% | 26 -12% | 26.3 -13% | 25 -7% | 26 -12% |
| Idle min * (dB) | 23.8 | 27 -13% | 26 -9% | 26.4 -11% | 27 -13% | 26 -9% |
| Idle avg * (dB) | 23.8 | 30 -26% | 27 -13% | 31 -30% | 29 -22% | 26 -9% |
| Idle max * (dB) | 30.1 | 39 -30% | 29 4% | 34 -13% | 32 -6% | 27.4 9% |
| Last avg * (dB) | 31.1 | 45 -45% | 37 -19% | 47.8 -54% | 57 -83% | 46.6 -50% |
| Witcher 3 ultra * (dB) | 51.3 | 45 12% | 44 14% | 51.7 -1% | 56 -9% | |
| Last max * (dB) | 55.1 | 47 15% | 45 18% | 57.1 -4% | 58 -5% | 49.3 11% |
* ... kleinere Werte sind besser
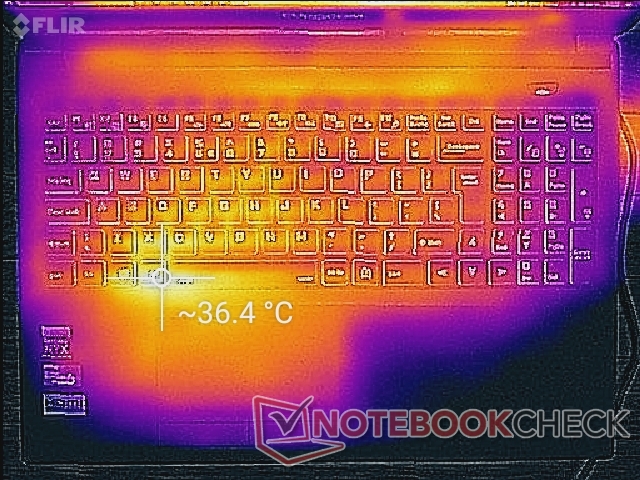
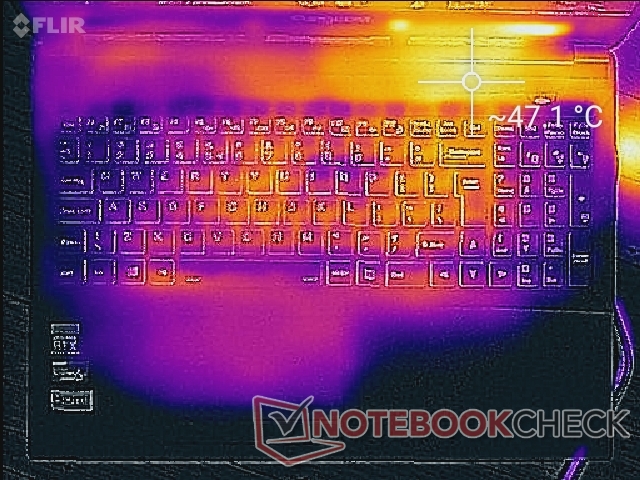
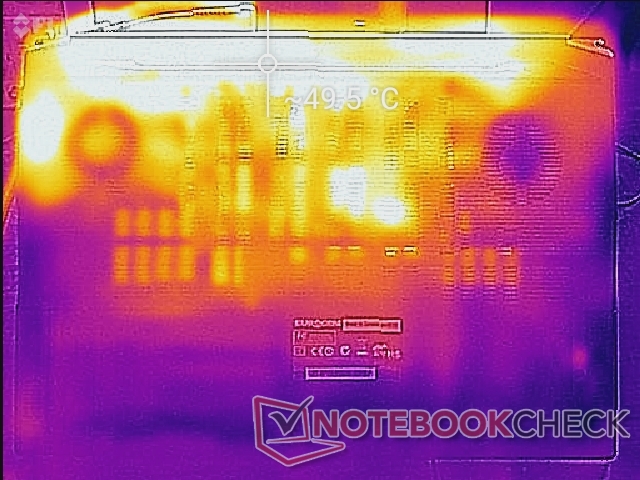
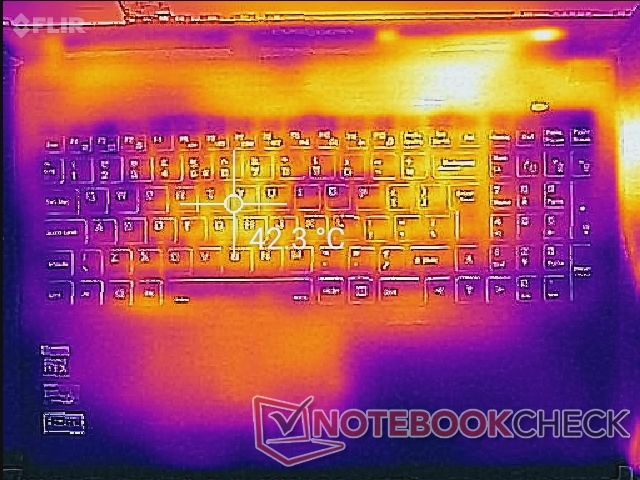
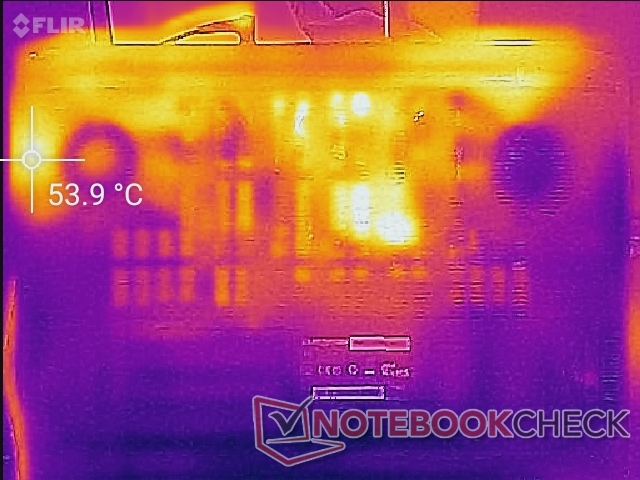
Temperaturen
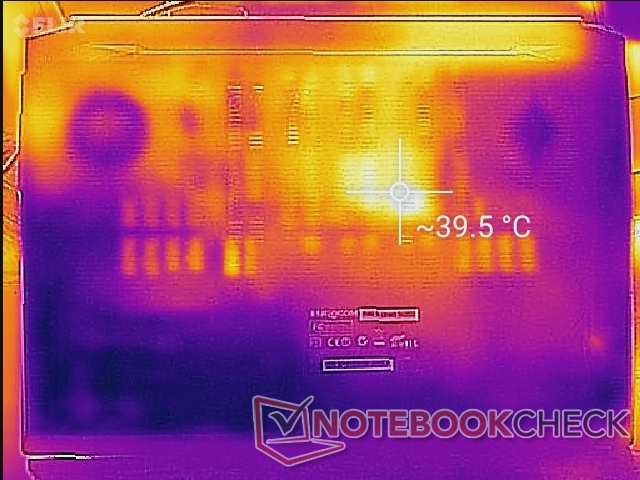
Die Hotspots der Oberflächentemperatur befinden sich bei anspruchsvollen Anwendungen in der Nähe der linken Handballenauflage und der Tastaturmitte. Die linke Handballenauflage ist in der Regel wärmer als die rechte, da sich darunter die PCIe4-NVMe-SSD befindet. Wie die Temperaturkarten unten zeigen, können die Hotspots im oberen und unteren Bereich bis zu 50 °C erreichen.
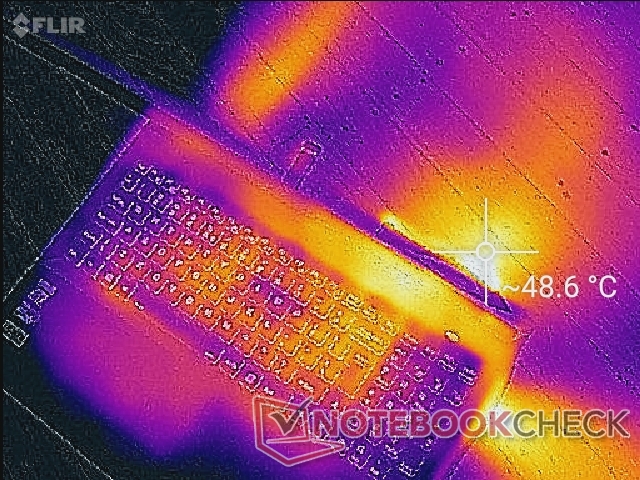
(-) Die maximale Temperatur auf der Oberseite ist 48.8 °C. Im Vergleich liegt der Klassendurchschnitt bei 40.4 °C (von 21.2 bis 68.8 °C für die Klasse Gaming).
(-) Auf der Unterseite messen wir eine maximalen Wert von 57.8 °C (im Vergleich zum Durchschnitt von 43.2 °C).
(+) Ohne Last messen wir eine durchschnittliche Temperatur von 30.2 °C auf der Oberseite. Der Klassendurchschnitt erreicht 33.9 °C.
(±) Beim längeren Spielen von The Witcher 3 erhitzt sich das Gerät durchschnittlich auf 34.3 °C. Der Durchschnitt der Klasse ist derzeit 33.9 °C.
(±) Die Handballen und der Touchpad-Bereich können sehr heiß werden mit maximal 37.2 °C.
(-) Die durchschnittliche Handballen-Temperatur anderer getesteter Geräte war 28.8 °C (-8.4 °C).
| Eurocom Raptor X15 Intel Core i7-12700K, NVIDIA GeForce RTX 3070 Ti Laptop GPU | MSI Raider GE66 12UHS Intel Core i9-12900HK, NVIDIA GeForce RTX 3080 Ti Laptop GPU | Razer Blade 15 Advanced Model Early 2022 Intel Core i7-12800H, NVIDIA GeForce RTX 3080 Ti Laptop GPU | Eurocom RX315 NH57AF1 Intel Core i7-11800H, NVIDIA GeForce RTX 3070 Laptop GPU | Gigabyte A5 X1 AMD Ryzen 9 5900HX, NVIDIA GeForce RTX 3070 Laptop GPU | Asus TUF Gaming A15 FA506QR-AZ061T AMD Ryzen 7 5800H, NVIDIA GeForce RTX 3070 Laptop GPU | |
|---|---|---|---|---|---|---|
| Hitze | 2% | 2% | 14% | 17% | 3% | |
| Last oben max * (°C) | 48.8 | 54 -11% | 53 -9% | 36 26% | 47 4% | 46.7 4% |
| Last unten max * (°C) | 57.8 | 65 -12% | 53 8% | 46 20% | 51 12% | 55.9 3% |
| Idle oben max * (°C) | 36.6 | 30 18% | 36 2% | 35.6 3% | 27 26% | 37.1 -1% |
| Idle unten max * (°C) | 40.2 | 35 13% | 38 5% | 36.8 8% | 30 25% | 38.1 5% |
* ... kleinere Werte sind besser
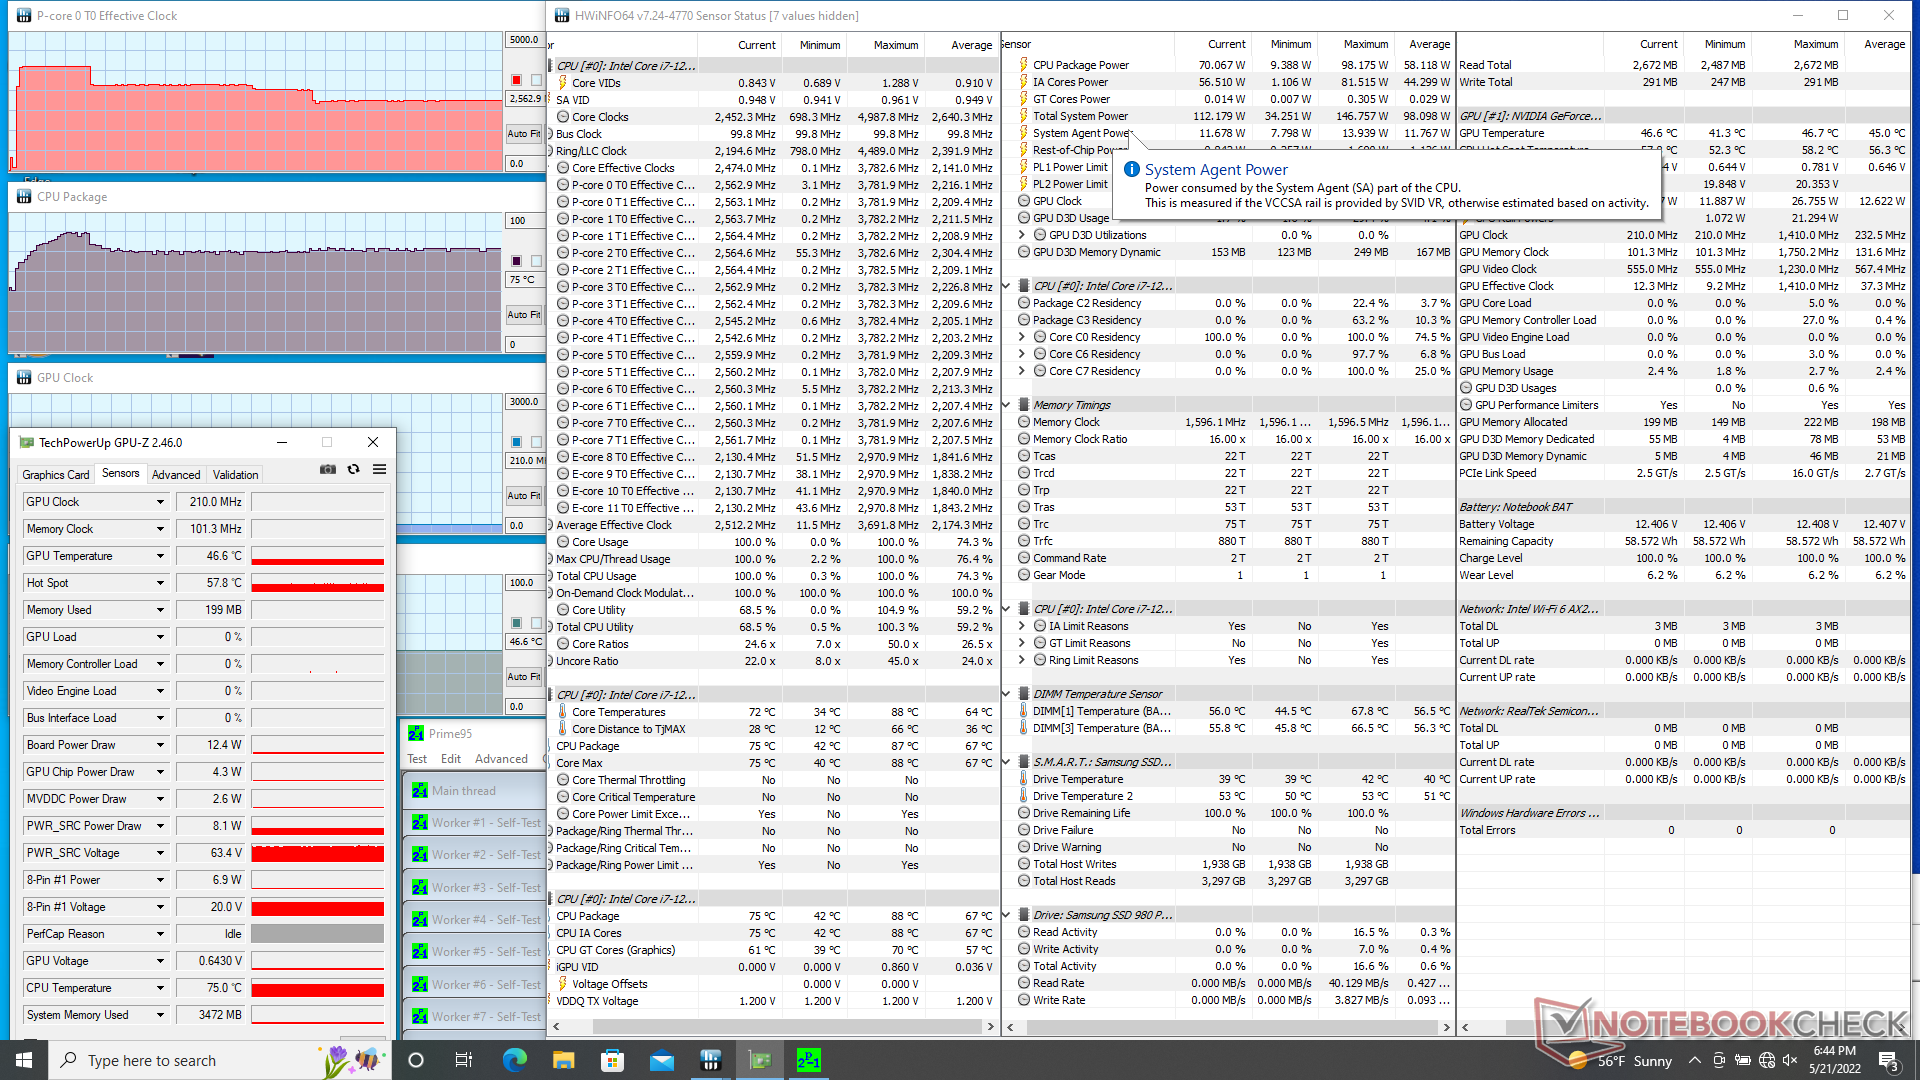
Stresstest
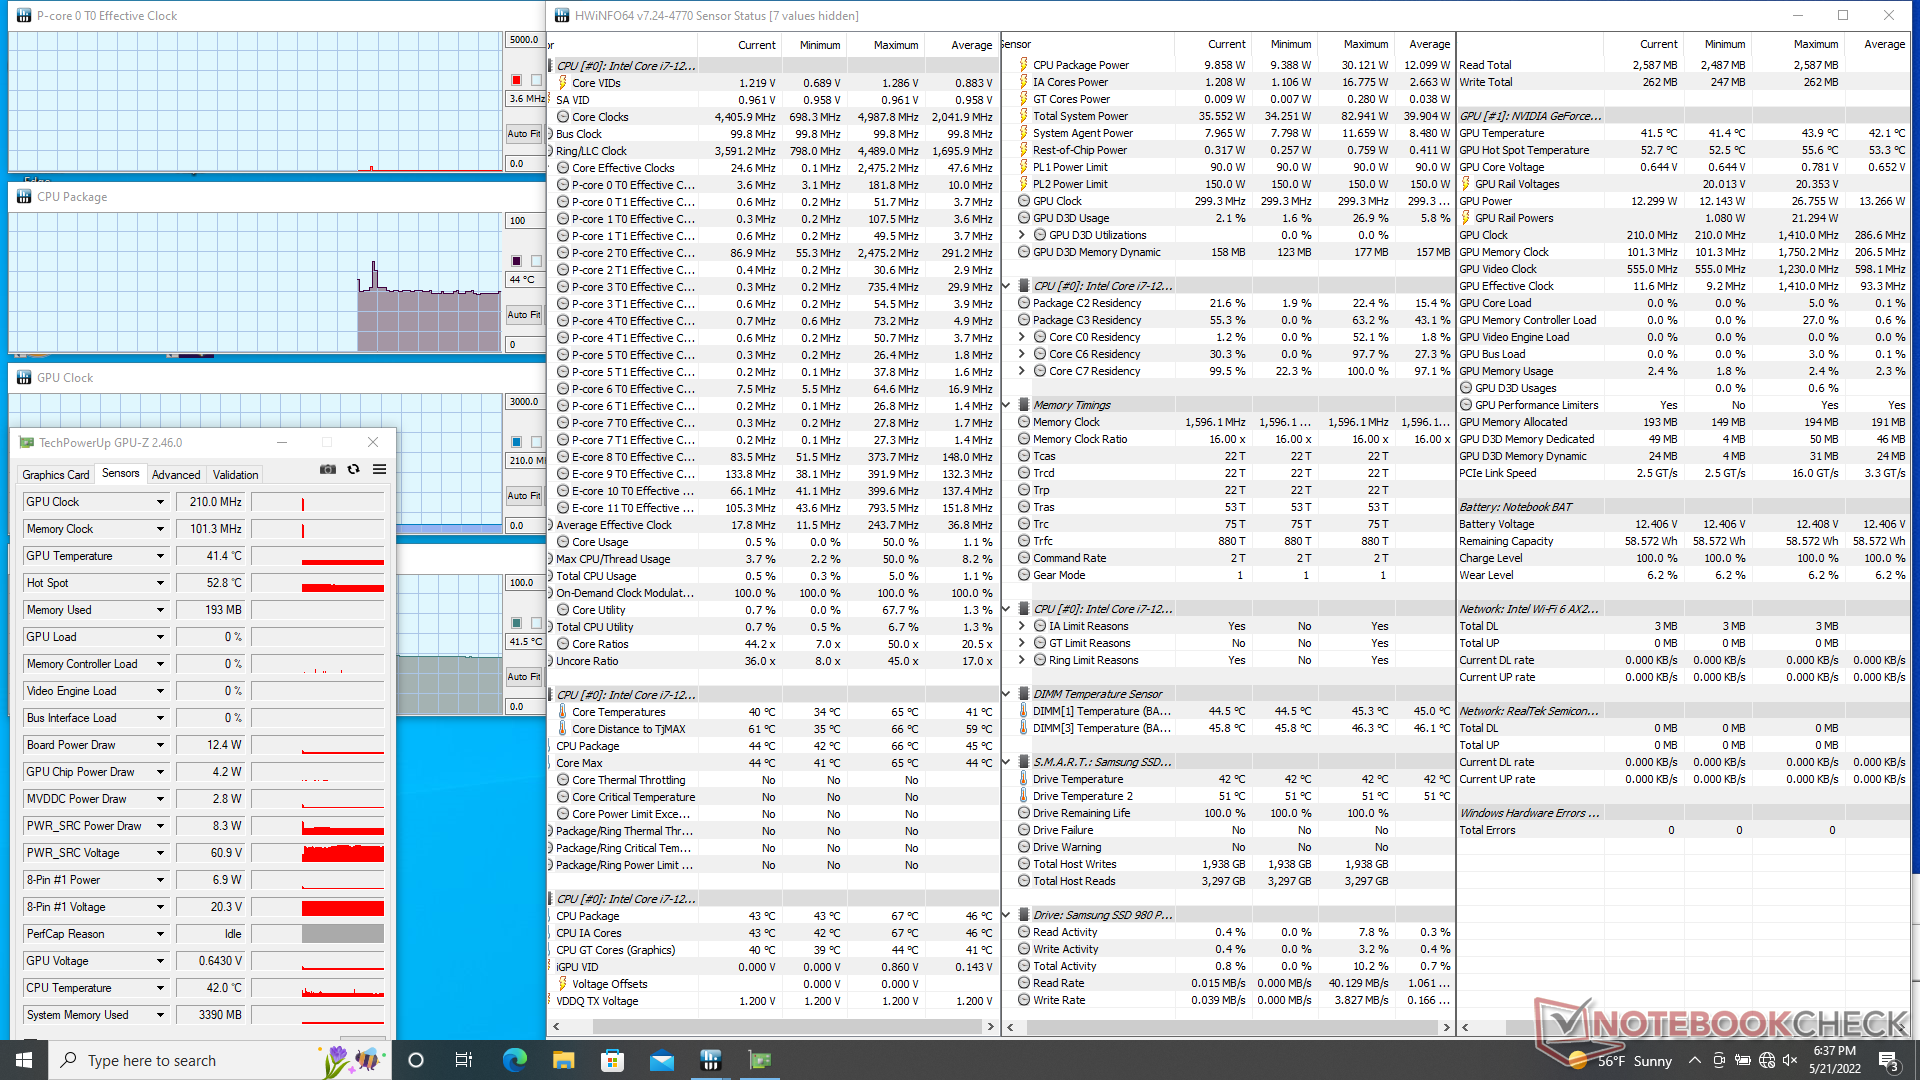
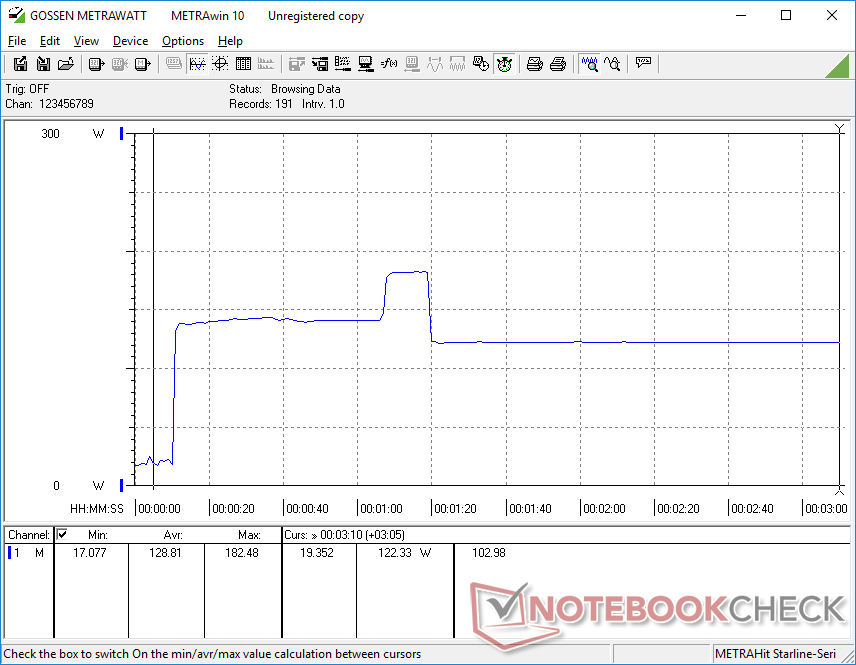
Unter Prime95 wird die CPU fast eine ganze Minute lang auf 3,8 GHz und 100 W hochgetaktet, bevor sie eine Kerntemperatur von 86 °C erreicht. Danach sinken die Taktraten kontinuierlich, bevor sie sich bei nur 2,6 GHz und 70 W stabilisieren, um eine stabilere Kerntemperatur von 75 °C zu erreichen.
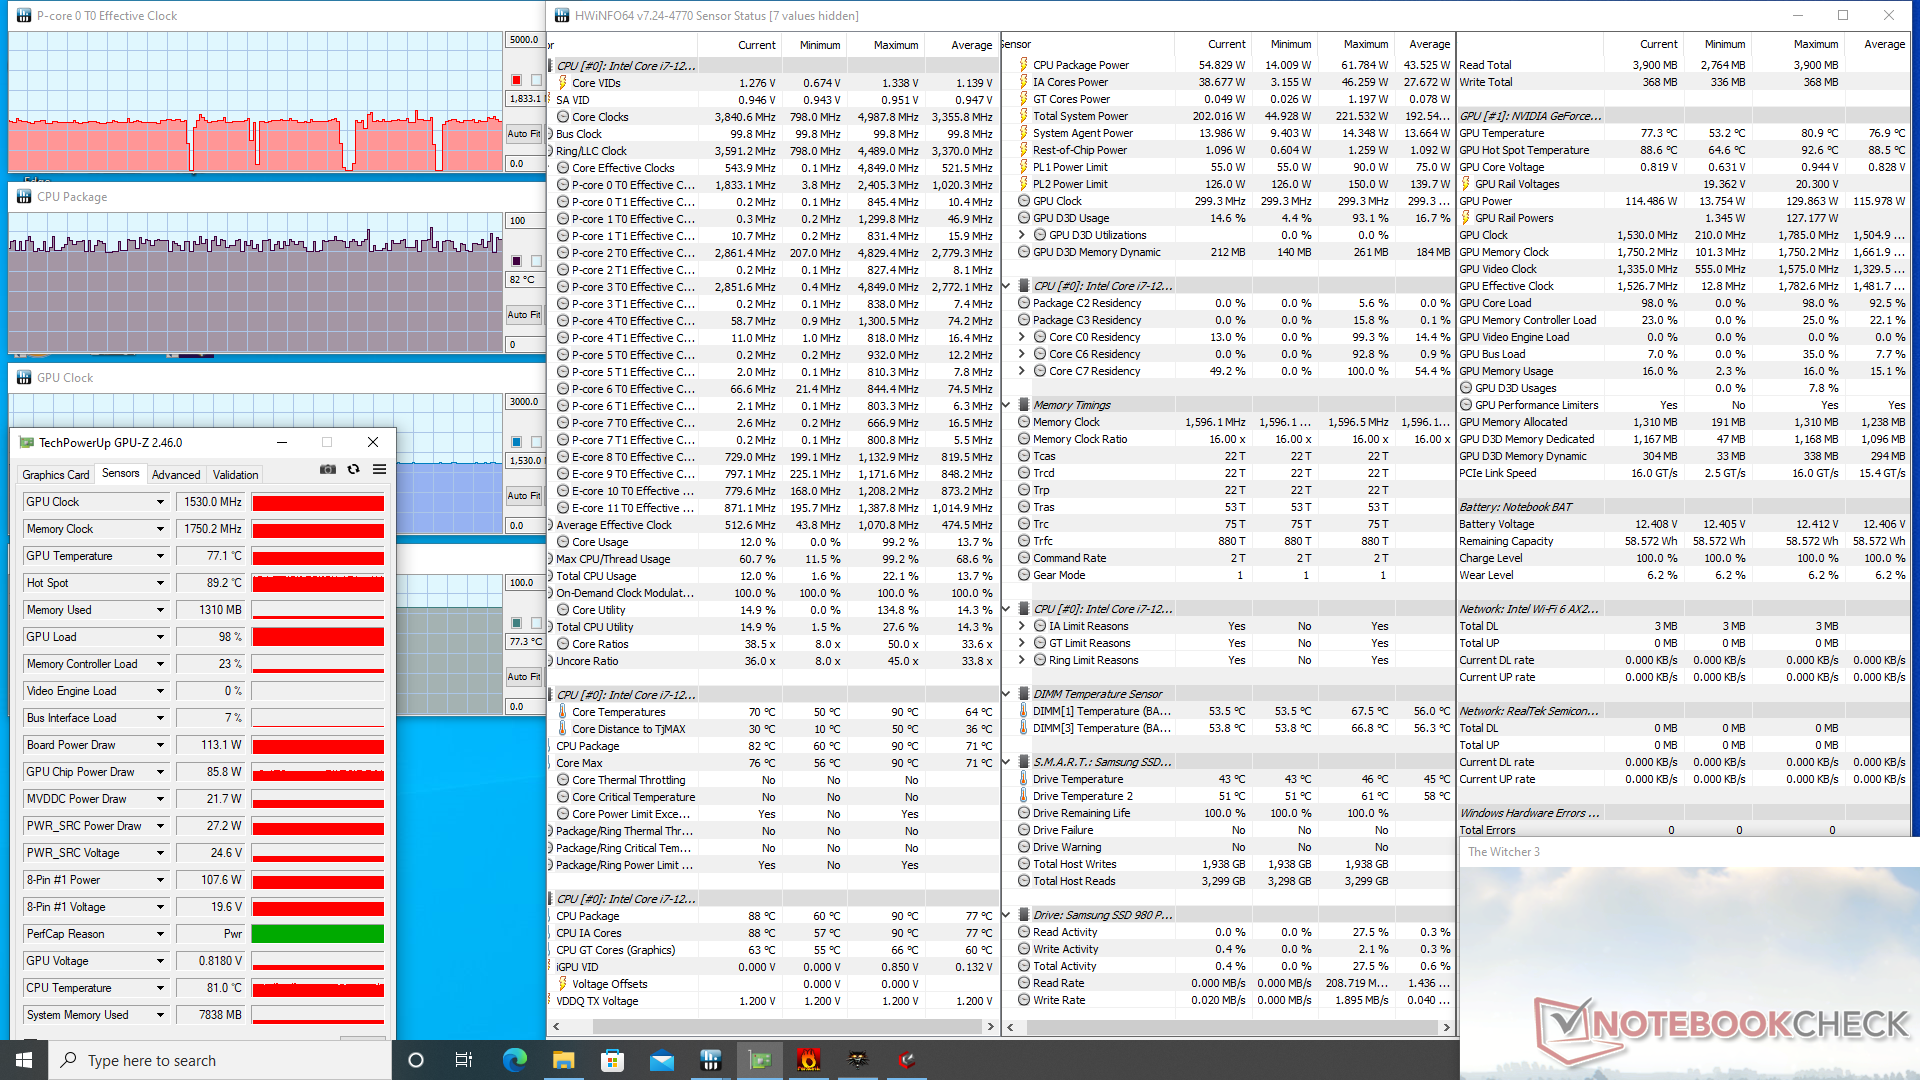
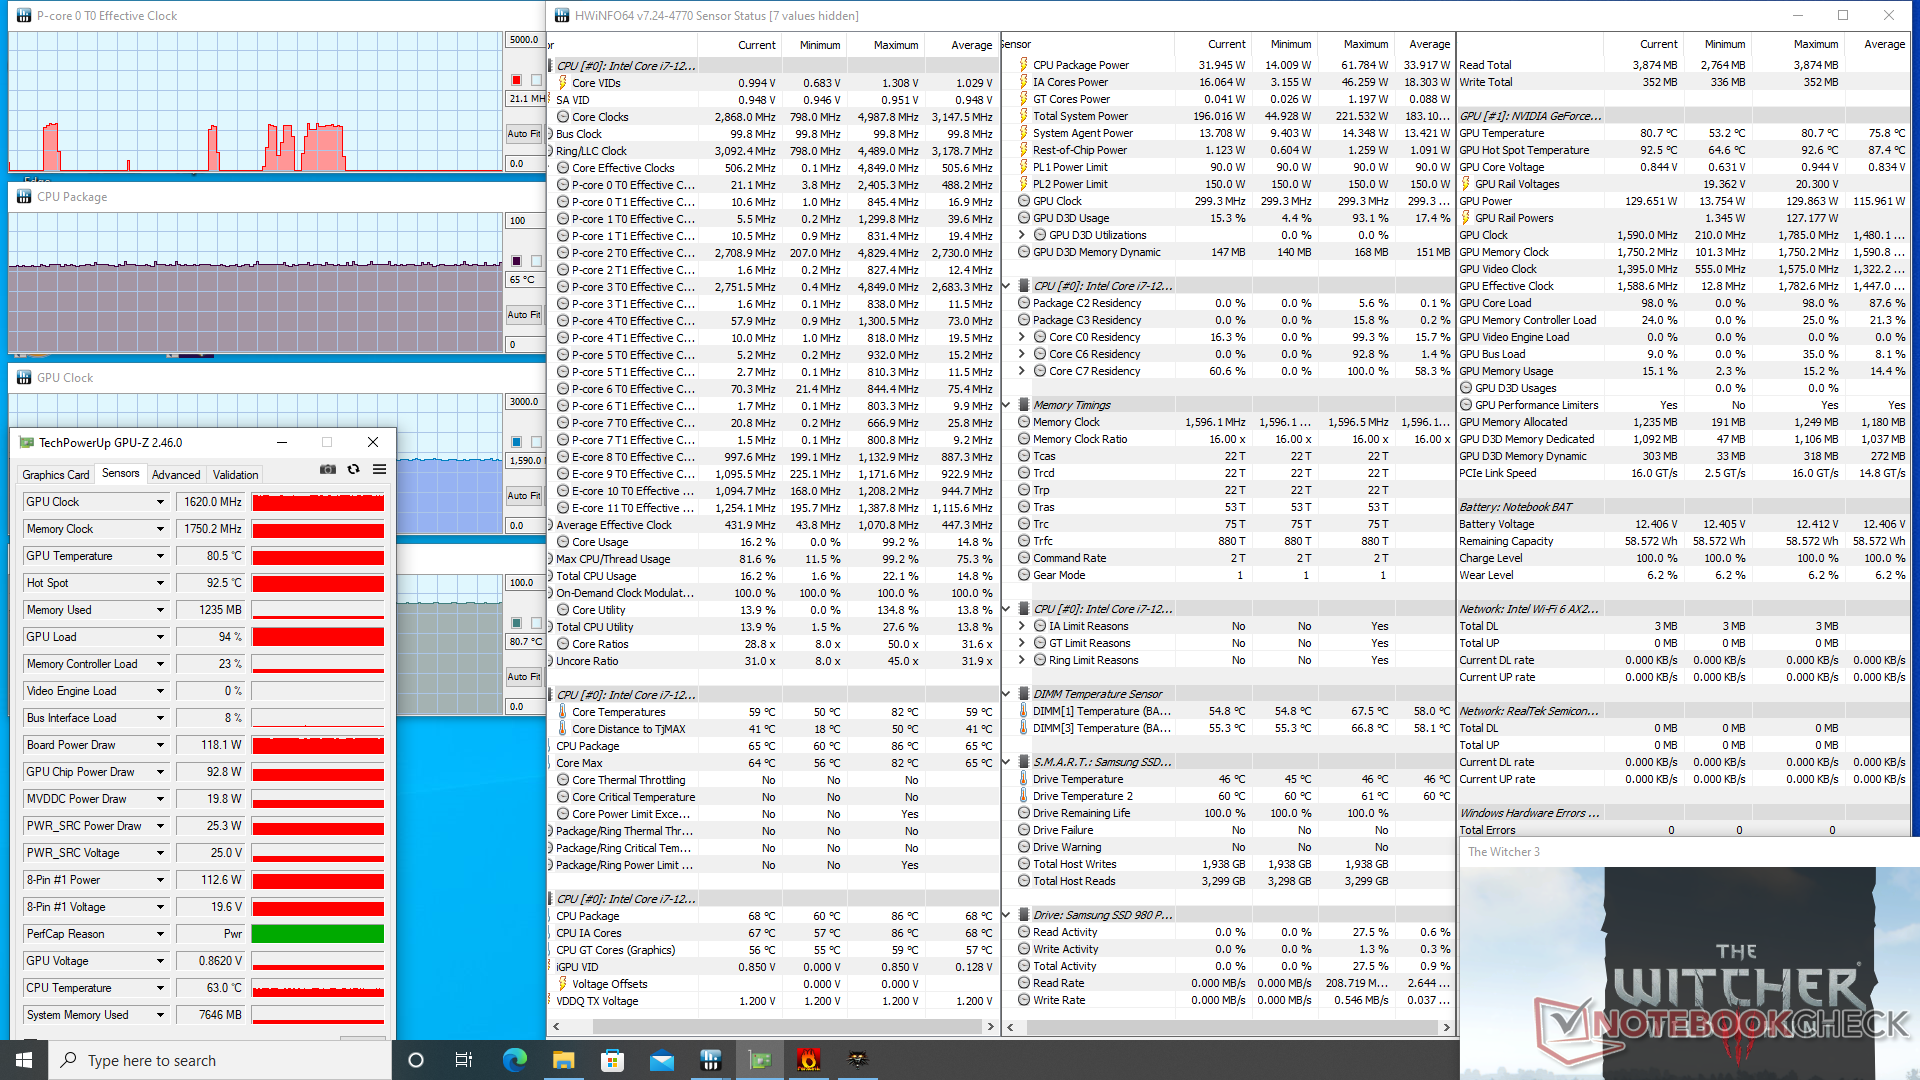
Die Grafikleistung steigt leicht an, wenn vom Unterhaltungsmodus in den Leistungsmodus gewechselt wird. Die Leistungsaufnahme der GPU-Karte und die Taktrate stabilisieren sich bei 118 W bzw. 1620 MHz, wenn Witcher 3 im Leistungsmodus läuft, gegenüber 113 W und 1.530 MHz, wenn dasselbe Spiel im Unterhaltungsmodus läuft. Ist der maximale Lüftermodus aktiviert, stabilisieren sich die GPU-Taktrate und die Leistungsaufnahme der Karte bei noch höheren Werten von 1.725 MHz bzw. 130 W. Es ist enttäuschend, dass die GPU nicht näher an das 140-Watt-Ziel herankommt, wie es im Nvidia Control Panel angegeben ist, und dass der Benutzer den Maximallüftermodus aktivieren muss, um das erwartete Leistungsniveau aus der GPU herauszuholen.
Der Betrieb im Akkubetrieb schränkt die Leistung ein. Ein Fire-Strike-Test im Akkubetrieb würde Physik- und Grafik-Scores von 12.708 bzw. 3.419 Punkten liefern, verglichen mit 31.240 und 30.473 Punkten im Netzbetrieb.
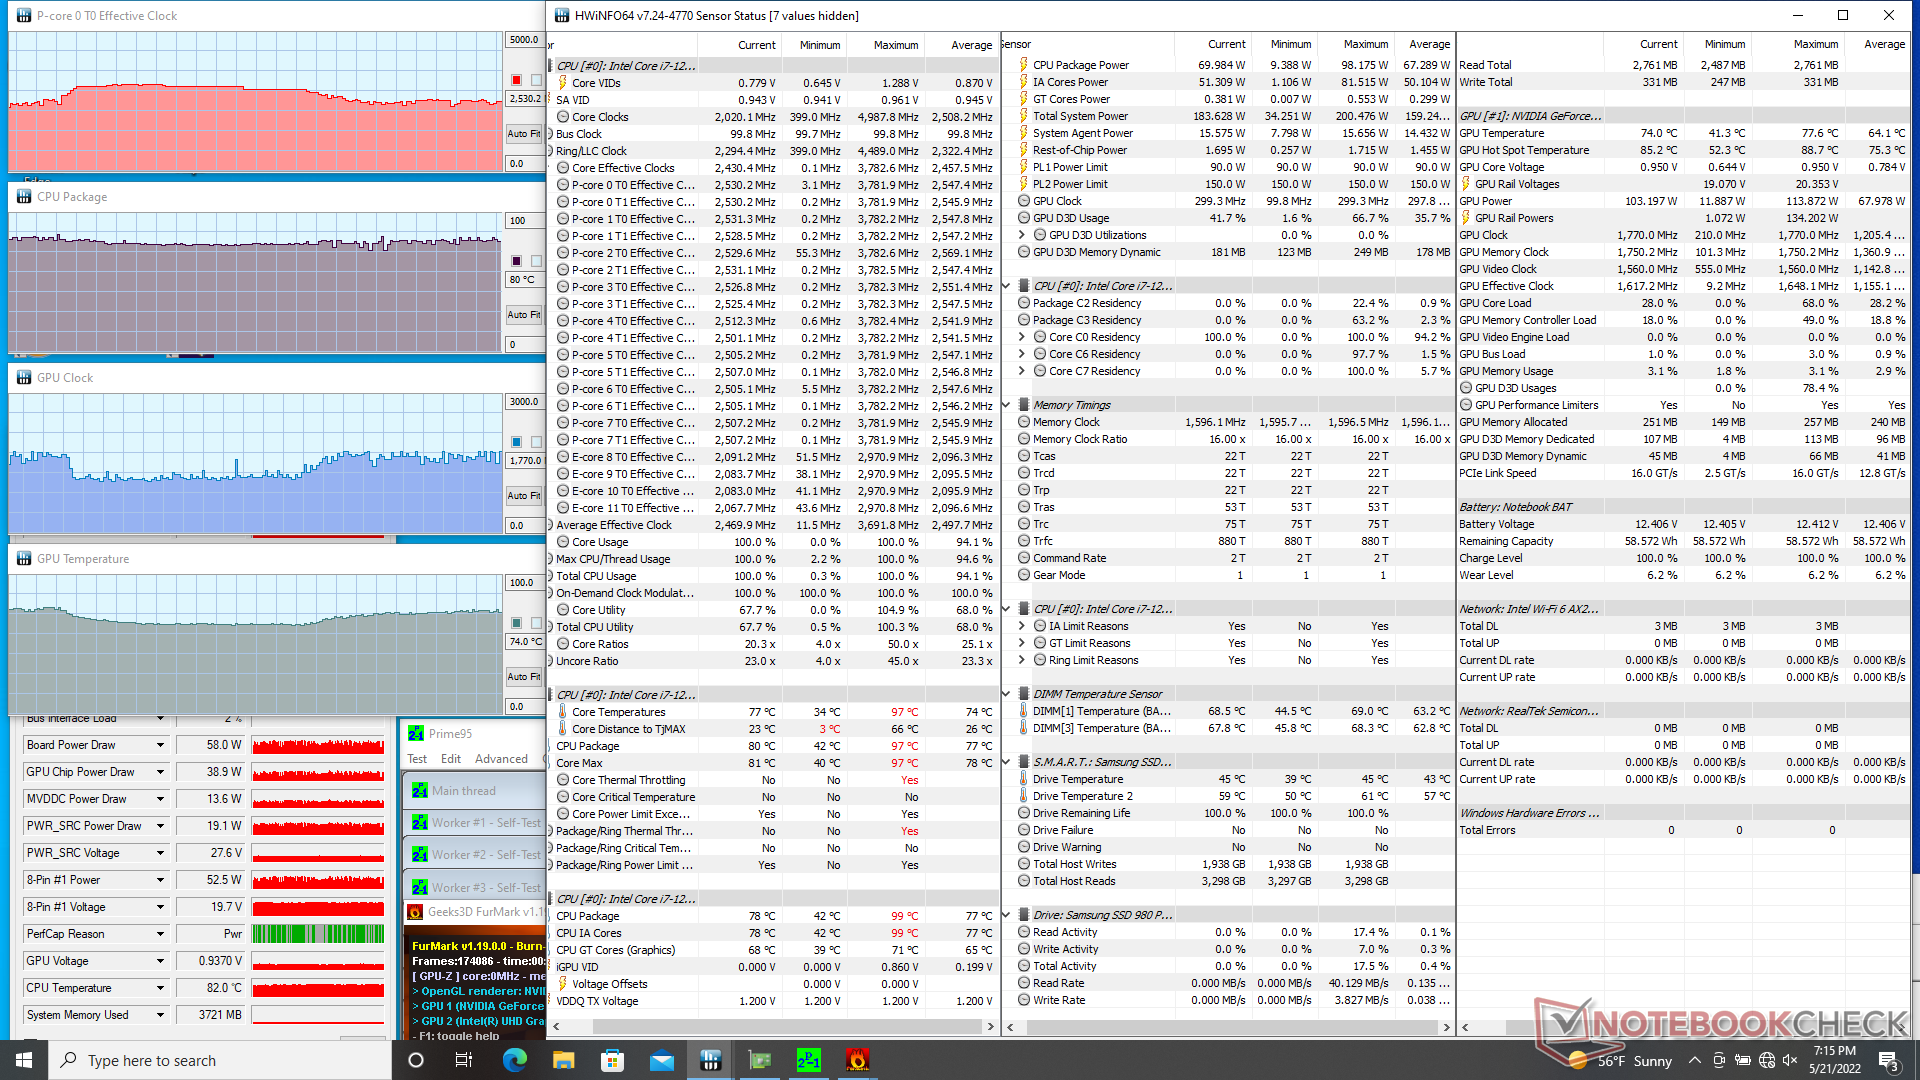
| CPU Clock (GHz) | GPU Clock (MHz) | Average CPU Temperature (°C) | Average GPU Temperature (°C) | |
| System Idle | -- | -- | 44 | 41 |
| Prime95 Stress | 2,6 | -- | 75 | 47 |
| Prime95 + FurMark Stress | ~2,5 | ~1.770 | 80 | 74 |
| Witcher 3 Stress (Entertainment mode) | -- | 1.530 | ~82 | 77 |
| Witcher 3 Stress (Performance mode) | -- | 1.620 | 65 | 81 |
Lautsprecher
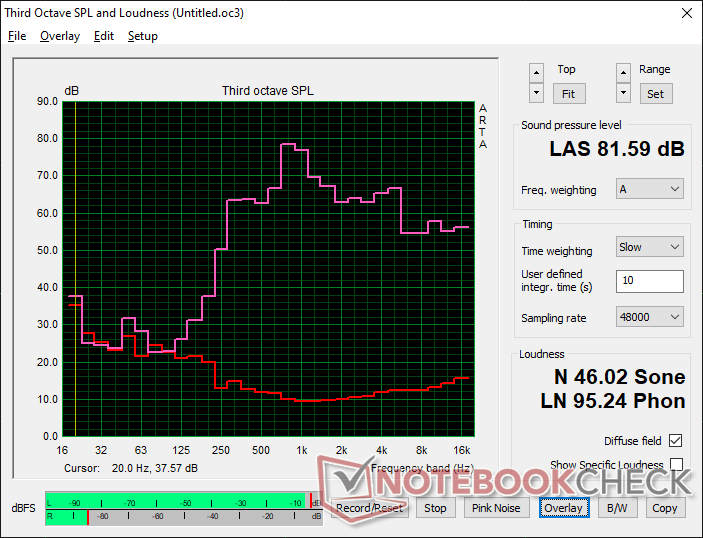
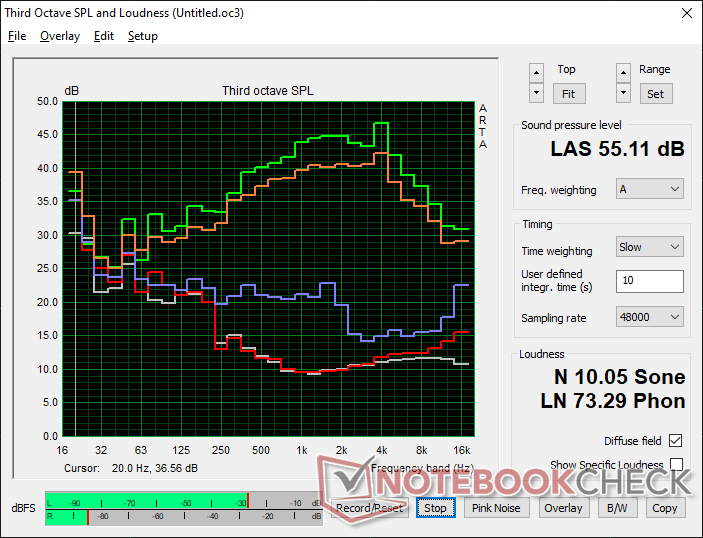
Eurocom Raptor X15 Audio Analyse
(±) | Mittelmäßig laut spielende Lautsprecher (81.6 dB)
Bass 100 - 315 Hz
(-) | kaum Bass - 24.6% niedriger als der Median
(±) | durchschnittlich lineare Bass-Wiedergabe (13.4% Delta zum Vorgänger)
Mitteltöne 400 - 2000 Hz
(±) | zu hohe Mitten, vom Median 5.6% abweichend
(±) | Linearität der Mitten ist durchschnittlich (8.1% Delta zum Vorgänger)
Hochtöne 2 - 16 kHz
(+) | ausgeglichene Hochtöne, vom Median nur 4.2% abweichend
(+) | sehr lineare Hochtöne (6% Delta zum Vorgänger)
Gesamt im hörbaren Bereich 100 - 16.000 Hz
(±) | hörbarer Bereich ist durchschnittlich linear (21.5% Abstand zum Median)
Im Vergleich zu allen Geräten derselben Klasse
» 77% aller getesteten Geräte dieser Klasse waren besser, 5% vergleichbar, 18% schlechter
» Das beste Gerät hat einen Delta-Wert von 6%, durchschnittlich ist 18%, das schlechteste Gerät hat 132%
Im Vergleich zu allen Geräten im Test
» 61% aller getesteten Geräte waren besser, 7% vergleichbar, 33% schlechter
» Das beste Gerät hat einen Delta-Wert von 4%, durchschnittlich ist 24%, das schlechteste Gerät hat 134%
Apple MacBook Pro 16 2021 M1 Pro Audio Analyse
(+) | Die Lautsprecher können relativ laut spielen (84.7 dB)
Bass 100 - 315 Hz
(+) | guter Bass - nur 3.8% Abweichung vom Median
(+) | lineare Bass-Wiedergabe (5.2% Delta zum Vorgänger)
Mitteltöne 400 - 2000 Hz
(+) | ausgeglichene Mitten, vom Median nur 1.3% abweichend
(+) | lineare Mitten (2.1% Delta zum Vorgänger)
Hochtöne 2 - 16 kHz
(+) | ausgeglichene Hochtöne, vom Median nur 1.9% abweichend
(+) | sehr lineare Hochtöne (2.7% Delta zum Vorgänger)
Gesamt im hörbaren Bereich 100 - 16.000 Hz
(+) | hörbarer Bereich ist sehr linear (4.6% Abstand zum Median
Im Vergleich zu allen Geräten derselben Klasse
» 0% aller getesteten Geräte dieser Klasse waren besser, 0% vergleichbar, 100% schlechter
» Das beste Gerät hat einen Delta-Wert von 5%, durchschnittlich ist 17%, das schlechteste Gerät hat 45%
Im Vergleich zu allen Geräten im Test
» 0% aller getesteten Geräte waren besser, 0% vergleichbar, 100% schlechter
» Das beste Gerät hat einen Delta-Wert von 4%, durchschnittlich ist 24%, das schlechteste Gerät hat 134%
Energiemanagement
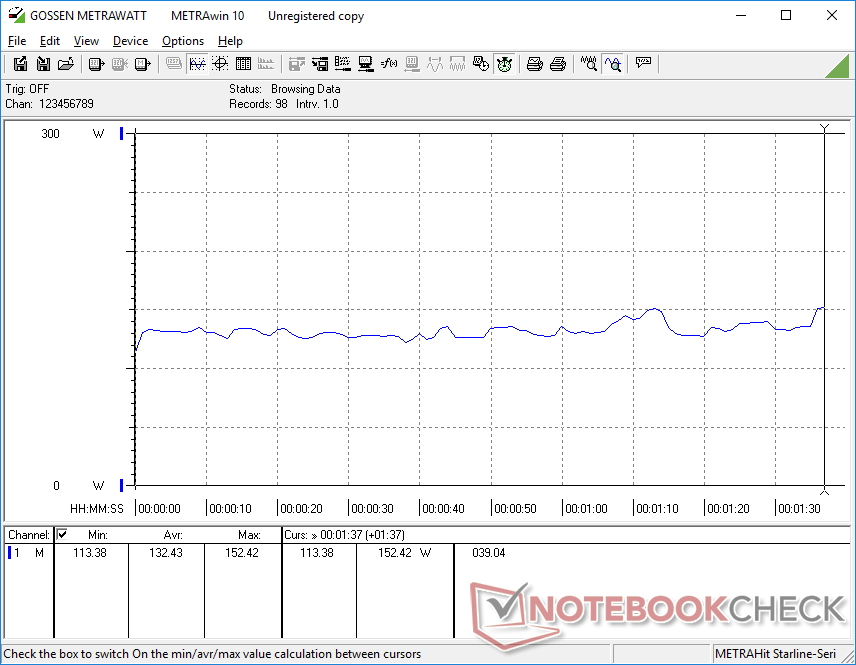
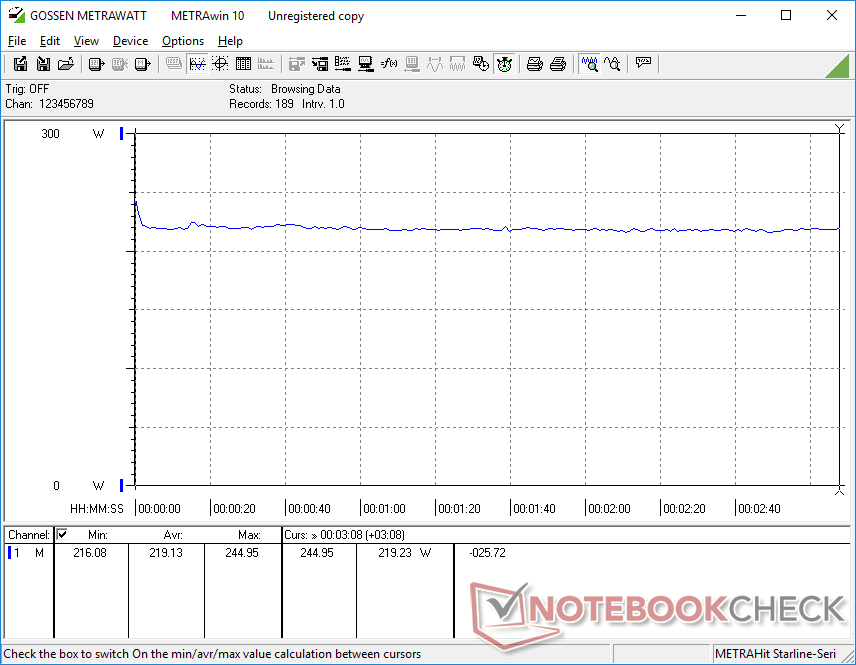
Stromverbrauch
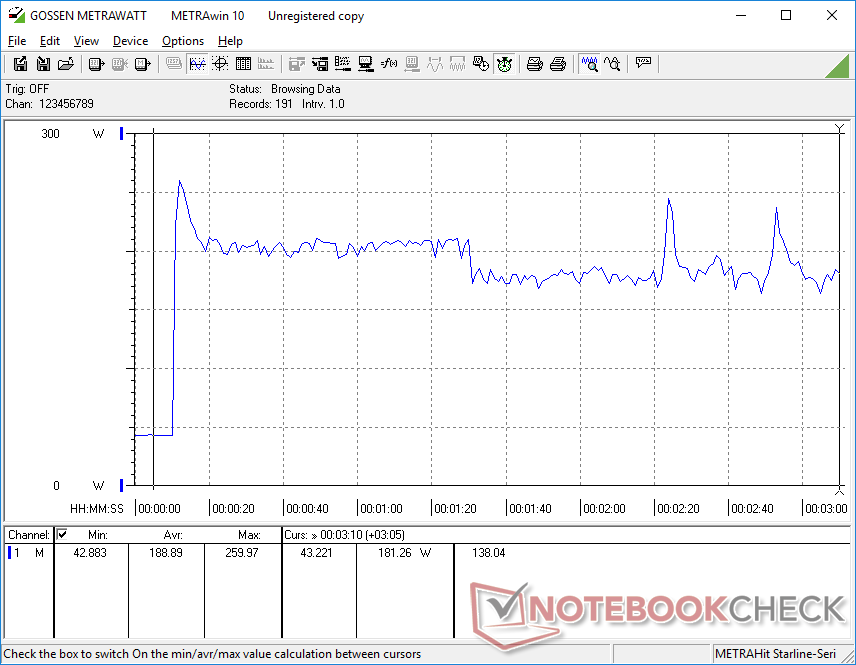
Der Stromverbrauch ist im Leerlauf auf dem Desktop recht niedrig. Unser Gerät verbraucht zwischen 12 und 22 W im Leerlauf, verglichen mit 33 bis 44 W beim viel älteren Eurocom Sky X4C mit einer Intel-9th-Gen-Desktop-CPU. Nichtsdestotrotz ist der Verbrauch bei anspruchsvolleren Anwendungen immer noch sehr hoch. Die Ausführung von Witcher 3 erfordert zum Beispiel mehr Strom als die meisten Laptops mit einer Intel- oder AMD CPU der H-Serie und einer ähnlichen GPU der GeForce-RTX-3070-Klasse.
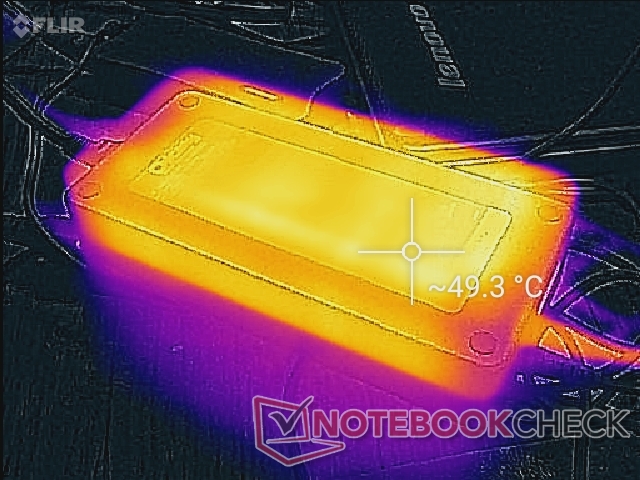
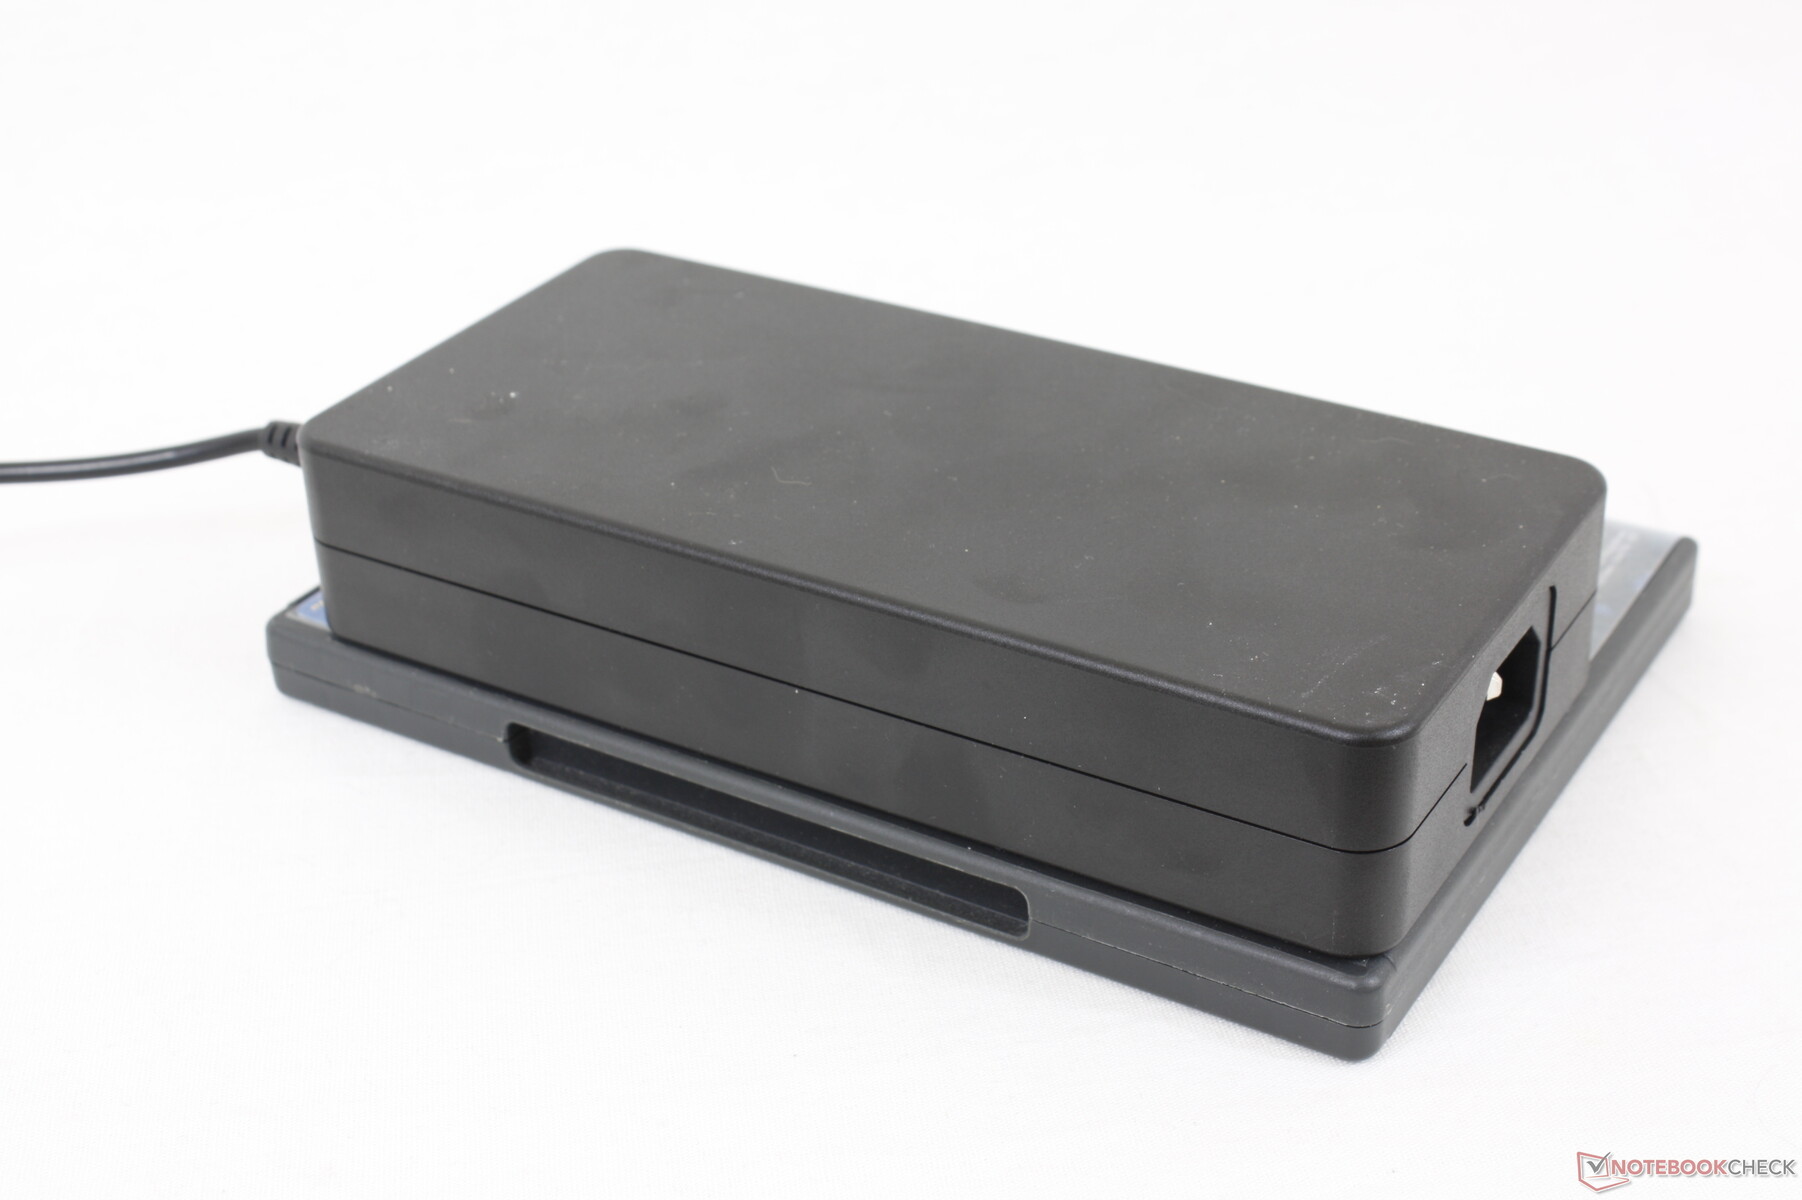
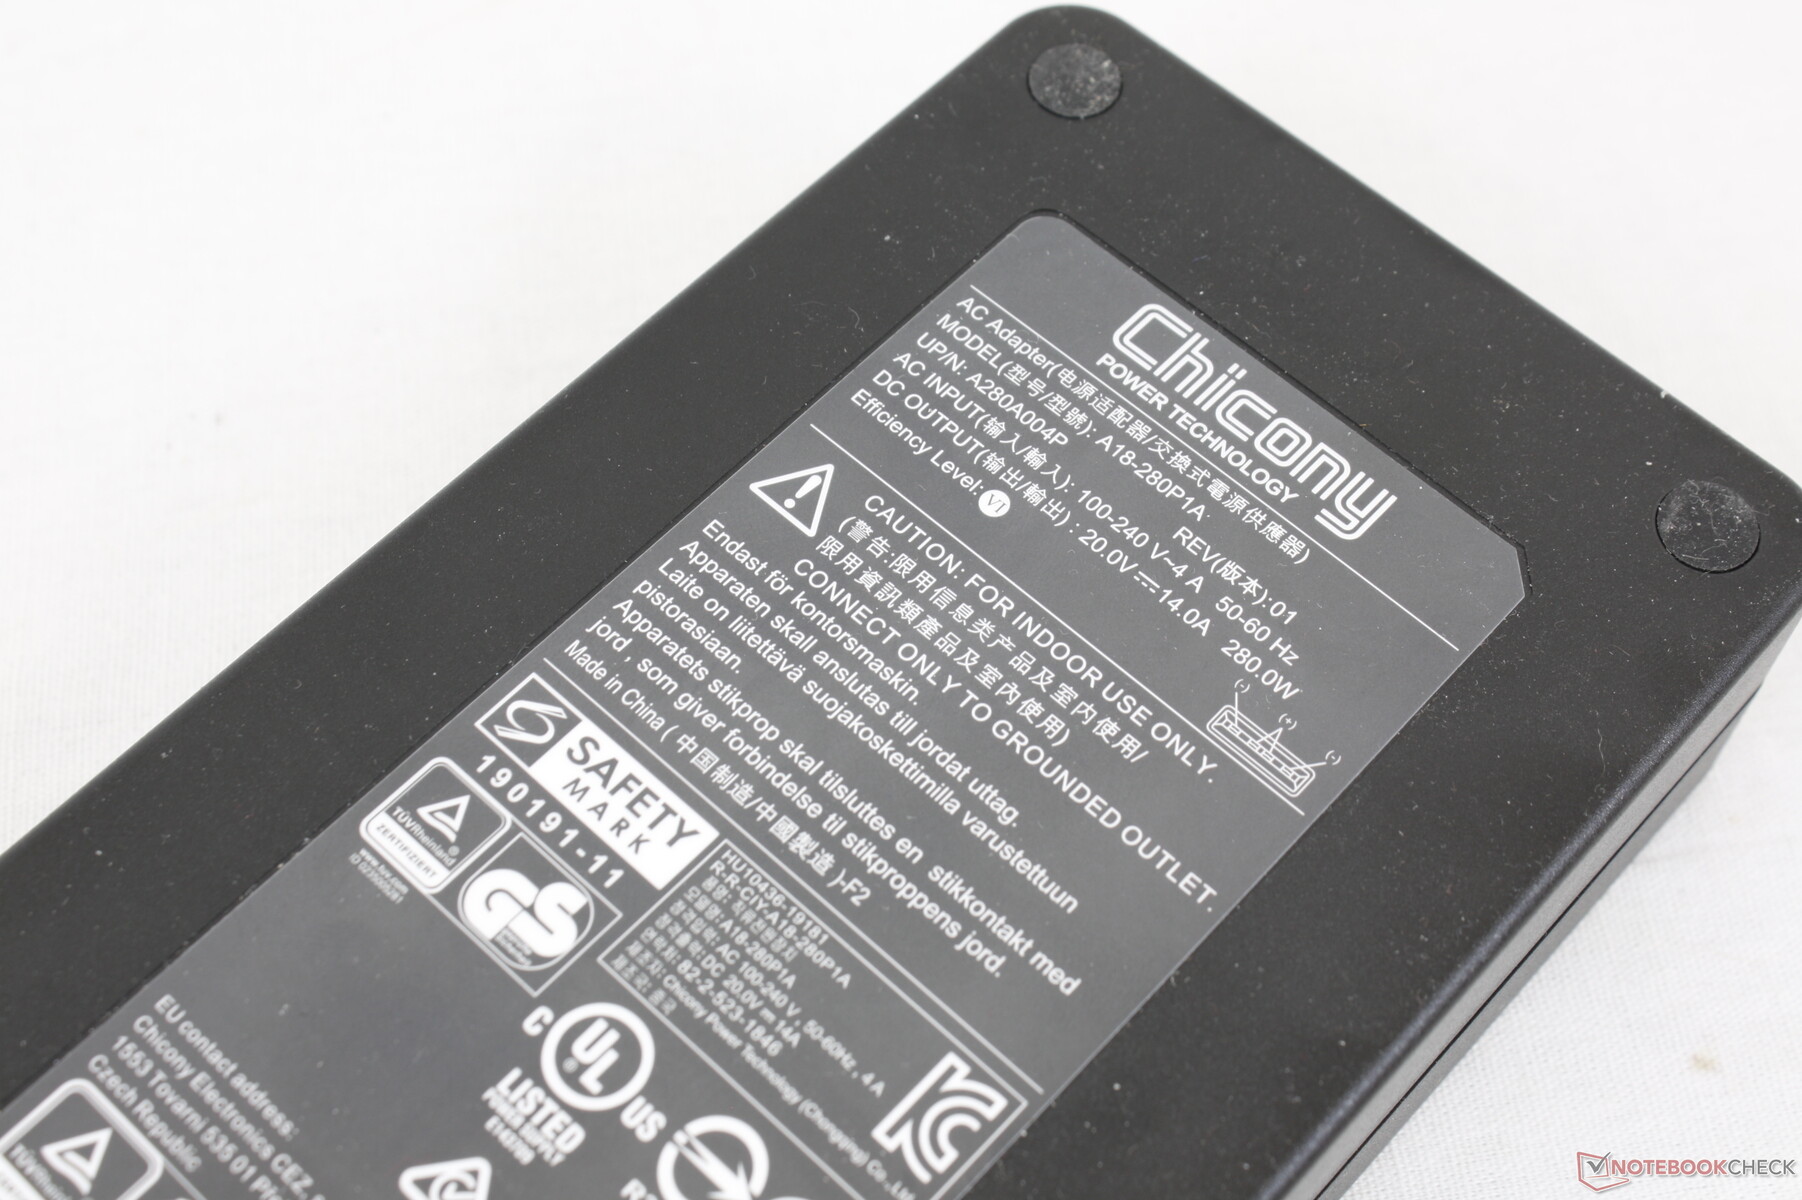
Das 280-Watt-Netzteil mag groß sein, aber es ist notwendig, um das System mit voller Leistung zu betreiben. Wir erreichen eine Leistungsaufnahme von 260 W, wenn sowohl die CPU als auch die GPU maximal ausgelastet sind.
| Aus / Standby | |
| Idle | |
| Last |
|
Legende:
min: | |
| Eurocom Raptor X15 i7-12700K, GeForce RTX 3070 Ti Laptop GPU, Samsung SSD 980 Pro 1TB MZ-V8P1T0BW, IPS, 1920x1080, 15.6" | MSI Raider GE66 12UHS i9-12900HK, GeForce RTX 3080 Ti Laptop GPU, Samsung PM9A1 MZVL22T0HBLB, IPS, 3840x2160, 15.6" | Razer Blade 15 Advanced Model Early 2022 i7-12800H, GeForce RTX 3080 Ti Laptop GPU, Samsung PM9A1 MZVL21T0HCLR, IPS, 1920x1080, 15.6" | Eurocom RX315 NH57AF1 i7-11800H, GeForce RTX 3070 Laptop GPU, Samsung SSD 980 Pro 1TB MZ-V8P1T0BW, IPS, 1920x1080, 15.6" | Gigabyte A5 X1 R9 5900HX, GeForce RTX 3070 Laptop GPU, ADATA XPG SX8200 Pro (ASX8200PNP-512GT), IPS, 1920x1080, 15.6" | Asus TUF Gaming A15 FA506QR-AZ061T R7 5800H, GeForce RTX 3070 Laptop GPU, SK Hynix HFM001TD3JX013N, IPS, 1920x1080, 15.6" | |
|---|---|---|---|---|---|---|
| Stromverbrauch | 0% | 8% | 3% | 17% | 27% | |
| Idle min * (Watt) | 12.8 | 16 -25% | 17 -33% | 12.7 1% | 10 22% | 10.2 20% |
| Idle avg * (Watt) | 21.7 | 19 12% | 19 12% | 16.4 24% | 12 45% | 12.8 41% |
| Idle max * (Watt) | 21.8 | 26 -19% | 25 -15% | 36.1 -66% | 16 27% | 15 31% |
| Last avg * (Watt) | 132.4 | 110 17% | 108 18% | 101.5 23% | 124 6% | 130 2% |
| Witcher 3 ultra * (Watt) | 219 | 202 8% | 150 32% | 197 10% | 204 7% | 137 37% |
| Last max * (Watt) | 260 | 242 7% | 179 31% | 196.1 25% | 272 -5% | 184 29% |
* ... kleinere Werte sind besser
Power Consumption Witcher 3 / Stresstest
Power Consumption external Monitor
Batterielaufzeit
Die Laufzeiten sind mit knapp 4 Stunden realer WLAN-Nutzung im Profil "Ausbalanciert" und mit aktiver integrierter GPU kurz. Die Ladezeit ist mit 2 bis 2,5 Stunden vom leeren bis zum vollen Akku anständig. Wir begrüßen jedoch, dass der Akku im Gegensatz zu den meisten anderen Notebooks leicht zu entfernen ist.
| Eurocom Raptor X15 i7-12700K, GeForce RTX 3070 Ti Laptop GPU, 62 Wh | MSI Raider GE66 12UHS i9-12900HK, GeForce RTX 3080 Ti Laptop GPU, 99 Wh | Razer Blade 15 Advanced Model Early 2022 i7-12800H, GeForce RTX 3080 Ti Laptop GPU, 80 Wh | Eurocom RX315 NH57AF1 i7-11800H, GeForce RTX 3070 Laptop GPU, 71 Wh | Gigabyte A5 X1 R9 5900HX, GeForce RTX 3070 Laptop GPU, 48.96 Wh | Asus TUF Gaming A15 FA506QR-AZ061T R7 5800H, GeForce RTX 3070 Laptop GPU, 90 Wh | |
|---|---|---|---|---|---|---|
| Akkulaufzeit | 43% | 23% | 20% | 60% | 185% | |
| WLAN (h) | 4 | 5.7 43% | 4.9 23% | 4.8 20% | 6.4 60% | 11.4 185% |
| H.264 (h) | 7.1 | 5.9 | 7.3 | |||
| Last (h) | 1.7 | 2 | 1.3 | 2.4 | ||
| Idle (h) | 8.1 | 10.1 | 17.4 |
Pro
Contra
Fazit

Das Raptor X15 nutzt die neuesten Intel CPUs und Nvidia GPUs, die in einem veralteten Gehäuse stecken. Dem Modell fehlen Funktionen, die bei anderen High-End-15,6-Zoll-Gaming-Laptops üblich sind, wie z. B. RGB-Beleuchtung per Taste, DisplayPort-over-USB, Thunderbolt, Wi-Fi-6E-Unterstützung und eine bessere NVMe-SSD-Kühlung. Wenn konkurrierende Modelle wie das MSI GE66 oder Gigabyte A5 X1 dünner und leichter sind und ähnliche TGP-Ziele wie der Raptor bieten, kann es schwierig sein, das Eurocom gegenüber solchen Alternativen zu empfehlen.
Man beachte, dass die maximale Leistung an den Modus "Maximaler Lüfter" gebunden ist. Daher müssen Benutzer das Systemprofil manuell auf den Modus "Maximaler Lüfter" einstellen und laute Lüfter ertragen, um die maximale Leistung aus dem System herauszuholen.
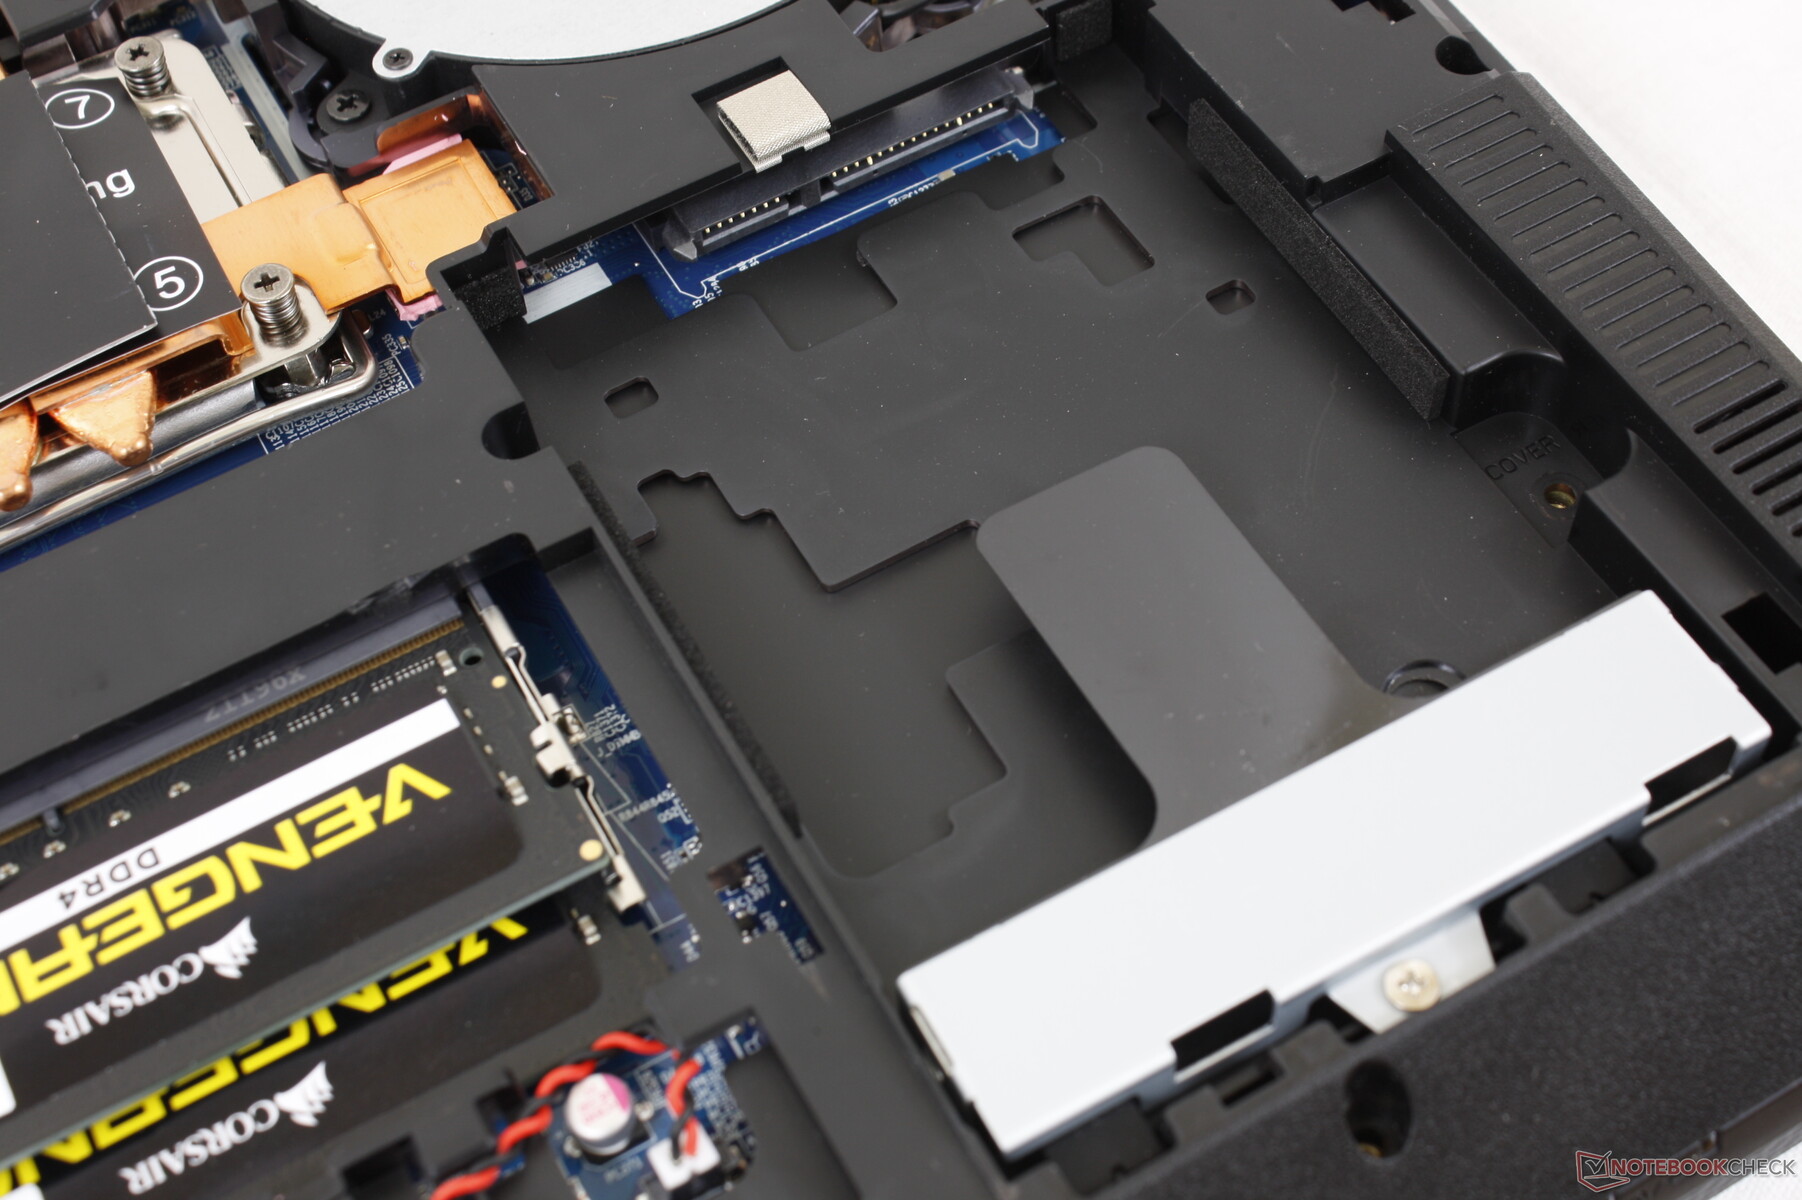
Der Raptor X15 verfügt über eine herausnehmbare LGA1700-CPU mit vielen Speicheroptionen, aber das gesamte Gehäusedesign könnte ein Facelifting vertragen. Dennoch gibt es einige bemerkenswerte Merkmale, die lobenswert sind. Der Laptop unterstützt zum Beispiel 2,5-Zoll-SATA-III-Laufwerke und einen leicht austauschbaren Akku, was bei modernen Gaming-Laptops mittlerweile eine Seltenheit ist. Wenn Sie den LGA1700-Sockel jedoch nicht nutzen wollen, wird das größte Verkaufsargument des Raptor X15 hinfällig.
Preis und Verfügbarkeit
Das bei unser getestet Modell ist hierzulande nicht verfügbar. Alternativ ist ein Modell mit einer RTX-3060-GPU und einem Intel Core i7-12700 erhältlich.
Eurocom Raptor X15
- 09.06.2022 v7 (old)
Allen Ngo
Preisvergleich

