|
|
Intel Core i9-12900K
Titan RTX, i9-12900K, Intel Optane 905P 480GB 2.5 (Idle: 70.5 W) |
463 (439min - 490max) Watt * -10% |
Intel Core i5-11600K
Titan RTX, i5-11600K, Intel Optane 905P 480GB 2.5 (Idle: 69.49 W) |
435 (427min - 463max) Watt * -4% |
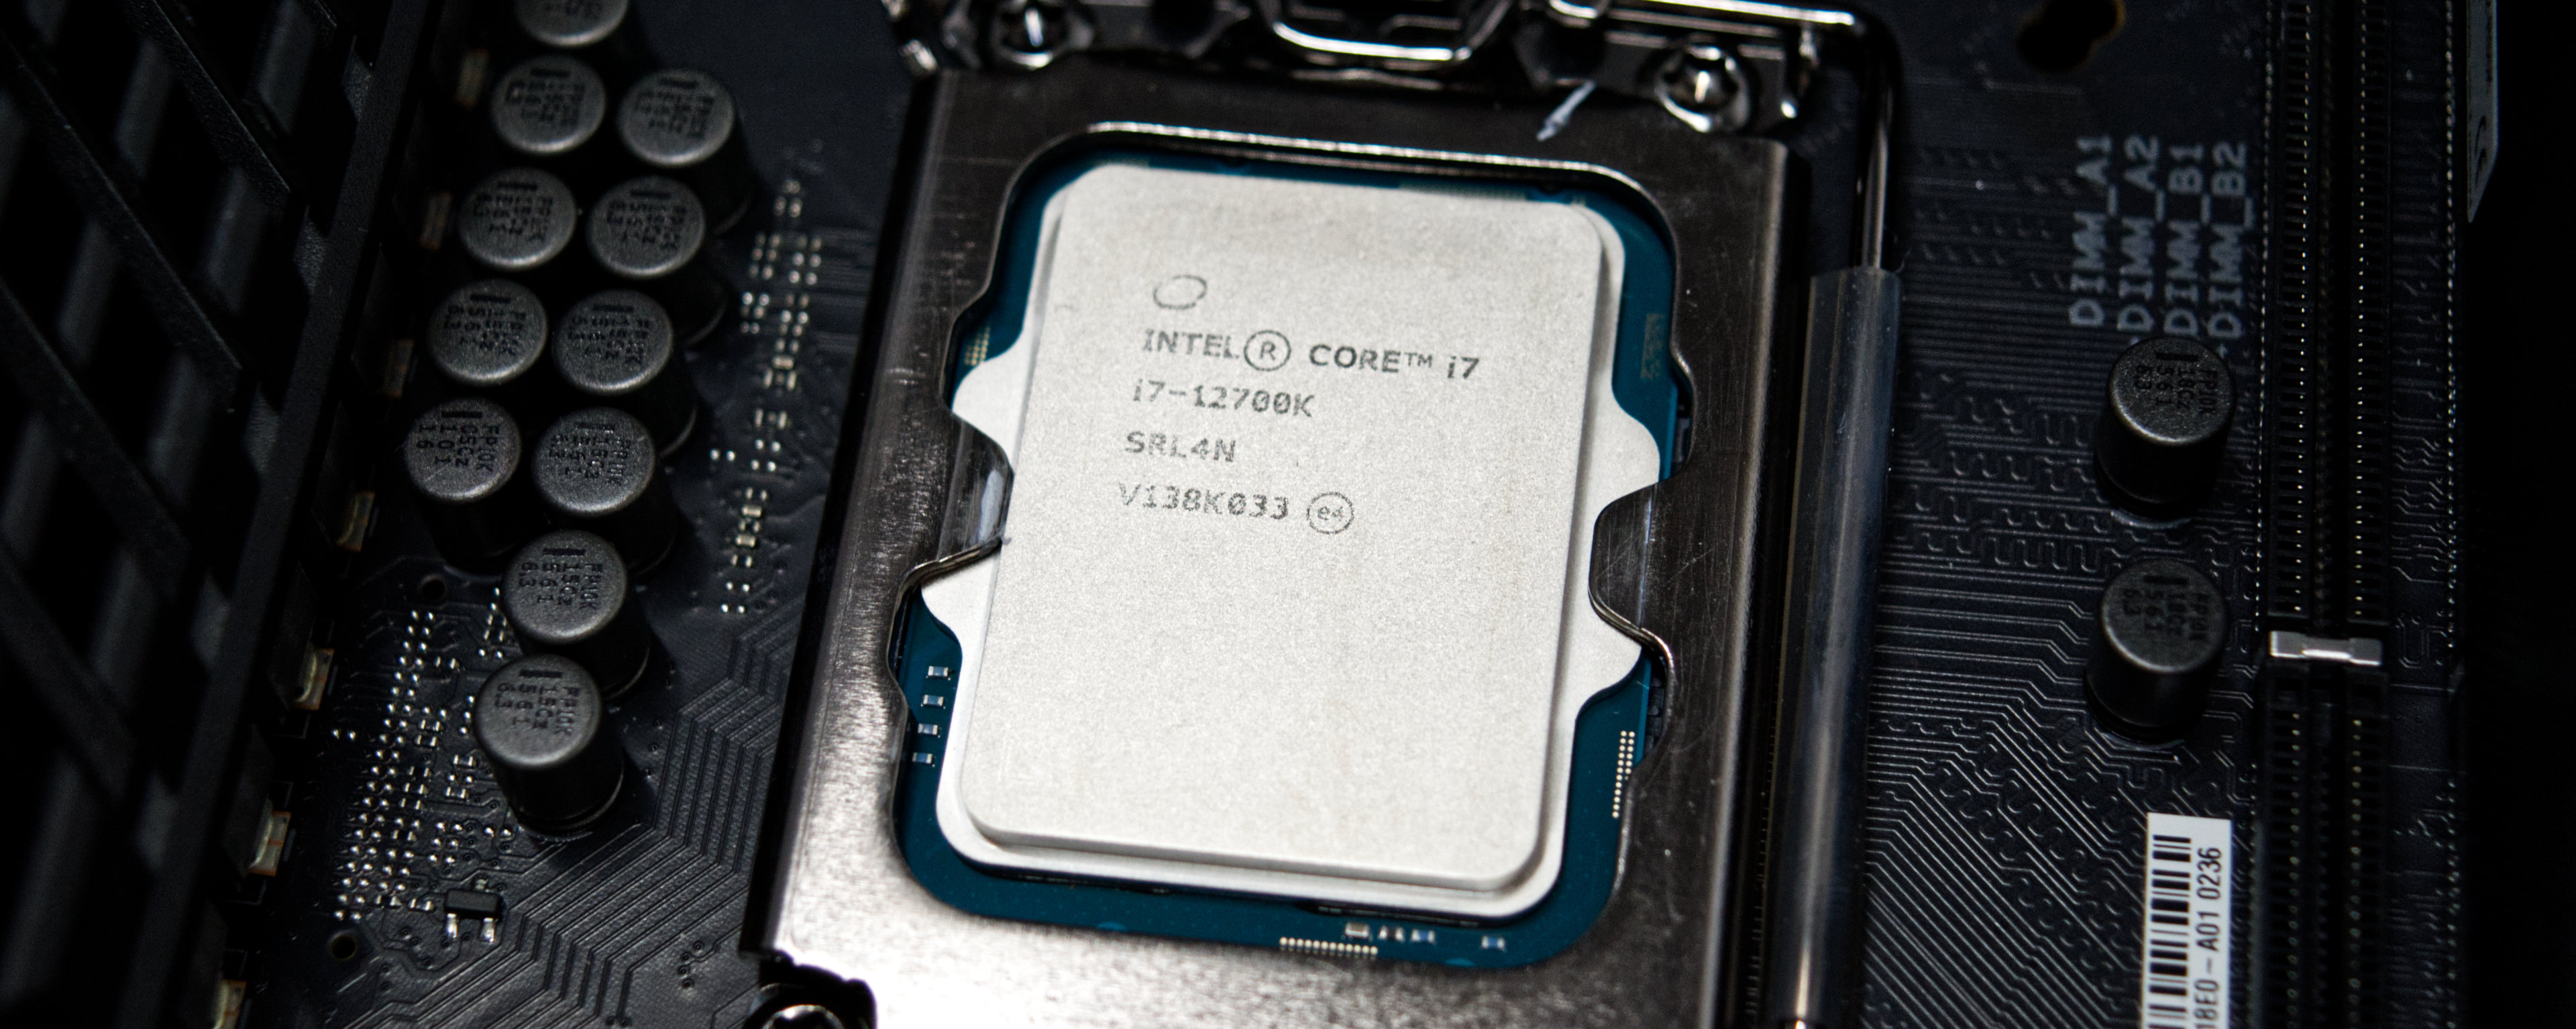
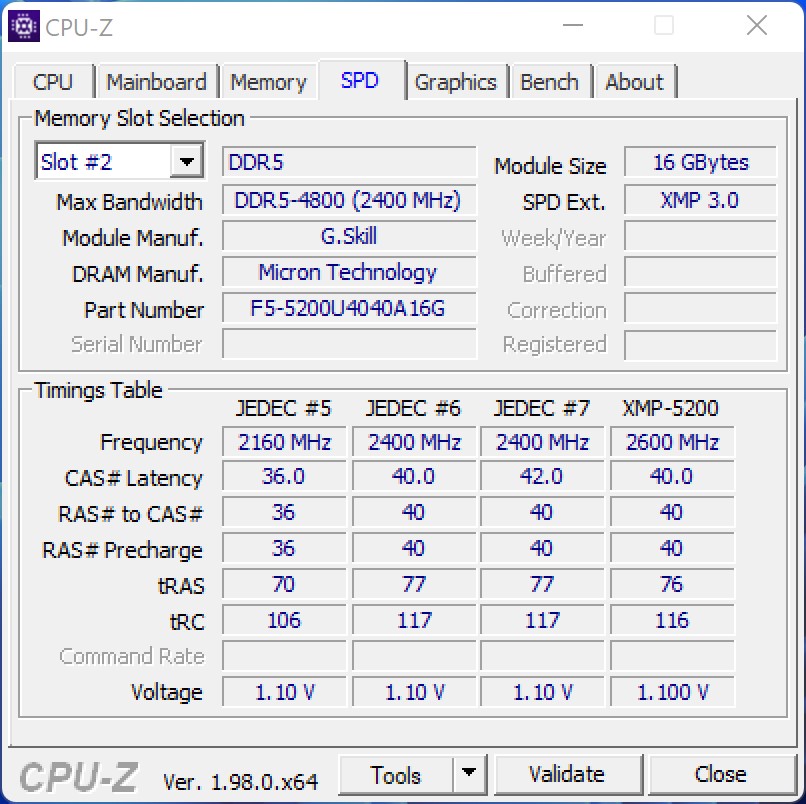
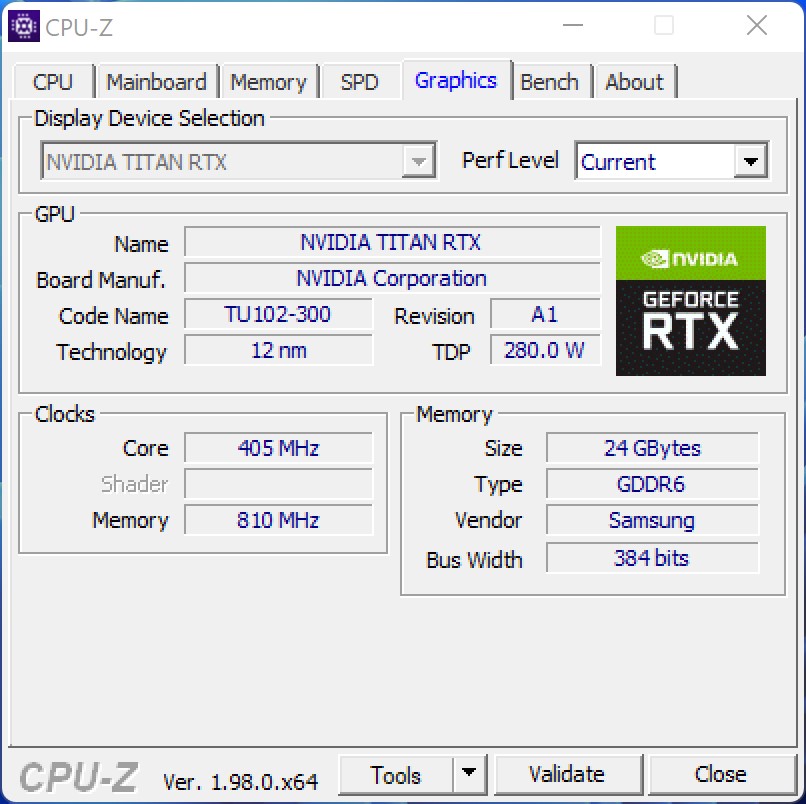
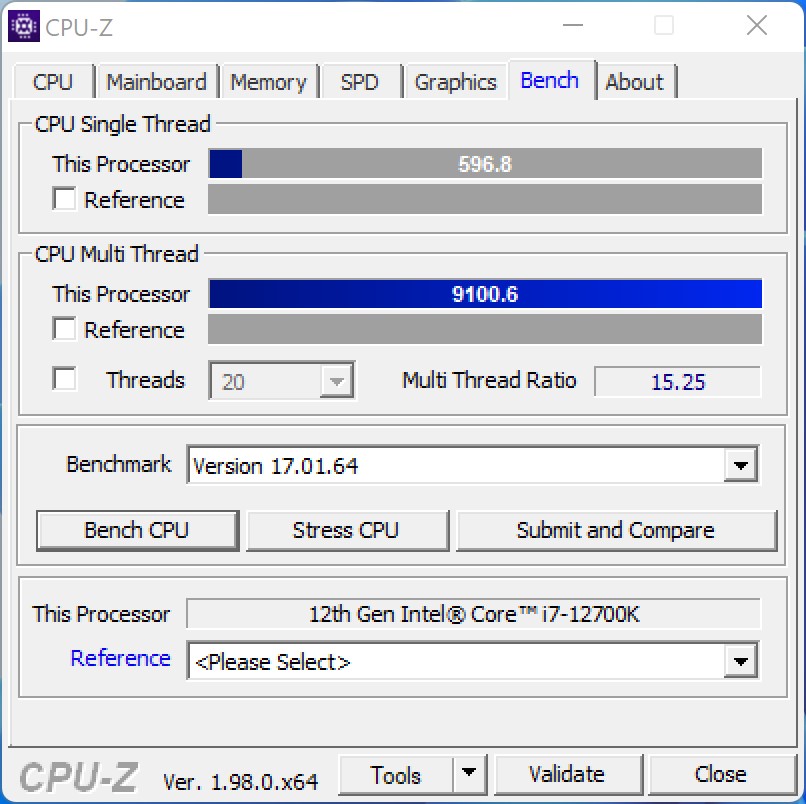
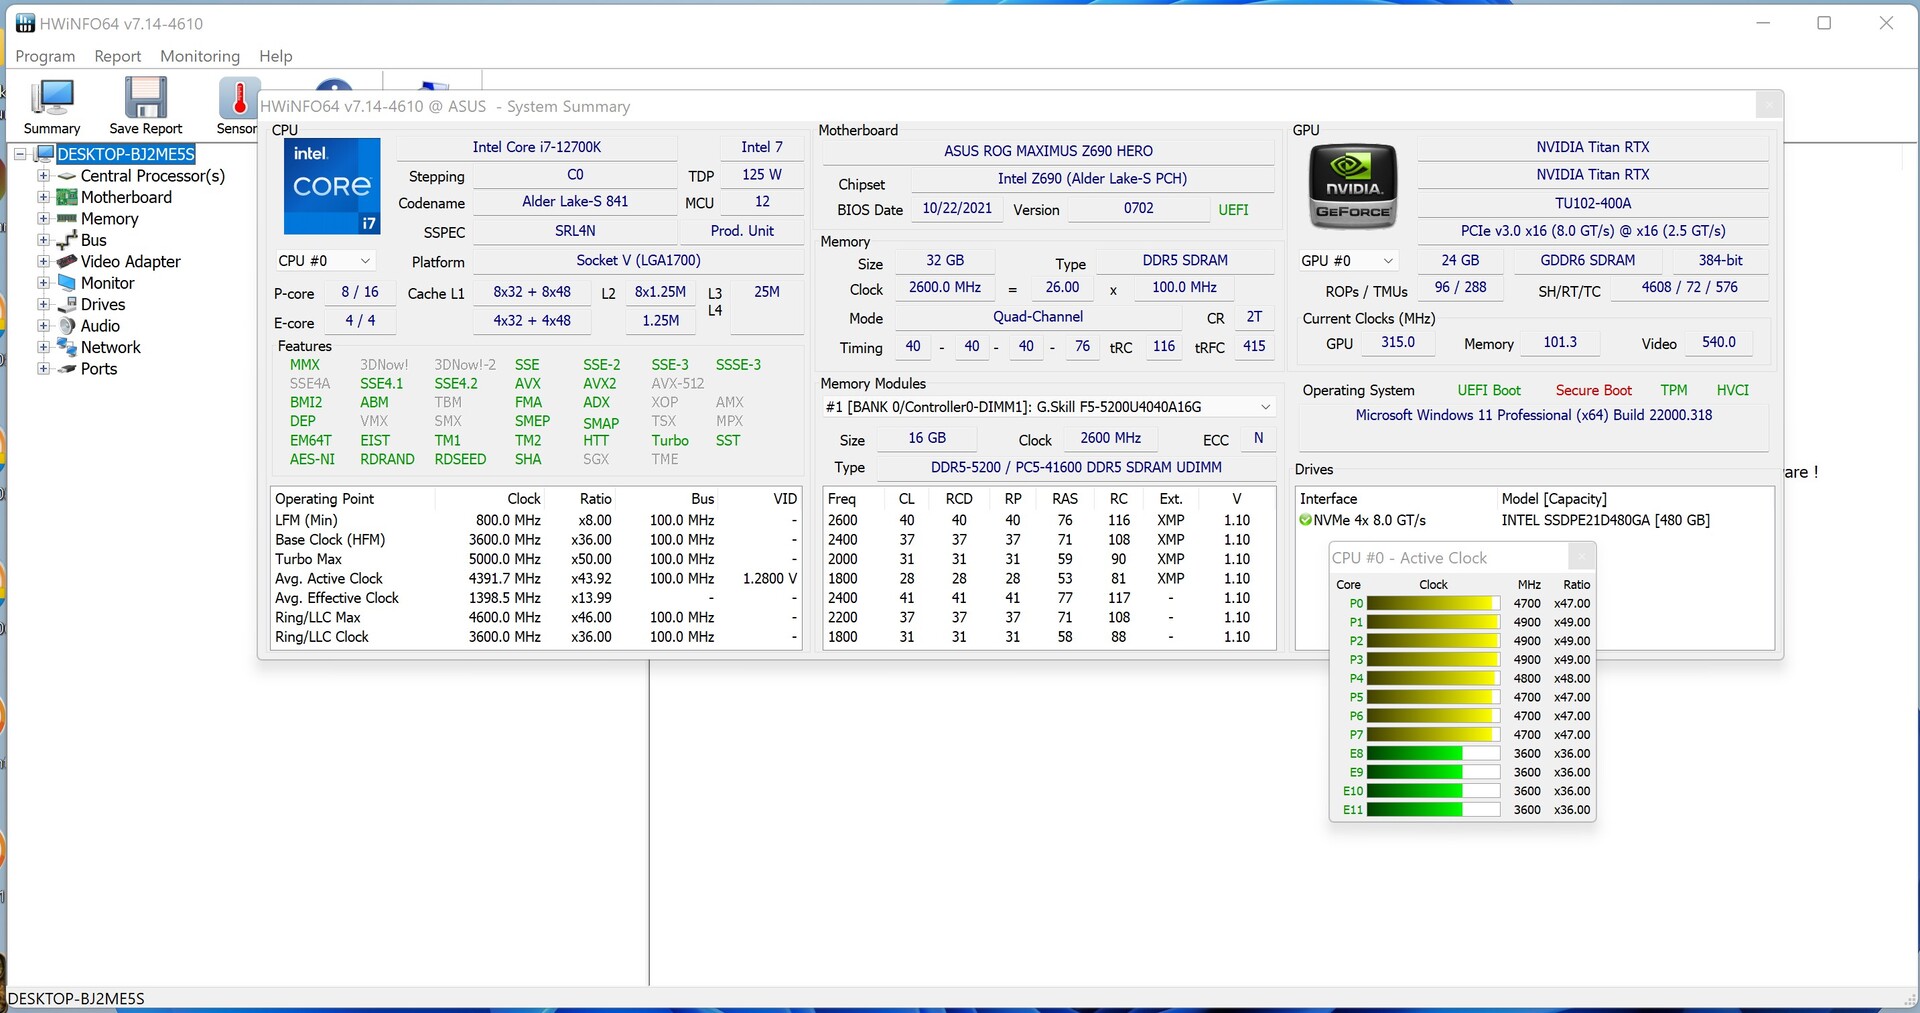
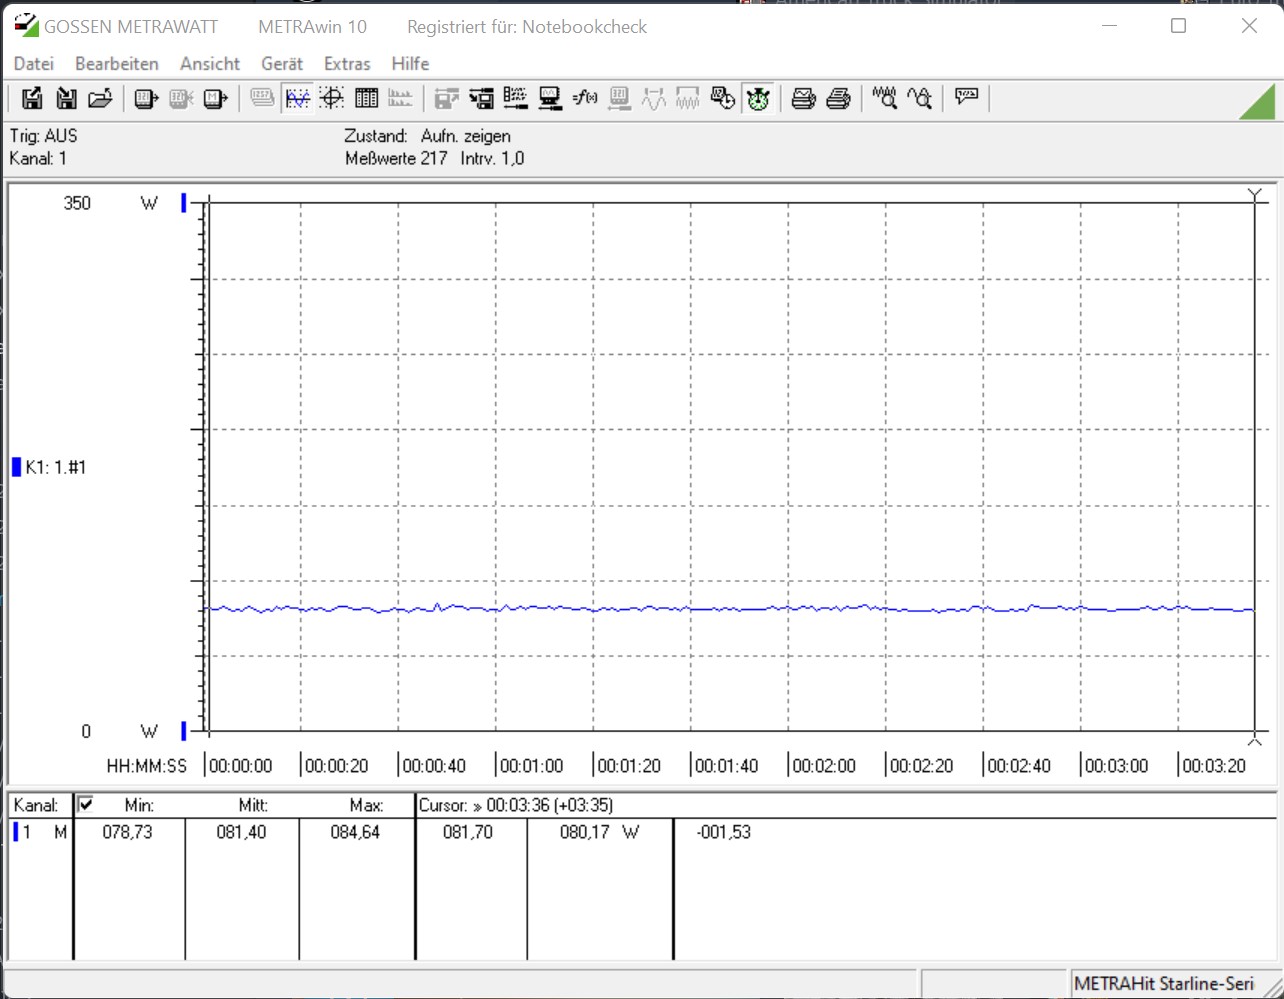
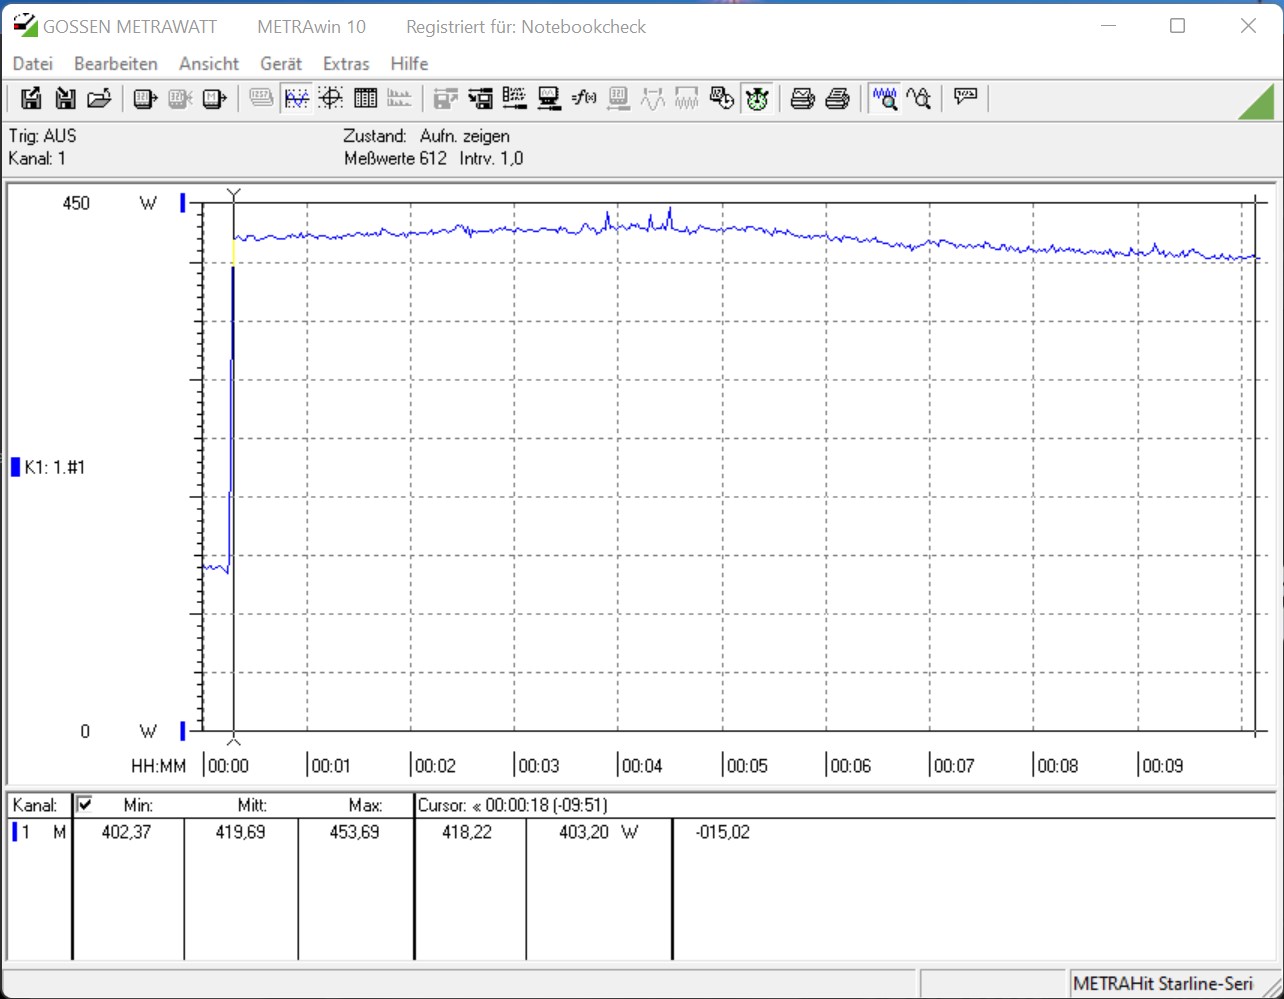
Intel Core i7-12700K
Titan RTX, i7-12700K, Intel Optane 905P 480GB 2.5 (Idle: 81 W) |
419.7 (402min - 454max) Watt * |
AMD Ryzen 9 3900X
Titan RTX, R9 3900X, Corsair MP600 (Idle: 87.4 W) | |
Intel Core i5-12600K
Titan RTX, i5-12600K, Intel Optane 905P 480GB 2.5 (Idle: 70.45 W) |
408.9 (401min - 460max) Watt * +3% |
AMD Ryzen 3 3300X
Titan RTX, R3 3300X, Intel Optane 905P 480GB 2.5 (Idle: 88.8 W) |
397.6 (356min - 412max) Watt * +5% |
Intel Core i9-10900K
Titan RTX, i9-10900K, WDC PC SN720 SDAQNTW-512G (Idle: 52.3 W) |
396.2 (380min - 475max) Watt * +6% |
Intel Core i9-11900K
Titan RTX, i9-11900K, Intel Optane 905P 480GB 2.5 (Idle: 57.3 W) |
387 (380min - 410max) Watt * +8% |
Intel Core i5-10600K
Titan RTX, i5-10600K (Idle: 52.2 W) |
386.9 (380min - 404max) Watt * +8% |
AMD Radeon RX Vega 64
RX Vega 64, R7 3700X, Corsair MP600 (Idle: 79.2 W) |
378 (316min - 411max) Watt * +10% |
Intel Core i9-9900K, AMD Radeon RX Vega 64
RX Vega 64, i9-9900K (80 fps) | |
Intel Core i7-9700K, AMD Radeon RX Vega 64
RX Vega 64, i7-9700K |
365.3 (316min - 388max) Watt * +13% |
Intel Core i5-9600K, AMD Radeon RX Vega 64
RX Vega 64, i5-9600K |
363.7 (403min) Watt * +13% |
|
Intel Core i9-11900K
Titan RTX, i9-11900K, Intel Optane 905P 480GB 2.5 (Idle: 57.3 W) |
302.2 (263min - 353max) Watt * -8% |
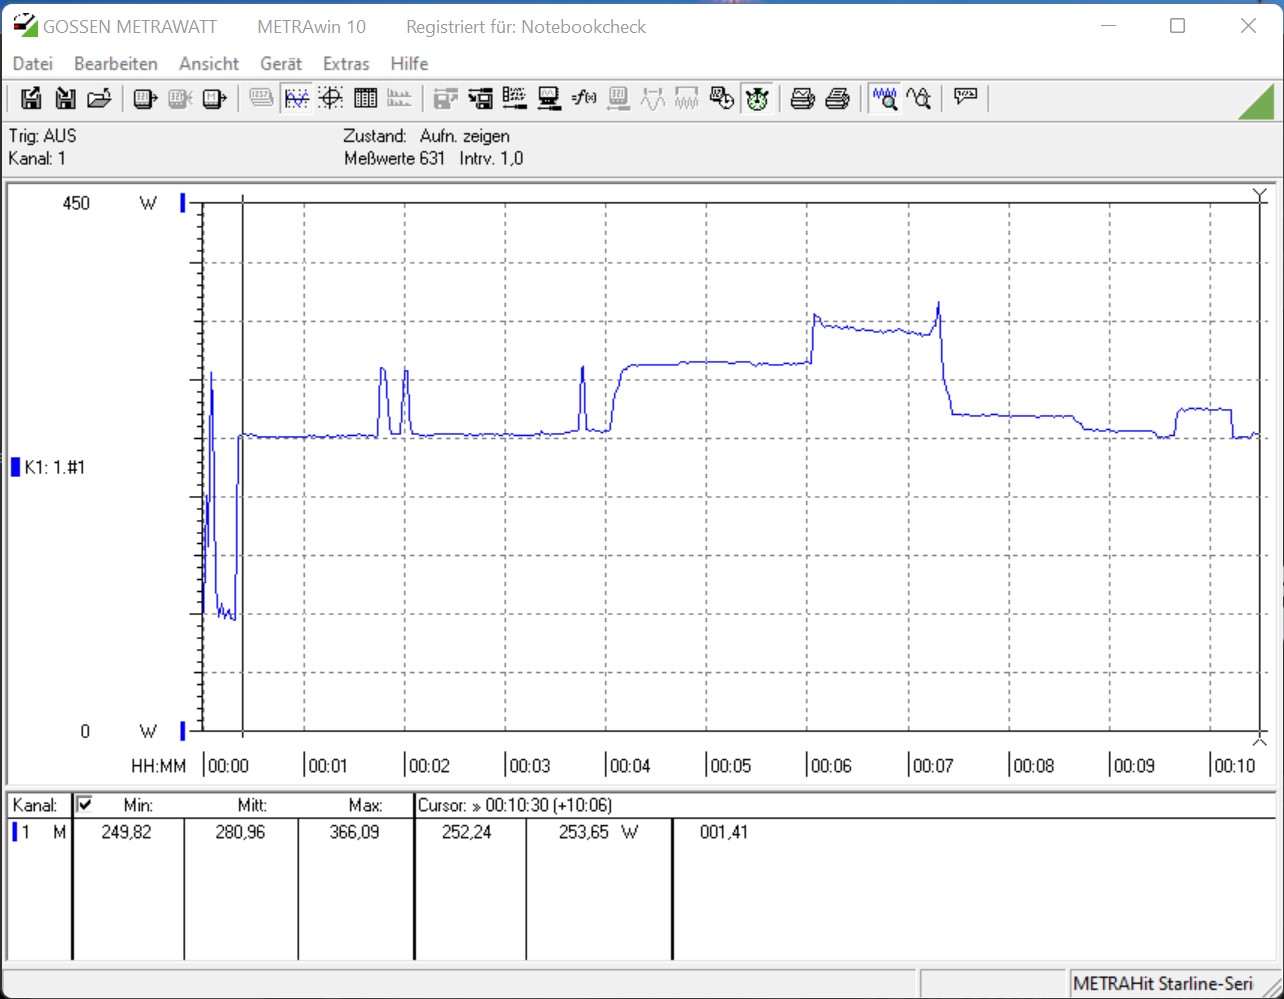
Intel Core i7-12700K
Titan RTX, i7-12700K, Intel Optane 905P 480GB 2.5 (Idle: 81 W) |
281 (250min - 366max) Watt * |
Intel Core i9-12900K
Titan RTX, i9-12900K, Intel Optane 905P 480GB 2.5 (Idle: 70.5 W) |
279.6 (261min - 357max) Watt * -0% |
Intel Core i9-10900K
Titan RTX, i9-10900K, WDC PC SN720 SDAQNTW-512G (Idle: 52.3 W) |
275.7 (254min - 385max) Watt * +2% |
Intel Core i5-12600K
Titan RTX, i5-12600K, Intel Optane 905P 480GB 2.5 (Idle: 70.45 W) |
256.5 (238min - 275max) Watt * +9% |
Intel Core i5-11600K
Titan RTX, i5-11600K, Intel Optane 905P 480GB 2.5 (Idle: 69.49 W) |
228 (212min - 295max) Watt * +19% |
Intel Core i7-9700K, AMD Radeon RX Vega 64
RX Vega 64, i7-9700K |
222.4 (193min - 249max) Watt * +21% |
Intel Core i5-10600K
Titan RTX, i5-10600K (Idle: 52.2 W) |
204.4 (191min - 261max) Watt * +27% |
Intel Core i9-9900K, AMD Radeon RX Vega 64
RX Vega 64, i9-9900K | |
AMD Ryzen 9 3900X
Titan RTX, R9 3900X, Corsair MP600 (Idle: 87.4 W) | |
AMD Radeon RX Vega 64
RX Vega 64, R7 3700X, Corsair MP600 (Idle: 79.2 W) |
170.3 (161min - 187max) Watt * +39% |
Intel Core i5-9600K, AMD Radeon RX Vega 64
RX Vega 64, i5-9600K |
145.9 (143min - 155max) Watt * +48% |
AMD Ryzen 3 3300X
Titan RTX, R3 3300X, Intel Optane 905P 480GB 2.5 (Idle: 88.8 W) |
144.7 (139min - 195max) Watt * +49% |
|
Intel Core i9-12900K
Titan RTX, i9-12900K, Intel Optane 905P 480GB 2.5 (Idle: 70.5 W) | |
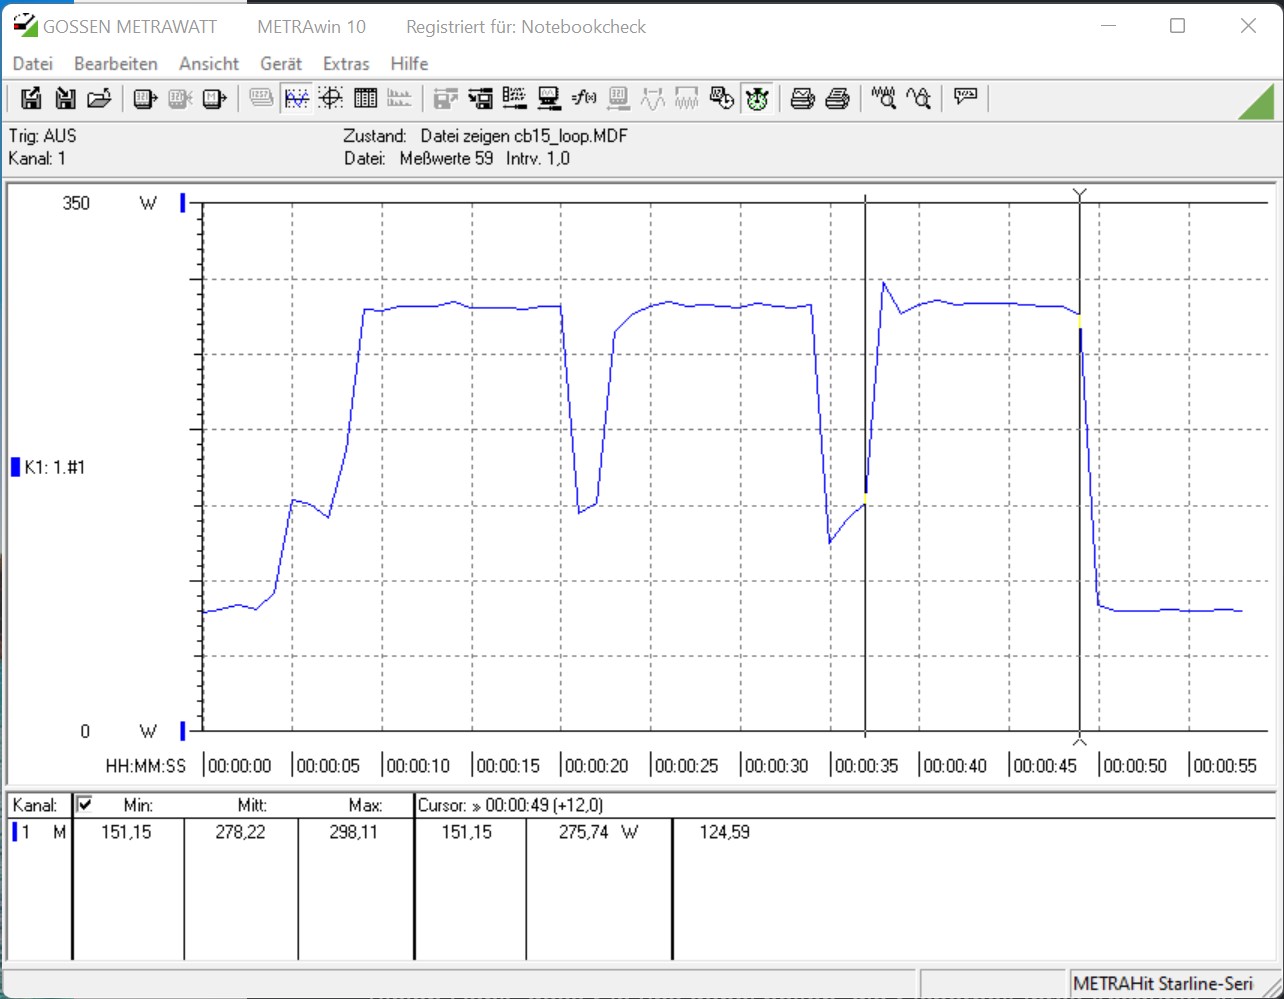
Intel Core i7-12700K
Titan RTX, i7-12700K, Intel Optane 905P 480GB 2.5 (Idle: 81 W) |
278.2 (151min - 298max) Watt * |
Intel Core i9-10900K
Titan RTX, i9-10900K, WDC PC SN720 SDAQNTW-512G (Idle: 52.3 W) |
268.5 (265min - 270max) Watt * +3% |
Intel Core i9-11900K
Titan RTX, i9-11900K, Intel Optane 905P 480GB 2.5 (Idle: 57.3 W) |
259.3 (256min - 281max) Watt * +7% |
Intel Core i5-11600K
Titan RTX, i5-11600K, Intel Optane 905P 480GB 2.5 (Idle: 69.49 W) |
219.9 (206min - 236max) Watt * +21% |
AMD Ryzen 9 3900X
Titan RTX, R9 3900X, Corsair MP600 (Idle: 87.4 W) | |
Intel Core i5-12600K
Titan RTX, i5-12600K, Intel Optane 905P 480GB 2.5 (Idle: 70.45 W) |
205.9 (145min - 213max) Watt * +26% |
Intel Core i9-9900K, AMD Radeon RX Vega 64
RX Vega 64, i9-9900K |
203.2 (197min - 205max) Watt * +27% |
Intel Core i7-9700K, AMD Radeon RX Vega 64
RX Vega 64, i7-9700K |
202.6 (190min - 207max) Watt * +27% |
Intel Core i5-10600K
Titan RTX, i5-10600K (Idle: 52.2 W) |
172.5 (170min - 176max) Watt * +38% |
AMD Radeon RX Vega 64
RX Vega 64, R7 3700X, Corsair MP600 (Idle: 79.2 W) |
171.6 (171min - 173max) Watt * +38% |
AMD Ryzen 3 3300X
Titan RTX, R3 3300X, Intel Optane 905P 480GB 2.5 (Idle: 88.8 W) |
137.3 (136min - 139max) Watt * +51% |
Intel Core i5-9600K, AMD Radeon RX Vega 64
RX Vega 64, i5-9600K |
134 (132min - 135max) Watt * +52% |
* ... kleinere Werte sind besser