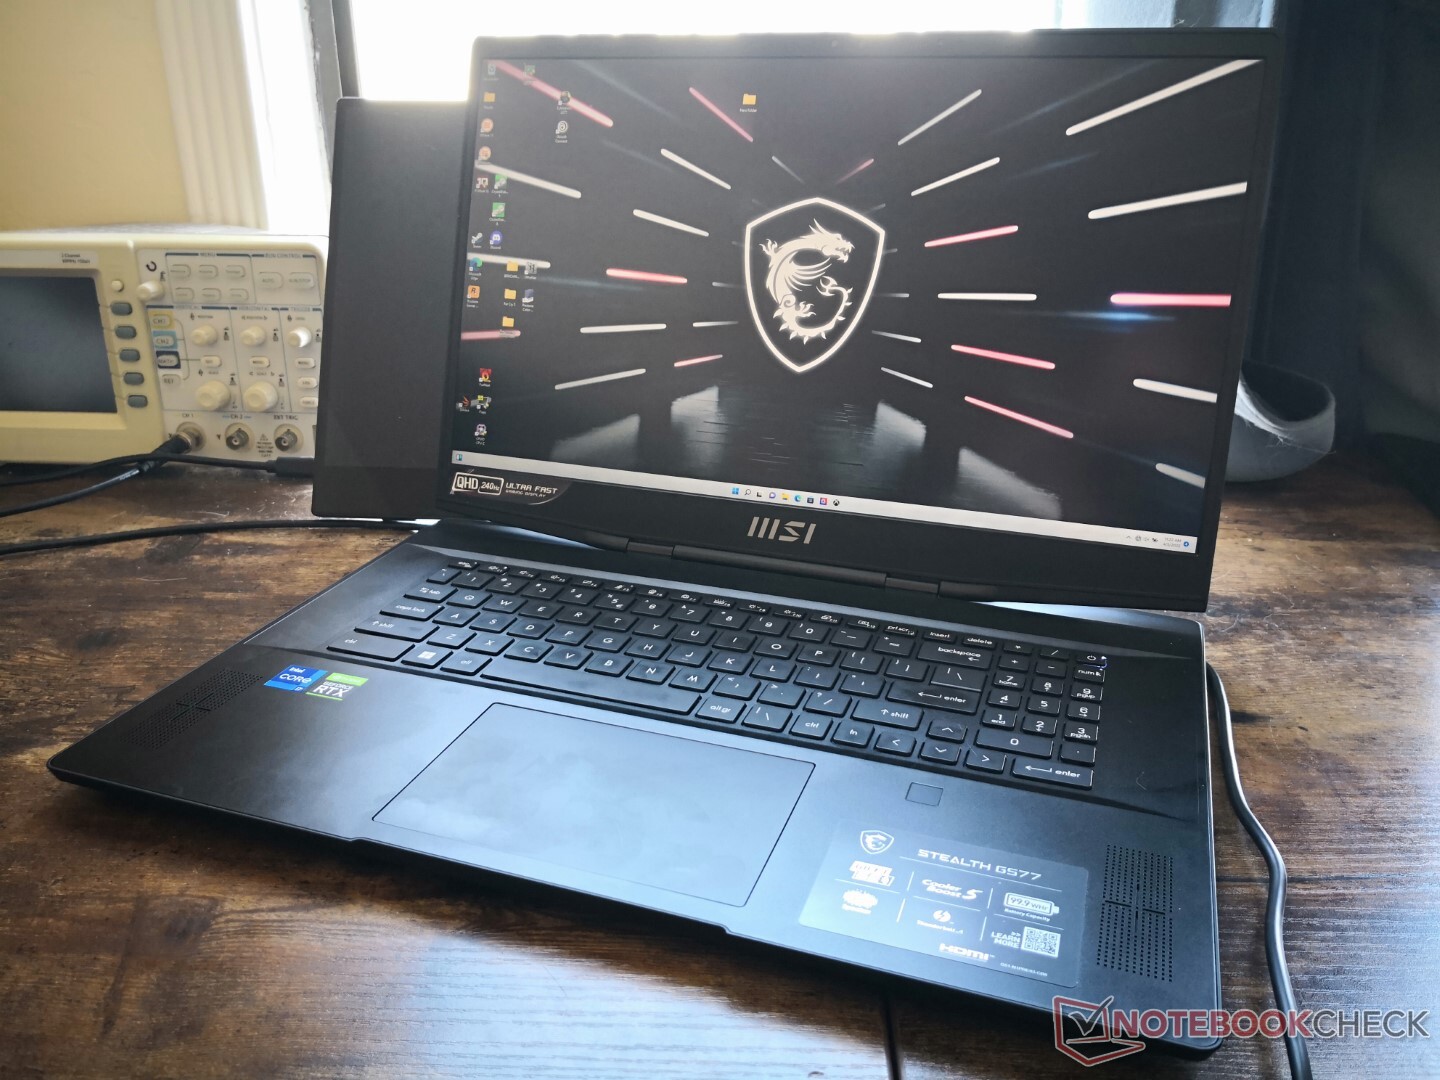
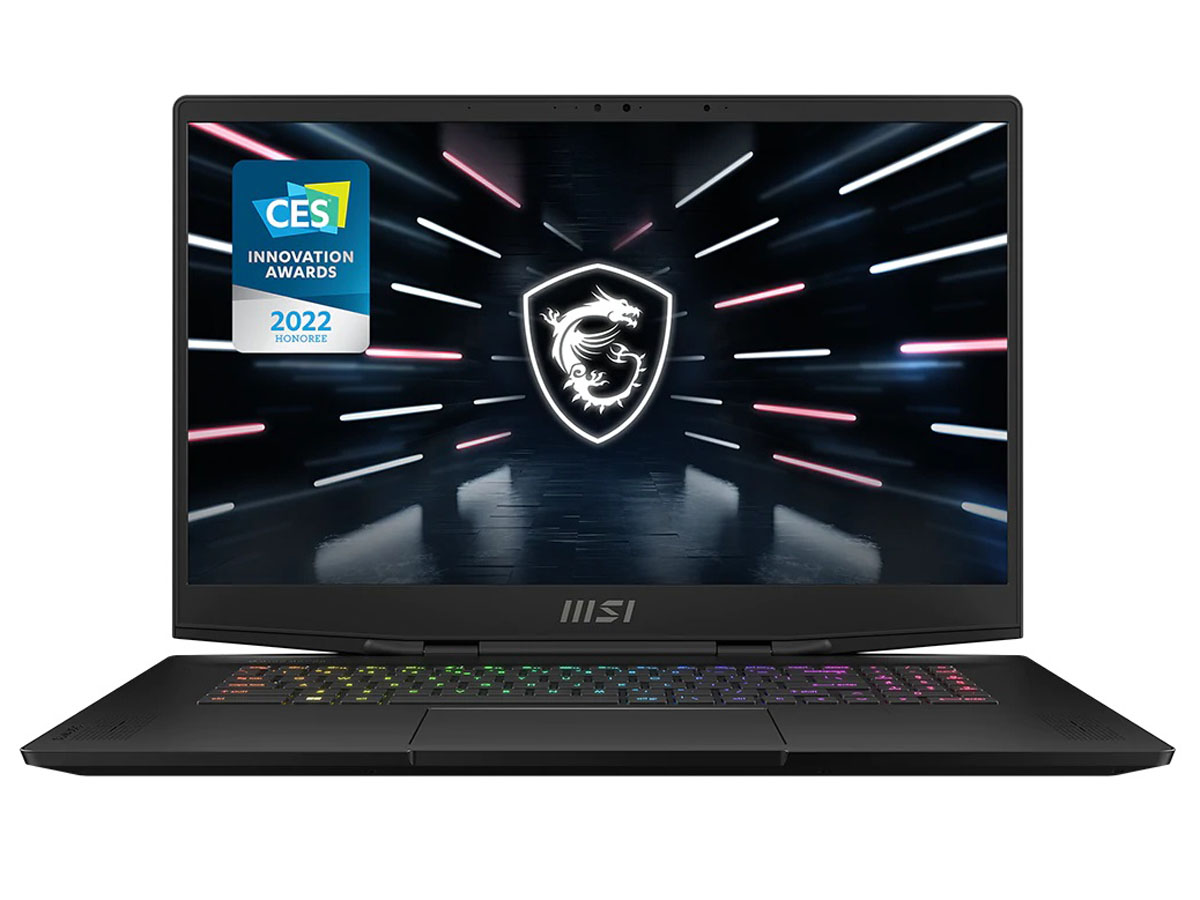
MSI Stealth GS77 Laptop Test: Eine Gute Alternative zum Razer Blade 17?
Als MSI das GS76 mit Intels 11. Generation vergangenes Jahr vorgestellt hat, basierte das Gehäuse auf einem im Vergleich zum Vorgänger, dem GS75, komplett neuen Design. Für dieses Jahr und das GS77 wiederholt sich die Geschichte. Der Laptop setzt nun auf eine CPU aus Intels 12. Generation sowie erneut in komplett neues Gehäuse. Uns hat das neue Design unerwartet überrascht, insbesondere da die meisten anderen Laptops ein Design in der Regel mehrere Jahre lang recyceln, bevor es erneuert wird.
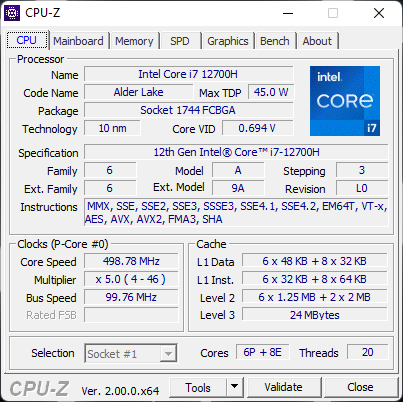
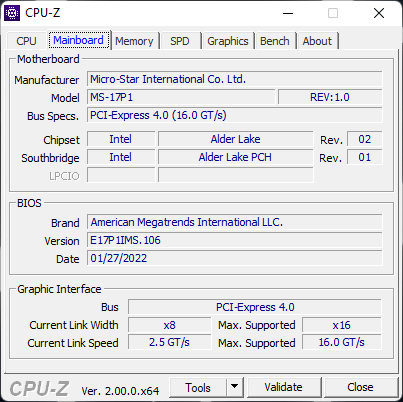
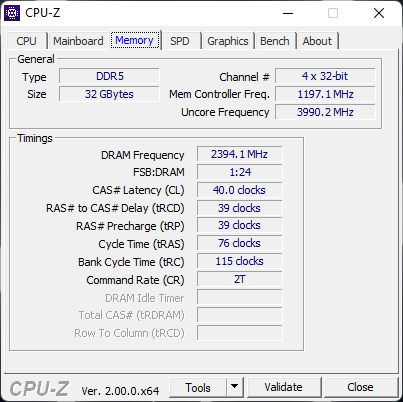
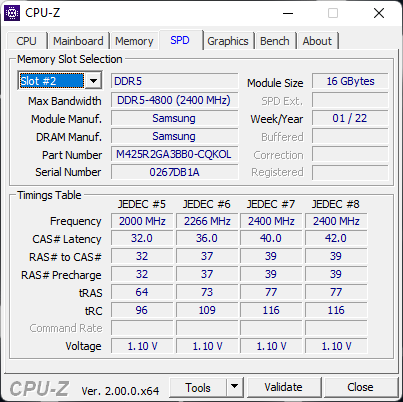
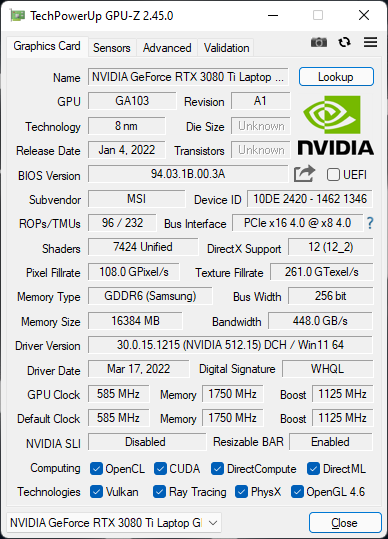
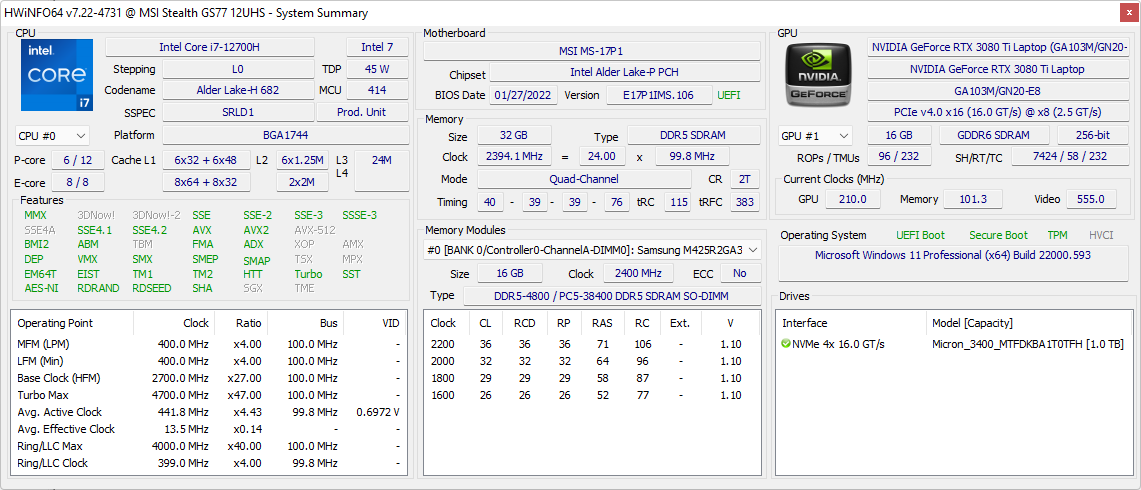
Unser von Xotic PC zur Verfügung gestelltes Testgerät kam mit einem Core i7-12700H der 12. Generation, einer GeForce RTX 3080 Ti mit 105 W TGP, 32 GB DDR5-4800-RAM, einem 1440p-IPS-Display mit einer Bildwiederholrate von 240 Hz und zuletzt einer 1 TB fassenden PCIe4-x4-NVMe-SSD zum Preis von etwa 3.700 US-Dollar. Andere Modelle, zum Beispiel mit Core i7-12900H, RTX 3070 Ti, RTX 3080, 360-Hz-FHD-Displaz oder 120-Hz-UHD-Display sind ebenfalls erhältlich.
Potenzielle Gegenspieler sind das Razer Blade 17, Dell Alienware x17, Asus ROG Zephyrus S17 sowie die Gigabyte-Aorus-17-Serie.
Weitere MSI-Reviews:
mögliche Konkurrenten im Vergleich
Bew. | Datum | Modell | Gewicht | Dicke | Größe | Auflösung | Preis ab |
|---|---|---|---|---|---|---|---|
| 87.2 % v7 (old) | 04 / 2022 | MSI Stealth GS77 12UHS-083US i7-12700H, GeForce RTX 3080 Ti Laptop GPU | 2.9 kg | 20.8 mm | 17.30" | 2560x1440 | |
| 86.2 % v7 (old) | 09 / 2021 | MSI GS76 Stealth 11UH i9-11900H, GeForce RTX 3080 Laptop GPU | 2.4 kg | 20 mm | 17.30" | 3840x2160 | |
| 91.2 % v7 (old) | 04 / 2022 | Razer Blade 17 RTX 3080 Ti i7-12800H, GeForce RTX 3080 Ti Laptop GPU | 2.7 kg | 19.9 mm | 17.30" | 2560x1440 | |
| 87.5 % v7 (old) | 01 / 2022 | MSI GE76 Raider i9-12900HK, GeForce RTX 3080 Ti Laptop GPU | 3 kg | 26 mm | 17.30" | 1920x1080 | |
| 89 % v7 (old) | 09 / 2021 | Alienware x17 RTX 3080 P48E i7-11800H, GeForce RTX 3080 Laptop GPU | 3.2 kg | 21.4 mm | 17.30" | 3840x2160 | |
| 90.1 % v7 (old) | 07 / 2021 | Asus ROG Zephyrus S17 GX703HSD i9-11900H, GeForce RTX 3080 Laptop GPU | 2.8 kg | 19.9 mm | 17.30" | 2560x1440 |
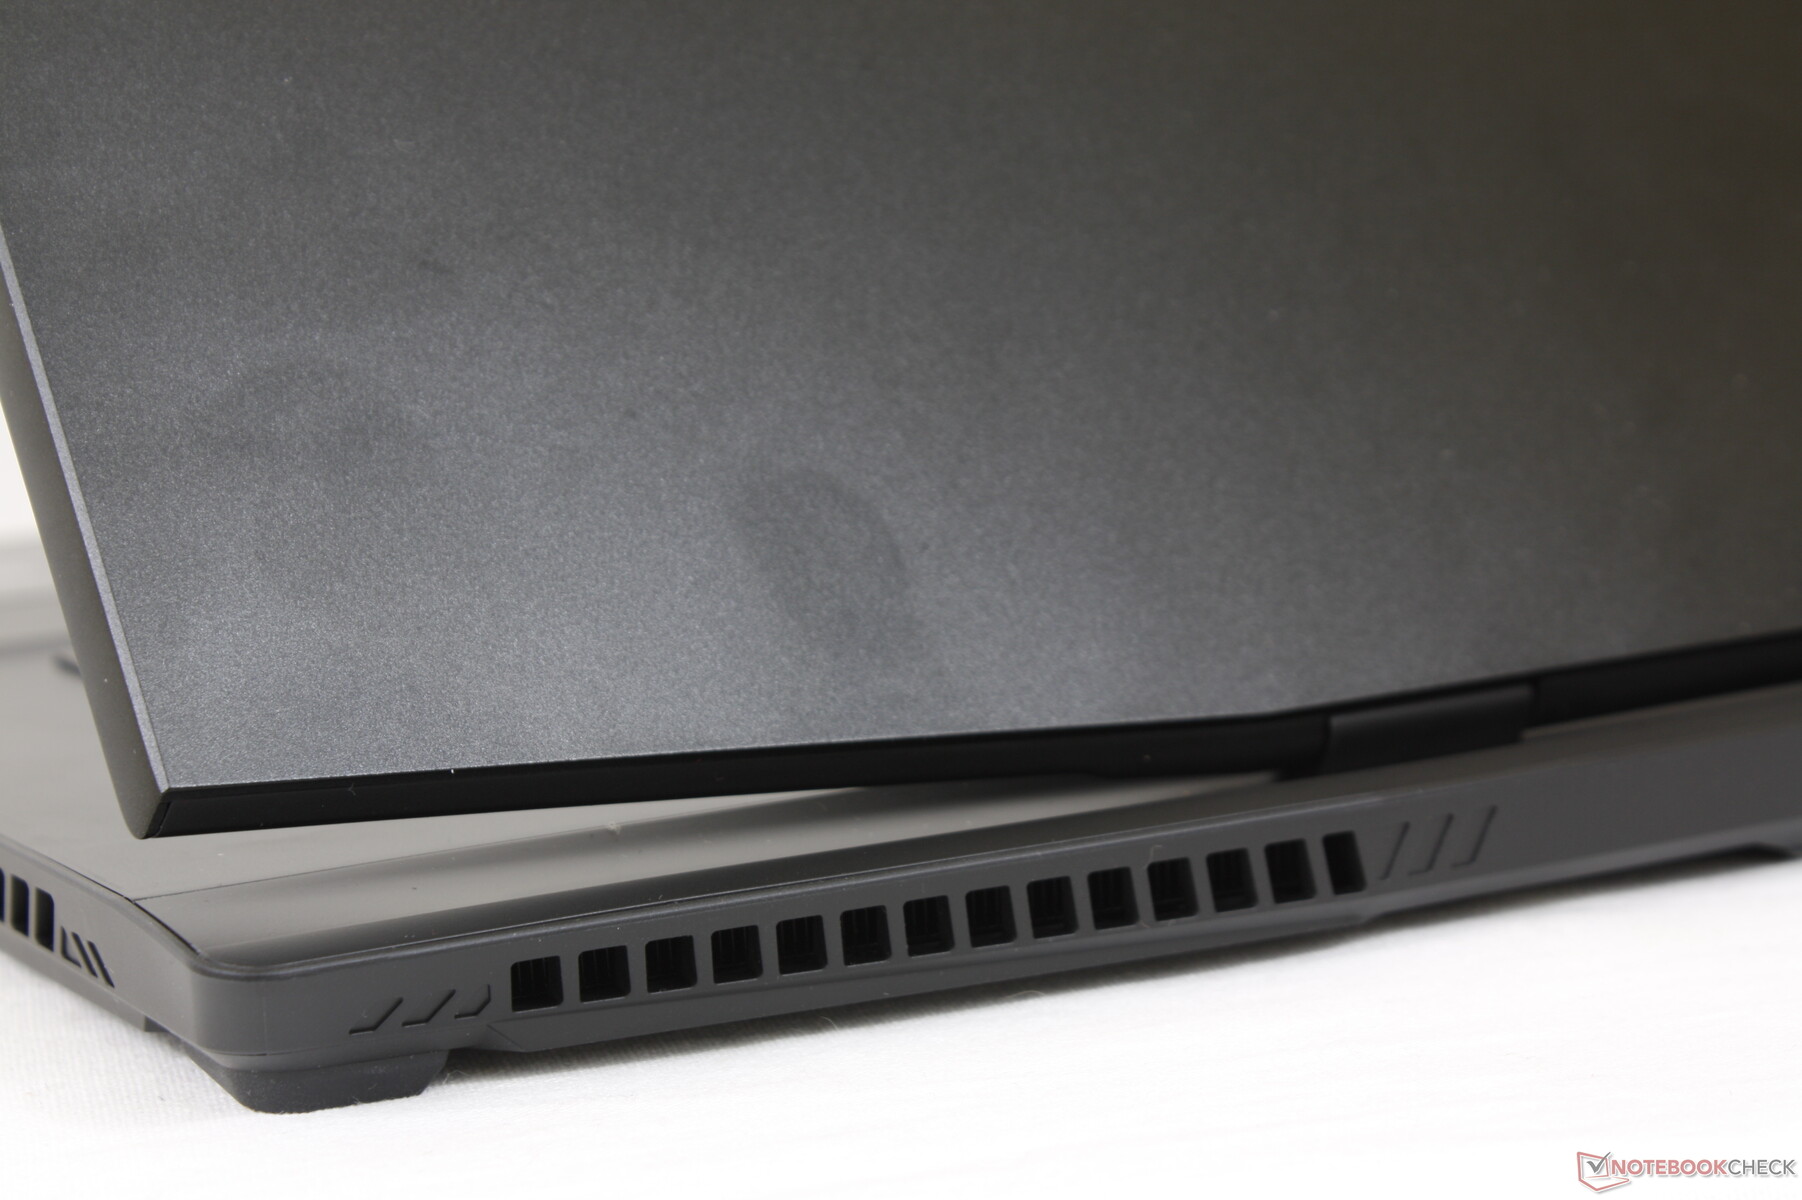
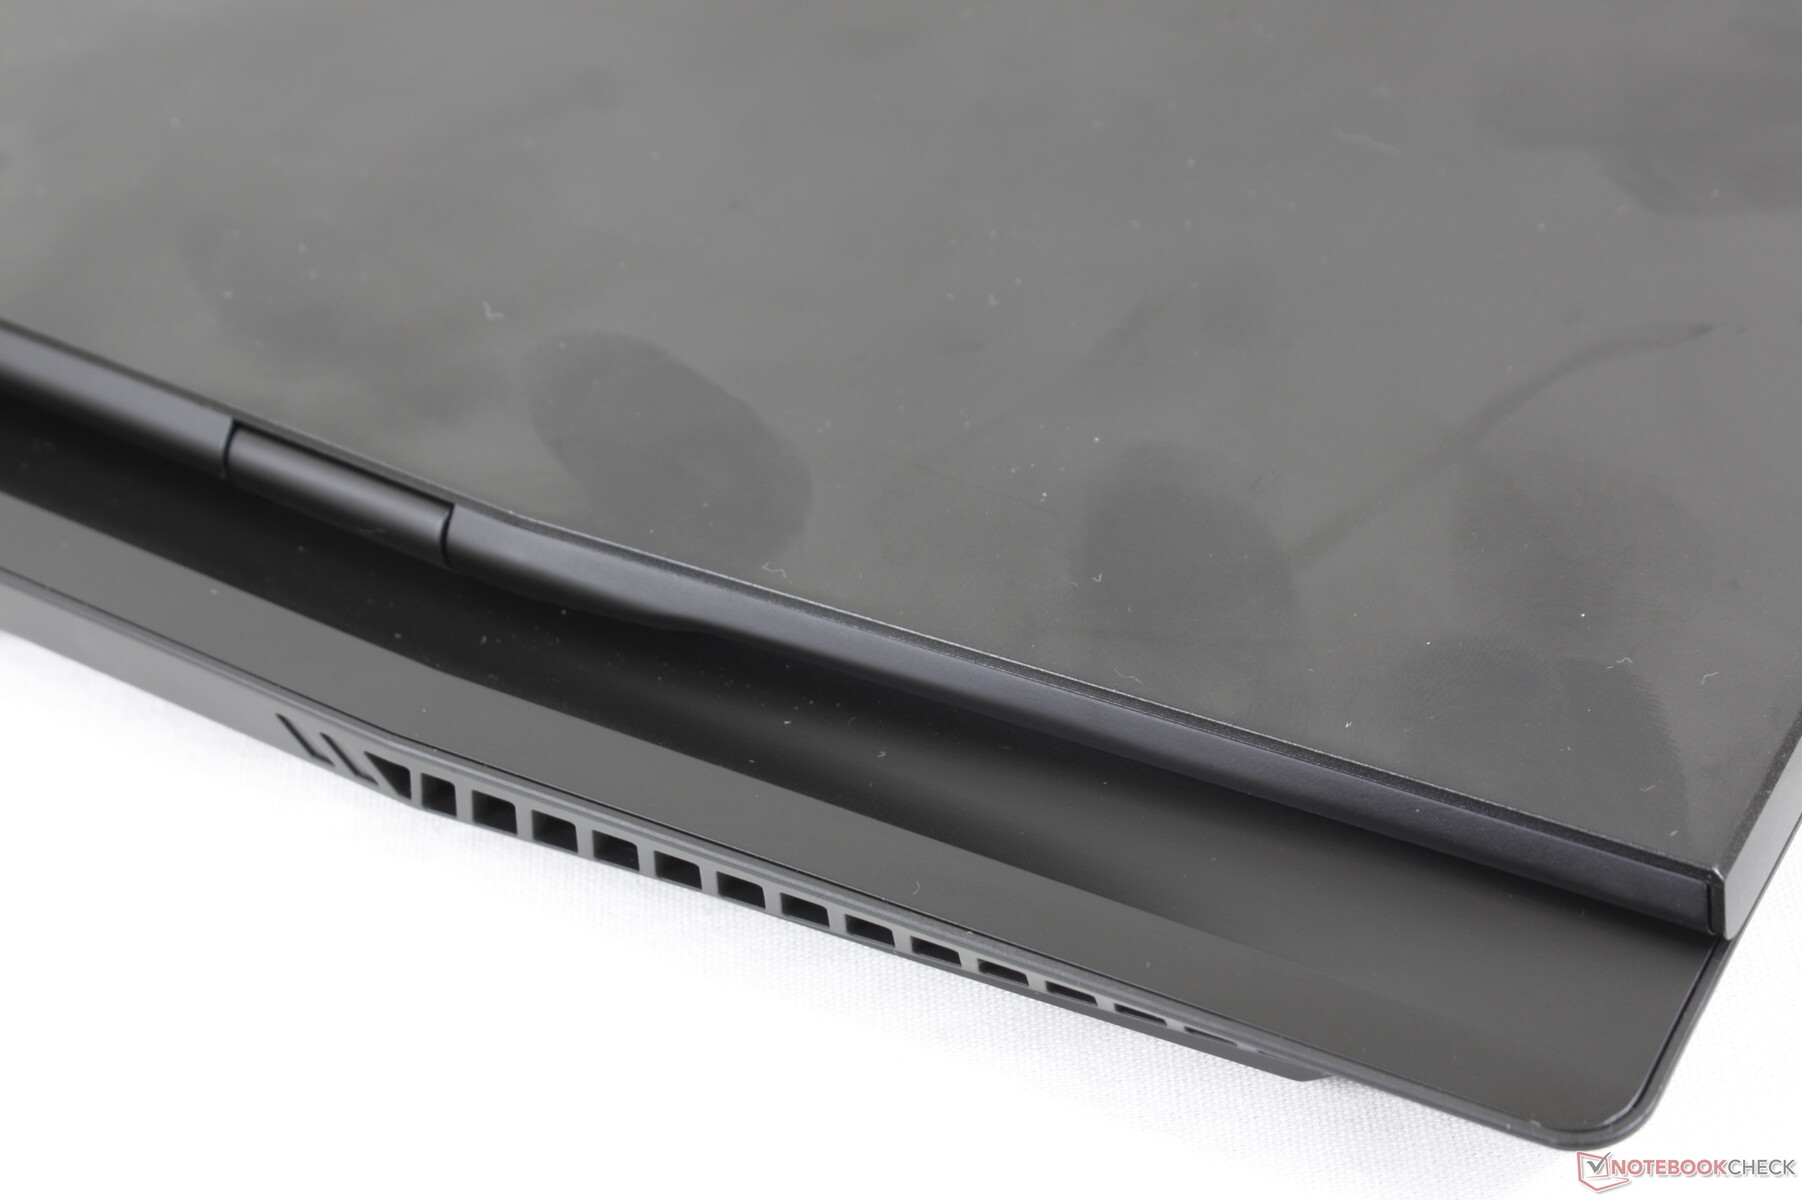
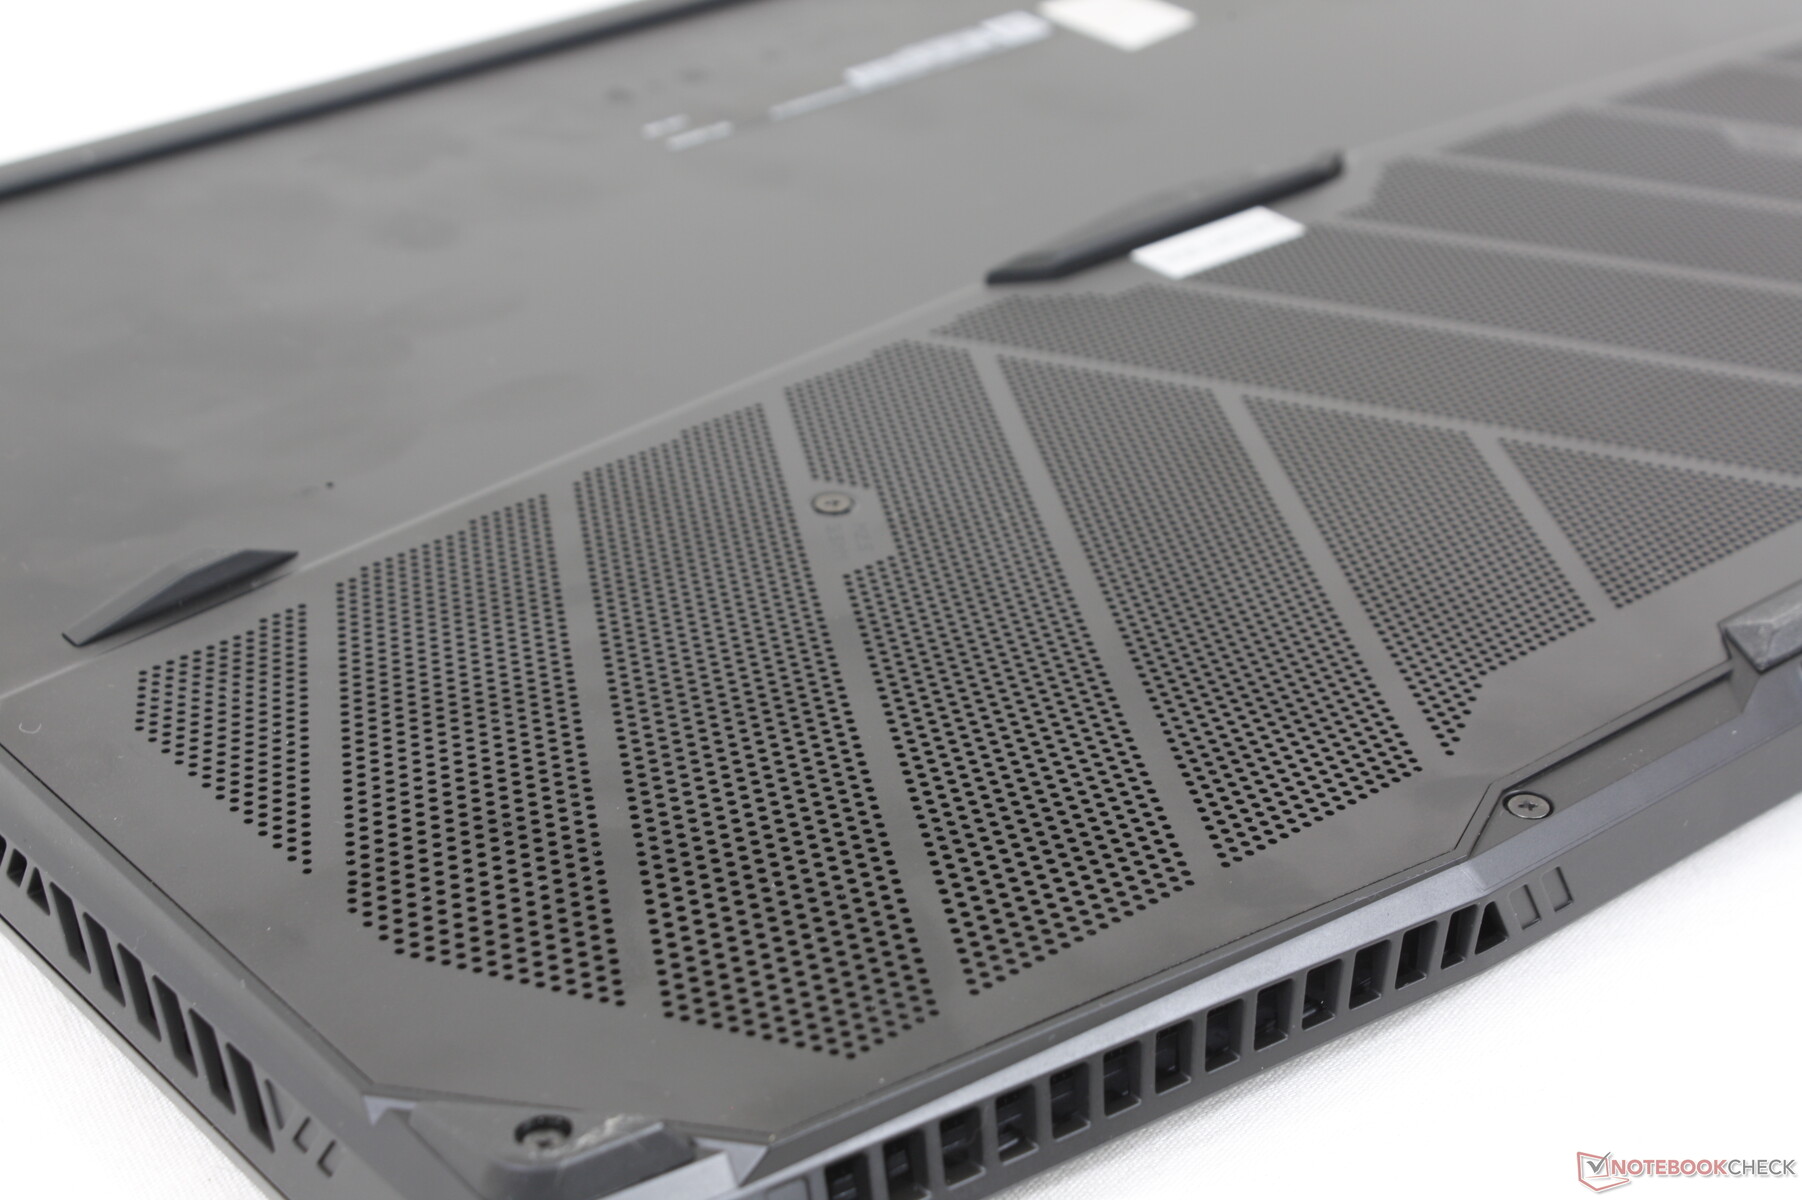
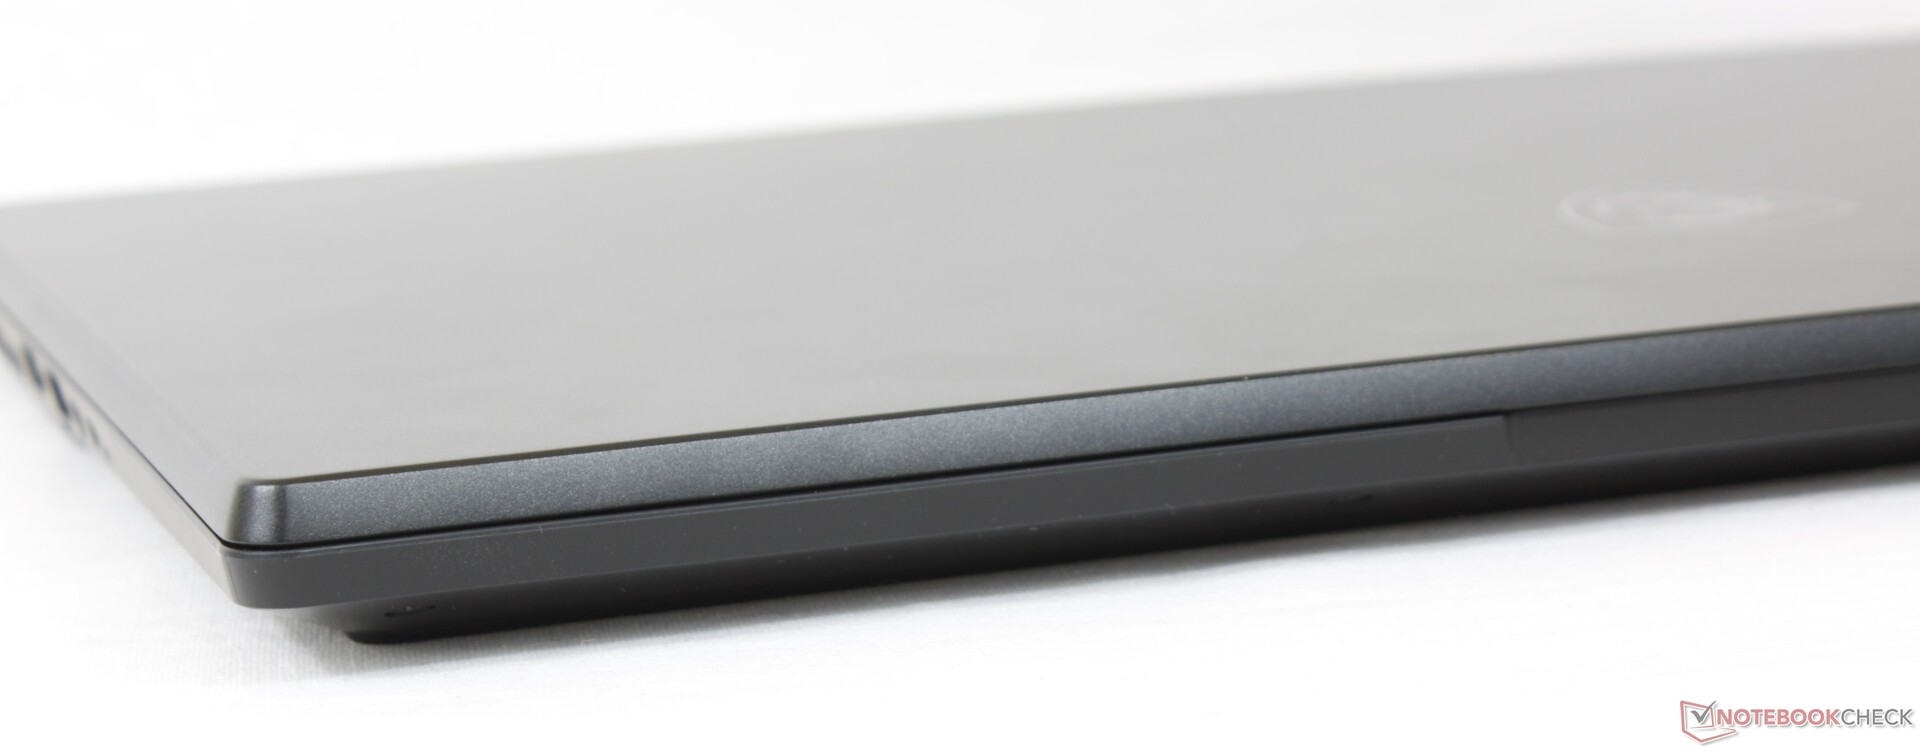
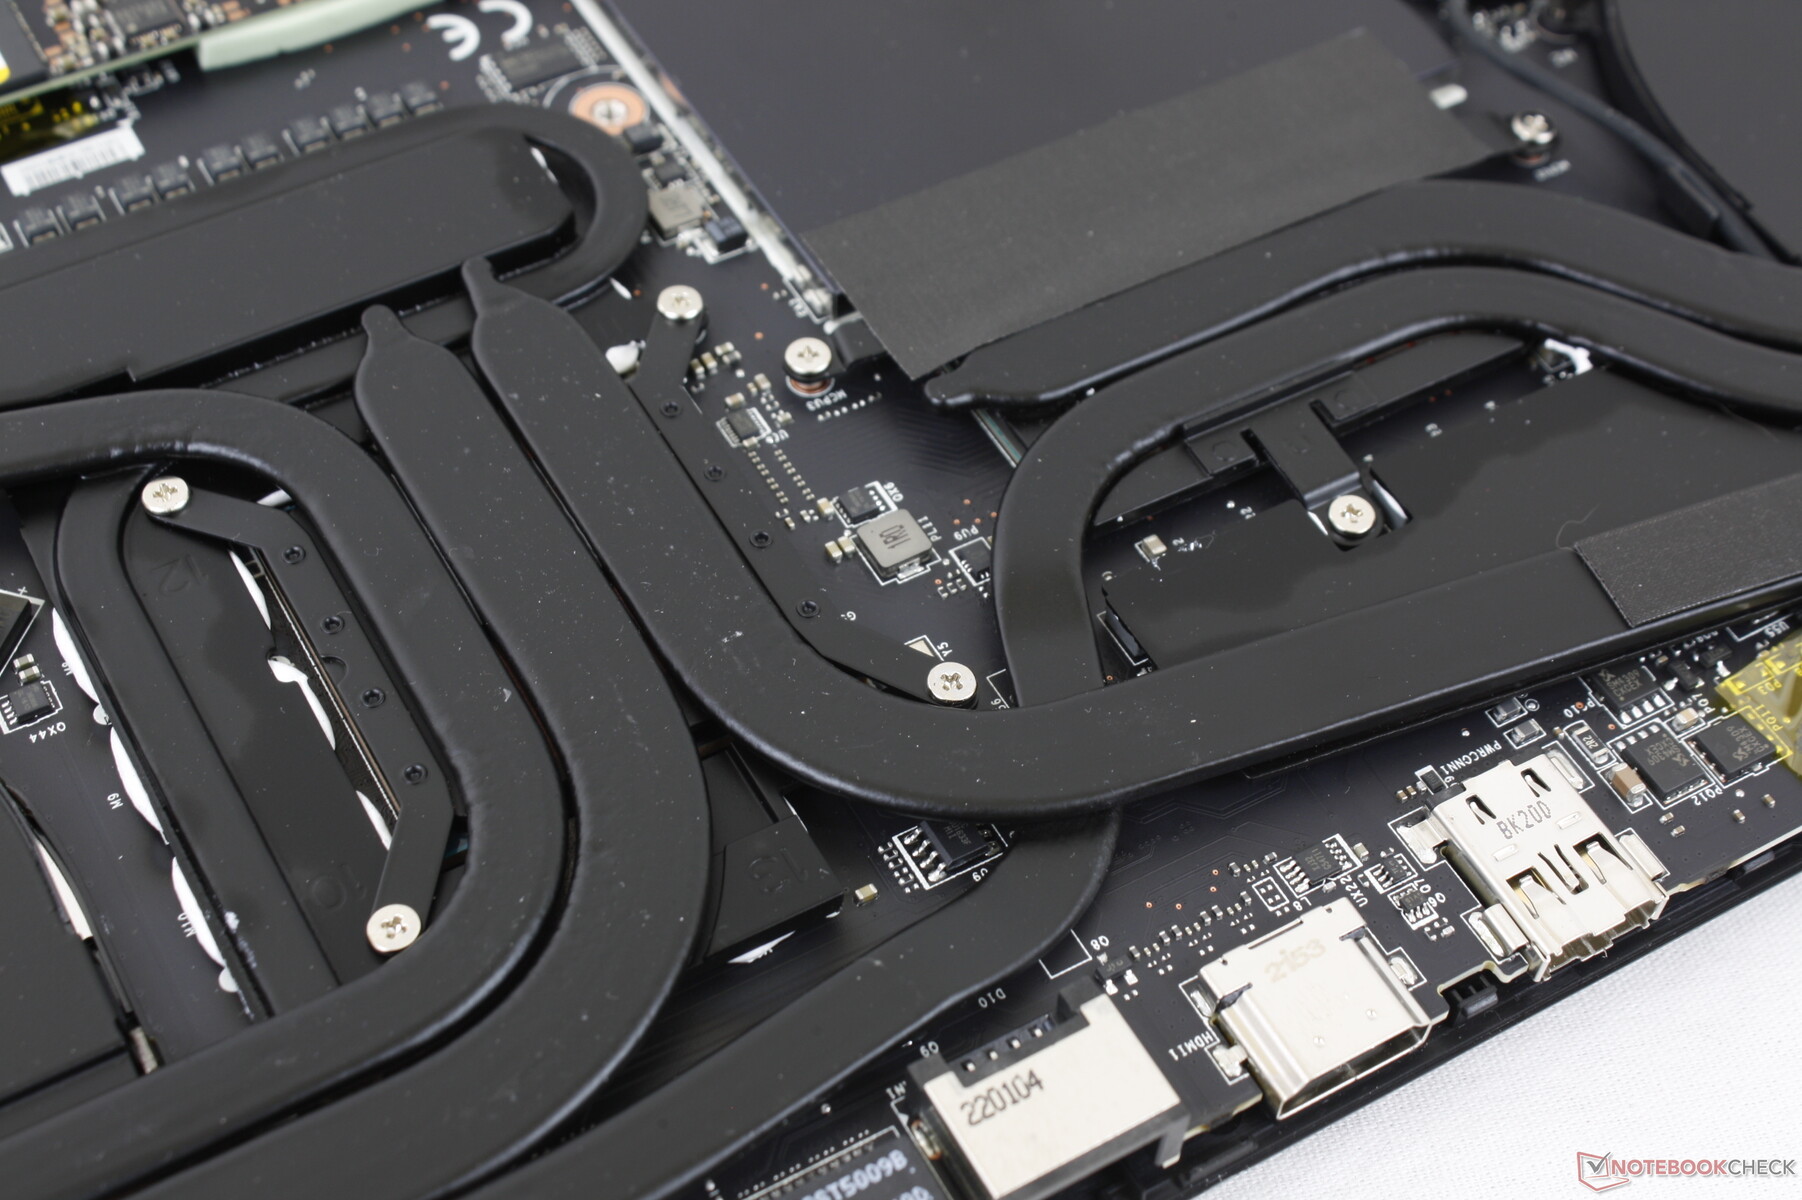
Gehäuse – Größer, Schwerer, Robuster
Einer unserer größten Kritikpunkte am GS76 war die Tatsache, dass dem dünneren und leichteren Gehäuse zu viel Performance zum Opfer gefallen ist. Das neu designte GS77 geht diesen Kritikpunkt an und führt, ähnlich wie schon das Alienware x17 oder MSIs hauseigene GT-Serie die nach hinten rausstehende Kühleinheit ein. Das Gehäuse ist zudem spürbar robuster und steifer als davor und sowohl Base als auch Display boten unseren Verwindungsversuchen erheblich mehr Widerstand als beim Vorgänger.
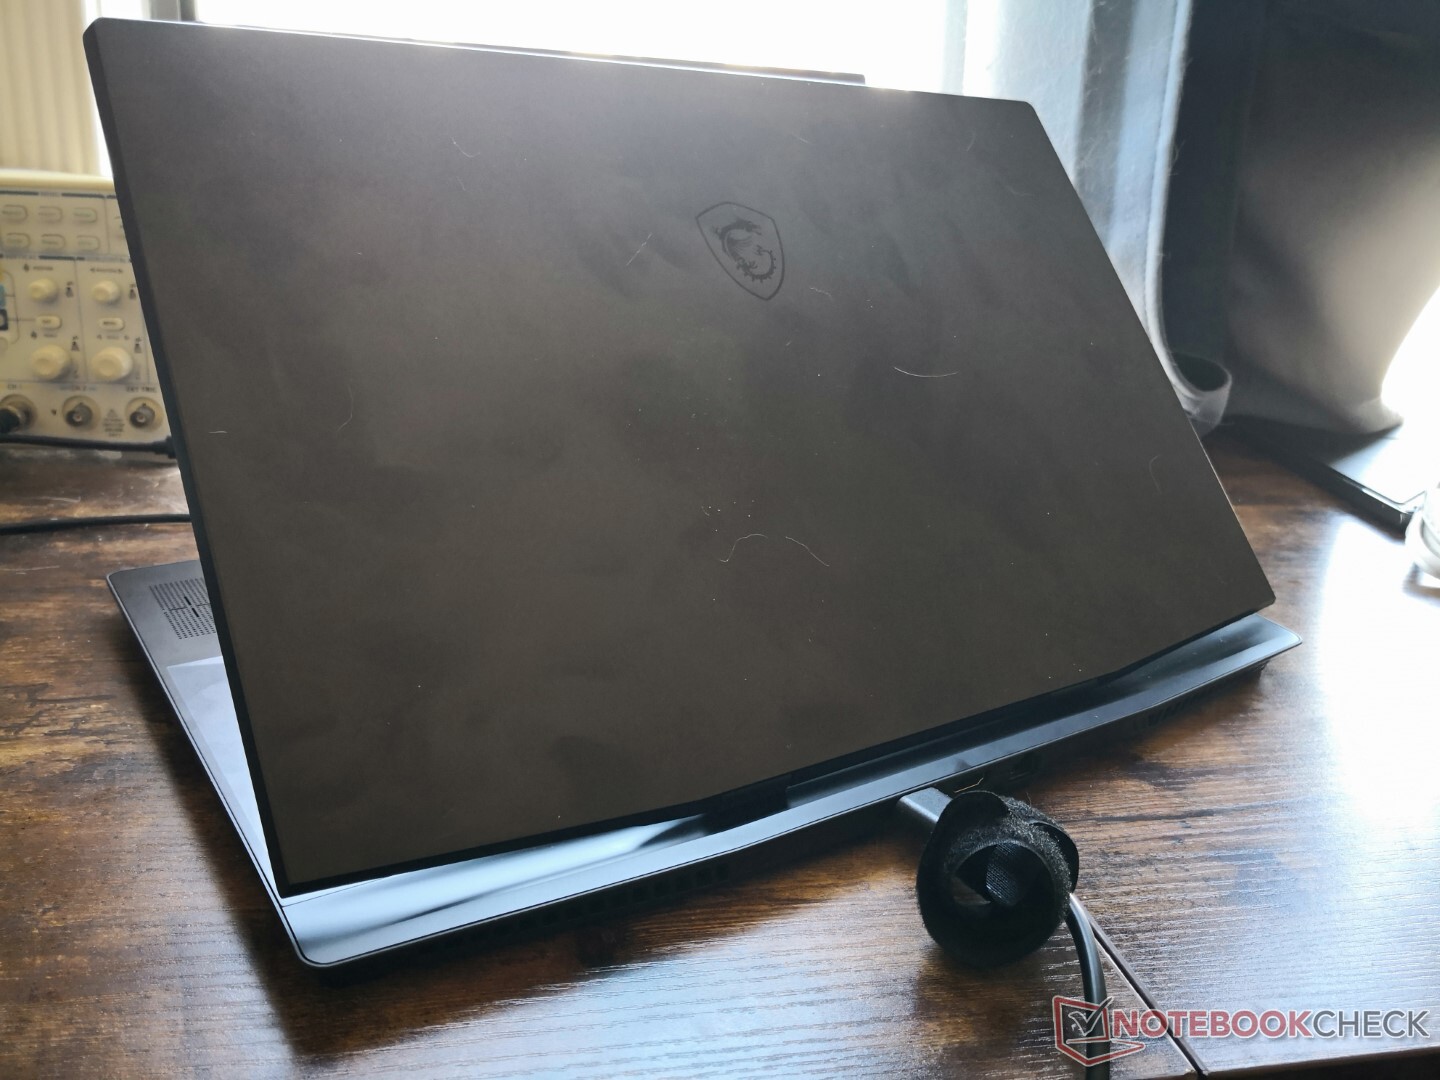
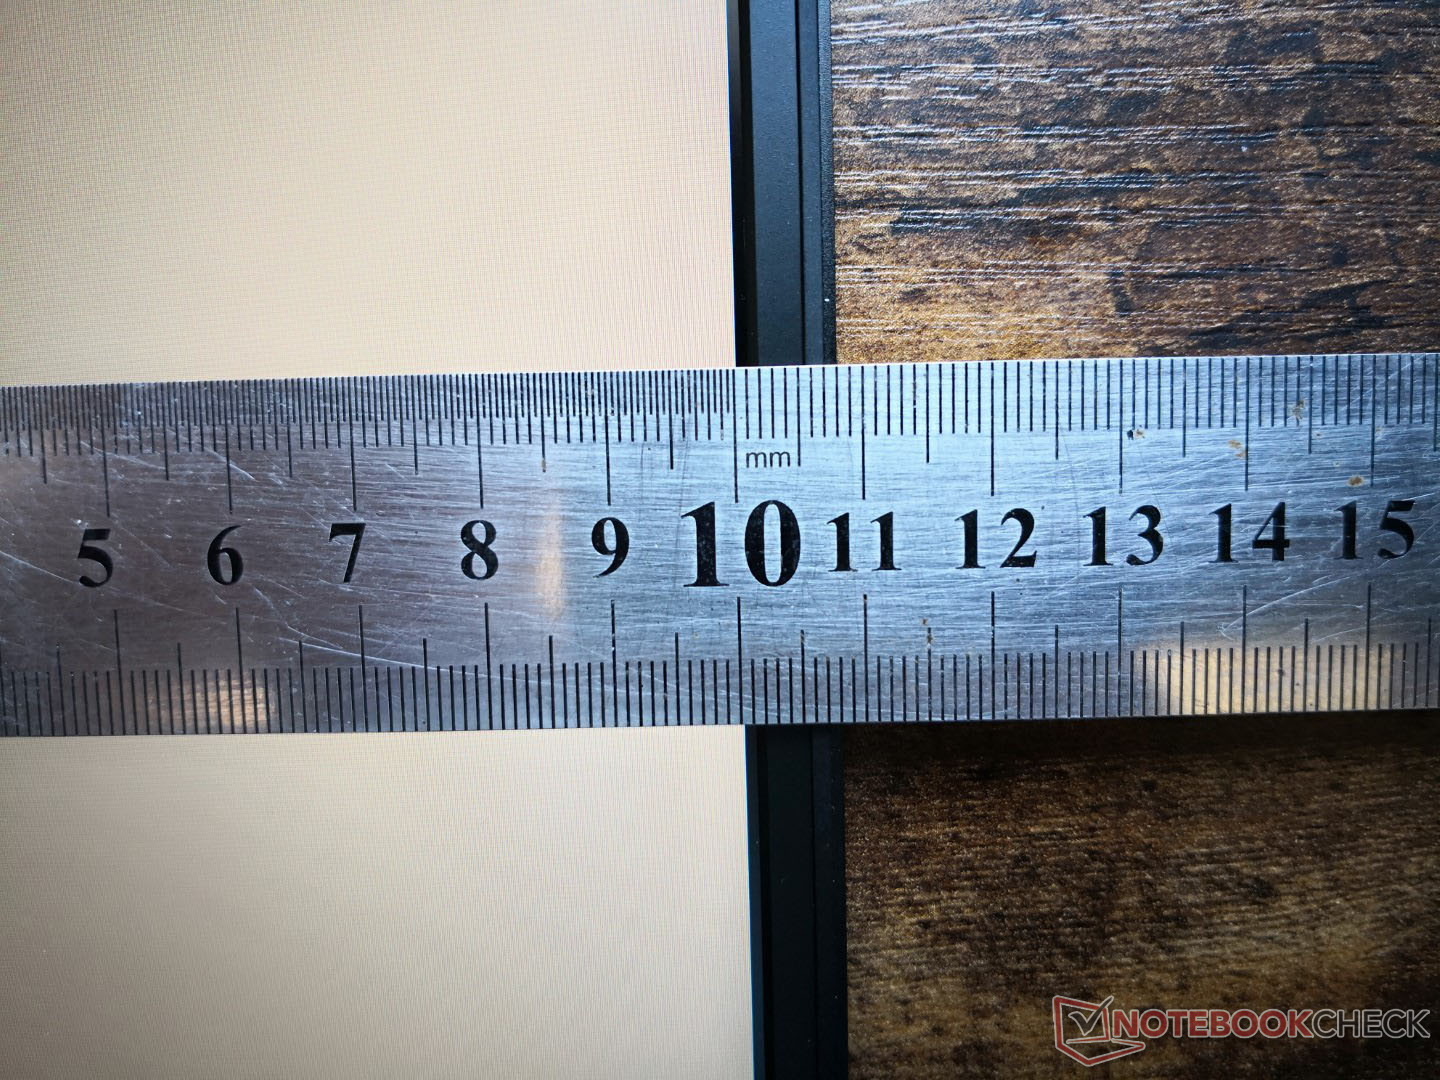
Eine unvermeidbare Folge dieses Redesigns sind gestiegene Abmessungen sowie ein höheres Gewicht, denn das GS77 ist um 14 % größer und 21 % schwerer als sein Vorgänger. Primär sind diese beiden Faktoren auf den größeren nach hinten rausstehenden Unterbau sowie den insgesamt dickeren Rahmen zurückzuführen. Das Gerät ordnet sich damit sowohl beim Gewicht wie auch bei der Größe zwischen dem Blade 17 und dem Alienware x17 ein. Das GS75 war im Vergleich dazu um über 600 g leichter.
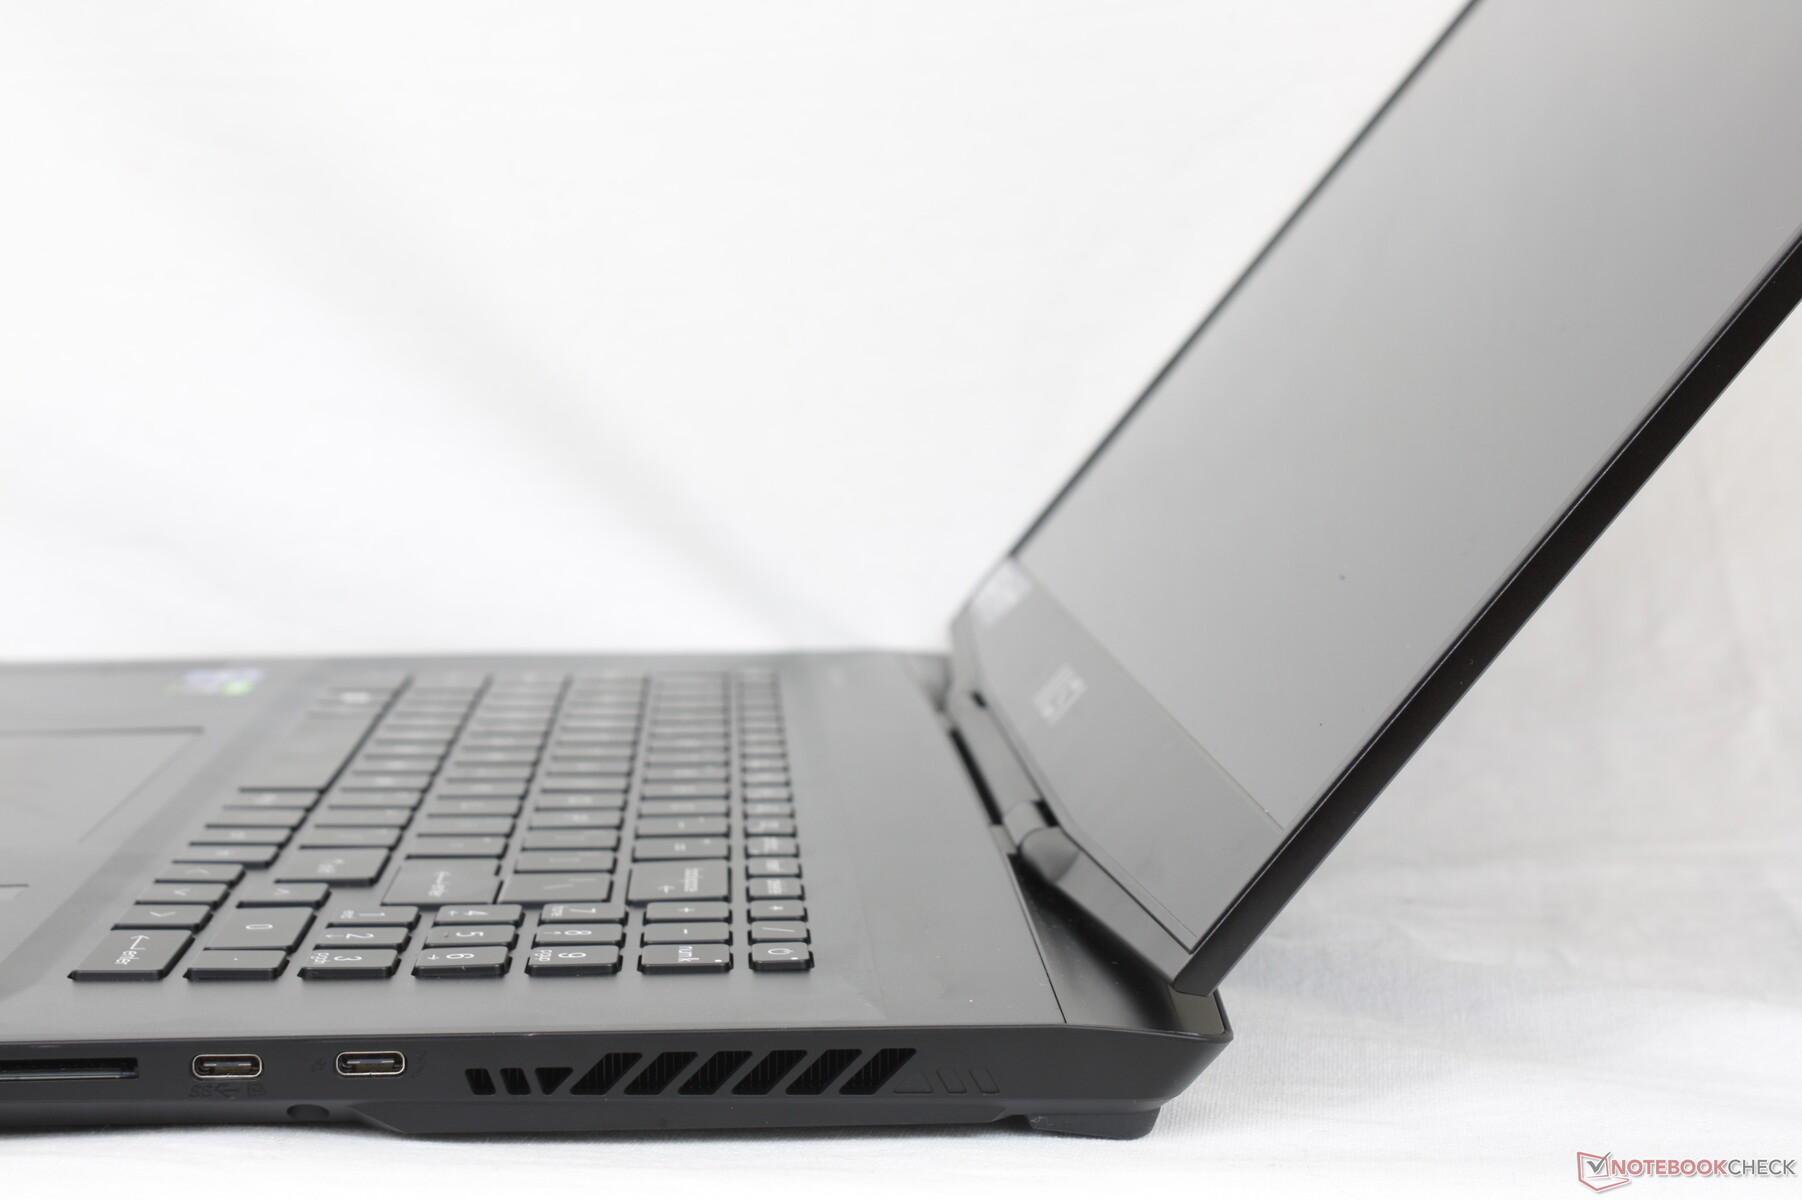
Ausstattung – Unverändert zum Vorgänger
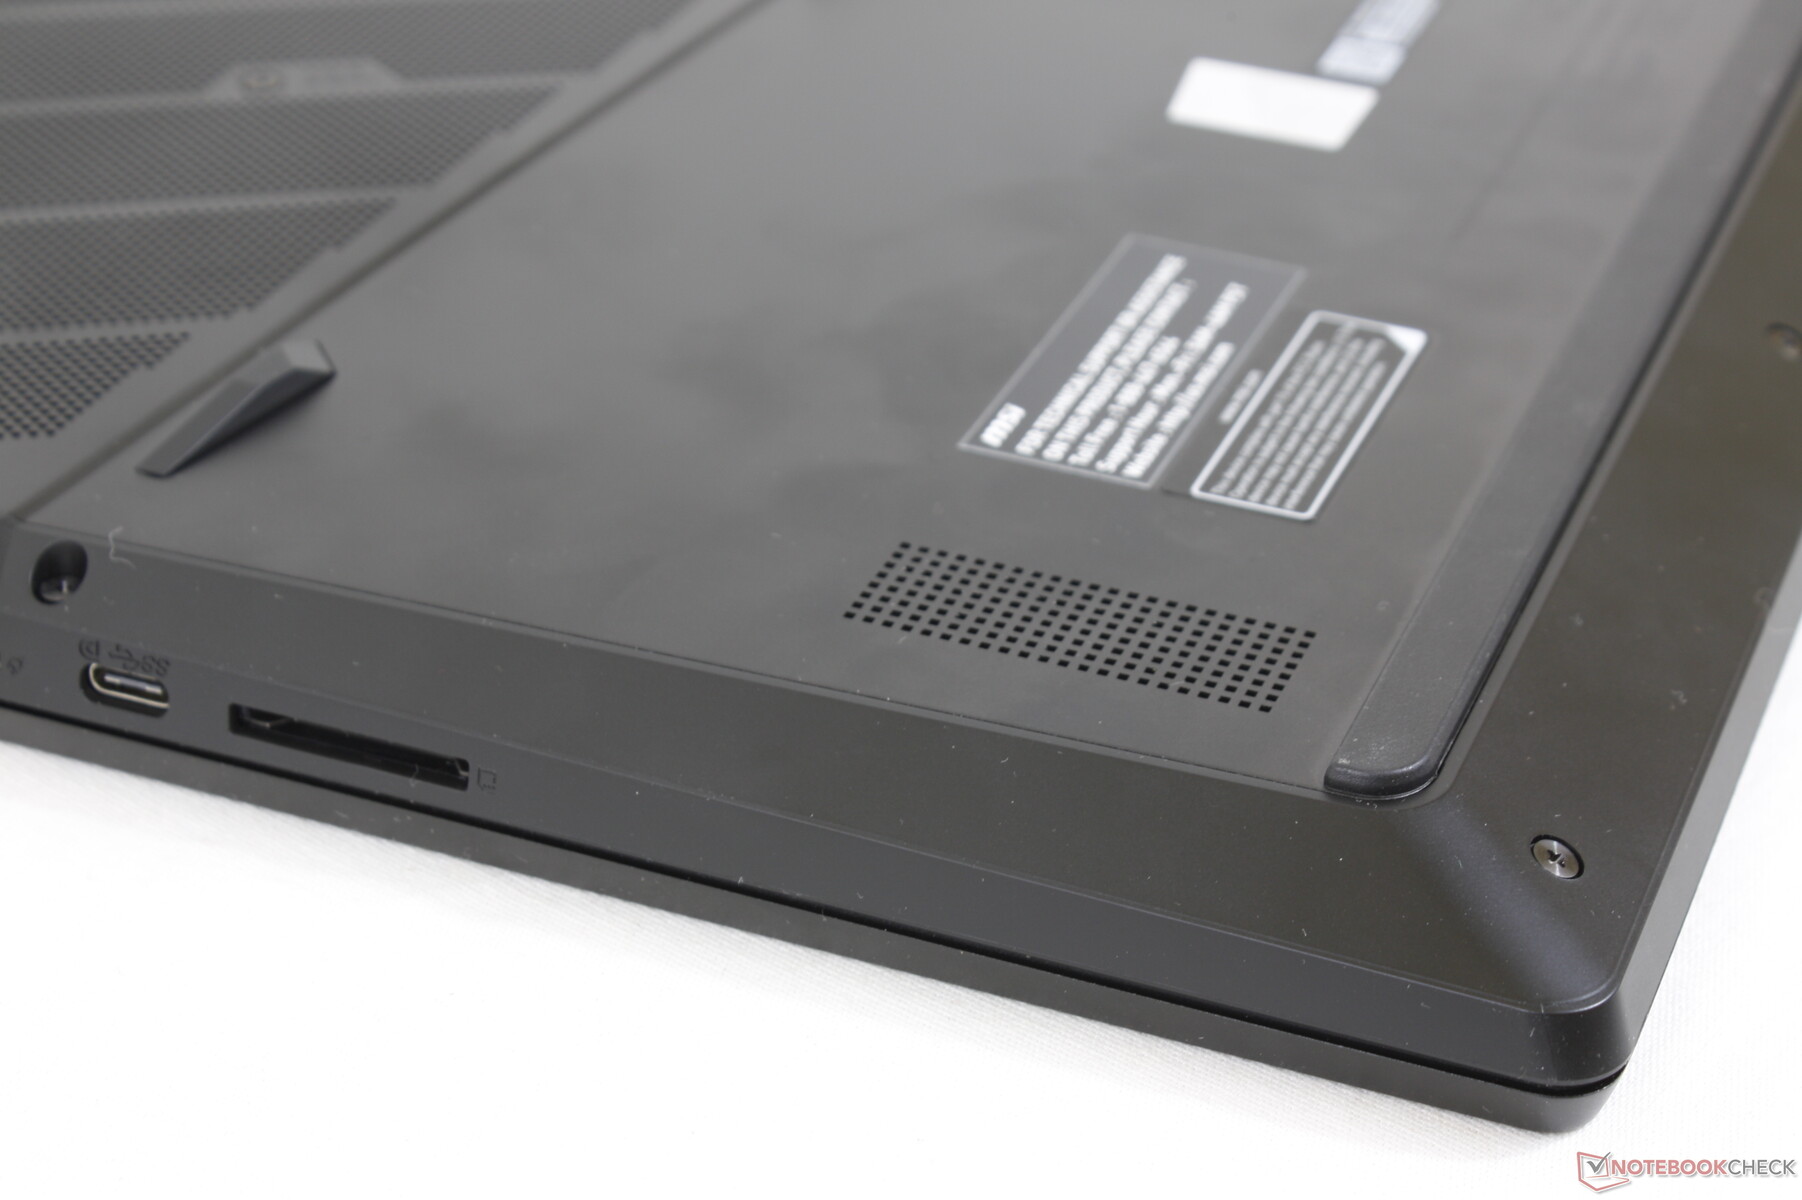
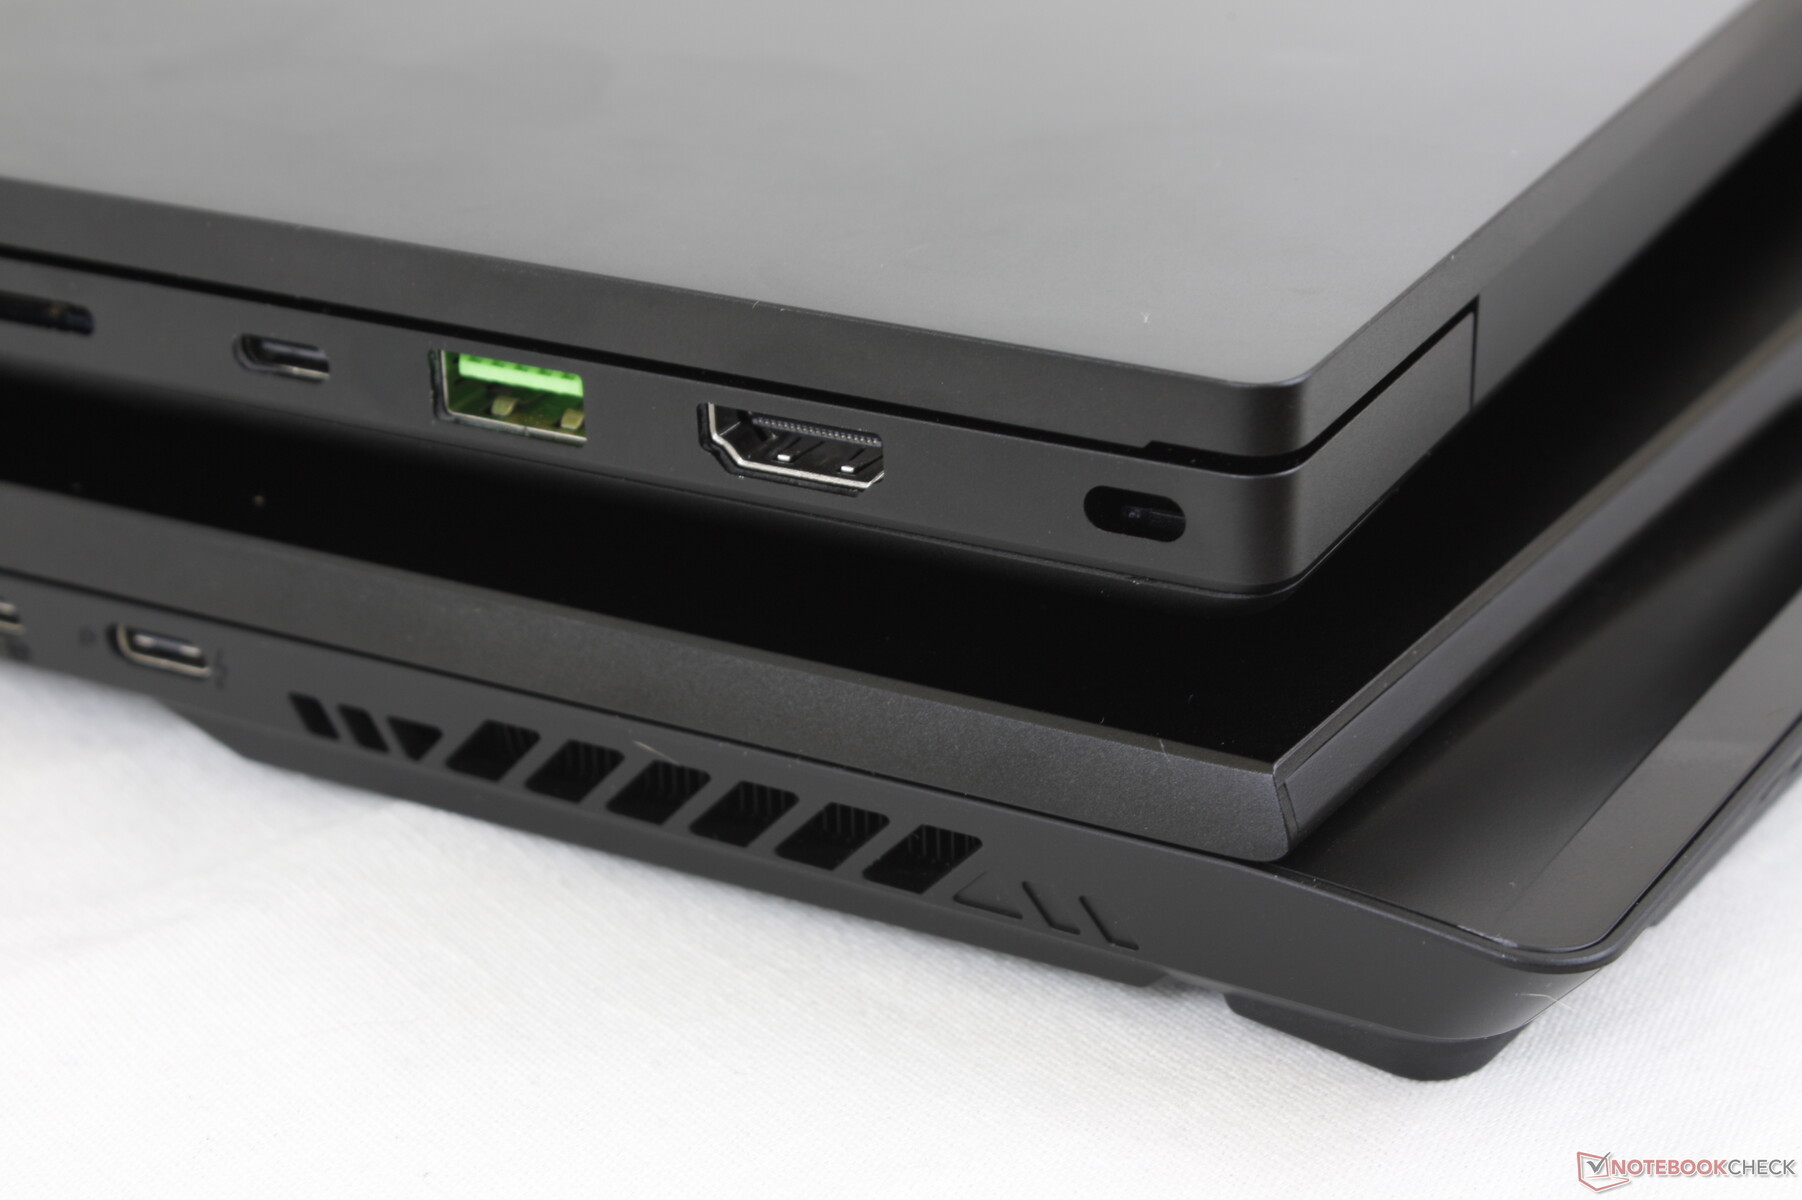
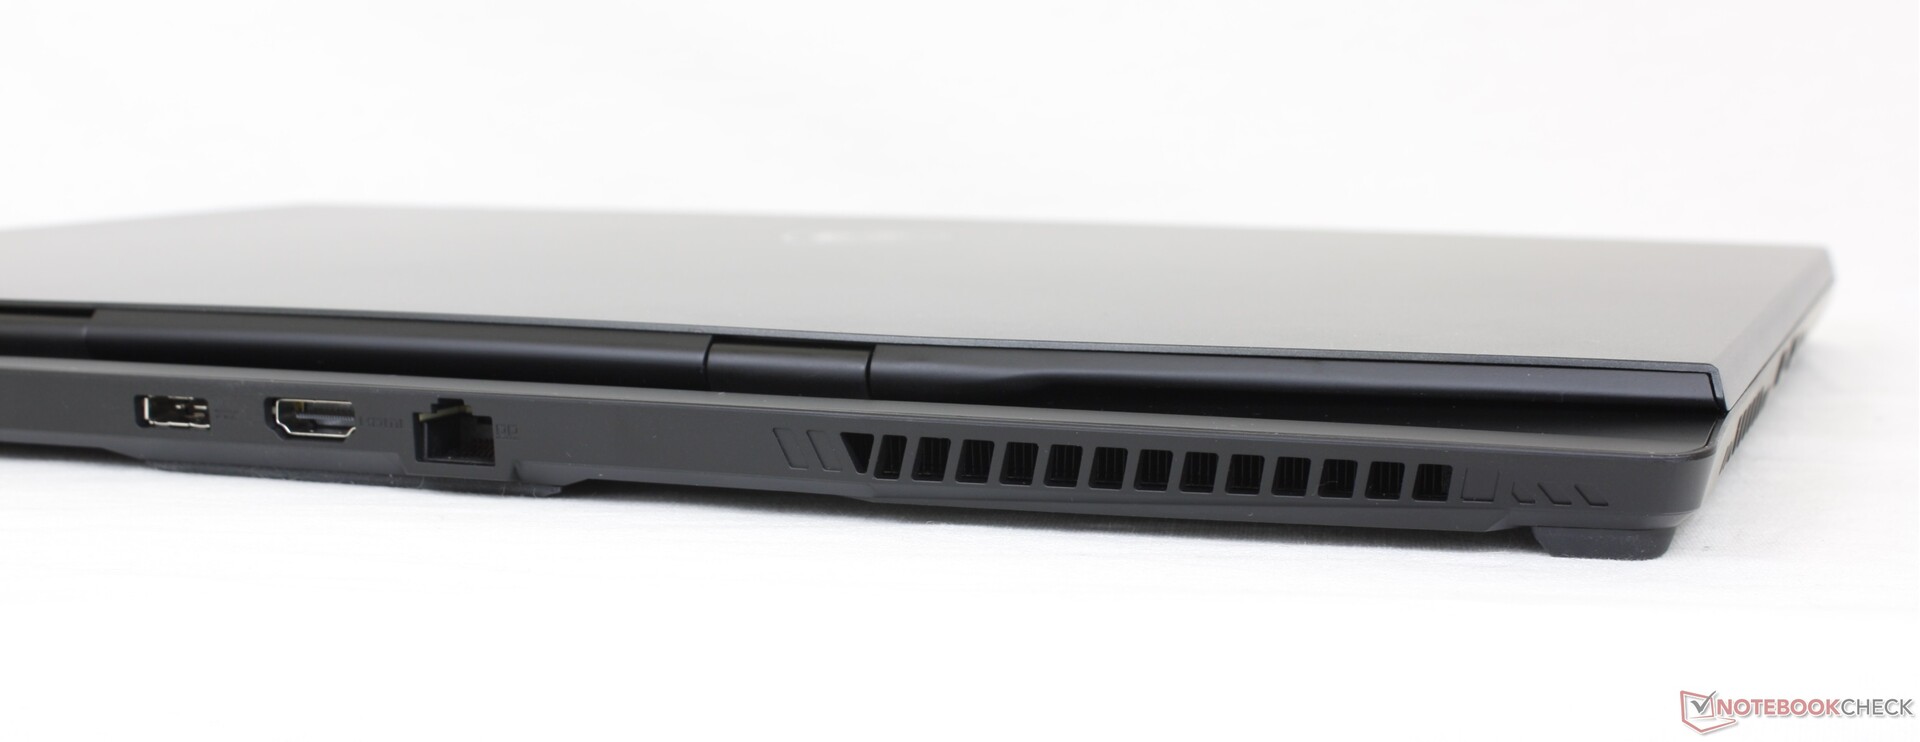
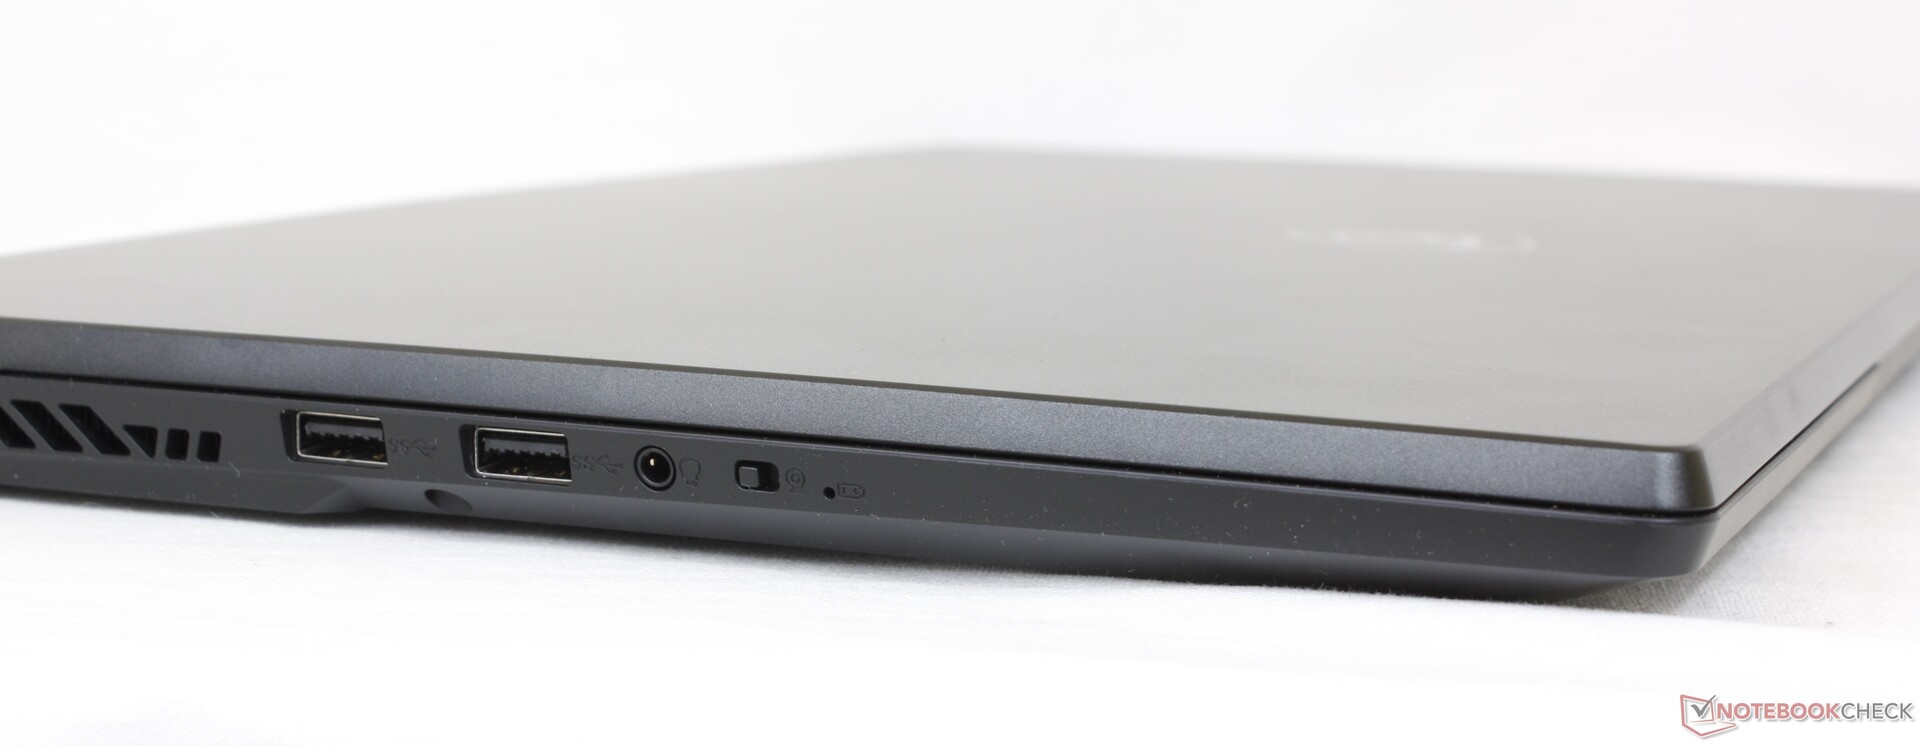
Die Ports sind im Vergleich zum Vorgänger unverändert geblieben, wurden jedoch umsortiert. Während die Rückseite des GS76 vollständig blank war sind die Anschlüsse des GS77 sehr ausgeglichen verteilt: 3 an der linken Seite, 3 an der rechten Seite und 3 an der Rückseite.
Zu beachten ist dass nur einer der beiden USB-C-Ports an der rechten Seite Thunderbolt unterstützt, wie schon schon beim GS76. Außerdem wurde der Ladeanschluss überarbeitet, so dass ältere Netzteile nicht mehr kompatibel sind.
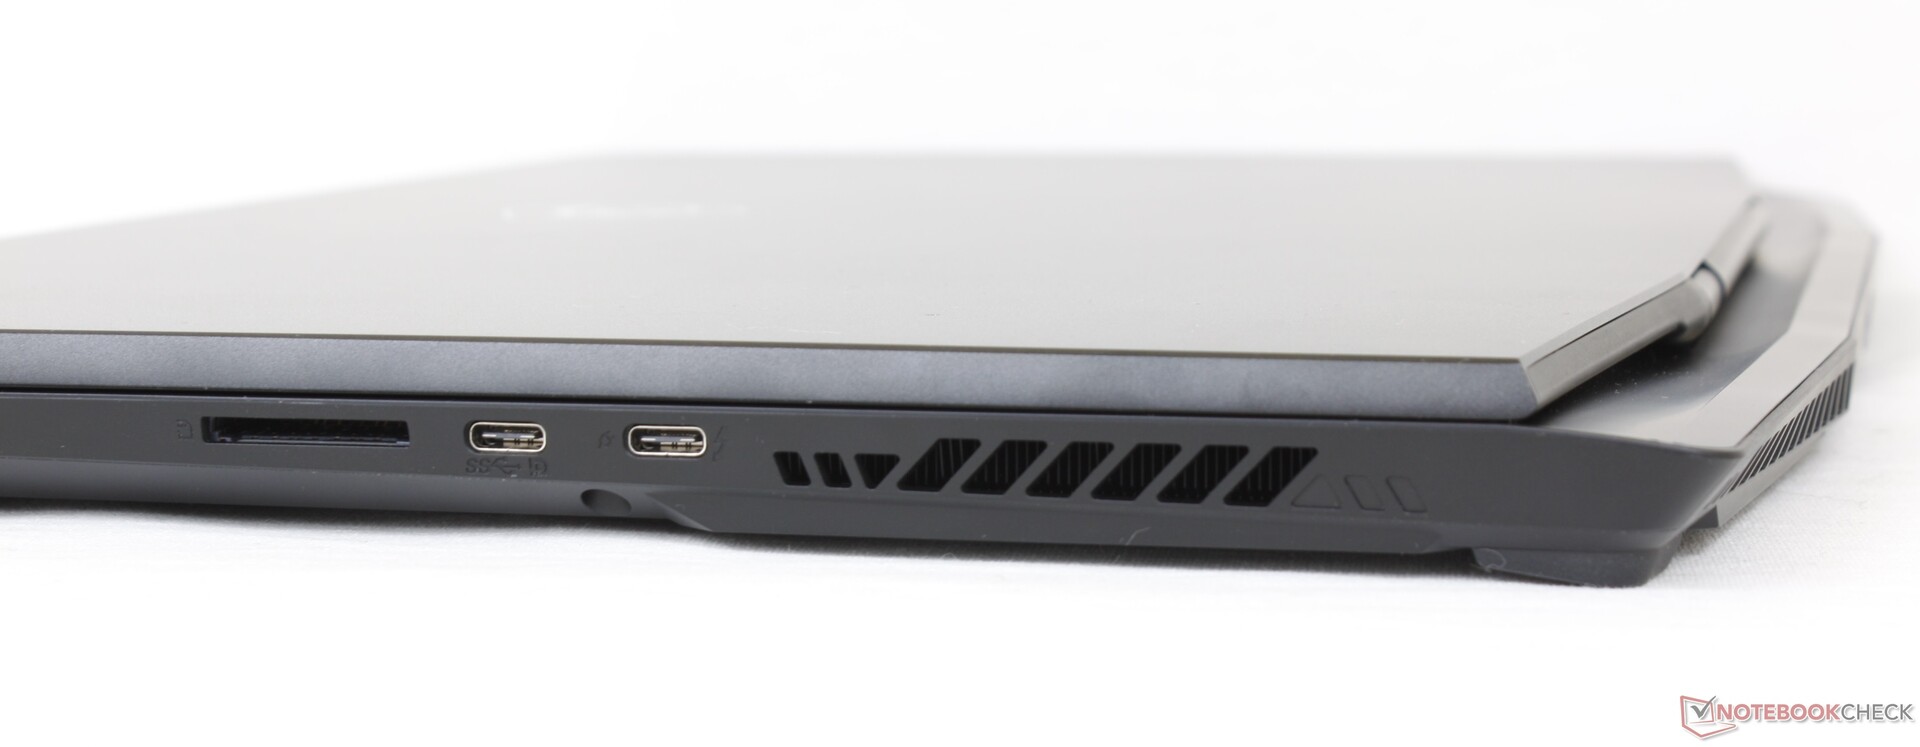
SD Card Reader
Verglichen zum Vorgänger hat sich die Geschwindigkeit des eingebauten SD-Kartenlesers mehr als halbiert. Die Übertragung von 1 GB an Bildern von unserer UHS-II-Referenzkarte auf den Desktop des GS77 dauerte 14 Sekunden, vergleichen mit nur 5-6 Sekunden beim Vorgänger. Wer also viel und häufig mit dem Kartenleser arbeitet wird enttäuscht sein.
| SD Card Reader | |
| average JPG Copy Test (av. of 3 runs) | |
| MSI GS76 Stealth 11UH (AV PRO microSD 128 GB V60) | |
| Asus ROG Zephyrus S17 GX703HSD | |
| Alienware x17 RTX 3080 P48E (AV Pro V60) | |
| Razer Blade 17 RTX 3080 Ti (AV Pro V60) | |
| MSI Stealth GS77 12UHS-083US (AV Pro V60) | |
| maximum AS SSD Seq Read Test (1GB) | |
| Asus ROG Zephyrus S17 GX703HSD | |
| Alienware x17 RTX 3080 P48E (AV Pro V60) | |
| MSI GS76 Stealth 11UH (AV PRO microSD 128 GB V60) | |
| Razer Blade 17 RTX 3080 Ti (AV Pro V60) | |
| MSI Stealth GS77 12UHS-083US (AV Pro V60) | |
Kommunikation
Webcam
Die 720p-Webcam des GS76 wurde im GS77 durch ein 1080p-Modell ersetzt. Damit ist die Bildqualität insgesamt sichtbar schärfer. Die Kamera unterstützt Infrarot und kann somit für Windows Hello eingesetzt werden. Außerdem verfügt sie über einen elektronischen Shutter auf der linken Seite mit dem sie verschlossen werden kann.


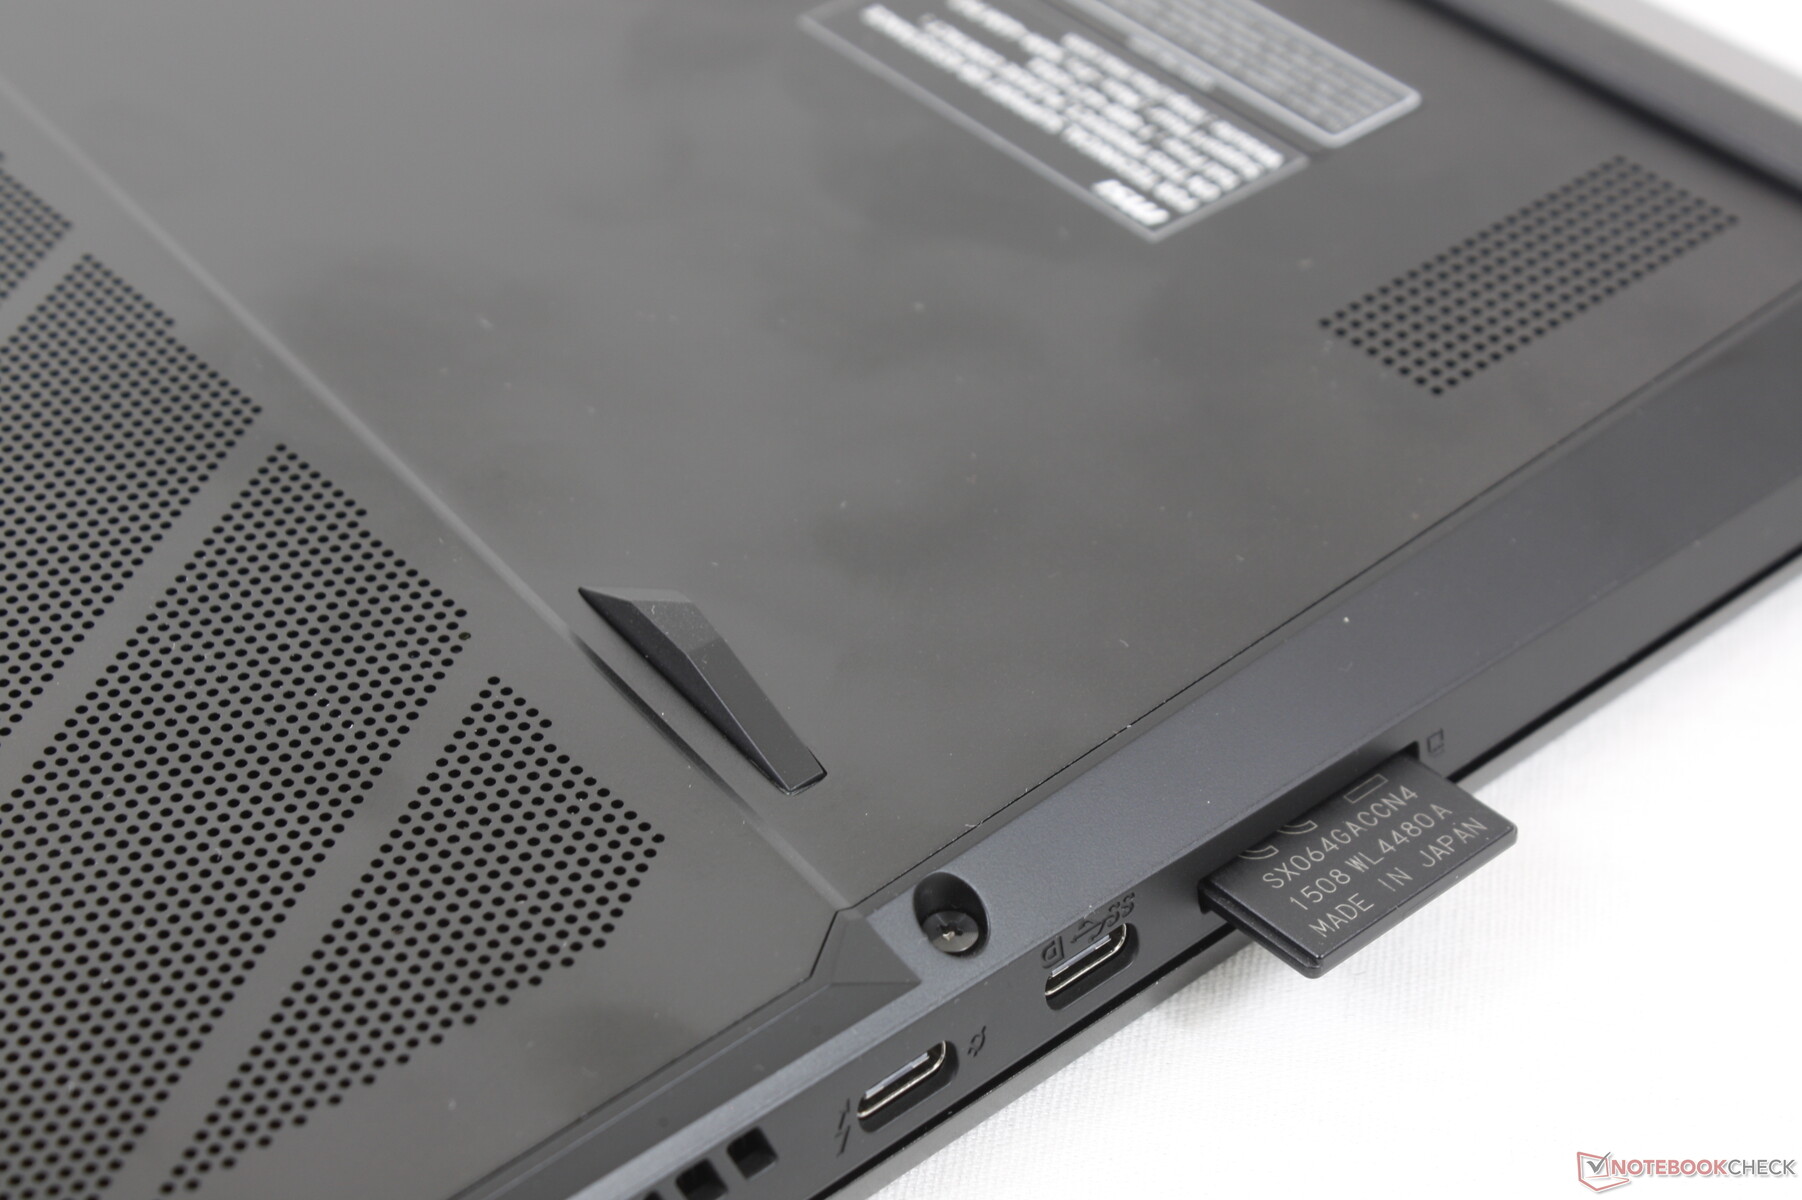
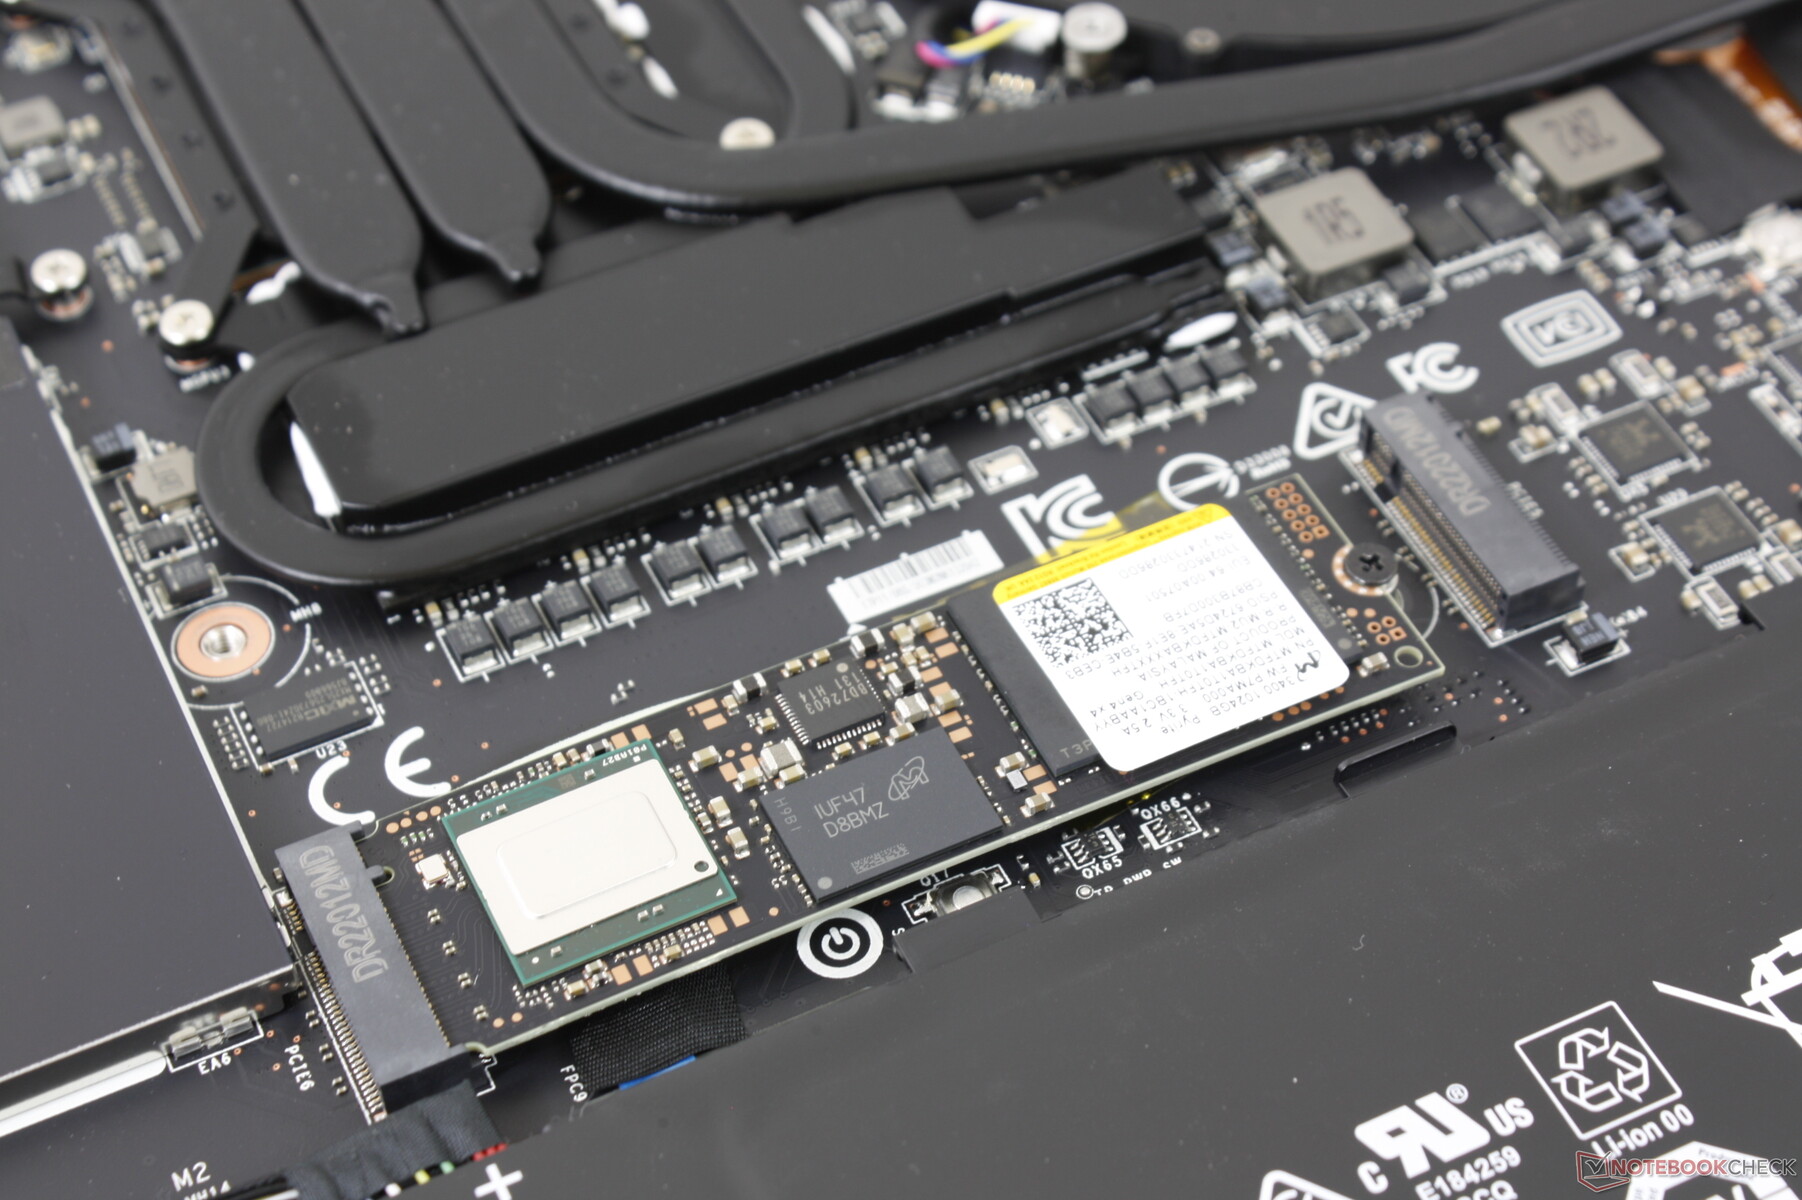
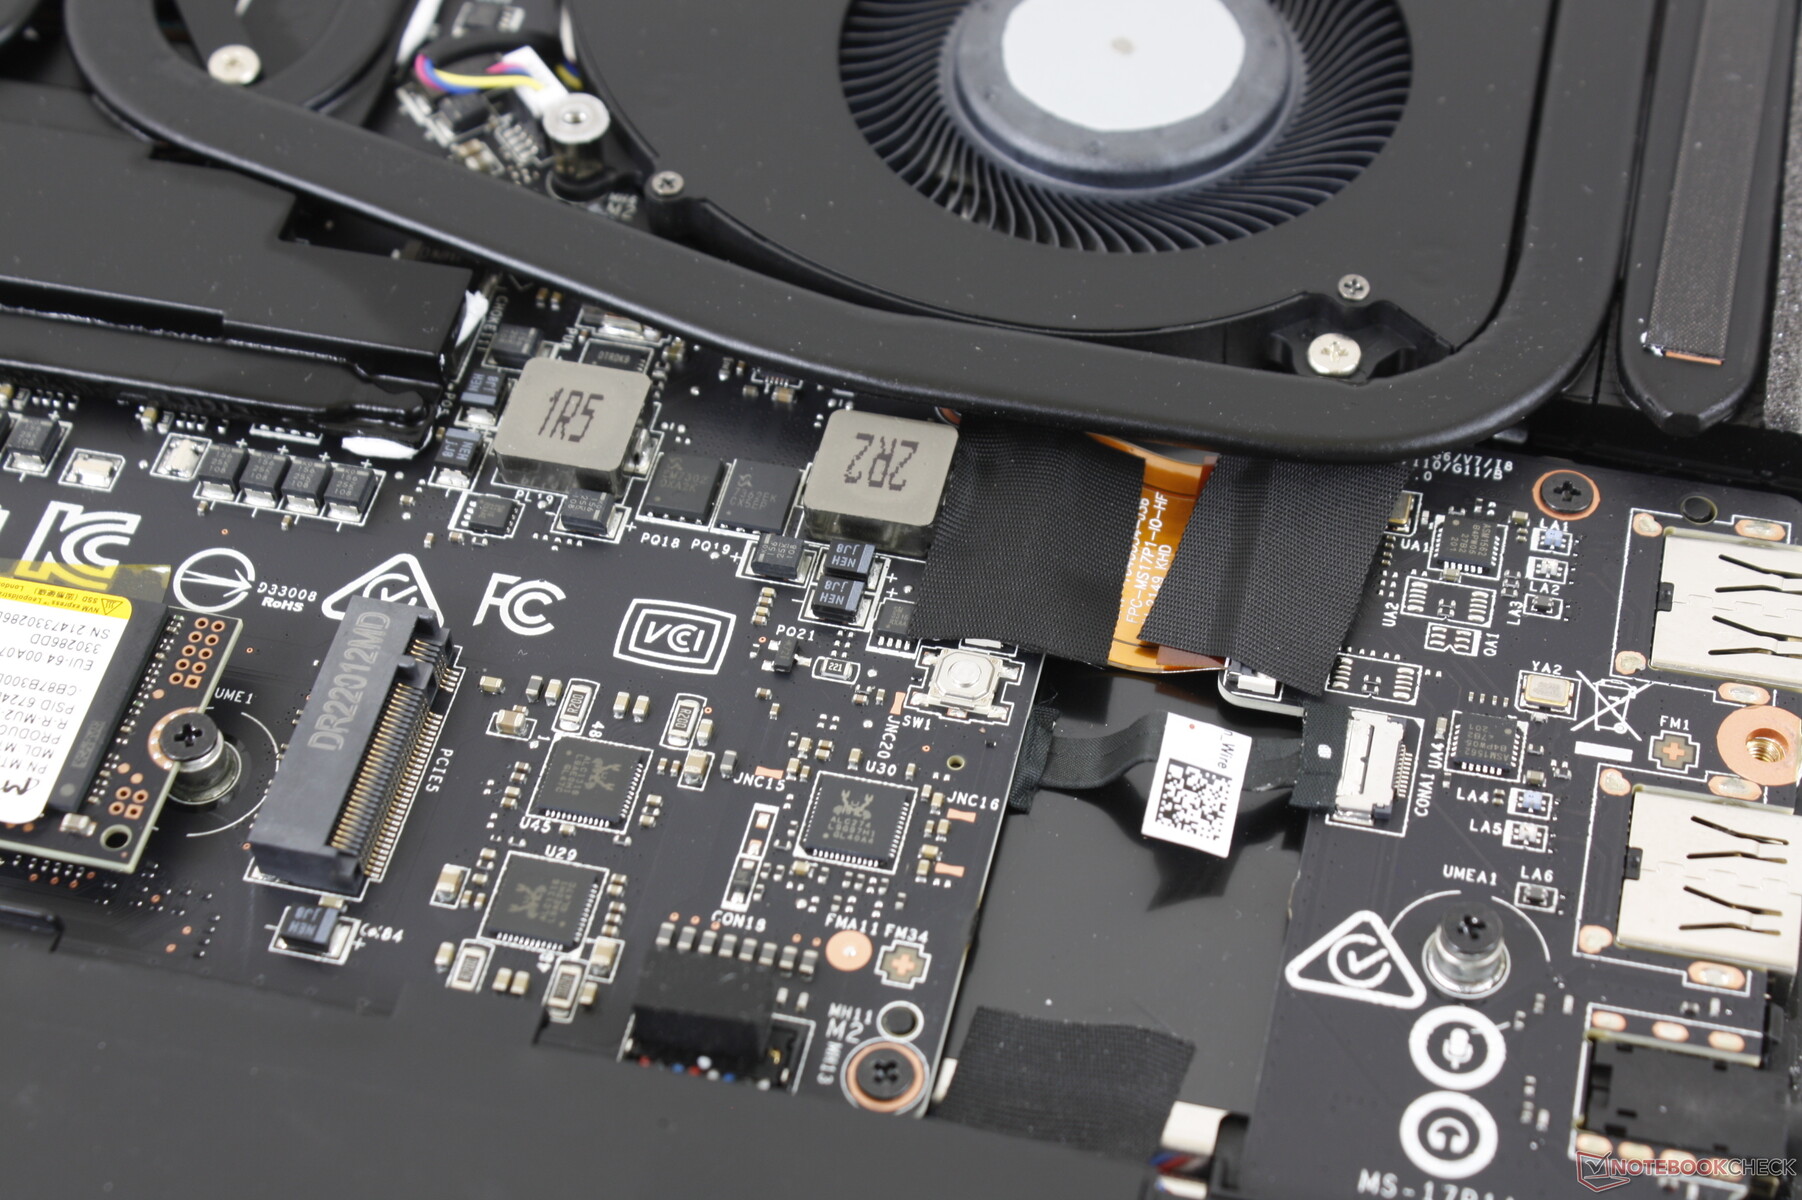
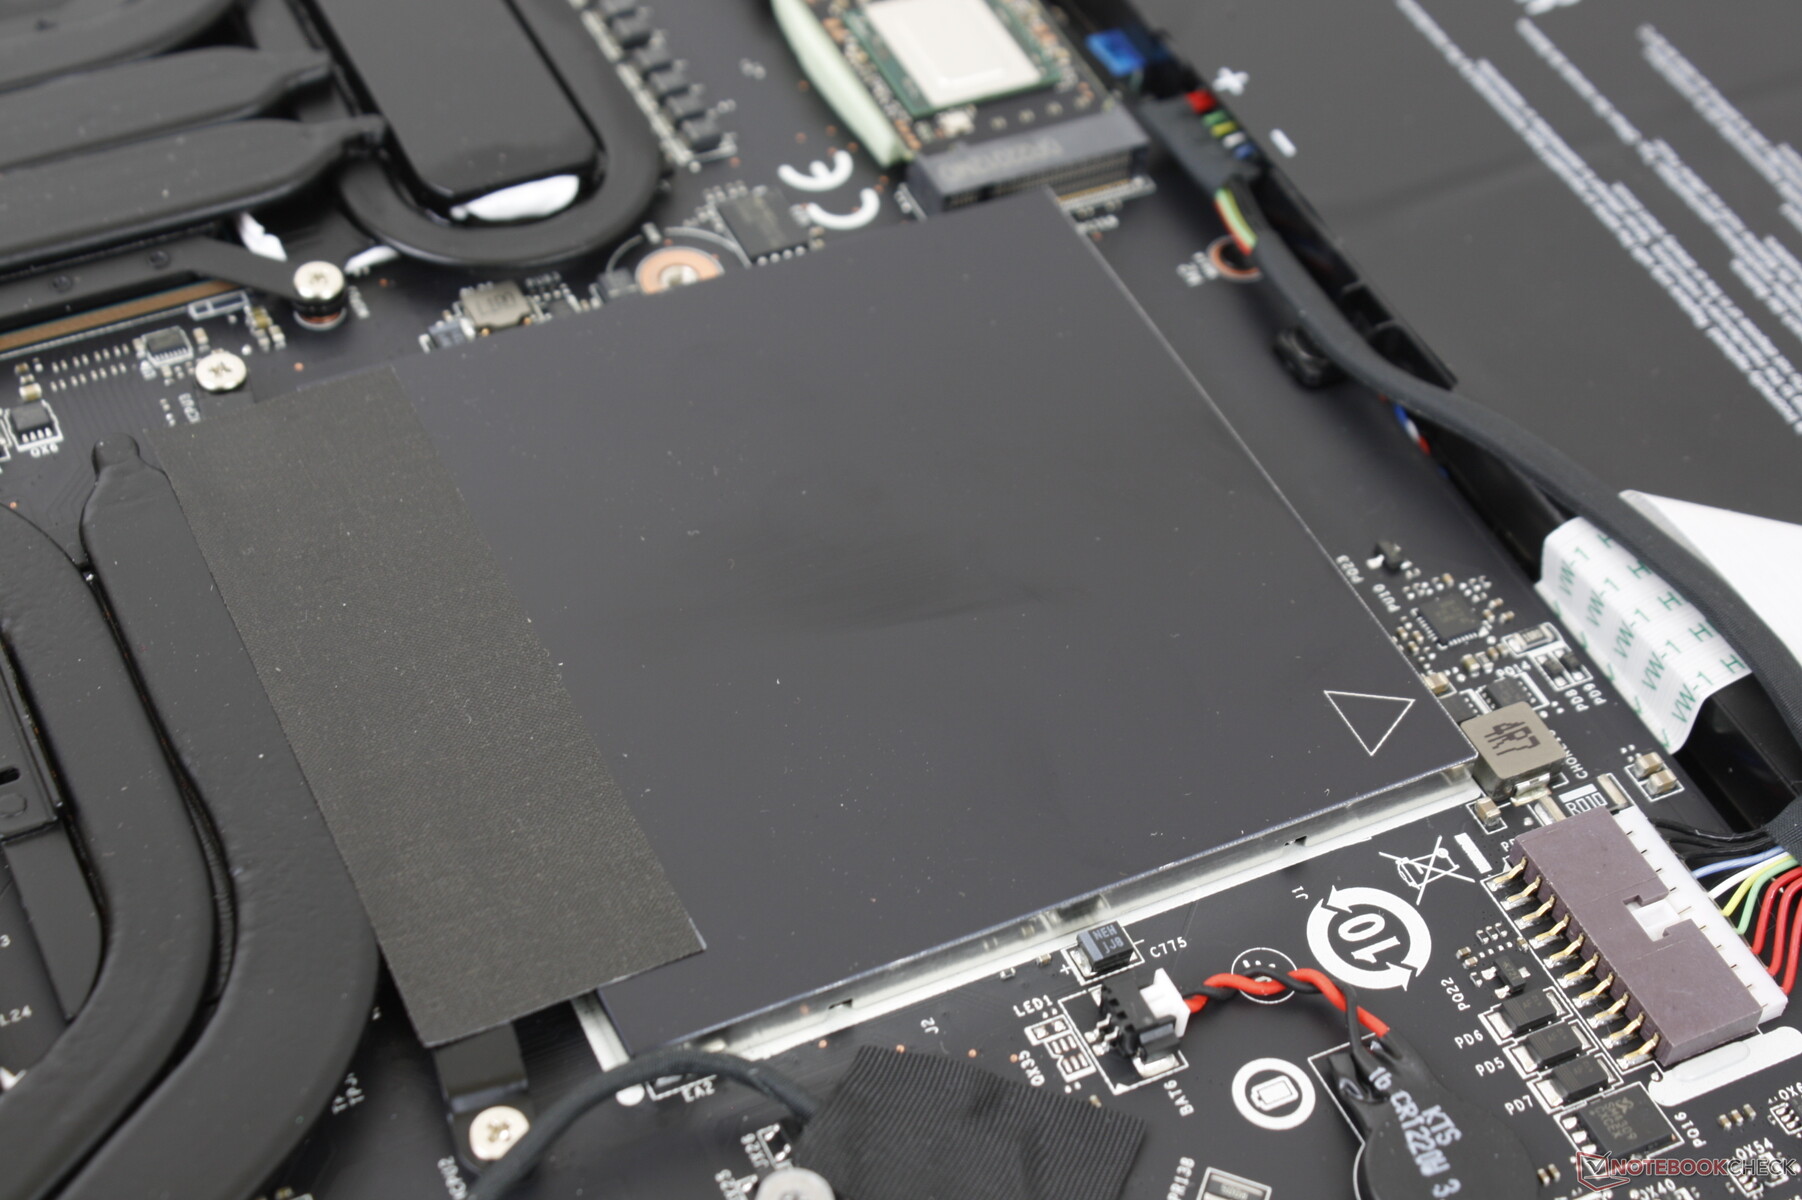
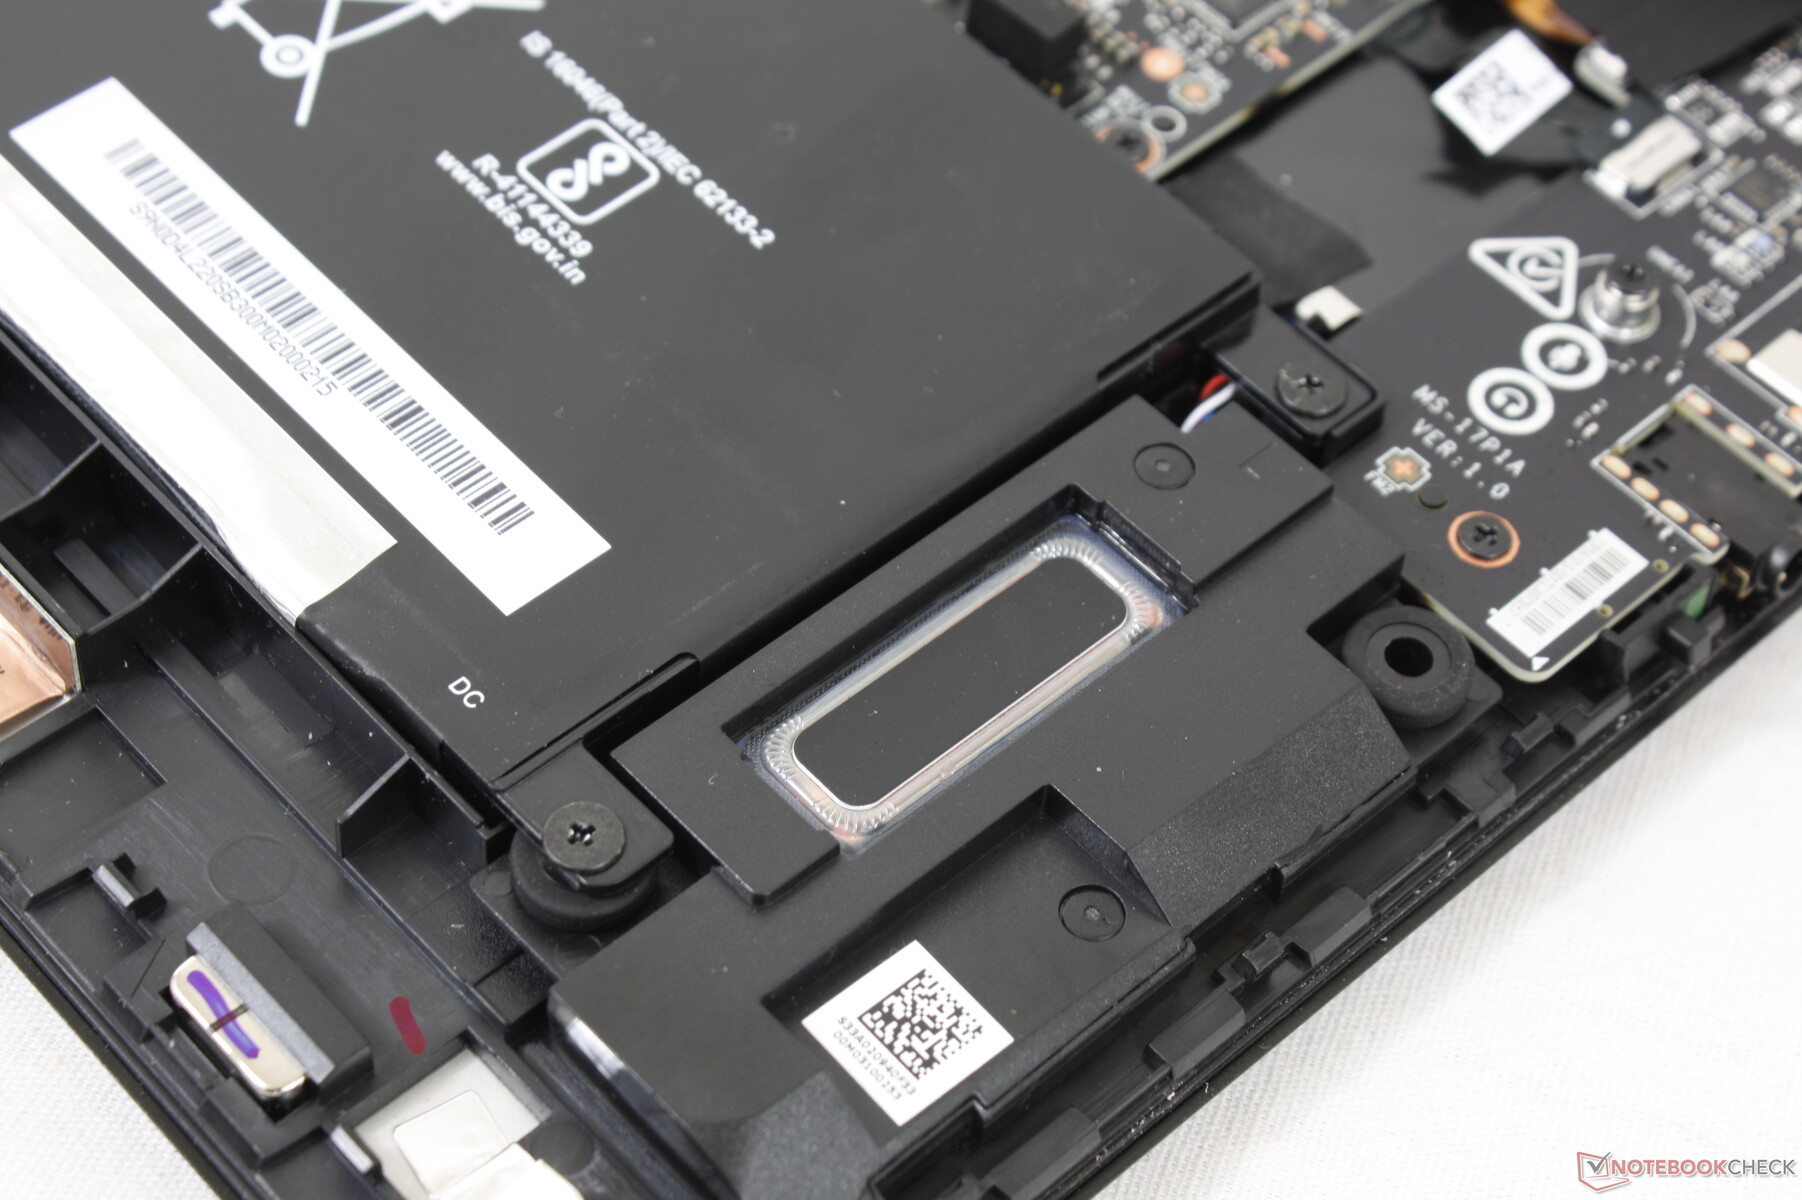
Wartung
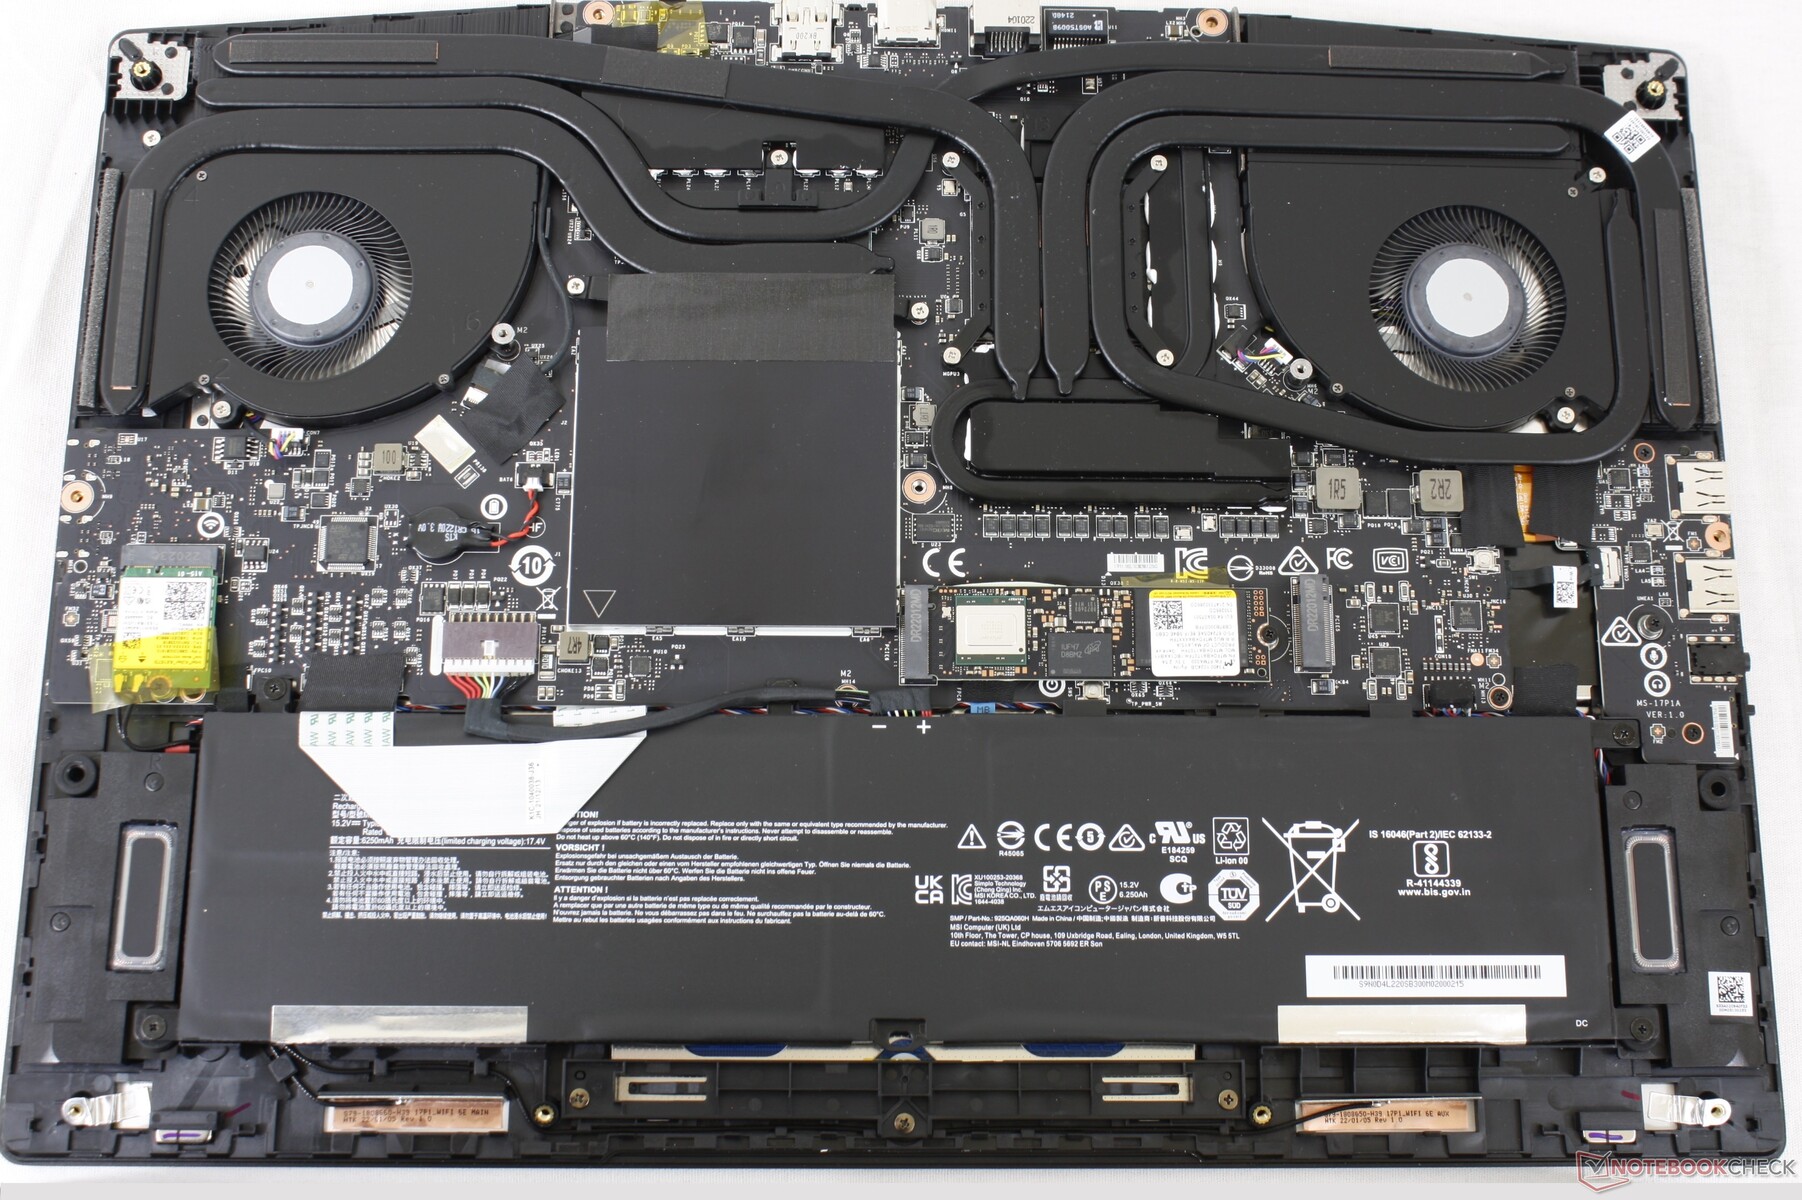
Die Unterseite wird von 11 Kreuzschlitzschrauben gehalten und lässt sich relativ leicht entfernen. Anders als bei den meisten anderen Laptops wird beim Öffnen des Laptops allerdings ein Siegel zerstört.
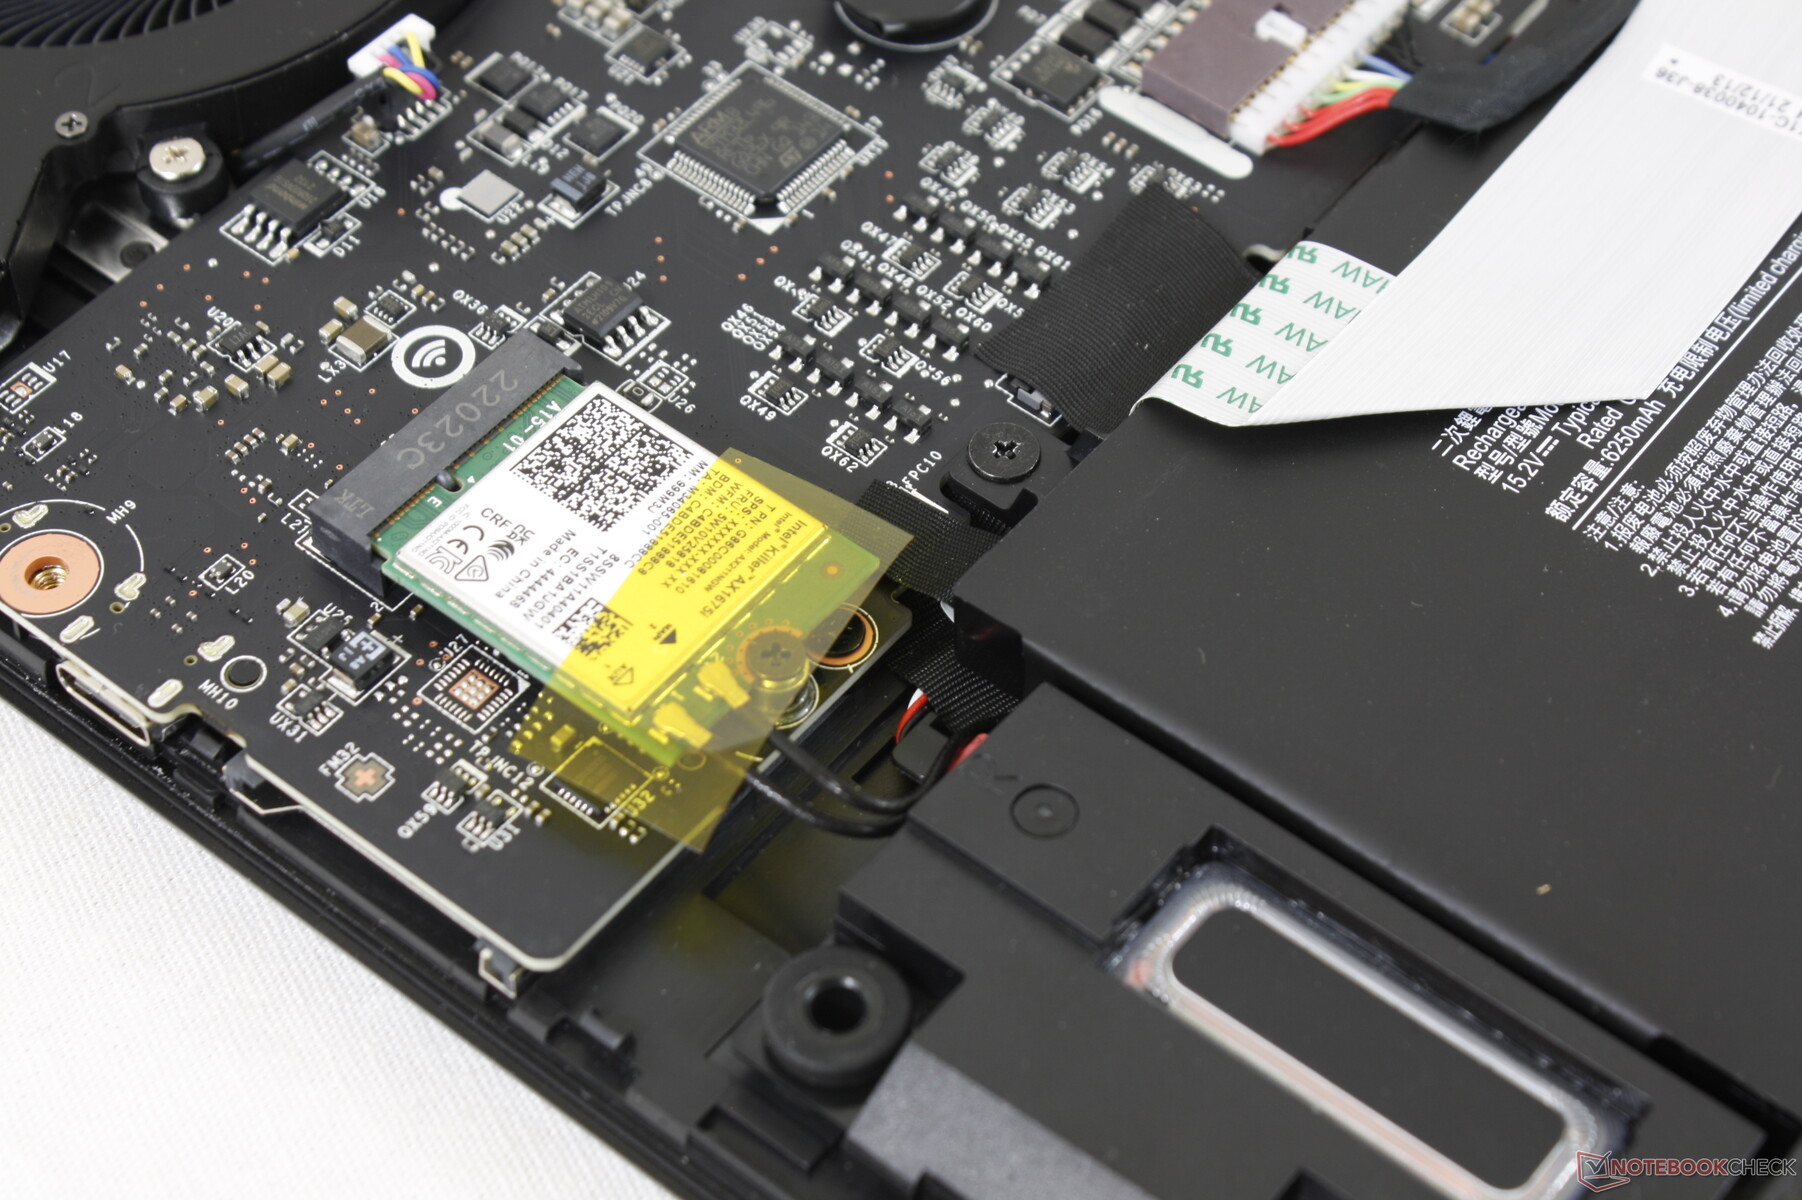
Einmal geöffnet hat man Zugriff auf 2x SO-DIMM, 2x PCIe4 x4 M.2-2280 sowie ein entfernbares WLAN-Modul. Die zwei SO-DIMM-Slots sind von einem Aluminium-Deckel geschützt.
Zubehör und Garantie
In der Box befindet sich neben dem Netzteil und den üblichen Papieren auch ein Samttuch zum Reinigen. Unser Testgerät kam mit der in den USA üblichen einjährigen Garantie. Die Garantie- und Gewährleistungsbedingungen in Europa unterscheiden sich hiervon jedoch.
Eingabegeräte – Schritt zur Seite statt nach Vorne
Tastatur
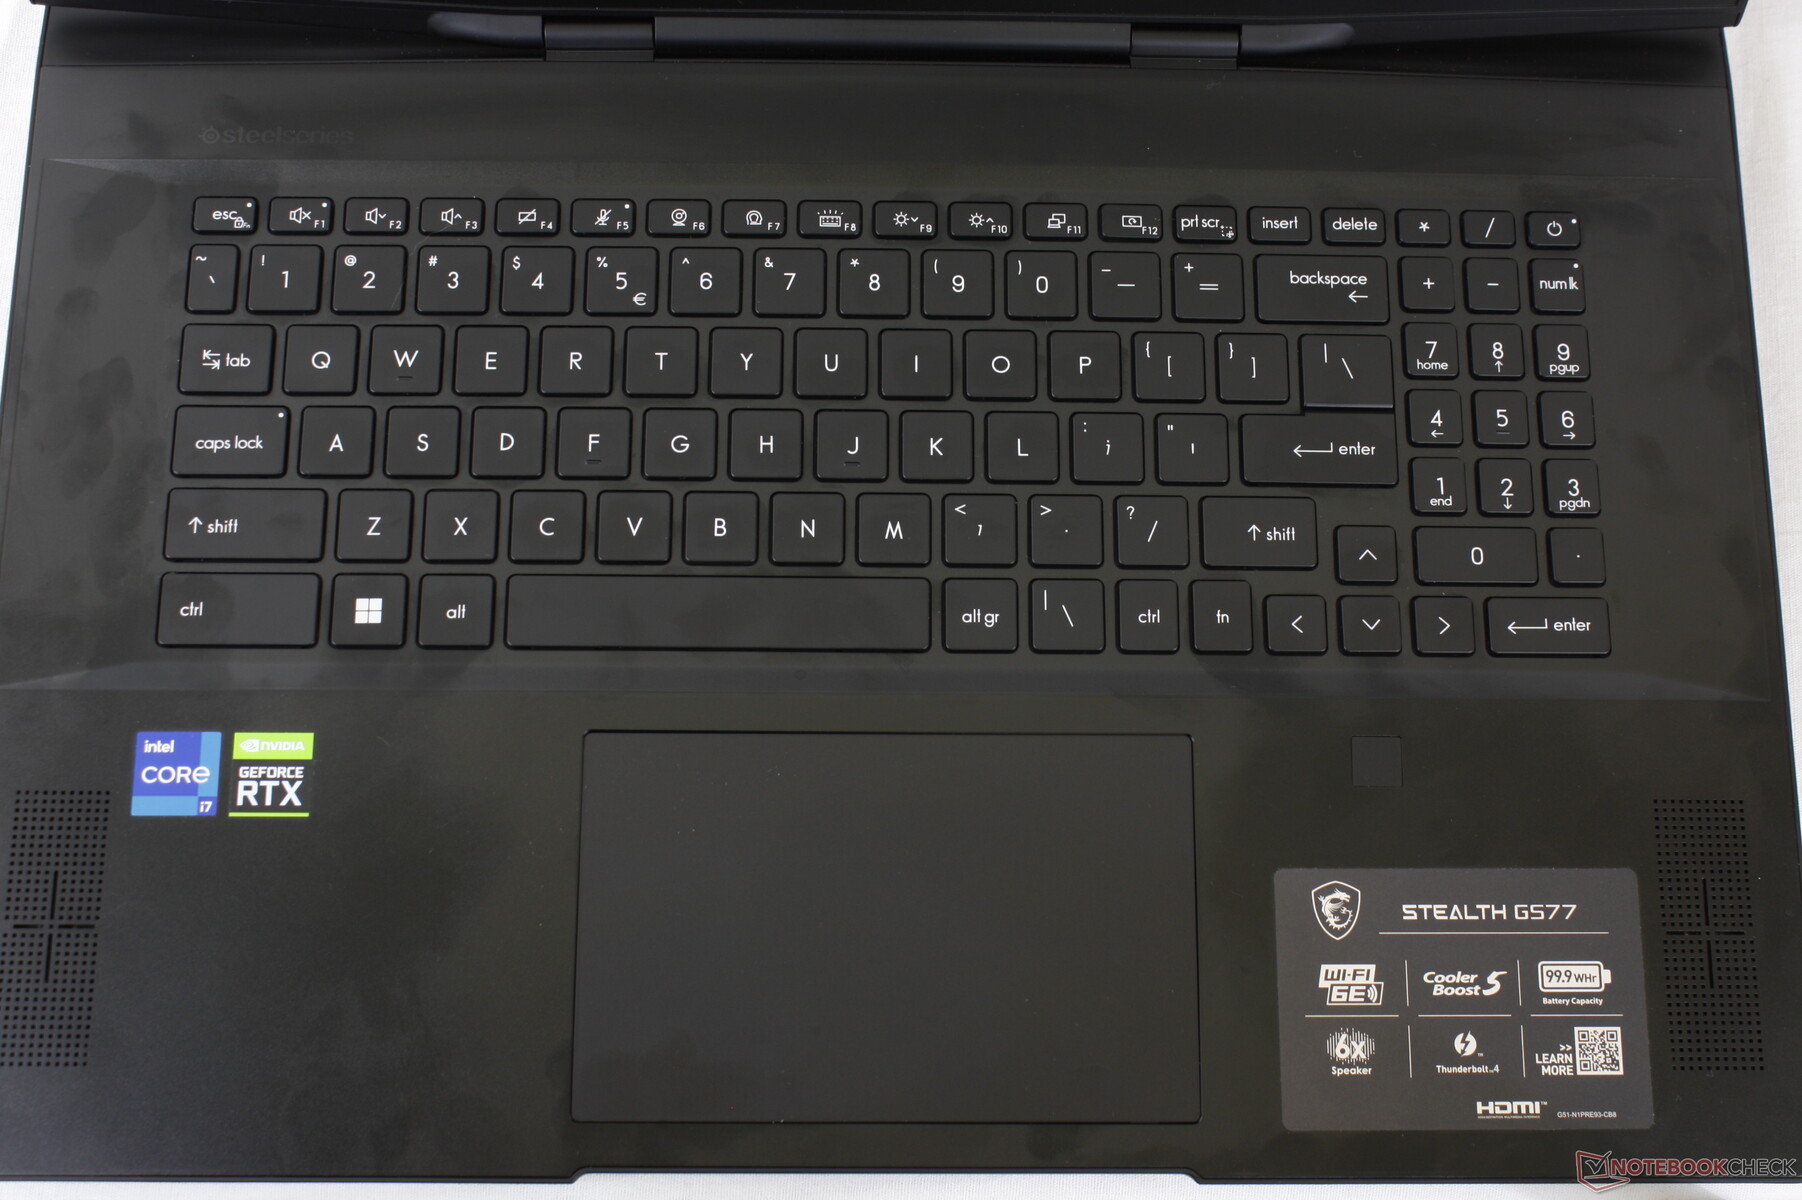
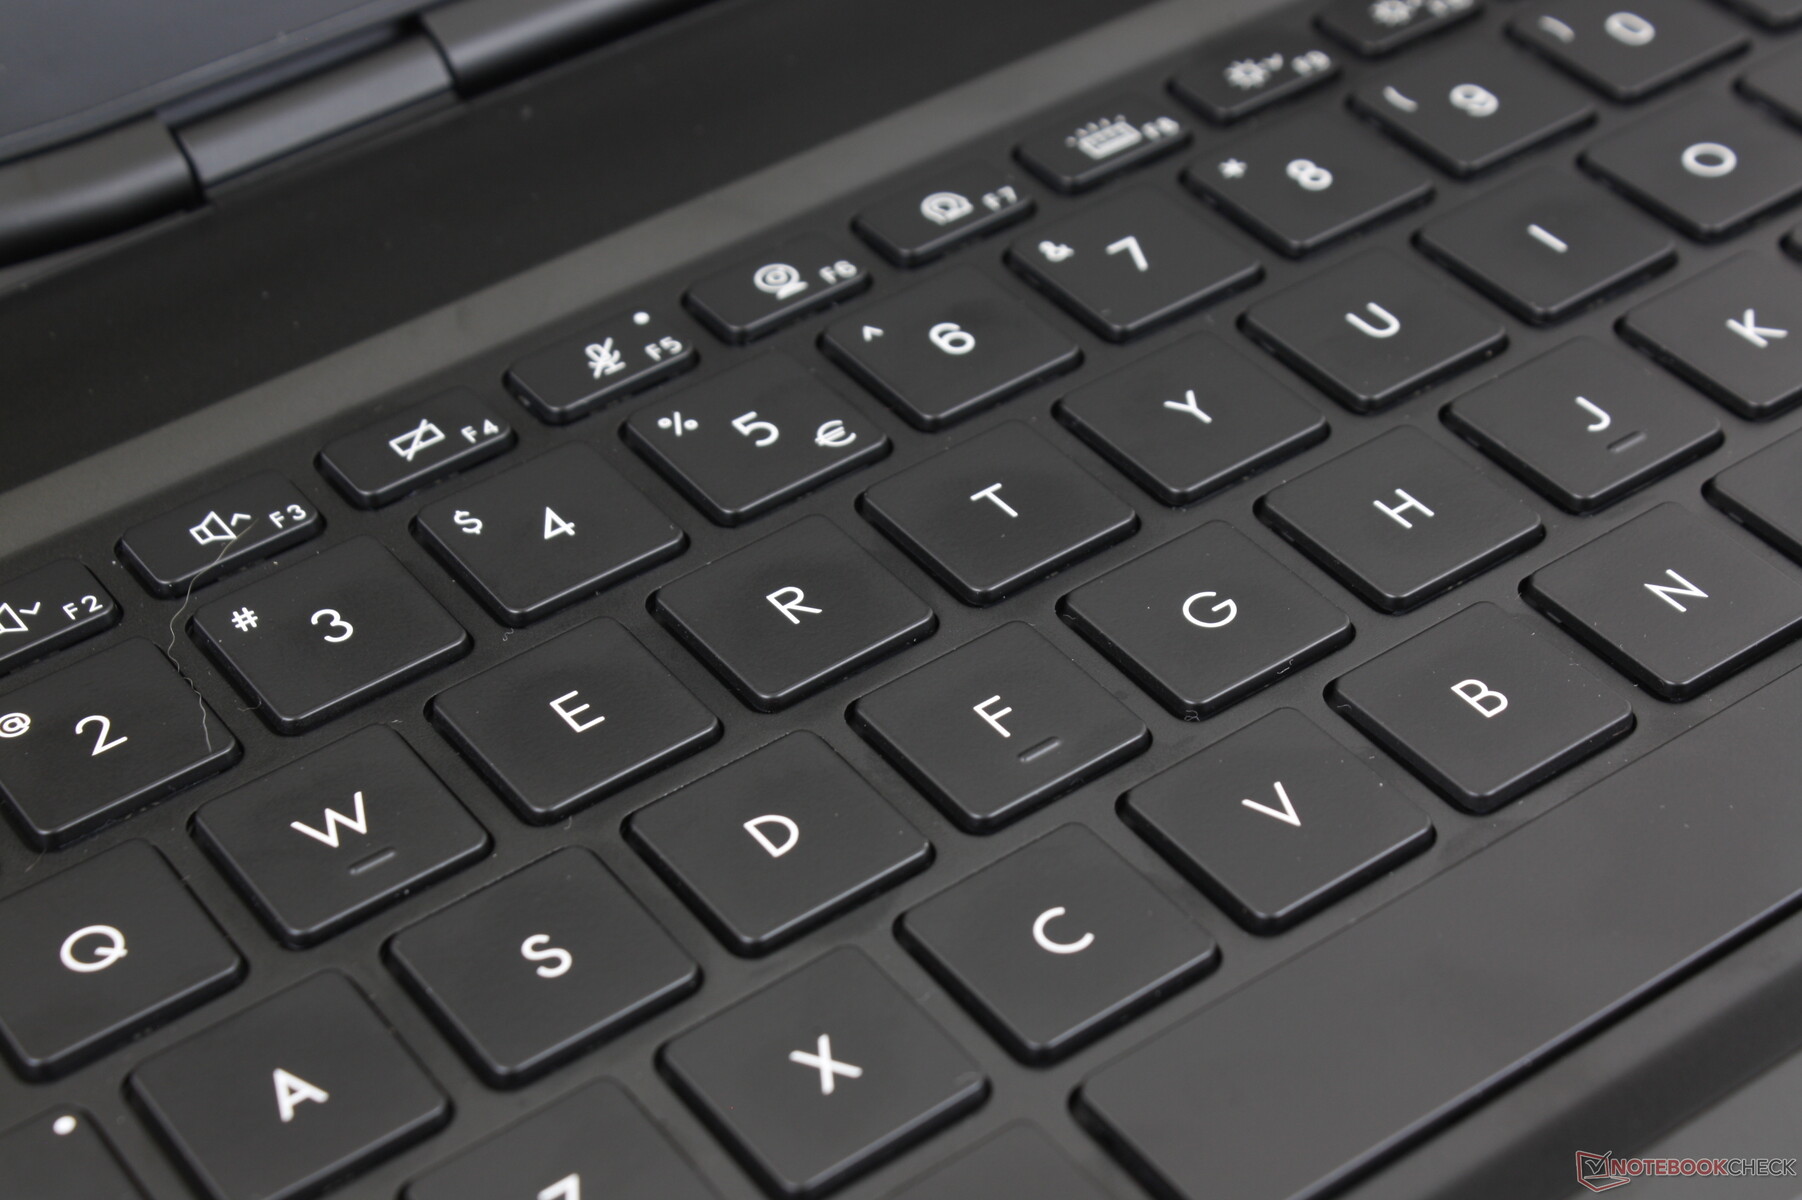
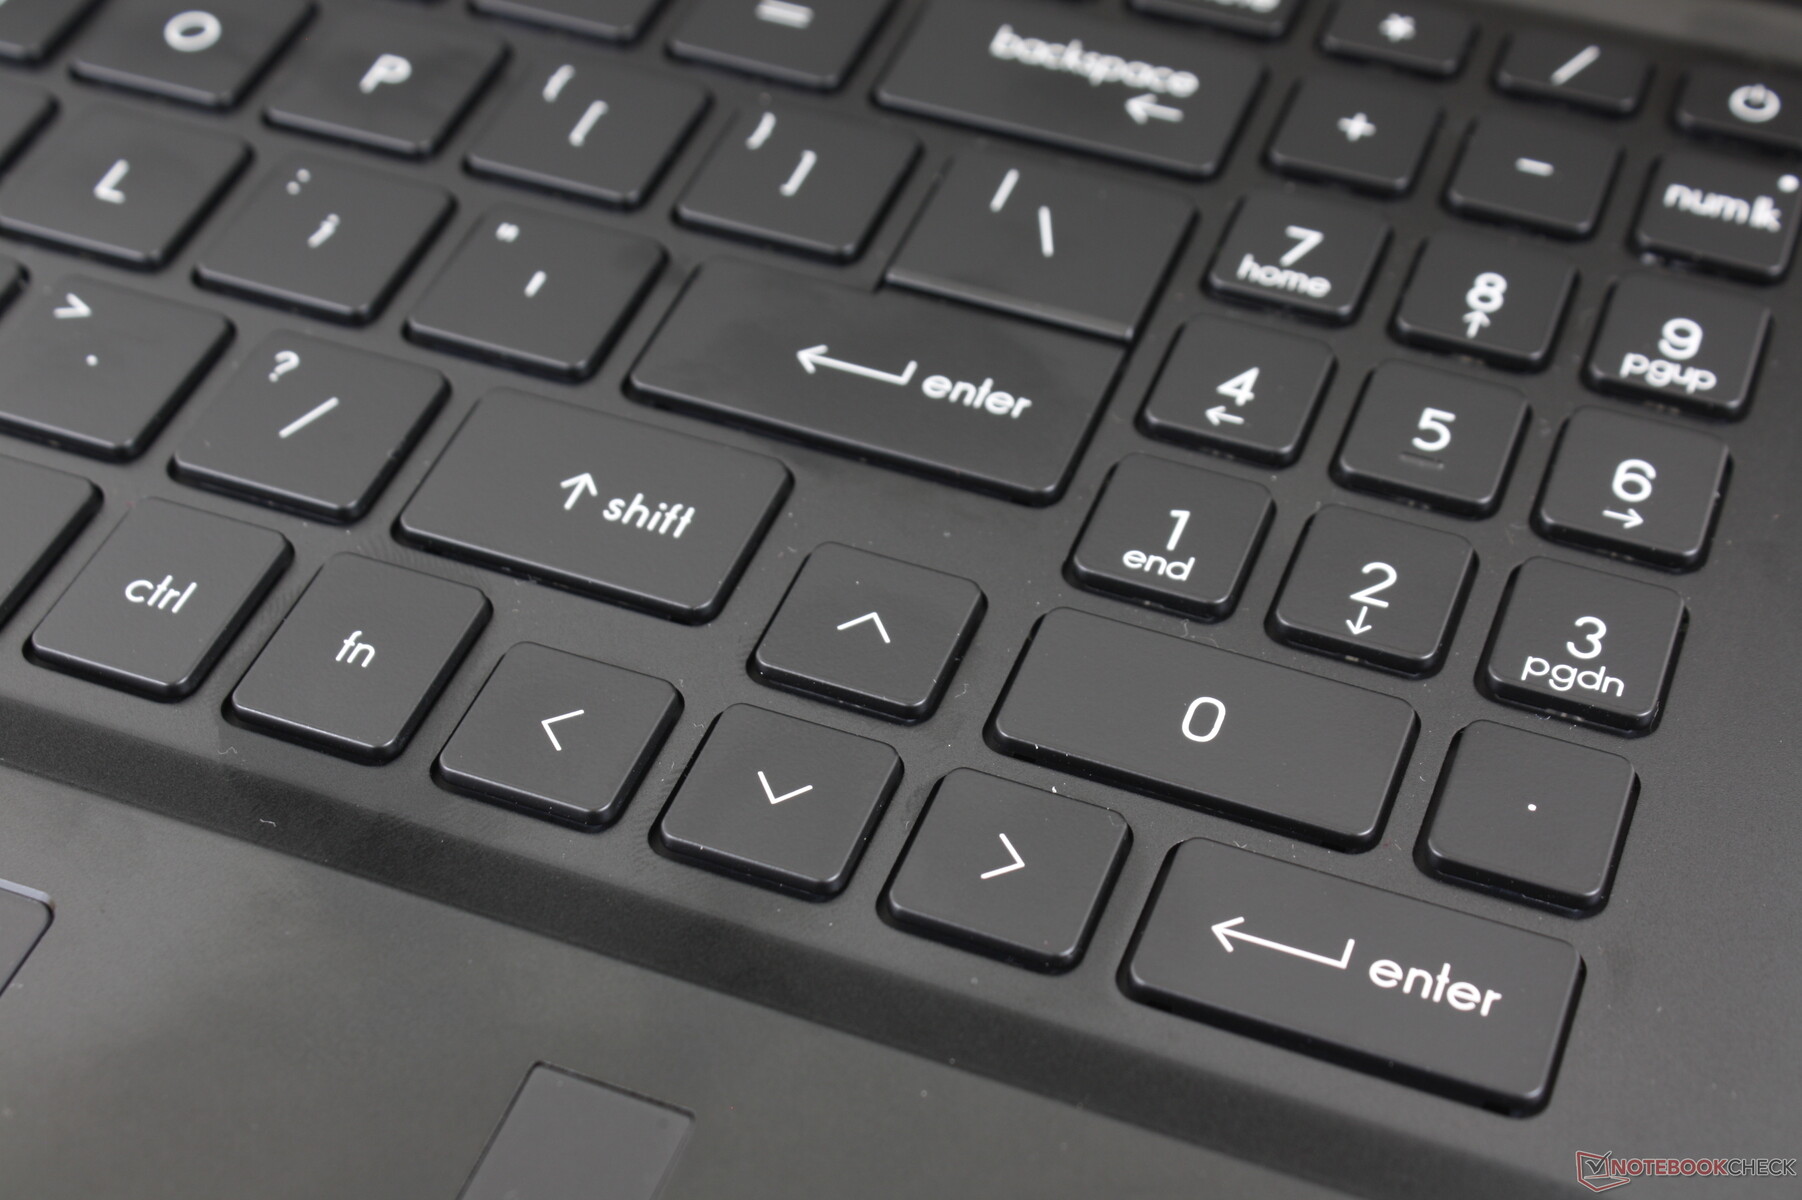
Die Tasten sind etwas weicher und leiser als beim Blade 17. Entsprechend sind sie weder schlechter noch besser, da der Tippeindruck sehr subjektiv ist. Einige Anwender wünschen sich leisere Tasten wohingegen anderen ein knackiges Feedback wichtiger ist. Anders als das Blade 17 enthält das GS77 hingegen einen Ziffernblock.
Einer der größten Nachteile der GS77-Tastatur ist die Größe der eigentlichen Tasten selbst. Insbesondere der Ziffernblock, die Pfeiltasten und die Funktionstasten sind deutlich kleiner gehalten als die restlichen Tasten. Entsprechend fühlen sie sich spürbar schwammiger an und auch das Feedback ist deutlich weicher. Beim Blade 17 sind zumindest die Funktionstasten gleich groß wie die normalen QWERTZ-Tasten, was einen gleichmäßigeren Eindruck hinterlässt.
Touchpad
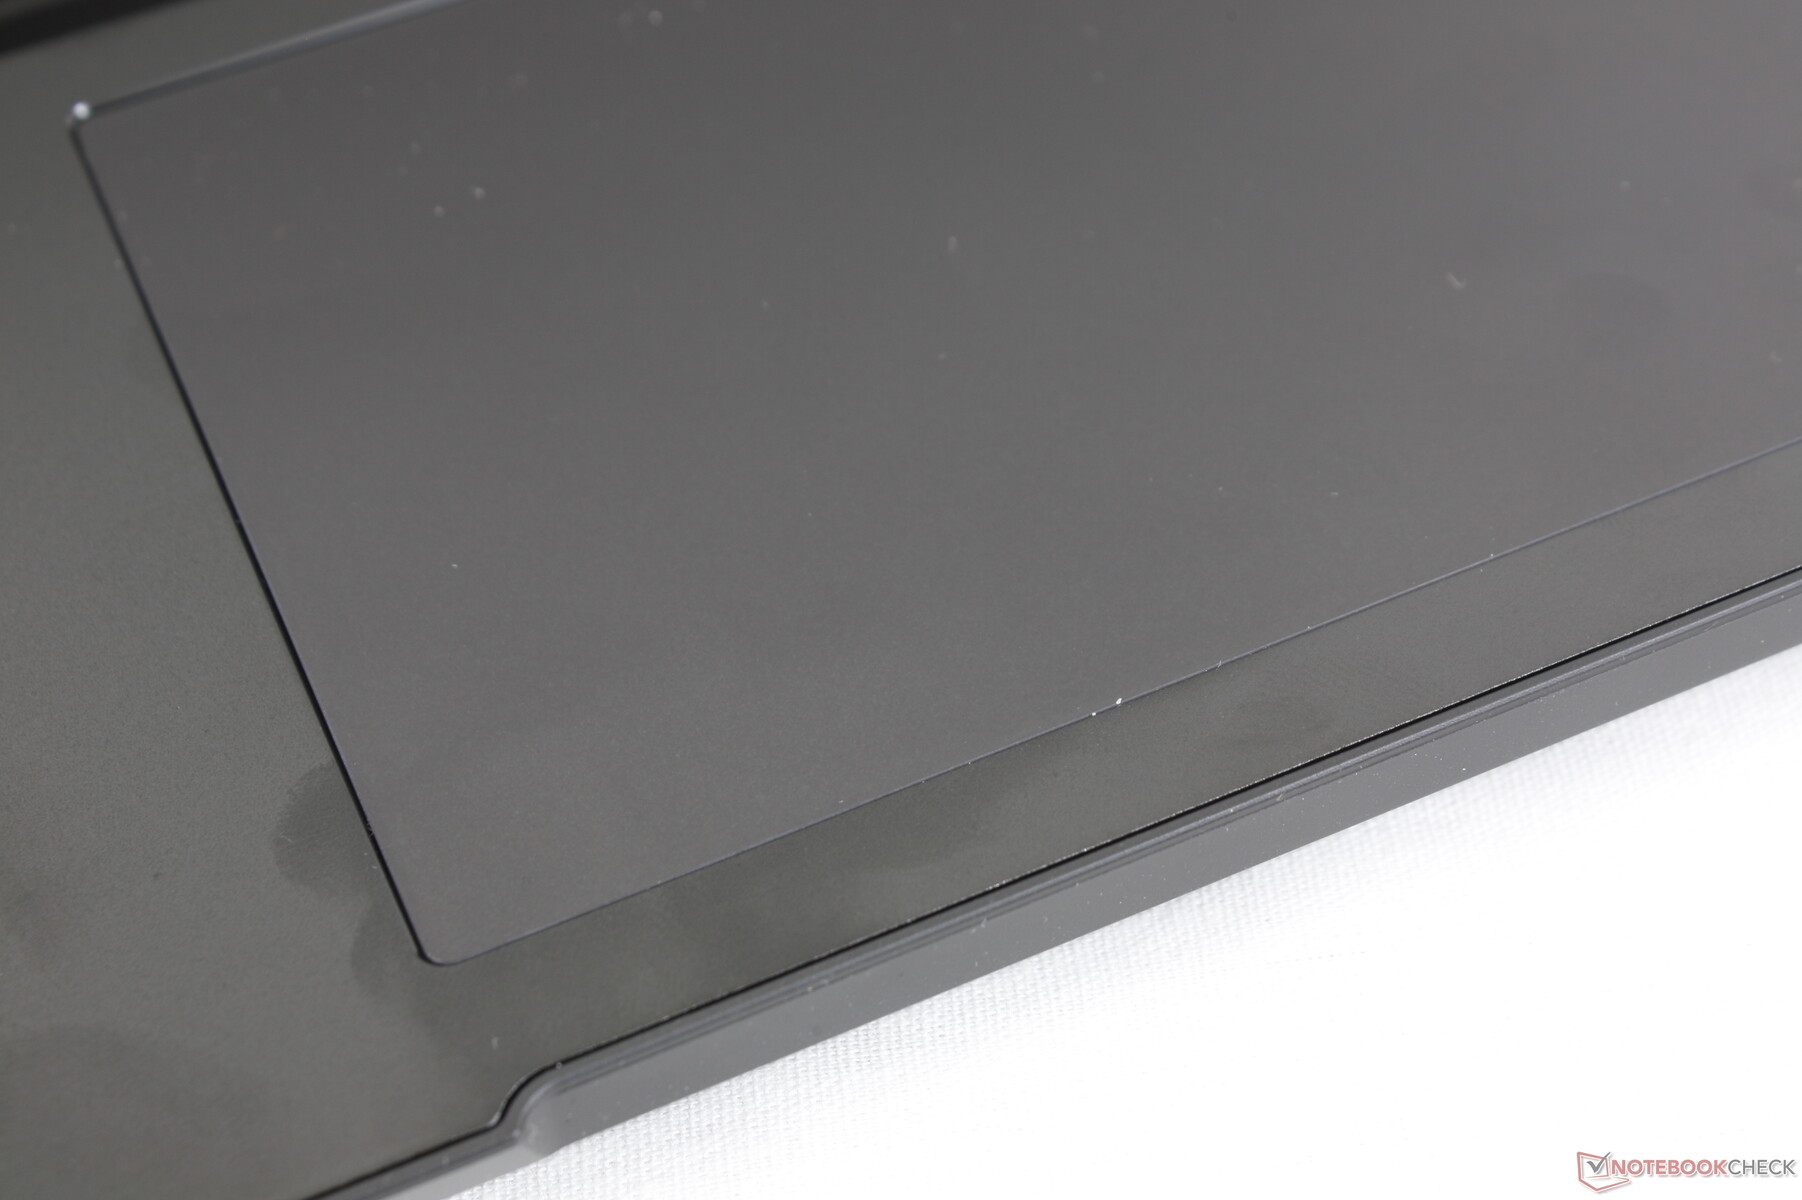
Das Clickpad ist minimal größer als beim Blade 17 (13,2 x 8,2 cm vs. 13 x 8 cm). Die Gleiteigenschaften sind sehr gut und auch bei langsamen Bewegungen vergleichbar zum Blade 17. Der größte Unterschied zwischen den beiden Clickpads sind die integrierten Tasten. Das Feedback und der Klick selber sind beim GS77 spürbar fester, ausgeprägter und lauter als beim Blade 17.
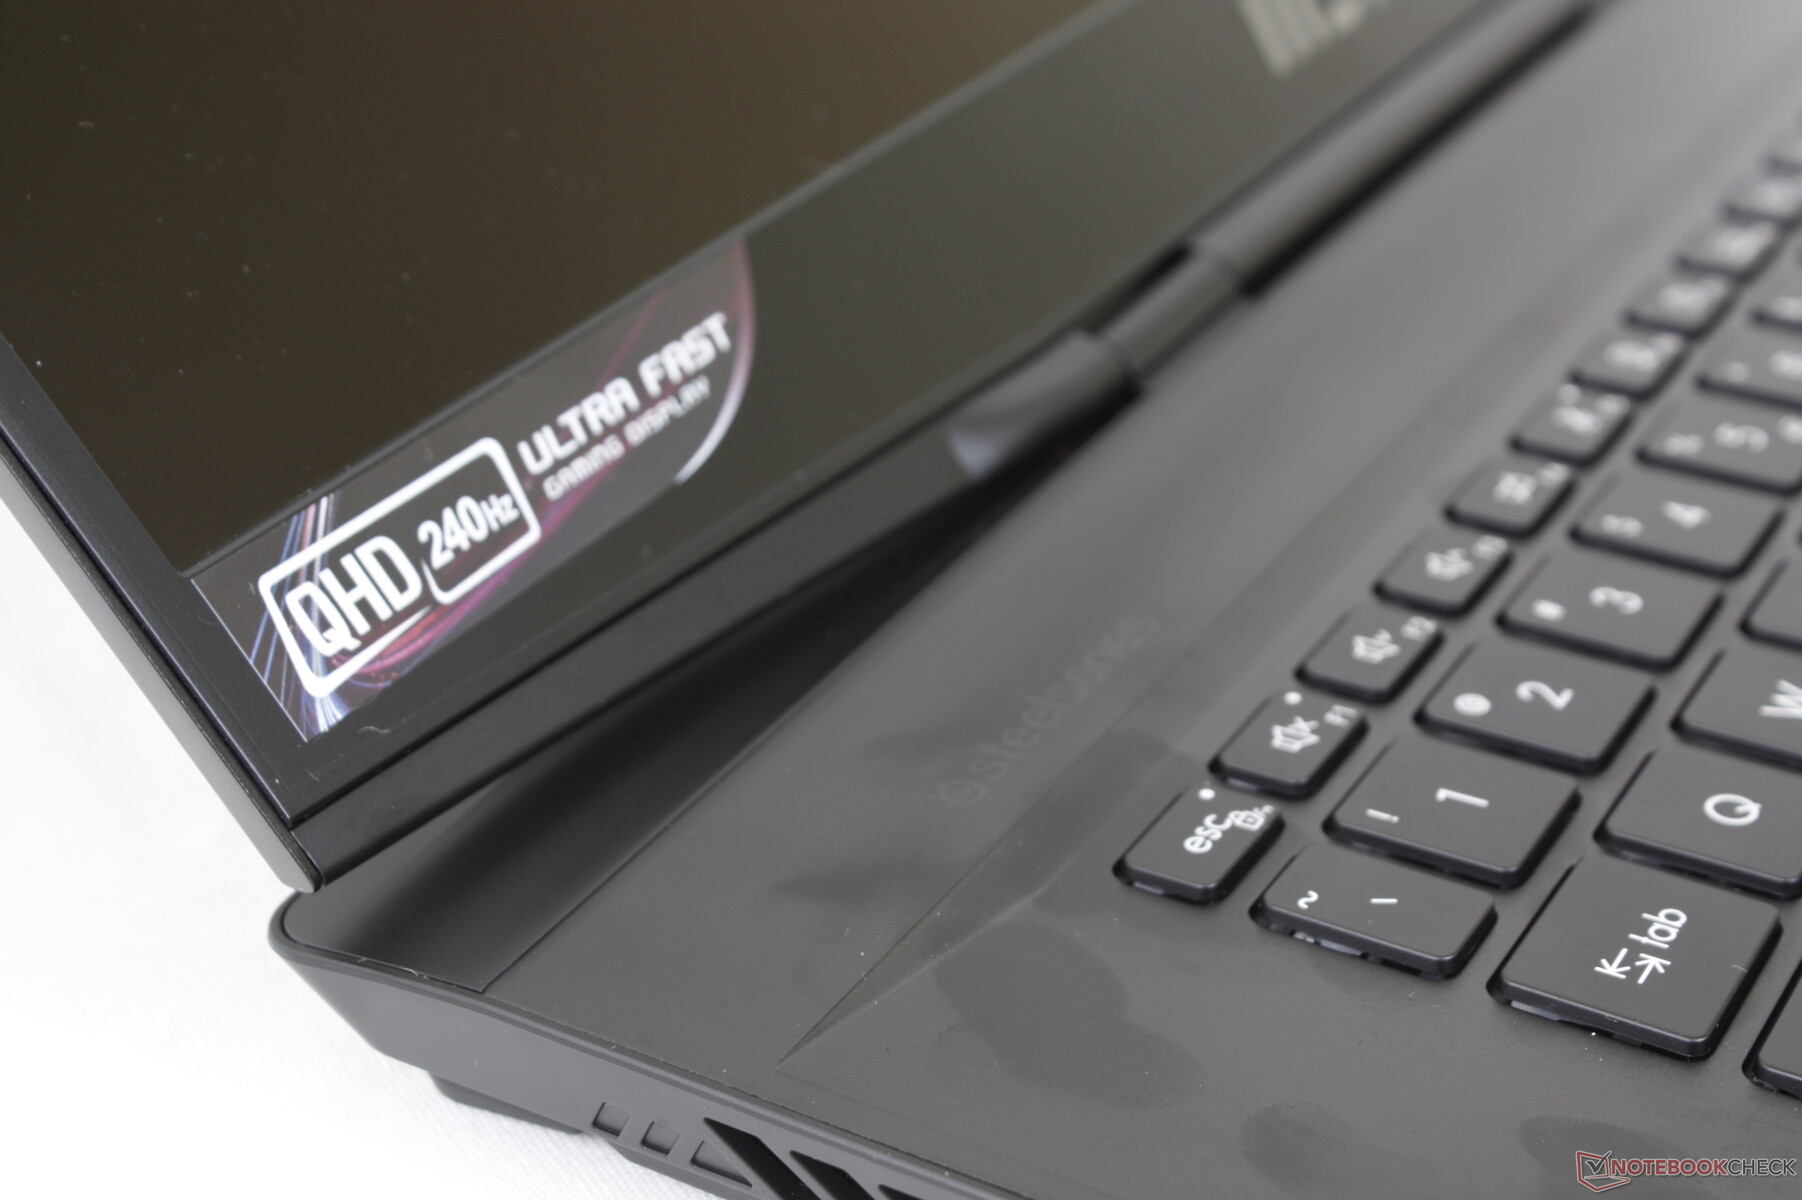
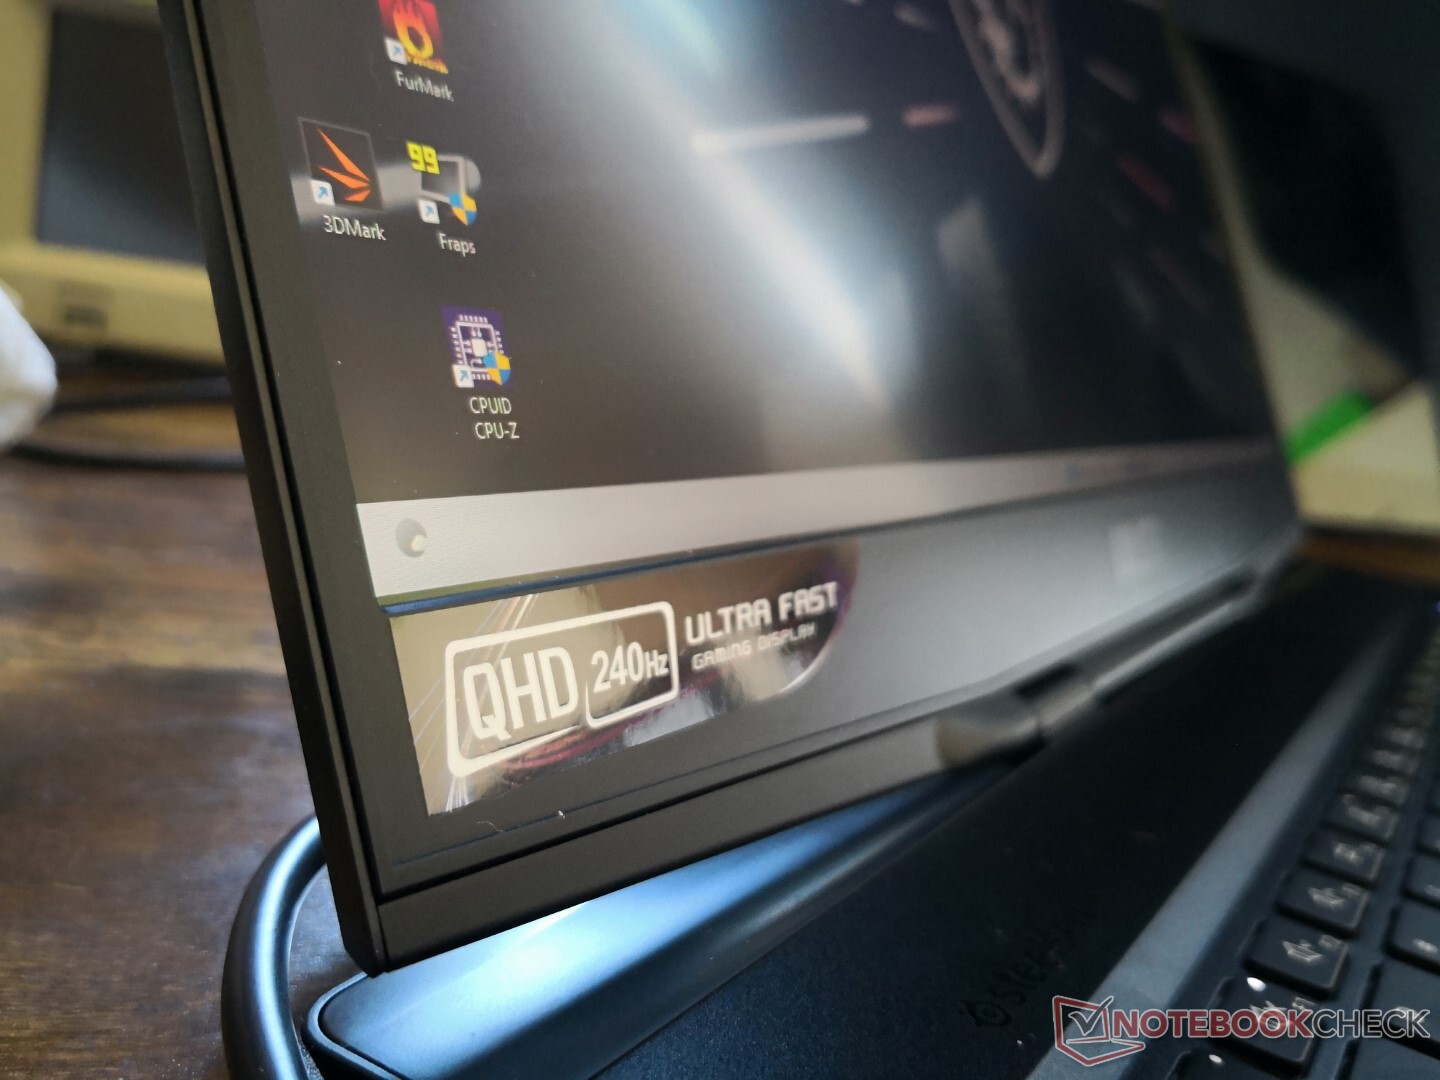
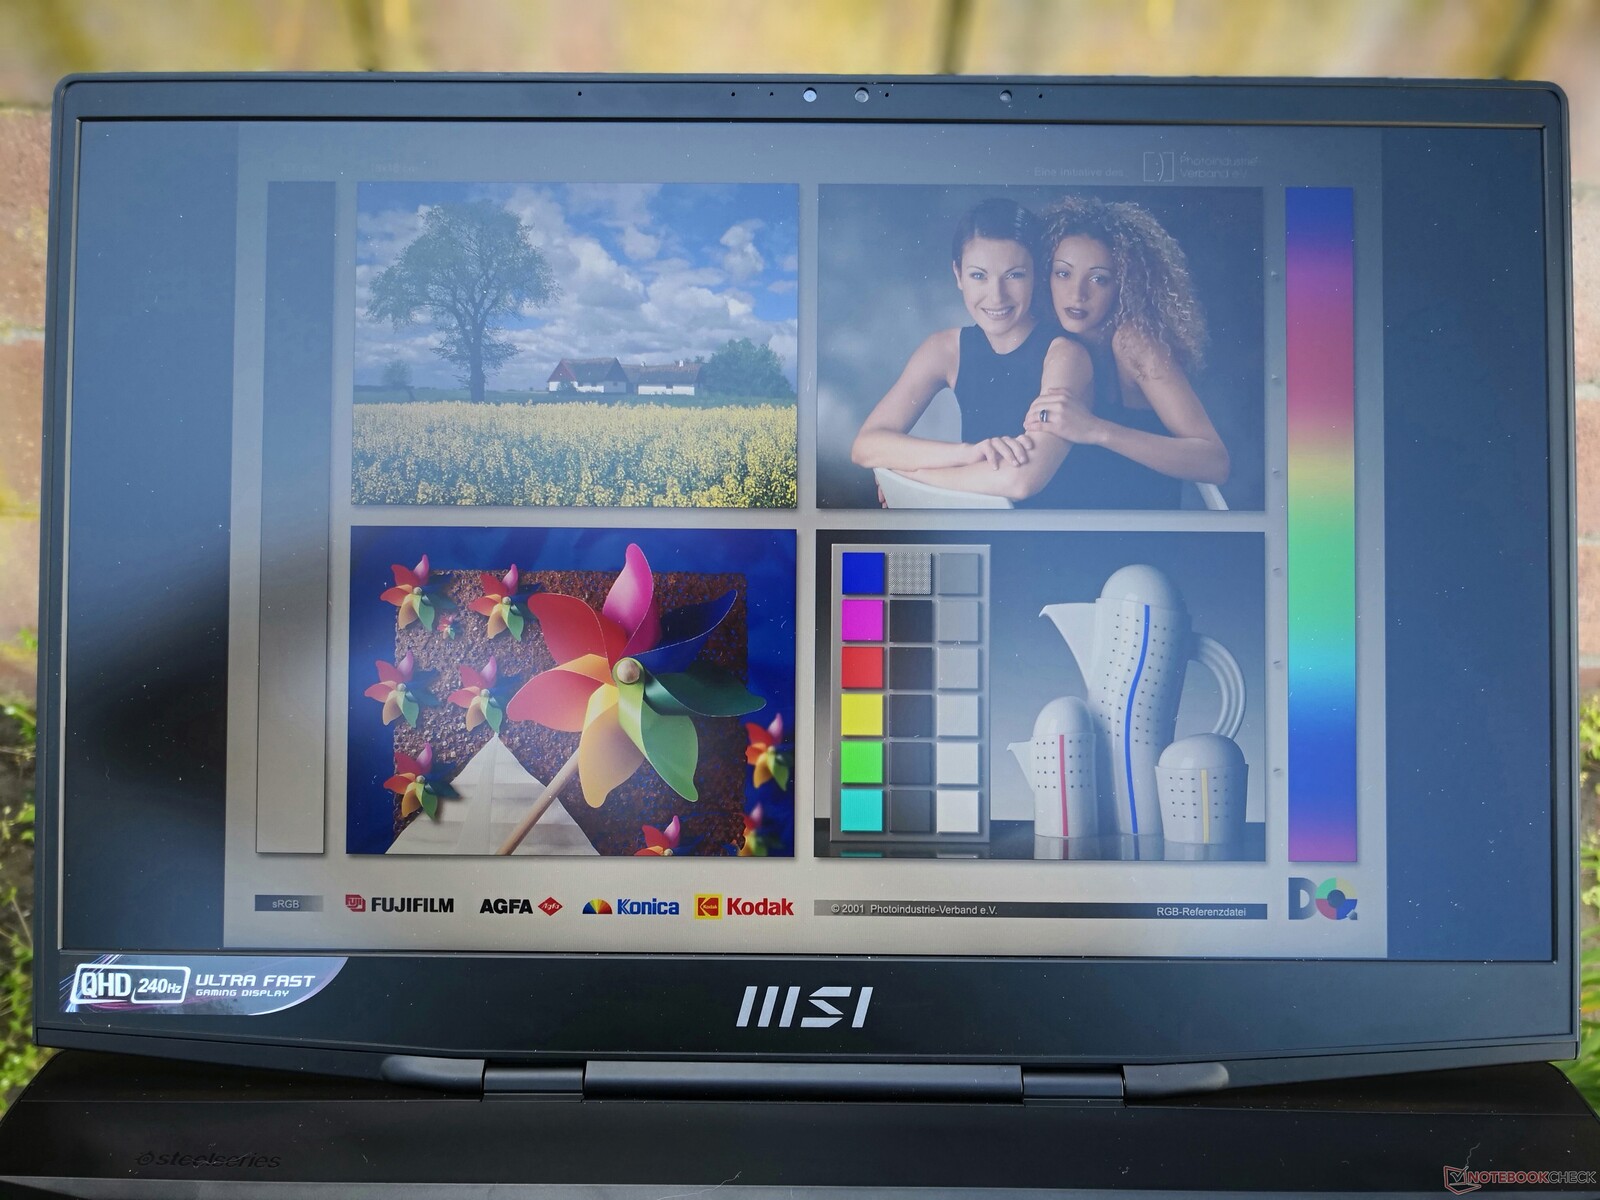
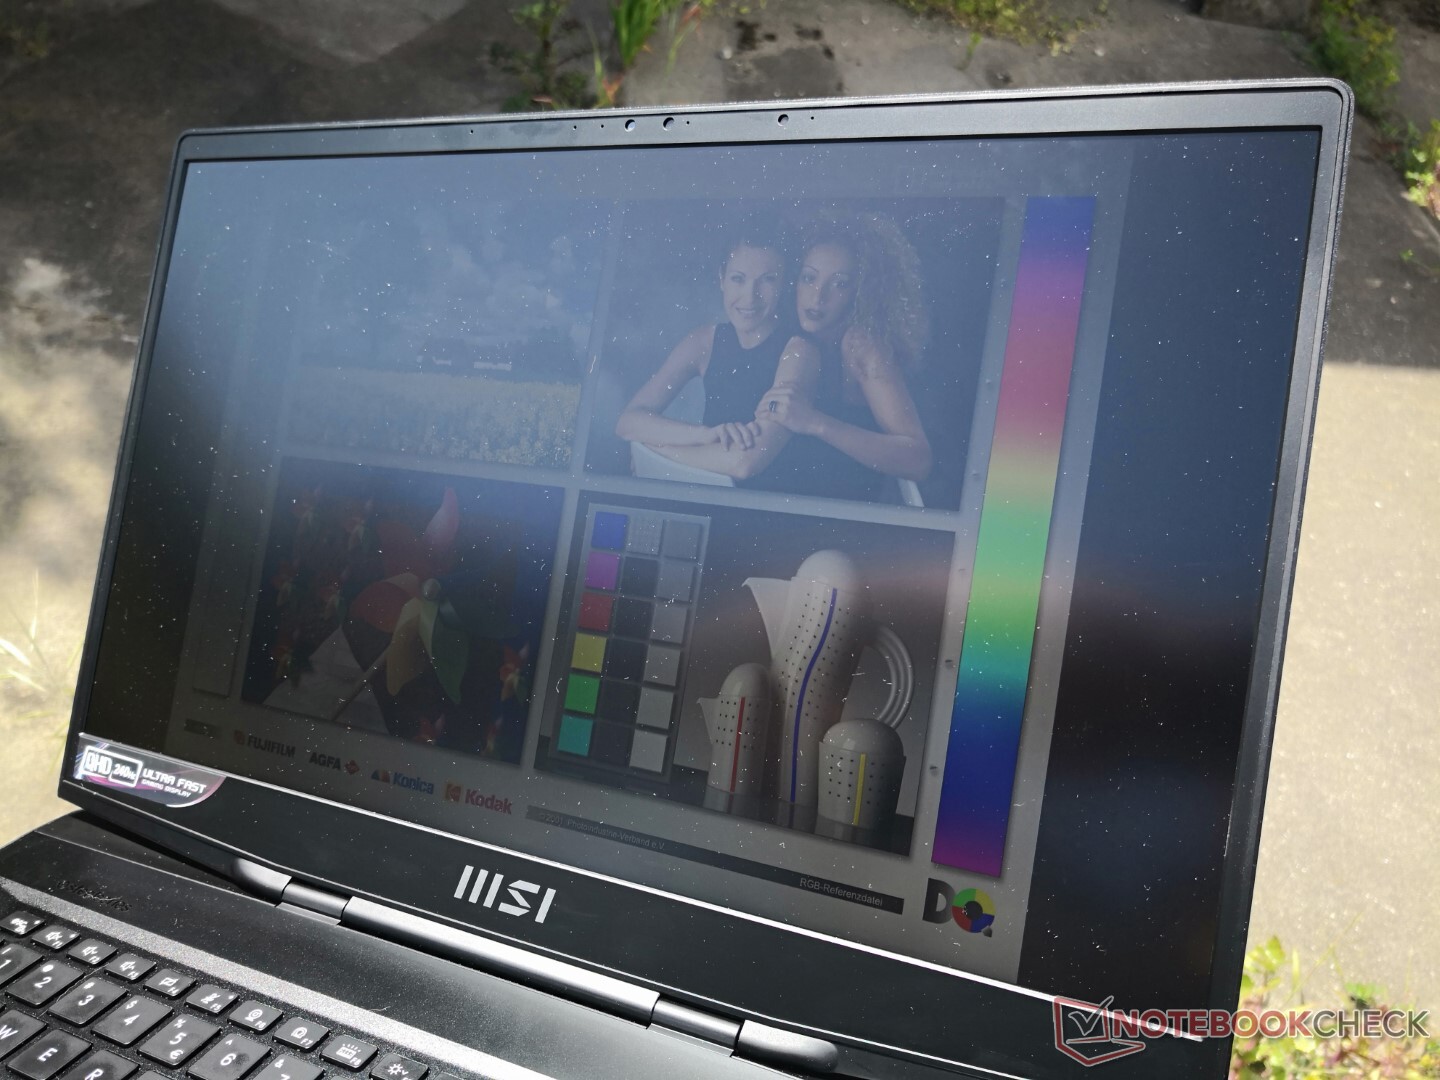
Display – Hohe Bildwiederholrate ist Standard
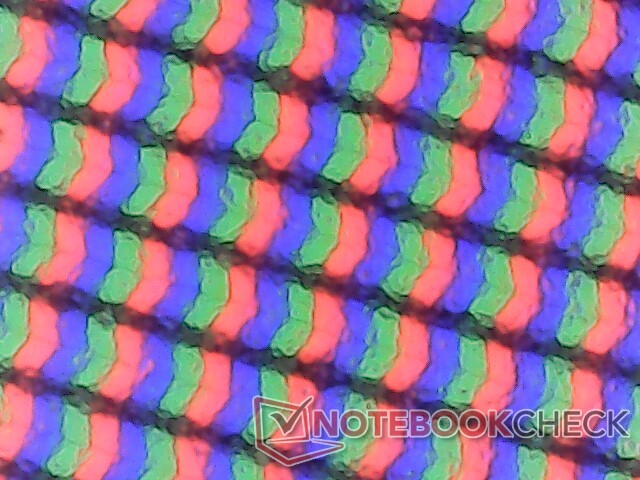
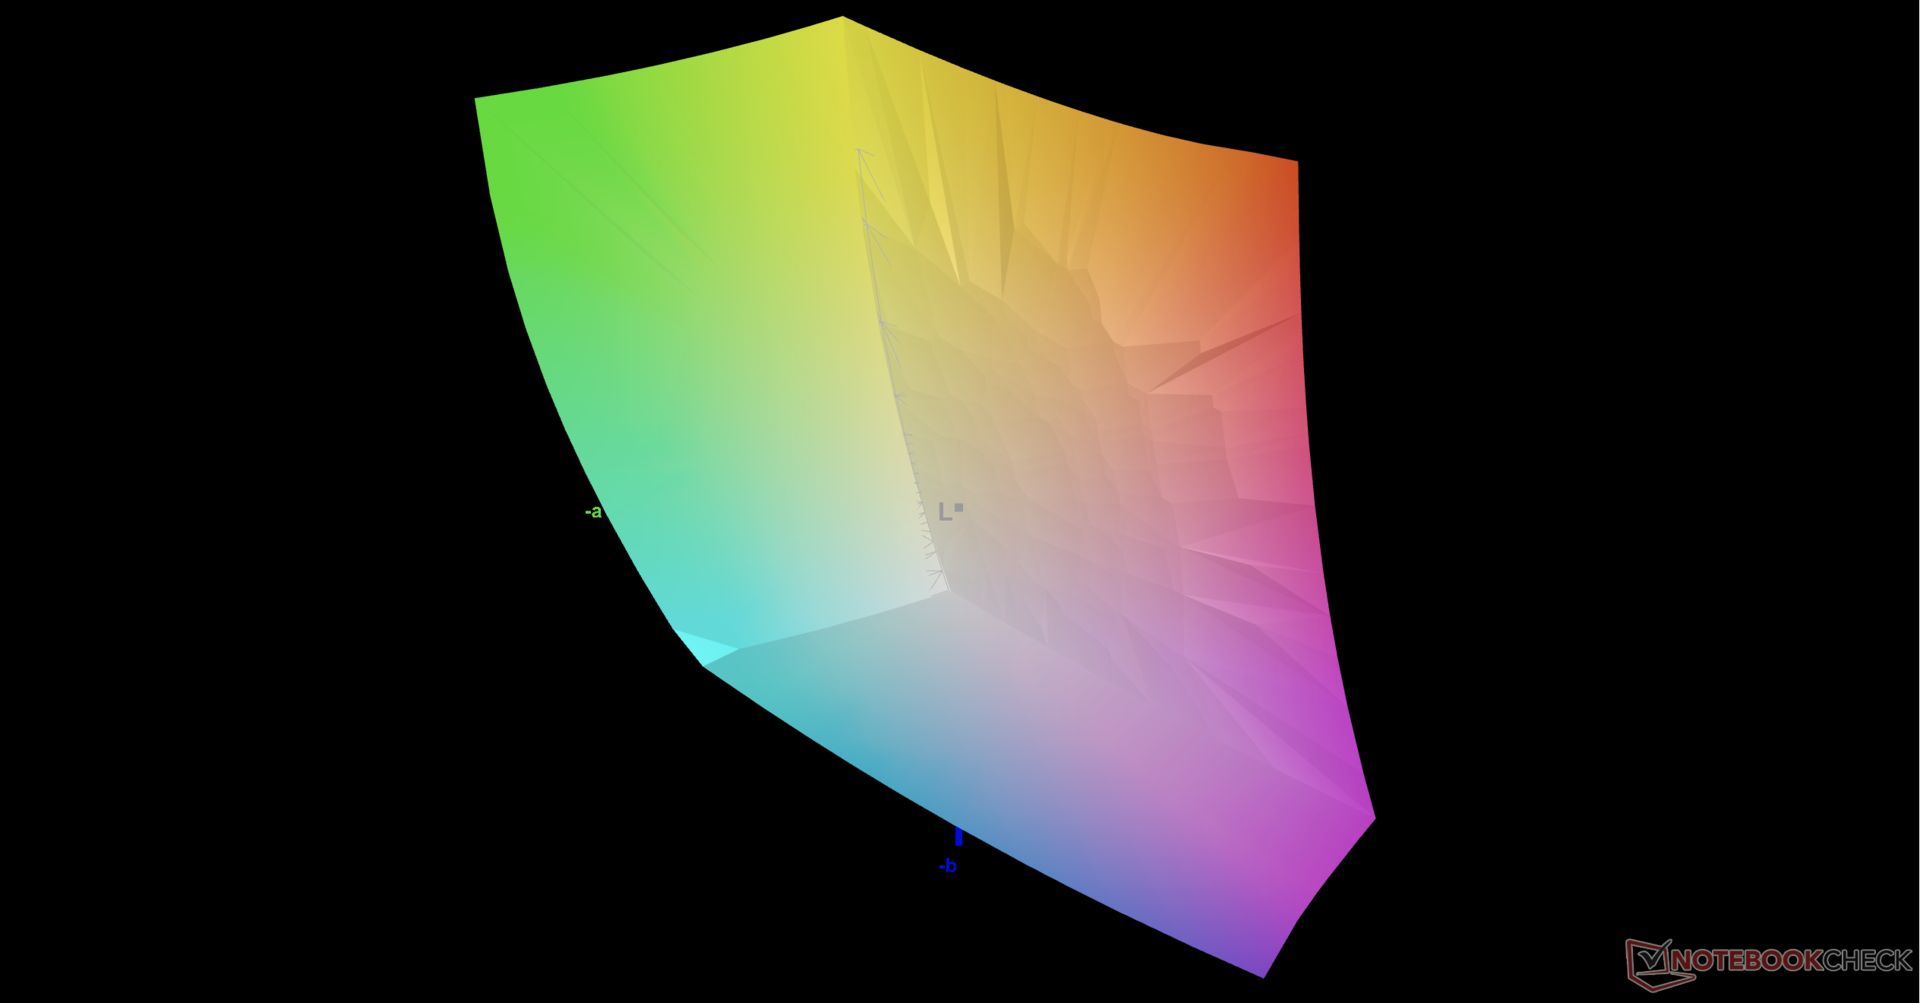
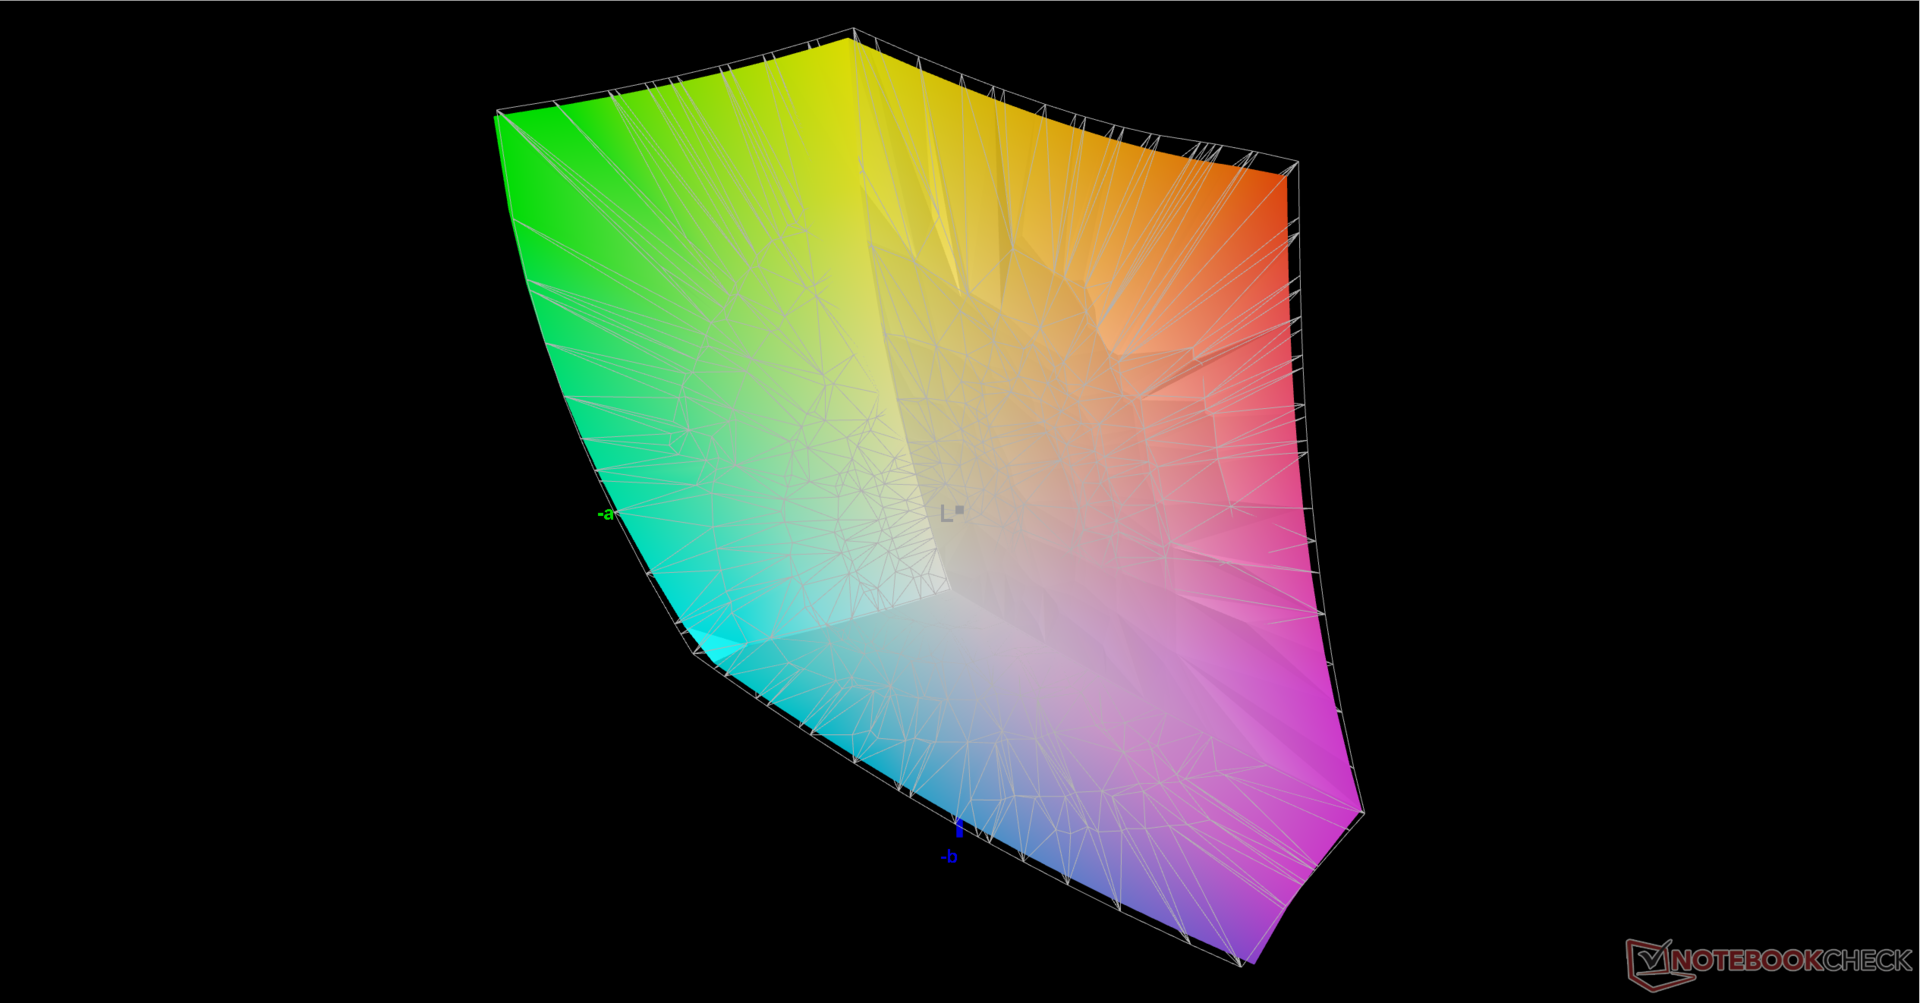
Im GS77 steckt dasselbe hochwertige BOE-NE173QHM-NZ1-1440p-IPS-Panel wie im Razer Blade 17. Entsprechend unterscheiden sich die beiden 17.3-Zoll-Konkurrenten bei Aspekten wie der Bildwiederholrate von 240 Hz, den kurzen Reaktionszeiten, dem brauchbaren Kontrastverhältnis von 1.000:1 und der vollständigen Abdeckung des DCI-P3-Farbraums nicht.
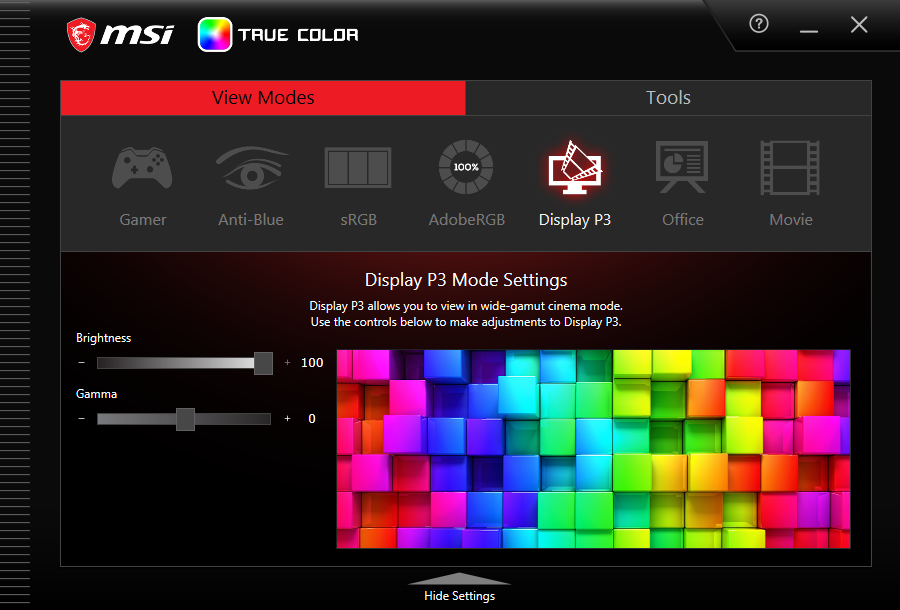
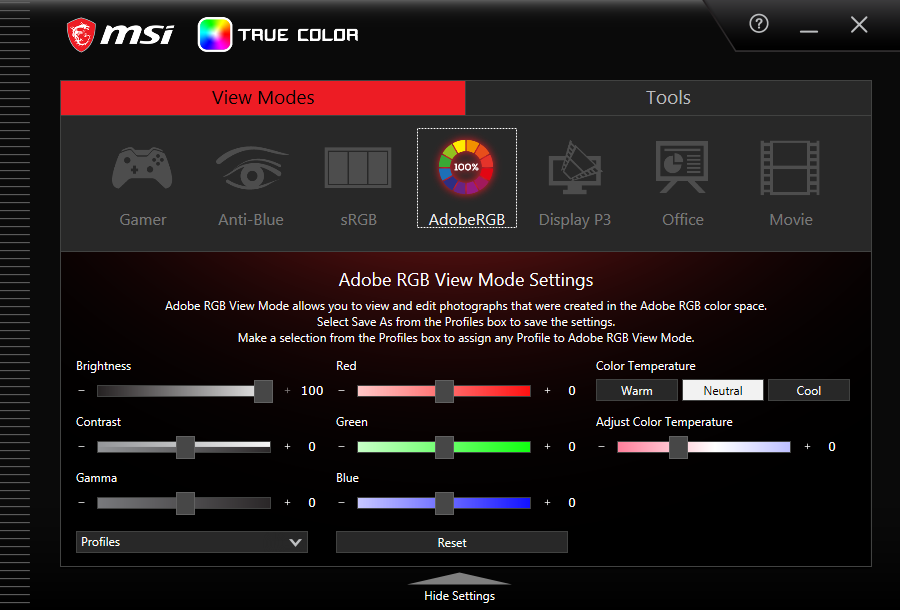
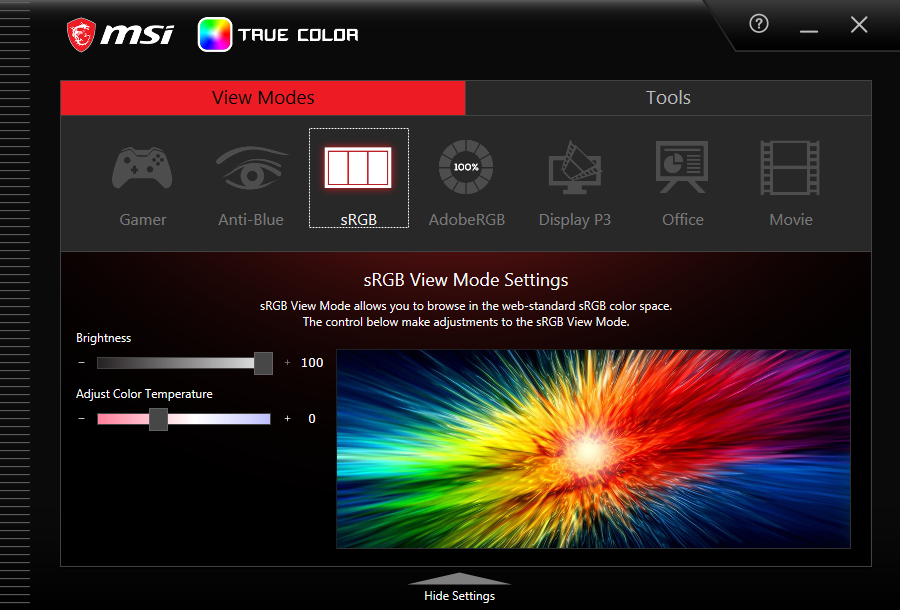
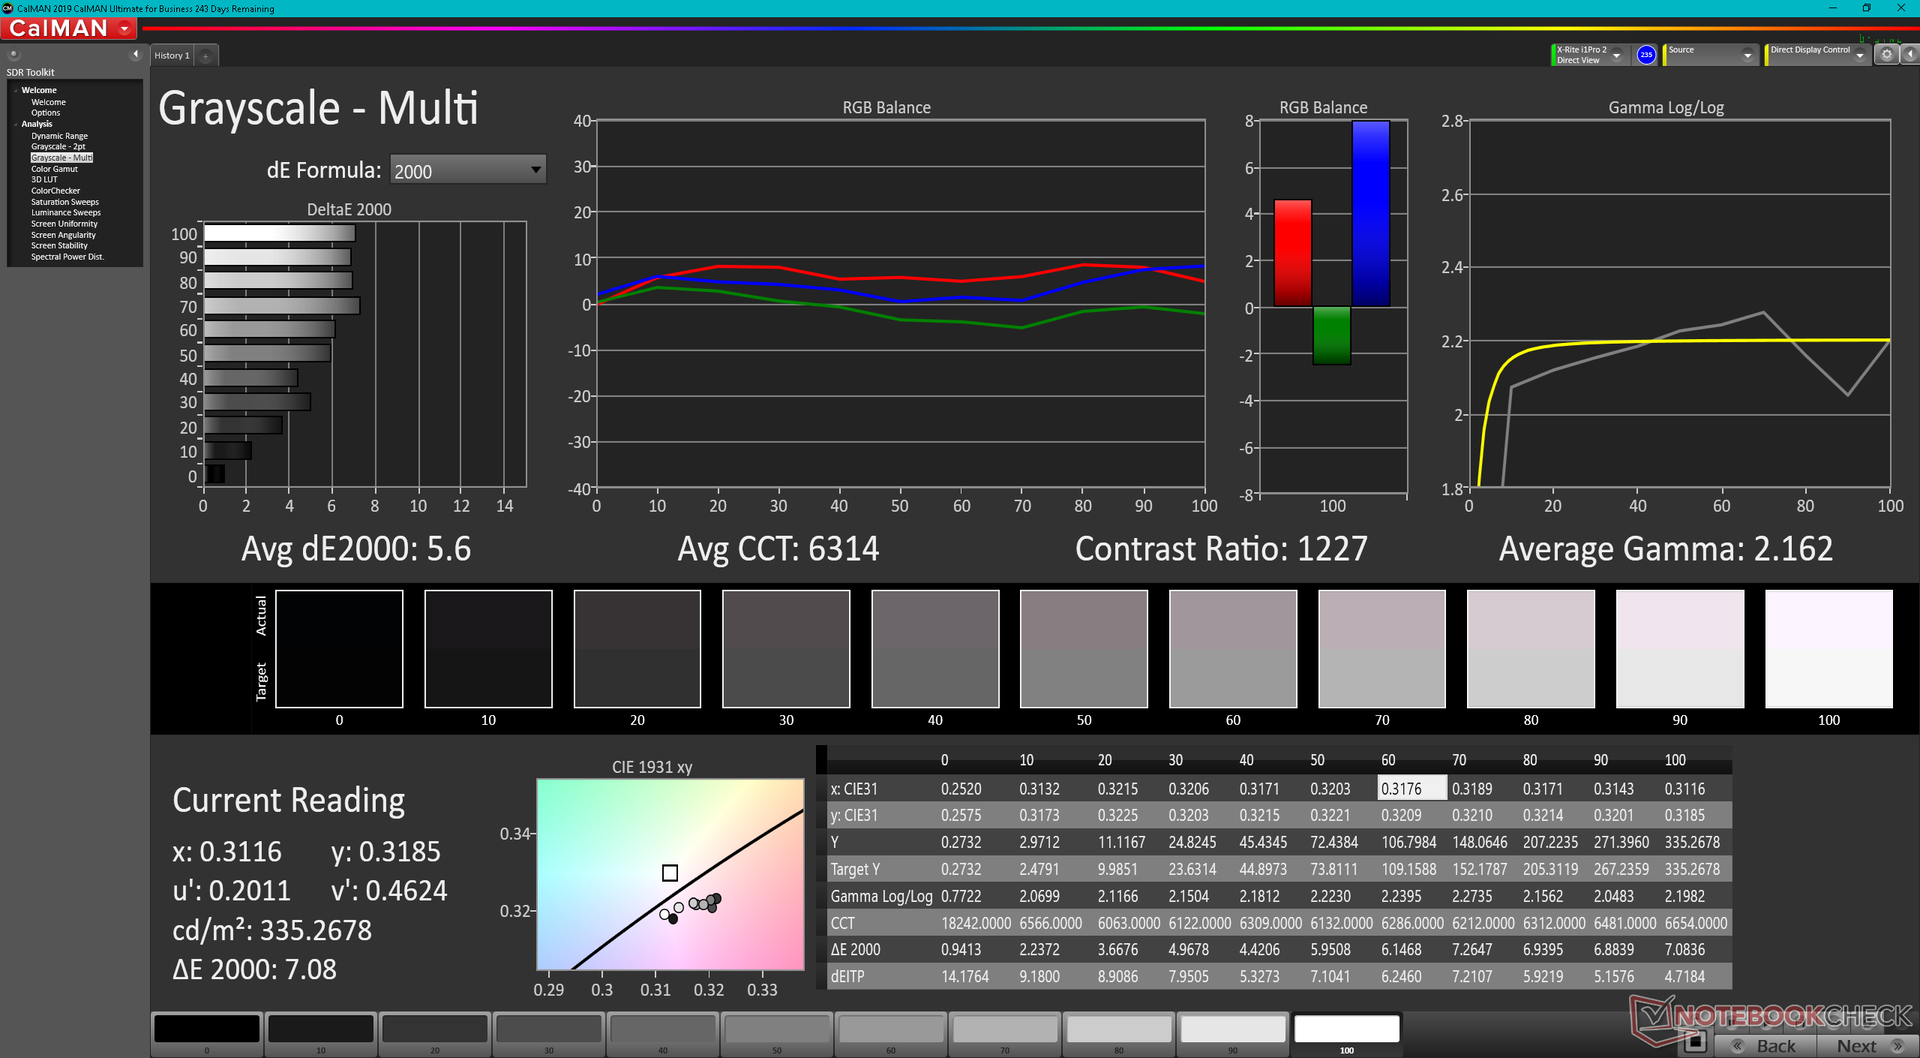
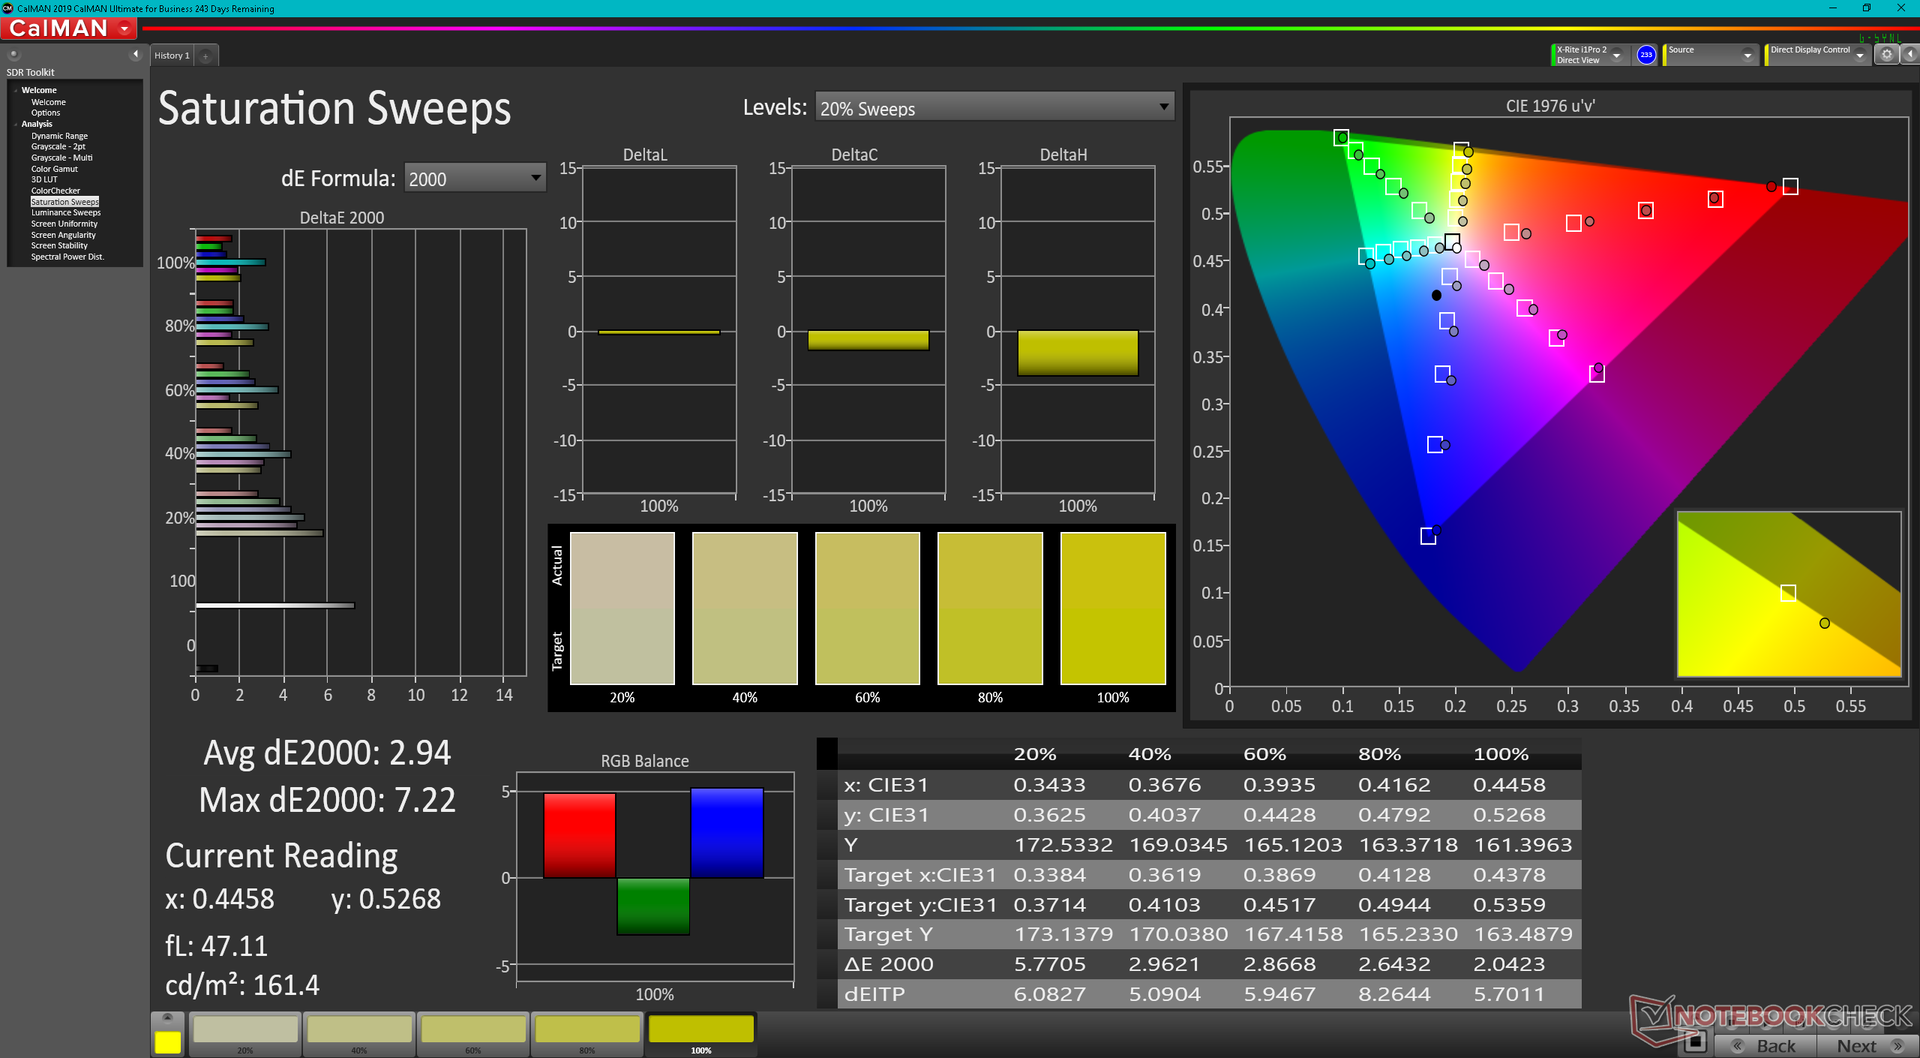
Trotzdem gibt es zwischen den beiden Displays zwei gewichtige Unterschiede. Erstens fehlt dem GS77 die Unterstützung für G-Sync oder Adaptive Sync da es weder Advanced Optimus noch MUX unterstützt. Und zweitens ist das Panel des GS77 ab Werk nicht individuell vorkalibriert. Daher sind die Farben im DCI-P3-Modus sichtbar im Farbspektrum verschoben.
| |||||||||||||||||||||||||
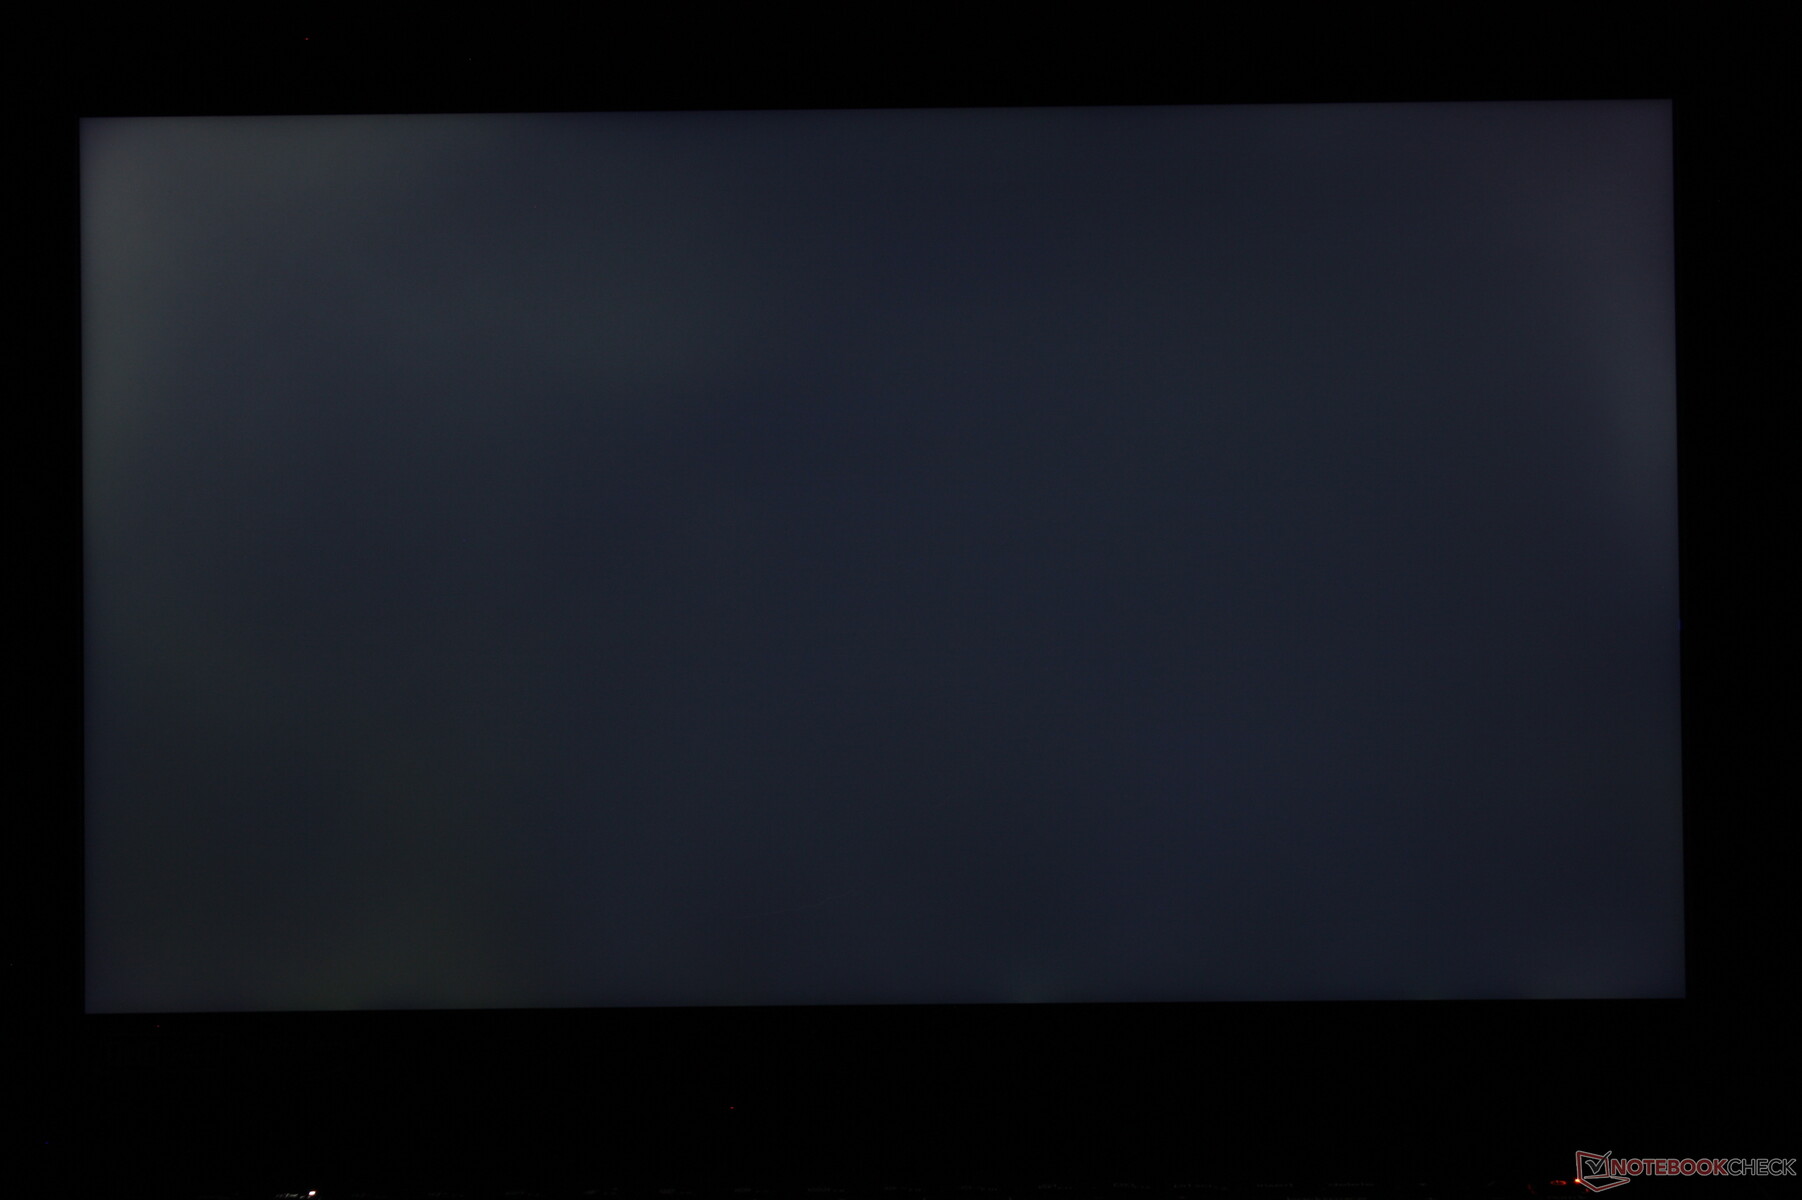
Ausleuchtung: 79 %
Helligkeit Akku: 334.8 cd/m²
Kontrast: 985:1 (Schwarzwert: 0.34 cd/m²)
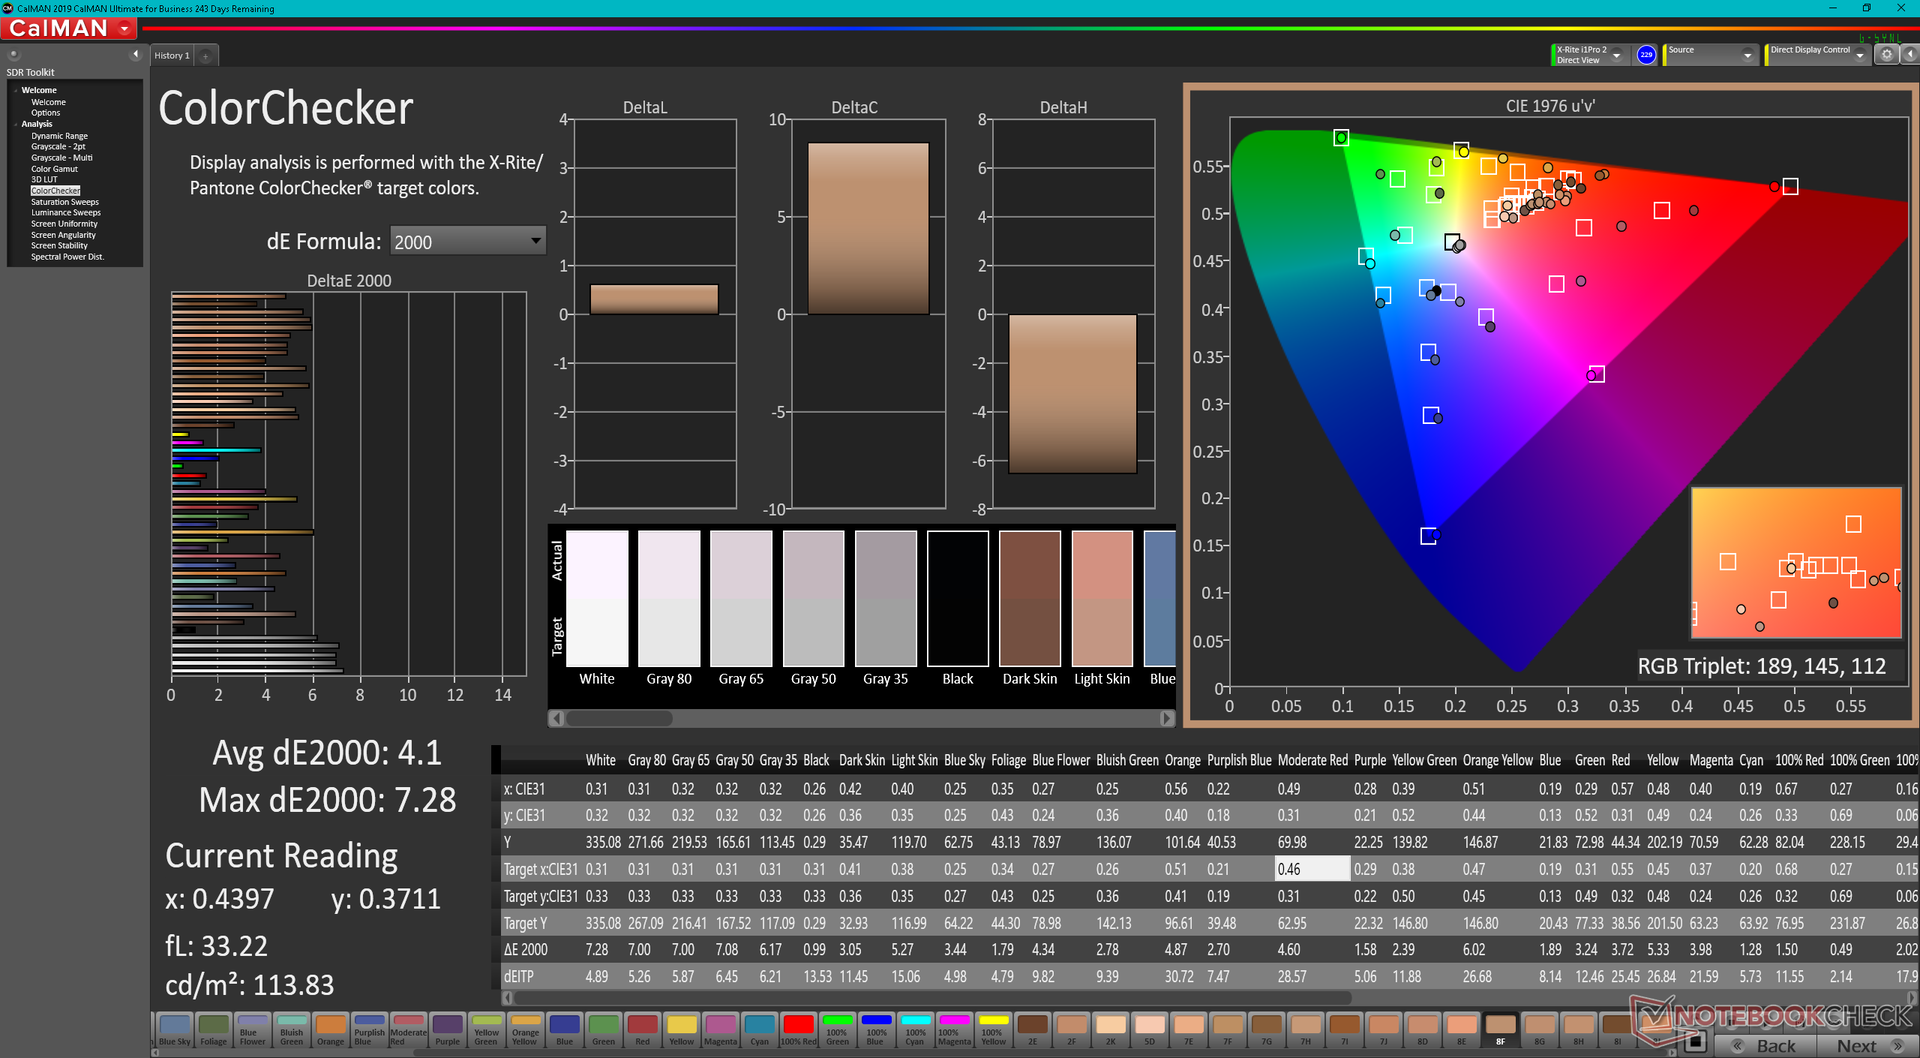
ΔE ColorChecker Calman: 4.1 | ∀{0.5-29.43 Ø4.71}
ΔE Greyscale Calman: 5.6 | ∀{0.09-98 Ø4.96}
85.8% AdobeRGB 1998 (Argyll 3D)
99.7% sRGB (Argyll 3D)
96.2% Display P3 (Argyll 3D)
Gamma: 2.16
CCT: 6314 K
| MSI Stealth GS77 12UHS-083US BOE NE173QHM-NZ1, IPS, 2560x1440, 17.3" | MSI GS76 Stealth 11UH AUO B173ZAN06.1 (AUODE95), IPS, 3840x2160, 17.3" | Razer Blade 17 RTX 3080 Ti BOE NE173QHM-NZ1, IPS, 2560x1440, 17.3" | MSI GE76 Raider AU Optronics B173HAN05.4 (AUOE295), IPS-Level, 1920x1080, 17.3" | Alienware x17 RTX 3080 P48E AU Optronics B173ZAN, IPS, 3840x2160, 17.3" | Asus ROG Zephyrus S17 GX703HSD BOE099D (BOE CQ NE173QHM-NY3), IPS, 2560x1440, 17.3" | |
|---|---|---|---|---|---|---|
| Display | -21% | 1% | -21% | 3% | -2% | |
| Display P3 Coverage (%) | 96.2 | 63 -35% | 98.7 3% | 63.1 -34% | 88.3 -8% | 94.2 -2% |
| sRGB Coverage (%) | 99.7 | 94.8 -5% | 99.9 0% | 94 -6% | 100 0% | 98.7 -1% |
| AdobeRGB 1998 Coverage (%) | 85.8 | 65 -24% | 86.2 0% | 65.2 -24% | 100 17% | 84.4 -2% |
| Response Times | 50% | 6% | 47% | 19% | 55% | |
| Response Time Grey 50% / Grey 80% * (ms) | 17.6 ? | 8.8 ? 50% | 17.6 ? -0% | 5.6 ? 68% | 14.4 ? 18% | 4.8 73% |
| Response Time Black / White * (ms) | 12.8 ? | 6.4 ? 50% | 11.4 ? 11% | 9.6 ? 25% | 10.4 ? 19% | 8 37% |
| PWM Frequency (Hz) | ||||||
| Bildschirm | 26% | 13% | 30% | 12% | 13% | |
| Helligkeit Bildmitte (cd/m²) | 334.8 | 474 42% | 335.9 0% | 290 -13% | 438.7 31% | 322 -4% |
| Brightness (cd/m²) | 305 | 454 49% | 294 -4% | 290 -5% | 435 43% | 288 -6% |
| Brightness Distribution (%) | 79 | 88 11% | 75 -5% | 96 22% | 91 15% | 72 -9% |
| Schwarzwert * (cd/m²) | 0.34 | 0.46 -35% | 0.38 -12% | 0.23 32% | 0.48 -41% | 0.3 12% |
| Kontrast (:1) | 985 | 1030 5% | 884 -10% | 1261 28% | 914 -7% | 1073 9% |
| Delta E Colorchecker * | 4.1 | 1.5 63% | 2.82 31% | 1.59 61% | 4.34 -6% | 3.05 26% |
| Colorchecker dE 2000 max. * | 7.28 | 5.59 23% | 5.04 31% | 3.17 56% | 7.3 -0% | 5.23 28% |
| Delta E Graustufen * | 5.6 | 2.8 50% | 1.7 70% | 2.5 55% | 2.4 57% | 3.11 44% |
| Gamma | 2.16 102% | 2.158 102% | 2.14 103% | 2.253 98% | 2.09 105% | 2.13 103% |
| CCT | 6314 103% | 6597 99% | 6382 102% | 6640 98% | 6413 101% | 6553 99% |
| Colorchecker dE 2000 calibrated * | 0.86 | 0.87 | 0.72 | 1.92 | ||
| Farbraum (Prozent von AdobeRGB 1998) (%) | 84 | |||||
| Color Space (Percent of sRGB) (%) | 99 | |||||
| Durchschnitt gesamt (Programm / Settings) | 18% /
19% | 7% /
9% | 19% /
20% | 11% /
11% | 22% /
16% |
* ... kleinere Werte sind besser
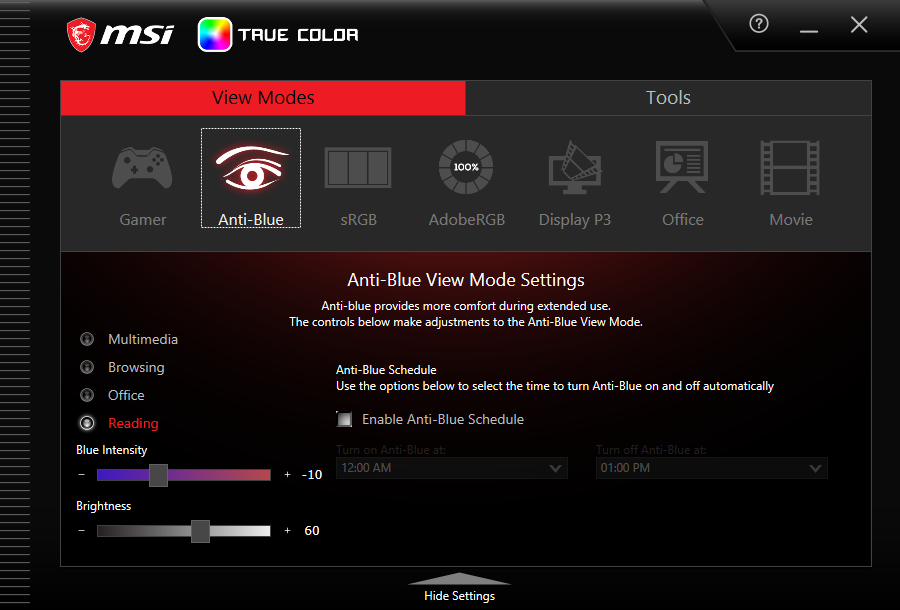
Wie oben erwähnt wird das Display des GS77 von MSI nicht individuell kalibriert, was sich bei den Messungen mit unserem X-Rite-Colorimeter sehr deutlich zeigt. Ab Werk war die Farbtemperatur zu warm, wodurch die durchschnittliche Delta-E-Abweichung des GS77 relativ hoch ausfällt. Glücklicherweise lassen sich Farbtemperatur und RGB-Werte manuell mit Hilfe der vorinstallierten MSI-True-Color-Software anpassen.
Reaktionszeiten (Response Times) des Displays
| ↔ Reaktionszeiten Schwarz zu Weiß | ||
|---|---|---|
| 12.8 ms ... steigend ↗ und fallend ↘ kombiniert | ↗ 7.6 ms steigend | 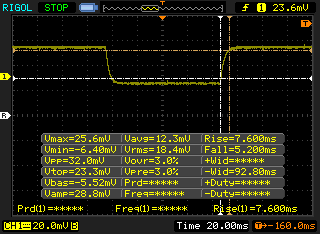 |
| ↘ 5.2 ms fallend | ||
| Die gemessenen Reaktionszeiten sind gut, für anspruchsvolle Spieler könnten der Bildschirm jedoch zu langsam sein. Im Vergleich rangierten die bei uns getesteten Geräte von 0.1 (Minimum) zu 240 (Maximum) ms. » 33 % aller Screens waren schneller als der getestete. Daher sind die gemessenen Reaktionszeiten besser als der Durchschnitt aller vermessenen Geräte (19.8 ms). | ||
| ↔ Reaktionszeiten 50% Grau zu 80% Grau | ||
| 17.6 ms ... steigend ↗ und fallend ↘ kombiniert | ↗ 10 ms steigend | 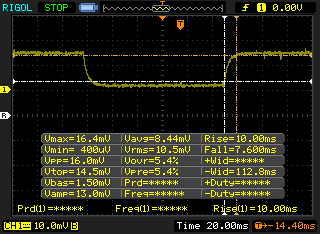 |
| ↘ 7.6 ms fallend | ||
| Die gemessenen Reaktionszeiten sind gut, für anspruchsvolle Spieler könnten der Bildschirm jedoch zu langsam sein. Im Vergleich rangierten die bei uns getesteten Geräte von 0.165 (Minimum) zu 636 (Maximum) ms. » 32 % aller Screens waren schneller als der getestete. Daher sind die gemessenen Reaktionszeiten besser als der Durchschnitt aller vermessenen Geräte (31 ms). | ||
Bildschirm-Flackern / PWM (Pulse-Width Modulation)
| Flackern / PWM nicht festgestellt | 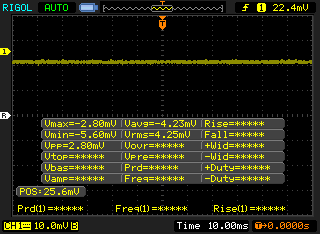 | ||
Im Vergleich: 52 % aller getesteten Geräte nutzten kein PWM um die Helligkeit zu reduzieren. Wenn PWM eingesetzt wurde, dann bei einer Frequenz von durchschnittlich 7757 (Minimum 5, Maximum 343500) Hz. | |||

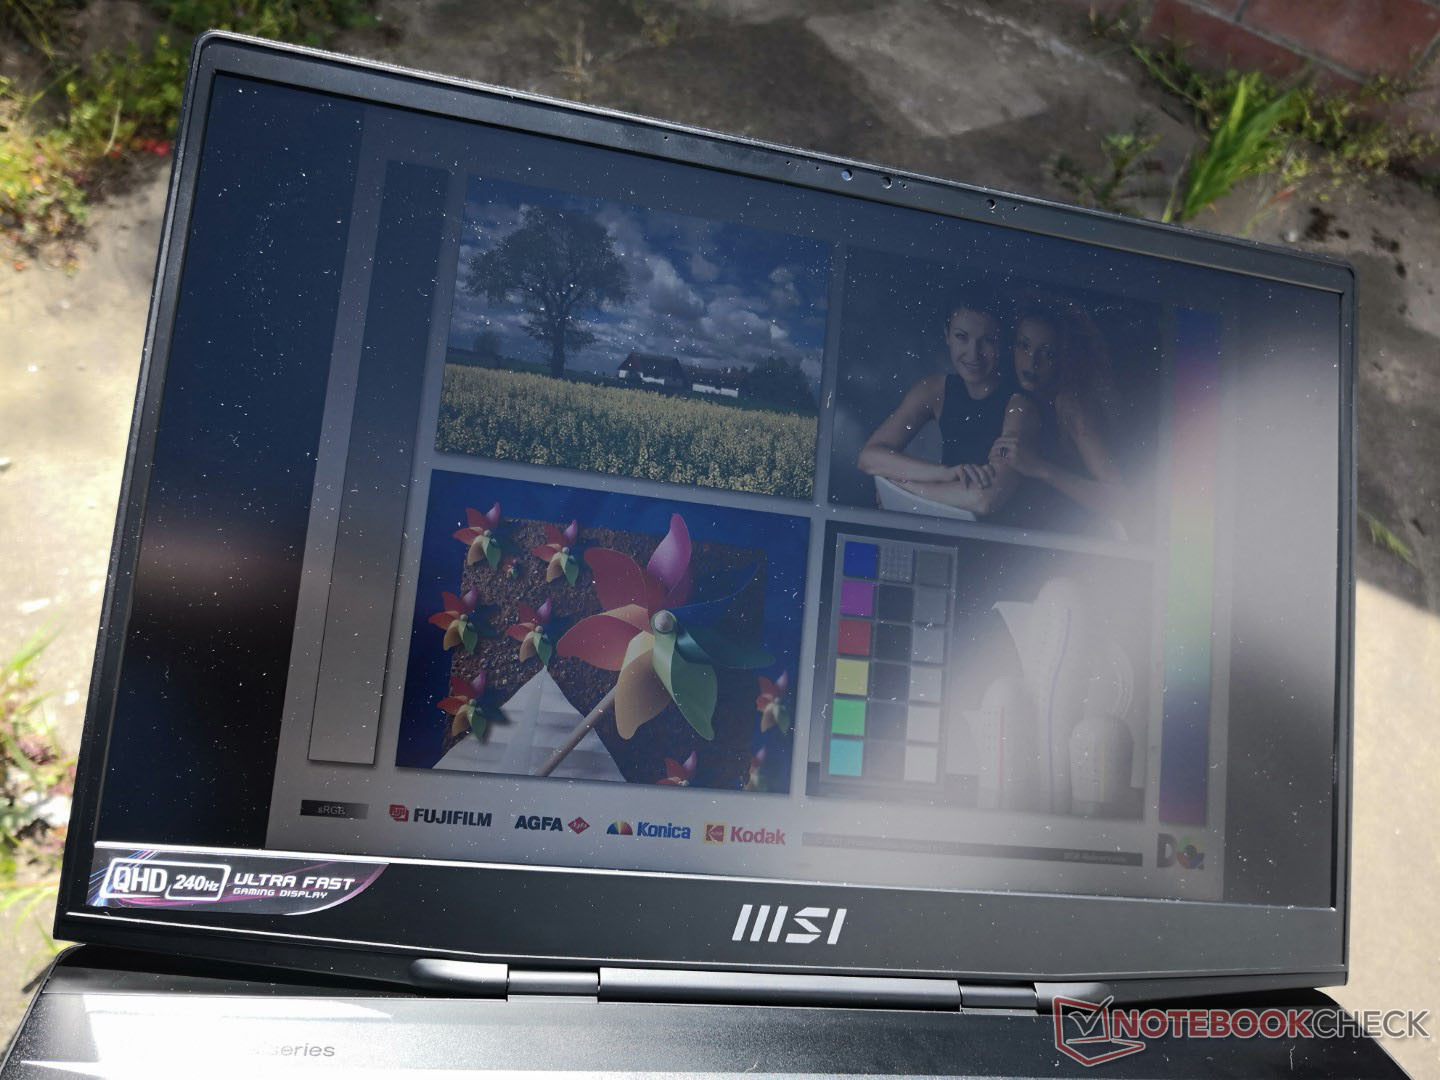
Das 1440p-Display unseres Testgeräts ist rund 30 % dunkler als das 4K-Display des GS76 und liegt nun auf einem zum Blade 17 vergleichbaren Niveau. Folglich ist die Nutzbarkeit im Freien verglichen zum Vorjahresmodell deutlich eingeschränkter.
Performance – 12. Generation Intel mit 105-W-TGP-Grafik
Testbedingungen
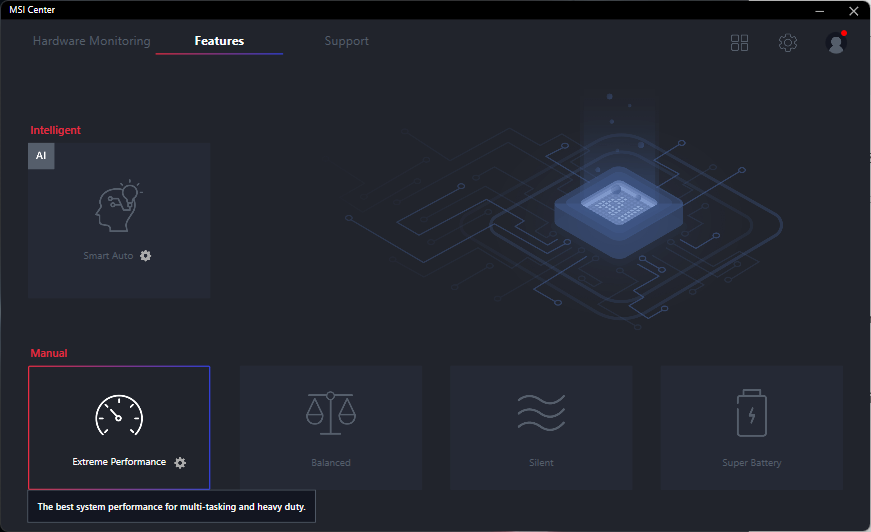
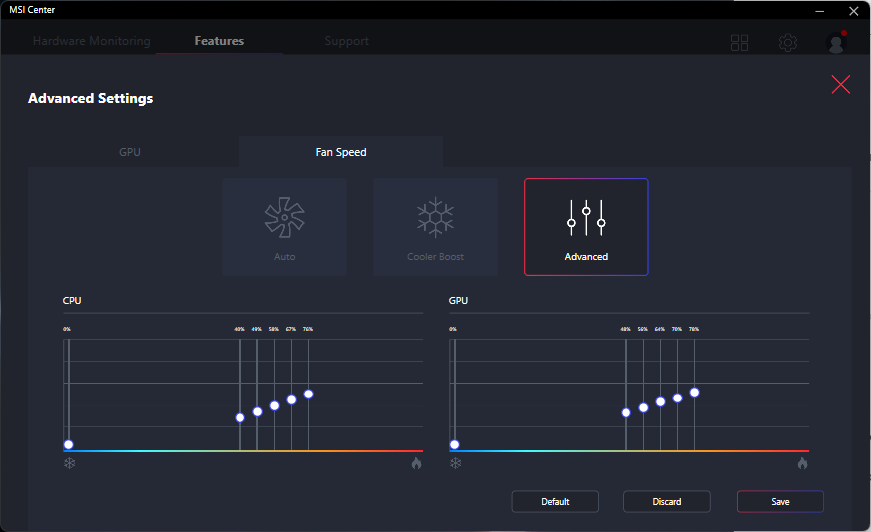
Für die Benchmarks haben wir auf unserem Testgerät den Preset „Extreme Performance“ in MSIs Control Center aktiviert. Wir empfehlen Anwendern sich mit dieser Software gut vertraut zu machen da hierüber diverse Systemeigenschaften beeinflusst werden können.
Prozessor – Deutliche Zugewinne zum Vorjahr
Die CPU-Performance fällt hervorragend aus und liegt nur ein bis zwei Prozentpunkte entfernt vom durchschnittlichen Core-i7-12700H-Laptop in unserer Datenbank. Im Multi-Thread-Test schnitt unser Testgerät sogar durchweg um 6-8 % besser ab als der Core i7-12800H im Razer Blade 17. Obwohl der Unterschied sehr gering ausfällt, erklärt er doch die höheren Framerates des GS77 im Vergleich zum Blade 17.
Zusätzlich zum i7 bekommt man das GS77 auch mit dem teureren Core i9-12900H. Basierend auf unseren bisherigen Erfahrungen mit anderen Core-i7-12900H-Laptops dürfte der erwartete Zugewinn gegenüber dem Core i7-12700H jedoch nur im einstelligen Prozentbereich liegen.
Der Unterschied zum Vorjahresmodell mit Intels 11.-Generation-Tiger-Lake-H-Serie fällt da schon dramatischer aus. Verglichen zum Core i9-11900H des letztjährigen GS76 läuft der Core i7-12700H in Single-Thread-Szenarien etwa 15 % schneller und bei Multi-Thread-Last sogar zwischen 25 und 30 %.
Cinebench R15 Multi Loop
Cinebench R23: Multi Core | Single Core
Cinebench R15: CPU Multi 64Bit | CPU Single 64Bit
Blender: v2.79 BMW27 CPU
7-Zip 18.03: 7z b 4 | 7z b 4 -mmt1
Geekbench 5.5: Multi-Core | Single-Core
HWBOT x265 Benchmark v2.2: 4k Preset
LibreOffice : 20 Documents To PDF
R Benchmark 2.5: Overall mean
| Cinebench R20 / CPU (Single Core) | |
| Corsair One i300 | |
| MSI GE76 Raider | |
| MSI Vector GP66 12UGS | |
| Razer Blade 17 RTX 3080 Ti | |
| Asus TUF Gaming F17 FX707Z-HX011W | |
| MSI Stealth GS77 12UHS-083US | |
| Durchschnittliche Intel Core i7-12700H (300 - 704, n=64) | |
| MSI GS76 Stealth 11UH | |
| Schenker XMG Pro 17 (Late 2021, RTX 3080) | |
| Gigabyte A7 X1 | |
| Asus ROG Strix G17 G713QE-RB74 | |
| MSI GS75 10SF-609US | |
| MSI GE76 Raider 10UH | |
| Geekbench 5.5 / Multi-Core | |
| Corsair One i300 | |
| MSI GE76 Raider | |
| MSI Stealth GS77 12UHS-083US | |
| Razer Blade 17 RTX 3080 Ti | |
| Asus TUF Gaming F17 FX707Z-HX011W | |
| MSI Vector GP66 12UGS | |
| Durchschnittliche Intel Core i7-12700H (5144 - 13745, n=64) | |
| MSI GS76 Stealth 11UH | |
| Schenker XMG Pro 17 (Late 2021, RTX 3080) | |
| MSI GS75 10SF-609US | |
| MSI GE76 Raider 10UH | |
| Gigabyte A7 X1 | |
| Geekbench 5.5 / Single-Core | |
| Corsair One i300 | |
| MSI GE76 Raider | |
| MSI Vector GP66 12UGS | |
| Asus TUF Gaming F17 FX707Z-HX011W | |
| Razer Blade 17 RTX 3080 Ti | |
| MSI Stealth GS77 12UHS-083US | |
| Durchschnittliche Intel Core i7-12700H (803 - 1851, n=64) | |
| MSI GS76 Stealth 11UH | |
| Schenker XMG Pro 17 (Late 2021, RTX 3080) | |
| Gigabyte A7 X1 | |
| MSI GS75 10SF-609US | |
| MSI GE76 Raider 10UH | |
| HWBOT x265 Benchmark v2.2 / 4k Preset | |
| Corsair One i300 | |
| MSI GE76 Raider | |
| MSI Vector GP66 12UGS | |
| MSI Stealth GS77 12UHS-083US | |
| Razer Blade 17 RTX 3080 Ti | |
| Durchschnittliche Intel Core i7-12700H (4.67 - 21.8, n=64) | |
| MSI GS76 Stealth 11UH | |
| Schenker XMG Pro 17 (Late 2021, RTX 3080) | |
| Asus ROG Strix G17 G713QE-RB74 | |
| Gigabyte A7 X1 | |
| Asus TUF Gaming F17 FX707Z-HX011W | |
| MSI GE76 Raider 10UH | |
| MSI GS75 10SF-609US | |
Cinebench R23: Multi Core | Single Core
Cinebench R15: CPU Multi 64Bit | CPU Single 64Bit
Blender: v2.79 BMW27 CPU
7-Zip 18.03: 7z b 4 | 7z b 4 -mmt1
Geekbench 5.5: Multi-Core | Single-Core
HWBOT x265 Benchmark v2.2: 4k Preset
LibreOffice : 20 Documents To PDF
R Benchmark 2.5: Overall mean
* ... kleinere Werte sind besser
AIDA64: FP32 Ray-Trace | FPU Julia | CPU SHA3 | CPU Queen | FPU SinJulia | FPU Mandel | CPU AES | CPU ZLib | FP64 Ray-Trace | CPU PhotoWorxx
| Performance Rating | |
| MSI GE76 Raider | |
| Durchschnittliche Intel Core i7-12700H | |
| MSI Stealth GS77 12UHS-083US | |
| Razer Blade 17 RTX 3080 Ti | |
| AIDA64 / FP32 Ray-Trace | |
| Durchschnittliche Intel Core i7-12700H (2585 - 17957, n=64) | |
| MSI GE76 Raider | |
| MSI Stealth GS77 12UHS-083US | |
| Razer Blade 17 RTX 3080 Ti | |
| AIDA64 / FPU Julia | |
| Durchschnittliche Intel Core i7-12700H (12439 - 90760, n=64) | |
| MSI GE76 Raider | |
| MSI Stealth GS77 12UHS-083US | |
| Razer Blade 17 RTX 3080 Ti | |
| AIDA64 / CPU SHA3 | |
| MSI GE76 Raider | |
| MSI Stealth GS77 12UHS-083US | |
| Durchschnittliche Intel Core i7-12700H (833 - 4242, n=64) | |
| Razer Blade 17 RTX 3080 Ti | |
| AIDA64 / CPU Queen | |
| MSI GE76 Raider | |
| Razer Blade 17 RTX 3080 Ti | |
| MSI Stealth GS77 12UHS-083US | |
| Durchschnittliche Intel Core i7-12700H (57923 - 103202, n=63) | |
| AIDA64 / FPU SinJulia | |
| MSI GE76 Raider | |
| MSI Stealth GS77 12UHS-083US | |
| Razer Blade 17 RTX 3080 Ti | |
| Durchschnittliche Intel Core i7-12700H (3249 - 9939, n=64) | |
| AIDA64 / FPU Mandel | |
| Durchschnittliche Intel Core i7-12700H (7135 - 44760, n=64) | |
| MSI GE76 Raider | |
| MSI Stealth GS77 12UHS-083US | |
| Razer Blade 17 RTX 3080 Ti | |
| AIDA64 / CPU AES | |
| MSI GE76 Raider | |
| MSI Stealth GS77 12UHS-083US | |
| Durchschnittliche Intel Core i7-12700H (31839 - 144360, n=64) | |
| Razer Blade 17 RTX 3080 Ti | |
| AIDA64 / CPU ZLib | |
| MSI GE76 Raider | |
| MSI Stealth GS77 12UHS-083US | |
| Durchschnittliche Intel Core i7-12700H (305 - 1171, n=64) | |
| Razer Blade 17 RTX 3080 Ti | |
| AIDA64 / FP64 Ray-Trace | |
| Durchschnittliche Intel Core i7-12700H (1437 - 9692, n=64) | |
| MSI GE76 Raider | |
| MSI Stealth GS77 12UHS-083US | |
| Razer Blade 17 RTX 3080 Ti | |
| AIDA64 / CPU PhotoWorxx | |
| Razer Blade 17 RTX 3080 Ti | |
| MSI GE76 Raider | |
| MSI Stealth GS77 12UHS-083US | |
| Durchschnittliche Intel Core i7-12700H (12863 - 52207, n=64) | |
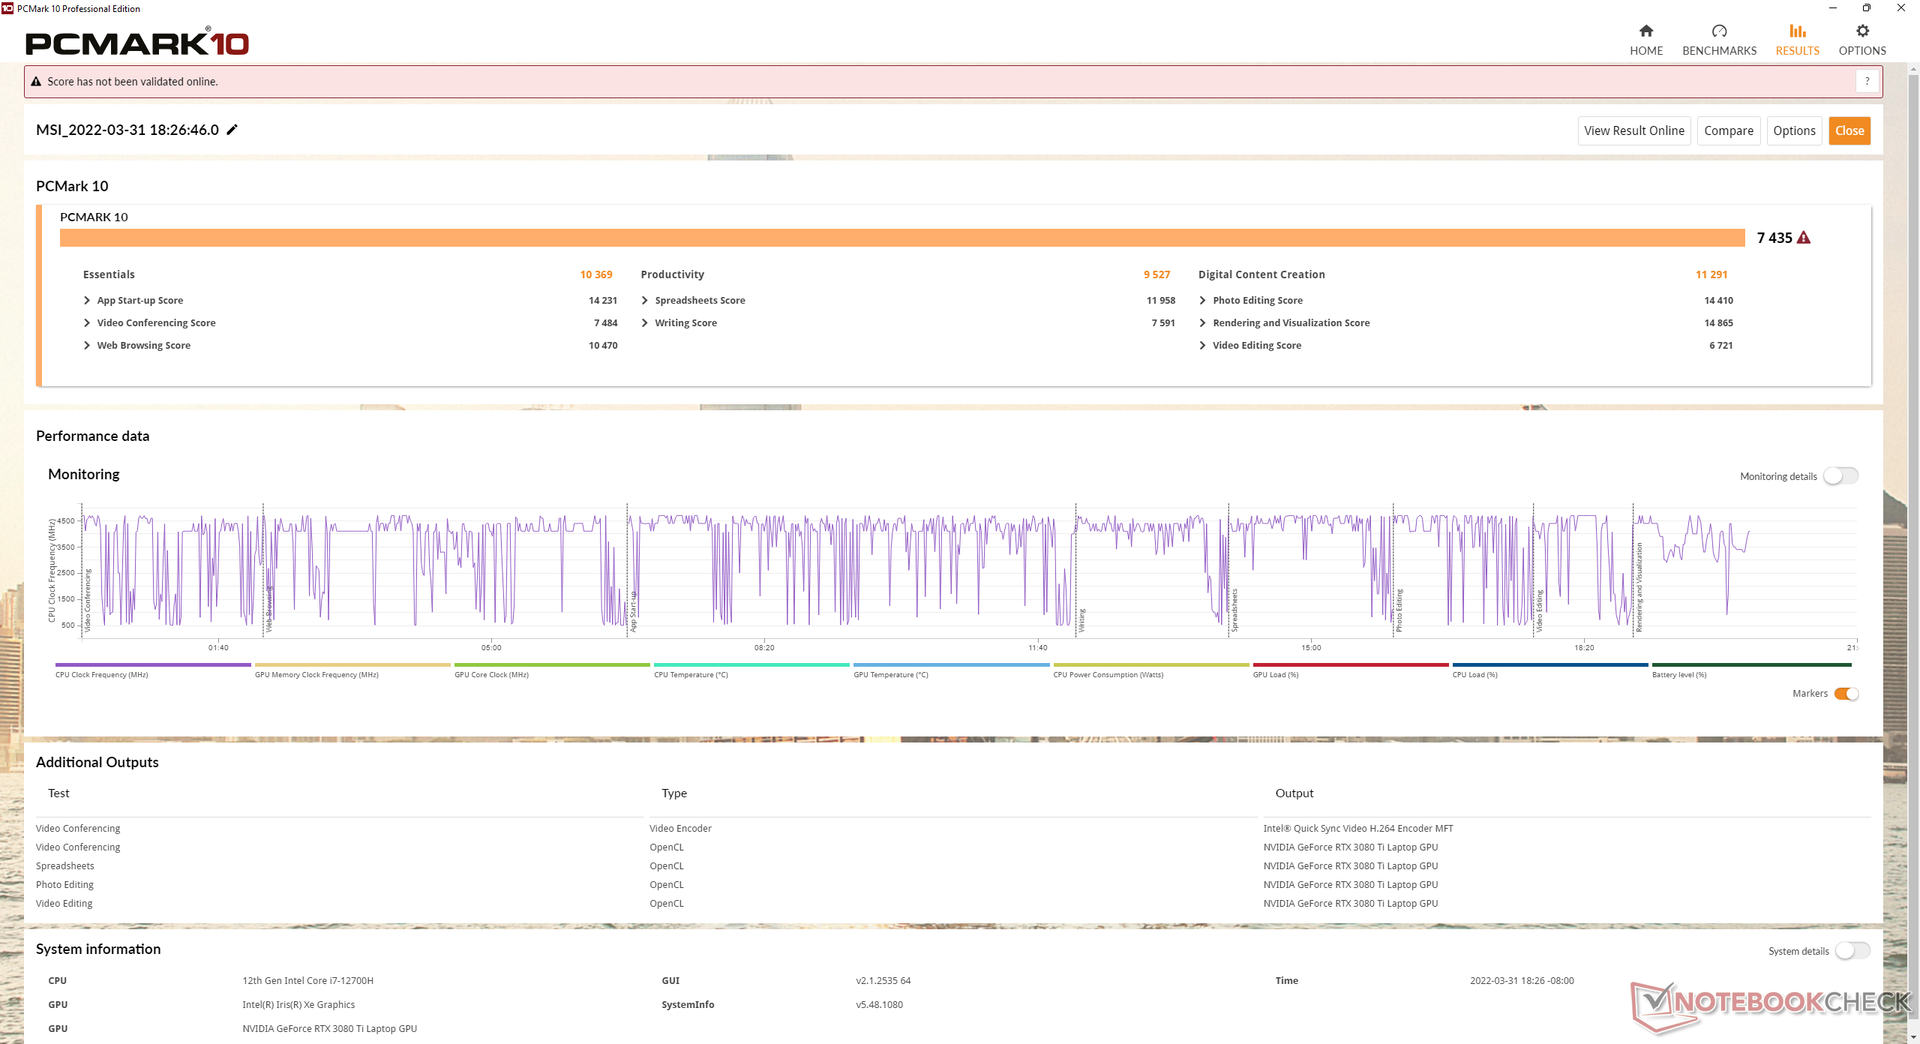
System Performance
Im PCMark schließt unser Testgerät durch die Bank durch besser ab als das GS76 vom Vorjahr, schafft es jedoch nicht am Blade 17 vorbei.
Uns sind während des Testzeitraums ein paar Ungereimtheiten in Zusammenhang mit Standby und der Bildwiederholrate aufgefallen. Manchmal, wenn wir unser Gerät schlafen gelegt haben, waren sowohl der Energiebedarf als auch die daraus resultierenden Oberflächentemperaturen abnormal hoch. Außerdem begrüßten uns manche Spiele, wie Witcher 3, Far Cry 5 und Strange Brigade mit einem schwarzen Bildschirm, wenn die Bildwiederholrate auf 240 Hz statt 60 Hz stand. Obwohl beide Gerät mit demselben BOE-240-Hz-Panel ausgestattet sind konnten wir keines dieser Probleme beim Blade 17 beobachten.
| PCMark 10 / Score | |
| MSI GE76 Raider | |
| Razer Blade 17 RTX 3080 Ti | |
| Alienware x17 RTX 3080 P48E | |
| MSI Stealth GS77 12UHS-083US | |
| Durchschnittliche Intel Core i7-12700H, NVIDIA GeForce RTX 3080 Ti Laptop GPU (6868 - 7638, n=7) | |
| Asus ROG Zephyrus S17 GX703HSD | |
| MSI GS76 Stealth 11UH | |
| PCMark 10 / Essentials | |
| Razer Blade 17 RTX 3080 Ti | |
| MSI GE76 Raider | |
| Asus ROG Zephyrus S17 GX703HSD | |
| Durchschnittliche Intel Core i7-12700H, NVIDIA GeForce RTX 3080 Ti Laptop GPU (9987 - 11318, n=7) | |
| MSI Stealth GS77 12UHS-083US | |
| Alienware x17 RTX 3080 P48E | |
| MSI GS76 Stealth 11UH | |
| PCMark 10 / Productivity | |
| MSI GE76 Raider | |
| Alienware x17 RTX 3080 P48E | |
| MSI Stealth GS77 12UHS-083US | |
| Durchschnittliche Intel Core i7-12700H, NVIDIA GeForce RTX 3080 Ti Laptop GPU (8944 - 10726, n=7) | |
| Razer Blade 17 RTX 3080 Ti | |
| Asus ROG Zephyrus S17 GX703HSD | |
| MSI GS76 Stealth 11UH | |
| PCMark 10 / Digital Content Creation | |
| MSI GE76 Raider | |
| Razer Blade 17 RTX 3080 Ti | |
| Alienware x17 RTX 3080 P48E | |
| MSI Stealth GS77 12UHS-083US | |
| Durchschnittliche Intel Core i7-12700H, NVIDIA GeForce RTX 3080 Ti Laptop GPU (8956 - 12249, n=7) | |
| Asus ROG Zephyrus S17 GX703HSD | |
| MSI GS76 Stealth 11UH | |
| PCMark 10 Score | 7435 Punkte | |
Hilfe | ||
| AIDA64 / Memory Copy | |
| MSI GE76 Raider | |
| Razer Blade 17 RTX 3080 Ti | |
| MSI Stealth GS77 12UHS-083US | |
| Durchschnittliche Intel Core i7-12700H (25615 - 80511, n=64) | |
| AIDA64 / Memory Read | |
| Razer Blade 17 RTX 3080 Ti | |
| MSI GE76 Raider | |
| MSI Stealth GS77 12UHS-083US | |
| Durchschnittliche Intel Core i7-12700H (25586 - 79442, n=64) | |
| AIDA64 / Memory Write | |
| Razer Blade 17 RTX 3080 Ti | |
| MSI Stealth GS77 12UHS-083US | |
| MSI GE76 Raider | |
| Durchschnittliche Intel Core i7-12700H (23679 - 88660, n=64) | |
| AIDA64 / Memory Latency | |
| MSI Stealth GS77 12UHS-083US | |
| MSI GE76 Raider | |
| Durchschnittliche Intel Core i7-12700H (76.2 - 133.9, n=62) | |
| Asus ROG Zephyrus S17 GX703HSD | |
| Alienware x17 RTX 3080 P48E | |
| Razer Blade 17 RTX 3080 Ti | |
* ... kleinere Werte sind besser
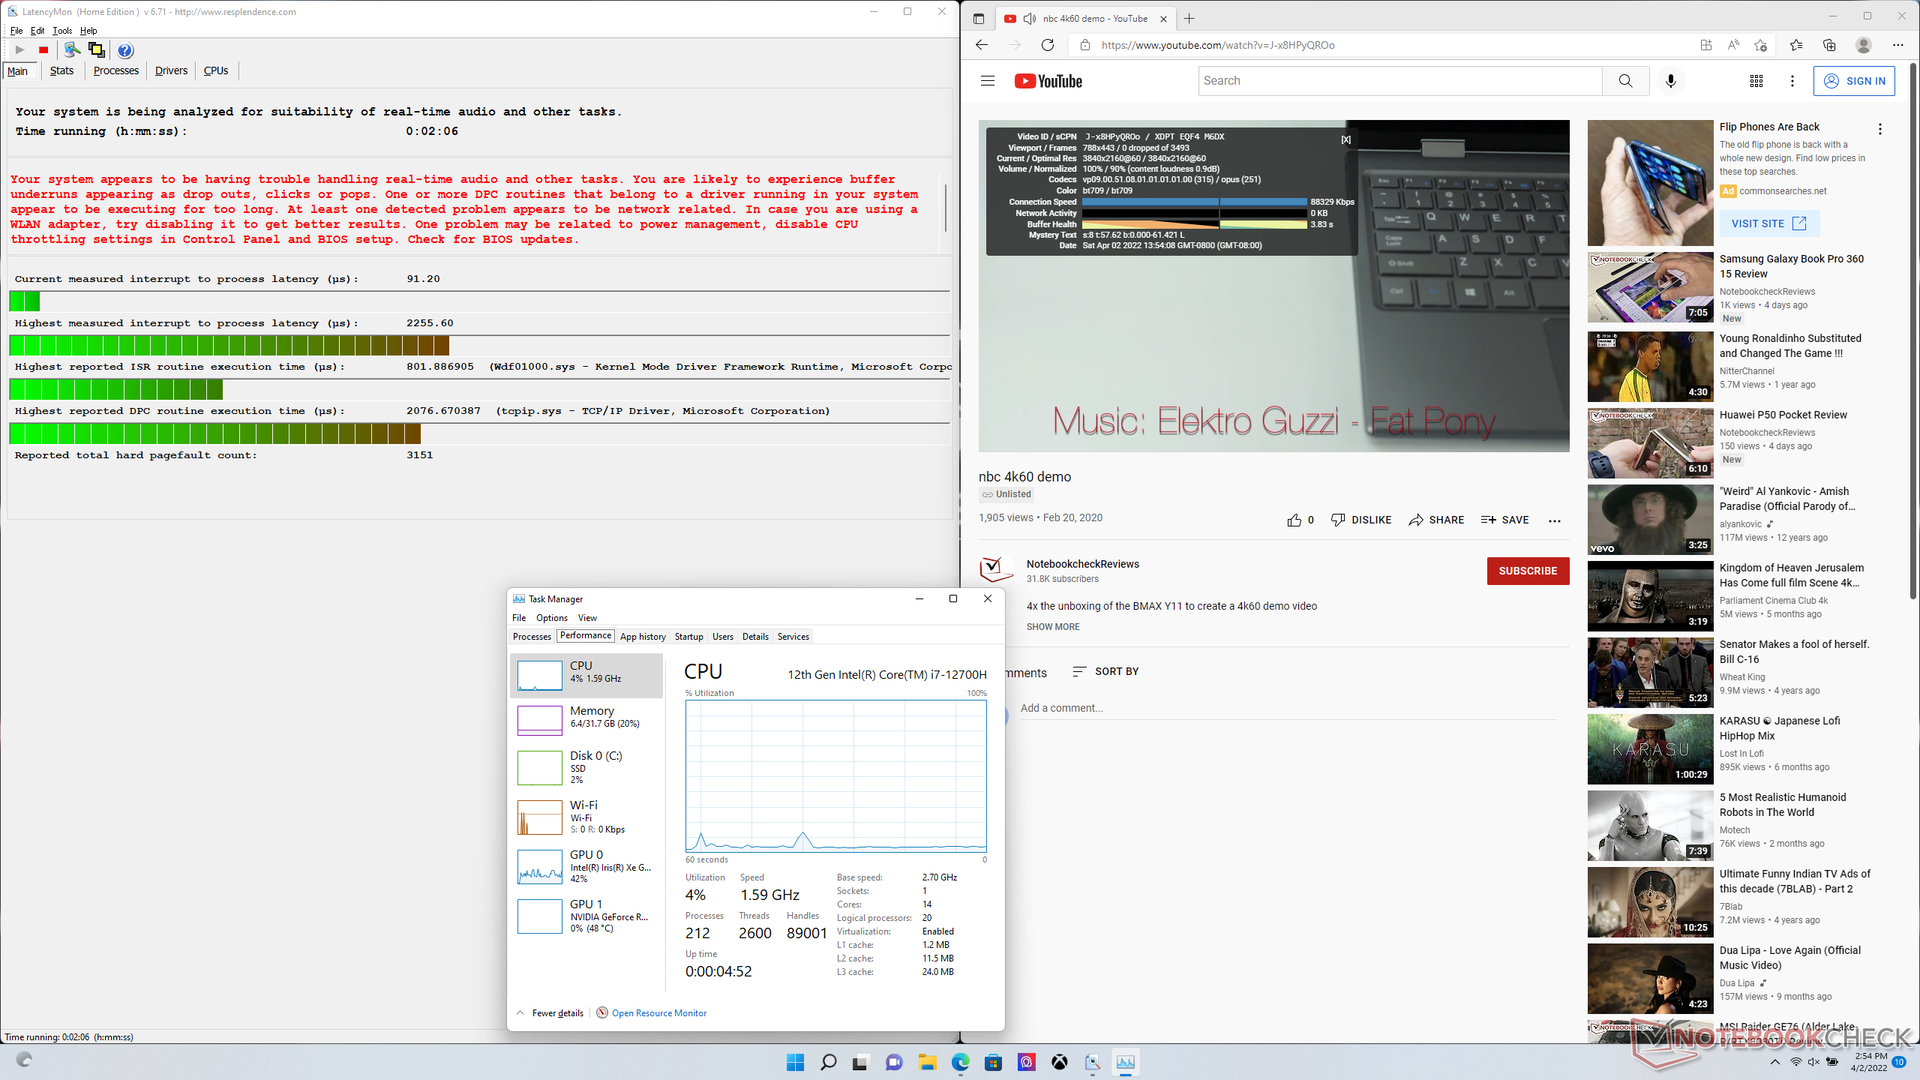
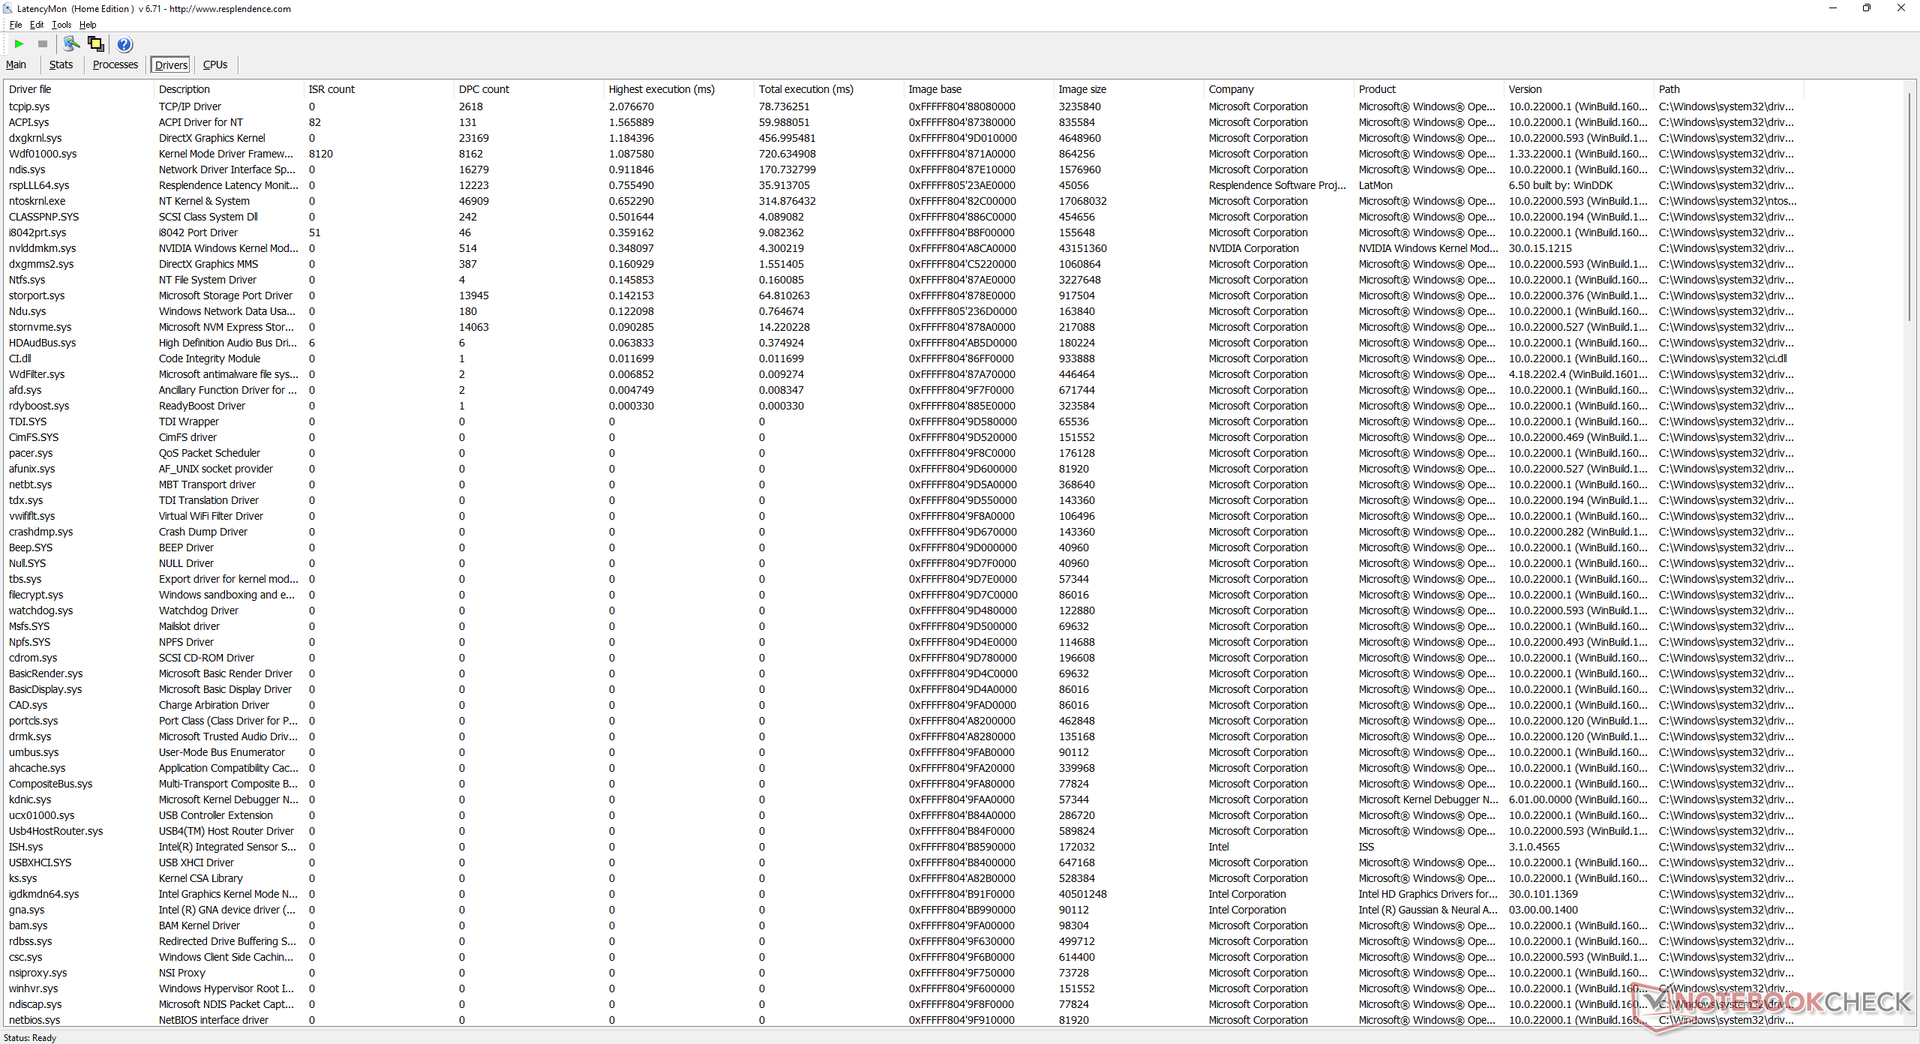
DPC-Latenzen
LatencyMon zeigte beim Öffnen multipler Browser-Tabs unserer Homepage erhöhte Latenzen an. 4K-Videowiedergabe mit 60 FPS auf der integrierten GPU lief dagegen flüssig und ohne Dropped Frames.
| DPC Latencies / LatencyMon - interrupt to process latency (max), Web, Youtube, Prime95 | |
| Alienware x17 RTX 3080 P48E | |
| MSI Stealth GS77 12UHS-083US | |
| MSI GE76 Raider | |
| Asus ROG Zephyrus S17 GX703HSD | |
| Razer Blade 17 RTX 3080 Ti | |
| MSI GS76 Stealth 11UH | |
* ... kleinere Werte sind besser
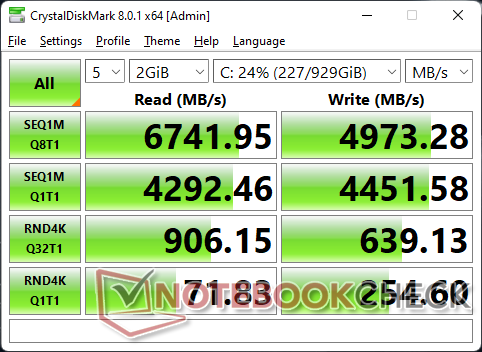
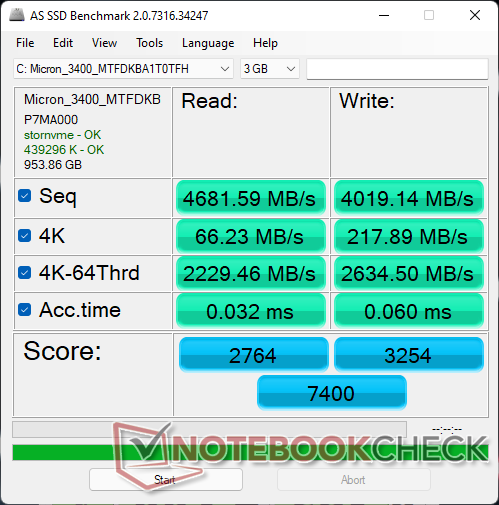
Massenspeicher – Bis Zu 2x PCIe4-x4-NVMe-SSD
In unserem Testgerät steckte eine Micron-3400-PCIe4-x4-NVMe-SSD. Und obwohl es sich hierbei um ein High-End-Modell handelt war sie durchgehend langsamer als Samsungs PM9A1, die in den meisten hochwertigen Gaming-Laptops steckt. Nichtsdestotrotz war die Konsistent der SSD hervorragend.

| Drive Performance Rating - Percent | |
| Asus ROG Zephyrus S17 GX703HSD | |
| MSI GE76 Raider | |
| Razer Blade 17 RTX 3080 Ti | |
| MSI GS76 Stealth 11UH | |
| MSI Stealth GS77 12UHS-083US | |
| Alienware x17 RTX 3080 P48E | |
* ... kleinere Werte sind besser
Disk Throttling: DiskSpd Read Loop, Queue Depth 8
Grafikkarte – Minimal Langsamer als eine RTX 3080
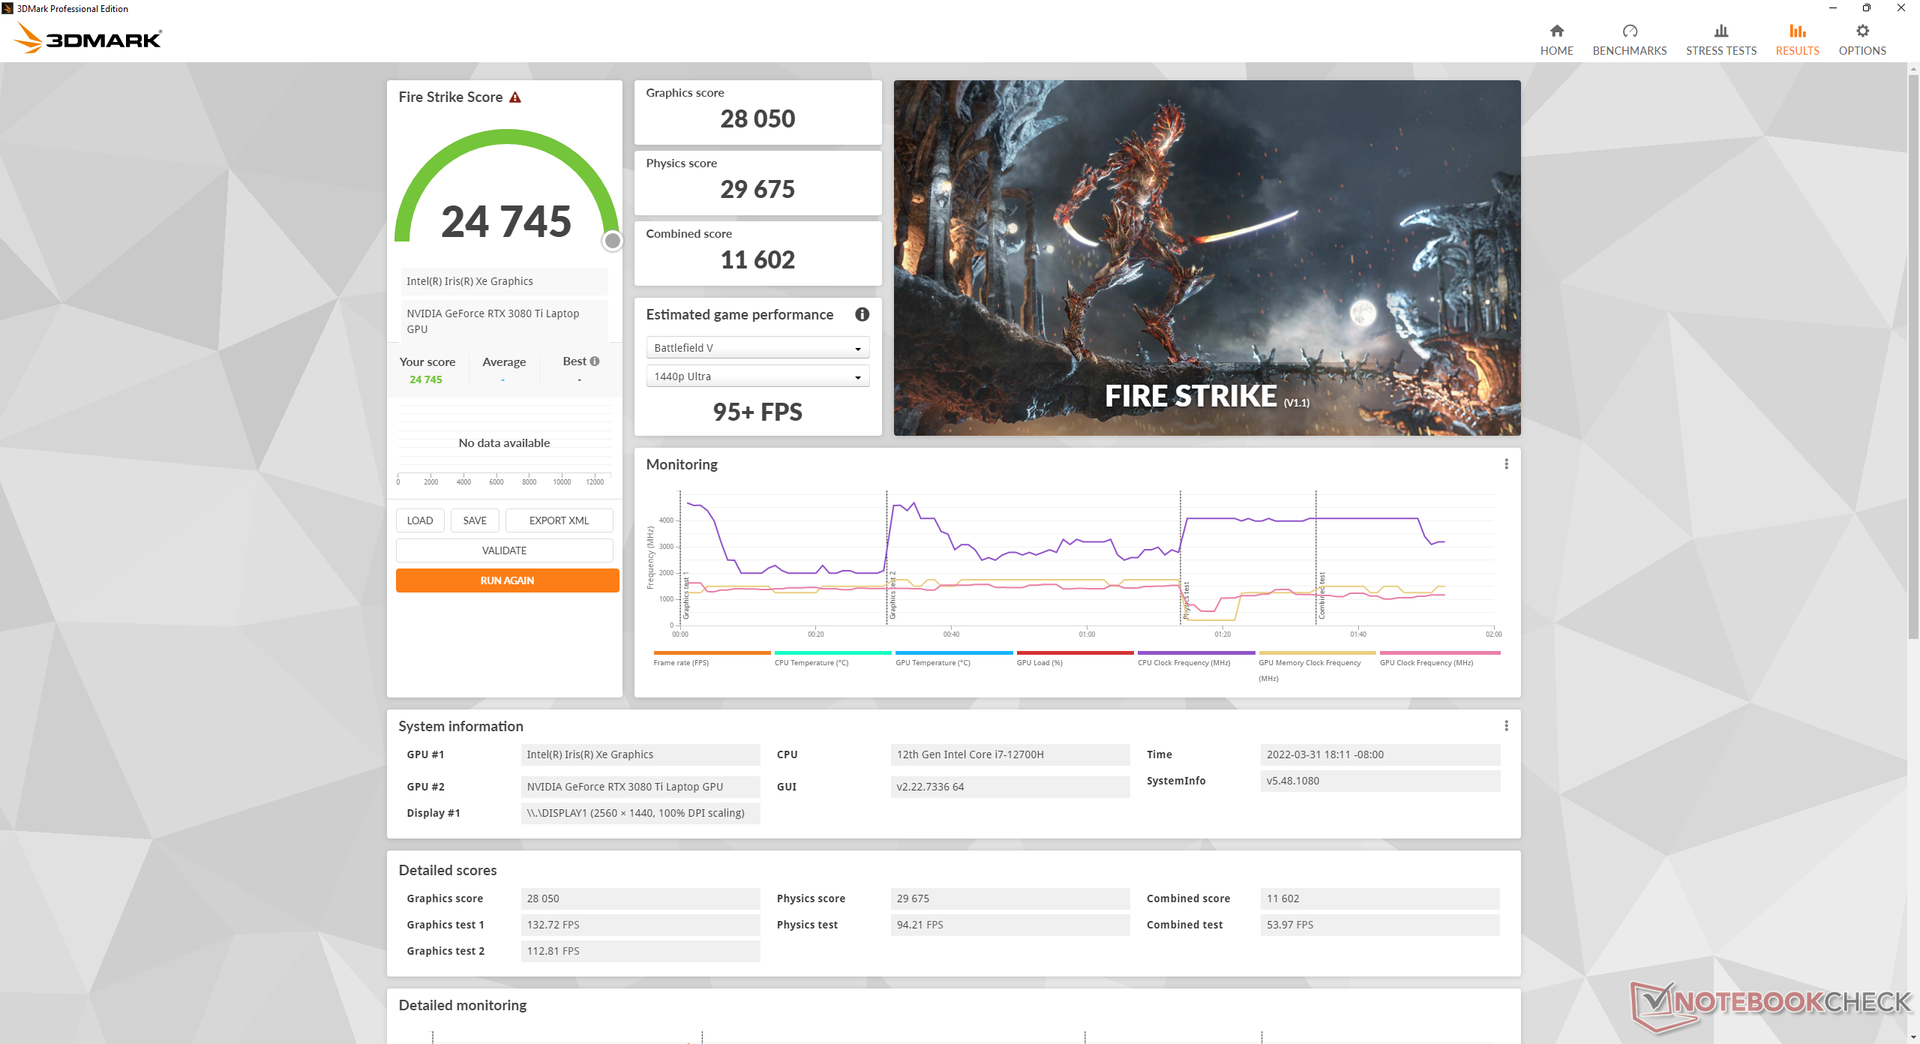
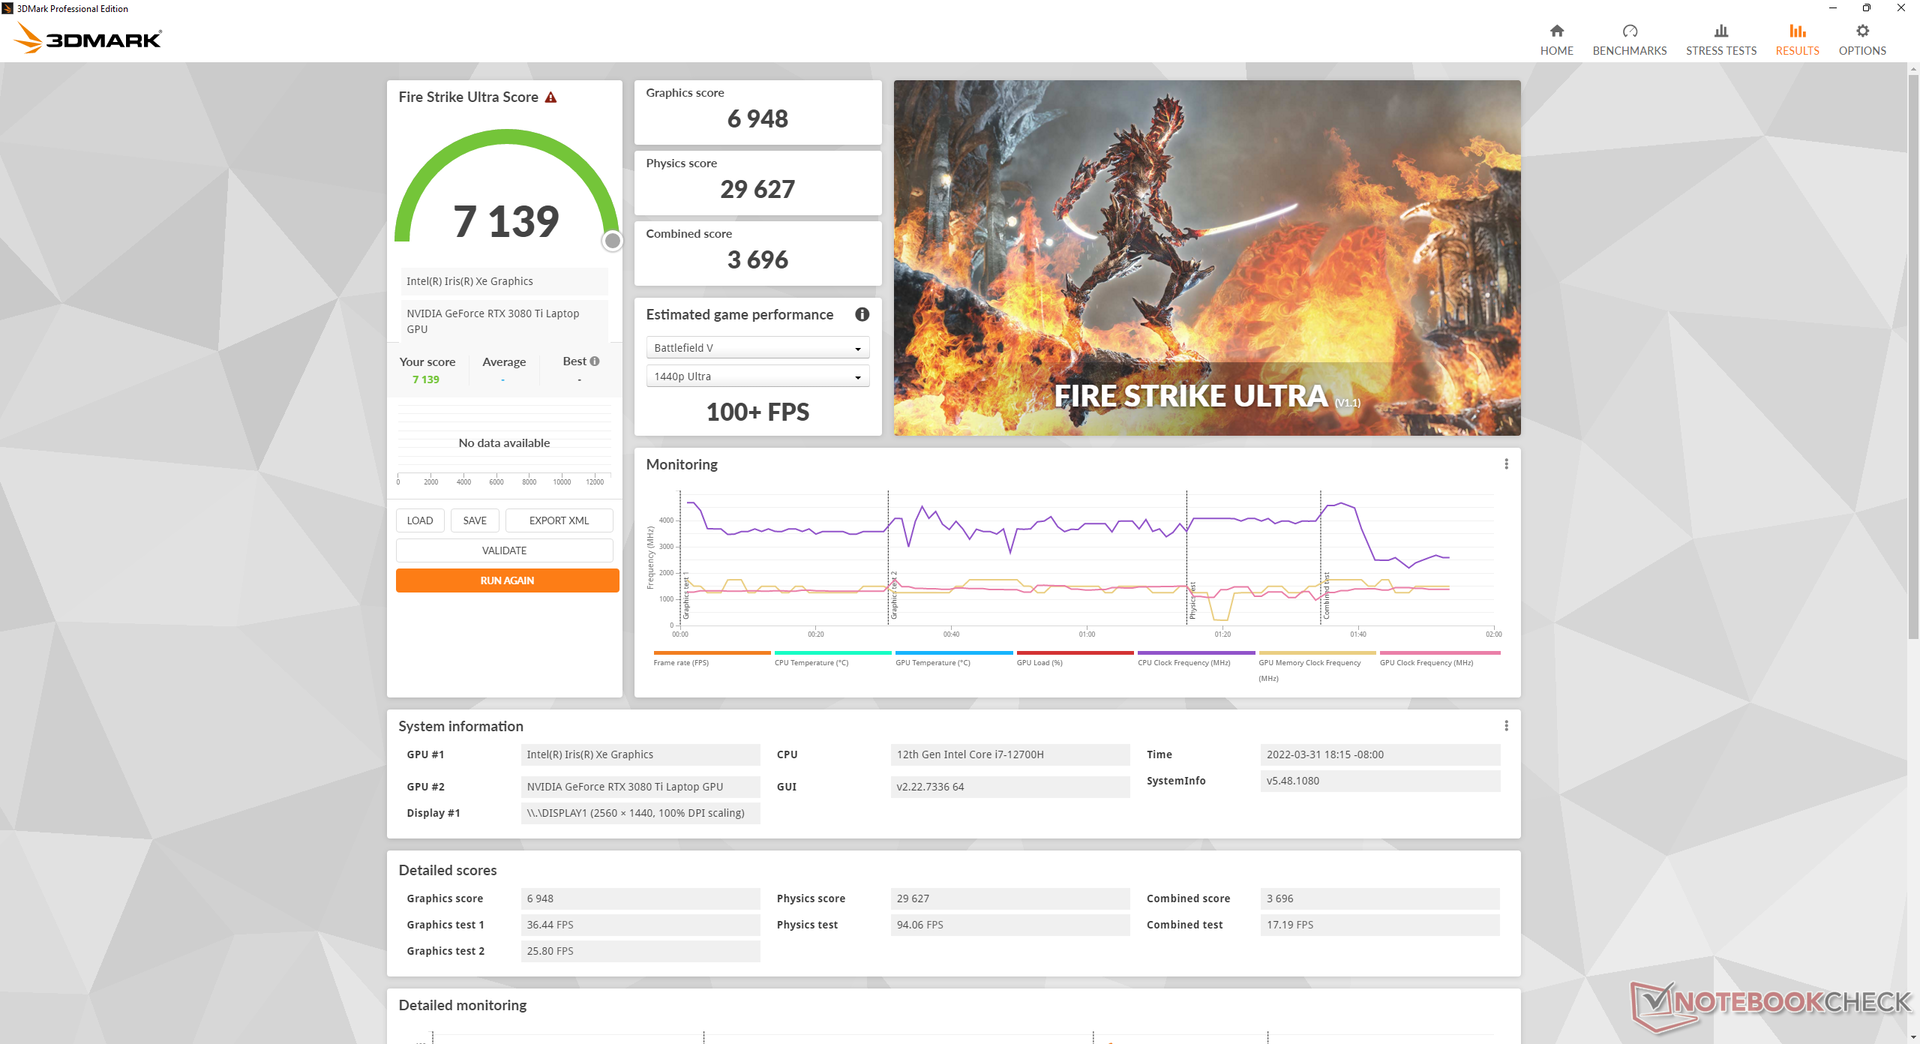
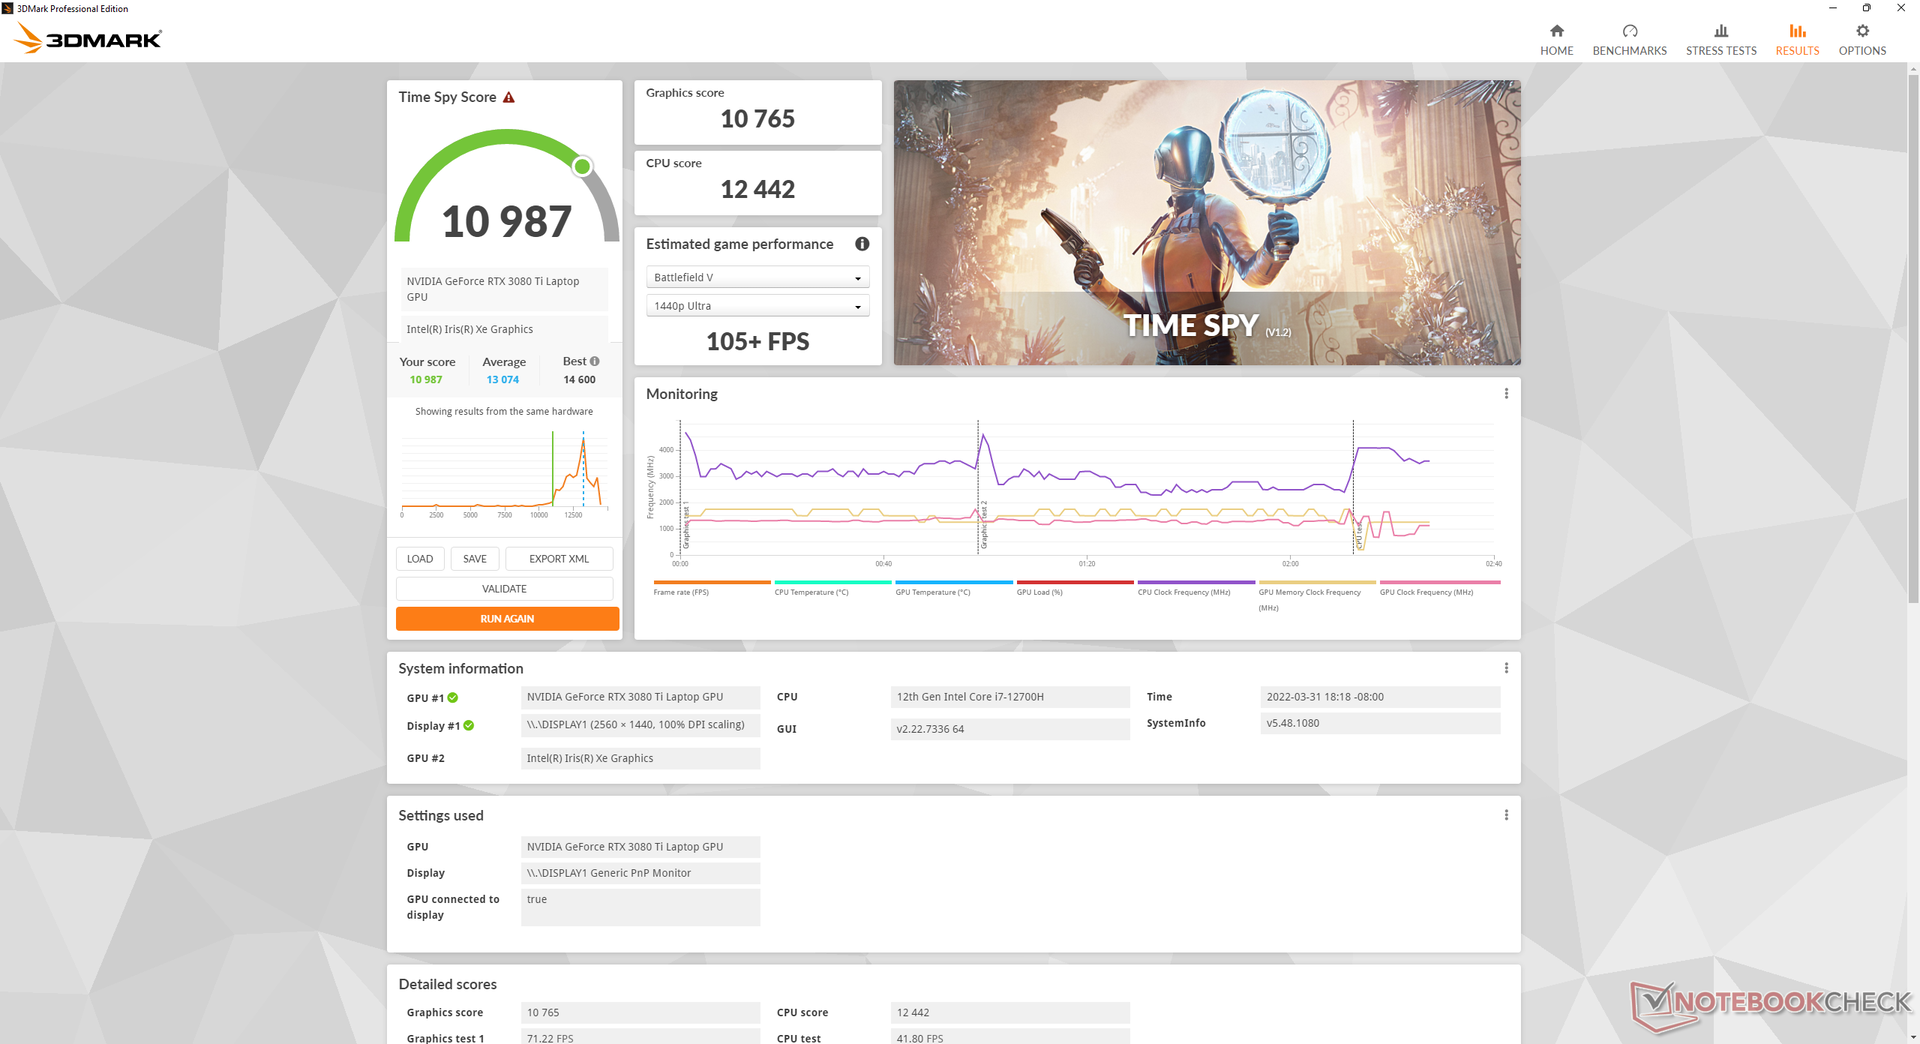
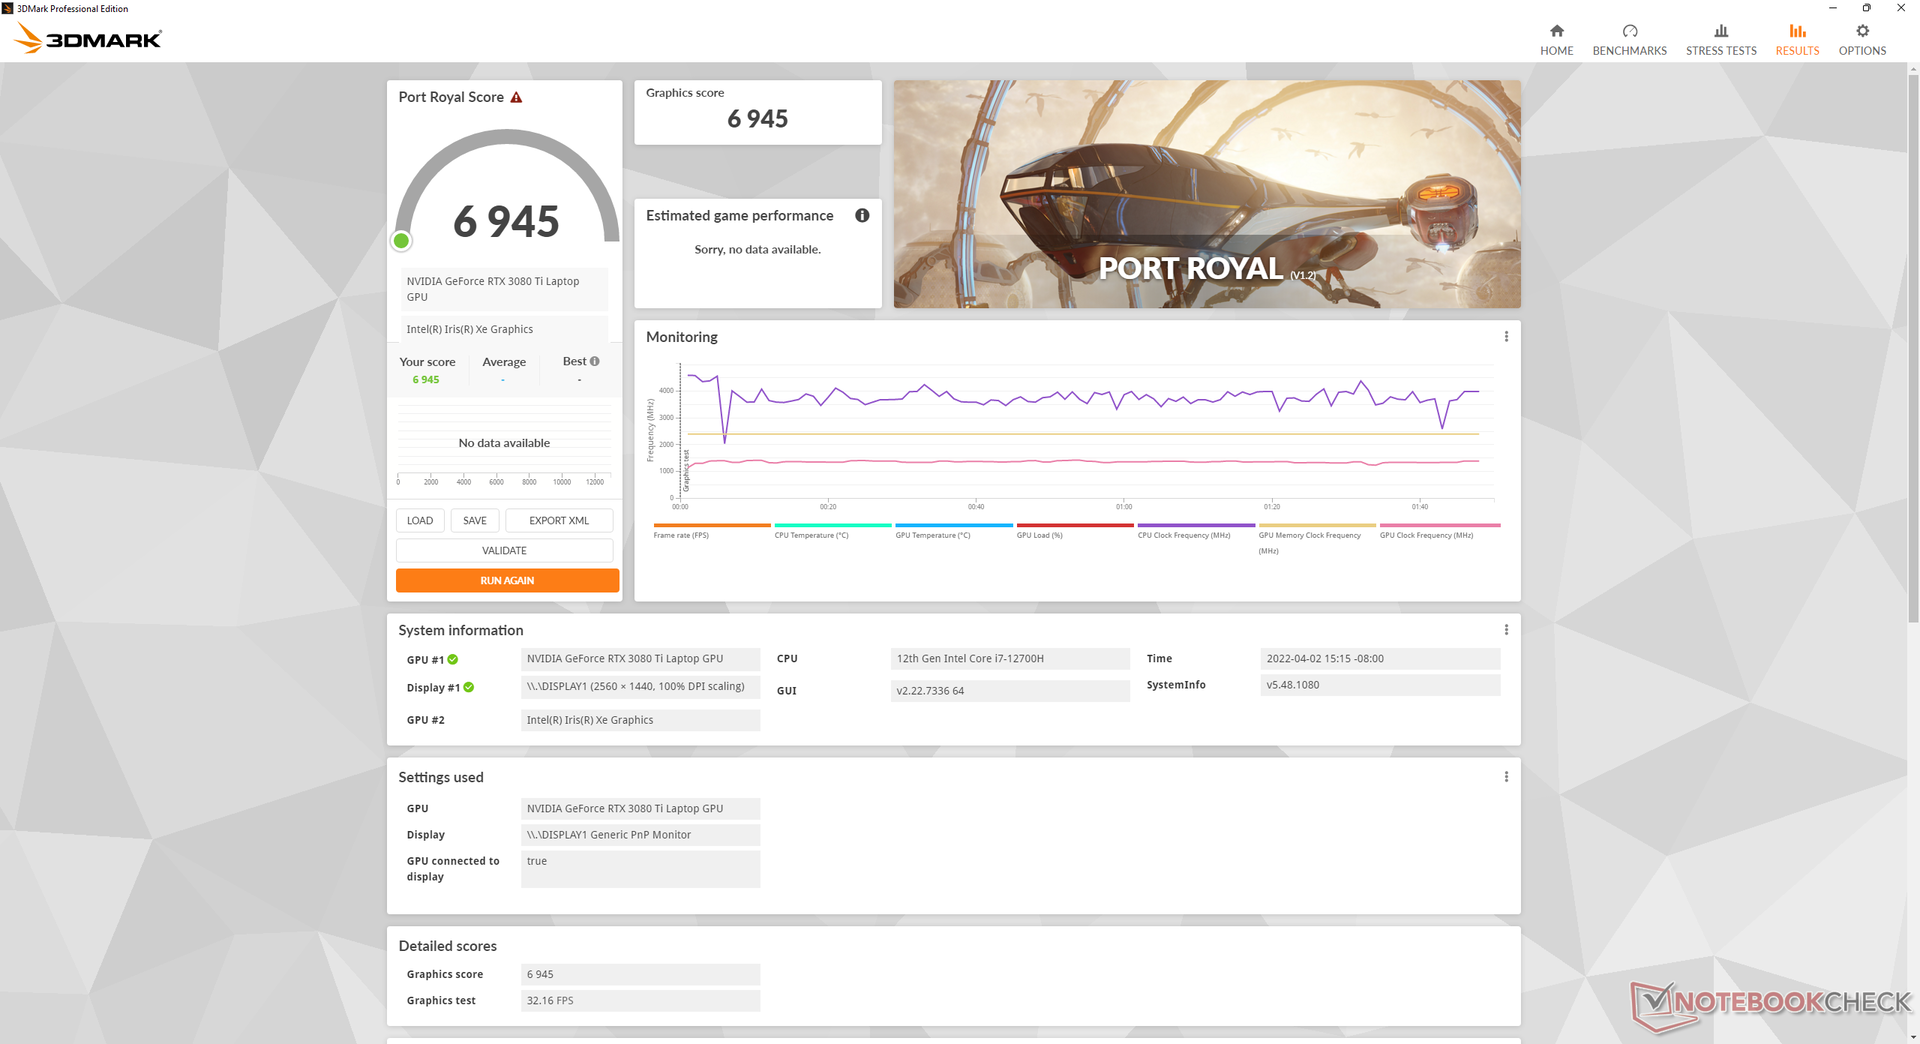
Die GeForce RTX 3080 Ti des GS77 läuft um etwa 12 bis 15 % schneller als die RTX 3080 im Vorgängermodell. Vergleicht man sie dagegen mit der RTX 3080 Ti mit 165 W TGP des Razer Blade 17 ist die 105-W-GPU des GS77 im Schnitt um 13-18 % langsamer. Dieses Delta zeigt sich besonders in hohen Auflösungen, wo unser GS77-Testgerät durchgehend hinter dem Blade 17 zurücklag. Bei niedrigeren Auflösungen wie 1080p oder darunter ist der Unterschied zwischen einer 105-W-RTX-3080-Ti und einer 165-W-RTX-3080-Ti dagegen deutlich weniger ausgeprägt, da hier die CPU der begrenzende Faktor ist.
Stellt man das Performance-Profil von Extreme Performance auf Balanced um ergibt sich ein Abfall der GPU-Leistung um etwa 12 %.
Eine Desktop-GeForce-RTX-3080-Ti dagegen ist und bleibt mit einem Vorsprung von 65-80 % signifikant schneller als jede mobile GPU.
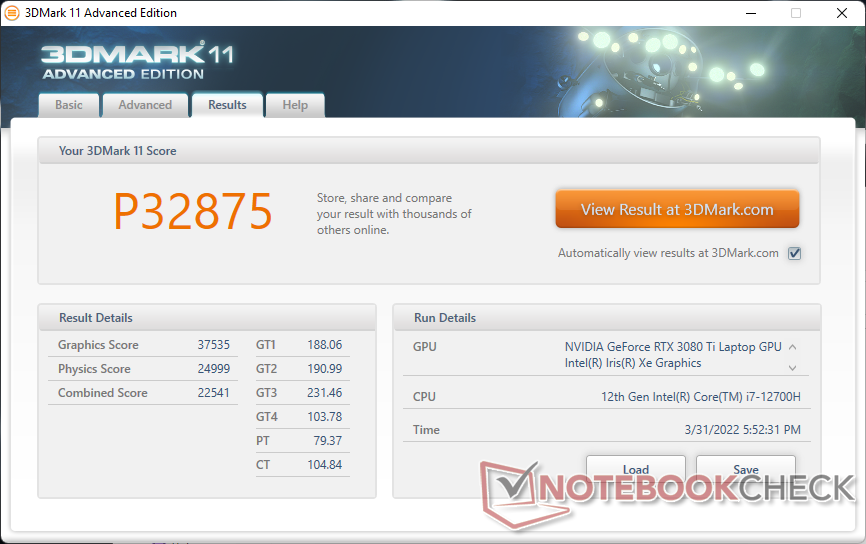
| 3DMark 11 Performance | 32875 Punkte | |
| 3DMark Cloud Gate Standard Score | 55980 Punkte | |
| 3DMark Fire Strike Score | 24745 Punkte | |
| 3DMark Time Spy Score | 10987 Punkte | |
Hilfe | ||
Witcher 3 FPS Chart
| min. | mittel | hoch | max. | QHD | |
|---|---|---|---|---|---|
| GTA V (2015) | 186 | 185 | 175 | 113 | 94.2 |
| The Witcher 3 (2015) | 447.2 | 298.8 | 206.8 | 109.1 | |
| Dota 2 Reborn (2015) | 182 | 169 | 161 | 154 | |
| Final Fantasy XV Benchmark (2018) | 196 | 130 | 101 | 79.5 | |
| X-Plane 11.11 (2018) | 146 | 126 | 103 | ||
| Far Cry 5 (2018) | 190 | 145 | 136 | 129 | 101 |
| Strange Brigade (2018) | 447 | 239 | 196 | 177 | 126 |
| Cyberpunk 2077 1.6 (2022) | 133.2 | 113.6 | 92.9 | 92.8 | 49.7 |
Emissionen
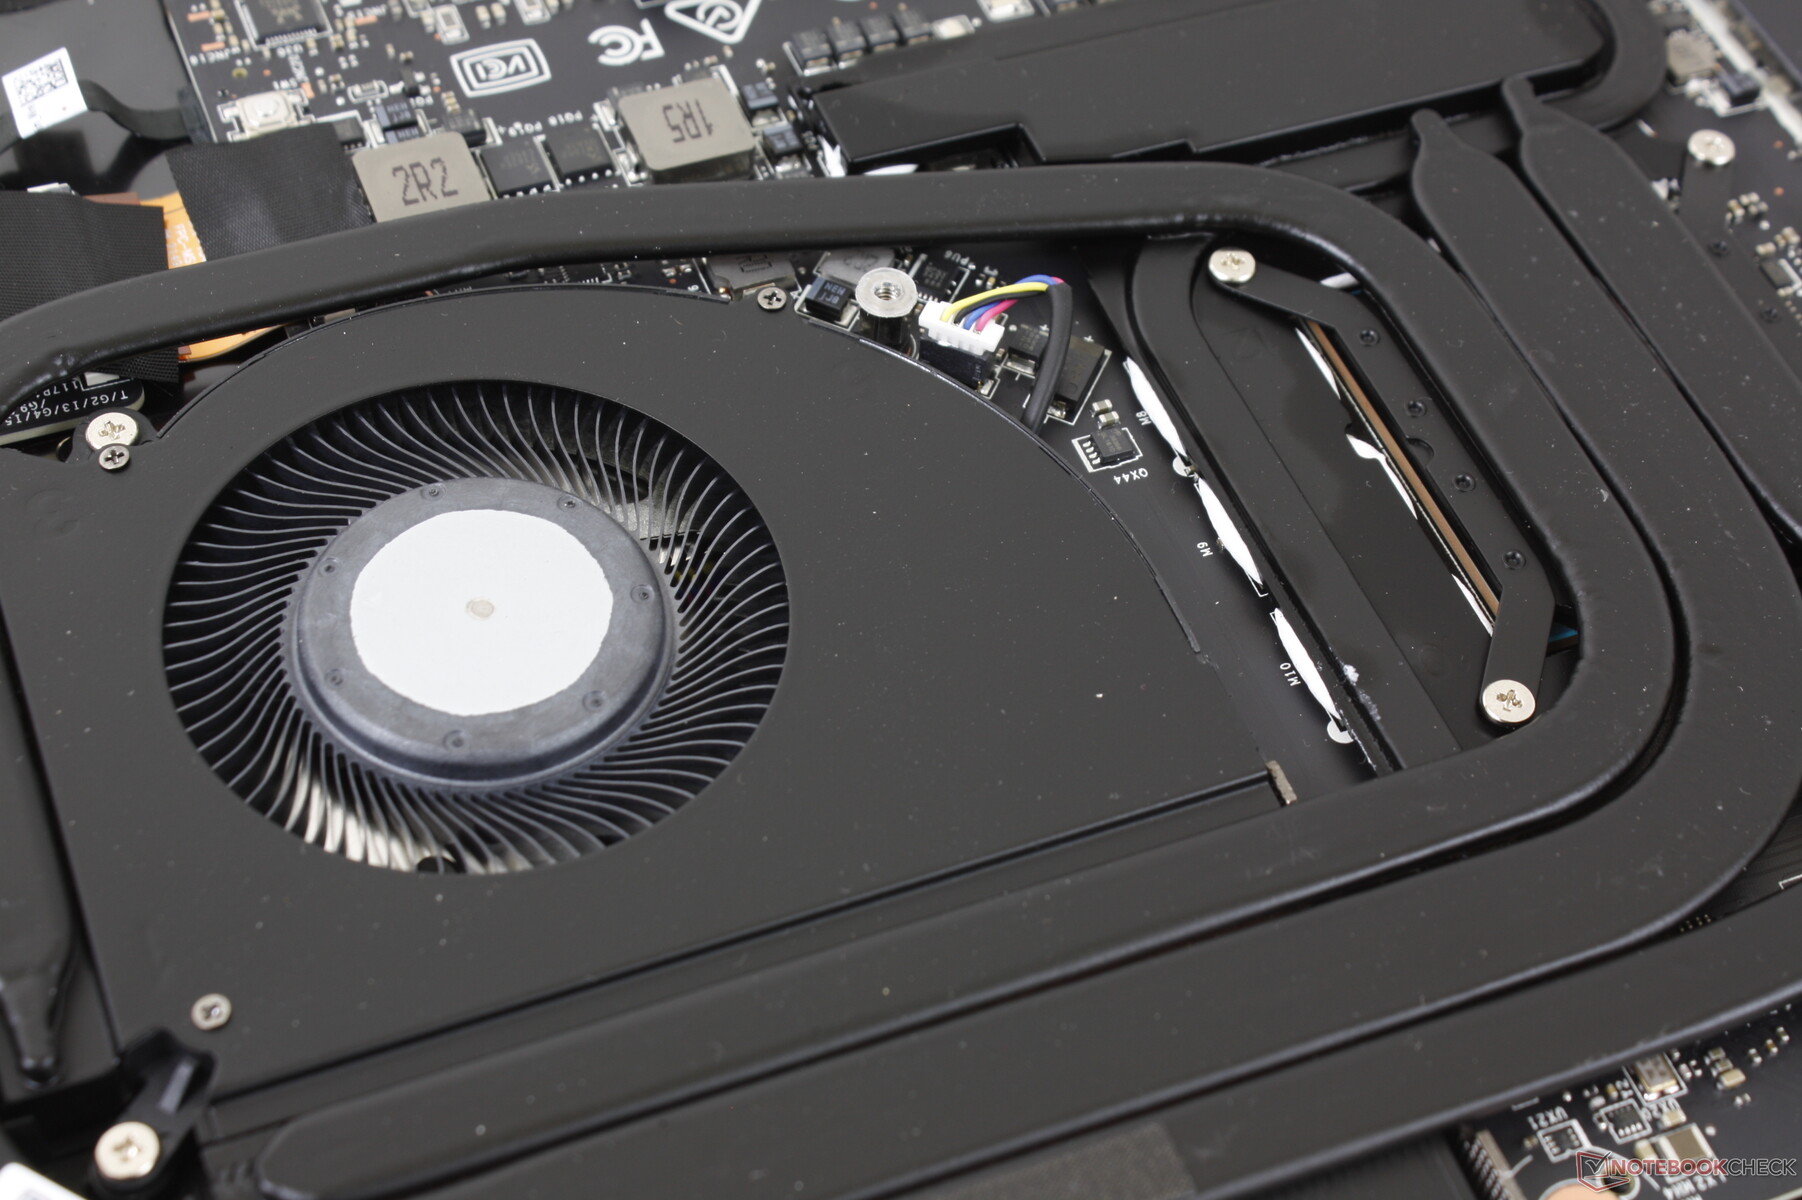
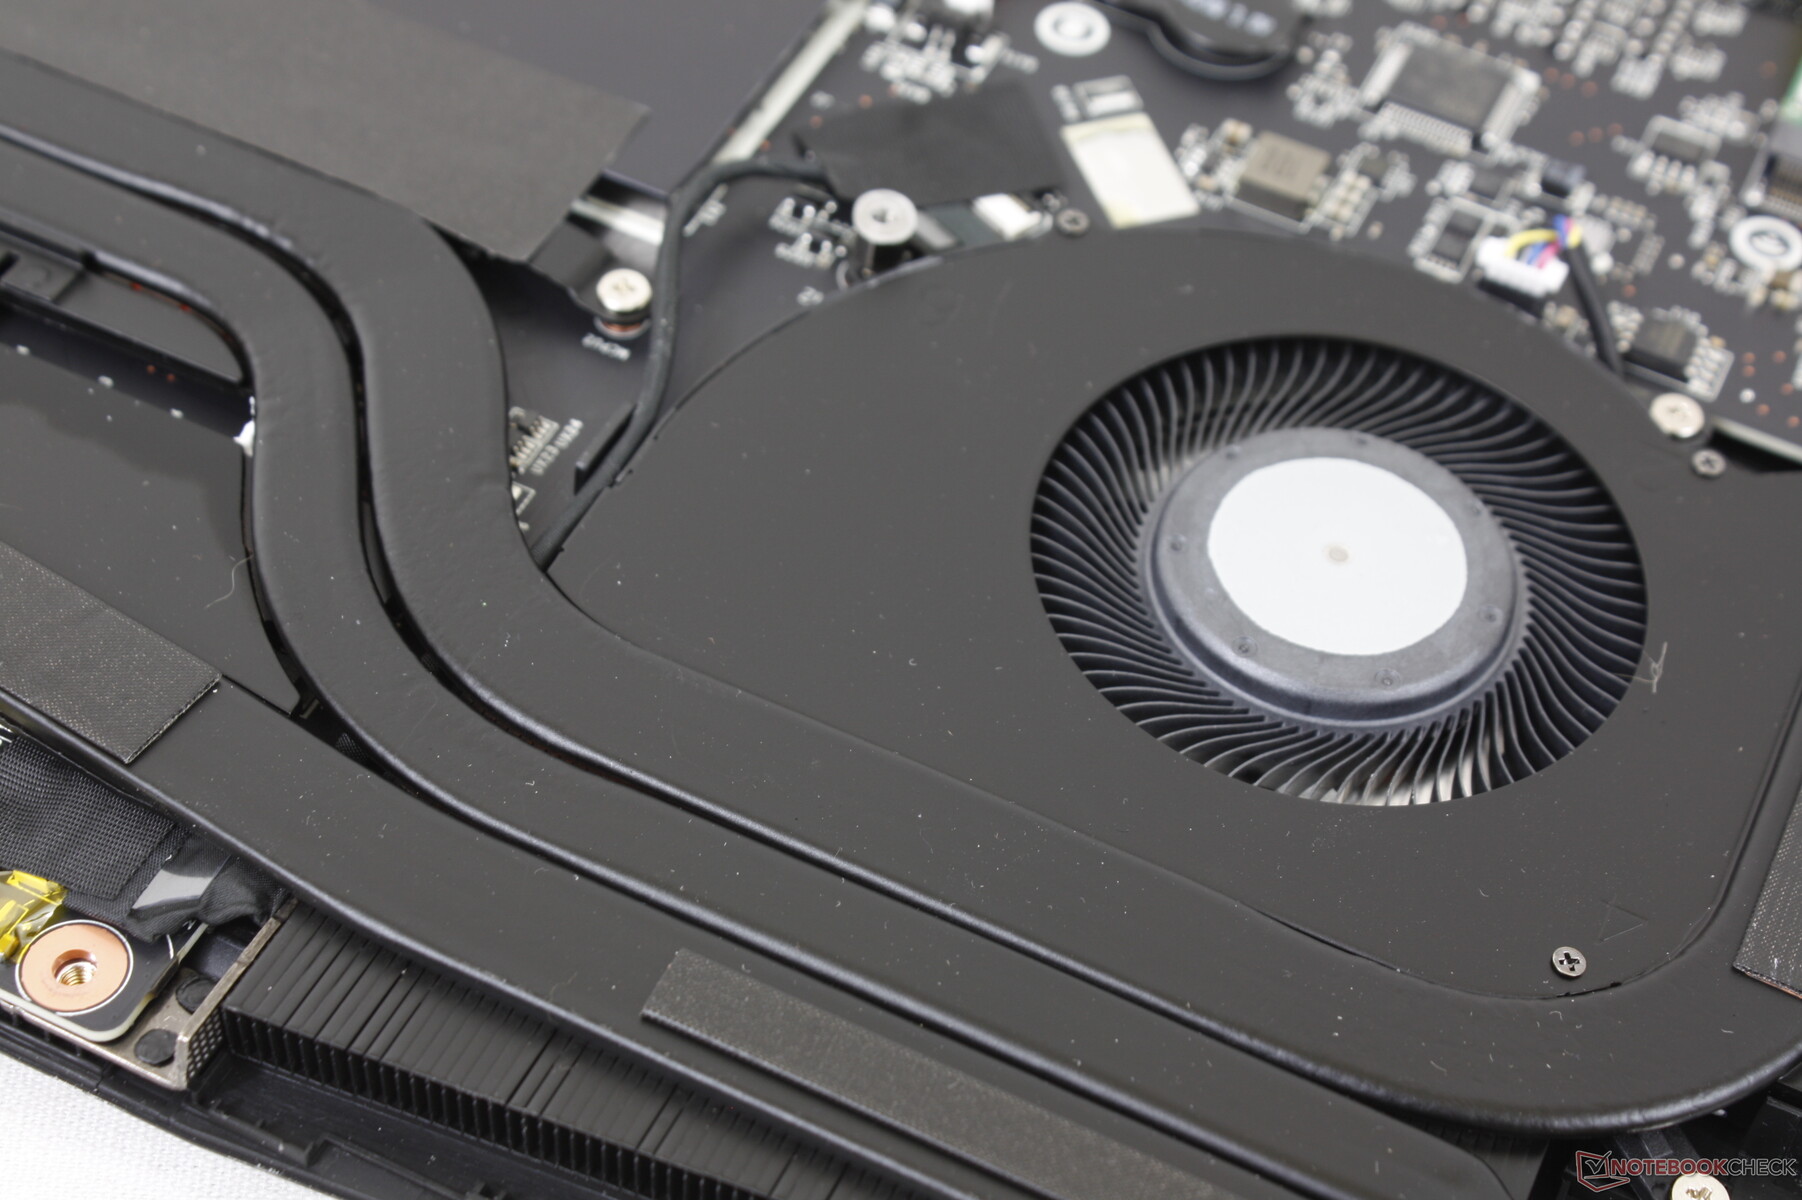
Geräuschemissionen – Kein Triple-Fan Mehr
In den Modi Battery Saver und Silent leisten die internen Lüfter sehr gute Arbeit das Gerät möglichst leise zu kühlen. Bei einem Hintergrundpegel von 24,5 dB(A) konnten wir beim Surfen im Netz oder Streamen von Videos gelegentlich zwar leise hörbare, jedoch nicht störende 31 dB(A) messen.
Bei der Ausführung von Witcher 3 im Modus Extreme Performance blieben die Lüfter des GS77 erheblich leiser als die des Blade 17 (46 vs. 51 dB(A)). Mit aktiviertem Cooler-Boost-Modus dreht das GS77 dagegen richtig auf und wird mit bis zu 57 dB(A) das lautere Notebook. Glücklicherweise wird der Cooler-Boost-Modus nicht benötigt um aus dem Gerät maximale Leistung herauszukitzeln.
Führt man dieselben Tests im Balanced- anstelle des Extreme-Performance-Mode durch reduziert sich der Geräuschpegel leicht auf 44,1 dB(A), wobei hier wie schon erwähnt ein Einbruch der Grafikleistung um 12 % zu verzeichnen ist. Wer also an einem möglichst leisen Spiel-Erlebnis interessiert ist sollte den Stromsparmodi also durchaus eine Chance geben.
Lautstärkediagramm
| Idle |
| 24.5 / 24.5 / 30.8 dB(A) |
| Last |
| 34.6 / 56.8 dB(A) |
 | ||
30 dB leise 40 dB(A) deutlich hörbar 50 dB(A) störend |
||
min: | ||
| MSI Stealth GS77 12UHS-083US GeForce RTX 3080 Ti Laptop GPU, i7-12700H, Micron 3400 1TB MTFDKBA1T0TFH | MSI GS76 Stealth 11UH GeForce RTX 3080 Laptop GPU, i9-11900H, Samsung PM9A1 MZVL22T0HBLB | Razer Blade 17 RTX 3080 Ti GeForce RTX 3080 Ti Laptop GPU, i7-12800H, Samsung PM9A1 MZVL21T0HCLR | MSI GE76 Raider GeForce RTX 3080 Ti Laptop GPU, i9-12900HK, Samsung PM9A1 MZVL22T0HBLB | Alienware x17 RTX 3080 P48E GeForce RTX 3080 Laptop GPU, i7-11800H, 2x WDC PC SN730 SDBPNTY-1T00 (RAID 0) | Asus ROG Zephyrus S17 GX703HSD GeForce RTX 3080 Laptop GPU, i9-11900H, Samsung PM9A1 MZVL22T0HBLB | |
|---|---|---|---|---|---|---|
| Geräuschentwicklung | -8% | 3% | -15% | 1% | 5% | |
| aus / Umgebung * (dB) | 24.5 | 24 2% | 23.3 5% | 26 -6% | 24.9 -2% | 23 6% |
| Idle min * (dB) | 24.5 | 24 2% | 23.3 5% | 26 -6% | 24.9 -2% | 23 6% |
| Idle avg * (dB) | 24.5 | 25 -2% | 23.3 5% | 27 -10% | 24.9 -2% | 23 6% |
| Idle max * (dB) | 30.8 | 42 -36% | 26.3 15% | 40 -30% | 29.6 4% | 23 25% |
| Last avg * (dB) | 34.6 | 46 -33% | 38.2 -10% | 50 -45% | 31.1 10% | 41 -18% |
| Witcher 3 ultra * (dB) | 46.2 | 48 -4% | 50.9 -10% | 53 -15% | 49.7 -8% | 45 3% |
| Last max * (dB) | 56.8 | 48 15% | 49.1 14% | 53 7% | 54.8 4% | 52 8% |
* ... kleinere Werte sind besser
Temperatur
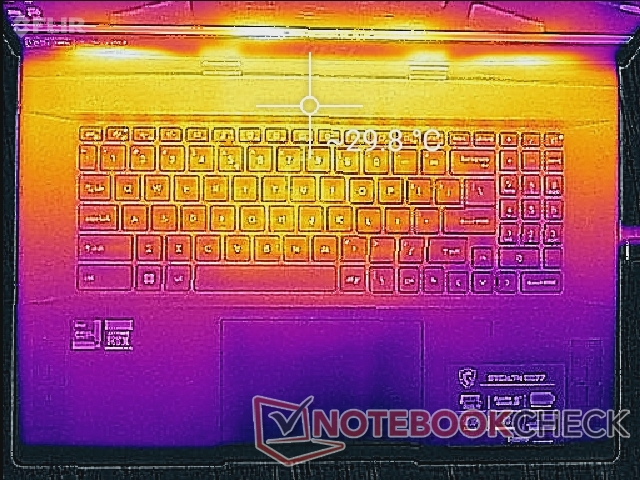
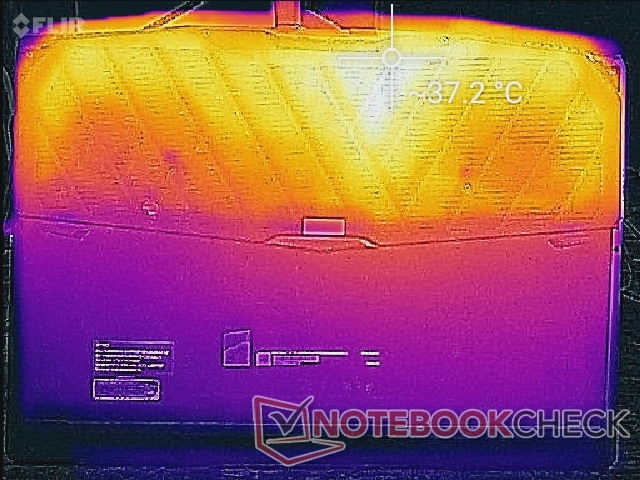
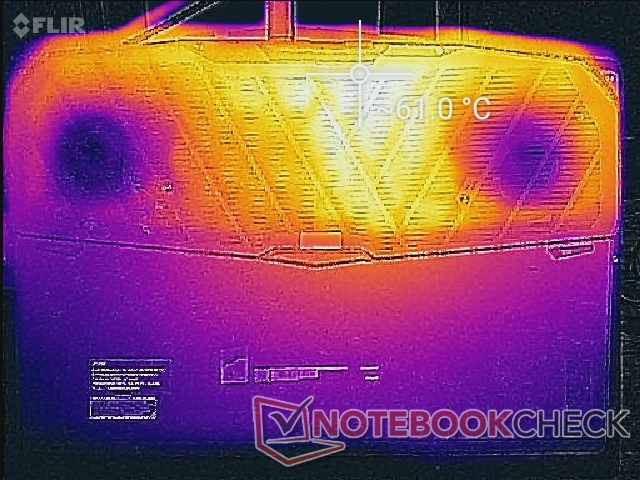
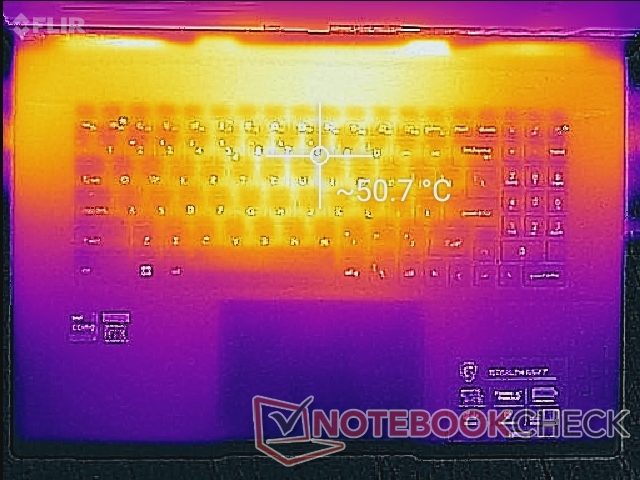
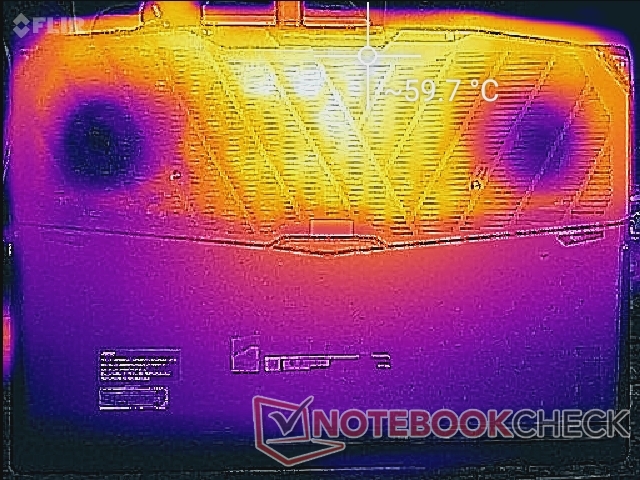
Die Hot Spots beim Gaming sind in etwa identisch zu denen des GS76; rund 49 °C bei der Tastatur und etwa 61 °C auf der Unterseite. Die Verteilung ist beim neueren Modell dagegen etwas besser, so dass die Handballenablagen mit nur 30 °C deutlich unterhalb der 35 °C des Vorgängers bleiben.
Das Blade 17 hat verglichen zum GS77 kühlere WASD-Tasten, da es hierüber Frischluft anzieht. Dies zeigt sich besonders eindrucksvoll, wenn man die Wärmebildaufnahmen der beiden Laptops miteinander vergleicht.
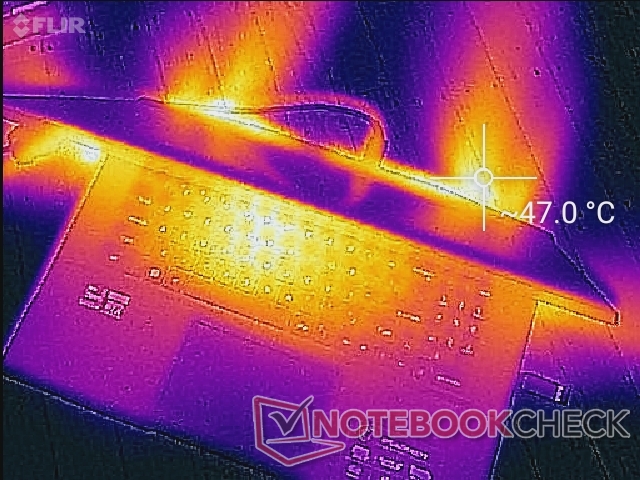
(-) Die maximale Temperatur auf der Oberseite ist 50.6 °C. Im Vergleich liegt der Klassendurchschnitt bei 40.4 °C (von 21.2 bis 68.8 °C für die Klasse Gaming).
(-) Auf der Unterseite messen wir eine maximalen Wert von 59.6 °C (im Vergleich zum Durchschnitt von 43.2 °C).
(+) Ohne Last messen wir eine durchschnittliche Temperatur von 26.9 °C auf der Oberseite. Der Klassendurchschnitt erreicht 33.9 °C.
(±) Beim längeren Spielen von The Witcher 3 erhitzt sich das Gerät durchschnittlich auf 36.2 °C. Der Durchschnitt der Klasse ist derzeit 33.9 °C.
(+) Die Handballen und der Touchpad-Bereich sind mit gemessenen 30 °C kühler als die typische Hauttemperatur und fühlen sich dadurch kühl an.
(±) Die durchschnittliche Handballen-Temperatur anderer getesteter Geräte war 28.8 °C (-1.2 °C).

| MSI Stealth GS77 12UHS-083US Intel Core i7-12700H, NVIDIA GeForce RTX 3080 Ti Laptop GPU | MSI GS76 Stealth 11UH Intel Core i9-11900H, NVIDIA GeForce RTX 3080 Laptop GPU | Razer Blade 17 RTX 3080 Ti Intel Core i7-12800H, NVIDIA GeForce RTX 3080 Ti Laptop GPU | MSI GE76 Raider Intel Core i9-12900HK, NVIDIA GeForce RTX 3080 Ti Laptop GPU | Alienware x17 RTX 3080 P48E Intel Core i7-11800H, NVIDIA GeForce RTX 3080 Laptop GPU | Asus ROG Zephyrus S17 GX703HSD Intel Core i9-11900H, NVIDIA GeForce RTX 3080 Laptop GPU | |
|---|---|---|---|---|---|---|
| Hitze | 9% | 2% | 7% | -1% | -4% | |
| Last oben max * (°C) | 50.6 | 49 3% | 46 9% | 43 15% | 58.4 -15% | 59 -17% |
| Last unten max * (°C) | 59.6 | 57 4% | 46.8 21% | 47 21% | 49 18% | 53 11% |
| Idle oben max * (°C) | 30 | 28 7% | 36.2 -21% | 33 -10% | 33.6 -12% | 35 -17% |
| Idle unten max * (°C) | 37.4 | 30 20% | 38.6 -3% | 37 1% | 34.6 7% | 35 6% |
* ... kleinere Werte sind besser
Stresstest
Bei der alleinigen Ausführung von Prime95 steigen die Taktraten der CPU für ein paar Sekunden auf 4 GHz bei einer Temperatur von bis zu 95 °C. Anschließend sinken sie auf stabile 2,7-3 GHz, um die Temperatur nicht noch weiter ansteigen zu lassen. Im Vergleich dazu läuft der Core i7-12800H des Blade 17 mit 2,4-2,6 GHz etwas langsamer, bleibt mit 71 °C aber auch bedeutend kühler. MSI fährt die CPU damit deutlich näher an ihr Limit ran um maximale Performance herauszukitzeln. Die CPU-Package-Power lag entsprechend beim Start des Tests bei bis zu 122,7 W und sank anschließend auf konstante 71 W. Damit liegt sie deutlich höher als die 61 W des Razer Blade 17.
Die GPU pendelte sich bei einem Speichertakt von 1.750 MHz und einer Temperatur von 75 °C im Witcher-3-Test bei 1.432 MHz ein. Das Blade 17 erreichte im selben Test Taktraten von 1.597 MHz (GPU) und 2.000 MHz (Speicher) bei einer Temperatur von 77 °C. Die höhere GPU-Performance des Blade 17 liegt primär an dessen höherem TGP-Rating von 165 W vergleichen mit 105 W beim GS77. GPU-Z zufolge lag der Energiebedarf während des Witcher-3-Tests bei sehr konstanten 104,5 W.
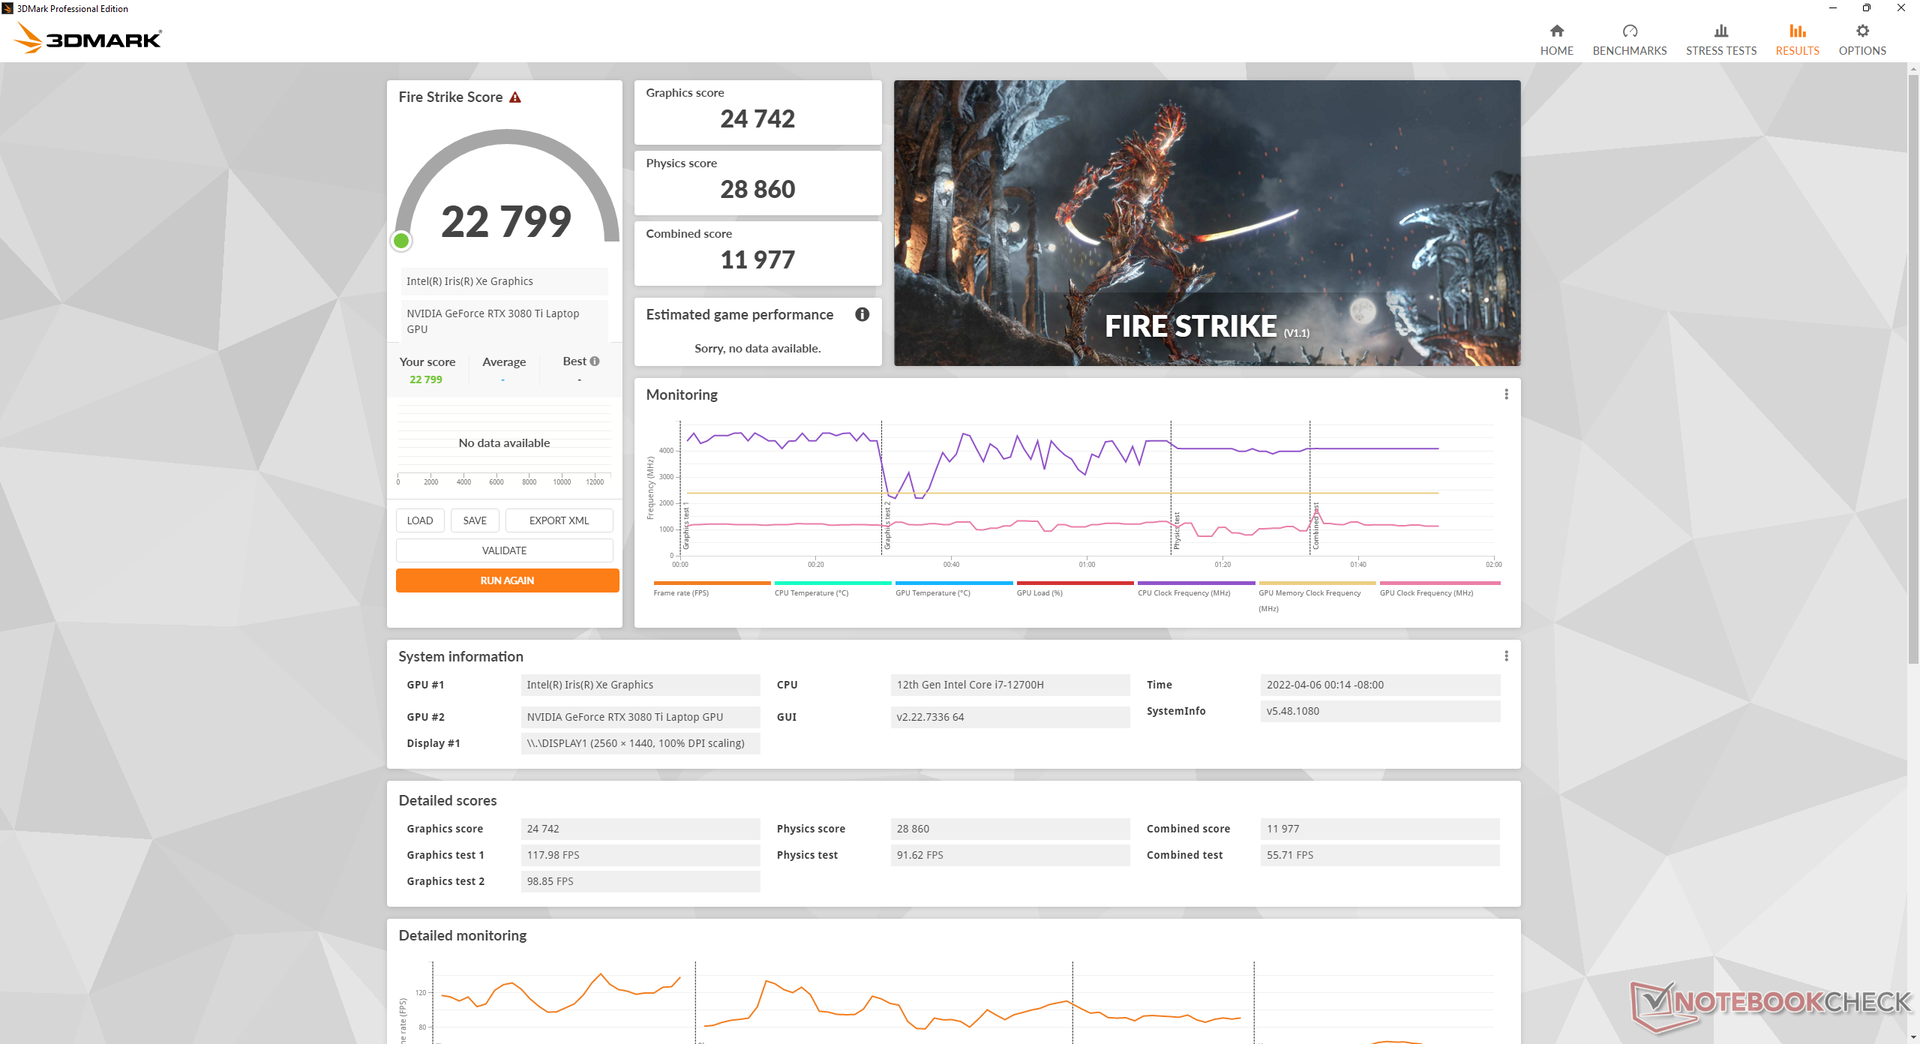
Auf Akku wird die Performance gedrosselt. Einem Fire-Strike-Ergebnis von 29.675 und 28.050 Punkten in Physics und Graphics angesteckt am Strom standen auf Akku nur noch 14.170 und 6.220 Punkte gegenüber.
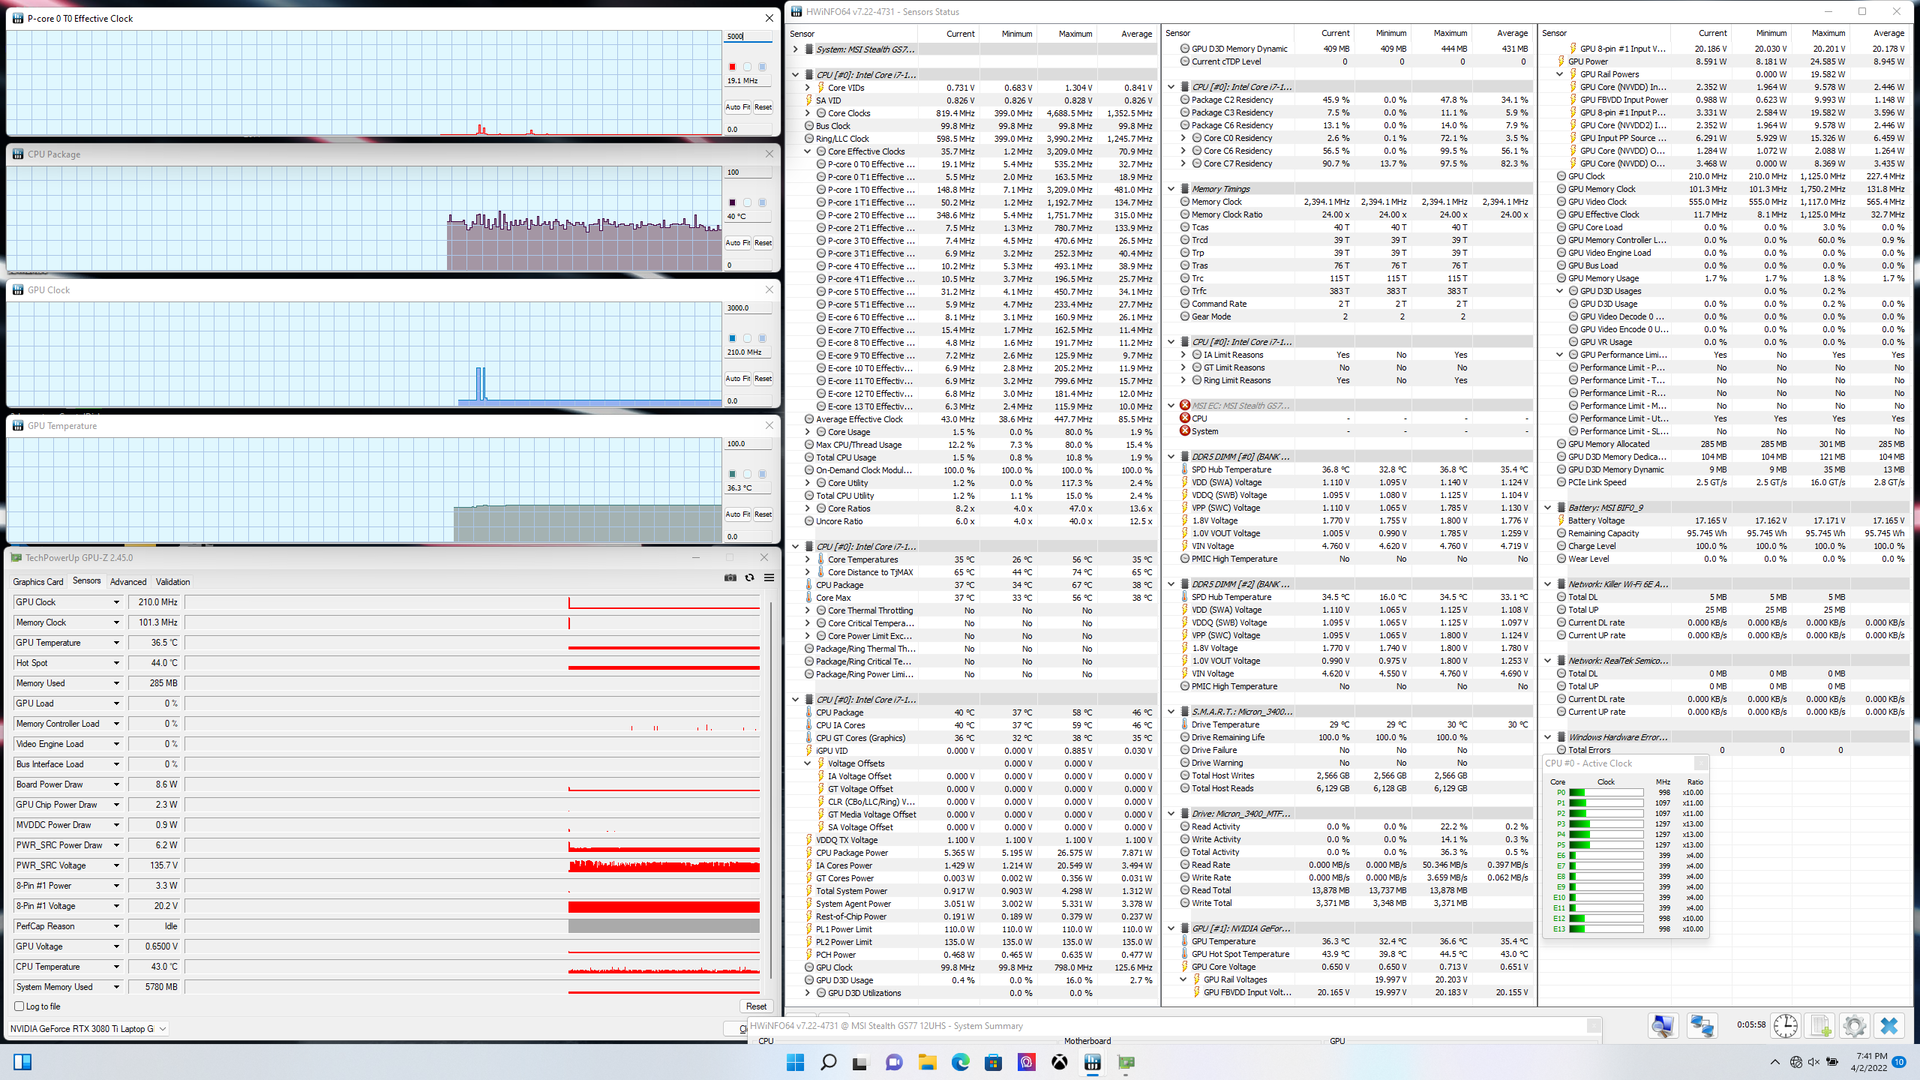
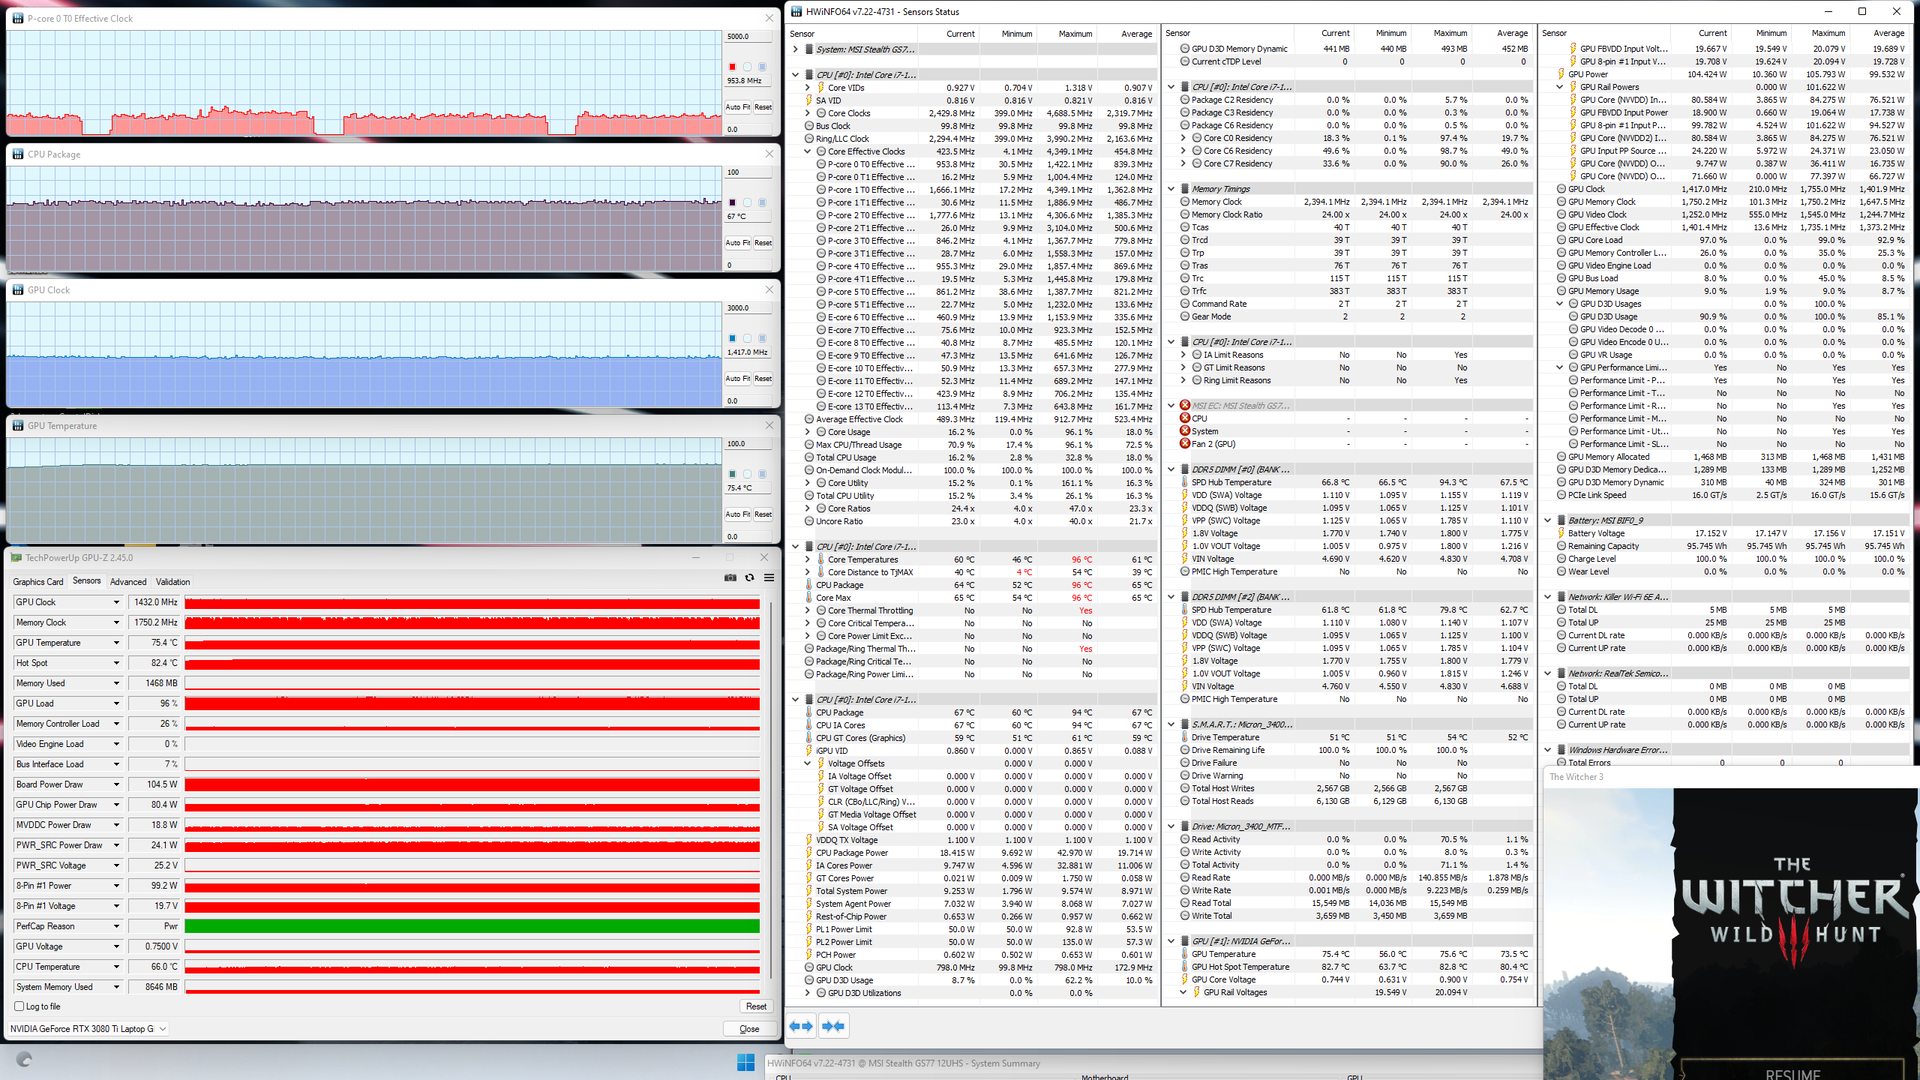
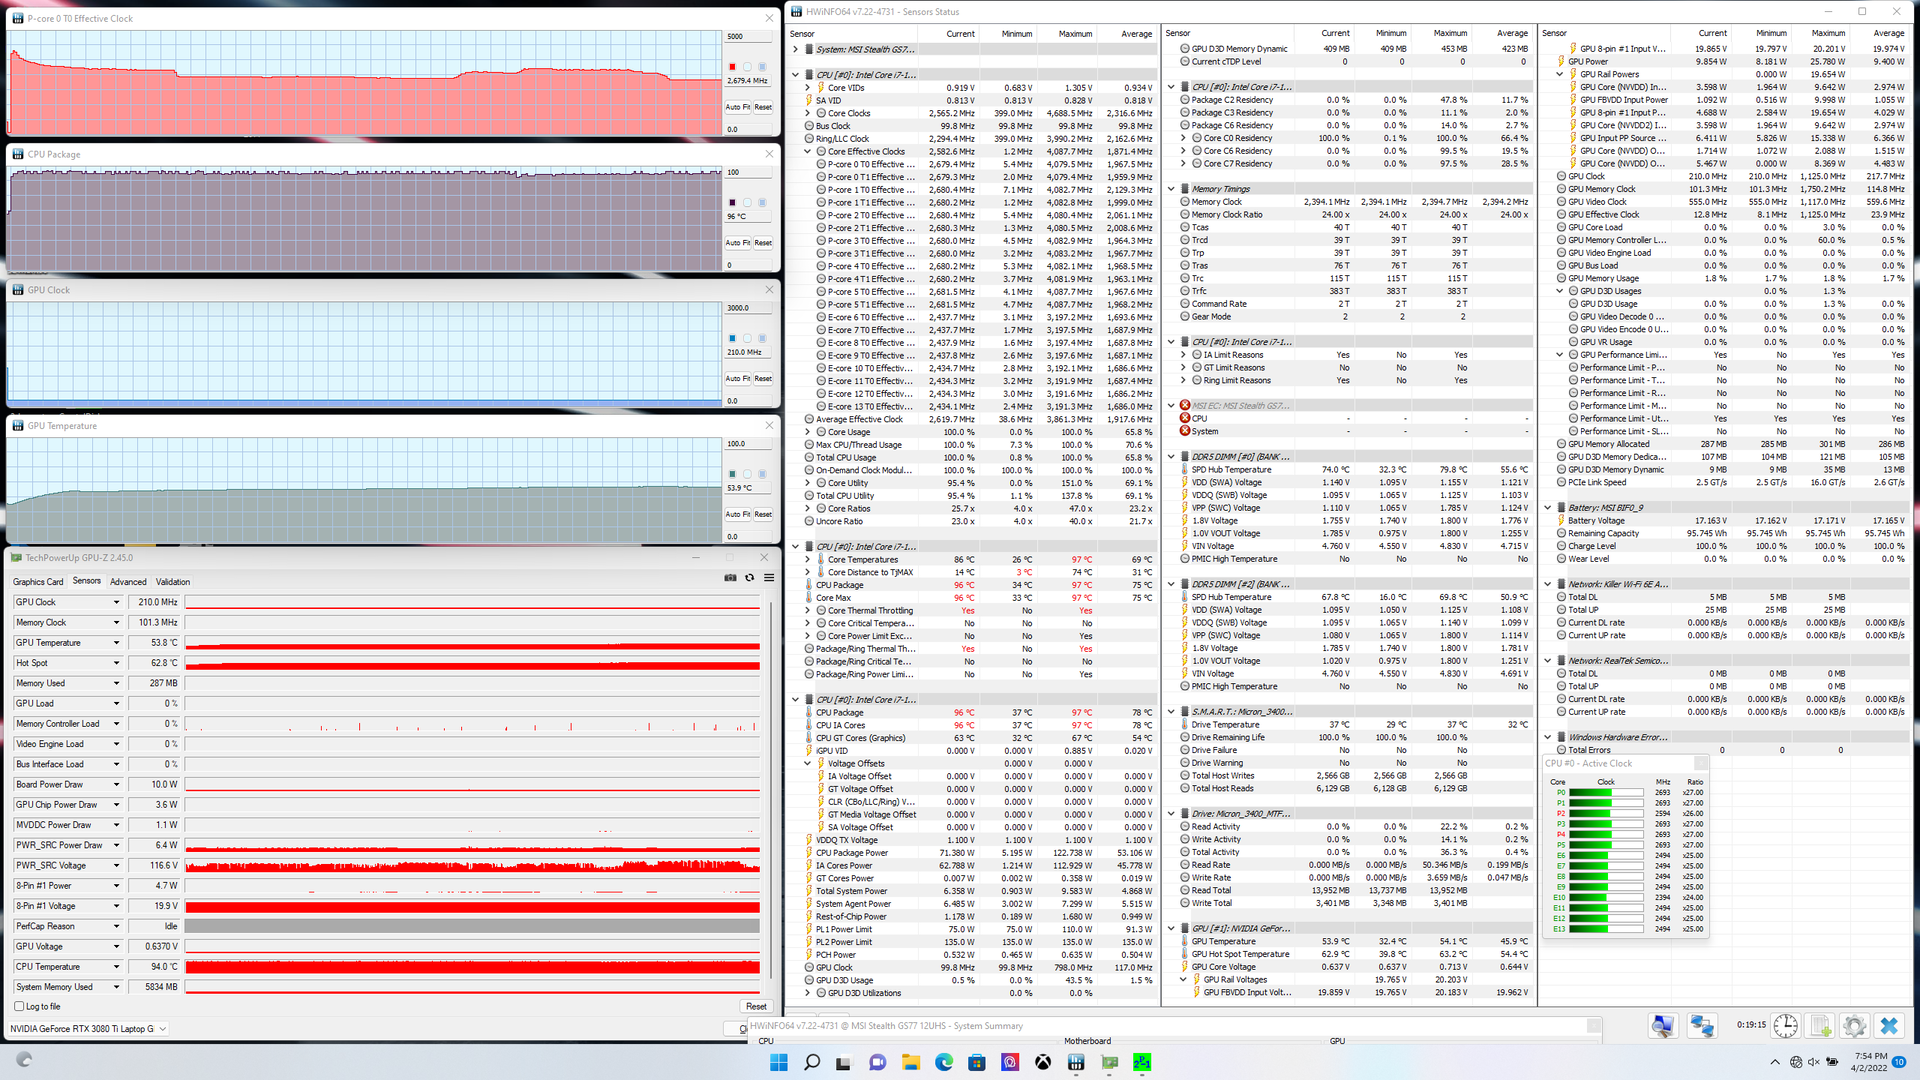
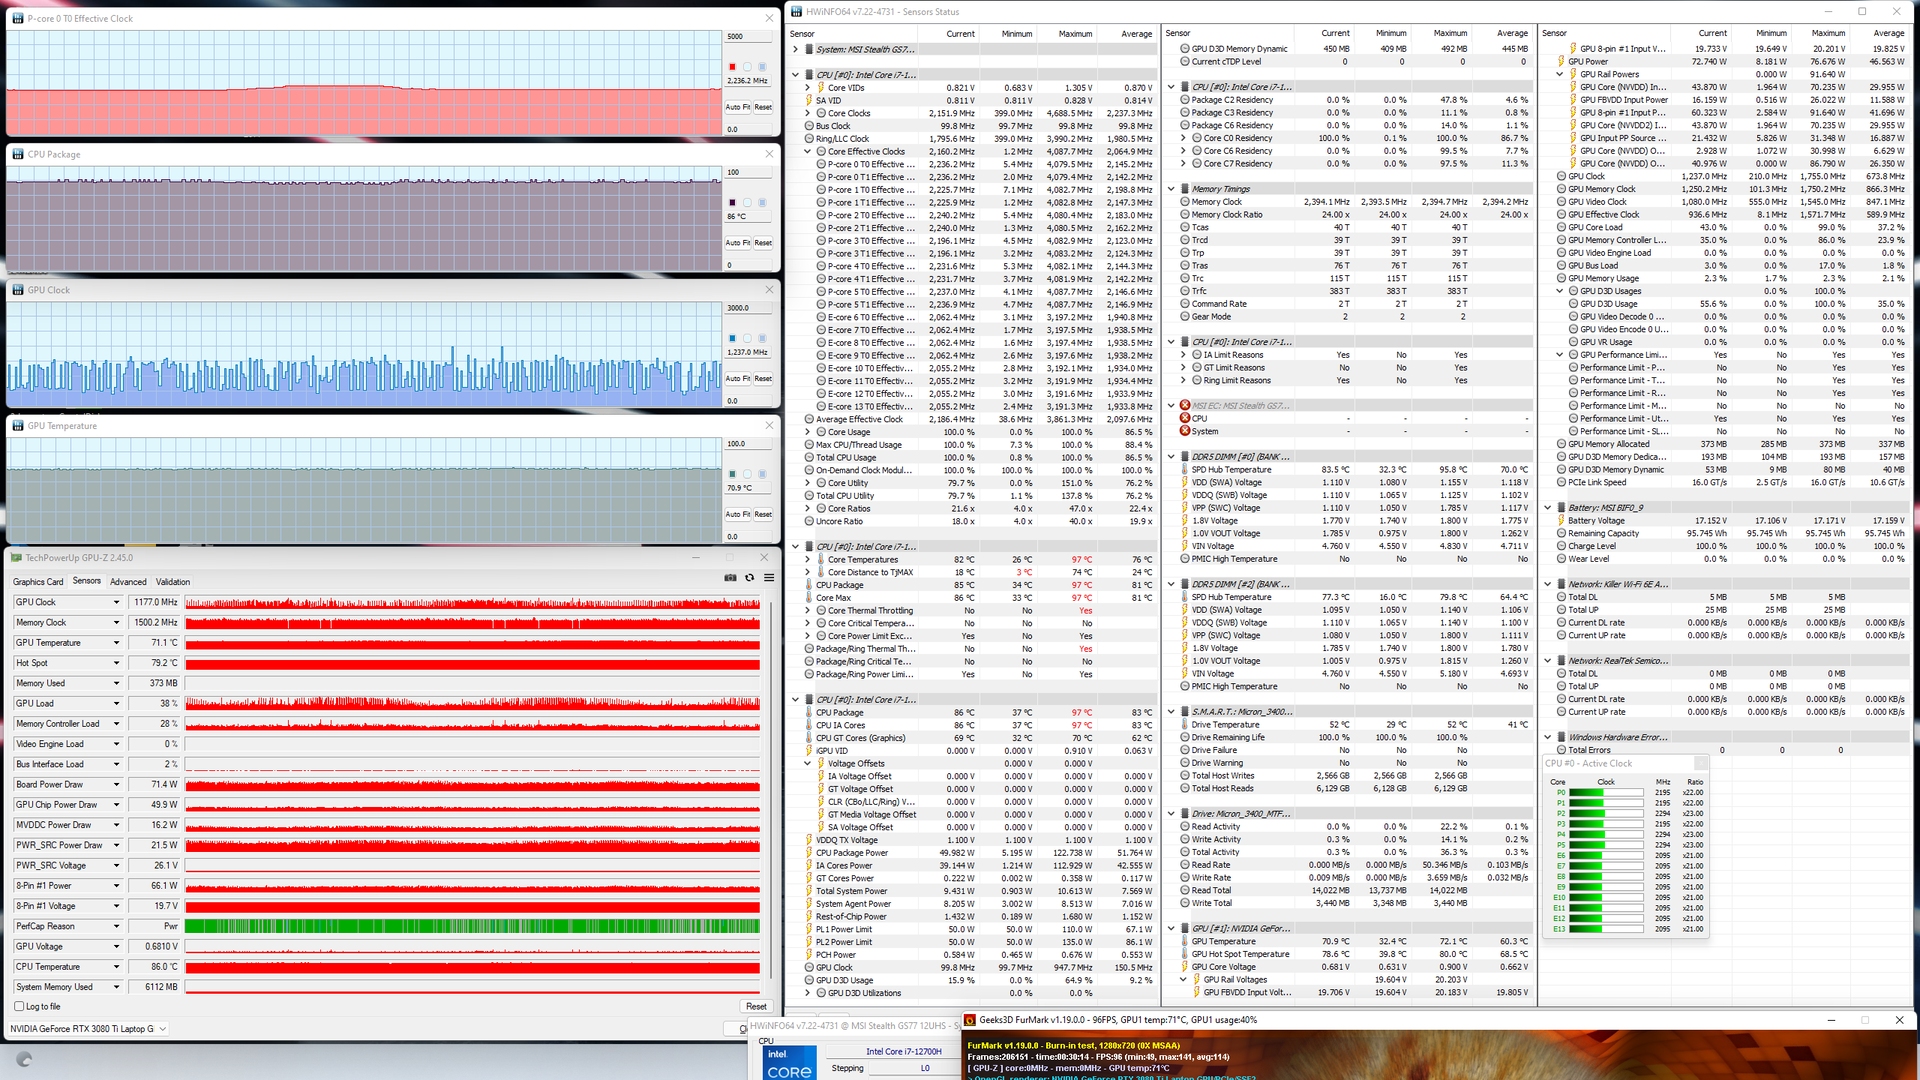
| CPU-Takt (GHz) | GPU-Takt (MHz) | Durchschnittliche CPU-Temperatur (°C) | Durchschnittliche GPU-Temperatur (°C) | |
| Leerlauf | -- | -- | 40 | 37 |
| Prime95 | 2,7 - 3,0 | -- | 96 | 54 |
| Prime95 + FurMark | 2,2 | 430 - 1237 | 86 | 71 |
| Witcher 3 | ~1,0 | 1432 | 67 | 75 |
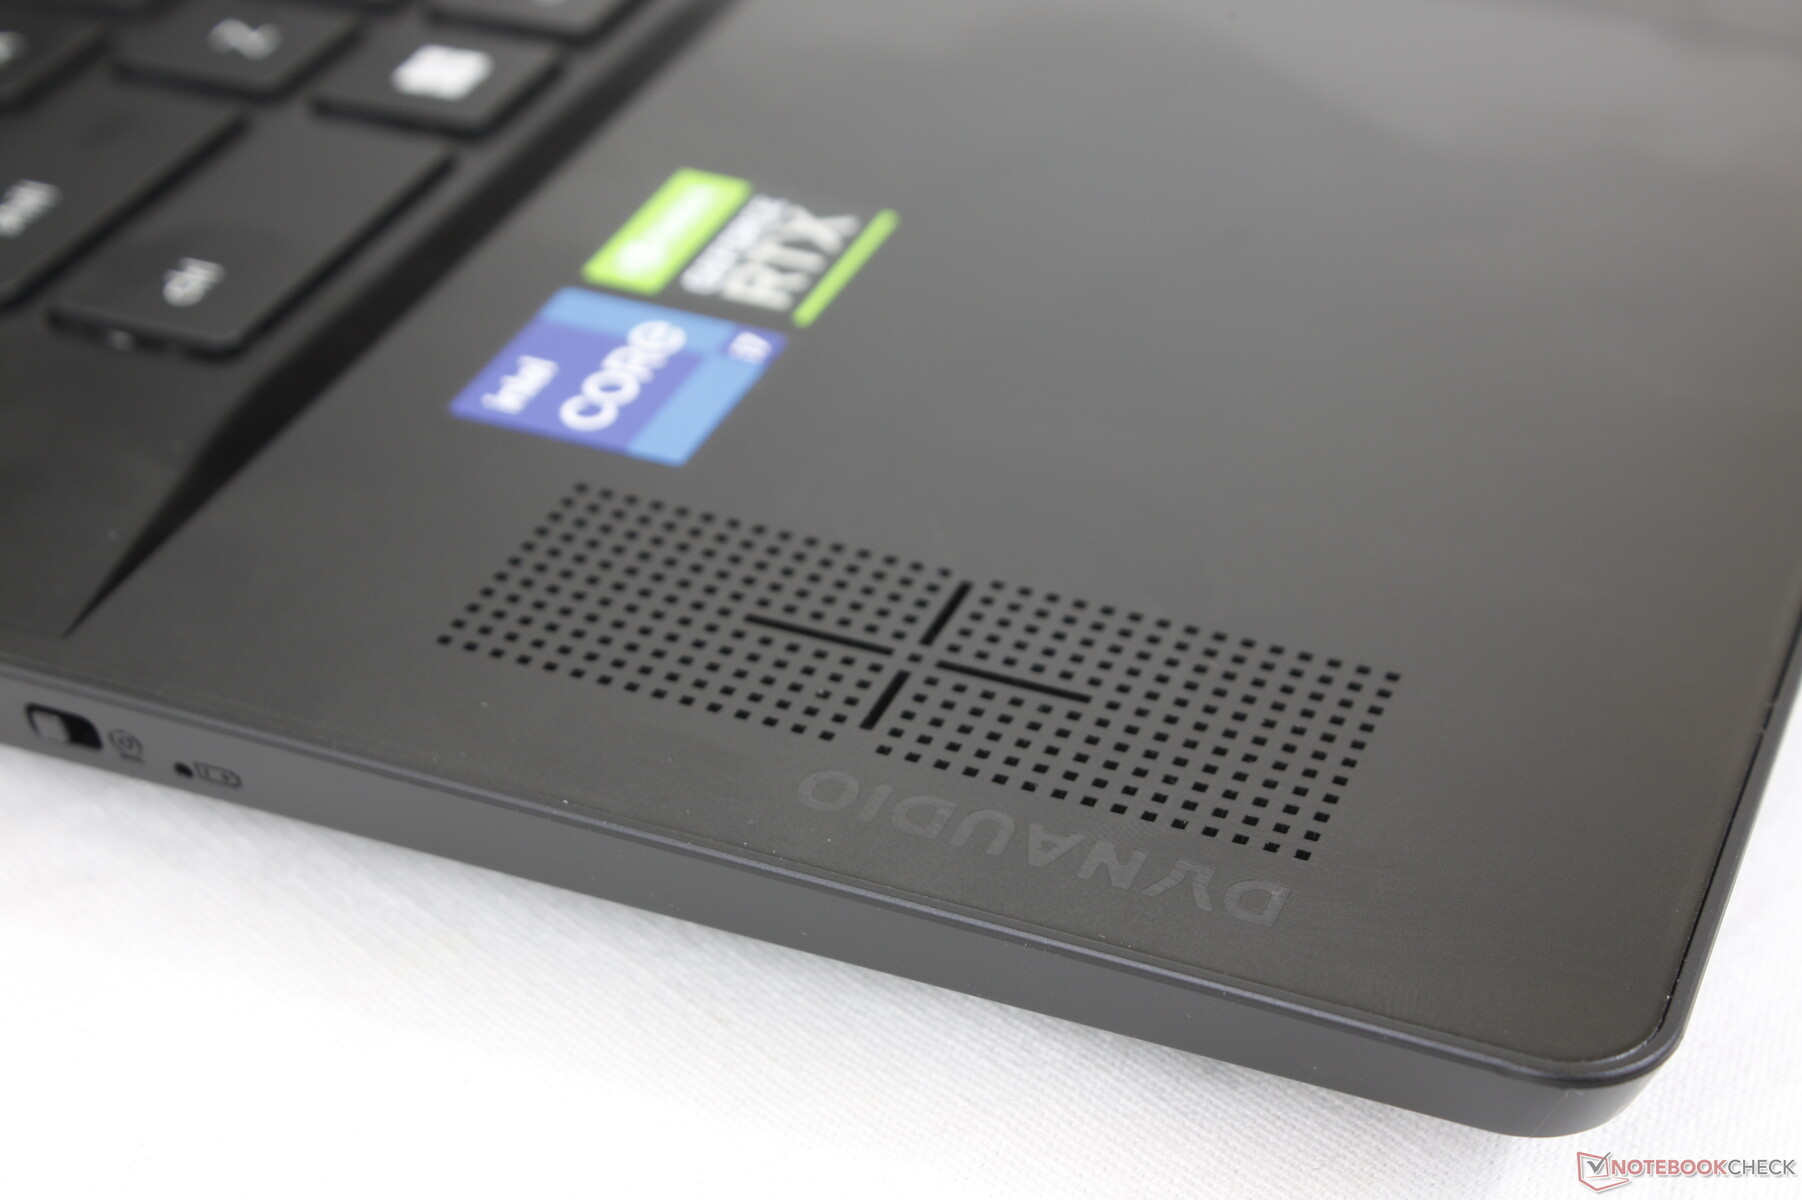
Lautsprecher
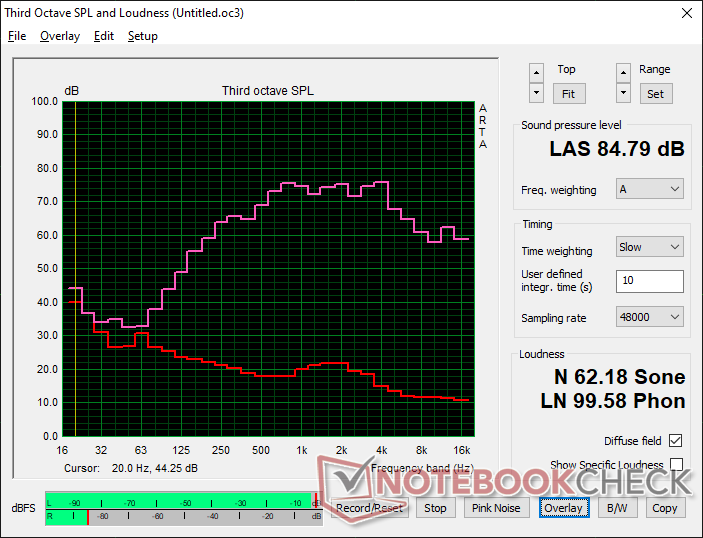
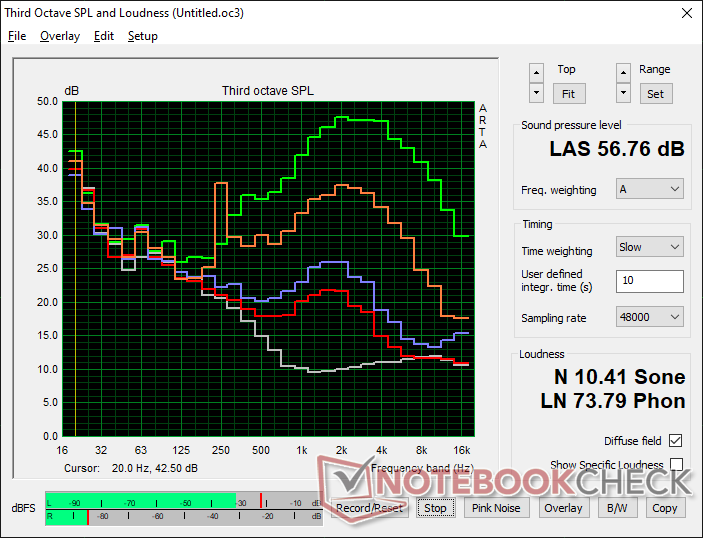
MSI Stealth GS77 12UHS-083US Audio Analyse
(+) | Die Lautsprecher können relativ laut spielen (84.8 dB)
Bass 100 - 315 Hz
(±) | abgesenkter Bass - 9.4% geringer als der Median
(±) | durchschnittlich lineare Bass-Wiedergabe (9.8% Delta zum Vorgänger)
Mitteltöne 400 - 2000 Hz
(±) | zu hohe Mitten, vom Median 7% abweichend
(+) | lineare Mitten (4.9% Delta zum Vorgänger)
Hochtöne 2 - 16 kHz
(±) | zu hohe Hochtöne, vom Median nur 5.8% abweichend
(±) | durchschnittlich lineare Hochtöne (7.9% Delta zum Vorgänger)
Gesamt im hörbaren Bereich 100 - 16.000 Hz
(±) | hörbarer Bereich ist durchschnittlich linear (15.9% Abstand zum Median)
Im Vergleich zu allen Geräten derselben Klasse
» 38% aller getesteten Geräte dieser Klasse waren besser, 7% vergleichbar, 56% schlechter
» Das beste Gerät hat einen Delta-Wert von 6%, durchschnittlich ist 18%, das schlechteste Gerät hat 132%
Im Vergleich zu allen Geräten im Test
» 25% aller getesteten Geräte waren besser, 5% vergleichbar, 70% schlechter
» Das beste Gerät hat einen Delta-Wert von 4%, durchschnittlich ist 23%, das schlechteste Gerät hat 134%
Apple MacBook Pro 16 2021 M1 Pro Audio Analyse
(+) | Die Lautsprecher können relativ laut spielen (84.7 dB)
Bass 100 - 315 Hz
(+) | guter Bass - nur 3.8% Abweichung vom Median
(+) | lineare Bass-Wiedergabe (5.2% Delta zum Vorgänger)
Mitteltöne 400 - 2000 Hz
(+) | ausgeglichene Mitten, vom Median nur 1.3% abweichend
(+) | lineare Mitten (2.1% Delta zum Vorgänger)
Hochtöne 2 - 16 kHz
(+) | ausgeglichene Hochtöne, vom Median nur 1.9% abweichend
(+) | sehr lineare Hochtöne (2.7% Delta zum Vorgänger)
Gesamt im hörbaren Bereich 100 - 16.000 Hz
(+) | hörbarer Bereich ist sehr linear (4.6% Abstand zum Median
Im Vergleich zu allen Geräten derselben Klasse
» 0% aller getesteten Geräte dieser Klasse waren besser, 0% vergleichbar, 100% schlechter
» Das beste Gerät hat einen Delta-Wert von 5%, durchschnittlich ist 17%, das schlechteste Gerät hat 45%
Im Vergleich zu allen Geräten im Test
» 0% aller getesteten Geräte waren besser, 0% vergleichbar, 100% schlechter
» Das beste Gerät hat einen Delta-Wert von 4%, durchschnittlich ist 23%, das schlechteste Gerät hat 134%
Energieverwaltung
Energiebedarf – Etwas Mehr Hunger
Verglichen mit dem letztjährigen GS76 ist das GS77 trotz deutlich höherer Performance nicht nennenswert energiehungriger. In Witcher 3 liegt der Energiebedarf zum Beispiel nur um rund 5 % höher, die Leistung steigt jedoch wie bereits erwähnt um 12-15 %. Diese Vergleichbarkeit des Energiebedarfs lässt sich auch damit erklären, dass die TDP- und TGP-Werte des GS76 und GS77 nahezu identisch sind. Im Gegensatz dazu stieg die TGP des Blade 17 von 100 W im Jahr 2021 auf 165 W des 2022-Modells. Entsprechend liegt auch der Energiebedarf des Blade 17 deutlich höher als der des GS77.
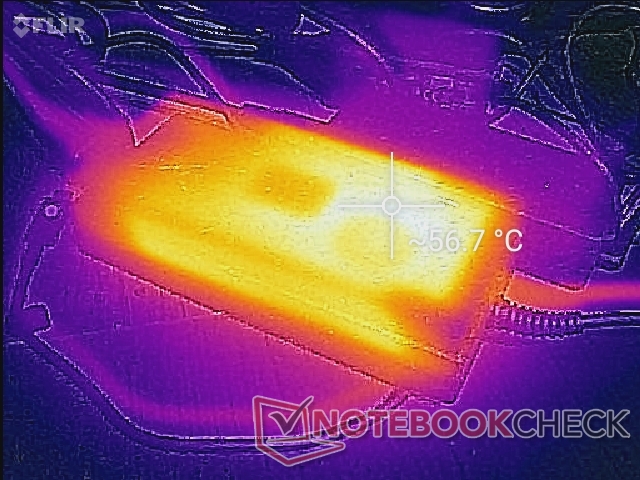
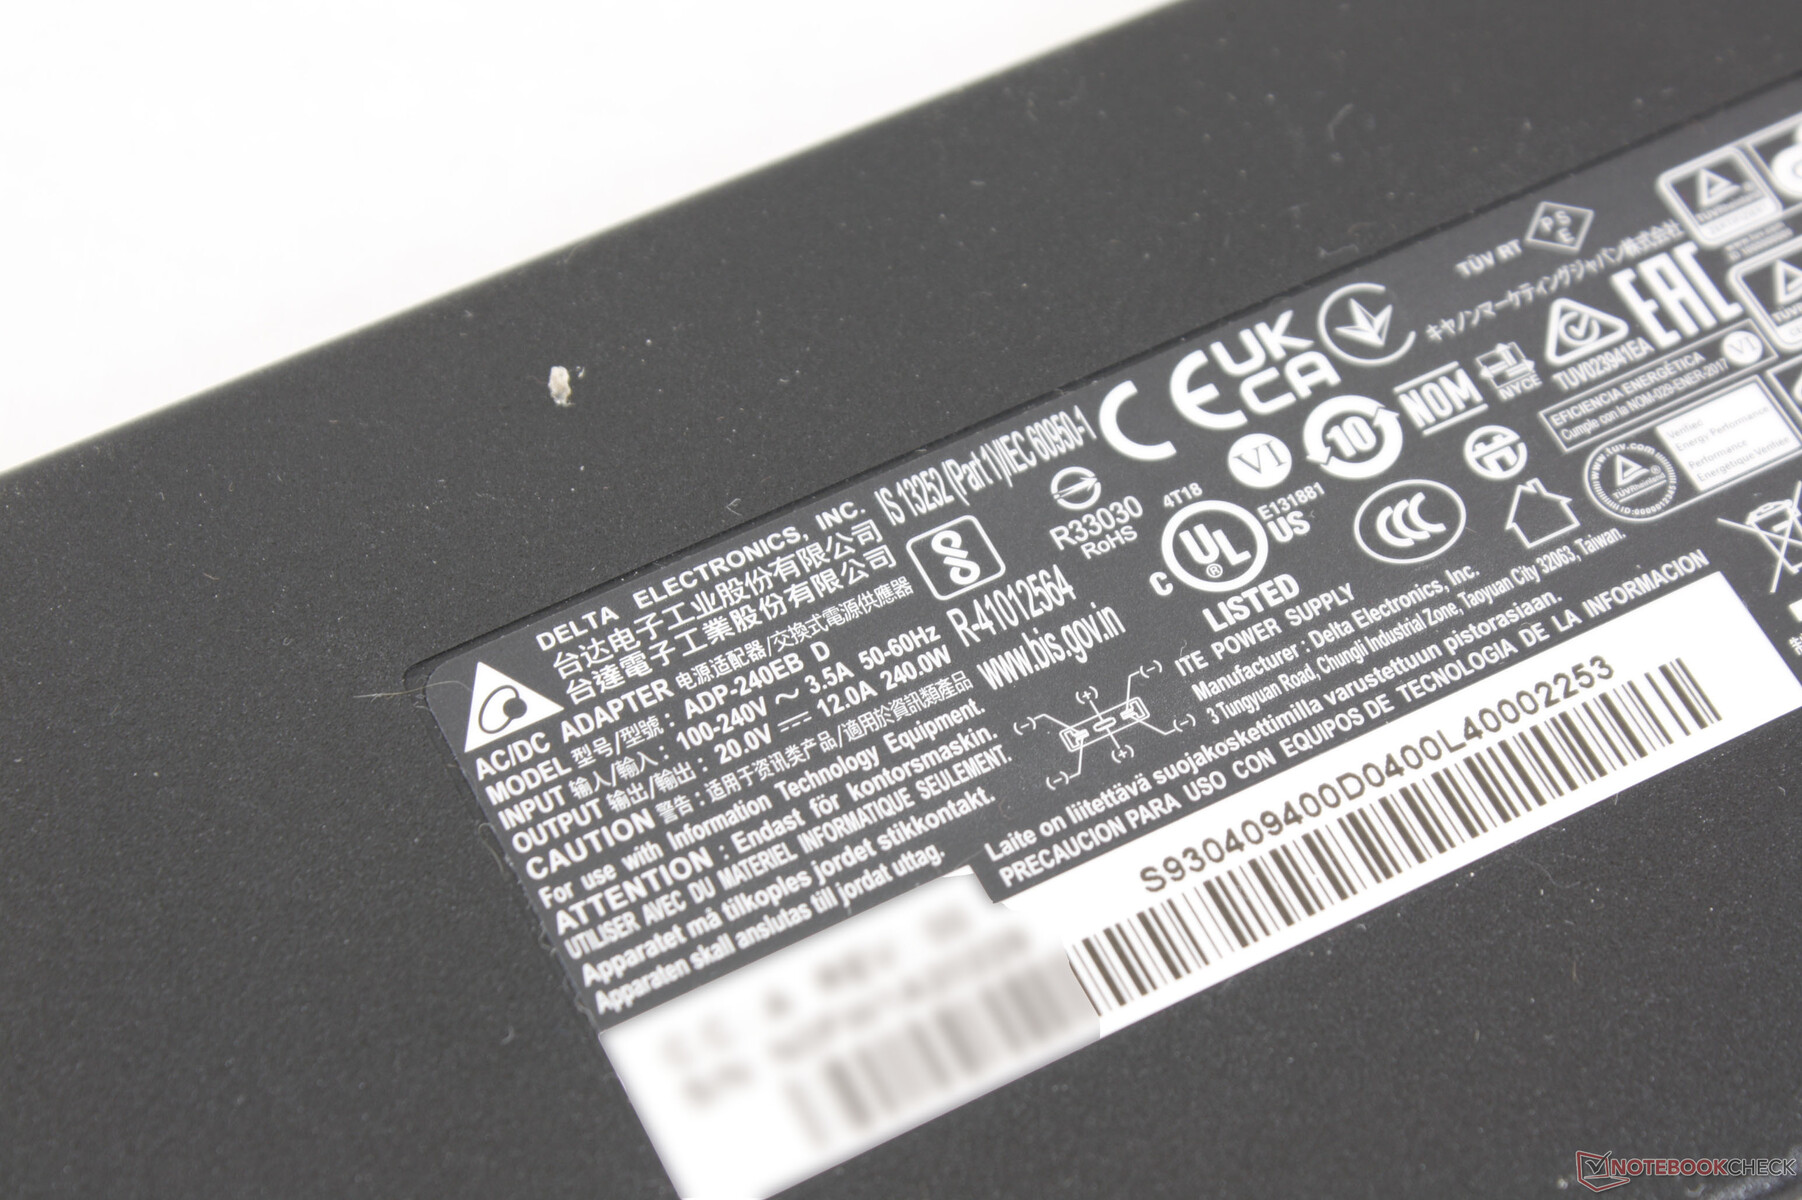
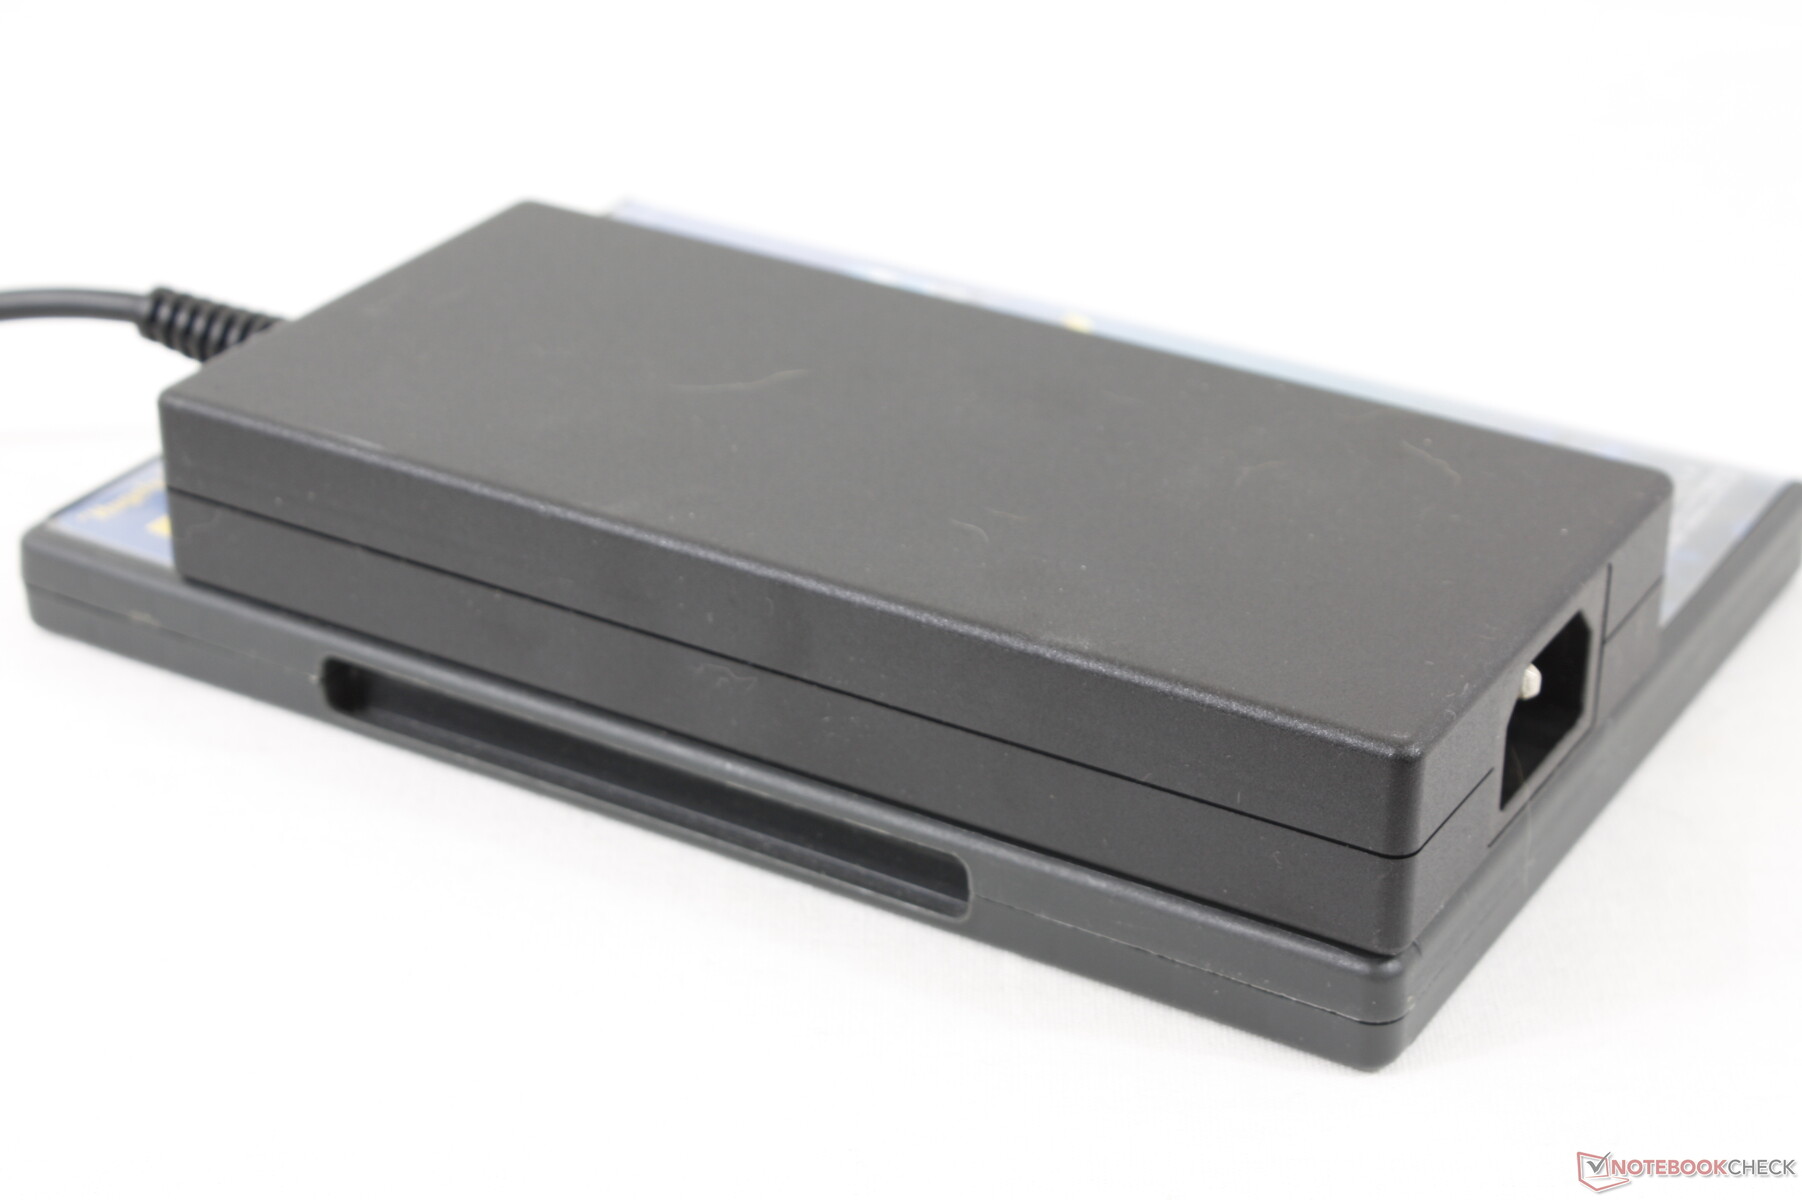
Standardmäßig wird das GS77 mit einem 240 W Netzteil ausgeliefert (Blade 17: 280 W). Trotzdem ist das Netzteil des GS77 mit 16.4 x 7.5 x 2.5 cm minimal größer als das des Blade 17 (16.4 x 7 x 2.5 cm).
| Aus / Standby | |
| Idle | |
| Last |
|
Legende:
min: | |
| MSI Stealth GS77 12UHS-083US i7-12700H, GeForce RTX 3080 Ti Laptop GPU, Micron 3400 1TB MTFDKBA1T0TFH, IPS, 2560x1440, 17.3" | MSI GS76 Stealth 11UH i9-11900H, GeForce RTX 3080 Laptop GPU, Samsung PM9A1 MZVL22T0HBLB, IPS, 3840x2160, 17.3" | Razer Blade 17 RTX 3080 Ti i7-12800H, GeForce RTX 3080 Ti Laptop GPU, Samsung PM9A1 MZVL21T0HCLR, IPS, 2560x1440, 17.3" | MSI GE76 Raider i9-12900HK, GeForce RTX 3080 Ti Laptop GPU, Samsung PM9A1 MZVL22T0HBLB, IPS-Level, 1920x1080, 17.3" | Alienware x17 RTX 3080 P48E i7-11800H, GeForce RTX 3080 Laptop GPU, 2x WDC PC SN730 SDBPNTY-1T00 (RAID 0), IPS, 3840x2160, 17.3" | Asus ROG Zephyrus S17 GX703HSD i9-11900H, GeForce RTX 3080 Laptop GPU, Samsung PM9A1 MZVL22T0HBLB, IPS, 2560x1440, 17.3" | |
|---|---|---|---|---|---|---|
| Stromverbrauch | 7% | -57% | -4% | -17% | -11% | |
| Idle min * (Watt) | 20 | 14 30% | 29.8 -49% | 12 40% | 10.2 49% | 21.7 -9% |
| Idle avg * (Watt) | 21.4 | 19 11% | 37.1 -73% | 17 21% | 21.2 1% | 27 -26% |
| Idle max * (Watt) | 27 | 31 -15% | 60.8 -125% | 28 -4% | 48.4 -79% | 33 -22% |
| Last avg * (Watt) | 100.5 | 97 3% | 135.3 -35% | 118 -17% | 118.7 -18% | 108 -7% |
| Witcher 3 ultra * (Watt) | 165 | 156 5% | 243 -47% | 252 -53% | 249 -51% | 195 -18% |
| Last max * (Watt) | 247.1 | 231 7% | 273.1 -11% | 272 -10% | 262 -6% | 210 15% |
* ... kleinere Werte sind besser
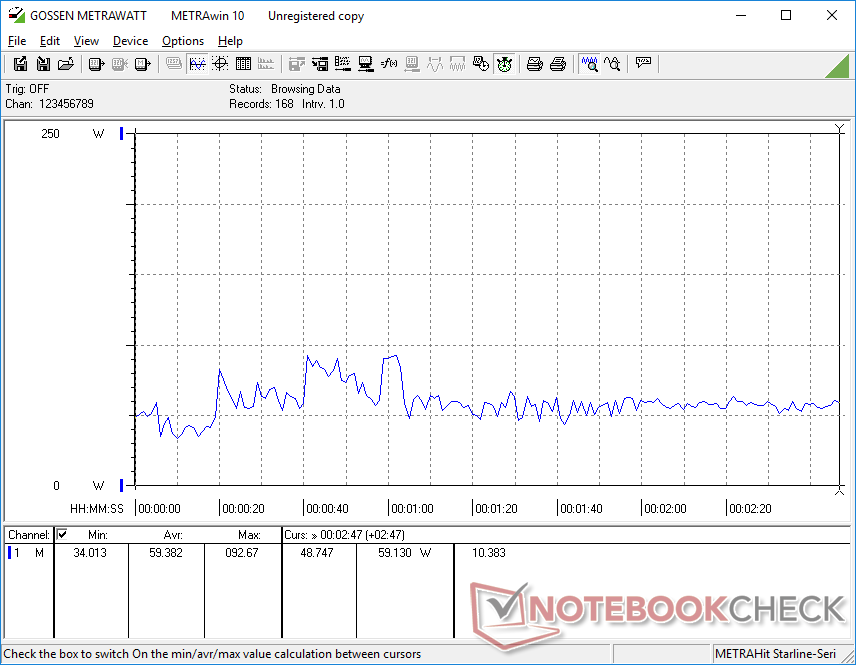
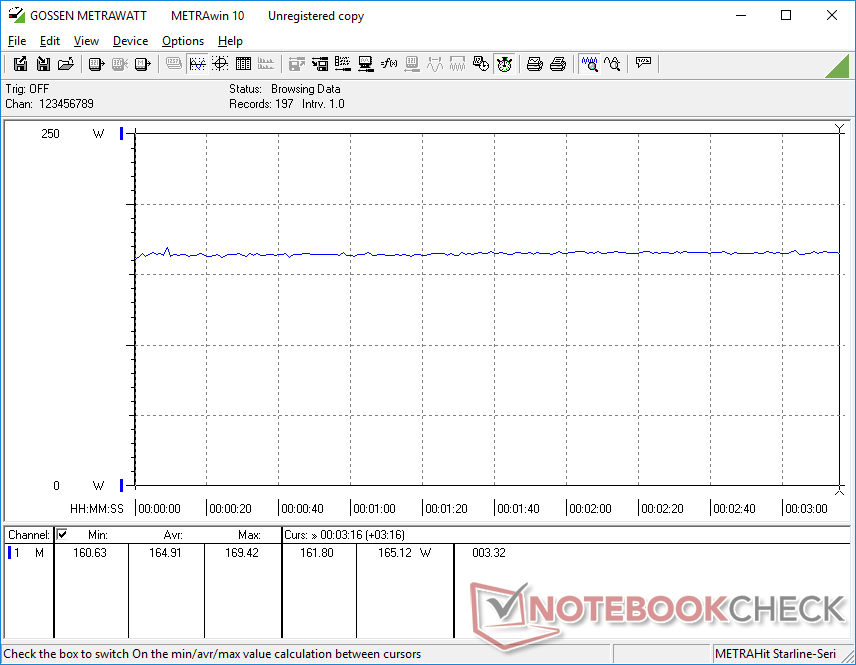
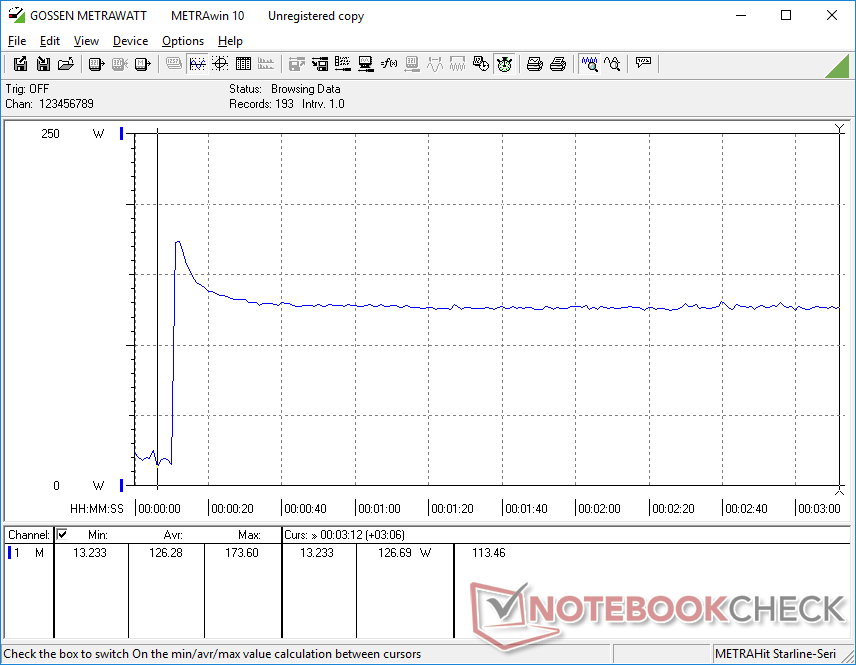
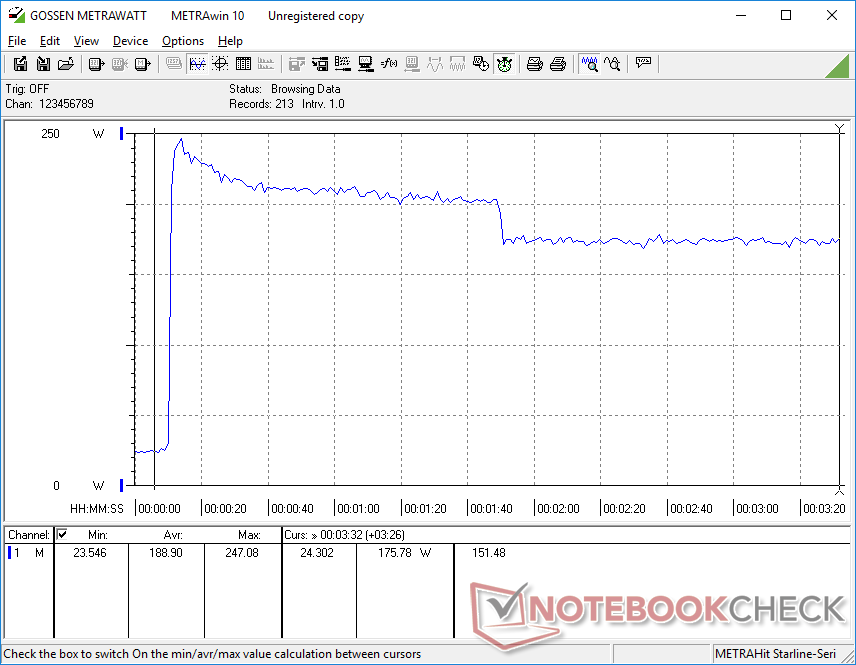
Power Consumption Witcher 3 / Stresstest
Power Consumption external Monitor
Akkulaufzeit – 99-Wh-Akku als Retter
Verglichen mit dem GS76 sind die Akkulaufzeiten des GS77 nahezu identisch und damit minimal länger als die des neuen Blade 17. Im neuen GS77 steckt ein Akku mit einer Kapazität von 99 Wh während die meisten anderen Gaming-Laptops mit 90 Wh auskommen müssen.
Das Aufladen von 0 auf 100 % dauert mit rund 2,5 Stunden fast eine volle Stunde länger als bei den meisten anderen Laptops. Der Laptop kann außerdem auch über USB-C geladen werden, allerdings ausschließlich über den einzelnen Thunderbolt-4-Port.
| MSI Stealth GS77 12UHS-083US i7-12700H, GeForce RTX 3080 Ti Laptop GPU, 99 Wh | MSI GS76 Stealth 11UH i9-11900H, GeForce RTX 3080 Laptop GPU, 99.9 Wh | Razer Blade 17 RTX 3080 Ti i7-12800H, GeForce RTX 3080 Ti Laptop GPU, 82 Wh | MSI GE76 Raider i9-12900HK, GeForce RTX 3080 Ti Laptop GPU, 99.99 Wh | Alienware x17 RTX 3080 P48E i7-11800H, GeForce RTX 3080 Laptop GPU, 87 Wh | Asus ROG Zephyrus S17 GX703HSD i9-11900H, GeForce RTX 3080 Laptop GPU, 90 Wh | |
|---|---|---|---|---|---|---|
| Akkulaufzeit | -4% | -19% | -18% | -28% | 57% | |
| Idle (h) | 10.8 | 9.9 -8% | 8 -26% | 7 -35% | ||
| WLAN (h) | 6.2 | 6.4 3% | 5.5 -11% | 5.1 -18% | 5.9 -5% | 7.5 21% |
| Last (h) | 1.4 | 1.3 -7% | 1.1 -21% | 0.8 -43% | 2.7 93% | |
| H.264 (h) | 7.2 | |||||
| Witcher 3 ultra (h) | 1 |
Pro
Contra
Fazit – (Größtenteils) Besser als das GS76
Das GS77 macht im Vergleich zum Vorgänger ein paar Schritte nach vorne aber auch gleichzeitig ein paar Schritte zurück. Die Verbesserungen beinhalten unter anderem das robustere Gehäuse, die höher auflösende Webcam, das größere Clickpad, die einfachere Wartbarkeit, die leicht gesteigerte Akkulaufzeit, die neuen Display-Optionen und zuletzt eine höhere Performance bei gleichbleibenden TDP- und TGP-Levels. Verglichen mit anderen Core i7 und Core-i9-Laptops ist die CPU-Performance des GS77 besser als erwartet. Das GS77 fühlt sich außerdem deutlich wertiger und wuchtiger an als der Vorgänger.
An anderen Stellen müssen wir allerdings eine Rückentwicklung feststellen. Unter anderem sind zum Beispiel Gewicht und Größe deutlich gestiegen, wodurch die Mobilität und Portabilität leiden. Das 240-Hz-QHD-Panel ist nicht so hell wie das 4K-Panel des GS76 und der SD-Kartenleser des Vorgängers war fast noch mehr als doppelt so schnell. Auch der maximale Öffnungswinkel ist geringer, wodurch die Mobilität noch weiter eingeschränkt wird.
Insgesamt stellt das GS77 trotzdem eine ordentliche Weiterentwicklung der GS-Serie dar. Die 105-W-TGP-GPU macht uns ein wenig Sorgen, deutet sie schließlich an, dass auch zukünftige auf diesem Design basierende Modelle auf GPUs mit einer Leistung von etwa 100 W eingeschränkt bleiben. Das Blade 17 mit Vapor-Chamber-Kühlung kann dagegen mit stolzen 165 W aufwarten. MSI hat die Gelegenheit verpasst das GS77 mit zusätzlichen Features auszustatten, wie zum Beispiel MUX, ein kalibriertes Display oder G-Sync-Support für den internen Bildschirm. All diese Optionen sind auf dem etwas kleineren Razer Blade 17 nämlich verfügbar.
Preise und Verfügbarkeit
Aktuell ist das GS77 in Deutschland noch nicht lieferbar. Es ist jedoch bereits bei diversen Händlern gelistet, zum Beispiel ab 3.109 Euro bei Notebooksbilliger.
MSI Stealth GS77 12UHS-083US
- 07.04.2022 v7 (old)
Allen Ngo
Preisvergleich

