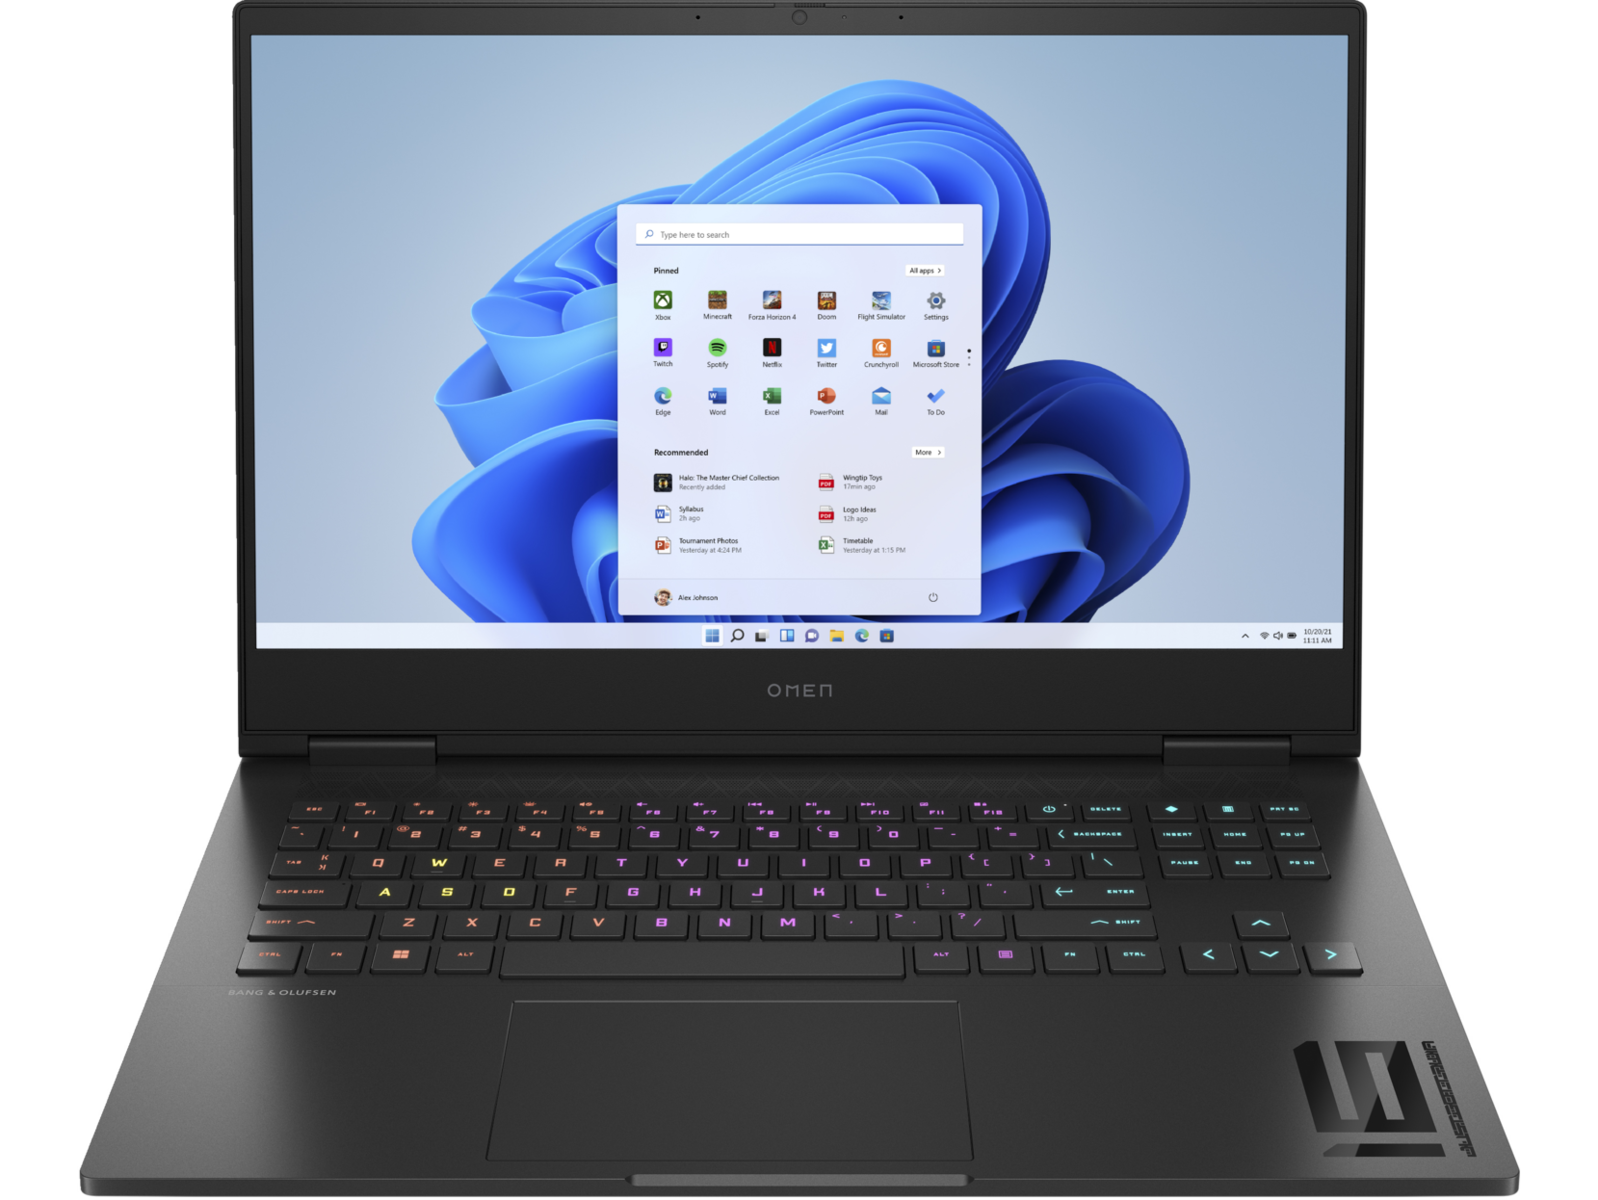
HP Omen 16 (2023) Gaming-Notebook im Test: RTX 4080 mit 145 Watt GPU-Power

Das HP Omen 16 (2023) kommt als Nachfolger des letztjährigen Modells mit schnelleren Raptor-Lake-H-Prozessoren der 13. Generation, Nvidias RTX-Grafikkarten auf Ada-Lovelace-Basis sowie einem überarbeiteten Gehäuse daher. Damit liegt es ein paar Stufen über dem eher preisorientierten HP Pavilion Gaming 16.
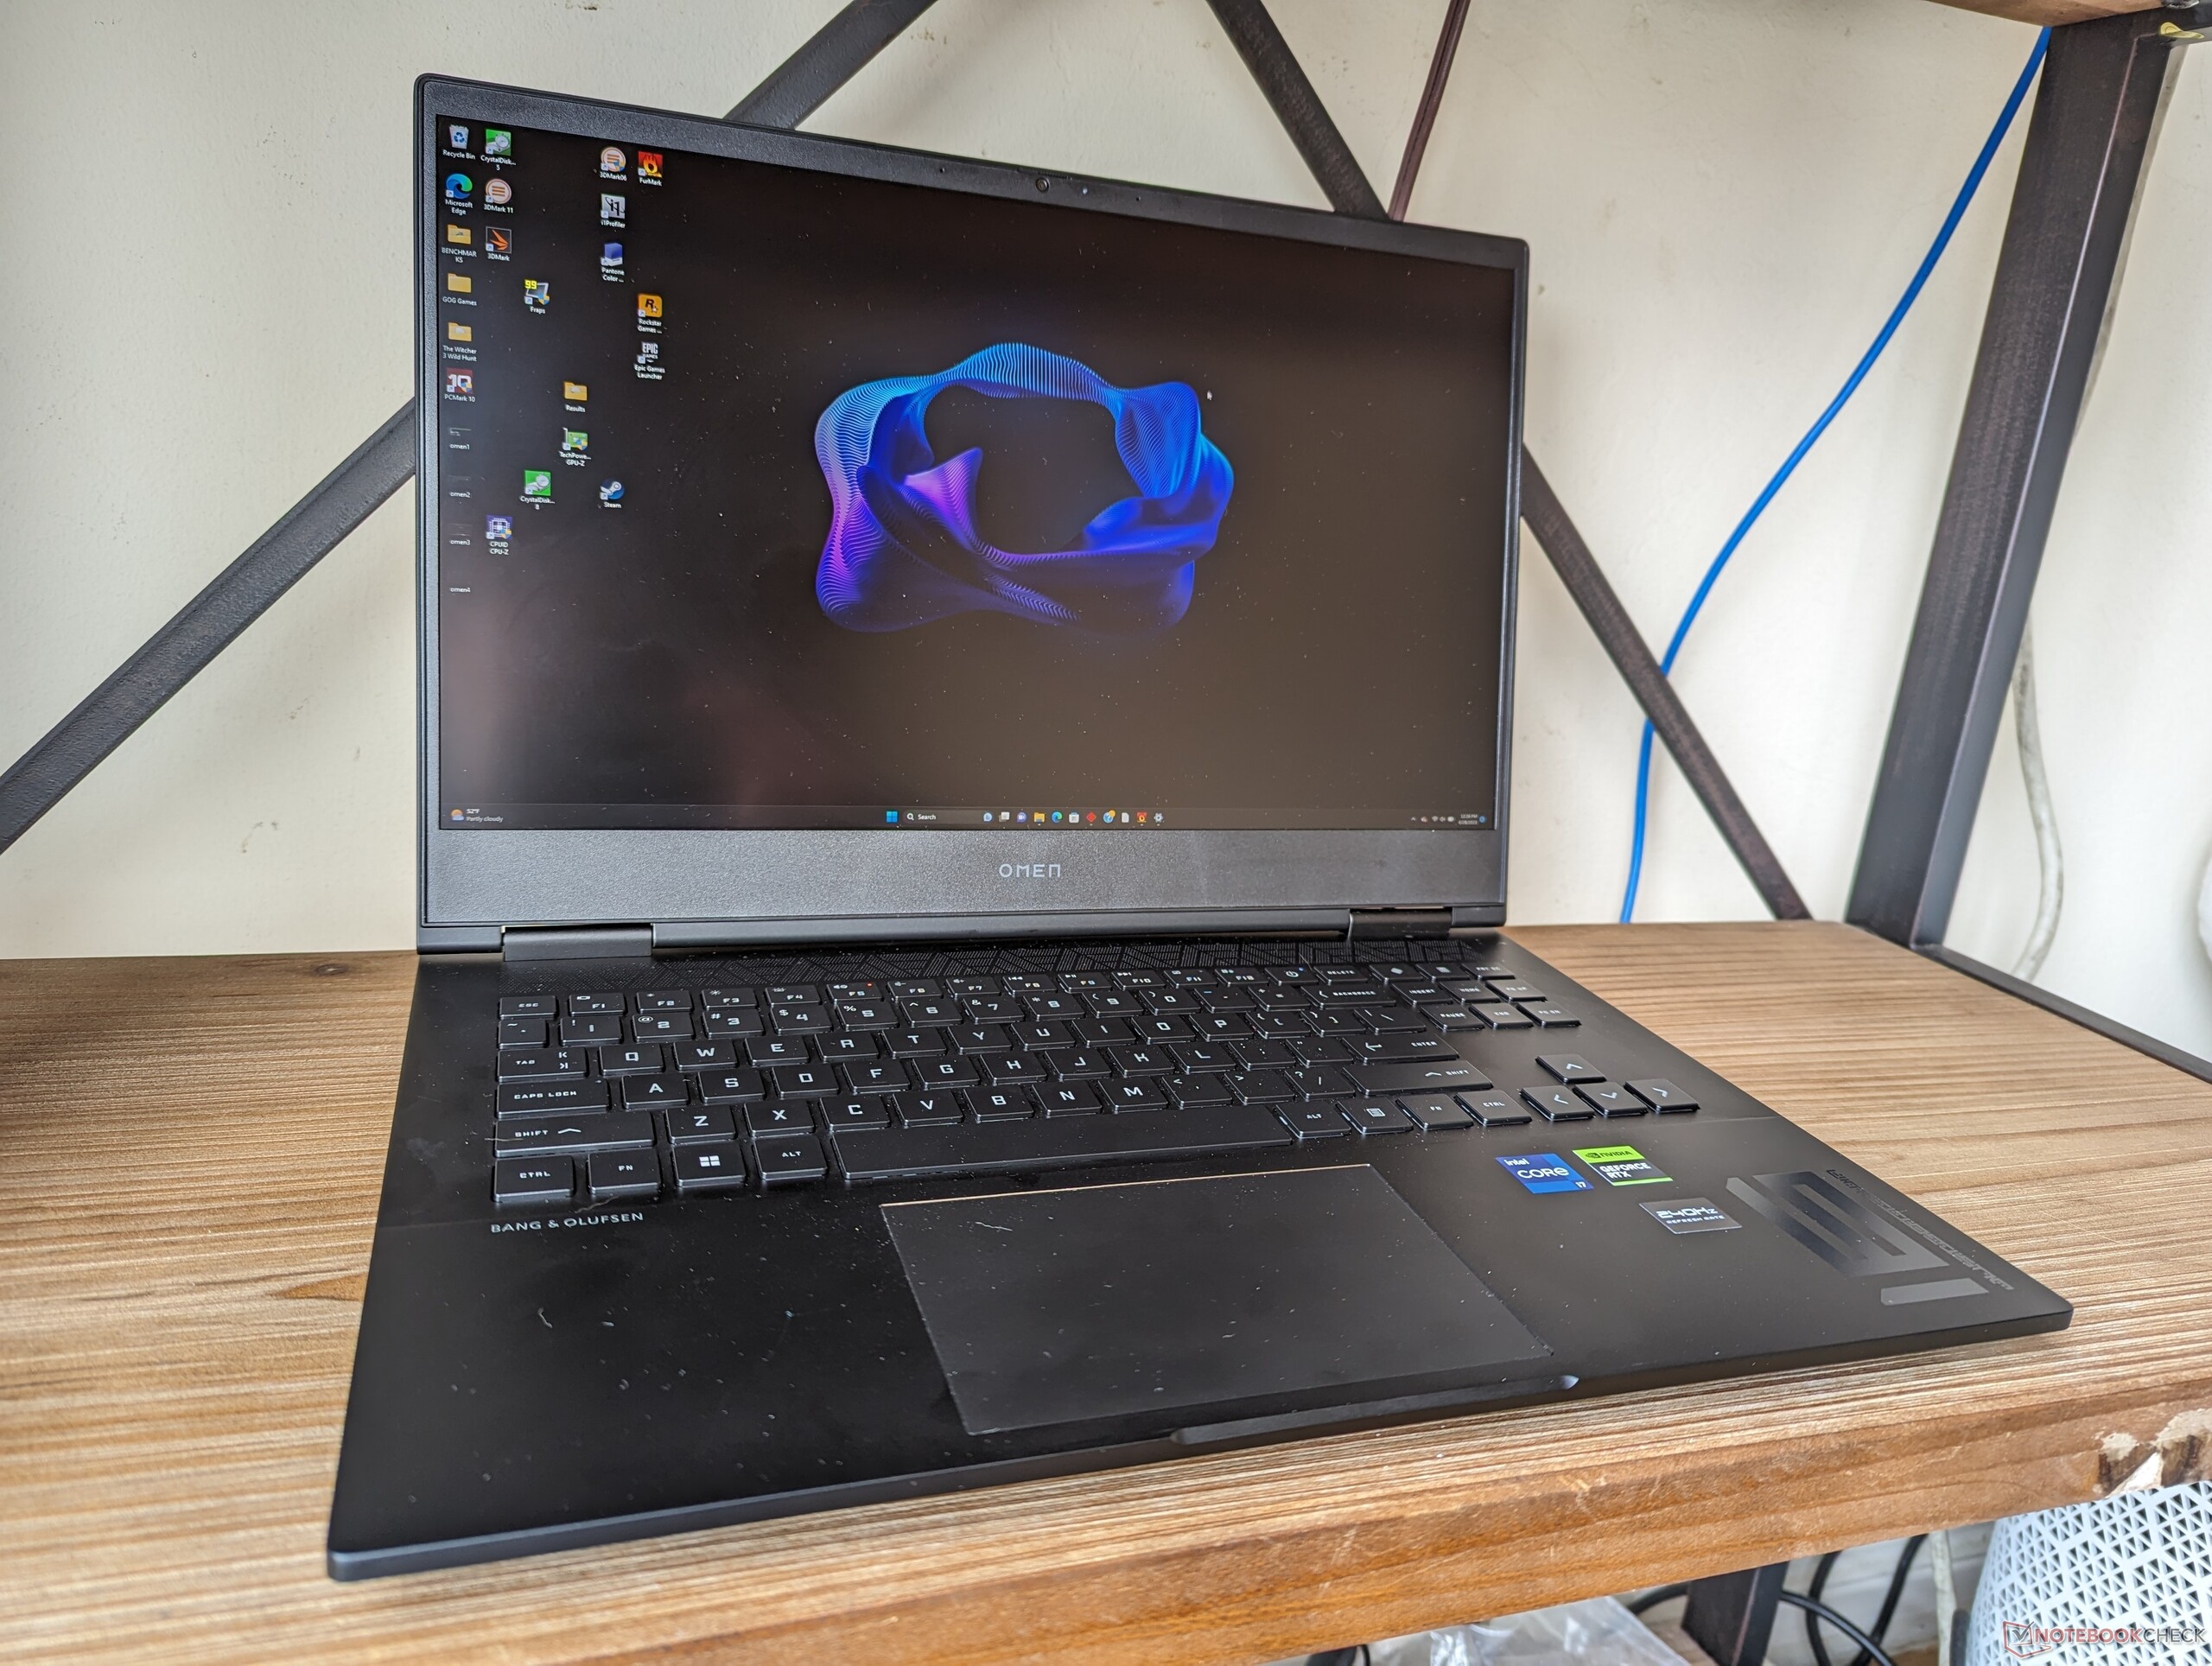
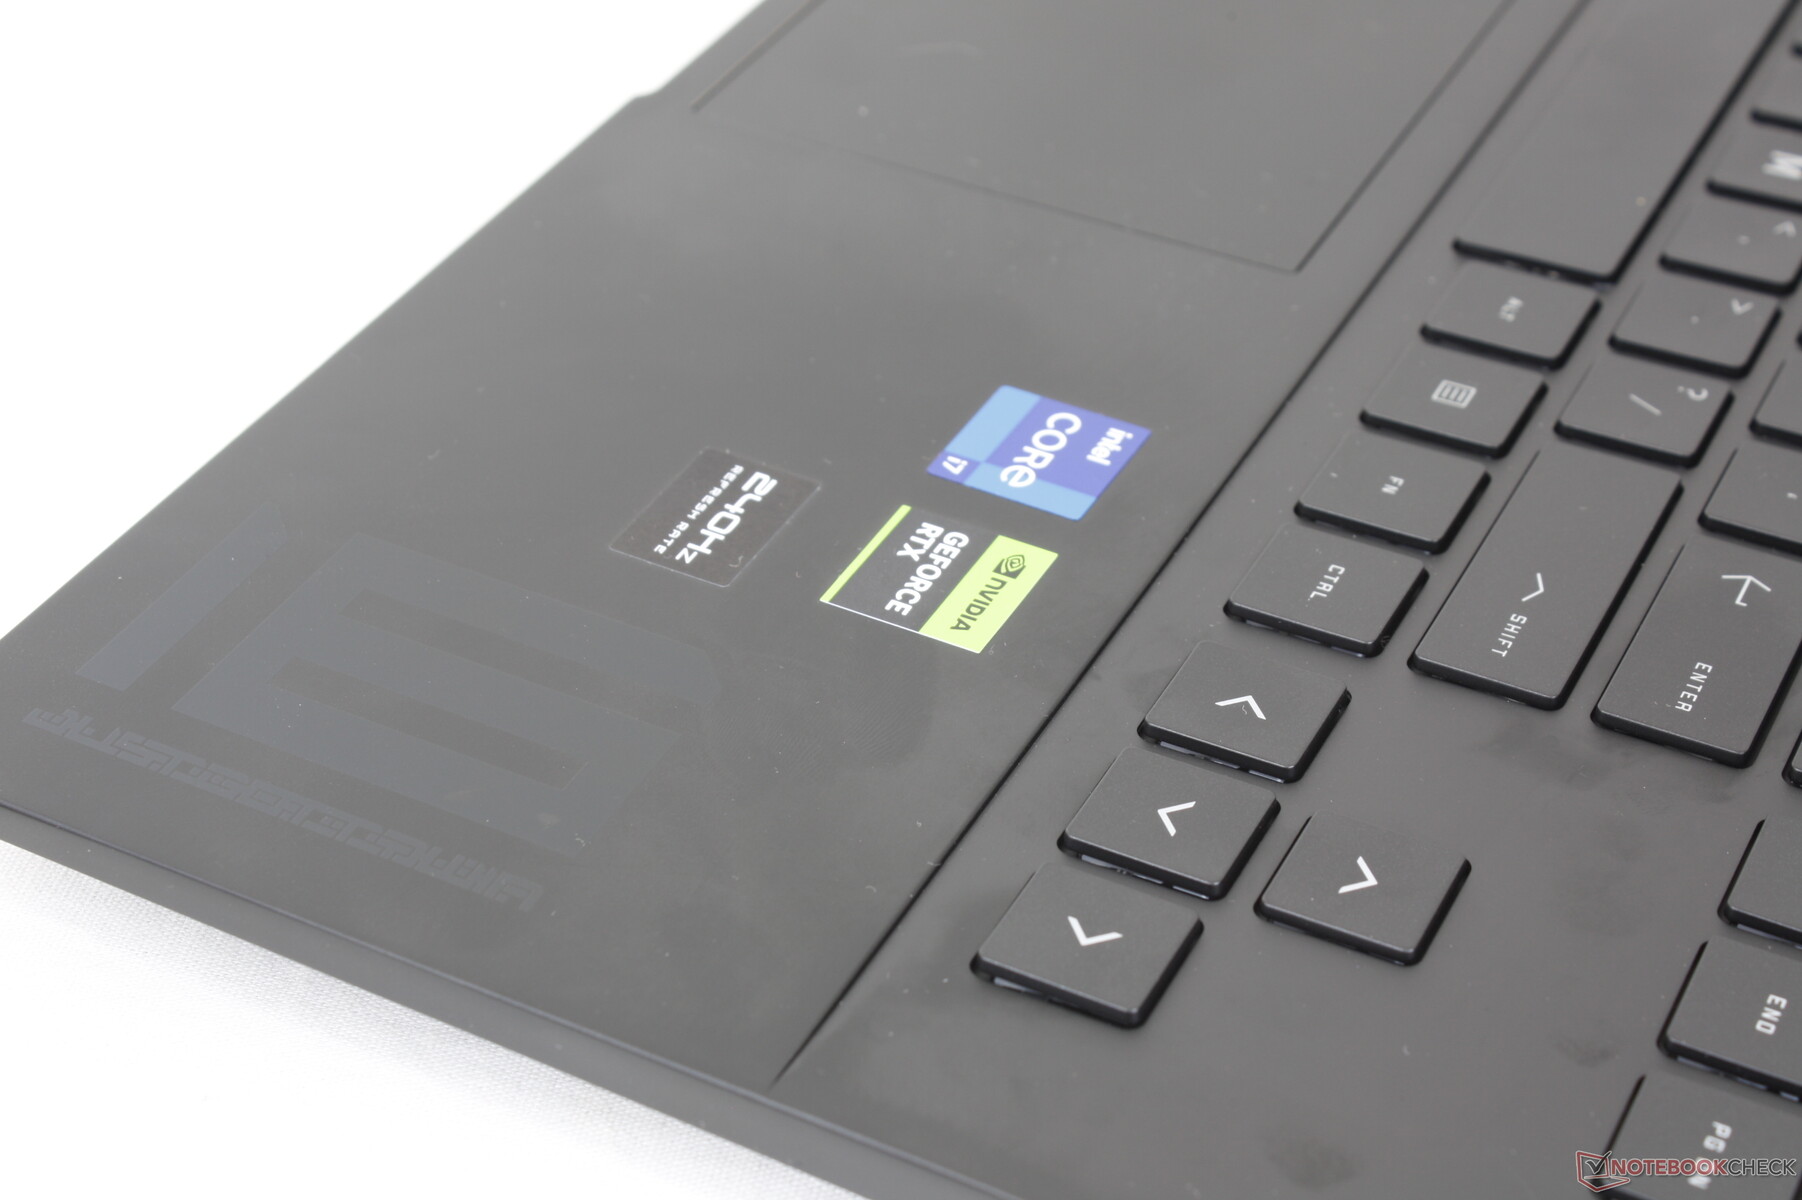
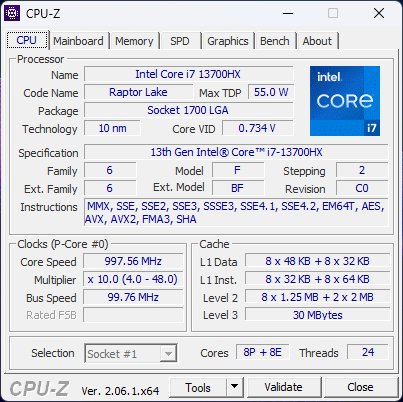
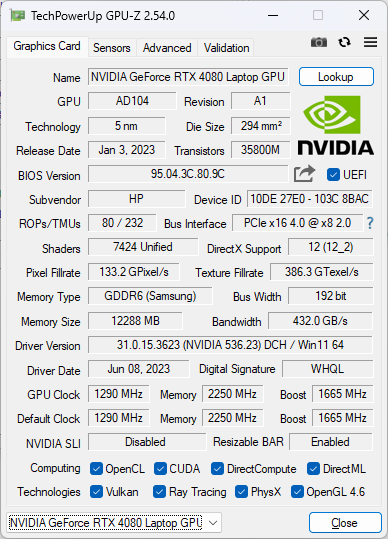
Unser Testgerät ist die Spitzenkonfiguration mit der Intel Core i7-13700HX Raptor-Lake-CPU, einer 145 Watt starken GeForce RTX 4080 GPU, einem 240Hz schnellen QHD-IPS-Display, einer Tastatur mit frei anpassbarer RGB-Beleuchtung für jede einzelne Taste und 32GB Arbeitsspeicher für rund 3.000 Euro. Günstigere Ausführungen mit RTX 4060, einem 165Hz schnellem Full-HD-IPS-Display und einer ganzflächig anpassbaren Tastaturbeleuchtung sind ab 1.299 Euro verfügbar. HP bietet dieses Jahr keine Radeon-Konfigurationen mehr an.
Als Alternativen zum HP Omen 16 sind andere High-End-Gaming-Notebooks im 16-Zoll-Segment zu nennen. Hierzu gehört das Alienware x16 R1, Lenovo Legion Pro 7 16, Asus ROG Strix G16 und Razer Blade 16.
Weitere HP-Testberichte:
Mögliche Konkurrenten im Vergleich
Bew. | Datum | Modell | Gewicht | Dicke | Größe | Auflösung | Preis ab |
|---|---|---|---|---|---|---|---|
| 87.4 % v7 (old) | 07 / 2023 | HP Omen 16-wf000 i7-13700HX, GeForce RTX 4080 Laptop GPU | 2.4 kg | 23.6 mm | 16.10" | 2560x1440 | |
| 86.4 % v7 (old) | 12 / 2022 | HP Omen 16-n0033dx R7 6800H, Radeon RX 6650M | 2.4 kg | 22.6 mm | 16.10" | 1920x1080 | |
| 88.4 % v7 (old) | 06 / 2023 | Alienware x16 R1 i9-13900HK, GeForce RTX 4080 Laptop GPU | 2.6 kg | 18.57 mm | 16.00" | 2560x1600 | |
| 88.8 % v7 (old) | 06 / 2023 | Lenovo Legion Pro 7 RTX4090 i9-13900HX, GeForce RTX 4090 Laptop GPU | 2.7 kg | 26 mm | 16.00" | 2560x1600 | |
| 88.4 % v7 (old) | 03 / 2023 | Asus ROG Strix G16 G614JZ i9-13980HX, GeForce RTX 4080 Laptop GPU | 2.4 kg | 30.4 mm | 16.00" | 2560x1600 | |
| 91.2 % v7 (old) | 02 / 2023 | Razer Blade 16 Early 2023 i9-13950HX, GeForce RTX 4080 Laptop GPU | 2.4 kg | 21.99 mm | 16.00" | 2560x1600 |
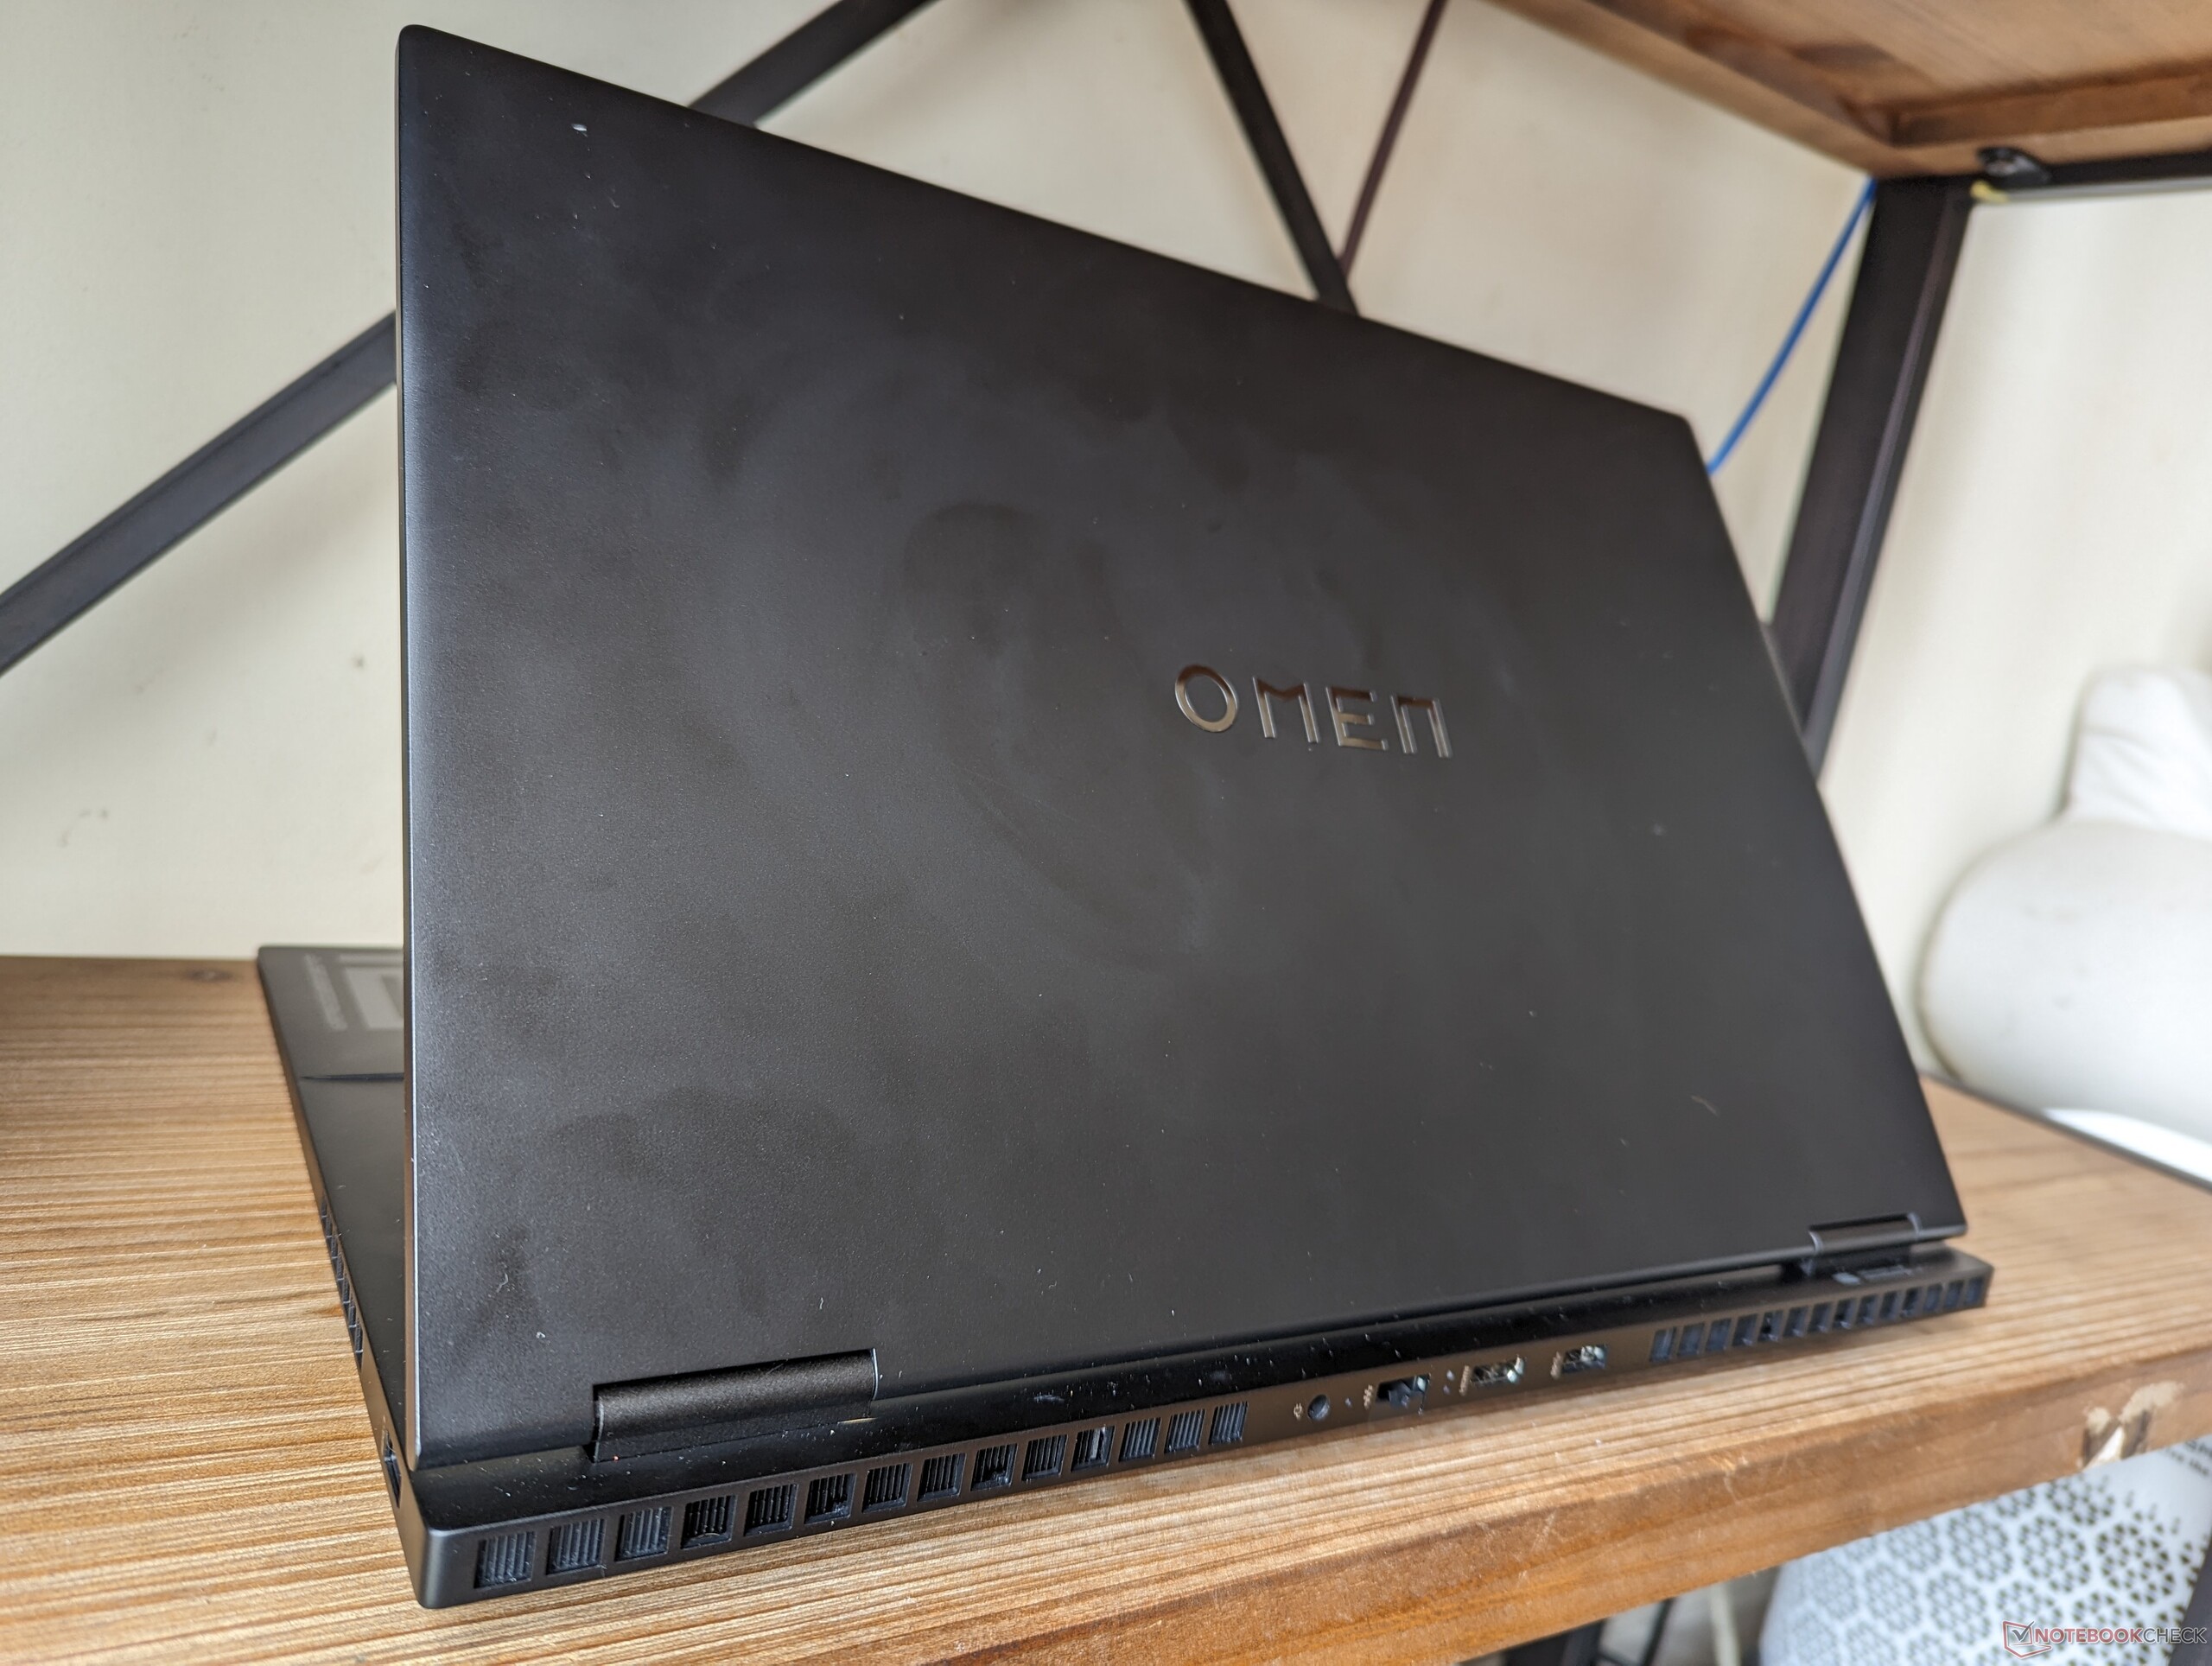
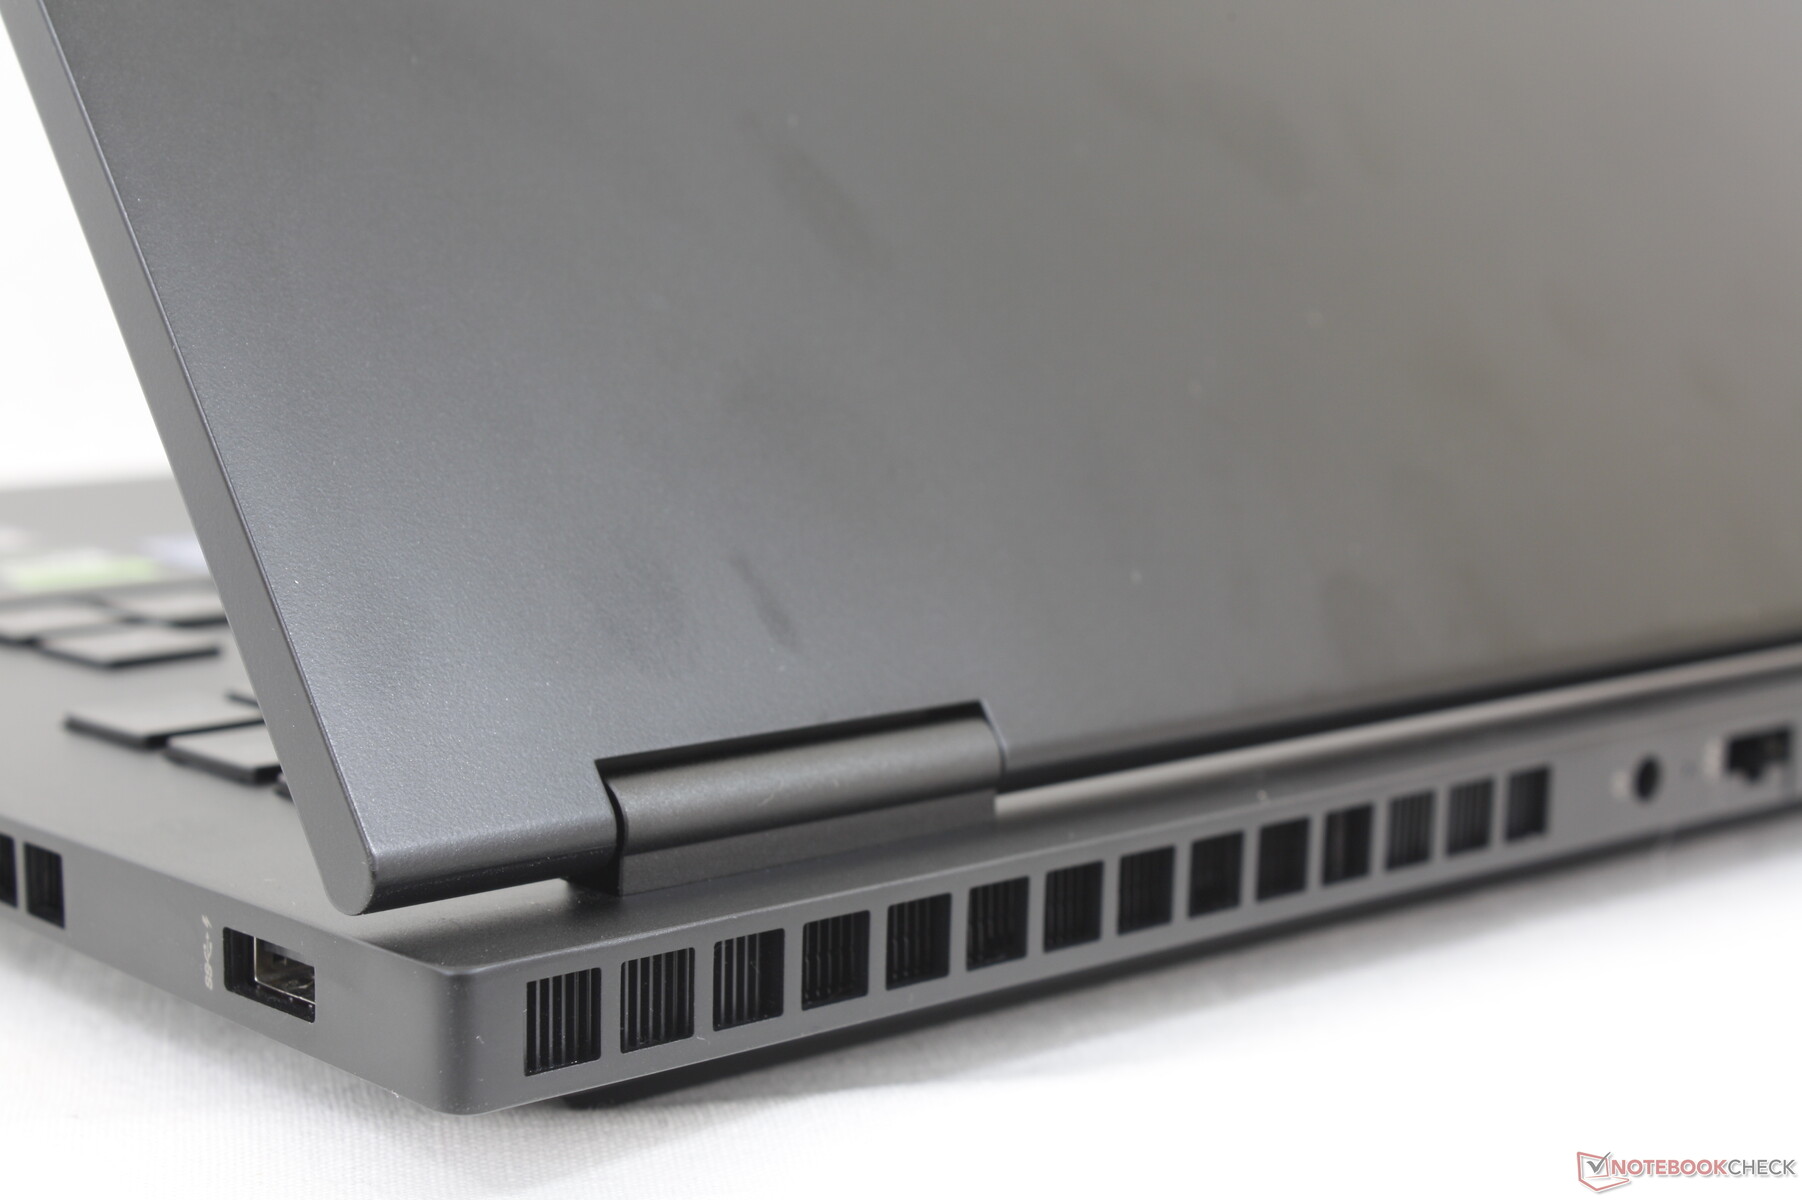
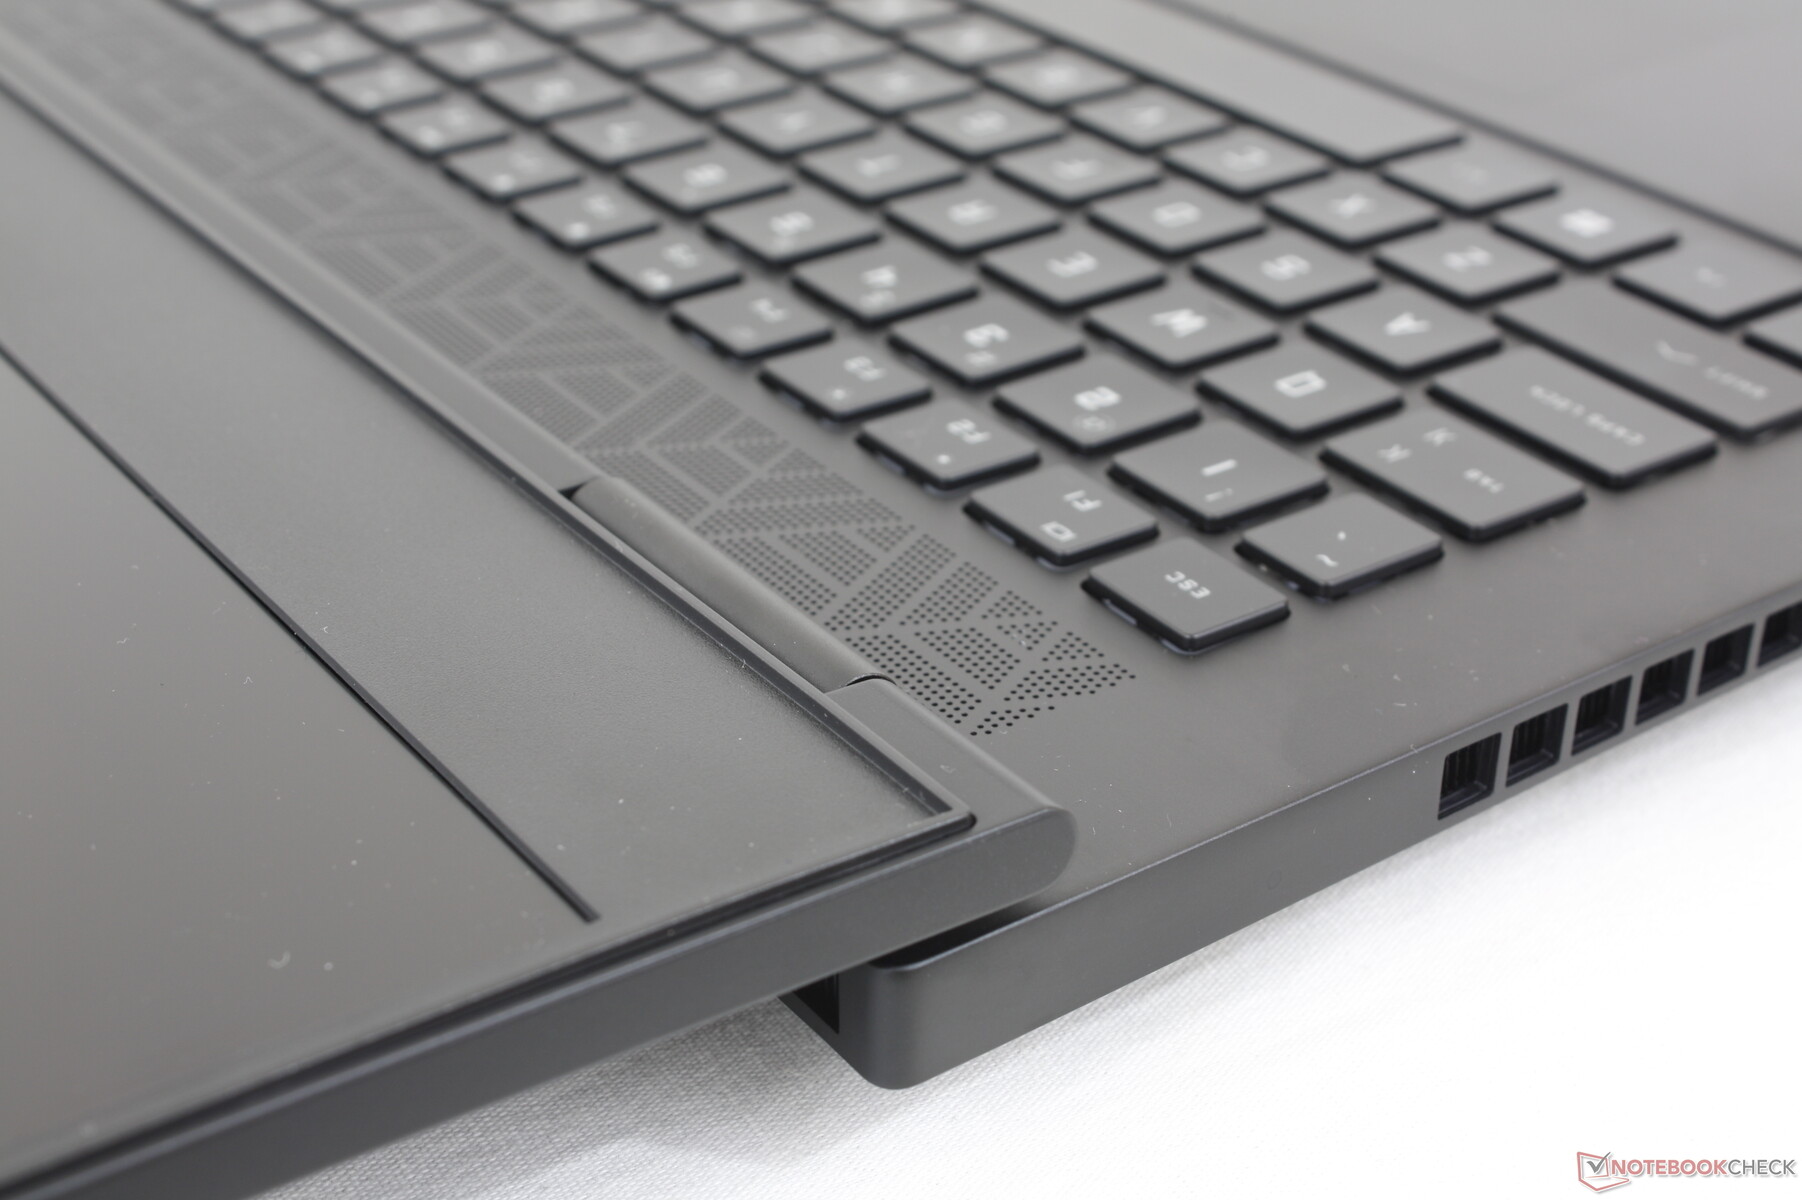
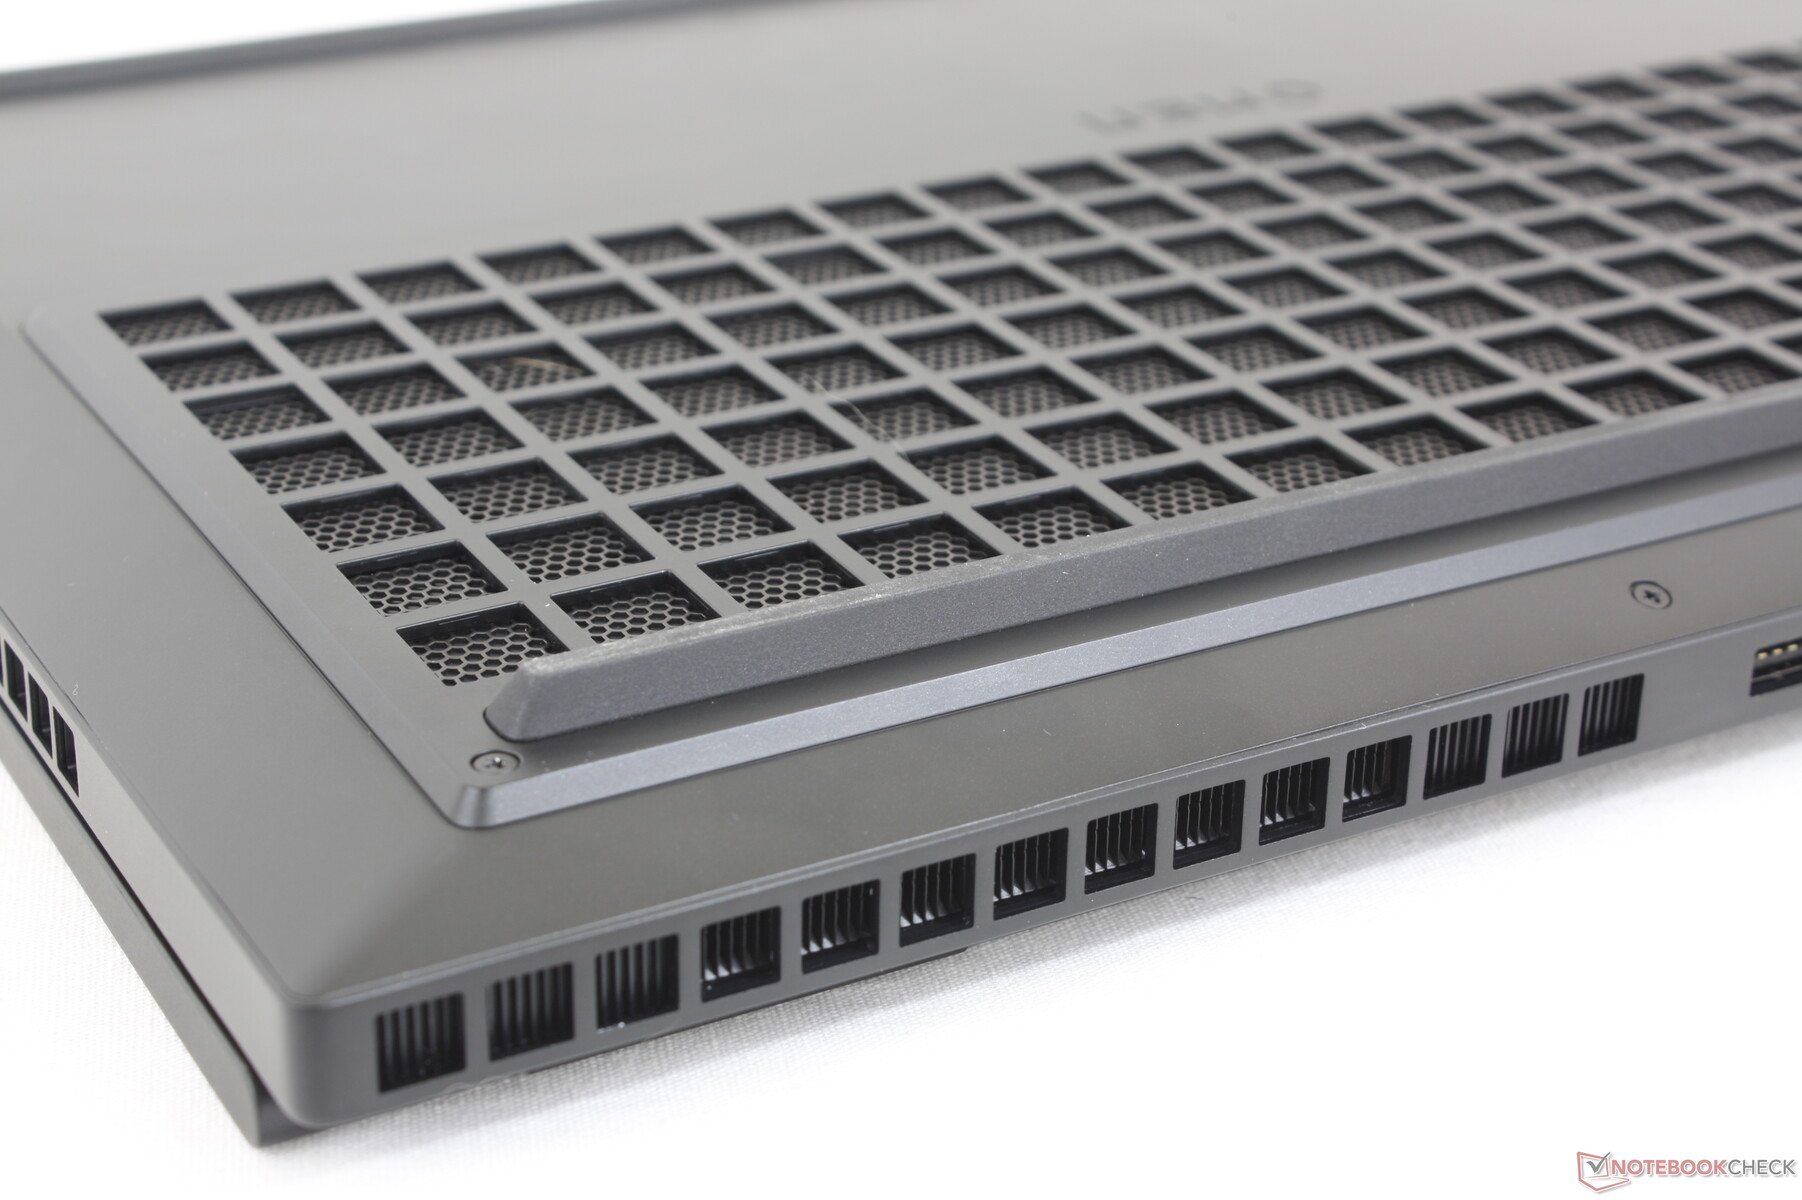
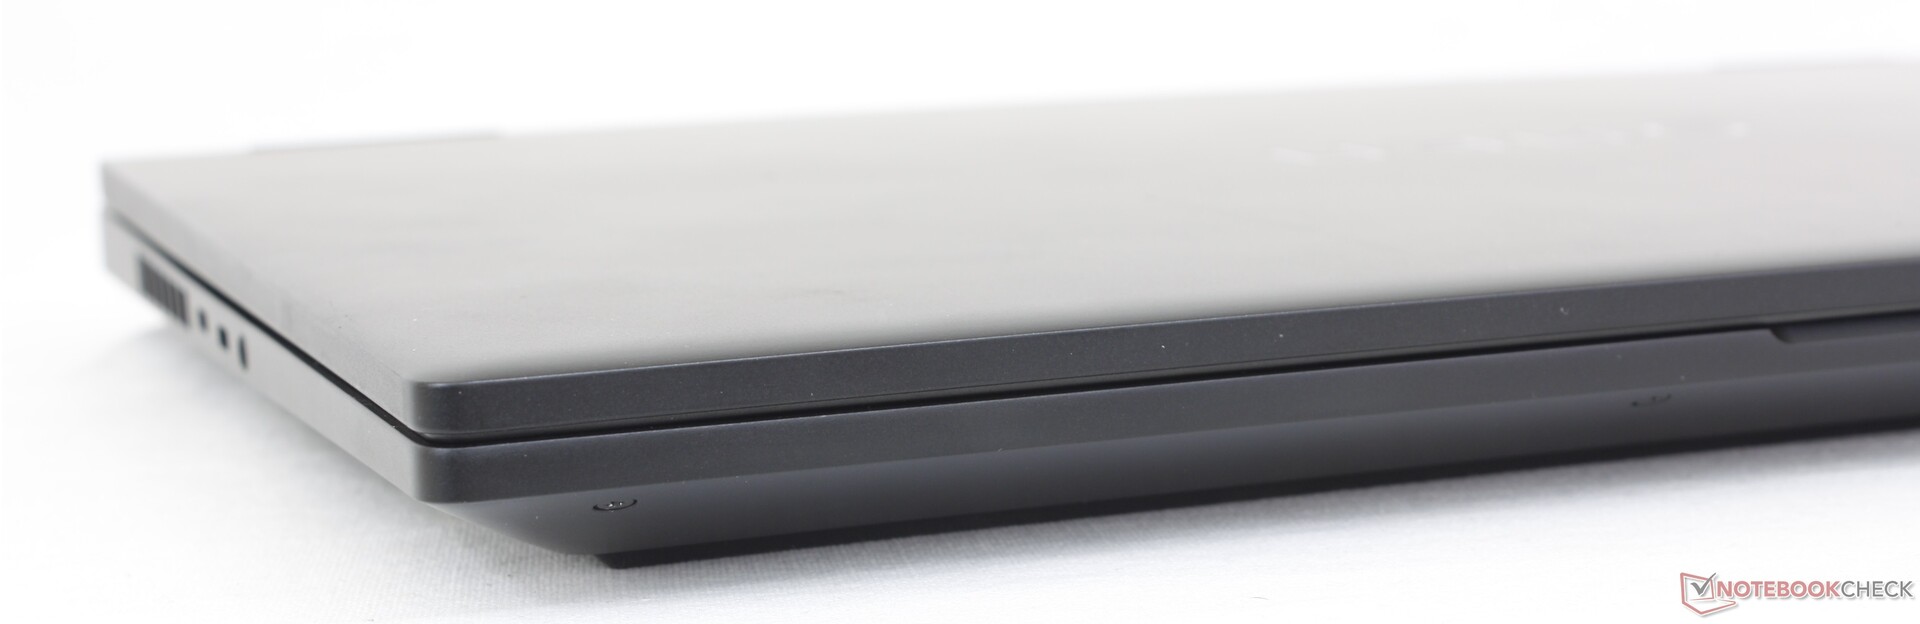
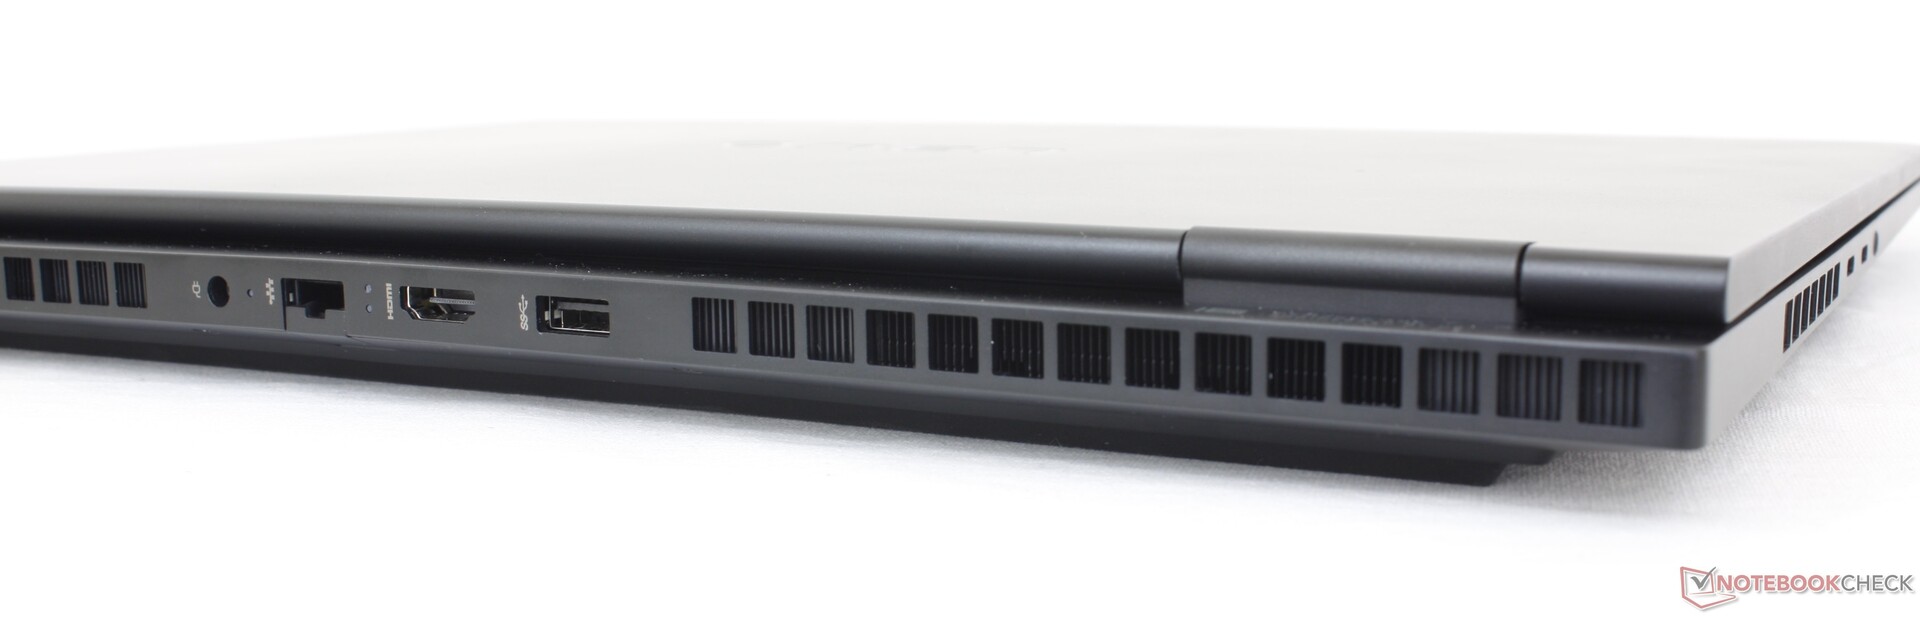
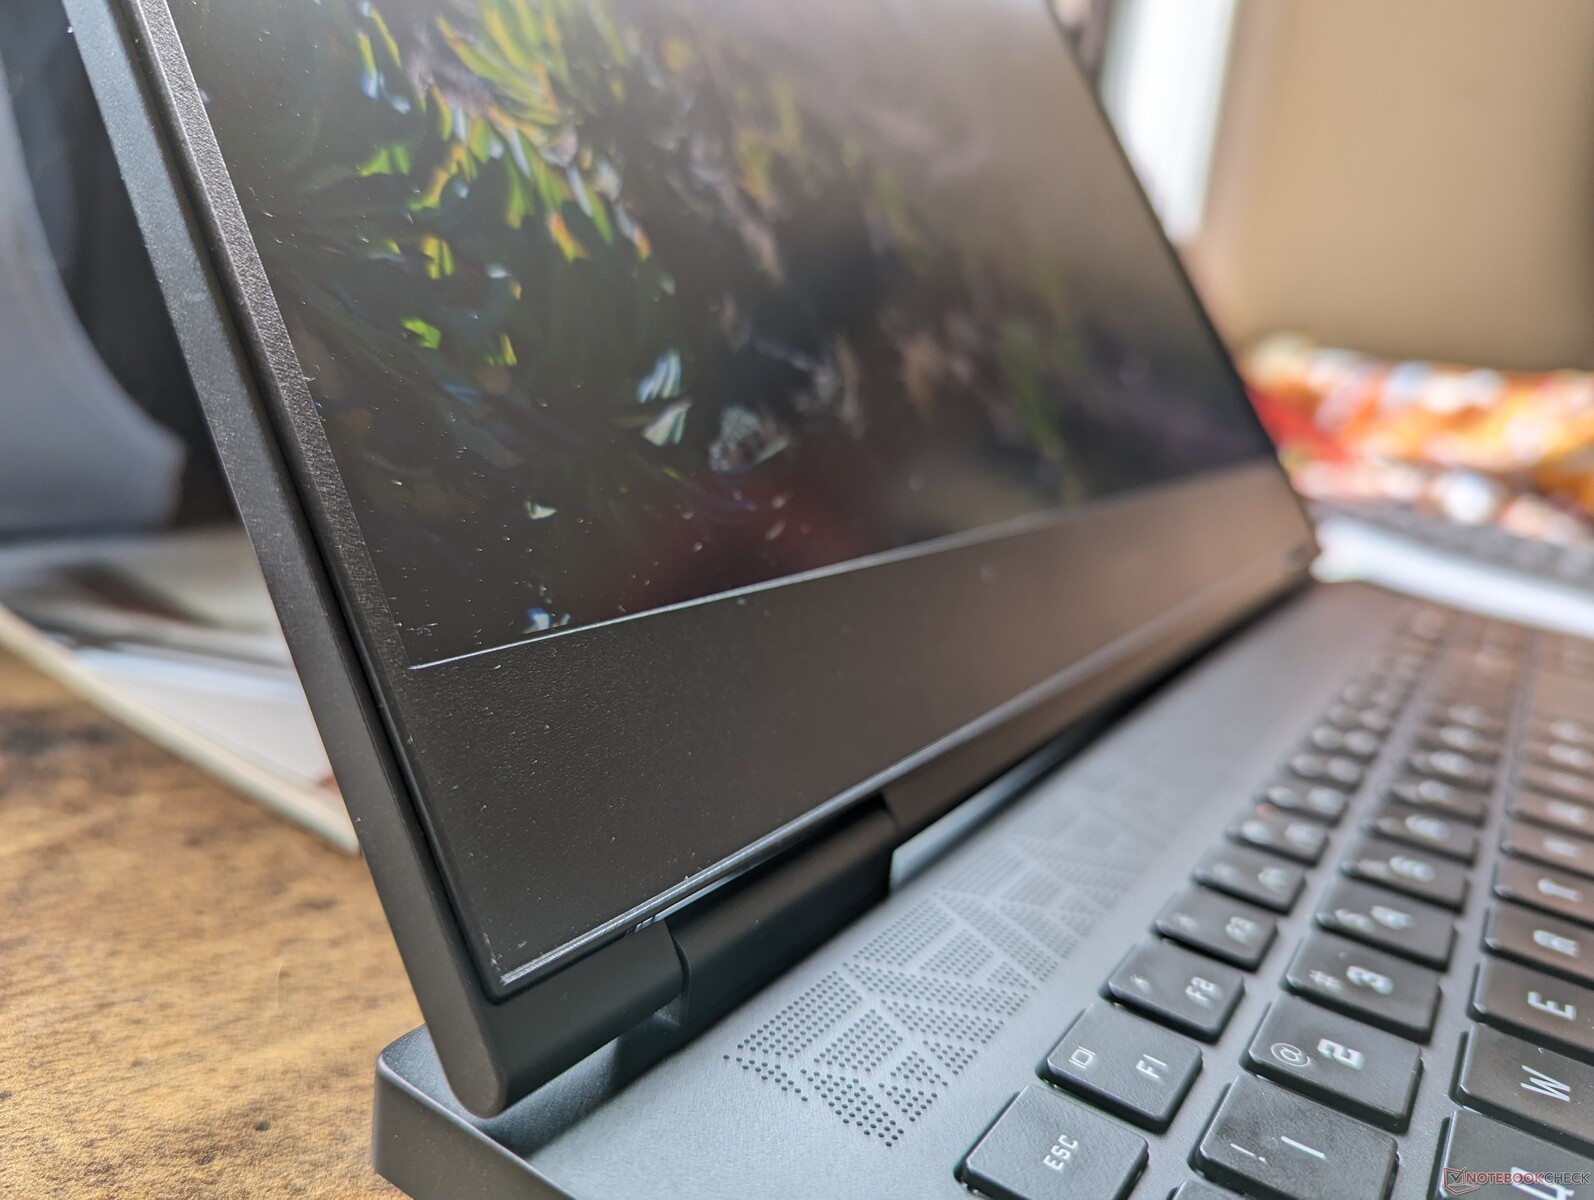
Gehäuse — Hinten länger zur besseren Kühlung
Die große optische Änderungen ist in diesem Jahr die verlängerte Heckpartie mit größeren Luftauslässen für die höheren TGPs und höherer Performance. Von vorne sieht das Gerät deshalb ähnlich aus wie der Vorgänger, während die Anpassungen in der Rückansicht leichter erkennbar sind. Das fürs Gehäuse verwendete Metall und die glatten Oberflächen fühlen sich ansonsten ähnlich an wie beim alten Design.
Die Gehäusestabilität ist sehr gut, das Chassis ist aber nicht ganz so starr wie beim Razer Blade 16. Bei Verwindungsversuchen des Deckels gibt das HP etwas mehr nach, Knarzen oder andere sichtbare Mängel sind uns bei unserem Testgerät aber nicht aufgefallen.
Aufgrund der oben genannten Änderungen ist das neue HP Omen 16 tatsächlich rund 11mm länger als das alte Design aus dem Jahr 2022. Trotzdem bleibt das Gewicht ungefähr gleich, und die Abmessungen sind trotzdem noch geringer als beim ROG Strix G16, Legion Pro 7 16 oder Alienware x16 R1.
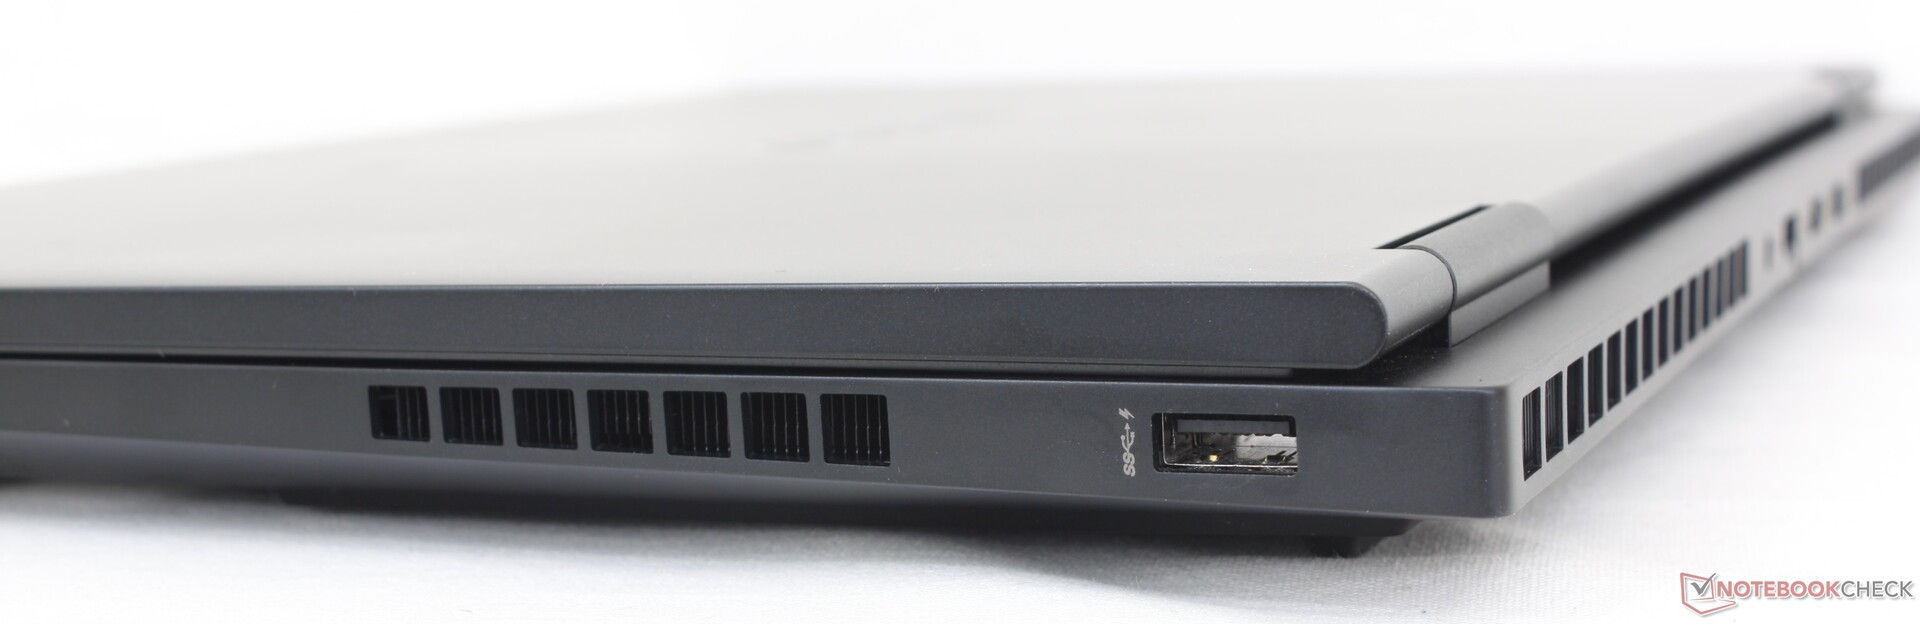
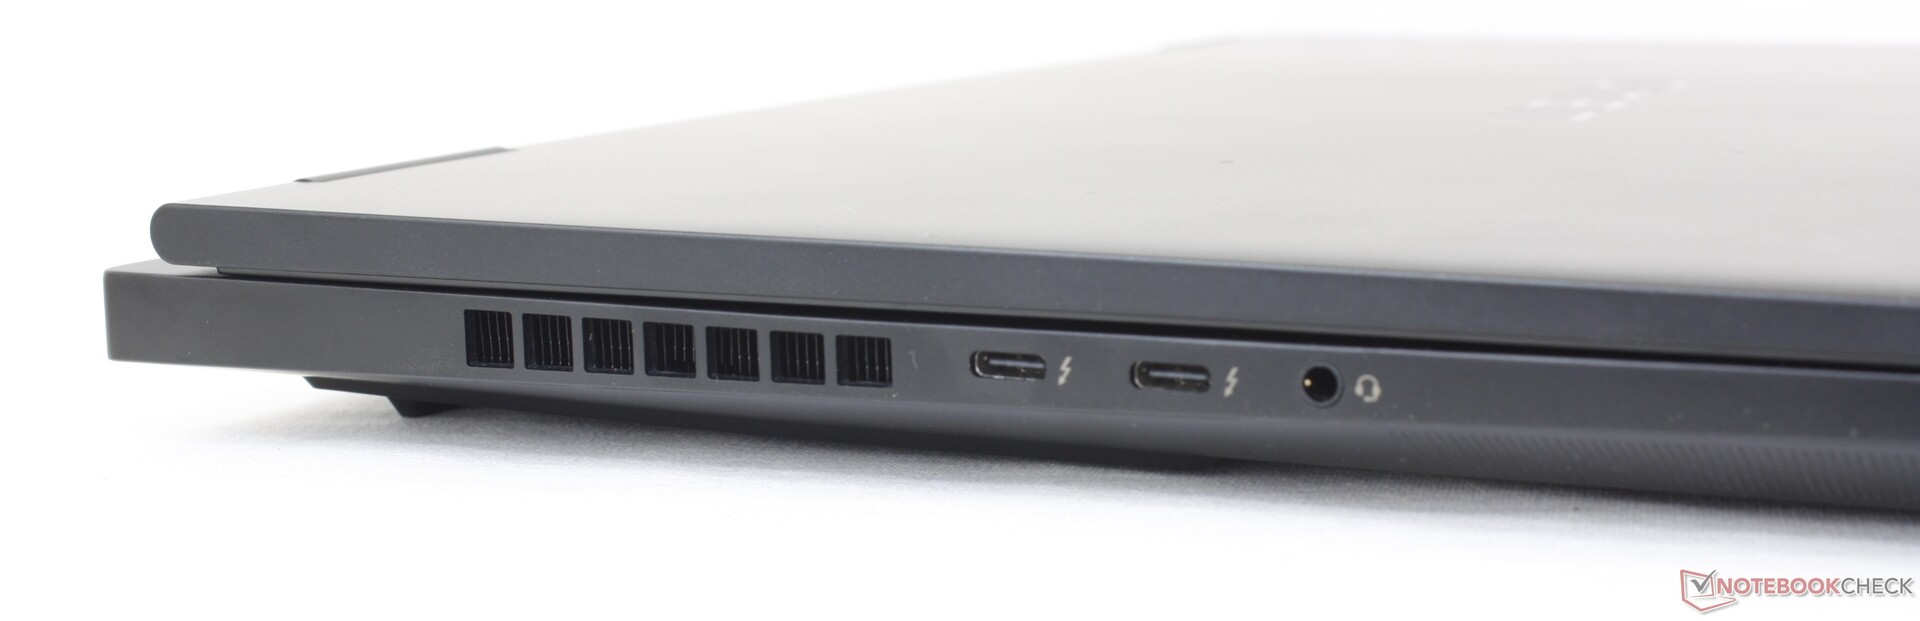
Konnektivität
Die Anschlussauswahl hat sich im Vergleich zum Vorjahresmodell verringert, es gibt jetzt einen USB-A-Port weniger und keinen SD-Kartenleser mehr. Die beiden USB-C-Buchsen sind nicht mehr an der Rückseite, sondern an der linken Seite des Gehäuses platziert und können somit leichter erreicht werden.
Kommunikation
Das optionale Intel AX211 Modul beherrscht WiFi 6E und Bluetooth 5.3. Wir haben mit unserem Asus AXE11000 im 6-GHz-WLAN keinerlei Verbindungsprobleme beobachtet.
| Networking | |
| iperf3 transmit AXE11000 | |
| Lenovo Legion Pro 7 RTX4090 | |
| Asus ROG Strix G16 G614JZ | |
| HP Omen 16-n0033dx | |
| Razer Blade 16 Early 2023 | |
| HP Omen 16-wf000 | |
| Alienware x16 R1 | |
| iperf3 receive AXE11000 | |
| Lenovo Legion Pro 7 RTX4090 | |
| Asus ROG Strix G16 G614JZ | |
| HP Omen 16-n0033dx | |
| Razer Blade 16 Early 2023 | |
| Alienware x16 R1 | |
| HP Omen 16-wf000 | |
| iperf3 transmit AXE11000 6GHz | |
| HP Omen 16-n0033dx | |
| Razer Blade 16 Early 2023 | |
| HP Omen 16-wf000 | |
| Alienware x16 R1 | |
| iperf3 receive AXE11000 6GHz | |
| Razer Blade 16 Early 2023 | |
| HP Omen 16-wf000 | |
| HP Omen 16-n0033dx | |
| Alienware x16 R1 | |
Webcam — Upgrade auf 2 Megapixel
Eine 2-Megapixel-Webcam ist Standard und ersetzt die 1-MP-Webcam des HP Omen 16 von 2022. Eine Blende für die Wahrung der Privatsphäre ist auch vorhanden, Infrarot für Windows Hello ist allerdings nicht mit an Board.


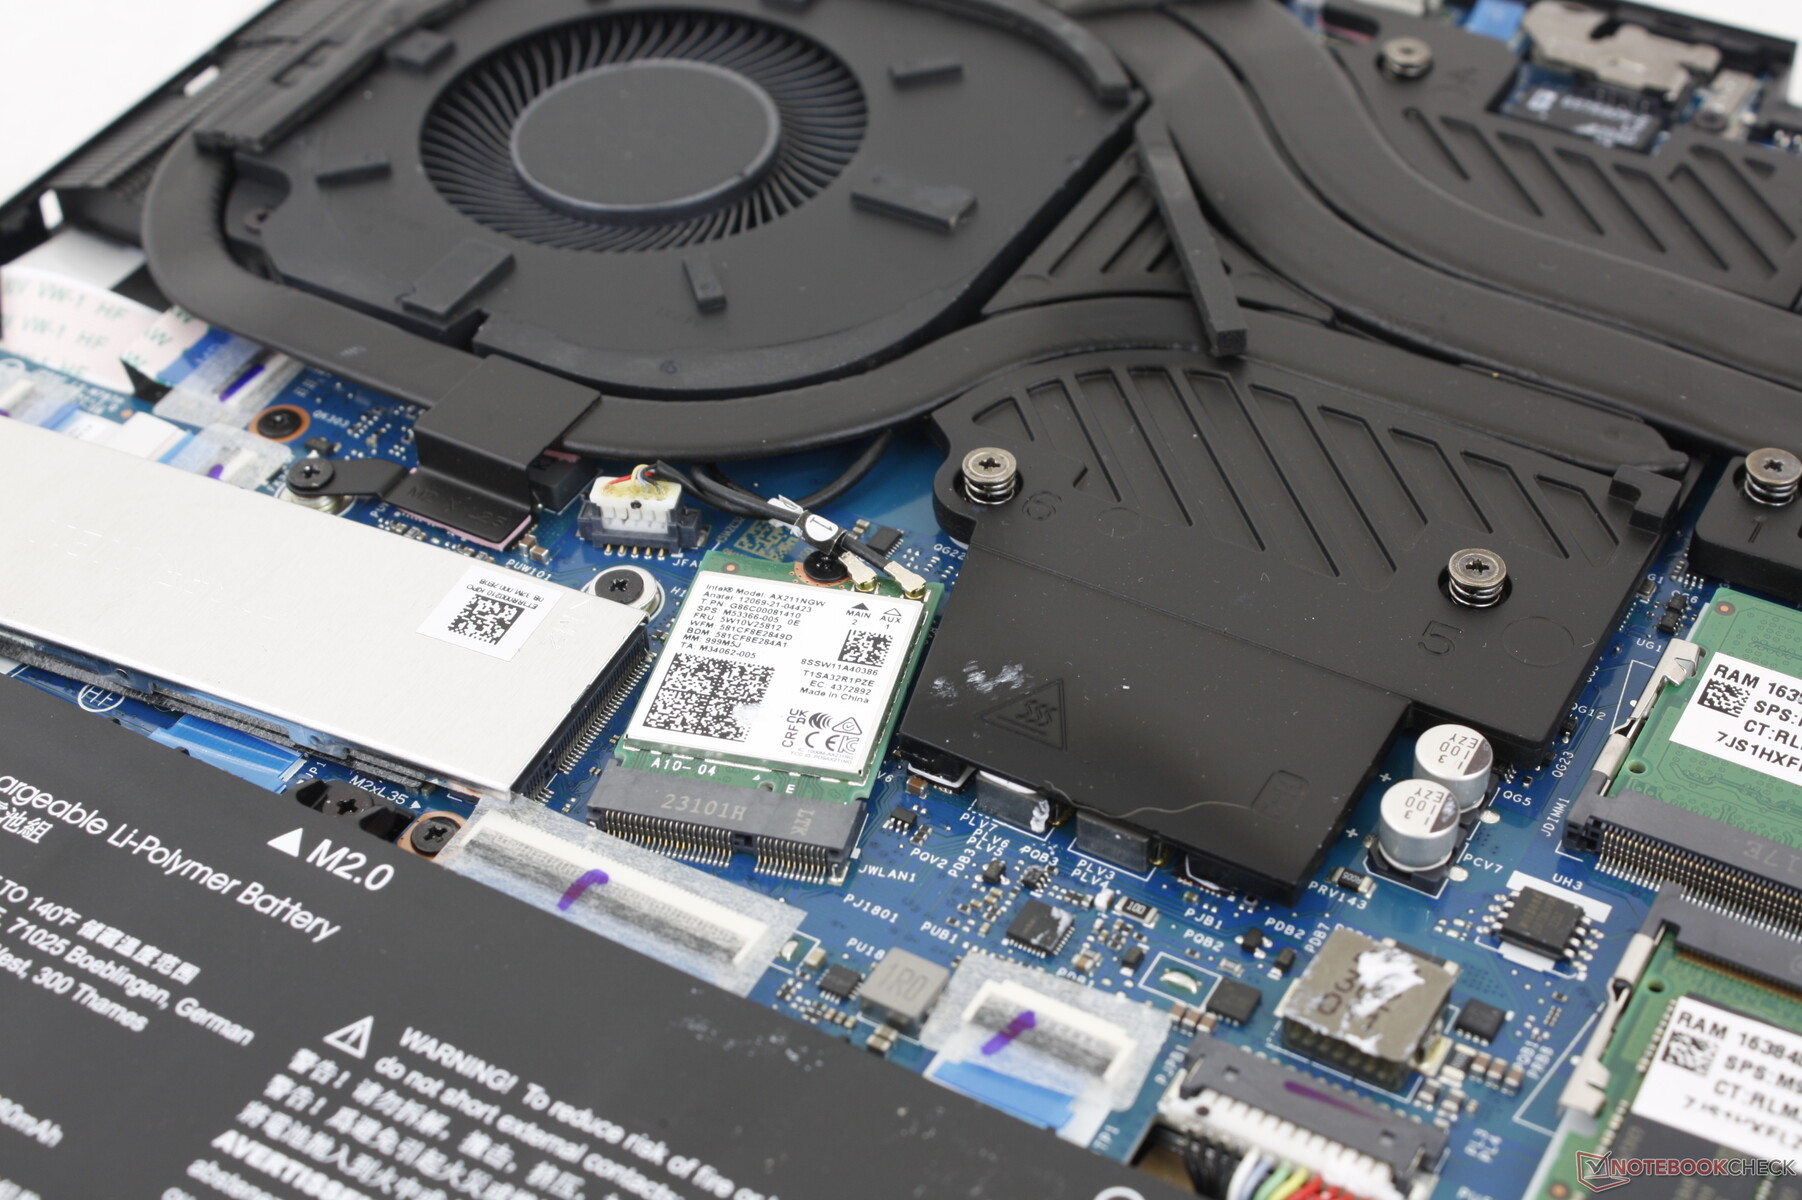
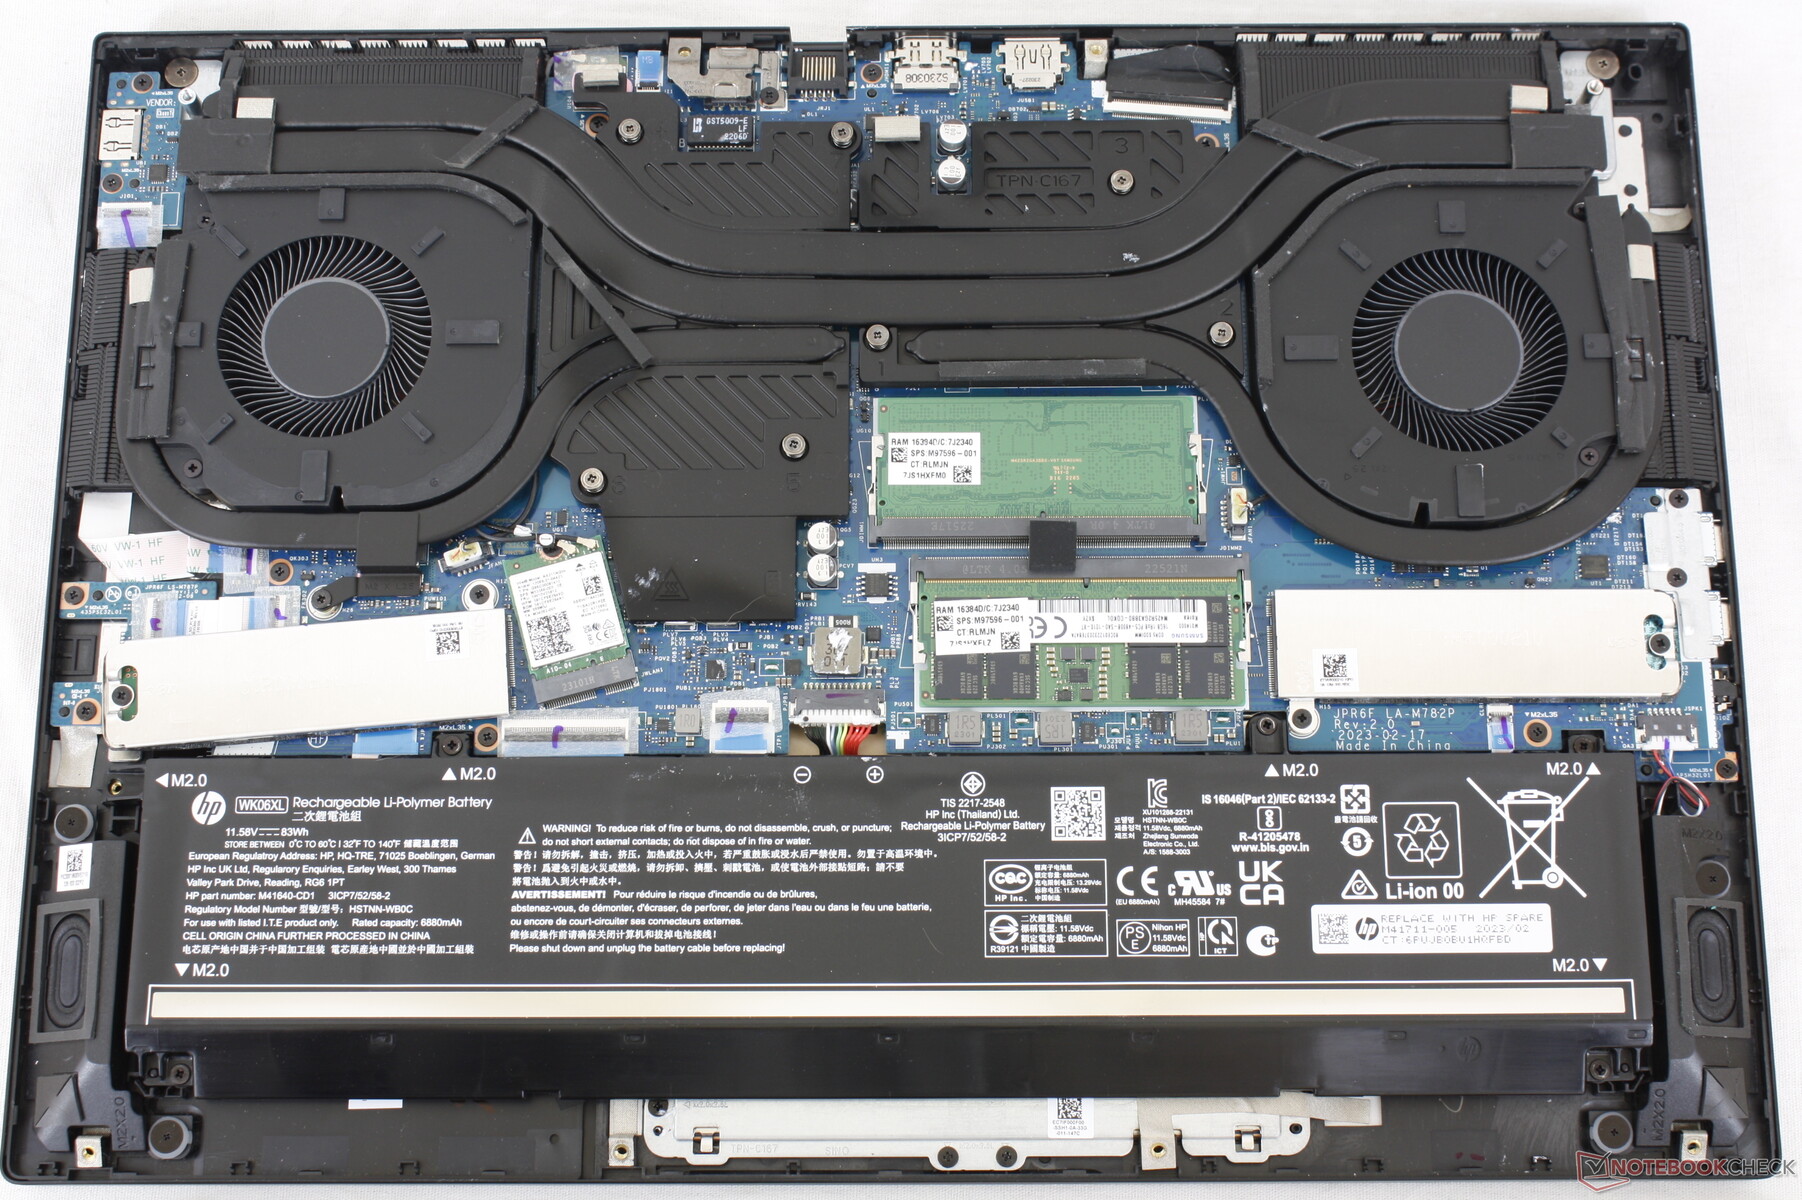
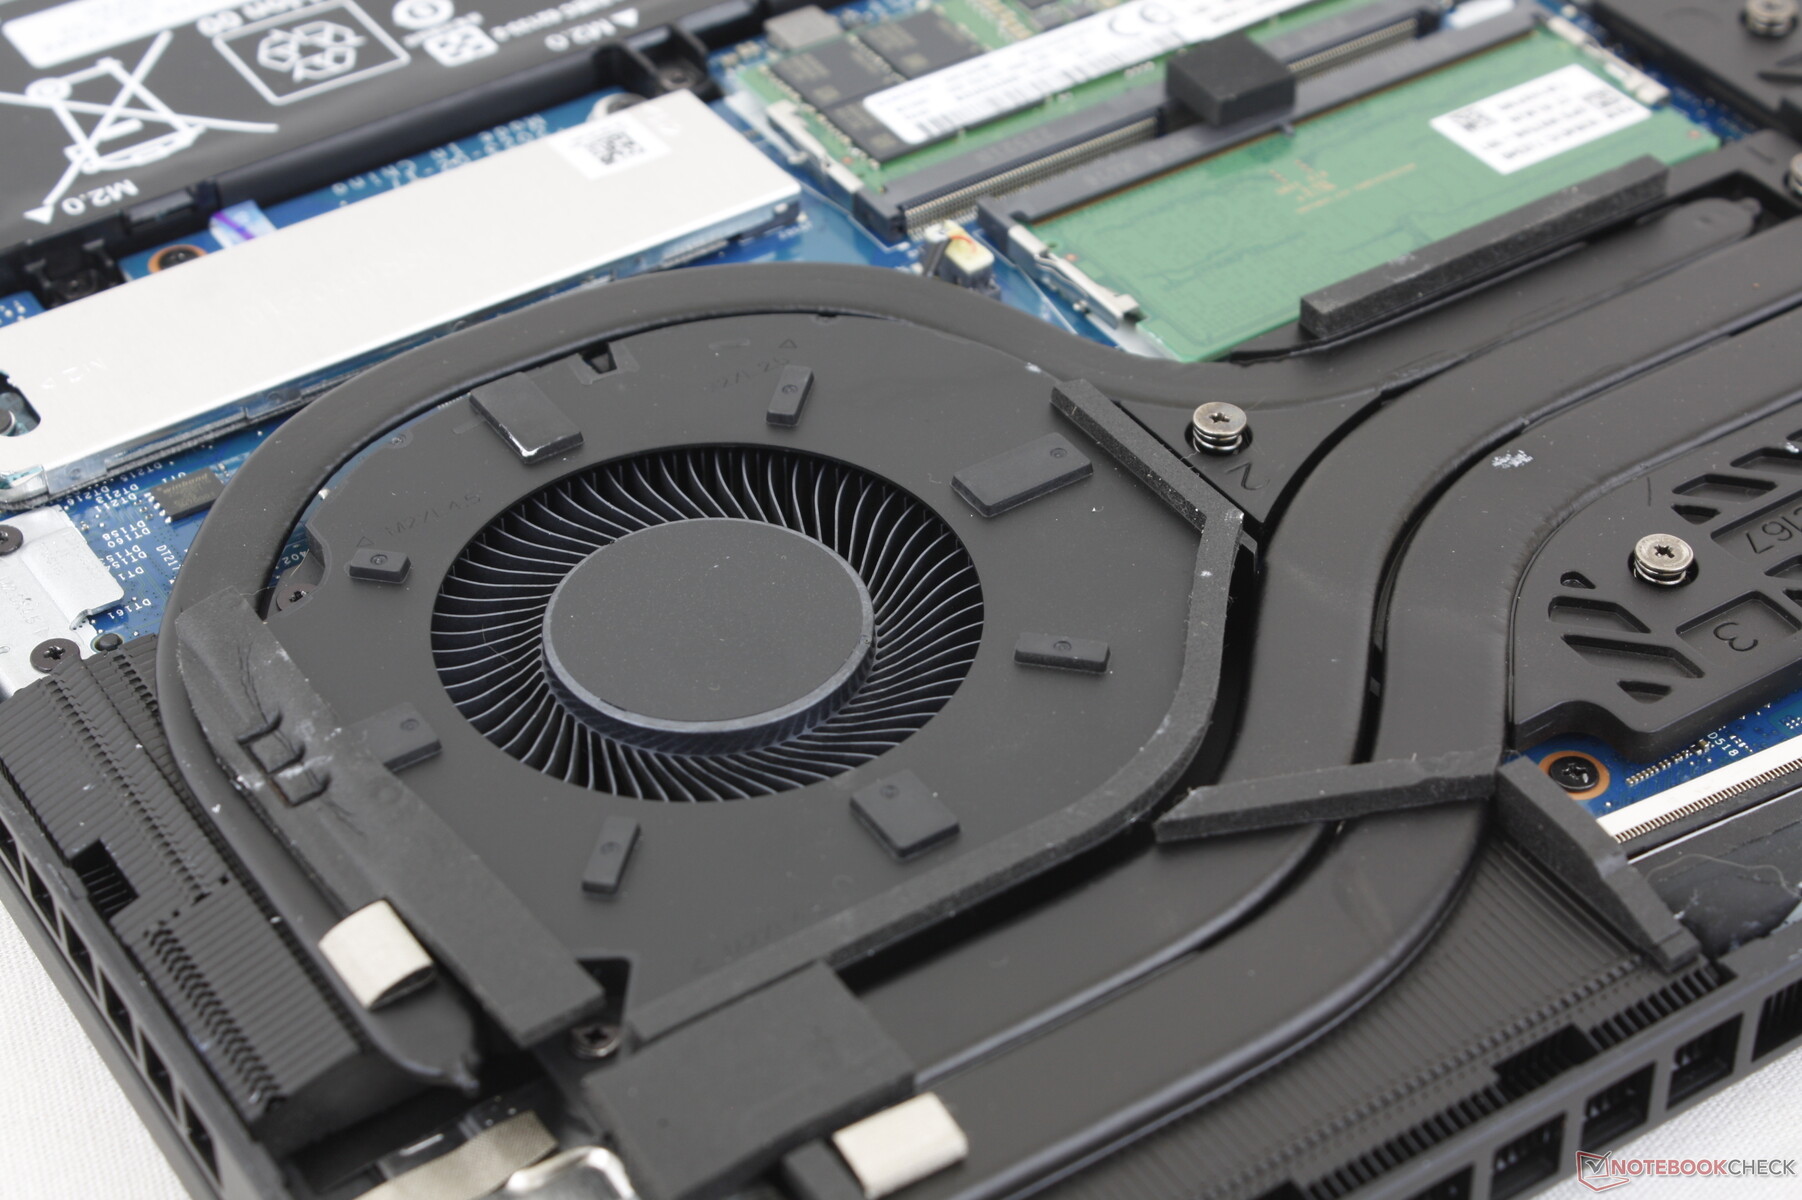
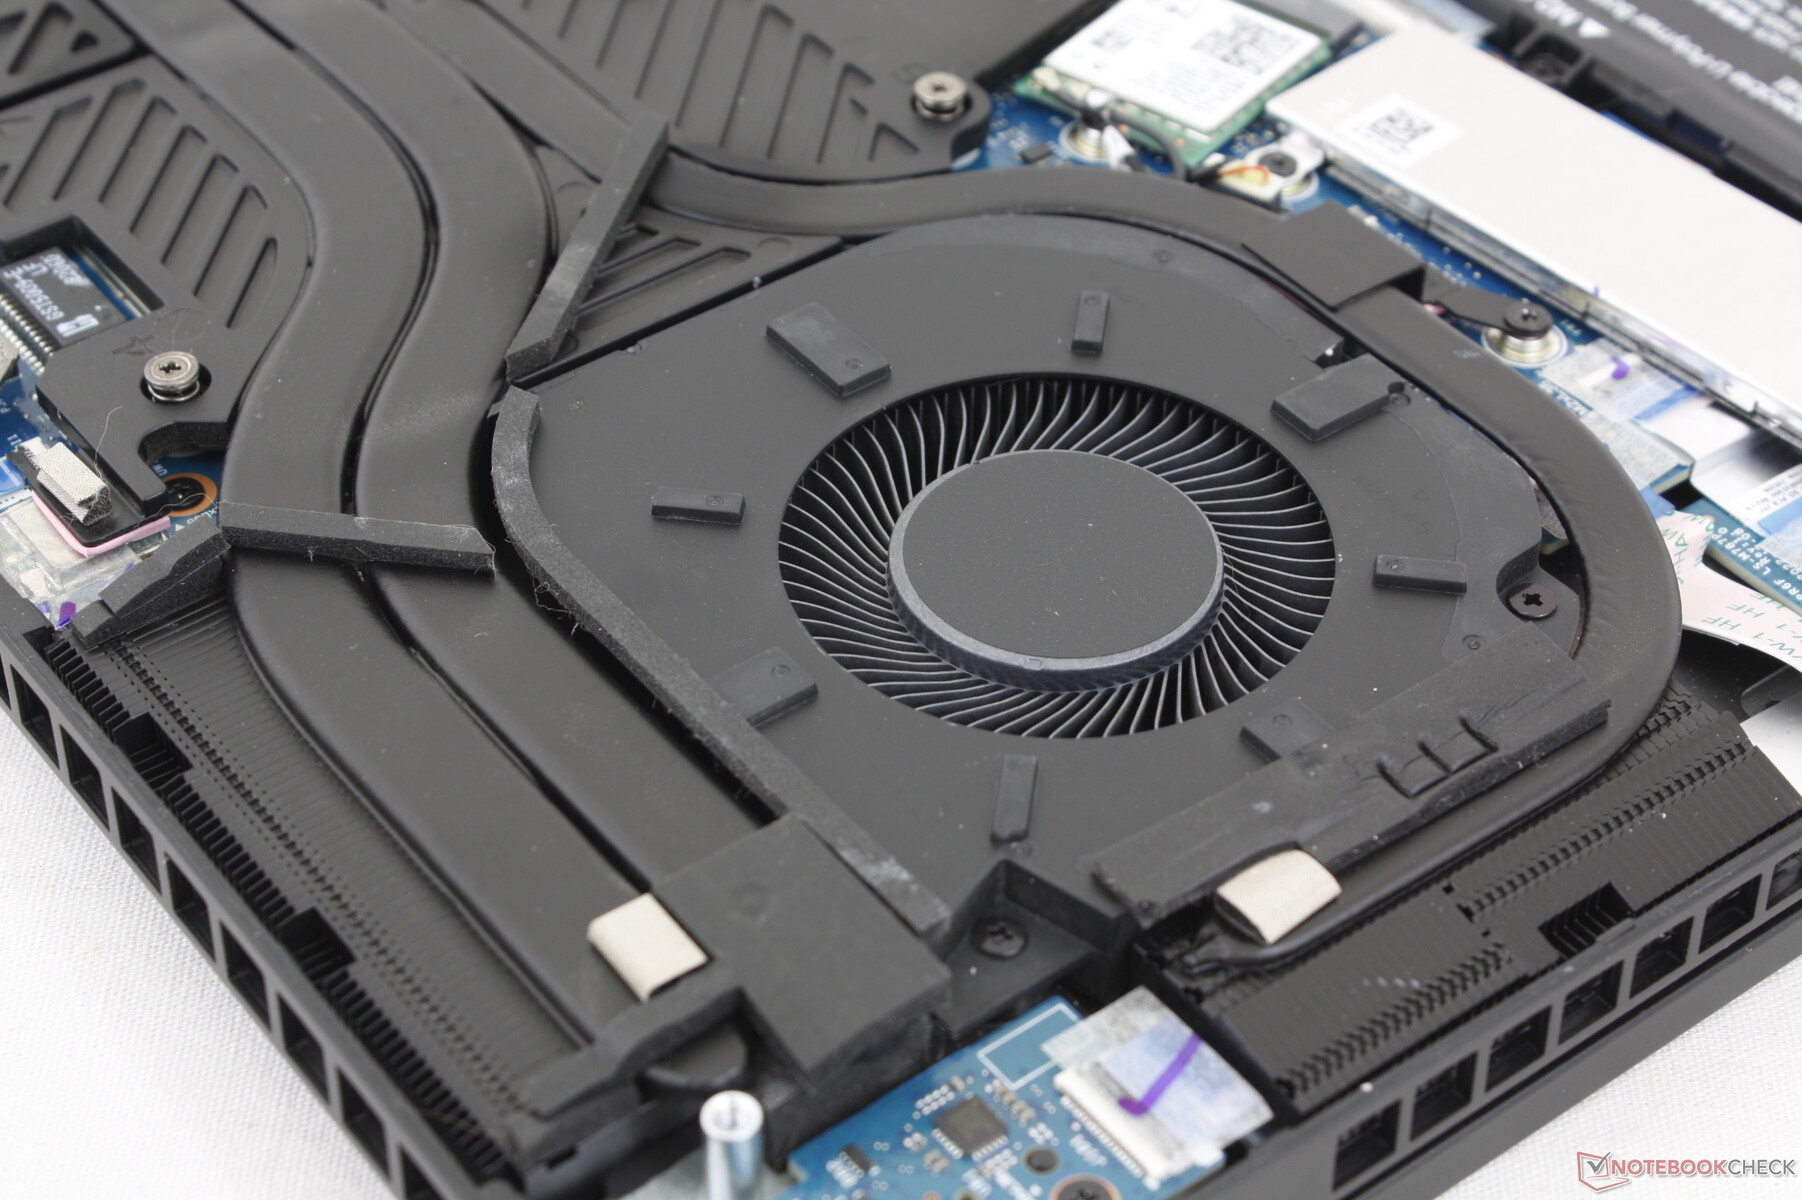
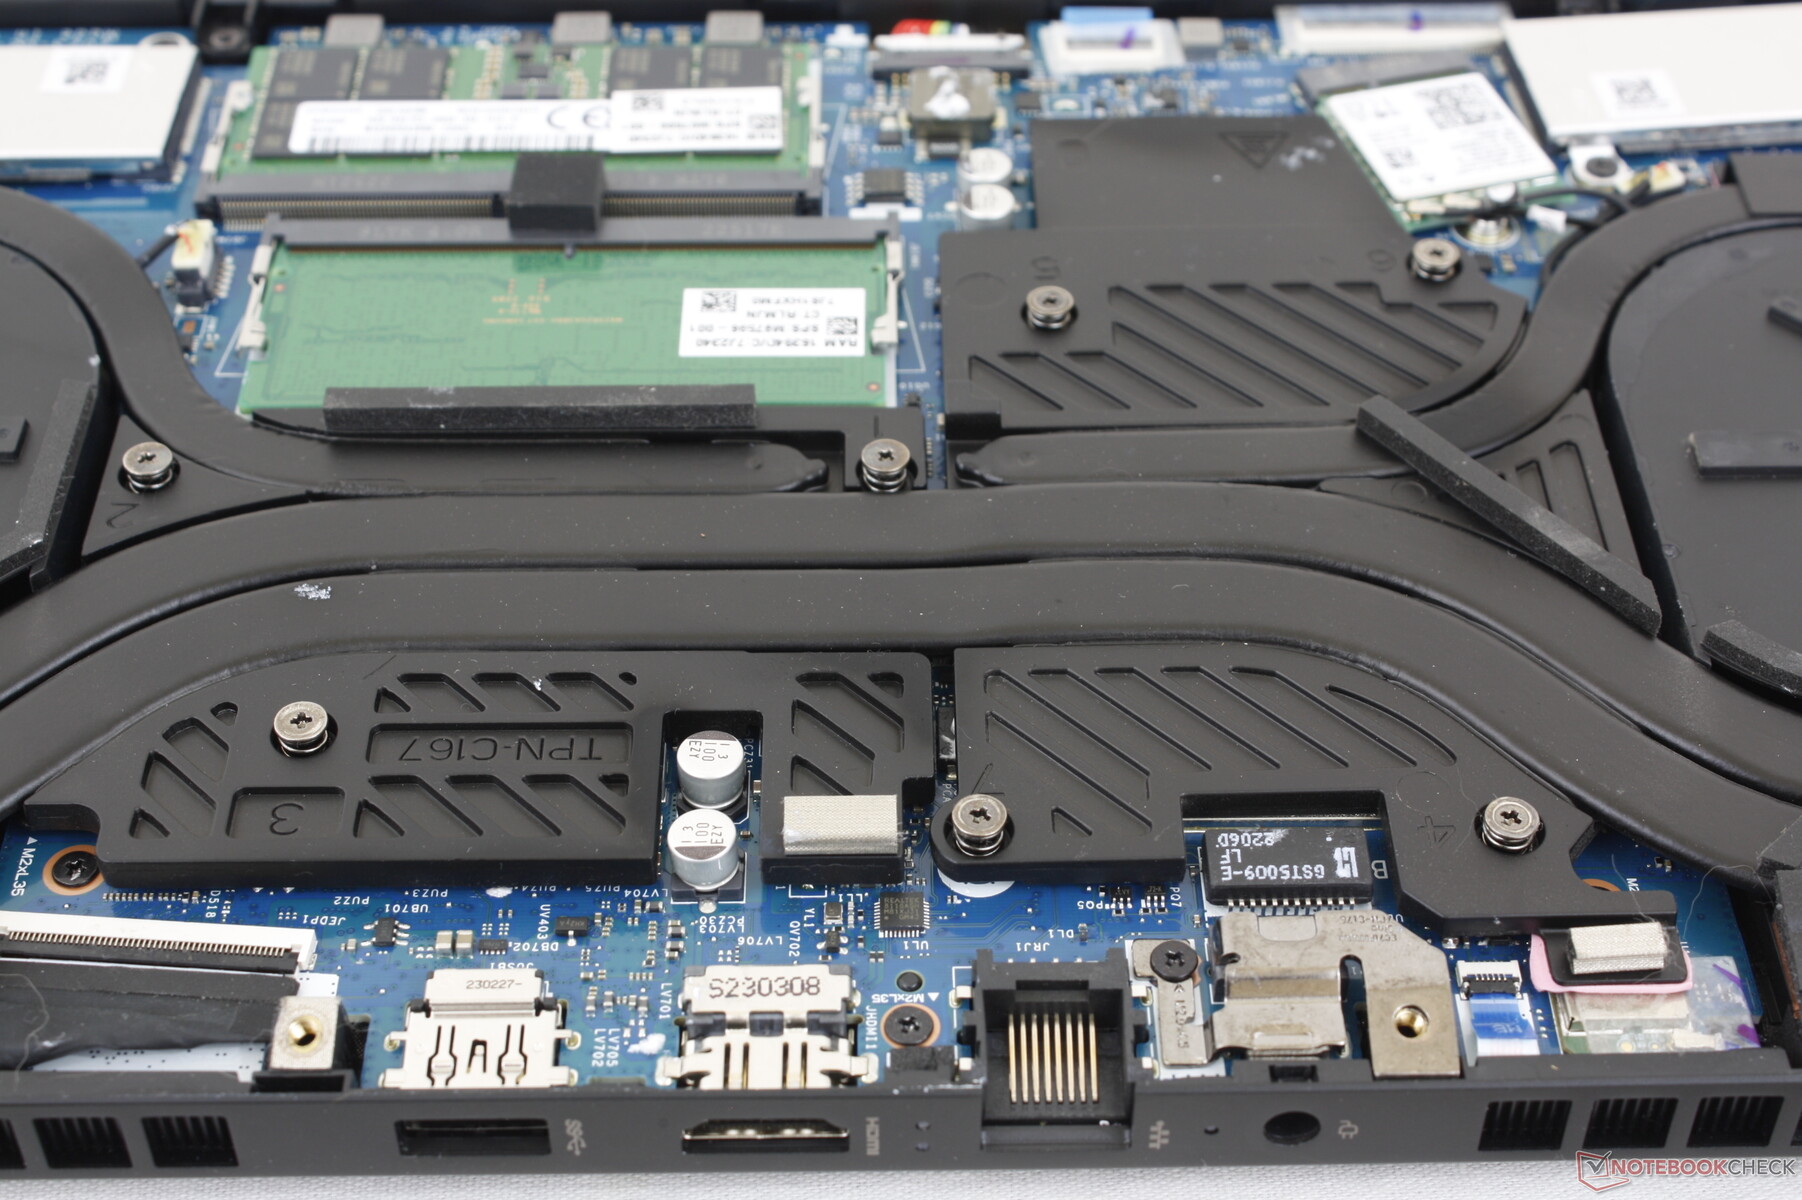
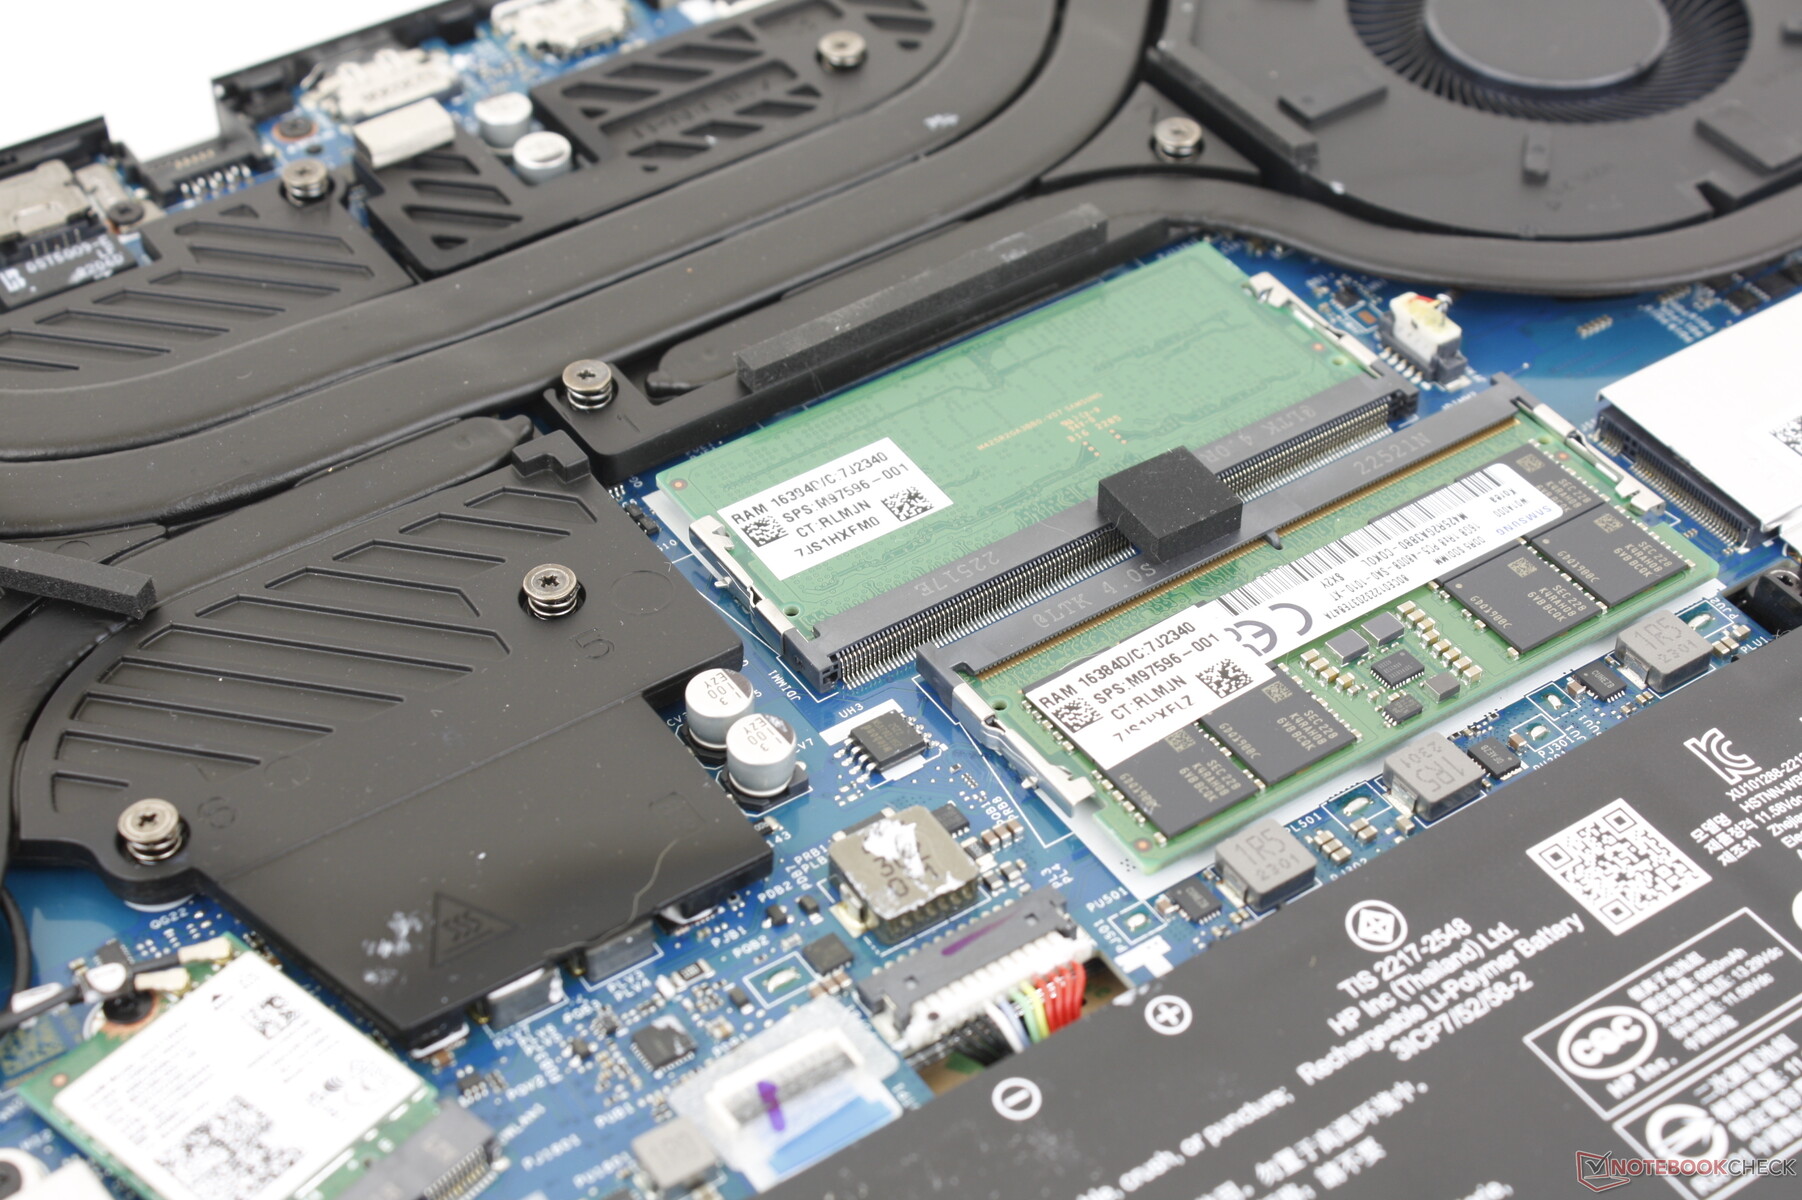
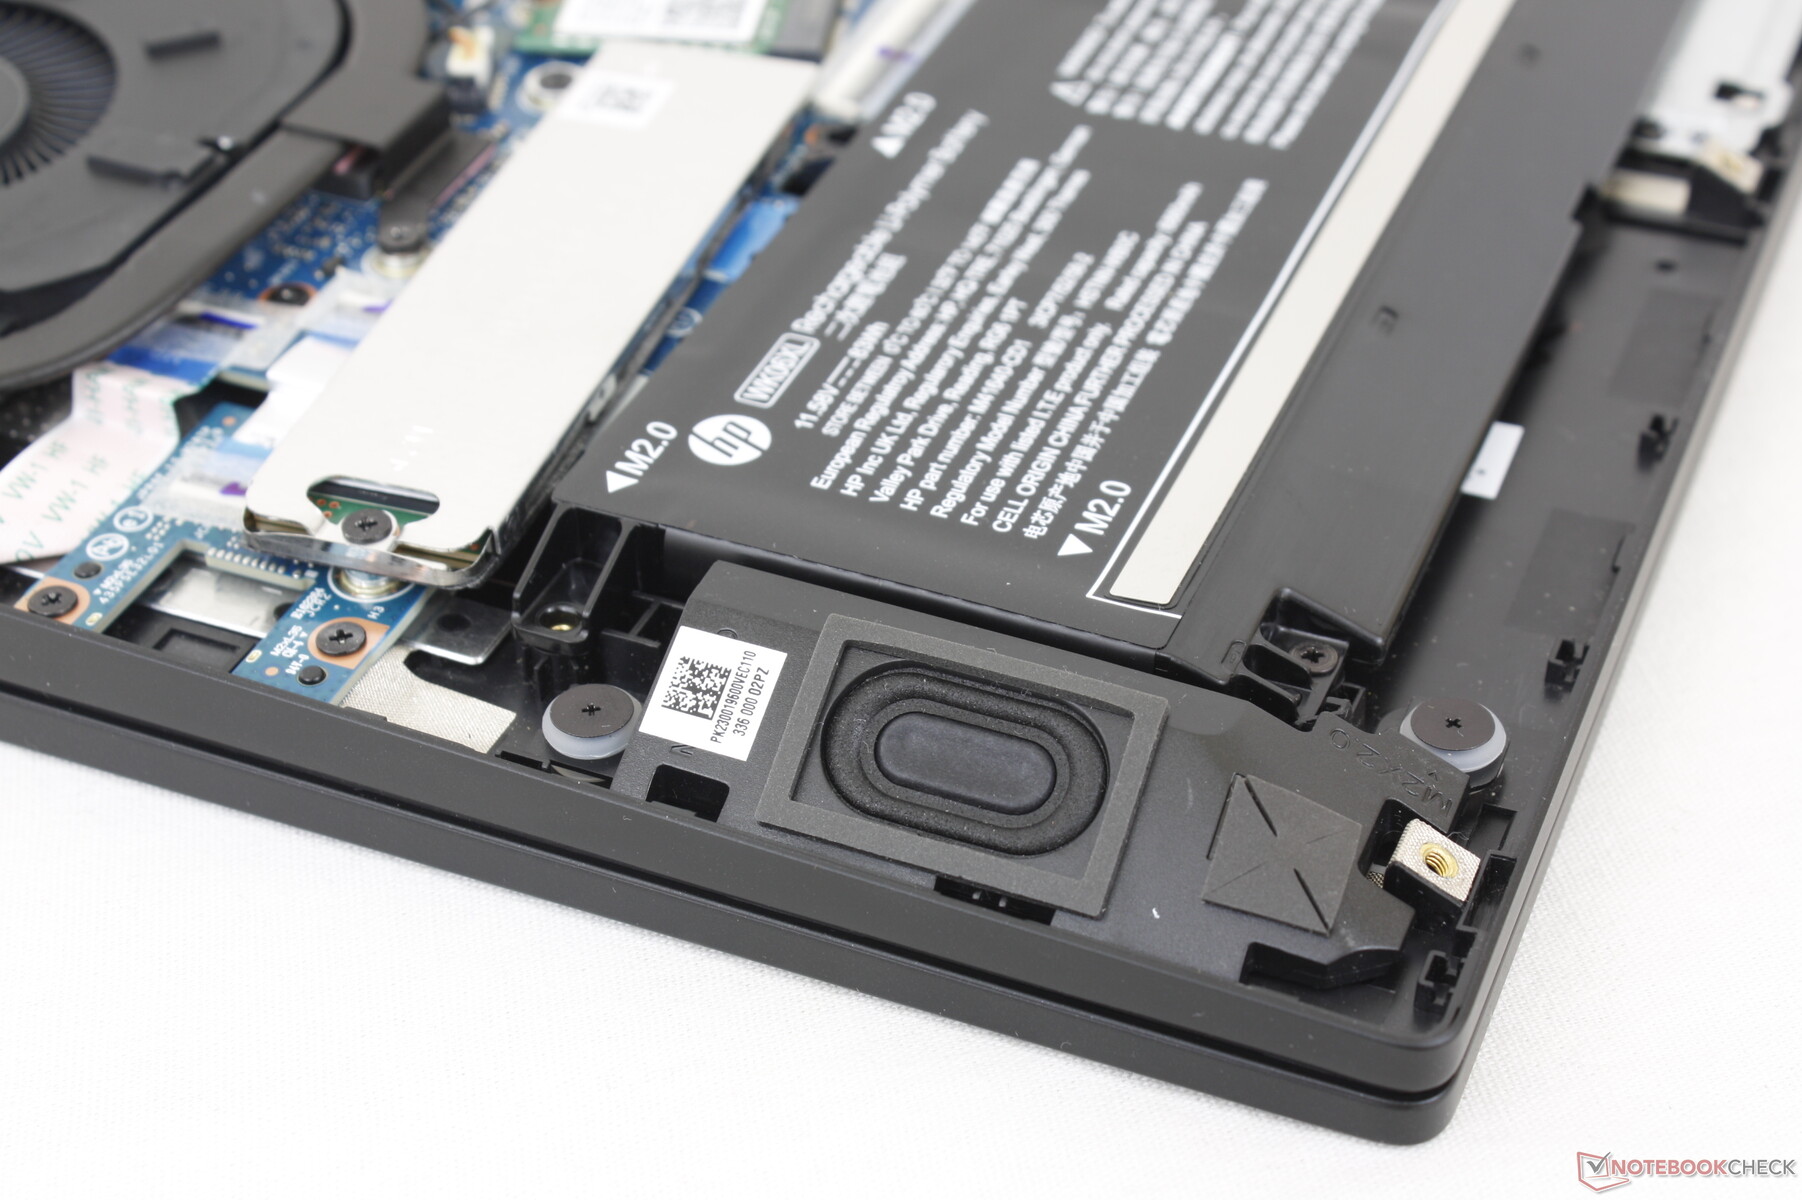
Wartung
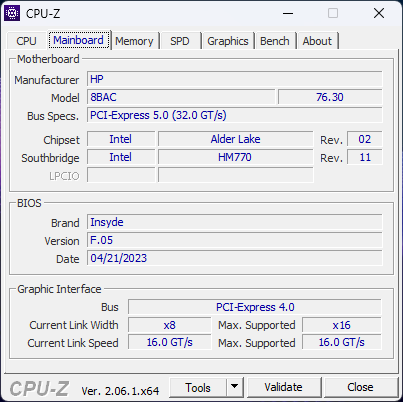
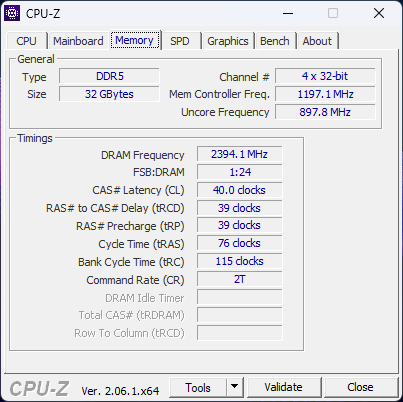
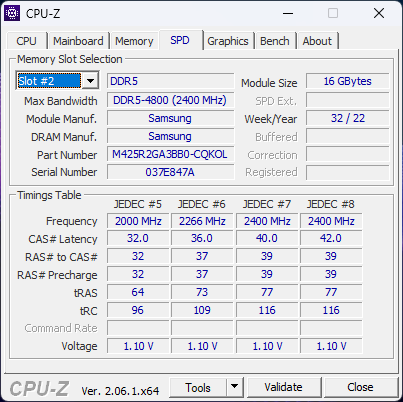
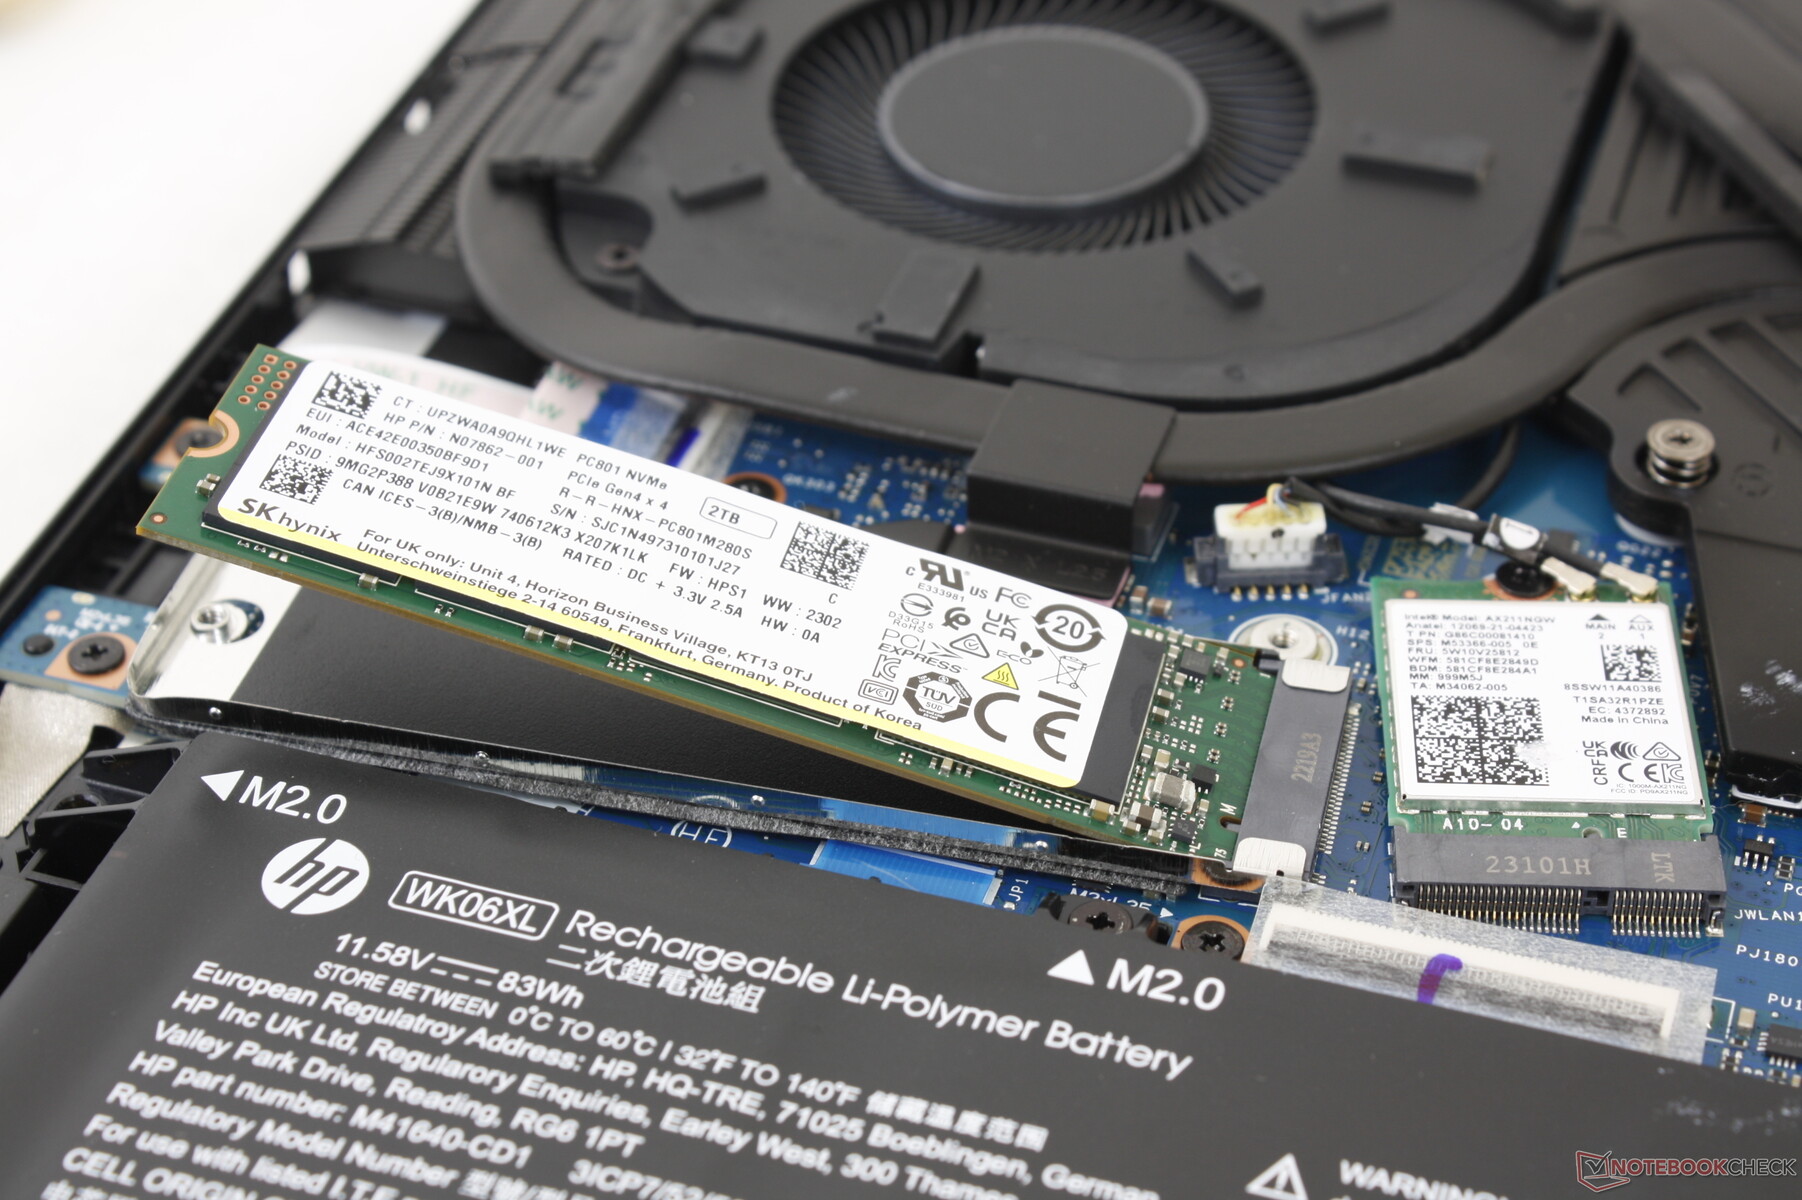
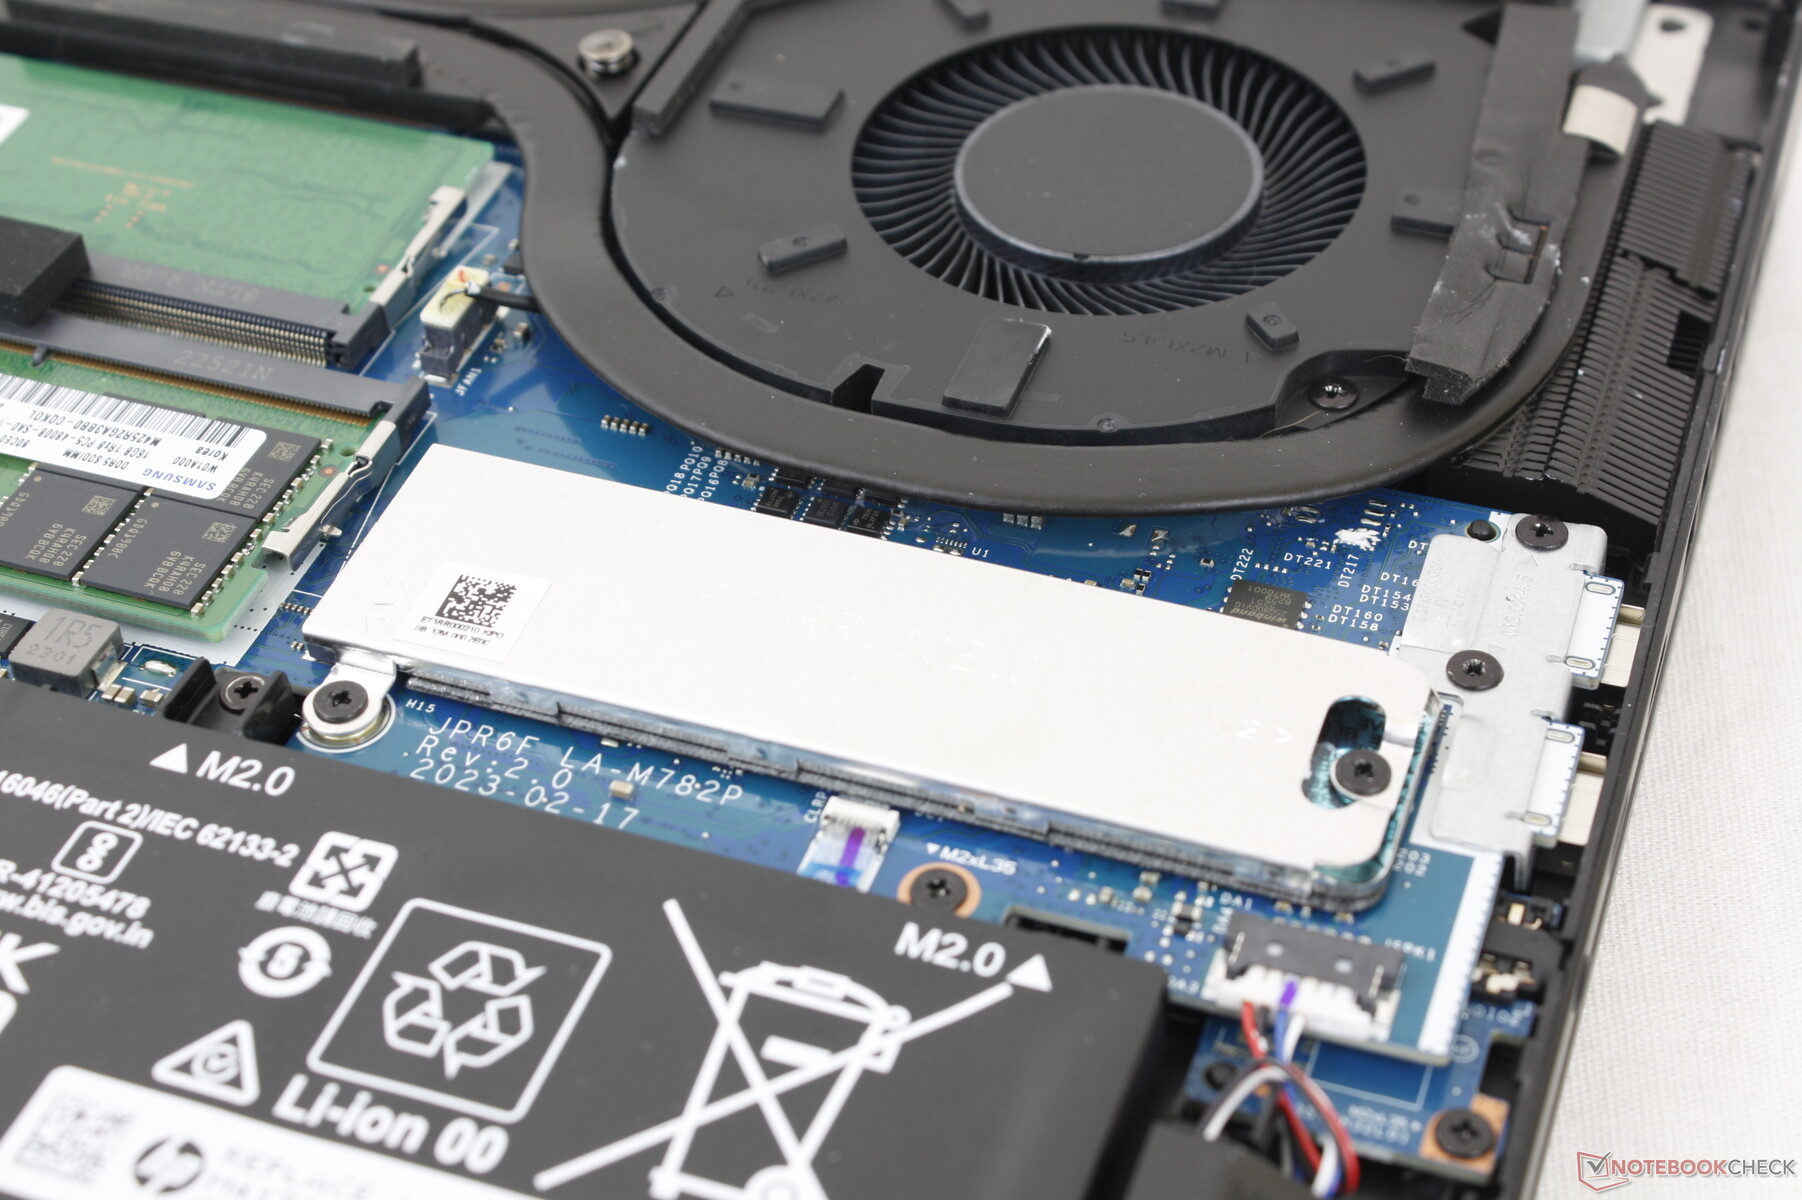
Die leicht zu entfernende Bodenplatte ist mit sechs Kreuzschlitzschrauben befestigt. Wie schon beim Vorgänger haben Besitzer direkten zugriff auf die zwei PCIe-4.0-SSD-Slots im M.2-2280-Format, zwei SODIMM-Slots, den Akku und das wechselbare WLAN-Modul.
Zubehör und Garantie
Die Verkaufsverpackung der RTX-4080-Konfiguration beinhaltet ein kabelloses HyperX Cloud II Core Headset. Andernfalls ist nur das übliche Netzteil und Papierkram im Lieferumfang enthalten.
In den USA ist das Gaming-Notebook von einer einjährigen Herstellergarantie abgedeckt, in Europa dürfte die Garantiezeit zwei Jahre betragen.
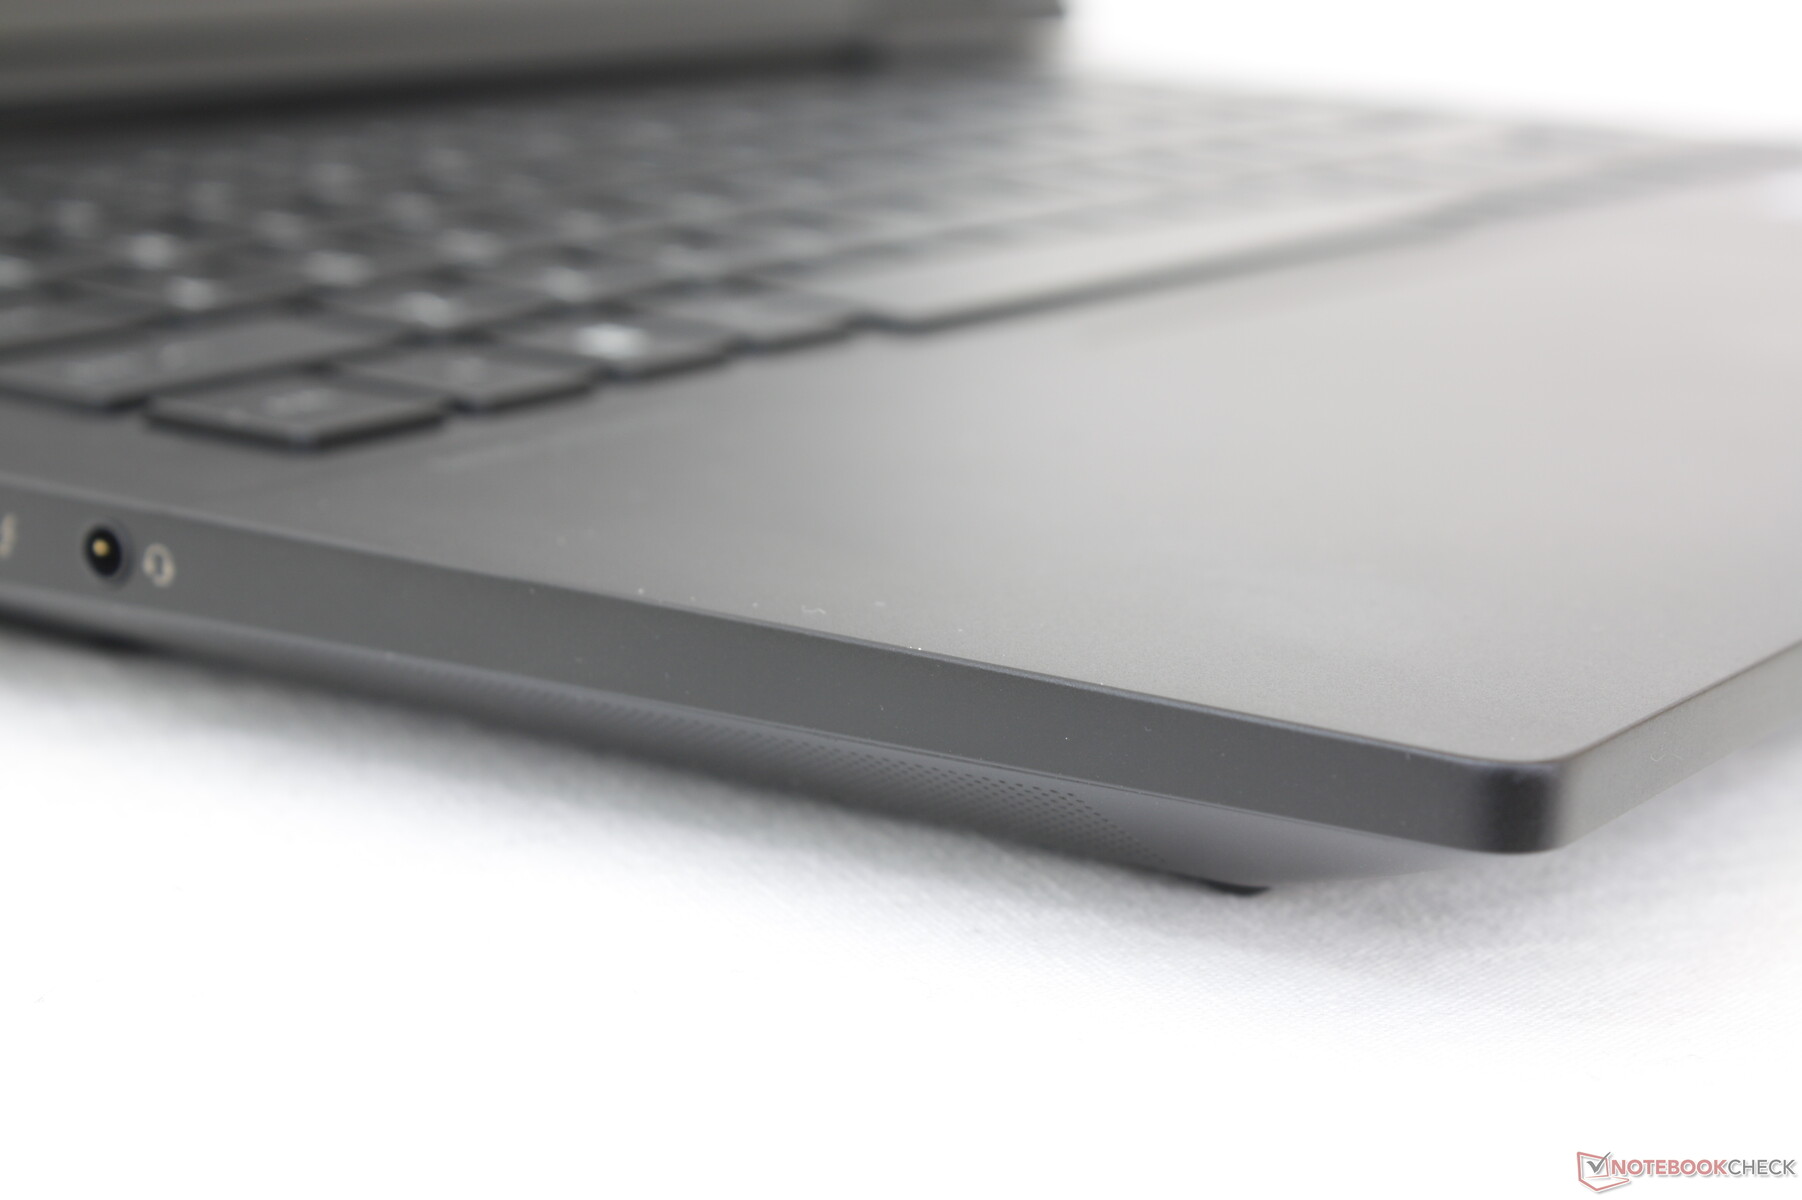
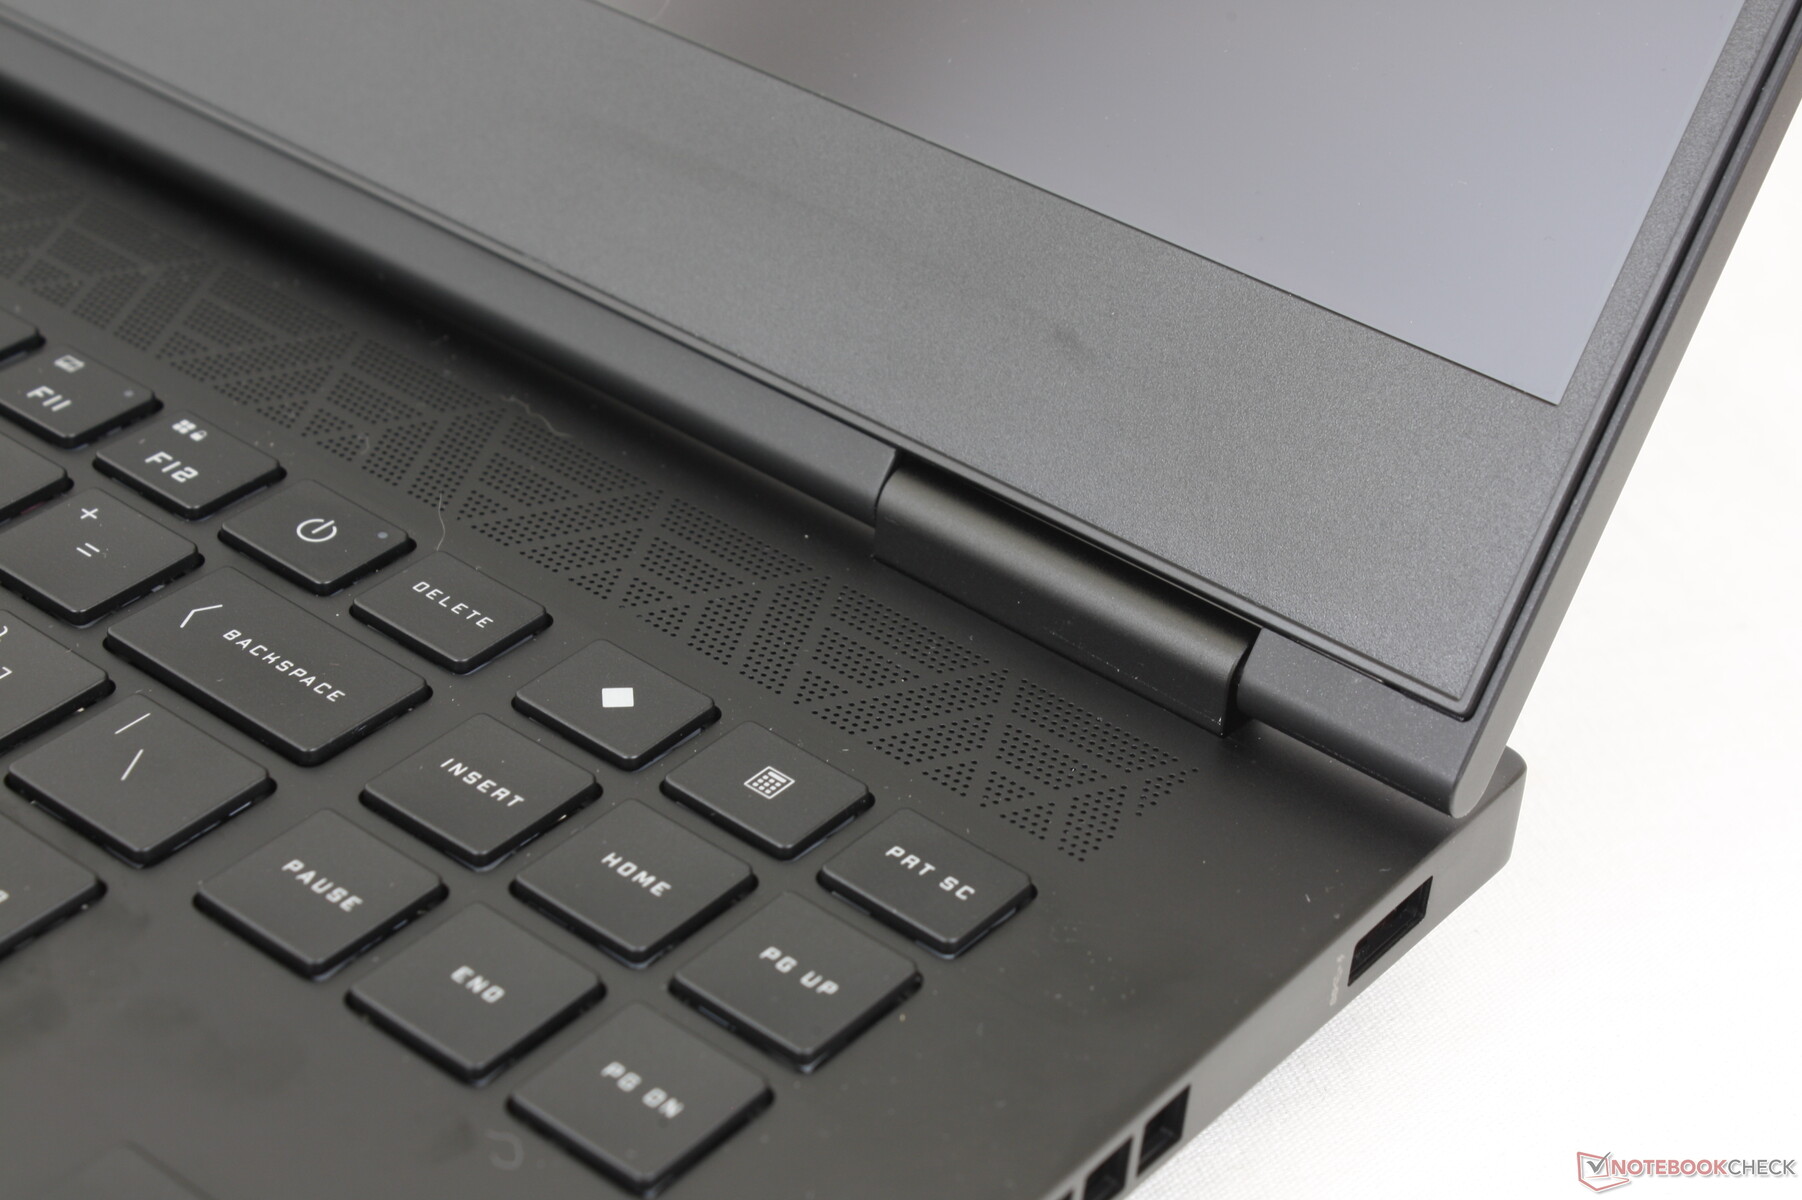
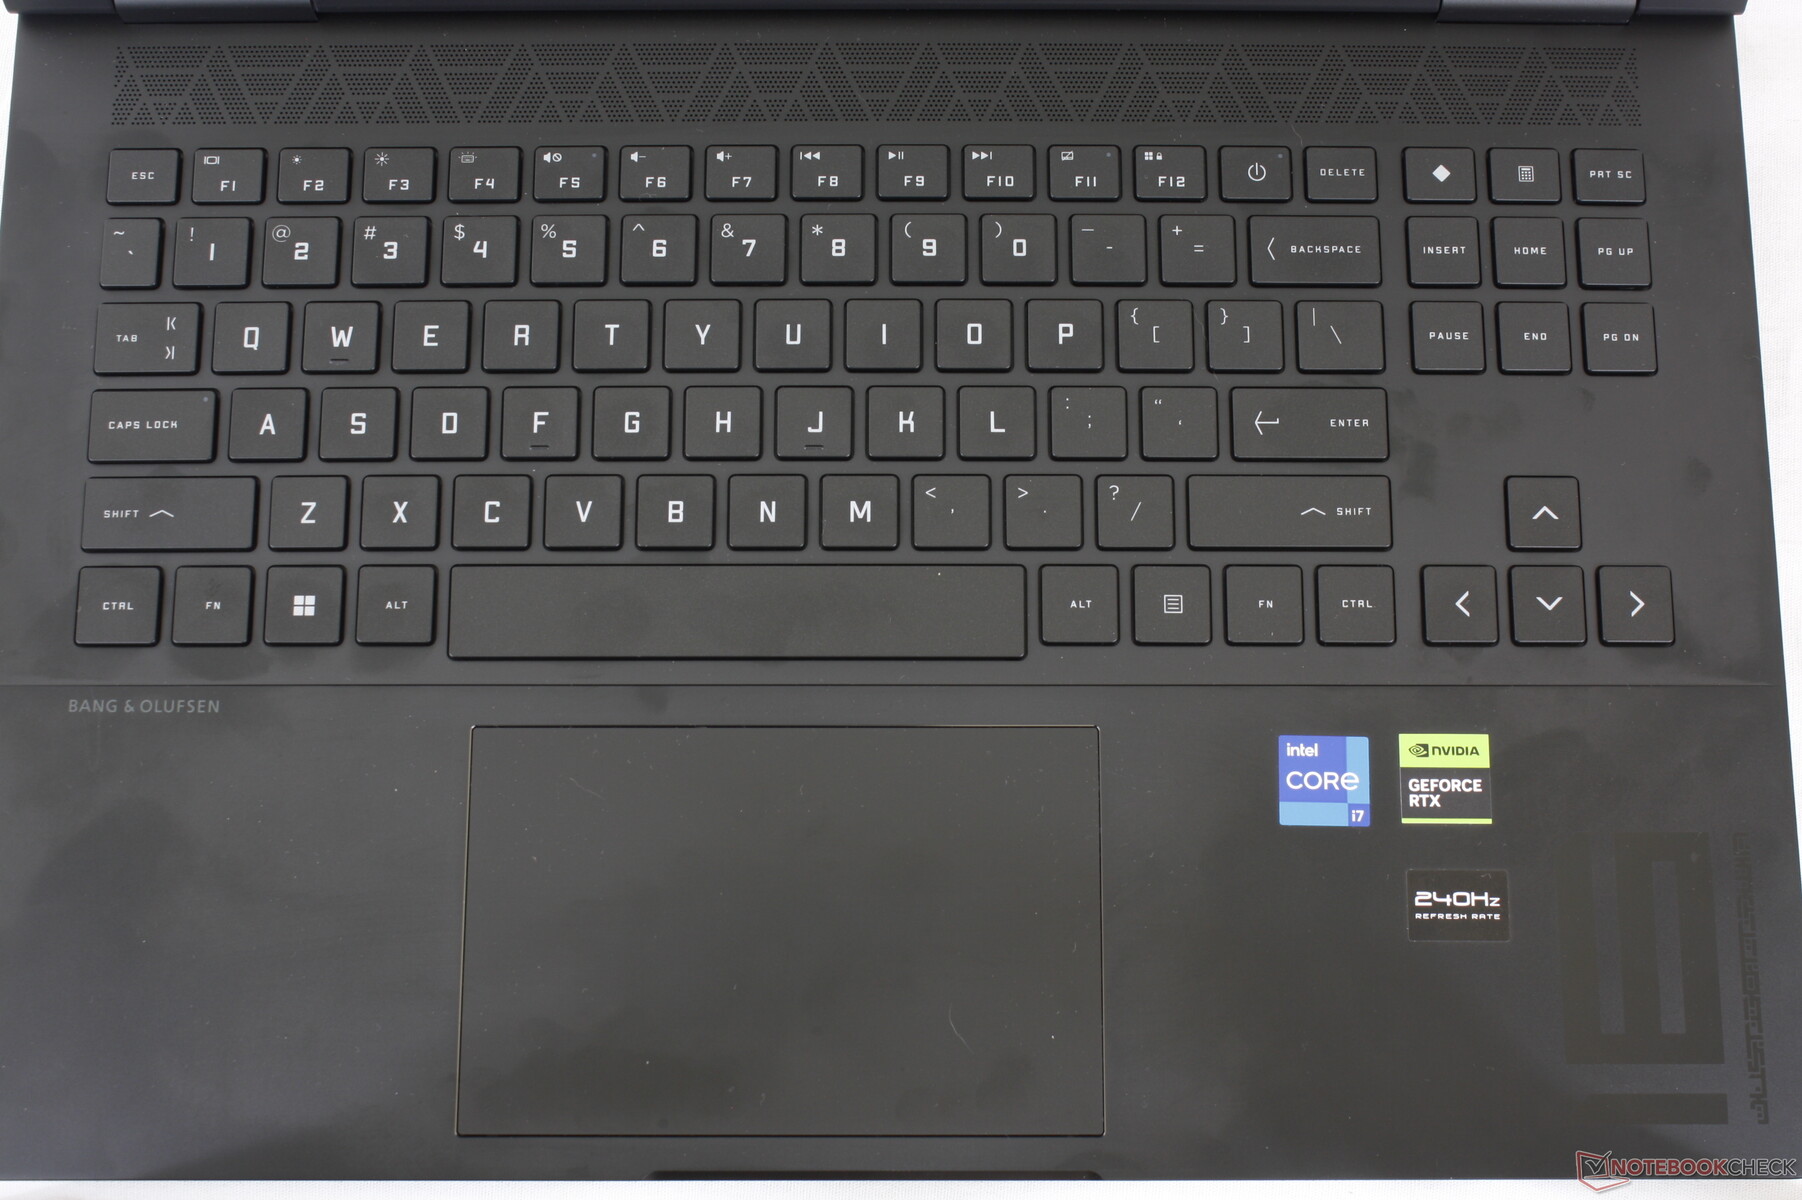
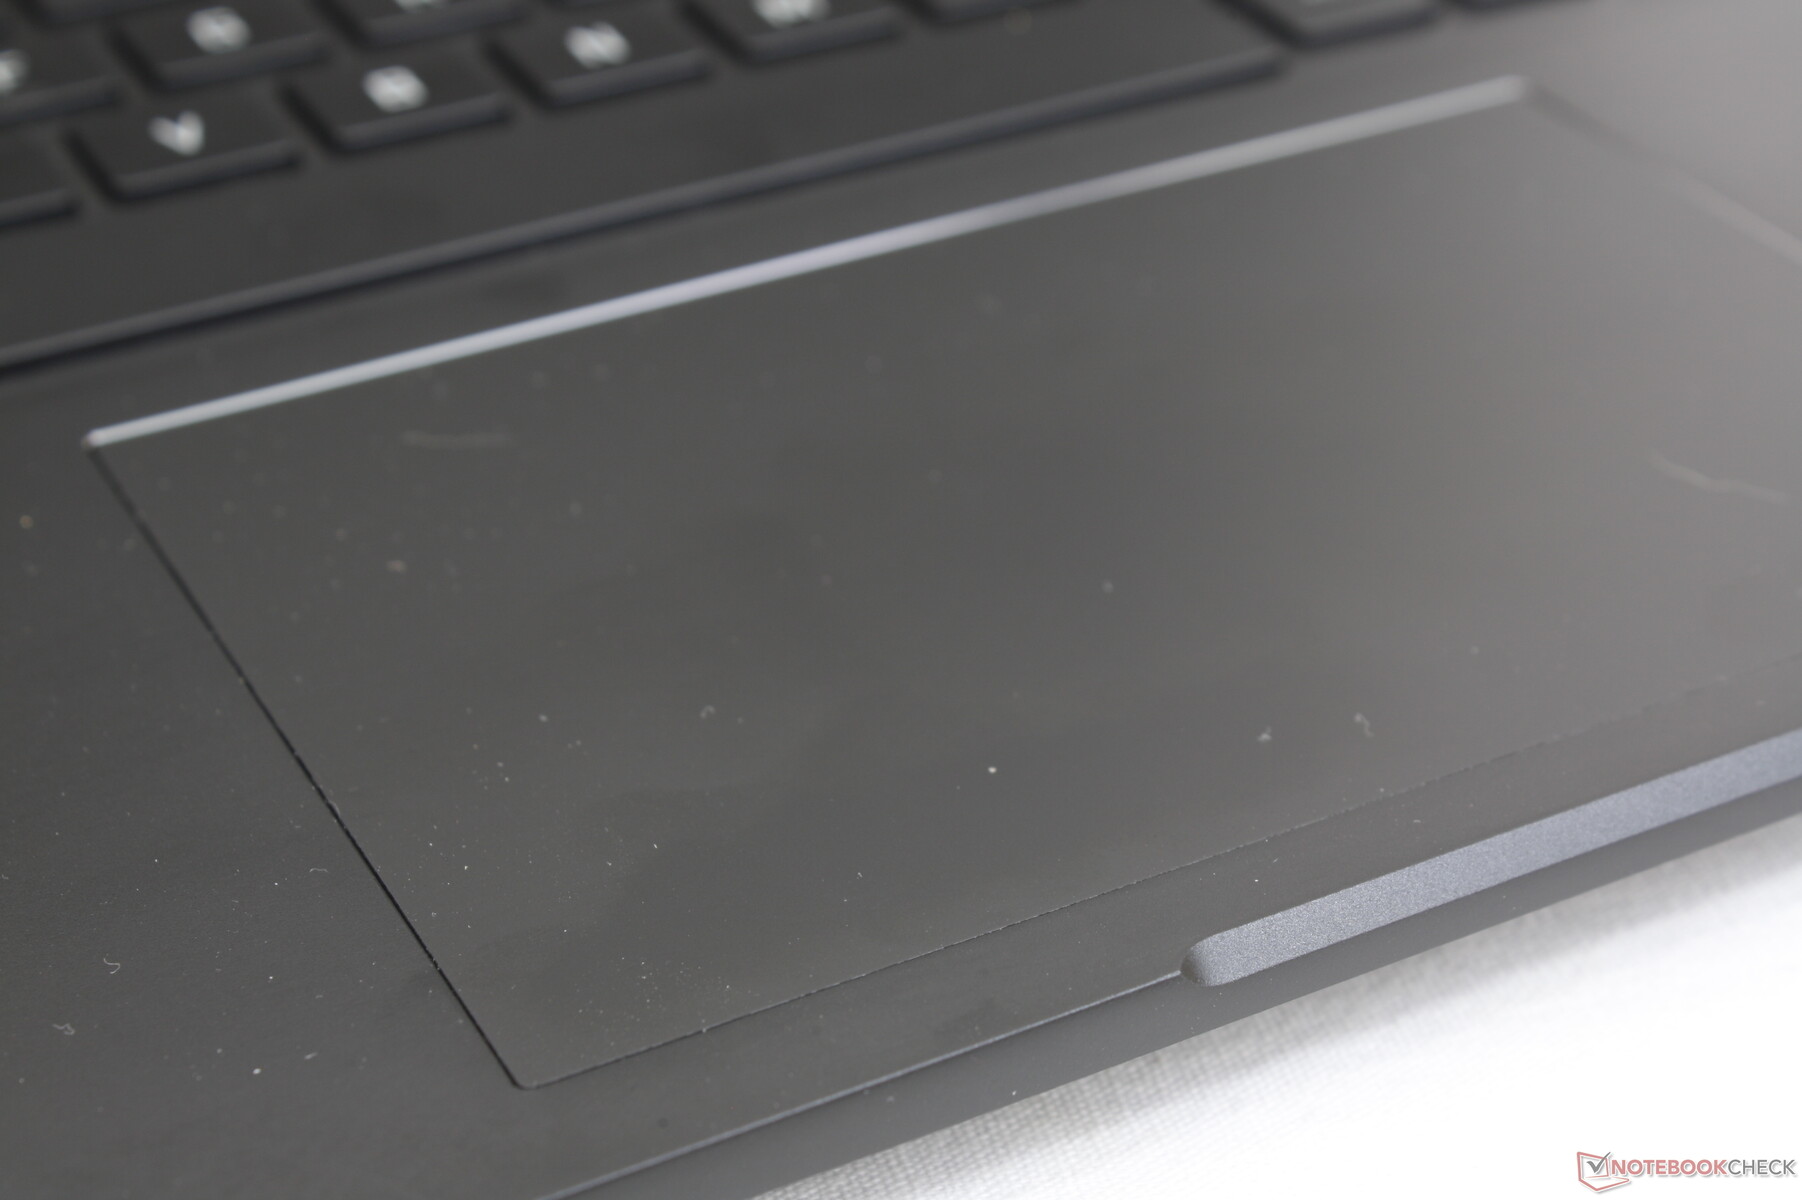
Eingabegeräte — Kleineres aber besseres Touchpad
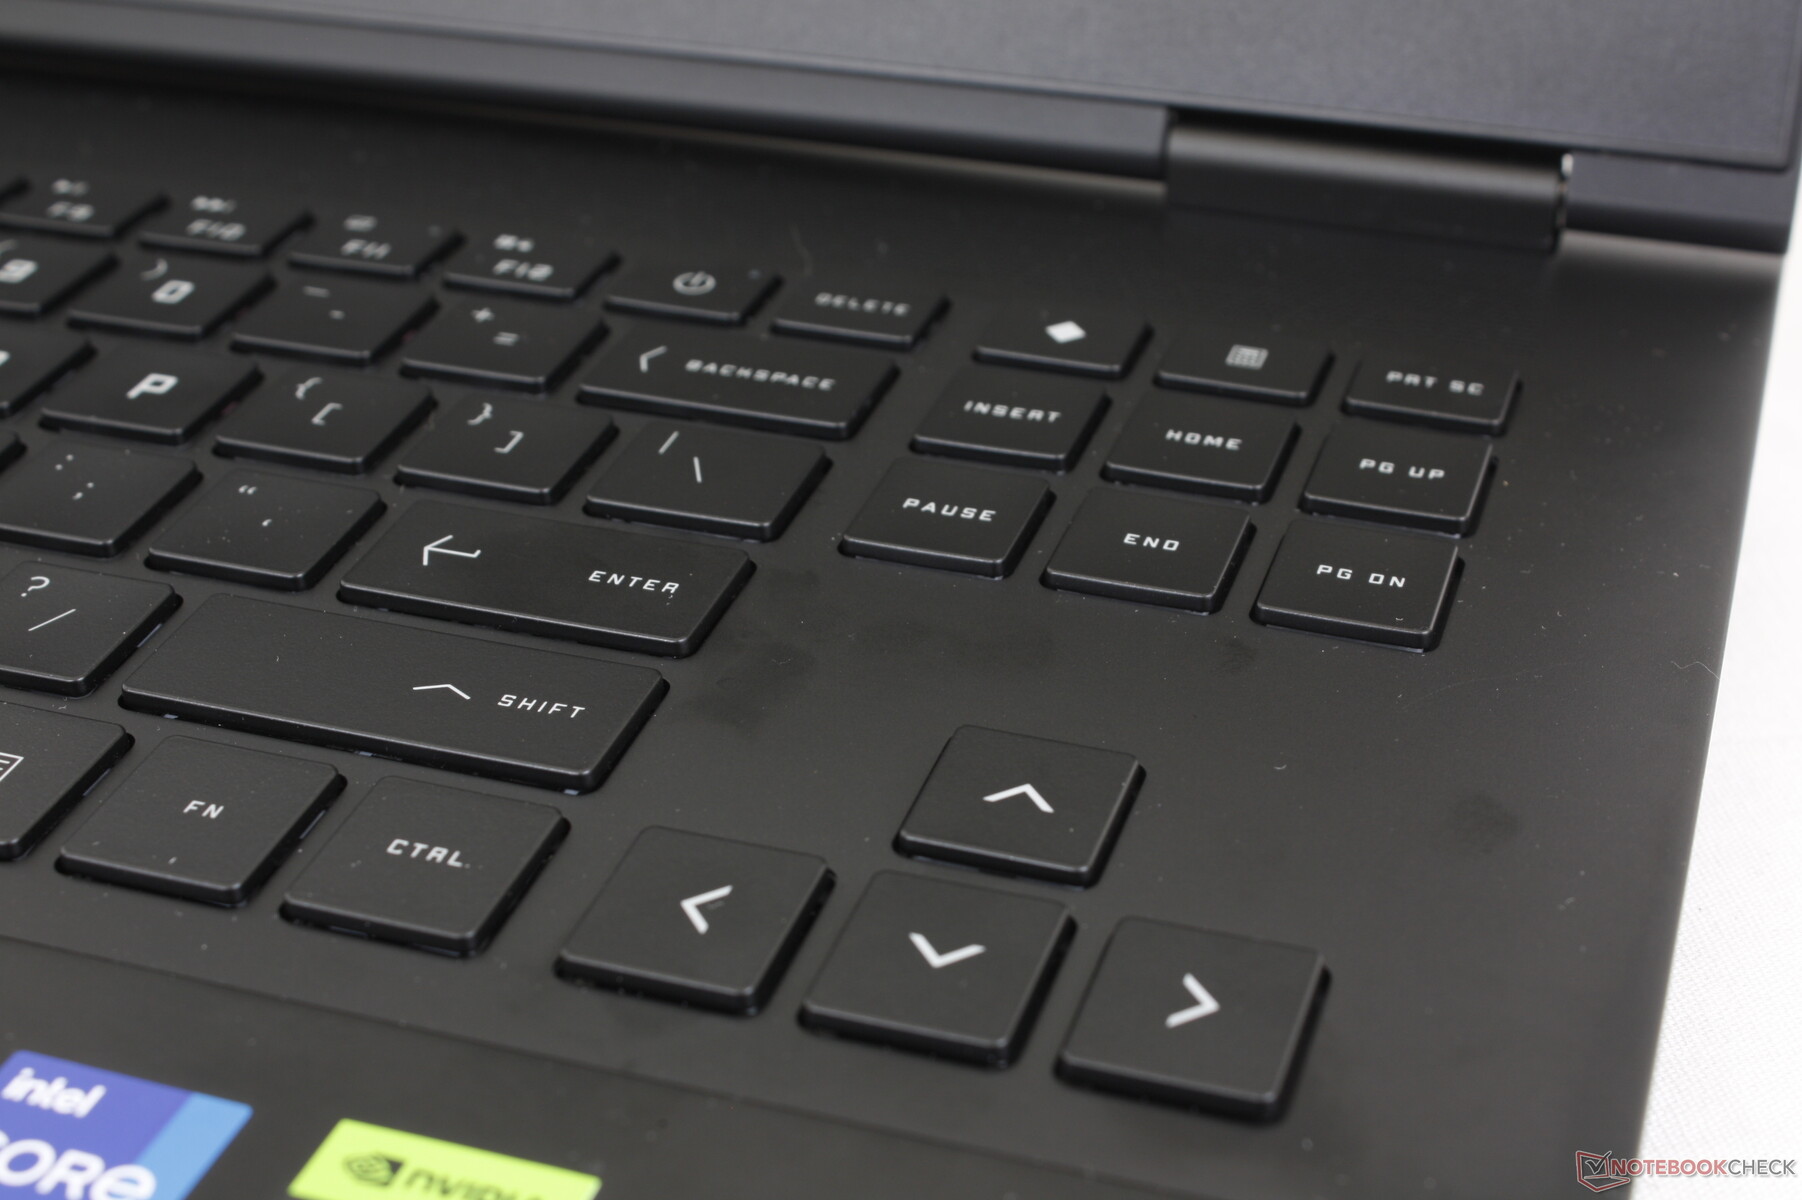
Tastatur
Während das Gehäuse und Touchpad überarbeitet wurden, bleibt die Tastatur unverändert und bietet somit das gleiche Tippgefühl wie das das 2022er HP Omen 16. Das Feedback der Tasten ist besonders bei der Leertaste sehr angenehm, die Enter-Taste dürfte aber gerne etwas straffer sein. Das Tippen fühlt sich etwas geräumiger an als beim Razer Blade 16.
Touchpad
Interessanterweise hat HP die Größe des Clickpads von 13 x 8,6 cm beim 2022er HP Omen 16 auf 12,5 x 8 cm beim 2023er Modell verringert. Das Feedback beim Drücken des Touchpads hat sich aber verbessert und bietet jetzt ein befriedigendes und hörbares Klickgeräusch. Deshalb sind wir von den kleineren Abmessungen letztendlich nicht allzu enttäuscht.

Display — Keine schlechten Optionen
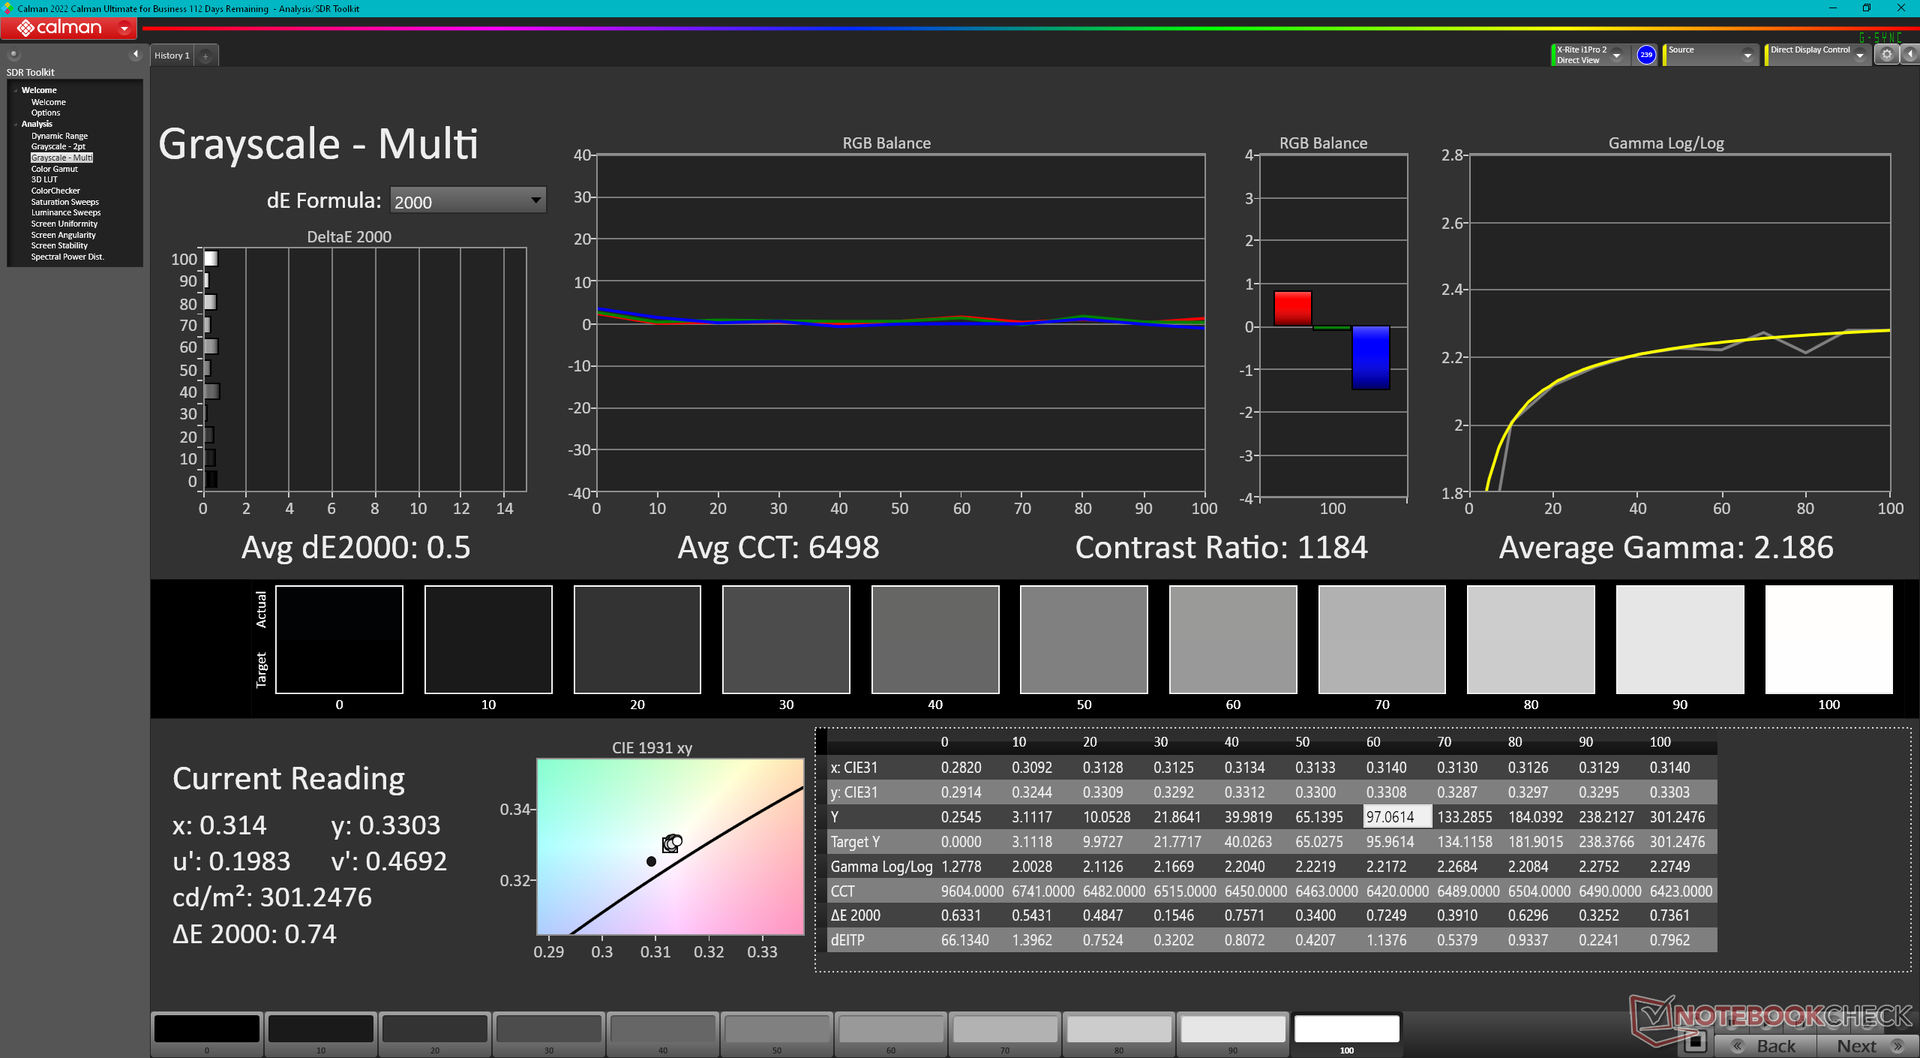
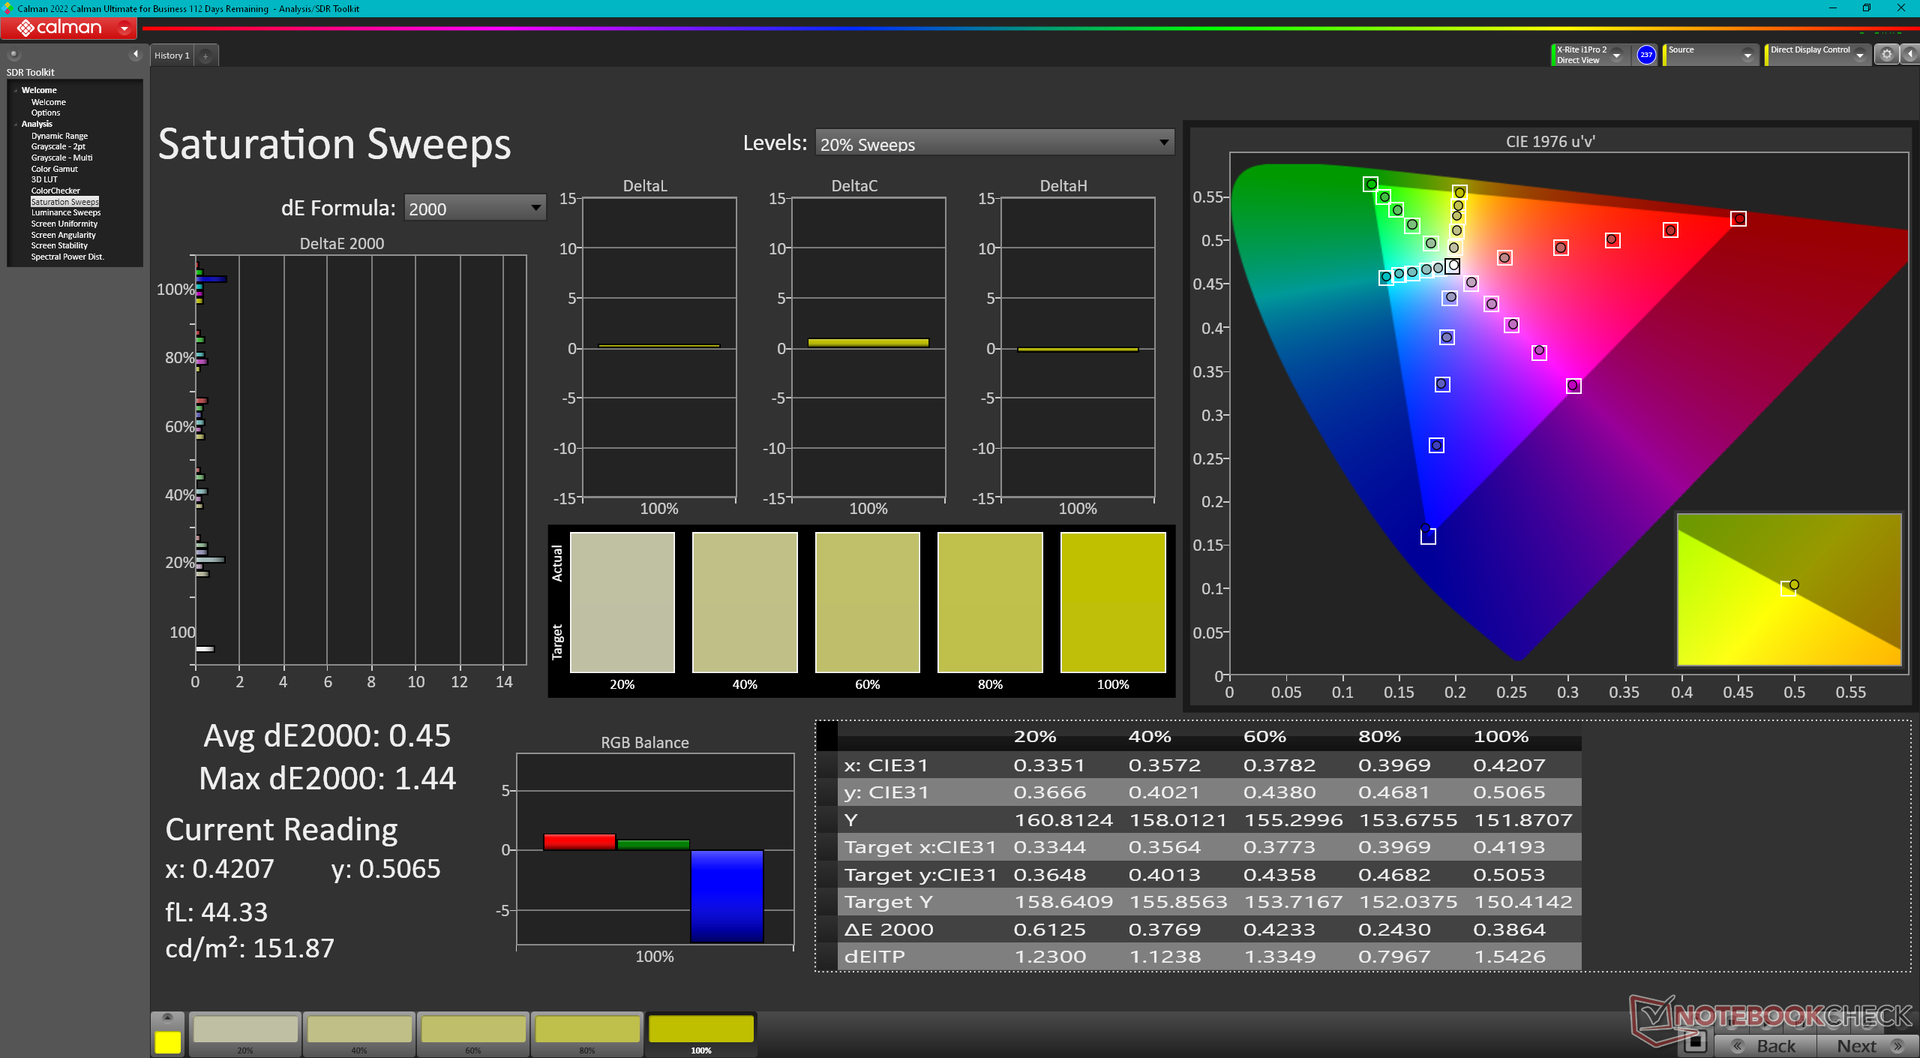
HP offeriert zwei verschiedene Bildschirme, die unten aufgelistet sind. Unsere Messungen beziehen sich auf das fett-gedruckte QHD-Display.
- 1920 x 1080, 165 Hz, IPS, 7 ms Reaktionszeit, matt, 300 Nits
- 2560 x 1440, 240 Hz, IPS, 3 ms Reaktionszeit, matt, 300 Nits
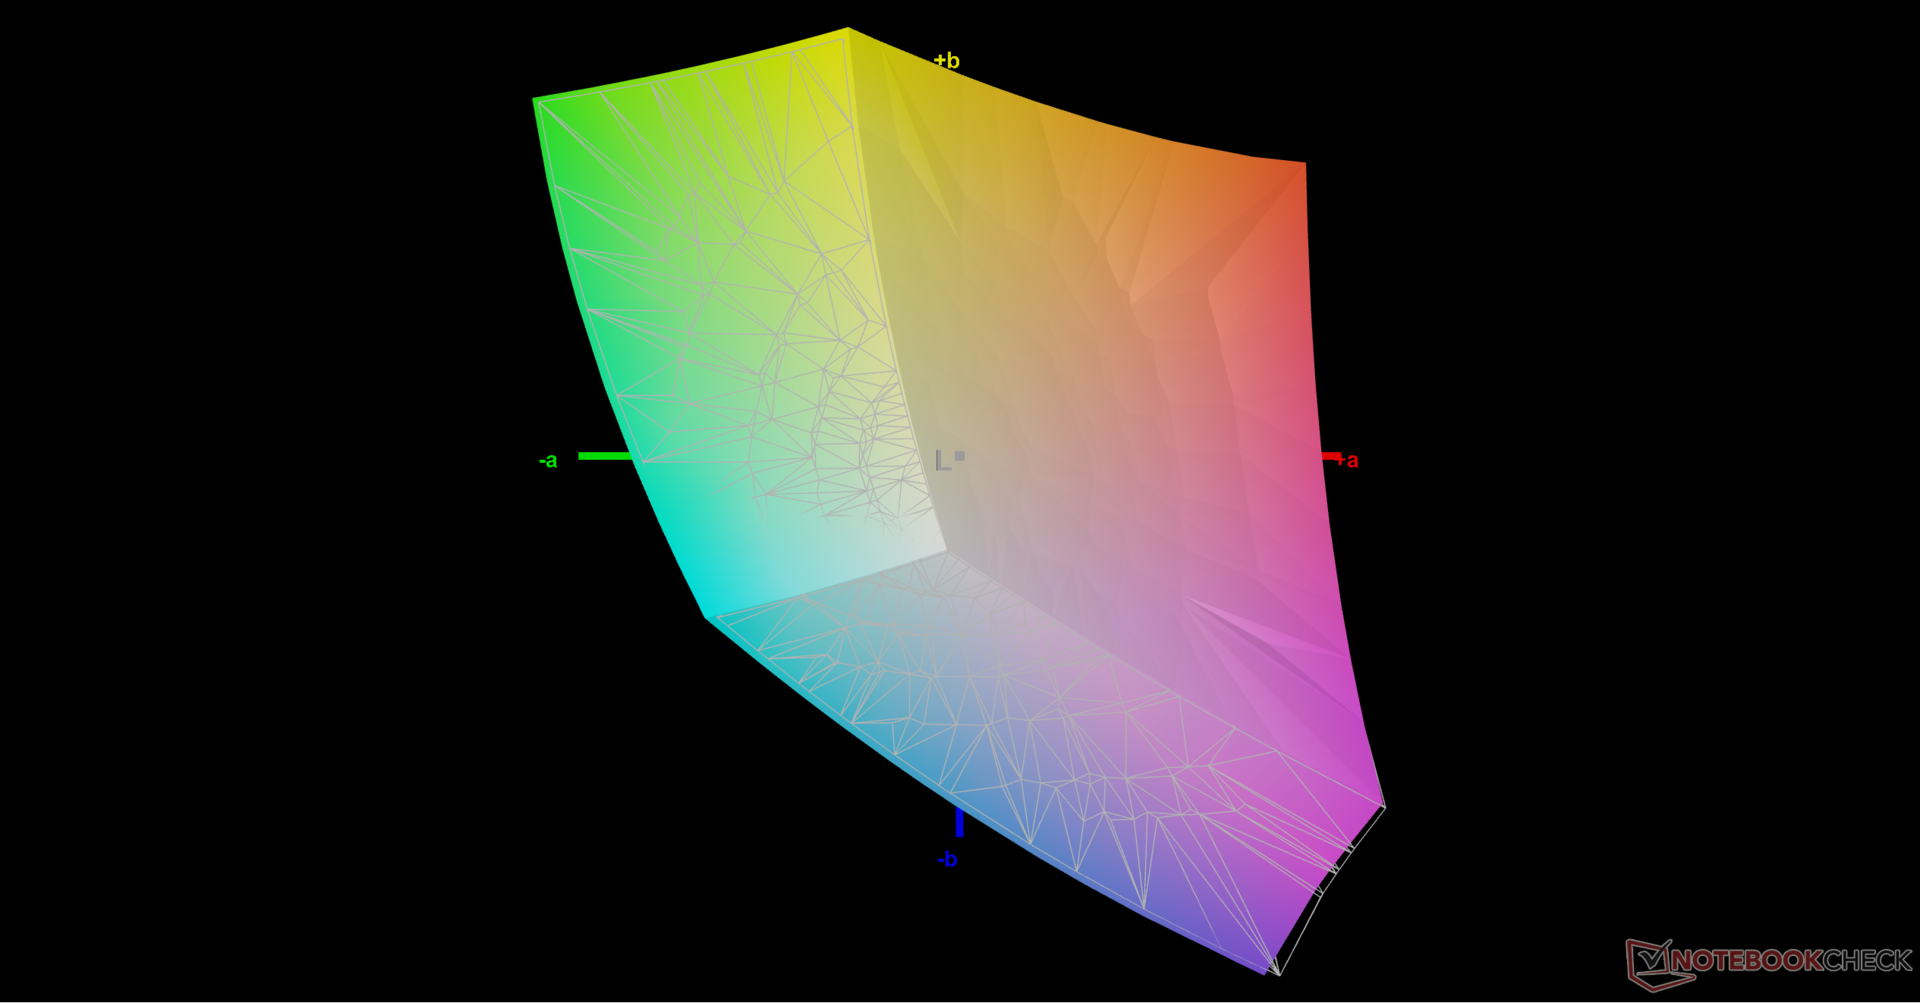
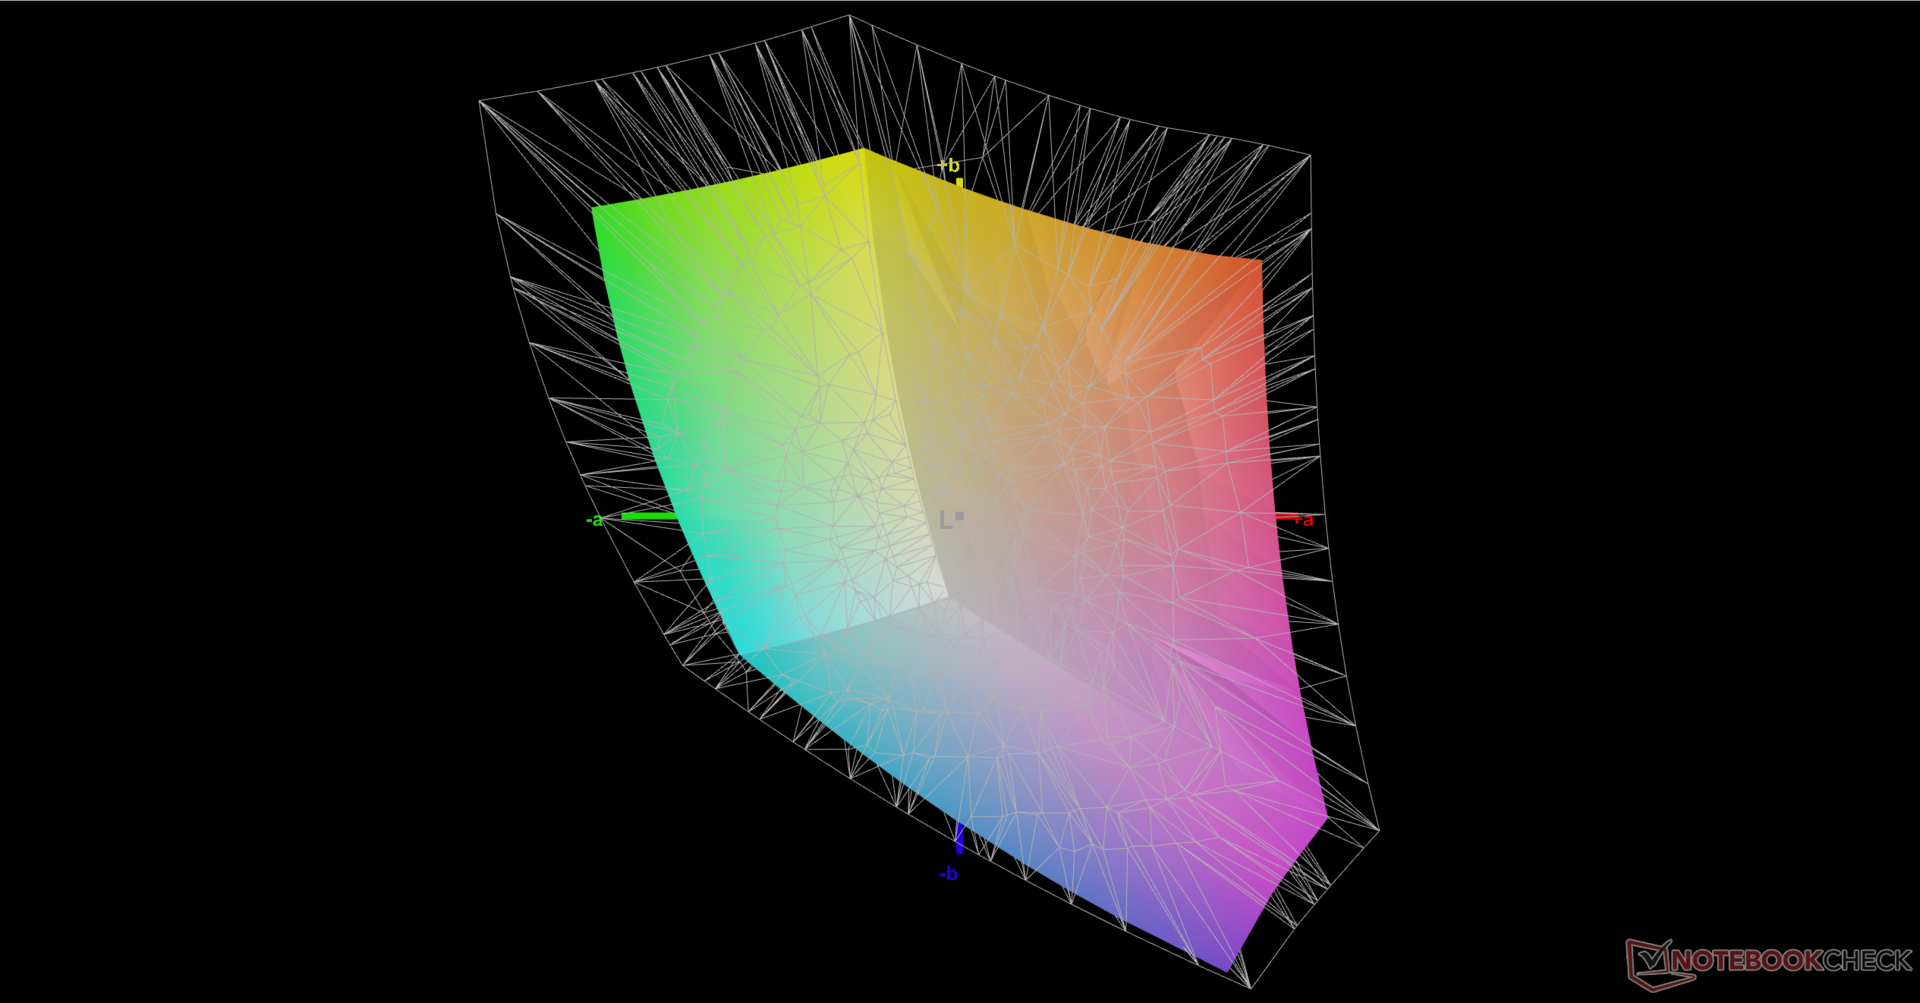
Keines der beiden Panels ist schlecht zum Zocken, aber Fans von actionreichen Titeln wie Overwatch 2 oder Valorant sollten wegen der schnelleren Reaktionszeit und höheren Bildrate vielleicht eher zum QHD-Display greifen. Die Farbraumabdeckung ist auf 100% sRGB begrenzt, während Mitbewerber wie das Legion Pro 7 oder ROG Strix G16 farbenfrohe DCI-P3-Panels bieten.
Es gilt zu beachten, dass das HP Omen 16 einer der wenigen verbleibenden Gaming-Laptops mit einem Seitenverhältnis von 16:9 ist, während die meisten anderen Geräte in dieser Klasse schon auf 16:10 umgerüstet wurden.


| |||||||||||||||||||||||||
Ausleuchtung: 91 %
Helligkeit Akku: 310.9 cd/m²
Kontrast: 888:1 (Schwarzwert: 0.35 cd/m²)
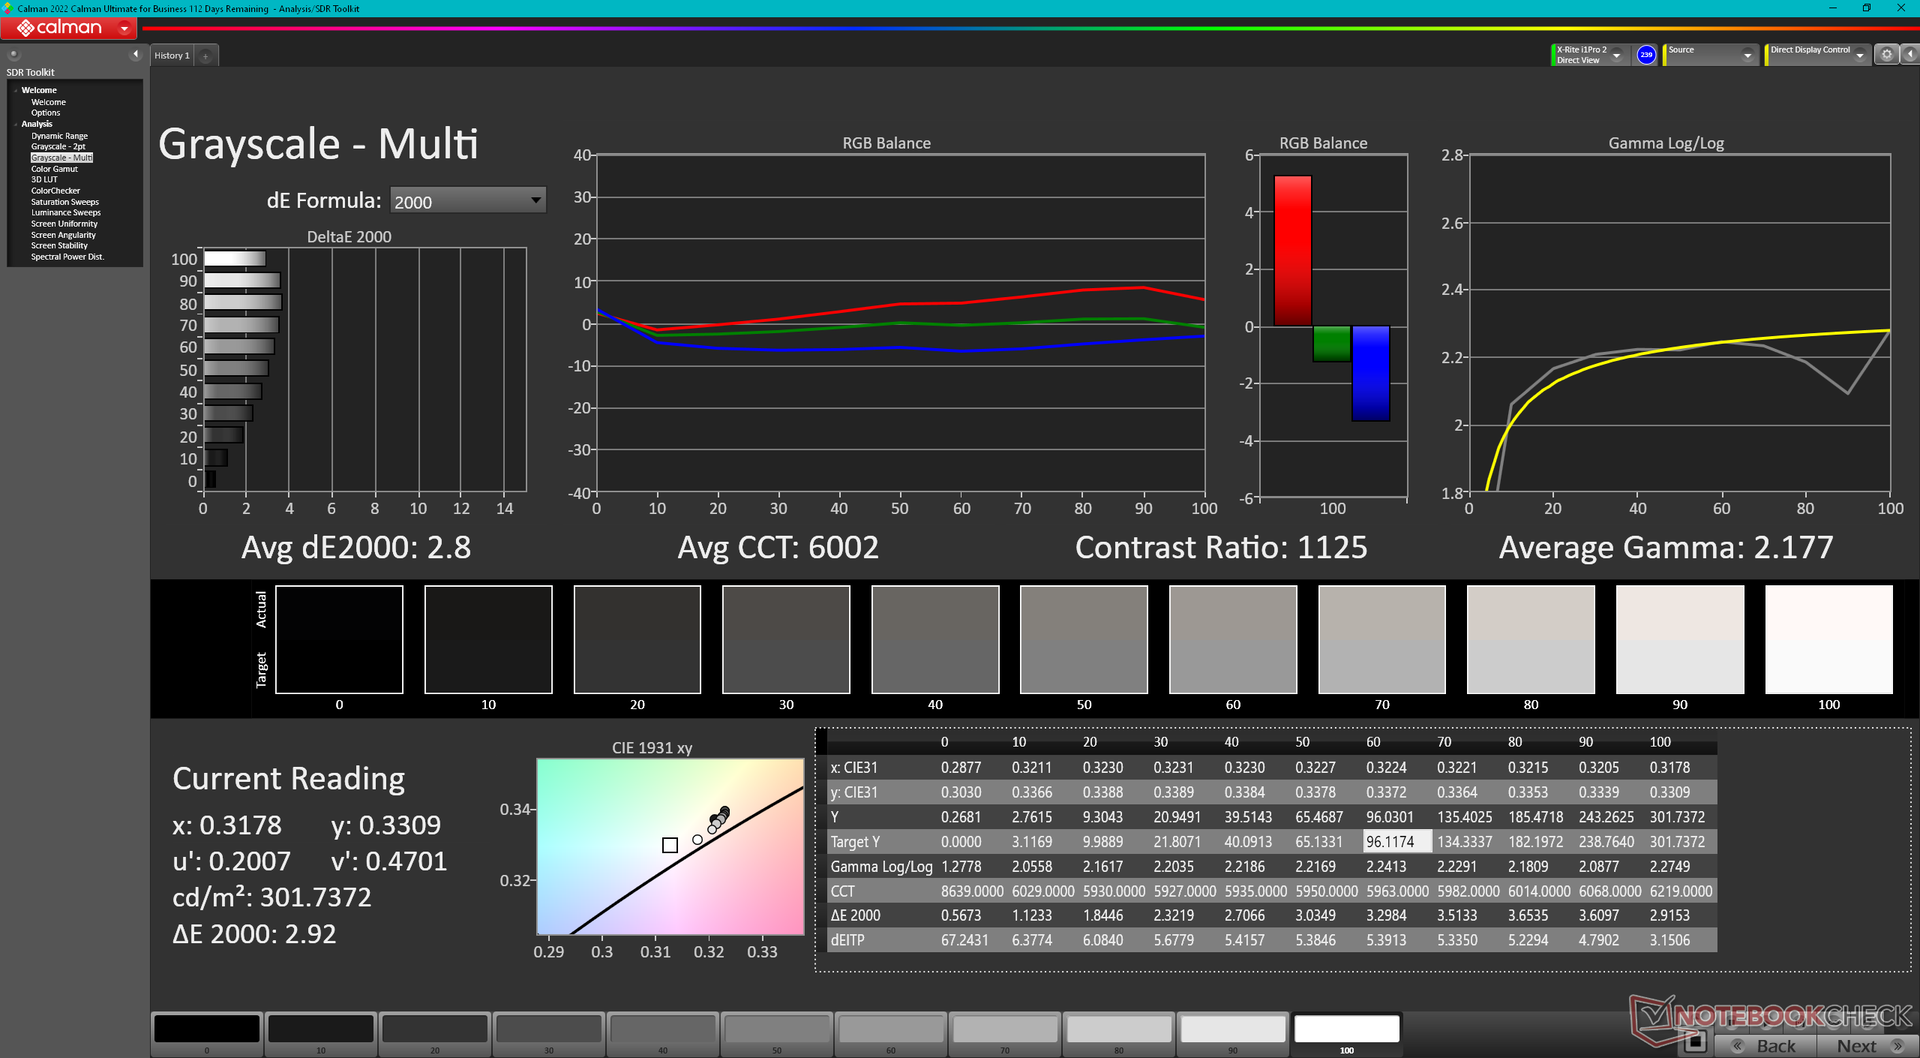
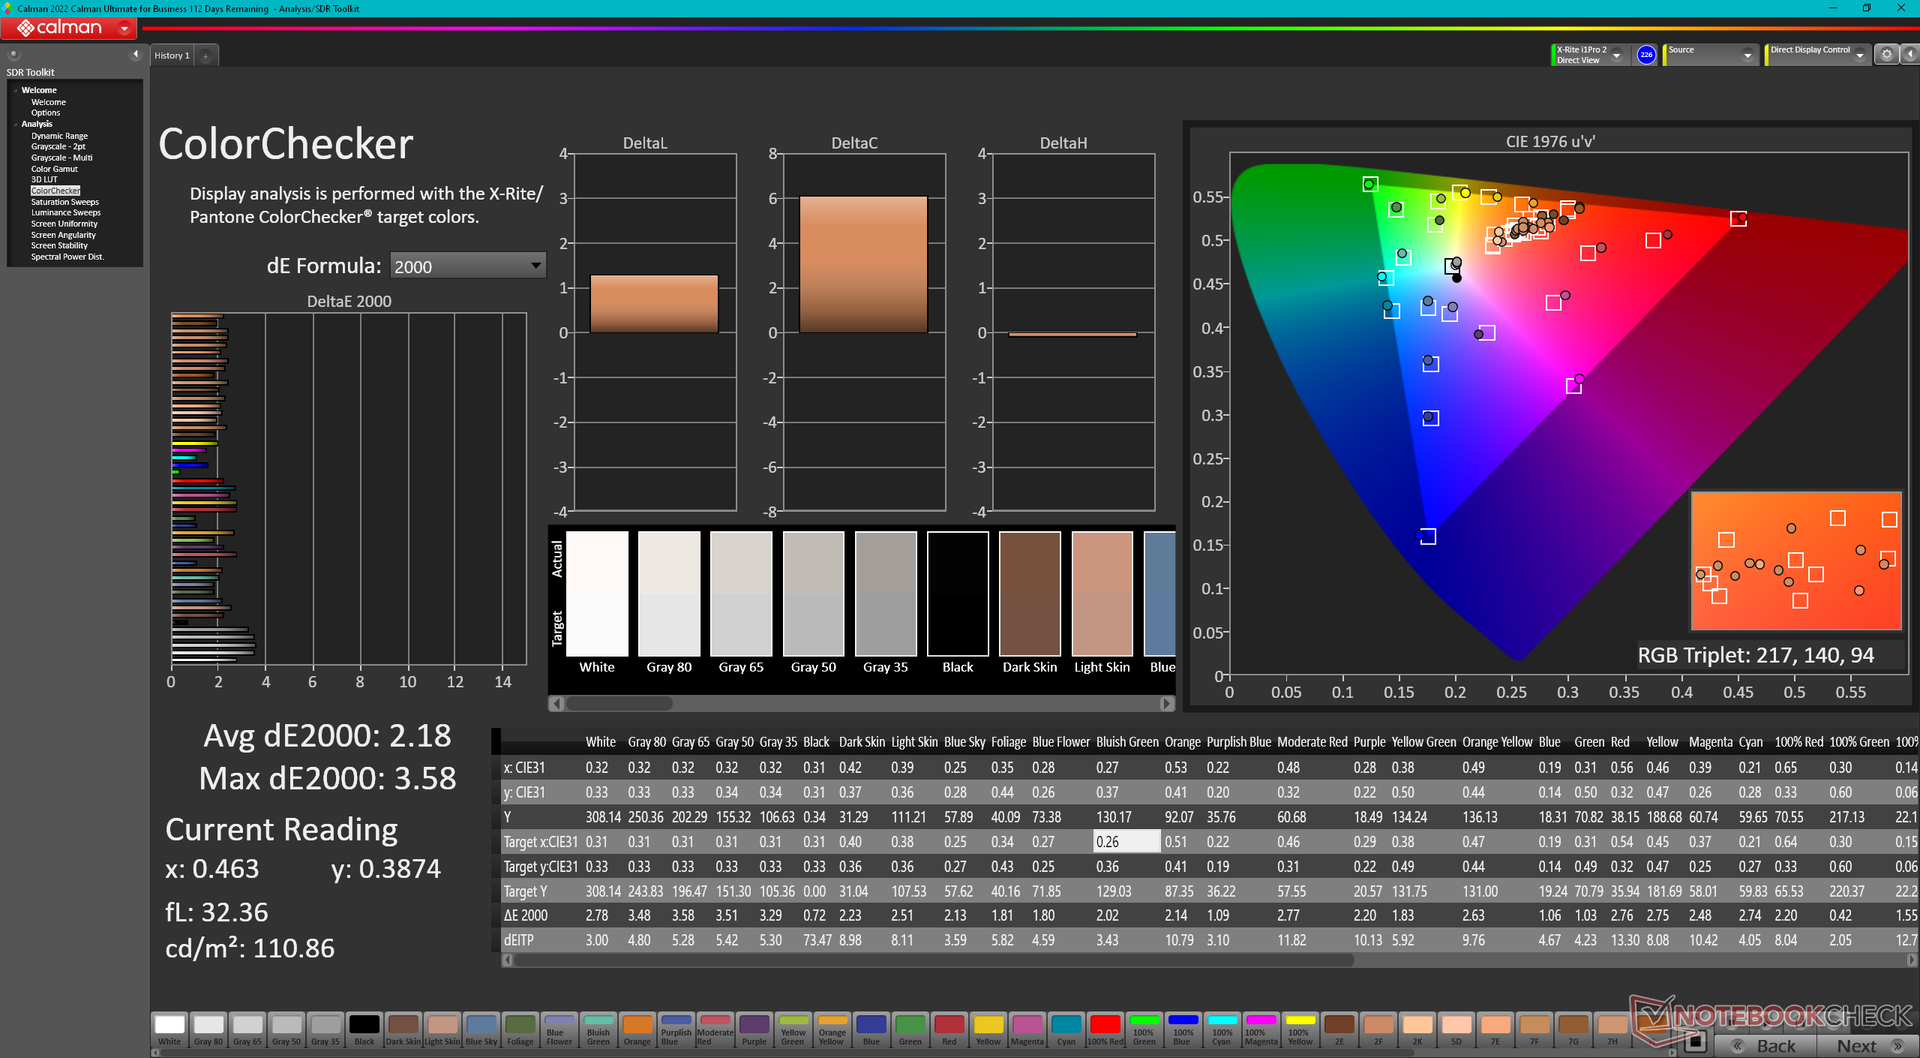
ΔE ColorChecker Calman: 2.18 | ∀{0.5-29.43 Ø4.71}
calibrated: 0.52
ΔE Greyscale Calman: 2.8 | ∀{0.09-98 Ø4.96}
71.2% AdobeRGB 1998 (Argyll 3D)
99.2% sRGB (Argyll 3D)
69% Display P3 (Argyll 3D)
Gamma: 2.18
CCT: 6002 K
| HP Omen 16-wf000 BOE0B7D, IPS, 2560x1440, 16.1" | HP Omen 16-n0033dx BOE0AAE, IPS, 1920x1080, 16.1" | Alienware x16 R1 BOE NE16NZ4, IPS, 2560x1600, 16" | Lenovo Legion Pro 7 RTX4090 MNG007DA2-3 (CSO1628), IPS, 2560x1600, 16" | Asus ROG Strix G16 G614JZ TL160ADMP03-0, IPS, 2560x1600, 16" | Razer Blade 16 Early 2023 CSOT T3 MNG007DA4-1, IPS, 2560x1600, 16" | |
|---|---|---|---|---|---|---|
| Display | 4% | 23% | 1% | 20% | 23% | |
| Display P3 Coverage (%) | 69 | 74.4 8% | 99.2 44% | 69.5 1% | 97 41% | 98.5 43% |
| sRGB Coverage (%) | 99.2 | 99.2 0% | 100 1% | 99.8 1% | 99.9 1% | 100 1% |
| AdobeRGB 1998 Coverage (%) | 71.2 | 73.4 3% | 88.6 24% | 71.6 1% | 84.9 19% | 89.7 26% |
| Response Times | -149% | -9% | -42% | 11% | -34% | |
| Response Time Grey 50% / Grey 80% * (ms) | 4.6 ? | 17.6 ? -283% | 5.1 ? -11% | 10.9 ? -137% | 5.1 ? -11% | 6.6 ? -43% |
| Response Time Black / White * (ms) | 9.7 ? | 11.2 ? -15% | 10.3 ? -6% | 4.6 ? 53% | 6.6 ? 32% | 12 ? -24% |
| PWM Frequency (Hz) | ||||||
| Bildschirm | -38% | -6% | 3% | 5% | -4% | |
| Helligkeit Bildmitte (cd/m²) | 310.9 | 373.3 20% | 302.2 -3% | 491 58% | 470 51% | 456.8 47% |
| Brightness (cd/m²) | 296 | 361 22% | 285 -4% | 472 59% | 459 55% | 437 48% |
| Brightness Distribution (%) | 91 | 79 -13% | 89 -2% | 91 0% | 93 2% | 83 -9% |
| Schwarzwert * (cd/m²) | 0.35 | 0.44 -26% | 0.26 26% | 0.4 -14% | 0.42 -20% | 0.35 -0% |
| Kontrast (:1) | 888 | 848 -5% | 1162 31% | 1228 38% | 1119 26% | 1305 47% |
| Delta E Colorchecker * | 2.18 | 2.12 3% | 1.63 25% | 1.6 27% | 1.86 15% | 3.7 -70% |
| Colorchecker dE 2000 max. * | 3.58 | 5.62 -57% | 4.13 -15% | 5.15 -44% | 3.87 -8% | 6.42 -79% |
| Colorchecker dE 2000 calibrated * | 0.52 | 2.06 -296% | 1.17 -125% | 0.97 -87% | 0.93 -79% | 0.66 -27% |
| Delta E Graustufen * | 2.8 | 2.5 11% | 2.5 11% | 3 -7% | 2.7 4% | 2.6 7% |
| Gamma | 2.18 101% | 2.3 96% | 2.23 99% | 2.211 100% | 2.246 98% | 2.3 96% |
| CCT | 6002 108% | 6408 101% | 6590 99% | 6979 93% | 6711 97% | 6108 106% |
| Durchschnitt gesamt (Programm / Settings) | -61% /
-45% | 3% /
-0% | -13% /
-4% | 12% /
9% | -5% /
-2% |
* ... kleinere Werte sind besser
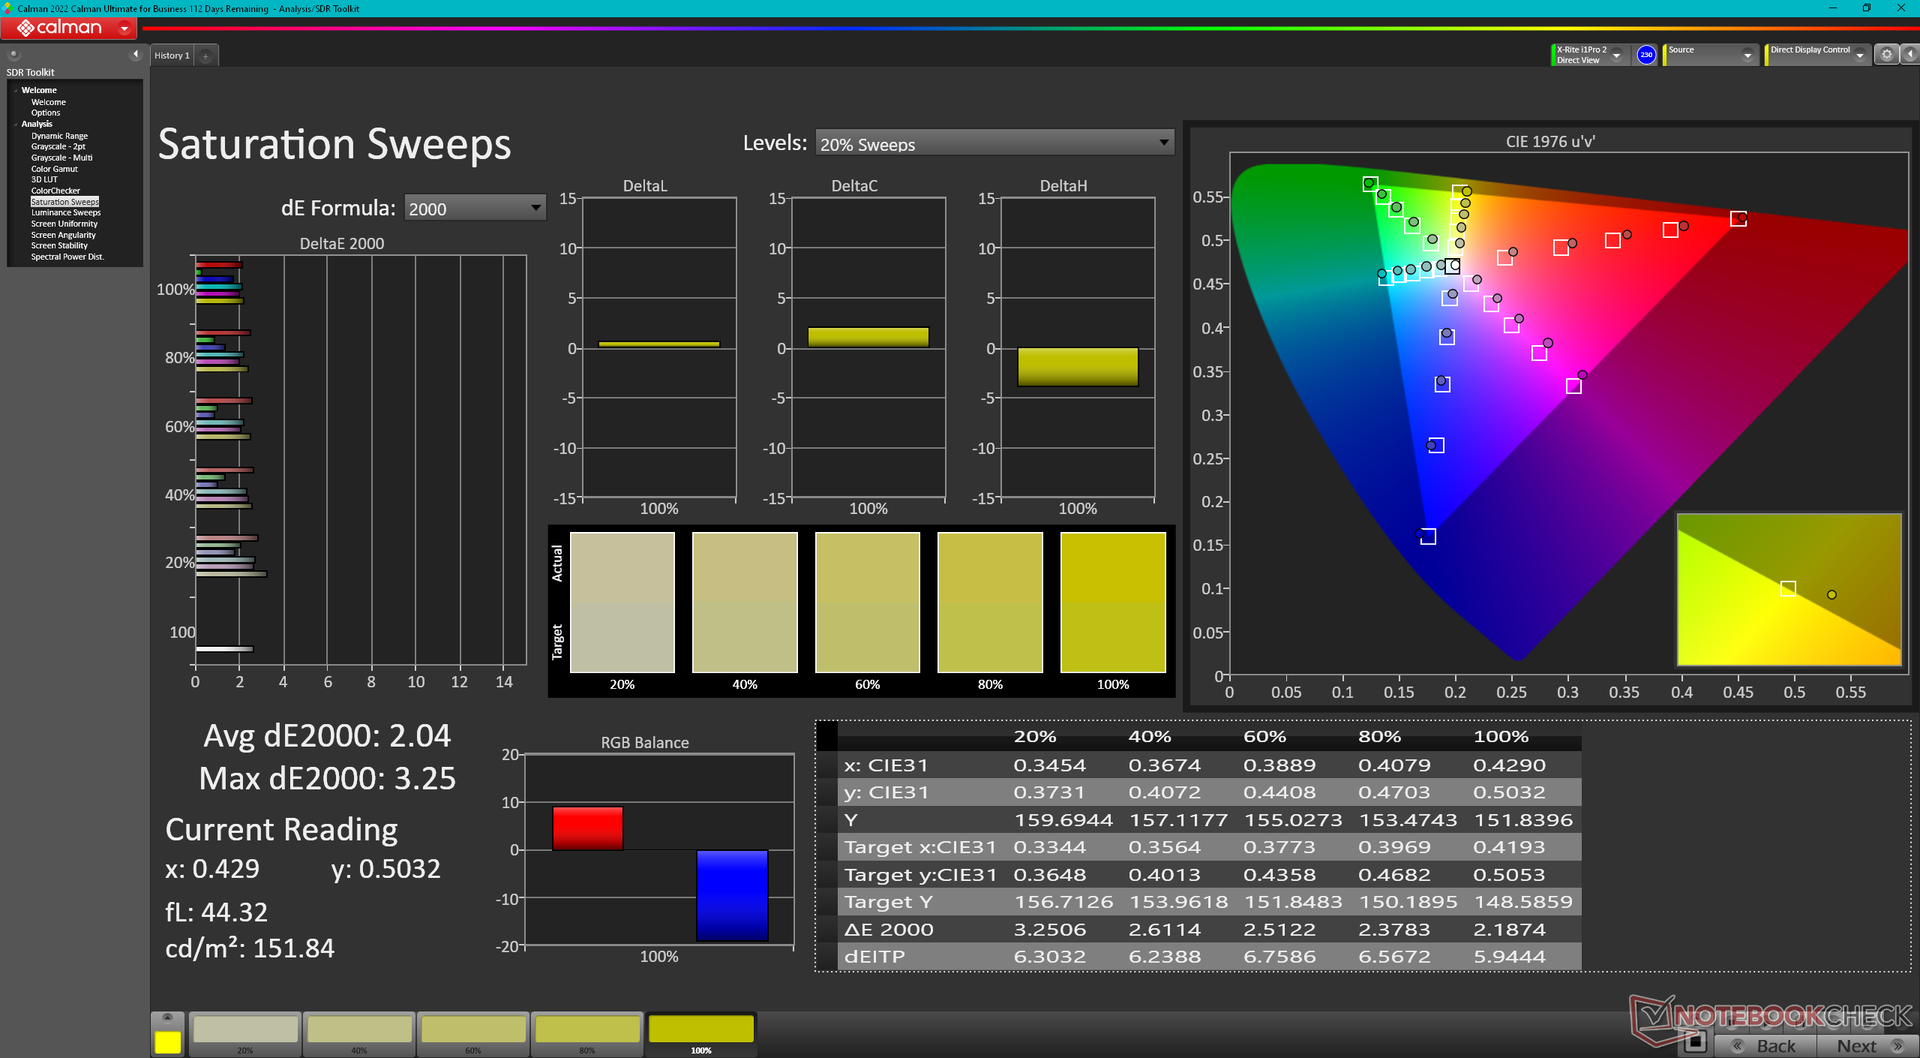
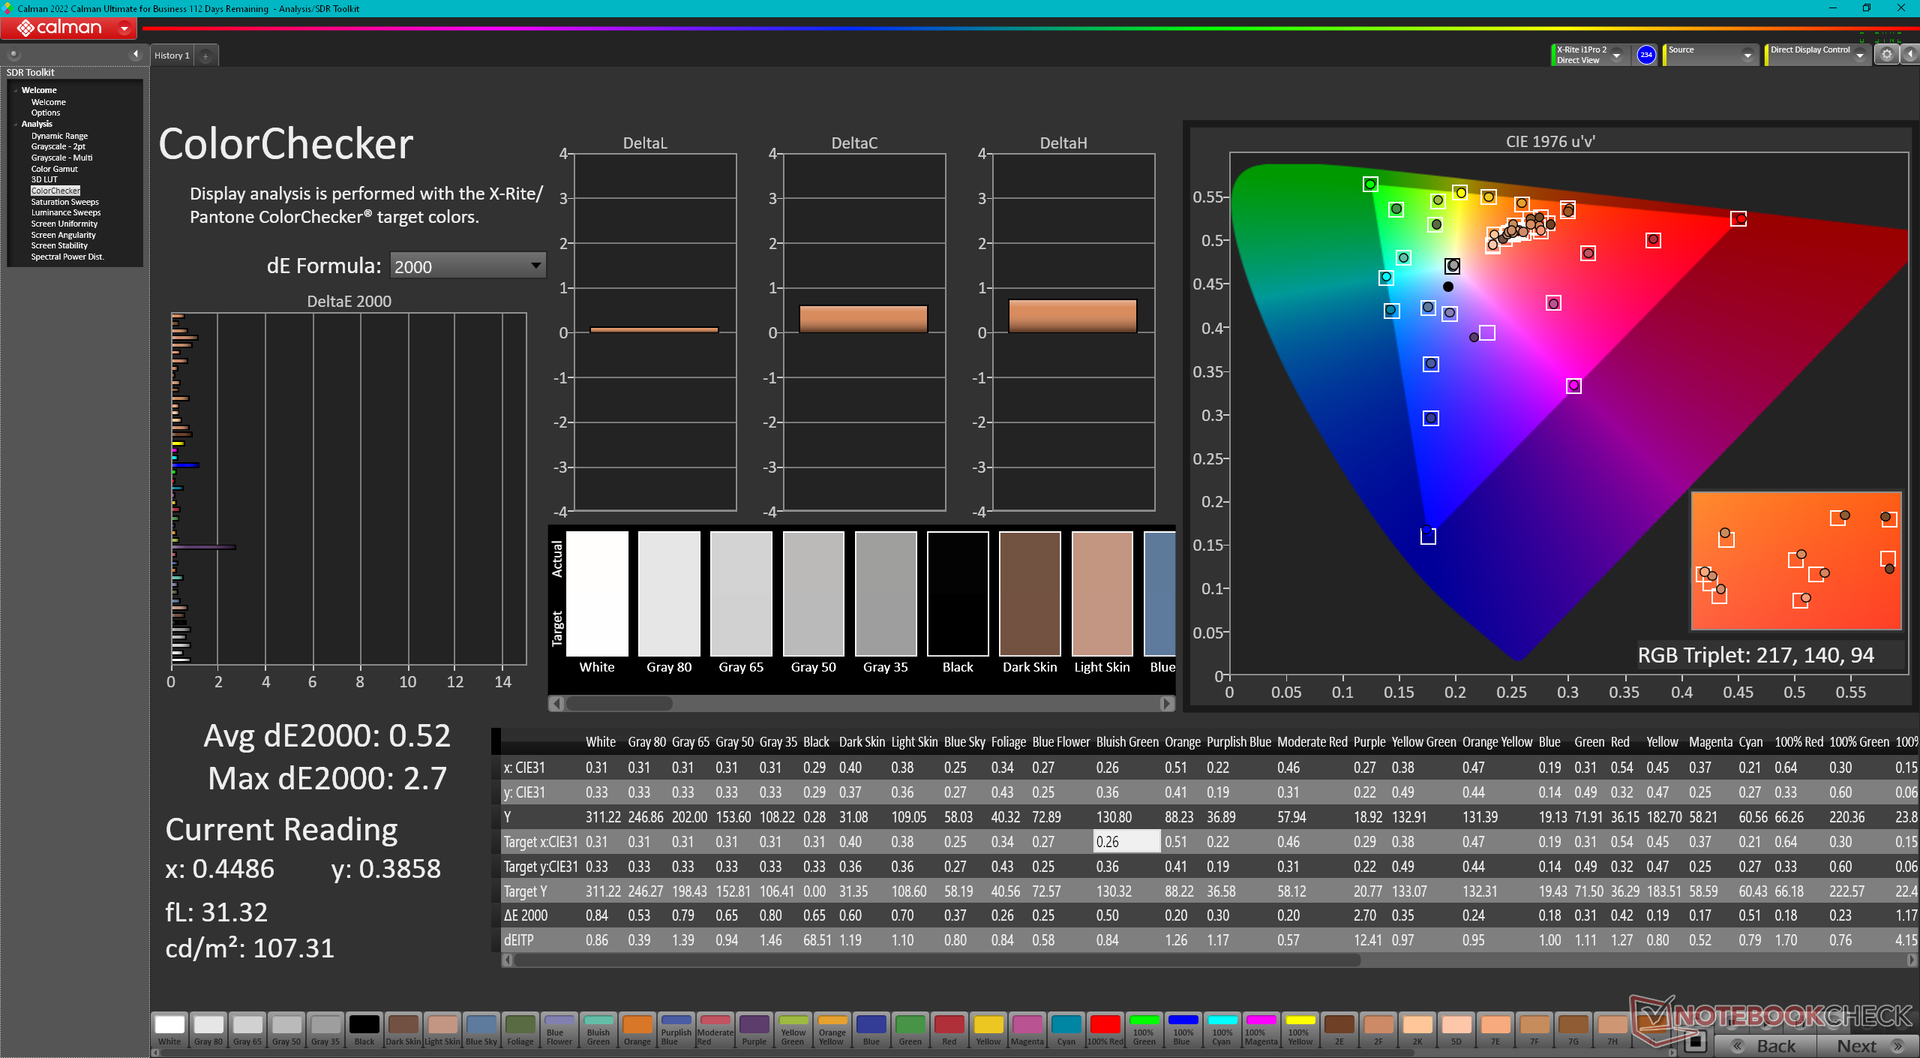
Das Display ist von Werk aus gut kalibriert, die Delta-E-Werte für Graustufen und Farben liegen bei 2,8 beziehungsweise 2,18. Mit dem X-Rite-Farbmessgerät können diese Werte auf 0,5 und 0,52 verbessert werden. Neubesitzer können auf Wunsch unser oben verlinktes ICM-Profil nutzen.
Reaktionszeiten (Response Times) des Displays
| ↔ Reaktionszeiten Schwarz zu Weiß | ||
|---|---|---|
| 9.7 ms ... steigend ↗ und fallend ↘ kombiniert | ↗ 4.6 ms steigend | 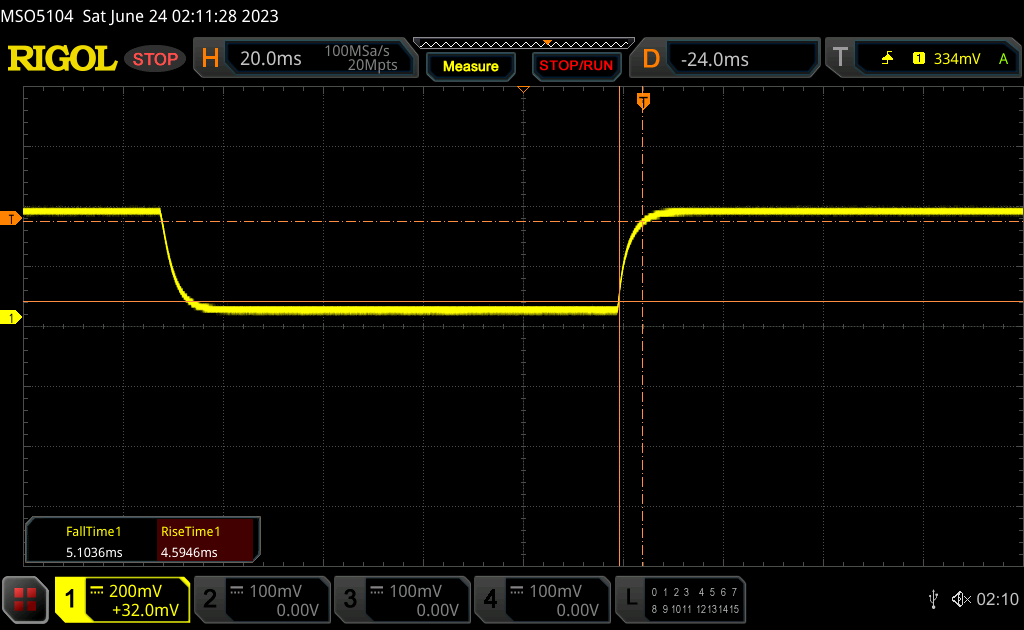 |
| ↘ 5.1 ms fallend | ||
| Die gemessenen Reaktionszeiten sind kurz wodurch sich der Bildschirm auch für Spiele gut eignen sollte. Im Vergleich rangierten die bei uns getesteten Geräte von 0.1 (Minimum) zu 240 (Maximum) ms. » 27 % aller Screens waren schneller als der getestete. Daher sind die gemessenen Reaktionszeiten besser als der Durchschnitt aller vermessenen Geräte (19.8 ms). | ||
| ↔ Reaktionszeiten 50% Grau zu 80% Grau | ||
| 4.6 ms ... steigend ↗ und fallend ↘ kombiniert | ↗ 2.1 ms steigend | 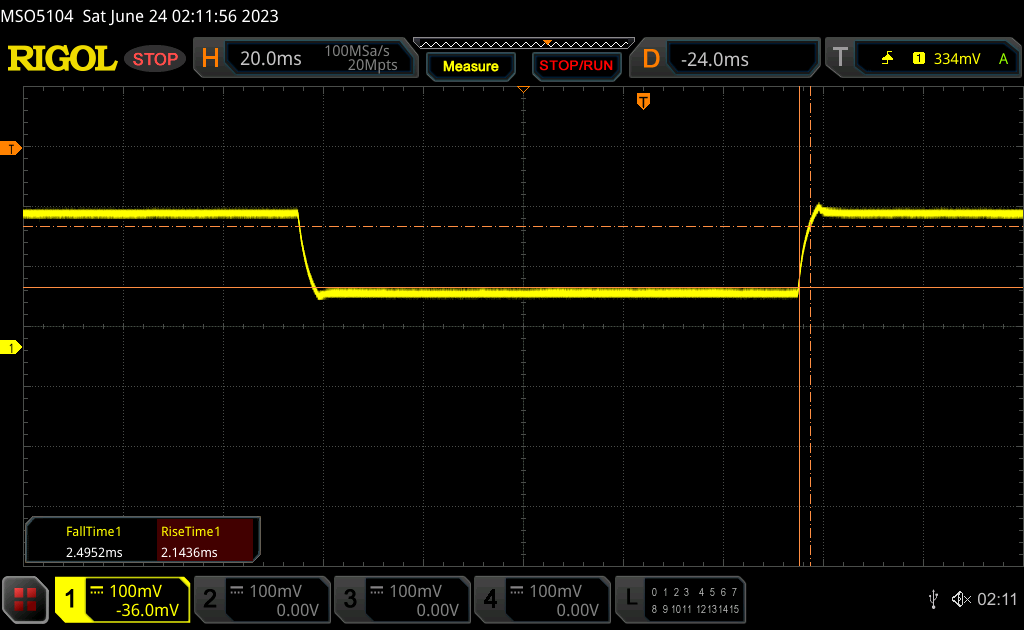 |
| ↘ 2.5 ms fallend | ||
| Die gemessenen Reaktionszeiten sind sehr kurz, wodurch sich der Bildschirm auch für schnelle 3D Spiele eignen sollte. Im Vergleich rangierten die bei uns getesteten Geräte von 0.165 (Minimum) zu 636 (Maximum) ms. » 16 % aller Screens waren schneller als der getestete. Daher sind die gemessenen Reaktionszeiten besser als der Durchschnitt aller vermessenen Geräte (30.9 ms). | ||
Bildschirm-Flackern / PWM (Pulse-Width Modulation)
| Flackern / PWM nicht festgestellt | 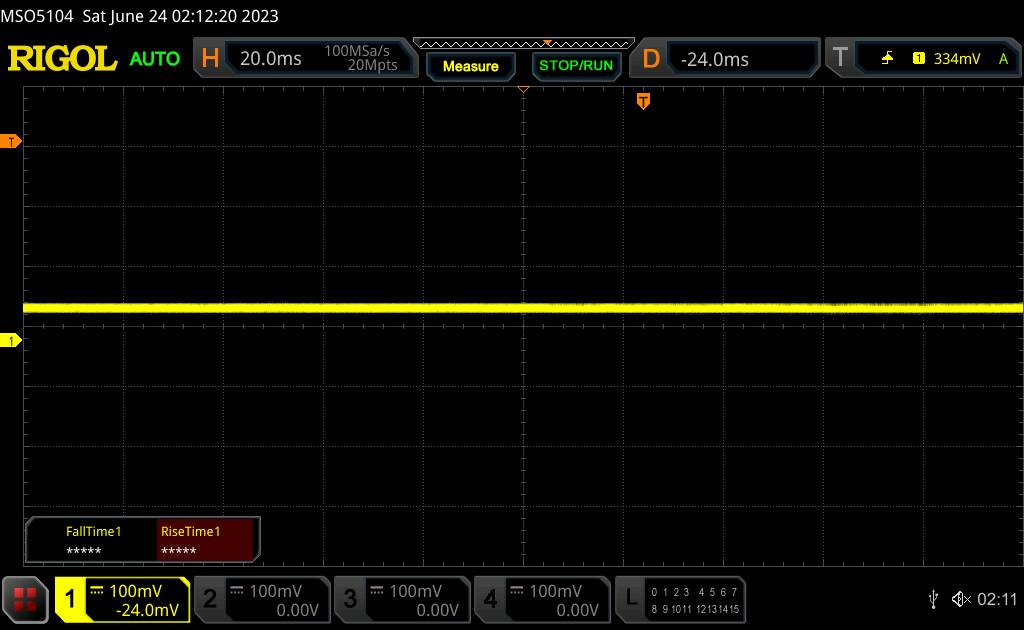 | ||
Im Vergleich: 52 % aller getesteten Geräte nutzten kein PWM um die Helligkeit zu reduzieren. Wenn PWM eingesetzt wurde, dann bei einer Frequenz von durchschnittlich 7748 (Minimum 5, Maximum 343500) Hz. | |||
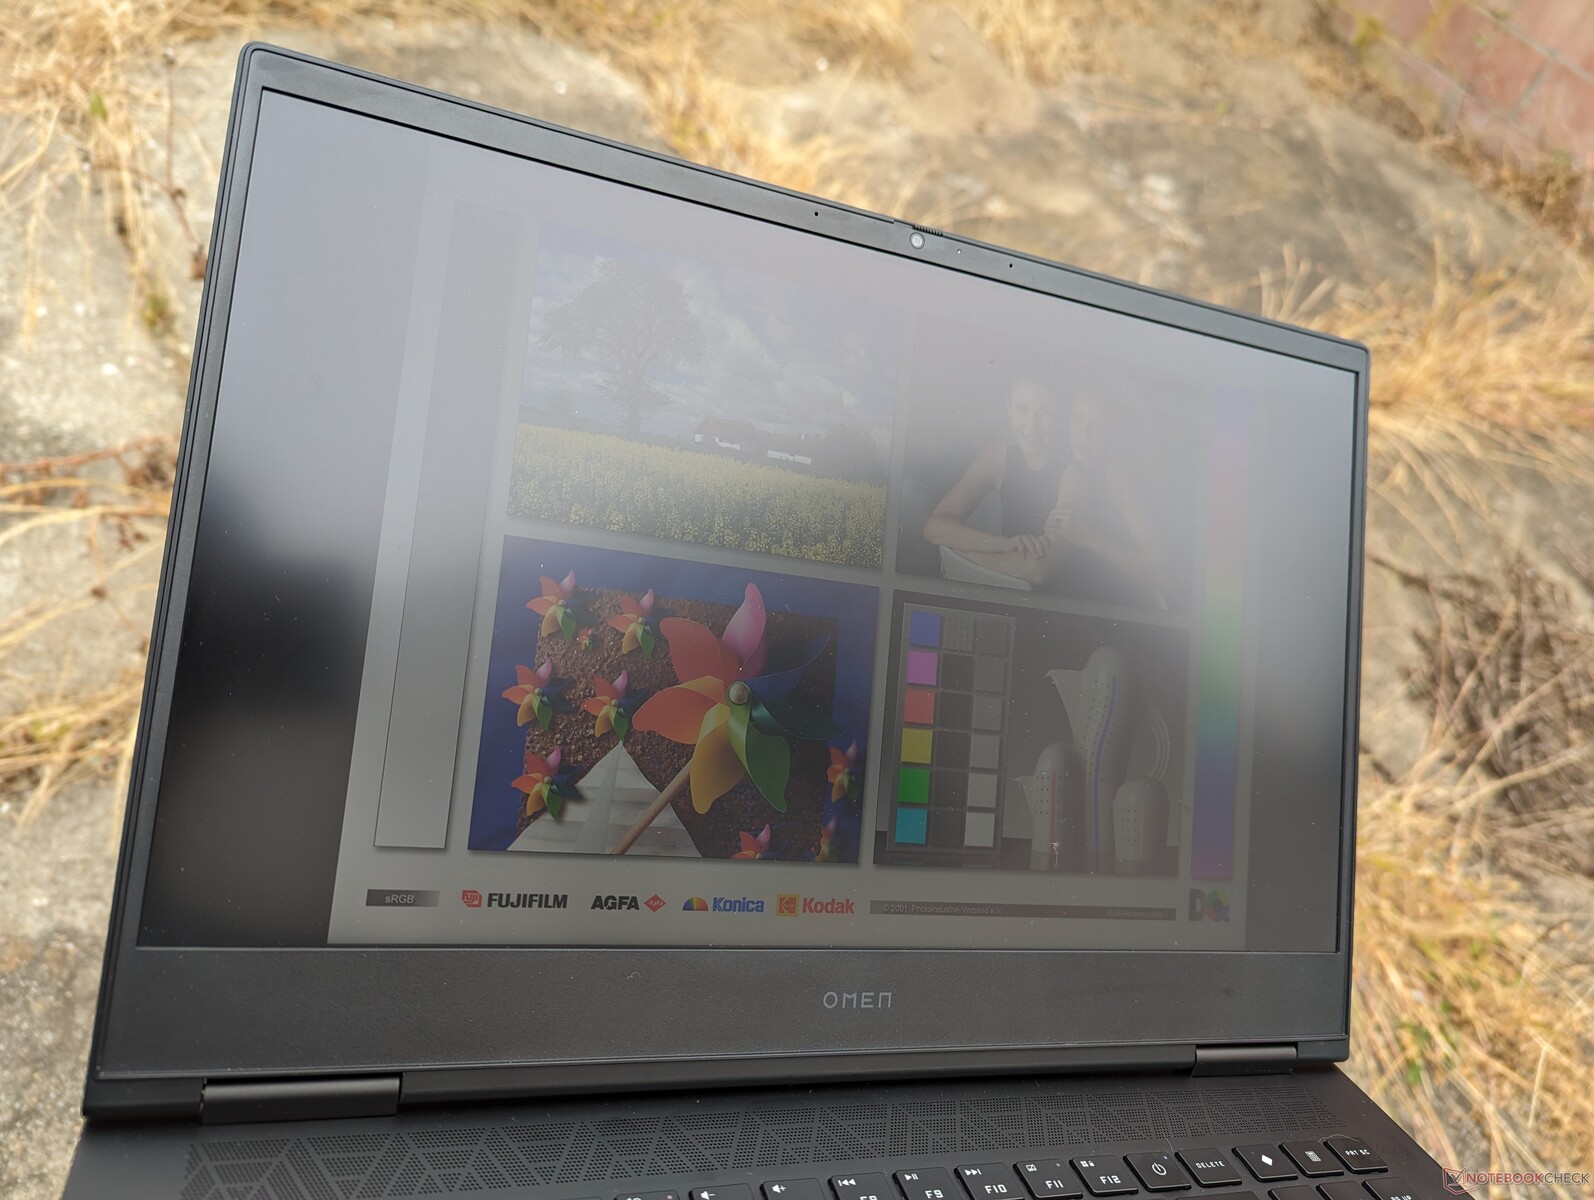
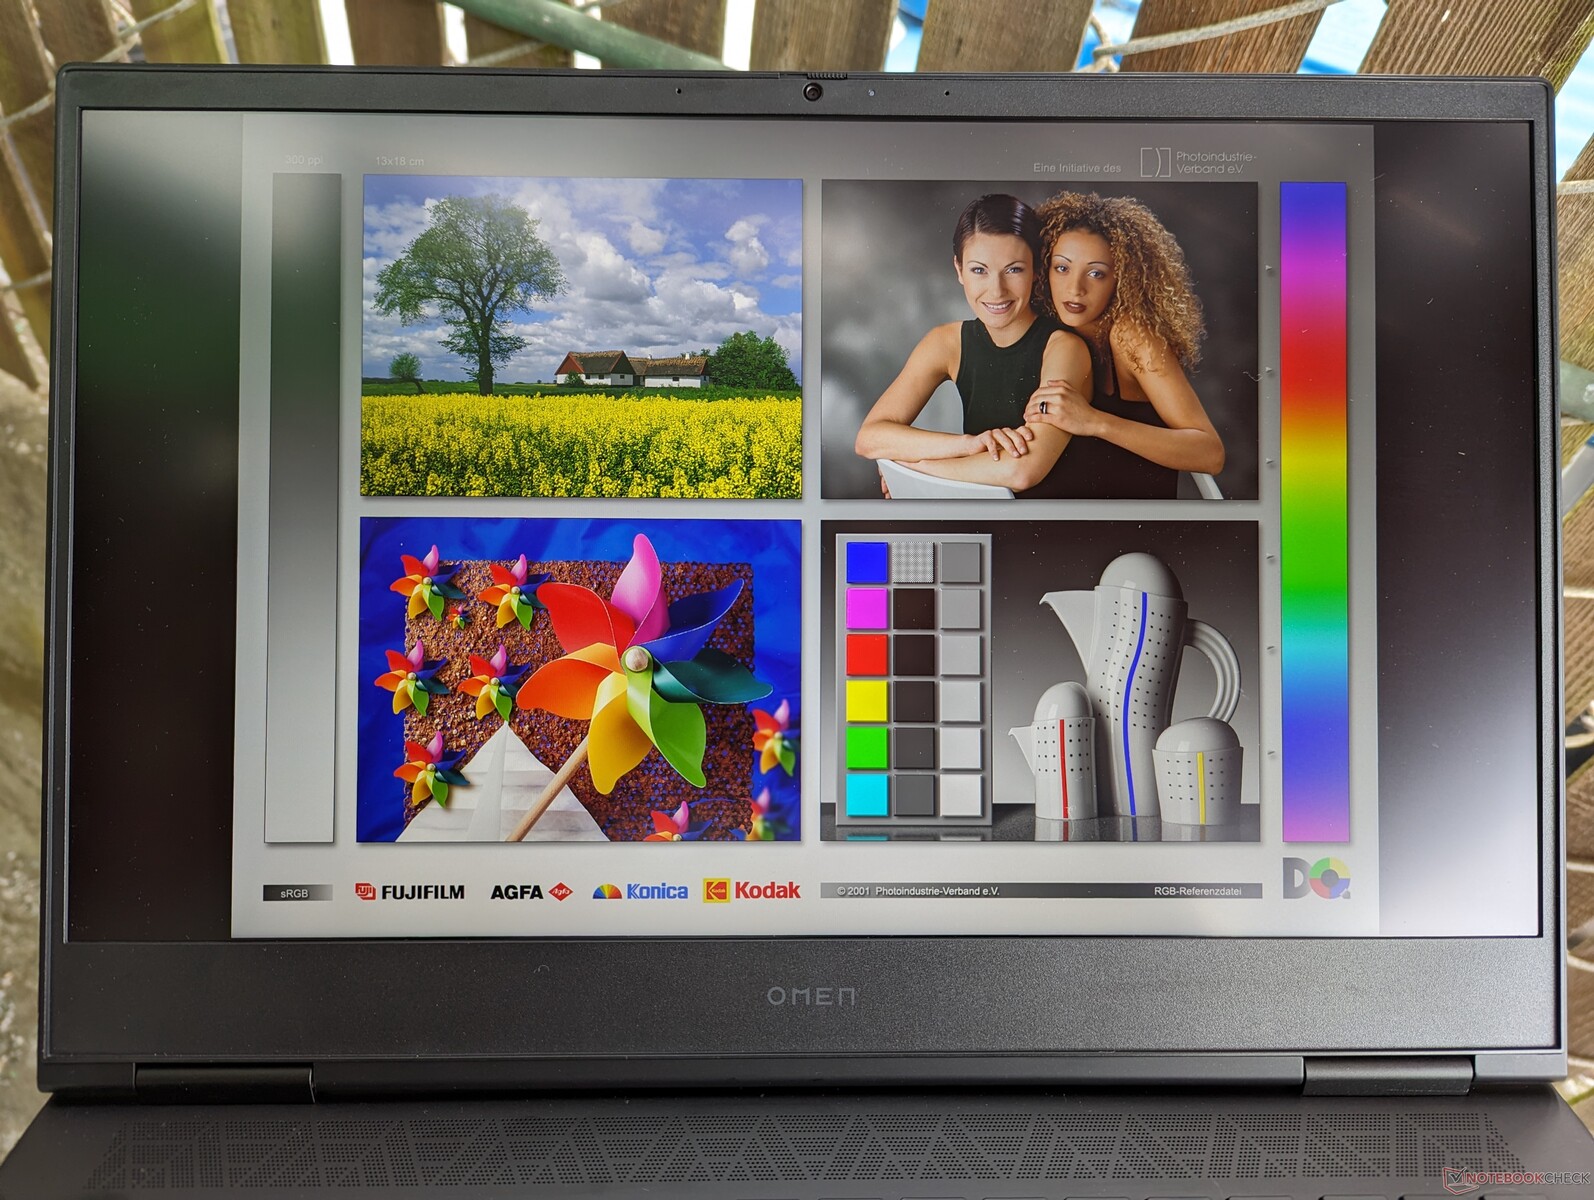
Die Ablesbarkeit im Freien ist nur im Schatten akzeptabel. Das Display ist nicht so hell wie beim Legion Pro 7, ROG Strix G16 oder Blade 16, die draußen allesamt besser nutzbar sind.


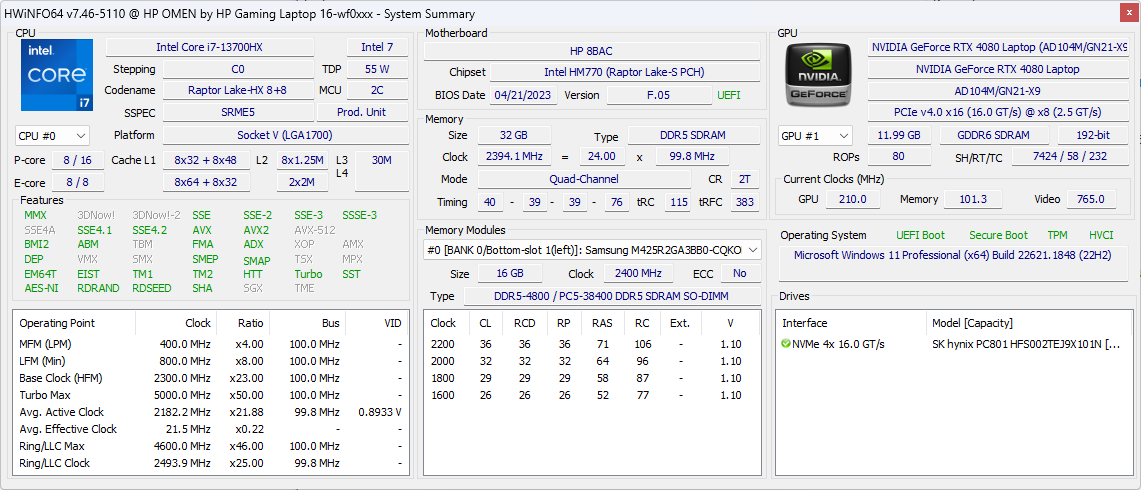
Leistung — Intel Raptor Lake-H der 13. Generation
Testbedingungen
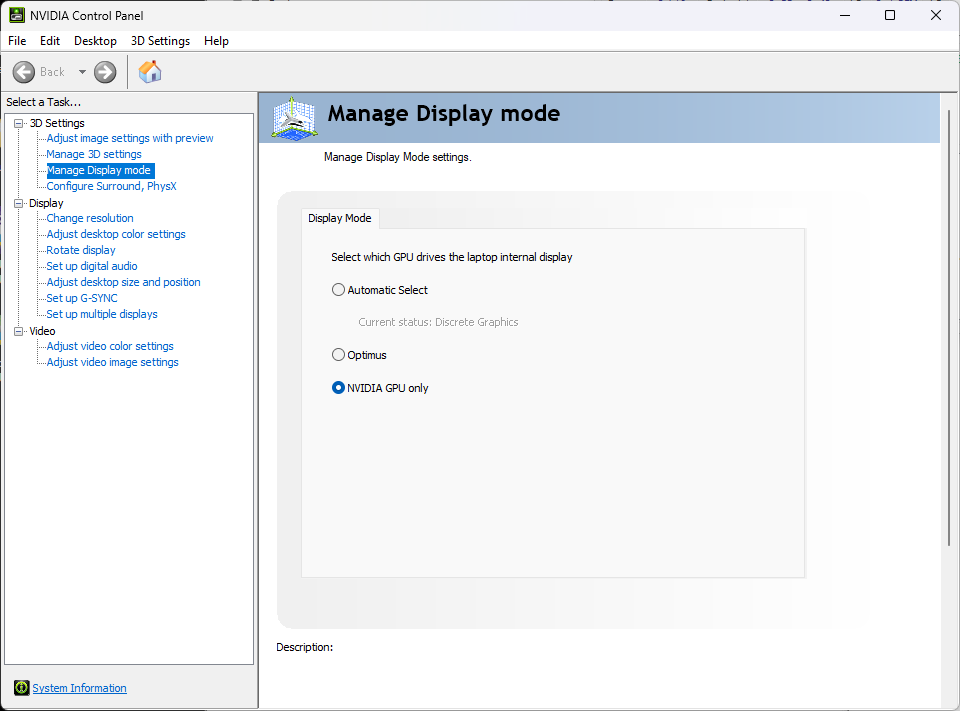
Vor der Durchführung unserer Benchmarks haben wir unser Testgerät im Nvidia-Kontrollzentrum in den dGPU-Modus versetzt und den Leistungsmodus im HP Omen Gaming-Hub und in Windows aktiviert. Zusätzlich zum Leistungsmodus gibt es auch einen maximalen Lüftungsmodus. Besitzer sollten sich mit dem Omen Gamin-Hub vertraut machen, um Energieoptionen, RGB-Beleuchtung, Spiele-Settings und mehr anzupassen. Leider werden die Energieeinstellungen in HPs Software nicht mit Windows synchronisiert.
Advanced Optimus (Mux-Switch) und G-Sync werden unterstützt.
Prozessor
Die CPU-Leistung entspricht unseren Erwartungen und liegt in einer Linie mit anderen Notebooks mit dem Core i7-13700HX, das HP Omen 16 hat also keine sonderlichen Probleme mit Throttling. Bemerkenswert ist, dass der Prozessor dem teureren Core i9-13900HK im Alienware x16 R1 direkt im Nacken sitzt und zwischen 15 und 20 Prozent schneller ist als der alte Core i7-12700H der 12. Generation. Der Core i9-13900HX wäre nochmal ein ganzes Stück schneller, der Chip kann in diesem Modell aber nicht ausgewählt werden.
Cinebench R15 Dauertest
Cinebench R20: CPU (Multi Core) | CPU (Single Core)
Cinebench R23: Multi Core | Single Core
Cinebench R15: CPU Multi 64Bit | CPU Single 64Bit
Blender: v2.79 BMW27 CPU
7-Zip 18.03: 7z b 4 | 7z b 4 -mmt1
Geekbench 5.5: Multi-Core | Single-Core
HWBOT x265 Benchmark v2.2: 4k Preset
LibreOffice : 20 Documents To PDF
R Benchmark 2.5: Overall mean
* ... kleinere Werte sind besser
AIDA64: FP32 Ray-Trace | FPU Julia | CPU SHA3 | CPU Queen | FPU SinJulia | FPU Mandel | CPU AES | CPU ZLib | FP64 Ray-Trace | CPU PhotoWorxx
| Performance Rating | |
| Lenovo Legion Pro 7 RTX4090 | |
| Asus ROG Strix G16 G614JZ | |
| Razer Blade 16 Early 2023 | |
| Alienware x16 R1 | |
| Durchschnittliche Intel Core i7-13700HX | |
| HP Omen 16-wf000 | |
| HP Omen 16-n0033dx | |
| AIDA64 / FP32 Ray-Trace | |
| Asus ROG Strix G16 G614JZ | |
| Lenovo Legion Pro 7 RTX4090 | |
| Razer Blade 16 Early 2023 | |
| Razer Blade 16 Early 2023 | |
| Razer Blade 16 Early 2023 | |
| Durchschnittliche Intel Core i7-13700HX (14261 - 21999, n=11) | |
| HP Omen 16-wf000 | |
| Alienware x16 R1 | |
| HP Omen 16-n0033dx | |
| AIDA64 / FPU Julia | |
| Lenovo Legion Pro 7 RTX4090 | |
| Asus ROG Strix G16 G614JZ | |
| Razer Blade 16 Early 2023 | |
| Razer Blade 16 Early 2023 | |
| Razer Blade 16 Early 2023 | |
| HP Omen 16-n0033dx | |
| HP Omen 16-wf000 | |
| Durchschnittliche Intel Core i7-13700HX (74636 - 109364, n=11) | |
| Alienware x16 R1 | |
| AIDA64 / CPU SHA3 | |
| Lenovo Legion Pro 7 RTX4090 | |
| Asus ROG Strix G16 G614JZ | |
| Razer Blade 16 Early 2023 | |
| Razer Blade 16 Early 2023 | |
| Razer Blade 16 Early 2023 | |
| Durchschnittliche Intel Core i7-13700HX (3359 - 5053, n=11) | |
| HP Omen 16-wf000 | |
| Alienware x16 R1 | |
| HP Omen 16-n0033dx | |
| AIDA64 / CPU Queen | |
| Asus ROG Strix G16 G614JZ | |
| Lenovo Legion Pro 7 RTX4090 | |
| Razer Blade 16 Early 2023 | |
| Razer Blade 16 Early 2023 | |
| Alienware x16 R1 | |
| Durchschnittliche Intel Core i7-13700HX (86532 - 114717, n=11) | |
| HP Omen 16-n0033dx | |
| HP Omen 16-wf000 | |
| AIDA64 / FPU SinJulia | |
| Asus ROG Strix G16 G614JZ | |
| Razer Blade 16 Early 2023 | |
| Razer Blade 16 Early 2023 | |
| Razer Blade 16 Early 2023 | |
| Lenovo Legion Pro 7 RTX4090 | |
| HP Omen 16-n0033dx | |
| Durchschnittliche Intel Core i7-13700HX (9290 - 13519, n=11) | |
| HP Omen 16-wf000 | |
| Alienware x16 R1 | |
| AIDA64 / FPU Mandel | |
| Lenovo Legion Pro 7 RTX4090 | |
| Asus ROG Strix G16 G614JZ | |
| Razer Blade 16 Early 2023 | |
| Razer Blade 16 Early 2023 | |
| Razer Blade 16 Early 2023 | |
| HP Omen 16-n0033dx | |
| HP Omen 16-wf000 | |
| Durchschnittliche Intel Core i7-13700HX (35751 - 53484, n=11) | |
| Alienware x16 R1 | |
| AIDA64 / CPU AES | |
| Razer Blade 16 Early 2023 | |
| Razer Blade 16 Early 2023 | |
| Razer Blade 16 Early 2023 | |
| HP Omen 16-n0033dx | |
| Lenovo Legion Pro 7 RTX4090 | |
| Asus ROG Strix G16 G614JZ | |
| Durchschnittliche Intel Core i7-13700HX (67846 - 182575, n=11) | |
| HP Omen 16-wf000 | |
| Alienware x16 R1 | |
| AIDA64 / CPU ZLib | |
| Lenovo Legion Pro 7 RTX4090 | |
| Asus ROG Strix G16 G614JZ | |
| Razer Blade 16 Early 2023 | |
| Razer Blade 16 Early 2023 | |
| Razer Blade 16 Early 2023 | |
| HP Omen 16-wf000 | |
| Durchschnittliche Intel Core i7-13700HX (981 - 1451, n=11) | |
| Alienware x16 R1 | |
| HP Omen 16-n0033dx | |
| AIDA64 / FP64 Ray-Trace | |
| Asus ROG Strix G16 G614JZ | |
| Lenovo Legion Pro 7 RTX4090 | |
| Razer Blade 16 Early 2023 | |
| Razer Blade 16 Early 2023 | |
| Razer Blade 16 Early 2023 | |
| Durchschnittliche Intel Core i7-13700HX (7728 - 11837, n=11) | |
| HP Omen 16-wf000 | |
| Alienware x16 R1 | |
| HP Omen 16-n0033dx | |
| AIDA64 / CPU PhotoWorxx | |
| Razer Blade 16 Early 2023 | |
| Razer Blade 16 Early 2023 | |
| Razer Blade 16 Early 2023 | |
| Lenovo Legion Pro 7 RTX4090 | |
| Alienware x16 R1 | |
| HP Omen 16-wf000 | |
| Asus ROG Strix G16 G614JZ | |
| Durchschnittliche Intel Core i7-13700HX (19678 - 42415, n=11) | |
| HP Omen 16-n0033dx | |
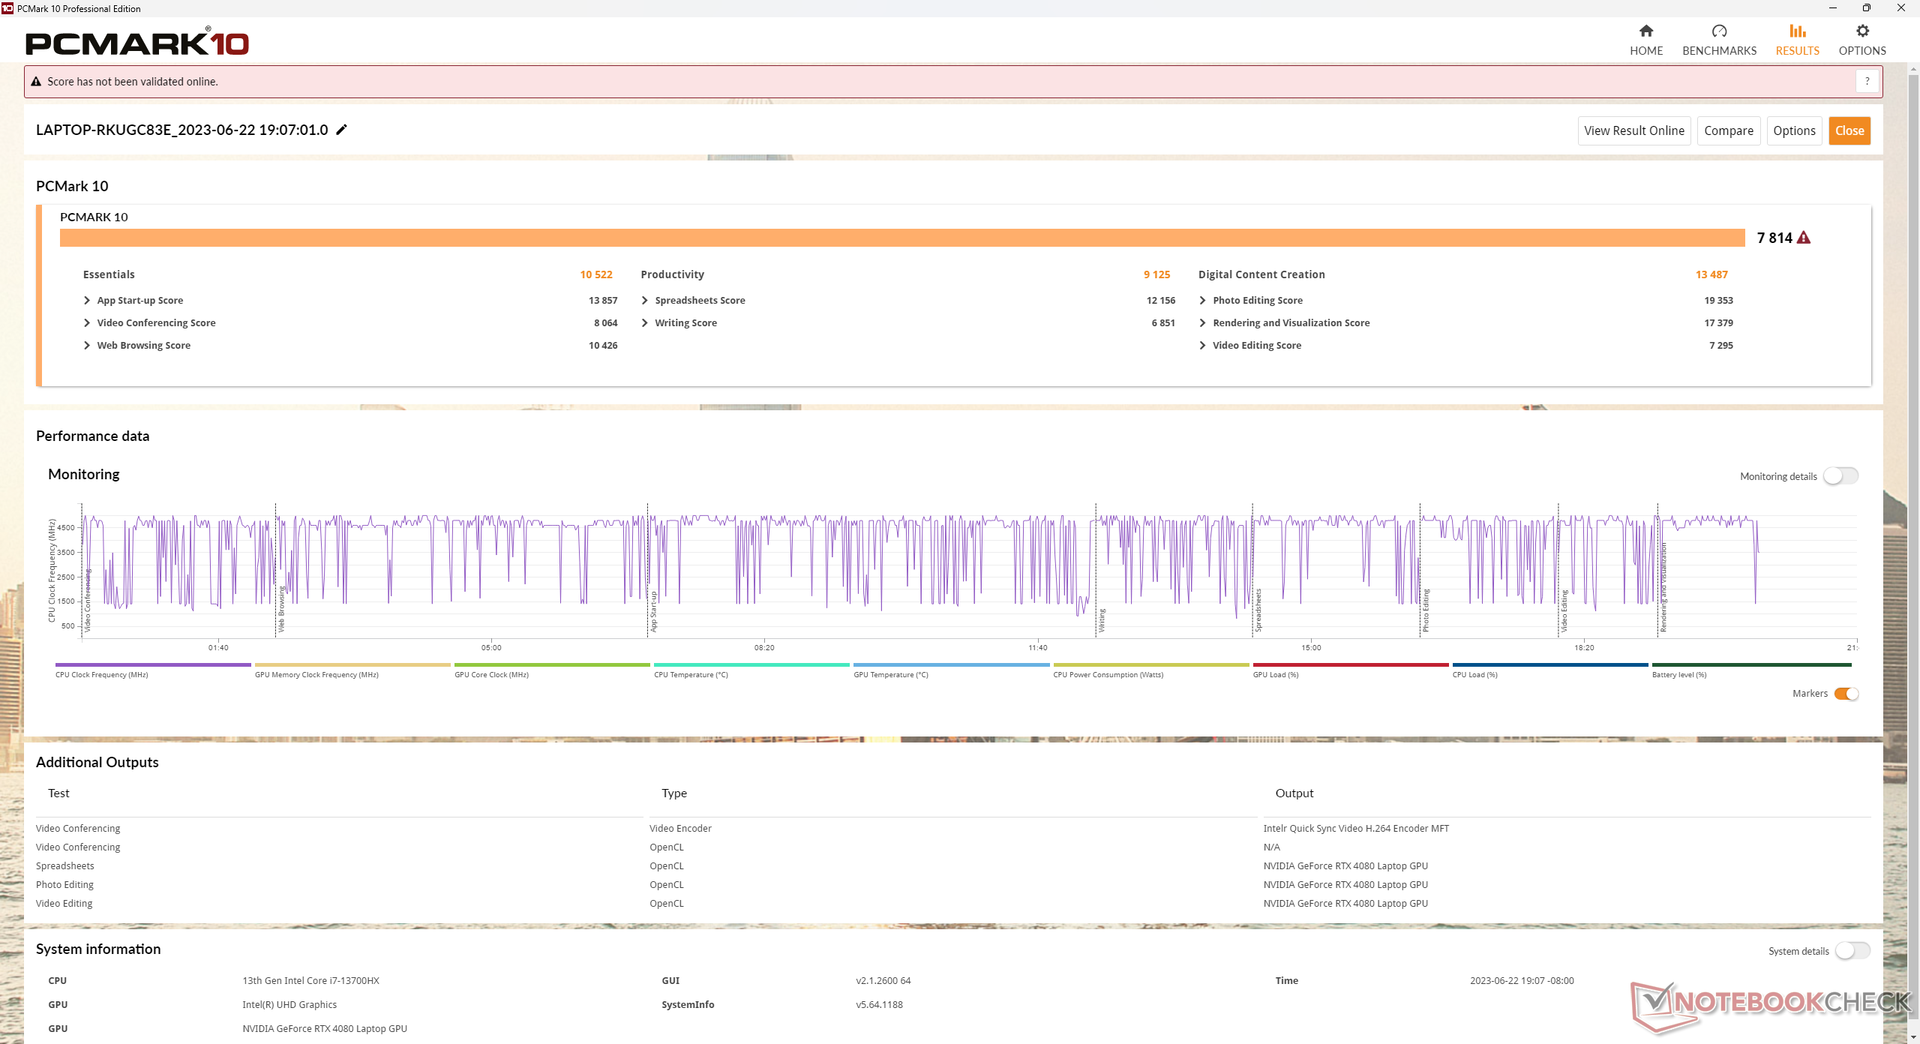
Systemleistung
Die PCMark-Ergebnisse liegen über denen des letztjährigen HP Omen 16, insbesondere im GPU-lastigen Digital Content Creation Test schneidet die schnellere RTX 4080 besser ab.
CrossMark: Overall | Productivity | Creativity | Responsiveness
| PCMark 10 / Score | |
| Alienware x16 R1 | |
| Lenovo Legion Pro 7 RTX4090 | |
| Razer Blade 16 Early 2023 | |
| HP Omen 16-wf000 | |
| Durchschnittliche Intel Core i7-13700HX, NVIDIA GeForce RTX 4080 Laptop GPU (n=1) | |
| Asus ROG Strix G16 G614JZ | |
| HP Omen 16-n0033dx | |
| PCMark 10 / Essentials | |
| Asus ROG Strix G16 G614JZ | |
| Alienware x16 R1 | |
| Lenovo Legion Pro 7 RTX4090 | |
| Razer Blade 16 Early 2023 | |
| HP Omen 16-wf000 | |
| Durchschnittliche Intel Core i7-13700HX, NVIDIA GeForce RTX 4080 Laptop GPU (n=1) | |
| HP Omen 16-n0033dx | |
| PCMark 10 / Productivity | |
| Alienware x16 R1 | |
| HP Omen 16-n0033dx | |
| HP Omen 16-wf000 | |
| Durchschnittliche Intel Core i7-13700HX, NVIDIA GeForce RTX 4080 Laptop GPU (n=1) | |
| Lenovo Legion Pro 7 RTX4090 | |
| Razer Blade 16 Early 2023 | |
| Asus ROG Strix G16 G614JZ | |
| PCMark 10 / Digital Content Creation | |
| Lenovo Legion Pro 7 RTX4090 | |
| Razer Blade 16 Early 2023 | |
| Alienware x16 R1 | |
| HP Omen 16-wf000 | |
| Durchschnittliche Intel Core i7-13700HX, NVIDIA GeForce RTX 4080 Laptop GPU (n=1) | |
| Asus ROG Strix G16 G614JZ | |
| HP Omen 16-n0033dx | |
| CrossMark / Overall | |
| Asus ROG Strix G16 G614JZ | |
| Alienware x16 R1 | |
| HP Omen 16-wf000 | |
| Durchschnittliche Intel Core i7-13700HX, NVIDIA GeForce RTX 4080 Laptop GPU (n=1) | |
| Razer Blade 16 Early 2023 | |
| HP Omen 16-n0033dx | |
| CrossMark / Productivity | |
| Asus ROG Strix G16 G614JZ | |
| Alienware x16 R1 | |
| HP Omen 16-wf000 | |
| Durchschnittliche Intel Core i7-13700HX, NVIDIA GeForce RTX 4080 Laptop GPU (n=1) | |
| HP Omen 16-n0033dx | |
| Razer Blade 16 Early 2023 | |
| CrossMark / Creativity | |
| Asus ROG Strix G16 G614JZ | |
| Alienware x16 R1 | |
| HP Omen 16-wf000 | |
| Durchschnittliche Intel Core i7-13700HX, NVIDIA GeForce RTX 4080 Laptop GPU (n=1) | |
| Razer Blade 16 Early 2023 | |
| HP Omen 16-n0033dx | |
| CrossMark / Responsiveness | |
| Asus ROG Strix G16 G614JZ | |
| Alienware x16 R1 | |
| HP Omen 16-wf000 | |
| Durchschnittliche Intel Core i7-13700HX, NVIDIA GeForce RTX 4080 Laptop GPU (n=1) | |
| Razer Blade 16 Early 2023 | |
| HP Omen 16-n0033dx | |
| PCMark 10 Score | 7814 Punkte | |
Hilfe | ||
| AIDA64 / Memory Copy | |
| Razer Blade 16 Early 2023 | |
| Razer Blade 16 Early 2023 | |
| Razer Blade 16 Early 2023 | |
| Lenovo Legion Pro 7 RTX4090 | |
| Alienware x16 R1 | |
| HP Omen 16-wf000 | |
| Asus ROG Strix G16 G614JZ | |
| Durchschnittliche Intel Core i7-13700HX (36125 - 63990, n=11) | |
| HP Omen 16-n0033dx | |
| AIDA64 / Memory Read | |
| Lenovo Legion Pro 7 RTX4090 | |
| Razer Blade 16 Early 2023 | |
| Razer Blade 16 Early 2023 | |
| Razer Blade 16 Early 2023 | |
| Asus ROG Strix G16 G614JZ | |
| Alienware x16 R1 | |
| HP Omen 16-wf000 | |
| Durchschnittliche Intel Core i7-13700HX (36510 - 69729, n=11) | |
| HP Omen 16-n0033dx | |
| AIDA64 / Memory Write | |
| Alienware x16 R1 | |
| Razer Blade 16 Early 2023 | |
| Razer Blade 16 Early 2023 | |
| Razer Blade 16 Early 2023 | |
| Lenovo Legion Pro 7 RTX4090 | |
| HP Omen 16-wf000 | |
| Asus ROG Strix G16 G614JZ | |
| Durchschnittliche Intel Core i7-13700HX (33598 - 85675, n=11) | |
| HP Omen 16-n0033dx | |
| AIDA64 / Memory Latency | |
| Alienware x16 R1 | |
| Razer Blade 16 Early 2023 | |
| Razer Blade 16 Early 2023 | |
| Razer Blade 16 Early 2023 | |
| Asus ROG Strix G16 G614JZ | |
| HP Omen 16-n0033dx | |
| HP Omen 16-wf000 | |
| Durchschnittliche Intel Core i7-13700HX (81.5 - 97.9, n=11) | |
| Lenovo Legion Pro 7 RTX4090 | |
* ... kleinere Werte sind besser
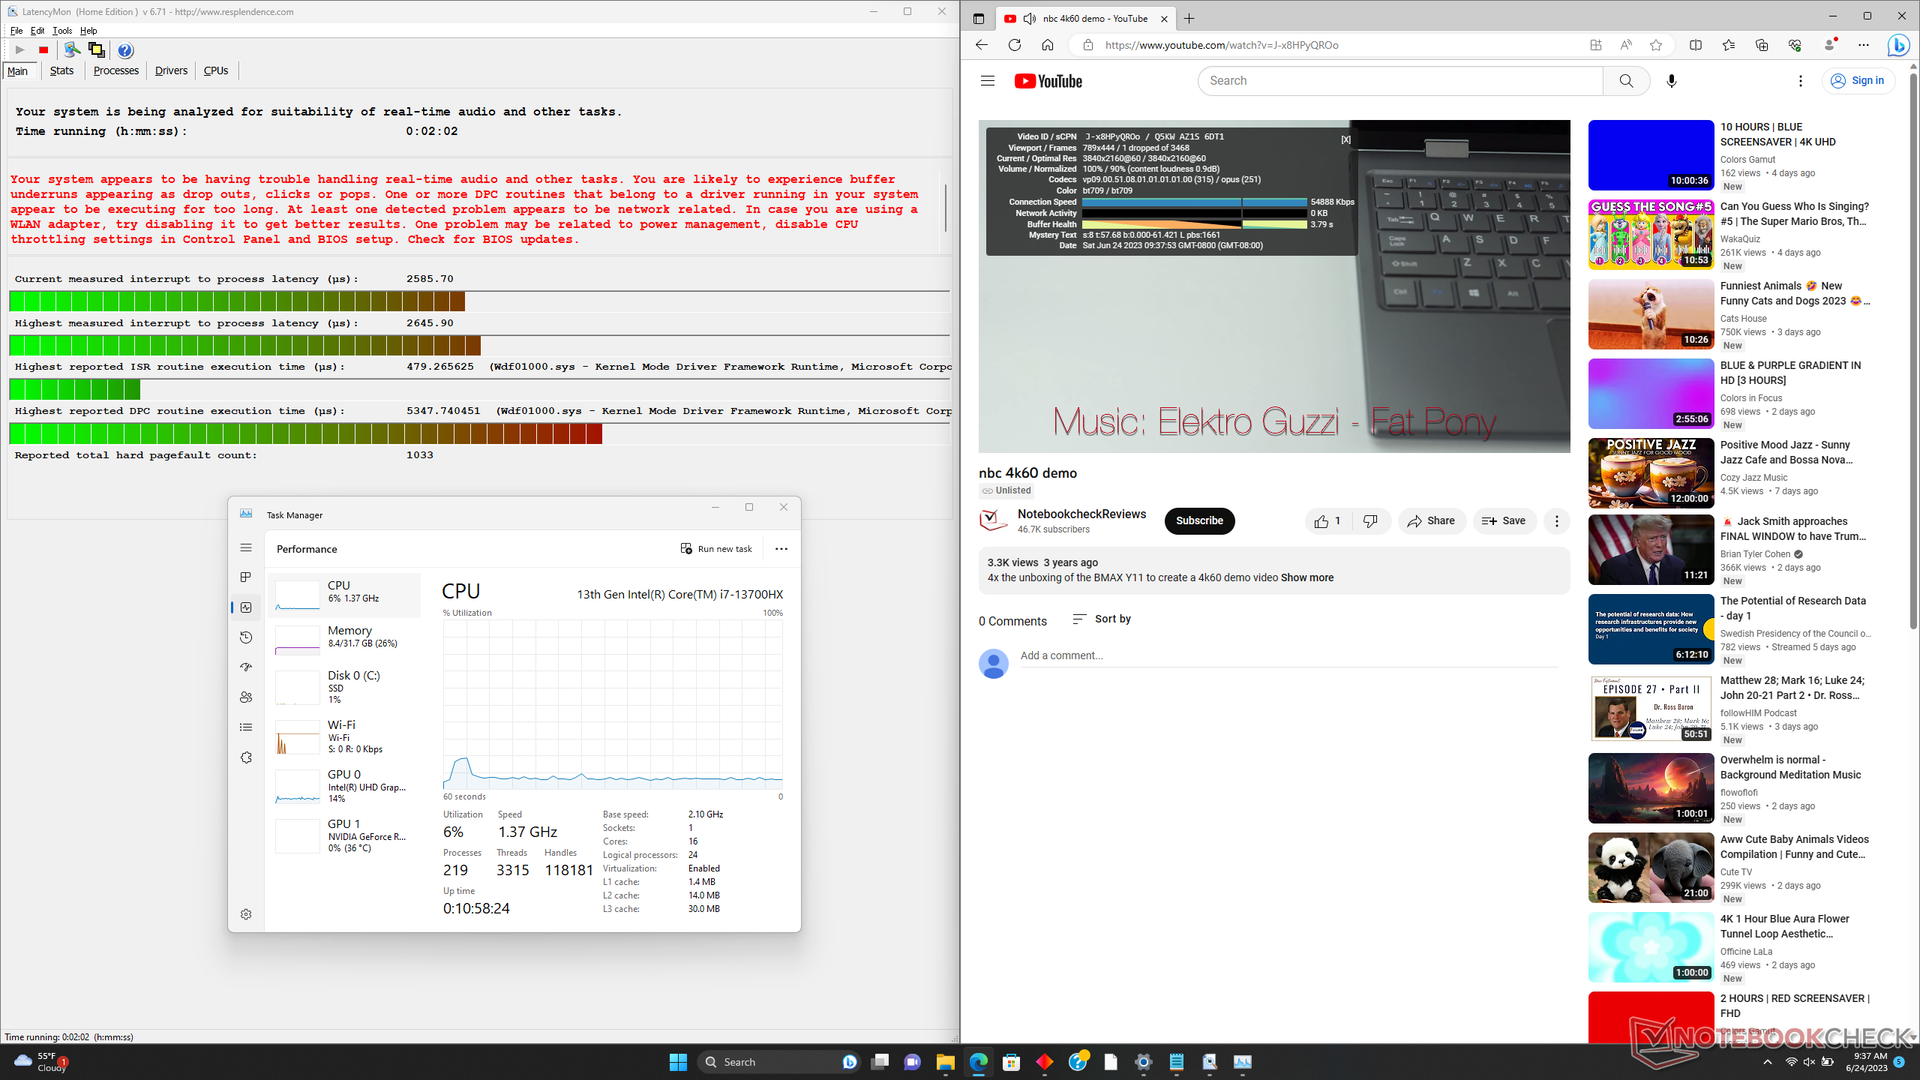
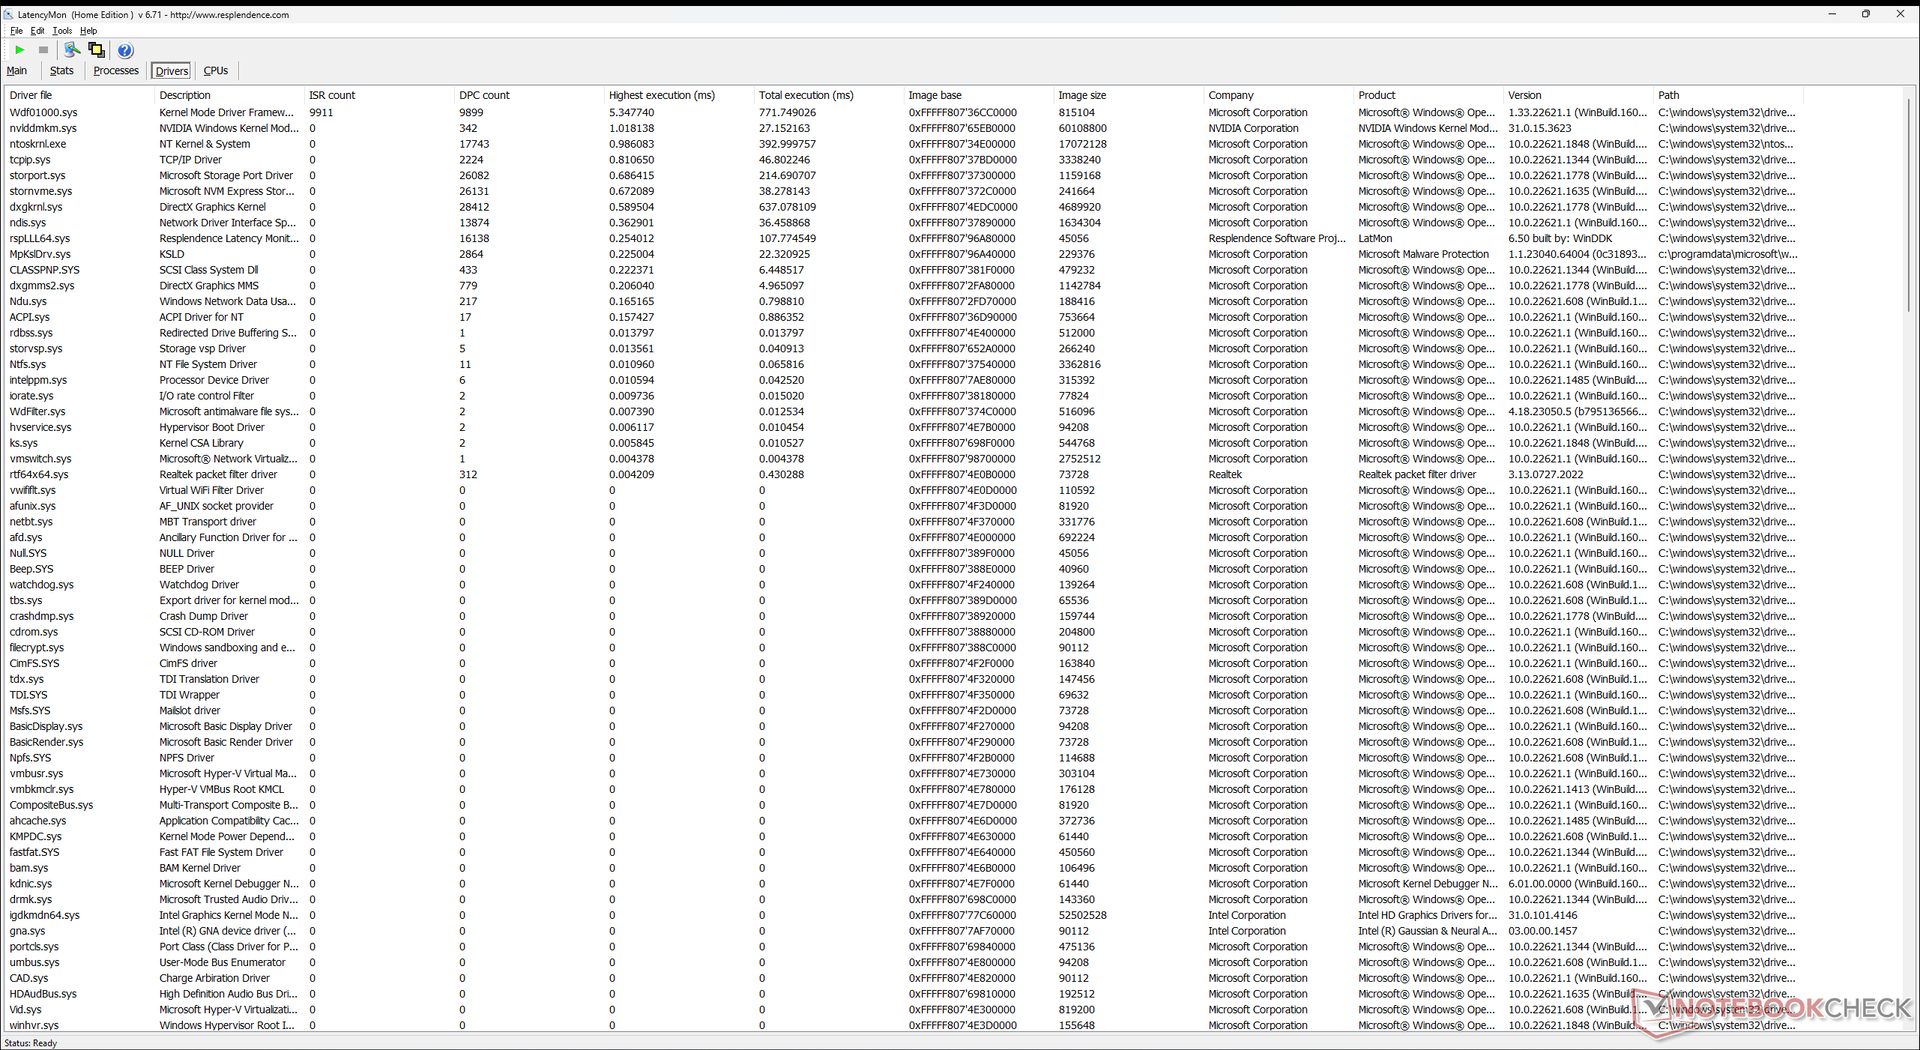
DPC Latenzen
LatencyMon hat DPC-Probleme beim Öffnen mehrerer Browser-Fenster unserer Homepage angezeigt, ähnlich wie beim ROG Strix G16 und Blade 16. Die Videowiedergabe bei 4K und 60 Bildern pro Sekunde ist ansonsten aber fast perfekt mit nur einem einzelnen übersprungenen Frame in unserem 1 Minute langen Test.
| DPC Latencies / LatencyMon - interrupt to process latency (max), Web, Youtube, Prime95 | |
| Lenovo Legion Pro 7 RTX4090 | |
| HP Omen 16-wf000 | |
| Asus ROG Strix G16 G614JZ | |
| Razer Blade 16 Early 2023 | |
| Alienware x16 R1 | |
| HP Omen 16-n0033dx | |
* ... kleinere Werte sind besser
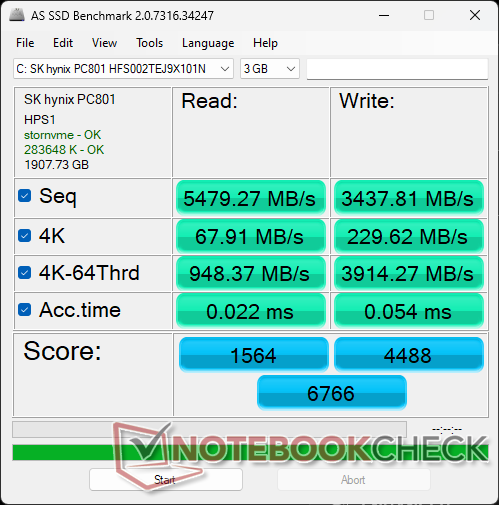
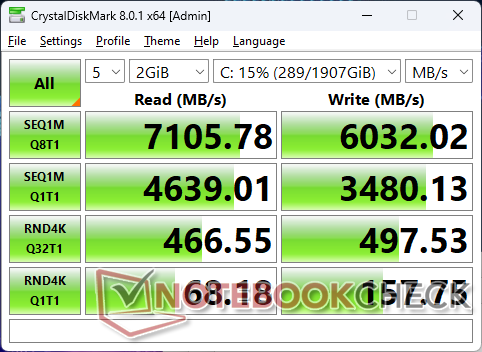
Massenspeicher
Unser Testgerät wurde mit einer 2TB fassenden SK Hynix PC801 NVMe-SSD mit sequentiellen Lese- und Schreibgeschwindigkeiten von 7100 respektive 6000 MB/s ausgeliefert, was vergleichbar mit der populären Samsung PM9A1 ist. Schreib- und Lesevorgänge mit kleineren 4k-Q32-Blöcken sind allerdings ungewöhnlich langsam, auch nach mehreren Wiederholungen. Unter dauerhafter Last ist die Gesamtleistung nichtsdestotrotz konstant, was auf eine sehr gute Wärmeableitung hinweist.

| Drive Performance Rating - Percent | |
| Alienware x16 R1 | |
| Lenovo Legion Pro 7 RTX4090 | |
| HP Omen 16-wf000 | |
| Razer Blade 16 Early 2023 | |
| Asus ROG Strix G16 G614JZ | |
| HP Omen 16-n0033dx | |
* ... kleinere Werte sind besser
Dauerleistung Lesen: DiskSpd Read Loop, Queue Depth 8
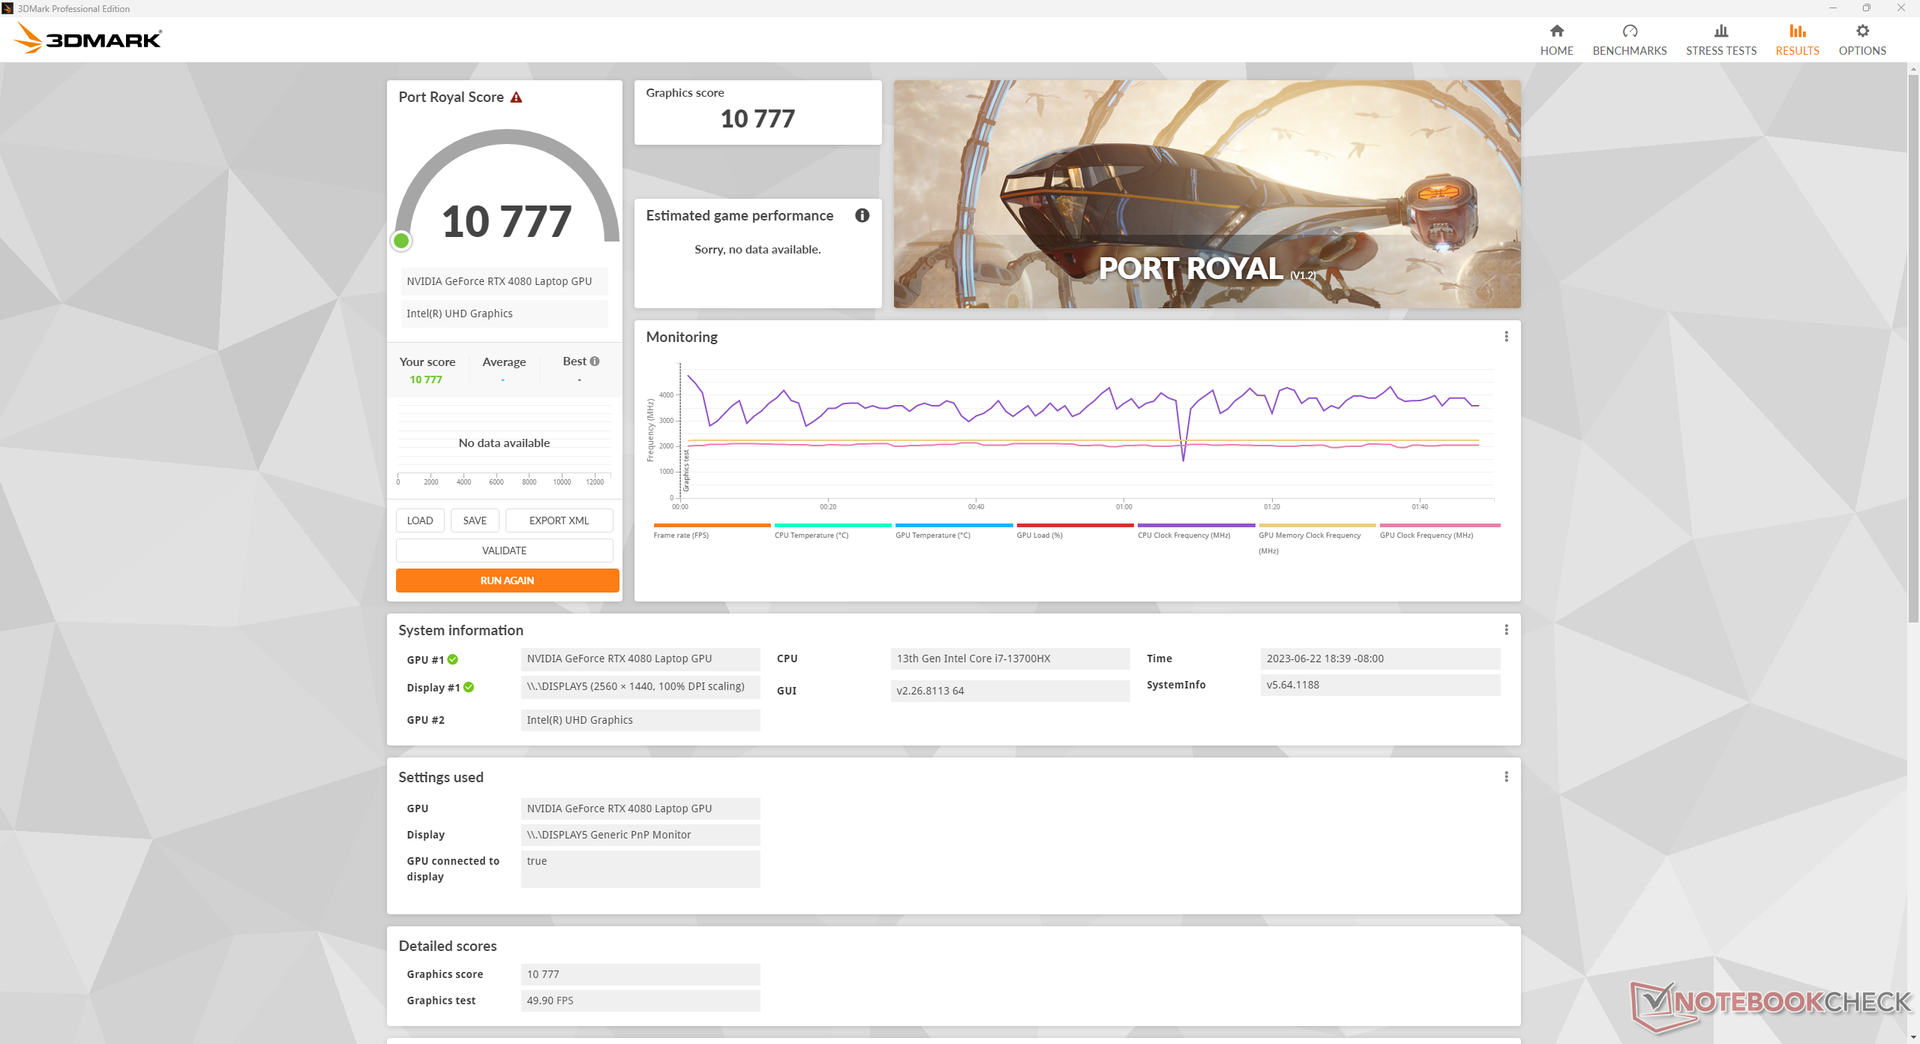
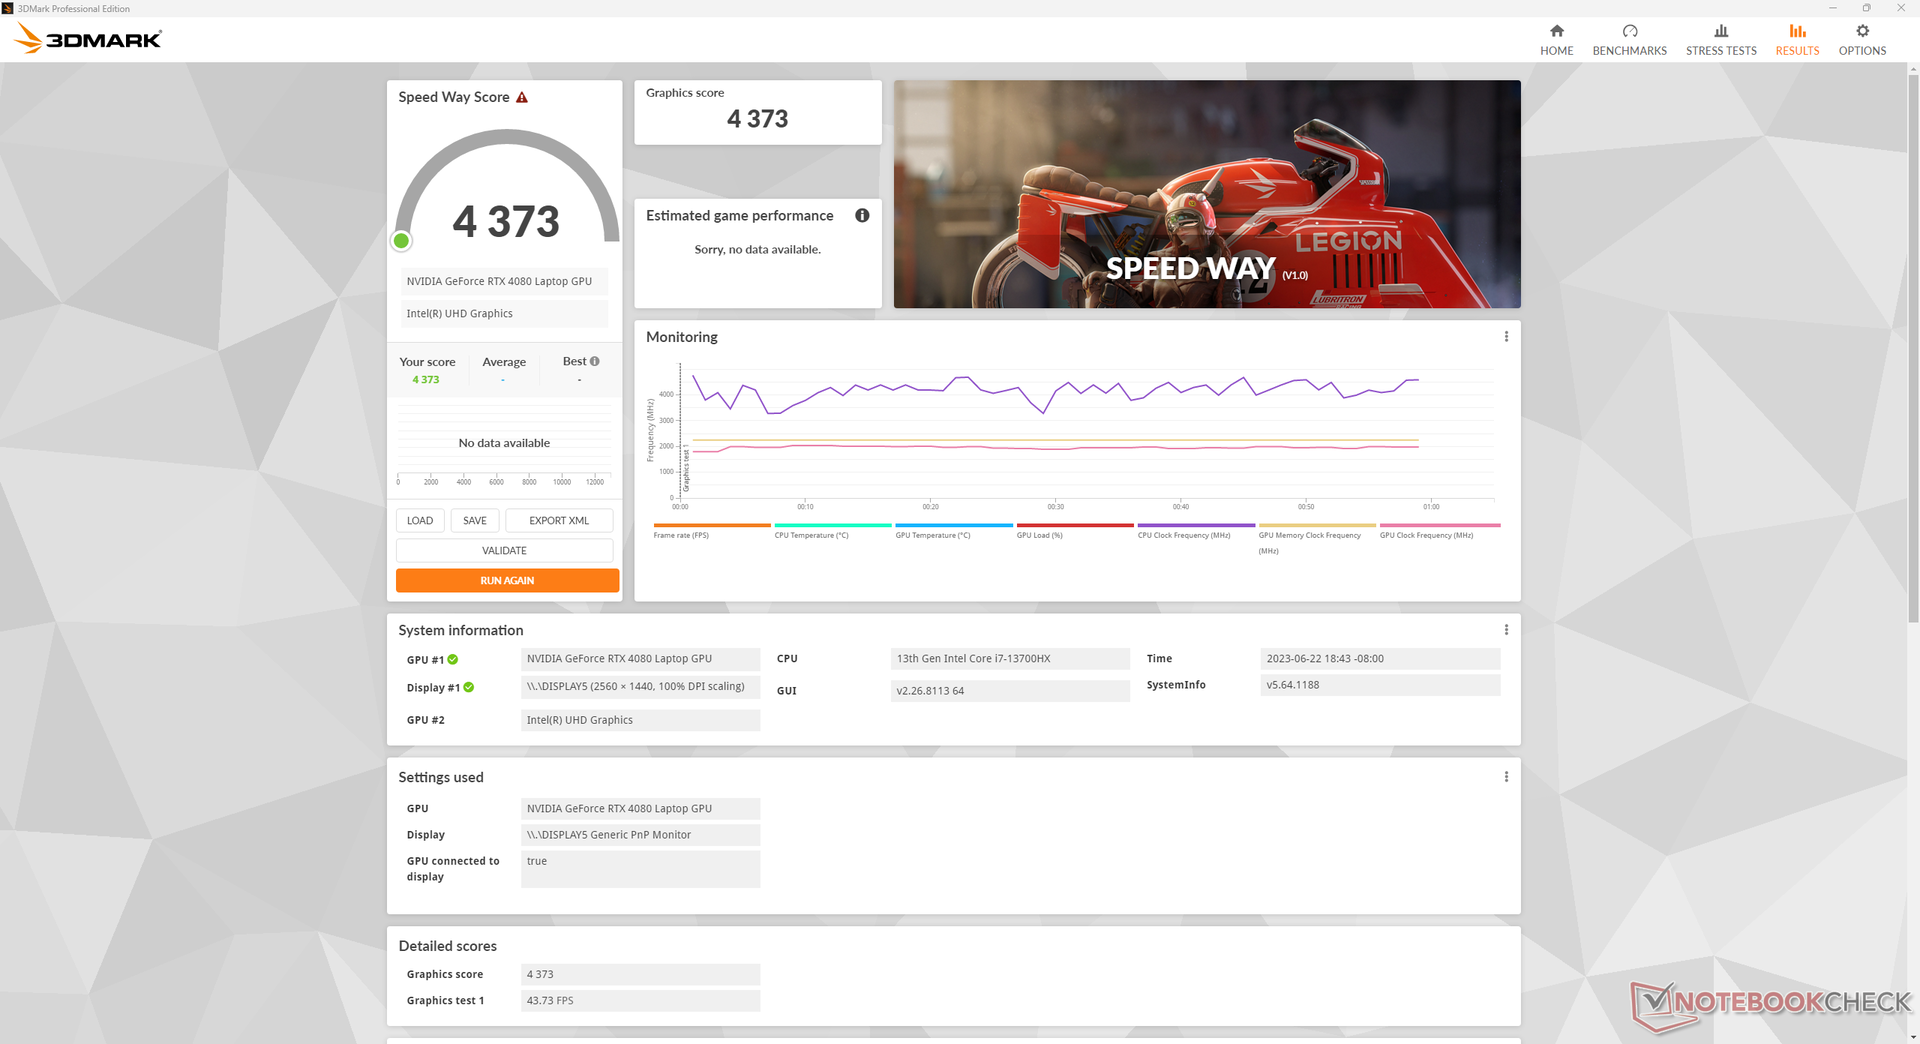
Grafikleistung — 145 Watt starke GeForce RTX 4080
Die Grafikleistung ist exzellent und liegt innerhalb von 5 Prozent anderer Gaming-Laptops mit der gleichen GeForce RTX 4080 Grafikkarte. Das Downgrade auf eine RTX 4070 oder RTX 4060 dürfte die GPU-Performance um 20 beziehungsweise 30 Prozent verringern.
Bei deaktiviertem Kühlungsmodus ("Max Fan") ist die Leistung nur ein kleines bisschen niedriger, wie die folgende Tabelle illustriert. Im ausbalancierten Modus ist die Grafikleistung fast 15 Prozent niedriger, während die Auswirkungen auf die Prozessorleistung sehr viel geringer sind.
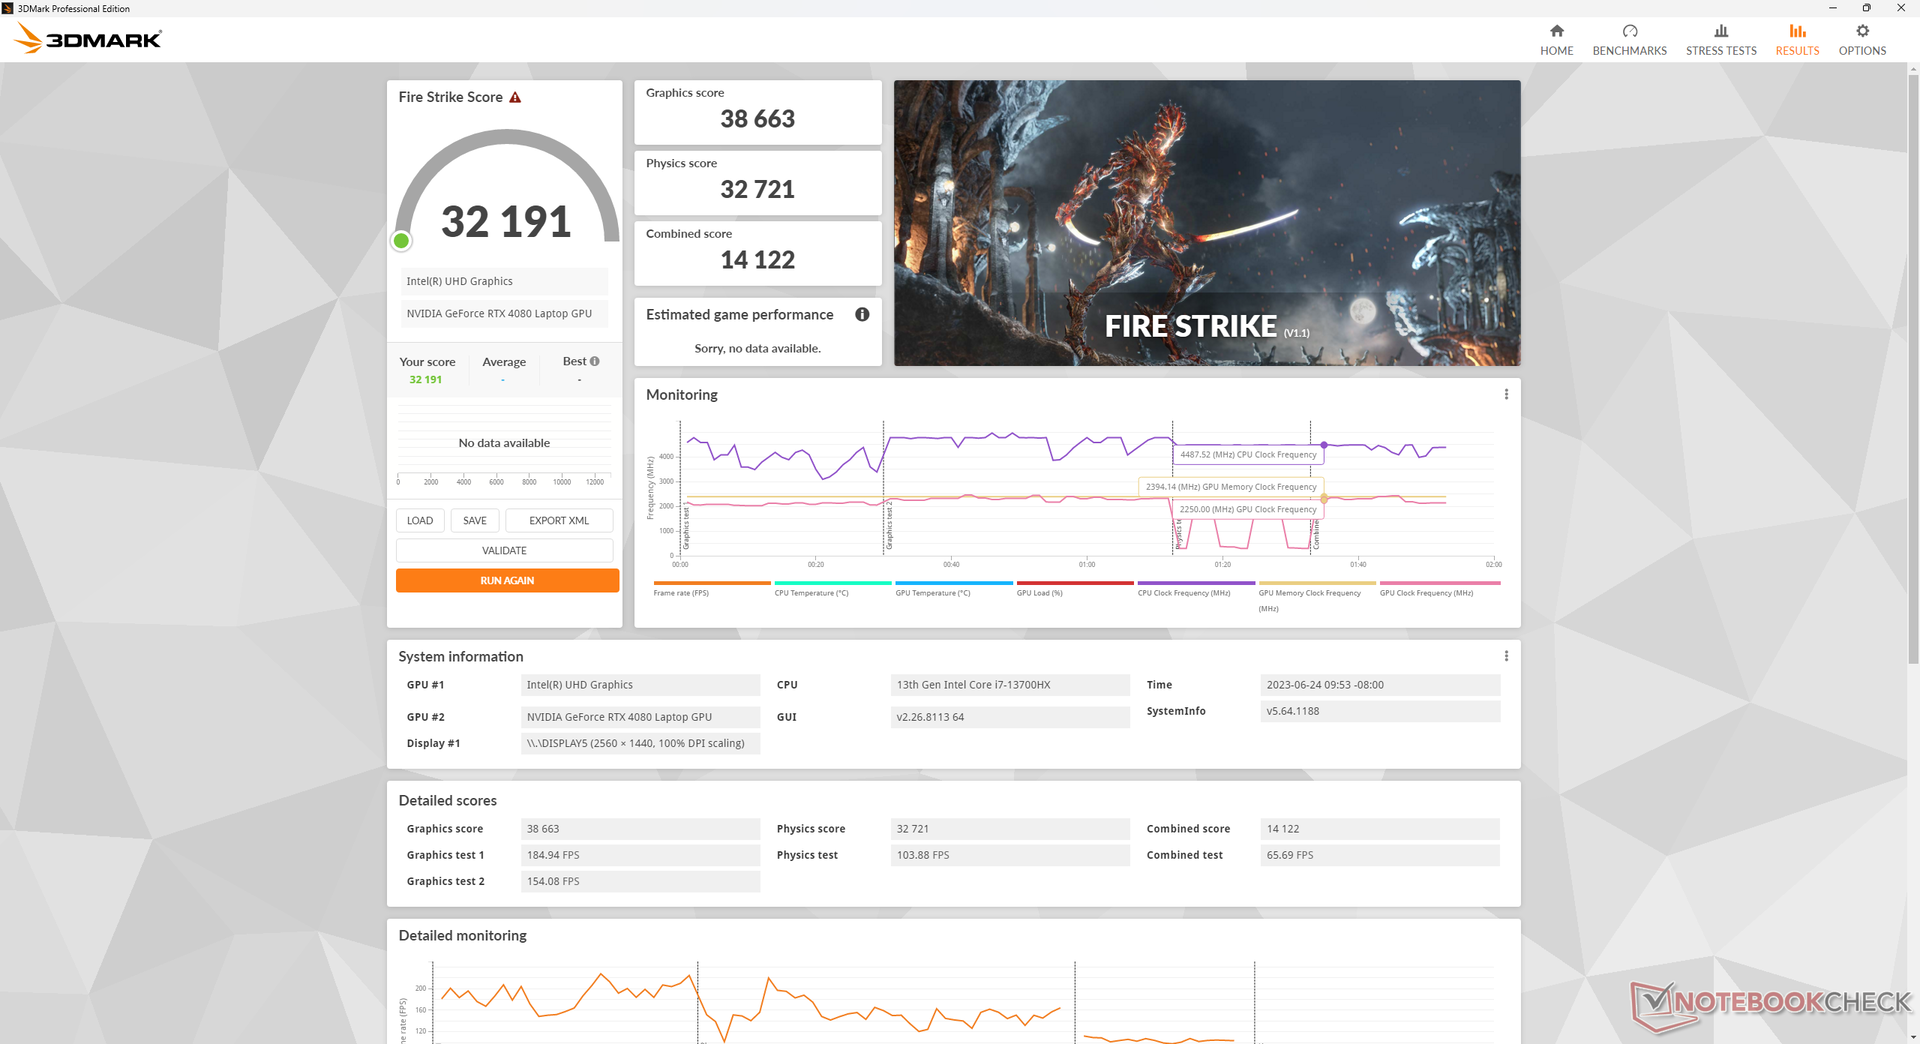
| Energieeinstellung | Fire Strike Physics | Fire Strike GPU | Fire Strike kombiniert |
| Leistungsmodus + maximale Kühlung an | 32721 | 38663 | 14122 |
| Leistungsmodus + maximale Kühlung aus | 31314 (-4%) | 38142 (-1%) | 13655 (-3%) |
| Ausbalanciert | 31837 (-3%) | 33328 (-14%) | 12426 (-12%) |
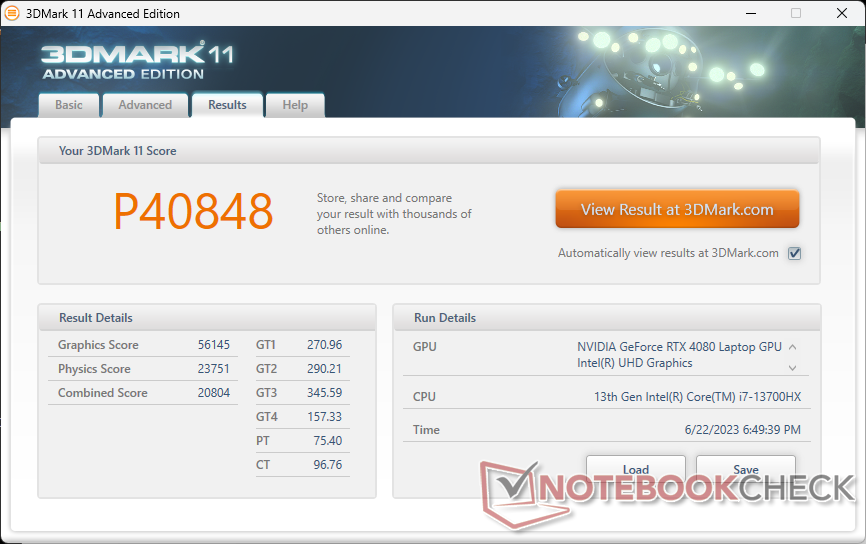
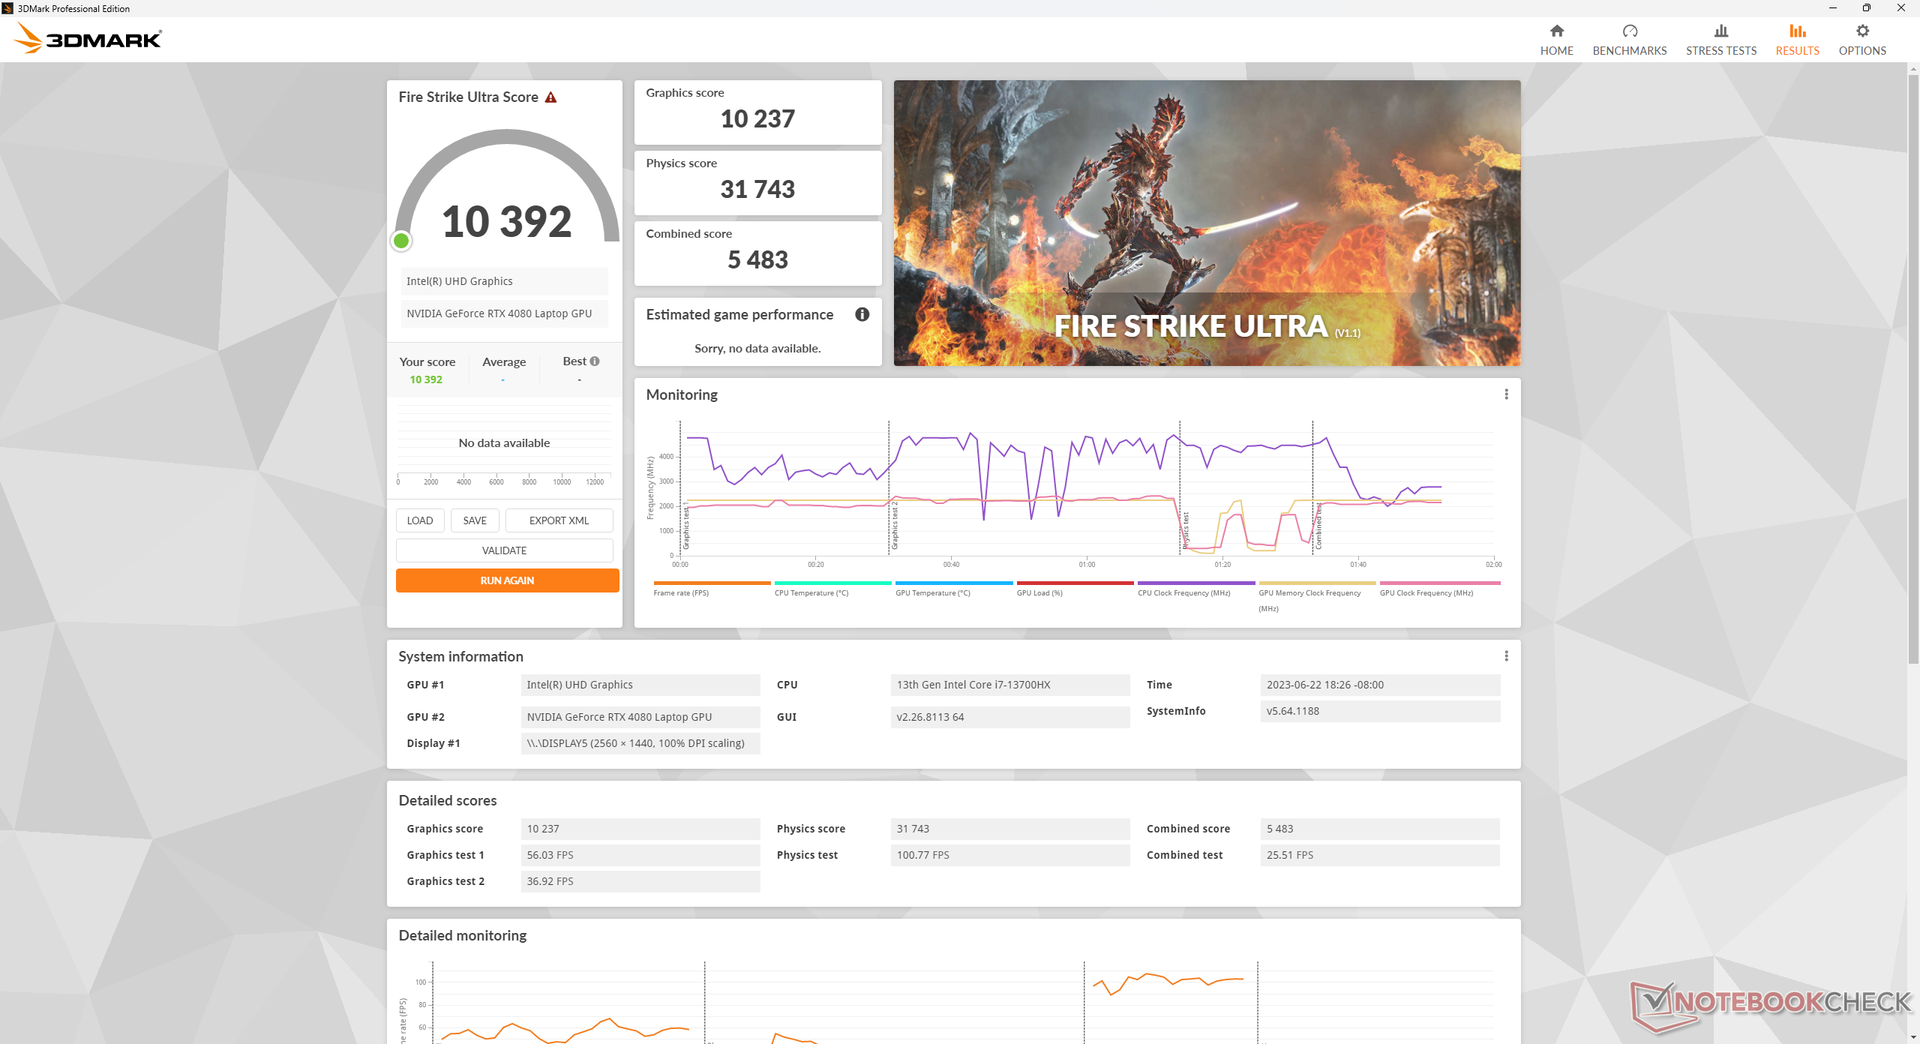
| 3DMark 11 Performance | 40848 Punkte | |
| 3DMark Fire Strike Score | 32191 Punkte | |
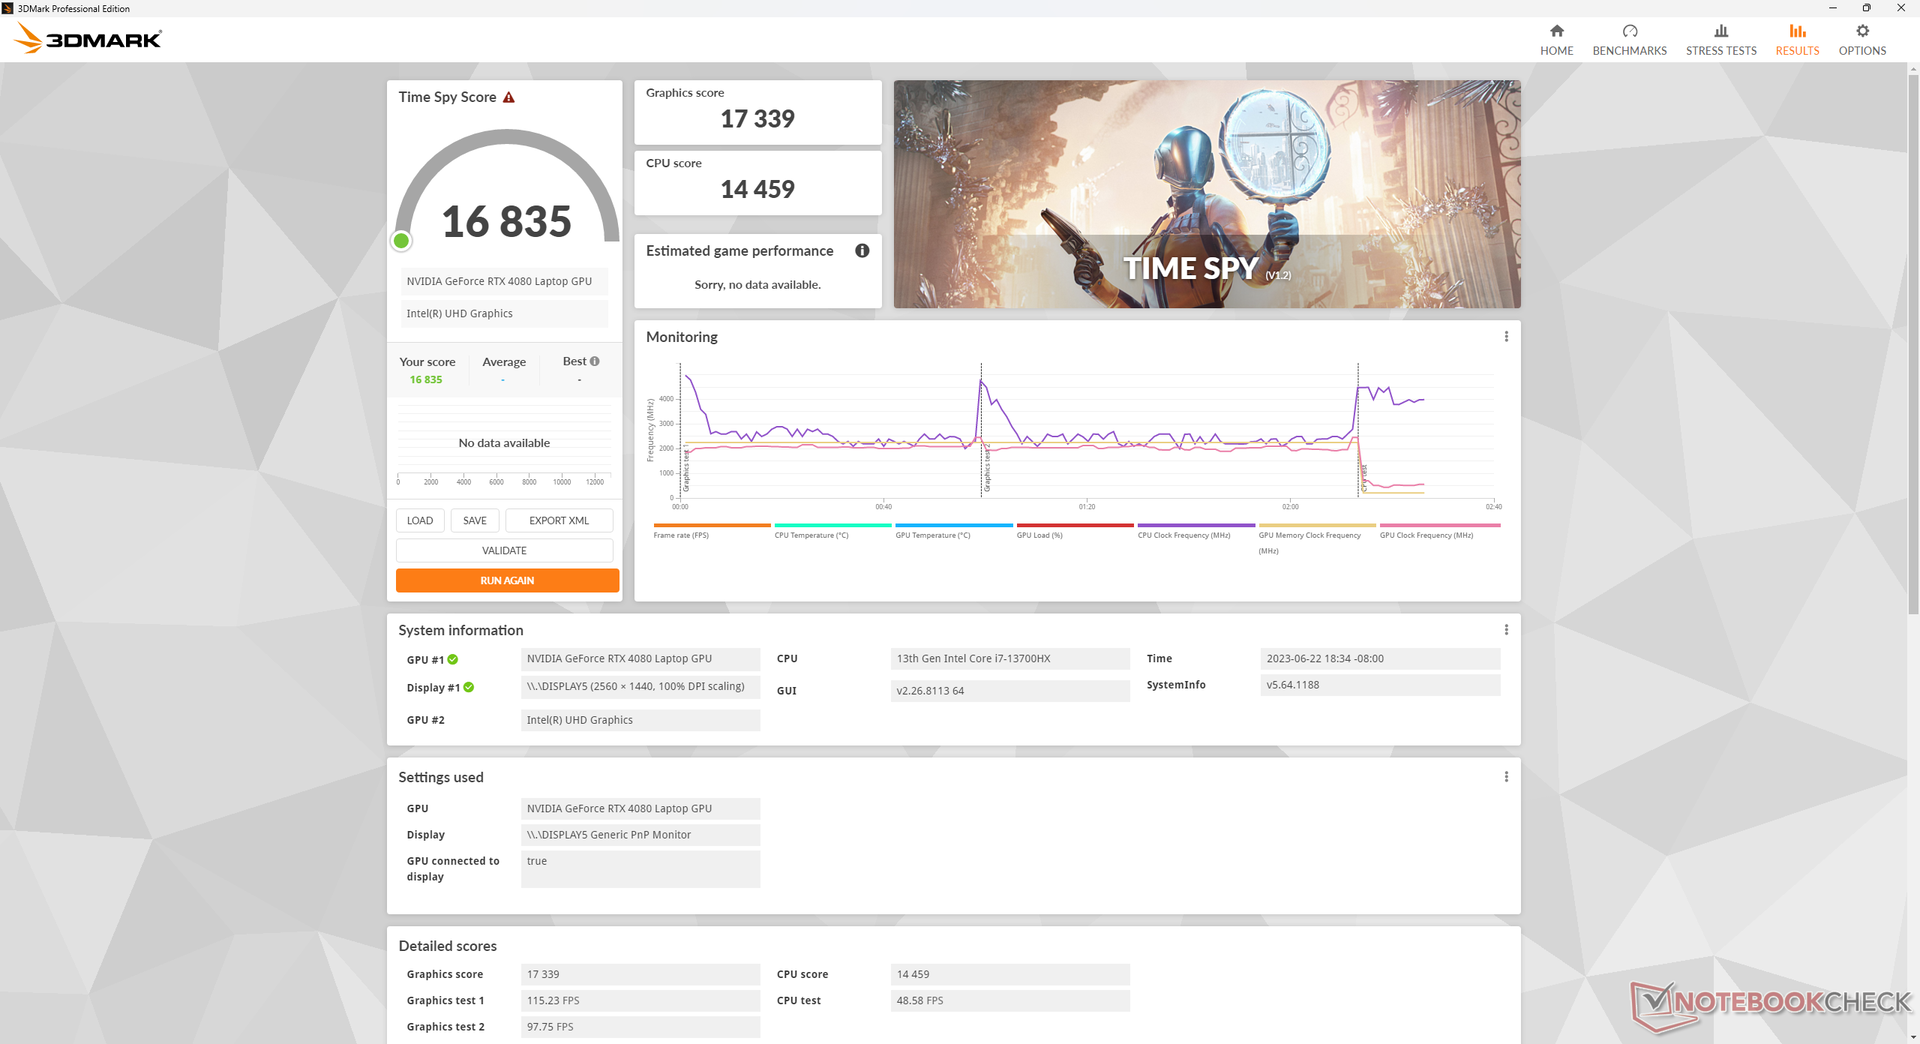
| 3DMark Time Spy Score | 16835 Punkte | |
Hilfe | ||
* ... kleinere Werte sind besser
Spieleleistung
Alle Spiele sind bei nativen 1440p mit durchschnittlichen Bildarten von über 60 fps spielbar, selbst auf anspruchsvolle Titel wie Returnal trifft dies zu. Die mobile RTX 4080 passt sehr gut zu dem verbauten QHD-Display.
Wer mit Raytracing oder auf einem externen 4K-Monitor spielen möchte, dem sei die Aktivierung von DLSS ans Herz zu legen, da die mobile RTX 4080 erheblich schwächer ist als die gleichnamige Desktop-Variante. Die durchschnittlichen Bildraten bei Cyberpunk 2077 in 4K springen nach der Aktivierung von DLSS 2 zum Beispiel von 35 fps auf 55 fps.
| Tiny Tina's Wonderlands | |
| 1920x1080 Low Preset (DX12) | |
| Durchschnittliche NVIDIA GeForce RTX 4080 Laptop GPU (221 - 353, n=6) | |
| HP Omen 16-wf000 | |
| 1920x1080 Medium Preset (DX12) | |
| Durchschnittliche NVIDIA GeForce RTX 4080 Laptop GPU (199.6 - 297, n=6) | |
| HP Omen 16-wf000 | |
| 1920x1080 High Preset (DX12) | |
| Durchschnittliche NVIDIA GeForce RTX 4080 Laptop GPU (166.7 - 213, n=6) | |
| HP Omen 16-wf000 | |
| 1920x1080 Badass Preset (DX12) | |
| Asus Zephyrus Duo 16 GX650PY-NM006W | |
| Durchschnittliche NVIDIA GeForce RTX 4080 Laptop GPU (112.9 - 167.1, n=9) | |
| HP Omen 16-wf000 | |
| 2560x1440 Badass Preset (DX12) | |
| Asus Zephyrus Duo 16 GX650PY-NM006W | |
| Durchschnittliche NVIDIA GeForce RTX 4080 Laptop GPU (85 - 114.8, n=9) | |
| HP Omen 16-wf000 | |
| 3840x2160 Badass Preset (DX12) | |
| Durchschnittliche NVIDIA GeForce RTX 4080 Laptop GPU (46.4 - 60.9, n=9) | |
| HP Omen 16-wf000 | |
| Returnal | |
| 1920x1080 Low Preset | |
| HP Omen 16-wf000 | |
| Durchschnittliche NVIDIA GeForce RTX 4080 Laptop GPU (116 - 150, n=4) | |
| 1920x1080 Medium Preset | |
| HP Omen 16-wf000 | |
| Durchschnittliche NVIDIA GeForce RTX 4080 Laptop GPU (117 - 148, n=4) | |
| 1920x1080 High Preset | |
| HP Omen 16-wf000 | |
| Durchschnittliche NVIDIA GeForce RTX 4080 Laptop GPU (114 - 137, n=4) | |
| 1920x1080 Epic Preset | |
| Durchschnittliche NVIDIA GeForce RTX 4080 Laptop GPU (107 - 121, n=4) | |
| HP Omen 16-wf000 | |
| 2560x1440 Epic Preset | |
| HP Omen 16-wf000 | |
| Durchschnittliche NVIDIA GeForce RTX 4080 Laptop GPU (79 - 92, n=4) | |
| 3840x2160 Epic Preset | |
| HP Omen 16-wf000 | |
| Durchschnittliche NVIDIA GeForce RTX 4080 Laptop GPU (43 - 53, n=3) | |
Witcher 3 FPS-Diagramm
| min. | mittel | hoch | max. | QHD | 4K | |
|---|---|---|---|---|---|---|
| GTA V (2015) | 184.7 | 176.8 | 171.6 | 114 | 108.6 | 142.8 |
| The Witcher 3 (2015) | 453.2 | 407 | 296.5 | 163.4 | 113.1 | |
| Dota 2 Reborn (2015) | 187.4 | 173 | 164.2 | 153.7 | 145.7 | |
| Final Fantasy XV Benchmark (2018) | 208 | 194.9 | 153.9 | 120.6 | 71.6 | |
| X-Plane 11.11 (2018) | 172.4 | 151.2 | 118.5 | 102.3 | ||
| Strange Brigade (2018) | 413 | 334 | 320 | 299 | 225 | 116.7 |
| Cyberpunk 2077 1.6 (2022) | 132.3 | 127.1 | 124.4 | 116.7 | 77.6 | 35.3 |
| Tiny Tina's Wonderlands (2022) | 260.2 | 232.5 | 177.1 | 145.2 | 102.6 | 54.4 |
| F1 22 (2022) | 261 | 260 | 245 | 100.7 | 70.7 | 35.5 |
| Returnal (2023) | 148 | 148 | 136 | 107 | 91 | 53 |
Emissionen
Systemlautstärke — Im Leistungsmodus immer noch sehr laut
Egal wie das Gaming-Notebook genutzt wird, die Lüfter laufen immer mit 30 dB(A) bei einem Hintergrundgeräusch 23 dB(A). Auf der anderen Seite drehen die Lüfter nicht allzu oft hoch, weshalb sie sich beim Video-Streaming und anderen genügsamen Anwendungen im unauffälligen Bereich zwischen 30 und 33 dB(A) bewegen.
Beim Spielen im ausbalancierten Modus sind die Lüfter mit 44,2 dB(A) merklich leiser, was die um 15 Prozent niedrigere Grafikleistung womöglich wert ist. Mit über 57 dB(A) im Leistungsmodus gehört das HP Omen 16 ansonsten aber zu den lauteren Gaming-Laptops auf dem Markt.
| Energieeinstellung | Witcher 3 Lüftergeräusch in dB(A) |
| Ausbalanciert | 44,2 |
| Leistungsmodus + maximale Kühlung aus | 57 |
| Leistungsmodus + maximale Kühlung an | 58,3 |
Lautstärkediagramm
| Idle |
| 29.6 / 29.8 / 30.4 dB(A) |
| Last |
| 33.8 / 58.3 dB(A) |
 | ||
30 dB leise 40 dB(A) deutlich hörbar 50 dB(A) störend |
||
min: | ||
| HP Omen 16-wf000 GeForce RTX 4080 Laptop GPU, i7-13700HX, SK hynix PC801 HFS002TEJ9X101N | HP Omen 16-n0033dx Radeon RX 6650M, R7 6800H, Samsung PM9A1 MZVL21T0HCLR | Alienware x16 R1 GeForce RTX 4080 Laptop GPU, i9-13900HK, SK hynix PC801 HFS001TEJ9X101N | Lenovo Legion Pro 7 RTX4090 GeForce RTX 4090 Laptop GPU, i9-13900HX, Samsung PM9A1 MZVL21T0HCLR | Asus ROG Strix G16 G614JZ GeForce RTX 4080 Laptop GPU, i9-13980HX, WD PC SN560 SDDPNQE-1T00 | Razer Blade 16 Early 2023 GeForce RTX 4080 Laptop GPU, i9-13950HX, SSSTC CA6-8D1024 | |
|---|---|---|---|---|---|---|
| Geräuschentwicklung | 4% | 8% | -8% | -1% | 10% | |
| aus / Umgebung * (dB) | 23 | 24.2 -5% | 22.7 1% | 25 -9% | 25 -9% | 23 -0% |
| Idle min * (dB) | 29.6 | 27.4 7% | 23.1 22% | 28 5% | 26 12% | 23 22% |
| Idle avg * (dB) | 29.8 | 27.4 8% | 25.8 13% | 30 -1% | 28 6% | 23 23% |
| Idle max * (dB) | 30.4 | 28.9 5% | 25.8 15% | 38 -25% | 30 1% | 23.6 22% |
| Last avg * (dB) | 33.8 | 32.3 4% | 39.3 -16% | 48 -42% | 48 -42% | 39 -15% |
| Witcher 3 ultra * (dB) | 57 | 54.1 5% | 49.9 12% | 53 7% | 49 14% | 51.6 9% |
| Last max * (dB) | 58.3 | 57.6 1% | 54.8 6% | 55 6% | 52 11% | 51.3 12% |
* ... kleinere Werte sind besser
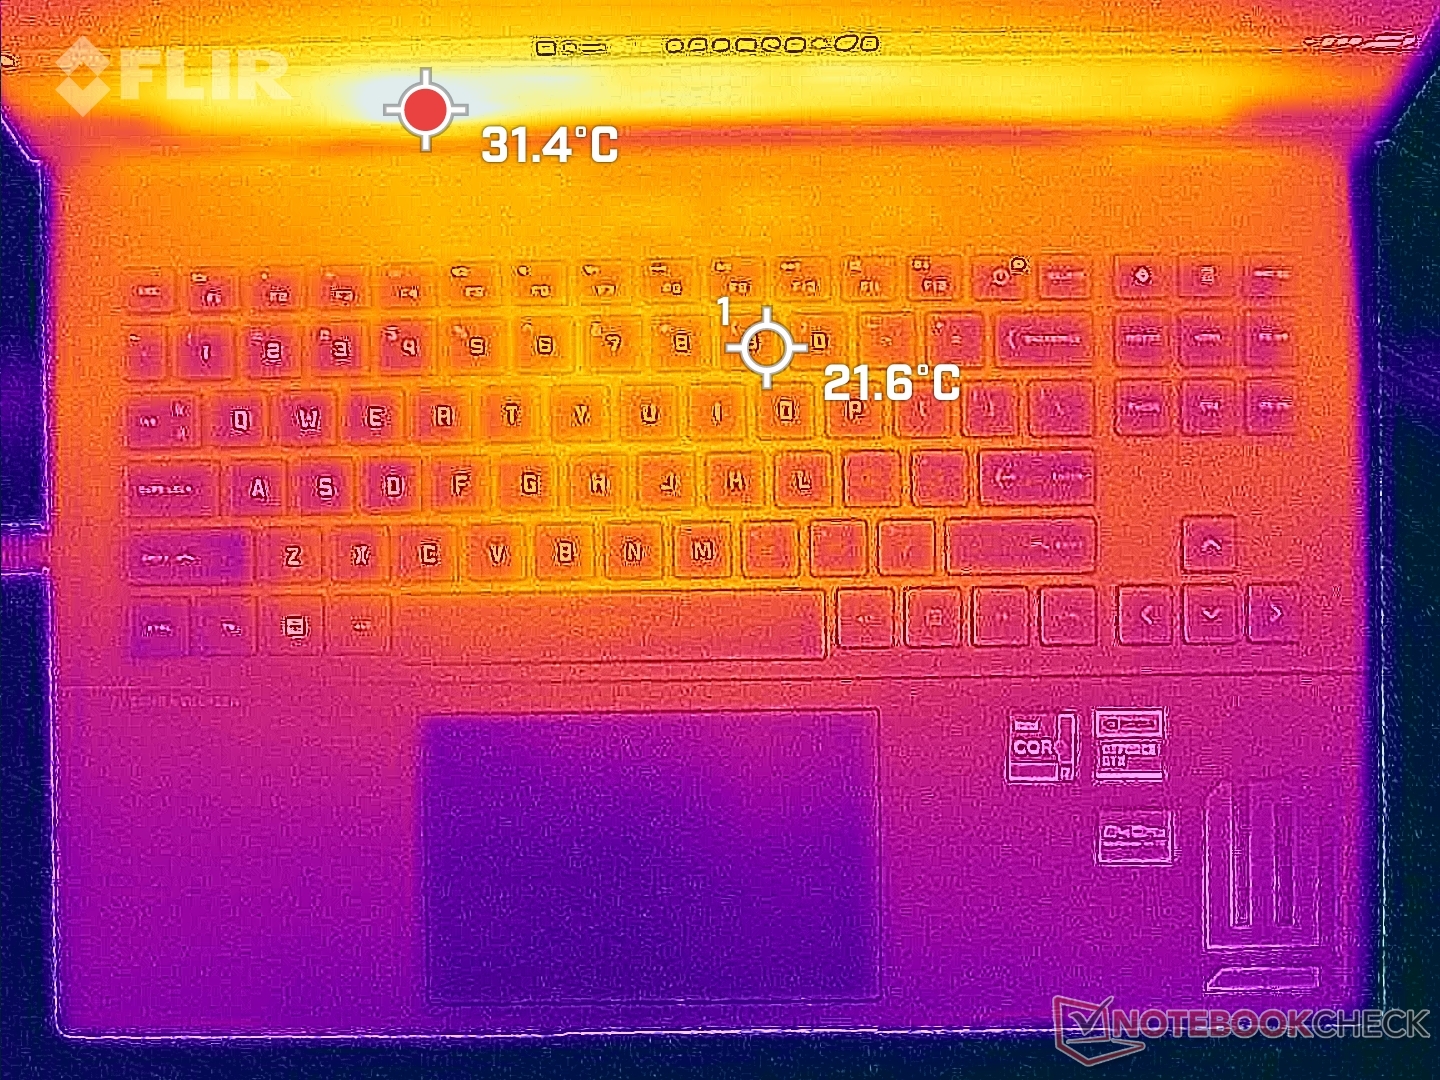
Temperatur
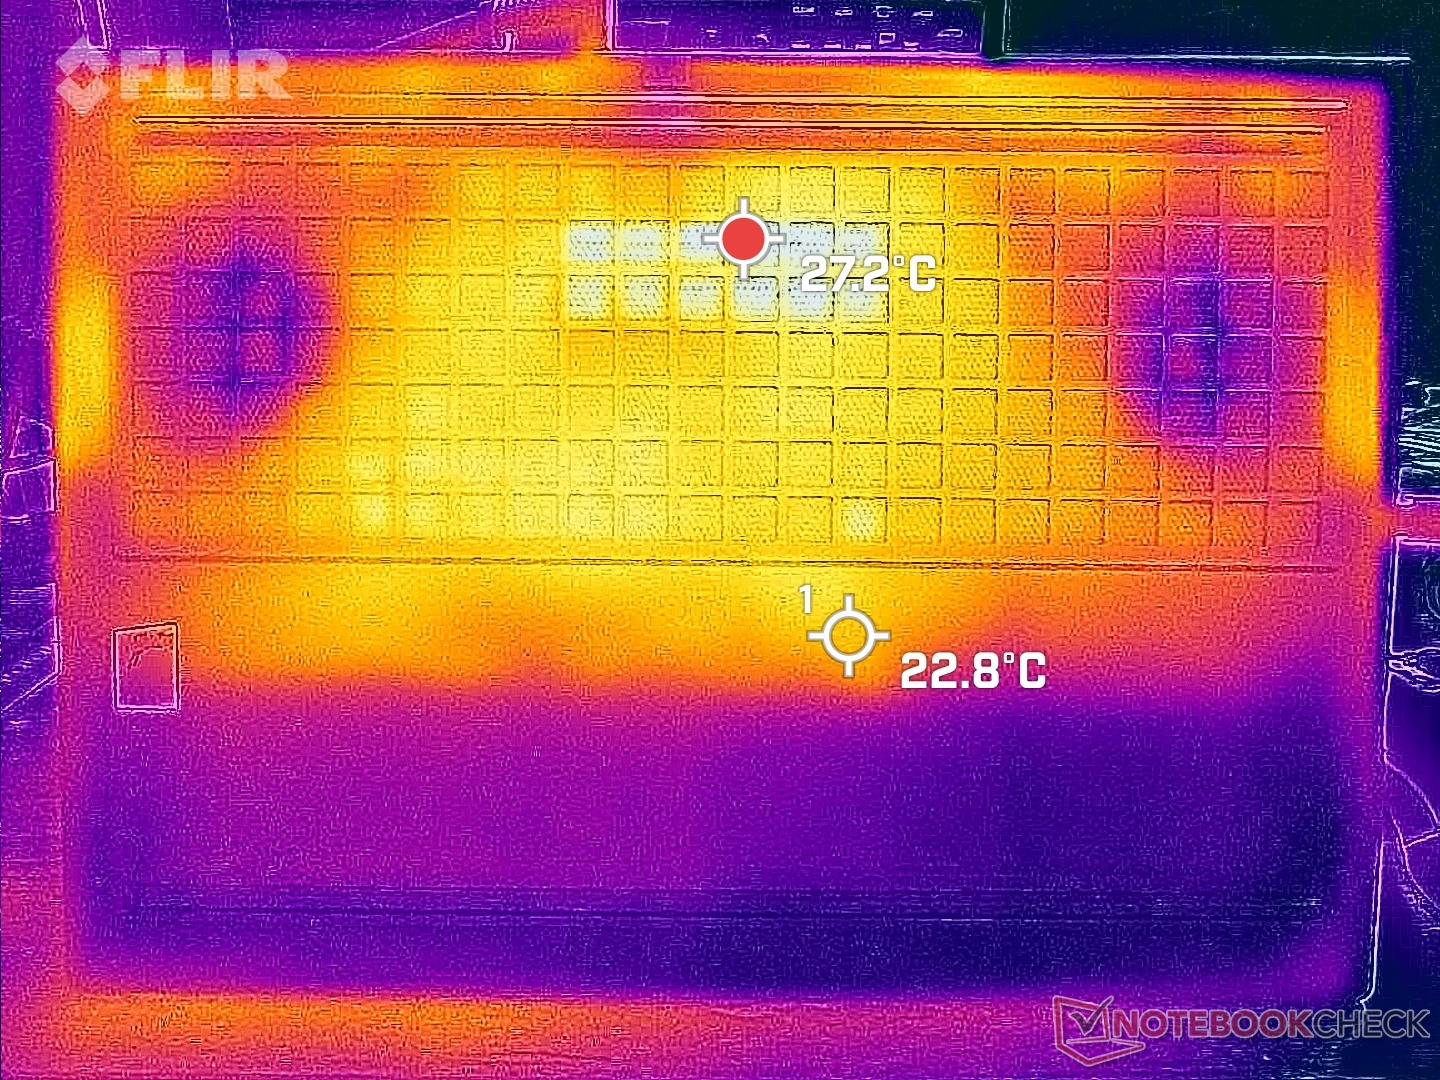
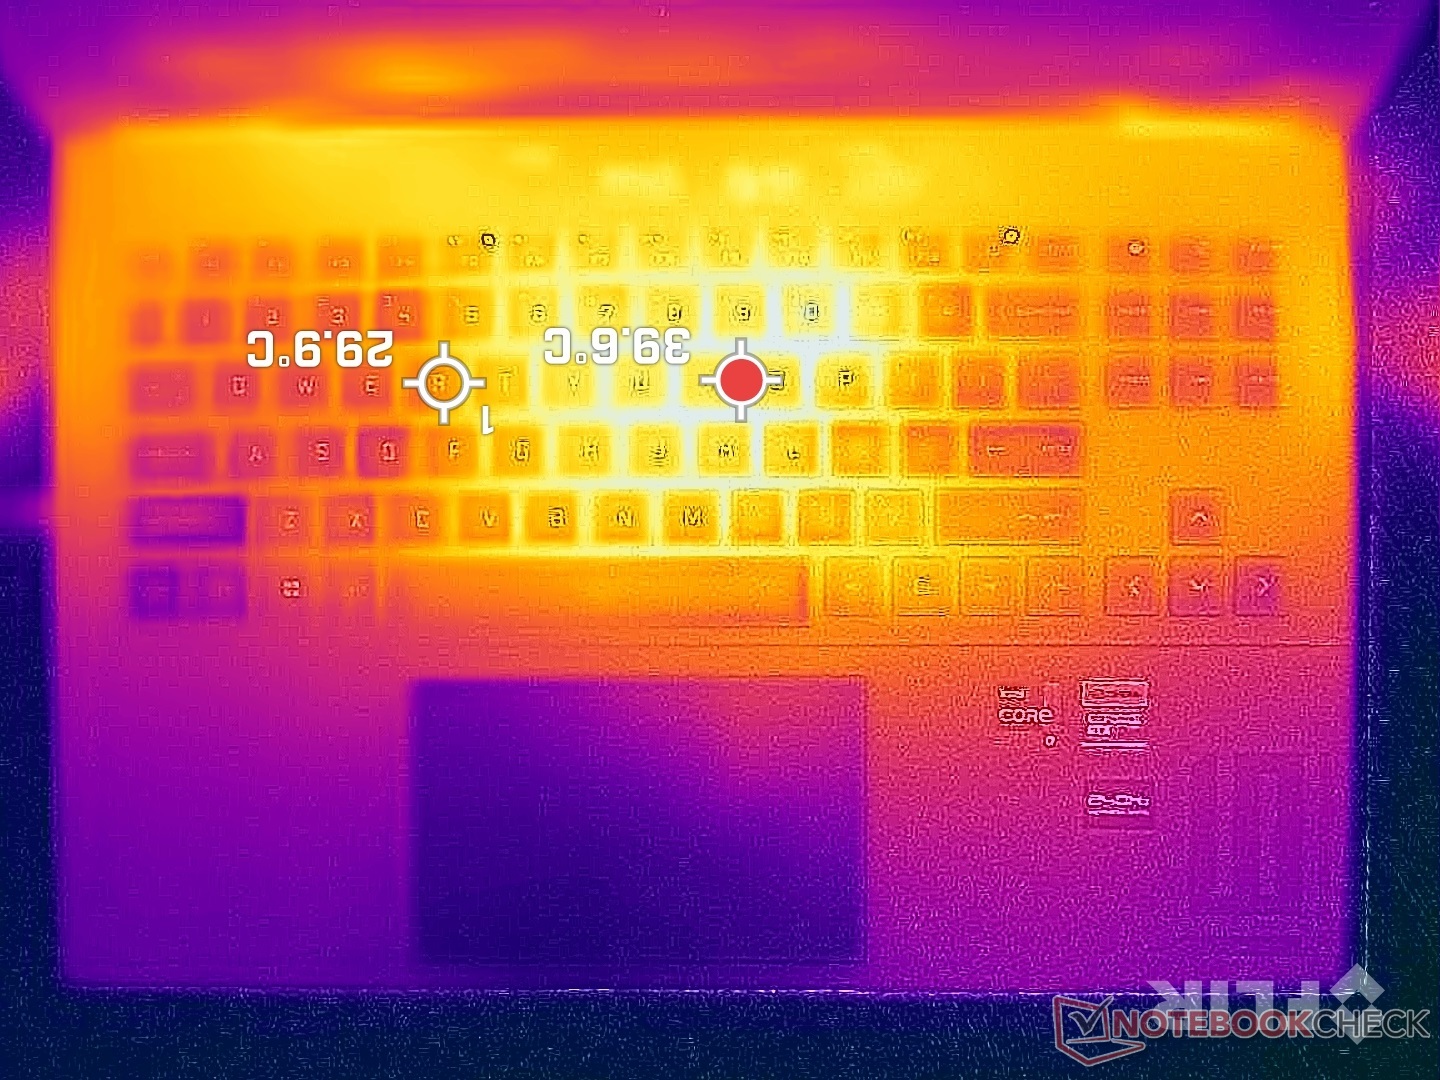
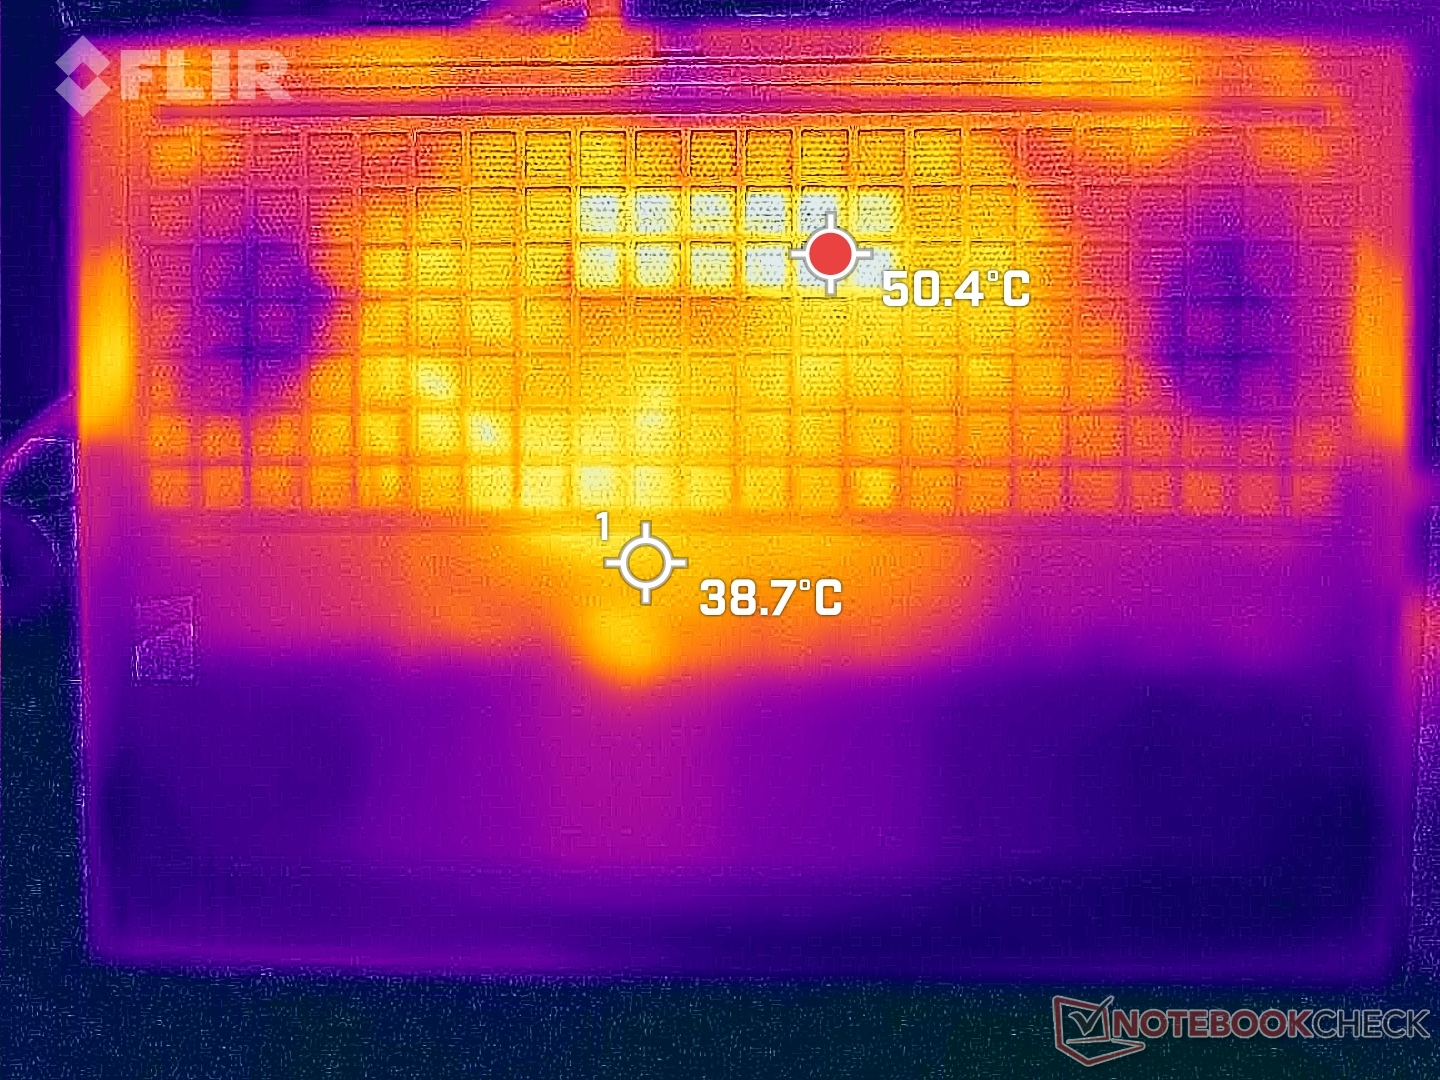
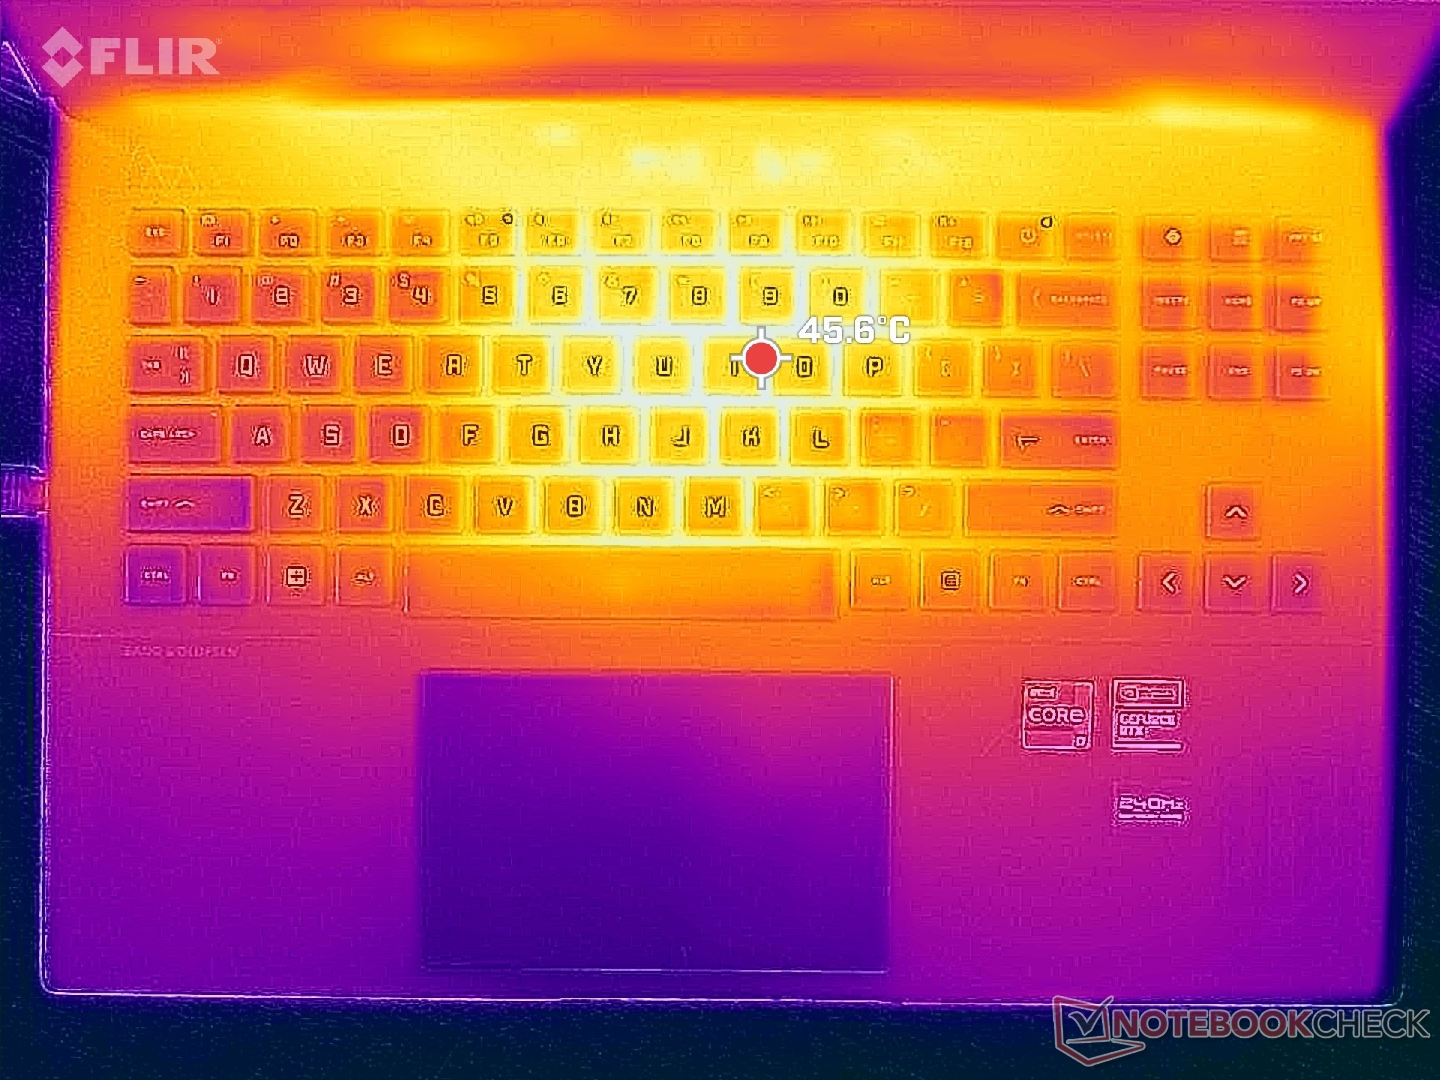
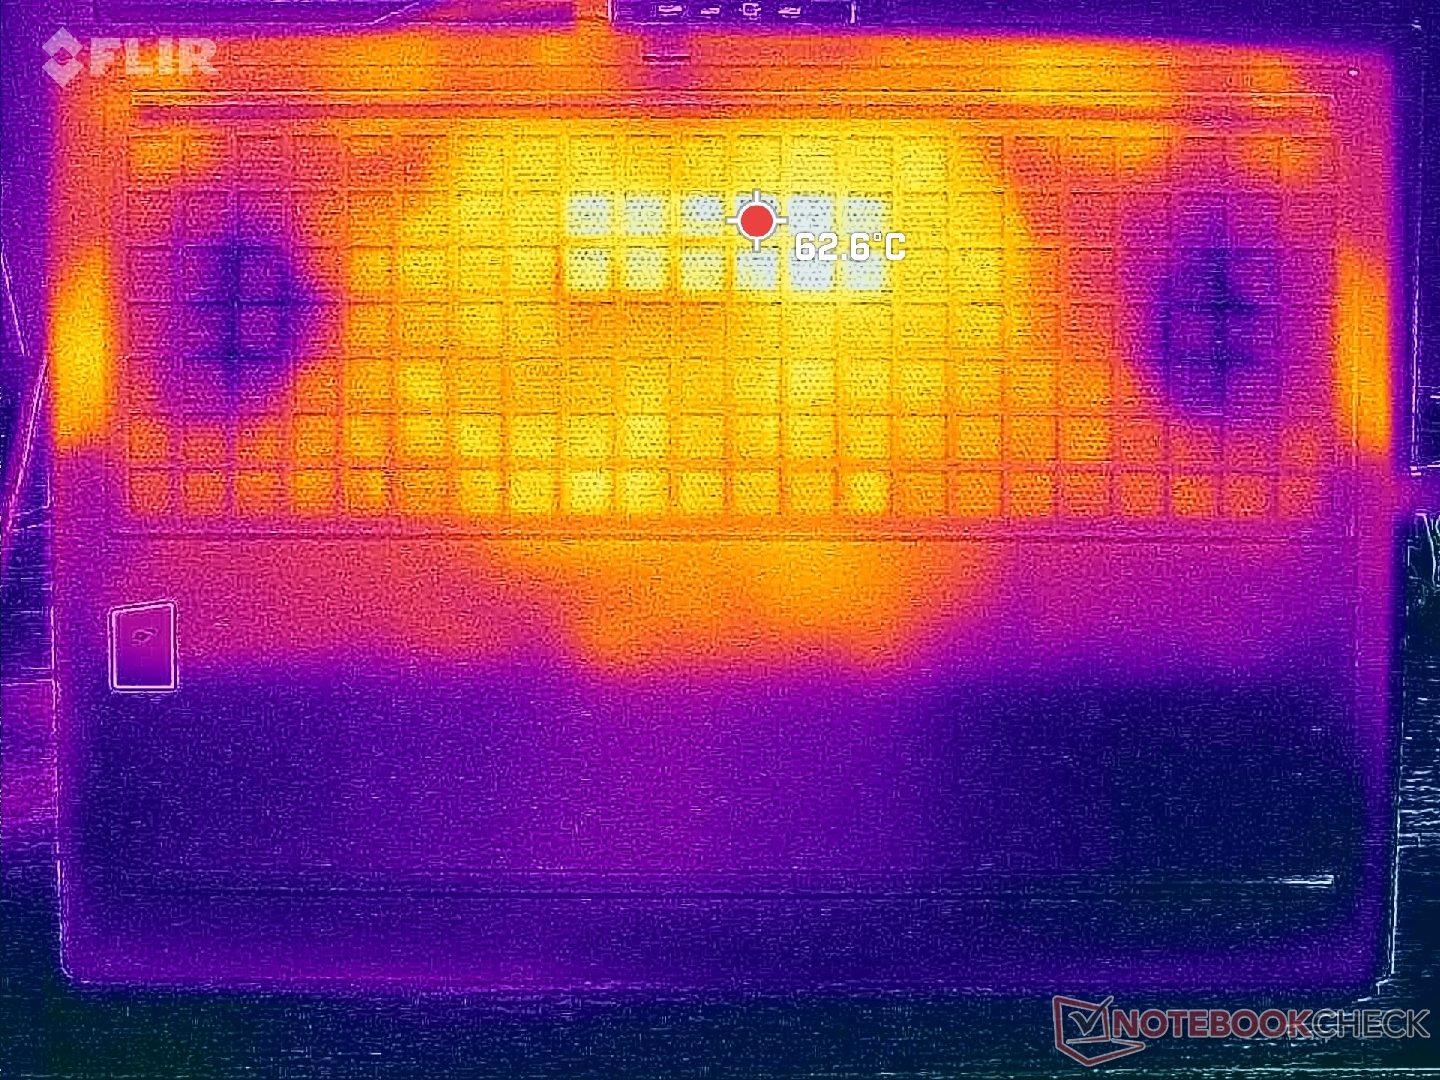
Die Oberflächentemperaturen sind gleichmäßig mit Hot Spots in der Mitte der Tastatur. In diesem Bereich erhitzt sich das Gaming-Notebook beim Spielen auf 40 bis 45 Grad Celsius, beim dickeren, schwereren und schnelleren Lenovo Legion Pro 7 16 haben wir 55 bis 60 Grad gemessen. Die insgesamt kühleren Oberflächentemperaturen sind womöglich auf die größeren Luftauslässe und die geringere TGP des HP-Laptops zurückzuführen.
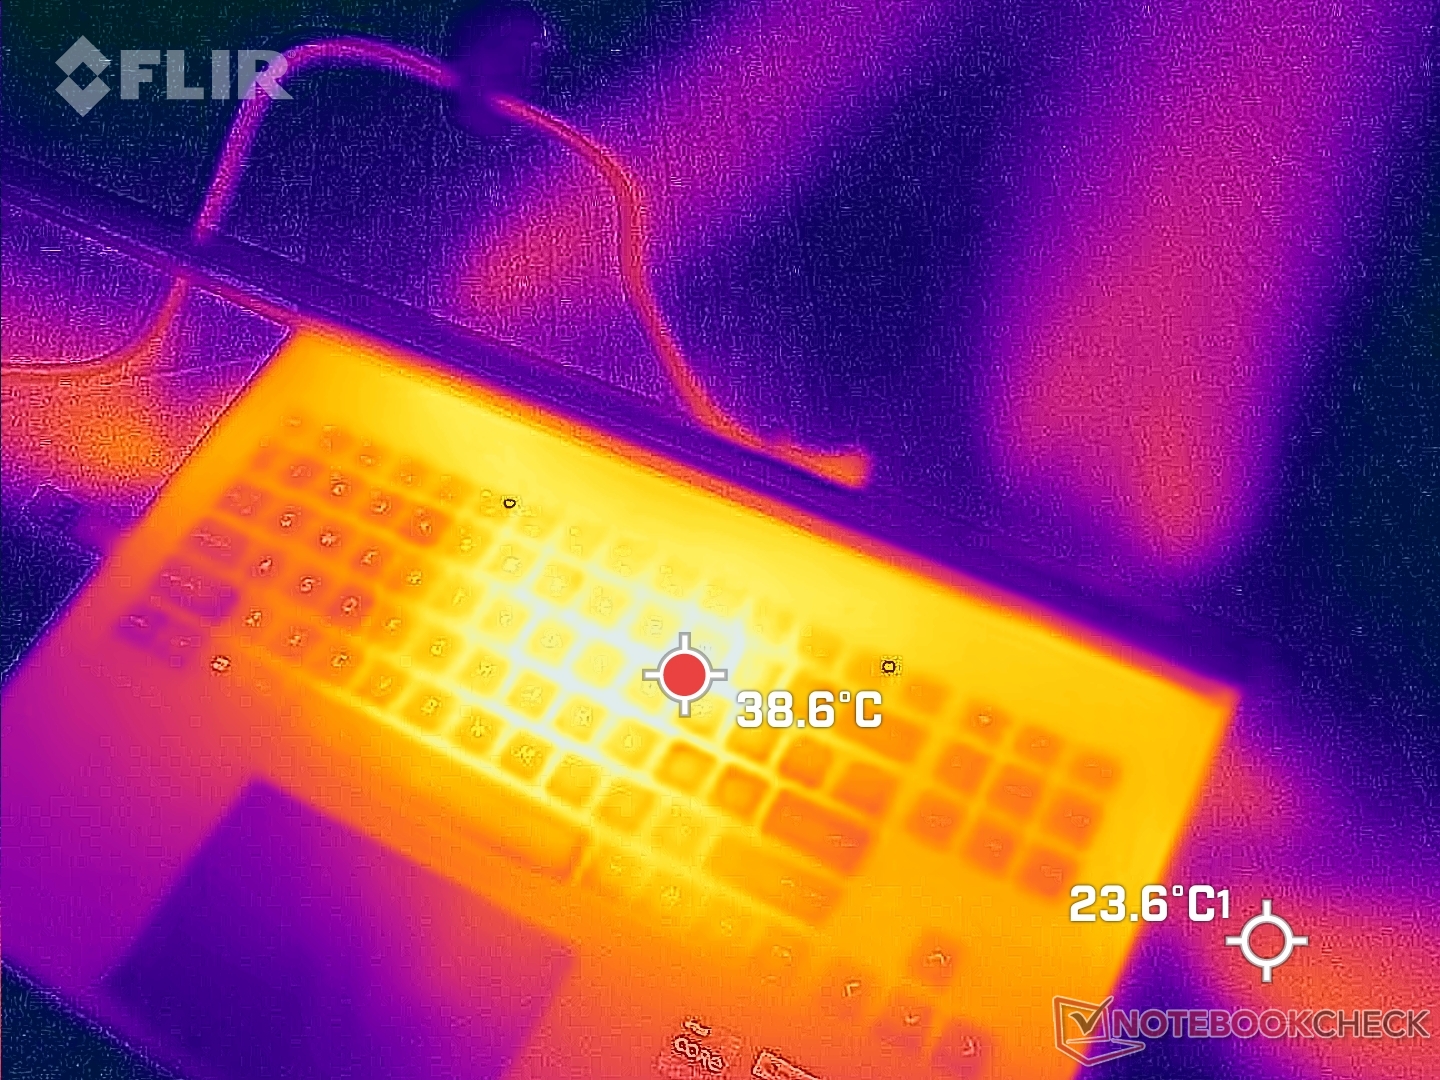
(±) Die maximale Temperatur auf der Oberseite ist 45 °C. Im Vergleich liegt der Klassendurchschnitt bei 40.4 °C (von 21.2 bis 68.8 °C für die Klasse Gaming).
(-) Auf der Unterseite messen wir eine maximalen Wert von 48.8 °C (im Vergleich zum Durchschnitt von 43.2 °C).
(+) Ohne Last messen wir eine durchschnittliche Temperatur von 26.6 °C auf der Oberseite. Der Klassendurchschnitt erreicht 33.9 °C.
(±) Beim längeren Spielen von The Witcher 3 erhitzt sich das Gerät durchschnittlich auf 33.9 °C. Der Durchschnitt der Klasse ist derzeit 33.9 °C.
(+) Die Handballen und der Touchpad-Bereich sind mit gemessenen 31.4 °C kühler als die typische Hauttemperatur und fühlen sich dadurch kühl an.
(-) Die durchschnittliche Handballen-Temperatur anderer getesteter Geräte war 28.8 °C (-2.6 °C).
| HP Omen 16-wf000 Intel Core i7-13700HX, NVIDIA GeForce RTX 4080 Laptop GPU | HP Omen 16-n0033dx AMD Ryzen 7 6800H, AMD Radeon RX 6650M | Alienware x16 R1 Intel Core i9-13900HK, NVIDIA GeForce RTX 4080 Laptop GPU | Lenovo Legion Pro 7 RTX4090 Intel Core i9-13900HX, NVIDIA GeForce RTX 4090 Laptop GPU | Asus ROG Strix G16 G614JZ Intel Core i9-13980HX, NVIDIA GeForce RTX 4080 Laptop GPU | Razer Blade 16 Early 2023 Intel Core i9-13950HX, NVIDIA GeForce RTX 4080 Laptop GPU | |
|---|---|---|---|---|---|---|
| Hitze | 3% | -13% | -17% | -12% | 4% | |
| Last oben max * (°C) | 45 | 41.2 8% | 47.2 -5% | 53 -18% | 54 -20% | 40 11% |
| Last unten max * (°C) | 48.8 | 53.2 -9% | 47.8 2% | 59 -21% | 55 -13% | 37.6 23% |
| Idle oben max * (°C) | 29.2 | 26.4 10% | 36.8 -26% | 34 -16% | 29 1% | 32.4 -11% |
| Idle unten max * (°C) | 28.8 | 27.8 3% | 35.8 -24% | 32 -11% | 33 -15% | 31.4 -9% |
* ... kleinere Werte sind besser
Stresstest
Die Taktrate und Energieaufnahme der CPU liegen beim Start des Stresstests mit Prime95 bei 3,4 GHz und 110 Watt, was circa zwei Minuten lang oder bis zu einer Kerntemperatur von 91 Grad gehalten wird. Danach fällt der Prozessor auf durchschnittlich 3,0 GHz bei 90 Watt, um eine kühlere Temperatur zwischen 80 und 90 Grad Celsius zu halten. Dieses Temperaturfenster ist ähnlich wie beim AMD-Modell des HP Omen 16 von 2022 oder dem schnelleren Razer Blade 16.
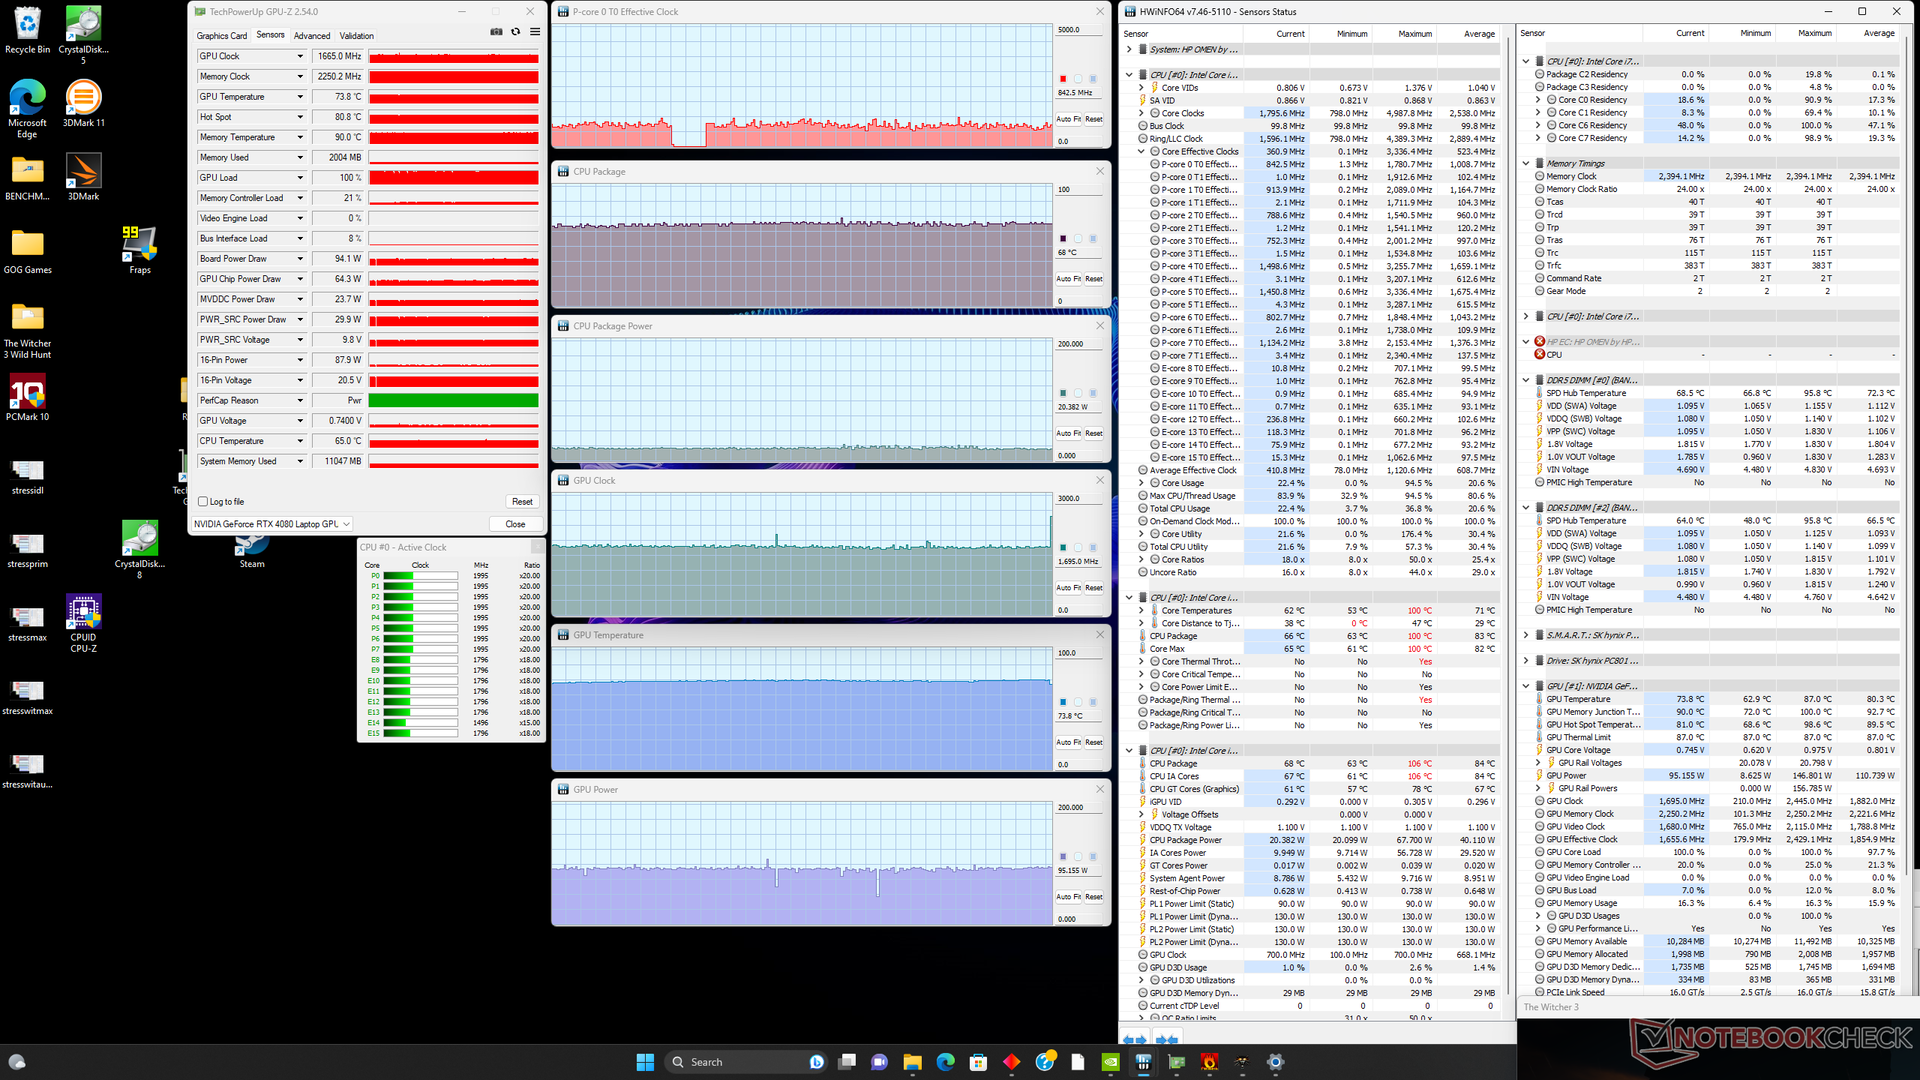
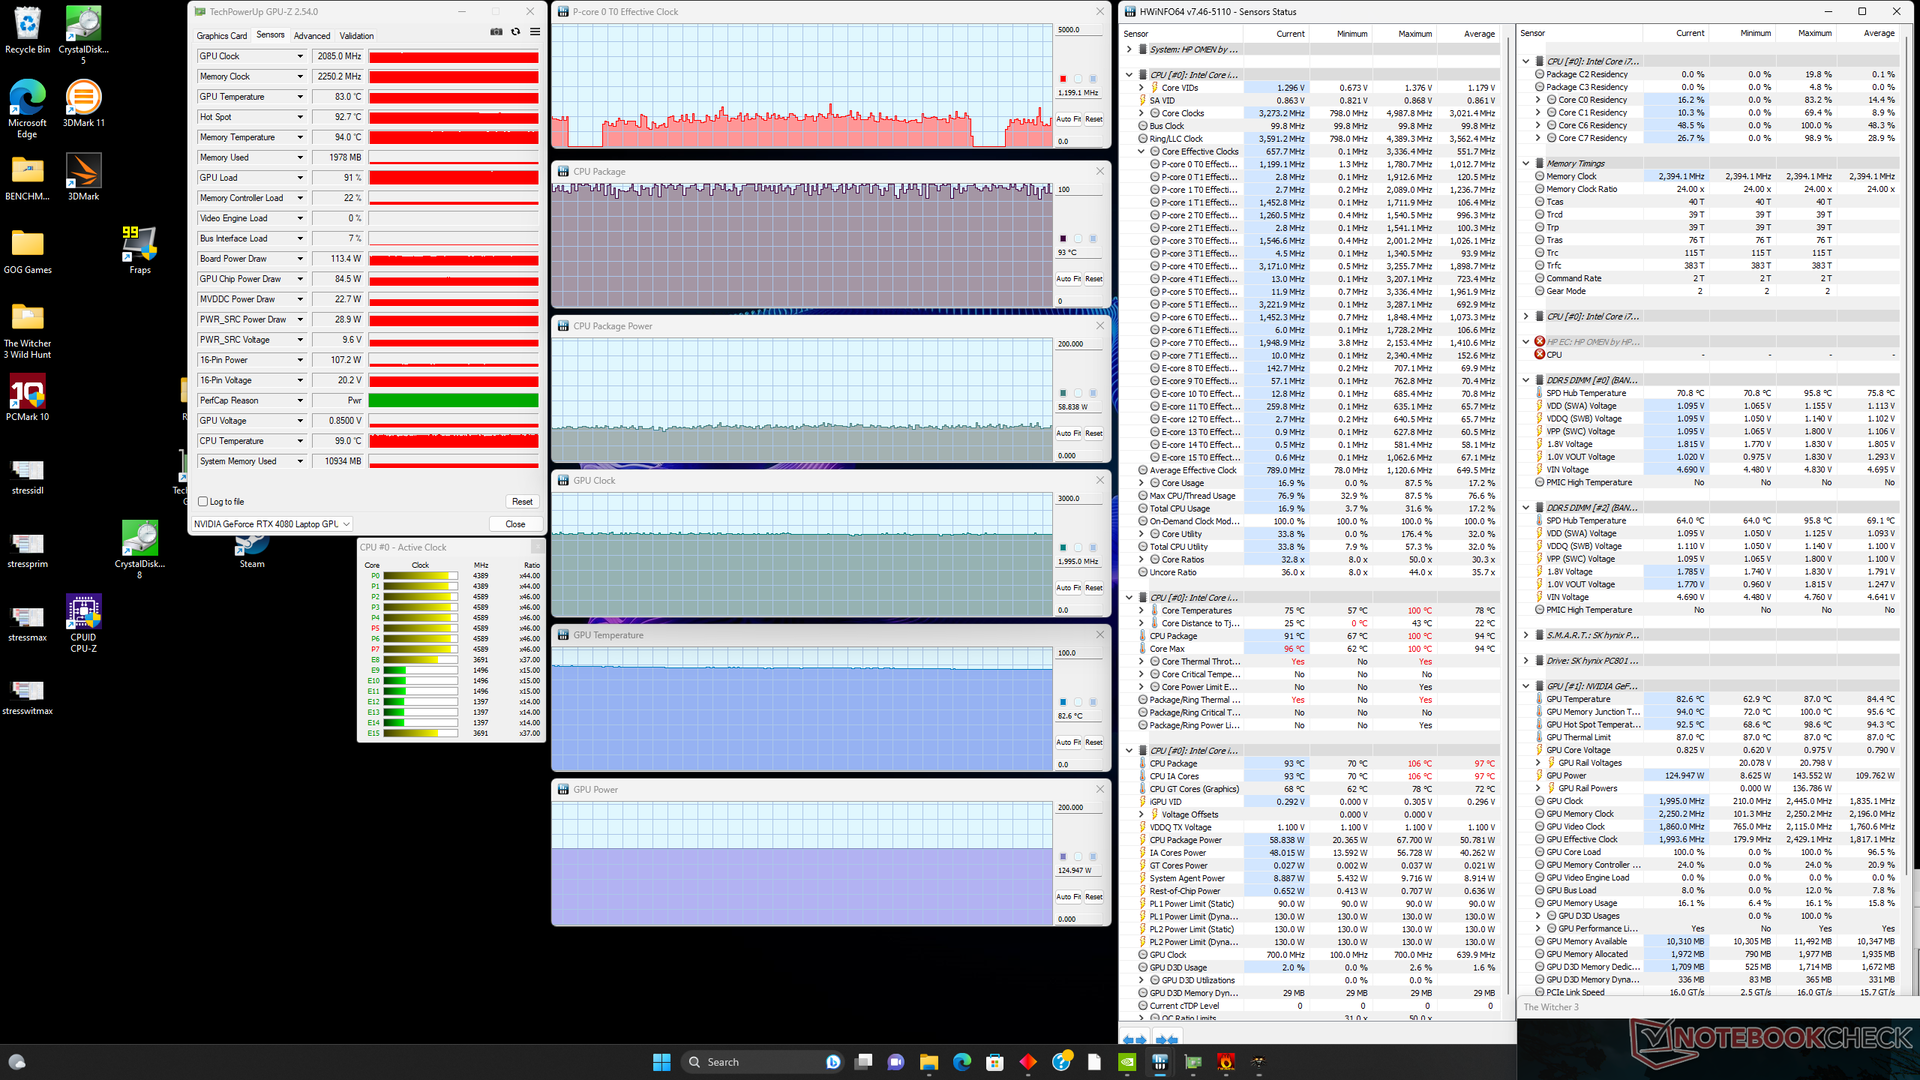
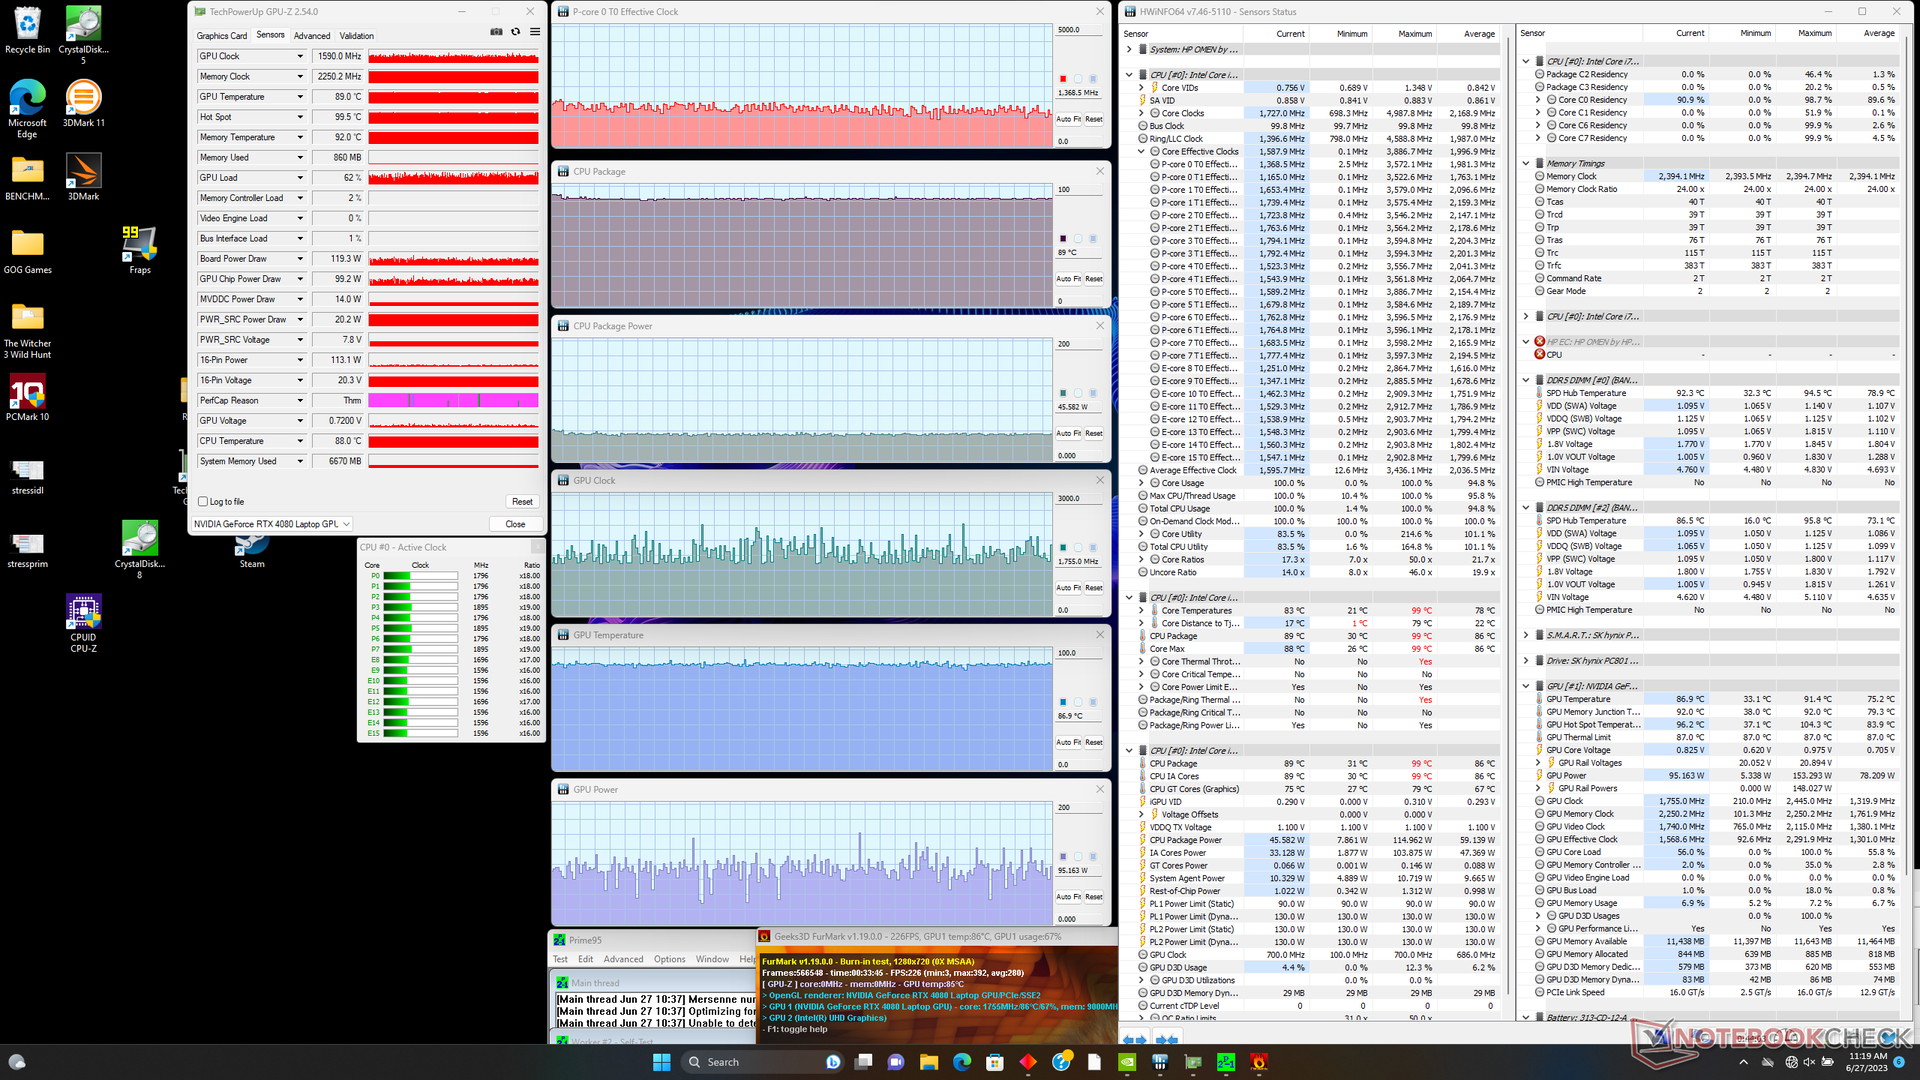
Beim Spielen von Witcher 3 im Leistungsmodus mit aktivierter maximaler Kühlung ist die GPU-Taktfrequenz und Energieaufnahme etwas höher als im Leistungsmodus mit deaktivierter maximaler Kühlung, wie am unten eigebundenen Screenshot erkennbar ist. Dieses Ergebnis deckt sich mit den obigen Ergebnissen aus Fire Strike, die Kerntemperaturen sind im Kühlungsmodus außerdem spürbar geringer. Wer also die meiste Performance aus dem Laptop herausholen möchte, der muss den maximalen Kühlungsmodus aktivieren.
Im ausbalancierten Modus zieht die Grafikkarte in Witcher 3 nur 95 Watt anstelle der maximalen 130 bis 145 Watt. Das Lüftergeräusch ist dann natürlich leiser, was aber auf Kosten der Grafikleistung geht.
Im Akku-Modus wird die Leistung massiv eingeschränkt. In 3DMark 11 liegen die Physics- und GPU-Scores dann bei 8347 und 10654, während es im Netzbetrieb 23751 und 56145 Punkte sind.
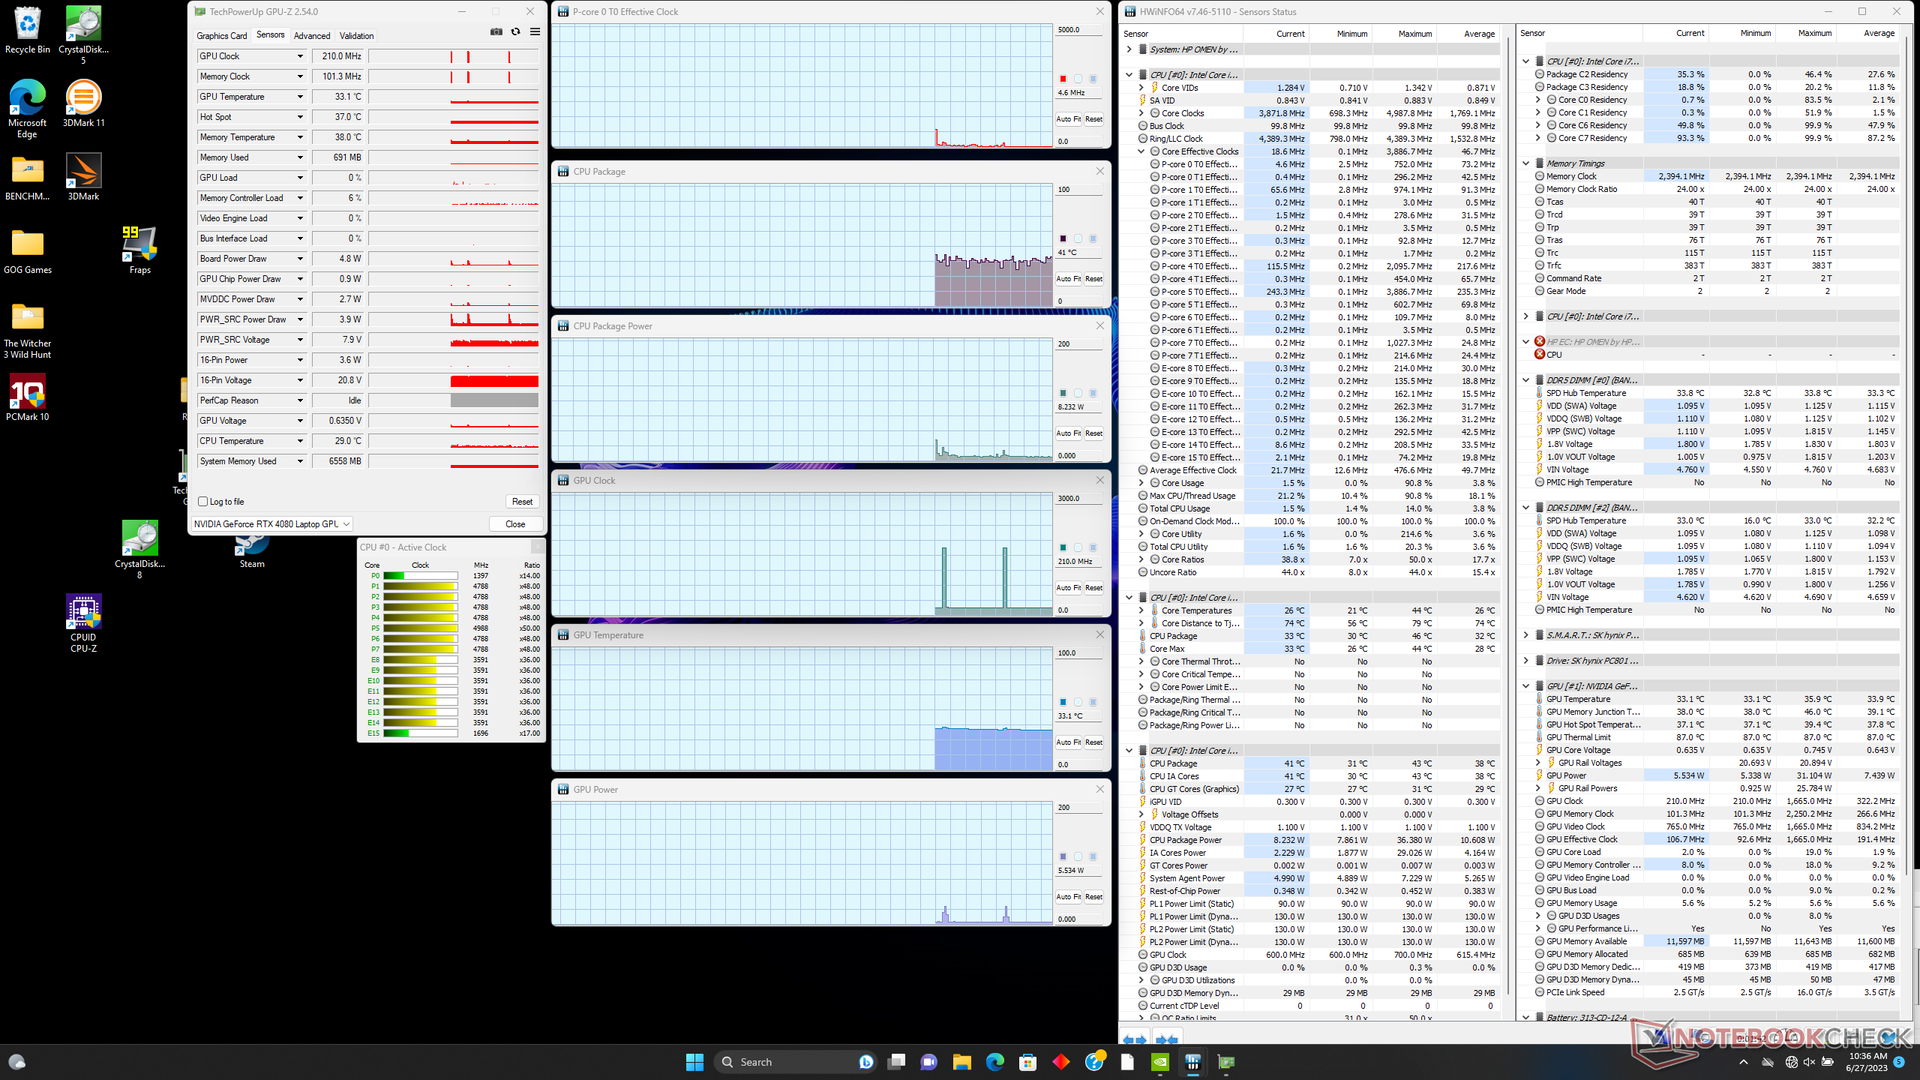
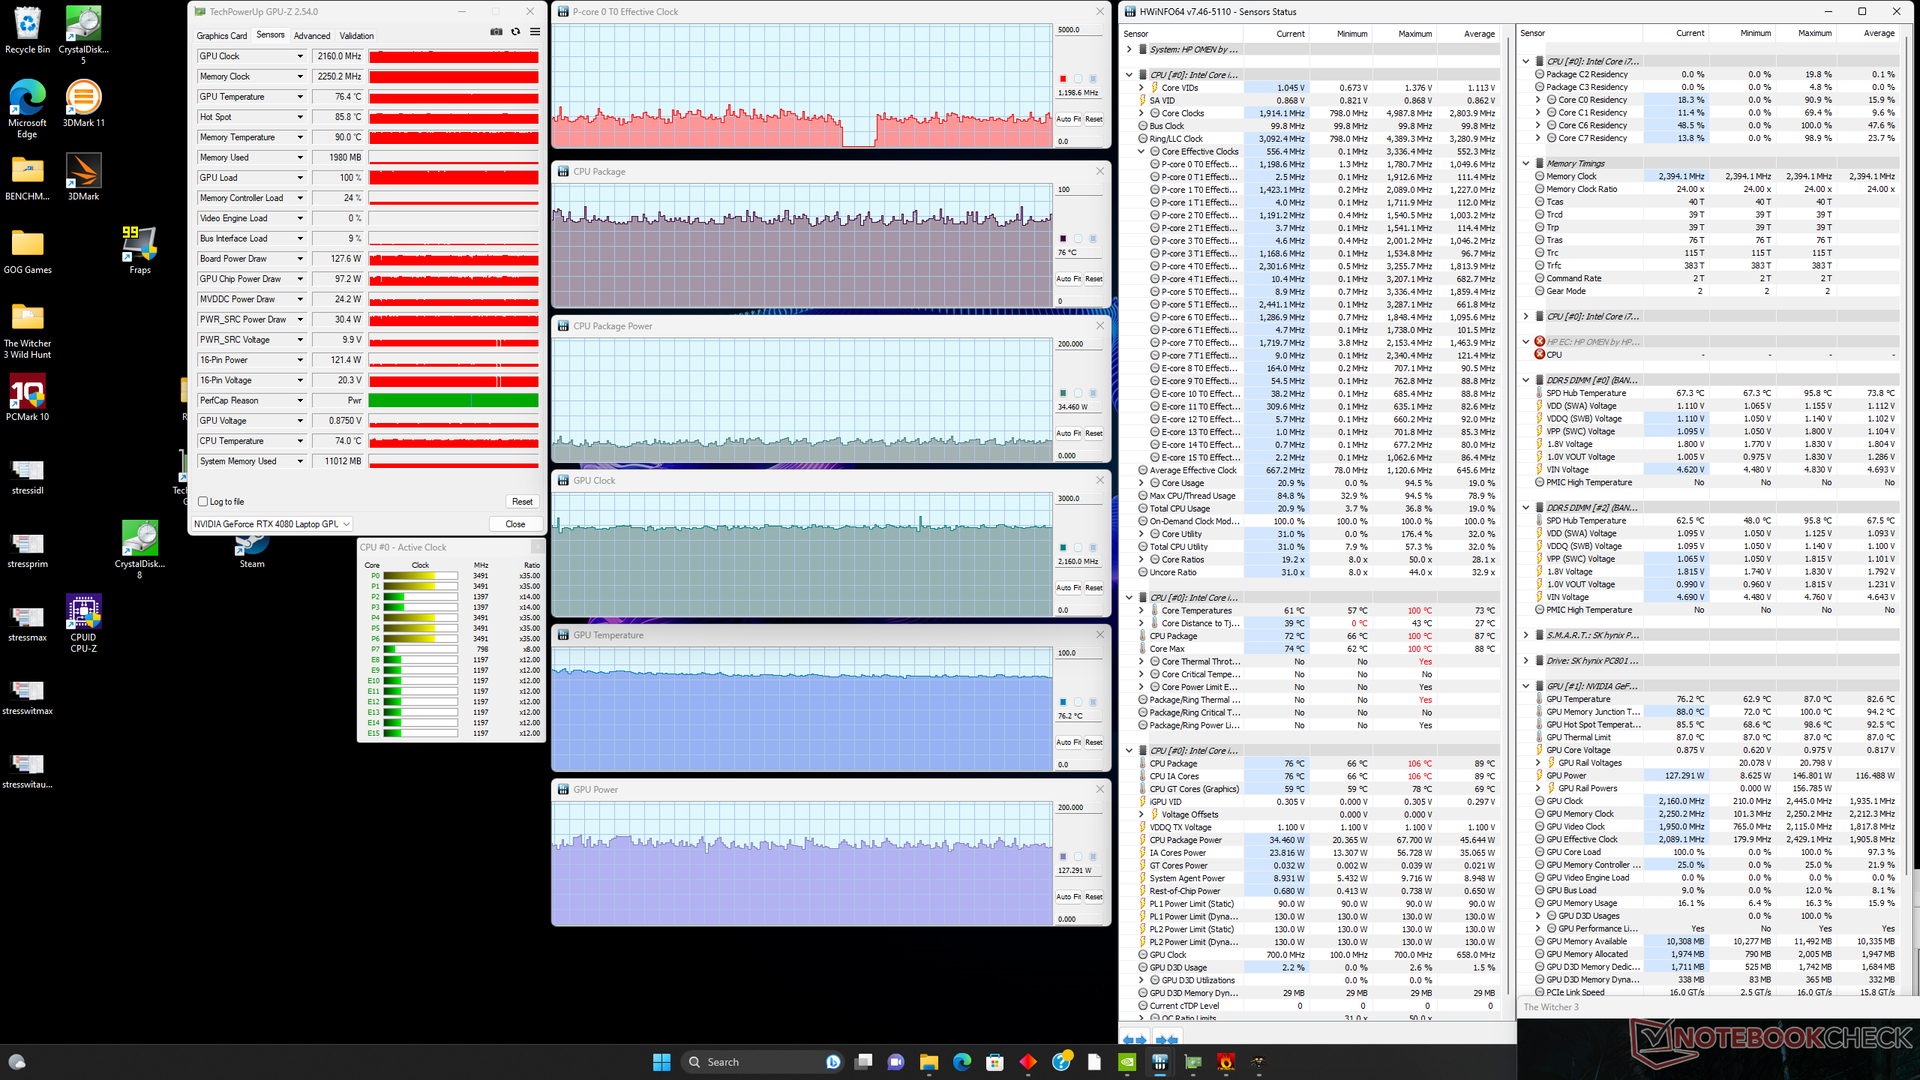
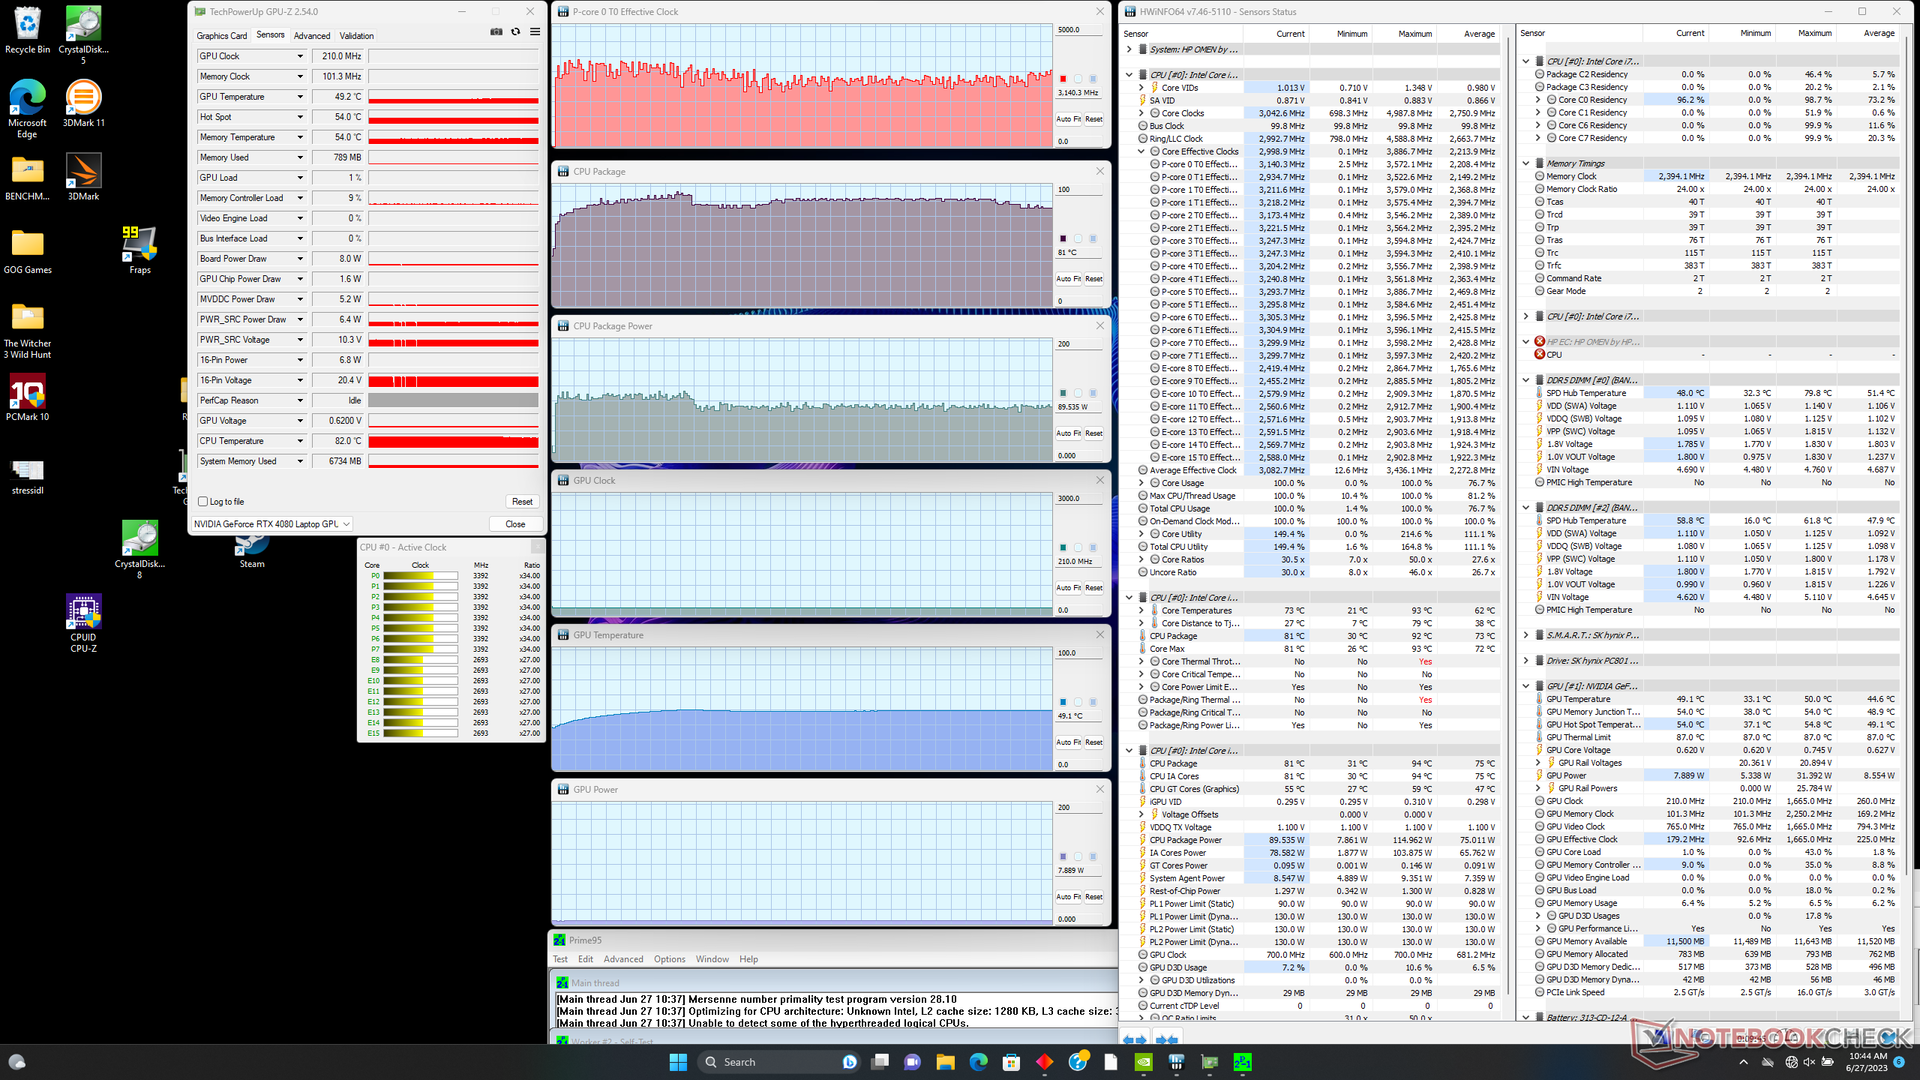
| CPU Clock (GHz) | GPU Clock (MHz) | Average CPU Temperature (°C) | Average GPU Temperature (°C) | |
| System Idle | -- | -- | 41 | 33 |
| Prime95 Stress | 2.4 - 3.2 | -- | 81 - 88 | 49 |
| Prime95 + FurMark Stress | 1.3 - 1.8 | 1300 - 2250 | 89 | 87 |
| Witcher 3 Stress (Balanced mode) | ~0.8 | 1665 | 68 | 74 |
| Witcher 3 Stress (Performance mode + Max Fan Off) | ~1.2 | 2085 | ~95 | 83 |
| Witcher 3 Stress (Performance mode + Max Fan On) | ~1.2 | 2160 | 76 | 76 |
Lautsprecher
Die Stereo-Lautsprecher sind nicht annähernd so laut wie die Quad-Speaker des Alienware x16 R1, der Klang ist aber trotzdem ausgewogen. Die Tonqualität beim Zocken ist aufgrund der lauten Lüfter deutlich schlechter.
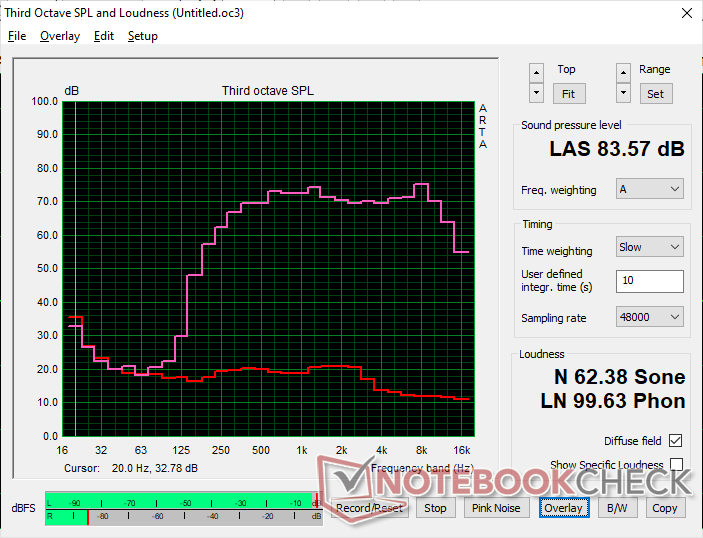
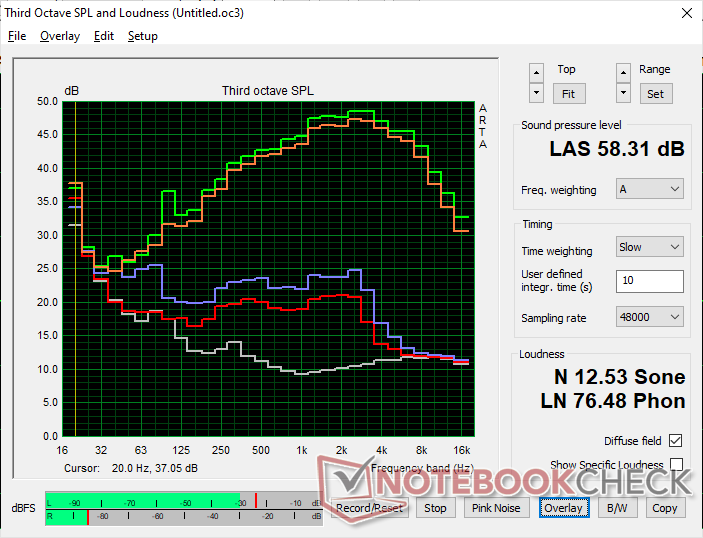
HP Omen 16-wf000 Audio Analyse
(+) | Die Lautsprecher können relativ laut spielen (83.6 dB)
Bass 100 - 315 Hz
(-) | kaum Bass - 21.9% niedriger als der Median
(±) | durchschnittlich lineare Bass-Wiedergabe (14.7% Delta zum Vorgänger)
Mitteltöne 400 - 2000 Hz
(+) | ausgeglichene Mitten, vom Median nur 2.1% abweichend
(+) | lineare Mitten (3% Delta zum Vorgänger)
Hochtöne 2 - 16 kHz
(+) | ausgeglichene Hochtöne, vom Median nur 1.4% abweichend
(+) | sehr lineare Hochtöne (3.5% Delta zum Vorgänger)
Gesamt im hörbaren Bereich 100 - 16.000 Hz
(±) | hörbarer Bereich ist durchschnittlich linear (15.3% Abstand zum Median)
Im Vergleich zu allen Geräten derselben Klasse
» 34% aller getesteten Geräte dieser Klasse waren besser, 6% vergleichbar, 60% schlechter
» Das beste Gerät hat einen Delta-Wert von 6%, durchschnittlich ist 18%, das schlechteste Gerät hat 132%
Im Vergleich zu allen Geräten im Test
» 22% aller getesteten Geräte waren besser, 4% vergleichbar, 74% schlechter
» Das beste Gerät hat einen Delta-Wert von 4%, durchschnittlich ist 23%, das schlechteste Gerät hat 134%
Apple MacBook Pro 16 2021 M1 Pro Audio Analyse
(+) | Die Lautsprecher können relativ laut spielen (84.7 dB)
Bass 100 - 315 Hz
(+) | guter Bass - nur 3.8% Abweichung vom Median
(+) | lineare Bass-Wiedergabe (5.2% Delta zum Vorgänger)
Mitteltöne 400 - 2000 Hz
(+) | ausgeglichene Mitten, vom Median nur 1.3% abweichend
(+) | lineare Mitten (2.1% Delta zum Vorgänger)
Hochtöne 2 - 16 kHz
(+) | ausgeglichene Hochtöne, vom Median nur 1.9% abweichend
(+) | sehr lineare Hochtöne (2.7% Delta zum Vorgänger)
Gesamt im hörbaren Bereich 100 - 16.000 Hz
(+) | hörbarer Bereich ist sehr linear (4.6% Abstand zum Median
Im Vergleich zu allen Geräten derselben Klasse
» 0% aller getesteten Geräte dieser Klasse waren besser, 0% vergleichbar, 100% schlechter
» Das beste Gerät hat einen Delta-Wert von 5%, durchschnittlich ist 17%, das schlechteste Gerät hat 45%
Im Vergleich zu allen Geräten im Test
» 0% aller getesteten Geräte waren besser, 0% vergleichbar, 100% schlechter
» Das beste Gerät hat einen Delta-Wert von 4%, durchschnittlich ist 23%, das schlechteste Gerät hat 134%
Energiemanagement — Größerer Akku, kürzere Laufzeiten
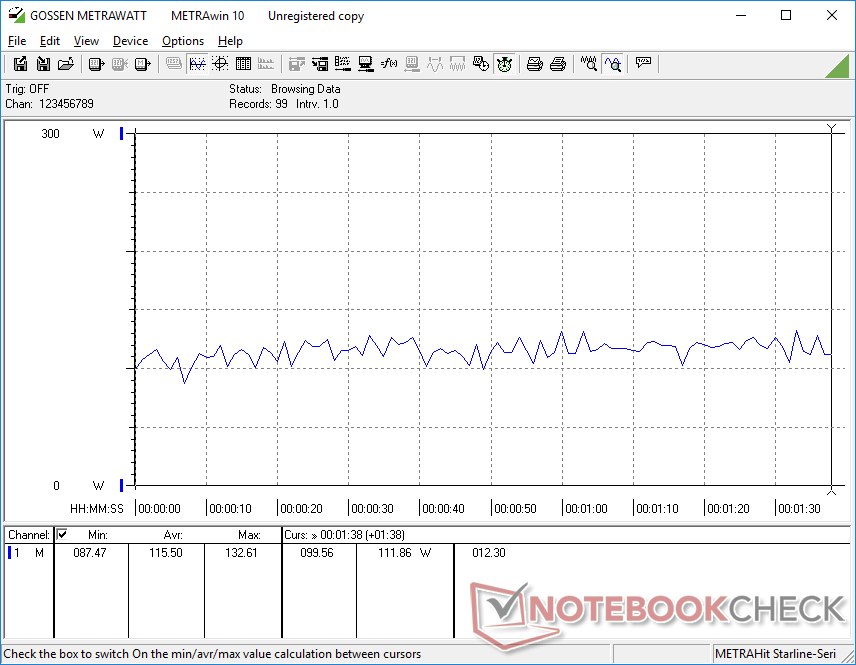
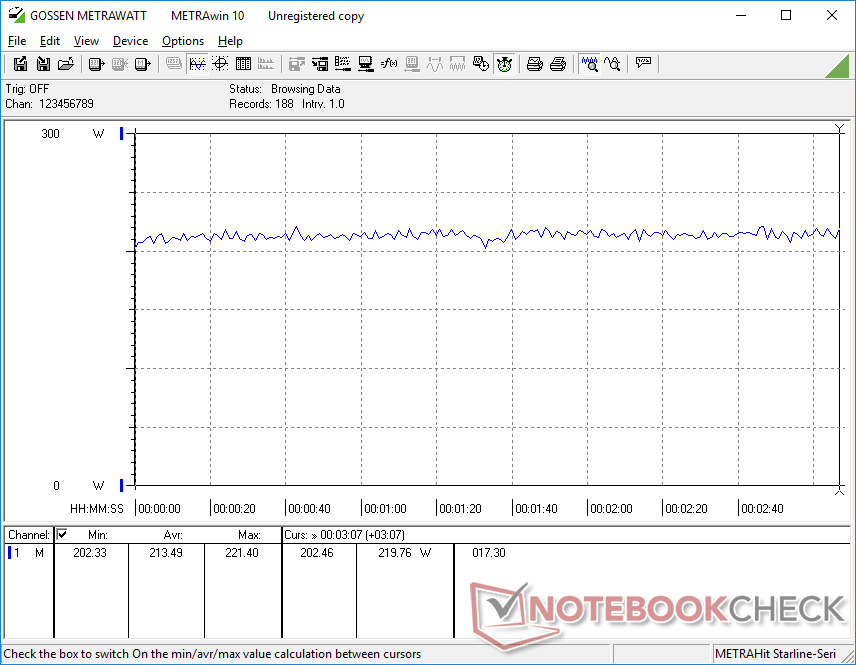
Energieverbrauch
Die Energieaufnahme im Leerlauf ist höher als erwartet, selbst bei Nutzung des Energiesparmodus mit aktivierter iGPU und minimaler Display-Helligkeit. Dieser hoher Grundverbrauch ist vielleicht für die kürzeren Akkulaufzeiten verantwortlich, die im nächsten Textabschnitt diskutiert werden.
Glücklicherweise wurde der Verbrauch beim Spielen im Vergleich zur AMD-Konfiguration des 2022er HP Omen 16 signifikant verbessert. In Witcher 3 werden nur 4 Prozent mehr Energie verbraucht, aber die 1,5 bis 2-fache Leistung der Radeon RX 6650M geboten. Dies erklärt wahrscheinlich auch, warum HP dieses Jahr keine Radeon-Grafikkarten mehr verbaut, da die Leistung pro Watt von Ada-Lovelace-GPUs wirklich beeindruckend ist.
Konkurrierende Laptops mit der gleichen RTX-4080-Grafikkarte, wie beispielsweise das Asus ROG Strix G16 oder Razer Blade 16, verbrauchen im selben Spiel 30 Watt mehr als das HP-Notebook. Diese Systeme sind allerdings auch mit viel schnelleren Core-i9-HX-Prozessoren ausgerüstet.
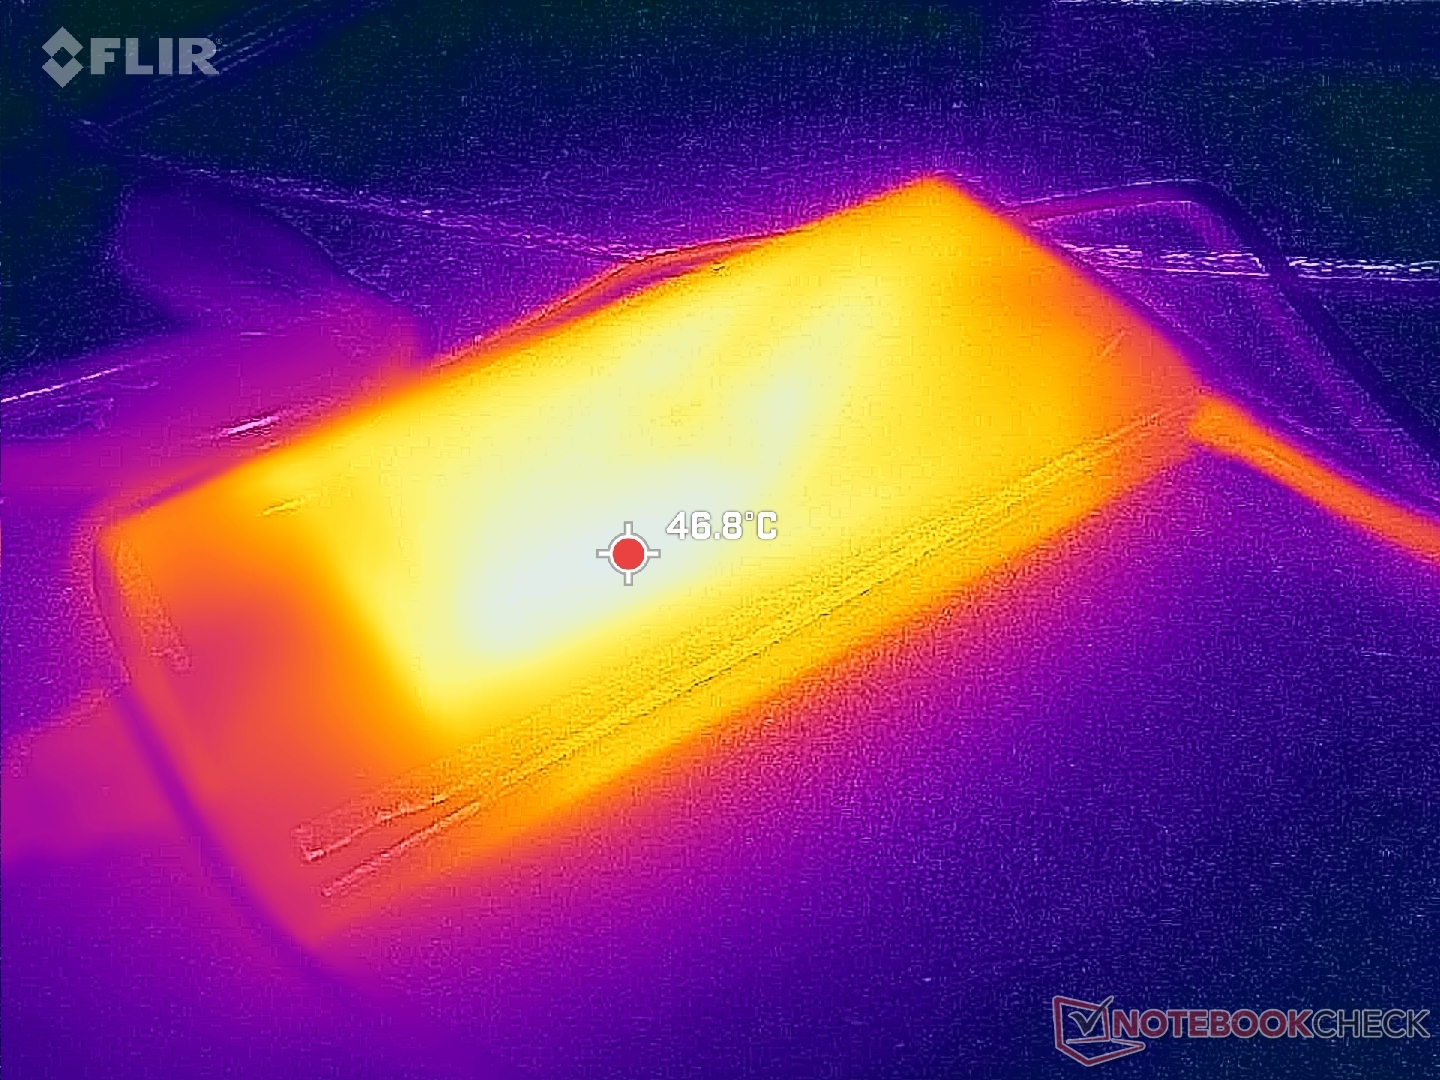
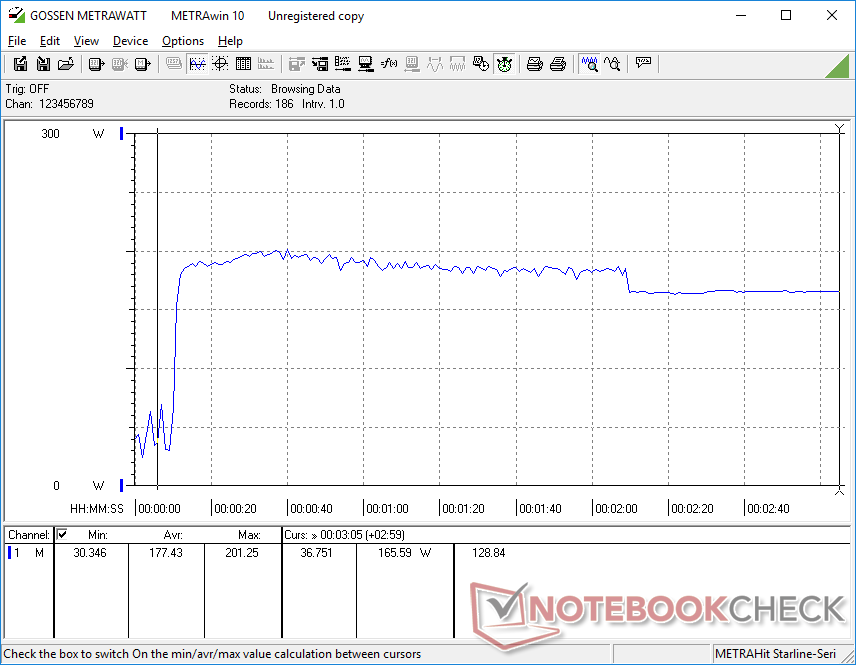
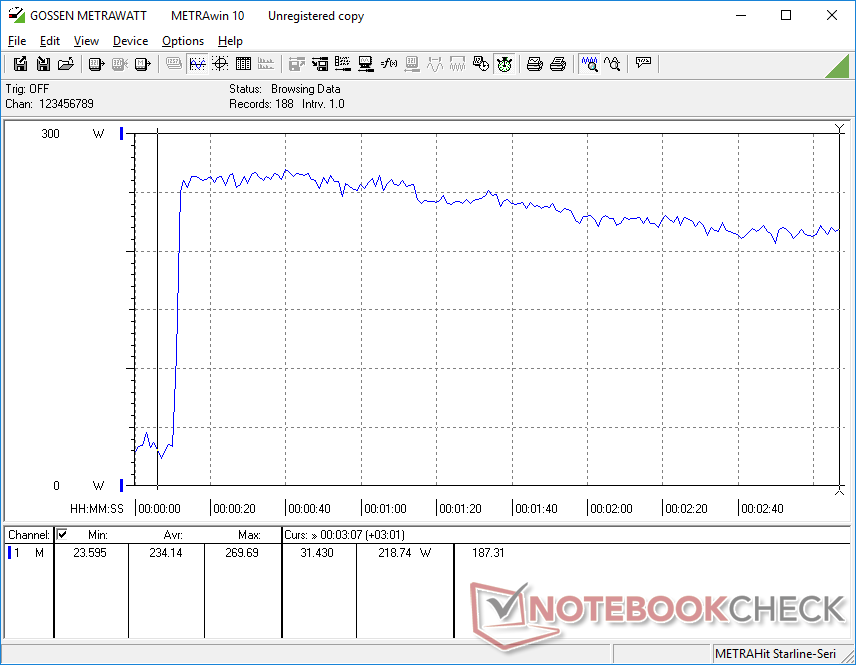
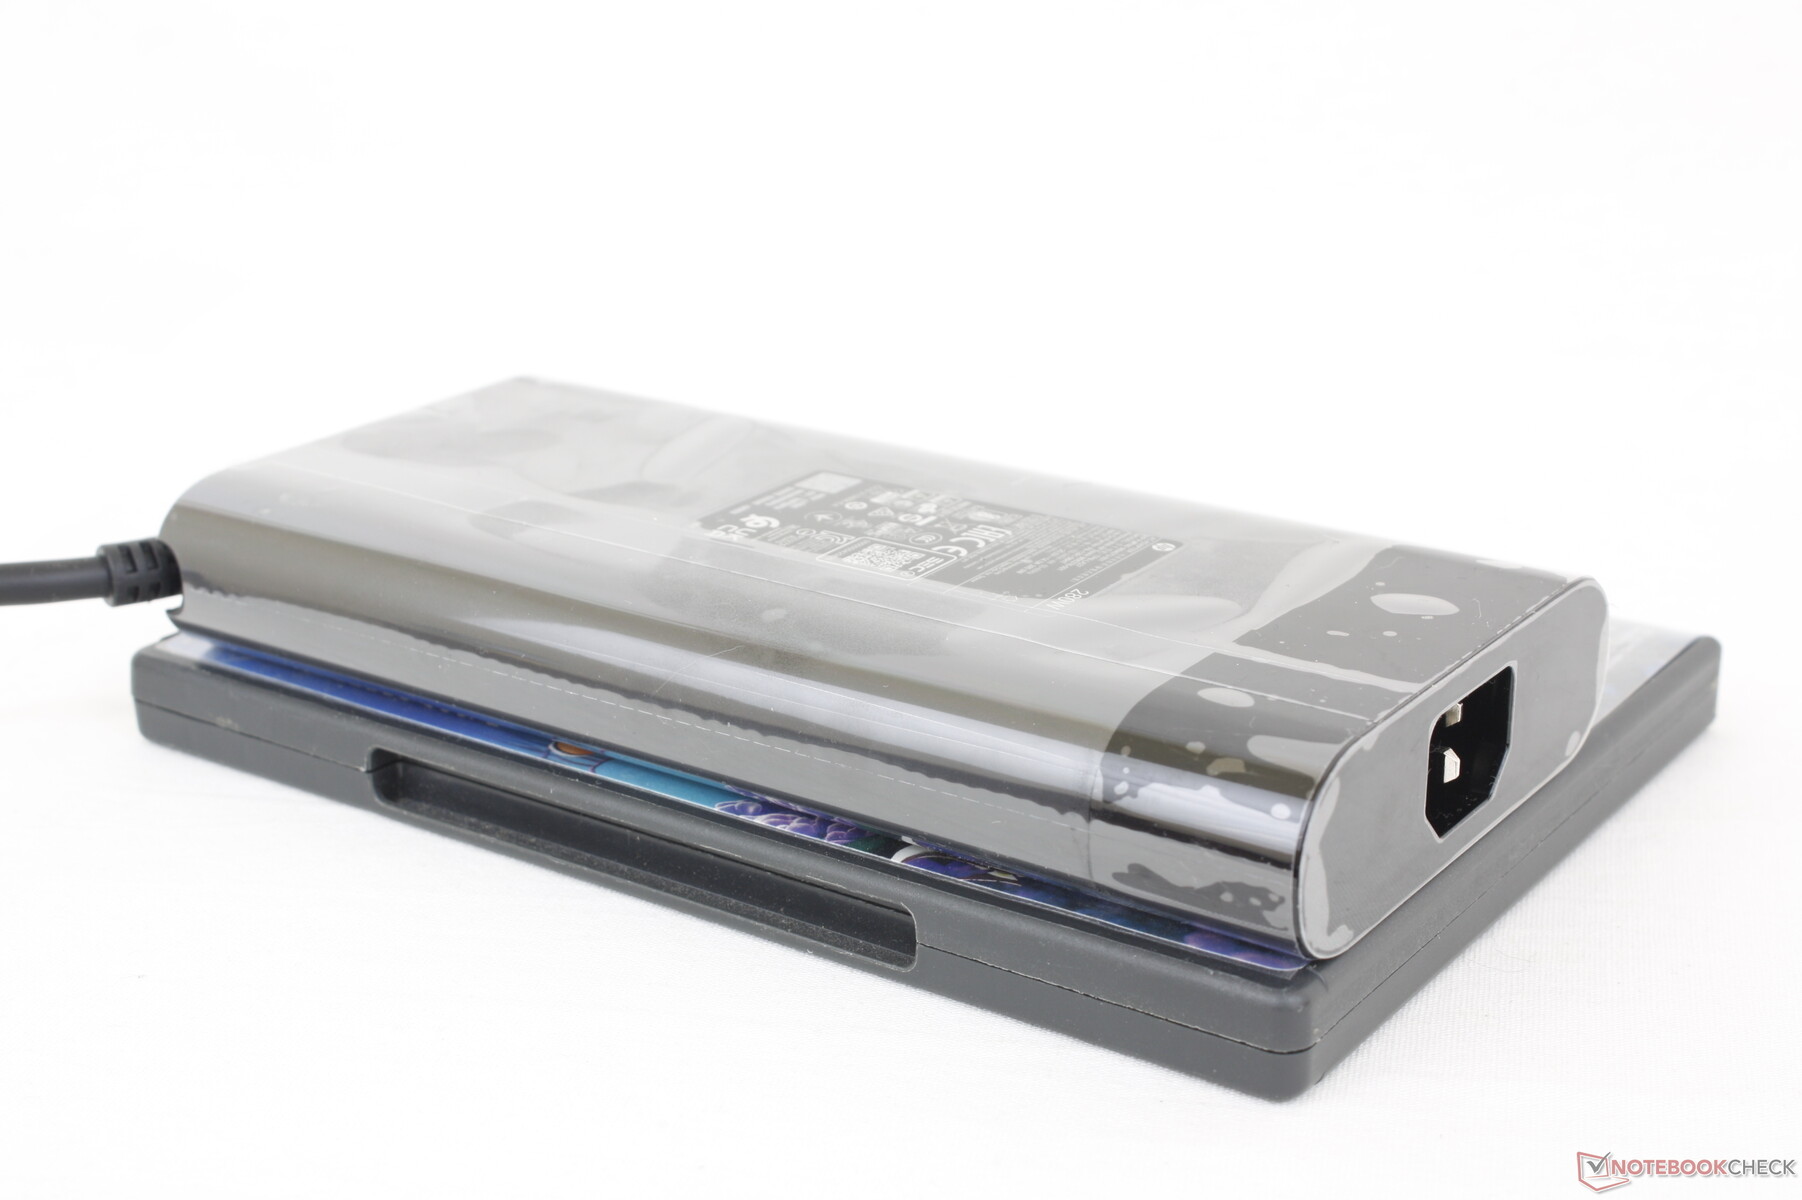
In der Spitze verbrauch das mittelgroße 280-Watt-Netzteil (rund 18 x 8,8 x 2,4 cm) bis zu 270 Watt wenn sowohl die CPU als auch GPU zu 100% belastet werden. Ein größeres Netzteil mit 330 Watt wäre wahrscheinlich also zu viel des Guten gewesen.
| Aus / Standby | |
| Idle | |
| Last |
|
Legende:
min: | |
| HP Omen 16-wf000 i7-13700HX, GeForce RTX 4080 Laptop GPU, SK hynix PC801 HFS002TEJ9X101N, IPS, 2560x1440, 16.1" | HP Omen 16-n0033dx R7 6800H, Radeon RX 6650M, Samsung PM9A1 MZVL21T0HCLR, IPS, 1920x1080, 16.1" | Alienware x16 R1 i9-13900HK, GeForce RTX 4080 Laptop GPU, SK hynix PC801 HFS001TEJ9X101N, IPS, 2560x1600, 16" | Lenovo Legion Pro 7 RTX4090 i9-13900HX, GeForce RTX 4090 Laptop GPU, Samsung PM9A1 MZVL21T0HCLR, IPS, 2560x1600, 16" | Asus ROG Strix G16 G614JZ i9-13980HX, GeForce RTX 4080 Laptop GPU, WD PC SN560 SDDPNQE-1T00, IPS, 2560x1600, 16" | Razer Blade 16 Early 2023 i9-13950HX, GeForce RTX 4080 Laptop GPU, SSSTC CA6-8D1024, IPS, 2560x1600, 16" | |
|---|---|---|---|---|---|---|
| Stromverbrauch | 34% | -17% | -9% | 11% | -3% | |
| Idle min * (Watt) | 21.8 | 7.9 64% | 25.2 -16% | 20 8% | 10 54% | 15.2 30% |
| Idle avg * (Watt) | 26 | 11.5 56% | 29.9 -15% | 25 4% | 16 38% | 22.8 12% |
| Idle max * (Watt) | 36 | 18.3 49% | 49.8 -38% | 35 3% | 27 25% | 49.8 -38% |
| Last avg * (Watt) | 115.5 | 88.1 24% | 105.4 9% | 136 -18% | 129 -12% | 121.2 -5% |
| Witcher 3 ultra * (Watt) | 214 | 206 4% | 263 -23% | 282 -32% | 247 -15% | 242 -13% |
| Last max * (Watt) | 269.7 | 246.4 9% | 313.8 -16% | 320 -19% | 342 -27% | 273.7 -1% |
* ... kleinere Werte sind besser
Energieverbrauch Witcher 3 / Stresstest
Energieverbrauch mit externem Monitor
Akkulaufzeit
Die Akkukapazität wurde von 68 Wh beim Vorjahresmodell auf nunmehr 83 Wh erhöht. Trotzdem ist die Akkulaufzeit fast zwei Stunden kürzer als zuvor. In unserem WLAN-Test hielt das Gaming-Notebook im ausbalancierten Energiemodus mit aktivierter iGPU nur etwas über 5 Stunden durch, ähnlich wie das Legion Pro 7.
Das Aufladen von 0 auf 100 Prozent dauert mit dem mitgelieferten Netzteil etwa 90 Minuten. Der Laptop kann auch über USB-C aufgeladen werden, aber die Kompatibilität mit diversen Ladegeräten ist wie immer nicht garantiert. Unser 130 Watt starkes USB-C-Netzteil von Dell wird nach Anschluss in einem Popup-Fenster beispielsweise als inkompatibel bezeichnet, während ein 135 Watt leistendes USB-C-Ladegerät von Lenovo ohne Probleme angenommen wird.
| HP Omen 16-wf000 i7-13700HX, GeForce RTX 4080 Laptop GPU, 83 Wh | HP Omen 16-n0033dx R7 6800H, Radeon RX 6650M, 68 Wh | Alienware x16 R1 i9-13900HK, GeForce RTX 4080 Laptop GPU, 90 Wh | Lenovo Legion Pro 7 RTX4090 i9-13900HX, GeForce RTX 4090 Laptop GPU, 99.9 Wh | Asus ROG Strix G16 G614JZ i9-13980HX, GeForce RTX 4080 Laptop GPU, 90 Wh | Razer Blade 16 Early 2023 i9-13950HX, GeForce RTX 4080 Laptop GPU, 95.2 Wh | |
|---|---|---|---|---|---|---|
| Akkulaufzeit | 40% | -18% | 0% | 45% | 36% | |
| Idle (h) | 5.5 | 10 82% | 7.3 33% | 8.9 62% | ||
| WLAN (h) | 5.1 | 7 37% | 2.5 -51% | 5.1 0% | 9.7 90% | 6.1 20% |
| Last (h) | 1.1 | 1.1 0% | 0.7 -36% | 1.1 0% | 1.4 27% |
Pro
Contra
Fazit — Geringerer Einstiegspreis für ein dünneres und attraktiveres Design
Das vielleicht beste Merkmal des HP Omen 16 (2023) ist der erschwingliche Einstiegspreis von umgerechnet gerade einmal 1.000 Euro für die Konfiguration mit einem Intel Core i7-13700HX, 16GB RAM und einer RTX 4060, die in Deutschland leider ein ganzes Stück teurer ist. Das Gehäuse ist in der oberen Mittelklasse einzuordnen und ist schlanker und besser verarbeitet als ähnlich günstige Gaming-Notebooks wie das MSI Katana, Dell G16 oder die Asus TUF F Serie. Wer nach einem RTX-4060-Laptop ohne billige Plastik-Teile sucht, der sollte das Omen 16 also in Betracht ziehen.
Das neue Modell ist etwas dicker und breiter als der Vorgänger und bietet zudem kürzere Akkulaufzeiten, was dank der deutlich besseren CPU- und GPU-Leistung aber verschmerzbar sein dürfte. Am Gewicht hat sich trotz der größeren Abmessungen nicht wirklich etwas geändert, und die meisten Zockern werden sich wahrscheinlich nicht an dem schwächeren Akku stören.
Das HP Omen 16 2023 sieht besser aus und performt besser als es der günstige Einstiegspreis vermuten lässt.
Zwei bedeutende Features, die das Omen 16 nicht zu bieten hat, sind DCI-P3-Support und ein integrierter SD-Kartenleser. Diese wirken sich zwar nicht auf die Spiele-Erlebnis des Notebooks aus, aber Gamer die gleichzeitig auch als Content-Creator tätig sind, greifen lieber zu Alternativen wie dem Alienware x16 R1 oder Razer Blade 16, die einen Kartenslot, bessere Farbraumabdeckung und höhere Display-Auflösungen bieten. Natürlich sind diese vielseitiger einsetzbaren Mitbewerber aber auch merklich teurer.
Preis und Verfügbarkeit
Das 2023 Omen 16 ist direkt bei HP zu Preisen ab 1.199 Euro für die RTX-4050-Konfiguration bestellbar. Unser Testmodell mit RTX 4080 schlägt regulär mit 2.999 Euro mit zu Buche.
HP Omen 16-wf000
- 13.09.2023 v7 (old)
Allen Ngo
Transparenz
Die Auswahl der zu testenden Geräte erfolgt innerhalb der Redaktion. Das vorliegende Testmuster wurde dem Autor vom Hersteller oder einem Shop zu Testzwecken leihweise zur Verfügung gestellt. Eine Einflussnahme des Leihstellers auf den Testbericht gab es nicht, der Hersteller erhielt keine Version des Reviews vor der Veröffentlichung. Es bestand keine Verpflichtung zur Publikation. Als eigenständiges, unabhängiges Unternehmen unterliegt Notebookcheck keiner Diktion von Herstellern, Shops und Verlagen.
So testet Notebookcheck
Pro Jahr werden von Notebookcheck hunderte Laptops und Smartphones unabhängig in von uns standardisierten technischen Verfahren getestet, um eine Vergleichbarkeit aller Testergebnisse zu gewährleisten. Seit rund 20 Jahren entwickeln wir diese Testmethoden kontinuierlich weiter und setzen damit Branchenstandards. In unseren Testlaboren kommt ausschließlich hochwertiges Messequipment in die Hände erfahrener Techniker und Redakteure. Die Tests unterliegen einer mehrstufigen Kontrolle. Unsere komplexe Gesamtbewertung basiert auf hunderten fundierten Messergebnissen und Benchmarks, womit Ihnen Objektivität garantiert ist. Weitere Informationen zu unseren Testmethoden gibt es hier.
Preisvergleich

