Intel Core i7-14700K im Test: Vergleichbare Leistung zum Core i9-13900K und Ryzen 9 7950X3D, jedoch für fast 200 Euro weniger

Intels Raptor Lake-S Refresh der 14. Generation zeichnet sich hauptsächlich durch erhöhte Boost-Taktraten, Unterstützung für schnellere XMP-Profile und einige Übertaktungsverbesserungen aus. Trotzdem bleibt die Architektur identisch mit den Raptor Lake-S-CPUs der 13. Generation.
Obwohl wir bereits die Core i5-14600K und Core i9-14900K Prozessoren getestet haben, ist der neue Core i7 einer der Prozessoren, die sich von der Masse abheben.
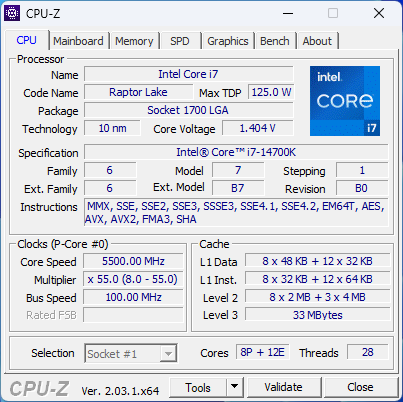
Traditionell hat die Core i7-Serie seit Alder Lake mit jeder Generation eine steigende Anzahl an E-Kernen erlebt. Mit 20 Kernen (8P + 12E) und 28 Threads sind der Core i7-14700K und der Core i7-14700KF die einzigen CPUs der 14. Generation, die eine höhere E-Kernanzahl im Vergleich zu den entsprechenden SKUs der 13. Generation aufweisen.
In diesem Test überprüfen wir, wie sich der Core i7-14700K im Vergleich zur Konkurrenz schlägt und ob sich die erhöhte Anzahl an E-Kernen in Produktivitäts- und Spielerlebnissen als vorteilhaft erweist.
Eine Zusammenfassung der Intel Raptor Lake-S Refresh Desktop-Prozessoren der 14. Generation
| SKU | Kerne / Threads | P-Kern Takt / Turbo | E-Kern Takt / Turbo | Cache L2 + L3 | Integrierte Grafiken | PBP (PL1) | MTB (PL2) | MSRP (US$) |
| Core i9-14900K | 24 (8P + 16E) / 32 | 3.2 GHz / 6.0 GHz | 2.4 GHz / 4.4 GHz | 32 + 36 MB | UHD Grafik 770 | 125 W | 253 W | 589 |
| Core i9-14900KF | 24 (8P + 16E) / 32 | 3.2 GHz / 6.0 GHz | 2.4 GHz / 4.4 GHz | 32 + 36 MB | N/A | 125 W | 253 W | 564 |
| Core i9-13900K | 24 (8P + 16E) / 32 | 3.0 GHz / 5.8 GHz | 2.2 GHz / 4.3 GHz | 32 + 36 MB | UHD Grafik 770 | 125 W | 253 W | 589 |
| Core i9-12900K | 16 (8P + 8E) / 24 | 3.2 GHz / 5.1 GHz | 2.4 GHz / 3.9 GHz | 14 + 30 MB | UHD Grafik 770 | 125 W | 241 W | 589 |
| Core i7-14700K | 20 (8P + 12E) / 28 | 3.4 GHz / 5.6 GHz | 2.5 GHz / 4.3 GHz | 28 + 33 MB | UHD Grafik 770 | 125 W | 253 W | 409 |
| Core i7-14700KF | 20 (8P + 12E) / 28 | 3.4 GHz / 5.6 GHz | 2.5 GHz / 4.3 GHz | 28 + 33 MB | N/A | 125 W | 253 W | 384 |
| Core i7-13700K | 16 (8P + 8E) / 24 | 3.4 GHz / 5.4 GHz | 2.5 GHz / 4.2 GHz | 24 + 30 MB | UHD Grafik 770 | 125 W | 253 W | 409 |
| Core i7-12700K | 12 (8P + 4E) / 20 | 3.6 GHz / 4.9 GHz | 2.7 GHz / 3.8 GHz | 12 + 25 MB | UHD Grafik 770 | 125 W | 190 W | 409 |
| Core i5-14600K | 14 (6P + 8E) / 20 | 3.5 GHz / 5.3 GHz | 2.6 GHz / 4.0 GHz | 20 + 24 MB | UHD Grafik 770 | 125 W | 181 W | 319 |
| Core i5-14600KF | 14 (6P + 8E) / 20 | 3.5 GHz / 5.3 GHz | 2.6 GHz / 4.0 GHz | 20 + 24 MB | N/A | 125 W | 181 W | 294 |
| Core i5-13600K | 14 (6P + 8E) / 20 | 3.5 GHz / 5.1 GHz | 2.6 GHz / 3.9 GHz | 20 + 24 MB | UHD Grafik 770 | 125 W | 181 W | 319 |
| Core i5-12600K | 10 (6P + 4E) / 16 | 3,7 GHz / 4,9 GHz | 2,8 GHz / 3,6 GHz | 9,5 + 20 MB | UHD Grafik 770 | 125 W | 150 W | 289 |
Entsprechend der gesteigerten Anzahl an E-Kernen beträgt der kombinierte L2- und L3-Cache nun 61 MB im Vergleich zu 54 MB beim Core i7-13700K. Darüber hinaus wurden beim Core i7-14700K auch die Boost-Frequenzen für P-Core und E-Core leicht angehoben, die nun mit 5,6 GHz bzw. 4,3 GHz angegeben werden.
Intel setzt weiterhin auf eine 125 W Prozessor-Basisleistung (PBP) oder PL1 und einen 253 W Maximum Turbo Boost (MTB) oder PL2.
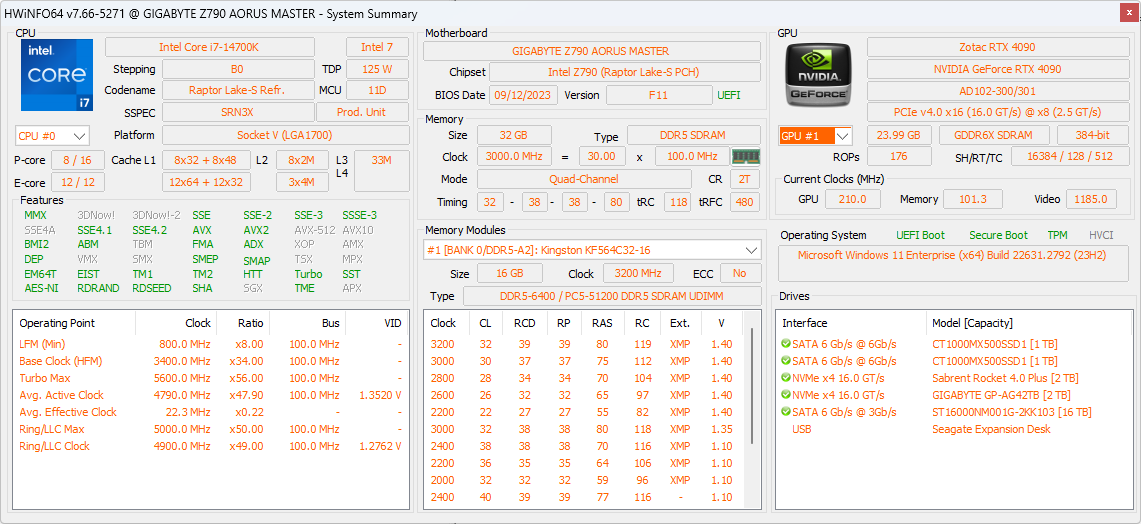
Testsystem: Intel Core i7-14700K fühlt sich mit der RTX 4090 pudelwohl
Unser Core-i7-14700K Testsystem besteht aus den folgenden Komponenten:
- Cooler Master MasterFrame 700 offenes Testsystem
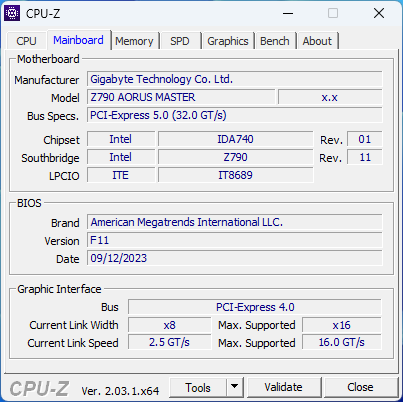
- Gigabyte Z790 Aorus Master Mainboard mit BIOS-Version F11
- Zotac Gaming GeForce RTX 4090 AMP Extreme Airo GPU
- Gigabyte Aorus Gen 4 2 TB NVMe SSD für Benchmarks und Spiele
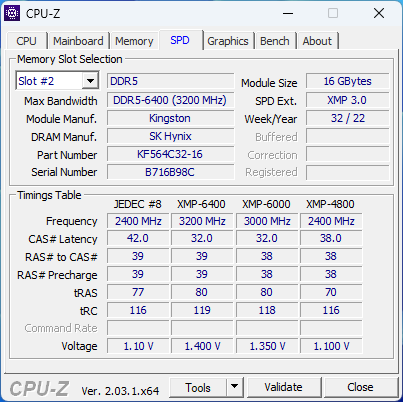
- 2x 16 GB Kingston Fury Beast DDR5-6400 RAM mit DDR5-6000 und Timings 32-38-38-80 bei 1,35 V
- Gigabyte M28U 4K 144 Hz Bildschirm
- Cooler Master MasterLiquid ML360L V2 ARGB AIO Kühler
- Cooler Master MVE Gold V2 1250 ATX 3.0 vollmodulares Netzgerät
Zum Zeitpunkt des Tests wurde Windows 11 23H2 mit den neuesten Patches, zusammen mit dem Nvidia Game Ready-Treiber v546.26 verwendet.
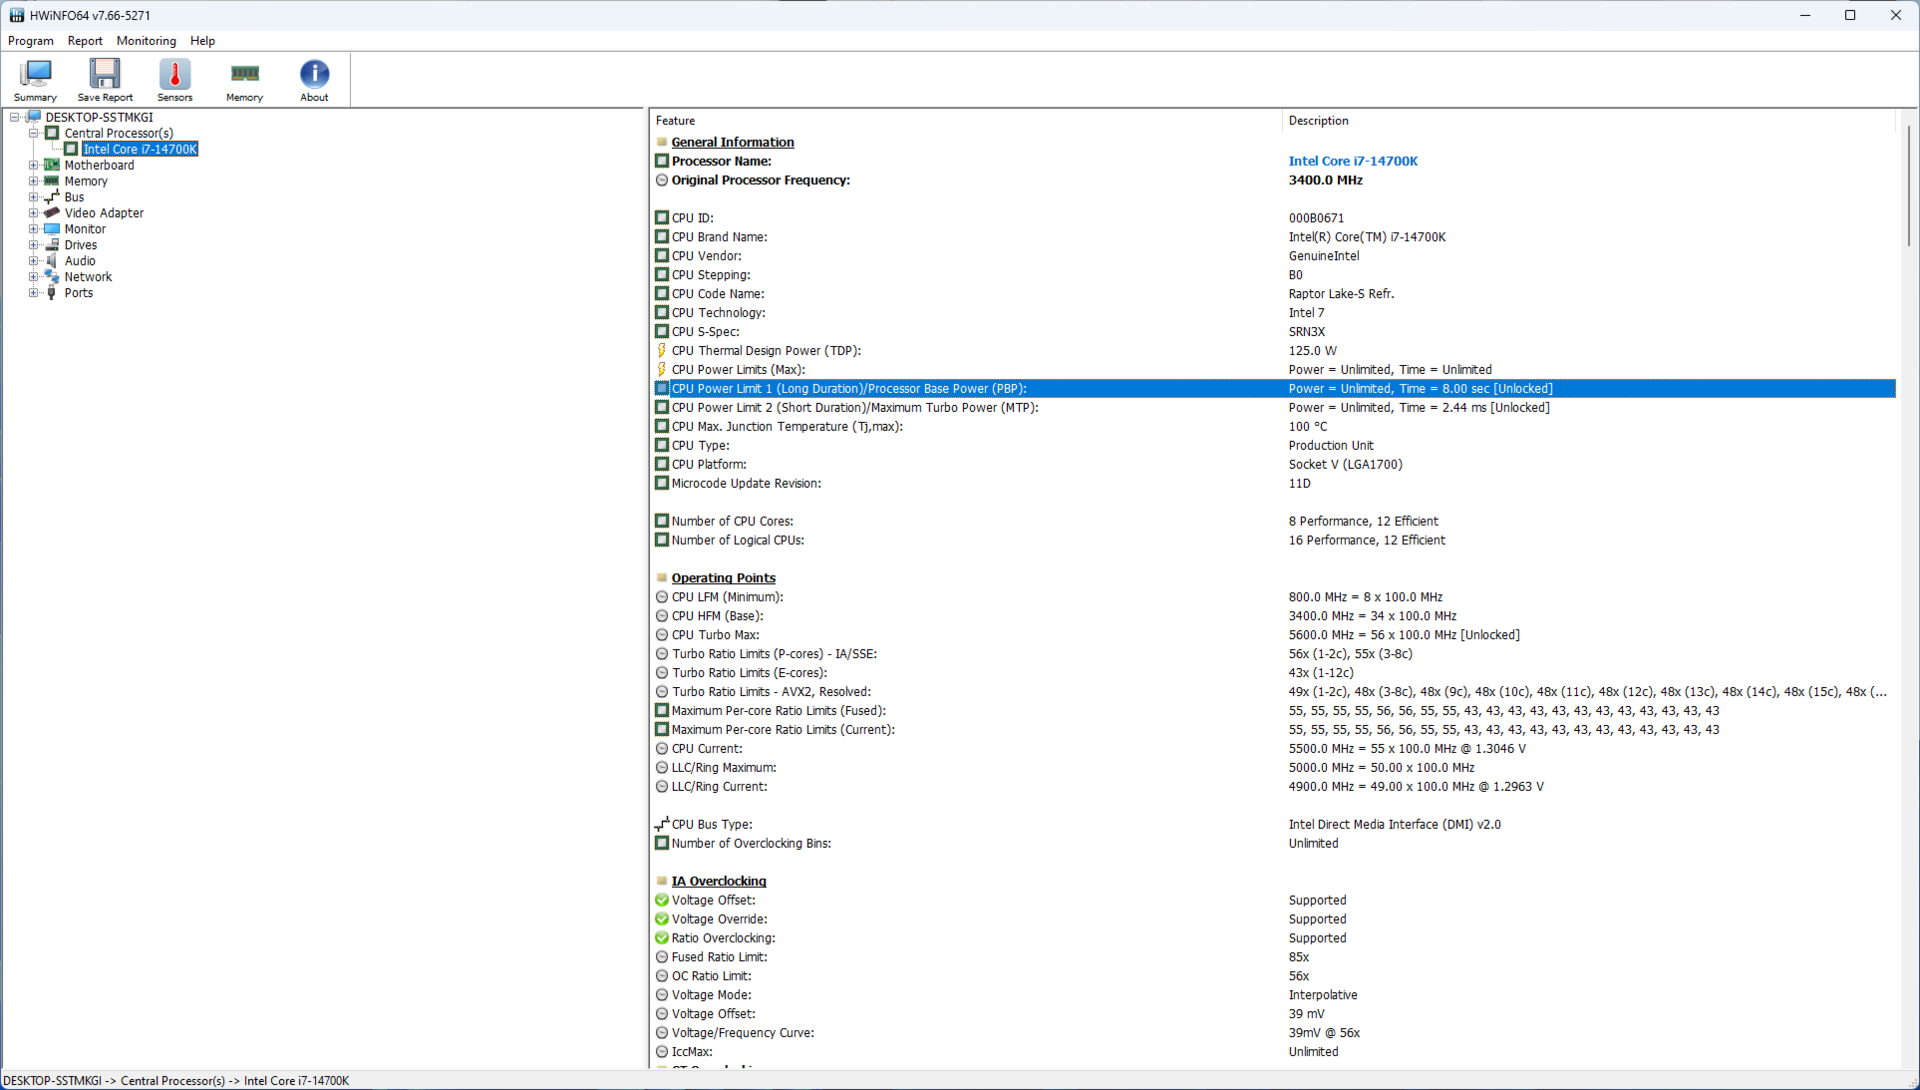
Um sicherzustellen, dass der Core i7-14700K während des Tests seine volle Leistung entfalten kann, haben wir PL1=PL2 auf „unendlich“ eingestellt und Thermal Velocity Boost über Intel XTU aktiviert.
Wir bedanken uns bei Intel für die Bereitstellung des Core i7-14700K-Testsamples, bei Zotac für die RTX 4090 AMP Extreme Airo GPU, bei Gigabyte für das Z790 Aorus Master Mainboard, den M28U Monitor und die Aorus NVMe SSD, bei Kingston für das DDR5-Speicher-Kit und schließlich bei Cooler Master für den Teststand, den AIO-Kühler und das Netzteil.
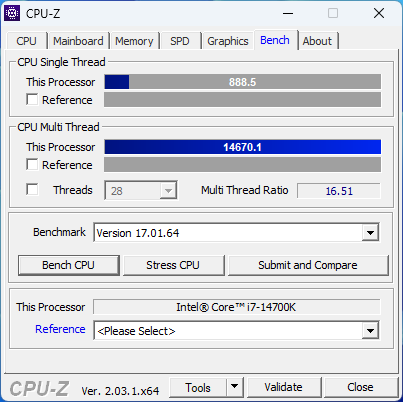
CPU-Benchmarks: Überlegenheit im Single-Core-Bereich gegenüber AMD Zen 4
Die kumulative CPU-Leistung des Core i7-14700K liegt direkt hinter dem AMD Ryzen 9 7950X3D und der Ryzen 9 7950X, während sie nur 7% hinter dem Core i9-14900K zurückliegt.
Im Single-Core-Betrieb zeigt der Core i7-14700K in den Cinebench R20 und R23 eine klare Überlegenheit gegenüber AMDs Zen 4-Angeboten, während letztere in den Geekbench Single-Core-Tests Vorteile aufweisen.
Aufgrund der höheren Anzahl an Threads haben der Ryzen 9 7950XD und der Ryzen 9 7950X im Multi-Core-Bereich einen ordentlichen Vorteil gegenüber dem Core i7-14700K. Dies spiegelt sich auch in den V-Ray-CPU-Tests wider, in denen der Core i7-14700K bis zu 20% hinter dem Ryzen 9 7950X liegt.
In den Cinebench-Single-Core-Tests liegt der Core i7-14700K bis zu 8% und in den Multi-Core-Tests bis zu 13% hinter dem Flaggschiff Core i9-14900K zurück. Dies erscheint angesichts des Preisunterschieds von~ 165 Euro zwischen diesen beiden Raptor Lake-S Refresh-CPUs angemessen.
| Performance Rating - Percent | |
| Intel Core i9-14900K | |
| Intel Core i9-13900K | |
| AMD Ryzen 9 7950X | |
| AMD Ryzen 9 7950X3D | |
| Intel Core i7-14700K | |
| AMD Ryzen 9 7900X | |
| AMD Ryzen 9 5950X -1! | |
| Intel Core i5-14600K | |
| Intel Core i9-12900K | |
| Intel Core i5-13600K | |
| AMD Ryzen 7 7800X3D -1! | |
| AMD Ryzen 5 7600X | |
| Intel Core i5-12600K | |
| Intel Core i5-13400 | |
| Intel Core i5-12400F | |
| Cinebench R15 | |
| CPU Single 64Bit | |
| Intel Core i9-14900K | |
| AMD Ryzen 9 7950X | |
| Intel Core i9-13900K | |
| AMD Ryzen 9 7950X3D | |
| AMD Ryzen 9 7900X | |
| AMD Ryzen 5 7600X | |
| Intel Core i7-14700K | |
| Intel Core i5-14600K | |
| AMD Ryzen 7 7800X3D | |
| Intel Core i5-13600K | |
| Intel Core i9-12900K | |
| Intel Core i5-12600K | |
| AMD Ryzen 9 5950X | |
| Intel Core i5-13400 | |
| Intel Core i5-12400F | |
| CPU Multi 64Bit | |
| Intel Core i9-14900K | |
| AMD Ryzen 9 7950X | |
| Intel Core i9-13900K | |
| AMD Ryzen 9 7950X3D | |
| Intel Core i7-14700K | |
| AMD Ryzen 9 7900X | |
| AMD Ryzen 9 5950X | |
| Intel Core i9-12900K | |
| Intel Core i5-13600K | |
| Intel Core i5-14600K | |
| AMD Ryzen 7 7800X3D | |
| Intel Core i5-12600K | |
| AMD Ryzen 5 7600X | |
| Intel Core i5-13400 | |
| Intel Core i5-12400F | |
| Cinebench R20 | |
| CPU (Single Core) | |
| Intel Core i9-14900K | |
| Intel Core i7-14700K | |
| Intel Core i9-13900K | |
| AMD Ryzen 9 7950X | |
| AMD Ryzen 9 7950X3D | |
| Intel Core i5-14600K | |
| AMD Ryzen 9 7900X | |
| Intel Core i5-13600K | |
| Intel Core i9-12900K | |
| AMD Ryzen 5 7600X | |
| Intel Core i5-12600K | |
| AMD Ryzen 7 7800X3D | |
| Intel Core i5-13400 | |
| Intel Core i5-12400F | |
| AMD Ryzen 9 5950X | |
| CPU (Multi Core) | |
| Intel Core i9-14900K | |
| Intel Core i9-13900K | |
| AMD Ryzen 9 7950X | |
| AMD Ryzen 9 7950X3D | |
| Intel Core i7-14700K | |
| AMD Ryzen 9 7900X | |
| AMD Ryzen 9 5950X | |
| Intel Core i9-12900K | |
| Intel Core i5-14600K | |
| Intel Core i5-13600K | |
| AMD Ryzen 7 7800X3D | |
| Intel Core i5-12600K | |
| Intel Core i5-13400 | |
| AMD Ryzen 5 7600X | |
| Intel Core i5-12400F | |
| Cinebench R23 | |
| Single Core | |
| Intel Core i9-14900K | |
| Intel Core i9-13900K | |
| Intel Core i7-14700K | |
| Intel Core i5-14600K | |
| AMD Ryzen 9 7950X3D | |
| AMD Ryzen 9 7950X | |
| AMD Ryzen 9 7900X | |
| Intel Core i5-13600K | |
| Intel Core i9-12900K | |
| AMD Ryzen 5 7600X | |
| Intel Core i5-12600K | |
| AMD Ryzen 7 7800X3D | |
| Intel Core i5-13400 | |
| Intel Core i5-12400F | |
| AMD Ryzen 9 5950X | |
| Multi Core | |
| Intel Core i9-14900K | |
| Intel Core i9-13900K | |
| AMD Ryzen 9 7950X | |
| AMD Ryzen 9 7950X3D | |
| Intel Core i7-14700K | |
| AMD Ryzen 9 7900X | |
| AMD Ryzen 9 5950X | |
| Intel Core i9-12900K | |
| Intel Core i5-14600K | |
| Intel Core i5-13600K | |
| AMD Ryzen 7 7800X3D | |
| Intel Core i5-12600K | |
| Intel Core i5-13400 | |
| AMD Ryzen 5 7600X | |
| Intel Core i5-12400F | |
| Cinebench R11.5 | |
| CPU Single 64Bit | |
| Intel Core i9-14900K | |
| Intel Core i9-13900K | |
| AMD Ryzen 9 7950X | |
| AMD Ryzen 9 7950X3D | |
| AMD Ryzen 9 7900X | |
| AMD Ryzen 5 7600X | |
| Intel Core i7-14700K | |
| Intel Core i5-14600K | |
| Intel Core i9-12900K | |
| Intel Core i5-13600K | |
| AMD Ryzen 7 7800X3D | |
| Intel Core i5-12600K | |
| AMD Ryzen 9 5950X | |
| Intel Core i5-13400 | |
| Intel Core i5-12400F | |
| CPU Multi 64Bit | |
| Intel Core i9-14900K | |
| Intel Core i9-13900K | |
| AMD Ryzen 9 7950X | |
| AMD Ryzen 9 7950X3D | |
| Intel Core i7-14700K | |
| AMD Ryzen 9 7900X | |
| AMD Ryzen 9 5950X | |
| Intel Core i9-12900K | |
| Intel Core i5-13600K | |
| Intel Core i5-14600K | |
| AMD Ryzen 7 7800X3D | |
| Intel Core i5-12600K | |
| AMD Ryzen 5 7600X | |
| Intel Core i5-13400 | |
| Intel Core i5-12400F | |
| Cinebench R10 | |
| Rendering Single CPUs 64Bit | |
| Intel Core i9-14900K | |
| Intel Core i9-13900K | |
| Intel Core i7-14700K | |
| Intel Core i5-14600K | |
| AMD Ryzen 9 7900X | |
| AMD Ryzen 9 7950X | |
| Intel Core i5-13600K | |
| Intel Core i9-12900K | |
| AMD Ryzen 5 7600X | |
| Intel Core i5-12600K | |
| AMD Ryzen 7 7800X3D | |
| Intel Core i5-13400 | |
| Intel Core i5-12400F | |
| AMD Ryzen 9 5950X | |
| AMD Ryzen 9 7950X3D | |
| Rendering Multiple CPUs 64Bit | |
| Intel Core i9-14900K | |
| Intel Core i7-14700K | |
| Intel Core i9-13900K | |
| AMD Ryzen 9 7950X | |
| AMD Ryzen 9 7900X | |
| Intel Core i5-14600K | |
| Intel Core i9-12900K | |
| Intel Core i5-13600K | |
| AMD Ryzen 9 5950X | |
| AMD Ryzen 7 7800X3D | |
| AMD Ryzen 5 7600X | |
| Intel Core i5-12600K | |
| Intel Core i5-13400 | |
| AMD Ryzen 9 7950X3D | |
| Intel Core i5-12400F | |
| Blender - v2.79 BMW27 CPU | |
| Intel Core i5-12400F | |
| Intel Core i5-13400 | |
| AMD Ryzen 5 7600X | |
| Intel Core i5-12600K | |
| AMD Ryzen 7 7800X3D | |
| Intel Core i5-13600K | |
| Intel Core i5-14600K | |
| Intel Core i9-12900K | |
| AMD Ryzen 9 5950X | |
| AMD Ryzen 9 7900X | |
| Intel Core i7-14700K | |
| AMD Ryzen 9 7950X3D | |
| AMD Ryzen 9 7950X | |
| Intel Core i9-13900K | |
| Intel Core i9-14900K | |
| wPrime 2.10 | |
| 32m | |
| Intel Core i9-12900K | |
| Intel Core i5-12600K | |
| Intel Core i5-12400F | |
| Intel Core i5-13400 | |
| AMD Ryzen 5 7600X | |
| AMD Ryzen 9 5950X | |
| Intel Core i5-13600K | |
| AMD Ryzen 7 7800X3D | |
| Intel Core i5-14600K | |
| Intel Core i7-14700K | |
| Intel Core i9-14900K | |
| AMD Ryzen 9 7950X3D | |
| Intel Core i9-13900K | |
| AMD Ryzen 9 7900X | |
| AMD Ryzen 9 7950X | |
| 1024m | |
| Intel Core i5-13400 | |
| Intel Core i5-12600K | |
| Intel Core i9-12900K | |
| Intel Core i5-13600K | |
| Intel Core i5-14600K | |
| Intel Core i5-12400F | |
| Intel Core i7-14700K | |
| Intel Core i9-13900K | |
| AMD Ryzen 5 7600X | |
| Intel Core i9-14900K | |
| AMD Ryzen 9 5950X | |
| AMD Ryzen 7 7800X3D | |
| AMD Ryzen 9 7900X | |
| AMD Ryzen 9 7950X3D | |
| AMD Ryzen 9 7950X | |
| X264 HD Benchmark 4.0 | |
| Pass 1 | |
| Intel Core i9-14900K | |
| Intel Core i7-14700K | |
| Intel Core i9-13900K | |
| Intel Core i5-14600K | |
| AMD Ryzen 9 7950X3D | |
| Intel Core i5-13600K | |
| AMD Ryzen 9 7950X | |
| AMD Ryzen 9 7900X | |
| Intel Core i9-12900K | |
| AMD Ryzen 5 7600X | |
| AMD Ryzen 7 7800X3D | |
| AMD Ryzen 9 5950X | |
| Intel Core i5-12600K | |
| Intel Core i5-13400 | |
| Intel Core i5-12400F | |
| Pass 2 | |
| Intel Core i9-14900K | |
| Intel Core i9-13900K | |
| AMD Ryzen 9 7950X | |
| AMD Ryzen 9 7950X3D | |
| Intel Core i7-14700K | |
| AMD Ryzen 9 7900X | |
| AMD Ryzen 9 5950X | |
| Intel Core i5-14600K | |
| Intel Core i9-12900K | |
| Intel Core i5-13600K | |
| AMD Ryzen 7 7800X3D | |
| Intel Core i5-12600K | |
| AMD Ryzen 5 7600X | |
| Intel Core i5-13400 | |
| Intel Core i5-12400F | |
| WinRAR - Result | |
| AMD Ryzen 9 7900X | |
| AMD Ryzen 7 7800X3D | |
| AMD Ryzen 9 7950X | |
| AMD Ryzen 5 7600X | |
| Intel Core i9-14900K | |
| AMD Ryzen 9 7950X3D | |
| Intel Core i9-13900K | |
| Intel Core i7-14700K | |
| AMD Ryzen 9 5950X | |
| Intel Core i5-14600K | |
| Intel Core i5-13600K | |
| Intel Core i9-12900K | |
| Intel Core i5-13400 | |
| Intel Core i5-12400F | |
| Intel Core i5-12600K | |
| TrueCrypt | |
| AES Mean 100MB | |
| AMD Ryzen 9 7950X | |
| Intel Core i9-13900K | |
| AMD Ryzen 9 5950X | |
| AMD Ryzen 9 7950X3D | |
| Intel Core i9-14900K | |
| Intel Core i7-14700K | |
| Intel Core i5-14600K | |
| Intel Core i5-13600K | |
| Intel Core i9-12900K | |
| AMD Ryzen 7 7800X3D | |
| AMD Ryzen 9 7900X | |
| AMD Ryzen 5 7600X | |
| Intel Core i5-12600K | |
| Intel Core i5-13400 | |
| Intel Core i5-12400F | |
| Twofish Mean 100MB | |
| Intel Core i9-14900K | |
| Intel Core i9-13900K | |
| Intel Core i7-14700K | |
| AMD Ryzen 9 7950X | |
| AMD Ryzen 9 7950X3D | |
| AMD Ryzen 9 5950X | |
| Intel Core i9-12900K | |
| Intel Core i5-14600K | |
| Intel Core i5-13600K | |
| AMD Ryzen 9 7900X | |
| Intel Core i5-12600K | |
| AMD Ryzen 7 7800X3D | |
| Intel Core i5-13400 | |
| AMD Ryzen 5 7600X | |
| Intel Core i5-12400F | |
| Serpent Mean 100MB | |
| Intel Core i9-13900K | |
| AMD Ryzen 9 7950X | |
| AMD Ryzen 9 7950X3D | |
| Intel Core i9-14900K | |
| Intel Core i7-14700K | |
| AMD Ryzen 9 5950X | |
| Intel Core i9-12900K | |
| Intel Core i5-14600K | |
| Intel Core i5-13600K | |
| AMD Ryzen 9 7900X | |
| Intel Core i5-12600K | |
| AMD Ryzen 7 7800X3D | |
| Intel Core i5-13400 | |
| AMD Ryzen 5 7600X | |
| Intel Core i5-12400F | |
| Geekbench 5.5 | |
| Multi-Core | |
| Intel Core i9-14900K | |
| AMD Ryzen 9 7950X | |
| AMD Ryzen 9 7950X3D | |
| Intel Core i9-13900K | |
| Intel Core i7-14700K | |
| AMD Ryzen 9 7900X | |
| Intel Core i9-12900K | |
| Intel Core i5-14600K | |
| AMD Ryzen 9 5950X | |
| Intel Core i5-13600K | |
| AMD Ryzen 7 7800X3D | |
| Intel Core i5-12600K | |
| Intel Core i5-13400 | |
| AMD Ryzen 5 7600X | |
| Intel Core i5-12400F | |
| Single-Core | |
| AMD Ryzen 9 7950X | |
| AMD Ryzen 9 7950X3D | |
| Intel Core i9-13900K | |
| AMD Ryzen 9 7900X | |
| Intel Core i9-14900K | |
| AMD Ryzen 5 7600X | |
| Intel Core i7-14700K | |
| Intel Core i9-12900K | |
| AMD Ryzen 7 7800X3D | |
| Intel Core i5-14600K | |
| Intel Core i5-13600K | |
| Intel Core i5-12600K | |
| Intel Core i5-13400 | |
| Intel Core i5-12400F | |
| AMD Ryzen 9 5950X | |
| Geekbench 5.0 | |
| 5.0 Multi-Core | |
| Intel Core i9-14900K | |
| AMD Ryzen 9 7950X | |
| Intel Core i9-13900K | |
| AMD Ryzen 9 7950X3D | |
| Intel Core i7-14700K | |
| AMD Ryzen 9 7900X | |
| Intel Core i9-12900K | |
| Intel Core i5-14600K | |
| Intel Core i5-13600K | |
| AMD Ryzen 9 5950X | |
| AMD Ryzen 7 7800X3D | |
| Intel Core i5-12600K | |
| AMD Ryzen 5 7600X | |
| Intel Core i5-13400 | |
| Intel Core i5-12400F | |
| 5.0 Single-Core | |
| Intel Core i9-14900K | |
| AMD Ryzen 9 7950X | |
| Intel Core i9-13900K | |
| AMD Ryzen 9 7900X | |
| AMD Ryzen 9 7950X3D | |
| AMD Ryzen 5 7600X | |
| Intel Core i7-14700K | |
| Intel Core i5-14600K | |
| Intel Core i9-12900K | |
| AMD Ryzen 7 7800X3D | |
| Intel Core i5-13600K | |
| Intel Core i5-12600K | |
| Intel Core i5-13400 | |
| AMD Ryzen 9 5950X | |
| Intel Core i5-12400F | |
| Geekbench 4.4 | |
| 64 Bit Single-Core Score | |
| Intel Core i9-14900K | |
| Intel Core i9-13900K | |
| AMD Ryzen 9 7950X | |
| Intel Core i7-14700K | |
| AMD Ryzen 9 7950X3D | |
| AMD Ryzen 9 7900X | |
| AMD Ryzen 7 7800X3D | |
| AMD Ryzen 5 7600X | |
| Intel Core i5-14600K | |
| Intel Core i9-12900K | |
| Intel Core i5-13600K | |
| Intel Core i5-12600K | |
| Intel Core i5-13400 | |
| Intel Core i5-12400F | |
| AMD Ryzen 9 5950X | |
| 64 Bit Multi-Core Score | |
| AMD Ryzen 9 7950X | |
| Intel Core i9-14900K | |
| AMD Ryzen 9 7950X3D | |
| Intel Core i9-13900K | |
| Intel Core i7-14700K | |
| AMD Ryzen 9 7900X | |
| Intel Core i5-14600K | |
| Intel Core i9-12900K | |
| AMD Ryzen 9 5950X | |
| Intel Core i5-13600K | |
| AMD Ryzen 7 7800X3D | |
| AMD Ryzen 5 7600X | |
| Intel Core i5-12600K | |
| Intel Core i5-13400 | |
| Intel Core i5-12400F | |
| 3DMark 11 - 1280x720 Performance Physics | |
| AMD Ryzen 9 7950X3D | |
| AMD Ryzen 7 7800X3D | |
| Intel Core i7-14700K | |
| Intel Core i9-13900K | |
| Intel Core i9-14900K | |
| Intel Core i5-14600K | |
| Intel Core i5-13600K | |
| AMD Ryzen 9 7900X | |
| AMD Ryzen 9 7950X | |
| Intel Core i9-12900K | |
| AMD Ryzen 5 7600X | |
| AMD Ryzen 9 5950X | |
| Intel Core i5-12600K | |
| Intel Core i5-13400 | |
| Intel Core i5-12400F | |
| 7-Zip 18.03 | |
| 7z b 4 | |
| AMD Ryzen 9 7950X | |
| AMD Ryzen 9 7950X3D | |
| Intel Core i9-14900K | |
| Intel Core i9-13900K | |
| Intel Core i7-14700K | |
| AMD Ryzen 9 5950X | |
| AMD Ryzen 9 7900X | |
| Intel Core i9-12900K | |
| Intel Core i5-14600K | |
| Intel Core i5-13600K | |
| AMD Ryzen 7 7800X3D | |
| AMD Ryzen 5 7600X | |
| Intel Core i5-12600K | |
| Intel Core i5-13400 | |
| Intel Core i5-12400F | |
| 7z b 4 -mmt1 | |
| AMD Ryzen 9 7950X | |
| AMD Ryzen 9 7950X3D | |
| AMD Ryzen 9 7900X | |
| AMD Ryzen 7 7800X3D | |
| AMD Ryzen 5 7600X | |
| Intel Core i9-14900K | |
| Intel Core i7-14700K | |
| Intel Core i9-13900K | |
| AMD Ryzen 9 5950X | |
| Intel Core i5-14600K | |
| Intel Core i9-12900K | |
| Intel Core i5-13600K | |
| Intel Core i5-12600K | |
| Intel Core i5-13400 | |
| Intel Core i5-12400F | |
| HWBOT x265 Benchmark v2.2 - 4k Preset | |
| AMD Ryzen 9 7950X | |
| Intel Core i9-14900K | |
| Intel Core i9-13900K | |
| AMD Ryzen 9 7950X3D | |
| Intel Core i7-14700K | |
| AMD Ryzen 9 7900X | |
| AMD Ryzen 9 5950X | |
| Intel Core i5-12600K | |
| Intel Core i9-12900K | |
| Intel Core i5-14600K | |
| Intel Core i5-13600K | |
| AMD Ryzen 7 7800X3D | |
| AMD Ryzen 5 7600X | |
| Intel Core i5-13400 | |
| Intel Core i5-12400F | |
| R Benchmark 2.5 - Overall mean | |
| Intel Core i5-12400F | |
| Intel Core i5-13400 | |
| AMD Ryzen 9 5950X | |
| Intel Core i5-12600K | |
| Intel Core i9-12900K | |
| AMD Ryzen 7 7800X3D | |
| Intel Core i5-13600K | |
| Intel Core i5-14600K | |
| Intel Core i7-14700K | |
| AMD Ryzen 5 7600X | |
| AMD Ryzen 9 7900X | |
| AMD Ryzen 9 7950X3D | |
| AMD Ryzen 9 7950X | |
| Intel Core i9-13900K | |
| Intel Core i9-14900K | |
| LibreOffice - 20 Documents To PDF | |
| Intel Core i5-12600K | |
| Intel Core i5-12400F | |
| AMD Ryzen 9 5950X | |
| AMD Ryzen 7 7800X3D | |
| Intel Core i9-12900K | |
| Intel Core i7-14700K | |
| Intel Core i5-13400 | |
| AMD Ryzen 9 7950X3D | |
| AMD Ryzen 5 7600X | |
| Intel Core i9-13900K | |
| AMD Ryzen 9 7950X | |
| Intel Core i5-13600K | |
| AMD Ryzen 9 7900X | |
| Intel Core i9-14900K | |
| Intel Core i5-14600K | |
| WebXPRT 3 - Overall | |
| AMD Ryzen 9 7950X3D | |
| Intel Core i9-14900K | |
| AMD Ryzen 9 7900X | |
| AMD Ryzen 9 7950X | |
| AMD Ryzen 5 7600X | |
| Intel Core i9-13900K | |
| Intel Core i5-14600K | |
| AMD Ryzen 7 7800X3D | |
| Intel Core i7-14700K | |
| Intel Core i5-13600K | |
| Intel Core i9-12900K | |
| Intel Core i5-13400 | |
| Intel Core i5-12600K | |
| AMD Ryzen 9 5950X | |
| Intel Core i5-12400F | |
| Mozilla Kraken 1.1 - Total | |
| Intel Core i5-12400F | |
| AMD Ryzen 9 5950X | |
| Intel Core i5-13400 | |
| Intel Core i5-12600K | |
| AMD Ryzen 7 7800X3D | |
| Intel Core i9-12900K | |
| Intel Core i5-13600K | |
| Intel Core i5-14600K | |
| AMD Ryzen 5 7600X | |
| Intel Core i7-14700K | |
| AMD Ryzen 9 7950X3D | |
| AMD Ryzen 9 7950X | |
| Intel Core i9-13900K | |
| AMD Ryzen 9 7900X | |
| Intel Core i9-14900K | |
| V-Ray Benchmark Next 4.10 - CPU | |
| AMD Ryzen 9 7950X | |
| AMD Ryzen 9 7950X3D | |
| Intel Core i9-14900K | |
| Intel Core i9-13900K | |
| Intel Core i7-14700K | |
| AMD Ryzen 9 7900X | |
| AMD Ryzen 9 5950X | |
| Intel Core i9-12900K | |
| Intel Core i5-14600K | |
| Intel Core i5-13600K | |
| Intel Core i5-12600K | |
| AMD Ryzen 5 7600X | |
| Intel Core i5-13400 | |
| Intel Core i5-12400F | |
| V-Ray 5 Benchmark - CPU | |
| AMD Ryzen 9 7950X | |
| AMD Ryzen 9 7950X3D | |
| Intel Core i9-13900K | |
| Intel Core i9-14900K | |
| Intel Core i7-14700K | |
| AMD Ryzen 9 7900X | |
| Intel Core i9-12900K | |
| Intel Core i5-14600K | |
| Intel Core i5-13600K | |
| AMD Ryzen 7 7800X3D | |
| Intel Core i5-12600K | |
| AMD Ryzen 5 7600X | |
| Intel Core i5-13400 | |
| Intel Core i5-12400F | |
* ... kleinere Werte sind besser
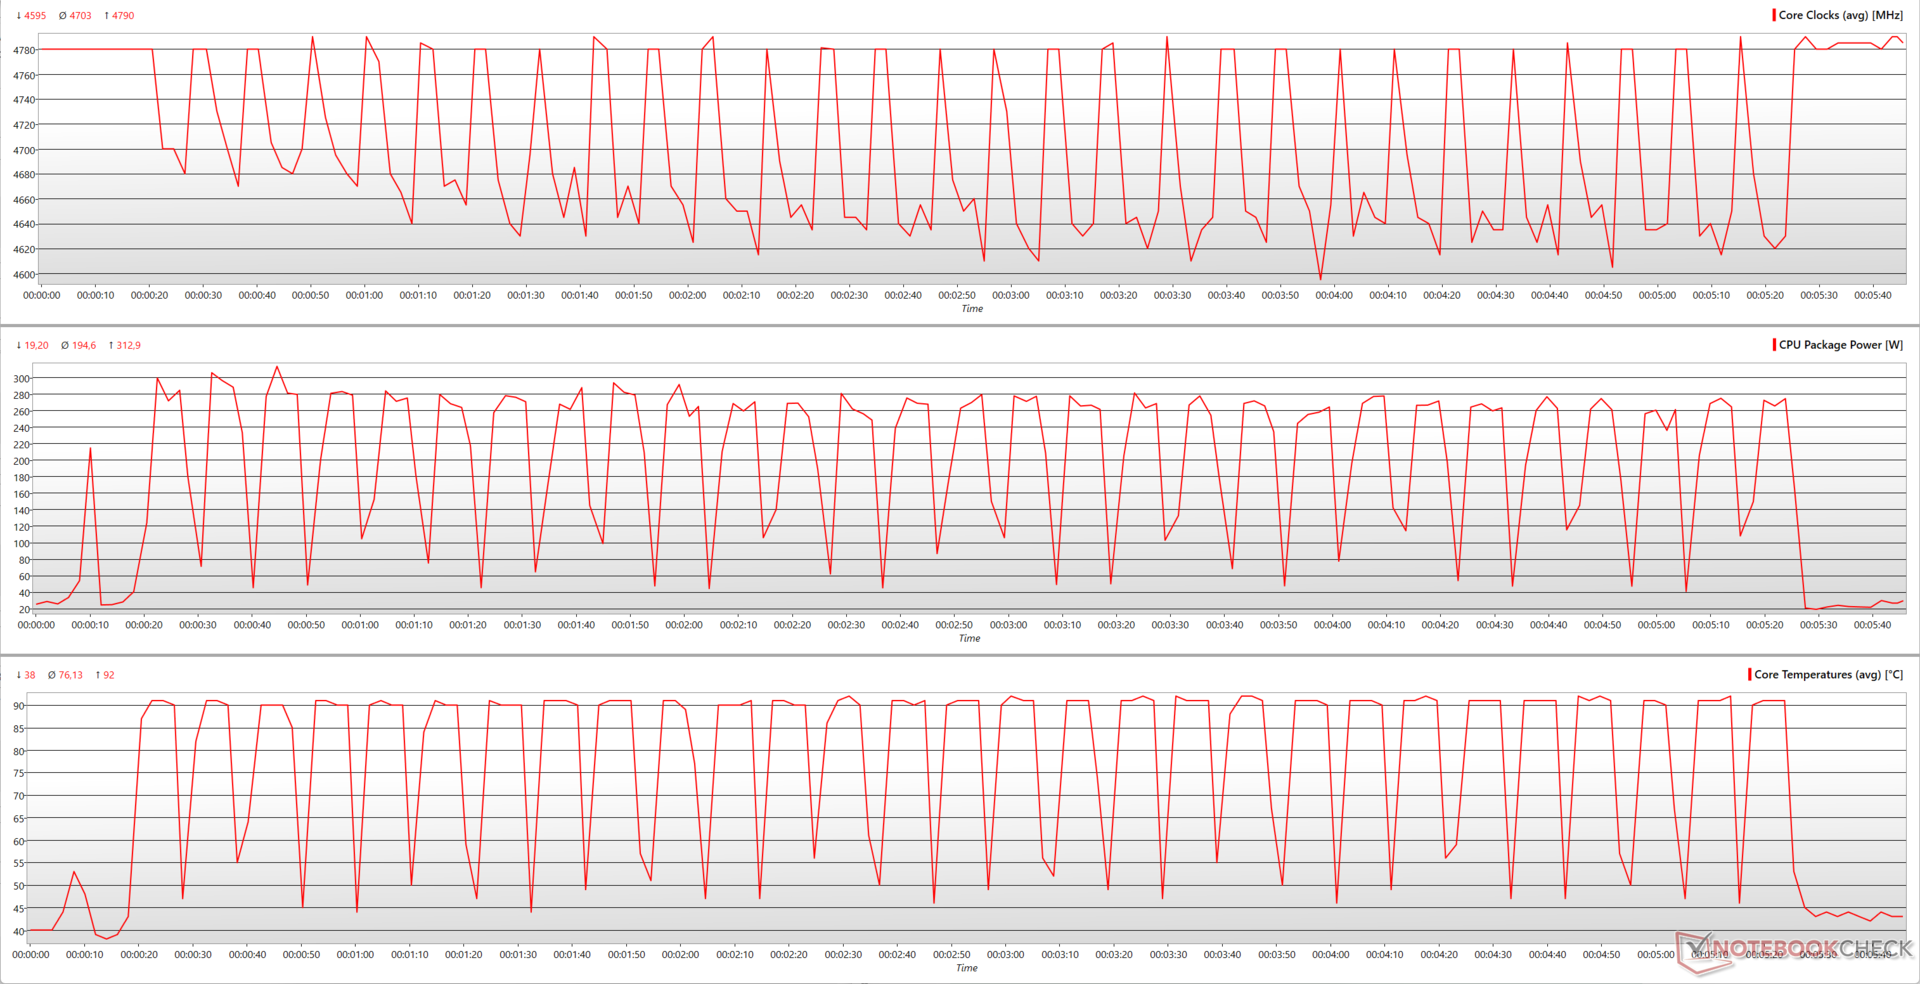
Cinebench R15 Multi Dauertest
Intel liefert keinen Kühler mit, daher müssen Sie auf eine leistungsfähige Lösung eines Drittanbieters zurückgreifen, vorzugsweise einen All-in-One-Flüssigkeitskühler (AiO). Während eines Cinebench R15 Multi-Core-Loop-Tests mit dem Cooler Master MasterLiquid ML360L AiO konnten wir kein Leistungs-Throttling feststellen.
Während der Cinebench-R15-Multicore-Schleife kann der Core i7-14700K bis zu 4,79 GHz erreichen, was jedoch mit einem Verbrauch von fast 313 W und einer Kerntemperatur von 92 °C einhergeht.
Die durchschnittliche Leistung des Gehäuses während der Schleife beträgt jedoch nur etwa 195 W, was immer noch zu einem durchschnittlichen Takt von 4,7 GHz führt, während sich die Kerntemperaturen bei etwa 76 °C einpendeln.
System Performance: Auf dem gleichen Stand wie ein Ryzen 9 7950X3D
Der Core i7-14700K kommt bei normalen Produktivitätsaufgaben nicht ins Schwitzen. Seine Gesamtsystemleistung liegt auf einem Level mit einem Ryzen 9 7900X und einem Ryzen 9 7950X3D, während er um 9% hinter dem Core i9-14900K zurückbleibt.
Einzeln betrachtet schließt der Core i7-14700K die Lücke zum Core i9-14900K und auch zum Core i9-13900K im 3DMark 11 Performance Physics und auch im PCMark 10 insgesamt fast auf.
Der 3DMark Time Spy CPU zeigt interessanterweise, dass der Core i7-14700K einen Vorsprung von 11% gegenüber dem Core i9-13900K hat, obwohl er in Fire Strike Physics 9% hinter dieser CPU zurückbleibt.
Die neue Raptor Lake-S Refresh CPU muss in den AIDA64 FPU Tests einen Rückschlag hinnehmen, schneidet aber in Untertests wie PhotoWorxx und CPU ZLib gut ab.
3DMark 11: 1280x720 Performance Physics
3DMark: 1920x1080 Fire Strike Physics | 2560x1440 Time Spy CPU
CrossMark: Overall | Responsiveness | Creativity | Productivity
PCMark 10: Score | Essentials | Productivity | Digital Content Creation
AIDA64: FP32 Ray-Trace | FPU Julia | CPU SHA3 | CPU Queen | FPU SinJulia | FPU Mandel | CPU AES | CPU ZLib | FP64 Ray-Trace | CPU PhotoWorxx
| Performance Rating | |
| Intel Core i9-14900K | |
| AMD Ryzen 9 7950X | |
| Intel Core i9-13900K | |
| AMD Ryzen 9 7950X3D -2! | |
| Intel Core i7-14700K | |
| AMD Ryzen 9 7900X | |
| Intel Core i5-14600K | |
| AMD Ryzen 7 7800X3D | |
| Intel Core i5-13600K | |
| AMD Ryzen 5 7600X | |
| AMD Ryzen 9 5950X | |
| Intel Core i9-12900K -4! | |
| Intel Core i5-13400 | |
| Intel Core i5-12400F | |
| Intel Core i5-12600K -4! | |
| 3DMark 11 / Performance Physics | |
| AMD Ryzen 9 7950X3D | |
| AMD Ryzen 7 7800X3D | |
| Intel Core i7-14700K | |
| Intel Core i9-13900K | |
| Intel Core i9-14900K | |
| Intel Core i5-14600K | |
| Intel Core i5-13600K | |
| AMD Ryzen 9 7900X | |
| AMD Ryzen 9 7950X | |
| Intel Core i9-12900K | |
| AMD Ryzen 5 7600X | |
| AMD Ryzen 9 5950X | |
| Intel Core i5-12600K | |
| Intel Core i5-13400 | |
| Intel Core i5-12400F | |
| 3DMark / Fire Strike Physics | |
| Intel Core i9-14900K | |
| Intel Core i9-13900K | |
| Intel Core i7-14700K | |
| AMD Ryzen 9 7950X3D | |
| AMD Ryzen 9 7900X | |
| AMD Ryzen 9 7950X | |
| Intel Core i5-14600K | |
| AMD Ryzen 9 5950X | |
| Intel Core i9-12900K | |
| Intel Core i5-13600K | |
| AMD Ryzen 7 7800X3D | |
| AMD Ryzen 5 7600X | |
| Intel Core i5-12600K | |
| Intel Core i5-13400 | |
| Intel Core i5-12400F | |
| 3DMark / Time Spy CPU | |
| Intel Core i9-14900K | |
| Intel Core i7-14700K | |
| Intel Core i9-13900K | |
| Intel Core i5-14600K | |
| Intel Core i9-12900K | |
| AMD Ryzen 9 7950X3D | |
| Intel Core i5-13600K | |
| AMD Ryzen 9 7900X | |
| AMD Ryzen 9 7950X | |
| AMD Ryzen 7 7800X3D | |
| Intel Core i5-12600K | |
| AMD Ryzen 9 5950X | |
| Intel Core i5-13400 | |
| AMD Ryzen 5 7600X | |
| Intel Core i5-12400F | |
| CrossMark / Overall | |
| Intel Core i9-14900K | |
| Intel Core i9-13900K | |
| AMD Ryzen 9 7950X | |
| AMD Ryzen 9 7900X | |
| Intel Core i5-14600K | |
| Intel Core i7-14700K | |
| Intel Core i5-13600K | |
| AMD Ryzen 5 7600X | |
| AMD Ryzen 7 7800X3D | |
| AMD Ryzen 9 7950X3D | |
| Intel Core i5-13400 | |
| Intel Core i5-12400F | |
| AMD Ryzen 9 5950X | |
| CrossMark / Responsiveness | |
| Intel Core i9-13900K | |
| Intel Core i9-14900K | |
| Intel Core i5-13600K | |
| AMD Ryzen 9 7950X | |
| AMD Ryzen 9 7900X | |
| AMD Ryzen 5 7600X | |
| Intel Core i5-14600K | |
| AMD Ryzen 7 7800X3D | |
| Intel Core i7-14700K | |
| Intel Core i5-13400 | |
| Intel Core i5-12400F | |
| AMD Ryzen 9 7950X3D | |
| AMD Ryzen 9 5950X | |
| CrossMark / Creativity | |
| Intel Core i9-14900K | |
| AMD Ryzen 9 7950X | |
| Intel Core i9-13900K | |
| AMD Ryzen 9 7900X | |
| Intel Core i7-14700K | |
| Intel Core i5-14600K | |
| AMD Ryzen 9 7950X3D | |
| AMD Ryzen 7 7800X3D | |
| AMD Ryzen 5 7600X | |
| Intel Core i5-13600K | |
| Intel Core i5-13400 | |
| Intel Core i5-12400F | |
| AMD Ryzen 9 5950X | |
| CrossMark / Productivity | |
| Intel Core i9-14900K | |
| Intel Core i9-13900K | |
| AMD Ryzen 9 7950X | |
| AMD Ryzen 9 7900X | |
| Intel Core i5-14600K | |
| Intel Core i5-13600K | |
| AMD Ryzen 5 7600X | |
| Intel Core i7-14700K | |
| AMD Ryzen 7 7800X3D | |
| AMD Ryzen 9 7950X3D | |
| Intel Core i5-13400 | |
| Intel Core i5-12400F | |
| AMD Ryzen 9 5950X | |
| PCMark 10 / Score | |
| Intel Core i9-14900K | |
| AMD Ryzen 9 7900X | |
| AMD Ryzen 9 7950X | |
| Intel Core i9-13900K | |
| Intel Core i7-14700K | |
| Intel Core i5-14600K | |
| AMD Ryzen 7 7800X3D | |
| AMD Ryzen 5 7600X | |
| Intel Core i5-13600K | |
| AMD Ryzen 9 5950X | |
| Intel Core i5-13400 | |
| Intel Core i9-12900K | |
| Intel Core i5-12600K | |
| Intel Core i5-12400F | |
| PCMark 10 / Essentials | |
| Intel Core i9-13900K | |
| AMD Ryzen 9 7900X | |
| AMD Ryzen 9 7950X | |
| Intel Core i9-14900K | |
| Intel Core i5-13600K | |
| AMD Ryzen 5 7600X | |
| AMD Ryzen 9 7950X3D | |
| Intel Core i7-14700K | |
| Intel Core i5-14600K | |
| AMD Ryzen 7 7800X3D | |
| AMD Ryzen 9 5950X | |
| Intel Core i9-12900K | |
| Intel Core i5-12600K | |
| Intel Core i5-13400 | |
| Intel Core i5-12400F | |
| PCMark 10 / Productivity | |
| AMD Ryzen 5 7600X | |
| AMD Ryzen 9 7950X3D | |
| AMD Ryzen 7 7800X3D | |
| Intel Core i5-14600K | |
| Intel Core i7-14700K | |
| AMD Ryzen 9 7900X | |
| AMD Ryzen 9 7950X | |
| Intel Core i9-14900K | |
| Intel Core i5-13600K | |
| Intel Core i9-13900K | |
| AMD Ryzen 9 5950X | |
| Intel Core i5-12600K | |
| Intel Core i5-13400 | |
| Intel Core i9-12900K | |
| Intel Core i5-12400F | |
| PCMark 10 / Digital Content Creation | |
| Intel Core i9-14900K | |
| Intel Core i7-14700K | |
| AMD Ryzen 9 7900X | |
| AMD Ryzen 9 7950X | |
| Intel Core i9-13900K | |
| Intel Core i5-14600K | |
| AMD Ryzen 7 7800X3D | |
| Intel Core i5-13600K | |
| Intel Core i5-13400 | |
| AMD Ryzen 5 7600X | |
| AMD Ryzen 9 5950X | |
| Intel Core i9-12900K | |
| Intel Core i5-12400F | |
| Intel Core i5-12600K | |
| AIDA64 / FP32 Ray-Trace | |
| AMD Ryzen 9 7950X | |
| AMD Ryzen 9 7950X3D | |
| Intel Core i9-14900K | |
| Intel Core i9-14900K | |
| Intel Core i9-13900K | |
| AMD Ryzen 9 7900X | |
| Intel Core i7-14700K | |
| AMD Ryzen 7 7800X3D | |
| AMD Ryzen 9 5950X | |
| Intel Core i5-14600K | |
| Intel Core i5-13600K | |
| AMD Ryzen 5 7600X | |
| Intel Core i5-13400 | |
| Intel Core i5-12400F | |
| Intel Core i9-12900K | |
| Intel Core i5-12600K | |
| AIDA64 / FPU Julia | |
| AMD Ryzen 9 7950X3D | |
| AMD Ryzen 9 7950X | |
| AMD Ryzen 9 7900X | |
| Intel Core i9-14900K | |
| Intel Core i9-14900K | |
| Intel Core i9-13900K | |
| Intel Core i7-14700K | |
| AMD Ryzen 9 5950X | |
| AMD Ryzen 7 7800X3D | |
| Intel Core i5-14600K | |
| Intel Core i5-13600K | |
| AMD Ryzen 5 7600X | |
| Intel Core i5-13400 | |
| Intel Core i5-12400F | |
| Intel Core i9-12900K | |
| Intel Core i5-12600K | |
| AIDA64 / CPU SHA3 | |
| AMD Ryzen 9 7950X3D | |
| AMD Ryzen 9 7950X | |
| Intel Core i9-13900K | |
| Intel Core i9-14900K | |
| Intel Core i9-14900K | |
| Intel Core i7-14700K | |
| AMD Ryzen 9 7900X | |
| Intel Core i5-14600K | |
| AMD Ryzen 7 7800X3D | |
| Intel Core i5-13600K | |
| Intel Core i9-12900K | |
| AMD Ryzen 9 5950X | |
| AMD Ryzen 5 7600X | |
| Intel Core i5-13400 | |
| Intel Core i5-12600K | |
| Intel Core i5-12400F | |
| AIDA64 / CPU Queen | |
| AMD Ryzen 9 7950X | |
| AMD Ryzen 9 7950X3D | |
| AMD Ryzen 9 7900X | |
| Intel Core i7-14700K | |
| AMD Ryzen 9 5950X | |
| Intel Core i9-14900K | |
| Intel Core i9-13900K | |
| Intel Core i5-14600K | |
| AMD Ryzen 7 7800X3D | |
| Intel Core i5-13600K | |
| Intel Core i9-12900K | |
| AMD Ryzen 5 7600X | |
| Intel Core i5-12600K | |
| Intel Core i5-13400 | |
| Intel Core i5-12400F | |
| AIDA64 / FPU SinJulia | |
| AMD Ryzen 9 7950X | |
| AMD Ryzen 9 7950X3D | |
| AMD Ryzen 9 5950X | |
| AMD Ryzen 9 7900X | |
| Intel Core i9-14900K | |
| Intel Core i9-14900K | |
| Intel Core i9-13900K | |
| Intel Core i7-14700K | |
| AMD Ryzen 7 7800X3D | |
| Intel Core i9-12900K | |
| AMD Ryzen 5 7600X | |
| Intel Core i5-14600K | |
| Intel Core i5-13600K | |
| Intel Core i5-12600K | |
| Intel Core i5-13400 | |
| Intel Core i5-12400F | |
| AIDA64 / FPU Mandel | |
| AMD Ryzen 9 7950X3D | |
| AMD Ryzen 9 7950X | |
| AMD Ryzen 9 7900X | |
| Intel Core i9-14900K | |
| Intel Core i9-14900K | |
| Intel Core i9-13900K | |
| AMD Ryzen 9 5950X | |
| Intel Core i7-14700K | |
| AMD Ryzen 7 7800X3D | |
| Intel Core i5-14600K | |
| Intel Core i5-13600K | |
| AMD Ryzen 5 7600X | |
| Intel Core i5-13400 | |
| Intel Core i9-12900K | |
| Intel Core i5-12400F | |
| Intel Core i5-12600K | |
| AIDA64 / CPU AES | |
| AMD Ryzen 9 7950X | |
| AMD Ryzen 9 7950X3D | |
| Intel Core i9-14900K | |
| Intel Core i9-14900K | |
| Intel Core i9-13900K | |
| AMD Ryzen 9 7900X | |
| Intel Core i5-14600K | |
| AMD Ryzen 7 7800X3D | |
| Intel Core i5-13600K | |
| AMD Ryzen 9 5950X | |
| AMD Ryzen 5 7600X | |
| Intel Core i7-14700K | |
| Intel Core i9-12900K | |
| Intel Core i5-13400 | |
| Intel Core i5-12600K | |
| Intel Core i5-12400F | |
| AIDA64 / CPU ZLib | |
| Intel Core i9-14900K | |
| Intel Core i9-14900K | |
| Intel Core i9-13900K | |
| AMD Ryzen 9 7950X | |
| AMD Ryzen 9 7950X3D | |
| Intel Core i7-14700K | |
| AMD Ryzen 9 7900X | |
| AMD Ryzen 9 5950X | |
| Intel Core i9-12900K | |
| Intel Core i5-14600K | |
| Intel Core i5-13600K | |
| AMD Ryzen 7 7800X3D | |
| Intel Core i5-12600K | |
| AMD Ryzen 5 7600X | |
| Intel Core i5-13400 | |
| Intel Core i5-12400F | |
| AIDA64 / FP64 Ray-Trace | |
| AMD Ryzen 9 7950X | |
| AMD Ryzen 9 7950X3D | |
| Intel Core i9-14900K | |
| Intel Core i9-14900K | |
| Intel Core i9-13900K | |
| AMD Ryzen 9 7900X | |
| Intel Core i7-14700K | |
| AMD Ryzen 7 7800X3D | |
| AMD Ryzen 9 5950X | |
| Intel Core i5-14600K | |
| Intel Core i5-13600K | |
| AMD Ryzen 5 7600X | |
| Intel Core i5-13400 | |
| Intel Core i9-12900K | |
| Intel Core i5-12400F | |
| Intel Core i5-12600K | |
| AIDA64 / CPU PhotoWorxx | |
| Intel Core i9-14900K | |
| Intel Core i9-14900K | |
| Intel Core i5-14600K | |
| Intel Core i7-14700K | |
| AMD Ryzen 9 7950X3D | |
| Intel Core i9-13900K | |
| Intel Core i5-13400 | |
| Intel Core i5-12600K | |
| Intel Core i5-13600K | |
| Intel Core i9-12900K | |
| AMD Ryzen 7 7800X3D | |
| Intel Core i5-12400F | |
| AMD Ryzen 9 7950X | |
| AMD Ryzen 9 7900X | |
| AMD Ryzen 5 7600X | |
| AMD Ryzen 9 5950X | |
3DMark 11: 1280x720 Performance Physics
3DMark: 1920x1080 Fire Strike Physics | 2560x1440 Time Spy CPU
CrossMark: Overall | Responsiveness | Creativity | Productivity
PCMark 10: Score | Essentials | Productivity | Digital Content Creation
AIDA64: FP32 Ray-Trace | FPU Julia | CPU SHA3 | CPU Queen | FPU SinJulia | FPU Mandel | CPU AES | CPU ZLib | FP64 Ray-Trace | CPU PhotoWorxx
| Performance Rating - Percent | |
| Intel Core i9-12900K -1! | |
| Intel Core i5-12600K -1! | |
| Intel Core i9-14900K | |
| Intel Core i7-14700K | |
| Intel Core i5-14600K | |
| AMD Ryzen 9 7950X3D | |
| AMD Ryzen 9 7950X | |
| AMD Ryzen 9 7900X | |
| Intel Core i9-13900K | |
| AMD Ryzen 7 7800X3D | |
| Intel Core i5-13400 | |
| Intel Core i5-12400F | |
| Intel Core i5-13600K | |
| AMD Ryzen 5 7600X | |
| AMD Ryzen 9 5950X | |
* ... kleinere Werte sind besser
| PCMark 10 Score | 9741 Punkte | |
Hilfe | ||
3D und Gaming Performance: Core i5-14600K und Ryzen Zen 4 haben immer noch die Nase vorn
In Verbindung mit der Nvidia GeForce RTX 4090 GPU erreichte der Core i7-14700K die gleiche Leistung wie der Ryzen 9 7950X3D, Ryzen 9 7950X und sogar der Core i9-14900K in den gesamten 3DMark-Tests.
Der Core i5-14600K mit 14C/20T wies im 3DMark insgesamt einen respektablen Vorsprung von 9% auf.
| Performance Rating - Percent | |
| Intel Core i5-14600K | |
| AMD Ryzen 7 7800X3D | |
| AMD Ryzen 9 7950X | |
| AMD Ryzen 9 7950X3D | |
| Intel Core i9-14900K | |
| Intel Core i7-14700K | |
| Intel Core i5-13400 | |
| Intel Core i5-12400F | |
| Intel Core i9-13900K | |
| 3DMark 11 - 1280x720 Performance GPU | |
| AMD Ryzen 7 7800X3D | |
| Intel Core i5-14600K | |
| AMD Ryzen 9 7950X | |
| AMD Ryzen 9 7950X3D | |
| Intel Core i9-14900K | |
| Intel Core i5-13400 | |
| Intel Core i7-14700K | |
| Intel Core i5-12400F | |
| Intel Core i9-13900K | |
| 3DMark | |
| 2560x1440 Time Spy Graphics | |
| Intel Core i5-14600K | |
| Intel Core i9-14900K | |
| AMD Ryzen 7 7800X3D | |
| Intel Core i7-14700K | |
| AMD Ryzen 9 7950X | |
| AMD Ryzen 9 7950X3D | |
| Intel Core i9-13900K | |
| Intel Core i5-13400 | |
| Intel Core i5-12400F | |
| 1920x1080 Fire Strike Graphics | |
| Intel Core i5-14600K | |
| Intel Core i5-12400F | |
| Intel Core i5-13400 | |
| AMD Ryzen 7 7800X3D | |
| AMD Ryzen 9 7950X3D | |
| AMD Ryzen 9 7950X | |
| Intel Core i9-14900K | |
| Intel Core i7-14700K | |
| Intel Core i9-13900K | |
| 3DMark 11 Performance | 64680 Punkte | |
| 3DMark Fire Strike Score | 52237 Punkte | |
| 3DMark Time Spy Score | 33810 Punkte | |
Hilfe | ||
In der kombinierten Spieleleistung mit den Einstellungen 720p Low und 1080p Ultra zeigte der Core i5-14600K ebenfalls einen leichten Vorteil von 6% gegenüber dem Core i7-14700K.
Im Gegensatz dazu scheinen der Core i9-14900K (+16%) und die AMD-Flaggschiffe (bis zu +28%) beim Gaming besser abzuschneiden, als dies im 3DMark der Fall ist.
| Performance Rating - Percent | |
| AMD Ryzen 7 7800X3D | |
| AMD Ryzen 9 7950X3D | |
| Intel Core i9-14900K | |
| AMD Ryzen 9 7950X | |
| Intel Core i9-13900K | |
| Intel Core i5-14600K | |
| Intel Core i7-14700K | |
| Intel Core i5-13400 | |
| Intel Core i5-12400F | |
| F1 22 | |
| 1920x1080 Low Preset AA:T AF:16x | |
| AMD Ryzen 7 7800X3D | |
| AMD Ryzen 9 7950X3D | |
| Intel Core i9-14900K | |
| AMD Ryzen 9 7950X | |
| Intel Core i9-13900K | |
| Intel Core i5-14600K | |
| Intel Core i7-14700K | |
| Intel Core i5-12400F | |
| Intel Core i5-13400 | |
| 1920x1080 Ultra High Preset AA:T AF:16x | |
| AMD Ryzen 7 7800X3D | |
| Intel Core i9-14900K | |
| Intel Core i5-14600K | |
| AMD Ryzen 9 7950X3D | |
| Intel Core i9-13900K | |
| AMD Ryzen 9 7950X | |
| Intel Core i7-14700K | |
| Intel Core i5-12400F | |
| Intel Core i5-13400 | |
| Far Cry 5 | |
| 1920x1080 Ultra Preset AA:T | |
| AMD Ryzen 7 7800X3D | |
| AMD Ryzen 9 7950X3D | |
| Intel Core i9-14900K | |
| Intel Core i9-13900K | |
| Intel Core i5-14600K | |
| AMD Ryzen 9 7950X | |
| Intel Core i7-14700K | |
| Intel Core i5-13400 | |
| Intel Core i5-12400F | |
| 1280x720 Low Preset AA:T | |
| AMD Ryzen 7 7800X3D | |
| AMD Ryzen 9 7950X3D | |
| Intel Core i9-14900K | |
| Intel Core i5-14600K | |
| Intel Core i9-13900K | |
| AMD Ryzen 9 7950X | |
| Intel Core i5-13400 | |
| Intel Core i7-14700K | |
| Intel Core i5-12400F | |
| X-Plane 11.11 | |
| 1920x1080 high (fps_test=3) | |
| AMD Ryzen 7 7800X3D | |
| AMD Ryzen 9 7950X3D | |
| Intel Core i9-13900K | |
| Intel Core i9-14900K | |
| Intel Core i7-14700K | |
| AMD Ryzen 9 7950X | |
| Intel Core i5-14600K | |
| Intel Core i5-13400 | |
| Intel Core i5-12400F | |
| 1280x720 low (fps_test=1) | |
| Intel Core i9-13900K | |
| Intel Core i9-14900K | |
| Intel Core i5-14600K | |
| Intel Core i7-14700K | |
| AMD Ryzen 9 7950X3D | |
| AMD Ryzen 9 7950X | |
| AMD Ryzen 7 7800X3D | |
| Intel Core i5-13400 | |
| Intel Core i5-12400F | |
| Final Fantasy XV Benchmark | |
| 1920x1080 High Quality | |
| Intel Core i9-14900K | |
| AMD Ryzen 9 7950X | |
| AMD Ryzen 7 7800X3D | |
| Intel Core i5-14600K | |
| AMD Ryzen 9 7950X3D | |
| Intel Core i9-13900K | |
| Intel Core i7-14700K | |
| Intel Core i5-13400 | |
| Intel Core i5-12400F | |
| 1280x720 Lite Quality | |
| AMD Ryzen 9 7950X | |
| Intel Core i9-13900K | |
| AMD Ryzen 7 7800X3D | |
| Intel Core i5-14600K | |
| Intel Core i9-14900K | |
| Intel Core i7-14700K | |
| AMD Ryzen 9 7950X3D | |
| Intel Core i5-12400F | |
| Intel Core i5-13400 | |
| Dota 2 Reborn | |
| 1920x1080 ultra (3/3) best looking | |
| AMD Ryzen 7 7800X3D | |
| AMD Ryzen 9 7950X3D | |
| Intel Core i9-13900K | |
| AMD Ryzen 9 7950X | |
| Intel Core i9-14900K | |
| Intel Core i5-14600K | |
| Intel Core i7-14700K | |
| Intel Core i5-13400 | |
| Intel Core i5-12400F | |
| 1280x720 min (0/3) fastest | |
| AMD Ryzen 7 7800X3D | |
| AMD Ryzen 9 7950X3D | |
| AMD Ryzen 9 7950X | |
| Intel Core i9-14900K | |
| Intel Core i9-13900K | |
| Intel Core i5-14600K | |
| Intel Core i7-14700K | |
| Intel Core i5-12400F | |
| Intel Core i5-13400 | |
| The Witcher 3 | |
| 1920x1080 Ultra Graphics & Postprocessing (HBAO+) | |
| AMD Ryzen 9 7950X | |
| Intel Core i5-14600K | |
| AMD Ryzen 7 7800X3D | |
| Intel Core i9-14900K | |
| AMD Ryzen 9 7950X3D | |
| Intel Core i9-13900K | |
| Intel Core i7-14700K | |
| Intel Core i5-13400 | |
| Intel Core i5-12400F | |
| 1024x768 Low Graphics & Postprocessing | |
| AMD Ryzen 9 7950X3D | |
| AMD Ryzen 7 7800X3D | |
| Intel Core i9-14900K | |
| AMD Ryzen 9 7950X | |
| Intel Core i9-13900K | |
| Intel Core i7-14700K | |
| Intel Core i5-14600K | |
| Intel Core i5-13400 | |
| Intel Core i5-12400F | |
| GTA V | |
| 1920x1080 Highest AA:4xMSAA + FX AF:16x | |
| AMD Ryzen 7 7800X3D | |
| Intel Core i9-14900K | |
| Intel Core i9-13900K | |
| Intel Core i5-14600K | |
| AMD Ryzen 9 7950X | |
| AMD Ryzen 9 7950X3D | |
| Intel Core i7-14700K | |
| Intel Core i5-13400 | |
| Intel Core i5-12400F | |
| 1024x768 Lowest Settings possible | |
| AMD Ryzen 7 7800X3D | |
| AMD Ryzen 9 7950X | |
| Intel Core i9-13900K | |
| AMD Ryzen 9 7950X3D | |
| Intel Core i9-14900K | |
| Intel Core i5-14600K | |
| Intel Core i7-14700K | |
| Intel Core i5-13400 | |
| Intel Core i5-12400F | |
| Borderlands 3 | |
| 1280x720 Very Low Overall Quality (DX11) | |
| AMD Ryzen 7 7800X3D | |
| AMD Ryzen 9 7950X3D | |
| Intel Core i9-14900K | |
| AMD Ryzen 9 7950X | |
| Intel Core i9-13900K | |
| Intel Core i5-14600K | |
| Intel Core i7-14700K | |
| Intel Core i5-13400 | |
| Intel Core i5-12400F | |
| 1920x1080 Badass Overall Quality (DX11) | |
| AMD Ryzen 9 7950X3D | |
| AMD Ryzen 7 7800X3D | |
| Intel Core i9-14900K | |
| Intel Core i9-13900K | |
| AMD Ryzen 9 7950X | |
| Intel Core i5-14600K | |
| Intel Core i7-14700K | |
| Intel Core i5-13400 | |
| Intel Core i5-12400F | |
| Shadow of the Tomb Raider | |
| 1280x720 Lowest Preset | |
| AMD Ryzen 7 7800X3D | |
| AMD Ryzen 9 7950X3D | |
| AMD Ryzen 9 7950X | |
| Intel Core i9-14900K | |
| Intel Core i9-13900K | |
| Intel Core i5-14600K | |
| Intel Core i7-14700K | |
| Intel Core i5-13400 | |
| Intel Core i5-12400F | |
| 1920x1080 Highest Preset AA:T | |
| AMD Ryzen 7 7800X3D | |
| AMD Ryzen 9 7950X3D | |
| Intel Core i9-14900K | |
| Intel Core i9-13900K | |
| AMD Ryzen 9 7950X | |
| Intel Core i5-14600K | |
| Intel Core i7-14700K | |
| Intel Core i5-13400 | |
| Intel Core i5-12400F | |
| Metro Exodus | |
| 1280x720 Low Quality AF:4x | |
| AMD Ryzen 7 7800X3D | |
| Intel Core i9-14900K | |
| AMD Ryzen 9 7950X | |
| Intel Core i5-14600K | |
| AMD Ryzen 9 7950X3D | |
| Intel Core i7-14700K | |
| Intel Core i9-13900K | |
| Intel Core i5-12400F | |
| Intel Core i5-13400 | |
| 1920x1080 Ultra Quality AF:16x | |
| AMD Ryzen 7 7800X3D | |
| Intel Core i9-14900K | |
| Intel Core i5-14600K | |
| AMD Ryzen 9 7950X | |
| Intel Core i7-14700K | |
| AMD Ryzen 9 7950X3D | |
| Intel Core i9-13900K | |
| Intel Core i5-13400 | |
| Intel Core i5-12400F | |
| F1 2021 | |
| 1280x720 Ultra Low Preset | |
| AMD Ryzen 7 7800X3D | |
| Intel Core i9-14900K | |
| AMD Ryzen 9 7950X3D | |
| AMD Ryzen 9 7950X | |
| Intel Core i9-13900K | |
| Intel Core i5-14600K | |
| Intel Core i7-14700K | |
| Intel Core i5-12400F | |
| Intel Core i5-13400 | |
| 1920x1080 Ultra High Preset + Raytracing AA:T AF:16x | |
| AMD Ryzen 7 7800X3D | |
| Intel Core i9-14900K | |
| Intel Core i9-13900K | |
| Intel Core i5-14600K | |
| AMD Ryzen 9 7950X | |
| AMD Ryzen 9 7950X3D | |
| Intel Core i7-14700K | |
| Intel Core i5-12400F | |
| Intel Core i5-13400 | |
Leistungsunterschiede gegenüber dem Core i9-14900K und dem Ryzen 9 7950X3D sind vorhanden, jedoch werden diese bei kumulativen QHD-Ultra- und 4K-Ultra-Spielen vergleichsweise reduziert, da die Arbeitslasten GPU-intensiver werden.
In diesem Szenario liegt der Core i7-14700K gegenüber dem Core i9-14900K und dem Ryzen 9 7950X3D um 9% zurück, verglichen mit 14% bzw. 16% bei 720p Low und 1080p Ultra.
| Performance Rating - Percent | |
| AMD Ryzen 7 7800X3D | |
| AMD Ryzen 9 7950X3D | |
| Intel Core i9-14900K | |
| Intel Core i5-14600K | |
| AMD Ryzen 9 7950X | |
| Intel Core i9-13900K | |
| Intel Core i7-14700K | |
| Intel Core i5-13400 | |
| Intel Core i5-12400F -1! | |
| F1 22 | |
| 2560x1440 Ultra High Preset AA:T AF:16x | |
| AMD Ryzen 7 7800X3D | |
| Intel Core i9-14900K | |
| Intel Core i5-14600K | |
| AMD Ryzen 9 7950X3D | |
| AMD Ryzen 9 7950X | |
| Intel Core i7-14700K | |
| Intel Core i9-13900K | |
| Intel Core i5-12400F | |
| Intel Core i5-13400 | |
| 3840x2160 Ultra High Preset AA:T AF:16x | |
| AMD Ryzen 7 7800X3D | |
| Intel Core i5-14600K | |
| Intel Core i9-14900K | |
| AMD Ryzen 9 7950X | |
| AMD Ryzen 9 7950X3D | |
| Intel Core i7-14700K | |
| Intel Core i5-12400F | |
| Intel Core i5-13400 | |
| Intel Core i9-13900K | |
| Far Cry 5 | |
| 2560x1440 Ultra Preset AA:T | |
| AMD Ryzen 7 7800X3D | |
| AMD Ryzen 9 7950X3D | |
| Intel Core i9-14900K | |
| Intel Core i9-13900K | |
| Intel Core i5-14600K | |
| AMD Ryzen 9 7950X | |
| Intel Core i7-14700K | |
| Intel Core i5-13400 | |
| Intel Core i5-12400F | |
| 3840x2160 Ultra Preset AA:T | |
| AMD Ryzen 7 7800X3D | |
| Intel Core i9-14900K | |
| AMD Ryzen 9 7950X3D | |
| Intel Core i5-14600K | |
| Intel Core i9-13900K | |
| AMD Ryzen 9 7950X | |
| Intel Core i7-14700K | |
| Intel Core i5-13400 | |
| Intel Core i5-12400F | |
| X-Plane 11.11 - 3840x2160 high (fps_test=3) | |
| AMD Ryzen 7 7800X3D | |
| AMD Ryzen 9 7950X3D | |
| Intel Core i9-13900K | |
| Intel Core i9-14900K | |
| Intel Core i7-14700K | |
| Intel Core i5-14600K | |
| AMD Ryzen 9 7950X | |
| Intel Core i5-13400 | |
| Intel Core i5-12400F | |
| Final Fantasy XV Benchmark | |
| 2560x1440 High Quality | |
| AMD Ryzen 7 7800X3D | |
| Intel Core i9-14900K | |
| Intel Core i5-14600K | |
| AMD Ryzen 9 7950X | |
| AMD Ryzen 9 7950X3D | |
| Intel Core i9-13900K | |
| Intel Core i7-14700K | |
| Intel Core i5-13400 | |
| Intel Core i5-12400F | |
| 3840x2160 High Quality | |
| Intel Core i9-14900K | |
| Intel Core i5-14600K | |
| AMD Ryzen 9 7950X | |
| Intel Core i7-14700K | |
| AMD Ryzen 7 7800X3D | |
| AMD Ryzen 9 7950X3D | |
| Intel Core i5-12400F | |
| Intel Core i9-13900K | |
| Intel Core i5-13400 | |
| Dota 2 Reborn - 3840x2160 ultra (3/3) best looking | |
| AMD Ryzen 7 7800X3D | |
| AMD Ryzen 9 7950X3D | |
| AMD Ryzen 9 7950X | |
| Intel Core i9-13900K | |
| Intel Core i9-14900K | |
| Intel Core i5-14600K | |
| Intel Core i7-14700K | |
| Intel Core i5-12400F | |
| Intel Core i5-13400 | |
| The Witcher 3 - 3840x2160 Ultra Graphics & Postprocessing (HBAO+) | |
| AMD Ryzen 9 7950X | |
| Intel Core i9-14900K | |
| AMD Ryzen 7 7800X3D | |
| Intel Core i5-12400F | |
| Intel Core i5-13400 | |
| Intel Core i5-14600K | |
| AMD Ryzen 9 7950X3D | |
| Intel Core i9-13900K | |
| Intel Core i7-14700K | |
| GTA V | |
| 2560x1440 Highest AA:4xMSAA + FX AF:16x | |
| AMD Ryzen 7 7800X3D | |
| Intel Core i9-14900K | |
| Intel Core i9-13900K | |
| AMD Ryzen 9 7950X | |
| Intel Core i5-14600K | |
| AMD Ryzen 9 7950X3D | |
| Intel Core i7-14700K | |
| Intel Core i5-13400 | |
| Intel Core i5-12400F | |
| 3840x2160 Highest AA:4xMSAA + FX AF:16x | |
| AMD Ryzen 7 7800X3D | |
| Intel Core i9-14900K | |
| Intel Core i5-14600K | |
| AMD Ryzen 9 7950X | |
| Intel Core i9-13900K | |
| AMD Ryzen 9 7950X3D | |
| Intel Core i7-14700K | |
| Intel Core i5-13400 | |
| Borderlands 3 | |
| 2560x1440 Badass Overall Quality (DX11) | |
| AMD Ryzen 7 7800X3D | |
| AMD Ryzen 9 7950X3D | |
| Intel Core i9-14900K | |
| Intel Core i9-13900K | |
| AMD Ryzen 9 7950X | |
| Intel Core i5-14600K | |
| Intel Core i7-14700K | |
| Intel Core i5-13400 | |
| Intel Core i5-12400F | |
| 3840x2160 Badass Overall Quality (DX11) | |
| Intel Core i9-14900K | |
| AMD Ryzen 7 7800X3D | |
| AMD Ryzen 9 7950X3D | |
| Intel Core i5-14600K | |
| AMD Ryzen 9 7950X | |
| Intel Core i9-13900K | |
| Intel Core i7-14700K | |
| Intel Core i5-13400 | |
| Intel Core i5-12400F | |
| Shadow of the Tomb Raider | |
| 2560x1440 Highest Preset AA:T | |
| AMD Ryzen 7 7800X3D | |
| AMD Ryzen 9 7950X3D | |
| Intel Core i9-14900K | |
| Intel Core i9-13900K | |
| AMD Ryzen 9 7950X | |
| Intel Core i5-14600K | |
| Intel Core i7-14700K | |
| Intel Core i5-13400 | |
| Intel Core i5-12400F | |
| 3840x2160 Highest Preset AA:T | |
| Intel Core i9-14900K | |
| Intel Core i5-14600K | |
| AMD Ryzen 7 7800X3D | |
| AMD Ryzen 9 7950X3D | |
| AMD Ryzen 9 7950X | |
| Intel Core i9-13900K | |
| Intel Core i7-14700K | |
| Intel Core i5-13400 | |
| Intel Core i5-12400F | |
| Metro Exodus | |
| 2560x1440 Ultra Quality AF:16x | |
| AMD Ryzen 7 7800X3D | |
| Intel Core i9-14900K | |
| Intel Core i5-14600K | |
| AMD Ryzen 9 7950X | |
| Intel Core i7-14700K | |
| AMD Ryzen 9 7950X3D | |
| Intel Core i9-13900K | |
| Intel Core i5-13400 | |
| Intel Core i5-12400F | |
| 3840x2160 Ultra Quality AF:16x | |
| Intel Core i9-14900K | |
| Intel Core i5-14600K | |
| AMD Ryzen 7 7800X3D | |
| AMD Ryzen 9 7950X | |
| AMD Ryzen 9 7950X3D | |
| Intel Core i7-14700K | |
| Intel Core i9-13900K | |
| Intel Core i5-13400 | |
| Intel Core i5-12400F | |
| F1 2021 | |
| 2560x1440 Ultra High Preset + Raytracing AA:T AF:16x | |
| AMD Ryzen 7 7800X3D | |
| Intel Core i9-14900K | |
| Intel Core i9-13900K | |
| AMD Ryzen 9 7950X3D | |
| Intel Core i5-14600K | |
| AMD Ryzen 9 7950X | |
| Intel Core i7-14700K | |
| Intel Core i5-12400F | |
| Intel Core i5-13400 | |
| 3840x2160 Ultra High Preset + Raytracing AA:T AF:16x | |
| AMD Ryzen 7 7800X3D | |
| AMD Ryzen 9 7950X3D | |
| Intel Core i9-14900K | |
| Intel Core i5-14600K | |
| AMD Ryzen 9 7950X | |
| Intel Core i7-14700K | |
| Intel Core i9-13900K | |
| Intel Core i5-12400F | |
| Intel Core i5-13400 | |
Hilft die Deaktivierung zusätzlicher E-Kerne beim Spielen?
Seit Intel im Jahr 2002 erstmals simultanes Multithreading (SMT) bzw. HyperThreading auf den Pentium 4 NetBurst-CPUs für Endverbraucher eingeführt hat, haben sich Enthusiasten oft darüber lustig gemacht, diese Funktion zu deaktivieren, um die FPS in Spielen zu steigern.
Mit der Einführung der Hybrid-Core-Architektur in Alder Lake kamen erneut Diskussionen darüber auf, wie man durch die Deaktivierung der E-Cores mit niedrigem IPC noch mehr FPS in Spielen erreichen kann.
Bestimmte Spiele wie Atlas Fallen sind dafür bekannt, dass sie bei aktivierten E-Kernen auf Raptor Lake CPUs Leistungseinbußen erleiden. Cyberpunk 2077 hat kürzlich ein Patch 2.11-Update erhalten, das eine Option bietet, um Intels Thread Director und das Scheduling des Betriebssystems außer Kraft zu setzen und die P-Kerne zu priorisieren.
Laut Intel ist es nicht möglich, alle E-Cores in der CPU vollständig zu deaktivieren. Außerdem hat der Core i5-14600K bei 1080p-Spielen einen Leistungsvorsprung gegenüber dem Core i7-14700K und ist daher für die meisten Gamer die erste Wahl.
Vor diesem Hintergrund haben wir die Spieleleistung des Core i7-14700K getestet, wobei vier der 12 E-Kerne deaktiviert wurden, um die E-Kern-Anzahl des Core i5-14600K zu imitieren.
Insgesamt zeigt der Core i7-14700K mit nur acht funktionierenden E-Kernen eine geringfügig bessere Leistung beim Spielen. Der genaue Vorteil hängt, wenn überhaupt, vom jeweiligen Spiel ab.
Far Cry 5 beispielsweise zeigt die höchsten Zuwächse bei den Presets 1080p Ultra (+19%) und 720p Low (+31%) im Vergleich zur Standardkonfiguration des Core i7-14700K, während Borderlands 3 keinen Vorteil durch die Deaktivierung der E-Kerne zeigt.
Andere Titel wie Metro Exodus zeigen nur minimale Unterschiede, während die Gewinne in The Witcher 3 nicht viel ausmachen.
| Performance Rating - Percent | |
| AMD Ryzen 7 7800X3D | |
| AMD Ryzen 9 7950X3D | |
| Intel Core i9-14900K | |
| AMD Ryzen 9 7950X | |
| Intel Core i9-13900K | |
| Intel Core i5-14600K | |
| Intel Core i7-14700K (8 E-cores) | |
| Intel Core i7-14700K | |
| Intel Core i5-13400 | |
| Intel Core i5-12400F | |
| Far Cry 5 | |
| 1920x1080 Ultra Preset AA:T | |
| AMD Ryzen 7 7800X3D | |
| AMD Ryzen 9 7950X3D | |
| Intel Core i9-14900K | |
| Intel Core i9-13900K | |
| Intel Core i5-14600K | |
| AMD Ryzen 9 7950X | |
| Intel Core i7-14700K (8 E-cores) | |
| Intel Core i7-14700K | |
| Intel Core i5-13400 | |
| Intel Core i5-12400F | |
| 1280x720 Low Preset AA:T | |
| AMD Ryzen 7 7800X3D | |
| AMD Ryzen 9 7950X3D | |
| Intel Core i9-14900K | |
| Intel Core i5-14600K | |
| Intel Core i9-13900K | |
| AMD Ryzen 9 7950X | |
| Intel Core i7-14700K (8 E-cores) | |
| Intel Core i5-13400 | |
| Intel Core i7-14700K | |
| Intel Core i5-12400F | |
| X-Plane 11.11 | |
| 1920x1080 high (fps_test=3) | |
| AMD Ryzen 7 7800X3D | |
| AMD Ryzen 9 7950X3D | |
| Intel Core i9-13900K | |
| Intel Core i9-14900K | |
| Intel Core i7-14700K | |
| AMD Ryzen 9 7950X | |
| Intel Core i5-14600K | |
| Intel Core i7-14700K (8 E-cores) | |
| Intel Core i5-13400 | |
| Intel Core i5-12400F | |
| 1280x720 low (fps_test=1) | |
| Intel Core i9-13900K | |
| Intel Core i9-14900K | |
| Intel Core i7-14700K (8 E-cores) | |
| Intel Core i5-14600K | |
| Intel Core i7-14700K | |
| AMD Ryzen 9 7950X3D | |
| AMD Ryzen 9 7950X | |
| AMD Ryzen 7 7800X3D | |
| Intel Core i5-13400 | |
| Intel Core i5-12400F | |
| Final Fantasy XV Benchmark | |
| 1920x1080 High Quality | |
| Intel Core i9-14900K | |
| AMD Ryzen 9 7950X | |
| AMD Ryzen 7 7800X3D | |
| Intel Core i5-14600K | |
| Intel Core i7-14700K (8 E-cores) | |
| AMD Ryzen 9 7950X3D | |
| Intel Core i9-13900K | |
| Intel Core i7-14700K | |
| Intel Core i5-13400 | |
| Intel Core i5-12400F | |
| 1280x720 Lite Quality | |
| AMD Ryzen 9 7950X | |
| Intel Core i9-13900K | |
| AMD Ryzen 7 7800X3D | |
| Intel Core i5-14600K | |
| Intel Core i7-14700K (8 E-cores) | |
| Intel Core i9-14900K | |
| Intel Core i7-14700K | |
| AMD Ryzen 9 7950X3D | |
| Intel Core i5-12400F | |
| Intel Core i5-13400 | |
| Dota 2 Reborn | |
| 1920x1080 ultra (3/3) best looking | |
| AMD Ryzen 7 7800X3D | |
| AMD Ryzen 9 7950X3D | |
| Intel Core i9-13900K | |
| AMD Ryzen 9 7950X | |
| Intel Core i9-14900K | |
| Intel Core i5-14600K | |
| Intel Core i7-14700K (8 E-cores) | |
| Intel Core i7-14700K | |
| Intel Core i5-13400 | |
| Intel Core i5-12400F | |
| 1280x720 min (0/3) fastest | |
| AMD Ryzen 7 7800X3D | |
| AMD Ryzen 9 7950X3D | |
| AMD Ryzen 9 7950X | |
| Intel Core i9-14900K | |
| Intel Core i9-13900K | |
| Intel Core i5-14600K | |
| Intel Core i7-14700K (8 E-cores) | |
| Intel Core i7-14700K | |
| Intel Core i5-12400F | |
| Intel Core i5-13400 | |
| The Witcher 3 | |
| 1920x1080 Ultra Graphics & Postprocessing (HBAO+) | |
| AMD Ryzen 9 7950X | |
| Intel Core i5-14600K | |
| AMD Ryzen 7 7800X3D | |
| Intel Core i9-14900K | |
| AMD Ryzen 9 7950X3D | |
| Intel Core i7-14700K (8 E-cores) | |
| Intel Core i9-13900K | |
| Intel Core i7-14700K | |
| Intel Core i5-13400 | |
| Intel Core i5-12400F | |
| 1024x768 Low Graphics & Postprocessing | |
| AMD Ryzen 9 7950X3D | |
| AMD Ryzen 7 7800X3D | |
| Intel Core i9-14900K | |
| AMD Ryzen 9 7950X | |
| Intel Core i9-13900K | |
| Intel Core i7-14700K (8 E-cores) | |
| Intel Core i7-14700K | |
| Intel Core i5-14600K | |
| Intel Core i5-13400 | |
| Intel Core i5-12400F | |
| Borderlands 3 | |
| 1280x720 Very Low Overall Quality (DX11) | |
| AMD Ryzen 7 7800X3D | |
| AMD Ryzen 9 7950X3D | |
| Intel Core i9-14900K | |
| AMD Ryzen 9 7950X | |
| Intel Core i9-13900K | |
| Intel Core i5-14600K | |
| Intel Core i7-14700K | |
| Intel Core i7-14700K (8 E-cores) | |
| Intel Core i5-13400 | |
| Intel Core i5-12400F | |
| 1920x1080 Badass Overall Quality (DX11) | |
| AMD Ryzen 9 7950X3D | |
| AMD Ryzen 7 7800X3D | |
| Intel Core i9-14900K | |
| Intel Core i9-13900K | |
| AMD Ryzen 9 7950X | |
| Intel Core i5-14600K | |
| Intel Core i7-14700K | |
| Intel Core i7-14700K (8 E-cores) | |
| Intel Core i5-13400 | |
| Intel Core i5-12400F | |
| Metro Exodus | |
| 1280x720 Low Quality AF:4x | |
| AMD Ryzen 7 7800X3D | |
| Intel Core i9-14900K | |
| AMD Ryzen 9 7950X | |
| Intel Core i5-14600K | |
| AMD Ryzen 9 7950X3D | |
| Intel Core i7-14700K (8 E-cores) | |
| Intel Core i7-14700K | |
| Intel Core i9-13900K | |
| Intel Core i5-12400F | |
| Intel Core i5-13400 | |
| 1920x1080 Ultra Quality AF:16x | |
| AMD Ryzen 7 7800X3D | |
| Intel Core i9-14900K | |
| Intel Core i5-14600K | |
| AMD Ryzen 9 7950X | |
| Intel Core i7-14700K (8 E-cores) | |
| Intel Core i7-14700K | |
| AMD Ryzen 9 7950X3D | |
| Intel Core i9-13900K | |
| Intel Core i5-13400 | |
| Intel Core i5-12400F | |
Intel Core i7-14700K mit Nvidia GeForce RTX 4090
| min. | mittel | hoch | max. | QHD | 4K DLSS | 4K | |
|---|---|---|---|---|---|---|---|
| GTA V (2015) | 187.6 | 187.4 | 185.6 | 151.2 | 151.2 | 185.9 | |
| The Witcher 3 (2015) | 634 | 572 | 531 | 287 | 250 | 274 | |
| Dota 2 Reborn (2015) | 239.4 | 226.7 | 213.4 | 200 | 198.1 | ||
| Final Fantasy XV Benchmark (2018) | 235 | 236 | 228 | 219 | 159.2 | ||
| X-Plane 11.11 (2018) | 227 | 199.8 | 151.7 | 128.2 | |||
| Far Cry 5 (2018) | 180 | 165 | 163 | 154 | 155 | 152 | |
| Strange Brigade (2018) | 577 | 512 | 468 | 463 | 454 | 273 | |
| Shadow of the Tomb Raider (2018) | 278 | 270 | 268 | 266 | 258 | 180.4 | |
| Metro Exodus (2019) | 289 | 261 | 227 | 194.7 | 181.3 | 138.5 | |
| Borderlands 3 (2019) | 220 | 191.9 | 178.1 | 170.4 | 171.6 | 132.6 | |
| F1 2021 (2021) | 547 | 517 | 476 | 260 | 257 | 194.9 | |
| Far Cry 6 (2021) | 222 | 205 | 187 | 175 | 168 | 135 | |
| Tiny Tina's Wonderlands (2022) | 402 | 349 | 300 | 277 | 223 | 127.9 | |
| F1 22 (2022) | 359 | 372 | 351 | 187 | 151.1 | 82.3 | |
| The Witcher 3 v4 (2023) | 354 | 297 | 269 | 230 | 172.9 | 85.4 | |
| F1 23 (2023) | 345 | 364 | 346 | 190.7 | 152.5 | 131 | 79.7 |
| Cyberpunk 2077 (2023) | 183.2 | 182.2 | 171.7 | 166.3 | 144.8 | 71.8 | |
| Assassin's Creed Mirage (2023) | 259 | 247 | 241 | 185 | 176 | 154 | 125 |
| Call of Duty Modern Warfare 3 2023 (2023) | 277 | 272 | 258 | 251 | 216 | 167 | 156 |
Energieaufnahme: Zen 4 übertrumpft Intel weiterhin bei der Energieeffizienz
Auch auf der Notebook-Seite haben unsere Messungen gezeigt, dass AMDs Zen 4-Modelle immer noch eine hervorragende Energieeffizienz im Vergleich zur Konkurrenz von Intel Raptor Lake-S aufweisen.
Obwohl der Core i7-14700K im Cinebench R23 Multi-Core eine um 17% höhere Energieeffizienz als der Core i5-14600K aufweist, schafft der Ryzen 9 7950X3D einen beeindruckenden Vorsprung von 45%, auch wenn beide CPUs ähnliche Ergebnisse im Benchmark erzielen.
Das Core i9-14900K-basierte System zieht während eines Prime95 In-Place Large FFTs-Stresses 537 W aus der Steckdose, was 26% höher ist als der 400 W Gesamtsystemverbrauch des Core i7-14700K PCs. Dies ist wiederum 45% höher als bei einem Ryzen 9 7950X3D-basierten PC.
Energieverbrauch externer Monitor
| Power Consumption / Cinebench R23 Multi Power Efficiency - external Monitor | |
| AMD Ryzen 9 7950X3D, NVIDIA GeForce RTX 4090 | |
| AMD Ryzen 7 7800X3D, NVIDIA GeForce RTX 4090 | |
| Intel Core i7-14700K, NVIDIA GeForce RTX 4090 | |
| Intel Core i9-14900K, NVIDIA GeForce RTX 4090 | |
| Intel Core i5-14600K, NVIDIA GeForce RTX 4090 | |
| Power Consumption / Witcher 3 ultra Efficiency (external Monitor) | |
| AMD Ryzen 7 7800X3D, NVIDIA GeForce RTX 4090 | |
| Intel Core i5-12400F, NVIDIA GeForce RTX 4090 | |
| AMD Ryzen 9 7950X3D, NVIDIA GeForce RTX 4090 | |
| Intel Core i9-14900K, NVIDIA GeForce RTX 4090 | |
| Intel Core i5-14600K, NVIDIA GeForce RTX 4090 | |
| Intel Core i5-13400, NVIDIA GeForce RTX 4090 | |
| Intel Core i7-14700K, NVIDIA GeForce RTX 4090 | |
| Intel Core i5-13600K, NVIDIA GeForce RTX 3090 | |
| AMD Ryzen 5 7600X, NVIDIA GeForce RTX 3090 | |
| AMD Ryzen 9 7950X, NVIDIA GeForce RTX 3090 | |
| Intel Core i5-12600K, NVIDIA Titan RTX | |
| AMD Ryzen 9 7900X, NVIDIA GeForce RTX 3090 | |
| Intel Core i9-13900K, NVIDIA GeForce RTX 3090 | |
| AMD Ryzen 9 5950X, NVIDIA Titan RTX | |
| Intel Core i9-12900K, NVIDIA Titan RTX | |
| Power Consumption / Cinebench R15 Multi (external Monitor) | |
| Intel Core i9-14900K, NVIDIA GeForce RTX 4090 | |
| Intel Core i9-13900K, NVIDIA GeForce RTX 3090 | |
| Intel Core i7-14700K, NVIDIA GeForce RTX 4090 | |
| Intel Core i5-14600K, NVIDIA GeForce RTX 4090 | |
| Intel Core i9-12900K, NVIDIA Titan RTX (Idle: 70.5 W) | |
| AMD Ryzen 9 7950X, NVIDIA GeForce RTX 3090 | |
| AMD Ryzen 9 7900X, NVIDIA GeForce RTX 3090 | |
| Intel Core i5-13600K, NVIDIA GeForce RTX 3090 | |
| AMD Ryzen 9 7950X3D, NVIDIA GeForce RTX 4090 | |
| AMD Ryzen 9 5950X, NVIDIA Titan RTX (Idle: 78 W) | |
| AMD Ryzen 5 7600X, NVIDIA GeForce RTX 3090 | |
| AMD Ryzen 7 7800X3D, NVIDIA GeForce RTX 4090 | |
| Intel Core i5-12600K, NVIDIA Titan RTX (Idle: 70.45 W) | |
| Intel Core i5-13400, NVIDIA GeForce RTX 4090 | |
| Intel Core i5-12400F, NVIDIA GeForce RTX 4090 | |
| Power Consumption / Cinebench R23 Single (external Monitor) | |
| AMD Ryzen 7 7800X3D, NVIDIA GeForce RTX 4090 | |
| Intel Core i7-14700K, NVIDIA GeForce RTX 4090 | |
| Intel Core i9-14900K, NVIDIA GeForce RTX 4090 | |
| Intel Core i5-14600K, NVIDIA GeForce RTX 4090 | |
| Power Consumption / Cinebench R23 Multi (external Monitor) | |
| Intel Core i9-14900K, NVIDIA GeForce RTX 4090 | |
| Intel Core i7-14700K, NVIDIA GeForce RTX 4090 | |
| Intel Core i5-14600K, NVIDIA GeForce RTX 4090 | |
| AMD Ryzen 9 7950X3D, NVIDIA GeForce RTX 4090 | |
| AMD Ryzen 7 7800X3D, NVIDIA GeForce RTX 4090 | |
| Power Consumption / The Witcher 3 ultra (external Monitor) | |
| Intel Core i5-14600K, NVIDIA GeForce RTX 4090 | |
| Intel Core i9-14900K, NVIDIA GeForce RTX 4090 | |
| AMD Ryzen 9 7900X, NVIDIA GeForce RTX 3090 | |
| AMD Ryzen 9 7950X, NVIDIA GeForce RTX 3090 | |
| Intel Core i9-13900K, NVIDIA GeForce RTX 3090 | |
| Intel Core i7-14700K, NVIDIA GeForce RTX 4090 | |
| AMD Ryzen 5 7600X, NVIDIA GeForce RTX 3090 | |
| AMD Ryzen 9 7950X3D, NVIDIA GeForce RTX 4090 | |
| Intel Core i5-13600K, NVIDIA GeForce RTX 3090 | |
| Intel Core i5-13400, NVIDIA GeForce RTX 4090 | |
| AMD Ryzen 7 7800X3D, NVIDIA GeForce RTX 4090 | |
| Intel Core i9-12900K, NVIDIA Titan RTX (Idle: 70.5 W) | |
| AMD Ryzen 9 5950X, NVIDIA Titan RTX (Idle: 78 W) | |
| Intel Core i5-12400F, NVIDIA GeForce RTX 4090 | |
| Intel Core i5-12600K, NVIDIA Titan RTX (Idle: 70.45 W) | |
| Power Consumption / Prime95 V2810 Stress (external Monitor) | |
| Intel Core i9-14900K, NVIDIA GeForce RTX 4090 | |
| Intel Core i9-13900K, NVIDIA GeForce RTX 3090 | |
| Intel Core i7-14700K, NVIDIA GeForce RTX 4090 | |
| Intel Core i5-14600K, NVIDIA GeForce RTX 4090 | |
| Intel Core i5-13600K, NVIDIA GeForce RTX 3090 | |
| AMD Ryzen 9 7950X, NVIDIA GeForce RTX 3090 | |
| AMD Ryzen 9 7900X, NVIDIA GeForce RTX 3090 | |
| Intel Core i9-12900K, NVIDIA Titan RTX (Idle: 70.5 W) | |
| AMD Ryzen 9 7950X3D, NVIDIA GeForce RTX 4090 | |
| Intel Core i5-12600K, NVIDIA Titan RTX (Idle: 70.45 W) | |
| AMD Ryzen 9 5950X, NVIDIA Titan RTX (Idle: 78 W) | |
| Intel Core i5-12400F, NVIDIA GeForce RTX 4090 | |
| Intel Core i5-13400, NVIDIA GeForce RTX 4090 | |
| AMD Ryzen 5 7600X, NVIDIA GeForce RTX 3090 | |
| AMD Ryzen 7 7800X3D, NVIDIA GeForce RTX 4090 | |
* ... kleinere Werte sind besser
Pro
Contra
Fazit - In puncto Produktivität praktisch nicht vom Core i9-13900K und Ryzen 9 7950X3D zu unterscheiden

Da Intel beschlossen hat, Meteor Lake nur für Laptops anzubieten, müssen sich Desktop-Nutzer mit aufgefrischten Raptor Lake-S-Teilen begnügen. Der Core i7-14700K und sein KF-Pendant sind einzigartige SKUs in der Intel Raptor Lake-S-Refresh-Reihe der 14. Generation, da sie als einzige mit ihrer 20C/28T-Konfiguration eine Erhöhung der Kern- und Threadanzahl erhalten haben.
Diese erhöhte Kern- und Thread-Anzahl hilft dem Core i7-14700K, in kumulativen CPU-Benchmarks immer näher an Giganten wie den AMD Ryzen 9 7950X3D (+2%) und den Core i9-13900K (+4%) heranzurücken, während er in Schlagdistanz zum AMD Ryzen 9 7950X (+5%) und dem Core i9-14900K (+9%) bleibt.
Die 14. Generation des Intel Core i7-14700K bietet dank seiner einzigartigen 20C/28T-Konfiguration das Leistungsniveau des Core i9-13900K. Gamer sind jedoch kaum motiviert, von der 13. Generation aufzusteigen.
Beim Gaming ergibt sich allerdings ein etwas anderes Bild. Der Core i7-14700K ist für sich genommen eine gute Gaming-CPU, aber der Core i5-14600K (321 Euro auf Amazon) und der Ryzen 7 7800X3D (340 Euro auf Amazon) sind sinnvoller, wenn Gaming Ihre Priorität ist. Während die acht P-Kerne im Core i7-14700K sicherlich willkommen sind, scheinen die hinzugefügten E-Kerne kumulativ einen Rückschritt bei Gaming-Workloads zu verursachen. Die wahrnehmbaren Gewinne durch die Deaktivierung von vier der 12 E-Kerne bestätigen diese Tatsache.
Dies hängt natürlich stark vom Spiel ab und davon, wie effektiv es die verfügbaren Threads nutzen kann. Die Core i9-Prozessoren können dieses Problem dank der höheren Leistung der P- und E-Kerne und der größeren Caches umgehen. Die großen Caches sind auch der Hauptgrund dafür, dass der Ryzen 7 7800X3D und der Ryzen 9 7950X3D (550 Euro auf Amazon) die absolut besten CPUs für Spiele sind.
Der Core i7-14700K wird derzeit für etwa 400 Euro angeboten. Zu diesem Preis ist er sicherlich billiger als der Core i9-13900K (627 Euro auf Amazon) und der Core i9-14900K (586 Euro auf Amazon), während er eine vergleichbare Leistung bei CPU-spezifischen Aufgaben bietet. Der AMD Ryzen 9 7900X (339 Euro auf Amazon) ist preislich das nächste Pendant von Team Red. Allerdings zeigt der Core i7-14700K bei Single- und Multi-Core-Tests im Vergleich deutliche Vorteile.
Offen gesagt gibt es nicht viel, was die Raptor Lake-S-CPUs der 13. und 14. Generation voneinander trennt, so dass Sie für alle praktischen Zwecke mit den Prozessoren beider Generationen gut zurechtkommen sollten. Ob Sie auf einen Core i7-14700K aufrüsten sollten, hängt allein vom Preis und Ihrer aktuellen Konfiguration ab.
Ein Upgrade von Alder Lake-S oder niedriger? Wahrscheinlich sinnvoll. Sie haben einen Core i7-13700K? Vergessen Sie es. Sind Sie auf der Suche nach einem energieeffizienteren Gaming-Chip? Kaufen Sie Zen 4.
Preis und Verfügbarkeit
Der Intel Core i7-14700K ist derzeit für 400 Euro bei Amazon.de erhältlich, während der Core i7-14700KF ohne iGPU für etwa 384 Euro zu haben ist.
Transparenz
Die Auswahl der zu testenden Geräte erfolgt innerhalb der Redaktion. Das vorliegende Testmuster wurde dem Autor vom Hersteller oder einem Shop zu Testzwecken leihweise zur Verfügung gestellt. Eine Einflussnahme des Leihstellers auf den Testbericht gab es nicht, der Hersteller erhielt keine Version des Reviews vor der Veröffentlichung. Es bestand keine Verpflichtung zur Publikation. Als eigenständiges, unabhängiges Unternehmen unterliegt Notebookcheck keiner Diktion von Herstellern, Shops und Verlagen.
So testet Notebookcheck
Pro Jahr werden von Notebookcheck hunderte Laptops und Smartphones unabhängig in von uns standardisierten technischen Verfahren getestet, um eine Vergleichbarkeit aller Testergebnisse zu gewährleisten. Seit rund 20 Jahren entwickeln wir diese Testmethoden kontinuierlich weiter und setzen damit Branchenstandards. In unseren Testlaboren kommt ausschließlich hochwertiges Messequipment in die Hände erfahrener Techniker und Redakteure. Die Tests unterliegen einer mehrstufigen Kontrolle. Unsere komplexe Gesamtbewertung basiert auf hunderten fundierten Messergebnissen und Benchmarks, womit Ihnen Objektivität garantiert ist. Weitere Informationen zu unseren Testmethoden gibt es hier.
Preisvergleich

