Test: Intel Core i9-14900K und Intel Core i5-14600K - Mit 6 GHz out of the Box gegen AMDs X3D Prozessoren
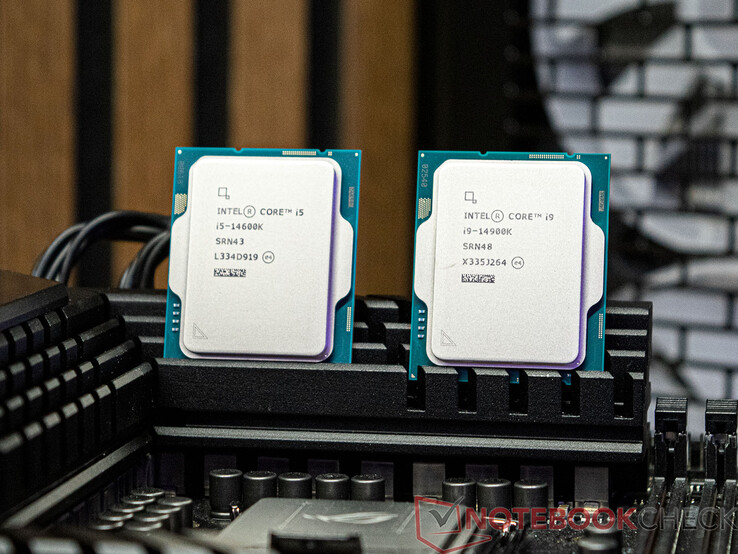
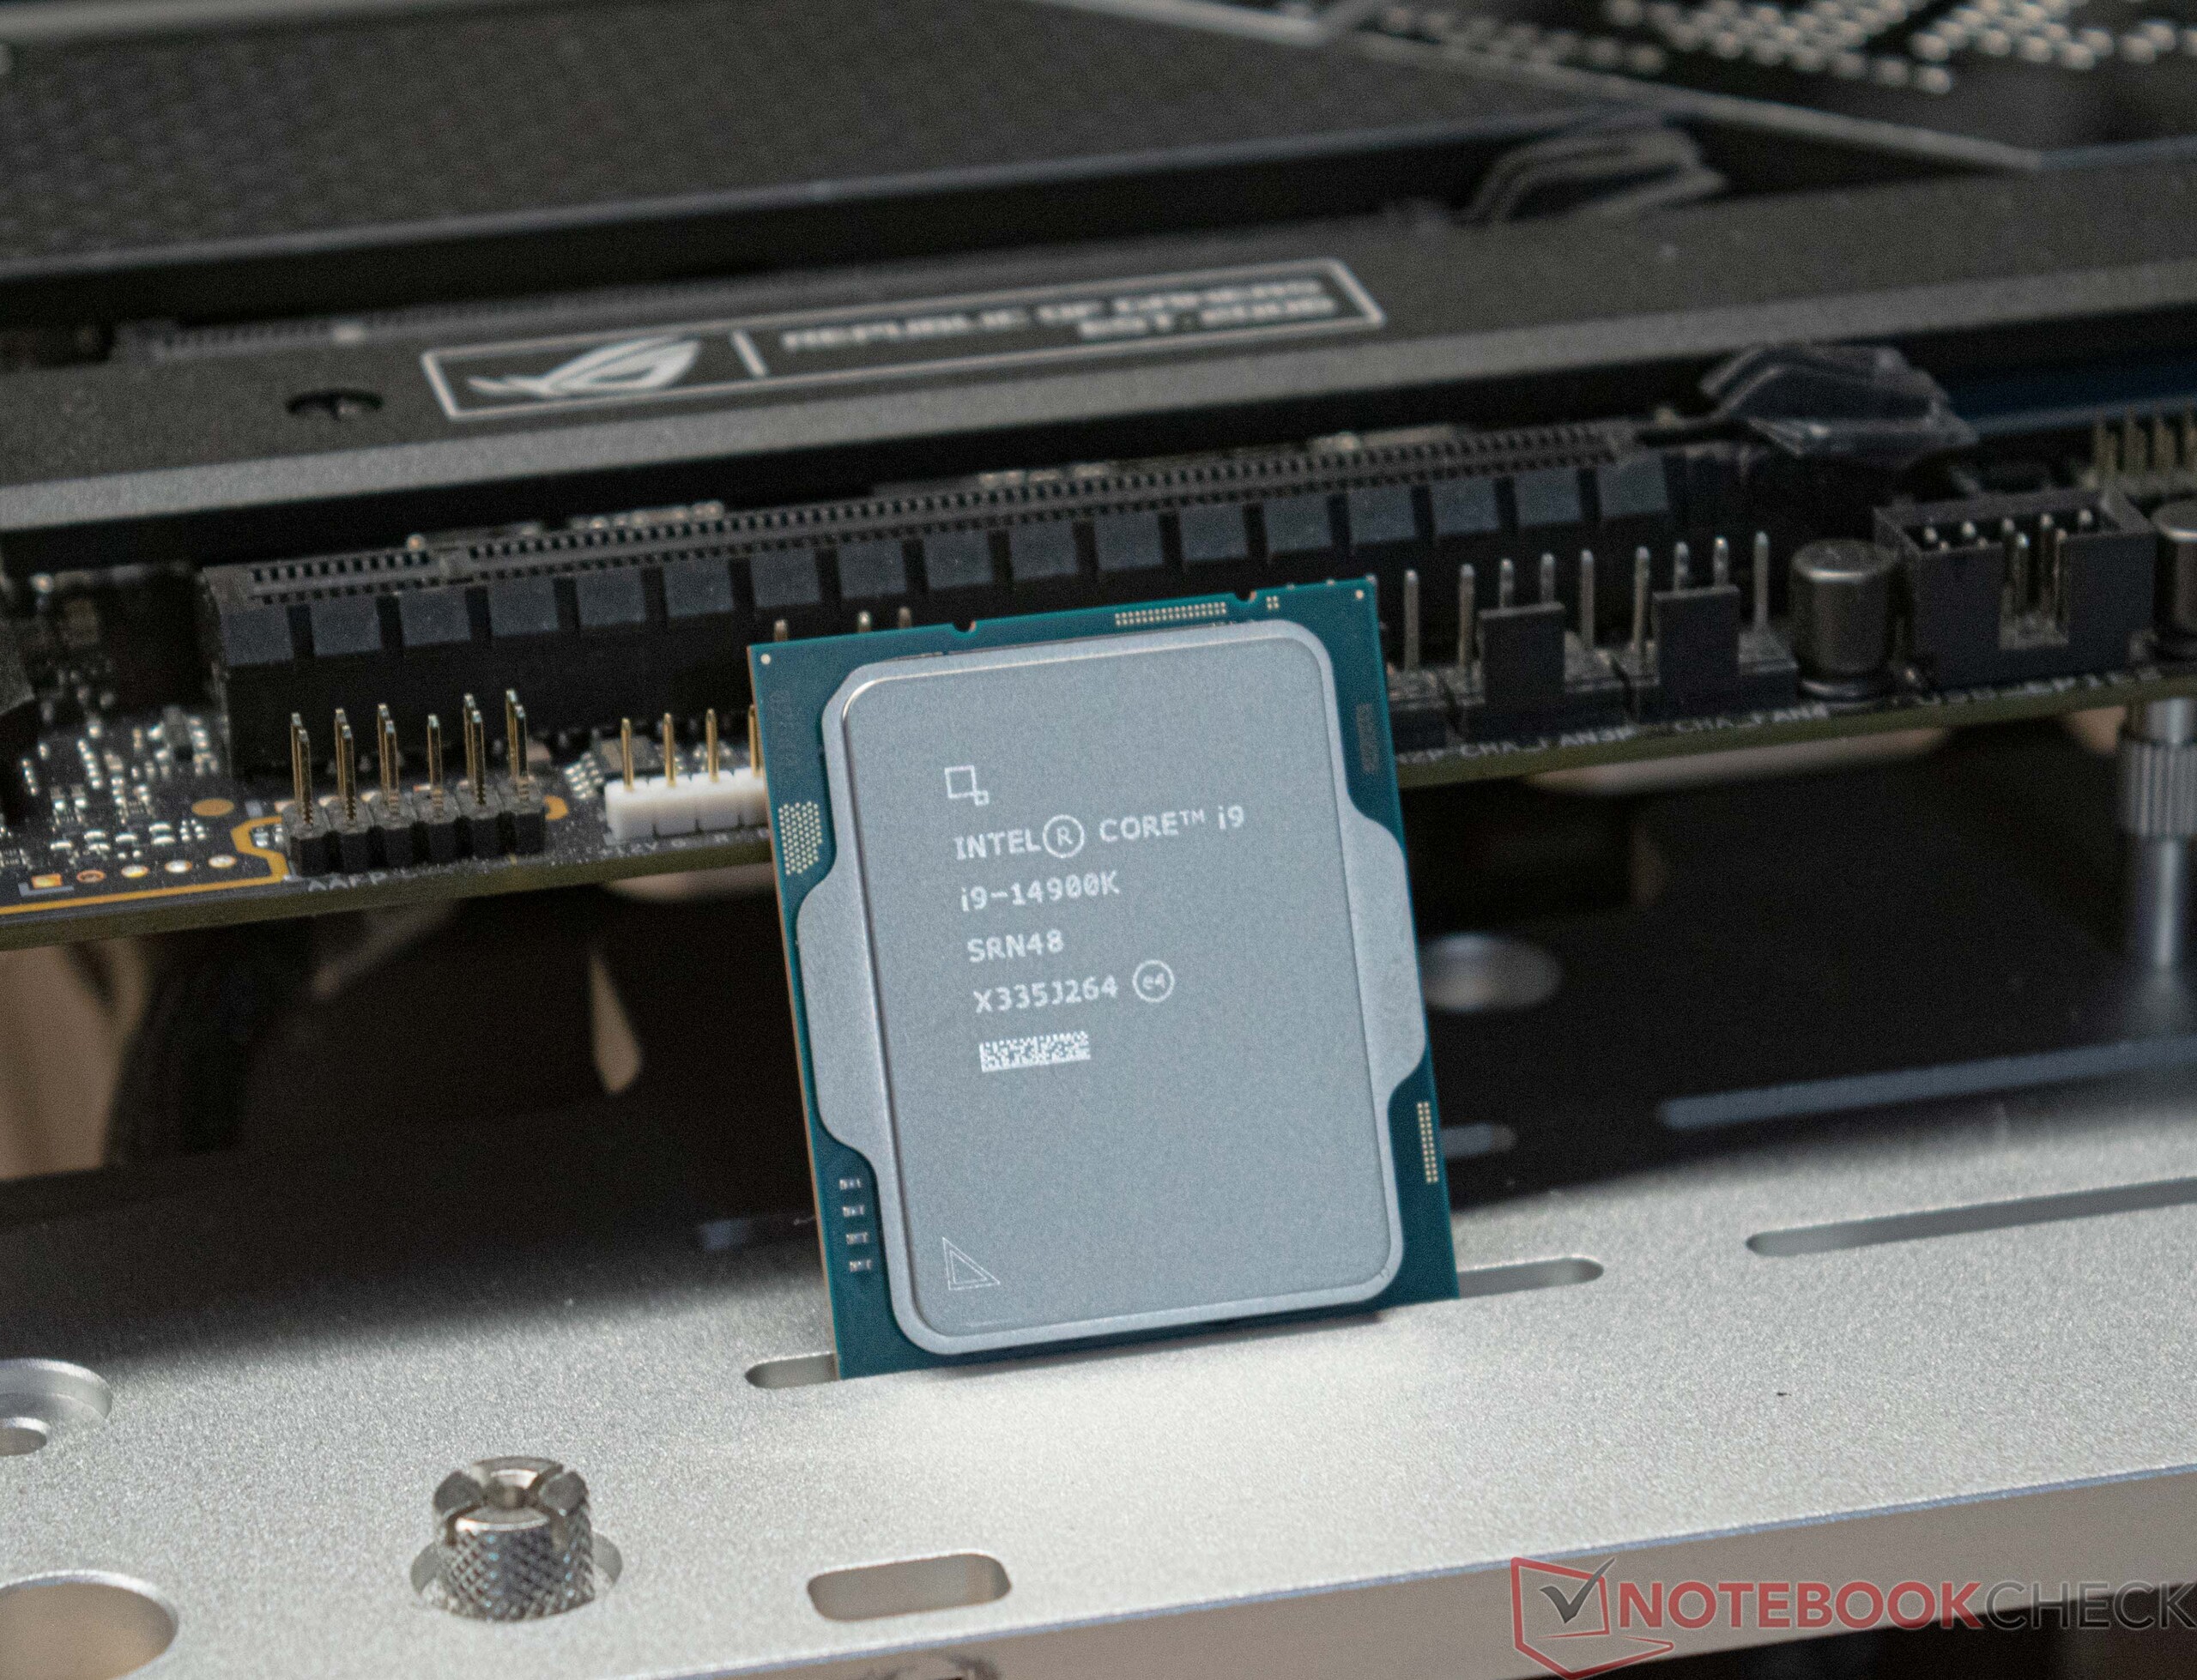
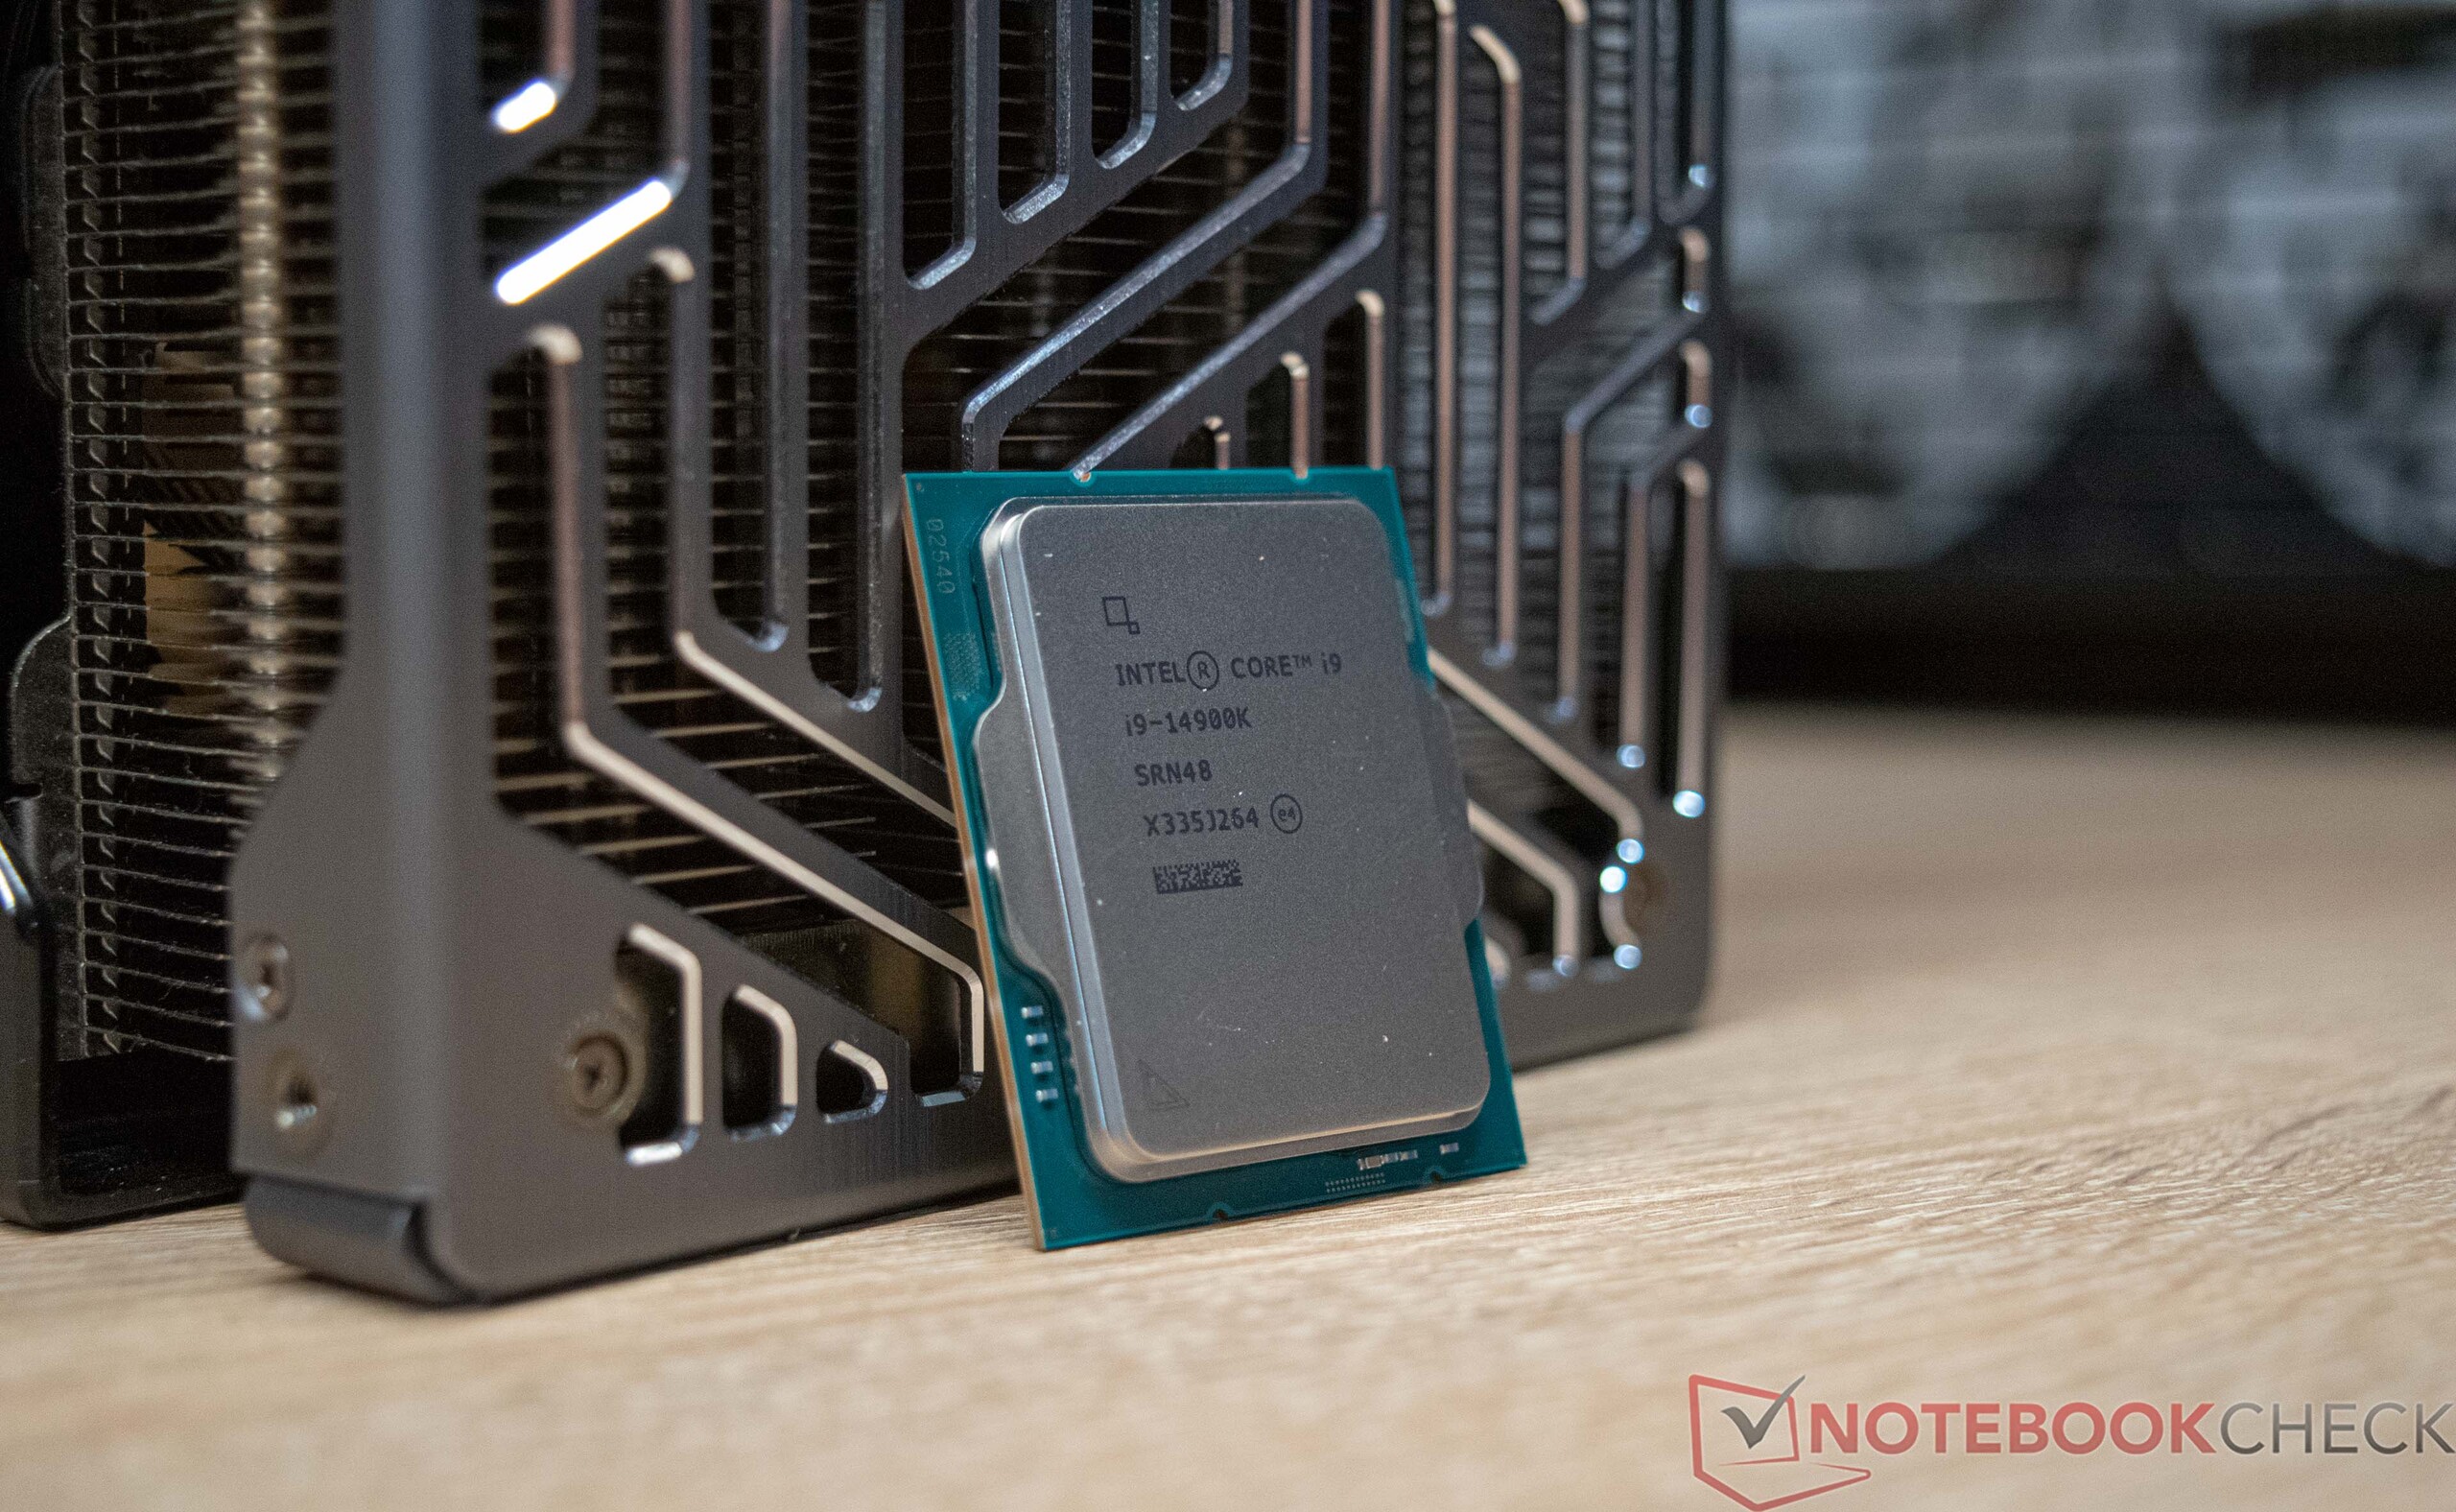
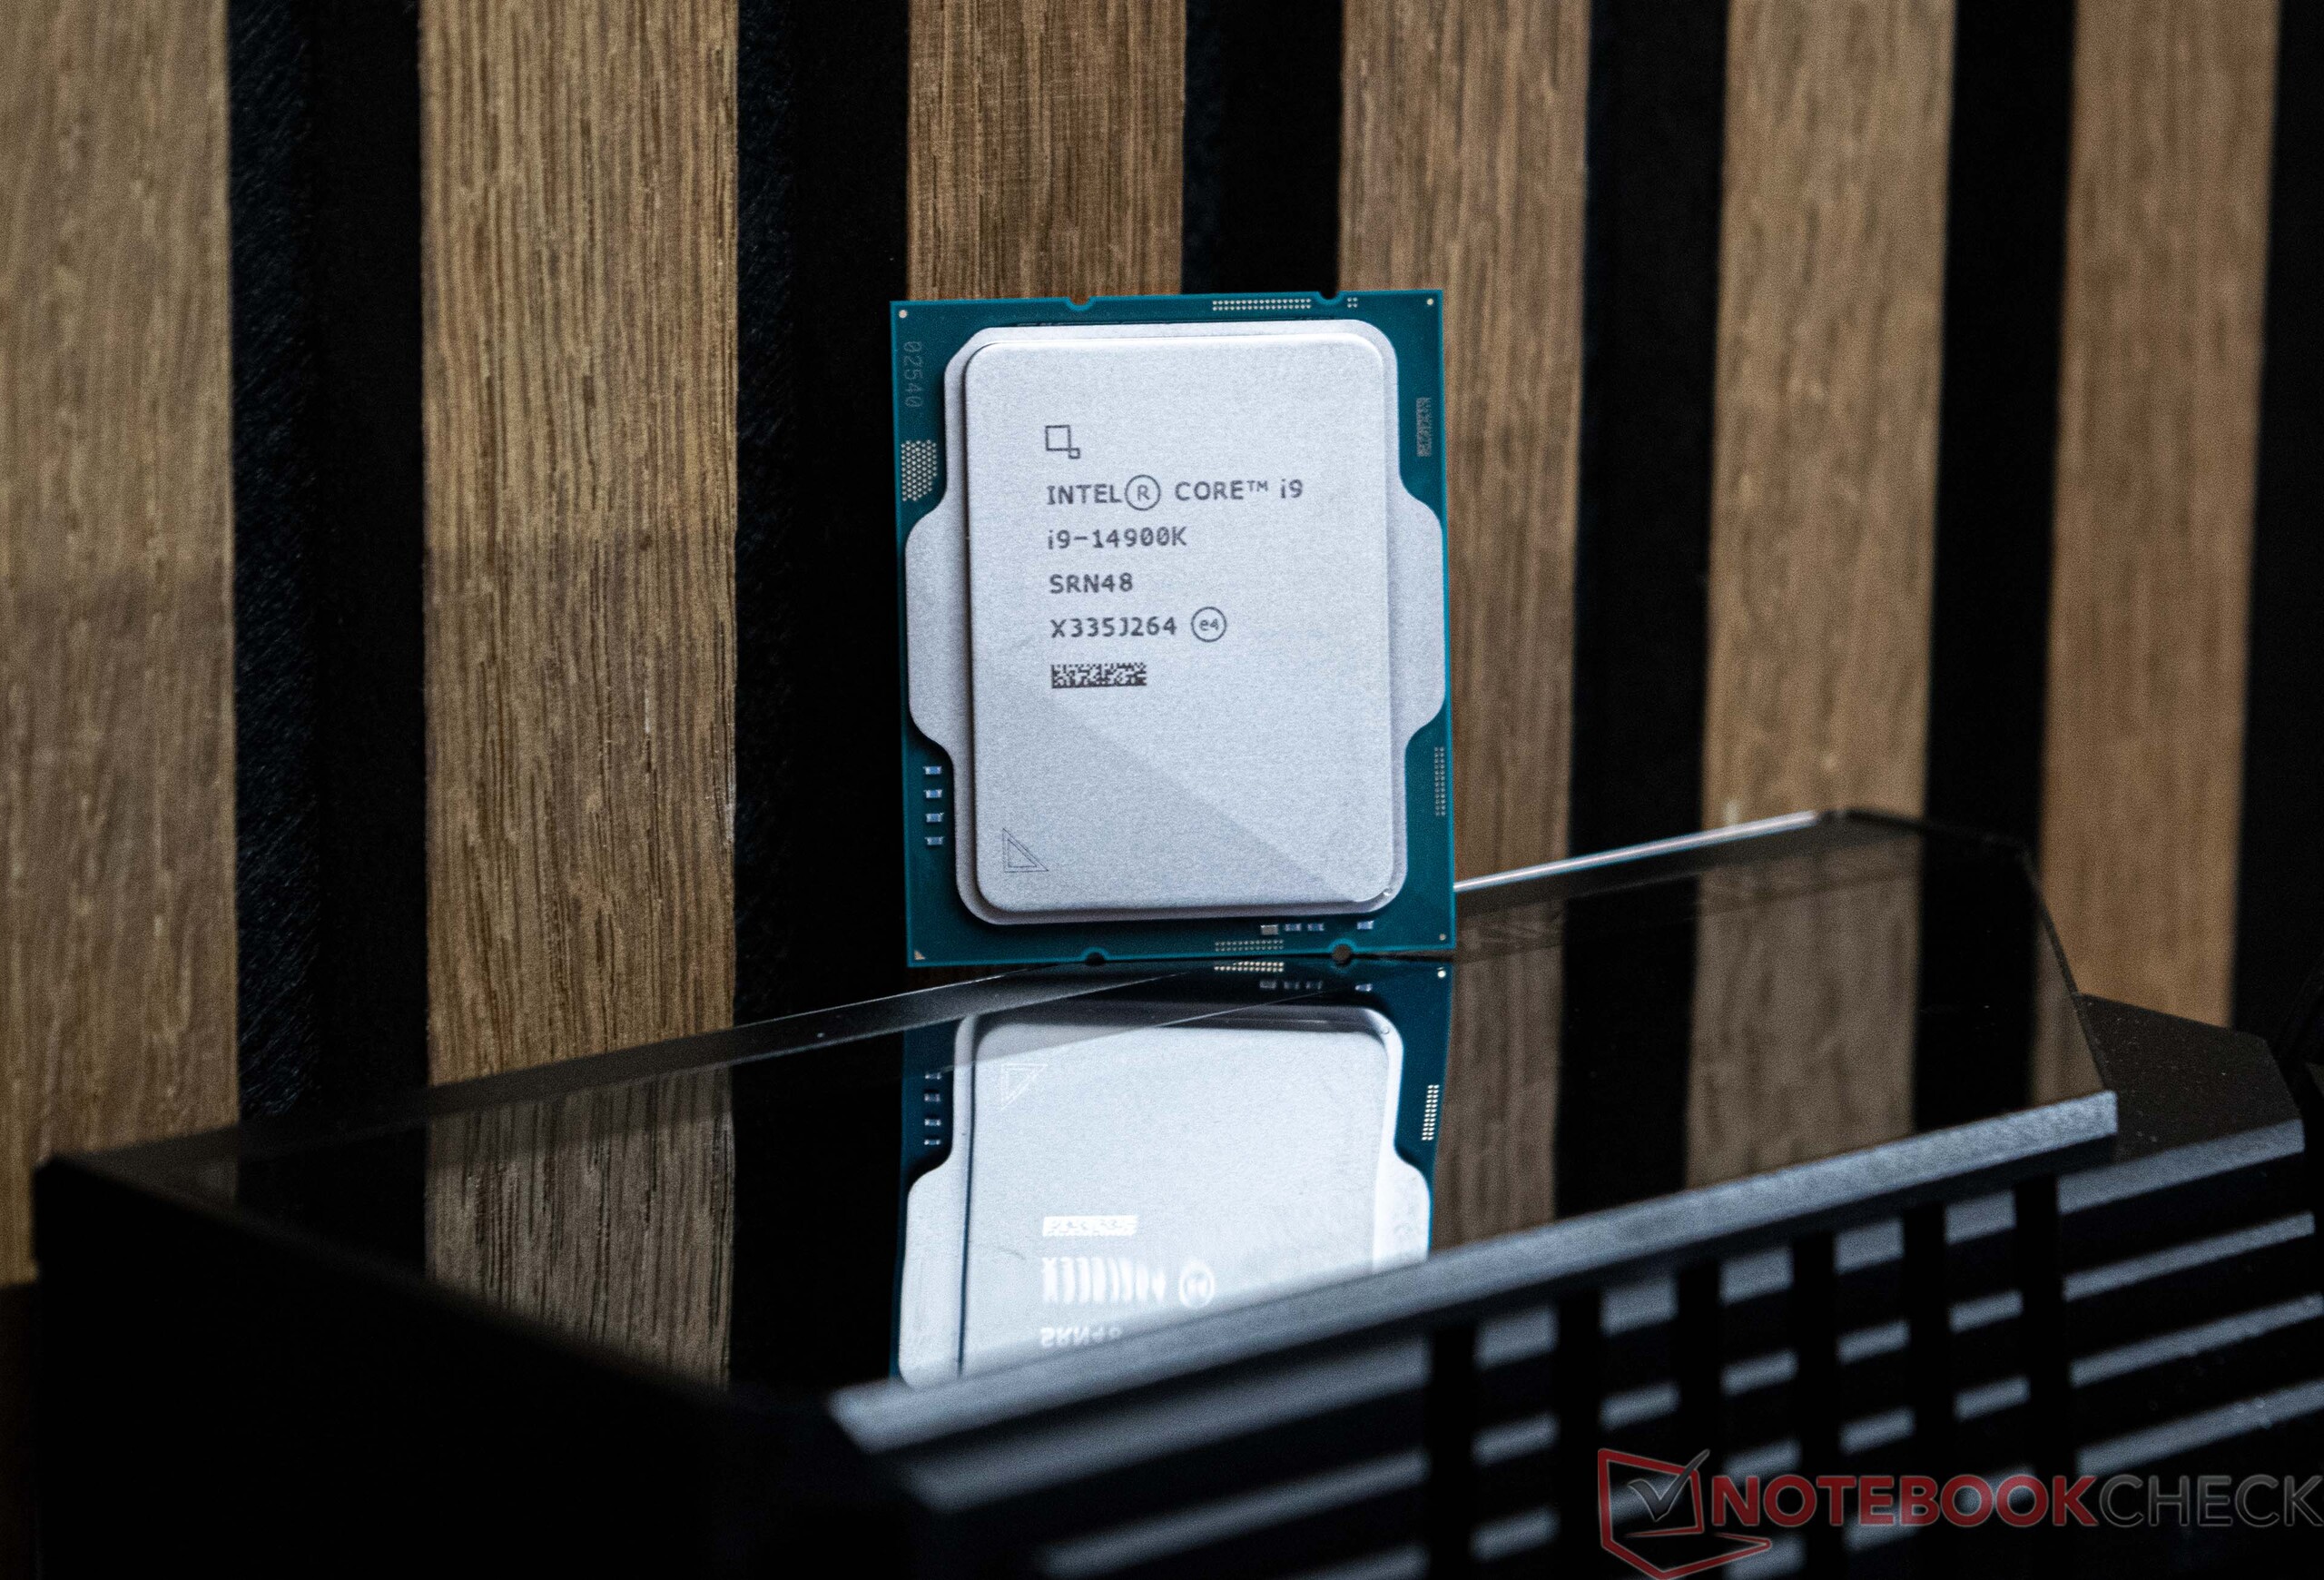
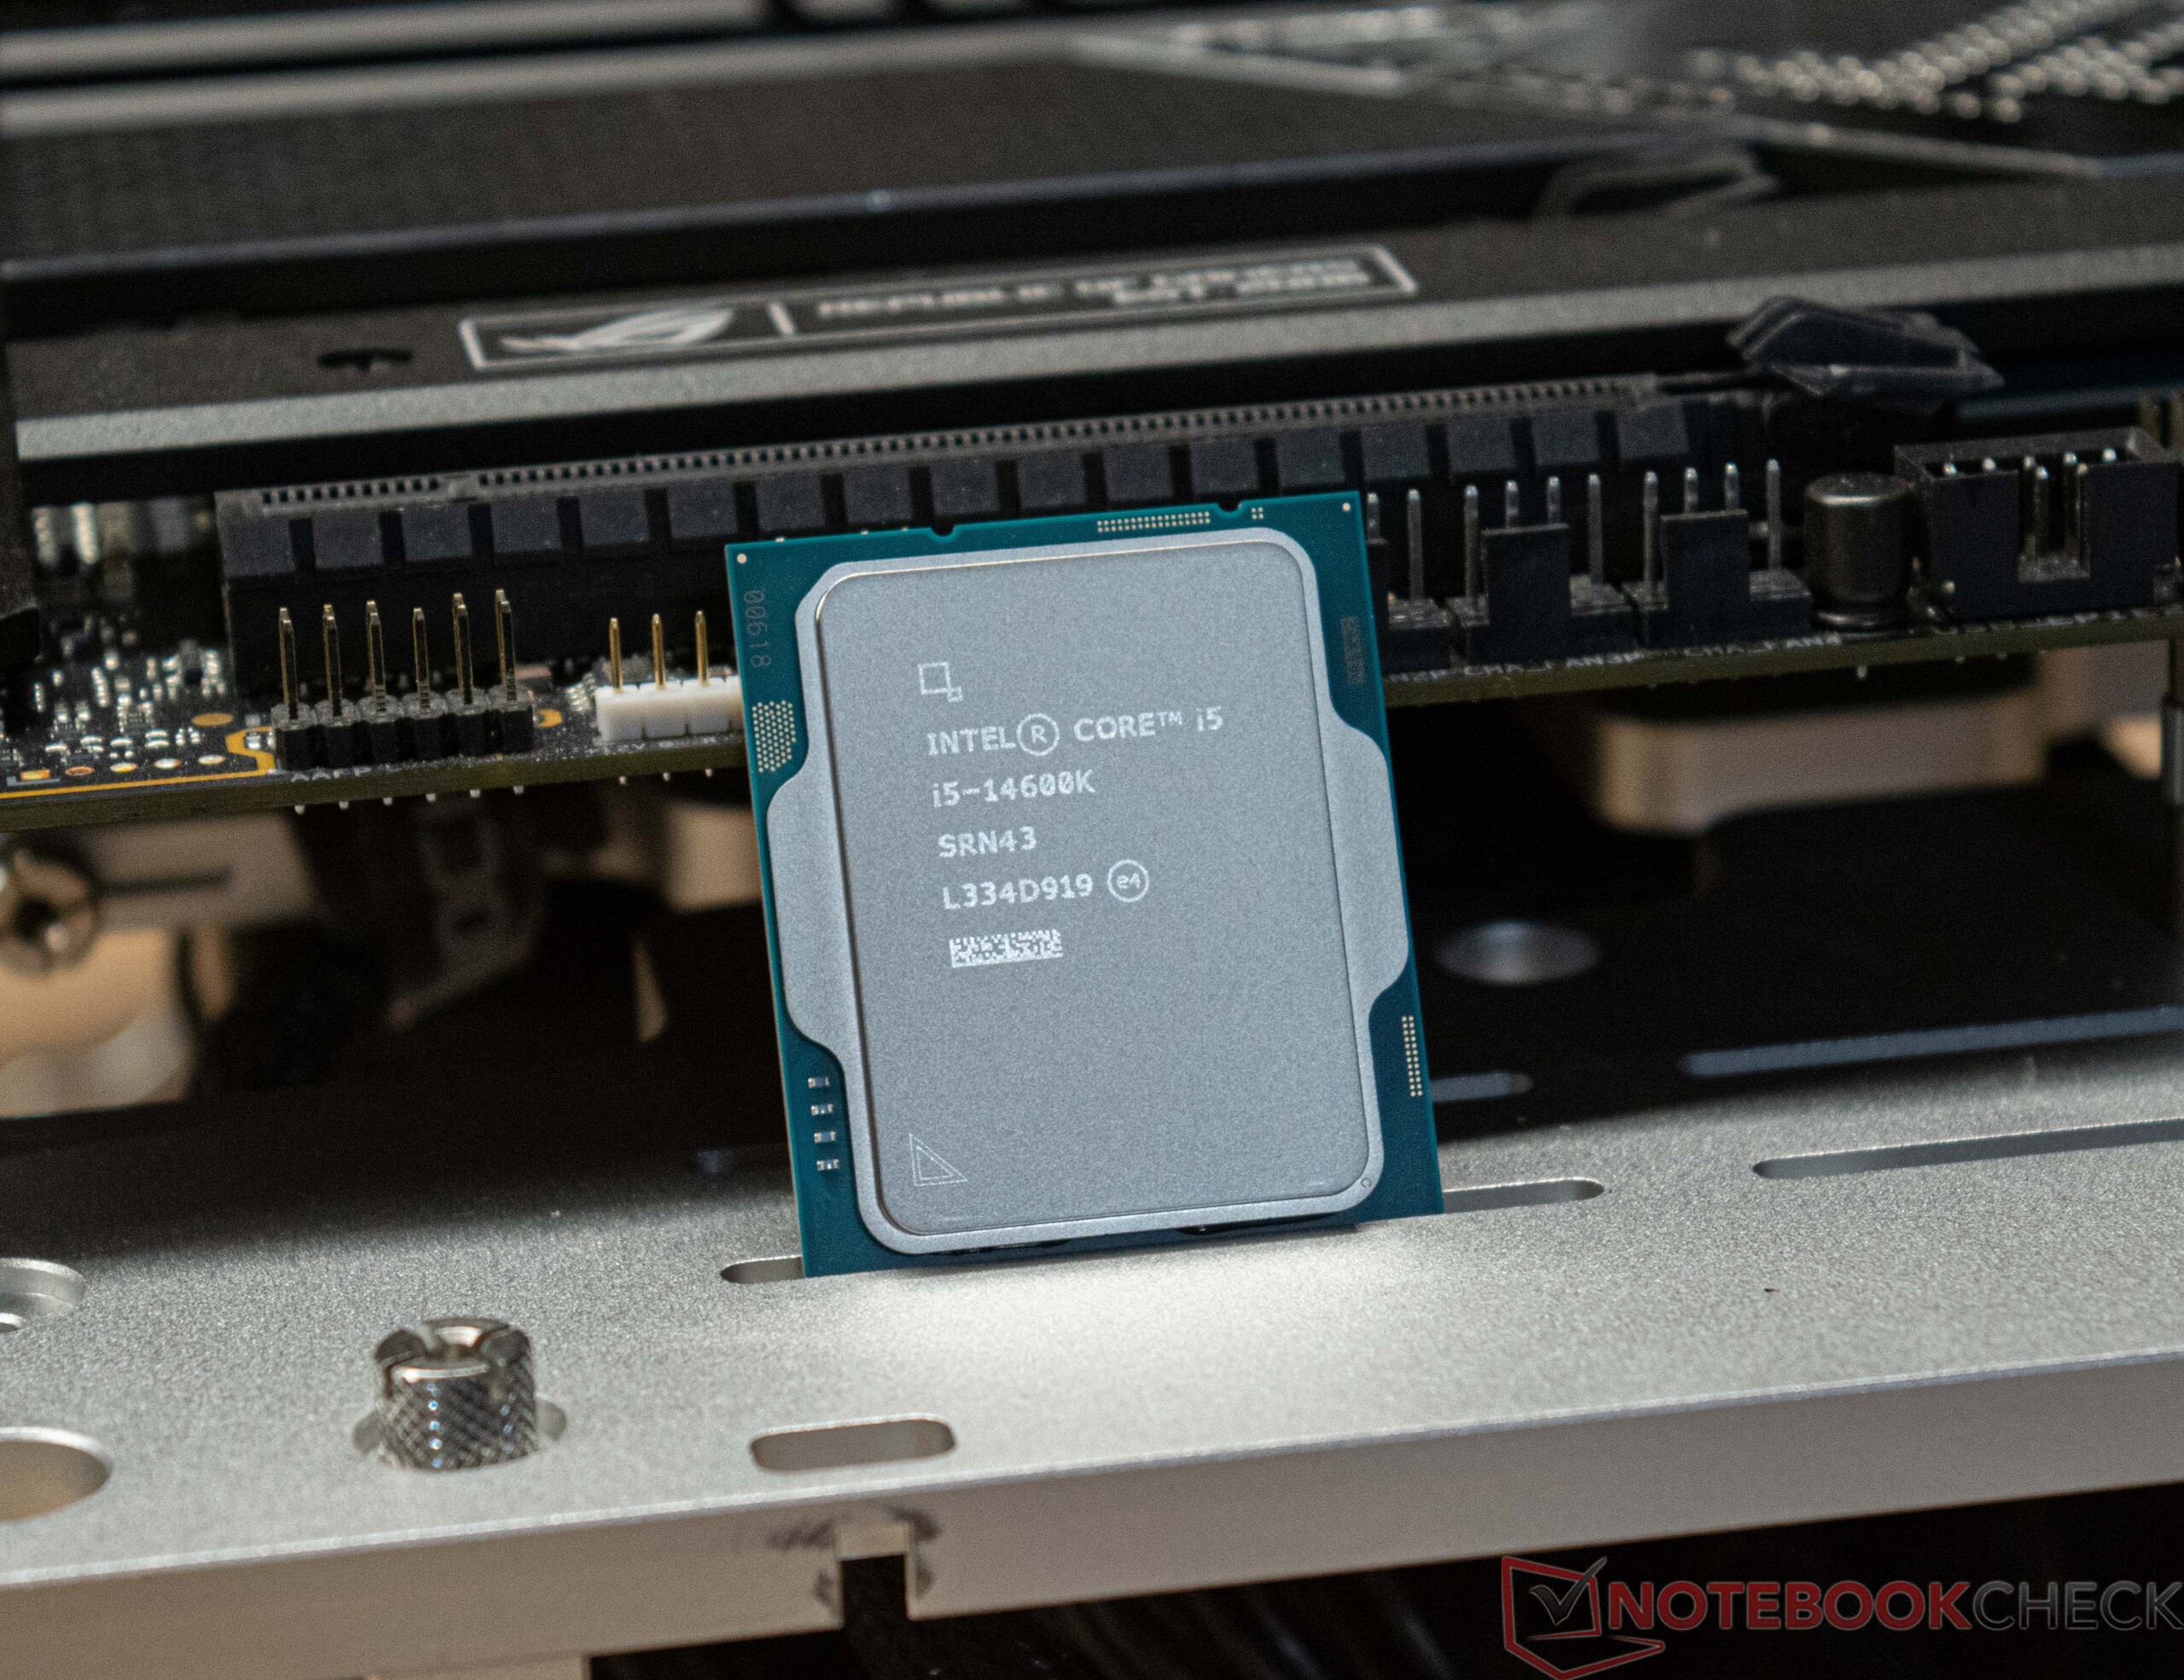
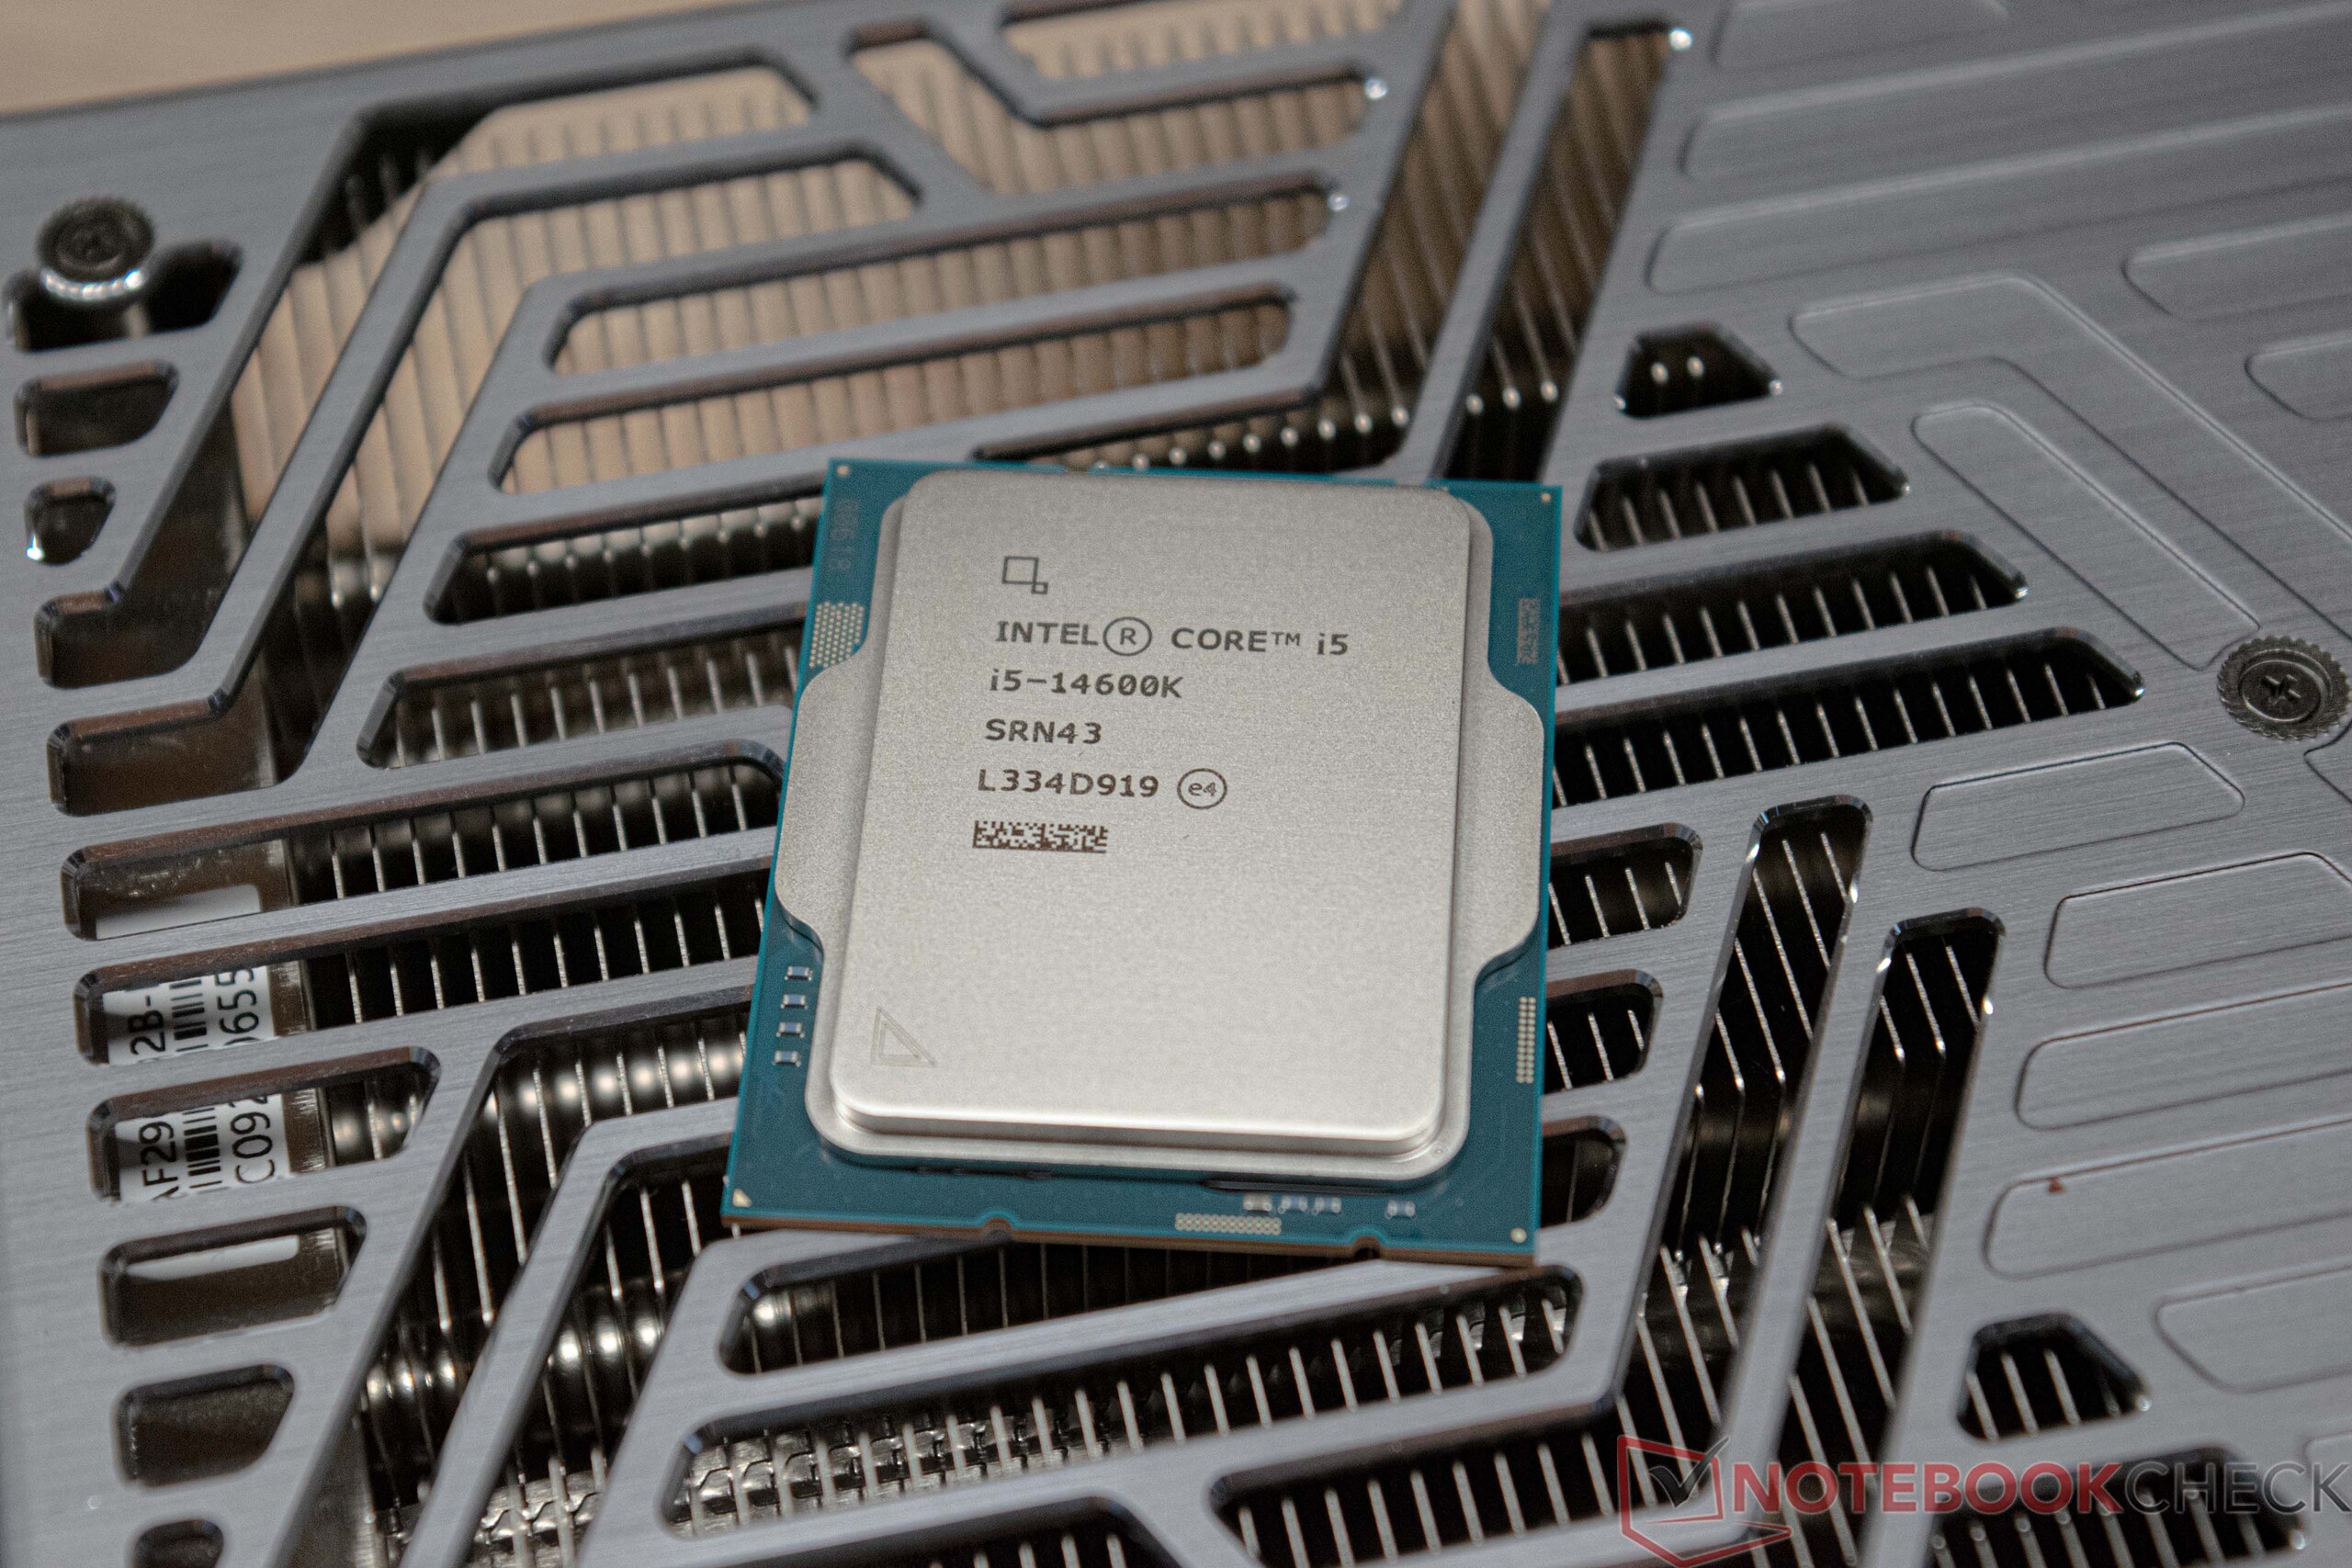
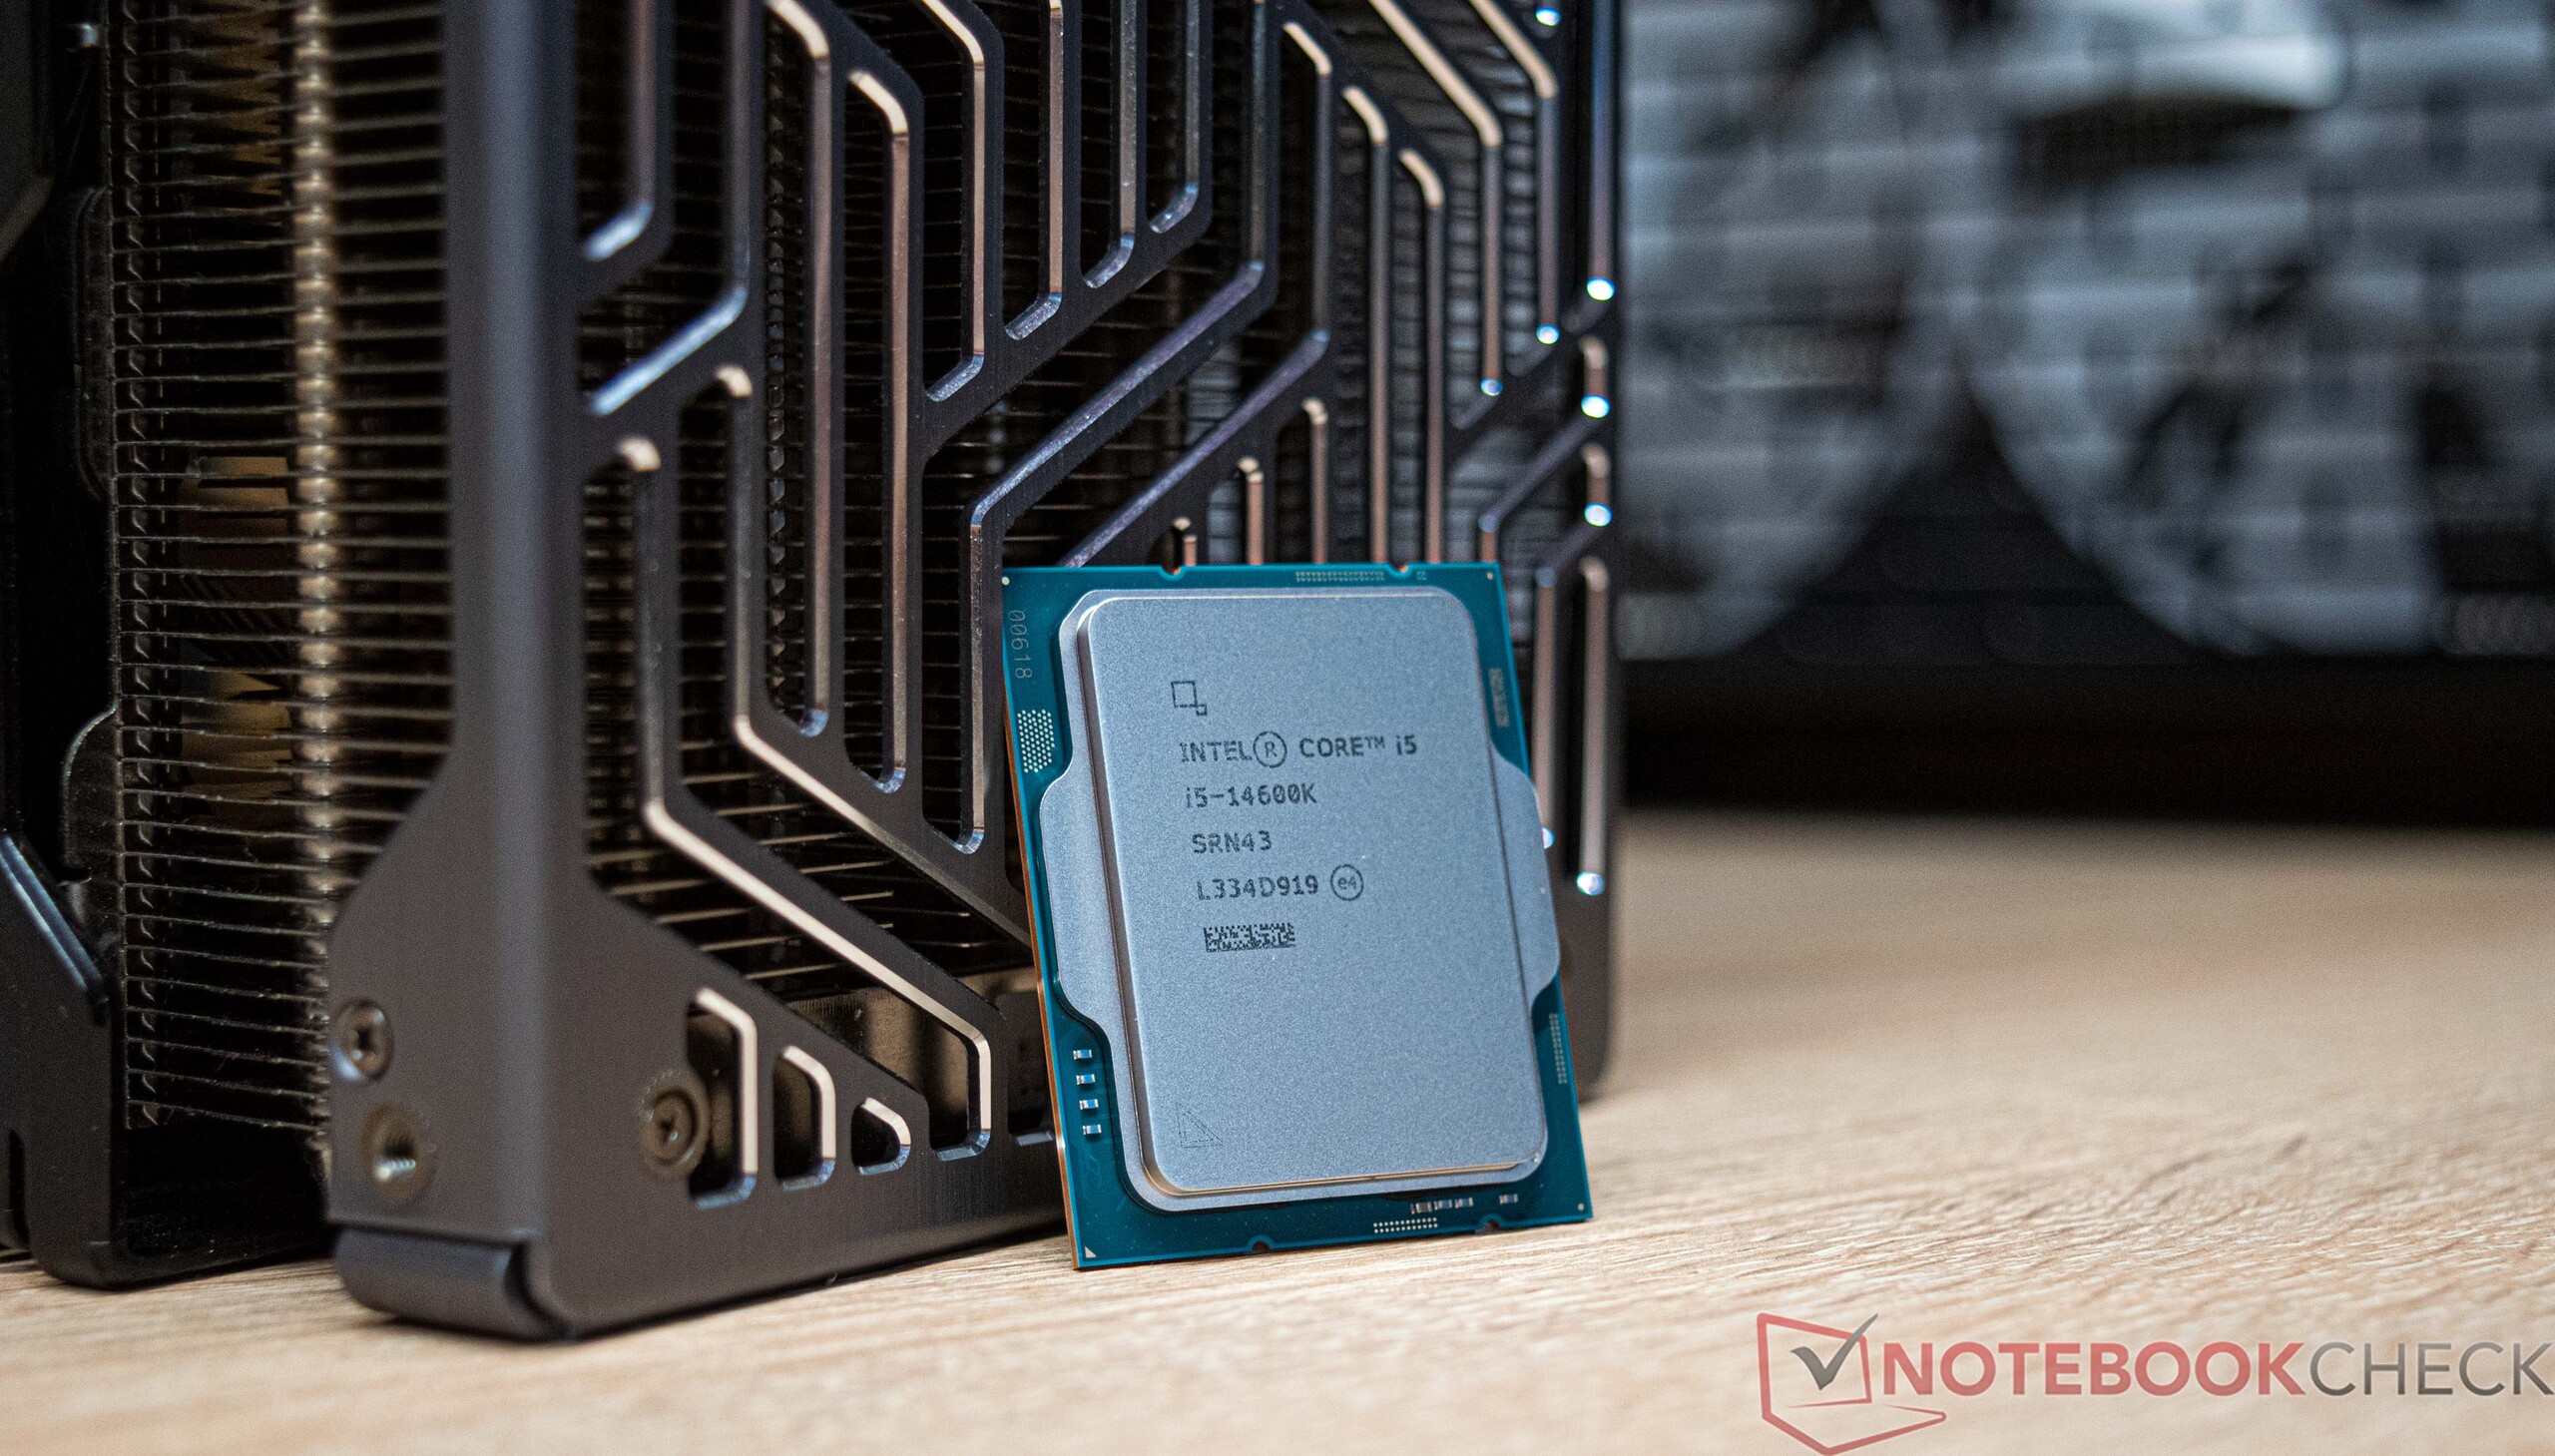
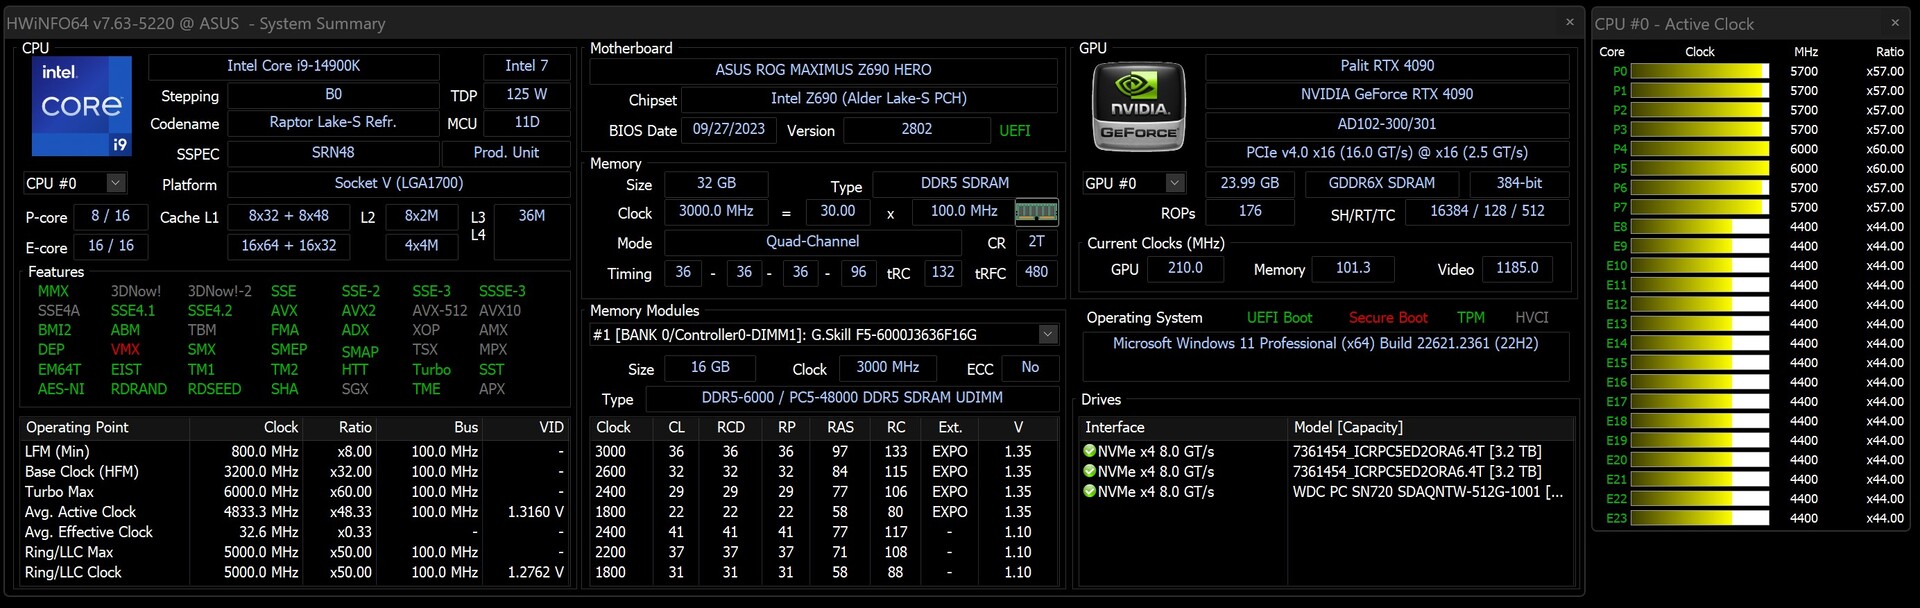
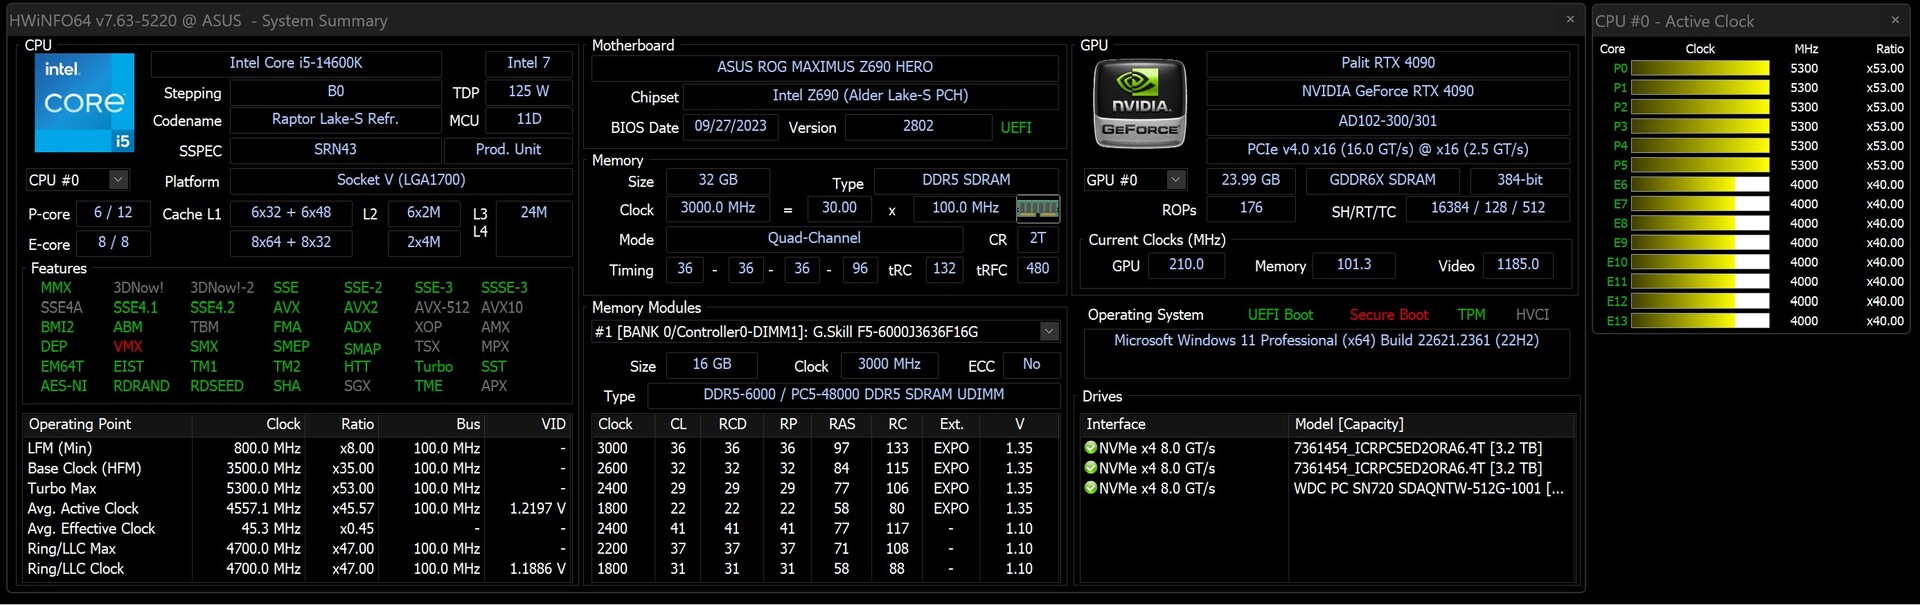
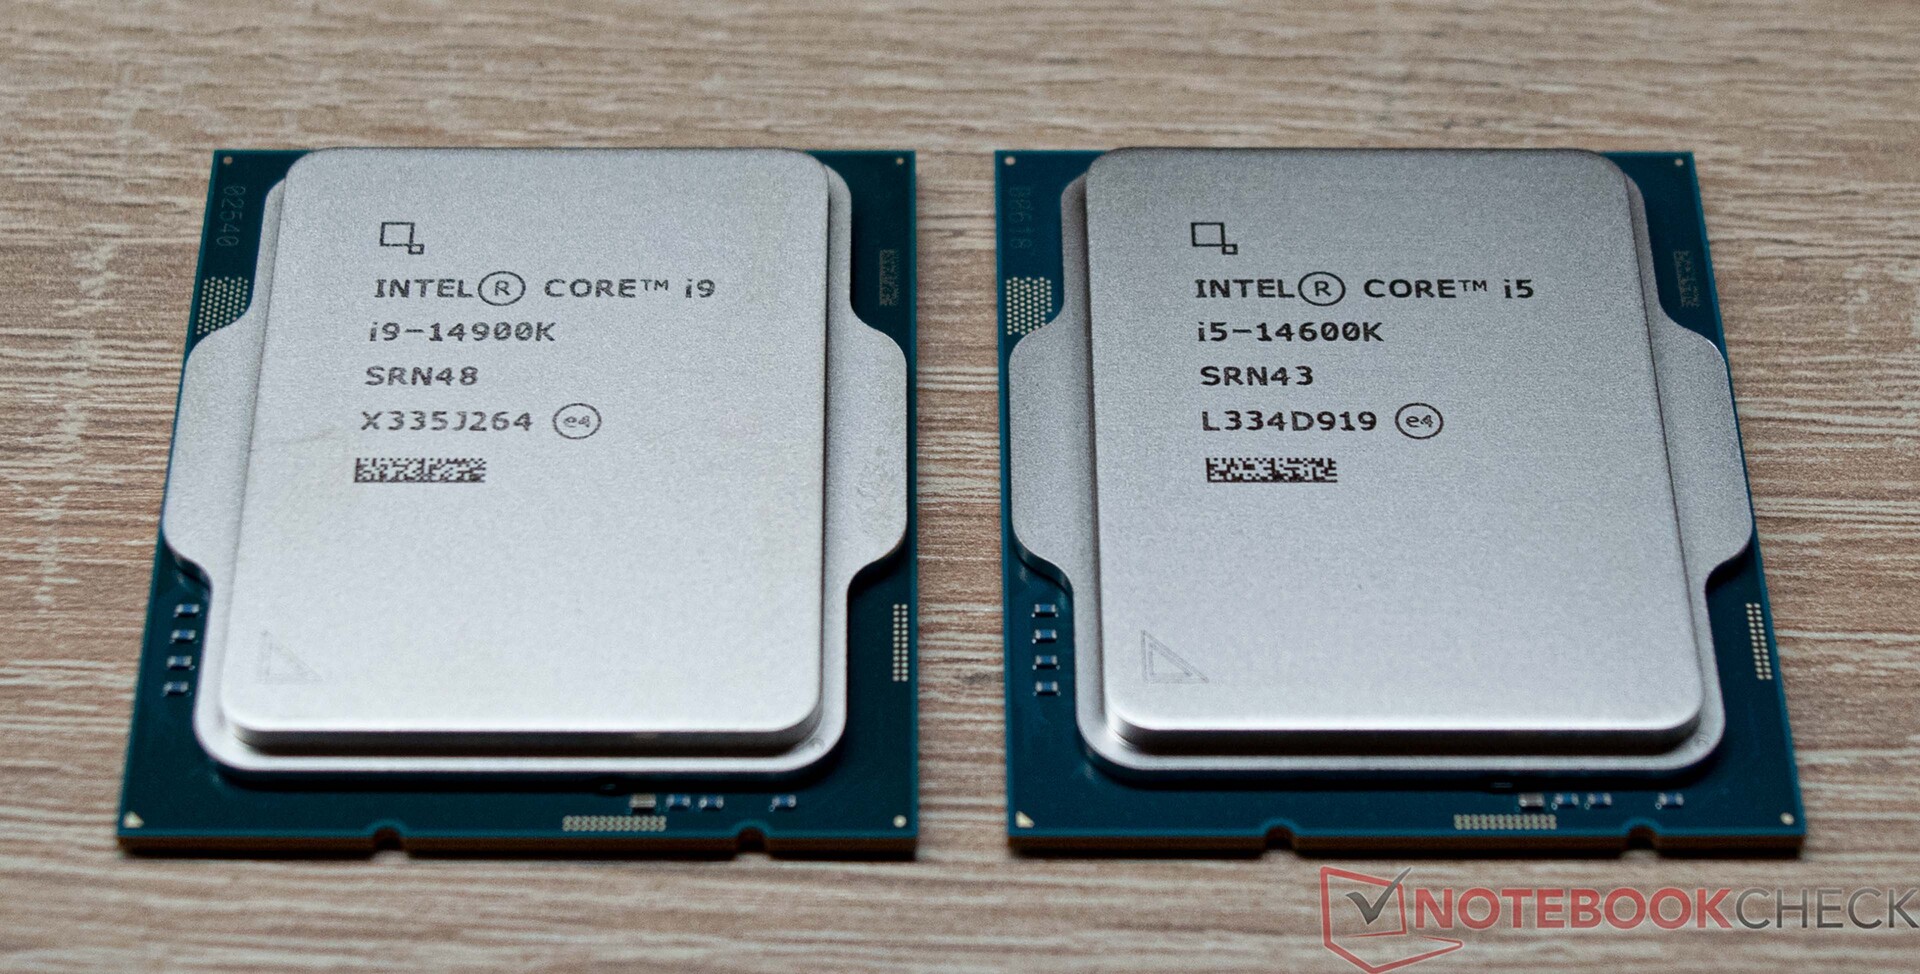
Entgegen den Erwartungen nach zwei Jahren einen neuen Sockel einzuführen, lässt Intel den Sockel 1700 mit der 14. Generation der Core-Prozessoren länger leben. Das Topmodell, der Intel Core i9-14900K, bringt es in Summe auf 24 native Rechenkerne und 32 Threads, welche es so auch schon beim Intel Core i9-13900K gab. Bei den Taktfrequenzen hat Intel jedoch etwas nachgebessert, womit nunmehr direkt die 6,0-GHz-Grenze erreicht wird. Im Test konnten wir dies auch dokumentieren, womit der Hersteller seinen Worten auch Taten folgen lässt. Leider hat Intel beim Thema Energieversorgung nicht viel verändert, womit auch das neue Flaggschiff mit bis zu 253 Watt den gleichen PL2-Wert bekommt wie bereits bekannt. Deaktiviert man zudem alle Restriktionen im BIOS, steigt der Energiebedarf noch deutlich weiter, wie wir im Test später sehen werden. Neben dem Topmodell widmen wir uns in diesem Test auch dem Intel Core i5-14600K. Dieser bringt es mit 14 Kernen und 20 Threads auf die gleiche Anzahl wie der Intel Core i5-13600K. Auch hier hat Intel an der Taktschraube gedreht, um den P- und E-Kernen etwas mehr Leistung abzuverlangen.
Somit sind keine großen Leistungssprünge zu erwarten, und auch beim grundsätzlichen CPU-Aufbau hat Intel nichts verändert. Ein Pendant zu AMDs 3D-V-Cache-Technologie gibt es seitens Intel bislang nicht. Gerade damit konnte AMD in der jüngsten Vergangenheit ordentlich punkten und die Konkurrenz unter Druck setzen.
Die Preise seitens Intel zeigen, dass wir hier auf demselben Level sind wie beim Start der Raptor-Lake-S-Modelle aus dem letzten Jahr. Aufgrund der Nachfrage, die bekanntlich im 4. Quartal ansteigt, bleibt abzuwarten, wie sich die neuen Modelle tatsächlich einpendeln werden. Ausschlaggebend hierbei ist auch immer der Euro-Dollar-Kurs.
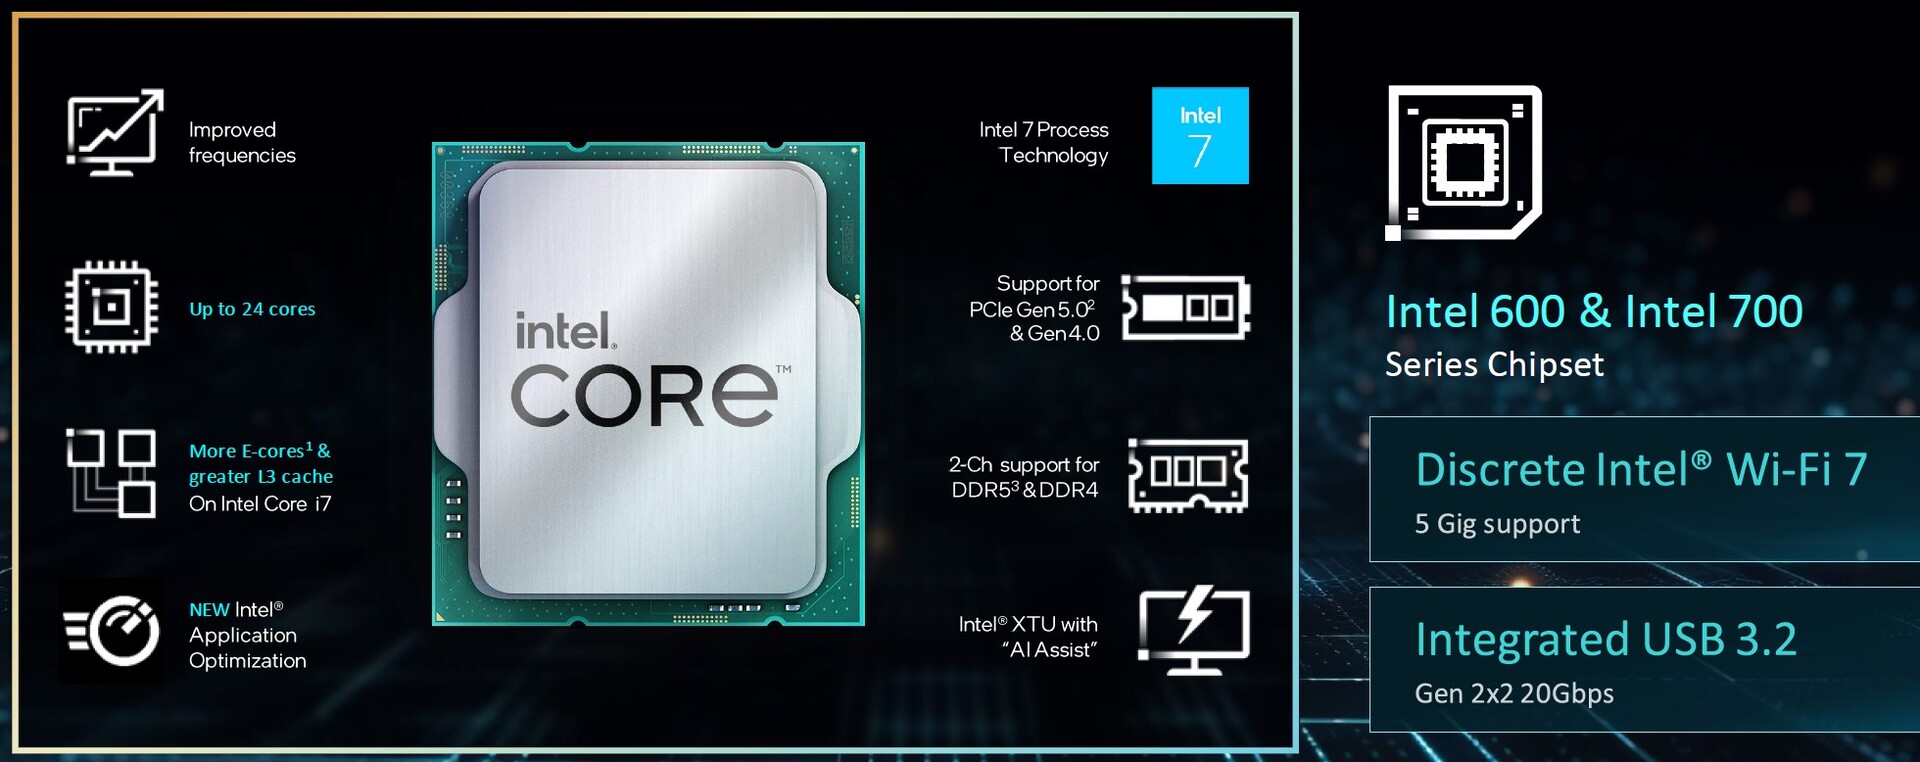
Kleine Neuerungen bei Intels 14th-Gen-Prozessoren
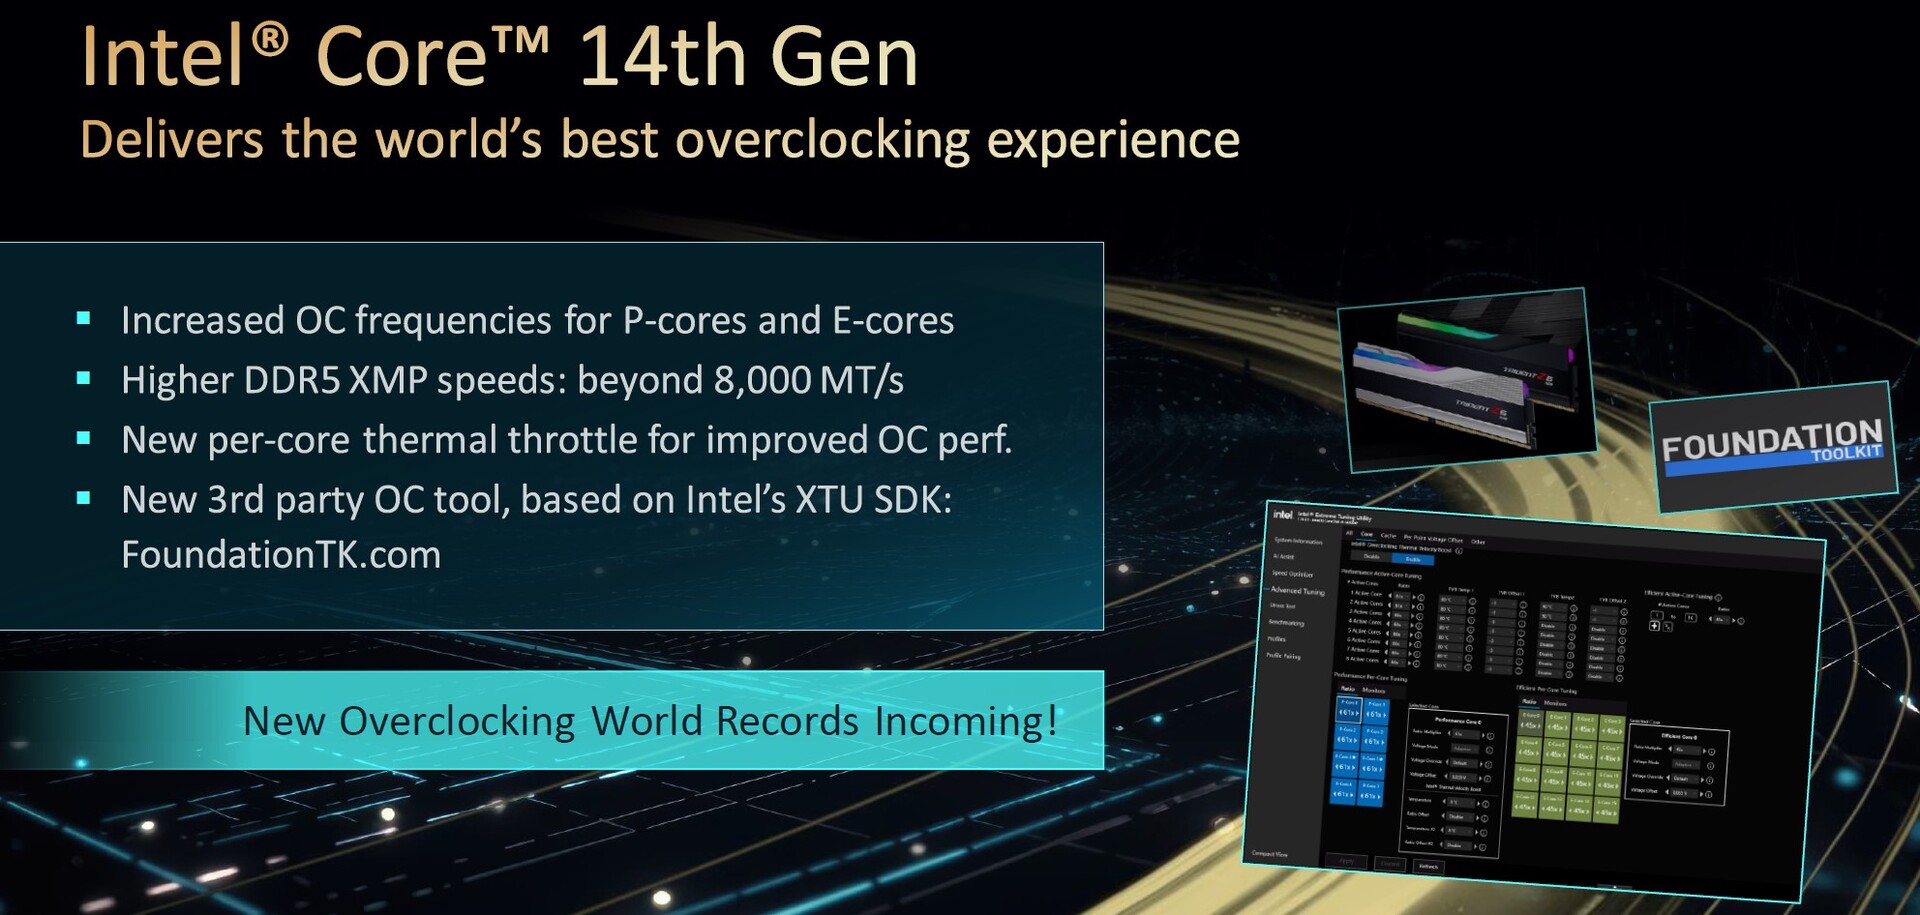


Neben den angehobenen Taktraten legt Intel viel Wert auf die RAM-Geschwindigkeiten, welche mit XMP und bis zu 8.000 MT/s beworben werden. In der Vergangenheit gab es aber oftmals Probleme mit diesen hohen Taktraten beim Arbeitsspeicher. Das ist vermutlich auch ein Grund für die Neuauflage der Mainboards, welche mit Verbesserungen die Taktraten erreichen sollen. Intel selbst gibt für den Intel Core i9-14900K für DDR5 5.600 MT/s frei. In der Praxis ist es jedoch kein Problem, Arbeitsspeicher mit höheren Taktraten zu verwenden, wenngleich die Stabilität darunter leiden kann. Ein Blick in die QVL-Listen der Mainboard-Hersteller gibt Aufschluss, welche RAM-Module unterstützt werden.
Als Weiteres vertraut Intel zunehmend auf den Einsatz von AI, was insbesondere auch das Übertakten vereinfachen soll. Die aktuelle Version des Intel Extreme Utility (XTU) unterstützt dies, und mit einem Klick wird das gesamte System analysiert, um die besten Einstellungen hinsichtlich Spannungen, Multiplikator und Power-Target herauszufinden.
Intel hat für diesen Test den Intel Core i9-14900K sowie den Intel Core i5-14600K zur Verfügung gestellt. Ein Blick auf die Tabelle der neuen Prozessoren macht aber schnell deutlich, dass der Intel Core i7-14700K das eindeutig interessantere Produkt der Reihe ist. Als einziges Modell bekommt der Core i7 mehr Kerne, womit im direkten Vergleich zum Intel Core i7-13700K der Leistungszuwachs deutlich weitreichender ausfallen sollte. Wir versuchen ein passendes Sample der CPU zu bekommen.
Details zu unserem Testsystem
Für die folgenden Tests und Benchmarks nutzen wir dieses System:
- Streacom BC1 V2 Open Benchtable
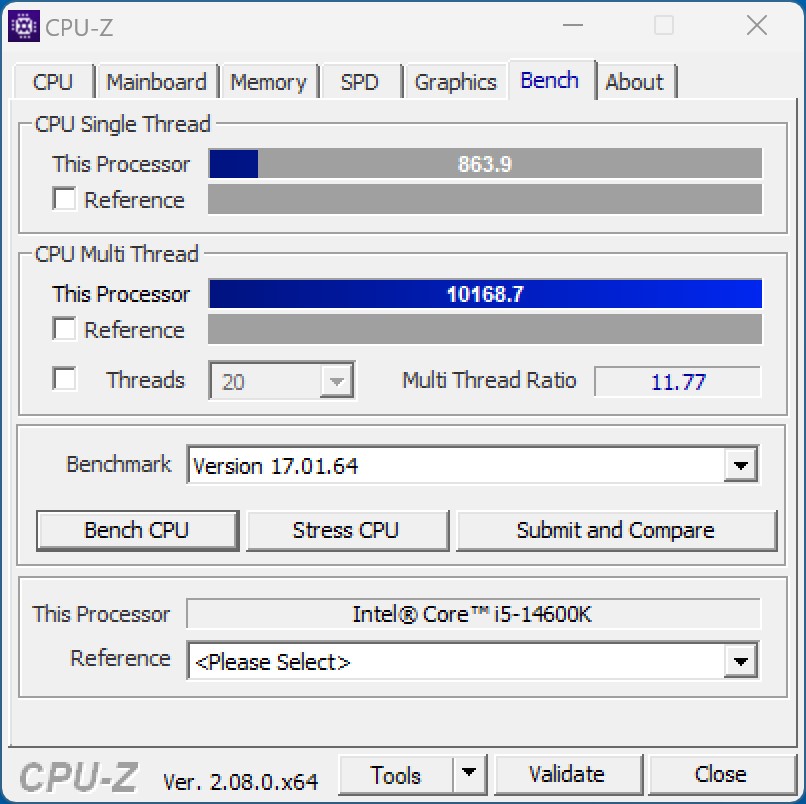
- Intel Core i9-14900K, Intel Core i5-14600K
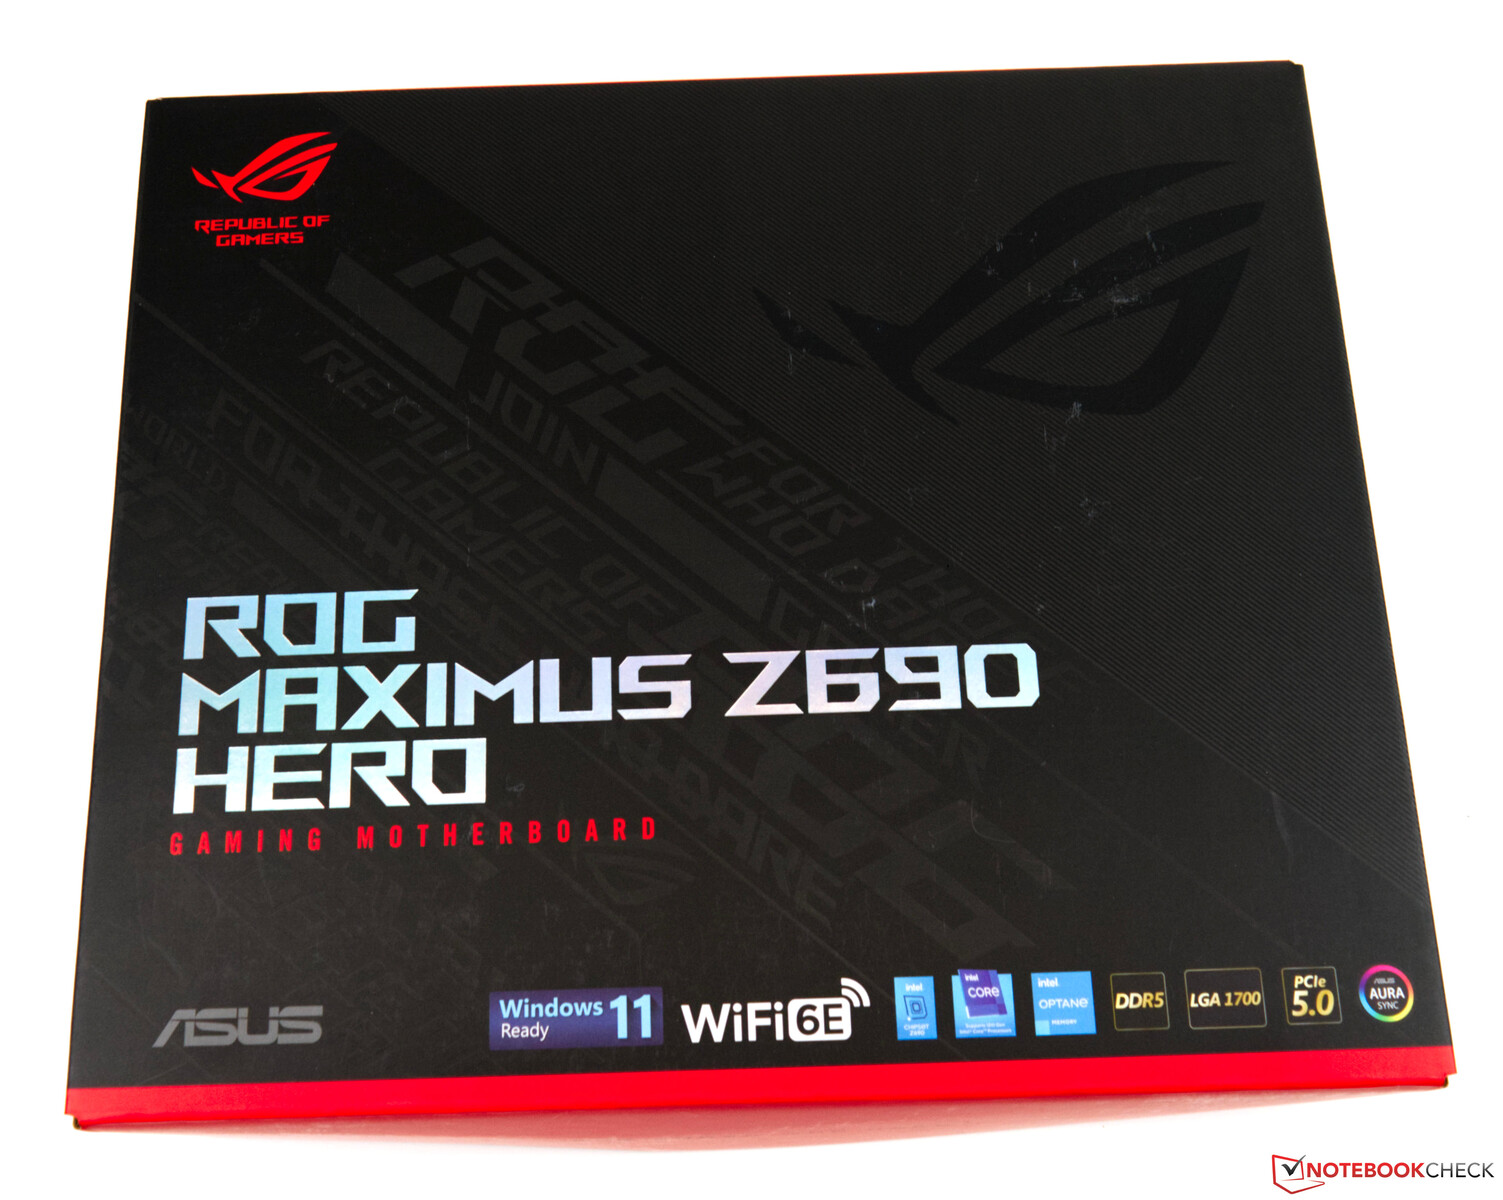
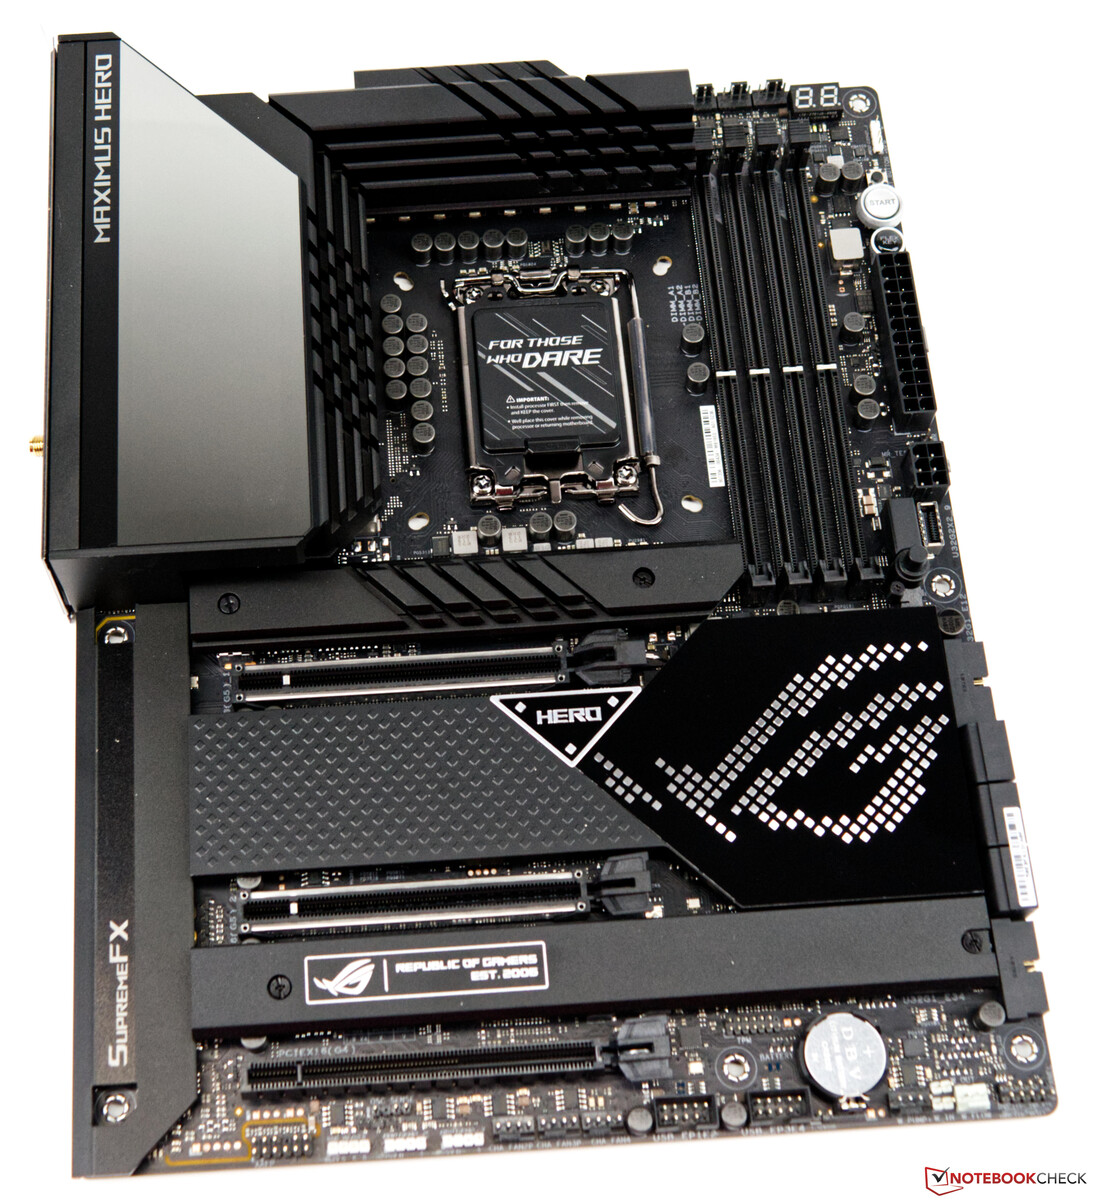
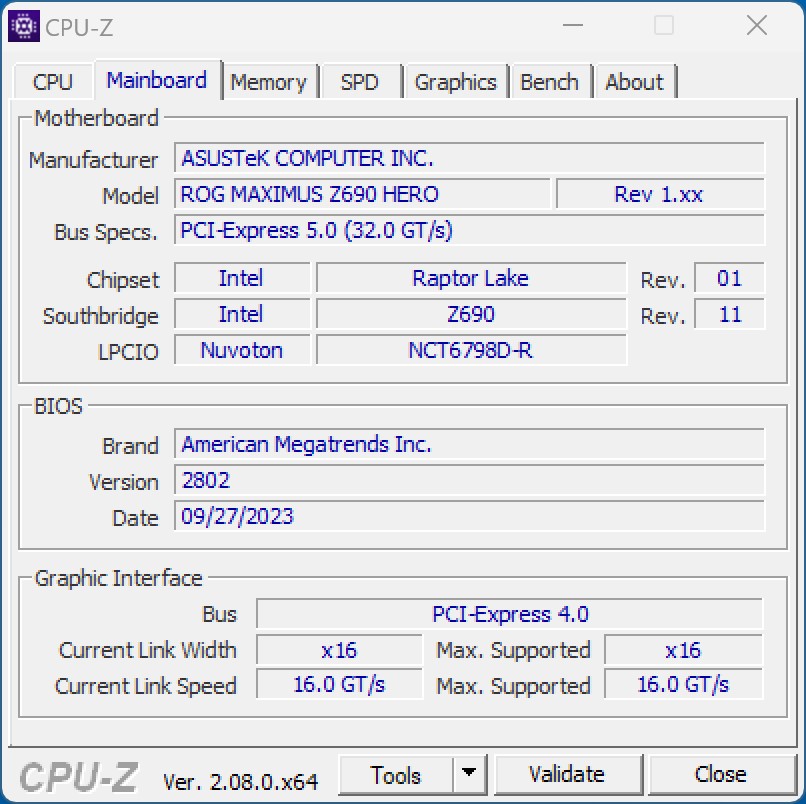
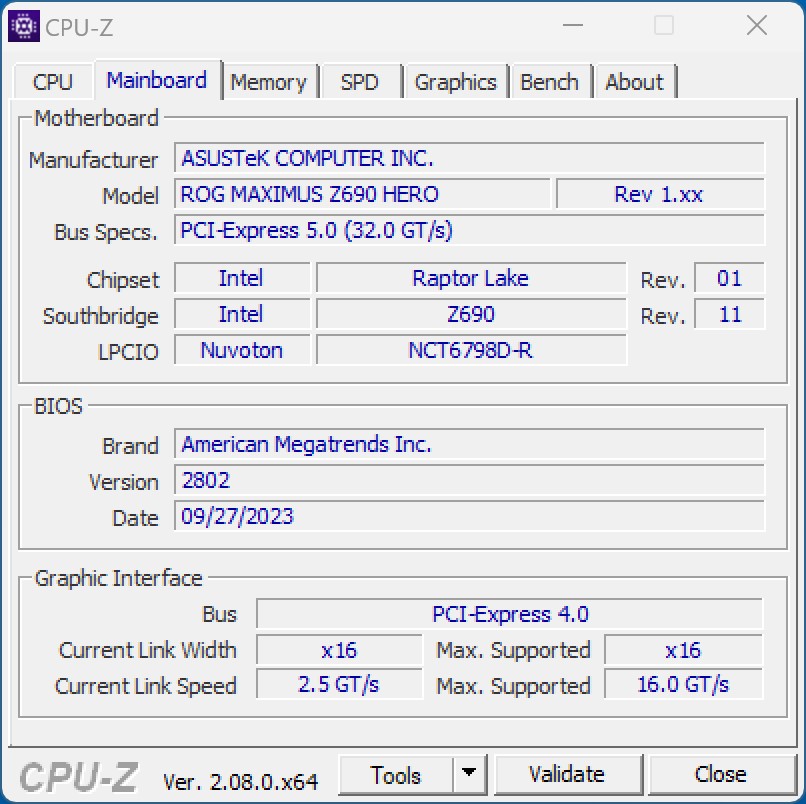
- Asus ROG Maximus Z690 Hero (BIOS v2802)
- Custom-Loop-Wasserkühlung (Pumpe: Watercool WCP D5, Radiator: EK MO-RA3 420 Pro)
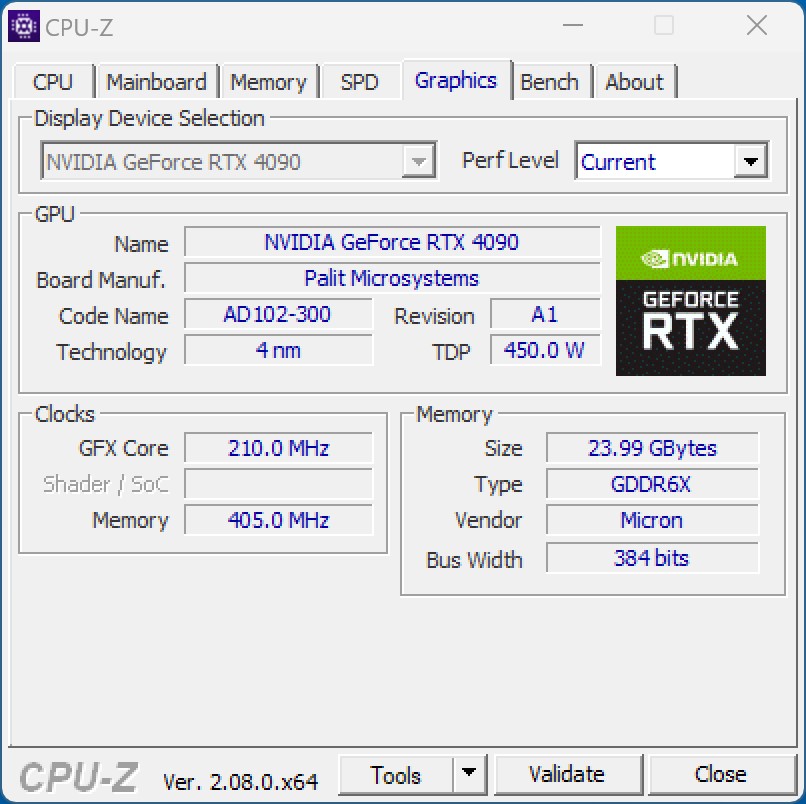
- Nvidia GeForce RTX 4090 Founder's Edition (Treiber: 537.42)
- EVGA SuperNOVA P+ 1.600 W
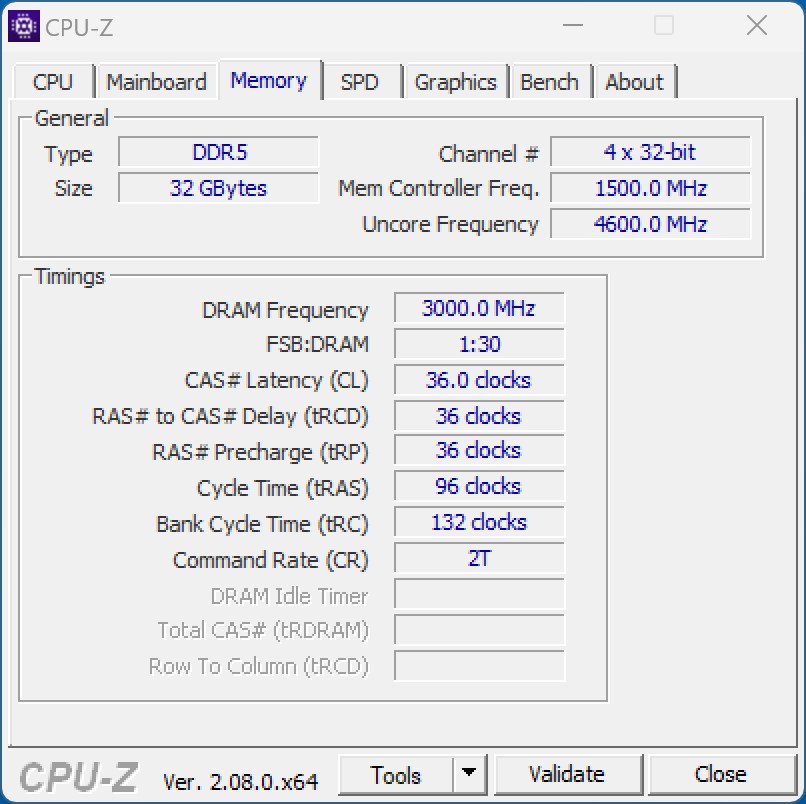
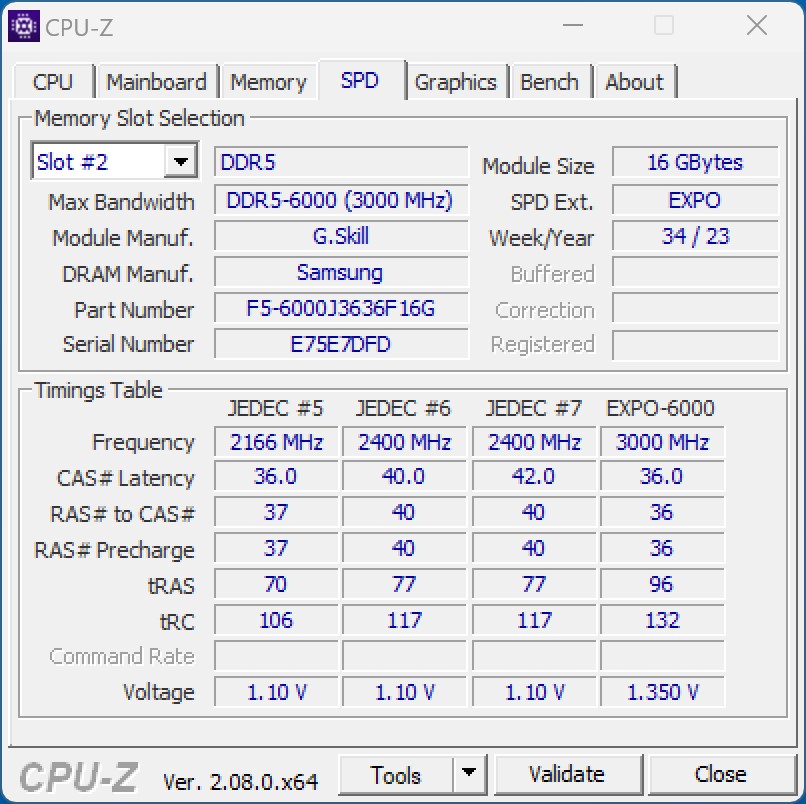
- G.Skill Ripjaws S5 (2x 16 GB - DDR5-6000 XMP)
- Western Digital SN720 - 512GB (System)
- Intel SSD DC P4618 - 6,4 TB (Benchmarks)
- Microsoft Windows 11 Professional 64-Bit (Version 22H2)
Intel Prozessoren im Vergleich
| Modell | Kerne / Threads |
Takt P-Core / Turbo | Takt E-Core / Turbo | Cache L2 + L3 | Grafik | PBP | MTB | Preis (UVP) |
| Core i9-14900K | 24 (8P + 16E) /32 | 3,4 GHz / 6,0 GHz | 2,4 GHz / 4,4 GHz | 32 + 36 MB | UHD 770 | 125 Watt | 253 Watt | 589 US-Dollar |
| Core i9-13900K | 24 (8P + 16E) /32 | 3,0 GHz / 5,8 GHz | 2,2 GHz / 4,3 GHz | 32 + 36 MB | UHD 770 | 125 Watt | 253 Watt | 589 US-Dollar |
| Core i9-12900K | 16 (8P + 8E) /24 | 3,2 GHz / 5,1 GHz | 2,4 GHz / 3,9 GHz | 14 + 30 MB | UHD 770 | 125 Watt | 241 Watt | 589 US-Dollar |
| Core i7-14700K | 20 (8P + 12E) /28 | 3,4 GHz / 5,6 GHz | 2,5 GHz / 4,3 GHz | 24 + 30 MB | UHD 770 | 125 Watt | 253 Watt | 409 US-Dollar |
| Core i7-13700K | 16 (8P + 8E) /24 | 3,4 GHz / 5,4 GHz | 2,5 GHz / 4,2 GHz | 24 + 30 MB | UHD 770 | 125 Watt | 253 Watt | 409 US-Dollar |
| Core i7-12700K | 12 (8P + 4E) /20 | 3,6 GHz / 4,9 GHz | 2,7 GHz / 3,8 GHz | 12 + 25 MB | UHD 770 | 125 Watt | 190 Watt | 409 US-Dollar |
| Core i5-14600K | 14 (6P + 8E) /20 | 3,5 GHz / 5,3 GHz | 2,6 GHz / 4,0 GHz | 20 + 24 MB | UHD 770 | 125 Watt | 181 Watt | 319 US-Dollar |
| Core i5-13600K | 14 (6P + 8E) /20 | 3,5 GHz / 5,1 GHz | 2,6 GHz / 3,9 GHz | 20 + 24 MB | UHD 770 | 125 Watt | 181 Watt | 319 US-Dollar |
| Core i5-12600K | 10 (6P + 4E) /16 | 3,7 GHz / 4,9 GHz | 2,8 GHz / 3,6 GHz | 9,5 + 20 MB | UHD 770 | 125 Watt | 150 Watt | 289 US-Dollar |


Testbedingungen - Z690 nach BIOS-Update weiterhin nutzbar
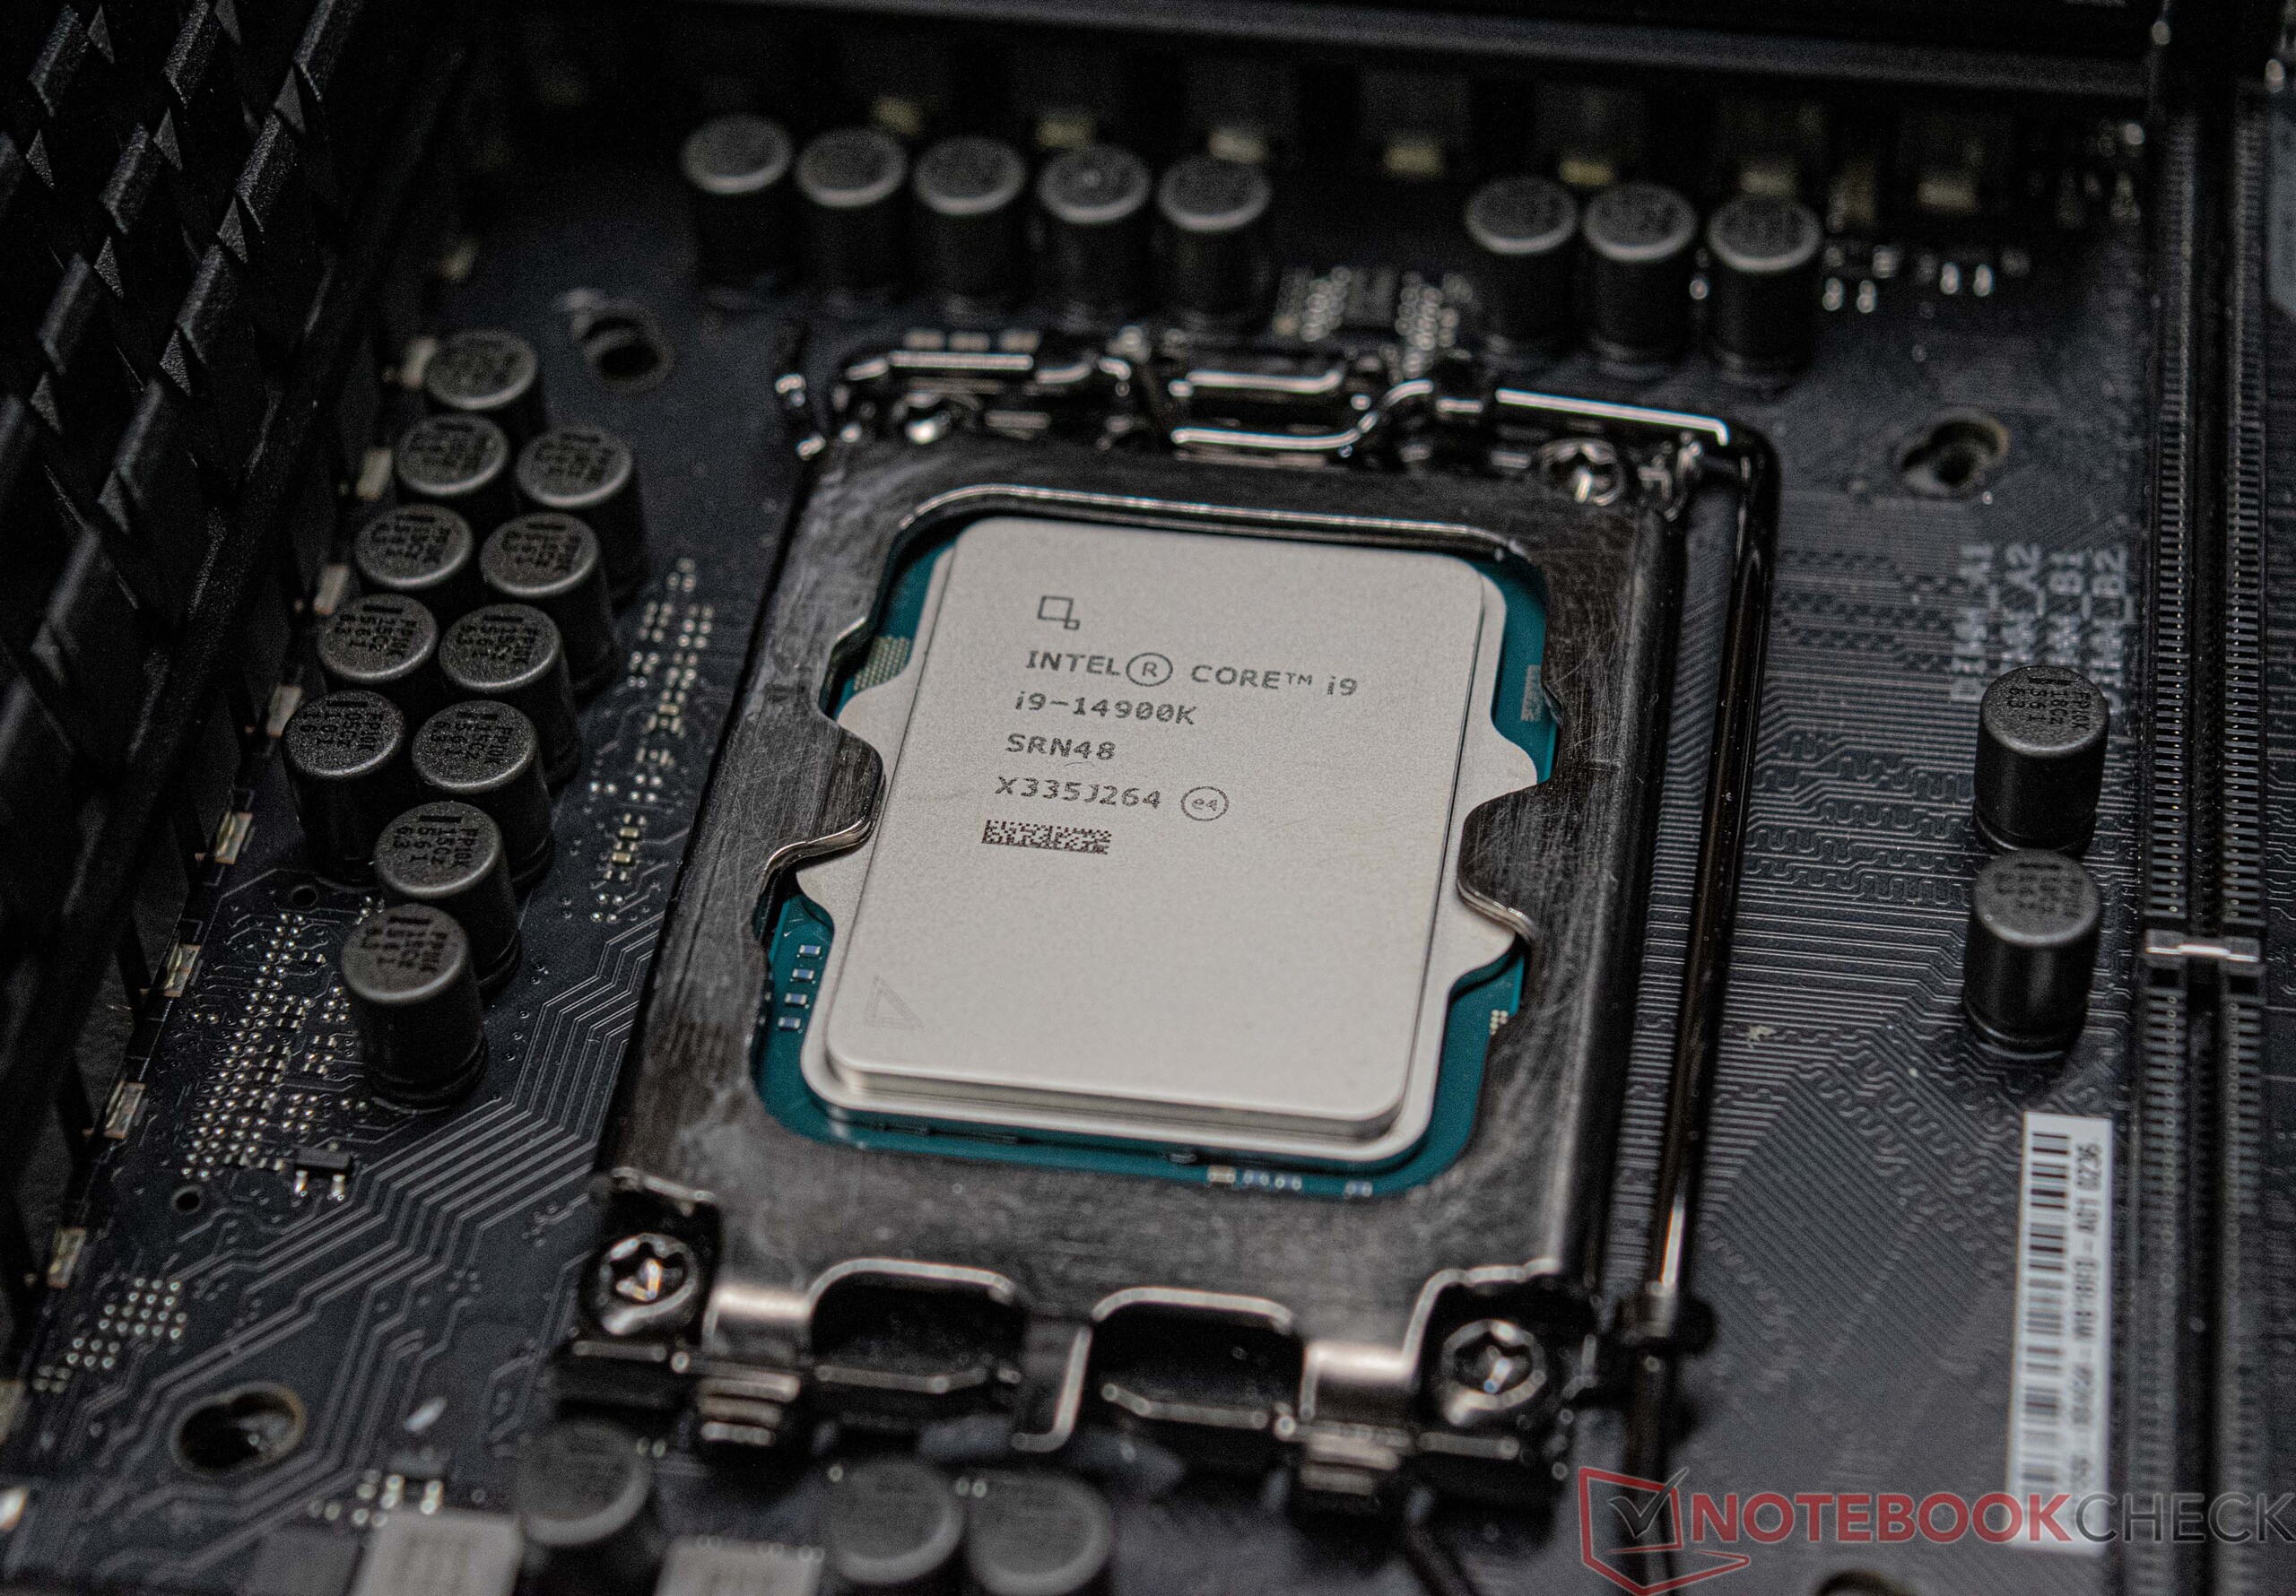
Für diesen Test nutzen wir mit dem Asus ROG Maximus Z690 Hero den gleichen Unterbau, welcher schon bei den Alder-Lake-S- und den Raptor-Lake-S-Prozessoren zum Einsatz kam. Dennoch gibt es auf Basis des Z790-Chipsatzes überarbeitete Mainboards, welche mit besseren Übertaktungs-Features noch mehr Leistung aus den Prozessoren quetschen sollen. Wer nicht auf der Jagd nach Rekorden ist, kann die neuen Prozessoren der 14. Generation auch mit einem 600er-Chipsatz betreiben. Vorab sollte man sich beim jeweiligen Mainboard-Hersteller das passende BIOS herunterladen und aktualisieren. Wir haben von Asus vorab eine BIOS-Version für das Asus ROG Maximus Z690 Hero erhalten. Probleme hinsichtlich der Stabilität und der RAM-Kompatibilität konnten wir in unserem Fall nicht feststellen.
Alle Tests wurden mit der neuesten BIOS-Version (2802) und aktiviertem XMP-Profil durchgeführt. Zudem wurden alle Power-Limit-Beschränkungen deaktiviert, um die volle Leistung der Prozessoren abzurufen.
Prozessor-Benchmarks
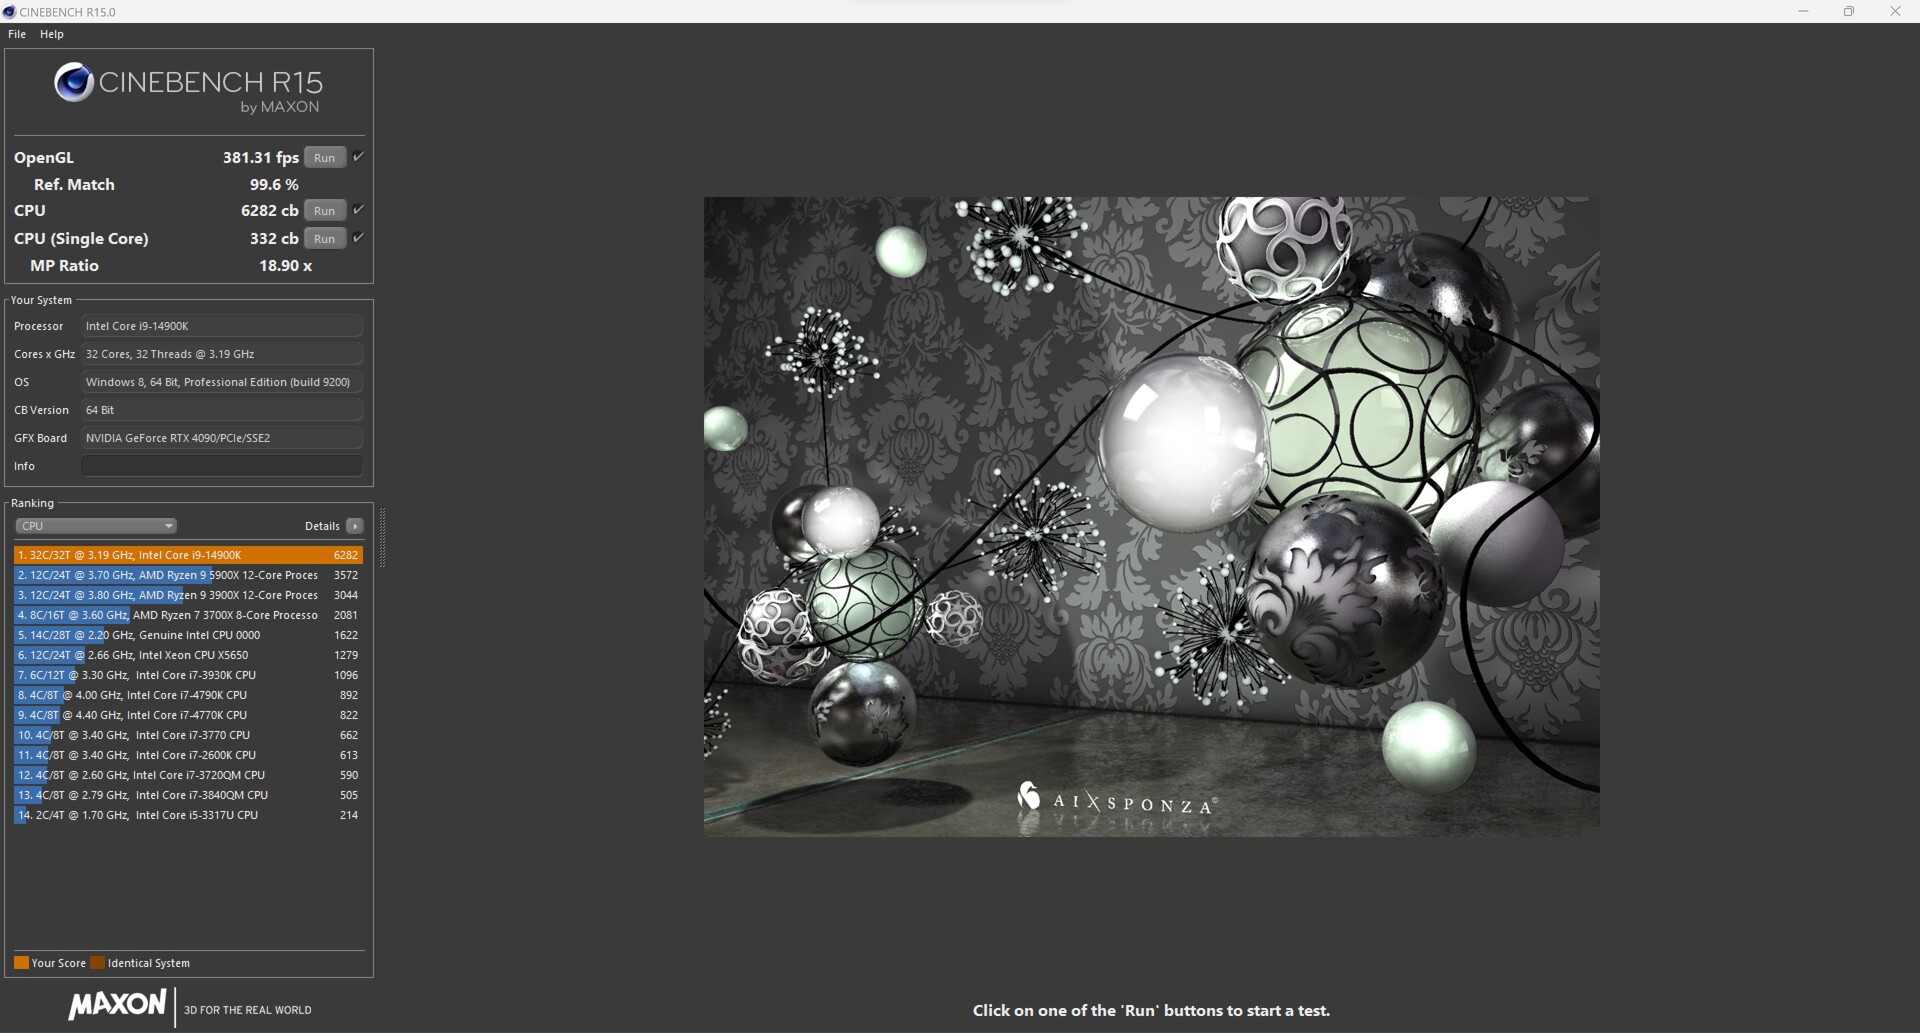
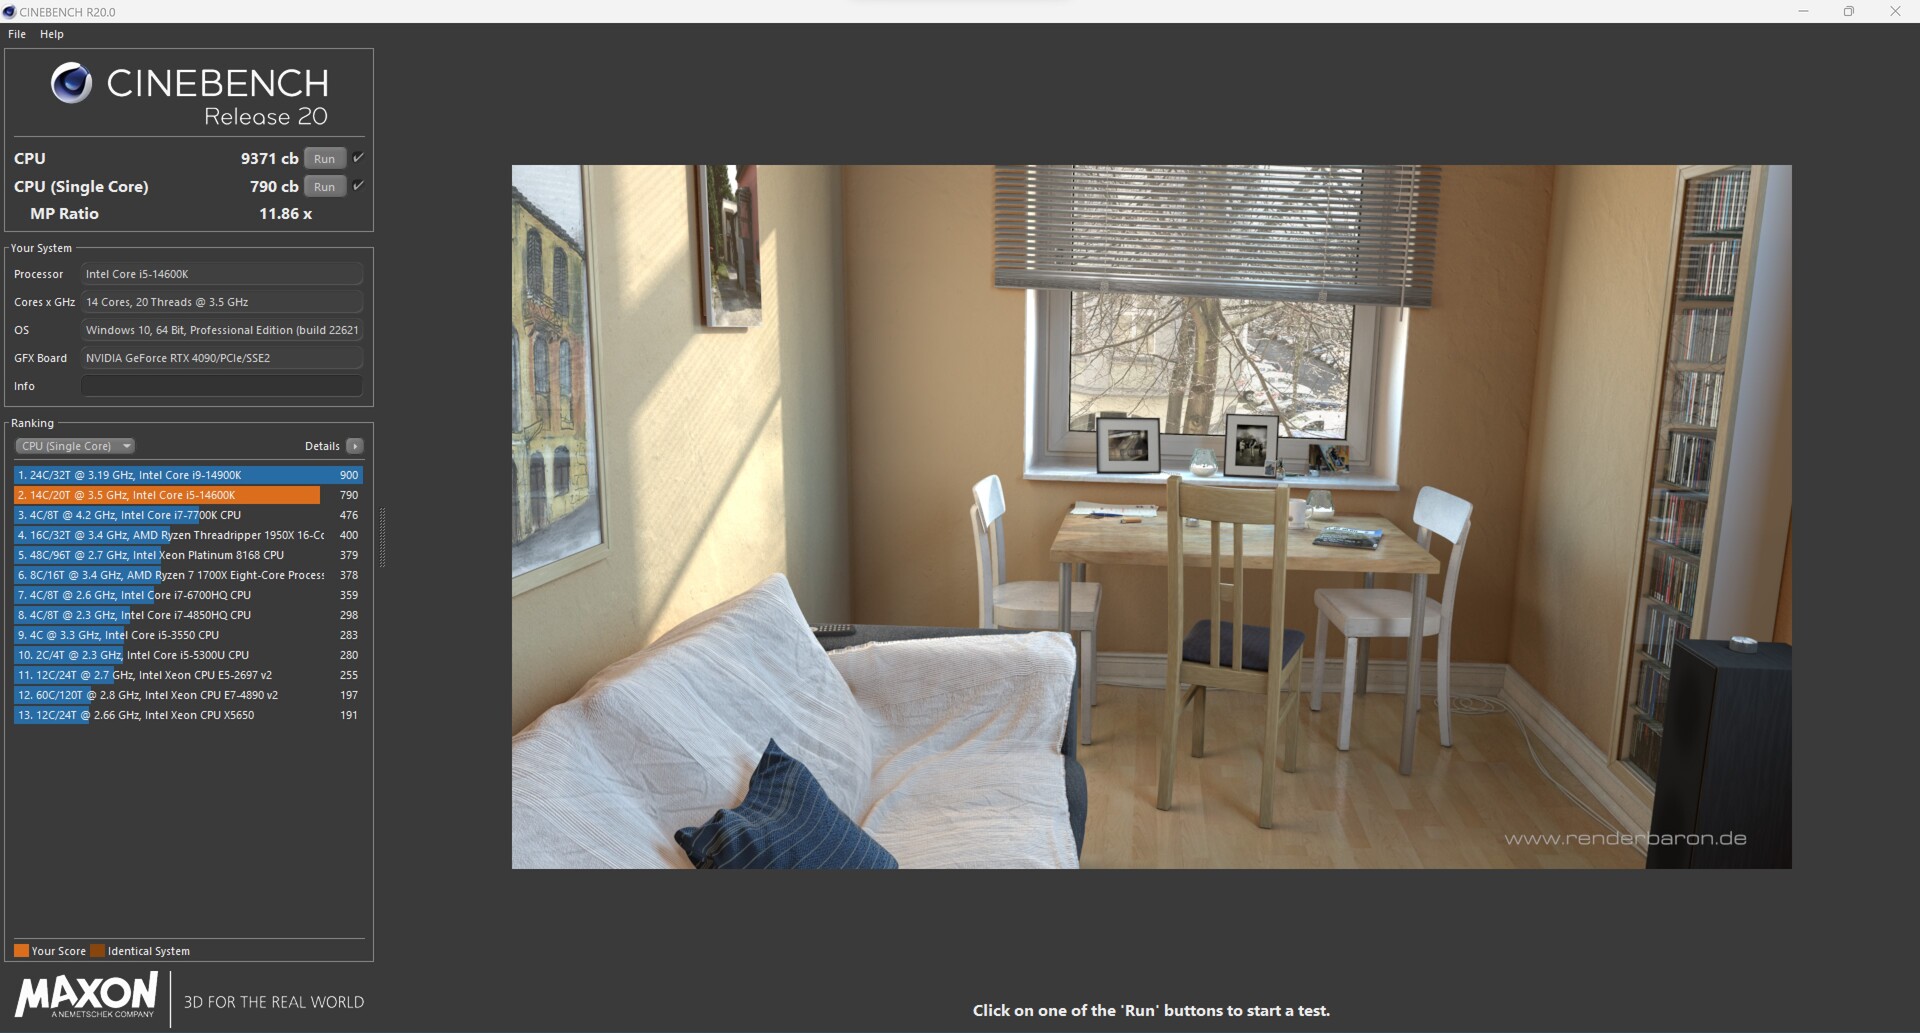
Bei unseren CPU-Tests schafft es Intel tatsächlich, die Leistung des Intel Core i9-13900K zu übertreffen. Mit nur drei Prozentpunkten beim gemittelten Performance-Rating fällt der Vorsprung des Intel Core i9-14900K allerdings sehr gering aus. Auch der Intel Core i5-14600K positioniert sich nur mit einem geringen Vorsprung vor dem älteren Intel Core i5-13600K. Gegenüber Alder Lake kann es das neue Core-i5-Modell jedoch mit einem Intel Core i9-12900K aufnehmen.
Im Duell mit AMD wird die Leistung des Ryzen 9 7950X abermals überboten. Aber auch hier ist die Differenz sehr gering, und von einem spürbaren Unterschied kann keine Rede sein. Der kleinere Intel Core i5-14600K kann es fast mit einem AMD Ryzen 9 7900X aufnehmen. Diese beiden Kontrahenten trennen nur 6 Prozent bei unserm Performance-Rating.
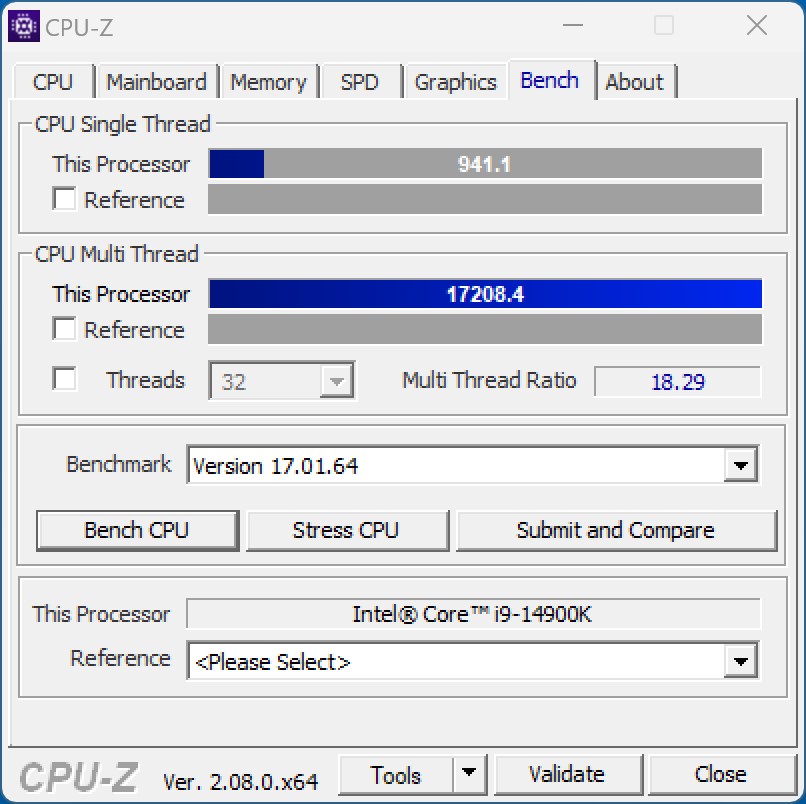
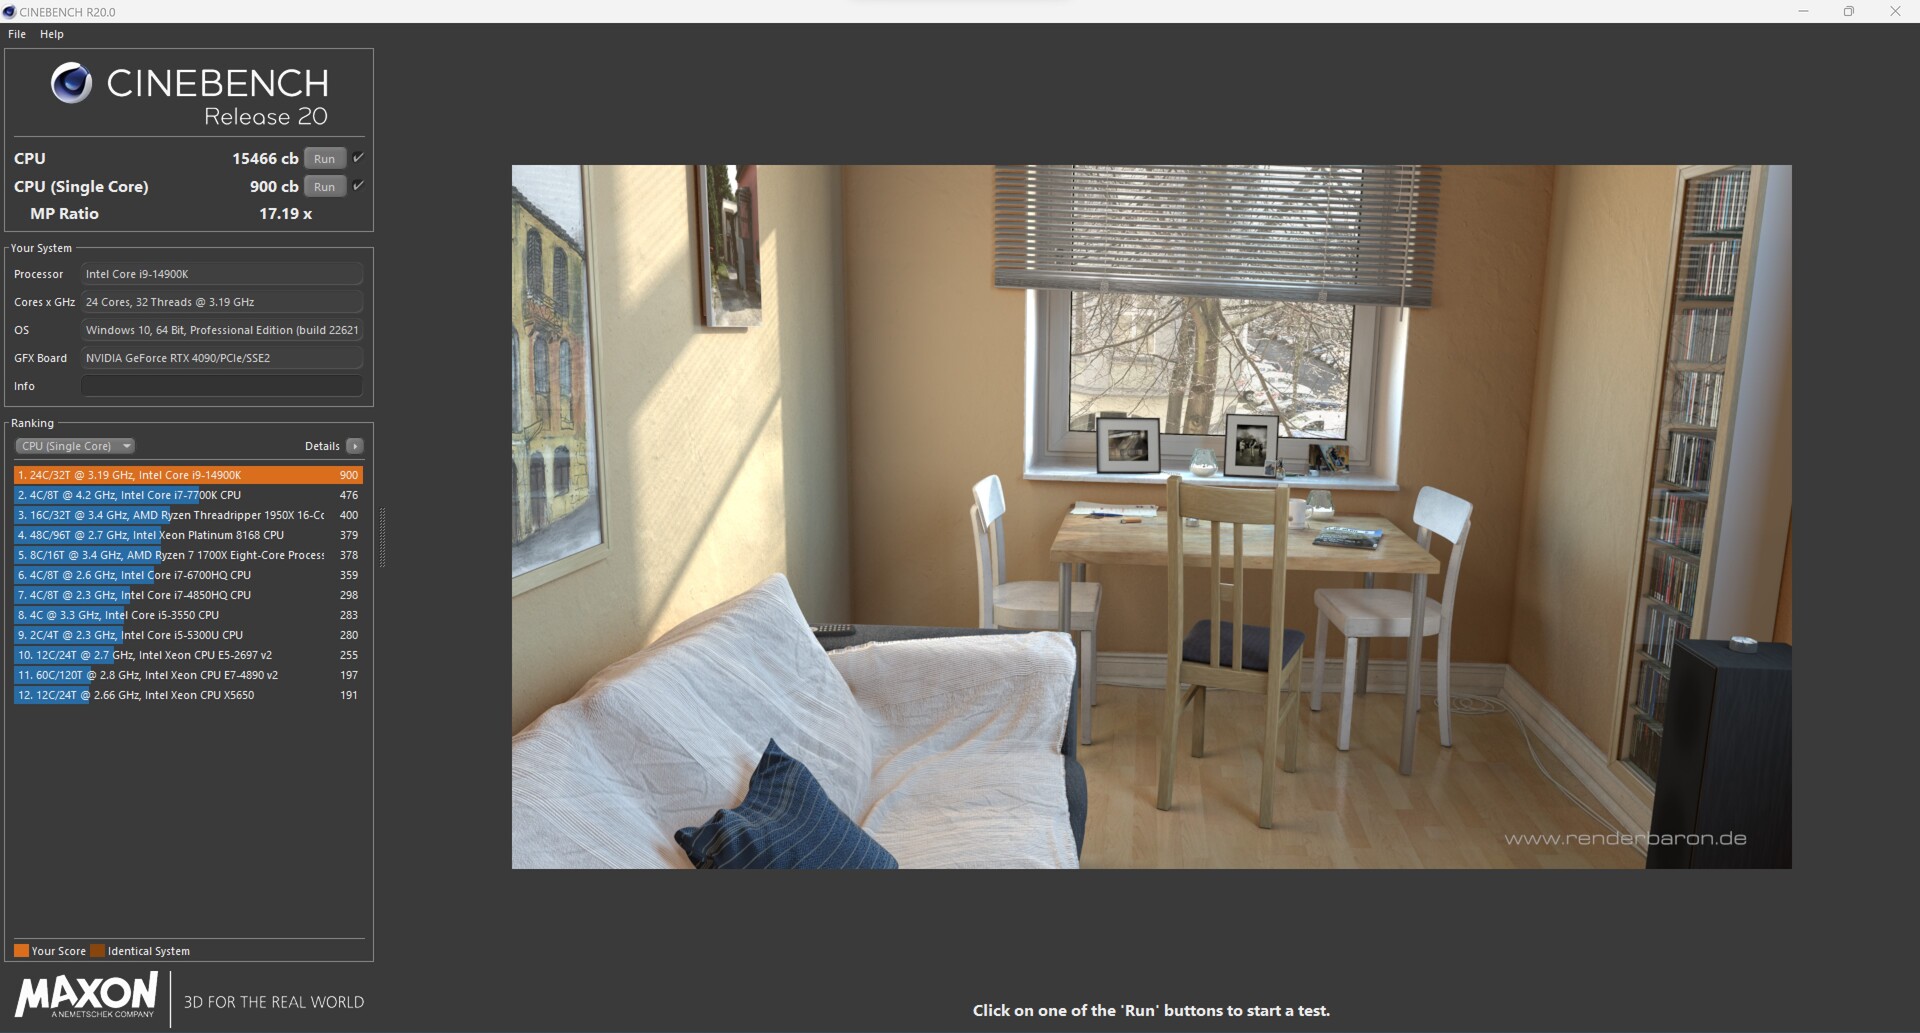
Je nach Test fallen die Leistungsunterschiede jedoch deutlich höher aus. Grundsätzlich sehen wir aber einen eindeutigen Zugewinn der Single-Core-Performance beim Intel Core i9-14900K, welcher mit seinen 6 GHz unschlagbar ist.
Weitere Benchmarks zu den Prozessoren finden Sie hier.
Intel Core i9-14900K


Intel Core i5-14600K


| Performance Rating - Percent | |
| Intel Core i9-14900K | |
| Intel Core i9-13900K | |
| AMD Ryzen 9 7950X | |
| AMD Ryzen 9 7950X3D | |
| AMD Ryzen 9 7900X | |
| Intel Core i5-14600K | |
| Intel Core i9-12900K | |
| AMD Ryzen 9 5950X | |
| Intel Core i5-13600K | |
| AMD Ryzen 7 7800X3D | |
| AMD Ryzen 5 7600X | |
| Intel Core i5-12600K | |
| Intel Core i5-13400 | |
| Intel Core i5-12400F | |
| Cinebench R15 | |
| CPU Single 64Bit | |
| Intel Core i9-14900K | |
| AMD Ryzen 9 7950X | |
| Intel Core i9-13900K | |
| AMD Ryzen 9 7950X3D | |
| AMD Ryzen 9 7900X | |
| AMD Ryzen 5 7600X | |
| Intel Core i5-14600K | |
| AMD Ryzen 7 7800X3D | |
| Intel Core i5-13600K | |
| Intel Core i9-12900K | |
| Intel Core i5-12600K | |
| AMD Ryzen 9 5950X | |
| Intel Core i5-13400 | |
| Intel Core i5-12400F | |
| CPU Multi 64Bit | |
| Intel Core i9-14900K | |
| AMD Ryzen 9 7950X | |
| Intel Core i9-13900K | |
| AMD Ryzen 9 7950X3D | |
| AMD Ryzen 9 7900X | |
| AMD Ryzen 9 5950X | |
| Intel Core i9-12900K | |
| Intel Core i5-13600K | |
| Intel Core i5-14600K | |
| AMD Ryzen 7 7800X3D | |
| Intel Core i5-12600K | |
| AMD Ryzen 5 7600X | |
| Intel Core i5-13400 | |
| Intel Core i5-12400F | |
| Cinebench R20 | |
| CPU (Single Core) | |
| Intel Core i9-14900K | |
| Intel Core i9-13900K | |
| AMD Ryzen 9 7950X | |
| AMD Ryzen 9 7950X3D | |
| Intel Core i5-14600K | |
| AMD Ryzen 9 7900X | |
| Intel Core i5-13600K | |
| Intel Core i9-12900K | |
| AMD Ryzen 5 7600X | |
| Intel Core i5-12600K | |
| AMD Ryzen 7 7800X3D | |
| Intel Core i5-13400 | |
| Intel Core i5-12400F | |
| AMD Ryzen 9 5950X | |
| CPU (Multi Core) | |
| Intel Core i9-14900K | |
| Intel Core i9-13900K | |
| AMD Ryzen 9 7950X | |
| AMD Ryzen 9 7950X3D | |
| AMD Ryzen 9 7900X | |
| AMD Ryzen 9 5950X | |
| Intel Core i9-12900K | |
| Intel Core i5-14600K | |
| Intel Core i5-13600K | |
| AMD Ryzen 7 7800X3D | |
| Intel Core i5-12600K | |
| Intel Core i5-13400 | |
| AMD Ryzen 5 7600X | |
| Intel Core i5-12400F | |
| Cinebench R23 | |
| Single Core | |
| Intel Core i9-14900K | |
| Intel Core i9-13900K | |
| Intel Core i5-14600K | |
| AMD Ryzen 9 7950X3D | |
| AMD Ryzen 9 7950X | |
| AMD Ryzen 9 7900X | |
| Intel Core i5-13600K | |
| Intel Core i9-12900K | |
| AMD Ryzen 5 7600X | |
| Intel Core i5-12600K | |
| AMD Ryzen 7 7800X3D | |
| Intel Core i5-13400 | |
| Intel Core i5-12400F | |
| AMD Ryzen 9 5950X | |
| Multi Core | |
| Intel Core i9-14900K | |
| Intel Core i9-13900K | |
| AMD Ryzen 9 7950X | |
| AMD Ryzen 9 7950X3D | |
| AMD Ryzen 9 7900X | |
| AMD Ryzen 9 5950X | |
| Intel Core i9-12900K | |
| Intel Core i5-14600K | |
| Intel Core i5-13600K | |
| AMD Ryzen 7 7800X3D | |
| Intel Core i5-12600K | |
| Intel Core i5-13400 | |
| AMD Ryzen 5 7600X | |
| Intel Core i5-12400F | |
| Cinebench R11.5 | |
| CPU Single 64Bit | |
| Intel Core i9-14900K | |
| Intel Core i9-13900K | |
| AMD Ryzen 9 7950X | |
| AMD Ryzen 9 7950X3D | |
| AMD Ryzen 9 7900X | |
| AMD Ryzen 5 7600X | |
| Intel Core i5-14600K | |
| Intel Core i9-12900K | |
| Intel Core i5-13600K | |
| AMD Ryzen 7 7800X3D | |
| Intel Core i5-12600K | |
| AMD Ryzen 9 5950X | |
| Intel Core i5-13400 | |
| Intel Core i5-12400F | |
| CPU Multi 64Bit | |
| Intel Core i9-14900K | |
| Intel Core i9-13900K | |
| AMD Ryzen 9 7950X | |
| AMD Ryzen 9 7950X3D | |
| AMD Ryzen 9 7900X | |
| AMD Ryzen 9 5950X | |
| Intel Core i9-12900K | |
| Intel Core i5-13600K | |
| Intel Core i5-14600K | |
| AMD Ryzen 7 7800X3D | |
| Intel Core i5-12600K | |
| AMD Ryzen 5 7600X | |
| Intel Core i5-13400 | |
| Intel Core i5-12400F | |
| Cinebench R10 | |
| Rendering Single CPUs 64Bit | |
| Intel Core i9-14900K | |
| Intel Core i9-13900K | |
| Intel Core i5-14600K | |
| AMD Ryzen 9 7900X | |
| AMD Ryzen 9 7950X | |
| Intel Core i5-13600K | |
| Intel Core i9-12900K | |
| AMD Ryzen 5 7600X | |
| Intel Core i5-12600K | |
| AMD Ryzen 7 7800X3D | |
| Intel Core i5-13400 | |
| Intel Core i5-12400F | |
| AMD Ryzen 9 5950X | |
| AMD Ryzen 9 7950X3D | |
| Rendering Multiple CPUs 64Bit | |
| Intel Core i9-14900K | |
| Intel Core i9-13900K | |
| AMD Ryzen 9 7950X | |
| AMD Ryzen 9 7900X | |
| Intel Core i5-14600K | |
| Intel Core i9-12900K | |
| Intel Core i5-13600K | |
| AMD Ryzen 9 5950X | |
| AMD Ryzen 7 7800X3D | |
| AMD Ryzen 5 7600X | |
| Intel Core i5-12600K | |
| Intel Core i5-13400 | |
| AMD Ryzen 9 7950X3D | |
| Intel Core i5-12400F | |
| Blender - v2.79 BMW27 CPU | |
| Intel Core i5-12400F | |
| Intel Core i5-13400 | |
| AMD Ryzen 5 7600X | |
| Intel Core i5-12600K | |
| AMD Ryzen 7 7800X3D | |
| Intel Core i5-13600K | |
| Intel Core i5-14600K | |
| Intel Core i9-12900K | |
| AMD Ryzen 9 5950X | |
| AMD Ryzen 9 7900X | |
| AMD Ryzen 9 7950X3D | |
| AMD Ryzen 9 7950X | |
| Intel Core i9-13900K | |
| Intel Core i9-14900K | |
| wPrime 2.10 | |
| 32m | |
| Intel Core i9-12900K | |
| Intel Core i5-12600K | |
| Intel Core i5-12400F | |
| Intel Core i5-13400 | |
| AMD Ryzen 5 7600X | |
| AMD Ryzen 9 5950X | |
| Intel Core i5-13600K | |
| AMD Ryzen 7 7800X3D | |
| Intel Core i5-14600K | |
| Intel Core i9-14900K | |
| AMD Ryzen 9 7950X3D | |
| Intel Core i9-13900K | |
| AMD Ryzen 9 7900X | |
| AMD Ryzen 9 7950X | |
| 1024m | |
| Intel Core i5-13400 | |
| Intel Core i5-12600K | |
| Intel Core i9-12900K | |
| Intel Core i5-13600K | |
| Intel Core i5-14600K | |
| Intel Core i5-12400F | |
| Intel Core i9-13900K | |
| AMD Ryzen 5 7600X | |
| Intel Core i9-14900K | |
| AMD Ryzen 9 5950X | |
| AMD Ryzen 7 7800X3D | |
| AMD Ryzen 9 7900X | |
| AMD Ryzen 9 7950X3D | |
| AMD Ryzen 9 7950X | |
| X264 HD Benchmark 4.0 | |
| Pass 1 | |
| Intel Core i9-14900K | |
| Intel Core i9-13900K | |
| Intel Core i5-14600K | |
| AMD Ryzen 9 7950X3D | |
| Intel Core i5-13600K | |
| AMD Ryzen 9 7950X | |
| AMD Ryzen 9 7900X | |
| Intel Core i9-12900K | |
| AMD Ryzen 5 7600X | |
| AMD Ryzen 7 7800X3D | |
| AMD Ryzen 9 5950X | |
| Intel Core i5-12600K | |
| Intel Core i5-13400 | |
| Intel Core i5-12400F | |
| Pass 2 | |
| Intel Core i9-14900K | |
| Intel Core i9-13900K | |
| AMD Ryzen 9 7950X | |
| AMD Ryzen 9 7950X3D | |
| AMD Ryzen 9 7900X | |
| AMD Ryzen 9 5950X | |
| Intel Core i5-14600K | |
| Intel Core i9-12900K | |
| Intel Core i5-13600K | |
| AMD Ryzen 7 7800X3D | |
| Intel Core i5-12600K | |
| AMD Ryzen 5 7600X | |
| Intel Core i5-13400 | |
| Intel Core i5-12400F | |
| WinRAR - Result | |
| AMD Ryzen 9 7900X | |
| AMD Ryzen 7 7800X3D | |
| AMD Ryzen 9 7950X | |
| AMD Ryzen 5 7600X | |
| Intel Core i9-14900K | |
| AMD Ryzen 9 7950X3D | |
| Intel Core i9-13900K | |
| AMD Ryzen 9 5950X | |
| Intel Core i5-14600K | |
| Intel Core i5-13600K | |
| Intel Core i9-12900K | |
| Intel Core i5-13400 | |
| Intel Core i5-12400F | |
| Intel Core i5-12600K | |
| TrueCrypt | |
| AES Mean 100MB | |
| AMD Ryzen 9 7950X | |
| Intel Core i9-13900K | |
| AMD Ryzen 9 5950X | |
| AMD Ryzen 9 7950X3D | |
| Intel Core i9-14900K | |
| Intel Core i5-14600K | |
| Intel Core i5-13600K | |
| Intel Core i9-12900K | |
| AMD Ryzen 7 7800X3D | |
| AMD Ryzen 9 7900X | |
| AMD Ryzen 5 7600X | |
| Intel Core i5-12600K | |
| Intel Core i5-13400 | |
| Intel Core i5-12400F | |
| Twofish Mean 100MB | |
| Intel Core i9-14900K | |
| Intel Core i9-13900K | |
| AMD Ryzen 9 7950X | |
| AMD Ryzen 9 7950X3D | |
| AMD Ryzen 9 5950X | |
| Intel Core i9-12900K | |
| Intel Core i5-14600K | |
| Intel Core i5-13600K | |
| AMD Ryzen 9 7900X | |
| Intel Core i5-12600K | |
| AMD Ryzen 7 7800X3D | |
| Intel Core i5-13400 | |
| AMD Ryzen 5 7600X | |
| Intel Core i5-12400F | |
| Serpent Mean 100MB | |
| Intel Core i9-13900K | |
| AMD Ryzen 9 7950X | |
| AMD Ryzen 9 7950X3D | |
| Intel Core i9-14900K | |
| AMD Ryzen 9 5950X | |
| Intel Core i9-12900K | |
| Intel Core i5-14600K | |
| Intel Core i5-13600K | |
| AMD Ryzen 9 7900X | |
| Intel Core i5-12600K | |
| AMD Ryzen 7 7800X3D | |
| Intel Core i5-13400 | |
| AMD Ryzen 5 7600X | |
| Intel Core i5-12400F | |
| Geekbench 5.5 | |
| Multi-Core | |
| Intel Core i9-14900K | |
| AMD Ryzen 9 7950X | |
| AMD Ryzen 9 7950X3D | |
| Intel Core i9-13900K | |
| AMD Ryzen 9 7900X | |
| Intel Core i9-12900K | |
| Intel Core i5-14600K | |
| AMD Ryzen 9 5950X | |
| Intel Core i5-13600K | |
| AMD Ryzen 7 7800X3D | |
| Intel Core i5-12600K | |
| Intel Core i5-13400 | |
| AMD Ryzen 5 7600X | |
| Intel Core i5-12400F | |
| Single-Core | |
| AMD Ryzen 9 7950X | |
| AMD Ryzen 9 7950X3D | |
| Intel Core i9-13900K | |
| AMD Ryzen 9 7900X | |
| Intel Core i9-14900K | |
| AMD Ryzen 5 7600X | |
| Intel Core i9-12900K | |
| AMD Ryzen 7 7800X3D | |
| Intel Core i5-14600K | |
| Intel Core i5-13600K | |
| Intel Core i5-12600K | |
| Intel Core i5-13400 | |
| Intel Core i5-12400F | |
| AMD Ryzen 9 5950X | |
| Geekbench 5.0 | |
| 5.0 Multi-Core | |
| Intel Core i9-14900K | |
| AMD Ryzen 9 7950X | |
| Intel Core i9-13900K | |
| AMD Ryzen 9 7950X3D | |
| AMD Ryzen 9 7900X | |
| Intel Core i9-12900K | |
| Intel Core i5-14600K | |
| Intel Core i5-13600K | |
| AMD Ryzen 9 5950X | |
| AMD Ryzen 7 7800X3D | |
| Intel Core i5-12600K | |
| AMD Ryzen 5 7600X | |
| Intel Core i5-13400 | |
| Intel Core i5-12400F | |
| 5.0 Single-Core | |
| Intel Core i9-14900K | |
| AMD Ryzen 9 7950X | |
| Intel Core i9-13900K | |
| AMD Ryzen 9 7900X | |
| AMD Ryzen 9 7950X3D | |
| AMD Ryzen 5 7600X | |
| Intel Core i5-14600K | |
| Intel Core i9-12900K | |
| AMD Ryzen 7 7800X3D | |
| Intel Core i5-13600K | |
| Intel Core i5-12600K | |
| Intel Core i5-13400 | |
| AMD Ryzen 9 5950X | |
| Intel Core i5-12400F | |
| Geekbench 4.4 | |
| 64 Bit Single-Core Score | |
| Intel Core i9-14900K | |
| Intel Core i9-13900K | |
| AMD Ryzen 9 7950X | |
| AMD Ryzen 9 7950X3D | |
| AMD Ryzen 9 7900X | |
| AMD Ryzen 7 7800X3D | |
| AMD Ryzen 5 7600X | |
| Intel Core i5-14600K | |
| Intel Core i9-12900K | |
| Intel Core i5-13600K | |
| Intel Core i5-12600K | |
| Intel Core i5-13400 | |
| Intel Core i5-12400F | |
| AMD Ryzen 9 5950X | |
| 64 Bit Multi-Core Score | |
| AMD Ryzen 9 7950X | |
| Intel Core i9-14900K | |
| AMD Ryzen 9 7950X3D | |
| Intel Core i9-13900K | |
| AMD Ryzen 9 7900X | |
| Intel Core i5-14600K | |
| Intel Core i9-12900K | |
| AMD Ryzen 9 5950X | |
| Intel Core i5-13600K | |
| AMD Ryzen 7 7800X3D | |
| AMD Ryzen 5 7600X | |
| Intel Core i5-12600K | |
| Intel Core i5-13400 | |
| Intel Core i5-12400F | |
| 3DMark 11 - 1280x720 Performance Physics | |
| AMD Ryzen 9 7950X3D | |
| AMD Ryzen 7 7800X3D | |
| Intel Core i9-13900K | |
| Intel Core i9-14900K | |
| Intel Core i5-14600K | |
| Intel Core i5-13600K | |
| AMD Ryzen 9 7900X | |
| AMD Ryzen 9 7950X | |
| Intel Core i9-12900K | |
| AMD Ryzen 5 7600X | |
| AMD Ryzen 9 5950X | |
| Intel Core i5-12600K | |
| Intel Core i5-13400 | |
| Intel Core i5-12400F | |
| 7-Zip 18.03 | |
| 7z b 4 | |
| AMD Ryzen 9 7950X | |
| AMD Ryzen 9 7950X3D | |
| Intel Core i9-14900K | |
| Intel Core i9-13900K | |
| AMD Ryzen 9 5950X | |
| AMD Ryzen 9 7900X | |
| Intel Core i9-12900K | |
| Intel Core i5-14600K | |
| Intel Core i5-13600K | |
| AMD Ryzen 7 7800X3D | |
| AMD Ryzen 5 7600X | |
| Intel Core i5-12600K | |
| Intel Core i5-13400 | |
| Intel Core i5-12400F | |
| 7z b 4 -mmt1 | |
| AMD Ryzen 9 7950X | |
| AMD Ryzen 9 7950X3D | |
| AMD Ryzen 9 7900X | |
| AMD Ryzen 7 7800X3D | |
| AMD Ryzen 5 7600X | |
| Intel Core i9-14900K | |
| Intel Core i9-13900K | |
| AMD Ryzen 9 5950X | |
| Intel Core i5-14600K | |
| Intel Core i9-12900K | |
| Intel Core i5-13600K | |
| Intel Core i5-12600K | |
| Intel Core i5-13400 | |
| Intel Core i5-12400F | |
| HWBOT x265 Benchmark v2.2 - 4k Preset | |
| AMD Ryzen 9 7950X | |
| Intel Core i9-14900K | |
| Intel Core i9-13900K | |
| AMD Ryzen 9 7950X3D | |
| AMD Ryzen 9 7900X | |
| AMD Ryzen 9 5950X | |
| Intel Core i5-12600K | |
| Intel Core i9-12900K | |
| Intel Core i5-14600K | |
| Intel Core i5-13600K | |
| AMD Ryzen 7 7800X3D | |
| AMD Ryzen 5 7600X | |
| Intel Core i5-13400 | |
| Intel Core i5-12400F | |
| R Benchmark 2.5 - Overall mean | |
| Intel Core i5-12400F | |
| Intel Core i5-13400 | |
| AMD Ryzen 9 5950X | |
| Intel Core i5-12600K | |
| Intel Core i9-12900K | |
| AMD Ryzen 7 7800X3D | |
| Intel Core i5-13600K | |
| Intel Core i5-14600K | |
| AMD Ryzen 5 7600X | |
| AMD Ryzen 9 7900X | |
| AMD Ryzen 9 7950X3D | |
| AMD Ryzen 9 7950X | |
| Intel Core i9-13900K | |
| Intel Core i9-14900K | |
| LibreOffice - 20 Documents To PDF | |
| Intel Core i5-12600K | |
| Intel Core i5-12400F | |
| AMD Ryzen 9 5950X | |
| AMD Ryzen 7 7800X3D | |
| Intel Core i9-12900K | |
| Intel Core i5-13400 | |
| AMD Ryzen 9 7950X3D | |
| AMD Ryzen 5 7600X | |
| Intel Core i9-13900K | |
| AMD Ryzen 9 7950X | |
| Intel Core i5-13600K | |
| AMD Ryzen 9 7900X | |
| Intel Core i9-14900K | |
| Intel Core i5-14600K | |
| WebXPRT 3 - Overall | |
| AMD Ryzen 9 7950X3D | |
| Intel Core i9-14900K | |
| AMD Ryzen 9 7900X | |
| AMD Ryzen 9 7950X | |
| AMD Ryzen 5 7600X | |
| Intel Core i9-13900K | |
| Intel Core i5-14600K | |
| AMD Ryzen 7 7800X3D | |
| Intel Core i5-13600K | |
| Intel Core i9-12900K | |
| Intel Core i5-13400 | |
| Intel Core i5-12600K | |
| AMD Ryzen 9 5950X | |
| Intel Core i5-12400F | |
| Mozilla Kraken 1.1 - Total | |
| Intel Core i5-12400F | |
| AMD Ryzen 9 5950X | |
| Intel Core i5-13400 | |
| Intel Core i5-12600K | |
| AMD Ryzen 7 7800X3D | |
| Intel Core i9-12900K | |
| Intel Core i5-13600K | |
| Intel Core i5-14600K | |
| AMD Ryzen 5 7600X | |
| AMD Ryzen 9 7950X3D | |
| AMD Ryzen 9 7950X | |
| Intel Core i9-13900K | |
| AMD Ryzen 9 7900X | |
| Intel Core i9-14900K | |
| 3DMark | |
| 3840x2160 Fire Strike Ultra Physics | |
| Intel Core i9-14900K | |
| Intel Core i9-13900K | |
| AMD Ryzen 9 7950X3D | |
| AMD Ryzen 9 7900X | |
| AMD Ryzen 9 7950X | |
| Intel Core i5-14600K | |
| Intel Core i9-12900K | |
| AMD Ryzen 9 5950X | |
| Intel Core i5-13600K | |
| AMD Ryzen 7 7800X3D | |
| AMD Ryzen 5 7600X | |
| Intel Core i5-12600K | |
| Intel Core i5-13400 | |
| Intel Core i5-12400F | |
| 1920x1080 Fire Strike Physics | |
| Intel Core i9-14900K | |
| Intel Core i9-13900K | |
| AMD Ryzen 9 7950X3D | |
| AMD Ryzen 9 7900X | |
| AMD Ryzen 9 7950X | |
| Intel Core i5-14600K | |
| AMD Ryzen 9 5950X | |
| Intel Core i9-12900K | |
| Intel Core i5-13600K | |
| AMD Ryzen 7 7800X3D | |
| AMD Ryzen 5 7600X | |
| Intel Core i5-12600K | |
| Intel Core i5-13400 | |
| Intel Core i5-12400F | |
| 2560x1440 Time Spy CPU | |
| Intel Core i9-14900K | |
| Intel Core i9-13900K | |
| Intel Core i5-14600K | |
| Intel Core i9-12900K | |
| AMD Ryzen 9 7950X3D | |
| Intel Core i5-13600K | |
| AMD Ryzen 9 7900X | |
| AMD Ryzen 9 7950X | |
| AMD Ryzen 7 7800X3D | |
| Intel Core i5-12600K | |
| AMD Ryzen 9 5950X | |
| Intel Core i5-13400 | |
| AMD Ryzen 5 7600X | |
| Intel Core i5-12400F | |
* ... kleinere Werte sind besser
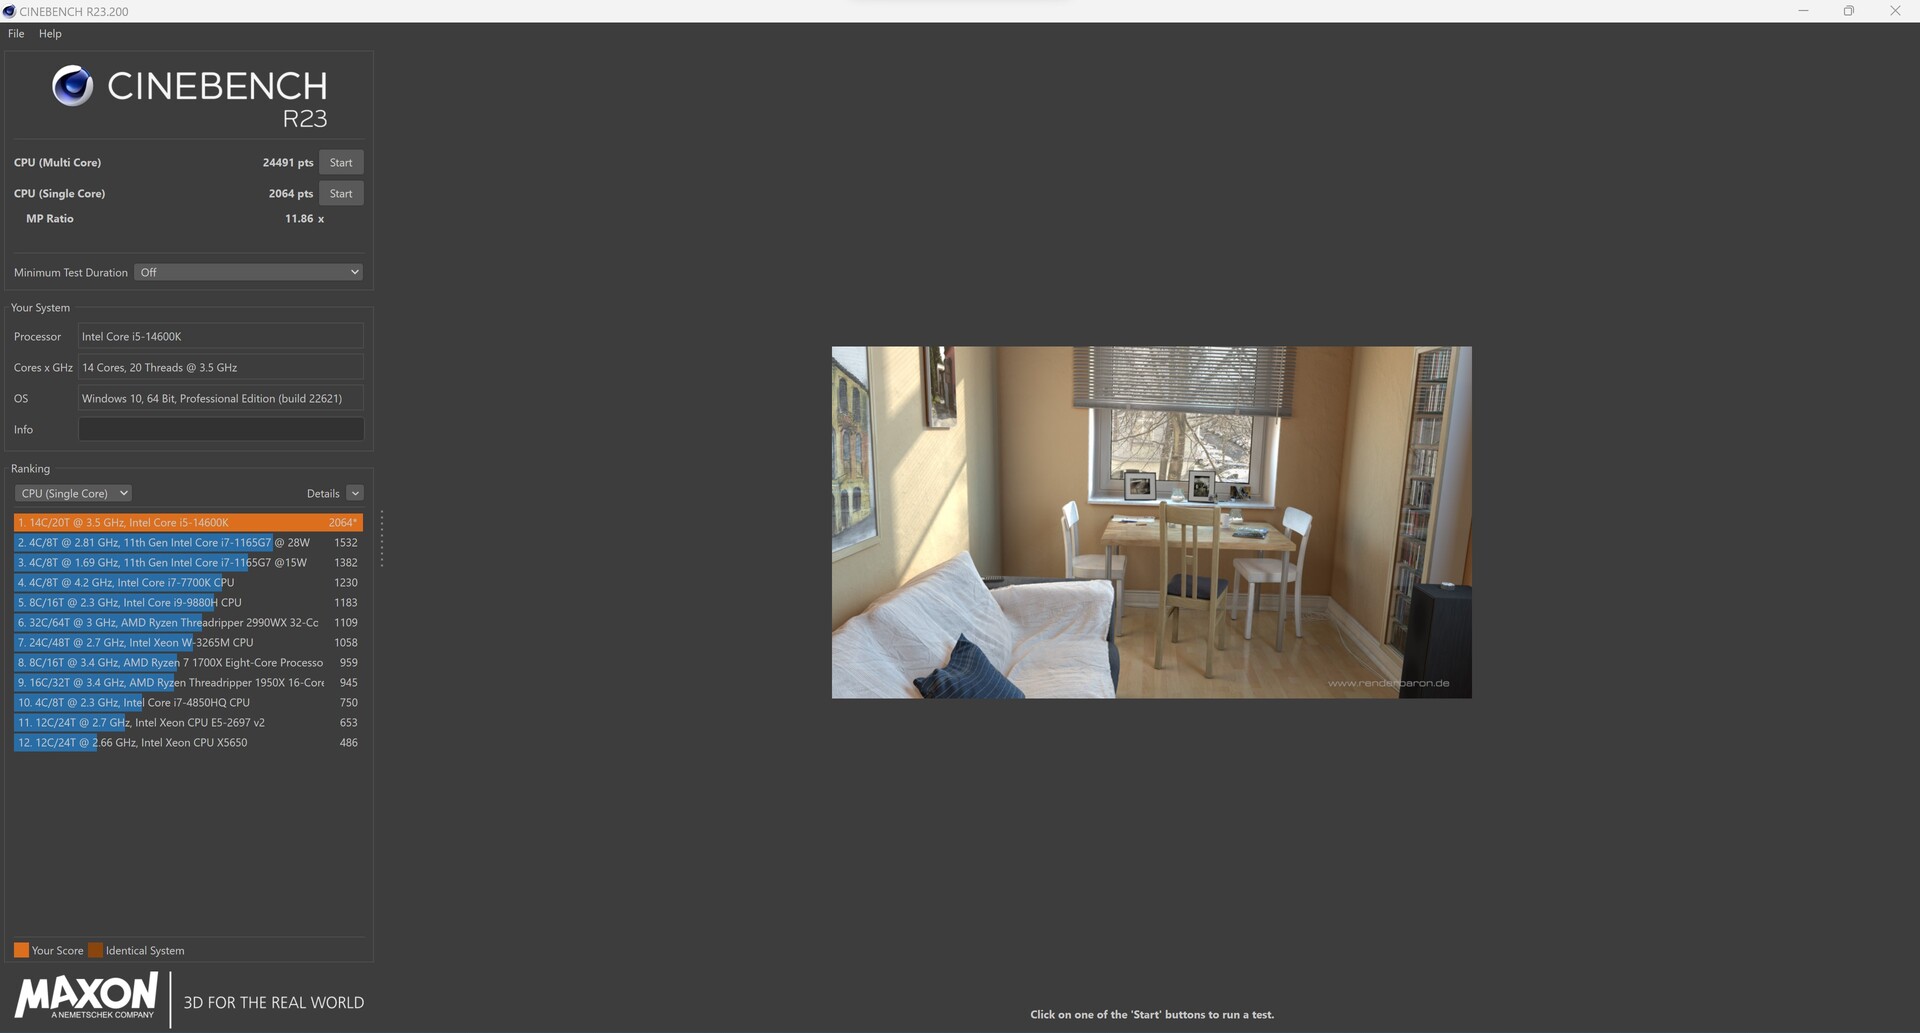
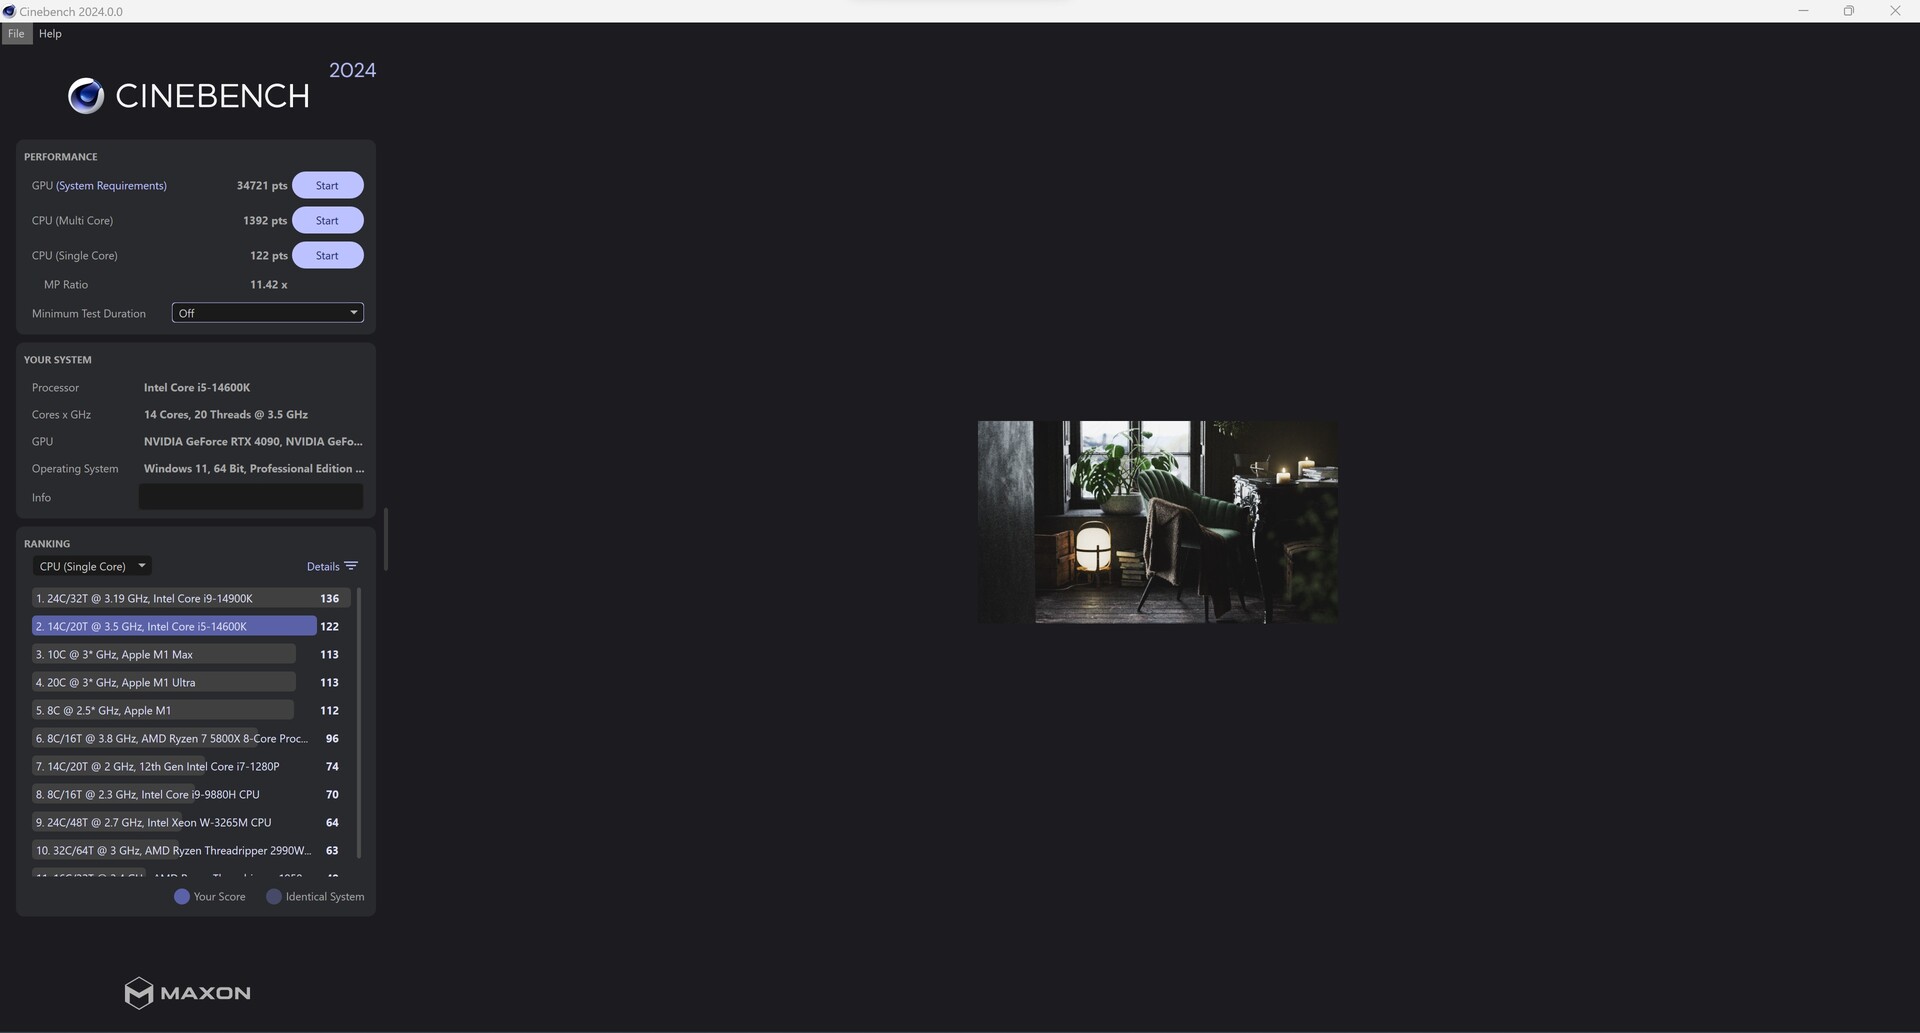
Cinebench-Ergebnisse Intel Core i9-14900K


Cinebench Ergebnisse Intel Core i5-14600K

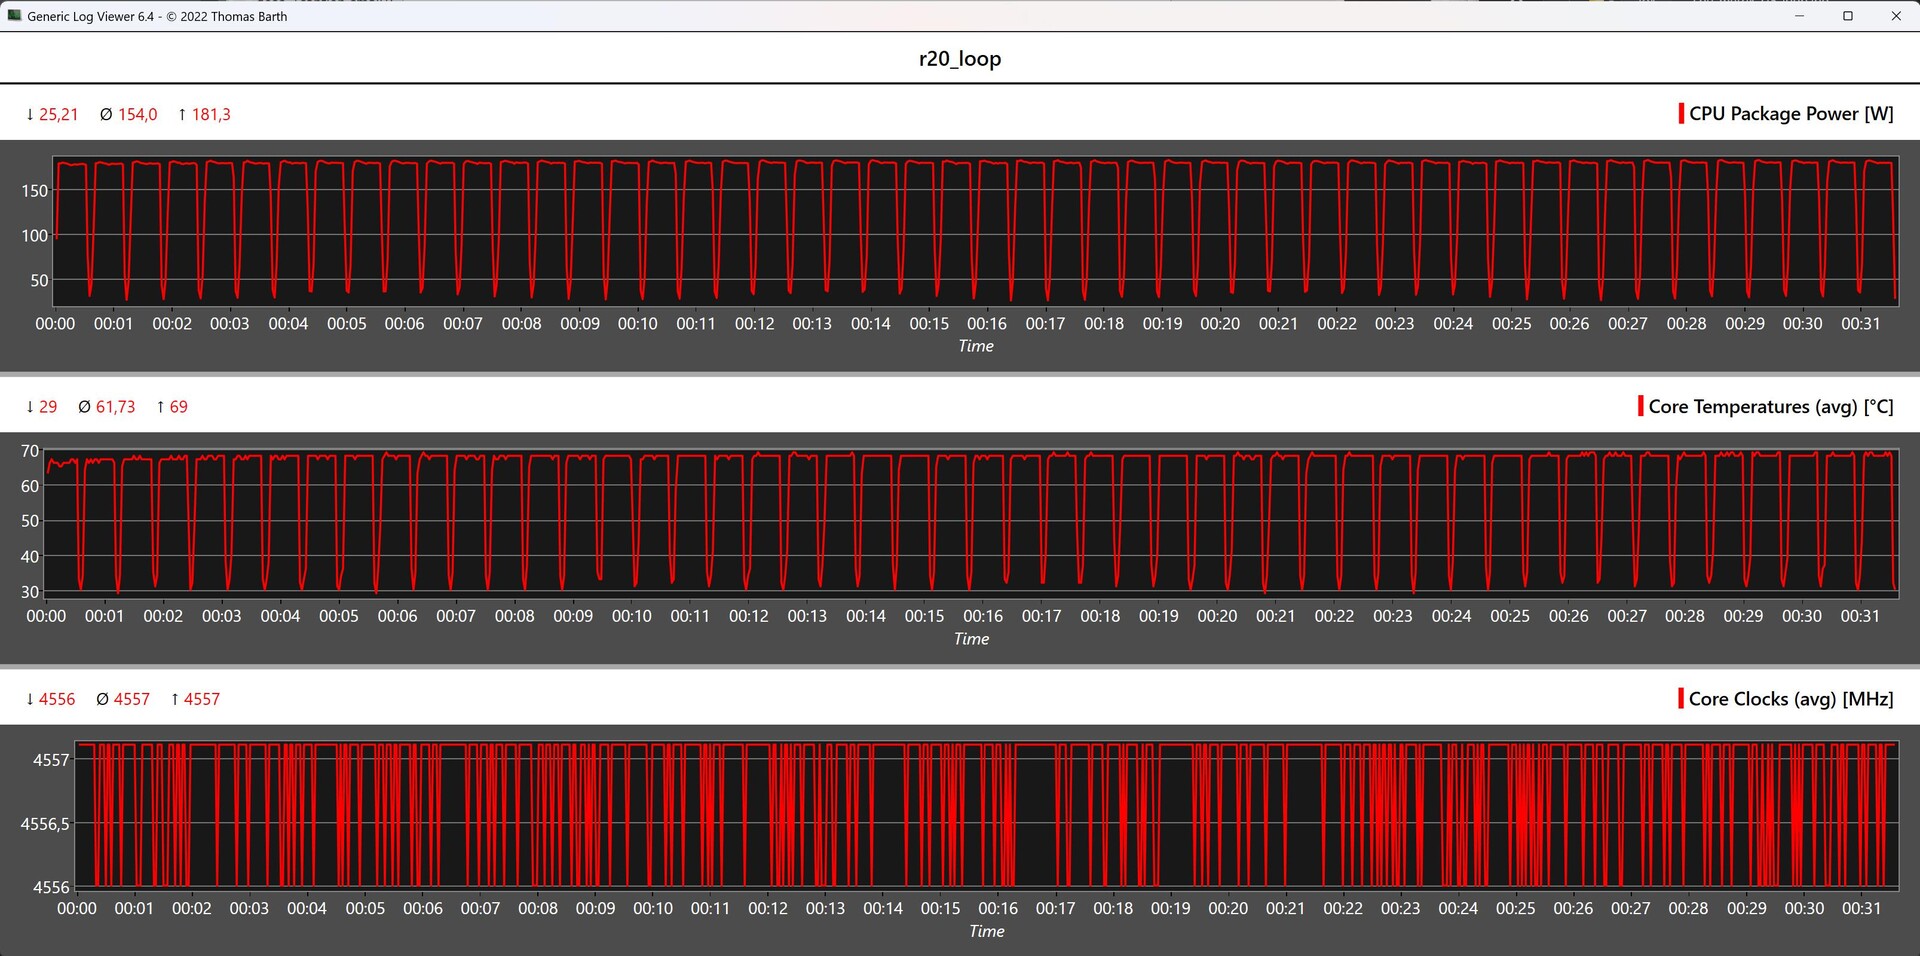
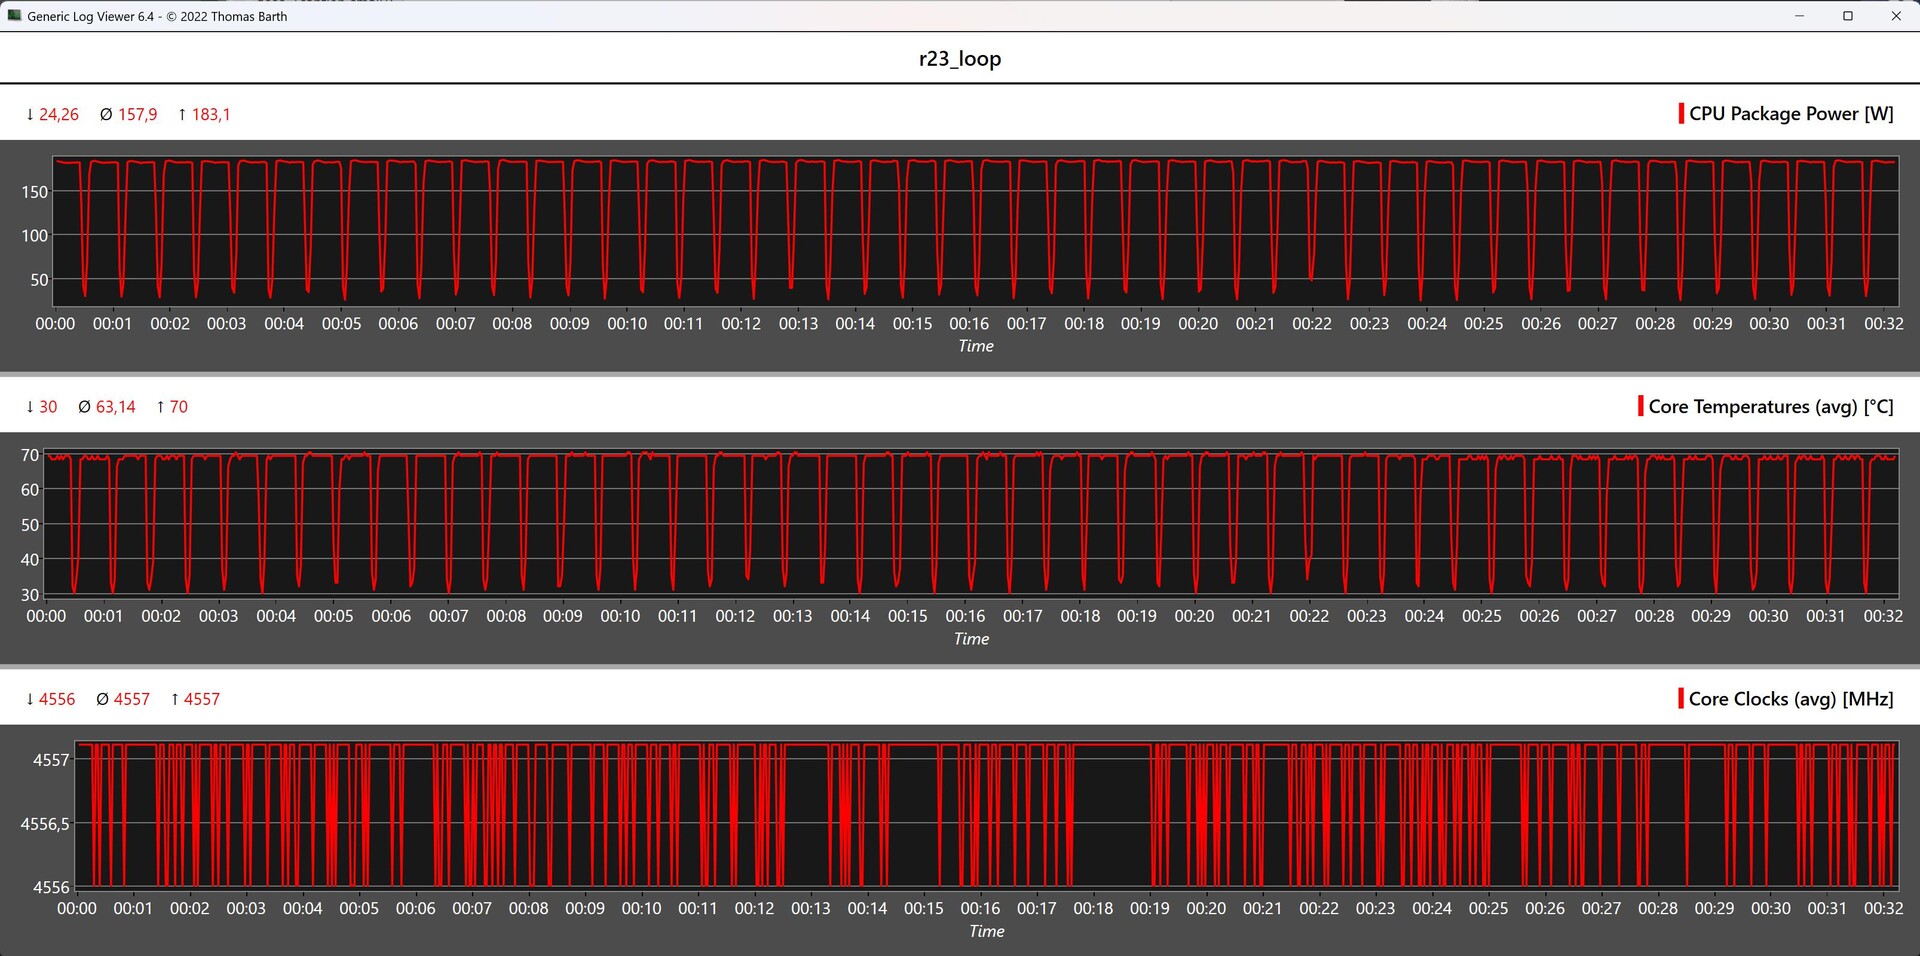
Core i9-14900K und Core i5-14600K vs. Cinebench-R15-Multi-Schleife
Für den ersten längeren Belastungstest schauen wir uns das Verhalten der Prozessoren während der Cinebench-R15-Dauerschleife an. Auf den ersten Blick sehen wir eine stabile Leistung aller hier aufgelisteten Modelle. Dennoch zeigt sich, dass der Intel Core i9-14900K nicht mehr den ersten Platz halten kann. Der Aufwand, um die CPU zu kühlen, ist groß, denn mit bis zu 348 Watt ist der Intel Core i9-14900K sehr durstig. Damit erreicht die CPU immer wieder das thermische Limit von 100 °C, was im Umkehrschluss nur zum drittbesten Ergebnis reicht.
Beim Intel Core i5-14600K sehen wir ein minimal besseres Ergebnis als im Vergleich zum Intel Core i5-13600K. Allerdings fällt der Vorsprung so gering aus, dass wir uns hier im Bereich der Messtoleranzen bewegen. Mit knapp über 180 Watt lässt sich der Intel Core i5-13600K deutlich einfacher kühlen.
Alle CPU-Tests wurden mit gleichen Rahmenbedingungen durchgeführt, was bedeutet, dass keine Power-Limits im BIOS definiert wurden.
CPU-Metrik während der Cinebench-Schleifen (R15, R20, R23)
Intel Core i9-14900K

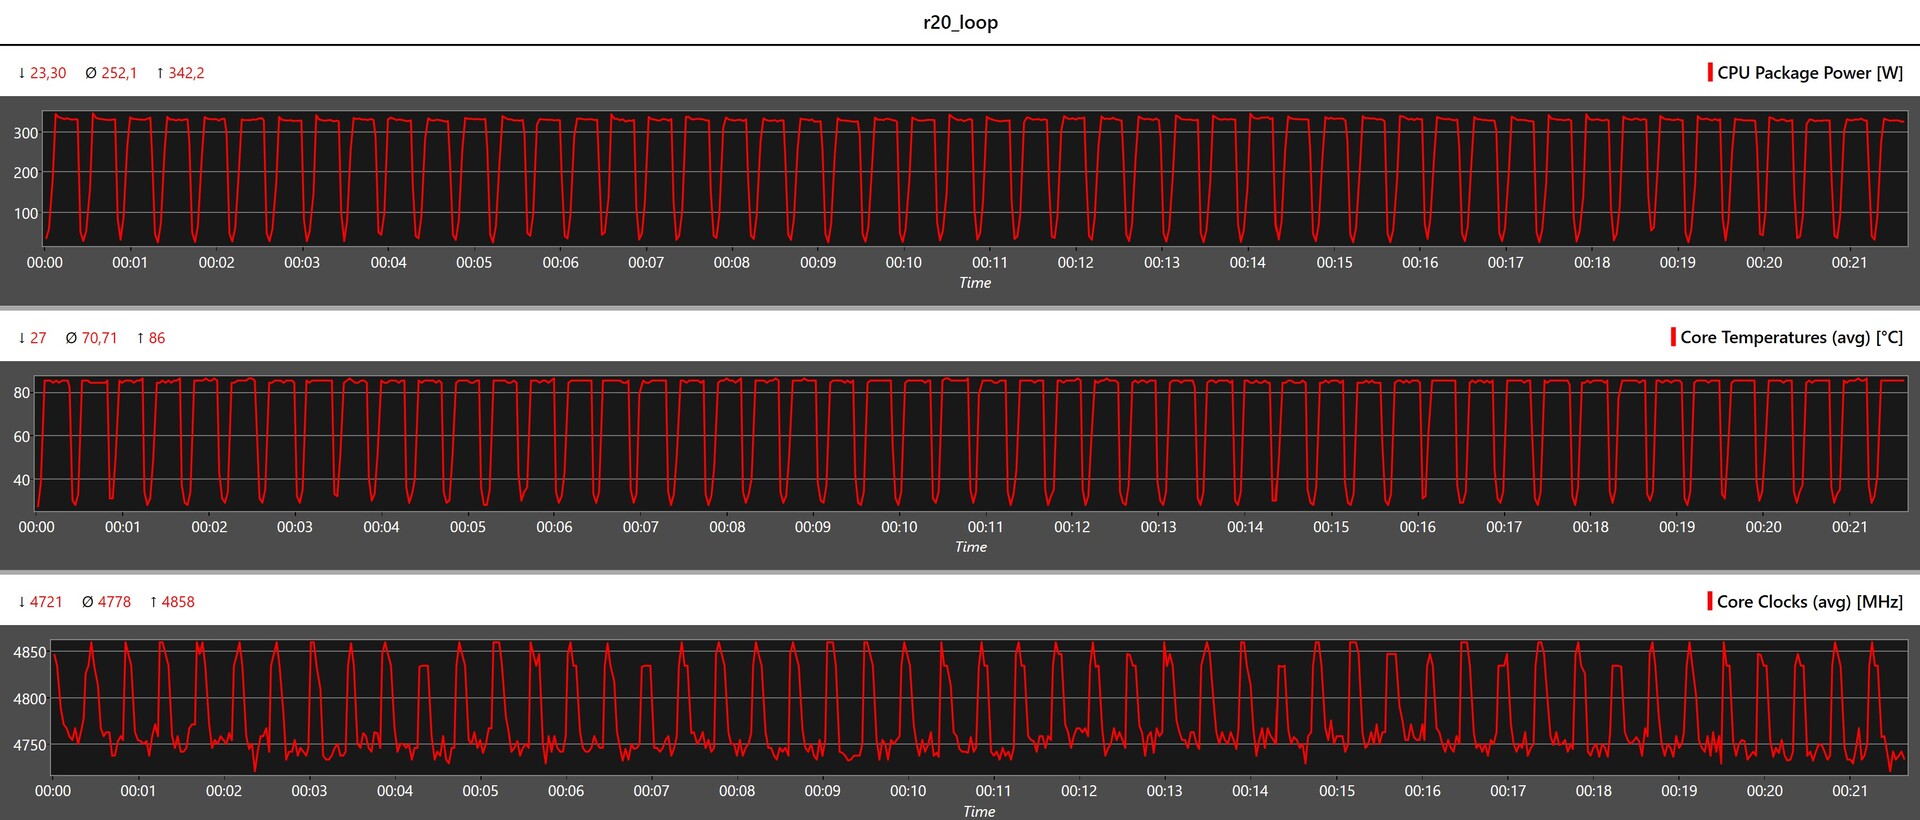
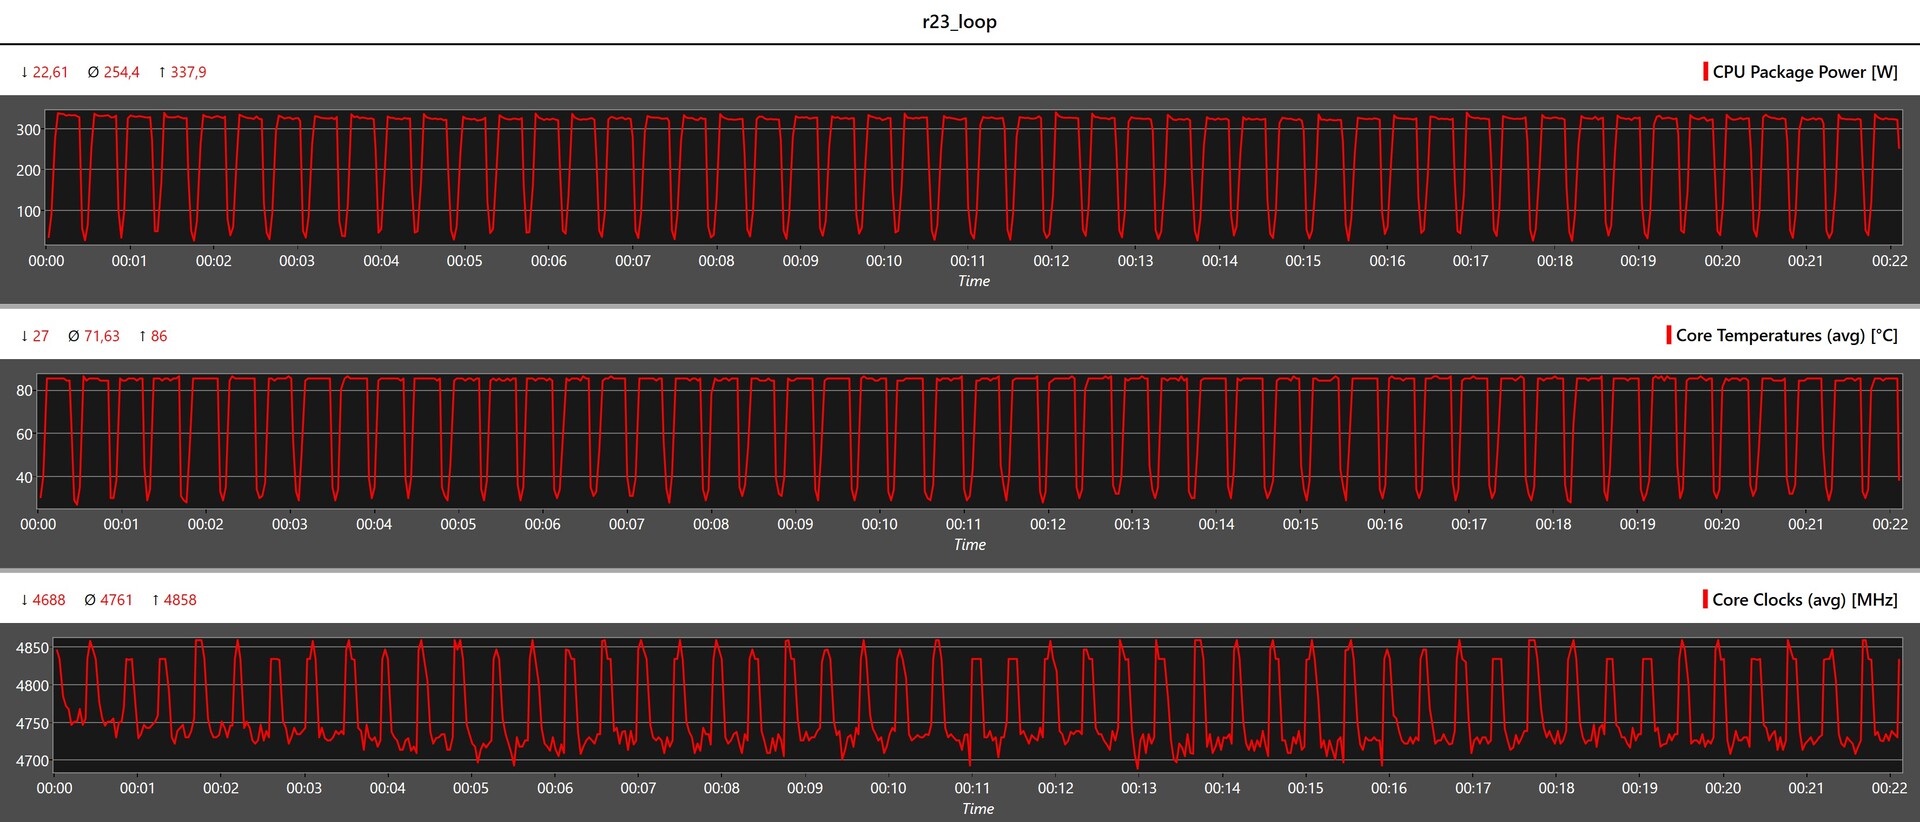
Intel Core i5-14600K

Synthetische Benchmarks und Anwendungsleistung
Nachdem AMD mit dem Ryzen 9 7950X den Intel Core i9-13900K übertreffen konnte, dreht sich nun wieder das Blatt zugunsten von Intel. Der Vorsprung ist aber auch hier wieder nur hauchdünn, wenn wir die Ergebnisse des PCMark 10 Benchmark anschauen.
Die RAM-Tests absolvieren beide Raptor-Lake-Refresh-Modelle mit Bravour. Mit dem verbauten DDR5-6000 RAM kann sich der Intel Core i9-14900K den ersten Platz sichern. AMD geriet hierbei deutlich ins Hintertreffen, obwohl die RAM-Taktraten die gleichen waren.
| PCMark 10 - Score | |
| Intel Core i9-14900K | |
| AMD Ryzen 9 7950X | |
| Intel Core i9-13900K | |
| Intel Core i5-14600K | |
| AMD Ryzen 7 7800X3D | |
| AMD Ryzen 5 7600X | |
| Intel Core i5-13600K | |
| Intel Core i9-12900K | |
| Intel Core i5-12600K | |
| 3DMark | |
| 1920x1080 Fire Strike Physics | |
| Intel Core i9-14900K | |
| Intel Core i9-13900K | |
| AMD Ryzen 9 7950X | |
| Intel Core i5-14600K | |
| Intel Core i9-12900K | |
| Intel Core i5-13600K | |
| AMD Ryzen 7 7800X3D | |
| AMD Ryzen 5 7600X | |
| Intel Core i5-12600K | |
| 2560x1440 Time Spy CPU | |
| Intel Core i9-14900K | |
| Intel Core i9-13900K | |
| Intel Core i5-14600K | |
| Intel Core i9-12900K | |
| Intel Core i5-13600K | |
| AMD Ryzen 9 7950X | |
| AMD Ryzen 7 7800X3D | |
| Intel Core i5-12600K | |
| AMD Ryzen 5 7600X | |
| 3DMark 11 - 1280x720 Performance Physics | |
| AMD Ryzen 7 7800X3D | |
| Intel Core i9-13900K | |
| Intel Core i9-14900K | |
| Intel Core i5-14600K | |
| Intel Core i5-13600K | |
| AMD Ryzen 9 7950X | |
| Intel Core i9-12900K | |
| AMD Ryzen 5 7600X | |
| Intel Core i5-12600K | |
| CrossMark - Overall | |
| Intel Core i9-14900K | |
| Intel Core i9-13900K | |
| AMD Ryzen 9 7950X | |
| Intel Core i5-14600K | |
| Intel Core i5-13600K | |
| AMD Ryzen 5 7600X | |
| AMD Ryzen 7 7800X3D | |
| AIDA64 / Memory Copy | |
| Intel Core i9-14900K | |
| Intel Core i9-14900K | |
| Intel Core i5-14600K | |
| Intel Core i9-13900K | |
| AMD Ryzen 9 7950X3D | |
| Intel Core i9-12900K | |
| AMD Ryzen 9 7950X | |
| Intel Core i5-13600K | |
| Intel Core i5-12600K | |
| AMD Ryzen 7 7800X3D | |
| AMD Ryzen 5 7600X | |
| Durchschnitt der Klasse (4514 - 234662, n=2211) | |
| AIDA64 / Memory Read | |
| Intel Core i9-14900K | |
| Intel Core i9-14900K | |
| Intel Core i5-14600K | |
| Intel Core i9-13900K | |
| Intel Core i9-12900K | |
| AMD Ryzen 9 7950X3D | |
| AMD Ryzen 9 7950X | |
| Intel Core i5-12600K | |
| Intel Core i5-13600K | |
| AMD Ryzen 7 7800X3D | |
| AMD Ryzen 5 7600X | |
| Durchschnitt der Klasse (4031 - 271066, n=2173) | |
| AIDA64 / Memory Write | |
| AMD Ryzen 7 7800X3D | |
| AMD Ryzen 9 7950X3D | |
| Intel Core i5-14600K | |
| Intel Core i9-14900K | |
| Intel Core i9-14900K | |
| AMD Ryzen 5 7600X | |
| AMD Ryzen 9 7950X | |
| Intel Core i9-13900K | |
| Intel Core i5-12600K | |
| Intel Core i9-12900K | |
| Intel Core i5-13600K | |
| Durchschnitt der Klasse (3506 - 242868, n=2178) | |
| AIDA64 / Memory Latency | |
| Durchschnitt der Klasse (6.1 - 536, n=2239) | |
| Intel Core i5-13600K | |
| Intel Core i9-13900K | |
| Intel Core i9-14900K | |
| Intel Core i9-14900K | |
| Intel Core i5-14600K | |
| AMD Ryzen 7 7800X3D | |
| AMD Ryzen 9 7950X3D | |
| AMD Ryzen 5 7600X | |
| AMD Ryzen 9 7950X | |
* ... kleinere Werte sind besser
| Performance Rating - Percent | |
| Intel Core i9-14900K | |
| Intel Core i5-14600K | |
| AMD Ryzen 7 7800X3D | |
| AMD Ryzen 9 7950X3D | |
| AMD Ryzen 9 7950X | |
| Intel Core i9-13900K | |
| 3DMark | |
| 2560x1440 Time Spy Graphics | |
| Intel Core i5-14600K | |
| Intel Core i9-14900K | |
| AMD Ryzen 7 7800X3D | |
| AMD Ryzen 9 7950X | |
| AMD Ryzen 9 7950X3D | |
| Intel Core i9-13900K | |
| Fire Strike Extreme Graphics | |
| AMD Ryzen 7 7800X3D | |
| Intel Core i5-14600K | |
| Intel Core i9-14900K | |
| AMD Ryzen 9 7950X | |
| AMD Ryzen 9 7950X3D | |
| Intel Core i9-13900K | |
| 3840x2160 Fire Strike Ultra Graphics | |
| AMD Ryzen 7 7800X3D | |
| Intel Core i5-14600K | |
| Intel Core i9-14900K | |
| AMD Ryzen 9 7950X | |
| AMD Ryzen 9 7950X3D | |
| Intel Core i9-13900K | |
| 1920x1080 Fire Strike Graphics | |
| Intel Core i5-14600K | |
| AMD Ryzen 7 7800X3D | |
| AMD Ryzen 9 7950X3D | |
| AMD Ryzen 9 7950X | |
| Intel Core i9-14900K | |
| Intel Core i9-13900K | |
| Unigine Heaven 4.0 | |
| Extreme Preset DX11 | |
| AMD Ryzen 9 7950X3D | |
| AMD Ryzen 9 7950X | |
| Intel Core i9-14900K | |
| Intel Core i5-14600K | |
| Intel Core i9-13900K | |
| AMD Ryzen 7 7800X3D | |
| Extreme Preset OpenGL | |
| Intel Core i9-14900K | |
| AMD Ryzen 9 7950X3D | |
| Intel Core i5-14600K | |
| AMD Ryzen 9 7950X | |
| Intel Core i9-13900K | |
| AMD Ryzen 7 7800X3D | |
| Unigine Valley 1.0 | |
| 1920x1080 Extreme HD DirectX AA:x8 | |
| Intel Core i9-14900K | |
| Intel Core i5-14600K | |
| Intel Core i9-13900K | |
| AMD Ryzen 9 7950X3D | |
| AMD Ryzen 9 7950X | |
| AMD Ryzen 7 7800X3D | |
| 1920x1080 Extreme HD Preset OpenGL AA:x8 | |
| Intel Core i9-14900K | |
| Intel Core i9-13900K | |
| Intel Core i5-14600K | |
| AMD Ryzen 9 7950X3D | |
| AMD Ryzen 9 7950X | |
| AMD Ryzen 7 7800X3D | |
| Intel Core i9-14900K, NVIDIA GeForce RTX 4090 GeForce RTX 4090, i9-14900K, WDC PC SN720 SDAQNTW-512G | Intel Core i5-14600K, NVIDIA GeForce RTX 4090 GeForce RTX 4090, i5-14600K, WDC PC SN720 SDAQNTW-512G | Intel Core i9-13900K, NVIDIA GeForce RTX 4090 GeForce RTX 4090, i9-13900K | Intel Core i7-13700K, NVIDIA GeForce RTX 4090 GeForce RTX 4090, i7-13700K, Intel Optane 905P 480GB 2.5 | AMD Ryzen 9 7950X, NVIDIA GeForce RTX 4090 GeForce RTX 4090, R9 7950X, Corsair MP600 GS | AMD Ryzen 9 7950X3D, NVIDIA GeForce RTX 4090 GeForce RTX 4090, R9 7950X3D | AMD Ryzen 7 7800X3D, NVIDIA GeForce RTX 4090 GeForce RTX 4090, R7 7800X3D, Corsair MP600 | |
|---|---|---|---|---|---|---|---|
| SPECviewperf 12 | -2% | -14% | -4% | -15% | -7% | -7% | |
| 1900x1060 3ds Max (3dsmax-05) (fps) | 565 | 563 0% | 543 -4% | 543 -4% | 571 1% | 560 -1% | 564 0% |
| 1900x1060 Catia (catia-04) (fps) | 291 | 277 -5% | 263 -10% | 273 -6% | 257 -12% | 274 -6% | 263 -10% |
| 1900x1060 Creo (creo-01) (fps) | 127 | 122 -4% | 123 -3% | 124 -2% | 115 -9% | 118 -7% | 114 -10% |
| 1900x1060 Energy (energy-01) (fps) | 84.7 | 84.5 0% | 56.7 -33% | 83.8 -1% | 54.7 -35% | 80.1 -5% | 83.1 -2% |
| 1900x1060 Maya (maya-04) (fps) | 340 | 314 -8% | 290 -15% | 304 -11% | 317 -7% | 329 -3% | 306 -10% |
| 1900x1060 Medical (medical-01) (fps) | 303 | 299 -1% | 131 -57% | 284 -6% | 119 -61% | 212 -30% | 238 -21% |
| 1900x1060 Showcase (showcase-01) (fps) | 398 | 440 11% | 432 9% | 434 9% | 457 15% | 427 7% | 442 11% |
| 1900x1060 Siemens NX (snx-02) (fps) | 31.4 | 30 -4% | 28.7 -9% | 28.3 -10% | 27.1 -14% | 27.4 -13% | 28.8 -8% |
| 1900x1060 Solidworks (sw-03) (fps) | 139 | 133 -4% | 132 -5% | 132 -5% | 126 -9% | 130 -6% | 127 -9% |
| SPECviewperf 13 | -2% | -4% | -3% | -5% | -2% | -4% | |
| 3ds Max (3dsmax-06) (fps) | 567 | 563 -1% | 542 -4% | 529 -7% | 563 -1% | 573 1% | 575 1% |
| Catia (catia-05) (fps) | 428 | 406 -5% | 398 -7% | 408 -5% | 402 -6% | 427 0% | 412 -4% |
| Creo (creo-02) (fps) | 618 | 584 -6% | 570 -8% | 599 -3% | 552 -11% | 577 -7% | 562 -9% |
| Energy (energy-02) (fps) | 127 | 127 0% | 126 -1% | 127 0% | 126 -1% | 127 0% | 127 0% |
| Maya (maya-05) (fps) | 881 | 829 -6% | 736 -16% | 807 -8% | 715 -19% | 748 -15% | 679 -23% |
| Medical (medical-02) (fps) | 180 | 179 -1% | 190 6% | 190 6% | 186 3% | 189 5% | 186 3% |
| Showcase (showcase-02) (fps) | 400 | 440 10% | 436 9% | 430 8% | 455 14% | 456 14% | 438 10% |
| Siemens NX (snx-03) (fps) | 56.3 | 53.8 -4% | 51.9 -8% | 51.4 -9% | 49.1 -13% | 49.3 -12% | 51.6 -8% |
| Solidworks (sw-04) (fps) | 199 | 189 -5% | 189 -5% | 188 -6% | 186 -7% | 191 -4% | 182 -9% |
| SPECviewperf 2020 | -2% | -7% | -2% | -9% | -7% | -8% | |
| 3840x2160 Siemens NX (snx-04) (fps) | 47.2 | 46.3 -2% | 44.7 -5% | 43.4 -8% | 41.3 -13% | 42.5 -10% | 44.3 -6% |
| 3840x2160 Medical (medical-03) (fps) | 40.3 | 40.2 0% | 42 4% | 43.7 8% | 45.9 14% | 46.2 15% | 46.2 15% |
| 3840x2160 Energy (energy-03) (fps) | 230 | 229 0% | 141 -39% | 228 -1% | 141 -39% | 140 -39% | 140 -39% |
| 3840x2160 Creo (creo-03) (fps) | 148 | 139 -6% | 146 -1% | 139 -6% | 133 -10% | 140 -5% | 129 -13% |
| 3840x2160 CATIA (catia-06) (fps) | 97.1 | 94.3 -3% | 99.8 3% | 97.9 1% | 95.3 -2% | 95.9 -1% | 93.3 -4% |
| 3840x2160 3ds Max (3dsmax-07) (fps) | 236 | 235 0% | 231 -2% | 229 -3% | 228 -3% | 236 0% | 237 0% |
| Durchschnitt gesamt (Programm / Settings) | -2% /
-2% | -8% /
-8% | -3% /
-3% | -10% /
-9% | -5% /
-5% | -6% /
-6% |
Spiele-Benchmarks
Die Performance-Spitze bei den Spiele-Benchmarks wurde in den vergangenen Jahren immer von den Intel Prozessoren eingenommen. Mit Einführung der AM5-Plattform und den 7000er-Ryzen-CPUs, welche nun auch mit dem 3D V-Cache bestückt sind, hat sich das Blatt gewendet. Intel ist mit dem Core i9-14900K etwas dichter an AMD herangerückt, doch in unserem Vergleich reicht es lediglich für den dritten Platz. Wenn es um die reine Gaming-Leistung geht, ist man aktuell mit dem Ryzen 7 7800X3D bestens versorgt. Mit einem geringen Abstand von etwa zehn Prozentpunkten reiht sich das neue Flaggschiff aus dem Hause Intel ein. Das Duell mit dem AMD Ryzen 9 7950X gewinnt der Intel Core i9-14900K jedoch.
Mit dem Intel Core i5-14600K bekommt man aktuell ebenfalls eine sehr starke CPU, welche es schafft, den Intel Core i7-13700K zu übertrumpfen.
Alle hier im Vergleich aufgelisteten Systeme wurden mit derselben Grafikkarte getestet. Als Grafikkarte diente eine Pait GeForce RTX 4090 Gamerock OC.
| Performance Rating - Percent | |
| AMD Ryzen 7 7800X3D | |
| AMD Ryzen 9 7950X3D | |
| Intel Core i9-14900K | |
| AMD Ryzen 9 7950X | |
| Intel Core i9-13900K | |
| AMD Ryzen 5 7600X | |
| Intel Core i5-14600K | |
| Intel Core i7-13700K | |
| Intel Core i7-13700 | |
| Intel Core i7-12700 | |
| Intel Core i5-13400 | |
| Intel Core i5-12400F | |
| F1 22 | |
| 1920x1080 Low Preset AA:T AF:16x | |
| AMD Ryzen 7 7800X3D | |
| AMD Ryzen 9 7950X3D | |
| Intel Core i9-14900K | |
| AMD Ryzen 9 7950X | |
| AMD Ryzen 5 7600X | |
| Intel Core i9-13900K | |
| Intel Core i7-13700K | |
| Intel Core i5-14600K | |
| Intel Core i7-13700 | |
| Intel Core i7-12700 | |
| Intel Core i5-12400F | |
| Intel Core i5-13400 | |
| 1920x1080 Ultra High Preset AA:T AF:16x | |
| AMD Ryzen 7 7800X3D | |
| Intel Core i9-14900K | |
| Intel Core i5-14600K | |
| AMD Ryzen 5 7600X | |
| AMD Ryzen 9 7950X3D | |
| AMD Ryzen 9 7950X | |
| Intel Core i9-13900K | |
| Intel Core i7-13700K | |
| Intel Core i7-13700 | |
| Intel Core i7-12700 | |
| Intel Core i5-12400F | |
| Intel Core i5-13400 | |
| Far Cry 5 | |
| 1920x1080 Ultra Preset AA:T | |
| AMD Ryzen 7 7800X3D | |
| AMD Ryzen 9 7950X3D | |
| Intel Core i9-14900K | |
| Intel Core i9-13900K | |
| Intel Core i5-14600K | |
| AMD Ryzen 9 7950X | |
| AMD Ryzen 5 7600X | |
| Intel Core i7-13700 | |
| Intel Core i7-13700K | |
| Intel Core i7-12700 | |
| Intel Core i5-13400 | |
| Intel Core i5-12400F | |
| 1280x720 Low Preset AA:T | |
| AMD Ryzen 7 7800X3D | |
| AMD Ryzen 9 7950X3D | |
| Intel Core i9-14900K | |
| Intel Core i9-13900K | |
| Intel Core i5-14600K | |
| Intel Core i7-13700K | |
| AMD Ryzen 5 7600X | |
| AMD Ryzen 9 7950X | |
| Intel Core i7-13700 | |
| Intel Core i7-12700 | |
| Intel Core i5-13400 | |
| Intel Core i5-12400F | |
| X-Plane 11.11 | |
| 1920x1080 high (fps_test=3) | |
| AMD Ryzen 7 7800X3D | |
| AMD Ryzen 9 7950X3D | |
| Intel Core i9-14900K | |
| Intel Core i9-13900K | |
| AMD Ryzen 9 7950X | |
| AMD Ryzen 5 7600X | |
| Intel Core i5-14600K | |
| Intel Core i7-13700K | |
| Intel Core i7-13700 | |
| Intel Core i7-12700 | |
| Intel Core i5-13400 | |
| Intel Core i5-12400F | |
| 1280x720 low (fps_test=1) | |
| Intel Core i9-13900K | |
| Intel Core i9-14900K | |
| Intel Core i5-14600K | |
| AMD Ryzen 9 7950X3D | |
| Intel Core i7-13700K | |
| AMD Ryzen 9 7950X | |
| AMD Ryzen 7 7800X3D | |
| Intel Core i7-13700 | |
| AMD Ryzen 5 7600X | |
| Intel Core i7-12700 | |
| Intel Core i5-13400 | |
| Intel Core i5-12400F | |
| Final Fantasy XV Benchmark | |
| 1920x1080 High Quality | |
| Intel Core i9-14900K | |
| AMD Ryzen 9 7950X | |
| AMD Ryzen 7 7800X3D | |
| Intel Core i5-14600K | |
| Intel Core i9-13900K | |
| AMD Ryzen 9 7950X3D | |
| Intel Core i7-13700K | |
| AMD Ryzen 5 7600X | |
| Intel Core i7-13700 | |
| Intel Core i7-12700 | |
| Intel Core i5-13400 | |
| Intel Core i5-12400F | |
| 1280x720 Lite Quality | |
| Intel Core i9-13900K | |
| AMD Ryzen 9 7950X | |
| AMD Ryzen 5 7600X | |
| Intel Core i7-13700 | |
| Intel Core i7-13700K | |
| AMD Ryzen 7 7800X3D | |
| Intel Core i5-14600K | |
| Intel Core i9-14900K | |
| AMD Ryzen 9 7950X3D | |
| Intel Core i7-12700 | |
| Intel Core i5-12400F | |
| Intel Core i5-13400 | |
| Dota 2 Reborn | |
| 1920x1080 ultra (3/3) best looking | |
| AMD Ryzen 7 7800X3D | |
| AMD Ryzen 9 7950X3D | |
| AMD Ryzen 9 7950X | |
| Intel Core i9-13900K | |
| Intel Core i9-14900K | |
| AMD Ryzen 5 7600X | |
| Intel Core i5-14600K | |
| Intel Core i7-13700K | |
| Intel Core i7-13700 | |
| Intel Core i7-12700 | |
| Intel Core i5-13400 | |
| Intel Core i5-12400F | |
| 1280x720 min (0/3) fastest | |
| AMD Ryzen 7 7800X3D | |
| AMD Ryzen 9 7950X3D | |
| AMD Ryzen 9 7950X | |
| Intel Core i9-14900K | |
| Intel Core i9-13900K | |
| AMD Ryzen 5 7600X | |
| Intel Core i5-14600K | |
| Intel Core i7-13700K | |
| Intel Core i7-13700 | |
| Intel Core i7-12700 | |
| Intel Core i5-12400F | |
| Intel Core i5-13400 | |
| The Witcher 3 | |
| 1920x1080 Ultra Graphics & Postprocessing (HBAO+) | |
| Intel Core i9-13900K | |
| AMD Ryzen 9 7950X | |
| Intel Core i5-14600K | |
| AMD Ryzen 7 7800X3D | |
| Intel Core i9-14900K | |
| AMD Ryzen 5 7600X | |
| Intel Core i7-13700K | |
| Intel Core i7-13700 | |
| AMD Ryzen 9 7950X3D | |
| Intel Core i7-12700 | |
| Intel Core i5-13400 | |
| Intel Core i5-12400F | |
| 1024x768 Low Graphics & Postprocessing | |
| AMD Ryzen 9 7950X3D | |
| AMD Ryzen 7 7800X3D | |
| Intel Core i9-14900K | |
| AMD Ryzen 9 7950X | |
| Intel Core i9-13900K | |
| AMD Ryzen 5 7600X | |
| Intel Core i7-13700K | |
| Intel Core i7-13700 | |
| Intel Core i5-14600K | |
| Intel Core i7-12700 | |
| Intel Core i5-13400 | |
| Intel Core i5-12400F | |
| GTA V | |
| 1920x1080 Highest AA:4xMSAA + FX AF:16x | |
| AMD Ryzen 7 7800X3D | |
| Intel Core i9-14900K | |
| Intel Core i9-13900K | |
| Intel Core i5-14600K | |
| AMD Ryzen 9 7950X | |
| AMD Ryzen 9 7950X3D | |
| Intel Core i7-13700K | |
| AMD Ryzen 5 7600X | |
| Intel Core i7-13700 | |
| Intel Core i7-12700 | |
| Intel Core i5-13400 | |
| Intel Core i5-12400F | |
| 1024x768 Lowest Settings possible | |
| AMD Ryzen 7 7800X3D | |
| AMD Ryzen 9 7950X | |
| AMD Ryzen 9 7950X3D | |
| AMD Ryzen 5 7600X | |
| Intel Core i9-14900K | |
| Intel Core i9-13900K | |
| Intel Core i7-13700 | |
| Intel Core i5-14600K | |
| Intel Core i7-13700K | |
| Intel Core i7-12700 | |
| Intel Core i5-13400 | |
| Intel Core i5-12400F | |
| Borderlands 3 | |
| 1280x720 Very Low Overall Quality (DX11) | |
| AMD Ryzen 7 7800X3D | |
| AMD Ryzen 9 7950X3D | |
| Intel Core i9-14900K | |
| Intel Core i9-13900K | |
| AMD Ryzen 9 7950X | |
| Intel Core i5-14600K | |
| AMD Ryzen 5 7600X | |
| Intel Core i7-13700 | |
| Intel Core i7-13700K | |
| Intel Core i7-12700 | |
| Intel Core i5-13400 | |
| Intel Core i5-12400F | |
| 1920x1080 Badass Overall Quality (DX11) | |
| AMD Ryzen 9 7950X3D | |
| AMD Ryzen 7 7800X3D | |
| Intel Core i9-14900K | |
| AMD Ryzen 9 7950X | |
| Intel Core i9-13900K | |
| Intel Core i5-14600K | |
| AMD Ryzen 5 7600X | |
| Intel Core i7-13700K | |
| Intel Core i7-13700 | |
| Intel Core i7-12700 | |
| Intel Core i5-13400 | |
| Intel Core i5-12400F | |
| Far Cry New Dawn | |
| 1280x720 Low Preset | |
| AMD Ryzen 7 7800X3D | |
| AMD Ryzen 9 7950X3D | |
| Intel Core i9-14900K | |
| Intel Core i9-13900K | |
| Intel Core i5-14600K | |
| Intel Core i7-13700 | |
| Intel Core i7-13700K | |
| AMD Ryzen 9 7950X | |
| AMD Ryzen 5 7600X | |
| Intel Core i7-12700 | |
| Intel Core i5-13400 | |
| Intel Core i5-12400F | |
| 1920x1080 Ultra Preset | |
| AMD Ryzen 7 7800X3D | |
| AMD Ryzen 9 7950X3D | |
| Intel Core i9-14900K | |
| Intel Core i9-13900K | |
| Intel Core i5-14600K | |
| AMD Ryzen 9 7950X | |
| Intel Core i7-13700K | |
| AMD Ryzen 5 7600X | |
| Intel Core i7-13700 | |
| Intel Core i7-12700 | |
| Intel Core i5-13400 | |
| Intel Core i5-12400F | |
| Shadow of the Tomb Raider | |
| 1280x720 Lowest Preset | |
| AMD Ryzen 7 7800X3D | |
| AMD Ryzen 9 7950X3D | |
| AMD Ryzen 9 7950X | |
| Intel Core i9-14900K | |
| AMD Ryzen 5 7600X | |
| Intel Core i9-13900K | |
| Intel Core i5-14600K | |
| Intel Core i7-13700 | |
| Intel Core i7-13700K | |
| Intel Core i7-12700 | |
| Intel Core i5-13400 | |
| Intel Core i5-12400F | |
| 1920x1080 Highest Preset AA:T | |
| AMD Ryzen 7 7800X3D | |
| AMD Ryzen 9 7950X3D | |
| Intel Core i9-14900K | |
| AMD Ryzen 9 7950X | |
| Intel Core i9-13900K | |
| AMD Ryzen 5 7600X | |
| Intel Core i5-14600K | |
| Intel Core i7-13700K | |
| Intel Core i7-13700 | |
| Intel Core i7-12700 | |
| Intel Core i5-13400 | |
| Intel Core i5-12400F | |
| Tiny Tina's Wonderlands | |
| 1920x1080 Low Preset (DX12) | |
| AMD Ryzen 7 7800X3D | |
| Intel Core i9-14900K | |
| AMD Ryzen 9 7950X3D | |
| Intel Core i5-14600K | |
| AMD Ryzen 9 7950X | |
| AMD Ryzen 5 7600X | |
| Intel Core i9-13900K | |
| Intel Core i7-13700 | |
| Intel Core i7-13700K | |
| Intel Core i7-12700 | |
| Intel Core i5-13400 | |
| Intel Core i5-12400F | |
| 1920x1080 Badass Preset (DX12) | |
| AMD Ryzen 7 7800X3D | |
| Intel Core i9-14900K | |
| AMD Ryzen 9 7950X3D | |
| Intel Core i5-14600K | |
| AMD Ryzen 9 7950X | |
| AMD Ryzen 5 7600X | |
| Intel Core i9-13900K | |
| Intel Core i7-13700 | |
| Intel Core i7-13700K | |
| Intel Core i7-12700 | |
| Intel Core i5-13400 | |
| Intel Core i5-12400F | |
| Strange Brigade | |
| 1280x720 lowest AF:1 | |
| AMD Ryzen 5 7600X | |
| Intel Core i9-14900K | |
| AMD Ryzen 7 7800X3D | |
| Intel Core i5-14600K | |
| AMD Ryzen 9 7950X | |
| Intel Core i9-13900K | |
| AMD Ryzen 9 7950X3D | |
| Intel Core i7-13700K | |
| Intel Core i7-13700 | |
| Intel Core i7-12700 | |
| Intel Core i5-12400F | |
| Intel Core i5-13400 | |
| 1920x1080 ultra AA:ultra AF:16 | |
| Intel Core i9-14900K | |
| AMD Ryzen 5 7600X | |
| AMD Ryzen 7 7800X3D | |
| AMD Ryzen 9 7950X | |
| Intel Core i9-13900K | |
| Intel Core i5-14600K | |
| AMD Ryzen 9 7950X3D | |
| Intel Core i7-13700K | |
| Intel Core i7-13700 | |
| Intel Core i7-12700 | |
| Intel Core i5-12400F | |
| Intel Core i5-13400 | |
| Metro Exodus | |
| 1280x720 Low Quality AF:4x | |
| AMD Ryzen 7 7800X3D | |
| Intel Core i9-14900K | |
| AMD Ryzen 5 7600X | |
| AMD Ryzen 9 7950X | |
| Intel Core i5-14600K | |
| AMD Ryzen 9 7950X3D | |
| Intel Core i7-13700 | |
| Intel Core i9-13900K | |
| Intel Core i7-13700K | |
| Intel Core i7-12700 | |
| Intel Core i5-12400F | |
| Intel Core i5-13400 | |
| 1920x1080 Ultra Quality AF:16x | |
| AMD Ryzen 7 7800X3D | |
| Intel Core i9-14900K | |
| Intel Core i5-14600K | |
| AMD Ryzen 9 7950X | |
| AMD Ryzen 5 7600X | |
| AMD Ryzen 9 7950X3D | |
| Intel Core i9-13900K | |
| Intel Core i7-13700 | |
| Intel Core i7-13700K | |
| Intel Core i7-12700 | |
| Intel Core i5-13400 | |
| Intel Core i5-12400F | |
| F1 2020 | |
| 1280x720 Ultra Low Preset | |
| AMD Ryzen 7 7800X3D | |
| Intel Core i9-14900K | |
| AMD Ryzen 9 7950X3D | |
| AMD Ryzen 9 7950X | |
| AMD Ryzen 5 7600X | |
| Intel Core i9-13900K | |
| Intel Core i7-13700K | |
| Intel Core i7-13700 | |
| Intel Core i5-14600K | |
| Intel Core i7-12700 | |
| Intel Core i5-12400F | |
| Intel Core i5-13400 | |
| 1920x1080 Ultra High Preset AA:T AF:16x | |
| AMD Ryzen 7 7800X3D | |
| AMD Ryzen 9 7950X3D | |
| Intel Core i9-14900K | |
| AMD Ryzen 5 7600X | |
| AMD Ryzen 9 7950X | |
| Intel Core i9-13900K | |
| Intel Core i5-14600K | |
| Intel Core i7-13700K | |
| Intel Core i7-13700 | |
| Intel Core i7-12700 | |
| Intel Core i5-12400F | |
| Intel Core i5-13400 | |
| F1 2021 | |
| 1280x720 Ultra Low Preset | |
| AMD Ryzen 7 7800X3D | |
| Intel Core i9-14900K | |
| AMD Ryzen 5 7600X | |
| AMD Ryzen 9 7950X3D | |
| AMD Ryzen 9 7950X | |
| Intel Core i9-13900K | |
| Intel Core i7-13700K | |
| Intel Core i7-13700 | |
| Intel Core i5-14600K | |
| Intel Core i7-12700 | |
| Intel Core i5-12400F | |
| Intel Core i5-13400 | |
| 1920x1080 Ultra High Preset + Raytracing AA:T AF:16x | |
| AMD Ryzen 7 7800X3D | |
| Intel Core i9-14900K | |
| Intel Core i5-14600K | |
| AMD Ryzen 5 7600X | |
| Intel Core i9-13900K | |
| AMD Ryzen 9 7950X | |
| AMD Ryzen 9 7950X3D | |
| Intel Core i7-13700K | |
| Intel Core i7-13700 | |
| Intel Core i7-12700 | |
| Intel Core i5-12400F | |
| Intel Core i5-13400 | |
Intel Core i9-14900K mit Nvidia GeForce RTX 4090
| min. | mittel | hoch | max. | QHD | 4K DLSS | 4K | |
|---|---|---|---|---|---|---|---|
| GTA V (2015) | 187.9 | 187.8 | 187.6 | 170.9 | 171.9 | 187.6 | |
| The Witcher 3 (2015) | 829 | 750 | 661 | 314 | 273 | 293 | |
| Dota 2 Reborn (2015) | 299.9 | 258.2 | 248.2 | 231.4 | 227.8 | ||
| Final Fantasy XV Benchmark (2018) | 235 | 233 | 234 | 229 | 161.9 | ||
| X-Plane 11.11 (2018) | 244 | 212 | 161 | 136.3 | |||
| Far Cry 5 (2018) | 280 | 246 | 234 | 217 | 216 | 187 | |
| Strange Brigade (2018) | 762 | 619 | 612 | 602 | 542 | 291 | |
| Shadow of the Tomb Raider (2018) | 332 | 326 | 318 | 313 | 293 | 189.7 | |
| Far Cry New Dawn (2019) | 235 | 202 | 194 | 175 | 174 | 161 | |
| Metro Exodus (2019) | 319 | 288 | 250 | 214 | 194.6 | 143.4 | |
| Borderlands 3 (2019) | 263 | 232 | 215 | 204 | 198.4 | 137.9 | |
| F1 2020 (2020) | 598 | 503 | 497 | 450 | 426 | 289 | |
| F1 2021 (2021) | 733 | 683 | 586 | 307 | 291 | 203 | |
| Far Cry 6 (2021) | 264 | 228 | 202 | 204 | 195.6 | 141.9 | |
| Forza Horizon 5 (2021) | 416 | 337 | 317 | 224 | 207 | 162 | |
| God of War (2022) | 283 | 283 | 274 | 215 | 183.3 | 134 | |
| GRID Legends (2022) | 290 | 257 | 238 | 230 | 225 | 191.2 | |
| Tiny Tina's Wonderlands (2022) | 502 | 427 | 359 | 305 | 234 | 131.7 | |
| F1 22 (2022) | 462 | 483 | 429 | 217 | 161.1 | 83.4 | |
| The Quarry (2022) | 432 | 343 | 297 | 261 | 198.7 | 81.8 | |
| The Witcher 3 v4 (2023) | 378 | 325 | 289 | 270 | 266 | 170.7 | |
| F1 23 (2023) | 454 | 472 | 453 | 213 | 155.5 | 134.4 | 80.1 |
| Cyberpunk 2077 (2023) | 198.8 | 199.9 | 188.4 | 179.5 | 161.7 | 78.9 | |
| F1 24 (2024) | 377 | 408 | 389 | 217 | 177.5 | 93.9 | |
| F1 25 (2025) | 299 | 290 | 277 | 95.9 | 60.4 | 29.4 |
Intel Core i5-14600K mit Nvidia GeForce RTX 4090
| min. | mittel | hoch | max. | QHD | 4K DLSS | 4K | |
|---|---|---|---|---|---|---|---|
| GTA V (2015) | 187.7 | 187.6 | 186.9 | 162.3 | 163.5 | 187.4 | |
| The Witcher 3 (2015) | 632 | 585 | 550 | 316 | 275 | 288 | |
| Dota 2 Reborn (2015) | 261.5 | 239.2 | 229.9 | 217 | 211.5 | ||
| Final Fantasy XV Benchmark (2018) | 236 | 237 | 233 | 226 | 161.5 | ||
| X-Plane 11.11 (2018) | 228 | 196.9 | 147.8 | 124.6 | |||
| Far Cry 5 (2018) | 255 | 219 | 211 | 196 | 195 | 181 | |
| Strange Brigade (2018) | 717 | 542 | 548 | 546 | 514 | 289 | |
| Shadow of the Tomb Raider (2018) | 281 | 272 | 279 | 272 | 266 | 188.8 | |
| Far Cry New Dawn (2019) | 216 | 189 | 180 | 163 | 162 | 153 | |
| Metro Exodus (2019) | 296 | 271 | 238 | 202 | 188.8 | 142.1 | |
| Borderlands 3 (2019) | 237 | 209 | 192.9 | 182 | 179.3 | 136.1 | |
| F1 2020 (2020) | 403 | 402 | 406 | 373 | 368 | 288 | |
| F1 2021 (2021) | 562 | 541 | 468 | 278 | 268 | 201 | |
| Far Cry 6 (2021) | 230 | 199.8 | 178.3 | 182.4 | 175.5 | 139.4 | |
| Forza Horizon 5 (2021) | 364 | 300 | 292 | 214 | 199 | 162 | |
| God of War (2022) | 244 | 245 | 244 | 214 | 180 | 130.9 | |
| GRID Legends (2022) | 248 | 220 | 208 | 201 | 201 | 181.6 | |
| Tiny Tina's Wonderlands (2022) | 429 | 372 | 319 | 291 | 232 | 130.4 | |
| F1 22 (2022) | 379 | 390 | 380 | 210 | 160.3 | 83.5 | |
| The Quarry (2022) | 359 | 312 | 277 | 252 | 197.1 | 82.9 | |
| The Witcher 3 v4 (2023) | 317 | 285 | 313 | 226 | 225 | 169 | |
| F1 23 (2023) | 376 | 393 | 374 | 199.7 | 154.5 | 134 | 79.9 |
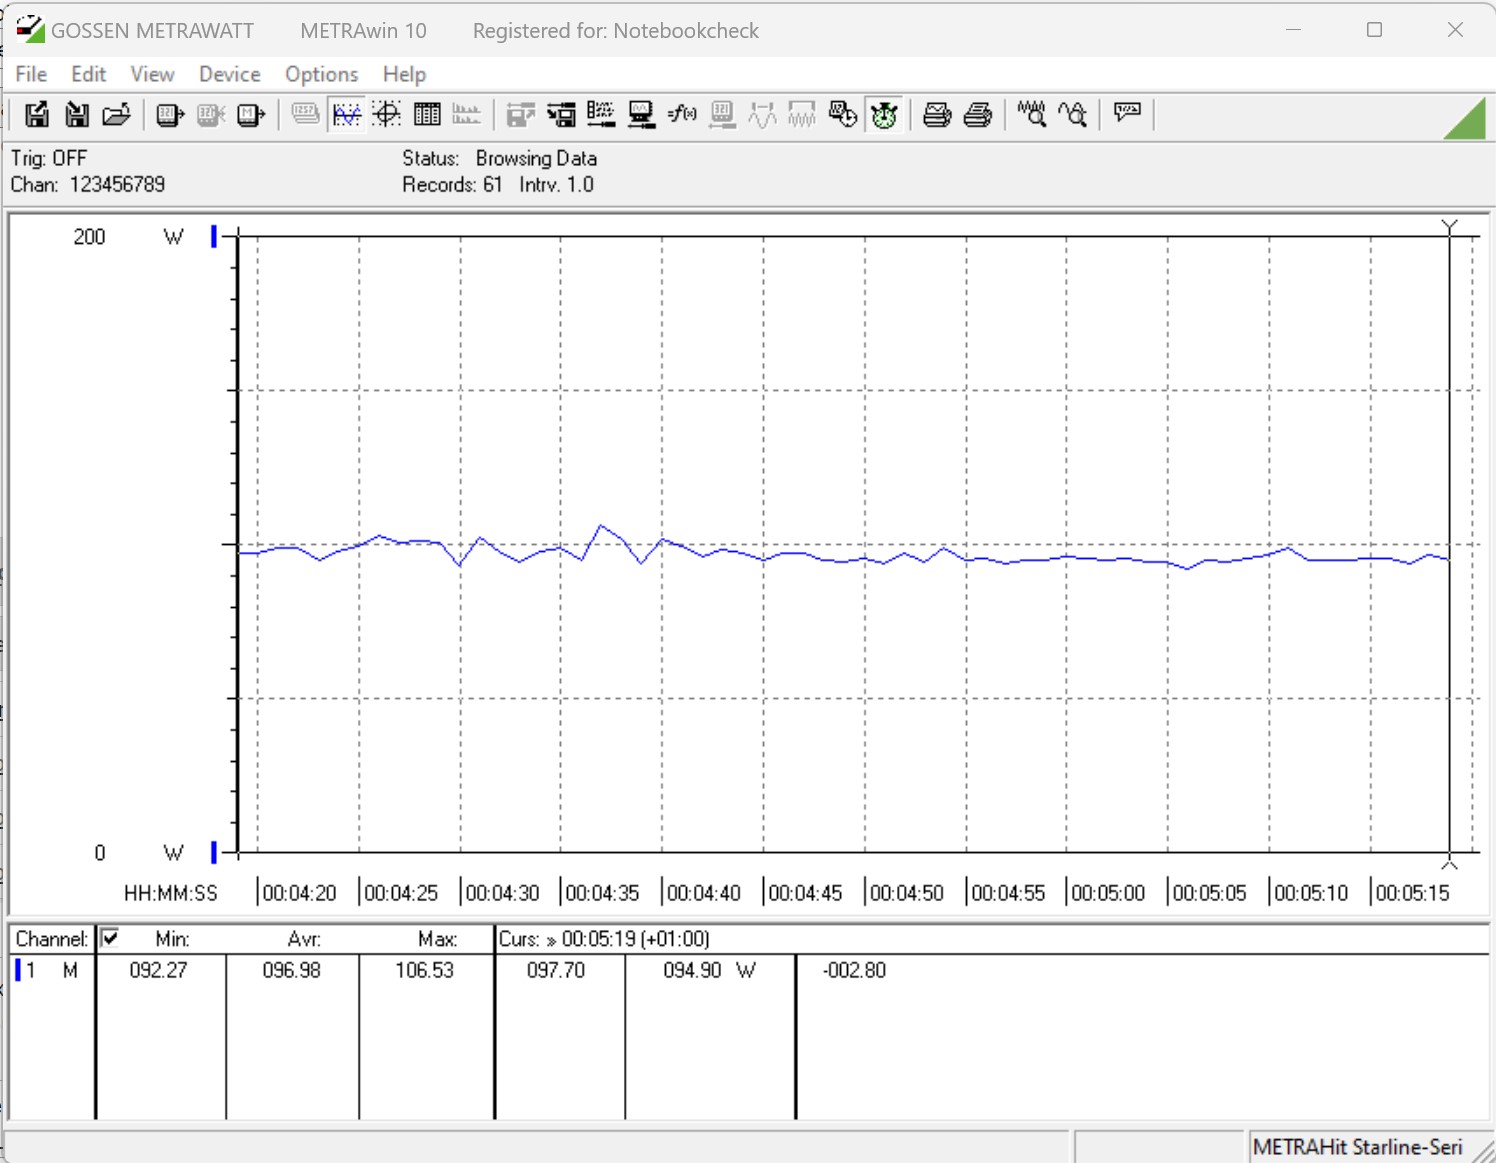
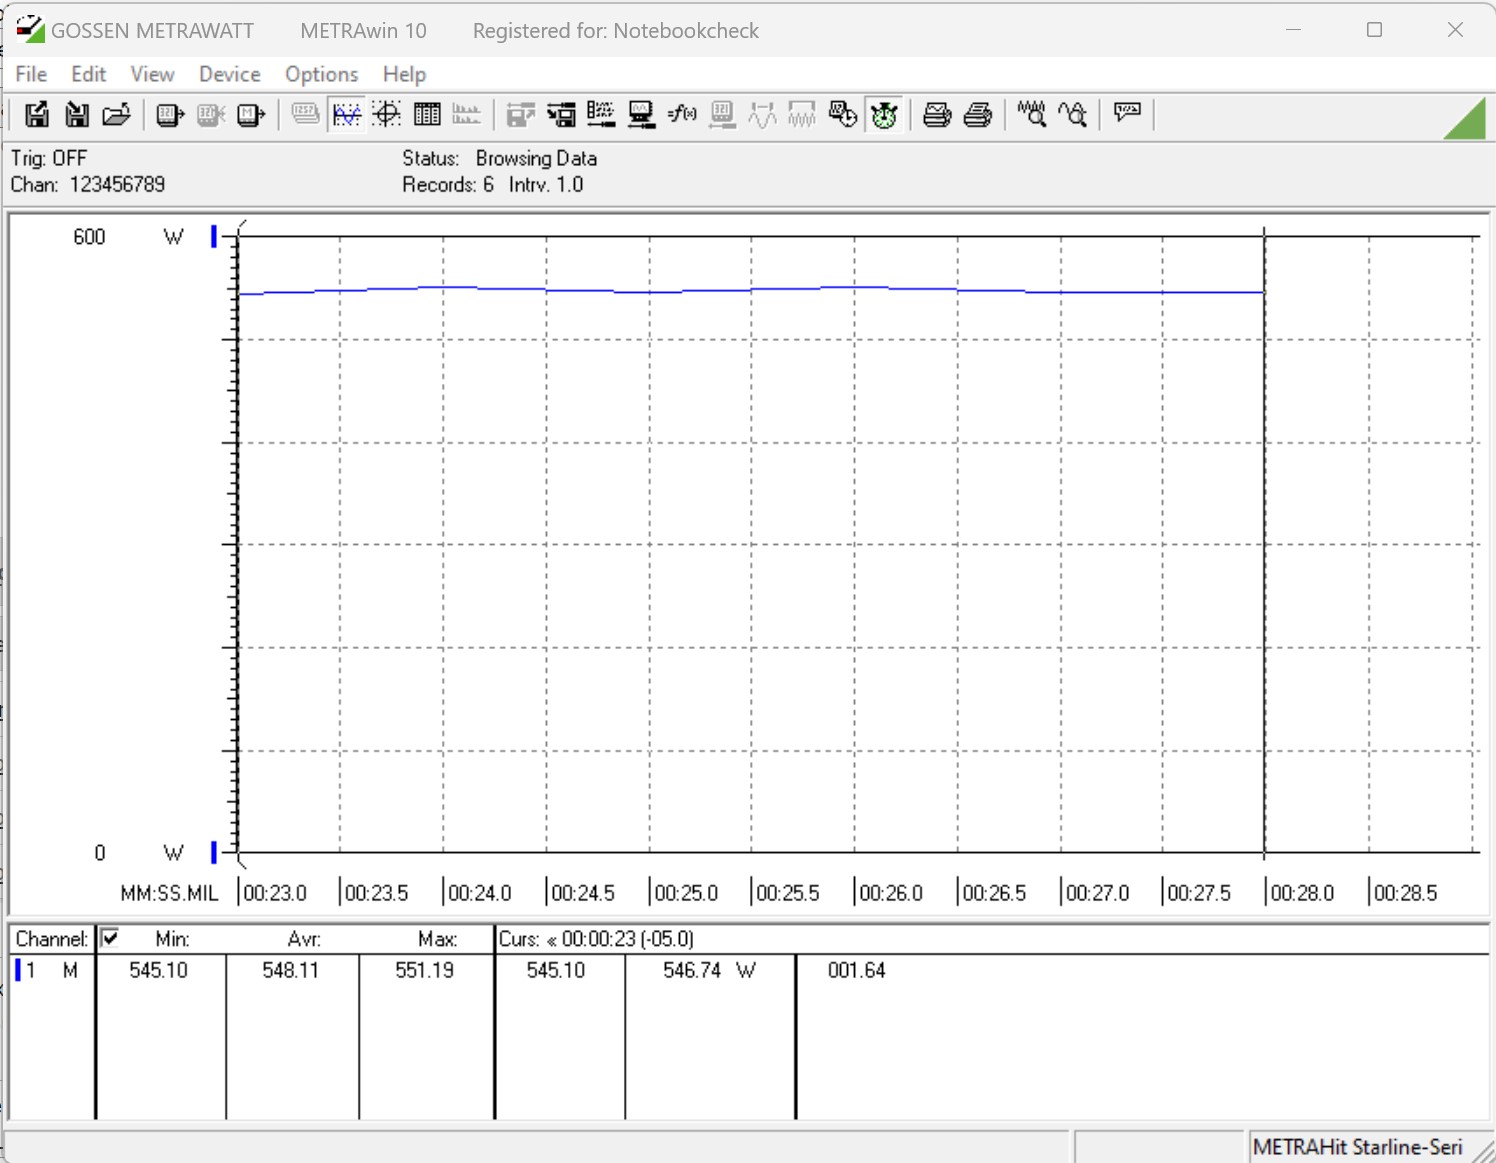
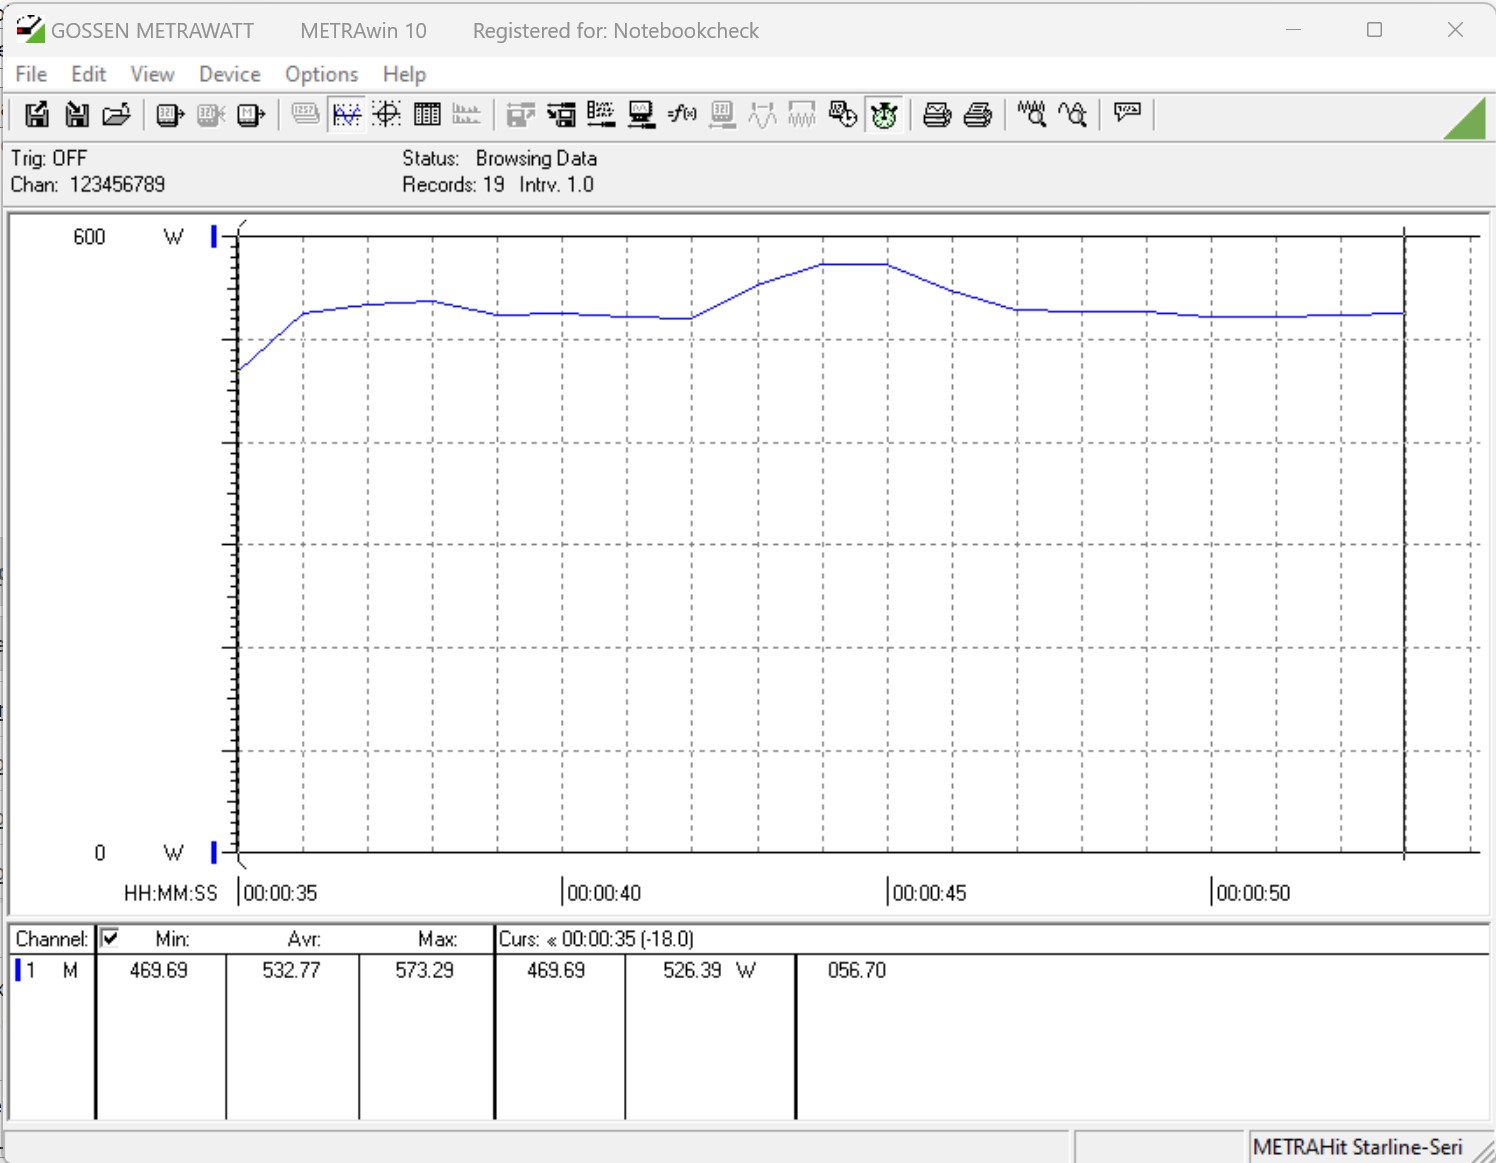
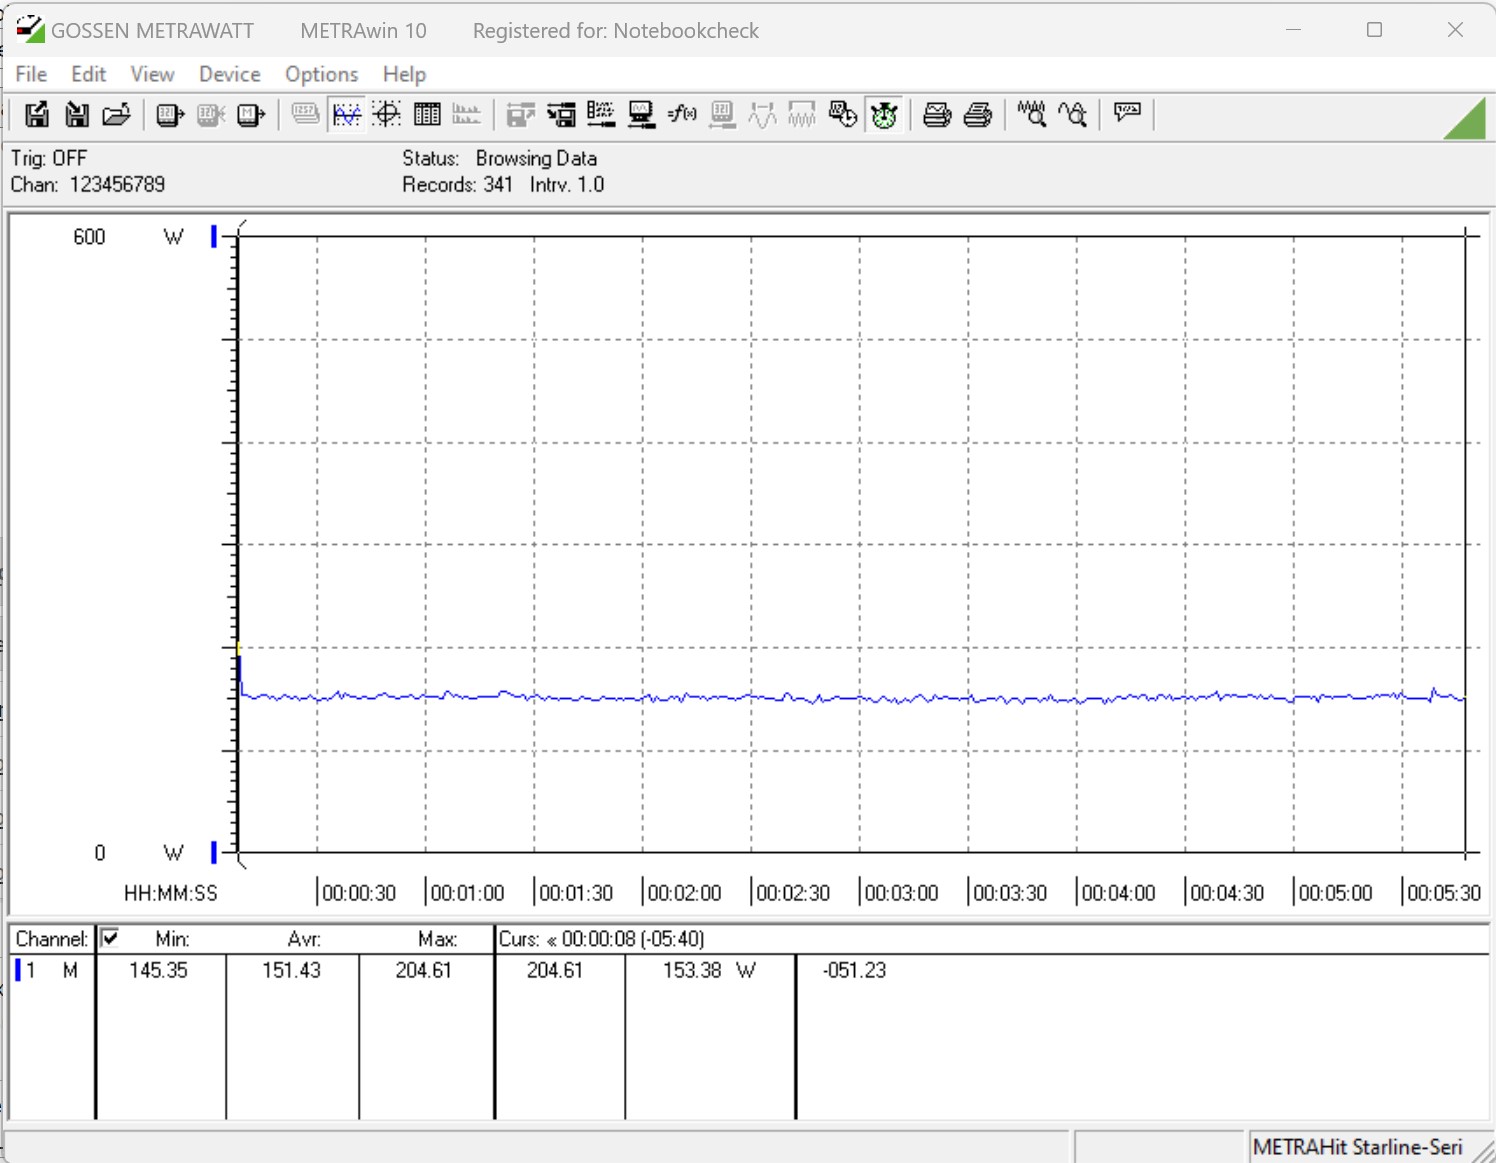
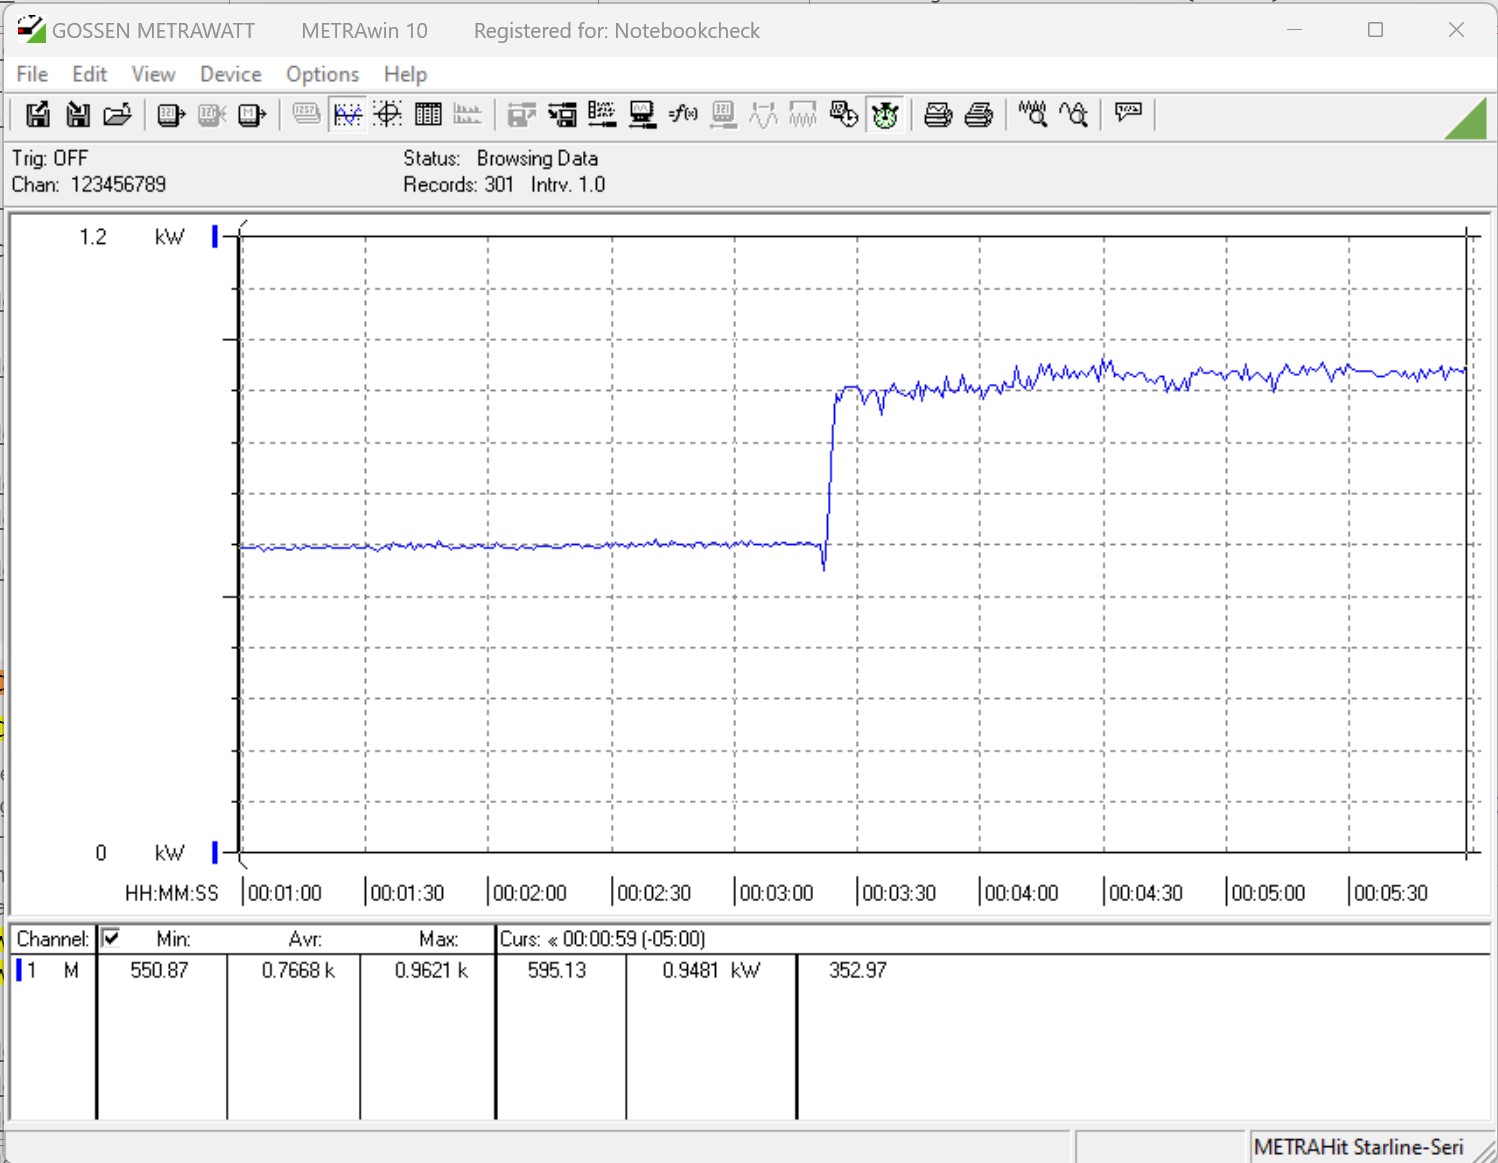
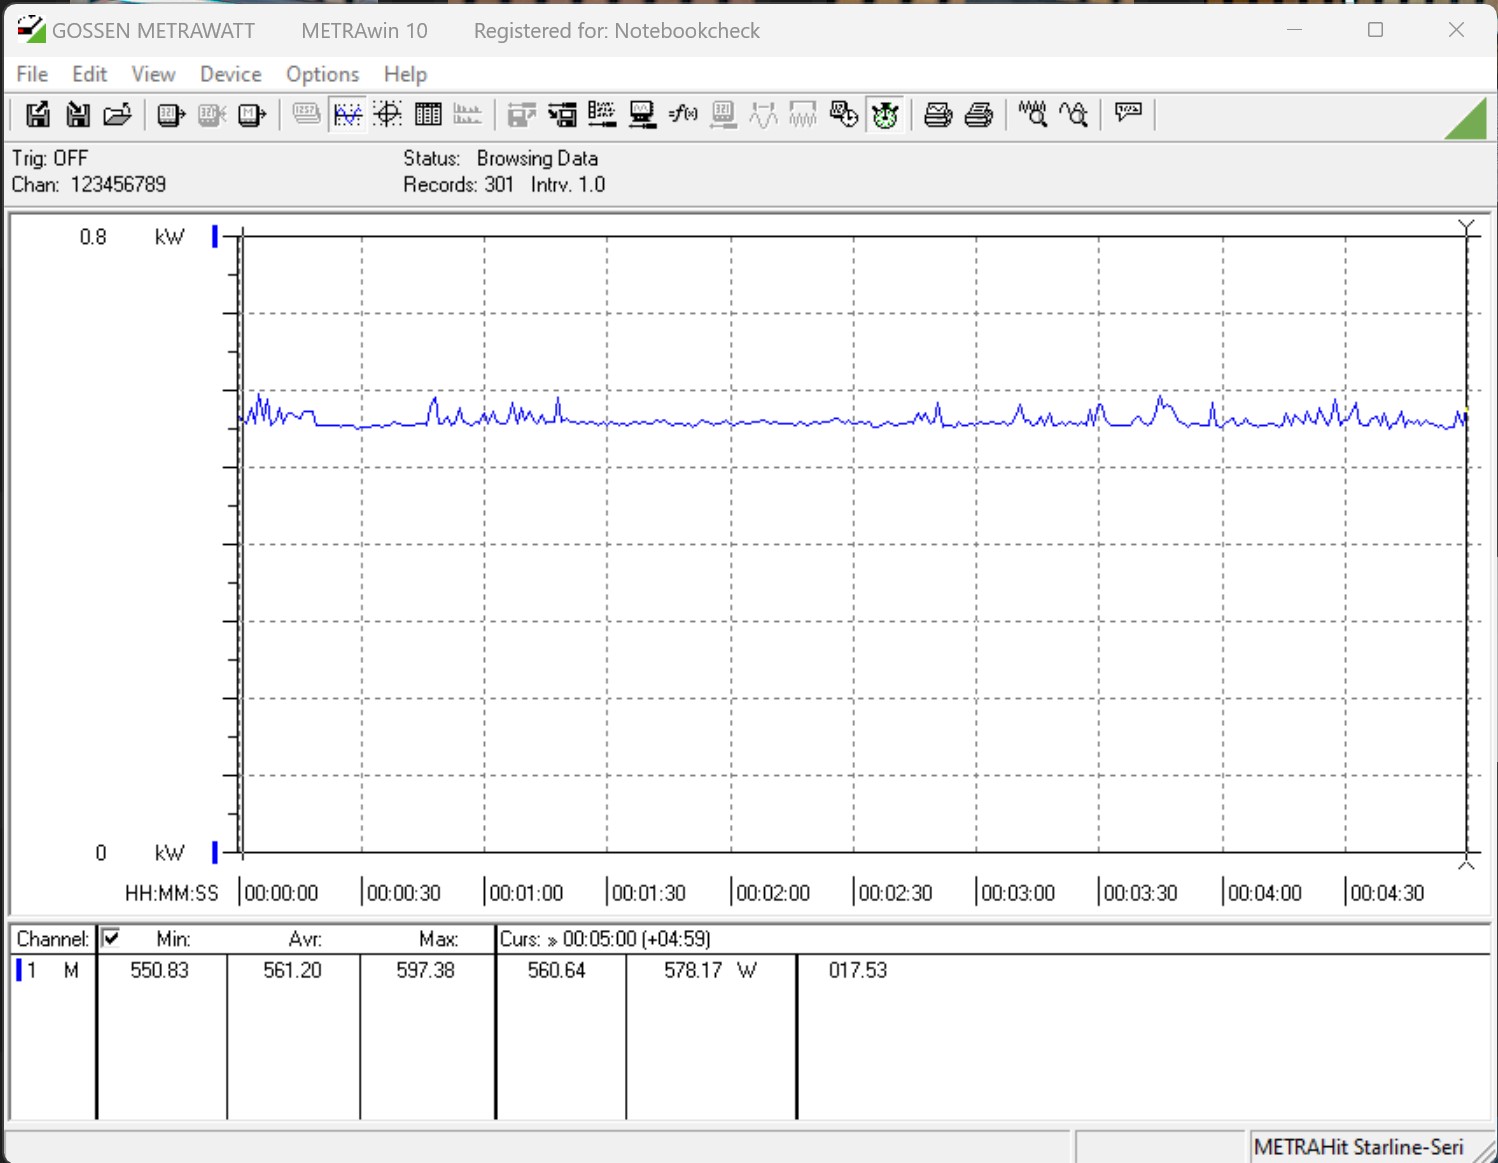
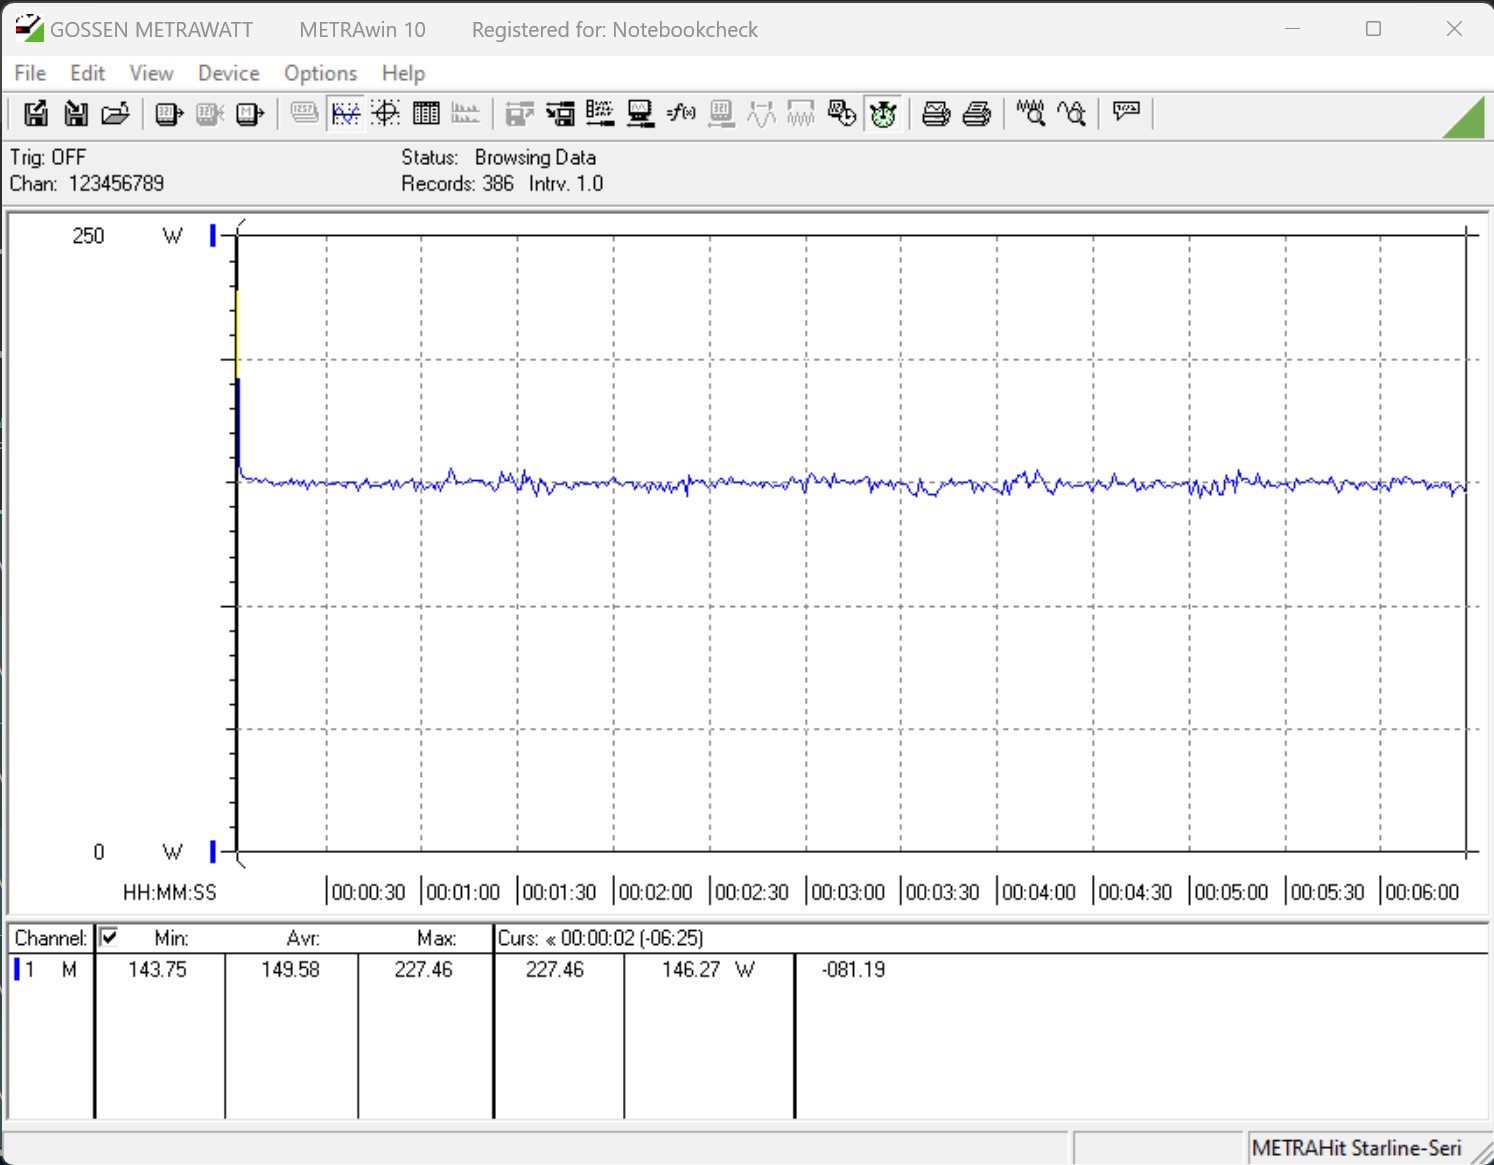
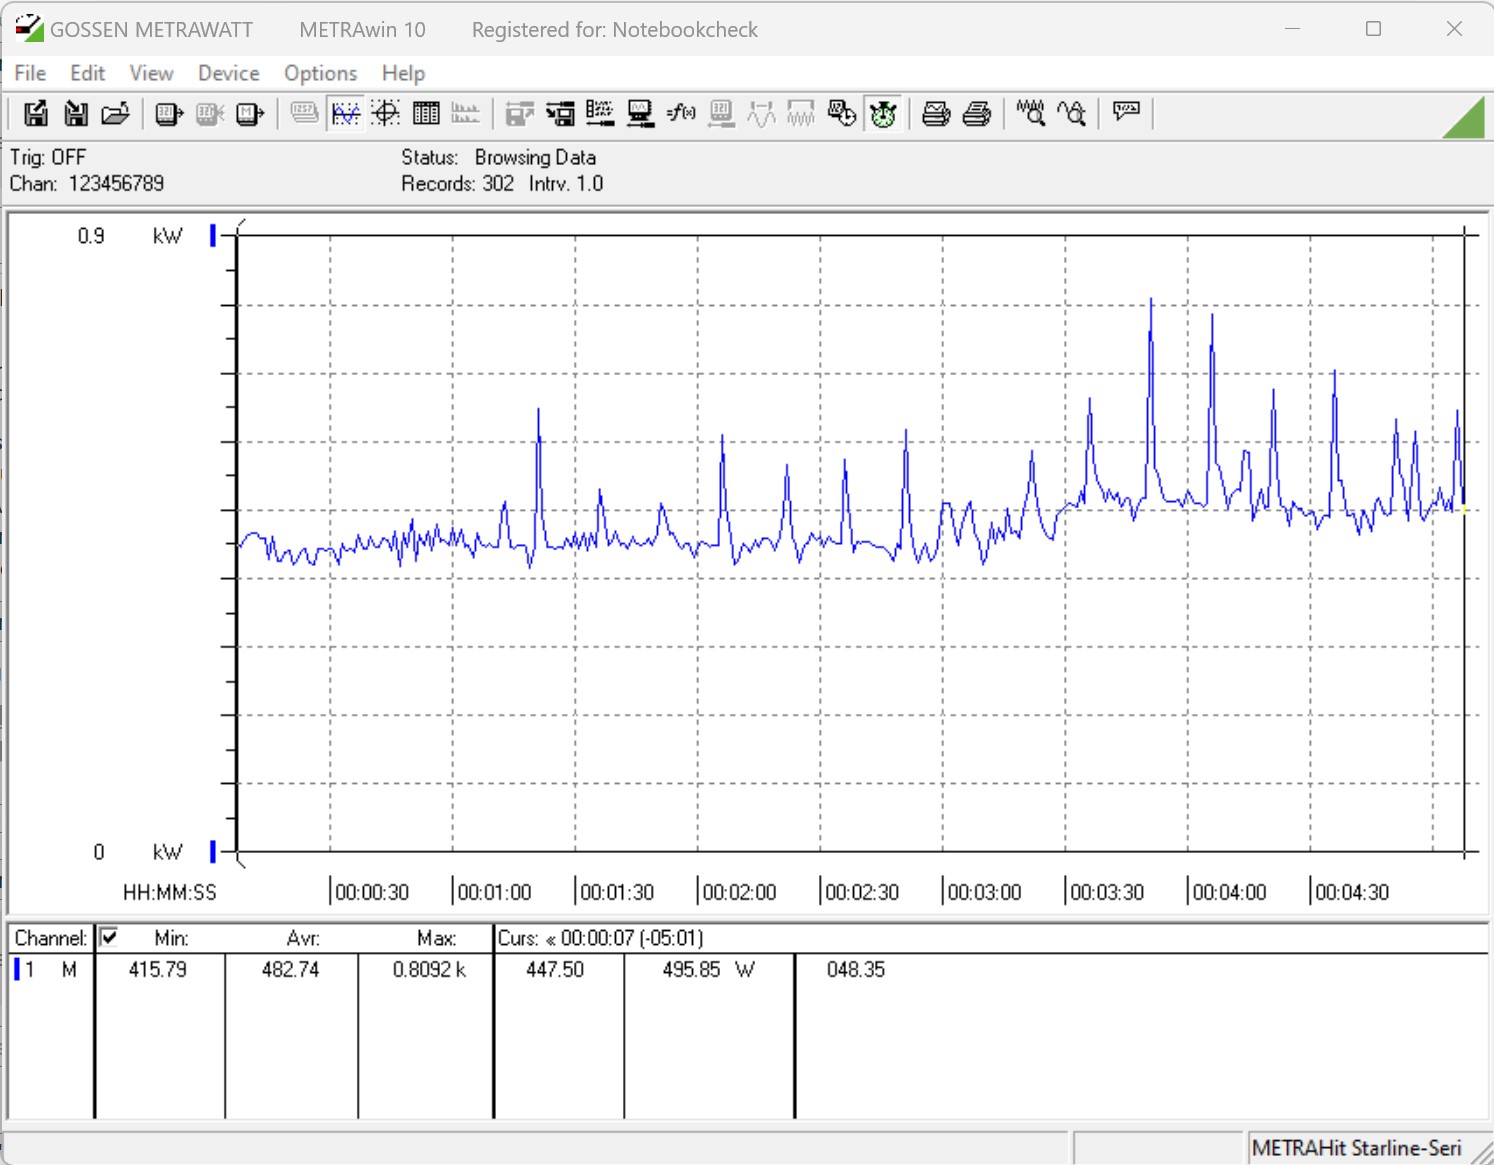
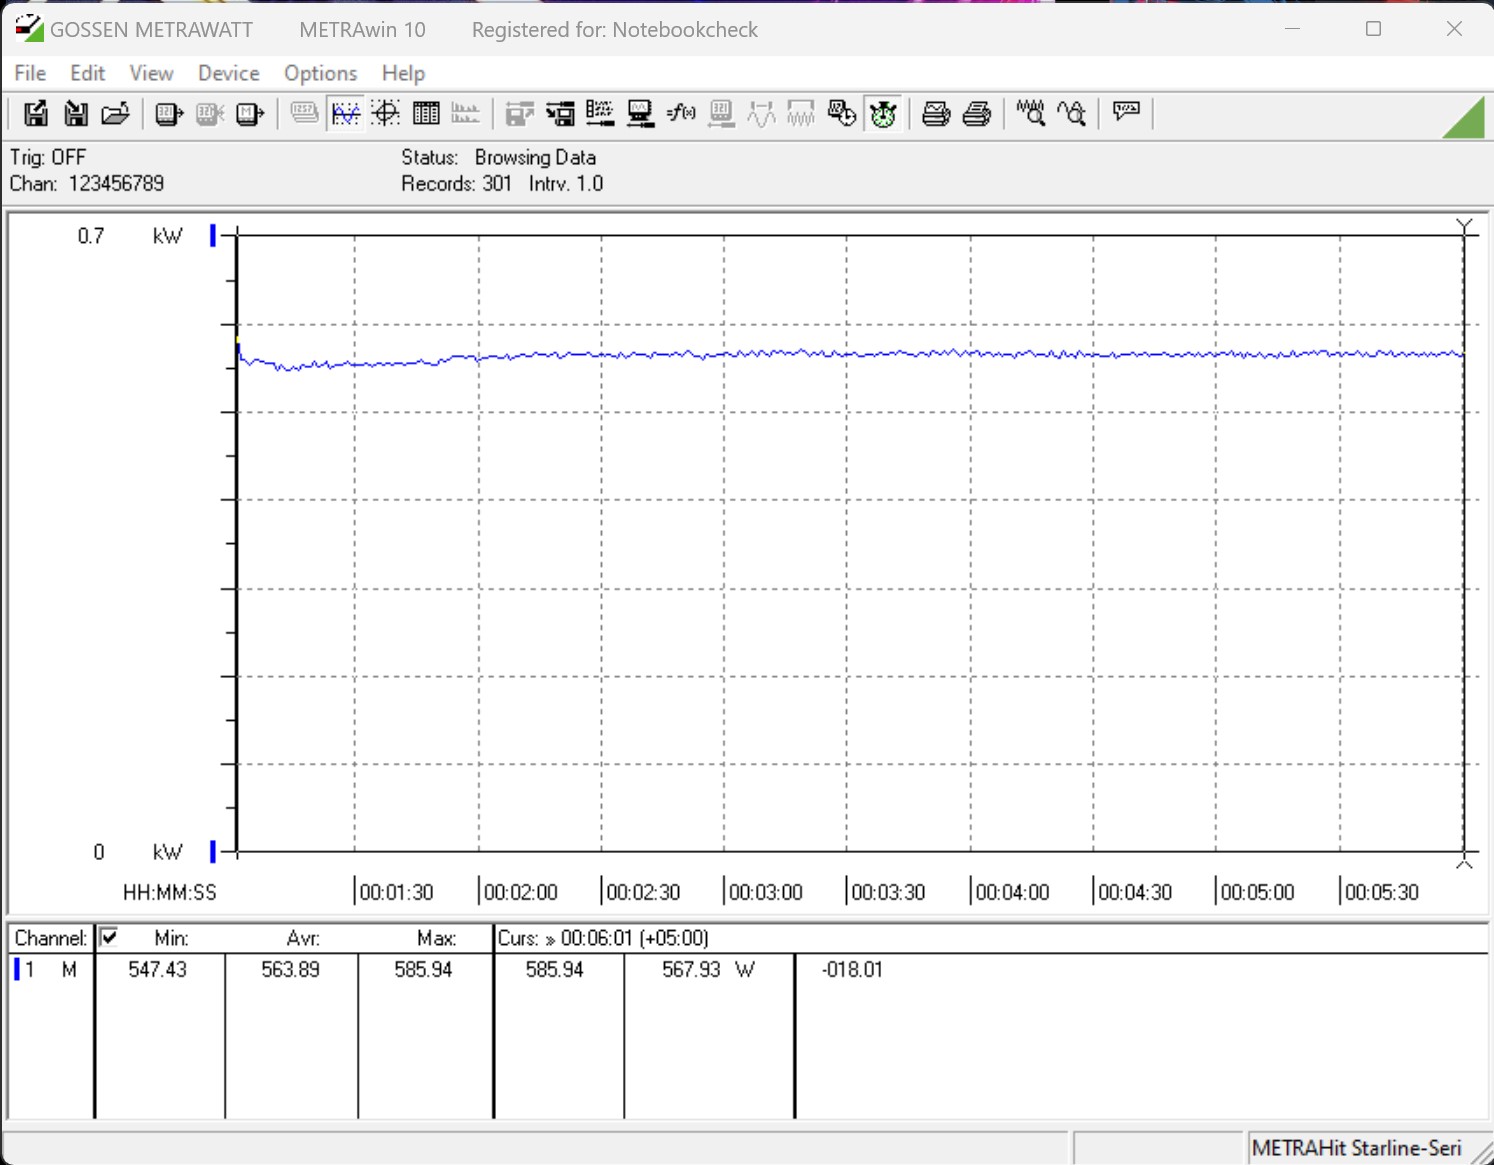
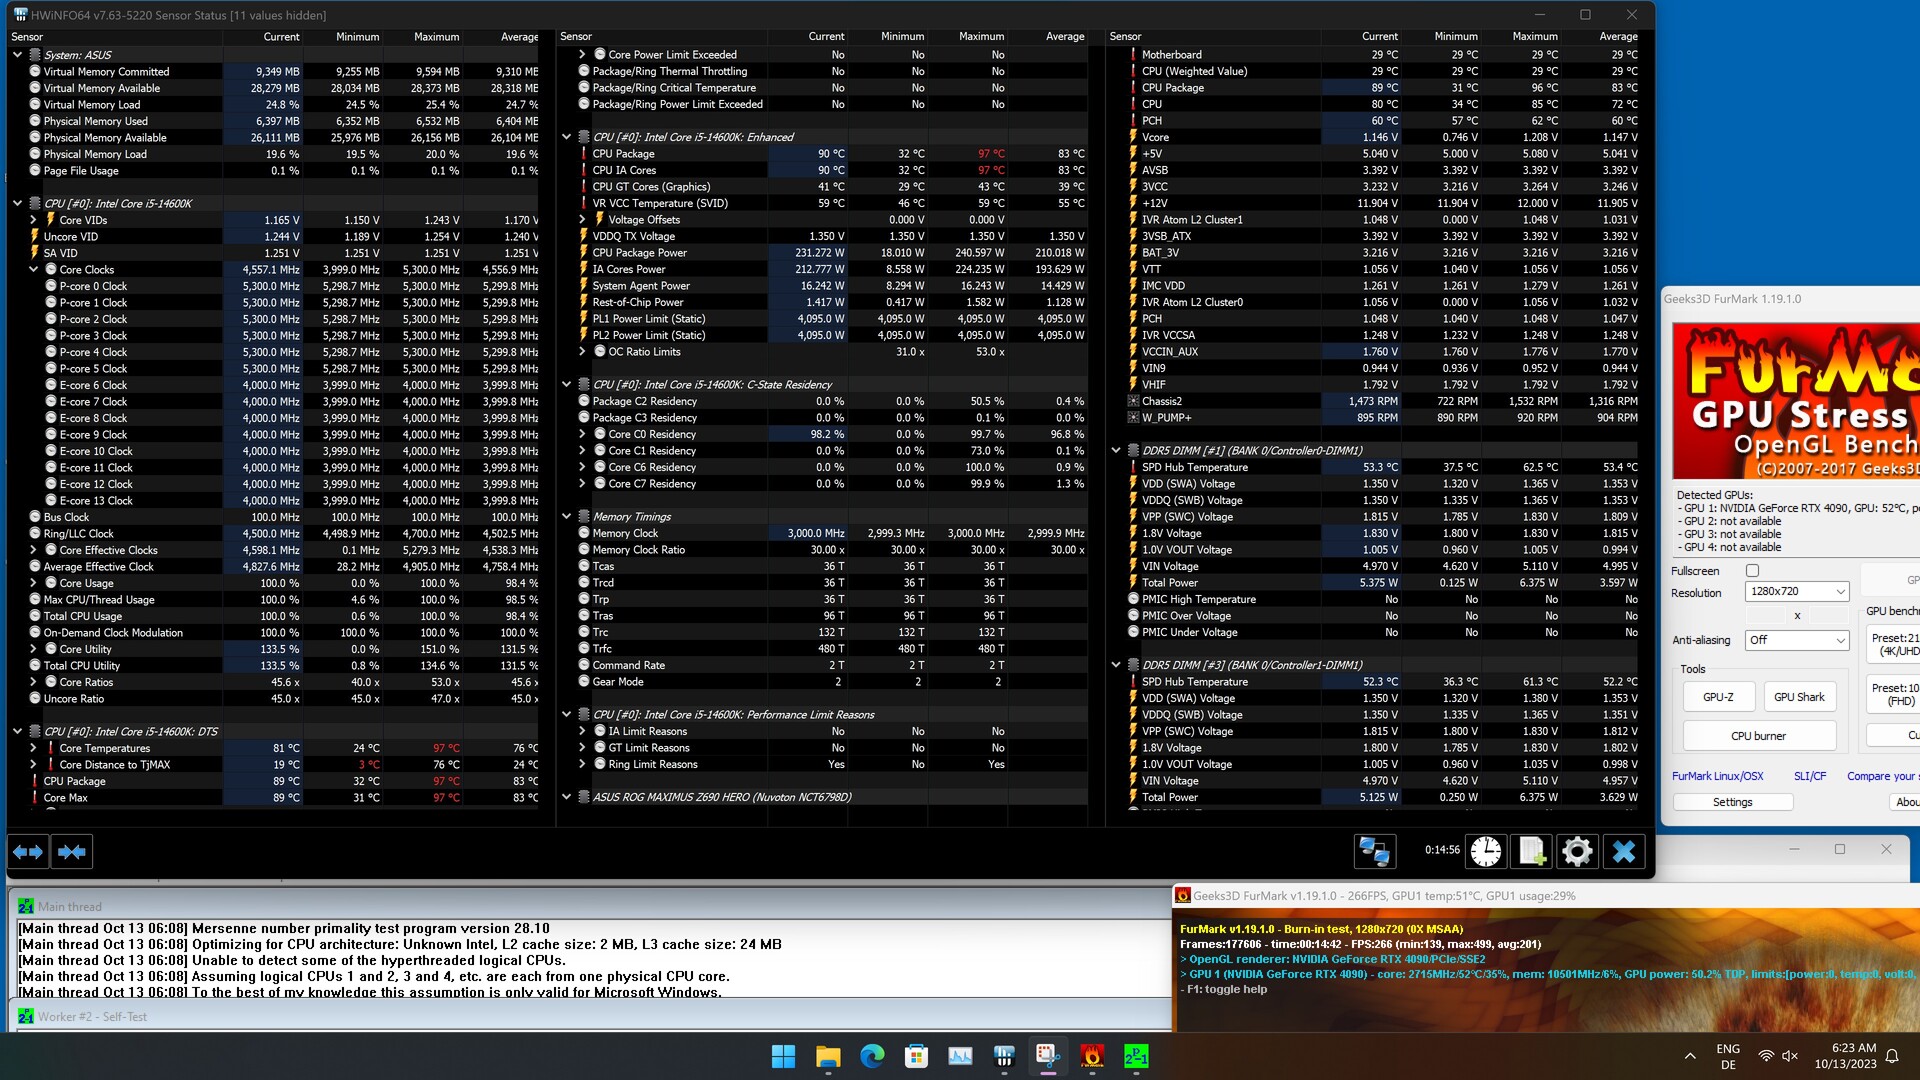
Energiebedarf
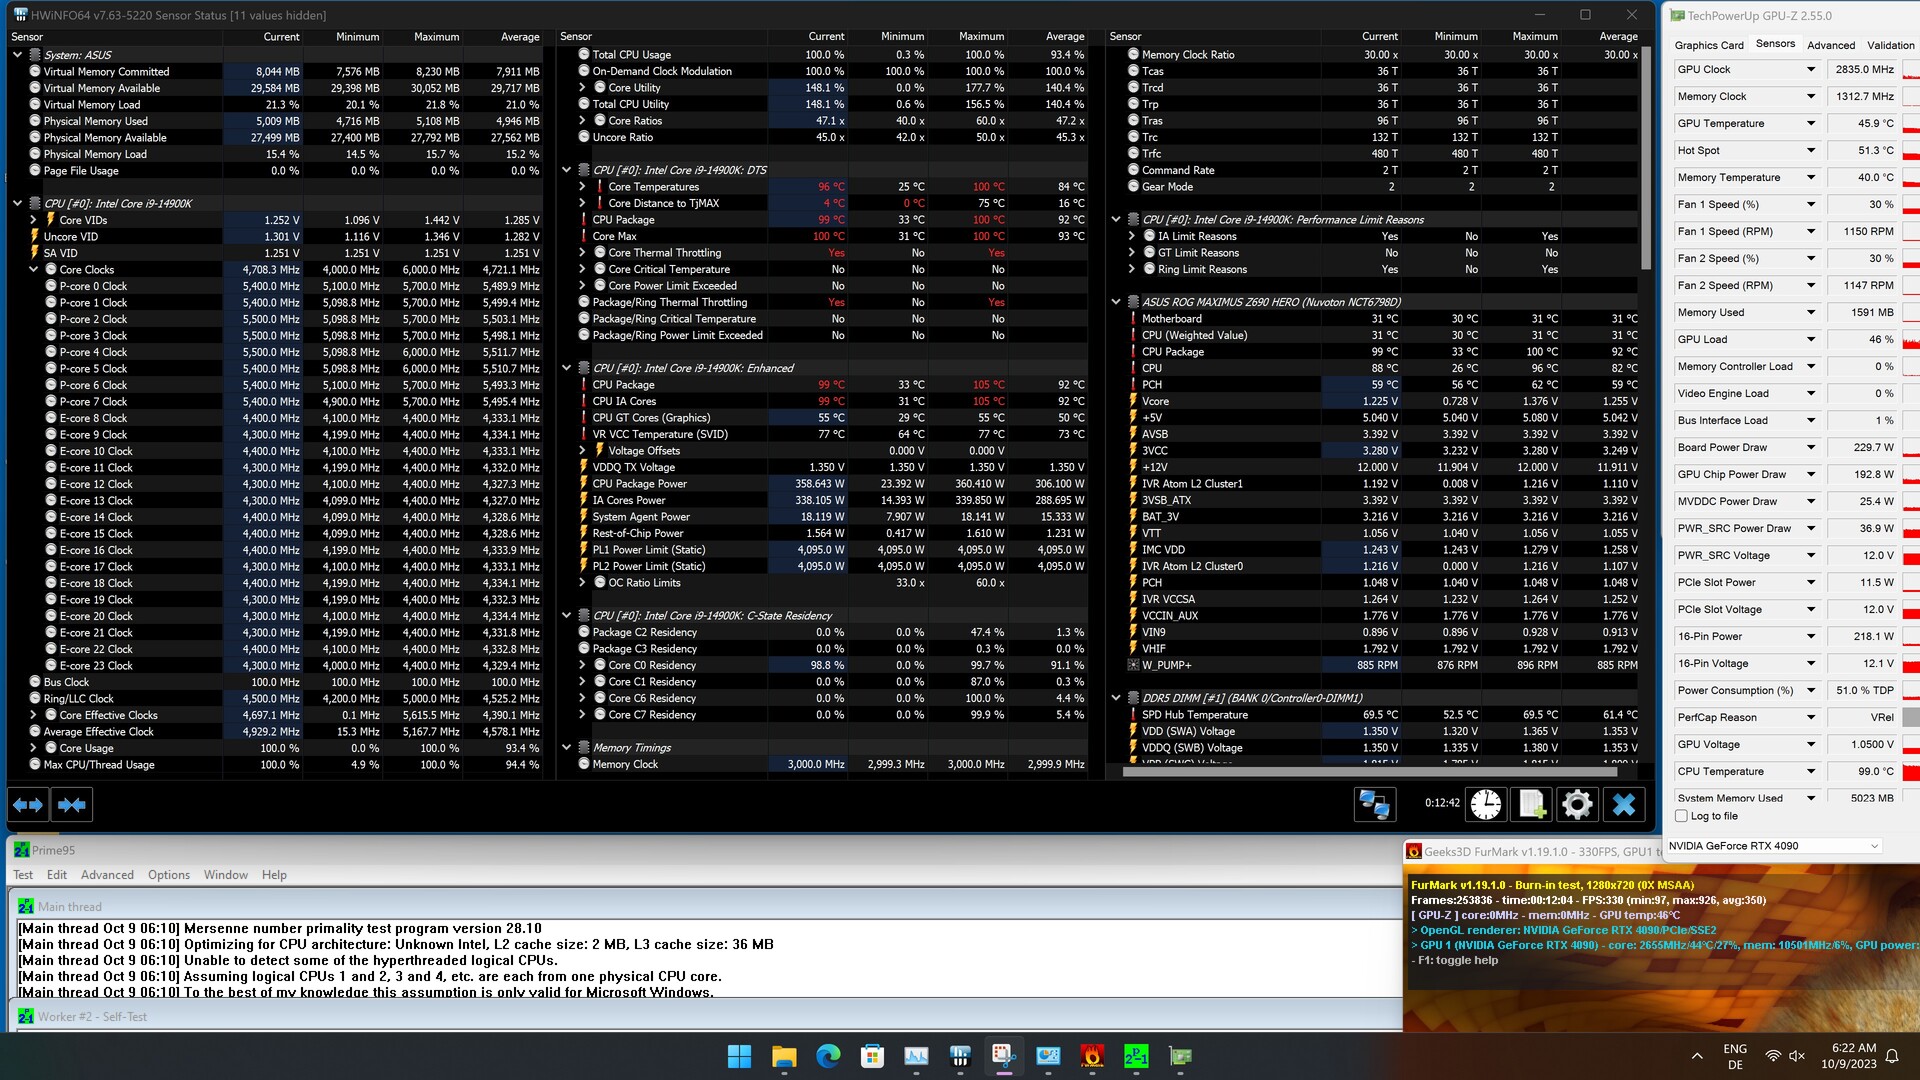
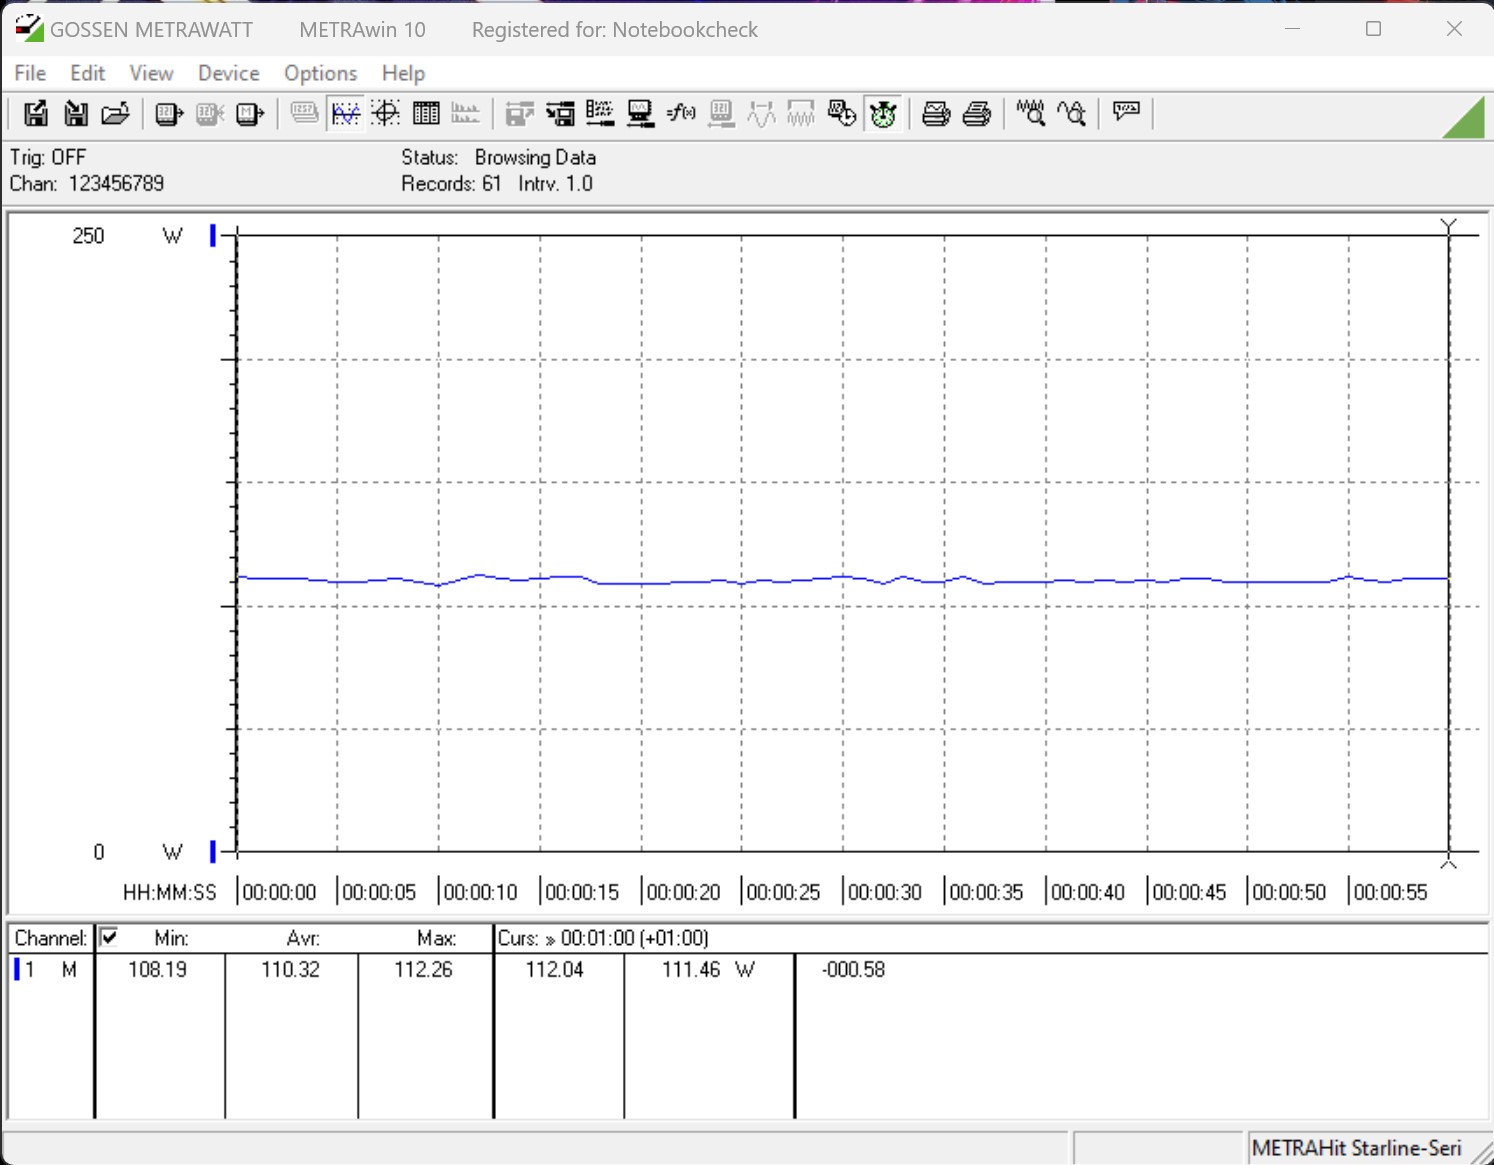
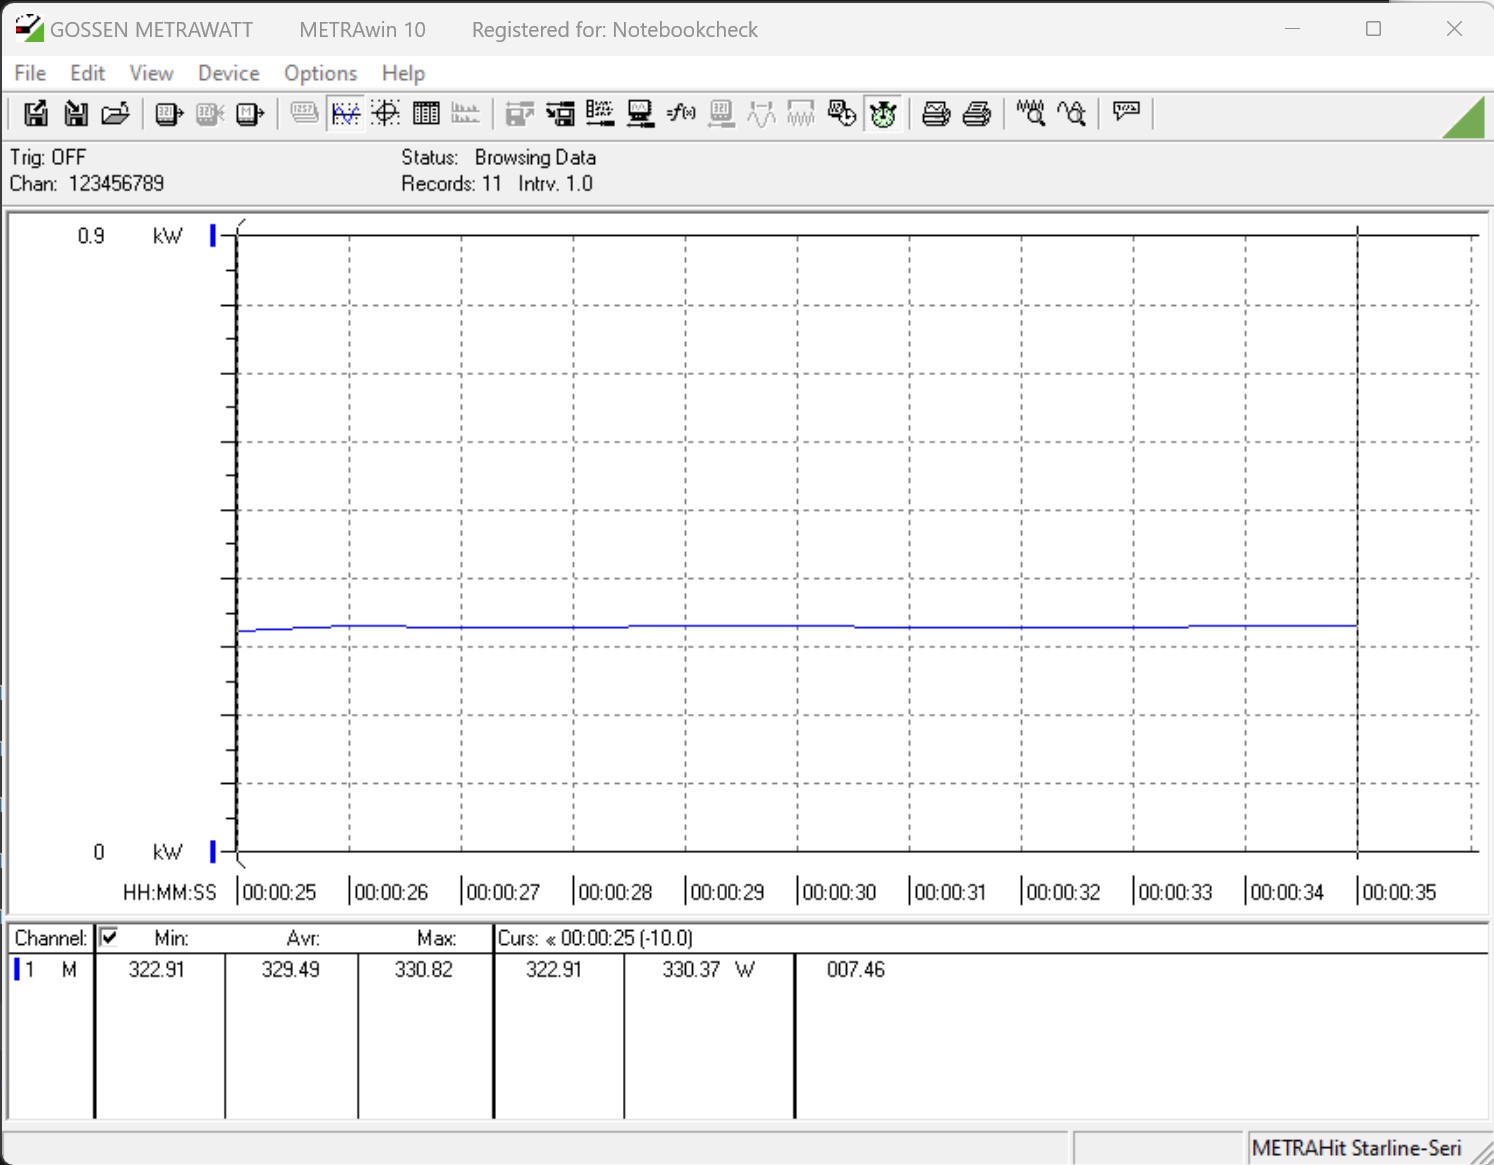
Gemäß den technischen Daten des Herstellers sehen wir bei den Spezifikationen hinsichtlich des Energiebedarfes keine Änderungen: Die PL1-Grenze beträgt noch immer 125 Watt, wenngleich der PL2-Wert bei 253 Watt beim Core i9-14900K liegt. Beim Intel Core i5-14600K gibt der Hersteller weiterhin die 181 Watt als PL2-Limit an. Wie bereits angesprochen, haben wir alle Tests mit offenem Power-Limit durchgeführt. Im Umkehrschluss bedeutet dies, dass nur noch das Temperatur-Limit die CPU einbremsen kann. Somit ist es auch nicht verwunderlich, dass wir bei unseren Stresstests immer wieder die 100-°C-Marke knacken. Das konnten wir bereits bei der Cinebench Schleife beobachten. Beim Strombedarf sehen wir einen Maximalwert von 360 Watt beim Core i9-14900K und 240 Watt beim Core i5-14600K. Aufgrund der leistungsstarken Wasserkühlung steigt die Leistungsaufnahme drastisch an.
Vergleichen wir die Werte einmal mit den AMD Systemen, so hat Intel hier noch sehr viel Nachholbedarf. Der ebenfalls energiehungrige AMD Ryzen 9 7950X ist mit 364 Watt deutlich sparsamer, und wenn wir uns das X3D-Pendant dazuholen, schaut es für Intel noch düsterer aus.
Unsere Empfehlung ist daher, das Power-Limit gemäß den Herstellerangaben bei maximal 253 Watt unter Dauerlast zu begrenzen. Allerdings sollte man dennoch auf eine leistungsstarke AiO-Kühllösung mit einem 360-Millimeter-Radiator setzen. Wer mit dem Gedanken spielt, sich den Intel Core i5-14600K zuzulegen, kann diesen dank der geringeren Leistungsaufnahme recht gut kontrollieren. Wer aber auch hier alle Limits entfernt, sollte ebenfalls auf eine 360er-AiO-Kühllösung setzen.
Intel Core i9-14900K
Intel Core i5-14600K
| Power Consumption / Cinebench R15 Multi (external Monitor) | |
| Intel Core i9-14900K | |
| Intel Core i9-13900K | |
| AMD Ryzen 9 7950X (Idle: 95.2 W) | |
| Intel Core i7-13700K | |
| Intel Core i5-14600K | |
| Intel Core i5-13600K | |
| Intel Core i7-12700 | |
| AMD Ryzen 9 7950X3D | |
| AMD Ryzen 7 7800X3D | |
| Intel Core i5-13400 | |
| Intel Core i5-12400F | |
| Power Consumption / Prime95 V2810 Stress (external Monitor) | |
| Intel Core i9-14900K | |
| Intel Core i9-13900K | |
| Intel Core i5-14600K | |
| Intel Core i7-13700K | |
| Intel Core i5-13600K | |
| AMD Ryzen 9 7950X (Idle: 95.2 W) | |
| Intel Core i7-12700 | |
| AMD Ryzen 9 7950X3D | |
| Intel Core i5-12400F | |
| Intel Core i5-13400 | |
| AMD Ryzen 7 7800X3D | |
| Power Consumption / Cinebench R23 Multi (external Monitor) | |
| Intel Core i9-14900K | |
| AMD Ryzen 9 7950X (95.2) | |
| Intel Core i5-14600K | |
| AMD Ryzen 9 7950X3D | |
| AMD Ryzen 7 7800X3D | |
| Power Consumption / Cinebench R23 Single (external Monitor) | |
| AMD Ryzen 7 7800X3D | |
| AMD Ryzen 9 7950X (95.2) | |
| Intel Core i9-14900K | |
| Intel Core i5-14600K | |
* ... kleinere Werte sind besser
| Power Consumption / The Witcher 3 ultra (external Monitor) | |
| Intel Core i5-14600K | |
| Intel Core i9-14900K | |
| Intel Core i7-13700 | |
| Intel Core i7-13700K | |
| AMD Ryzen 9 7950X | |
| AMD Ryzen 9 7950X3D | |
| Intel Core i9-13900K | |
| Intel Core i7-12700 | |
| Intel Core i5-13400 | |
| AMD Ryzen 7 7800X3D | |
| Intel Core i5-12400F | |
* ... kleinere Werte sind besser
Energieaufnahme mit externem Monitor
Pro
Contra
Fazit - Mehr Leistung, aber auch mehr Energiebedarf
Intels Neuauflage der Raptor-Lake-Serie konnte die Leistung nochmals leicht erhöhen. Allerdings fallen die Leistungssprünge im Vergleich zur 13. Generation relativ gering aus. Im Großen und Ganzen bekommt man mit dem Intel Core i9-14900K einen richtig schnellen Prozessor, welcher als Multitalent in allen Bereichen punkten kann. Multi-Thread-Aufgaben meistert das neue High-End-Modell ebenso wie Single-Core-Aufgaben, und mit den 6 GHz im Boost profitieren auch Spiele von der Leistung. Als größten Nachteil sehen wir allerdings die Leistungsaufnahme: Sicherlich liegt die hohe Leistungsaufnahme im Alltag nicht ständig an, und auch Spiele erfordern nicht die volle Leistung der CPU. AMD ist hier eindeutig besser aufgestellt und zeigt mit seinen X3D-Prozessoren, dass es auch deutlich besser gehen kann.
Die Neuauflage der Intel-Raptor-Lake-Prozessoren sind zweifelsohne gute Alleskönner. Die Effizienzkrone kann der Intel Core i9-14900K allerdings nicht aufsetzen.
Mit mehr Takt und einem höheren Stromverbrauch erkämpft sich Intel diesen Stand hart. Mit 253 Watt erhöht Intel die Leistungsgrenze glücklicherweise nicht noch weiter. Beim kleineren Intel Core i5-14600K sind es immerhin noch 181 Watt unter Volllast. Das erfordert zudem eine optimale Kühlung, um die Leistung auch abrufen zu können. Damit einher sind auch höhere Kosten verbunden, denn die 162 Watt des AMD Ryzen 9 7950X3D lassen sich deutlich einfacher kontrollieren als die 253 Watt beim Intel Core i9-14900K.
Die Kompatibilität zu den bereits im Umlauf befindlichen Sockel-1700-Mainboards begrüßen wir. Ob das nun so gewollt war, oder rein aus der Not geboren wurde, wissen wir nicht genau, denn in der Vergangenheit wechselte Intel nach zwei CPU-Generationen den Sockel. Erst mit der kommenden CPU-Generation wird Intel auf den Sockel 1851 setzen und mit Arrow-Lake weitere Neuerungen einführen. Bleibt nur zu hoffen, dass sich Intel von AMD inspirieren lässt und ebenfalls eine Art 3D-Cache verbaut sowie das Thema Effizienz deutlich verbessert.
Transparenz
Die Auswahl der zu testenden Geräte erfolgt innerhalb der Redaktion. Das vorliegende Testmuster wurde dem Autor vom Hersteller unentgeltlich zu Testzwecken überlassen. Eine Einflussnahme auf den Testbericht gab es nicht, der Hersteller erhielt keine Version des Reviews vor der Veröffentlichung. Es bestand keine Verpflichtung zur Publikation. Als eigenständiges, unabhängiges Unternehmen unterliegt Notebookcheck keiner Diktion von Herstellern, Shops und Verlagen.
So testet Notebookcheck
Pro Jahr werden von Notebookcheck hunderte Laptops und Smartphones unabhängig in von uns standardisierten technischen Verfahren getestet, um eine Vergleichbarkeit aller Testergebnisse zu gewährleisten. Seit rund 20 Jahren entwickeln wir diese Testmethoden kontinuierlich weiter und setzen damit Branchenstandards. In unseren Testlaboren kommt ausschließlich hochwertiges Messequipment in die Hände erfahrener Techniker und Redakteure. Die Tests unterliegen einer mehrstufigen Kontrolle. Unsere komplexe Gesamtbewertung basiert auf hunderten fundierten Messergebnissen und Benchmarks, womit Ihnen Objektivität garantiert ist. Weitere Informationen zu unseren Testmethoden gibt es hier.
