XMG SECTOR High-End-Desktop-PC mit Intel Core i9-13900K und Nvidia GeForce RTX 4090 im Test

Schenker ist vielen ein Begriff, wenn es um leistungsstarke Laptops geht. Der Namenszusatz XMG
verweist dabei auf High-End-Gaming-Geräte, welche inzwischen auch als Desktop-PCs erhältlich sind. In diesem Review widmen wir uns dem XMG Sector auf Intel Basis. Der PC ist in der Basiskonfiguration mit einem Intel Core i5-12400F, 16-GB-RAM und einer Nvidia GeForce RTX 3060 ausgestattet und startet bei einem Kaufpreis von 1.239 Euro. Unsere High-End-Testkonfiguration auf Basis des Intel Core i9-13900K und einer Nvidia GeForce RTX 4090 schlägt allerdings mit 4.700 Euro stark zu Buche. Aufgrund der vielen Möglichkeiten, die der Shop bietet, lässt sich das Gerät mit verschiedenen Hardware-Komponenten ausstatten. Jeder kann sich ein System zusammenstellen, das auf seine Bedürfnisse zugeschnitten ist.
XMG Sector - Intel im Detail
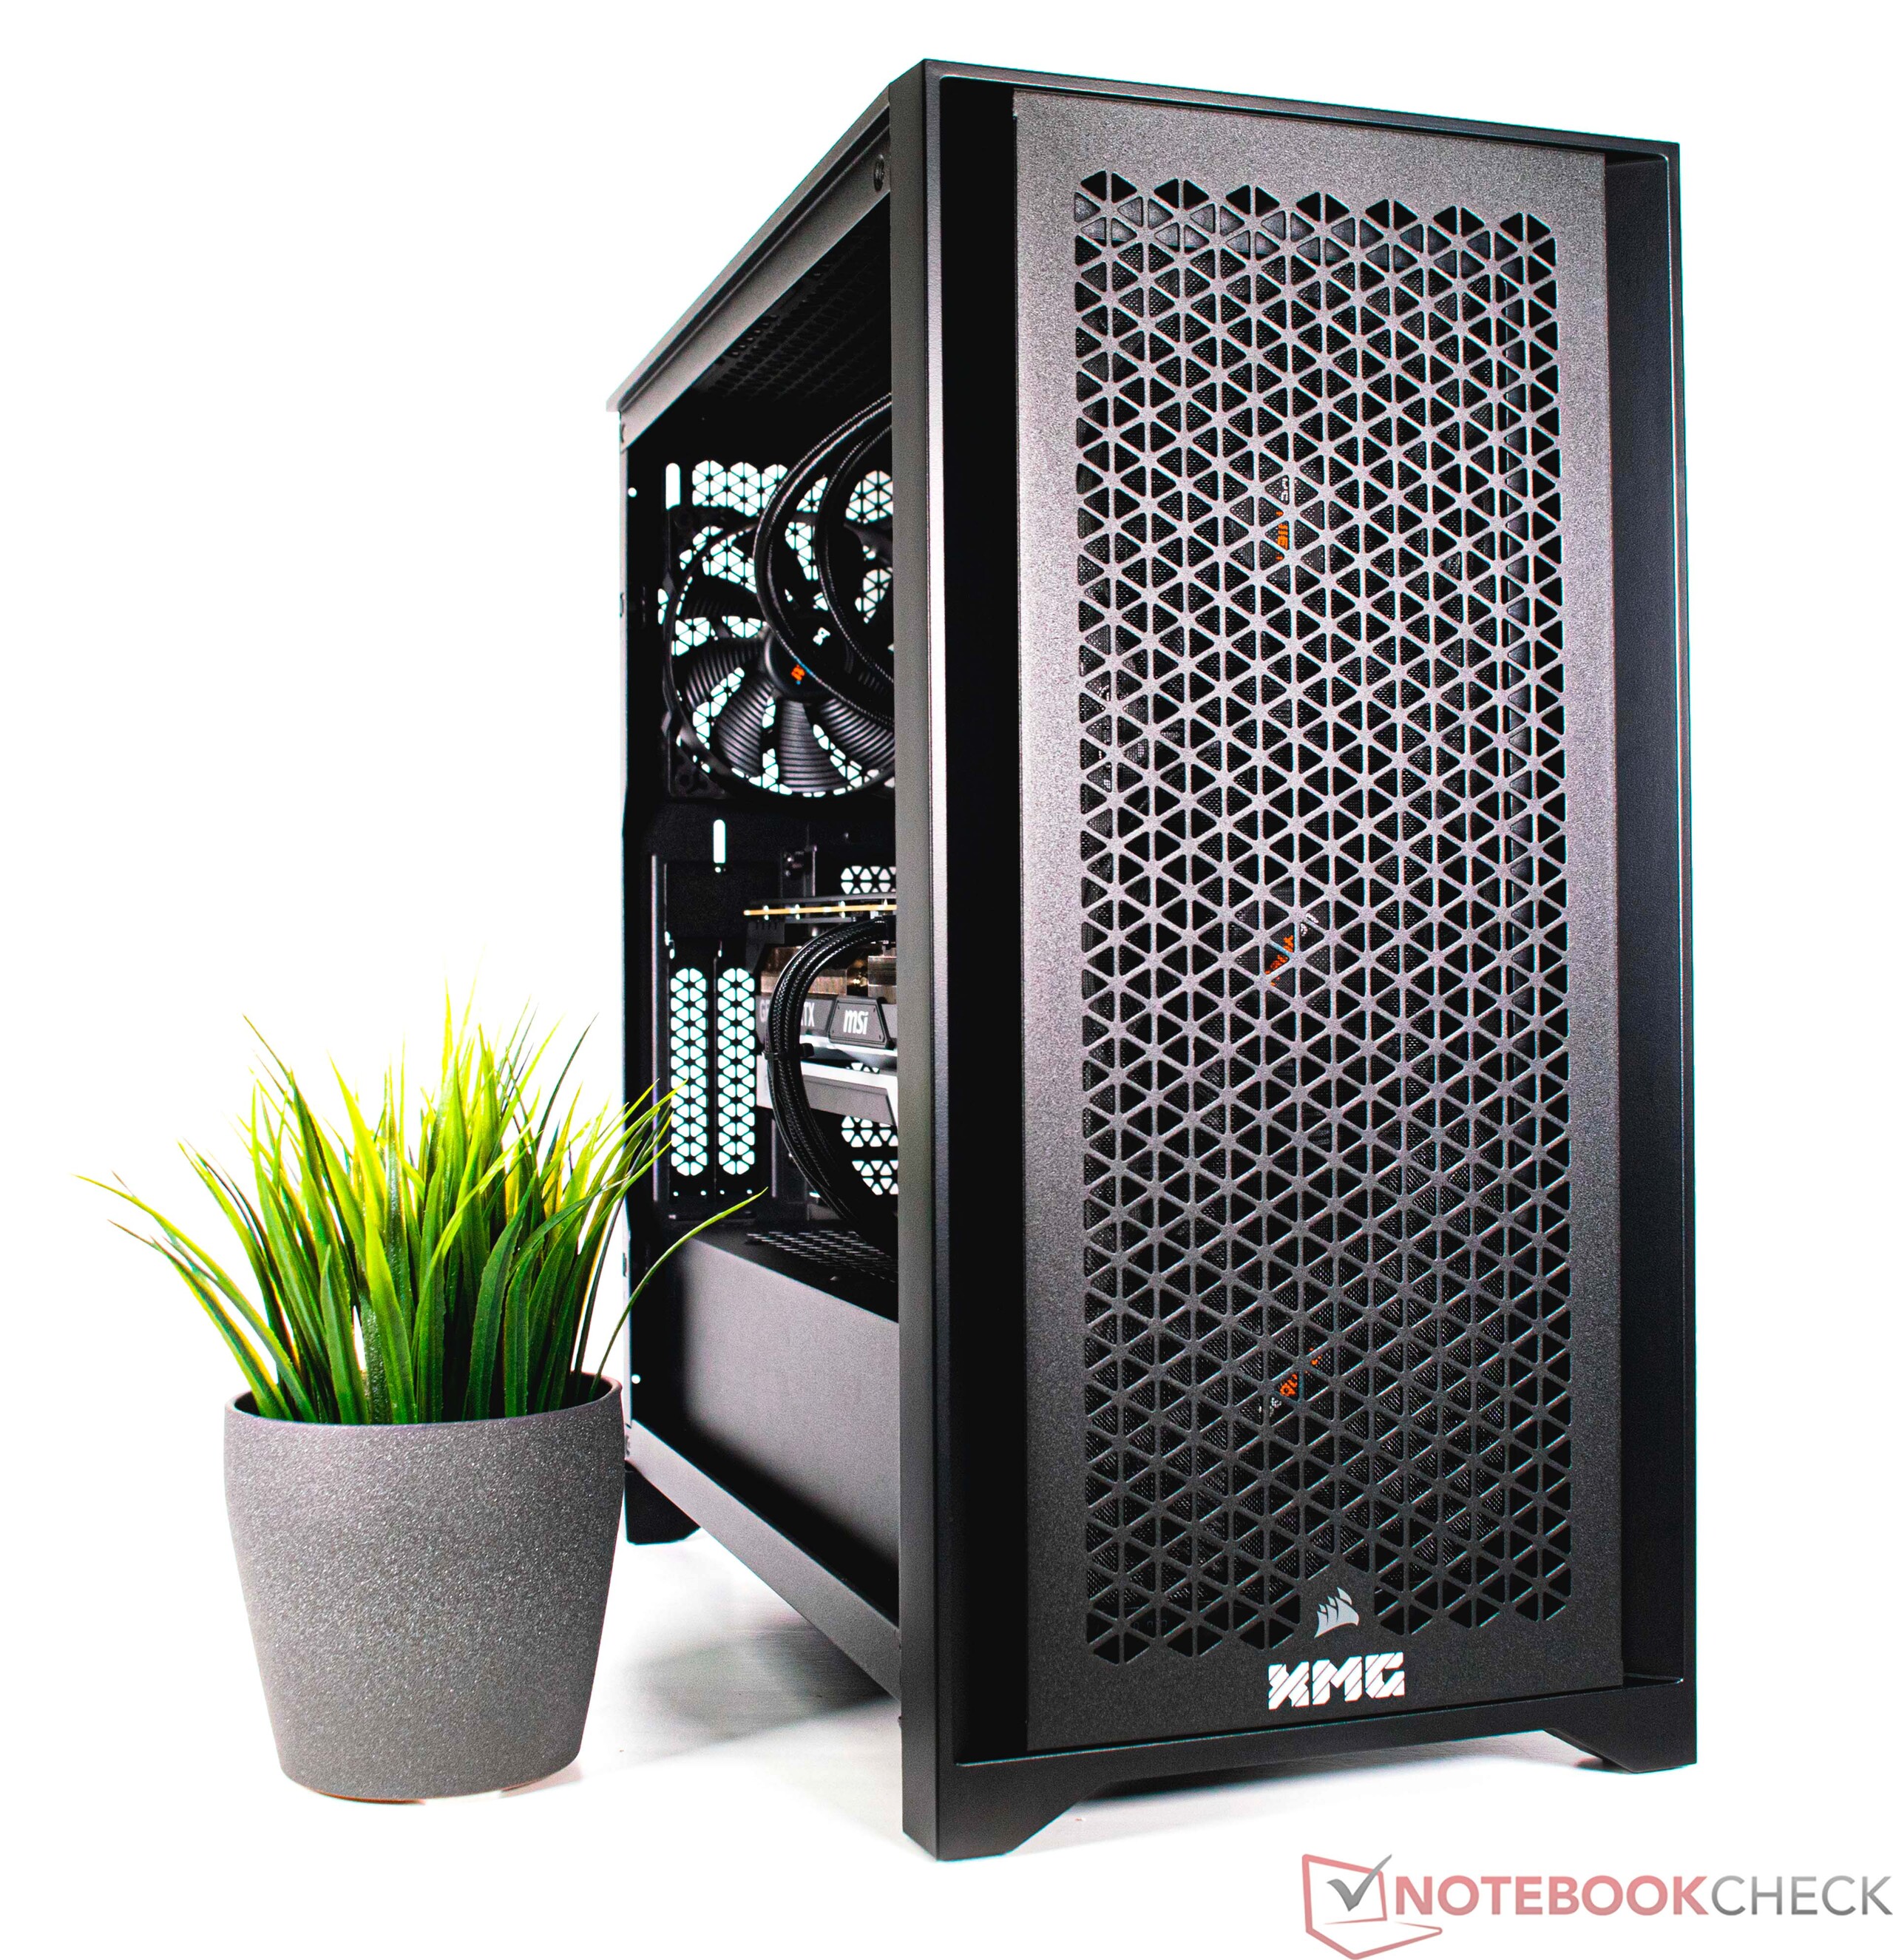
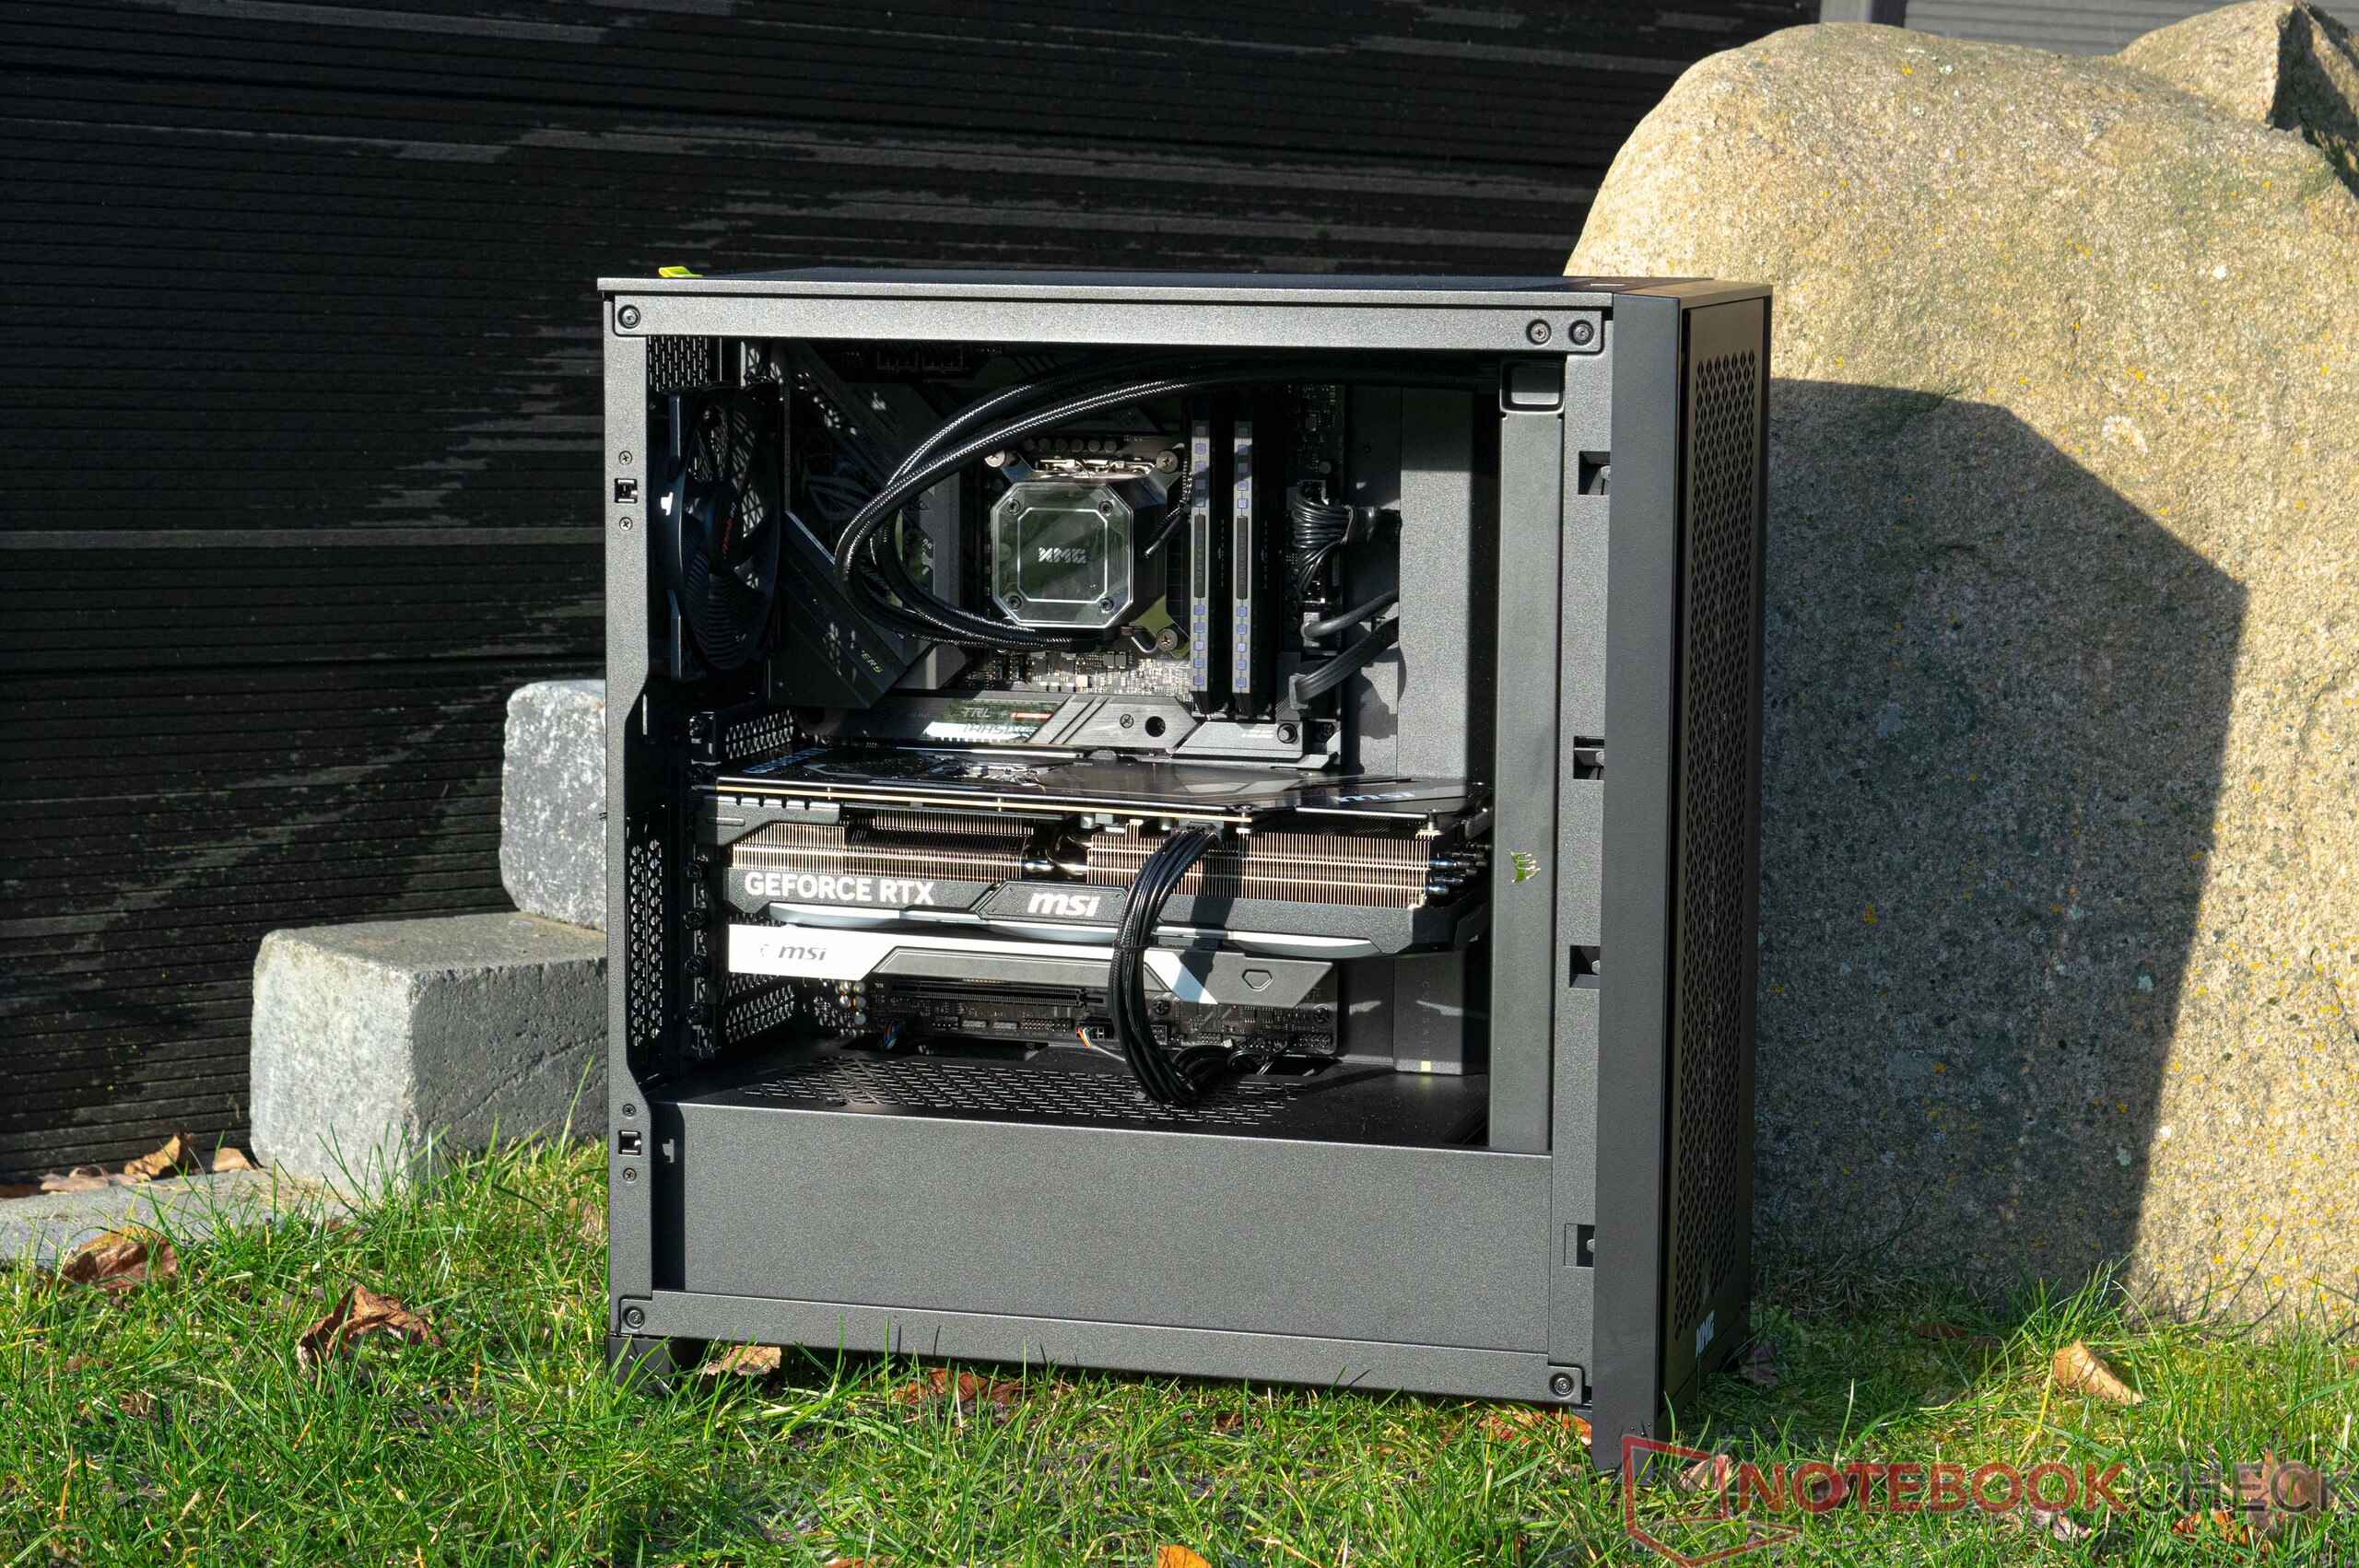
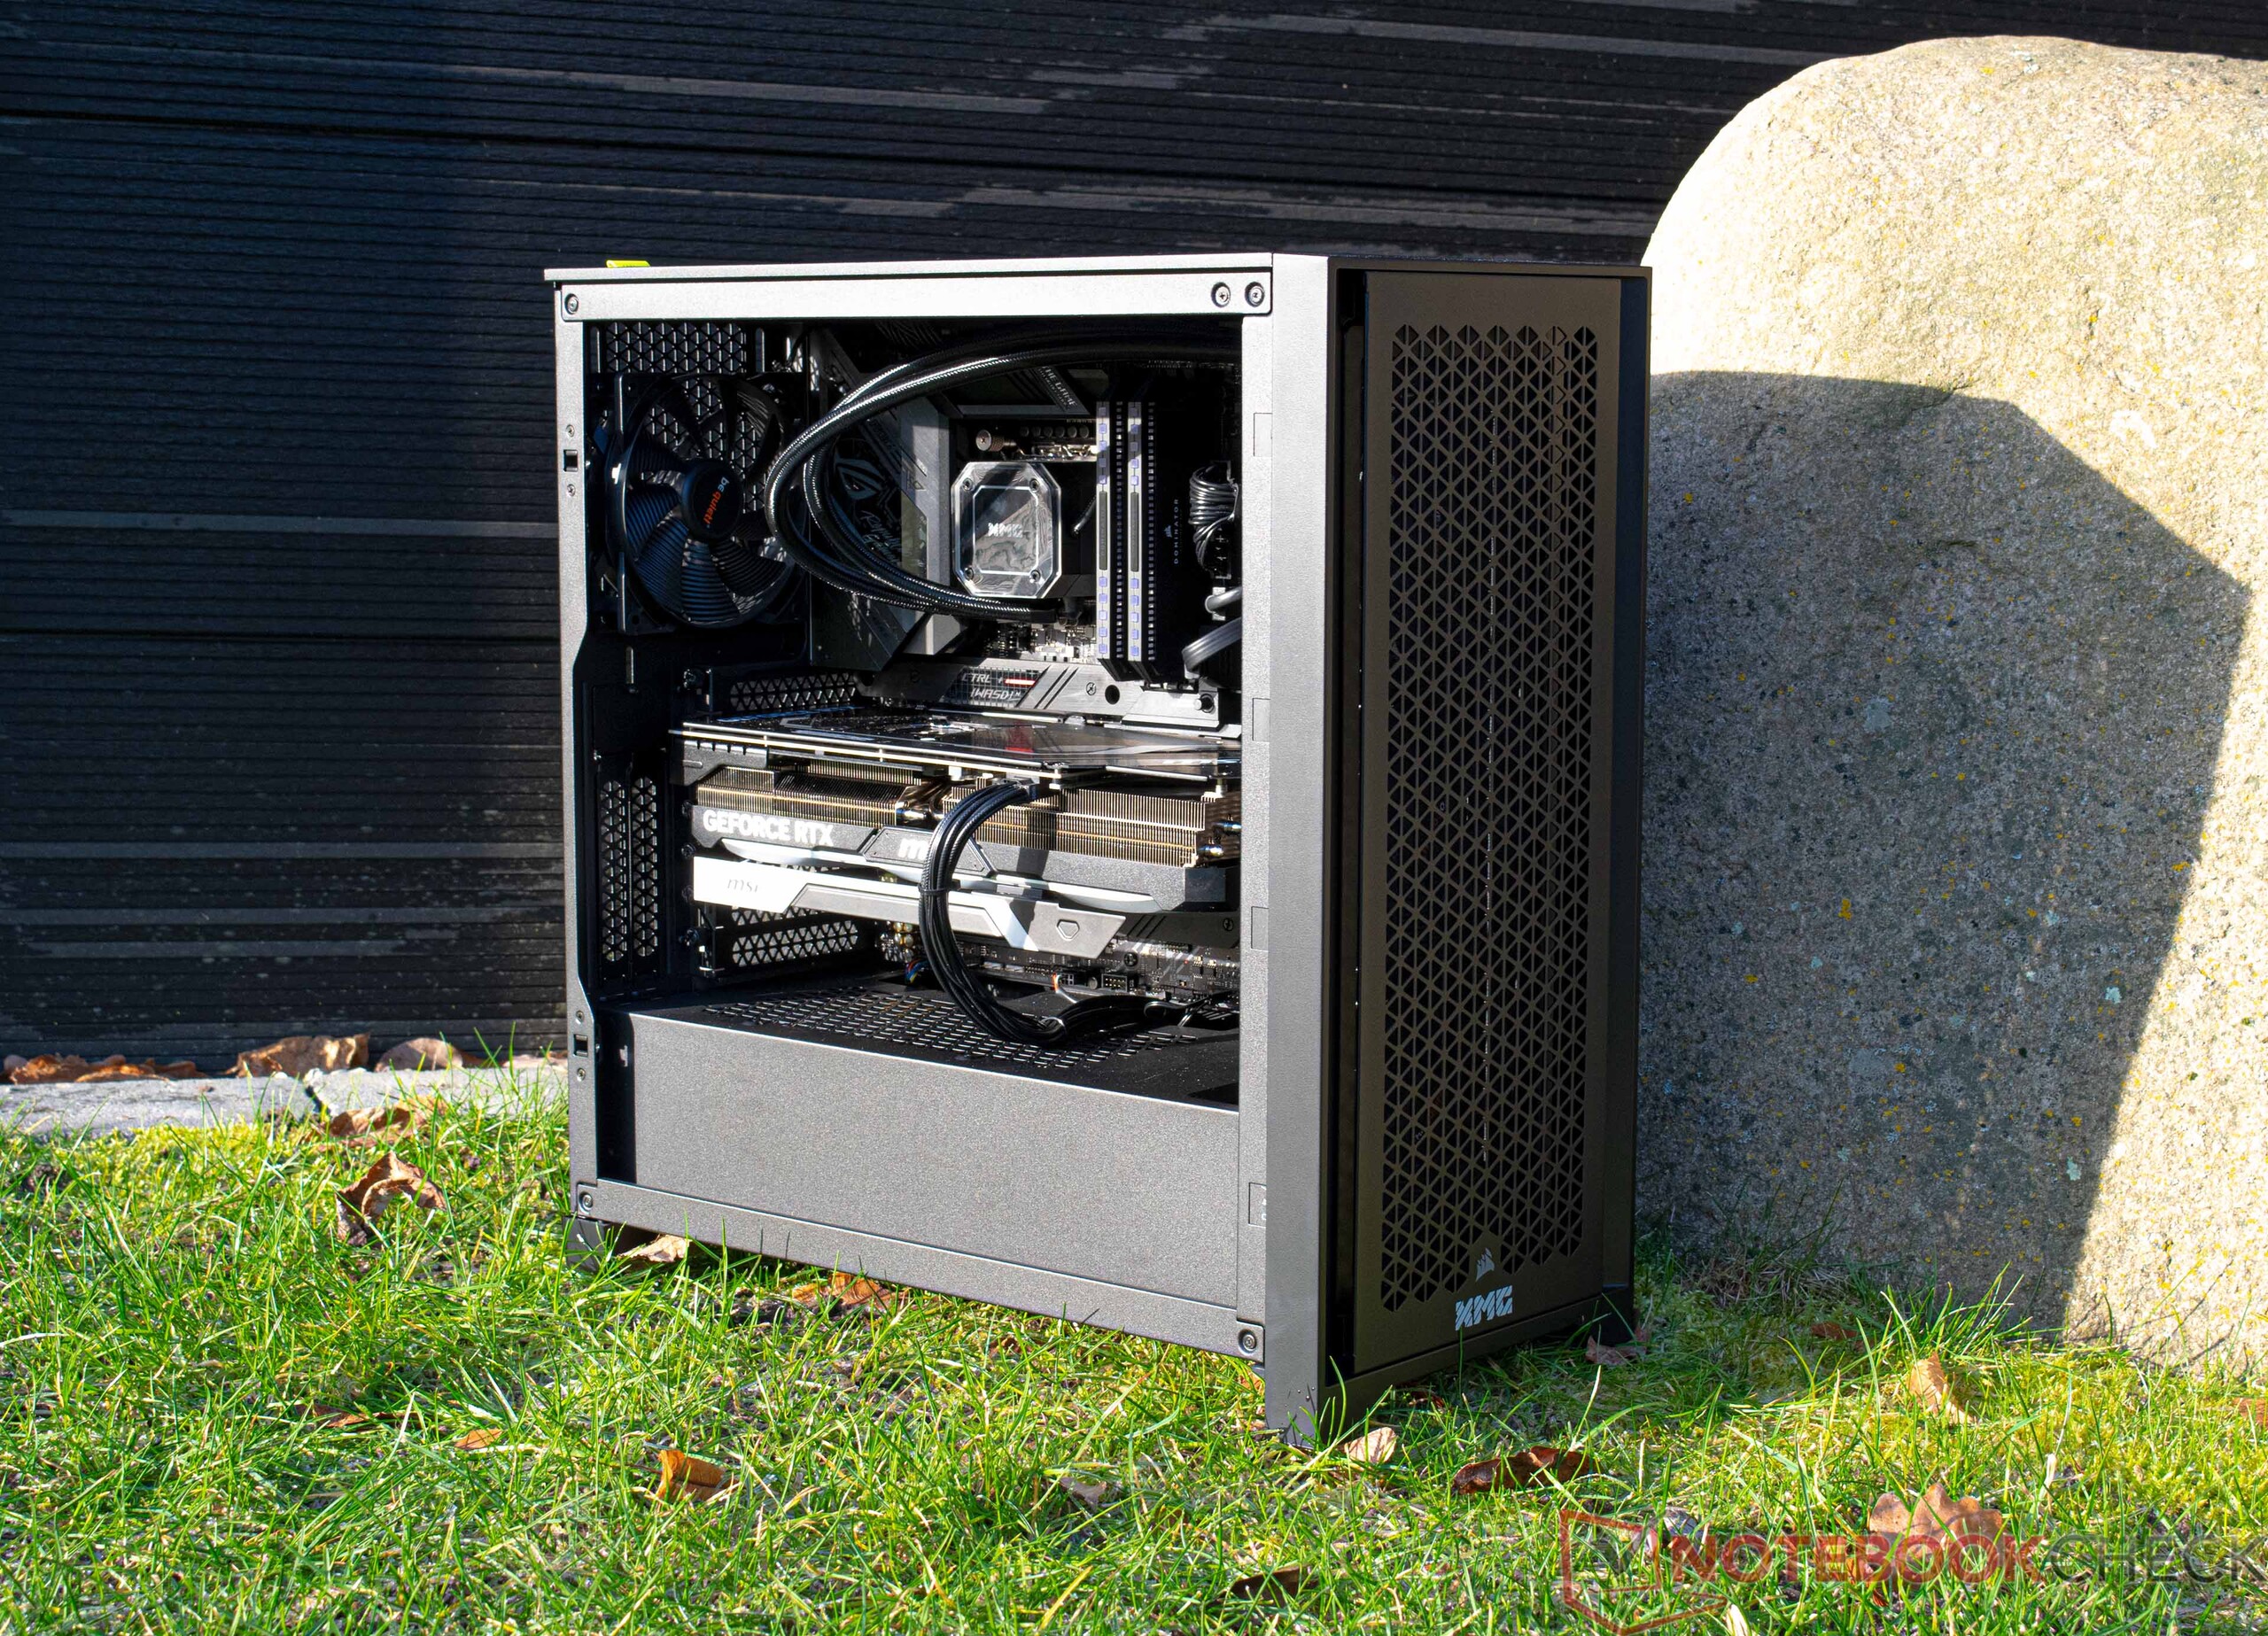
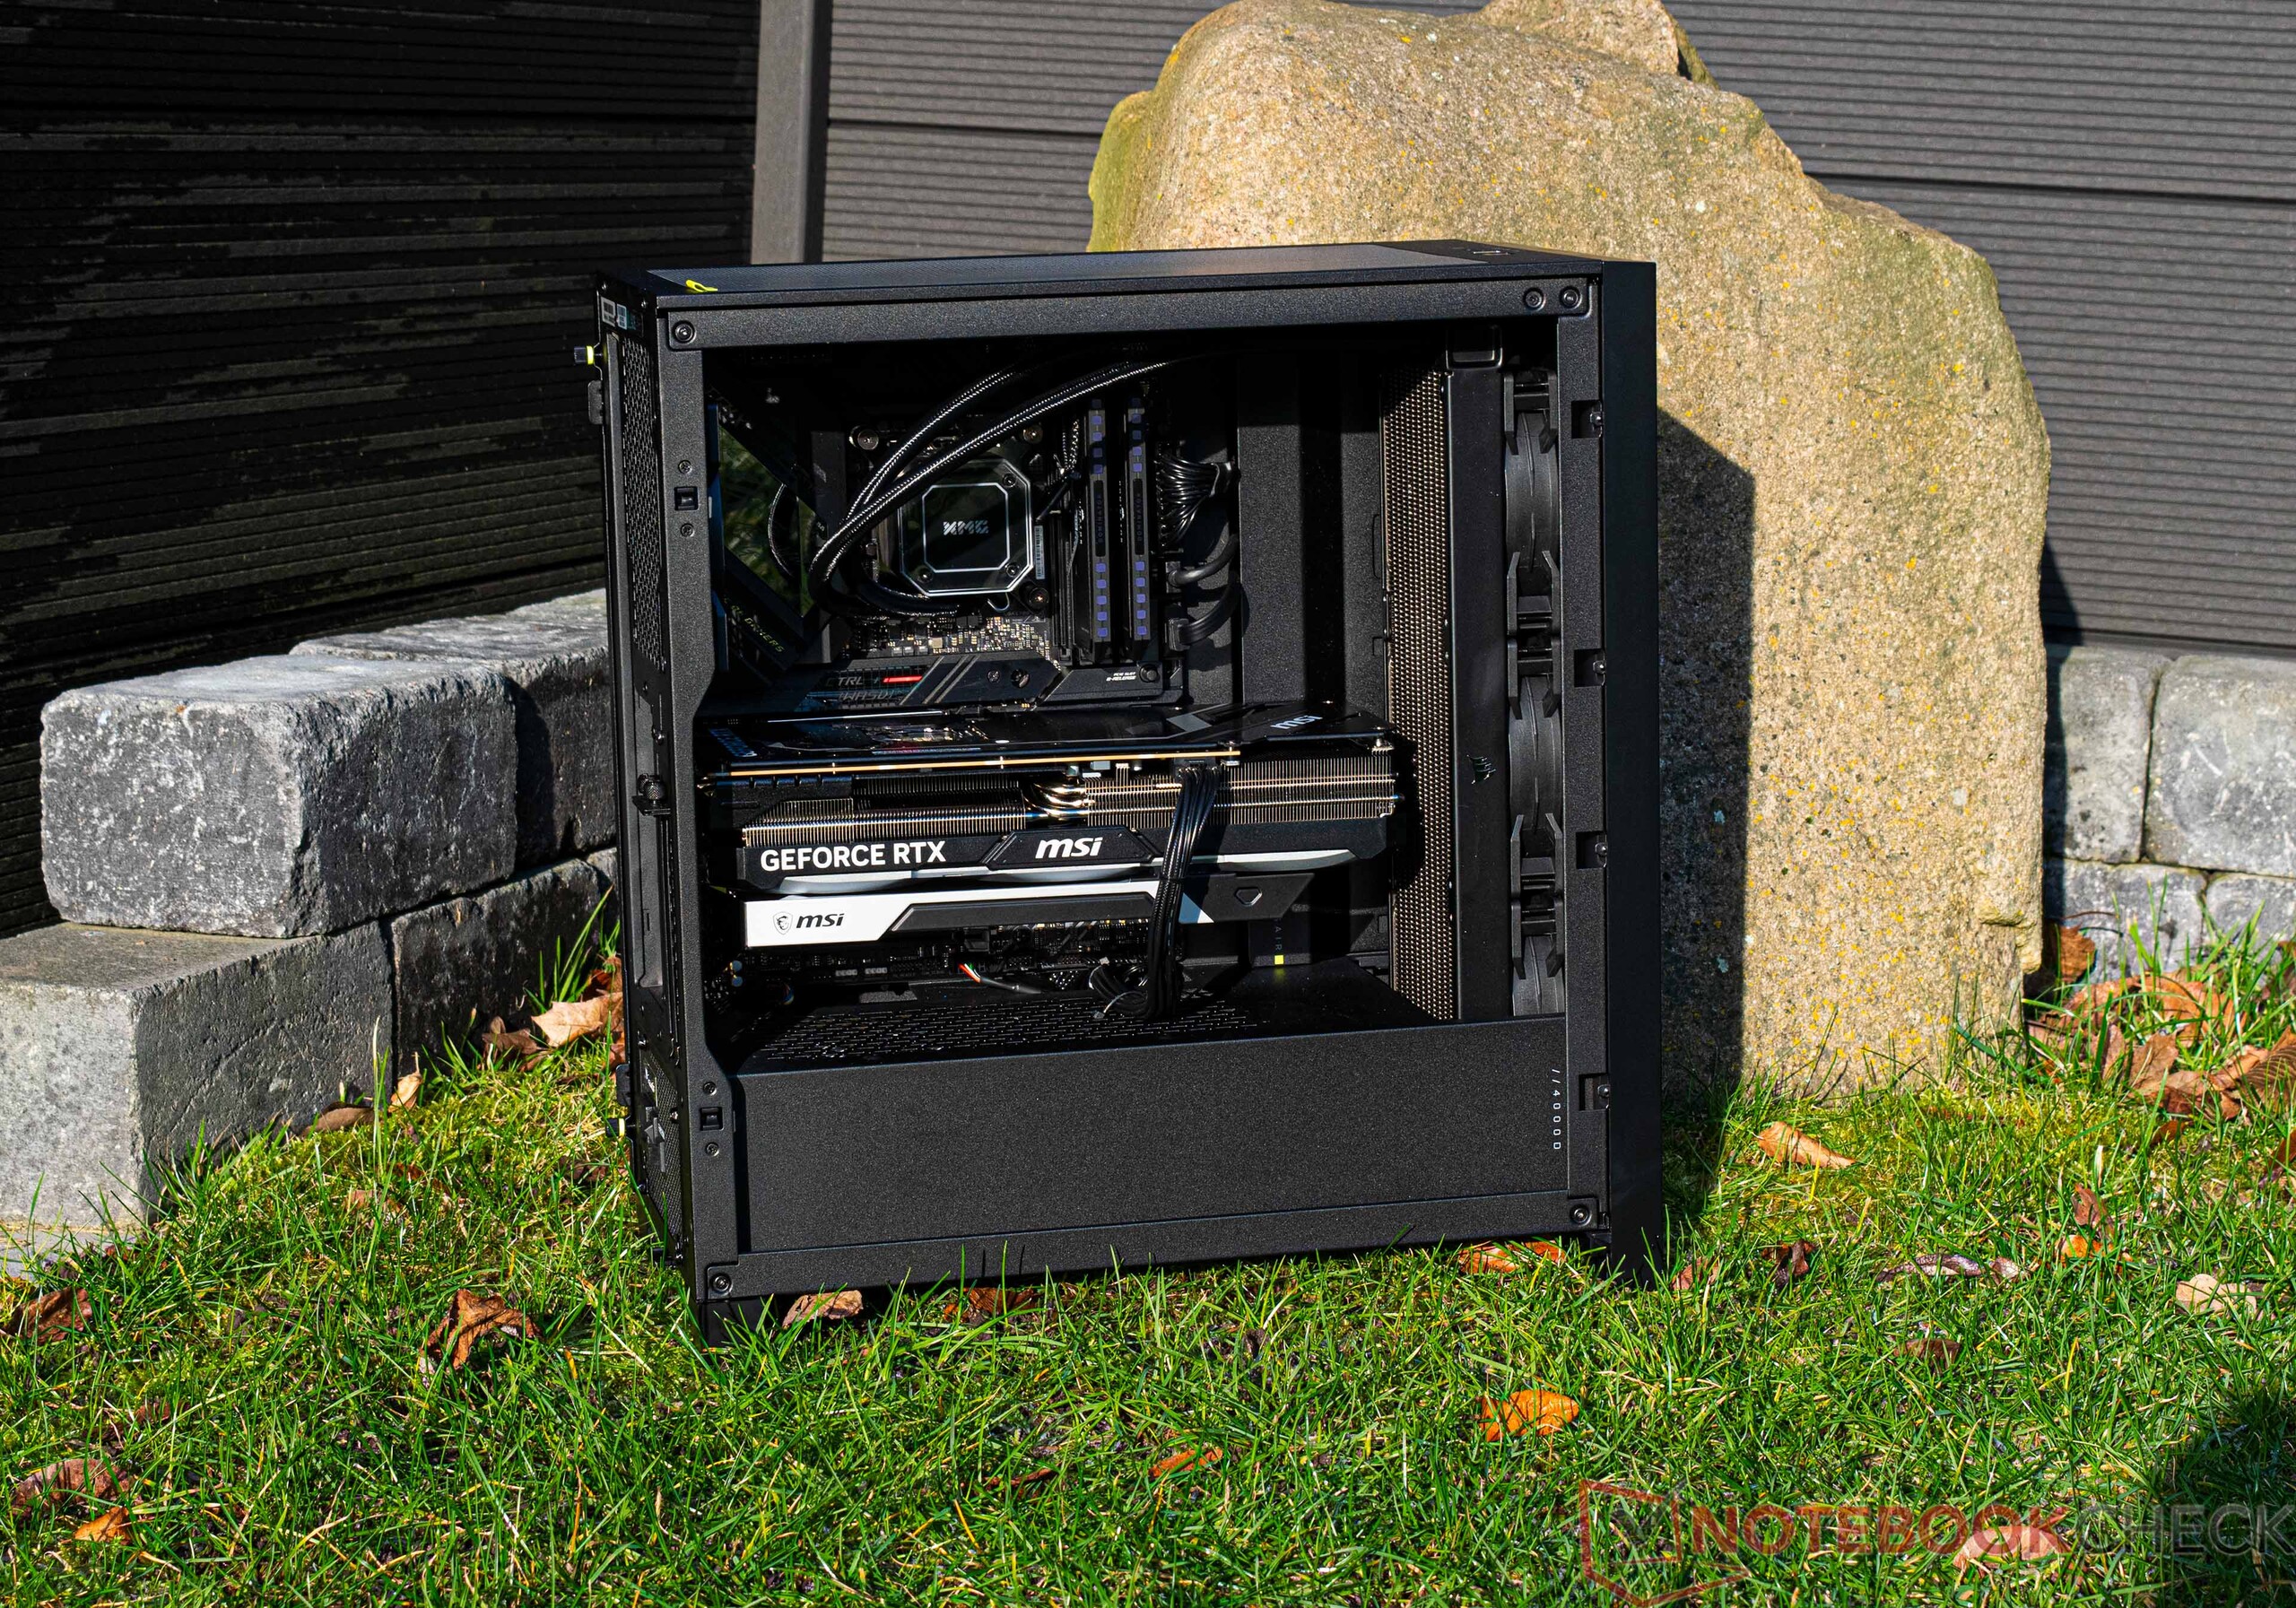
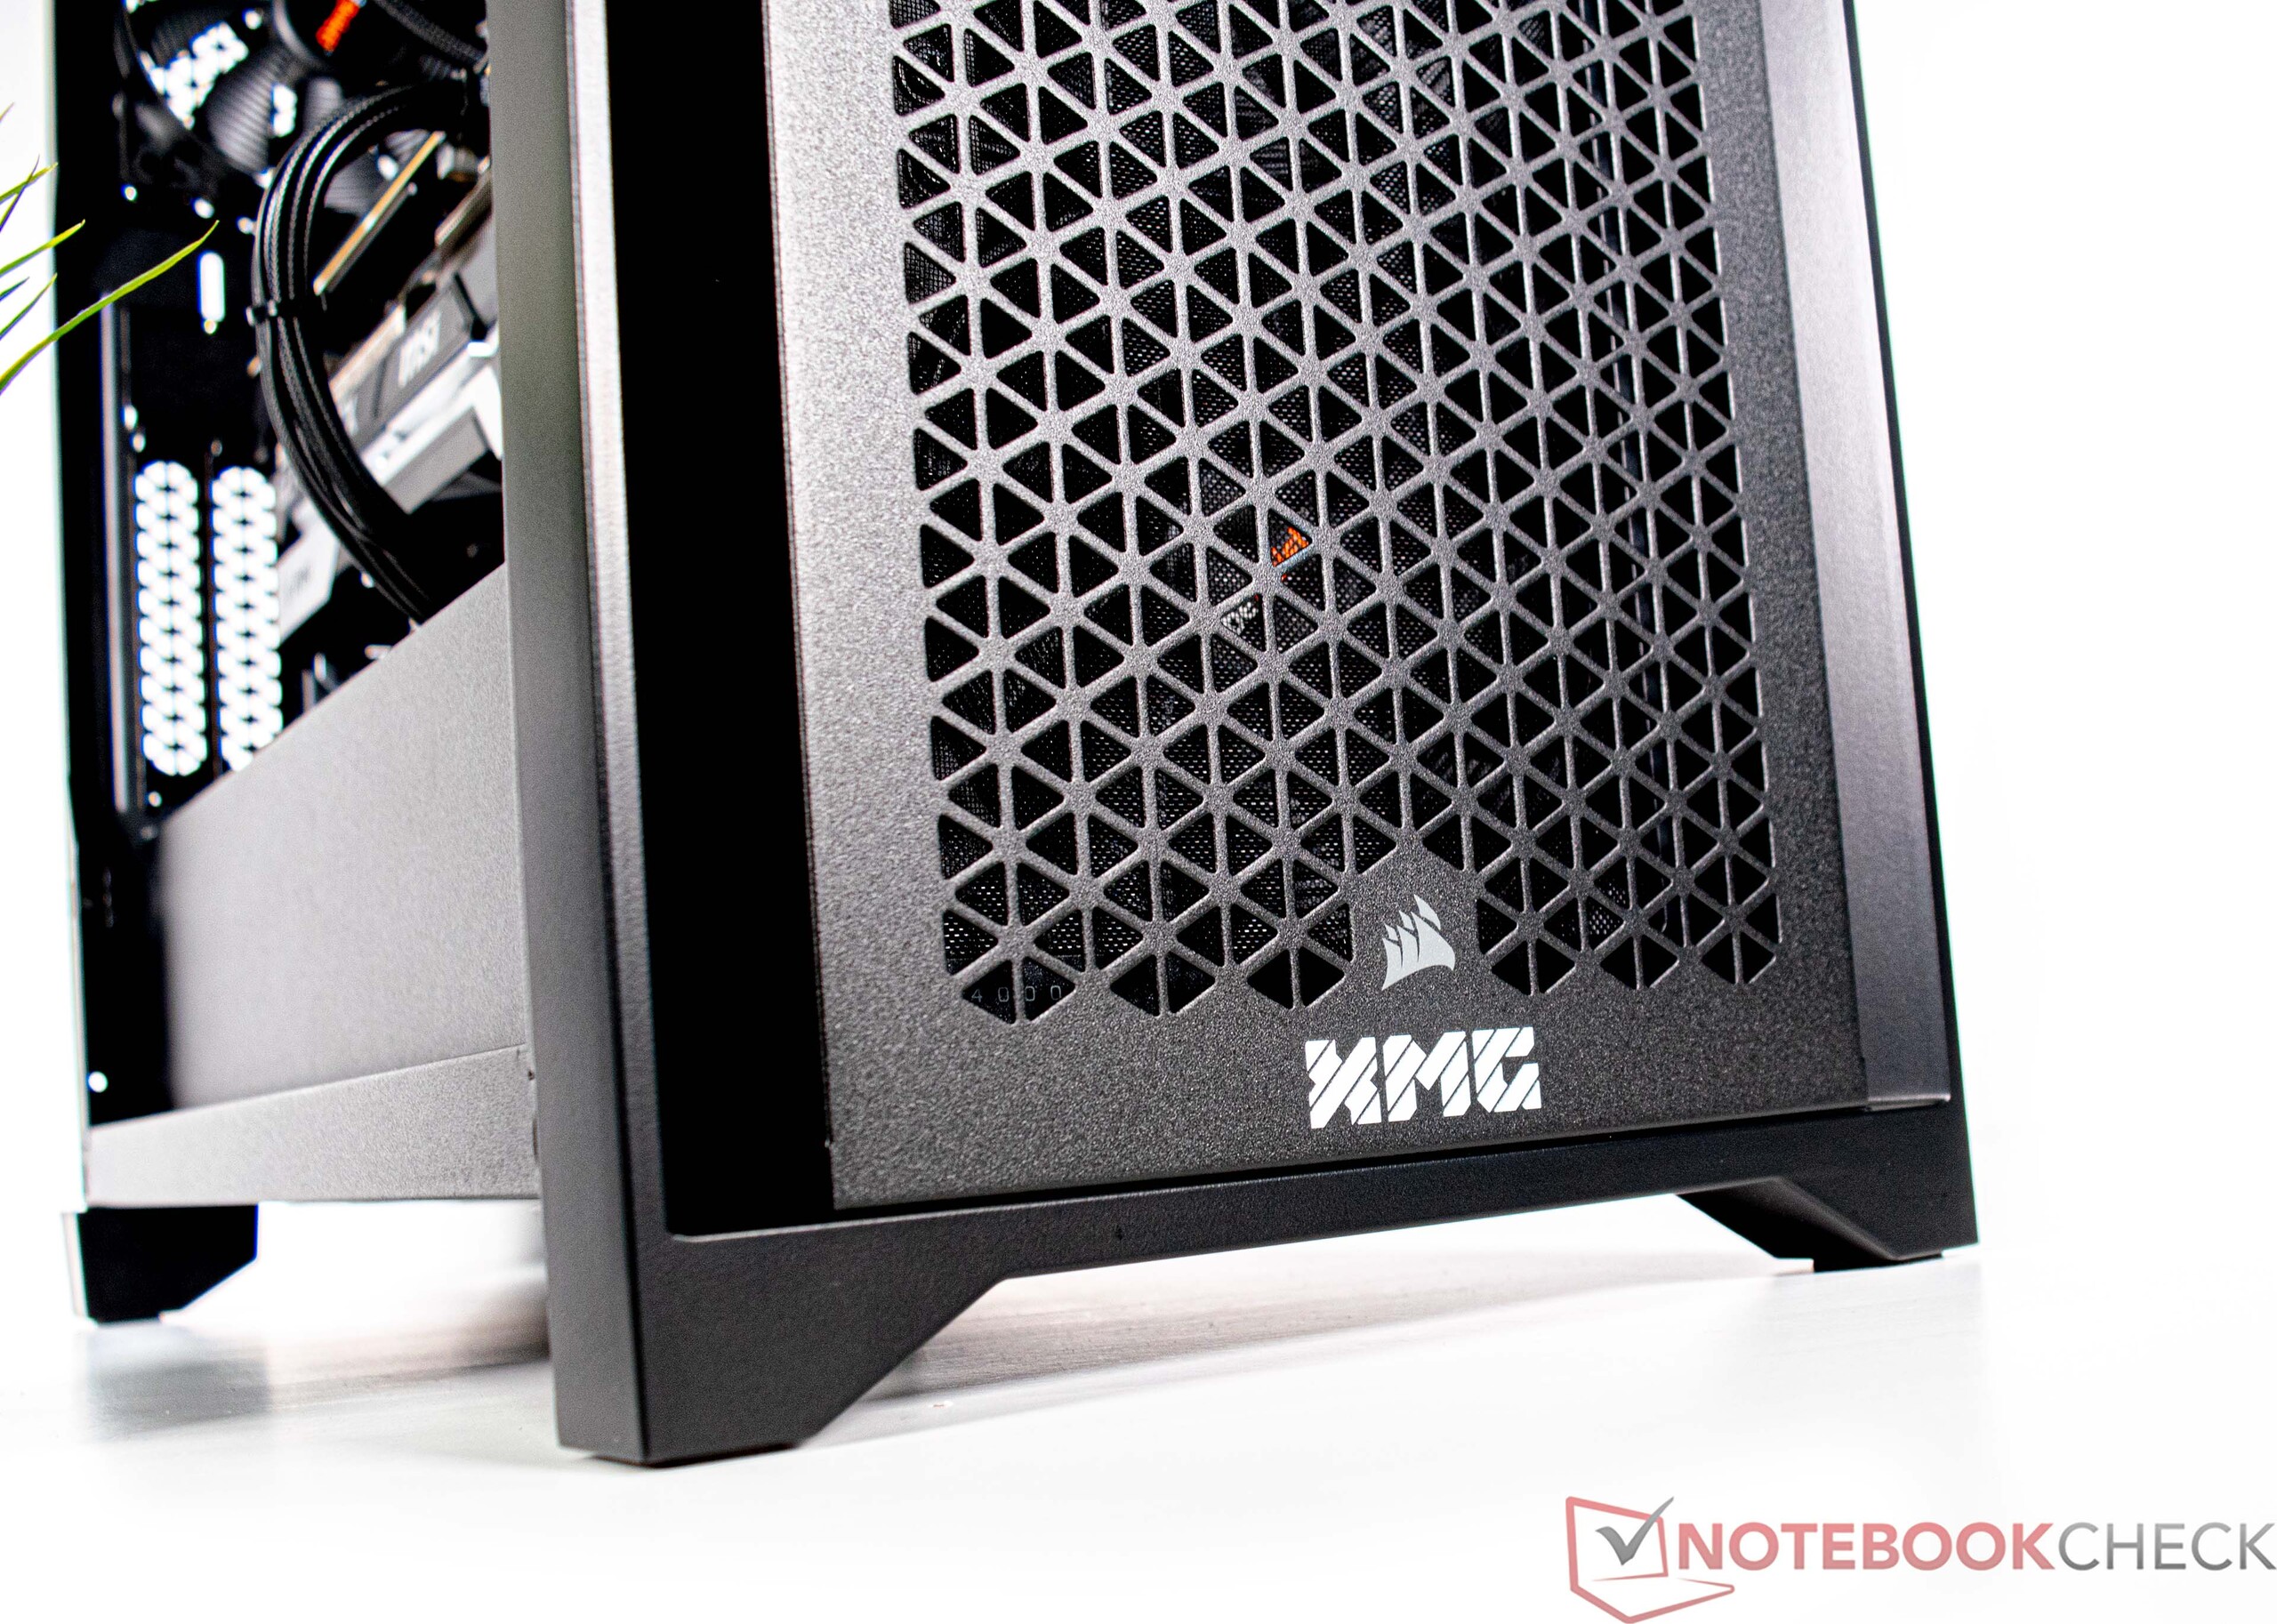
Gehäuse - Corsair 4000D Airflow
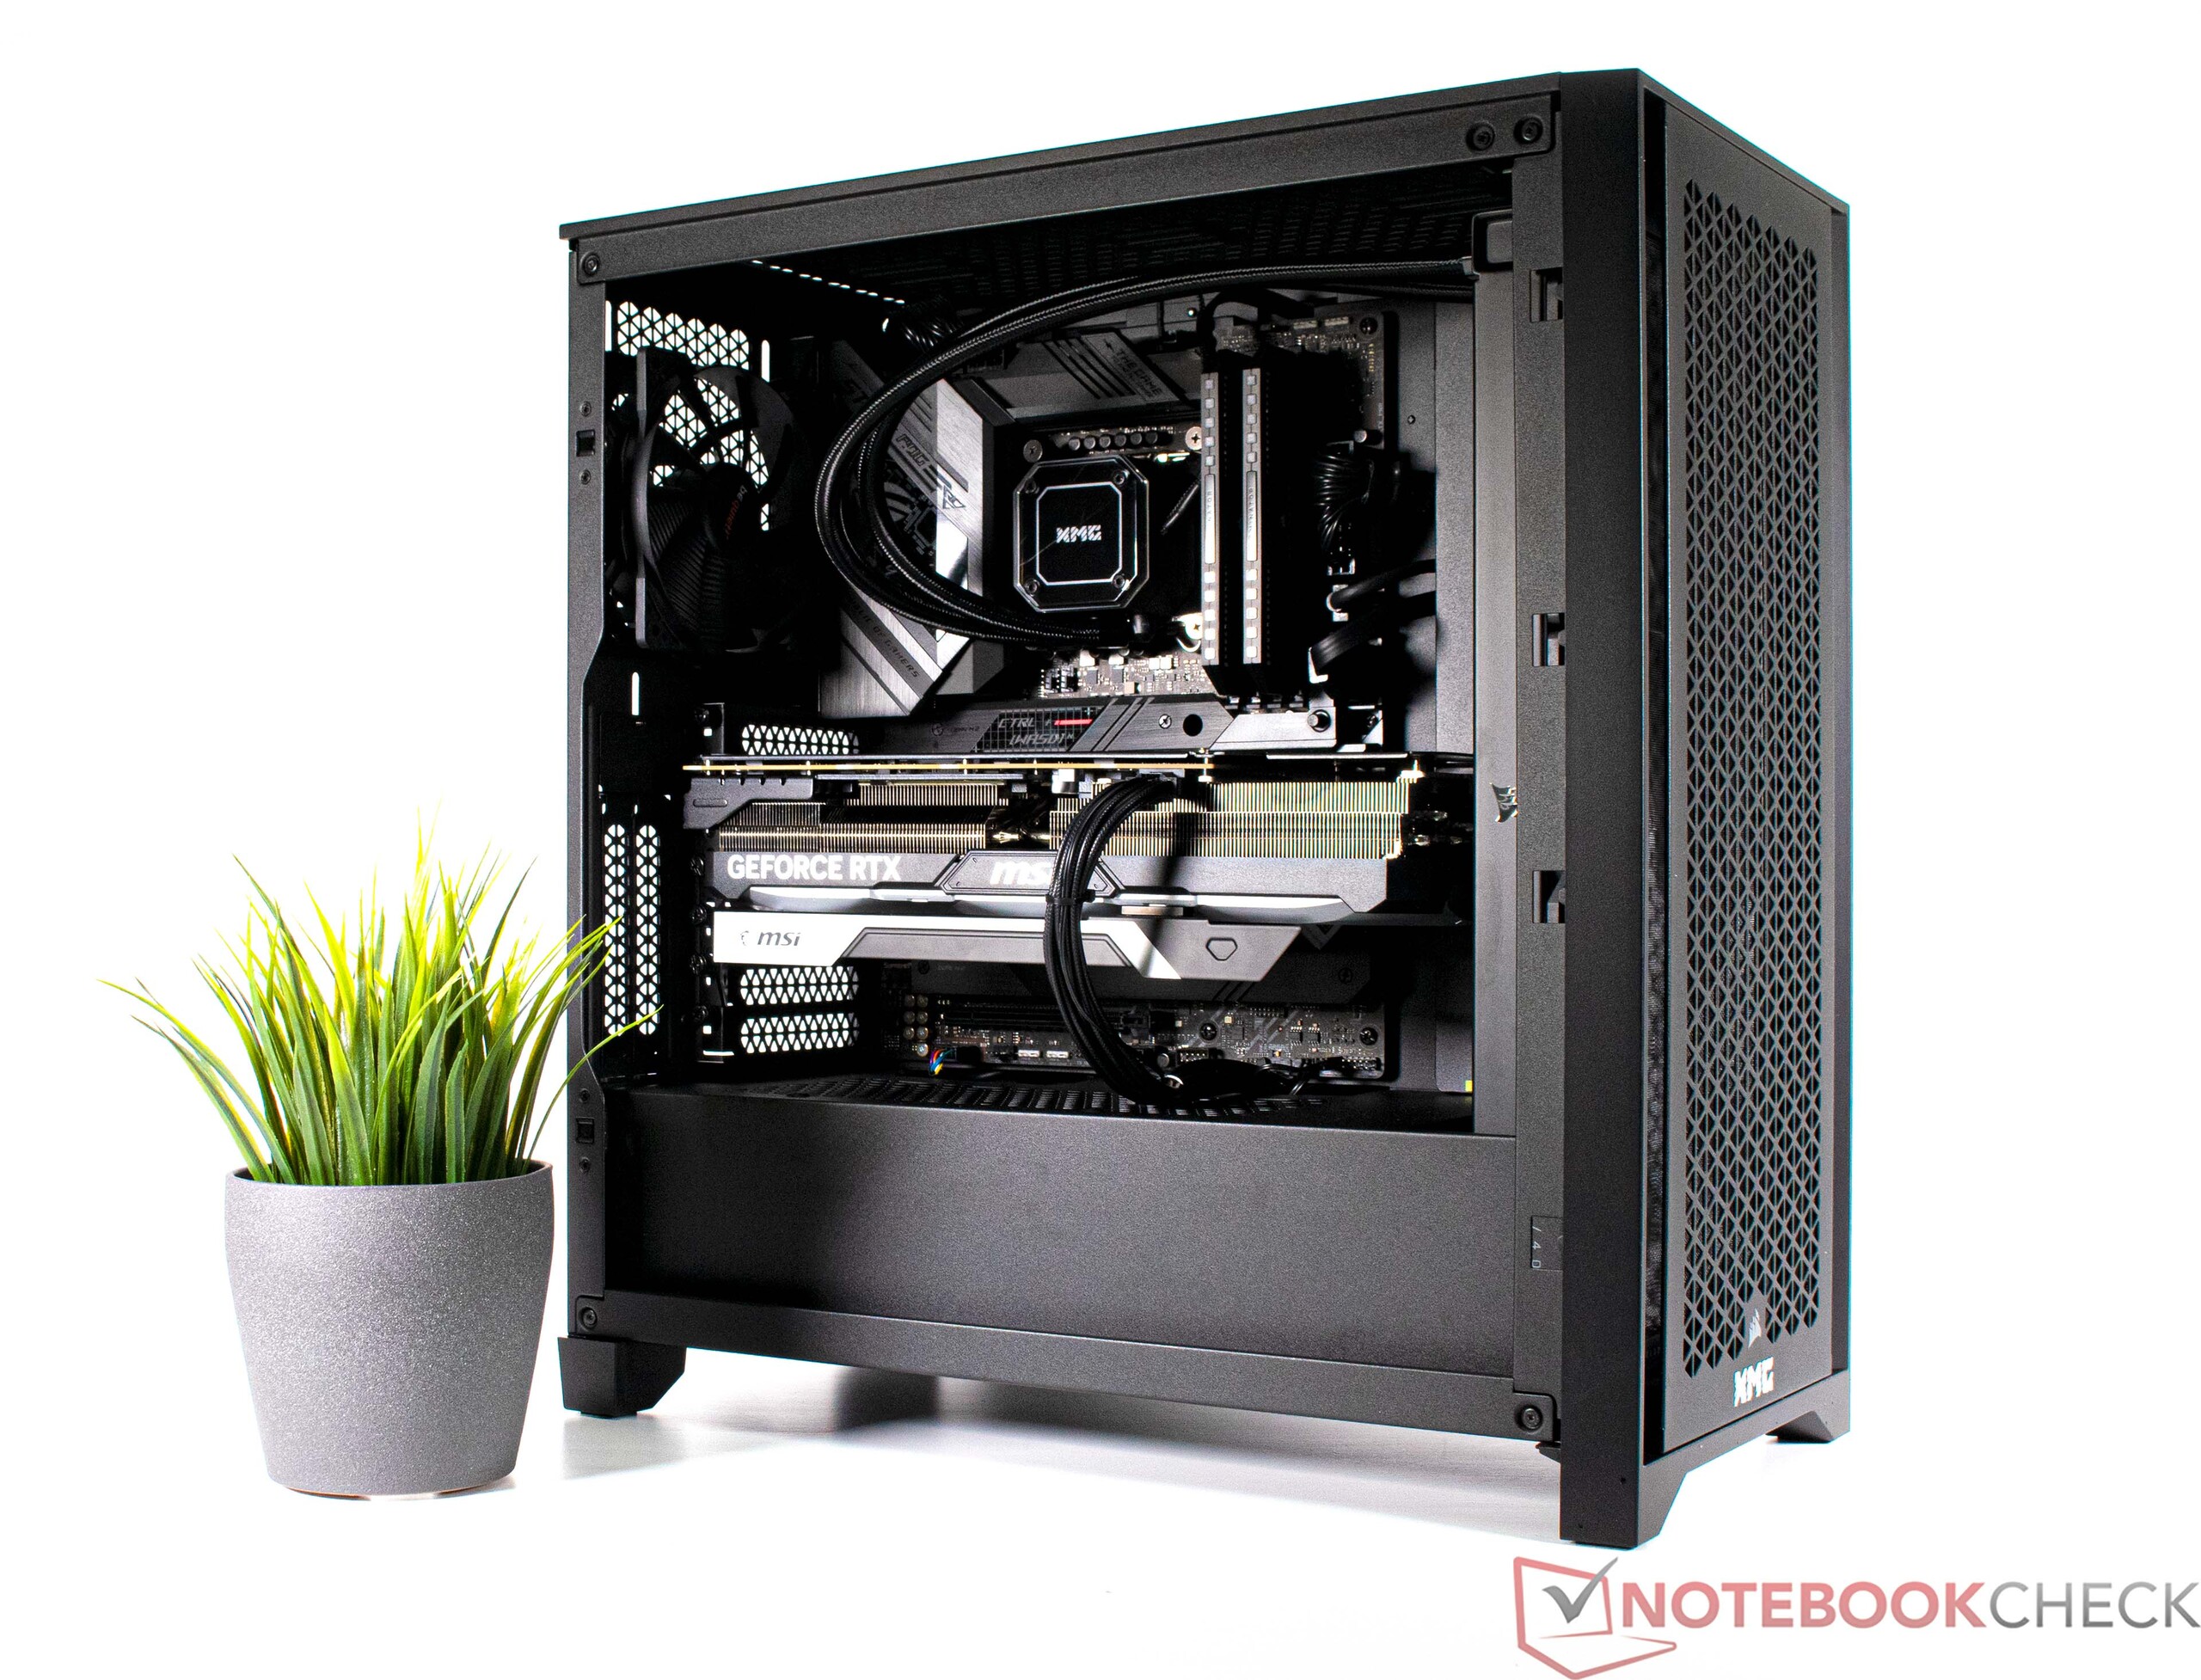
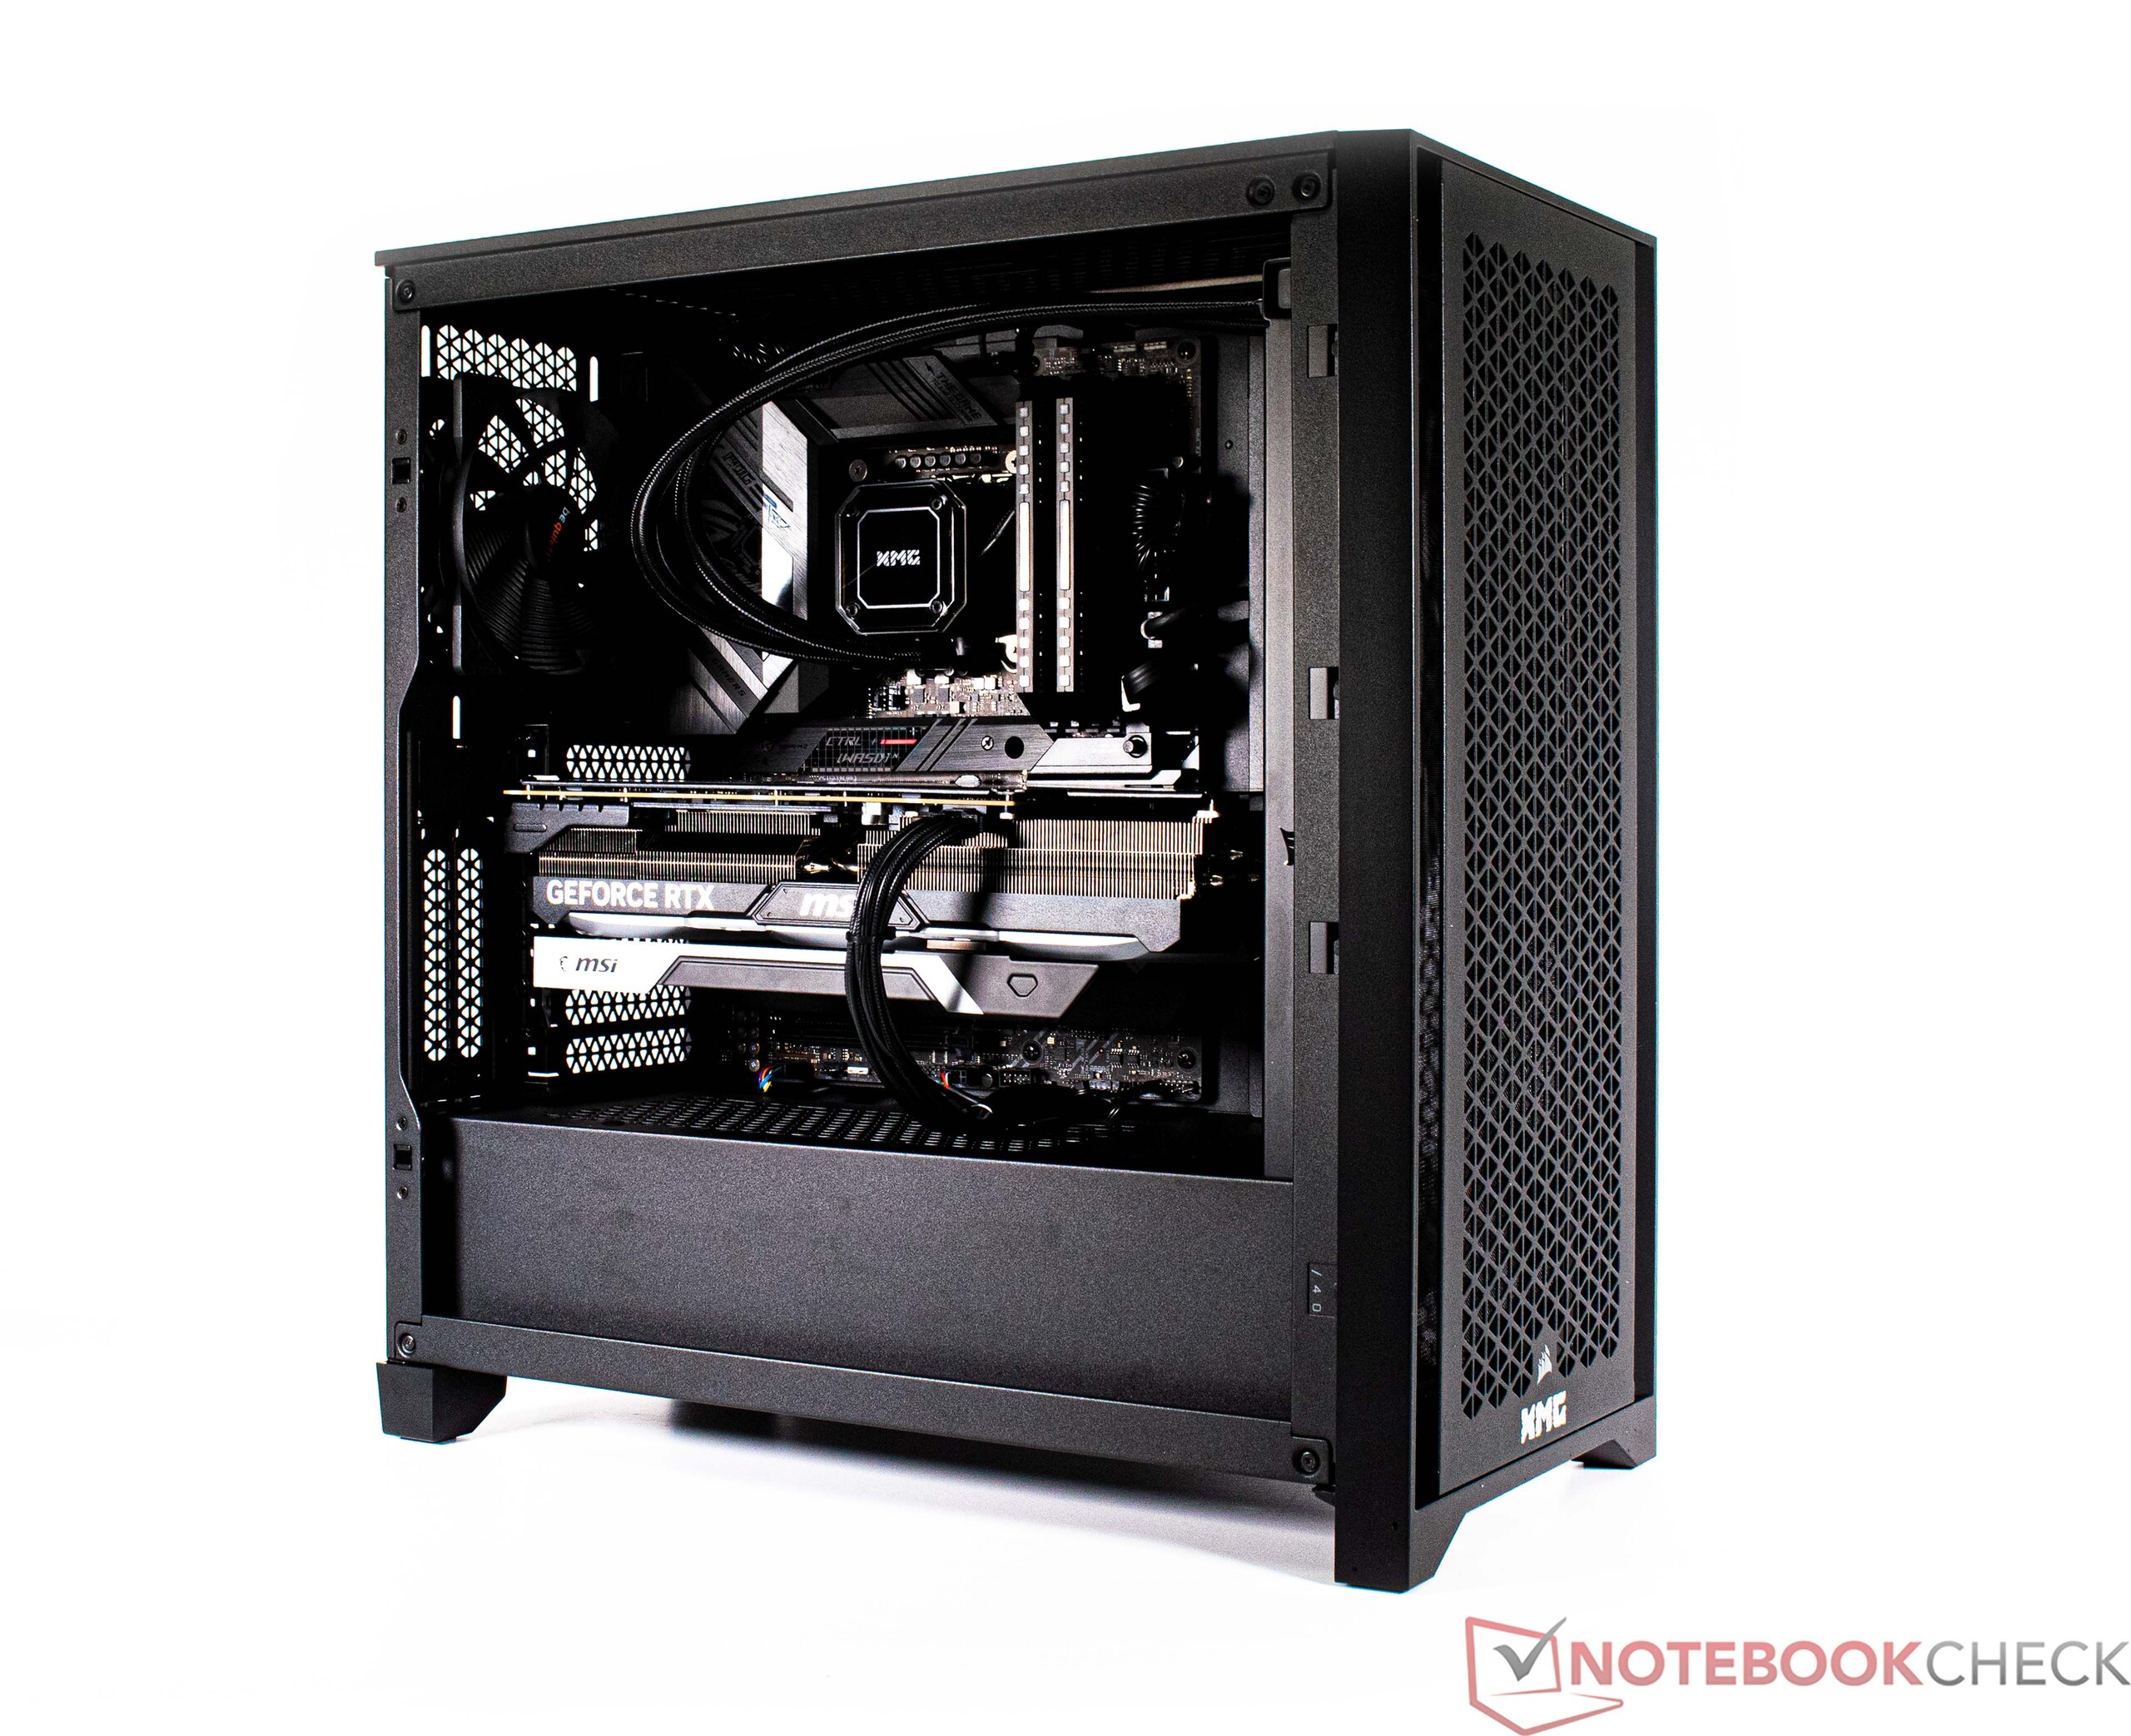
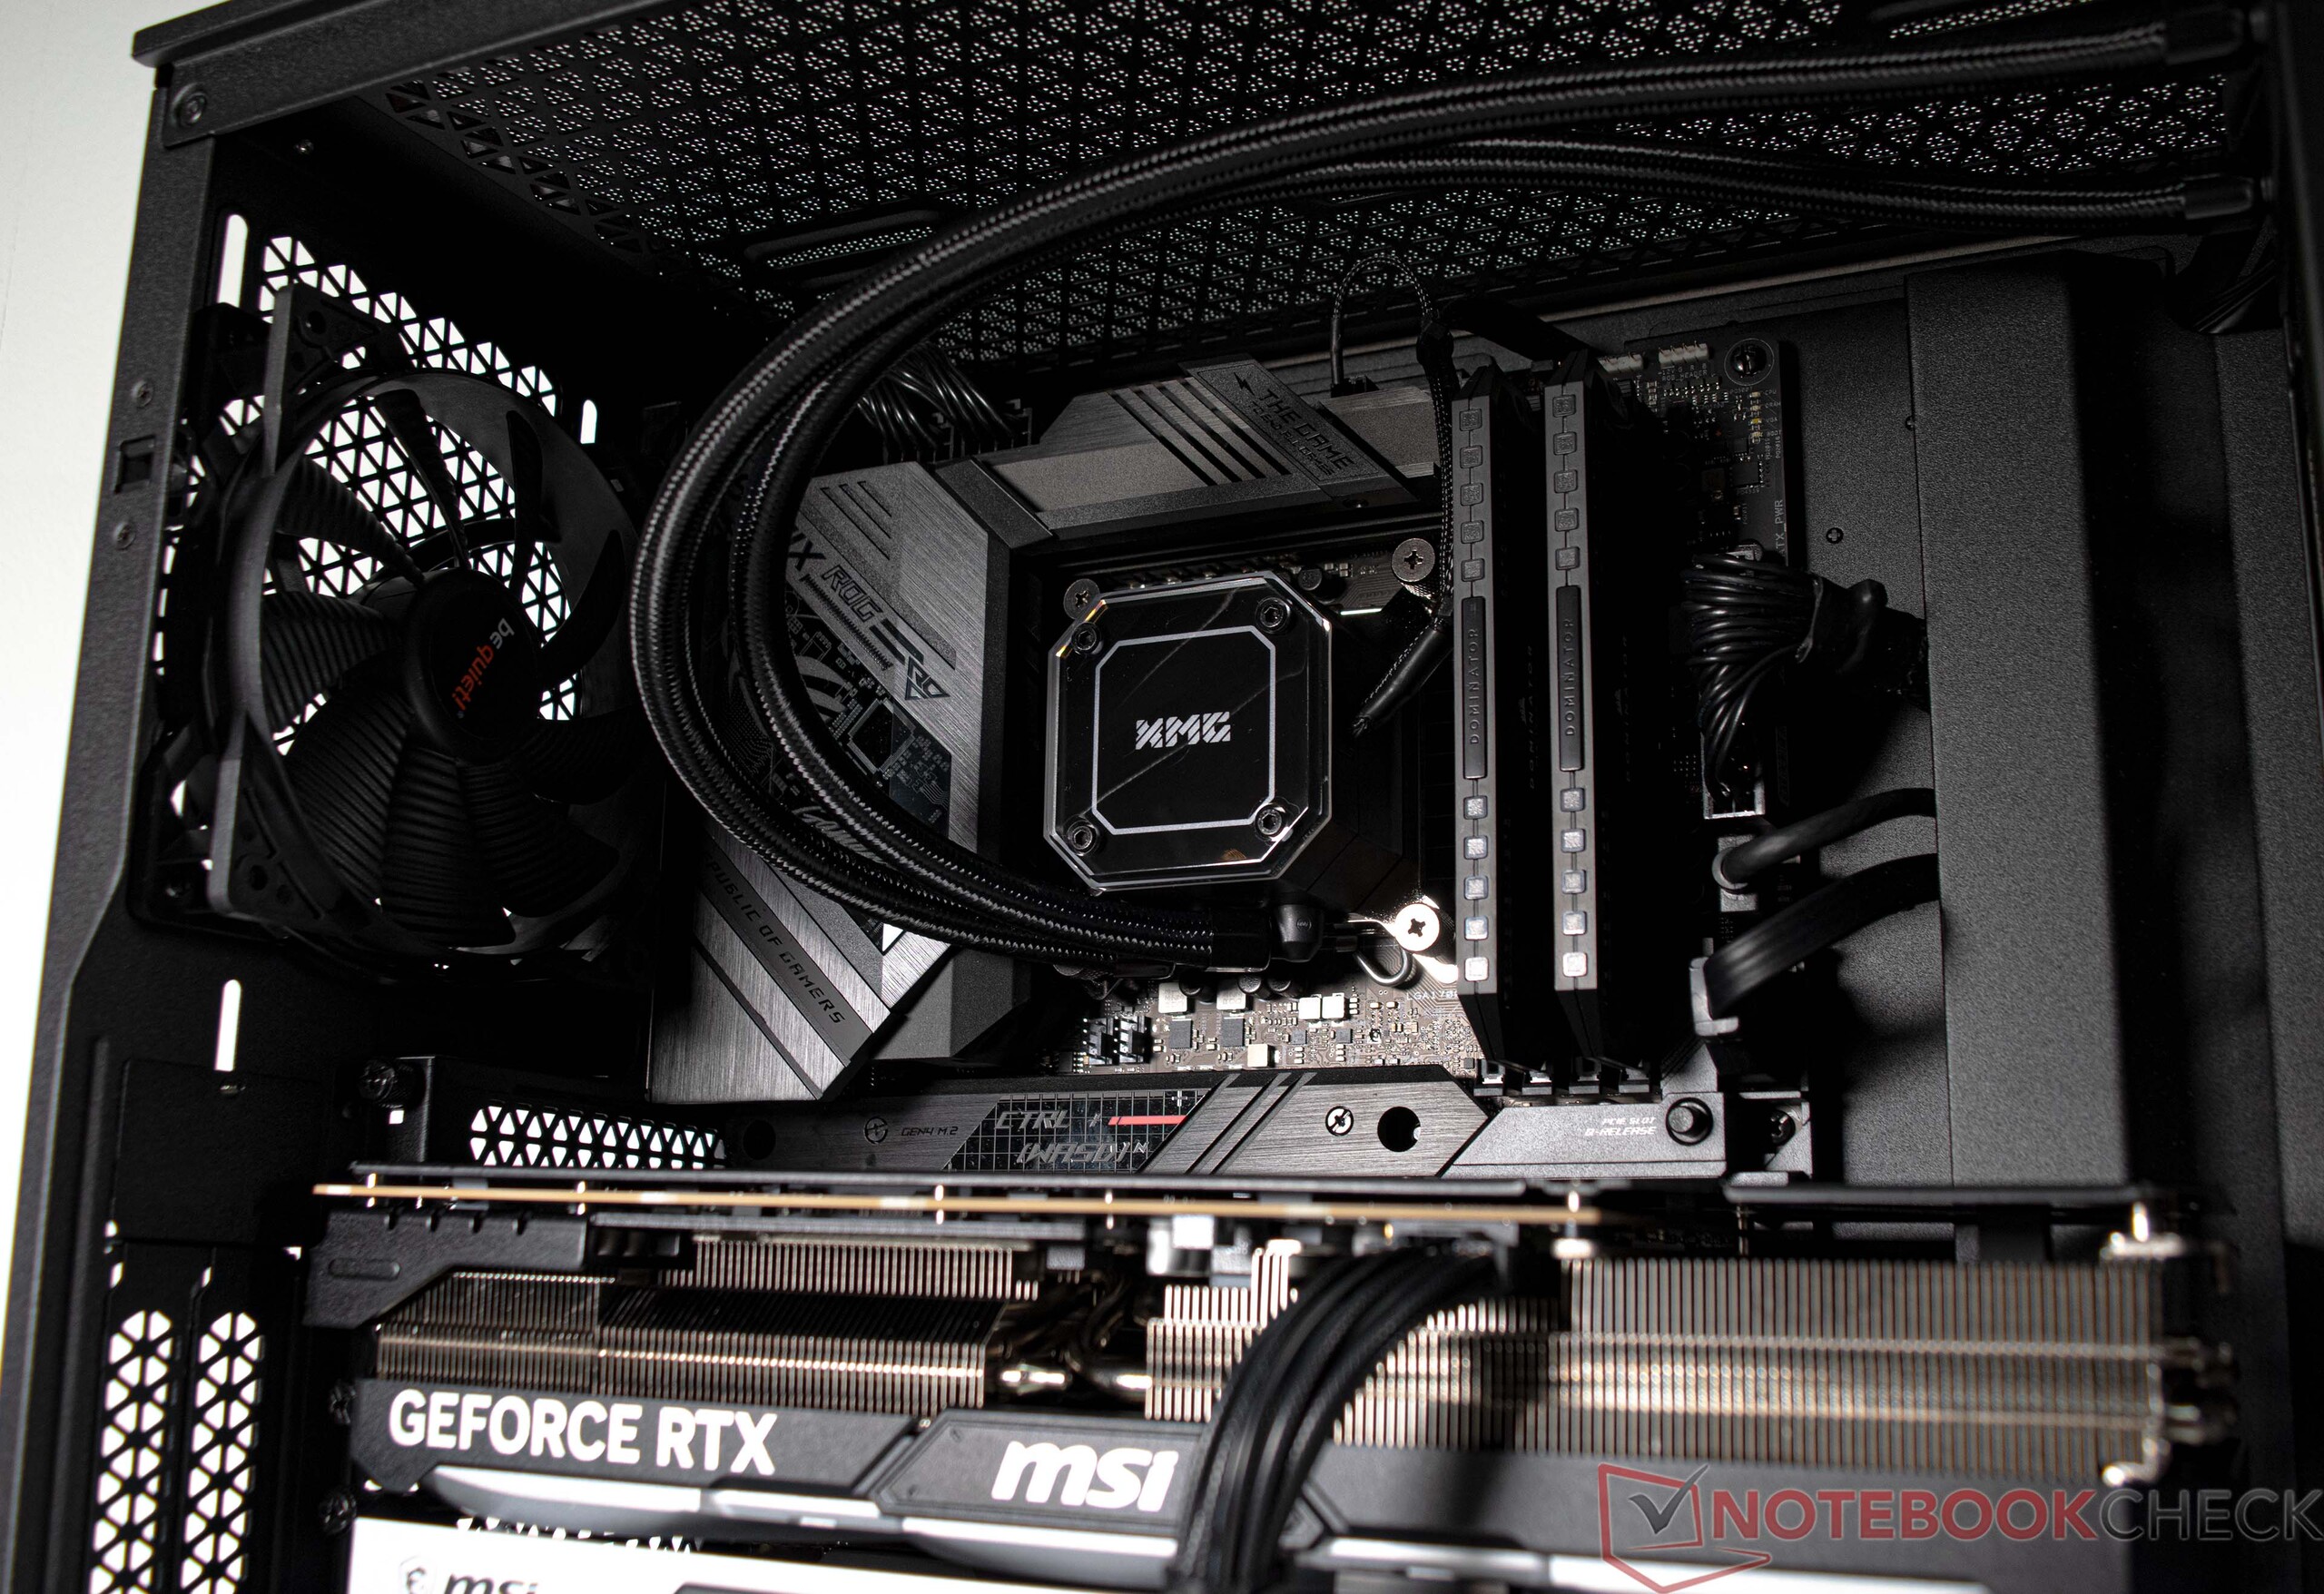
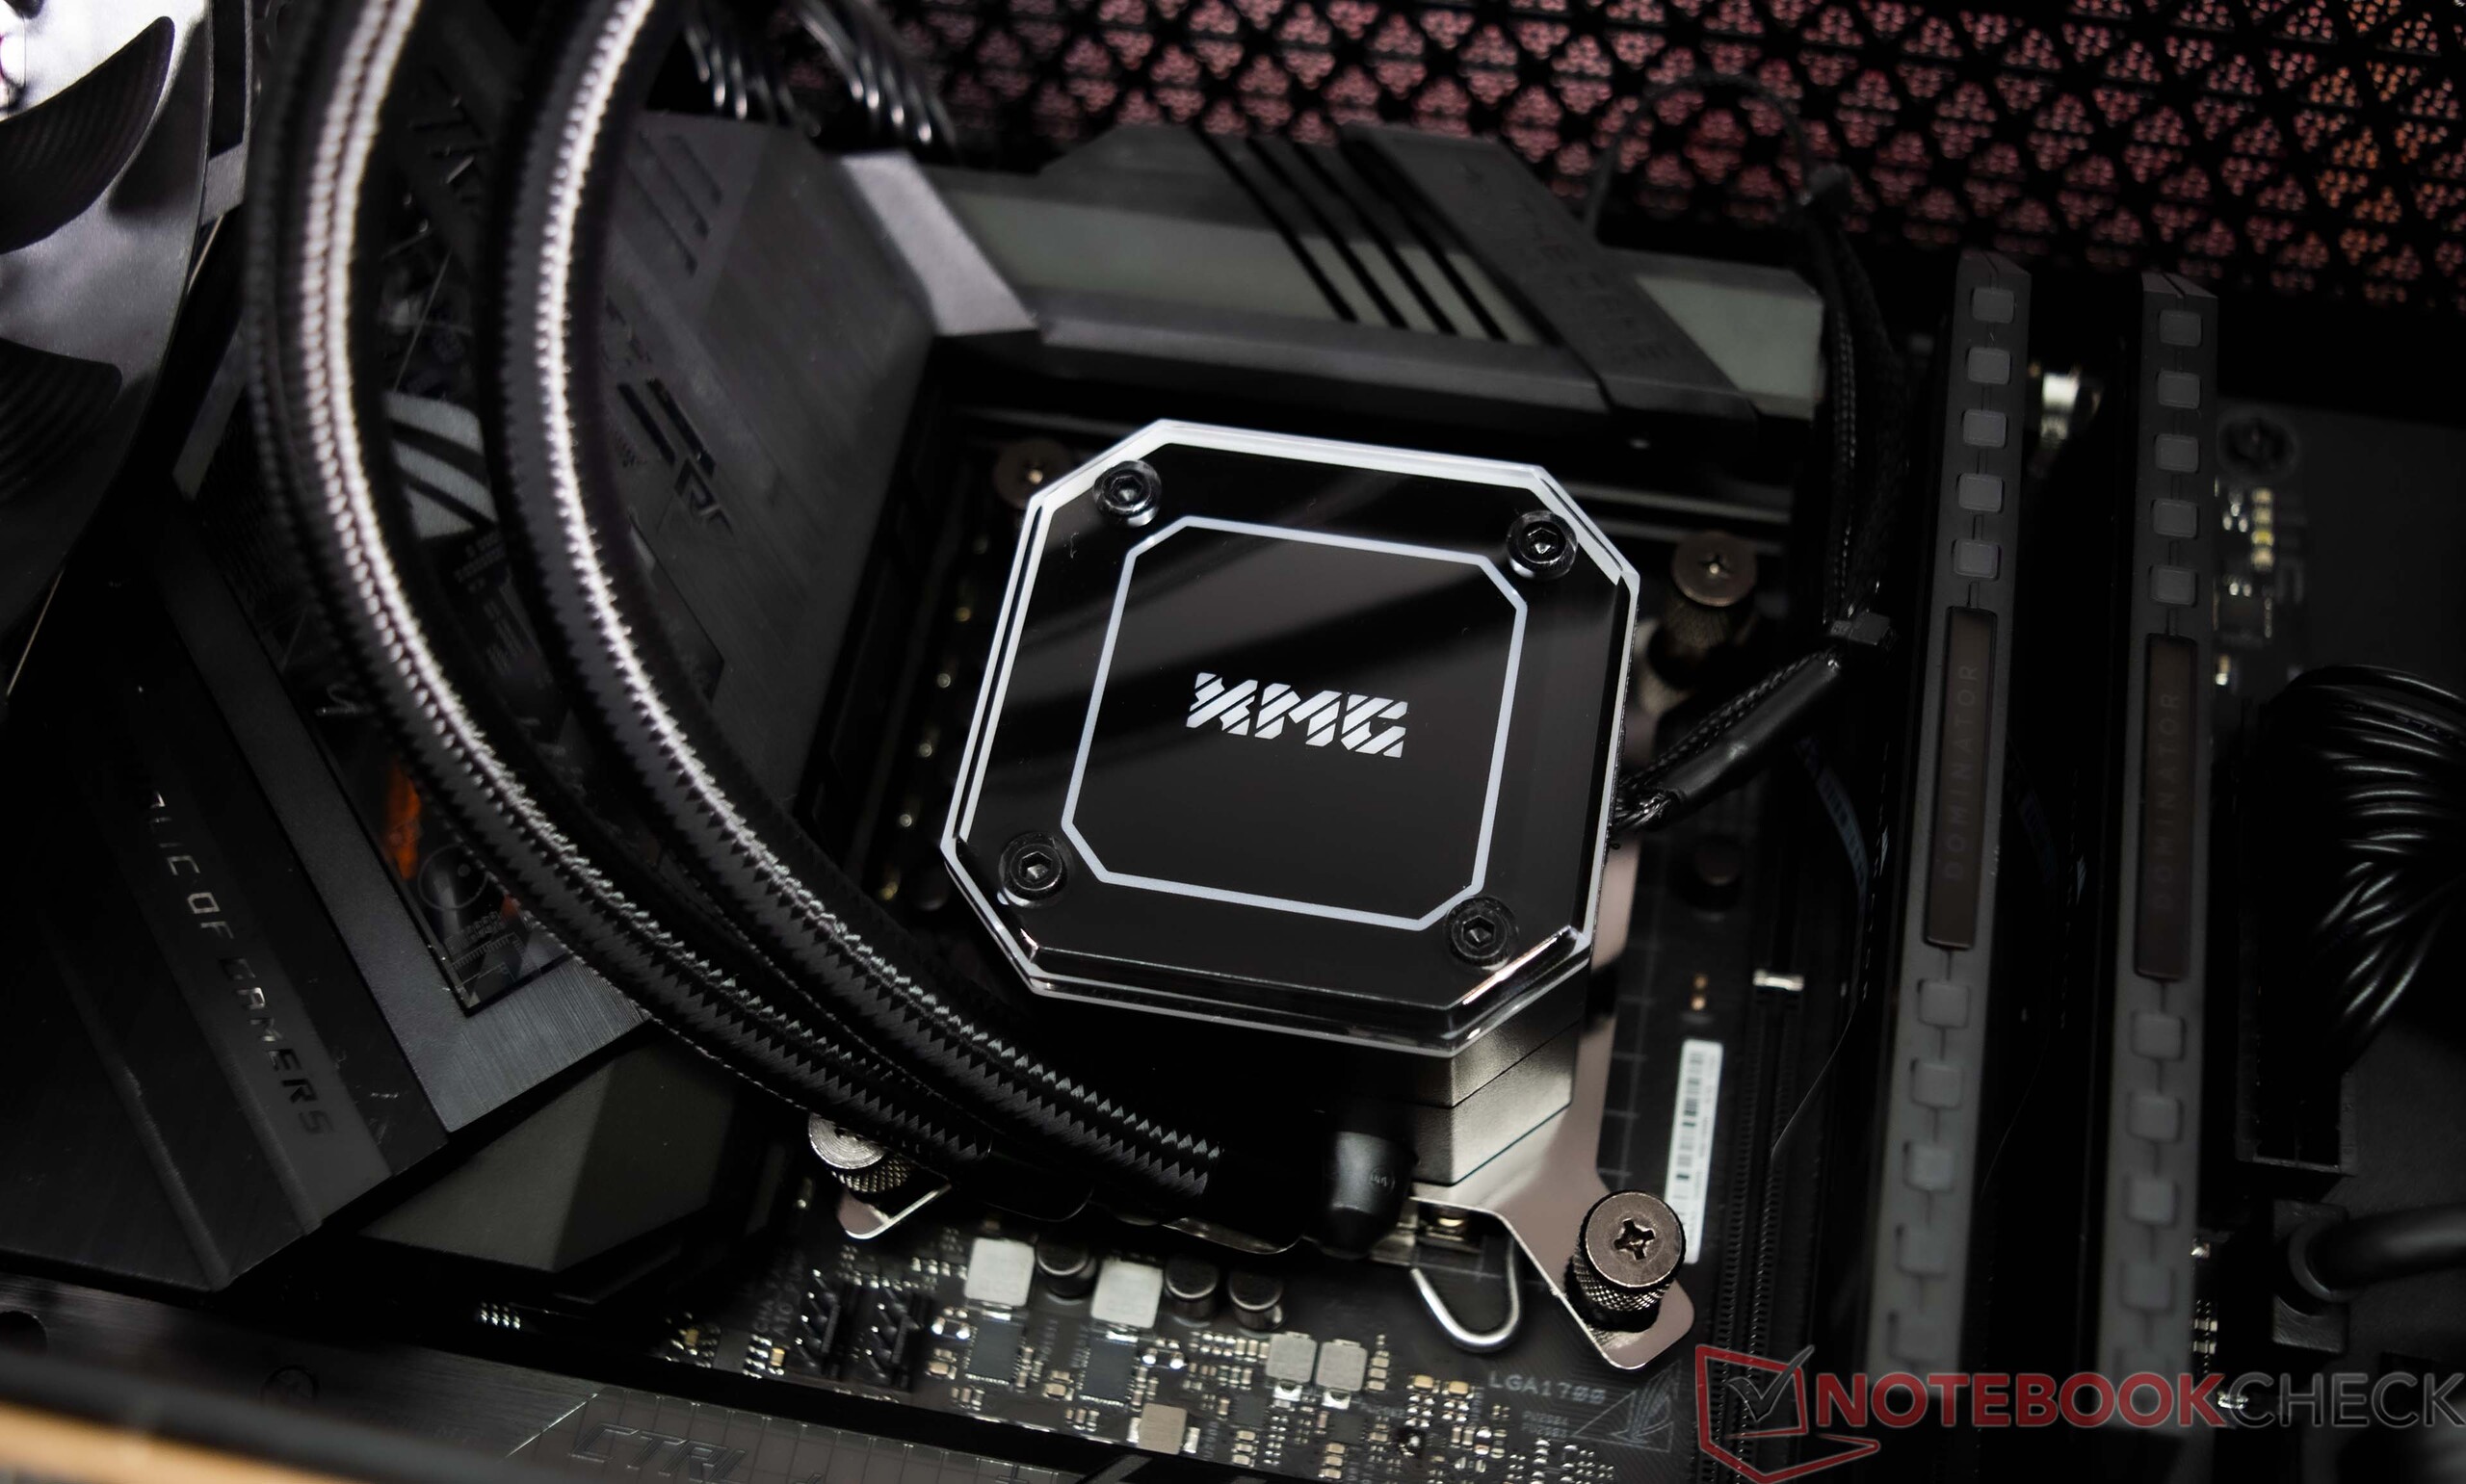
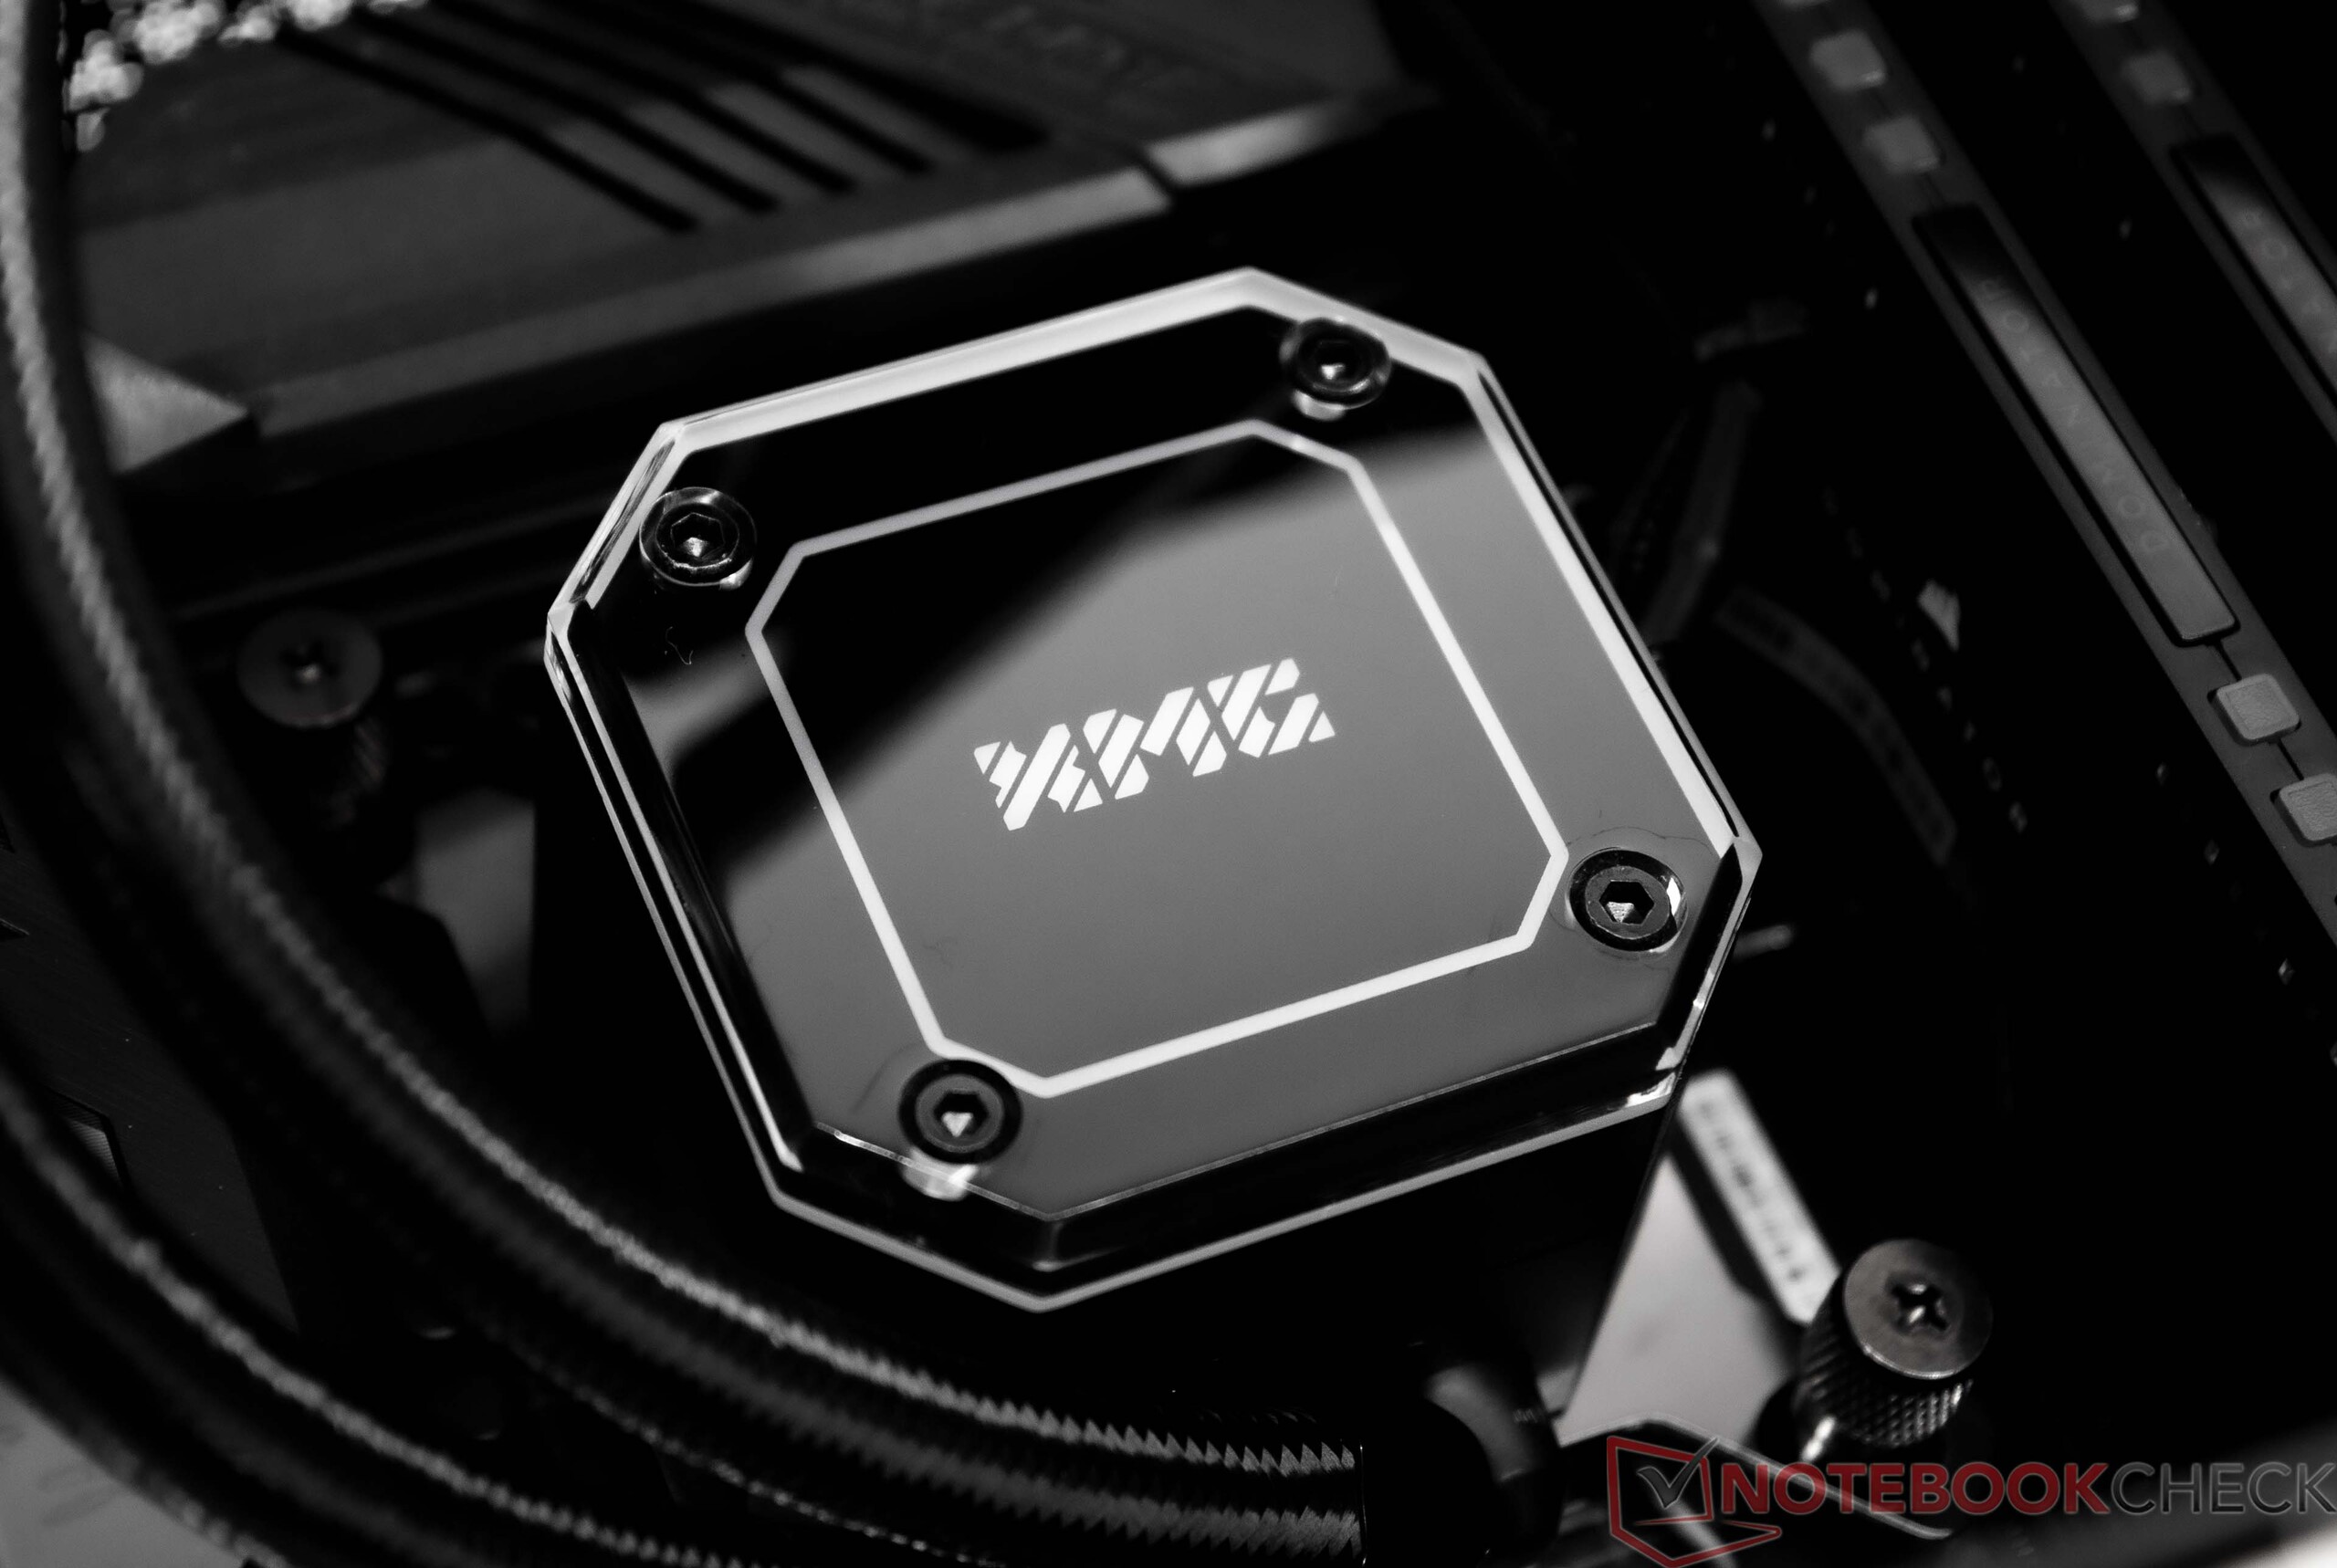
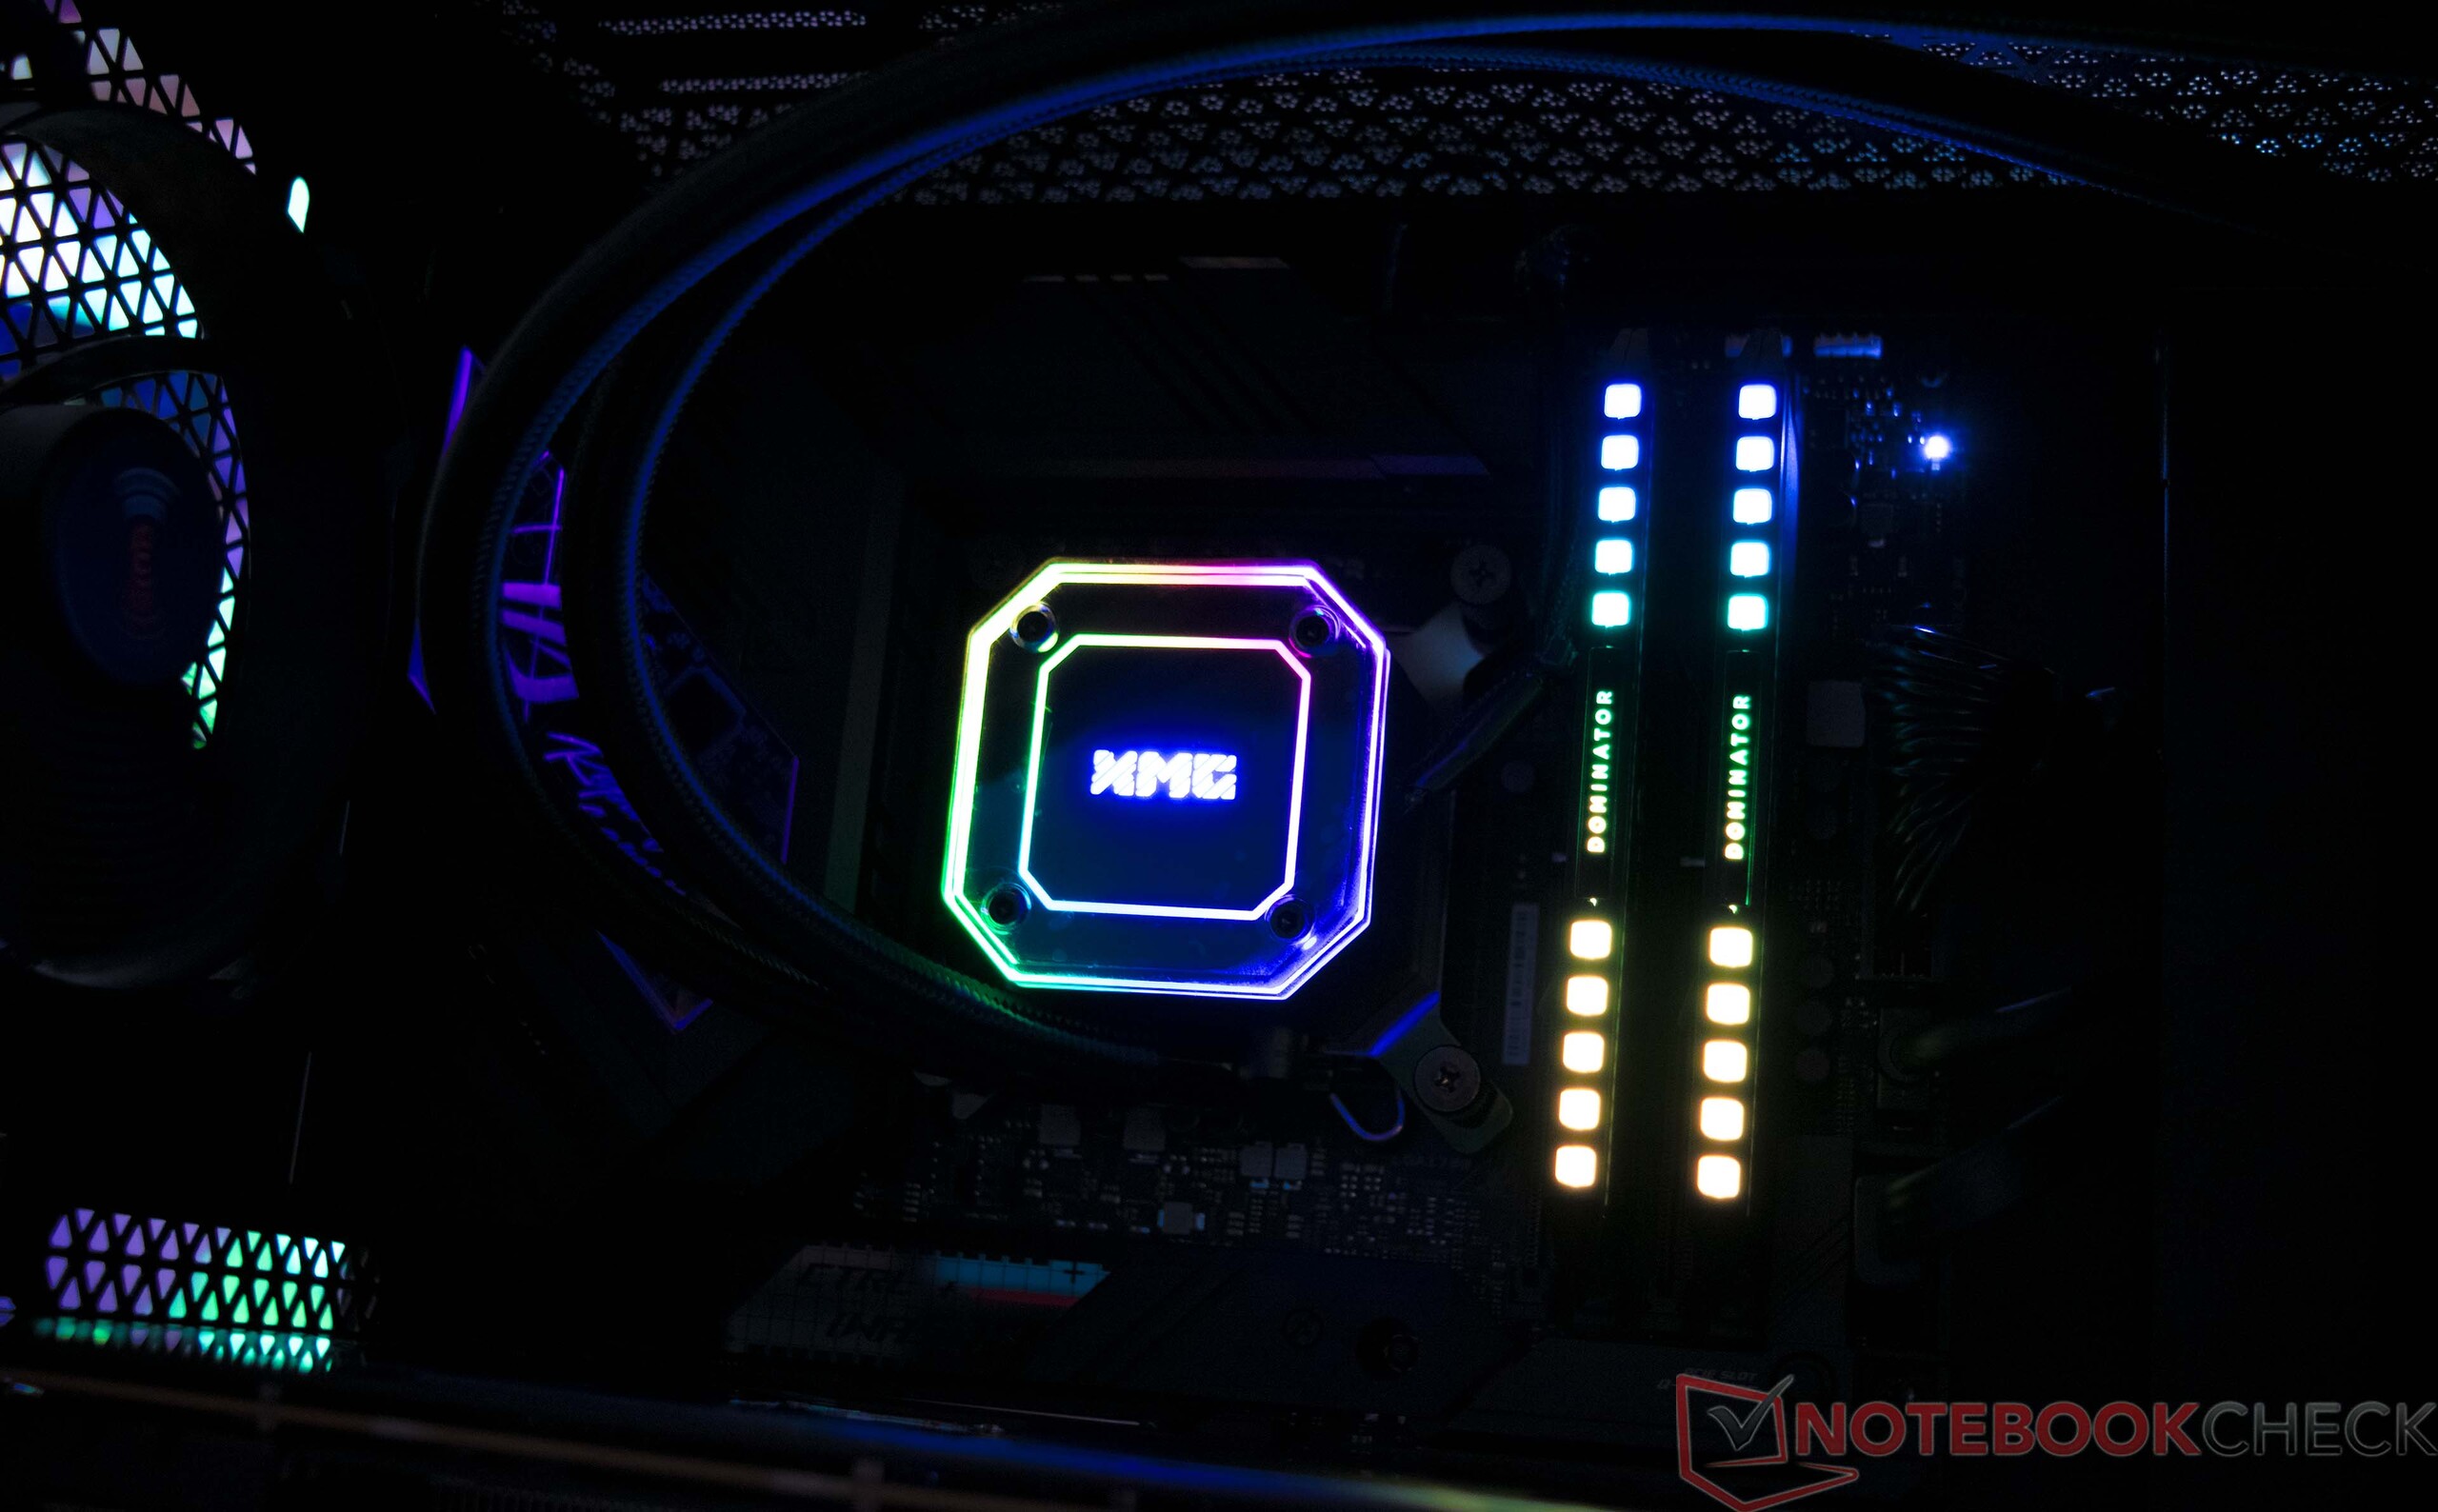
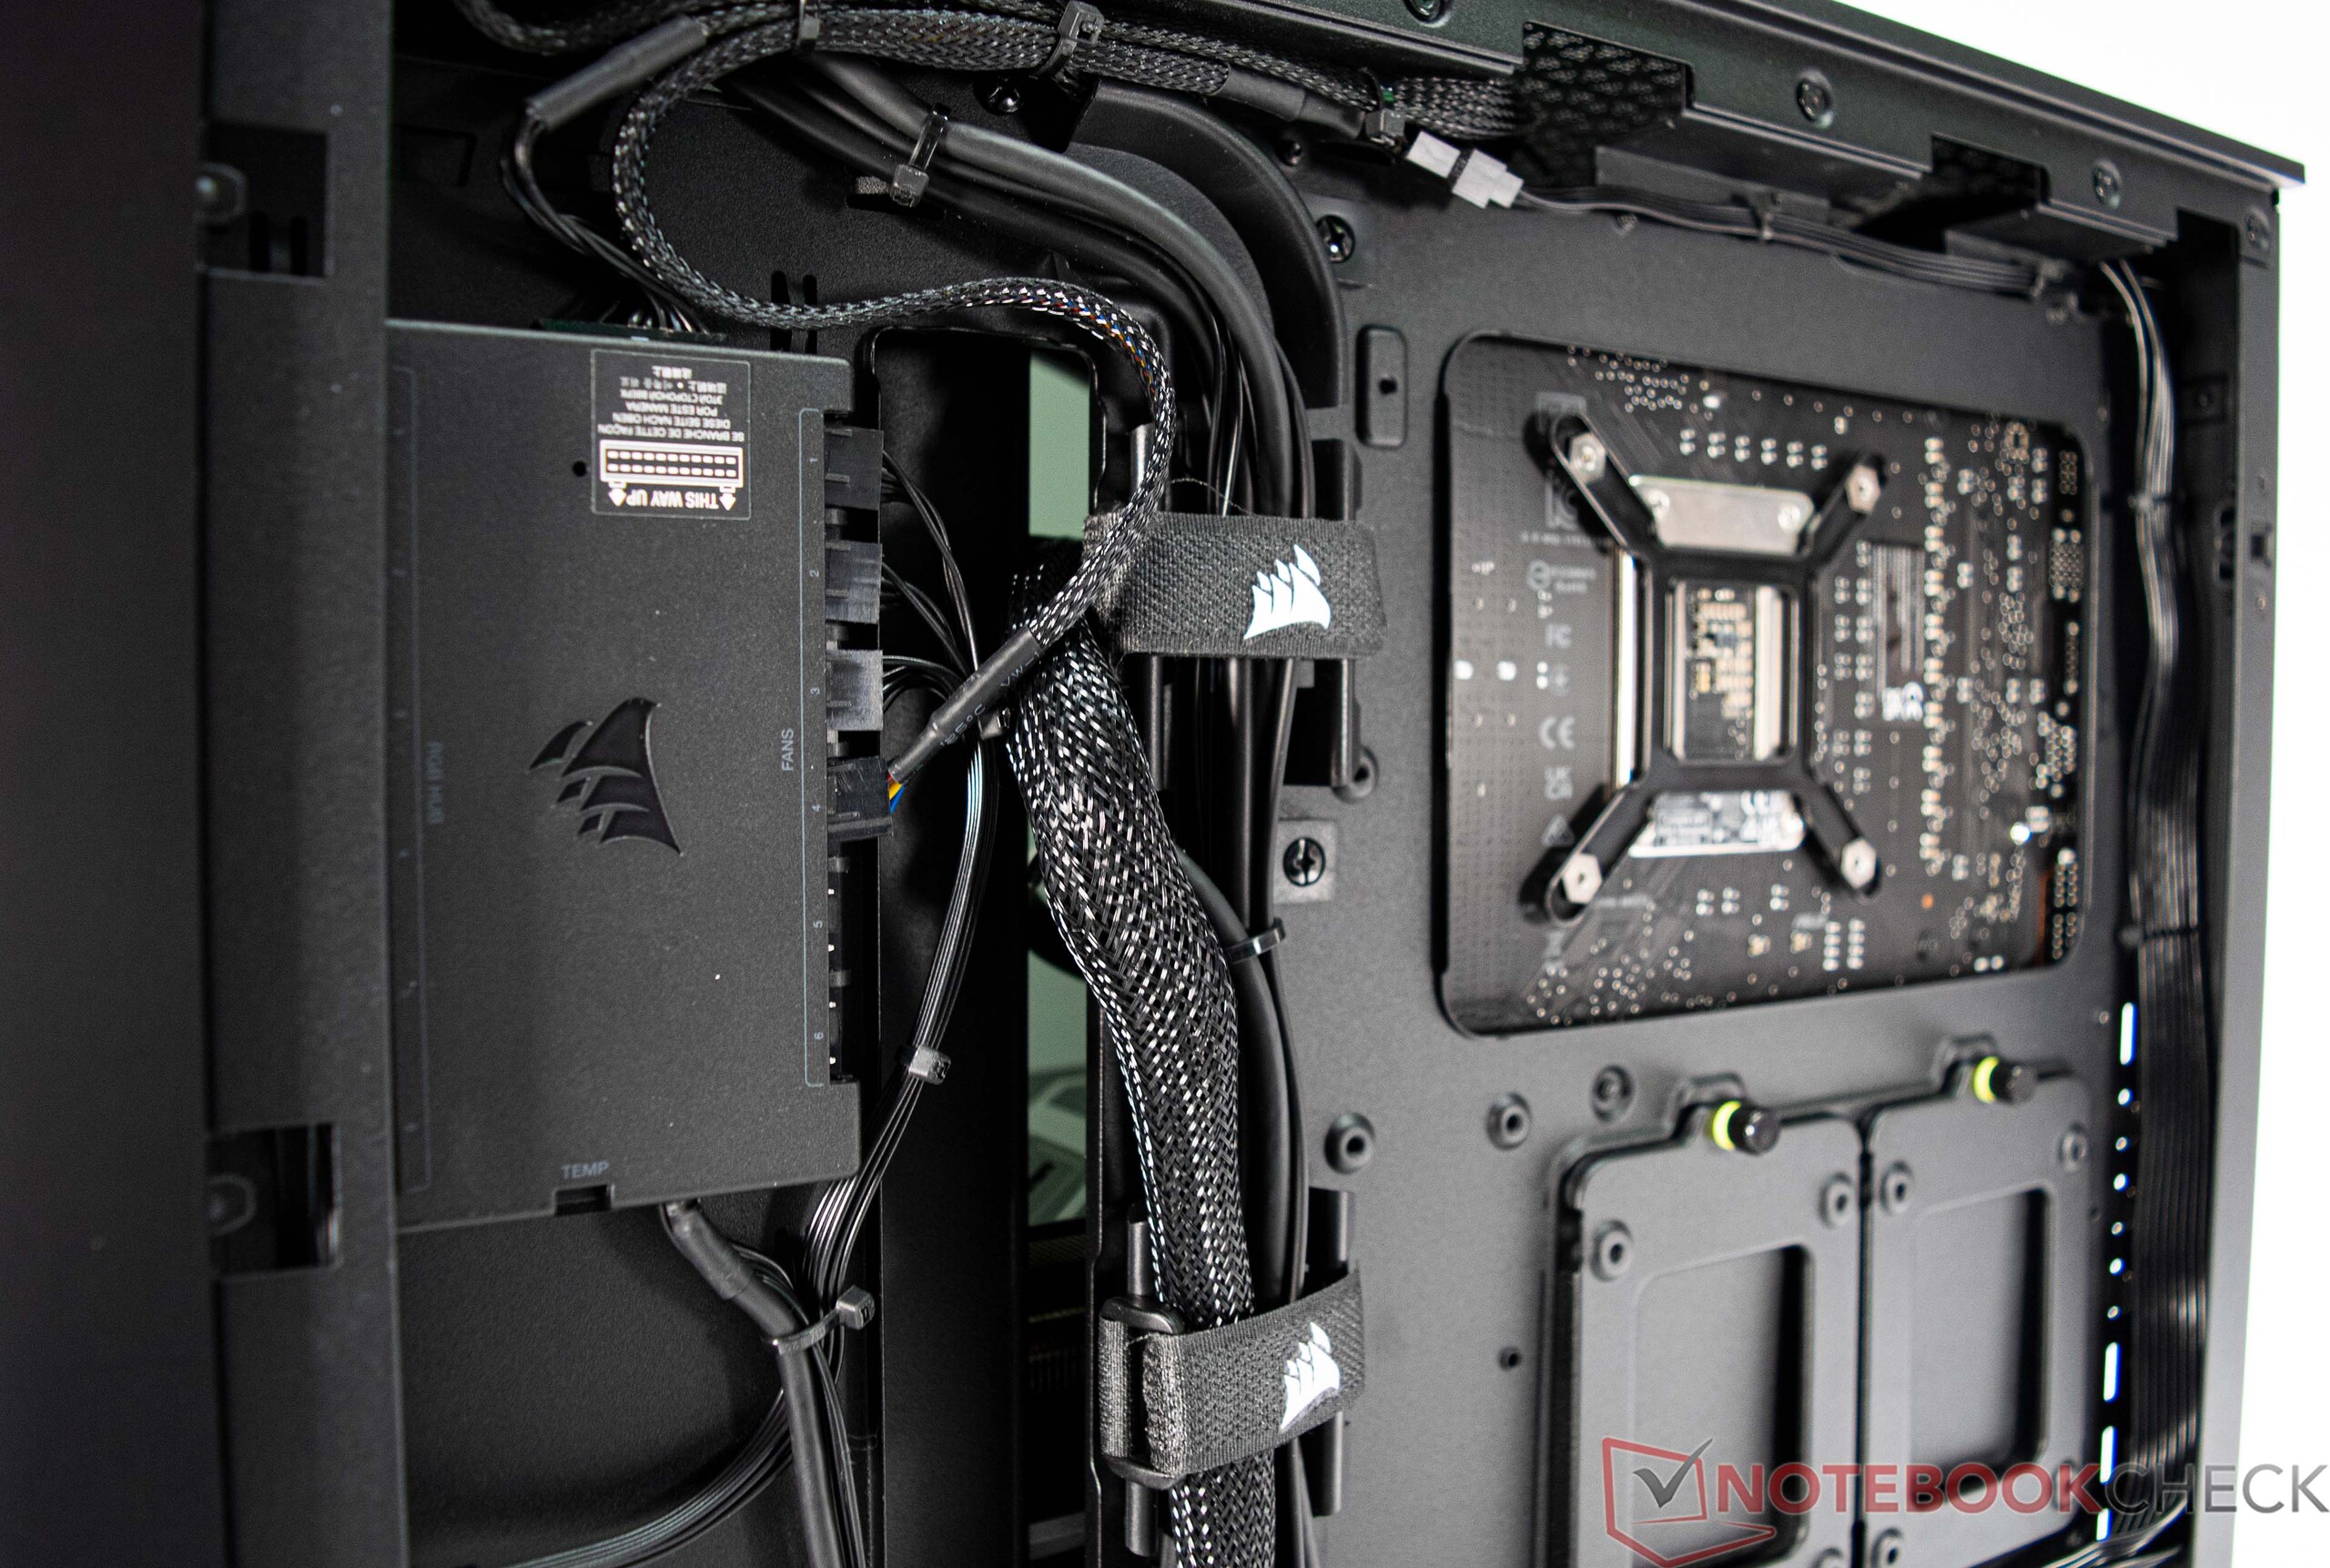
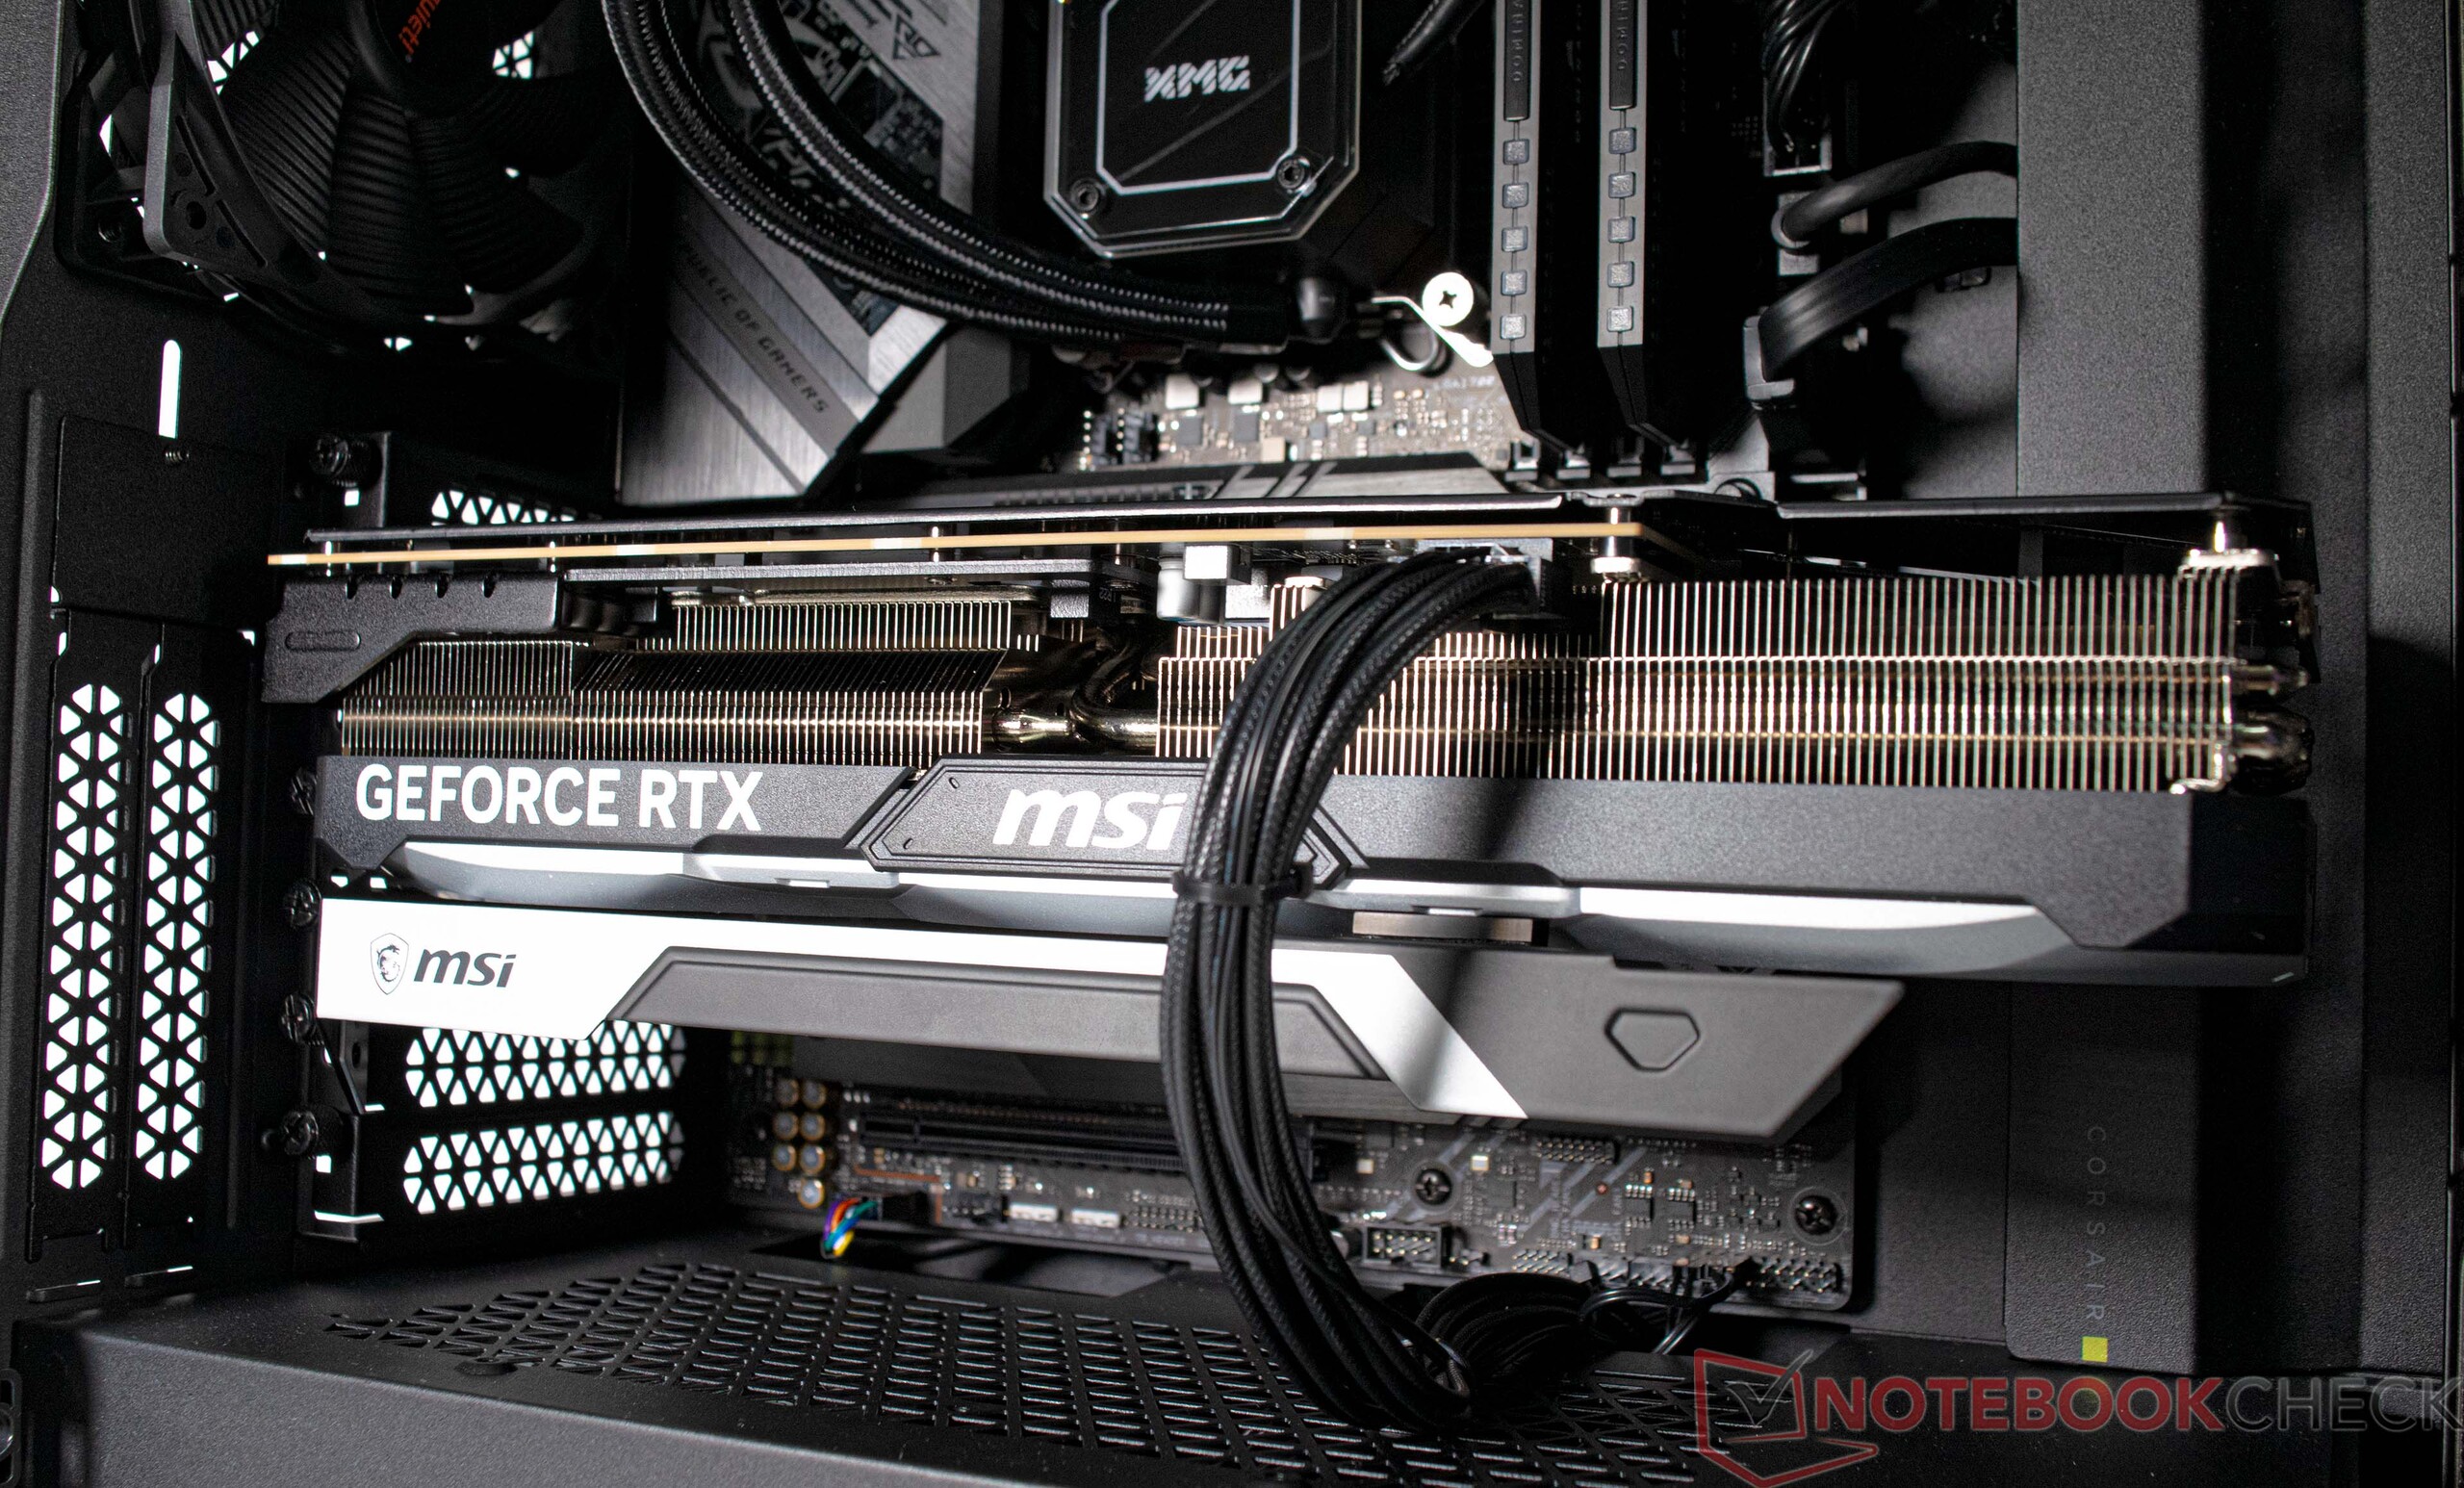
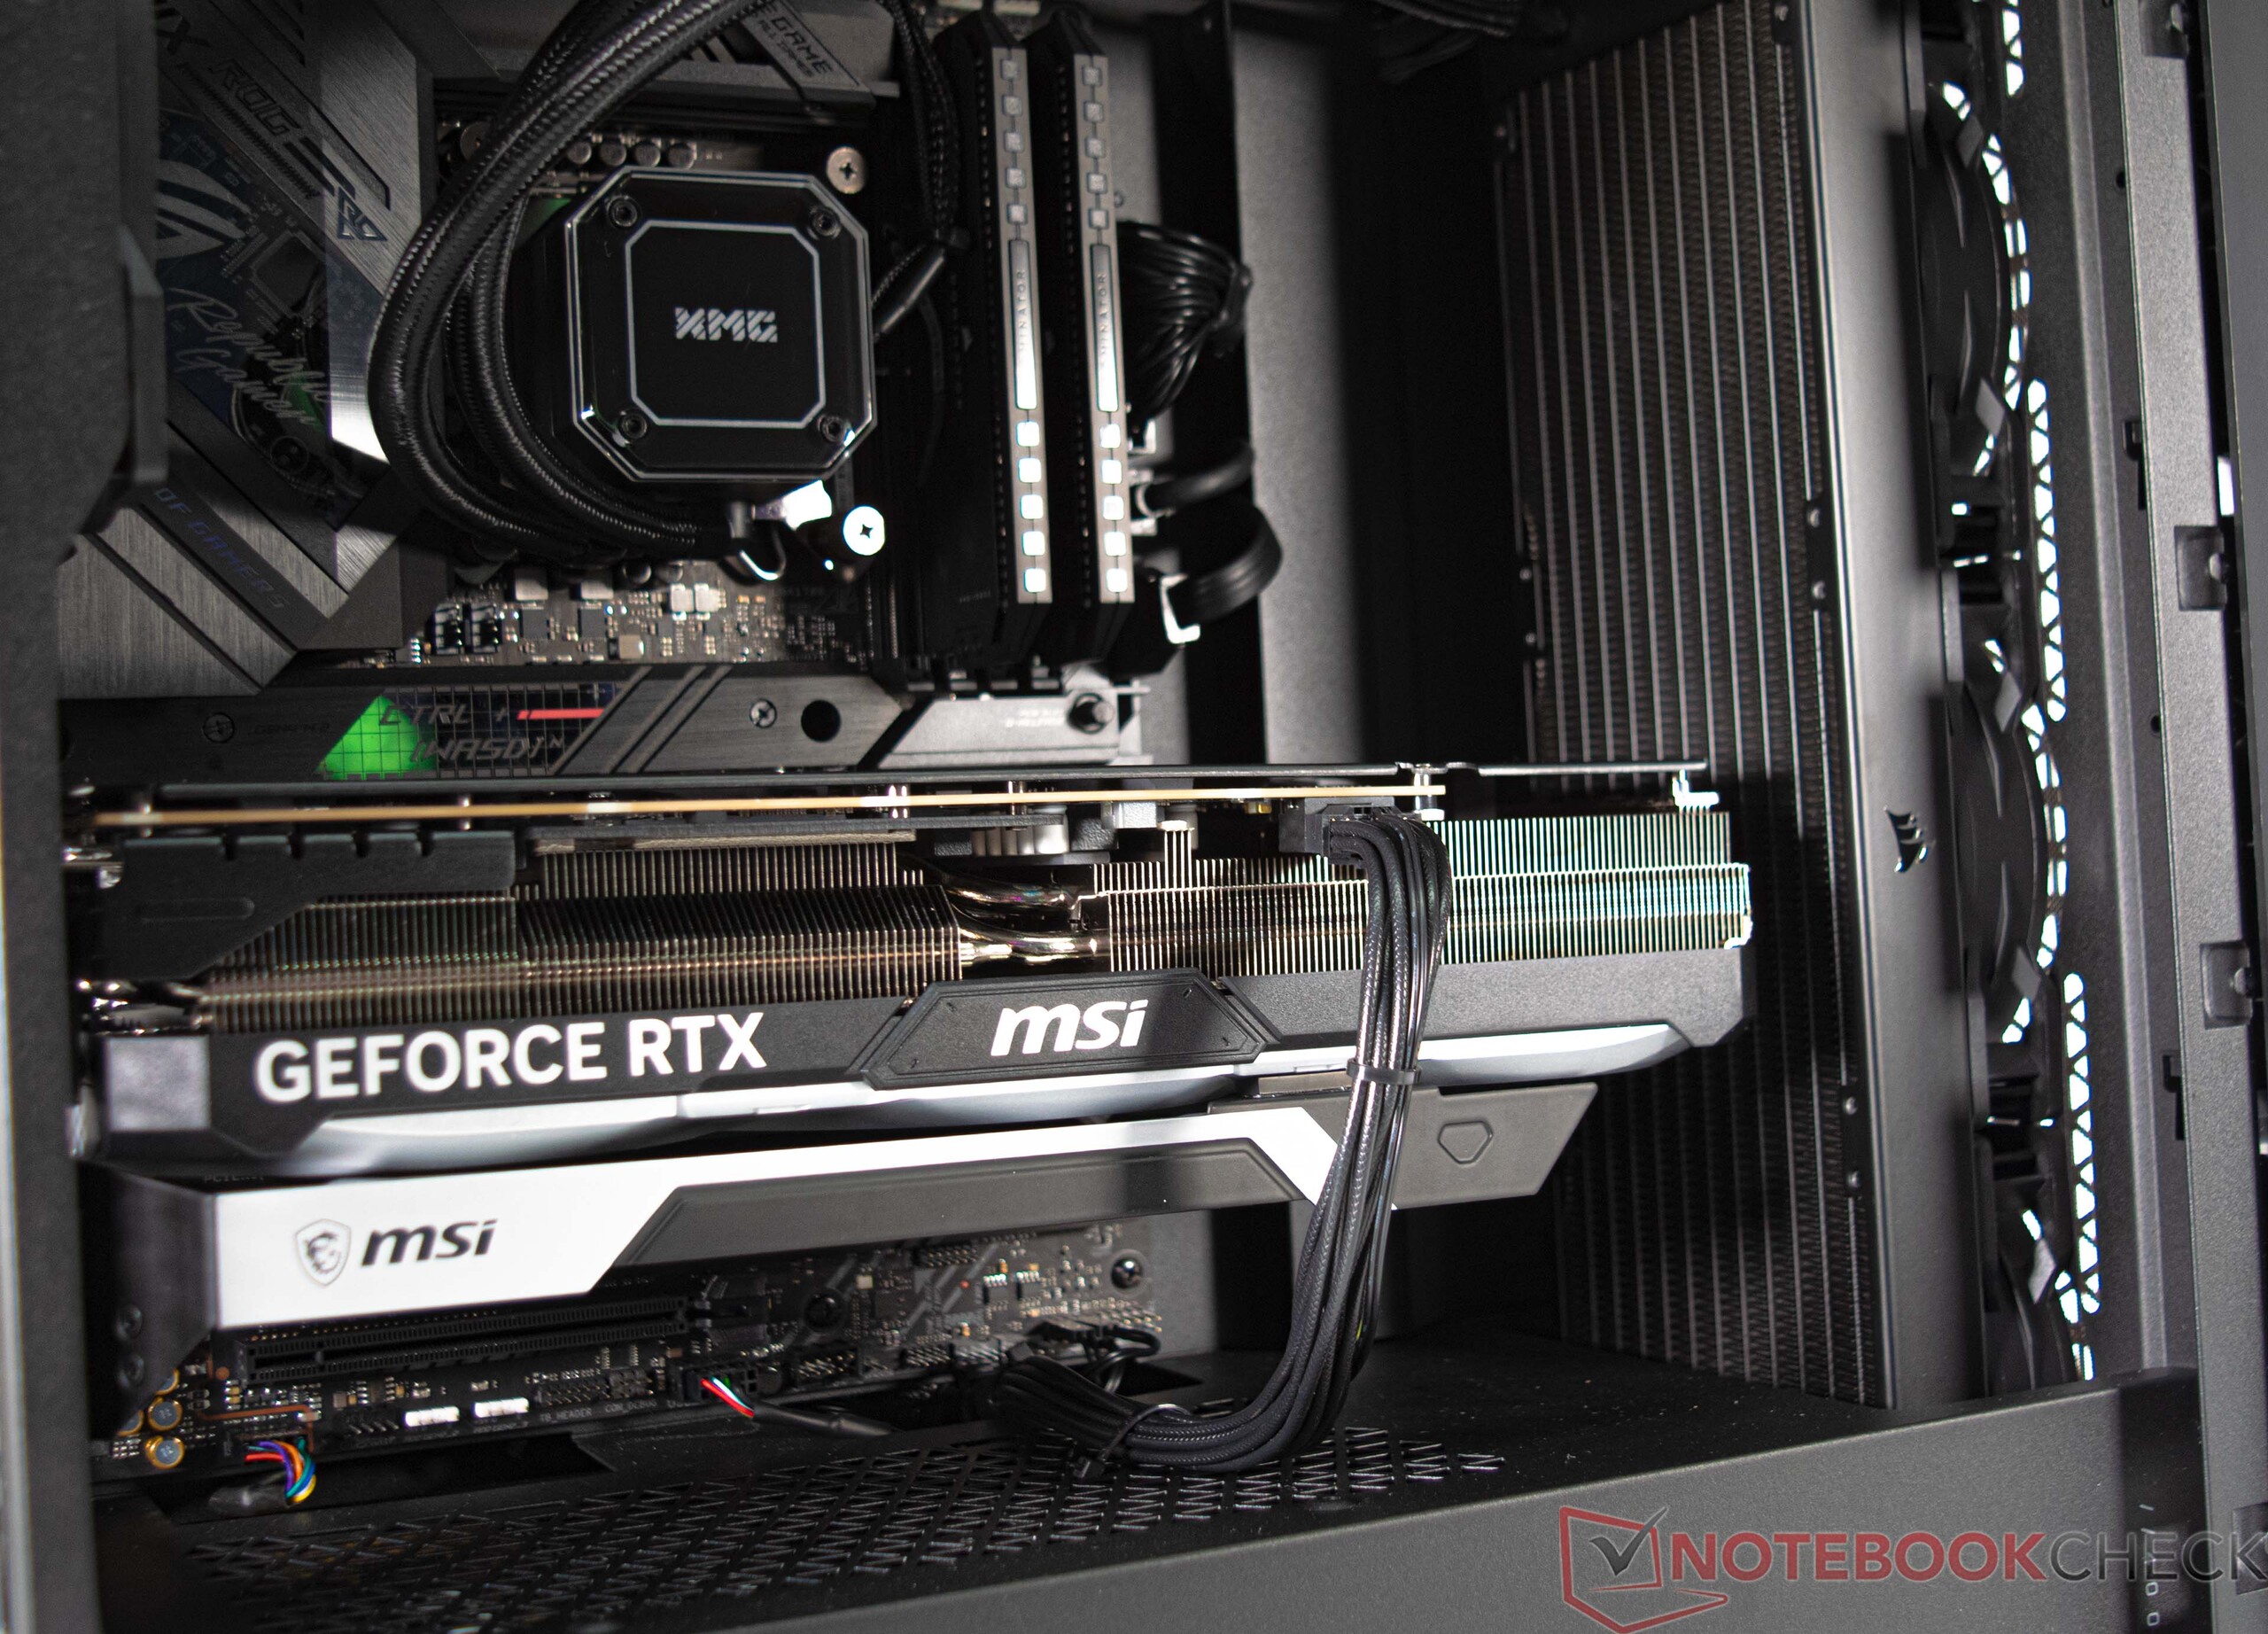
Schenker verbaut die Hardware des XMG Sector - Intel in einem Corsair 4000D Airflow in Schwarz. Das Gehäuse bietet zudem ein dunkles Glasfenster, womit die verbauten Komponenten zusätzlich mit Beleuchtungseffekten in Szene gesetzt werden können. Unsere Testausstattung verfügt hingegen nur über eine Beleuchtung des AiO-Kühlers – so wie bei dem verbauten Corsair Dominator RGB.
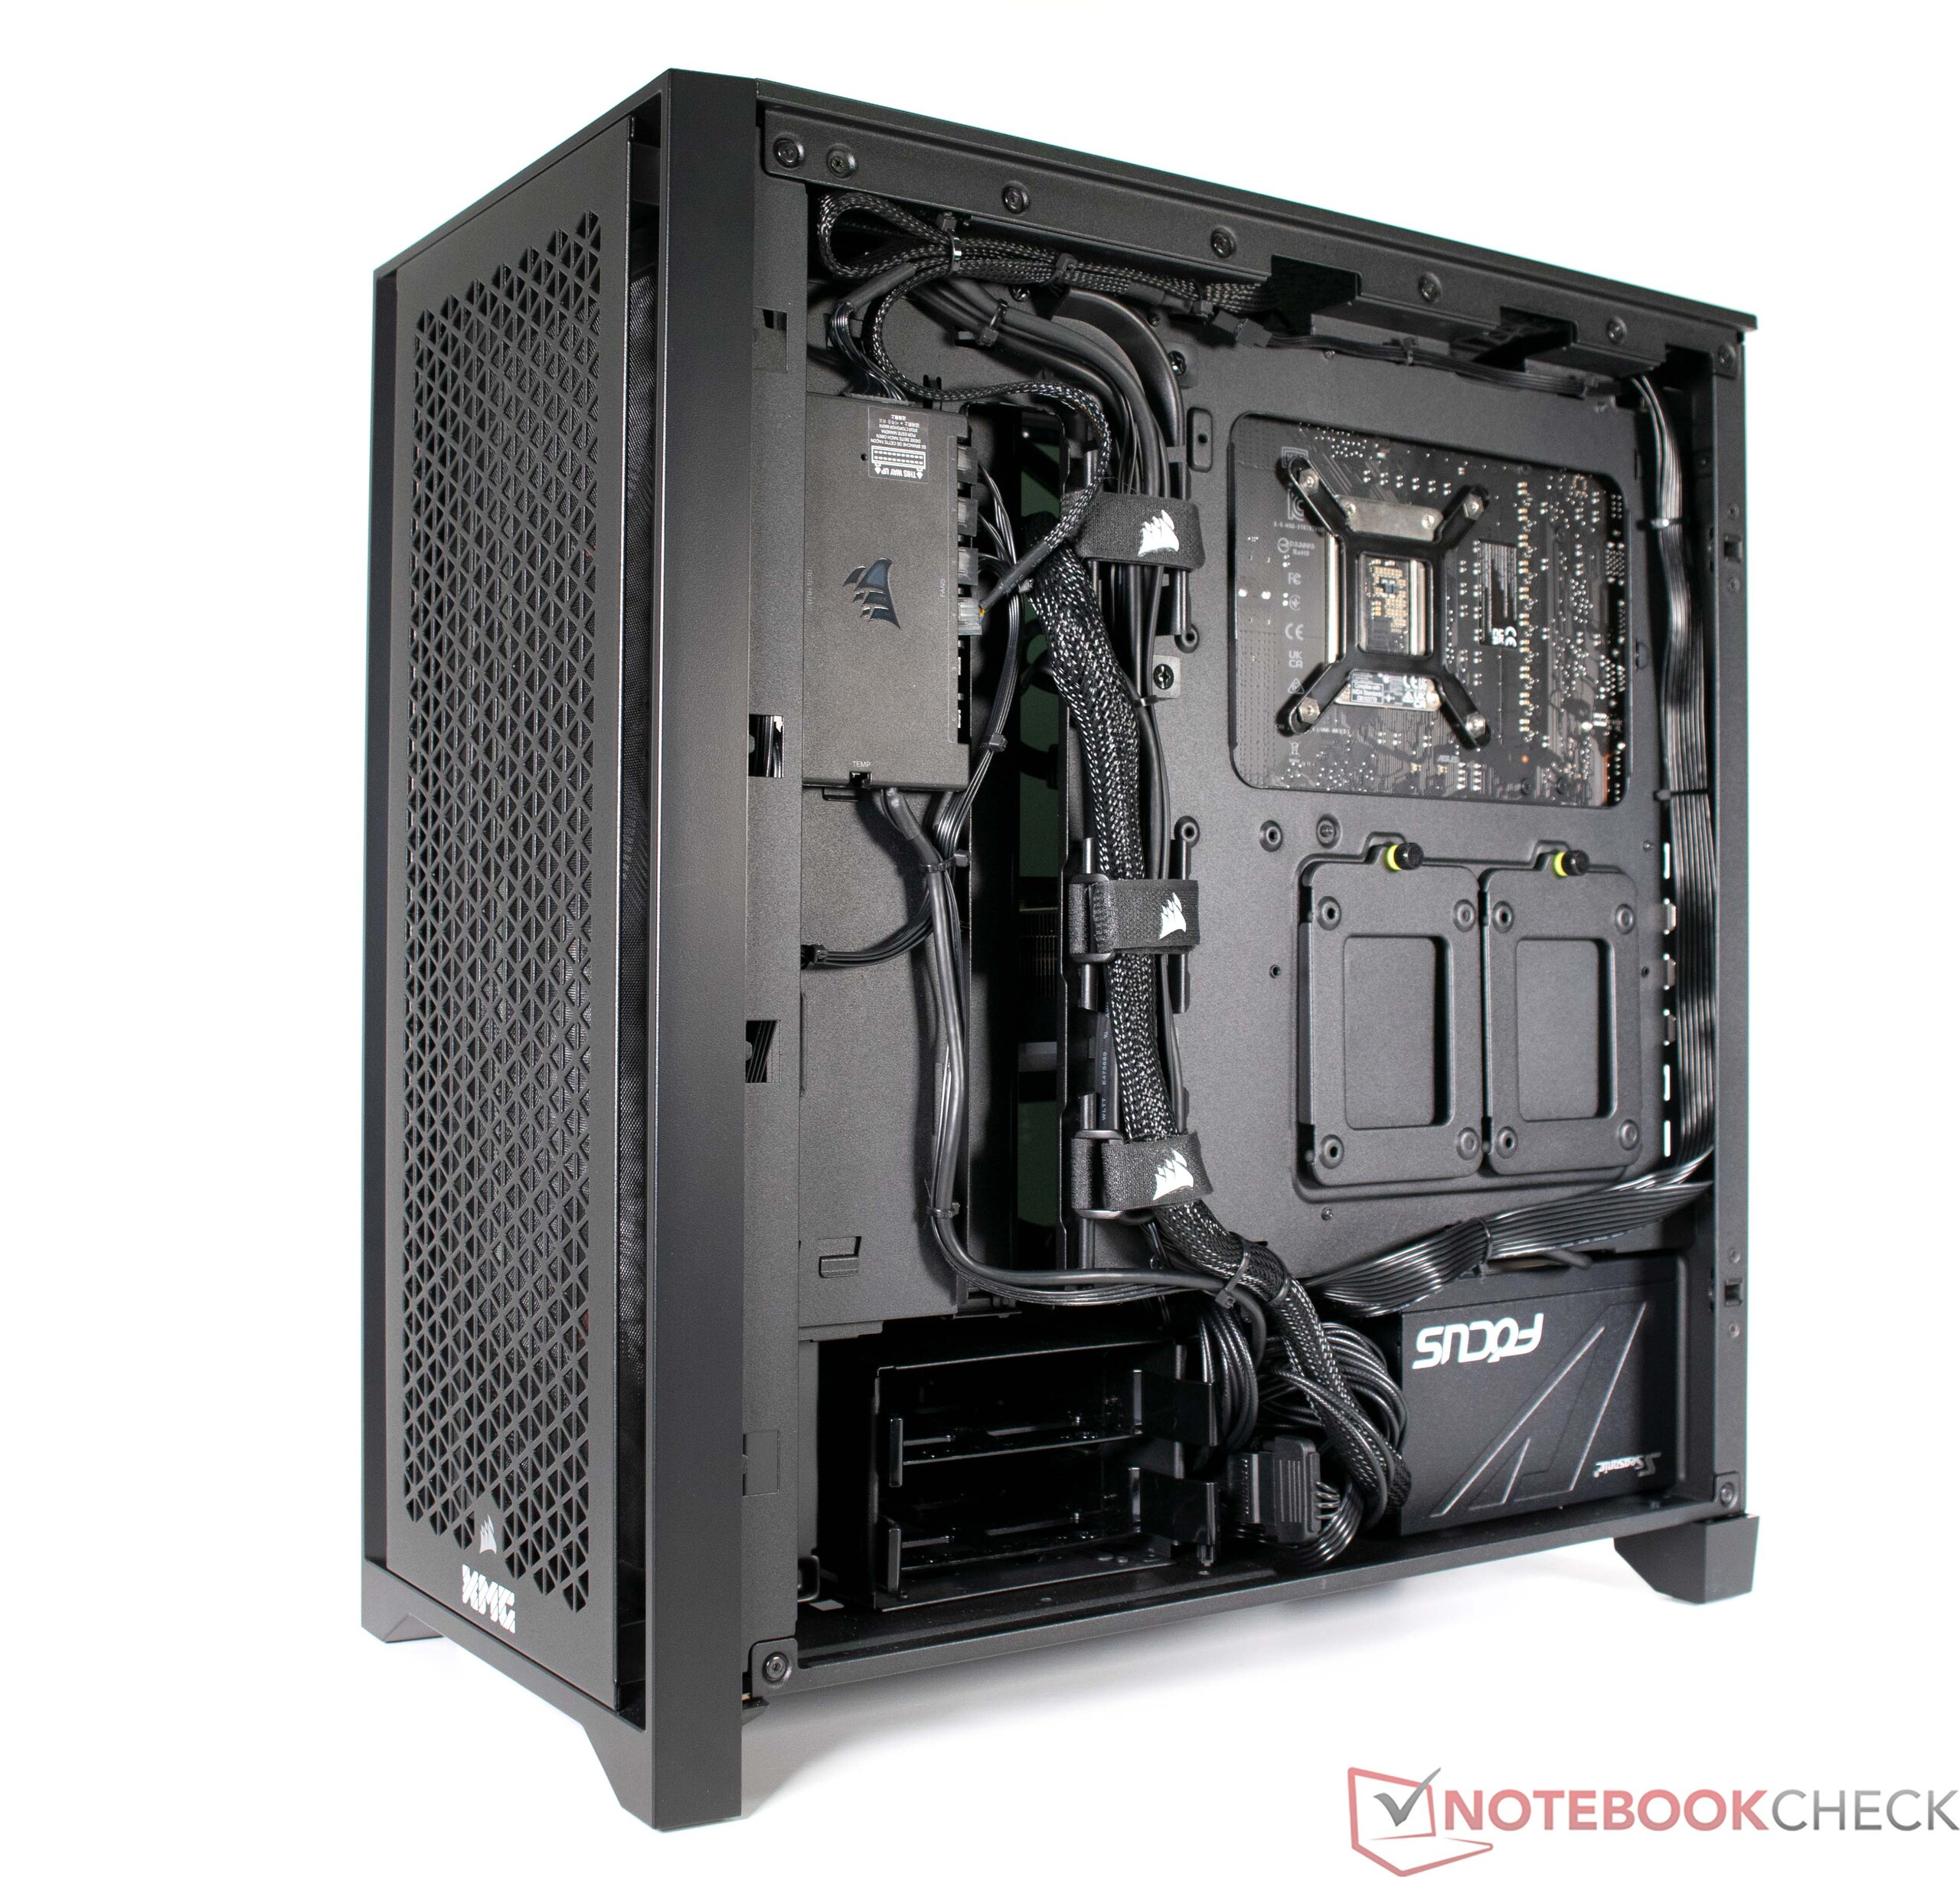
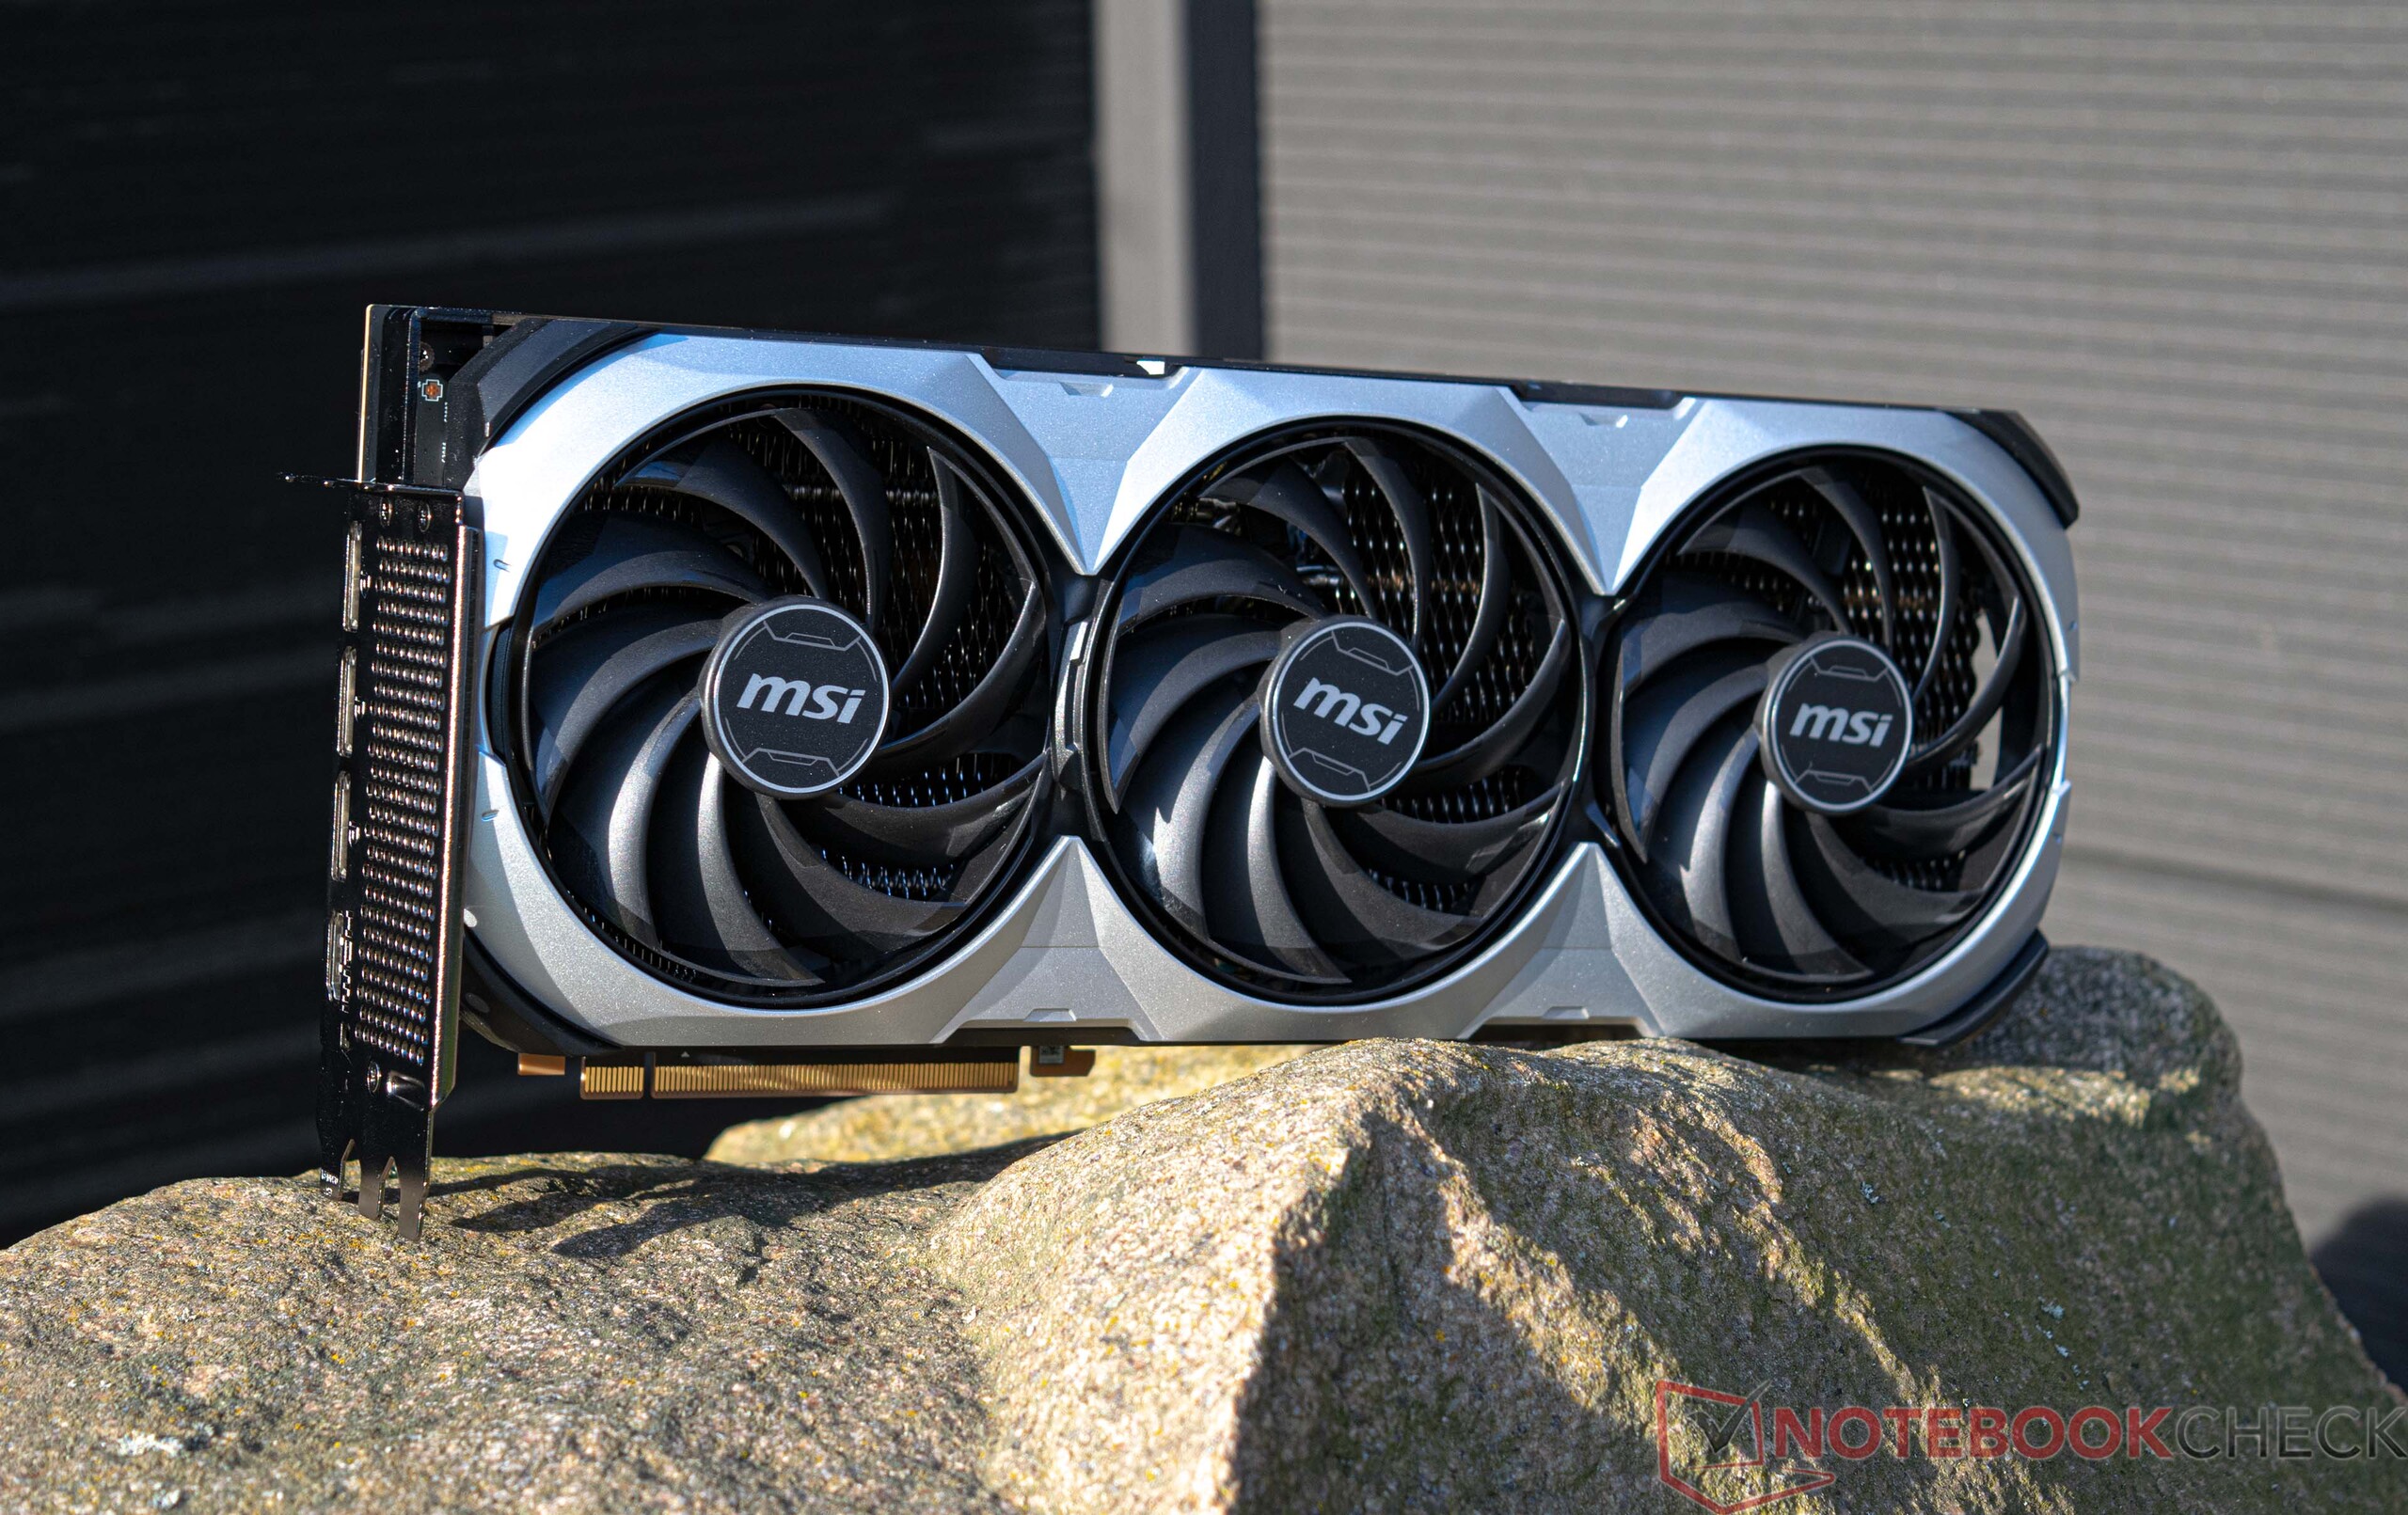
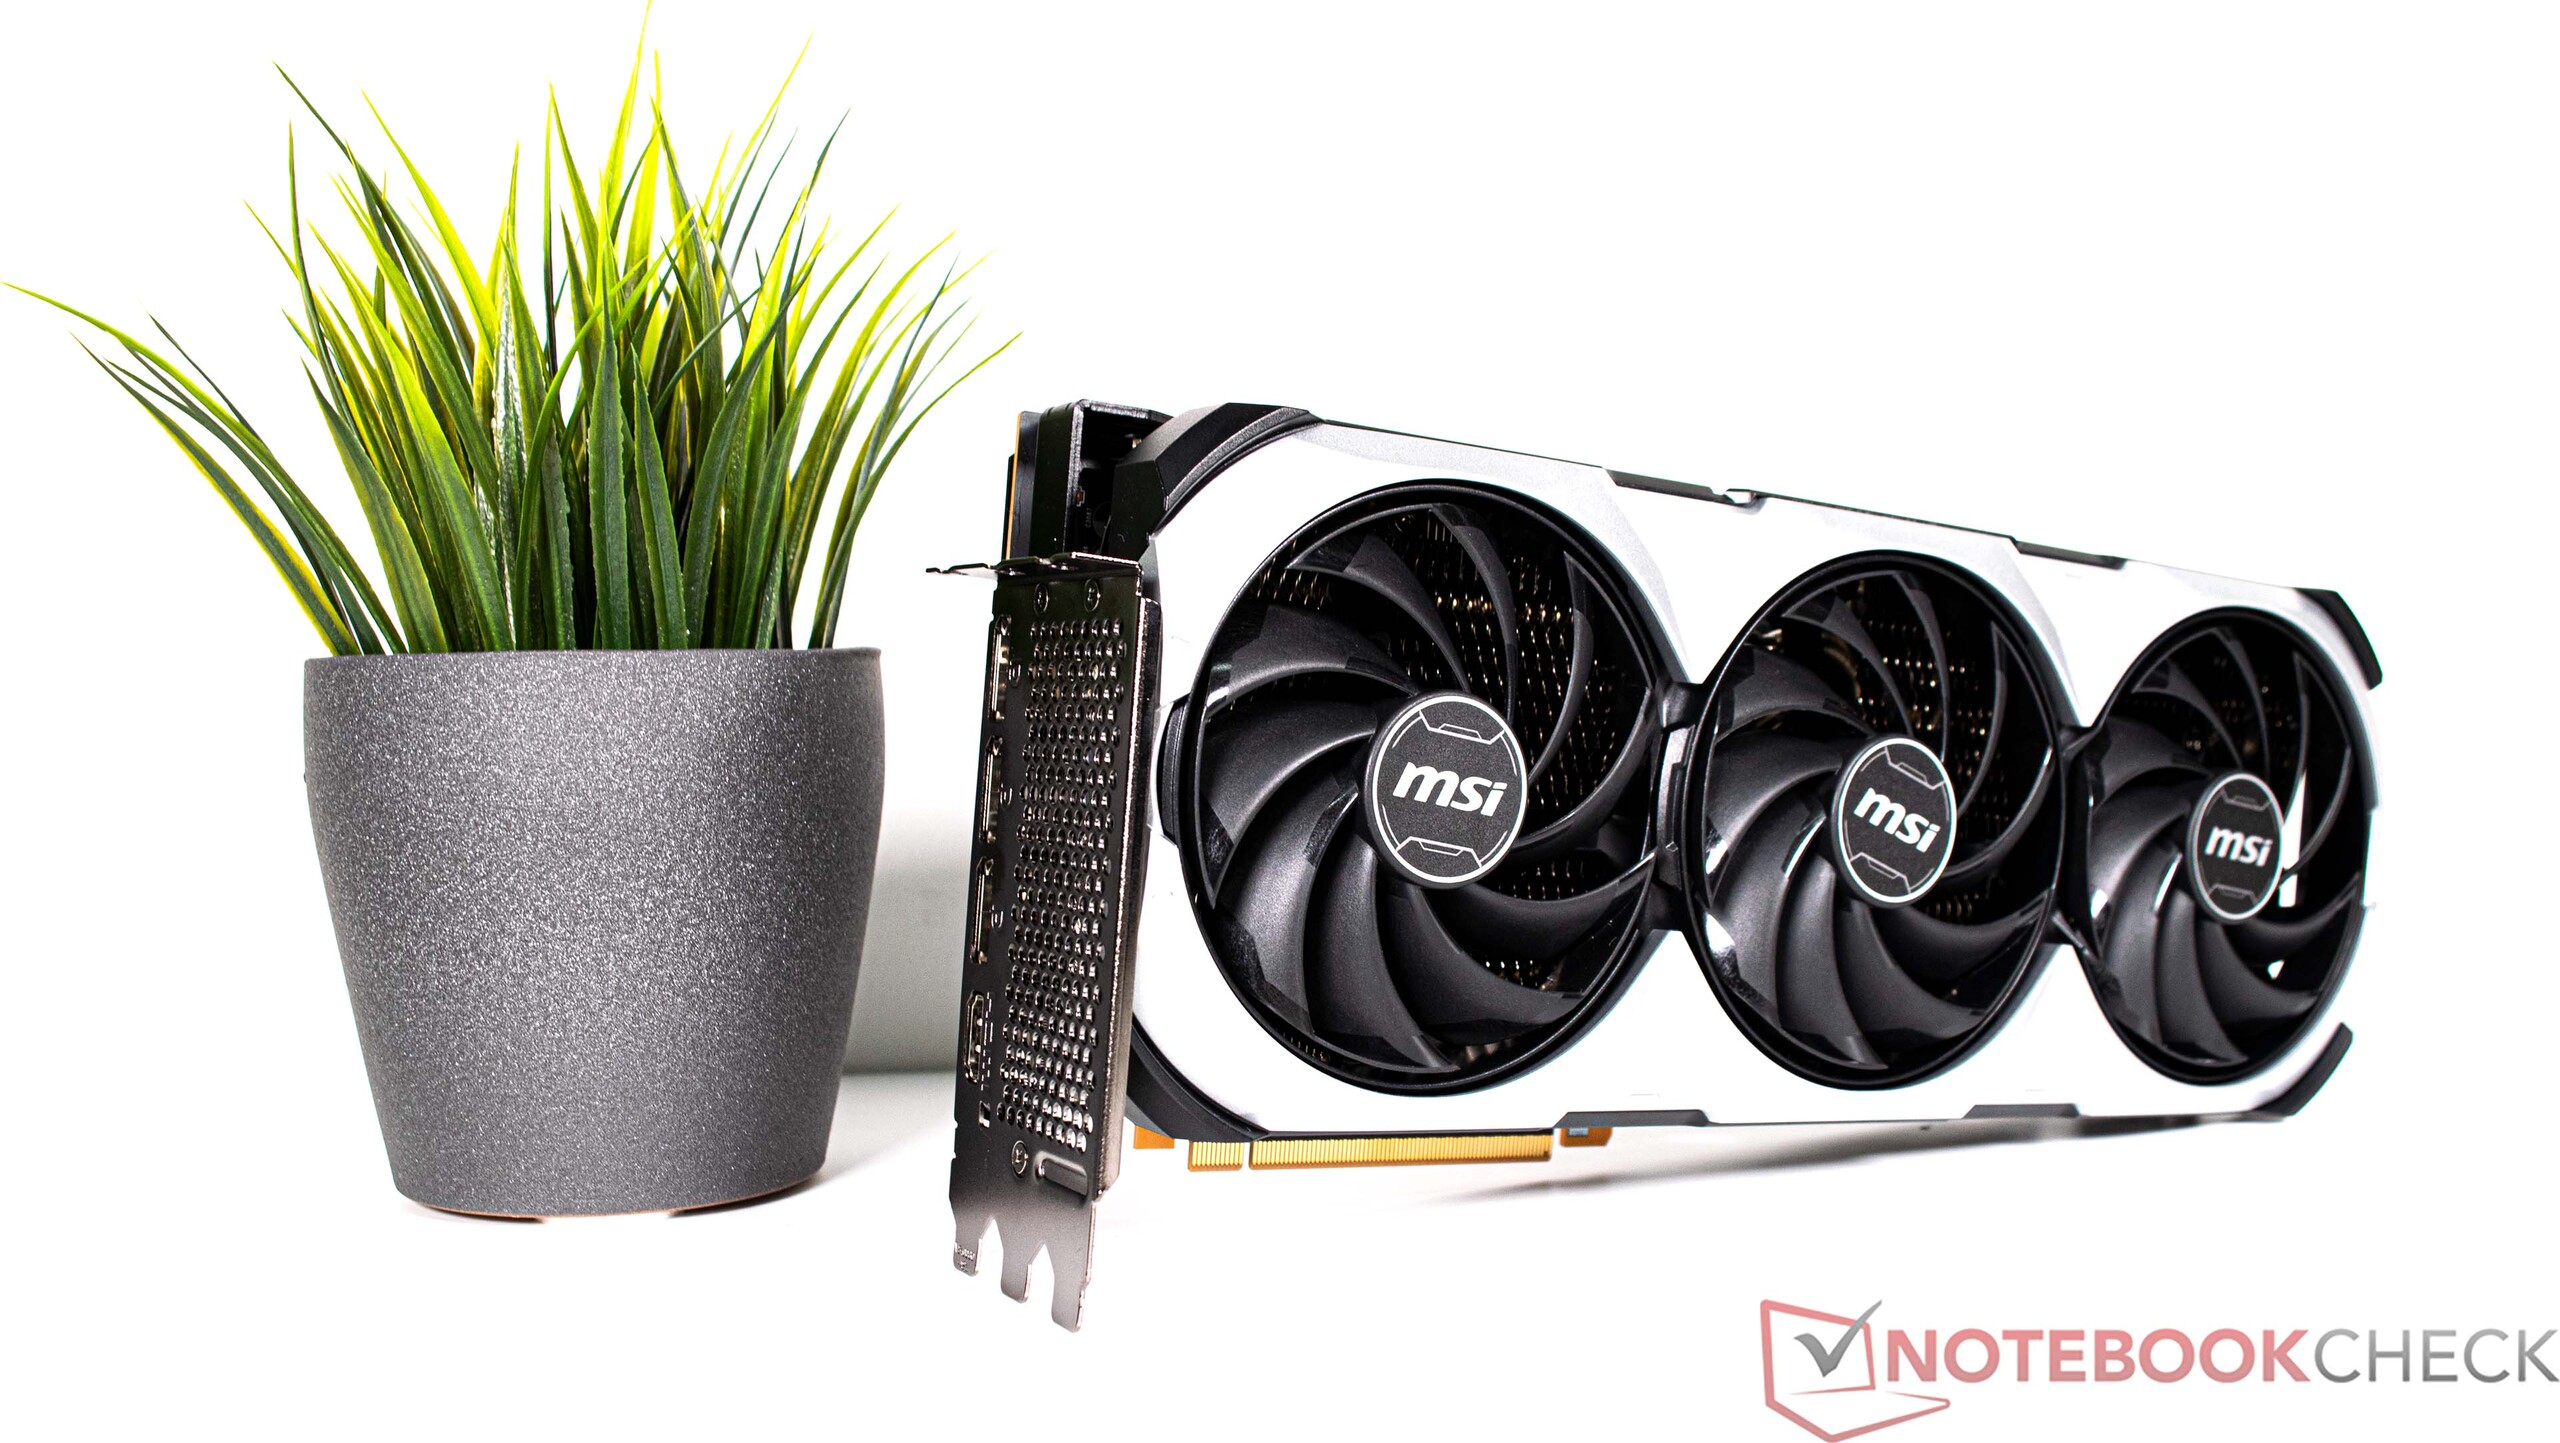
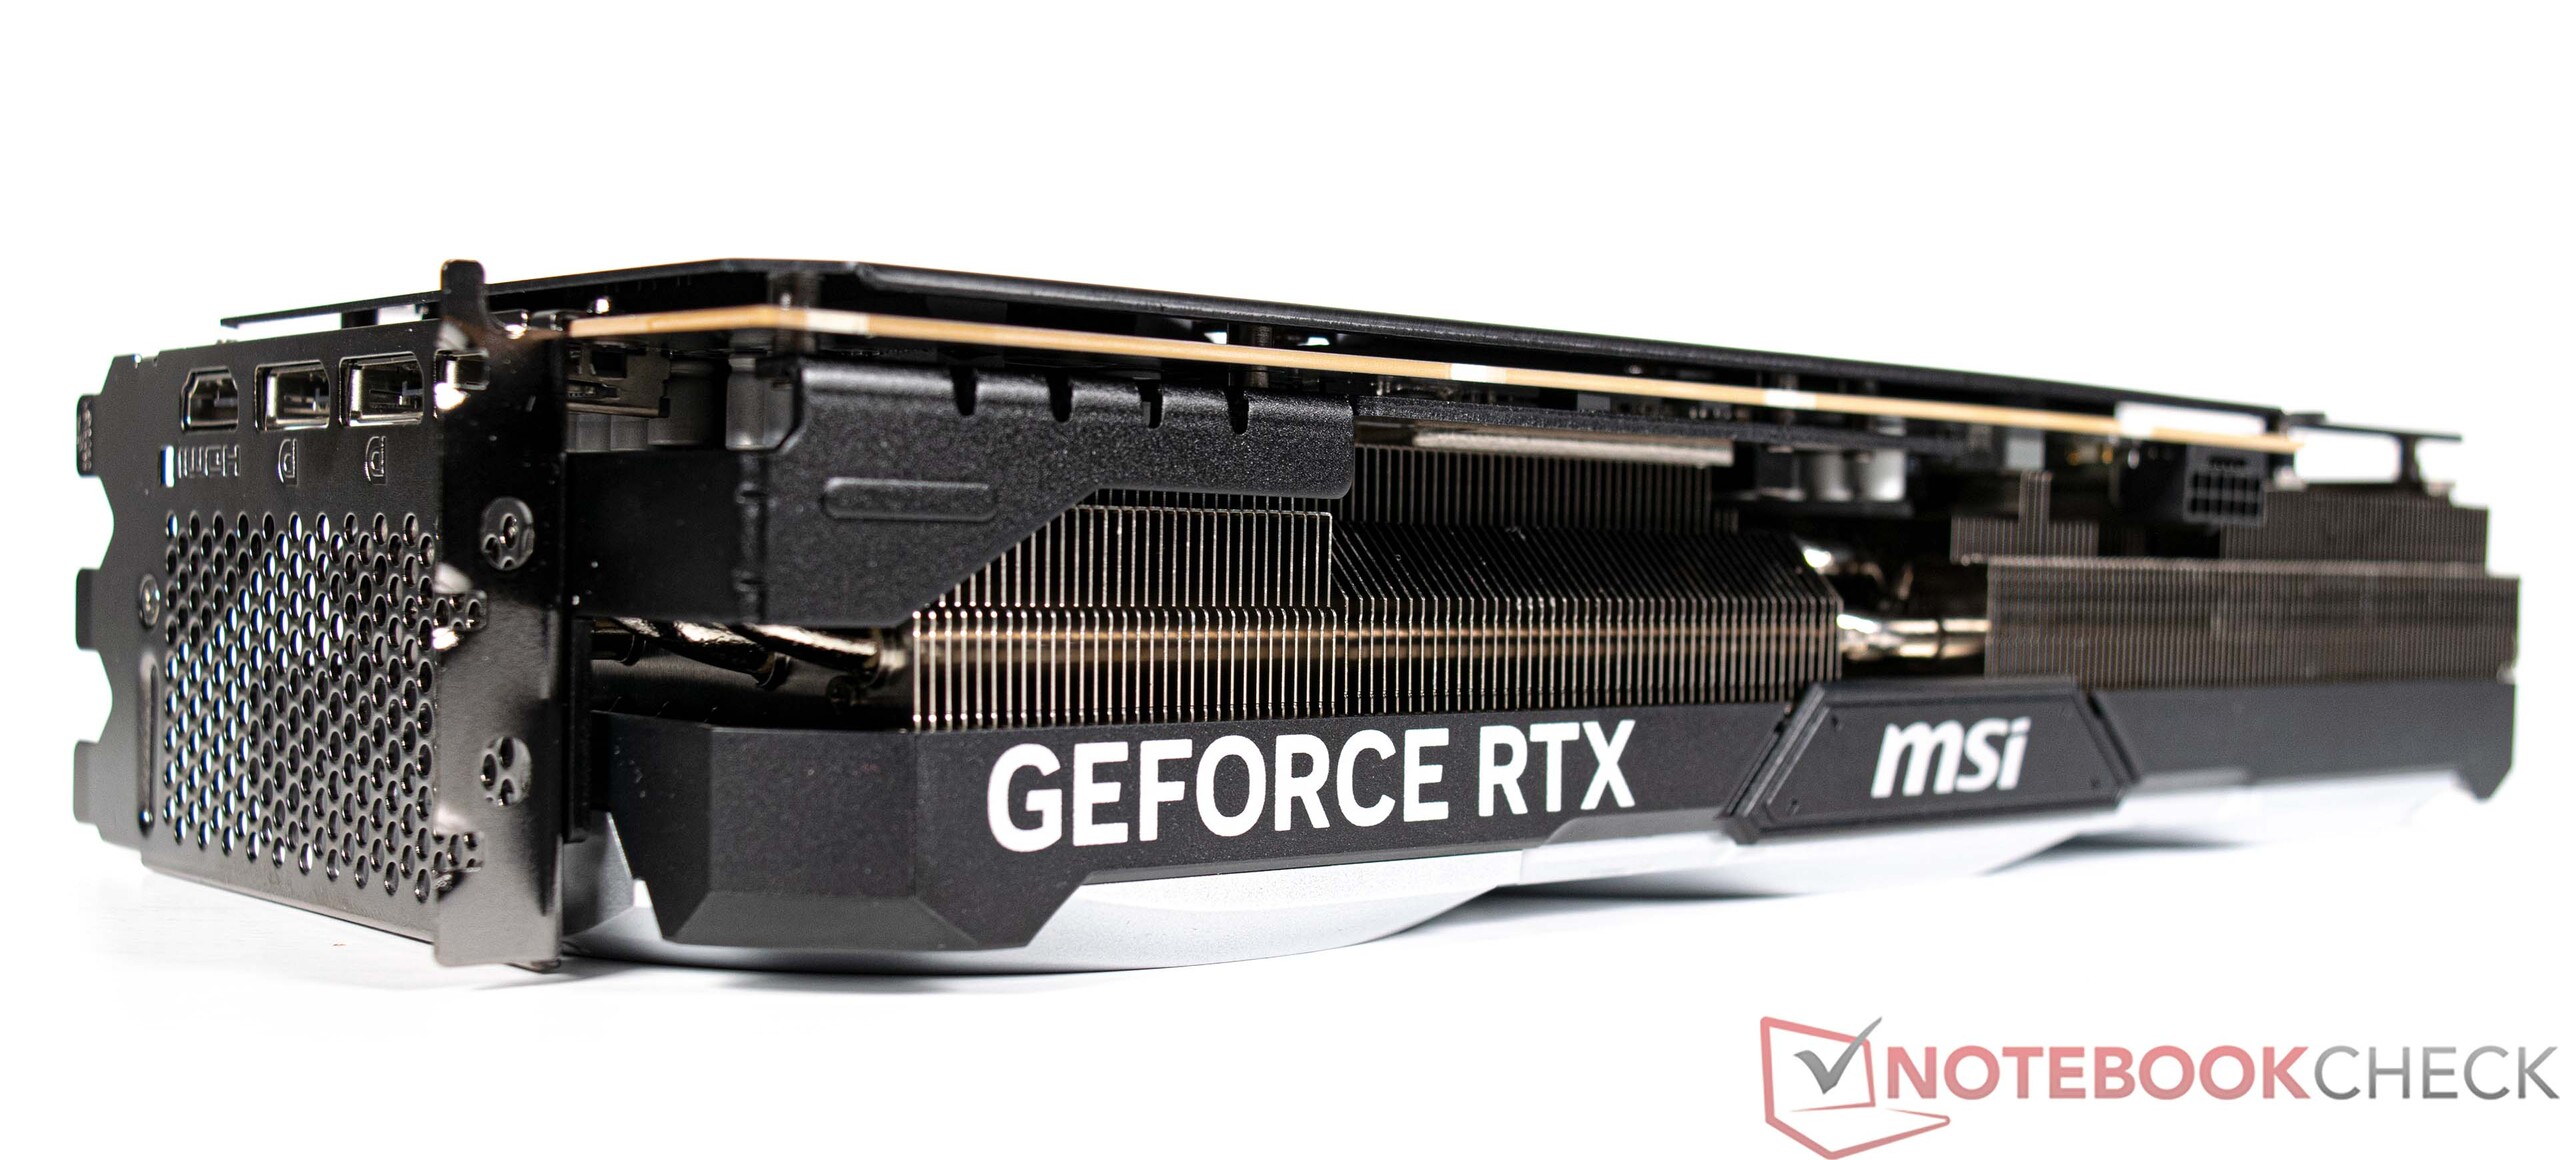
Das Corsair 4000D Airflow ist grundsätzlich ein sehr hochwertiges Gehäuse mit ausreichend Platz, um zahlreiche Komponenten zu verstauen. Immerhin passt sogar die große MSI GeForce RTX 4090 Ventus 3X GPU problemlos hinein.
Ausstattung
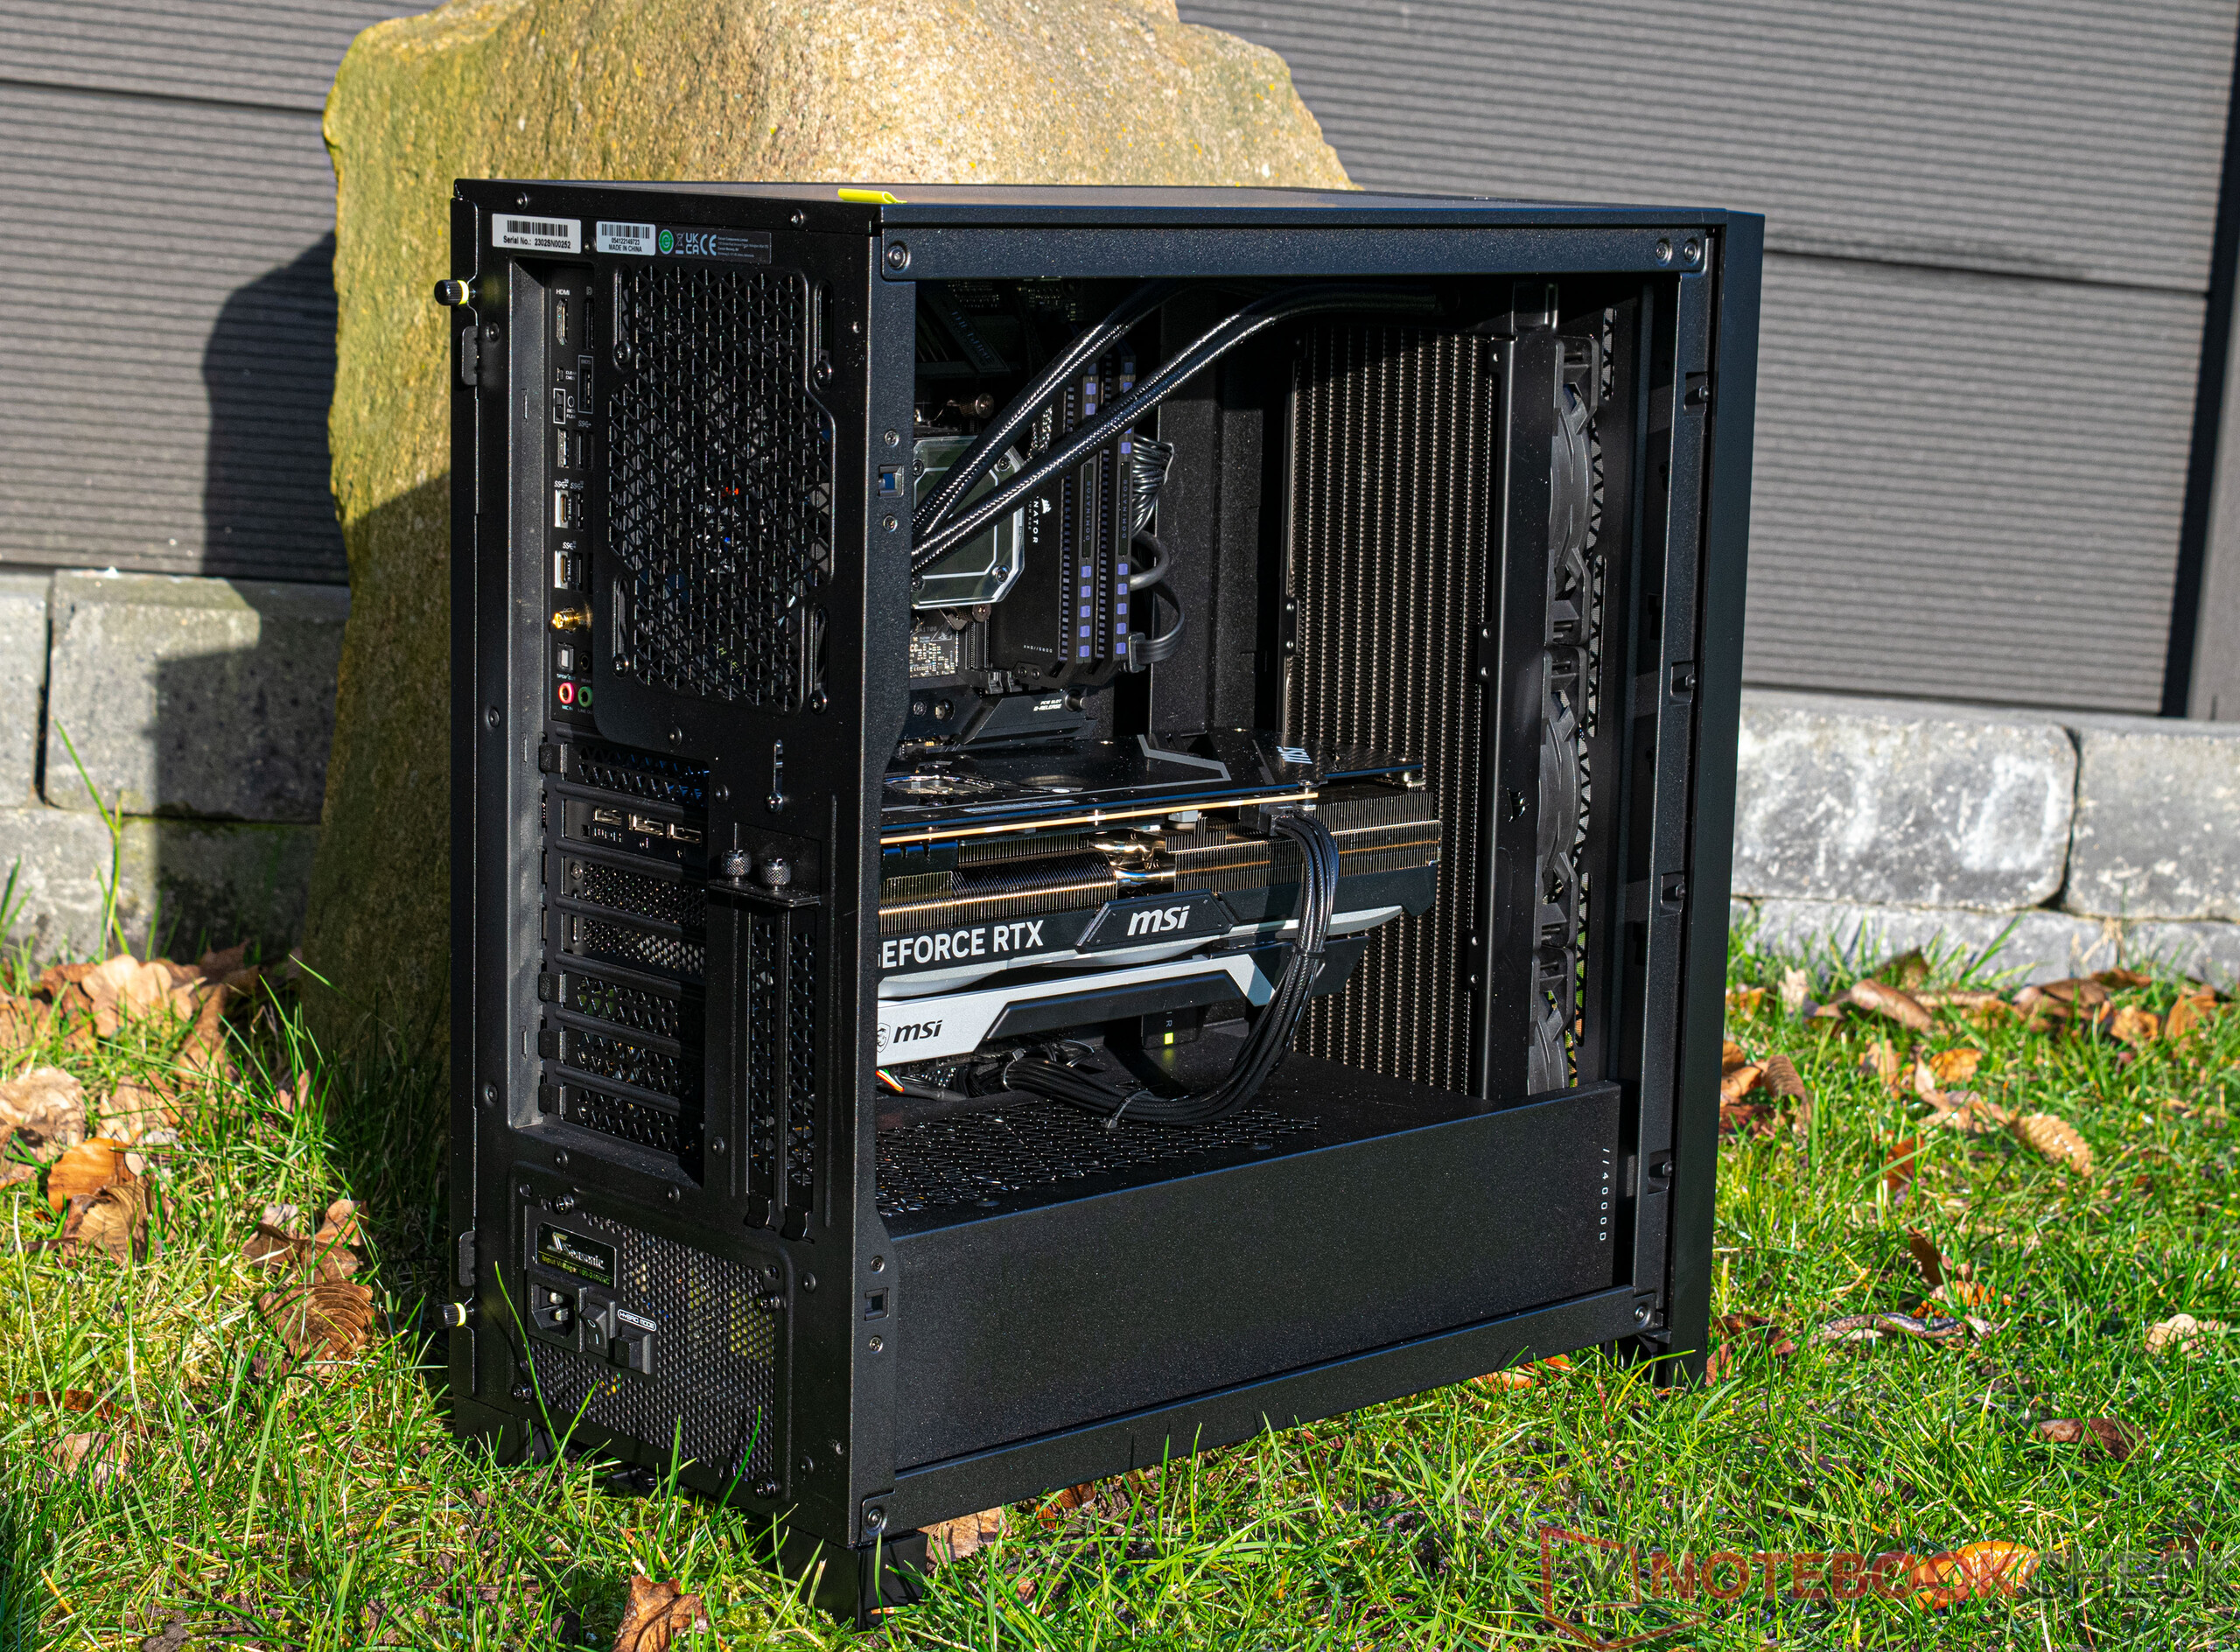
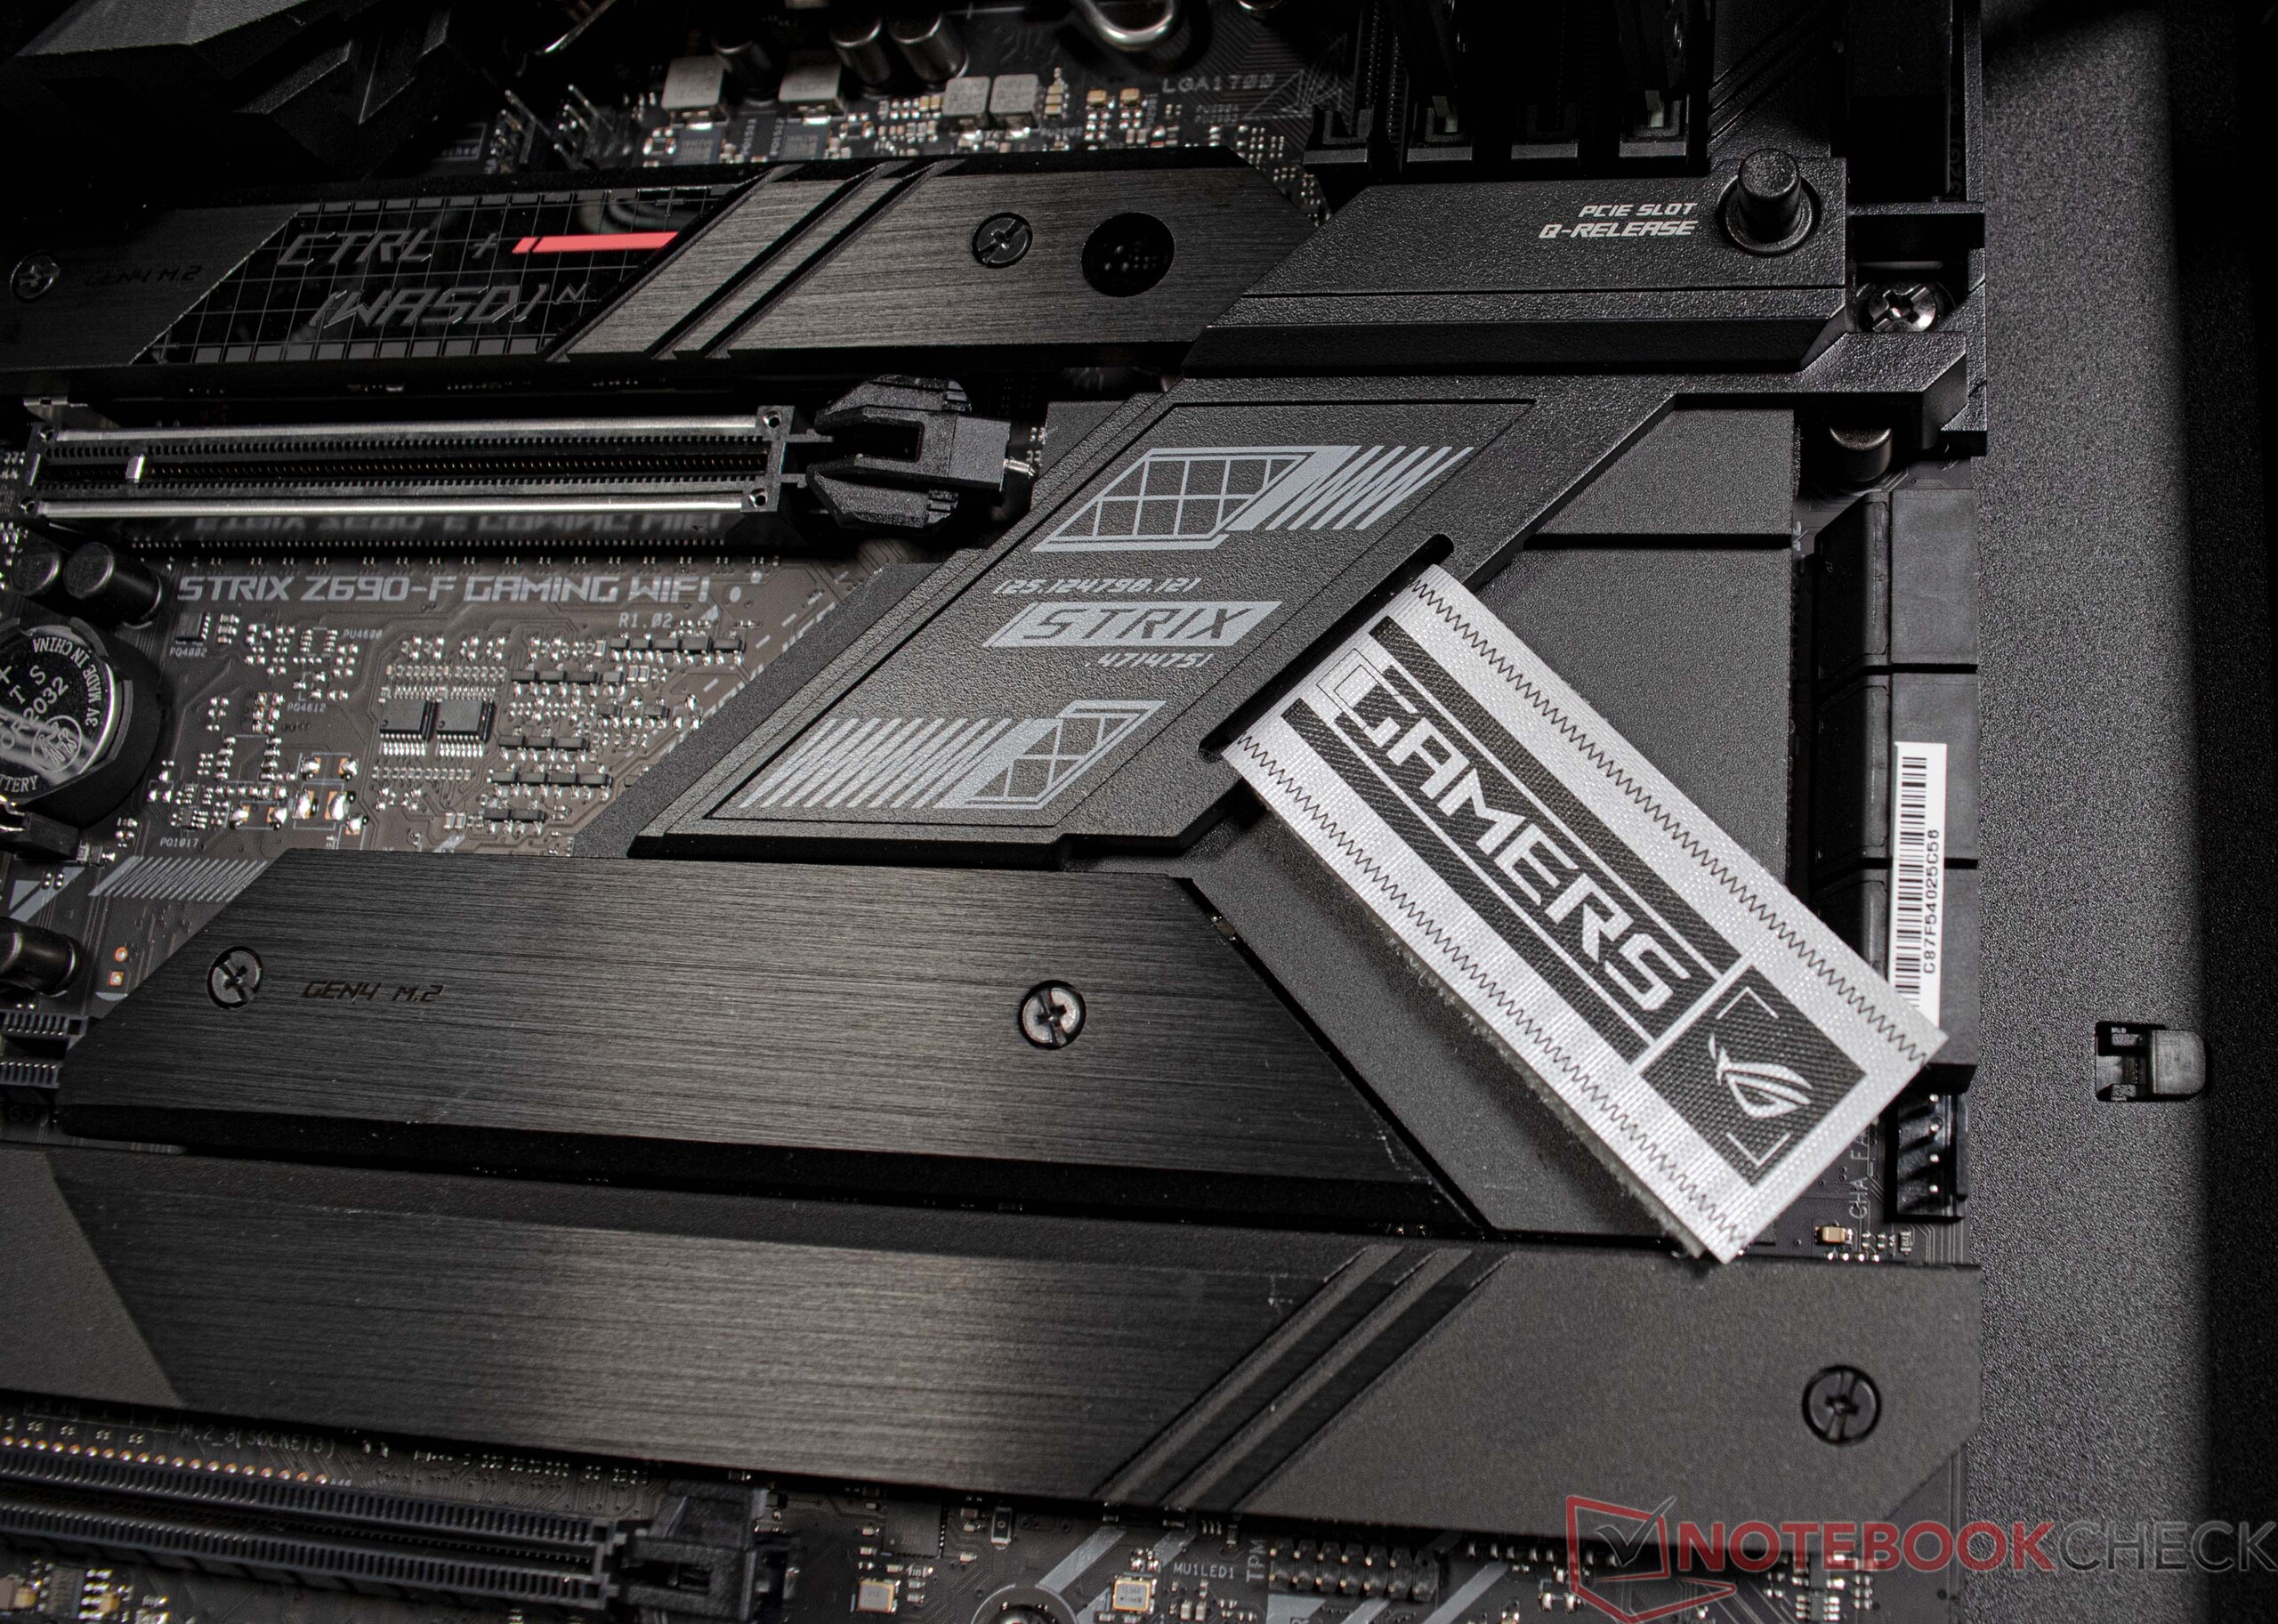
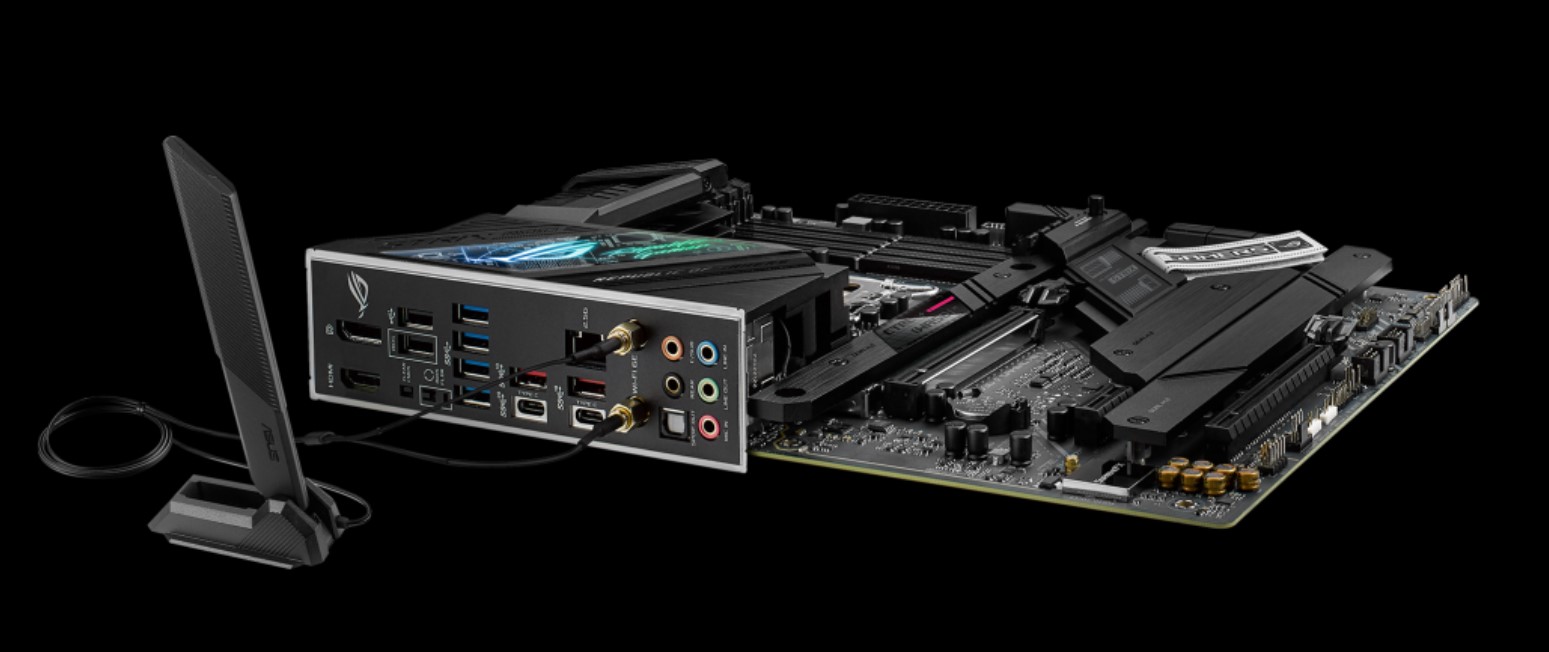
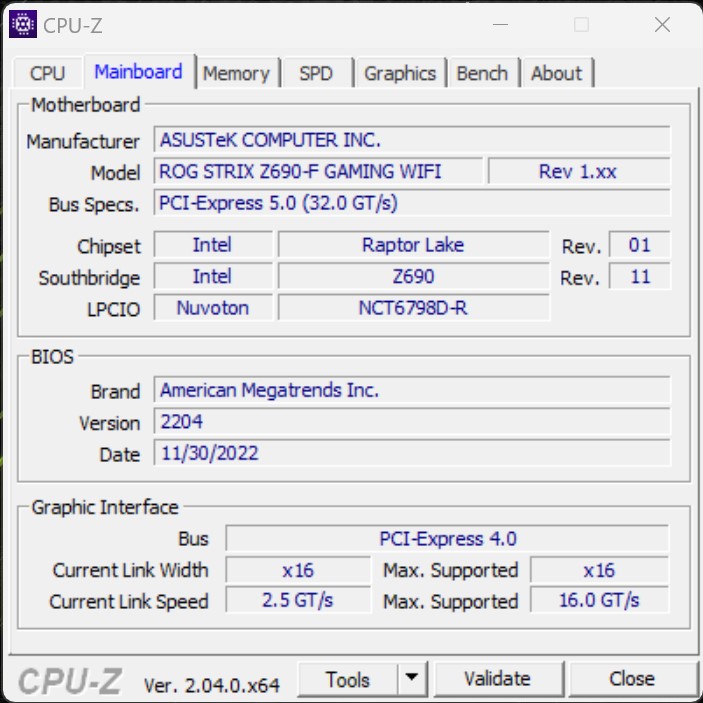
Bei der Anschlussausstattung müssen so gut wie keine Kompromisse eingegangen werden. So bietet das verbaute Mainboard, Asus ROG Strix Z690-F-Gaming, eine Vielzahl an USB-Schnittstellen sowie moderne Anschlüsse zur Netzwerkkommunikation. Insgesamt lassen sich bis zu vier M.2-SSDs auf der Platine verstauen. Zudem gibt es noch 6x SATA-6Gb/s-Anschlüsse und die Möglichkeit, bis zu 128-GB-RAM (DDR5) zu installieren. Einmal USB-TypA und einmal USB-TypC stehen dem Nutzer als Front-Panel direkt am Corsair 4000D Airflow zur Verfügung. Bei den Display-Ausgängen kommt es auf die verbaute Grafikkarte an, womit wir hier auf 3x DisplayPort und einmal HDMI zurückgreifen können. Wird keine Non-F-CPU verbaut, kann alternativ zu einer dedizierten Grafikkarte die integrierte Grafikeinheit des Prozessors für die Bildausgabe verwendet werden. Hierfür gibt es am Mainboard ebenfalls diverse Möglichkeiten, um Displays zu betreiben.
Kommunikation
Auf dem Asus ROG Strix Z690-F-Gaming sehen wir ein Intel-Wi-Fi-6E-AX211-WLAN-Modul. Den Test, welchen wir mit unserem Testrouter Asus ROG Rapture GT-AXE11000 durchgeführt haben, überzeugt nicht komplett. Bei Verwendung der 5G-Verbindung bleiben die dokumentierten Transferraten hinter unseren Erwartungen. Beim Wechsel auf eine 6G-Verbindung sehen die Übertragungsraten deutlich besser aus. Alternativ bietet das Mainboard des Testsystems noch eine RJ45-Schnittstelle, welche bis zu 2,5 GBit/s unterstützt.
Zubehör
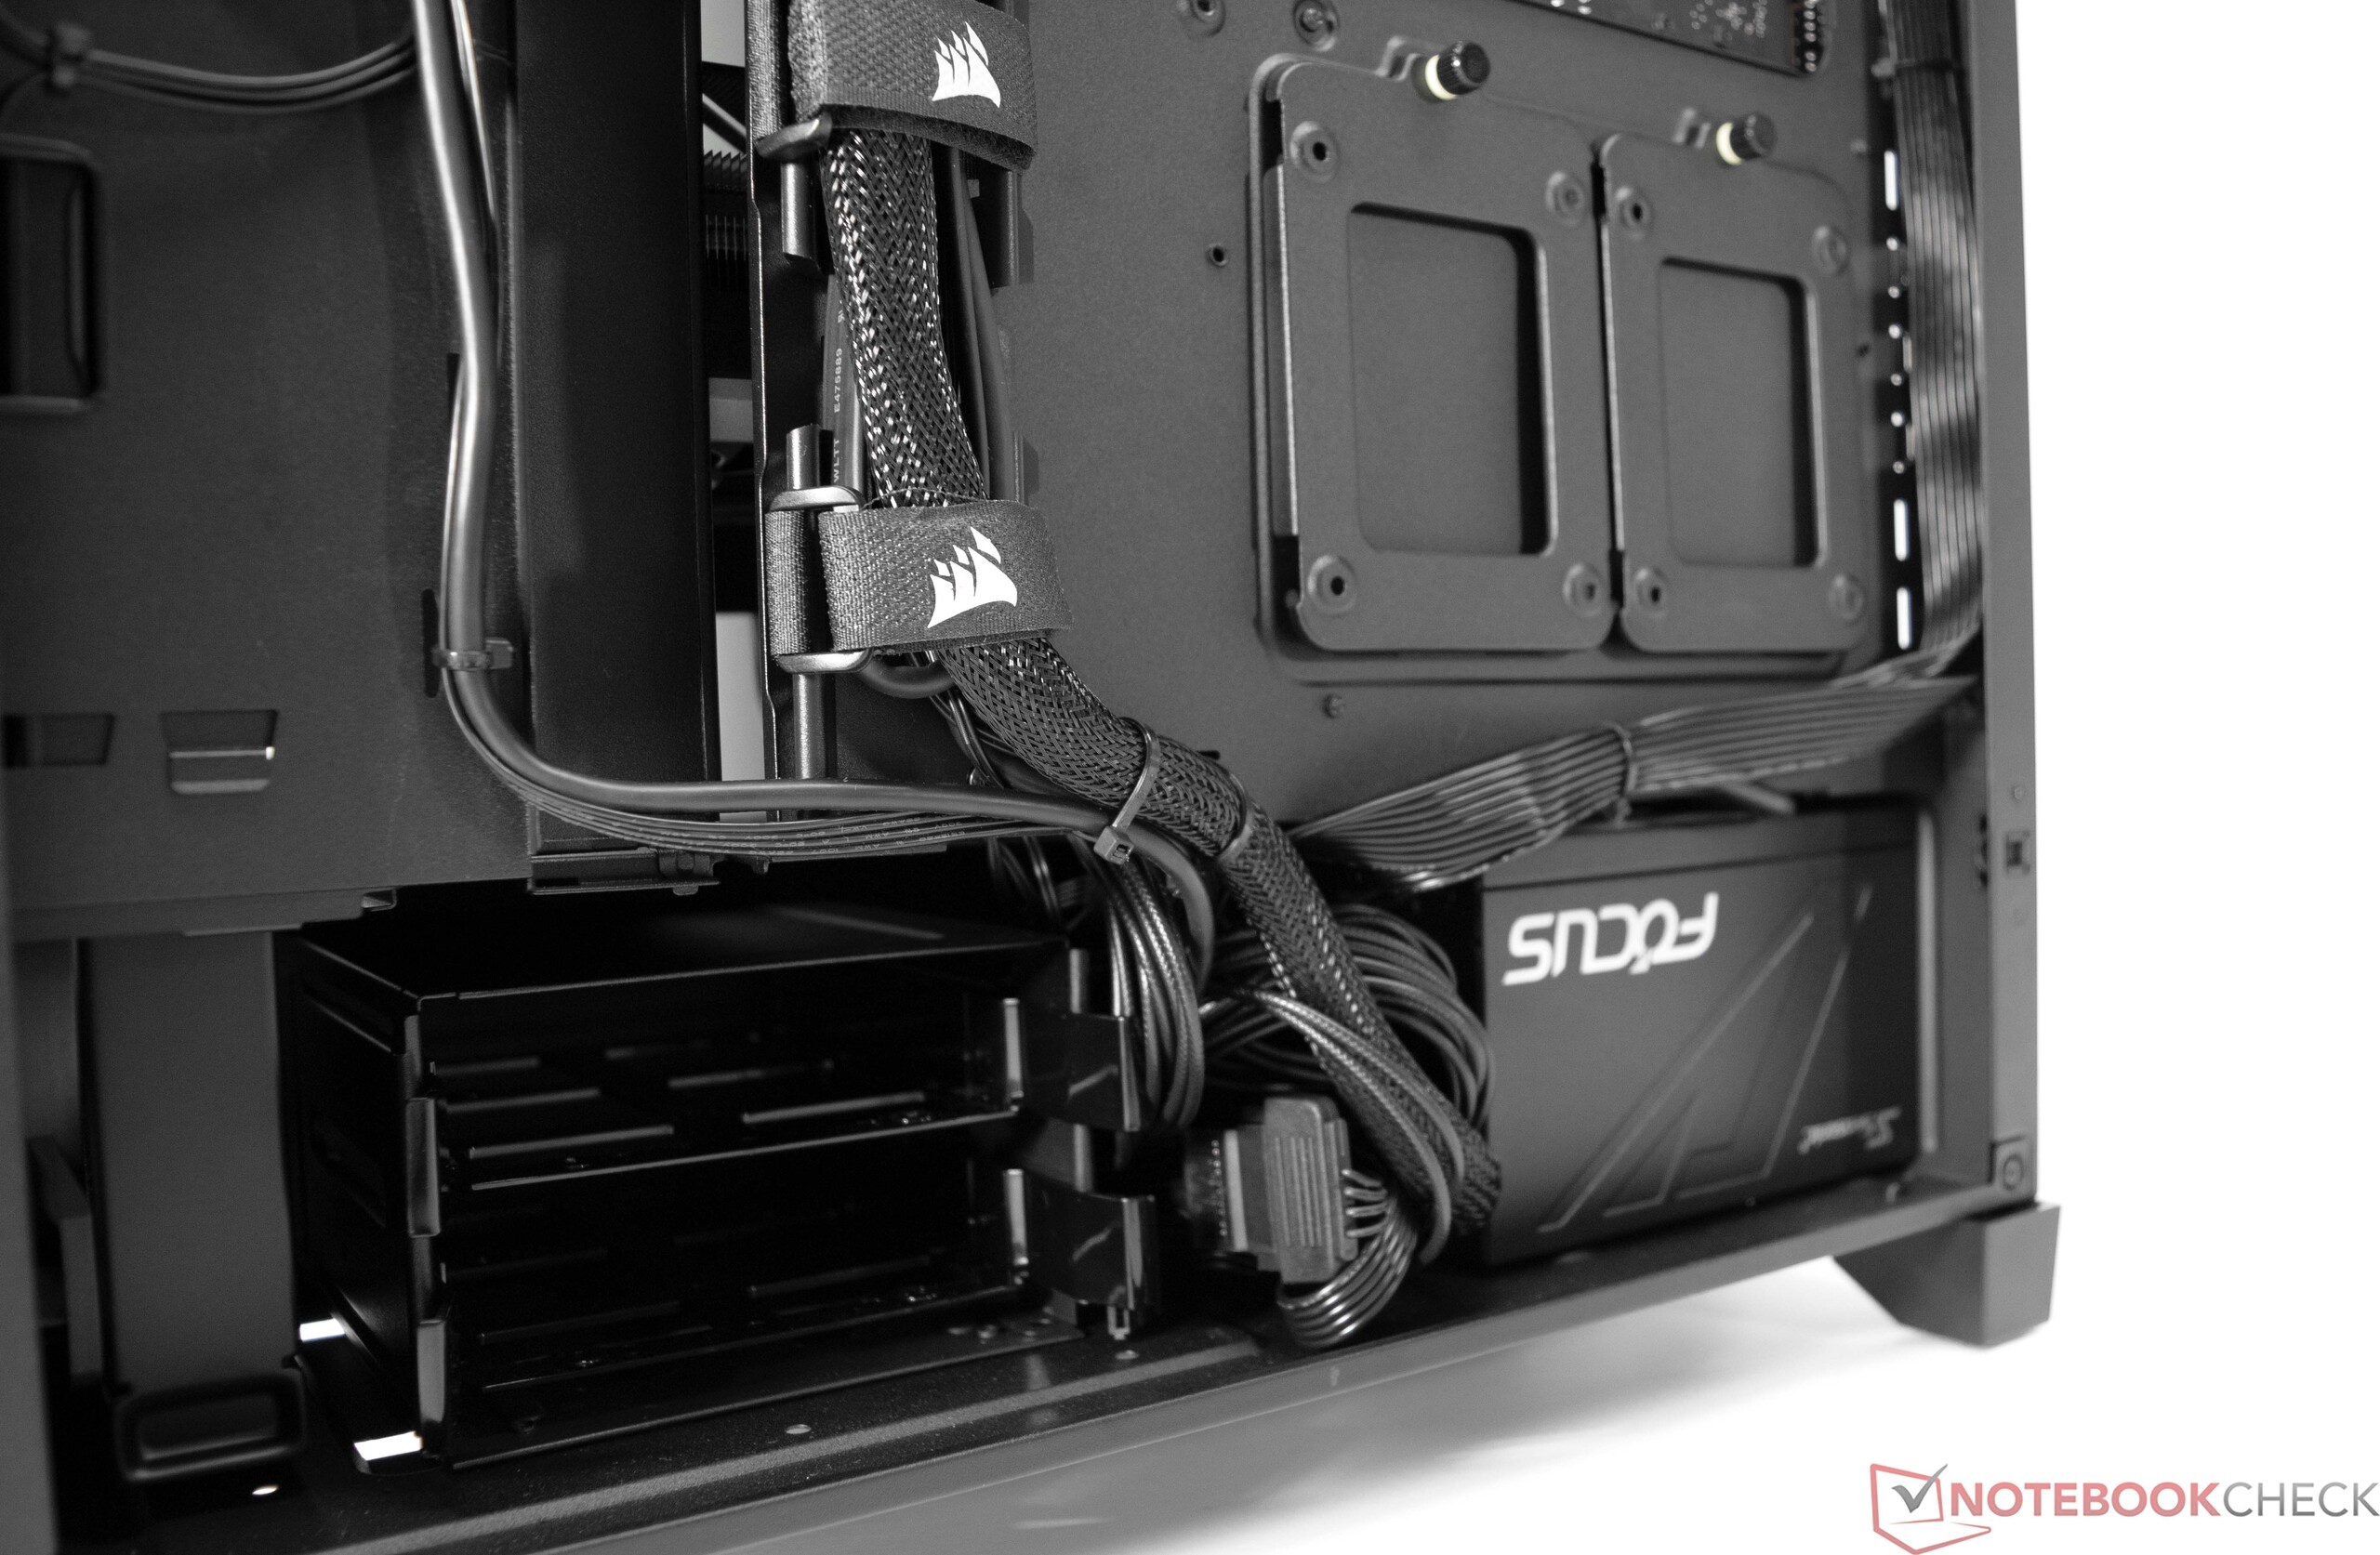
Der Lieferumfang umfasst neben dem Gerät diverses Zubehör des Mainboards in Form von Kabeln sowie der WLAN-Antenne. Des Weiteren gibt es noch die restlichen Kabel des verbauten Netzteils, denn dieses ist voll modular.
Wartung
Wartungsarbeiten sind bei dem XMG Sector - Intel kein Problem: Die Seitenteile des Corsair 4000D Airflow lassen sich leicht entfernen. Somit lassen sich die Lüfter schnell und unkompliziert von Staub befreien. Mit der Corsair iCUE H150i Elite Capellix ist eine leistungsstarke AiO-Lösung verbaut, welche keinen großartigen Wartungsaufwand darstellt.
Garantie
Eine 36-monatige Basis-Garantie mit Pickup-&-Return-Service ist beim Kauf eines XMG Sector - Intel inkludiert. Eine Erweiterung der Garantiezeit lässt sich beim Bestellprozess nicht auswählen.
Leistung - zweitschnellste Intel CPU trifft auf schnellste GPU
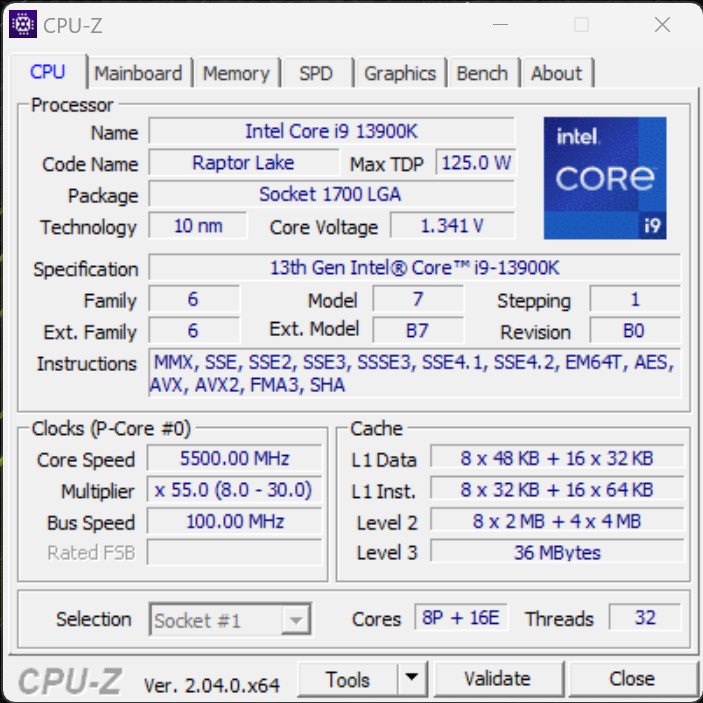
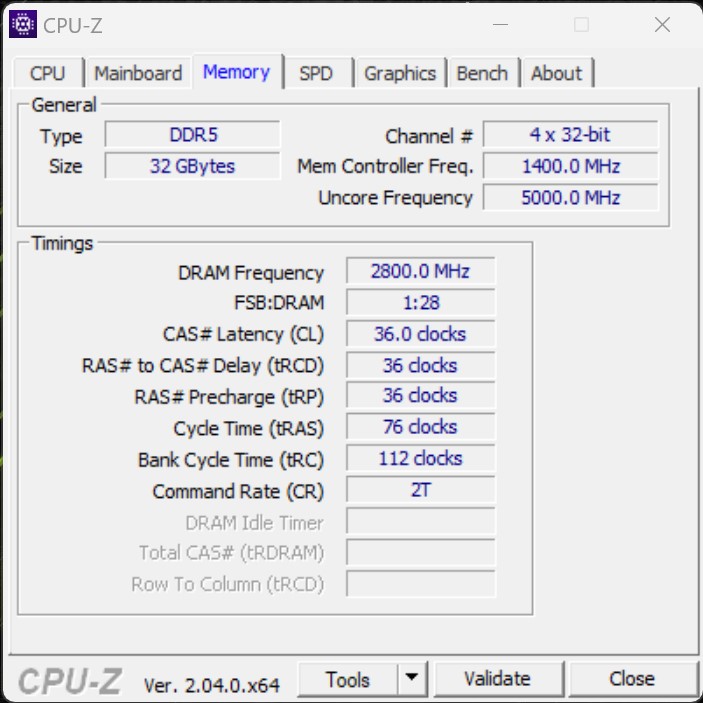
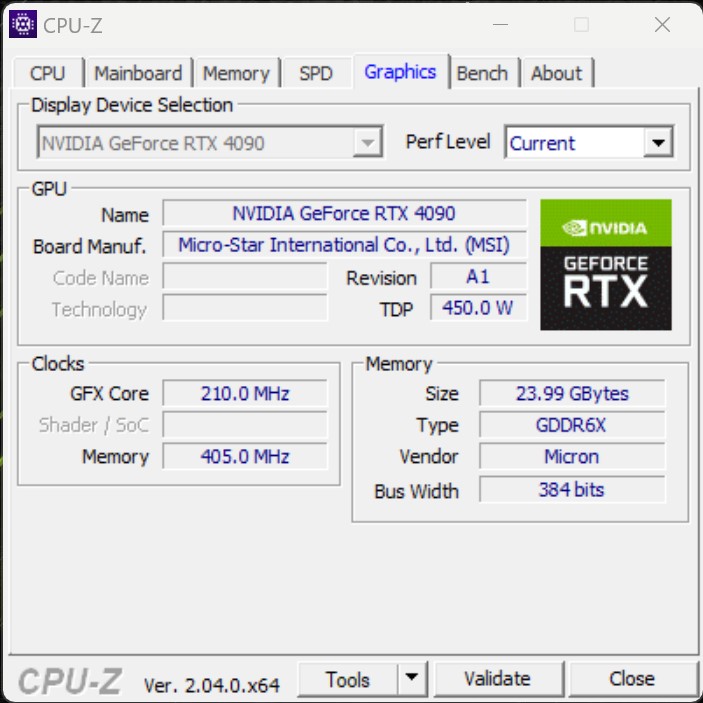
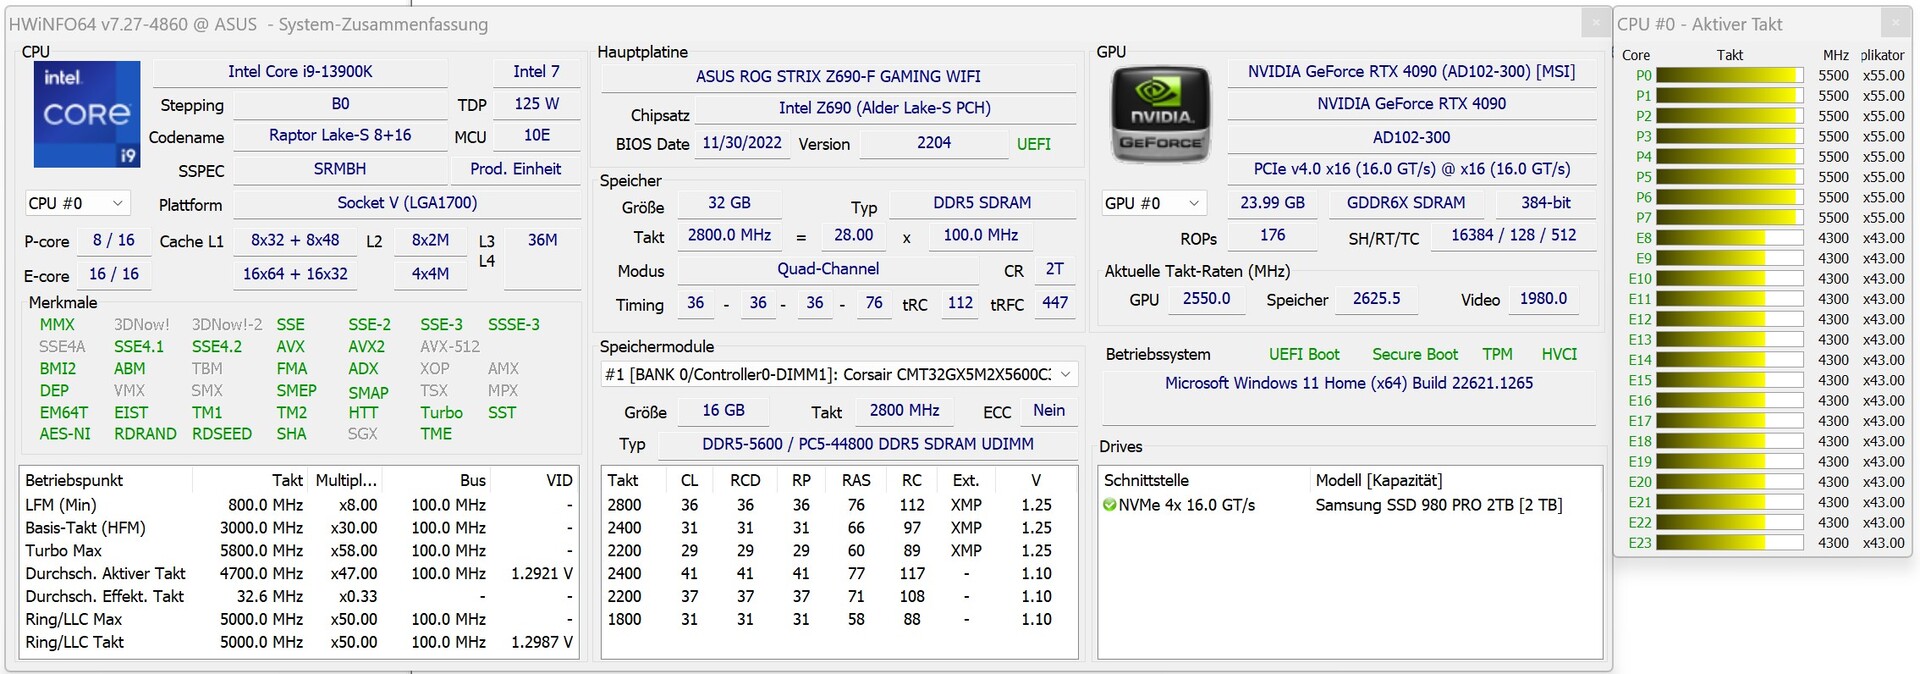
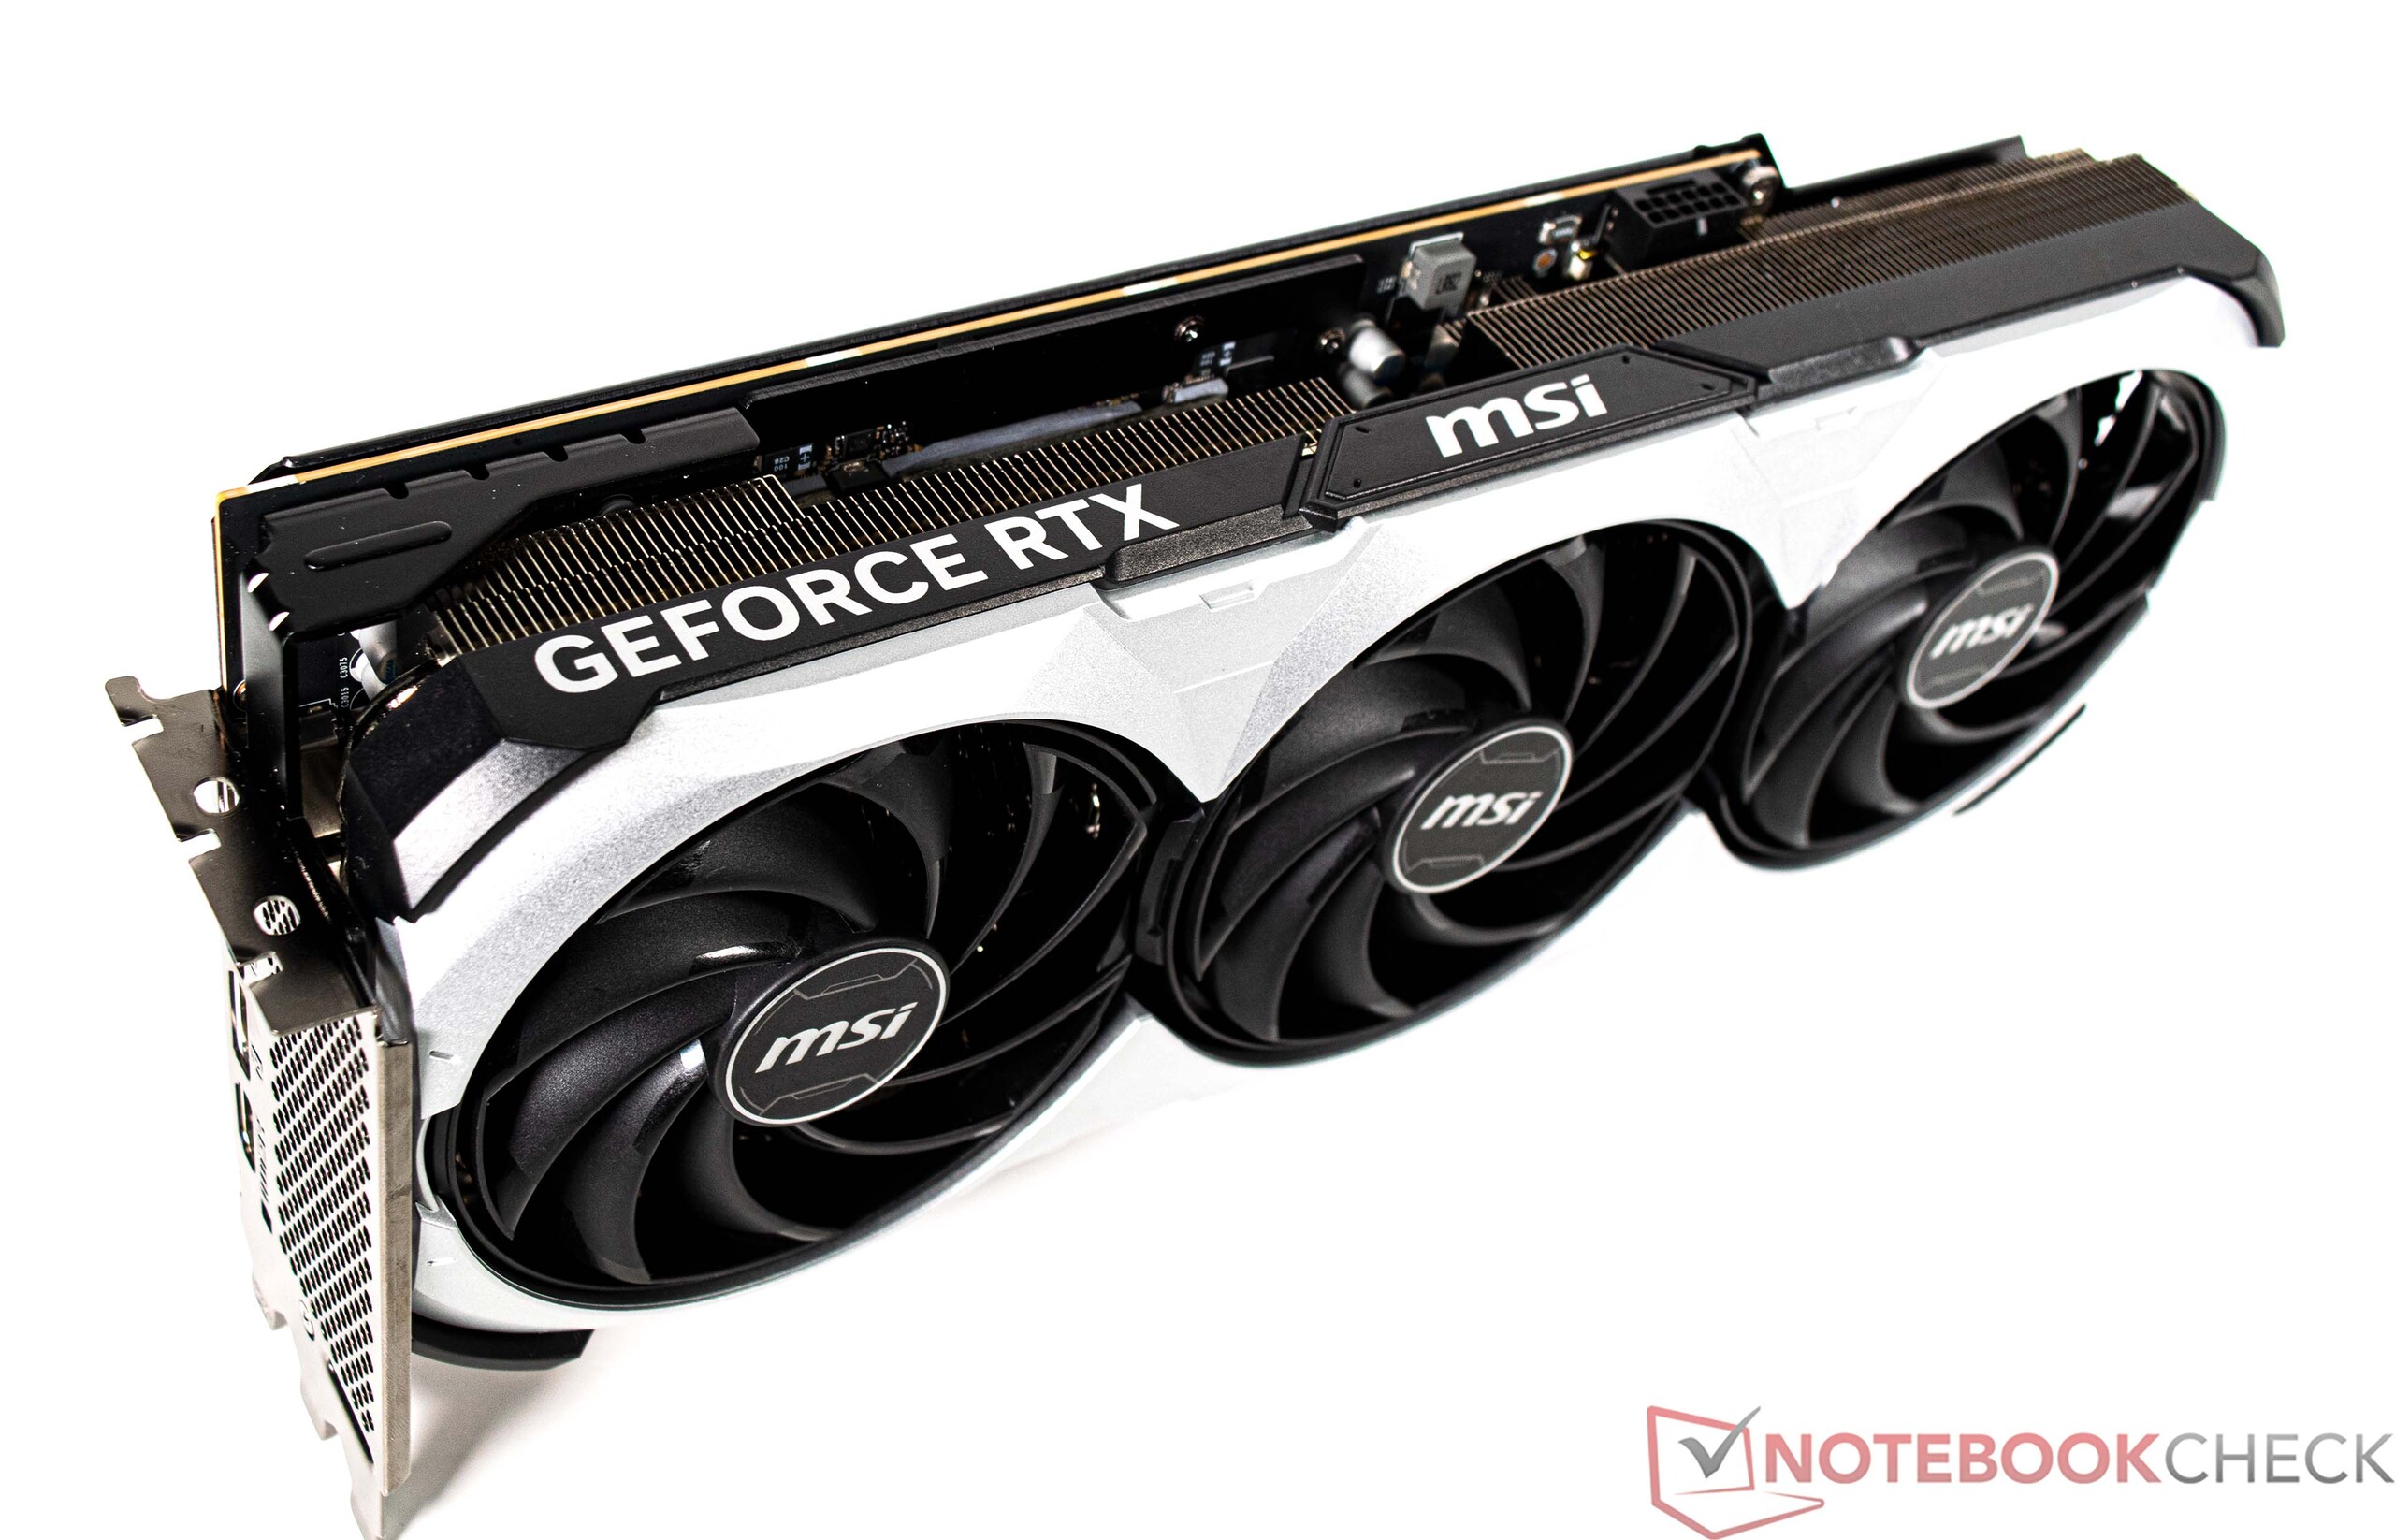
Der XMG Sector - Intel ist mit Intels zweitschnellster Gaming-CPU, der Intel Core i9-13900K, ausgestattet. Zu dieser gesellen sich 32 GB Arbeitsspeicher und eine SSD mit satten 2 TB Speicherplatz, um auch speicherintensive Spiele beherbergen zu können. Als Grafikkarte kommt eine MSI GeForce RTX 4090 Ventus 3X zum Einsatz, welche aktuell die schnellste Grafikkarte für den Consumer-Markt ist.
Testbedingungen
Alle Leistungstests haben wir mit dem Energieprofil Höchstleistung
durchgeführt, um die bestmögliche Leistung zu erzielen. Zudem wurden alle Restriktionen hinsichtlich der CPU-Leistungsaufnahme im BIOS deaktiviert, womit der Intel Core i9-13900K nicht bei 253 Watt limitiert wird. Dies wurde bereits durch den Hersteller vorgenommen. Abweichende Energiesparpläne kamen nur bei den Energieverbrauchsmessungen sowie bei den Lautstärkemessungen zum Tragen. Weitere Details zu unseren Testkriterien finden Sie hier.
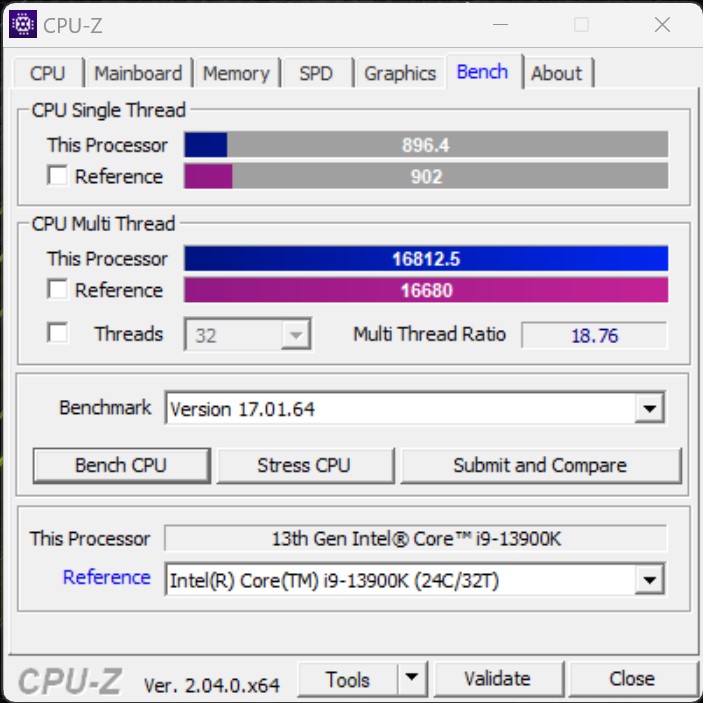
Prozessor
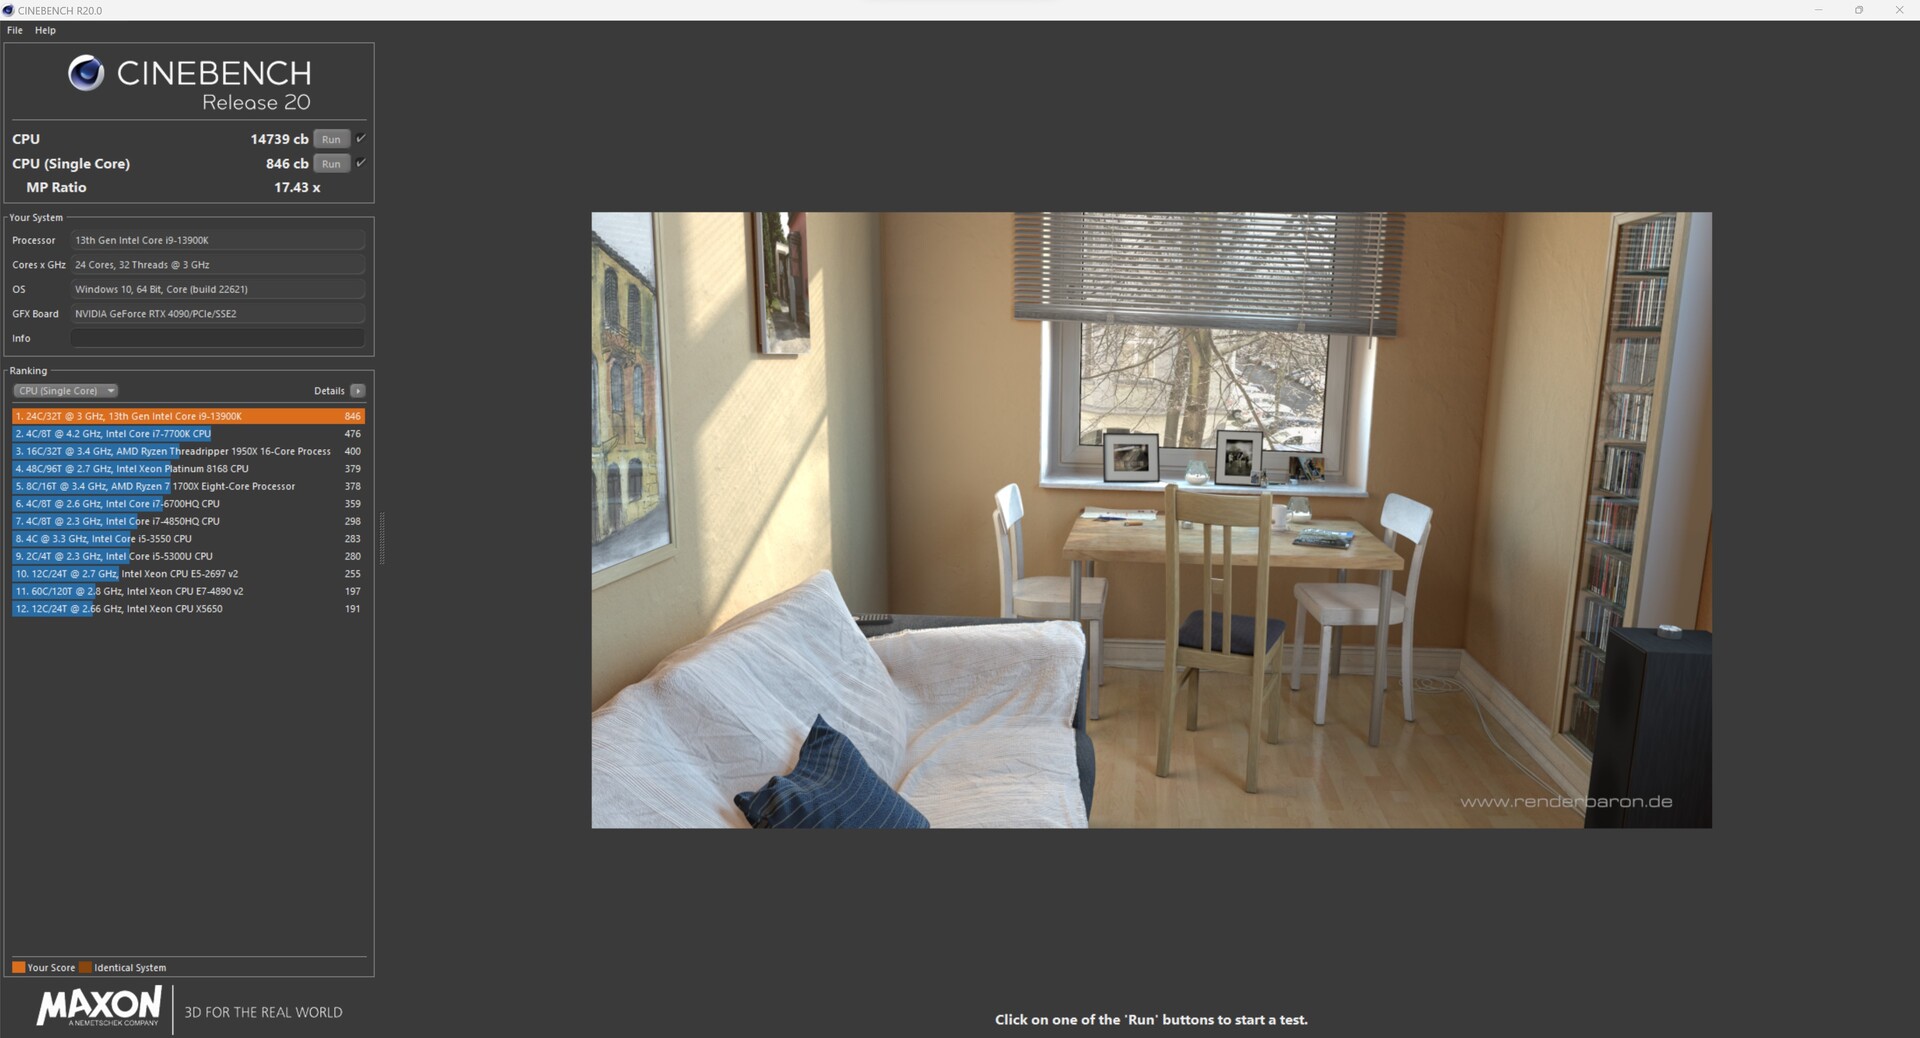
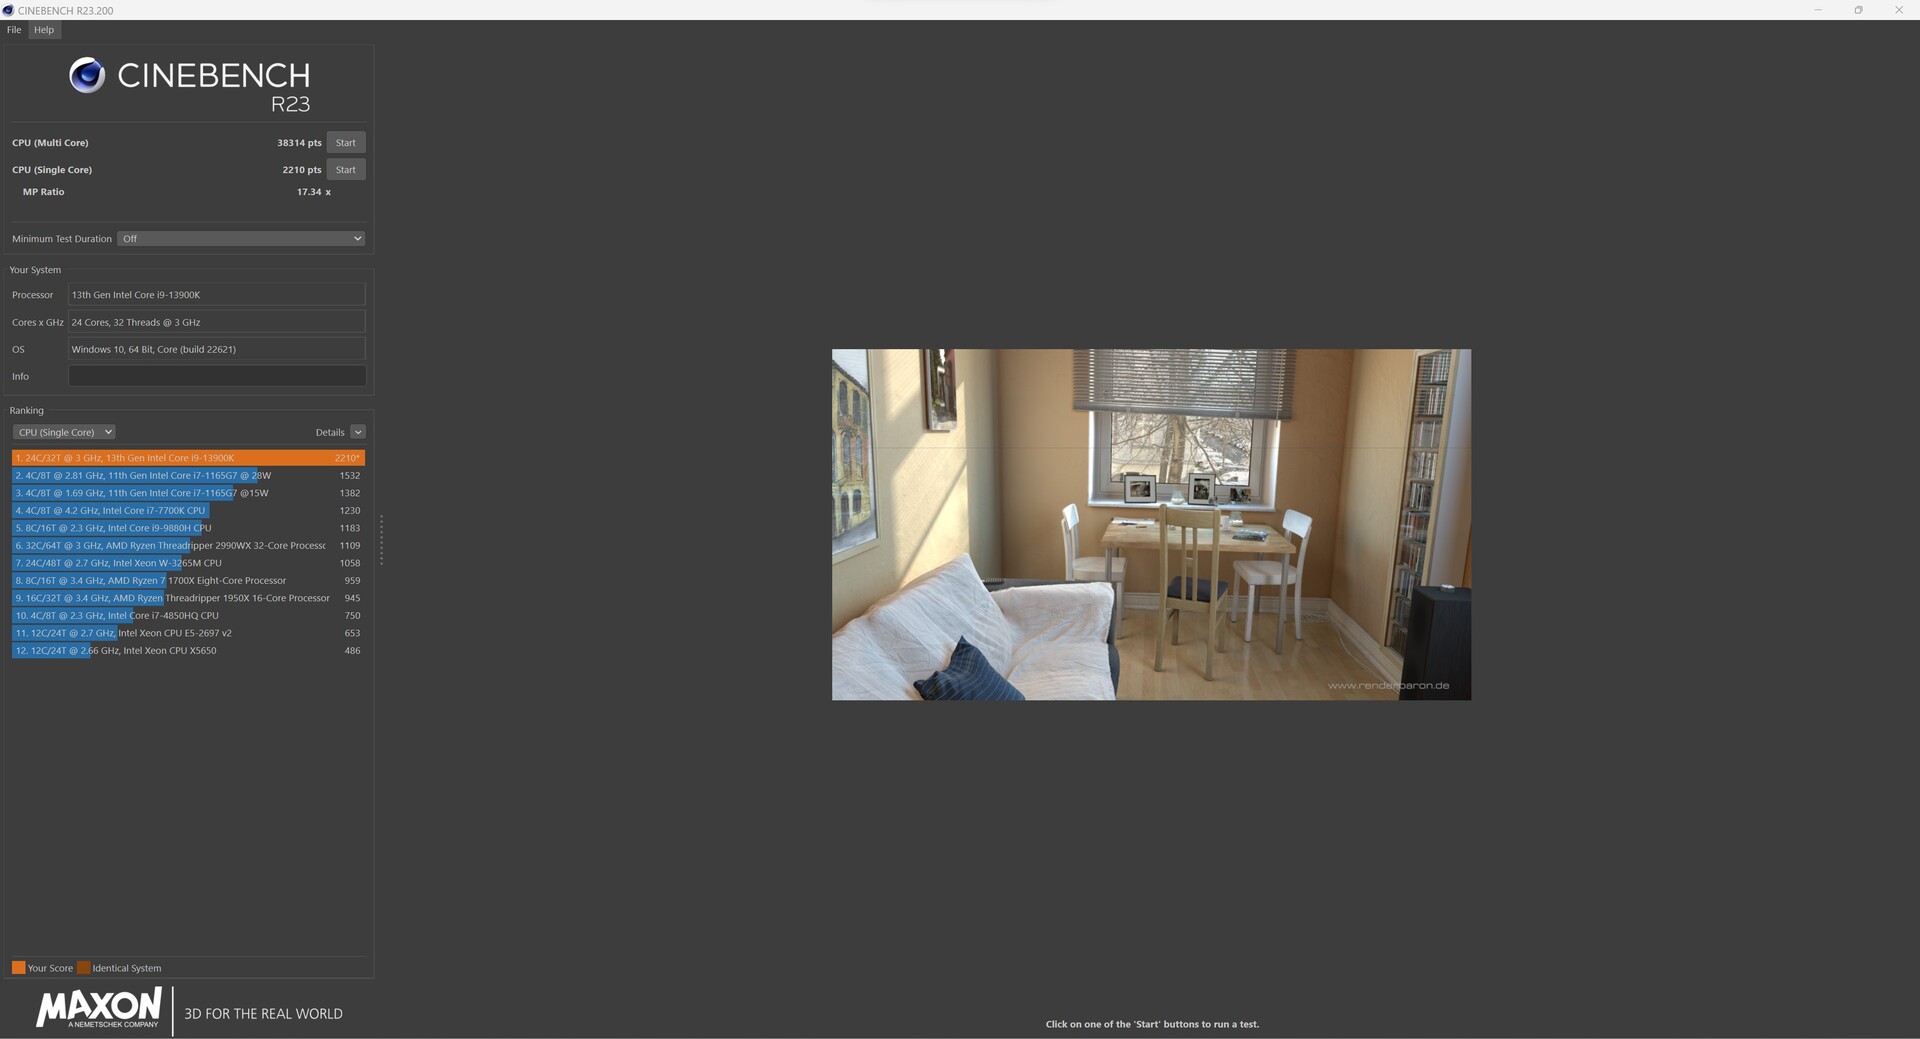
Mit dem Intel Core i9-13900K werkelt Intels aktuell zweitschnellste Gaming-CPU in dem XMG Sector - Intel. Dementsprechend gut fallen auch unsere ermittelten Ergebnisse des Testgerätes aus. Gegenüber unseren Vergleichsgeräten rangiert unser Testsample auf Augenhöhe. Der Unterschied zu dem ähnlich ausgestatteten Testsystem ist mit nur 2 Prozent im Performance-Rating verschwindend gering und kann schon fast unter Messtoleranzen verbucht werden.
Bei den Power-Limits gibt es aufgrund der Aufhebung aller Limits keine Einschränkungen für den Prozessor. Somit dient das Temperatur-Limit als Leistungsgrenze, welche mit der verbauten AiO einhergeht.
Weitere Benchmarks zu den Prozessoren finden Sie hier.
* ... kleinere Werte sind besser
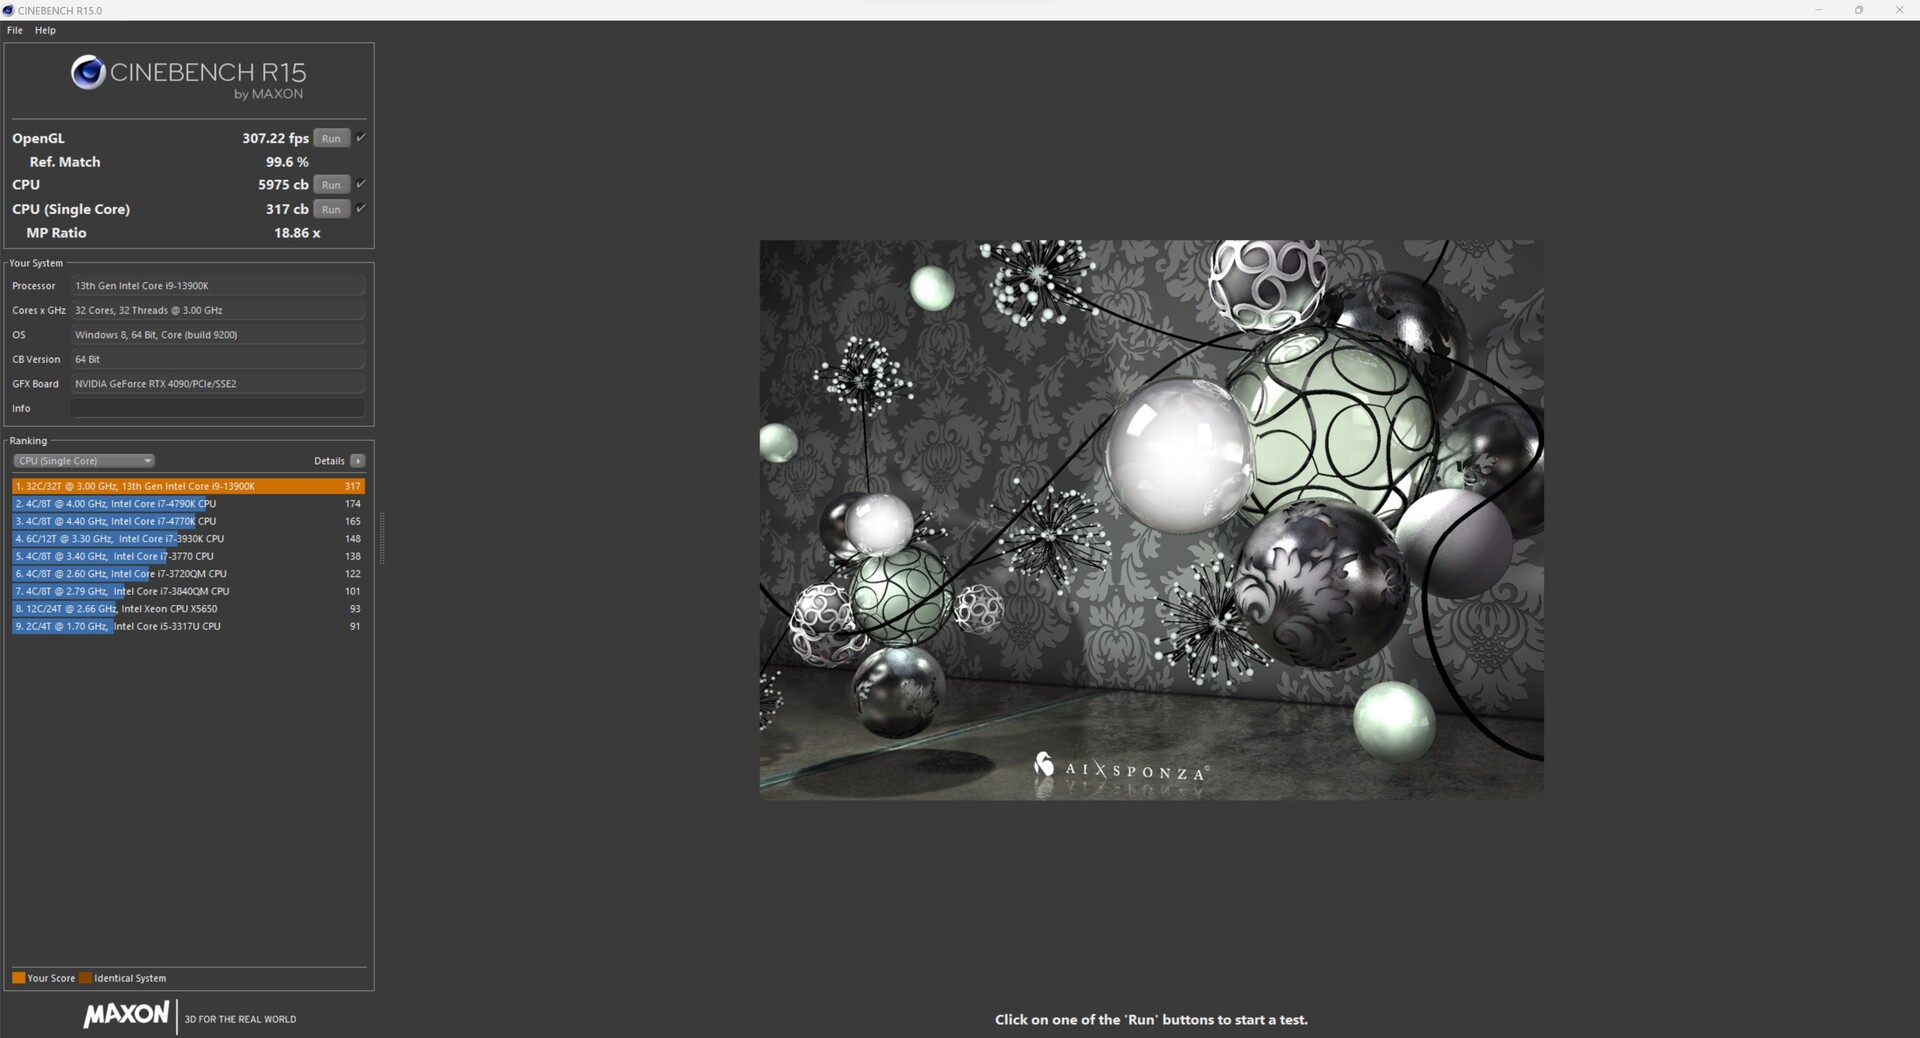
XMG Sector - Intel in der Cinebench-R15-Multi-Schleife
Einen ersten Einblick hinsichtlich der Effizienz der verbauten Kühlung bekommen wir bei der Cinebench-R15-Dauerschleife. Nach den ersten Durchläufen ist keinerlei Nachlassen der Leistung erkennbar. Mit durchschnittlich 5.917 Punkten schneidet der XMG Sector - Intel sehr gut ab.

System Performance
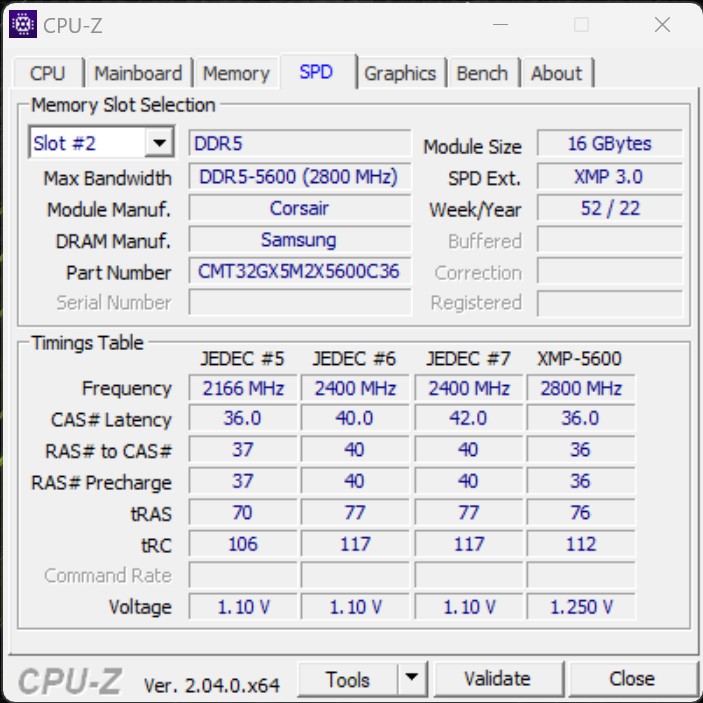
Bei den synthetischen Benchmarks kann der XMG Sector - Intel mit einem sehr hohen Arbeitstempo punkten und ist somit auf Augenhöhe zu den Kontrahenten. Sehr gut performt unser Testsample allerdings bei den RAM-Test mit AIDA64: Hier kann sich das Testsystem aufgrund des schnellen Arbeitsspeichers (DDR5-5600) und der guten Latenzen den ersten Platz sichern. Subjektiv bewertet arbeitet der XMG Sector - Intel zu jeder Zeit sehr schnell und ohne nennenswerte Latenzen.
| Performance Rating - Percent | |
| AMD Ryzen 9 7900X | |
| NVIDIA GeForce RTX 3090 Founders Edition | |
| Intel Core i9-13900K | |
| Schenker XMG SECTOR, i9 13900K, RTX 4090 | |
| Intel Core i5-13600K | |
| Intel NUC13 Raptor Canyon | |
| Corsair One i300 | |
| Intel Core i9-12900K | |
| Intel Dragon Canyon NUC - RTX 3060 | |
| Minisforum Neptune Series NAD9 | |
| AIDA64 / Memory Copy | |
| Schenker XMG SECTOR, i9 13900K, RTX 4090 | |
| Intel Core i9-13900K | |
| Durchschnittliche Intel Core i9-13900K (68722 - 80203, n=4) | |
| Corsair One i300 | |
| Intel Core i9-12900K | |
| NVIDIA GeForce RTX 3090 Founders Edition | |
| Intel Core i5-13600K | |
| Durchschnitt der Klasse Desktop (54743 - 98416, n=21, der letzten 2 Jahre) | |
| AMD Ryzen 9 7900X | |
| Intel NUC13 Raptor Canyon | |
| Minisforum Neptune Series NAD9 | |
| Intel Dragon Canyon NUC - RTX 3060 | |
| AIDA64 / Memory Read | |
| Schenker XMG SECTOR, i9 13900K, RTX 4090 | |
| Intel Core i9-13900K | |
| Durchschnittliche Intel Core i9-13900K (73392 - 88780, n=4) | |
| Intel Core i9-12900K | |
| NVIDIA GeForce RTX 3090 Founders Edition | |
| Intel Core i5-13600K | |
| Durchschnitt der Klasse Desktop (58375 - 110448, n=21, der letzten 2 Jahre) | |
| AMD Ryzen 9 7900X | |
| Corsair One i300 | |
| Intel NUC13 Raptor Canyon | |
| Intel Dragon Canyon NUC - RTX 3060 | |
| Minisforum Neptune Series NAD9 | |
| AIDA64 / Memory Write | |
| NVIDIA GeForce RTX 3090 Founders Edition | |
| Durchschnitt der Klasse Desktop (60635 - 93889, n=21, der letzten 2 Jahre) | |
| Schenker XMG SECTOR, i9 13900K, RTX 4090 | |
| AMD Ryzen 9 7900X | |
| Intel Core i9-13900K | |
| Durchschnittliche Intel Core i9-13900K (68948 - 78678, n=4) | |
| Intel Core i9-12900K | |
| Intel Core i5-13600K | |
| Corsair One i300 | |
| Intel NUC13 Raptor Canyon | |
| Minisforum Neptune Series NAD9 | |
| Intel Dragon Canyon NUC - RTX 3060 | |
| AIDA64 / Memory Latency | |
| Minisforum Neptune Series NAD9 | |
| Intel NUC13 Raptor Canyon | |
| Durchschnitt der Klasse Desktop (68.5 - 168, n=21, der letzten 2 Jahre) | |
| Intel Dragon Canyon NUC - RTX 3060 | |
| Corsair One i300 | |
| Intel Core i5-13600K | |
| Durchschnittliche Intel Core i9-13900K (72.6 - 93.4, n=4) | |
| Intel Core i9-13900K | |
| Schenker XMG SECTOR, i9 13900K, RTX 4090 | |
| AMD Ryzen 9 7900X | |
| NVIDIA GeForce RTX 3090 Founders Edition | |
* ... kleinere Werte sind besser
Massenspeicher
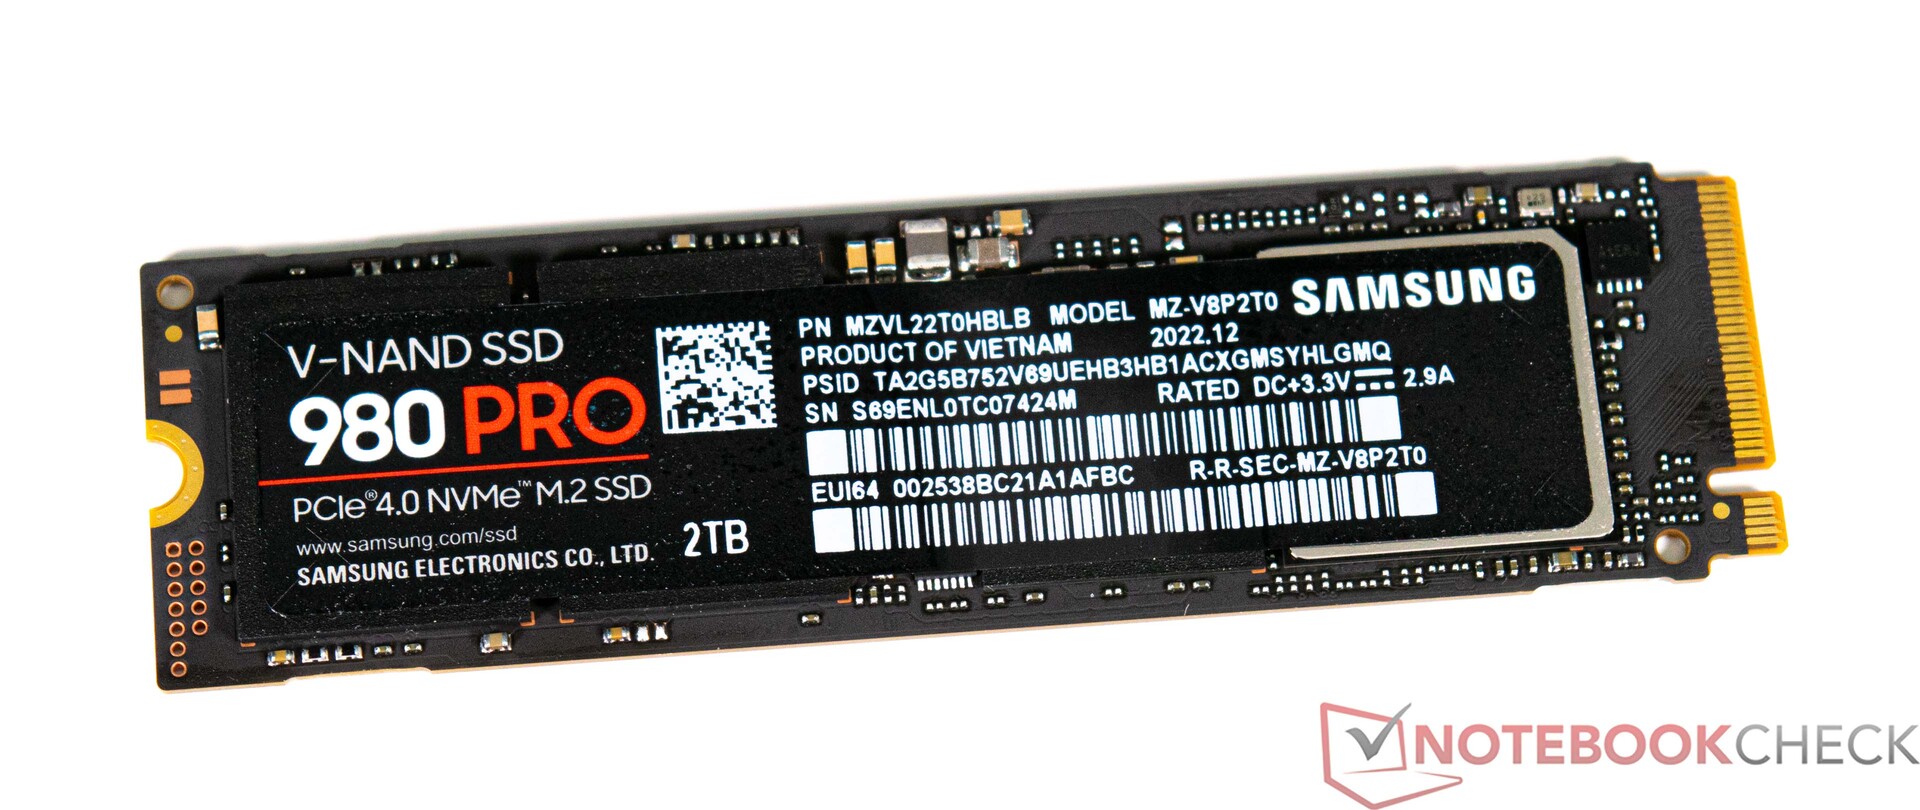
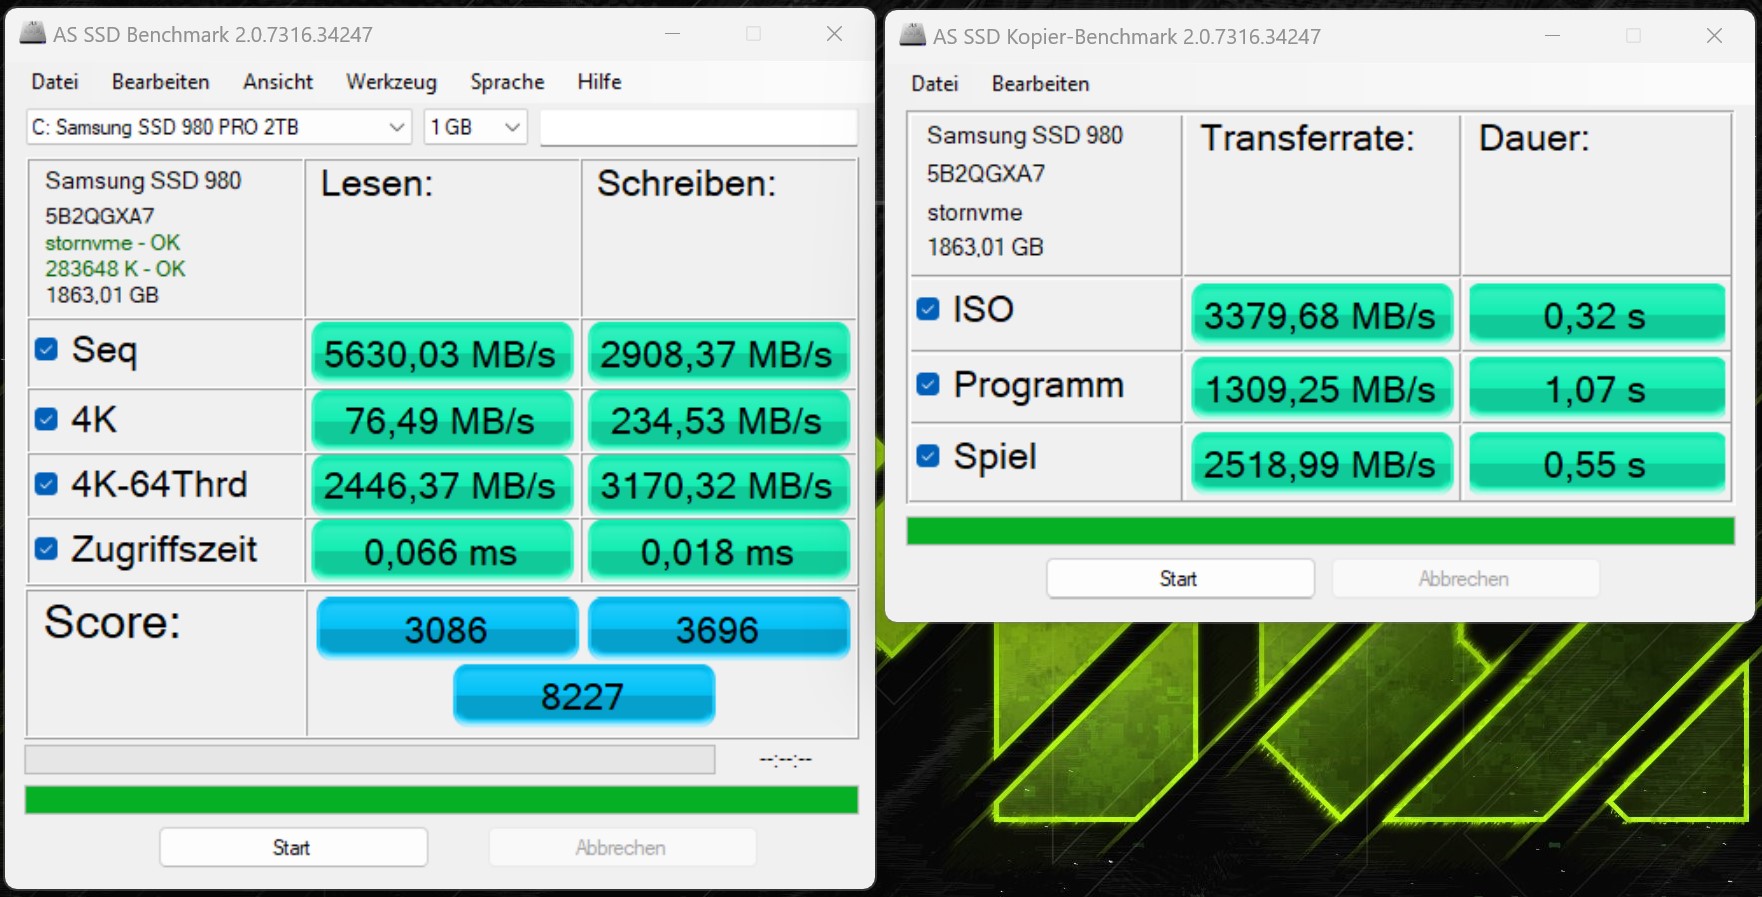
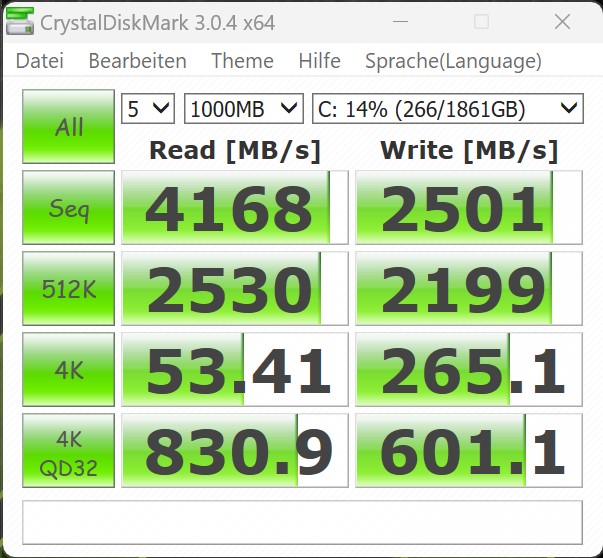
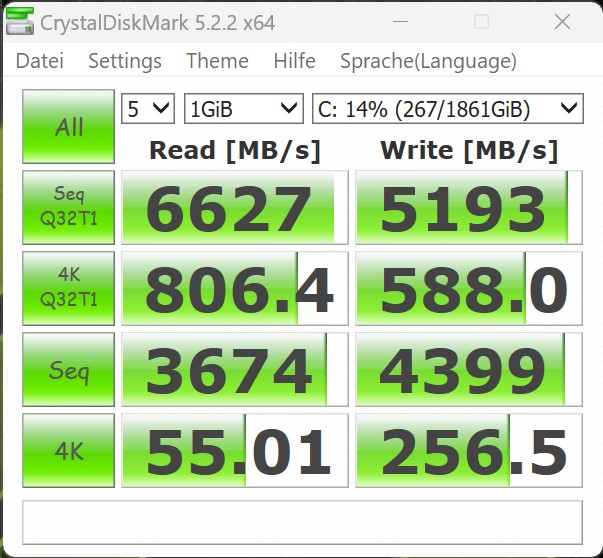
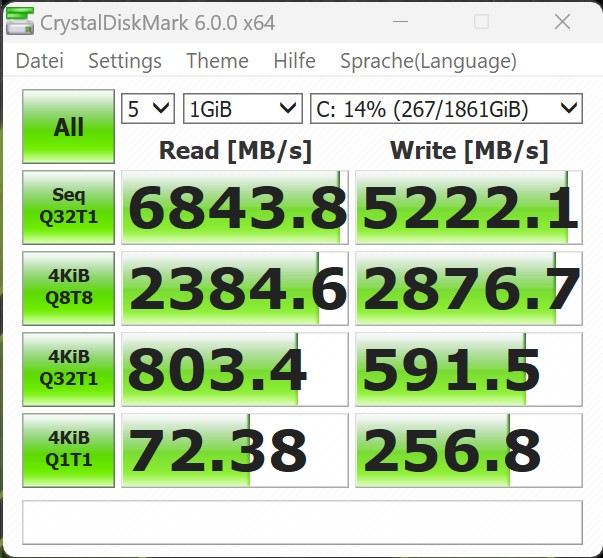
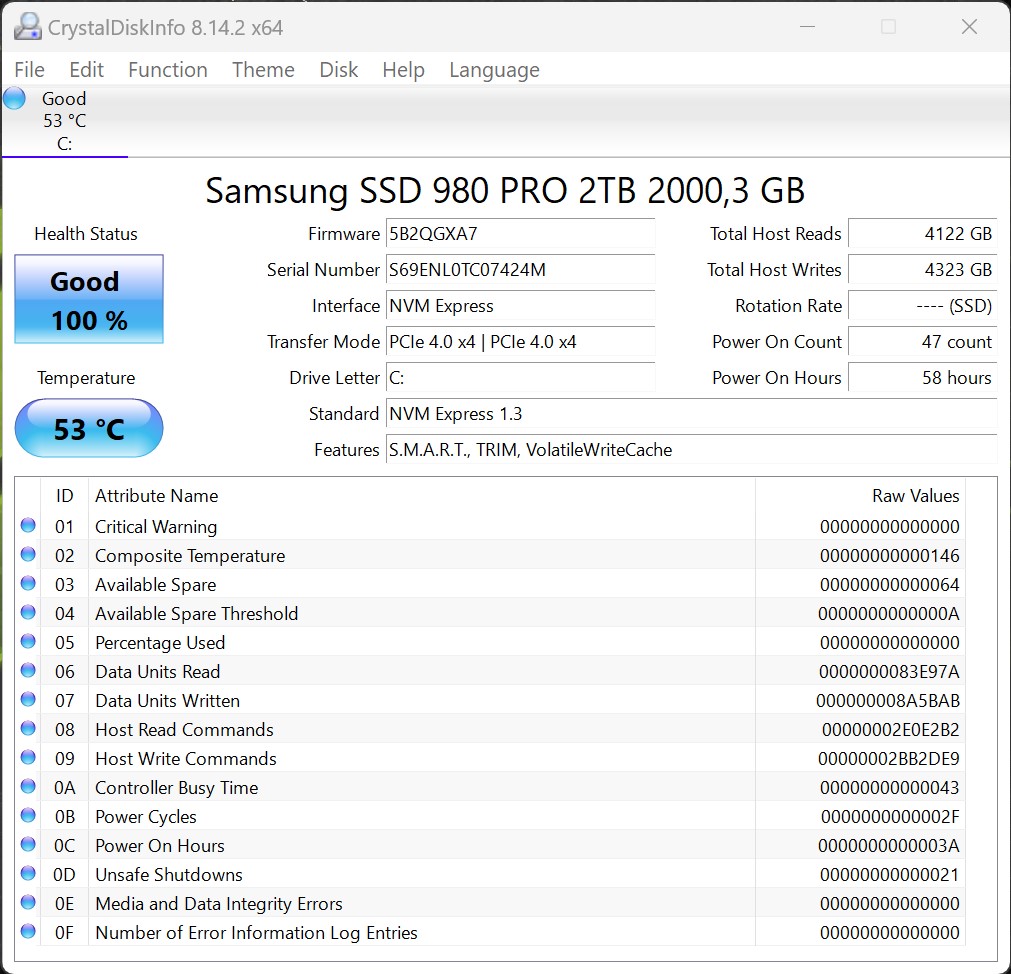
Als Massenspeicher finden wir in unserem Testsample eine sehr schnelle NVMe-SSD aus dem Hause Samsung. Die Samsung 980 Pro zählt mit zu den schnellsten SSDs im Consumer-Bereich. Das sehen wir auch bei den Benchmarks, wo sich das Modell gegen die Kontrahenten fast durchweg durchsetzen kann. Nur die Kingston Fury Renegade, welche im Intel NUC13 Raptor Canyon zum Einsatz kam, kann die Leistung der Samsung 980 Pro im AS-SSD-Test toppen. Dennoch reicht es für das Modell aus dem Hause Samsung für den ersten Platz im Gesamt-Rating. Selbst beim Stresstest konnte die Leistung der Leserate dauerhaft auf einem hohen Level gehalten werden. Hier funktioniert die Kühlung der SSD sehr gut.
Insgesamt lassen sich noch drei weitere SSDs im M.2-Format auf dem Asus ROG Strix Z690-F-Gaming unterbringen. Zudem gibt es die Möglichkeit, über SATA zusätzliche Massenspeicher anzuschließen.
Für weitere Vergleiche und Benchmarks verweisen wir auf unsere Vergleichstabelle.

| Drive Performance Rating - Percent | |
| Durchschnitt der Klasse Desktop | |
| Schenker XMG SECTOR, i9 13900K, RTX 4090 | |
| Corsair One i300 | |
| NVIDIA GeForce RTX 3090 Founders Edition | |
| Intel NUC13 Raptor Canyon | |
| Intel Core i5-13600K | |
| Intel Core i9-13900K | |
| Minisforum Neptune Series NAD9 | |
| Intel Core i9-12900K -11! | |
| Intel Dragon Canyon NUC - RTX 3060 -11! | |
* ... kleinere Werte sind besser
Dauerleistung Lesen: DiskSpd Read Loop, Queue Depth 8
Grafikkarte - keine Kompromisse mit der Nvidia GeForce RTX 4090
Synthetische Benchmarks
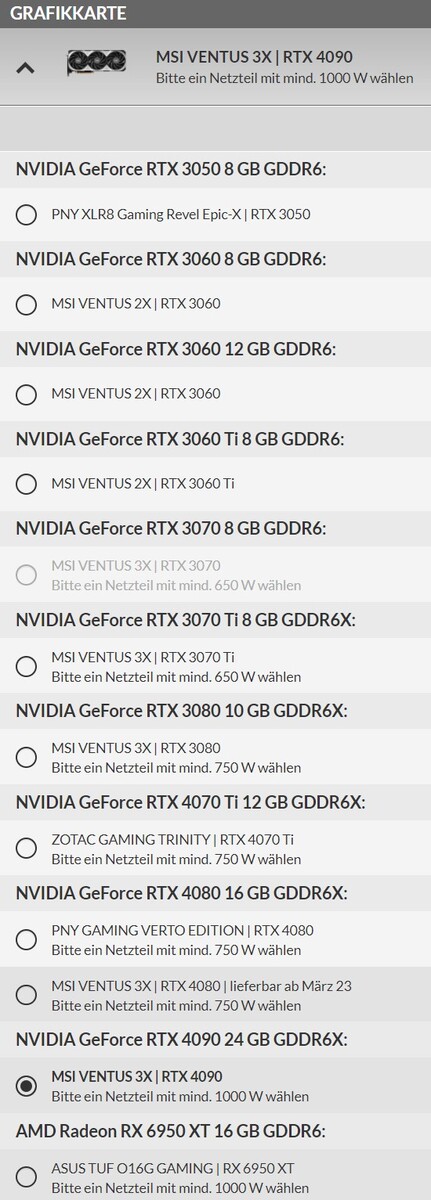
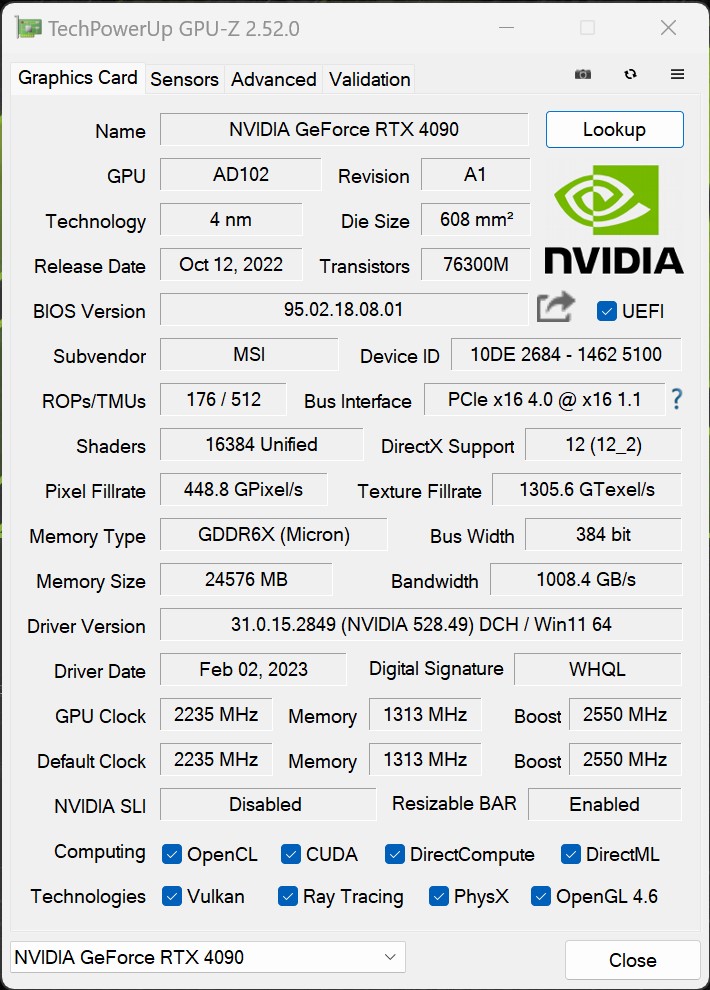
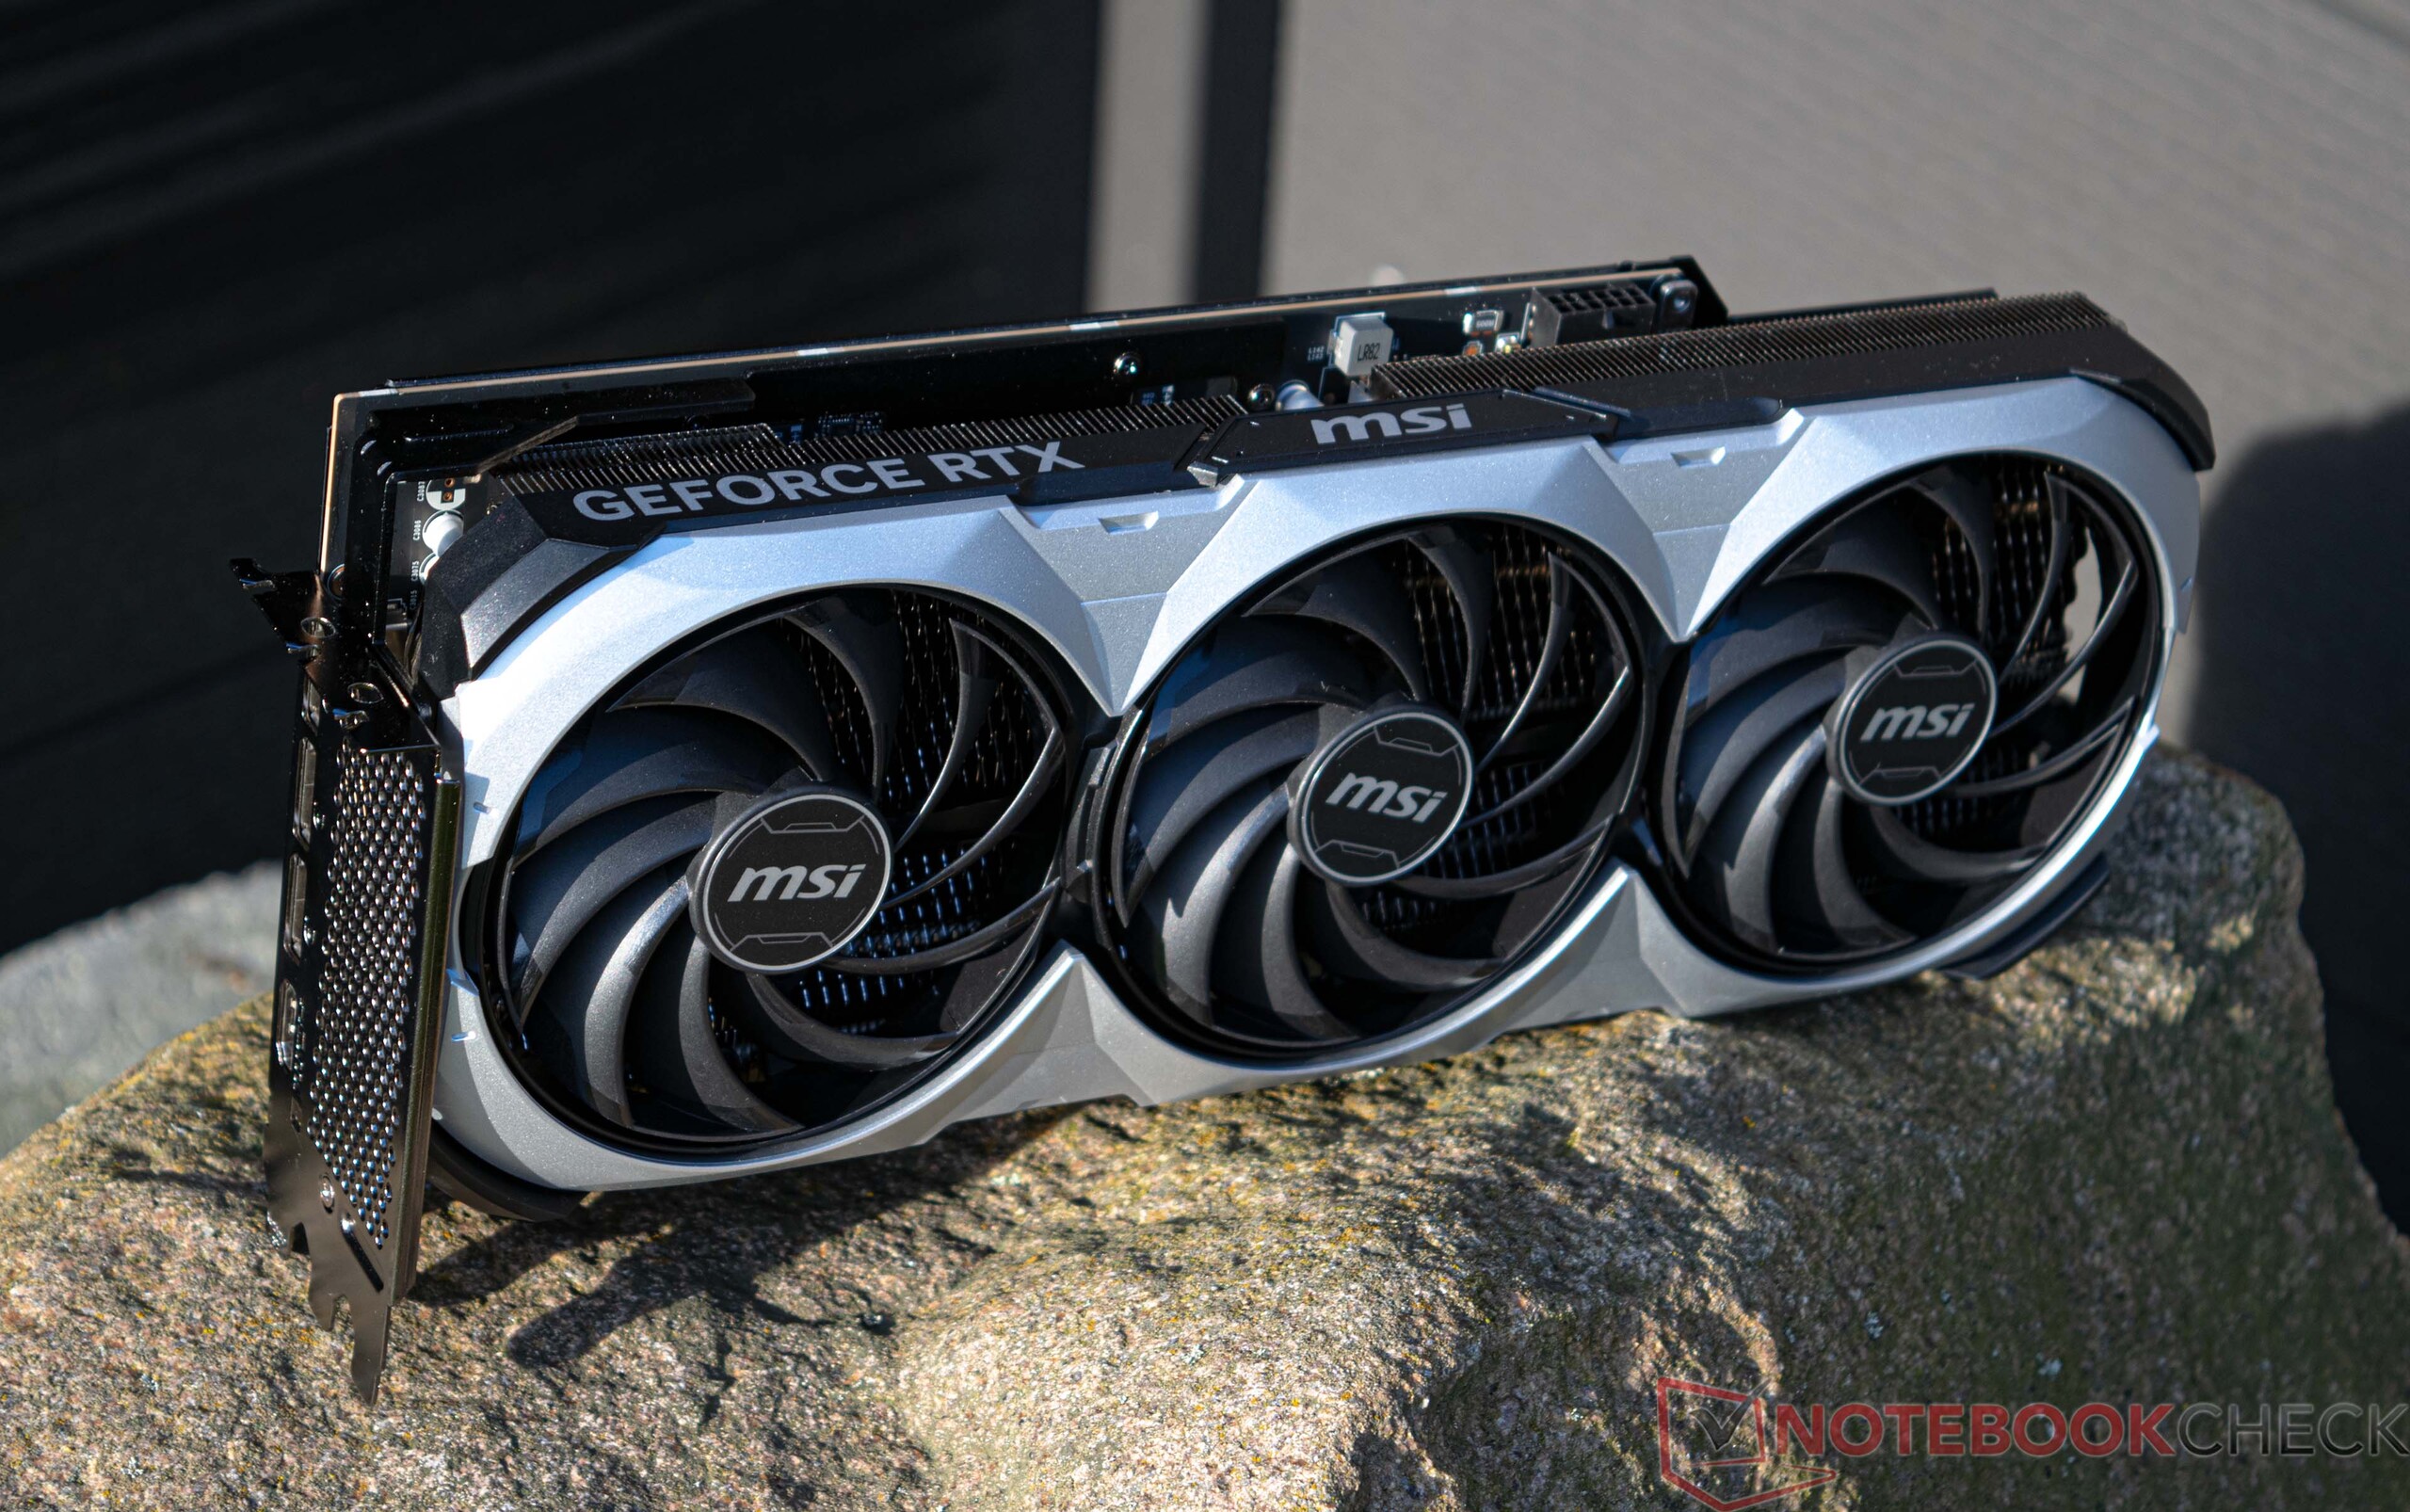
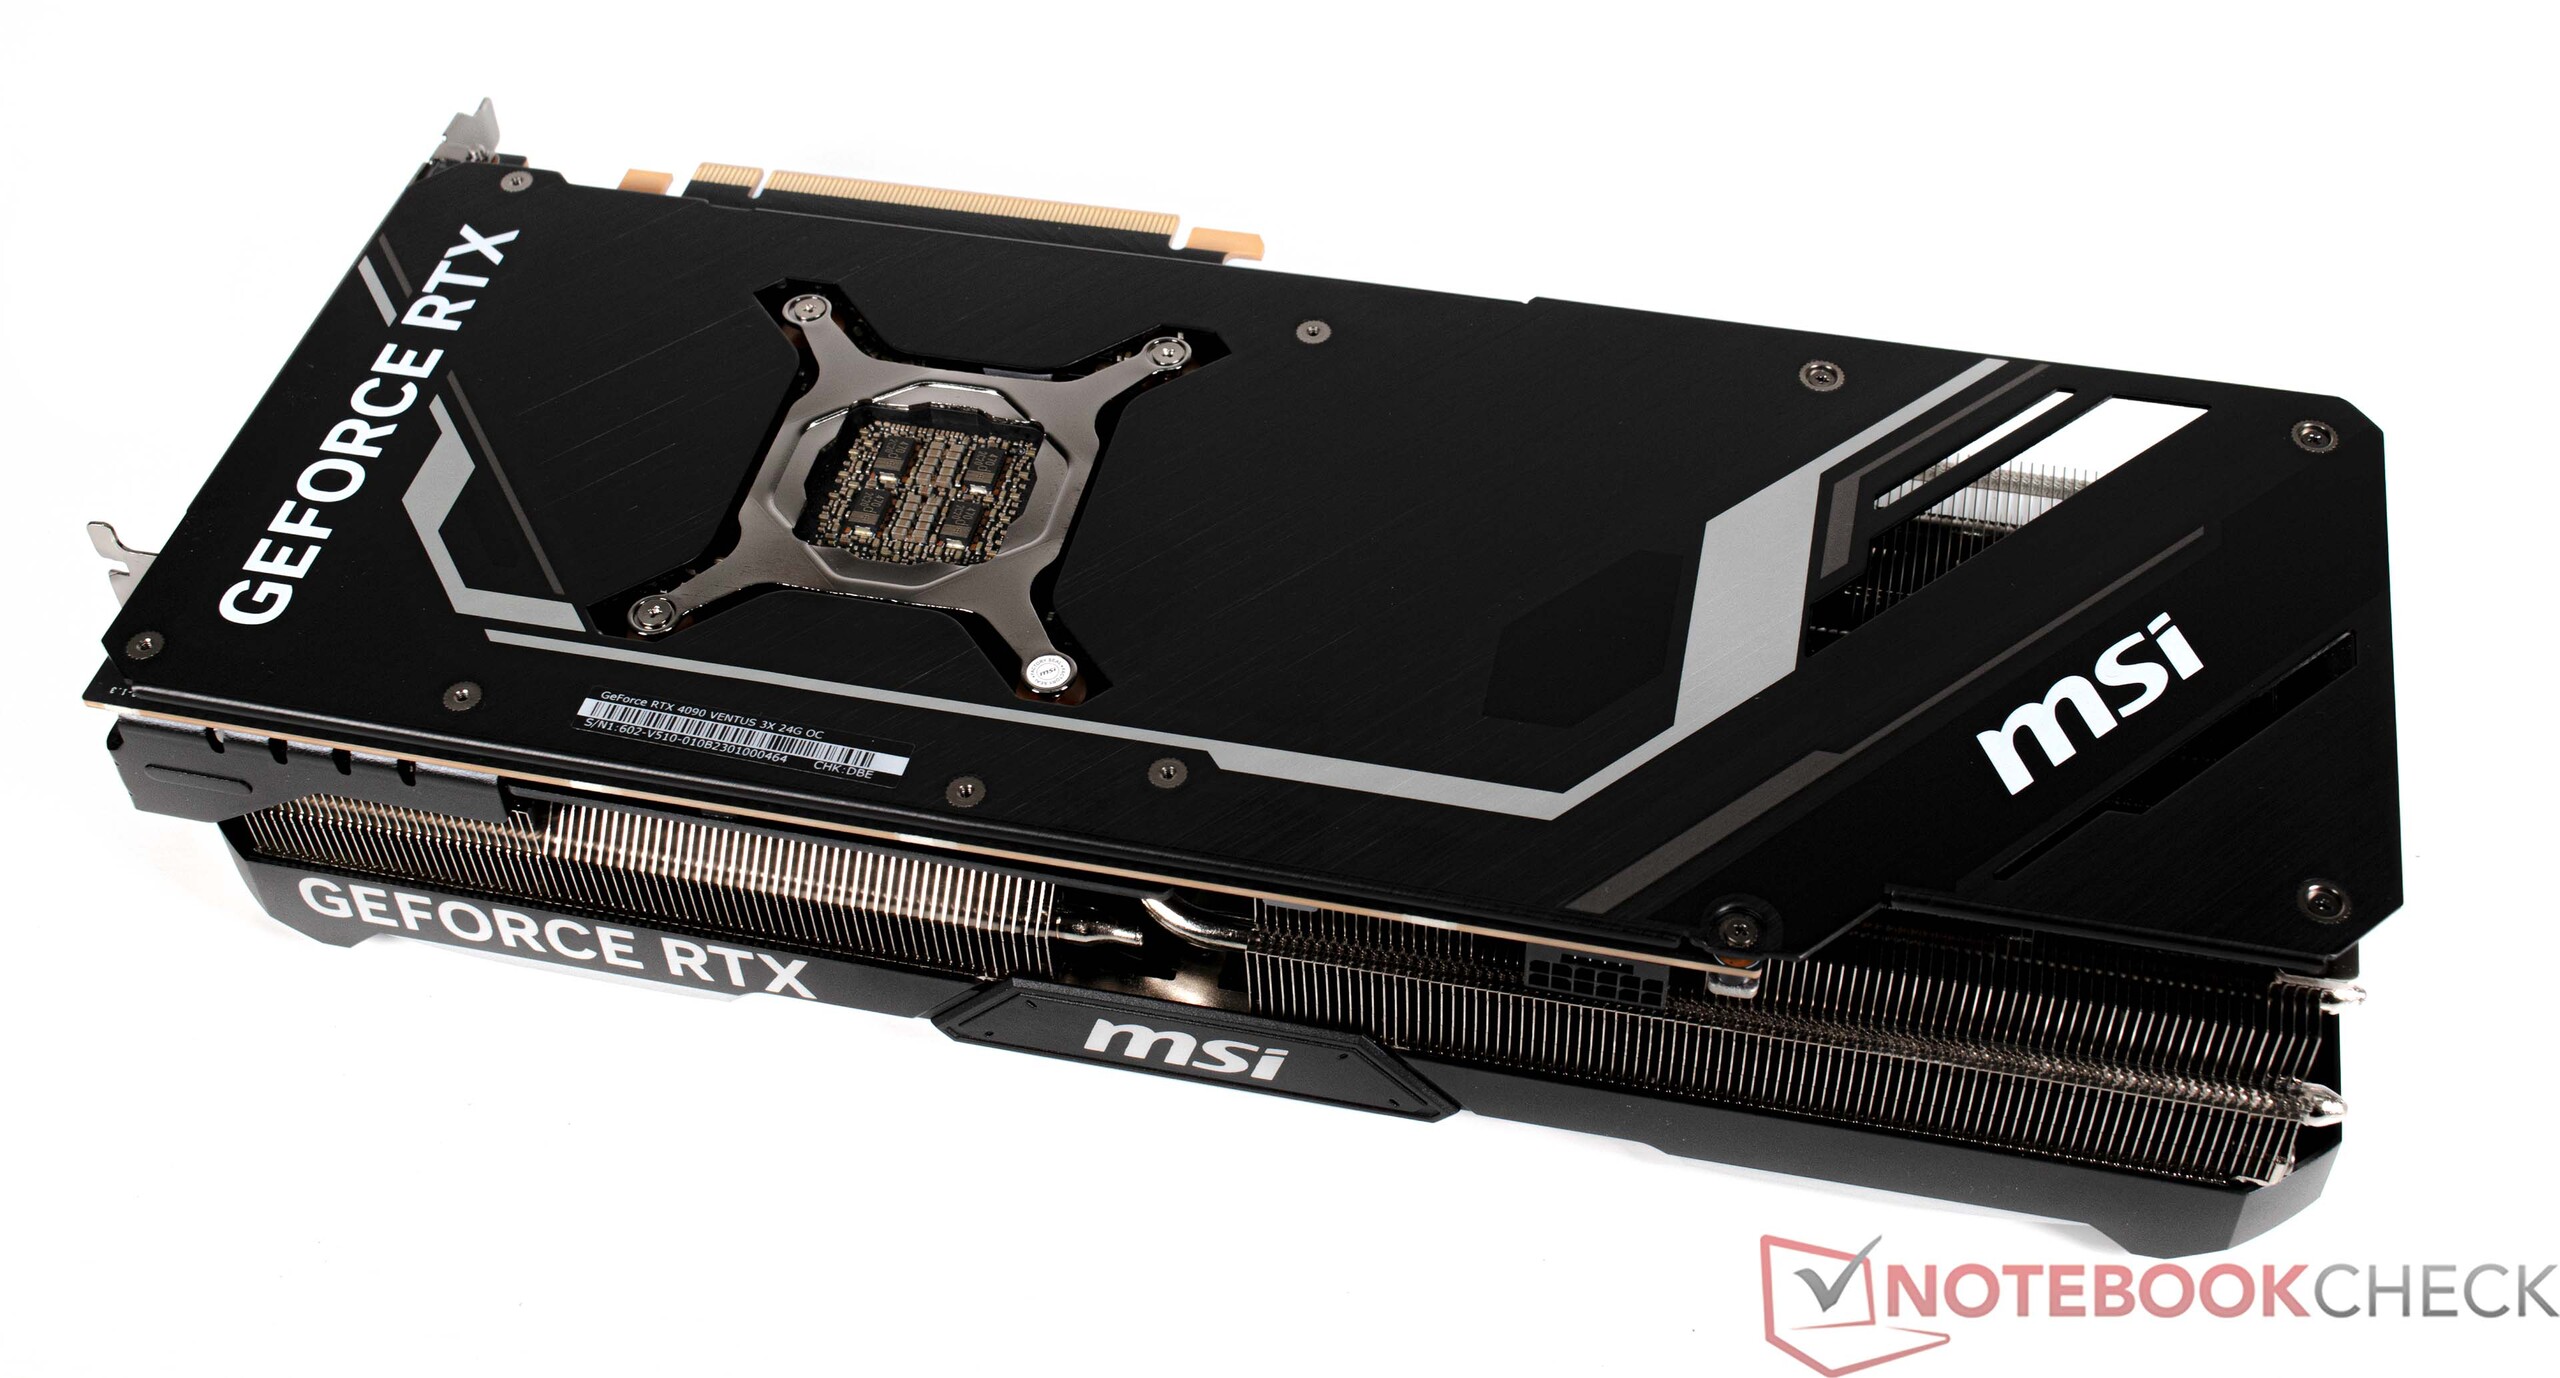
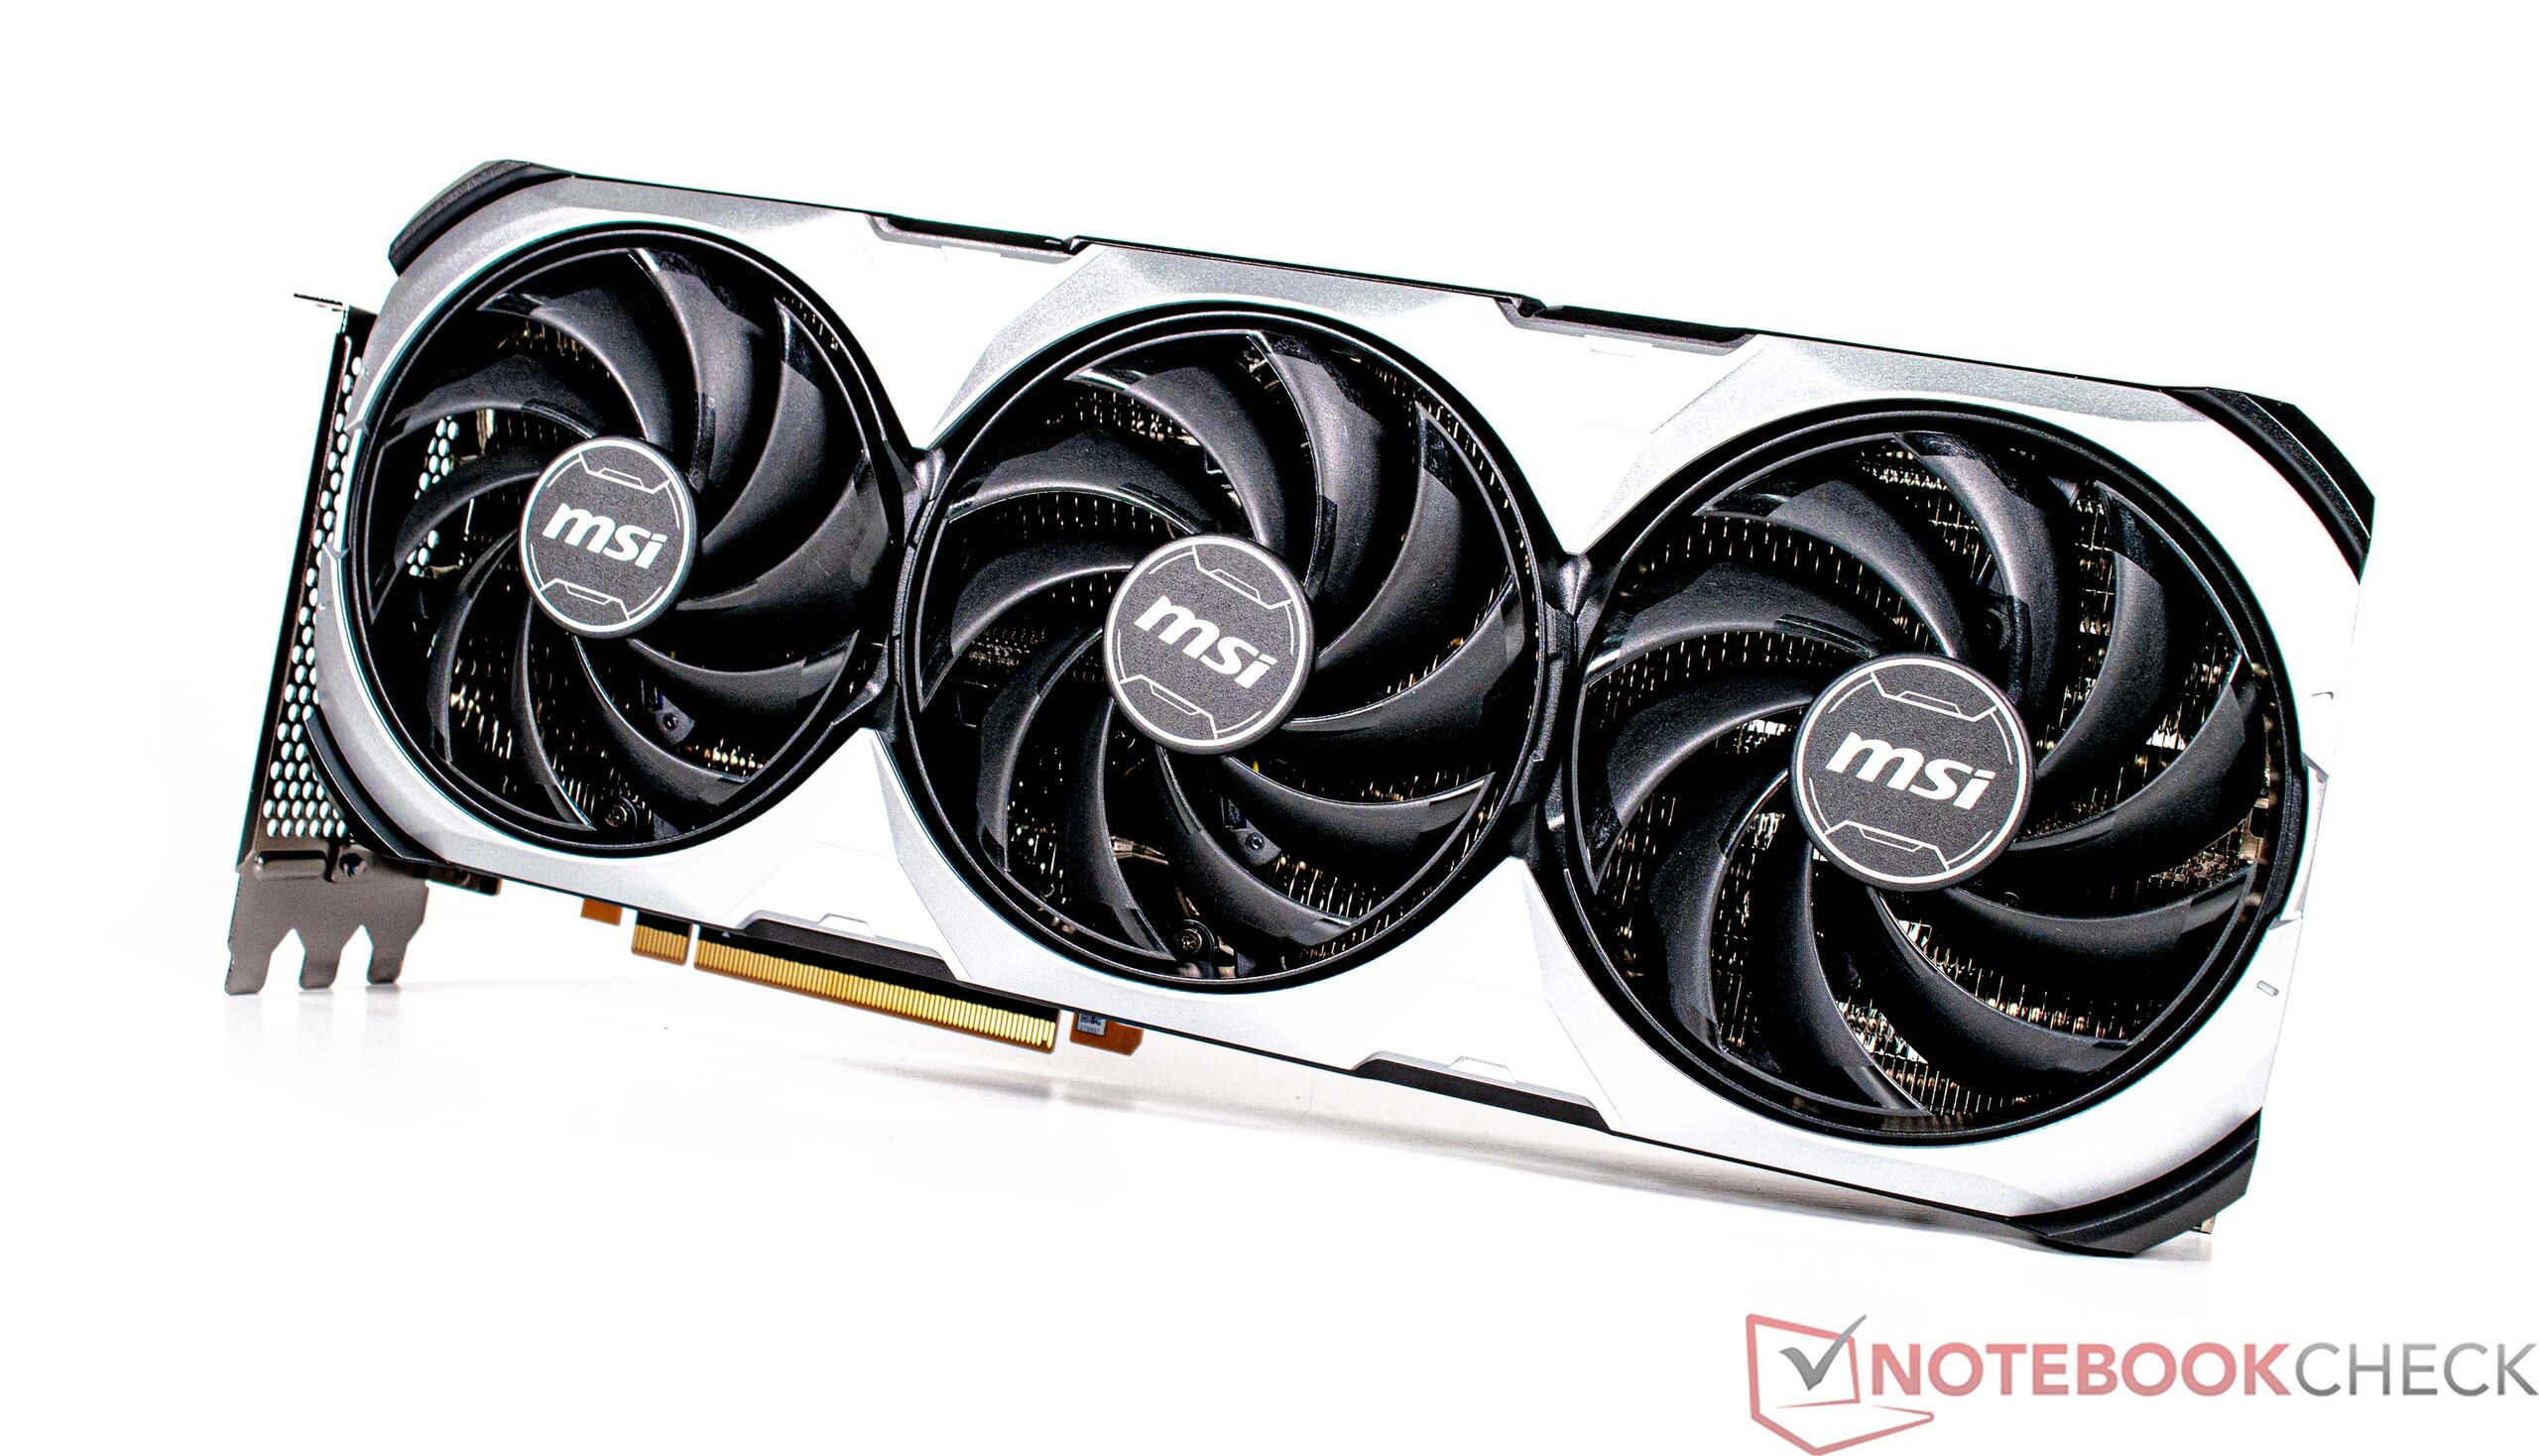
Mit der Nvidia GeForce RTX 4090 sehen wir in unserem Testmuster die aktuell schnellste Grafikkarte für den Consumer-Bereich. In allen synthetischen Tests liefert die Grafikkarte eine sehr hohe Leistung, was wir allerdings auch so erwartet haben. Zusammen mit dem Intel Core i9-13900K kann sich das Testsystem im 3DMark Rating den zweiten Platz sichern. Platz eins geht hier allerdings ebenfalls an eine Nvidia GeForce RTX 4090 aus dem Hause KFA2. Dennoch kann die MSI GeForce RTX 4090 Ventus 3x sehr gut mithalten. Das Modell von MSI nimmt einen Großteil des Platzes im XMG Sector - Intel ein. Auf aufwendige Beleuchtungseffekte wird bei dem Modell jedoch verzichtet. Gegenüber AMDs High-End-Grafikkarten verbucht die Speerspitze aus dem Hause Nvidia einen deutlichen Vorsprung für sich. Per Konfigurator kann aus einer breiten Palette an Nvidia Grafikkarte der 3000er- und 4000er-Grafikkarten gewählt werden. Wer unbedingt eine AMD Grafikkarte in seinem System haben möchte, kann hier nur zu einer AMD Radeon RX 6950 XT greifen. AMDs 7000er-Generation steht aktuell nicht zur Auswahl.
Für weitere technische Details zur Nvidia GeForce RTX 4090 verweisen wir auf diese Seite.
Mehr Vergleiche und Benchmarks finden Sie in unserer GPU-Vergleichstabelle.
Compute-Benchmarks und professionelle Anwendungen
| 3DMark 05 Standard | 68661 Punkte | |
| 3DMark 06 Standard Score | 70557 Punkte | |
| 3DMark Vantage P Result | 133759 Punkte | |
| 3DMark 11 Performance | 62922 Punkte | |
| 3DMark Ice Storm Standard Score | 257615 Punkte | |
| 3DMark Cloud Gate Standard Score | 85474 Punkte | |
| 3DMark Fire Strike Score | 45450 Punkte | |
| 3DMark Fire Strike Extreme Score | 37831 Punkte | |
| 3DMark Time Spy Score | 32024 Punkte | |
Hilfe | ||
Gaming Performance
Die guten Ergebisse bei den synthetischen Benchmarks kann der XMG Sector - Intel auch mit einer sehr hohen Spieleleistung untermauern. Die Nvidia GeForce RTX 4090 trägt hier natürlich maßgeblich dazu bei. Um die Effektivität der schnellsten Nvidia Grafikkarte auch nutzen zu können, bedarf es einer extrem schnellen CPU. Ebenfalls raten wir dazu, primär in 2.160p mit maximalen Details zu spielen, um die Leistung der Grafikkarte überhaupt nutzen zu können. Wer also nur in 1.080p zockt, kann getrost zu einer Nvidia GeForce RTX 4070 Ti greifen und somit ordentlich Geld sparen.
Die speziellen RTX-Features wie DLSS 3.0 inklusive Frame Generation (FG) gibt es bisweilen nur bei den GeForce-RTX-4000-Grafikkarten. Wer also in den Genuss der neuen Features kommen möchte, für denjenigen führt aktuell kein Weg an Nvidias RTX-4000-Grafikkarten vorbei. Ohne Probleme lassen sich alle getesteten Spiele mit dem XMG Sector - Intel in 2.160p bei maximalen Details flüssig wiedergeben. Wer zudem auf Raytracing nicht verzichten möchte, kann das Feature oftmals auch ohne Einschränkungen nutzen. Bei einigen Spielen, wie beispielsweise Cyberpunk 2077, geht dann aber auch das High-End-Modell in die Knie. Mit aktiviertem DLSS lassen sich wieder flüssige Frameraten in 2.160p ermöglichen. AMD hat seinerseits mit FSR ein ähnliches Feature am Start. Schlussendlich liegt es an den Spieleherstellern, diese Features zu implementieren. Eine Liste mit Spielen, die schon DLSS 3.0 unterstützen oder zukünftig mit diesem Feature ausgestattet werden, finden Sie hier.
| Metro Exodus - 1920x1080 Ultra Quality DXR AF:16x | |
| NVIDIA GeForce RTX 4090 | |
| AMD Radeon RX 7900 XTX | |
| NVIDIA GeForce RTX 4080 | |
| NVIDIA GeForce RTX 4090 | |
| AMD Radeon RX 7900 XT | |
| NVIDIA GeForce RTX 3080 Ti | |
| NVIDIA GeForce RTX 3090 | |
| Far Cry 6 - 1920x1080 Ultra Graphics Quality + HD Textures + DXR AA:T | |
| NVIDIA GeForce RTX 4080 | |
| AMD Radeon RX 7900 XTX | |
| AMD Radeon RX 7900 XT | |
| NVIDIA GeForce RTX 4090 | |
| NVIDIA GeForce RTX 4090 | |
| NVIDIA GeForce RTX 3080 Ti | |
| NVIDIA GeForce RTX 3090 | |
| AMD Radeon RX 6800 | |
| AMD Radeon RX 6950 XT | |
| Cyberpunk 2077 1.6 | |
| 3840x2160 Ray Tracing Ultra Preset (DLSS off) | |
| NVIDIA GeForce RTX 4090 | |
| NVIDIA GeForce RTX 4090 (1.6) | |
| NVIDIA GeForce RTX 4080 (1.6) | |
| NVIDIA GeForce RTX 3090 (1.6) | |
| AMD Radeon RX 7900 XTX (1.61) | |
| NVIDIA GeForce RTX 3080 Ti (1.61) | |
| AMD Radeon RX 7900 XT (1.61) | |
| AMD Radeon RX 6800 (1.61) | |
| 1920x1080 Ray Tracing Ultra Preset (DLSS off) | |
| NVIDIA GeForce RTX 4090 | |
| NVIDIA GeForce RTX 4090 (1.6) | |
| NVIDIA GeForce RTX 4080 (1.6) | |
| NVIDIA GeForce RTX 3080 Ti (1.61) | |
| NVIDIA GeForce RTX 3090 (1.6) | |
| AMD Radeon RX 7900 XTX (1.61) | |
| AMD Radeon RX 7900 XT (1.61) | |
| AMD Radeon RX 6800 (1.61) | |
| Control - 1920x1080 High Quality Preset & High Ray Tracing Preset (DX12) | |
| NVIDIA GeForce RTX 4090 | |
| NVIDIA GeForce RTX 4080 | |
| NVIDIA GeForce RTX 4090 | |
| AMD Radeon RX 7900 XTX | |
| NVIDIA GeForce RTX 3080 Ti | |
| AMD Radeon RX 7900 XT | |
| AMD Radeon RX 6950 XT | |
| Ghostwire Tokyo - 1920x1080 Highest Settings + Maximum Ray Tracing | |
| NVIDIA GeForce RTX 4090 | |
| NVIDIA GeForce RTX 4090 | |
| NVIDIA GeForce RTX 4080 | |
| AMD Radeon RX 7900 XTX | |
| NVIDIA GeForce RTX 3080 Ti | |
| AMD Radeon RX 7900 XT | |
| Guardians of the Galaxy - 1920x1080 Ultra Preset + Ultra Ray-Tracing | |
| NVIDIA GeForce RTX 4090 | |
| AMD Radeon RX 7900 XTX | |
| AMD Radeon RX 7900 XT | |
| The Callisto Protocol - 1920x1080 Ultra Preset (without FSR Upscaling) + Full Ray-Tracing | |
| AMD Radeon RX 7900 XTX | |
| NVIDIA GeForce RTX 4090 | |
| NVIDIA GeForce RTX 4090 | |
| AMD Radeon RX 7900 XT | |
| NVIDIA GeForce RTX 3080 Ti | |
| AMD Radeon RX 6800 | |
| min. | mittel | hoch | max. | QHD | 4K DLSS | 4K | |
|---|---|---|---|---|---|---|---|
| GTA V (2015) | 187.6 | 187.6 | 187 | 165.9 | 166.3 | 187.5 | |
| The Witcher 3 (2015) | 731.4 | 664.6 | 613.4 | 314.1 | 282 | ||
| Dota 2 Reborn (2015) | 287.9 | 258.5 | 256.3 | 219.7 | 226.8 | ||
| Final Fantasy XV Benchmark (2018) | 234 | 232 | 227 | 224 | 155.7 | ||
| X-Plane 11.11 (2018) | 237 | 209 | 160.6 | 139.3 | |||
| Far Cry 5 (2018) | 240 | 208 | 201 | 187 | 187 | 173 | |
| Strange Brigade (2018) | 627 | 506 | 506 | 506 | 488 | 281 | |
| Shadow of the Tomb Raider (2018) | 300 | 288 | 285 | 282 | 269 | 186 | |
| Far Cry New Dawn (2019) | 206 | 188 | 180 | 161 | 164 | 152 | |
| Metro Exodus (2019) | 260 | 235 | 191.9 | 177.3 | 165 | 136.3 | |
| Control (2019) | 233 | 233 | 233 | 232 | 114.4 | ||
| Borderlands 3 (2019) | 243 | 213 | 197.3 | 182.9 | 182.5 | 132.9 | |
| F1 2020 (2020) | 521 | 445 | 431 | 395 | 386 | 282 | |
| F1 2021 (2021) | 632 | 585 | 501 | 277 | 267 | 196.6 | |
| Far Cry 6 (2021) | 213 | 187.4 | 168.7 | 166.8 | 163.8 | 133.4 | |
| Guardians of the Galaxy (2021) | 220 | 220 | 219 | 216 | 215 | 214 | |
| Forza Horizon 5 (2021) | 285 | 245 | 244 | 187 | 178 | 148 | |
| God of War (2022) | 263 | 263 | 255 | 203 | 173.4 | 125.1 | |
| GRID Legends (2022) | 311 | 286 | 258 | 248 | 242 | 191.4 | |
| Cyberpunk 2077 1.6 (2022) | 195 | 185 | 182 | 181 | 167 | 80 | |
| Ghostwire Tokyo (2022) | 278 | 275 | 273 | 272 | 266 | 174.7 | |
| Tiny Tina's Wonderlands (2022) | 413 | 355 | 309 | 280 | 224 | 128.4 | |
| F1 22 (2022) | 415 | 377 | 364 | 195.4 | 149.7 | 81.1 | |
| A Plague Tale Requiem (2022) | 188.6 | 175.4 | 158.5 | 147.8 | 104.6 | 193.6 | 74.7 |
| Uncharted Legacy of Thieves Collection (2022) | 139.5 | 138.1 | 137.1 | 136.6 | 134.9 | 99.1 | |
| Call of Duty Modern Warfare 2 2022 (2022) | 248 | 247 | 232 | 230 | 187 | 215 | 128 |
| Spider-Man Miles Morales (2022) | 169.9 | 163.3 | 150.9 | 149.3 | 127.4 | 126.8 | |
| The Callisto Protocol (2022) | 234.8 | 224 | 204.9 | 203.8 | 184.8 | 124.9 | |
| The Witcher 3 v4 (2023) | 304 | 271 | 218 | 198.8 | 154.1 | 199.7 |
Emissionen
Geräuschemissionen
Bei der Lautstärke messen wir im Leerlauf nur 32 dB(A), womit das System relativ leise arbeitet. Bei durchschnittlicher Last ist das Gerät ebenfalls nur leise hörbar, was daran liegt, dass die Grafikkarte noch passiv gekühlt werden kann. Erst bei hoher Last drehen die Gehäuselüfter und auch die drei Lüfter der Grafikkarte hörbar auf. So sehen wir beim Stresstest maximal 40,6 dB(A) auf unserem Messgerät.
Lautstärkediagramm
| Idle |
| 32 / 32.1 / 32.3 dB(A) |
| Last |
| 32.4 / 40.6 dB(A) |
 | ||
30 dB leise 40 dB(A) deutlich hörbar 50 dB(A) störend |
||
min: | ||
Temperatur
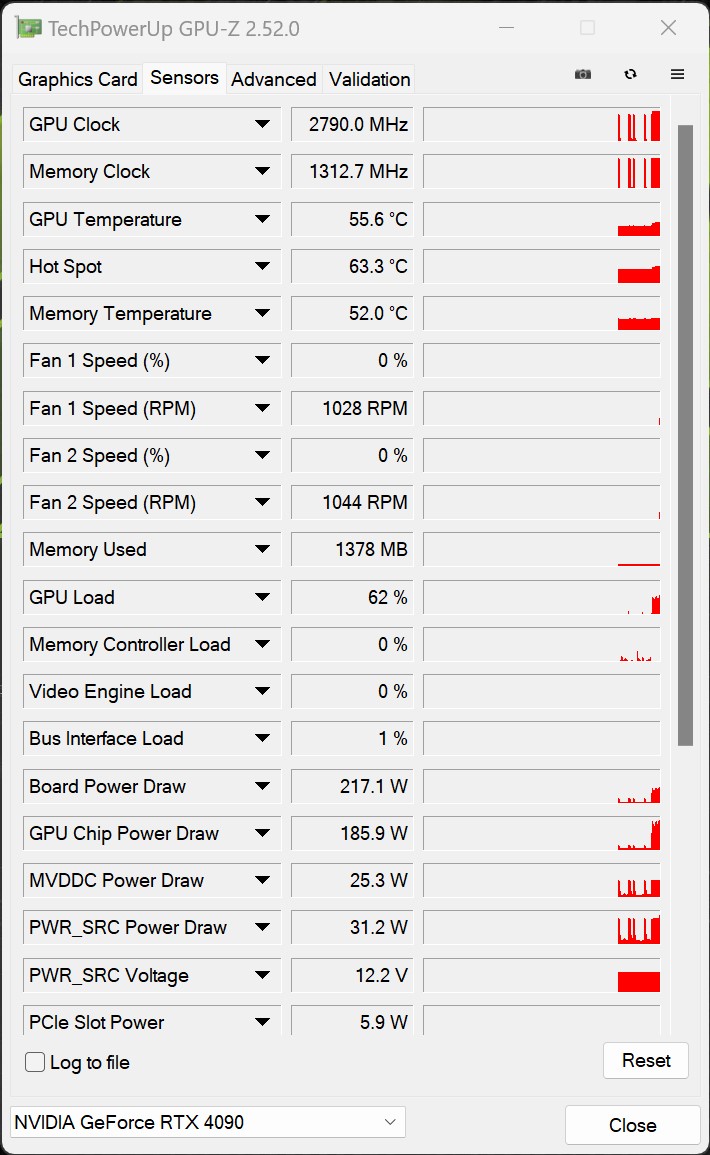
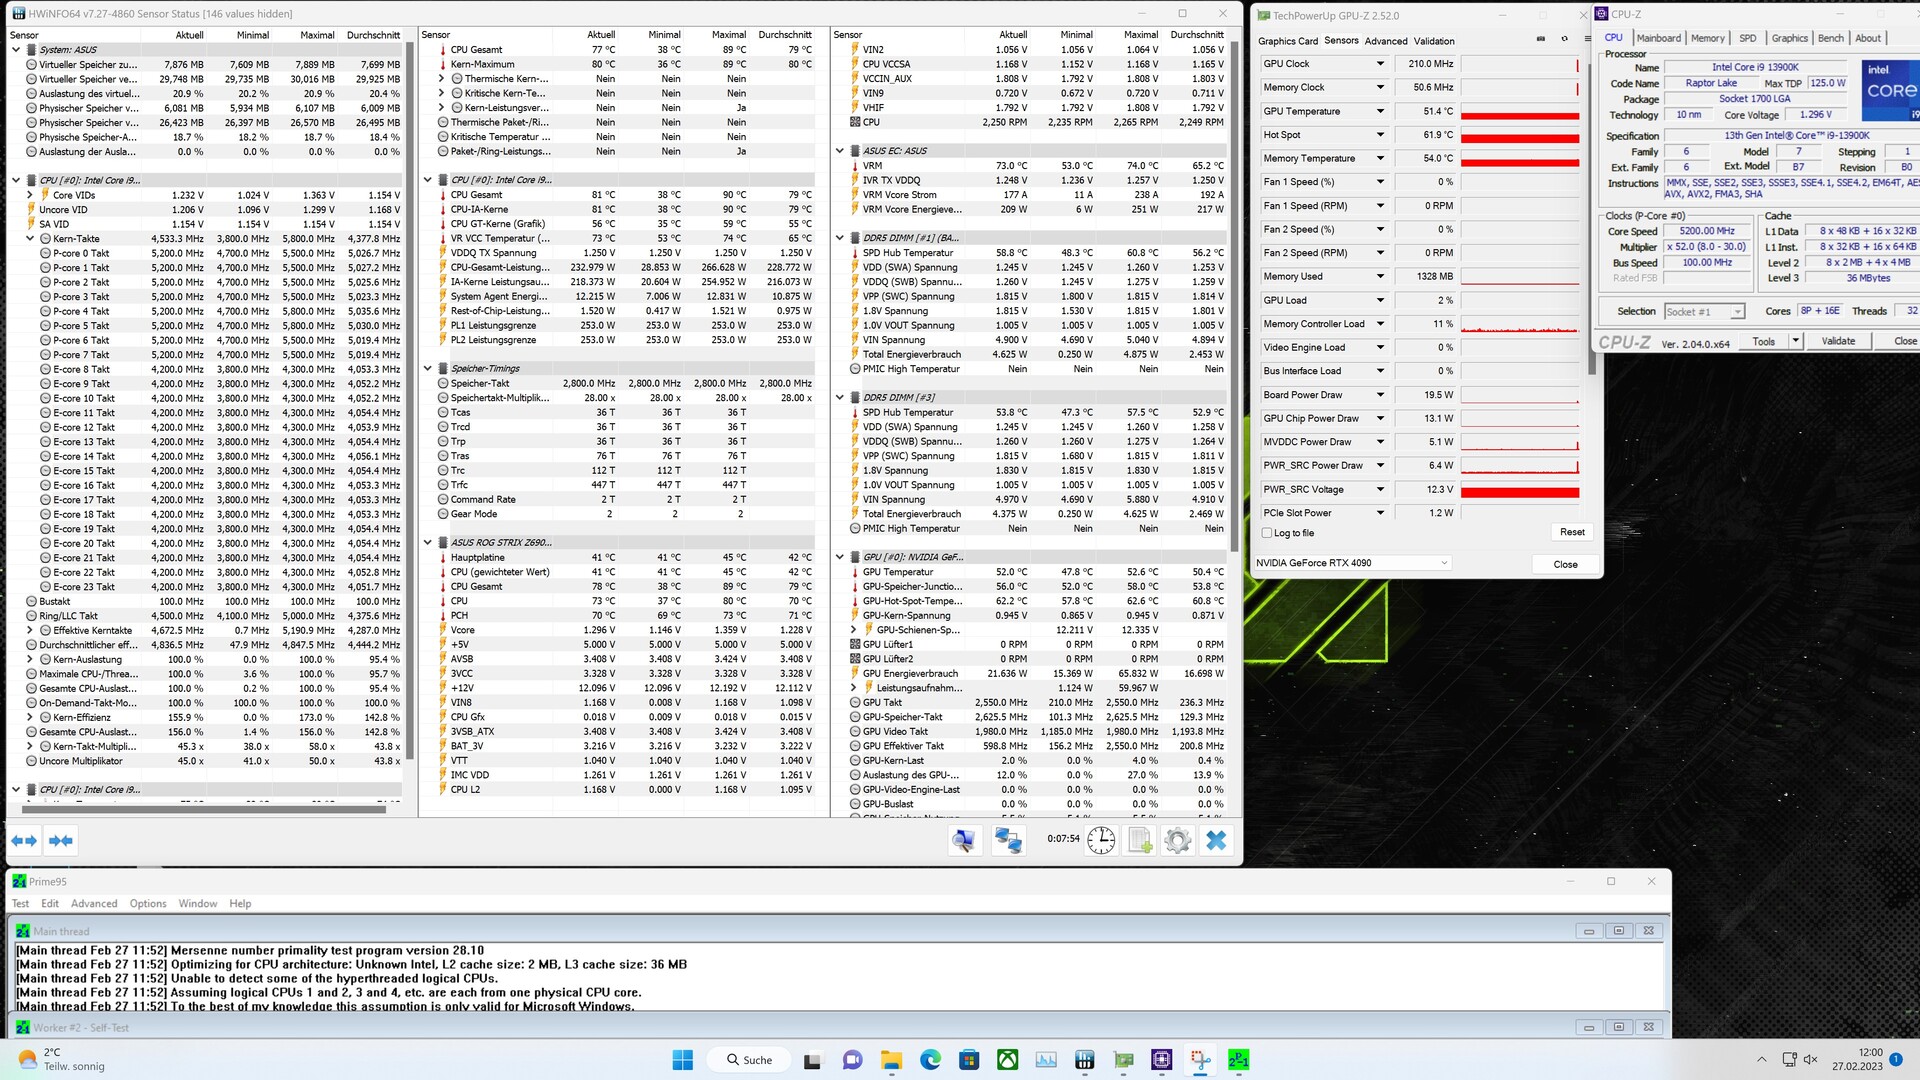
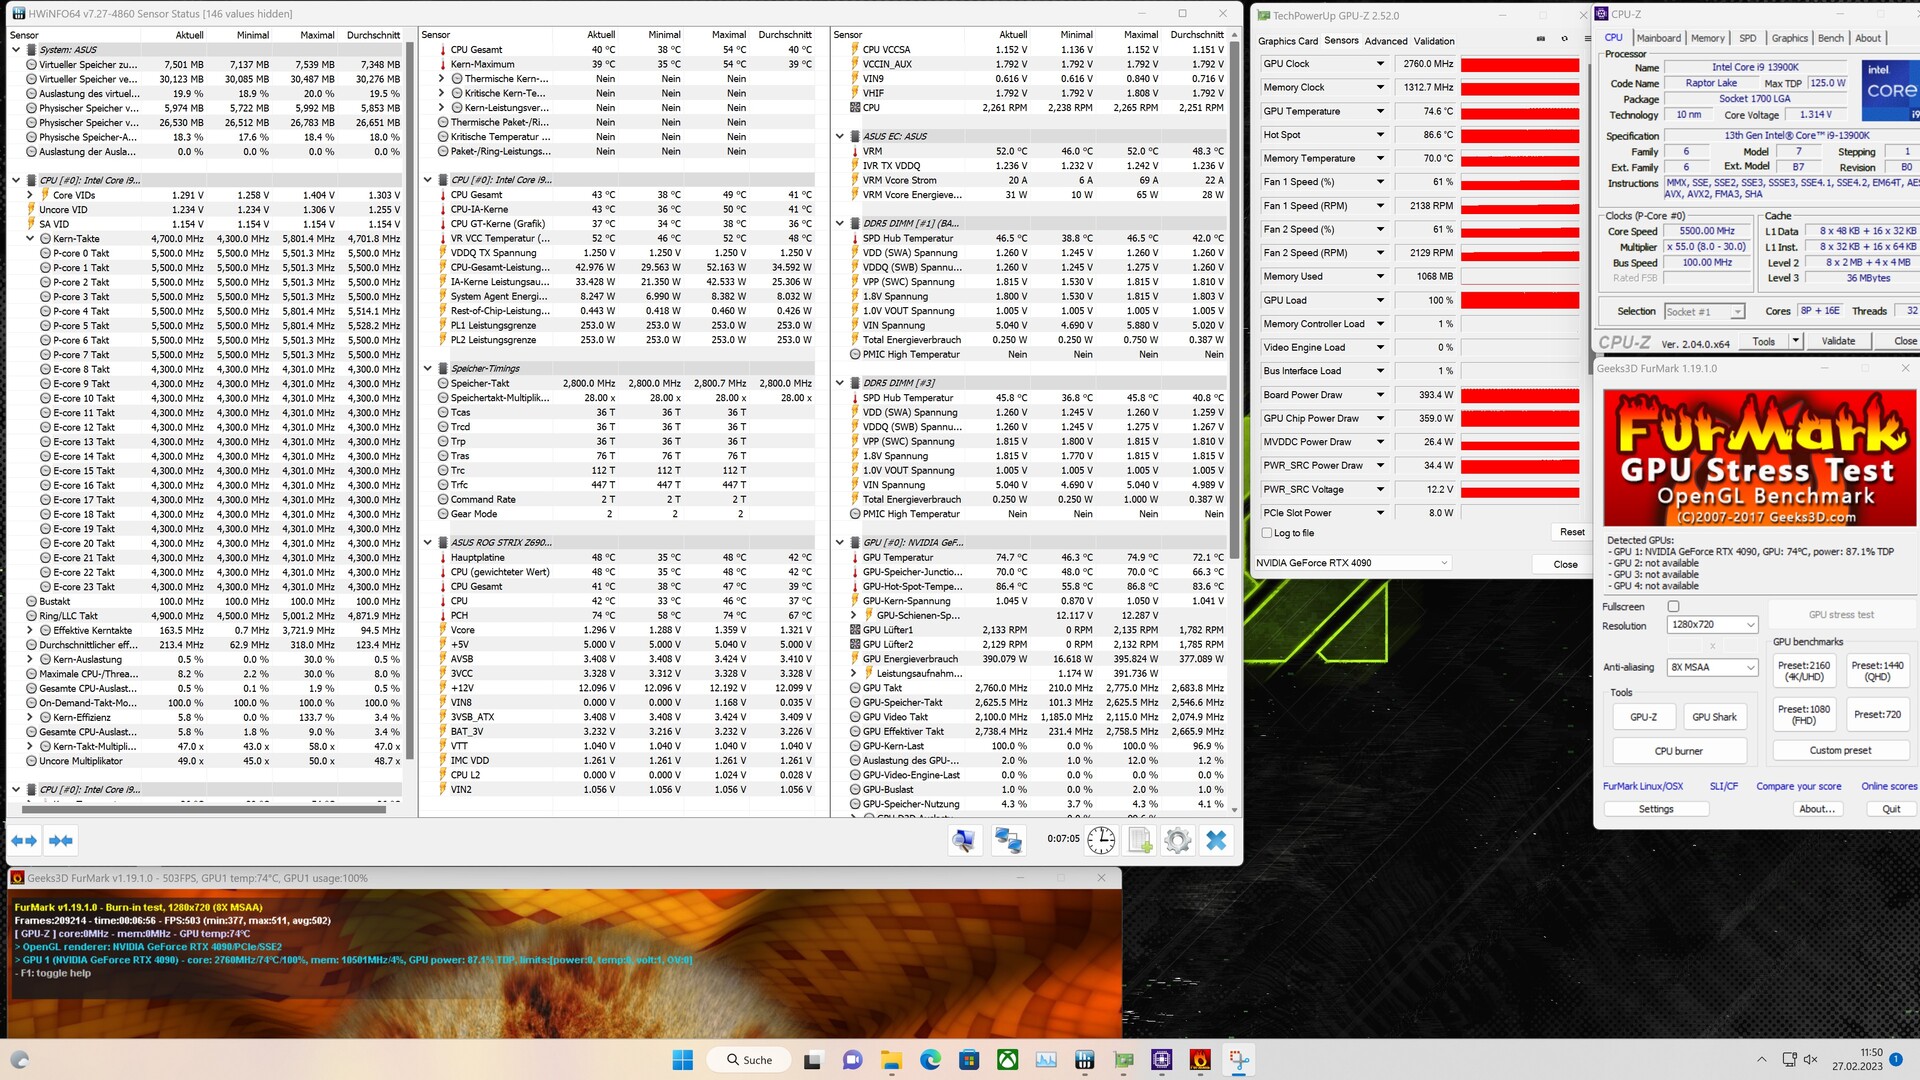
Das Kühlkonzept des XMG Sector - Intel ist so aufgebaut, dass an der Front kühle Luft angesaugt wird und oben sowie hinten wieder aus dem Gehäuse geleitet wird. Dabei kommt allerdings nur ein Lüfter zum Einsatz, welcher die warme Luft wieder aus dem Gehäuse befördern muss. An der Oberseite sind keine Lüfter installiert. Das Corsair 4000D Airflow ist allerdings so konzipiert, dass dennoch die warme Luft durch den Überdruck der drei ansaugenden Lüfter aus dem Gehäuse gelangen kann. Direkt hinter der Front ist der 360-Millimeter-Radiator der AiO installiert. Somit kann hier die optimale Kühlung für den Prozessor gewährleistet werden. Beim Stresstest sehen wir hier maximal 90 °C bei durchschnittlich 228 Watt Leistungsaufnahme. Bei der Grafikkarte dokumentieren wir beim Stresstest knapp 75 °C, was völlig unbedenklich ist.
Energieaufnahme
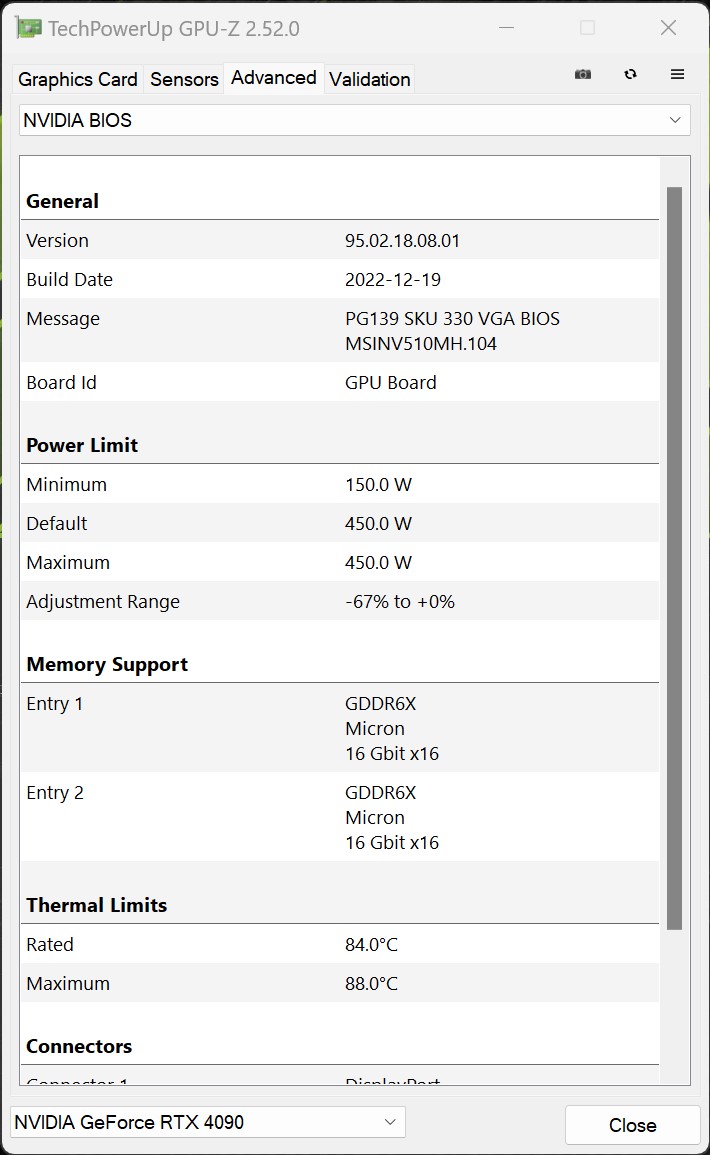
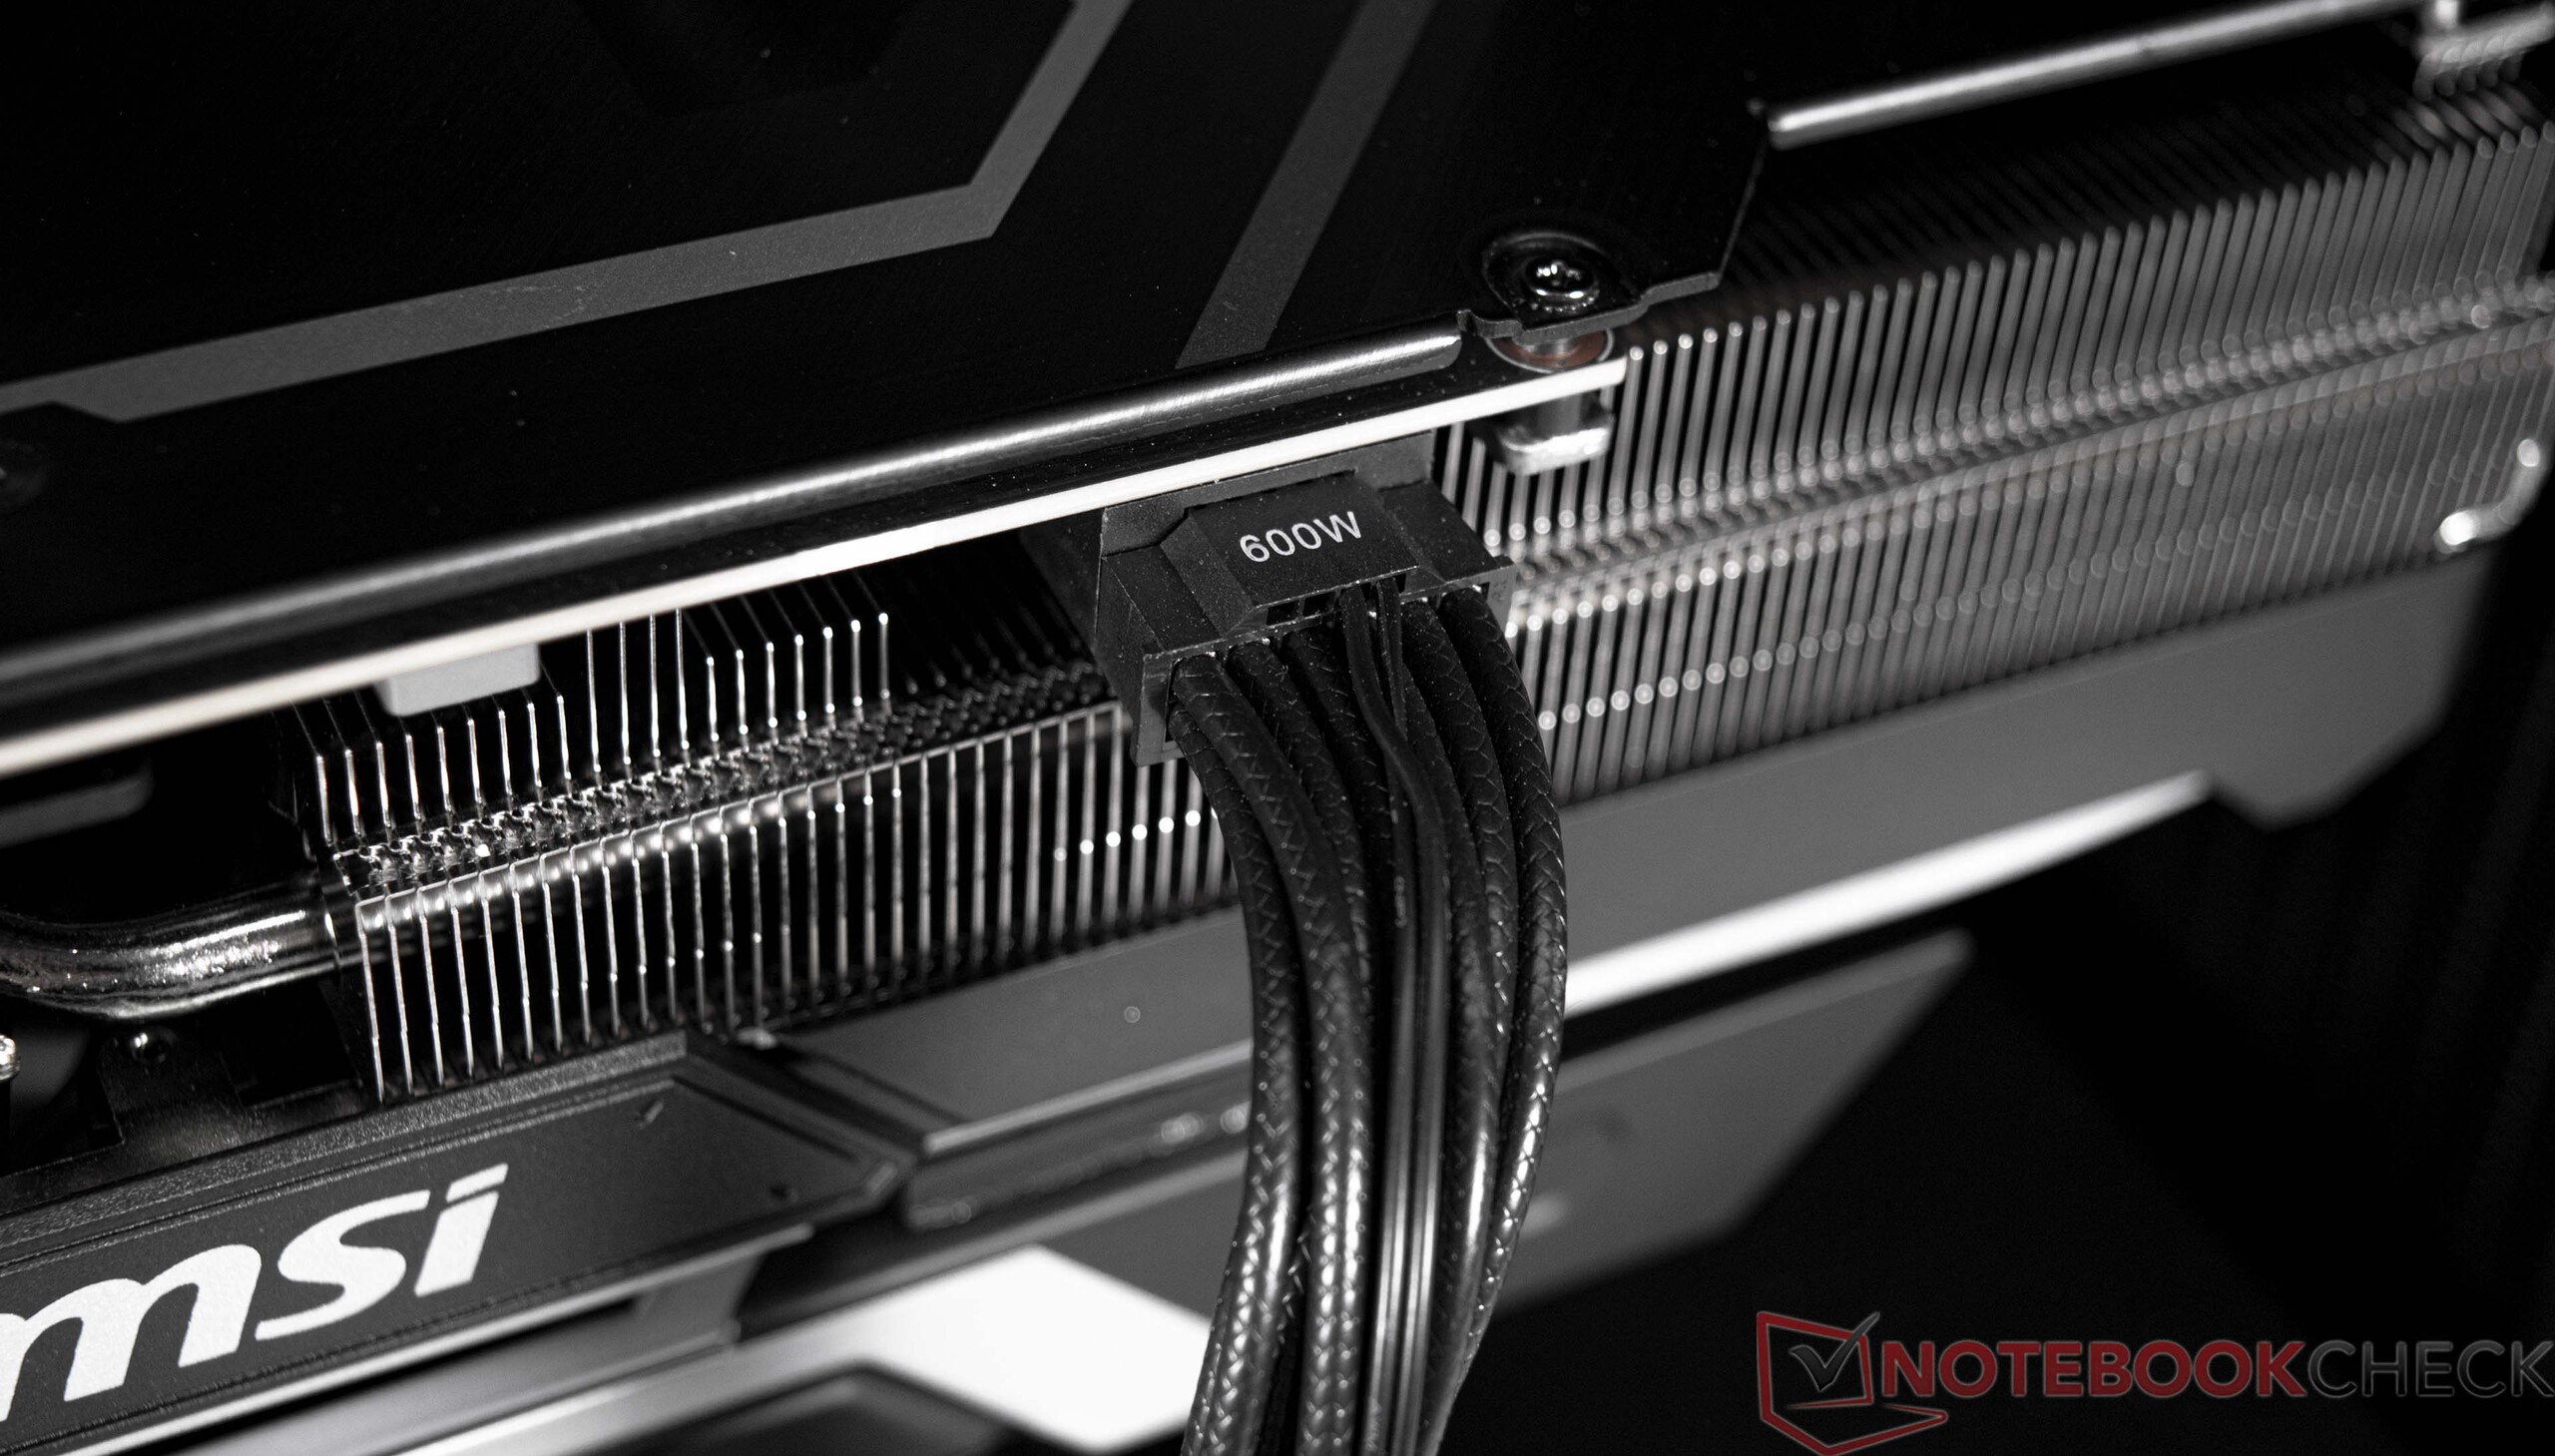
Die Stromversorgung wird über ein 1000-Watt-Netzteil aus dem Hause Seasonic sichergestellt. Das Netzteil hatte im Test keinerlei Probleme, die Komponenten auch unter voller Belastung mit ausreichend Energie zu versorgen. Aufgrund der verbauten High-End-Komponenten ist klar, dass hier kein sparsames Gerät vor uns steht. Im Leerlauf notieren wir 78 bis 96 Watt, was noch vertretbar ist. Beim Spielen wird das 1000-Watt-Netzteil hingegen mit 511 Watt im Durchschnitt belastet. Gleichwohl sehen wir aber auch hin und wieder deutliche Ausreißer nach oben. Aber auch die Spitzen mit bis zu 778 Watt bringen das Netzteil nicht an die Belastungsgrenze. Im Vergleich sortiert sich unser Testsample etwas hinter unserem GPU-Testsystem mit vergleichbarer Grafikkarte ein.
| Power Consumption / The Witcher 3 ultra (external Monitor) | |
| AMD Radeon RX 6950 XT | |
| NVIDIA GeForce RTX 3090 Ti (Idle: 102 W) | |
| NVIDIA GeForce RTX 3090 | |
| NVIDIA GeForce RTX 4090 | |
| NVIDIA GeForce RTX 3080 12 GB | |
| NVIDIA GeForce RTX 4090 | |
| AMD Radeon RX 6900 XT (Idle: 99.15 W) | |
| Power Consumption / FurMark 1.19 GPU Stress Test (external Monitor) | |
| NVIDIA GeForce RTX 4090 | |
| AMD Radeon RX 6950 XT | |
| NVIDIA GeForce RTX 3090 | |
| NVIDIA GeForce RTX 3080 12 GB | |
| AMD Radeon RX 6900 XT (Idle: 99.15 W) | |
| NVIDIA GeForce RTX 4090 | |
* ... kleinere Werte sind besser
| Aus / Standby | |
| Idle | |
| Last |
|
Legende:
min: | |
Energieaufnahme mit externem Monitor
Pro
Contra
Fazit - extrem schneller Gaming-PC

Mit der Testkonfiguration auf Basis des Intel Core i9-13900K und einer Nvidia GeForce RTX 4090 bekommt man mit dem XMG Sector - Intel aktuell ein Gaming-System, welches mit zu den schnellsten Systemen zählt, was man sich momentan zusammenstellen kann. Auch der Unterbau ist zeitgemäß, auch wenn nur
ein Mainboard mit Z690-Chipsatz verbaut wird. So kommt dennoch ein DDR5-Arbeitsspeicher zum Einsatz, und auch der Massenspeicher konnte hinsichtlich der Leistung überzeugen. Dabei bietet dieser mit 2 TB sogar ausreichend Platz für viele Spiele.
Der XMG Sector - Intel bietet auf Basis eines Intel Core i9-13900K eine hervorragende Leistung für viele Anwendungsfälle. Zusammen mit der Nvidia GeForce RTX 4090 gehört das System aktuell zu den schnellsten Gaming-PCs auf dem Markt.
In der von uns getesteten Version verfügt das System über eine sehr hohe Leistung, die ausreichend ist, um alle aktuellen Spiele in 2.160p flüssig zu spielen. Mit 4.600 Euro ist das System wahrlich kein Schnäppchen. Gleichwohl ist dieses System aber eine sinnvolle Zusammenstellung, wenn ohne Kompromisse die neuesten Spiele gezockt werden sollen. Ein ähnlich zusammengestelltes AMD System auf Basis des AMD Ryzen 9 7950X, welcher ebenfalls im Shop als XMG Sector - AMD angeboten wird, ist etwa 300 Euro teurer.
Preise und Verfügbarkeit
Den XMG Sector - Intel gibt es im hauseigenen Shop bei bestware.com und kostet derzeit knapp 4.600 Euro. Alternative Optionen lassen sich über den großzügigen Konfigurator wählen.
Schenker XMG SECTOR, i9 13900K, RTX 4090
- 04.03.2023 v7 (old)
Sebastian Bade
Transparenz
Die Auswahl der zu testenden Geräte erfolgt innerhalb der Redaktion. Das vorliegende Testmuster wurde dem Autor vom Hersteller oder einem Shop zu Testzwecken leihweise zur Verfügung gestellt. Eine Einflussnahme des Leihstellers auf den Testbericht gab es nicht, der Hersteller erhielt keine Version des Reviews vor der Veröffentlichung. Es bestand keine Verpflichtung zur Publikation. Als eigenständiges, unabhängiges Unternehmen unterliegt Notebookcheck keiner Diktion von Herstellern, Shops und Verlagen.
So testet Notebookcheck
Pro Jahr werden von Notebookcheck hunderte Laptops und Smartphones unabhängig in von uns standardisierten technischen Verfahren getestet, um eine Vergleichbarkeit aller Testergebnisse zu gewährleisten. Seit rund 20 Jahren entwickeln wir diese Testmethoden kontinuierlich weiter und setzen damit Branchenstandards. In unseren Testlaboren kommt ausschließlich hochwertiges Messequipment in die Hände erfahrener Techniker und Redakteure. Die Tests unterliegen einer mehrstufigen Kontrolle. Unsere komplexe Gesamtbewertung basiert auf hunderten fundierten Messergebnissen und Benchmarks, womit Ihnen Objektivität garantiert ist. Weitere Informationen zu unseren Testmethoden gibt es hier.
