Dell Precision 5690 im Workstation-Test: Bereit für die KI-Revolution

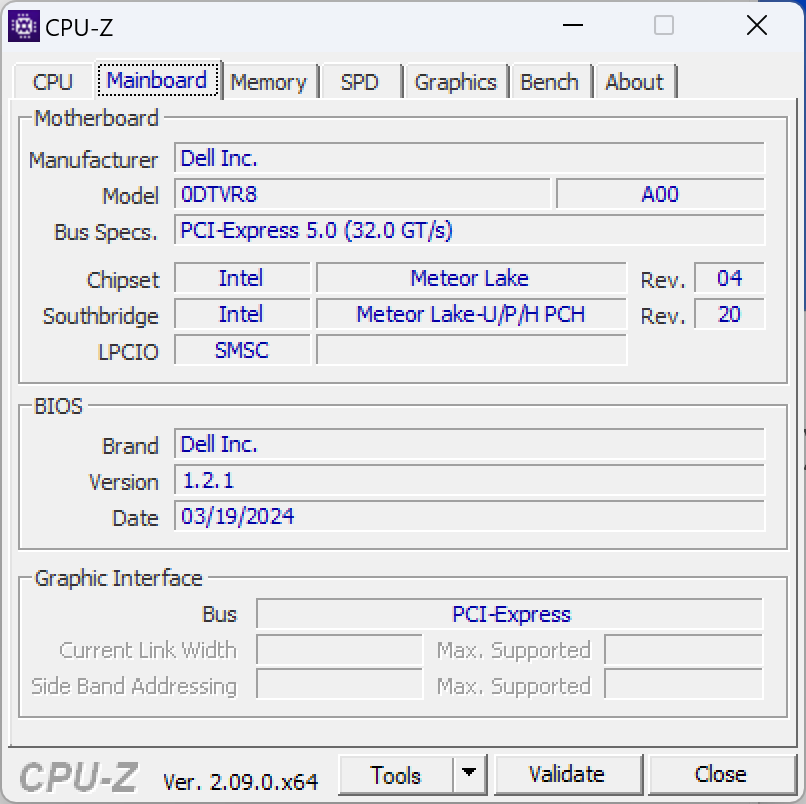
Das Precision 5690 beerbt das letztjährige Precision 5680 und ersetzt die älteren Raptor-Lake-H-CPUs durch die neueren Meteor Lake-H-CPUs mit integrierter NPU. Ansonsten sind beide Modelle identisch, inklusive dem gleichen Display und den gleichen GPU-Optionen. Daher empfehlen wir unseren Test des Precision 5680, um mehr über die physischen Merkmale des vom XPS 16 inspirierten, neuesten Spross der Serie zu erfahren.
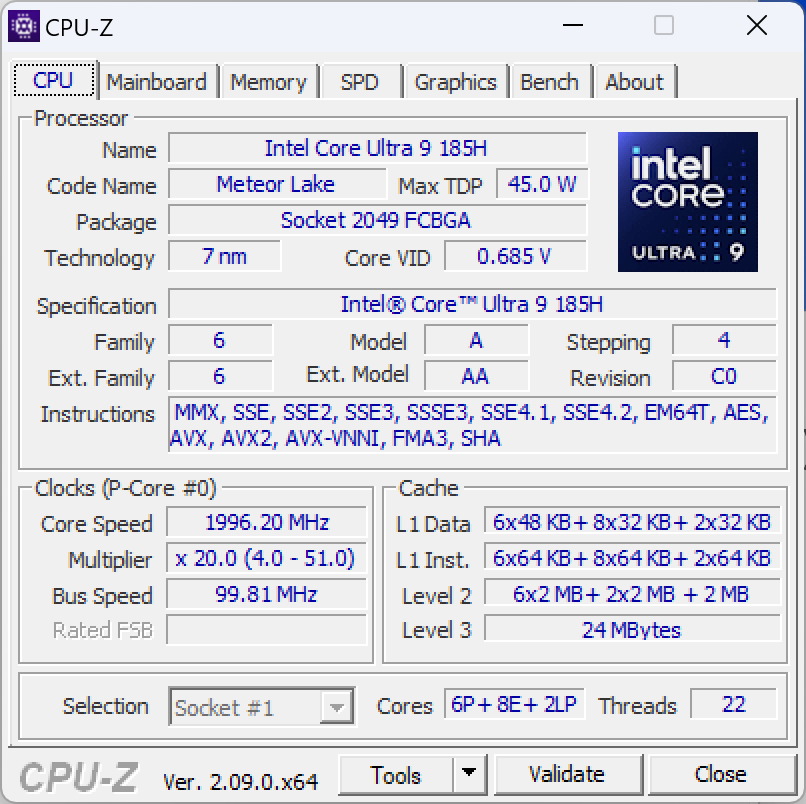
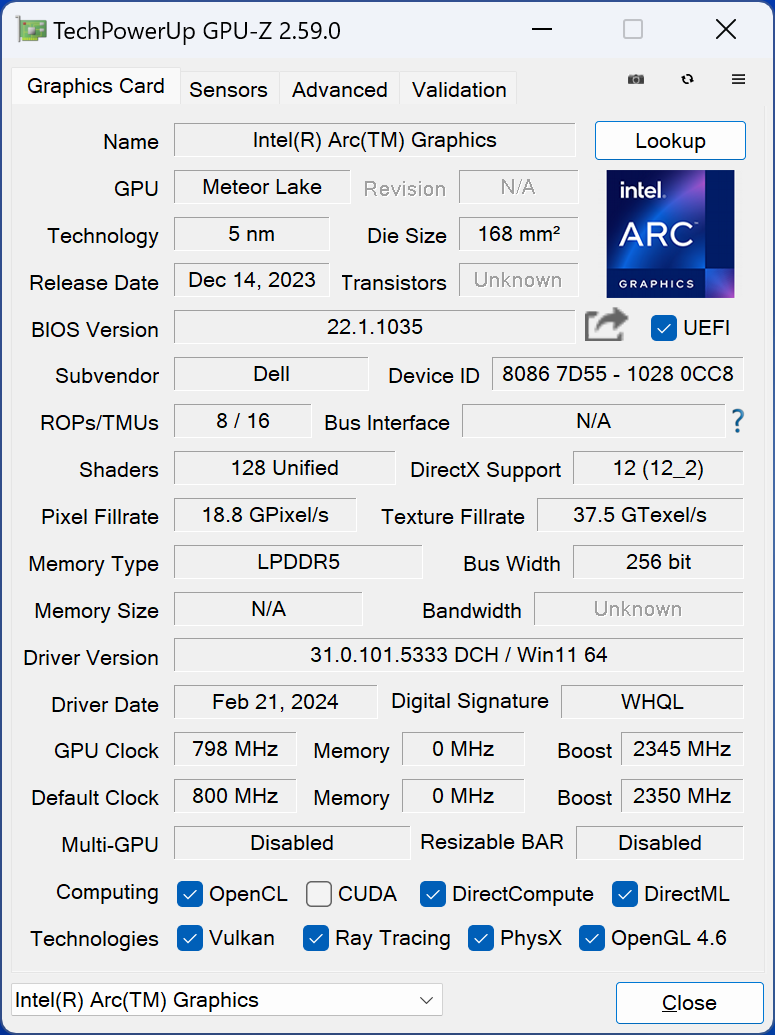
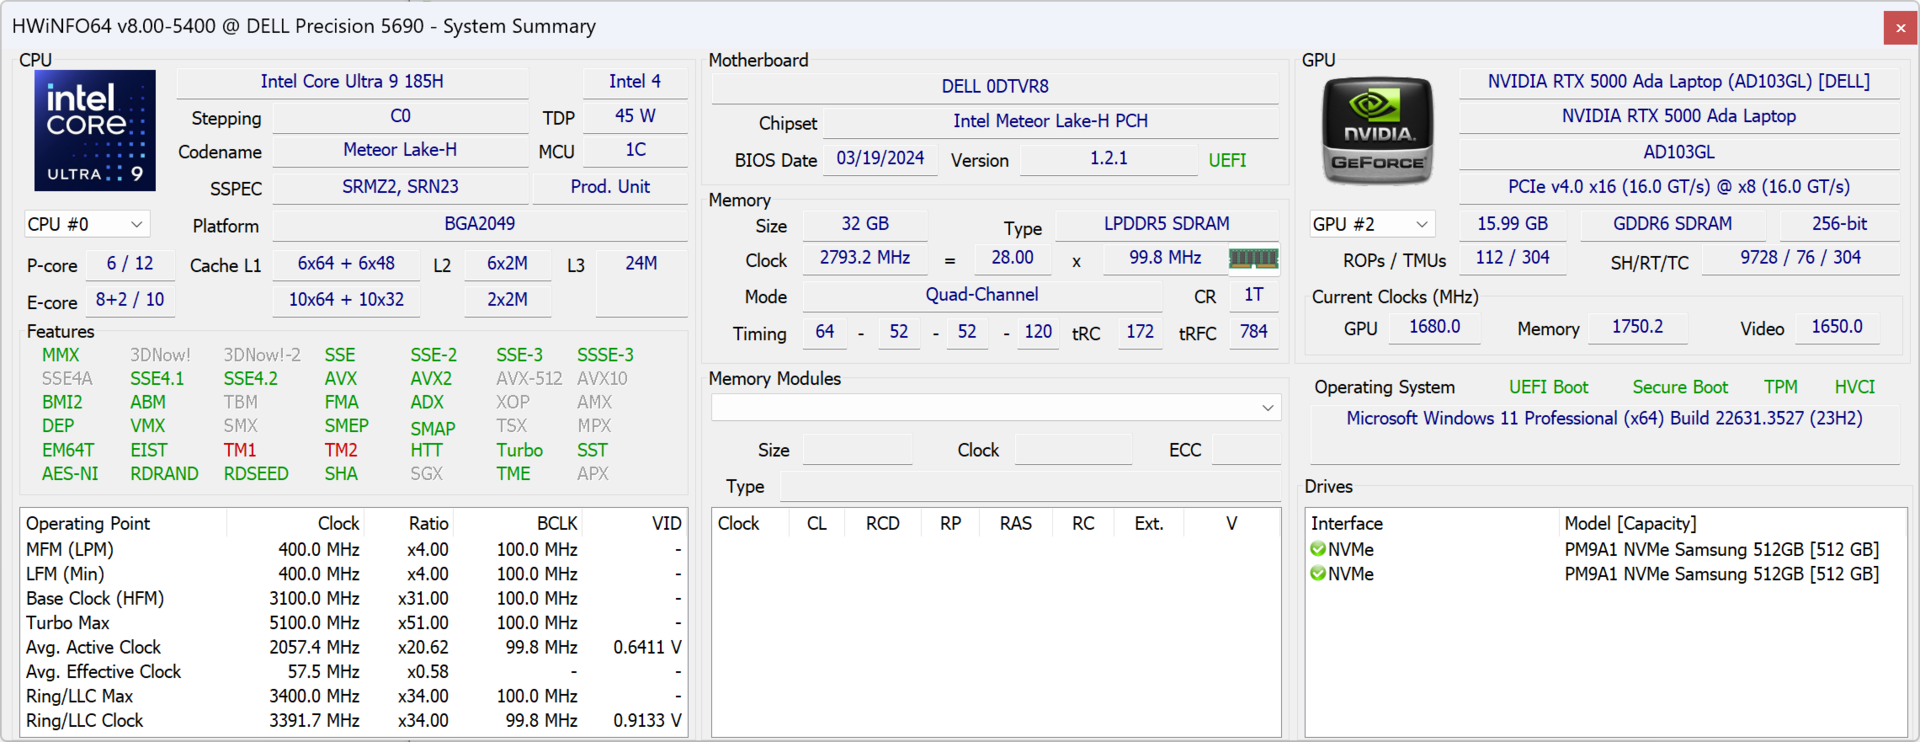
Unsere Testeinheit stellt die aktuell beste dar und ist mit einem Core Ultra 9 185H vPro, einer Nvidia 5000 Ada GPU sowie einem 16-Zoll großen 2.400p-OLED-Touchscreen für etwa $5.900 USD (6.475 Euro in Deutschland). Schwächere SKUs starten mit einem Core Ultra 5 135H vPro, integrierter Arc-Grafik und einem 1.200p-IPS-Display für nur $2300 (ca. 2.740 Euro in Deutschland).
Alternativen zum Precision 5690 finden sich in anderen 16-Zoll-Workstations wie dem Lenovo ThinkPad P16 G2, HP ZBook Fury 16 G10 oder MSI CreatorPro Z16P.
Weitere Dell-Tests:
Preisvergleich
Potentielle Konkurrenten im Vergleich
Bew. | Datum | Modell | Gewicht | Dicke | Größe | Auflösung | Preis ab |
|---|---|---|---|---|---|---|---|
| 88.3 % v7 (old) | 05 / 2024 | Dell Precision 5690 Ultra 9 185H, RTX 5000 Ada Generation Laptop | 2.3 kg | 22.17 mm | 16.00" | 3840x2400 | |
| 89 % v7 (old) | 08 / 2023 | Dell Precision 5000 5680 i9-13900H, RTX 5000 Ada Generation Laptop | 2.3 kg | 22.17 mm | 16.00" | 3840x2400 | |
| 90.2 % v7 (old) | 03 / 2024 | Lenovo ThinkPad P16 G2 21FA000FGE i7-13700HX, RTX 2000 Ada Generation Laptop | 3 kg | 30.23 mm | 16.00" | 2560x1600 | |
| 91.7 % v7 (old) | 10 / 2023 | Lenovo ThinkPad P1 G6-21FV000DGE i9-13900H, RTX 2000 Ada Generation Laptop | 1.9 kg | 17.5 mm | 16.00" | 2560x1600 | |
| 92.3 % v7 (old) | 09 / 2023 | HP ZBook Fury 16 G10 i9-13950HX, RTX 5000 Ada Generation Laptop | 2.6 kg | 28.5 mm | 16.00" | 3840x2400 | |
| 84.3 % v7 (old) | 11 / 2022 | MSI CreatorPro Z16P B12UKST i7-12700H, RTX A3000 Laptop GPU | 2.4 kg | 19 mm | 16.00" | 2560x1600 |
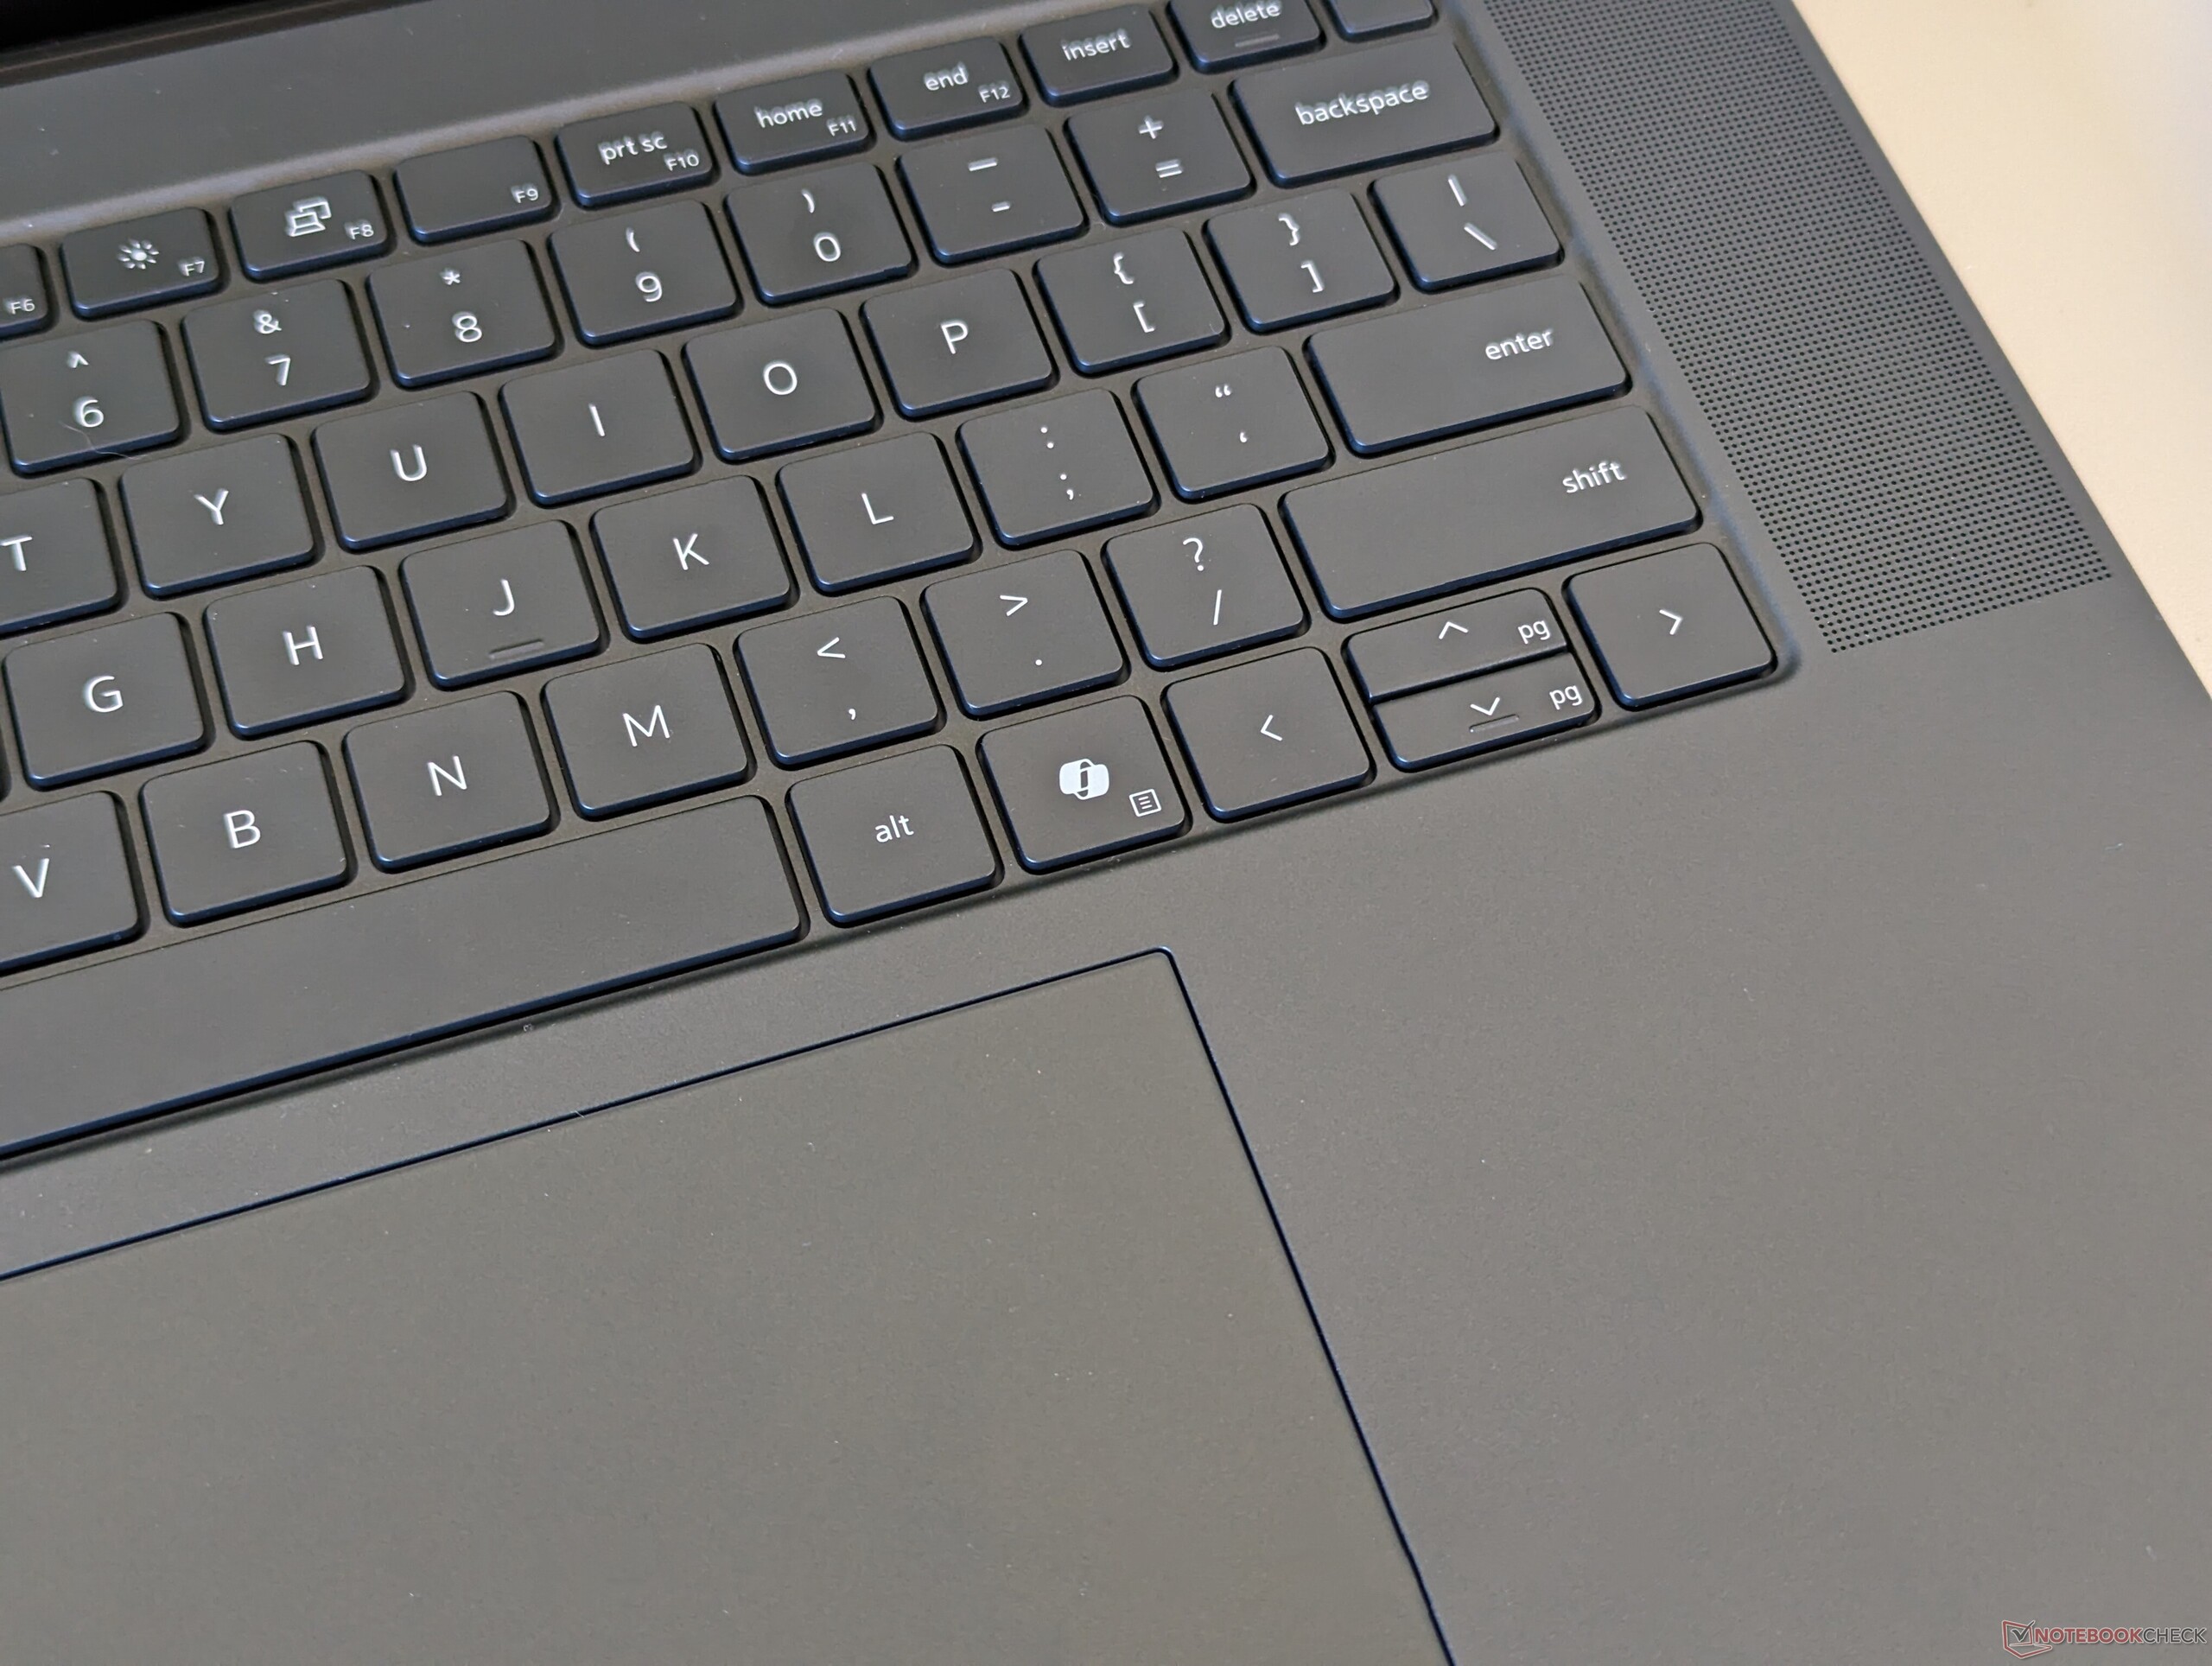
Gehäuse — Vom XPS 16 inspiriert
Die Tastatur integriert nun eine dedizierte Taste für Microsofts Co-Pilot, welche den Platz der rechten Strg-Taste einnimmt und das Precision 5690 damit visuell vom 5680 abgrenzt.
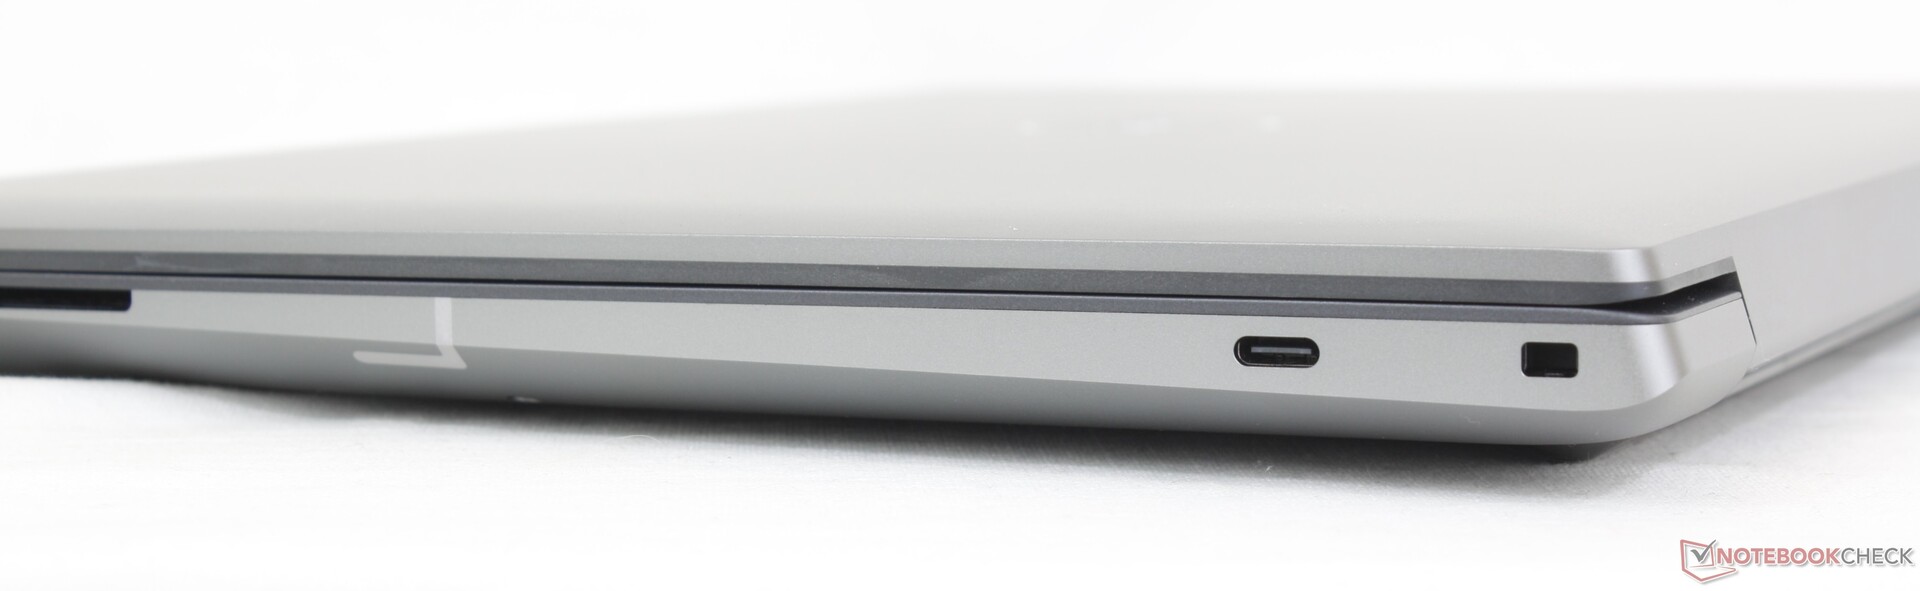
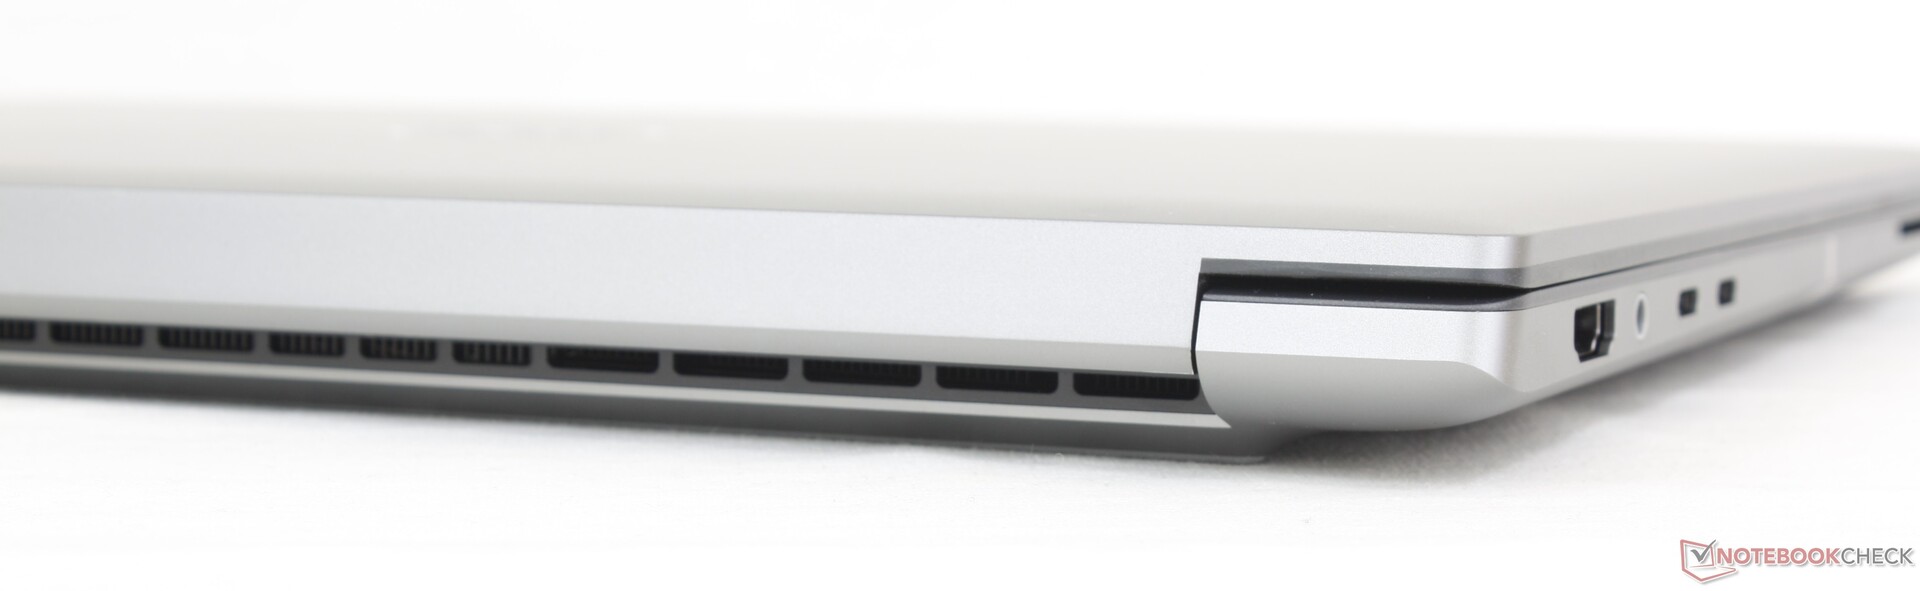
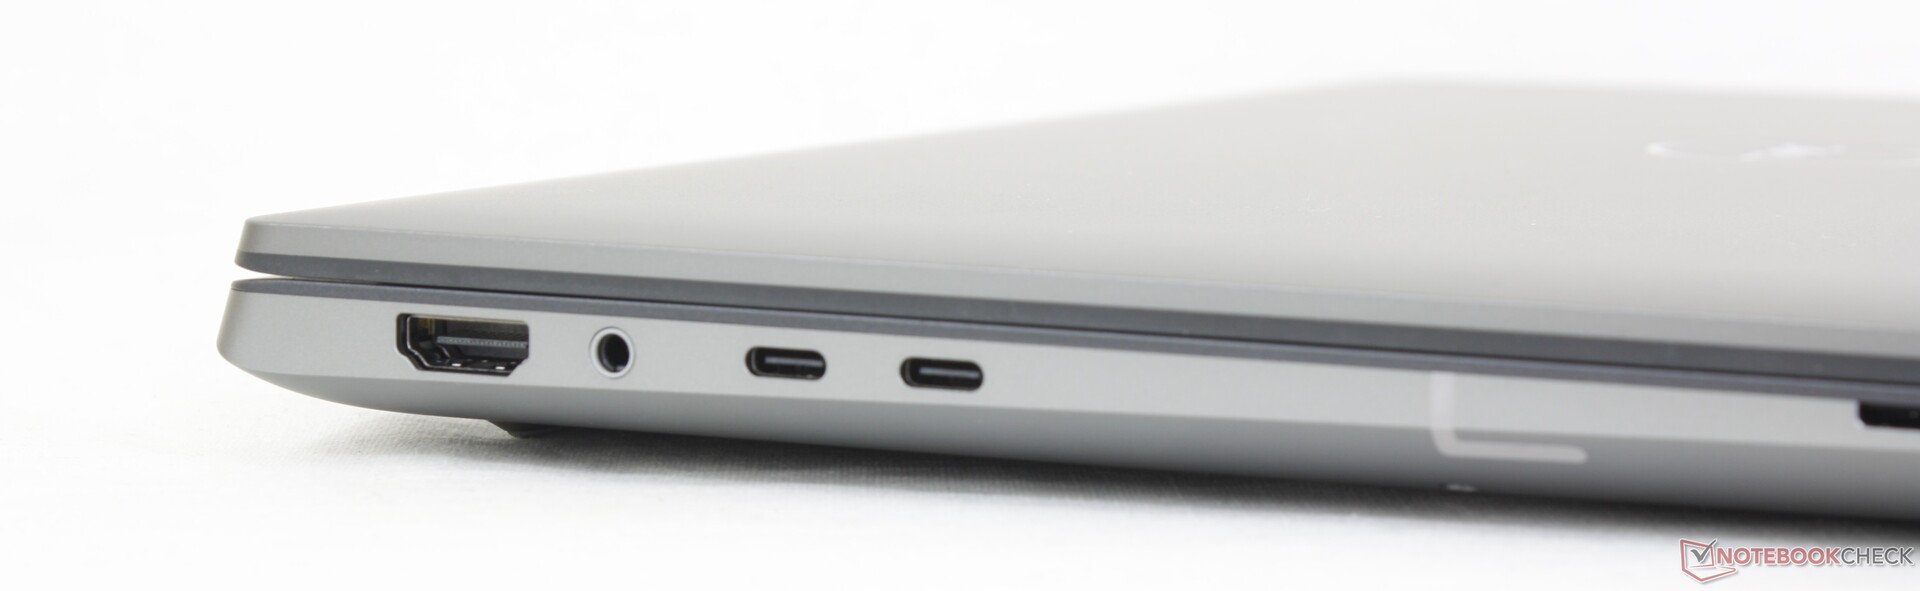
Anschlüsse

Kommunikation
Neben der CPU hat auch das WLAN ein Upgrade erfahren, vom Intel AX211 auf das Intel BE200, welches nun Wi-Fi 7 unterstützt. Allerdings dürften die allermeisten Nutzer noch auf Wi-Fi 6E oder ältere Netzwerke limitiert sein und so vorerst kaum Leistungssteigerungen bemerken.
Webcam

")
")
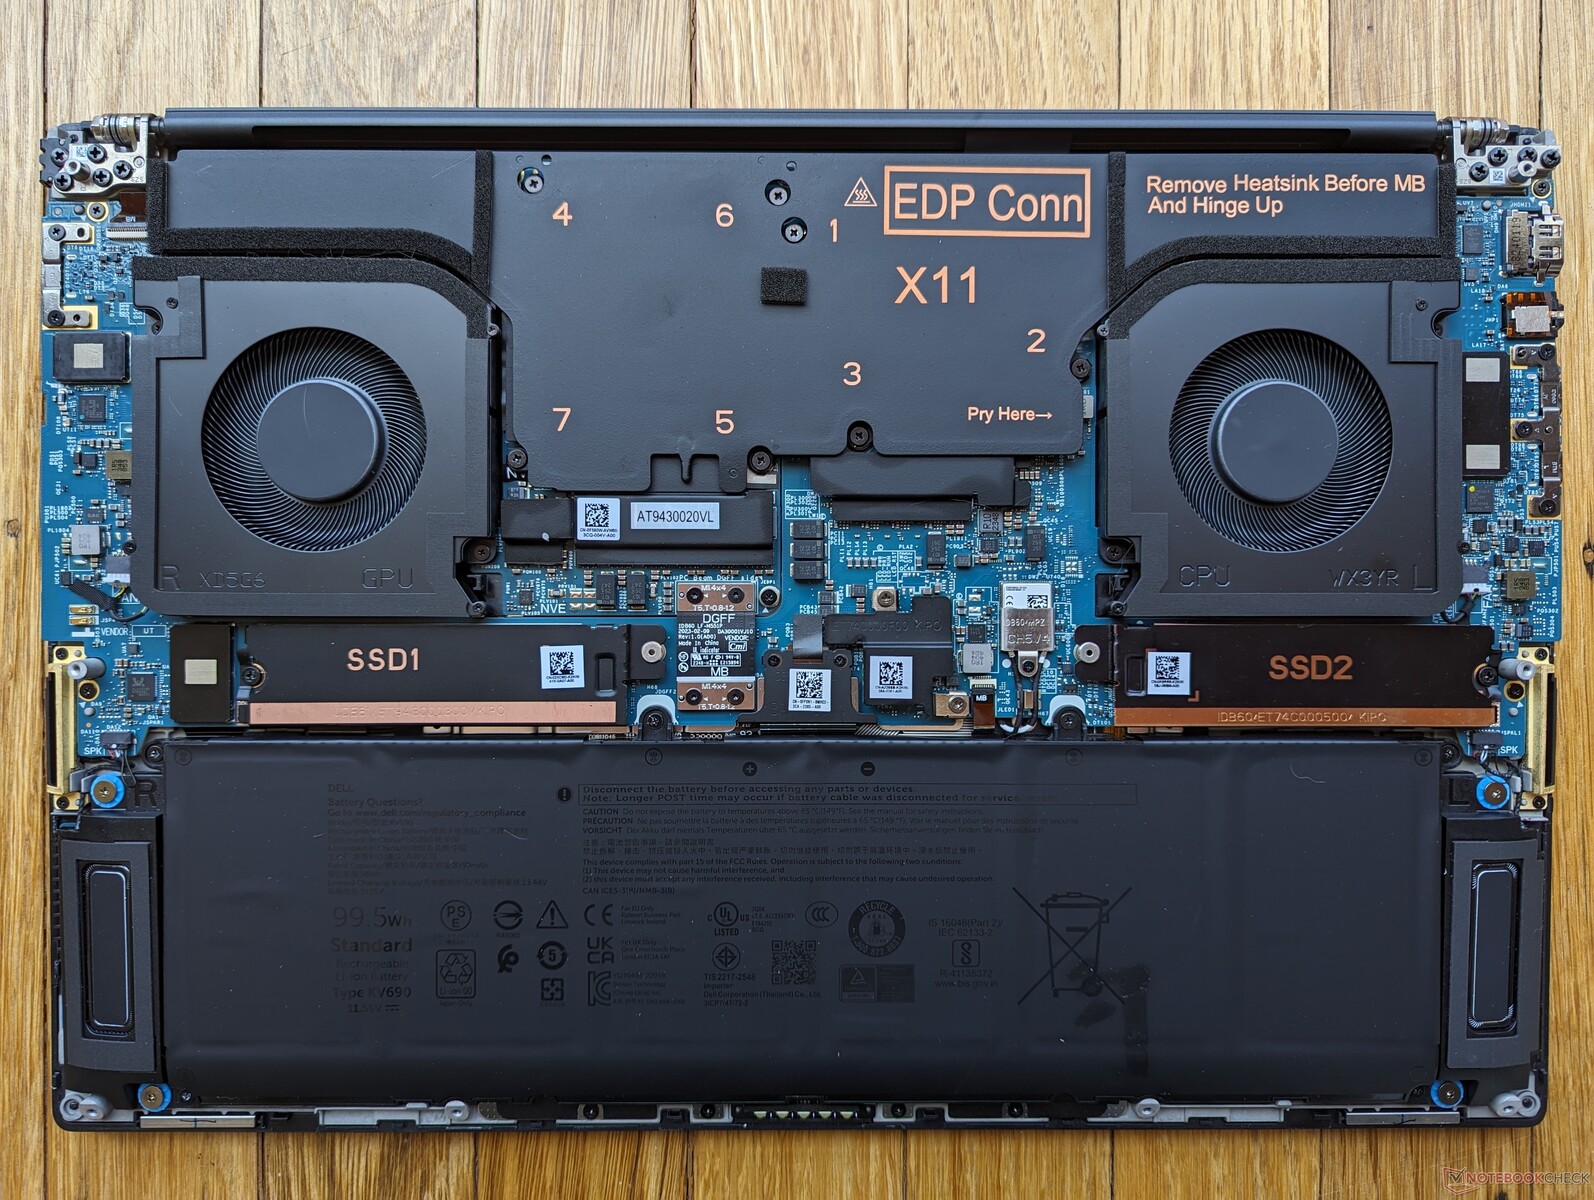
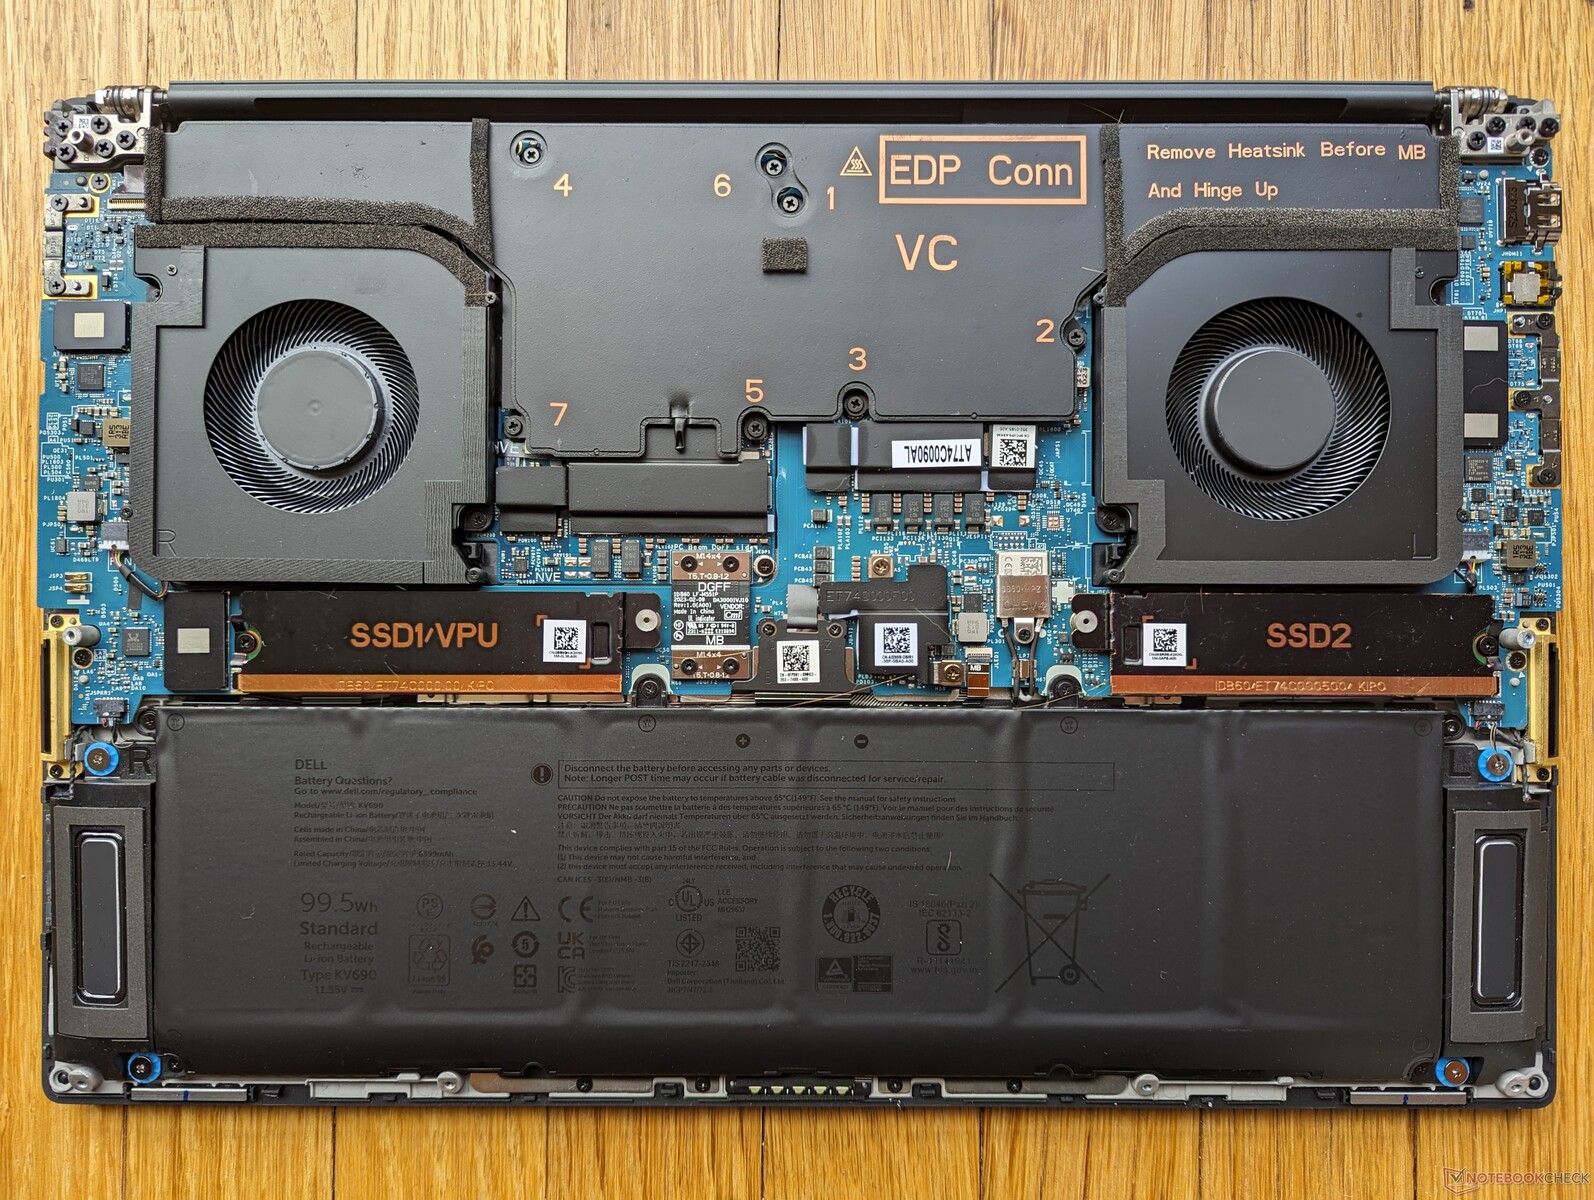
Wartung
Es gibt keine ersichtlichen Unterschiede zwischen dem Precision 5690 und dem älteren 5680.
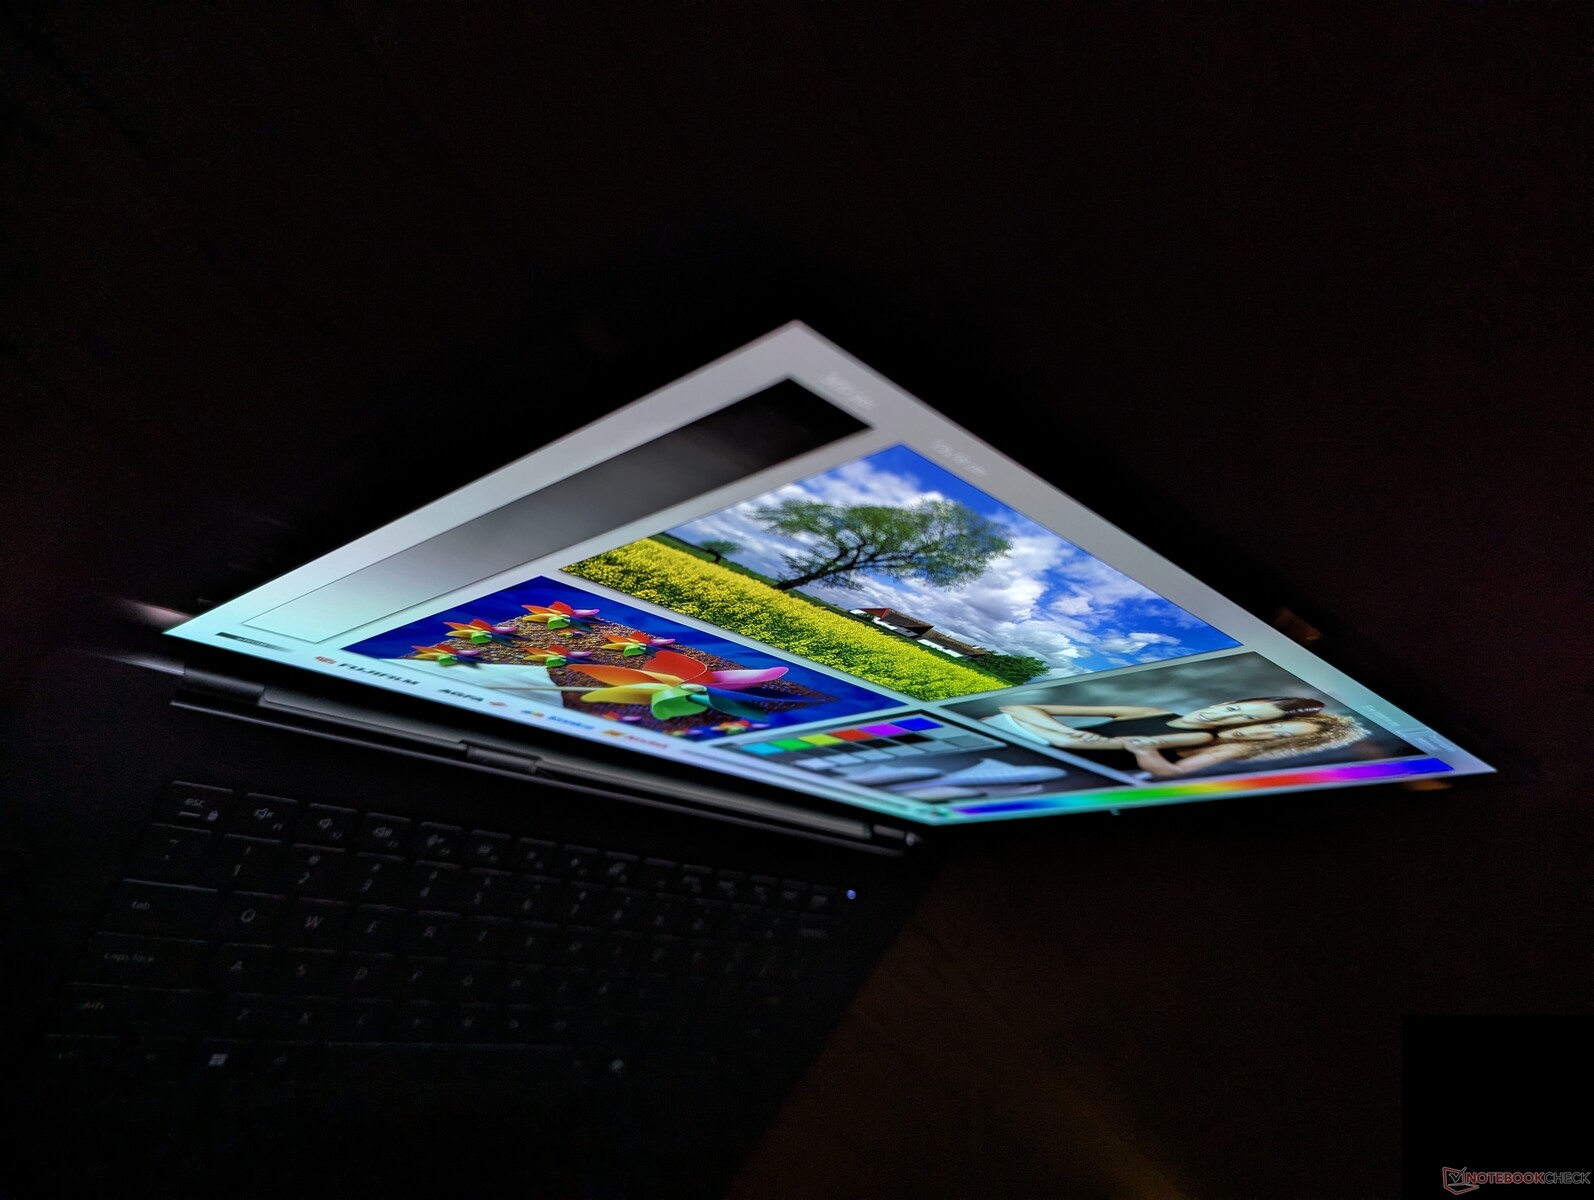
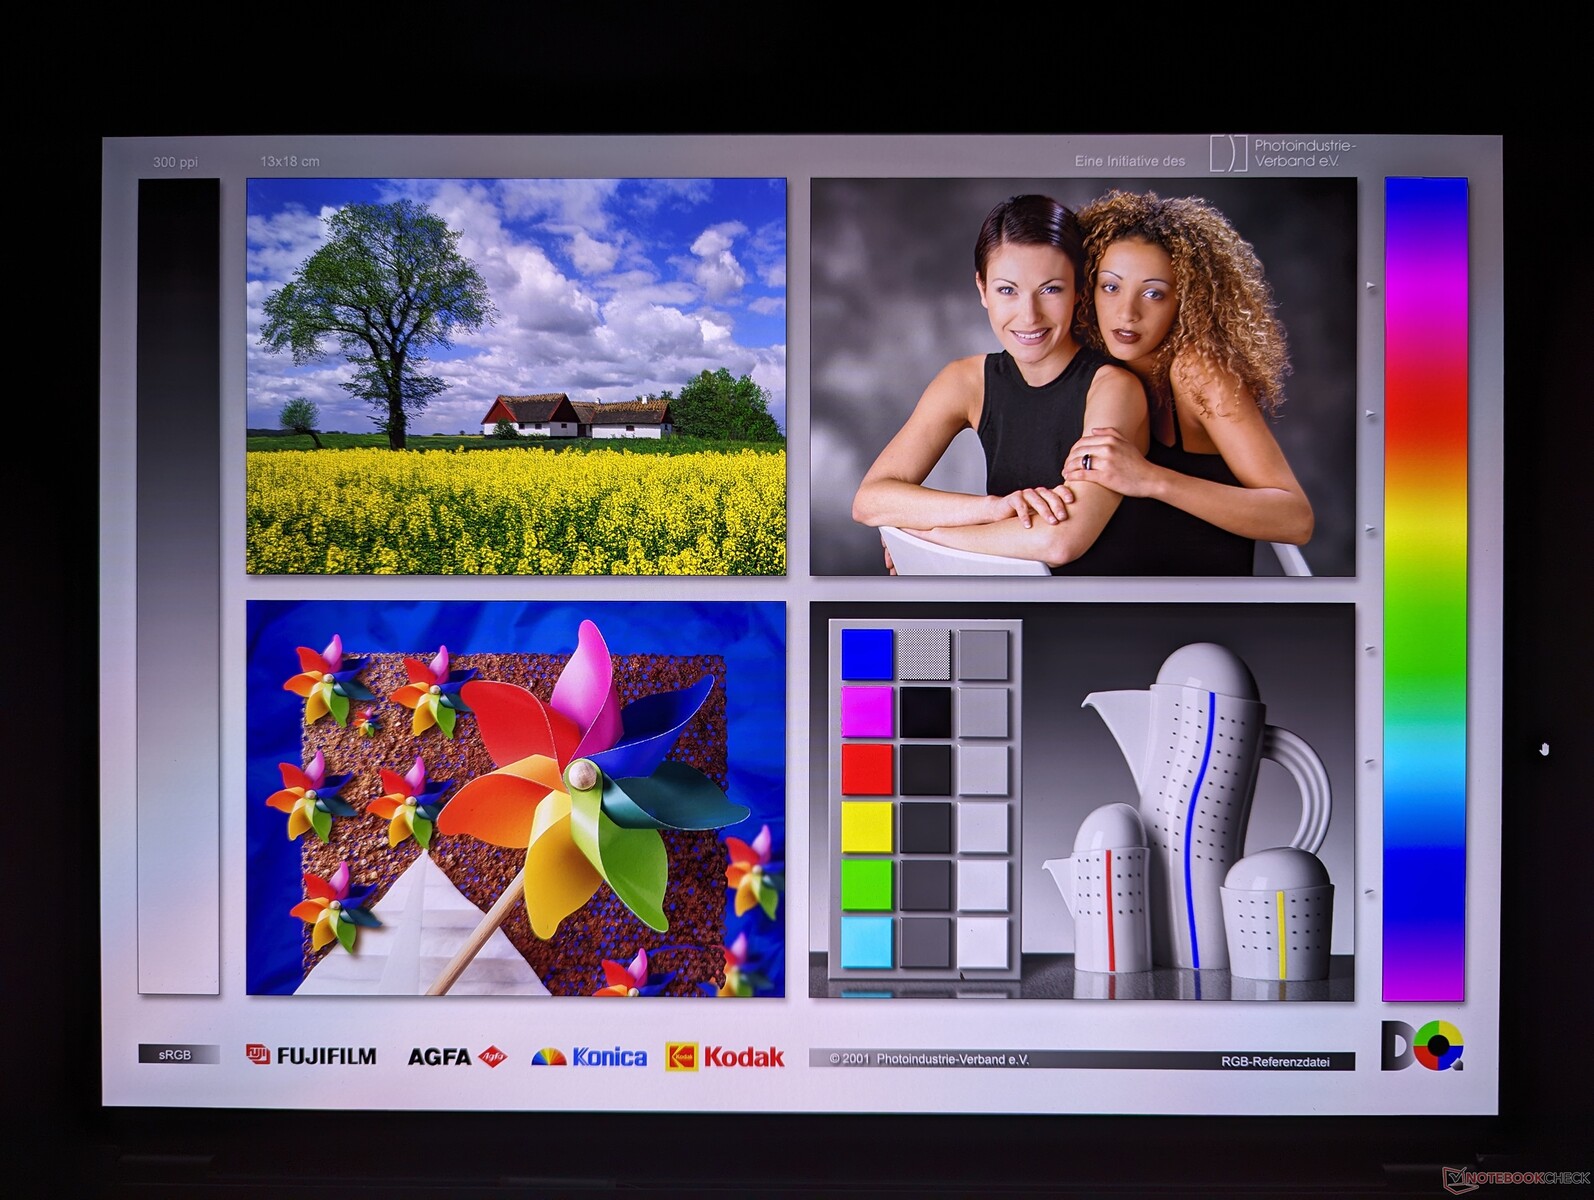
Display — HDR-OLED mit 60 Hz

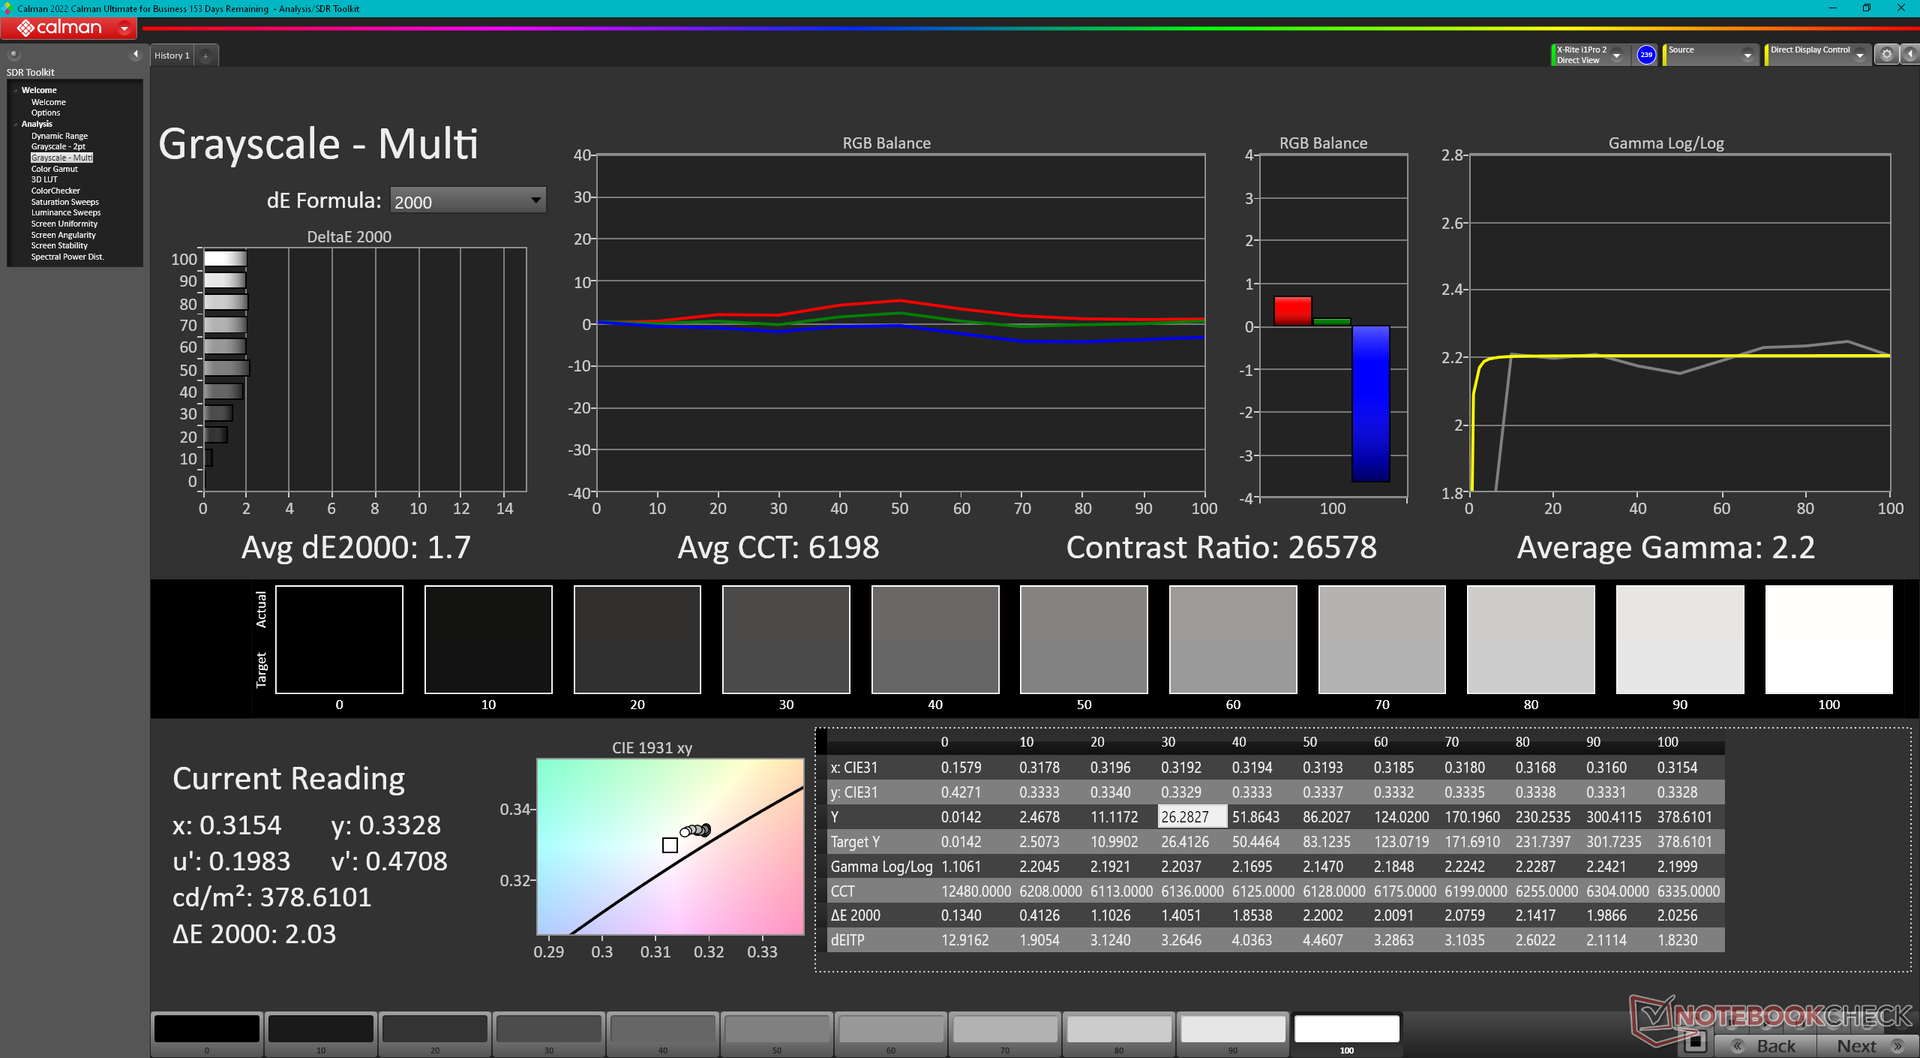
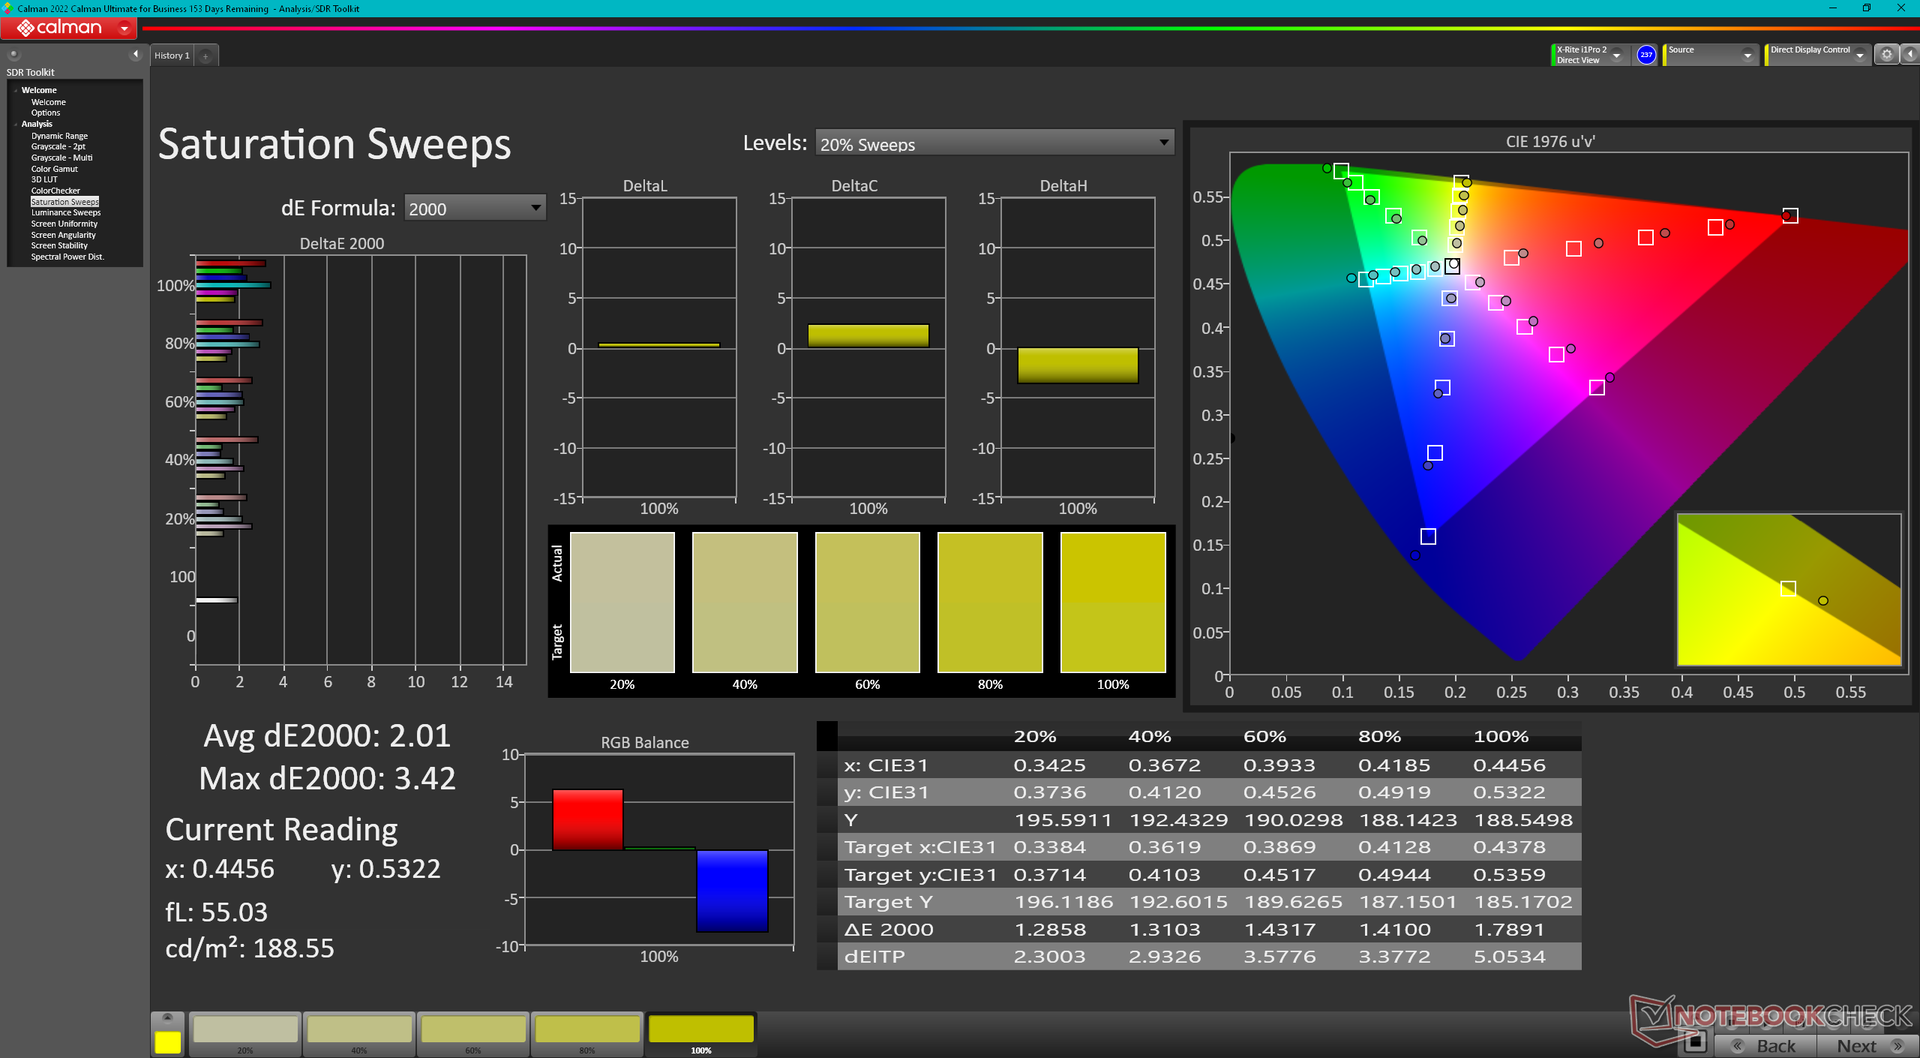
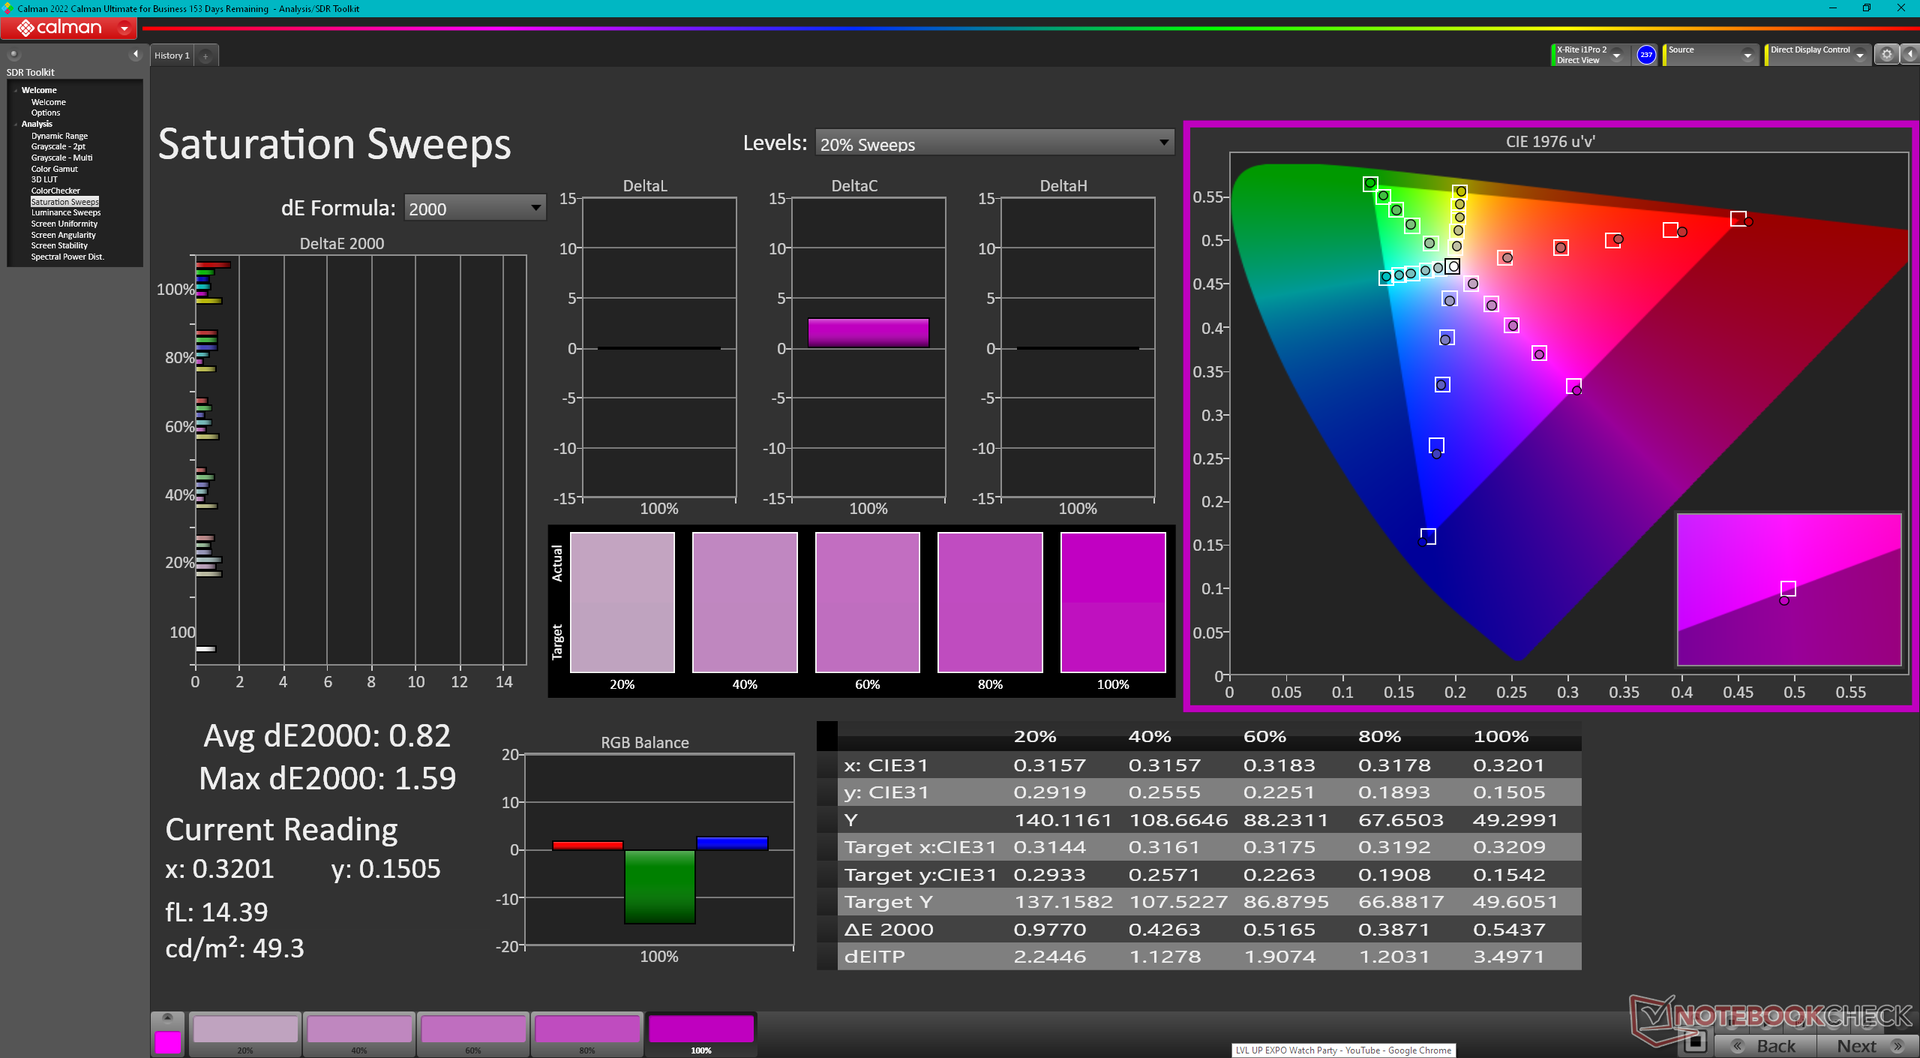
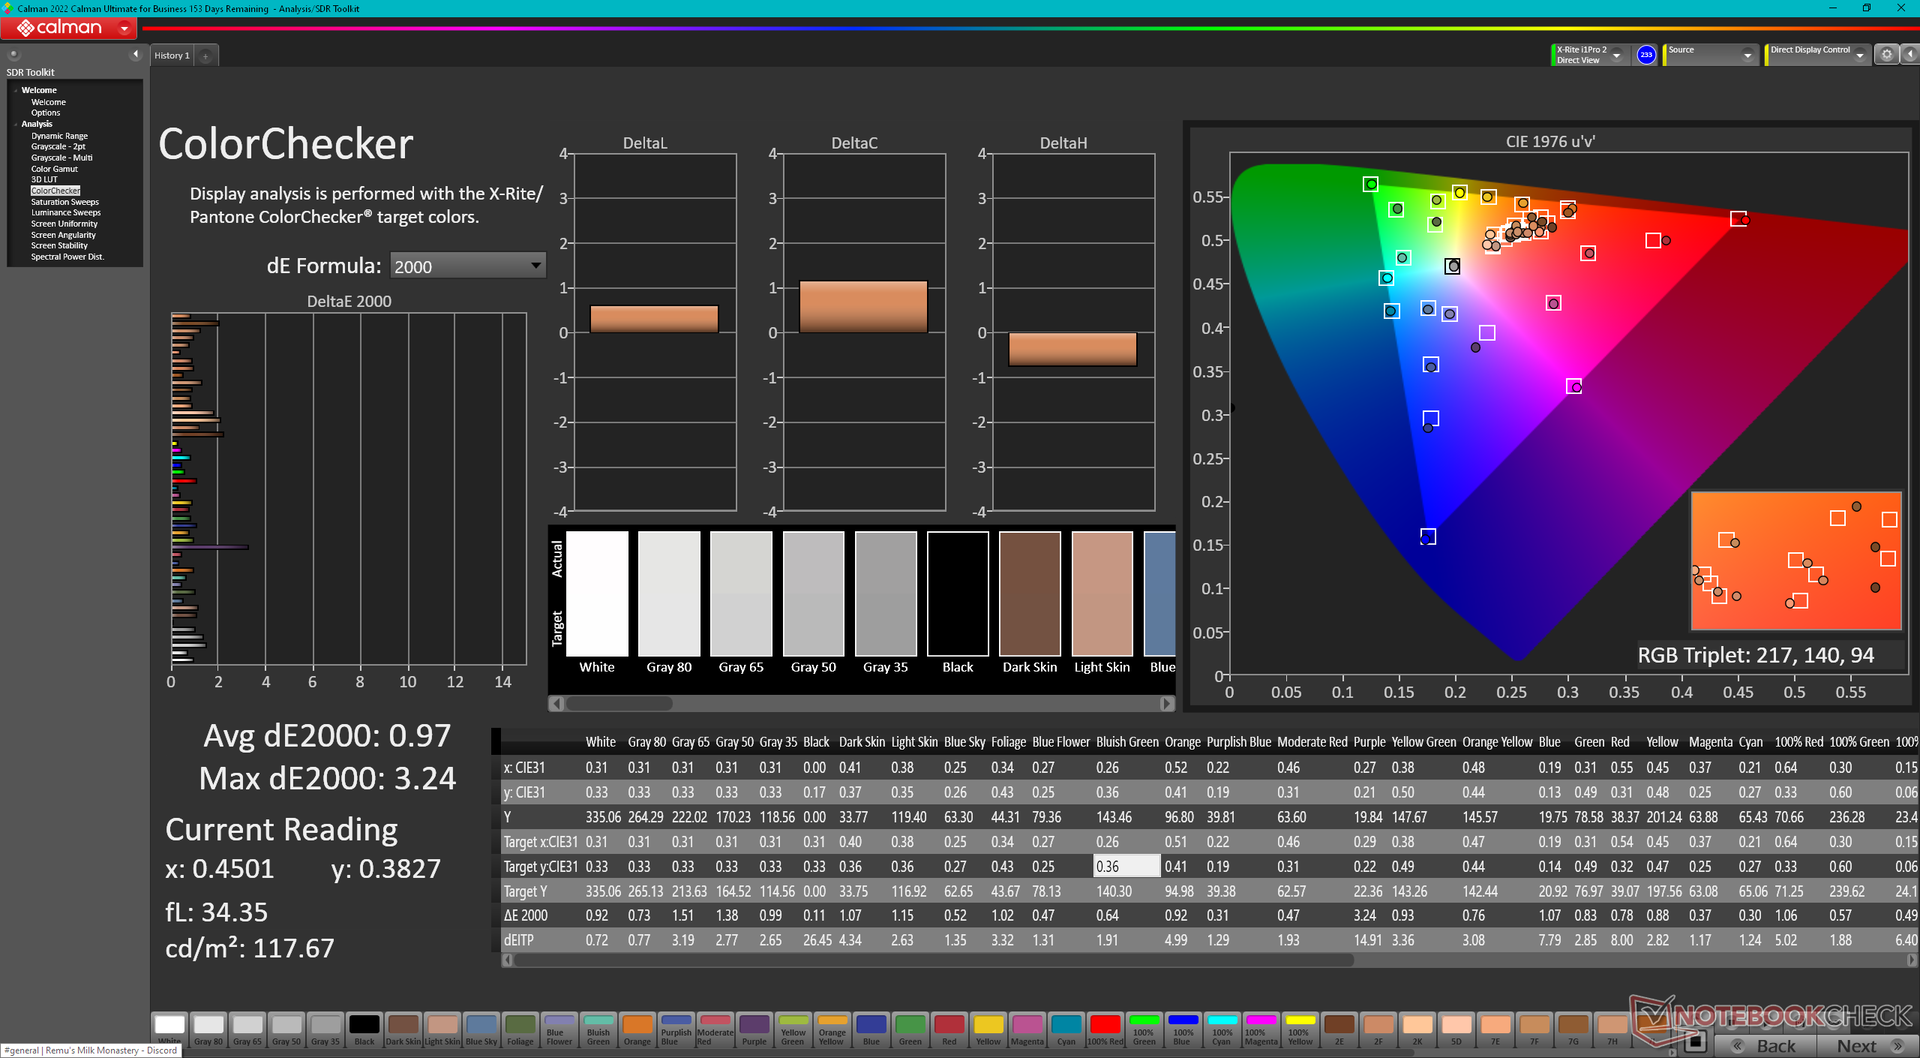
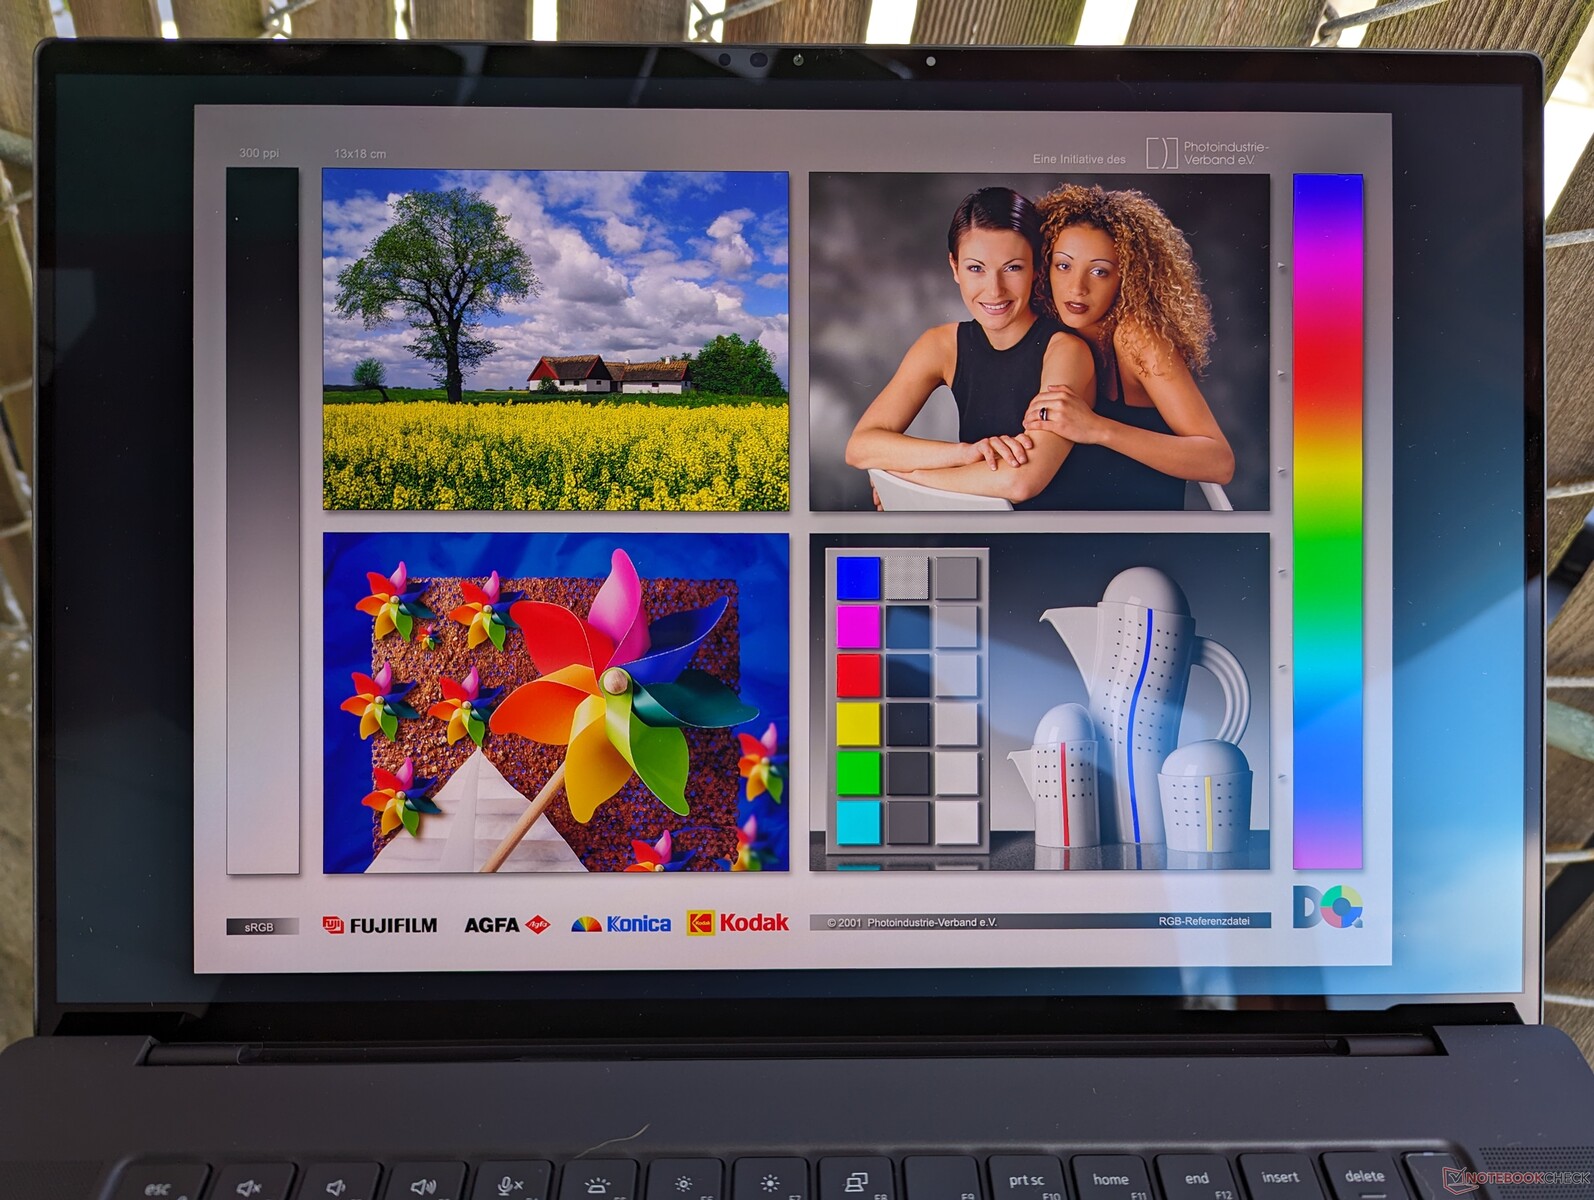
Das 2024er Modell setzt auf das gleiche 4K-Samsung-160YV03-OLED-Panel mit der gleichen Teilenummer (D3KJF) wie der Vorgänger, sodass sich an der visuellen Darstellung nichts ändert. Einerseits ist dies gut, immerhin kommt das OLED ab Werk vorkalibriert, stellt die vollen DCI-P3-Farben dar und bietet Touch-Support. Andererseits wäre es begrüßenswert gewesen höhere Bildwiederholraten zu haben, da die 60 Hz langsam in die Jahre kommen.
Die maximale Helligkeit liegt in SDR und HDR bei 350 beziehungsweise 600 Nits.
| |||||||||||||||||||||||||
Ausleuchtung: 97 %
Helligkeit Akku: 348.1 cd/m²
Kontrast: ∞:1 (Schwarzwert: 0 cd/m²)
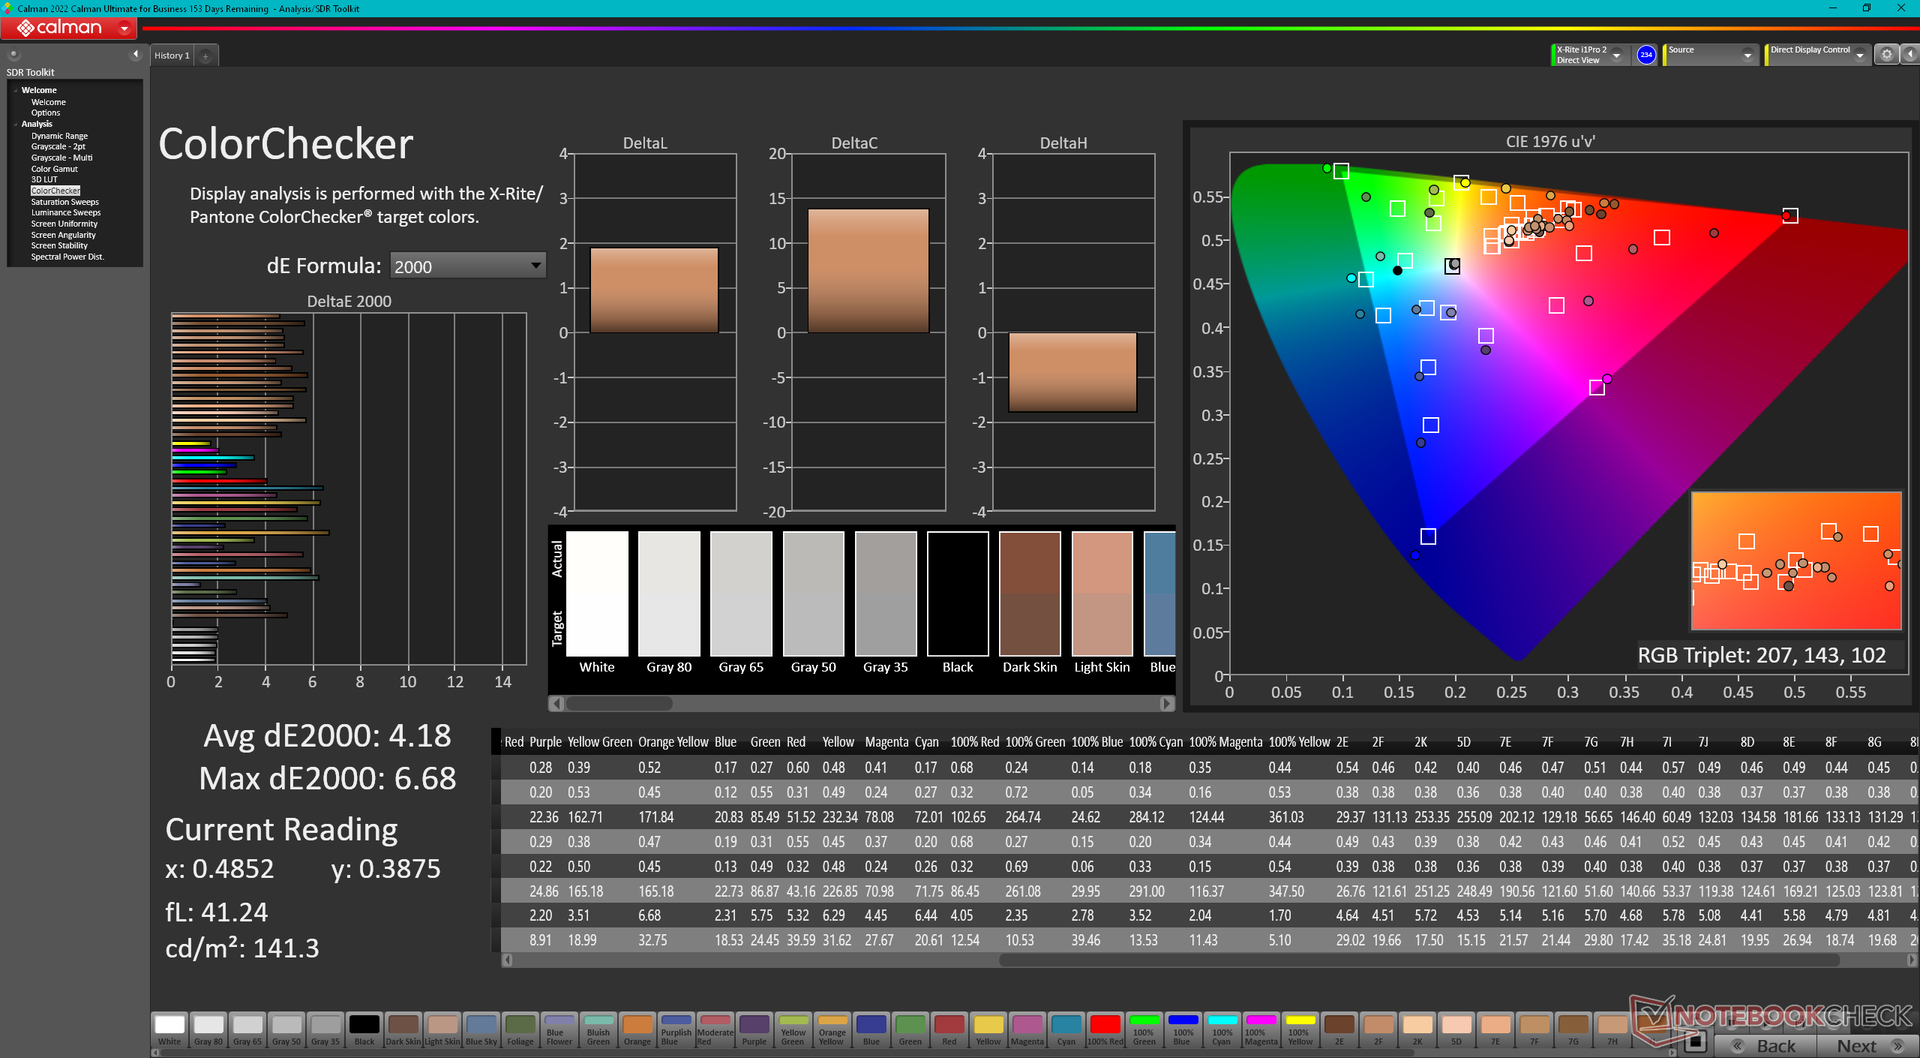
ΔE ColorChecker Calman: 4.18 | ∀{0.5-29.43 Ø4.73}
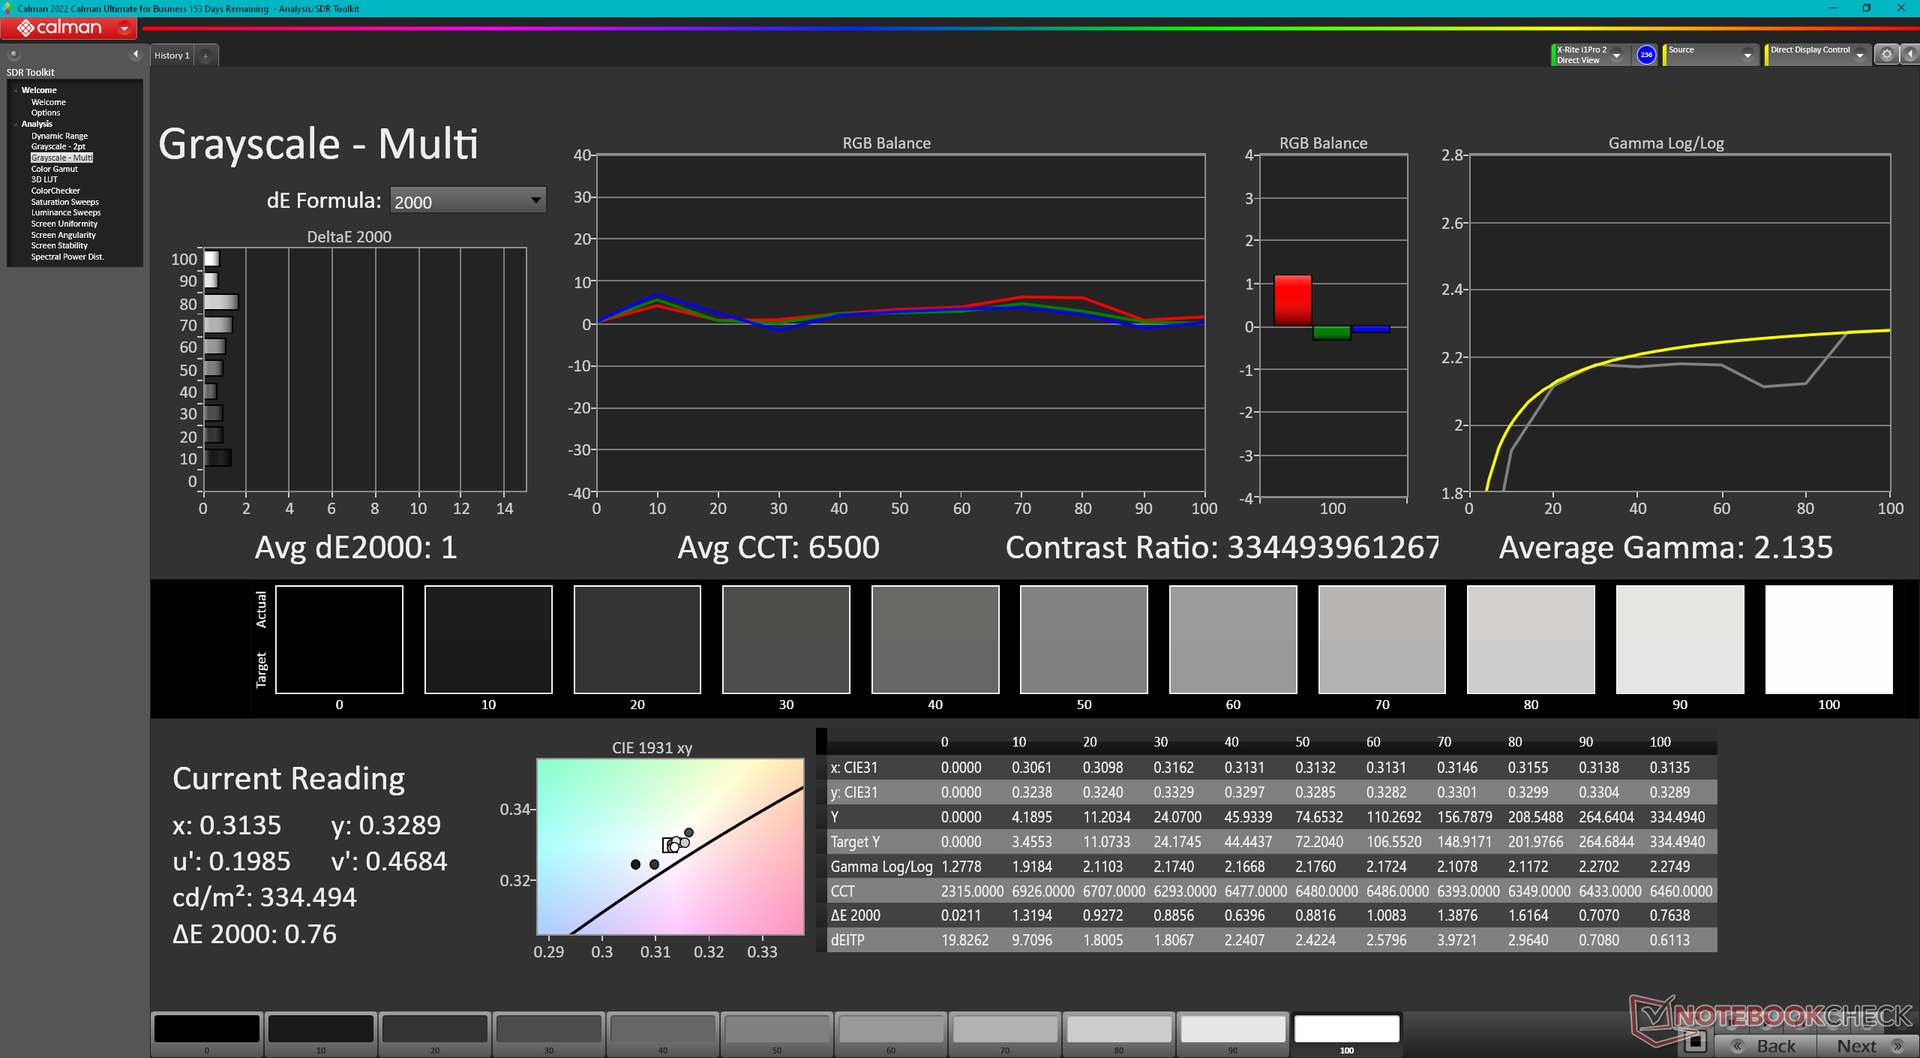
calibrated: 0.97
ΔE Greyscale Calman: 1.7 | ∀{0.09-98 Ø4.97}
96.6% AdobeRGB 1998 (Argyll 3D)
100% sRGB (Argyll 3D)
99.8% Display P3 (Argyll 3D)
Gamma: 2.2
CCT: 6198 K
| Dell Precision 5690 Samsung 160YV03, OLED, 3840x2400, 16" | Dell Precision 5000 5680 Samsung 160YV03, OLED, 3840x2400, 16" | Lenovo ThinkPad P16 G2 21FA000FGE MNG007DA1-9, IPS LED, 2560x1600, 16" | Lenovo ThinkPad P1 G6-21FV000DGE NE160QDM-NY1, IPS, 2560x1600, 16" | HP ZBook Fury 16 G10 AUO87A8, IPS, 3840x2400, 16" | MSI CreatorPro Z16P B12UKST B160QAN02.N, IPS, 2560x1600, 16" | |
|---|---|---|---|---|---|---|
| Display | 0% | -18% | -20% | -4% | -4% | |
| Display P3 Coverage (%) | 99.8 | 99.9 0% | 71 -29% | 68.1 -32% | 98 -2% | 97.6 -2% |
| sRGB Coverage (%) | 100 | 100 0% | 99.2 -1% | 97.5 -2% | 99.9 0% | 99.9 0% |
| AdobeRGB 1998 Coverage (%) | 96.6 | 97.5 1% | 73.2 -24% | 70.2 -27% | 86.2 -11% | 87.4 -10% |
| Response Times | -2% | -574% | -586% | -533% | -494% | |
| Response Time Grey 50% / Grey 80% * (ms) | 1.7 ? | 1.68 ? 1% | 12.8 ? -653% | 13.7 ? -706% | 11.9 ? -600% | 12.8 ? -653% |
| Response Time Black / White * (ms) | 1.7 ? | 1.77 ? -4% | 10.1 ? -494% | 9.6 ? -465% | 9.6 ? -465% | 7.4 ? -335% |
| PWM Frequency (Hz) | 60 ? | 60 ? | ||||
| Bildschirm | -11% | -15% | 33% | 36% | 22% | |
| Helligkeit Bildmitte (cd/m²) | 348.1 | 345.7 -1% | 510 47% | 521 50% | 514.6 48% | 407 17% |
| Brightness (cd/m²) | 351 | 349 -1% | 517 47% | 484 38% | 495 41% | 388 11% |
| Brightness Distribution (%) | 97 | 98 1% | 89 -8% | 89 -8% | 90 -7% | 88 -9% |
| Schwarzwert * (cd/m²) | 0.37 | 0.36 | 0.46 | 0.36 | ||
| Delta E Colorchecker * | 4.18 | 3.59 14% | 2.6 38% | 1.2 71% | 2.4 43% | 1.3 69% |
| Colorchecker dE 2000 max. * | 6.68 | 7.02 -5% | 5.2 22% | 2.5 63% | 4.86 27% | 2.5 63% |
| Colorchecker dE 2000 calibrated * | 0.97 | 0.99 -2% | 2.3 -137% | 1 -3% | 0.4 59% | 0.7 28% |
| Delta E Graustufen * | 1.7 | 3.1 -82% | 3.6 -112% | 1.4 18% | 1 41% | 2.1 -24% |
| Gamma | 2.2 100% | 2.13 103% | 2.26 97% | 2.25 98% | 2.3 96% | 2.26 97% |
| CCT | 6198 105% | 6448 101% | 5969 109% | 6682 97% | 6553 99% | 6437 101% |
| Kontrast (:1) | 1378 | 1447 | 1119 | 1131 | ||
| Durchschnitt gesamt (Programm / Settings) | -4% /
-7% | -202% /
-109% | -191% /
-84% | -167% /
-69% | -159% /
-70% |
* ... kleinere Werte sind besser
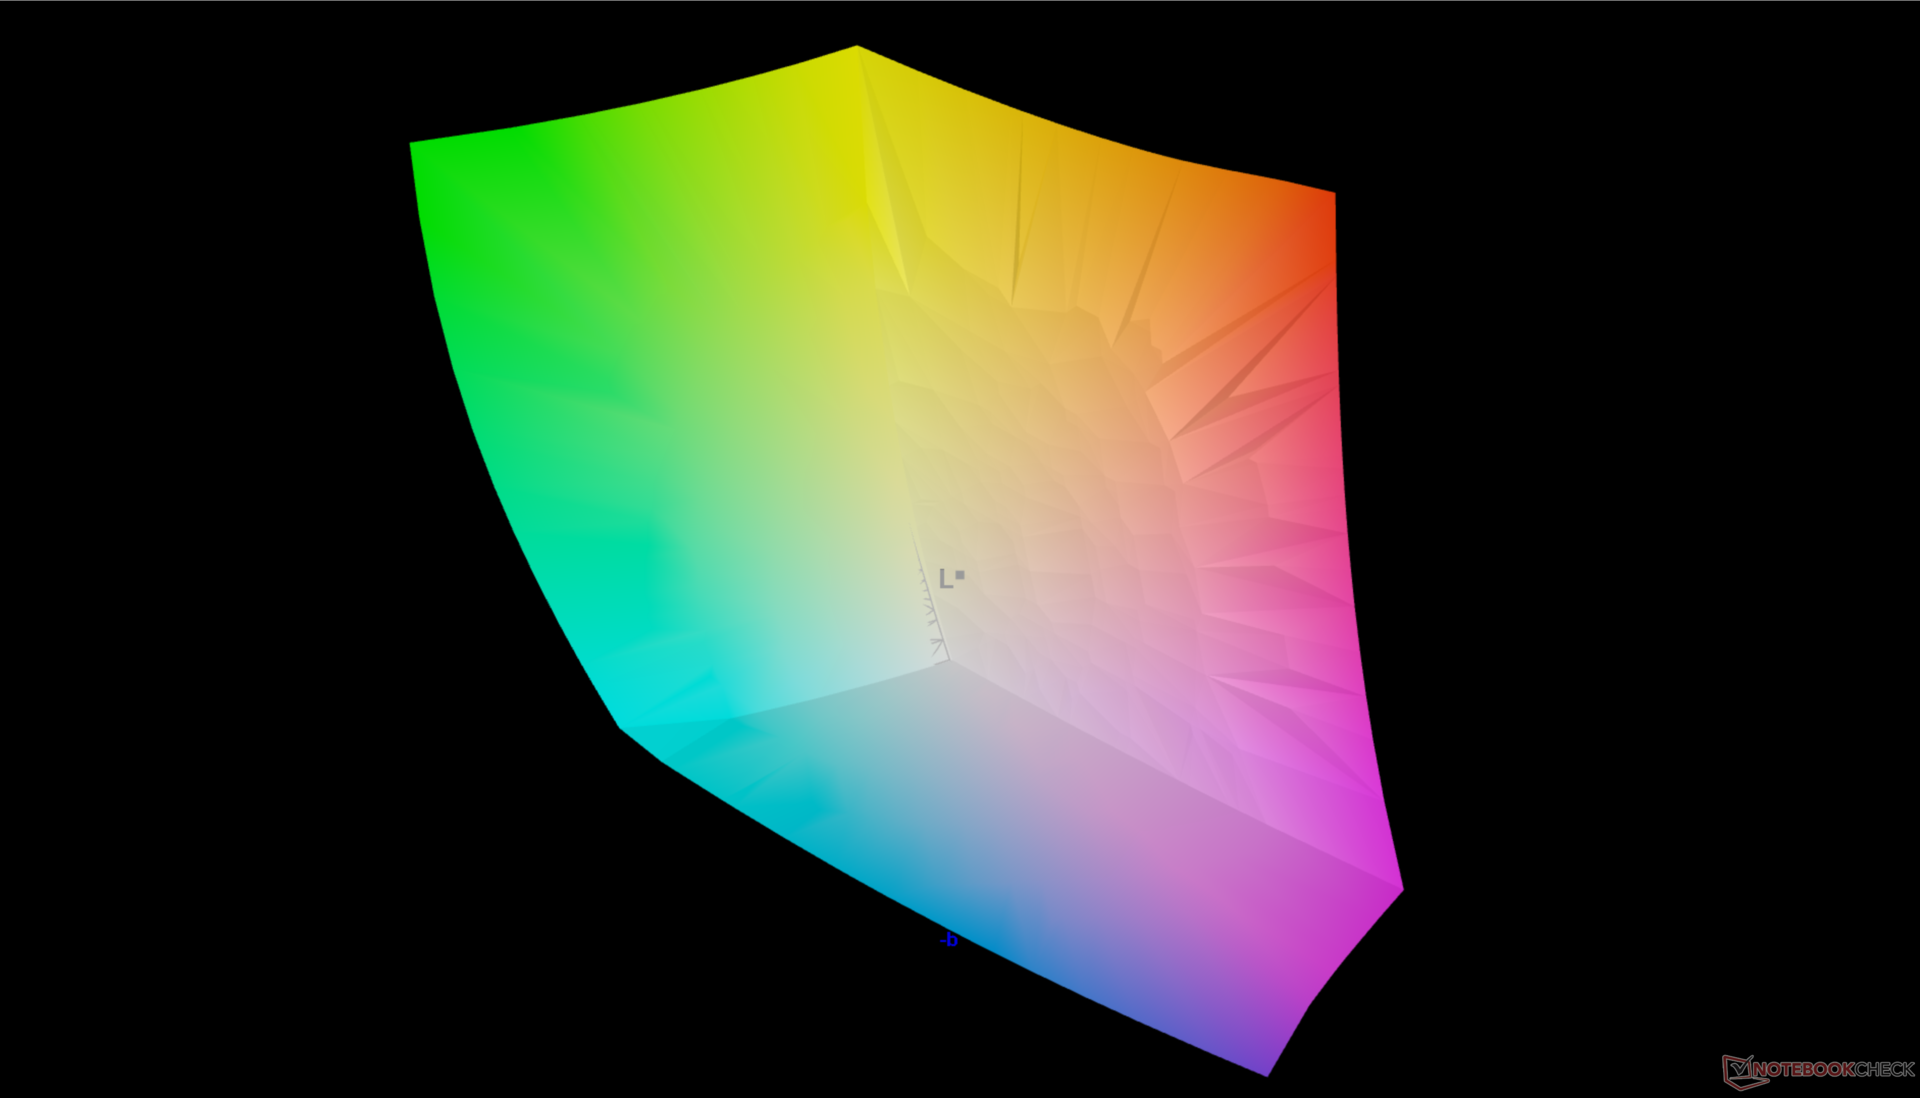
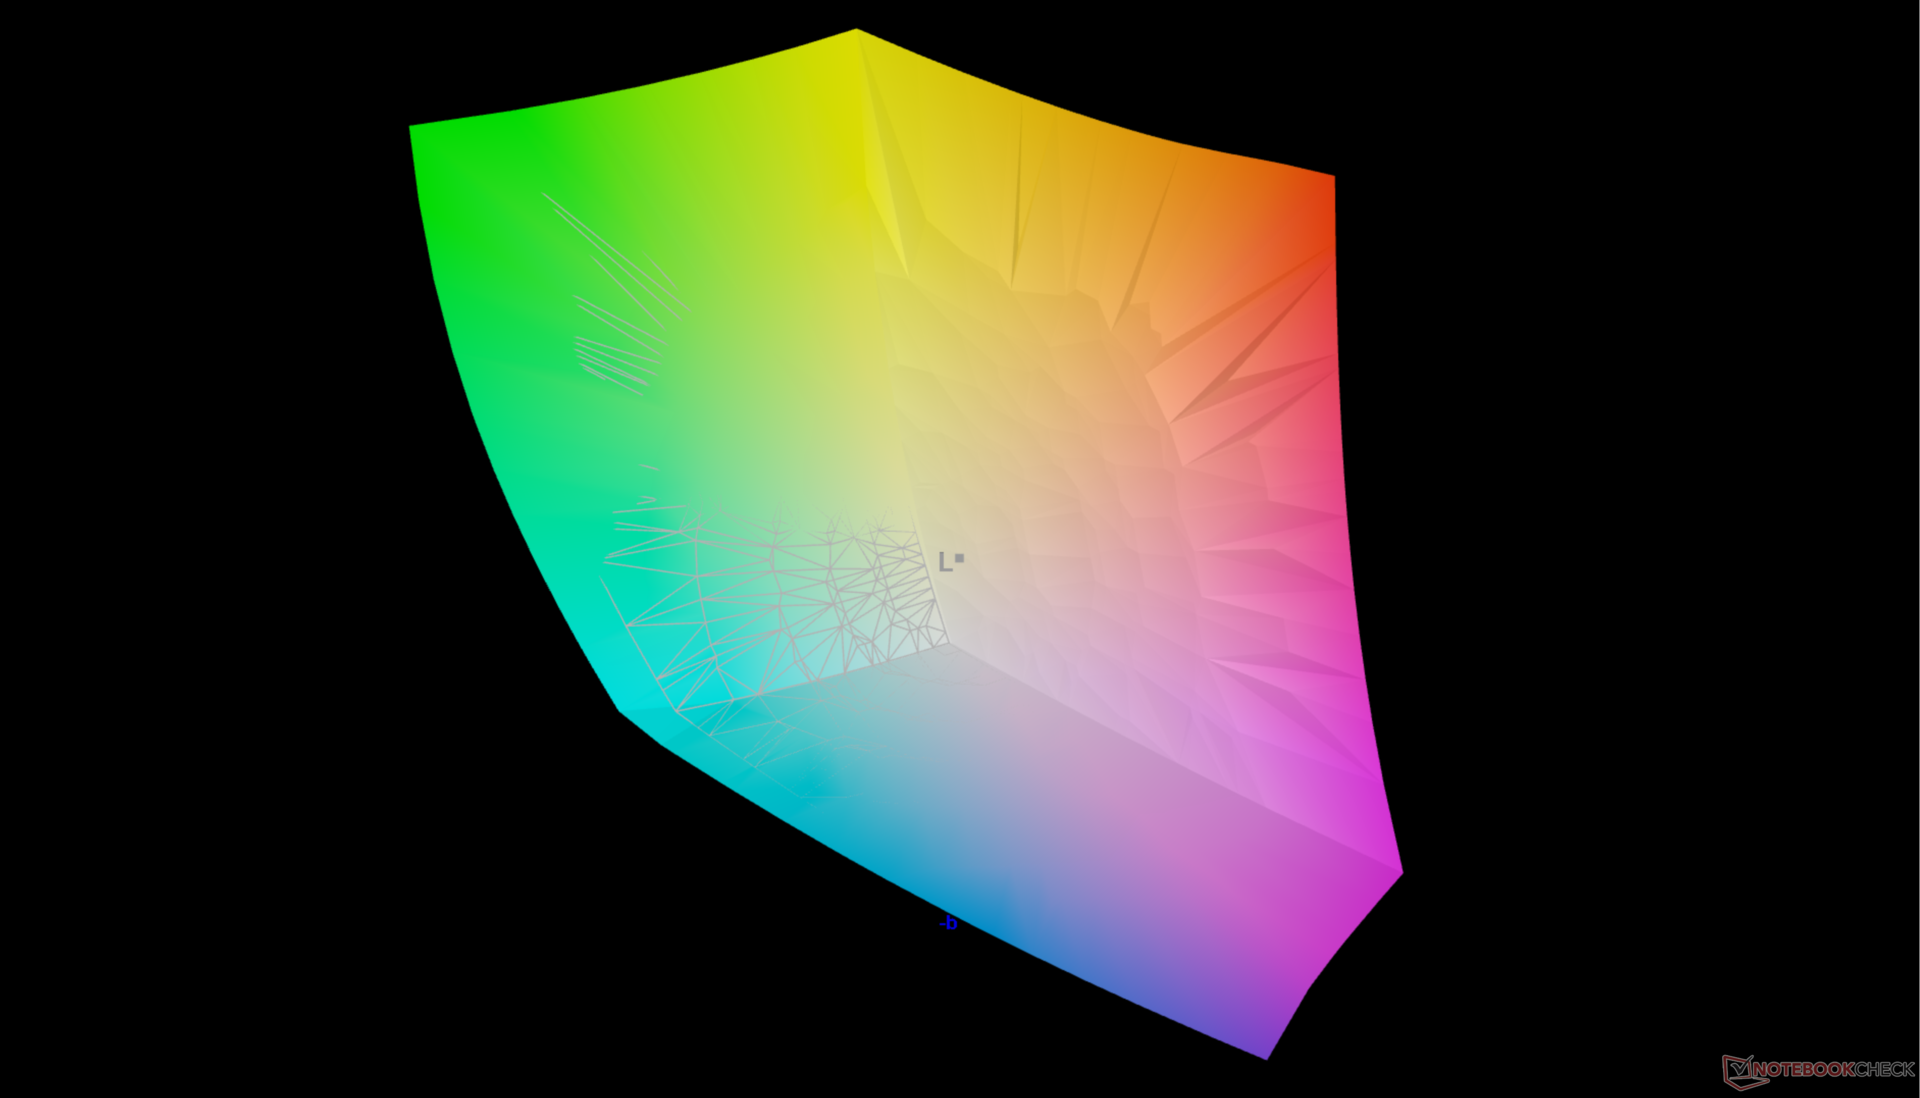
Ab Werk ist das Display sehr gut gegen den P3-Standard vorkalibriert und weist Graustufen- und Farb-DeltaE-Werte von nur 1,7 beziehungsweise 4,18 auf.
Reaktionszeiten (Response Times) des Displays
| ↔ Reaktionszeiten Schwarz zu Weiß | ||
|---|---|---|
| 1.7 ms ... steigend ↗ und fallend ↘ kombiniert | ↗ 0.74 ms steigend | 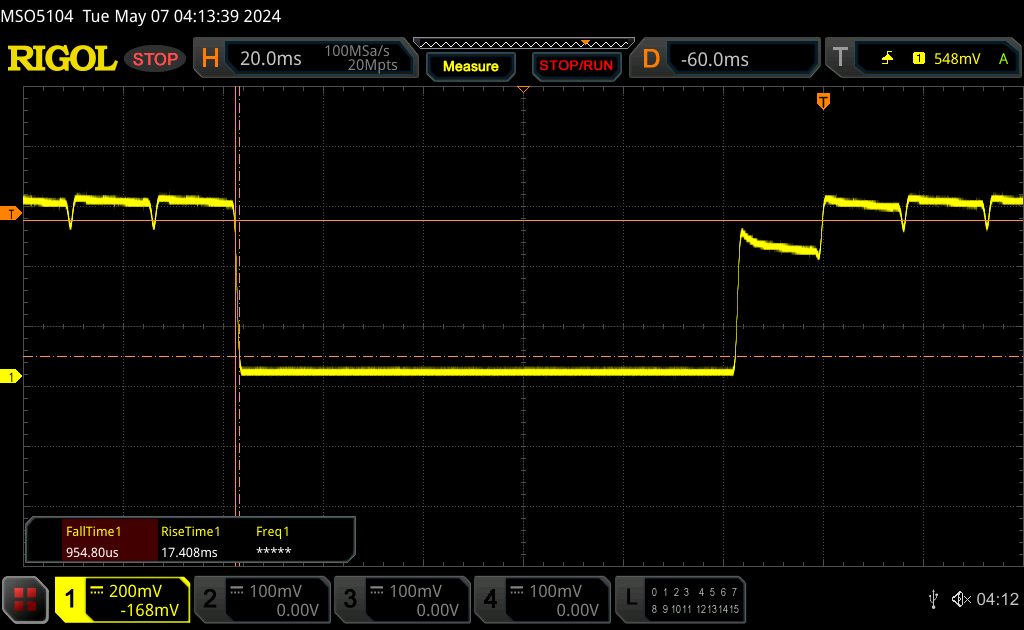 |
| ↘ 0.96 ms fallend | ||
| Die gemessenen Reaktionszeiten sind sehr kurz, wodurch sich der Bildschirm auch für schnelle 3D Spiele eignen sollte. Im Vergleich rangierten die bei uns getesteten Geräte von 0.1 (Minimum) zu 240 (Maximum) ms. » 10 % aller Screens waren schneller als der getestete. Daher sind die gemessenen Reaktionszeiten besser als der Durchschnitt aller vermessenen Geräte (19.9 ms). | ||
| ↔ Reaktionszeiten 50% Grau zu 80% Grau | ||
| 1.7 ms ... steigend ↗ und fallend ↘ kombiniert | ↗ 0.88 ms steigend | 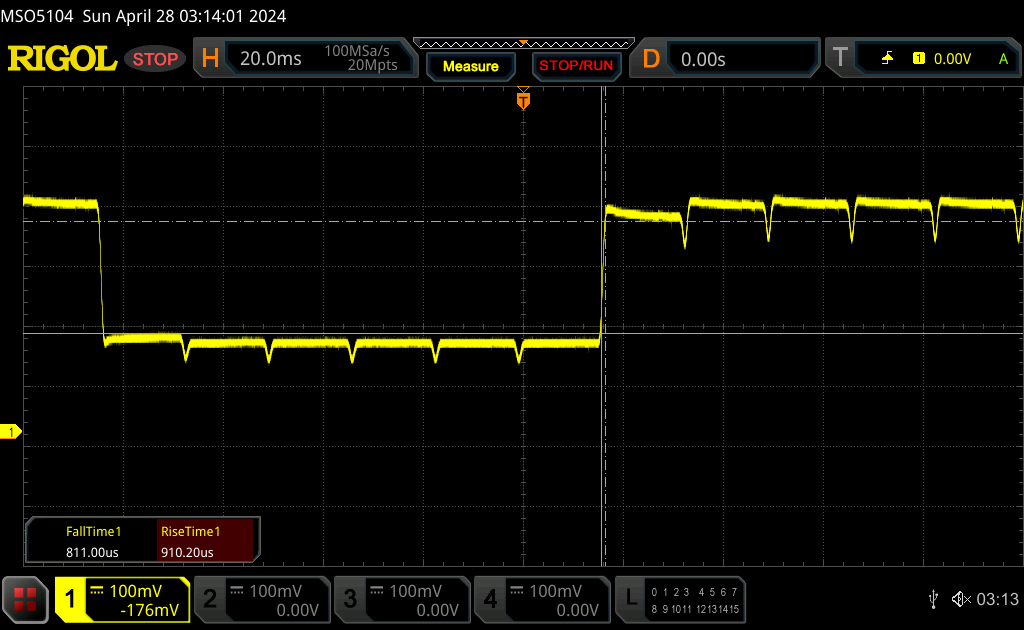 |
| ↘ 0.82 ms fallend | ||
| Die gemessenen Reaktionszeiten sind sehr kurz, wodurch sich der Bildschirm auch für schnelle 3D Spiele eignen sollte. Im Vergleich rangierten die bei uns getesteten Geräte von 0.165 (Minimum) zu 636 (Maximum) ms. » 8 % aller Screens waren schneller als der getestete. Daher sind die gemessenen Reaktionszeiten besser als der Durchschnitt aller vermessenen Geräte (31.1 ms). | ||
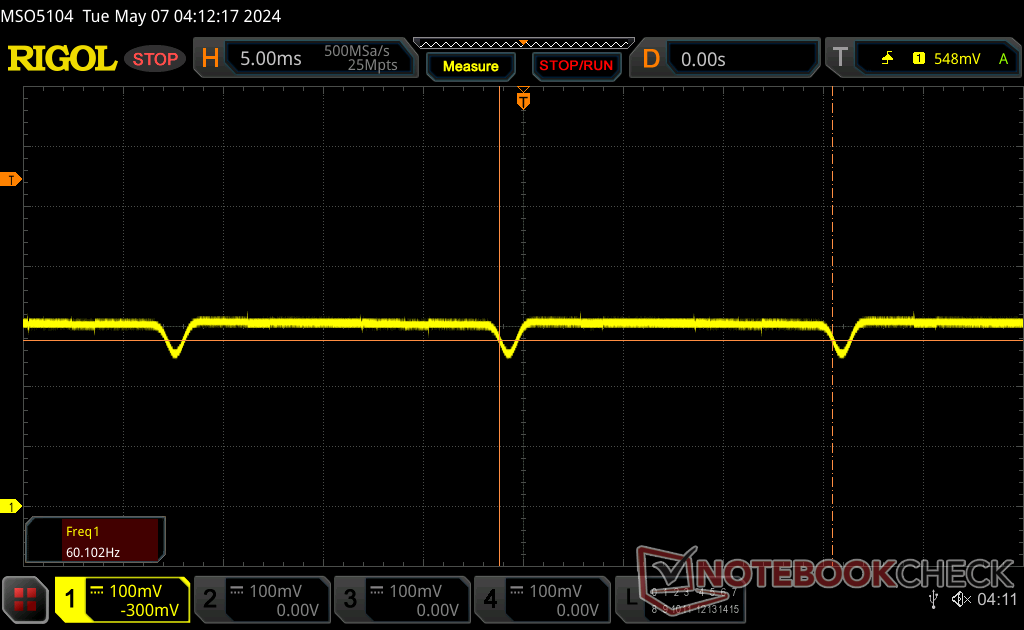
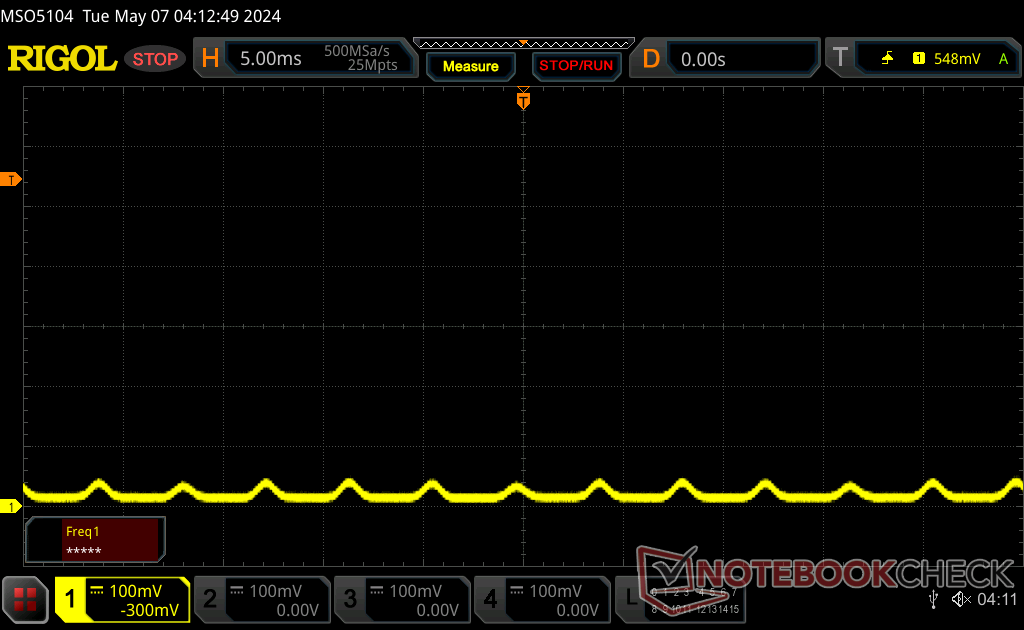
Bildschirm-Flackern / PWM (Pulse-Width Modulation)
| Flackern / PWM festgestellt | 60 Hz | ≤ 100 % Helligkeit | 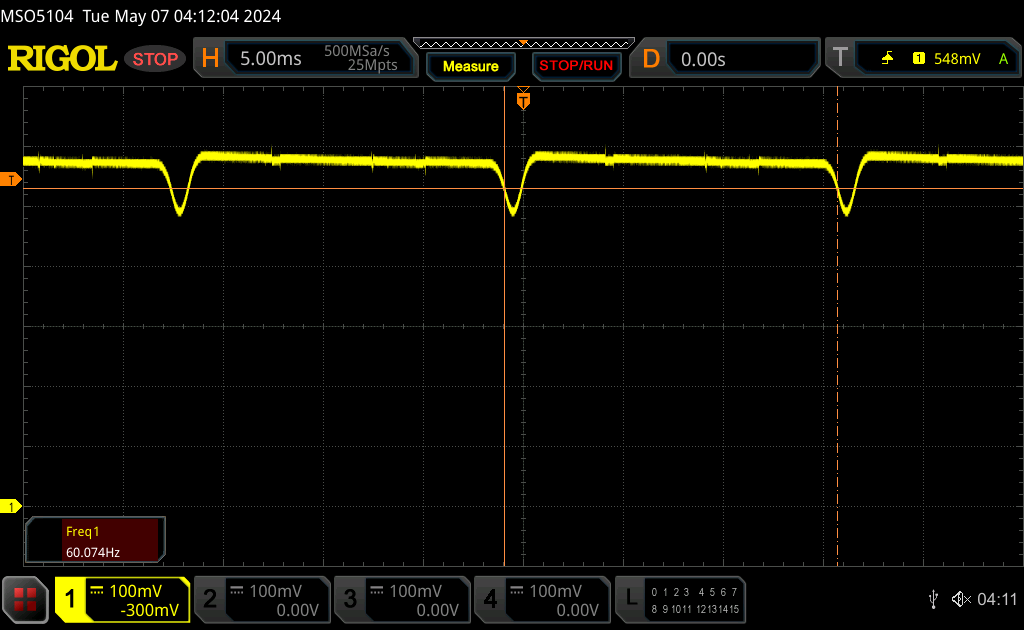 |
Das Display flackert mit 60 Hz (im schlimmsten Fall, eventuell durch Pulsweitenmodulation PWM) bei einer eingestellten Helligkeit von 100 % und darunter. Darüber sollte es zu keinem Flackern kommen. Die Frequenz von 60 Hz ist sehr gering und daher kann es bei allen Usern zu sichtbaren Flackern, brennenden Augen oder Kopfweh kommen. Im Vergleich: 52 % aller getesteten Geräte nutzten kein PWM um die Helligkeit zu reduzieren. Wenn PWM eingesetzt wurde, dann bei einer Frequenz von durchschnittlich 7784 (Minimum 5, Maximum 343500) Hz. | |||

Leistung
Testbedingungen
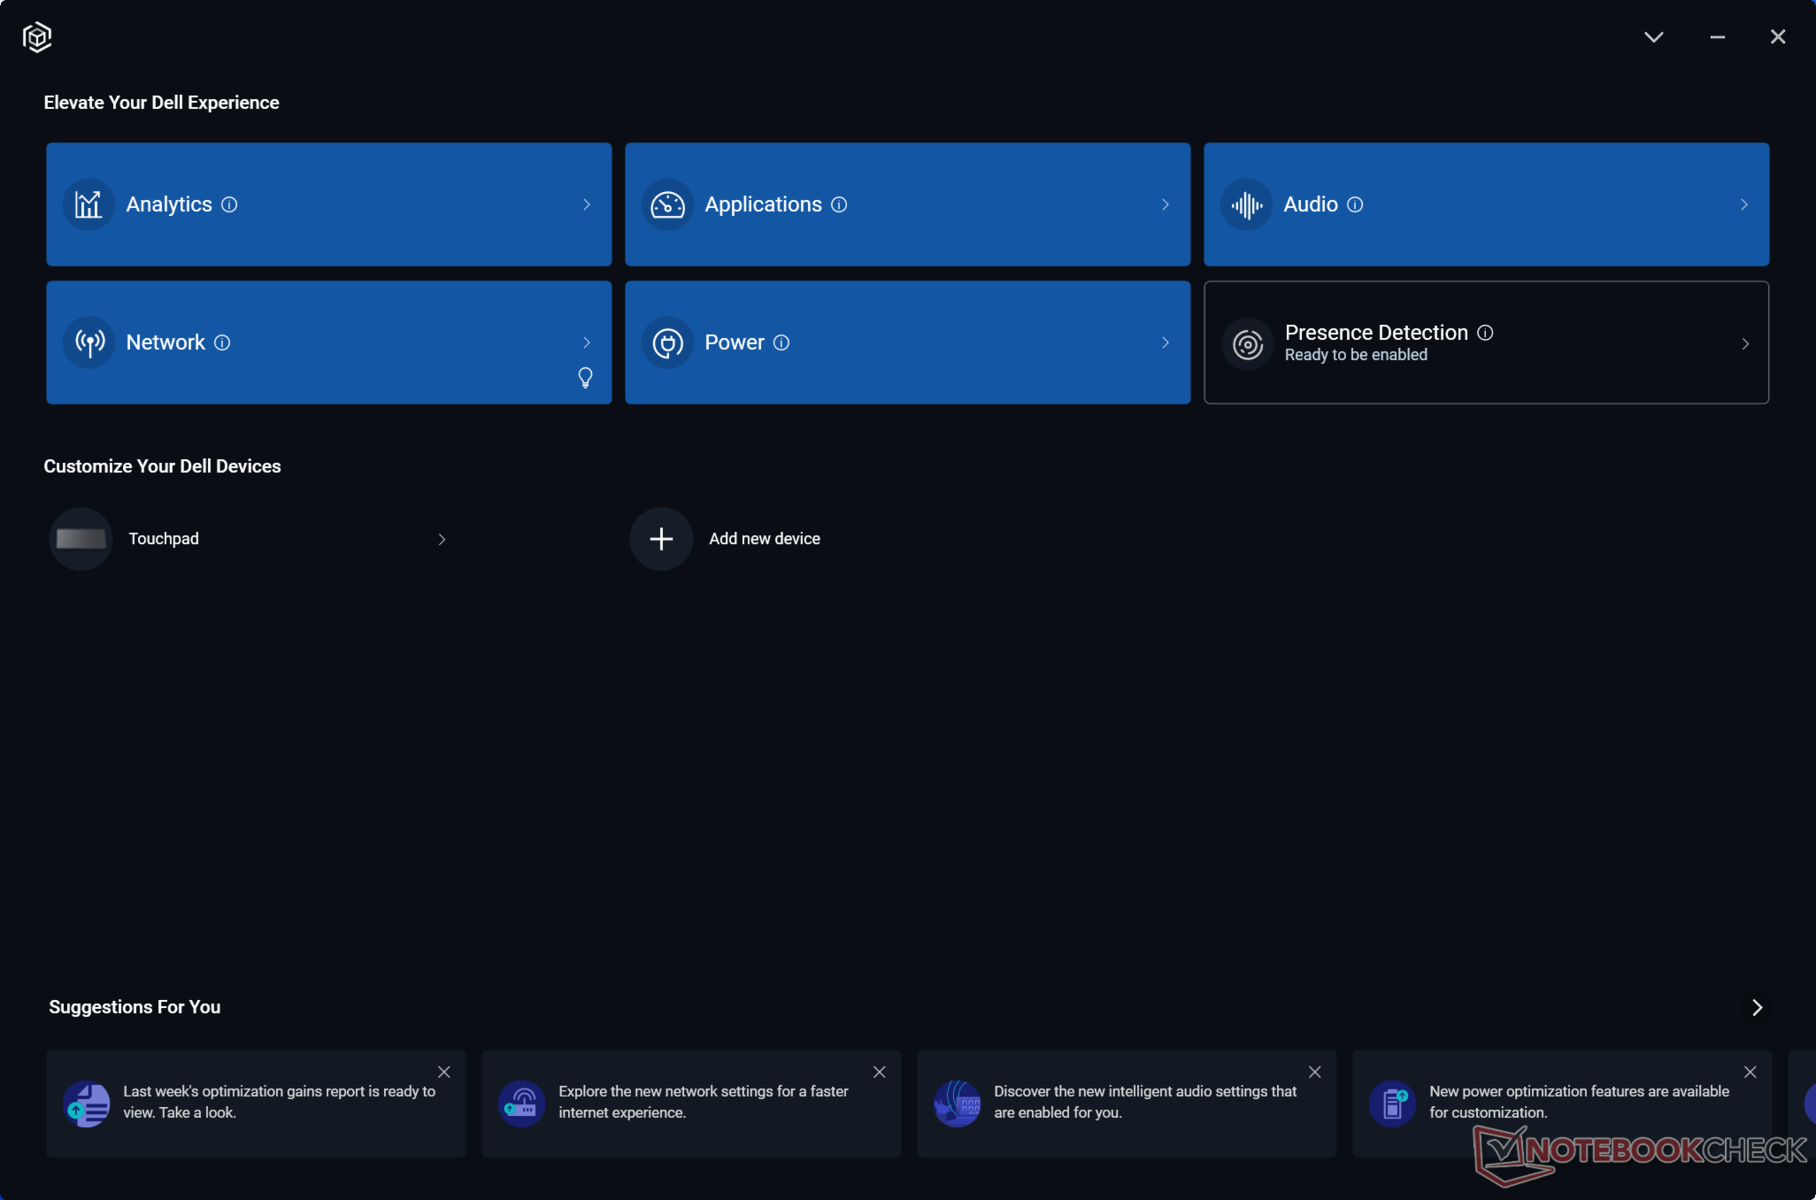
Wir haben für unsere Benchmarks den Dell Optimizer auf den Ultra Performance Modus eingestellt. Außerdem haben wir über die Nvidia Systemsteuerung den ECC VRAM deaktiviert. Das Aktivieren des ECC VRAM reduziert den verfügbaren Arbeitsspeicher um etwa 1 GB.


Prozessor
Der Core Ultra 9 185H performt nahezu identisch zum Core i9-13900H, sowohl in Single- als auch in Multi-Thread-Workloads. Er profitiert von einem etwas höheren Turbo Boost, was vorteilhaft für kurze Lastanstiege ist, aber der kleine Vorteil ist nur temporär, denn nach kurzer Zeit pendelt sich die Leistung genau bei der des älteren Core i9 im Precision 5680 ein, wie auch unser Graph weiter unten zeigt.
Wählt man stattdessen einen der schwächeren Core Ultra 7 165H oder gar Ultra 5 135H, so kann man sich auf einen Leistungsverlust von 5 bis 10 beziehungsweise 40 bis 50 Prozent einstellen. Der Leistungsunterschied zwischen dem Core Ultra 5 und dem Ultra 7 ist also deutlich relevanter als der zwischen dem Core Ultra 7 und dem Ultra 9. Gen14-Raptor-Lake-HX-Optionen gibt es im Precision 5690 nicht, obwohl sie die Workstation nochmal schneller gemacht hätten als der Core Ultra 9 185H. Auf der anderen Seite bieten die Core Ultra CPUs jedoch eine integrierte NPUs für lokale KI-Beschleunigung, sofern diese in naher Zukunft breiter verfügbar werden.
Cinebench R15 Multi Loop
Cinebench R23: Multi Core | Single Core
Cinebench R20: CPU (Multi Core) | CPU (Single Core)
Cinebench R15: CPU Multi 64Bit | CPU Single 64Bit
Blender: v2.79 BMW27 CPU
7-Zip 18.03: 7z b 4 | 7z b 4 -mmt1
Geekbench 6.7: Multi-Core | Single-Core
Geekbench 5.5: Multi-Core | Single-Core
HWBOT x265 Benchmark v2.2: 4k Preset
LibreOffice : 20 Documents To PDF
R Benchmark 2.5: Overall mean
| CPU Performance Rating | |
| Lenovo Legion Pro 7 RTX4090 -2! | |
| HP ZBook Fury 16 G10 | |
| Dell Precision 5000 5680 | |
| Lenovo ThinkPad P1 G6-21FV000DGE | |
| Lenovo ThinkPad P16 G2 21FA000FGE -2! | |
| Dell Precision 5690 | |
| Dell XPS 16 9640 | |
| HP ZBook Fury 16 G9 -2! | |
| Durchschnittliche Intel Core Ultra 9 185H | |
| Lenovo ThinkPad P16 G1 21D6001DMB -2! | |
| MSI CreatorPro Z16P B12UKST -2! | |
| Lenovo ThinkPad P16v G1 AMD | |
| Lenovo ThinkPad P16s G2 21K9000CGE | |
| Samsung Galaxy Book4 Pro 360 -1! | |
| Asus ProArt StudioBook 16 W7600H5A-2BL2 -2! | |
| Lenovo ThinkPad P1 G4-20Y30017GE -2! | |
| Geekbench 6.7 / Multi-Core | |
| HP ZBook Fury 16 G10 | |
| Dell Precision 5000 5680 | |
| Dell Precision 5690 | |
| Dell XPS 16 9640 | |
| Durchschnittliche Intel Core Ultra 9 185H (9140 - 14540, n=20) | |
| Lenovo ThinkPad P1 G6-21FV000DGE | |
| Lenovo ThinkPad P16s G2 21K9000CGE | |
| Samsung Galaxy Book4 Pro 360 | |
| Lenovo ThinkPad P16v G1 AMD | |
| Geekbench 6.7 / Single-Core | |
| HP ZBook Fury 16 G10 | |
| Lenovo ThinkPad P1 G6-21FV000DGE | |
| Dell Precision 5000 5680 | |
| Lenovo ThinkPad P16v G1 AMD | |
| Dell Precision 5690 | |
| Lenovo ThinkPad P16s G2 21K9000CGE | |
| Dell XPS 16 9640 | |
| Durchschnittliche Intel Core Ultra 9 185H (1490 - 2573, n=20) | |
| Samsung Galaxy Book4 Pro 360 | |
Cinebench R23: Multi Core | Single Core
Cinebench R20: CPU (Multi Core) | CPU (Single Core)
Cinebench R15: CPU Multi 64Bit | CPU Single 64Bit
Blender: v2.79 BMW27 CPU
7-Zip 18.03: 7z b 4 | 7z b 4 -mmt1
Geekbench 6.7: Multi-Core | Single-Core
Geekbench 5.5: Multi-Core | Single-Core
HWBOT x265 Benchmark v2.2: 4k Preset
LibreOffice : 20 Documents To PDF
R Benchmark 2.5: Overall mean
* ... kleinere Werte sind besser
AIDA64: FP32 Ray-Trace | FPU Julia | CPU SHA3 | CPU Queen | FPU SinJulia | FPU Mandel | CPU AES | CPU ZLib | FP64 Ray-Trace | CPU PhotoWorxx
| Performance Rating | |
| HP ZBook Fury 16 G10 | |
| Dell Precision 5690 | |
| Lenovo ThinkPad P16 G2 21FA000FGE | |
| Durchschnittliche Intel Core Ultra 9 185H | |
| Dell Precision 5000 5680 | |
| MSI CreatorPro Z16P B12UKST | |
| Lenovo ThinkPad P1 G6-21FV000DGE | |
| AIDA64 / FP32 Ray-Trace | |
| HP ZBook Fury 16 G10 | |
| Dell Precision 5690 | |
| Lenovo ThinkPad P16 G2 21FA000FGE | |
| Lenovo ThinkPad P1 G6-21FV000DGE | |
| Durchschnittliche Intel Core Ultra 9 185H (9220 - 18676, n=20) | |
| Dell Precision 5000 5680 | |
| MSI CreatorPro Z16P B12UKST | |
| AIDA64 / FPU Julia | |
| HP ZBook Fury 16 G10 | |
| Dell Precision 5690 | |
| Lenovo ThinkPad P16 G2 21FA000FGE | |
| Lenovo ThinkPad P1 G6-21FV000DGE | |
| Durchschnittliche Intel Core Ultra 9 185H (48865 - 96463, n=20) | |
| Dell Precision 5000 5680 | |
| MSI CreatorPro Z16P B12UKST | |
| AIDA64 / CPU SHA3 | |
| HP ZBook Fury 16 G10 | |
| Dell Precision 5690 | |
| Lenovo ThinkPad P16 G2 21FA000FGE | |
| Durchschnittliche Intel Core Ultra 9 185H (2394 - 4534, n=20) | |
| Lenovo ThinkPad P1 G6-21FV000DGE | |
| MSI CreatorPro Z16P B12UKST | |
| Dell Precision 5000 5680 | |
| AIDA64 / CPU Queen | |
| HP ZBook Fury 16 G10 | |
| Dell Precision 5000 5680 | |
| Lenovo ThinkPad P1 G6-21FV000DGE | |
| Lenovo ThinkPad P16 G2 21FA000FGE | |
| MSI CreatorPro Z16P B12UKST | |
| Dell Precision 5690 | |
| Durchschnittliche Intel Core Ultra 9 185H (66785 - 95241, n=20) | |
| AIDA64 / FPU SinJulia | |
| HP ZBook Fury 16 G10 | |
| Lenovo ThinkPad P16 G2 21FA000FGE | |
| Dell Precision 5690 | |
| Durchschnittliche Intel Core Ultra 9 185H (7255 - 11392, n=20) | |
| Lenovo ThinkPad P1 G6-21FV000DGE | |
| Dell Precision 5000 5680 | |
| MSI CreatorPro Z16P B12UKST | |
| AIDA64 / FPU Mandel | |
| HP ZBook Fury 16 G10 | |
| Dell Precision 5690 | |
| Lenovo ThinkPad P16 G2 21FA000FGE | |
| Durchschnittliche Intel Core Ultra 9 185H (24004 - 48020, n=20) | |
| Lenovo ThinkPad P1 G6-21FV000DGE | |
| Dell Precision 5000 5680 | |
| MSI CreatorPro Z16P B12UKST | |
| AIDA64 / CPU AES | |
| MSI CreatorPro Z16P B12UKST | |
| HP ZBook Fury 16 G10 | |
| Durchschnittliche Intel Core Ultra 9 185H (53116 - 154066, n=20) | |
| Dell Precision 5690 | |
| Lenovo ThinkPad P16 G2 21FA000FGE | |
| Lenovo ThinkPad P1 G6-21FV000DGE | |
| Dell Precision 5000 5680 | |
| AIDA64 / CPU ZLib | |
| HP ZBook Fury 16 G10 | |
| Dell Precision 5690 | |
| Durchschnittliche Intel Core Ultra 9 185H (678 - 1341, n=20) | |
| Lenovo ThinkPad P16 G2 21FA000FGE | |
| Lenovo ThinkPad P1 G6-21FV000DGE | |
| MSI CreatorPro Z16P B12UKST | |
| Dell Precision 5000 5680 | |
| AIDA64 / FP64 Ray-Trace | |
| HP ZBook Fury 16 G10 | |
| Lenovo ThinkPad P16 G2 21FA000FGE | |
| Dell Precision 5690 | |
| Lenovo ThinkPad P1 G6-21FV000DGE | |
| Dell Precision 5000 5680 | |
| Durchschnittliche Intel Core Ultra 9 185H (4428 - 10078, n=20) | |
| MSI CreatorPro Z16P B12UKST | |
| AIDA64 / CPU PhotoWorxx | |
| Dell Precision 5690 | |
| Durchschnittliche Intel Core Ultra 9 185H (44547 - 53918, n=20) | |
| Dell Precision 5000 5680 | |
| MSI CreatorPro Z16P B12UKST | |
| HP ZBook Fury 16 G10 | |
| Lenovo ThinkPad P16 G2 21FA000FGE | |
| Lenovo ThinkPad P1 G6-21FV000DGE | |
Stresstest
Beim Starten unseres Prime95-Stresstests, boostet die CPU auf 3,7 GHz und 120 W hoch bis die Kerne nur wenige Sekunden später eine Temperatur von 100 °C erreichen. Danach fallen die CPU-Werte auf 3 GHz und 73 W und bleiben dann relativ konstant. Sowohl Kerntemperaturen als auch Leistungsaufnahme sind etwas höher als beim Precision 5680.
Unter Witcher 3 beträgt die GPU Board Power Draw stabile 72 W, auch wenn Nvidias Systemsteuerung 90 W für die GPU listet. Die Ergebnisse liegen auf einem Niveau mit denen vom Vorgänger.
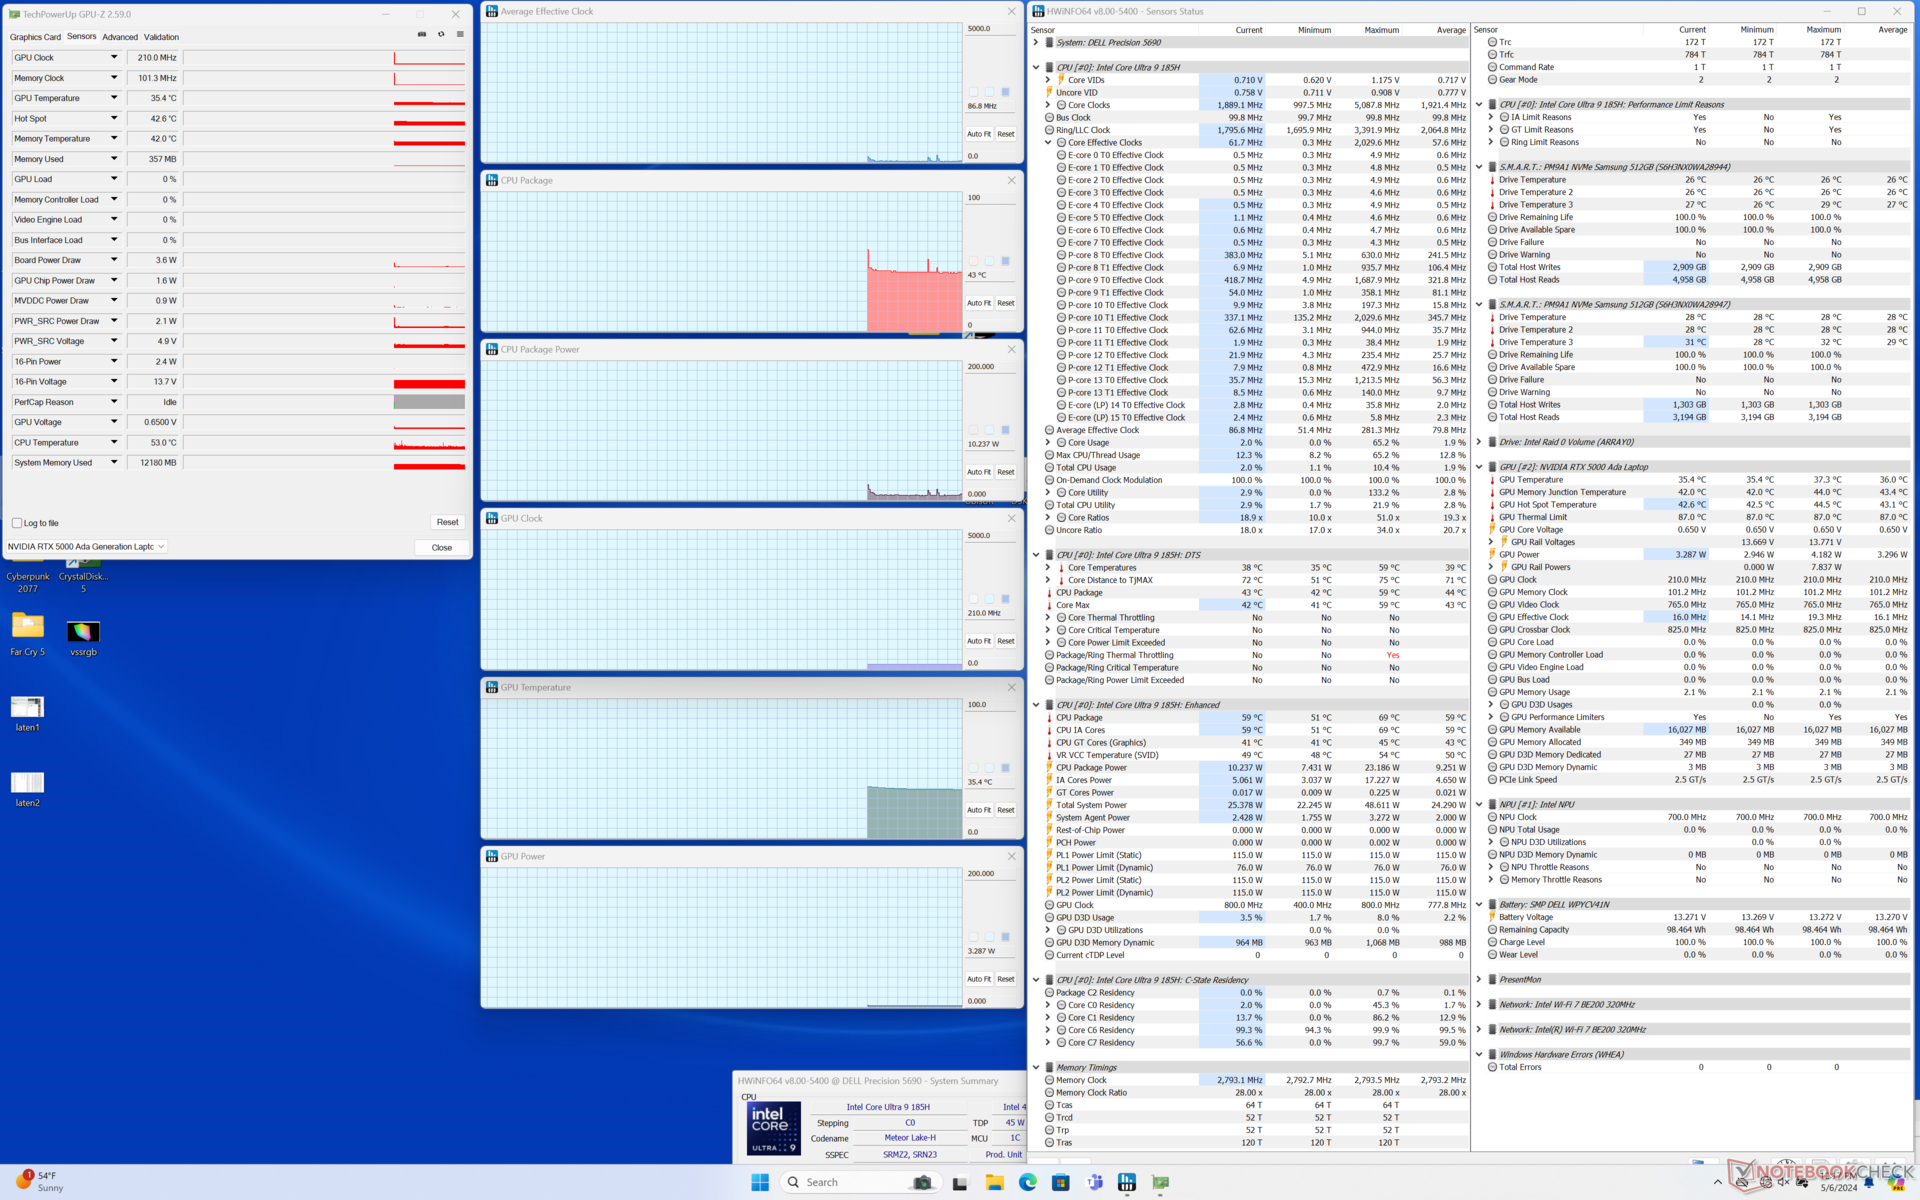
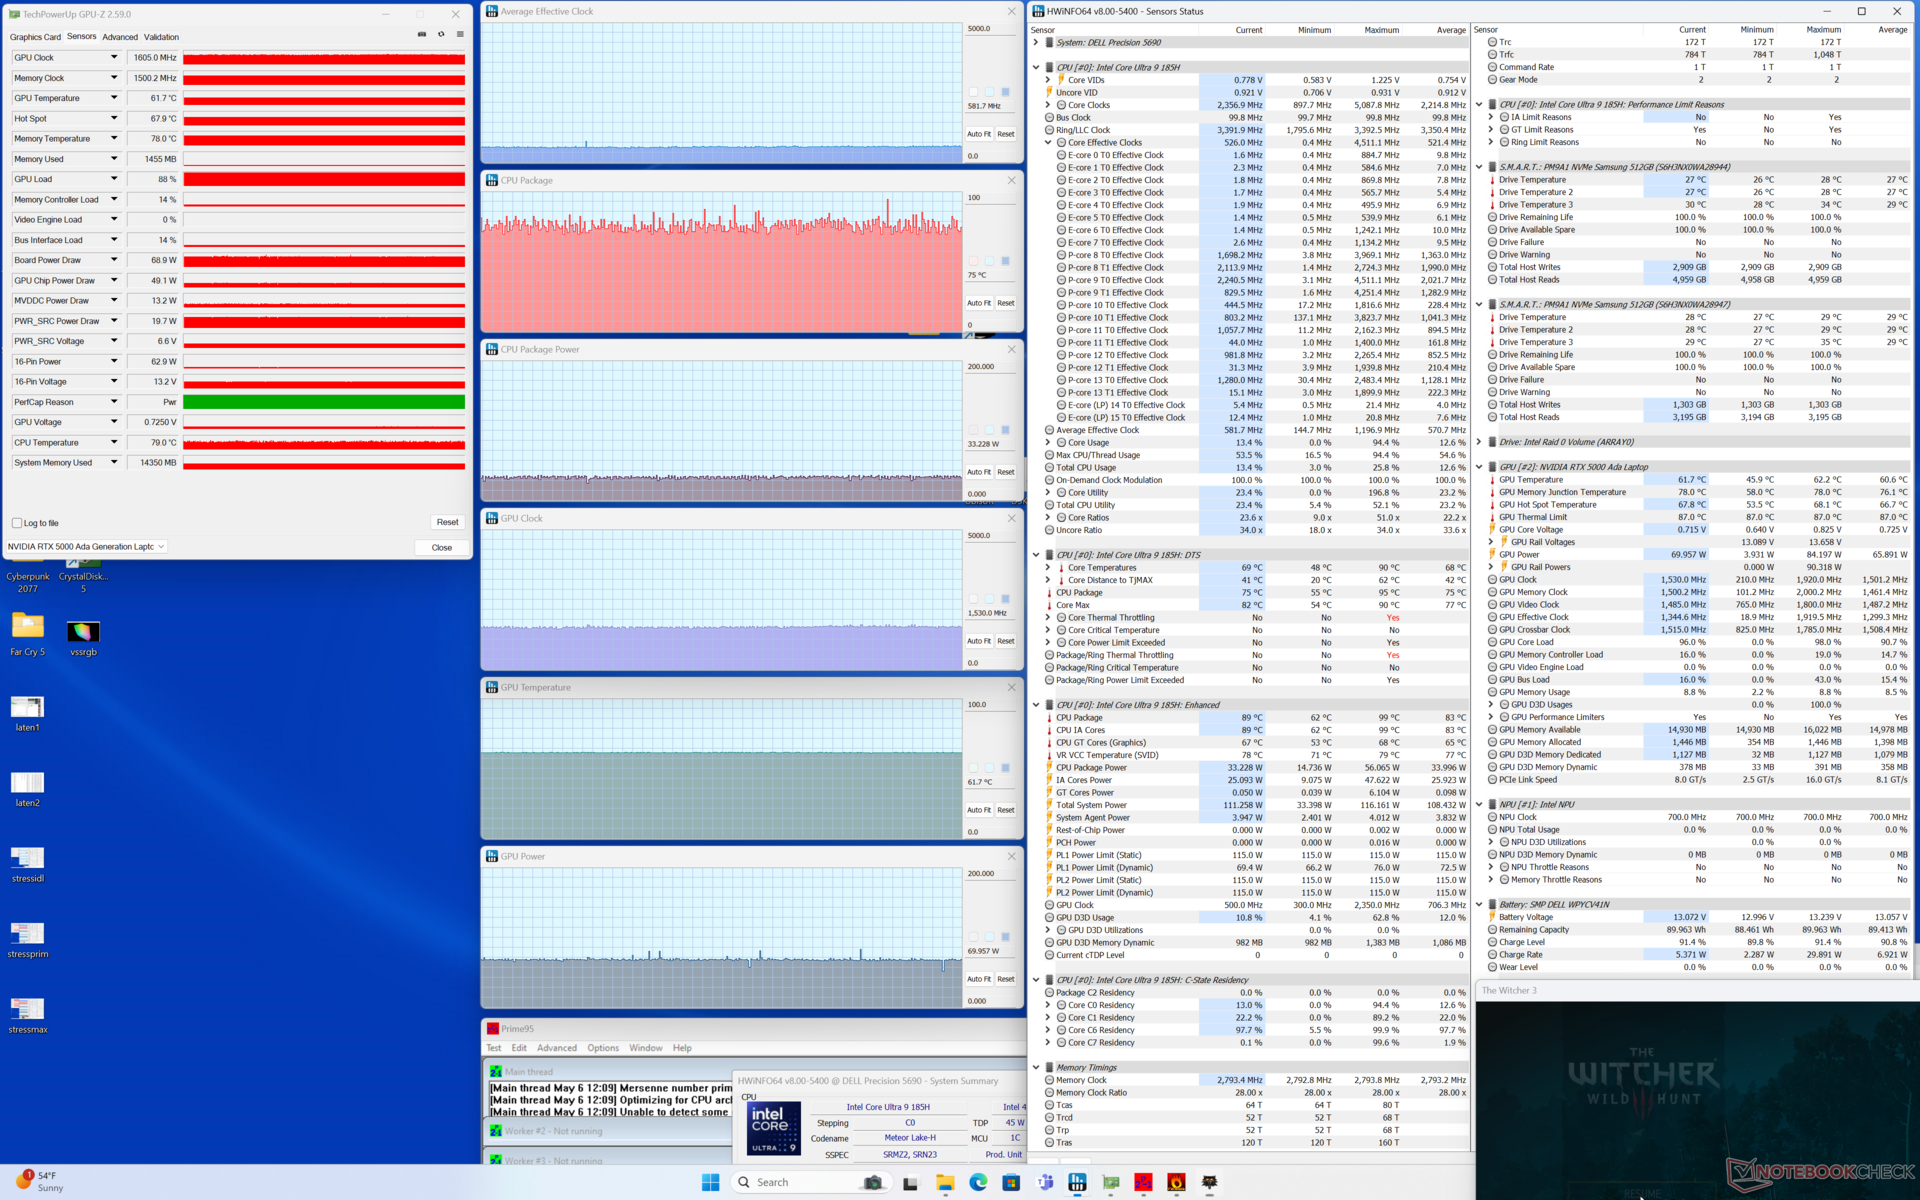
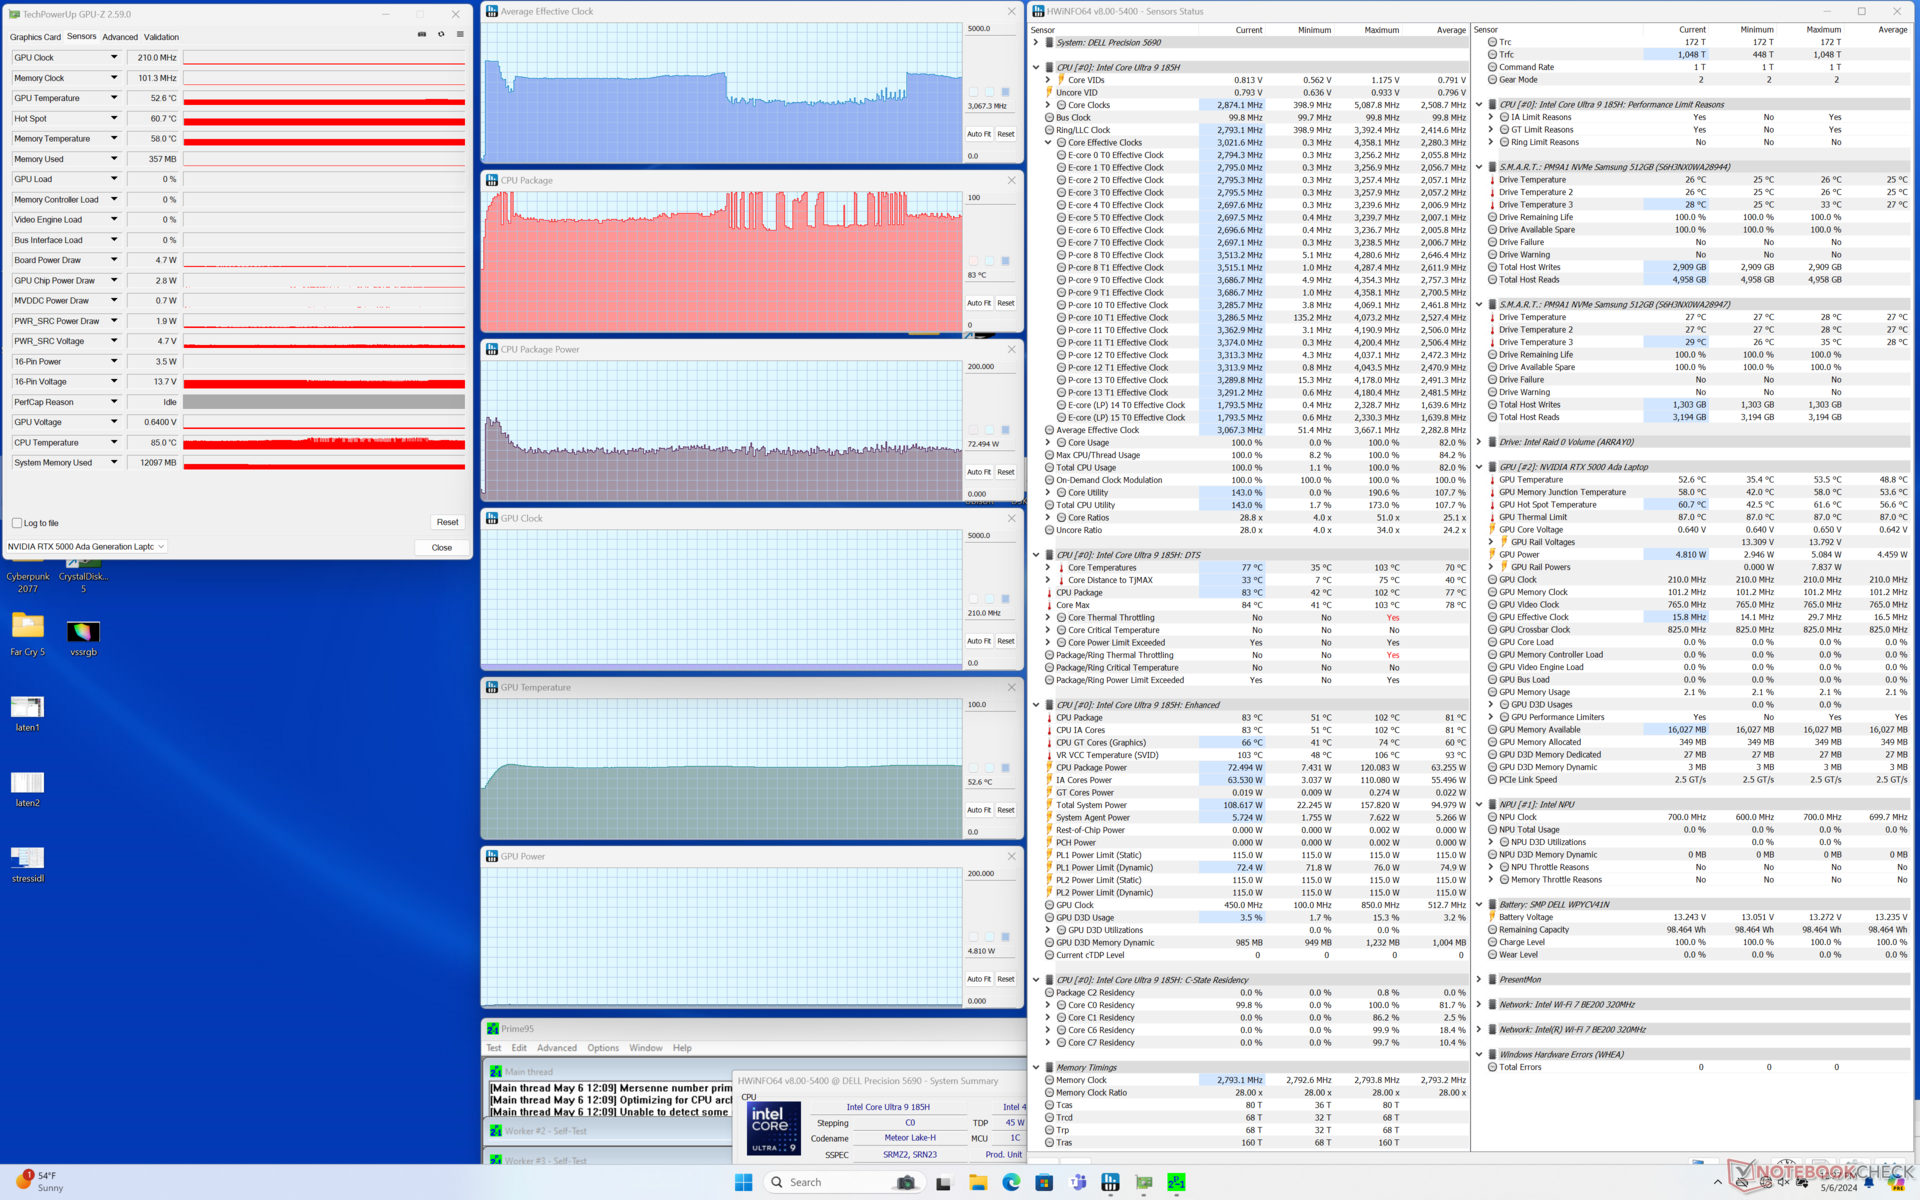
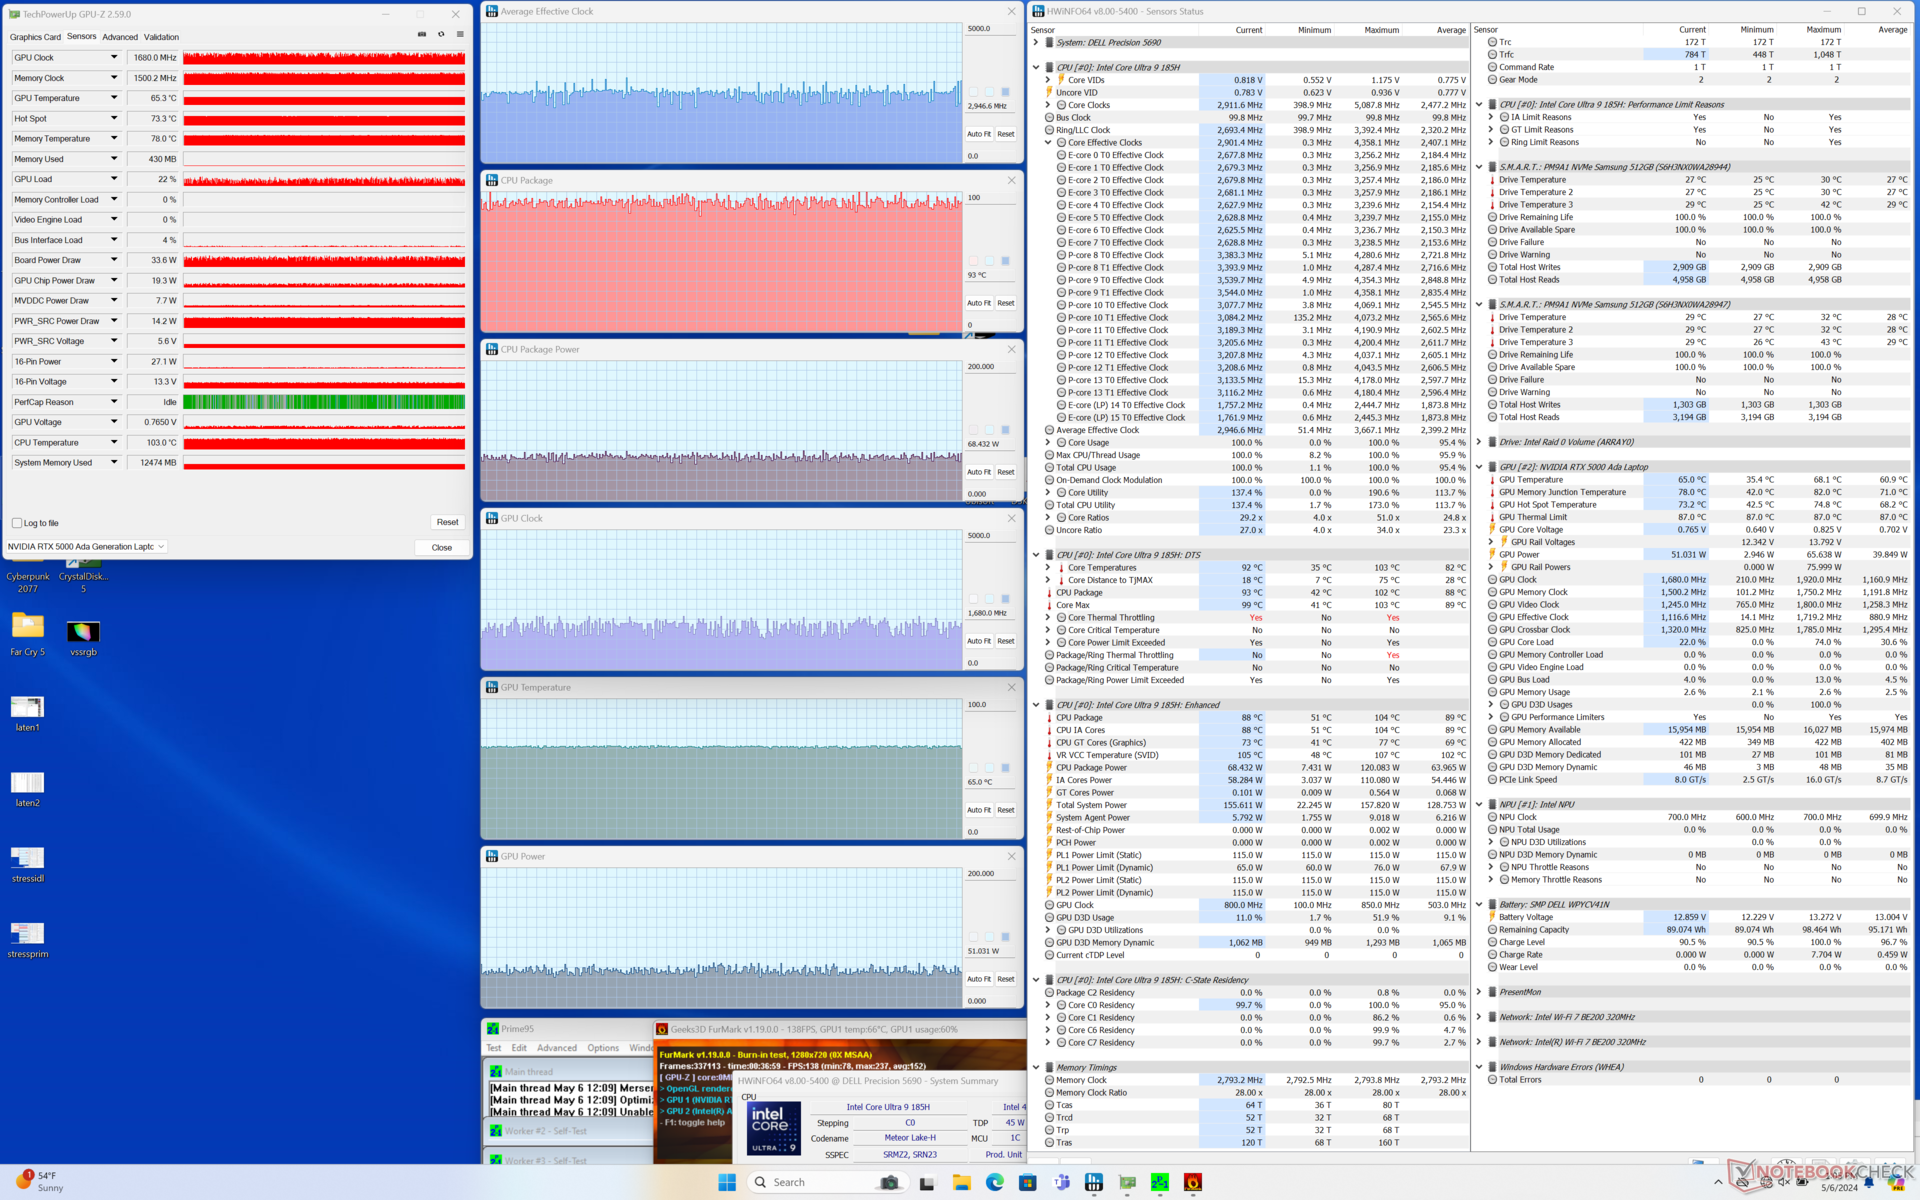
| CPU-Takt (GHz) | GPU-Takt (MHz) | Durchschn. CPU-Temperatur (°C) | Durchschn. GPU-Temperatur (°C) | |
| Leerllauf | -- | -- | 43 | 35 |
| Prime95 Stress | 3,0 | -- | 83 | 53 |
| Prime95 + FurMark Stress | ~3,0 | ~1.680 | 93 | 65 |
| Witcher 3 Stress | ~0,6 | 1.530 | 75 | 62 |
Systemleistung
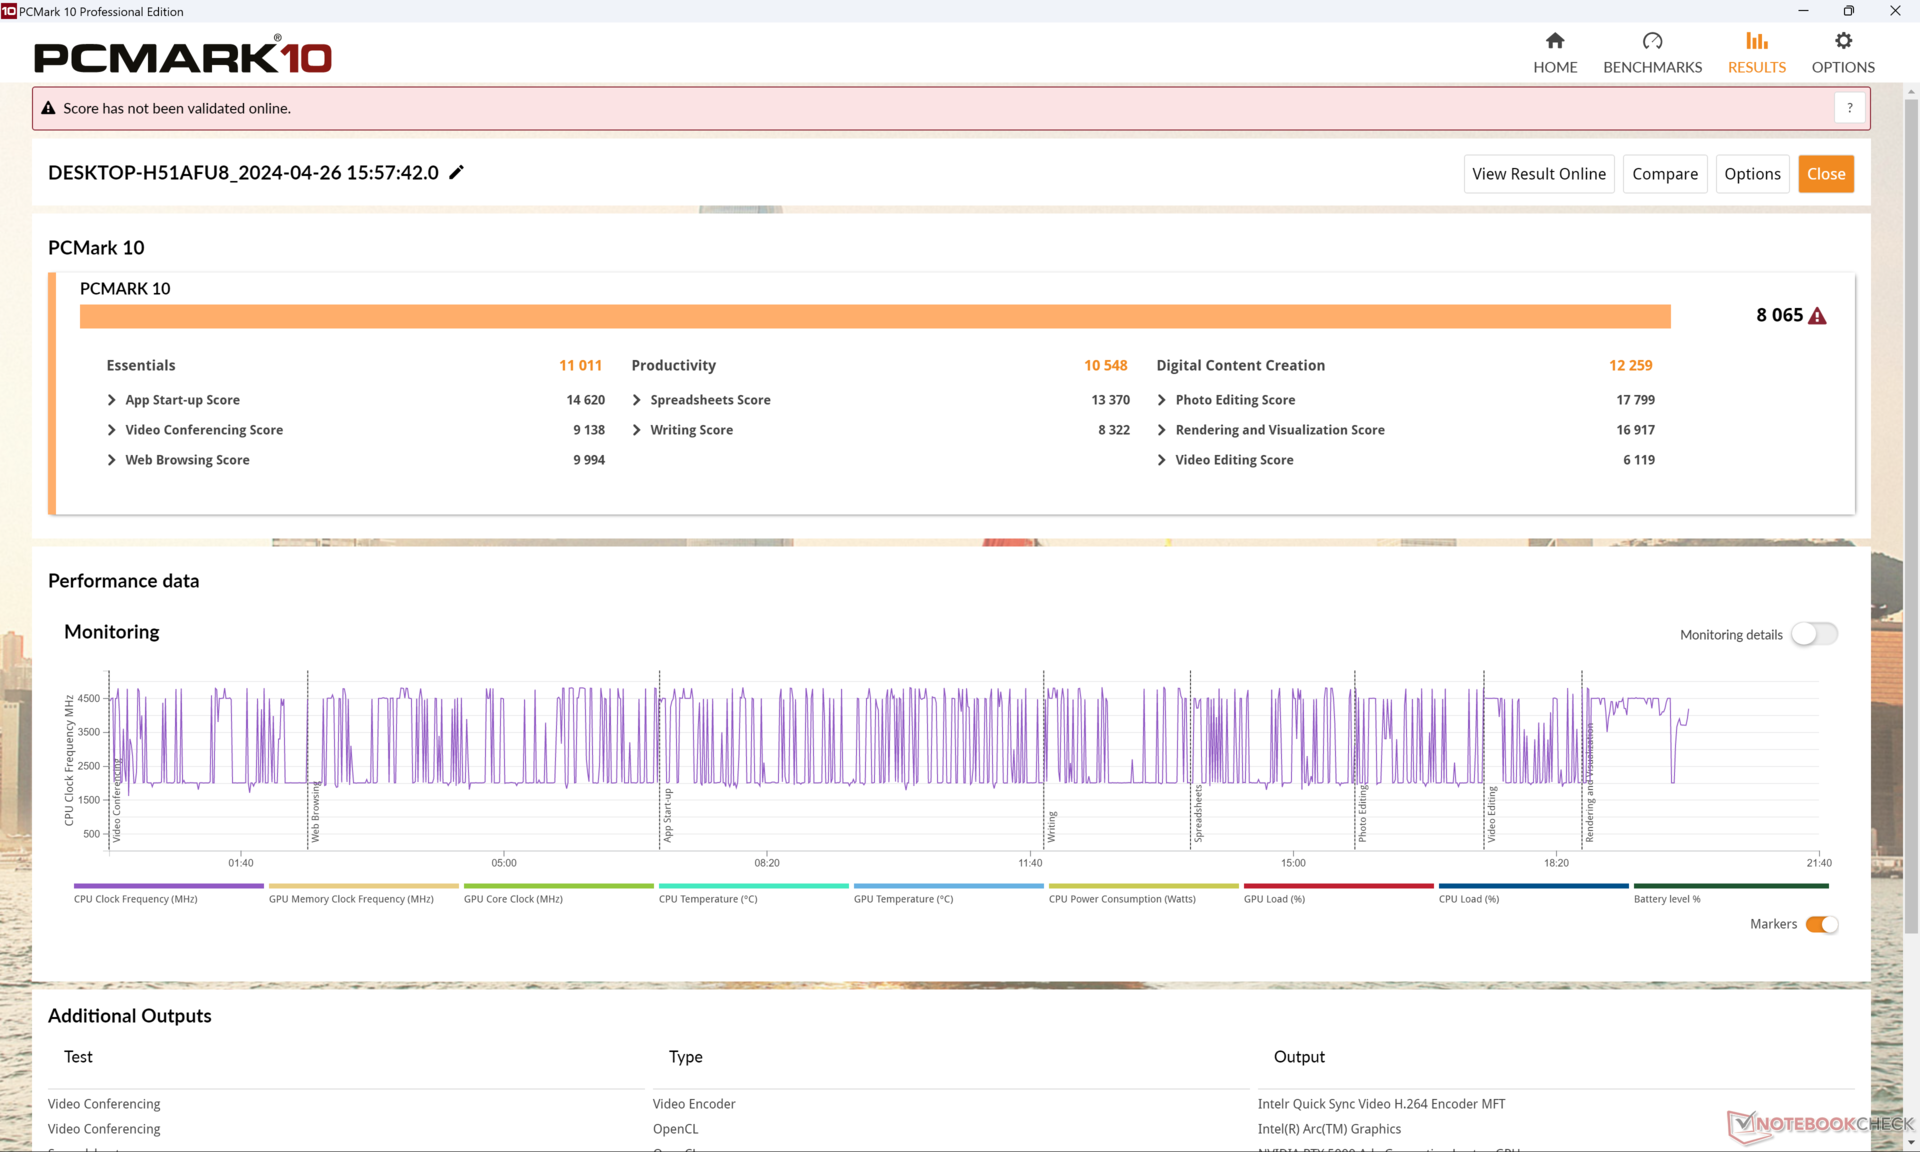
Die PCMark-10-Scores sind quasi identisch zu denen auf dem Precision 5680, was zu dem Schluss führt, dass es keine Unterschiede zwischen beiden Modellen gibt, wenn es um traditionelle Aufgaben geht.
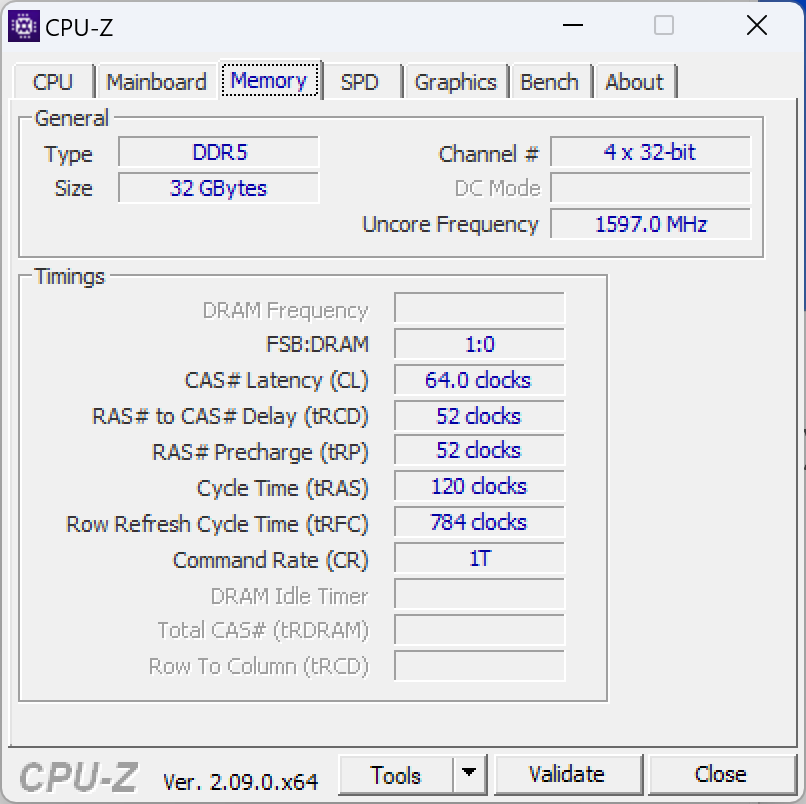
Der Arbeitsspeicher ist in diesem Jahr etwas schneller geworden (7.467 vs. 6.000 MT/s), was sich in leicht gestiegenen AIDA64-Benchmark-Ergebnissen widerspiegelt.
CrossMark: Overall | Productivity | Creativity | Responsiveness
WebXPRT 3: Overall
WebXPRT 4: Overall
Mozilla Kraken 1.1: Total
| PCMark 10 / Score | |
| Dell Precision 5000 5680 | |
| HP ZBook Fury 16 G10 | |
| Dell Precision 5690 | |
| Durchschnittliche Intel Core Ultra 9 185H, NVIDIA RTX 5000 Ada Generation Laptop (n=1) | |
| Lenovo ThinkPad P1 G6-21FV000DGE | |
| Lenovo ThinkPad P16 G2 21FA000FGE | |
| MSI CreatorPro Z16P B12UKST | |
| PCMark 10 / Essentials | |
| Dell Precision 5000 5680 | |
| Lenovo ThinkPad P1 G6-21FV000DGE | |
| HP ZBook Fury 16 G10 | |
| Dell Precision 5690 | |
| Durchschnittliche Intel Core Ultra 9 185H, NVIDIA RTX 5000 Ada Generation Laptop (n=1) | |
| Lenovo ThinkPad P16 G2 21FA000FGE | |
| MSI CreatorPro Z16P B12UKST | |
| PCMark 10 / Productivity | |
| Dell Precision 5000 5680 | |
| Dell Precision 5690 | |
| Durchschnittliche Intel Core Ultra 9 185H, NVIDIA RTX 5000 Ada Generation Laptop (n=1) | |
| Lenovo ThinkPad P1 G6-21FV000DGE | |
| Lenovo ThinkPad P16 G2 21FA000FGE | |
| MSI CreatorPro Z16P B12UKST | |
| HP ZBook Fury 16 G10 | |
| PCMark 10 / Digital Content Creation | |
| HP ZBook Fury 16 G10 | |
| Dell Precision 5000 5680 | |
| Dell Precision 5690 | |
| Durchschnittliche Intel Core Ultra 9 185H, NVIDIA RTX 5000 Ada Generation Laptop (n=1) | |
| Lenovo ThinkPad P1 G6-21FV000DGE | |
| MSI CreatorPro Z16P B12UKST | |
| Lenovo ThinkPad P16 G2 21FA000FGE | |
| CrossMark / Overall | |
| MSI CreatorPro Z16P B12UKST | |
| Dell Precision 5000 5680 | |
| HP ZBook Fury 16 G10 | |
| Lenovo ThinkPad P1 G6-21FV000DGE | |
| Lenovo ThinkPad P16 G2 21FA000FGE | |
| Dell Precision 5690 | |
| Durchschnittliche Intel Core Ultra 9 185H, NVIDIA RTX 5000 Ada Generation Laptop (n=1) | |
| CrossMark / Productivity | |
| HP ZBook Fury 16 G10 | |
| MSI CreatorPro Z16P B12UKST | |
| Dell Precision 5000 5680 | |
| Lenovo ThinkPad P1 G6-21FV000DGE | |
| Dell Precision 5690 | |
| Durchschnittliche Intel Core Ultra 9 185H, NVIDIA RTX 5000 Ada Generation Laptop (n=1) | |
| Lenovo ThinkPad P16 G2 21FA000FGE | |
| CrossMark / Creativity | |
| Dell Precision 5000 5680 | |
| Lenovo ThinkPad P16 G2 21FA000FGE | |
| HP ZBook Fury 16 G10 | |
| MSI CreatorPro Z16P B12UKST | |
| Lenovo ThinkPad P1 G6-21FV000DGE | |
| Dell Precision 5690 | |
| Durchschnittliche Intel Core Ultra 9 185H, NVIDIA RTX 5000 Ada Generation Laptop (n=1) | |
| CrossMark / Responsiveness | |
| MSI CreatorPro Z16P B12UKST | |
| HP ZBook Fury 16 G10 | |
| Lenovo ThinkPad P1 G6-21FV000DGE | |
| Dell Precision 5000 5680 | |
| Dell Precision 5690 | |
| Durchschnittliche Intel Core Ultra 9 185H, NVIDIA RTX 5000 Ada Generation Laptop (n=1) | |
| Lenovo ThinkPad P16 G2 21FA000FGE | |
| WebXPRT 3 / Overall | |
| Dell Precision 5000 5680 | |
| HP ZBook Fury 16 G10 | |
| Lenovo ThinkPad P16 G2 21FA000FGE | |
| Lenovo ThinkPad P1 G6-21FV000DGE | |
| MSI CreatorPro Z16P B12UKST | |
| Dell Precision 5690 | |
| Durchschnittliche Intel Core Ultra 9 185H, NVIDIA RTX 5000 Ada Generation Laptop (n=1) | |
| WebXPRT 4 / Overall | |
| Lenovo ThinkPad P1 G6-21FV000DGE | |
| HP ZBook Fury 16 G10 | |
| Dell Precision 5000 5680 | |
| Dell Precision 5690 | |
| Durchschnittliche Intel Core Ultra 9 185H, NVIDIA RTX 5000 Ada Generation Laptop (n=1) | |
| MSI CreatorPro Z16P B12UKST | |
| Mozilla Kraken 1.1 / Total | |
| MSI CreatorPro Z16P B12UKST | |
| Dell Precision 5690 | |
| Durchschnittliche Intel Core Ultra 9 185H, NVIDIA RTX 5000 Ada Generation Laptop (n=1) | |
| Lenovo ThinkPad P16 G2 21FA000FGE | |
| Dell Precision 5000 5680 | |
| Lenovo ThinkPad P1 G6-21FV000DGE | |
| HP ZBook Fury 16 G10 | |
* ... kleinere Werte sind besser
| PCMark 10 Score | 8065 Punkte | |
Hilfe | ||
| AIDA64 / Memory Copy | |
| Dell Precision 5690 | |
| Durchschnittliche Intel Core Ultra 9 185H (69929 - 95718, n=20) | |
| Dell Precision 5000 5680 | |
| MSI CreatorPro Z16P B12UKST | |
| HP ZBook Fury 16 G10 | |
| Lenovo ThinkPad P16 G2 21FA000FGE | |
| Lenovo ThinkPad P1 G6-21FV000DGE | |
| AIDA64 / Memory Read | |
| Dell Precision 5690 | |
| Durchschnittliche Intel Core Ultra 9 185H (64619 - 87768, n=20) | |
| Dell Precision 5000 5680 | |
| MSI CreatorPro Z16P B12UKST | |
| HP ZBook Fury 16 G10 | |
| Lenovo ThinkPad P16 G2 21FA000FGE | |
| Lenovo ThinkPad P1 G6-21FV000DGE | |
| AIDA64 / Memory Write | |
| Dell Precision 5000 5680 | |
| Dell Precision 5690 | |
| Durchschnittliche Intel Core Ultra 9 185H (51114 - 93871, n=20) | |
| MSI CreatorPro Z16P B12UKST | |
| HP ZBook Fury 16 G10 | |
| Lenovo ThinkPad P16 G2 21FA000FGE | |
| Lenovo ThinkPad P1 G6-21FV000DGE | |
| AIDA64 / Memory Latency | |
| Durchschnittliche Intel Core Ultra 9 185H (121.4 - 259, n=20) | |
| Dell Precision 5690 | |
| HP ZBook Fury 16 G10 | |
| Lenovo ThinkPad P16 G2 21FA000FGE | |
| MSI CreatorPro Z16P B12UKST | |
| Dell Precision 5000 5680 | |
| Lenovo ThinkPad P1 G6-21FV000DGE | |
* ... kleinere Werte sind besser
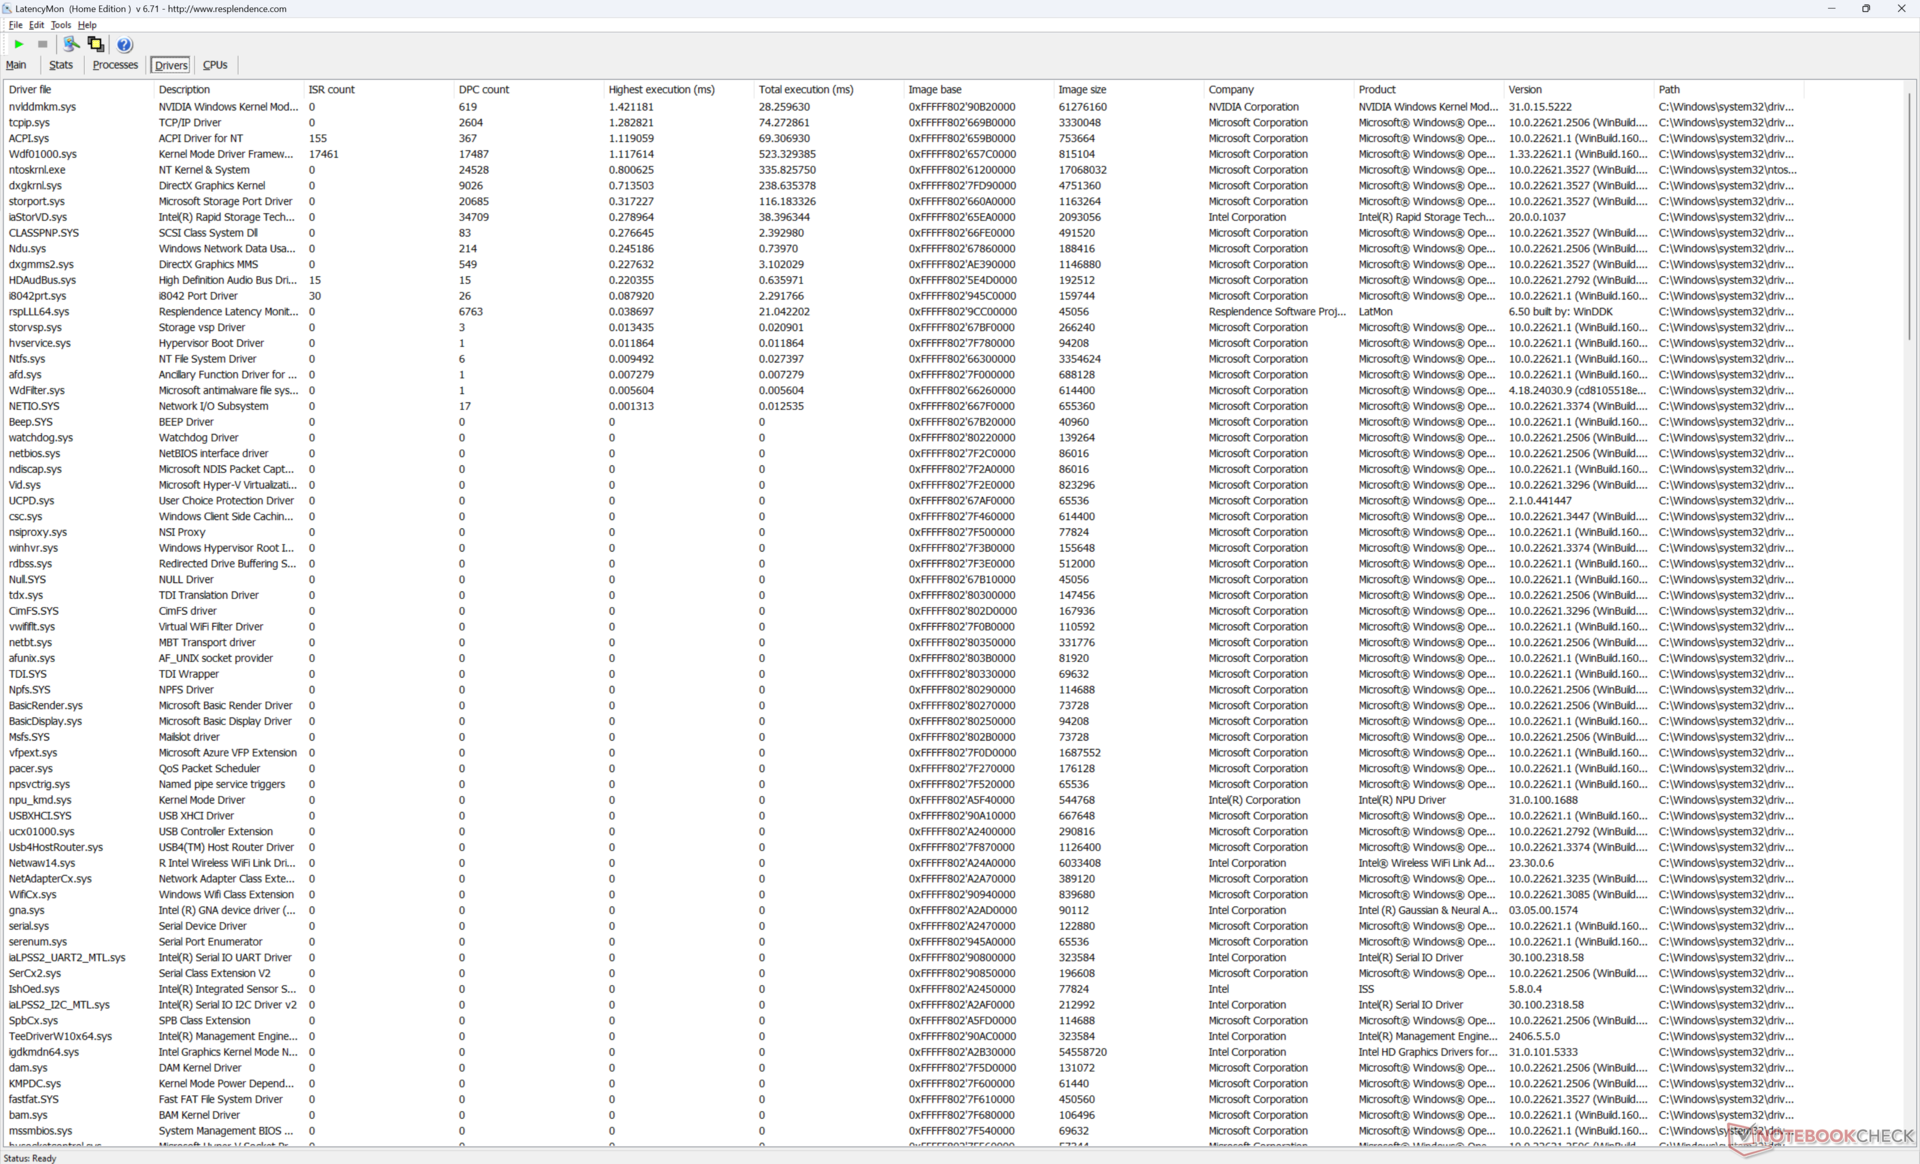
DPC Latency
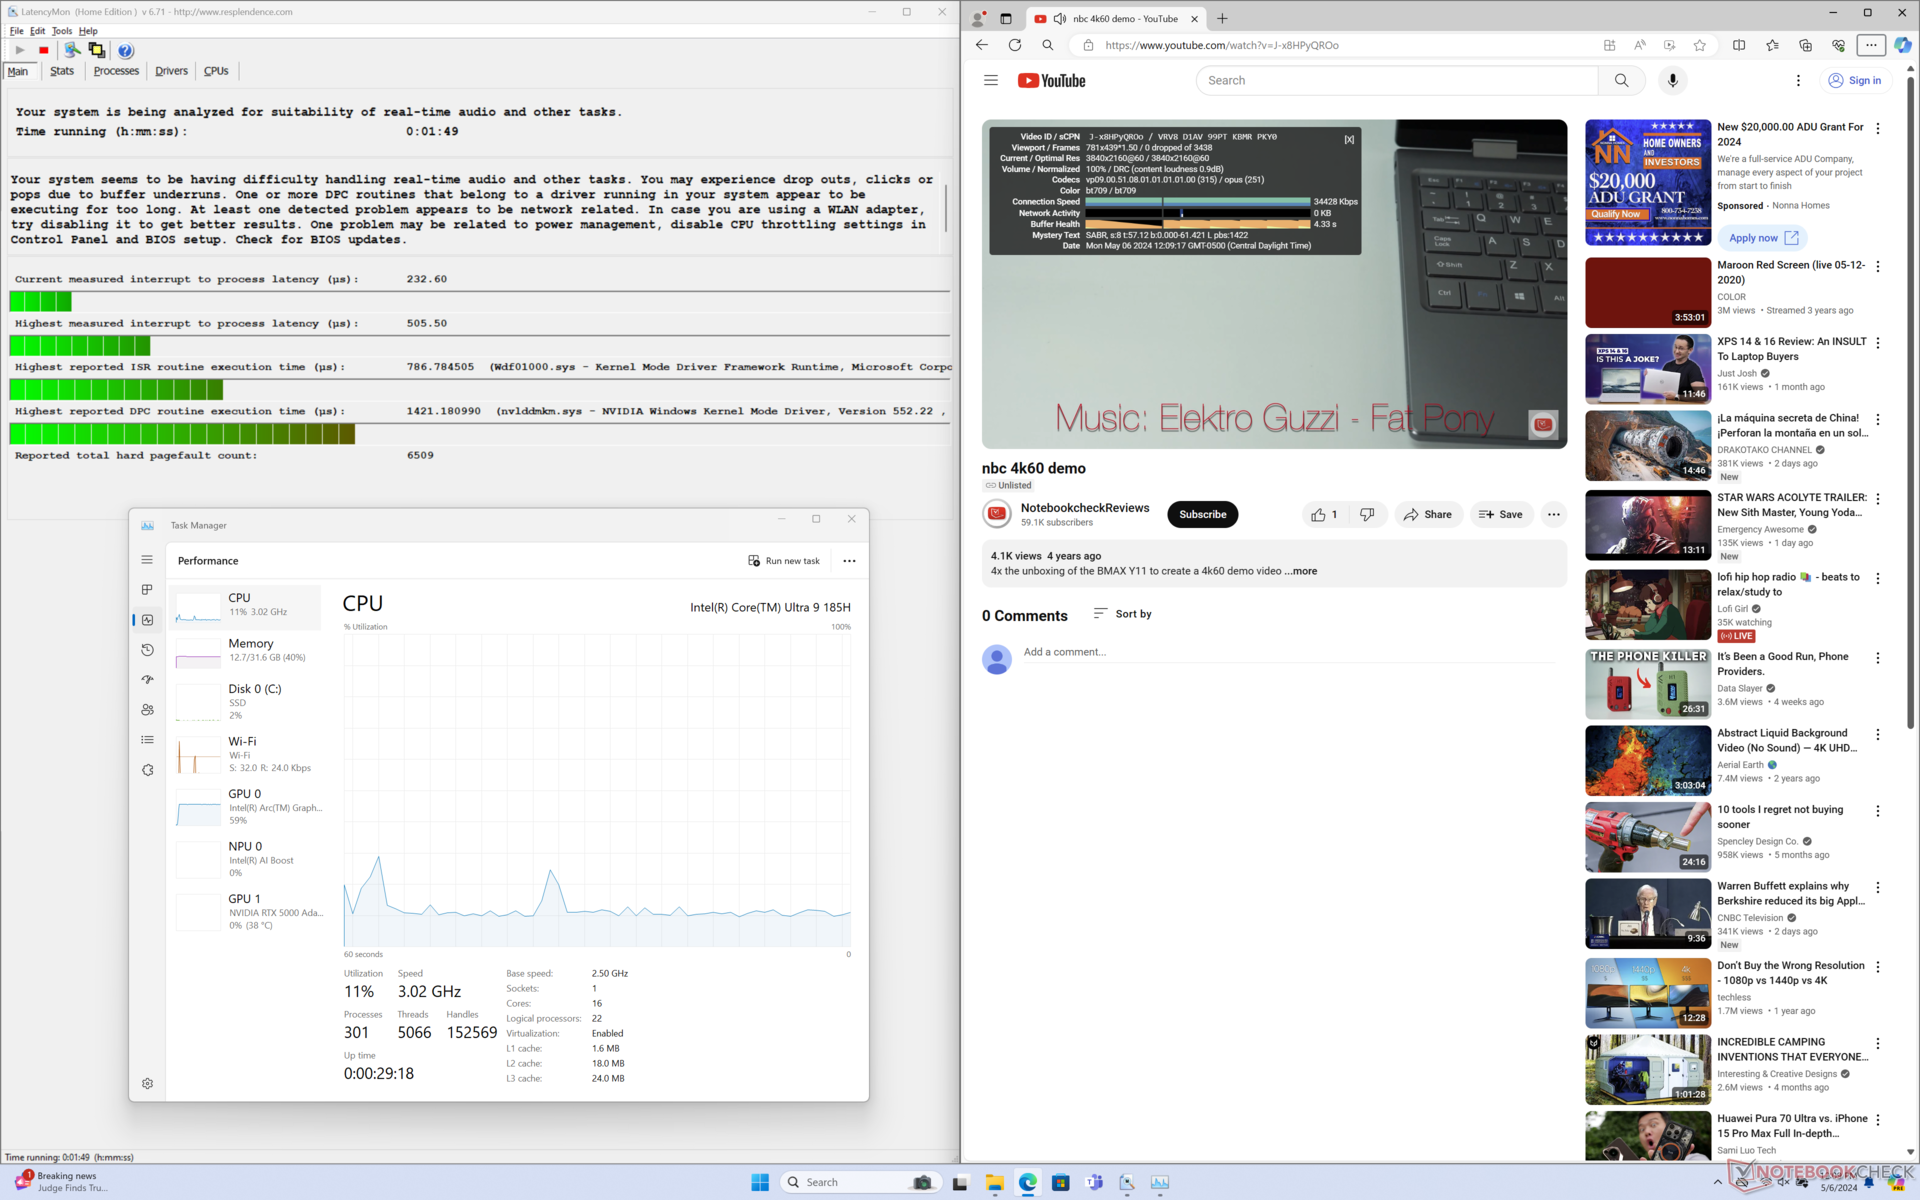
LatencyMon zeigt nur geringfügige DPC-Probleme beim Öffnen mehrerer Browsertabs auf usnerer Homepage auf. Die Wiedergabe unseres 4K/60-FPS-YouTubevideos läuft ansonsten perfekt und ohne ausgelassene Bilder ab.
| DPC Latencies / LatencyMon - interrupt to process latency (max), Web, Youtube, Prime95 | |
| HP ZBook Fury 16 G10 | |
| Lenovo ThinkPad P1 G6-21FV000DGE | |
| Dell Precision 5000 5680 | |
| Lenovo ThinkPad P16 G2 21FA000FGE | |
| MSI CreatorPro Z16P B12UKST | |
| Dell Precision 5690 | |
* ... kleinere Werte sind besser
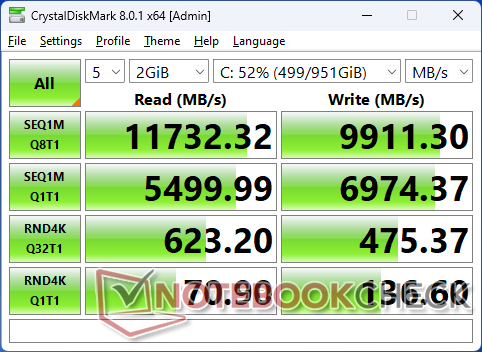
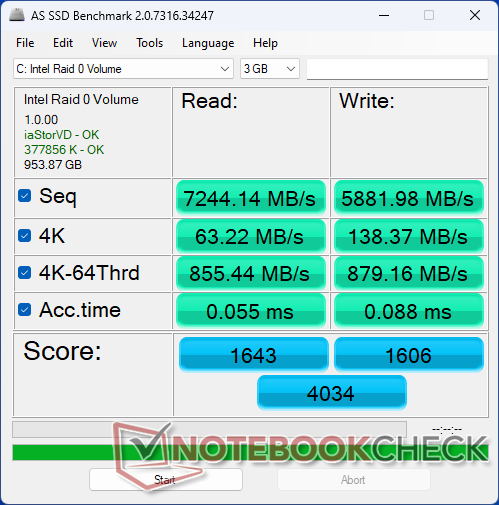
Massenspeicher
Unsere Testeinheit ist mit zwei Samsung-PM9A1-PCIe4-x4-NVMe-SSDs im RAID-0-Verbund ausgestattet. Die Lese- und Schreibratten übertreffen 12.000 MB/s beziehungsweise 9.000 MB/s. Die Leistung ist konstant und auch DiskSpd im Loop lässt keine thermische Drosselung erkennen.

| Drive Performance Rating - Percent | |
| MSI CreatorPro Z16P B12UKST -8! | |
| Lenovo ThinkPad P1 G6-21FV000DGE | |
| Dell Precision 5690 | |
| HP ZBook Fury 16 G10 | |
| Dell Precision 5000 5680 | |
| Lenovo ThinkPad P16 G2 21FA000FGE | |
* ... kleinere Werte sind besser
Disk Throttling: DiskSpd Read Loop, Queue Depth 8
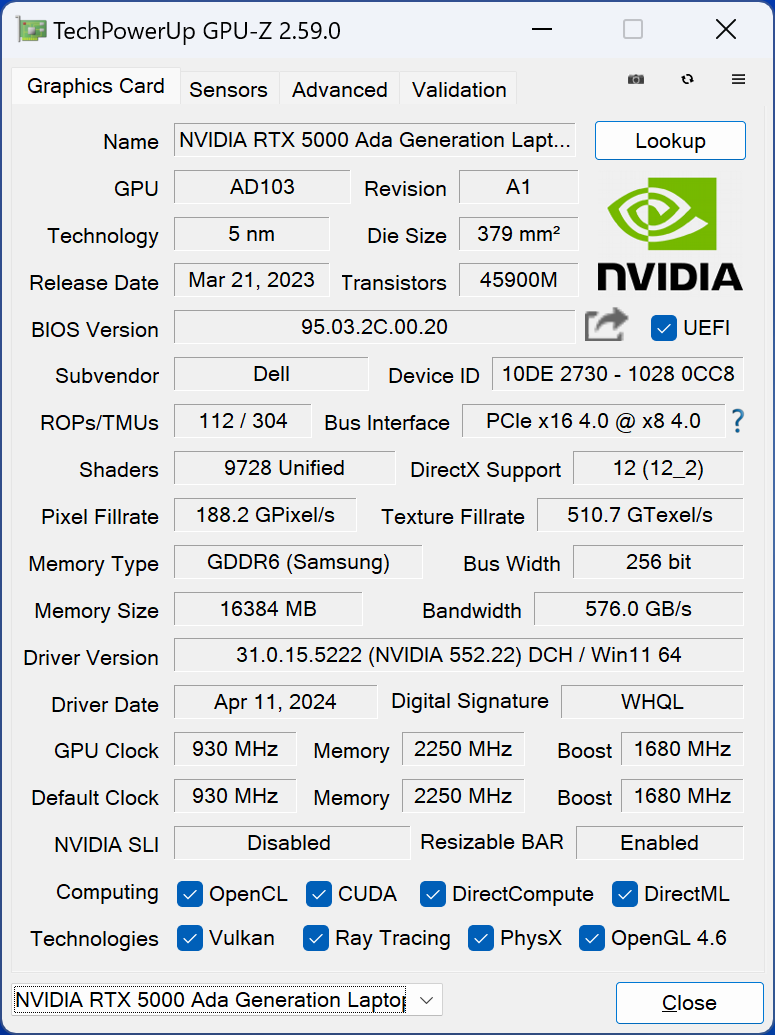
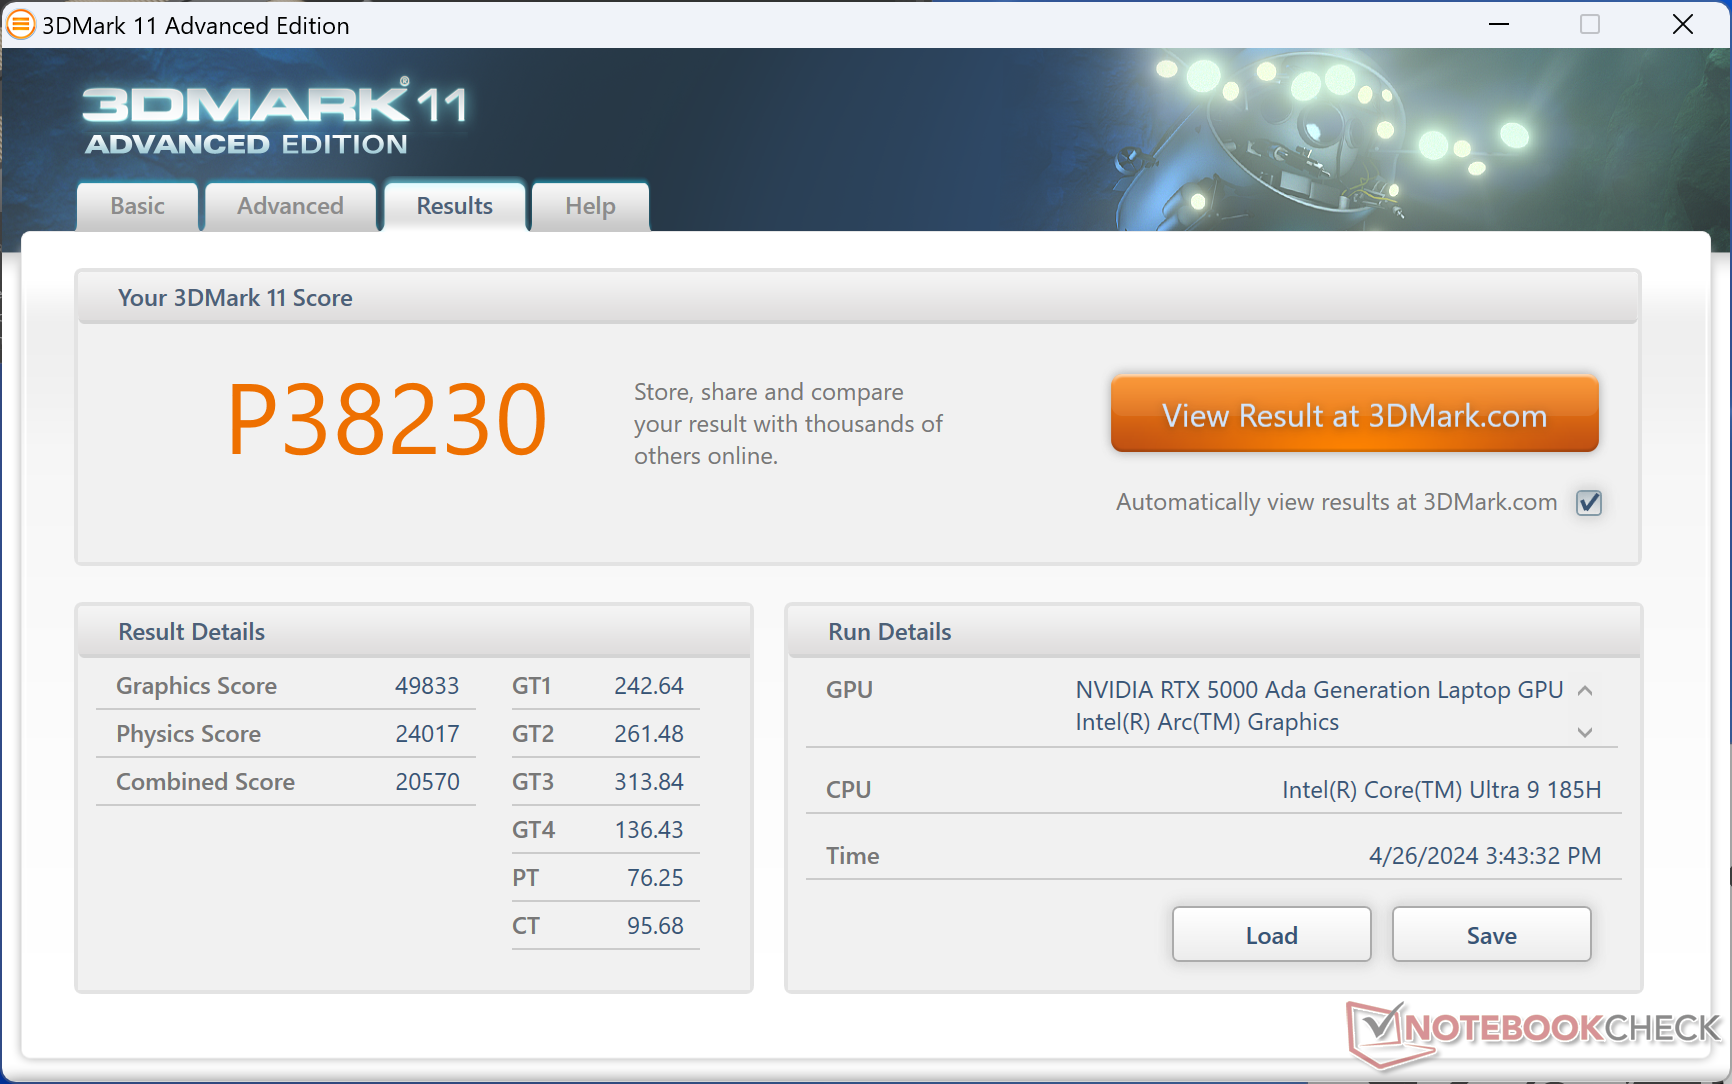
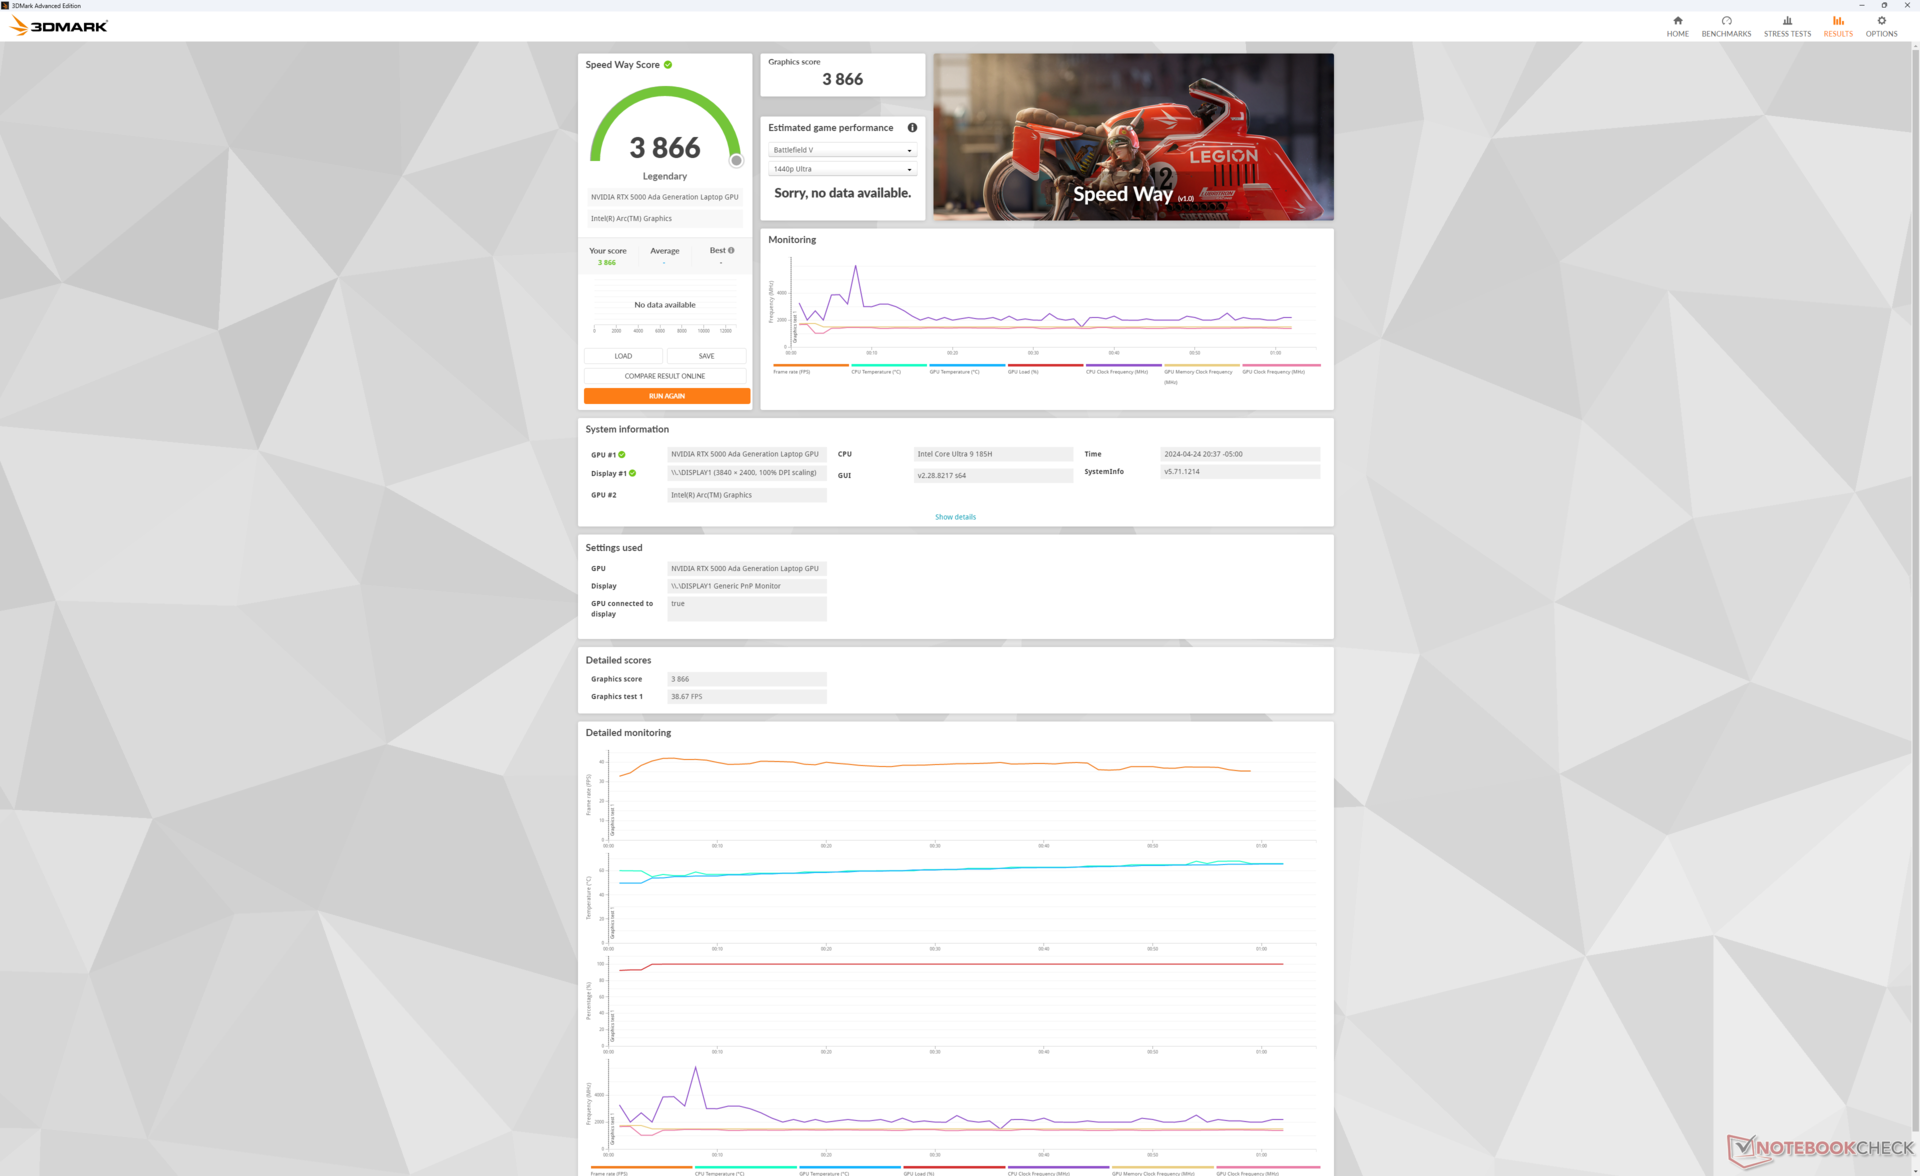
Grafikleistung — Bis zur RTX 5000 Ada
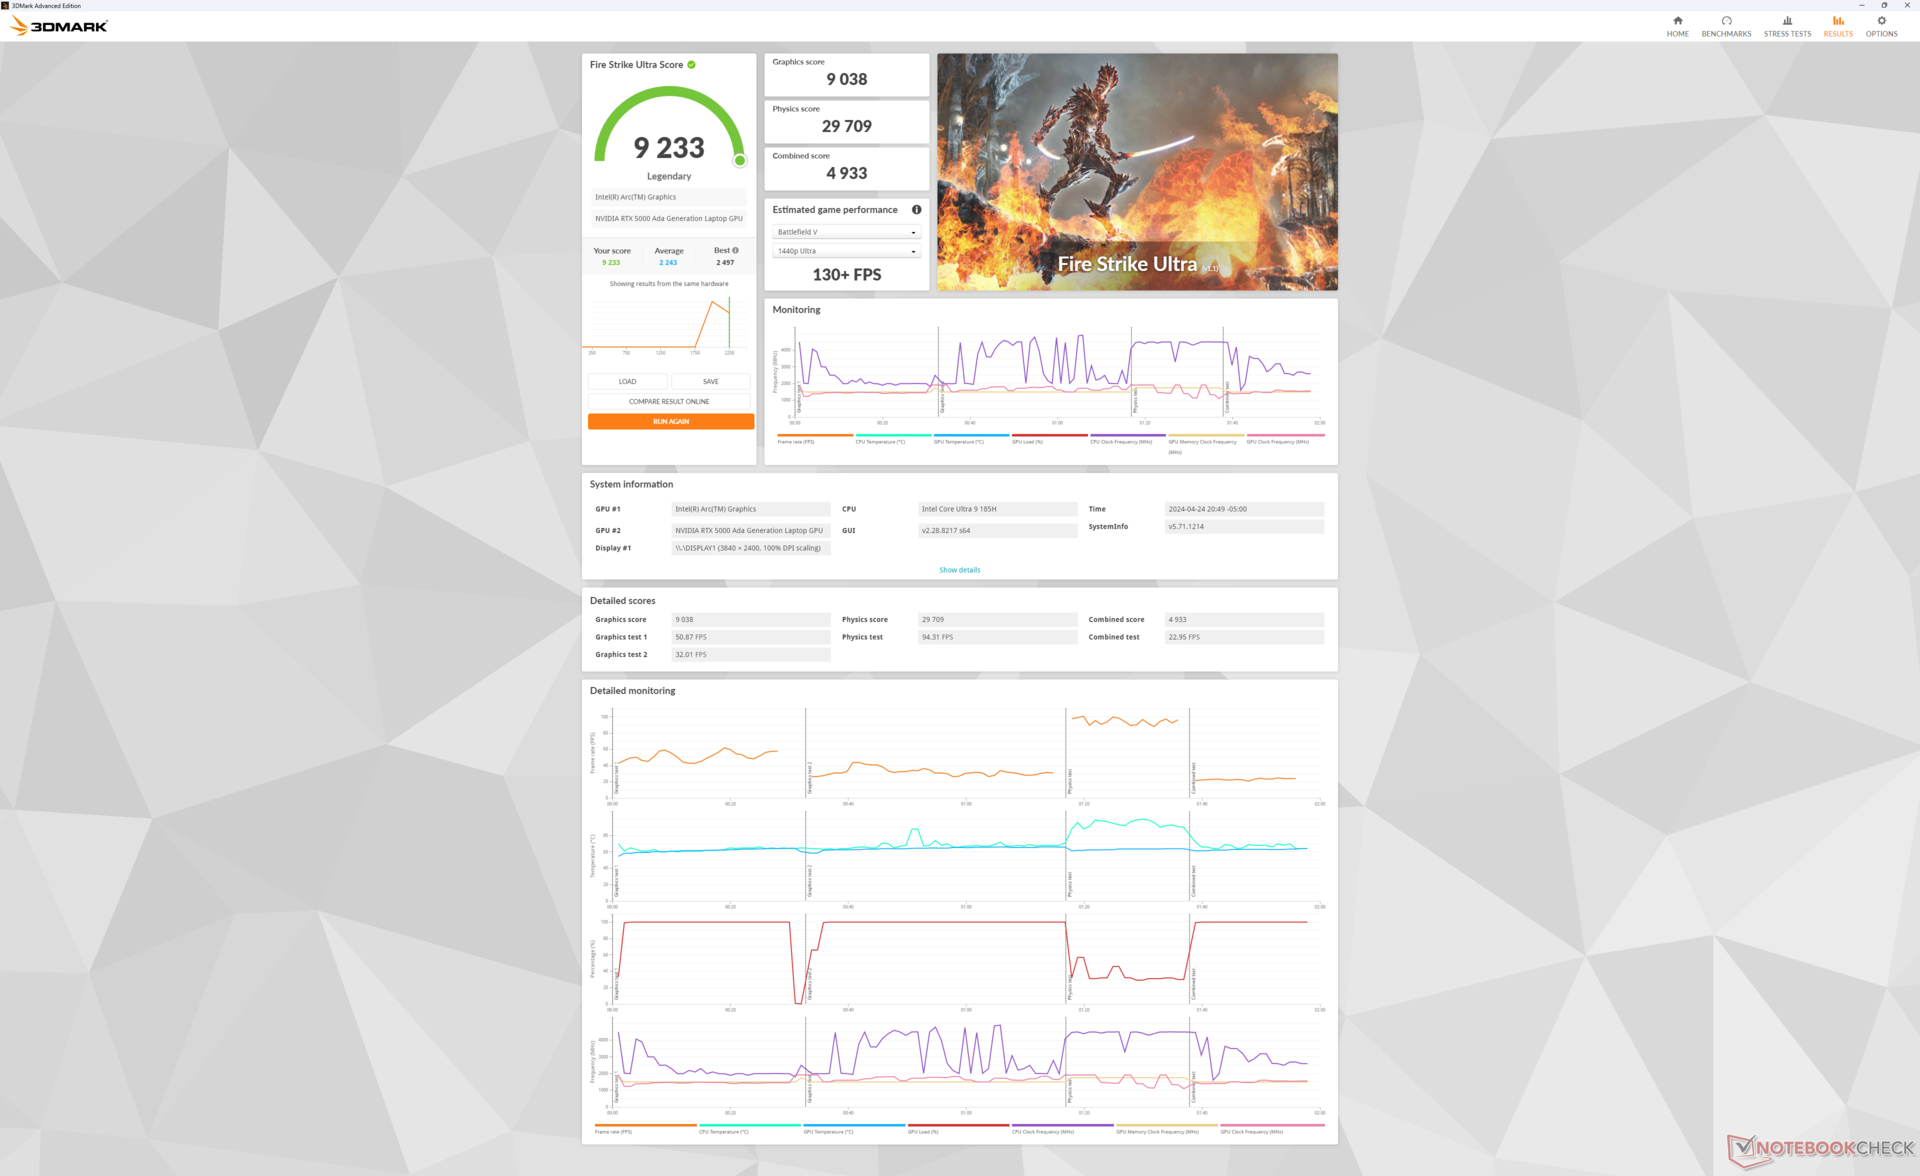
Die Nvidia-Grafikoptionen haben sich im Jahresvergleich nicht verändert, sodass die RTX 5000 Ada weiterhin die Topkonfiguration darstellt. Diese GPU entstammt der GeForce RTX 4090 sodass sie auf 16 GB VRAM zugreifen kann, anstelle der nur 12 GB wenn man die Optionen mit den langsameren RTX 4000 Ada oder 3500 Ada wählt. Nutzer haben eine ganze Reihe an RTX Ada GPUs zur Auswahl, von der RTX 1000 Ada bis hoch zu der bei uns verbauten RTX 5000 Ada.
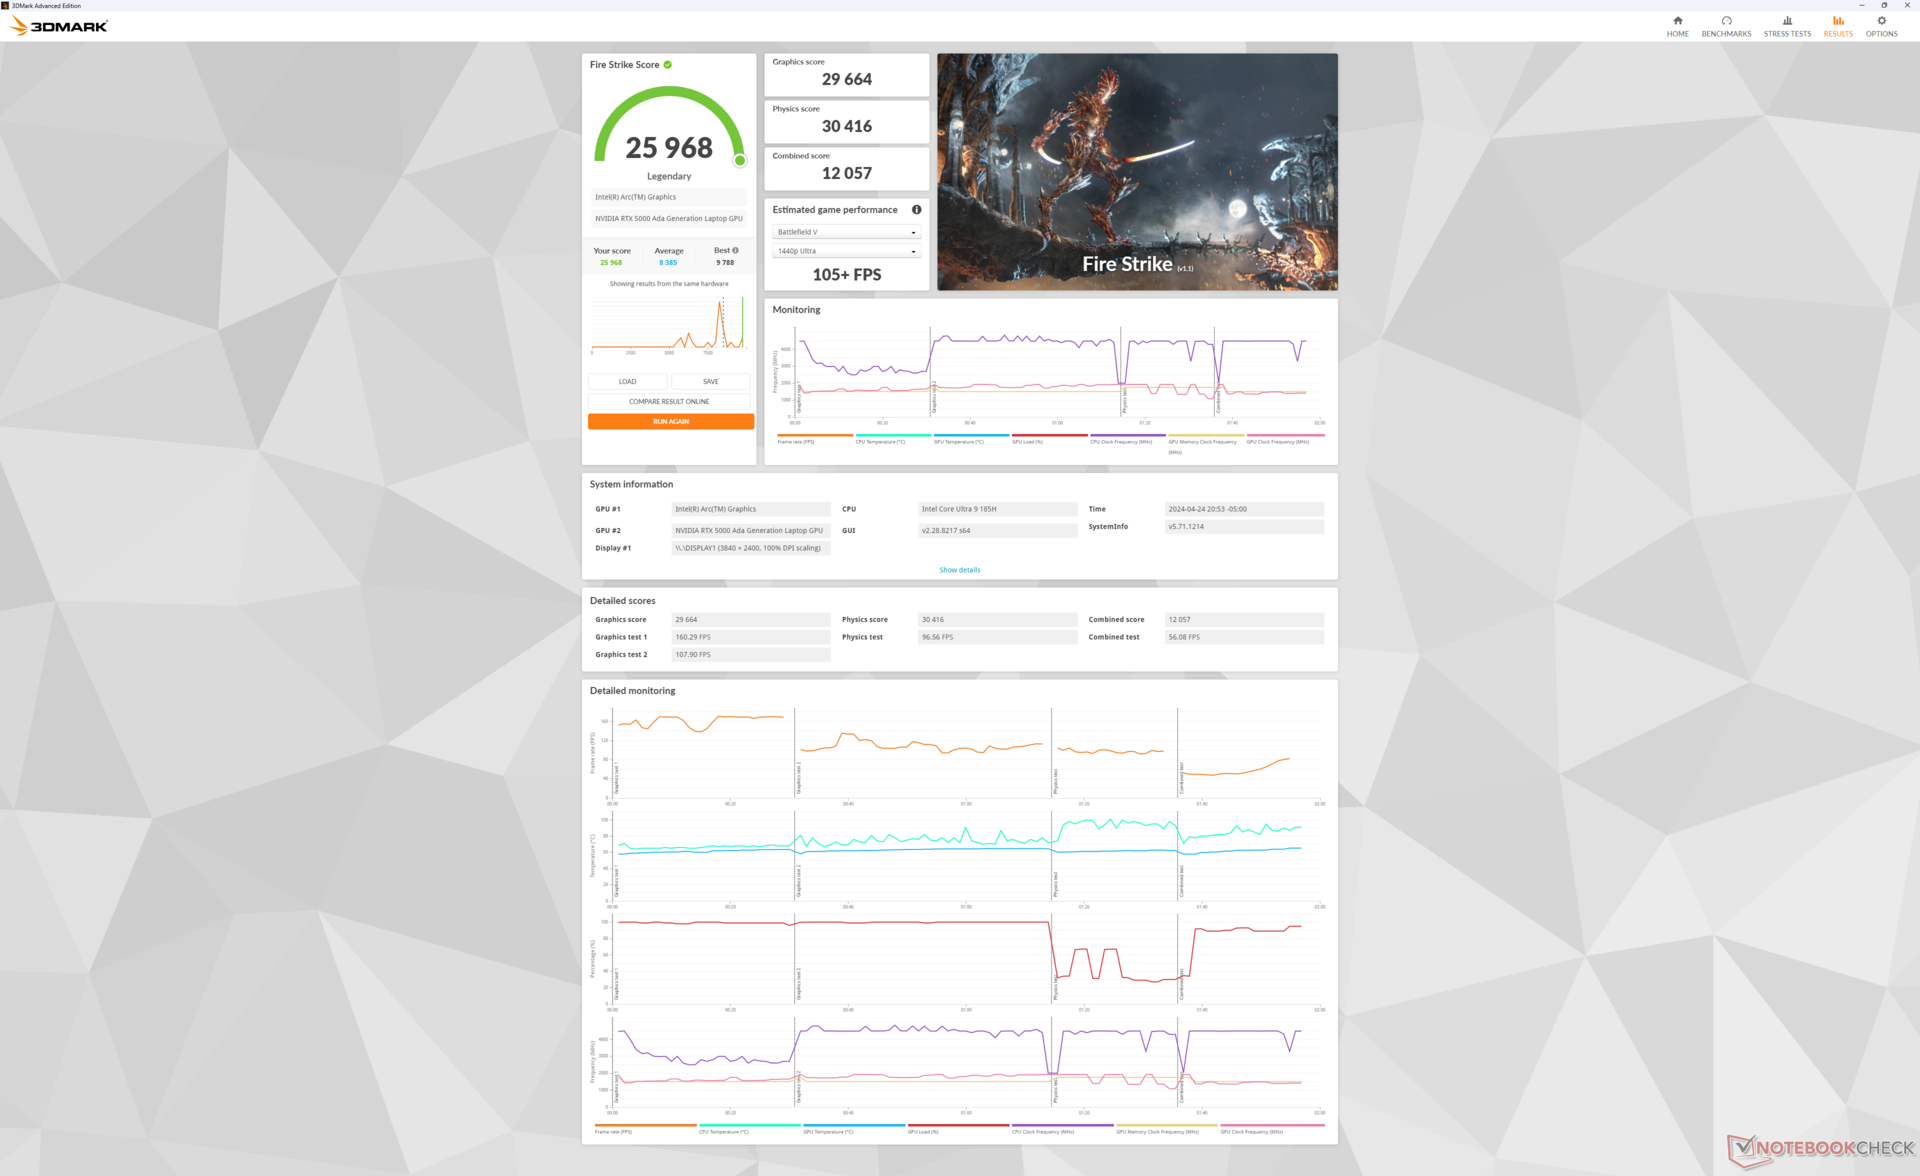
| Leistungsprofil | Graphics Score | Physics Score | Combined Score |
| Performance Mode | 29.664 | 30.416 | 12.057 |
| Balanced Mode | 29.771 (-0%) | 27.199 (-11%) | 11.770 (-2%) |
| Battery Power | 26.674 (-10%) | 20.268 (-33%) | 9.539 (-21%) |
Der Balanced-Modus beeinflusst die Prozessor-Leistung, während die Grafikleistung gleich bleibt, wie die Ergebnisse im Fire Strike zeigen.
| 3DMark Performance Rating - Percent | |
| HP ZBook Fury 16 G10 -2! | |
| Durchschnittliche NVIDIA RTX 5000 Ada Generation Laptop | |
| Dell Precision 5690 -2! | |
| Dell Precision 5000 5680 -2! | |
| Asus ProArt StudioBook 16 W7600H5A-2BL2 -20! | |
| HP ZBook Fury 16 G9 -2! | |
| Dell XPS 16 9640 -35! | |
| Lenovo ThinkPad P1 G6-21FV000DGE -16! | |
| Lenovo ThinkPad P16 G2 21FA000FGE -18! | |
| MSI CreatorPro Z16P B12UKST -17! | |
| Lenovo ThinkPad P16v G1 AMD -16! | |
| Lenovo ThinkPad P16 G1 21D6001DMB -18! | |
| Lenovo ThinkPad P1 G4-20Y30017GE -18! | |
| Lenovo ThinkPad P16s G2 21K9000CGE -18! | |
| 3DMark 11 Performance | 38230 Punkte | |
| 3DMark Fire Strike Score | 25968 Punkte | |
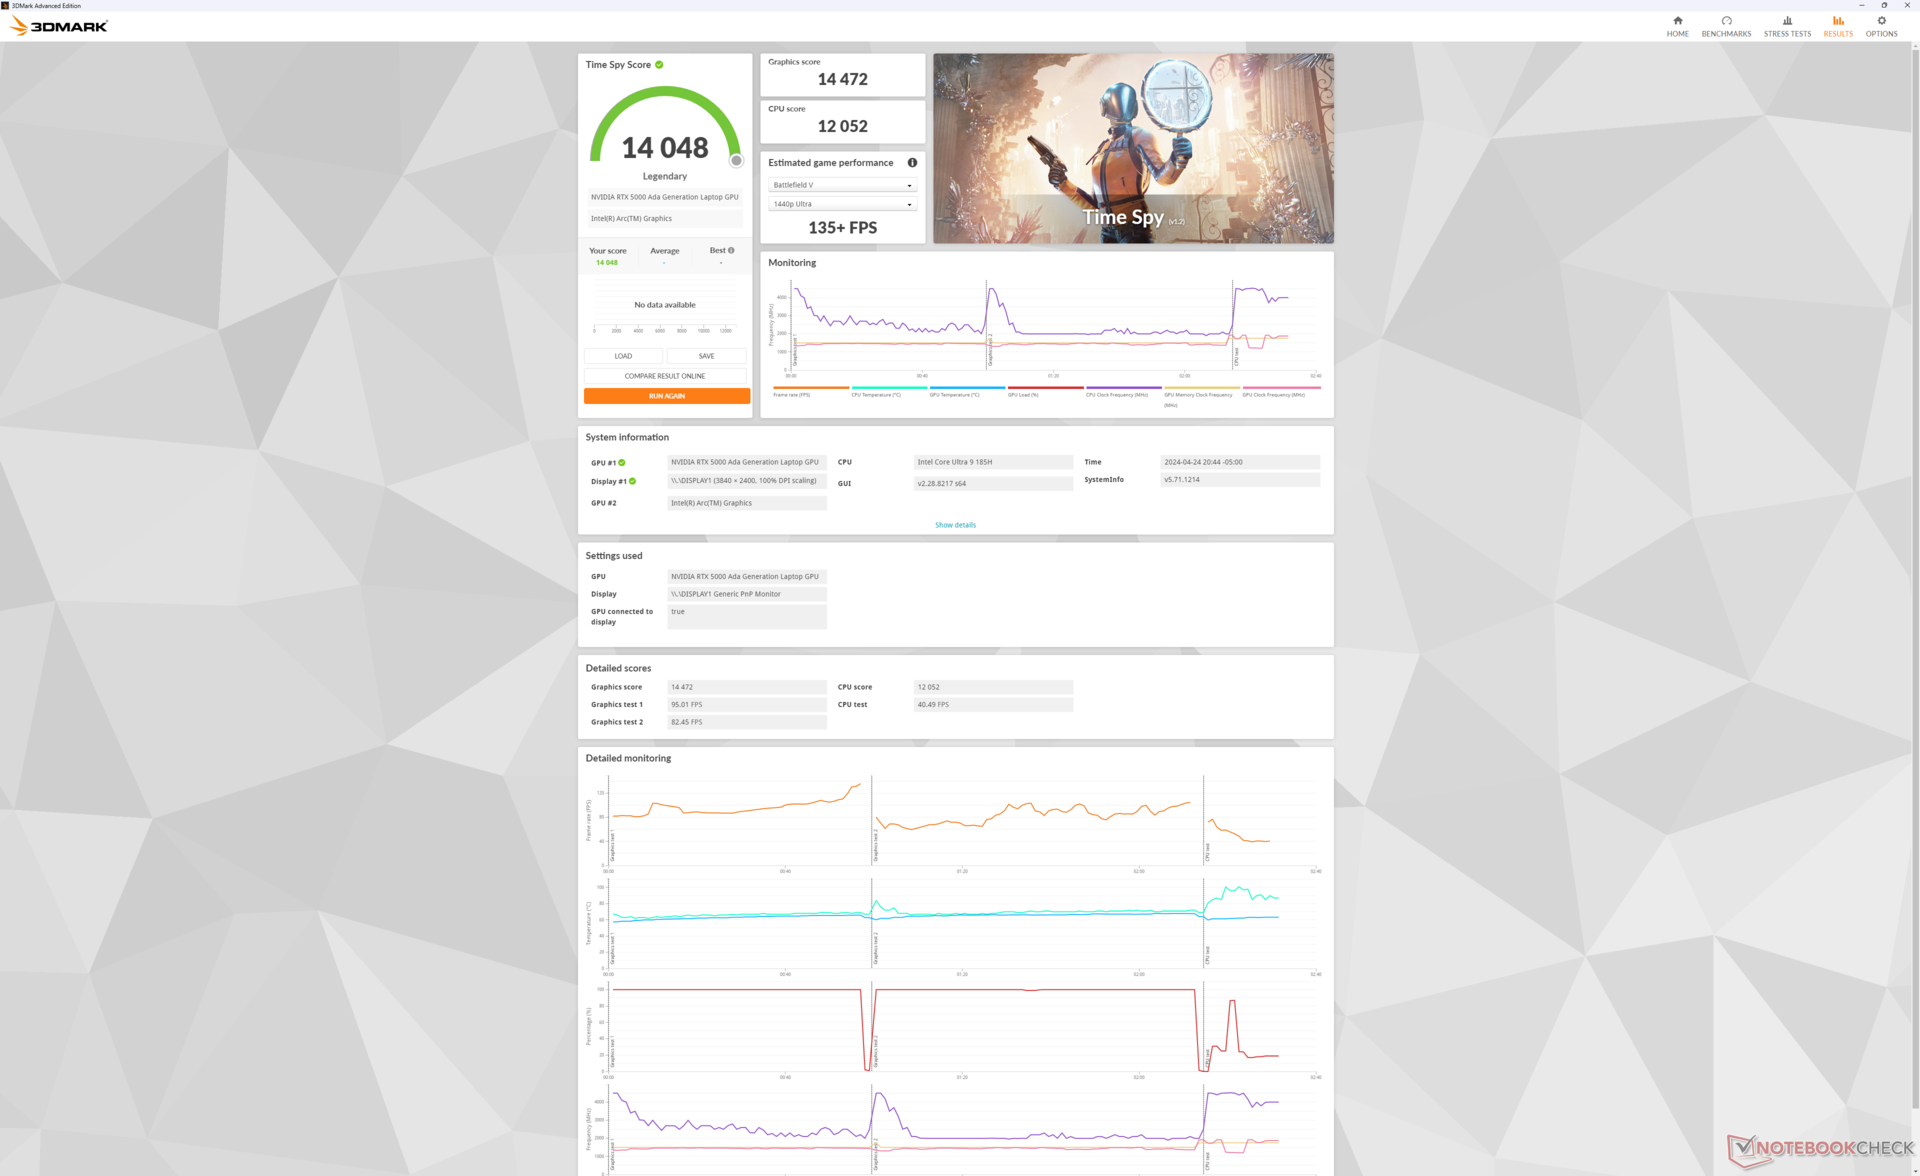
| 3DMark Time Spy Score | 14048 Punkte | |
Hilfe | ||
* ... kleinere Werte sind besser
| Performance Rating - Percent | |
| HP ZBook Fury 16 G10 | |
| Dell Precision 5000 5680 -1! | |
| Dell Precision 5690 | |
| Lenovo ThinkPad P16 G2 21FA000FGE | |
| Lenovo ThinkPad P1 G6-21FV000DGE | |
| MSI CreatorPro Z16P B12UKST | |
| The Witcher 3 - 1920x1080 Ultra Graphics & Postprocessing (HBAO+) | |
| HP ZBook Fury 16 G10 | |
| Dell Precision 5690 | |
| Dell Precision 5000 5680 | |
| Lenovo ThinkPad P16 G2 21FA000FGE | |
| Lenovo ThinkPad P1 G6-21FV000DGE | |
| MSI CreatorPro Z16P B12UKST | |
| Final Fantasy XV Benchmark - 1920x1080 High Quality | |
| HP ZBook Fury 16 G10 | |
| Dell Precision 5690 | |
| Dell Precision 5000 5680 | |
| Lenovo ThinkPad P16 G2 21FA000FGE | |
| Lenovo ThinkPad P1 G6-21FV000DGE | |
| MSI CreatorPro Z16P B12UKST | |
| Strange Brigade - 1920x1080 ultra AA:ultra AF:16 | |
| HP ZBook Fury 16 G10 | |
| Dell Precision 5690 | |
| Lenovo ThinkPad P16 G2 21FA000FGE | |
| Lenovo ThinkPad P1 G6-21FV000DGE | |
| MSI CreatorPro Z16P B12UKST | |
| Dota 2 Reborn - 1920x1080 ultra (3/3) best looking | |
| HP ZBook Fury 16 G10 | |
| Lenovo ThinkPad P16 G2 21FA000FGE | |
| MSI CreatorPro Z16P B12UKST | |
| Dell Precision 5000 5680 | |
| Dell Precision 5690 | |
| Lenovo ThinkPad P1 G6-21FV000DGE | |
| X-Plane 11.11 - 1920x1080 high (fps_test=3) | |
| HP ZBook Fury 16 G10 | |
| Lenovo ThinkPad P1 G6-21FV000DGE | |
| Lenovo ThinkPad P16 G2 21FA000FGE | |
| Dell Precision 5000 5680 | |
| MSI CreatorPro Z16P B12UKST | |
| Dell Precision 5690 | |
| Baldur's Gate 3 | |
| 1920x1080 High Preset AA:T | |
| Dell Precision 5690 | |
| Durchschnittliche NVIDIA RTX 5000 Ada Generation Laptop (n=1) | |
| Dell XPS 16 9640 | |
| 1920x1080 Ultra Preset AA:T | |
| Dell Precision 5690 | |
| Durchschnittliche NVIDIA RTX 5000 Ada Generation Laptop (n=1) | |
| Dell XPS 16 9640 | |
| 2560x1440 Ultra Preset AA:T | |
| Dell Precision 5690 | |
| Durchschnittliche NVIDIA RTX 5000 Ada Generation Laptop (n=1) | |
| Dell XPS 16 9640 | |
| 3840x2160 Ultra Preset AA:T | |
| Dell Precision 5690 | |
| Durchschnittliche NVIDIA RTX 5000 Ada Generation Laptop (n=1) | |
| 3840x2160 Ultra Preset + Quality DLSS | |
| Dell Precision 5690 | |
| Durchschnittliche NVIDIA RTX 5000 Ada Generation Laptop (n=1) | |
| Cyberpunk 2077 | |
| 1920x1080 High Preset (FSR off) | |
| Dell Precision 5690 | |
| Durchschnittliche NVIDIA RTX 5000 Ada Generation Laptop (n=1) | |
| Dell XPS 16 9640 | |
| Lenovo ThinkPad P16v G1 AMD | |
| 1920x1080 Ultra Preset (FSR off) | |
| Dell Precision 5690 | |
| Durchschnittliche NVIDIA RTX 5000 Ada Generation Laptop (n=1) | |
| Dell XPS 16 9640 | |
| Lenovo ThinkPad P16v G1 AMD | |
| 2560x1440 Ultra Preset (FSR off) | |
| Dell Precision 5690 | |
| Durchschnittliche NVIDIA RTX 5000 Ada Generation Laptop (n=1) | |
| Dell XPS 16 9640 | |
| 3840x2160 Ultra Preset (FSR off) | |
| Dell Precision 5690 | |
| Durchschnittliche NVIDIA RTX 5000 Ada Generation Laptop (n=1) | |
| 1920x1080 Ray Tracing Ultra Preset (DLSS off) | |
| Dell Precision 5690 | |
| Durchschnittliche NVIDIA RTX 5000 Ada Generation Laptop (n=1) | |
| Tiny Tina's Wonderlands | |
| 1920x1080 High Preset (DX12) | |
| HP ZBook Fury 16 G10 | |
| Durchschnittliche NVIDIA RTX 5000 Ada Generation Laptop (145.5 - 171.7, n=3) | |
| Dell Precision 5000 5680 | |
| Dell Precision 5690 | |
| HP ZBook Fury 16 G9 | |
| 1920x1080 Badass Preset (DX12) | |
| HP ZBook Fury 16 G10 | |
| Durchschnittliche NVIDIA RTX 5000 Ada Generation Laptop (124 - 139.4, n=3) | |
| Dell Precision 5000 5680 | |
| Dell Precision 5690 | |
| HP ZBook Fury 16 G9 | |
| 2560x1440 Badass Preset (DX12) | |
| HP ZBook Fury 16 G10 | |
| Durchschnittliche NVIDIA RTX 5000 Ada Generation Laptop (87.1 - 99.4, n=3) | |
| Dell Precision 5000 5680 | |
| Dell Precision 5690 | |
| HP ZBook Fury 16 G9 | |
| 3840x2160 Badass Preset (DX12) | |
| HP ZBook Fury 16 G10 | |
| Durchschnittliche NVIDIA RTX 5000 Ada Generation Laptop (48.4 - 53.9, n=3) | |
| Dell Precision 5000 5680 | |
| Dell Precision 5690 | |
| HP ZBook Fury 16 G9 | |
Witcher 3 FPS Chart
| min. | mittel | hoch | max. | QHD | 4K DLSS | 4K | |
|---|---|---|---|---|---|---|---|
| The Witcher 3 (2015) | 411.3 | 351.2 | 258.7 | 137.6 | 103.9 | ||
| Dota 2 Reborn (2015) | 169.4 | 149.2 | 150.1 | 139.9 | 130 | ||
| Final Fantasy XV Benchmark (2018) | 196.6 | 165.4 | 132.5 | 103.8 | 63.2 | ||
| X-Plane 11.11 (2018) | 132.8 | 113.9 | 88.7 | 74.8 | |||
| Far Cry 5 (2018) | 144 | 134 | 127 | 119 | 113 | 72 | |
| Strange Brigade (2018) | 405 | 314 | 276 | 252 | 190.6 | 105.3 | |
| Tiny Tina's Wonderlands (2022) | 196.5 | 179.4 | 145.5 | 124 | 87.1 | 48.4 | |
| F1 22 (2022) | 228 | 224 | 217 | 91.1 | 60.1 | 29.6 | |
| Baldur's Gate 3 (2023) | 172.3 | 155.2 | 139.2 | 134.6 | 100.5 | 87.8 | 53.3 |
| Cyberpunk 2077 (2023) | 125 | 116.6 | 94.6 | 108.5 | 63.7 | 28.8 |
Emissionen
Systemlautstärke — Laut wie ein Gamer unter starker Last
Die Lüfterlautstärke orientiert sich am gewählten Leistungsprofil. Im Quiet-Modus bleibt die Lüfterlautstärke unterhalb von 25 dB(A) gegen einen Hintergrund von 23,4 dB(A). Im Balanced- oder Performance-Modus pulsieren die Lüfter schon aktiver bis zu 30 dB(A), selbst bei wenig anspruchsvollen Lasten wie Surfen.
Das obere Lautstärkeende liegt ansonsten auf einem ähnlichen Level wie beim Precision 5680, nämlich bei 51 dB(A), was in etwa so laut ist wie viele Gaming-Laptops. Dieses Maximum wird erreicht, wenn anspruchsvollere Grafiklasten für mehr als ein paar Minuten anliegen.
Lautstärkediagramm
| Idle |
| 23.6 / 24.9 / 30.9 dB(A) |
| Last |
| 40.4 / 51.9 dB(A) |
 | ||
30 dB leise 40 dB(A) deutlich hörbar 50 dB(A) störend |
||
min: | ||
| Dell Precision 5690 RTX 5000 Ada Generation Laptop, Ultra 9 185H, 2x Samsung PM9A1 1TB (RAID 0) | Dell Precision 5000 5680 RTX 5000 Ada Generation Laptop, i9-13900H, 2x SK hynix PC801 HFS512GEJ9X101N RAID 0 | Lenovo ThinkPad P16 G2 21FA000FGE RTX 2000 Ada Generation Laptop, i7-13700HX, SK hynix PC801 HFS001TEJ9X162N | Lenovo ThinkPad P1 G6-21FV000DGE RTX 2000 Ada Generation Laptop, i9-13900H, SK Hynix PC711 1TB HFS001TDE9X084N | HP ZBook Fury 16 G10 RTX 5000 Ada Generation Laptop, i9-13950HX, SK hynix PC801 HFS001TEJ9X101N | MSI CreatorPro Z16P B12UKST RTX A3000 Laptop GPU, i7-12700H, Samsung PM9A1 MZVL21T0HCLR | |
|---|---|---|---|---|---|---|
| Geräuschentwicklung | 6% | -1% | 3% | 6% | -0% | |
| aus / Umgebung * (dB) | 23.4 | 22.8 3% | 23.5 -0% | 24.5 -5% | 22.9 2% | 24.1 -3% |
| Idle min * (dB) | 23.6 | 23 3% | 23.5 -0% | 24.5 -4% | 22.9 3% | 27.1 -15% |
| Idle avg * (dB) | 24.9 | 23 8% | 29.2 -17% | 24.5 2% | 22.9 8% | 27.1 -9% |
| Idle max * (dB) | 30.9 | 23 26% | 29.5 5% | 24.5 21% | 28.5 8% | 27.1 12% |
| Last avg * (dB) | 40.4 | 37.2 8% | 32.7 19% | 48 -19% | 40.6 -0% | 42.9 -6% |
| Witcher 3 ultra * (dB) | 48.3 | 51 -6% | 50.6 -5% | 40.7 16% | 44.1 9% | 44 9% |
| Last max * (dB) | 51.9 | 51 2% | 56.6 -9% | 48 8% | 45.8 12% | 47 9% |
* ... kleinere Werte sind besser
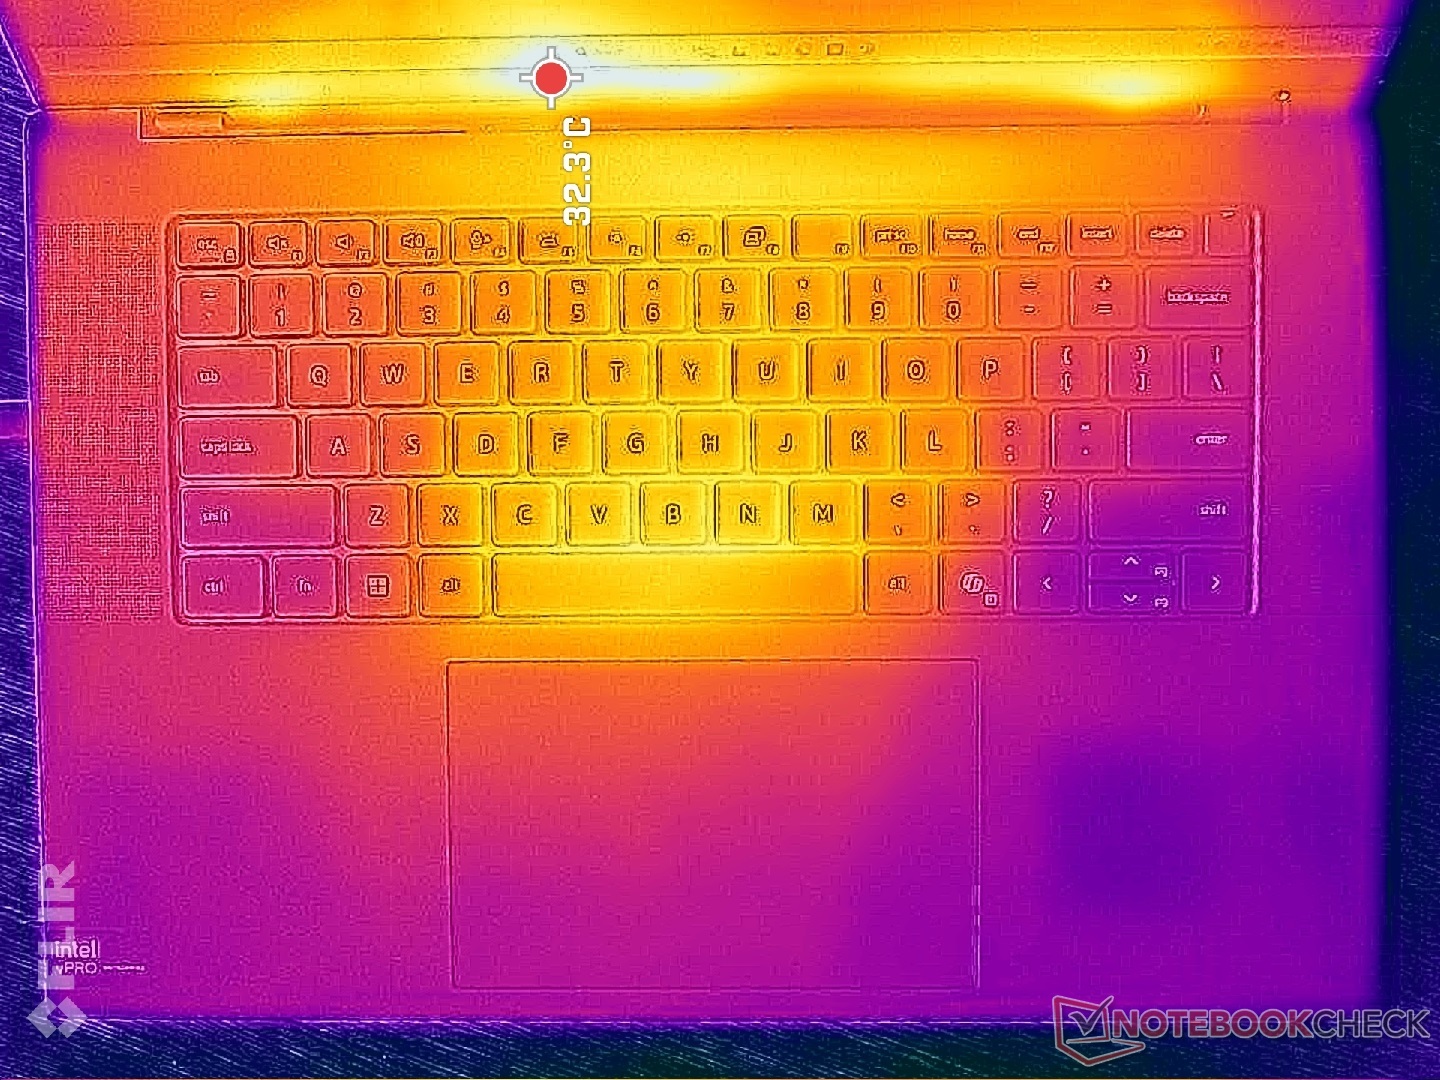
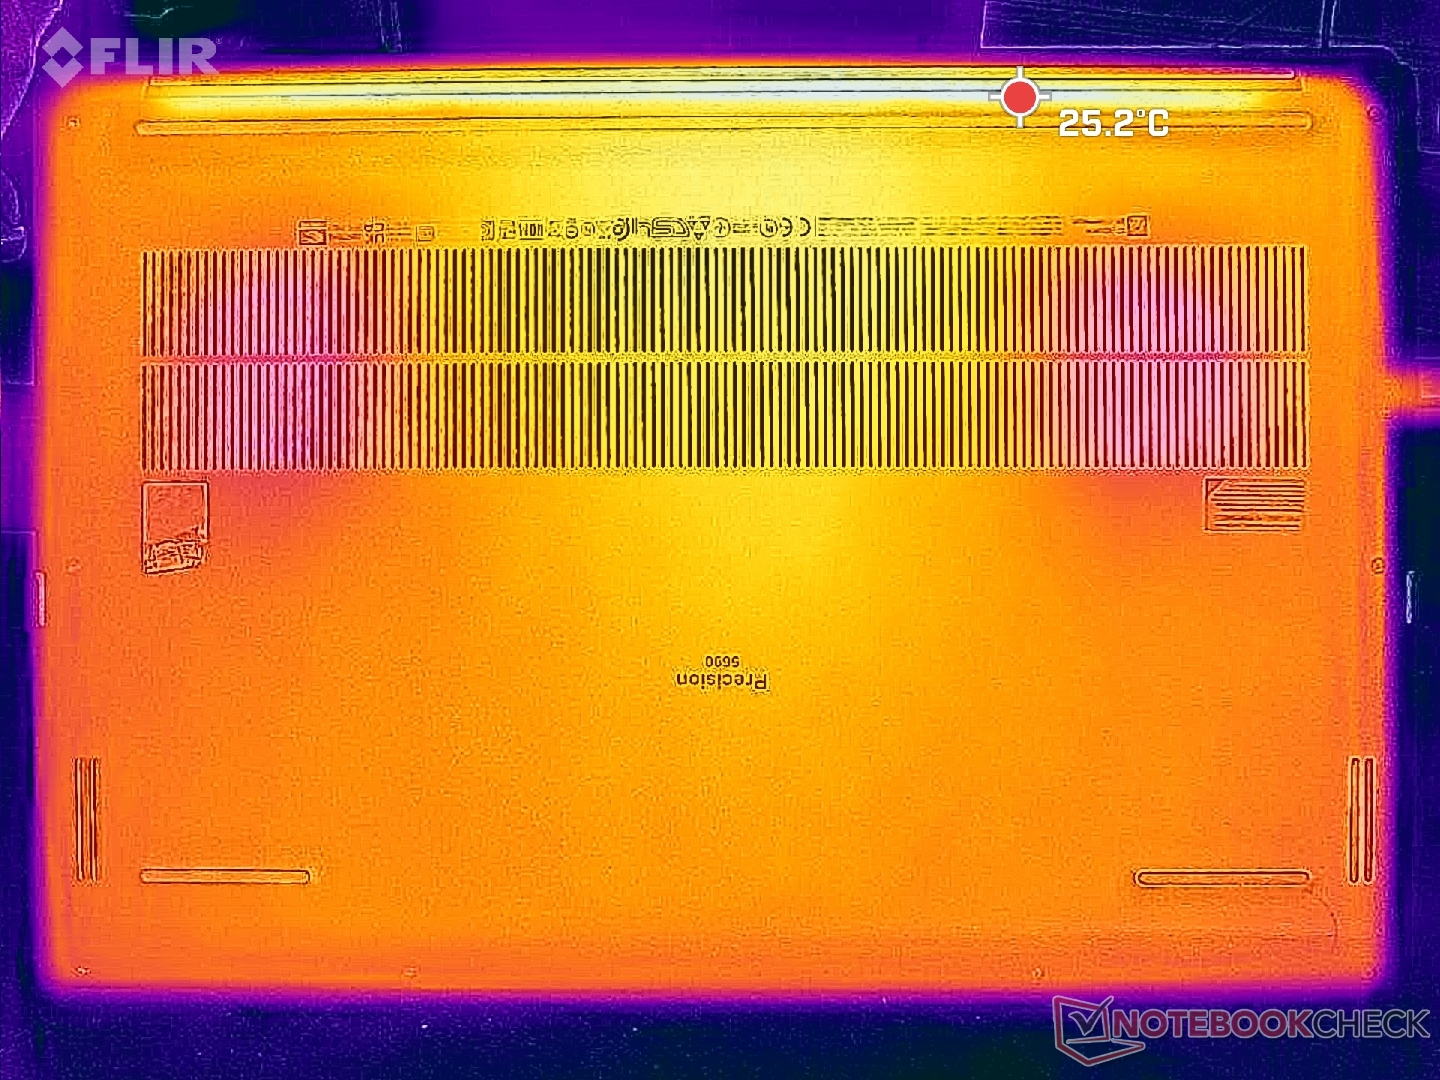
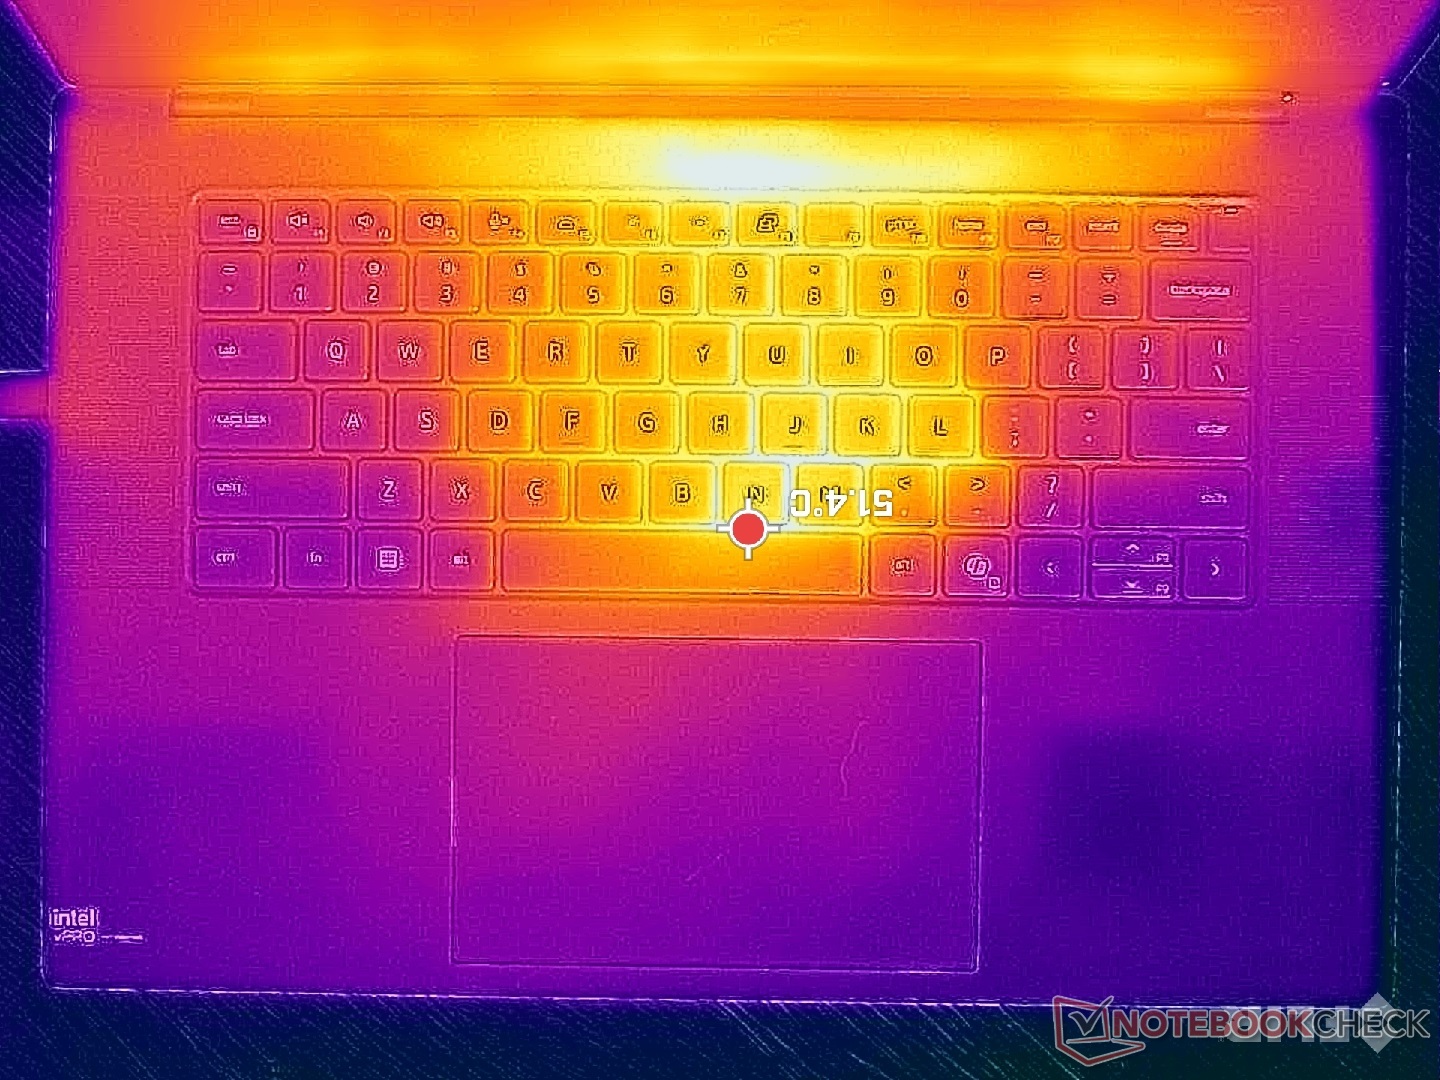
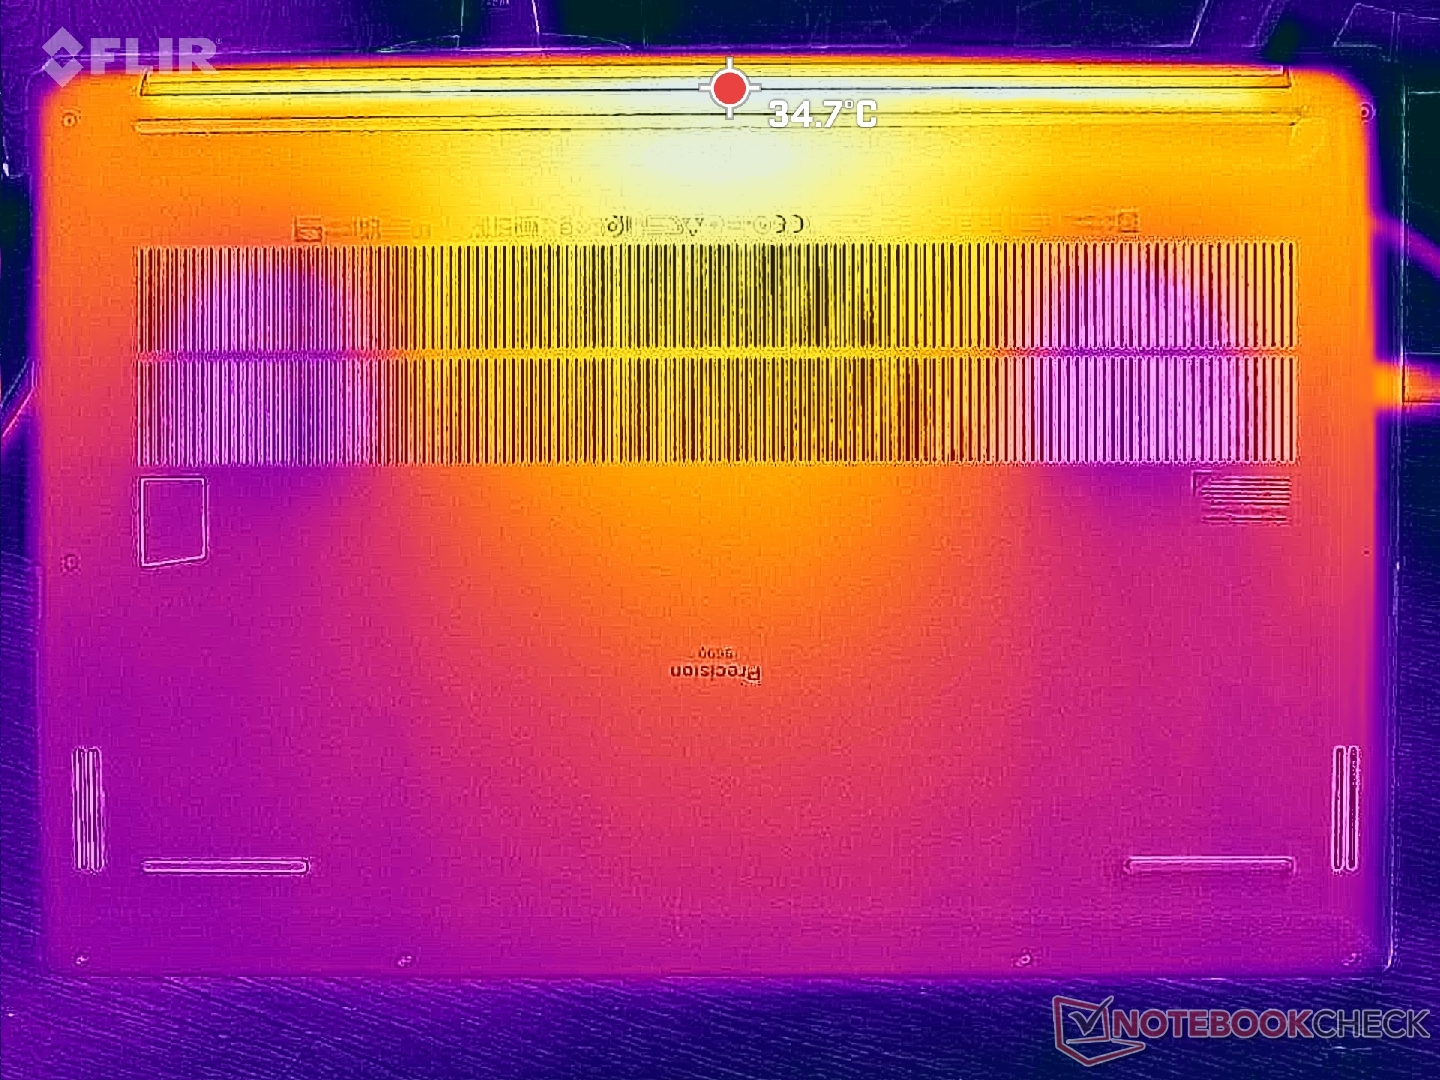
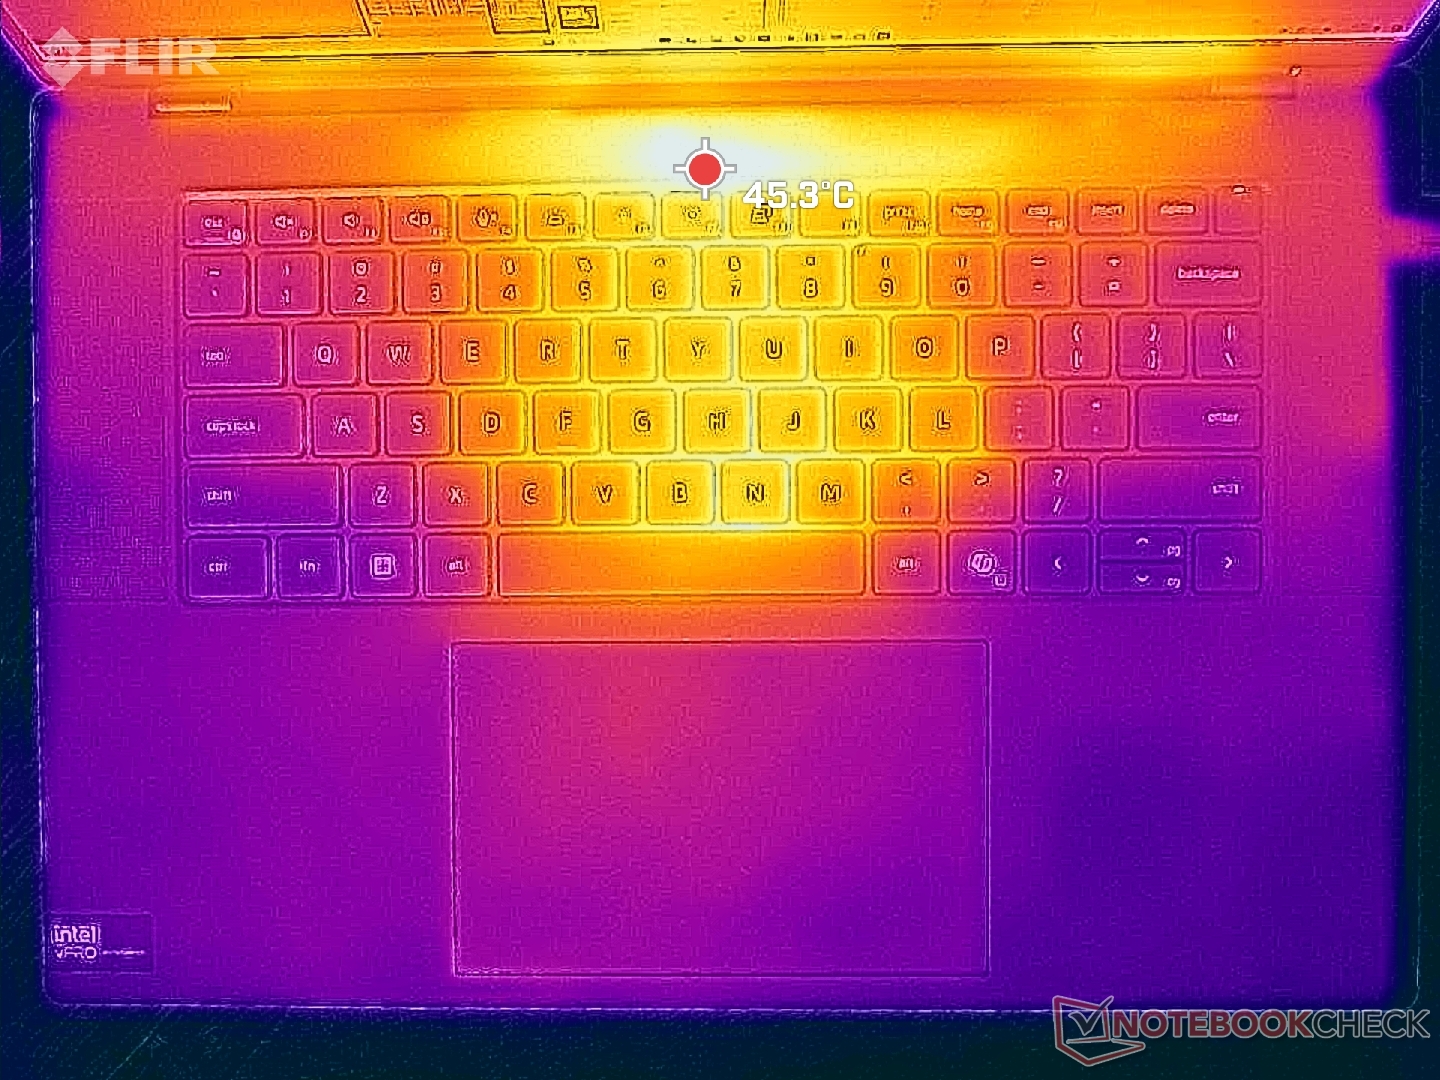
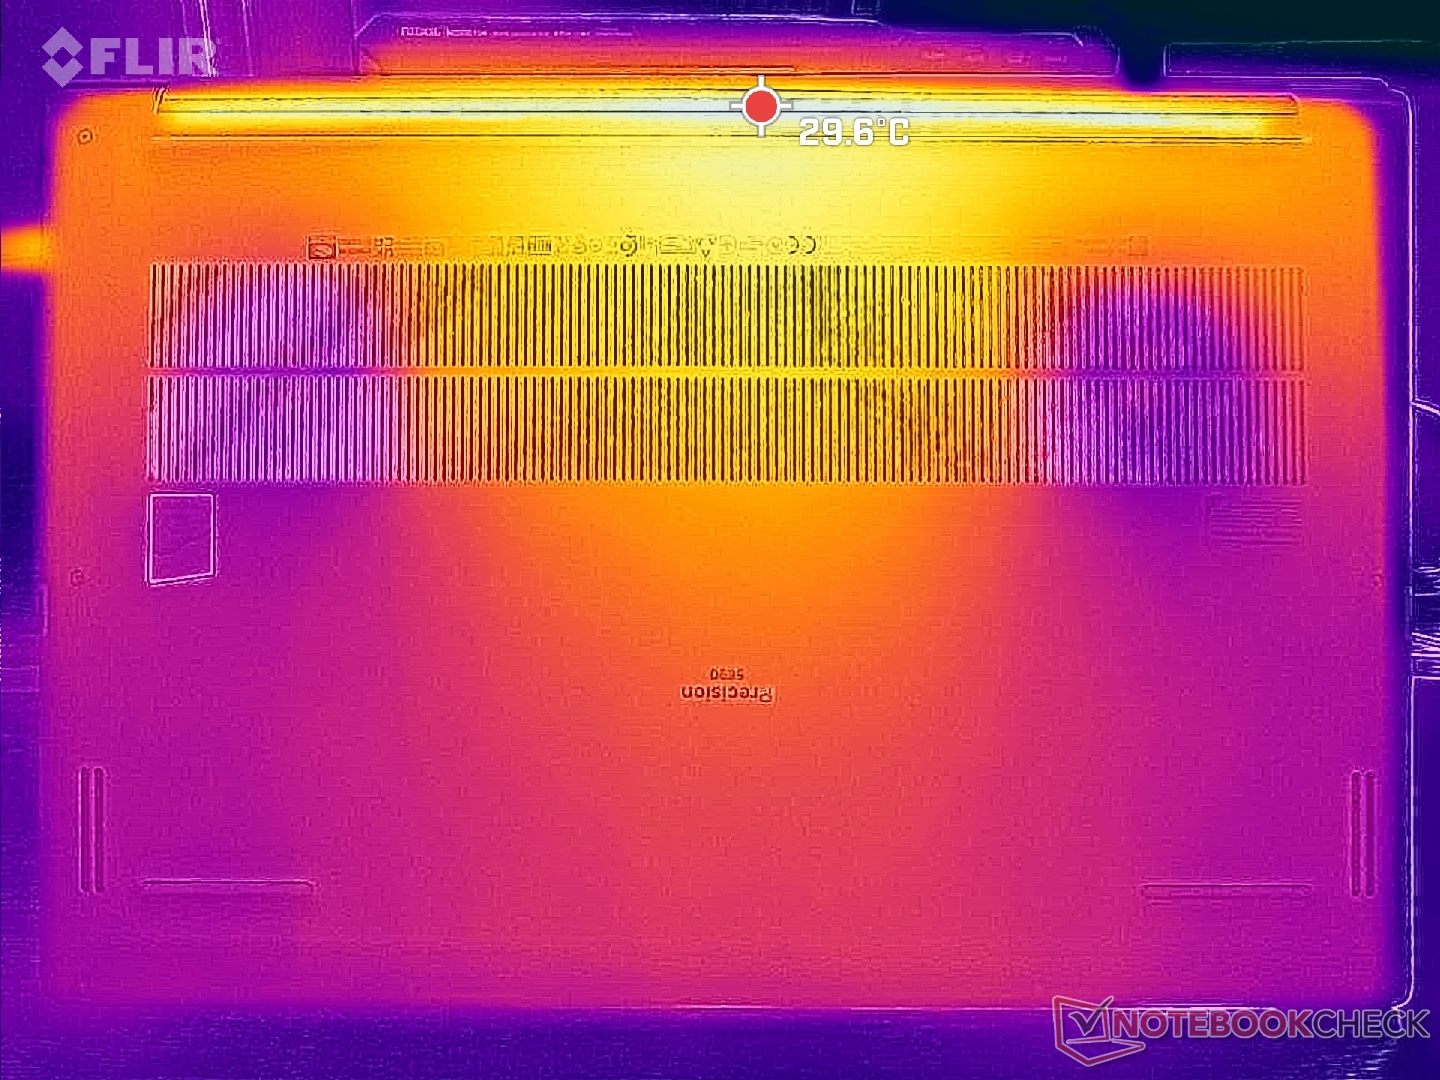
Temperatur
Die Oberflächen können sich an den Hot Spots auf bis zu 43 bis 47 °C erwärmen, vor allem im Bereich der Tastaturmitte. Dabei bleibt die Laptopunterseite spürbar kühler als die Tastatur, auch bei anspruchsvollen Lasten.

(-) Die maximale Temperatur auf der Oberseite ist 46.6 °C. Im Vergleich liegt der Klassendurchschnitt bei 38.2 °C (von 22.2 bis 69.8 °C für die Klasse Workstation).
(+) Auf der Unterseite messen wir eine maximalen Wert von 33 °C (im Vergleich zum Durchschnitt von 41.1 °C).
(+) Ohne Last messen wir eine durchschnittliche Temperatur von 29.2 °C auf der Oberseite. Der Klassendurchschnitt erreicht 32 °C.
(±) Beim längeren Spielen von The Witcher 3 erhitzt sich das Gerät durchschnittlich auf 34 °C. Der Durchschnitt der Klasse ist derzeit 32 °C.
(+) Die Handballen und der Touchpad-Bereich sind mit gemessenen 27.6 °C kühler als die typische Hauttemperatur und fühlen sich dadurch kühl an.
(±) Die durchschnittliche Handballen-Temperatur anderer getesteter Geräte war 27.8 °C (+0.2 °C).
| Dell Precision 5690 Intel Core Ultra 9 185H, NVIDIA RTX 5000 Ada Generation Laptop | Dell Precision 5000 5680 Intel Core i9-13900H, NVIDIA RTX 5000 Ada Generation Laptop | Lenovo ThinkPad P16 G2 21FA000FGE Intel Core i7-13700HX, NVIDIA RTX 2000 Ada Generation Laptop | Lenovo ThinkPad P1 G6-21FV000DGE Intel Core i9-13900H, NVIDIA RTX 2000 Ada Generation Laptop | HP ZBook Fury 16 G10 Intel Core i9-13950HX, NVIDIA RTX 5000 Ada Generation Laptop | MSI CreatorPro Z16P B12UKST Intel Core i7-12700H, NVIDIA RTX A3000 Laptop GPU | |
|---|---|---|---|---|---|---|
| Hitze | -7% | 2% | -13% | -16% | -24% | |
| Last oben max * (°C) | 46.6 | 50.2 -8% | 47.2 -1% | 47.1 -1% | 44.8 4% | 56.3 -21% |
| Last unten max * (°C) | 33 | 32 3% | 39.5 -20% | 56.5 -71% | 50 -52% | 68.3 -107% |
| Idle oben max * (°C) | 32.4 | 37.4 -15% | 28.1 13% | 28.1 13% | 34.4 -6% | 25.2 22% |
| Idle unten max * (°C) | 29.4 | 31.2 -6% | 25.3 14% | 27.6 6% | 31.8 -8% | 25.9 12% |
* ... kleinere Werte sind besser
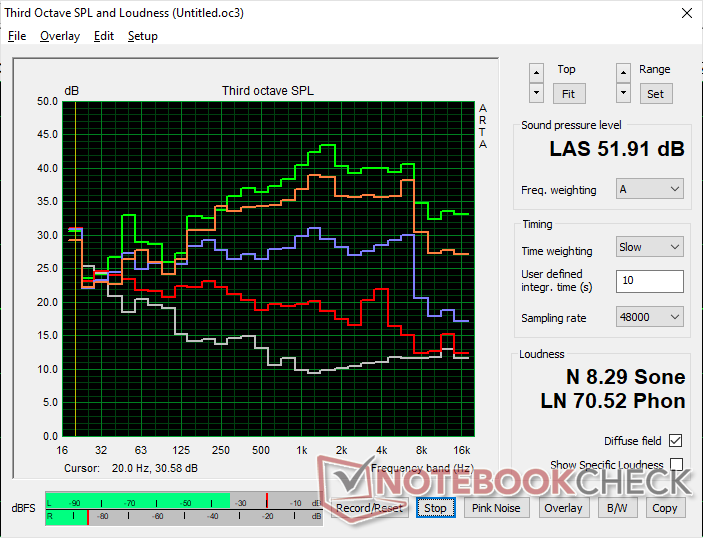
Lautsprecher
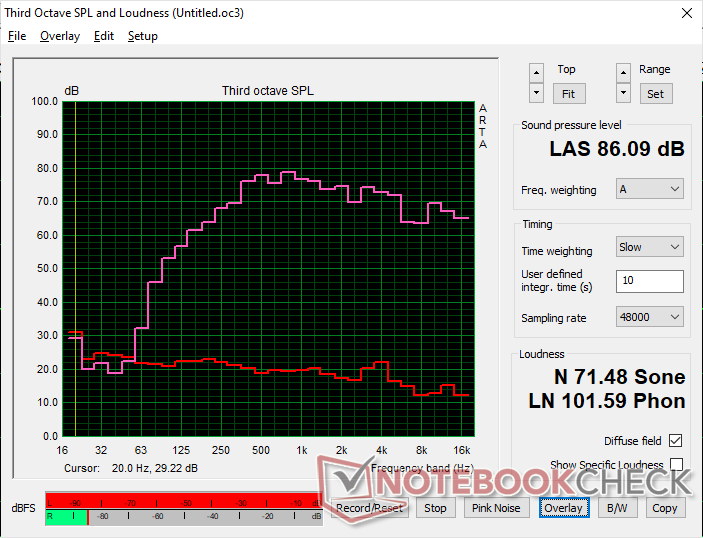
Dell Precision 5690 Audio Analyse
(+) | Die Lautsprecher können relativ laut spielen (86.1 dB)
Bass 100 - 315 Hz
(±) | abgesenkter Bass - 9.4% geringer als der Median
(±) | durchschnittlich lineare Bass-Wiedergabe (7.6% Delta zum Vorgänger)
Mitteltöne 400 - 2000 Hz
(+) | ausgeglichene Mitten, vom Median nur 4.7% abweichend
(+) | lineare Mitten (4.8% Delta zum Vorgänger)
Hochtöne 2 - 16 kHz
(+) | ausgeglichene Hochtöne, vom Median nur 3.4% abweichend
(±) | durchschnittlich lineare Hochtöne (7.3% Delta zum Vorgänger)
Gesamt im hörbaren Bereich 100 - 16.000 Hz
(+) | hörbarer Bereich ist sehr linear (11.1% Abstand zum Median
Im Vergleich zu allen Geräten derselben Klasse
» 12% aller getesteten Geräte dieser Klasse waren besser, 4% vergleichbar, 84% schlechter
» Das beste Gerät hat einen Delta-Wert von 7%, durchschnittlich ist 17%, das schlechteste Gerät hat 35%
Im Vergleich zu allen Geräten im Test
» 7% aller getesteten Geräte waren besser, 2% vergleichbar, 92% schlechter
» Das beste Gerät hat einen Delta-Wert von 4%, durchschnittlich ist 24%, das schlechteste Gerät hat 134%
Apple MacBook Pro 16 2021 M1 Pro Audio Analyse
(+) | Die Lautsprecher können relativ laut spielen (84.7 dB)
Bass 100 - 315 Hz
(+) | guter Bass - nur 3.8% Abweichung vom Median
(+) | lineare Bass-Wiedergabe (5.2% Delta zum Vorgänger)
Mitteltöne 400 - 2000 Hz
(+) | ausgeglichene Mitten, vom Median nur 1.3% abweichend
(+) | lineare Mitten (2.1% Delta zum Vorgänger)
Hochtöne 2 - 16 kHz
(+) | ausgeglichene Hochtöne, vom Median nur 1.9% abweichend
(+) | sehr lineare Hochtöne (2.7% Delta zum Vorgänger)
Gesamt im hörbaren Bereich 100 - 16.000 Hz
(+) | hörbarer Bereich ist sehr linear (4.6% Abstand zum Median
Im Vergleich zu allen Geräten derselben Klasse
» 0% aller getesteten Geräte dieser Klasse waren besser, 0% vergleichbar, 100% schlechter
» Das beste Gerät hat einen Delta-Wert von 5%, durchschnittlich ist 17%, das schlechteste Gerät hat 45%
Im Vergleich zu allen Geräten im Test
» 0% aller getesteten Geräte waren besser, 0% vergleichbar, 100% schlechter
» Das beste Gerät hat einen Delta-Wert von 4%, durchschnittlich ist 24%, das schlechteste Gerät hat 134%
Energiemanagement
Energieverbrauch
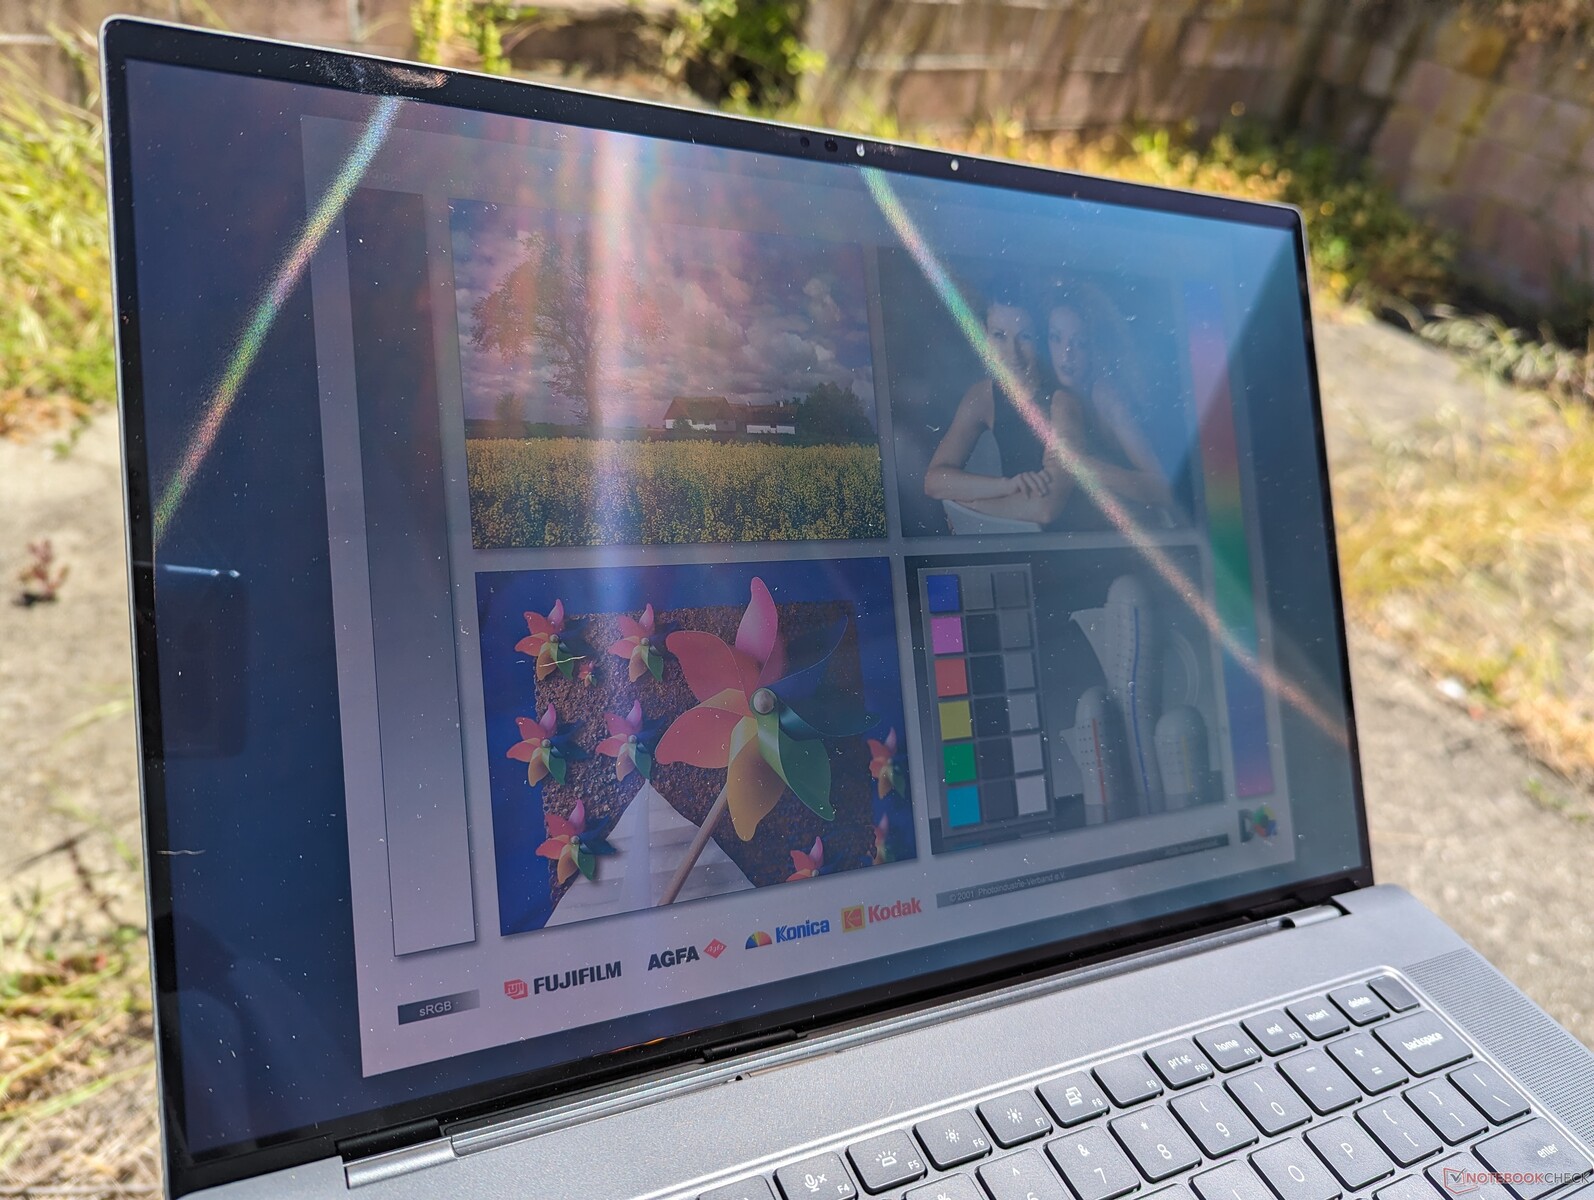
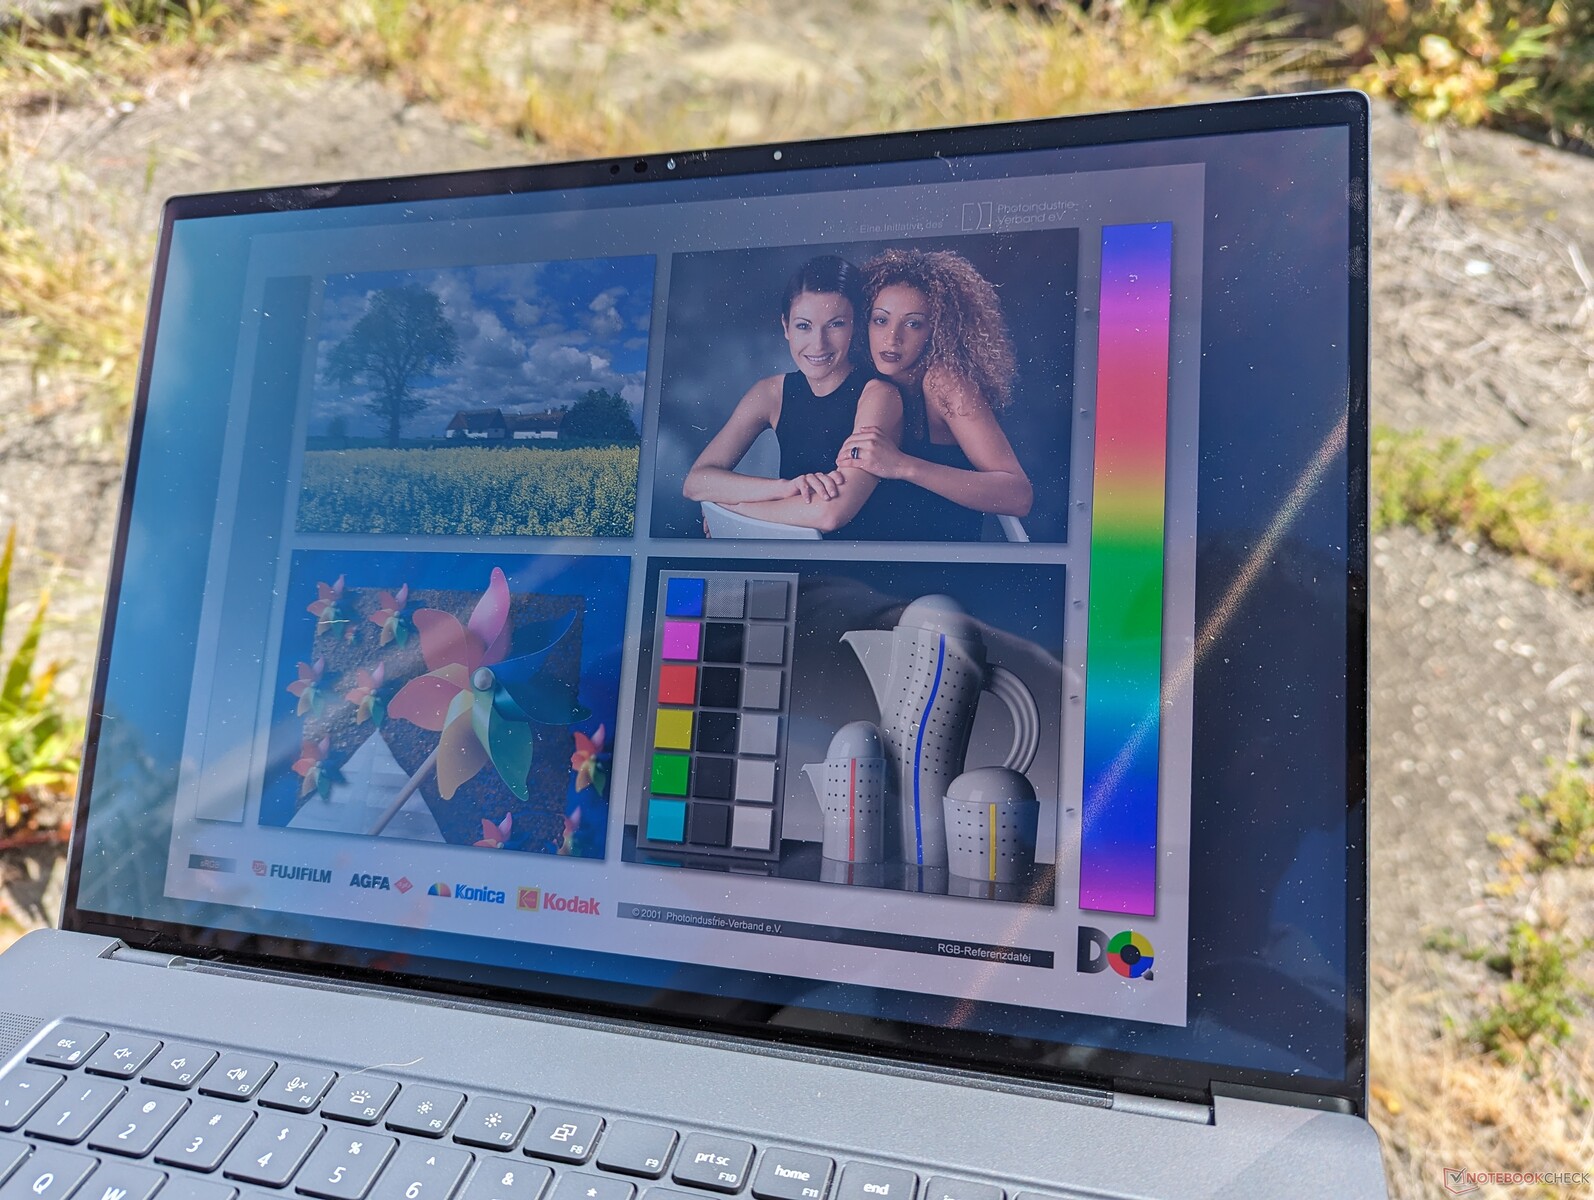
Im Leerlauf auf dem Desktop kann der Verbrauch mit nur 8 W bei minimaler Helligkeit niedrig sein. Bei maximaler Helligkeit und einem komplett weißen Hintergrund kann der Bedarf aber auf bis zu 29 W ansteigen. Diese Spannweite ist größer als bei den meisten IPS-Laptops, was mit der Funktionsweise von OLEDs zusammenhängt. Alltagsaufgaben wie Surfen, Word oder Tabellenkalkulationen können durch die hauptsächlich weißen Hintergründe den Akku schneller leer saugen als erwartet. Das Absenken der Helligkeit oder dunklere Farben und Designs können die Akkulaufzeit deutlich stärker verlängern als auf IPS-Alternativen.
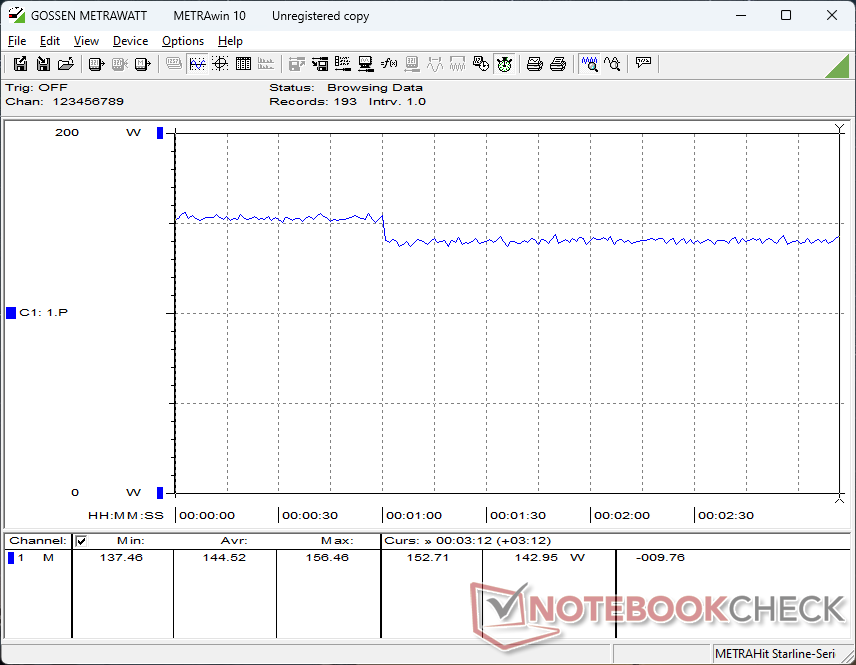
Unter hohen Lasten wie Witcher 3 ist der Verbrauch beinahe identisch zu dem des älteren Precision 5680. Das wiederum korreliert mit unseren Benchmarkergebnissen, welche bestenfalls marginale Leistungsunterschiede zwischen beiden Modellen aufzeigen.
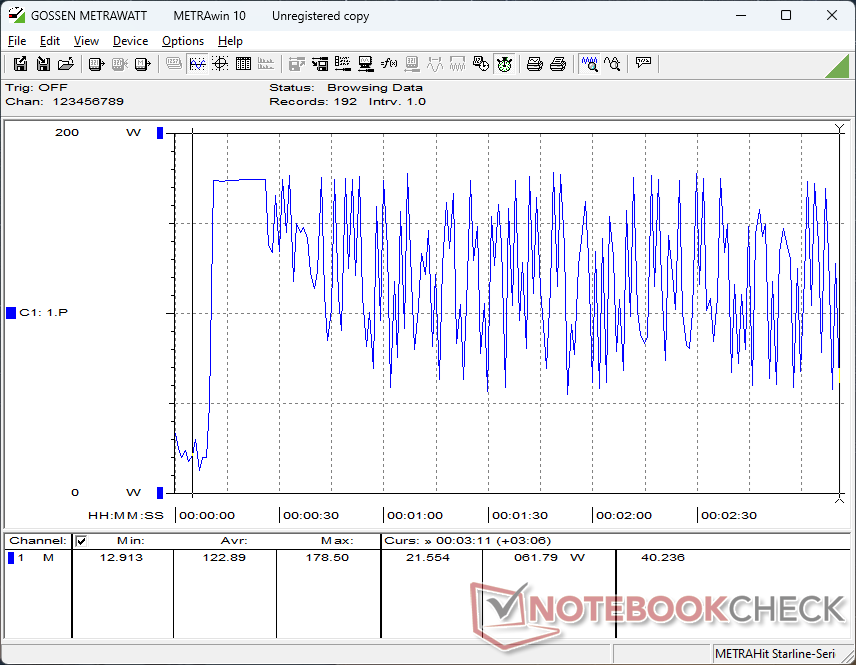
Seltsamerweise fluktuiert der Verbrauch im Prime95-Stress sehr stark, selbst nach mehreren Wiederholungsversuchen. Die Leistung scheint ansonsten aber stabil zu sein.
| Aus / Standby | |
| Idle | |
| Last |
|
Legende:
min: | |
| Dell Precision 5690 Ultra 9 185H, RTX 5000 Ada Generation Laptop, 2x Samsung PM9A1 1TB (RAID 0), OLED, 3840x2400, 16" | Dell Precision 5000 5680 i9-13900H, RTX 5000 Ada Generation Laptop, 2x SK hynix PC801 HFS512GEJ9X101N RAID 0, OLED, 3840x2400, 16" | Lenovo ThinkPad P16 G2 21FA000FGE i7-13700HX, RTX 2000 Ada Generation Laptop, SK hynix PC801 HFS001TEJ9X162N, IPS LED, 2560x1600, 16" | Lenovo ThinkPad P1 G6-21FV000DGE i9-13900H, RTX 2000 Ada Generation Laptop, SK Hynix PC711 1TB HFS001TDE9X084N, IPS, 2560x1600, 16" | HP ZBook Fury 16 G10 i9-13950HX, RTX 5000 Ada Generation Laptop, SK hynix PC801 HFS001TEJ9X101N, IPS, 3840x2400, 16" | MSI CreatorPro Z16P B12UKST i7-12700H, RTX A3000 Laptop GPU, Samsung PM9A1 MZVL21T0HCLR, IPS, 2560x1600, 16" | |
|---|---|---|---|---|---|---|
| Stromverbrauch | 6% | -5% | 10% | -39% | -9% | |
| Idle min * (Watt) | 7.9 | 8 -1% | 9.3 -18% | 8.3 -5% | 15.3 -94% | 10.8 -37% |
| Idle avg * (Watt) | 12 | 10.4 13% | 14.1 -18% | 14.5 -21% | 18.2 -52% | 16.3 -36% |
| Idle max * (Watt) | 28.6 | 30.5 -7% | 15.5 46% | 15.3 47% | 28 2% | 16.9 41% |
| Last avg * (Watt) | 98.8 | 75.4 24% | 133.6 -35% | 91.8 7% | 137.9 -40% | 111.7 -13% |
| Witcher 3 ultra * (Watt) | 144.5 | 134 7% | 144.9 -0% | 104.7 28% | 189.4 -31% | 152.1 -5% |
| Last max * (Watt) | 174.8 | 175 -0% | 179.6 -3% | 164.5 6% | 202 -16% | 177.4 -1% |
* ... kleinere Werte sind besser
Energieverbrauch unter Witcher 3 / Stresstest
Energieverbrauch mit externem Monitor
Akkulaufzeit
Die Laufzeiten sind ähnlich wie zuvor, wenn nicht etwas kürzer. Unser WLAN-Test erbrachte knapp über 9 Stunden, während das ältere 5680 näher an die 10 Stunden herankam.
| Dell Precision 5690 Ultra 9 185H, RTX 5000 Ada Generation Laptop, 98 Wh | Dell Precision 5000 5680 i9-13900H, RTX 5000 Ada Generation Laptop, 98 Wh | Lenovo ThinkPad P16 G2 21FA000FGE i7-13700HX, RTX 2000 Ada Generation Laptop, 94 Wh | Lenovo ThinkPad P1 G6-21FV000DGE i9-13900H, RTX 2000 Ada Generation Laptop, 90 Wh | HP ZBook Fury 16 G10 i9-13950HX, RTX 5000 Ada Generation Laptop, 95 Wh | MSI CreatorPro Z16P B12UKST i7-12700H, RTX A3000 Laptop GPU, 90 Wh | |
|---|---|---|---|---|---|---|
| Akkulaufzeit | 8% | -7% | 3% | -21% | -37% | |
| WLAN (h) | 9.2 | 9.9 8% | 8.6 -7% | 9.5 3% | 7.3 -21% | 5.8 -37% |
| Idle (h) | 17.9 | |||||
| Last (h) | 1.7 | 1.1 | ||||
| H.264 (h) | 11.2 |
Pro
Contra
Fazit — Bereit für die KI-Revolution
Das Precision 5680 kam mit einem eleganten neuen Design daher, welches sich am XPS 16 orientiert. Dazu gab es vPro-CPUs sowie eine High-End-Nvidia-RTX-Ada-Grafik. Daher war sie folglich eine der schnellsten 16-Zoll-Workstations, im Verhältnis zu ihrer Größe und Gewicht. Das Problem ist nur, dass das "ältere" Precision 5680 gerade einmal ein halbes Jahr alt ist und sich auch weiterhin frisch anfühlt. Das neuere Precision 5690 bietet das gleiche Gehäuse, die gleiche GPU, das gleiche Display, die gleichen Verbrauchswerte, Akkulaufzeit und Prozessorleistung wie das Precision 5680. Wer ein wenig Geld sparen möchte, findet im letztjährigen Precision 5680 quasi die gleiche Nutzererfahrung und Leistung zu einem niedrigeren Preis.
Der Vorteil des Precision 5690 gegenüber seinem Vorgänger ist die integrierte NPU für lokale KI-Beschleunigung. Wer das nicht braucht, findet in dem erst 6 Monate alten Vorgänger Precision 5680 die gleichen Leistungswerte für weniger Geld.
Der große Unterschiedsfaktor zwischen dem 2024er Precision 5690 und dem 2023er Precision 5680 liegt in der integrierten NPU in den Meteor-Lake-H-CPUs. Daher ist das neuere Dell-Modell "KI Ready" wenn Windows für lokale KI-Anwendungen optimiert wird. Wer schon jetzt gerne den Co-Pilot nutzt oder verstärkt KI-optimierte Anwendungen in der nahen Zukunft nutzen möchte, hat mit dem Precision 5690 einen spürbaren Vorteil durch dessen NPU-Beschleunigung. Davon abgesehen laufen traditionelle Anwendungen auf dem neuen Modell nicht schneller.
Preise und Verfügbarkeit
In Deutschland kann man sich direkt über die Dell-Seite auch das Topmodell mit Core Ultra 9 185H und RTX 5000 Ado konfigurieren, zum Preis von exklusiven 6.475 Euro! Die Startkonfigurationen mit Core Ultra 5 135H und integrierter Arc-Grafik ist ab 2.740 Euro erhältlich, das Modell mit Core Ultra 7 165H und RTX 2000 Ada für 3.593 Euro direkt über Dell.
Dell Precision 5690
- 08.05.2024 v7 (old)
Allen Ngo
Transparenz
Die Auswahl der zu testenden Geräte erfolgt innerhalb der Redaktion. Das vorliegende Testmuster wurde dem Autor vom Hersteller oder einem Shop zu Testzwecken leihweise zur Verfügung gestellt. Eine Einflussnahme des Leihstellers auf den Testbericht gab es nicht, der Hersteller erhielt keine Version des Reviews vor der Veröffentlichung. Es bestand keine Verpflichtung zur Publikation. Als eigenständiges, unabhängiges Unternehmen unterliegt Notebookcheck keiner Diktion von Herstellern, Shops und Verlagen.
So testet Notebookcheck
Pro Jahr werden von Notebookcheck hunderte Laptops und Smartphones unabhängig in von uns standardisierten technischen Verfahren getestet, um eine Vergleichbarkeit aller Testergebnisse zu gewährleisten. Seit rund 20 Jahren entwickeln wir diese Testmethoden kontinuierlich weiter und setzen damit Branchenstandards. In unseren Testlaboren kommt ausschließlich hochwertiges Messequipment in die Hände erfahrener Techniker und Redakteure. Die Tests unterliegen einer mehrstufigen Kontrolle. Unsere komplexe Gesamtbewertung basiert auf hunderten fundierten Messergebnissen und Benchmarks, womit Ihnen Objektivität garantiert ist. Weitere Informationen zu unseren Testmethoden gibt es hier.
Preisvergleich

