HP Envy x360 2-in-1 16 im Test: Ryzen 7 8840HS schlägt Core Ultra 7 155U

Die Envy-Serie ist HPs Mittelklasse-Angebot, das sich zwischen dem preiswerteren Pavilion und der teureren Flaggschiff-Serie Spectre bewegt. In diesem Fall kann das Envy x360 16 als erschwinglichere Version des Spectre x360 16 mit besseren Optionen und einer luxuriöseren Ausstattung als das Pavilion x360 15 gesehen werden.
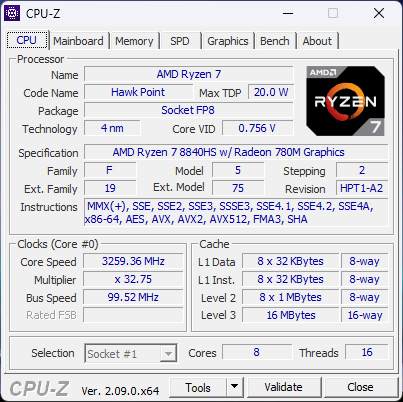
Unser Testgerät ist mit einer AMD-Ryzen-7-8840HS-CPU, einer integrierten Radeon-780M-GPU und einem 120-Hz-1800p-OLED-Touchscreen ausgestattet und ist für etwa 1.300 Euro erhältlich. Auch Intel-Versionen sind mit einer Core-Ultra-5-125U- bzw. Ultra-7-155U-CPU der 14. Generation und einem 1.200p-IPS-Touchscreen zu haben. Keine der Konfigurationen bietet eine dedizierte GPU. Dieses neueste Envy x360 16 ersetzt das Envy x360 15 effektiv.
Zu den Mitstreitern gehören weitere 16-Zoll-Multimedia-Laptops wie das Lenovo Yoga 7 2-in-1 16IML9, das Samsung Galaxy Book4 Pro 360, oder das LG Gram 2-in-1 16.
Weitere HP-Testberichte:
Mögliche Mitstreiter im Vergleich
Bew. | Datum | Modell | Gewicht | Dicke | Größe | Auflösung | Preis ab |
|---|---|---|---|---|---|---|---|
| 87.2 % v7 (old) | 05 / 2024 | HP Envy x360 2-in-1 16-ad0097nr R7 8840HS, Radeon 780M | 1.8 kg | 18.3 mm | 16.00" | 2880x1800 | |
| 86.9 % v7 (old) | 10 / 2022 | HP Envy 16 h0112nr i7-12700H, GeForce RTX 3060 Laptop GPU | 2.3 kg | 19.8 mm | 16.00" | 3840x2400 | |
| 91.1 % v7 (old) | 03 / 2024 | HP Spectre x360 16 RTX 4050 Ultra 7 155H, GeForce RTX 4050 Laptop GPU | 2 kg | 19.8 mm | 16.00" | 2880x1800 | |
| 86.7 % v7 (old) | 05 / 2024 | Lenovo Yoga 7 2-in-1 16IML9 Ultra 5 125U, Graphics 4-Core iGPU (Arrow Lake) | 2.1 kg | 16.99 mm | 16.00" | 1920x1200 | |
| 87.8 % v7 (old) | 03 / 2024 | Samsung Galaxy Book4 Pro 360 Ultra 5 125H, Arc 7-Core | 1.7 kg | 13 mm | 16.00" | 2880x1800 | |
| 85.8 % v7 (old) | 11 / 2023 | LG Gram 2in1 16 16T90R - G.AA78G i7-1360P, Iris Xe G7 96EUs | 1.5 kg | 17.2 mm | 16.00" | 2560x1600 |
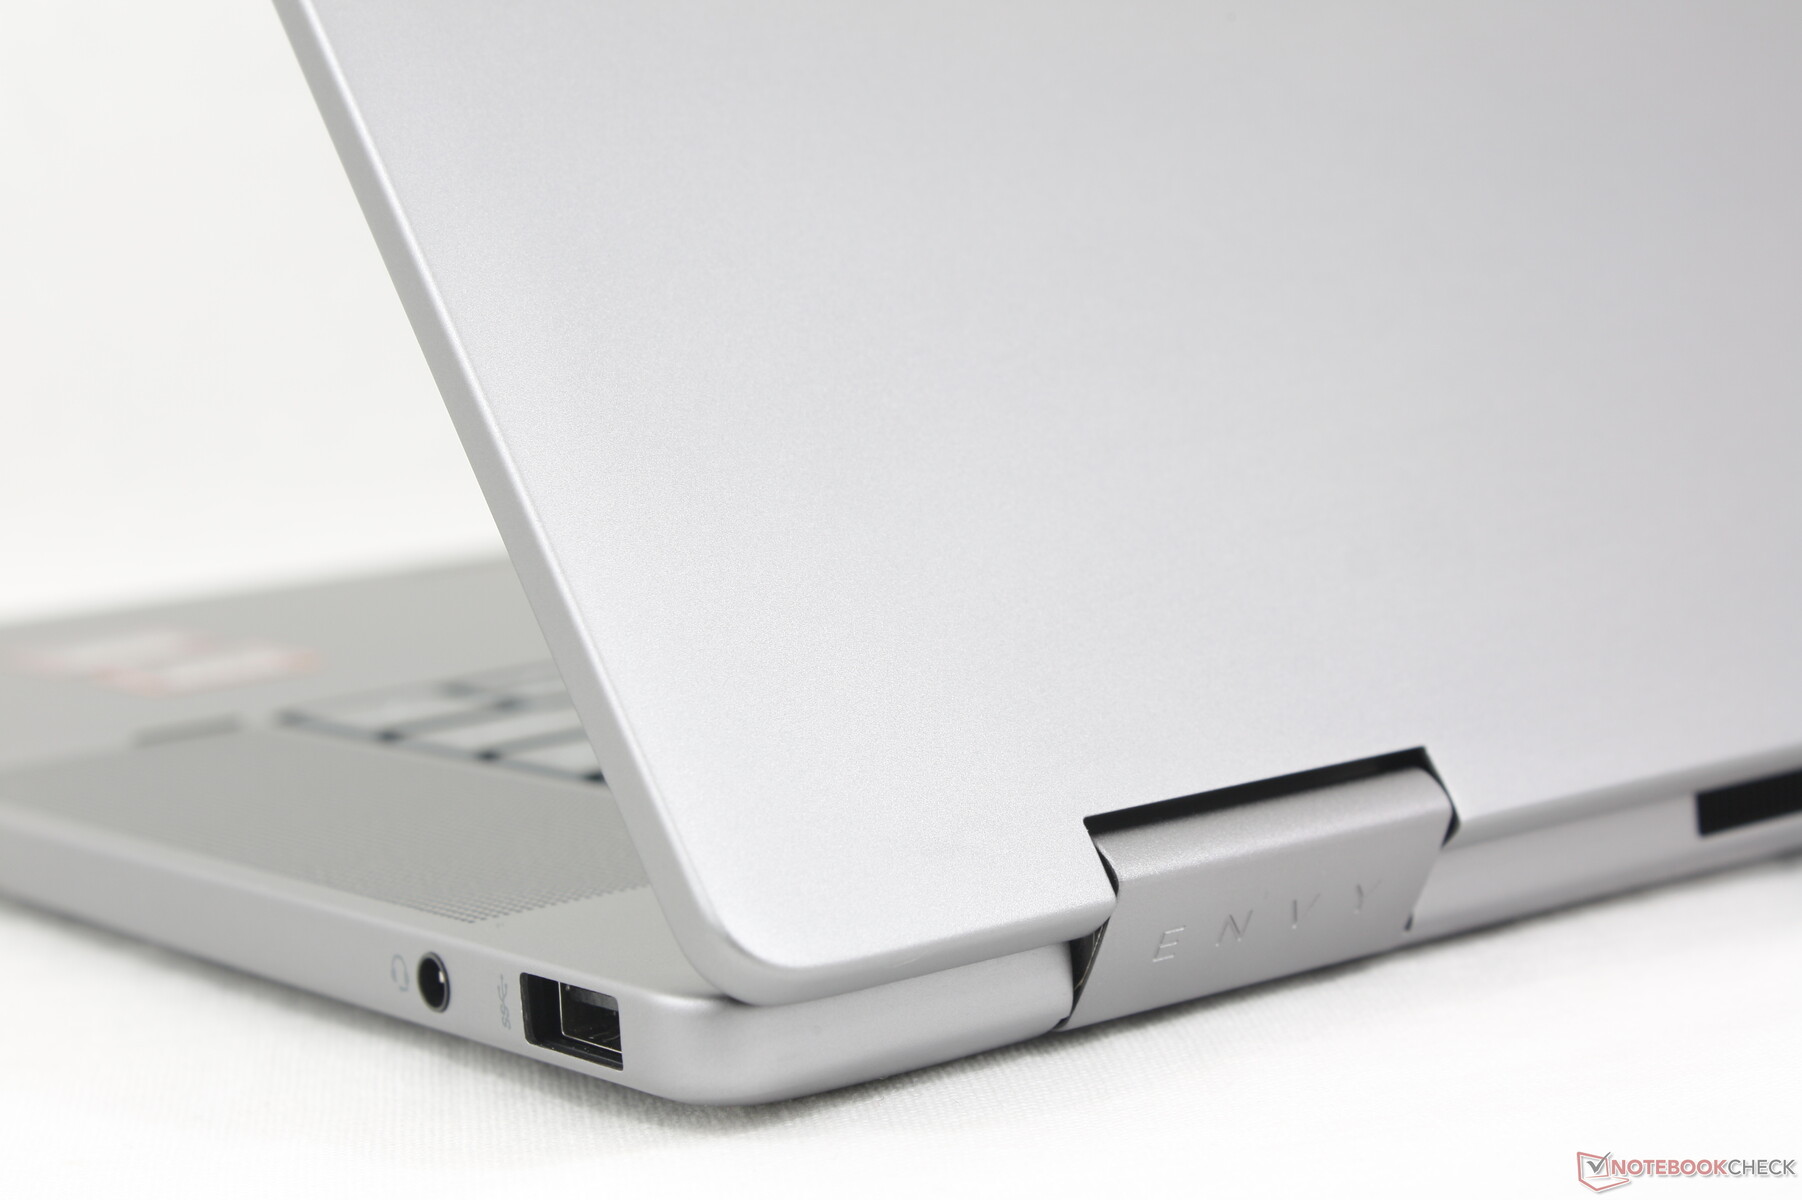
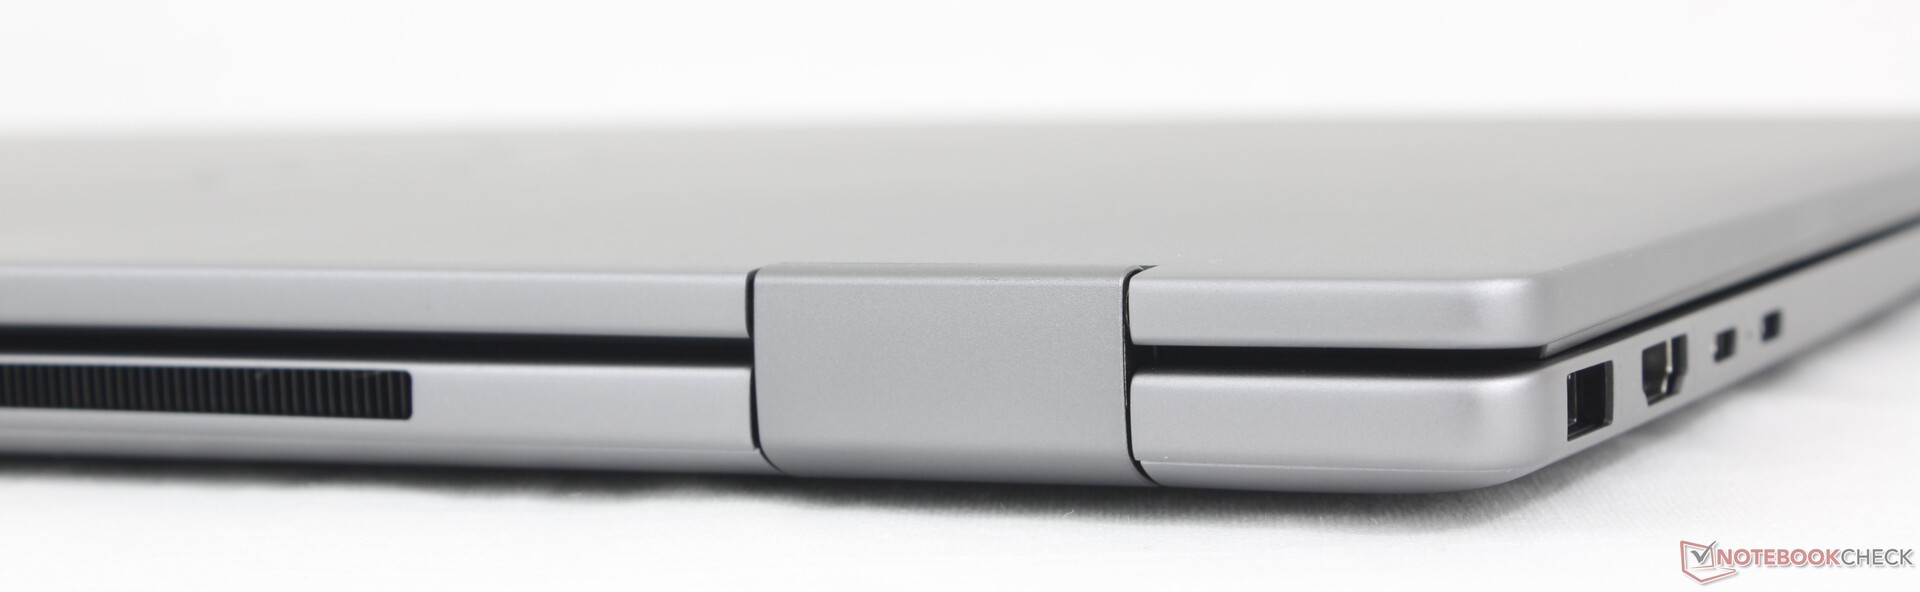
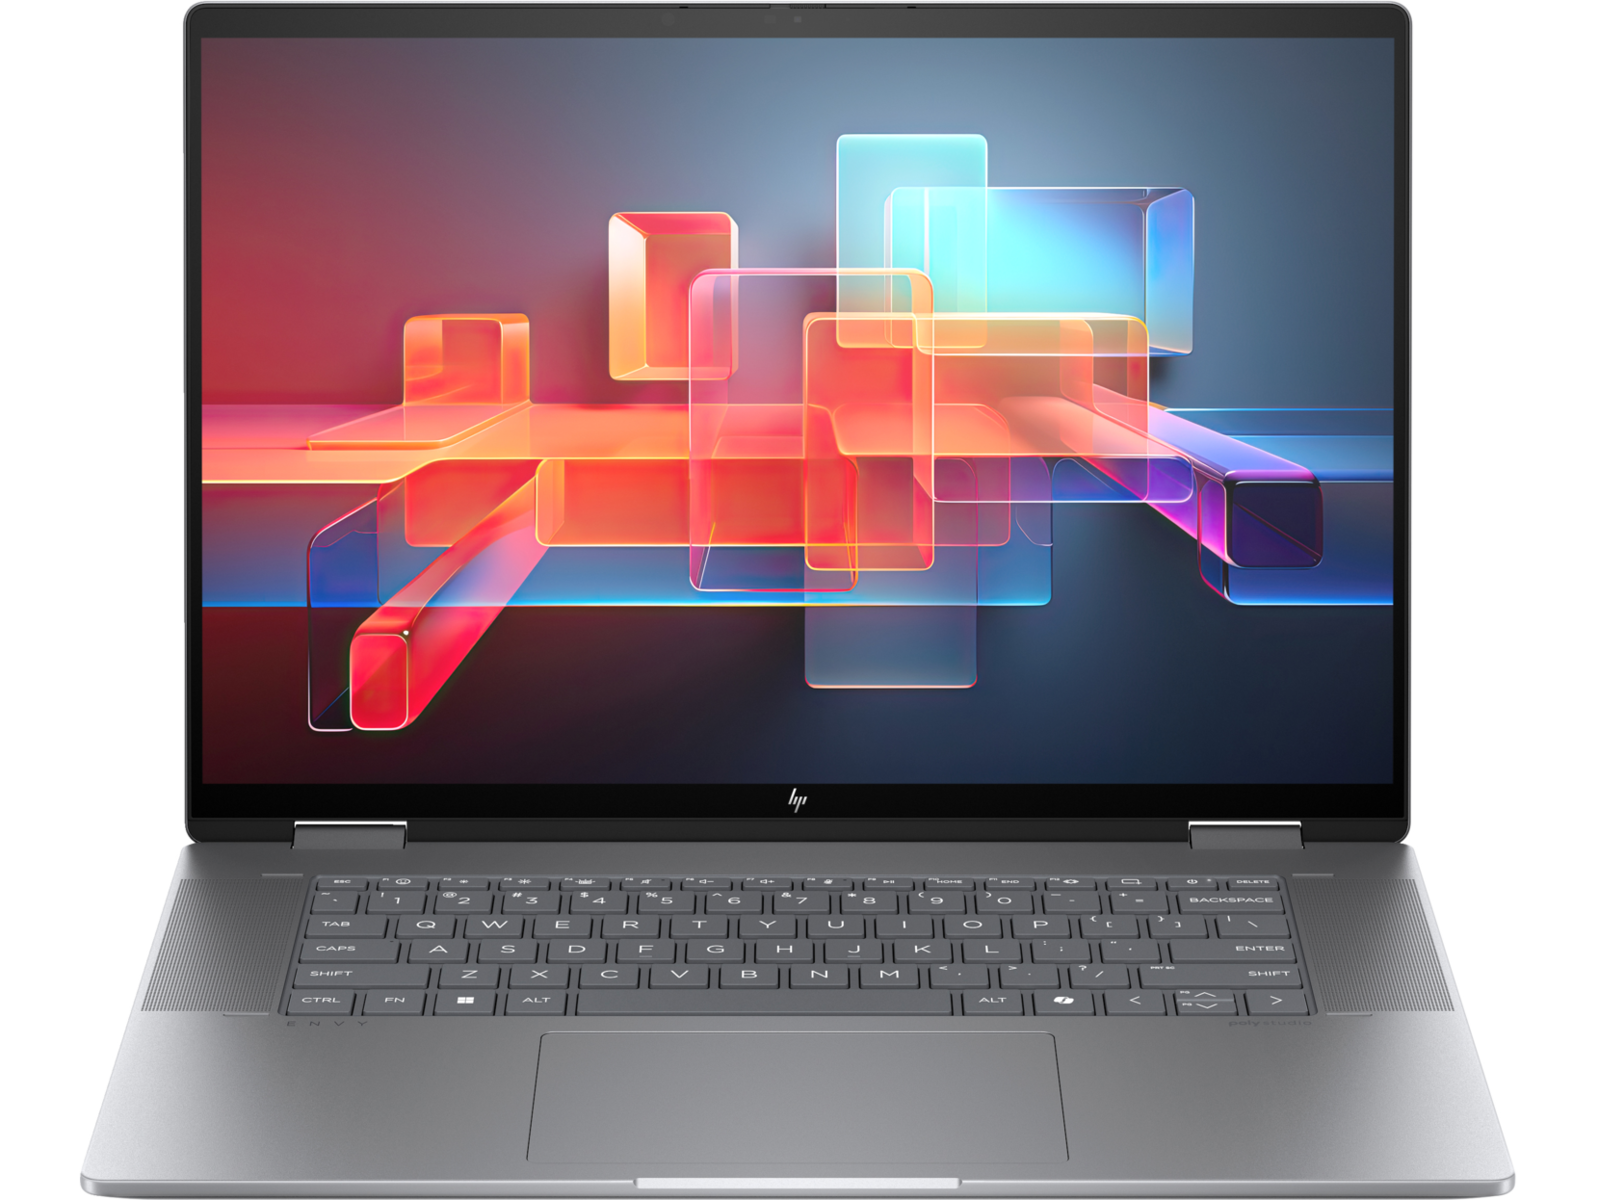
Gehäuse — Glattes Silber
Das Gehäuse ähnelt dem des Envy x360 15 und besteht aus einer ähnlichen Aluminiumoberfläche mit einer Tastatur aus Kunststoff. Die Oberflächen sind stabil und qualitativ hochwertig, wenngleich sie nicht so luxuriös wirken wie das Spectre. Das Gehäuse gibt unter Druck auf die Mitte der Tastatur oder bei Verwindungsversuchen etwas mehr nach als das Spectre, ist aber in etwa mit dem Yoga 7 2-in-1 16IML9 vergleichbar.
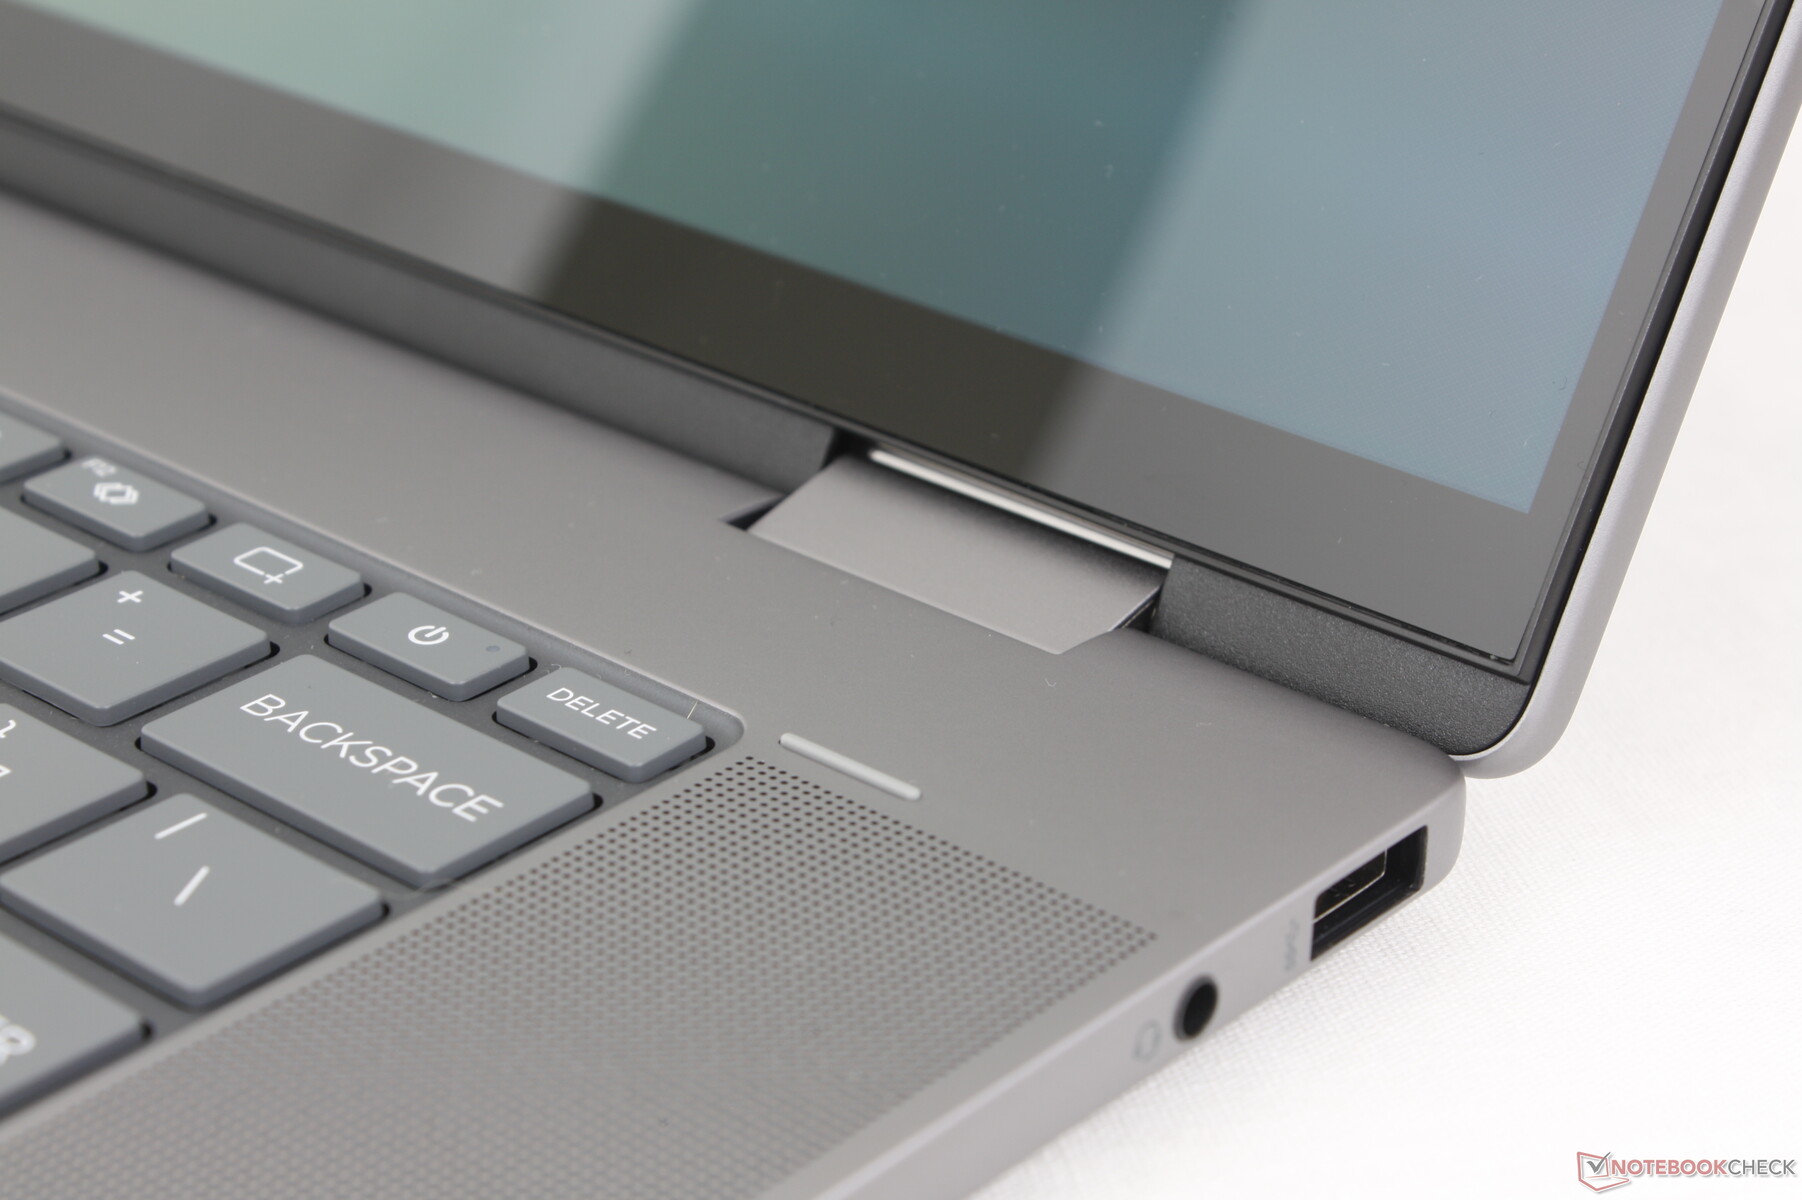
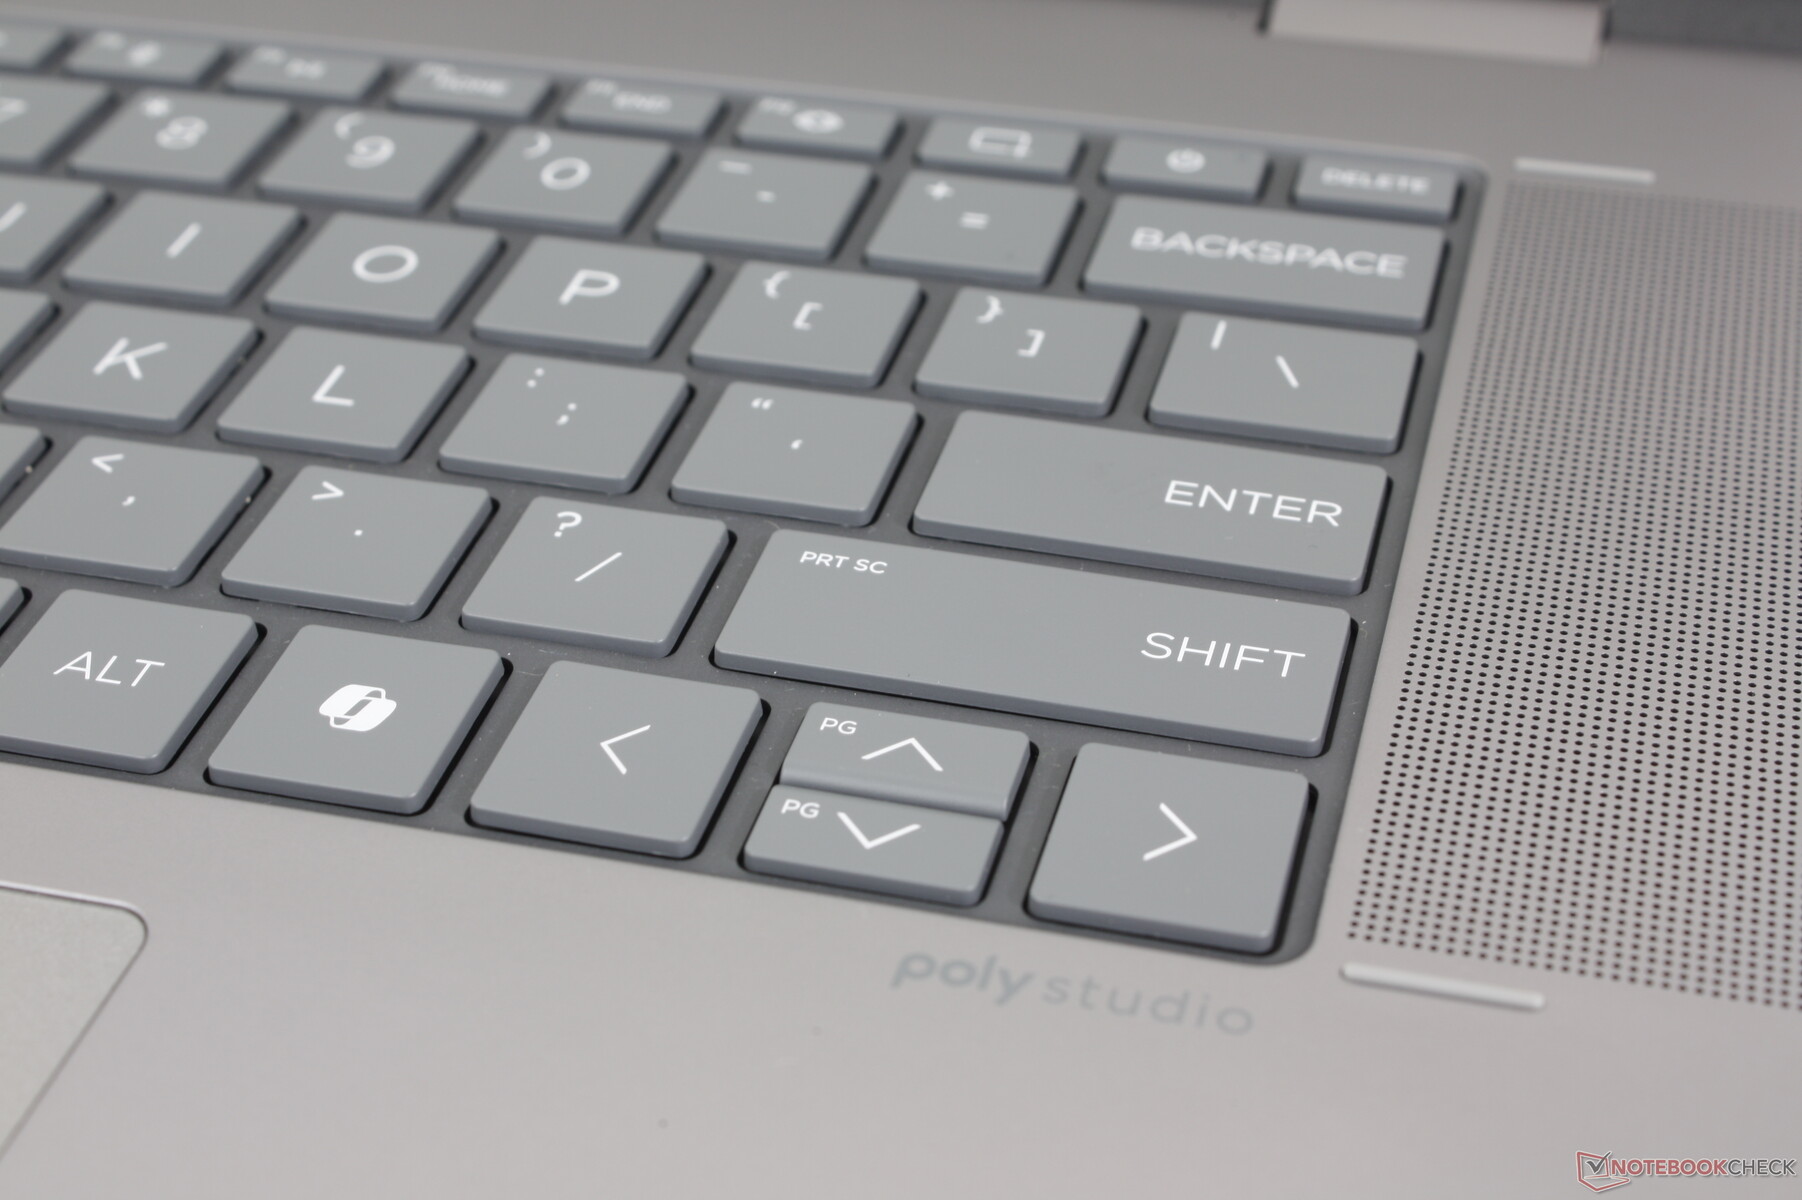
Einen deutlichen Unterschied zwischen dem Envy x360 16 und seinen kleineren Geschwistern findet sich in der Tastatur, die hier tiefer sitzt als das umliegende Lautsprechergitter und die Handballenablagen. Beim Envy x360 15 bzw. dem Spectre x360 sitzt sie hingegen höher. Durch die neue Ästhetik erinnert das Envy x360 16 auf ersten Blick an ein MacBook Pro.
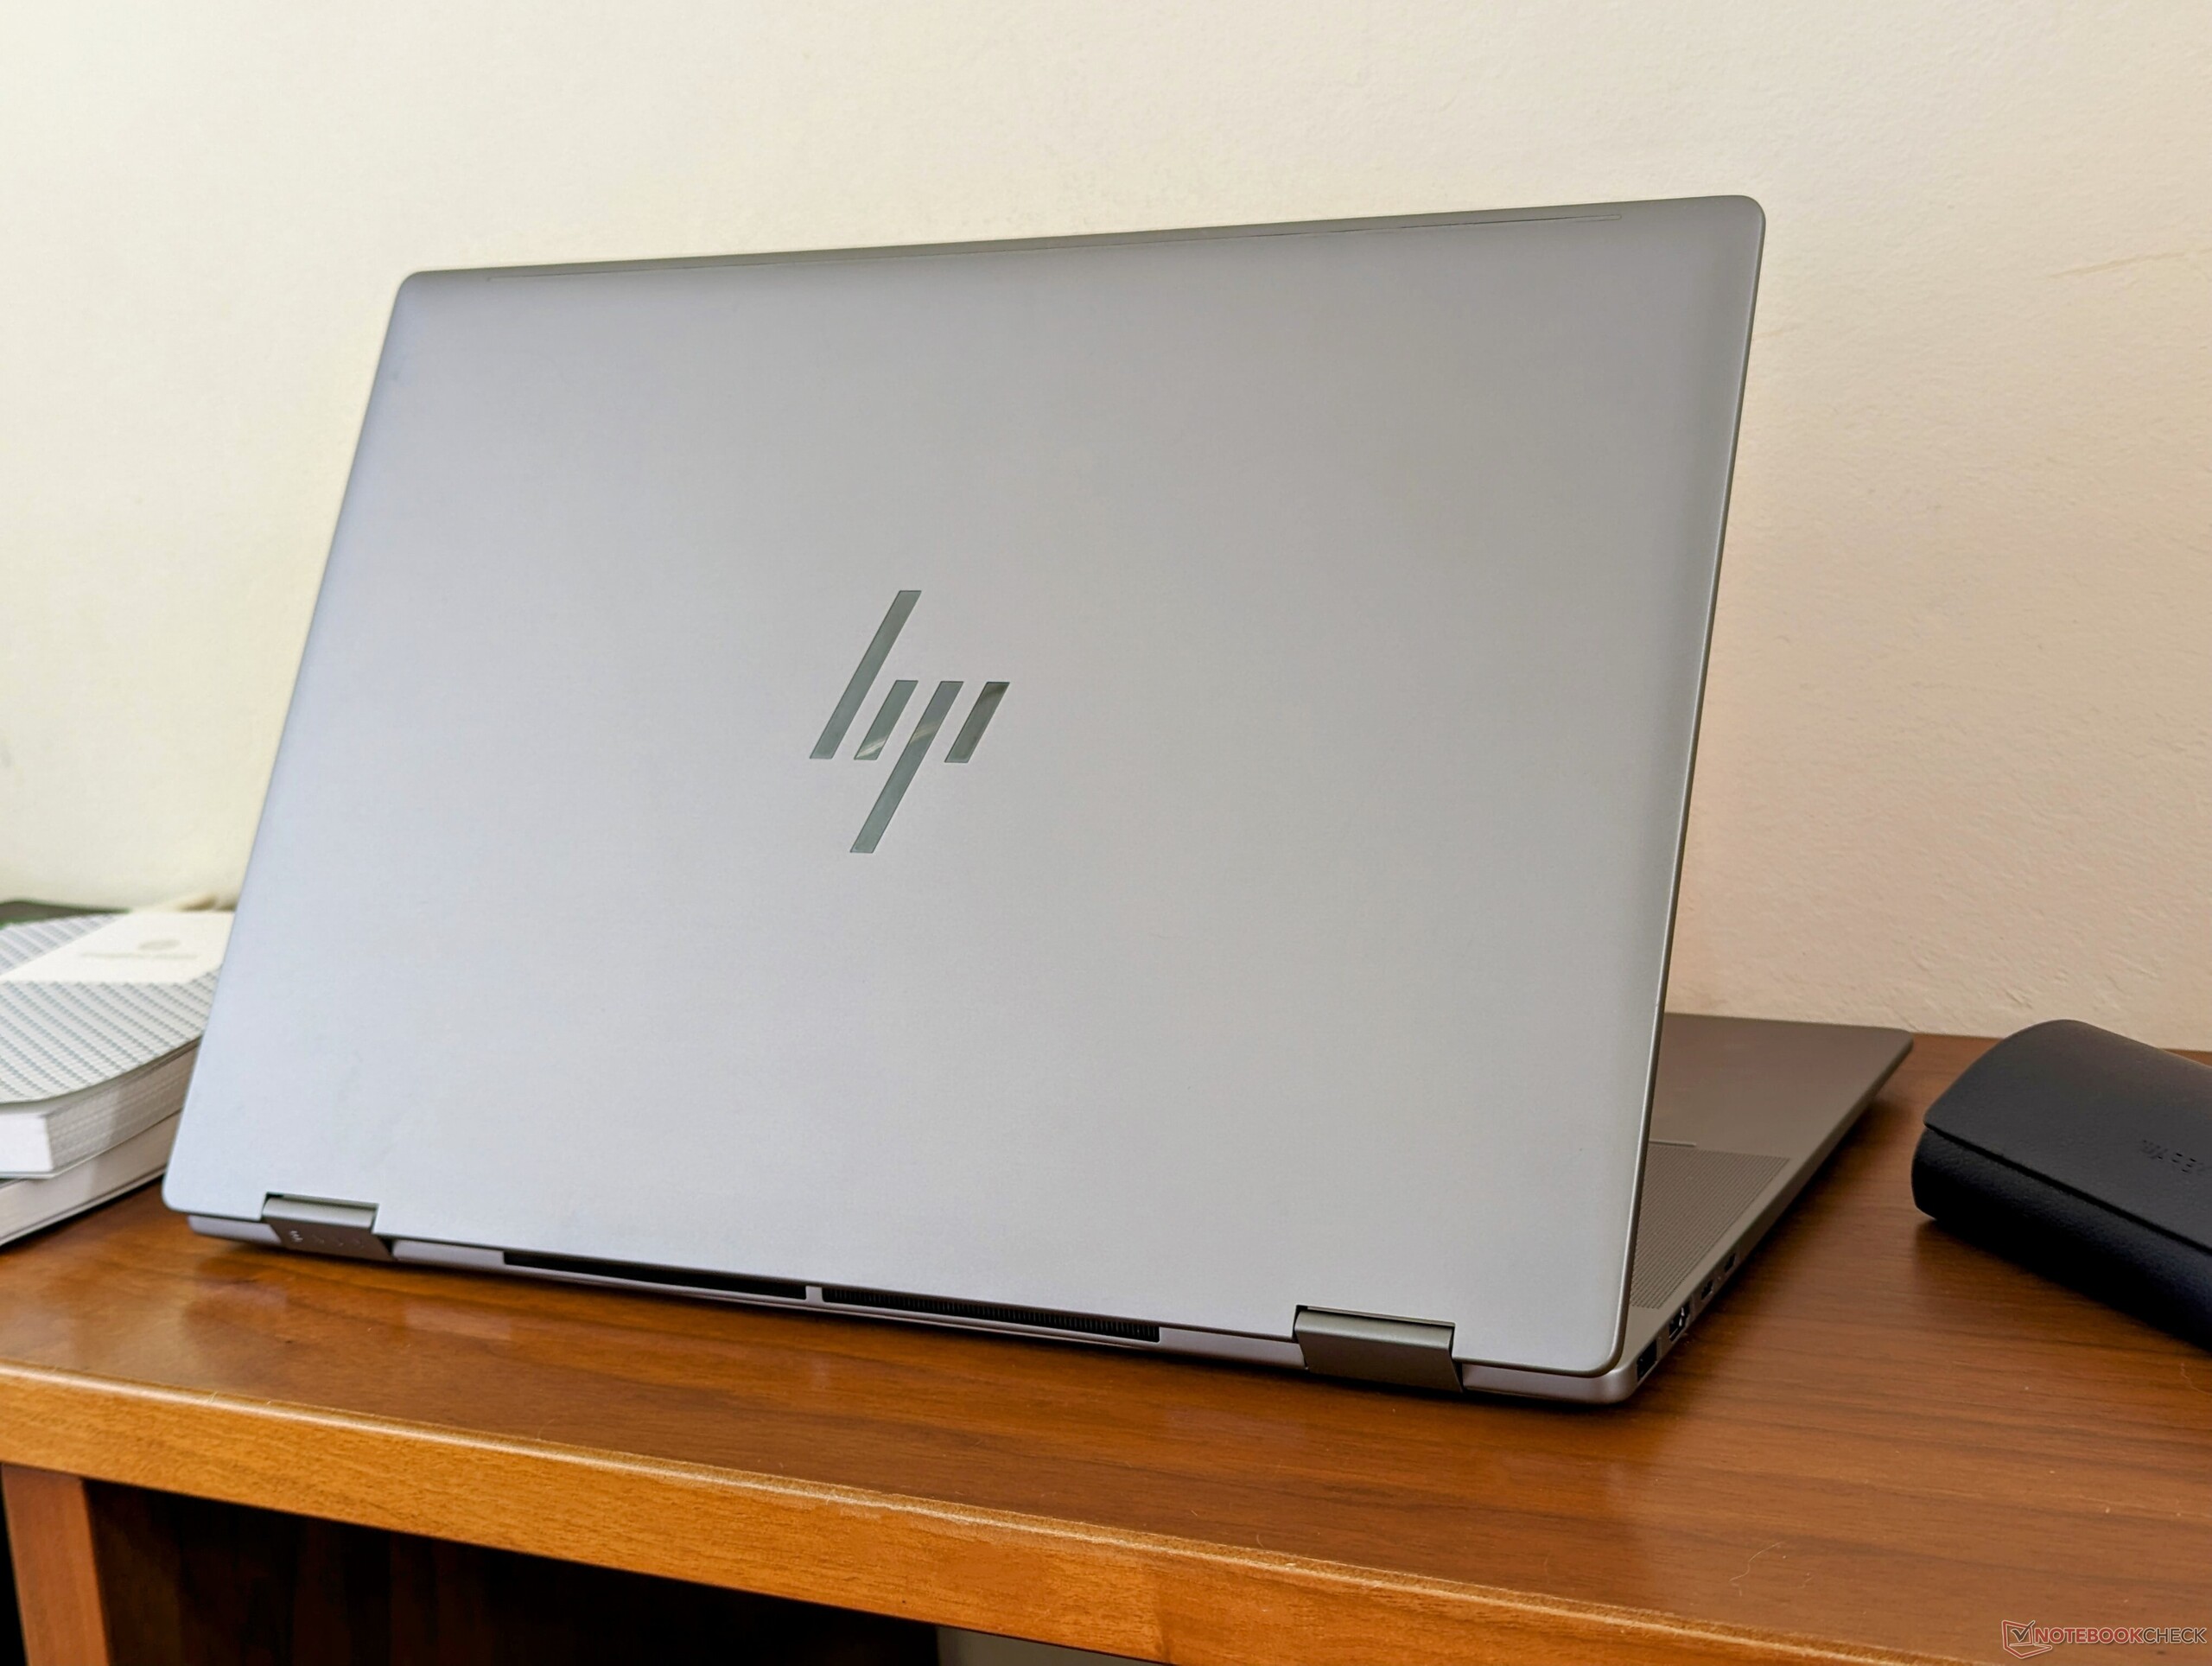
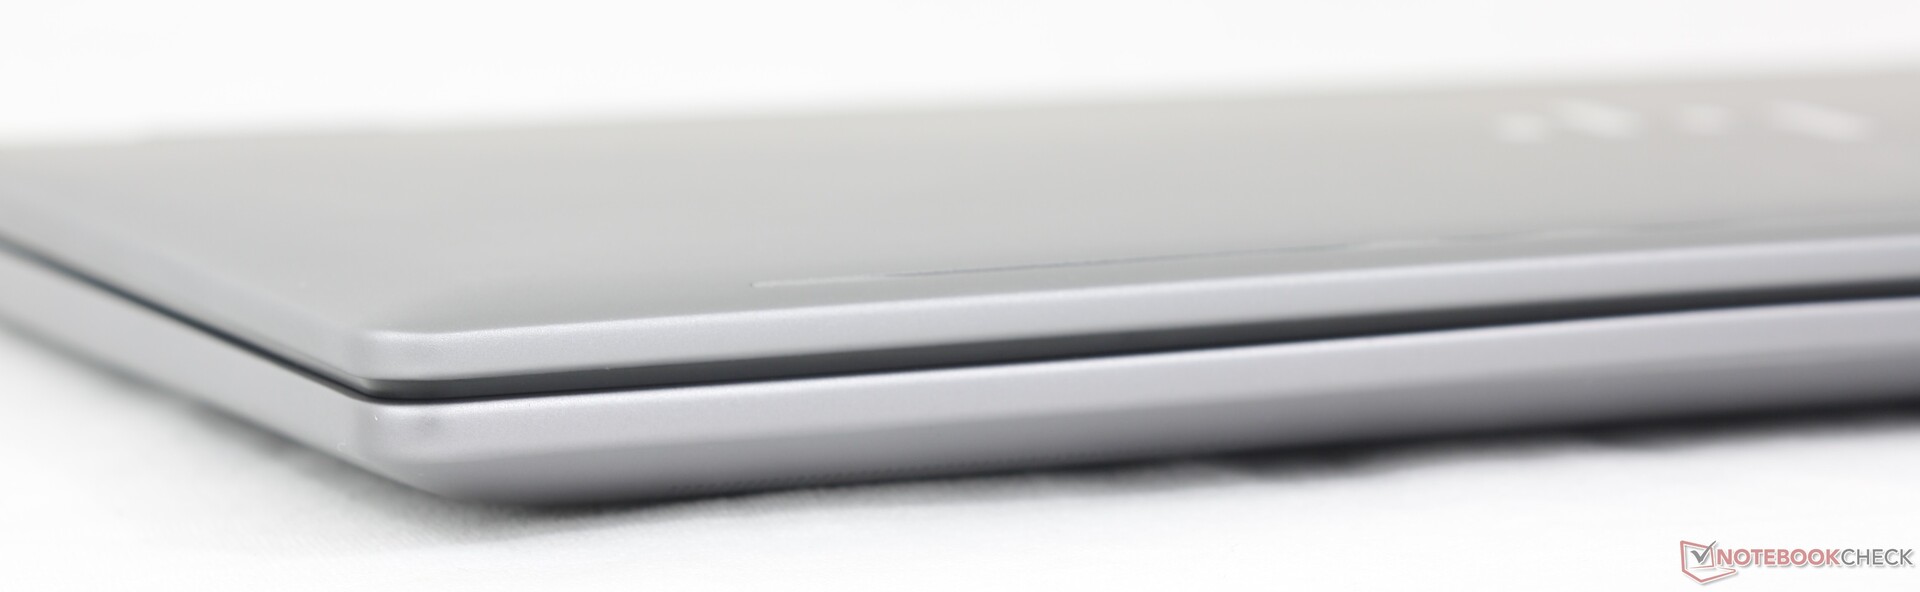
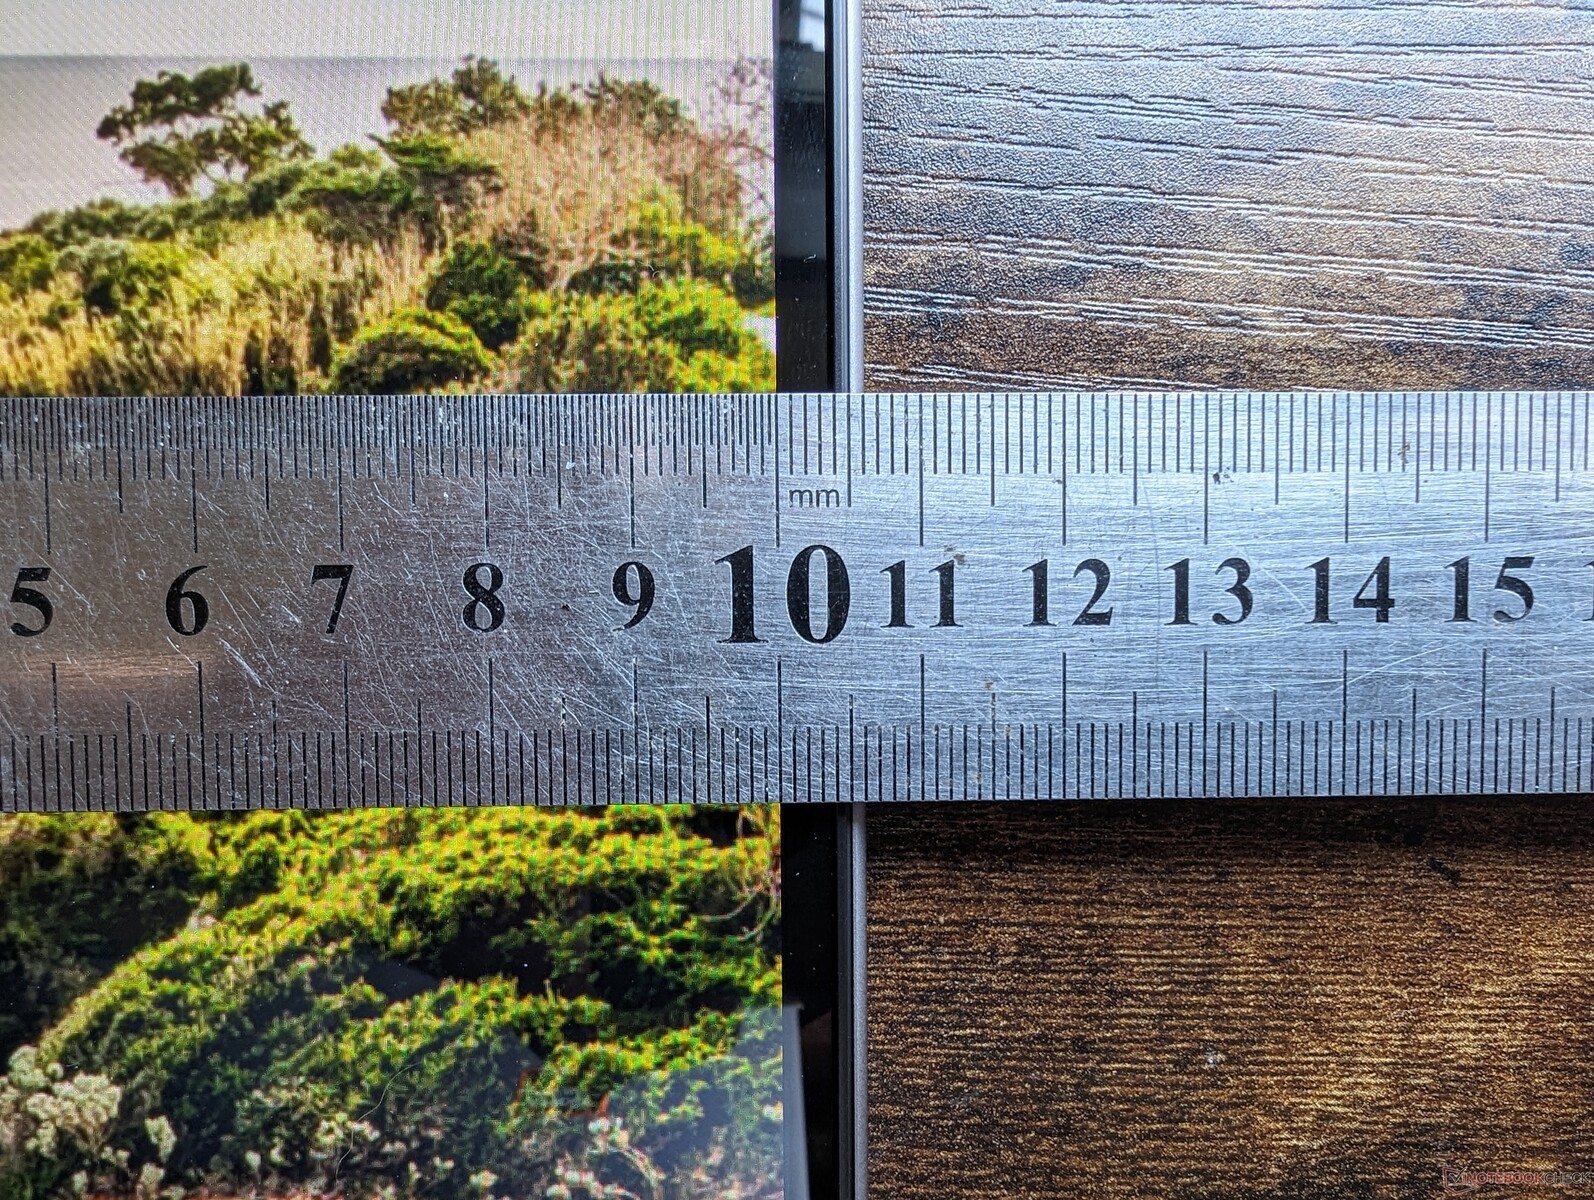
Das neue Modell ist sowohl dicker als auch größer als das Vorjahresmodell, Envy x360 15. Das Gewicht ist dagegen annähernd gleich geblieben. Noch auffälliger ist, dass das Envy x360 16 in allen drei Dimensionen mit dem teureren Spectre x360 16 nahezu identisch ist, wodurch es trotz des Preisunterschieds genauso mobil ist.
Seltsam ist, dass das neue Envy-Convertible in jeder Konfiguration in nur einer Farboption erhältlich ist. Kleinere Envy-x360-Modelle werden hingegen neben dem normalen Silber alternativ in Nightfall Black Aluminum angeboten. Verschiedene Farbkombinationen hätten außerdem ermöglicht, die Intel- und AMD-Konfigurationen des Envy x360 16 visuell zu unterscheiden.
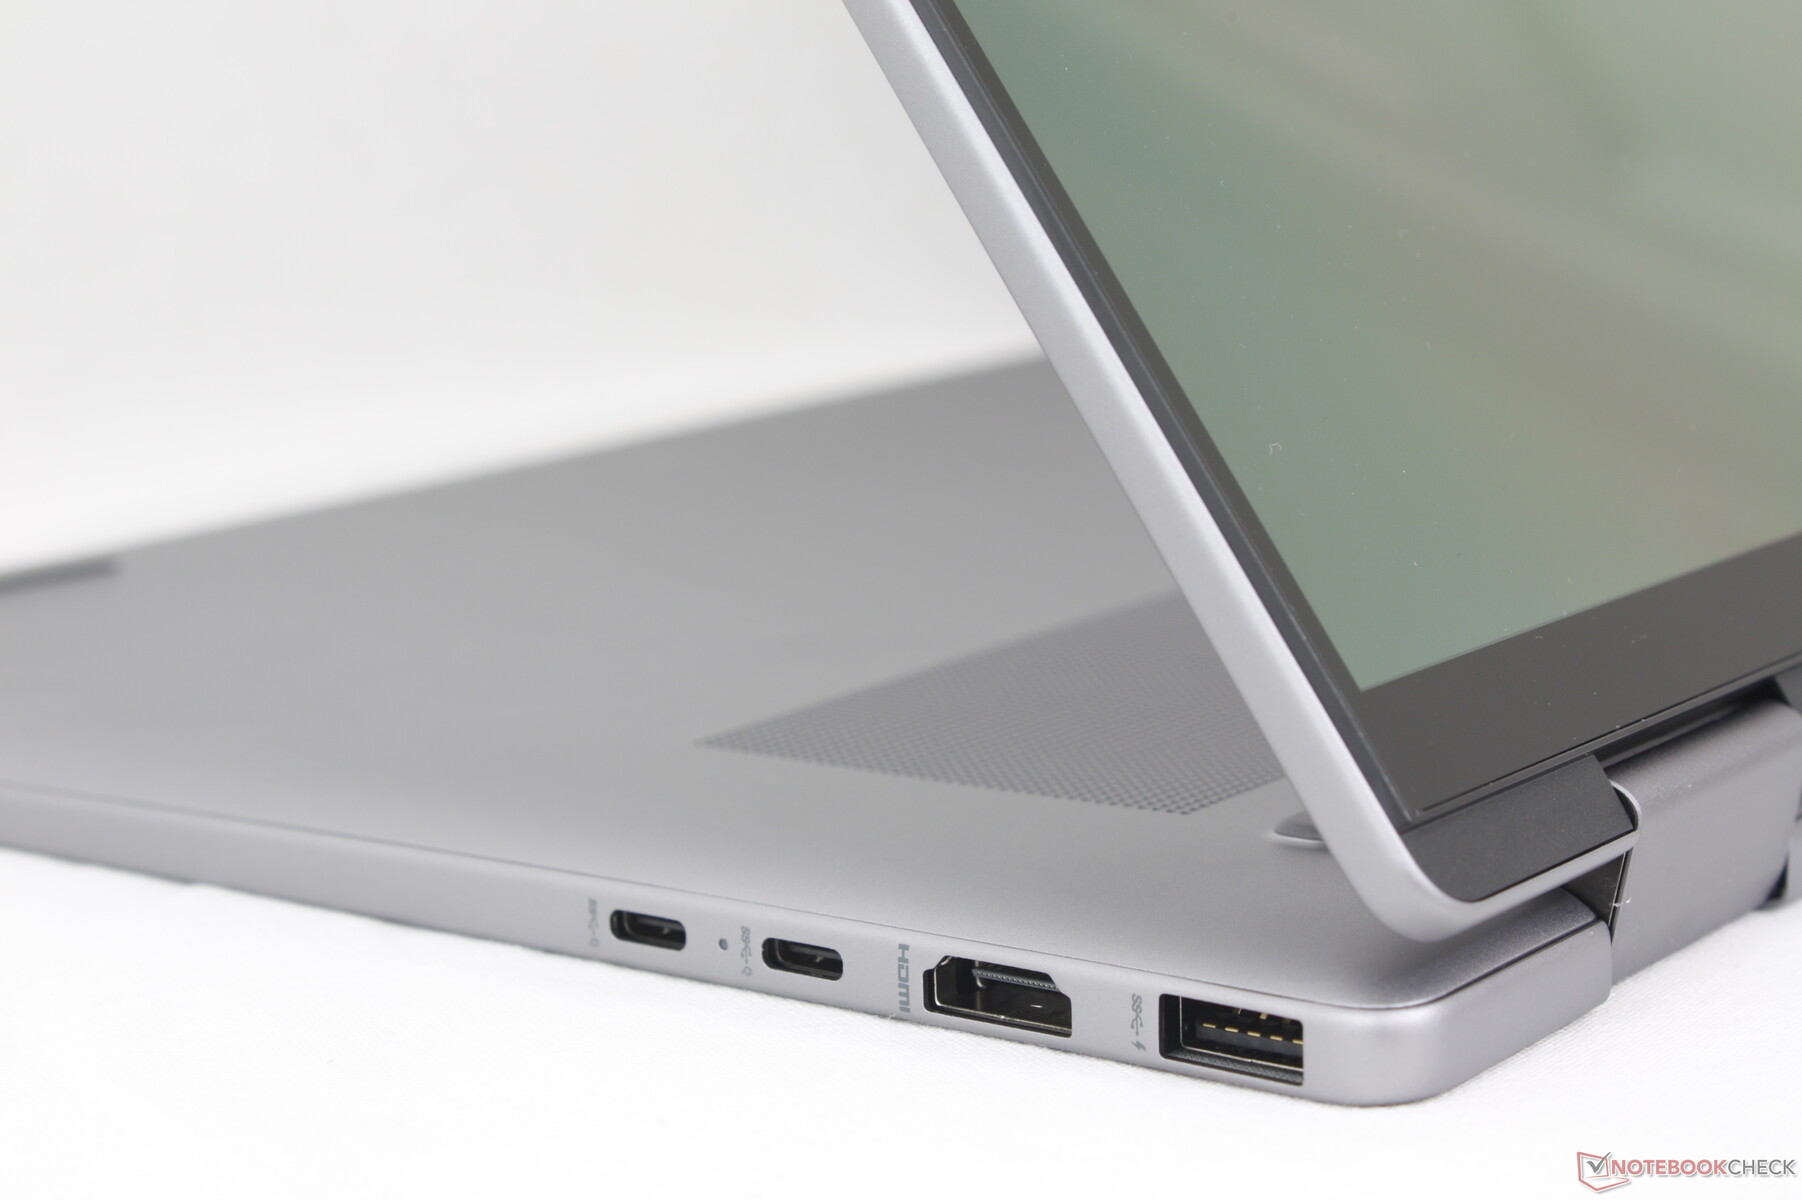
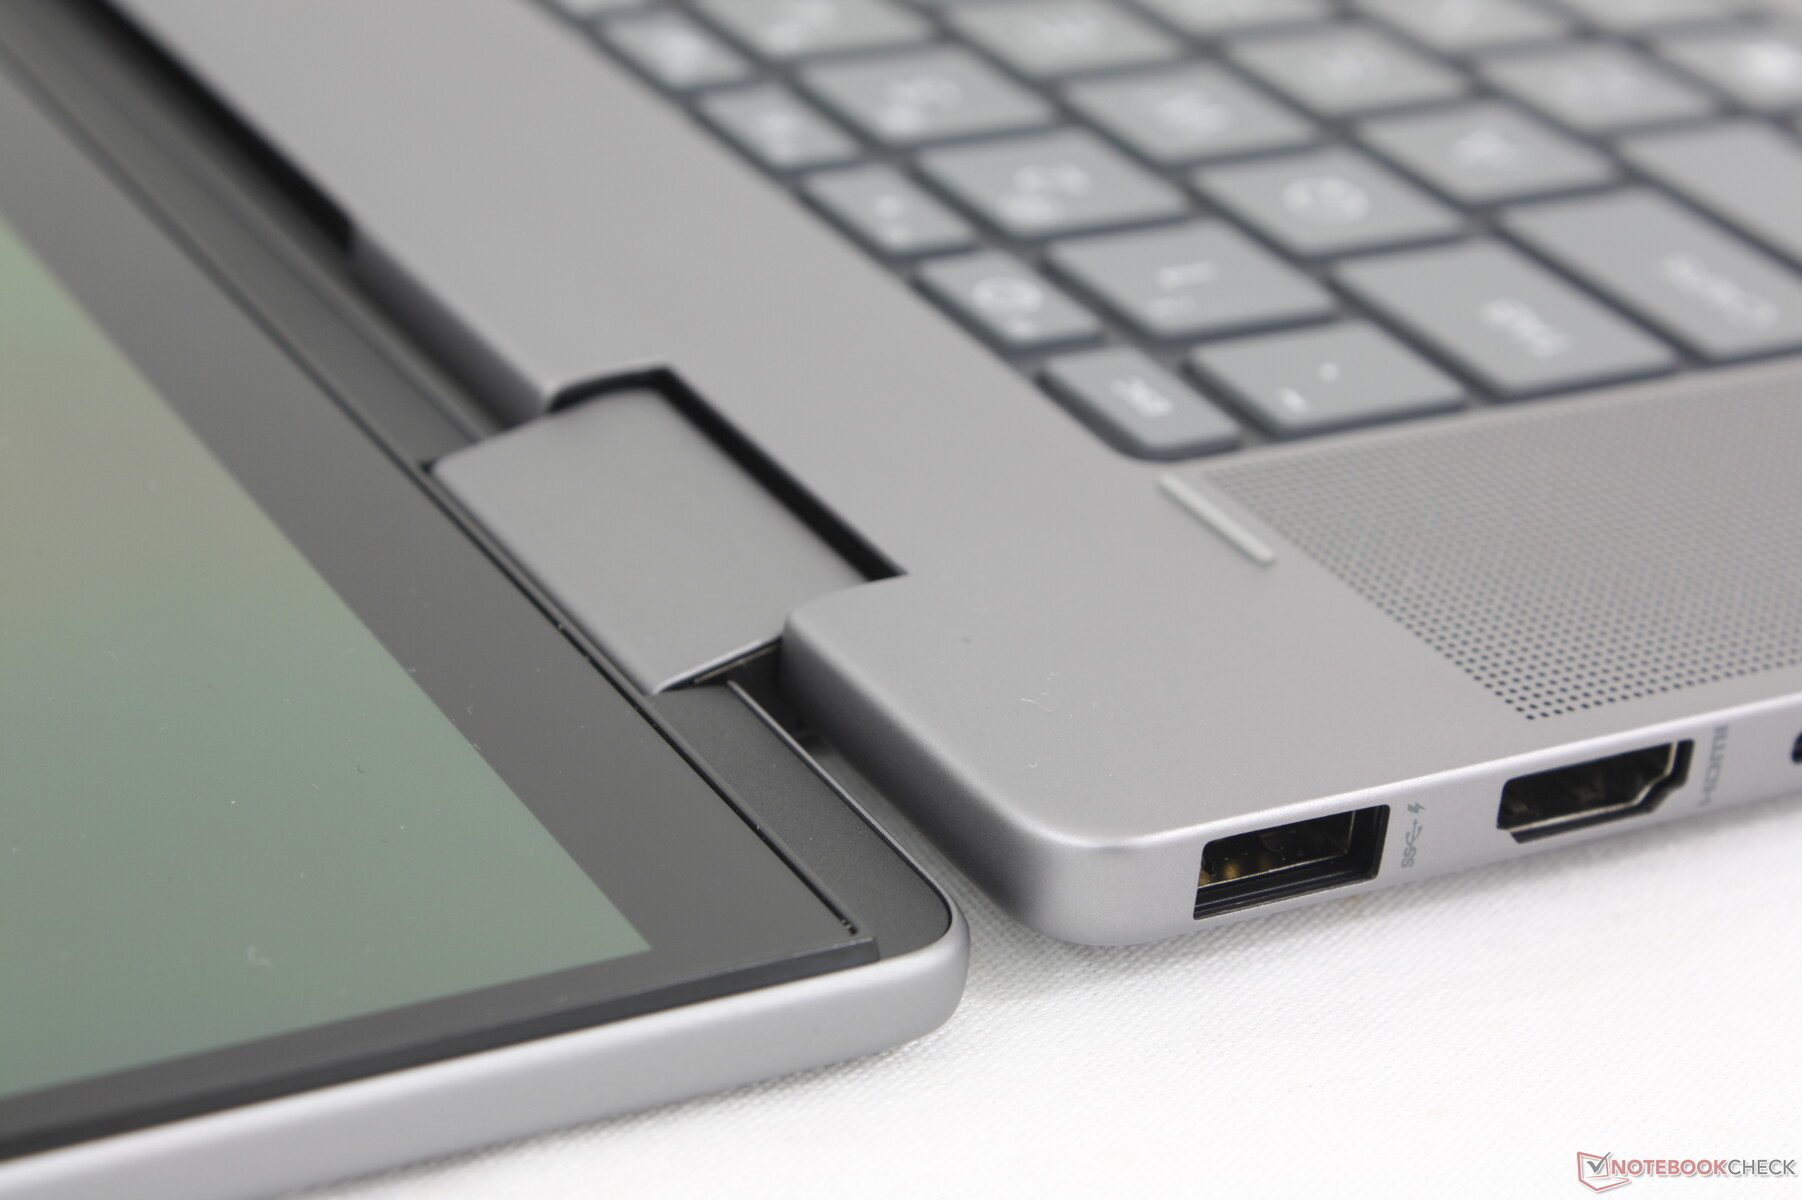

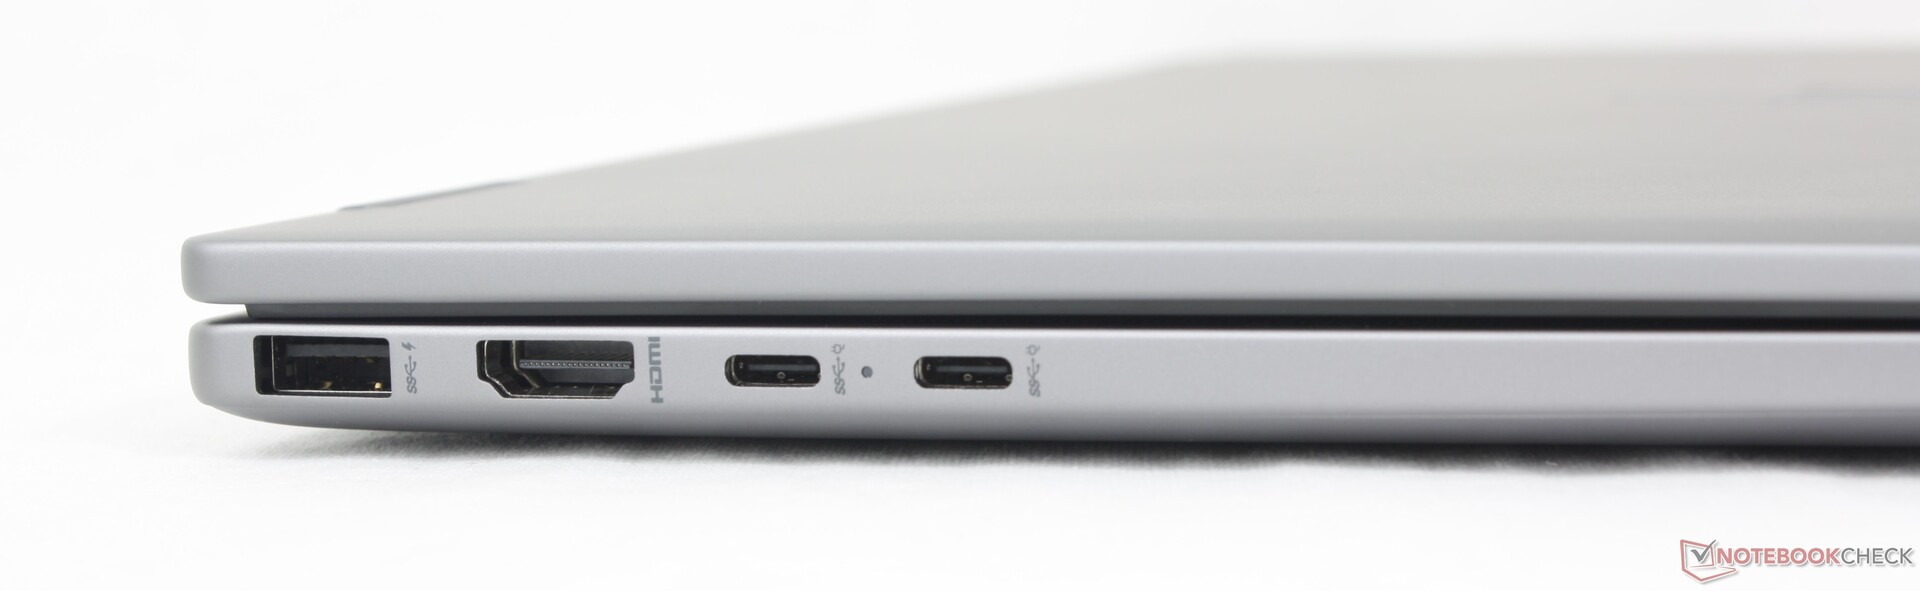
Ausstattung — Kein Thunderbolt oder USB4 für AMD
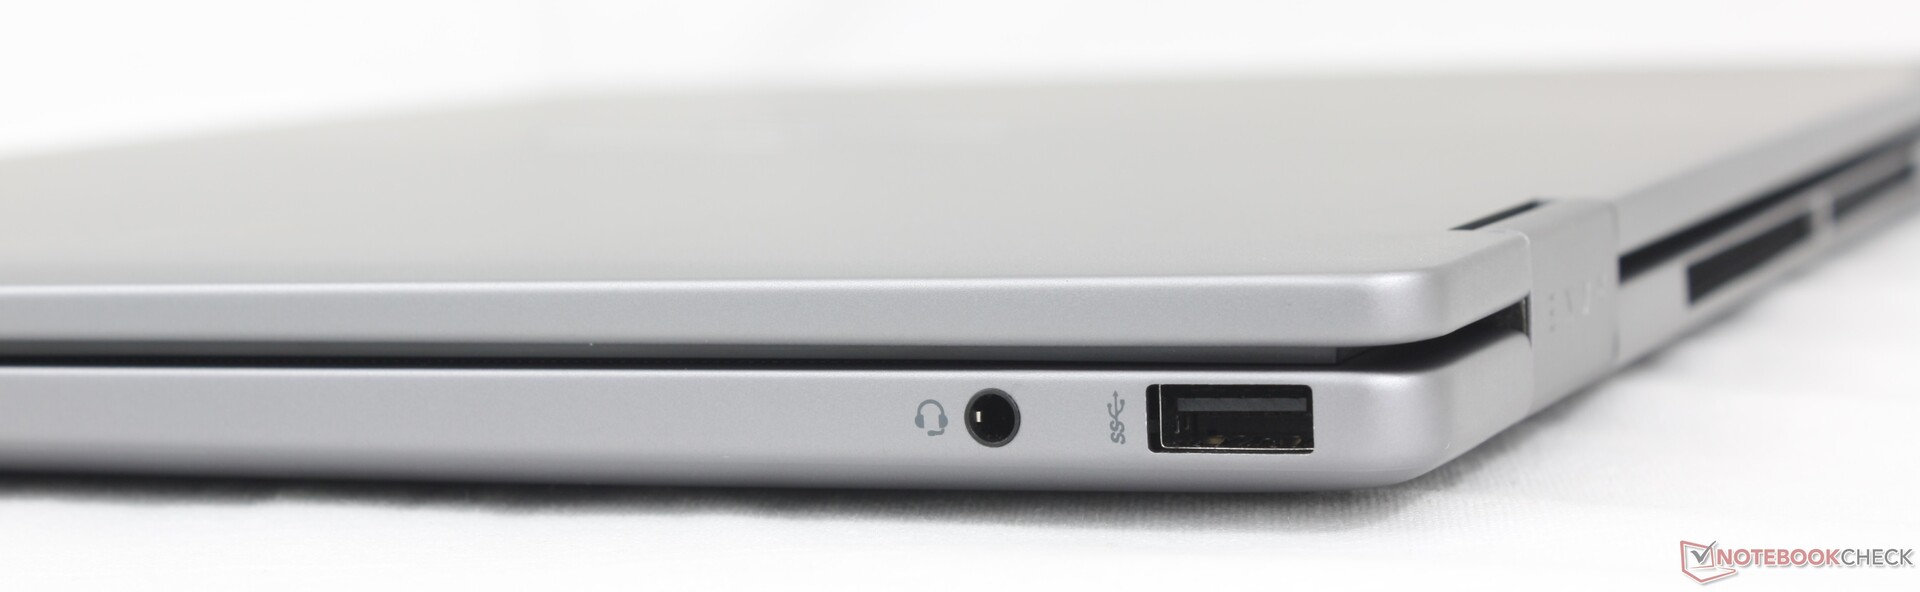
Abgesehen von dem SD-Kartenleser sind alle Anschlüsse des 2023er Envy x360 15 auch im diesjährigen Modell erhalten geblieben. Für einen Multimedia-Laptop dieser Größe ist das Fehlen eines integrierten Kartenlesers für Fotografen, die für die Übertragung von Daten darauf angewiesen sind, allerdings enttäuschend.
Auch USB4 und Thunderbolt werden auf dem neuen Envy leider nicht unterstützt; die beiden USB-C-Anschlüsse sind auf jeweils 10 GB/s eingeschränkt. Für eine Thunderbolt-Kompatibilität müssen Nutzer stattdessen die Intel-Version des Envy x360 16 in Betracht ziehen oder einen Aufpreis für das Spectre x360 16 akzeptieren.
Kommunikation
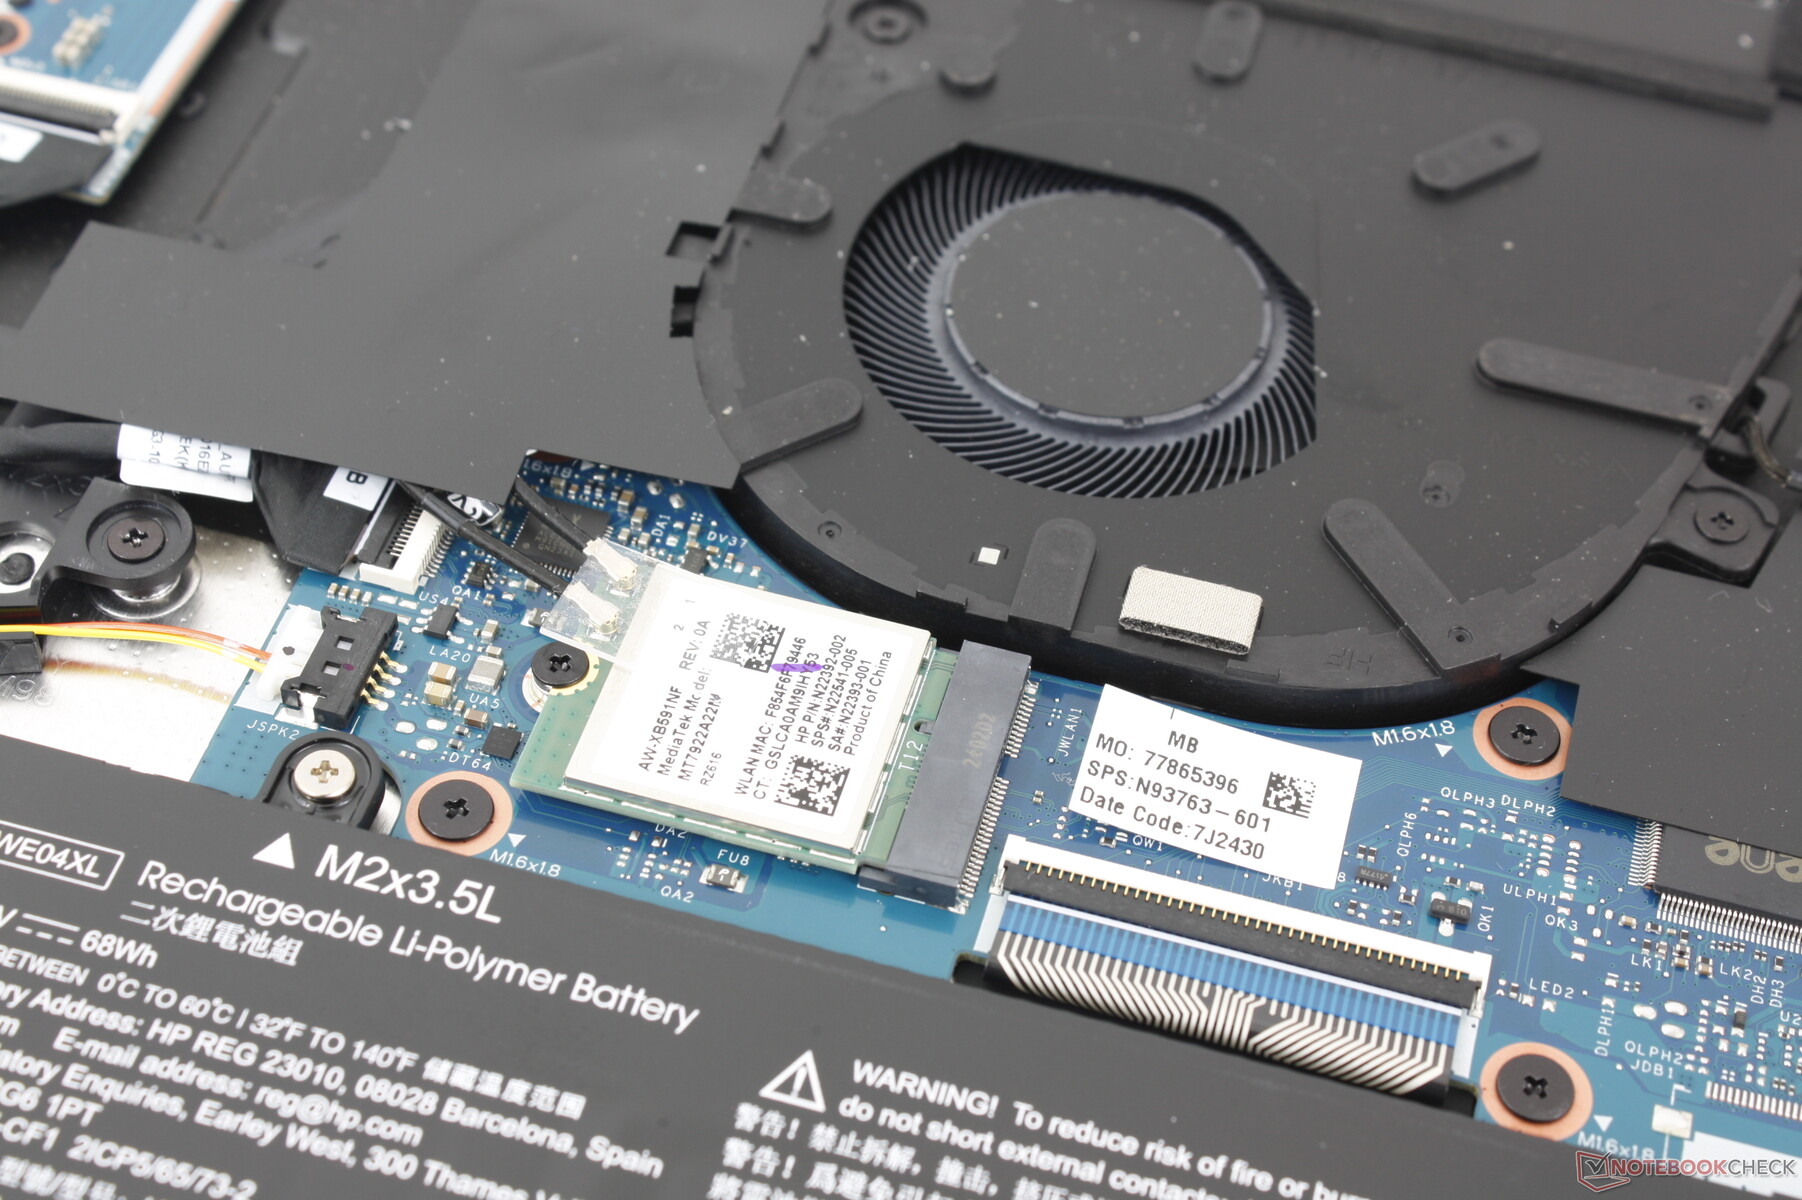
Das MediaTek MT7922 ist standardmäßig mit Wi-Fi 6E und Bluetooth 5.3 ausgestattet. Im Test mit Wi-Fi 6 als auch mit Wi-Fi 6E erlebten wir ausgezeichnete Übertragungsraten und keinerlei Verbindungsprobleme.
Webcam
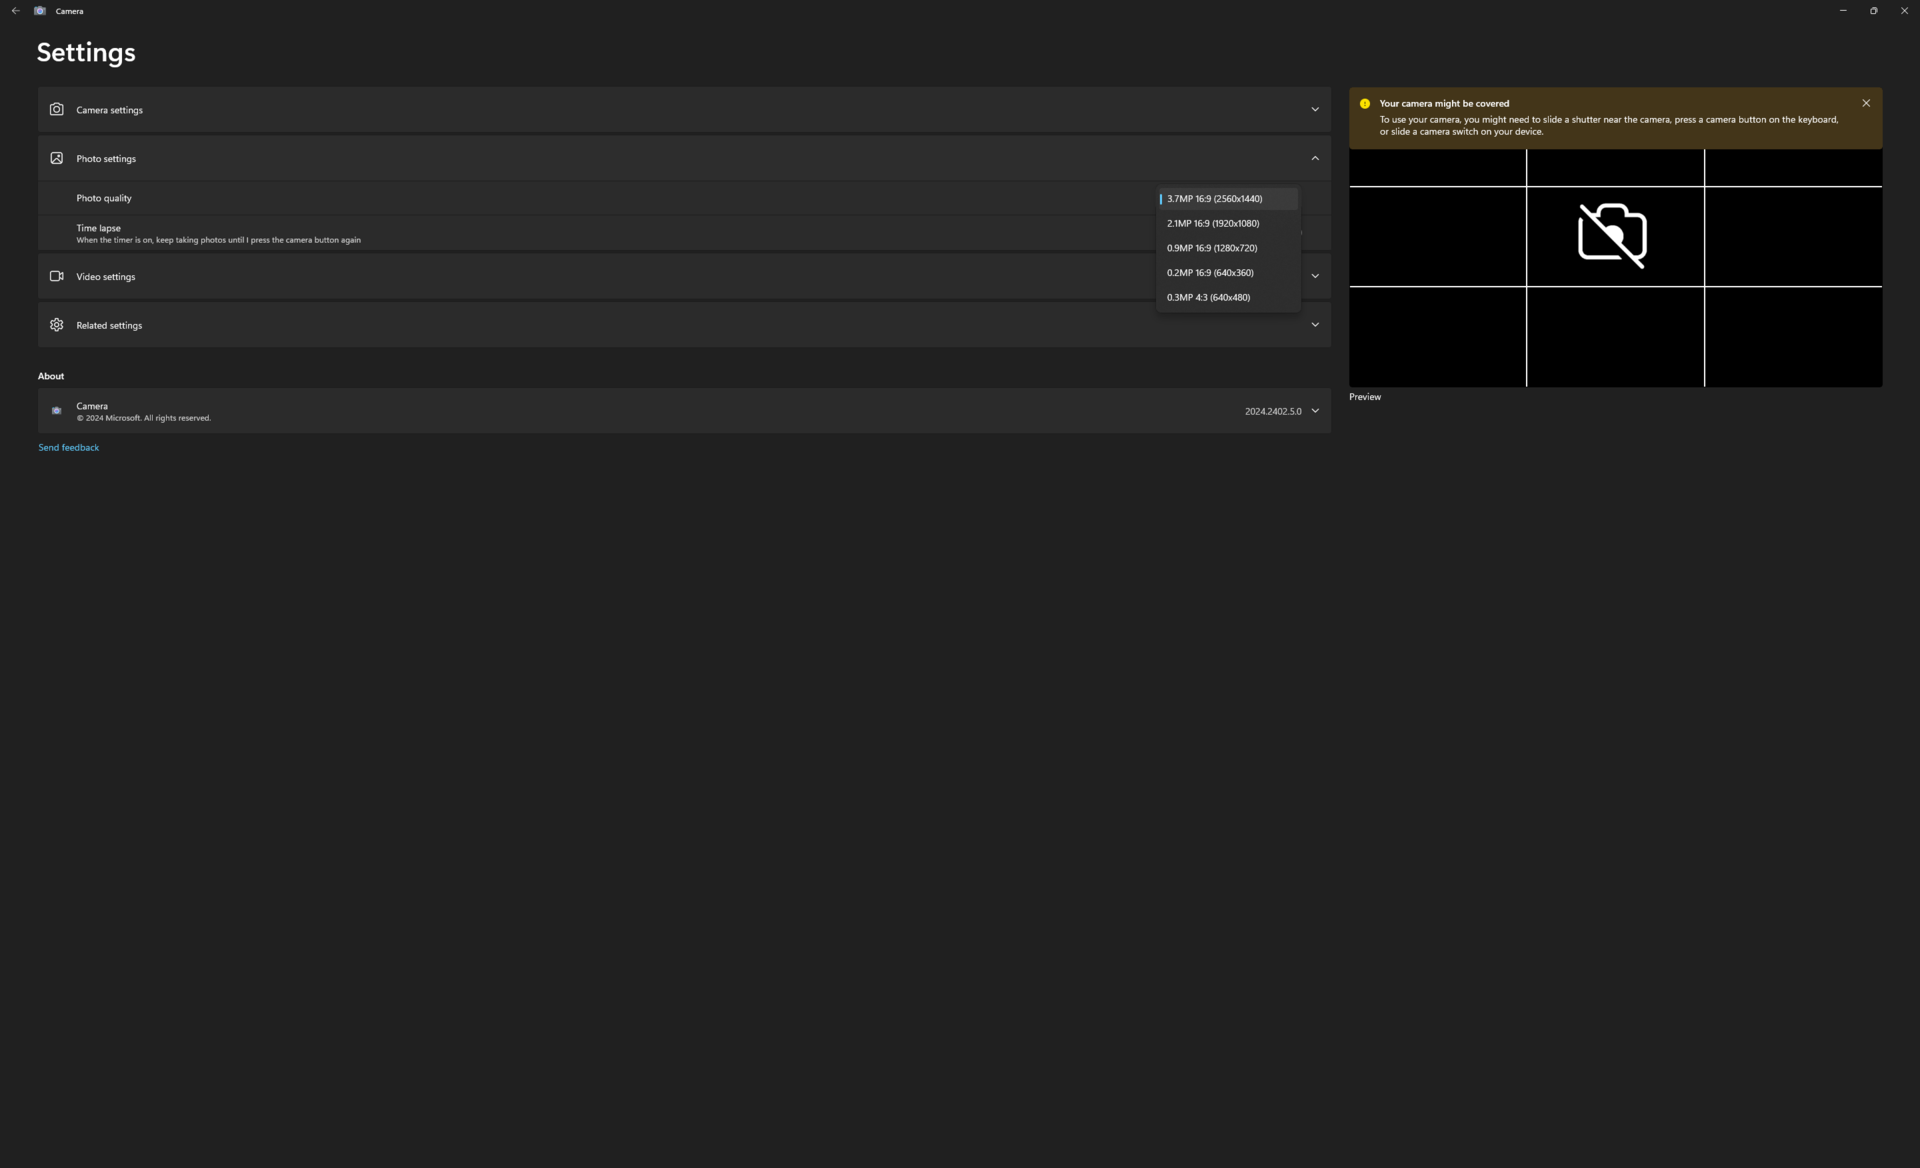
Während HP eine 5-MP-Webcam bewirbt, ermöglicht die Windows-Kamera-App nur bis zu 3,7 MP (siehe Screenshot). Wir haben bei HP nachgefragt, ob das so funktioniert wie vorgesehen oder ob es sich um einen Fehler handeln könnte.
Sowohl IR als auch ein physischer Privacy-Shutter sind standardmäßig inkludiert.


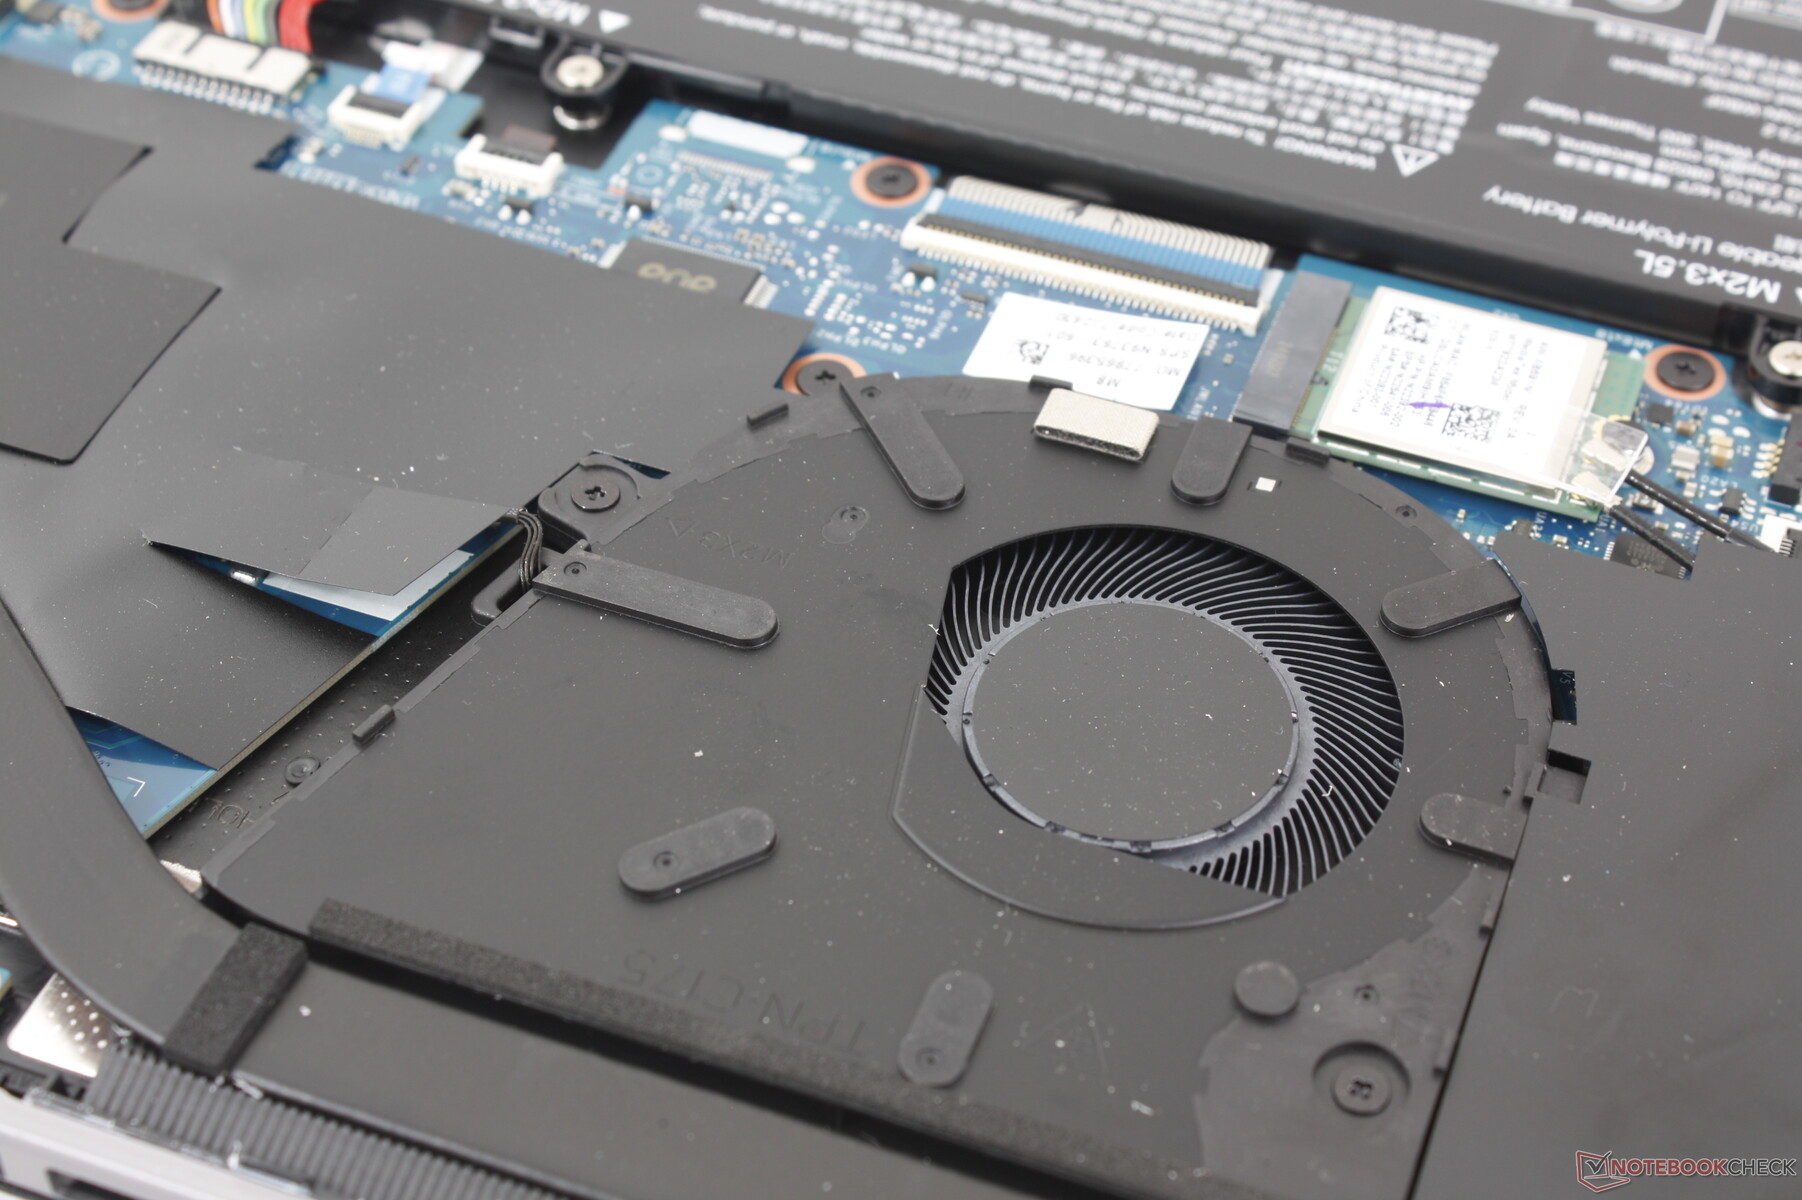
Wartung
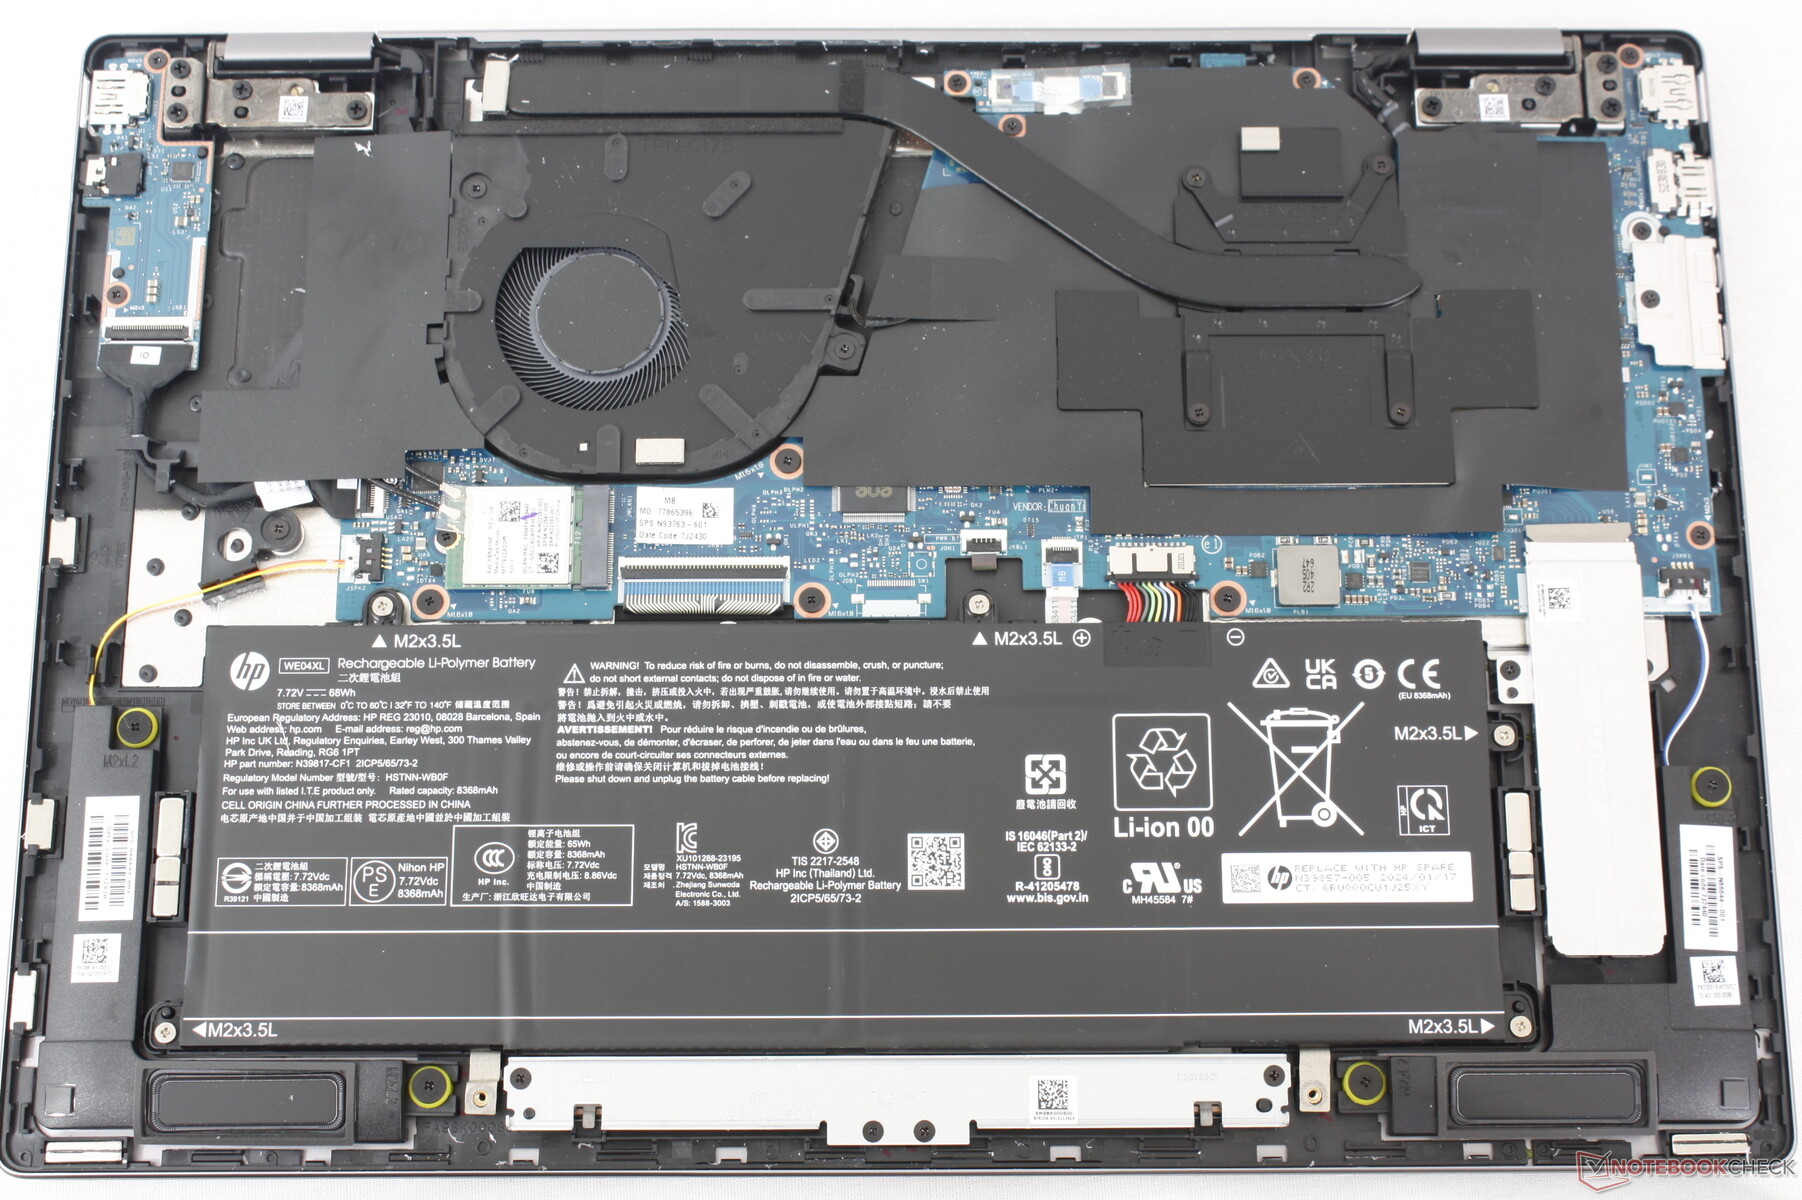
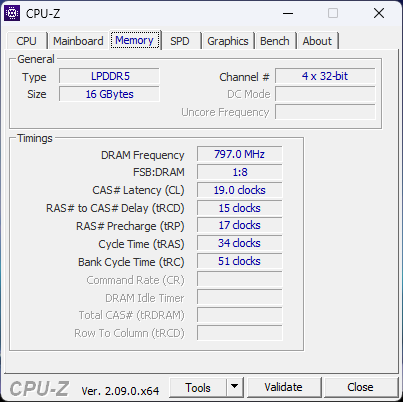
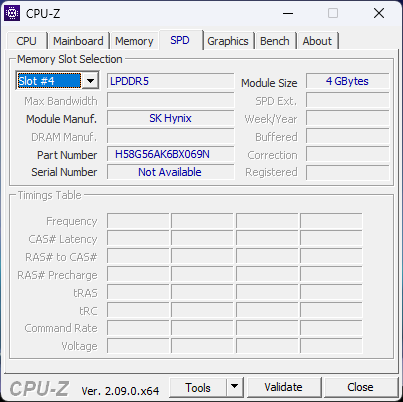
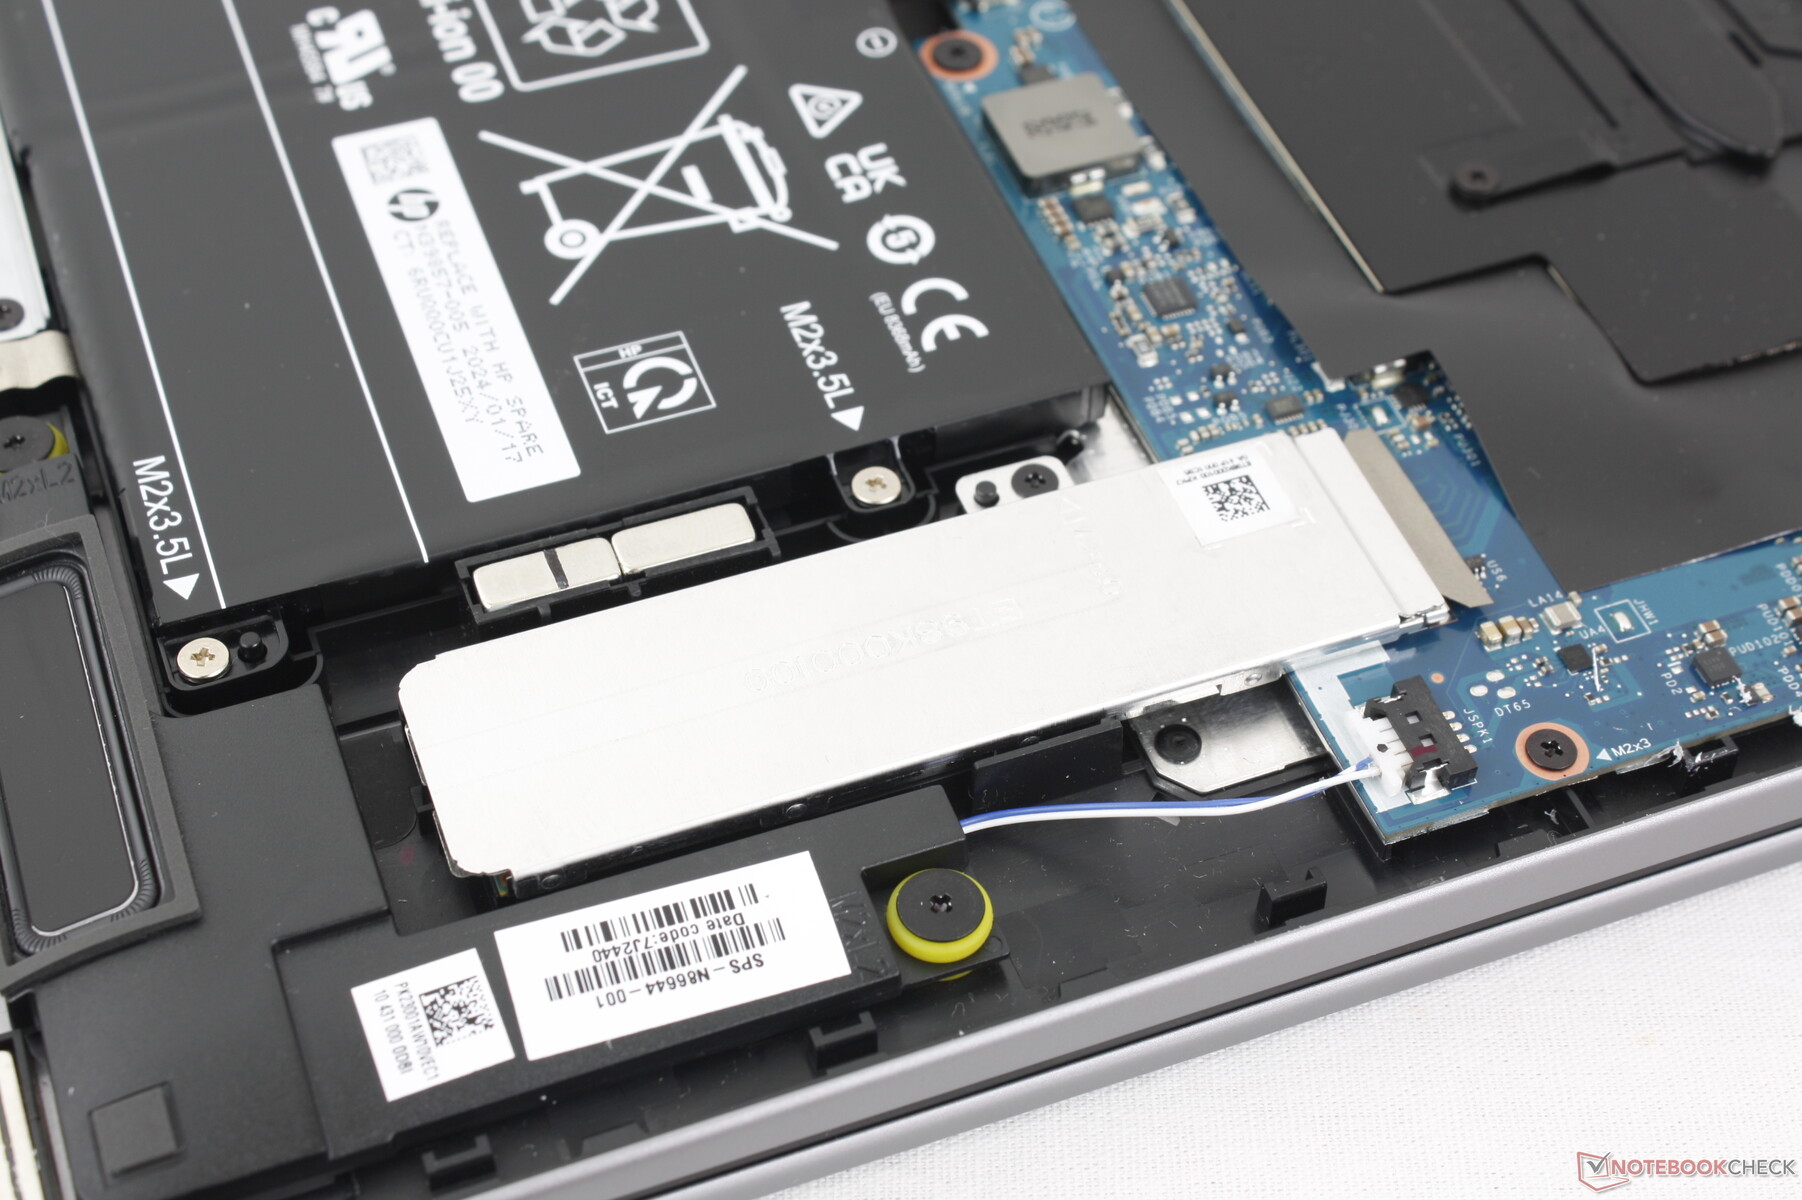
Die Unterseite des Geräts wird mit nur vier Torx-Schrauben festgehalten. Allerdings sind die Kanten scharf und alles extrem eng, was die Wartung schwieriger macht, als es sein müsste. Das gleiche Problem hatten wir bereits beim Envy x360 15 – HP hat sich also offenbar nicht die Mühe gemacht, diesen Aspekt für das Envy x360 16 zu verbessern. Einmal im Inneren angelangt gibt es ohnehin nicht viel zu tun, da das RAM-Modul angelötet ist.
Zubehör und Garantie
Optional kann ein aktiver Stylus-Stift dazugekauft werden. Das Gerät kommt mit 2 Jahre Herstellergarantie.
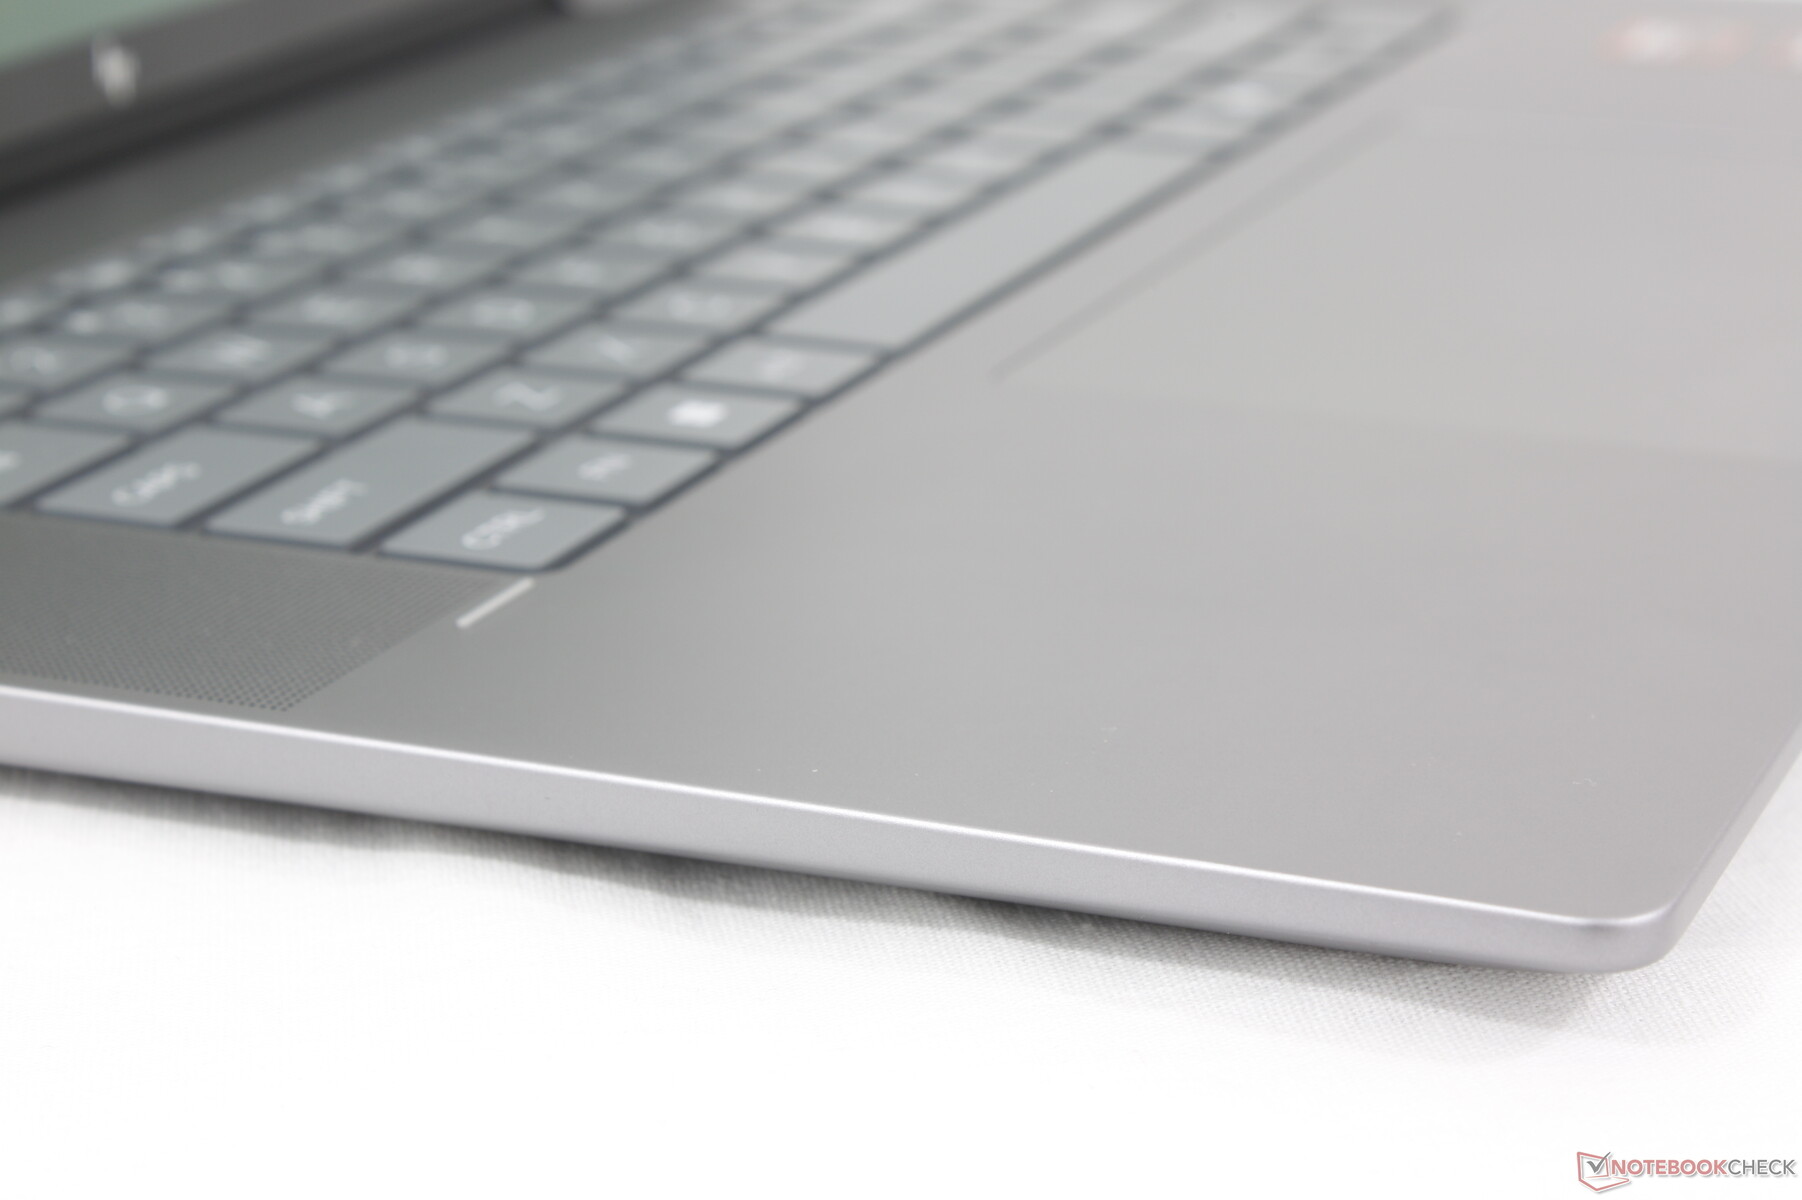
Eingabegeräte — Geräumig und komfortabel
Tastatur
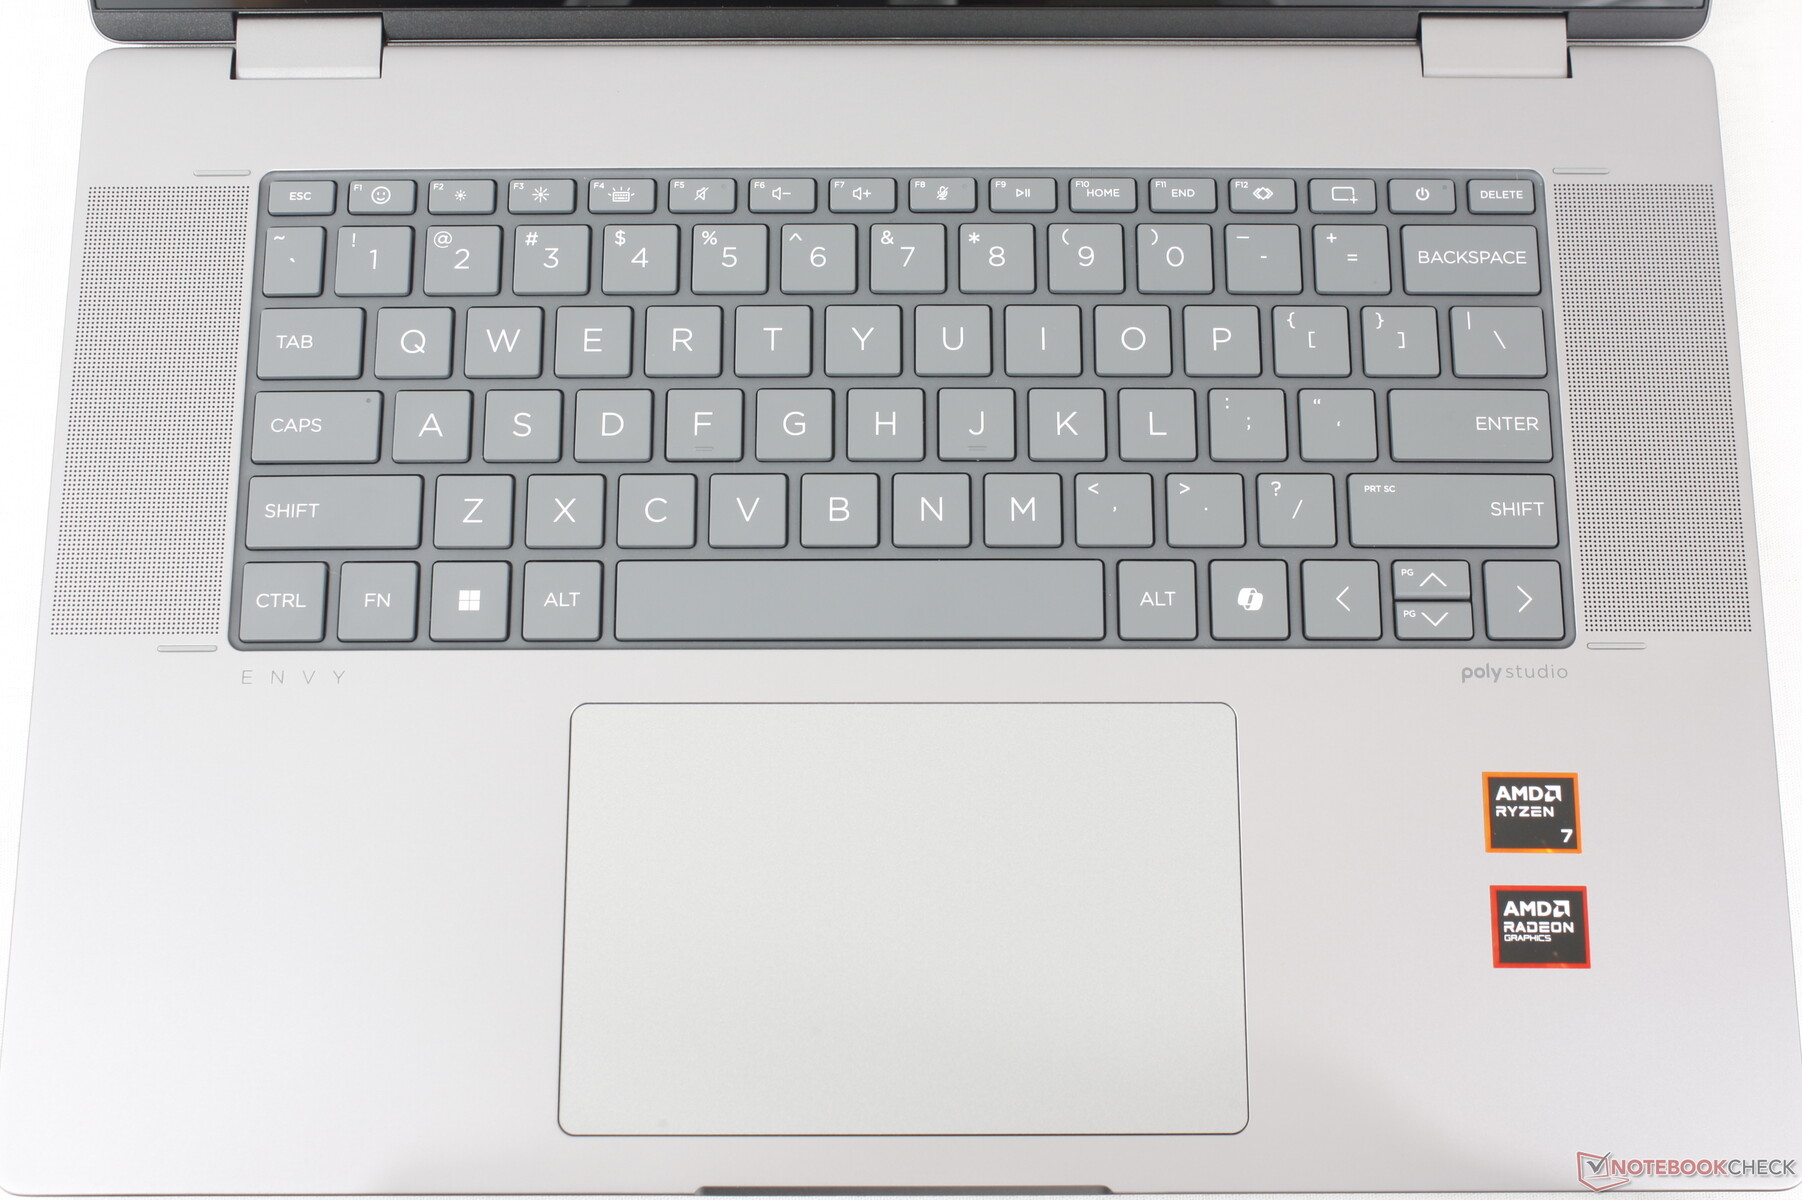
Das Tastaturlayout hat sich seit dem Envy x360 15 verändert. Die Spalte mit dedizierten Tasten am rechten Rand (BildRauf, BildRunter, Ende, usw.) wurde entfernt und deren Funktionen wurden in die restliche Tastatur integriert. Durch diese Änderungen entspricht das Layout optisch eher dem des Spectre x360 16, allerdings ohne den Fingerabdruckleser.
Abgesehen davon ist das Tippgefühl ausgezeichnet und lässt sich mit einem Spectre vergleichen. Es bietet ein knackigeres Feedback als die Mitstreiter VivoBook oder IdeaPad. Insbesondere die GIF-Taste und die anpassbaren Tasten sind erwähnenswert, da die meisten anderen Multimedia-Laptops nicht über solche Funktionen verfügen.
Touchpad
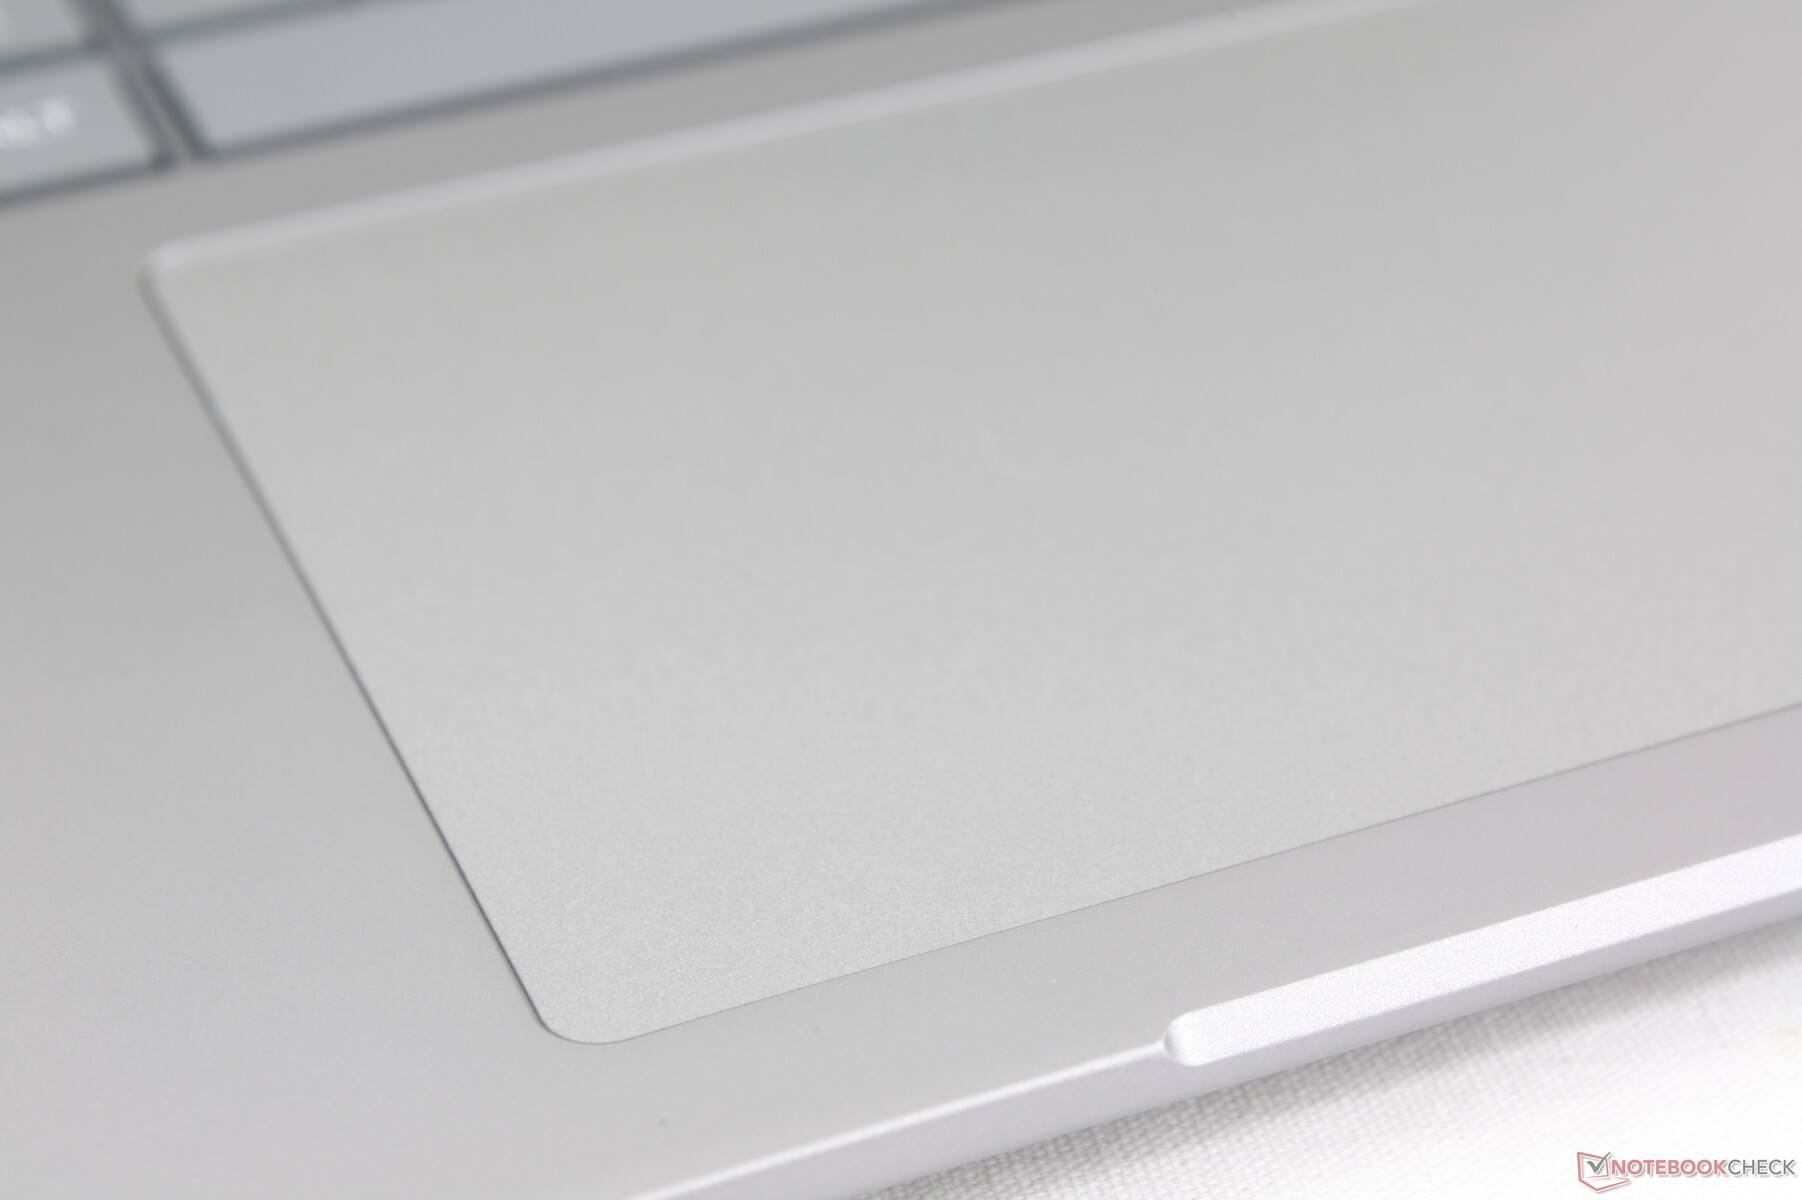
Das Clickpad ist kleiner als das auf dem Spectre x360 16 (13,5 x 8,8 cm vs 16 x 10 cm). Es fühlt sich dennoch geräumig an und ist selbst für einen 16-Zoll-Laptop ausreichend groß. Die Haftung ist gleichmäßig und man bleibt nur bei langsamerem Gleiten ein wenig hängen. Das Feedback beim Klicken ist etwas zu weich und könnte fester sein.

Display — High-End OLED zum Mittelklasse-Preis
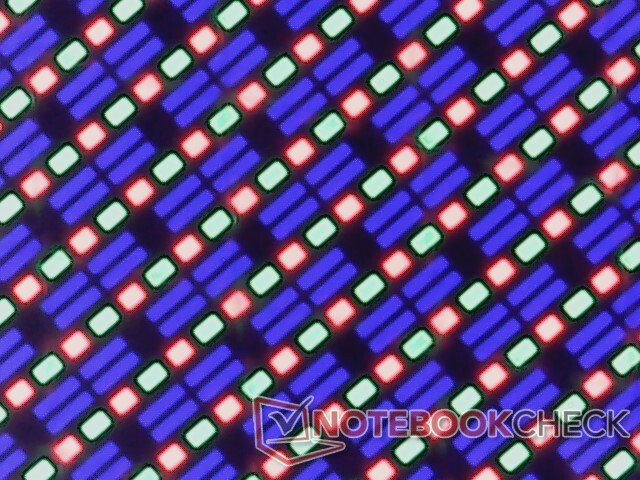
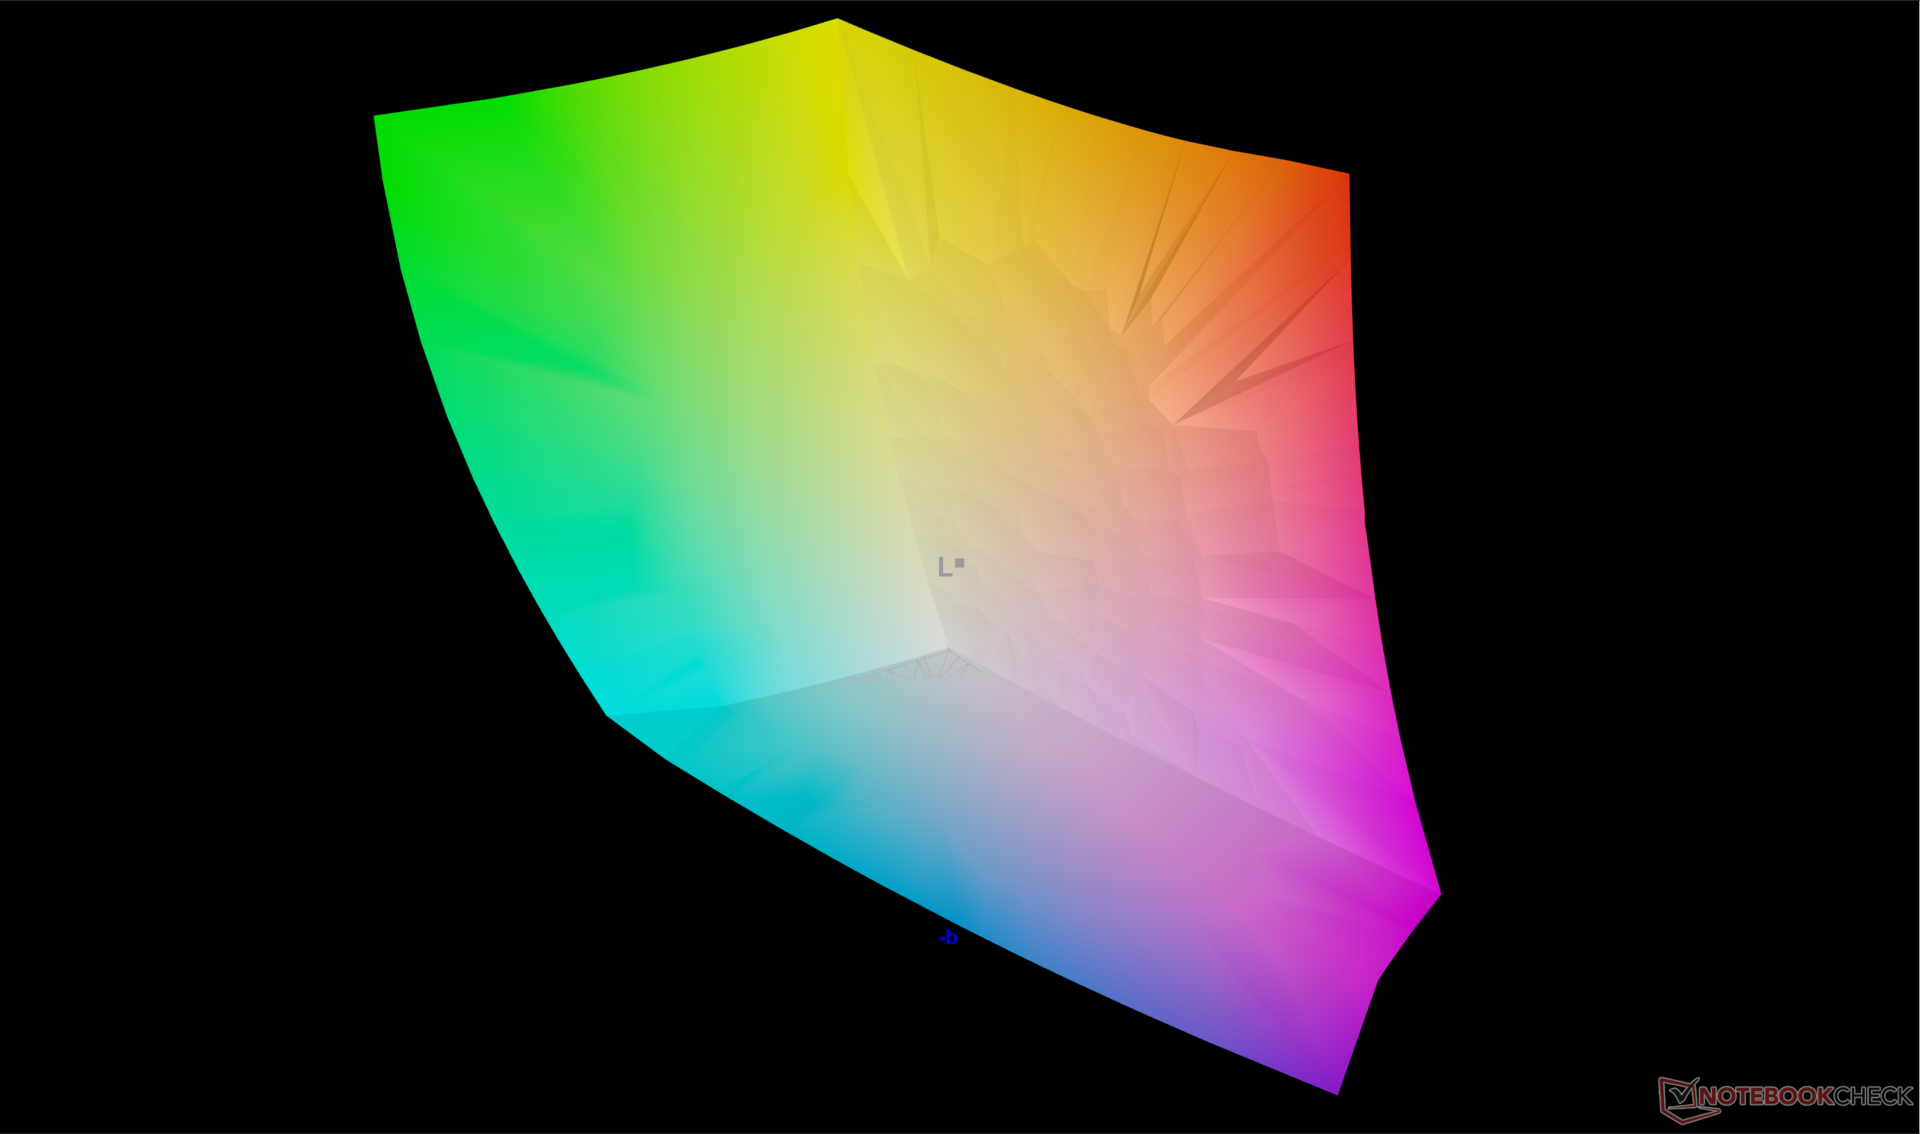
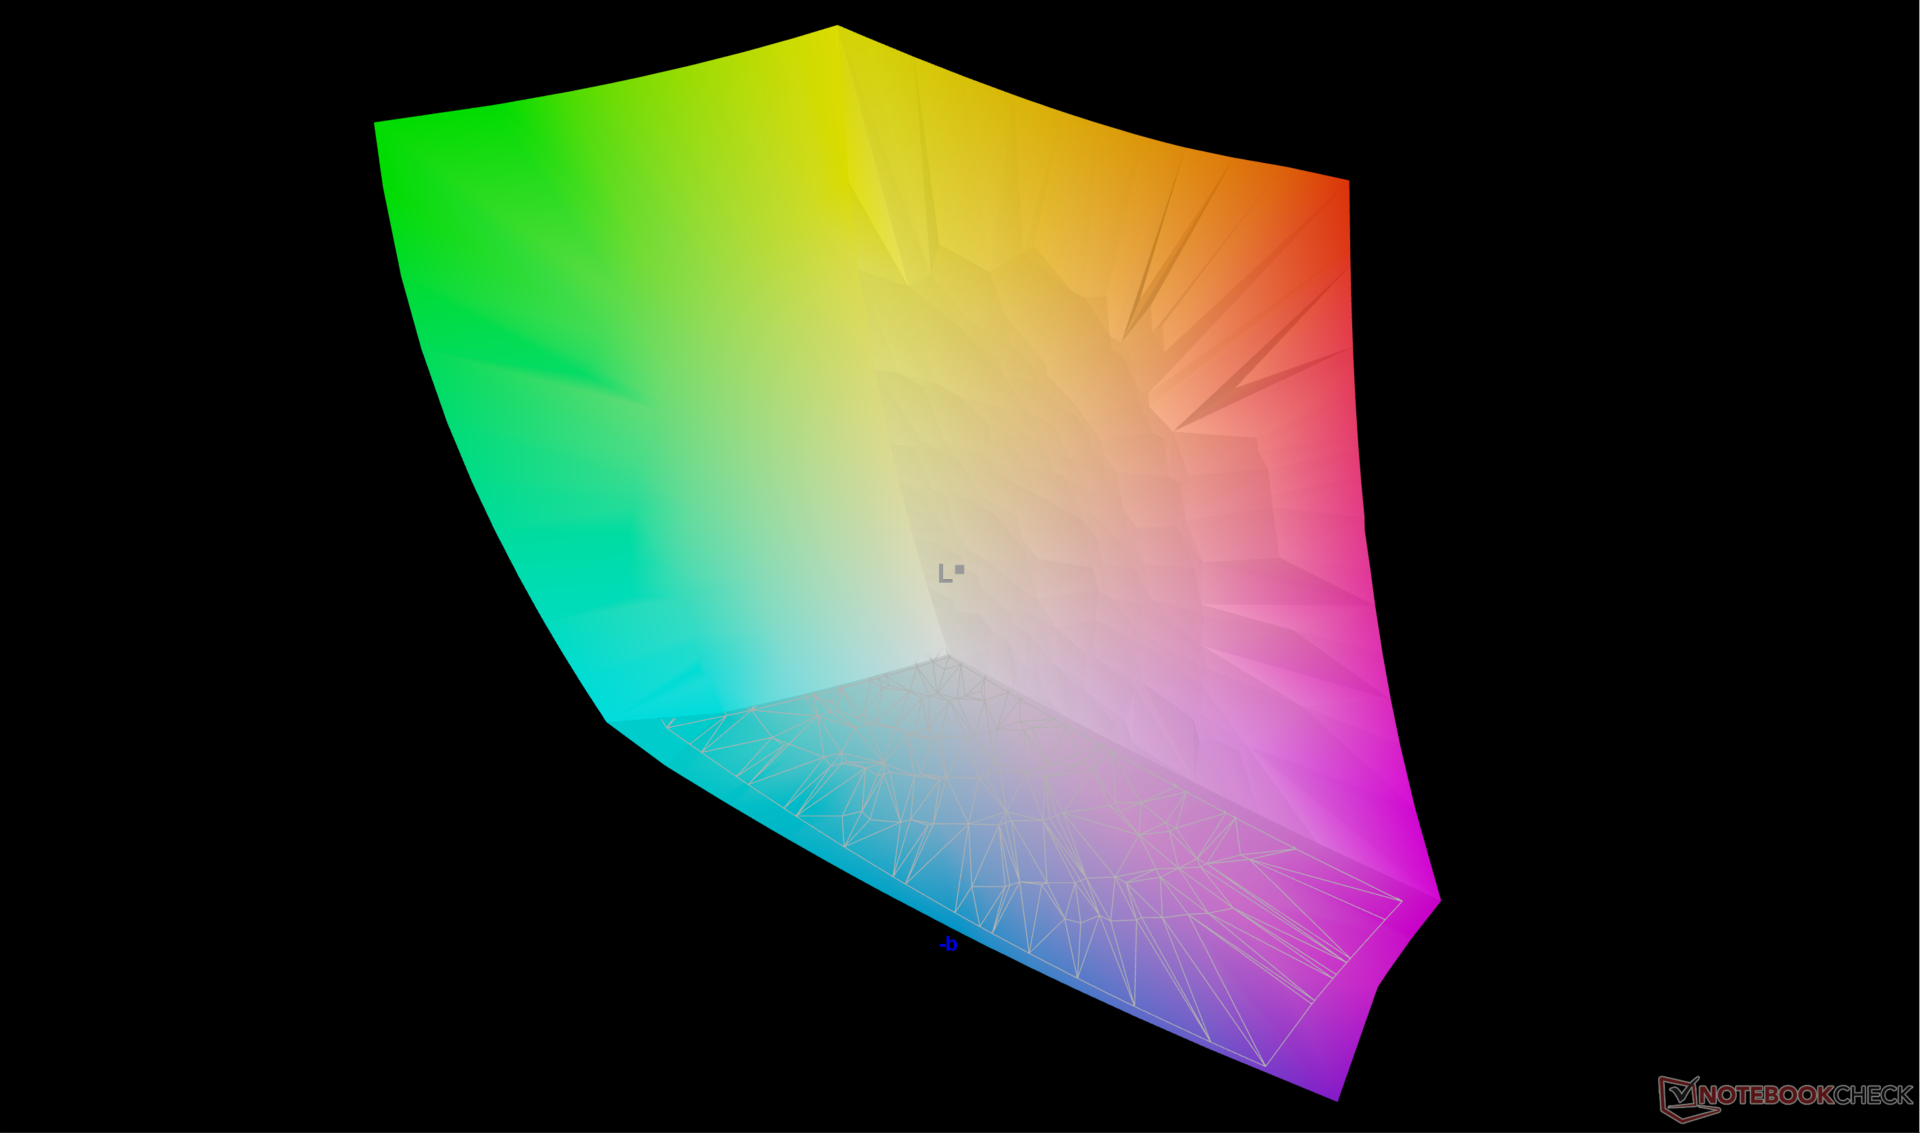
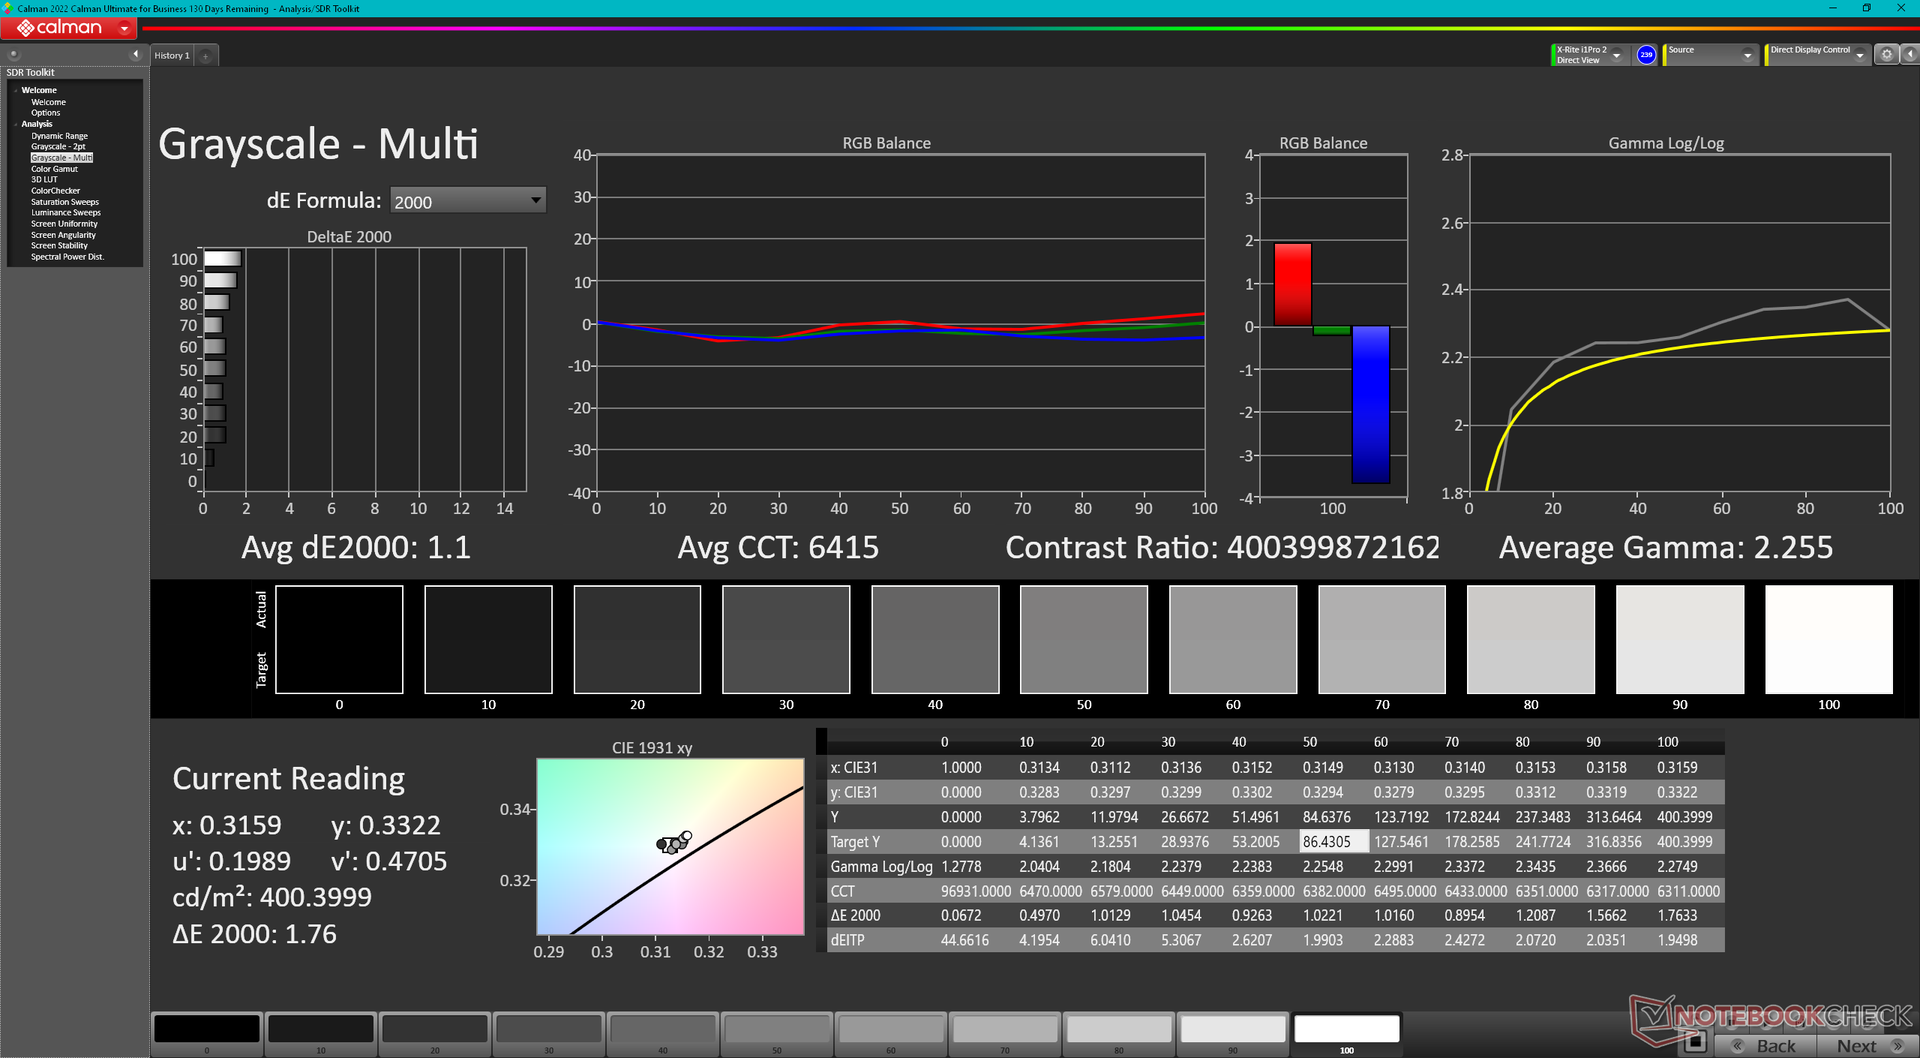
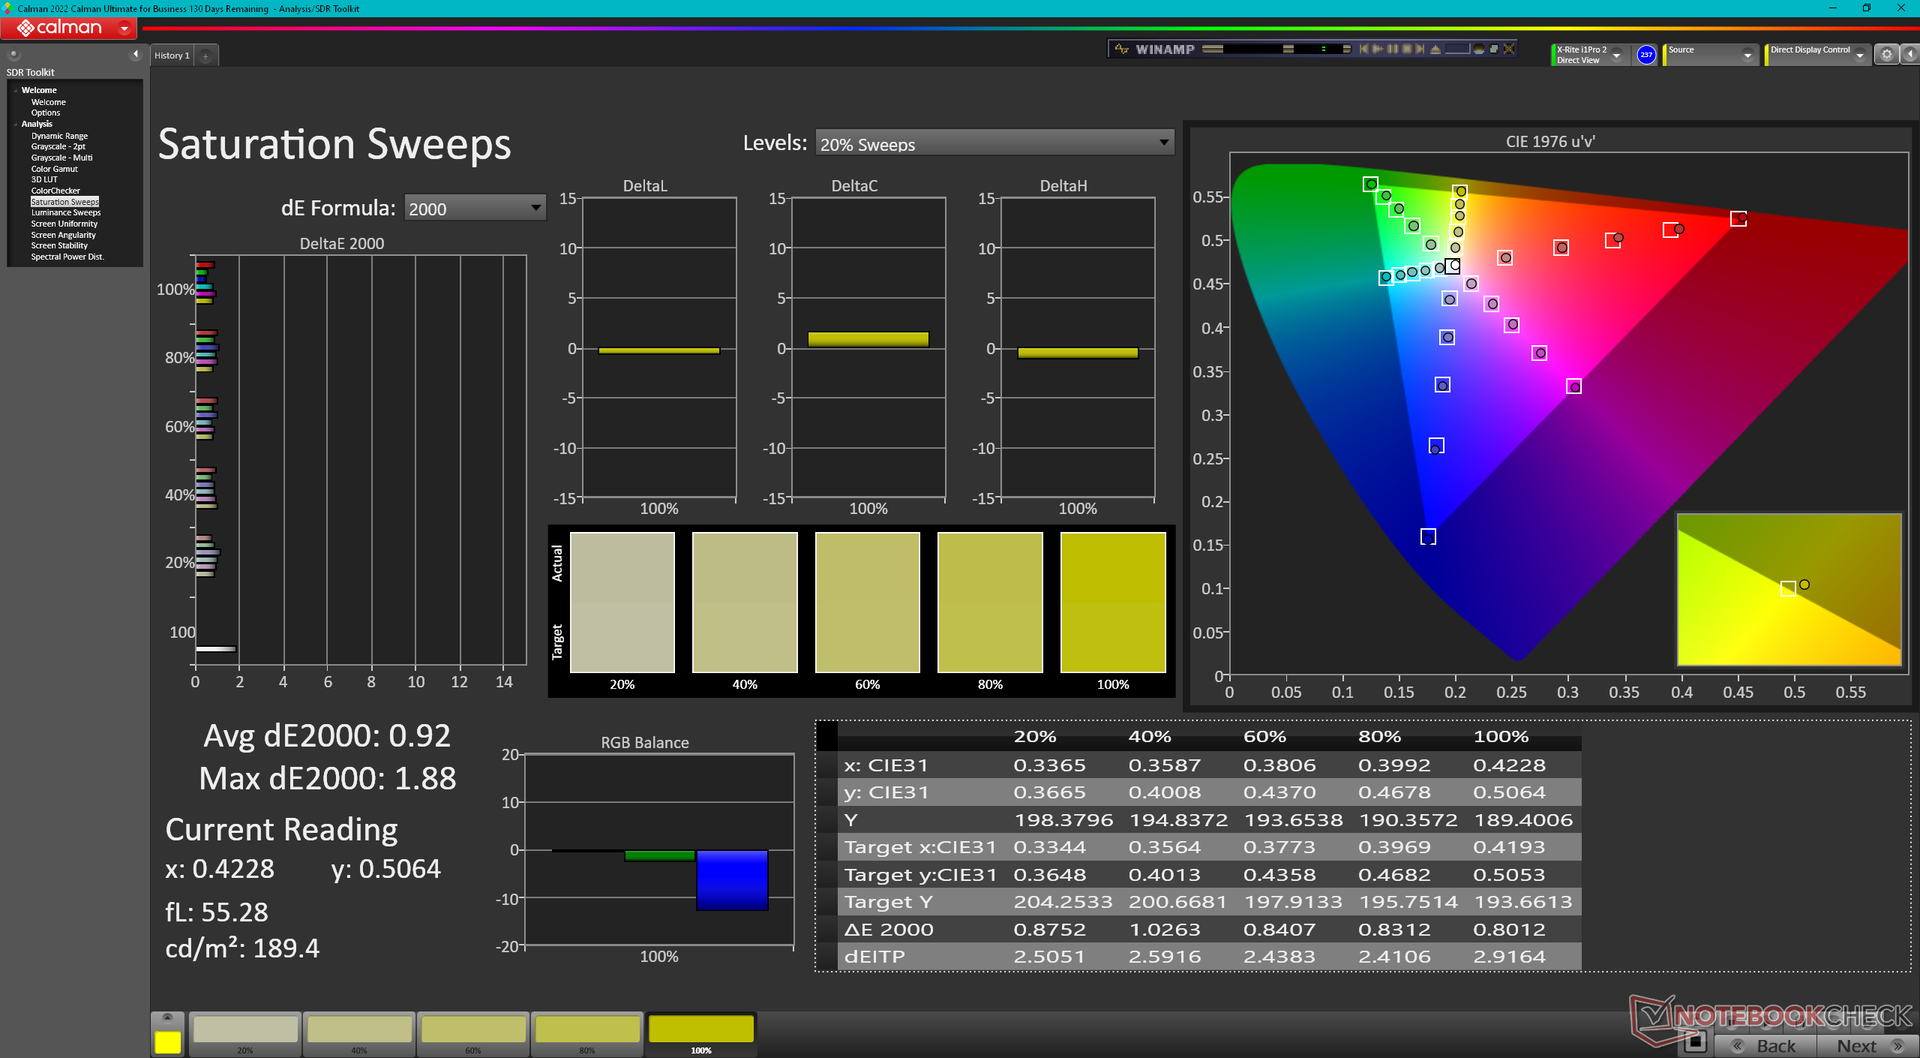
HP setzt im Envy x360 16 und im Spectre x360 16 trotz deutlichem Preisunterschied das gleiche Samsung-SDC41A6-OLED-Panel ein. Das visuelle Erlebnis ist also bei beiden Modellen von der 100-%-DCI-P3-Farbraumabdeckung, über die schnelle Reaktionszeit, die 120-Hz-Bildwiederholrate, die 400-cd/m²-Helligkeit bis hin zur OLED-DC-Dimming-Technologie identisch. Es handelt sich hier um ein High-End-Display in einem Mittelklasse-Laptop. Das wertet das Envy x360 16 im Vergleich zu preislich ähnlichen Alternativen auf.
Das Display erreicht im aktiven HDR-Modus bis zu 616 cd/m². Ansonsten sind SDR-Inhalte auf rund 400 cd/m² begrenzt.
Das 120-Hz-Display unterstützt keine variablen Bildwiederholraten und bietet stattdessen zwei Optionen: 48 Hz und 120 Hz. Anders als bei den meisten anderen Panels gibt es keine 60 Hz-Option.
| |||||||||||||||||||||||||
Ausleuchtung: 98 %
Helligkeit Akku: 399.4 cd/m²
Kontrast: ∞:1 (Schwarzwert: 0 cd/m²)
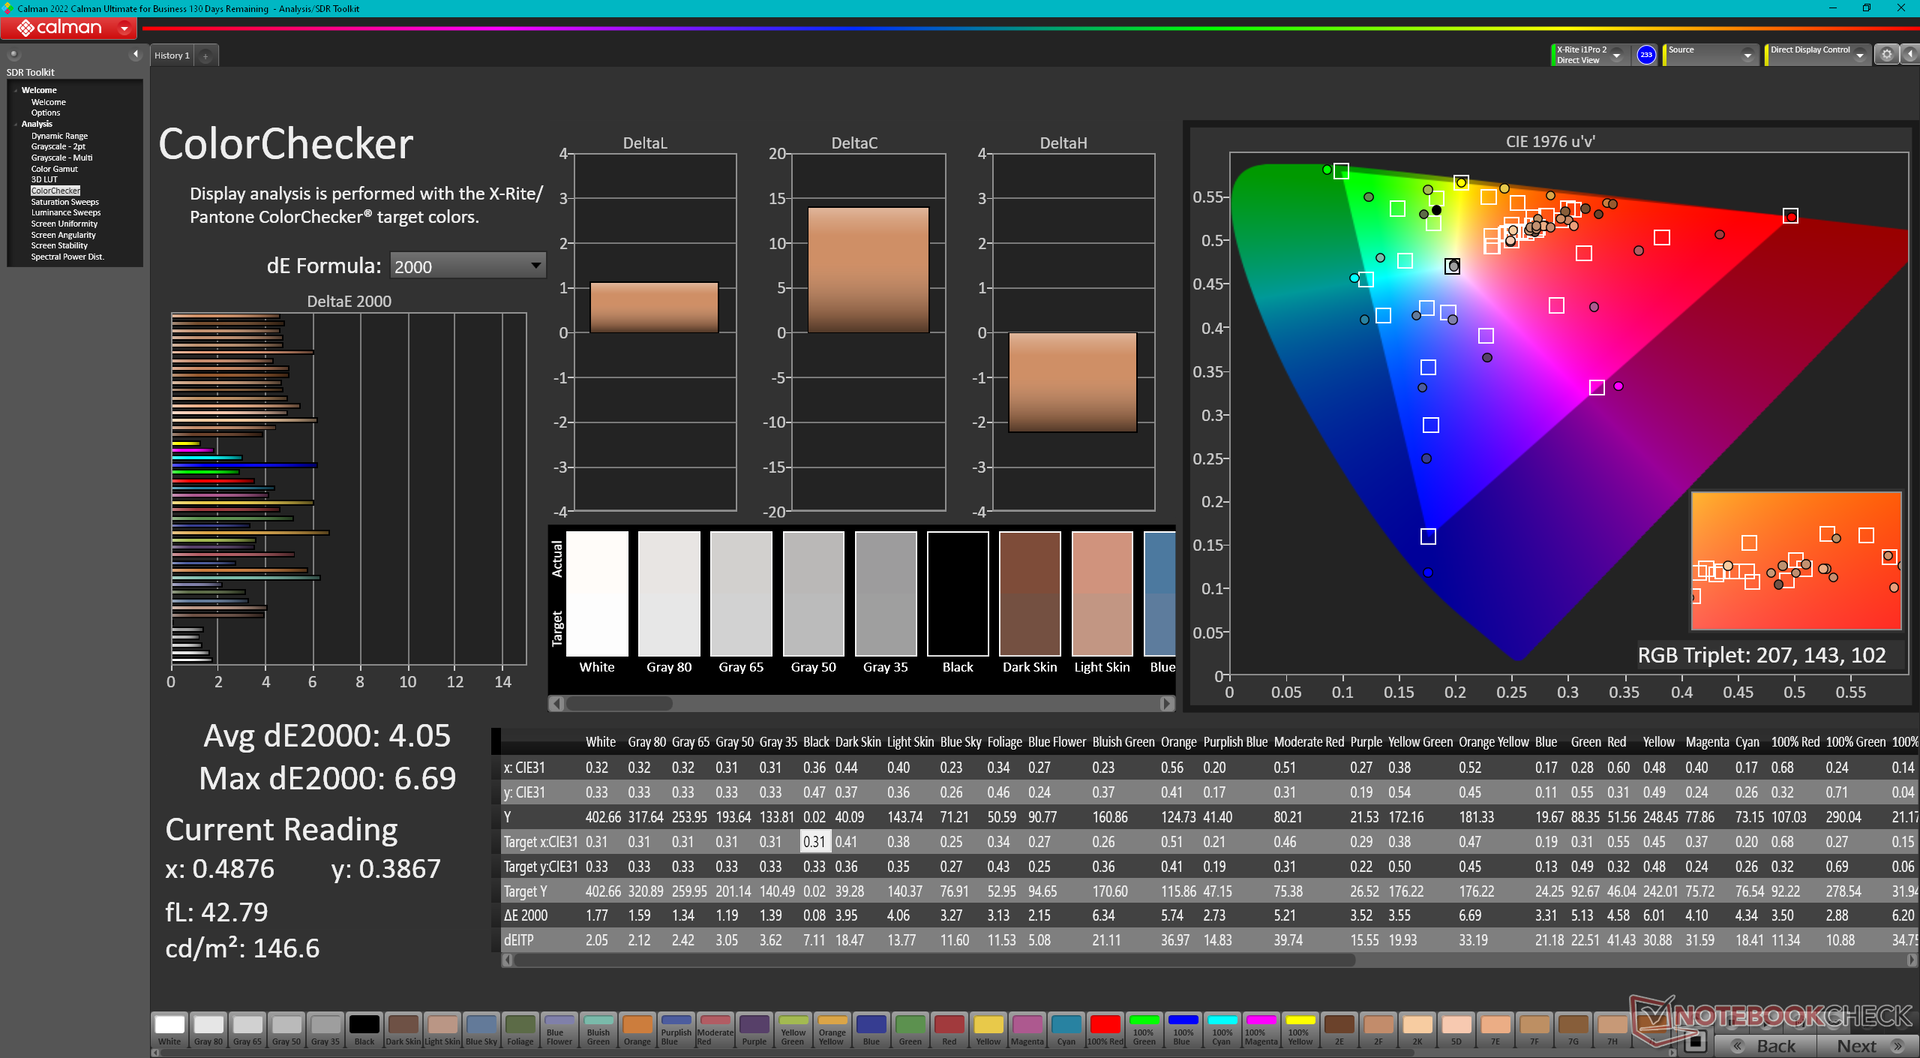
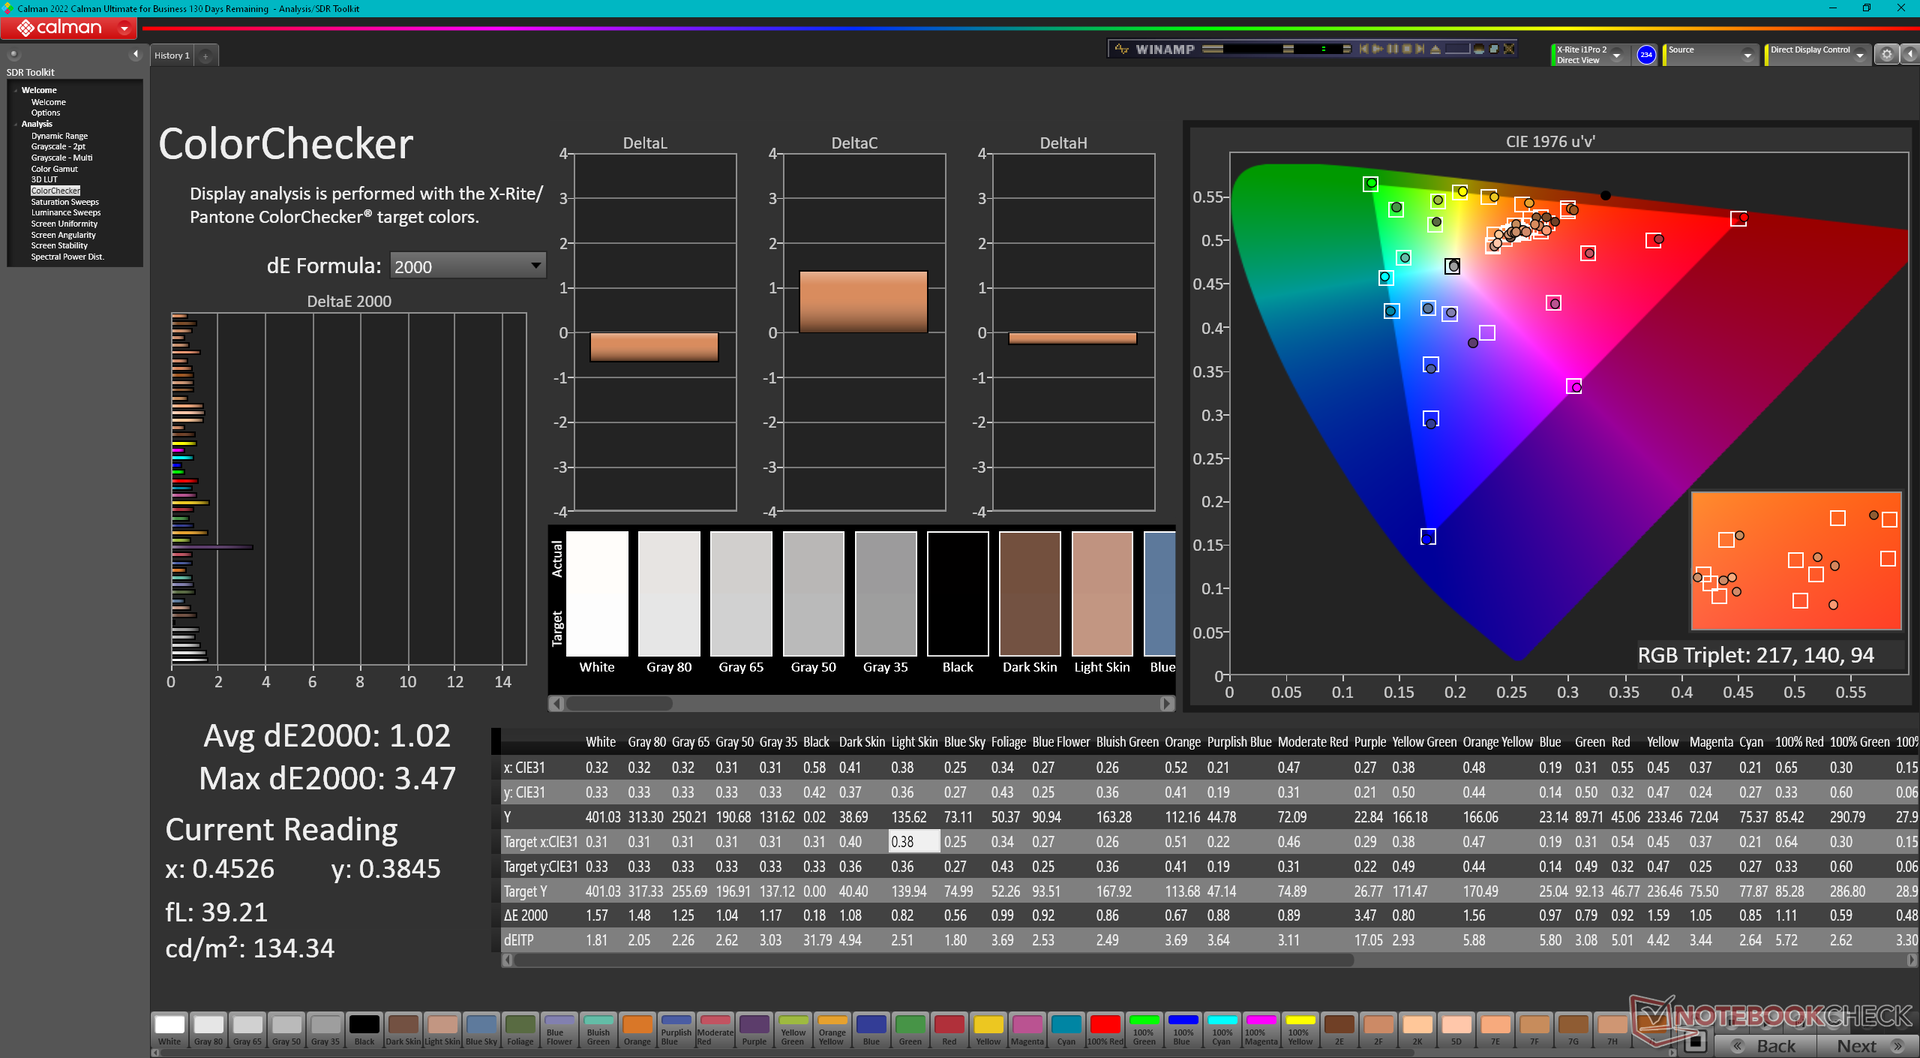
ΔE ColorChecker Calman: 4.05 | ∀{0.5-29.43 Ø4.72}
calibrated: 1.02
ΔE Greyscale Calman: 1.1 | ∀{0.09-98 Ø4.97}
96.5% AdobeRGB 1998 (Argyll 3D)
100% sRGB (Argyll 3D)
99.6% Display P3 (Argyll 3D)
Gamma: 2.27
CCT: 6419 K
| HP Envy x360 2-in-1 16-ad0097nr Samsung SDC41A6, OLED, 2880x1800, 16" | HP Envy 16 h0112nr Samsung SDC4174, OLED, 3840x2400, 16" | HP Spectre x360 16 RTX 4050 Samsung SDC41A6, OLED, 2880x1800, 16" | Lenovo Yoga 7 2-in-1 16IML9 LEN160FHD, IPS, 1920x1200, 16" | Samsung Galaxy Book4 Pro 360 ATNA60CL09-0, OLED, 2880x1800, 16" | LG Gram 2in1 16 16T90R - G.AA78G LP160WQ1-SPB2, IPS, 2560x1600, 16" | |
|---|---|---|---|---|---|---|
| Display | -3% | 0% | -51% | 0% | -5% | |
| Display P3 Coverage (%) | 99.6 | 99.3 0% | 99.6 0% | 40.9 -59% | 99.9 0% | 96.5 -3% |
| sRGB Coverage (%) | 100 | 100 0% | 100 0% | 61.4 -39% | 100 0% | 99.9 0% |
| AdobeRGB 1998 Coverage (%) | 96.5 | 88 -9% | 96.7 0% | 42.3 -56% | 96.6 0% | 84.6 -12% |
| Response Times | -132% | 3% | -3131% | 32% | -3502% | |
| Response Time Grey 50% / Grey 80% * (ms) | 0.8 ? | 2 ? -150% | 0.78 ? 2% | 32.1 ? -3913% | 0.49 ? 39% | 38.4 ? -4700% |
| Response Time Black / White * (ms) | 0.89 ? | 1.9 ? -113% | 0.86 ? 3% | 21.8 ? -2349% | 0.67 ? 25% | 21.4 ? -2304% |
| PWM Frequency (Hz) | 491.8 ? | 240.4 ? | 480 ? | 240 ? | ||
| Bildschirm | 3% | -8% | -84% | 14% | -68% | |
| Helligkeit Bildmitte (cd/m²) | 399.4 | 328.8 -18% | 385.2 -4% | 313.3 -22% | 387 -3% | 329 -18% |
| Brightness (cd/m²) | 405 | 332 -18% | 387 -4% | 294 -27% | 392 -3% | 310 -23% |
| Brightness Distribution (%) | 98 | 97 -1% | 99 1% | 82 -16% | 98 0% | 88 -10% |
| Schwarzwert * (cd/m²) | 0.35 | 0.39 | ||||
| Delta E Colorchecker * | 4.05 | 1.53 62% | 1.73 57% | 4.41 -9% | 1 75% | 3.52 13% |
| Colorchecker dE 2000 max. * | 6.69 | 6.04 10% | 3.95 41% | 15.75 -135% | 1.9 72% | 6.96 -4% |
| Colorchecker dE 2000 calibrated * | 1.02 | 1.84 -80% | 1.15 -13% | |||
| Delta E Graustufen * | 1.1 | 1.3 -18% | 2.6 -136% | 4.4 -300% | 1.7 -55% | 5.75 -423% |
| Gamma | 2.27 97% | 2.18 101% | 2.17 101% | 2.3 96% | 2.25 98% | 2.137 103% |
| CCT | 6419 101% | 6362 102% | 6133 106% | 7395 88% | 6325 103% | 7584 86% |
| Kontrast (:1) | 895 | 844 | ||||
| Durchschnitt gesamt (Programm / Settings) | -44% /
-23% | -2% /
-4% | -1089% /
-584% | 15% /
14% | -1192% /
-625% |
* ... kleinere Werte sind besser
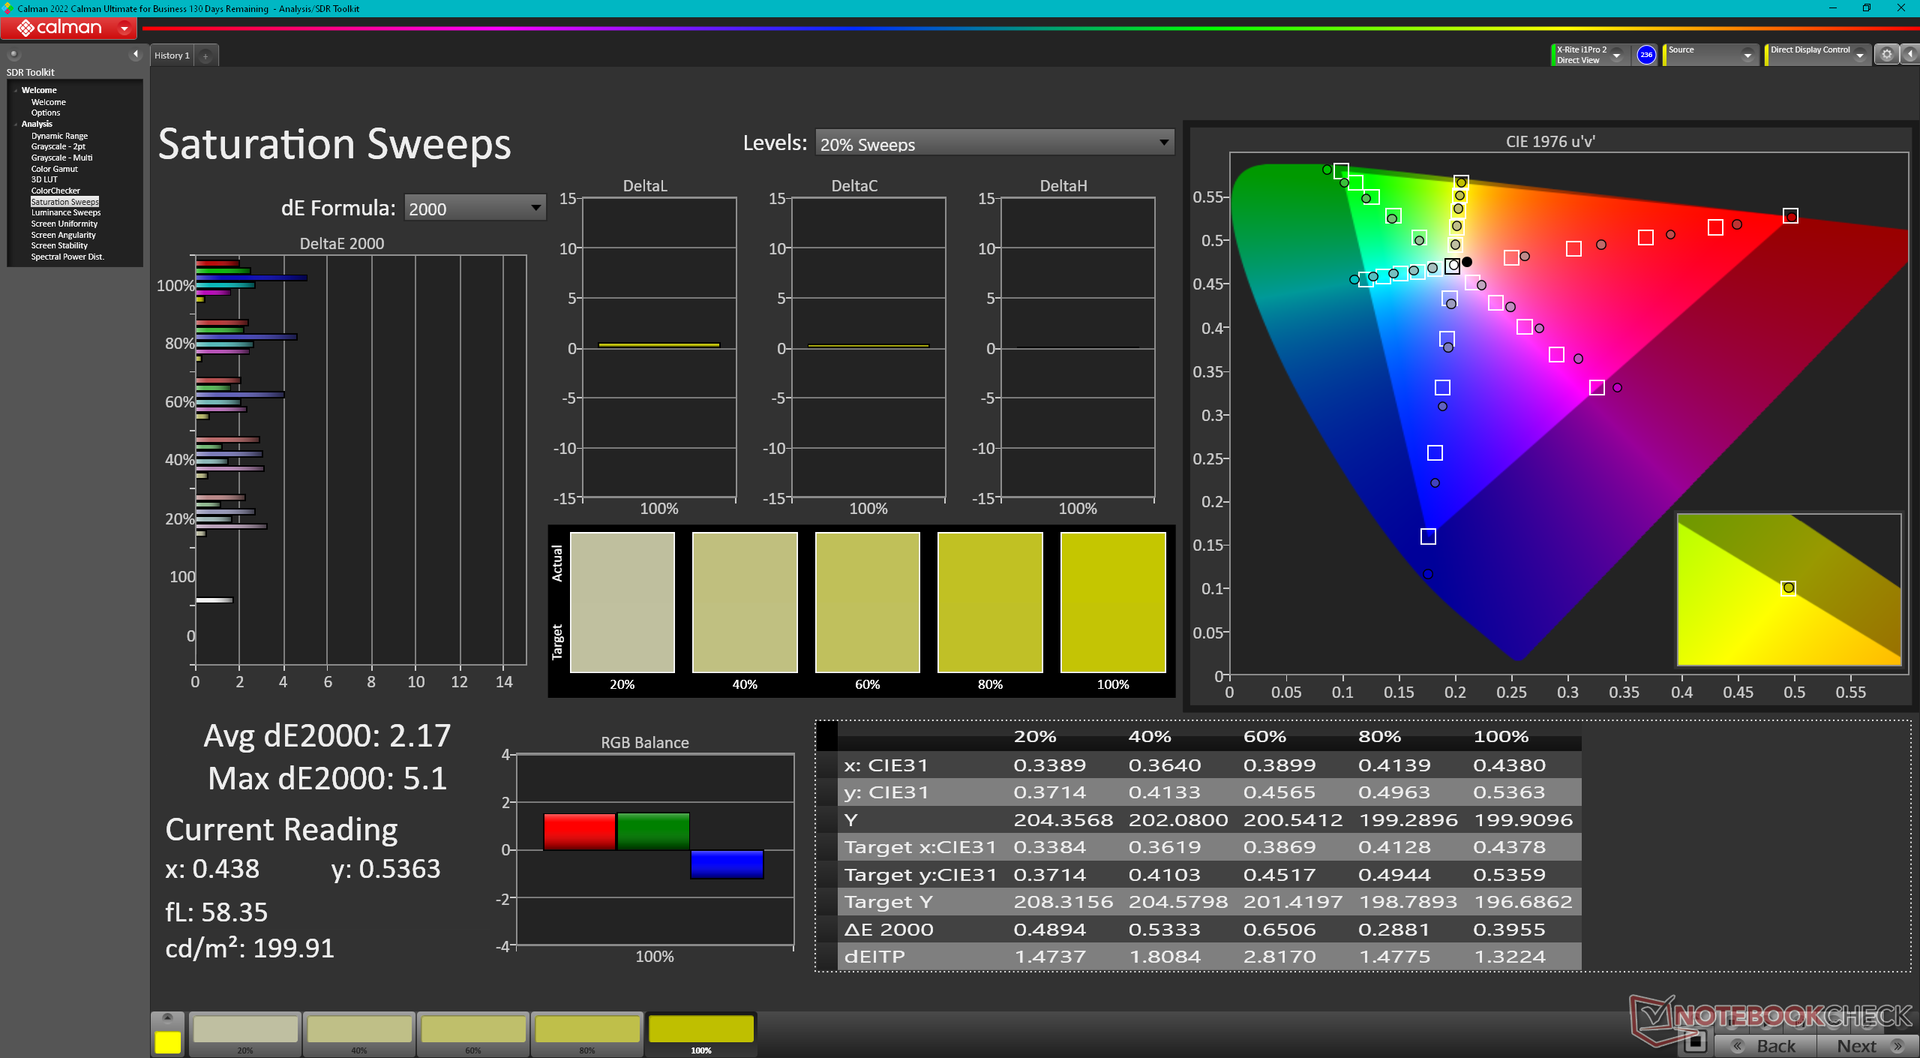
Das Display ist gut auf den P3-Standard kalibriert und bietet durchschnittliche Graustufen- und Farb-DeltaE-Werte von nur 1,1 bzw. 4,05.

Reaktionszeiten (Response Times) des Displays
| ↔ Reaktionszeiten Schwarz zu Weiß | ||
|---|---|---|
| 0.89 ms ... steigend ↗ und fallend ↘ kombiniert | ↗ 0.42 ms steigend | 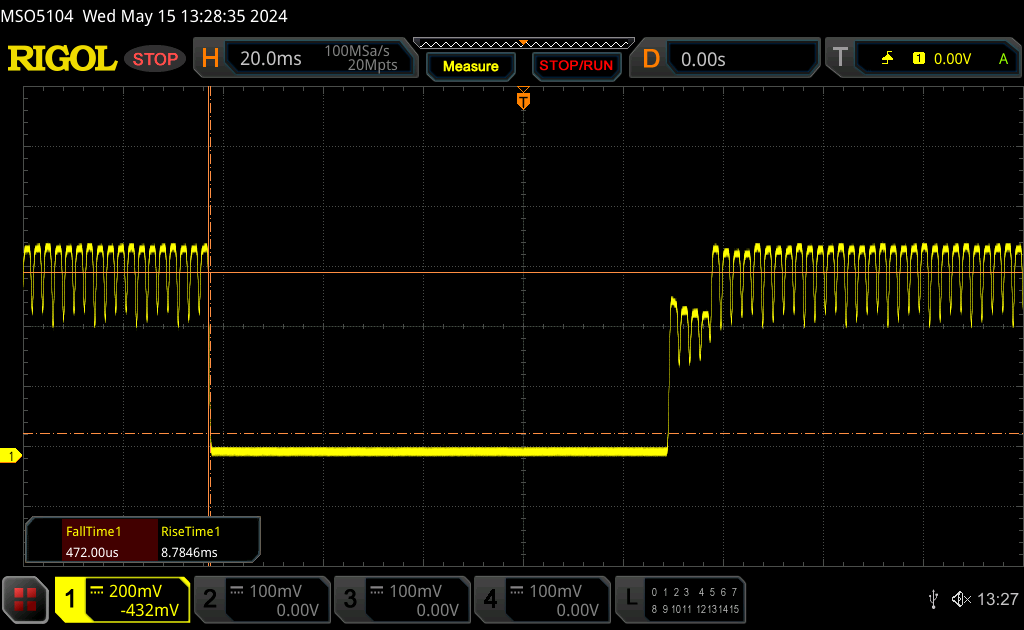 |
| ↘ 0.47 ms fallend | ||
| Die gemessenen Reaktionszeiten sind sehr kurz, wodurch sich der Bildschirm auch für schnelle 3D Spiele eignen sollte. Im Vergleich rangierten die bei uns getesteten Geräte von 0.1 (Minimum) zu 240 (Maximum) ms. » 3 % aller Screens waren schneller als der getestete. Daher sind die gemessenen Reaktionszeiten besser als der Durchschnitt aller vermessenen Geräte (19.8 ms). | ||
| ↔ Reaktionszeiten 50% Grau zu 80% Grau | ||
| 0.8 ms ... steigend ↗ und fallend ↘ kombiniert | ↗ 0.45 ms steigend | 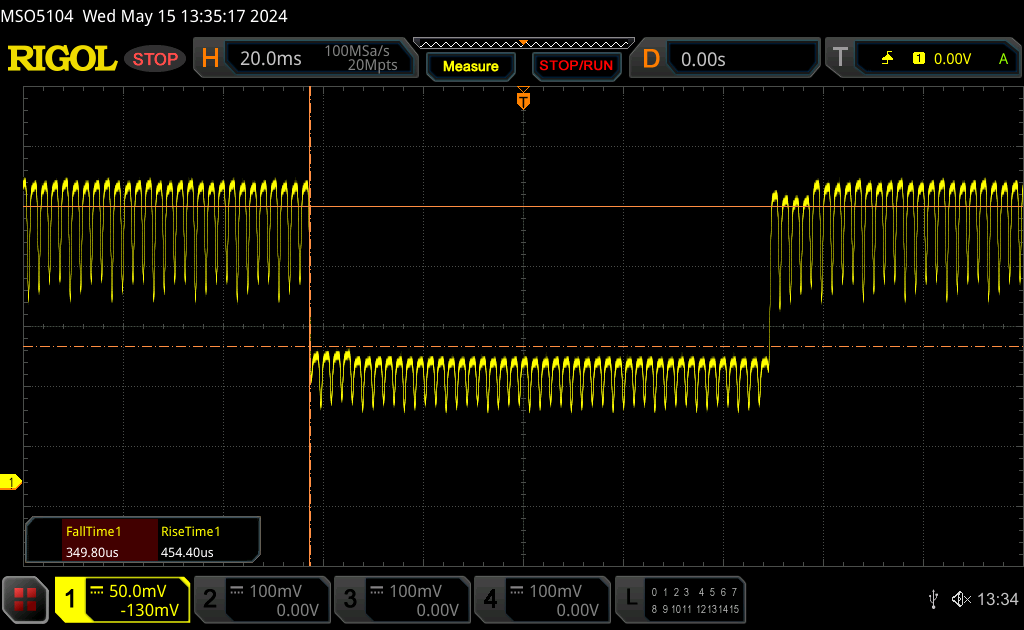 |
| ↘ 0.35 ms fallend | ||
| Die gemessenen Reaktionszeiten sind sehr kurz, wodurch sich der Bildschirm auch für schnelle 3D Spiele eignen sollte. Im Vergleich rangierten die bei uns getesteten Geräte von 0.165 (Minimum) zu 636 (Maximum) ms. » 3 % aller Screens waren schneller als der getestete. Daher sind die gemessenen Reaktionszeiten besser als der Durchschnitt aller vermessenen Geräte (31 ms). | ||
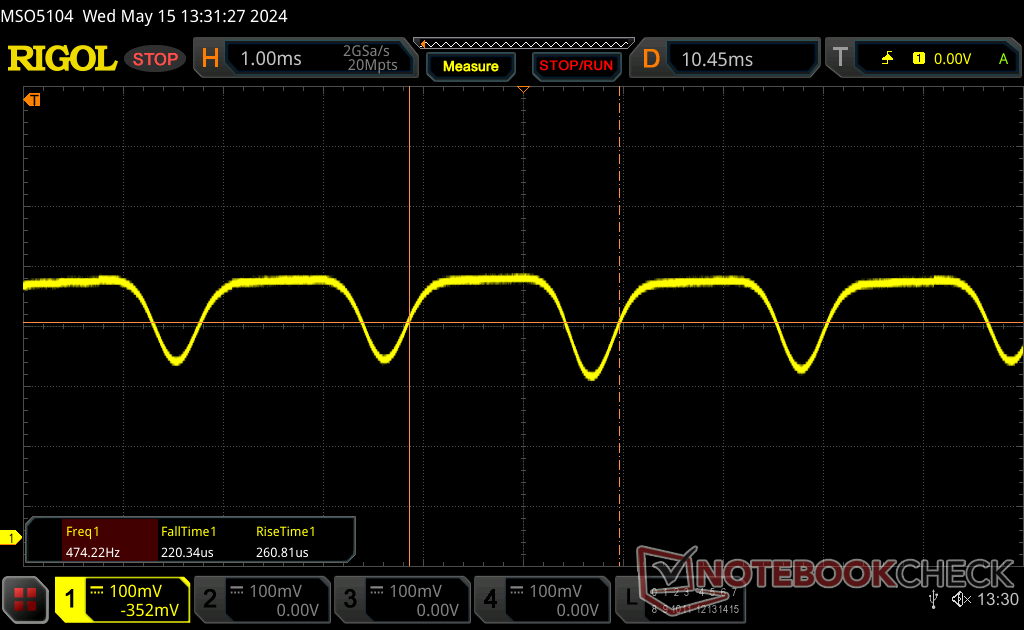
Bildschirm-Flackern / PWM (Pulse-Width Modulation)
| Flackern / PWM festgestellt | 491.8 Hz | ≤ 100 % Helligkeit | 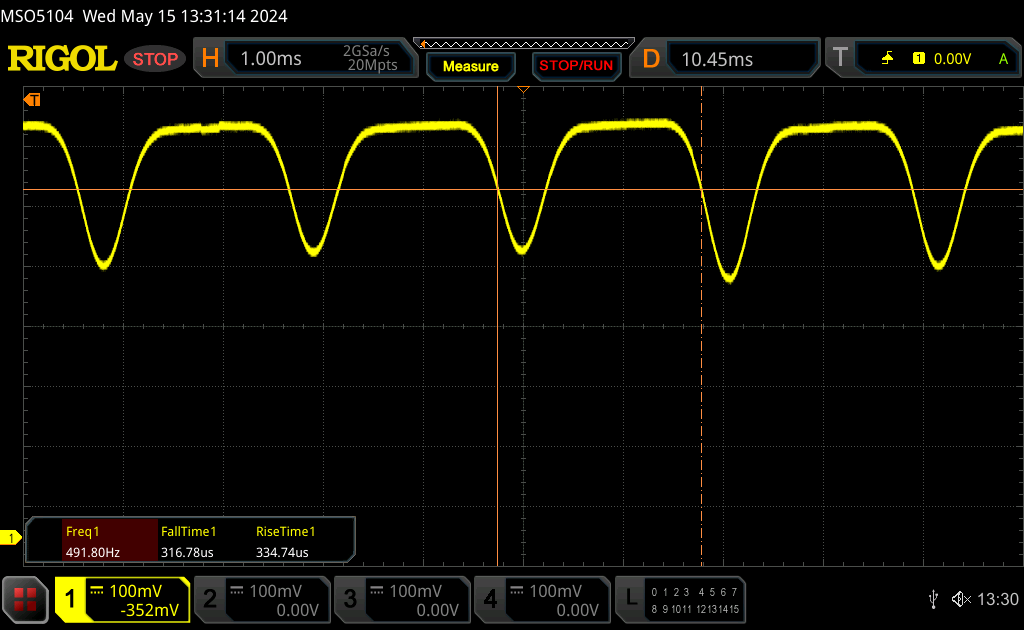 |
Das Display flackert mit 491.8 Hz (im schlimmsten Fall, eventuell durch Pulsweitenmodulation PWM) bei einer eingestellten Helligkeit von 100 % und darunter. Darüber sollte es zu keinem Flackern kommen. Die Frequenz von 491.8 Hz ist relativ hoch und sollte daher auch bei den meisten Personen zu keinen Problemen führen. Empfindliche User sollen laut Berichten aber sogar noch bei 500 Hz und darüber ein Flackern wahrnehmen. Im Vergleich: 52 % aller getesteten Geräte nutzten kein PWM um die Helligkeit zu reduzieren. Wenn PWM eingesetzt wurde, dann bei einer Frequenz von durchschnittlich 7778 (Minimum 5, Maximum 343500) Hz. | |||
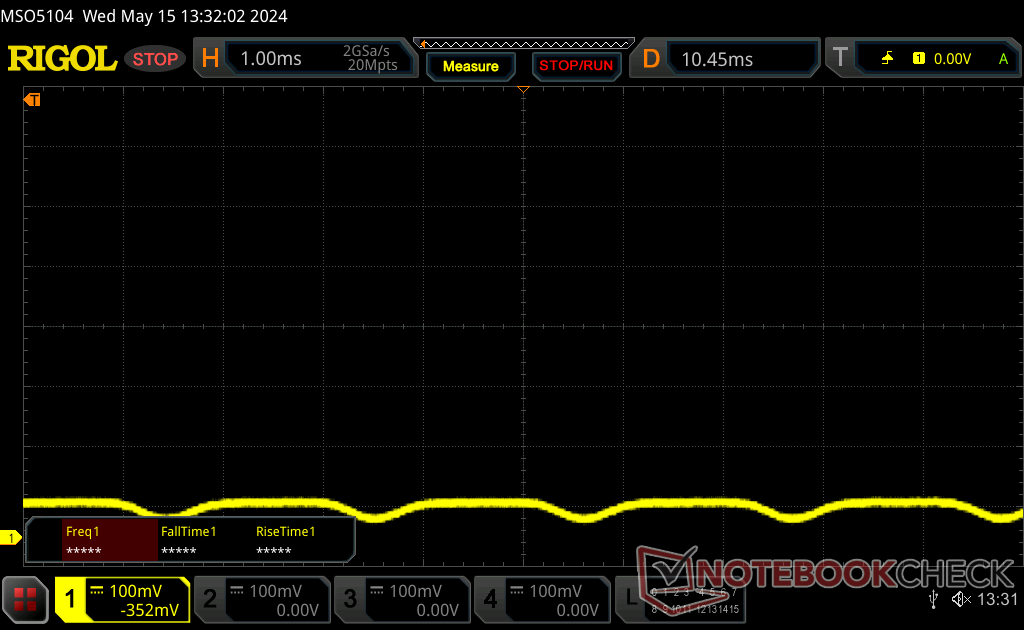
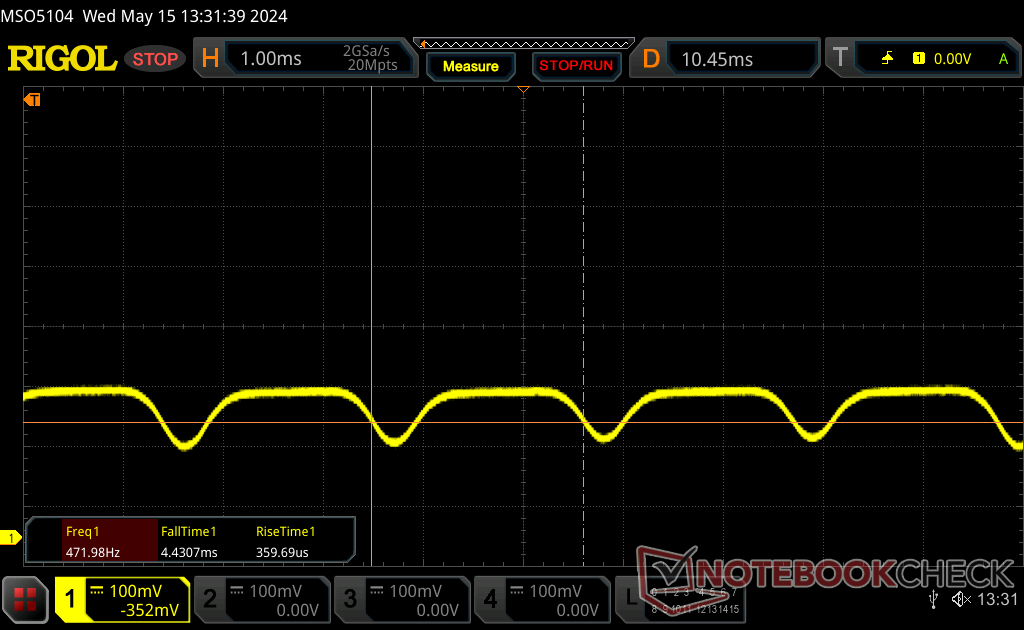
Die Pulsweitenmodulation ist auf allen Helligkeitsstufen präsent. Die Frequenz bleibt durchgehend bei 492 Hz konstant, während die meisten anderen OLED-Panele je nach Helligkeit zwischen zwei verschiedenen Frequenzen wechseln. Das liegt daran, dass HP DC Dimming nutzt, während andere OLED-Panele die Hintergrundbeleuchtung zyklenhaft ein- und ausschalten, um die Helligkeit zu kontrollieren.

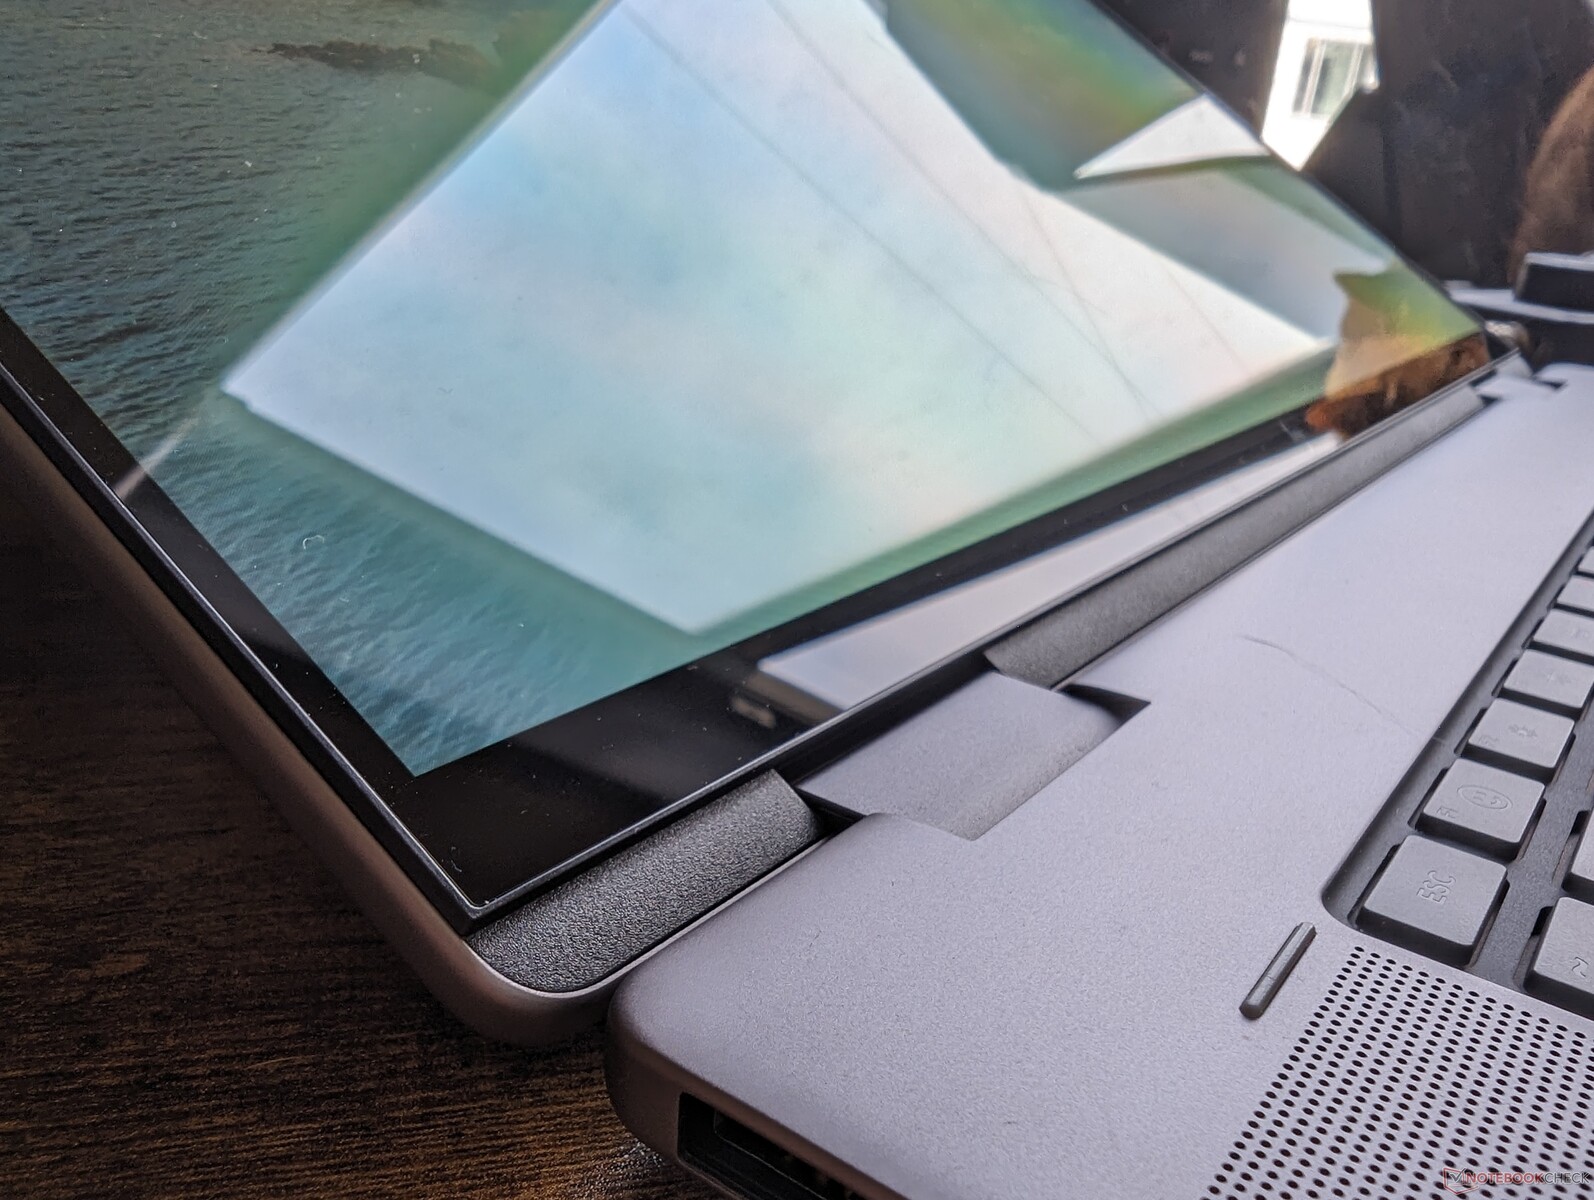
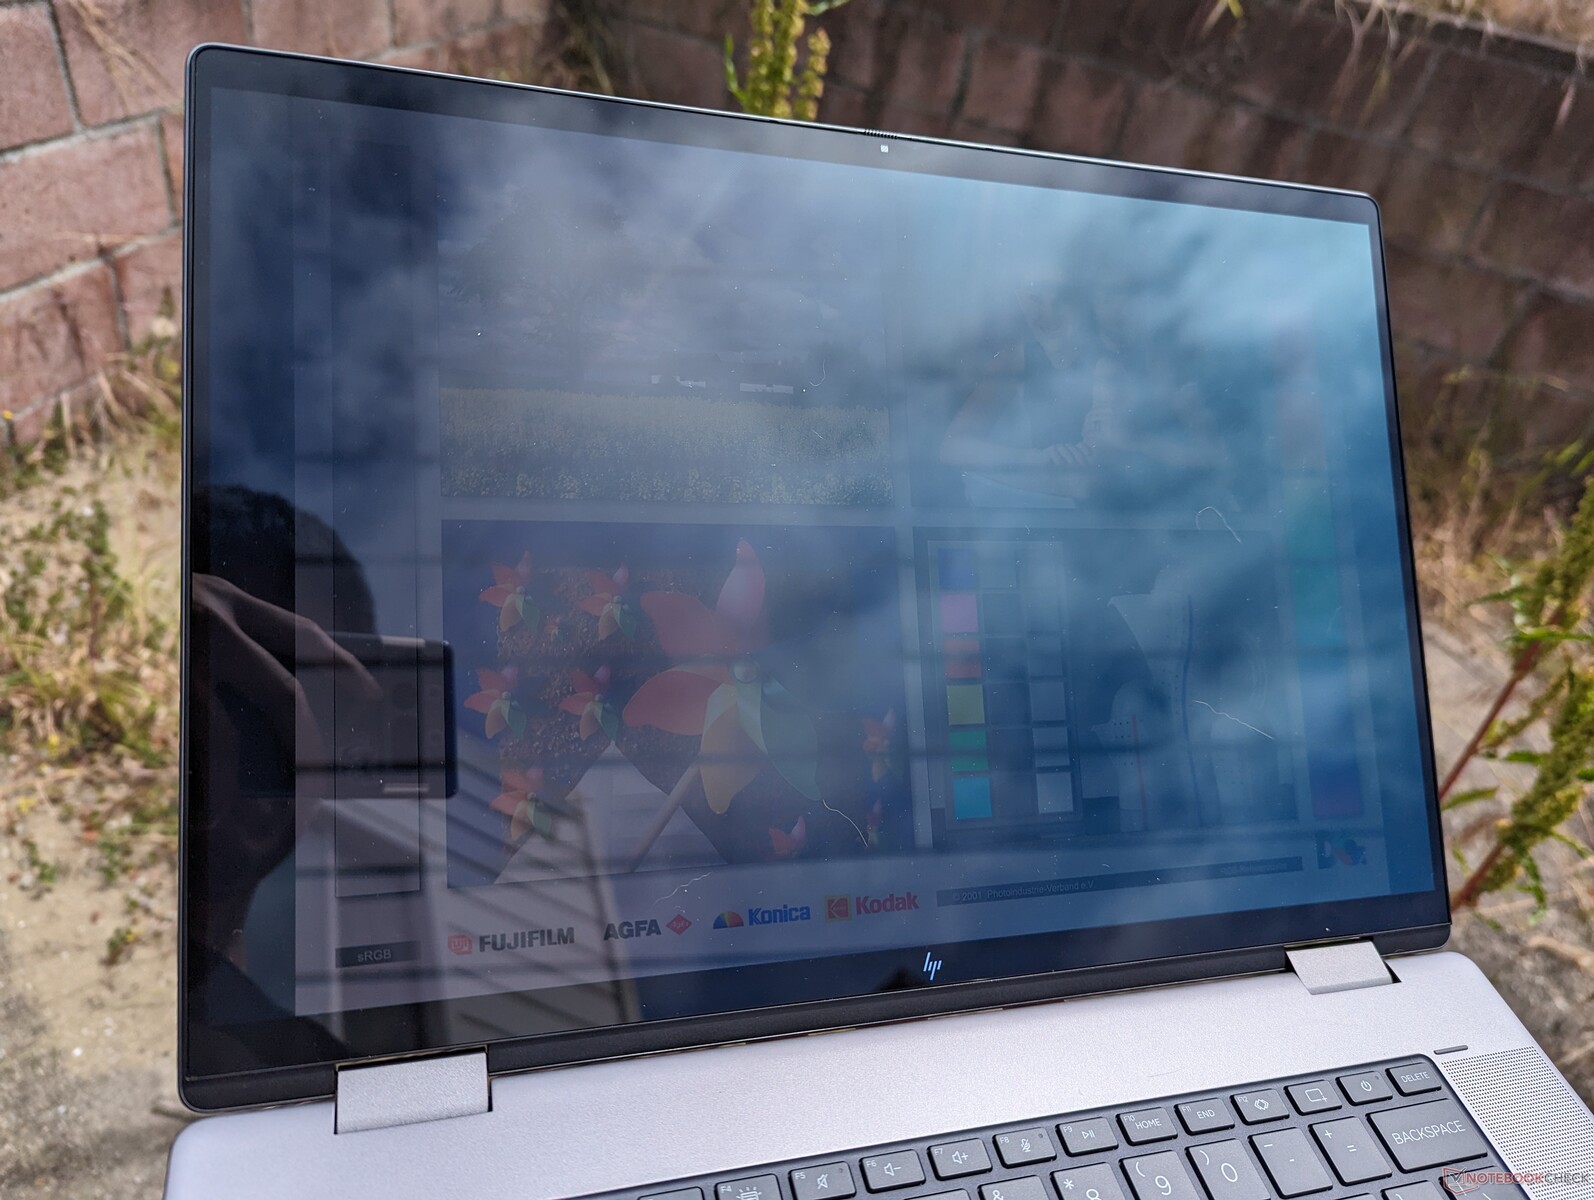
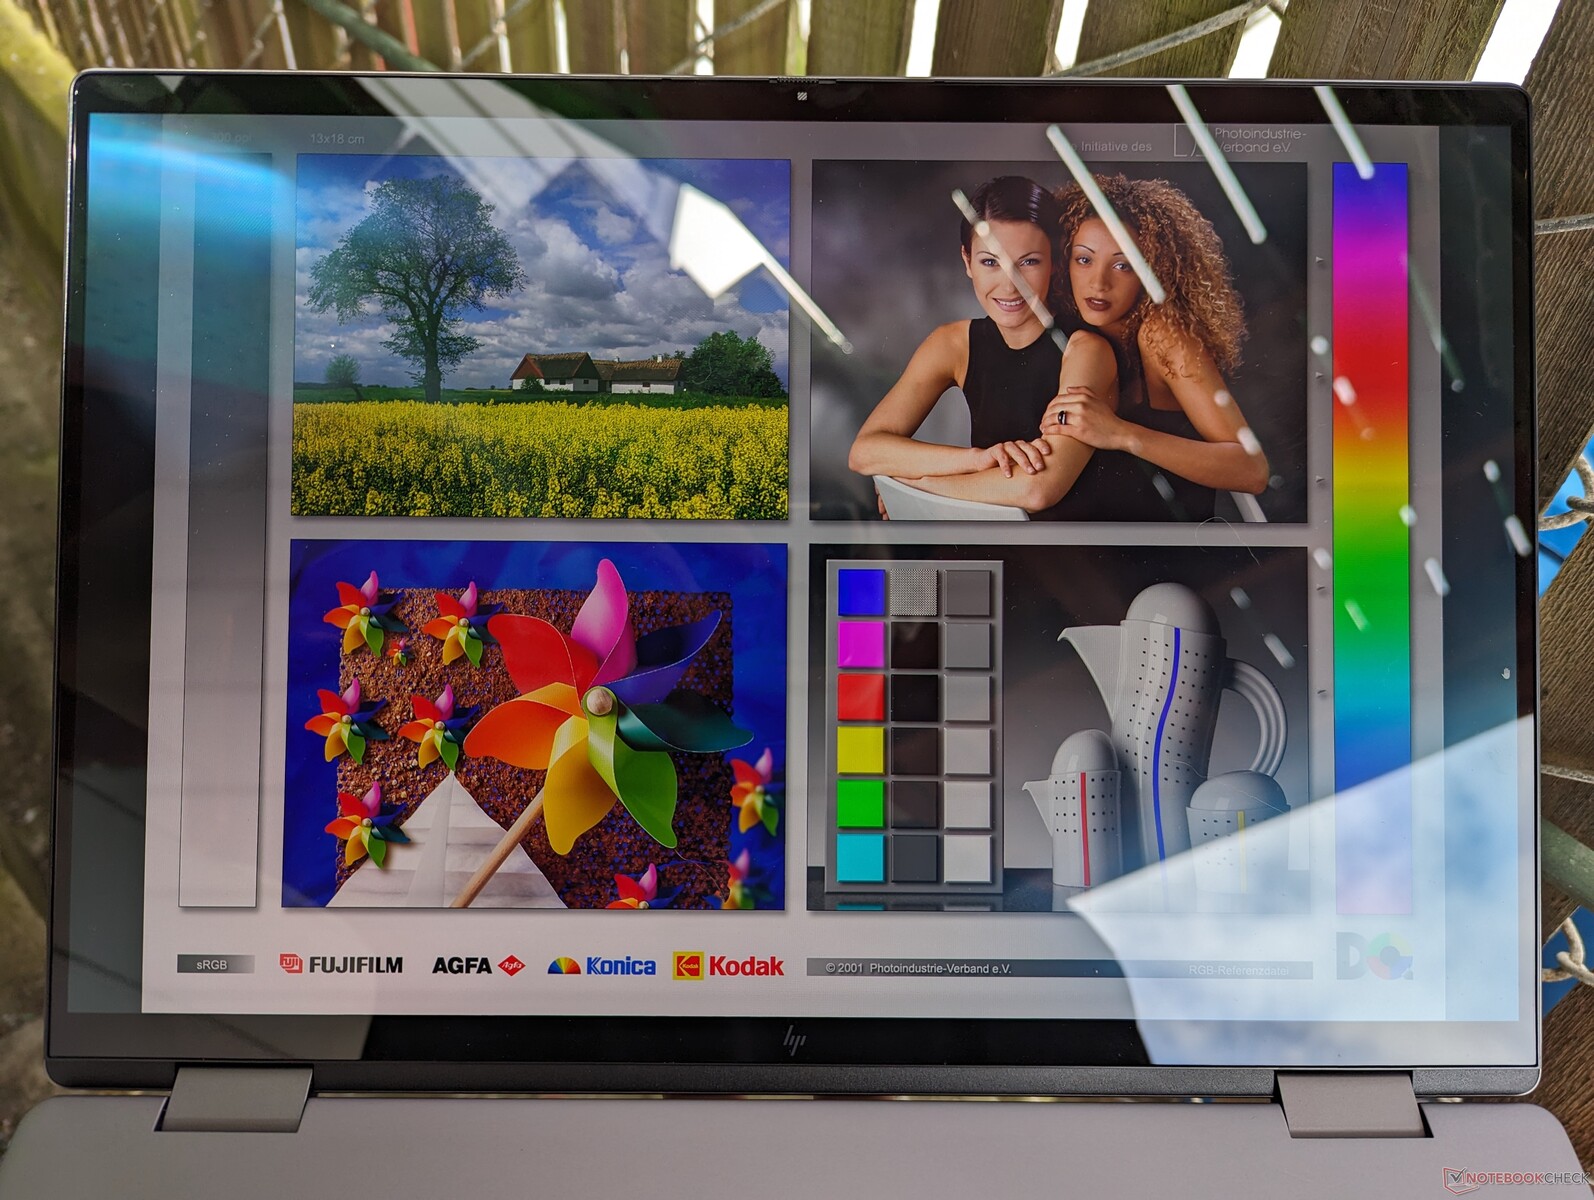
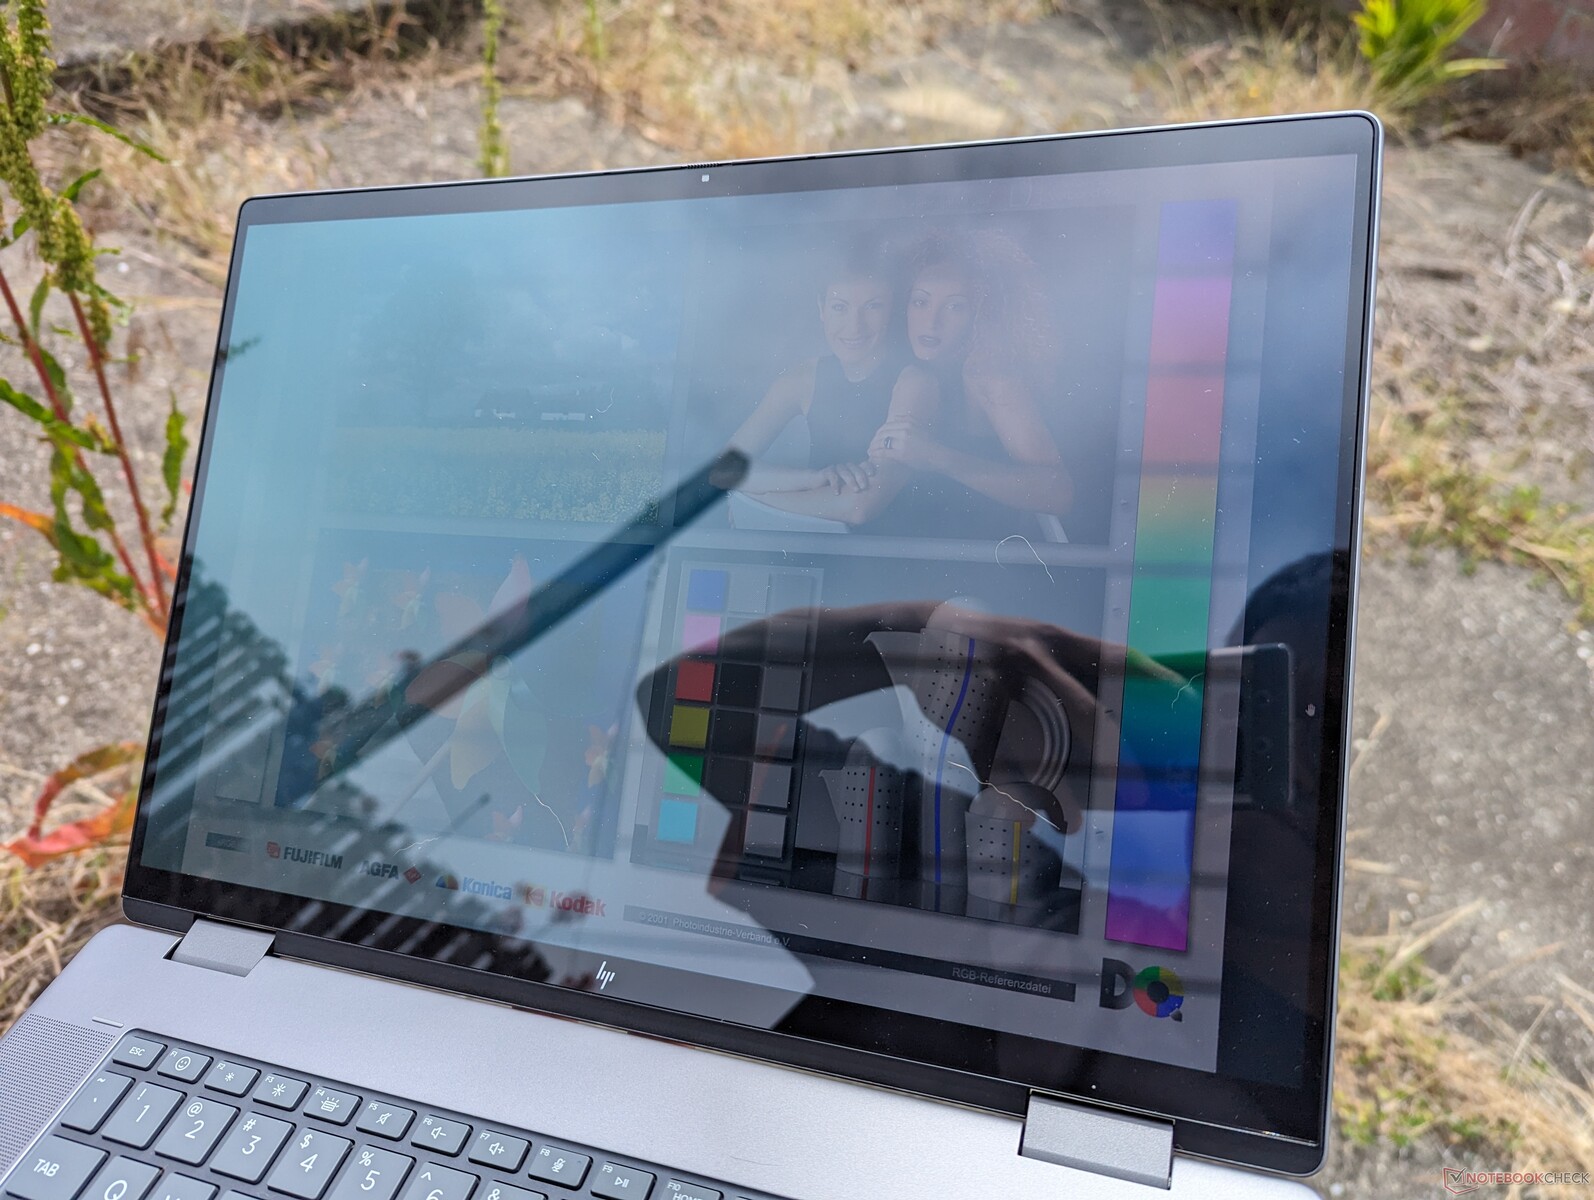
Blendeffekte auf dem glänzenden Display sind bei der Arbeit im Freien fast unvermeidlich. Die Hintergrundbeleuchtung ist nicht stark genug, um das Umgebungslicht zu überdecken, aber im Schatten kann die Blendung auf ein erträglicheres Maß reduziert werden.

Leistung — Ryzen 7 8840HS nicht unbedingt besser als Ryzen 7 7840HS
Testbedingungen
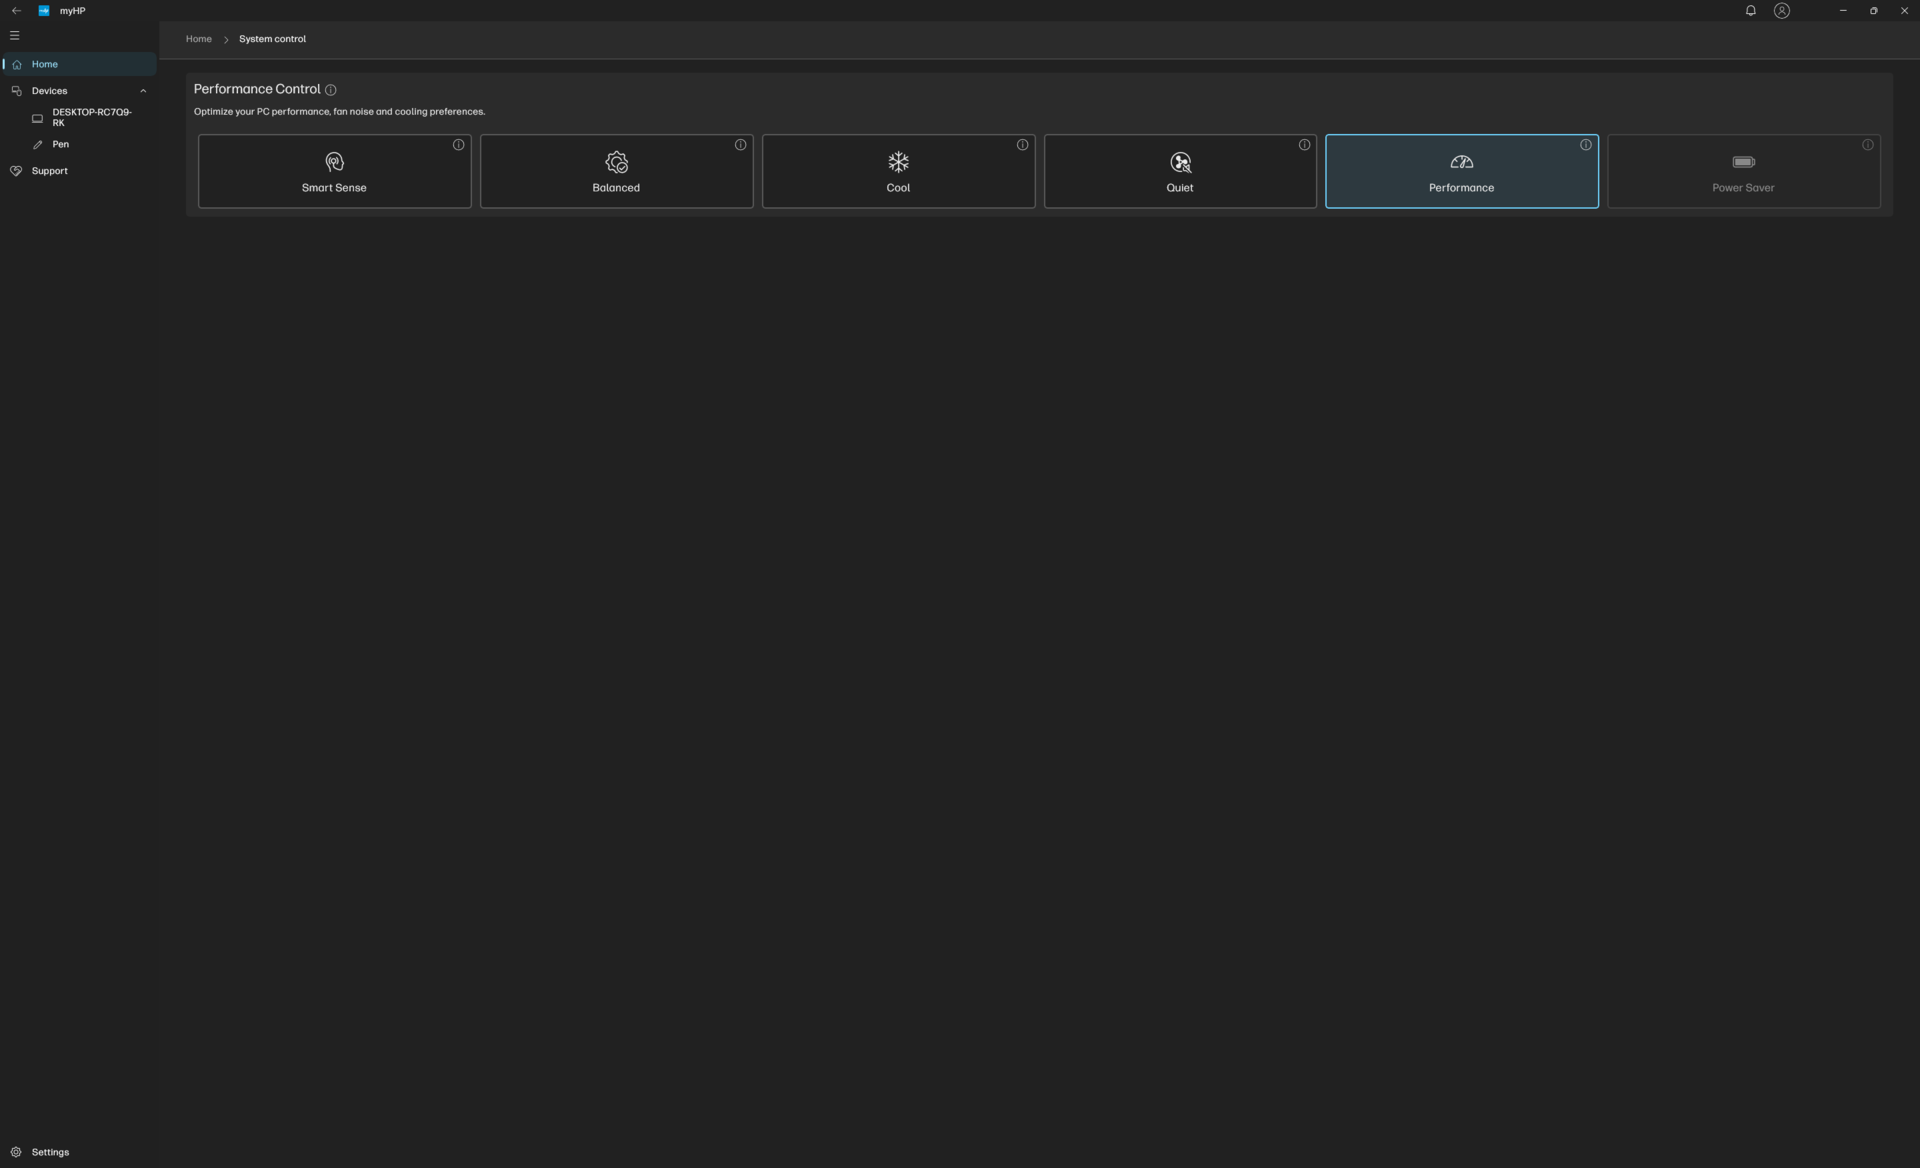
Wir haben unter MyHP und Windows den Performance-Modus aktiviert, bevor die Benchmarks durchgeführt wurden. Leider ändert die Anpassung des Leistungsprofils in Windows nicht automatisch das MyHP-Profil und umgekehrt. Bei Laptops von Dell werden unterschiedliche Leistungsprofile praktischerweise synchron umgestellt.
Die MyHP-Software könnte noch reaktionsfähiger sein und ist auch in Bezug auf Features verbesserungswürdig. Die App selbst wird nur sehr langsam geöffnet und die Displayoptionen können nicht mit denen der Asus ZenBook/VivoBook OLED-Modelle mithalten, wo Nutzer die Farbtemperatur, den Blaulichtanteil, den Bildschirmschoner, den Farbraum und mehr anpassen können.


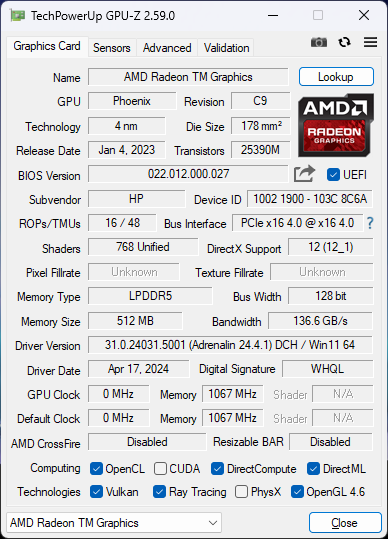
Prozessor
Die Ryzen 7 8840HS ersetzt die Ryzen 7 7840HS aus dem Vorjahr. Es handelt sich dabei um eine mobile GPU der Gaming-Klasse, die auch in leistungsstarken Geräten wie dem Lenovo Legion Slim 7 16 zu finden ist. Ganz wie die Intel-Meteor-Lake-Serie, hat die neue AMD-CPU eine integrierte NPU, um lokale KI-Anwendungen, die bis zum nächsten Jahr alltäglich werden sollen, zu beschleunigen.
Leider ist die reine Multi-Thread-Leistung um 15-20 Prozent langsamer als bei der alten Ryzen 7 7840HS – ein nicht unbedeutender Unterschied. Ein ähnliches Manko wurde auch bei dem neuen Asus Zenbook 14 festgestellt, der mit der gleichen CPU ausgestattet ist wie unser HP. Dieses Defizit lässt sich zurückführen auf die niedrigere TDP der neuen CPU (20 bis 30 W anstatt 35 bis 54 W) sowie auf die "hineingepresste" NPU, die wertvollen Platz einnimmt, der ansonsten nicht-KI-Funktionen gewidmet werden hätte können. Insgesamt liegt die Leistung daher in der Nähe der Core i7-12700H der 12. Generation im 2022er Envy 16 Laptop.
Dennoch ist die Ryzen 7 8840HS keinesfalls langsam und übertrifft die Envy-x360-16-Varianten mit Intel Core Ultra 5 125U und Ultra 7 155U um 35 bzw. 40 Prozent. Um aus der AMD-CPU wirklich das meiste herauszuholen, werden Nutzer allerdings lokale KI-Aufgaben durchführen müssen, sobald diese verfügbar werden.
Cinebench R15 Multi-Schleife
Cinebench R23: Multi Core | Single Core
Cinebench R20: CPU (Multi Core) | CPU (Single Core)
Cinebench R15: CPU Multi 64Bit | CPU Single 64Bit
Blender: v2.79 BMW27 CPU
7-Zip 18.03: 7z b 4 | 7z b 4 -mmt1
Geekbench 6.7: Multi-Core | Single-Core
Geekbench 5.5: Multi-Core | Single-Core
HWBOT x265 Benchmark v2.2: 4k Preset
LibreOffice : 20 Documents To PDF
R Benchmark 2.5: Overall mean
* ... kleinere Werte sind besser
AIDA64: FP32 Ray-Trace | FPU Julia | CPU SHA3 | CPU Queen | FPU SinJulia | FPU Mandel | CPU AES | CPU ZLib | FP64 Ray-Trace | CPU PhotoWorxx
| Performance Rating | |
| Durchschnittliche AMD Ryzen 7 8840HS | |
| HP Envy x360 2-in-1 16-ad0097nr | |
| HP Spectre x360 16 RTX 4050 | |
| HP Envy 16 h0112nr | |
| LG Gram 2in1 16 16T90R - G.AA78G | |
| Samsung Galaxy Book4 Pro 360 | |
| Lenovo Yoga 7 2-in-1 16IML9 | |
| AIDA64 / FP32 Ray-Trace | |
| Durchschnittliche AMD Ryzen 7 8840HS (17814 - 22477, n=5) | |
| HP Envy x360 2-in-1 16-ad0097nr | |
| HP Spectre x360 16 RTX 4050 | |
| HP Envy 16 h0112nr | |
| LG Gram 2in1 16 16T90R - G.AA78G | |
| LG Gram 2in1 16 16T90R - G.AA78G | |
| Lenovo Yoga 7 2-in-1 16IML9 | |
| Samsung Galaxy Book4 Pro 360 | |
| AIDA64 / FPU Julia | |
| Durchschnittliche AMD Ryzen 7 8840HS (71472 - 93550, n=5) | |
| HP Envy x360 2-in-1 16-ad0097nr | |
| HP Spectre x360 16 RTX 4050 | |
| HP Envy 16 h0112nr | |
| LG Gram 2in1 16 16T90R - G.AA78G | |
| Lenovo Yoga 7 2-in-1 16IML9 | |
| Samsung Galaxy Book4 Pro 360 | |
| AIDA64 / CPU SHA3 | |
| Durchschnittliche AMD Ryzen 7 8840HS (3559 - 4132, n=5) | |
| HP Envy x360 2-in-1 16-ad0097nr | |
| HP Spectre x360 16 RTX 4050 | |
| HP Envy 16 h0112nr | |
| LG Gram 2in1 16 16T90R - G.AA78G | |
| Lenovo Yoga 7 2-in-1 16IML9 | |
| Samsung Galaxy Book4 Pro 360 | |
| AIDA64 / CPU Queen | |
| HP Envy x360 2-in-1 16-ad0097nr | |
| Durchschnittliche AMD Ryzen 7 8840HS (90515 - 111581, n=5) | |
| HP Envy 16 h0112nr | |
| LG Gram 2in1 16 16T90R - G.AA78G | |
| HP Spectre x360 16 RTX 4050 | |
| Samsung Galaxy Book4 Pro 360 | |
| Lenovo Yoga 7 2-in-1 16IML9 | |
| AIDA64 / FPU SinJulia | |
| Durchschnittliche AMD Ryzen 7 8840HS (12168 - 13731, n=5) | |
| HP Envy x360 2-in-1 16-ad0097nr | |
| HP Spectre x360 16 RTX 4050 | |
| HP Envy 16 h0112nr | |
| Samsung Galaxy Book4 Pro 360 | |
| LG Gram 2in1 16 16T90R - G.AA78G | |
| Lenovo Yoga 7 2-in-1 16IML9 | |
| AIDA64 / FPU Mandel | |
| Durchschnittliche AMD Ryzen 7 8840HS (38404 - 49687, n=5) | |
| HP Envy x360 2-in-1 16-ad0097nr | |
| HP Spectre x360 16 RTX 4050 | |
| HP Envy 16 h0112nr | |
| LG Gram 2in1 16 16T90R - G.AA78G | |
| Lenovo Yoga 7 2-in-1 16IML9 | |
| Samsung Galaxy Book4 Pro 360 | |
| AIDA64 / CPU AES | |
| HP Envy 16 h0112nr | |
| LG Gram 2in1 16 16T90R - G.AA78G | |
| HP Envy x360 2-in-1 16-ad0097nr | |
| HP Spectre x360 16 RTX 4050 | |
| Durchschnittliche AMD Ryzen 7 8840HS (60328 - 76247, n=5) | |
| Lenovo Yoga 7 2-in-1 16IML9 | |
| Samsung Galaxy Book4 Pro 360 | |
| AIDA64 / CPU ZLib | |
| HP Spectre x360 16 RTX 4050 | |
| HP Envy x360 2-in-1 16-ad0097nr | |
| HP Envy 16 h0112nr | |
| Durchschnittliche AMD Ryzen 7 8840HS (468 - 930, n=5) | |
| LG Gram 2in1 16 16T90R - G.AA78G | |
| Lenovo Yoga 7 2-in-1 16IML9 | |
| Samsung Galaxy Book4 Pro 360 | |
| AIDA64 / FP64 Ray-Trace | |
| Durchschnittliche AMD Ryzen 7 8840HS (9368 - 11880, n=5) | |
| HP Envy x360 2-in-1 16-ad0097nr | |
| HP Spectre x360 16 RTX 4050 | |
| HP Envy 16 h0112nr | |
| LG Gram 2in1 16 16T90R - G.AA78G | |
| Samsung Galaxy Book4 Pro 360 | |
| Lenovo Yoga 7 2-in-1 16IML9 | |
| AIDA64 / CPU PhotoWorxx | |
| HP Spectre x360 16 RTX 4050 | |
| Lenovo Yoga 7 2-in-1 16IML9 | |
| Samsung Galaxy Book4 Pro 360 | |
| LG Gram 2in1 16 16T90R - G.AA78G | |
| HP Envy 16 h0112nr | |
| Durchschnittliche AMD Ryzen 7 8840HS (31491 - 35861, n=5) | |
| HP Envy x360 2-in-1 16-ad0097nr | |
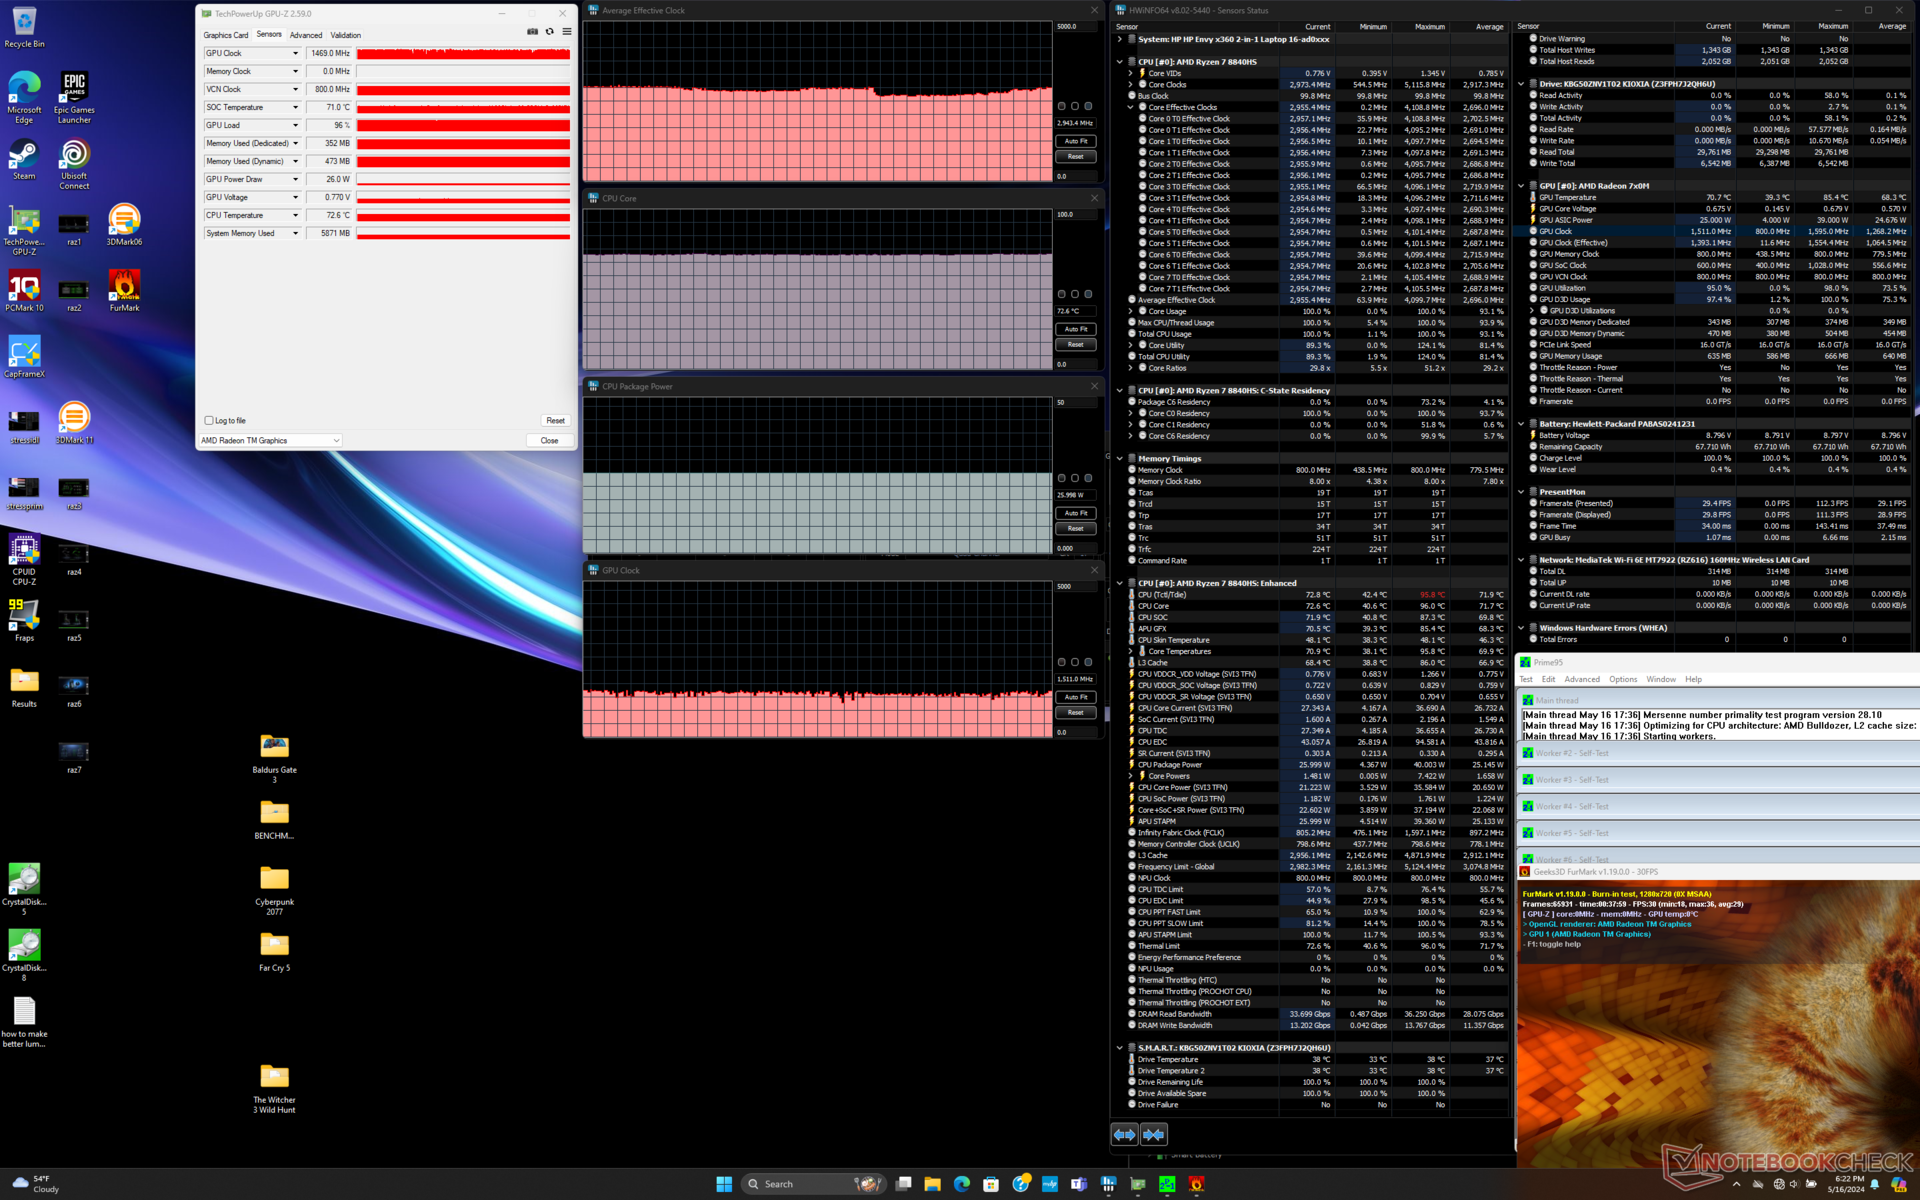
Stressstest
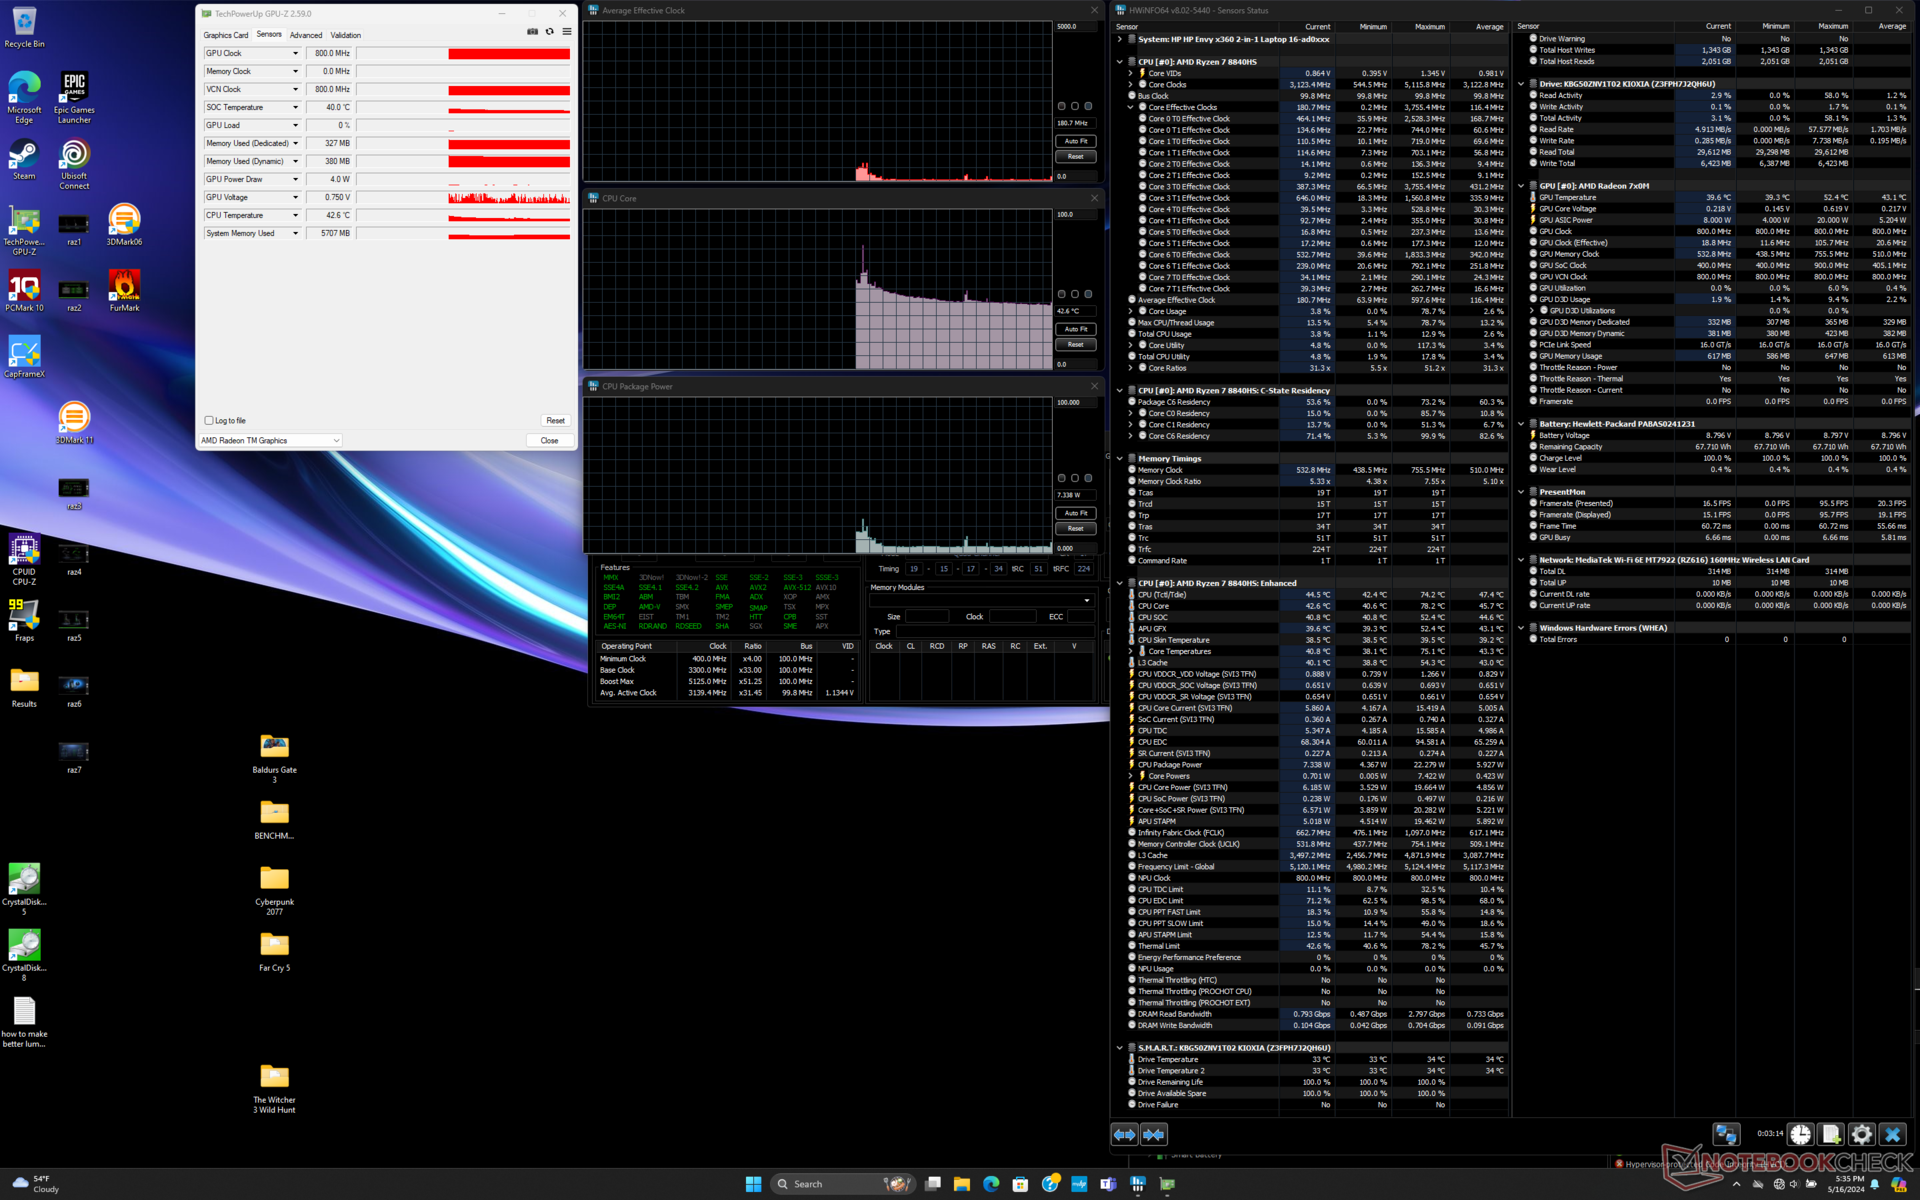
Die Ausführung von Prime95 lässt die CPU nur in den ersten Sekunden auf 4,1 GHz und 40 W ansteigen, bevor sie auf 3,4 GHz und 32 W fällt. Nach einigen Minuten fällt die Leistung weiter auf 3,1 GHz und 26 W ab, was darauf hindeutet, dass der Turbo Core in seinem Durchhaltevermögen eingeschränkt ist. Die Intel-Core-Ultra-7-CPU im Spectre x360 16 stabilisiert sich bereits bei der gleichen Temperatur wie unser Envy x360 16 mit AMD-Prozessor – nämlich bei 76 °C. Doch das ist womöglich purer Zufall.
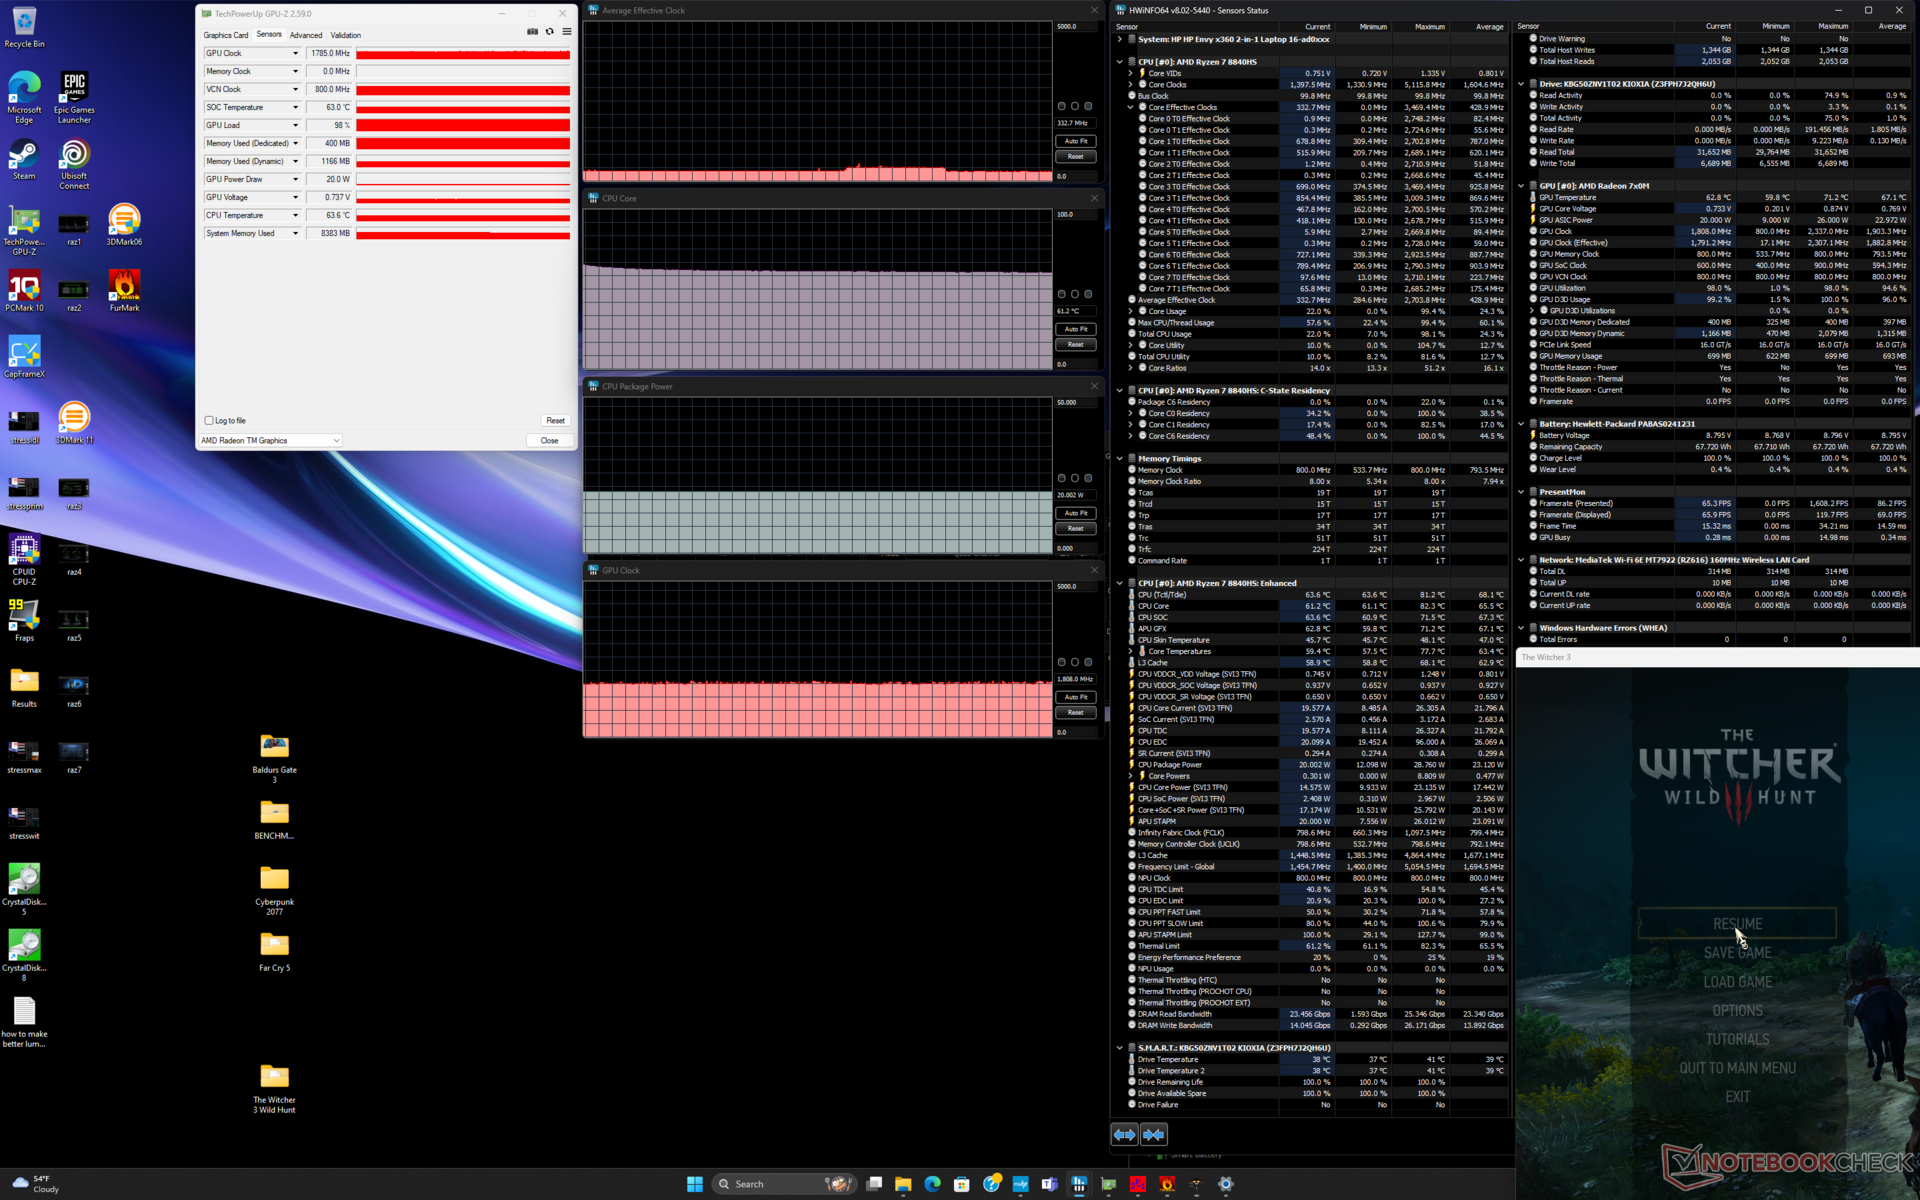
Läuft Witcher 3 im Performance-Modus, stabilisiert sich die CPU-Temperatur und GPU-Taktrate bei 68 °C und 2.180 MHz, während hier im Modus Ausgeglichen nur 61 °C bzw. 1.785 MHz erreicht werden. Diese Unterschiede entsprechen unseren Fire-Strike-Ergebnissen sowie den Unterschieden im Lüftergeräusch zwischen den beiden Energieprofilen. Auch die CPU-Leistung verändert sich von 26 W im Performance-Modus auf 20 W im ausgeglichenen Modus.
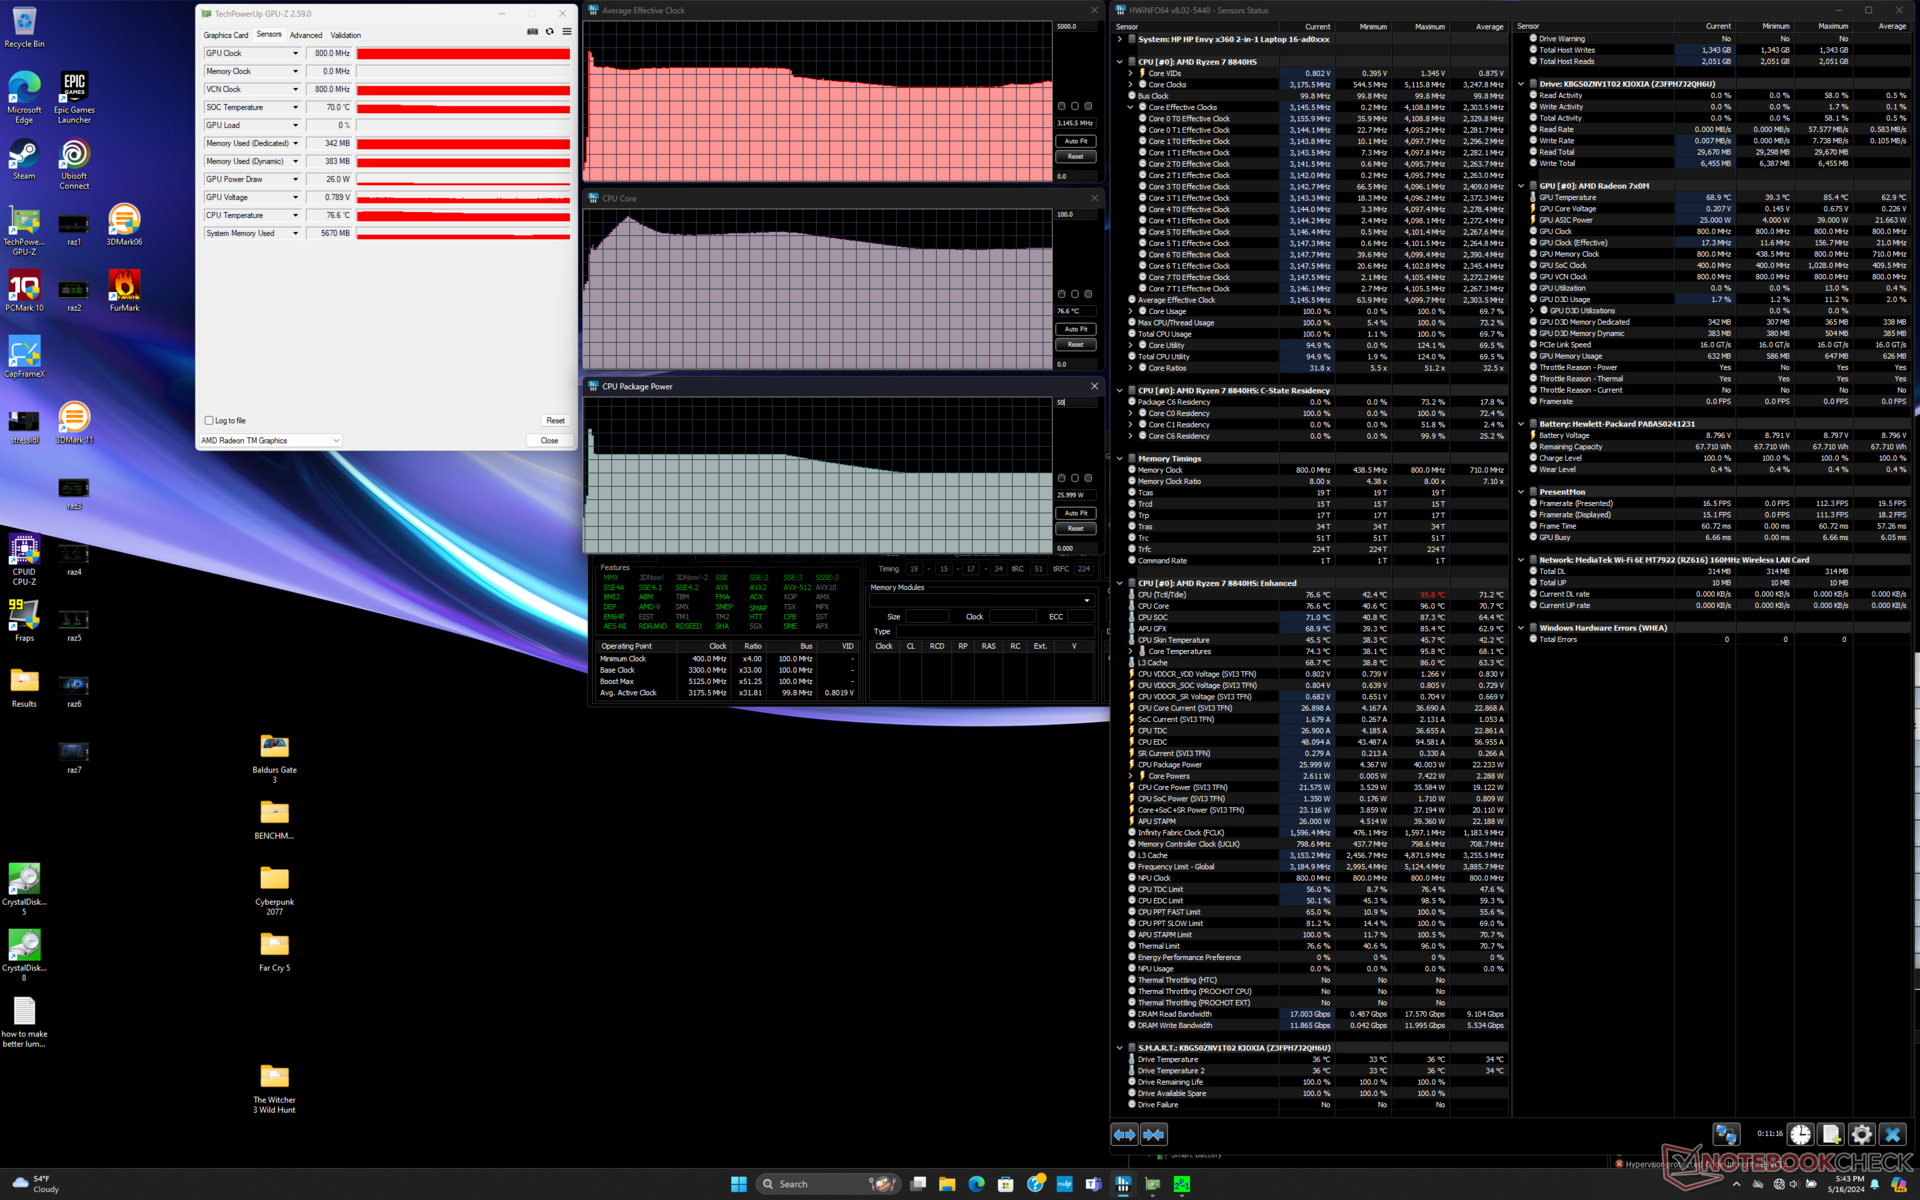

| Durchschnittliche CPU-Taktrate (GHz) | GPU-Taktrate (MHz) | Durchschnittliche CPU-Temperatur (°C) | |
| Leerlauf | -- | -- | 42 |
| Prime95-Last | 3,1 | -- | 77 |
| Prime95-+-FurMark-Last | 2,9 | 1469 | 73 |
| Witcher-3-Last (Ausgeglichen) | ~0,3 | 1785 | 61 |
| Witcher-3-Last (Performance) | ~0,5 | 2180 | 68 |
Systemleistung
Die PCMark-Ergebnisse liegen deutlich über den Werten des Envy x360 15 aus dem Vorjahr – insbesondere bei den Tests zu Produktivität und Digital Content Creation, bei denen die reine CPU- und GPU-Leistung eine große Rolle spielen. Die Envy-x360-16-Ergebnisse liegen durchschnittlich zwischen dem Envy x360 15 und dem Spectre x360 16.

CrossMark: Overall | Productivity | Creativity | Responsiveness
WebXPRT 3: Overall
WebXPRT 4: Overall
Mozilla Kraken 1.1: Total
| PCMark 10 / Score | |
| HP Envy 16 h0112nr | |
| Durchschnittliche AMD Ryzen 7 8840HS, AMD Radeon 780M (6775 - 7213, n=5) | |
| HP Envy x360 2-in-1 16-ad0097nr | |
| HP Spectre x360 16 RTX 4050 | |
| Samsung Galaxy Book4 Pro 360 | |
| Lenovo Yoga 7 2-in-1 16IML9 | |
| LG Gram 2in1 16 16T90R - G.AA78G | |
| PCMark 10 / Essentials | |
| HP Envy 16 h0112nr | |
| LG Gram 2in1 16 16T90R - G.AA78G | |
| Lenovo Yoga 7 2-in-1 16IML9 | |
| Durchschnittliche AMD Ryzen 7 8840HS, AMD Radeon 780M (10178 - 11449, n=5) | |
| Samsung Galaxy Book4 Pro 360 | |
| HP Envy x360 2-in-1 16-ad0097nr | |
| HP Spectre x360 16 RTX 4050 | |
| PCMark 10 / Productivity | |
| Durchschnittliche AMD Ryzen 7 8840HS, AMD Radeon 780M (9706 - 10449, n=5) | |
| HP Envy x360 2-in-1 16-ad0097nr | |
| HP Spectre x360 16 RTX 4050 | |
| HP Envy 16 h0112nr | |
| Samsung Galaxy Book4 Pro 360 | |
| Lenovo Yoga 7 2-in-1 16IML9 | |
| LG Gram 2in1 16 16T90R - G.AA78G | |
| PCMark 10 / Digital Content Creation | |
| HP Envy 16 h0112nr | |
| Durchschnittliche AMD Ryzen 7 8840HS, AMD Radeon 780M (8519 - 9163, n=5) | |
| HP Envy x360 2-in-1 16-ad0097nr | |
| HP Spectre x360 16 RTX 4050 | |
| Samsung Galaxy Book4 Pro 360 | |
| LG Gram 2in1 16 16T90R - G.AA78G | |
| Lenovo Yoga 7 2-in-1 16IML9 | |
| CrossMark / Overall | |
| HP Envy 16 h0112nr | |
| Durchschnittliche AMD Ryzen 7 8840HS, AMD Radeon 780M (1643 - 1698, n=5) | |
| Lenovo Yoga 7 2-in-1 16IML9 | |
| HP Envy x360 2-in-1 16-ad0097nr | |
| Samsung Galaxy Book4 Pro 360 | |
| HP Spectre x360 16 RTX 4050 | |
| LG Gram 2in1 16 16T90R - G.AA78G | |
| CrossMark / Productivity | |
| HP Envy 16 h0112nr | |
| Durchschnittliche AMD Ryzen 7 8840HS, AMD Radeon 780M (1605 - 1666, n=5) | |
| HP Envy x360 2-in-1 16-ad0097nr | |
| Samsung Galaxy Book4 Pro 360 | |
| LG Gram 2in1 16 16T90R - G.AA78G | |
| HP Spectre x360 16 RTX 4050 | |
| Lenovo Yoga 7 2-in-1 16IML9 | |
| CrossMark / Creativity | |
| HP Envy 16 h0112nr | |
| HP Spectre x360 16 RTX 4050 | |
| Durchschnittliche AMD Ryzen 7 8840HS, AMD Radeon 780M (1739 - 1863, n=5) | |
| HP Envy x360 2-in-1 16-ad0097nr | |
| Samsung Galaxy Book4 Pro 360 | |
| LG Gram 2in1 16 16T90R - G.AA78G | |
| Lenovo Yoga 7 2-in-1 16IML9 | |
| CrossMark / Responsiveness | |
| HP Envy 16 h0112nr | |
| LG Gram 2in1 16 16T90R - G.AA78G | |
| Samsung Galaxy Book4 Pro 360 | |
| Durchschnittliche AMD Ryzen 7 8840HS, AMD Radeon 780M (1334 - 1498, n=5) | |
| HP Envy x360 2-in-1 16-ad0097nr | |
| HP Spectre x360 16 RTX 4050 | |
| Lenovo Yoga 7 2-in-1 16IML9 | |
| WebXPRT 3 / Overall | |
| Durchschnittliche AMD Ryzen 7 8840HS, AMD Radeon 780M (297 - 440, n=5) | |
| HP Envy 16 h0112nr | |
| HP Envy x360 2-in-1 16-ad0097nr | |
| HP Spectre x360 16 RTX 4050 | |
| Samsung Galaxy Book4 Pro 360 | |
| LG Gram 2in1 16 16T90R - G.AA78G | |
| Lenovo Yoga 7 2-in-1 16IML9 | |
| WebXPRT 4 / Overall | |
| HP Envy 16 h0112nr | |
| HP Spectre x360 16 RTX 4050 | |
| Durchschnittliche AMD Ryzen 7 8840HS, AMD Radeon 780M (246 - 257, n=5) | |
| HP Envy x360 2-in-1 16-ad0097nr | |
| Samsung Galaxy Book4 Pro 360 | |
| Lenovo Yoga 7 2-in-1 16IML9 | |
| Mozilla Kraken 1.1 / Total | |
| LG Gram 2in1 16 16T90R - G.AA78G | |
| Lenovo Yoga 7 2-in-1 16IML9 | |
| Samsung Galaxy Book4 Pro 360 | |
| HP Envy x360 2-in-1 16-ad0097nr | |
| HP Spectre x360 16 RTX 4050 | |
| Durchschnittliche AMD Ryzen 7 8840HS, AMD Radeon 780M (518 - 563, n=5) | |
| HP Envy 16 h0112nr | |
* ... kleinere Werte sind besser
| PCMark 10 Score | 6958 Punkte | |
Hilfe | ||
| AIDA64 / Memory Copy | |
| Samsung Galaxy Book4 Pro 360 | |
| HP Spectre x360 16 RTX 4050 | |
| Lenovo Yoga 7 2-in-1 16IML9 | |
| HP Envy x360 2-in-1 16-ad0097nr | |
| Durchschnittliche AMD Ryzen 7 8840HS (62098 - 76766, n=5) | |
| LG Gram 2in1 16 16T90R - G.AA78G | |
| HP Envy 16 h0112nr | |
| AIDA64 / Memory Read | |
| HP Spectre x360 16 RTX 4050 | |
| Samsung Galaxy Book4 Pro 360 | |
| HP Envy 16 h0112nr | |
| Lenovo Yoga 7 2-in-1 16IML9 | |
| Durchschnittliche AMD Ryzen 7 8840HS (50273 - 61739, n=5) | |
| LG Gram 2in1 16 16T90R - G.AA78G | |
| HP Envy x360 2-in-1 16-ad0097nr | |
| AIDA64 / Memory Write | |
| HP Spectre x360 16 RTX 4050 | |
| HP Envy x360 2-in-1 16-ad0097nr | |
| Durchschnittliche AMD Ryzen 7 8840HS (78025 - 107658, n=5) | |
| LG Gram 2in1 16 16T90R - G.AA78G | |
| Samsung Galaxy Book4 Pro 360 | |
| Lenovo Yoga 7 2-in-1 16IML9 | |
| HP Envy 16 h0112nr | |
| AIDA64 / Memory Latency | |
| Lenovo Yoga 7 2-in-1 16IML9 | |
| HP Spectre x360 16 RTX 4050 | |
| Samsung Galaxy Book4 Pro 360 | |
| HP Envy x360 2-in-1 16-ad0097nr | |
| LG Gram 2in1 16 16T90R - G.AA78G | |
| Durchschnittliche AMD Ryzen 7 8840HS (91 - 122.4, n=5) | |
| HP Envy 16 h0112nr | |
* ... kleinere Werte sind besser
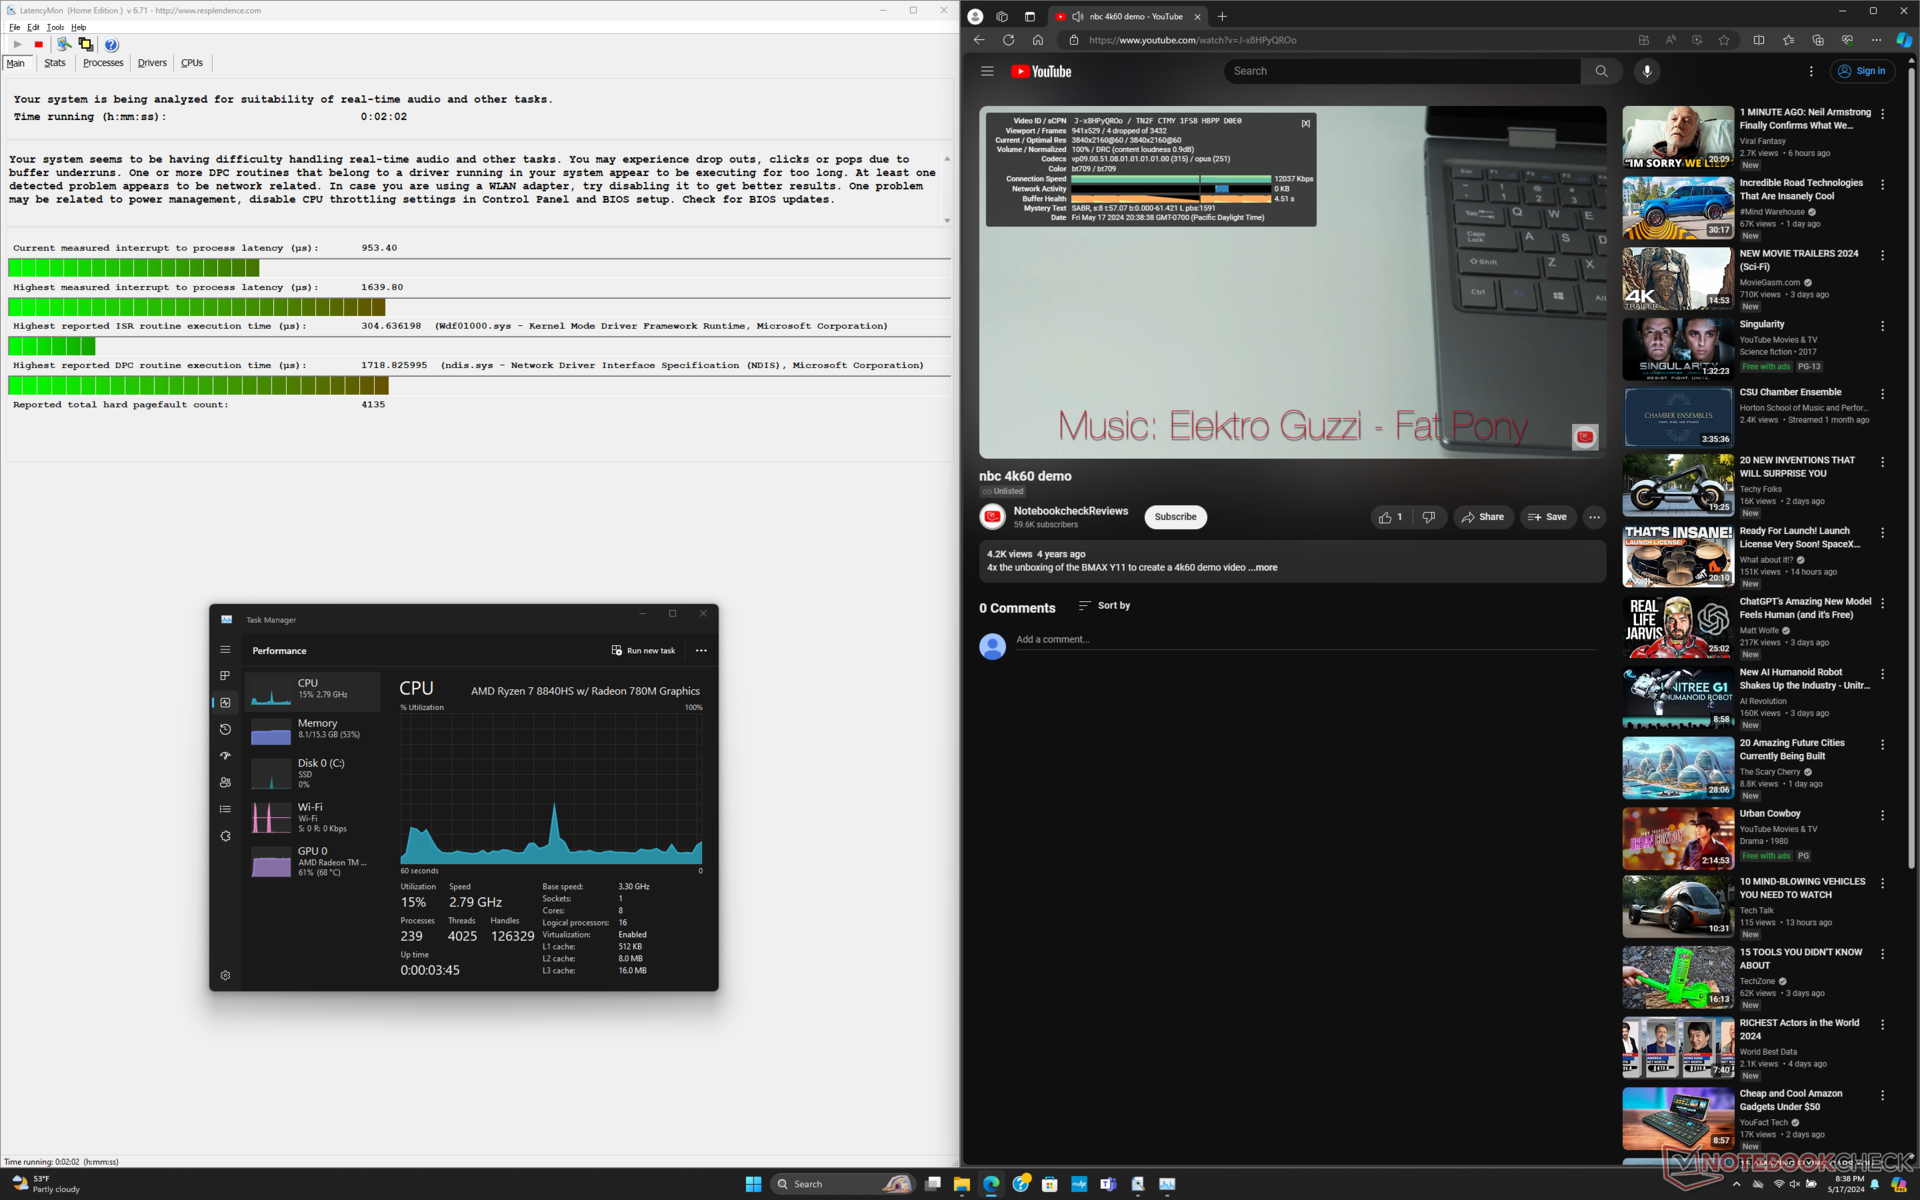
DPC-Latenz
Der LatencyMon zeigt beim Öffnen mehrer Tabs auf unsere Homepage kleine DPC-Probleme. Auch das 4K60-Videoplayback ist nicht perfekt und zeigt im aufgenommenen Zeitraum von 60 Sekunden 4 verlorene Frames. Obwohl die Bildsprünge nicht so häufig sind, dass sie auffallen, sollten sie im Idealfall überhaupt nicht auftreten.

| DPC Latencies / LatencyMon - interrupt to process latency (max), Web, Youtube, Prime95 | |
| LG Gram 2in1 16 16T90R - G.AA78G | |
| Samsung Galaxy Book4 Pro 360 | |
| HP Spectre x360 16 RTX 4050 | |
| HP Envy x360 2-in-1 16-ad0097nr | |
| HP Envy 16 h0112nr | |
| Lenovo Yoga 7 2-in-1 16IML9 | |
* ... kleinere Werte sind besser
Massenspeicher
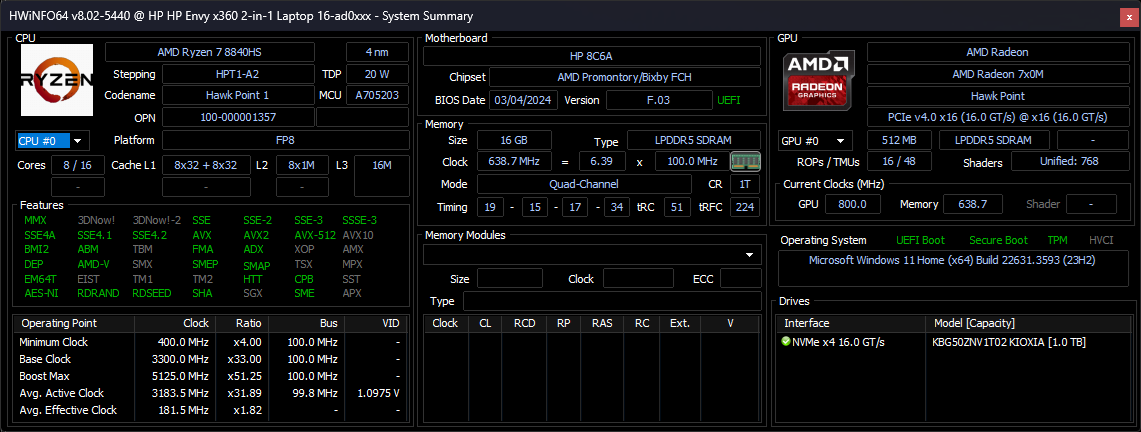
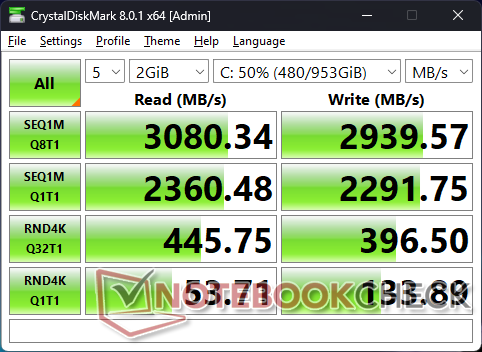
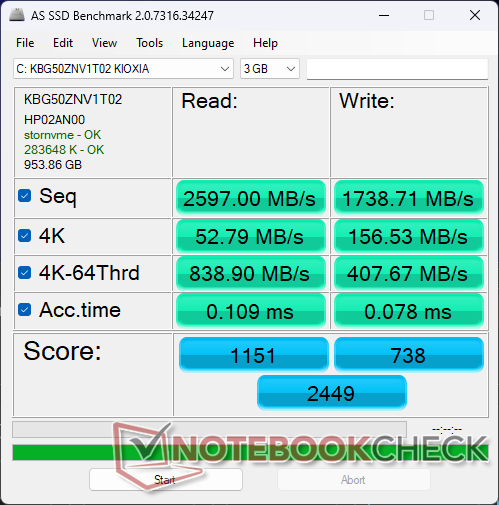
Unsere Einheit ist mit einer Kioxia KBG50ZNV1T02 ausgestattet, einer preiswerten 2280-PCIe4-x4-NVMe-SSD mit sequenziellen Lese- und Schreibraten von bis zu 3.500 MB/s bzw. 2.900 MB/s. Bessere Modelle wie das Samsung PM9A1 bieten hingegen 7.000 MB/s. Die Übertragungsraten fallen unter Last etwas ab, für ein Mittelklasse-Gerät ist die Leistung insgesamt dennoch gut.

| Drive Performance Rating - Percent | |
| LG Gram 2in1 16 16T90R - G.AA78G | |
| HP Envy 16 h0112nr | |
| Samsung Galaxy Book4 Pro 360 | |
| HP Spectre x360 16 RTX 4050 | |
| HP Envy x360 2-in-1 16-ad0097nr | |
| Lenovo Yoga 7 2-in-1 16IML9 | |
* ... kleinere Werte sind besser
Dauerleistung Lesen: DiskSpd Read Loop, Queue Depth 8
GPU-Leistung
Die Radeon 780M ist immer noch eine unglaublich starke integrierte GPU – auch wenn Intel mittlerweile mit der konkurrierenden Arc 8 parieren konnte. Die 3DMark-Ergebnisse positionieren die GPU in die Nähe des Arc 7 und deutlich vor ältere Iris-Xe-96-EUs-Modelle.
Die Wahl der Intel-Version des Envy-x360-16 würde zu einer deutlichen Verschlechterung der Grafikleistung führen, da diese Konfiguration anstatt der Core-Ultra-H-Serie mit Chips der Core-Ultra-U-Serie ausgestattet ist. Die integrierten Grafikeinheiten Arc 7 bzw. Arc 8 sind nur auf Core-Ultra-H-CPUs erhältlich, während die integrierte GPU in der Core-Ultra-U-Serie eher der Iris Xe 96 EUs entspricht.
| Leistungsprofil | Graphics | Physics | Combined |
| Performance Modus | 7357 | 22488 | 2636 |
| Ausgeglichener Modus | 6957 (-5 %) | 20442 (-9 %) | 2509 (-5 %) |
| Akkubetrieb | 4651 (-37 %) | 18788 (-17 %) | 1902 (-28 %) |
Im ausgeglichenen Modus wird die Leistung laut FireStrike-Tabelle um bis zu 10 Prozent eingeschränkt. Auch die Lüfterdrehzahl wird hier merklich träger und entspricht der langsameren Leistung.


| 3DMark 11 Performance | 11932 Punkte | |
| 3DMark Cloud Gate Standard Score | 32533 Punkte | |
| 3DMark Fire Strike Score | 6823 Punkte | |
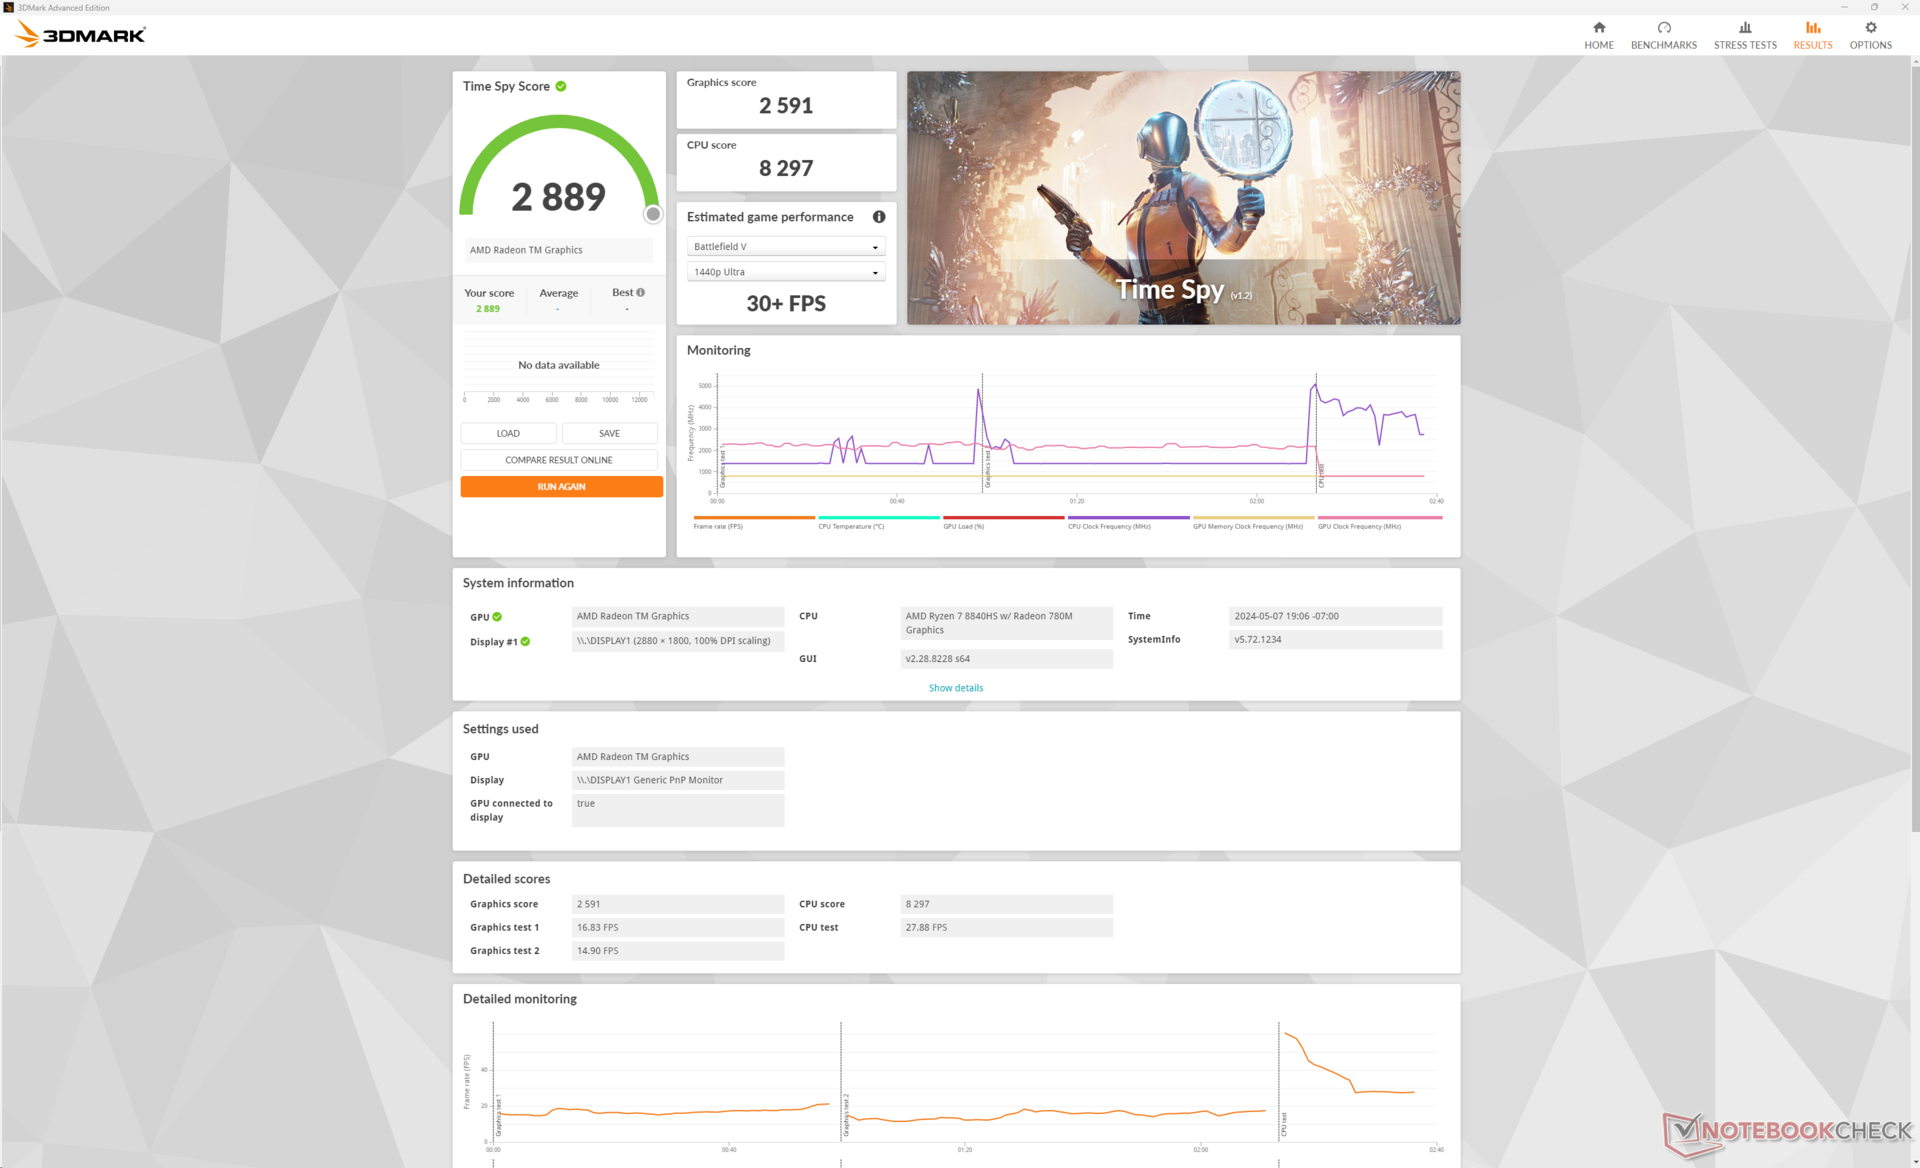
| 3DMark Time Spy Score | 2889 Punkte | |
Hilfe | ||
* ... kleinere Werte sind besser
Leider ist die Gaming-Leistung im Performance-Modus durchgehend langsamer als im durchschnittlichen mit der gleichen Radeon-780M-GPU ausgestatteten Laptop in unserer Datenbank. Das liegt wahrscheinlich an der insgesamt langsameren reinen Prozessorleistung des Ryzen 7 8840HS im Vergleich zum Ryzen 7 840HS aus dem Vorjahr.
| The Witcher 3 - 1920x1080 Ultra Graphics & Postprocessing (HBAO+) | |
| HP Spectre x360 16 RTX 4050 | |
| HP Envy x360 2-in-1 16-ad0097nr | |
| Samsung Galaxy Book4 Pro 360 | |
| HP Envy x360 15-fe0072ng | |
| Lenovo Yoga 7 2-in-1 16IML9 | |
| LG Gram 2in1 16 16T90R - G.AA78G | |
| Final Fantasy XV Benchmark - 1920x1080 High Quality | |
| HP Spectre x360 16 RTX 4050 | |
| HP Envy x360 2-in-1 16-ad0097nr | |
| Samsung Galaxy Book4 Pro 360 | |
| LG Gram 2in1 16 16T90R - G.AA78G | |
| HP Envy x360 15-fe0072ng | |
| Lenovo Yoga 7 2-in-1 16IML9 | |
| Strange Brigade - 1920x1080 ultra AA:ultra AF:16 | |
| HP Spectre x360 16 RTX 4050 | |
| HP Envy x360 2-in-1 16-ad0097nr | |
| Samsung Galaxy Book4 Pro 360 | |
| Lenovo Yoga 7 2-in-1 16IML9 | |
| LG Gram 2in1 16 16T90R - G.AA78G | |
| HP Envy x360 15-fe0072ng | |
| Dota 2 Reborn - 1920x1080 ultra (3/3) best looking | |
| HP Spectre x360 16 RTX 4050 | |
| HP Envy x360 2-in-1 16-ad0097nr | |
| LG Gram 2in1 16 16T90R - G.AA78G | |
| Samsung Galaxy Book4 Pro 360 | |
| Lenovo Yoga 7 2-in-1 16IML9 | |
| HP Envy x360 15-fe0072ng | |
| X-Plane 11.11 - 1920x1080 high (fps_test=3) | |
| HP Spectre x360 16 RTX 4050 | |
| LG Gram 2in1 16 16T90R - G.AA78G | |
| Samsung Galaxy Book4 Pro 360 | |
| HP Envy x360 15-fe0072ng | |
| HP Envy x360 2-in-1 16-ad0097nr | |
| Lenovo Yoga 7 2-in-1 16IML9 | |
| Far Cry 5 - 1920x1080 Ultra Preset AA:T | |
| HP Spectre x360 16 RTX 4050 | |
| HP Envy x360 2-in-1 16-ad0097nr | |
| LG Gram 2in1 16 16T90R - G.AA78G | |
| Lenovo Yoga 7 2-in-1 16IML9 | |
| Baldur's Gate 3 | |
| 1280x720 Low Preset AA:SM | |
| Durchschnittliche AMD Radeon 780M (30.7 - 67.6, n=34) | |
| HP Envy x360 2-in-1 16-ad0097nr | |
| Lenovo Yoga 7 2-in-1 16IML9 | |
| 1920x1080 Low Preset AA:SM | |
| Dell XPS 16 9640 | |
| HP Spectre x360 16 RTX 4050 | |
| Durchschnittliche AMD Radeon 780M (20.2 - 44.1, n=47) | |
| HP Envy x360 2-in-1 16-ad0097nr | |
| Lenovo Yoga 7 2-in-1 16IML9 | |
| 1920x1080 Medium Preset AA:T | |
| Dell XPS 16 9640 | |
| HP Spectre x360 16 RTX 4050 | |
| HP Envy x360 2-in-1 16-ad0097nr | |
| Durchschnittliche AMD Radeon 780M (15.7 - 36.8, n=50) | |
| 1920x1080 High Preset AA:T | |
| Dell XPS 16 9640 | |
| HP Spectre x360 16 RTX 4050 | |
| Durchschnittliche AMD Radeon 780M (13.3 - 30.6, n=50) | |
| HP Envy x360 2-in-1 16-ad0097nr | |
| 1920x1080 Ultra Preset AA:T | |
| Dell XPS 16 9640 | |
| HP Spectre x360 16 RTX 4050 | |
| Durchschnittliche AMD Radeon 780M (12.8 - 29.6, n=49) | |
| HP Envy x360 2-in-1 16-ad0097nr | |
Witcher-3-FPS-Chart
| min. | mittel | hoch | max. | |
|---|---|---|---|---|
| The Witcher 3 (2015) | 129.2 | 47.6 | 28.8 | |
| Dota 2 Reborn (2015) | 123.7 | 103.7 | 73 | 65.4 |
| Final Fantasy XV Benchmark (2018) | 64.5 | 34.1 | 25.2 | |
| X-Plane 11.11 (2018) | 47.8 | 33.9 | 27.9 | |
| Far Cry 5 (2018) | 63 | 36 | 33 | 31 |
| Strange Brigade (2018) | 138.2 | 60.3 | 50.2 | 42.2 |
| Tiny Tina's Wonderlands (2022) | 49.8 | 38 | 24 | 19.5 |
| F1 22 (2022) | 70.2 | 60 | 46 | 12 |
| Baldur's Gate 3 (2023) | 35 | 28.5 | 22.6 | 22.2 |
| Cyberpunk 2077 (2023) | 35.5 | 27.8 | 22.1 | 19.1 |
Emissionen — Niedrige Tiefs mit hohen Hochs
Geräuschemissionen
Die Lüfterdrehzahl und das Lüfterverhalten hängen stark mit dem ausgewählten Leistungsprofil zusammen. Im ausgeglichenen Modus tendiert der Lüfter dazu, spürbar leiser und länger zu laufen, bevor er wieder hochfahren muss. Im 3DMark 06 bleibt das Lüftergeräusch beispielsweise während der ersten Szene bei 23,8 dB(A), während hier im Performance-Modus bereits 28 dB(A) erreicht werden. Es empfiehlt sich daher, in MyHP den ausgeglichenen Modus zu aktivieren, um ein Pulsieren des Lüfters bei weniger anspruchsvollen Aufgaben wie beim Surfen oder Streamen zu vermeiden.
Wir haben unter Witcher 3 im Performance-Modus maximale Geräuschemissionen von 44 dB(A) gemessen. Das macht das Envy x360 16 unter hoher Last mit mehreren Dezibel Abstand zu einem der lautesten 16-Zoll-Convertibles.

Lautstärkediagramm
| Idle |
| 23 / 23 / 23 dB(A) |
| Last |
| 23.8 / 43.8 dB(A) |
 | ||
30 dB leise 40 dB(A) deutlich hörbar 50 dB(A) störend |
||
min: | ||
| HP Envy x360 2-in-1 16-ad0097nr Radeon 780M, R7 8840HS, KIOXIA BG5 KBG50ZNV1T02 | HP Envy 16 h0112nr GeForce RTX 3060 Laptop GPU, i7-12700H, Micron 3400 1TB MTFDKBA1T0TFH | HP Spectre x360 16 RTX 4050 GeForce RTX 4050 Laptop GPU, Ultra 7 155H, SK hynix PC801 HFS001TEJ9X101N | Lenovo Yoga 7 2-in-1 16IML9 Graphics 4-Core iGPU (Arrow Lake), Ultra 5 125U, SK hynix HFS512GEJ4X112N | Samsung Galaxy Book4 Pro 360 Arc 7-Core, Ultra 5 125H, Samsung PM9B1 512GB MZVL4512HBLU | LG Gram 2in1 16 16T90R - G.AA78G Iris Xe G7 96EUs, i7-1360P, Samsung PM9A1 MZVL21T0HCLR | |
|---|---|---|---|---|---|---|
| Geräuschentwicklung | -20% | 3% | 1% | -8% | -7% | |
| aus / Umgebung * (dB) | 22.9 | 22.8 -0% | 23.3 -2% | 22.8 -0% | 24.1 -5% | 25.1 -10% |
| Idle min * (dB) | 23 | 22.9 -0% | 23.6 -3% | 22.8 1% | 24.1 -5% | 25.1 -9% |
| Idle avg * (dB) | 23 | 22.9 -0% | 23.6 -3% | 22.8 1% | 24.1 -5% | 25.1 -9% |
| Idle max * (dB) | 23 | 30.5 -33% | 23.6 -3% | 22.8 1% | 26.4 -15% | 26.1 -13% |
| Last avg * (dB) | 23.8 | 41.4 -74% | 29.2 -23% | 30.8 -29% | 35.2 -48% | 31.4 -32% |
| Witcher 3 ultra * (dB) | 43.8 | 51.1 -17% | 32.1 27% | 31 29% | 38.5 12% | 41.1 6% |
| Last max * (dB) | 43.8 | 51.4 -17% | 32.1 27% | 40.8 7% | 39.2 11% | 36.6 16% |
* ... kleinere Werte sind besser
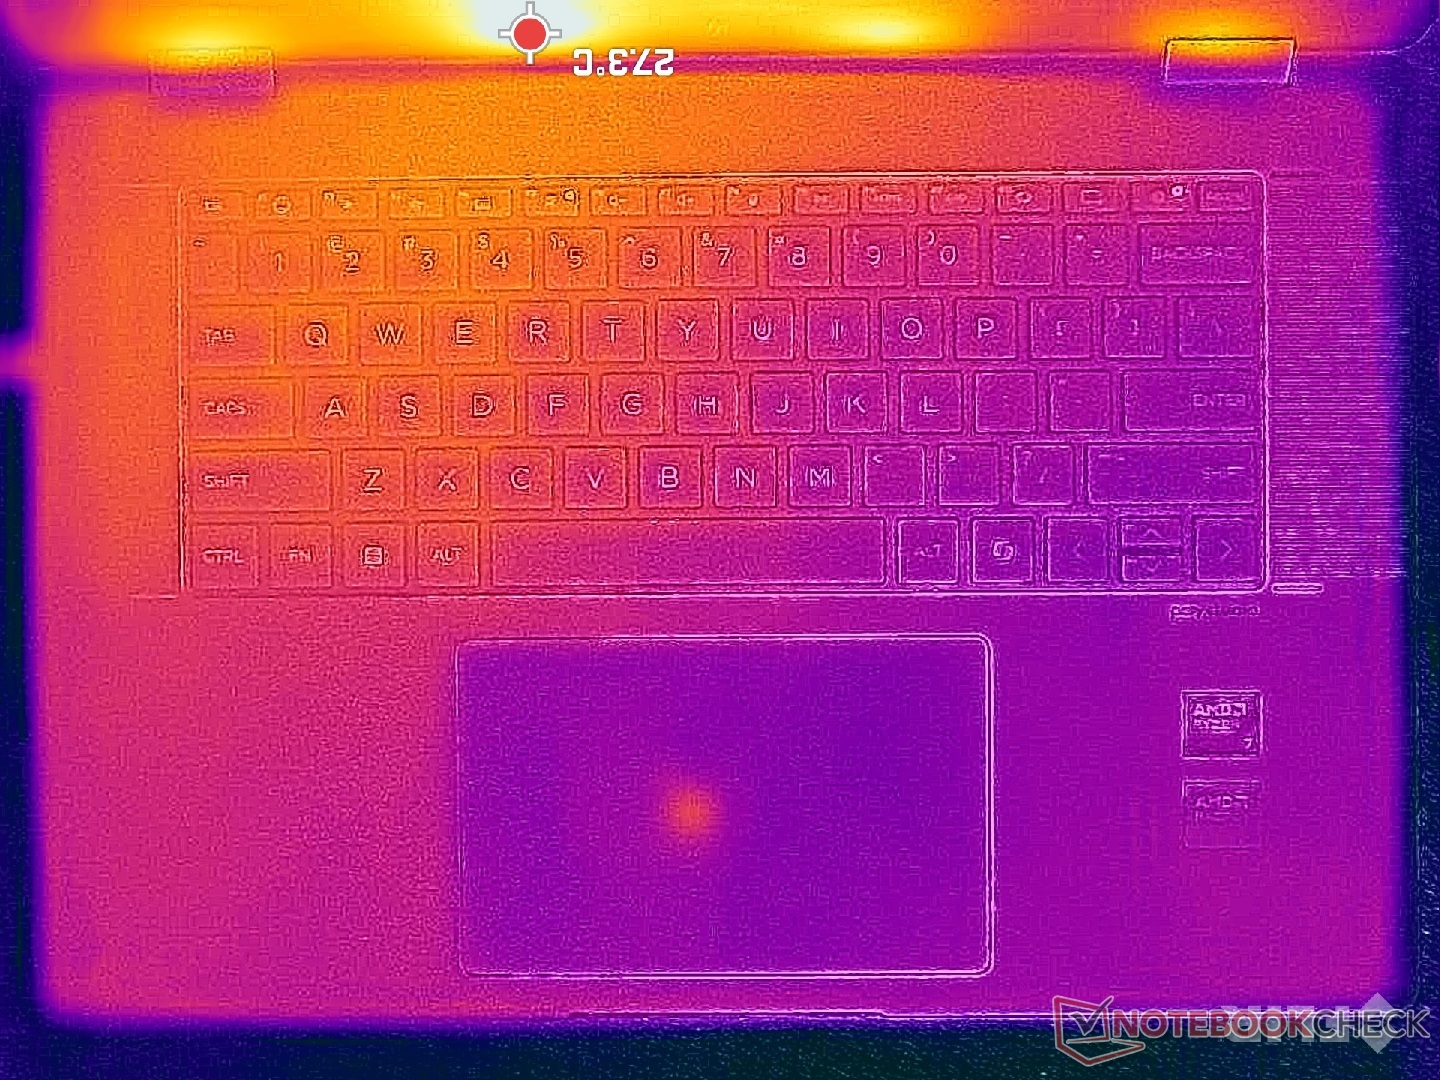
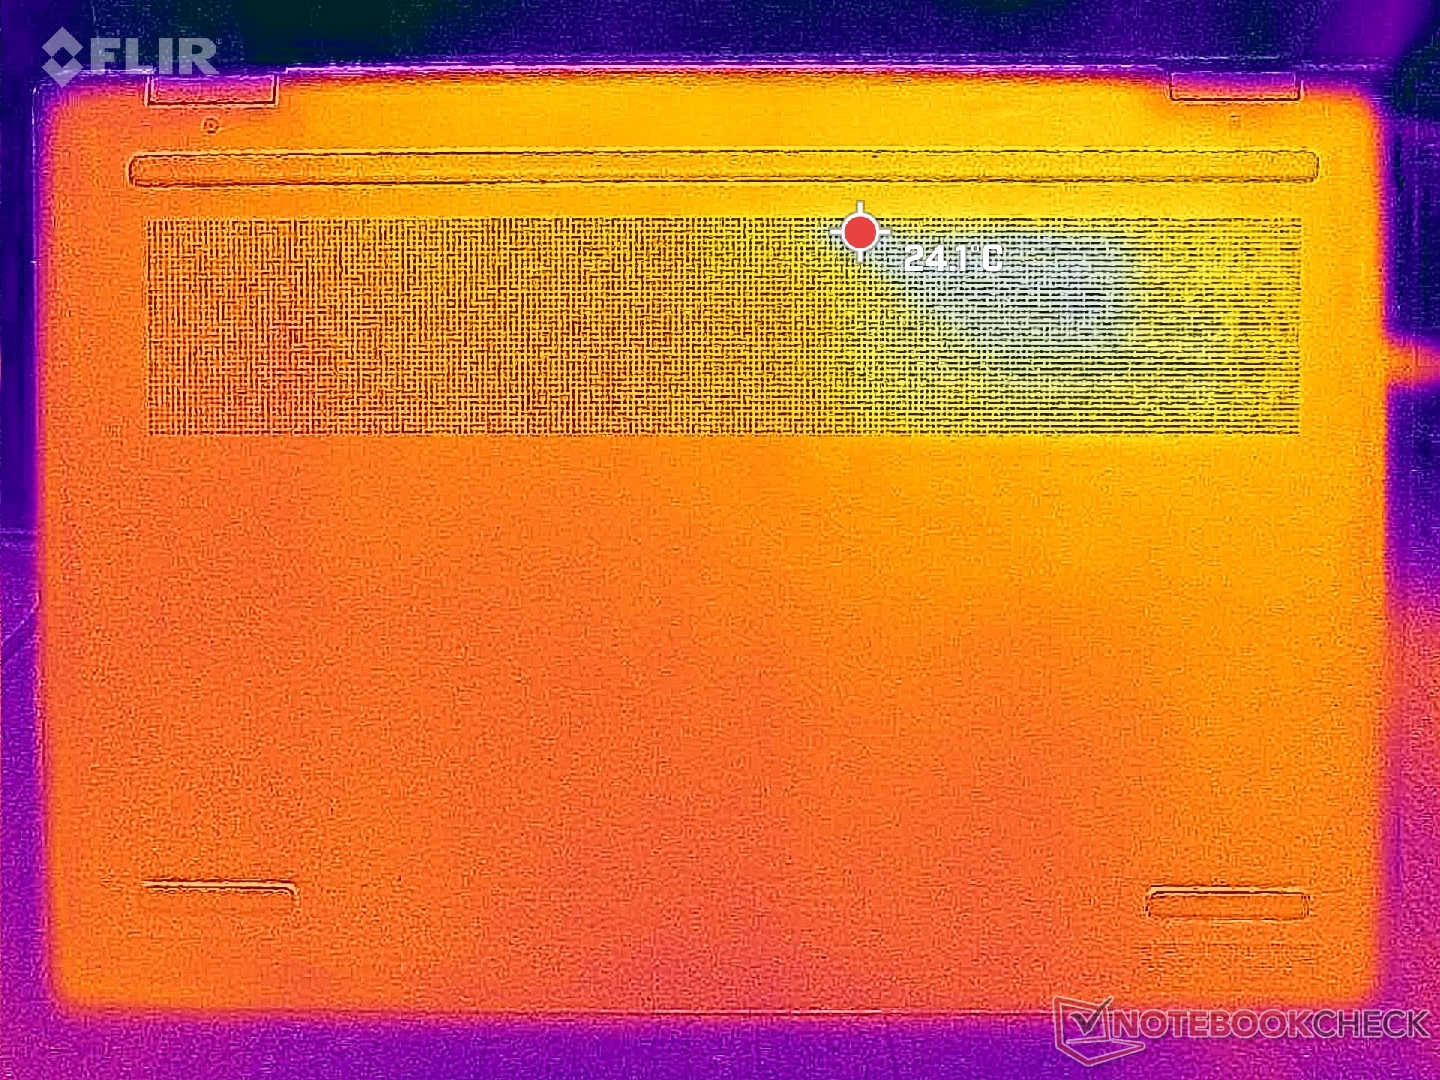
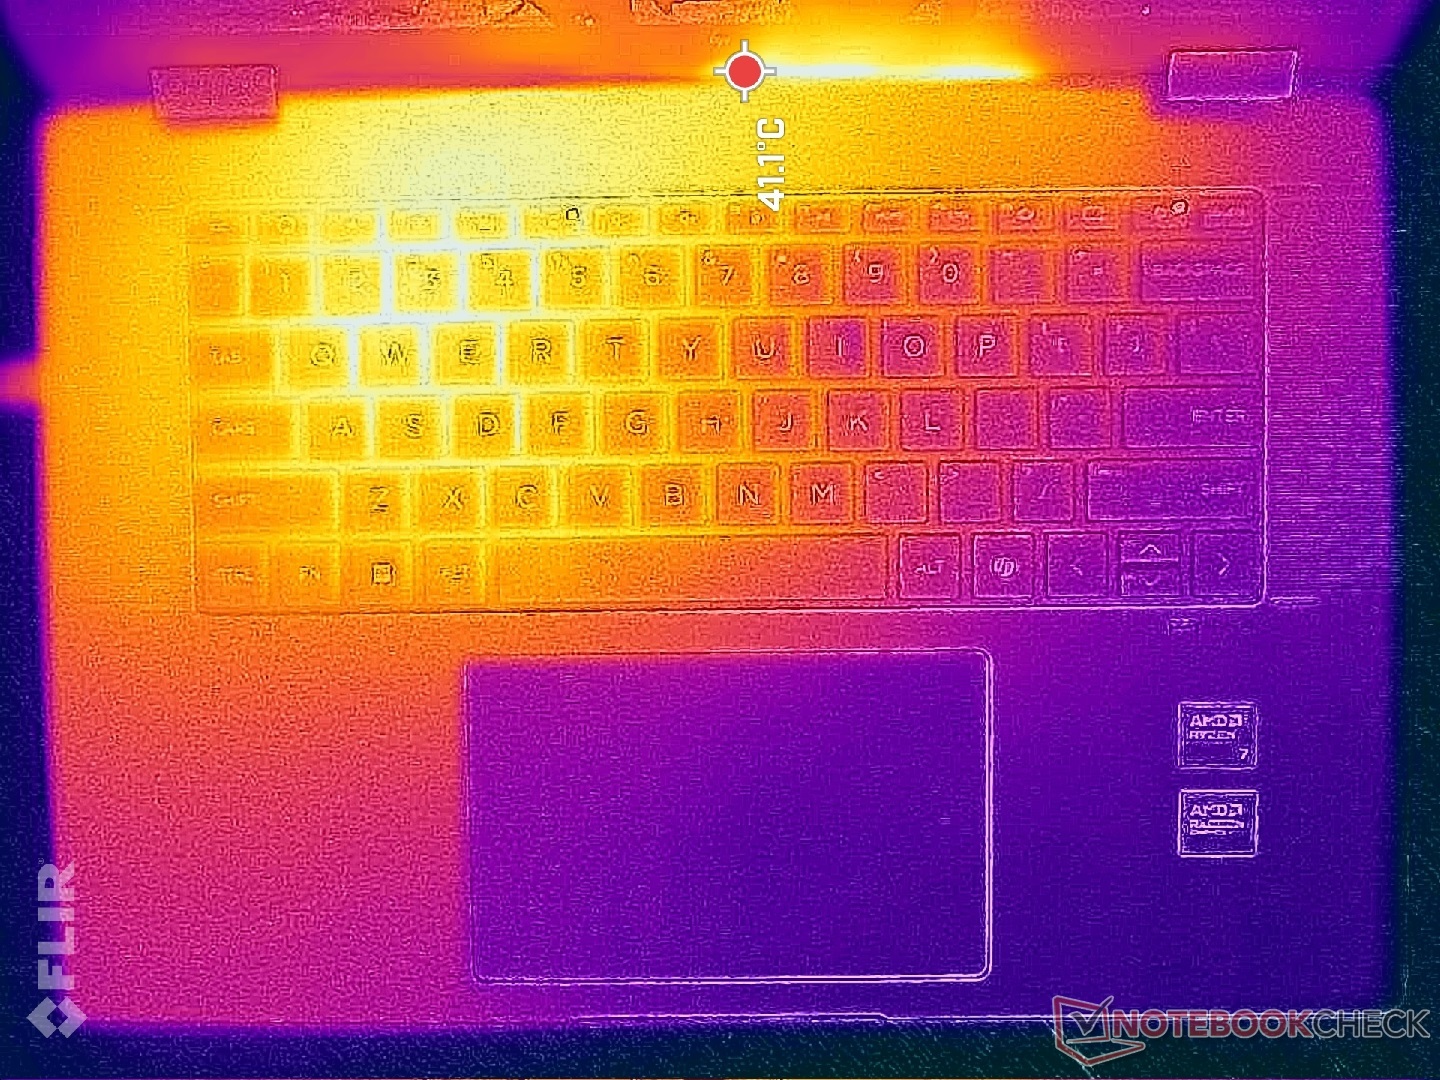
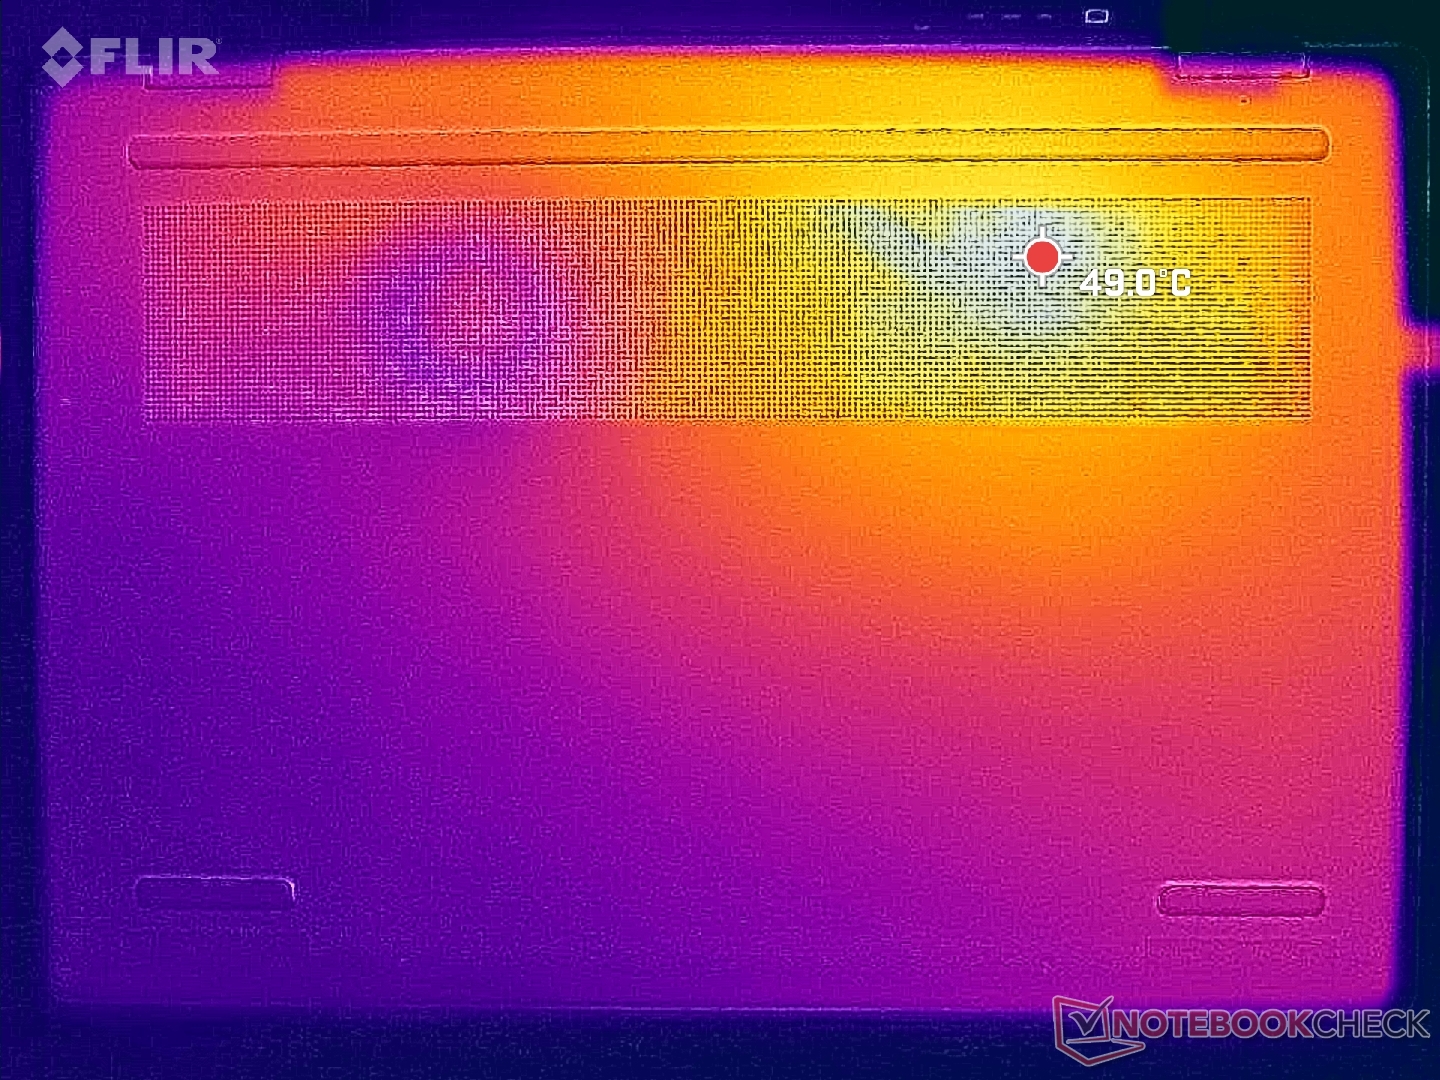
Temperatur
Die Hotspots in der Nähe der WASD-Tasten können bis zu 41 °C erreichen, während die langsameren Modelle mit Core U wie Yoga 7 2-in-1 16IML9 oder Envy x360 15 nur 38 bzw. 36 °C erreichen. Insbesondere die linke Handballenablage wird unter Last deutlich wärmer als die rechte. Zum Glück wird die Temperatur jedoch nie zu unangenehm.
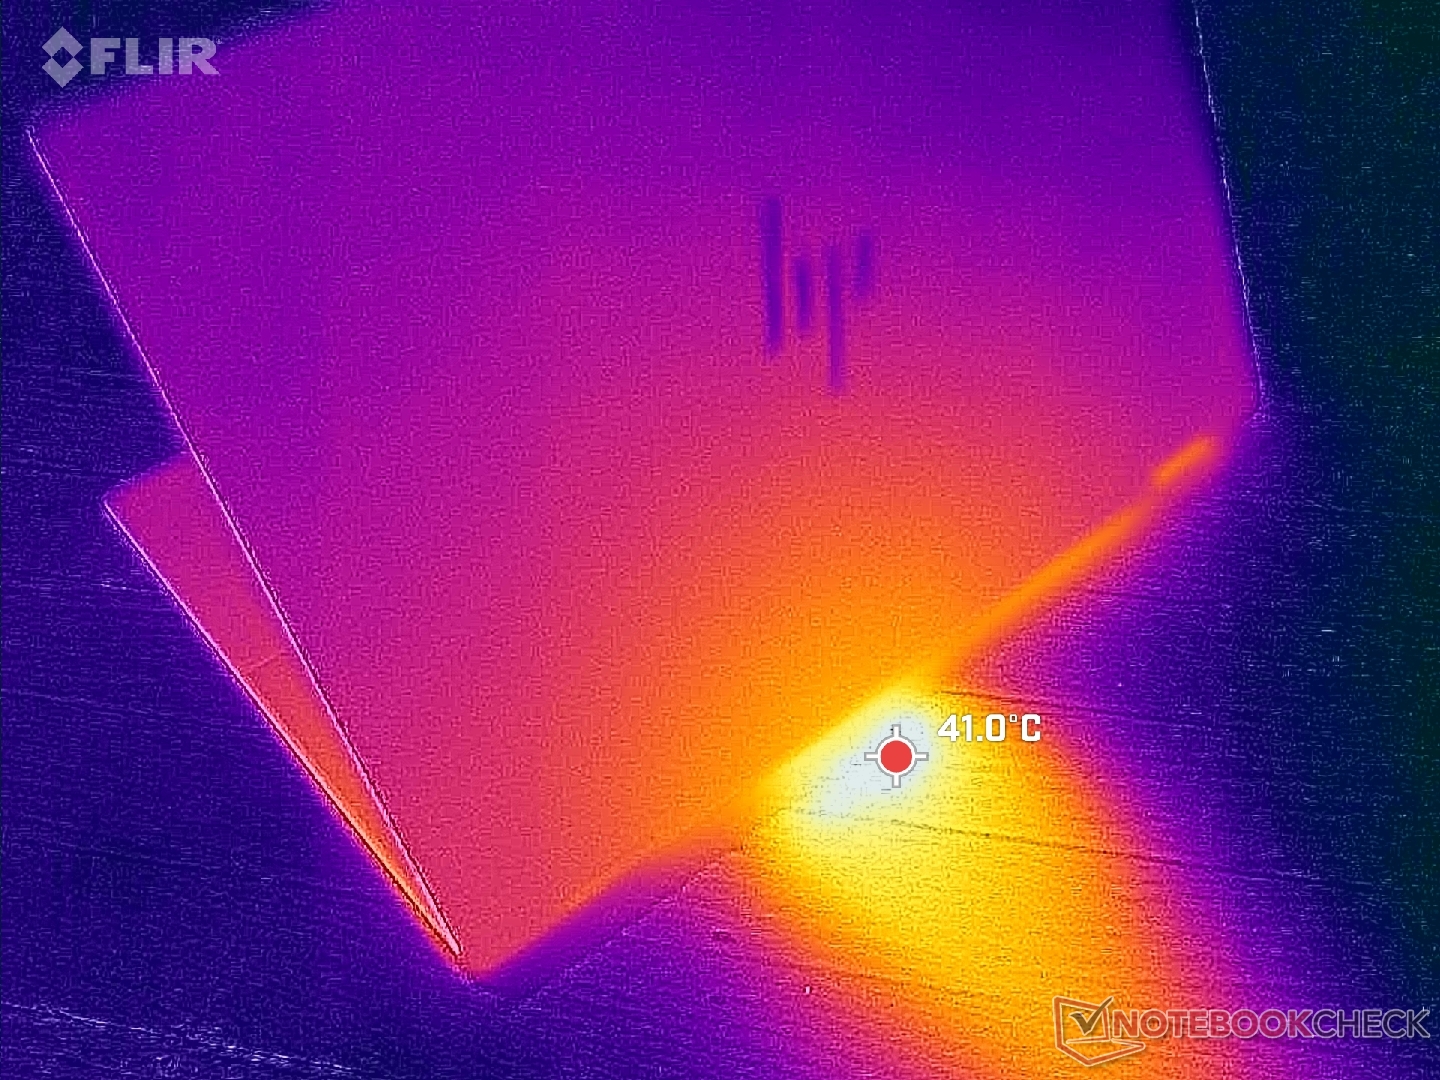
(±) Die maximale Temperatur auf der Oberseite ist 42.6 °C. Im Vergleich liegt der Klassendurchschnitt bei 35.4 °C (von 19.6 bis 60 °C für die Klasse Convertible).
(-) Auf der Unterseite messen wir eine maximalen Wert von 47.8 °C (im Vergleich zum Durchschnitt von 36.9 °C).
(+) Ohne Last messen wir eine durchschnittliche Temperatur von 26.5 °C auf der Oberseite. Der Klassendurchschnitt erreicht 30.3 °C.
(+) Die Handballen und der Touchpad-Bereich erreichen maximal 32.4 °C und damit die typische Hauttemperatur und fühlen sich daher nicht heiß an.
(-) Die durchschnittliche Handballen-Temperatur anderer getesteter Geräte war 28 °C (-4.4 °C).
| HP Envy x360 2-in-1 16-ad0097nr AMD Ryzen 7 8840HS, AMD Radeon 780M | HP Envy 16 h0112nr Intel Core i7-12700H, NVIDIA GeForce RTX 3060 Laptop GPU | HP Spectre x360 16 RTX 4050 Intel Core Ultra 7 155H, NVIDIA GeForce RTX 4050 Laptop GPU | Lenovo Yoga 7 2-in-1 16IML9 Intel Core Ultra 5 125U, Intel Graphics 4-Core iGPU (Meteor / Arrow Lake) | Samsung Galaxy Book4 Pro 360 Intel Core Ultra 5 125H, Intel Arc 7-Core iGPU | LG Gram 2in1 16 16T90R - G.AA78G Intel Core i7-1360P, Intel Iris Xe Graphics G7 96EUs | |
|---|---|---|---|---|---|---|
| Hitze | -10% | 1% | 10% | 11% | -20% | |
| Last oben max * (°C) | 42.6 | 45.2 -6% | 39.6 7% | 37.8 11% | 38.6 9% | 55 -29% |
| Last unten max * (°C) | 47.8 | 44 8% | 39.2 18% | 38.8 19% | 39.2 18% | 55.4 -16% |
| Idle oben max * (°C) | 27.4 | 33.6 -23% | 29 -6% | 25.4 7% | 25.2 8% | 34.9 -27% |
| Idle unten max * (°C) | 27.8 | 32.6 -17% | 31.6 -14% | 26.8 4% | 25.7 8% | 30 -8% |
* ... kleinere Werte sind besser
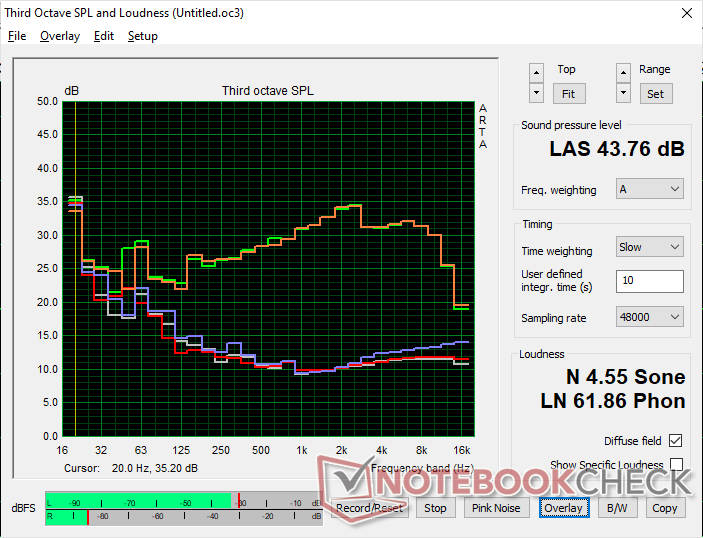
Lautsprecher

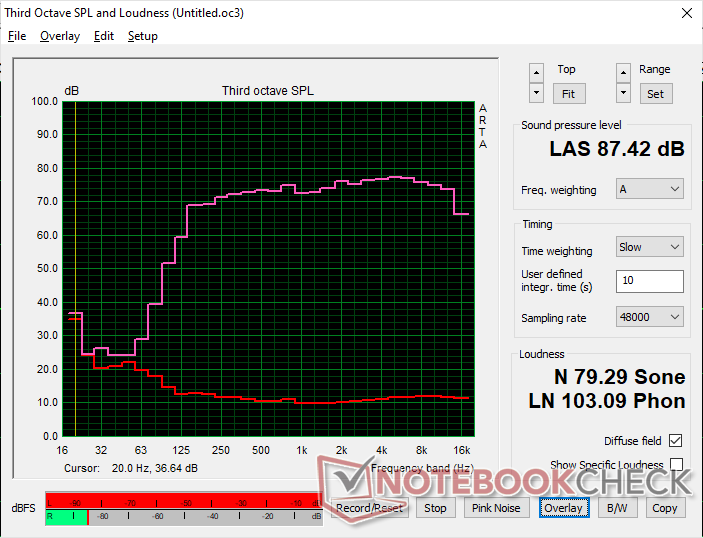
HP Envy x360 2-in-1 16-ad0097nr Audio Analyse
(+) | Die Lautsprecher können relativ laut spielen (87.4 dB)
Bass 100 - 315 Hz
(±) | abgesenkter Bass - 8.3% geringer als der Median
(±) | durchschnittlich lineare Bass-Wiedergabe (8.7% Delta zum Vorgänger)
Mitteltöne 400 - 2000 Hz
(+) | ausgeglichene Mitten, vom Median nur 1% abweichend
(+) | lineare Mitten (1.9% Delta zum Vorgänger)
Hochtöne 2 - 16 kHz
(+) | ausgeglichene Hochtöne, vom Median nur 2.5% abweichend
(+) | sehr lineare Hochtöne (1.2% Delta zum Vorgänger)
Gesamt im hörbaren Bereich 100 - 16.000 Hz
(+) | hörbarer Bereich ist sehr linear (6.5% Abstand zum Median
Im Vergleich zu allen Geräten derselben Klasse
» 0% aller getesteten Geräte dieser Klasse waren besser, 0% vergleichbar, 99% schlechter
» Das beste Gerät hat einen Delta-Wert von 6%, durchschnittlich ist 20%, das schlechteste Gerät hat 57%
Im Vergleich zu allen Geräten im Test
» 1% aller getesteten Geräte waren besser, 0% vergleichbar, 99% schlechter
» Das beste Gerät hat einen Delta-Wert von 4%, durchschnittlich ist 24%, das schlechteste Gerät hat 134%
Apple MacBook Pro 16 2021 M1 Pro Audio Analyse
(+) | Die Lautsprecher können relativ laut spielen (84.7 dB)
Bass 100 - 315 Hz
(+) | guter Bass - nur 3.8% Abweichung vom Median
(+) | lineare Bass-Wiedergabe (5.2% Delta zum Vorgänger)
Mitteltöne 400 - 2000 Hz
(+) | ausgeglichene Mitten, vom Median nur 1.3% abweichend
(+) | lineare Mitten (2.1% Delta zum Vorgänger)
Hochtöne 2 - 16 kHz
(+) | ausgeglichene Hochtöne, vom Median nur 1.9% abweichend
(+) | sehr lineare Hochtöne (2.7% Delta zum Vorgänger)
Gesamt im hörbaren Bereich 100 - 16.000 Hz
(+) | hörbarer Bereich ist sehr linear (4.6% Abstand zum Median
Im Vergleich zu allen Geräten derselben Klasse
» 0% aller getesteten Geräte dieser Klasse waren besser, 0% vergleichbar, 100% schlechter
» Das beste Gerät hat einen Delta-Wert von 5%, durchschnittlich ist 17%, das schlechteste Gerät hat 45%
Im Vergleich zu allen Geräten im Test
» 0% aller getesteten Geräte waren besser, 0% vergleichbar, 100% schlechter
» Das beste Gerät hat einen Delta-Wert von 4%, durchschnittlich ist 24%, das schlechteste Gerät hat 134%
Energieverwaltung
Energieaufnahme
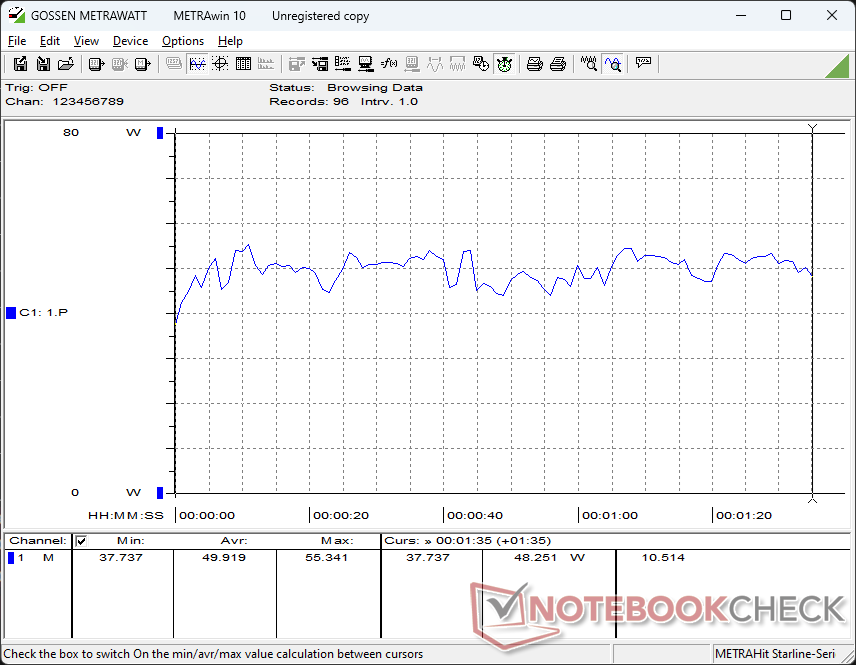
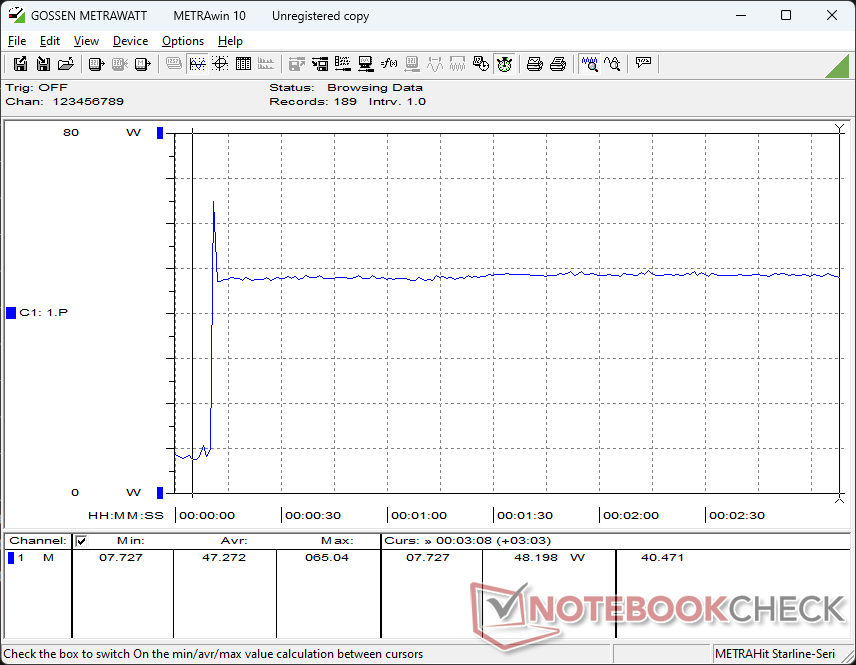
Im Leerlauf auf dem Desktop nimmt das Envy x360 16 zwischen 5 und 15 W auf, was etwa dem halben Energieverbrauch des Spectre x360 16 entspricht und der fehlenden dedizierten GPU zu verdanken ist. Dennoch sollten Nutzer die Bildschirmzeit mit weißem Hintergrund einschränken, da die Darstellung von weiß auf OLEDs deutlich mehr Energie frisst als bei IPS-Bildschirmen. Wir konnten bei unserem Envy etwa einen 9-W-Unterschied zwischen einem vollständig schwarzen und einem vollständig weißen Hintergrund, jeweils bei maximaler Helligkeit, messen.
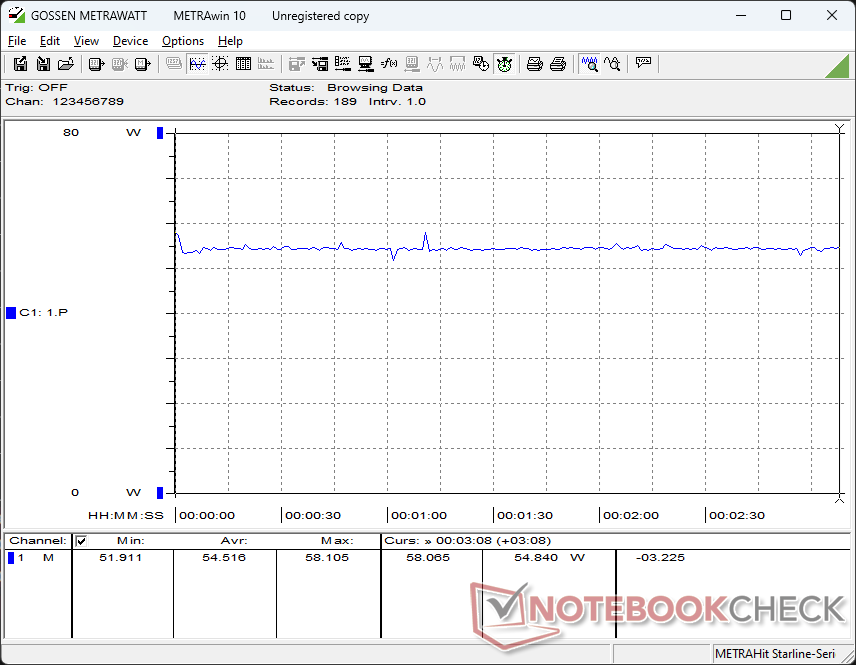
Unter Witcher 3 konsumiert das Gerät 55 W, während das Samsung Galaxy Book4 Pro 16 47 W, das IdeaPad Pro 6 16 54 W (jeweils mit Arc 8 ausgestattet) aufnimmt. Das Verhältnis von Leistung und Energieaufnahme ist dennoch sehr gut und liegt mit den neuesten Intel-Alternativen gleichauf, obwohl die AMD-Lösung schon fast zwei Jahre alt ist.
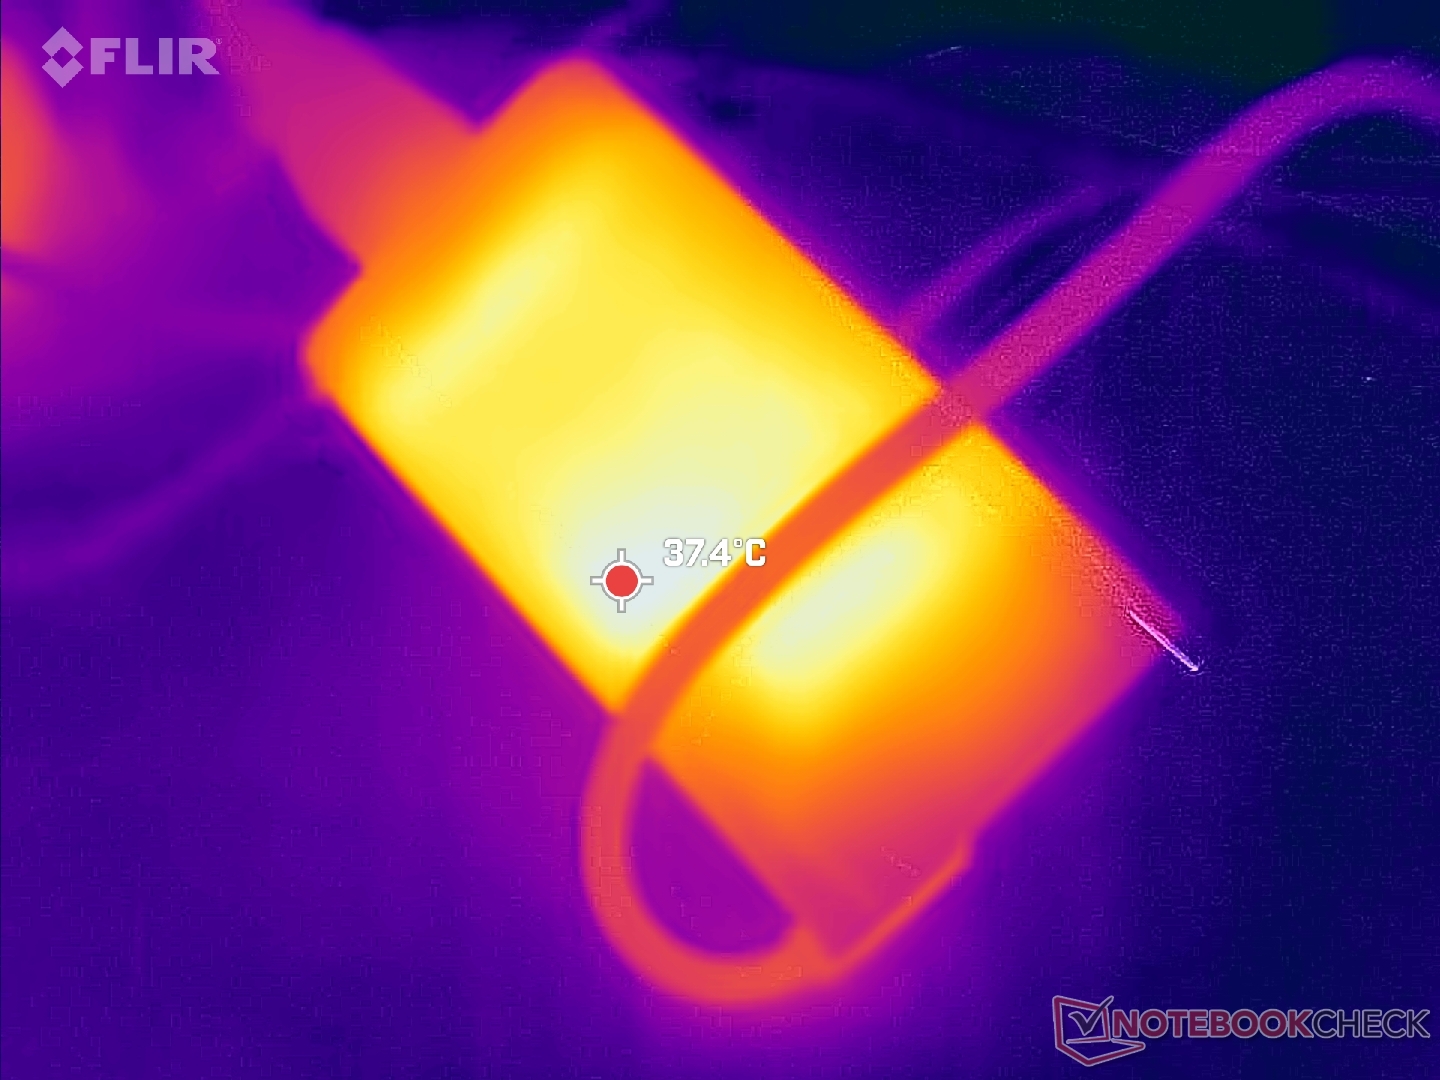
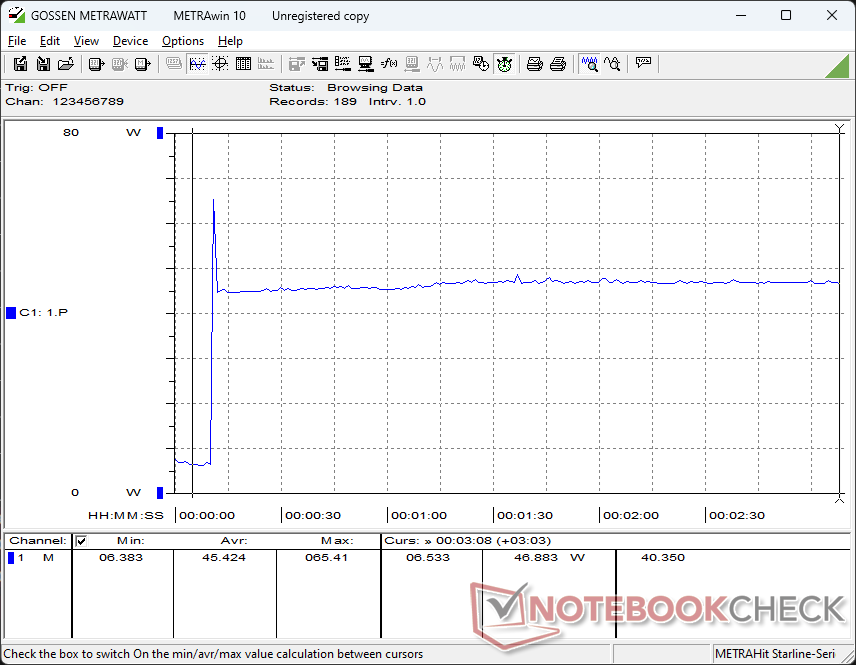
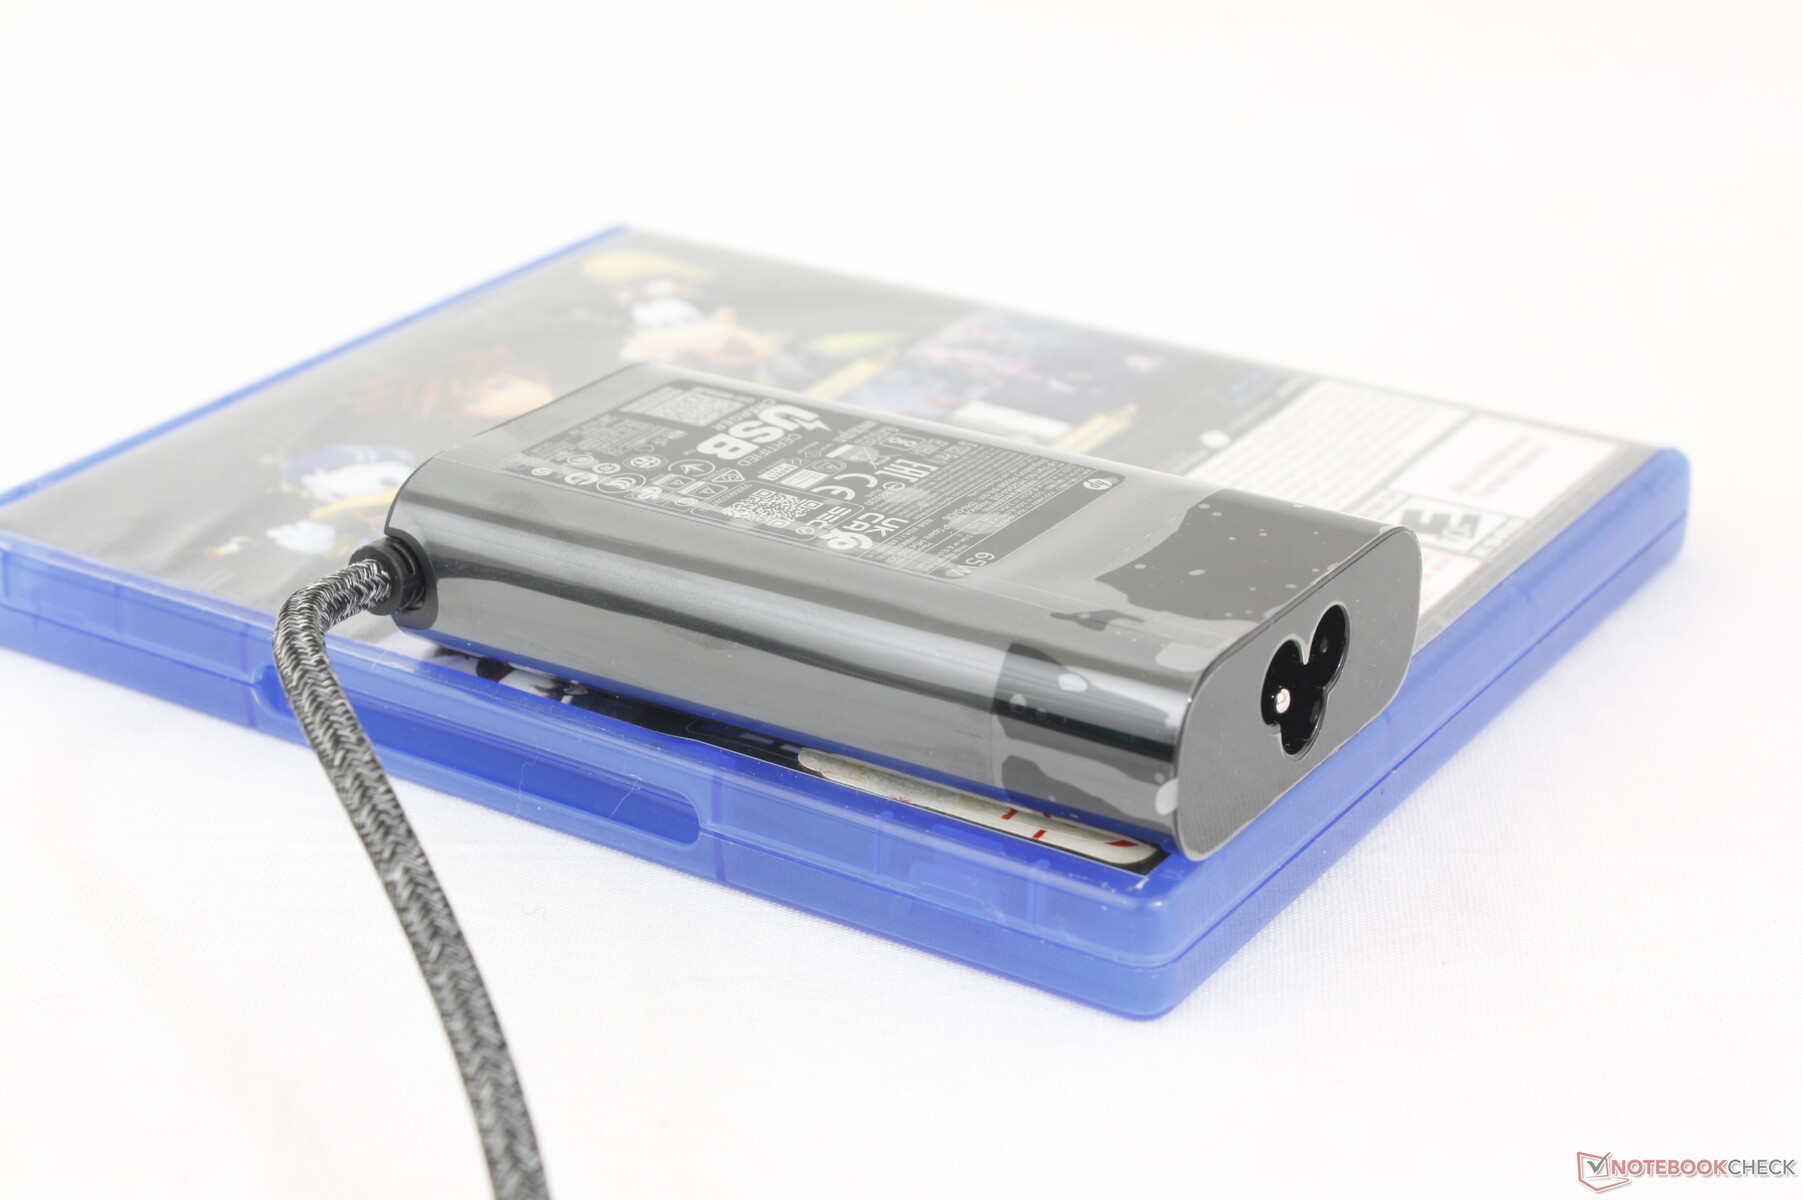
Wir haben temporär und unter extremer Last eine maximale Energieaufnahme von 66 W gemessen. Das USB-C-Netzgerät hat eine Größe von 9,6 x 5,5 x 2,2 cm und bietet 65 W Leistung.
| Aus / Standby | |
| Idle | |
| Last |
|
Legende:
min: | |
| HP Envy x360 2-in-1 16-ad0097nr R7 8840HS, Radeon 780M, KIOXIA BG5 KBG50ZNV1T02, OLED, 2880x1800, 16" | HP Envy 16 h0112nr i7-12700H, GeForce RTX 3060 Laptop GPU, Micron 3400 1TB MTFDKBA1T0TFH, OLED, 3840x2400, 16" | HP Spectre x360 16 RTX 4050 Ultra 7 155H, GeForce RTX 4050 Laptop GPU, SK hynix PC801 HFS001TEJ9X101N, OLED, 2880x1800, 16" | Lenovo Yoga 7 2-in-1 16IML9 Ultra 5 125U, Graphics 4-Core iGPU (Arrow Lake), SK hynix HFS512GEJ4X112N, IPS, 1920x1200, 16" | Samsung Galaxy Book4 Pro 360 Ultra 5 125H, Arc 7-Core, Samsung PM9B1 512GB MZVL4512HBLU, OLED, 2880x1800, 16" | LG Gram 2in1 16 16T90R - G.AA78G i7-1360P, Iris Xe G7 96EUs, Samsung PM9A1 MZVL21T0HCLR, IPS, 2560x1600, 16" | |
|---|---|---|---|---|---|---|
| Stromverbrauch | -128% | -77% | 18% | 18% | -1% | |
| Idle min * (Watt) | 5 | 10 -100% | 5.8 -16% | 3 40% | 3 40% | 5.5 -10% |
| Idle avg * (Watt) | 6.2 | 10.9 -76% | 12.3 -98% | 8.5 -37% | 6.3 -2% | 7.2 -16% |
| Idle max * (Watt) | 14.7 | 27.8 -89% | 33.9 -131% | 8.9 39% | 6.5 56% | 12.9 12% |
| Last avg * (Watt) | 49.9 | 116.4 -133% | 83.3 -67% | 41.1 18% | 49.3 1% | 55 -10% |
| Witcher 3 ultra * (Watt) | 54.5 | 133.7 -145% | 89.1 -63% | 30.7 44% | 45.9 16% | 47 14% |
| Last max * (Watt) | 65 | 209.8 -223% | 120.8 -86% | 64.6 1% | 65.5 -1% | 63.6 2% |
* ... kleinere Werte sind besser
Energieaufnahme Witcher 3 / Stresstest
Energieaufnahme externer Monitor
Akkulaufzeit
Die Akkukapazität ist kleiner als bei den meisten anderen 16-Zoll-Laptops, was in Kombination mit einem anspruchsvollen OLED-Touchscreen auch zu kürzeren Akkulaufzeiten führt. Im realistischen Browsertest simulierten wir 7,5 Stunden lang realistisches Surfverhalten, bis sich das Gerät abschaltete. Das Samsung Galaxy Book4 Pro 360 oder Spectre x360 16 liefen in diesem Szenario ein bis zwei Stunden länger. Solange sich Nutzer keine MacBook-Laufzeiten erwarten, ist die Akkulaufzeit dennoch recht gut.
Das vollständige Aufladen des leeren Akkus benötigt mit dem inkludierten Netzteil etwa 90 Minuten.
| HP Envy x360 2-in-1 16-ad0097nr R7 8840HS, Radeon 780M, 68 Wh | HP Envy 16 h0112nr i7-12700H, GeForce RTX 3060 Laptop GPU, 83 Wh | HP Spectre x360 16 RTX 4050 Ultra 7 155H, GeForce RTX 4050 Laptop GPU, 83 Wh | Lenovo Yoga 7 2-in-1 16IML9 Ultra 5 125U, Graphics 4-Core iGPU (Arrow Lake), 71 Wh | Samsung Galaxy Book4 Pro 360 Ultra 5 125H, Arc 7-Core, 76 Wh | LG Gram 2in1 16 16T90R - G.AA78G i7-1360P, Iris Xe G7 96EUs, 80 Wh | |
|---|---|---|---|---|---|---|
| Akkulaufzeit | 0% | 43% | 60% | 8% | 30% | |
| Idle (h) | 15.6 | 17.8 14% | ||||
| WLAN (h) | 7.7 | 7.9 3% | 11 43% | 12.3 60% | 8.9 16% | 11.9 55% |
| Last (h) | 1.9 | 1.6 -16% | 1.9 0% | 2 5% | ||
| H.264 (h) | 14.7 |
Pro
Contra
Fazit — Spectre-Erfahrung für weniger Geld
HP hat für Verbraucher derzeit zwei 16-Zoll-Convertibles zu bieten: das Mittelklasse Envy x360 16 und das etwas besser ausgestattete Spectre x360 16. Überraschenderweise ist das Envy bei nahezu identen Abmessungen leichter als das Spectre und ist dabei mit genau dem gleichen OLED-Touchscreen ausgestattet. Die User Experience der beiden Modelle überschneidet sich daher trotz des großen Preisunterschieds mehr als erwartet.
Dennoch gibt, neben seines luxuriöseren Designs, es einige Gründe warum Nutzer das teurere Spectre x360 16 bevorzugen könnten. Das Envy x360 16 hat einen kleineren Akku, keine dedizierte GPU und eine Webcam mit geringerer Auflösung. Außerdem ist es unter Last mit nur einem statt zwei Lüftern tendenziell lauter. Auch das Asus VivoBook Pro 16 ist eine gute Alternative zum Envy x360 16, da es für fast den gleichen Preis mit einem OLED, einer dGPU mit besserer Leistung und einem größeren Akku ausgestattet ist. Allerdings geht Nutzern bei dieser Wahl der 2-in-1-Formfaktor verloren.
Das KI-gestützte HP Envy x360 16 ist sowohl mit Intel- als auch mit AMD-Prozessoren erhältlich und bietet sehr ähnliche Eigenschaften wie das teurere Spectre x360 16. Obwohl die AMD-Versionen deutlich schneller sind als mit Intel, fehlt ihnen die USB4- und Thunderbolt-Unterstützung, was die Docking-Möglichkeiten einschränkt.
Wir müssen dem Modell auch zugutehalten, dass es sowohl Intel-Meteor-Lake-U als auch AMD-Hawk-Point-HS-CPUs zur Auswahl stellt – das ist bei anderen Laptops nur selten der Fall. Die AMD-Konfigurationen sind sowohl bei der reinen Prozessorleistung als auch bei der integrierten Grafikleistung eindeutig schneller. Allerdings werden sich Nutzer, die auf einen Thunderbolt-Anschluss bestehen, dennoch mit der langsameren Intel-Variante zufrieden geben müssen. Schade, dass die AMD-Versionen auch kein USB4 unterstützen. Das hätte sie gegenüber den Intel-basierten Envy-Optionen noch empfehlenswerter gemacht.
Preis und Verfügbarkeit
Das Envy x360 16 ist derzeit im HP Online-Shop in verschiedenen Varianten ab 1.300 Euro erhältlich.
HP Envy x360 2-in-1 16-ad0097nr
- 22.05.2024 v7 (old)
Allen Ngo
Transparenz
Die Auswahl der zu testenden Geräte erfolgt innerhalb der Redaktion. Das vorliegende Testmuster wurde dem Autor vom Hersteller oder einem Shop zu Testzwecken leihweise zur Verfügung gestellt. Eine Einflussnahme des Leihstellers auf den Testbericht gab es nicht, der Hersteller erhielt keine Version des Reviews vor der Veröffentlichung. Es bestand keine Verpflichtung zur Publikation. Als eigenständiges, unabhängiges Unternehmen unterliegt Notebookcheck keiner Diktion von Herstellern, Shops und Verlagen.
So testet Notebookcheck
Pro Jahr werden von Notebookcheck hunderte Laptops und Smartphones unabhängig in von uns standardisierten technischen Verfahren getestet, um eine Vergleichbarkeit aller Testergebnisse zu gewährleisten. Seit rund 20 Jahren entwickeln wir diese Testmethoden kontinuierlich weiter und setzen damit Branchenstandards. In unseren Testlaboren kommt ausschließlich hochwertiges Messequipment in die Hände erfahrener Techniker und Redakteure. Die Tests unterliegen einer mehrstufigen Kontrolle. Unsere komplexe Gesamtbewertung basiert auf hunderten fundierten Messergebnissen und Benchmarks, womit Ihnen Objektivität garantiert ist. Weitere Informationen zu unseren Testmethoden gibt es hier.
Preisvergleich

