Fazit - Schlanker und leichter als zuvor
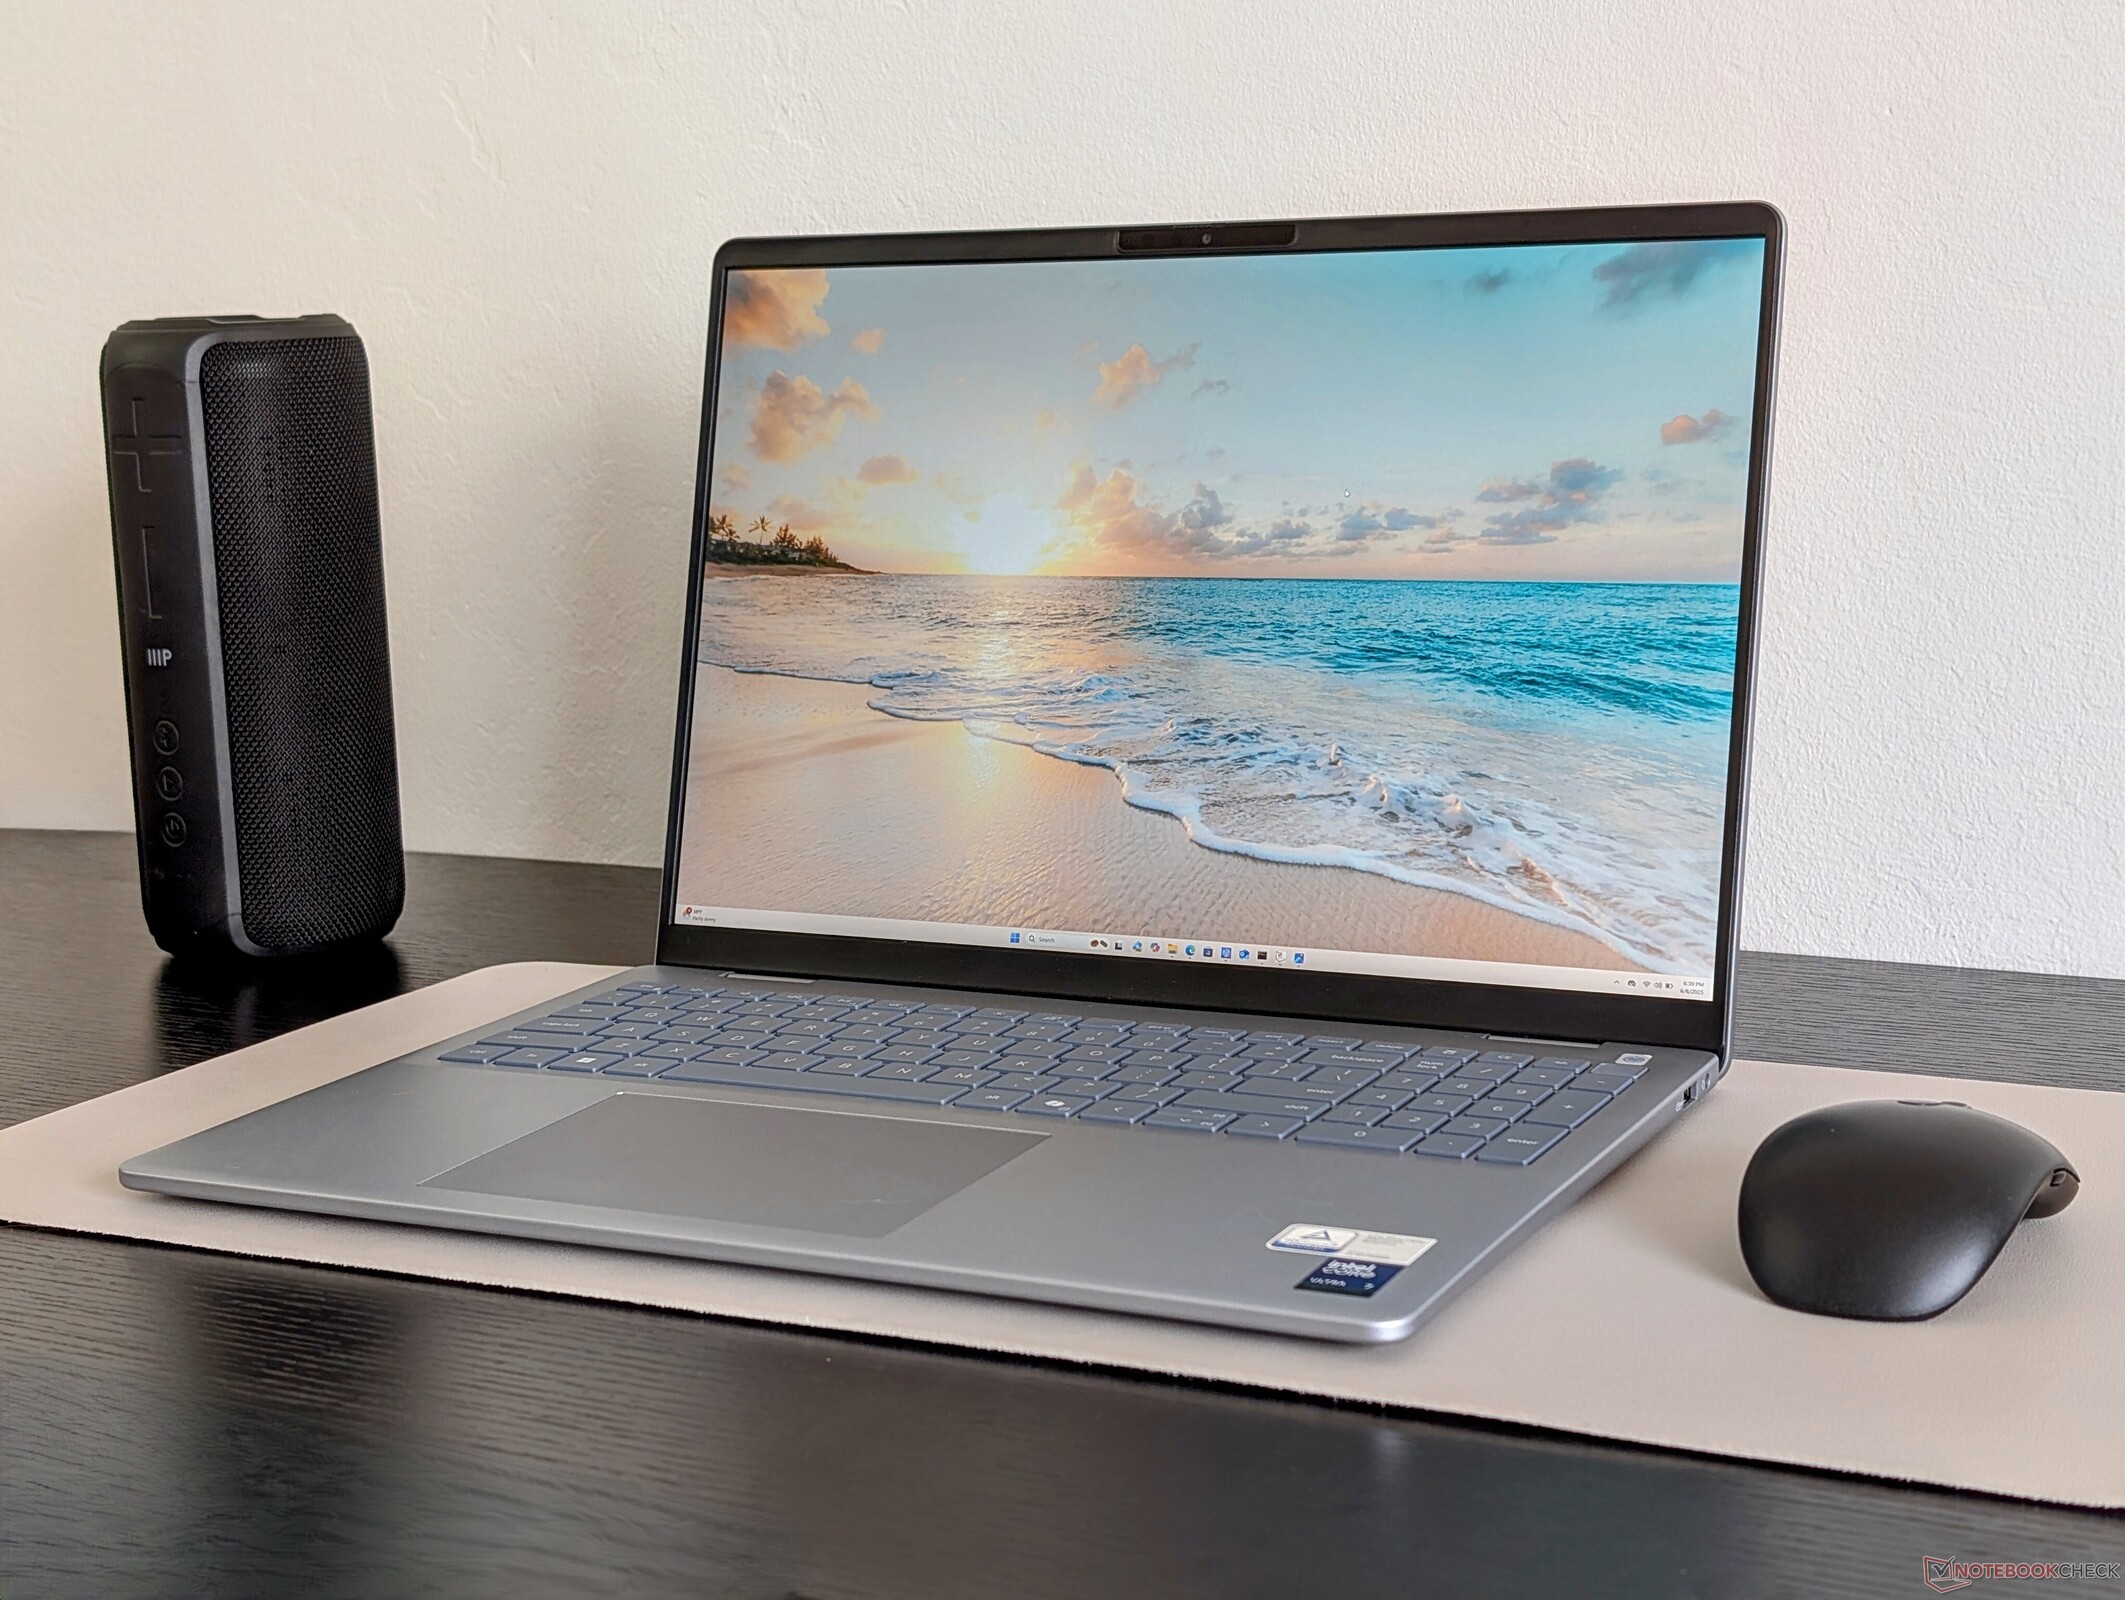
Obwohl es seinem Vorgänger, dem Inspiron 16 Plus 7640, sehr ähnlich sieht, ist das Dell 16 Plus dank dem Wechsel von einer Core-Ultra-H-CPU zur neueren Lunar Lake Core Ultra-V ein ganz anderes Kaliber. Das Ergebnis ist ein schlankeres, leichteres und langlebigeres Gerät, das besser für ein allgemeines Multimedia-Publikum geeignet sein dürfte. Wir schätzen auch, dass das 1.600p120-IPS-Display standardmäßig geliefert wird, was bedeutet, dass es keine "Low-End"-Optionen mit schlechten Panels oder Farben gibt.
Der Hauptkritikpunkt am Dell 16 Plus ist seine mangelnde Leistung für anspruchsvollere Anwendungen. Das ältere Inspiron 16 Plus 7640 und das Inspiron 16 7640 2-in-1 verfügen über Core-H- oder diskrete GPU-Optionen für eine viel schnellere Leistung als das Dell 16 Plus. Sie bieten außerdem das gleiche oder sogar ein besseres Seherlebnis für ungefähr denselben Preis. Benutzer, die die zusätzliche Leistung nicht benötigen, werden das Dell 16 Plus als die geeignetere Option für Reisen und gelegentliches Bearbeiten ansehen. Ansonsten kann man die leistungsstärkere Dell-Premium-Serie in Betracht ziehen.
Pro
Contra
Preis und Verfügbarkeit
Der Hersteller liefert das Dell 16 Plus jetzt ab 1.149 Euro aus, wie in unserem Test konfiguriert. Die Core-Ultra-9-Option wird von Dell für 1.649 Euro angeboten.
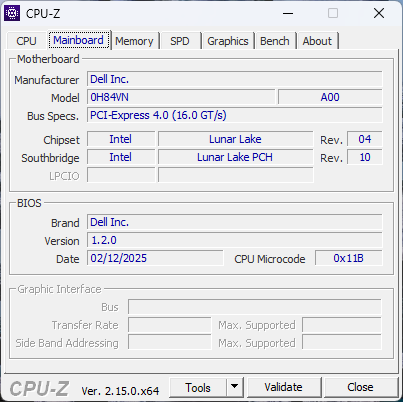
Das Dell 16 Plus ersetzt die Inspiron-16-Plus-Serie der letzten Generation. Auch wenn der Name und die Prozessoroptionen ganz anders sind, sind die physischen Eigenschaften immer noch stark an das letztjährige Inspiron 16 Plus 7640 oder Inspiron 16 7640 2-in-1 angelehnt, wie unser Test zeigen wird.
Unser Testgerät ist eine mittlere Konfiguration mit Core Ultra 7 256V und 1.600p120-IPS-Display ab 1.150 US-Dollar. Höhere SKUs bieten den Core Ultra 7 258V oder Core Ultra 9 288V mit doppeltem RAM und Speicher für 1.650 Euro, während andere Display-Optionen 1.200p IPS oder 1.600p Mini-LED umfassen.
Zu den Konkurrenten in diesem Bereich gehören andere 16-Zoll-Multimedia-Notebooks der Mittelklasse wie das Lenovo IdeaPad Pro 5 16, HP Pavilion Plus 16 oder das Asus Vivobook 16.
Weitere Dell Bewertungen:
Spezifikationen
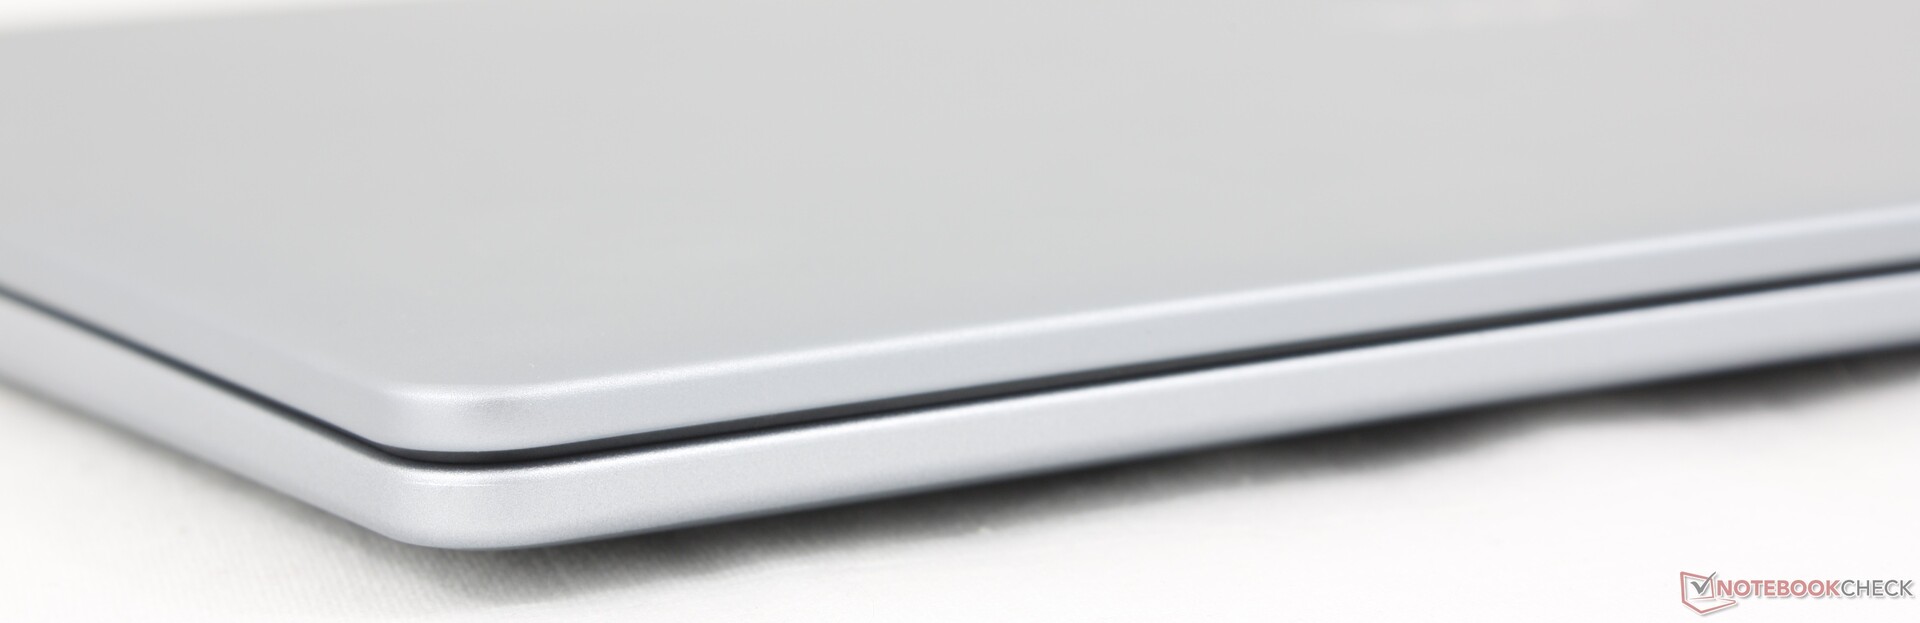
Gehäuse
Das glatte, matte Silbergehäuse sollte jedem, der bereits Erfahrungen mit einem Inspiron Modell gemacht hat, sofort bekannt vorkommen. Die Materialien und das Design sind weitgehend gleich geblieben wie bei der vorherigen Generation, so dass der erste Eindruck ähnlich ist. Das Gehäuse und der Deckel lassen sich leichter biegen als bei teureren Alternativen wie dem XPS 16 oder Lenovo Yoga Pro 9 16, aber ansonsten ist es vergleichbar mit dem HP Pavilion Plus 16 oder dem Asus Vivobook 16.
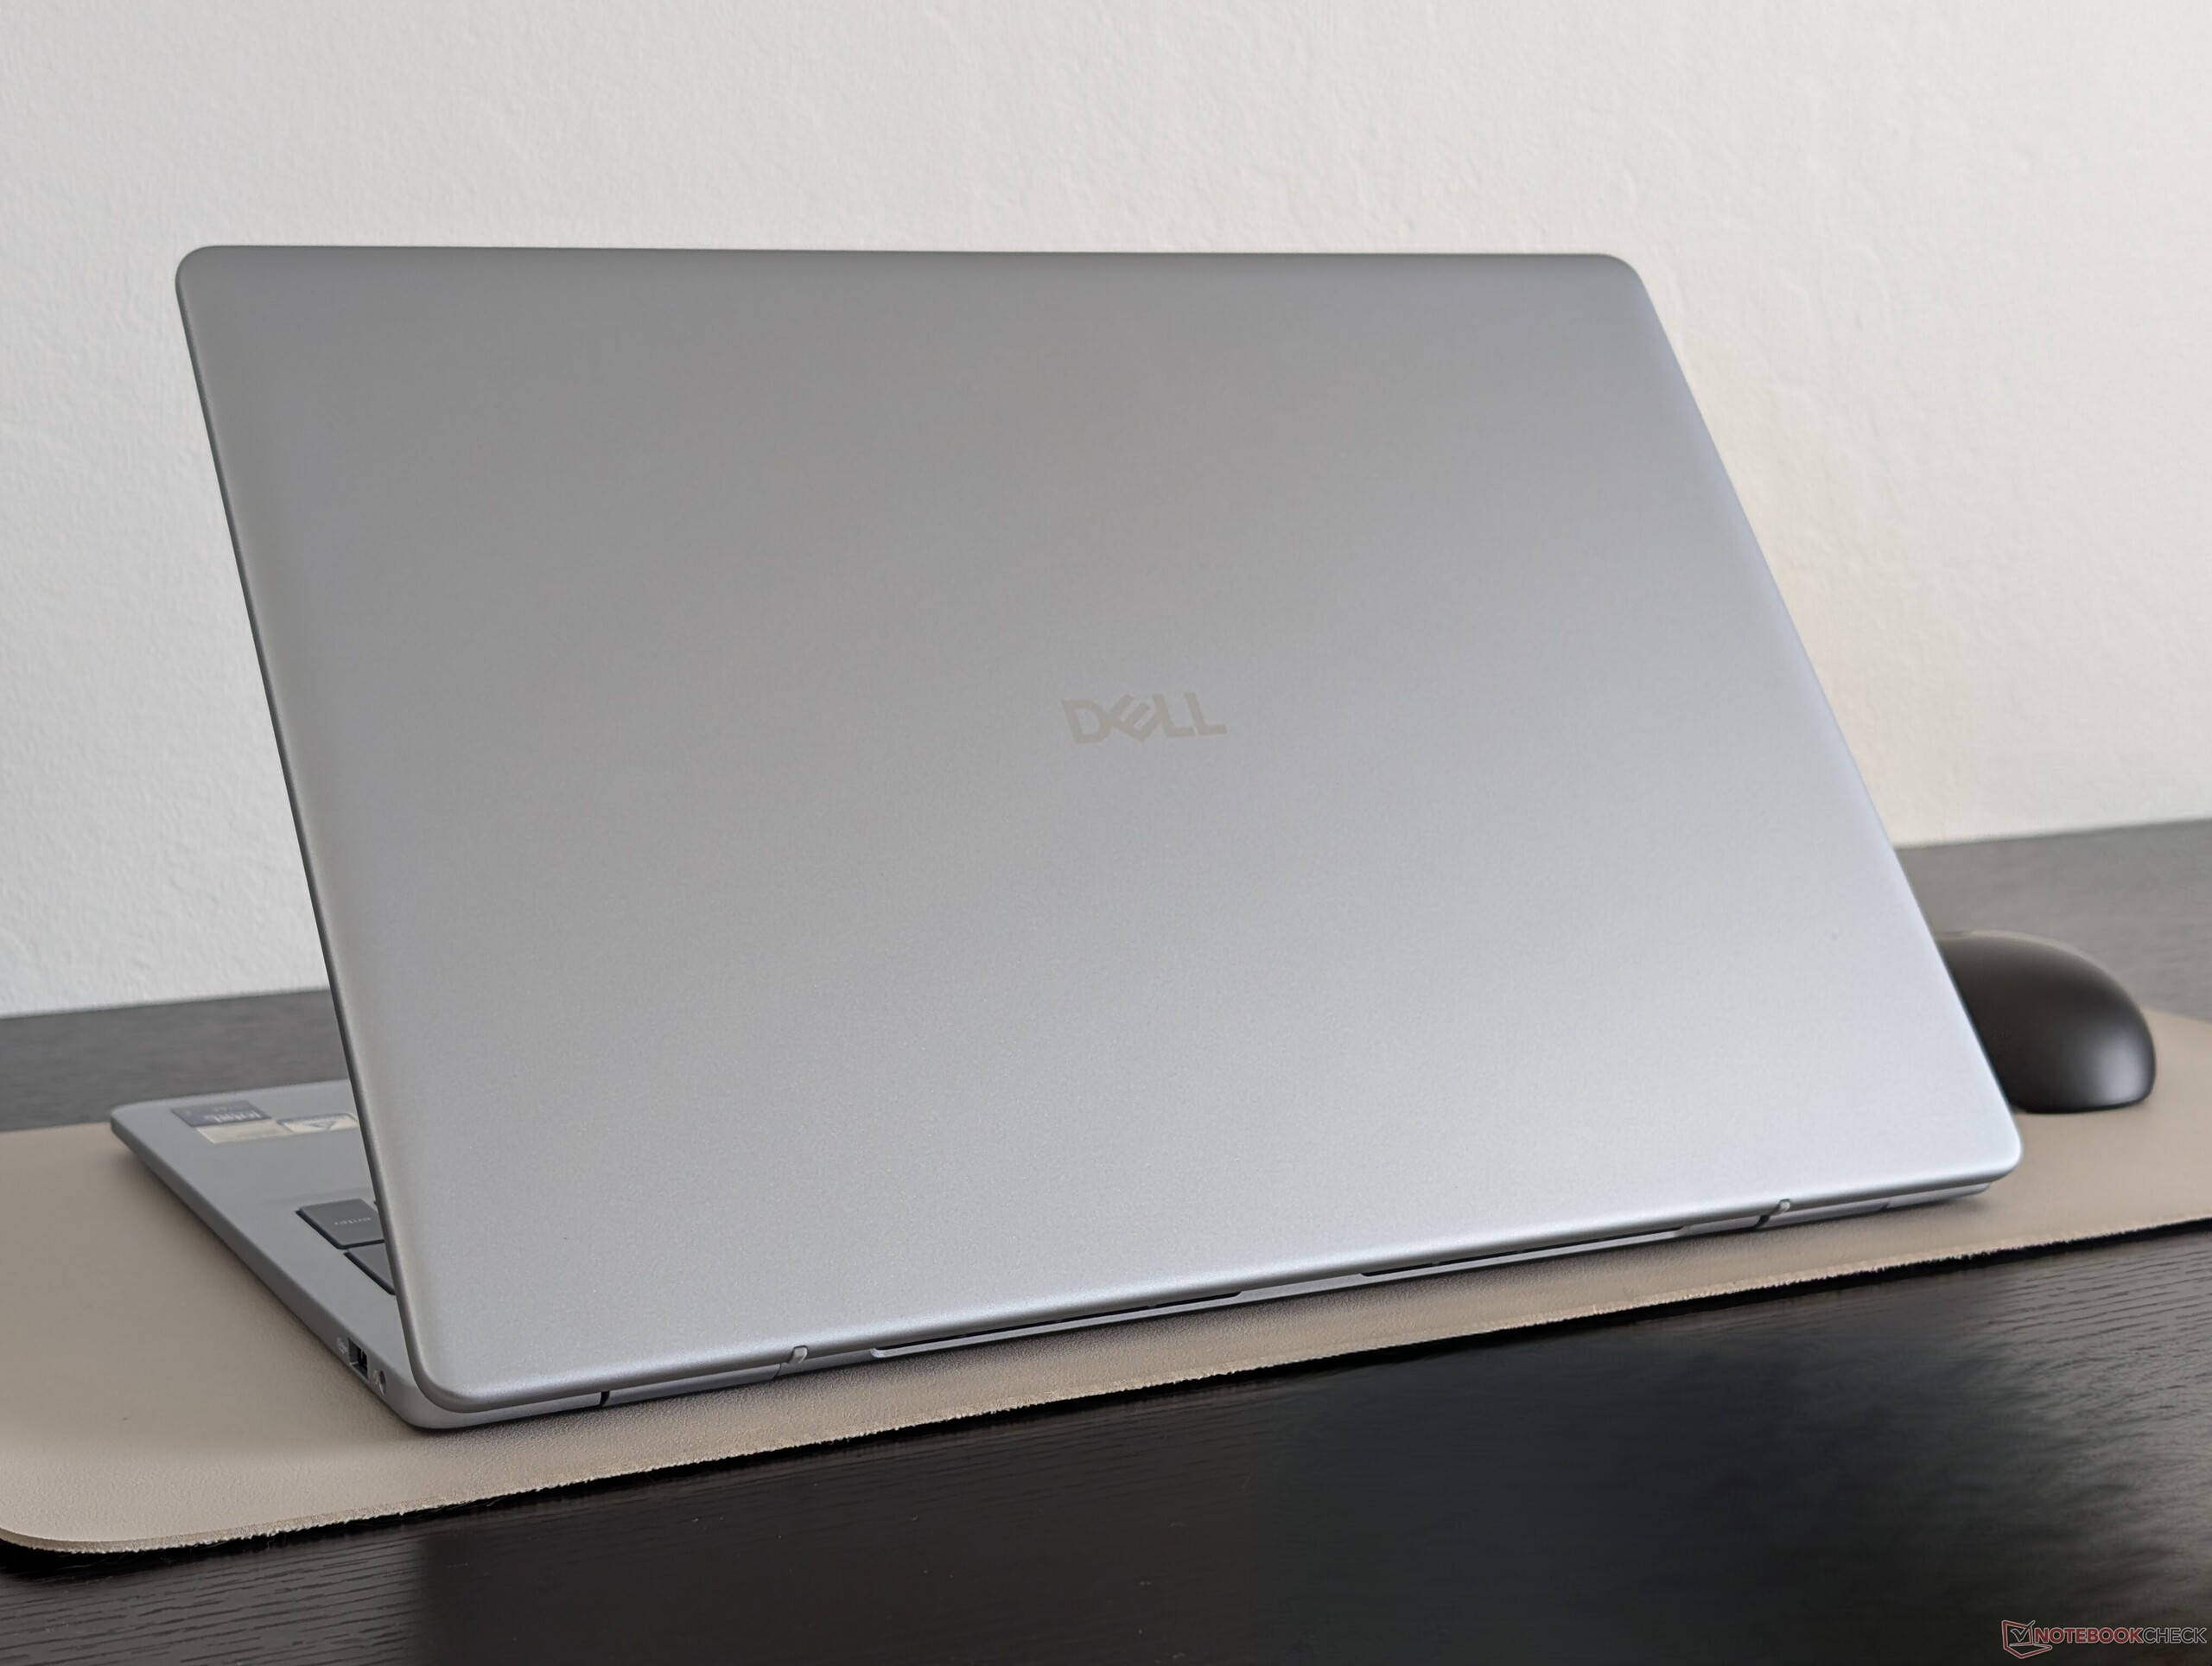
Die Abmessungen sind fast 1:1 mit dem Inspiron 16 Plus 7640 identisch, wenn nicht sogar noch etwas dünner. Der größte Unterschied zwischen den beiden ist das Gewicht, denn das neuere Modell ist rund 400 g leichter, was vor allem auf das Fehlen einer diskreten GPU-Option zurückzuführen ist.
Anschlussausstattung
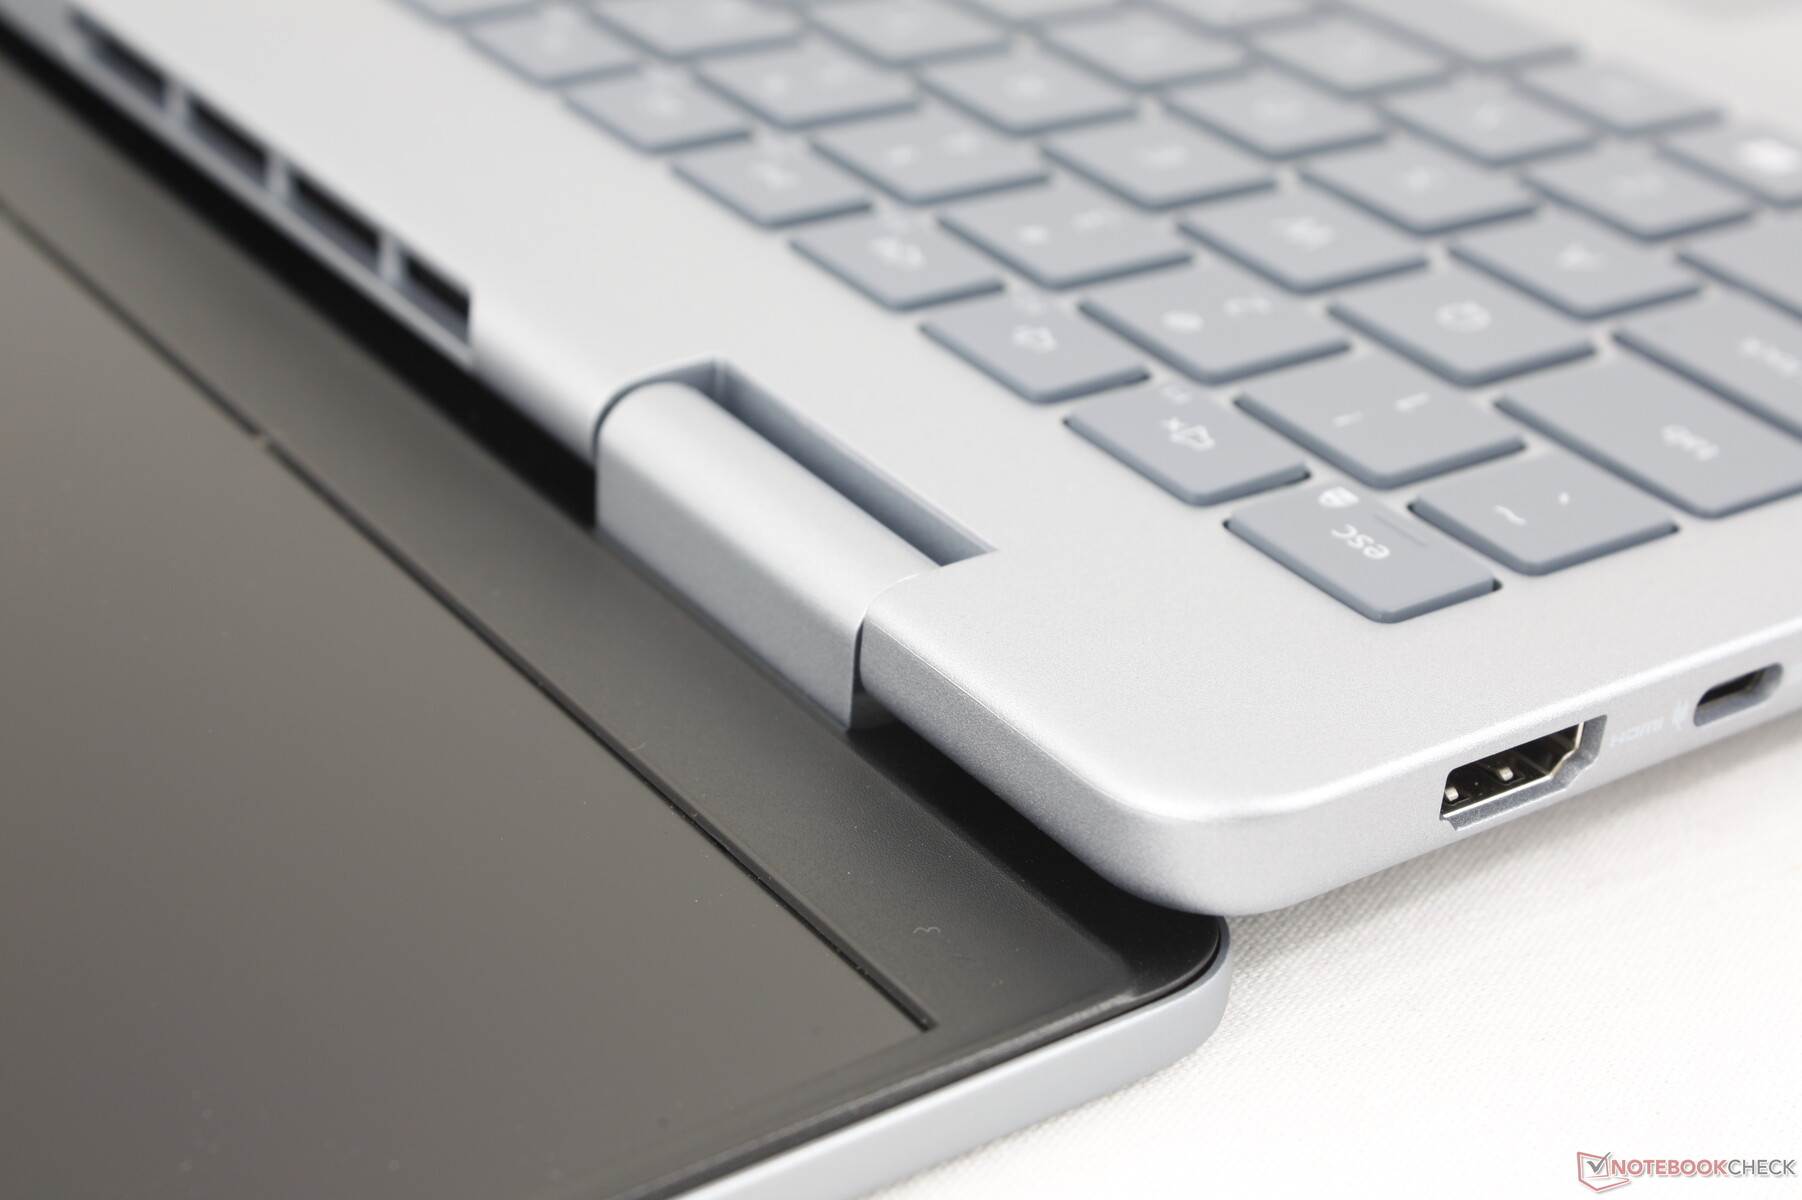
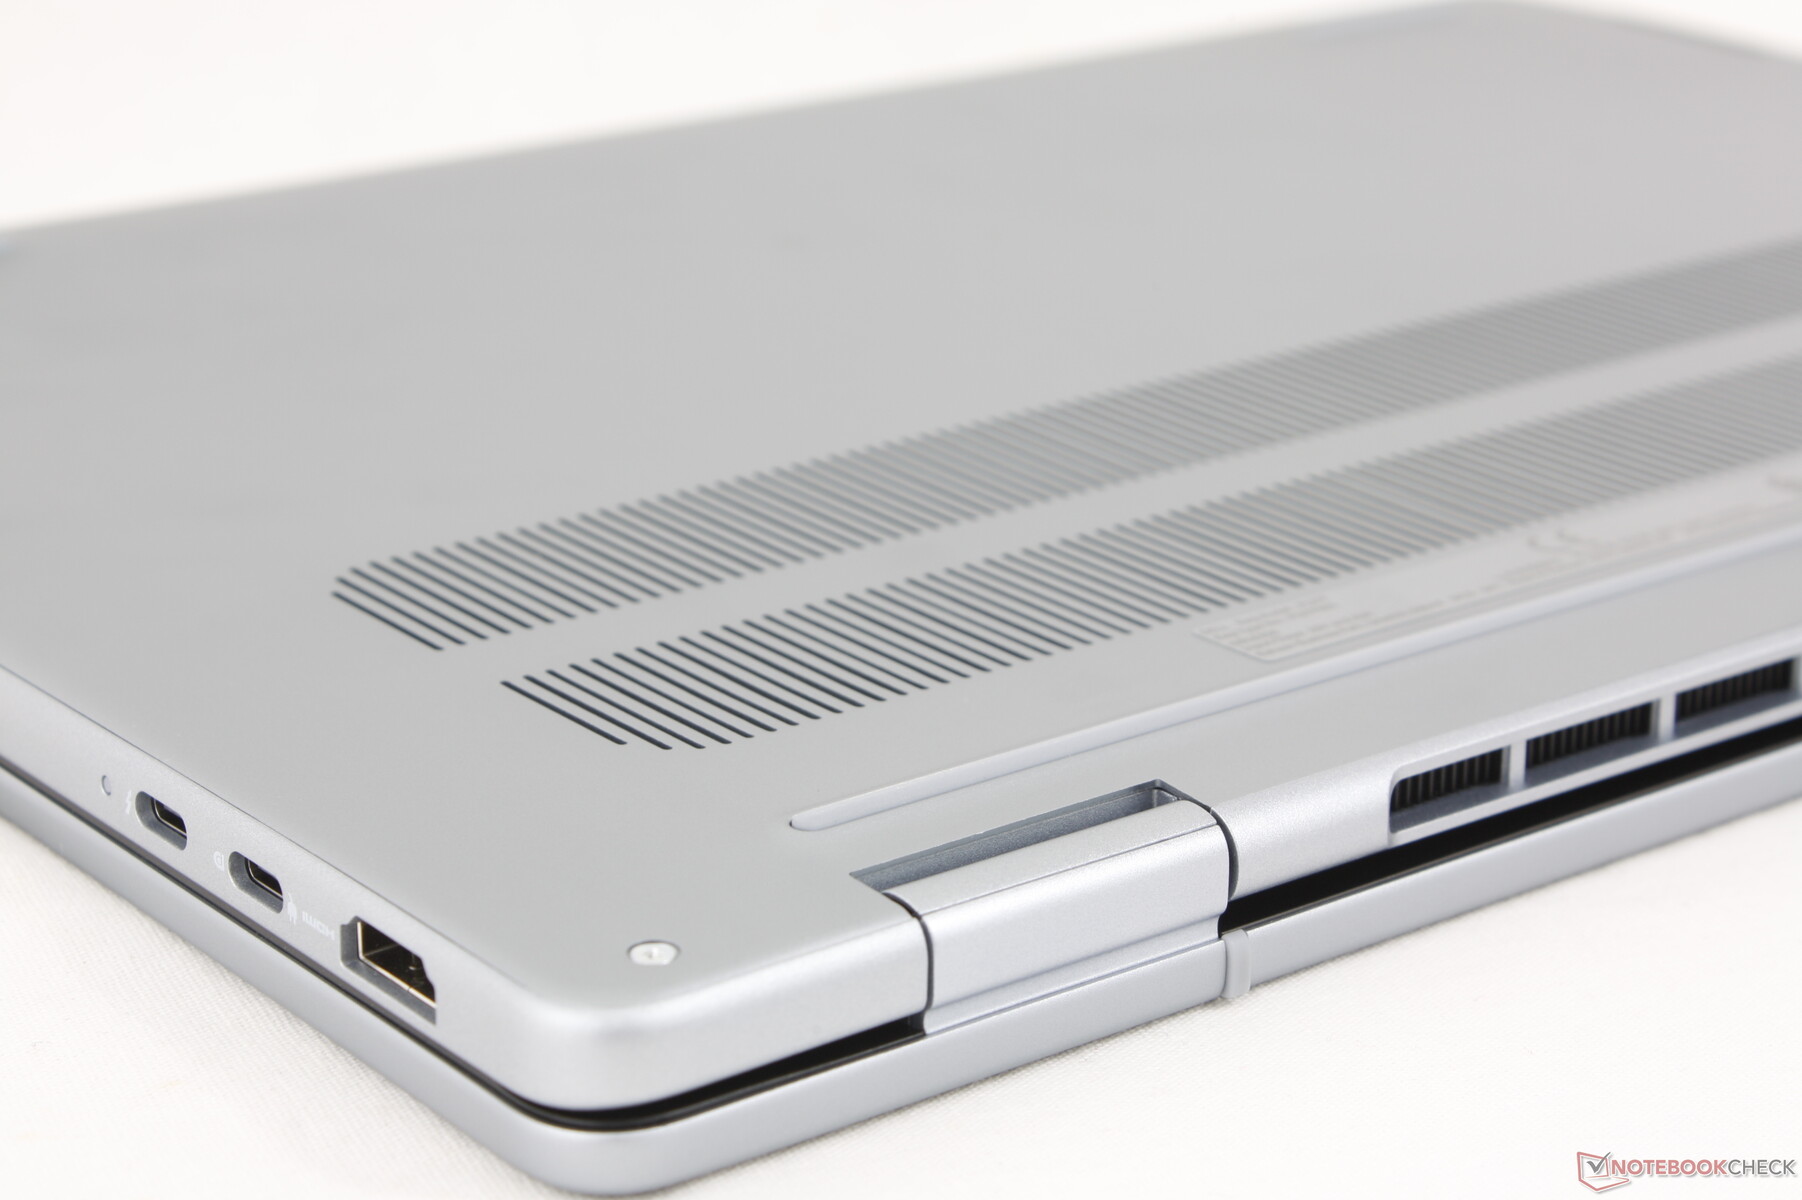
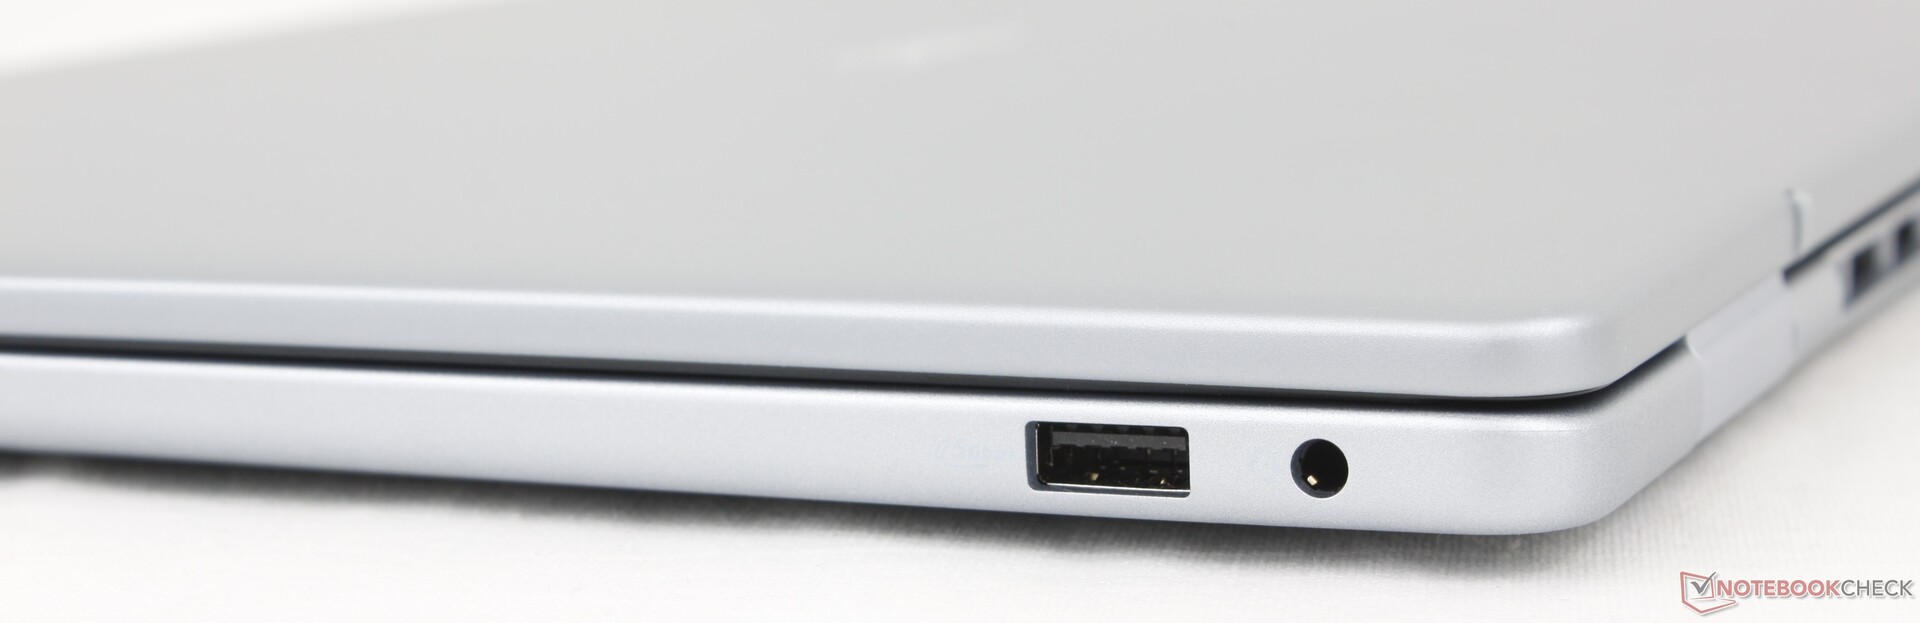
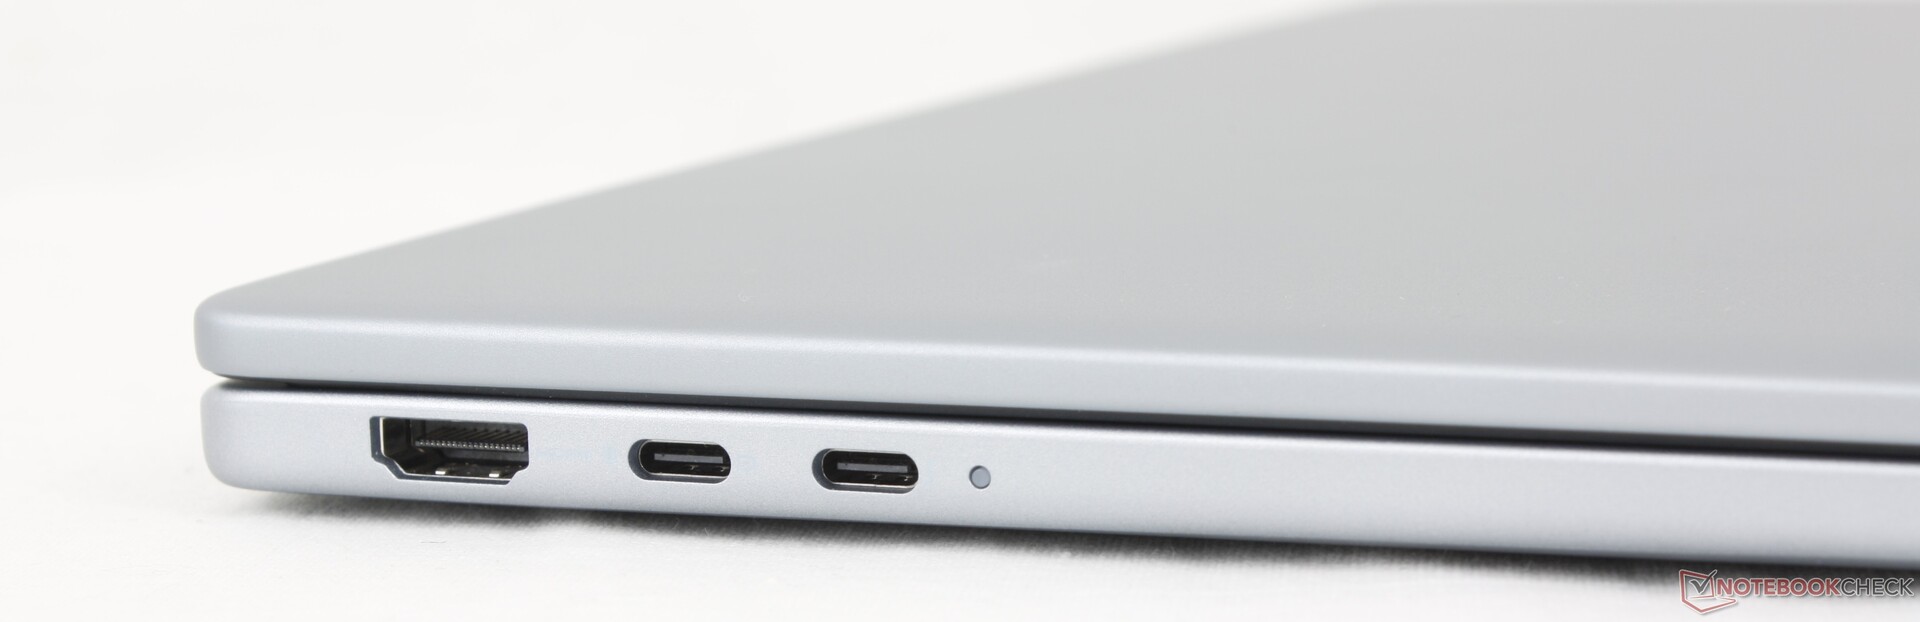
Es gibt weniger Anschlüsse als beim Inspiron 16 Plus 7640 oder 7640 2-in-1 vom letzten Jahr. Das Dell 16 Plus hat den SD-Kartenleser und einen der USB-A-Ports zu Gunsten eines zweiten USB-C-Anschlusses gestrichen. Beachten Sie, dass nur einer der beiden USB-C-Ports mit Thunderbolt 4 und DisplayPort 2.1 kompatibel ist.

Kommunikation
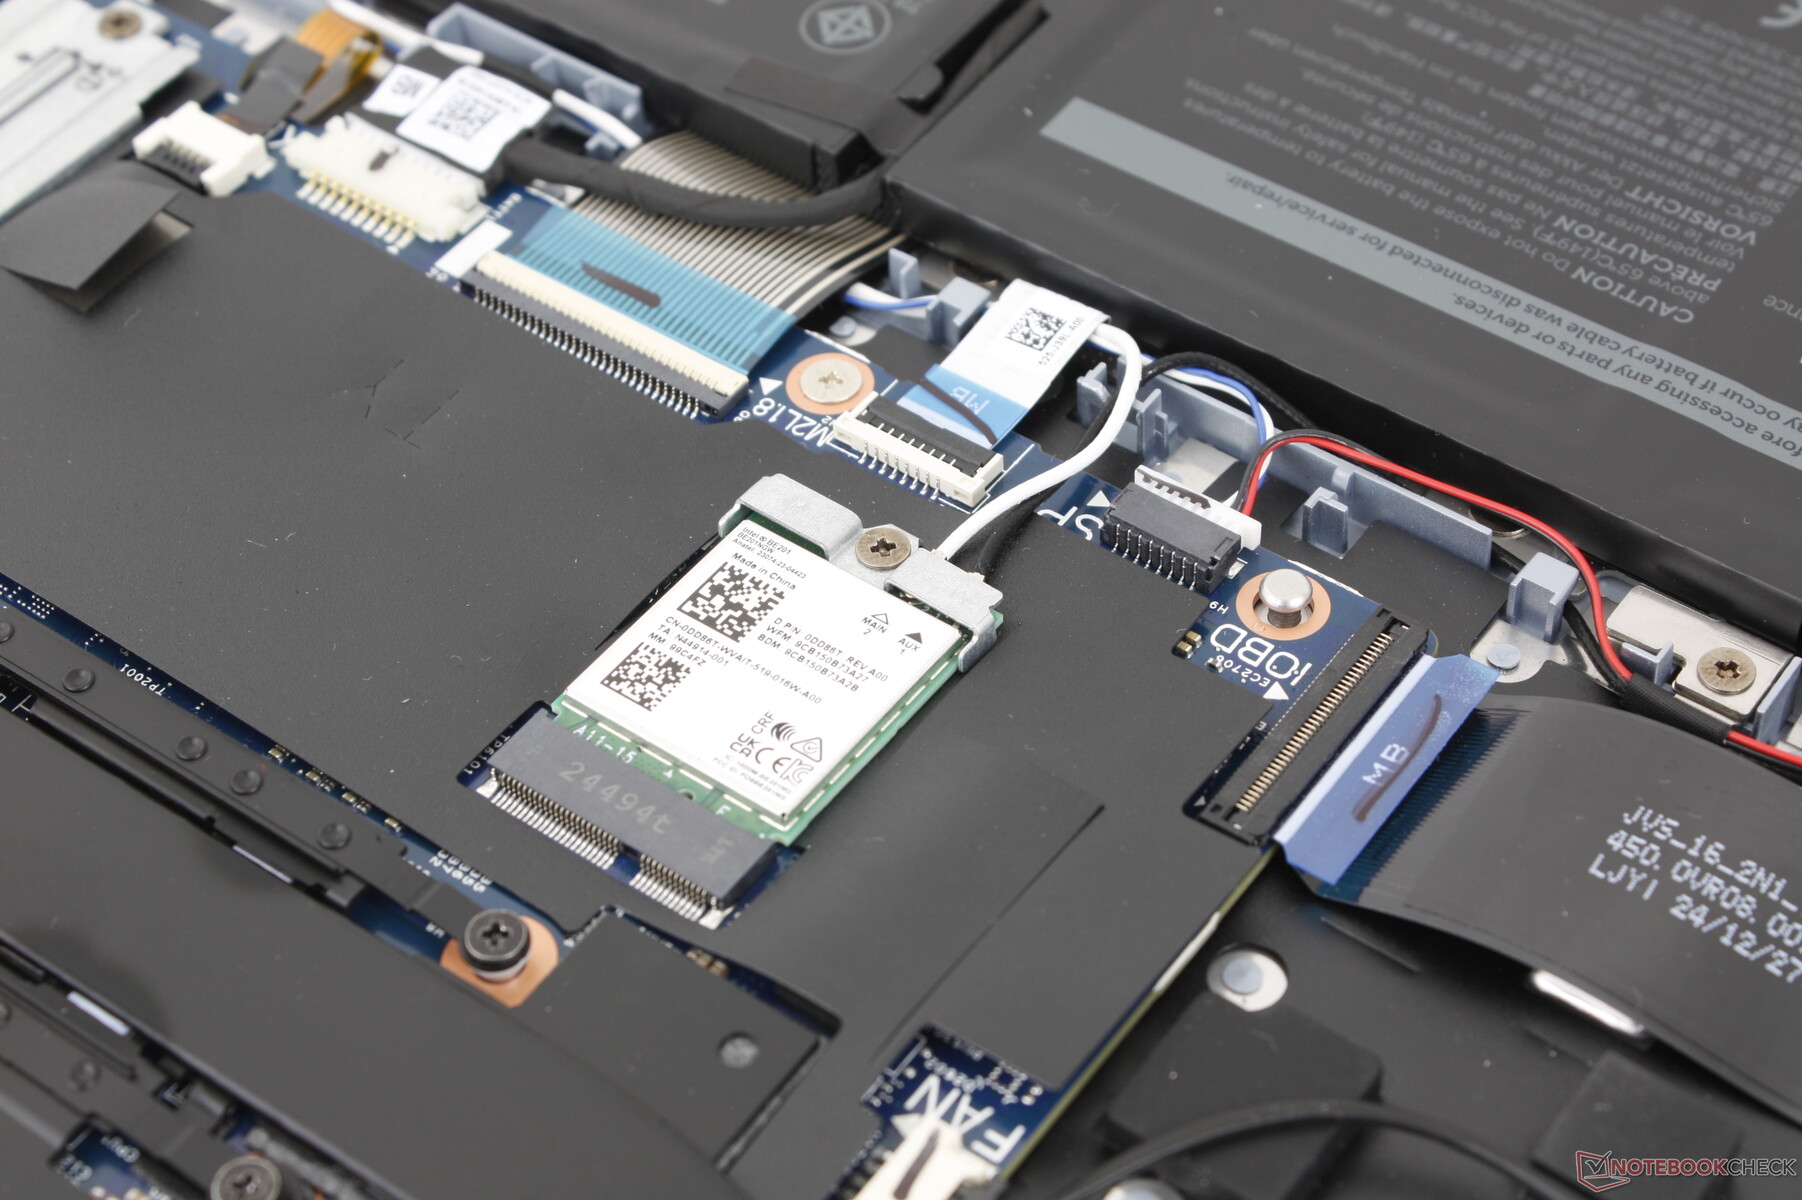
Der Intel BE201 wird standardmäßig für Wi-Fi-7- und Bluetooth-5.4-Anschlüsse geliefert.
| Networking | |
| iperf3 transmit AXE11000 | |
| Lenovo ThinkBook 16 G7+ AMD | |
| HP Pavilion Plus 16-ab0456tx | |
| Dell 16 Plus | |
| Asus Vivobook 16 M1606K | |
| Dell Inspiron 16 Plus 7640 | |
| iperf3 receive AXE11000 | |
| Lenovo ThinkBook 16 G7+ AMD | |
| HP Pavilion Plus 16-ab0456tx | |
| Dell 16 Plus | |
| Dell Inspiron 16 Plus 7640 | |
| Asus Vivobook 16 M1606K | |
| iperf3 transmit AXE11000 6GHz | |
| HP Pavilion Plus 16-ab0456tx | |
| Dell 16 Plus | |
| Acer Swift 16 AI SF16-51T-932H, Ultra 9 288V | |
| Dell Inspiron 16 Plus 7640 | |
| iperf3 receive AXE11000 6GHz | |
| Acer Swift 16 AI SF16-51T-932H, Ultra 9 288V | |
| HP Pavilion Plus 16-ab0456tx | |
| Dell 16 Plus | |
| Dell Inspiron 16 Plus 7640 | |
Webcam
Die 2-MP-Webcam verfügt über einen IR- und einen physischen Privacy Shutter.


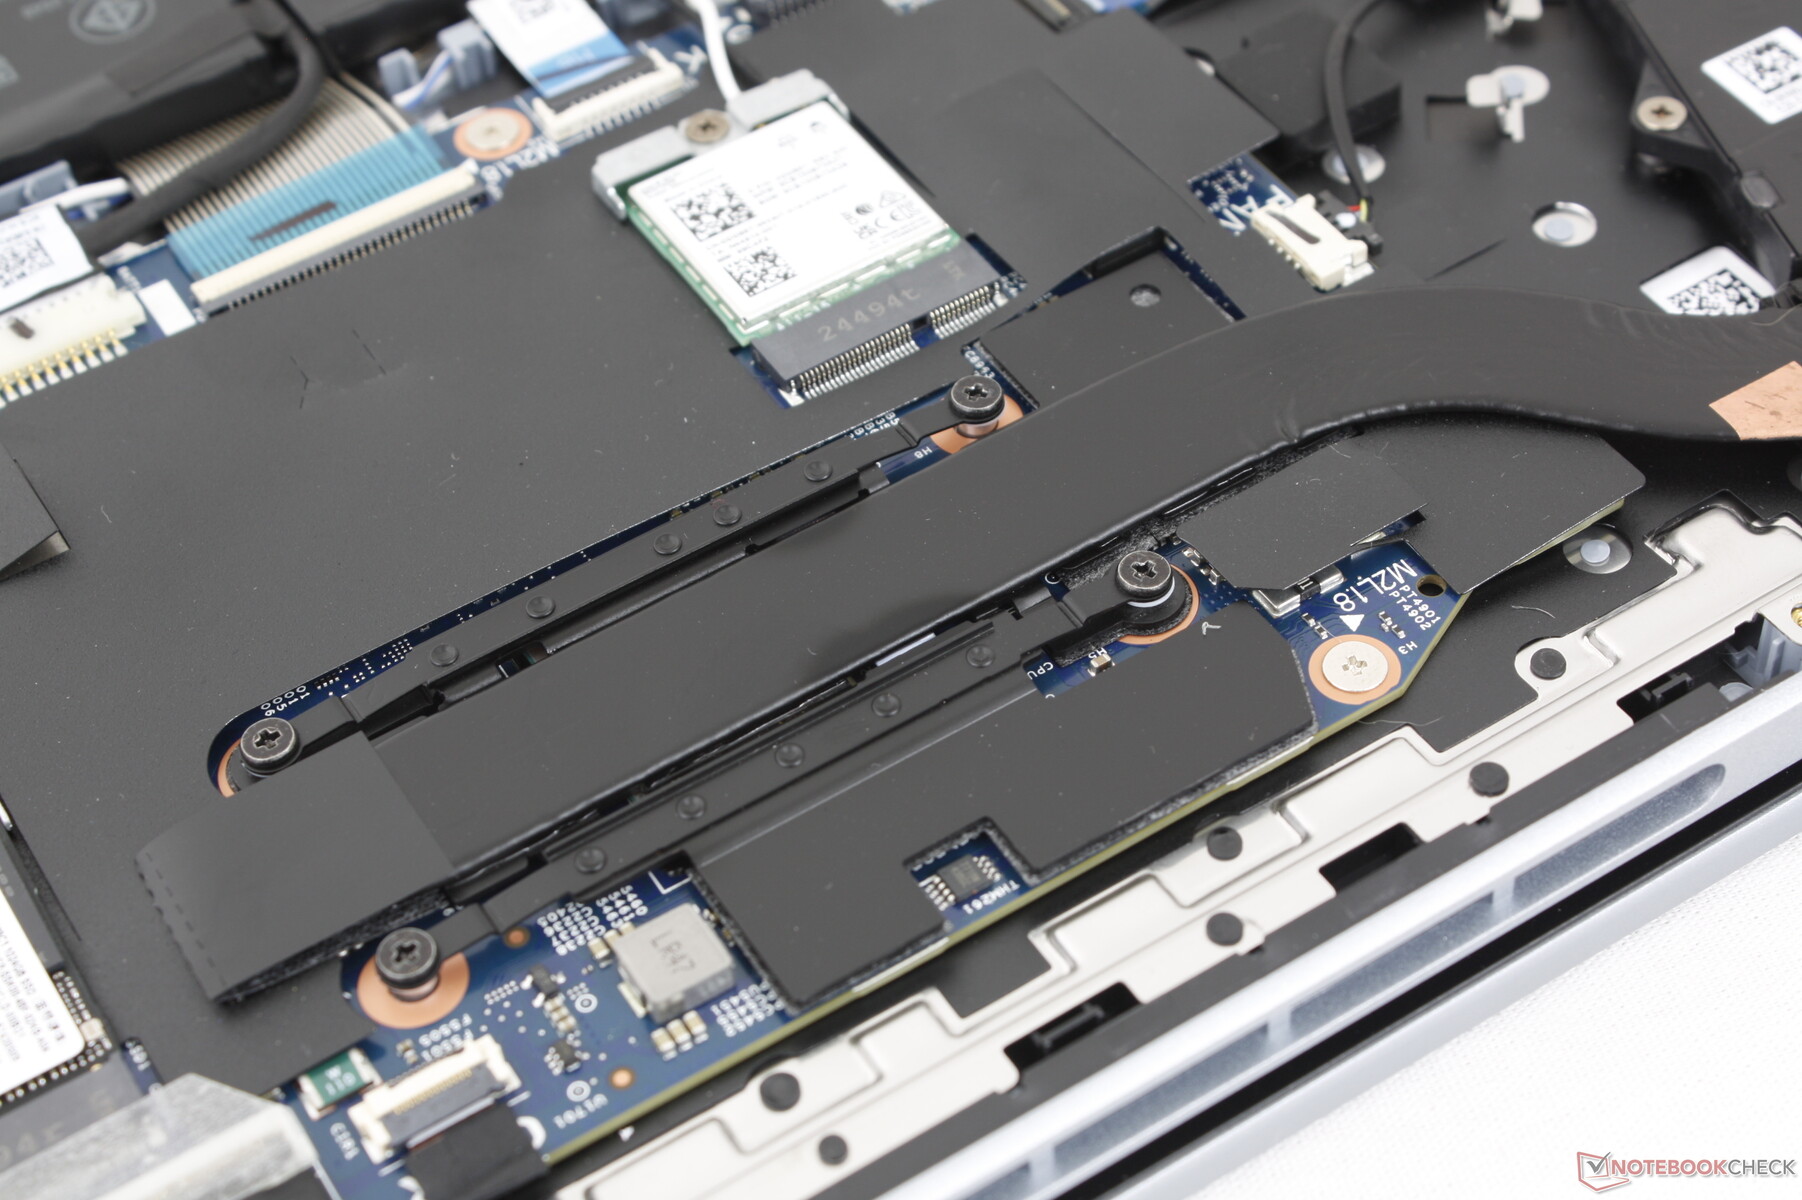
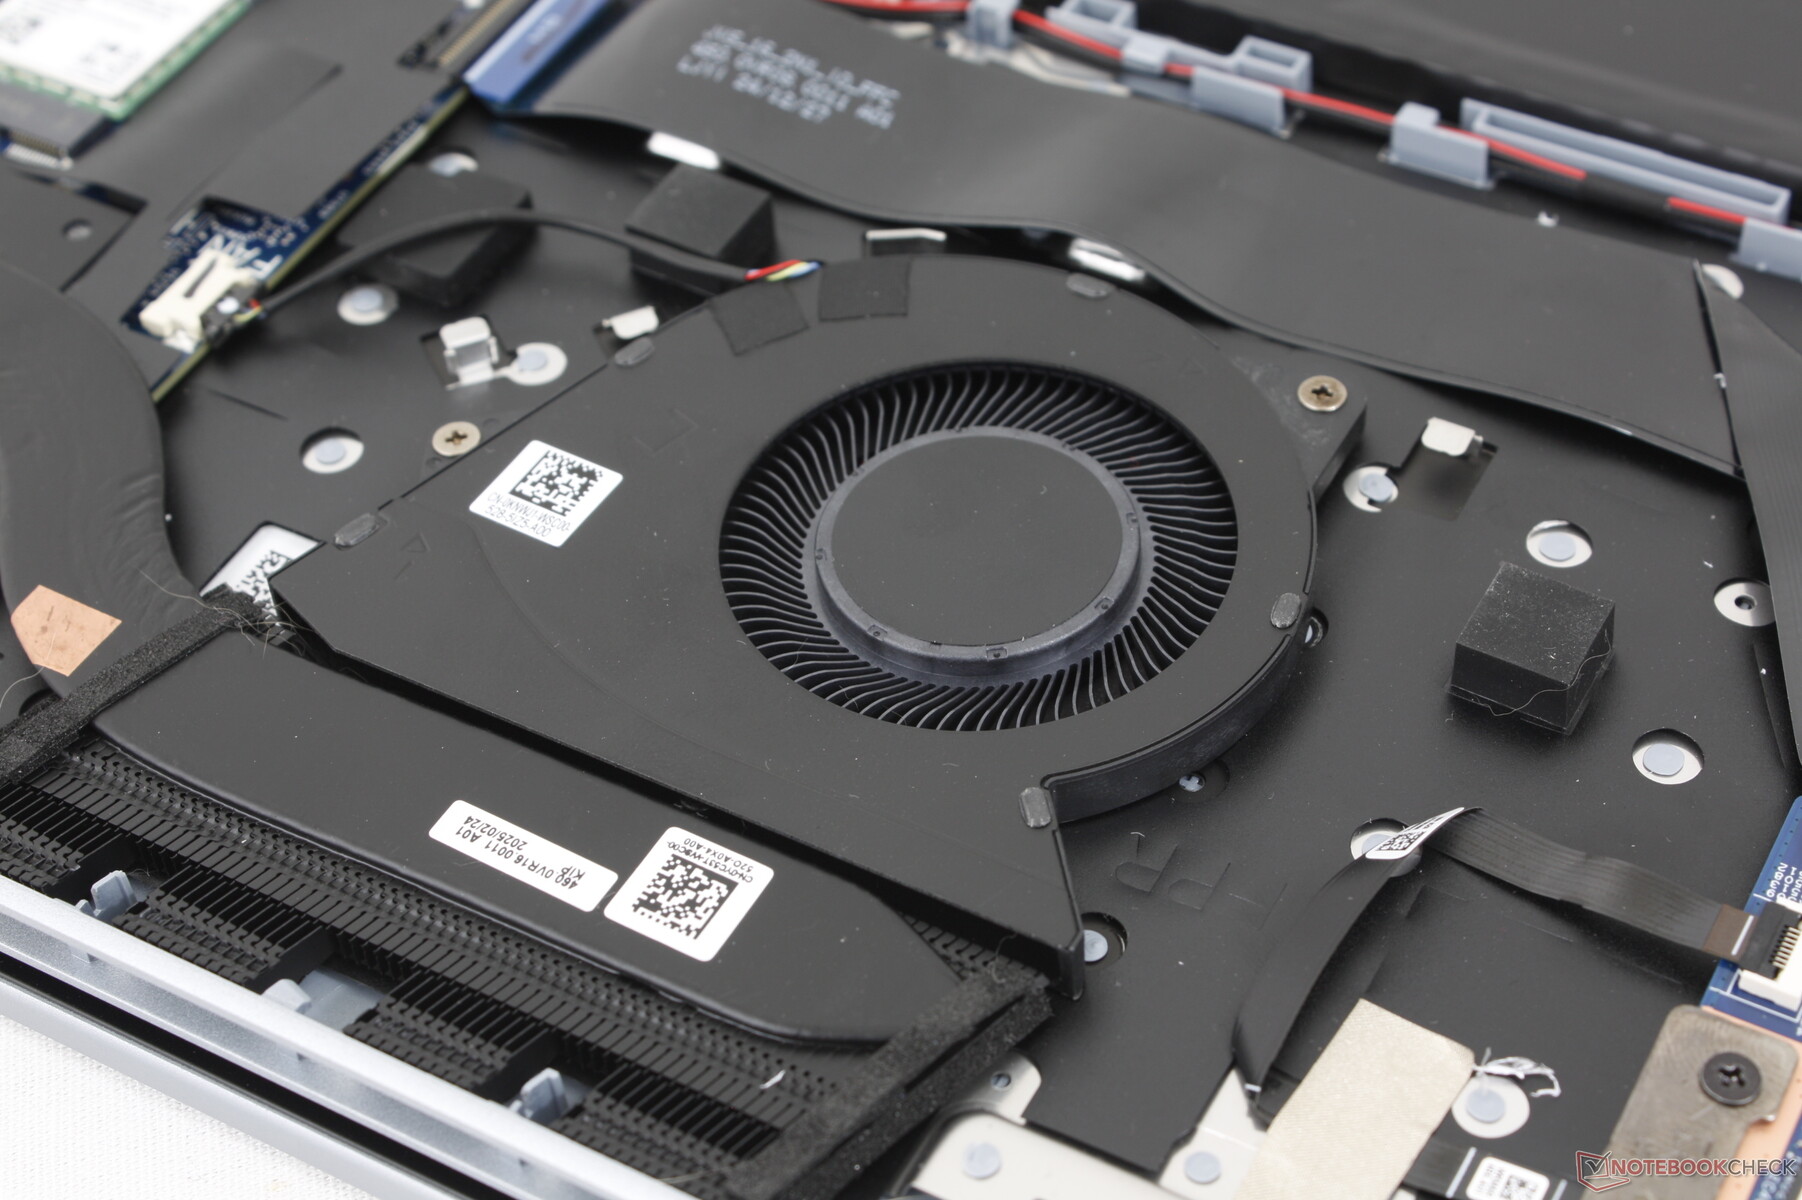
Wartung
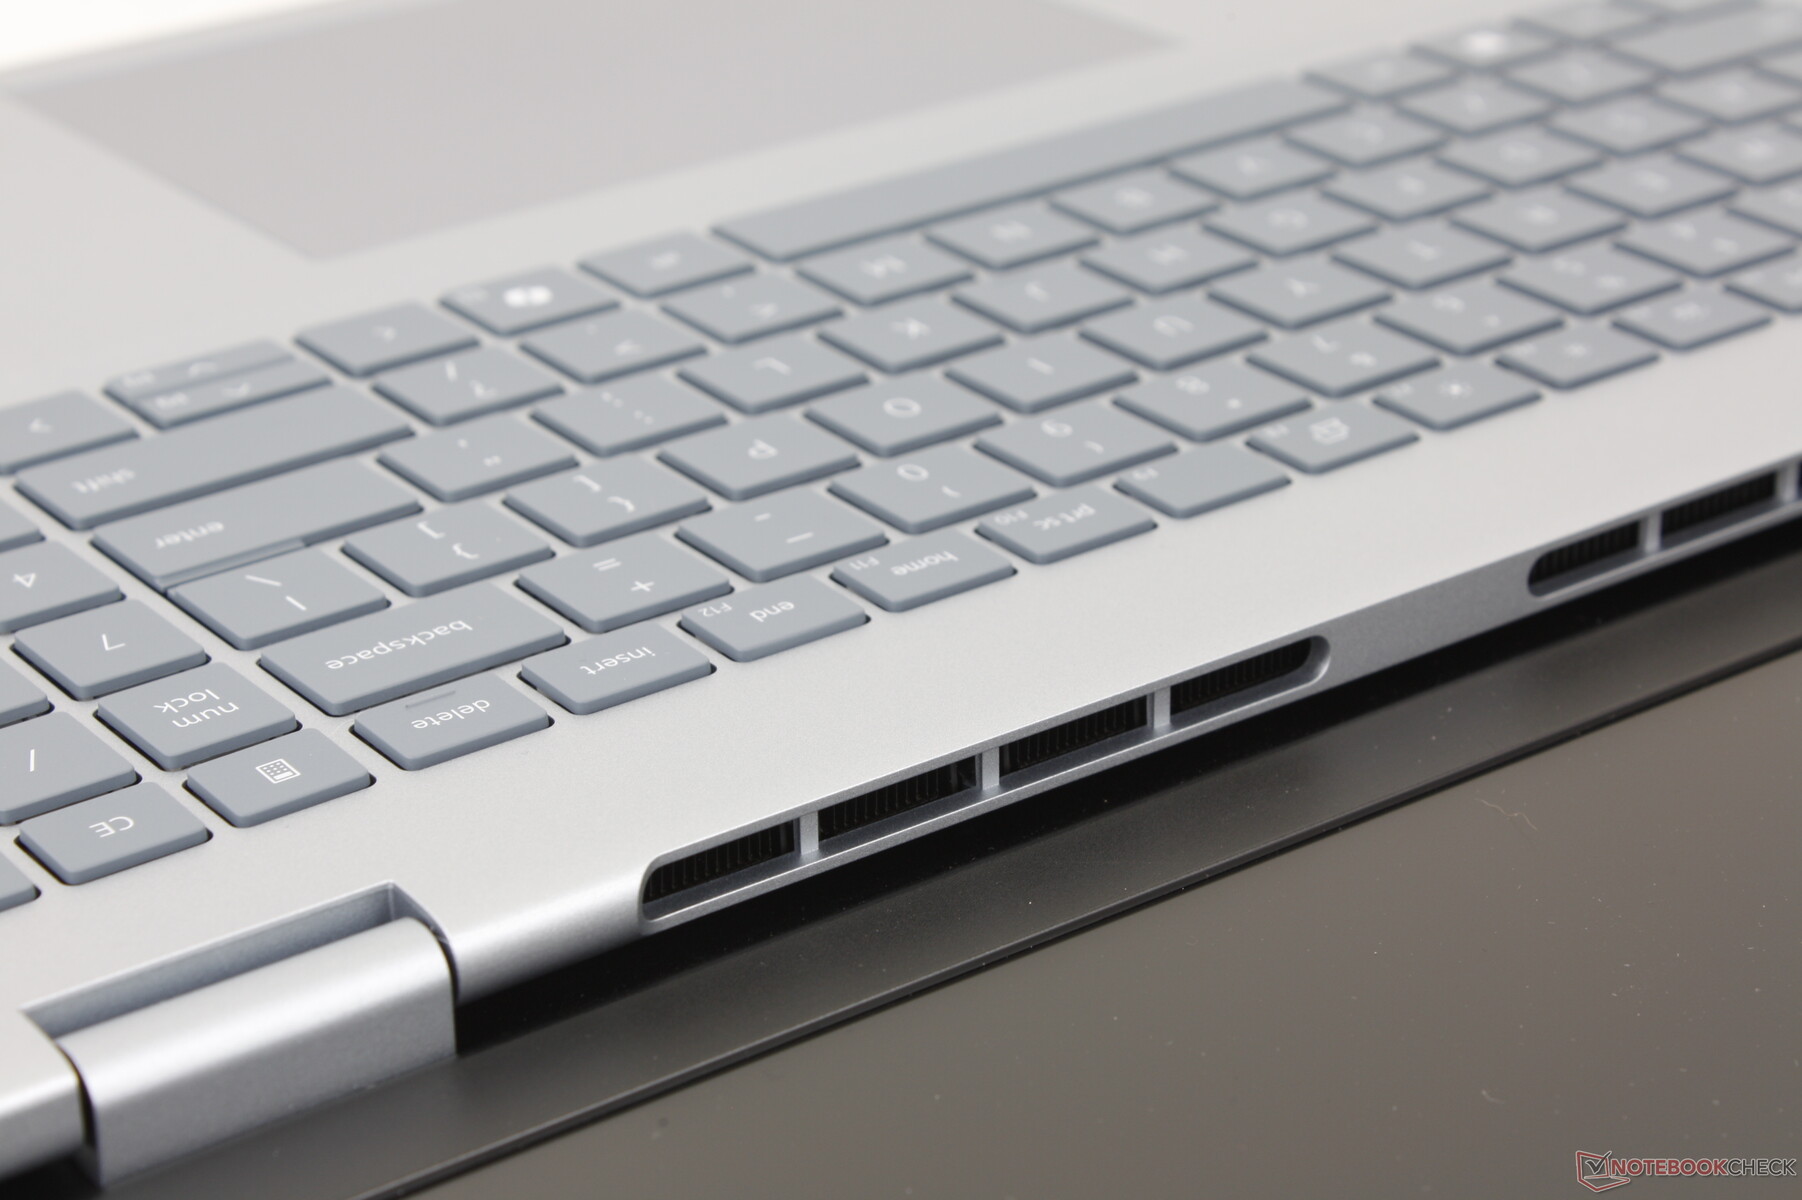
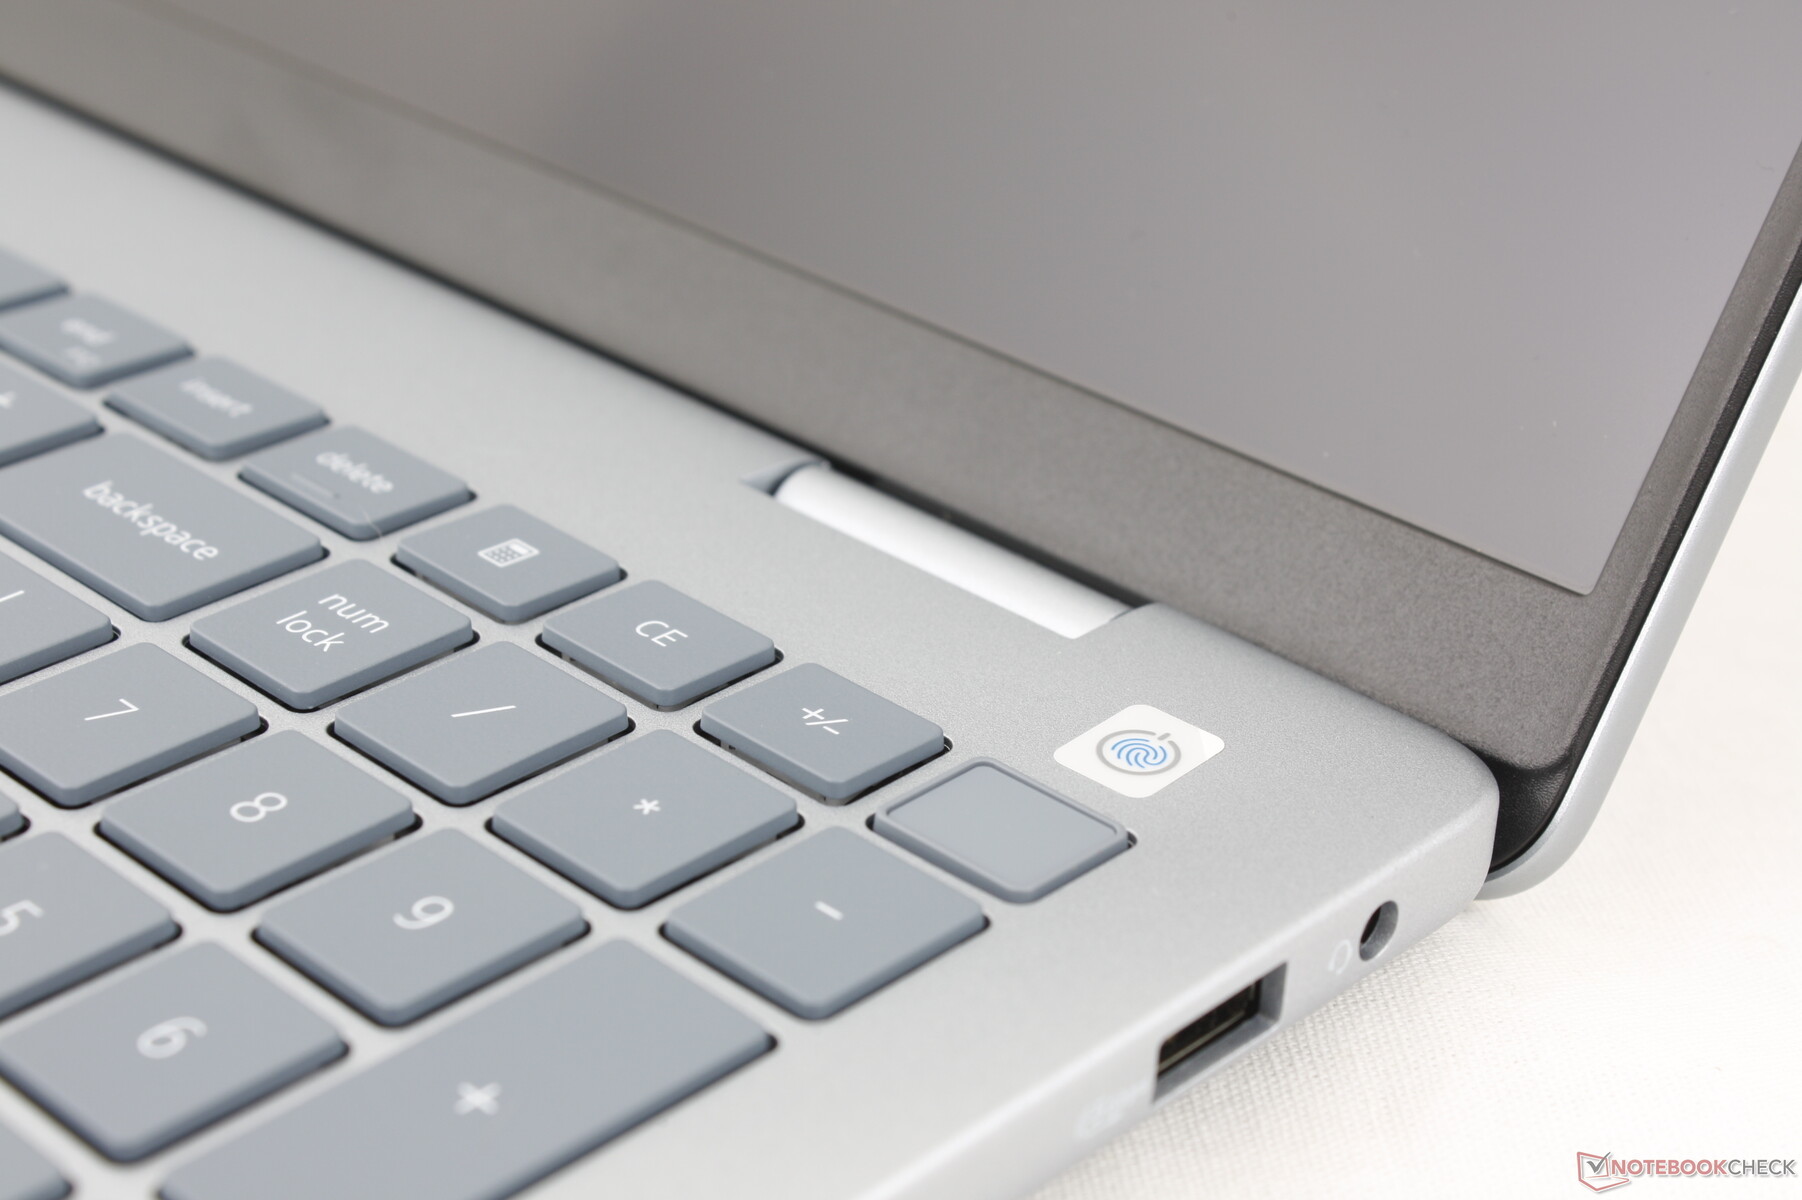
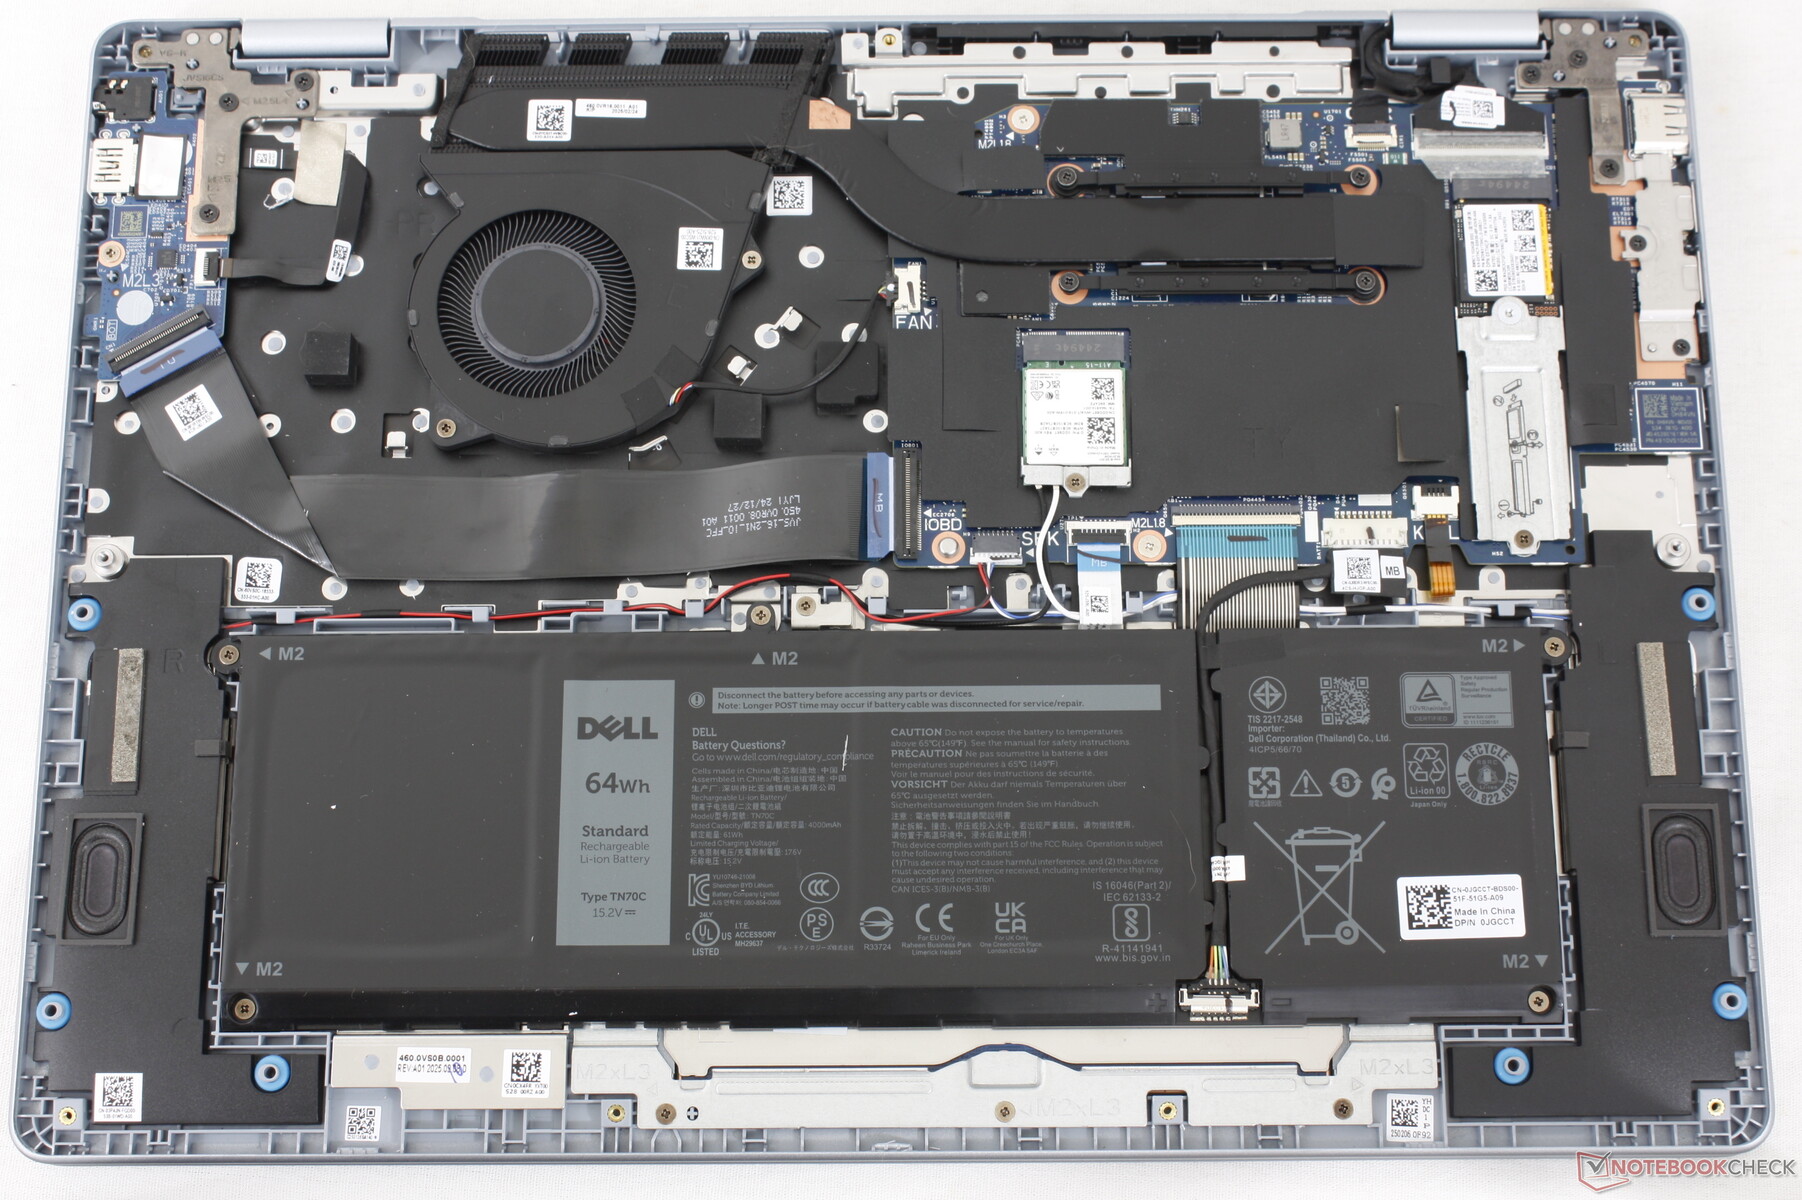
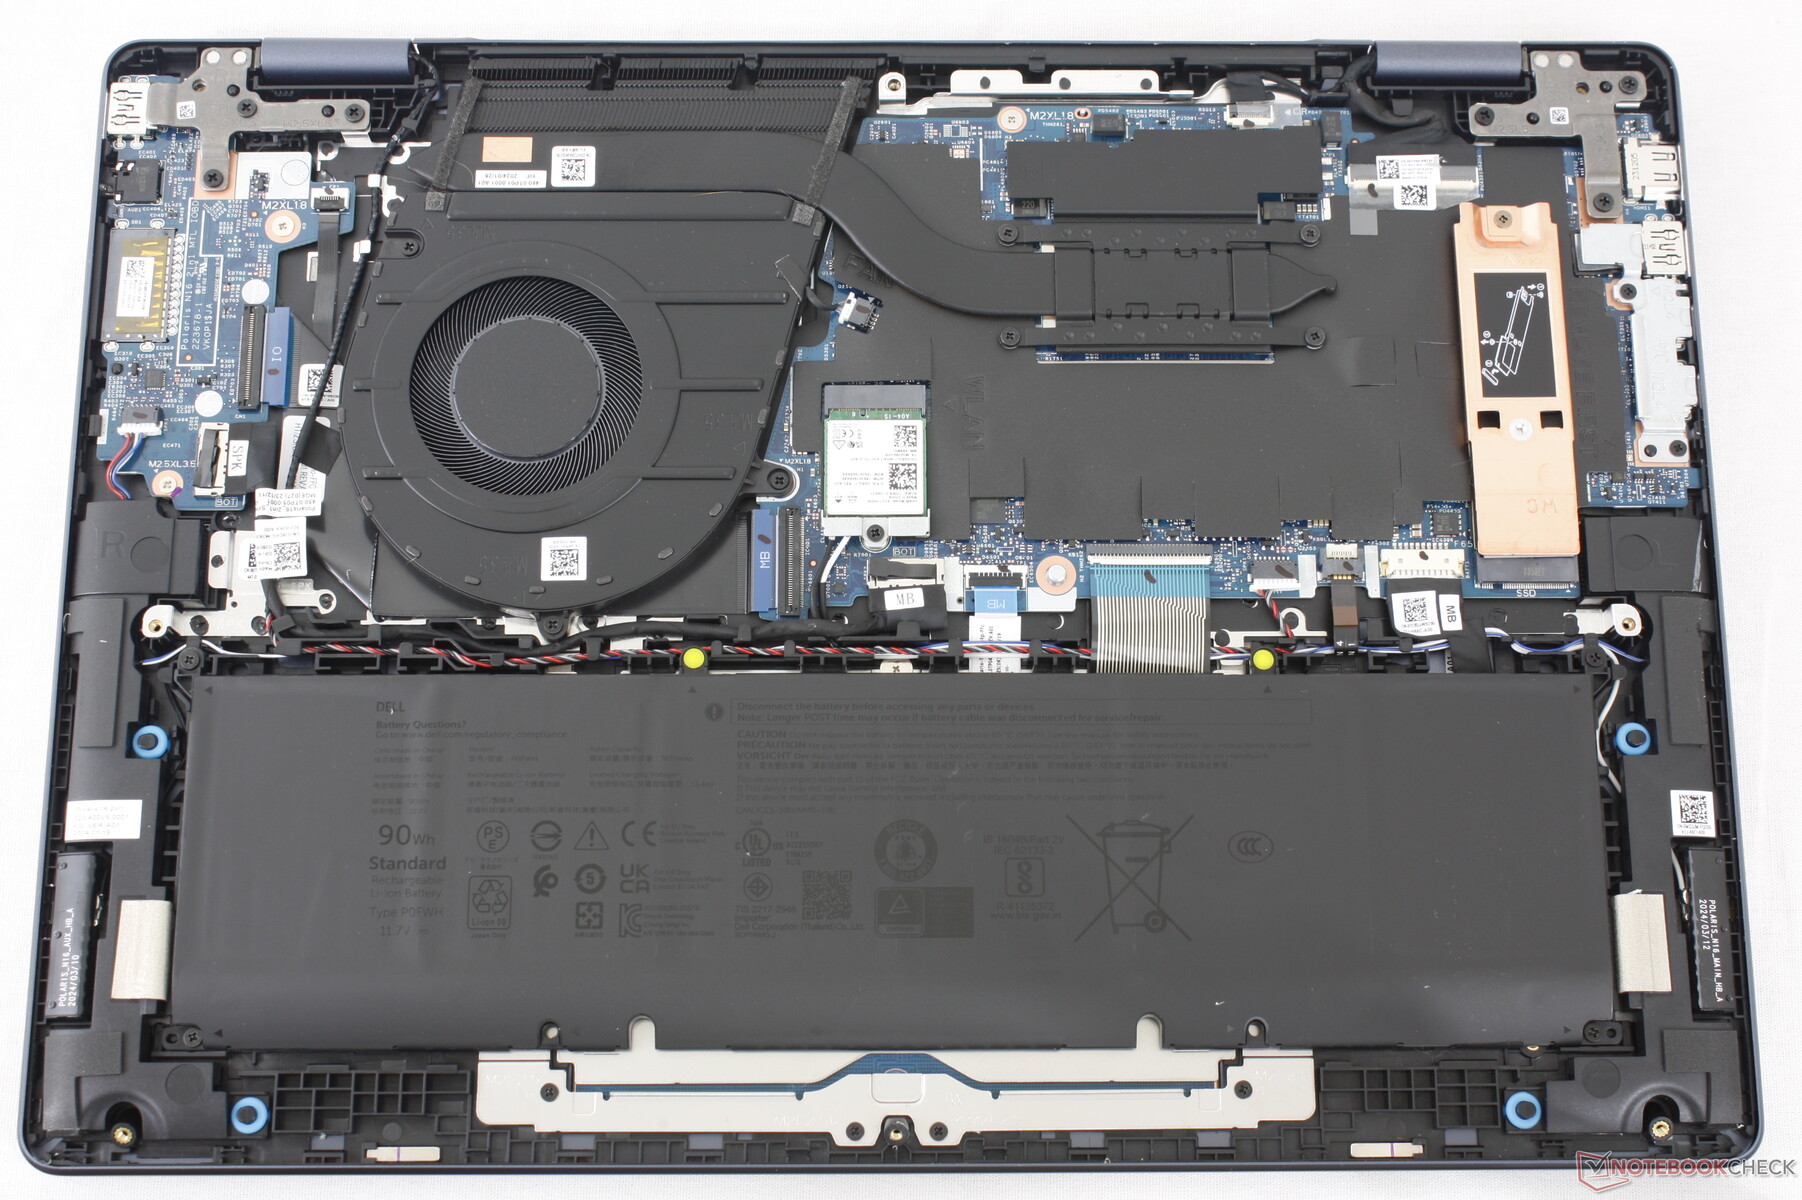
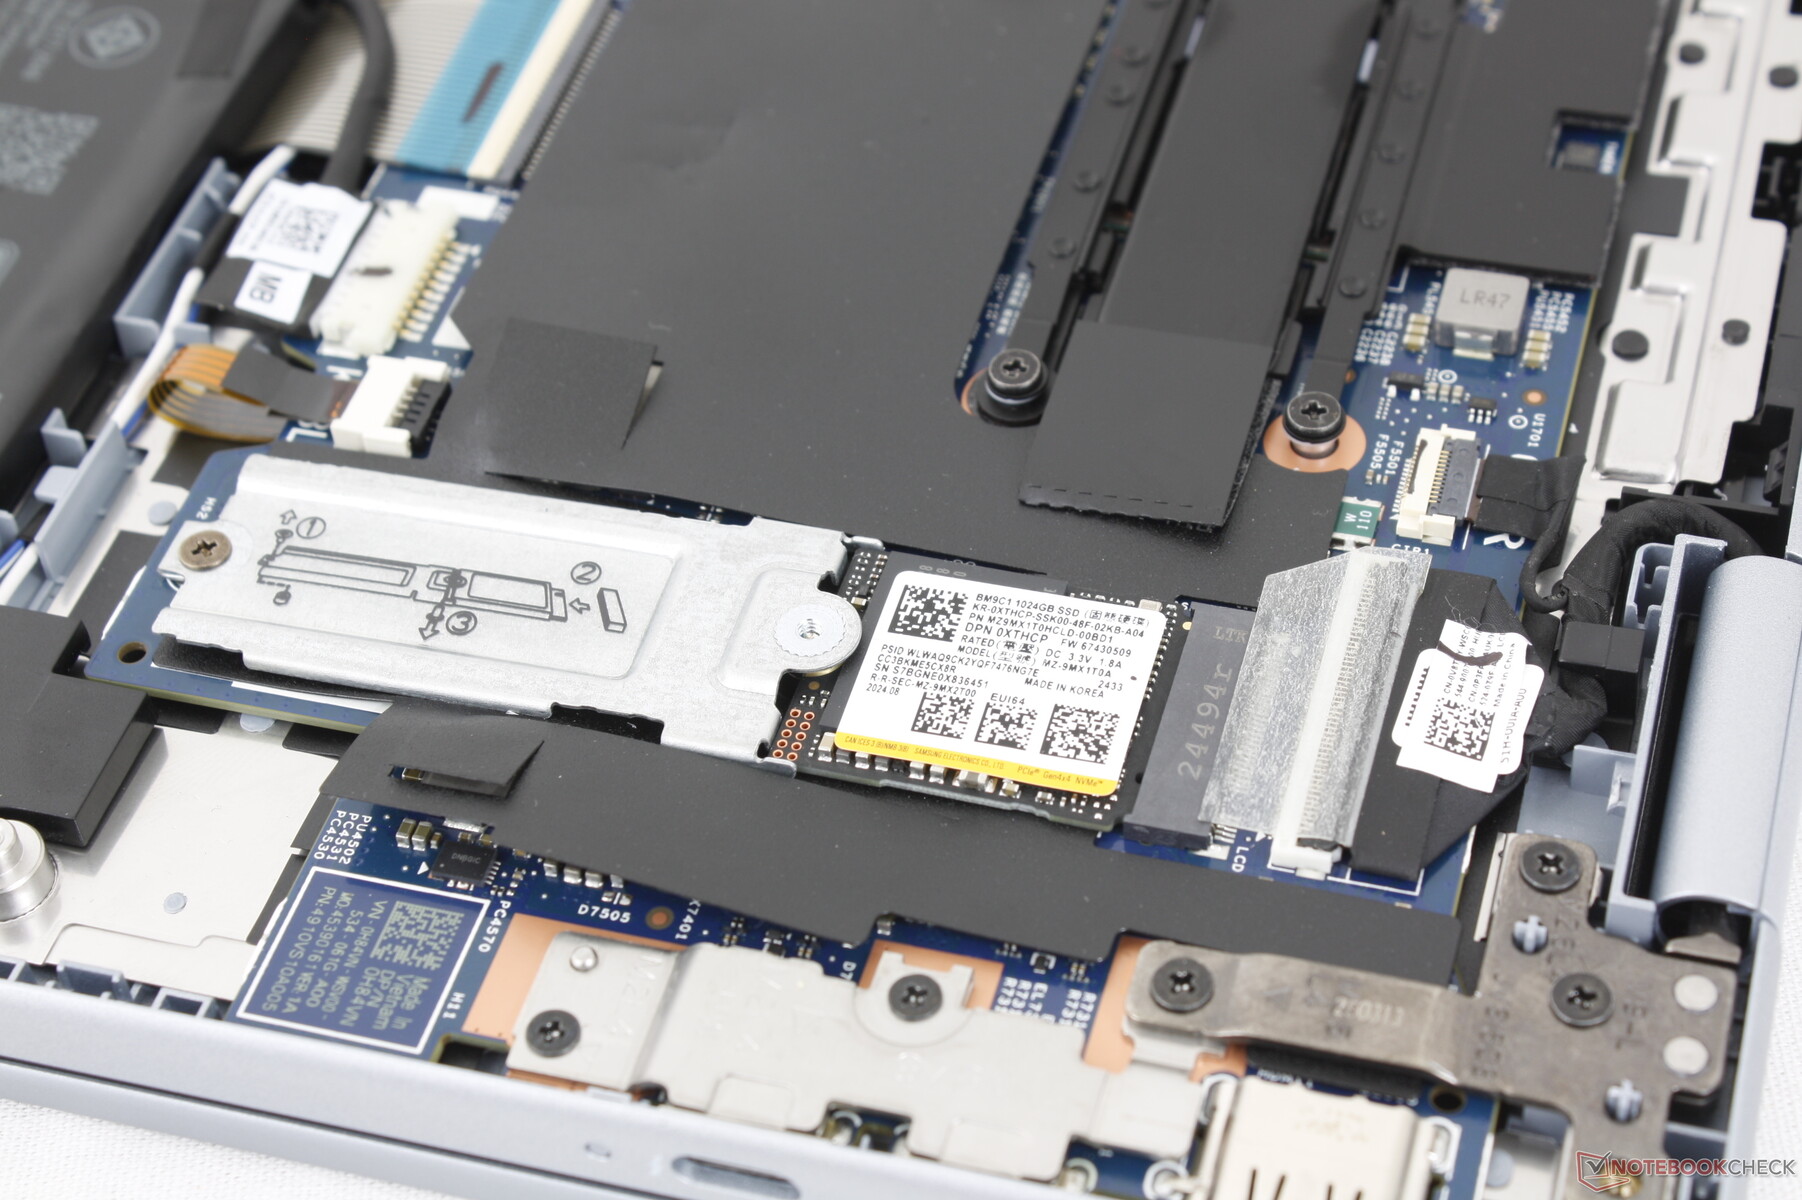
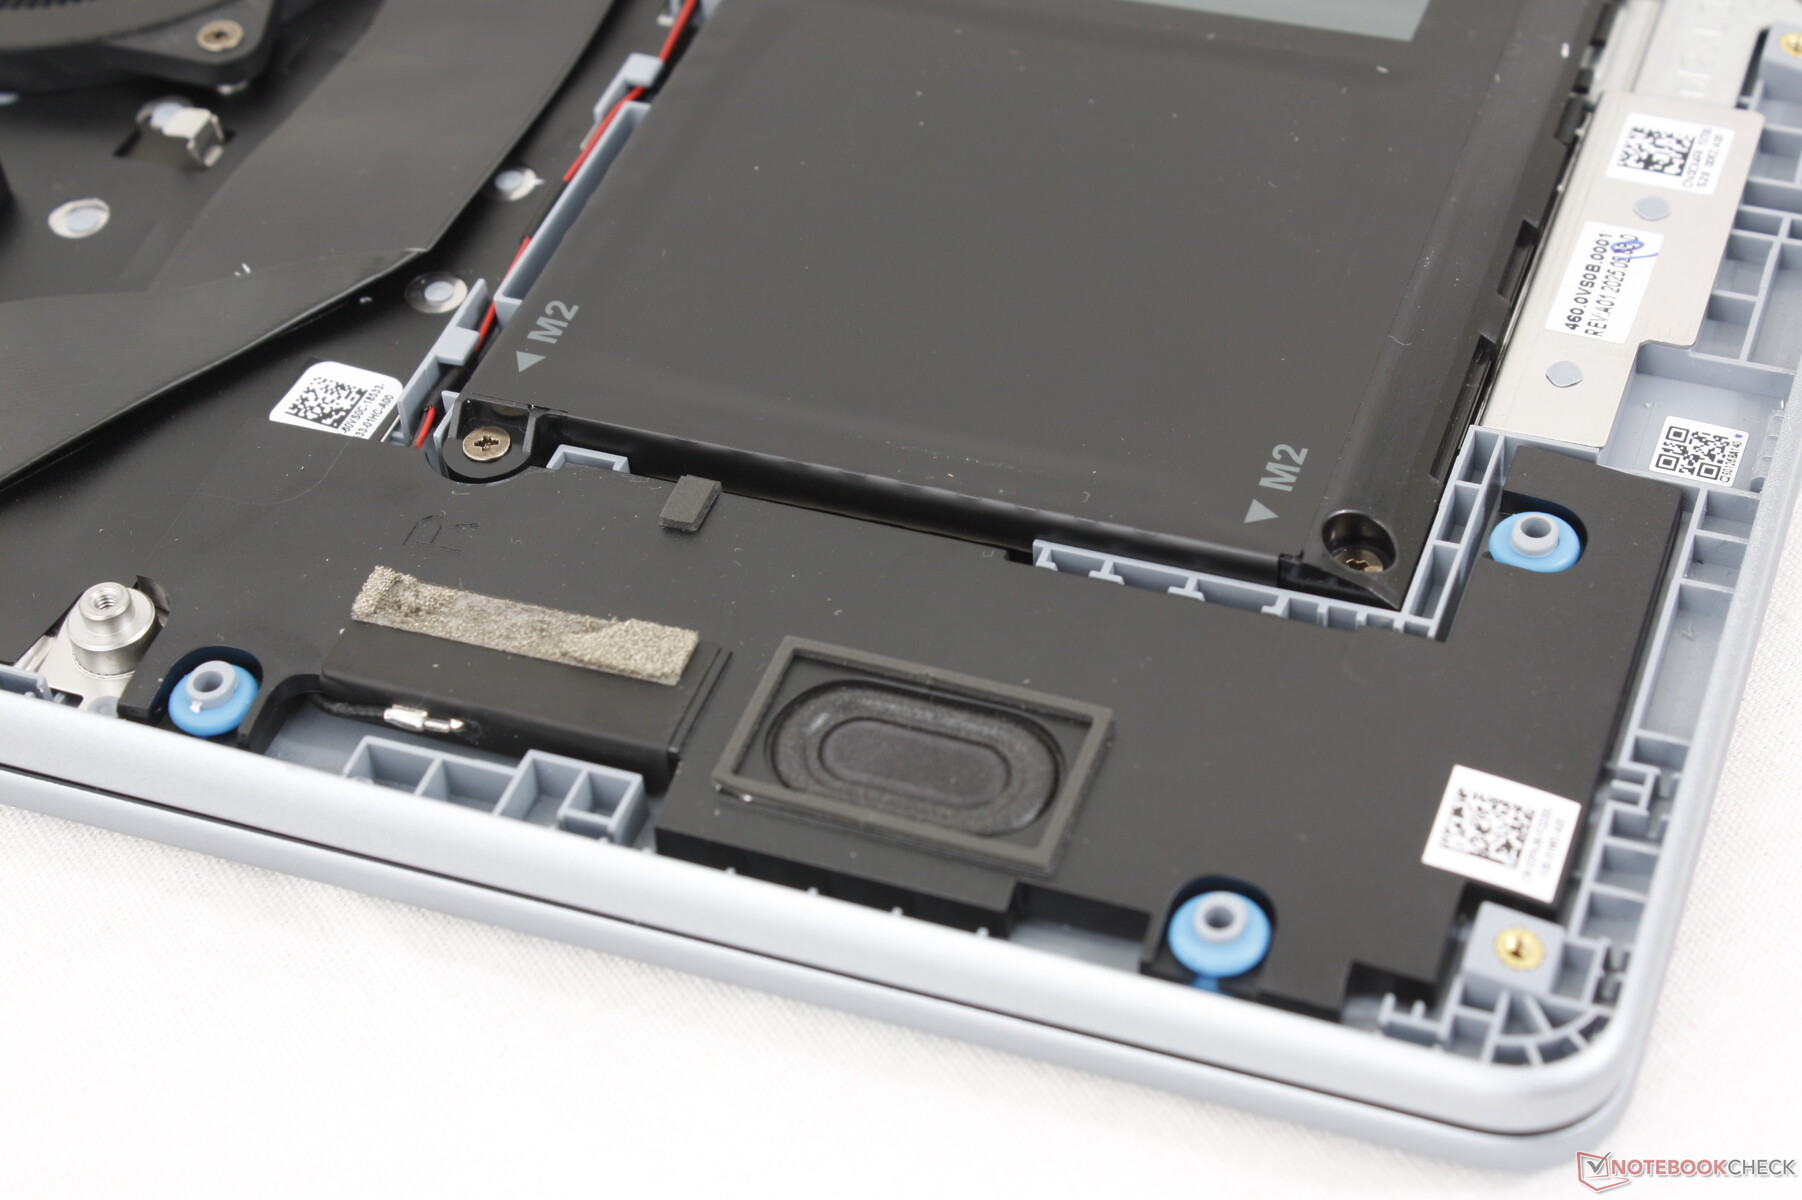
Die Unterseite ist mit acht Phillips Schrauben gesichert, die eine einfache Wartung ermöglichen. Vorsicht und eine scharfe Kante sind jedoch sehr zu empfehlen, da die Kanten des Panels fester als bei den meisten anderen Laptops mit der Basis verriegelt sind. Im Inneren findet man keine herausnehmbaren SODIMM-Module und nur einen einzigen M.2-2280-Steckplatz für Speicher.
Das Dell 16 Plus teilt viele interne Funktionen mit dem Inspiron 16 Plus 7640 2-in-1, wie die Vergleichsfotos unten zeigen.
Nachhaltigkeit
Das Modell verwendet bei der Herstellung recyceltes Aluminium, Stahl und meeresgebundenes Plastik, während die Verpackung vollständig recycelbar ist.
Zubehör und Garantie
In der Verpackung befinden sich außer dem Netzadapter und den Unterlagen keine weiteren Extras. Wenn man das Gerät in den USA kauft, gilt die übliche einjährige Herstellergarantie.
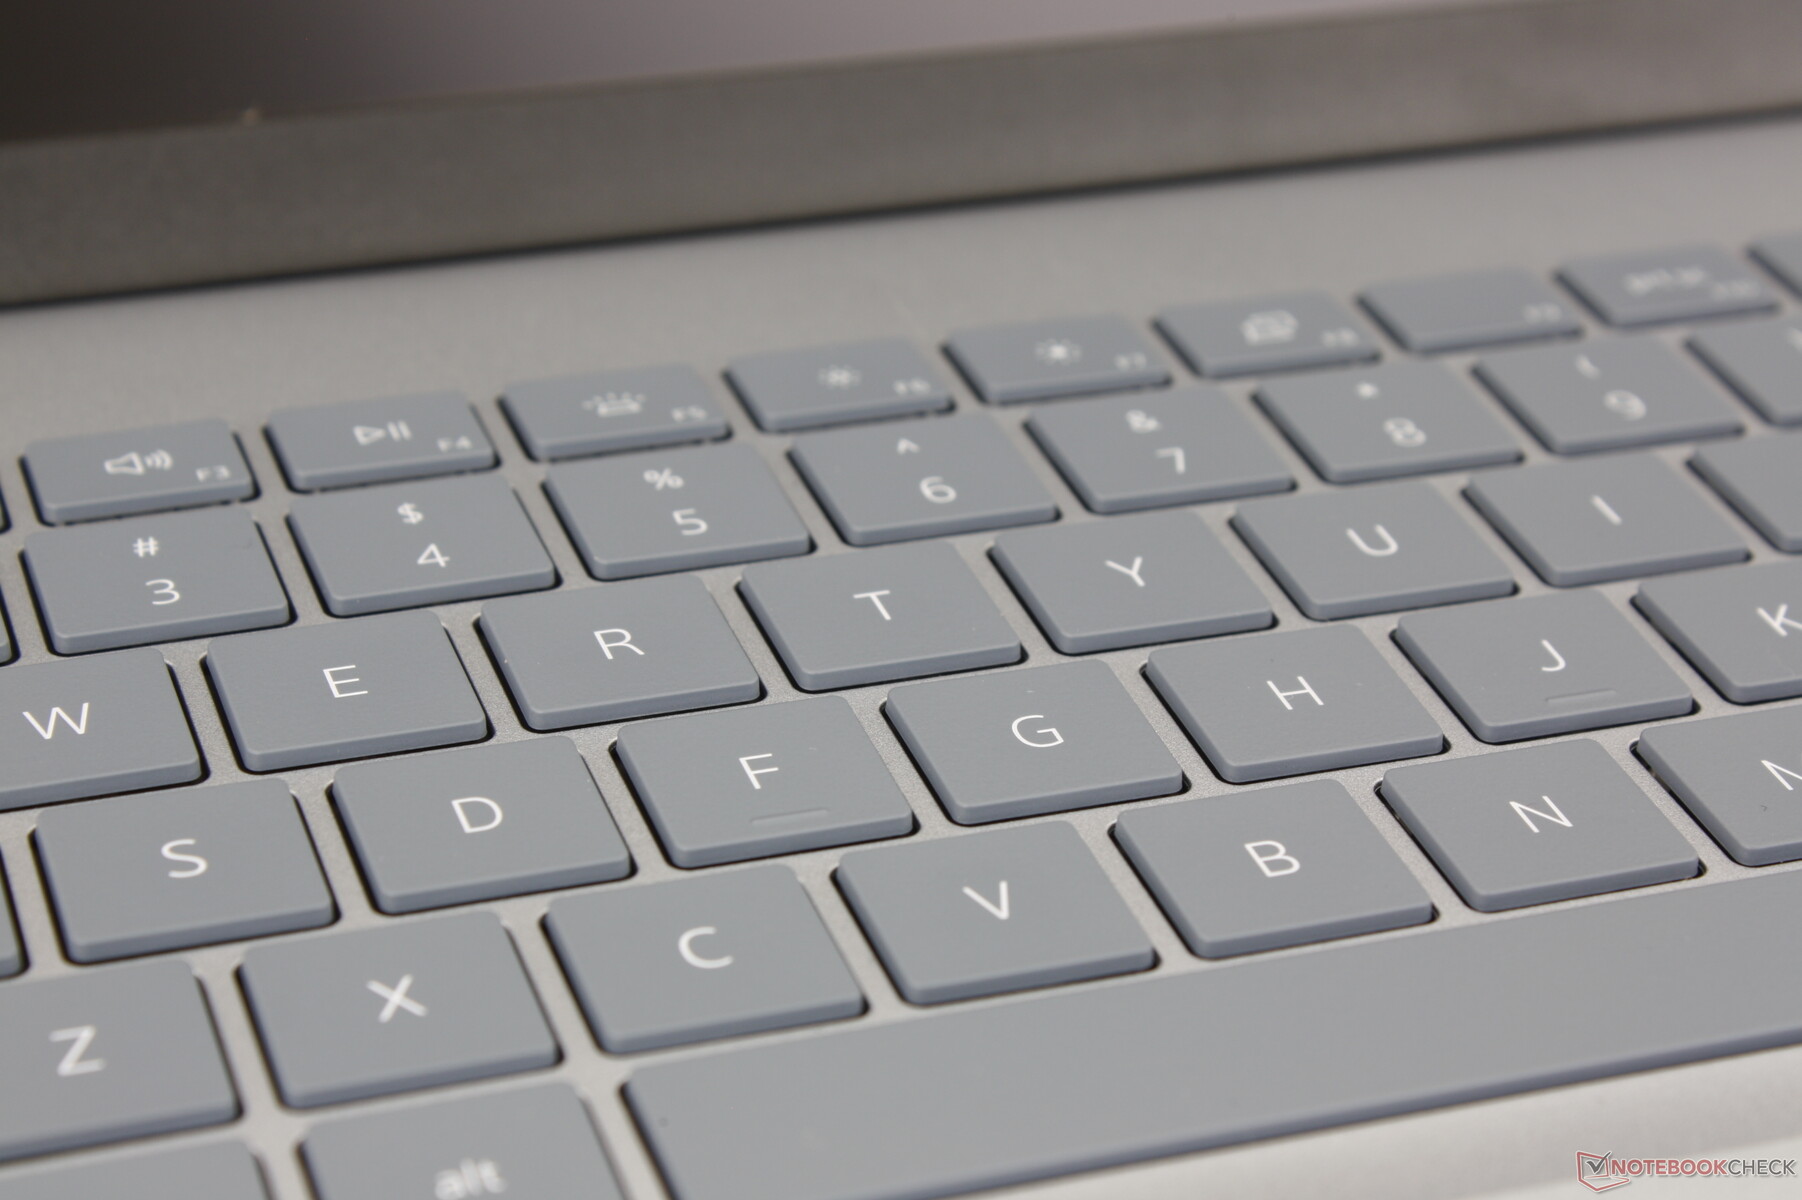
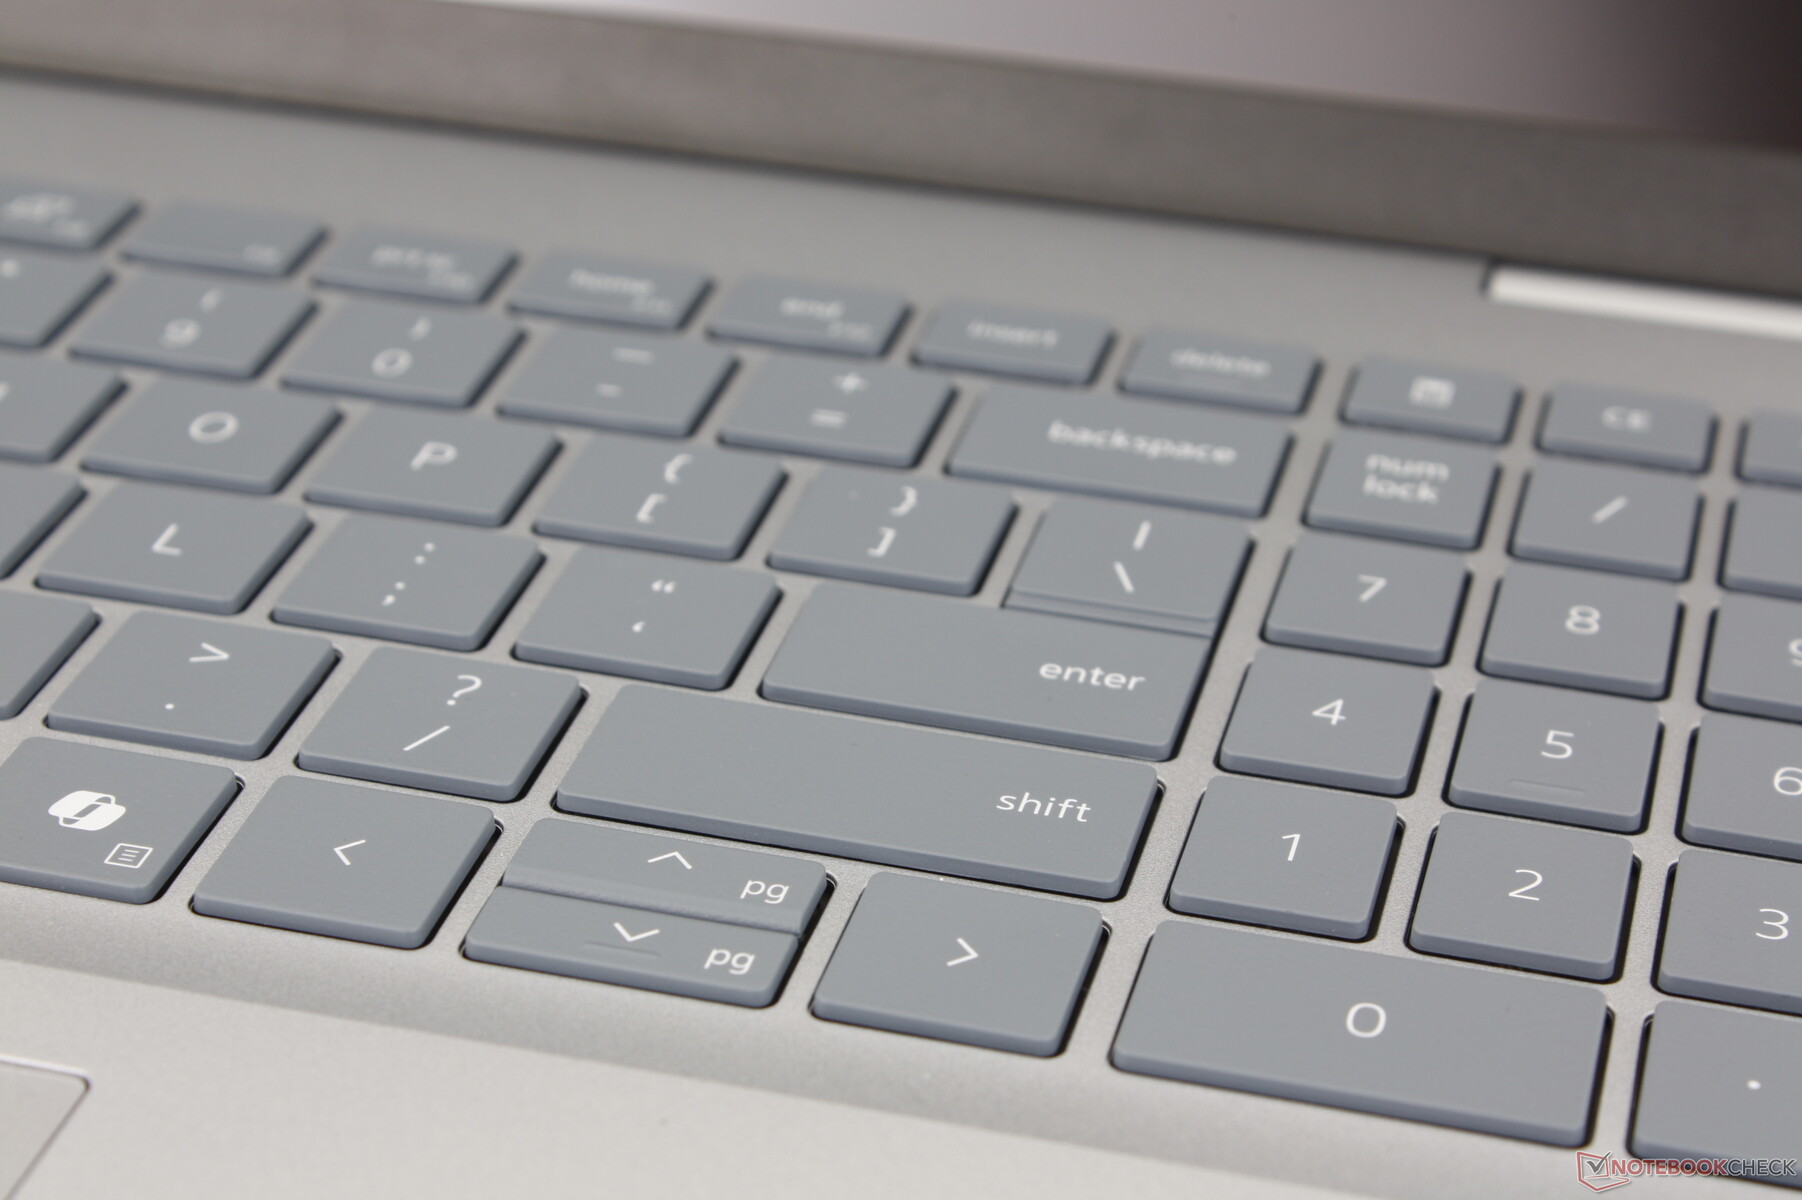
Eingabegeräte
Tastatur
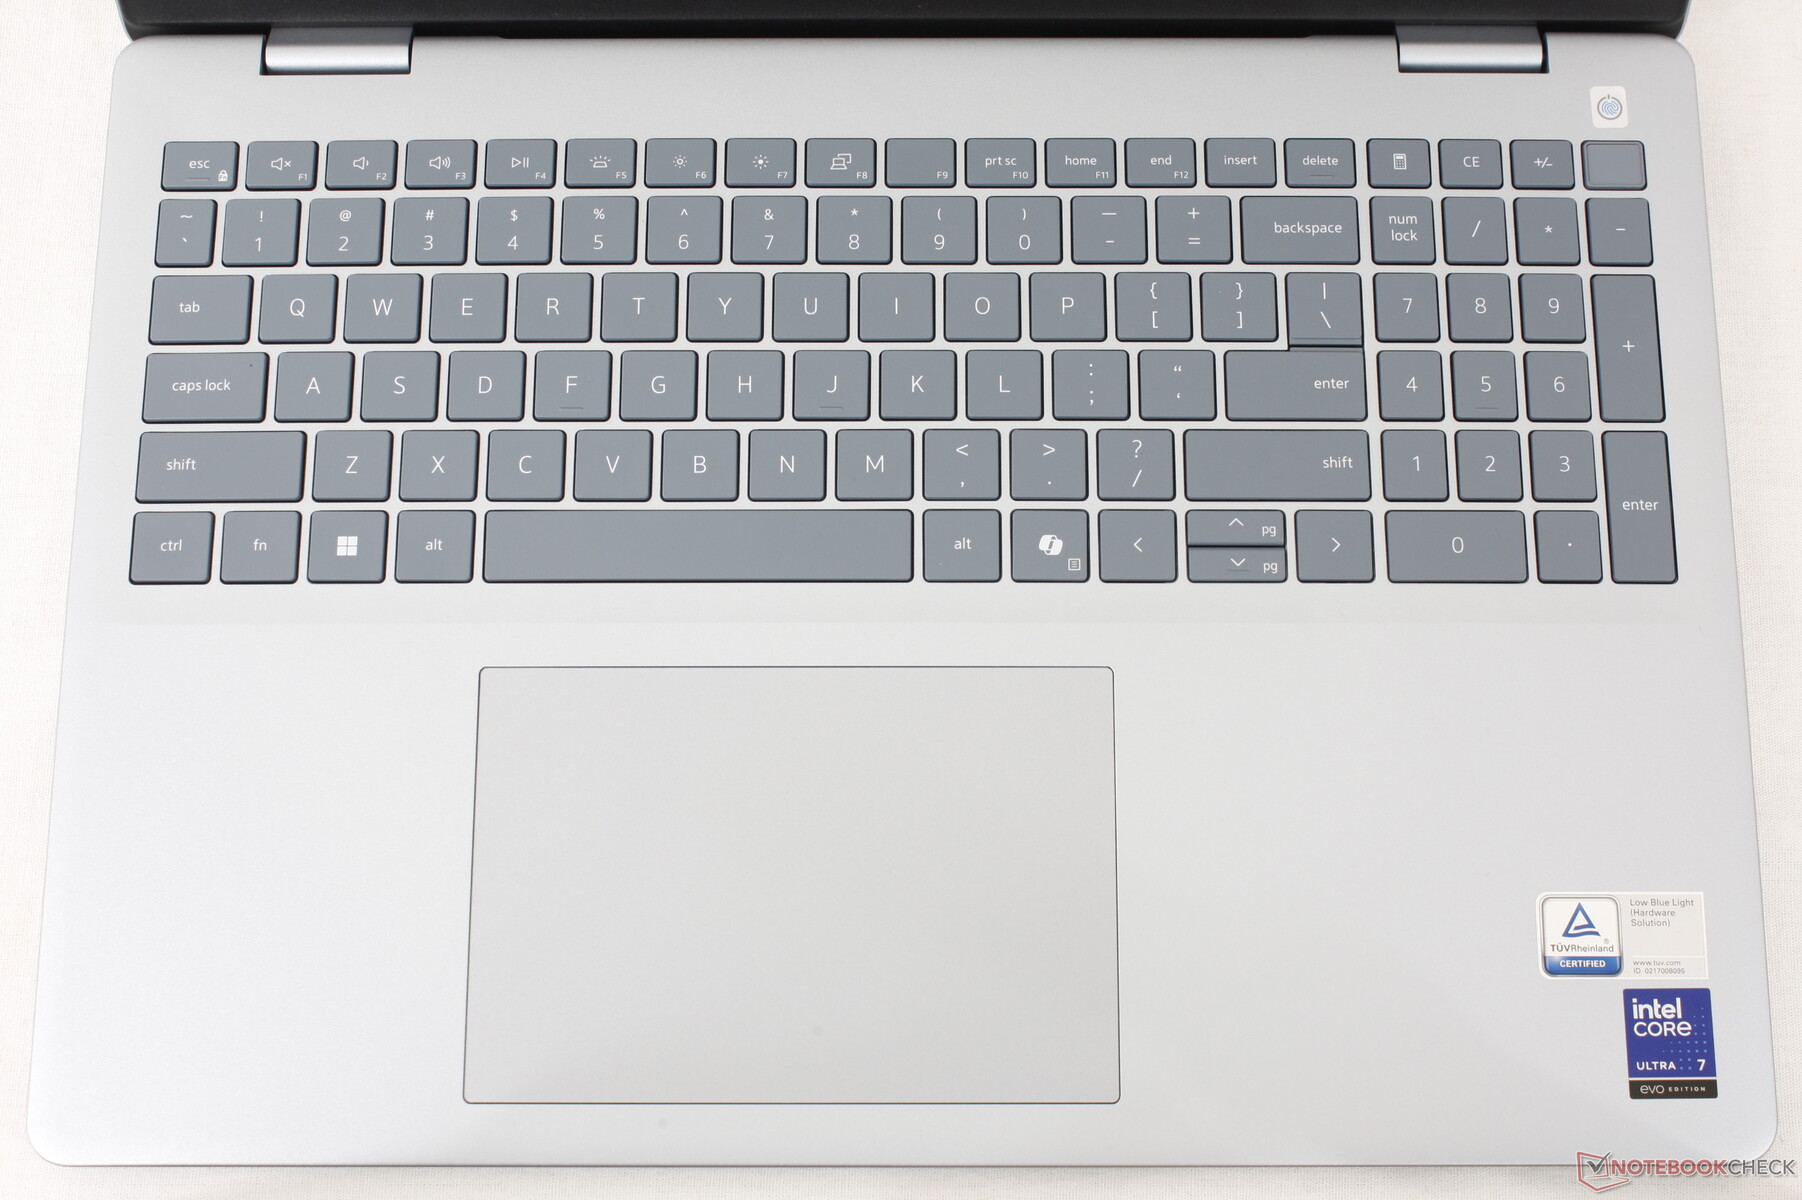
Das Dell 16 Plus verfügt über einen integrierten Nummernblock, während diese Funktion beim Inspiron 16 Plus 7640 fehlte. Ansonsten ähnelt das Tipperlebnis den Inspiron Modellen der älteren Generation - im Guten wie im Schlechten. Das Tastenfeedback ist etwas weicher, aber die Leertaste ist anständig laut und klackt.
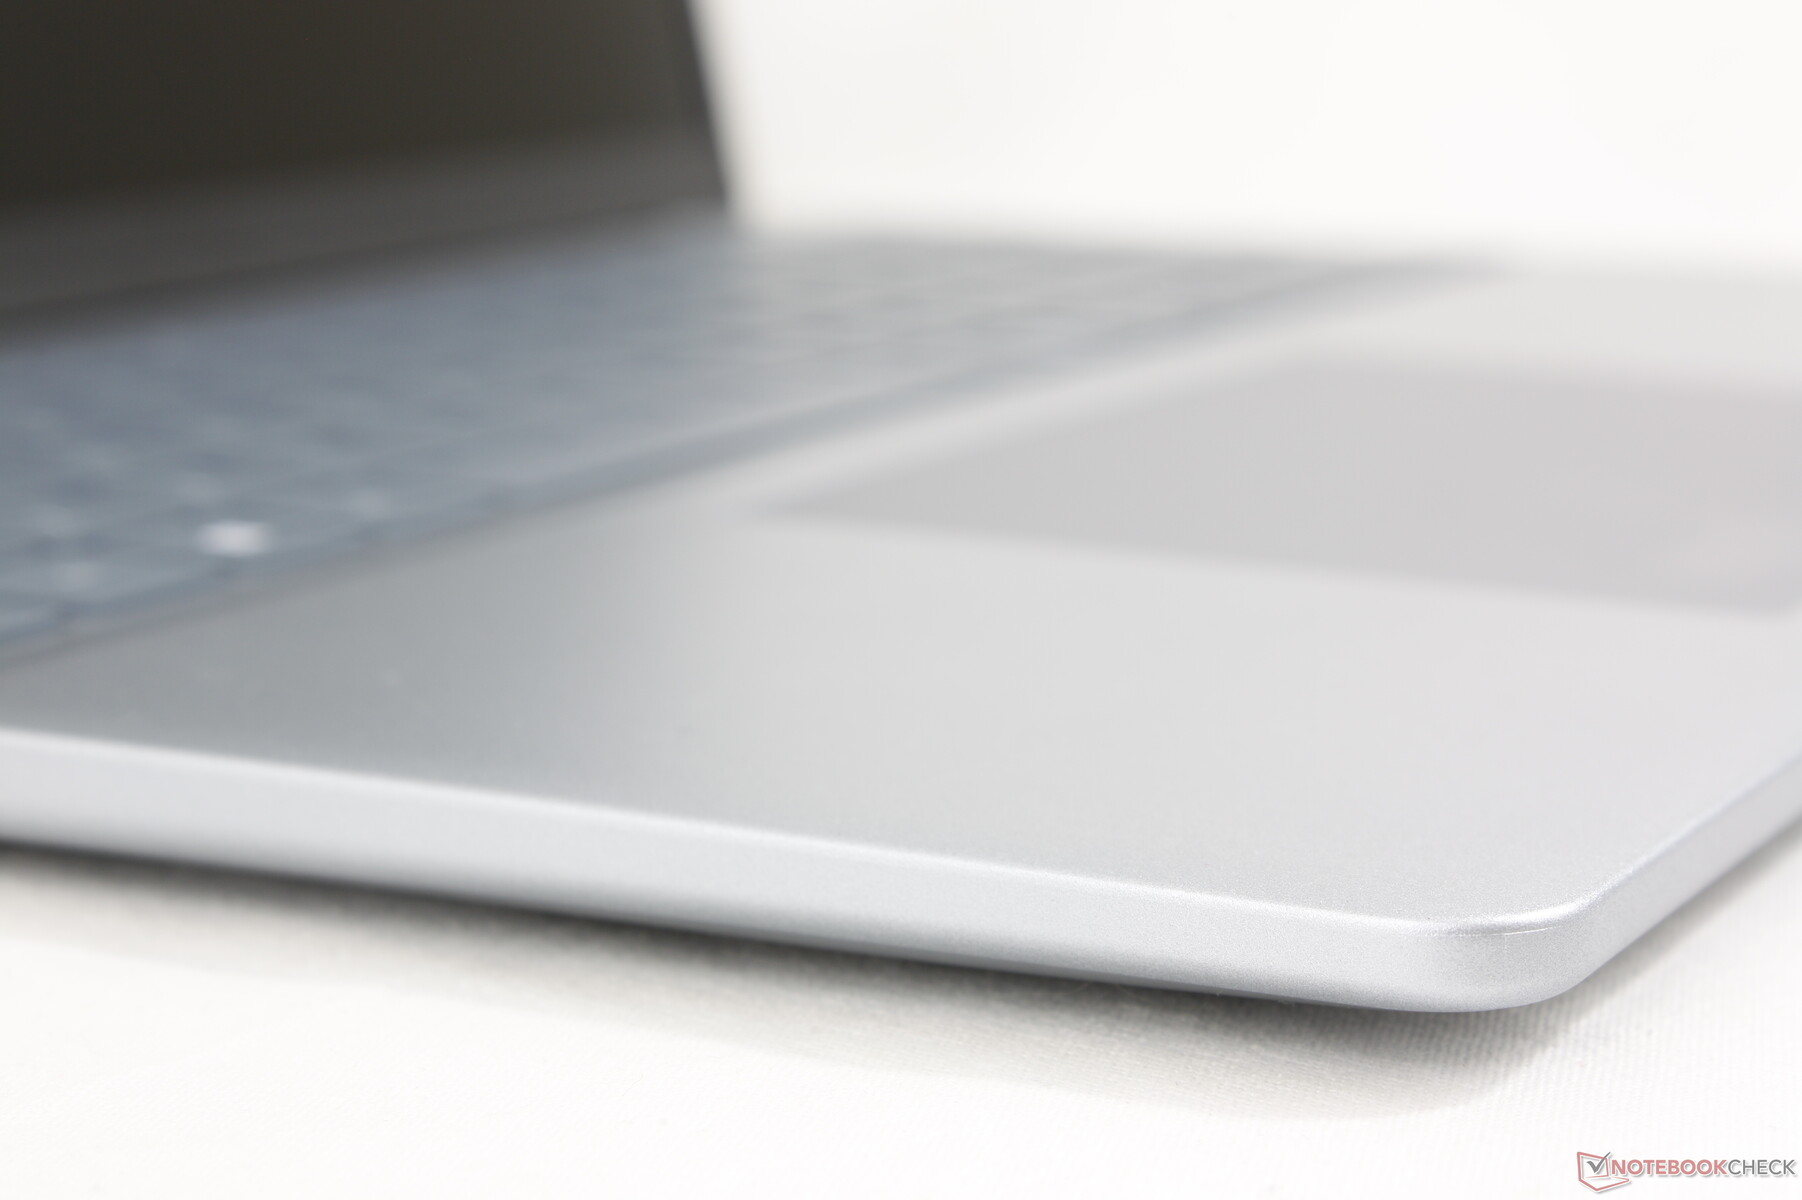
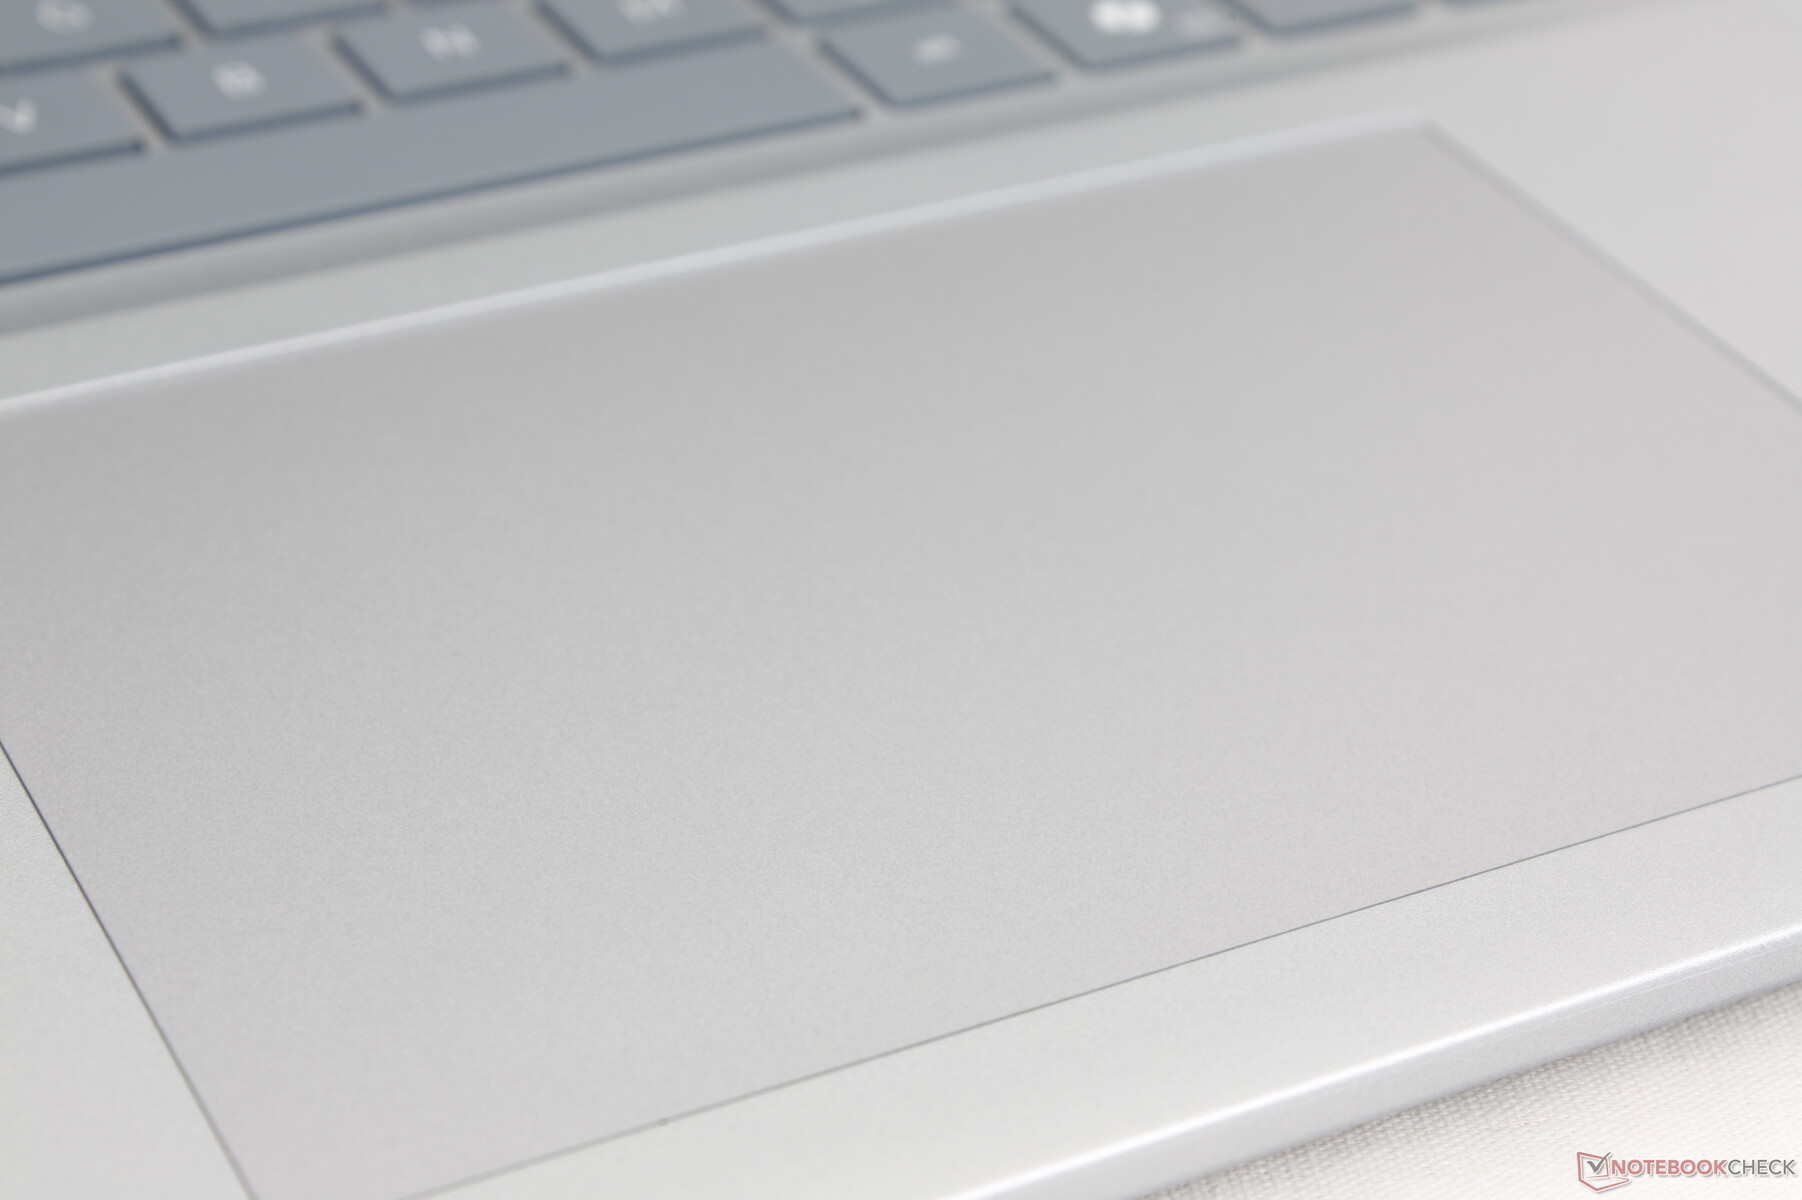
Touchpad
Während die Funktionalität der Tastatur erweitert wurde, bleibt das Clickpad bis auf die Größe (13,3 x 9 cm) gleich wie beim Inspiron 16 Plus 7640 2-in-1. Es ist groß und geräumig für eine komfortable Cursor-Steuerung und Multitouch-Eingaben, aber das Klicken auf der Oberfläche erfordert mehr Kraft als bei den meisten anderen Laptops.
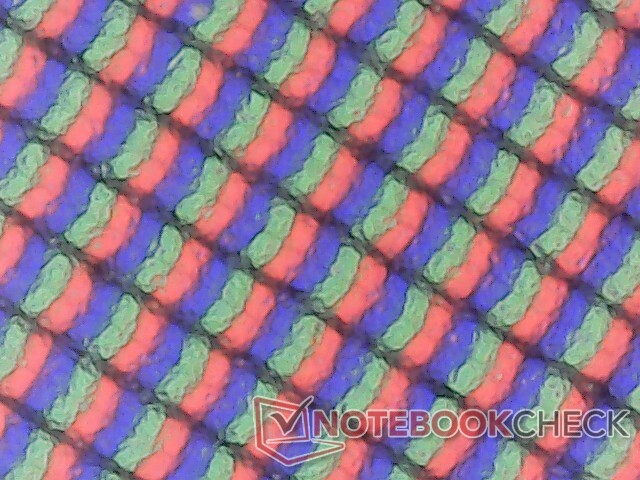
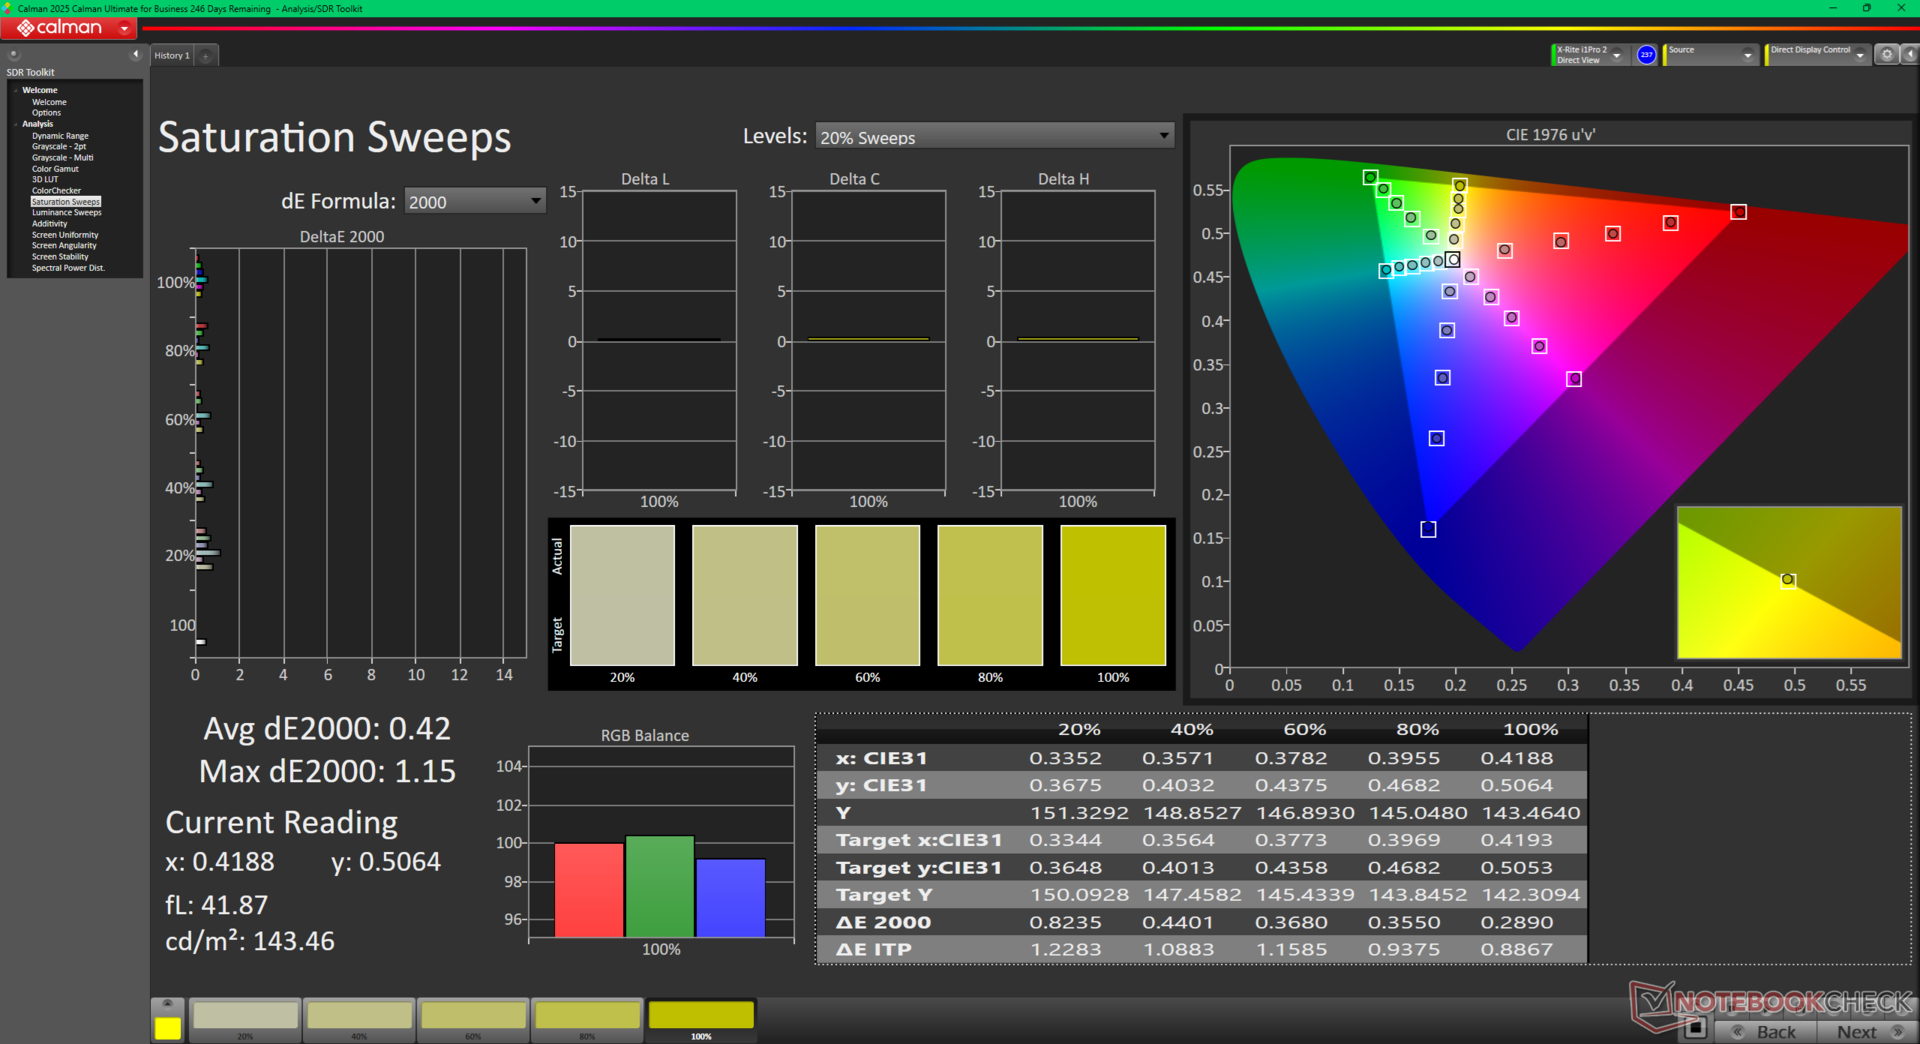
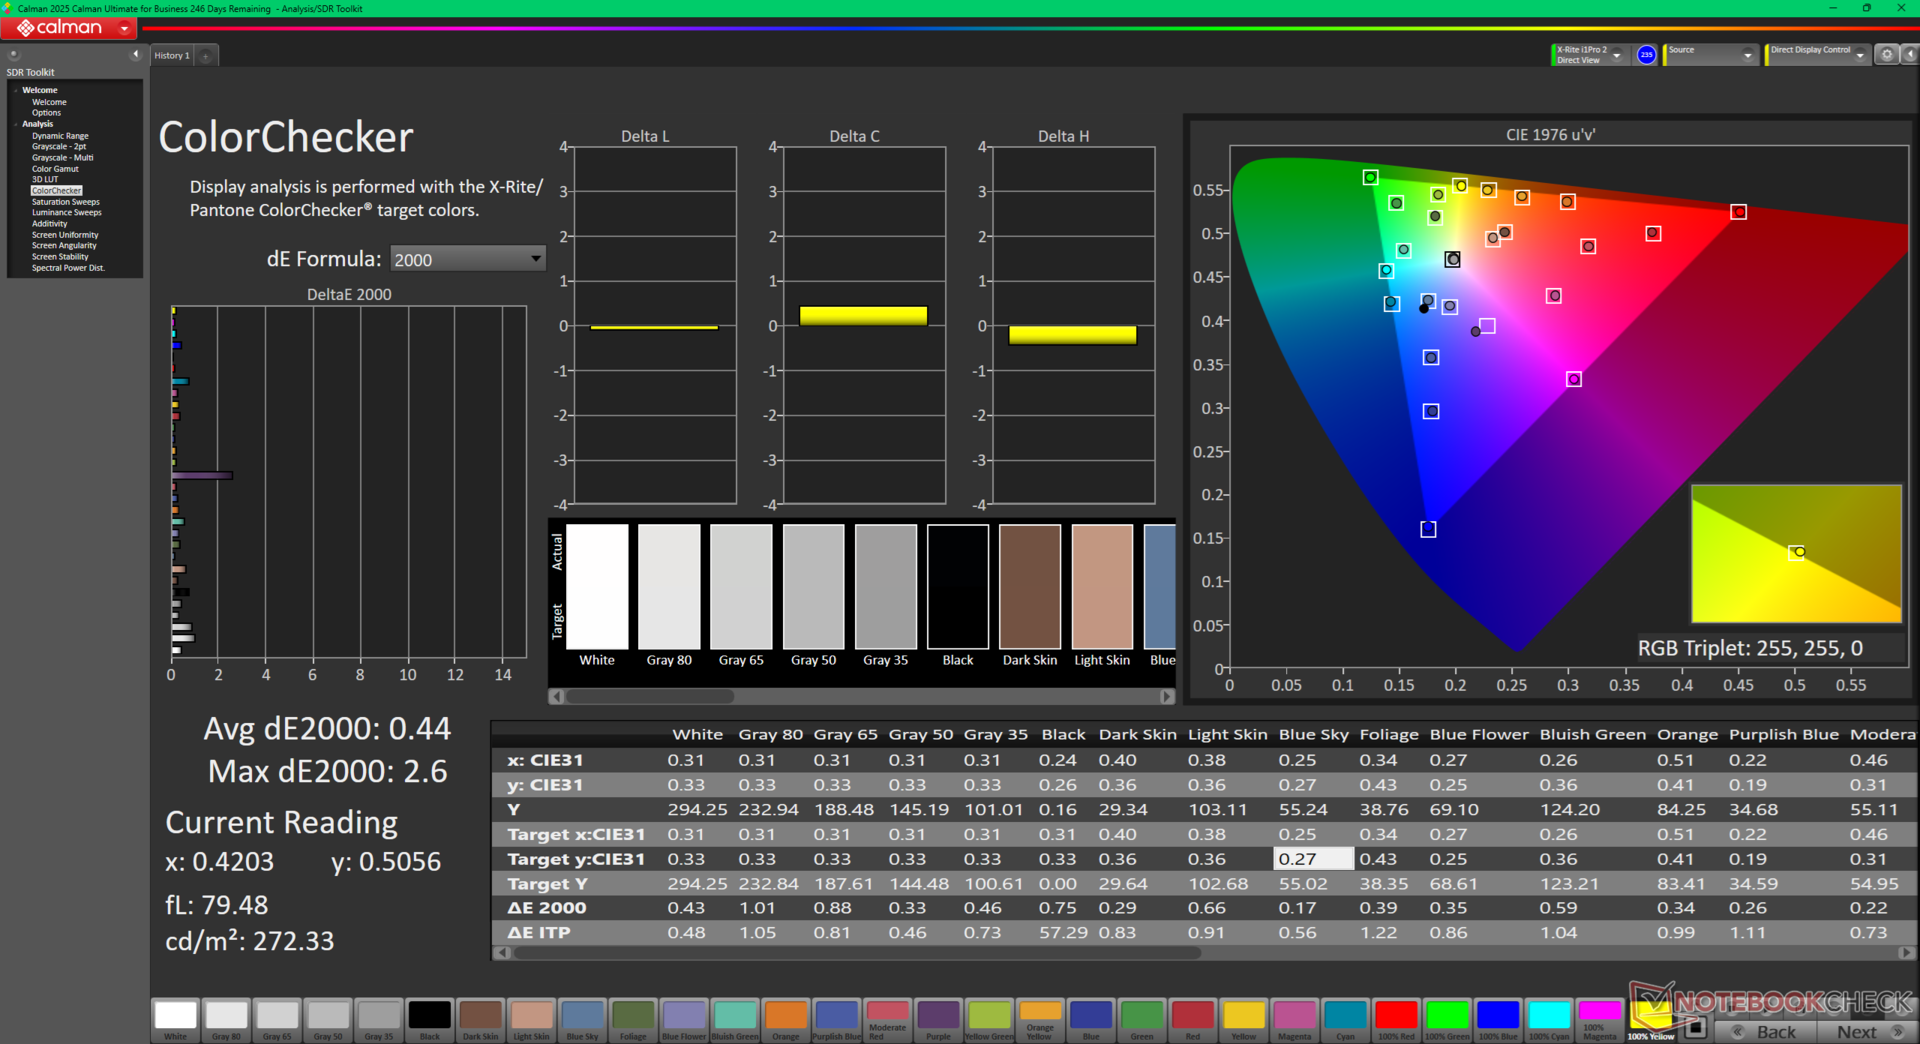
Display - 120 Hz und volle sRGB-Farben
Das Dell 16 Plus ist mit dem gleichen AU Optronics B160QAN IPS-Panel ausgestattet, das auch im Inspiron 16 Plus 7640 für ein im Wesentlichen gleiches Anzeigeerlebnis sorgte. Trotzdem hätten wir uns Verbesserungen bei der Helligkeit und der Unterstützung von HDR gewünscht.
Bei der 90-Hz-Mini-LED-Konfiguration handelt es sich höchstwahrscheinlich um das gleiche Panel wie beim Inspiron 16 7640 2-in-1 aus dem letzten Jahr.
| |||||||||||||||||||||||||
Ausleuchtung: 88 %
Helligkeit Akku: 335.6 cd/m²
Kontrast: 1525:1 (Schwarzwert: 0.22 cd/m²)
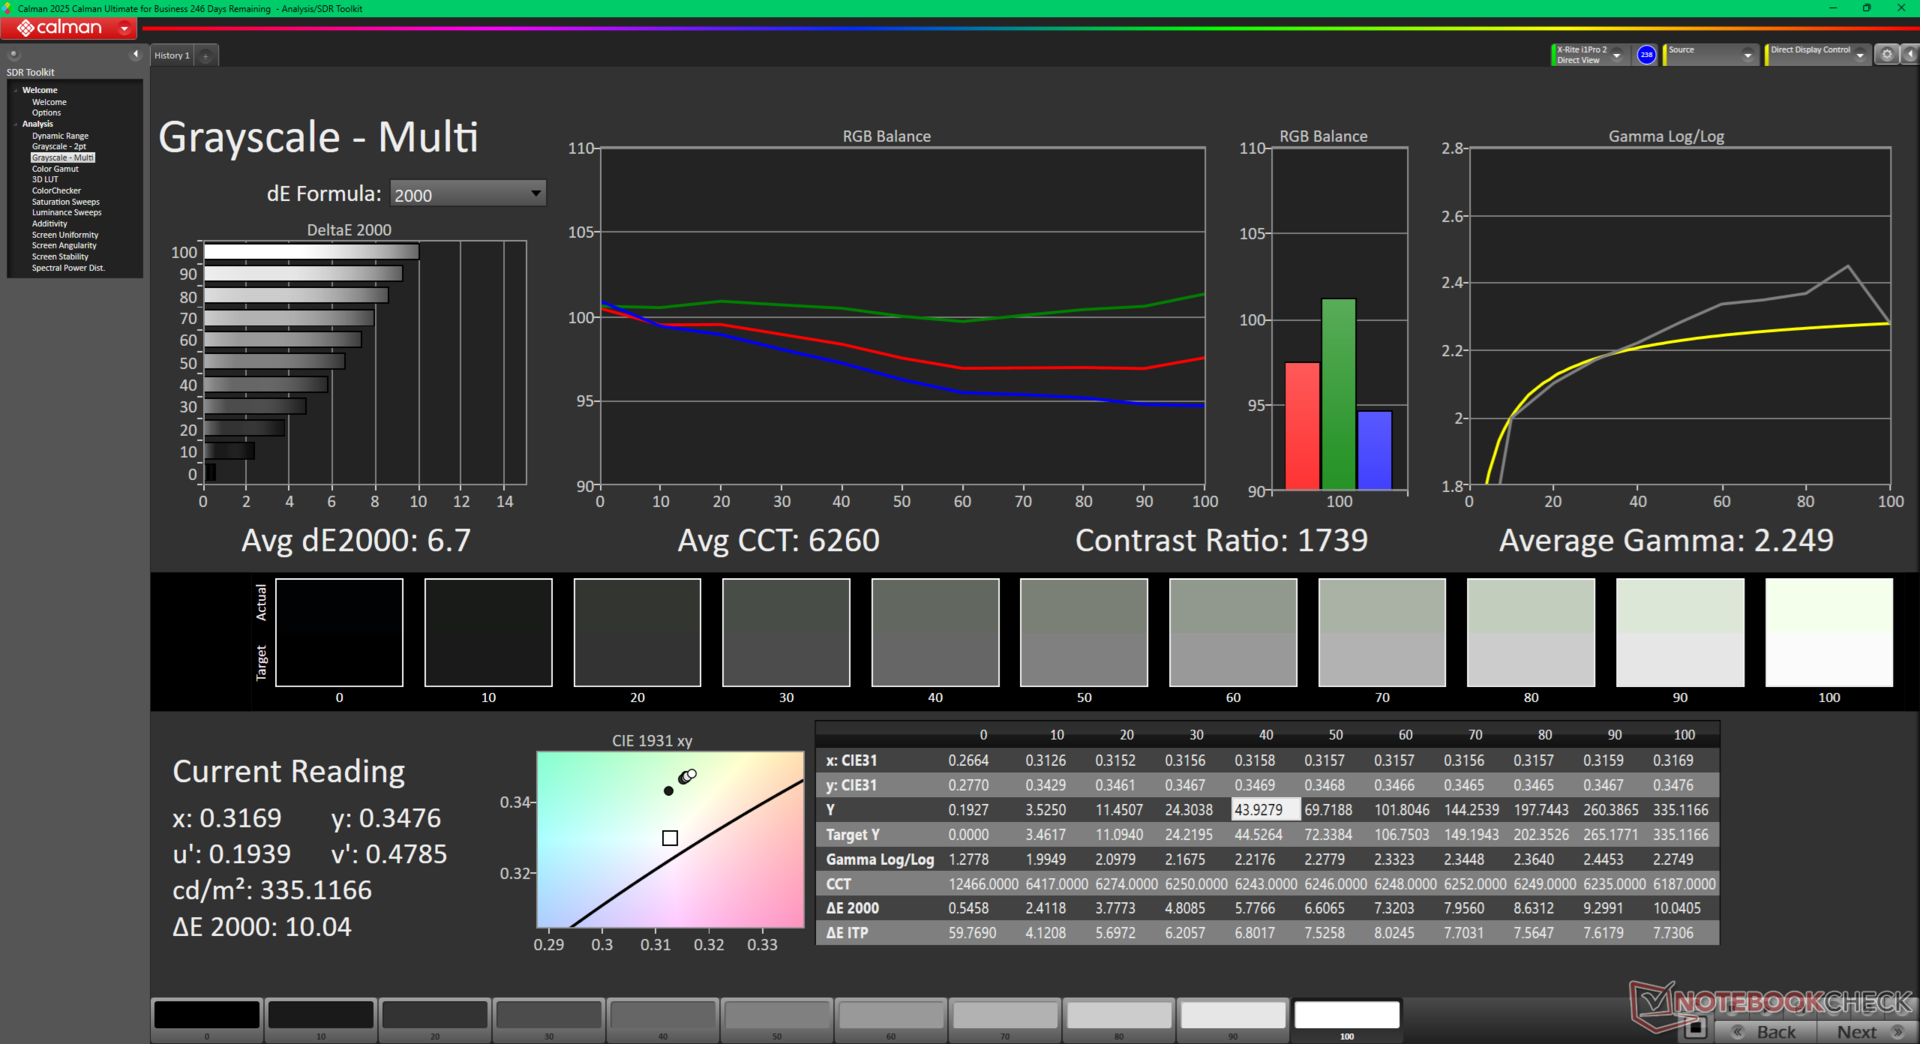
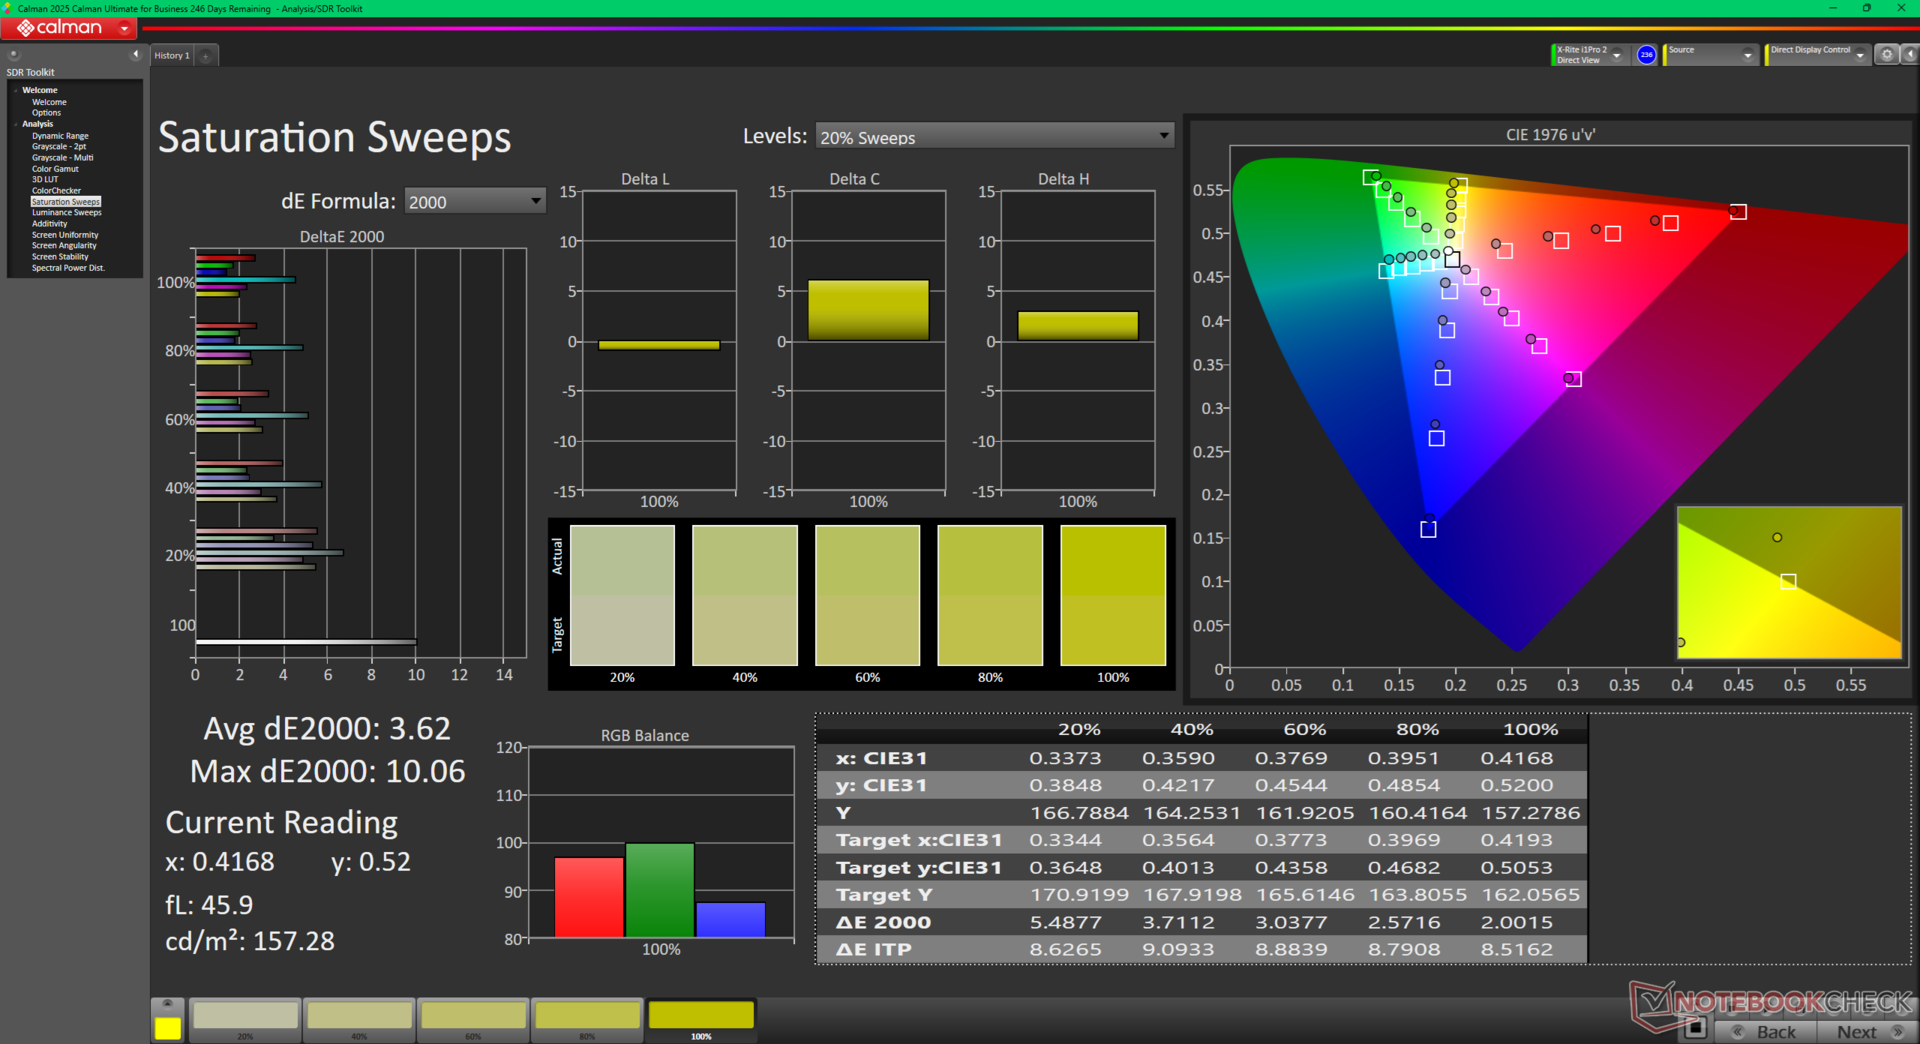
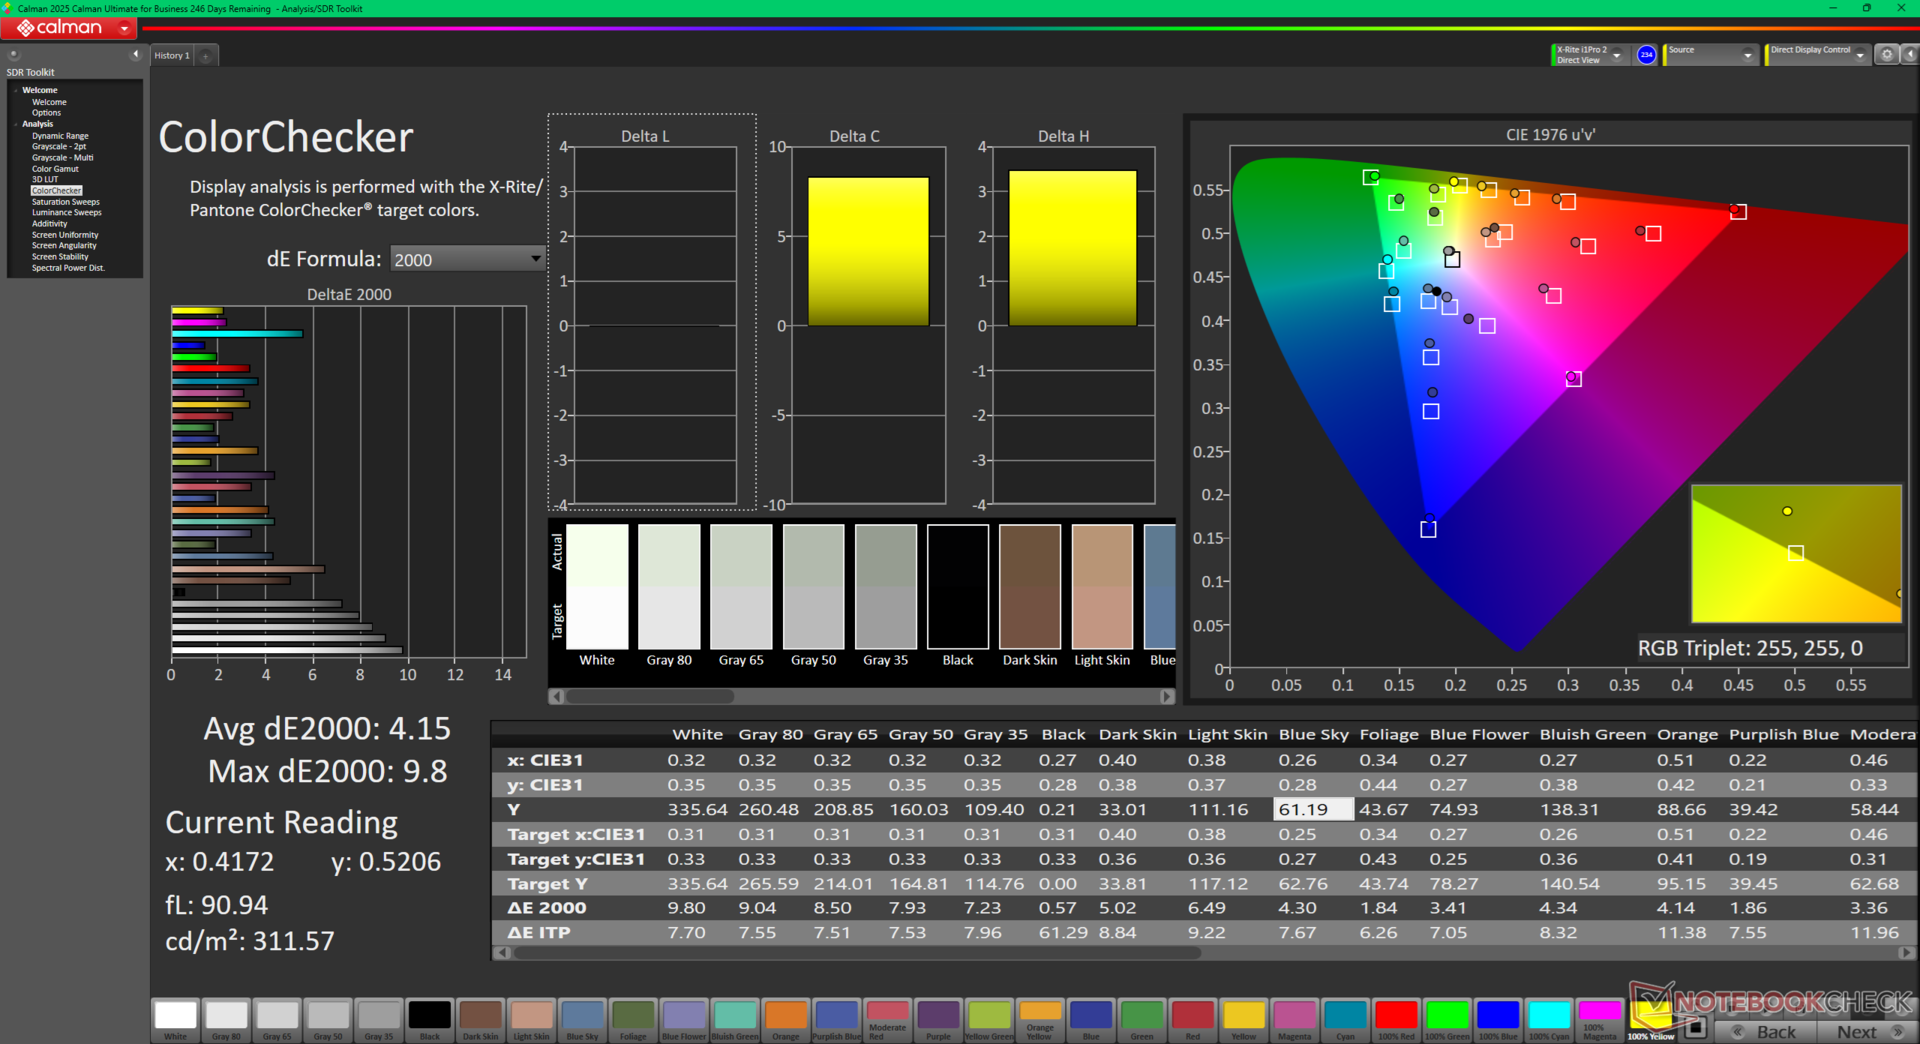
ΔE ColorChecker Calman: 4.15 | ∀{0.5-29.43 Ø4.73}
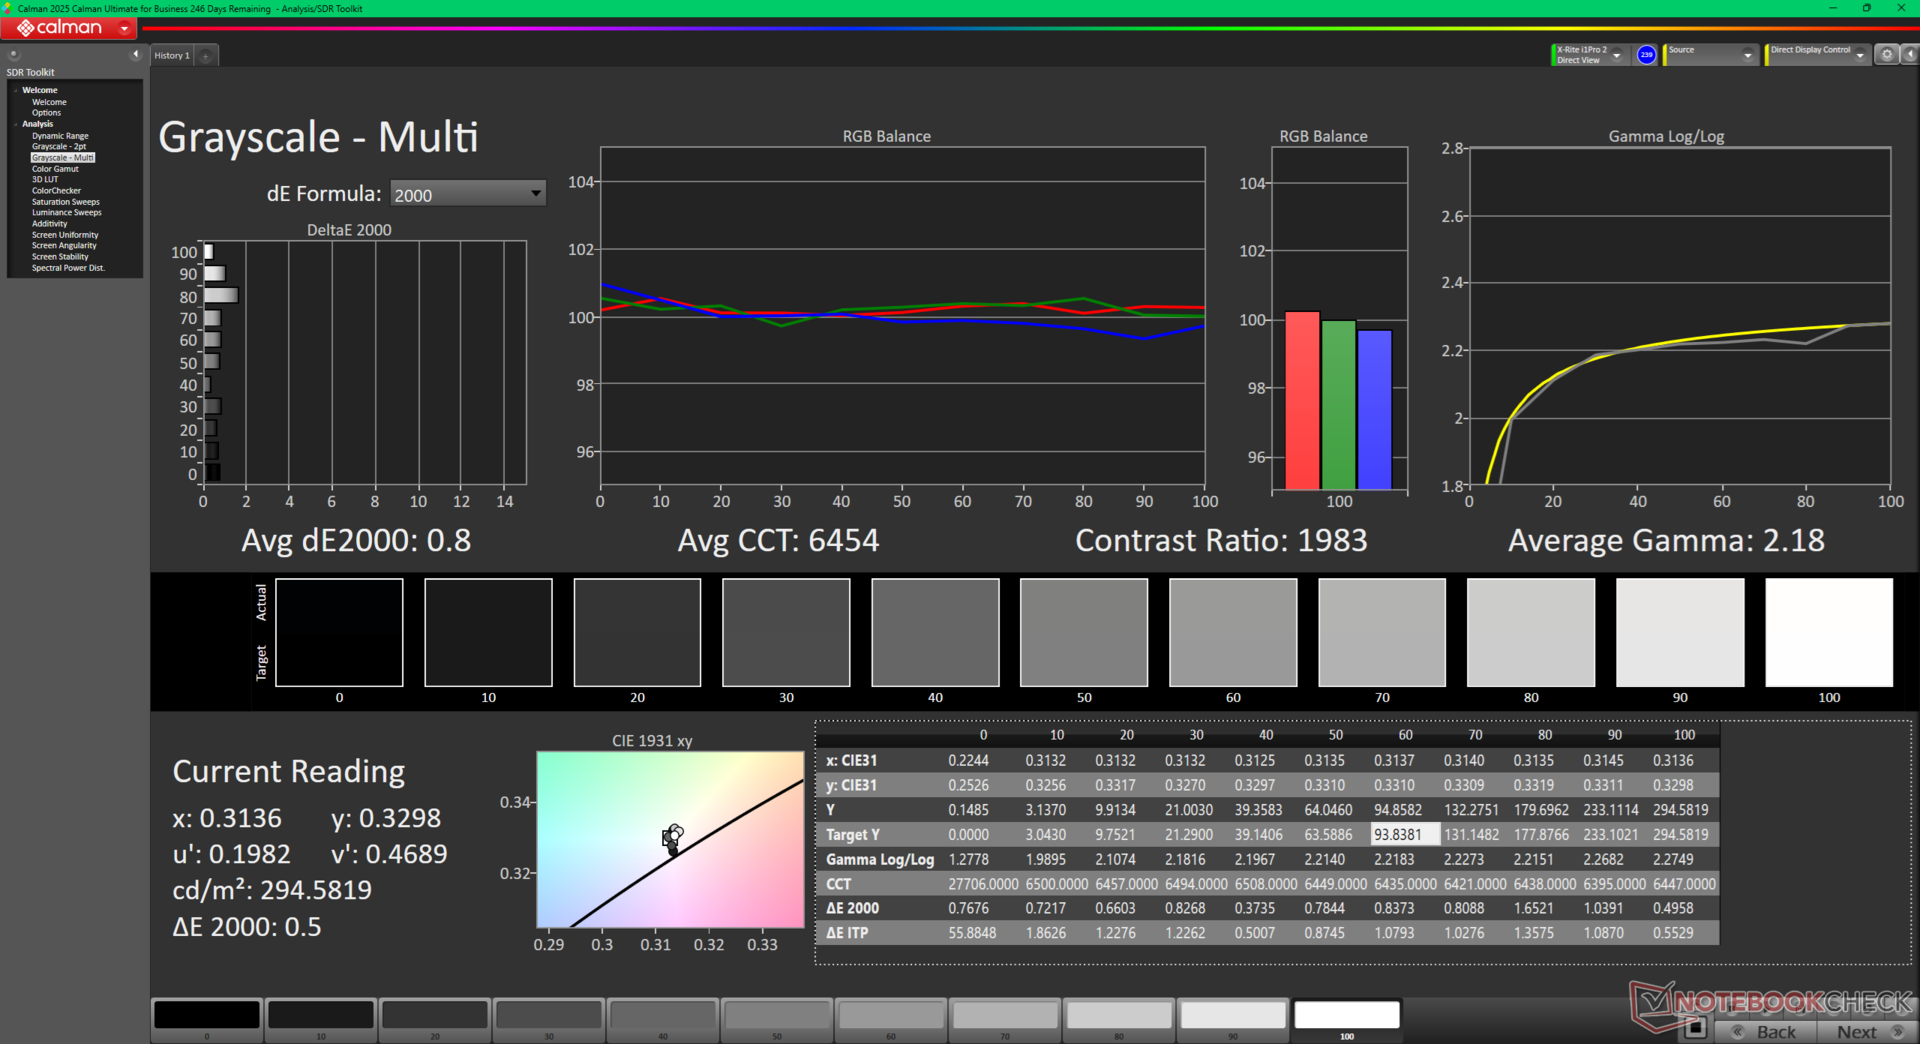
calibrated: 0.44
ΔE Greyscale Calman: 6.7 | ∀{0.09-98 Ø4.97}
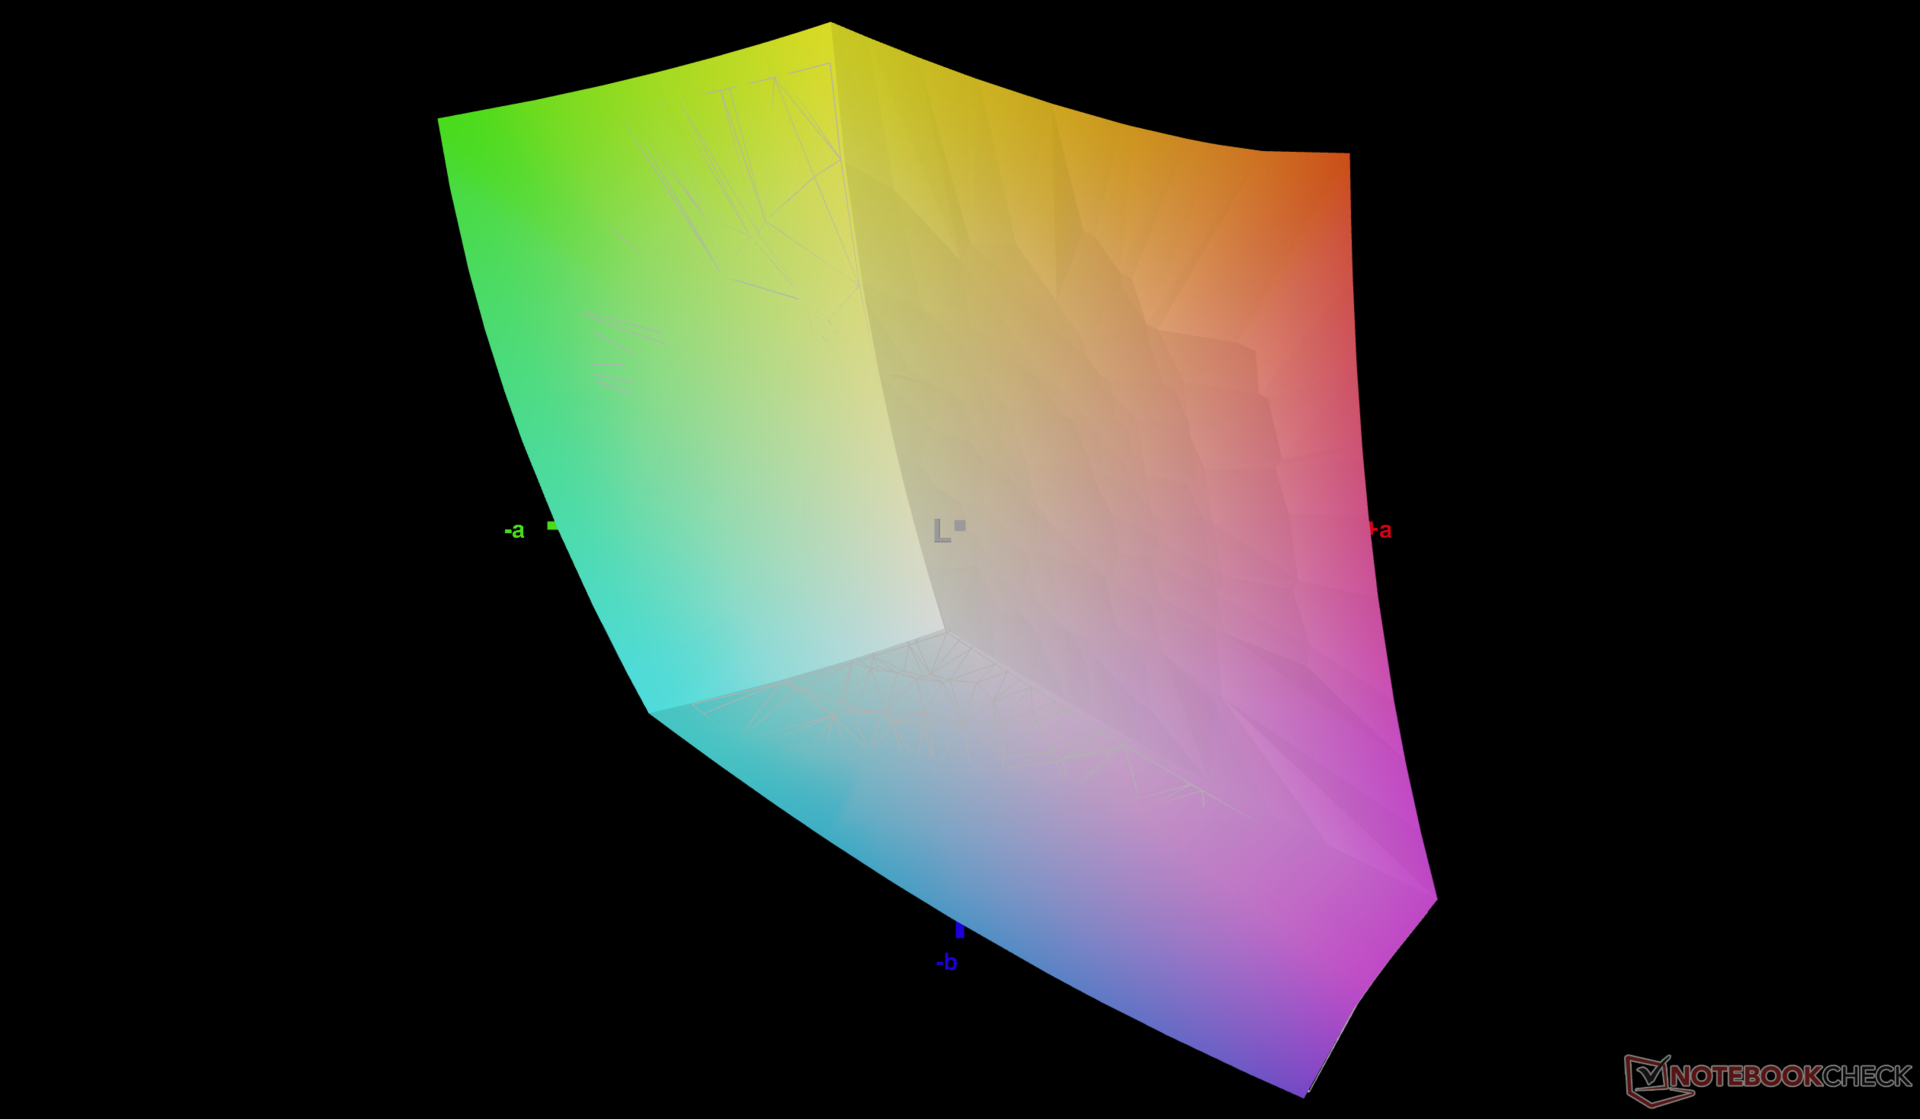
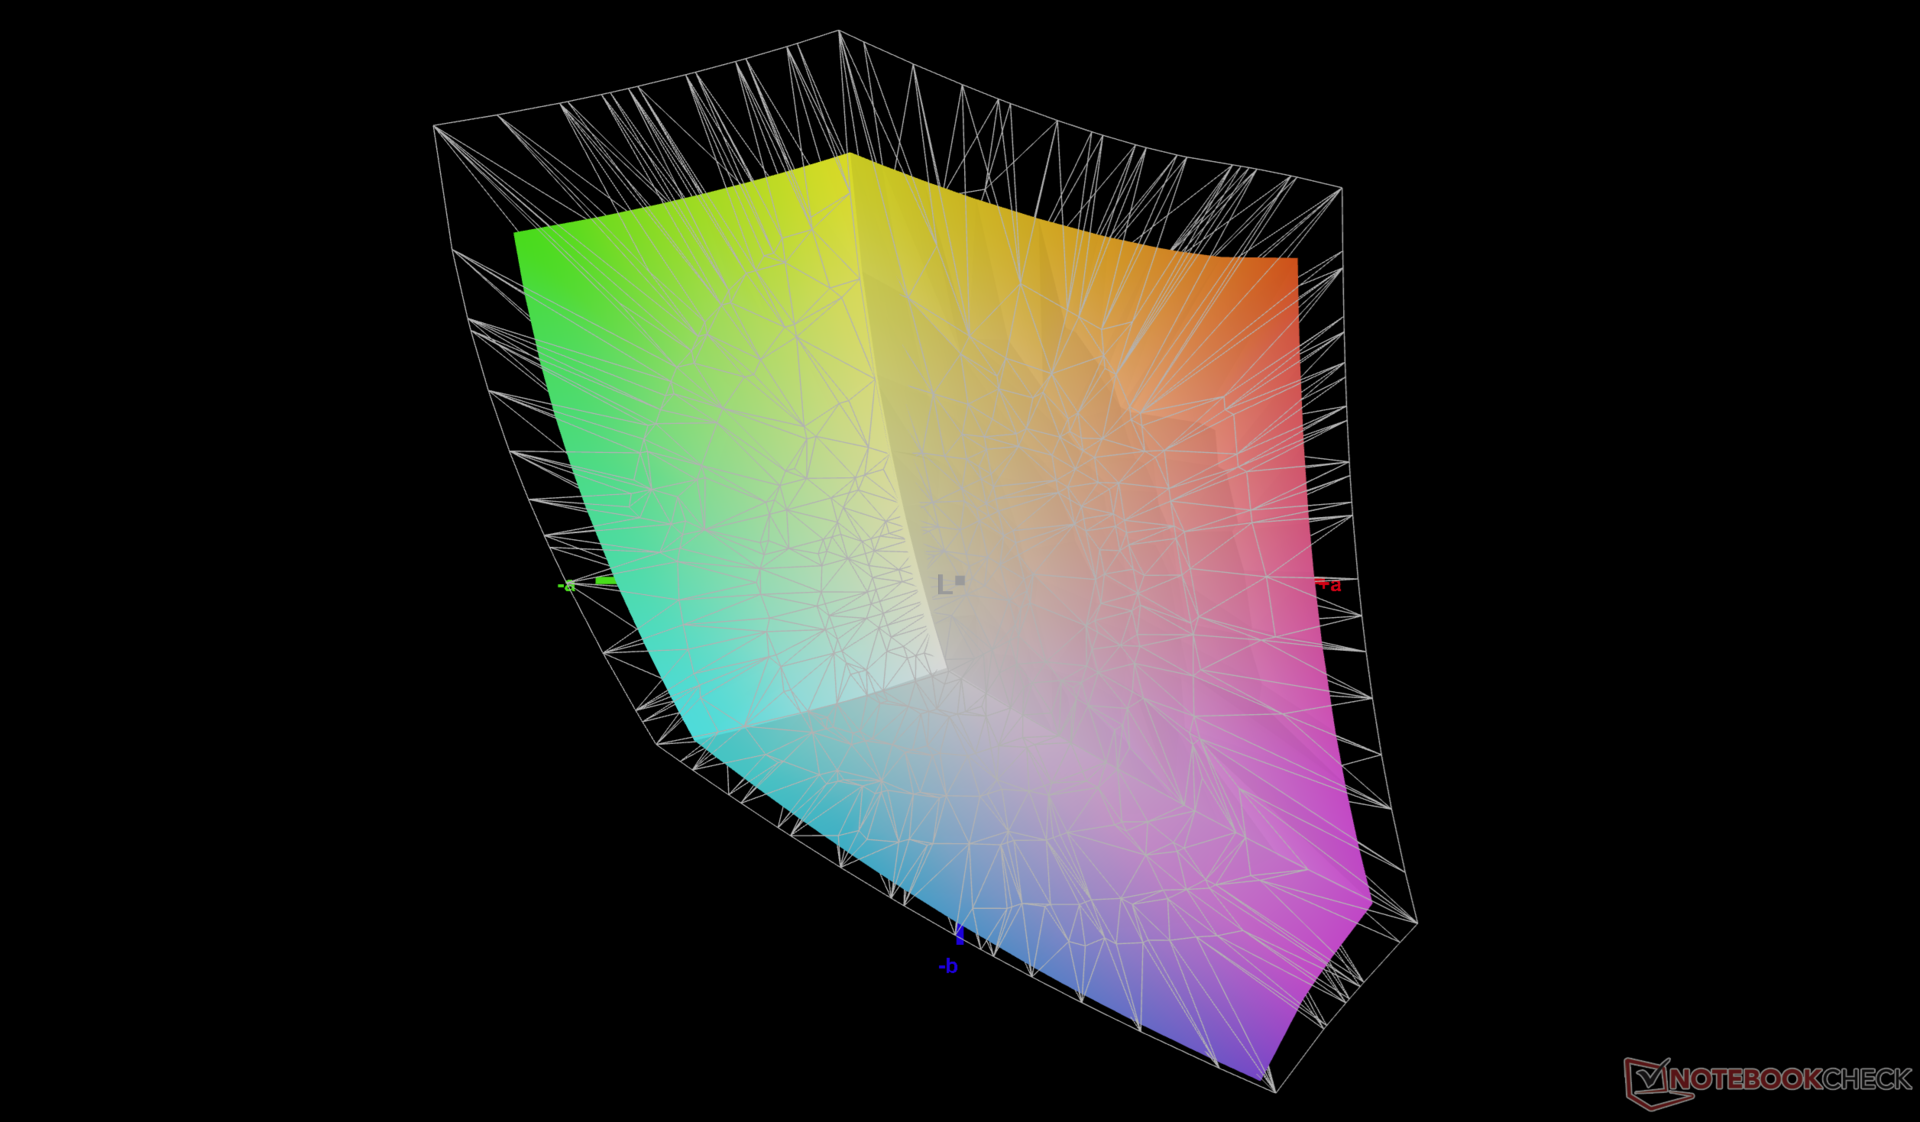
78.4% AdobeRGB 1998 (Argyll 3D)
99.8% sRGB (Argyll 3D)
76.6% Display P3 (Argyll 3D)
Gamma: 2.25
CCT: 6260 K
| Dell 16 Plus AU Optronics B160QAN, IPS, 2560x1600, 16", 120 Hz | Dell Inspiron 16 Plus 7640 AU Optronics B160QAN, IPS, 2560x1600, 16", 120 Hz | Acer Swift 16 AI SF16-51T-932H, Ultra 9 288V SDC41B6, OLED, 2880x1800, 16", 120 Hz | Lenovo ThinkBook 16 G7+ AMD LEN160-3.2K, IPS, 3200x2000, 16", 165 Hz | HP Pavilion Plus 16-ab0456tx AU Optronics AUOFDA4, IPS, 2560x1600, 16", 120 Hz | Asus Vivobook 16 M1606K B160UAN04.3 (AUOA5AB), IPS, 1920x1200, 16", 60 Hz | |
|---|---|---|---|---|---|---|
| Display | -1% | 17% | 12% | -2% | -50% | |
| Display P3 Coverage (%) | 76.6 | 76 -1% | 99.9 30% | 96.3 26% | 74.6 -3% | 36.8 -52% |
| sRGB Coverage (%) | 99.8 | 99.8 0% | 100 0% | 100 0% | 99 -1% | 55.3 -45% |
| AdobeRGB 1998 Coverage (%) | 78.4 | 76.7 -2% | 94.6 21% | 86.9 11% | 76.5 -2% | 38 -52% |
| Response Times | 24% | 54% | 66% | 72% | -1% | |
| Response Time Grey 50% / Grey 80% * (ms) | 32.8 ? | 25.6 ? 22% | 4.8 ? 85% | 13.9 ? 58% | 9.06 ? 72% | 36 ? -10% |
| Response Time Black / White * (ms) | 23.4 ? | 17.6 ? 25% | 18 ? 23% | 6.3 ? 73% | 6.7 ? 71% | 21.4 ? 9% |
| PWM Frequency (Hz) | 481 | |||||
| PWM Amplitude * (%) | 39 | |||||
| Bildschirm | 0% | 195% | 16% | -23% | -128% | |
| Helligkeit Bildmitte (cd/m²) | 335.6 | 314.7 -6% | 425 27% | 422 26% | 403 20% | 326 -3% |
| Brightness (cd/m²) | 308 | 291 -6% | 421 37% | 403 31% | 394 28% | 303 -2% |
| Brightness Distribution (%) | 88 | 89 1% | 98 11% | 93 6% | 90 2% | 89 1% |
| Schwarzwert * (cd/m²) | 0.22 | 0.28 -27% | 0.0219 90% | 0.3 -36% | 0.34 -55% | 0.24 -9% |
| Kontrast (:1) | 1525 | 1124 -26% | 19406 1173% | 1407 -8% | 1185 -22% | 1358 -11% |
| Delta E Colorchecker * | 4.15 | 1.62 61% | 1.73 58% | 1.7 59% | 3.13 25% | 6.48 -56% |
| Colorchecker dE 2000 max. * | 9.8 | 2.94 70% | 3.82 61% | 3.4 65% | 6.14 37% | 19.42 -98% |
| Colorchecker dE 2000 calibrated * | 0.44 | 1.08 -145% | 0.7 -59% | 1.65 -275% | 4.92 -1018% | |
| Delta E Graustufen * | 6.7 | 1.3 81% | 0.09 99% | 2.4 64% | 4.5 33% | 3.85 43% |
| Gamma | 2.25 98% | 2.26 97% | 2.346 94% | 2.19 100% | 2.18 101% | 2.79 79% |
| CCT | 6260 104% | 6385 102% | 6432 101% | 6989 93% | 6261 104% | 6739 96% |
| Durchschnitt gesamt (Programm / Settings) | 8% /
3% | 89% /
132% | 31% /
23% | 16% /
-5% | -60% /
-93% |
* ... kleinere Werte sind besser
Das Display ist nicht gut kalibriert ab Werk, was bei den meisten preisgünstigen bis mittelklassigen Consumer-Laptops üblich ist. Wenn wir den Bildschirm selbst mit einem X-Rite-Kolorimeter kalibrieren, können wir die durchschnittlichen Graustufen- und Farb-DeltaE-Werte von 6,7 bzw. 4,15 auf nur 0,8 bzw. 0,44 verbessern, um die volle sRGB-Abdeckung besser zu nutzen. Unser kalibriertes ICM-Profil ist oben kostenlos herunterladbar.
Reaktionszeiten (Response Times) des Displays
| ↔ Reaktionszeiten Schwarz zu Weiß | ||
|---|---|---|
| 23.4 ms ... steigend ↗ und fallend ↘ kombiniert | ↗ 11.6 ms steigend | 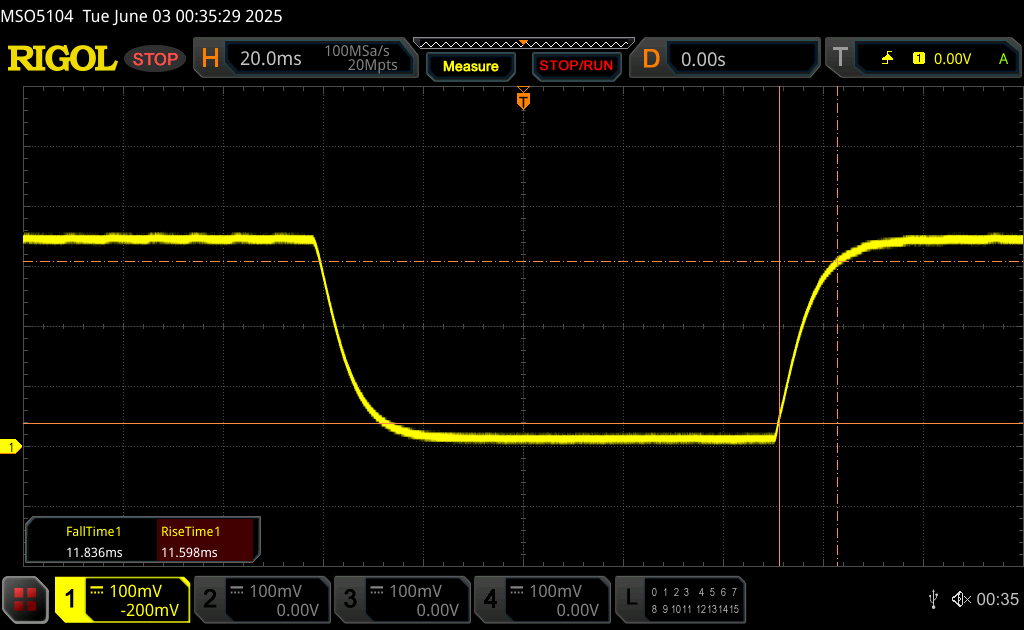 |
| ↘ 11.8 ms fallend | ||
| Die gemessenen Reaktionszeiten sind gut, für anspruchsvolle Spieler könnten der Bildschirm jedoch zu langsam sein. Im Vergleich rangierten die bei uns getesteten Geräte von 0.1 (Minimum) zu 240 (Maximum) ms. » 54 % aller Screens waren schneller als der getestete. Daher sind die gemessenen Reaktionszeiten schlechter als der Durchschnitt aller vermessenen Geräte (19.9 ms). | ||
| ↔ Reaktionszeiten 50% Grau zu 80% Grau | ||
| 32.8 ms ... steigend ↗ und fallend ↘ kombiniert | ↗ 16.1 ms steigend | 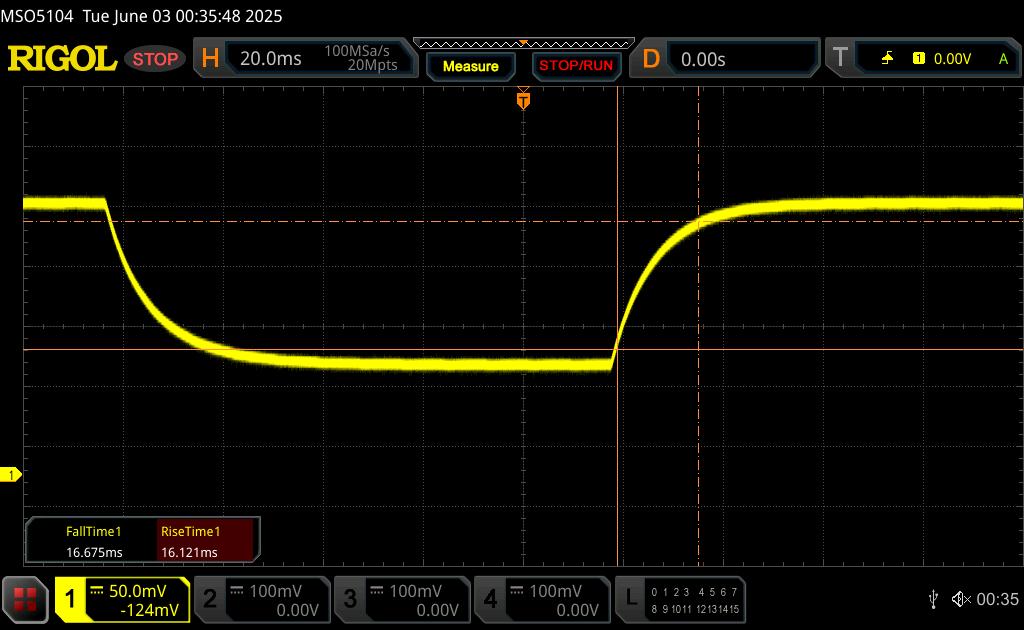 |
| ↘ 16.7 ms fallend | ||
| Die gemessenen Reaktionszeiten sind langsam und dadurch für viele Spieler wahrscheinlich zu langsam. Im Vergleich rangierten die bei uns getesteten Geräte von 0.165 (Minimum) zu 636 (Maximum) ms. » 44 % aller Screens waren schneller als der getestete. Daher sind die gemessenen Reaktionszeiten durchschnittlich (31.1 ms). | ||
Bildschirm-Flackern / PWM (Pulse-Width Modulation)
| Flackern / PWM nicht festgestellt | 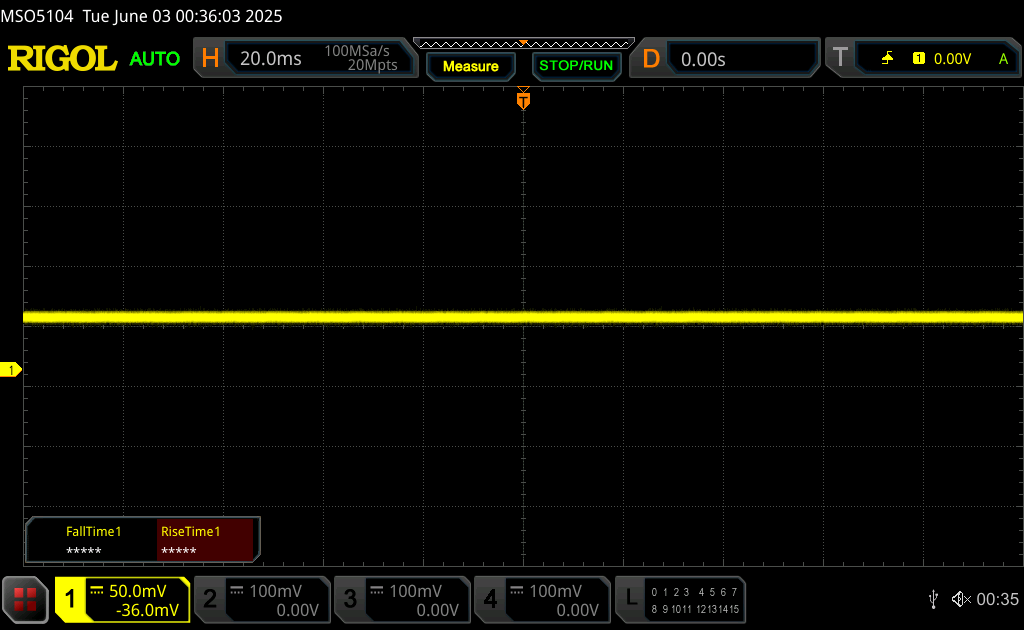 | ||
Im Vergleich: 52 % aller getesteten Geräte nutzten kein PWM um die Helligkeit zu reduzieren. Wenn PWM eingesetzt wurde, dann bei einer Frequenz von durchschnittlich 7784 (Minimum 5, Maximum 343500) Hz. | |||
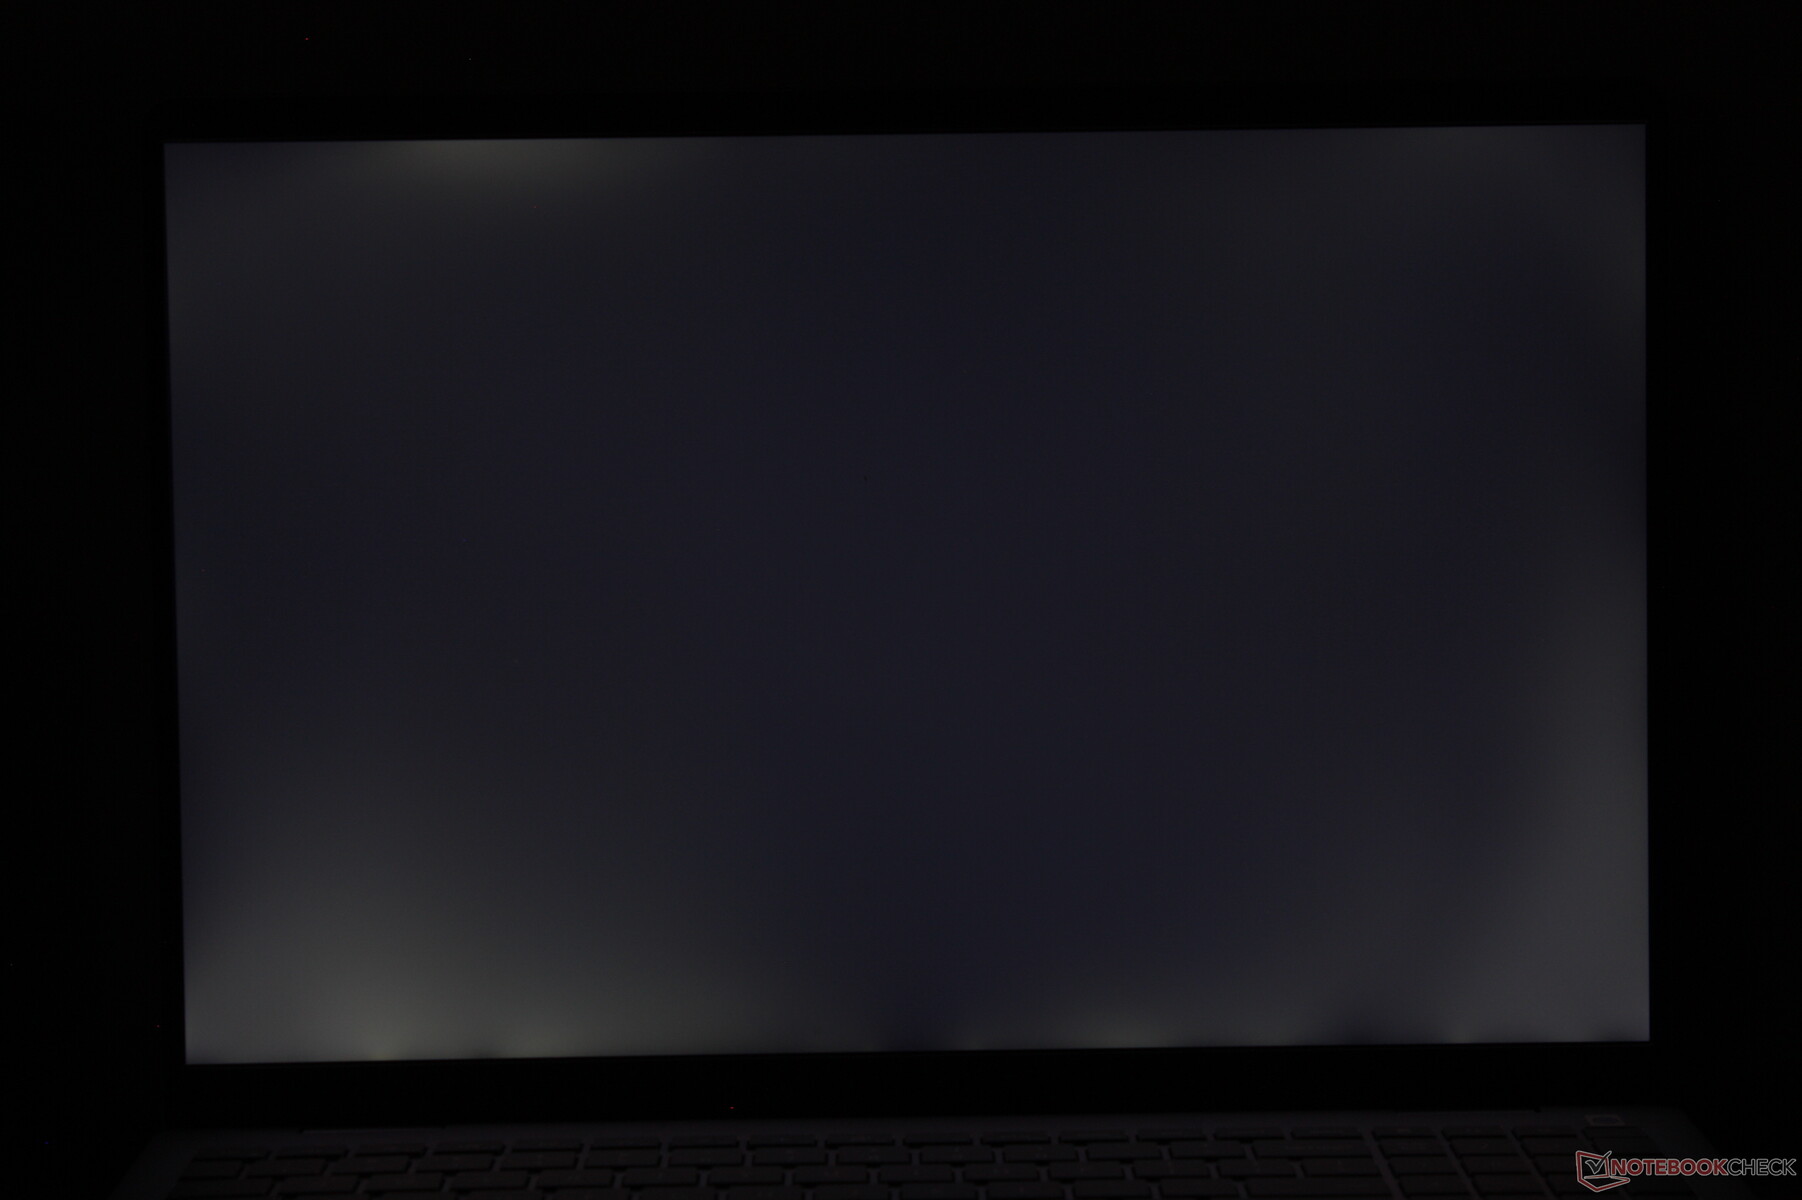
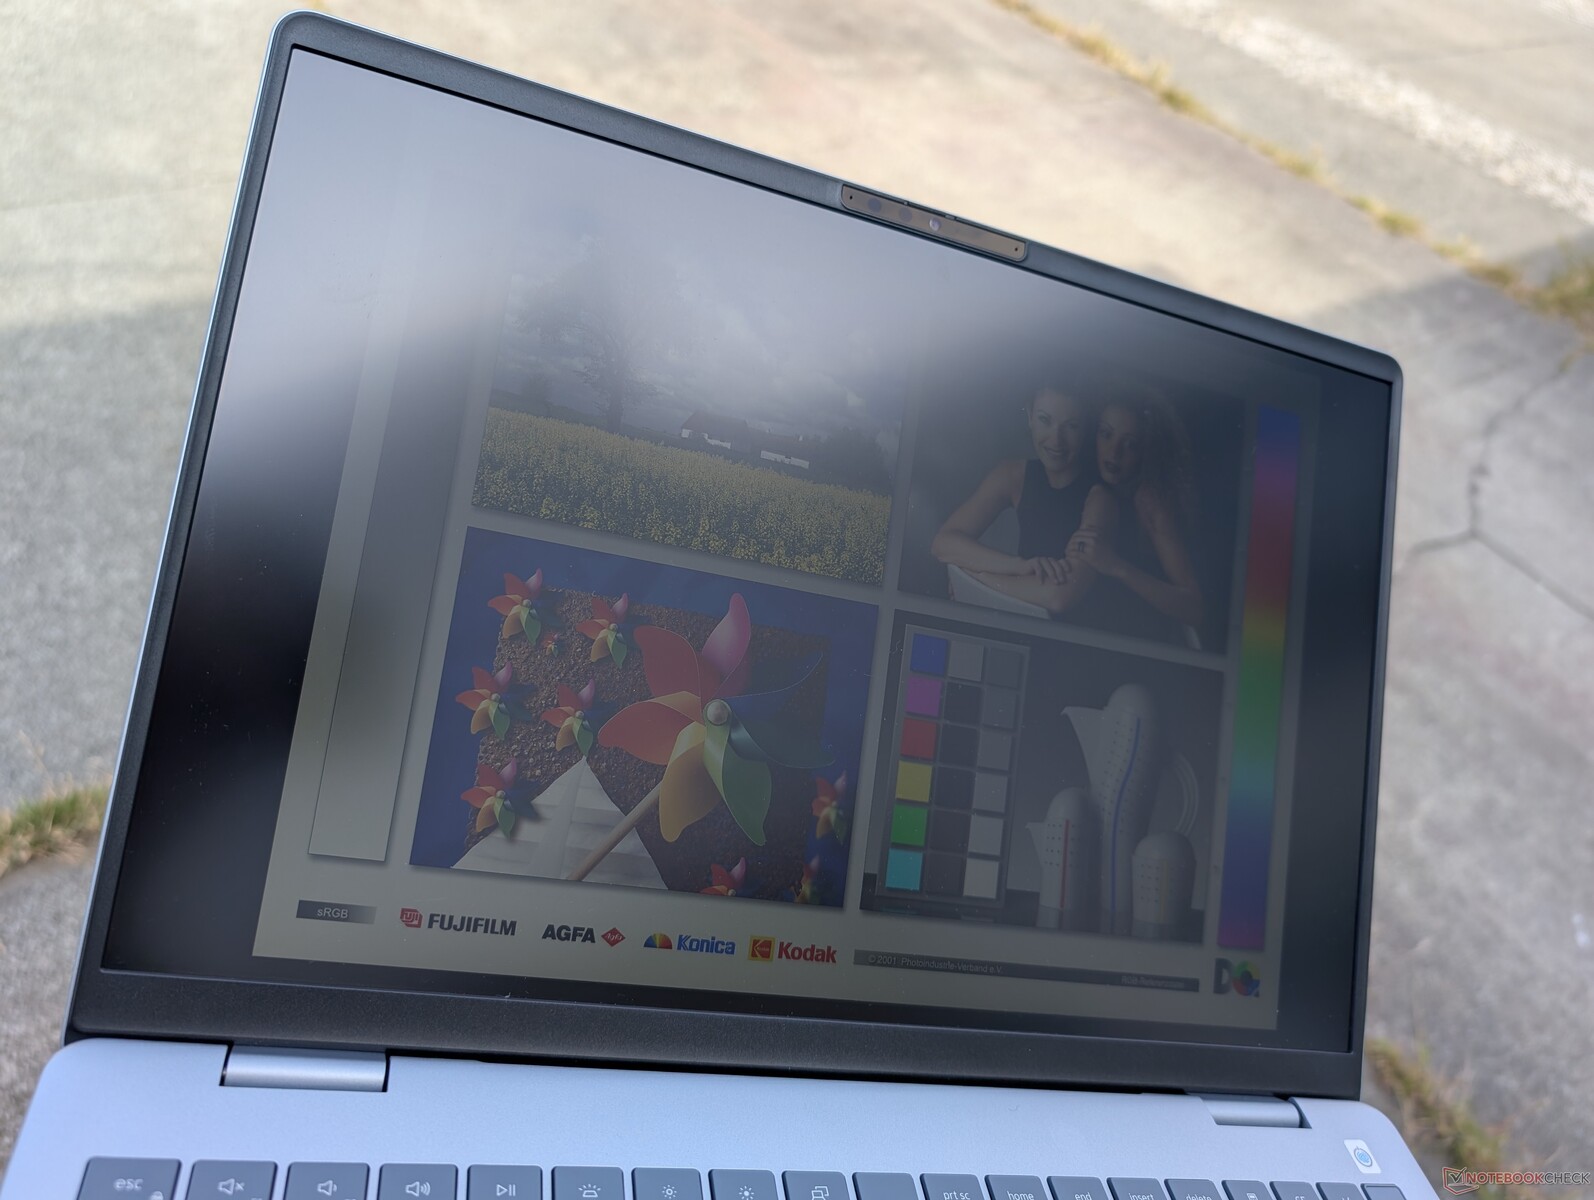
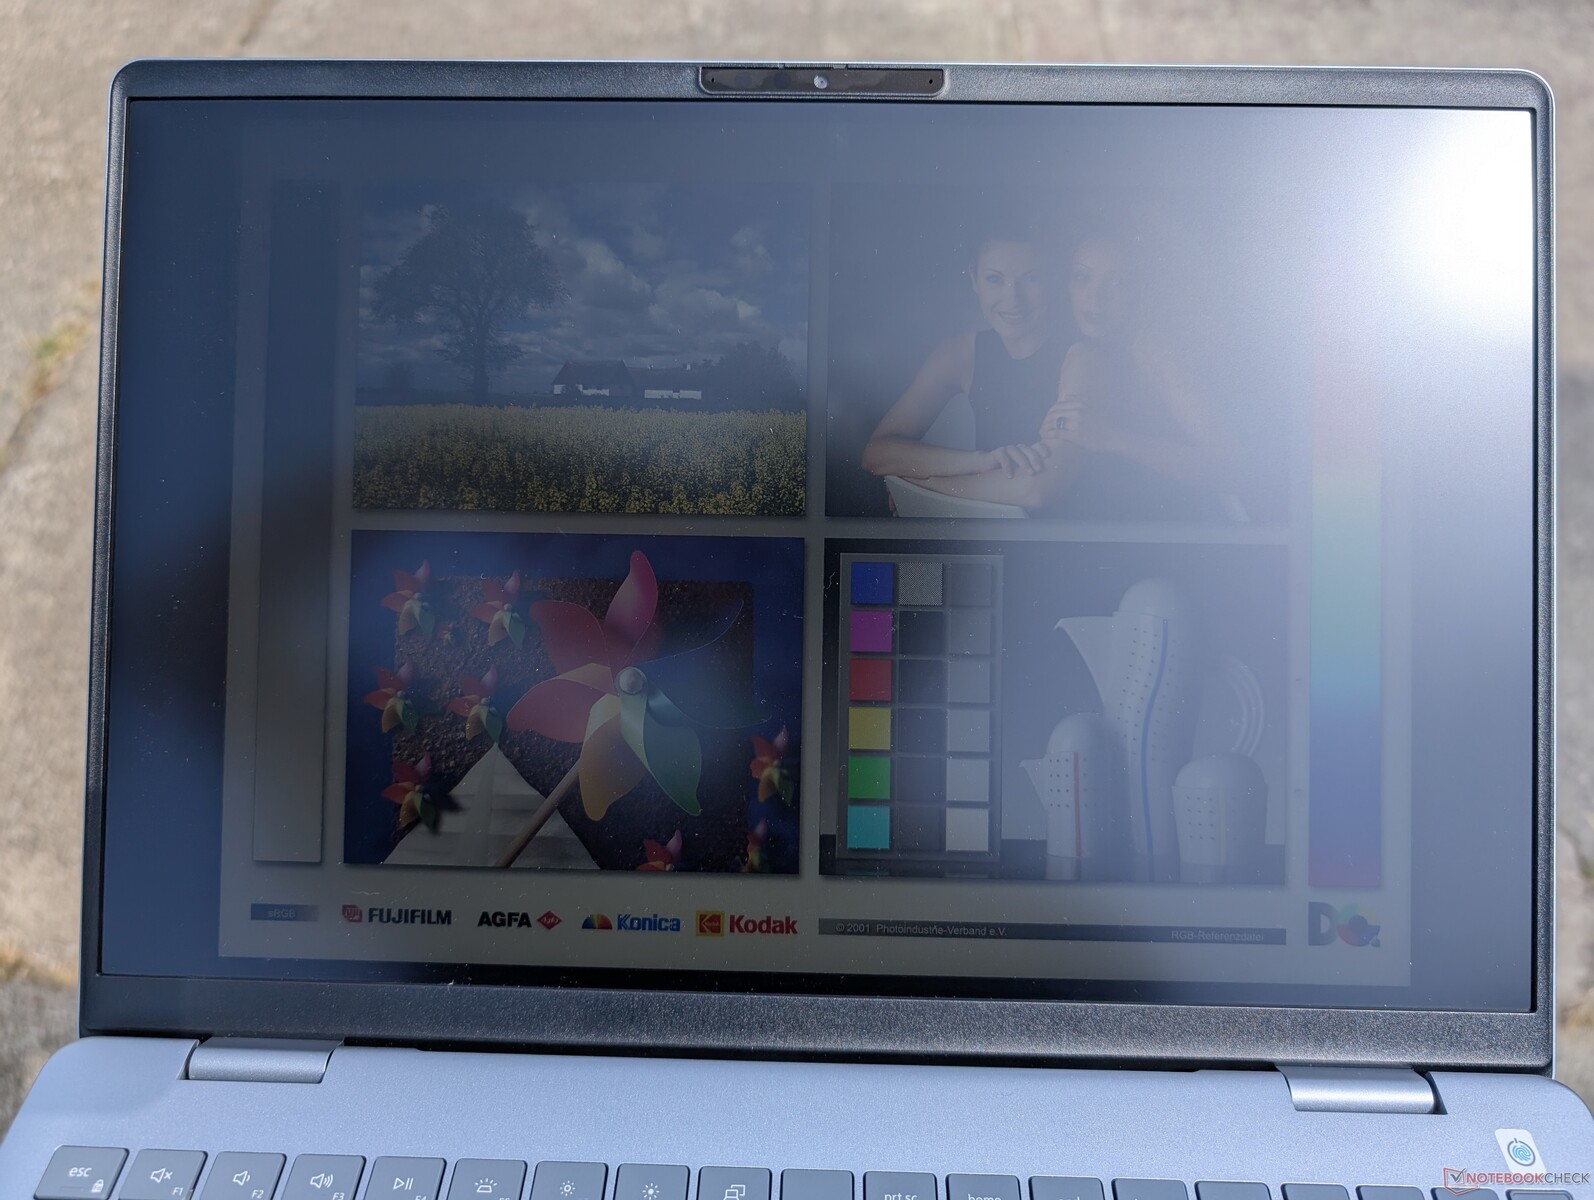
Die Sichtbarkeit im Freien ist schlecht, da das Display nicht hell genug ist, um Blendeffekte zu vermeiden.


Performance - Effizienter mit schnellerer integrierter Grafik
Testbedingungen
Wir haben Dell Optimizer auf den Modus Performance eingestellt, bevor wir die folgenden Benchmarks durchgeführt haben. Die Dell Energieprofile korrelieren mit den Standard-Energieprofilen von Windows, und die Änderung eines Profils wird mit dem anderen synchronisiert.
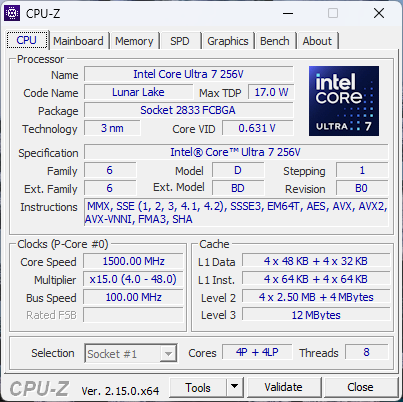
Prozessor
Der Core Ultra 7 256V setzt ganz auf Effizienz, während er gleichzeitig das reine Prozessorleistungsniveau der vorherigen Generation, des Core Ultra 7 155U, beibehält. Ältere Modelle mit Core-H-Optionen sind immer noch deutlich schneller, darunter das Inspiron 16 7640 2-in-1. Ein Upgrade auf die Core-Ultra-9-288V-Konfiguration wird voraussichtlich nur einen sehr geringen Zuwachs von bestenfalls unter zehn Prozent bringen, basierend auf unserer Zeit mit dem Acer Swift 16 AI.
Die Nachhaltigkeit der Leistung könnte besser sein, da wir bei unserem CineBench-R15-xT-Schleifentest einen Rückgang von 20 Prozent im Laufe der Zeit verzeichnen konnten, wie die unten stehende Grafik zeigt.
Cinebench R15 Multi Loop
Cinebench R23: Multi Core | Single Core
Cinebench R20: CPU (Multi Core) | CPU (Single Core)
Cinebench R15: CPU Multi 64Bit | CPU Single 64Bit
Blender: v2.79 BMW27 CPU
7-Zip 18.03: 7z b 4 | 7z b 4 -mmt1
Geekbench 6.7: Multi-Core | Single-Core
Geekbench 5.5: Multi-Core | Single-Core
HWBOT x265 Benchmark v2.2: 4k Preset
LibreOffice : 20 Documents To PDF
R Benchmark 2.5: Overall mean
* ... kleinere Werte sind besser
AIDA64: FP32 Ray-Trace | FPU Julia | CPU SHA3 | CPU Queen | FPU SinJulia | FPU Mandel | CPU AES | CPU ZLib | FP64 Ray-Trace | CPU PhotoWorxx
| Performance Rating | |
| Lenovo ThinkBook 16 G7+ AMD | |
| Asus Vivobook 16 M1606K | |
| HP Pavilion Plus 16-ab0456tx | |
| Dell Inspiron 16 Plus 7640 | |
| Acer Swift 16 AI SF16-51T-932H, Ultra 9 288V | |
| Durchschnittliche Intel Core Ultra 7 256V | |
| Dell 16 Plus | |
| AIDA64 / FP32 Ray-Trace | |
| Lenovo ThinkBook 16 G7+ AMD | |
| Asus Vivobook 16 M1606K | |
| HP Pavilion Plus 16-ab0456tx | |
| Dell Inspiron 16 Plus 7640 | |
| Acer Swift 16 AI SF16-51T-932H, Ultra 9 288V | |
| Durchschnittliche Intel Core Ultra 7 256V (10524 - 12898, n=7) | |
| Dell 16 Plus | |
| AIDA64 / FPU Julia | |
| Lenovo ThinkBook 16 G7+ AMD | |
| Asus Vivobook 16 M1606K | |
| HP Pavilion Plus 16-ab0456tx | |
| Dell Inspiron 16 Plus 7640 | |
| Acer Swift 16 AI SF16-51T-932H, Ultra 9 288V | |
| Durchschnittliche Intel Core Ultra 7 256V (52443 - 62522, n=7) | |
| Dell 16 Plus | |
| AIDA64 / CPU SHA3 | |
| Lenovo ThinkBook 16 G7+ AMD | |
| Asus Vivobook 16 M1606K | |
| HP Pavilion Plus 16-ab0456tx | |
| Dell Inspiron 16 Plus 7640 | |
| Acer Swift 16 AI SF16-51T-932H, Ultra 9 288V | |
| Durchschnittliche Intel Core Ultra 7 256V (2364 - 2915, n=7) | |
| Dell 16 Plus | |
| AIDA64 / CPU Queen | |
| HP Pavilion Plus 16-ab0456tx | |
| Dell Inspiron 16 Plus 7640 | |
| Lenovo ThinkBook 16 G7+ AMD | |
| Asus Vivobook 16 M1606K | |
| Acer Swift 16 AI SF16-51T-932H, Ultra 9 288V | |
| Durchschnittliche Intel Core Ultra 7 256V (49622 - 49794, n=6) | |
| Dell 16 Plus | |
| AIDA64 / FPU SinJulia | |
| Lenovo ThinkBook 16 G7+ AMD | |
| Asus Vivobook 16 M1606K | |
| Dell Inspiron 16 Plus 7640 | |
| HP Pavilion Plus 16-ab0456tx | |
| Durchschnittliche Intel Core Ultra 7 256V (4401 - 4434, n=7) | |
| Acer Swift 16 AI SF16-51T-932H, Ultra 9 288V | |
| Dell 16 Plus | |
| AIDA64 / FPU Mandel | |
| Lenovo ThinkBook 16 G7+ AMD | |
| Asus Vivobook 16 M1606K | |
| HP Pavilion Plus 16-ab0456tx | |
| Dell Inspiron 16 Plus 7640 | |
| Acer Swift 16 AI SF16-51T-932H, Ultra 9 288V | |
| Durchschnittliche Intel Core Ultra 7 256V (27382 - 33019, n=7) | |
| Dell 16 Plus | |
| AIDA64 / CPU AES | |
| Lenovo ThinkBook 16 G7+ AMD | |
| Dell Inspiron 16 Plus 7640 | |
| HP Pavilion Plus 16-ab0456tx | |
| Asus Vivobook 16 M1606K | |
| Durchschnittliche Intel Core Ultra 7 256V (38495 - 75938, n=7) | |
| Acer Swift 16 AI SF16-51T-932H, Ultra 9 288V | |
| Dell 16 Plus | |
| AIDA64 / CPU ZLib | |
| Lenovo ThinkBook 16 G7+ AMD | |
| Dell Inspiron 16 Plus 7640 | |
| Asus Vivobook 16 M1606K | |
| HP Pavilion Plus 16-ab0456tx | |
| Durchschnittliche Intel Core Ultra 7 256V (536 - 632, n=7) | |
| Acer Swift 16 AI SF16-51T-932H, Ultra 9 288V | |
| Dell 16 Plus | |
| AIDA64 / FP64 Ray-Trace | |
| Lenovo ThinkBook 16 G7+ AMD | |
| Asus Vivobook 16 M1606K | |
| HP Pavilion Plus 16-ab0456tx | |
| Dell Inspiron 16 Plus 7640 | |
| Acer Swift 16 AI SF16-51T-932H, Ultra 9 288V | |
| Durchschnittliche Intel Core Ultra 7 256V (5655 - 6878, n=7) | |
| Dell 16 Plus | |
| AIDA64 / CPU PhotoWorxx | |
| Acer Swift 16 AI SF16-51T-932H, Ultra 9 288V | |
| Durchschnittliche Intel Core Ultra 7 256V (49906 - 57060, n=7) | |
| Dell 16 Plus | |
| Lenovo ThinkBook 16 G7+ AMD | |
| HP Pavilion Plus 16-ab0456tx | |
| Dell Inspiron 16 Plus 7640 | |
| Asus Vivobook 16 M1606K | |
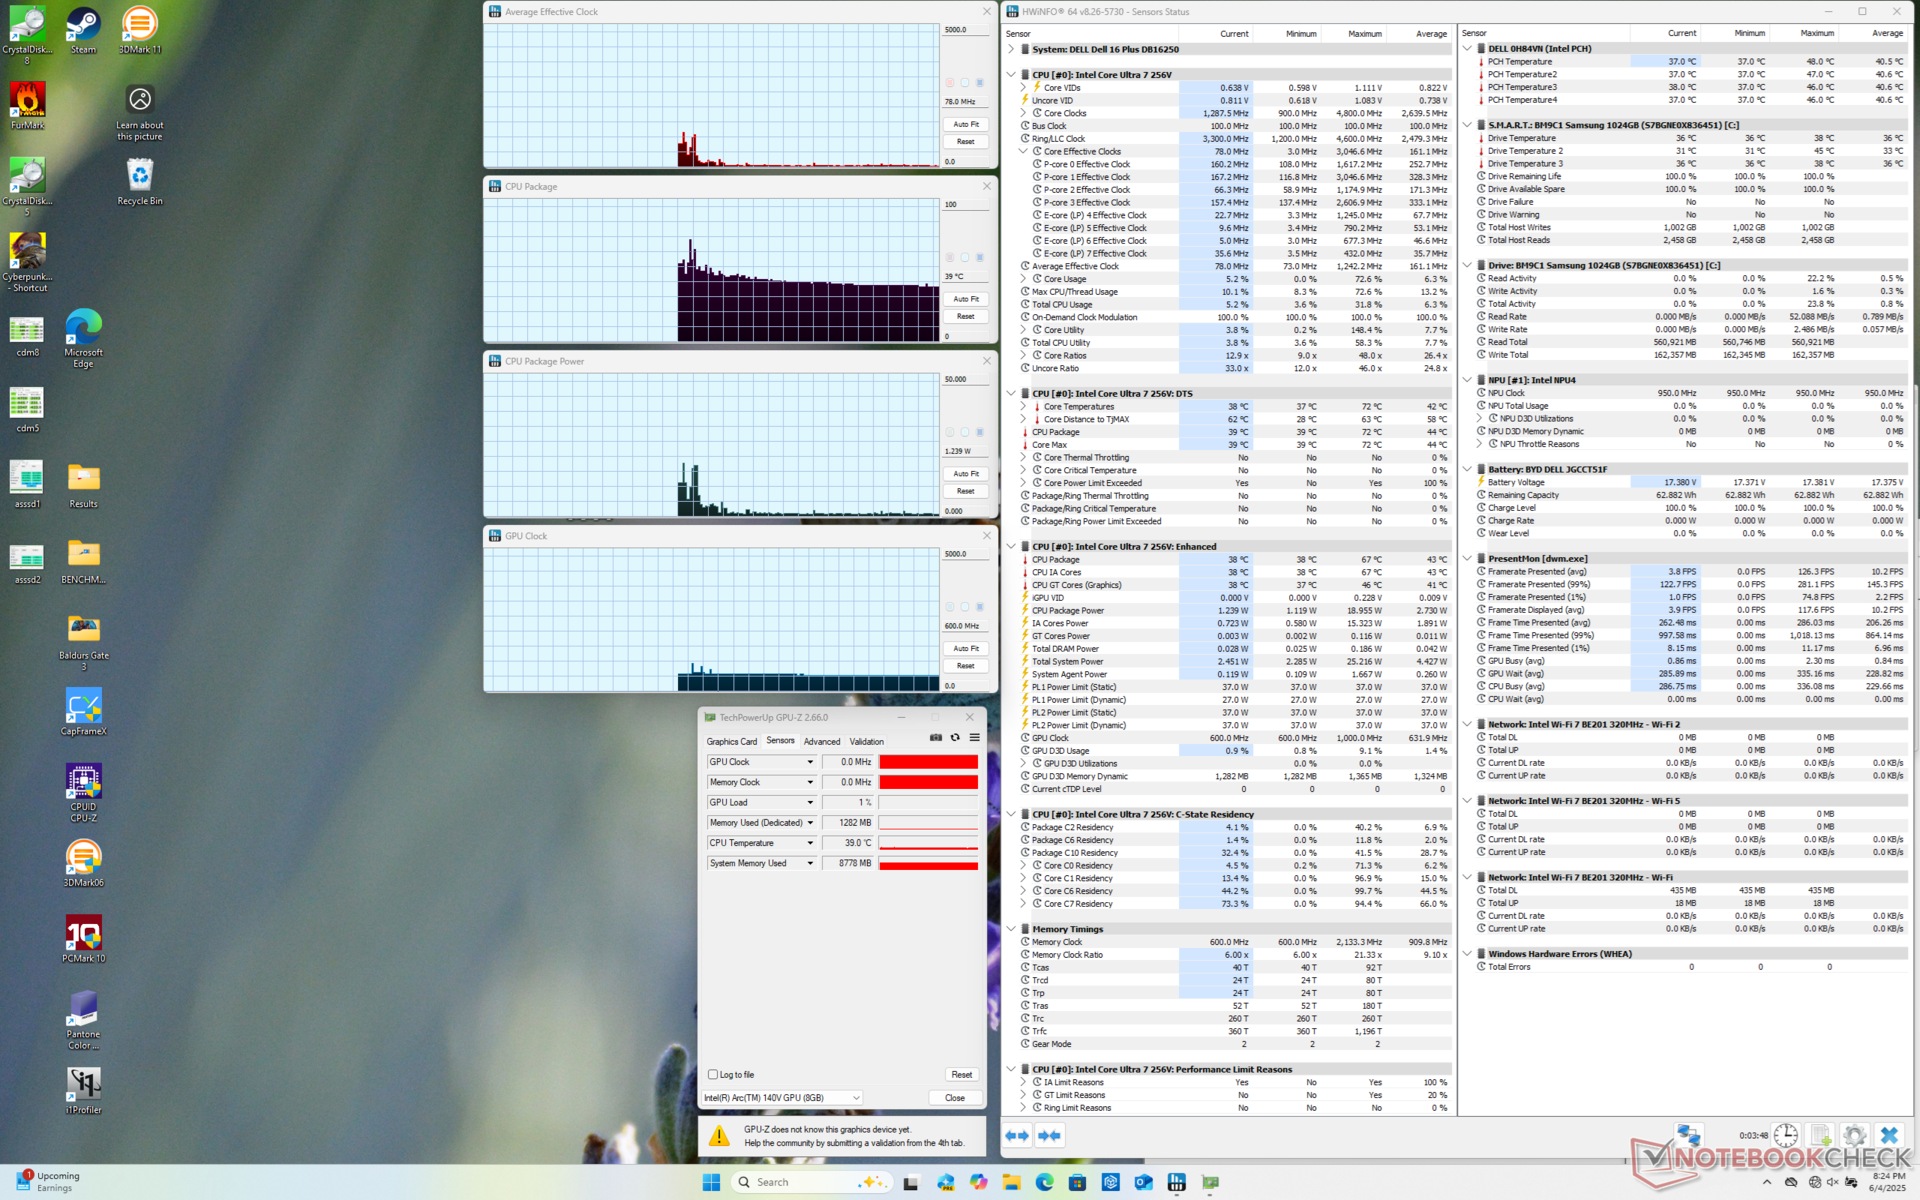
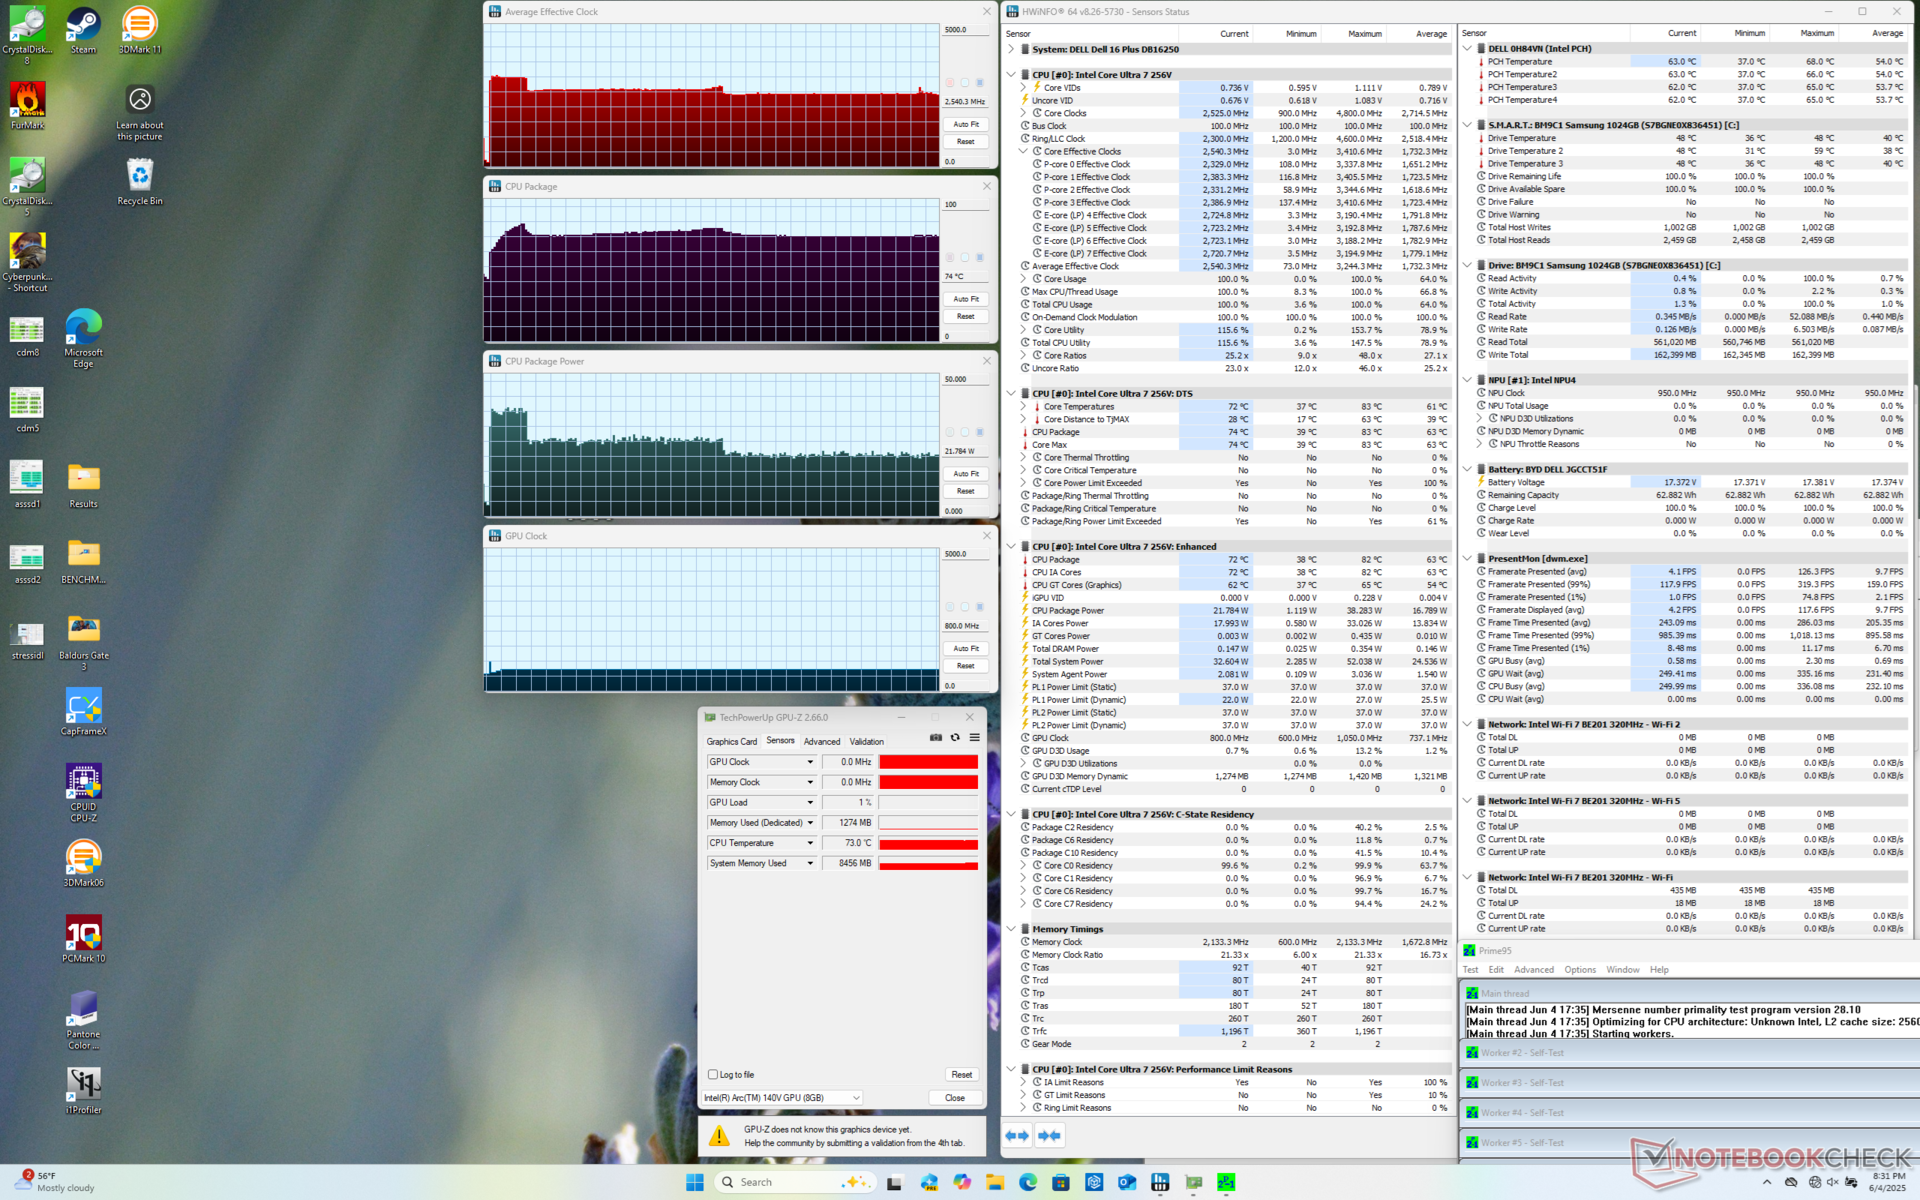
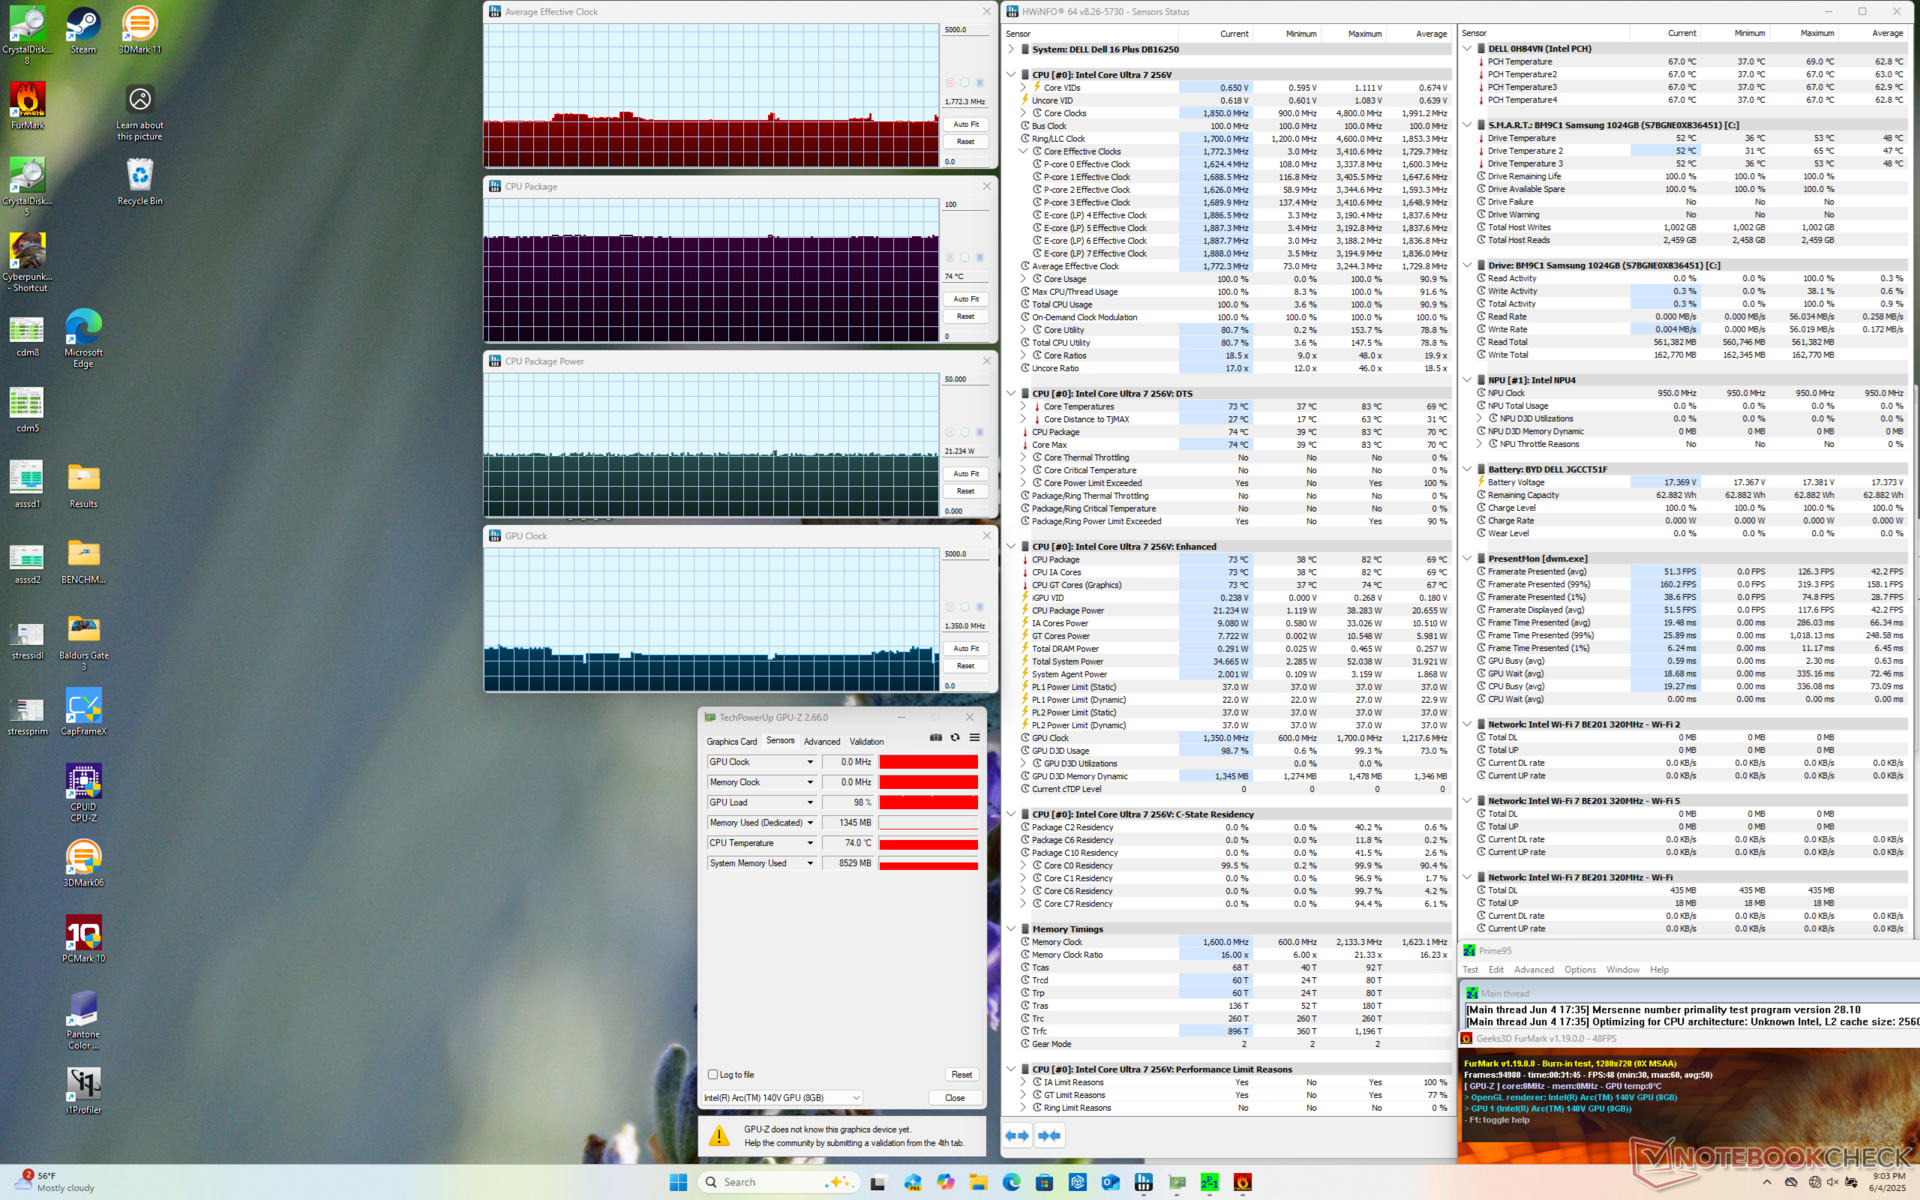
Stresstest
Bei der Ausführung von Prime95 Stress fährt die CPU etwa 20 Sekunden lang auf 3,2 GHz und 38 W hoch, bevor sie 83 °C erreicht. Danach sinkt sie ab und stabilisiert sich bei 2,5 GHz und 21 W, um eine kühlere Kerntemperatur von 74 °C aufrechtzuerhalten, um das begrenzte Turbo-Boost-Potenzial darzustellen. Dies spiegelt sich auch in unserem CineBench-R15-xT-Schleifentest wider, wie oben erwähnt.
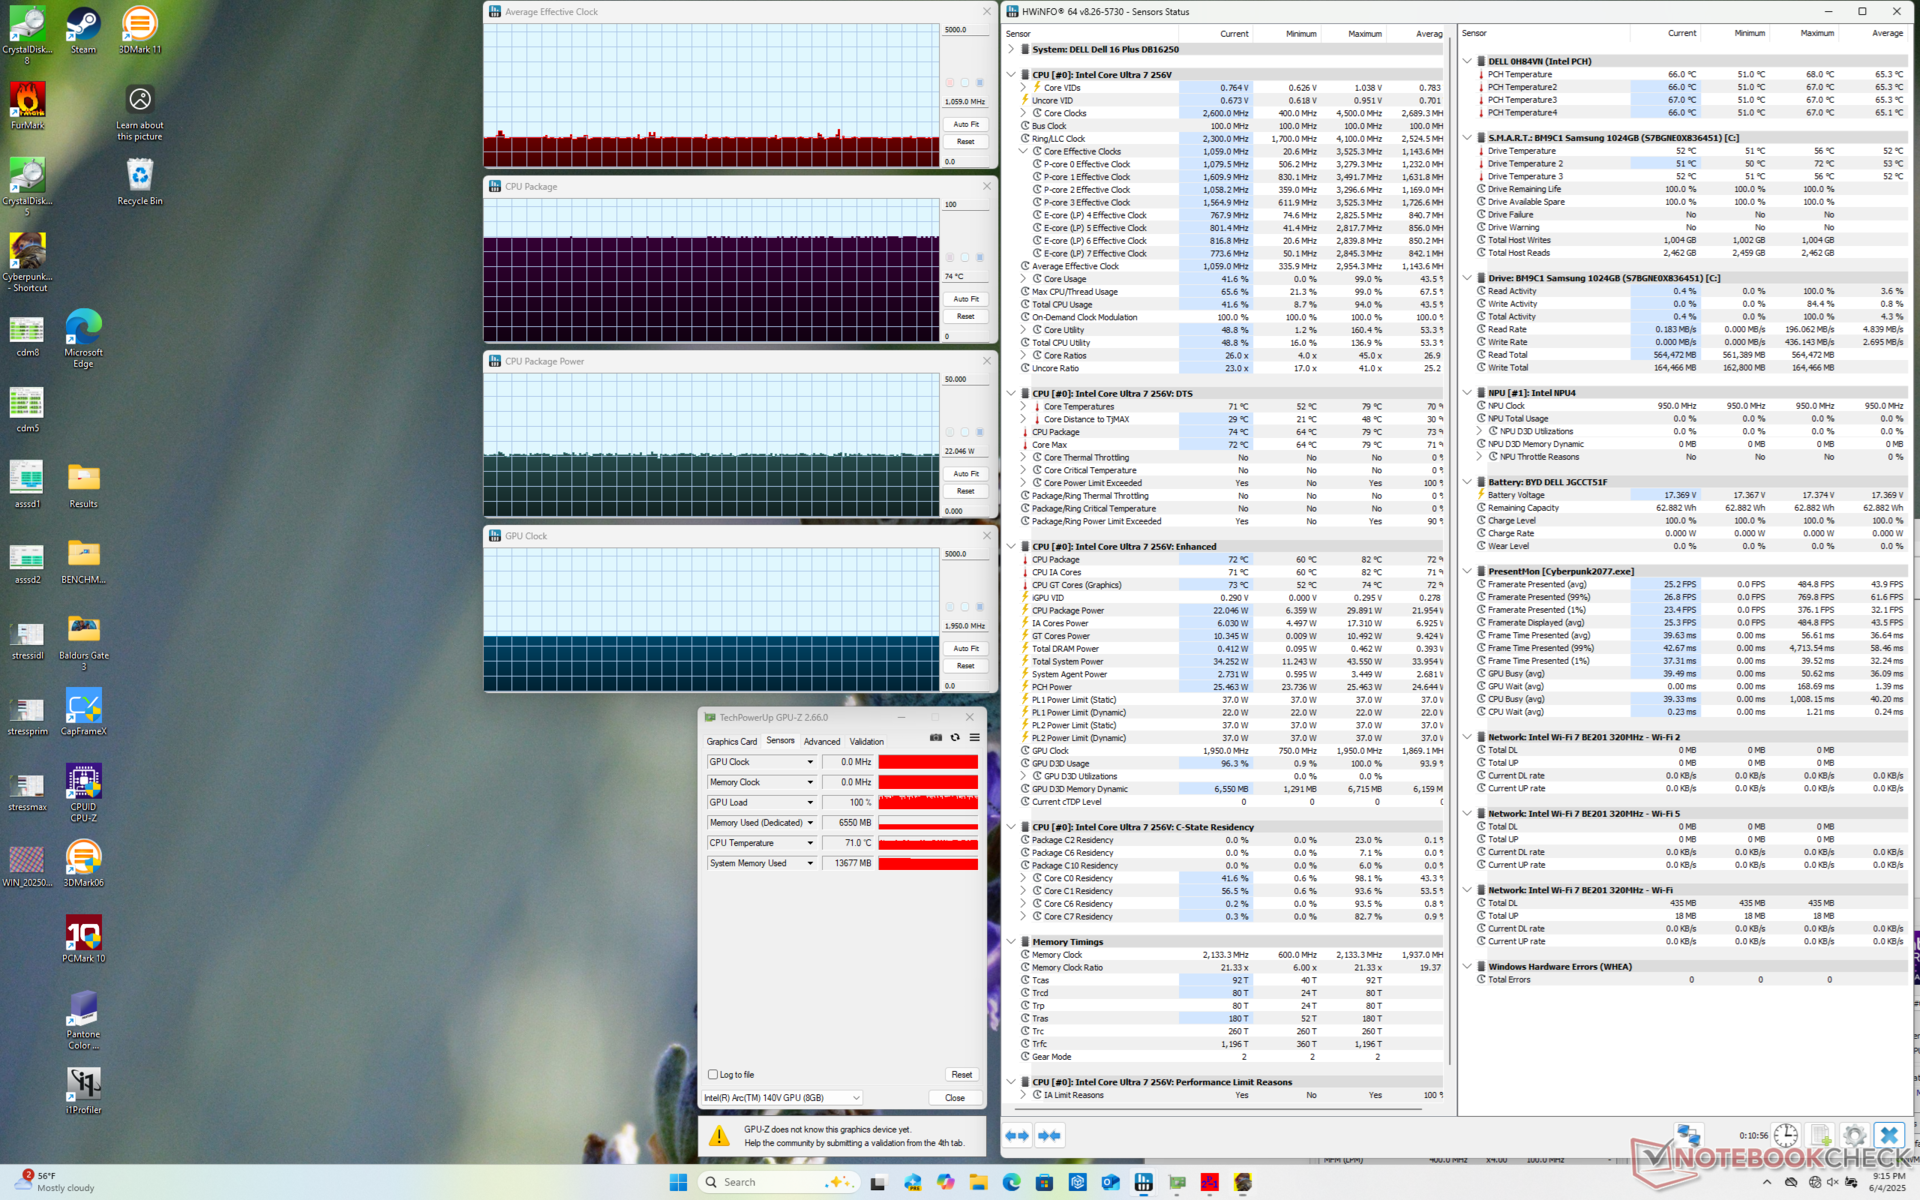
Wenn Sie Cyberpunk 2077 spielen, um ein typisches Spiel zu repräsentieren, erreicht der Prozessor erneut einen Höchstwert von 74 °C und ist damit deutlich kühler als das, was wir auf dem Inspiron 16 7640 2-in-1 beobachteten.
| durchschnittlicher CPU-Takt (GHz) | GPU-Takt (MHz) | durchschnittliche CPU-Temperatur (°C) | |
| System Leerlauf | -- | -- | 39 |
| Prime95 Stress | 2,5 | -- | 74 |
| Prime95 + FurMark Stress | 1,7 | 1.350 | 74 |
| Cyberpunk 2077 Stress | 1,0 | 1.950 | 74 |
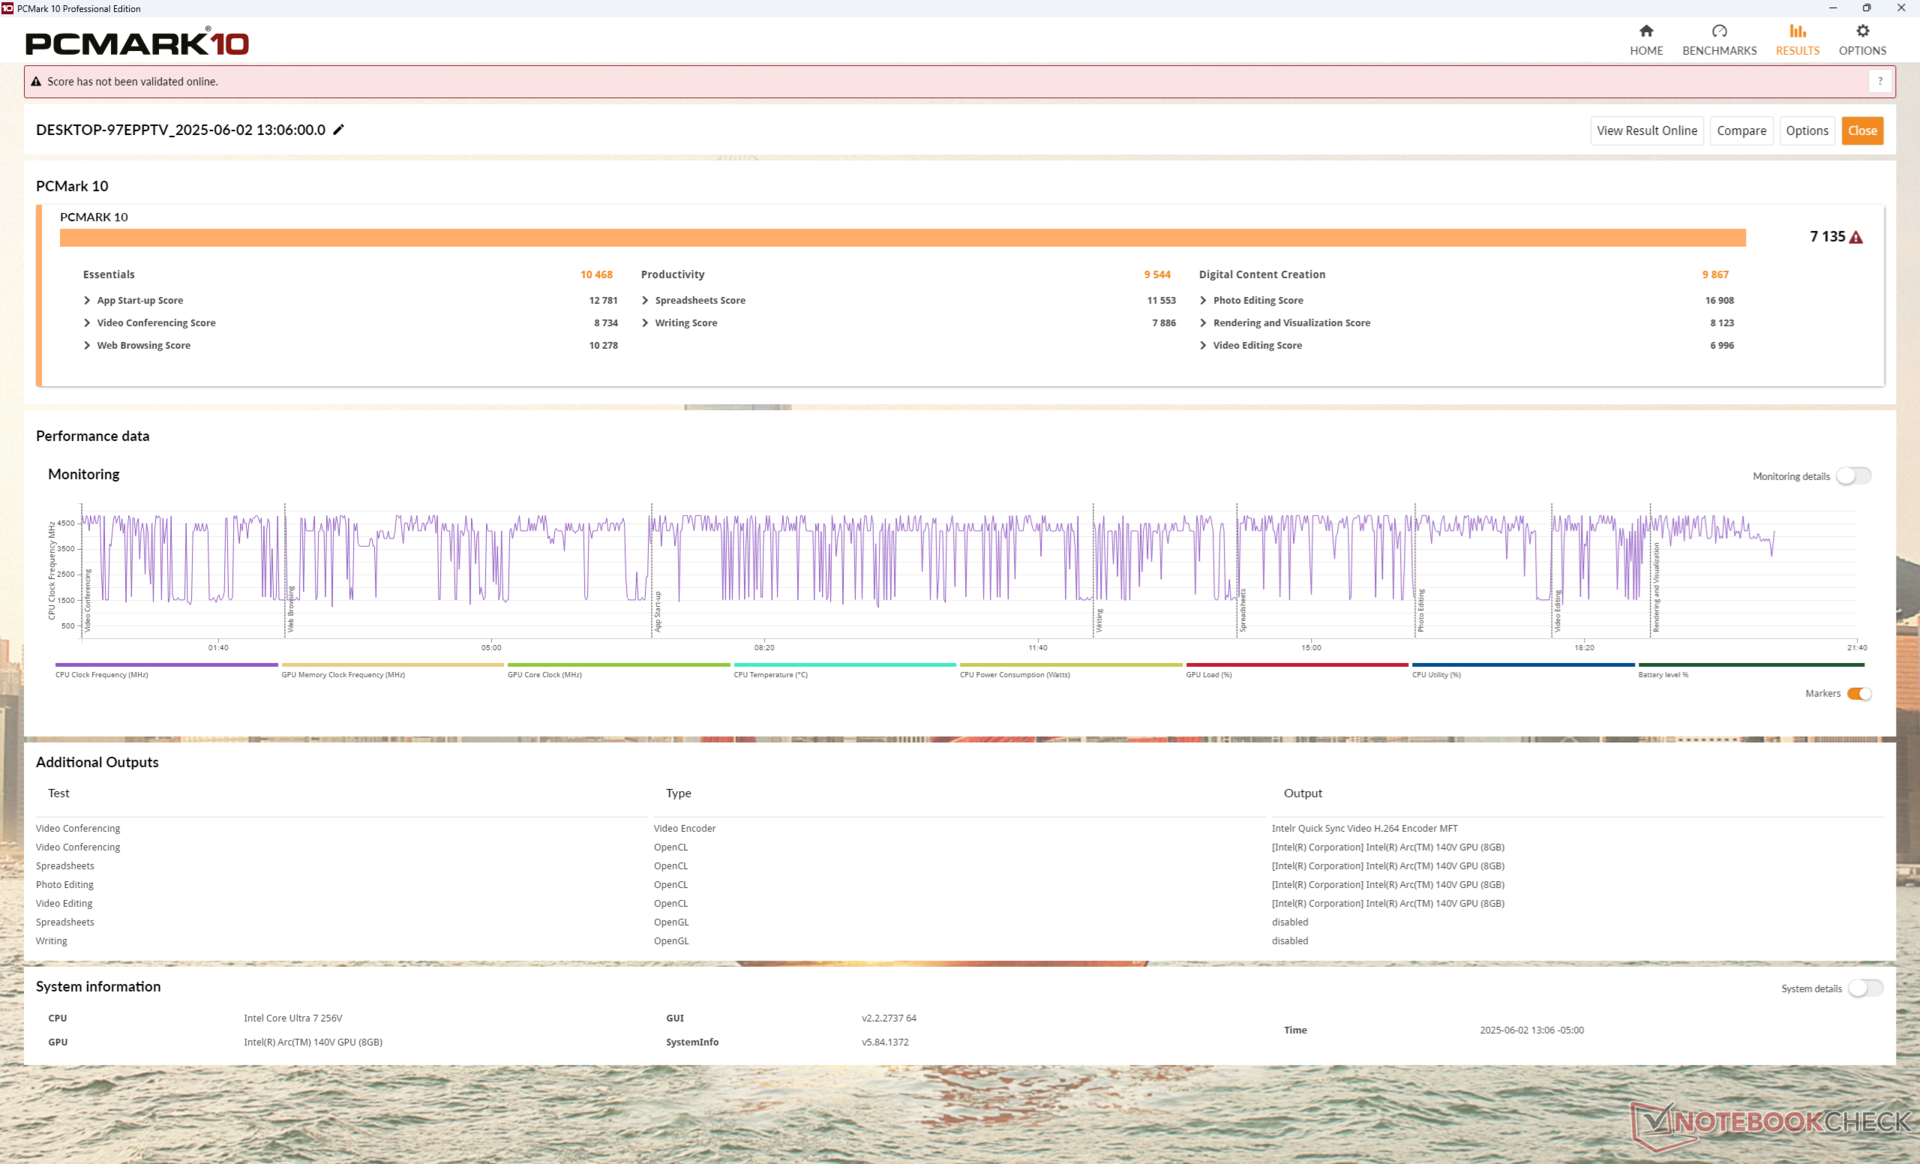
System Performance
Die PCMark Ergebnisse sind vergleichbar mit denen konkurrierender 16-Zoll-Notebooks, sogar mit denen mit schnelleren CPUs der H-Serie wie dem Asus Vivobook 16 M1606K. Die Leistung des Arbeitsspeichers ist dank dem integrierten Design von Lunar Lake ebenfalls ausgezeichnet.
PCMark 10: Score | Essentials | Productivity | Digital Content Creation
CrossMark: Overall | Productivity | Creativity | Responsiveness
WebXPRT 3: Overall
WebXPRT 4: Overall
Mozilla Kraken 1.1: Total
| Performance Rating | |
| Lenovo ThinkBook 16 G7+ AMD | |
| Acer Swift 16 AI SF16-51T-932H, Ultra 9 288V | |
| Dell 16 Plus | |
| Durchschnittliche Intel Core Ultra 7 256V, Intel Arc Graphics 140V | |
| Asus Vivobook 16 M1606K | |
| HP Pavilion Plus 16-ab0456tx | |
| Dell Inspiron 16 Plus 7640 | |
| PCMark 10 / Score | |
| Lenovo ThinkBook 16 G7+ AMD | |
| Acer Swift 16 AI SF16-51T-932H, Ultra 9 288V | |
| Dell 16 Plus | |
| Durchschnittliche Intel Core Ultra 7 256V, Intel Arc Graphics 140V (6677 - 7702, n=7) | |
| Dell Inspiron 16 Plus 7640 | |
| Asus Vivobook 16 M1606K | |
| HP Pavilion Plus 16-ab0456tx | |
| PCMark 10 / Essentials | |
| Asus Vivobook 16 M1606K | |
| Lenovo ThinkBook 16 G7+ AMD | |
| Acer Swift 16 AI SF16-51T-932H, Ultra 9 288V | |
| Dell 16 Plus | |
| Dell Inspiron 16 Plus 7640 | |
| Durchschnittliche Intel Core Ultra 7 256V, Intel Arc Graphics 140V (9627 - 11365, n=7) | |
| HP Pavilion Plus 16-ab0456tx | |
| PCMark 10 / Productivity | |
| Lenovo ThinkBook 16 G7+ AMD | |
| Asus Vivobook 16 M1606K | |
| Durchschnittliche Intel Core Ultra 7 256V, Intel Arc Graphics 140V (8161 - 12672, n=7) | |
| Dell 16 Plus | |
| Acer Swift 16 AI SF16-51T-932H, Ultra 9 288V | |
| HP Pavilion Plus 16-ab0456tx | |
| Dell Inspiron 16 Plus 7640 | |
| PCMark 10 / Digital Content Creation | |
| Dell Inspiron 16 Plus 7640 | |
| Lenovo ThinkBook 16 G7+ AMD | |
| Acer Swift 16 AI SF16-51T-932H, Ultra 9 288V | |
| Dell 16 Plus | |
| Durchschnittliche Intel Core Ultra 7 256V, Intel Arc Graphics 140V (9481 - 10126, n=7) | |
| Asus Vivobook 16 M1606K | |
| HP Pavilion Plus 16-ab0456tx | |
| CrossMark / Overall | |
| HP Pavilion Plus 16-ab0456tx | |
| Lenovo ThinkBook 16 G7+ AMD | |
| Acer Swift 16 AI SF16-51T-932H, Ultra 9 288V | |
| Asus Vivobook 16 M1606K | |
| Durchschnittliche Intel Core Ultra 7 256V, Intel Arc Graphics 140V (1636 - 1736, n=7) | |
| Dell Inspiron 16 Plus 7640 | |
| Dell 16 Plus | |
| CrossMark / Productivity | |
| Acer Swift 16 AI SF16-51T-932H, Ultra 9 288V | |
| HP Pavilion Plus 16-ab0456tx | |
| Durchschnittliche Intel Core Ultra 7 256V, Intel Arc Graphics 140V (1563 - 1682, n=7) | |
| Asus Vivobook 16 M1606K | |
| Dell 16 Plus | |
| Lenovo ThinkBook 16 G7+ AMD | |
| Dell Inspiron 16 Plus 7640 | |
| CrossMark / Creativity | |
| Lenovo ThinkBook 16 G7+ AMD | |
| HP Pavilion Plus 16-ab0456tx | |
| Acer Swift 16 AI SF16-51T-932H, Ultra 9 288V | |
| Dell Inspiron 16 Plus 7640 | |
| Durchschnittliche Intel Core Ultra 7 256V, Intel Arc Graphics 140V (1862 - 1962, n=7) | |
| Dell 16 Plus | |
| Asus Vivobook 16 M1606K | |
| CrossMark / Responsiveness | |
| HP Pavilion Plus 16-ab0456tx | |
| Asus Vivobook 16 M1606K | |
| Lenovo ThinkBook 16 G7+ AMD | |
| Dell Inspiron 16 Plus 7640 | |
| Acer Swift 16 AI SF16-51T-932H, Ultra 9 288V | |
| Durchschnittliche Intel Core Ultra 7 256V, Intel Arc Graphics 140V (1215 - 1371, n=7) | |
| Dell 16 Plus | |
| WebXPRT 3 / Overall | |
| Lenovo ThinkBook 16 G7+ AMD | |
| Dell 16 Plus | |
| Acer Swift 16 AI SF16-51T-932H, Ultra 9 288V | |
| Durchschnittliche Intel Core Ultra 7 256V, Intel Arc Graphics 140V (243 - 310, n=7) | |
| Asus Vivobook 16 M1606K | |
| Dell Inspiron 16 Plus 7640 | |
| HP Pavilion Plus 16-ab0456tx | |
| WebXPRT 4 / Overall | |
| Durchschnittliche Intel Core Ultra 7 256V, Intel Arc Graphics 140V (282 - 286, n=7) | |
| Dell 16 Plus | |
| Acer Swift 16 AI SF16-51T-932H, Ultra 9 288V | |
| HP Pavilion Plus 16-ab0456tx | |
| Dell Inspiron 16 Plus 7640 | |
| Lenovo ThinkBook 16 G7+ AMD | |
| Asus Vivobook 16 M1606K | |
| Mozilla Kraken 1.1 / Total | |
| Dell Inspiron 16 Plus 7640 | |
| HP Pavilion Plus 16-ab0456tx | |
| Durchschnittliche Intel Core Ultra 7 256V, Intel Arc Graphics 140V (470 - 480, n=7) | |
| Dell 16 Plus | |
| Acer Swift 16 AI SF16-51T-932H, Ultra 9 288V | |
| Asus Vivobook 16 M1606K | |
| Lenovo ThinkBook 16 G7+ AMD | |
* ... kleinere Werte sind besser
| PCMark 10 Score | 7135 Punkte | |
Hilfe | ||
| AIDA64 / Memory Copy | |
| Acer Swift 16 AI SF16-51T-932H, Ultra 9 288V | |
| Durchschnittliche Intel Core Ultra 7 256V (99227 - 104459, n=7) | |
| Dell 16 Plus | |
| Lenovo ThinkBook 16 G7+ AMD | |
| HP Pavilion Plus 16-ab0456tx | |
| Dell Inspiron 16 Plus 7640 | |
| Asus Vivobook 16 M1606K | |
| AIDA64 / Memory Read | |
| Lenovo ThinkBook 16 G7+ AMD | |
| Dell 16 Plus | |
| Durchschnittliche Intel Core Ultra 7 256V (86352 - 89848, n=7) | |
| Acer Swift 16 AI SF16-51T-932H, Ultra 9 288V | |
| Dell Inspiron 16 Plus 7640 | |
| HP Pavilion Plus 16-ab0456tx | |
| Asus Vivobook 16 M1606K | |
| AIDA64 / Memory Write | |
| Dell 16 Plus | |
| Durchschnittliche Intel Core Ultra 7 256V (108692 - 117933, n=7) | |
| Acer Swift 16 AI SF16-51T-932H, Ultra 9 288V | |
| Lenovo ThinkBook 16 G7+ AMD | |
| HP Pavilion Plus 16-ab0456tx | |
| Dell Inspiron 16 Plus 7640 | |
| Asus Vivobook 16 M1606K | |
| AIDA64 / Memory Latency | |
| Dell Inspiron 16 Plus 7640 | |
| Lenovo ThinkBook 16 G7+ AMD | |
| Dell 16 Plus | |
| Durchschnittliche Intel Core Ultra 7 256V (96.1 - 99.6, n=7) | |
| Acer Swift 16 AI SF16-51T-932H, Ultra 9 288V | |
| HP Pavilion Plus 16-ab0456tx | |
| Asus Vivobook 16 M1606K | |
* ... kleinere Werte sind besser
DPC-Latenzzeit
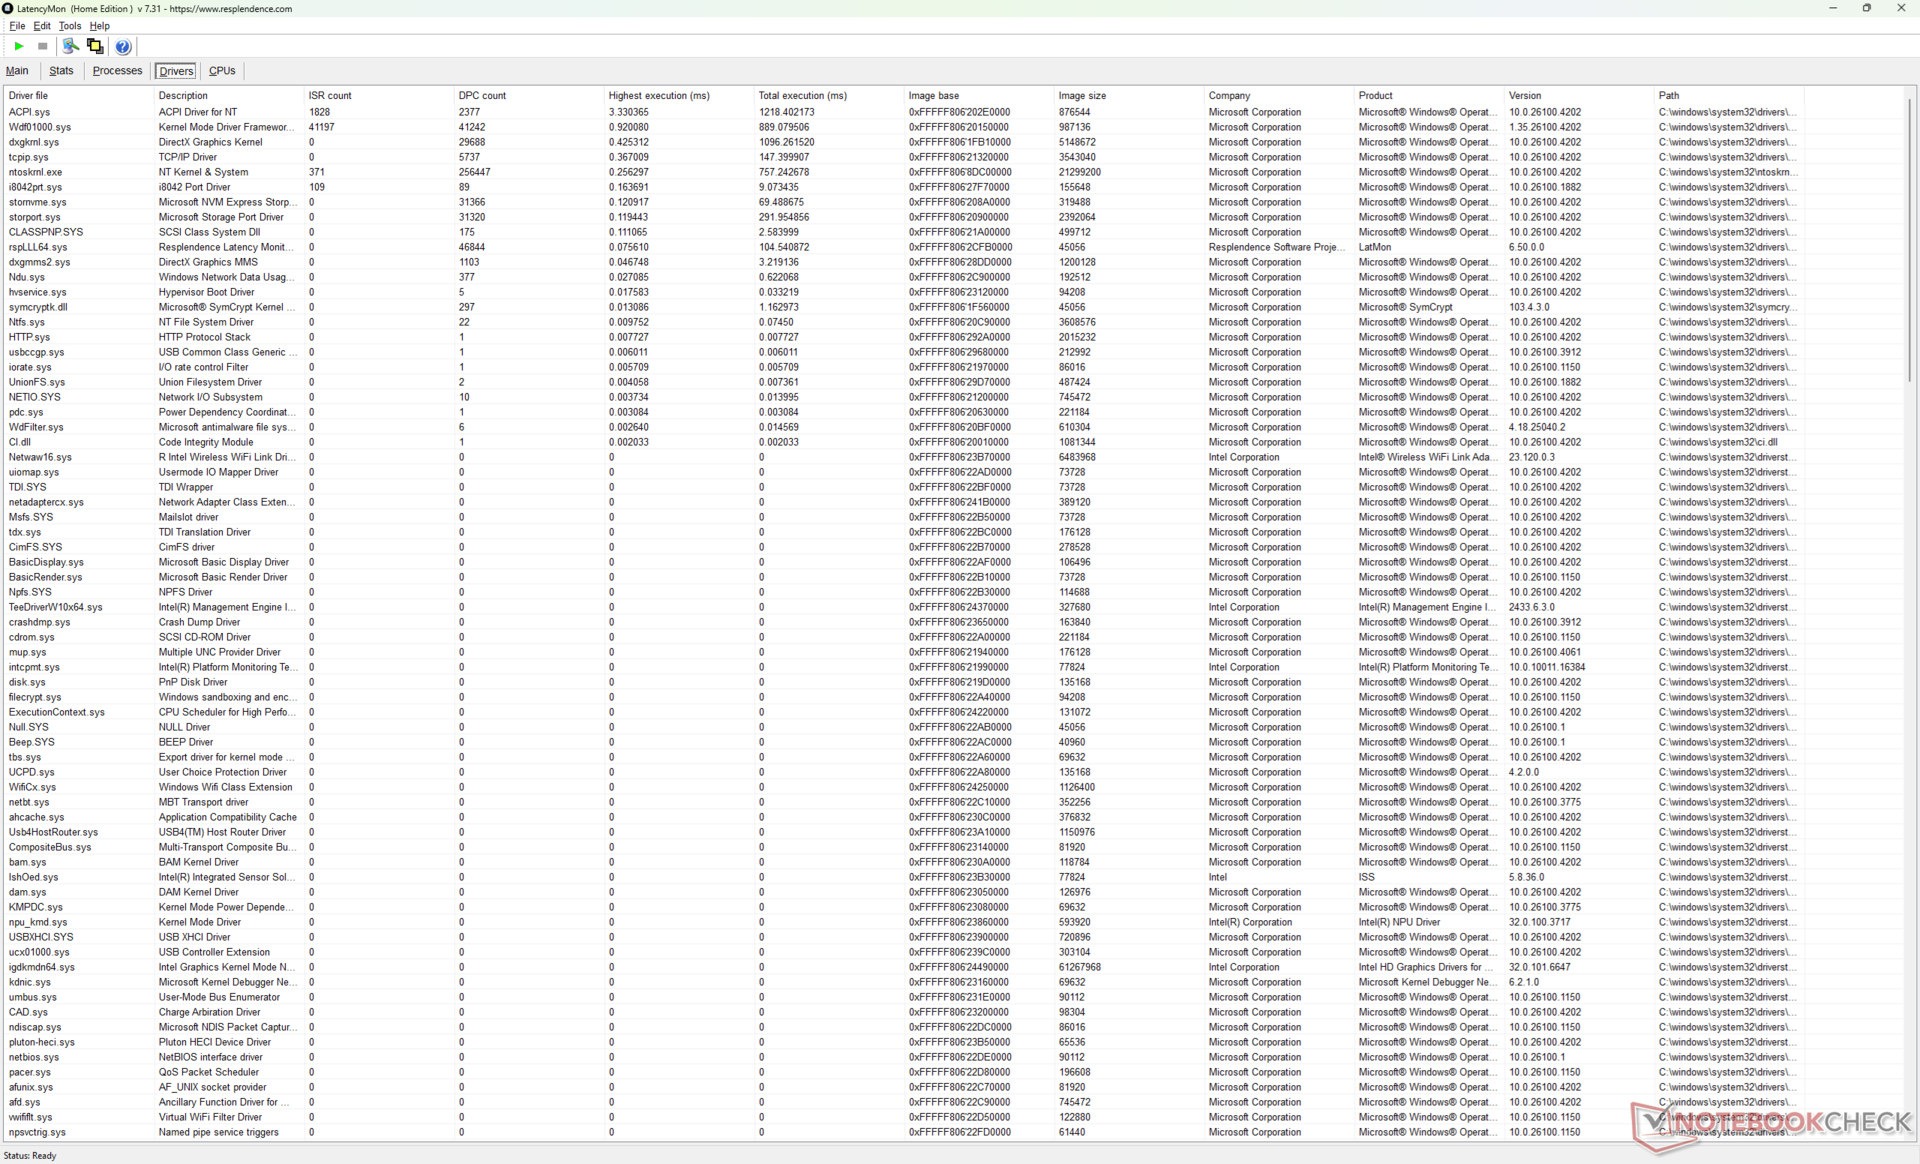
LatencyMon zeigt DPC-Probleme beim Öffnen mehrerer Browser Tabs unserer Homepage. Seltsamerweise schwankt die GPU-Aktivität bei der Wiedergabe von 4K60-Videos zwischen 0 und 100 Prozent, während die GPU bei den meisten anderen Lunar-Lake-Laptops stabil bei ~40 Prozent liegt. Ansonsten wurden keine Bildaussetzer aufgezeichnet, was für ein reibungsloses 4K60-Streaming-Erlebnis sorgt.

| DPC Latencies / LatencyMon - interrupt to process latency (max), Web, Youtube, Prime95 | |
| HP Pavilion Plus 16-ab0456tx | |
| Dell 16 Plus | |
| Acer Swift 16 AI SF16-51T-932H, Ultra 9 288V | |
| Lenovo ThinkBook 16 G7+ AMD | |
| Asus Vivobook 16 M1606K | |
| Dell Inspiron 16 Plus 7640 | |
* ... kleinere Werte sind besser
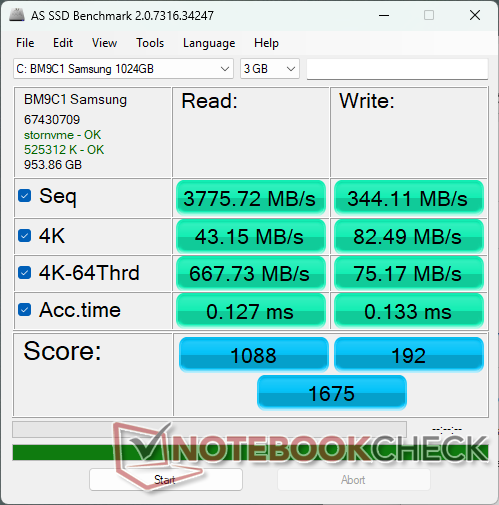
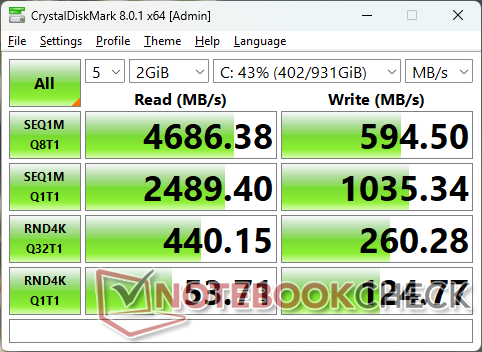
Speichergeräte
Die Samsung BM9C1 ist dem Micron 2550 im Inspiron 16 7640 2-in-1 vom letzten Jahr unterlegen. Die Übertragungsraten sind nicht so stabil, sie schwanken zwischen 3.600 und 4.900 MB/s und sogar bis zu 2.200 MB/s während unseres DiskSpd-Schleifentests.

| Drive Performance Rating - Percent | |
| HP Pavilion Plus 16-ab0456tx | |
| Asus Vivobook 16 M1606K | |
| Lenovo ThinkBook 16 G7+ AMD | |
| Dell Inspiron 16 Plus 7640 | |
| Acer Swift 16 AI SF16-51T-932H, Ultra 9 288V | |
| Dell 16 Plus | |
* ... kleinere Werte sind besser
Disk Throttling: DiskSpd Read Loop, Queue Depth 8
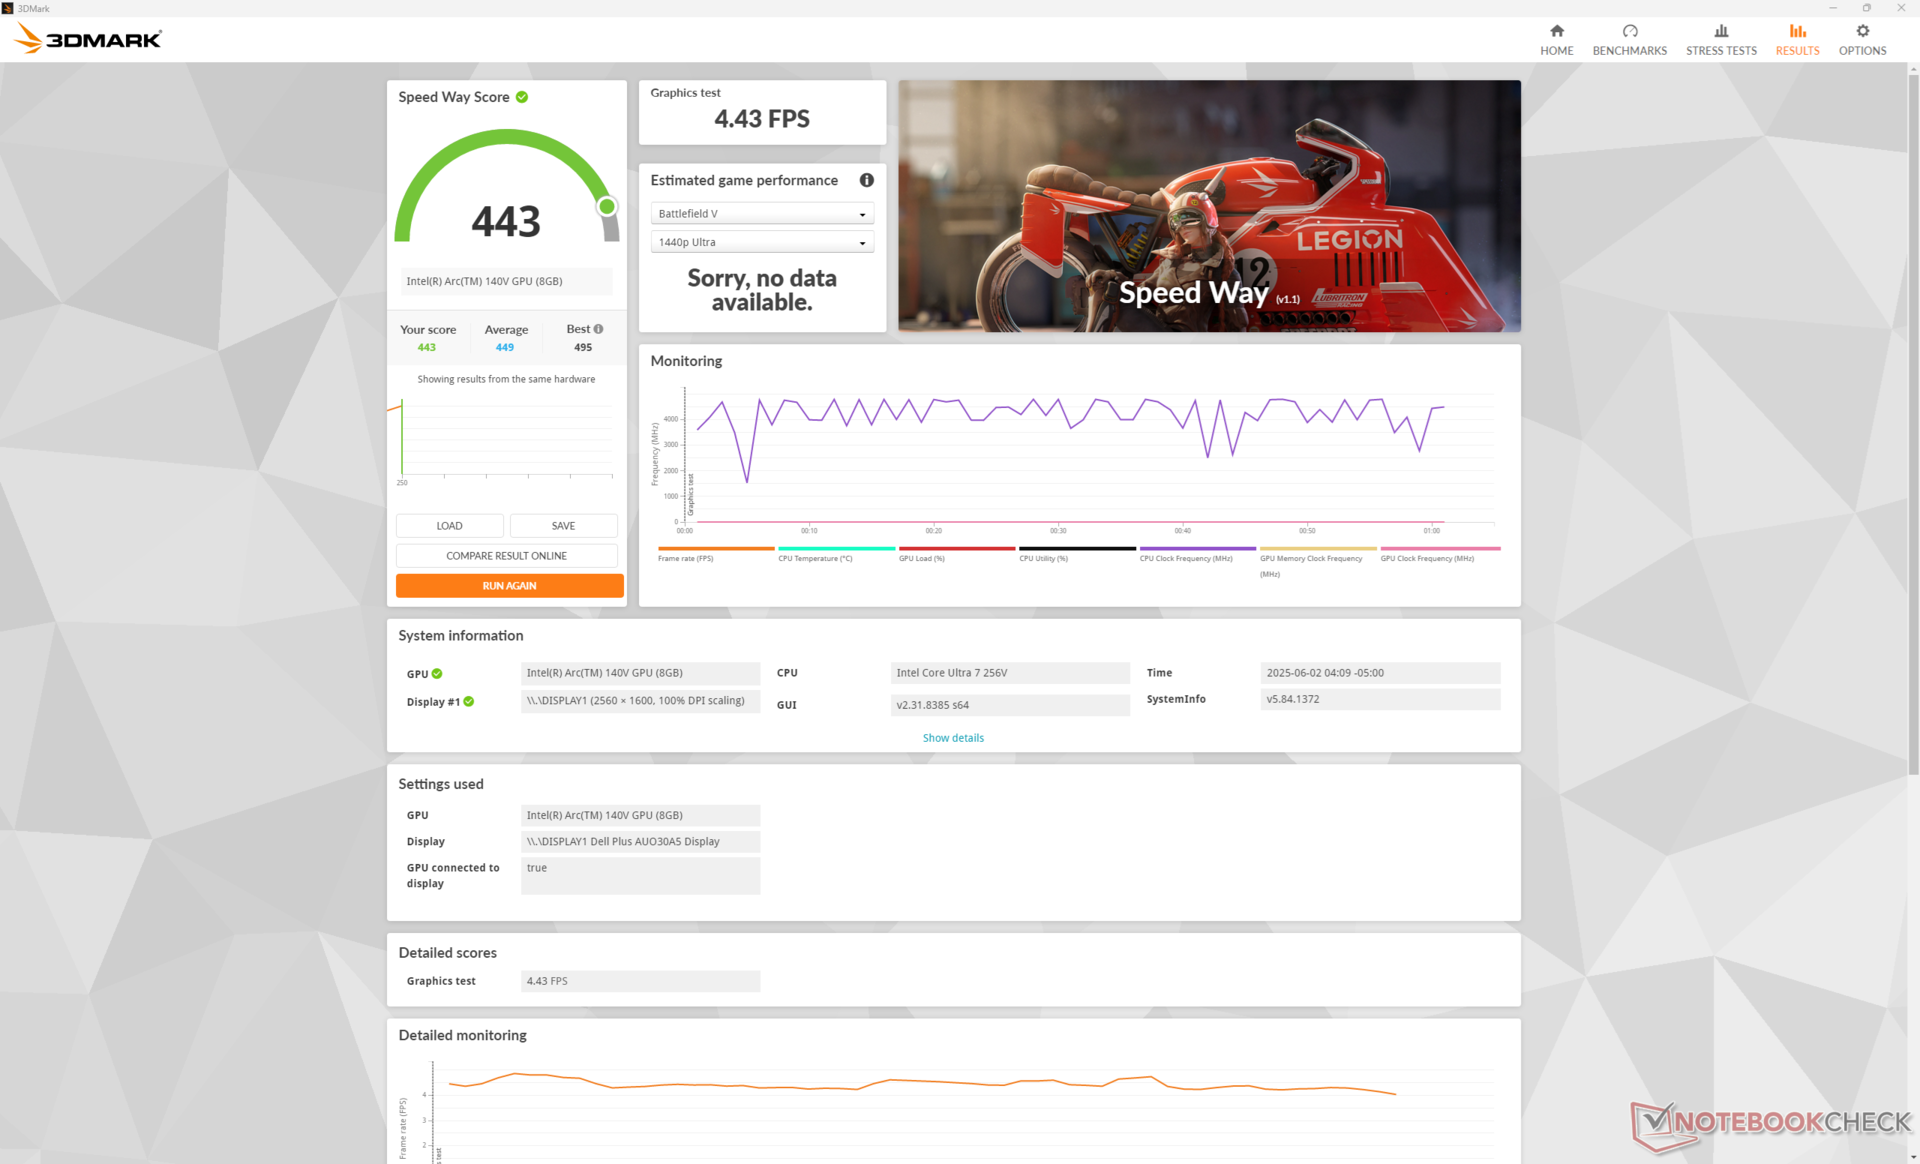
GPU Performance
Die Arc 140V ist eine ordentliche Verbesserung gegenüber der letztjährigen Arc 8. Tatsächlich läuft das Dell 16 Plus bei den meisten Spielen bis zu 25 Prozent schneller als das Inspiron 16 7640 2-in-1 vom letzten Jahr, obwohl Letzteres mit einer viel schnelleren Core-H-CPU ausgestattet ist.
| Leistungsprofil | Grafics-Punktzahl | Physics-Punktzahl | Kombinierte Punktzahl |
| Performance-Modus | 9.682 | 19.037 | 3.057 |
| Ausgeglichener Modus | 8.164 (-16 %) | 16.591 (-13 %) | 2.296 (-25 %) |
| Akku-Leistung | 8.266 (-15 %) | 16.361 (-14 %) | 2.350 (-23 %) |
Die Verwendung des Modus "Ausgewogen" anstelle des Modus "Leistung" wirkt sich erheblich auf die Gesamtleistung aus, wie unsere obige Fire-Strike-Ergebnistabelle zeigt.
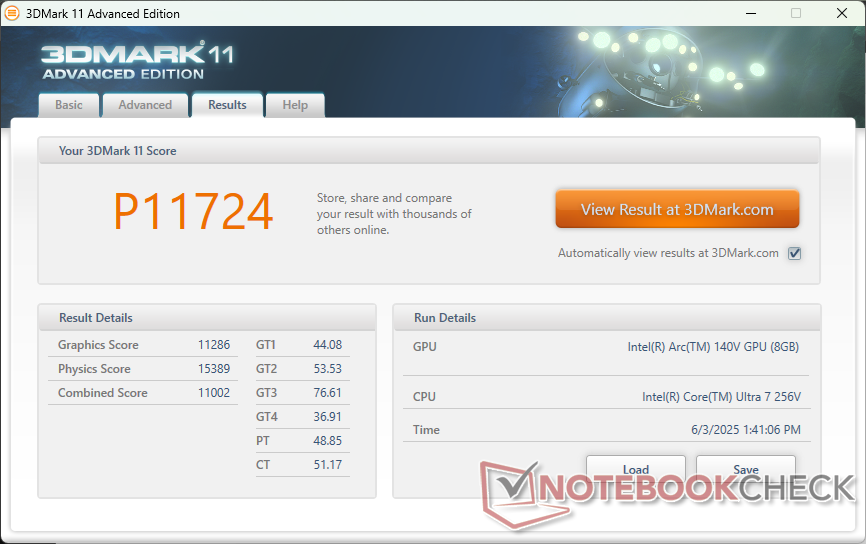

| 3DMark 11 Performance | 11724 Punkte | |
| 3DMark Fire Strike Score | 8470 Punkte | |
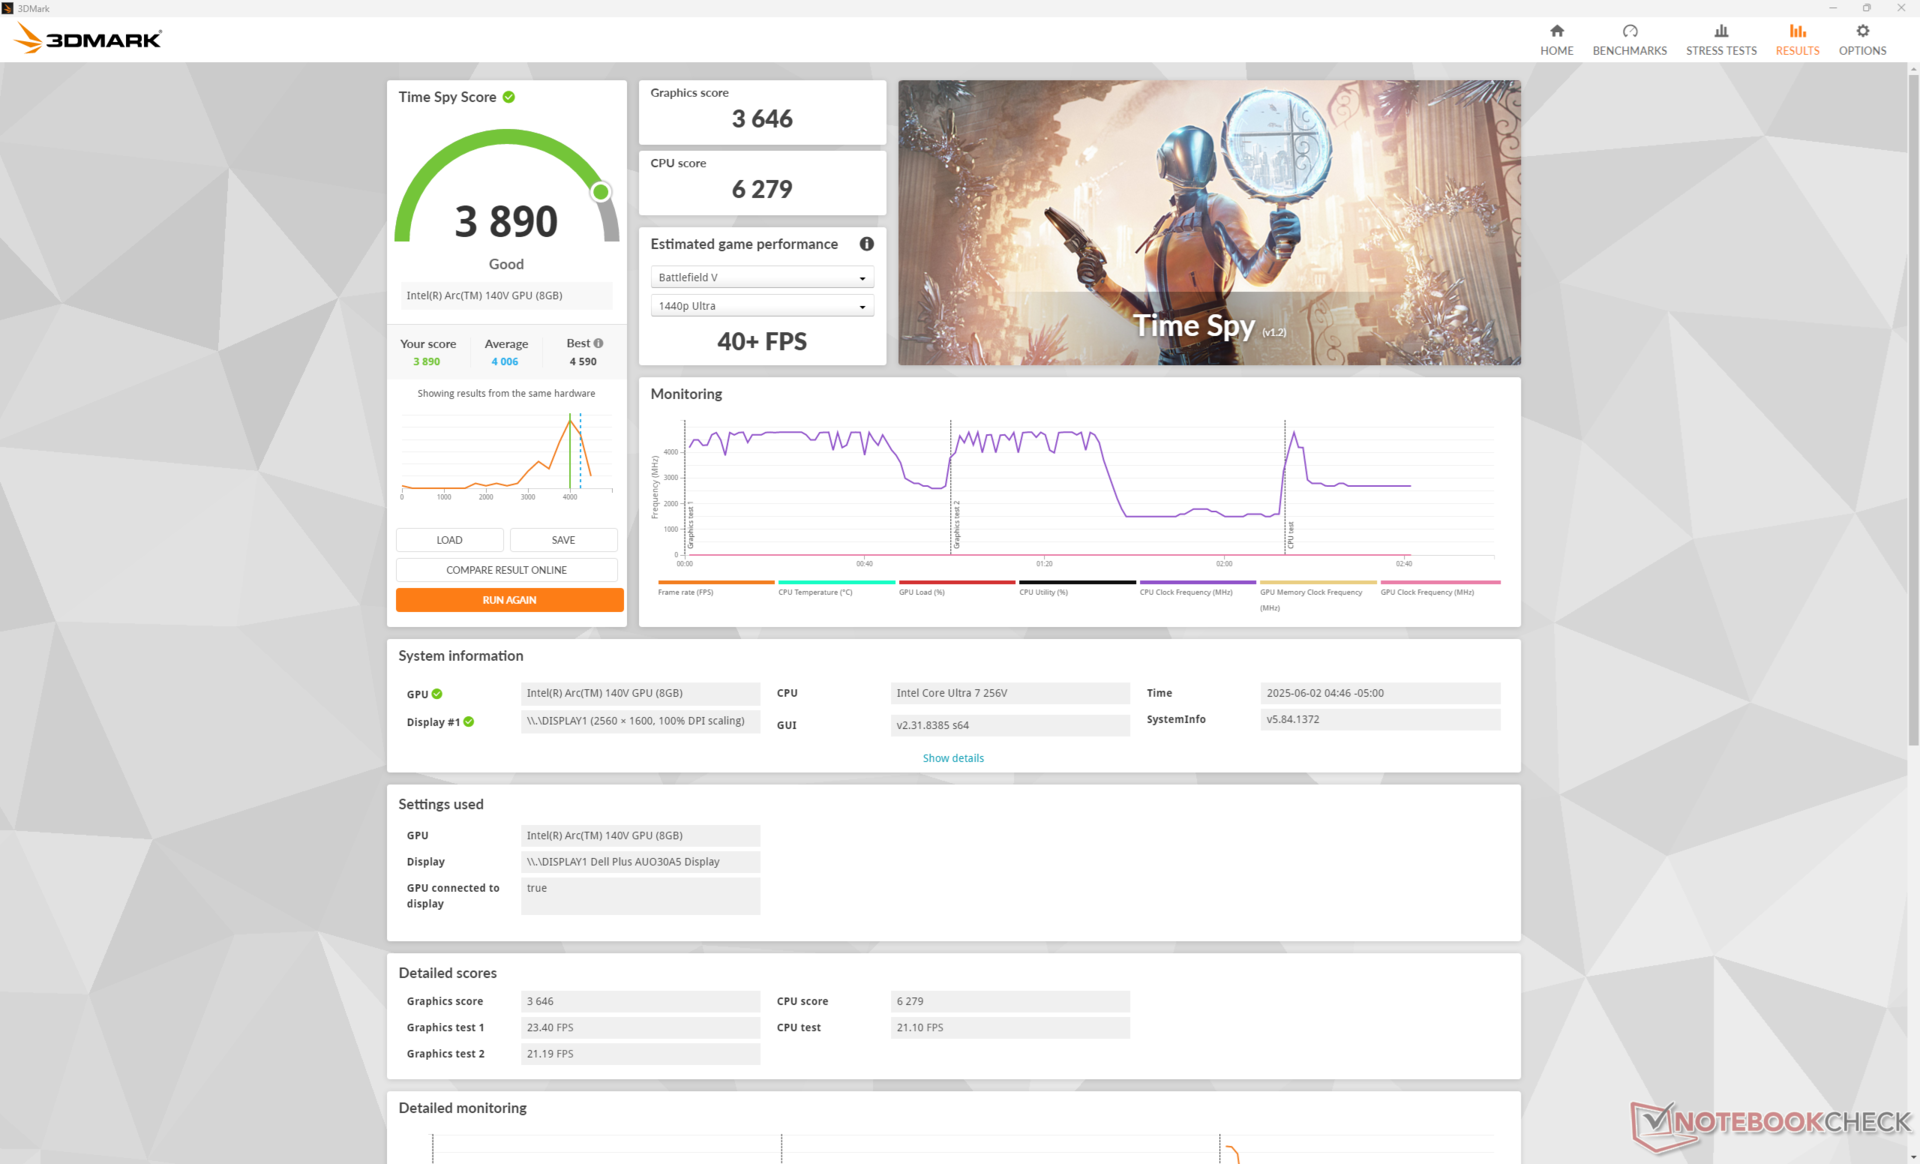
| 3DMark Time Spy Score | 3890 Punkte | |
Hilfe | ||
* ... kleinere Werte sind besser
Spiele-Performance
Die meisten Titel laufen auf dem System bei nativen 1.080p und niedrigen Einstellungen gut, einschließlich Baldur's Gate 3. Bei anspruchsvolleren Titeln wie Cyberpunk 2077 müssen Sie jedoch möglicherweise auf 720p heruntergehen, um ein flüssigeres Erlebnis zu erhalten.
| F1 24 | |
| 1920x1080 Low Preset AA:T AF:16x | |
| Durchschnittliche Intel Arc Graphics 140V (54 - 99, n=25) | |
| Dell 16 Plus | |
| Lenovo ThinkPad T16 Gen 3 21MN005XGE | |
| 1920x1080 Medium Preset AA:T AF:16x | |
| Durchschnittliche Intel Arc Graphics 140V (49.2 - 88.2, n=24) | |
| Dell 16 Plus | |
| Lenovo ThinkPad T16 Gen 3 21MN005XGE | |
| 1920x1080 High Preset AA:T AF:16x | |
| Durchschnittliche Intel Arc Graphics 140V (34.4 - 66.4, n=27) | |
| Dell 16 Plus | |
| LG Gram Pro 16Z90TS-G.AU89G | |
| Lenovo ThinkPad T16 Gen 3 21MN005XGE | |
| 1920x1080 Ultra High Preset AA:T AF:16x | |
| Dell 16 Plus | |
| Durchschnittliche Intel Arc Graphics 140V (14.6 - 22, n=25) | |
| Lenovo ThinkPad T16 Gen 3 21MN005XGE | |
Cyberpunk 2077 ultra fps Chart
| min. | mittel | hoch | max. | |
|---|---|---|---|---|
| Dota 2 Reborn (2015) | 98.3 | 70.3 | 71.1 | 71.9 |
| Final Fantasy XV Benchmark (2018) | 80.5 | 45.7 | 33.3 | |
| X-Plane 11.11 (2018) | 51.2 | 39.7 | 35.7 | |
| Strange Brigade (2018) | 205 | 81 | 68 | 56.9 |
| Baldur's Gate 3 (2023) | 38.1 | 31 | 27.7 | 27 |
| Cyberpunk 2077 (2023) | 44.2 | 35.2 | 24.7 | 24.1 |
| F1 24 (2024) | 75.3 | 70.7 | 55.3 | 18.8 |
Emissionen
Systemrauschen
Der interne Lüfter reagiert im Allgemeinen träge auf Last, d. h. er läuft beim Starten oder Ausführen anspruchsvoller Anwendungen langsam hoch. Das ist auch gut so, denn es dauert länger, bis das Lüftergeräusch bei intensiver Nutzung spürbar wird. Nach einer Weile erreicht das System jedoch einen ähnlichen Maximalpegel wie die meisten anderen 16-Zoll-Multimedia-Notebooks, darunter das Acer Swift 16 AI oder das Asus Vivobook 16.
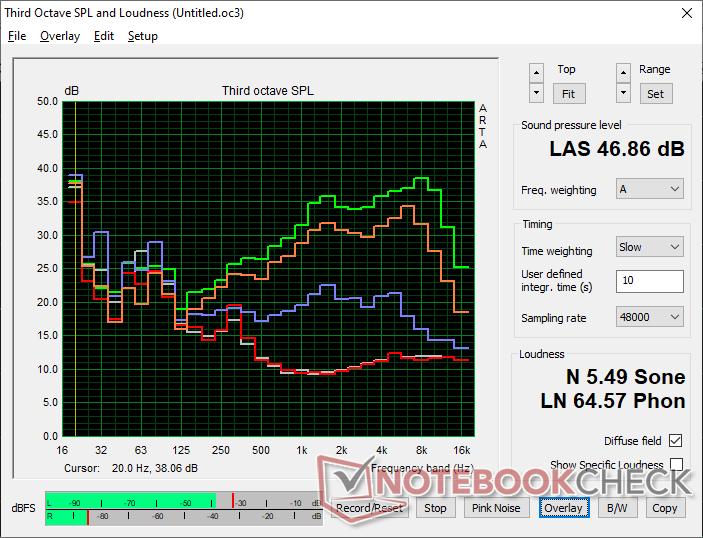
Lautstärkediagramm
| Idle |
| 23.5 / 23.5 / 23.5 dB(A) |
| Last |
| 31.9 / 46.9 dB(A) |
 | ||
30 dB leise 40 dB(A) deutlich hörbar 50 dB(A) störend |
||
min: | ||
| Dell 16 Plus Arc 140V, Core Ultra 7 256V, Samsung BM9C1 1024GB | Dell Inspiron 16 Plus 7640 GeForce RTX 4060 Laptop GPU, Ultra 7 155H, SK hynix BC901 HFS001TEJ4X164N | Acer Swift 16 AI SF16-51T-932H, Ultra 9 288V Arc 140V, Core Ultra 9 288V, Western Digital PC SN5000S SDEQNSJ-1T00 | Lenovo ThinkBook 16 G7+ AMD Radeon 880M, Ryzen AI 9 365, Samsung PM9C1a MZAL81T0HDLB | HP Pavilion Plus 16-ab0456tx GeForce RTX 3050 6GB Laptop GPU, i7-13700H, WDC PC SN810 1TB | Asus Vivobook 16 M1606K Radeon 860M, Ryzen AI 7 350, Micron 2500 1TB MTFDKBA1T0QGN | |
|---|---|---|---|---|---|---|
| Geräuschentwicklung | -2% | -6% | -2% | -0% | 2% | |
| aus / Umgebung * (dB) | 23.4 | 23.8 -2% | 25.8 -10% | 24.5 -5% | 22.22 5% | 23 2% |
| Idle min * (dB) | 23.5 | 24.2 -3% | 25.8 -10% | 24.5 -4% | 22.22 5% | 23 2% |
| Idle avg * (dB) | 23.5 | 24.2 -3% | 25.8 -10% | 24.5 -4% | 22.22 5% | 23 2% |
| Idle max * (dB) | 23.5 | 24.2 -3% | 26.7 -14% | 25.9 -10% | 22.22 5% | 24.67 -5% |
| Last avg * (dB) | 31.9 | 28.9 9% | 36.2 -13% | 42.03 -32% | 31.72 1% | |
| Cyberpunk 2077 ultra * (dB) | 42.6 | 44.4 -4% | 40.1 6% | 41.53 3% | ||
| Last max * (dB) | 46.9 | 51 -9% | 41.1 12% | 40.1 14% | 42.1 10% | 42.51 9% |
| Witcher 3 ultra * (dB) | 51 | 42.1 |
* ... kleinere Werte sind besser
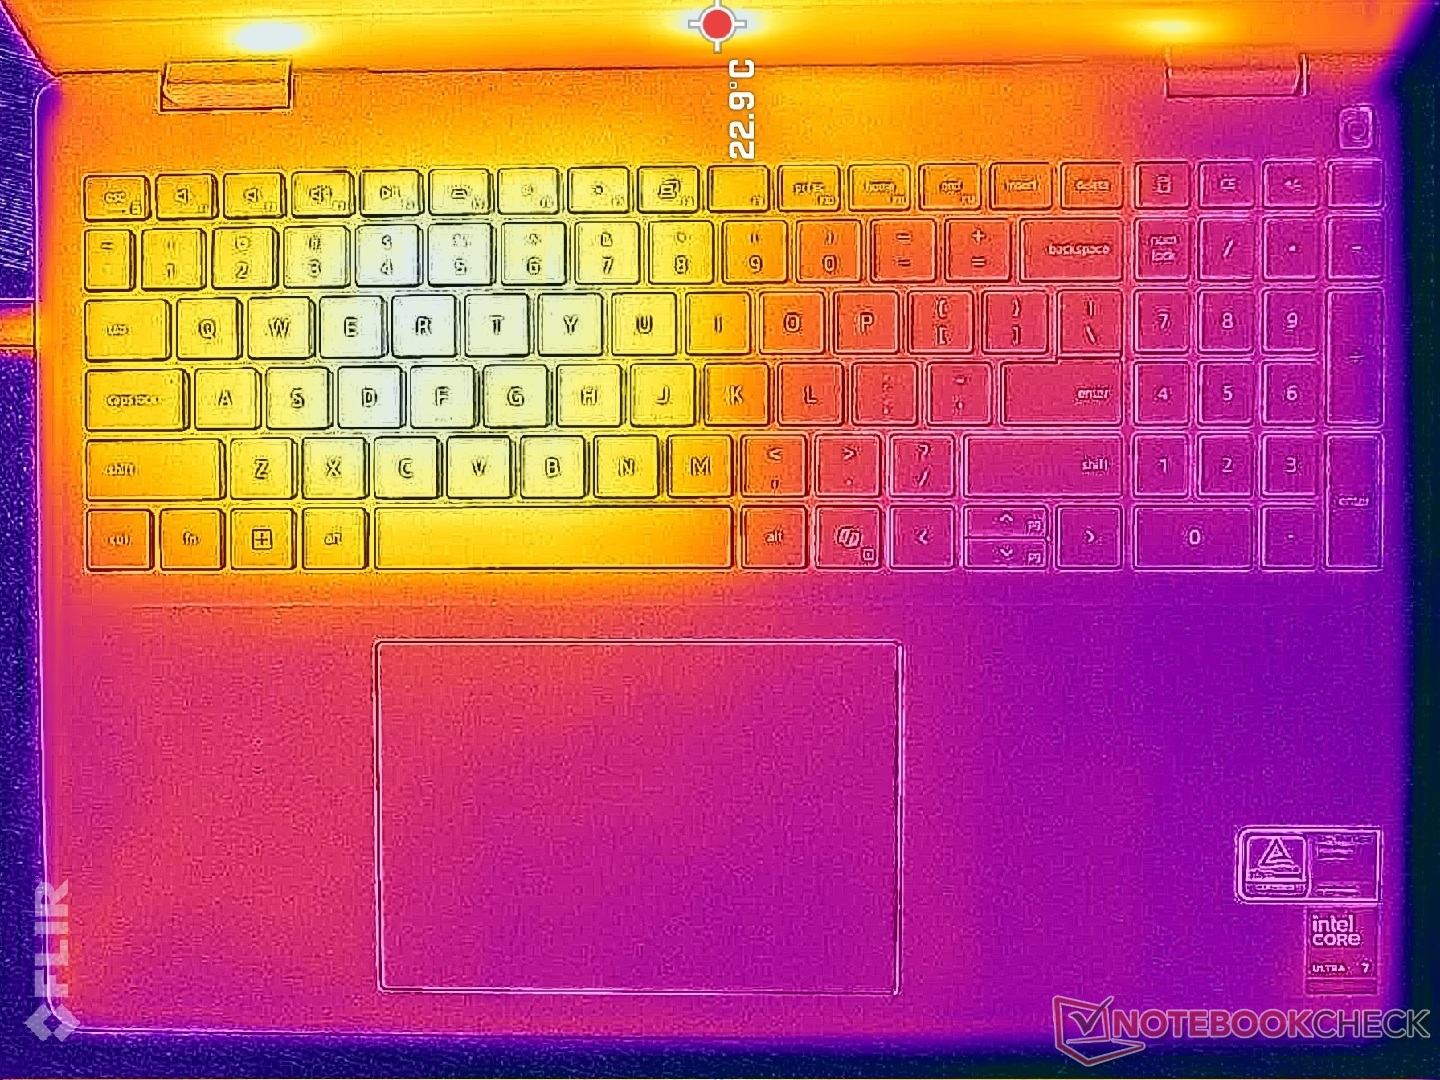
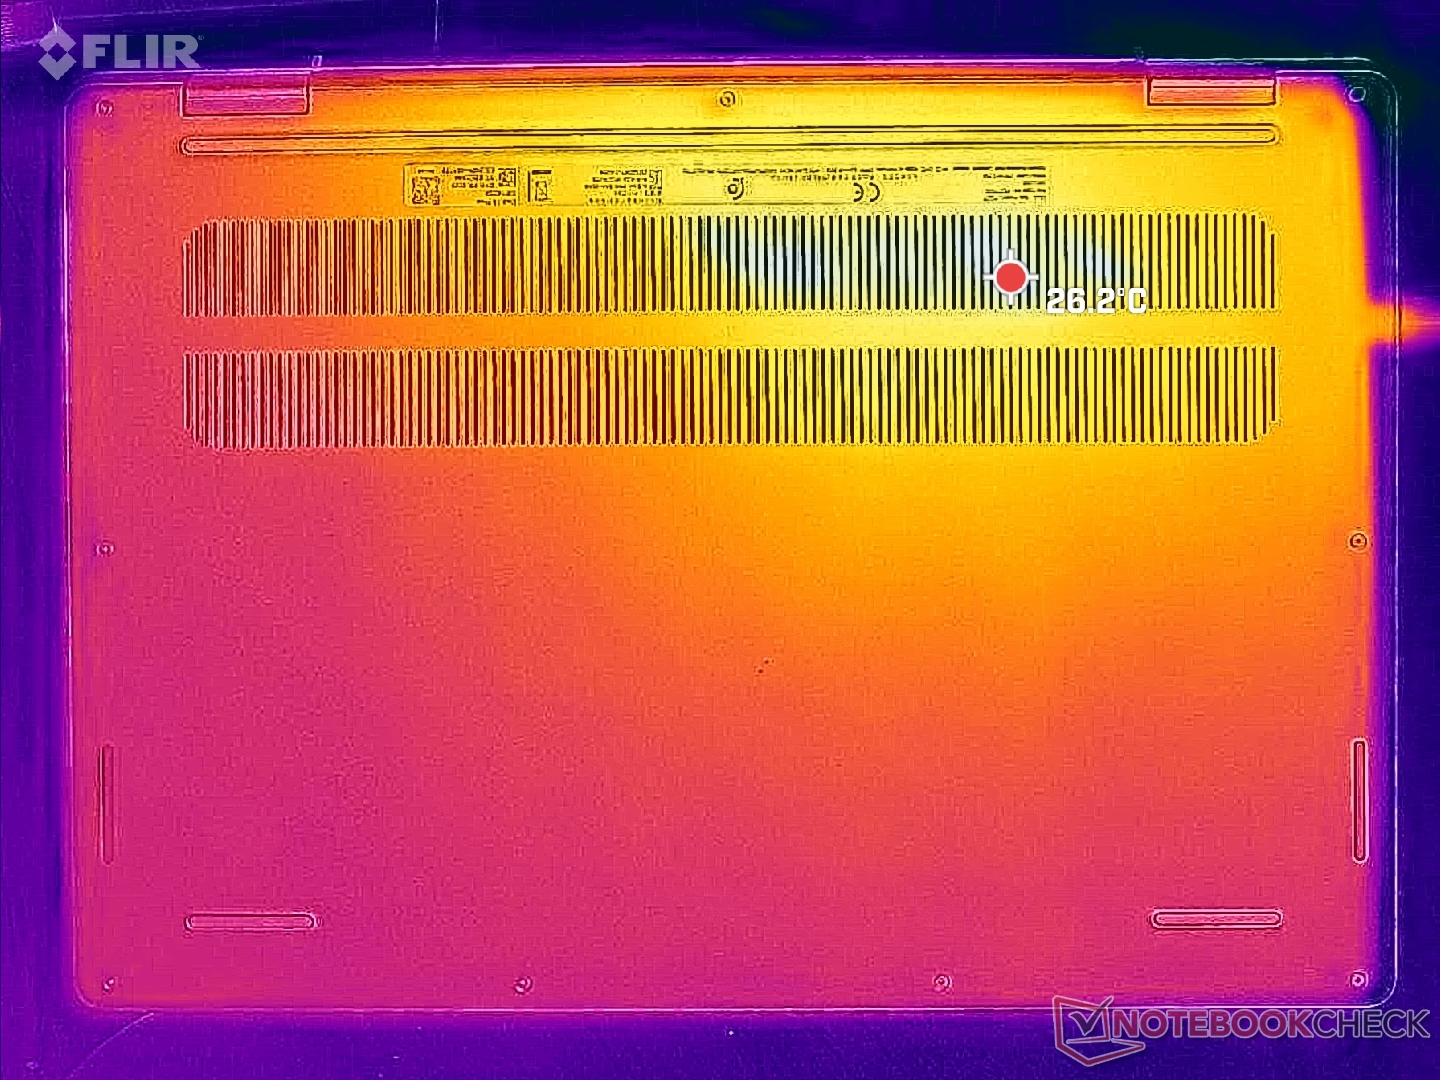
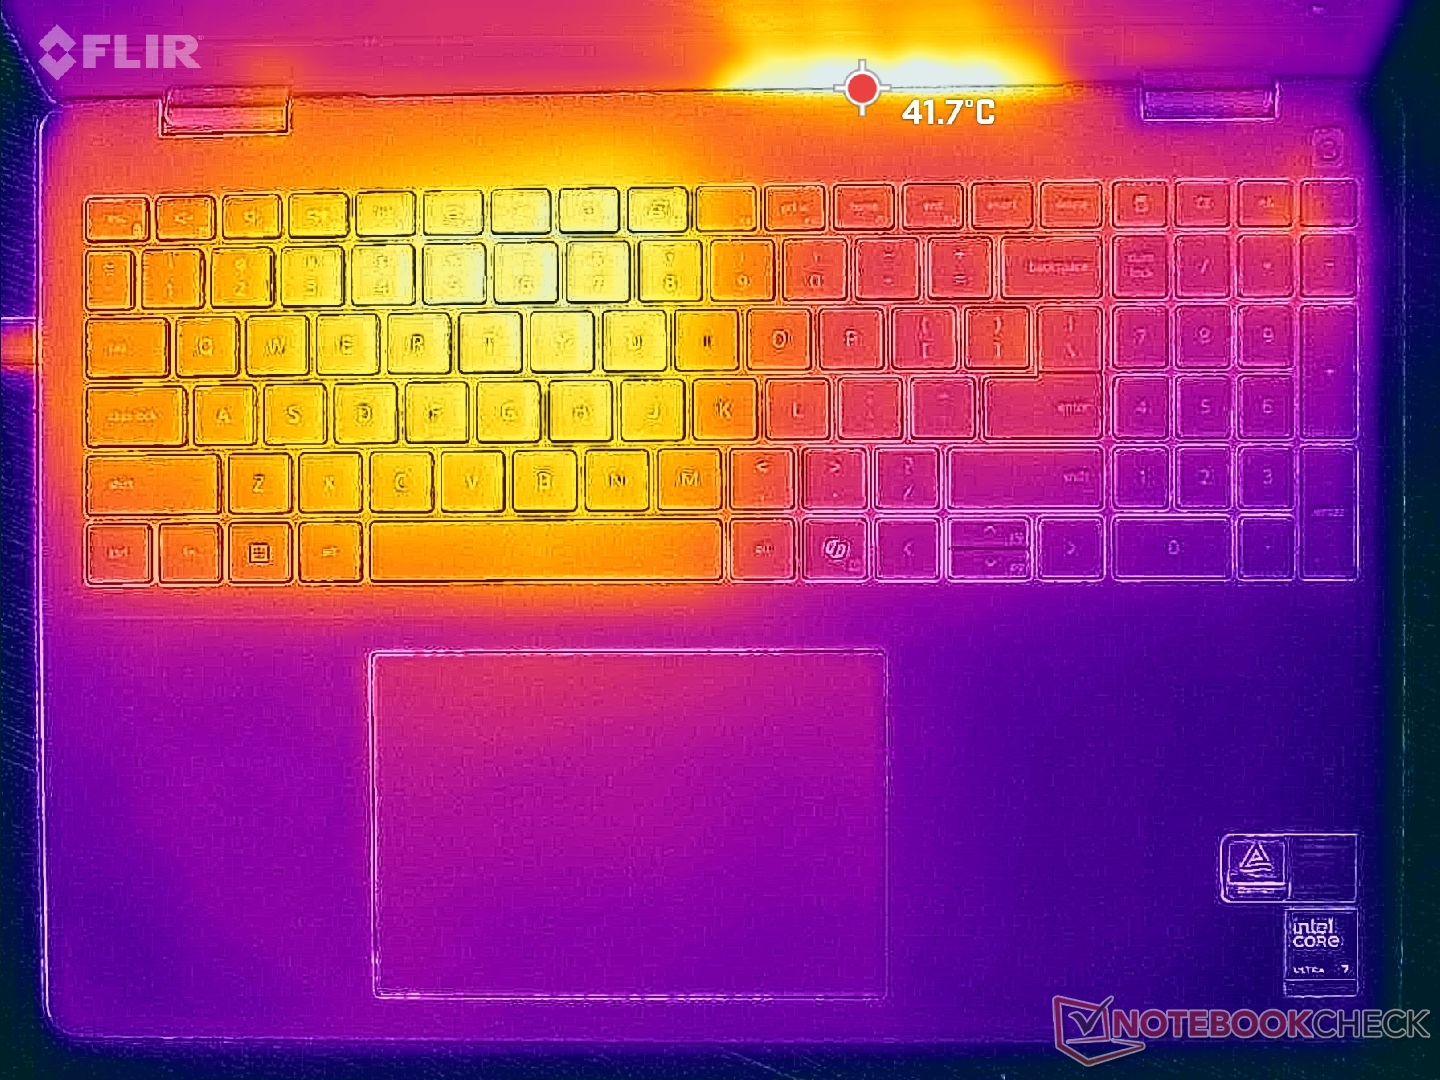
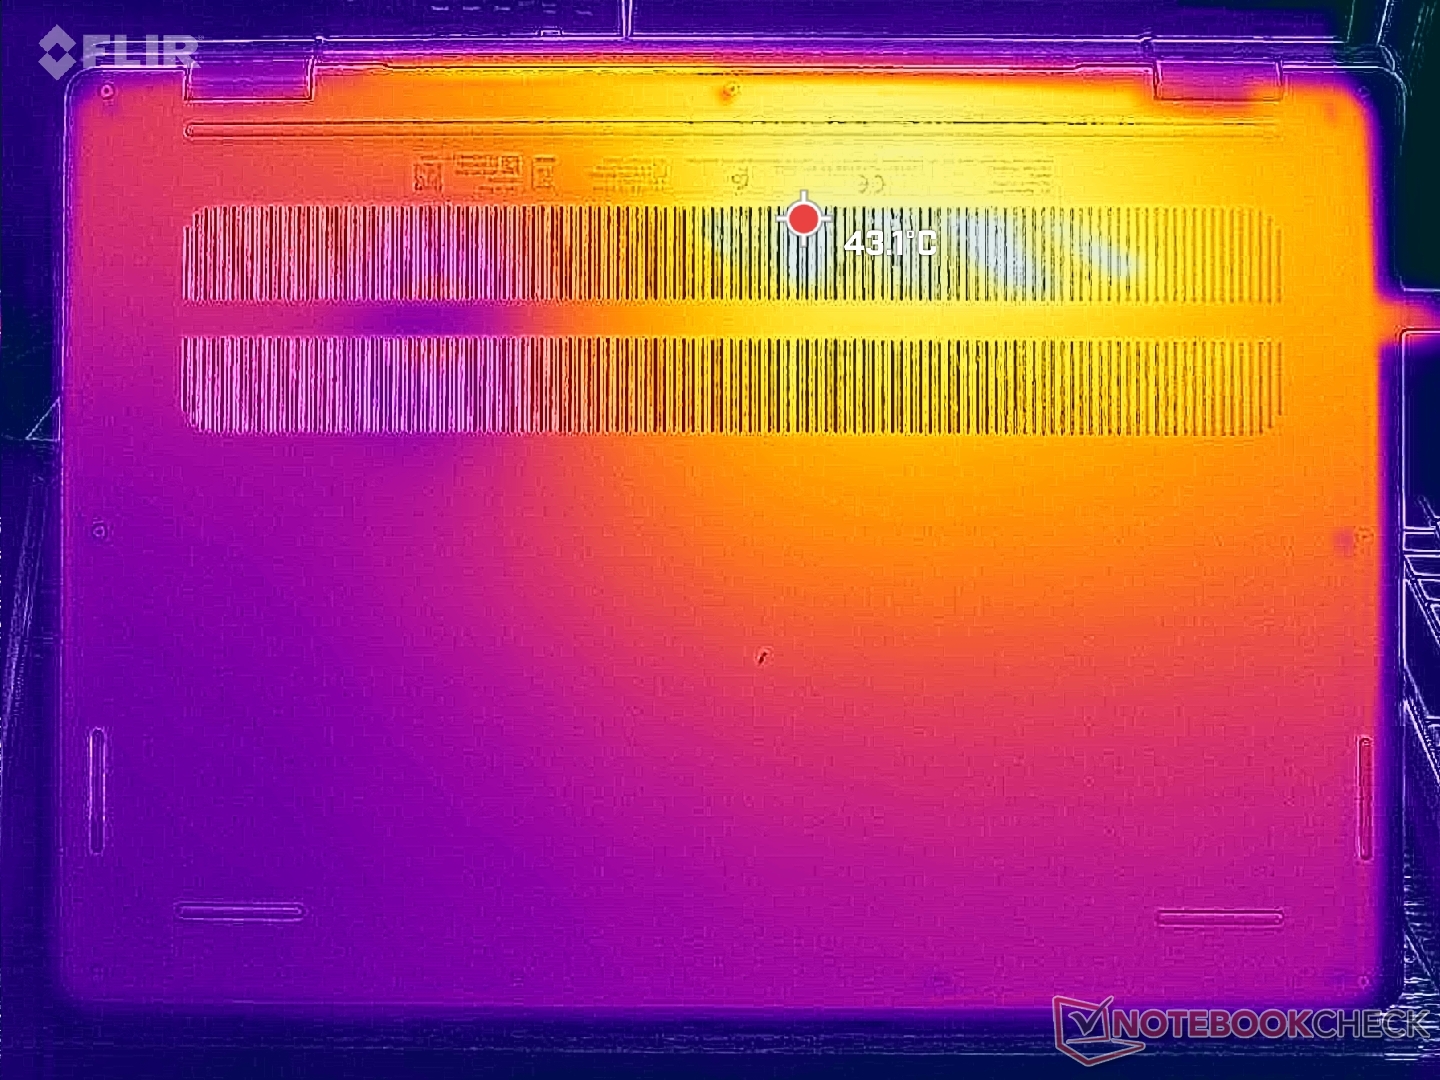
Temperatur
Die Oberflächentemperaturen sind im Vergleich zur Inspiron-16-7640-Serie merklich kühler, was vor allem auf die Prozessoränderungen zurückzuführen ist. Die Höchsttemperaturen liegen im niedrigen 40-°C-Bereich statt im höheren 40-°C-Bereich.
Das System ist eindeutig nicht für Gamer konzipiert, da der WASD-Bereich viel wärmer werden kann als der Rest der Tastatur, wie die Temperaturkarten unten zeigen.
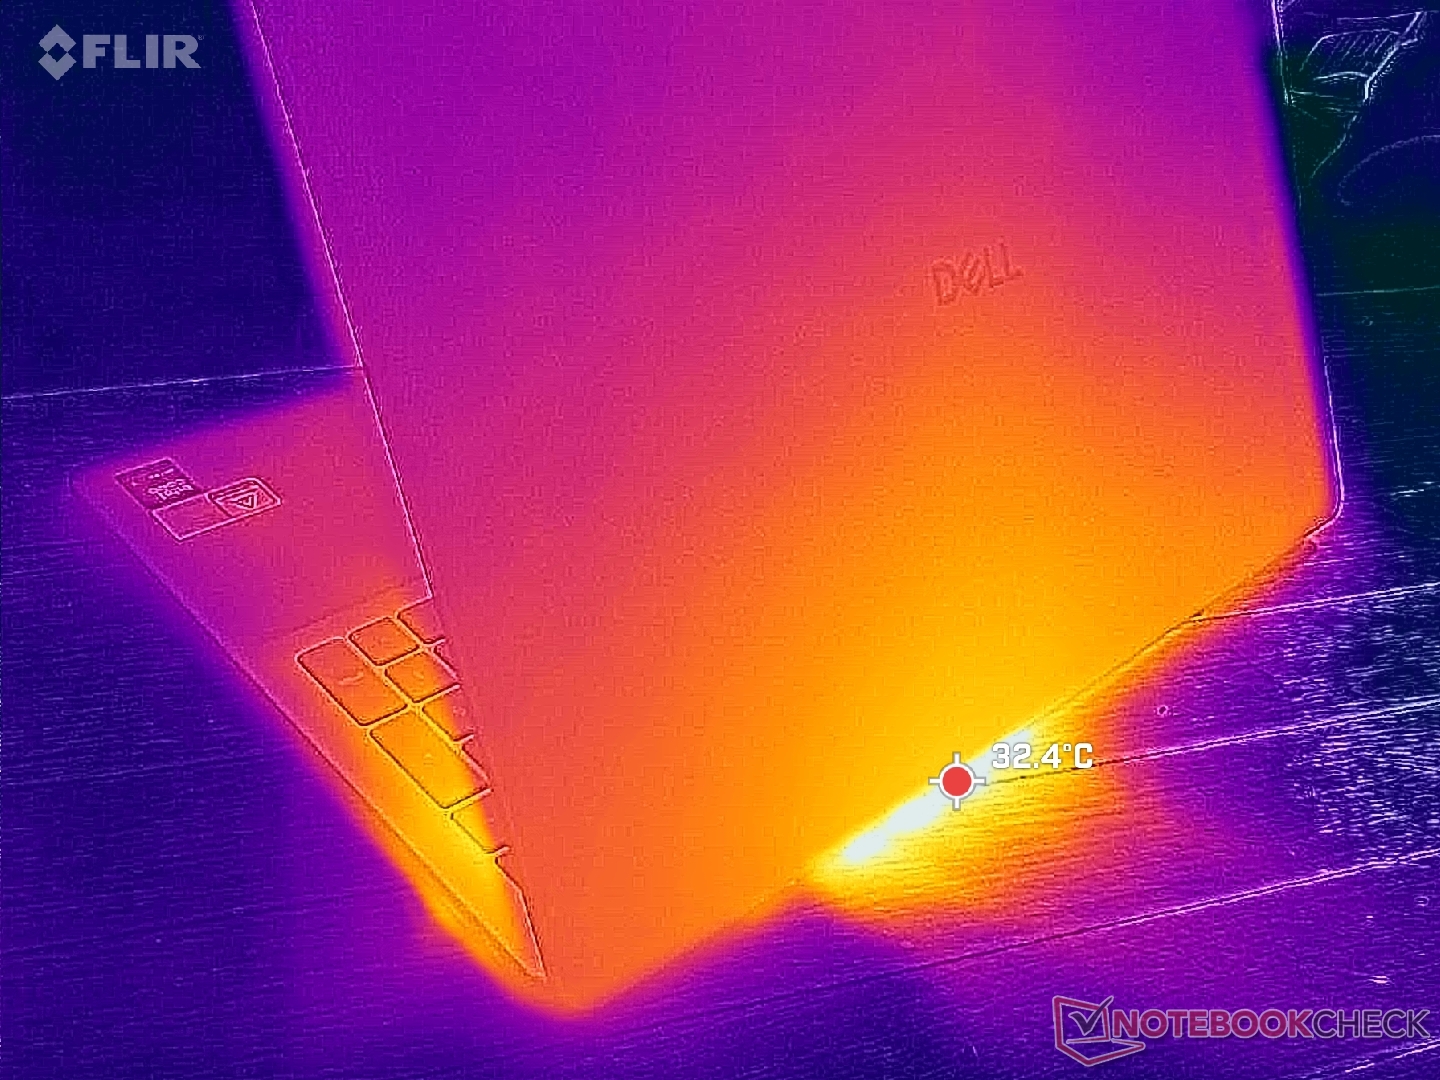
(±) Die maximale Temperatur auf der Oberseite ist 40.6 °C. Im Vergleich liegt der Klassendurchschnitt bei 36.8 °C (von 21 bis 71 °C für die Klasse Multimedia).
(±) Auf der Unterseite messen wir eine maximalen Wert von 40 °C (im Vergleich zum Durchschnitt von 39.1 °C).
(+) Ohne Last messen wir eine durchschnittliche Temperatur von 27.2 °C auf der Oberseite. Der Klassendurchschnitt erreicht 31.3 °C.
(+) Die Handballen und der Touchpad-Bereich sind mit gemessenen 25.8 °C kühler als die typische Hauttemperatur und fühlen sich dadurch kühl an.
(+) Die durchschnittliche Handballen-Temperatur anderer getesteter Geräte war 28.7 °C (+2.9 °C).
| Dell 16 Plus Intel Core Ultra 7 256V, Intel Arc Graphics 140V | Dell Inspiron 16 Plus 7640 Intel Core Ultra 7 155H, NVIDIA GeForce RTX 4060 Laptop GPU | Acer Swift 16 AI SF16-51T-932H, Ultra 9 288V Intel Core Ultra 9 288V, Intel Arc Graphics 140V | Lenovo ThinkBook 16 G7+ AMD AMD Ryzen AI 9 365, AMD Radeon 880M | HP Pavilion Plus 16-ab0456tx Intel Core i7-13700H, NVIDIA GeForce RTX 3050 6GB Laptop GPU | Asus Vivobook 16 M1606K AMD Ryzen AI 7 350, AMD Radeon 860M | |
|---|---|---|---|---|---|---|
| Hitze | -9% | 7% | 9% | -24% | 0% | |
| Last oben max * (°C) | 40.6 | 43.4 -7% | 37.9 7% | 38.2 6% | 49.6 -22% | 48 -18% |
| Last unten max * (°C) | 40 | 41.6 -4% | 31.5 21% | 37.9 5% | 45.8 -15% | 51 -27% |
| Idle oben max * (°C) | 29.2 | 32.8 -12% | 28.3 3% | 25.4 13% | 39.2 -34% | 22 25% |
| Idle unten max * (°C) | 28.6 | 32.4 -13% | 29.7 -4% | 25.7 10% | 35.4 -24% | 23 20% |
* ... kleinere Werte sind besser
Lautsprecher
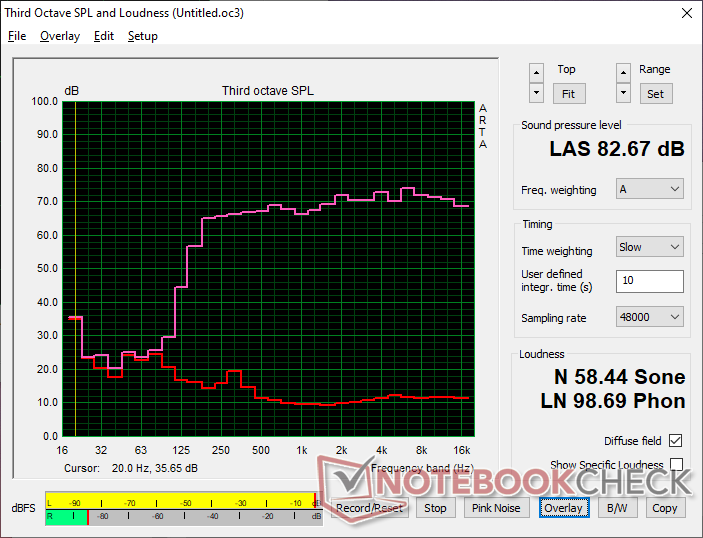
Dell 16 Plus Audio Analyse
(+) | Die Lautsprecher können relativ laut spielen (82.7 dB)
Bass 100 - 315 Hz
(±) | abgesenkter Bass - 14.1% geringer als der Median
(±) | durchschnittlich lineare Bass-Wiedergabe (11.8% Delta zum Vorgänger)
Mitteltöne 400 - 2000 Hz
(+) | ausgeglichene Mitten, vom Median nur 1.6% abweichend
(+) | lineare Mitten (2.4% Delta zum Vorgänger)
Hochtöne 2 - 16 kHz
(+) | ausgeglichene Hochtöne, vom Median nur 2.9% abweichend
(+) | sehr lineare Hochtöne (3.3% Delta zum Vorgänger)
Gesamt im hörbaren Bereich 100 - 16.000 Hz
(+) | hörbarer Bereich ist sehr linear (10% Abstand zum Median
Im Vergleich zu allen Geräten derselben Klasse
» 13% aller getesteten Geräte dieser Klasse waren besser, 2% vergleichbar, 84% schlechter
» Das beste Gerät hat einen Delta-Wert von 5%, durchschnittlich ist 17%, das schlechteste Gerät hat 45%
Im Vergleich zu allen Geräten im Test
» 4% aller getesteten Geräte waren besser, 1% vergleichbar, 94% schlechter
» Das beste Gerät hat einen Delta-Wert von 4%, durchschnittlich ist 24%, das schlechteste Gerät hat 134%
Apple MacBook Pro 16 2021 M1 Pro Audio Analyse
(+) | Die Lautsprecher können relativ laut spielen (84.7 dB)
Bass 100 - 315 Hz
(+) | guter Bass - nur 3.8% Abweichung vom Median
(+) | lineare Bass-Wiedergabe (5.2% Delta zum Vorgänger)
Mitteltöne 400 - 2000 Hz
(+) | ausgeglichene Mitten, vom Median nur 1.3% abweichend
(+) | lineare Mitten (2.1% Delta zum Vorgänger)
Hochtöne 2 - 16 kHz
(+) | ausgeglichene Hochtöne, vom Median nur 1.9% abweichend
(+) | sehr lineare Hochtöne (2.7% Delta zum Vorgänger)
Gesamt im hörbaren Bereich 100 - 16.000 Hz
(+) | hörbarer Bereich ist sehr linear (4.6% Abstand zum Median
Im Vergleich zu allen Geräten derselben Klasse
» 0% aller getesteten Geräte dieser Klasse waren besser, 0% vergleichbar, 100% schlechter
» Das beste Gerät hat einen Delta-Wert von 5%, durchschnittlich ist 17%, das schlechteste Gerät hat 45%
Im Vergleich zu allen Geräten im Test
» 0% aller getesteten Geräte waren besser, 0% vergleichbar, 100% schlechter
» Das beste Gerät hat einen Delta-Wert von 4%, durchschnittlich ist 24%, das schlechteste Gerät hat 134%
Energieverwaltung
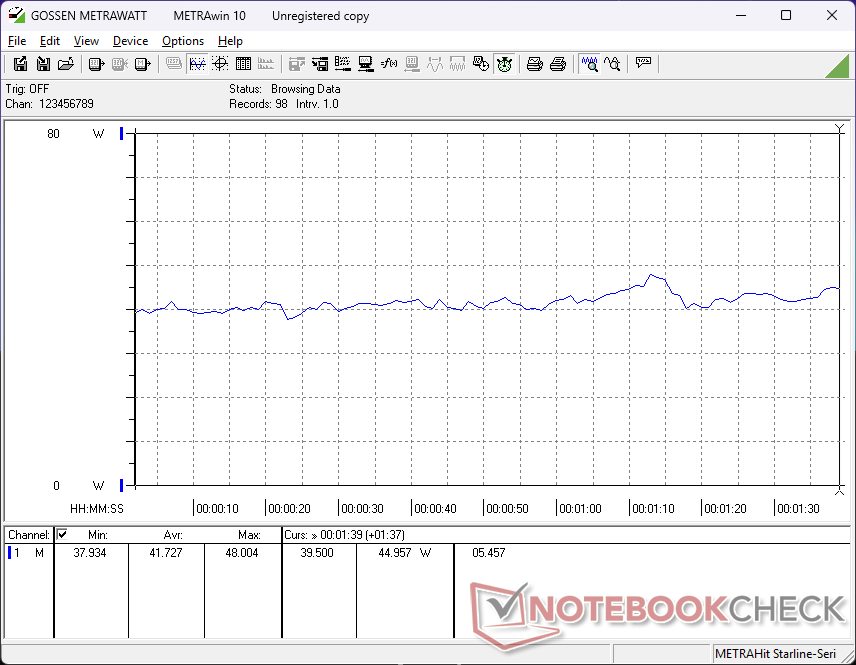
Stromverbrauch - Verbesserte Leistung-per-Watt
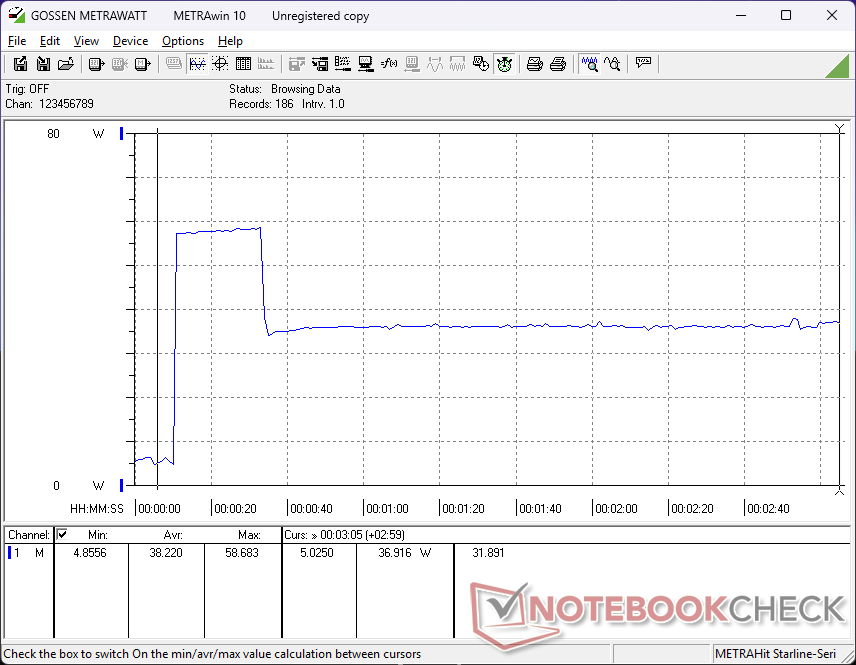
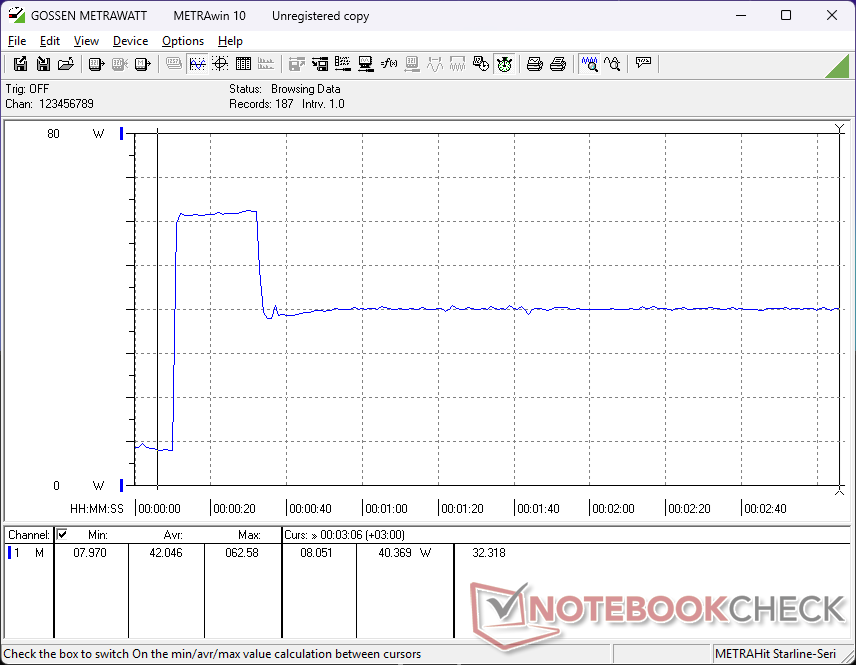
Der Gesamtverbrauch ist für ein 16-Zoll-Notebook recht niedrig. Das liegt an der fehlenden H-Series-CPU, der diskreten GPU oder den OLED-Optionen, die alle viel anspruchsvoller sind als unsere V-Series-CPU, die integrierte GPU und das IPS-Panel. Besonders bemerkenswert ist, dass das System nur 41 Watt verbraucht, wenn Cyberpunk 2077 läuft, verglichen mit 67 Watt beim Inspiron 16 7640 2-in-1, obwohl unser Dell 16 Plus das Spiel etwa 25 Prozent schneller ausführen kann.
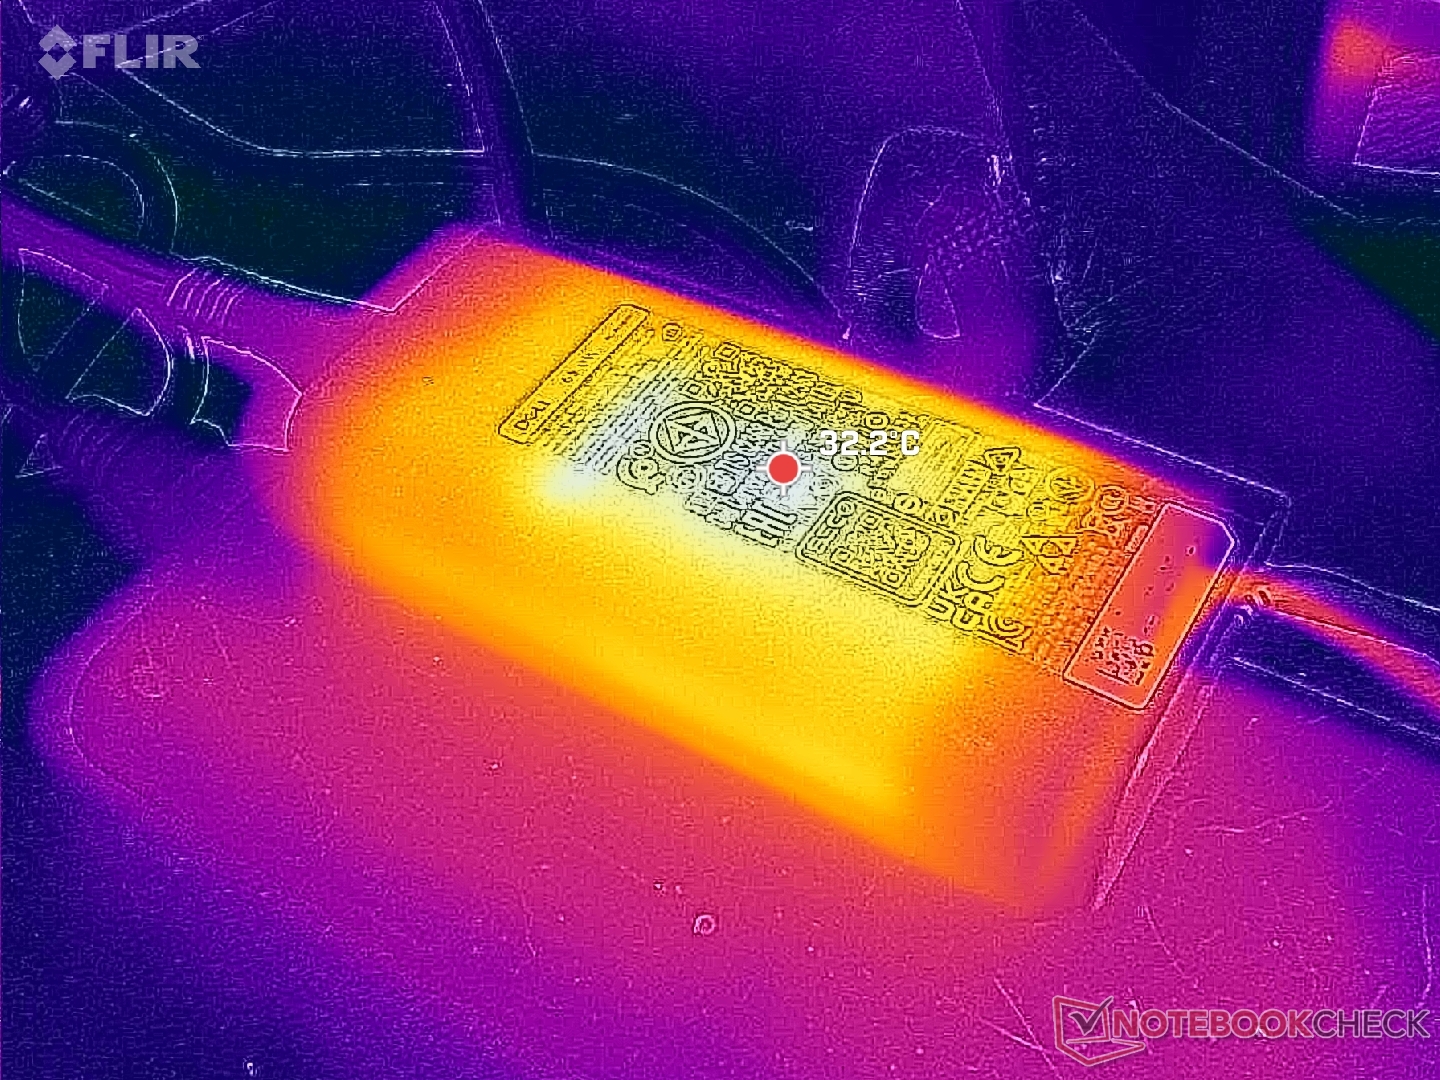
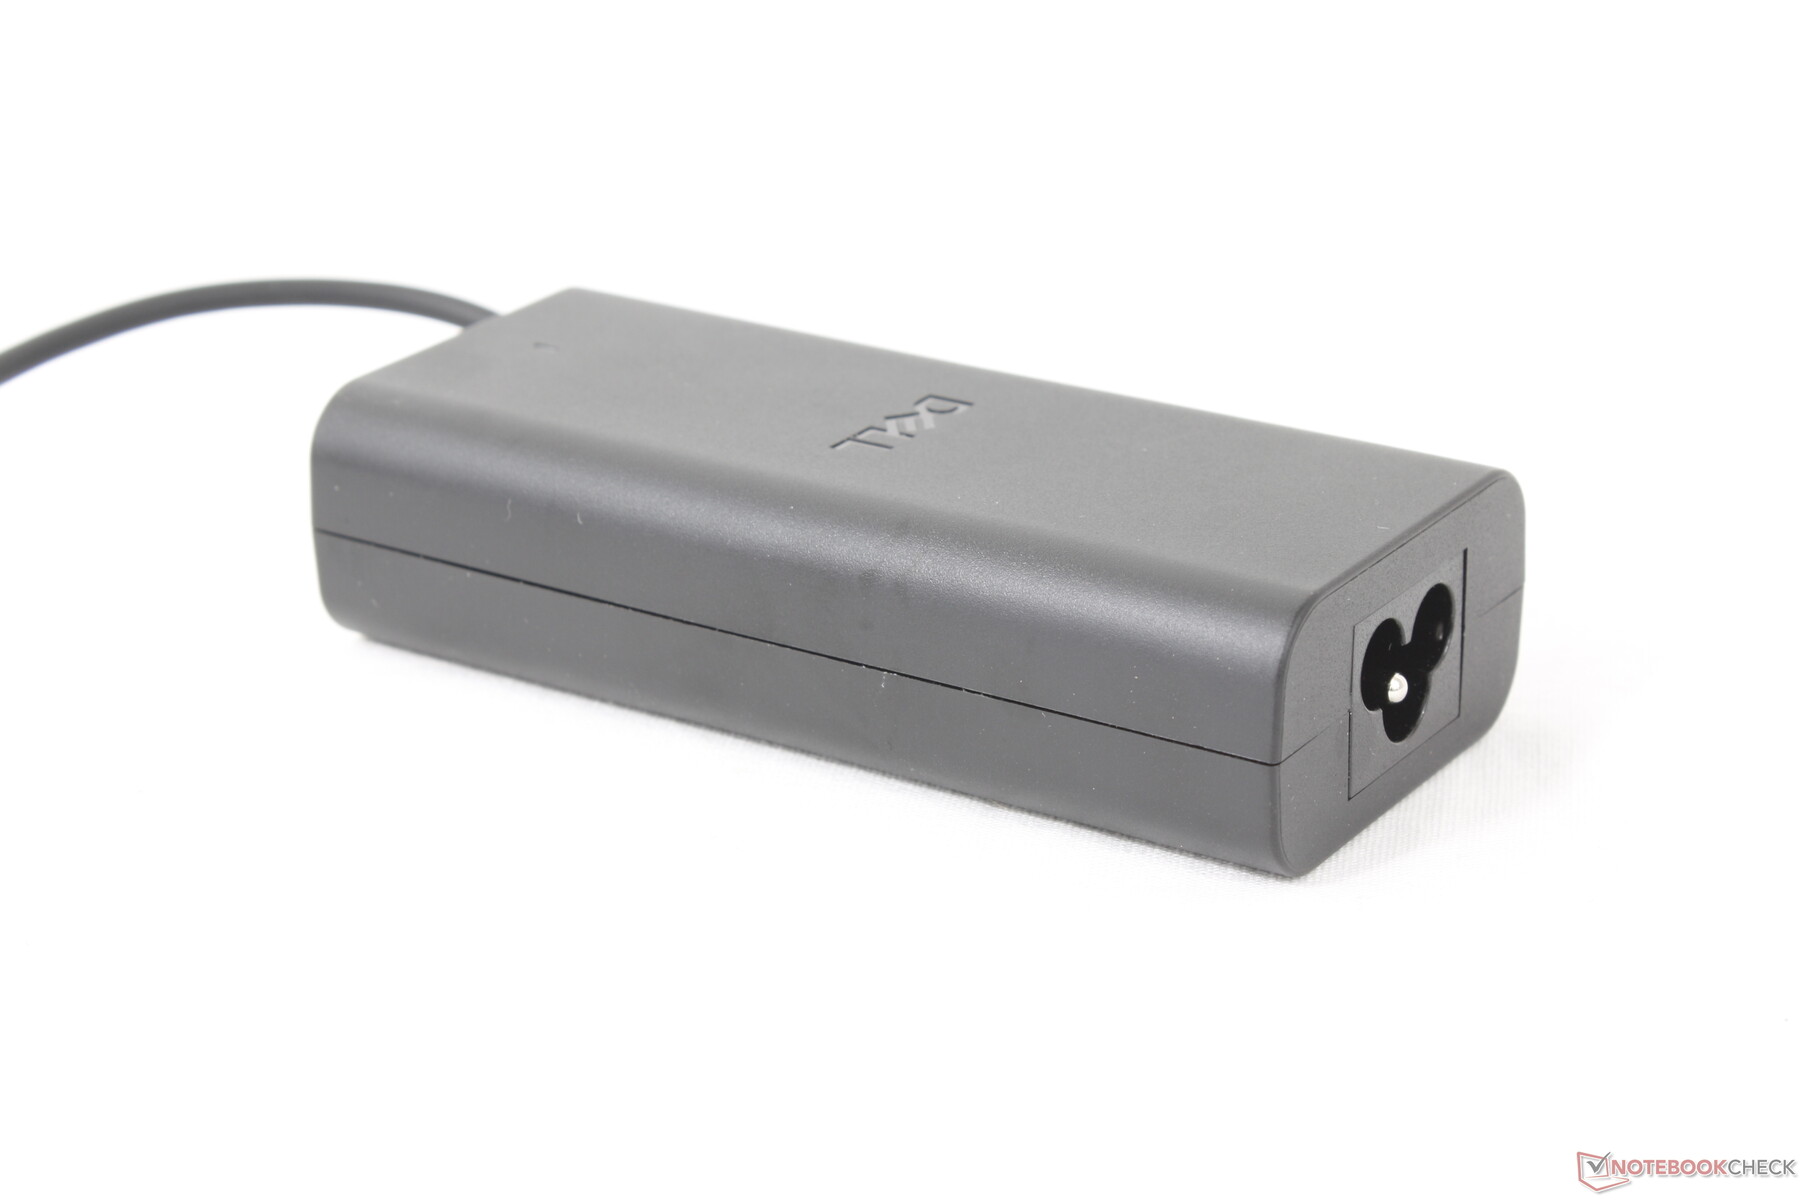
Mit dem kleinen bis mittelgroßen (~11,2 x 5 x 2,8 cm) 65-W-USB-C-Netzteil konnten wir eine vorübergehende maximale Leistungsaufnahme von 62 W messen.

| Aus / Standby | |
| Idle | |
| Last |
|
Legende:
min: | |
| Dell 16 Plus Core Ultra 7 256V, Arc 140V, Samsung BM9C1 1024GB, IPS, 2560x1600, 16" | Dell Inspiron 16 Plus 7640 Ultra 7 155H, GeForce RTX 4060 Laptop GPU, SK hynix BC901 HFS001TEJ4X164N, IPS, 2560x1600, 16" | Acer Swift 16 AI SF16-51T-932H, Ultra 9 288V Core Ultra 9 288V, Arc 140V, Western Digital PC SN5000S SDEQNSJ-1T00, OLED, 2880x1800, 16" | Lenovo ThinkBook 16 G7+ AMD Ryzen AI 9 365, Radeon 880M, Samsung PM9C1a MZAL81T0HDLB, IPS, 3200x2000, 16" | HP Pavilion Plus 16-ab0456tx i7-13700H, GeForce RTX 3050 6GB Laptop GPU, WDC PC SN810 1TB, IPS, 2560x1600, 16" | Asus Vivobook 16 M1606K Ryzen AI 7 350, Radeon 860M, Micron 2500 1TB MTFDKBA1T0QGN, IPS, 1920x1200, 16" | |
|---|---|---|---|---|---|---|
| Stromverbrauch | -64% | -22% | -93% | -60% | -36% | |
| Idle min * (Watt) | 3.4 | 4.2 -24% | 5.7 -68% | 6.4 -88% | 3.3 3% | 4.7 -38% |
| Idle avg * (Watt) | 6.9 | 6.9 -0% | 7.4 -7% | 14.1 -104% | 7.3 -6% | 8.2 -19% |
| Idle max * (Watt) | 7.4 | 15.2 -105% | 7.9 -7% | 14.3 -93% | 14.24 -92% | 9 -22% |
| Last avg * (Watt) | 41.7 | 70.4 -69% | 83.4 -100% | 91.7 -120% | 59 -41% | |
| Cyberpunk 2077 ultra external monitor * (Watt) | 38 | 77.5 -104% | 58 -53% | |||
| Cyberpunk 2077 ultra * (Watt) | 41.4 | 49.8 -20% | 79.8 -93% | 65 -57% | ||
| Last max * (Watt) | 62 | 137.4 -122% | 65.41 -6% | 102.9 -66% | 115.8 -87% | 74 -19% |
| Witcher 3 ultra * (Watt) | 115.9 | 96.2 |
* ... kleinere Werte sind besser
Energieverbrauch Cyberpunk / Stresstest
Energieverbrauch externer Monitor
Akkulaufzeit
Die Laufzeiten sind sehr lang, wie man es von einem solchen Lunar-Lake-Notebook erwarten kann. Die WLAN-Akkulaufzeit ist mit knapp über 14 Stunden sogar länger als beim Inspiron 16 Plus 7640, obwohl das Dell 16 Plus einen 30 Prozent kleineren Akku hat.
| Dell 16 Plus Core Ultra 7 256V, Arc 140V, 64 Wh | Dell Inspiron 16 Plus 7640 Ultra 7 155H, GeForce RTX 4060 Laptop GPU, 90 Wh | Acer Swift 16 AI SF16-51T-932H, Ultra 9 288V Core Ultra 9 288V, Arc 140V, 70 Wh | Lenovo ThinkBook 16 G7+ AMD Ryzen AI 9 365, Radeon 880M, 85 Wh | HP Pavilion Plus 16-ab0456tx i7-13700H, GeForce RTX 3050 6GB Laptop GPU, 68 Wh | Asus Vivobook 16 M1606K Ryzen AI 7 350, Radeon 860M, 42 Wh | |
|---|---|---|---|---|---|---|
| Akkulaufzeit | -6% | -6% | -23% | -26% | -52% | |
| WLAN (h) | 14.1 | 13.3 -6% | 13.2 -6% | 10.8 -23% | 10.4 -26% | 6.8 -52% |
| H.264 (h) | 13.9 | 12 | 6.8 | |||
| Last (h) | 1.1 |
Notebookcheck Bewertung
Dell 16 Plus
- 06.06.2025 v8
Allen Ngo
 Total Sustainability Score:
 Potentielle Mitbewerber im Vergleich
Bild | Modell / Test | Preis ab | Gewicht | Dicke | Display |
|---|---|---|---|---|---|
1. 81.8%  | Dell 16 Plus Intel Core Ultra 7 256V ⎘ Intel Arc Graphics 140V ⎘ 16 GB RAM, 1024 GB SSD | Amazon: 945,82 € Geizhals Suche | 1.8 kg | 16.99 mm | 16.00" 2560x1600 189 PPI IPS |
2. 83.4%  | Dell Inspiron 16 Plus 7640 Intel Core Ultra 7 155H ⎘ NVIDIA GeForce RTX 4060 Laptop GPU ⎘ 16 GB RAM, 1024 GB SSD | Amazon: Geizhals Suche | 2.2 kg | 19.9 mm | 16.00" 2560x1600 189 PPI IPS |
3. 85.3%  | Acer Swift 16 AI SF16-51T-932H, Ultra 9 288V Intel Core Ultra 9 288V ⎘ Intel Arc Graphics 140V ⎘ 32 GB RAM, 1024 GB SSD | Amazon: Geizhals Suche | 1.5 kg | 15.95 mm | 16.00" 2880x1800 212 PPI OLED |
4. 86.6%  | Lenovo ThinkBook 16 G7+ AMD AMD Ryzen AI 9 365 ⎘ AMD Radeon 880M ⎘ 32 GB RAM, 1024 GB SSD | Amazon: 1. 799,00 € Lenovo ThinkBook 16 G7 ARP B... 2. 769,00 € Lenovo Notebook ThinkBook 16... 3. 1.341,45 € Lenovo ThinkBook 16 G7 ARP A... Listenpreis: 1399€ | 1.9 kg | 16.9 mm | 16.00" 3200x2000 236 PPI IPS |
5. 88.7% v7 (old)  | HP Pavilion Plus 16-ab0456tx Intel Core i7-13700H ⎘ NVIDIA GeForce RTX 3050 6GB Laptop GPU ⎘ 16 GB RAM, 1024 GB SSD | Amazon: 1. 529,00 € HP Pavilion Laptop, 16" WUXG... 2. 899,00 € HP Pavilion Laptop | AMD Ryz... 3. 660,38 € HP Pavilion x360 2-in-1 Conv... Listenpreis: 1350 USD | 1.9 kg | 19.9 mm | 16.00" 2560x1600 189 PPI IPS |
6. 77.6%  | Asus Vivobook 16 M1606K AMD Ryzen AI 7 350 ⎘ AMD Radeon 860M ⎘ 16 GB RAM, 1024 GB SSD | Amazon: 1. 450,26 € ASUS Vivobook 16 X1605VA Lap... 2. 550,05 € ASUS Vivobook 17 X1704VA Lap... 3. 586,90 € ASUS Vivobook 16 M1605YA Lap... Bestpreis 899€ nullprozentshop.de 2. 899€ notebooksbilliger.de 3. 906.55€ notebooksbilliger.at | 1.9 kg | 19.9 mm | 16.00" 1920x1200 142 PPI IPS |
Transparenz
Die Auswahl der zu testenden Geräte erfolgt innerhalb der Redaktion. Das vorliegende Testmuster wurde dem Autor vom Hersteller oder einem Shop zu Testzwecken leihweise zur Verfügung gestellt. Eine Einflussnahme des Leihstellers auf den Testbericht gab es nicht, der Hersteller erhielt keine Version des Reviews vor der Veröffentlichung. Es bestand keine Verpflichtung zur Publikation. Als eigenständiges, unabhängiges Unternehmen unterliegt Notebookcheck keiner Diktion von Herstellern, Shops und Verlagen.
So testet Notebookcheck
Pro Jahr werden von Notebookcheck hunderte Laptops und Smartphones unabhängig in von uns standardisierten technischen Verfahren getestet, um eine Vergleichbarkeit aller Testergebnisse zu gewährleisten. Seit rund 20 Jahren entwickeln wir diese Testmethoden kontinuierlich weiter und setzen damit Branchenstandards. In unseren Testlaboren kommt ausschließlich hochwertiges Messequipment in die Hände erfahrener Techniker und Redakteure. Die Tests unterliegen einer mehrstufigen Kontrolle. Unsere komplexe Gesamtbewertung basiert auf hunderten fundierten Messergebnissen und Benchmarks, womit Ihnen Objektivität garantiert ist. Weitere Informationen zu unseren Testmethoden gibt es hier.

