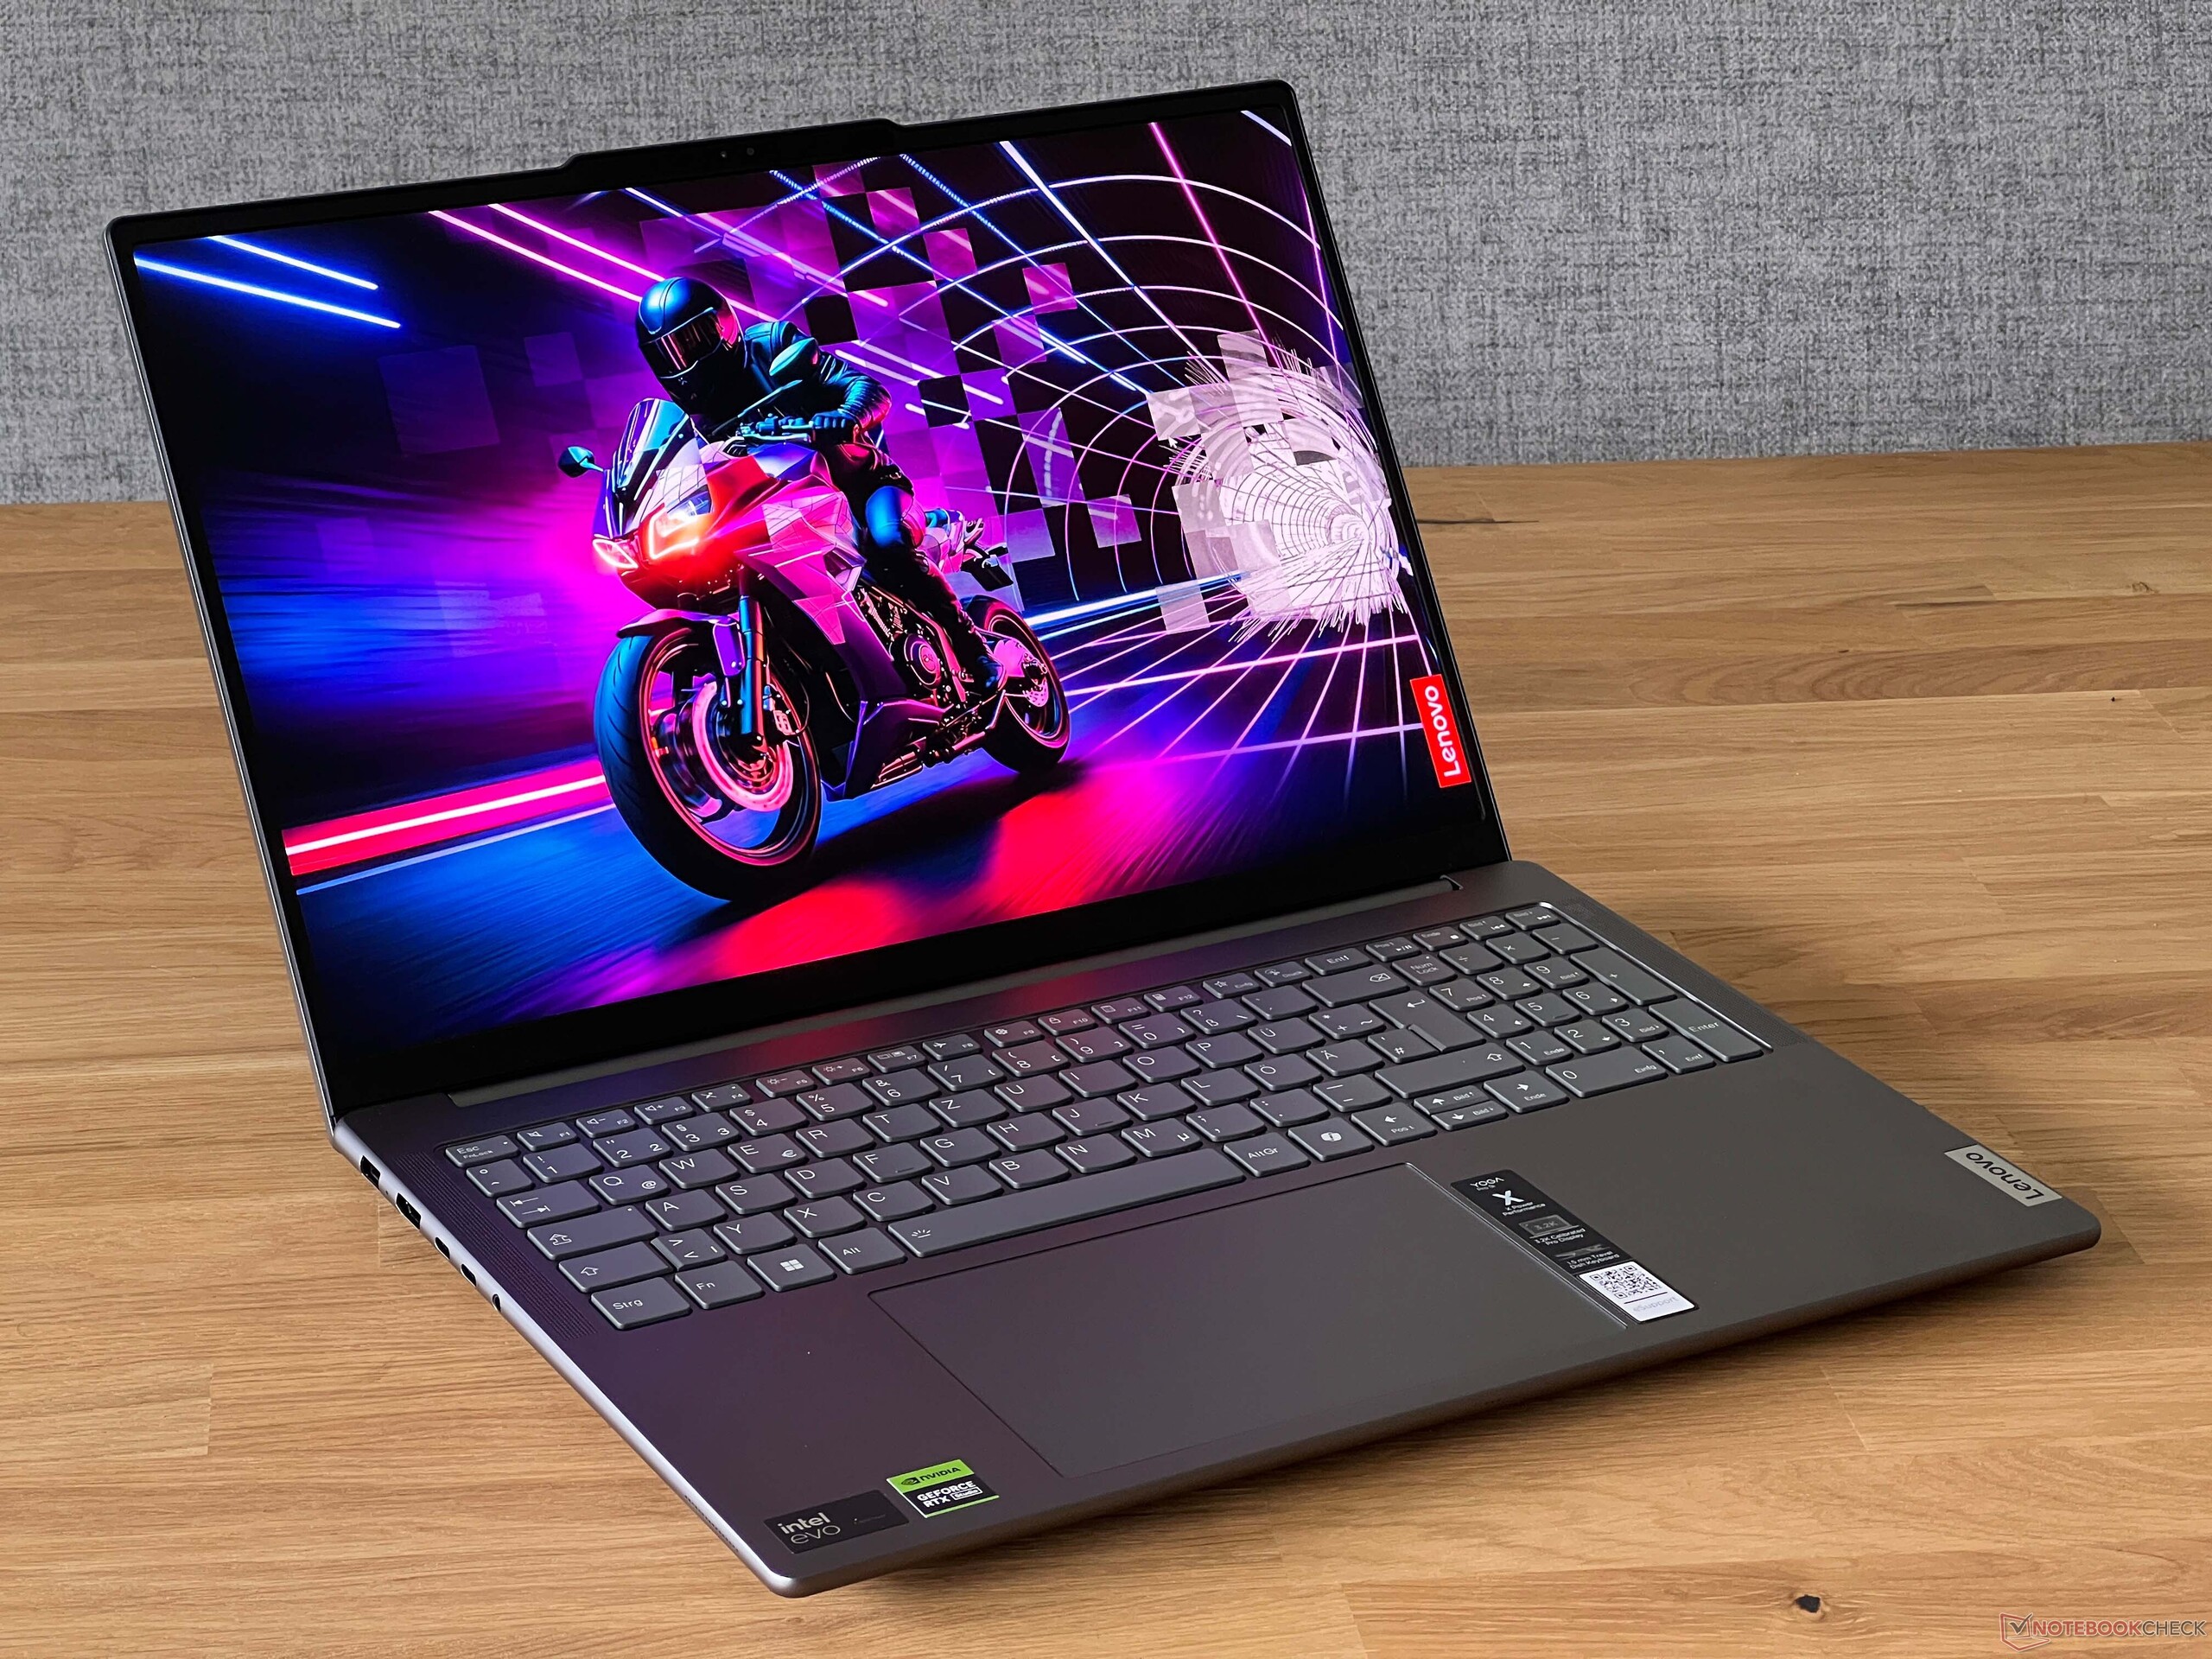
Lenovo Yoga Pro 9 16IMH9 Laptop im Test: Die Leistung der 75-Watt-GeForce RTX 4050 übertrifft Erwartungen

Die Yoga Pro 9-Serie ist das Flaggschiff der Multimedia-Notebooks von Lenovo und liegt über der oberen Mittelklasse der Yoga 7 16-Serie und der unteren IdeaPad Pro 5 16-Serie. Vor kurzem waren wir von der höchsten Konfiguration des Yoga Pro 9 mit Mini-LED und GeForce RTX 4070 Grafik beeindruckt. Diesmal nehmen wir eine günstigere SKU mit Standard-IPS und GeForce RTX 4050-Grafik unter die Lupe.
Die von uns getestete Konfiguration ist online für etwa 1.900 Euro erhältlich. Zu den Alternativen gehören andere 16-Zoll-Multimedia- oder Studio-Laptops wie das MSI Stealth 16, HP Envy x360 2-in-1 16, Dell XPS 16 9640, oder Samsung Galaxy Book4 Ultra.
Weitere Lenovo Bewertungen:
Mögliche Konkurrenten im Vergleich
Bew. | Datum | Modell | Gewicht | Dicke | Größe | Auflösung | Preis ab |
|---|---|---|---|---|---|---|---|
| 91.7 % v7 (old) | 06 / 2024 | Lenovo Yoga Pro 9 16IMH9 RTX 4050 Ultra 9 185H, GeForce RTX 4050 Laptop GPU | 2.1 kg | 18.3 mm | 16.00" | 3200x2000 | |
| 88.7 % v7 (old) | 04 / 2024 | Lenovo Yoga Pro 9 16IMH9 Ultra 9 185H, GeForce RTX 4070 Laptop GPU | 2.1 kg | 18.3 mm | 16.00" | 3200x2000 | |
| 87.2 % v7 (old) | 05 / 2024 | HP Envy x360 2-in-1 16-ad0097nr R7 8840HS, Radeon 780M | 1.8 kg | 18.3 mm | 16.00" | 2880x1800 | |
| 88.6 % v7 (old) | 04 / 2024 | Dell XPS 16 9640 Ultra 7 155H, GeForce RTX 4070 Laptop GPU | 2.3 kg | 18.7 mm | 16.30" | 3840x2400 | |
| 90.4 % v7 (old) | 03 / 2024 | Samsung Galaxy Book4 Ultra Ultra 7 155H, GeForce RTX 4050 Laptop GPU | 1.8 kg | 17 mm | 16.00" | 2880x1800 | |
| 87.6 % v7 (old) | 11 / 2023 | Asus VivoBook Pro 16 K6602VU i9-13900H, GeForce RTX 4050 Laptop GPU | 1.9 kg | 19 mm | 16.00" | 3200x2000 |
Gehäuse

Ausstattung
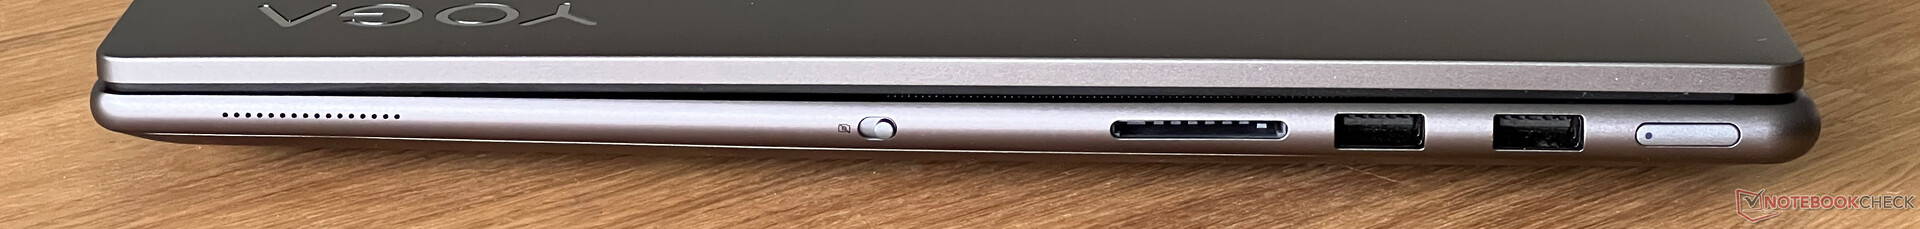
SD Card Reader
| SD Card Reader | |
| average JPG Copy Test (av. of 3 runs) | |
| Asus VivoBook Pro 16 K6602VU (Angelbird AV Pro V60) | |
| Dell XPS 16 9640 (Angelbird AV Pro V60) | |
| Lenovo Yoga Pro 9 16IMH9 RTX 4050 (Angelbird AV Pro V60) | |
| Samsung Galaxy Book4 Ultra (Angelbird AV Pro V60) | |
| Lenovo Yoga Pro 9 16IMH9 (Angelbird AV Pro V60) | |
| maximum AS SSD Seq Read Test (1GB) | |
| Asus VivoBook Pro 16 K6602VU (Angelbird AV Pro V60) | |
| Dell XPS 16 9640 (Angelbird AV Pro V60) | |
| Lenovo Yoga Pro 9 16IMH9 RTX 4050 (Angelbird AV Pro V60) | |
| Lenovo Yoga Pro 9 16IMH9 (Angelbird AV Pro V60) | |
| Samsung Galaxy Book4 Ultra (Angelbird AV Pro V60) | |
Kommunikation
Webcam


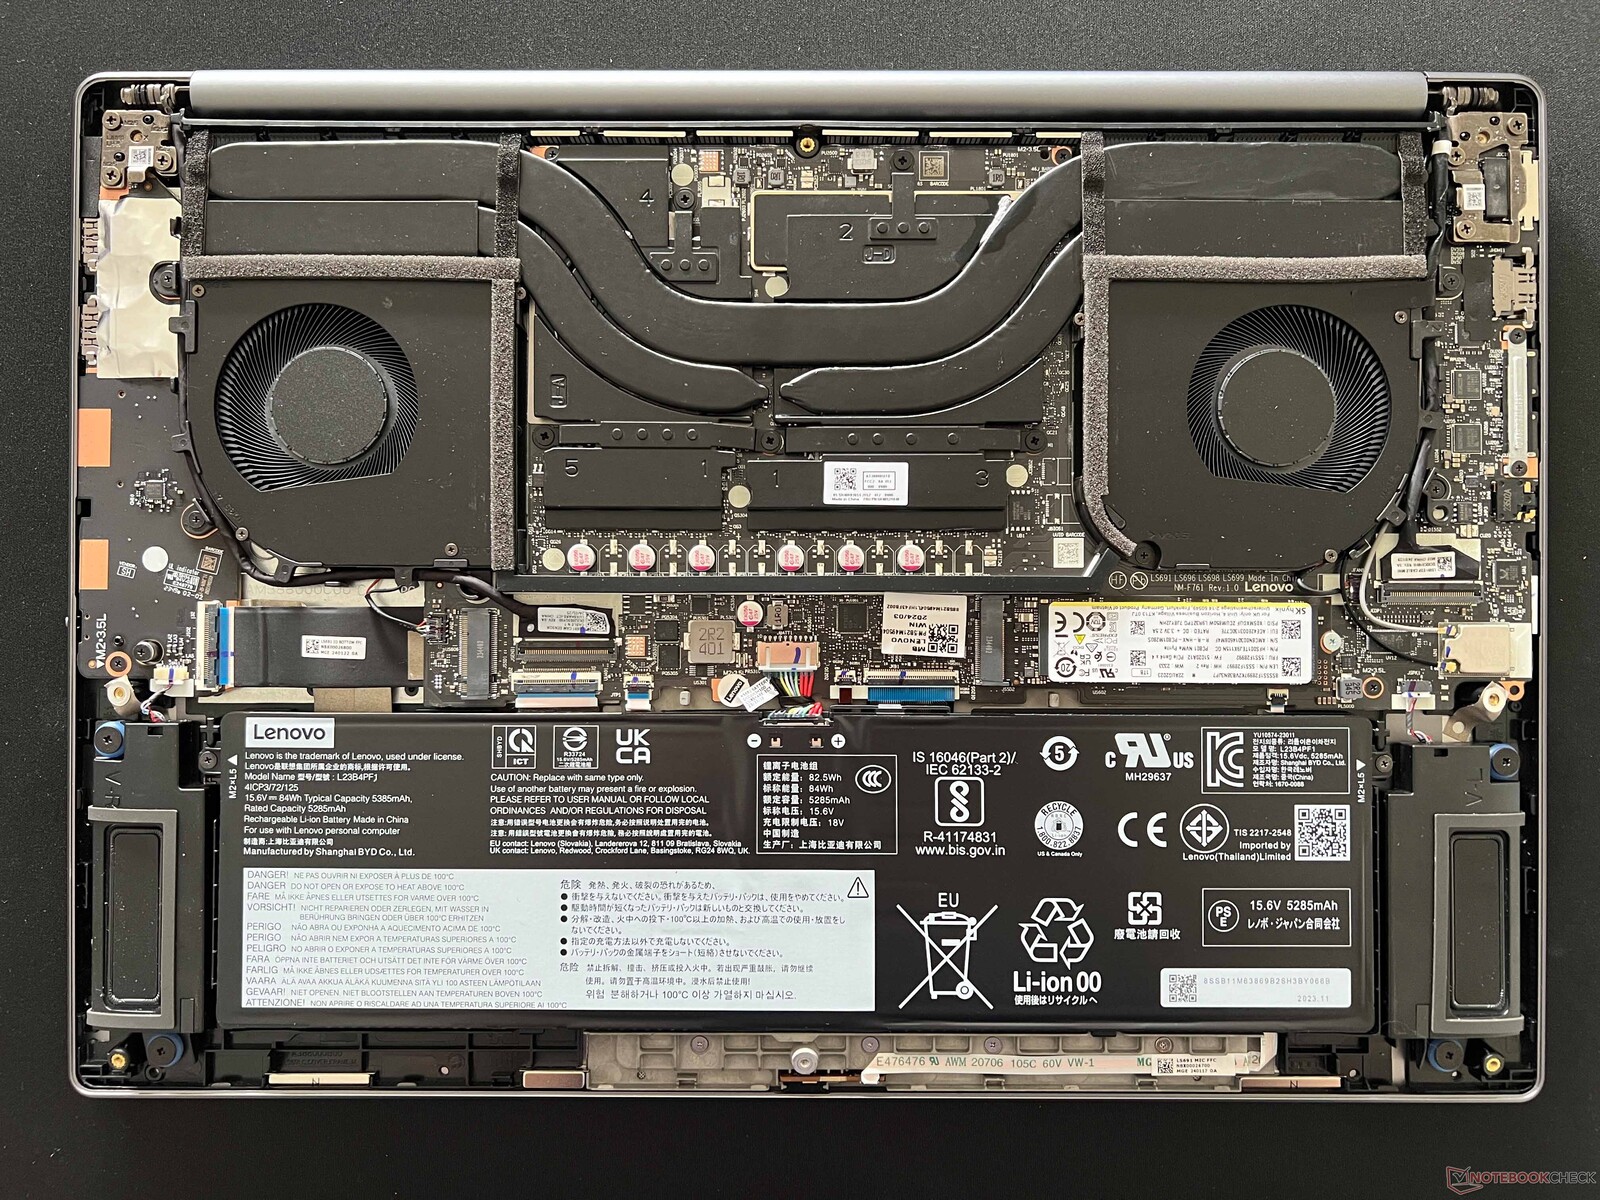
Wartung

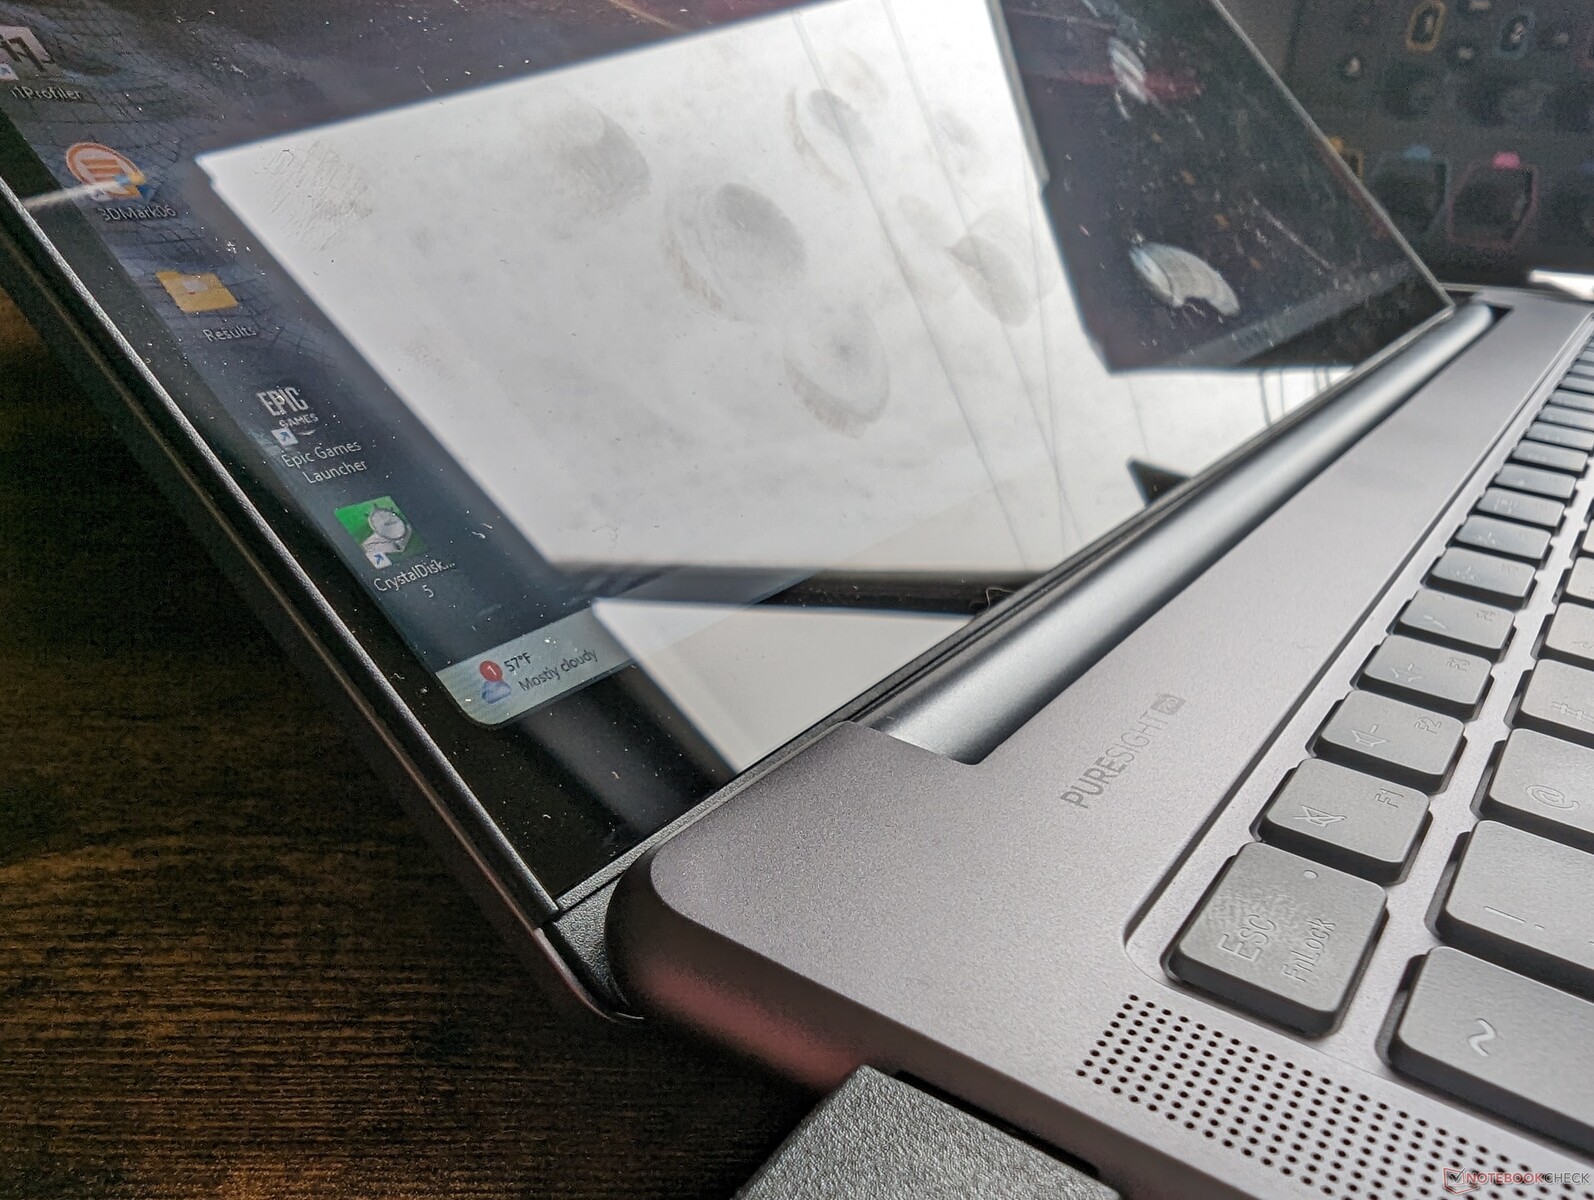
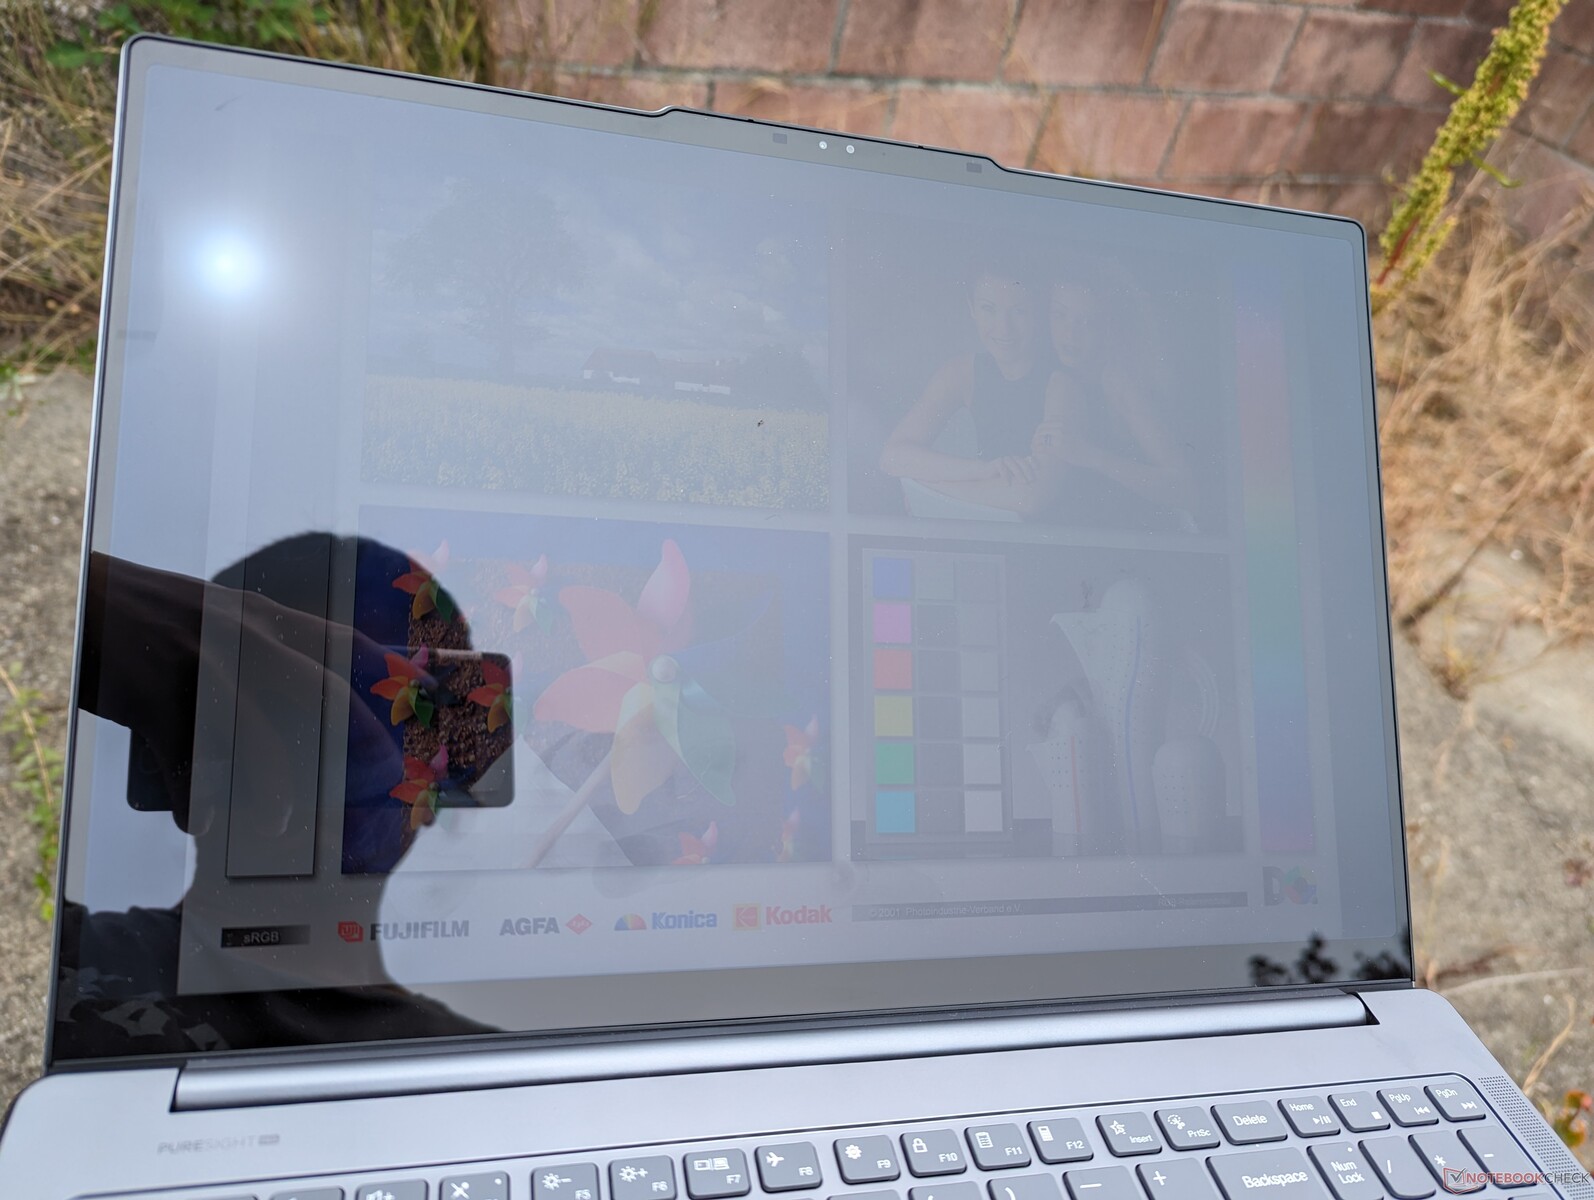
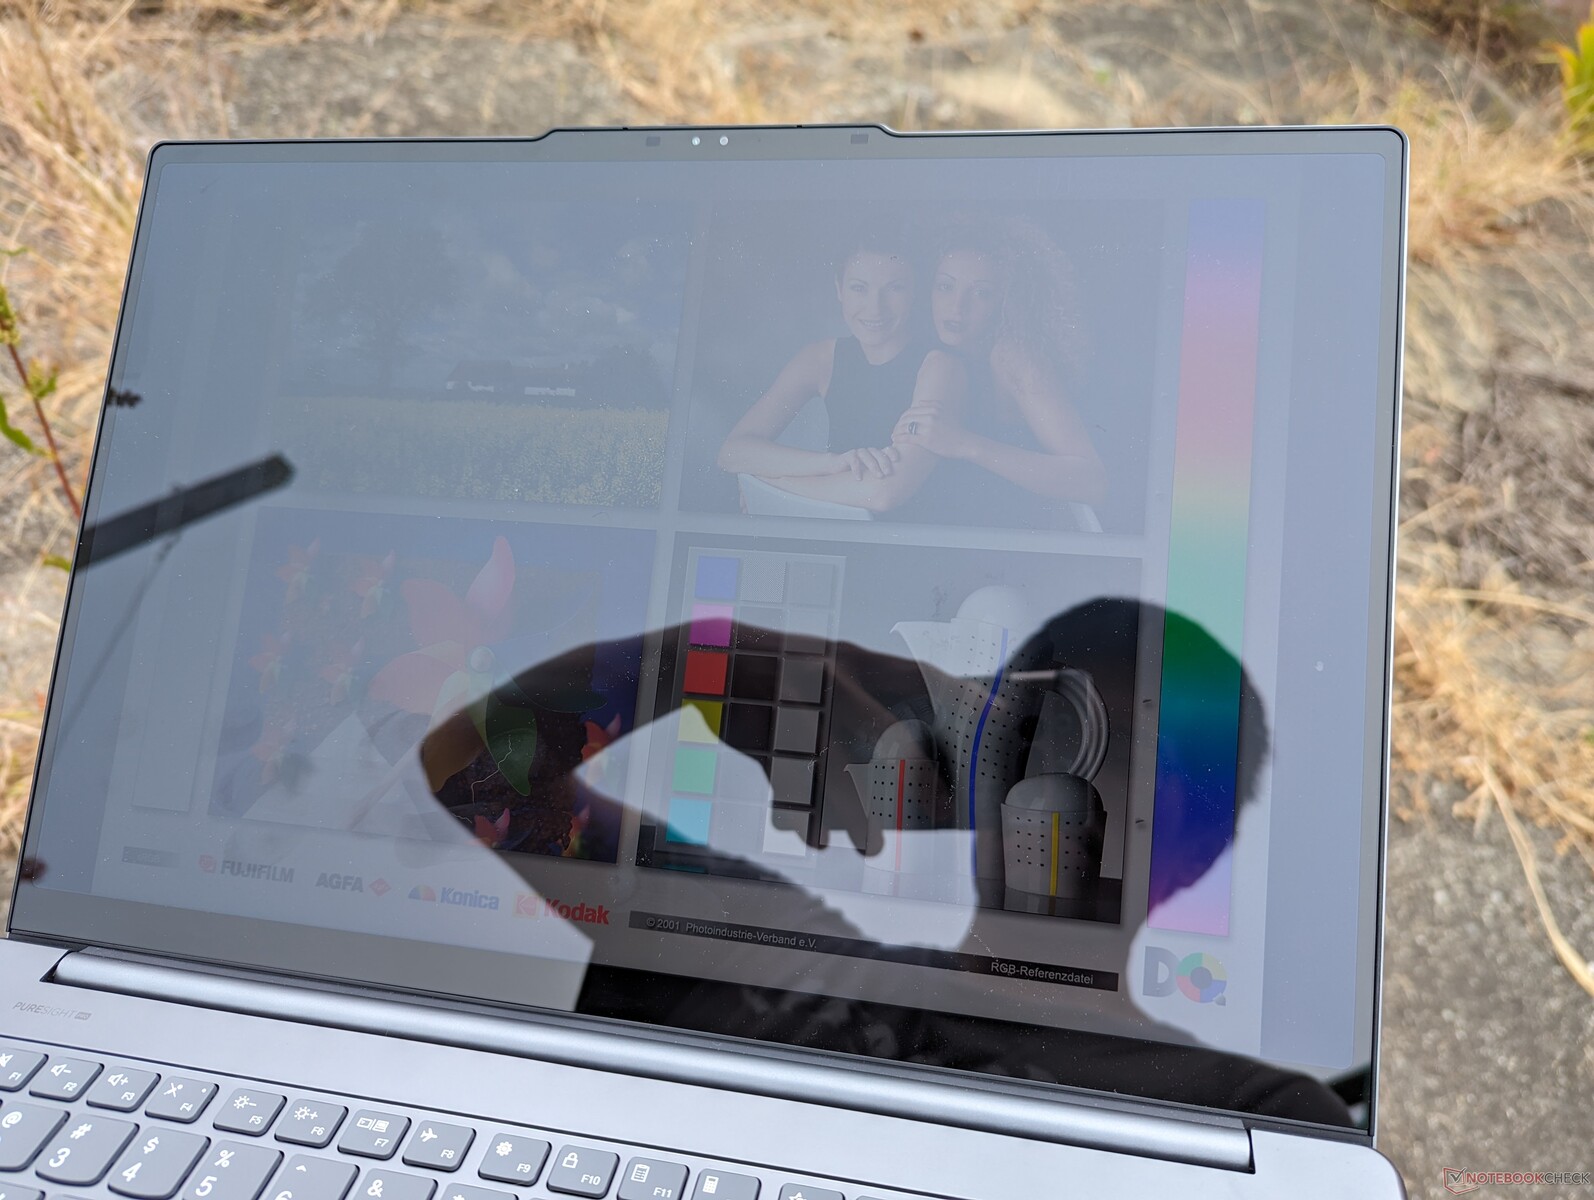
Display — 3.2K IPS und Mini-LED Optionen
Lenovo bietet die folgenden drei Display-Optionen an. Alle Panels haben die gleiche native Auflösung von 3200 x 2000 und die gleiche Bildwiederholrate mit Advanced Optimus-Unterstützung, aber kein G-Sync. Unser Testgerät ist mit der fettgedruckten Option ausgestattet, während die höherwertige RTX 4070-Konfiguration mit der Mini-LED-Option ausgestattet ist.
- 3.2K, 165 Hz, IPS, 400 nits, 100% P3, matt, non-touch
- 3.2K, 165 Hz, IPS, 400 nits, 100% P3, glänzend, Touch
- 3.2K, 165 Hz, Mini-LED, 1200 nits, 100% P3, glänzend, Touch
Das visuelle Erlebnis zwischen den IPS- und Mini-LED-Optionen ist überraschenderweise recht ähnlich, da ihre Farbbereiche und Bildwiederholraten im Wesentlichen gleich sind. IPS profitiert jedoch von schnelleren Schwarz-Weiß-Reaktionszeiten und keinen größeren Halo-Effekten im Vergleich zu Mini-LED. Die Unterschiede werden stattdessen verstärkt, wenn HDR-fähige Inhalte abgespielt werden. Hier glänzt Mini-LED mit seinem überlegenen Kontrast und Helligkeitsniveau. Nutzer, die viele HDR-Medien ansehen oder abspielen, sollten daher Mini-LED bevorzugen, während diejenigen, die Geld sparen wollen oder denen es nichts ausmacht, auf HDR zu verzichten, mit IPS ein traditionelleres Erlebnis haben können.


| |||||||||||||||||||||||||
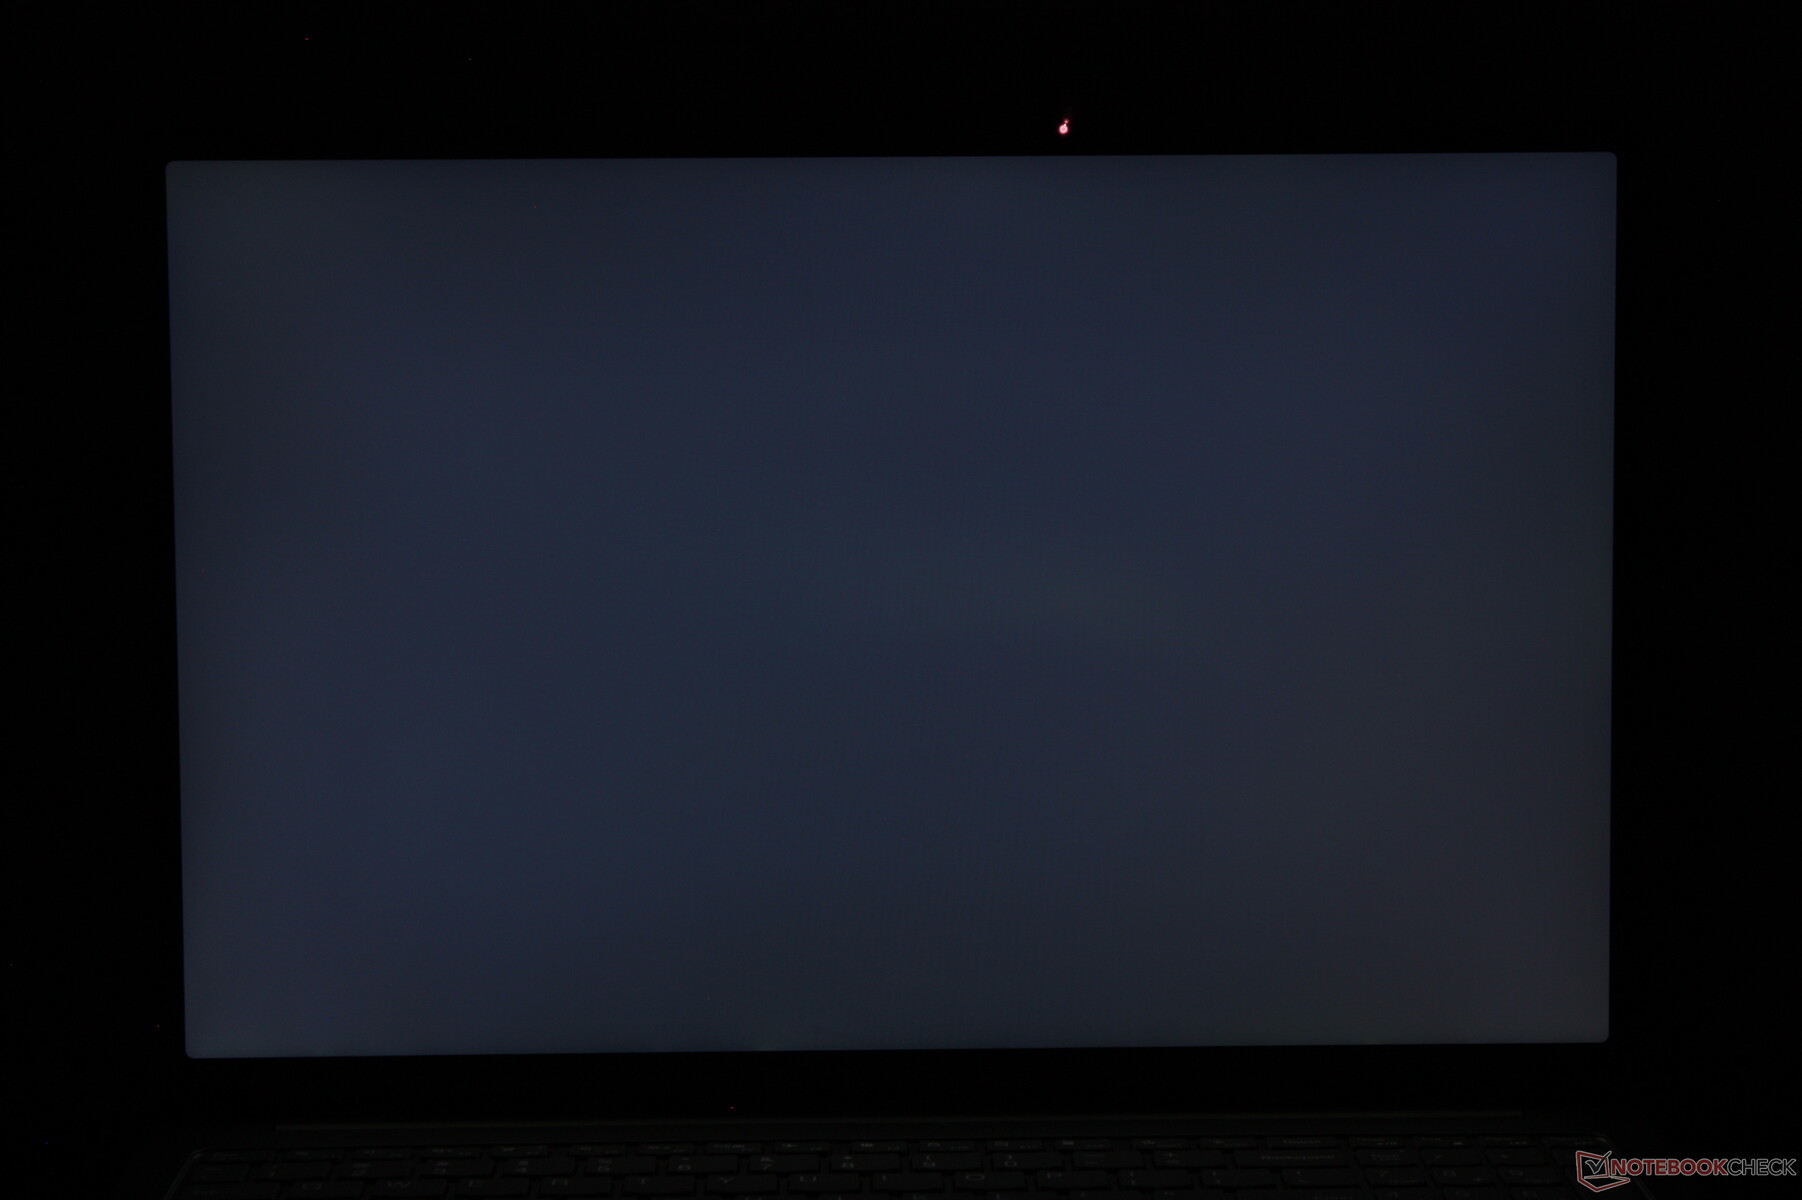
Ausleuchtung: 91 %
Helligkeit Akku: 404.9 cd/m²
Kontrast: 1012:1 (Schwarzwert: 0.4 cd/m²)
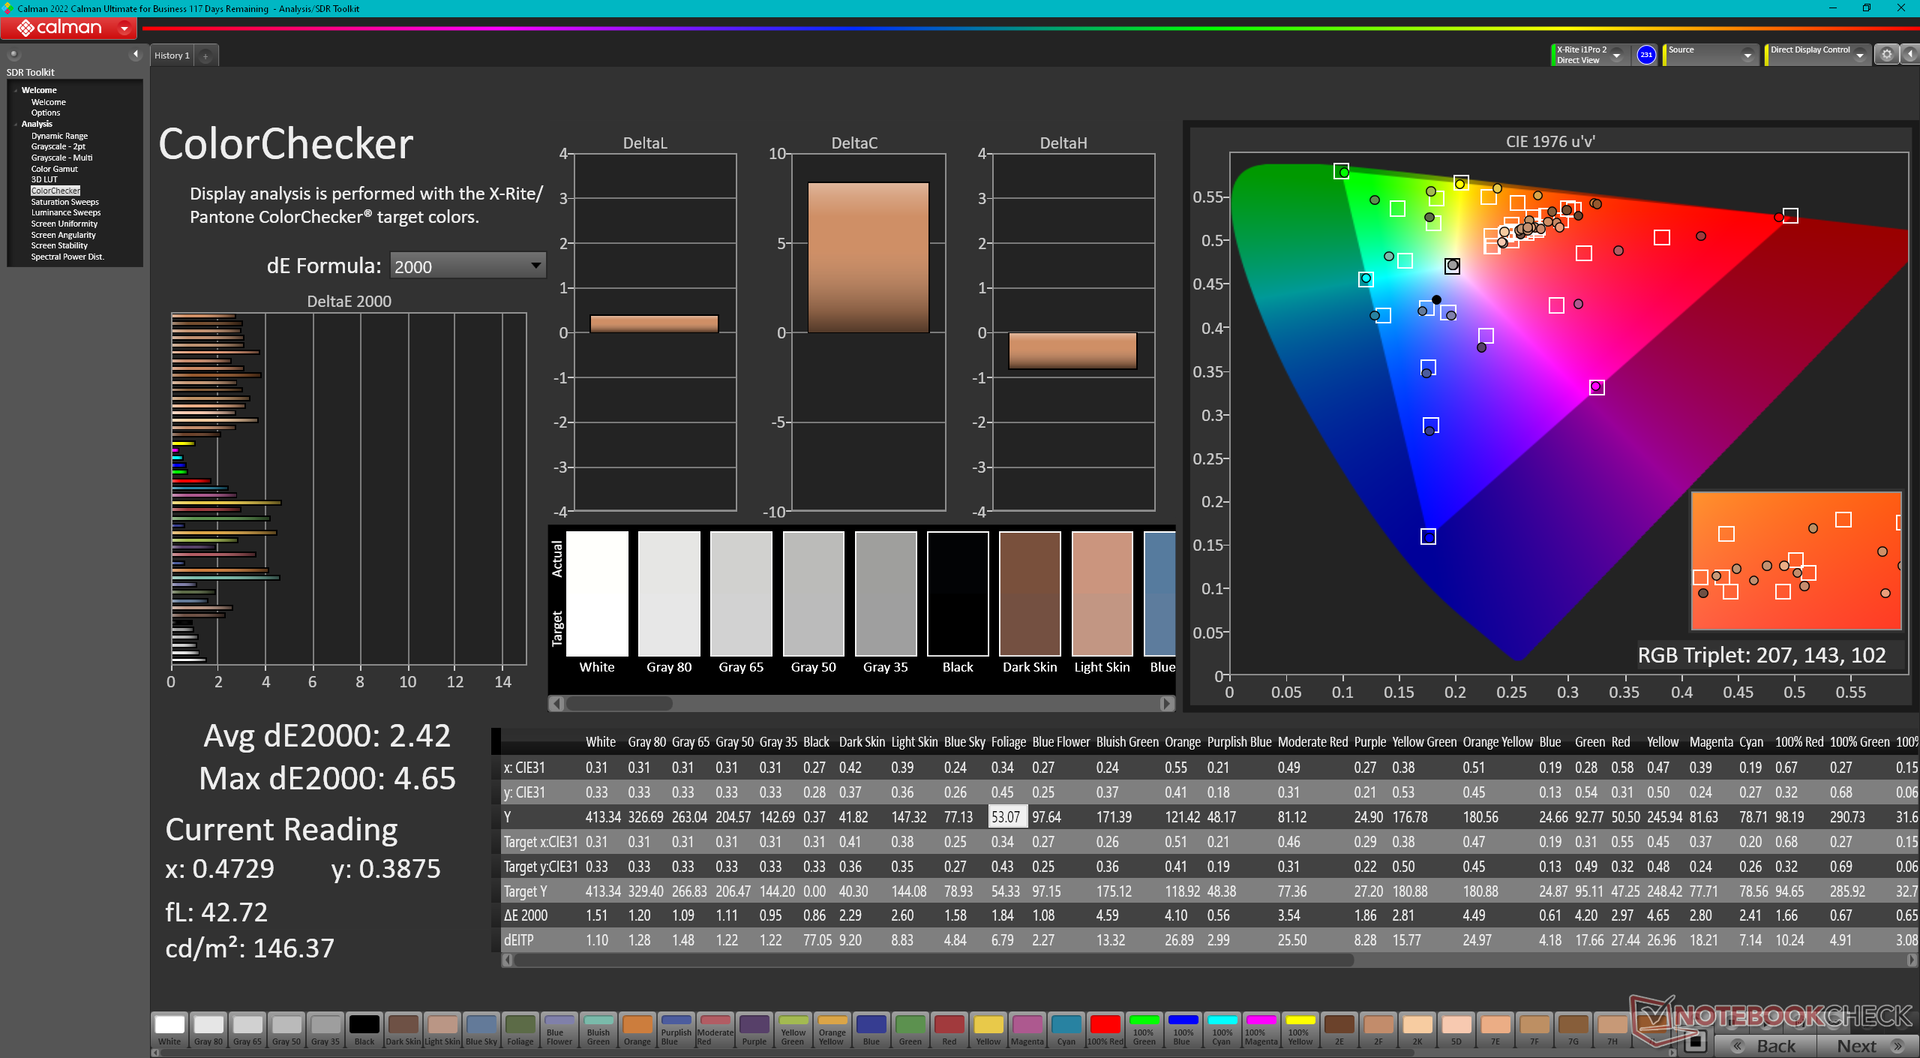
ΔE ColorChecker Calman: 2.42 | ∀{0.5-29.43 Ø4.72}
calibrated: 0.93
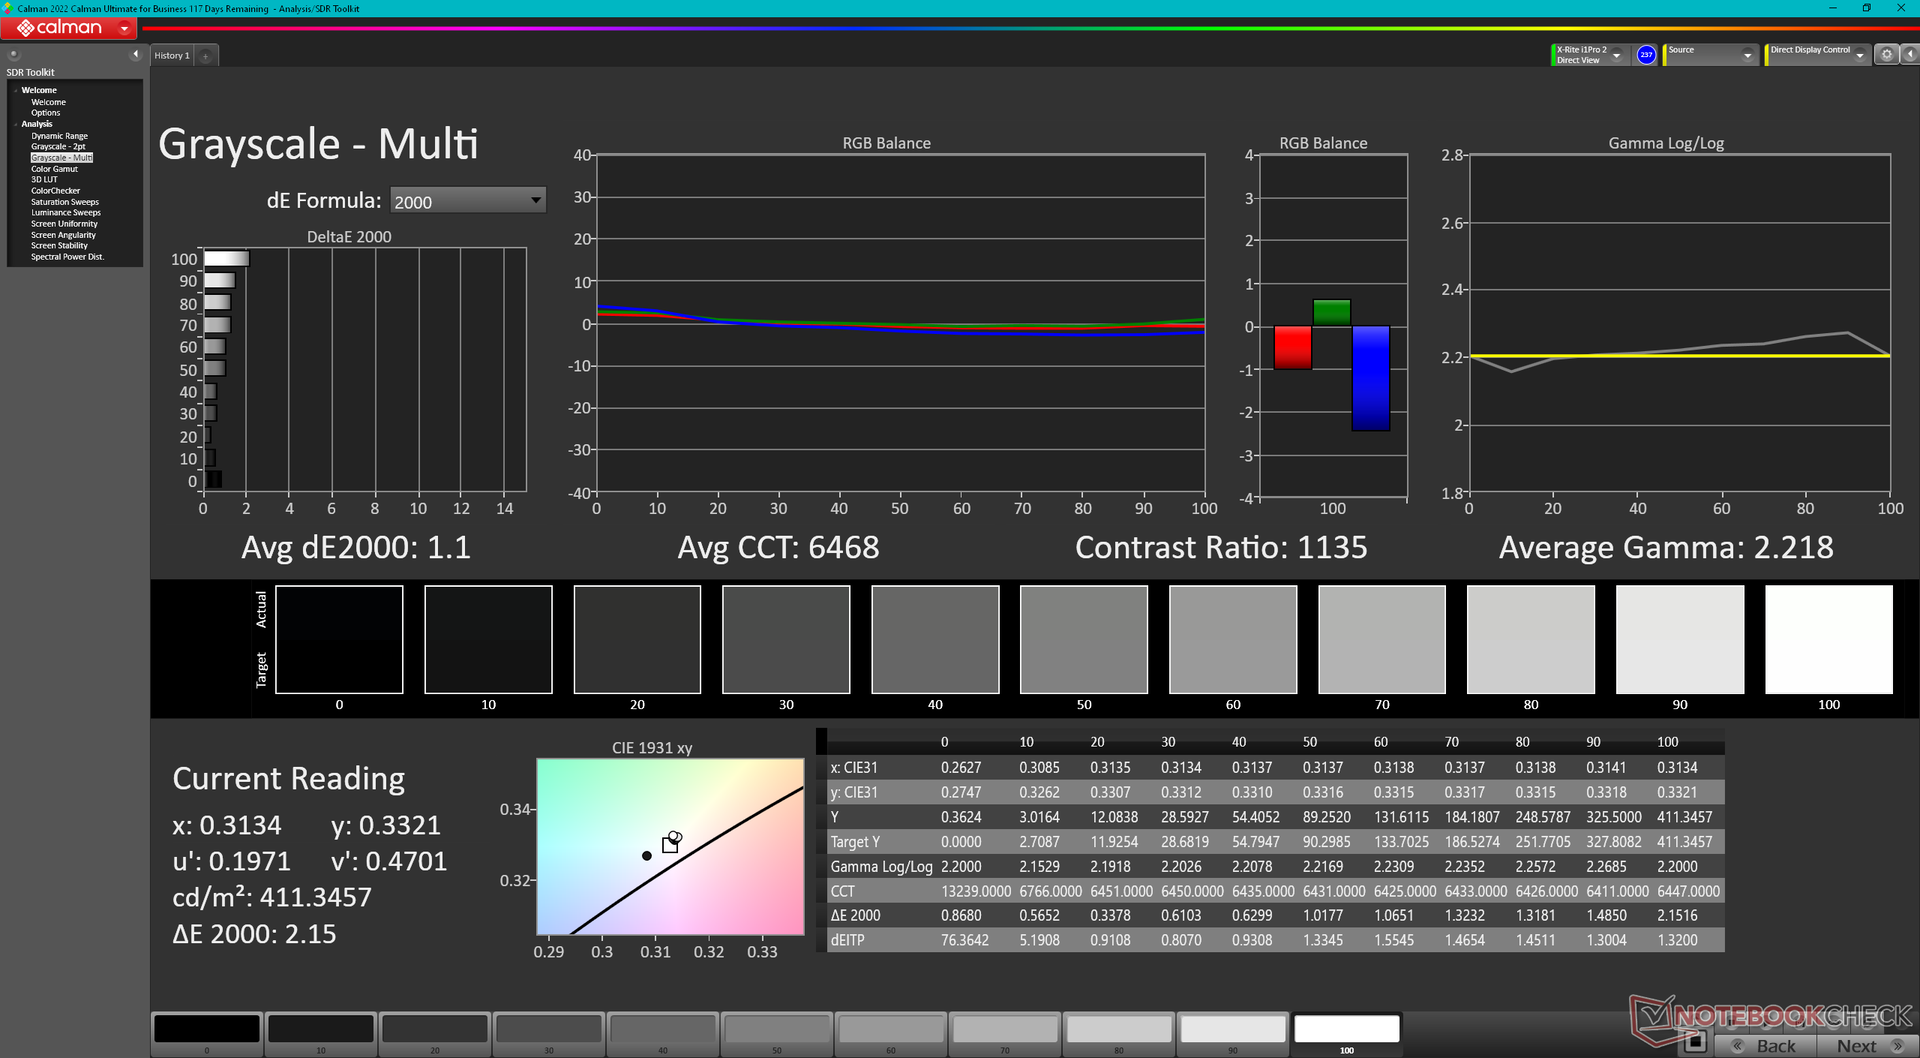
ΔE Greyscale Calman: 1.1 | ∀{0.09-98 Ø4.97}
86.5% AdobeRGB 1998 (Argyll 3D)
99.9% sRGB (Argyll 3D)
95.6% Display P3 (Argyll 3D)
Gamma: 2.22
CCT: 6468 K
| Lenovo Yoga Pro 9 16IMH9 RTX 4050 LEN160-3.2K, IPS, 3200x2000, 16" | Lenovo Yoga Pro 9 16IMH9 LEN160-3.2K, Mini-LED, 3200x2000, 16" | HP Envy x360 2-in-1 16-ad0097nr Samsung SDC41A6, OLED, 2880x1800, 16" | Dell XPS 16 9640 SDC4196, OLED, 3840x2400, 16.3" | Samsung Galaxy Book4 Ultra ATNA60CL07-0, OLED, 2880x1800, 16" | Asus VivoBook Pro 16 K6602VU Samsung ATNA60BX01-1, OLED, 3200x2000, 16" | |
|---|---|---|---|---|---|---|
| Display | 0% | 5% | 2% | 2% | 5% | |
| Display P3 Coverage (%) | 95.6 | 97 1% | 99.6 4% | 98.3 3% | 98.6 3% | 98.7 3% |
| sRGB Coverage (%) | 99.9 | 99.9 0% | 100 0% | 100 0% | 99.9 0% | 99.7 0% |
| AdobeRGB 1998 Coverage (%) | 86.5 | 86.6 0% | 96.5 12% | 87.8 2% | 88.5 2% | 96.5 12% |
| Response Times | -85% | 92% | 92% | 94% | 24% | |
| Response Time Grey 50% / Grey 80% * (ms) | 12.4 ? | 22.2 ? -79% | 0.8 ? 94% | 0.82 ? 93% | 0.54 ? 96% | 0.68 ? 95% |
| Response Time Black / White * (ms) | 8.9 ? | 17 ? -91% | 0.89 ? 90% | 0.85 ? 90% | 0.69 ? 92% | 13.2 ? -48% |
| PWM Frequency (Hz) | 4840 ? | 491.8 ? | 360 ? | 240 ? | 240 ? | |
| Bildschirm | 30% | -16% | -7% | -0% | -61% | |
| Helligkeit Bildmitte (cd/m²) | 404.9 | 651 61% | 399.4 -1% | 366 -10% | 390 -4% | 353 -13% |
| Brightness (cd/m²) | 390 | 673 73% | 405 4% | 367 -6% | 393 1% | 354 -9% |
| Brightness Distribution (%) | 91 | 93 2% | 98 8% | 96 5% | 98 8% | 98 8% |
| Schwarzwert * (cd/m²) | 0.4 | 0.22 45% | ||||
| Kontrast (:1) | 1012 | 2959 192% | ||||
| Delta E Colorchecker * | 2.42 | 1.9 21% | 4.05 -67% | 1.3 46% | 1.4 42% | 4.23 -75% |
| Colorchecker dE 2000 max. * | 4.65 | 4.2 10% | 6.69 -44% | 3.6 23% | 2.7 42% | 7.13 -53% |
| Colorchecker dE 2000 calibrated * | 0.93 | 0.6 35% | 1.02 -10% | 1 -8% | 2.42 -160% | |
| Delta E Graustufen * | 1.1 | 3 -173% | 1.1 -0% | 2.2 -100% | 2.1 -91% | 2.5 -127% |
| Gamma | 2.22 99% | 2.18 101% | 2.27 97% | 2.14 103% | 2.27 97% | 2.4 92% |
| CCT | 6468 100% | 6738 96% | 6419 101% | 6680 97% | 6431 101% | 6642 98% |
| Durchschnitt gesamt (Programm / Settings) | -18% /
7% | 27% /
8% | 29% /
12% | 32% /
17% | -11% /
-31% |
* ... kleinere Werte sind besser

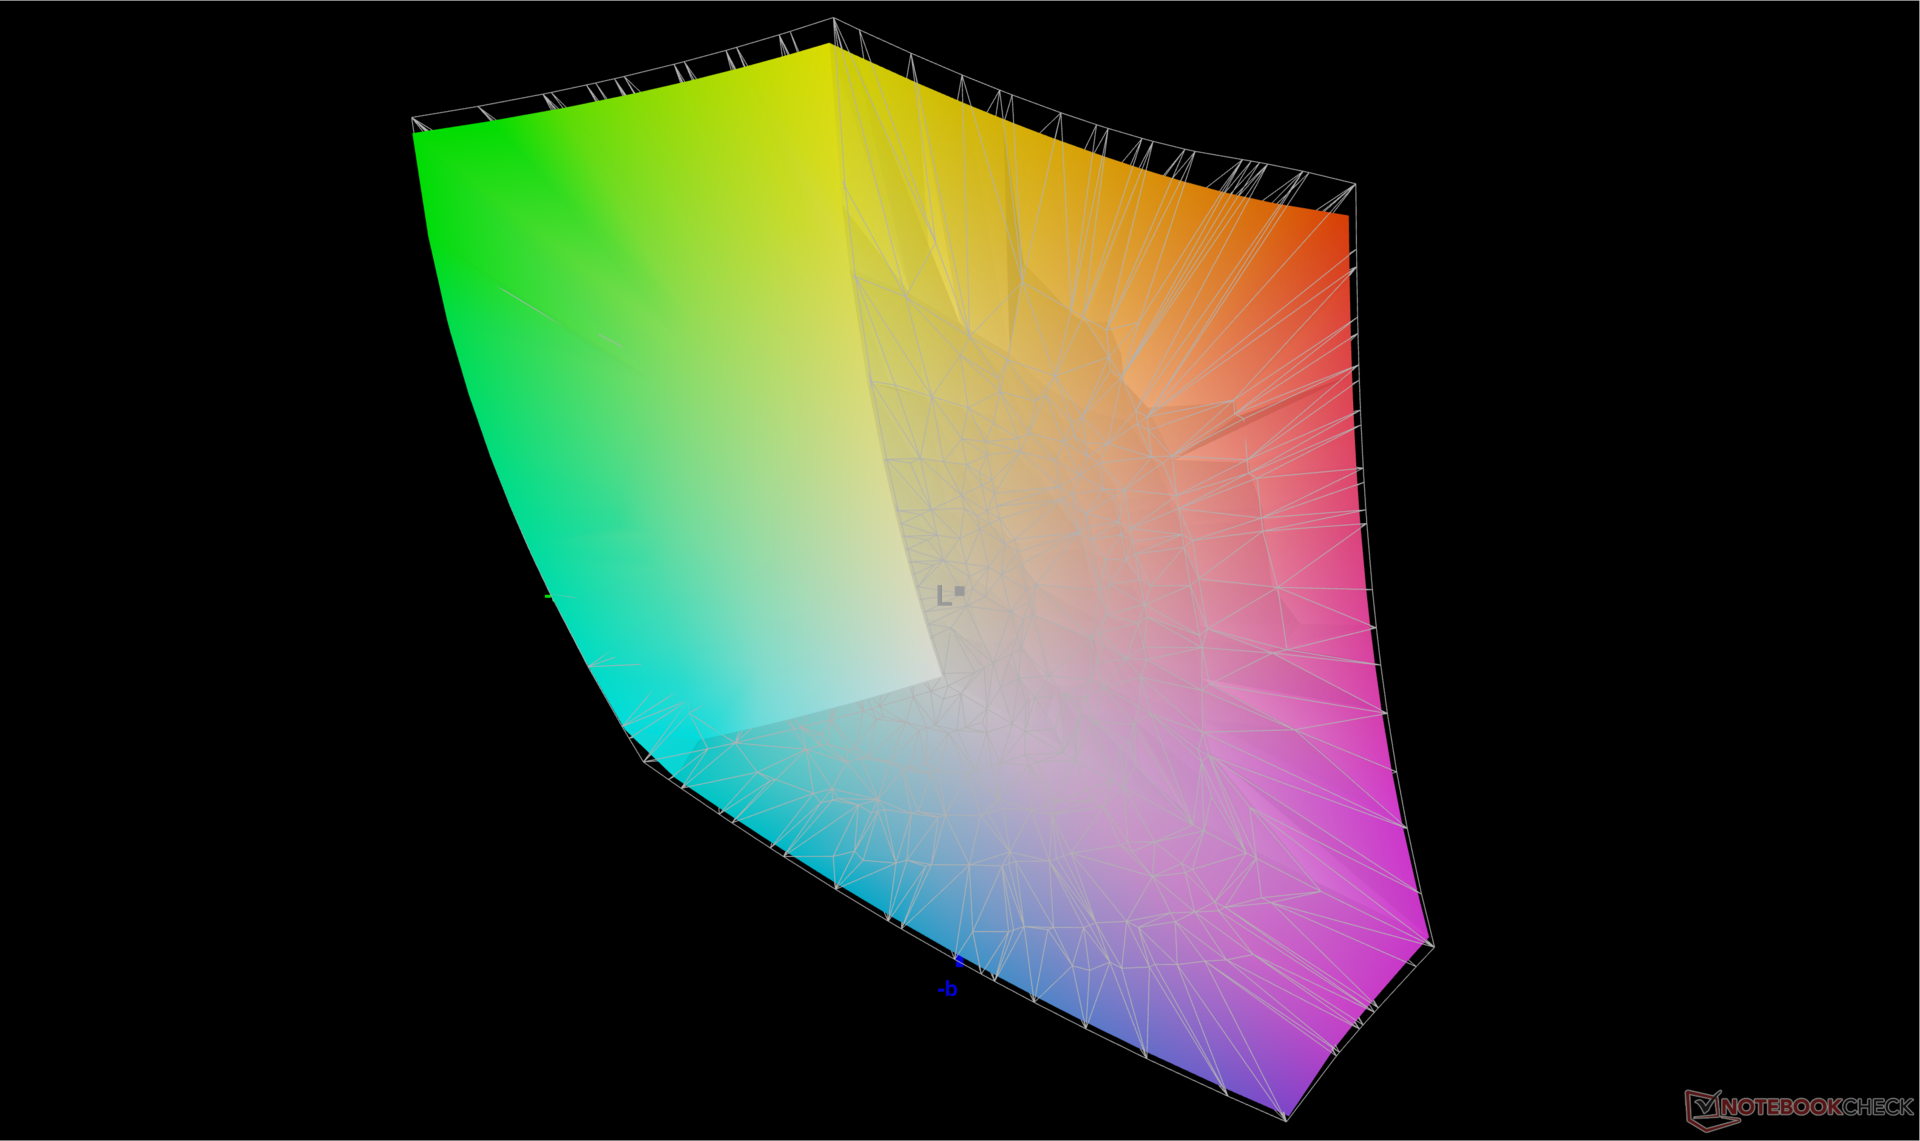
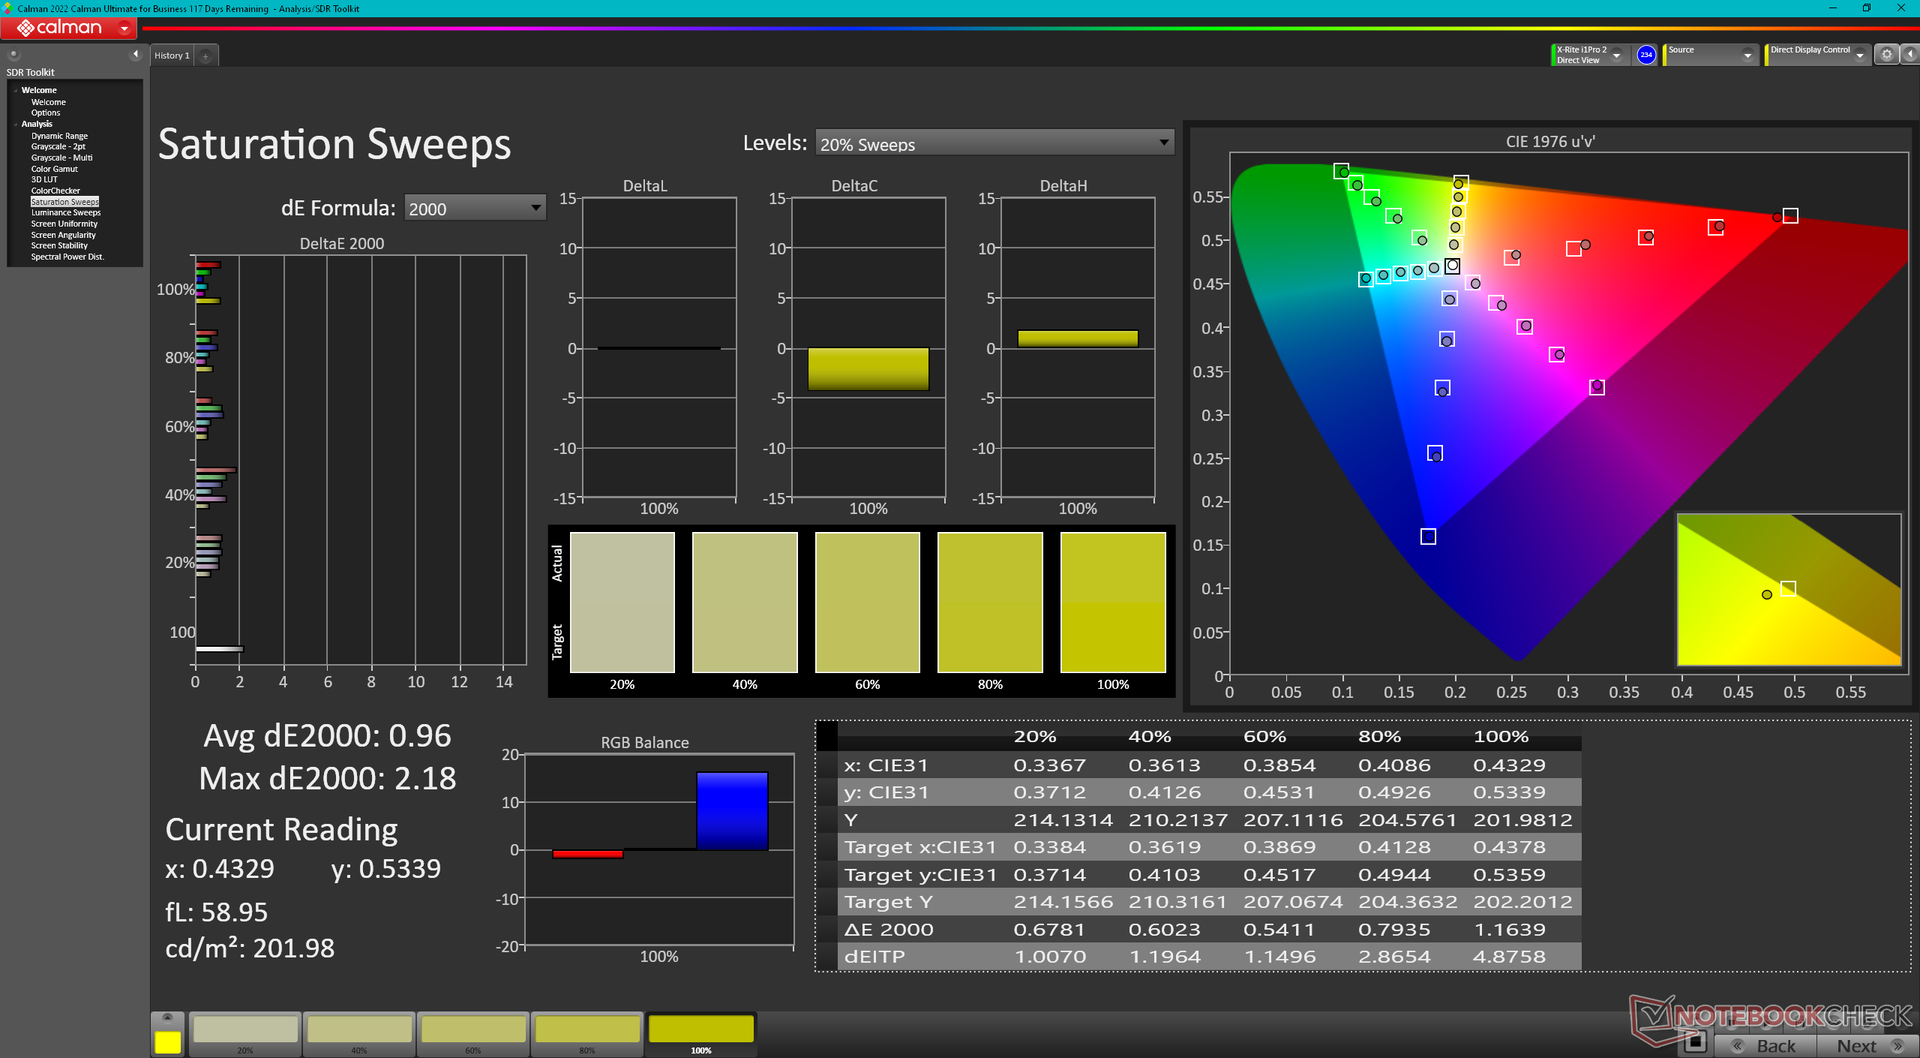
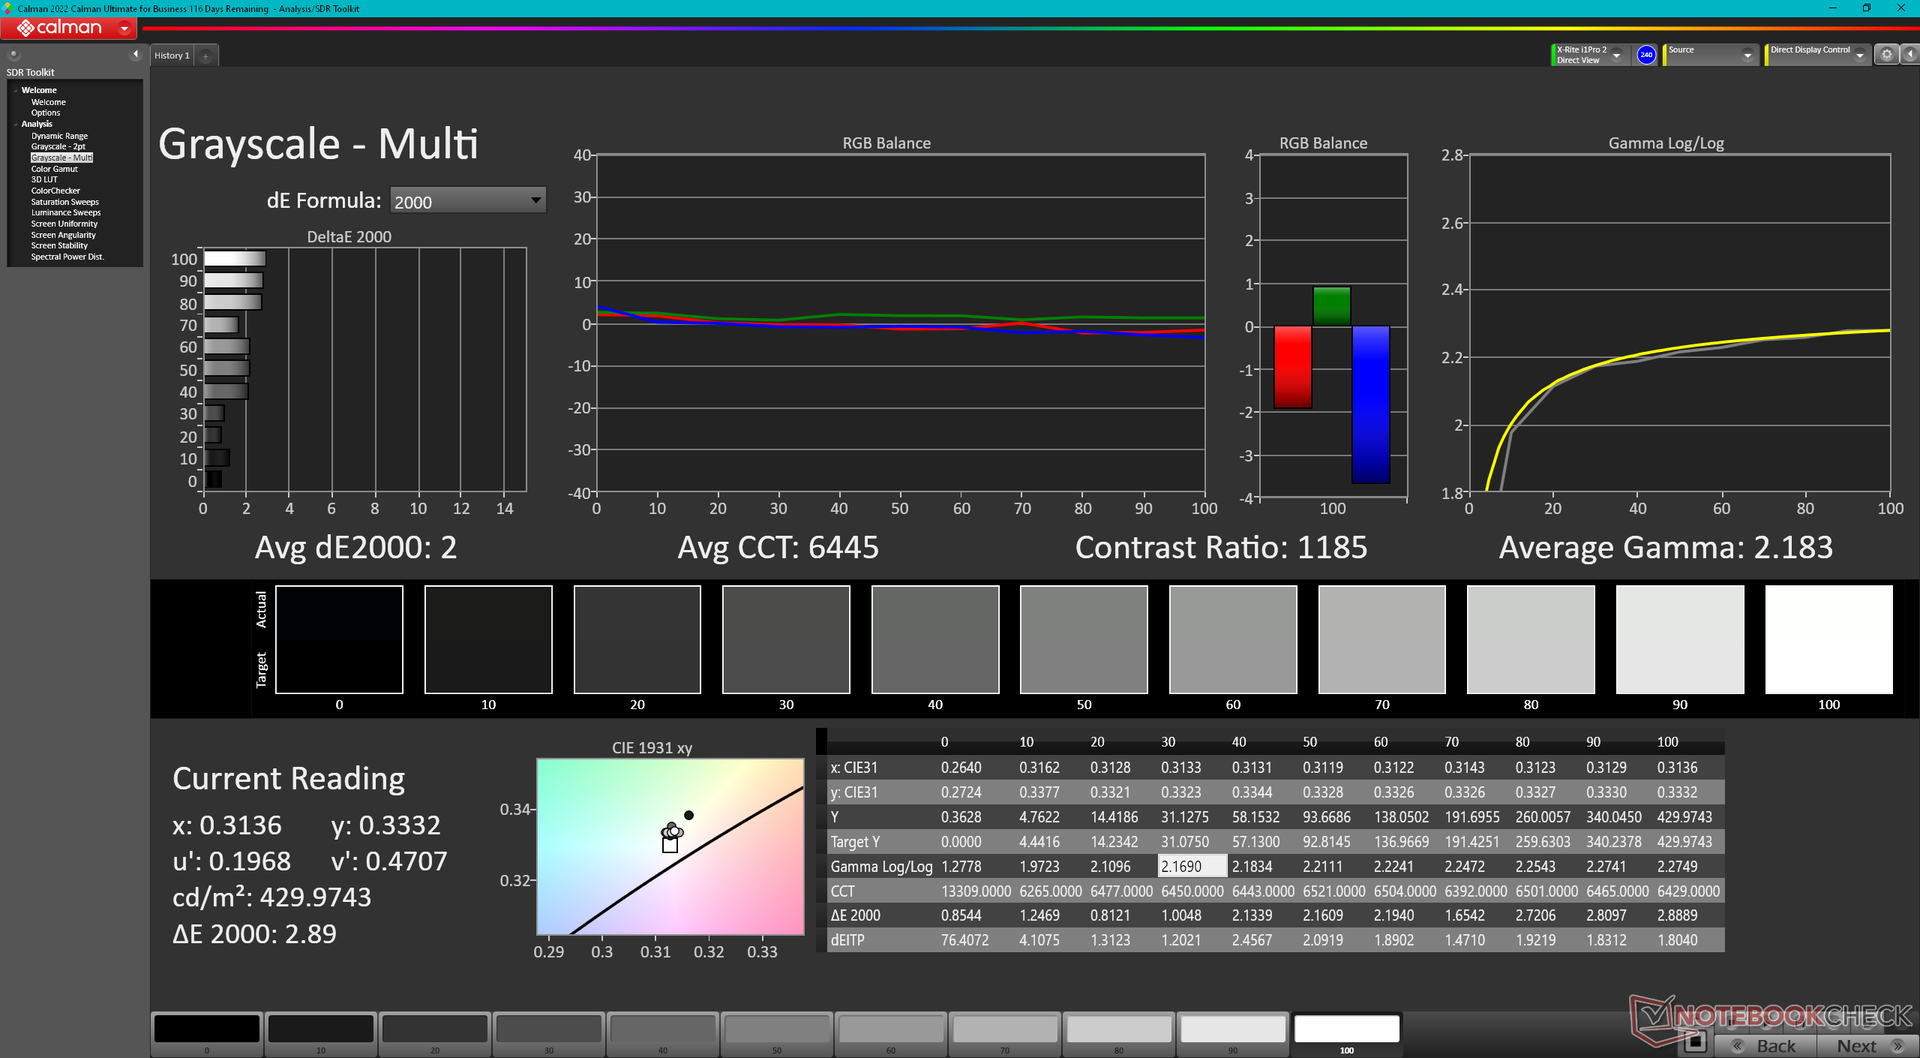
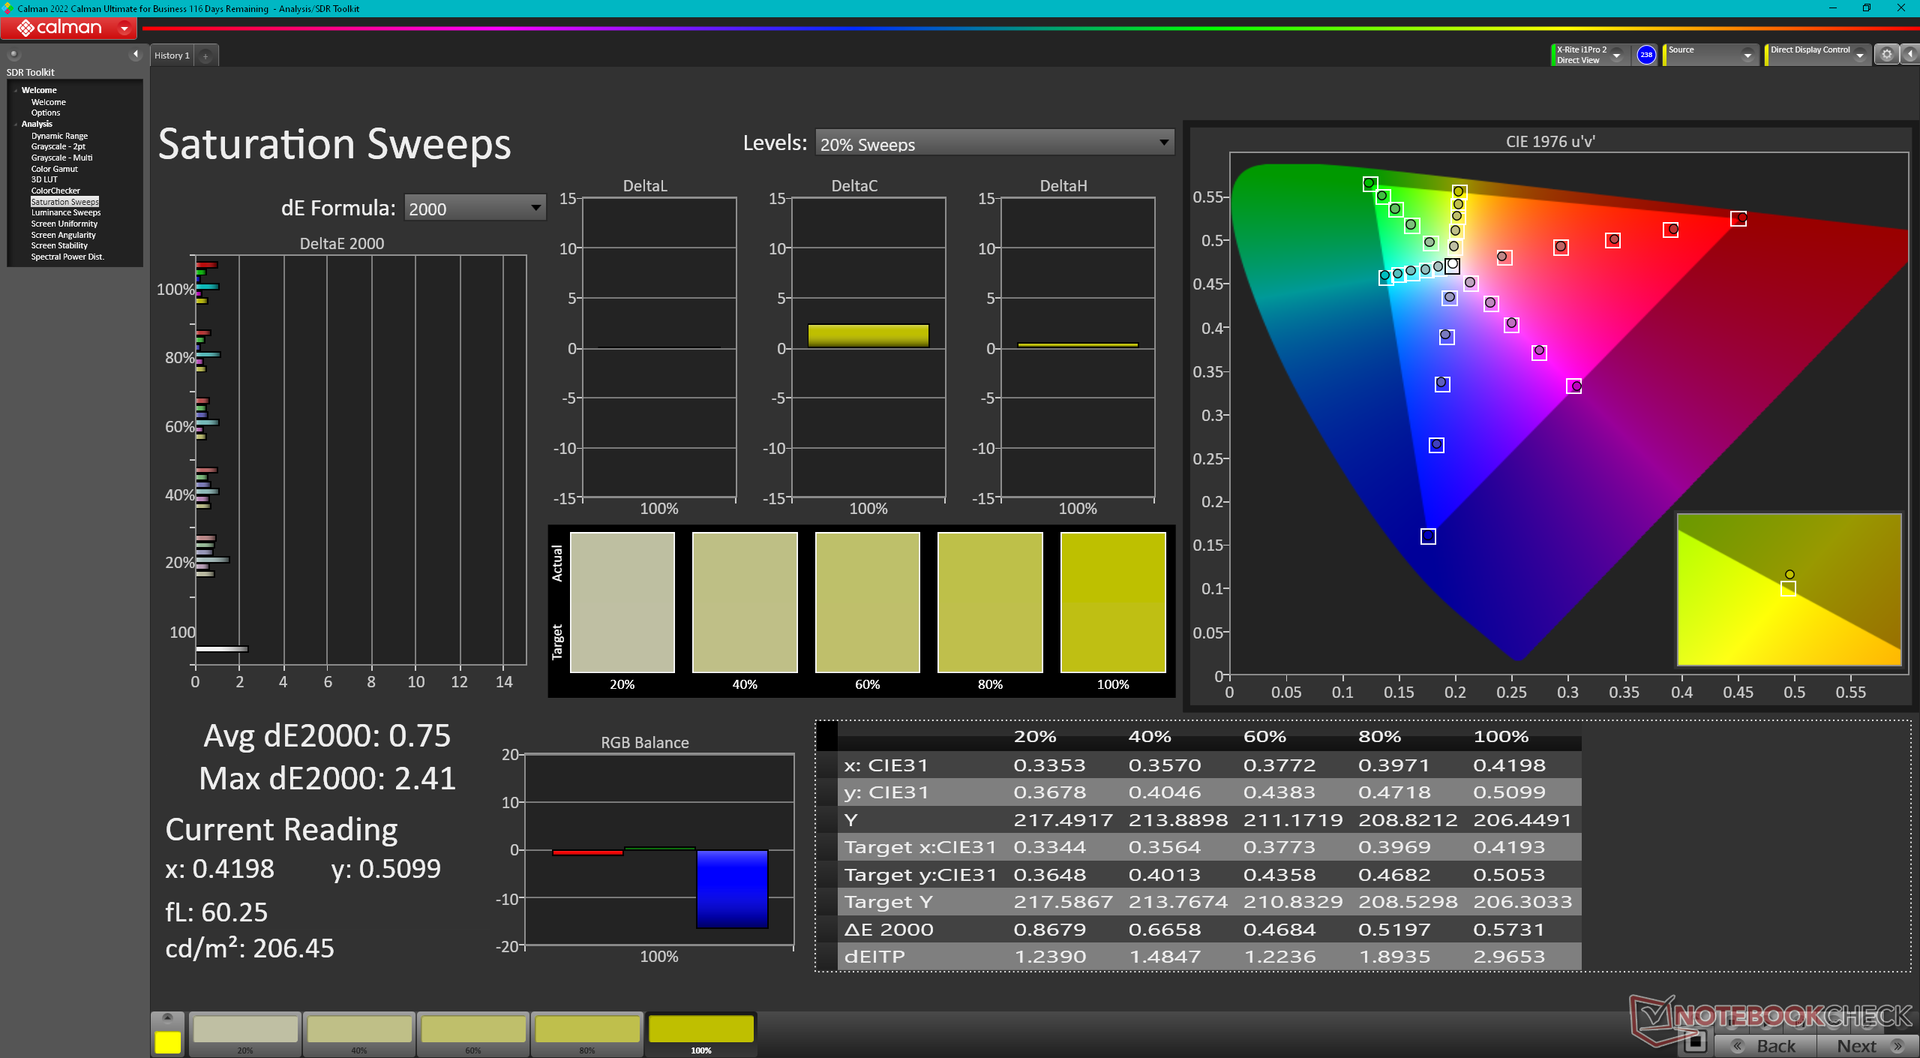
Das Display ist ab Werk nach dem P3-Standard kalibriert und weist durchschnittliche Graustufen- und Farb-DeltaE-Werte von nur 1,1 bzw. 2,42 auf. Eine Kalibrierung durch den Endbenutzer ist daher für die meisten Anwender nicht erforderlich.

Reaktionszeiten (Response Times) des Displays
| ↔ Reaktionszeiten Schwarz zu Weiß | ||
|---|---|---|
| 8.9 ms ... steigend ↗ und fallend ↘ kombiniert | ↗ 4.8 ms steigend | 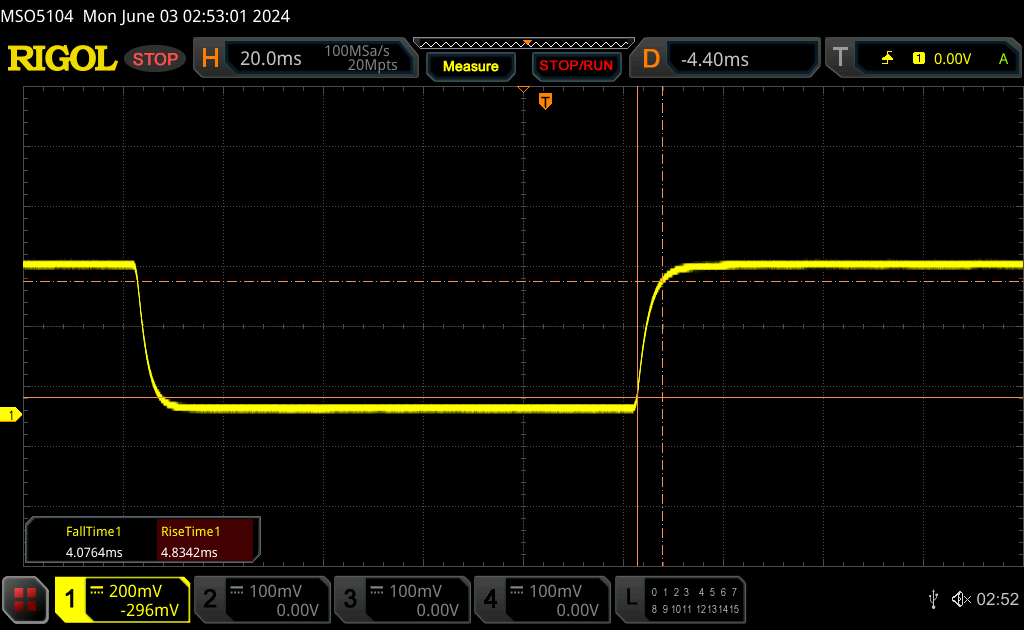 |
| ↘ 4.1 ms fallend | ||
| Die gemessenen Reaktionszeiten sind kurz wodurch sich der Bildschirm auch für Spiele gut eignen sollte. Im Vergleich rangierten die bei uns getesteten Geräte von 0.1 (Minimum) zu 240 (Maximum) ms. » 25 % aller Screens waren schneller als der getestete. Daher sind die gemessenen Reaktionszeiten besser als der Durchschnitt aller vermessenen Geräte (19.8 ms). | ||
| ↔ Reaktionszeiten 50% Grau zu 80% Grau | ||
| 12.4 ms ... steigend ↗ und fallend ↘ kombiniert | ↗ 6.3 ms steigend | 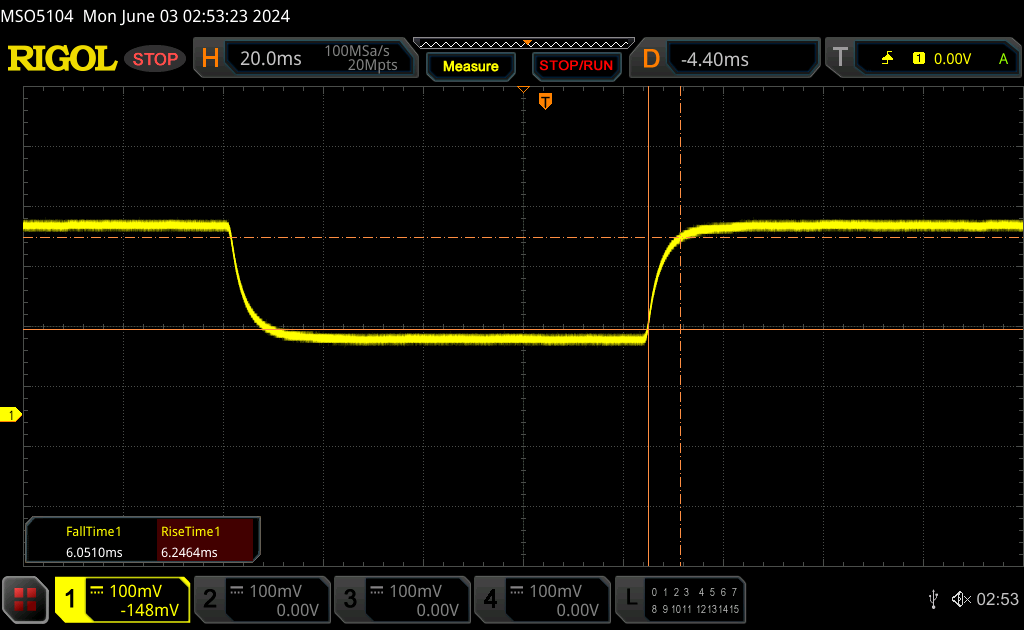 |
| ↘ 6.1 ms fallend | ||
| Die gemessenen Reaktionszeiten sind gut, für anspruchsvolle Spieler könnten der Bildschirm jedoch zu langsam sein. Im Vergleich rangierten die bei uns getesteten Geräte von 0.165 (Minimum) zu 636 (Maximum) ms. » 26 % aller Screens waren schneller als der getestete. Daher sind die gemessenen Reaktionszeiten besser als der Durchschnitt aller vermessenen Geräte (31 ms). | ||
Bildschirm-Flackern / PWM (Pulse-Width Modulation)
| Flackern / PWM nicht festgestellt |  | ||
Im Vergleich: 52 % aller getesteten Geräte nutzten kein PWM um die Helligkeit zu reduzieren. Wenn PWM eingesetzt wurde, dann bei einer Frequenz von durchschnittlich 7763 (Minimum 5, Maximum 343500) Hz. | |||


Performance — Vielseitige Multimedia-Gaming-Maschine

Testbedingungen
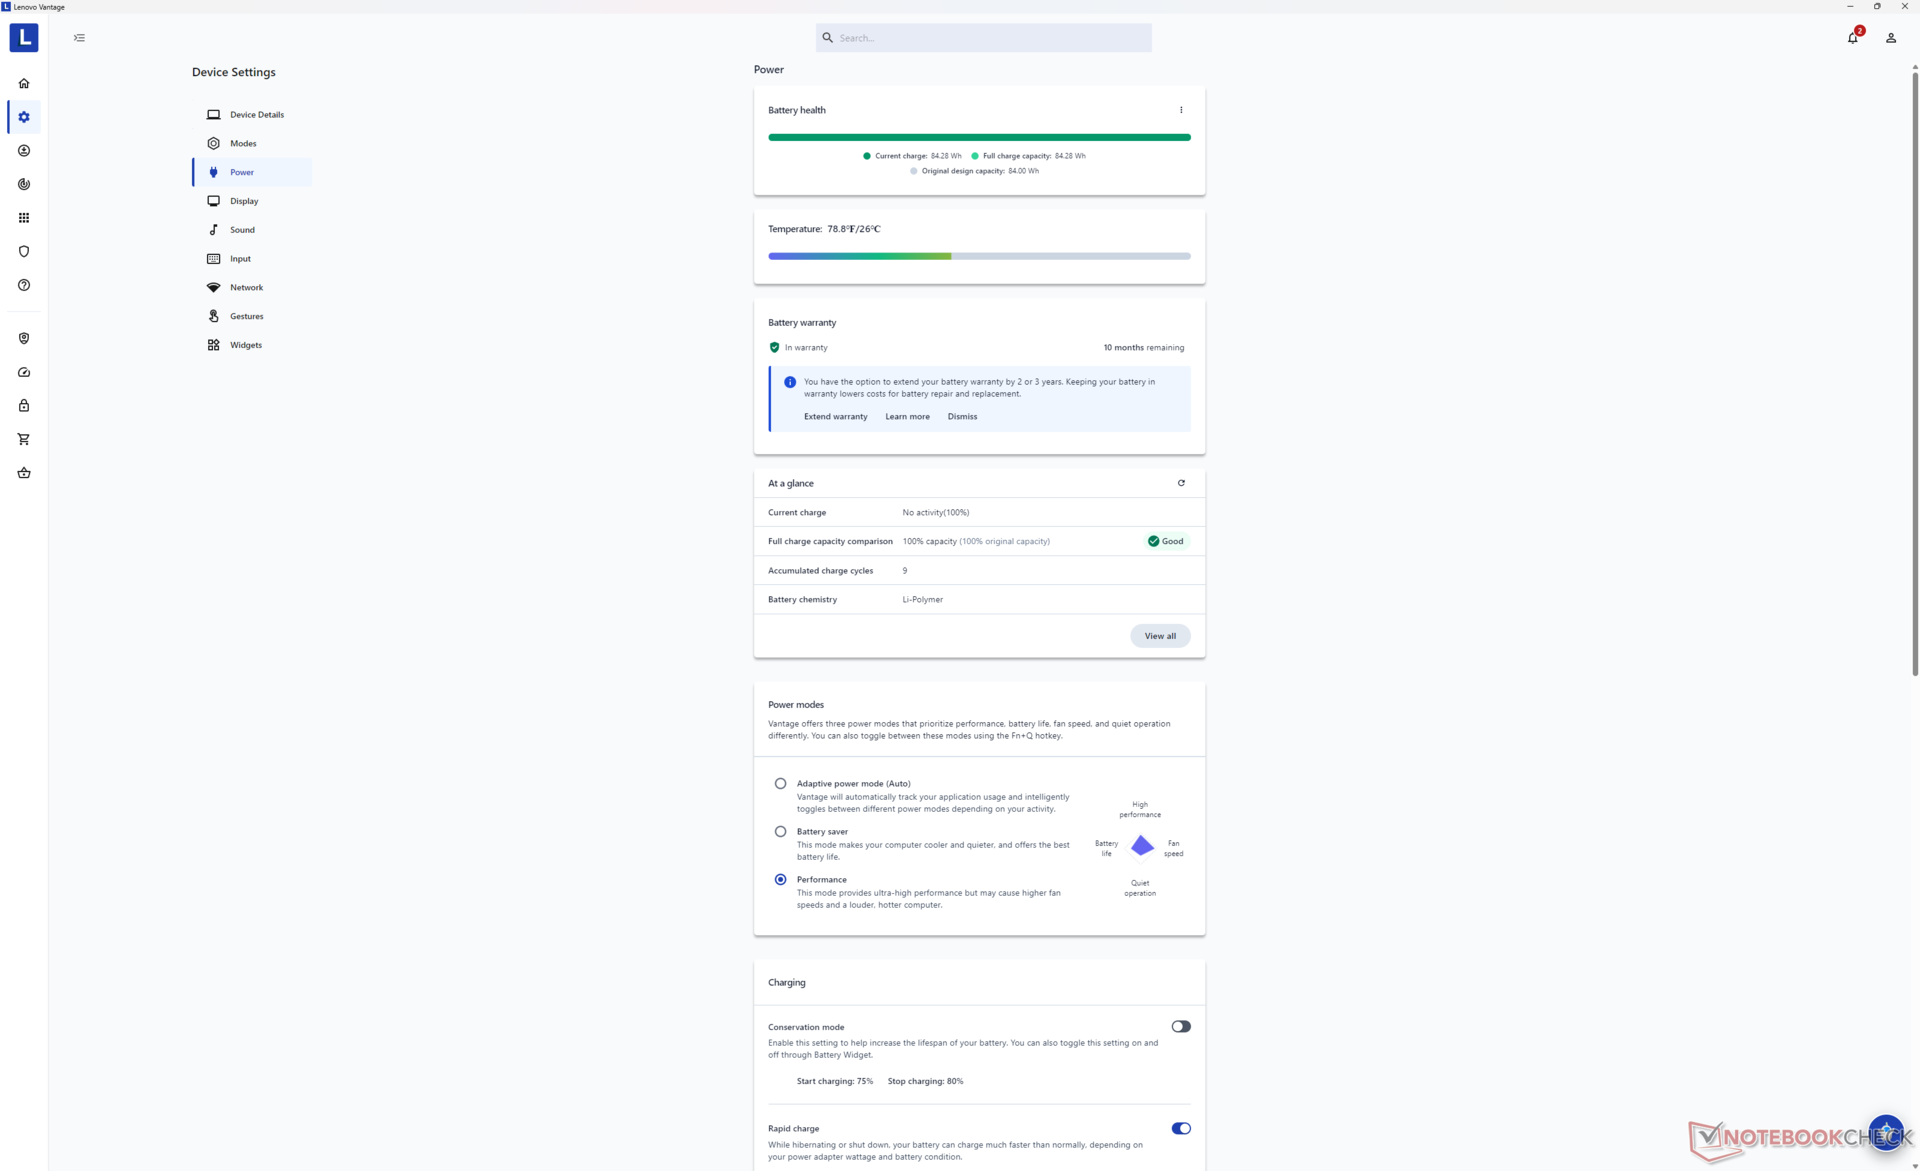
Wir haben Lenovo Vantage auf den Leistungsmodus und Nvidia auf den diskreten GPU-Modus eingestellt, bevor wir die folgenden Benchmarks durchgeführt haben.
Beachten Sie, dass die GPU zwar auf den diskreten Modus eingestellt werden kann, es aber keinen „iGPU only“-Modus in der Nvidia Systemsteuerung gibt.

Prozessor
Die Leistung des Core Ultra 9 185H in unserer RTX 4050-Konfiguration liegt innerhalb von 3 Prozentpunkten der gleichen CPU in der höherwertigen RTX 4070-Konfiguration. Er bietet eine schnellere Leistung als der aktuelle Core i7-13900H und integriert zudem eine NPU für KI-beschleunigte Aufgaben. Ein Downgrade auf die Core Ultra 7 155H-Konfiguration dürfte sich nur um 5 bis 10 Prozent auf die Leistung auswirken, basierend auf unserer Zeit mit dem Dell XPS 16 9640.
Cinebench R15 Multi Dauertest
Cinebench R23: Multi Core | Single Core
Cinebench R20: CPU (Multi Core) | CPU (Single Core)
Cinebench R15: CPU Multi 64Bit | CPU Single 64Bit
Blender: v2.79 BMW27 CPU
7-Zip 18.03: 7z b 4 | 7z b 4 -mmt1
Geekbench 6.7: Multi-Core | Single-Core
Geekbench 5.5: Multi-Core | Single-Core
HWBOT x265 Benchmark v2.2: 4k Preset
LibreOffice : 20 Documents To PDF
R Benchmark 2.5: Overall mean
* ... kleinere Werte sind besser
AIDA64: FP32 Ray-Trace | FPU Julia | CPU SHA3 | CPU Queen | FPU SinJulia | FPU Mandel | CPU AES | CPU ZLib | FP64 Ray-Trace | CPU PhotoWorxx
| Performance Rating | |
| Lenovo Yoga Pro 9 16IMH9 | |
| Lenovo Yoga Pro 9 16IMH9 RTX 4050 | |
| Dell XPS 16 9640 | |
| HP Envy x360 2-in-1 16-ad0097nr | |
| Durchschnittliche Intel Core Ultra 9 185H | |
| Asus VivoBook Pro 16 K6602VU | |
| Samsung Galaxy Book4 Ultra | |
| AIDA64 / FP32 Ray-Trace | |
| HP Envy x360 2-in-1 16-ad0097nr | |
| Lenovo Yoga Pro 9 16IMH9 RTX 4050 | |
| Lenovo Yoga Pro 9 16IMH9 | |
| Dell XPS 16 9640 | |
| Durchschnittliche Intel Core Ultra 9 185H (9220 - 18676, n=20) | |
| Asus VivoBook Pro 16 K6602VU | |
| Samsung Galaxy Book4 Ultra | |
| AIDA64 / FPU Julia | |
| Lenovo Yoga Pro 9 16IMH9 | |
| Lenovo Yoga Pro 9 16IMH9 RTX 4050 | |
| Dell XPS 16 9640 | |
| HP Envy x360 2-in-1 16-ad0097nr | |
| Durchschnittliche Intel Core Ultra 9 185H (48865 - 96463, n=20) | |
| Asus VivoBook Pro 16 K6602VU | |
| Samsung Galaxy Book4 Ultra | |
| AIDA64 / CPU SHA3 | |
| Lenovo Yoga Pro 9 16IMH9 RTX 4050 | |
| Lenovo Yoga Pro 9 16IMH9 | |
| Dell XPS 16 9640 | |
| Durchschnittliche Intel Core Ultra 9 185H (2394 - 4534, n=20) | |
| HP Envy x360 2-in-1 16-ad0097nr | |
| Asus VivoBook Pro 16 K6602VU | |
| Samsung Galaxy Book4 Ultra | |
| AIDA64 / CPU Queen | |
| HP Envy x360 2-in-1 16-ad0097nr | |
| Lenovo Yoga Pro 9 16IMH9 RTX 4050 | |
| Asus VivoBook Pro 16 K6602VU | |
| Lenovo Yoga Pro 9 16IMH9 | |
| Dell XPS 16 9640 | |
| Durchschnittliche Intel Core Ultra 9 185H (66785 - 95241, n=20) | |
| Samsung Galaxy Book4 Ultra | |
| AIDA64 / FPU SinJulia | |
| HP Envy x360 2-in-1 16-ad0097nr | |
| Lenovo Yoga Pro 9 16IMH9 | |
| Lenovo Yoga Pro 9 16IMH9 RTX 4050 | |
| Dell XPS 16 9640 | |
| Durchschnittliche Intel Core Ultra 9 185H (7255 - 11392, n=20) | |
| Samsung Galaxy Book4 Ultra | |
| Asus VivoBook Pro 16 K6602VU | |
| AIDA64 / FPU Mandel | |
| Lenovo Yoga Pro 9 16IMH9 | |
| Lenovo Yoga Pro 9 16IMH9 RTX 4050 | |
| HP Envy x360 2-in-1 16-ad0097nr | |
| Dell XPS 16 9640 | |
| Durchschnittliche Intel Core Ultra 9 185H (24004 - 48020, n=20) | |
| Samsung Galaxy Book4 Ultra | |
| Asus VivoBook Pro 16 K6602VU | |
| AIDA64 / CPU AES | |
| Asus VivoBook Pro 16 K6602VU | |
| Lenovo Yoga Pro 9 16IMH9 | |
| Lenovo Yoga Pro 9 16IMH9 RTX 4050 | |
| Durchschnittliche Intel Core Ultra 9 185H (53116 - 154066, n=20) | |
| Dell XPS 16 9640 | |
| HP Envy x360 2-in-1 16-ad0097nr | |
| Samsung Galaxy Book4 Ultra | |
| AIDA64 / CPU ZLib | |
| Lenovo Yoga Pro 9 16IMH9 | |
| Lenovo Yoga Pro 9 16IMH9 RTX 4050 | |
| Dell XPS 16 9640 | |
| Durchschnittliche Intel Core Ultra 9 185H (678 - 1341, n=20) | |
| Samsung Galaxy Book4 Ultra | |
| Asus VivoBook Pro 16 K6602VU | |
| HP Envy x360 2-in-1 16-ad0097nr | |
| AIDA64 / FP64 Ray-Trace | |
| HP Envy x360 2-in-1 16-ad0097nr | |
| Lenovo Yoga Pro 9 16IMH9 | |
| Lenovo Yoga Pro 9 16IMH9 RTX 4050 | |
| Dell XPS 16 9640 | |
| Durchschnittliche Intel Core Ultra 9 185H (4428 - 10078, n=20) | |
| Asus VivoBook Pro 16 K6602VU | |
| Samsung Galaxy Book4 Ultra | |
| AIDA64 / CPU PhotoWorxx | |
| Lenovo Yoga Pro 9 16IMH9 | |
| Lenovo Yoga Pro 9 16IMH9 RTX 4050 | |
| Dell XPS 16 9640 | |
| Samsung Galaxy Book4 Ultra | |
| Durchschnittliche Intel Core Ultra 9 185H (44547 - 53918, n=20) | |
| Asus VivoBook Pro 16 K6602VU | |
| HP Envy x360 2-in-1 16-ad0097nr | |
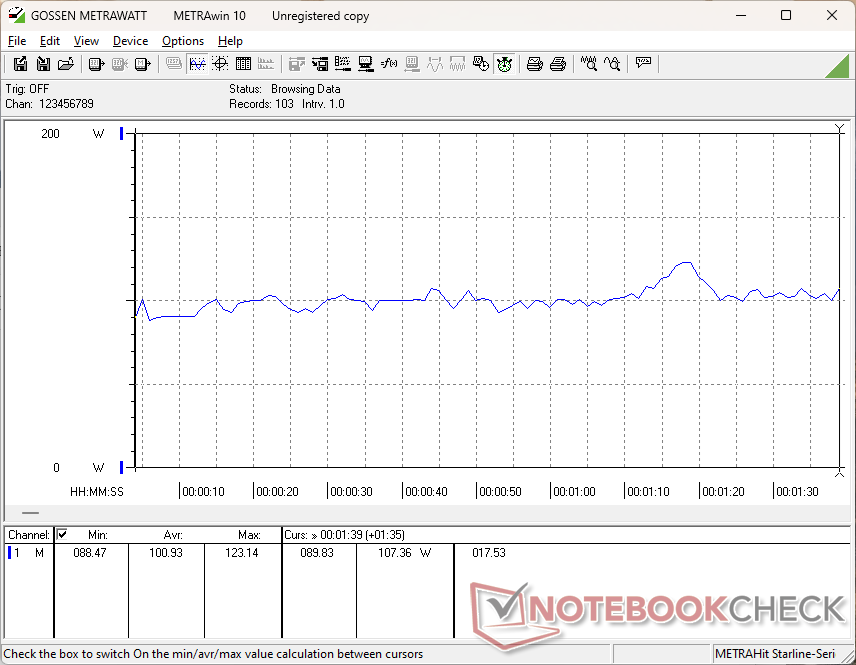
Stresstest

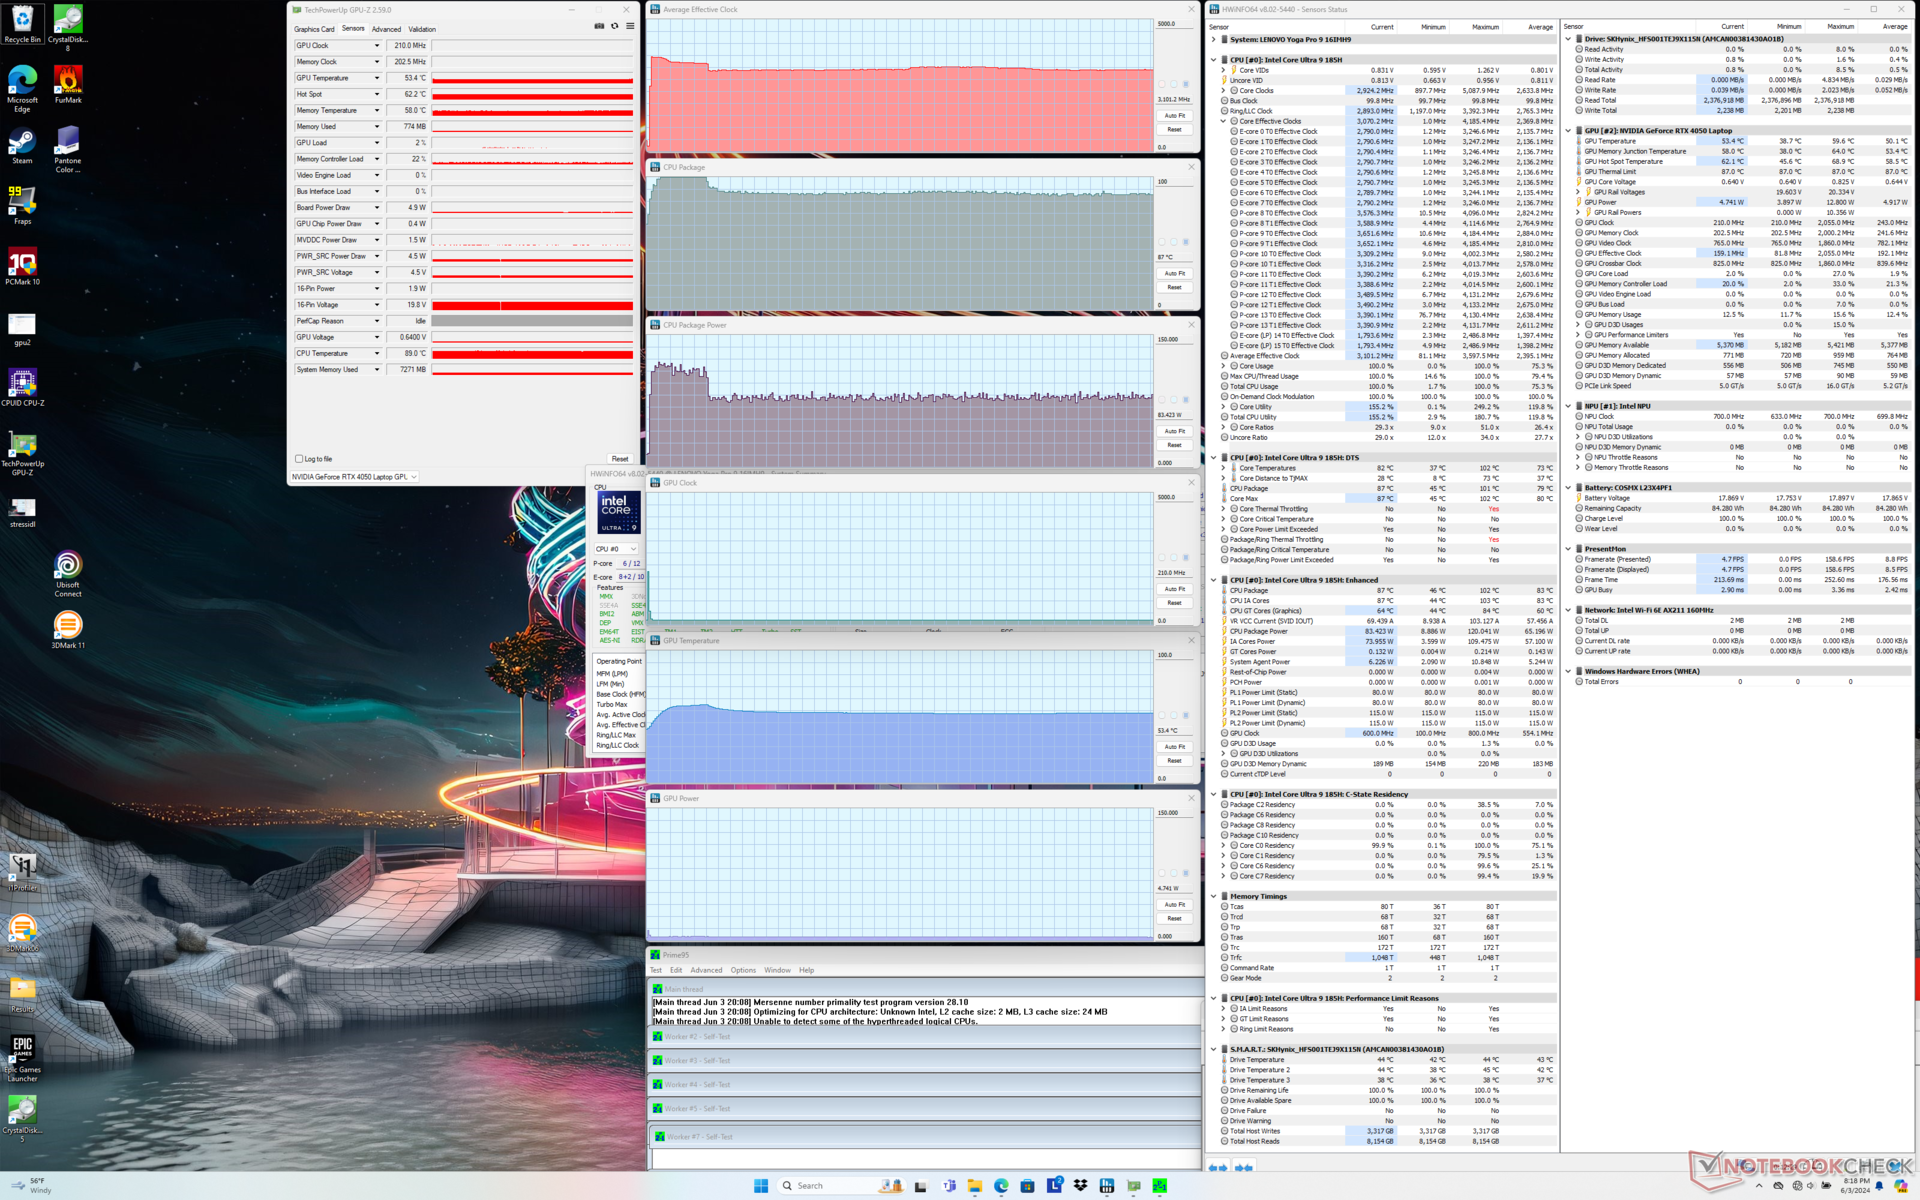
Nach dem Start des Prime95-Stresses stieg die CPU auf 3,6 GHz, erreichte eine Temperatur von 100 °C und verbrauchte 120 W, bevor sie etwa 70 Sekunden später auf 3,1 GHz, 90 °C und 83 W zurückging und sich stabilisierte.
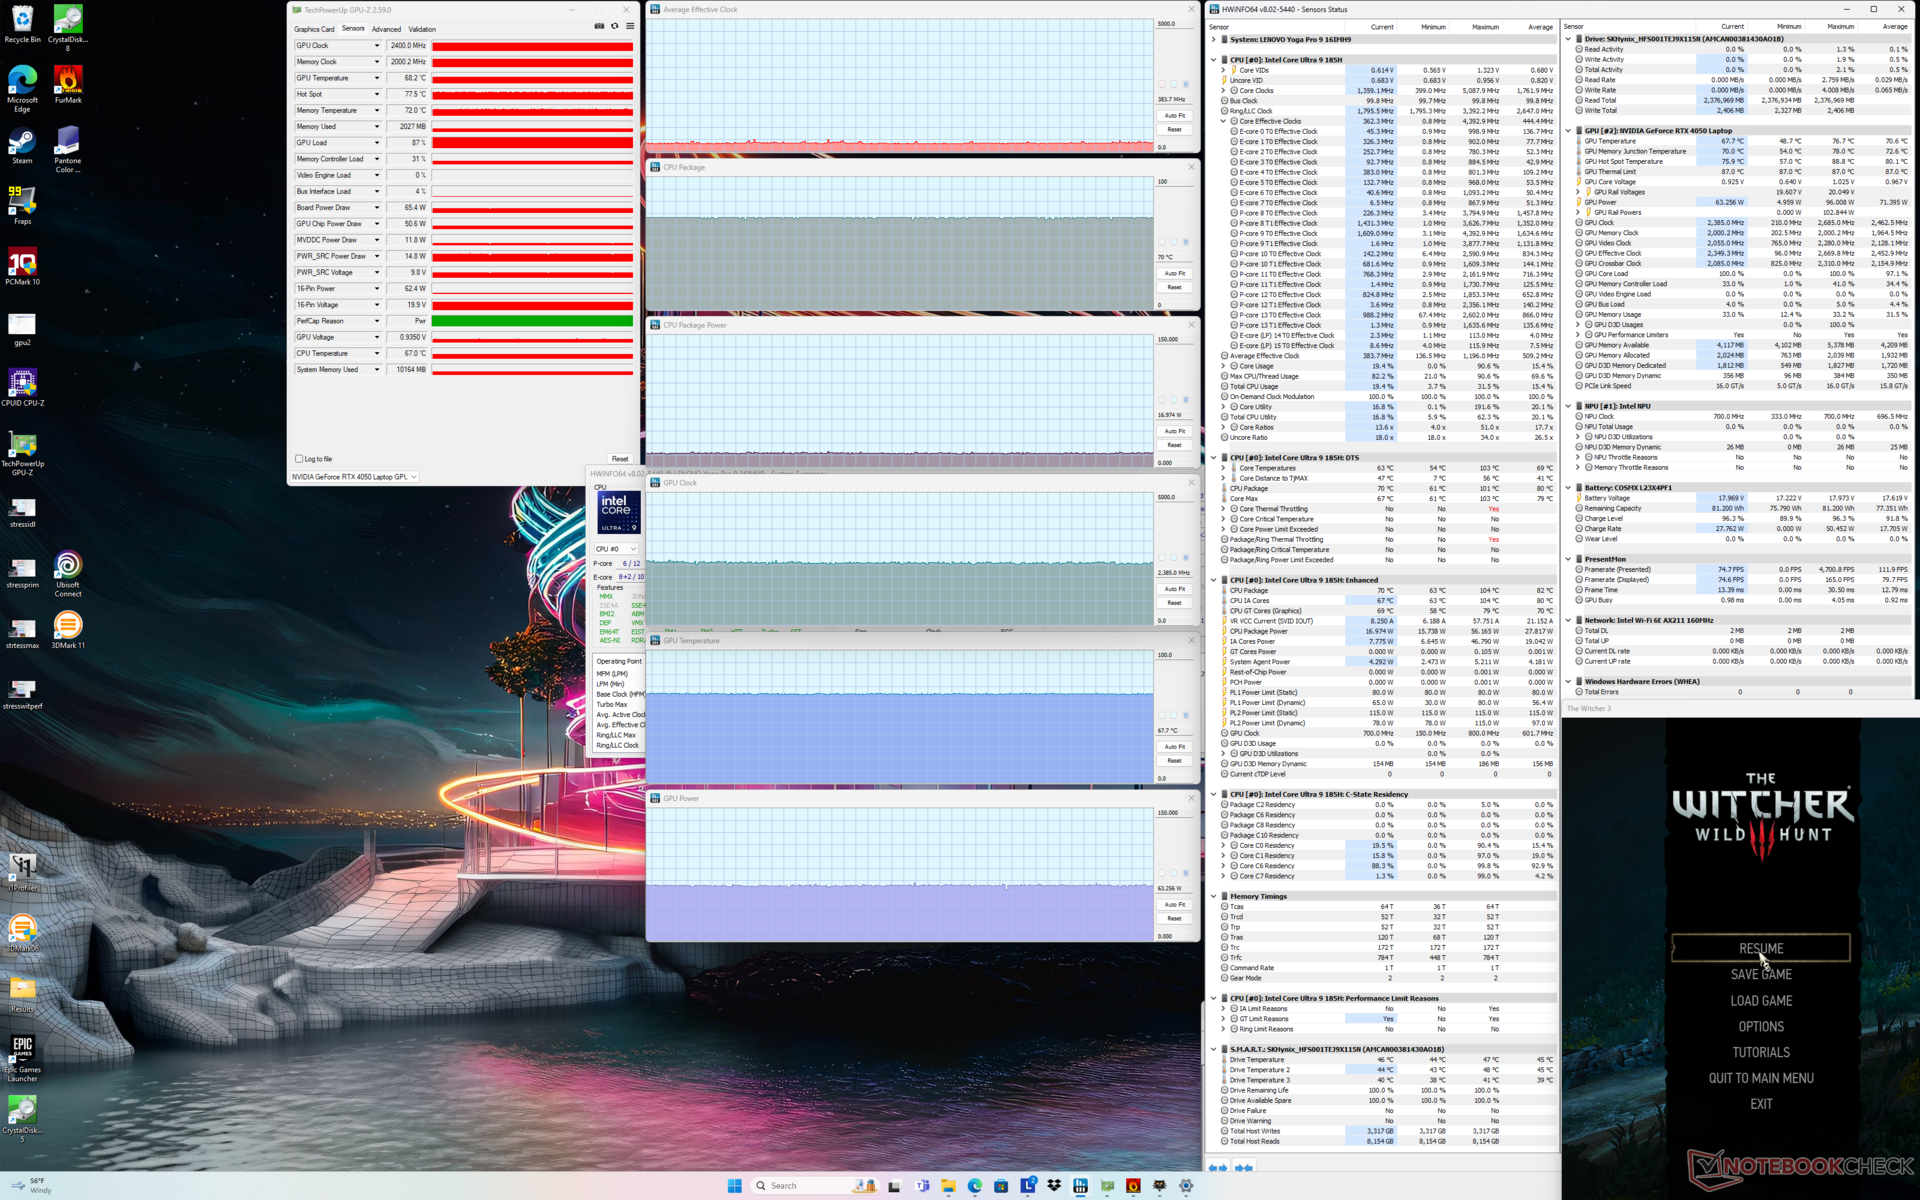
Die Grafikleistung wird beeinträchtigt, wenn sie im Balanced-Modus anstelle des Performance-Modus ausgeführt wird, wie unsere GPU-Leistungsergebnisse unten zeigen. Die Nvidia-GPU hält 2855 MHz und 78 W aufrecht, wenn Witcher 3 im Performance-Modus läuft, verglichen mit 2385 MHz und 63 W im Balanced-Modus. Die GPU-Temperatur wäre im Leistungsmodus ebenfalls höher.

| Durchschnittlicher CPU-Takt (GHz) | GPU--Takt (MHz) | Durchschnittliche CPU Temperatur (°C) | Durchschnittliche GPU Temperatur (°C) | |
| System im Leerlauf | -- | -- | 61 | 39 |
| Prime95 Stresstest | 3.1 | -- | 87 | 53 |
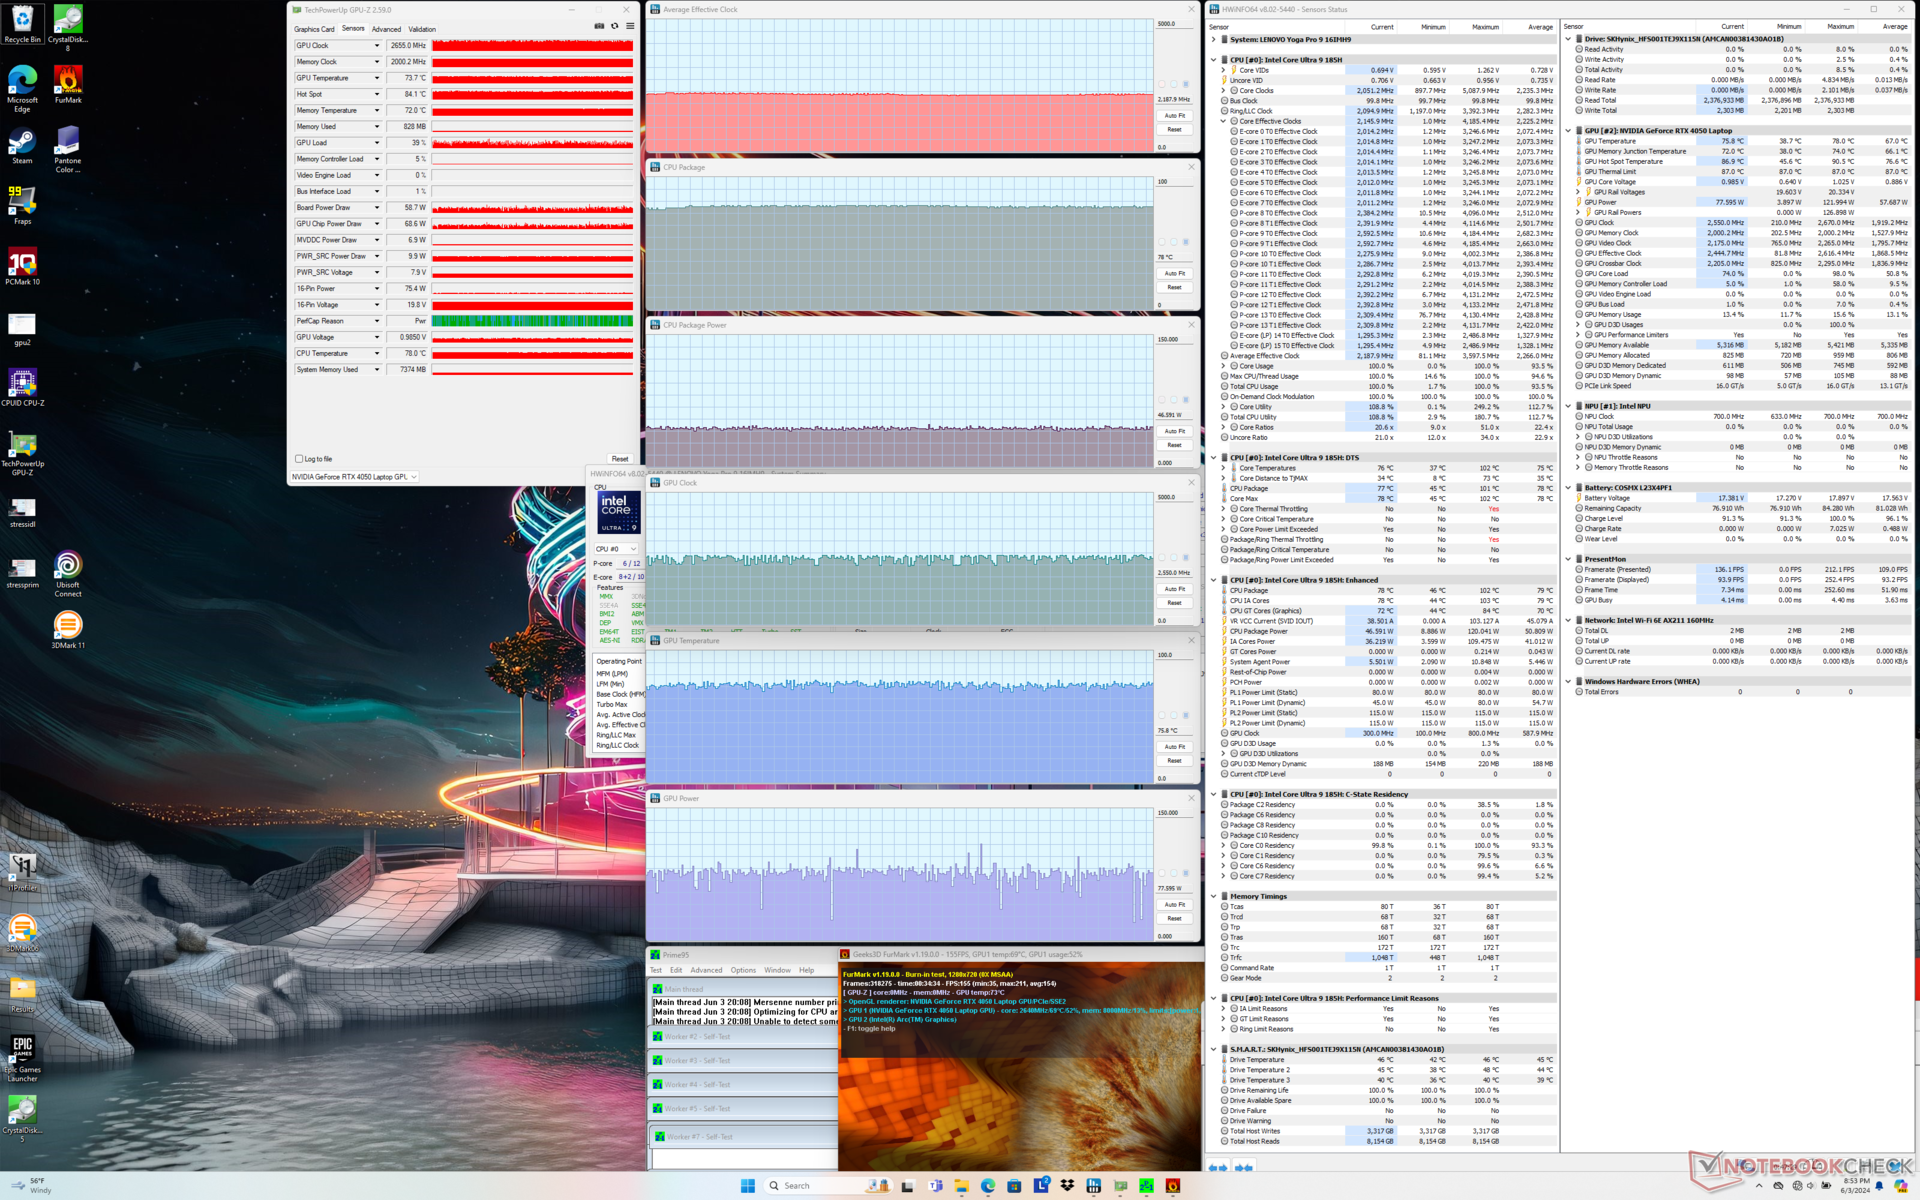
| Prime95 + FurMark Stresstest | 2.2 | 2550 | 78 | 76 |
| Witcher 3 Stresstest (Balanced-Modus) | 0.4 | 2385 | 70 | 68 |
| Witcher 3 Stresstest (Performance-Modus) | 0.7 | 2655 | 99 | 76 |
System Performance
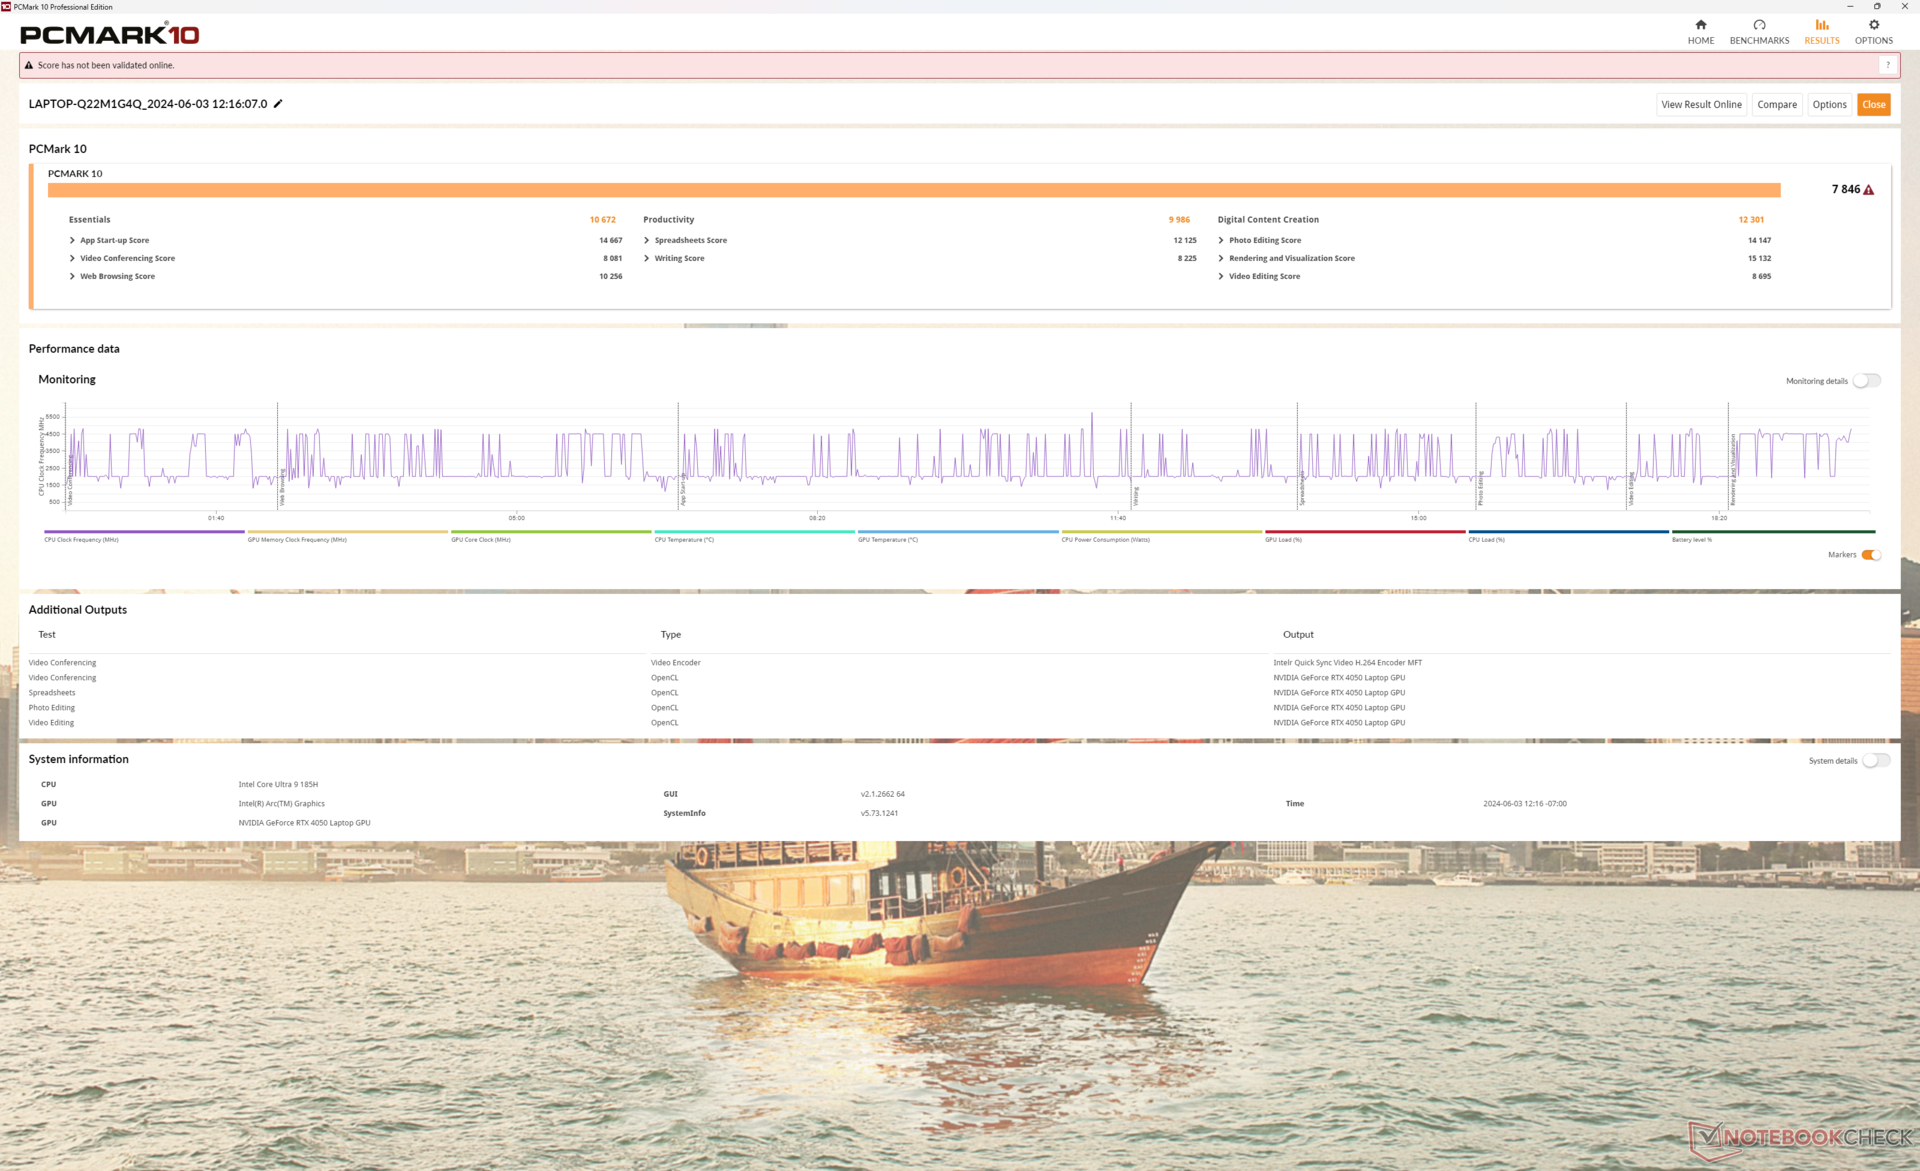
Die PCMark-Ergebnisse sind vergleichbar mit denen der meisten anderen Multimedia-Notebooks und deuten darauf hin, dass das Lenovo trotz der niedrigeren RTX 4050-Konfiguration bei den meisten alltäglichen Aufgaben oder Bearbeitungsvorgängen nicht wesentlich langsamer ist.
CrossMark: Overall | Productivity | Creativity | Responsiveness
WebXPRT 3: Overall
WebXPRT 4: Overall
Mozilla Kraken 1.1: Total
| PCMark 10 / Score | |
| Lenovo Yoga Pro 9 16IMH9 RTX 4050 | |
| Durchschnittliche Intel Core Ultra 9 185H, NVIDIA GeForce RTX 4050 Laptop GPU (7431 - 7846, n=2) | |
| Lenovo Yoga Pro 9 16IMH9 | |
| Dell XPS 16 9640 | |
| Asus VivoBook Pro 16 K6602VU | |
| Samsung Galaxy Book4 Ultra | |
| HP Envy x360 2-in-1 16-ad0097nr | |
| PCMark 10 / Essentials | |
| Lenovo Yoga Pro 9 16IMH9 | |
| Durchschnittliche Intel Core Ultra 9 185H, NVIDIA GeForce RTX 4050 Laptop GPU (10672 - 10807, n=2) | |
| Lenovo Yoga Pro 9 16IMH9 RTX 4050 | |
| HP Envy x360 2-in-1 16-ad0097nr | |
| Samsung Galaxy Book4 Ultra | |
| Dell XPS 16 9640 | |
| Asus VivoBook Pro 16 K6602VU | |
| PCMark 10 / Productivity | |
| Lenovo Yoga Pro 9 16IMH9 RTX 4050 | |
| HP Envy x360 2-in-1 16-ad0097nr | |
| Durchschnittliche Intel Core Ultra 9 185H, NVIDIA GeForce RTX 4050 Laptop GPU (9717 - 9986, n=2) | |
| Dell XPS 16 9640 | |
| Samsung Galaxy Book4 Ultra | |
| Lenovo Yoga Pro 9 16IMH9 | |
| Asus VivoBook Pro 16 K6602VU | |
| PCMark 10 / Digital Content Creation | |
| Lenovo Yoga Pro 9 16IMH9 RTX 4050 | |
| Lenovo Yoga Pro 9 16IMH9 | |
| Durchschnittliche Intel Core Ultra 9 185H, NVIDIA GeForce RTX 4050 Laptop GPU (10607 - 12301, n=2) | |
| Asus VivoBook Pro 16 K6602VU | |
| Dell XPS 16 9640 | |
| Samsung Galaxy Book4 Ultra | |
| HP Envy x360 2-in-1 16-ad0097nr | |
| CrossMark / Overall | |
| Dell XPS 16 9640 | |
| Lenovo Yoga Pro 9 16IMH9 RTX 4050 | |
| Durchschnittliche Intel Core Ultra 9 185H, NVIDIA GeForce RTX 4050 Laptop GPU (1790 - 1811, n=2) | |
| Samsung Galaxy Book4 Ultra | |
| Asus VivoBook Pro 16 K6602VU | |
| Lenovo Yoga Pro 9 16IMH9 | |
| HP Envy x360 2-in-1 16-ad0097nr | |
| CrossMark / Productivity | |
| Dell XPS 16 9640 | |
| Lenovo Yoga Pro 9 16IMH9 RTX 4050 | |
| Durchschnittliche Intel Core Ultra 9 185H, NVIDIA GeForce RTX 4050 Laptop GPU (1700 - 1717, n=2) | |
| Asus VivoBook Pro 16 K6602VU | |
| Samsung Galaxy Book4 Ultra | |
| Lenovo Yoga Pro 9 16IMH9 | |
| HP Envy x360 2-in-1 16-ad0097nr | |
| CrossMark / Creativity | |
| Durchschnittliche Intel Core Ultra 9 185H, NVIDIA GeForce RTX 4050 Laptop GPU (2037 - 2038, n=2) | |
| Lenovo Yoga Pro 9 16IMH9 RTX 4050 | |
| Dell XPS 16 9640 | |
| Lenovo Yoga Pro 9 16IMH9 | |
| Samsung Galaxy Book4 Ultra | |
| Asus VivoBook Pro 16 K6602VU | |
| HP Envy x360 2-in-1 16-ad0097nr | |
| CrossMark / Responsiveness | |
| Dell XPS 16 9640 | |
| Asus VivoBook Pro 16 K6602VU | |
| Lenovo Yoga Pro 9 16IMH9 RTX 4050 | |
| Samsung Galaxy Book4 Ultra | |
| Durchschnittliche Intel Core Ultra 9 185H, NVIDIA GeForce RTX 4050 Laptop GPU (1419 - 1493, n=2) | |
| HP Envy x360 2-in-1 16-ad0097nr | |
| Lenovo Yoga Pro 9 16IMH9 | |
| WebXPRT 3 / Overall | |
| HP Envy x360 2-in-1 16-ad0097nr | |
| Durchschnittliche Intel Core Ultra 9 185H, NVIDIA GeForce RTX 4050 Laptop GPU (293 - 301, n=2) | |
| Lenovo Yoga Pro 9 16IMH9 | |
| Lenovo Yoga Pro 9 16IMH9 RTX 4050 | |
| Dell XPS 16 9640 | |
| Samsung Galaxy Book4 Ultra | |
| WebXPRT 4 / Overall | |
| Durchschnittliche Intel Core Ultra 9 185H, NVIDIA GeForce RTX 4050 Laptop GPU (268 - 271, n=2) | |
| Lenovo Yoga Pro 9 16IMH9 | |
| Lenovo Yoga Pro 9 16IMH9 RTX 4050 | |
| Samsung Galaxy Book4 Ultra | |
| Dell XPS 16 9640 | |
| HP Envy x360 2-in-1 16-ad0097nr | |
| Asus VivoBook Pro 16 K6602VU | |
| Mozilla Kraken 1.1 / Total | |
| Asus VivoBook Pro 16 K6602VU | |
| HP Envy x360 2-in-1 16-ad0097nr | |
| Lenovo Yoga Pro 9 16IMH9 RTX 4050 | |
| Durchschnittliche Intel Core Ultra 9 185H, NVIDIA GeForce RTX 4050 Laptop GPU (498 - 512, n=2) | |
| Lenovo Yoga Pro 9 16IMH9 | |
| Samsung Galaxy Book4 Ultra | |
* ... kleinere Werte sind besser
| PCMark 10 Score | 7846 Punkte | |
Hilfe | ||
| AIDA64 / Memory Copy | |
| Lenovo Yoga Pro 9 16IMH9 | |
| Lenovo Yoga Pro 9 16IMH9 RTX 4050 | |
| Dell XPS 16 9640 | |
| Samsung Galaxy Book4 Ultra | |
| Durchschnittliche Intel Core Ultra 9 185H (69929 - 95718, n=20) | |
| HP Envy x360 2-in-1 16-ad0097nr | |
| Asus VivoBook Pro 16 K6602VU | |
| AIDA64 / Memory Read | |
| Samsung Galaxy Book4 Ultra | |
| Lenovo Yoga Pro 9 16IMH9 | |
| Lenovo Yoga Pro 9 16IMH9 RTX 4050 | |
| Dell XPS 16 9640 | |
| Durchschnittliche Intel Core Ultra 9 185H (64619 - 87768, n=20) | |
| Asus VivoBook Pro 16 K6602VU | |
| HP Envy x360 2-in-1 16-ad0097nr | |
| AIDA64 / Memory Write | |
| HP Envy x360 2-in-1 16-ad0097nr | |
| Samsung Galaxy Book4 Ultra | |
| Lenovo Yoga Pro 9 16IMH9 | |
| Lenovo Yoga Pro 9 16IMH9 RTX 4050 | |
| Dell XPS 16 9640 | |
| Durchschnittliche Intel Core Ultra 9 185H (51114 - 93871, n=20) | |
| Asus VivoBook Pro 16 K6602VU | |
| AIDA64 / Memory Latency | |
| Durchschnittliche Intel Core Ultra 9 185H (121.4 - 259, n=20) | |
| Samsung Galaxy Book4 Ultra | |
| Dell XPS 16 9640 | |
| Lenovo Yoga Pro 9 16IMH9 RTX 4050 | |
| Lenovo Yoga Pro 9 16IMH9 | |
| HP Envy x360 2-in-1 16-ad0097nr | |
| Asus VivoBook Pro 16 K6602VU | |
* ... kleinere Werte sind besser
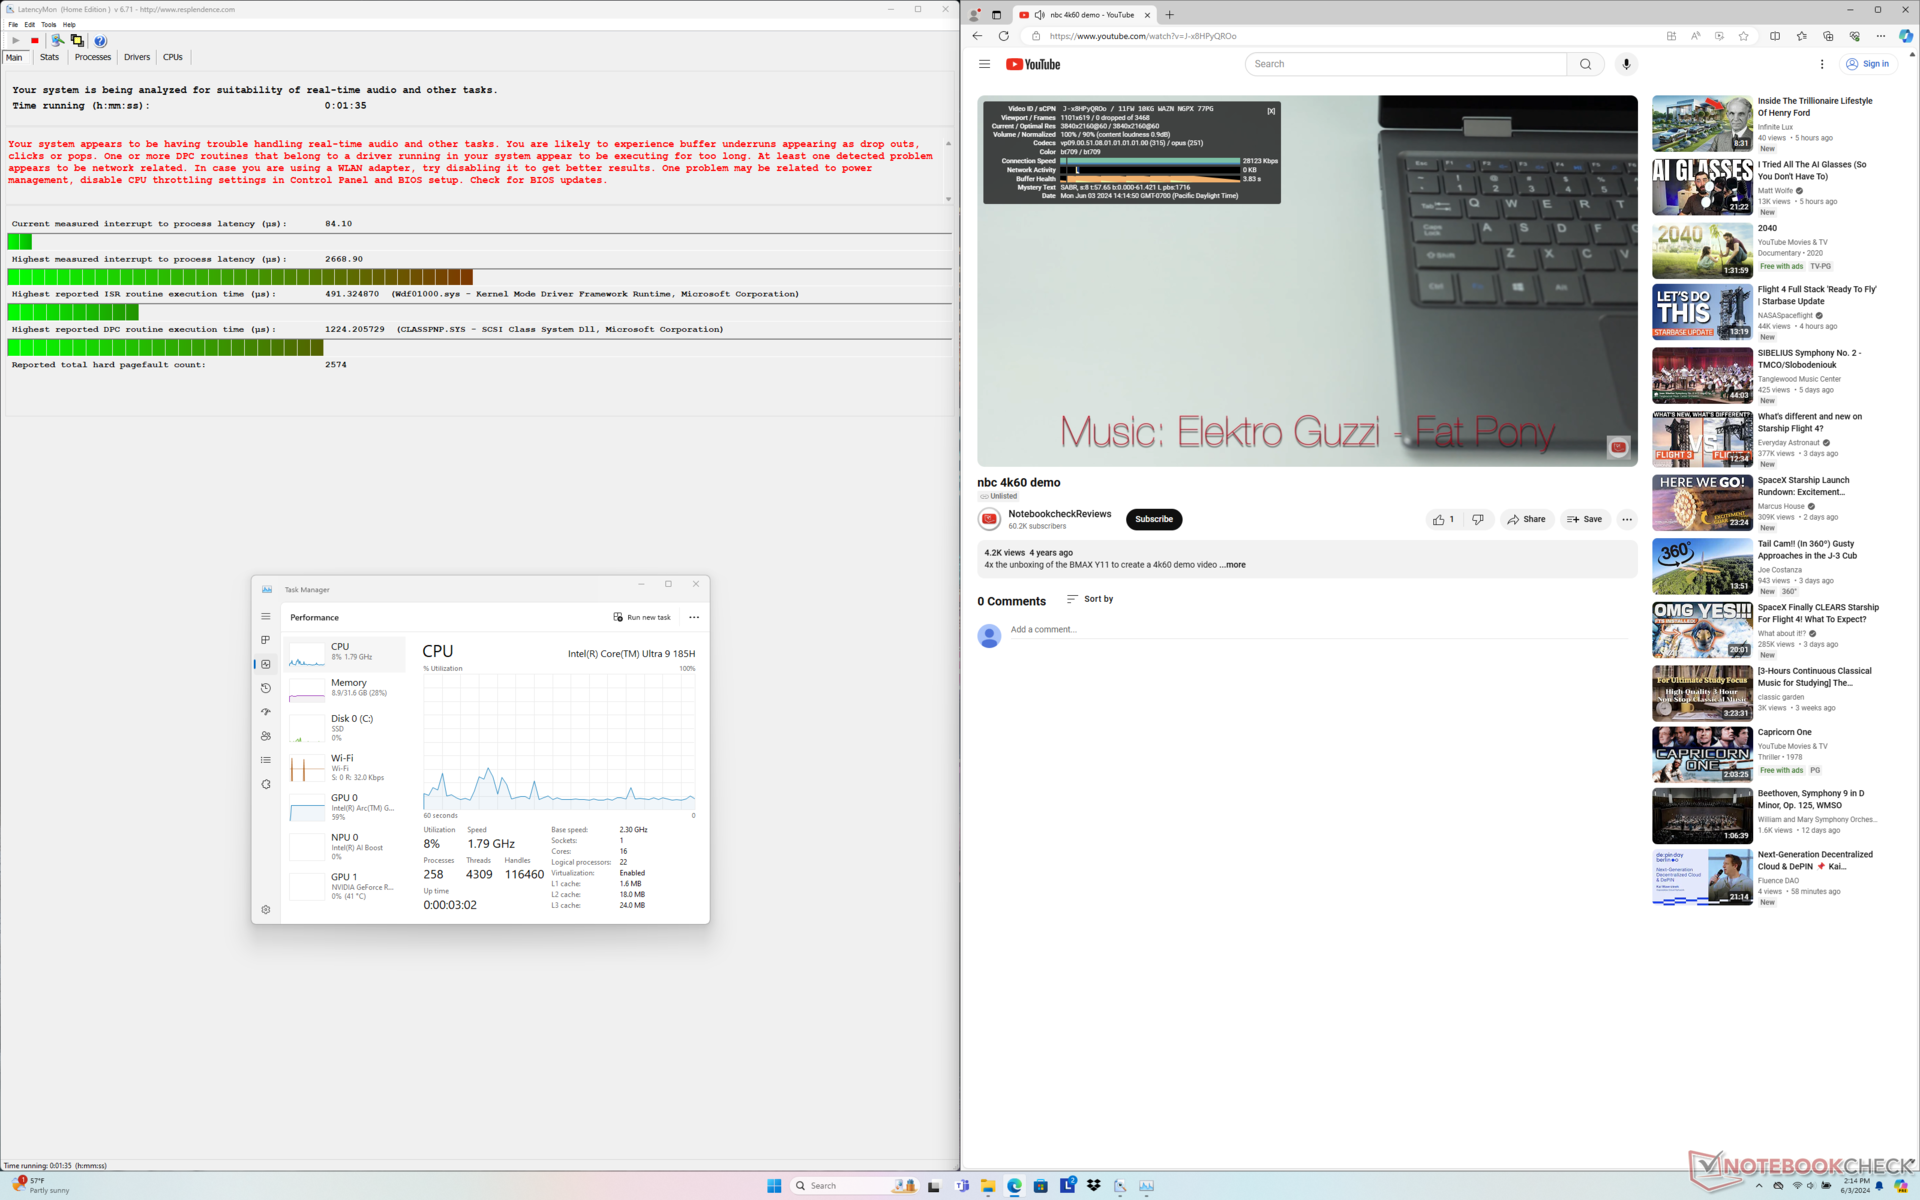
DPC-Latenzen
LatencyMon zeigt mehr DPC-Probleme als bei der RTX 4070-Konfiguration, insbesondere wenn mehrere Browser-Tabs unserer Homepage geöffnet werden. Die 4K-Videowiedergabe bei 60 FPS ist jedoch ansonsten perfekt, und es werden keine abgeworfenen Frames verzeichnet.

| DPC Latencies / LatencyMon - interrupt to process latency (max), Web, Youtube, Prime95 | |
| Lenovo Yoga Pro 9 16IMH9 RTX 4050 | |
| Asus VivoBook Pro 16 K6602VU | |
| HP Envy x360 2-in-1 16-ad0097nr | |
| Dell XPS 16 9640 | |
| Samsung Galaxy Book4 Ultra | |
| Lenovo Yoga Pro 9 16IMH9 | |
* ... kleinere Werte sind besser
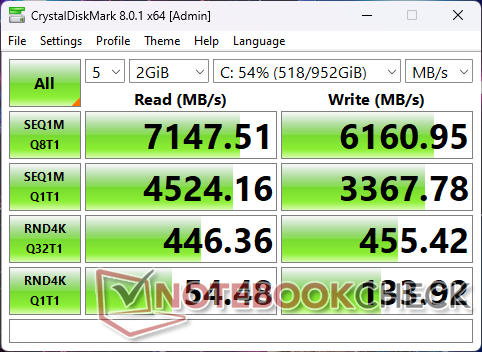
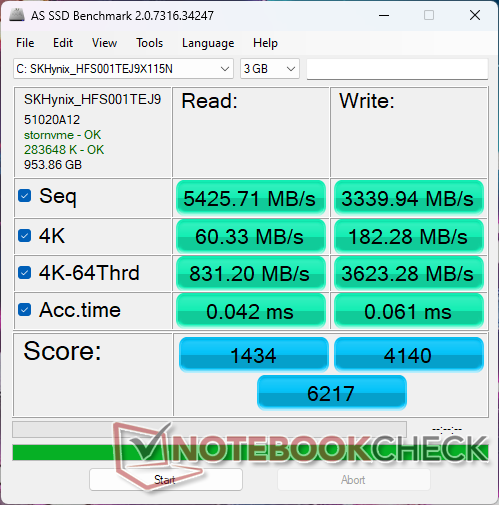
Massenspeicher
Lenovo liefert die gleiche SK Hynix HFS001TEJ9X115N PCIe4 NVMe SSD sowohl in der niedrigsten RTX 4050- als auch in der höchsten RTX 4070-Konfiguration.

| Drive Performance Rating - Percent | |
| Dell XPS 16 9640 | |
| Samsung Galaxy Book4 Ultra | |
| Lenovo Yoga Pro 9 16IMH9 RTX 4050 | |
| Lenovo Yoga Pro 9 16IMH9 | |
| Asus VivoBook Pro 16 K6602VU | |
| HP Envy x360 2-in-1 16-ad0097nr | |
* ... kleinere Werte sind besser
Dauerleistung Lesen: DiskSpd Read Loop, Queue Depth 8
GPU Performance
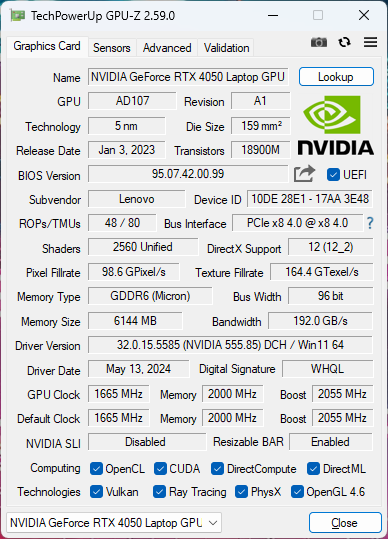
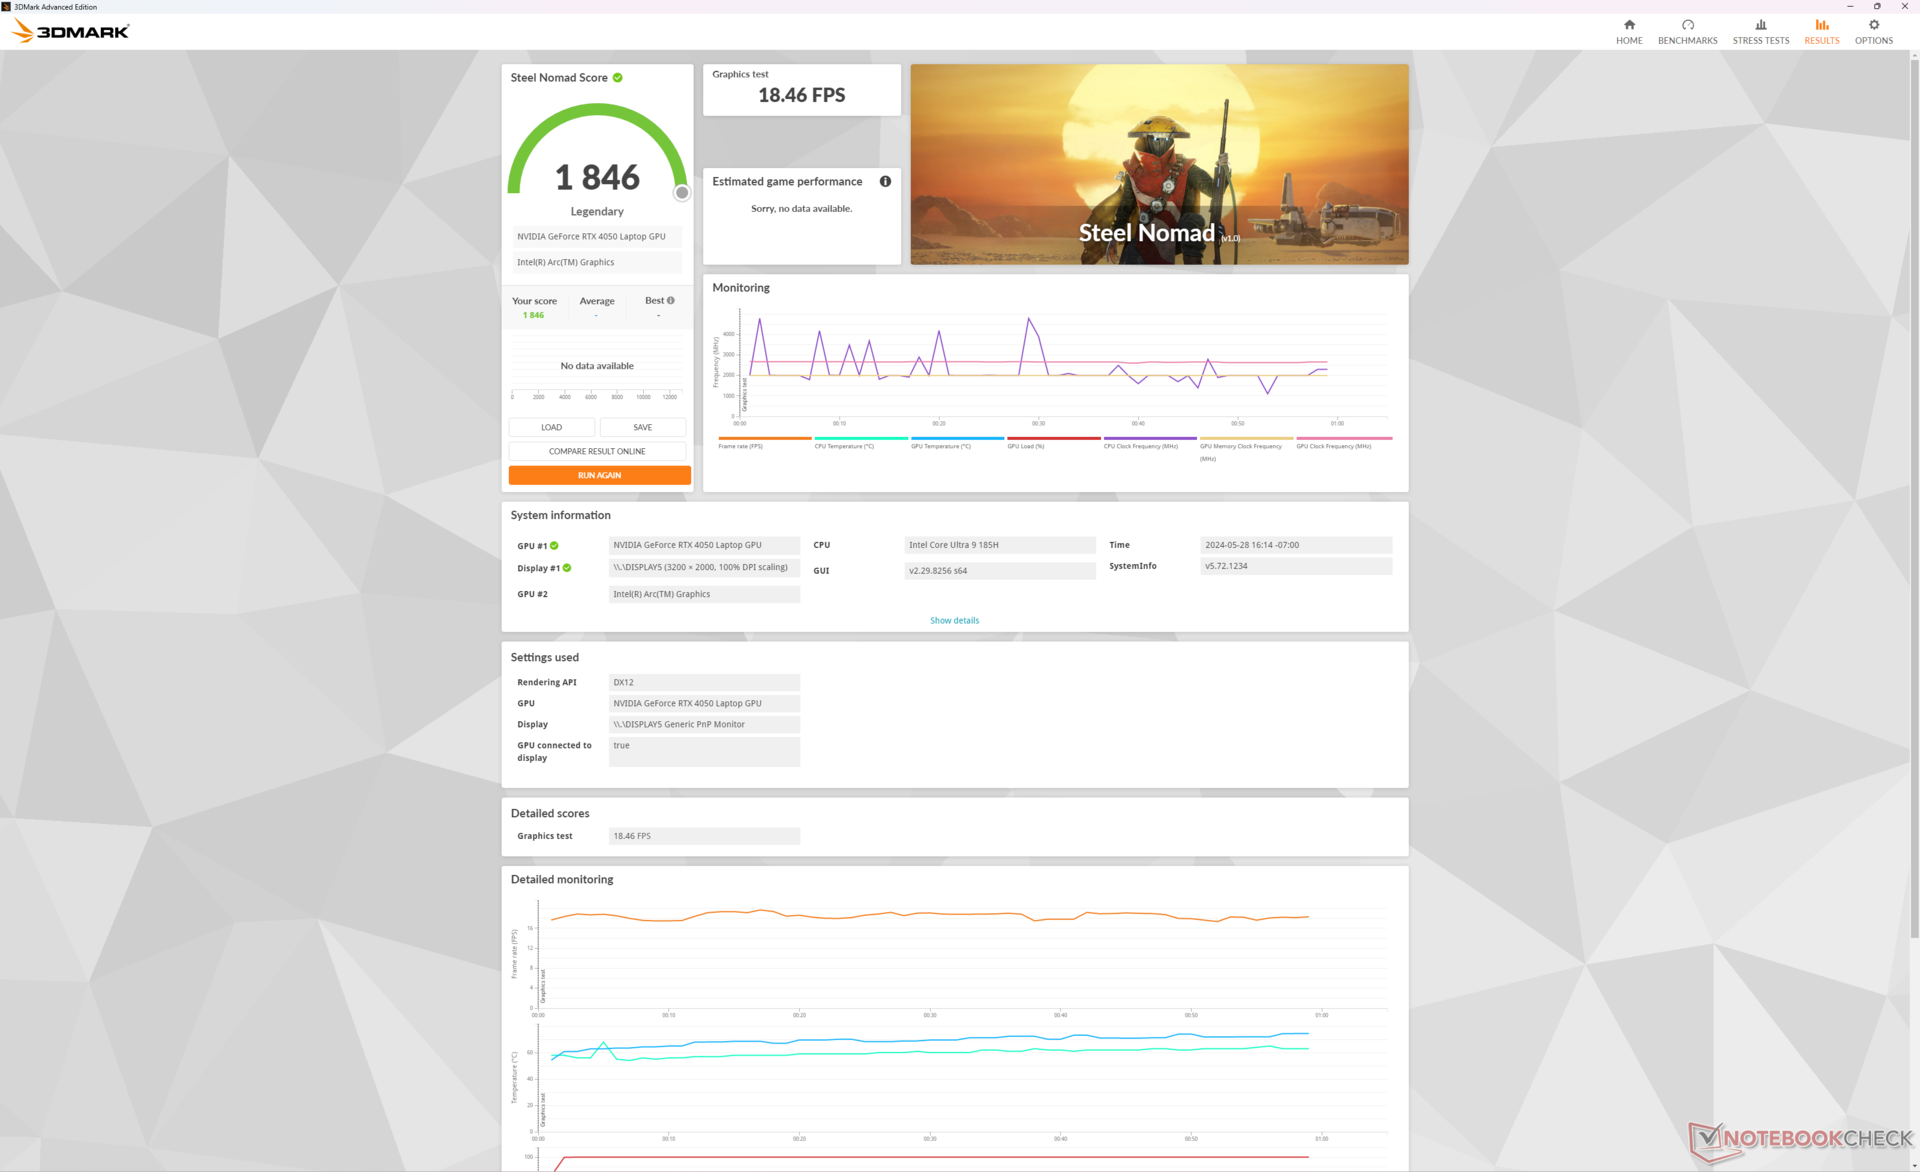
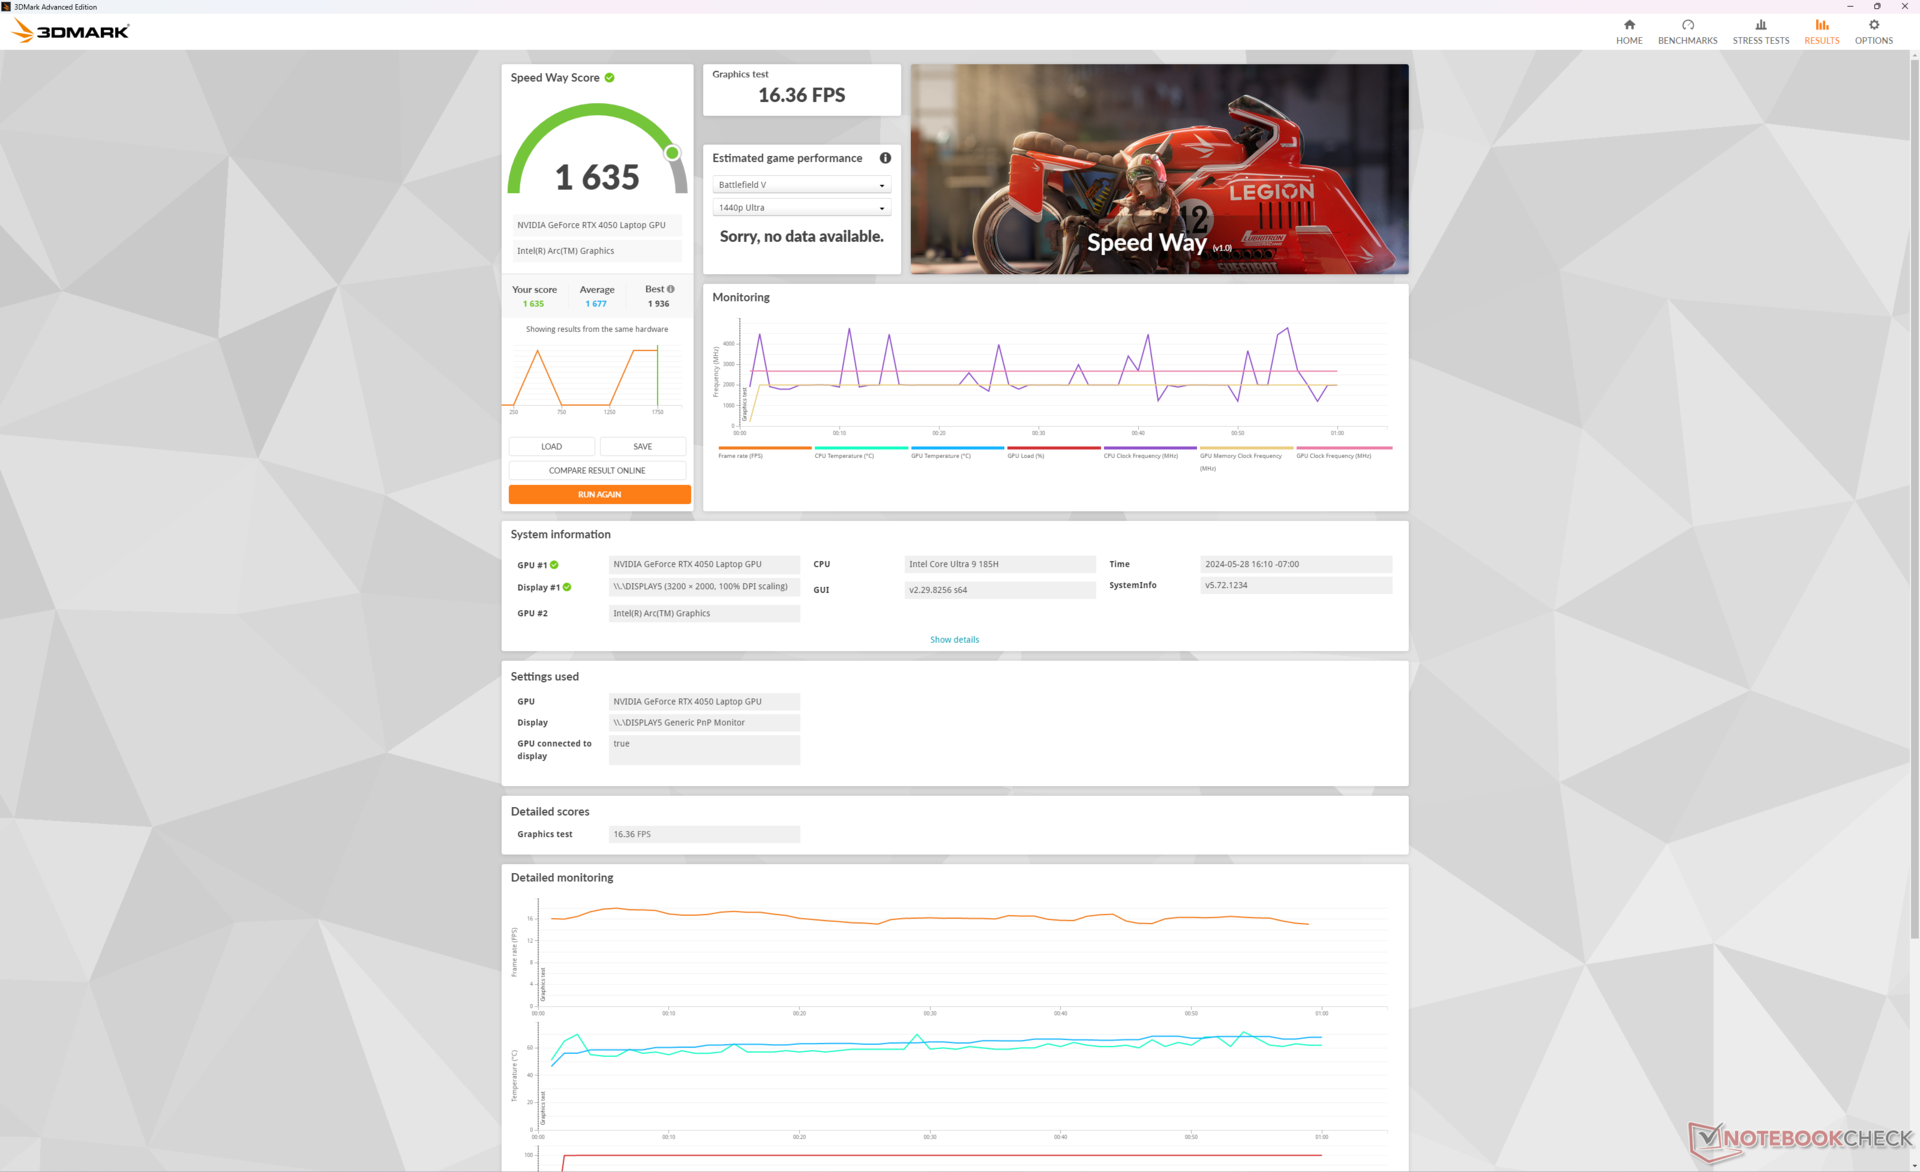
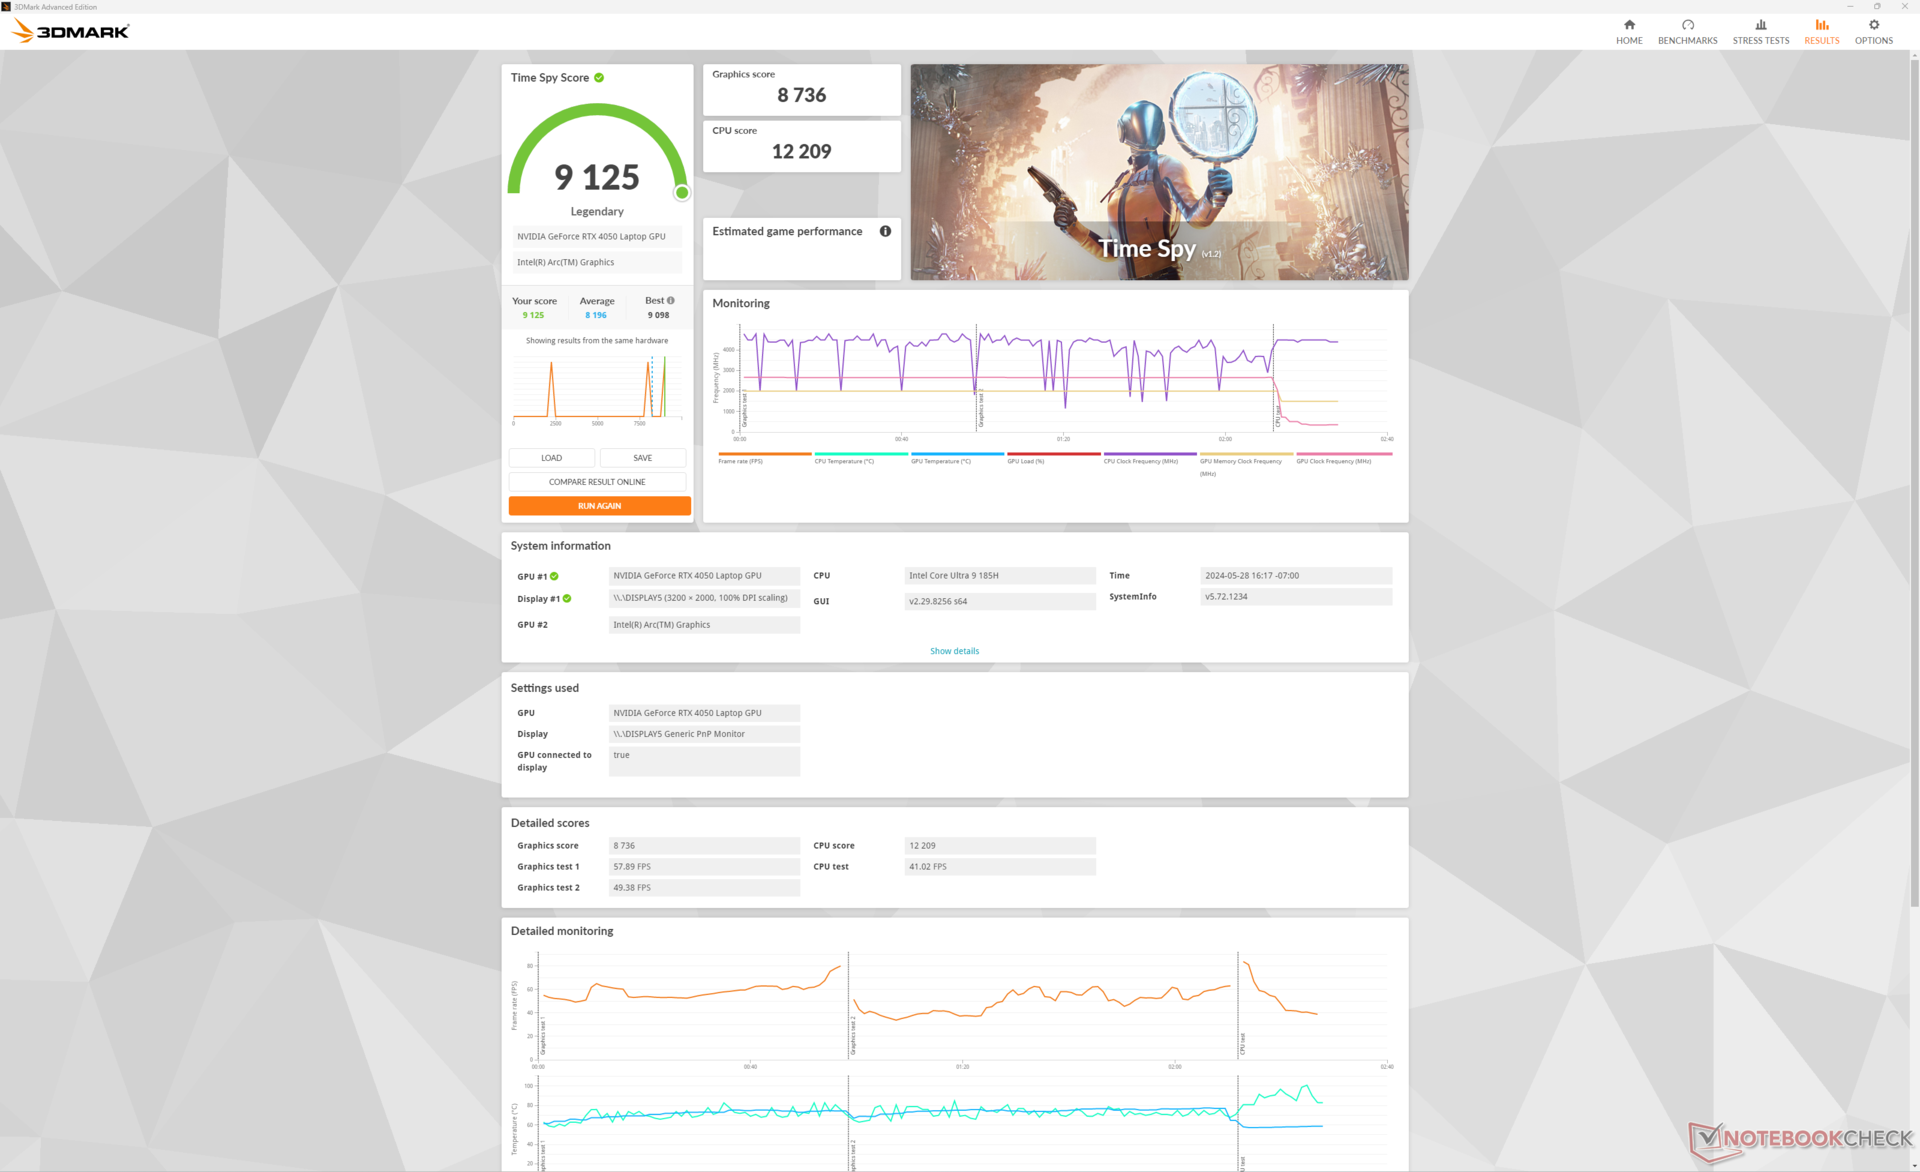
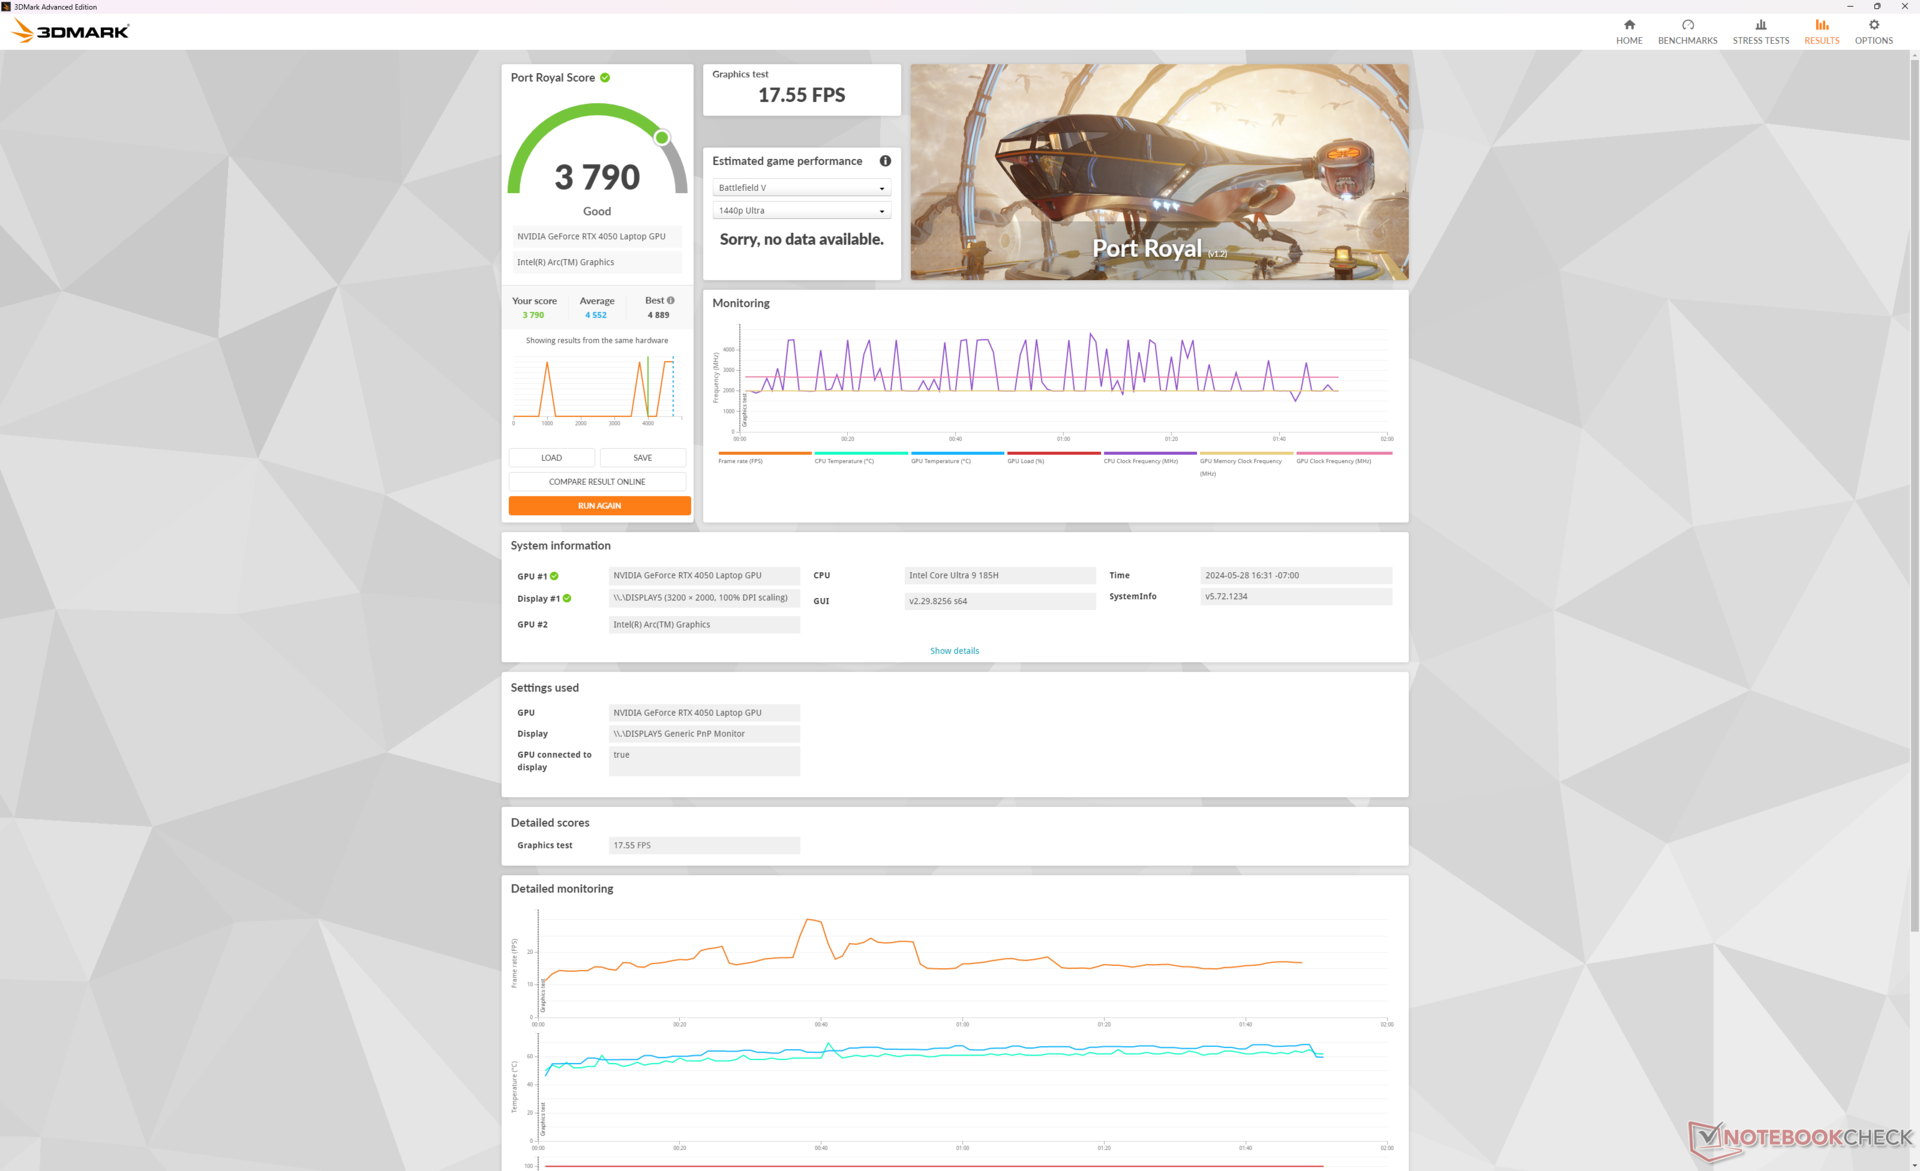
Die Grafikleistung übertrifft die Erwartungen und zeigt 3DMark-Ergebnisse, die etwa 10 % schneller sind als der Durchschnitt der Laptops in unserer Datenbank mit der gleichen GeForce RTX 4050 GPU. Dieser Vorteil ist größtenteils auf das hohe TGP-Ziel von 75 Watt bis 100 Watt bei Lenovo zurückzuführen, da die meisten anderen Laptops mit derselben GPU niedrigere TGP-Obergrenzen haben. Obwohl das Nvidia Control Panel eine Gesamtgrafikleistung von 100 W für die RTX 4050 angibt, stabilisiert sie sich bei Spielen typischerweise bei etwa 75 W bis 85 W, wie in unserem oben durchgeführten Stresstest zu sehen ist.
Die Gesamtleistung ist etwa 25 % bis 30 % langsamer als bei der RTX 4070-Konfiguration, die höhere Leistungsbereiche zwischen 90 W und 100 W erreichen kann. Dies ist wichtig für den Abschnitt zum Stromverbrauch weiter unten für Analysen der Leistung pro Watt.
| Energieprofile | Grafikleistung | CPU-Leistung | Gesamtwert |
| Performance-Modus | 22862 | 30623 | 10234 |
| Balanced-Modus | 21008 (-8%) | 29772 (-3%) | 8401 (-18%) |
| Battery Power | 20095 (-12%) | 30278 (-1%) | 7999 (-22%) |
Die Ausführung im Balanced-Modus wirkt sich stärker auf die GPU-Leistung als auf die CPU-Leistung aus, wie unsere Fire Strike-Ergebnistabelle zeigt.
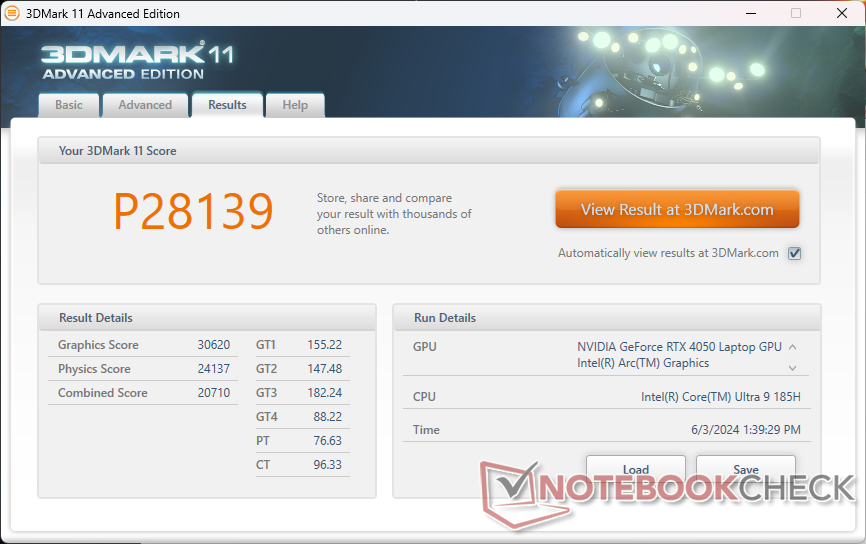
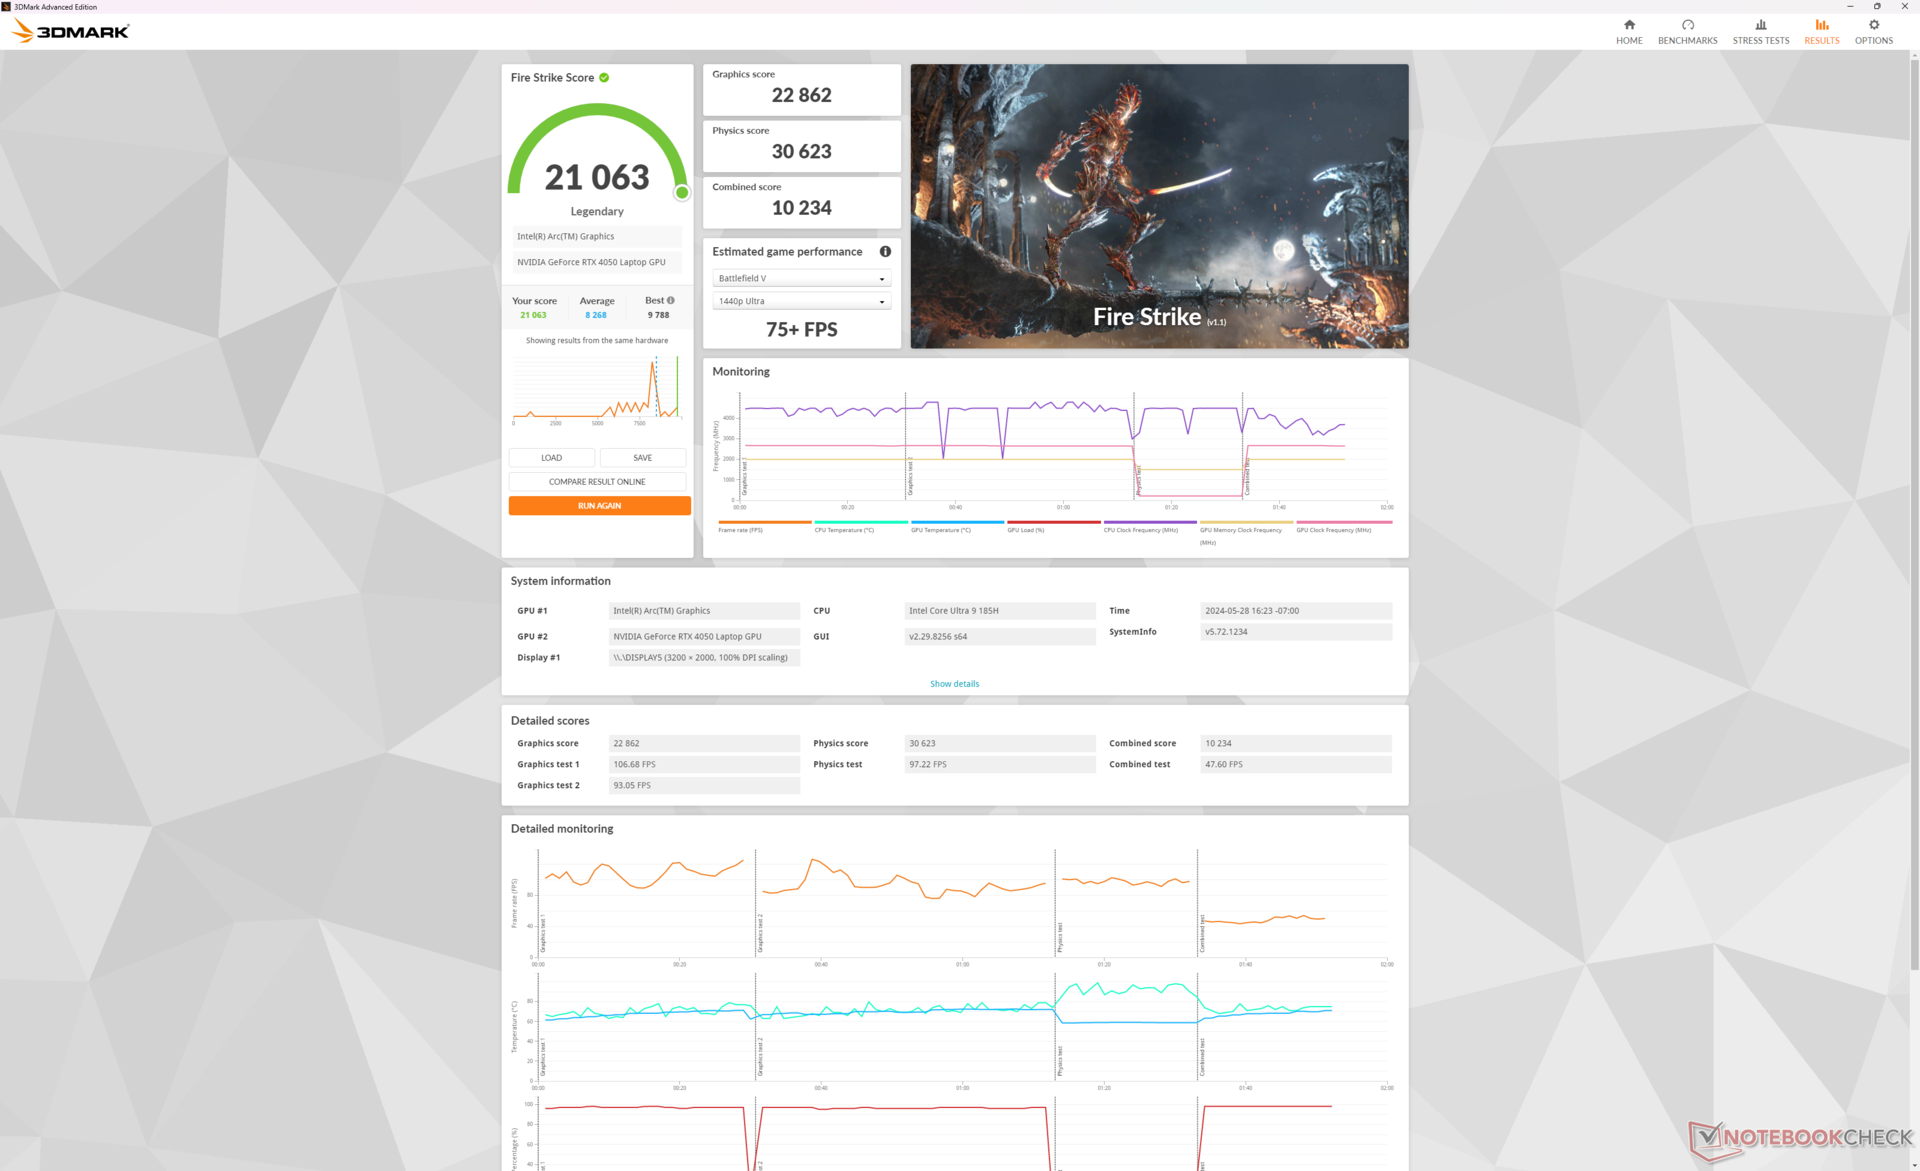
| 3DMark 11 Performance | 28139 Punkte | |
| 3DMark Fire Strike Score | 21063 Punkte | |
| 3DMark Time Spy Score | 9125 Punkte | |
| 3DMark Steel Nomad Score | 1846 Punkte | |
Hilfe | ||
* ... kleinere Werte sind besser
Gaming Performance
Das System ist leistungsstark genug, um anspruchsvolle Spiele wie Cyberpunk 2077 in der nativen Auflösung von 3200 x 2000 mit mittleren oder niedrigeren Einstellungen zu spielen. Für optimale Ergebnisse wird jedoch empfohlen, DLSS zu aktivieren, wann immer möglich, um die Bildraten auf über 60 FPS zu erhöhen.
| Performance Rating - Percent | |
| Lenovo Yoga Pro 9 16IMH9 | |
| Lenovo Yoga Pro 9 16IMH9 RTX 4050 | |
| Asus VivoBook Pro 16 K6602VU | |
| Dell XPS 16 9640 | |
| Samsung Galaxy Book4 Ultra | |
| HP Envy x360 2-in-1 16-ad0097nr | |
| The Witcher 3 - 1920x1080 Ultra Graphics & Postprocessing (HBAO+) | |
| Lenovo Yoga Pro 9 16IMH9 | |
| Dell XPS 16 9640 | |
| Lenovo Yoga Pro 9 16IMH9 RTX 4050 | |
| Asus VivoBook Pro 16 K6602VU | |
| Samsung Galaxy Book4 Ultra | |
| HP Envy x360 2-in-1 16-ad0097nr | |
| Final Fantasy XV Benchmark - 1920x1080 High Quality | |
| Lenovo Yoga Pro 9 16IMH9 | |
| Dell XPS 16 9640 | |
| Lenovo Yoga Pro 9 16IMH9 RTX 4050 | |
| Asus VivoBook Pro 16 K6602VU | |
| Samsung Galaxy Book4 Ultra | |
| HP Envy x360 2-in-1 16-ad0097nr | |
| Strange Brigade - 1920x1080 ultra AA:ultra AF:16 | |
| Lenovo Yoga Pro 9 16IMH9 | |
| Dell XPS 16 9640 | |
| Lenovo Yoga Pro 9 16IMH9 RTX 4050 | |
| Asus VivoBook Pro 16 K6602VU | |
| Samsung Galaxy Book4 Ultra | |
| HP Envy x360 2-in-1 16-ad0097nr | |
| Dota 2 Reborn - 1920x1080 ultra (3/3) best looking | |
| Lenovo Yoga Pro 9 16IMH9 | |
| Lenovo Yoga Pro 9 16IMH9 RTX 4050 | |
| Samsung Galaxy Book4 Ultra | |
| Asus VivoBook Pro 16 K6602VU | |
| Dell XPS 16 9640 | |
| HP Envy x360 2-in-1 16-ad0097nr | |
| X-Plane 11.11 - 1920x1080 high (fps_test=3) | |
| Asus VivoBook Pro 16 K6602VU | |
| Lenovo Yoga Pro 9 16IMH9 | |
| Lenovo Yoga Pro 9 16IMH9 RTX 4050 | |
| Dell XPS 16 9640 | |
| Dell XPS 16 9640 | |
| Samsung Galaxy Book4 Ultra | |
| HP Envy x360 2-in-1 16-ad0097nr | |
Witcher 3 FPS-Diagramm
| min. | mittel | hoch | max. | QHD | |
|---|---|---|---|---|---|
| The Witcher 3 (2015) | 395.6 | 290.5 | 164 | 83.7 | 61 |
| Dota 2 Reborn (2015) | 174.6 | 148.7 | 145.1 | 138.5 | |
| Final Fantasy XV Benchmark (2018) | 182.4 | 121.5 | 84.2 | 61.6 | |
| X-Plane 11.11 (2018) | 134.8 | 117.7 | 89.4 | ||
| Far Cry 5 (2018) | 151 | 129 | 121 | 113 | 86 |
| Strange Brigade (2018) | 432 | 213 | 170.9 | 150 | 99.7 |
| Tiny Tina's Wonderlands (2022) | 181.1 | 141.8 | 93.3 | 72.3 | 49.5 |
| F1 22 (2022) | 221 | 219 | 171.5 | 53.4 | 34 |
| Baldur's Gate 3 (2023) | 112.3 | 91.9 | 83.5 | 81.3 | 55 |
| Cyberpunk 2077 (2023) | 101.9 | 79.6 | 67.8 | 58.3 | 36.4 |
Emissionen
Geräuschemissionen
Das Lüftergeräusch ist fast identisch mit dem der höheren RTX 4070-Konfiguration, was darauf hindeutet, dass die schwächere RTX 4050-Konfiguration trotz ihrer langsameren GPU nicht leiser ist.
Lautstärkediagramm
| Idle |
| 23.6 / 25.4 / 25.4 dB(A) |
| Last |
| 44.2 / 52.6 dB(A) |
 | ||
30 dB leise 40 dB(A) deutlich hörbar 50 dB(A) störend |
||
min: | ||
| Lenovo Yoga Pro 9 16IMH9 RTX 4050 GeForce RTX 4050 Laptop GPU, Ultra 9 185H, SK Hynix HFS001TEJ9X115N | Lenovo Yoga Pro 9 16IMH9 GeForce RTX 4070 Laptop GPU, Ultra 9 185H, SK Hynix HFS001TEJ9X115N | HP Envy x360 2-in-1 16-ad0097nr Radeon 780M, R7 8840HS, KIOXIA BG5 KBG50ZNV1T02 | Dell XPS 16 9640 GeForce RTX 4070 Laptop GPU, Ultra 7 155H, Kioxia XG8 KXG80ZNV1T02 | Samsung Galaxy Book4 Ultra GeForce RTX 4050 Laptop GPU, Ultra 7 155H, Samsung PM9A1 MZVL2512HCJQ | Asus VivoBook Pro 16 K6602VU GeForce RTX 4050 Laptop GPU, i9-13900H, Micron 2400 MTFDKBA1T0QFM | |
|---|---|---|---|---|---|---|
| Geräuschentwicklung | -2% | 14% | 0% | 8% | -2% | |
| aus / Umgebung * (dB) | 23.6 | 24.3 -3% | 22.9 3% | 24.5 -4% | 24.2 -3% | 20.96 11% |
| Idle min * (dB) | 23.6 | 24.3 -3% | 23 3% | 24.5 -4% | 24.2 -3% | 25.28 -7% |
| Idle avg * (dB) | 25.4 | 24.3 4% | 23 9% | 24.5 4% | 24.2 5% | 25.28 -0% |
| Idle max * (dB) | 25.4 | 25.8 -2% | 23 9% | 27.5 -8% | 24.2 5% | 25.28 -0% |
| Last avg * (dB) | 44.2 | 48.1 -9% | 23.8 46% | 39.6 10% | 37.9 14% | 51.88 -17% |
| Witcher 3 ultra * (dB) | 48.9 | 49.7 -2% | 43.8 10% | 49.7 -2% | 41.7 15% | 49 -0% |
| Last max * (dB) | 52.6 | 53.9 -2% | 43.8 17% | 49.7 6% | 41.7 21% | 51.8 2% |
* ... kleinere Werte sind besser
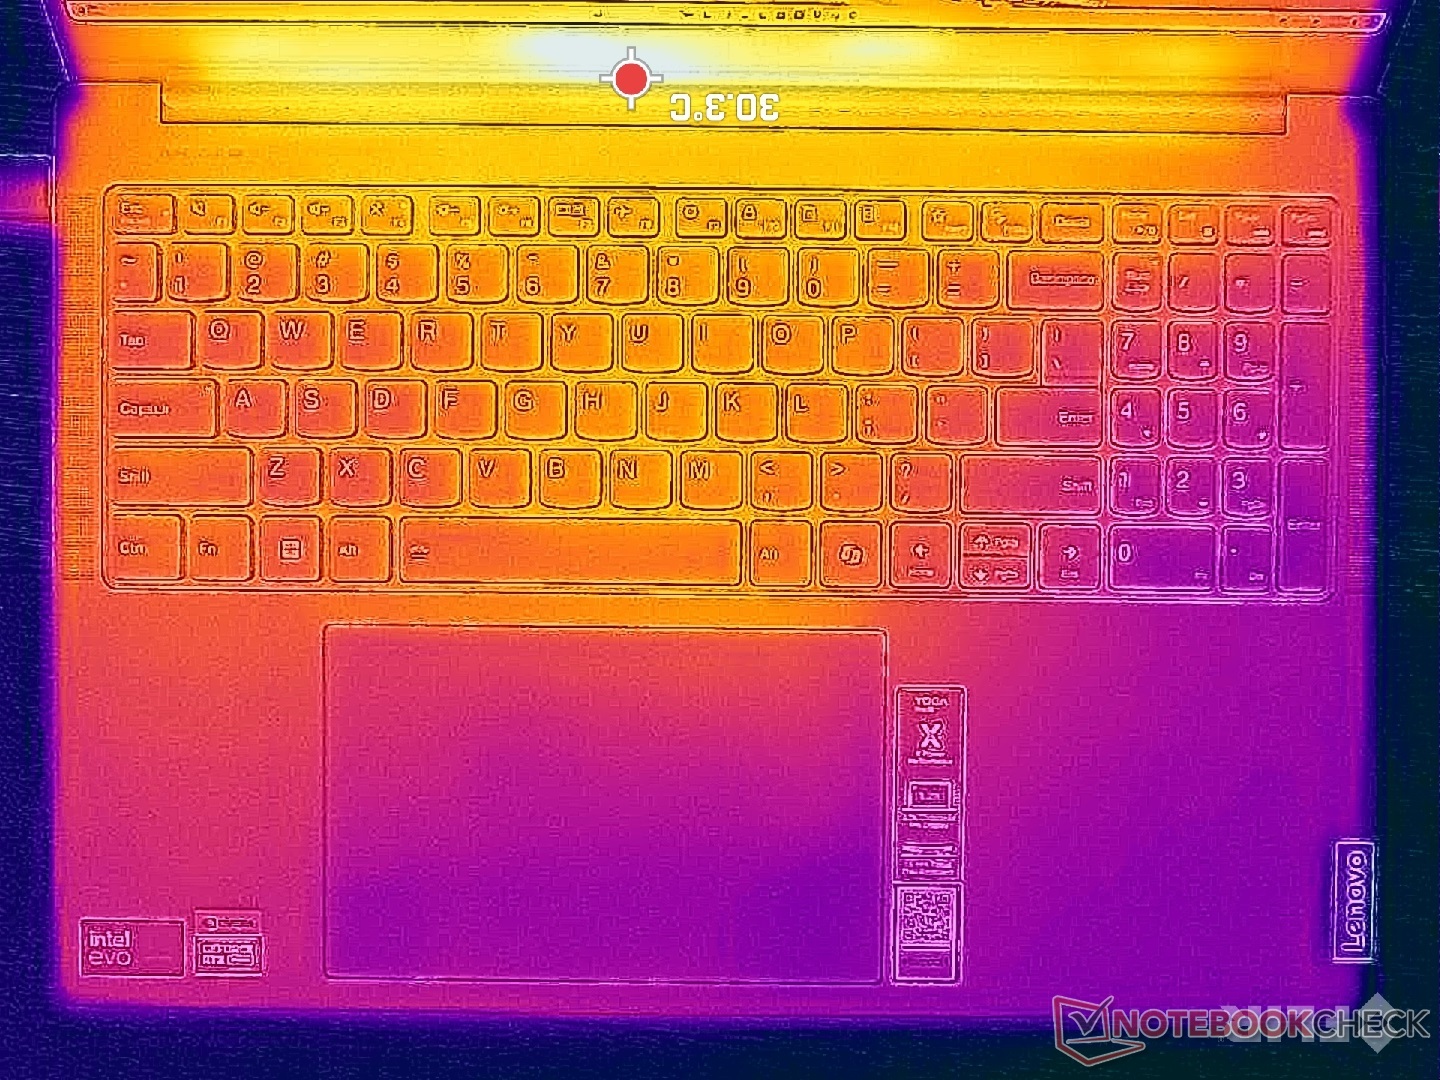
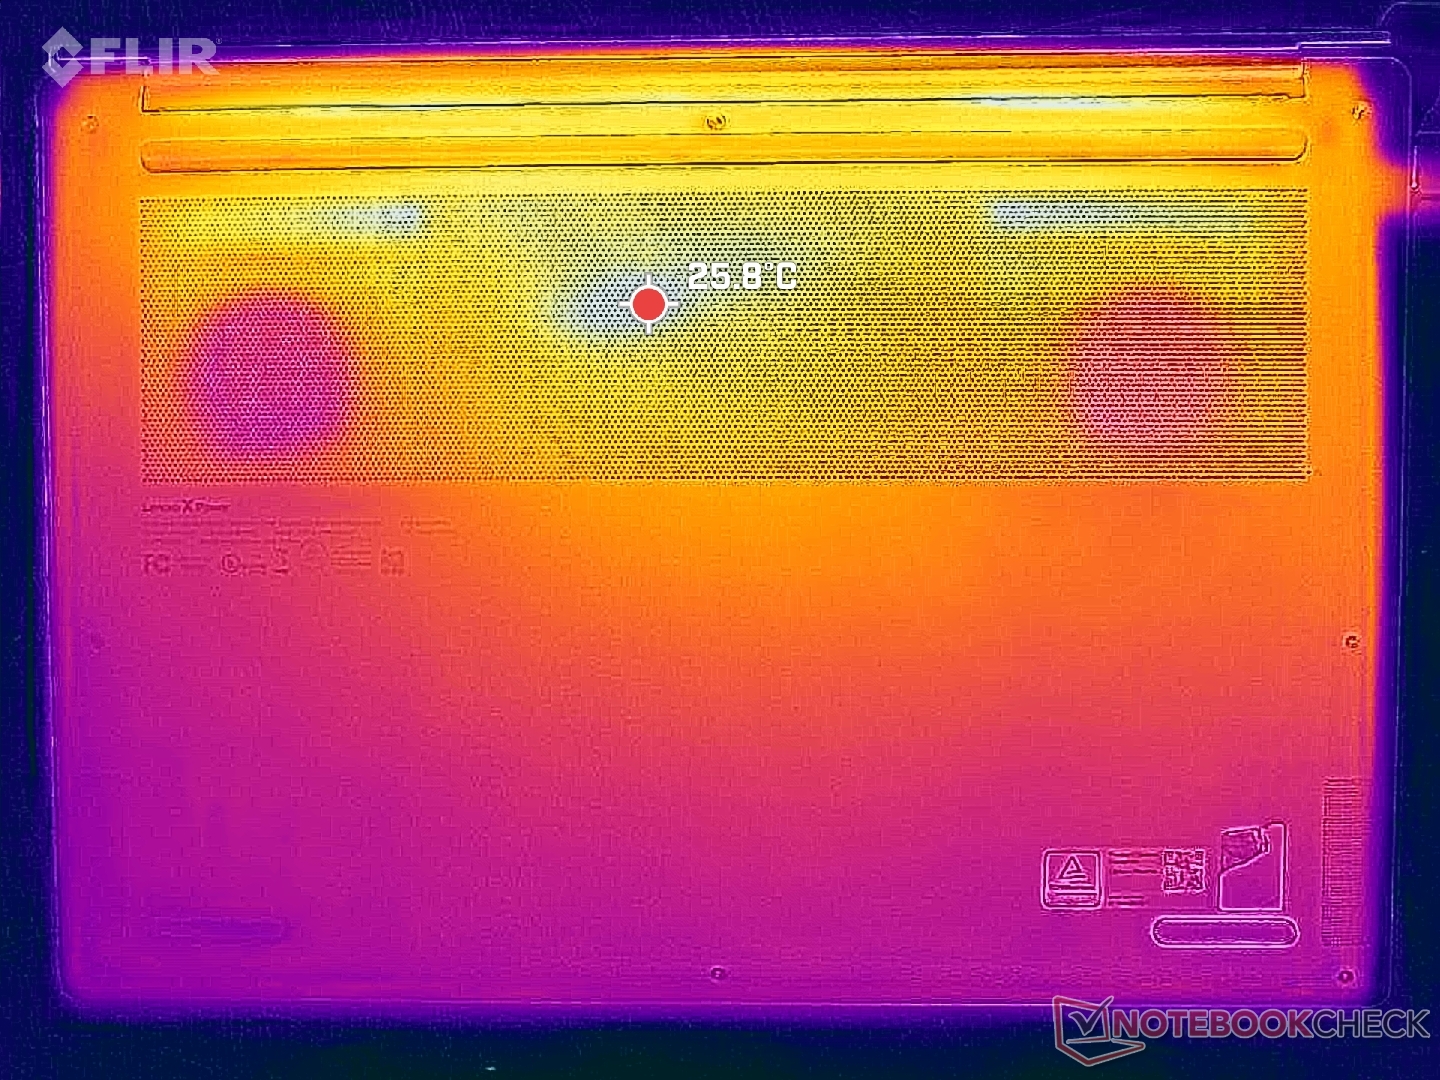
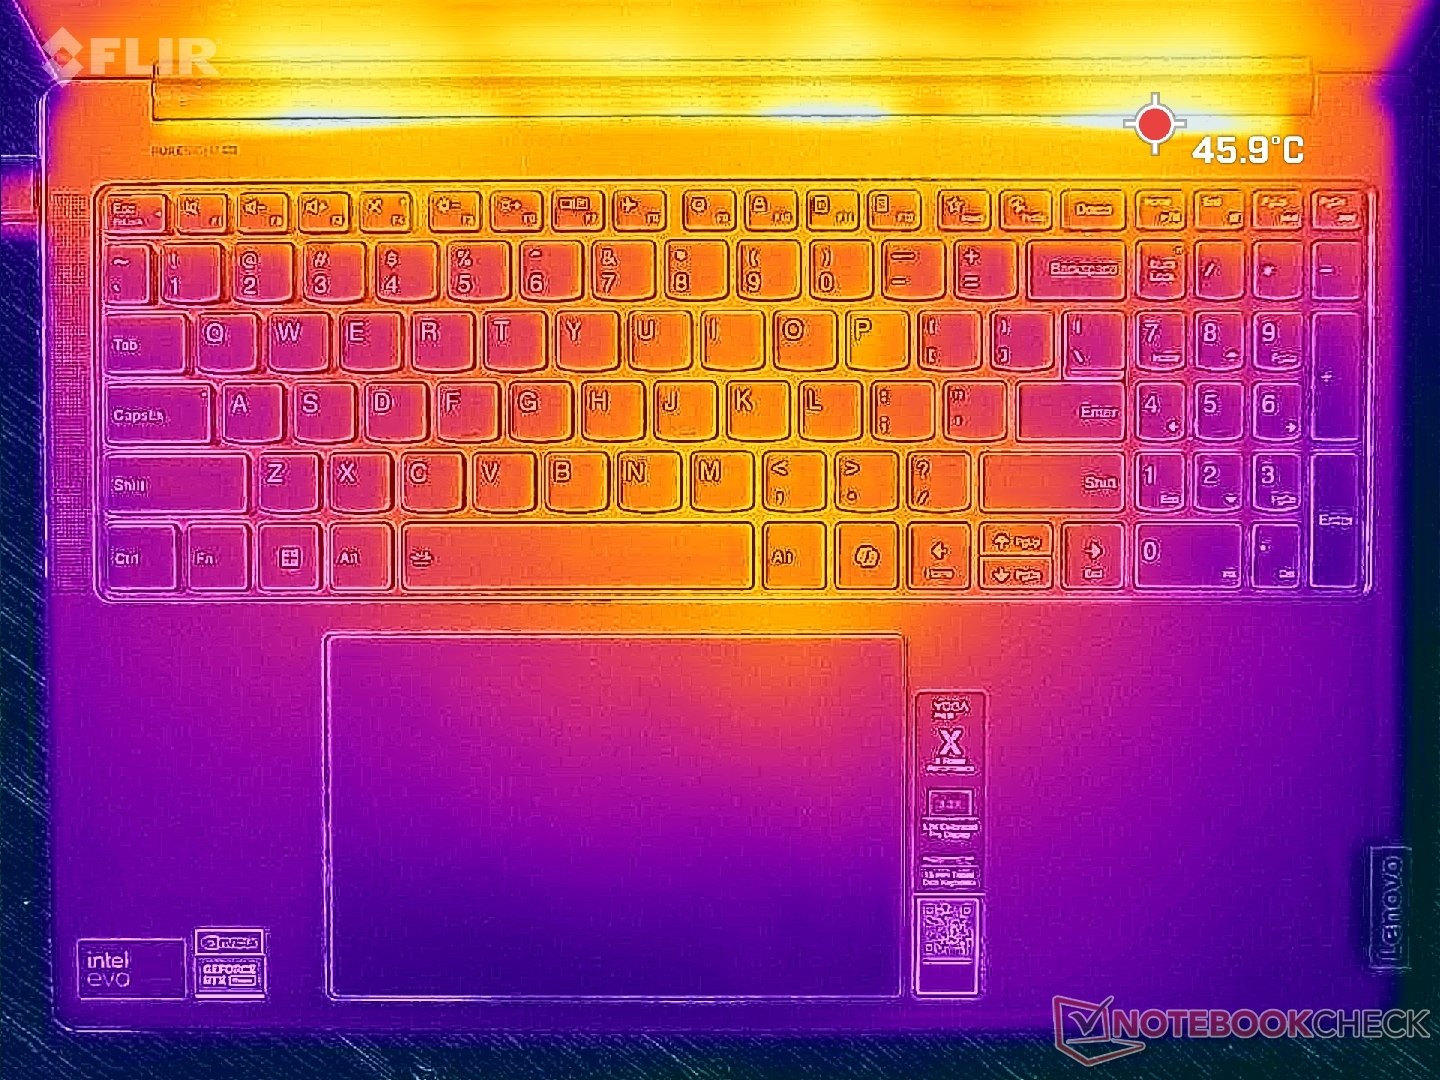
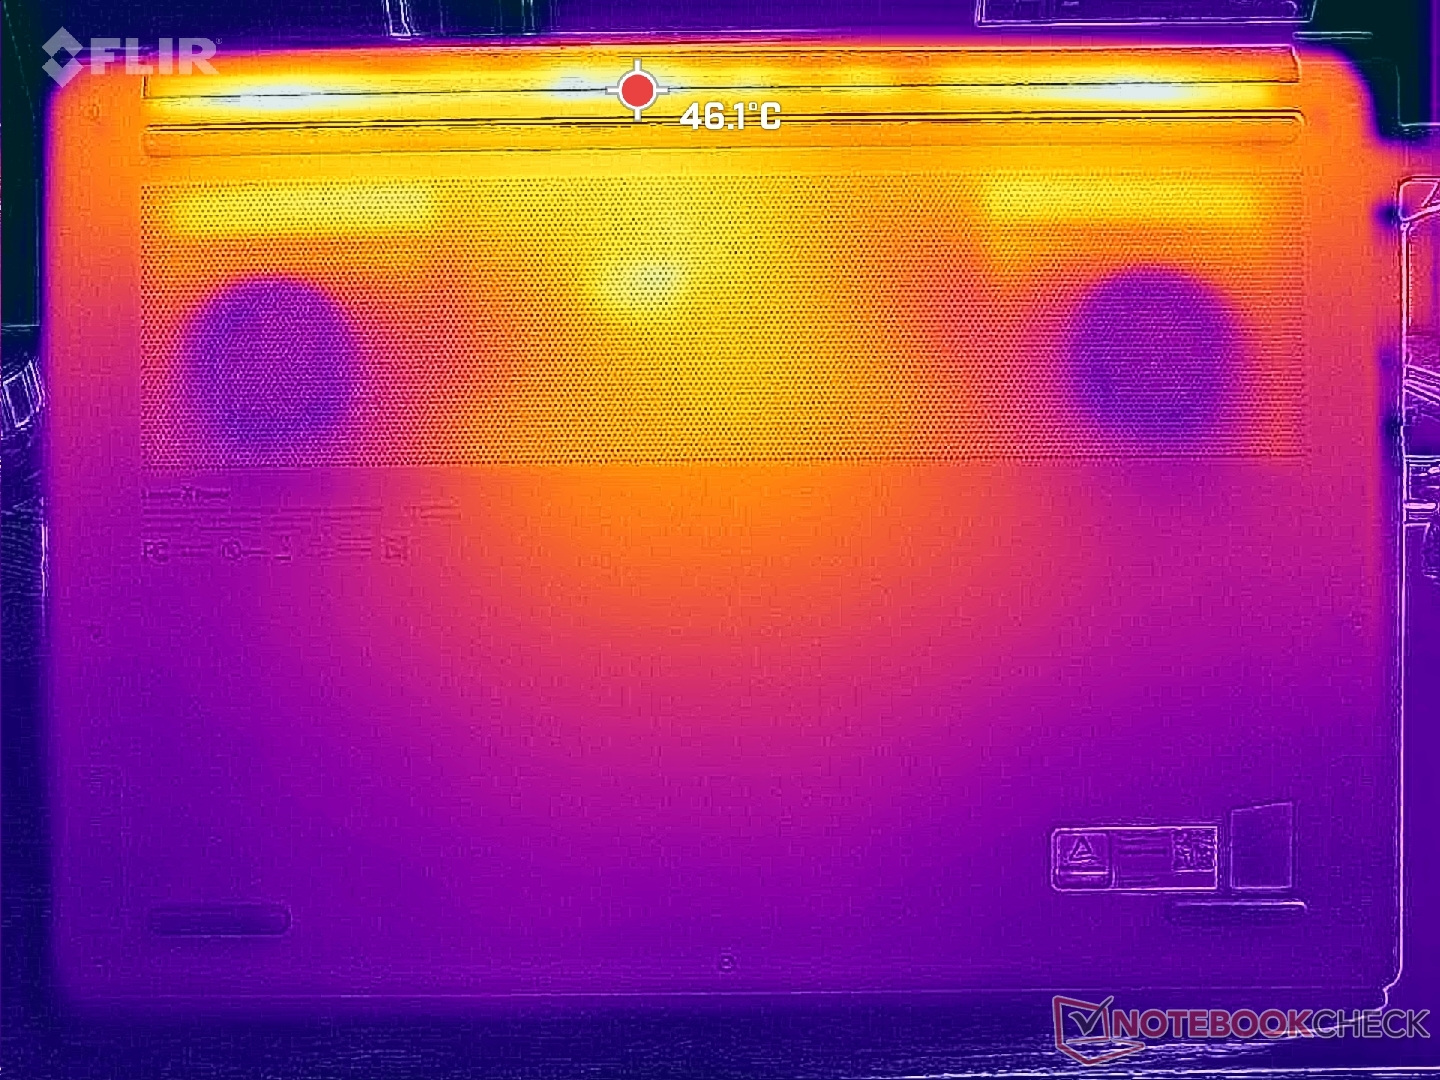
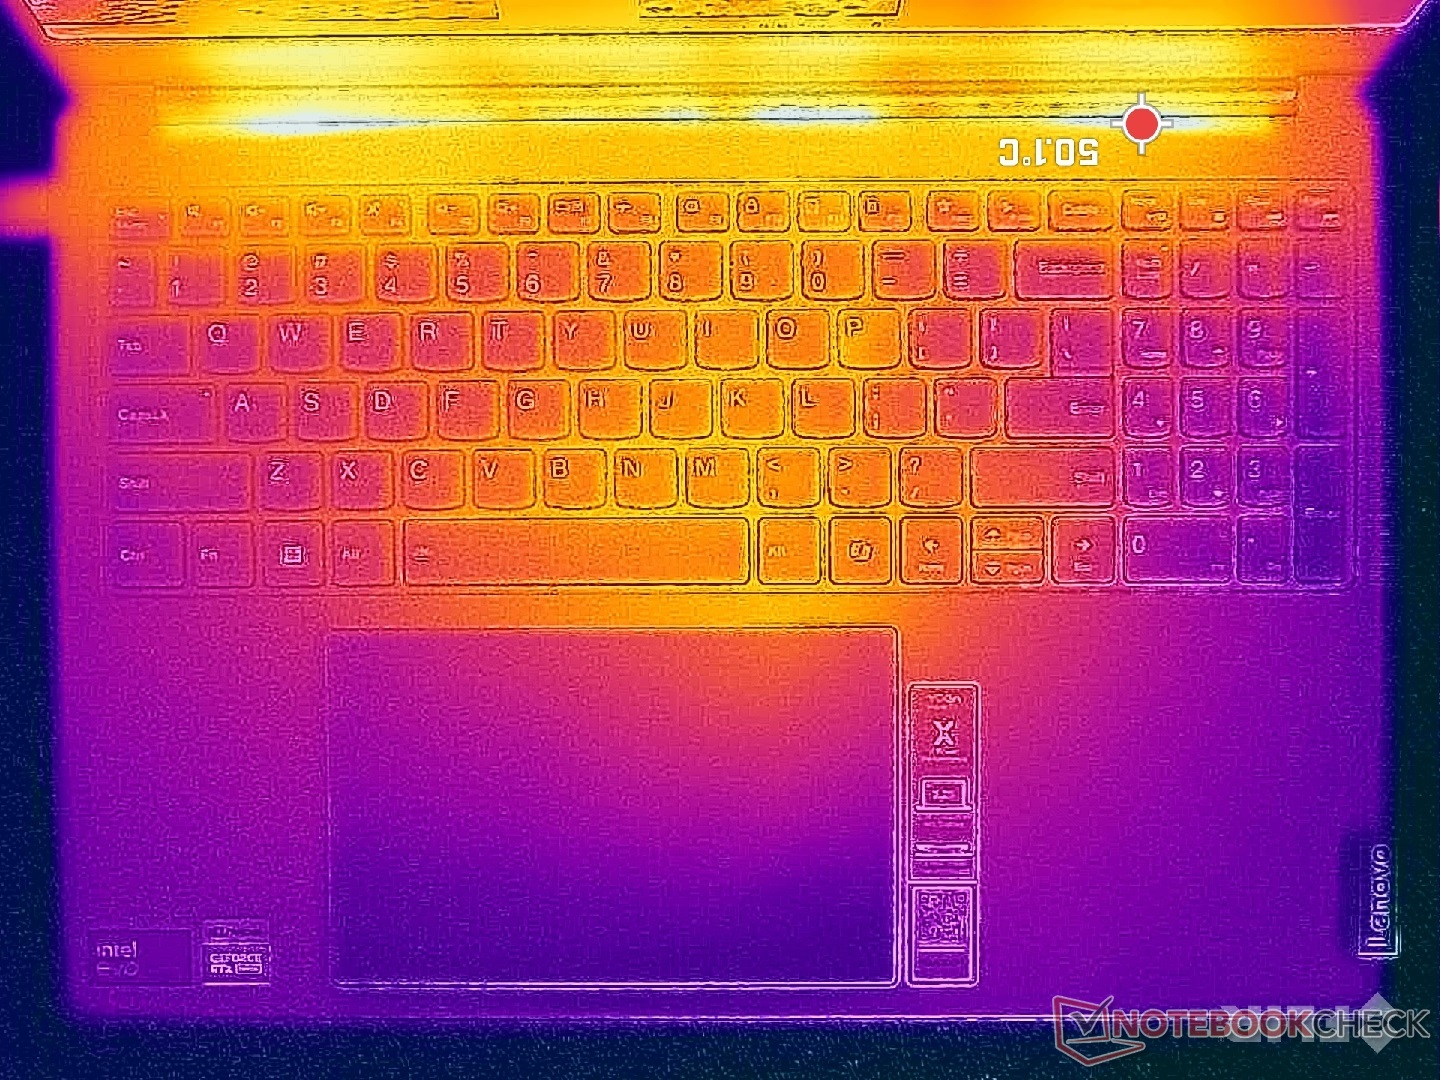
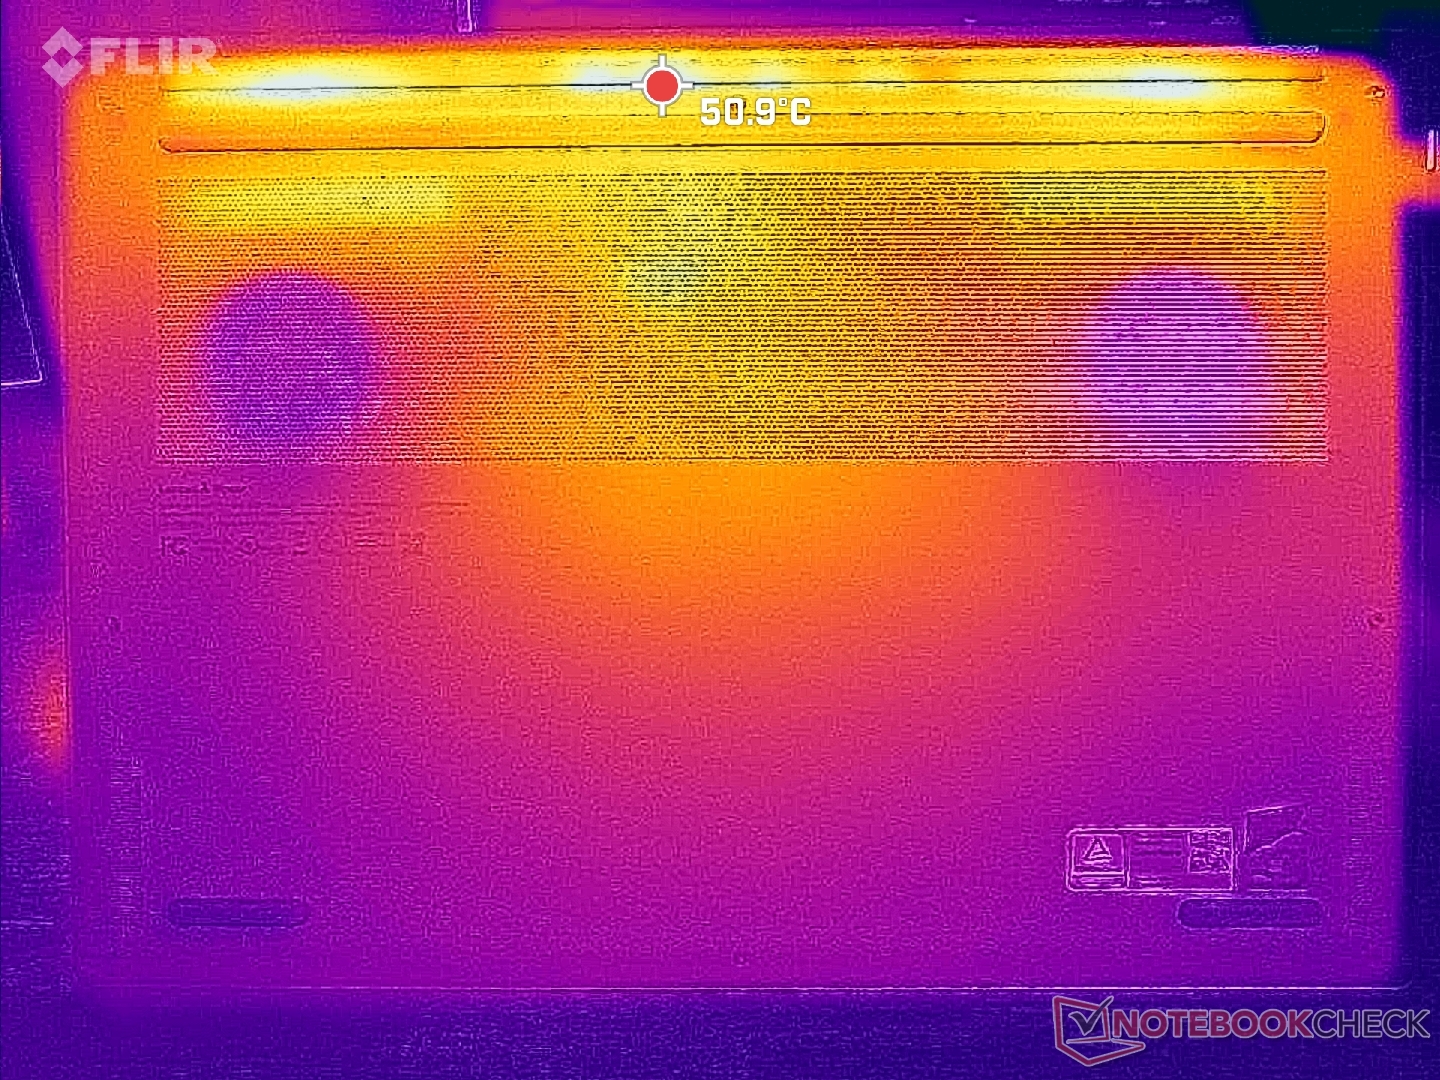
Temperatur
Hotspots können bei anspruchsvoller Last über 41 °C erreichen, was einige Grad kühler ist als das, was wir auf dem Asus VivoBook Pro 16 mit derselben RTX 4050 GPU gemessen haben.
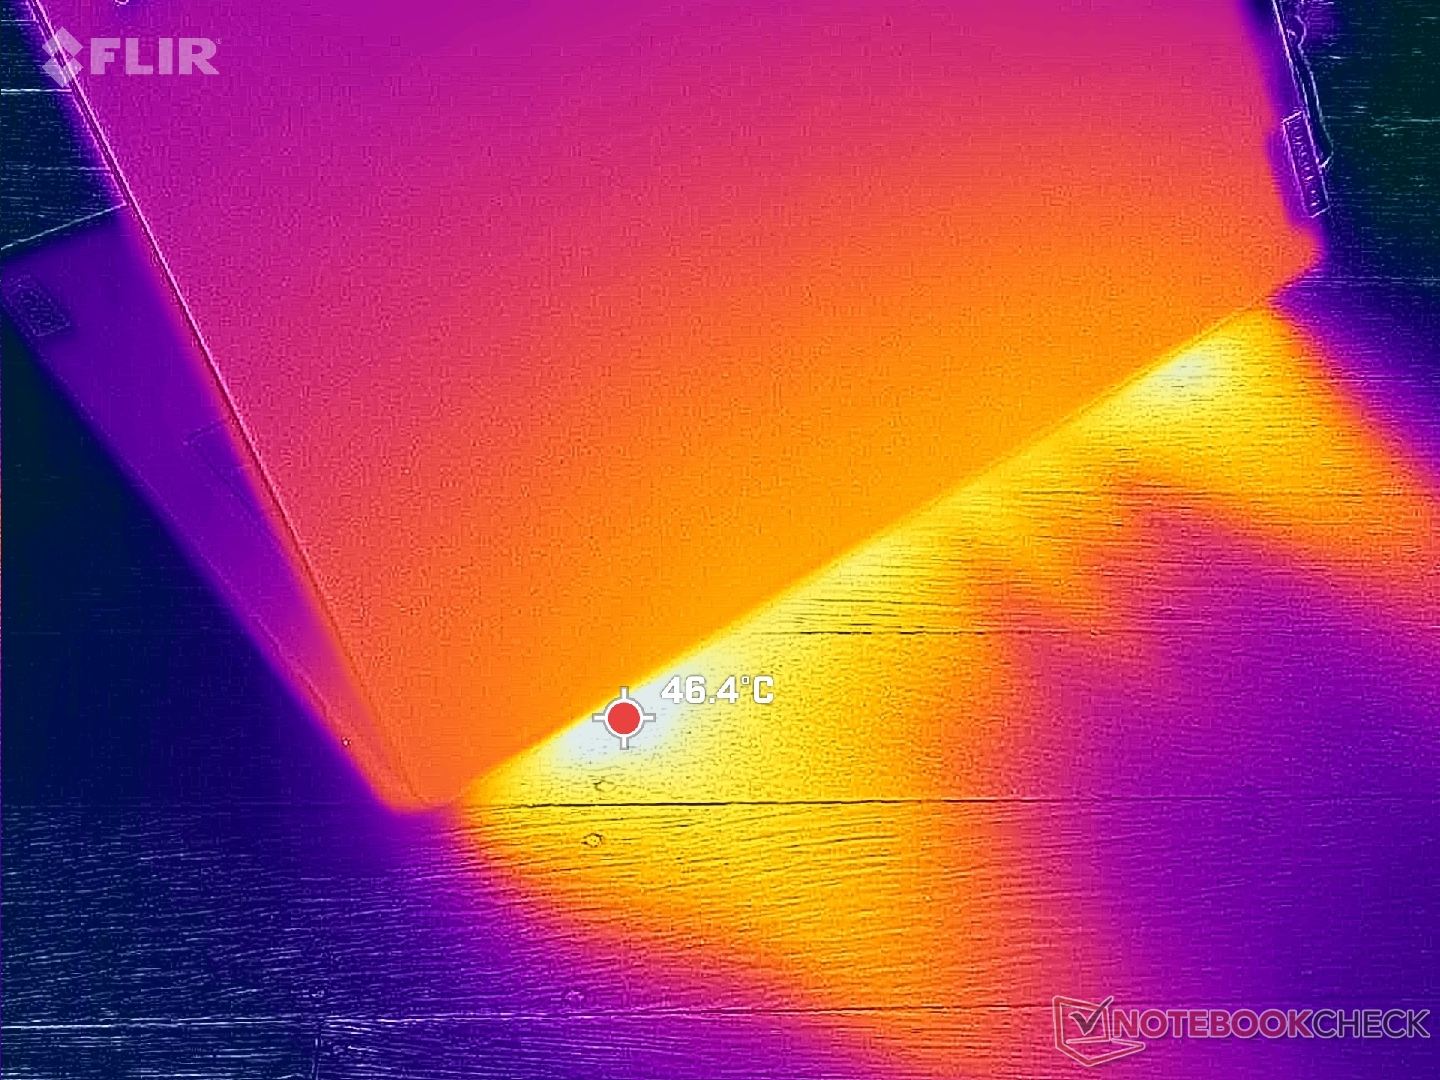
(±) Die maximale Temperatur auf der Oberseite ist 41 °C. Im Vergleich liegt der Klassendurchschnitt bei 40.4 °C (von 21.2 bis 68.8 °C für die Klasse Gaming).
(±) Auf der Unterseite messen wir eine maximalen Wert von 40.6 °C (im Vergleich zum Durchschnitt von 43.2 °C).
(+) Ohne Last messen wir eine durchschnittliche Temperatur von 27.8 °C auf der Oberseite. Der Klassendurchschnitt erreicht 33.9 °C.
(±) Beim längeren Spielen von The Witcher 3 erhitzt sich das Gerät durchschnittlich auf 33 °C. Der Durchschnitt der Klasse ist derzeit 33.9 °C.
(+) Die Handballen und der Touchpad-Bereich sind mit gemessenen 29.6 °C kühler als die typische Hauttemperatur und fühlen sich dadurch kühl an.
(±) Die durchschnittliche Handballen-Temperatur anderer getesteter Geräte war 28.8 °C (-0.8 °C).
| Lenovo Yoga Pro 9 16IMH9 RTX 4050 Intel Core Ultra 9 185H, NVIDIA GeForce RTX 4050 Laptop GPU | Lenovo Yoga Pro 9 16IMH9 Intel Core Ultra 9 185H, NVIDIA GeForce RTX 4070 Laptop GPU | HP Envy x360 2-in-1 16-ad0097nr AMD Ryzen 7 8840HS, AMD Radeon 780M | Dell XPS 16 9640 Intel Core Ultra 7 155H, NVIDIA GeForce RTX 4070 Laptop GPU | Samsung Galaxy Book4 Ultra Intel Core Ultra 7 155H, NVIDIA GeForce RTX 4050 Laptop GPU | Asus VivoBook Pro 16 K6602VU Intel Core i9-13900H, NVIDIA GeForce RTX 4050 Laptop GPU | |
|---|---|---|---|---|---|---|
| Hitze | 3% | -1% | 8% | 13% | -20% | |
| Last oben max * (°C) | 41 | 41.7 -2% | 42.6 -4% | 39.4 4% | 38.5 6% | 42.6 -4% |
| Last unten max * (°C) | 40.6 | 46.3 -14% | 47.8 -18% | 36.9 9% | 41.2 -1% | 48.4 -19% |
| Idle oben max * (°C) | 30.2 | 26.2 13% | 27.4 9% | 28.2 7% | 23.5 22% | 39.4 -30% |
| Idle unten max * (°C) | 31.4 | 27.2 13% | 27.8 11% | 27.4 13% | 24.1 23% | 39.8 -27% |
* ... kleinere Werte sind besser
Lautsprecher
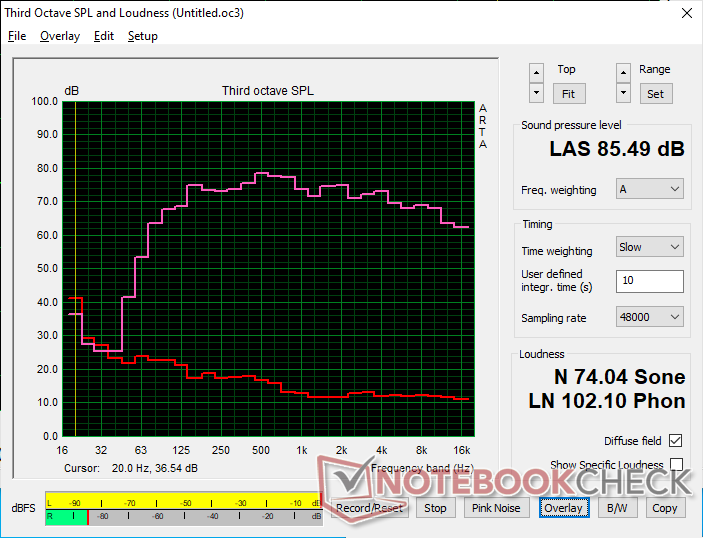
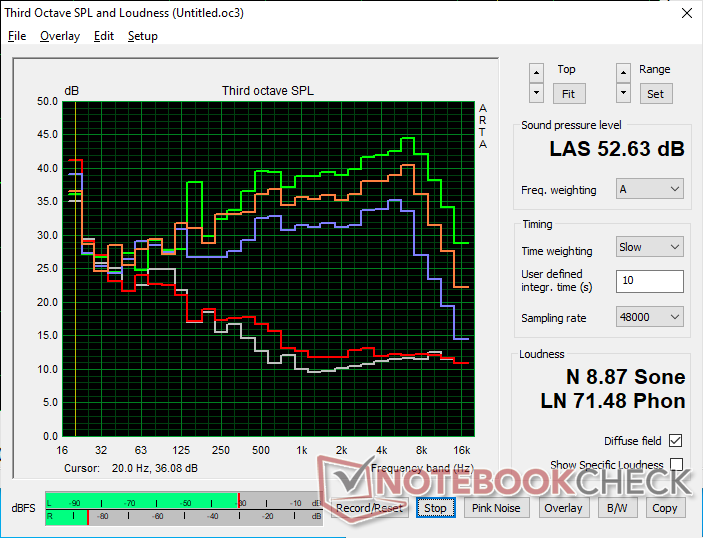
Lenovo Yoga Pro 9 16IMH9 RTX 4050 Audio Analyse
(+) | Die Lautsprecher können relativ laut spielen (85.5 dB)
Bass 100 - 315 Hz
(+) | guter Bass - nur 2.1% Abweichung vom Median
(+) | lineare Bass-Wiedergabe (3.8% Delta zum Vorgänger)
Mitteltöne 400 - 2000 Hz
(+) | ausgeglichene Mitten, vom Median nur 2.6% abweichend
(+) | lineare Mitten (3.1% Delta zum Vorgänger)
Hochtöne 2 - 16 kHz
(+) | ausgeglichene Hochtöne, vom Median nur 3.1% abweichend
(+) | sehr lineare Hochtöne (3% Delta zum Vorgänger)
Gesamt im hörbaren Bereich 100 - 16.000 Hz
(+) | hörbarer Bereich ist sehr linear (5.8% Abstand zum Median
Im Vergleich zu allen Geräten derselben Klasse
» 0% aller getesteten Geräte dieser Klasse waren besser, 0% vergleichbar, 100% schlechter
» Das beste Gerät hat einen Delta-Wert von 6%, durchschnittlich ist 18%, das schlechteste Gerät hat 132%
Im Vergleich zu allen Geräten im Test
» 0% aller getesteten Geräte waren besser, 0% vergleichbar, 100% schlechter
» Das beste Gerät hat einen Delta-Wert von 4%, durchschnittlich ist 23%, das schlechteste Gerät hat 134%
Apple MacBook Pro 16 2021 M1 Pro Audio Analyse
(+) | Die Lautsprecher können relativ laut spielen (84.7 dB)
Bass 100 - 315 Hz
(+) | guter Bass - nur 3.8% Abweichung vom Median
(+) | lineare Bass-Wiedergabe (5.2% Delta zum Vorgänger)
Mitteltöne 400 - 2000 Hz
(+) | ausgeglichene Mitten, vom Median nur 1.3% abweichend
(+) | lineare Mitten (2.1% Delta zum Vorgänger)
Hochtöne 2 - 16 kHz
(+) | ausgeglichene Hochtöne, vom Median nur 1.9% abweichend
(+) | sehr lineare Hochtöne (2.7% Delta zum Vorgänger)
Gesamt im hörbaren Bereich 100 - 16.000 Hz
(+) | hörbarer Bereich ist sehr linear (4.6% Abstand zum Median
Im Vergleich zu allen Geräten derselben Klasse
» 0% aller getesteten Geräte dieser Klasse waren besser, 0% vergleichbar, 100% schlechter
» Das beste Gerät hat einen Delta-Wert von 5%, durchschnittlich ist 17%, das schlechteste Gerät hat 45%
Im Vergleich zu allen Geräten im Test
» 0% aller getesteten Geräte waren besser, 0% vergleichbar, 100% schlechter
» Das beste Gerät hat einen Delta-Wert von 4%, durchschnittlich ist 23%, das schlechteste Gerät hat 134%
Energieverwaltung
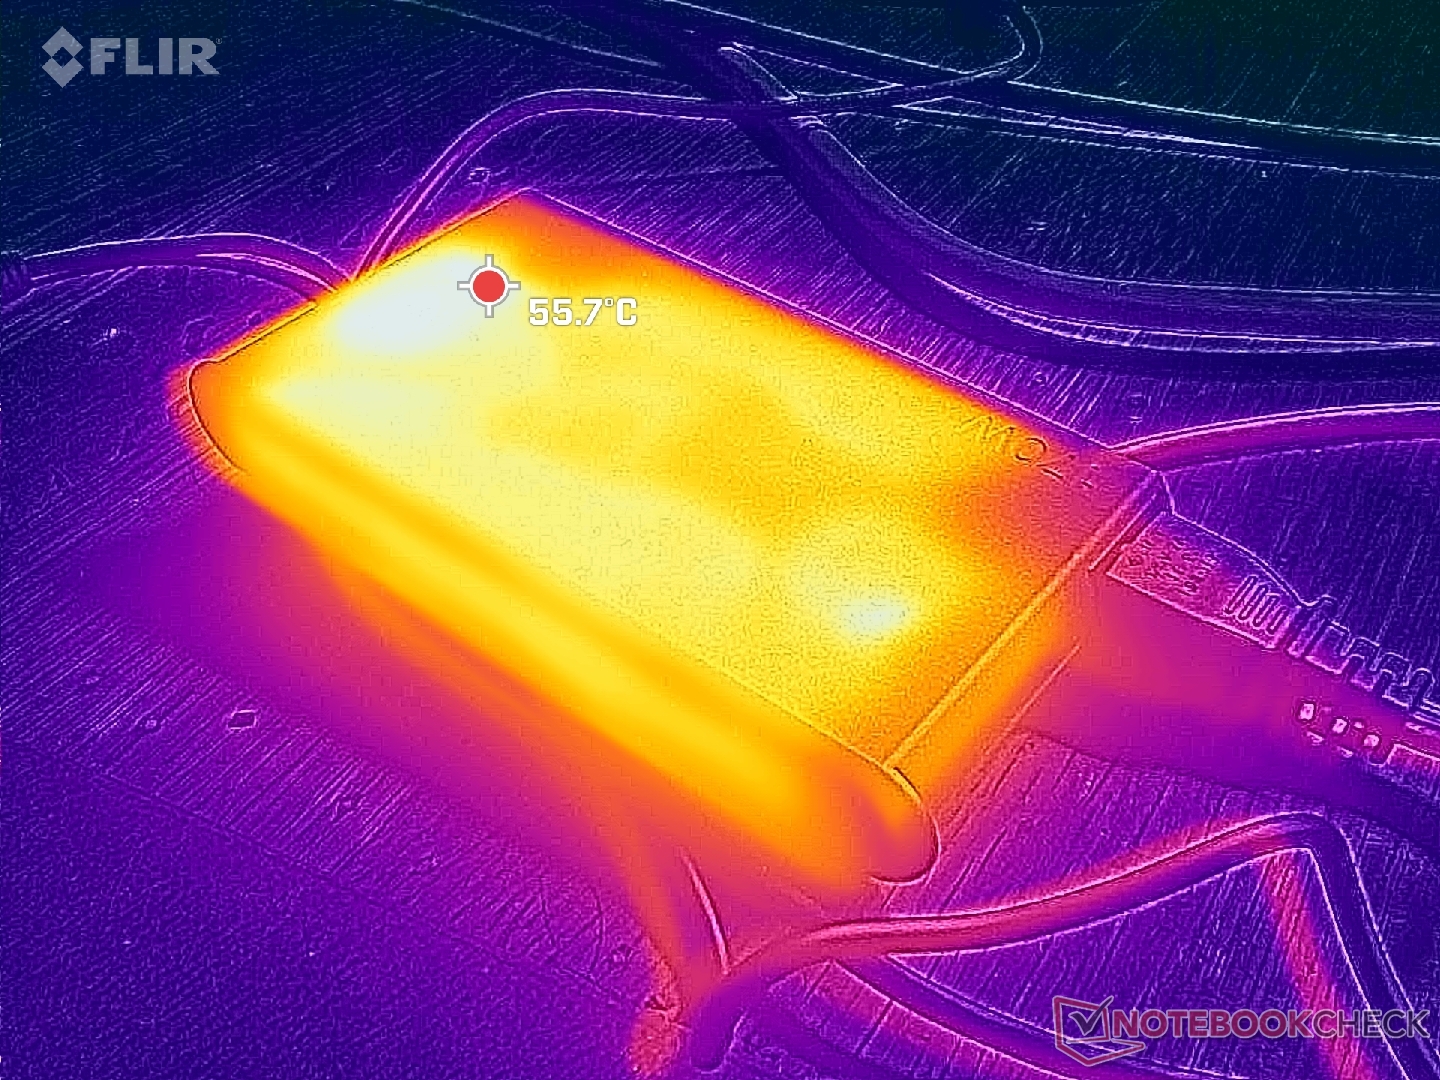
Energieaufnahme
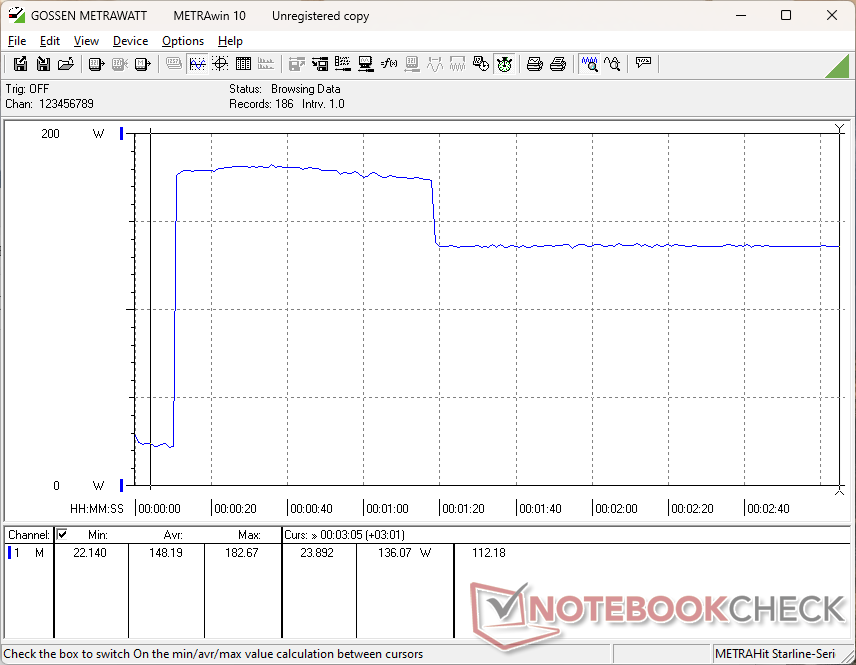
Der Gesamtverbrauch liegt sehr nahe an dem, was wir bei der High-End-Konfiguration der Mini-LED RTX 4070 gemessen haben. Bei der Ausführung von Witcher 3 würde unsere Low-End-Konfiguration im Durchschnitt nur 5 Prozent weniger verbrauchen, obwohl sie ein 25- bis 30-prozentiges Grafikleistungsdefizit gegenüber der RTX 4070 mit sich bringt. Das Verhältnis Leistung pro Watt spricht also ganz klar für die RTX 4070.
Nutzer sollten bedenken, dass das Netzteil nur für 170 W ausgelegt ist. Da Spiele bereits zwischen 150 W und 160 W benötigen, wird der Versuch, das Notebook beim Spielen aufzuladen, zu einer sehr langsamen Ladegeschwindigkeit führen.


| Aus / Standby | |
| Idle | |
| Last |
|
Legende:
min: | |
| Lenovo Yoga Pro 9 16IMH9 RTX 4050 Ultra 9 185H, GeForce RTX 4050 Laptop GPU, SK Hynix HFS001TEJ9X115N, IPS, 3200x2000, 16" | Lenovo Yoga Pro 9 16IMH9 Ultra 9 185H, GeForce RTX 4070 Laptop GPU, SK Hynix HFS001TEJ9X115N, Mini-LED, 3200x2000, 16" | HP Envy x360 2-in-1 16-ad0097nr R7 8840HS, Radeon 780M, KIOXIA BG5 KBG50ZNV1T02, OLED, 2880x1800, 16" | Dell XPS 16 9640 Ultra 7 155H, GeForce RTX 4070 Laptop GPU, Kioxia XG8 KXG80ZNV1T02, OLED, 3840x2400, 16.3" | Samsung Galaxy Book4 Ultra Ultra 7 155H, GeForce RTX 4050 Laptop GPU, Samsung PM9A1 MZVL2512HCJQ, OLED, 2880x1800, 16" | Asus VivoBook Pro 16 K6602VU i9-13900H, GeForce RTX 4050 Laptop GPU, Micron 2400 MTFDKBA1T0QFM, OLED, 3200x2000, 16" | |
|---|---|---|---|---|---|---|
| Stromverbrauch | -2% | 57% | 32% | 47% | -8% | |
| Idle min * (Watt) | 9.9 | 10.3 -4% | 5 49% | 7.7 22% | 4.8 52% | 21.06 -113% |
| Idle avg * (Watt) | 16.6 | 21.9 -32% | 6.2 63% | 10.3 38% | 7.5 55% | 24.27 -46% |
| Idle max * (Watt) | 29.2 | 22.4 23% | 14.7 50% | 10.6 64% | 7.9 73% | 25.12 14% |
| Last avg * (Watt) | 100.9 | 96.9 4% | 49.9 51% | 76.5 24% | 79.3 21% | 52.4 48% |
| Witcher 3 ultra * (Watt) | 151.8 | 159.6 -5% | 54.5 64% | 126.4 17% | 79.2 48% | 110.2 27% |
| Last max * (Watt) | 182.2 | 173.8 5% | 65 64% | 138.5 24% | 125 31% | 146 20% |
* ... kleinere Werte sind besser
Energieverbrauch Witcher 3 / Stresstest
Energieverbrauch externer Monitor
Akkulaufzeit
Die WLAN-Laufzeit im Balanced- und Optimus-Modus mit einer Display-Einstellung von 150 nits würde etwa genauso lange dauern wie die teurere RTX 4070 Mini-LED-Konfiguration. Die Ergebnisse sind auf den ersten Blick etwas überraschend, da Mini-LED und die RTX 4070 GPU stromhungriger sein können als IPS und die RTX 4050, aber die Daten machen Sinn, wenn man den Optimus-Modus und die ähnlichen Helligkeitseinstellungen während des Tests berücksichtigt. Die Surfzeit von 9 Stunden ist immer noch sehr gut für ein 16-Zoll-Multimedia-Notebook mit diskreter Grafik, auch wenn sie etwas kürzer ist als bei Konkurrenten wie dem Dell XPS 16 oder Samsung Galaxy Book4 Ultra.
| Lenovo Yoga Pro 9 16IMH9 RTX 4050 Ultra 9 185H, GeForce RTX 4050 Laptop GPU, 84 Wh | Lenovo Yoga Pro 9 16IMH9 Ultra 9 185H, GeForce RTX 4070 Laptop GPU, 84 Wh | HP Envy x360 2-in-1 16-ad0097nr R7 8840HS, Radeon 780M, 68 Wh | Dell XPS 16 9640 Ultra 7 155H, GeForce RTX 4070 Laptop GPU, 99.5 Wh | Samsung Galaxy Book4 Ultra Ultra 7 155H, GeForce RTX 4050 Laptop GPU, 76 Wh | Asus VivoBook Pro 16 K6602VU i9-13900H, GeForce RTX 4050 Laptop GPU, 96 Wh | |
|---|---|---|---|---|---|---|
| Akkulaufzeit | -2% | -14% | 17% | 21% | 12% | |
| WLAN (h) | 9 | 8.8 -2% | 7.7 -14% | 10.5 17% | 10.9 21% | 10.1 12% |
| H.264 (h) | 11.5 | 16.5 | 17.9 | 9.8 | ||
| Last (h) | 1.2 | 1.9 | 1.5 | 1.3 | ||
| Idle (h) | 15.6 |
Pro
Contra
Fazit — Eines der besten Produkte von Lenovo, wenn man bereit ist, dafür zu zahlen
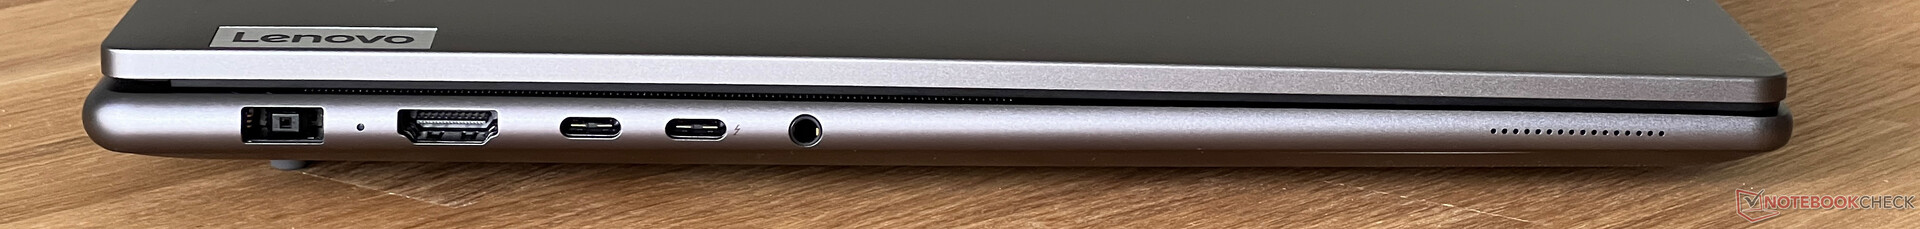
Das Yoga Pro 9 16IMH9 ist das bisher beeindruckendste Modell der Serie, selbst in der günstigsten Konfiguration ohne RTX 4070-Grafik oder den schicken Mini-LED-Bildschirm. Es bietet eine echte Alternative zum XPS 16 oder MacBook Pro 16. Sein IPS-Display, die Leistung und die Größe sind konkurrenzfähig zu den Äquivalenten von Dell oder Apple, während es einfacher zu warten ist und über eine bessere Tastatur als das XPS verfügt. Wir schätzen auch die größere Auswahl an Anschlüssen, während die beiden konkurrierenden Modelle nur USB-C haben.
Andere Faktoren wie die Akkulaufzeit und das Lüftergeräusch sind nicht merklich besser bzw. leiser als bei der höherwertigen RTX-4070-Konfiguration.
Das KI-fähige Lenovo Yoga Pro 9 16IMH9 ist nicht nur eine großartige Alternative zum Dell XPS 16 oder MacBook Pro 16, sondern es macht auch einige Dinge besser als beide.
Der Verkaufspreis von 1.500 Euro für die RTX 4050-Konfiguration ist etwas hoch, da Gaming-Laptops mit der gleichen GPU wie das MSI Thin GF63 oder Acer Nitro V für jeweils unter 1.000 Euro zu haben sind. Im Vergleich zum konkurrierenden XPS 16 oder MacBook Pro 16 ist das Lenovo jedoch einige hundert Euro günstiger und damit eine attraktive Lösung für alle, die etwas Geld sparen und gleichzeitig ein erstklassiges Benutzererlebnis genießen möchten.
Price and Availability
Derzeit bietet Amazon die Lenovo Yoga Pro 9 16 Konfiguration, für 1.900 Euro an.
Lenovo Yoga Pro 9 16IMH9 RTX 4050
- 06.06.2024 v7 (old)
Allen Ngo
Transparenz
Die Auswahl der zu testenden Geräte erfolgt innerhalb der Redaktion. Das vorliegende Testmuster wurde dem Autor vom Hersteller oder einem Shop zu Testzwecken leihweise zur Verfügung gestellt. Eine Einflussnahme des Leihstellers auf den Testbericht gab es nicht, der Hersteller erhielt keine Version des Reviews vor der Veröffentlichung. Es bestand keine Verpflichtung zur Publikation. Als eigenständiges, unabhängiges Unternehmen unterliegt Notebookcheck keiner Diktion von Herstellern, Shops und Verlagen.
So testet Notebookcheck
Pro Jahr werden von Notebookcheck hunderte Laptops und Smartphones unabhängig in von uns standardisierten technischen Verfahren getestet, um eine Vergleichbarkeit aller Testergebnisse zu gewährleisten. Seit rund 20 Jahren entwickeln wir diese Testmethoden kontinuierlich weiter und setzen damit Branchenstandards. In unseren Testlaboren kommt ausschließlich hochwertiges Messequipment in die Hände erfahrener Techniker und Redakteure. Die Tests unterliegen einer mehrstufigen Kontrolle. Unsere komplexe Gesamtbewertung basiert auf hunderten fundierten Messergebnissen und Benchmarks, womit Ihnen Objektivität garantiert ist. Weitere Informationen zu unseren Testmethoden gibt es hier.
Preisvergleich

