Fazit - Deckt alle Grundlagen ab
Als erschwingliches Subnotebook der Mittelklasse bietet das Dell 14 Plus nicht viel an ausgefallenem Schnickschnack oder glänzendem, aufsehenerregendem Design. Stattdessen konzentriert es sich auf die Kernfunktionen, auf die preisbewusste Nutzer Wert legen. Dazu gehören eine moderne CPU, ein hochauflösendes IPS-Display mit vollen sRGB-Farben und eine relativ dünne und leichte Bauweise für den einfachen Transport. Der Prozessor allein ist verantwortlich für die lange Akkulaufzeit und die höhere Effizienz im Vergleich zu Modellen der vorherigen Generation.
Zu den Nachteilen gehören die unterdurchschnittliche integrierte GPU, die durchschnittlichen Schwarz-Weiß-Reaktionszeiten und das etwas körnige matte Panel. Das System ist also nicht gerade ideal, wenn es um Games geht, aber selbst dann spielt es immer noch weitaus besser als seine Vorgänger, die mit Iris-Xe-Grafik laufen. Auch das Fehlen jeglicher Touchscreen-Optionen könnte einige Nutzer enttäuschen.
Pro
Contra
Preis und Verfügbarkeit
Beim Hersteller selber gibt es das Dell 14 Plus jetzt wie besprochen für 1.299 Euro. Alternativ hat Amazon das Gerät für 1.249 Euro gelistet.
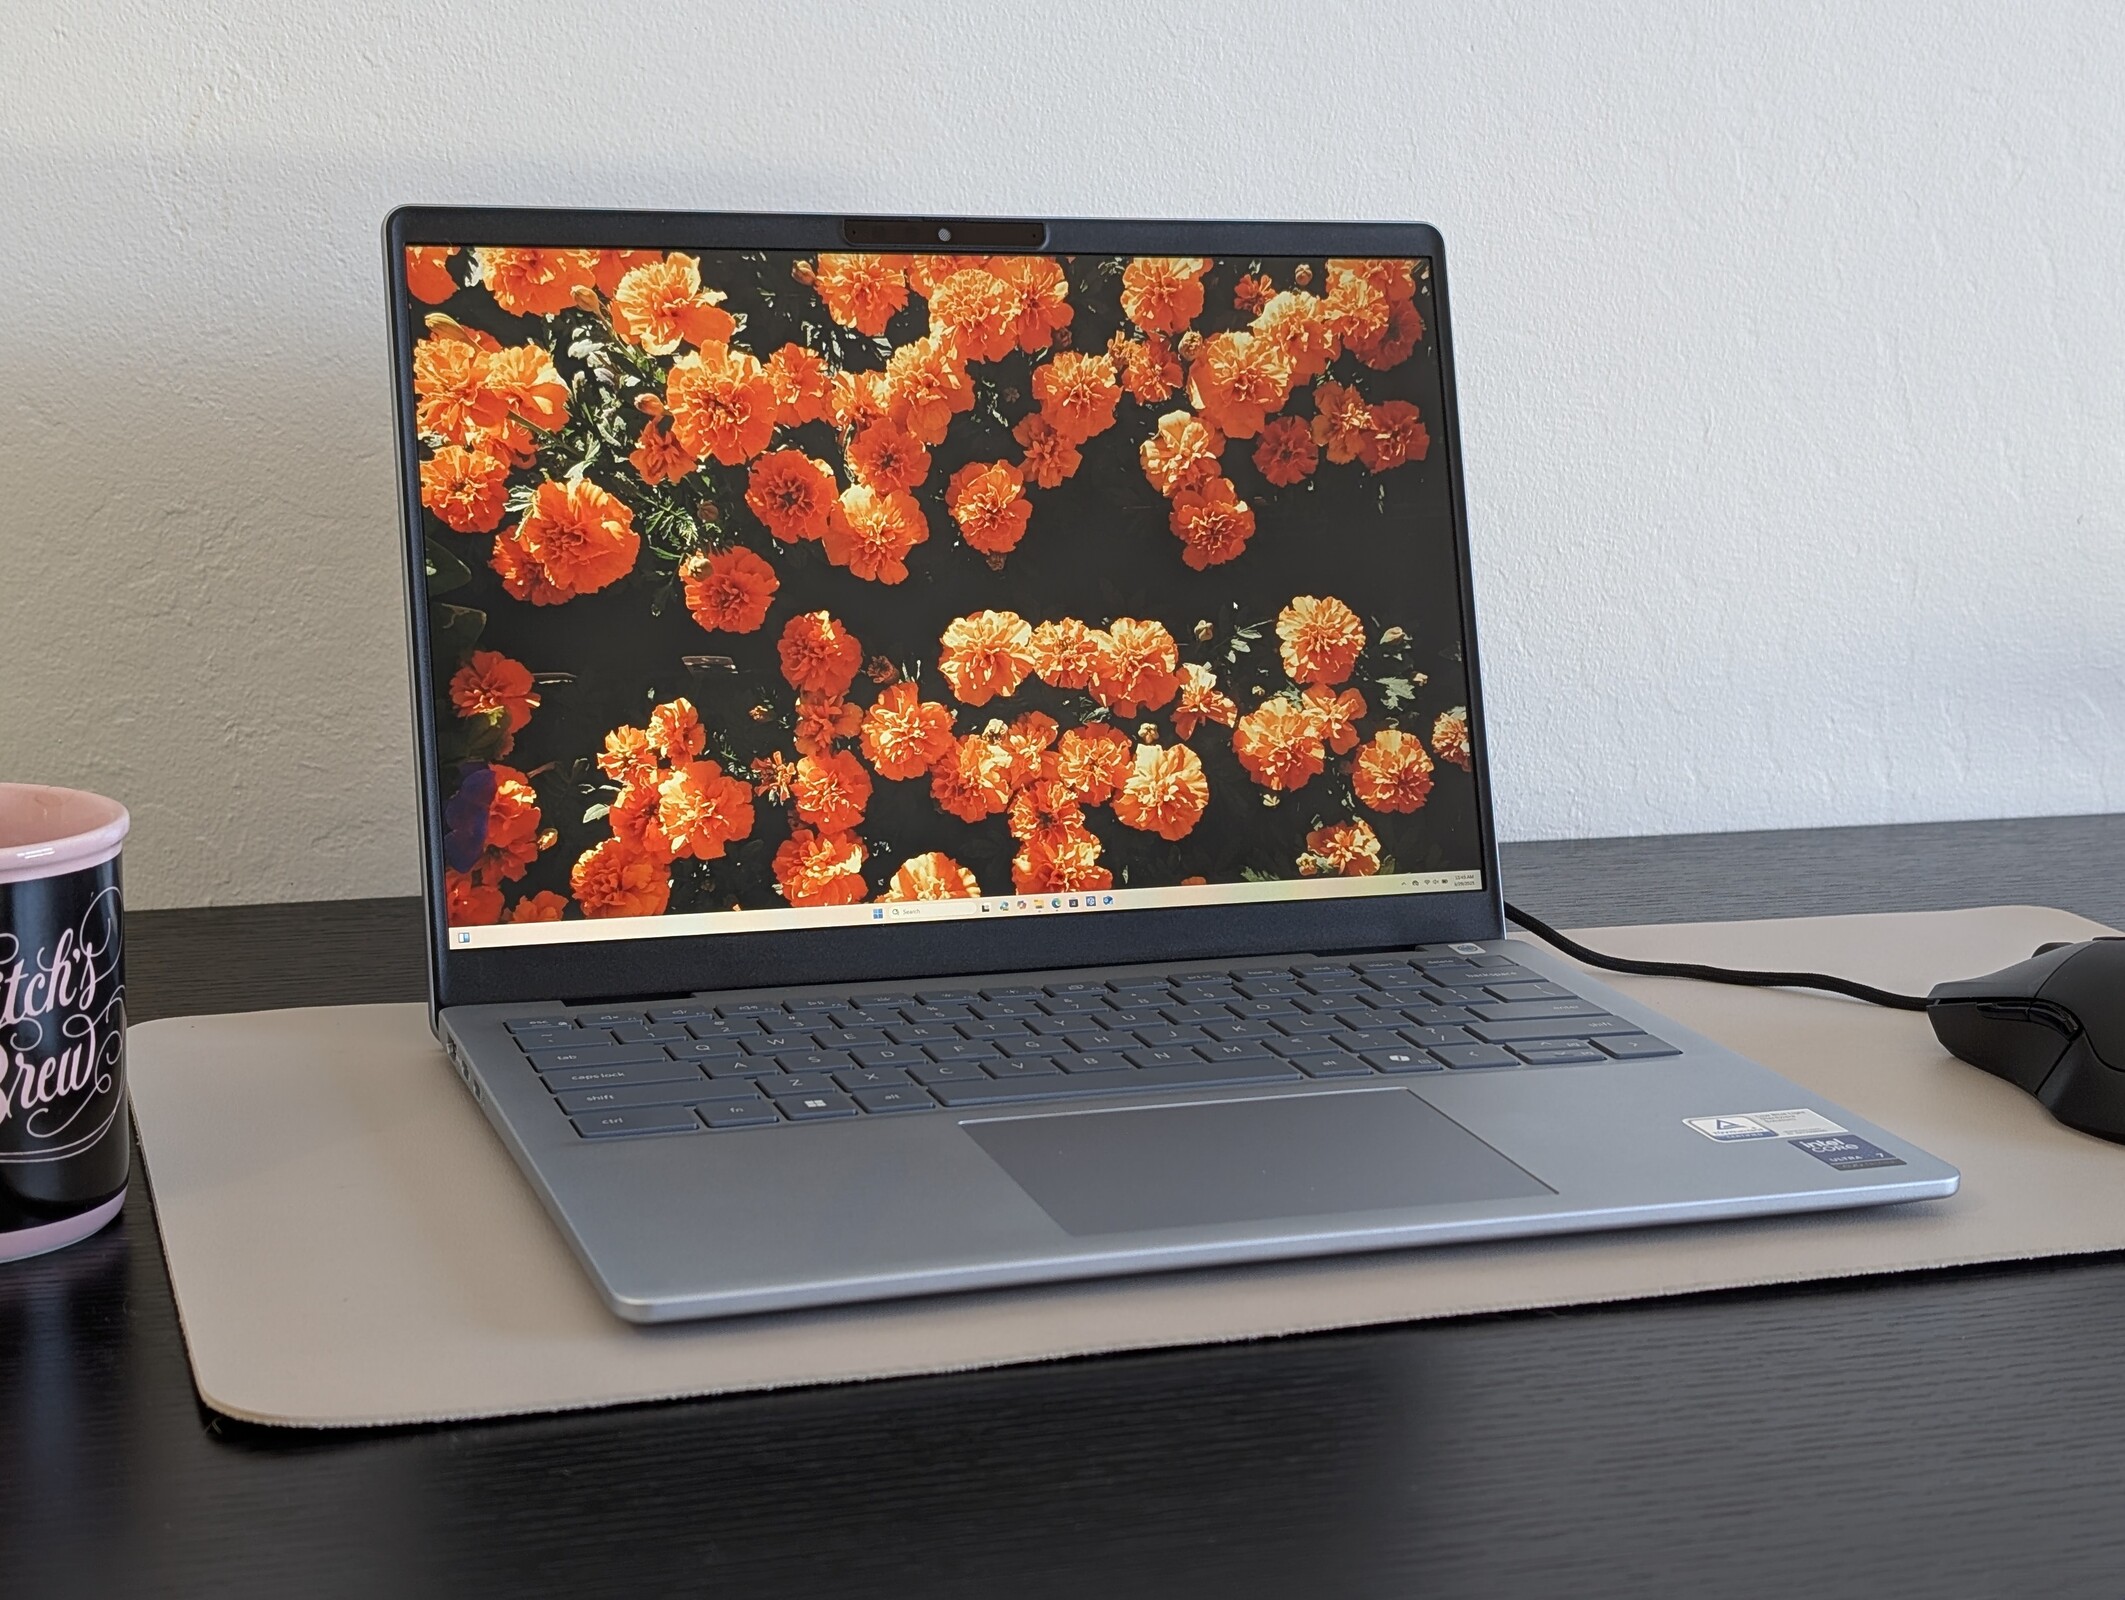
Das Dell 14 Plus ist der Nachfolger des letztjährigen Inspiron 14 Plus 7440 und ist eine preisgünstige Mittelklasse-Option für den Multimedia-Einsatz zu Hause oder für Studenten. Es teilt wichtige Designmerkmale mit dem Inspiron, wie unser Test unten zeigen wird.
Bei unserem Testgerät handelt es sich um eine niedrigere Konfiguration mit der Core Ultra 7 256V CPU und 16 GB RAM für ca. 1.100 US-Dollar. Höherwertige SKUs sind stattdessen mit dem Core Ultra 7 258V oder Core Ultra 9 288V und dem doppelten Arbeitsspeicher ausgestattet, aber das 2,5K-90-Hz-Display bleibt bei allen aktuellen Konfigurationen gleich.
Zu den Alternativen zum Dell 14 Plus gehören andere 14-Zoll-Clamshells für Privatkunden wie das Lenovo IdeaPad Pro 5 14 oder HP Pavilion Plus 14.
Mehr Dell Bewertungen:
Spezifikationen
Gehäuse
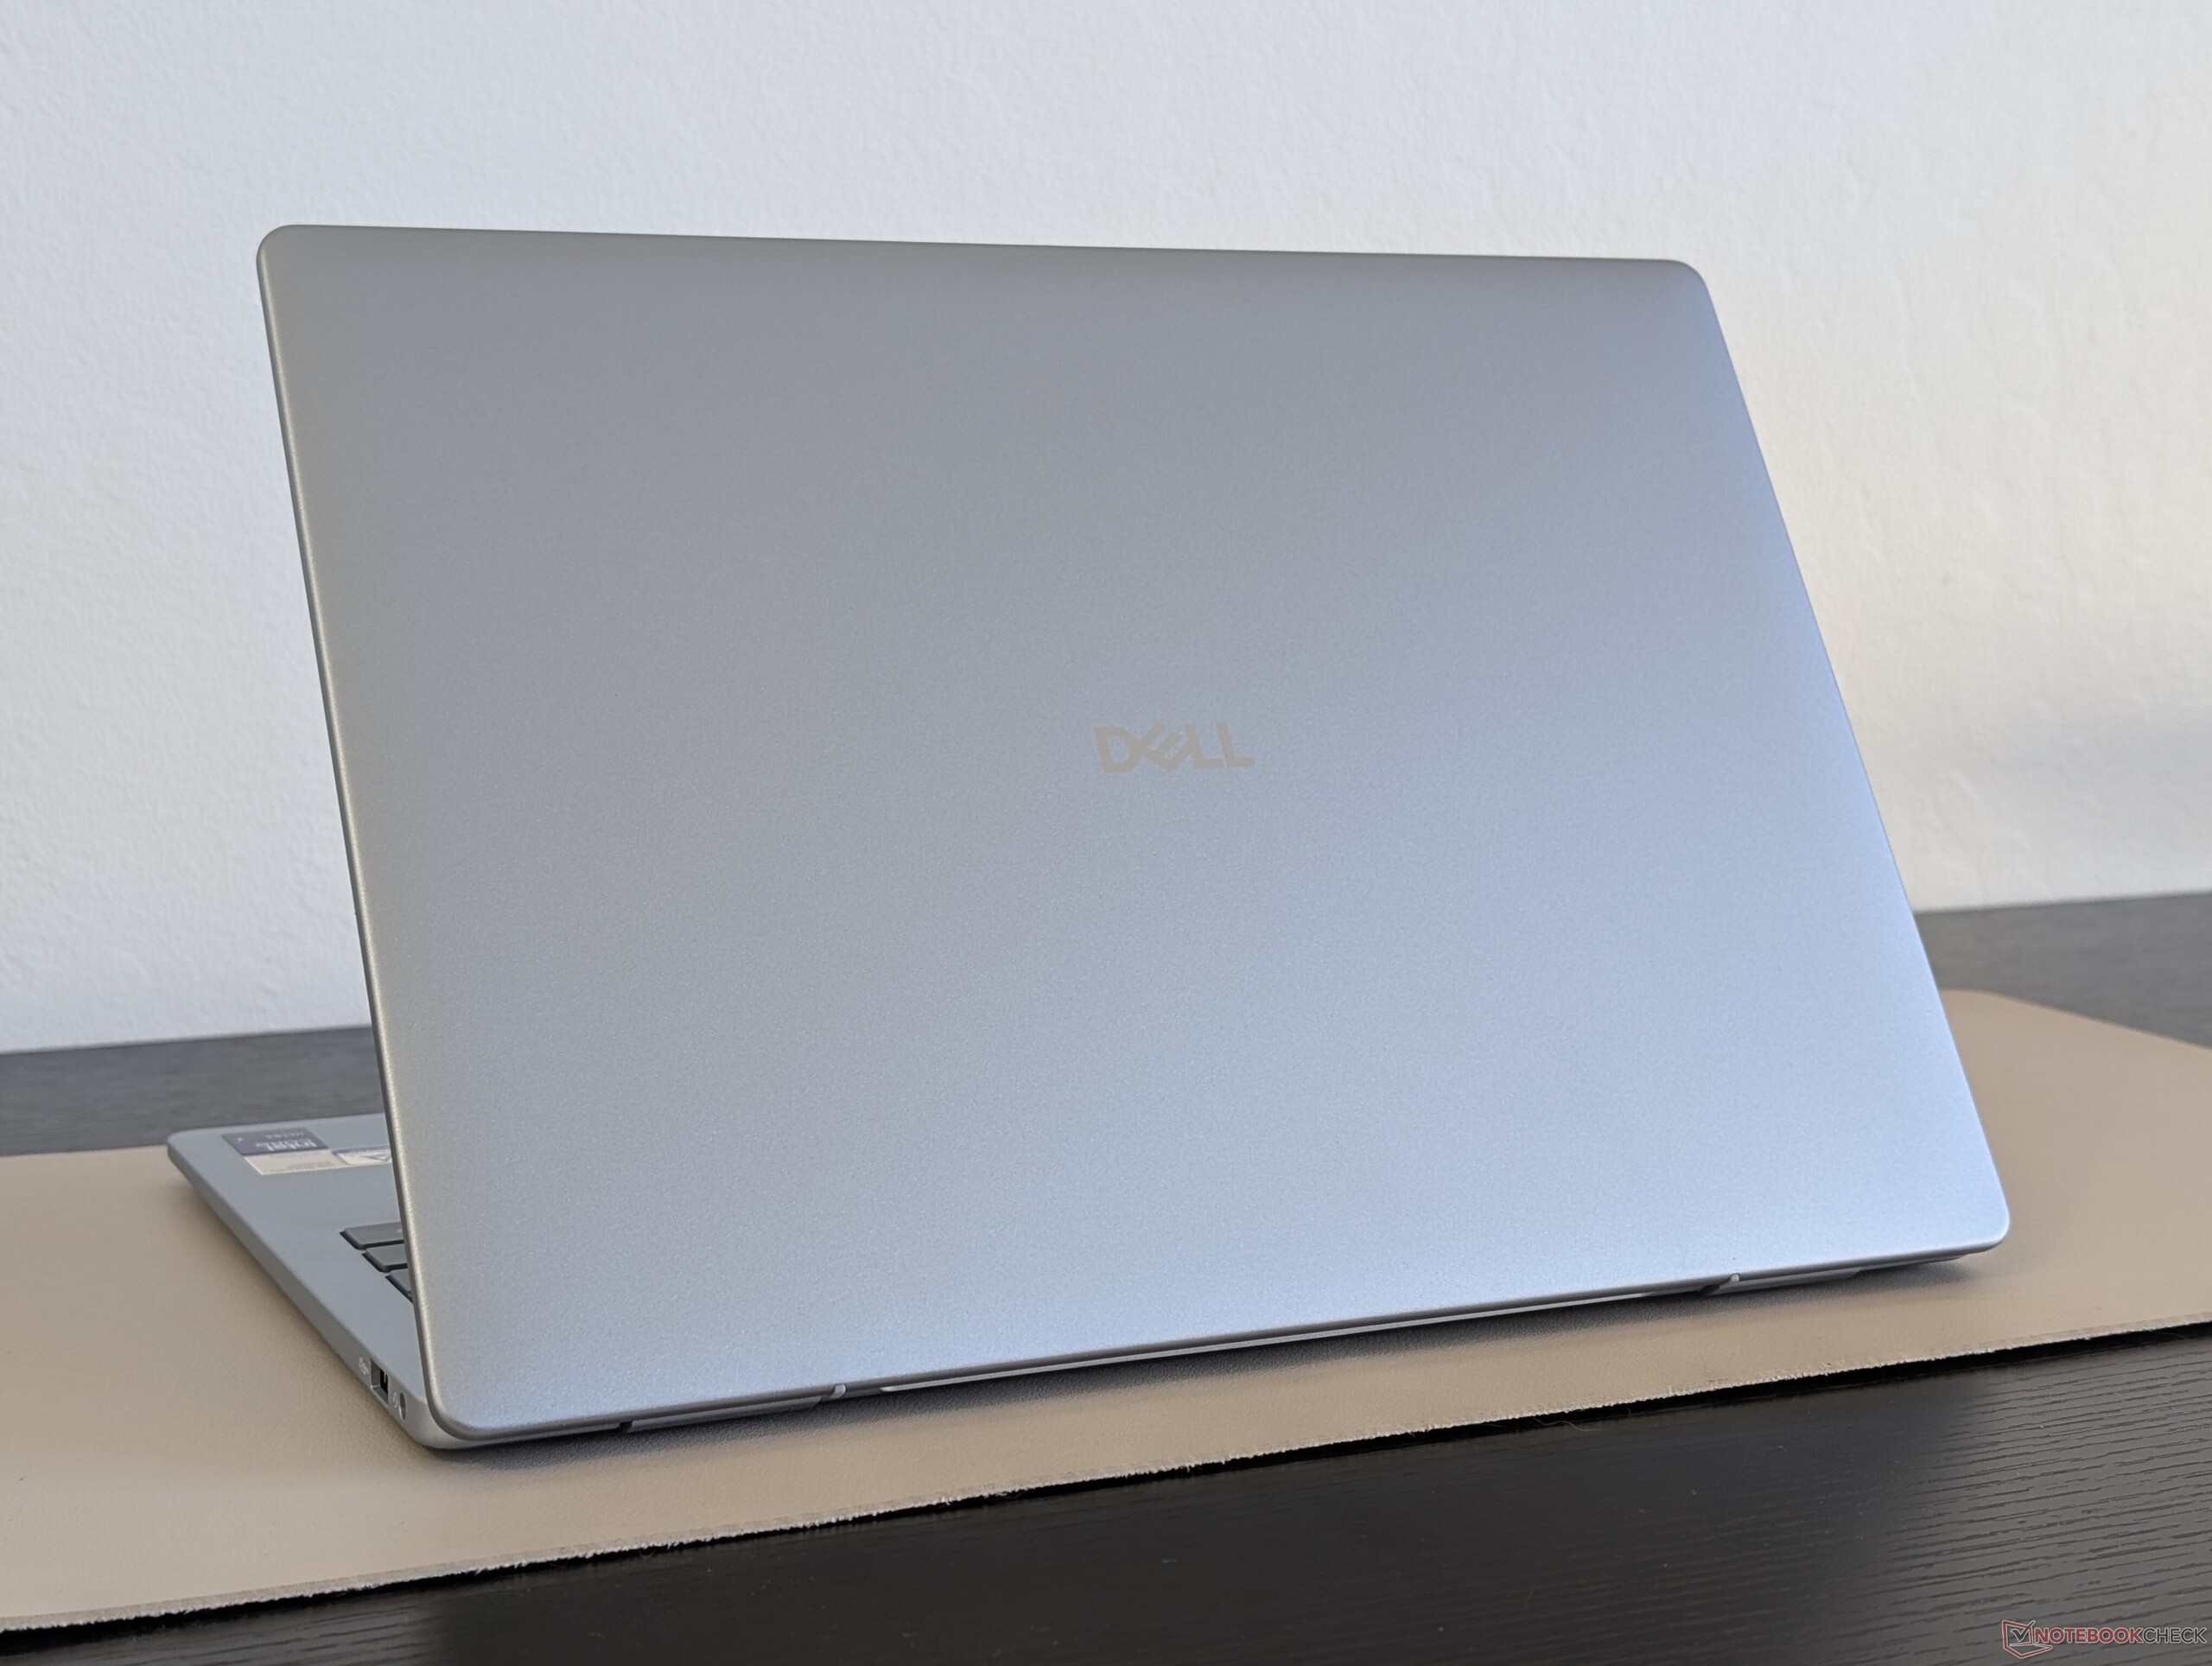
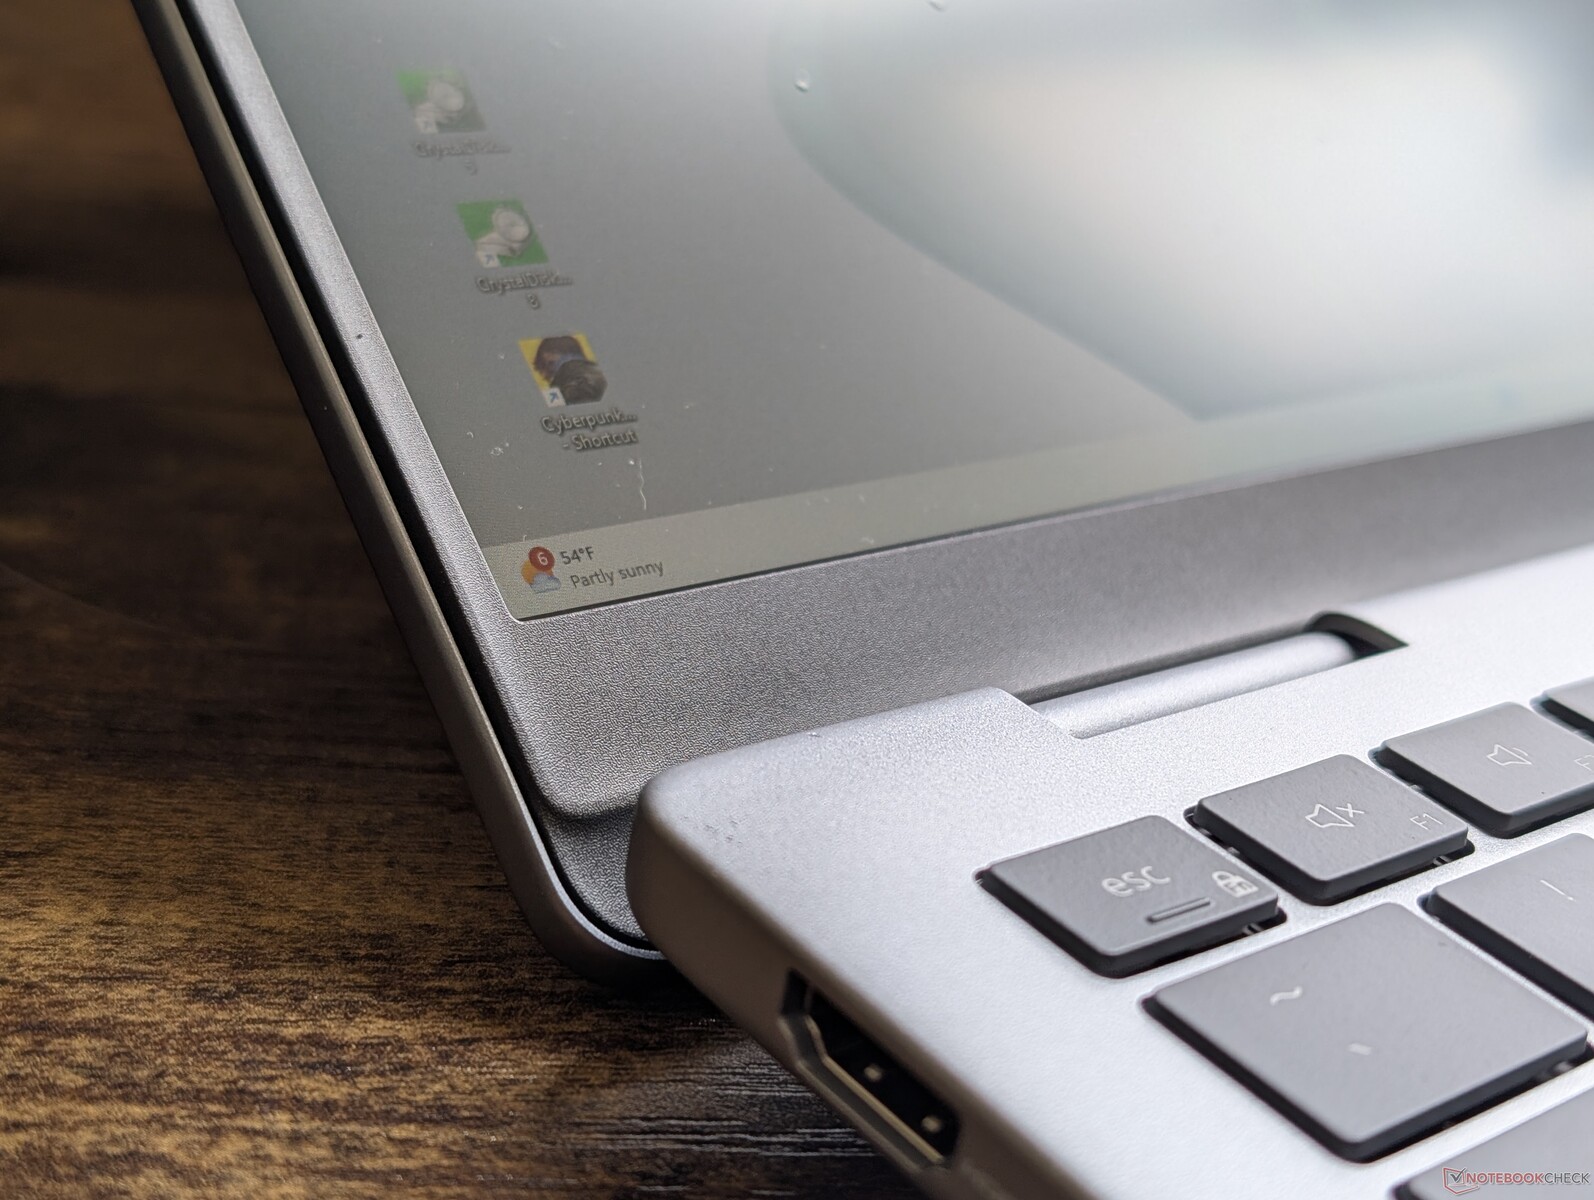
Das Gehäuse hat viel mit dem Inspiron 14 Plus 7440 gemeinsam, bis hin zu den Materialien, dem Farbschema und sogar den Abmessungen. Der vielleicht auffälligste Unterschied liegt in den Scharnieren, denn der Deckel des neueren Modells lässt sich um volle 180 Grad öffnen, während das letztjährige Modell auf maximal ~150 Grad beschränkt war. Auch die hinteren Lüftungsgitter und das Logo auf dem äußeren Deckel weisen kleinere Unterschiede auf. Ansonsten fühlt sich das Gerät immer noch wie ein Inspiron an, obwohl der Name weggefallen ist.
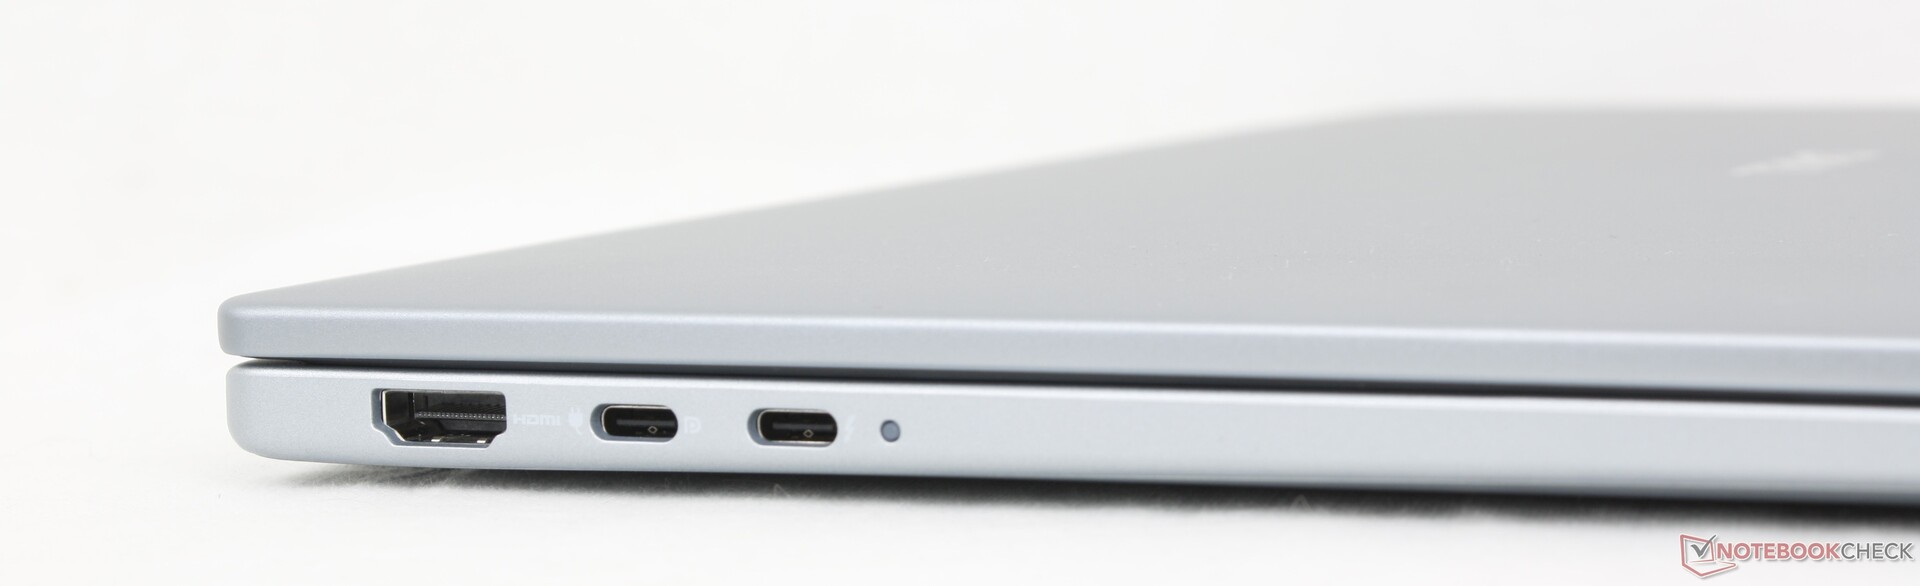
Anschlussausstattung
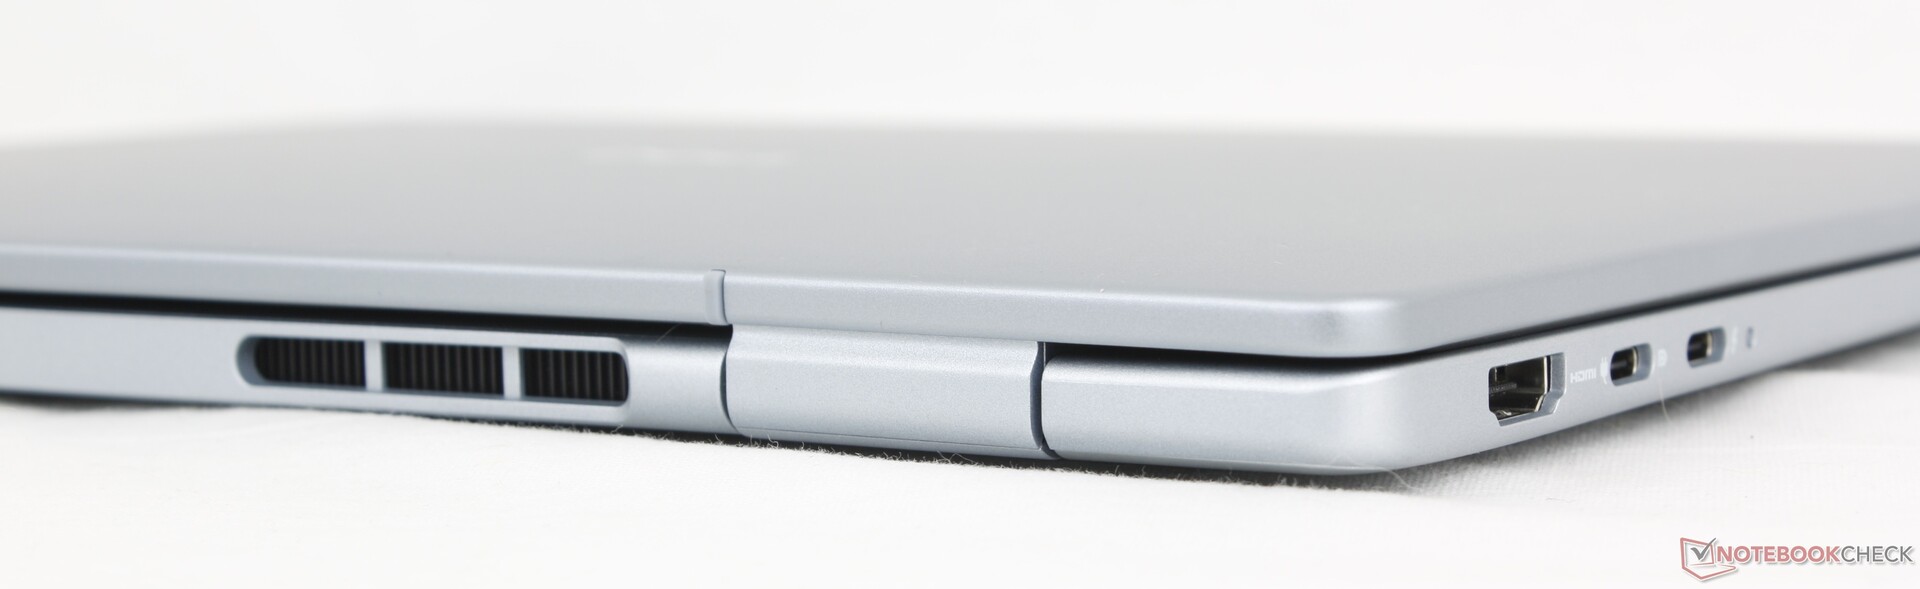
Die Anschlussmöglichkeiten sind mit zwei USB-C Ports und nur einem einzigen USB-A-Anschluss recht ordentlich. Der tonnenförmige Netzteilanschluss, der bei älteren Inspiron Modellen vorhanden war, wurde weggelassen, um das Laden über USB-C zu ermöglichen.
Beachten Sie, dass nur einer der beiden USB-C-Ports Thunderbolt 4 und DisplayPort 2.1 unterstützt.

Kommunikation
| Networking | |
| iperf3 transmit AX12 | |
| Dell Inspiron 14 5425 6VPKR | |
| iperf3 receive AX12 | |
| Dell Inspiron 14 5425 6VPKR | |
| iperf3 transmit AXE11000 | |
| Lenovo IdeaPad Pro 5 14AKP G10 | |
| HP Pavilion Plus 14-ew0153TU | |
| Dell 14 Plus | |
| Dell Latitude 3440 | |
| Lenovo ThinkPad E14 G6 | |
| iperf3 receive AXE11000 | |
| Lenovo IdeaPad Pro 5 14AKP G10 | |
| HP Pavilion Plus 14-ew0153TU | |
| Dell 14 Plus | |
| Dell Latitude 3440 | |
| Lenovo ThinkPad E14 G6 | |
| iperf3 transmit AXE11000 6GHz | |
| HP Pavilion Plus 14-ew0153TU | |
| Dell 14 Plus | |
| Dell Latitude 3440 | |
| iperf3 receive AXE11000 6GHz | |
| HP Pavilion Plus 14-ew0153TU | |
| Dell 14 Plus | |
| Dell Latitude 3440 | |
Webcam
Eine 2-MP-Webcam ist im Lieferumfang enthalten, ebenso wie eine Infrarotkamera und ein physischer Auslöser.


Wartung
Die Hauptplatine ist fast identisch mit der des Inspiron 14 Plus 7440 mit nur geringfügigen Änderungen an der Kühllösung.

Nachhaltigkeit
Die obere Abdeckung besteht zu 50 Prozent aus recyceltem Aluminium, während das Lüftergehäuse zu 25 Prozent aus recyceltem Kunststoff aus dem Meer besteht. Die Halterung für die Handballenauflage besteht zu 15 Prozent aus recyceltem Stahl.
Die Verpackung besteht nicht aus Kunststoff, um das Recycling zu erleichtern.
Zubehör und Garantie
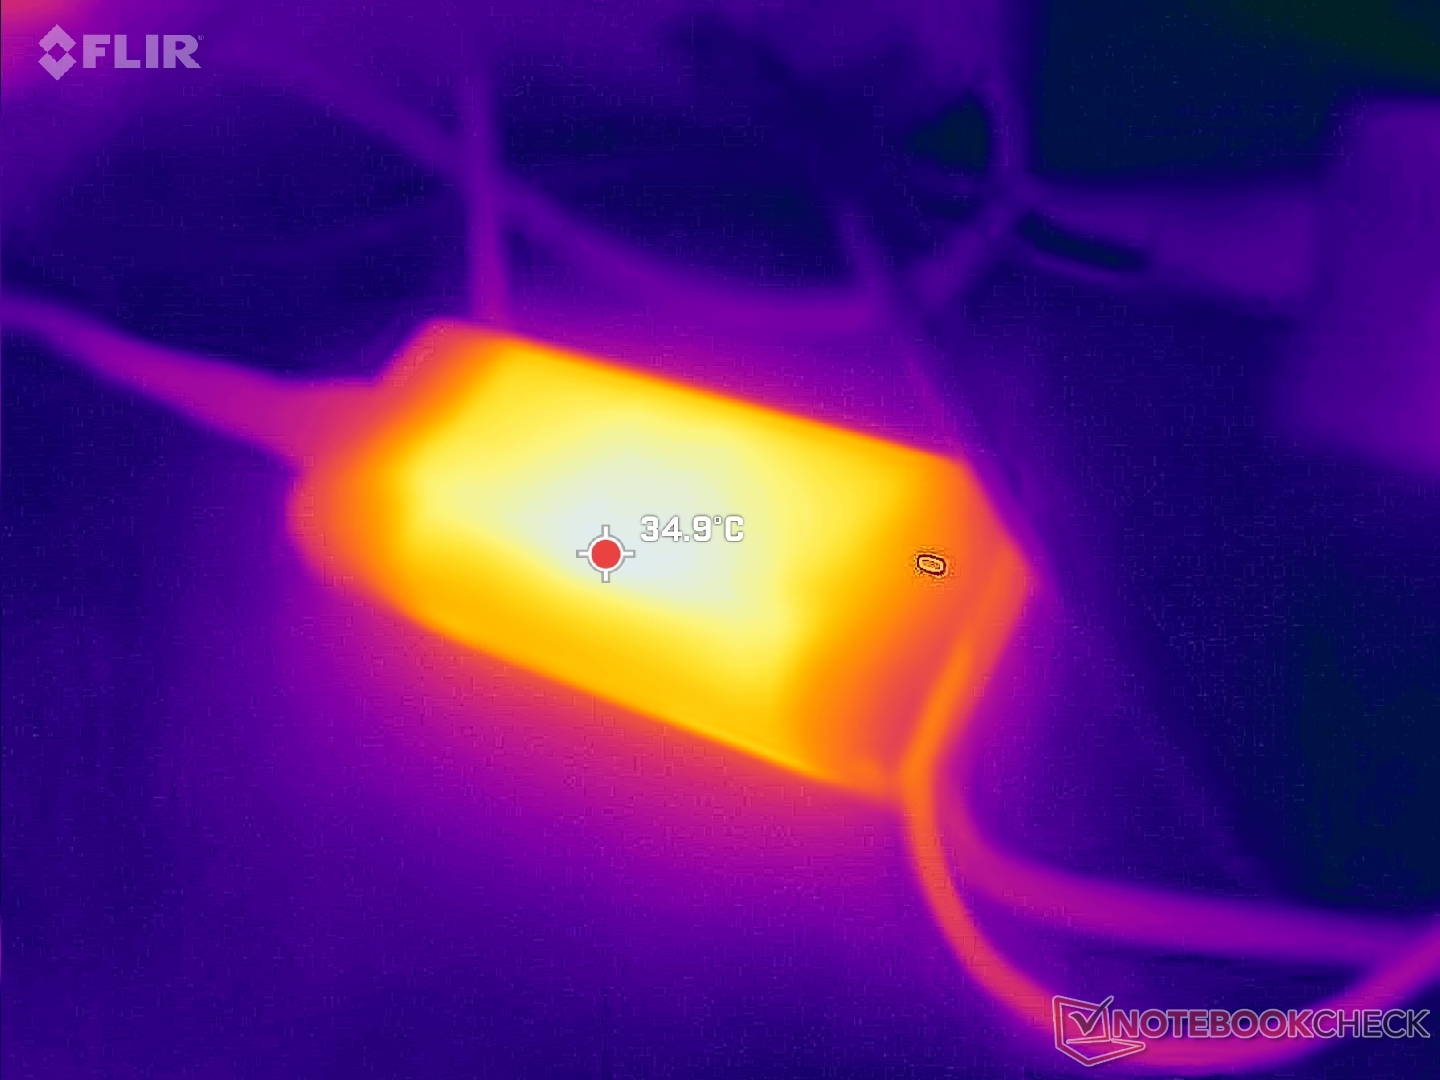
Die Verkaufsverpackung enthält ein kleines (~11,1 x 5 x 2,8 cm) 65-W-USB-C-Netzteil und den üblichen Papierkram. Beim Kauf in den USA gilt eine einjährige eingeschränkte Herstellergarantie.
Eingabegeräte
Tastatur
Die Tastatur ist im Wesentlichen identisch mit der des Inspiron 14 Plus 7440 vom letzten Jahr, bis hin zum Feedback, der Schriftart und sogar den sekundären Funktionen. Der einzige optische Unterschied ist die spezielle Co-Pilot-Taste, welche die rechte Strg-Taste ersetzt.
Touchpad
Das Clickpad hat mit 12,5 x 8 cm genau die gleiche Größe wie das des Inspiron 14 Plus 7440 vom letzten Jahr. Die Cursor-Steuerung ist geräumig und zuverlässig, aber die Rückmeldung beim Drücken auf die Oberfläche ist viel zu schwach und oberflächlich.

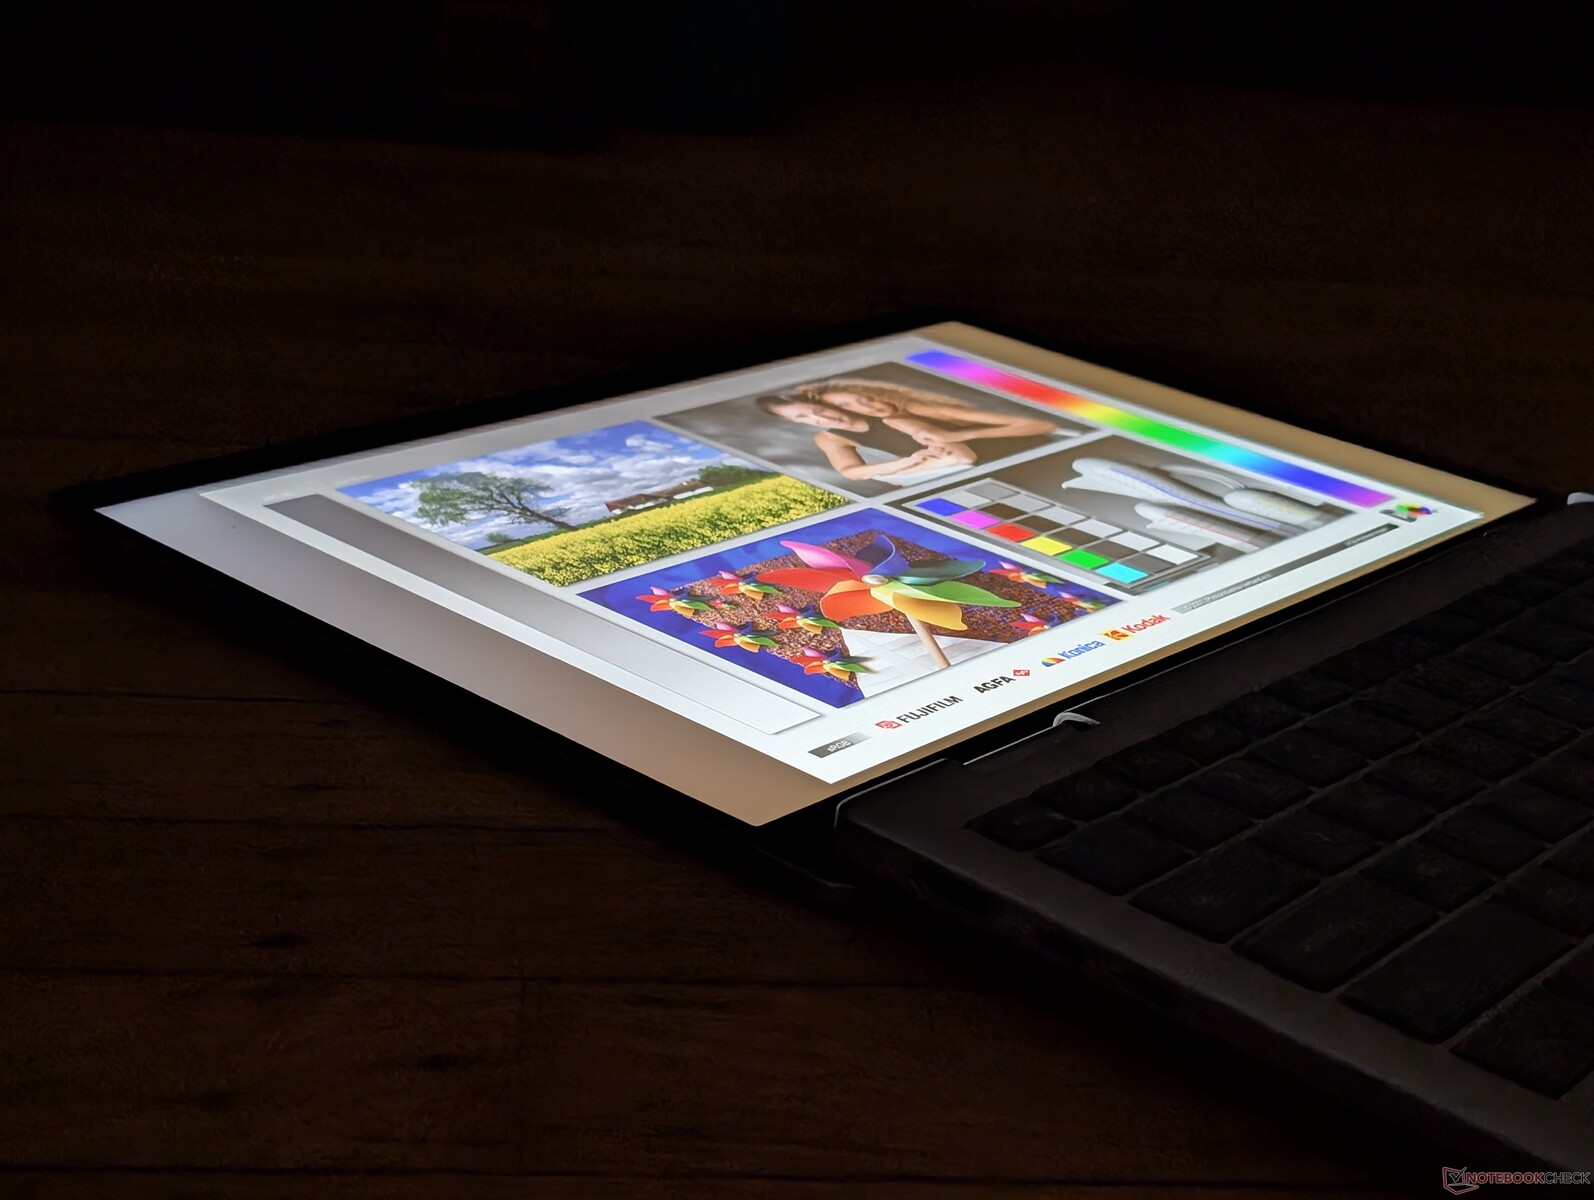
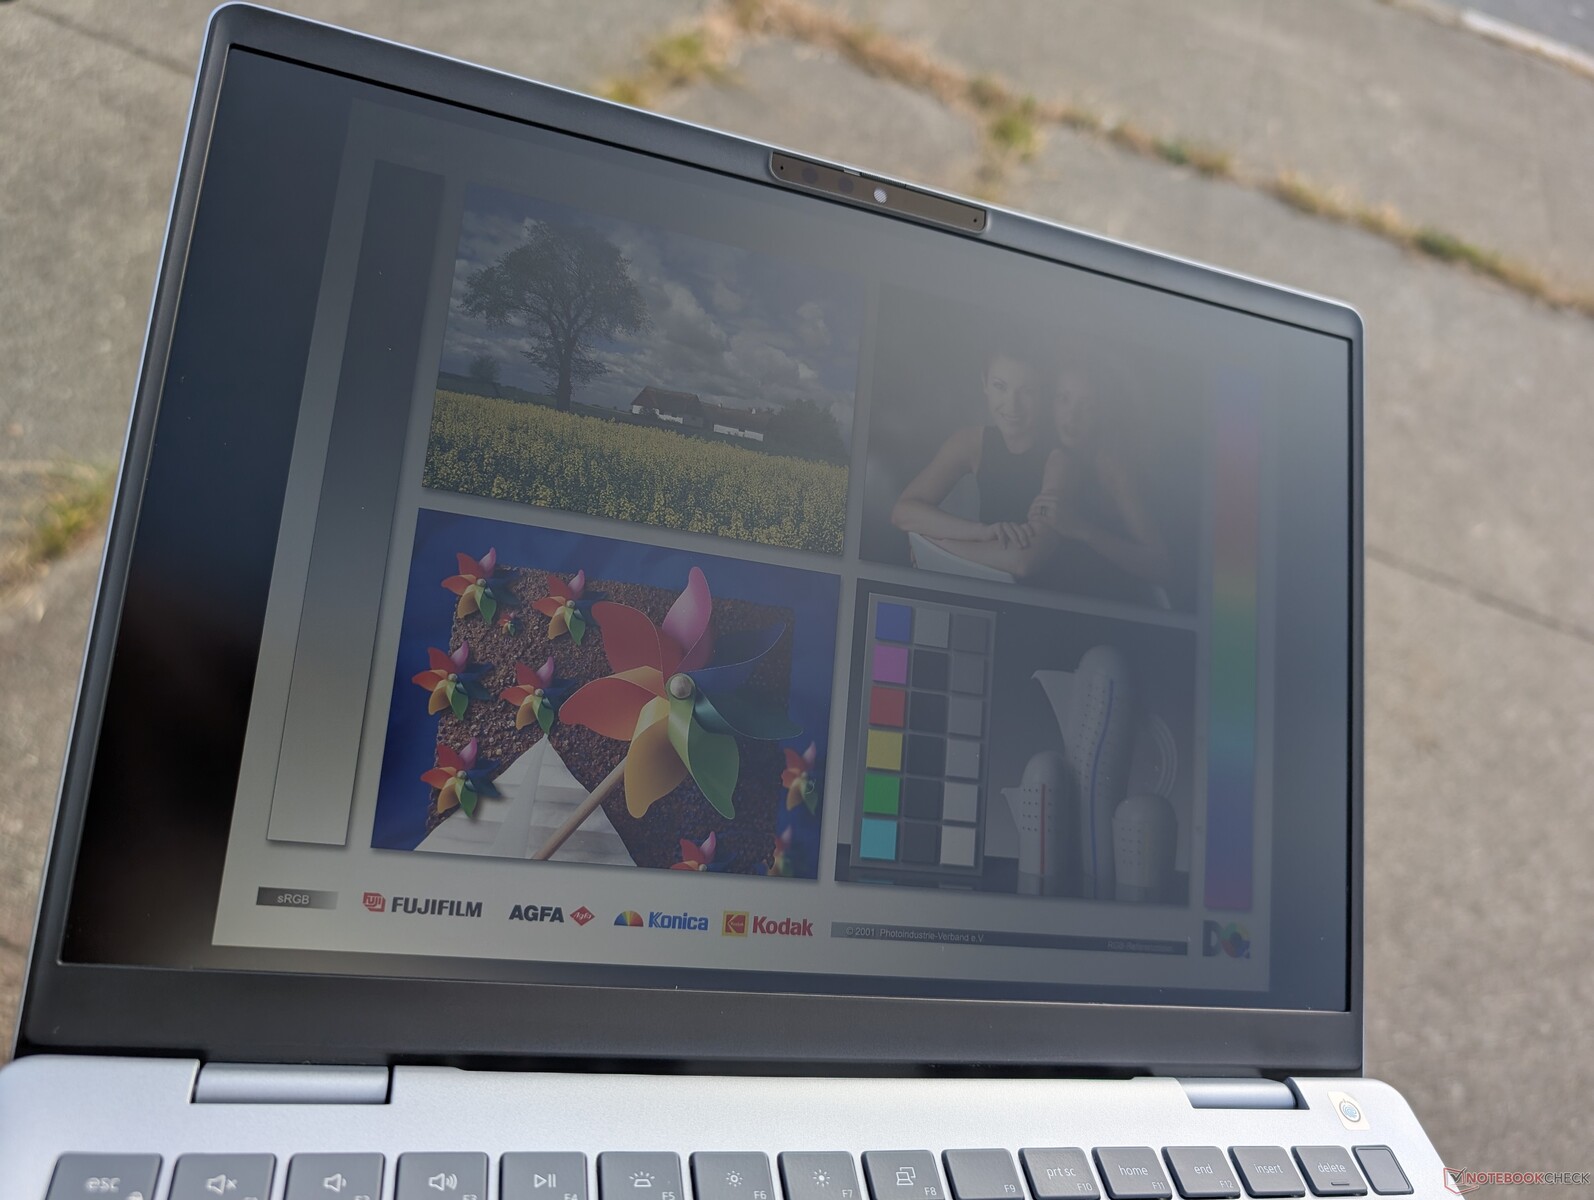
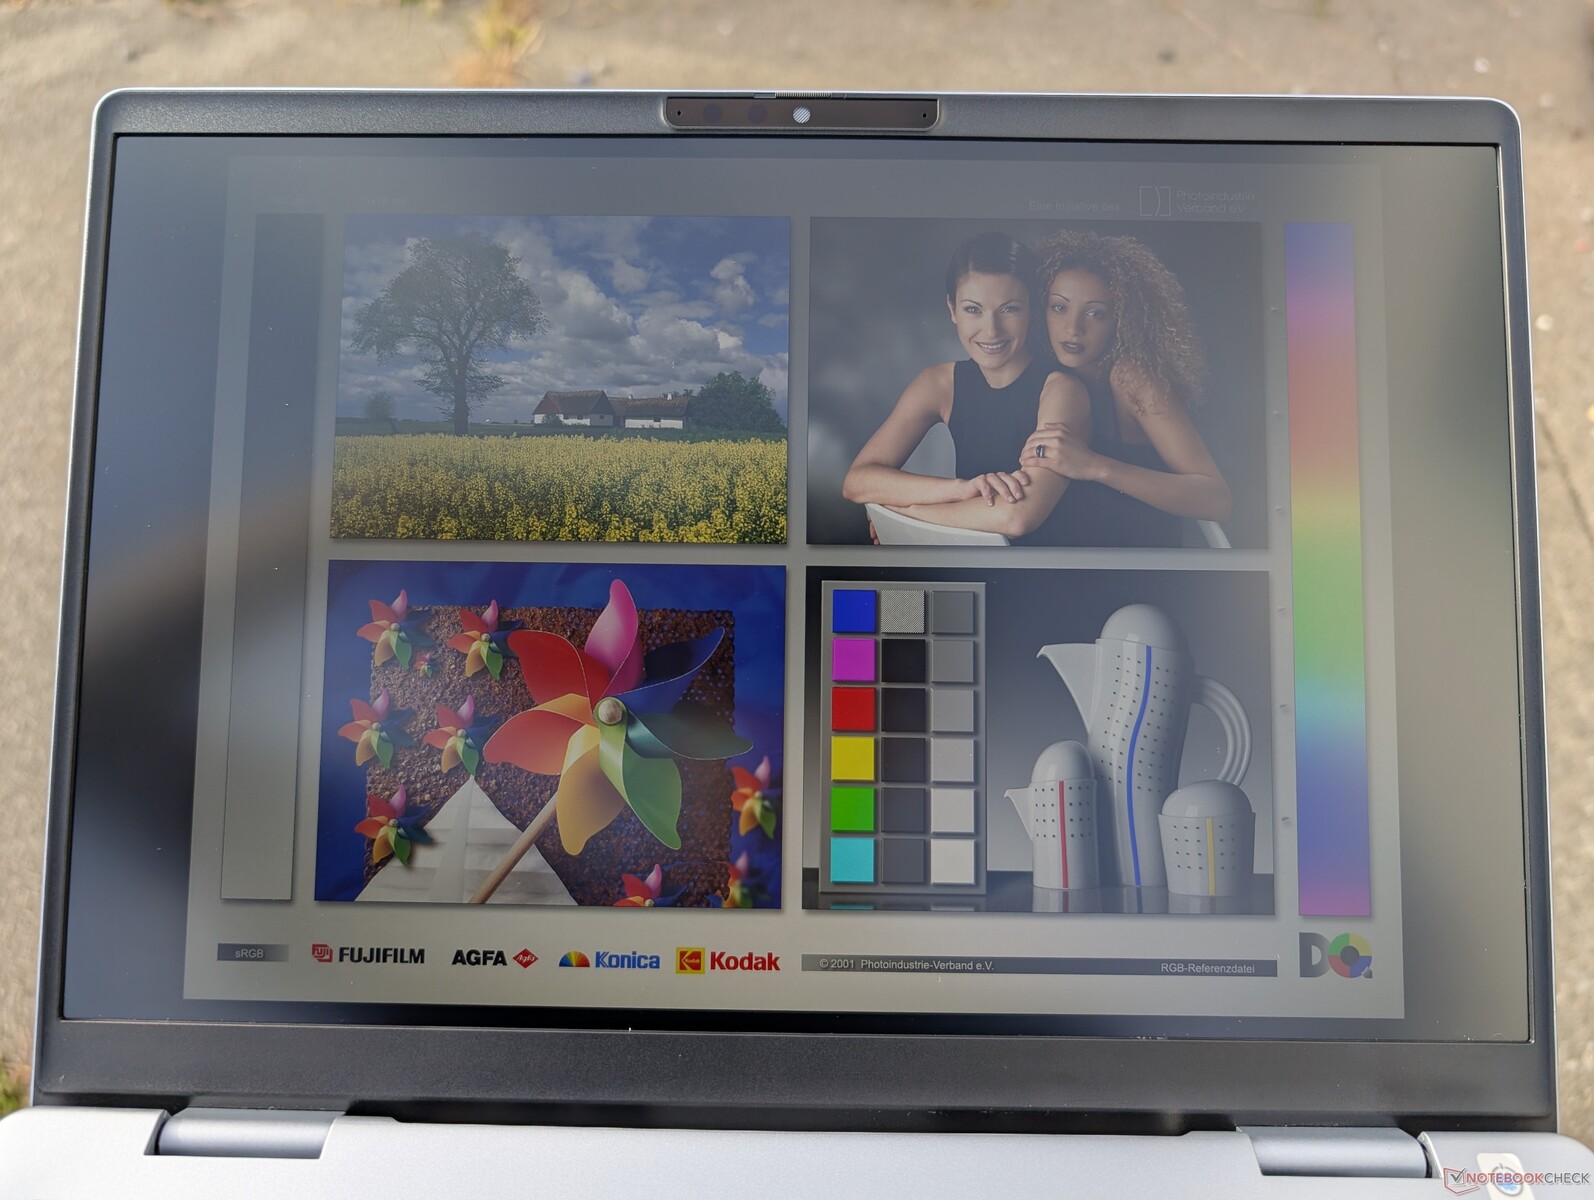
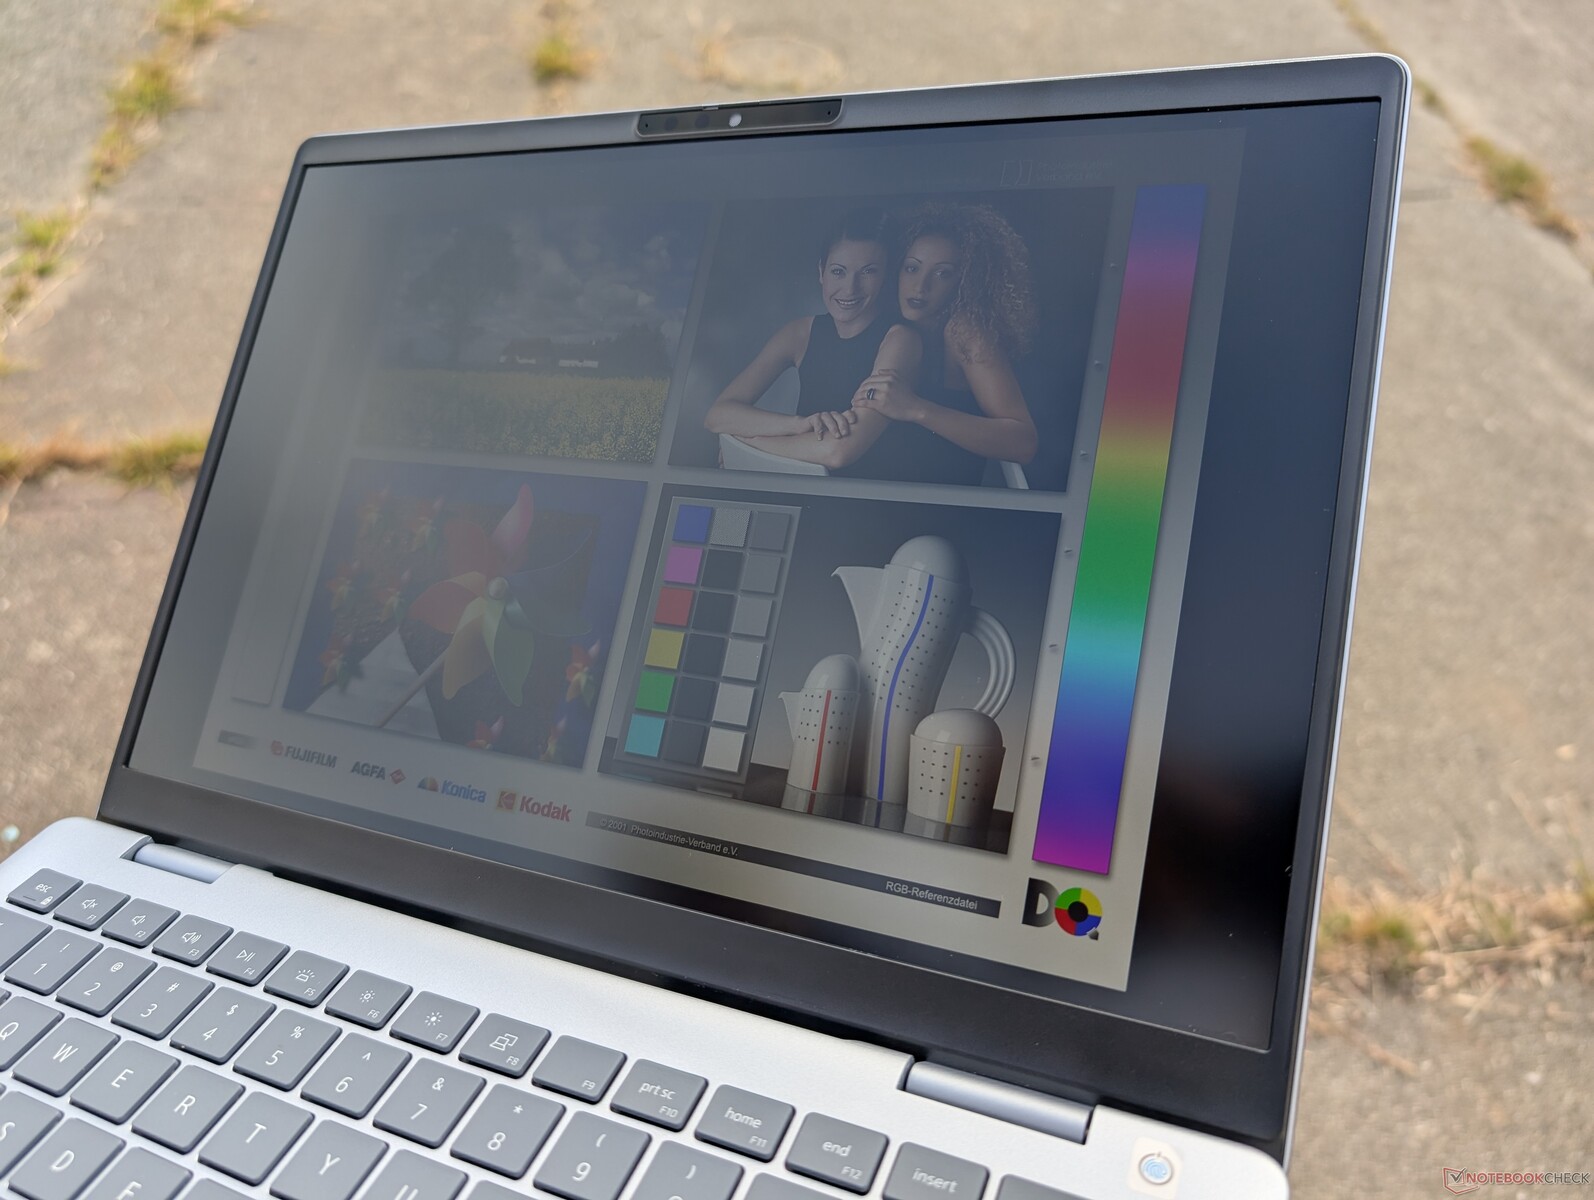
Display
Das 1.600p-Display bietet volle sRGB-Farben, ein hohes Kontrastverhältnis für ein IPS-Panel und eine Bildwiederholfrequenz von 90 Hz und ist damit besser als die meisten Displays von Budget-Notebooks. Die größten Nachteile sind die relativ langsamen Schwarz-Weiß-Reaktionszeiten und das leicht körnige, matte Overlay. Für das Surfen und die Videowiedergabe sollten diese Nachteile jedoch nur minimale Auswirkungen auf das Seherlebnis haben.


| |||||||||||||||||||||||||
Ausleuchtung: 92 %
Helligkeit Akku: 354 cd/m²
Kontrast: 1686:1 (Schwarzwert: 0.21 cd/m²)
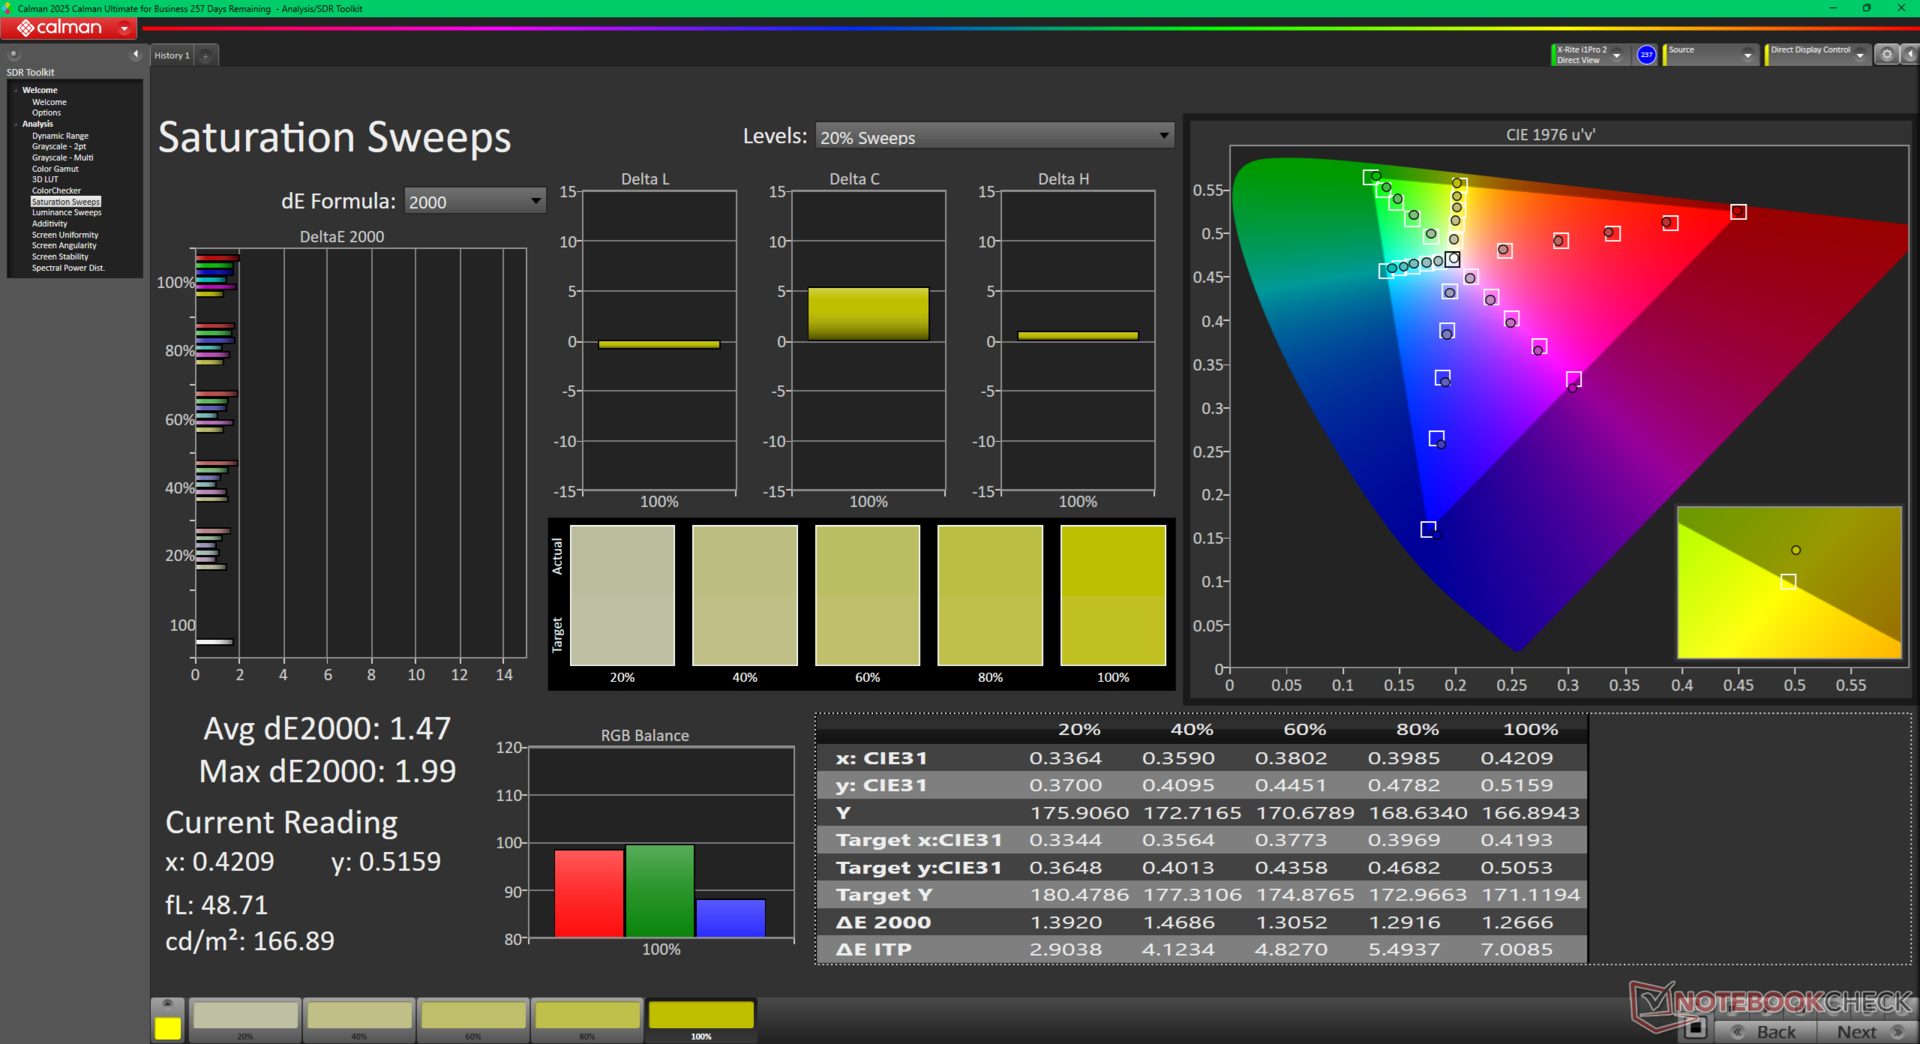
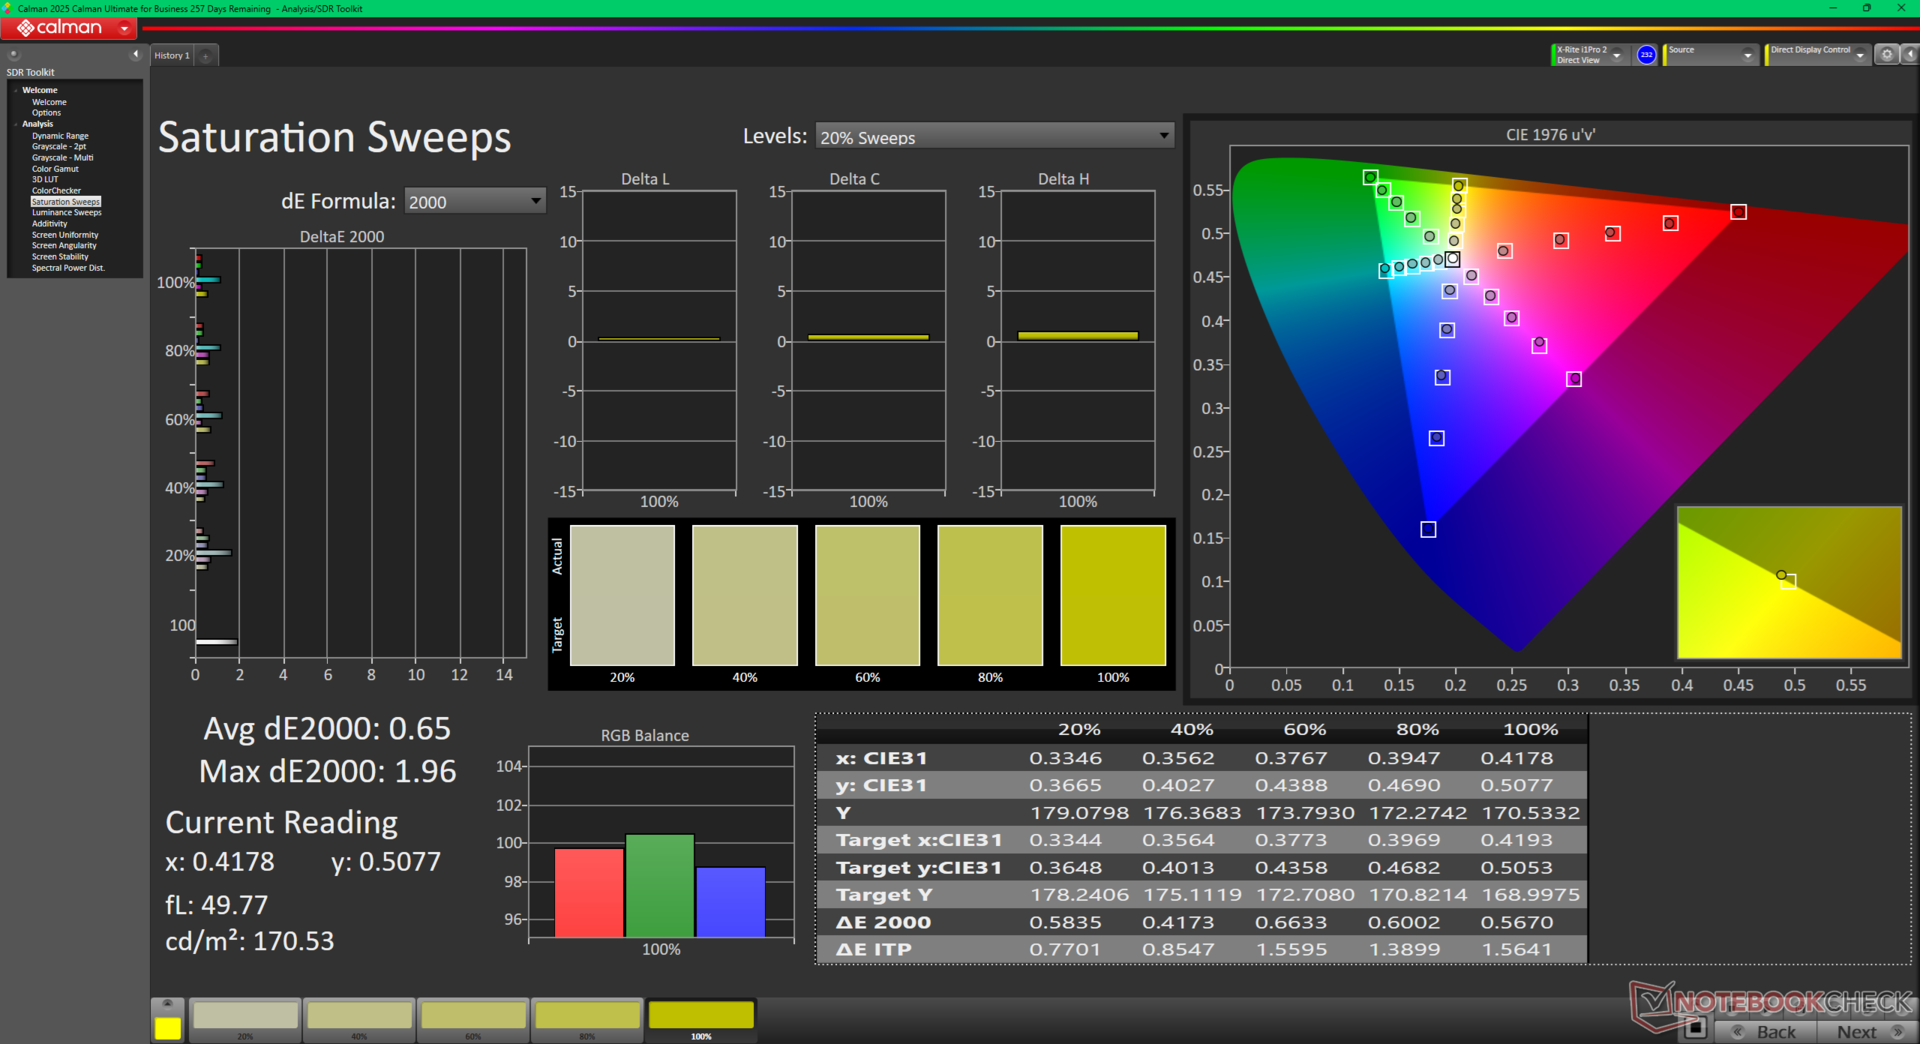
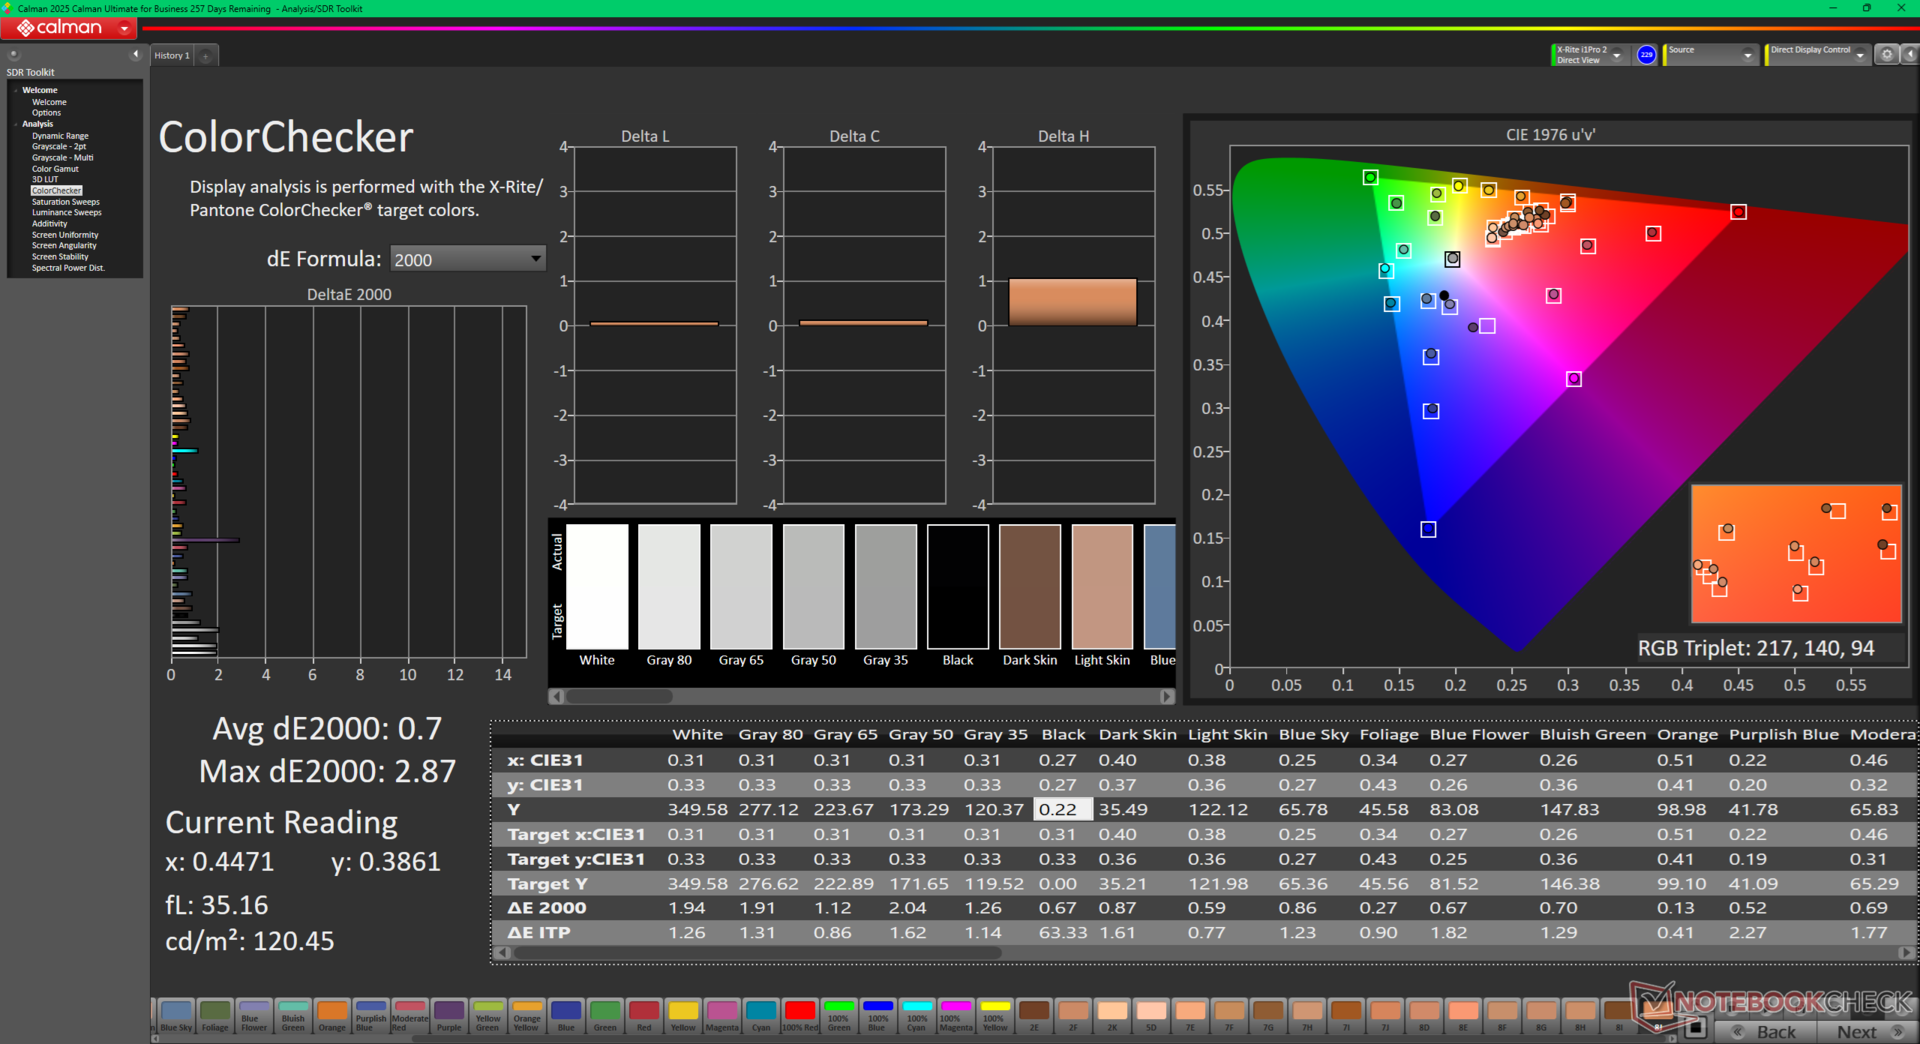
ΔE ColorChecker Calman: 1.94 | ∀{0.5-29.43 Ø4.71}
calibrated: 0.7
ΔE Greyscale Calman: 1.4 | ∀{0.09-98 Ø4.96}
71.9% AdobeRGB 1998 (Argyll 3D)
99.9% sRGB (Argyll 3D)
71.7% Display P3 (Argyll 3D)
Gamma: 2.25
CCT: 6453 K
| Dell 14 Plus BOE NE14N42, IPS, 2560x1600, 14", 90 Hz | Dell Inspiron 14 5425 6VPKR BOE NV14N42, IPS, 1920x1200, 14", 60 Hz | Dell Latitude 3440 BOE NE140FH, IPS, 1920x1080, 14", 60 Hz | Lenovo IdeaPad Pro 5 14AKP G10 LEN140WQ+, OLED, 2880x1800, 14", 120 Hz | Lenovo ThinkPad E14 G6 AU Optronics B140UAN03.2, IPS, 1920x1200, 14", 60 Hz | HP Pavilion Plus 14-ew0153TU Samsung SDC4197, OLED, 2880x1800, 14", 120 Hz | |
|---|---|---|---|---|---|---|
| Display | -44% | -42% | 23% | -40% | 22% | |
| Display P3 Coverage (%) | 71.7 | 39.2 -45% | 40.4 -44% | 99.9 39% | 41.3 -42% | 97.9 37% |
| sRGB Coverage (%) | 99.9 | 57.4 -43% | 60.7 -39% | 100 0% | 61.8 -38% | 99.6 0% |
| AdobeRGB 1998 Coverage (%) | 71.9 | 40.5 -44% | 41.8 -42% | 94.5 31% | 42.7 -41% | 92.1 28% |
| Response Times | 43% | -1% | 99% | 29% | 69% | |
| Response Time Grey 50% / Grey 80% * (ms) | 42.7 ? | 23 ? 46% | 35.3 ? 17% | 0.39 ? 99% | 28.8 ? 33% | 10.8 ? 75% |
| Response Time Black / White * (ms) | 25.2 ? | 15 ? 40% | 29.8 ? -18% | 0.49 ? 98% | 19.1 ? 24% | 9.29 ? 63% |
| PWM Frequency (Hz) | 1200 ? | 120 ? | ||||
| PWM Amplitude * (%) | 22 | |||||
| Bildschirm | -133% | -104% | 17% | -109% | 234% | |
| Helligkeit Bildmitte (cd/m²) | 354 | 292 -18% | 292.6 -17% | 473 34% | 369.9 4% | 387 9% |
| Brightness (cd/m²) | 333 | 279 -16% | 270 -19% | 474 42% | 361 8% | 387 16% |
| Brightness Distribution (%) | 92 | 90 -2% | 88 -4% | 99 8% | 93 1% | 97 5% |
| Schwarzwert * (cd/m²) | 0.21 | 0.34 -62% | 0.19 10% | 0.24 -14% | 0.01 95% | |
| Kontrast (:1) | 1686 | 859 -49% | 1540 -9% | 1541 -9% | 38700 2195% | |
| Delta E Colorchecker * | 1.94 | 6.26 -223% | 4.63 -139% | 1.2 38% | 5.2 -168% | 2.03 -5% |
| Colorchecker dE 2000 max. * | 3.28 | 19.14 -484% | 17.1 -421% | 3.8 -16% | 18.41 -461% | 3.86 -18% |
| Colorchecker dE 2000 calibrated * | 0.7 | 2.13 -204% | 2.04 -191% | 1.6 -129% | ||
| Delta E Graustufen * | 1.4 | 4.31 -208% | 3.2 -129% | 1.5 -7% | 3.5 -150% | 2.3 -64% |
| Gamma | 2.25 98% | 2.27 97% | 2.34 94% | 2.27 97% | 2.06 107% | 2.23 99% |
| CCT | 6453 101% | 6102 107% | 7184 90% | 6214 105% | 6204 105% | 6523 100% |
| Durchschnitt gesamt (Programm / Settings) | -45% /
-85% | -49% /
-76% | 46% /
33% | -40% /
-75% | 108% /
165% |
* ... kleinere Werte sind besser


Das Dell 14 Plus ist einer der wenigen preiswerten Laptops, die nicht nur über eine TÜV-Zertifizierung verfügen, sondern auch gut kalibriert sind. Die durchschnittlichen Graustufen- und Farb-DeltaE-Werte liegen bei nur 1,4 bzw. 1,89, und das schon vor den Kalibrierungsversuchen durch den Endbenutzer.


Reaktionszeiten (Response Times) des Displays
| ↔ Reaktionszeiten Schwarz zu Weiß | ||
|---|---|---|
| 25.2 ms ... steigend ↗ und fallend ↘ kombiniert | ↗ 12.7 ms steigend | 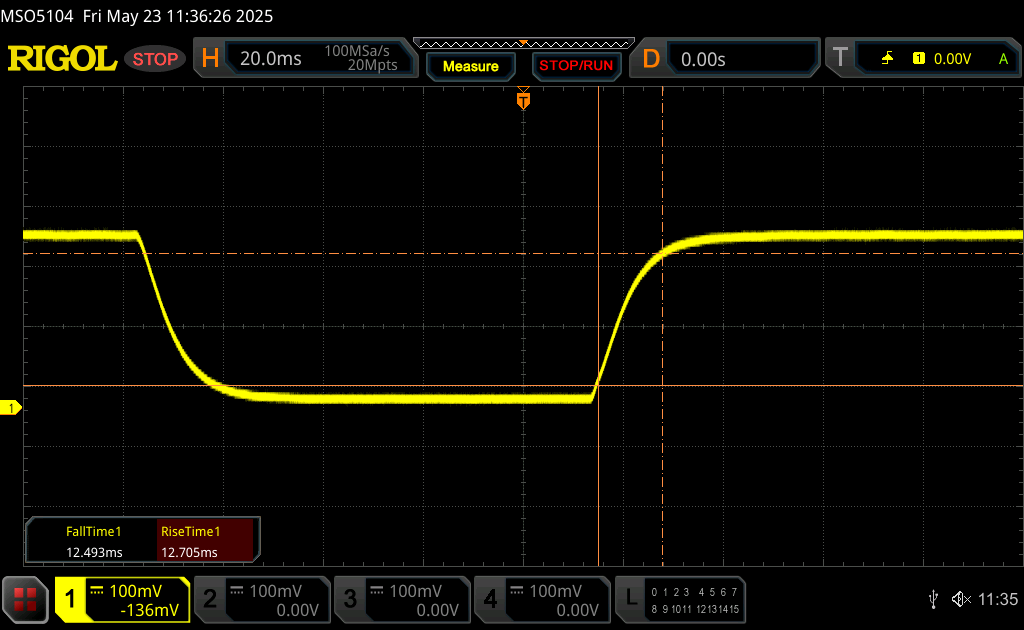 |
| ↘ 12.5 ms fallend | ||
| Die gemessenen Reaktionszeiten sind mittelmäßig und dadurch für Spieler eventuell zu langsam. Im Vergleich rangierten die bei uns getesteten Geräte von 0.1 (Minimum) zu 240 (Maximum) ms. » 61 % aller Screens waren schneller als der getestete. Daher sind die gemessenen Reaktionszeiten schlechter als der Durchschnitt aller vermessenen Geräte (19.8 ms). | ||
| ↔ Reaktionszeiten 50% Grau zu 80% Grau | ||
| 42.7 ms ... steigend ↗ und fallend ↘ kombiniert | ↗ 20.2 ms steigend | 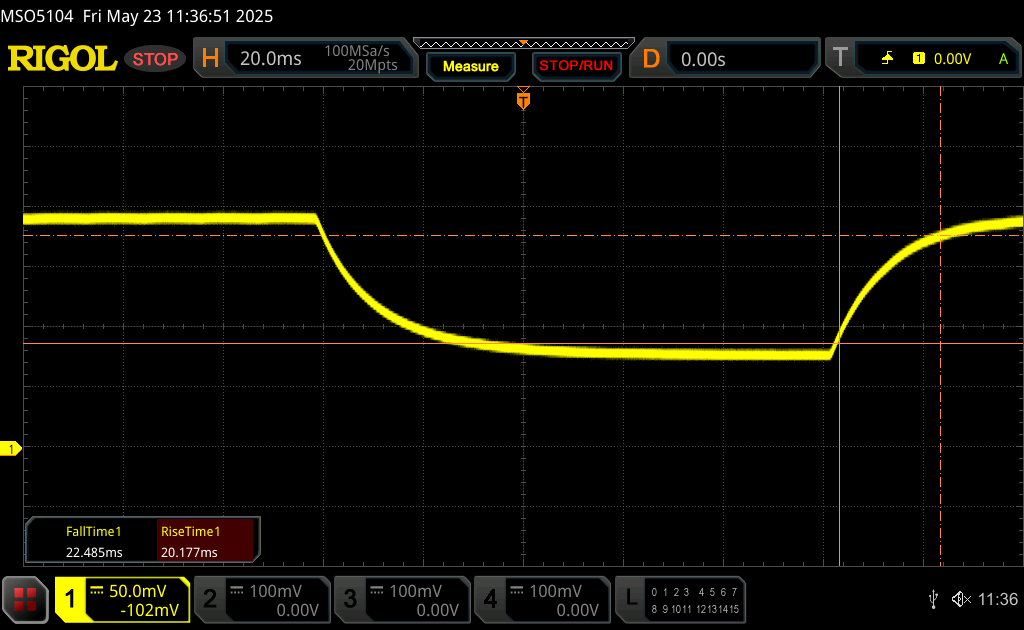 |
| ↘ 22.5 ms fallend | ||
| Die gemessenen Reaktionszeiten sind langsam und dadurch für viele Spieler wahrscheinlich zu langsam. Im Vergleich rangierten die bei uns getesteten Geräte von 0.165 (Minimum) zu 636 (Maximum) ms. » 70 % aller Screens waren schneller als der getestete. Daher sind die gemessenen Reaktionszeiten schlechter als der Durchschnitt aller vermessenen Geräte (31 ms). | ||
Bildschirm-Flackern / PWM (Pulse-Width Modulation)
| Flackern / PWM nicht festgestellt |  | ||
Im Vergleich: 52 % aller getesteten Geräte nutzten kein PWM um die Helligkeit zu reduzieren. Wenn PWM eingesetzt wurde, dann bei einer Frequenz von durchschnittlich 7754 (Minimum 5, Maximum 343500) Hz. | |||


Performance
Testbedingungen
Wir haben Windows in den Modus Performance versetzt, bevor wir die folgenden Benchmarks durchgeführt haben.
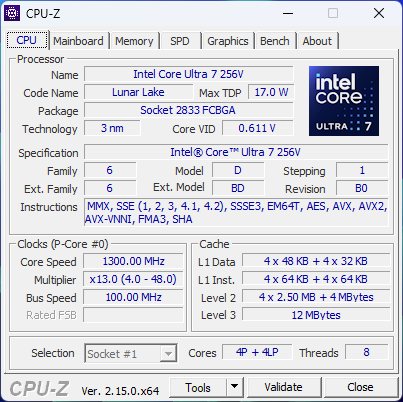
Prozessor
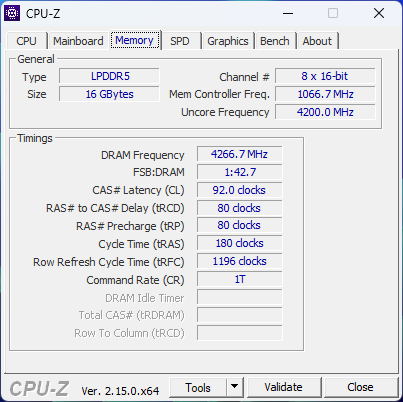
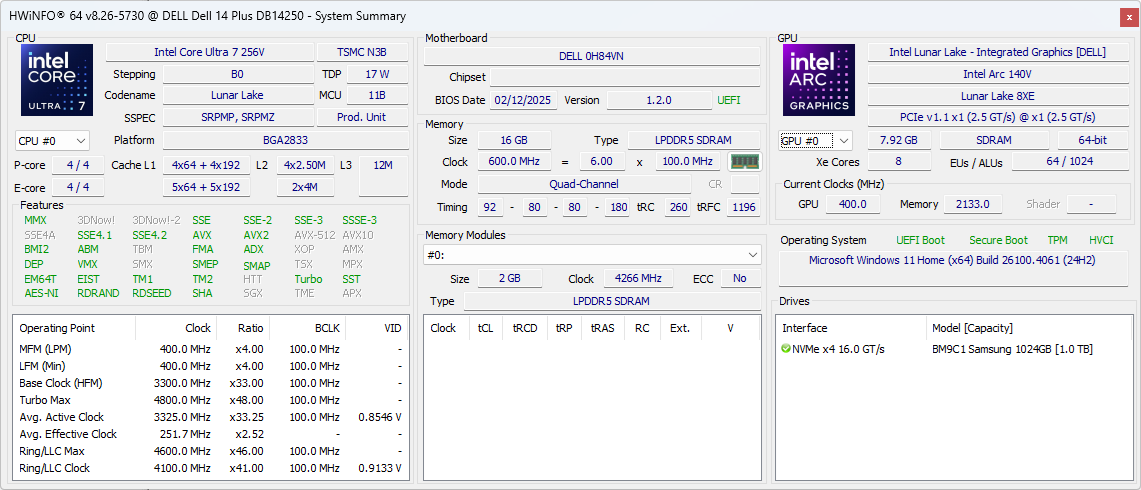
Die CPU-Rohleistung ist am ehesten vergleichbar mit der älteren Core Ultra 7 155U. Die Hauptvorteile des neueren Core Ultra 7 256V liegen stattdessen in der Leistung pro Watt, der integrierten NPU, dem schnelleren RAM und dem verbesserten integrierten Grafikprozessor.
Die Turbo-Boost-Nachhaltigkeit könnte besser sein; die Leistung würde bei der Ausführung von CineBench R15 xT in einer Schleife im Laufe der Zeit um etwa 17 Prozent sinken, wie unsere Vergleichsgrafik unten zeigt.
Cinebench R15 Multi Loop
Cinebench R23: Multi Core | Single Core
Cinebench R20: CPU (Multi Core) | CPU (Single Core)
Cinebench R15: CPU Multi 64Bit | CPU Single 64Bit
Blender: v2.79 BMW27 CPU
7-Zip 18.03: 7z b 4 | 7z b 4 -mmt1
Geekbench 6.7: Multi-Core | Single-Core
Geekbench 5.5: Multi-Core | Single-Core
HWBOT x265 Benchmark v2.2: 4k Preset
LibreOffice : 20 Documents To PDF
R Benchmark 2.5: Overall mean
| Geekbench 6.7 / Multi-Core | |
| Lenovo IdeaPad Pro 5 14AKP G10 | |
| Lenovo ThinkBook Plus Gen5 Hybrid | |
| Dell 14 Plus | |
| Lenovo ThinkPad X1 2-in-1 Gen 10 | |
| Durchschnittliche Intel Core Ultra 7 256V (9852 - 11085, n=8) | |
| Lenovo Yoga 7 2-in-1 14AKP10 | |
| Asus Vivobook S 14 OLED S5406SA | |
| Lenovo ThinkPad E14 G6 | |
| HP Pavilion Plus 14-ew0153TU | |
| Acer Aspire Spin 14 ASP14-52MTN-51V5 | |
| Geekbench 6.7 / Single-Core | |
| Lenovo IdeaPad Pro 5 14AKP G10 | |
| Lenovo ThinkPad X1 2-in-1 Gen 10 | |
| Lenovo Yoga 7 2-in-1 14AKP10 | |
| Durchschnittliche Intel Core Ultra 7 256V (2680 - 2784, n=8) | |
| Dell 14 Plus | |
| Asus Vivobook S 14 OLED S5406SA | |
| HP Pavilion Plus 14-ew0153TU | |
| Lenovo ThinkPad E14 G6 | |
| Lenovo ThinkBook Plus Gen5 Hybrid | |
| Acer Aspire Spin 14 ASP14-52MTN-51V5 | |
Cinebench R23: Multi Core | Single Core
Cinebench R20: CPU (Multi Core) | CPU (Single Core)
Cinebench R15: CPU Multi 64Bit | CPU Single 64Bit
Blender: v2.79 BMW27 CPU
7-Zip 18.03: 7z b 4 | 7z b 4 -mmt1
Geekbench 6.7: Multi-Core | Single-Core
Geekbench 5.5: Multi-Core | Single-Core
HWBOT x265 Benchmark v2.2: 4k Preset
LibreOffice : 20 Documents To PDF
R Benchmark 2.5: Overall mean
* ... kleinere Werte sind besser
AIDA64: FP32 Ray-Trace | FPU Julia | CPU SHA3 | CPU Queen | FPU SinJulia | FPU Mandel | CPU AES | CPU ZLib | FP64 Ray-Trace | CPU PhotoWorxx
| Performance Rating | |
| Lenovo IdeaPad Pro 5 14AKP G10 | |
| Durchschnittliche Intel Core Ultra 7 256V | |
| Dell 14 Plus | |
| Lenovo ThinkPad E14 G6 | |
| Dell Inspiron 14 5425 6VPKR | |
| Dell Latitude 3440 | |
| HP Pavilion Plus 14-ew0153TU | |
| AIDA64 / FP32 Ray-Trace | |
| Lenovo IdeaPad Pro 5 14AKP G10 | |
| Durchschnittliche Intel Core Ultra 7 256V (10524 - 12898, n=7) | |
| Dell 14 Plus | |
| Dell Inspiron 14 5425 6VPKR | |
| Lenovo ThinkPad E14 G6 | |
| Dell Latitude 3440 | |
| HP Pavilion Plus 14-ew0153TU | |
| AIDA64 / FPU Julia | |
| Lenovo IdeaPad Pro 5 14AKP G10 | |
| Dell Inspiron 14 5425 6VPKR | |
| Durchschnittliche Intel Core Ultra 7 256V (52443 - 62522, n=7) | |
| Dell 14 Plus | |
| Lenovo ThinkPad E14 G6 | |
| Dell Latitude 3440 | |
| HP Pavilion Plus 14-ew0153TU | |
| AIDA64 / CPU SHA3 | |
| Lenovo IdeaPad Pro 5 14AKP G10 | |
| Durchschnittliche Intel Core Ultra 7 256V (2364 - 2915, n=7) | |
| Lenovo ThinkPad E14 G6 | |
| Dell 14 Plus | |
| Dell Inspiron 14 5425 6VPKR | |
| Dell Latitude 3440 | |
| HP Pavilion Plus 14-ew0153TU | |
| AIDA64 / CPU Queen | |
| Lenovo IdeaPad Pro 5 14AKP G10 | |
| Dell Inspiron 14 5425 6VPKR | |
| Dell Latitude 3440 | |
| HP Pavilion Plus 14-ew0153TU | |
| Dell 14 Plus | |
| Durchschnittliche Intel Core Ultra 7 256V (49622 - 49794, n=6) | |
| Lenovo ThinkPad E14 G6 | |
| AIDA64 / FPU SinJulia | |
| Lenovo IdeaPad Pro 5 14AKP G10 | |
| Dell Inspiron 14 5425 6VPKR | |
| Lenovo ThinkPad E14 G6 | |
| Dell Latitude 3440 | |
| Dell 14 Plus | |
| Durchschnittliche Intel Core Ultra 7 256V (4401 - 4434, n=7) | |
| HP Pavilion Plus 14-ew0153TU | |
| AIDA64 / FPU Mandel | |
| Lenovo IdeaPad Pro 5 14AKP G10 | |
| Dell Inspiron 14 5425 6VPKR | |
| Durchschnittliche Intel Core Ultra 7 256V (27382 - 33019, n=7) | |
| Dell 14 Plus | |
| Lenovo ThinkPad E14 G6 | |
| Dell Latitude 3440 | |
| HP Pavilion Plus 14-ew0153TU | |
| AIDA64 / CPU AES | |
| Lenovo IdeaPad Pro 5 14AKP G10 | |
| Lenovo ThinkPad E14 G6 | |
| Durchschnittliche Intel Core Ultra 7 256V (38495 - 75938, n=7) | |
| Dell 14 Plus | |
| Dell Latitude 3440 | |
| Dell Inspiron 14 5425 6VPKR | |
| HP Pavilion Plus 14-ew0153TU | |
| AIDA64 / CPU ZLib | |
| Lenovo IdeaPad Pro 5 14AKP G10 | |
| Lenovo ThinkPad E14 G6 | |
| Durchschnittliche Intel Core Ultra 7 256V (536 - 632, n=7) | |
| Dell 14 Plus | |
| Dell Latitude 3440 | |
| Dell Inspiron 14 5425 6VPKR | |
| HP Pavilion Plus 14-ew0153TU | |
| AIDA64 / FP64 Ray-Trace | |
| Lenovo IdeaPad Pro 5 14AKP G10 | |
| Durchschnittliche Intel Core Ultra 7 256V (5655 - 6878, n=7) | |
| Dell 14 Plus | |
| Dell Inspiron 14 5425 6VPKR | |
| Lenovo ThinkPad E14 G6 | |
| Dell Latitude 3440 | |
| HP Pavilion Plus 14-ew0153TU | |
| AIDA64 / CPU PhotoWorxx | |
| Durchschnittliche Intel Core Ultra 7 256V (49906 - 57060, n=7) | |
| Dell 14 Plus | |
| Lenovo IdeaPad Pro 5 14AKP G10 | |
| Lenovo ThinkPad E14 G6 | |
| HP Pavilion Plus 14-ew0153TU | |
| Dell Latitude 3440 | |
| Dell Inspiron 14 5425 6VPKR | |
Stresstest
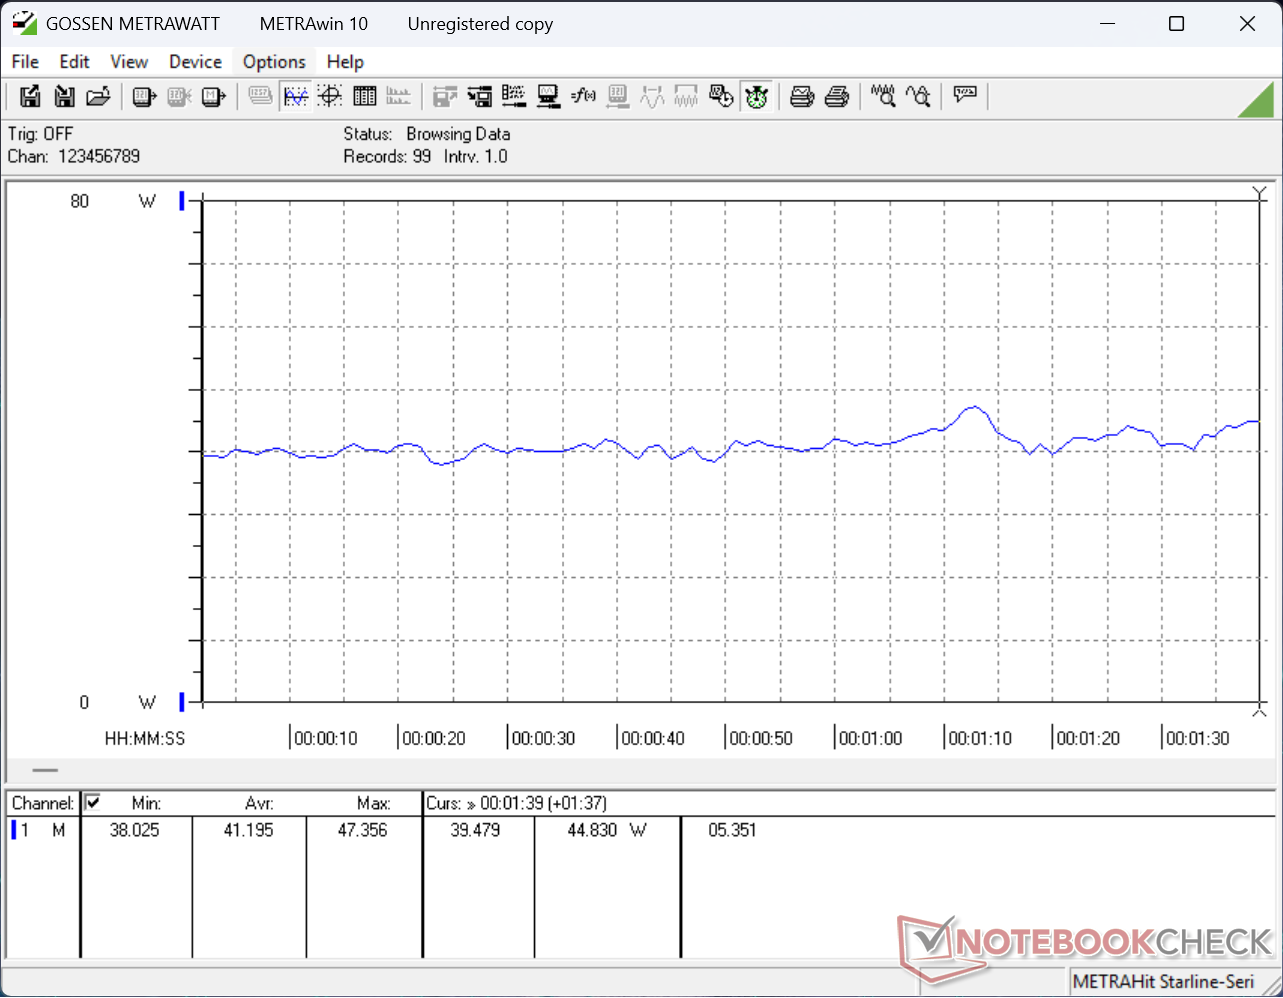
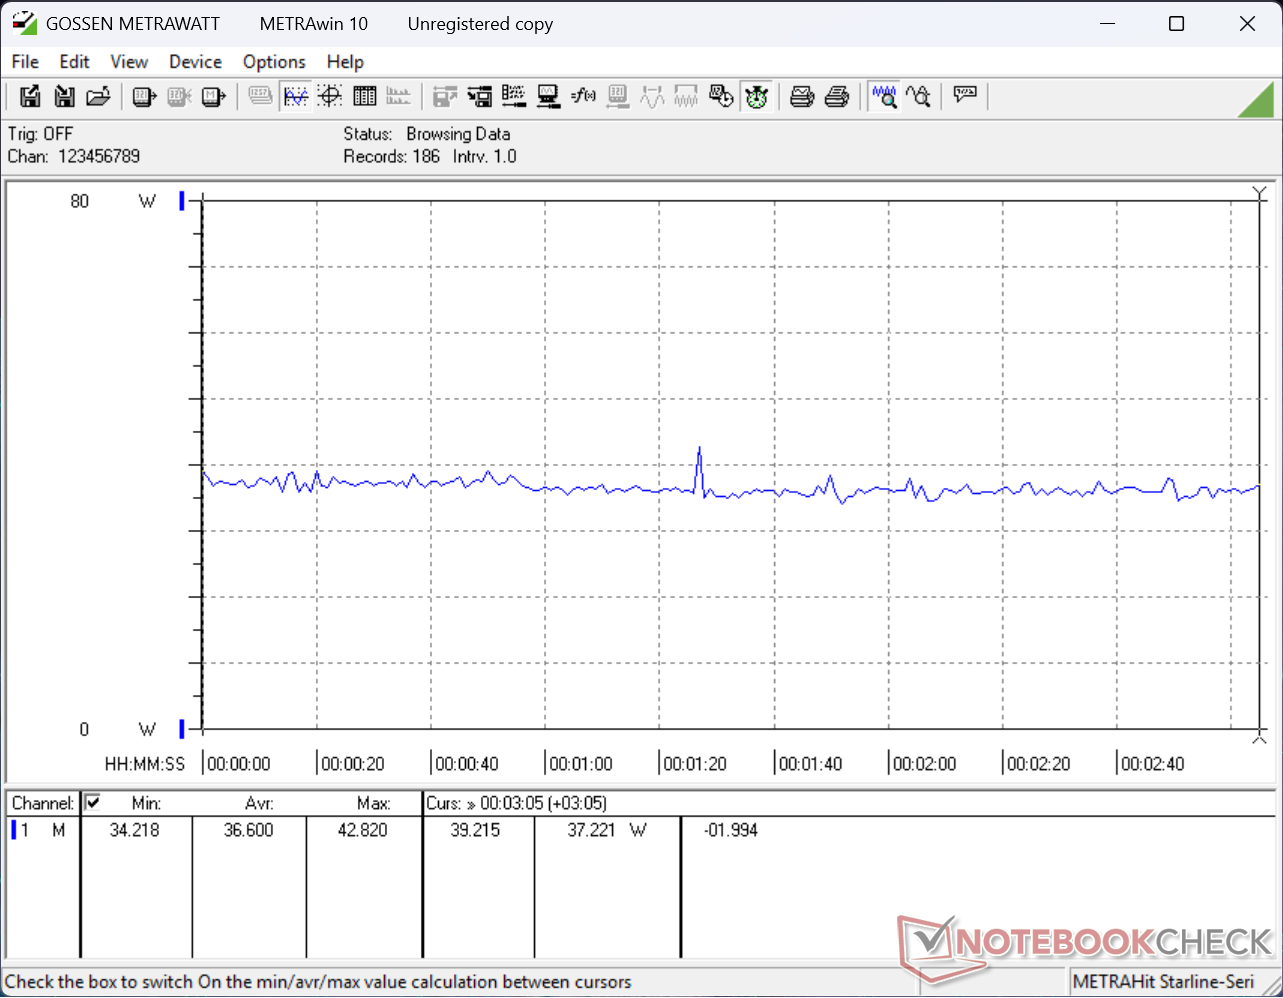
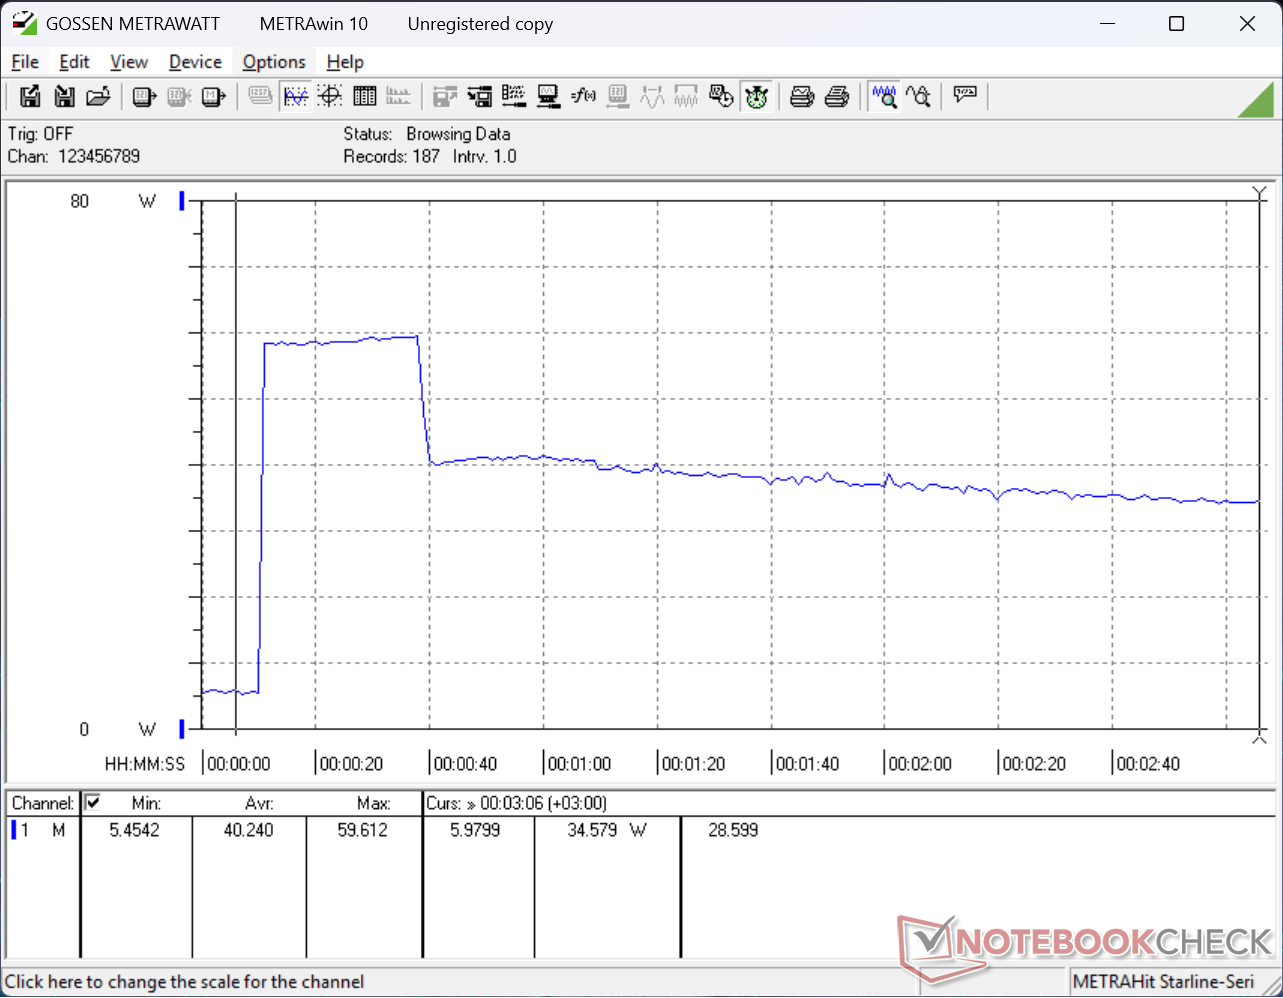
Bei der Ausführung von Prime95 Stress fährt die CPU auf 3,4 GHz und 39 W hoch, bevor sie etwa 30 Sekunden später eine Kerntemperatur von 80 °C erreicht. Danach stabilisiert sich die CPU bei 2,6 GHz, 20 W und 67 °C.

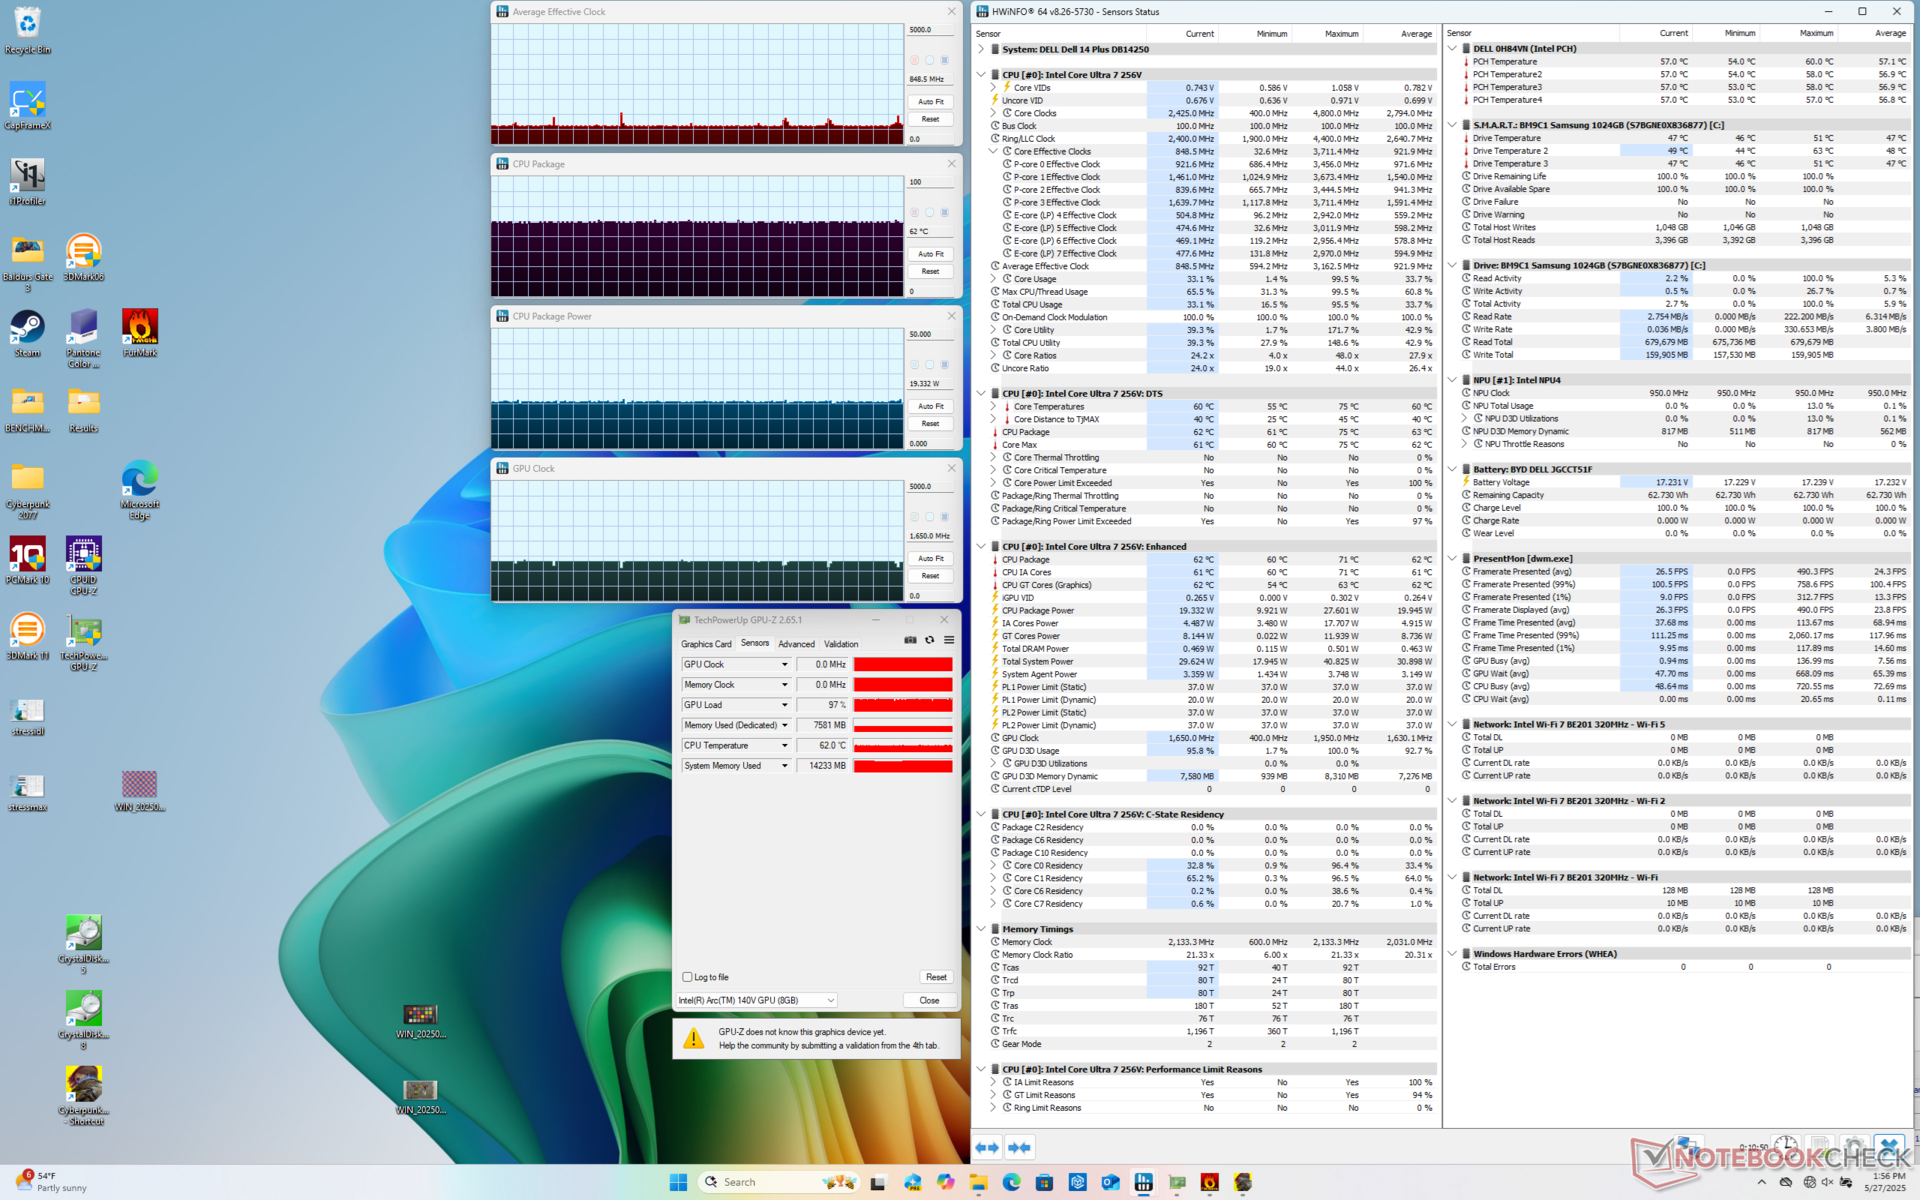
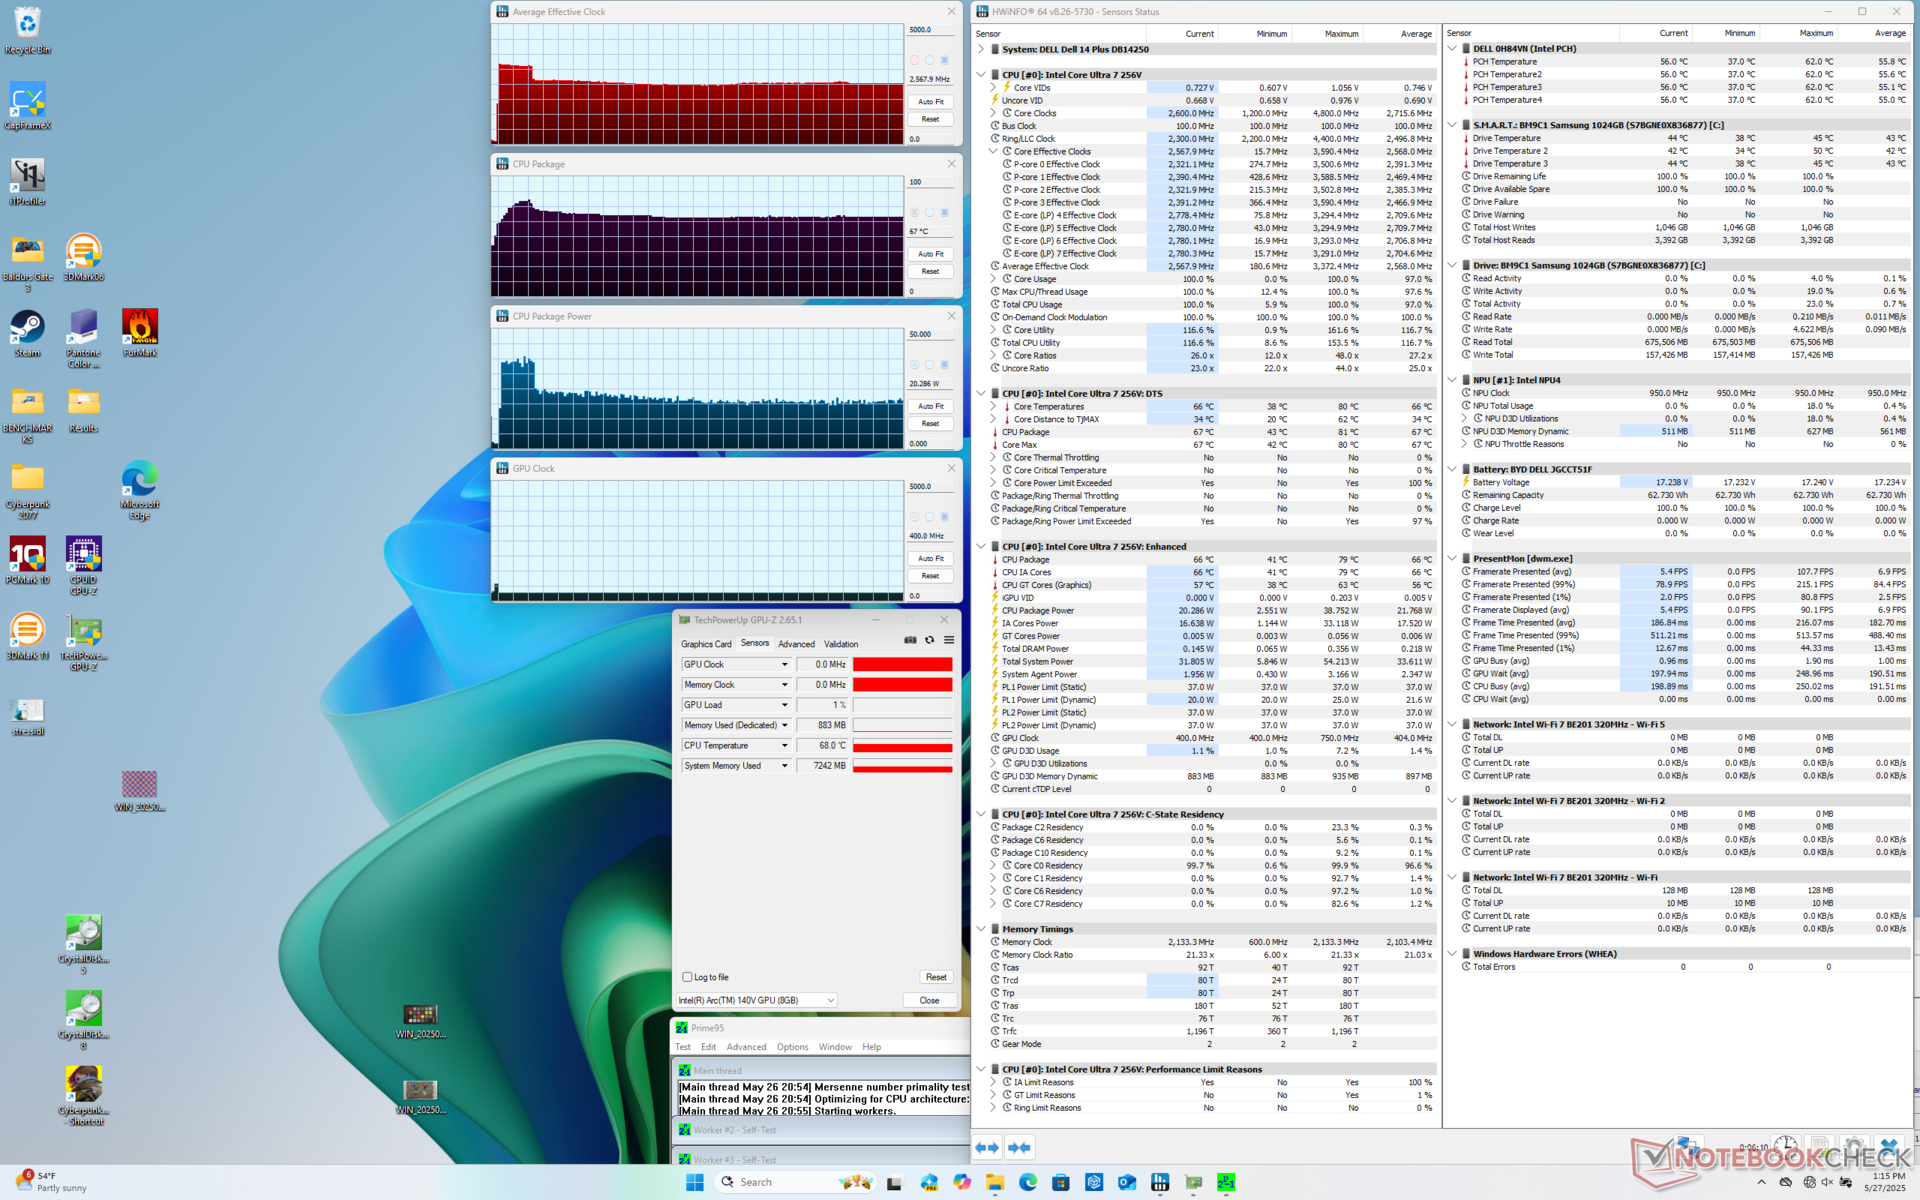

| durchschnittlicher CPU-Takt (GHz) | GPU-Takt (MHz) | durchschnittliche CPU-Temperatur (°C) | |
| System Leerlauf | -- | -- | 38 |
| Prime95 Stress | 2,6 | -- | 67 |
| Prime95 + FurMark Stress | 1,6 | 1.250 | 63 |
| Cyberpunk 2077 Stress | 0,8 | 1.650 | 62 |
System Performance
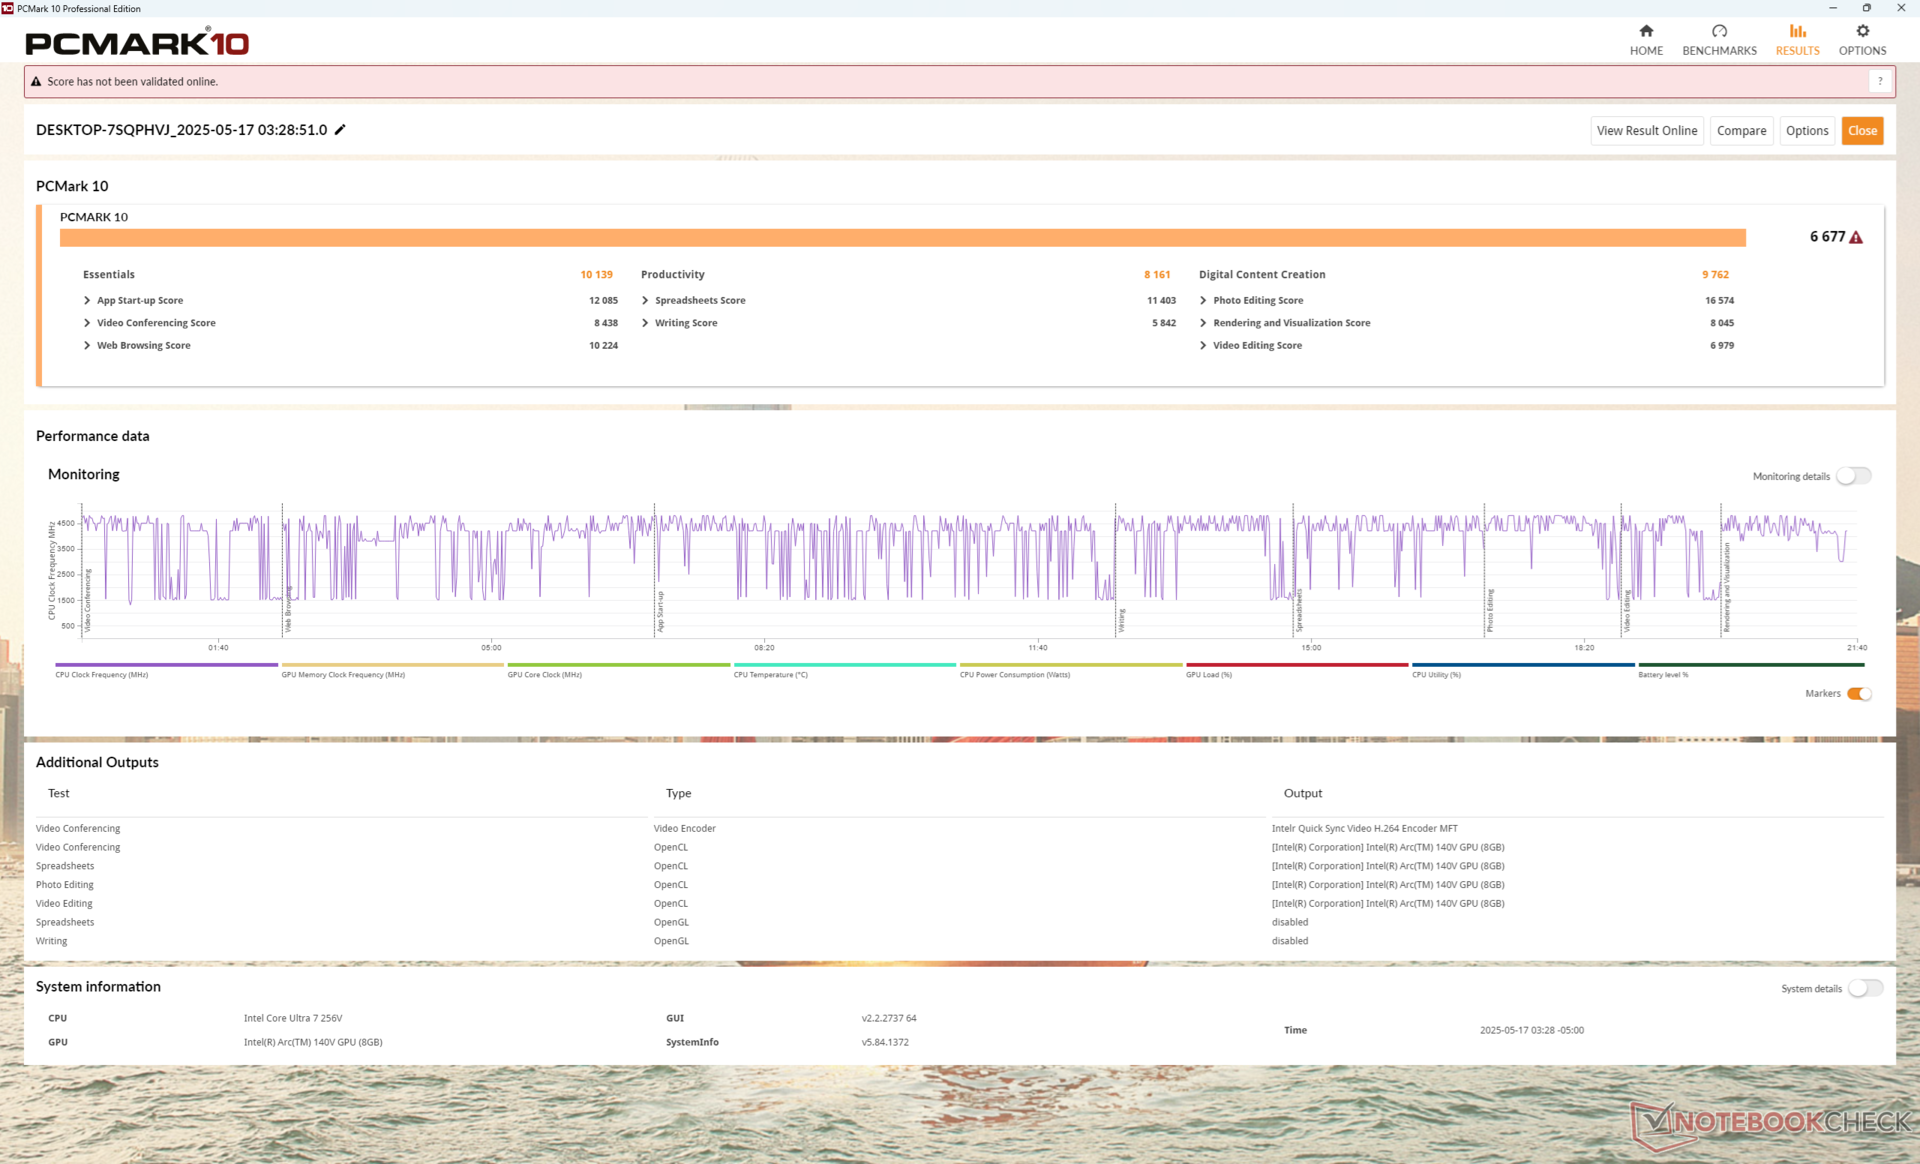
PCMark 10: Score | Essentials | Productivity | Digital Content Creation
CrossMark: Overall | Productivity | Creativity | Responsiveness
WebXPRT 3: Overall
WebXPRT 4: Overall
Mozilla Kraken 1.1: Total
| Performance Rating | |
| Lenovo IdeaPad Pro 5 14AKP G10 | |
| Durchschnittliche Intel Core Ultra 7 256V, Intel Arc Graphics 140V | |
| Dell 14 Plus | |
| Lenovo ThinkPad E14 G6 | |
| HP Pavilion Plus 14-ew0153TU | |
| Dell Latitude 3440 | |
| Dell Inspiron 14 5425 6VPKR | |
| PCMark 10 / Score | |
| Lenovo IdeaPad Pro 5 14AKP G10 | |
| Durchschnittliche Intel Core Ultra 7 256V, Intel Arc Graphics 140V (6677 - 7702, n=7) | |
| Dell 14 Plus | |
| Lenovo ThinkPad E14 G6 | |
| Dell Inspiron 14 5425 6VPKR | |
| HP Pavilion Plus 14-ew0153TU | |
| Dell Latitude 3440 | |
| PCMark 10 / Essentials | |
| Lenovo IdeaPad Pro 5 14AKP G10 | |
| Dell Latitude 3440 | |
| Lenovo ThinkPad E14 G6 | |
| Durchschnittliche Intel Core Ultra 7 256V, Intel Arc Graphics 140V (9627 - 11365, n=7) | |
| HP Pavilion Plus 14-ew0153TU | |
| Dell 14 Plus | |
| Dell Inspiron 14 5425 6VPKR | |
| PCMark 10 / Productivity | |
| Lenovo IdeaPad Pro 5 14AKP G10 | |
| Durchschnittliche Intel Core Ultra 7 256V, Intel Arc Graphics 140V (8161 - 12672, n=7) | |
| Dell Inspiron 14 5425 6VPKR | |
| Lenovo ThinkPad E14 G6 | |
| Dell 14 Plus | |
| Dell Latitude 3440 | |
| HP Pavilion Plus 14-ew0153TU | |
| PCMark 10 / Digital Content Creation | |
| Durchschnittliche Intel Core Ultra 7 256V, Intel Arc Graphics 140V (9481 - 10126, n=7) | |
| Dell 14 Plus | |
| Lenovo IdeaPad Pro 5 14AKP G10 | |
| Lenovo ThinkPad E14 G6 | |
| HP Pavilion Plus 14-ew0153TU | |
| Dell Inspiron 14 5425 6VPKR | |
| Dell Latitude 3440 | |
| CrossMark / Overall | |
| Lenovo IdeaPad Pro 5 14AKP G10 | |
| Dell 14 Plus | |
| Durchschnittliche Intel Core Ultra 7 256V, Intel Arc Graphics 140V (1636 - 1736, n=7) | |
| Lenovo ThinkPad E14 G6 | |
| HP Pavilion Plus 14-ew0153TU | |
| Dell Latitude 3440 | |
| Dell Inspiron 14 5425 6VPKR | |
| CrossMark / Productivity | |
| Lenovo IdeaPad Pro 5 14AKP G10 | |
| Dell 14 Plus | |
| Durchschnittliche Intel Core Ultra 7 256V, Intel Arc Graphics 140V (1563 - 1682, n=7) | |
| HP Pavilion Plus 14-ew0153TU | |
| Lenovo ThinkPad E14 G6 | |
| Dell Latitude 3440 | |
| Dell Inspiron 14 5425 6VPKR | |
| CrossMark / Creativity | |
| Lenovo IdeaPad Pro 5 14AKP G10 | |
| Dell 14 Plus | |
| Durchschnittliche Intel Core Ultra 7 256V, Intel Arc Graphics 140V (1862 - 1962, n=7) | |
| Lenovo ThinkPad E14 G6 | |
| HP Pavilion Plus 14-ew0153TU | |
| Dell Latitude 3440 | |
| Dell Inspiron 14 5425 6VPKR | |
| CrossMark / Responsiveness | |
| Lenovo IdeaPad Pro 5 14AKP G10 | |
| Lenovo ThinkPad E14 G6 | |
| HP Pavilion Plus 14-ew0153TU | |
| Durchschnittliche Intel Core Ultra 7 256V, Intel Arc Graphics 140V (1215 - 1371, n=7) | |
| Dell 14 Plus | |
| Dell Latitude 3440 | |
| Dell Inspiron 14 5425 6VPKR | |
| WebXPRT 3 / Overall | |
| Lenovo IdeaPad Pro 5 14AKP G10 | |
| Dell 14 Plus | |
| Durchschnittliche Intel Core Ultra 7 256V, Intel Arc Graphics 140V (243 - 310, n=7) | |
| Lenovo ThinkPad E14 G6 | |
| Dell Latitude 3440 | |
| HP Pavilion Plus 14-ew0153TU | |
| Dell Inspiron 14 5425 6VPKR | |
| WebXPRT 4 / Overall | |
| Dell 14 Plus | |
| Durchschnittliche Intel Core Ultra 7 256V, Intel Arc Graphics 140V (282 - 286, n=7) | |
| Lenovo IdeaPad Pro 5 14AKP G10 | |
| HP Pavilion Plus 14-ew0153TU | |
| Lenovo ThinkPad E14 G6 | |
| Dell Latitude 3440 | |
| Dell Inspiron 14 5425 6VPKR | |
| Mozilla Kraken 1.1 / Total | |
| Dell Inspiron 14 5425 6VPKR | |
| Dell Latitude 3440 | |
| Lenovo ThinkPad E14 G6 | |
| HP Pavilion Plus 14-ew0153TU | |
| Dell 14 Plus | |
| Durchschnittliche Intel Core Ultra 7 256V, Intel Arc Graphics 140V (470 - 480, n=7) | |
| Lenovo IdeaPad Pro 5 14AKP G10 | |
* ... kleinere Werte sind besser
| PCMark 10 Score | 6677 Punkte | |
Hilfe | ||
| AIDA64 / Memory Copy | |
| Durchschnittliche Intel Core Ultra 7 256V (99227 - 104459, n=7) | |
| Dell 14 Plus | |
| Lenovo IdeaPad Pro 5 14AKP G10 | |
| Lenovo ThinkPad E14 G6 | |
| HP Pavilion Plus 14-ew0153TU | |
| Dell Latitude 3440 | |
| Dell Inspiron 14 5425 6VPKR | |
| AIDA64 / Memory Read | |
| Durchschnittliche Intel Core Ultra 7 256V (86352 - 89848, n=7) | |
| Dell 14 Plus | |
| Lenovo ThinkPad E14 G6 | |
| Lenovo IdeaPad Pro 5 14AKP G10 | |
| HP Pavilion Plus 14-ew0153TU | |
| Dell Latitude 3440 | |
| Dell Inspiron 14 5425 6VPKR | |
| AIDA64 / Memory Write | |
| Dell 14 Plus | |
| Durchschnittliche Intel Core Ultra 7 256V (108692 - 117933, n=7) | |
| Lenovo IdeaPad Pro 5 14AKP G10 | |
| HP Pavilion Plus 14-ew0153TU | |
| Lenovo ThinkPad E14 G6 | |
| Dell Latitude 3440 | |
| Dell Inspiron 14 5425 6VPKR | |
| AIDA64 / Memory Latency | |
| Lenovo ThinkPad E14 G6 | |
| HP Pavilion Plus 14-ew0153TU | |
| Lenovo IdeaPad Pro 5 14AKP G10 | |
| Dell Inspiron 14 5425 6VPKR | |
| Durchschnittliche Intel Core Ultra 7 256V (96.1 - 99.6, n=7) | |
| Dell 14 Plus | |
| Dell Latitude 3440 | |
* ... kleinere Werte sind besser
DPC-Latenzzeit


| DPC Latencies / LatencyMon - interrupt to process latency (max), Web, Youtube, Prime95 | |
| Lenovo ThinkPad E14 G6 | |
| Dell Latitude 3440 | |
| HP Pavilion Plus 14-ew0153TU | |
| Dell 14 Plus | |
| Dell Inspiron 14 5425 6VPKR | |
| Lenovo IdeaPad Pro 5 14AKP G10 | |
* ... kleinere Werte sind besser
Speichergeräte
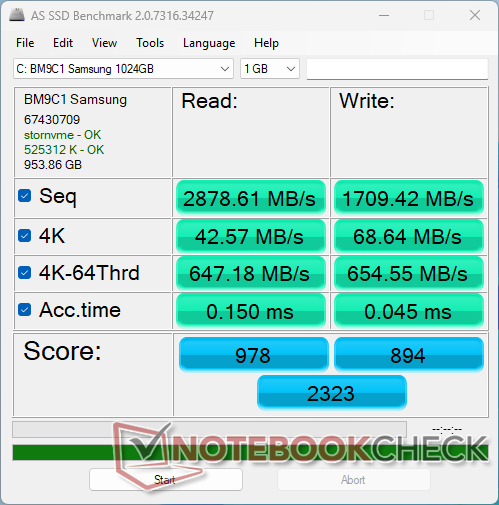
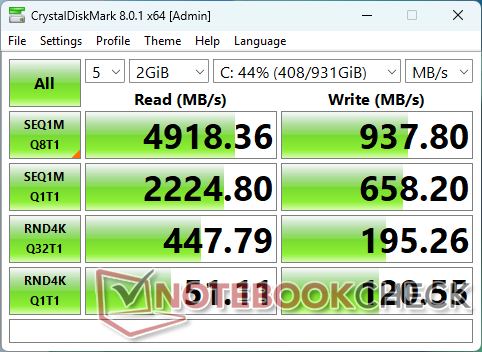
Unser Gerät wird mit dem Mittelklassegerät Samsung BM9C1 PCIe4 NVMe SSD mit anständigen Leseraten von bis zu 4.900 MB/s. Die Schreibraten können jedoch mit weniger als der Hälfte der Geschwindigkeit viel langsamer sein.


| Drive Performance Rating - Percent | |
| Lenovo IdeaPad Pro 5 14AKP G10 | |
| HP Pavilion Plus 14-ew0153TU | |
| Lenovo ThinkPad E14 G6 | |
| Dell Latitude 3440 | |
| Dell Inspiron 14 5425 6VPKR | |
| Dell 14 Plus | |
* ... kleinere Werte sind besser
Disk Throttling: DiskSpd Read Loop, Queue Depth 8
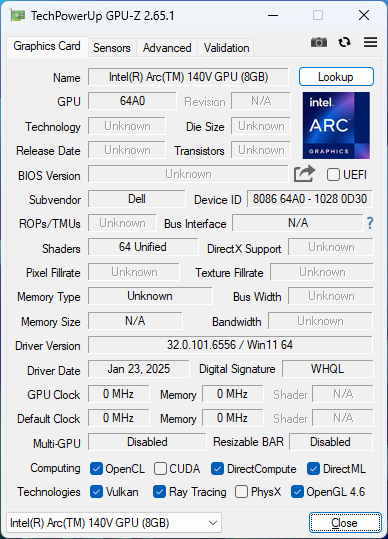
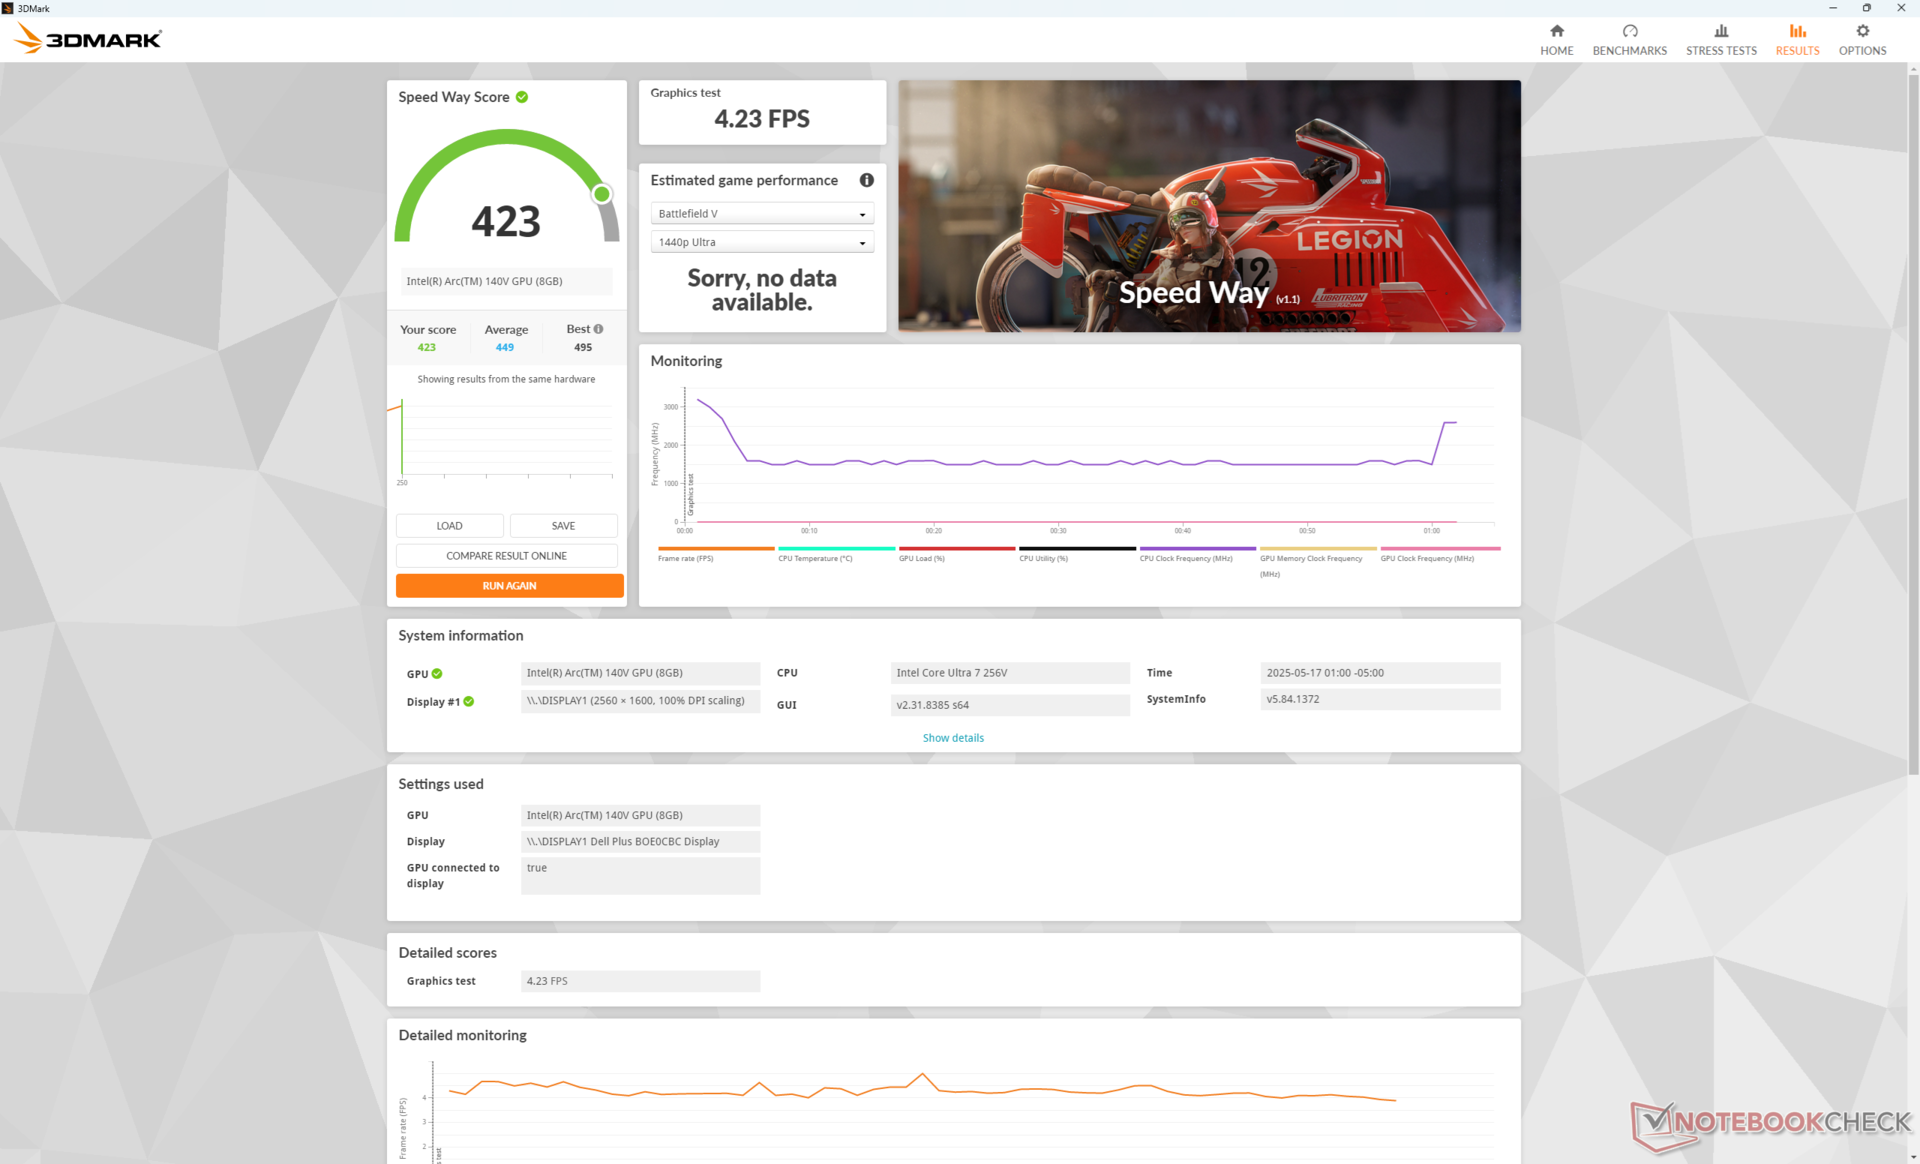
GPU Performance
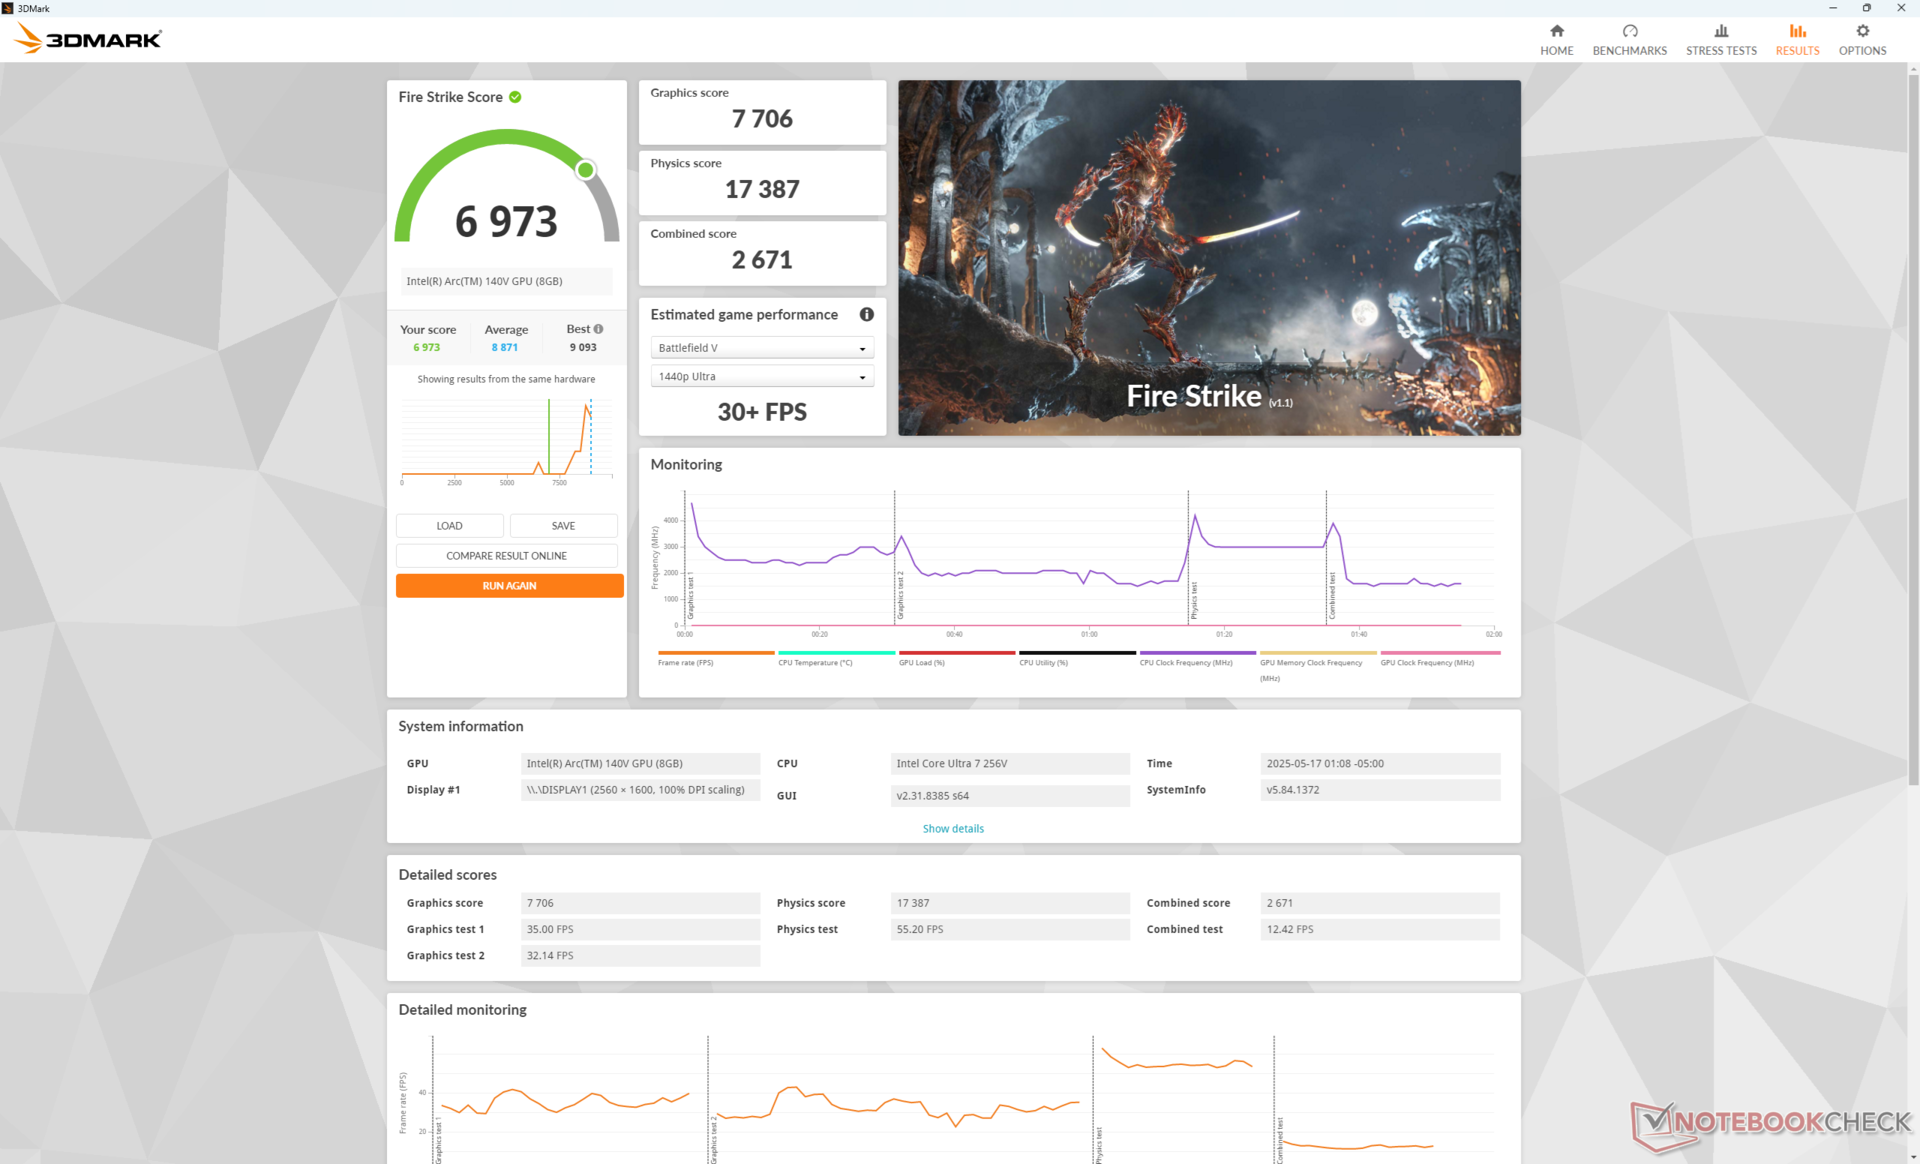
Die Arc 140V in unserem Gerät ist um bis zu 20 Prozent langsamer als der durchschnittliche Laptop in unserer Datenbank mit der gleichen iGPU. Dennoch ist das System ein deutliches Upgrade gegenüber den alternden Iris Xe 96 EUs, von denen viele Käufer aufrüsten werden.
| Leistungsprofil | Grafics-Punktzahl | Physics-Wertung | Kombinierte Wertung |
| Performance-Modus | 7.706 | 17.387 | 2.671 |
| Ausgeglichener Modus | 7.182 (-7 %) | 16.601 (-5 %) | 2.426 (-9 %) |
| Akku-Leistung | 7.374(-4 %) | 16.277 (-6 %) | 2.373 (-11 %) |
Der Betrieb im Modus "Ausgewogen" oder im Akkubetrieb verringert die Leistung nur um wenige Prozentpunkte, wie unsere obige Fire-Strike-Ergebnistabelle zeigt.
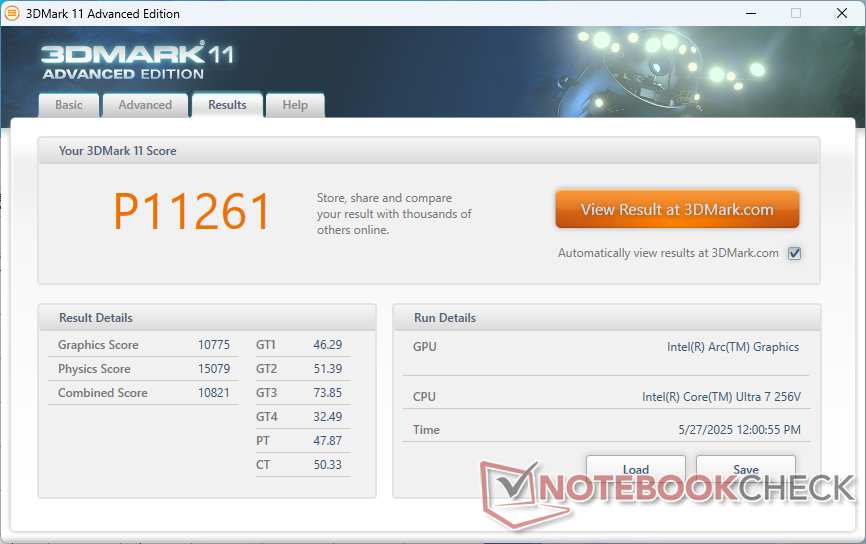

| 3DMark 11 Performance | 11261 Punkte | |
| 3DMark Fire Strike Score | 6973 Punkte | |
| 3DMark Time Spy Score | 3517 Punkte | |
Hilfe | ||
* ... kleinere Werte sind besser
| F1 24 | |
| 1920x1080 High Preset AA:T AF:16x | |
| Durchschnittliche Intel Arc Graphics 140V (34.4 - 66.4, n=27) | |
| Lenovo ThinkPad X1 2-in-1 Gen 10 | |
| Lenovo IdeaPad Pro 5 14AKP G10 | |
| Dell 14 Plus | |
| Lenovo Yoga 7 2-in-1 14AKP10 | |
| 1920x1080 Ultra High Preset AA:T AF:16x | |
| Durchschnittliche Intel Arc Graphics 140V (14.6 - 22, n=25) | |
| Lenovo ThinkPad X1 2-in-1 Gen 10 | |
| Dell 14 Plus | |
| Lenovo IdeaPad Pro 5 14AKP G10 | |
Cyberpunk 2077 ultra fps Chart
| min. | mittel | hoch | max. | |
|---|---|---|---|---|
| Dota 2 Reborn (2015) | 98.6 | 59.7 | 74.5 | 69.1 |
| Final Fantasy XV Benchmark (2018) | 76.9 | 42.8 | 32.3 | |
| X-Plane 11.11 (2018) | 43.8 | 35.3 | 36 | |
| Strange Brigade (2018) | 193.4 | 56.2 | 52.6 | 48.8 |
| Baldur's Gate 3 (2023) | 38.1 | 32.1 | 27.9 | 27.4 |
| Cyberpunk 2077 (2023) | 43.5 | 35.1 | 26 | 24.2 |
| F1 24 (2024) | 64.3 | 62.2 | 45.9 | 16.5 |
Emissionen
Systemrauschen
Der interne Lüfter ist im Allgemeinen lethargisch und bei den meisten niedrigen bis mittleren Lasten eher leise, wie es überwiegend bei den Subnotebooks mit Lunar-Lake-Antrieb der Fall ist Gehäuse. Der Lüfter braucht eine Weile, bis er bei höherer Last richtig in Fahrt kommt, aber ansonsten erreicht er eine ähnliche Lautstärke wie die meisten anderen 14-Zoll-Konkurrenten.
Lautstärkediagramm
| Idle |
| 23.8 / 23.8 / 23.8 dB(A) |
| Last |
| 31.4 / 45.2 dB(A) |
 | ||
30 dB leise 40 dB(A) deutlich hörbar 50 dB(A) störend |
||
min: | ||
| Dell 14 Plus Arc 140V, Core Ultra 7 256V | Dell Inspiron 14 5425 6VPKR Vega 7, R5 5625U, SK Hynix BC711 512GB HFM512GD3GX013N | Dell Latitude 3440 Iris Xe G7 80EUs, i5-1345U, Samsung PM9A1 MZVL2512HCJQ | Lenovo IdeaPad Pro 5 14AKP G10 Radeon 860M, Ryzen AI 7 350, SK hynix PVC10 HFS001TEM4X182N | Lenovo ThinkPad E14 G6 Graphics 4-Core iGPU (Arrow Lake), Ultra 7 155U, Samsung PM9C1a MZAL8512HDLU | HP Pavilion Plus 14-ew0153TU Iris Xe G7 96EUs, i7-1355U, SK hynix PC801 HFS001TEJ9X101N | |
|---|---|---|---|---|---|---|
| Geräuschentwicklung | -7% | -3% | -10% | 2% | 15% | |
| aus / Umgebung * (dB) | 23.8 | 25.5 -7% | 23.9 -0% | 23.6 1% | 24.6 -3% | 19.35 19% |
| Idle min * (dB) | 23.8 | 25.5 -7% | 24.4 -3% | 23.6 1% | 24.6 -3% | 20.57 14% |
| Idle avg * (dB) | 23.8 | 25.5 -7% | 24.4 -3% | 23.6 1% | 24.6 -3% | 20.57 14% |
| Idle max * (dB) | 23.8 | 25.5 -7% | 24.4 -3% | 23.6 1% | 24.6 -3% | 20.57 14% |
| Last avg * (dB) | 31.4 | 37.7 -20% | 37.1 -18% | 46.5 -48% | 27.5 12% | 32.18 -2% |
| Cyberpunk 2077 ultra * (dB) | 42 | 48.9 -16% | 39.4 6% | |||
| Last max * (dB) | 45.2 | 43.3 4% | 40.2 11% | 48.9 -8% | 42.5 6% | 32.26 29% |
| Witcher 3 ultra * (dB) | 38.2 | 29.44 |
* ... kleinere Werte sind besser
Temperatur
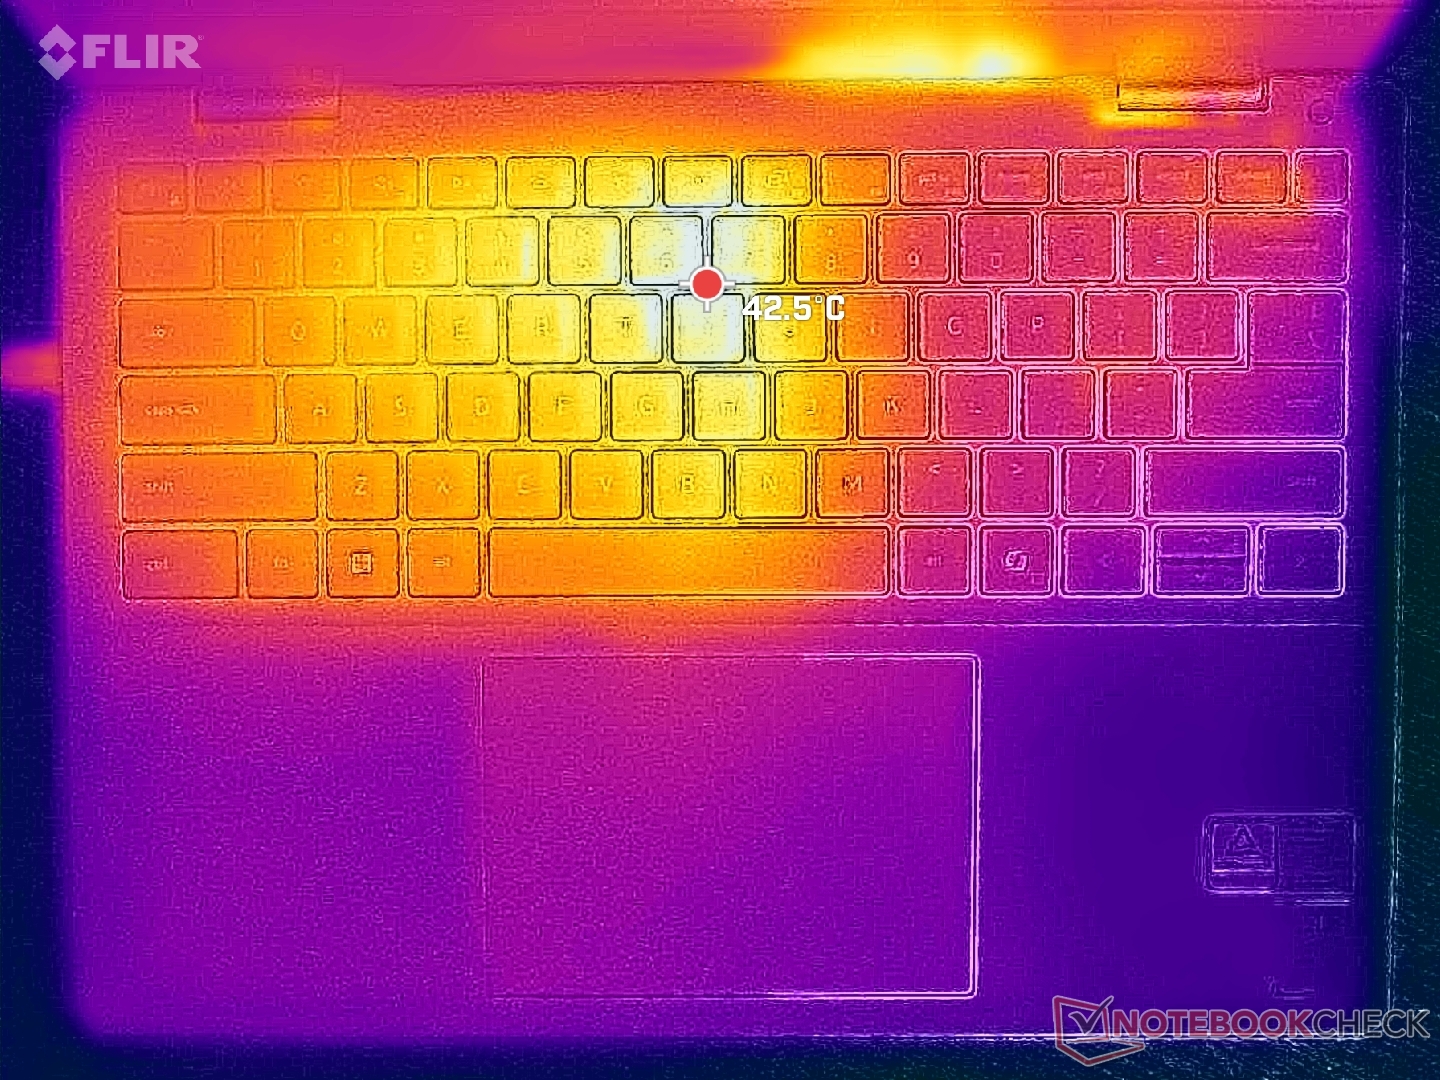
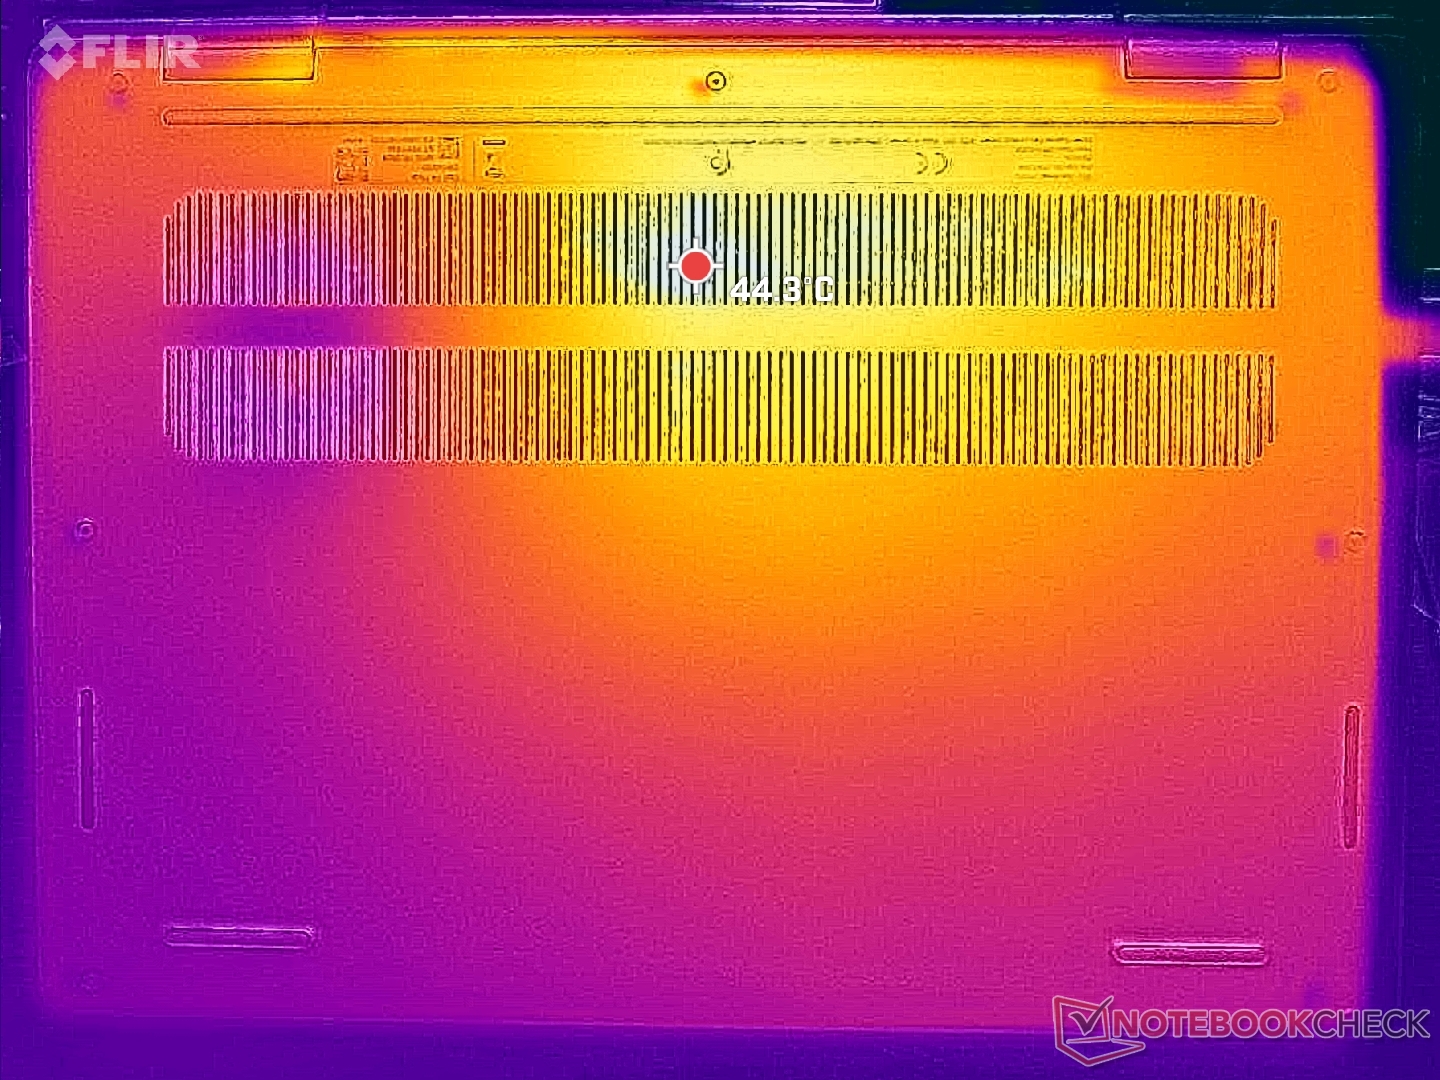
Die Oberflächentemperaturen können unter Last sowohl auf der Tastatur als auch auf der Unterseite bis zu 43 Grad Celsius erreichen und sind damit deutlich wärmer als die Werte, die wir auf dem HP Pavilion Plus 14 gemessen haben - um ein paar Grad.
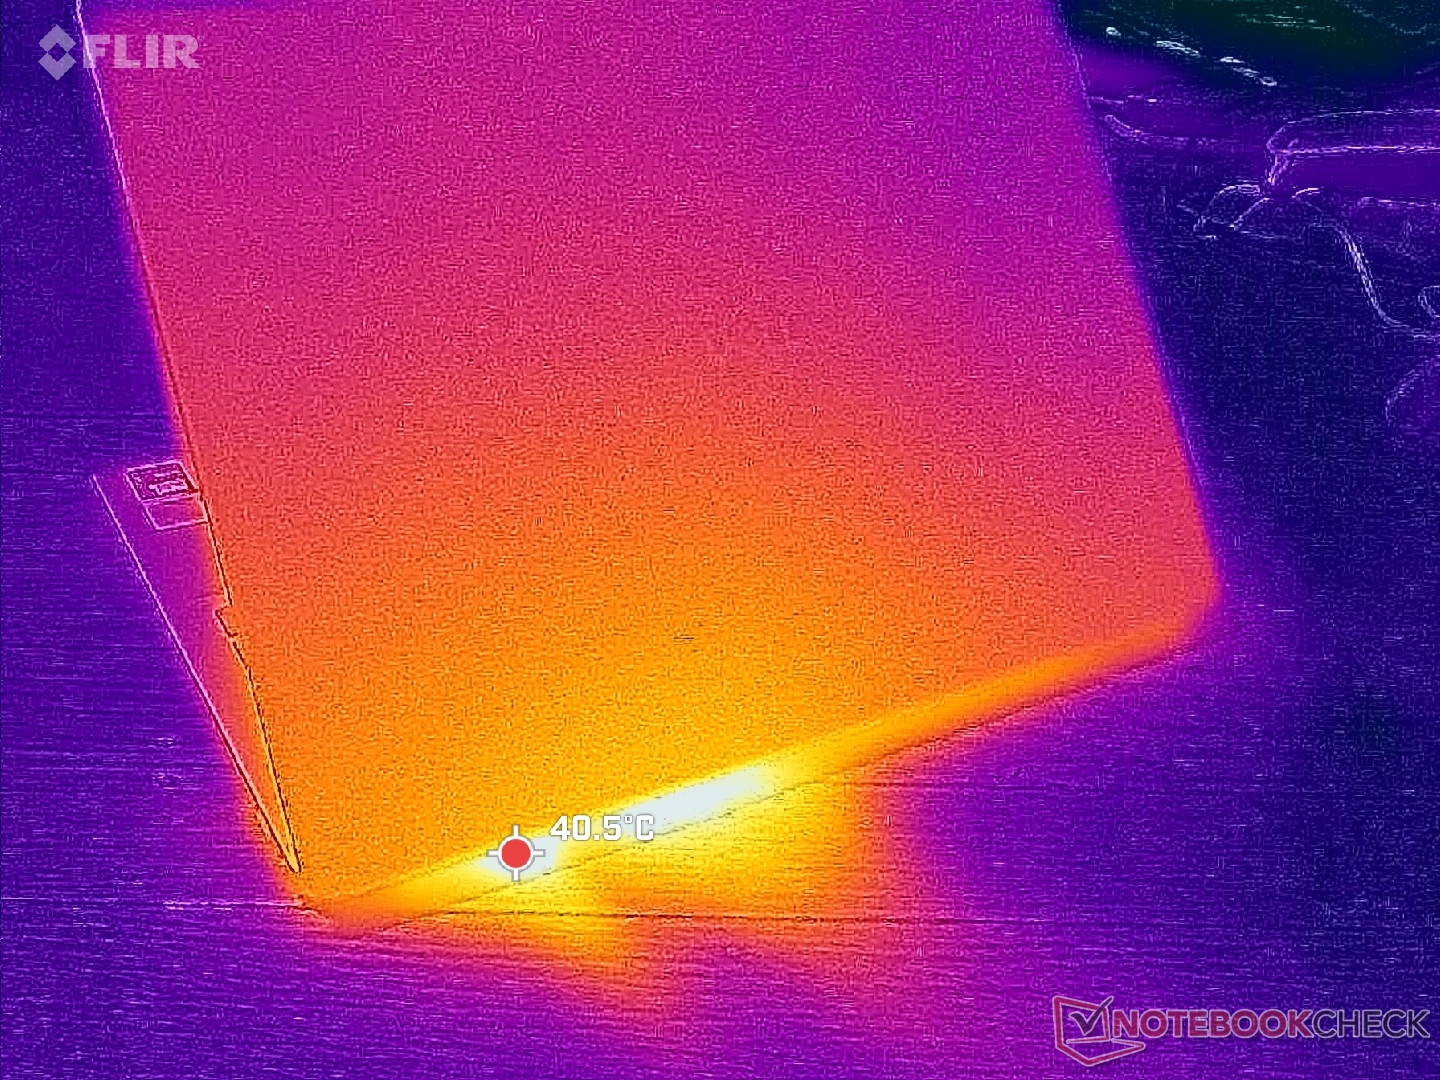
(±) Die maximale Temperatur auf der Oberseite ist 43 °C. Im Vergleich liegt der Klassendurchschnitt bei 35.9 °C (von 21.4 bis 59 °C für die Klasse Subnotebook).
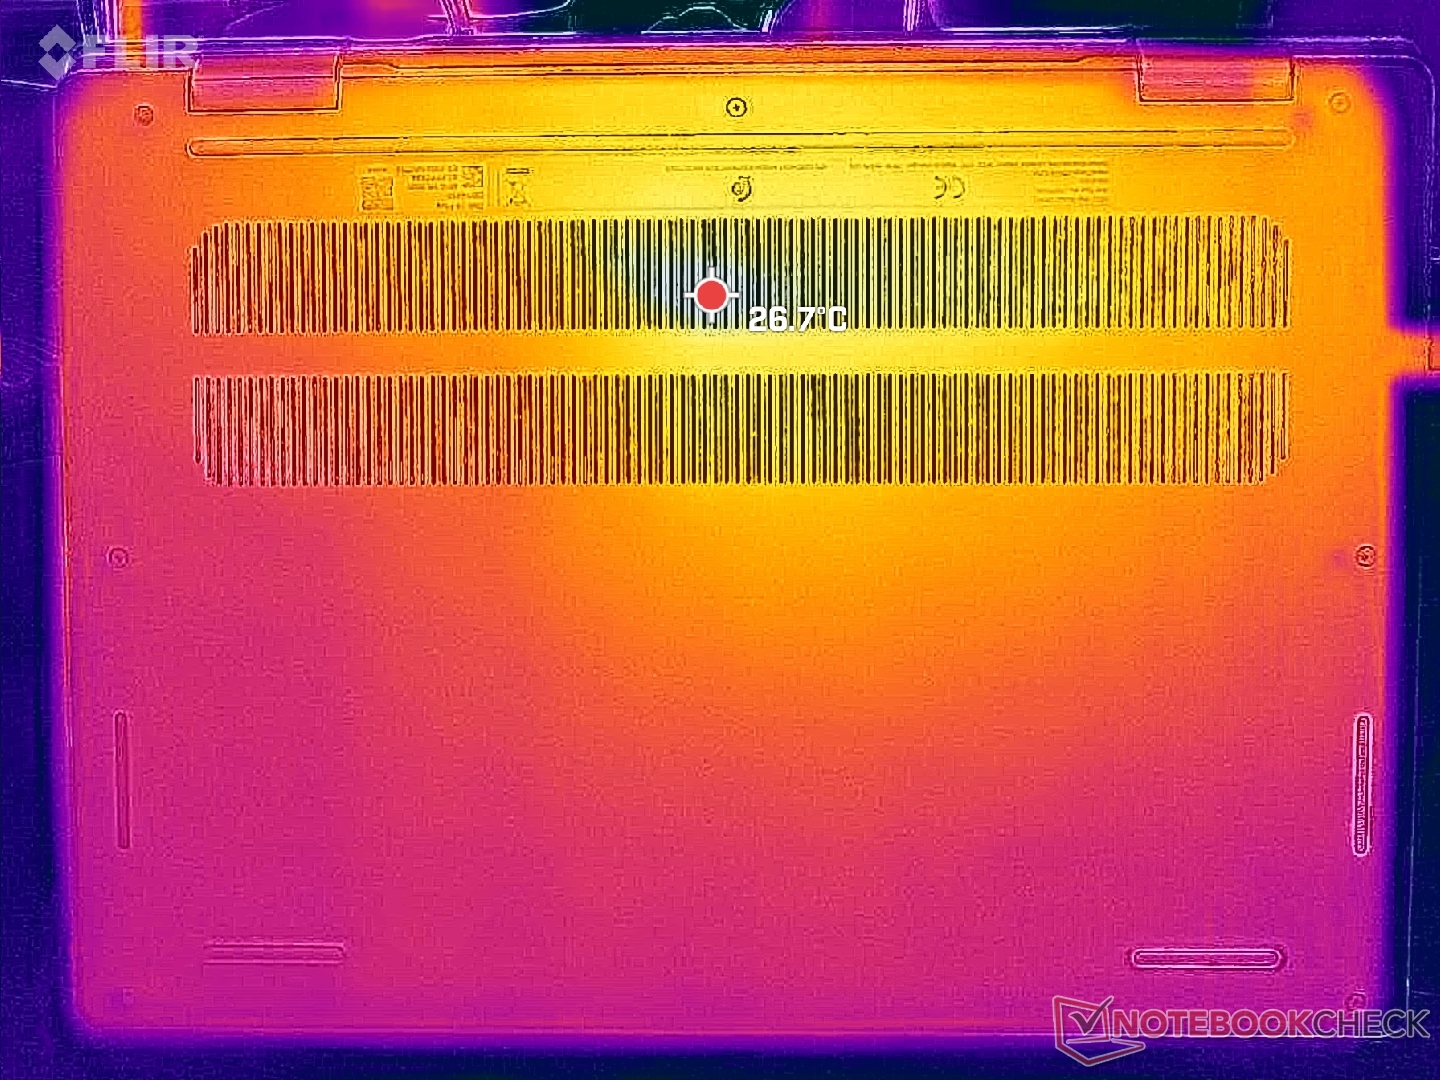
(±) Auf der Unterseite messen wir eine maximalen Wert von 42.6 °C (im Vergleich zum Durchschnitt von 39.2 °C).
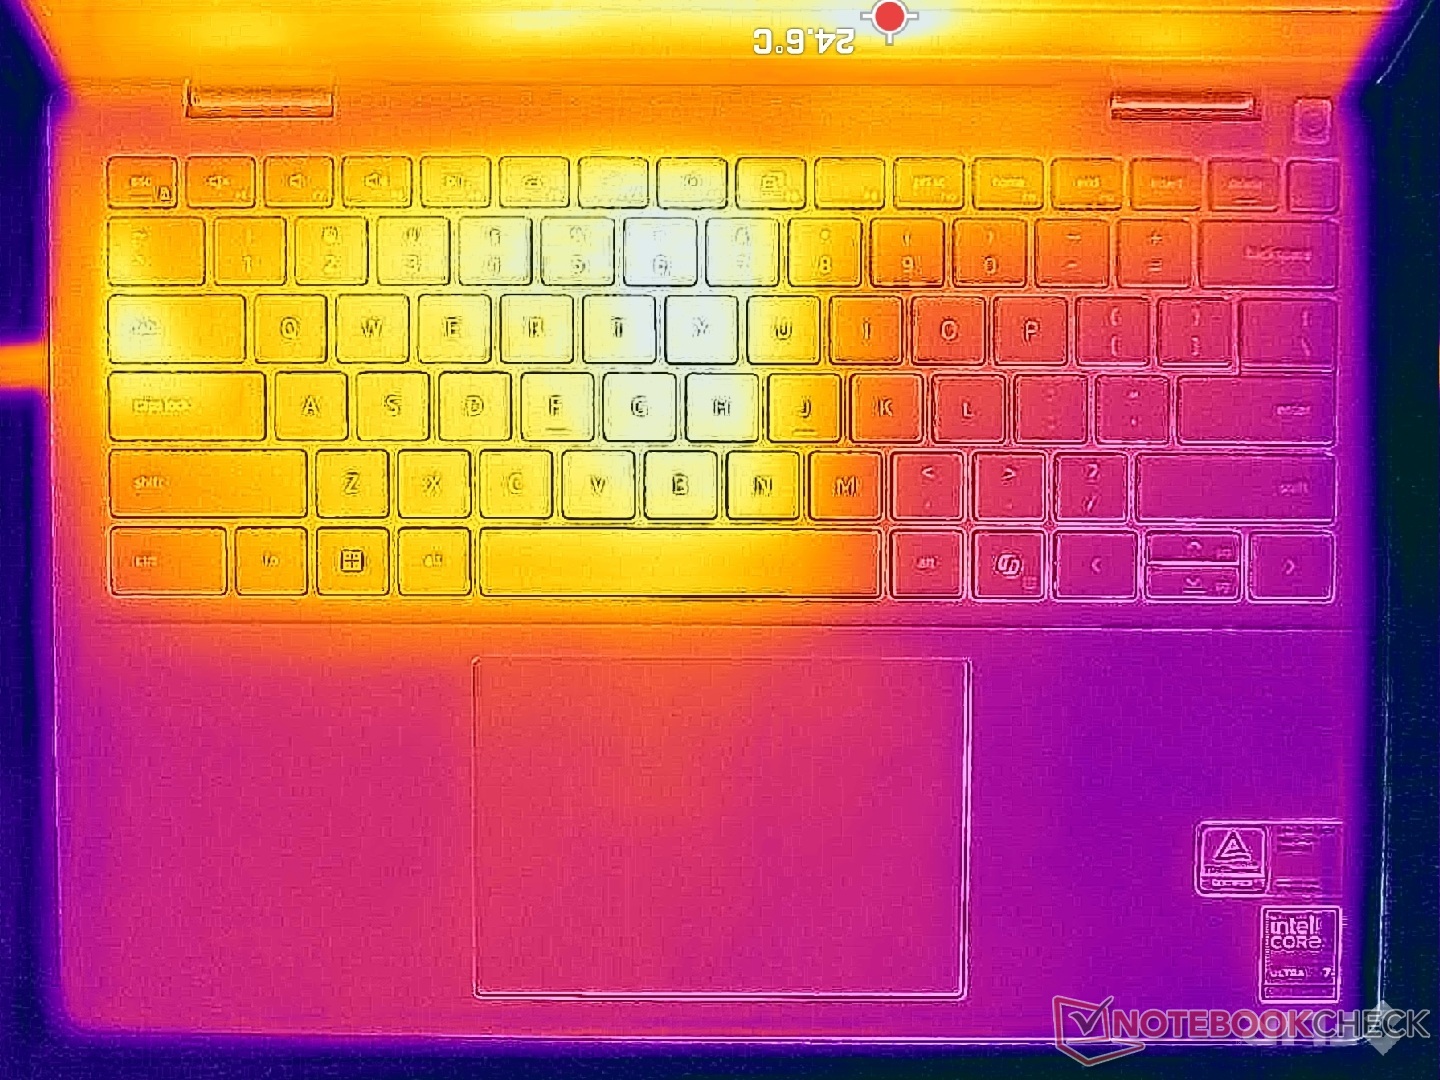
(+) Ohne Last messen wir eine durchschnittliche Temperatur von 28.8 °C auf der Oberseite. Der Klassendurchschnitt erreicht 30.8 °C.
(+) Die Handballen und der Touchpad-Bereich sind mit gemessenen 28.4 °C kühler als die typische Hauttemperatur und fühlen sich dadurch kühl an.
(±) Die durchschnittliche Handballen-Temperatur anderer getesteter Geräte war 28.2 °C (-0.2 °C).
| Dell 14 Plus Intel Core Ultra 7 256V, Intel Arc Graphics 140V | Dell Inspiron 14 5425 6VPKR AMD Ryzen 5 5625U, AMD Radeon RX Vega 7 | Dell Latitude 3440 Intel Core i5-1345U, Intel Iris Xe Graphics G7 80EUs | Lenovo IdeaPad Pro 5 14AKP G10 AMD Ryzen AI 7 350, AMD Radeon 860M | Lenovo ThinkPad E14 G6 Intel Core Ultra 7 155U, Intel Graphics 4-Core iGPU (Meteor / Arrow Lake) | HP Pavilion Plus 14-ew0153TU Intel Core i7-1355U, Intel Iris Xe Graphics G7 96EUs | |
|---|---|---|---|---|---|---|
| Hitze | 3% | 6% | 10% | 20% | 8% | |
| Last oben max * (°C) | 43 | 39.1 9% | 35.2 18% | 42.2 2% | 35 19% | 36.6 15% |
| Last unten max * (°C) | 42.6 | 41.9 2% | 41 4% | 42.4 -0% | 35.6 16% | 37.2 13% |
| Idle oben max * (°C) | 31.6 | 31.2 1% | 29.8 6% | 25.4 20% | 23.8 25% | 31.6 -0% |
| Idle unten max * (°C) | 30.6 | 30.9 -1% | 32 -5% | 25.7 16% | 24.8 19% | 30 2% |
* ... kleinere Werte sind besser
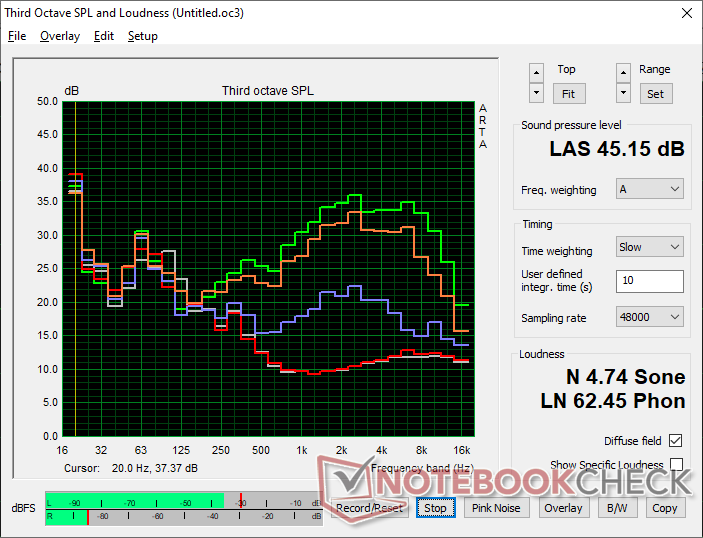
Lautsprecher
Dell 14 Plus Audio Analyse
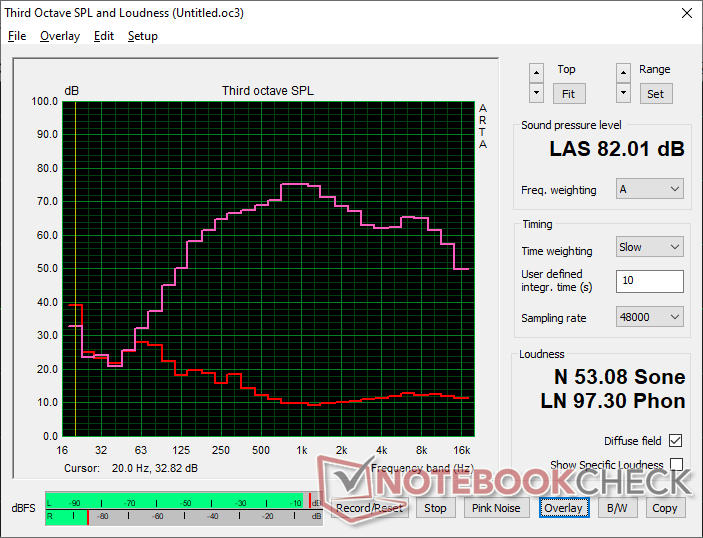
(+) | Die Lautsprecher können relativ laut spielen (82 dB)
Bass 100 - 315 Hz
(±) | abgesenkter Bass - 7.8% geringer als der Median
(±) | durchschnittlich lineare Bass-Wiedergabe (9.2% Delta zum Vorgänger)
Mitteltöne 400 - 2000 Hz
(±) | zu hohe Mitten, vom Median 6.5% abweichend
(+) | lineare Mitten (3.6% Delta zum Vorgänger)
Hochtöne 2 - 16 kHz
(+) | ausgeglichene Hochtöne, vom Median nur 1.9% abweichend
(+) | sehr lineare Hochtöne (3.7% Delta zum Vorgänger)
Gesamt im hörbaren Bereich 100 - 16.000 Hz
(+) | hörbarer Bereich ist sehr linear (12.4% Abstand zum Median
Im Vergleich zu allen Geräten derselben Klasse
» 17% aller getesteten Geräte dieser Klasse waren besser, 4% vergleichbar, 79% schlechter
» Das beste Gerät hat einen Delta-Wert von 5%, durchschnittlich ist 18%, das schlechteste Gerät hat 53%
Im Vergleich zu allen Geräten im Test
» 11% aller getesteten Geräte waren besser, 2% vergleichbar, 87% schlechter
» Das beste Gerät hat einen Delta-Wert von 4%, durchschnittlich ist 23%, das schlechteste Gerät hat 134%
Apple MacBook Pro 16 2021 M1 Pro Audio Analyse
(+) | Die Lautsprecher können relativ laut spielen (84.7 dB)
Bass 100 - 315 Hz
(+) | guter Bass - nur 3.8% Abweichung vom Median
(+) | lineare Bass-Wiedergabe (5.2% Delta zum Vorgänger)
Mitteltöne 400 - 2000 Hz
(+) | ausgeglichene Mitten, vom Median nur 1.3% abweichend
(+) | lineare Mitten (2.1% Delta zum Vorgänger)
Hochtöne 2 - 16 kHz
(+) | ausgeglichene Hochtöne, vom Median nur 1.9% abweichend
(+) | sehr lineare Hochtöne (2.7% Delta zum Vorgänger)
Gesamt im hörbaren Bereich 100 - 16.000 Hz
(+) | hörbarer Bereich ist sehr linear (4.6% Abstand zum Median
Im Vergleich zu allen Geräten derselben Klasse
» 0% aller getesteten Geräte dieser Klasse waren besser, 0% vergleichbar, 100% schlechter
» Das beste Gerät hat einen Delta-Wert von 5%, durchschnittlich ist 17%, das schlechteste Gerät hat 45%
Im Vergleich zu allen Geräten im Test
» 0% aller getesteten Geräte waren besser, 0% vergleichbar, 100% schlechter
» Das beste Gerät hat einen Delta-Wert von 4%, durchschnittlich ist 23%, das schlechteste Gerät hat 134%
Energieverwaltung
Stromverbrauch
Der Gesamtverbrauch liegt ziemlich nah an dem des Dell Latitude 7450 2-in-1 mit dem Core Ultra 7 165U, obwohl unser Dell 14 Plus eine deutlich schnellere KI-Beschleunigung, RAM-Leistung und iGPU-Leistung bietet, was zu einer höheren Leistung pro Watt führt.

| Aus / Standby | |
| Idle | |
| Last |
|
Legende:
min: | |
| Dell 14 Plus Core Ultra 7 256V, Arc 140V, , IPS, 2560x1600, 14" | Dell Inspiron 14 5425 6VPKR R5 5625U, Vega 7, SK Hynix BC711 512GB HFM512GD3GX013N, IPS, 1920x1200, 14" | Dell Latitude 3440 i5-1345U, Iris Xe G7 80EUs, Samsung PM9A1 MZVL2512HCJQ, IPS, 1920x1080, 14" | Lenovo IdeaPad Pro 5 14AKP G10 Ryzen AI 7 350, Radeon 860M, SK hynix PVC10 HFS001TEM4X182N, OLED, 2880x1800, 14" | Lenovo ThinkPad E14 G6 Ultra 7 155U, Graphics 4-Core iGPU (Arrow Lake), Samsung PM9C1a MZAL8512HDLU, IPS, 1920x1200, 14" | HP Pavilion Plus 14-ew0153TU i7-1355U, Iris Xe G7 96EUs, SK hynix PC801 HFS001TEJ9X101N, OLED, 2880x1800, 14" | |
|---|---|---|---|---|---|---|
| Stromverbrauch | -4% | -12% | -66% | -36% | -34% | |
| Idle min * (Watt) | 3.6 | 4 -11% | 3.7 -3% | 5.1 -42% | 5.4 -50% | 6.7 -86% |
| Idle avg * (Watt) | 6.7 | 6.6 1% | 6.5 3% | 6.8 -1% | 9.7 -45% | 7.16 -7% |
| Idle max * (Watt) | 6.9 | 9.4 -36% | 9.5 -38% | 6.9 -0% | 10.4 -51% | 11.17 -62% |
| Last avg * (Watt) | 41.2 | 37 10% | 46.9 -14% | 71.7 -74% | 49.2 -19% | 46.5 -13% |
| Cyberpunk 2077 ultra external monitor * (Watt) | 34.2 | 83.5 -144% | 47.1 -38% | |||
| Cyberpunk 2077 ultra * (Watt) | 36.6 | 84.8 -132% | 50.1 -37% | |||
| Last max * (Watt) | 62.6 | 53.7 14% | 67 -7% | 104.8 -67% | 68.9 -10% | 64.36 -3% |
| Witcher 3 ultra * (Watt) | 37.1 | 42.1 | 37.2 |
* ... kleinere Werte sind besser
Energieverbrauch Cyberpunk / Stresstest
Energieverbrauch externer Monitor
Akkulaufzeit
Die WLAN-Laufzeit ist mit über 14 Stunden aus dem großen 64-Wh-Akku sehr lang.
| Dell 14 Plus Core Ultra 7 256V, Arc 140V, 64 Wh | Dell Inspiron 14 5425 6VPKR R5 5625U, Vega 7, 54 Wh | Dell Latitude 3440 i5-1345U, Iris Xe G7 80EUs, 54 Wh | Lenovo IdeaPad Pro 5 14AKP G10 Ryzen AI 7 350, Radeon 860M, 84 Wh | Lenovo ThinkPad E14 G6 Ultra 7 155U, Graphics 4-Core iGPU (Arrow Lake), 47 Wh | HP Pavilion Plus 14-ew0153TU i7-1355U, Iris Xe G7 96EUs, 68 Wh | |
|---|---|---|---|---|---|---|
| Akkulaufzeit | -10% | -38% | -3% | -34% | -33% | |
| WLAN (h) | 14.3 | 12.8 -10% | 8.8 -38% | 13.9 -3% | 9.4 -34% | 9.6 -33% |
| H.264 (h) | 19.6 | 12 | ||||
| Last (h) | 0.9 | 1.5 | ||||
| Idle (h) | 22.8 |
Notebookcheck Bewertung
Dell 14 Plus
- 01.06.2025 v8
Allen Ngo
 Total Sustainability Score:
 Potential Competitors in Comparison
Bild | Modell / Test | Preis ab | Gewicht | Dicke | Display |
|---|---|---|---|---|---|
1. 83.4%  | Dell 14 Plus Intel Core Ultra 7 256V ⎘ Intel Arc Graphics 140V ⎘ 16 GB RAM | Amazon: Geizhals Suche | 1.5 kg | 16.95 mm | 14.00" 2560x1600 216 PPI IPS |
2. 84.6% v7 (old)  | Dell Inspiron 14 5425 6VPKR AMD Ryzen 5 5625U ⎘ AMD Radeon RX Vega 7 ⎘ 16 GB RAM, 512 GB SSD | Amazon: 1. 18,99 € 65W Laptop Netzteil für Del... 2. 13,59 € 65W Laptop Ladekabel für De... 3. 54,99 € T-ProTek Lüfter Kühler Fan... Listenpreis: 849 Euro | 1.6 kg | 18.37 mm | 14.00" 1920x1200 162 PPI IPS |
3. 85.3% v7 (old)  | Dell Latitude 3440 Intel Core i5-1345U ⎘ Intel Iris Xe Graphics G7 80EUs ⎘ 16 GB RAM, 512 GB SSD | Amazon: 1. 319,83 € Dell 34 Plus USB-C Monitor -... 2. 333,00 € Dell Latitude 3420, Intel i5... 3. 19,99 € 65W 19,5V Netzteile Ladekabe... Listenpreis: 1100 USD | 1.5 kg | 19.4 mm | 14.00" 1920x1080 157 PPI IPS |
4. 87.4% 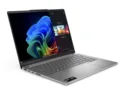 | Lenovo IdeaPad Pro 5 14AKP G10 AMD Ryzen AI 7 350 ⎘ AMD Radeon 860M ⎘ 32 GB RAM, 1024 GB SSD | Amazon: 1.384,44 € Geizhals Suche | 1.4 kg | 15.5 mm | 14.00" 2880x1800 243 PPI OLED |
5. 84.8%  | Lenovo ThinkPad E14 G6 Intel Core Ultra 7 155U ⎘ Intel Graphics 4-Core iGPU (Meteor / Arrow Lake) ⎘ 16 GB RAM, 512 GB SSD | Amazon: 1.157,99 € Geizhals Suche | 1.5 kg | 17.99 mm | 14.00" 1920x1200 162 PPI IPS |
6. 87.5% v7 (old)  | HP Pavilion Plus 14-ew0153TU Intel Core i7-1355U ⎘ Intel Iris Xe Graphics G7 96EUs ⎘ 16 GB RAM, 1024 GB SSD | Amazon: 1. 771,88 € HP Notebook Pavilion Plus 14... 2. 635,81 € HP Pavilon Plus 14-ew0000sf ... 3. 881,89 € HP Pavilion Plus Laptop | In... Listenpreis: 1020 USD | 1.4 kg | 17.5 mm | 14.00" 2880x1800 243 PPI OLED |
Transparenz
Die Auswahl der zu testenden Geräte erfolgt innerhalb der Redaktion. Das vorliegende Testmuster wurde dem Autor vom Hersteller oder einem Shop zu Testzwecken leihweise zur Verfügung gestellt. Eine Einflussnahme des Leihstellers auf den Testbericht gab es nicht, der Hersteller erhielt keine Version des Reviews vor der Veröffentlichung. Es bestand keine Verpflichtung zur Publikation. Als eigenständiges, unabhängiges Unternehmen unterliegt Notebookcheck keiner Diktion von Herstellern, Shops und Verlagen.
So testet Notebookcheck
Pro Jahr werden von Notebookcheck hunderte Laptops und Smartphones unabhängig in von uns standardisierten technischen Verfahren getestet, um eine Vergleichbarkeit aller Testergebnisse zu gewährleisten. Seit rund 20 Jahren entwickeln wir diese Testmethoden kontinuierlich weiter und setzen damit Branchenstandards. In unseren Testlaboren kommt ausschließlich hochwertiges Messequipment in die Hände erfahrener Techniker und Redakteure. Die Tests unterliegen einer mehrstufigen Kontrolle. Unsere komplexe Gesamtbewertung basiert auf hunderten fundierten Messergebnissen und Benchmarks, womit Ihnen Objektivität garantiert ist. Weitere Informationen zu unseren Testmethoden gibt es hier.

