Fazit - Relativ geringfügige Auffrischung
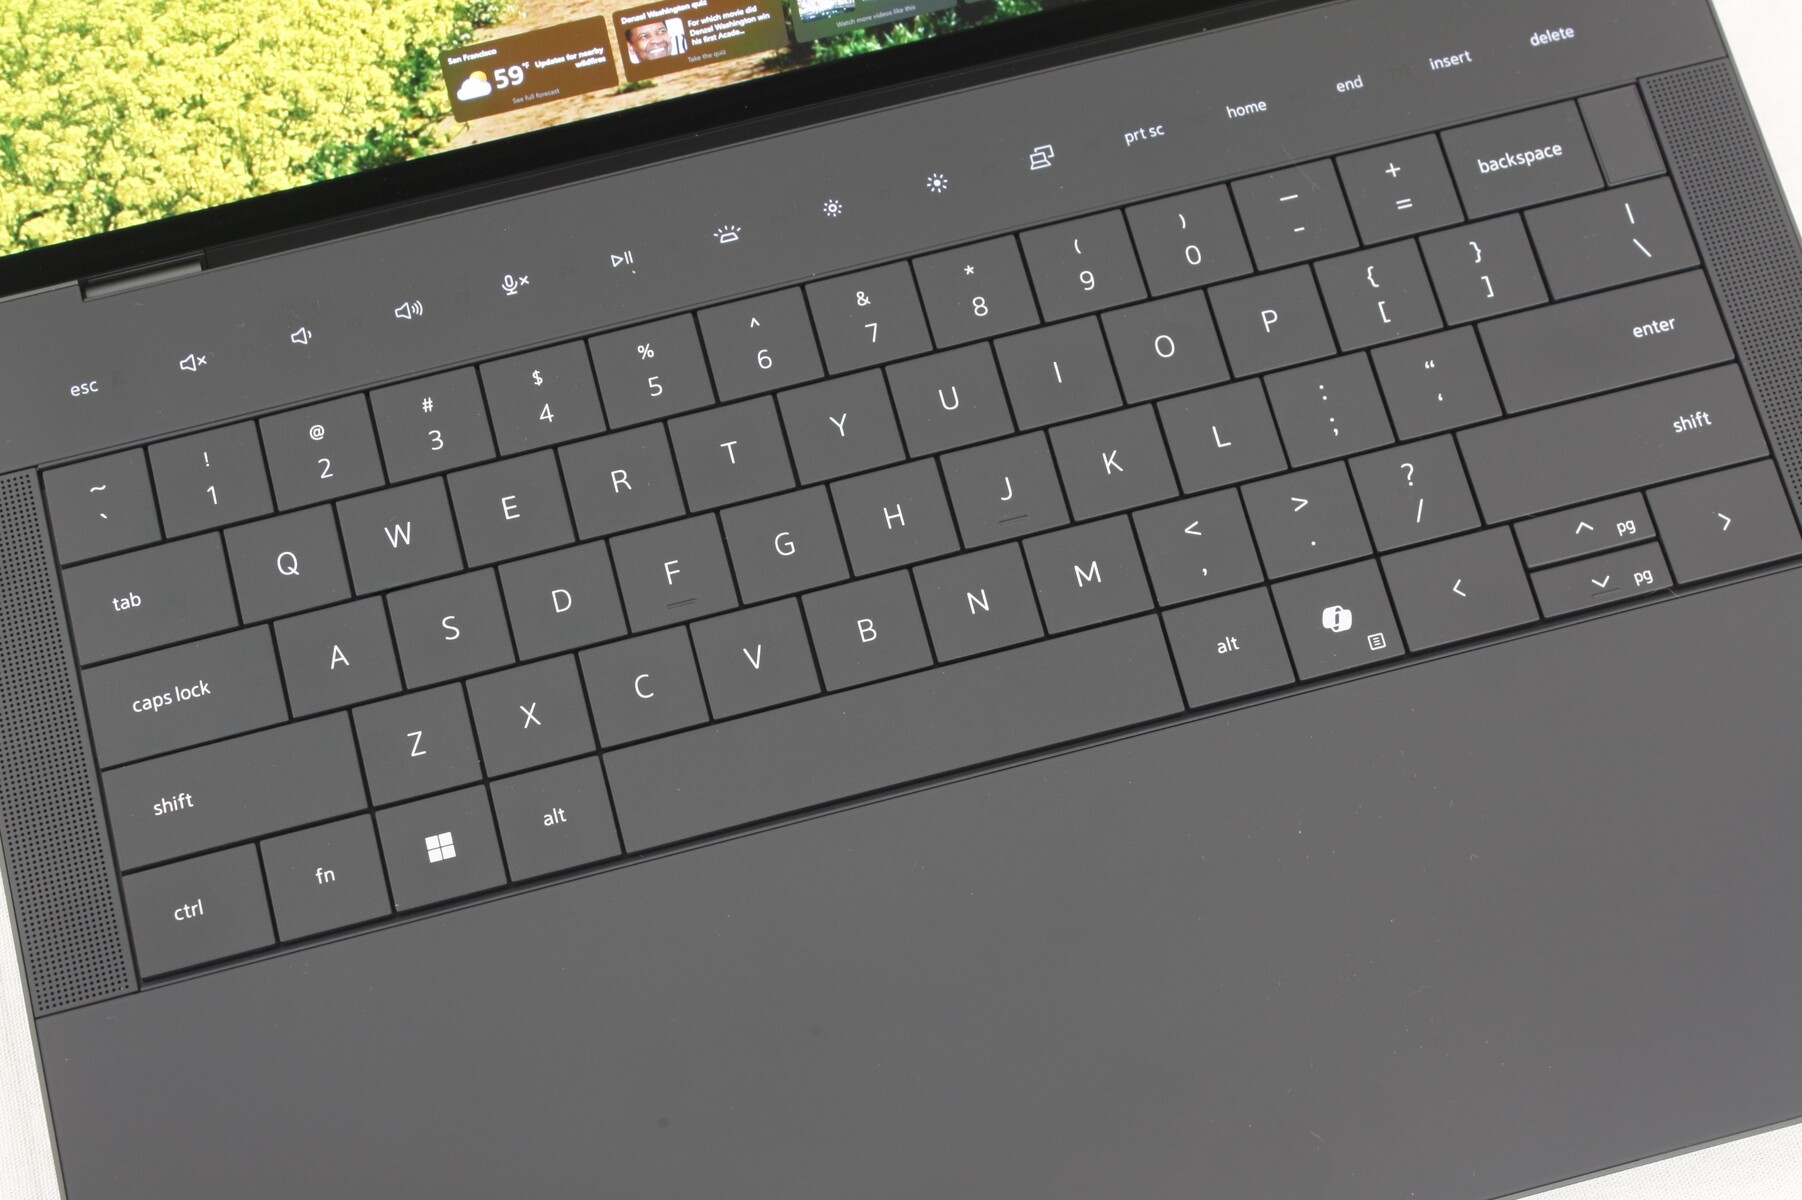
Das Dell 14 Premium ist ein relativ kleines Update des letztjährigen XPS 14. Abgesehen davon, dass der Core Ultra 7 155H durch den Core Ultra 7 255H ersetzt wurde, bleibt das Benutzererlebnis weitgehend gleich, da es keine äußeren Unterschiede zwischen den beiden Modellen gibt, nicht einmal bei den Samsung-OLED-Touchscreens. Die umstrittene Tastatur bleibt erhalten, ebenso wie die optionale GeForce-RTX-4050-Grafik.
Unter der Haube ist es erwähnenswert, dass der Core Ultra 7 255H in der Lage ist, die schnelleren Turbo-Boost-Taktraten länger aufrechtzuerhalten als die Meteor-Lake-H-CPU im XPS 14. Die Grafikleistung des Arc 140T ist nur geringfügig schneller als die des Arc 8, so dass Power User vielleicht trotzdem die RTX-4050-Konfiguration in Betracht ziehen sollten. Ansonsten ist das XPS 14 vom letzten Jahr für grundlegende Multimedia- und Multitasking-Szenarien im Wesentlichen identisch und kostet dabei weniger.
Der Preis von 2.000 US-Dollar für unsere Testkonfiguration verdient eine nähere Betrachtung, da Alternativen wie das Asus Zephyrus G14 oder Razer Blade 14 genau das Gleiche oder weniger kosten, aber eine viel schnellere Grafikleistung bieten und über ähnliche 14-Zoll-Formfaktoren verfügen. Gelegenheitsspieler oder Leistungsjäger finden in dieser Hinsicht vielleicht mehr Wert bei bestimmten Alternativen.
Pro
Contra
Preis und Verfügbarkeit
Dell liefert das Dell 14 Premium ab sofort zu Preisen ab 2.249 Euro für die Basiskonfiguration oder 2.349 Euro für die getestete Konfiguration aus.
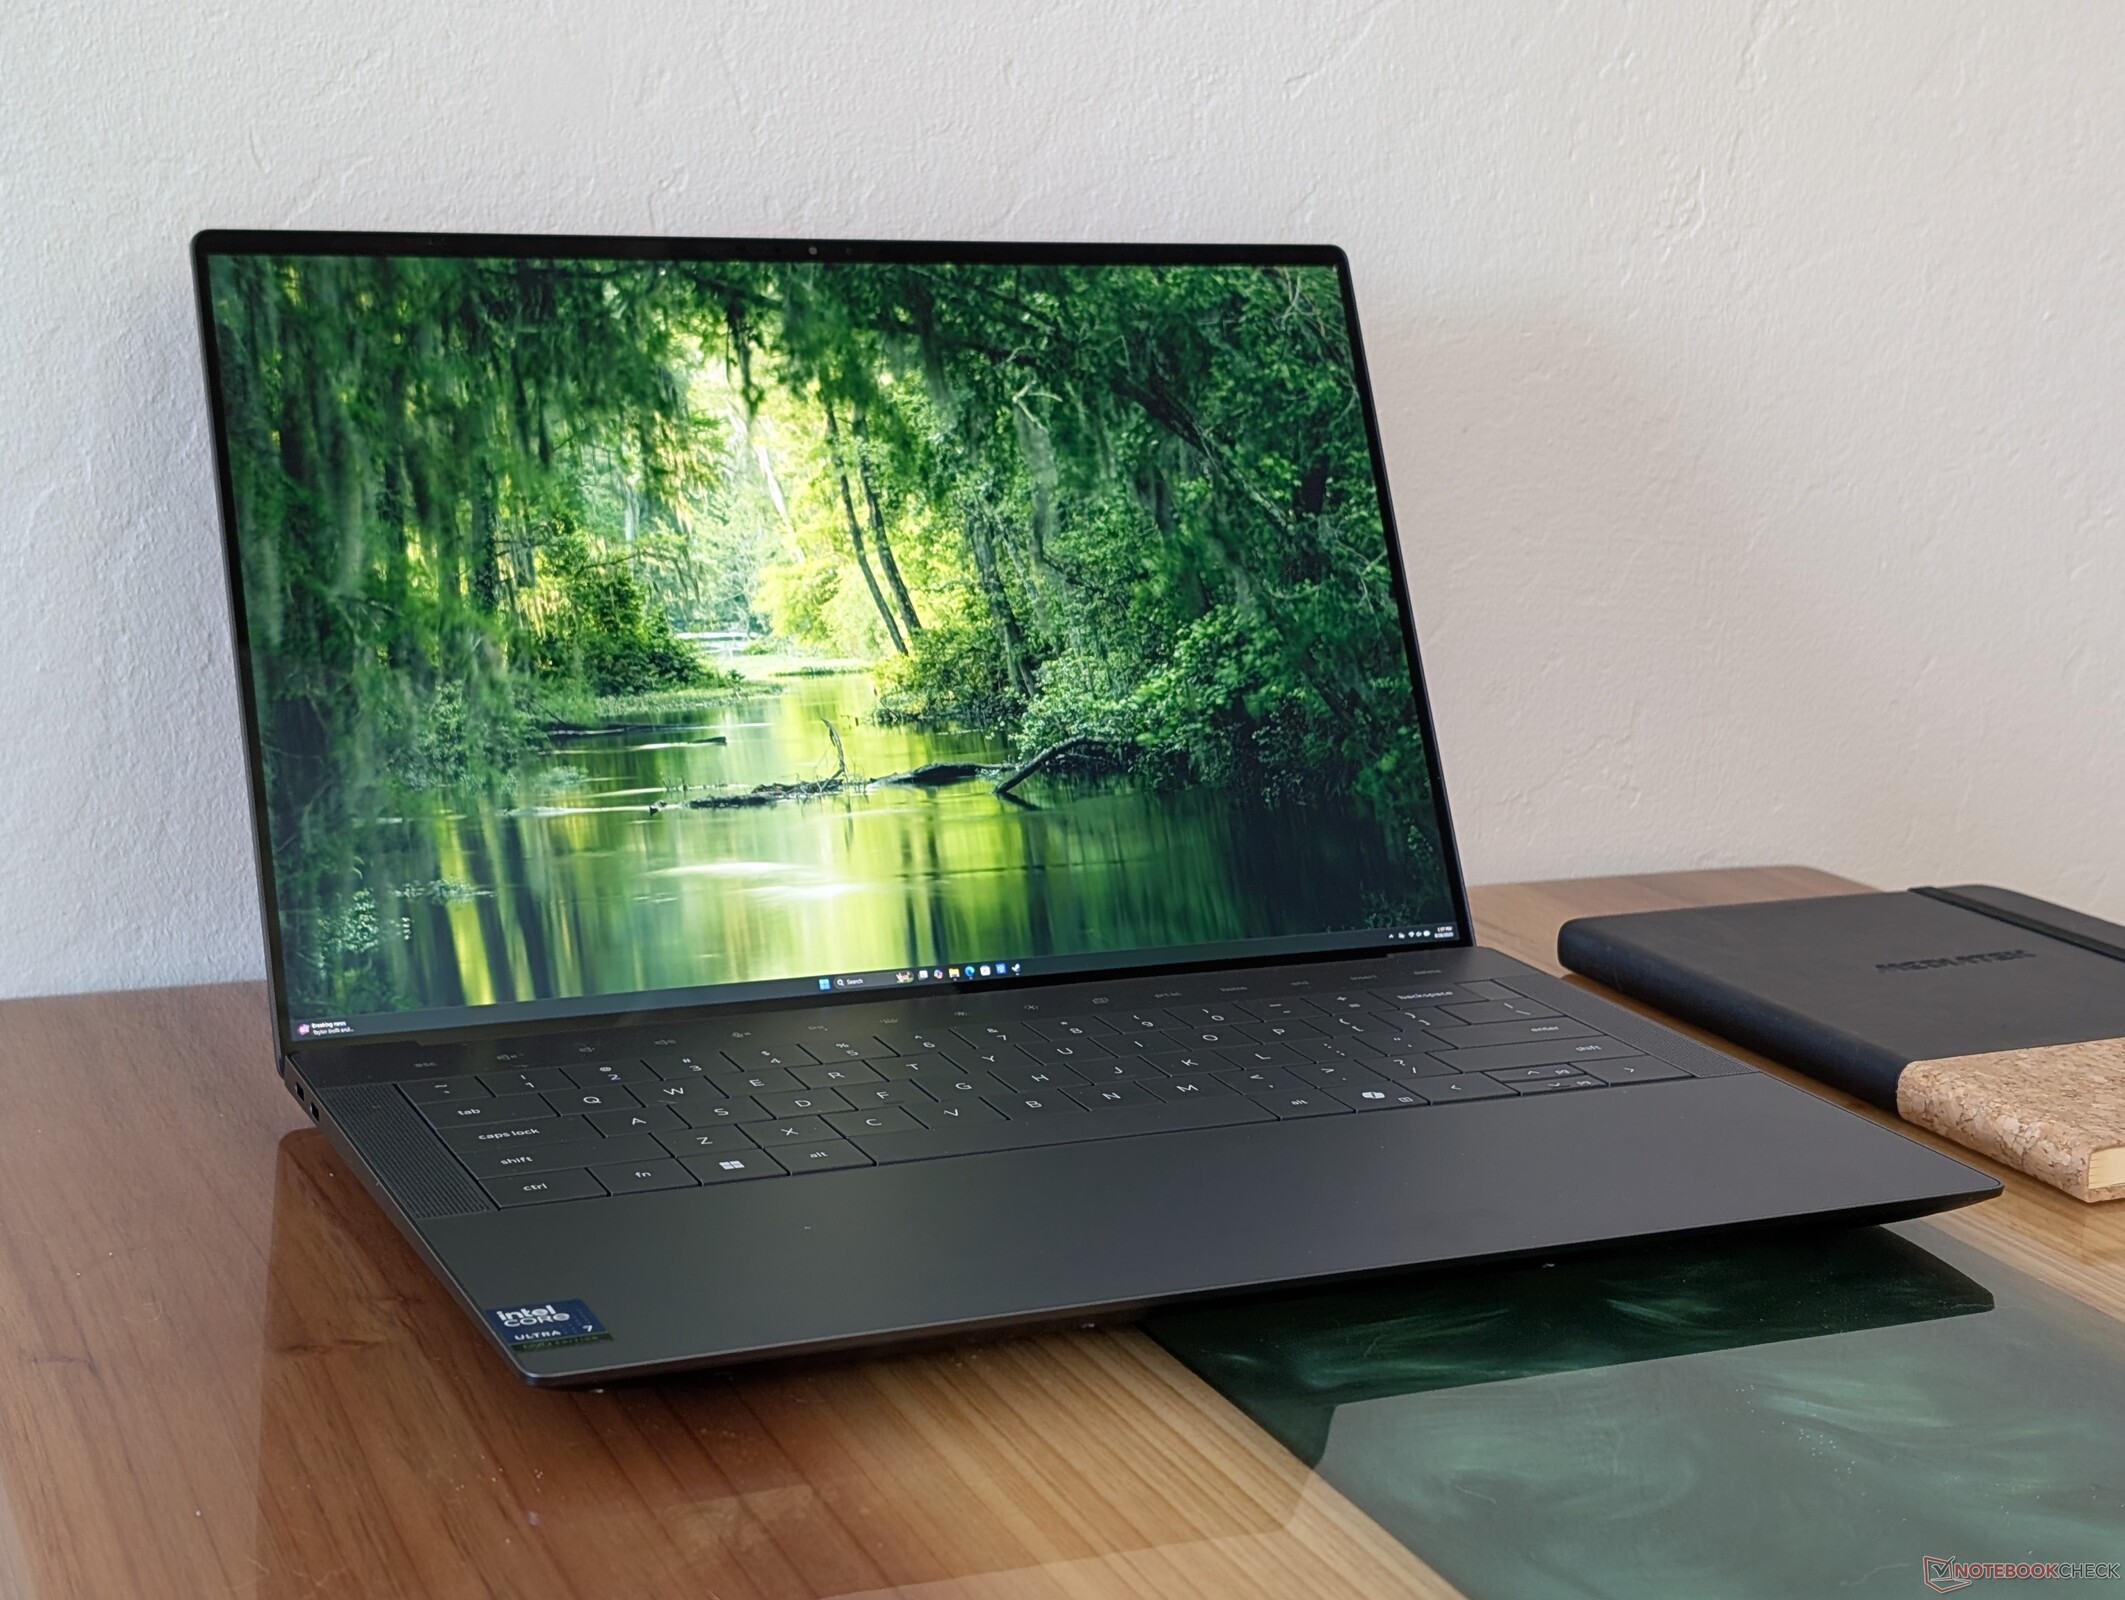
Das Dell 14 Premium ist der direkte Nachfolger des XPS 14 aus dem letzten Jahr. Die Namensänderung ist Teil des größeren Plans von Dell, Eigennamen wie "XPS", "Latitude" und "Precision" aus dem Sortiment zu streichen und durch aussagekräftigere Begriffe wie "Premium", "Plus" oder "Pro" zu ersetzen. Ansonsten gibt es keine nennenswerten Änderungen am Gehäuse und wir empfehlen daher, einen Blick auf unseren Test zum XPS 14 zu werfen, um mehr über die physischen Eigenschaften des Dell 14 Premium zu erfahren.
Unser Testgerät ist eine mittlere Konfiguration mit 32 GB RAM und einem 3,2K-120-Hz-OLED-Touchscreen für knapp 2.000 US-Dollar. Geringere SKUs sind mit der Hälfte des RAMs und des Speichers und einem 2K-IPS-Display erhältlich, während die höherwertigen SKUs mit einer diskreten GeForce-RTX-4050-GPU mit 30 W ausgestattet sind. Der Core-Ultra-7-255H-Prozessor bleibt konstant.
Mehr Dell Bewertungen:
Spezifikationen
Gehäuse
Die Gehäusefunktionen und das Skelett sind identisch mit dem XPS 14, einschließlich des dreifachen Thunderbolt-4-Ports.

Anschlussausstattung

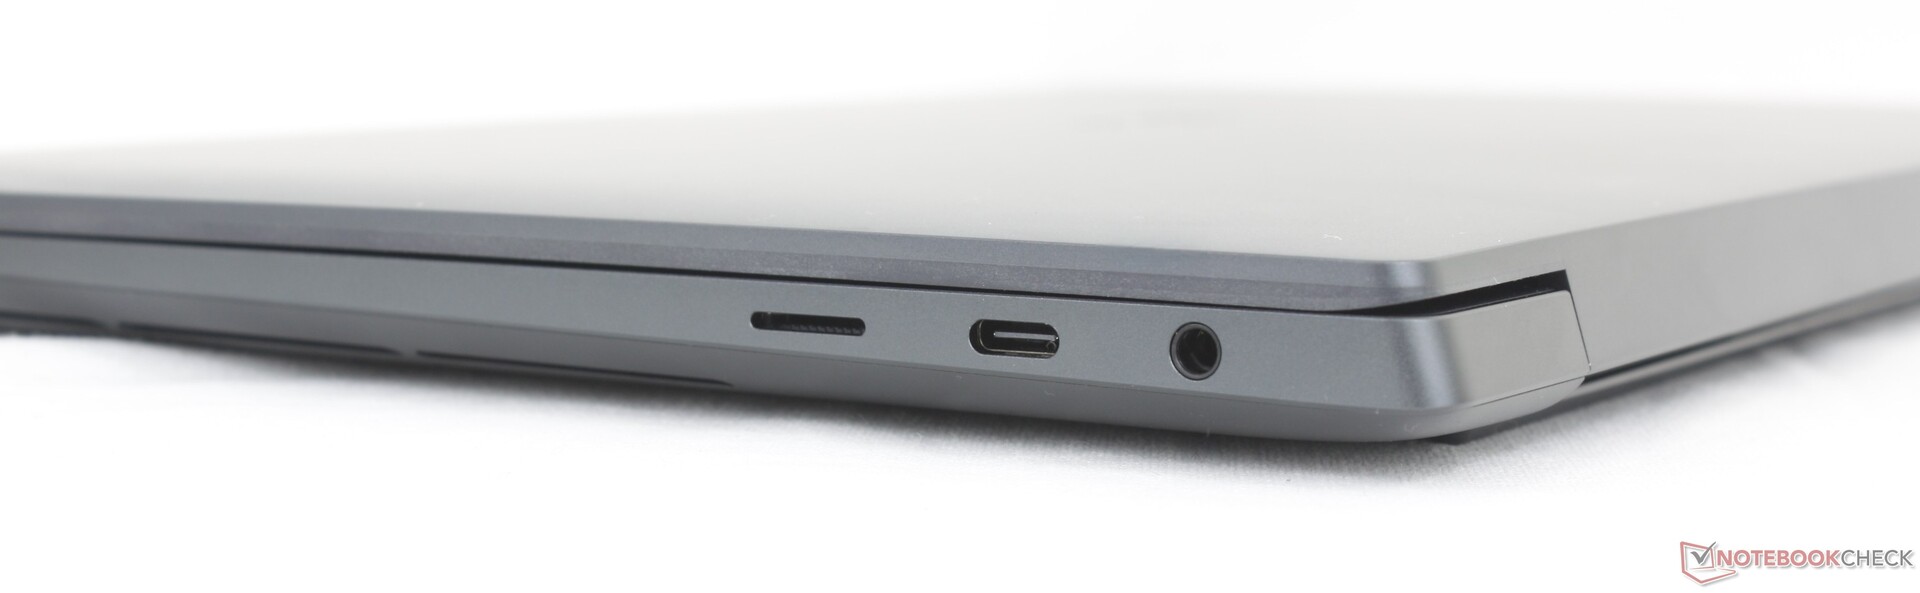
SD-Kartenleser
| SD Card Reader | |
| average JPG Copy Test (av. of 3 runs) | |
| Dell XPS 14 2024 OLED (Angelbird AV Pro V60) | |
| maximum AS SSD Seq Read Test (1GB) | |
| Dell XPS 14 2024 OLED (Angelbird AV Pro V60) | |
Kommunikation
| Networking | |
| iperf3 transmit AXE11000 | |
| Asus Zenbook S 14 UX5406 | |
| Dell XPS 14 2024 OLED | |
| Asus ZenBook Duo OLED UX8406CA | |
| HP OmniBook Ultra 14 | |
| Lenovo ThinkPad X9-14 Gen 1 Aura Edition | |
| Dell 14 Premium | |
| iperf3 receive AXE11000 | |
| Asus Zenbook S 14 UX5406 | |
| Dell XPS 14 2024 OLED | |
| Asus ZenBook Duo OLED UX8406CA | |
| Lenovo ThinkPad X9-14 Gen 1 Aura Edition | |
| HP OmniBook Ultra 14 | |
| Dell 14 Premium | |
| iperf3 transmit AXE11000 6GHz | |
| HP OmniBook Ultra 14 | |
| Dell 14 Premium | |
| Lenovo ThinkPad X9-14 Gen 1 Aura Edition | |
| iperf3 receive AXE11000 6GHz | |
| HP OmniBook Ultra 14 | |
| Lenovo ThinkPad X9-14 Gen 1 Aura Edition | |
| Dell 14 Premium | |
Webcam
Während die IR-Funktion standardmäßig verfügbar ist, gibt es keinen eingebauten Verschluss.


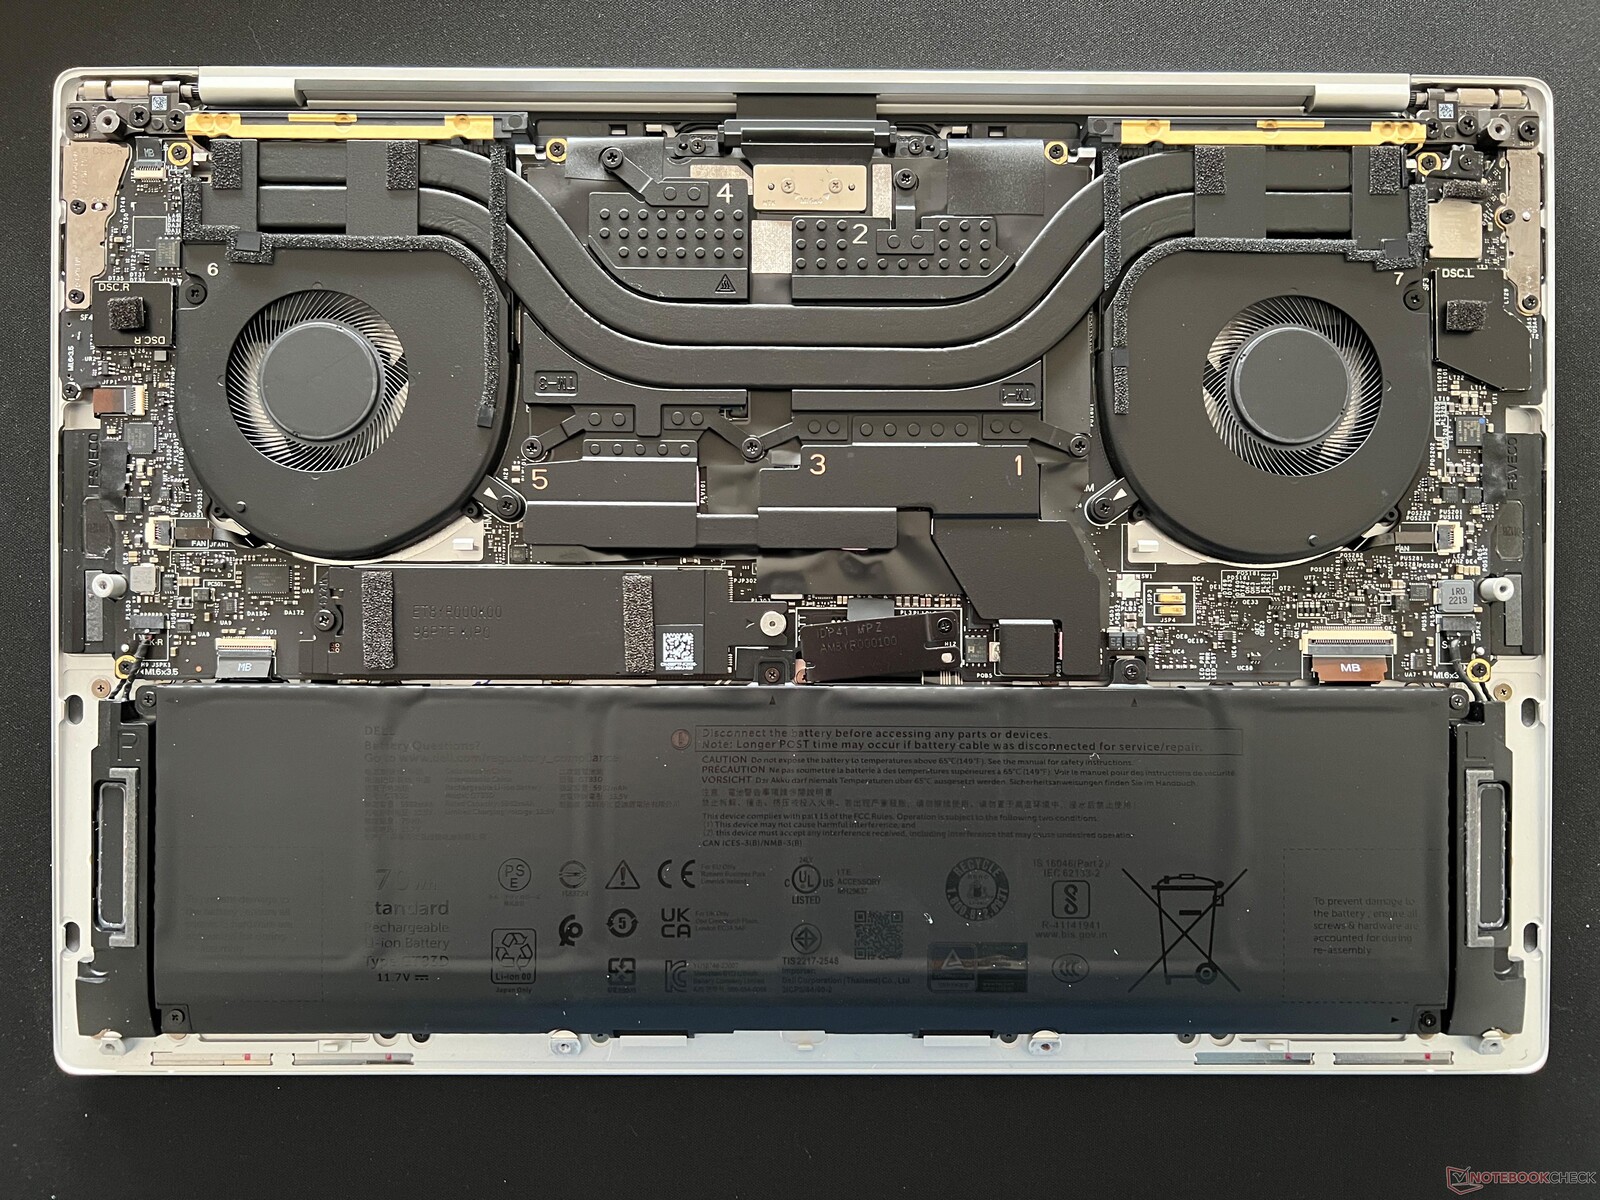
Wartung

Nachhaltigkeit
Das System besteht zu 75 Prozent aus recyceltem Aluminium für die obere Abdeckung, zu 25 Prozent aus Aluminium mit niedrigen Emissionen für die Handballenauflagen, zu 21 Prozent aus recyceltem Glas für das Display und zu 30 Prozent aus recyceltem Kunststoff insgesamt. Die Verpackung ist vollständig recycelbar.
Eingabegeräte
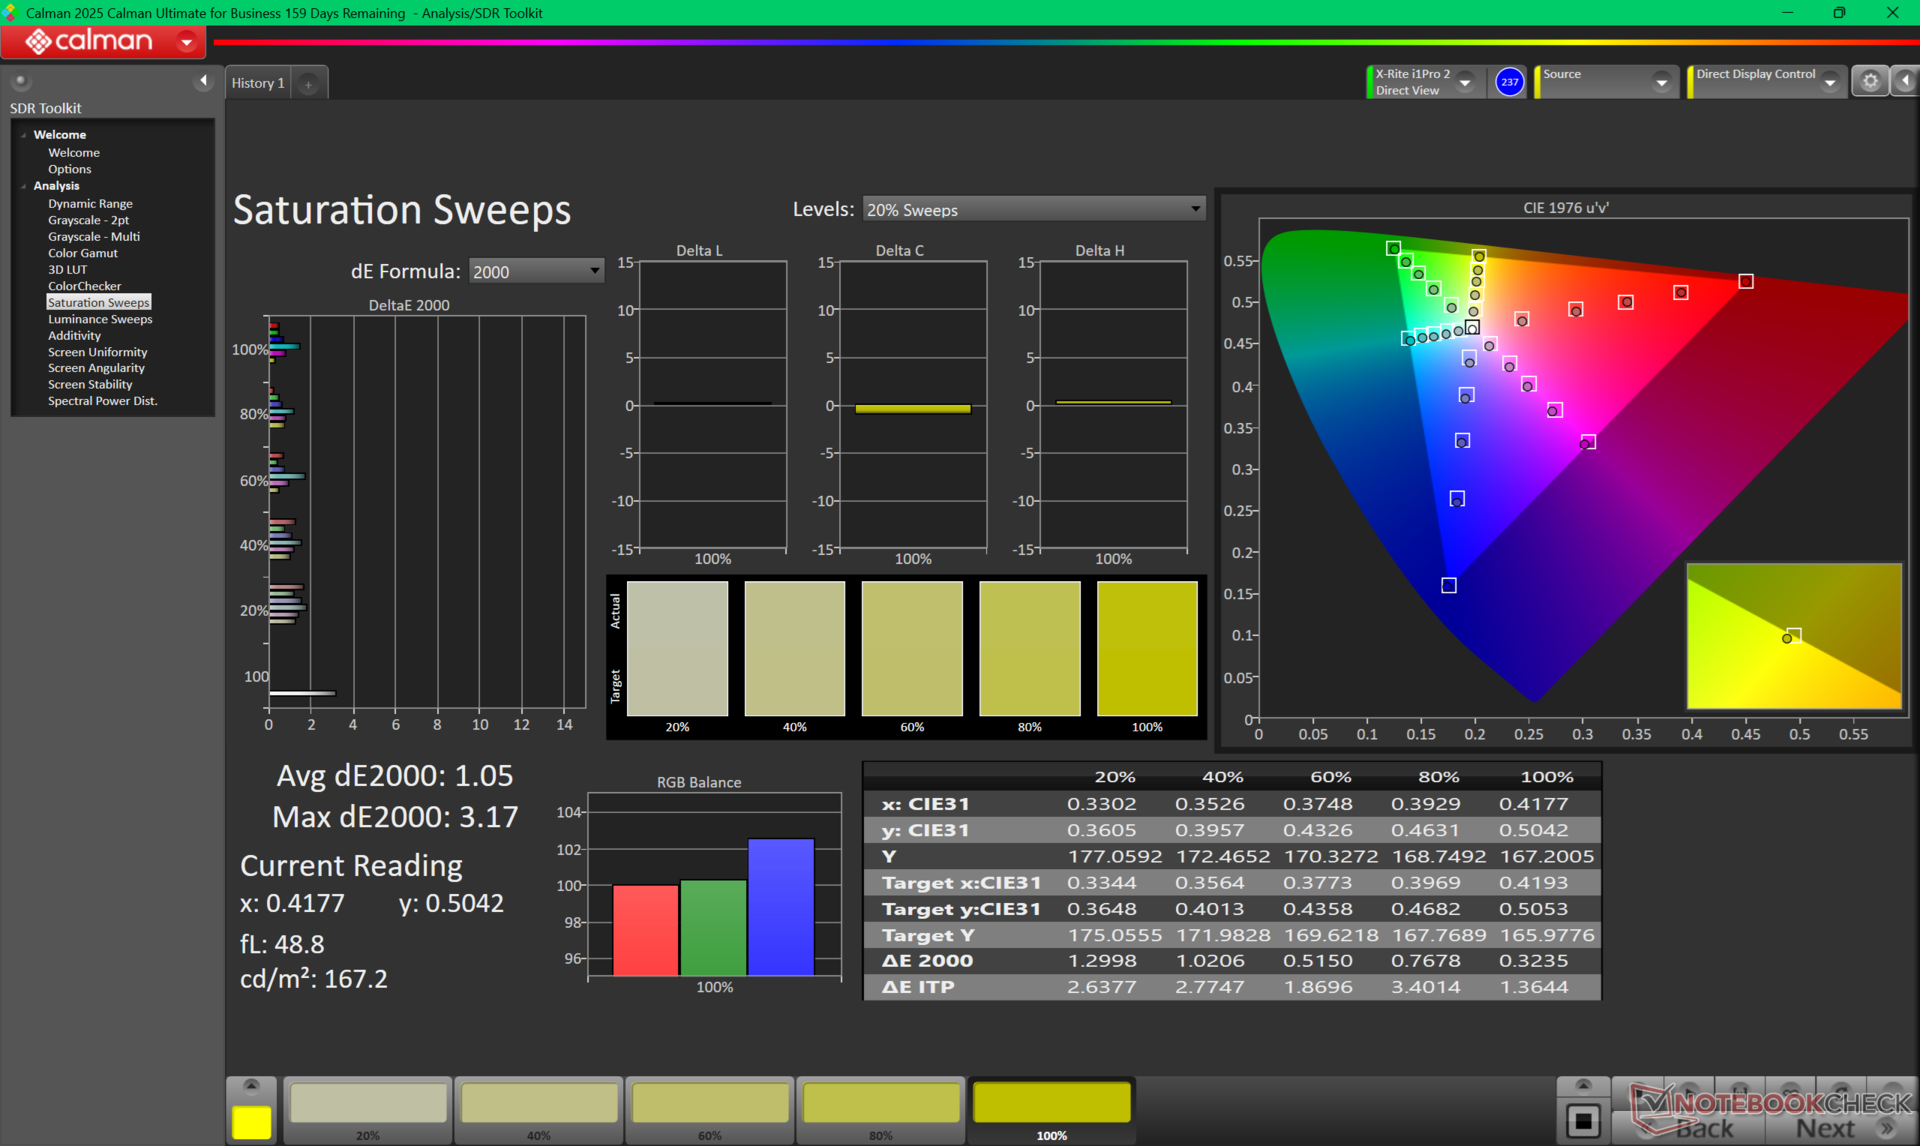
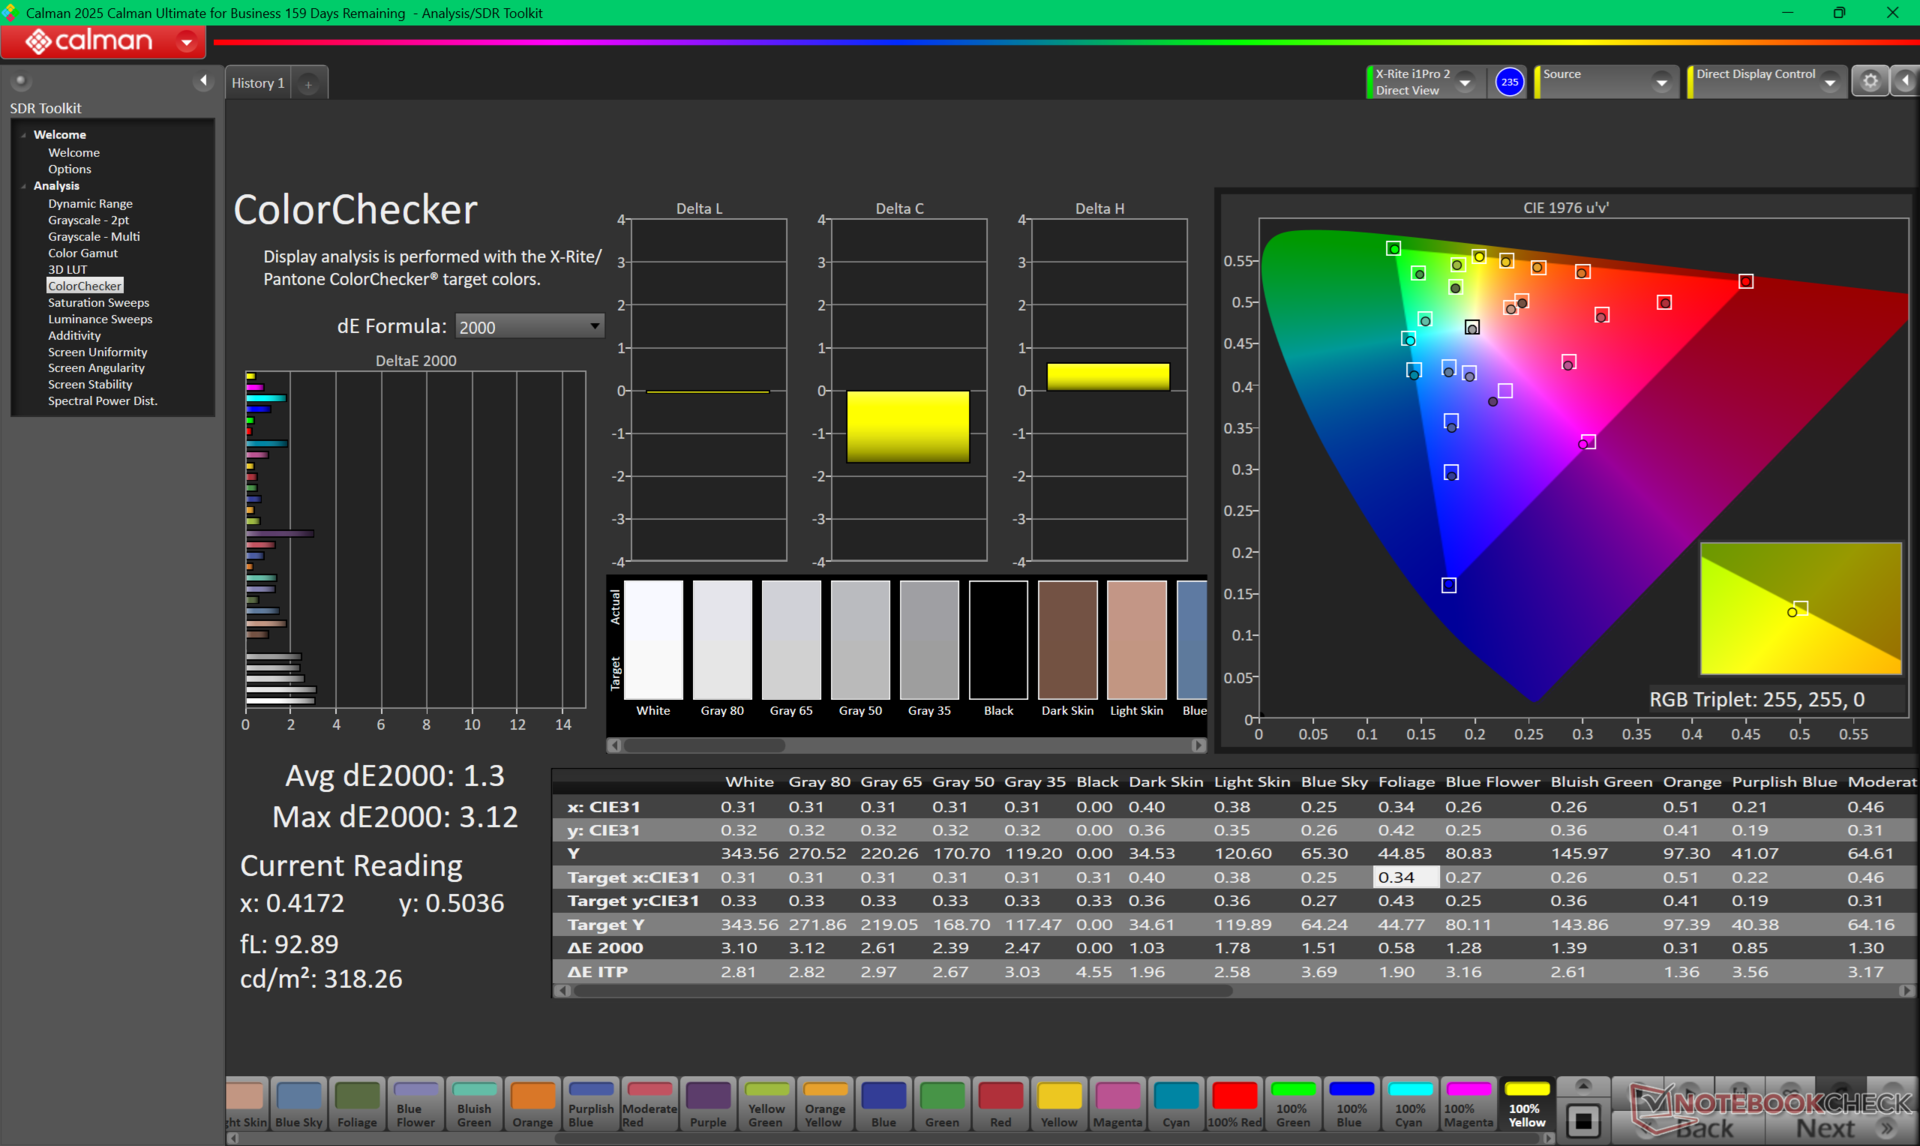
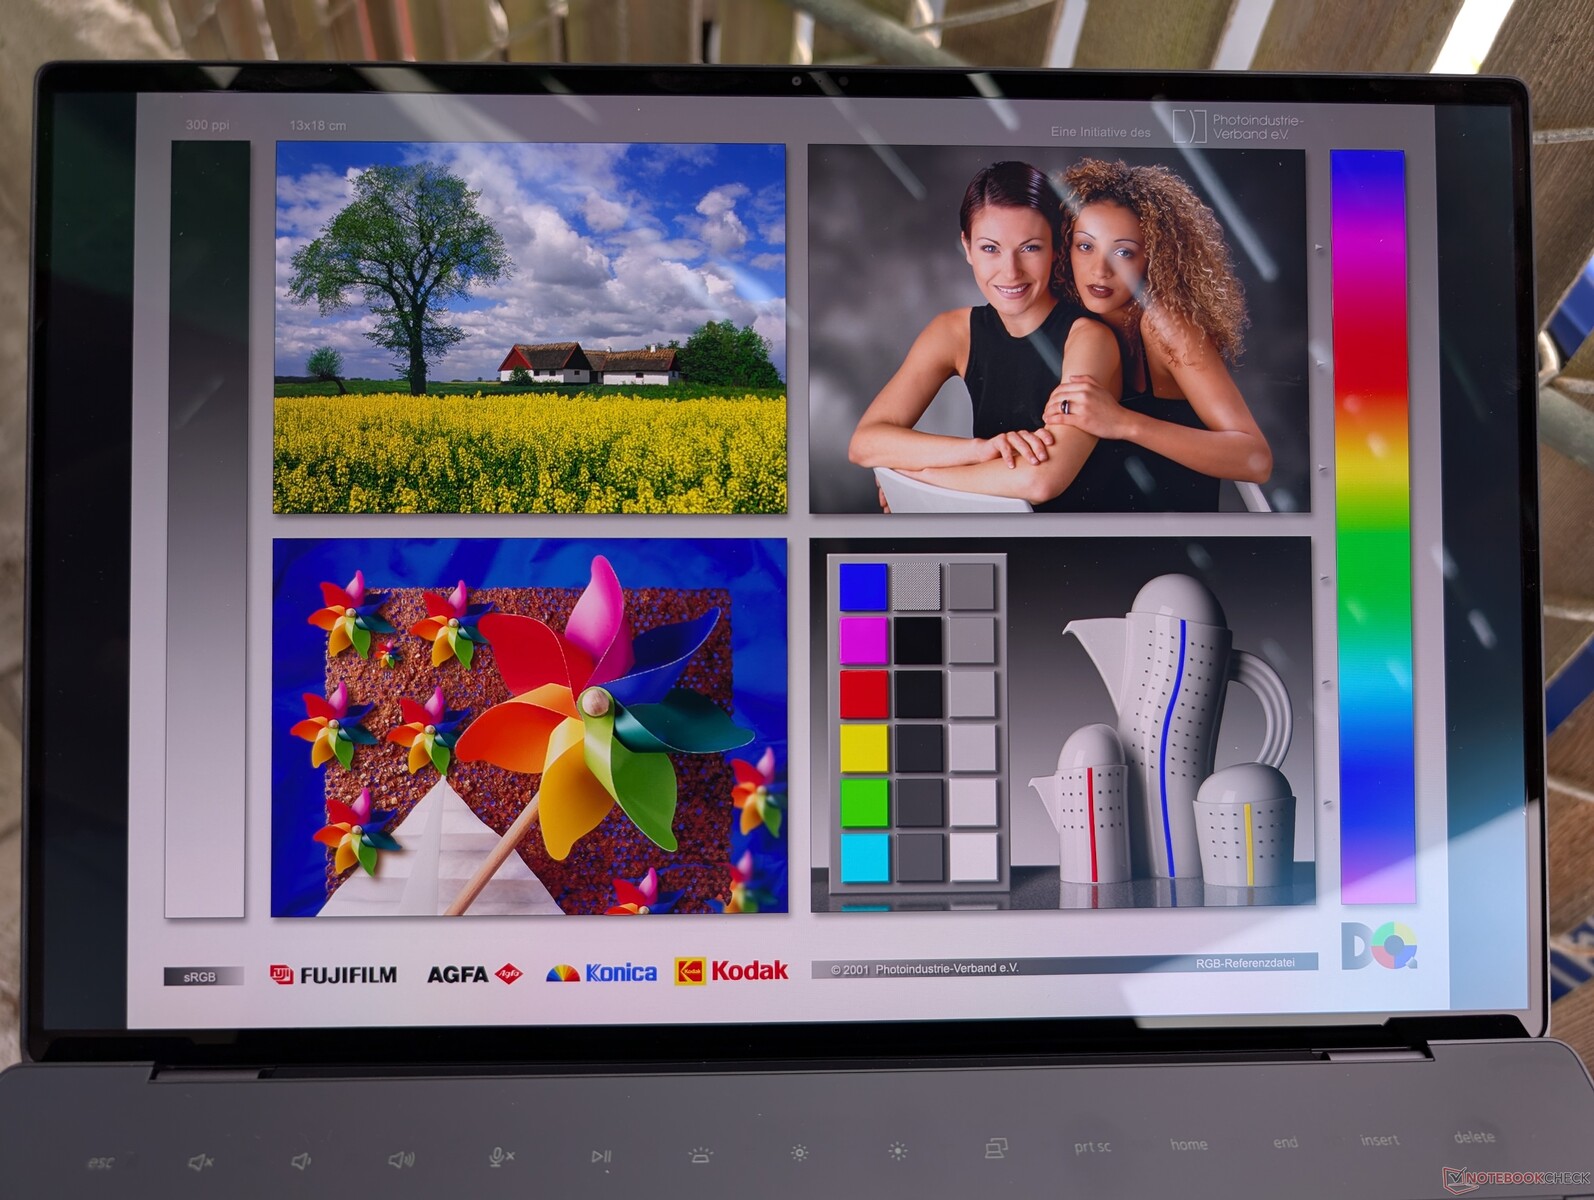
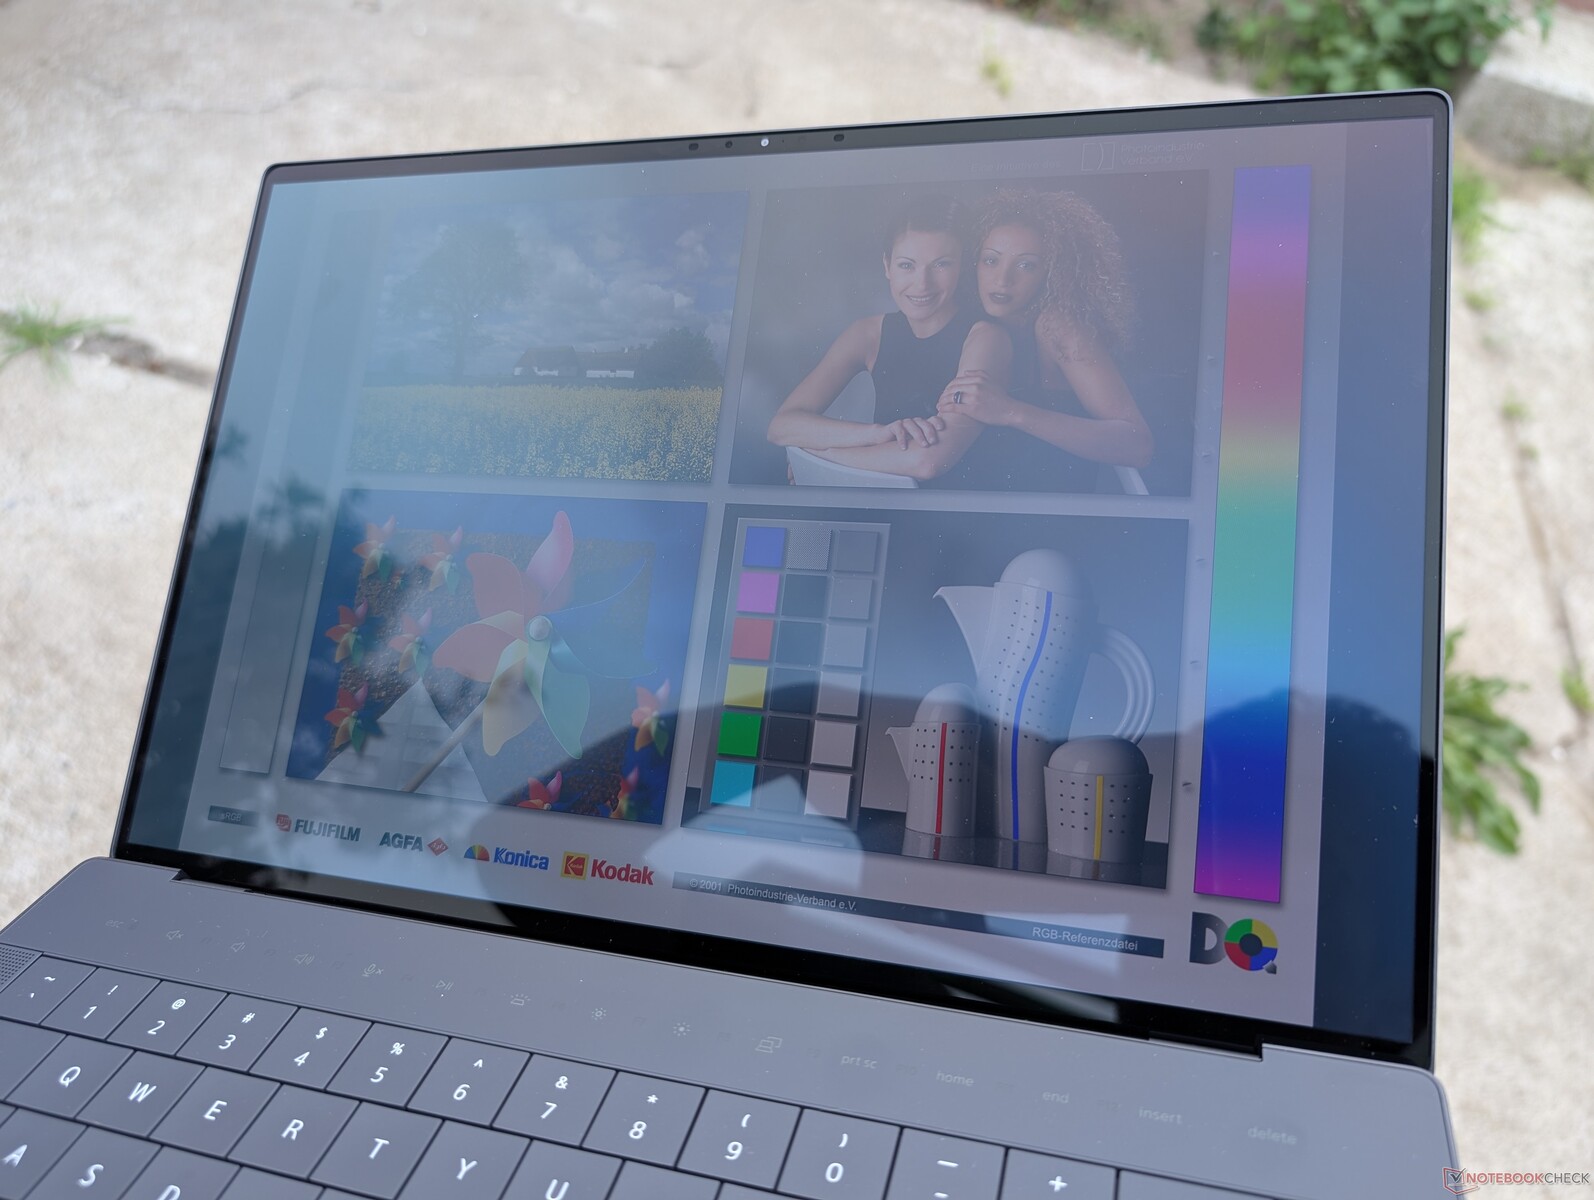
Display

Der 3,2K-Samsung-OLED-Touchscreen des XPS 14 wurde unversehrt in das Dell 14 Premium übernommen.
Die maximale Helligkeit liegt bei etwa 350 Nits im SDR-Modus oder 595 Nits bei aktiviertem HDR.
| |||||||||||||||||||||||||
Ausleuchtung: 98 %
Helligkeit Akku: 349.3 cd/m²
Kontrast: ∞:1 (Schwarzwert: 0 cd/m²)
ΔE ColorChecker Calman: 3.47 | ∀{0.5-29.43 Ø4.73}
calibrated: 1.3
ΔE Greyscale Calman: 2.6 | ∀{0.09-98 Ø4.97}
87.2% AdobeRGB 1998 (Argyll 3D)
100% sRGB (Argyll 3D)
99.3% Display P3 (Argyll 3D)
Gamma: 2.22
CCT: 6758 K
| Dell 14 Premium Samsung 145FB02, OLED, 3200x2000, 14.5", 120 Hz | HP OmniBook Ultra 14 BOE0C9E, IPS, 2240x1400, 14", 60 Hz | Asus Zenbook S 14 UX5406 ATNA40CU09-0, OLED, 2880x1800, 14", 120 Hz | Lenovo ThinkPad X9-14 Gen 1 Aura Edition ATNA40CT04-0 , OLED, 1920x1200, 14", 60 Hz | Asus ZenBook Duo OLED UX8406CA ATNA40CT02-0, OLED, 1920x1200, 14", 60 Hz | Dell XPS 14 2024 OLED SDC41A2, OLED, 3200x2000, 14.5", 120 Hz | |
|---|---|---|---|---|---|---|
| Display | -18% | 1% | 4% | -1% | -0% | |
| Display P3 Coverage (%) | 99.3 | 67.1 -32% | 99 0% | 99.2 0% | 98.4 -1% | 98.5 -1% |
| sRGB Coverage (%) | 100 | 99 -1% | 100 0% | 99.9 0% | 99.8 0% | 100 0% |
| AdobeRGB 1998 Coverage (%) | 87.2 | 68.9 -21% | 89.2 2% | 97.8 12% | 86.7 -1% | 87.2 0% |
| Response Times | -3852% | 5% | -217% | -38% | 12% | |
| Response Time Grey 50% / Grey 80% * (ms) | 0.72 ? | 35.9 ? -4886% | 0.7 ? 3% | 3 ? -317% | 1.51 ? -110% | 0.7 ? 3% |
| Response Time Black / White * (ms) | 0.96 ? | 28 ? -2817% | 0.71 ? 26% | 4.2 ? -338% | 1.36 ? -42% | 0.77 ? 20% |
| PWM Frequency (Hz) | 475 | 480 ? | 480 | 480 ? | 480 | |
| PWM Amplitude * (%) | 23 | 26 -13% | 22 4% | 14 39% | ||
| Bildschirm | 16% | 36% | -41% | 25% | 20% | |
| Helligkeit Bildmitte (cd/m²) | 349.3 | 359.5 3% | 374 7% | 398 14% | 359 3% | 351 0% |
| Brightness (cd/m²) | 352 | 361 3% | 379 8% | 399 13% | 362 3% | 353 0% |
| Brightness Distribution (%) | 98 | 92 -6% | 98 0% | 98 0% | 98 0% | 97 -1% |
| Schwarzwert * (cd/m²) | 0.27 | |||||
| Delta E Colorchecker * | 3.47 | 1.64 53% | 1 71% | 4.8 -38% | 1.2 65% | 1.7 51% |
| Colorchecker dE 2000 max. * | 7.38 | 4.68 37% | 2.2 70% | 9.1 -23% | 3.2 57% | 2.2 70% |
| Colorchecker dE 2000 calibrated * | 1.3 | 0.97 25% | 5 -285% | 0.8 38% | ||
| Delta E Graustufen * | 2.6 | 2.6 -0% | 1.1 58% | 1.7 35% | 2.1 19% | 3.1 -19% |
| Gamma | 2.22 99% | 2.22 99% | 2.15 102% | 2.2 100% | 2.24 98% | 2.12 104% |
| CCT | 6758 96% | 6388 102% | 6549 99% | 6485 100% | 6433 101% | 6616 98% |
| Kontrast (:1) | 1331 | |||||
| Durchschnitt gesamt (Programm / Settings) | -1285% /
-637% | 14% /
19% | -85% /
-71% | -5% /
3% | 11% /
13% |
* ... kleinere Werte sind besser


Reaktionszeiten (Response Times) des Displays
| ↔ Reaktionszeiten Schwarz zu Weiß | ||
|---|---|---|
| 0.96 ms ... steigend ↗ und fallend ↘ kombiniert | ↗ 0.45 ms steigend |  |
| ↘ 0.51 ms fallend | ||
| Die gemessenen Reaktionszeiten sind sehr kurz, wodurch sich der Bildschirm auch für schnelle 3D Spiele eignen sollte. Im Vergleich rangierten die bei uns getesteten Geräte von 0.1 (Minimum) zu 240 (Maximum) ms. » 4 % aller Screens waren schneller als der getestete. Daher sind die gemessenen Reaktionszeiten besser als der Durchschnitt aller vermessenen Geräte (19.9 ms). | ||
| ↔ Reaktionszeiten 50% Grau zu 80% Grau | ||
| 0.72 ms ... steigend ↗ und fallend ↘ kombiniert | ↗ 0.37 ms steigend |  |
| ↘ 0.35 ms fallend | ||
| Die gemessenen Reaktionszeiten sind sehr kurz, wodurch sich der Bildschirm auch für schnelle 3D Spiele eignen sollte. Im Vergleich rangierten die bei uns getesteten Geräte von 0.165 (Minimum) zu 636 (Maximum) ms. » 2 % aller Screens waren schneller als der getestete. Daher sind die gemessenen Reaktionszeiten besser als der Durchschnitt aller vermessenen Geräte (31.1 ms). | ||
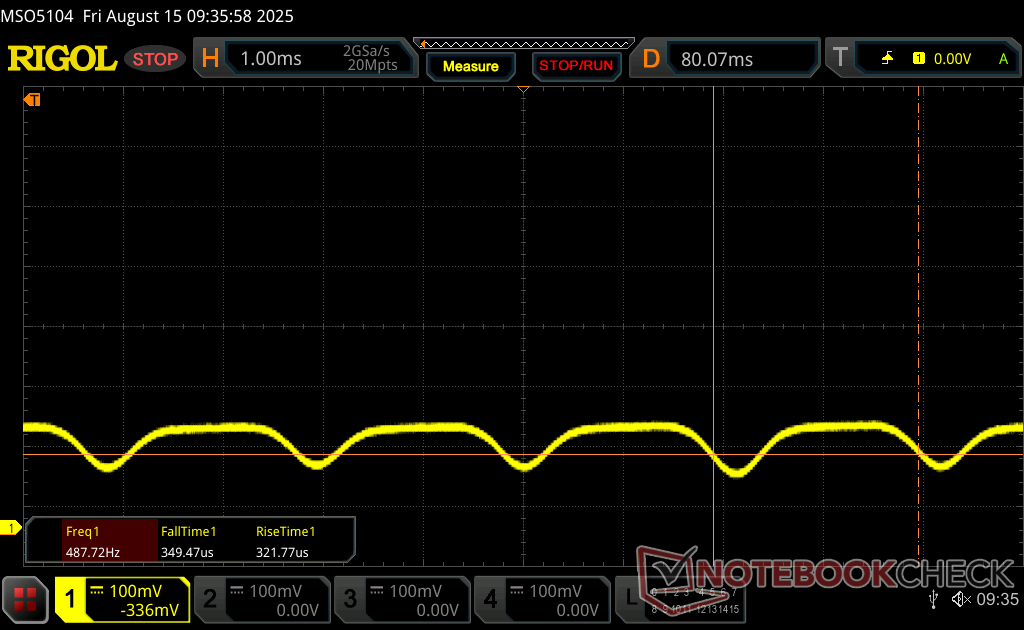
Bildschirm-Flackern / PWM (Pulse-Width Modulation)
| Flackern / PWM festgestellt | 475 Hz Amplitude: 23 % | 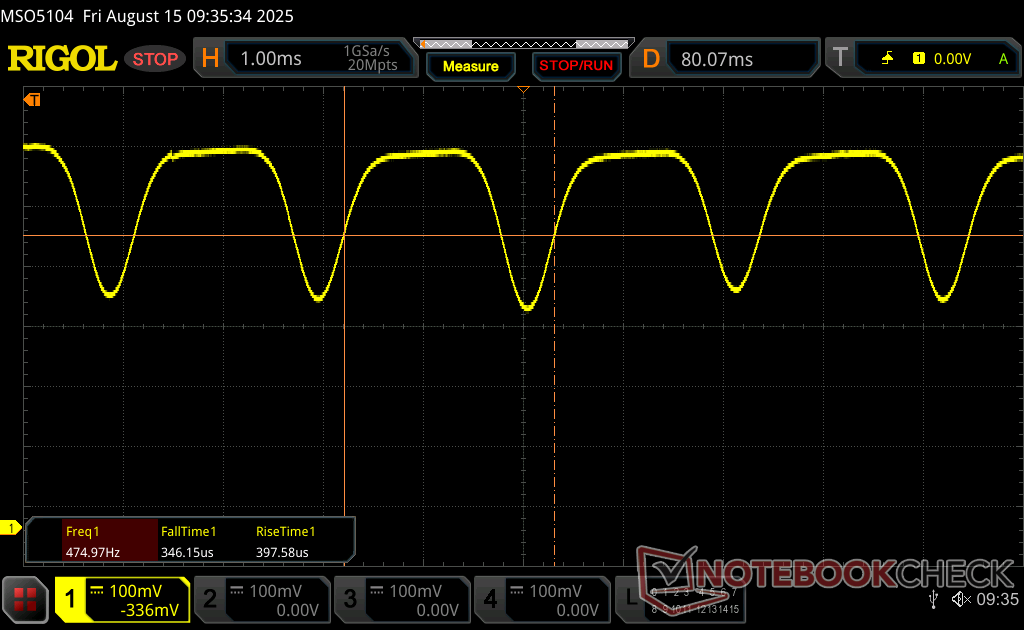 | |
Das Display flackert mit 475 Hz (im schlimmsten Fall, eventuell durch Pulsweitenmodulation PWM) . Die Frequenz von 475 Hz ist relativ hoch und sollte daher auch bei den meisten Personen zu keinen Problemen führen. Empfindliche User sollen laut Berichten aber sogar noch bei 500 Hz und darüber ein Flackern wahrnehmen. Im Vergleich: 52 % aller getesteten Geräte nutzten kein PWM um die Helligkeit zu reduzieren. Wenn PWM eingesetzt wurde, dann bei einer Frequenz von durchschnittlich 7784 (Minimum 5, Maximum 343500) Hz. | |||


Performance


Testbedingungen
Wir haben den Dell Optimizer auf den Modus Performance eingestellt, bevor wir die folgenden Tests durchgeführt haben.
Prozessor
Der Core Ultra 7 255H schneidet auf dem Dell 14 Premium gut ab - zumindest für ein kleines 14-Zoll-Subnotebook. Die meisten Laptops mit der gleichen CPU sind tendenziell größer und/oder dicker als unser Dell 14 Premium, und so führen die geringeren Abmessungen des Dell natürlich zu einer engeren Temperaturkontrolle und begrenzteren Turbo-Boost-Vorteilen. Unsere CineBench-R15-xT-Schleifengrafik unten zeigt eine konstante Leistung für die ersten paar Schleifen, bevor sie danach um bis zu 35 Prozent abfällt. Das Positive daran ist, dass die Nachhaltigkeit der Leistung zumindest besser ist als beim XPS 14.
Cinebench-R15-Mehrfachschleife
Cinebench R23: Multi Core | Single Core
Cinebench R20: CPU (Multi Core) | CPU (Single Core)
Cinebench R15: CPU Multi 64Bit | CPU Single 64Bit
Blender: v2.79 BMW27 CPU
7-Zip 18.03: 7z b 4 | 7z b 4 -mmt1
Geekbench 6.7: Multi-Core | Single-Core
Geekbench 5.5: Multi-Core | Single-Core
HWBOT x265 Benchmark v2.2: 4k Preset
LibreOffice : 20 Documents To PDF
R Benchmark 2.5: Overall mean
| Geekbench 6.7 / Multi-Core | |
| Asus ROG Zephyrus G14 2025 GA403WW | |
| Asus ZenBook Duo OLED UX8406CA | |
| Durchschnittliche Intel Core Ultra 7 255H (11979 - 17489, n=20) | |
| Razer Blade 14 2025 | |
| Dell 14 Premium | |
| Dell XPS 14 2024 OLED | |
| Lenovo ThinkPad X9-14 Gen 1 Aura Edition | |
| HP EliteBook X G1i 14 AI | |
| Dell Pro 14 Premium | |
| Asus Zenbook S 14 UX5406 | |
| Lenovo ThinkPad T14s Gen 6 Intel | |
| Geekbench 6.7 / Single-Core | |
| Asus ROG Zephyrus G14 2025 GA403WW | |
| Razer Blade 14 2025 | |
| Durchschnittliche Intel Core Ultra 7 255H (2712 - 2939, n=20) | |
| HP EliteBook X G1i 14 AI | |
| Dell Pro 14 Premium | |
| Asus ZenBook Duo OLED UX8406CA | |
| Lenovo ThinkPad X9-14 Gen 1 Aura Edition | |
| Dell 14 Premium | |
| Asus Zenbook S 14 UX5406 | |
| Lenovo ThinkPad T14s Gen 6 Intel | |
| Dell XPS 14 2024 OLED | |
Cinebench R23: Multi Core | Single Core
Cinebench R20: CPU (Multi Core) | CPU (Single Core)
Cinebench R15: CPU Multi 64Bit | CPU Single 64Bit
Blender: v2.79 BMW27 CPU
7-Zip 18.03: 7z b 4 | 7z b 4 -mmt1
Geekbench 6.7: Multi-Core | Single-Core
Geekbench 5.5: Multi-Core | Single-Core
HWBOT x265 Benchmark v2.2: 4k Preset
LibreOffice : 20 Documents To PDF
R Benchmark 2.5: Overall mean
* ... kleinere Werte sind besser
System Performance

PCMark 10: Score | Essentials | Productivity | Digital Content Creation
CrossMark: Overall | Productivity | Creativity | Responsiveness
WebXPRT 3: Overall
WebXPRT 4: Overall
Mozilla Kraken 1.1: Total
| Performance Rating | |
| Durchschnittliche Intel Core Ultra 7 255H, Intel Arc Graphics 140T | |
| Dell Pro 14 Premium | |
| HP EliteBook X G1i 14 AI | |
| Dell 14 Premium | |
| Asus Zenbook S 14 UX5406 | |
| Lenovo ThinkPad T14s Gen 6 Intel | |
| Dell Latitude 7440 -4! | |
| PCMark 10 / Score | |
| Durchschnittliche Intel Core Ultra 7 255H, Intel Arc Graphics 140T (6878 - 9156, n=13) | |
| Dell Pro 14 Premium | |
| HP EliteBook X G1i 14 AI | |
| Dell 14 Premium | |
| Asus Zenbook S 14 UX5406 | |
| Lenovo ThinkPad T14s Gen 6 Intel | |
| Dell Latitude 7440 | |
| PCMark 10 / Essentials | |
| Durchschnittliche Intel Core Ultra 7 255H, Intel Arc Graphics 140T (10637 - 11556, n=13) | |
| Dell Latitude 7440 | |
| Dell 14 Premium | |
| Dell Pro 14 Premium | |
| HP EliteBook X G1i 14 AI | |
| Lenovo ThinkPad T14s Gen 6 Intel | |
| Asus Zenbook S 14 UX5406 | |
| PCMark 10 / Productivity | |
| Durchschnittliche Intel Core Ultra 7 255H, Intel Arc Graphics 140T (7598 - 15694, n=13) | |
| Asus Zenbook S 14 UX5406 | |
| Dell Pro 14 Premium | |
| HP EliteBook X G1i 14 AI | |
| Lenovo ThinkPad T14s Gen 6 Intel | |
| Dell 14 Premium | |
| Dell Latitude 7440 | |
| PCMark 10 / Digital Content Creation | |
| Durchschnittliche Intel Core Ultra 7 255H, Intel Arc Graphics 140T (10461 - 12552, n=13) | |
| Dell 14 Premium | |
| HP EliteBook X G1i 14 AI | |
| Dell Pro 14 Premium | |
| Asus Zenbook S 14 UX5406 | |
| Lenovo ThinkPad T14s Gen 6 Intel | |
| Dell Latitude 7440 | |
| CrossMark / Overall | |
| Durchschnittliche Intel Core Ultra 7 255H, Intel Arc Graphics 140T (1610 - 2018, n=13) | |
| Dell Pro 14 Premium | |
| HP EliteBook X G1i 14 AI | |
| Asus Zenbook S 14 UX5406 | |
| Dell 14 Premium | |
| Lenovo ThinkPad T14s Gen 6 Intel | |
| CrossMark / Productivity | |
| Durchschnittliche Intel Core Ultra 7 255H, Intel Arc Graphics 140T (1566 - 1908, n=13) | |
| Dell Pro 14 Premium | |
| HP EliteBook X G1i 14 AI | |
| Asus Zenbook S 14 UX5406 | |
| Dell 14 Premium | |
| Lenovo ThinkPad T14s Gen 6 Intel | |
| CrossMark / Creativity | |
| Durchschnittliche Intel Core Ultra 7 255H, Intel Arc Graphics 140T (1827 - 2396, n=13) | |
| Dell Pro 14 Premium | |
| Asus Zenbook S 14 UX5406 | |
| HP EliteBook X G1i 14 AI | |
| Dell 14 Premium | |
| Lenovo ThinkPad T14s Gen 6 Intel | |
| CrossMark / Responsiveness | |
| Durchschnittliche Intel Core Ultra 7 255H, Intel Arc Graphics 140T (1194 - 1781, n=13) | |
| Dell Pro 14 Premium | |
| Asus Zenbook S 14 UX5406 | |
| HP EliteBook X G1i 14 AI | |
| Lenovo ThinkPad T14s Gen 6 Intel | |
| Dell 14 Premium | |
| WebXPRT 3 / Overall | |
| Dell Pro 14 Premium | |
| Durchschnittliche Intel Core Ultra 7 255H, Intel Arc Graphics 140T (273 - 327, n=13) | |
| HP EliteBook X G1i 14 AI | |
| Dell 14 Premium | |
| Lenovo ThinkPad T14s Gen 6 Intel | |
| Dell Latitude 7440 | |
| Asus Zenbook S 14 UX5406 | |
| WebXPRT 4 / Overall | |
| Durchschnittliche Intel Core Ultra 7 255H, Intel Arc Graphics 140T (247 - 317, n=13) | |
| Dell Pro 14 Premium | |
| HP EliteBook X G1i 14 AI | |
| Dell 14 Premium | |
| Lenovo ThinkPad T14s Gen 6 Intel | |
| Asus Zenbook S 14 UX5406 | |
| Dell Latitude 7440 | |
| Mozilla Kraken 1.1 / Total | |
| Asus Zenbook S 14 UX5406 | |
| Dell Latitude 7440 | |
| Dell 14 Premium | |
| Lenovo ThinkPad T14s Gen 6 Intel | |
| HP EliteBook X G1i 14 AI | |
| Dell Pro 14 Premium | |
| Durchschnittliche Intel Core Ultra 7 255H, Intel Arc Graphics 140T (427 - 510, n=13) | |
* ... kleinere Werte sind besser
| PCMark 10 Score | 7149 Punkte | |
Hilfe | ||
DPC-Latenzzeit


| DPC Latencies / LatencyMon - interrupt to process latency (max), Web, Youtube, Prime95 | |
| Dell Pro 14 Premium | |
| Dell 14 Premium | |
| Dell XPS 14 2024 OLED | |
| Asus Zenbook S 14 UX5406 | |
| Lenovo ThinkPad X9-14 Gen 1 Aura Edition | |
| Asus ZenBook Duo OLED UX8406CA | |
* ... kleinere Werte sind besser
Speichergeräte
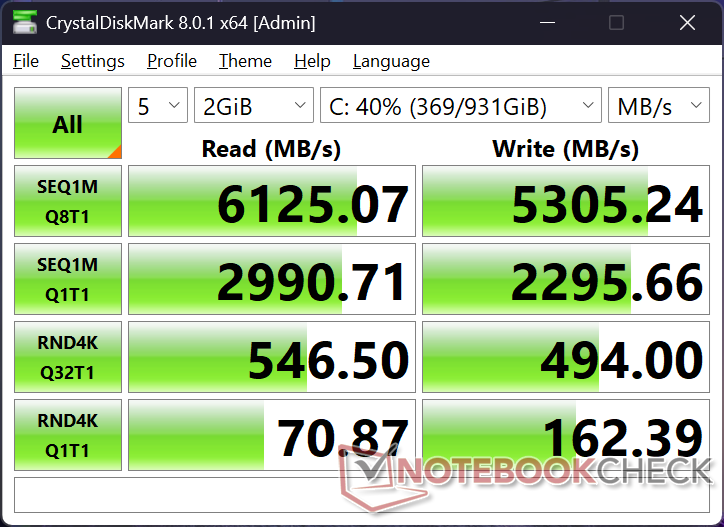


| Drive Performance Rating - Percent | |
| Asus ZenBook Duo OLED UX8406CA | |
| Dell XPS 14 2024 OLED | |
| Dell 14 Premium | |
| Asus Zenbook S 14 UX5406 | |
| Lenovo ThinkPad X9-14 Gen 1 Aura Edition | |
| Dell Pro 14 Premium | |
* ... kleinere Werte sind besser
Drosselung der Festplatte: DiskSpd Read Loop, Queue Depth 8
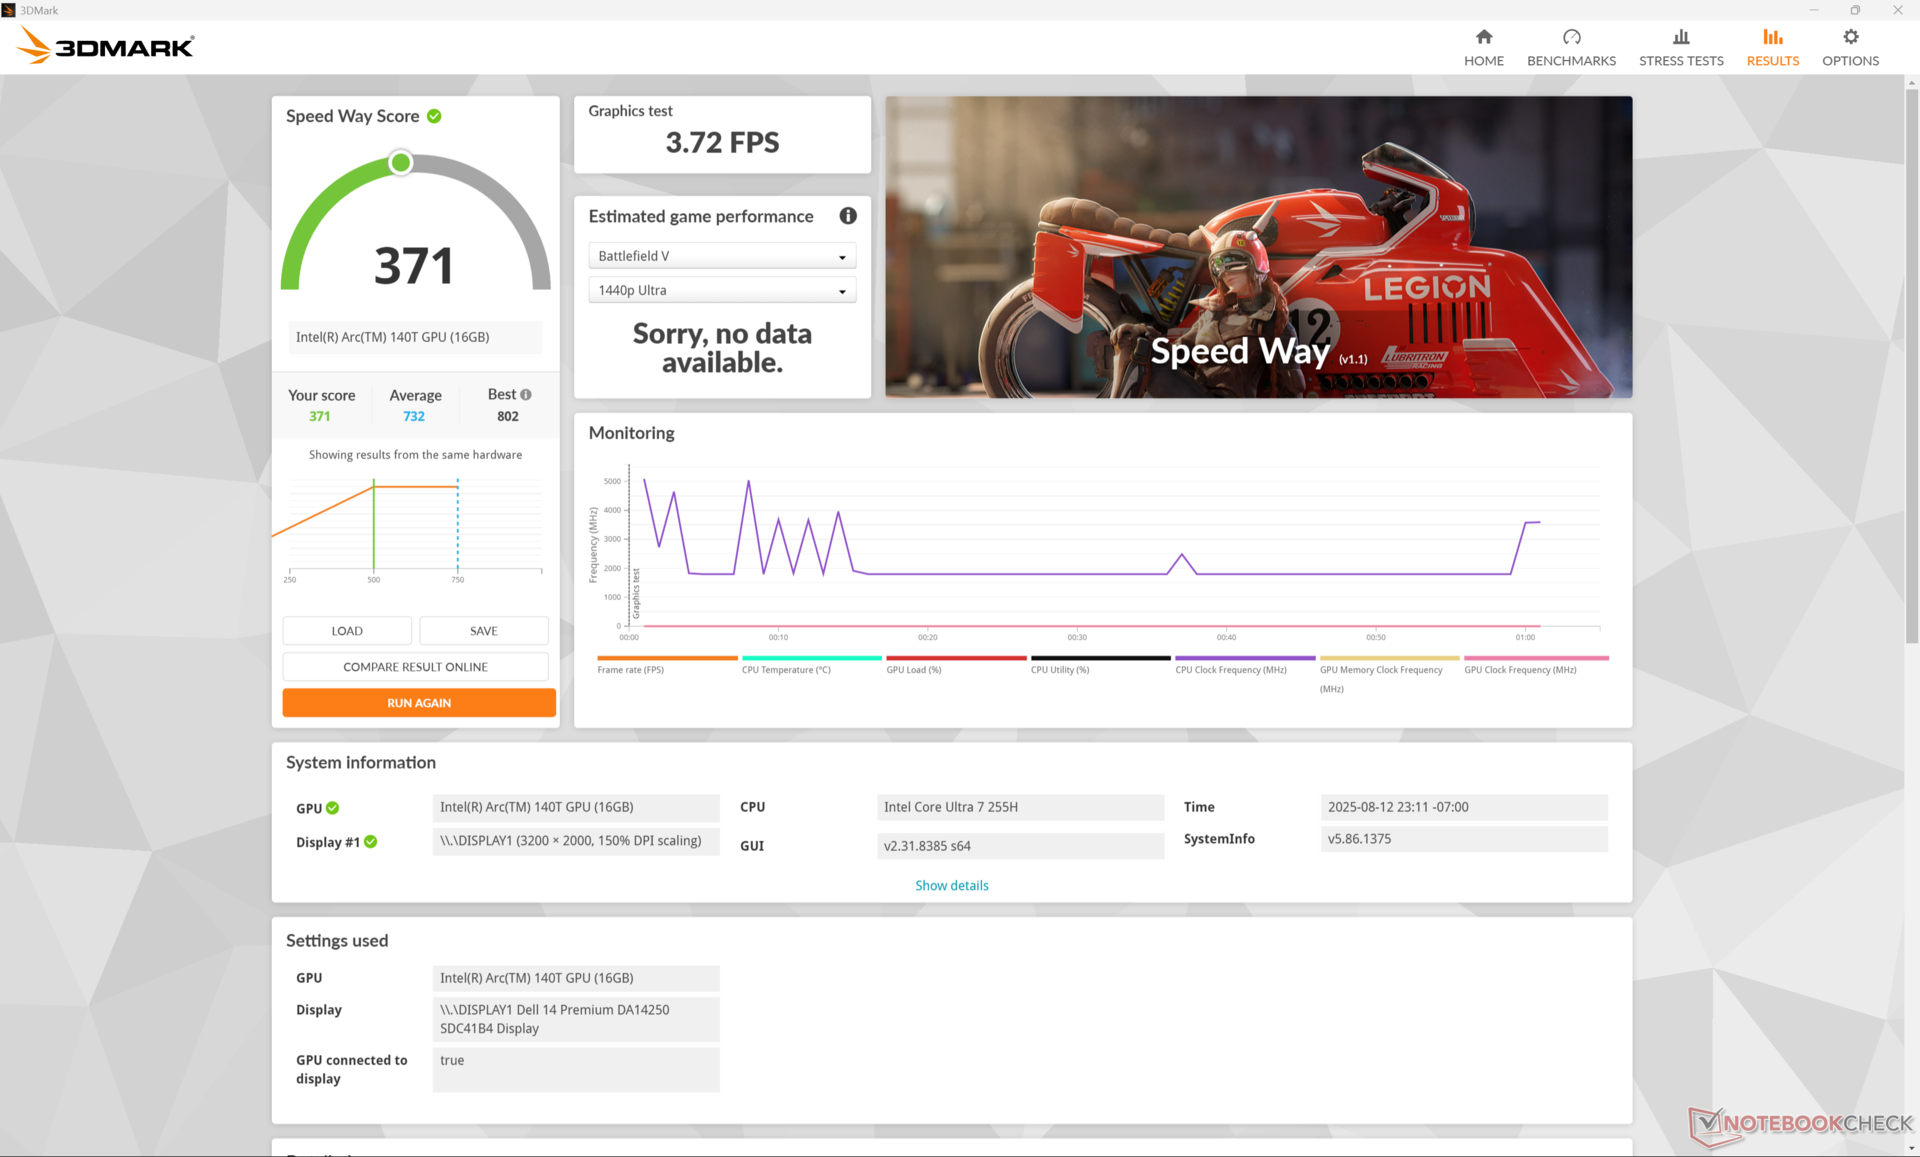
GPU Performance
Das System wird standardmäßig mit dem Arc 140T ausgeliefert, im Vergleich zum Arc 8 im XPS 14 für eine durchschnittliche Leistungssteigerung von 15 Prozent.
| Leistungsprofil | Grafics-Punktzahl | Physics-Punktzahl | Kombinierte Punktzahl |
| Performance-Modus | 8.762 | 30.950 | 3.166 |
| Ausgeglichener Modus | 8.743 | 31.107 | 3.165 |
| Batteriebetrieb | 8.707 | 27.949 | 3.139 |
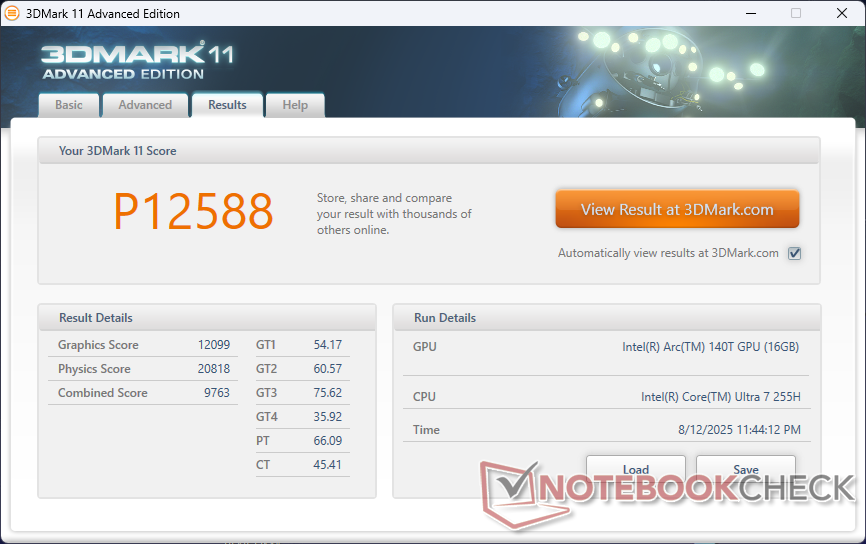


| 3DMark 11 Performance | 12588 Punkte | |
| 3DMark Cloud Gate Standard Score | 38051 Punkte | |
| 3DMark Fire Strike Score | 8194 Punkte | |
| 3DMark Time Spy Score | 4100 Punkte | |
Hilfe | ||
* ... kleinere Werte sind besser
| Performance Rating - Percent | |
| Dell XPS 14 2024 OLED | |
| HP OmniBook Ultra 14 | |
| Lenovo ThinkPad X9-14 Gen 1 Aura Edition -1! | |
| Dell 14 Premium | |
| Asus ZenBook Duo OLED UX8406CA | |
| Asus Zenbook S 14 UX5406 | |
| Cyberpunk 2077 - 1920x1080 Ultra Preset (FSR off) | |
| Dell XPS 14 2024 OLED | |
| HP OmniBook Ultra 14 | |
| Asus Zenbook S 14 UX5406 | |
| Asus ZenBook Duo OLED UX8406CA | |
| Dell 14 Premium | |
| Lenovo ThinkPad X9-14 Gen 1 Aura Edition | |
| Baldur's Gate 3 - 1920x1080 Ultra Preset AA:T | |
| Dell XPS 14 2024 OLED | |
| HP OmniBook Ultra 14 | |
| Dell 14 Premium | |
| Asus ZenBook Duo OLED UX8406CA | |
| Lenovo ThinkPad X9-14 Gen 1 Aura Edition | |
| Asus Zenbook S 14 UX5406 | |
| GTA V - 1920x1080 Highest AA:4xMSAA + FX AF:16x | |
| Dell XPS 14 2024 OLED | |
| HP OmniBook Ultra 14 | |
| Lenovo ThinkPad X9-14 Gen 1 Aura Edition | |
| Asus Zenbook S 14 UX5406 | |
| Asus ZenBook Duo OLED UX8406CA | |
| Dell 14 Premium | |
| Final Fantasy XV Benchmark - 1920x1080 High Quality | |
| Dell XPS 14 2024 OLED | |
| HP OmniBook Ultra 14 | |
| Asus Zenbook S 14 UX5406 | |
| Lenovo ThinkPad X9-14 Gen 1 Aura Edition | |
| Dell 14 Premium | |
| Asus ZenBook Duo OLED UX8406CA | |
| Strange Brigade - 1920x1080 ultra AA:ultra AF:16 | |
| Dell XPS 14 2024 OLED | |
| Asus ZenBook Duo OLED UX8406CA | |
| Dell 14 Premium | |
| HP OmniBook Ultra 14 | |
| Asus Zenbook S 14 UX5406 | |
| Dota 2 Reborn - 1920x1080 ultra (3/3) best looking | |
| Dell XPS 14 2024 OLED | |
| Lenovo ThinkPad X9-14 Gen 1 Aura Edition | |
| Dell 14 Premium | |
| Asus ZenBook Duo OLED UX8406CA | |
| Asus Zenbook S 14 UX5406 | |
| HP OmniBook Ultra 14 | |
| X-Plane 11.11 - 1920x1080 high (fps_test=3) | |
| Dell XPS 14 2024 OLED | |
| HP OmniBook Ultra 14 | |
| Dell 14 Premium | |
| Asus ZenBook Duo OLED UX8406CA | |
| Lenovo ThinkPad X9-14 Gen 1 Aura Edition | |
| Asus Zenbook S 14 UX5406 | |
Cyberpunk 2077 ultra fps-Grafik
| min. | mittel | hoch | max. | |
|---|---|---|---|---|
| GTA V (2015) | 164.1 | 154 | 38.1 | 15.4 |
| Dota 2 Reborn (2015) | 100.1 | 94.9 | 59.7 | 77.5 |
| Final Fantasy XV Benchmark (2018) | 80.1 | 43.9 | 29.8 | |
| X-Plane 11.11 (2018) | 61.7 | 50.2 | 41 | |
| Strange Brigade (2018) | 187.7 | 81.9 | 68.2 | 56.3 |
| Baldur's Gate 3 (2023) | 35.8 | 28.8 | 25.8 | 25.5 |
| Cyberpunk 2077 (2023) | 38 | 30.5 | 26.4 | 23.9 |
| F1 24 (2024) | 77.7 | 69.6 | 54.5 | 18.2 |
Emissionen
Systemrauschen
Die beiden Lüfter sind fast immer aktiv, wenn auch mit ausreichend niedrigen Drehzahlen, um beim Surfen im Internet oder beim Videostreaming nicht aufzufallen. Sie drehen jedoch schneller hoch als bei anderen 14-Zoll-Subnotebooks der U- oder V-Serie, wenn größere Lasten anfallen, um den höheren TDP-Anforderungen der H-Serien-CPU gerecht zu werden. Insgesamt wird das Lüftergeräusch bei hoher Belastung des Systems merklich lauter.

Lautstärkediagramm
| Idle |
| 23.2 / 24 / 24.7 dB(A) |
| Last |
| 39 / 44.9 dB(A) |
 | ||
30 dB leise 40 dB(A) deutlich hörbar 50 dB(A) störend |
||
min: | ||
| Dell 14 Premium Arc 140T, Ultra 7 255H, Kioxia BG6 KBG6AZNV1T02 | Dell Pro 14 Premium Arc 140V, Core Ultra 7 268V, Kioxia BG6 KBG6AZNV1T02 | Dell Latitude 7440 Iris Xe G7 80EUs, i5-1345U, Samsung MZ9L4512HBLU-00BMV | HP EliteBook X G1i 14 AI Arc 140V, Core Ultra 7 268V, Kioxia XG8 KXG80ZNV512G | Lenovo ThinkPad T14s Gen 6 Intel Arc 130V, Core Ultra 5 228V, SK hynix PCB01 HFS001TFM9X179N GL | Asus Zenbook S 14 UX5406 Arc 140V, Core Ultra 7 258V, WD PC SN560 SDDPNQE-1T00 | |
|---|---|---|---|---|---|---|
| Geräuschentwicklung | 2% | 11% | -7% | 5% | 11% | |
| aus / Umgebung * (dB) | 23 | 23.1 -0% | 22.8 1% | 28.2 -23% | 24.2 -5% | 23.7 -3% |
| Idle min * (dB) | 23.2 | 23.1 -0% | 22.8 2% | 28.4 -22% | 24.2 -4% | 23.7 -2% |
| Idle avg * (dB) | 24 | 23.1 4% | 22.8 5% | 28.4 -18% | 24.2 -1% | 23.7 1% |
| Idle max * (dB) | 24.7 | 23.1 6% | 22.8 8% | 28.8 -17% | 24.2 2% | 23.7 4% |
| Last avg * (dB) | 39 | 38.2 2% | 26.3 33% | 33.5 14% | 30.2 23% | 30.5 22% |
| Cyberpunk 2077 ultra * (dB) | 43 | 44.2 -3% | 39.1 9% | 39.3 9% | 31.1 28% | |
| Last max * (dB) | 44.9 | 44.2 2% | 38.3 15% | 40.4 10% | 39.6 12% | 33.6 25% |
| Witcher 3 ultra * (dB) | 30 |
* ... kleinere Werte sind besser
Temperatur
Die Wärmeentwicklung ist mit knapp über 33 °C auf der kühleren Seite, wenn Sie trotz der Hochleistungs-CPU über längere Zeiträume anspruchsvolle Lasten ausführen.


(+) Die maximale Temperatur auf der Oberseite ist 33 °C. Im Vergleich liegt der Klassendurchschnitt bei 36.8 °C (von 21 bis 71 °C für die Klasse Multimedia).
(+) Auf der Unterseite messen wir eine maximalen Wert von 33.6 °C (im Vergleich zum Durchschnitt von 39.1 °C).
(+) Ohne Last messen wir eine durchschnittliche Temperatur von 25 °C auf der Oberseite. Der Klassendurchschnitt erreicht 31.3 °C.
(+) Die Handballen und der Touchpad-Bereich sind mit gemessenen 29 °C kühler als die typische Hauttemperatur und fühlen sich dadurch kühl an.
(±) Die durchschnittliche Handballen-Temperatur anderer getesteter Geräte war 28.7 °C (-0.3 °C).


| Dell 14 Premium Intel Core Ultra 7 255H, Intel Arc Graphics 140T | Dell Pro 14 Premium Intel Core Ultra 7 268V, Intel Arc Graphics 140V | Asus Zenbook S 14 UX5406 Intel Core Ultra 7 258V, Intel Arc Graphics 140V | Lenovo ThinkPad X9-14 Gen 1 Aura Edition Intel Core Ultra 7 258V, Intel Arc Graphics 140V | Asus ZenBook Duo OLED UX8406CA Intel Core Ultra 9 285H, Intel Arc Graphics 140T | Dell XPS 14 2024 OLED Intel Core Ultra 7 155H, NVIDIA GeForce RTX 4050 Laptop GPU | |
|---|---|---|---|---|---|---|
| Hitze | -1% | -18% | -27% | -11% | -15% | |
| Last oben max * (°C) | 33 | 33 -0% | 43.7 -32% | 45.4 -38% | 35.3 -7% | 40.5 -23% |
| Last unten max * (°C) | 33.6 | 28 17% | 46.9 -40% | 46.4 -38% | 47.2 -40% | 42.6 -27% |
| Idle oben max * (°C) | 26.4 | 28 -6% | 25.8 2% | 30.2 -14% | 24.8 6% | 26.9 -2% |
| Idle unten max * (°C) | 25.6 | 28.8 -13% | 26.3 -3% | 29.9 -17% | 26.2 -2% | 27.8 -9% |
* ... kleinere Werte sind besser
Stresstest
Bei der Ausführung von Prime95 Stress steigen die durchschnittlichen Taktraten auf 3 GHz bei 60 W und 104 °C. Natürlich ist eine solche Temperatur auf Dauer unangenehm hoch, sodass der Prozessor bereits nach etwa einer Minute im Test schnell auf 2,5 GHz, 42 W und 85 °C heruntertaktet.
Eine ähnliche Drosselung der Taktrate tritt bei der Ausführung von Cyberpunk 2077 auf, um anspruchsvolle Lasten darzustellen, wie die Tabelle und der Screenshot unten zeigen. Die schwankenden Taktraten stimmen mit den langsamer als erwarteten Ergebnissen für die Bildrate in unserem Abschnitt zur GPU-Performance überein.


| durchschnittlicher CPU-Takt (GHz) | GPU-Takt (MHz) | durchschnittliche CPU-Temperatur (°C) | |
| System Leerlauf | -- | -- | 47 |
| Prime95 Stress | 2,5 | -- | 85 |
| Prime95 + FurMark Stress | 1,1 - 1,8 | 550 - 1.943 | ~71 |
| Cyberpunk 2077 Stress | 0,8 | 1.110 - 2.250 | ~83 |
Lautsprecher

Dell 14 Premium Audio Analyse
(±) | Mittelmäßig laut spielende Lautsprecher (80.7 dB)
Bass 100 - 315 Hz
(±) | abgesenkter Bass - 11.4% geringer als der Median
(±) | durchschnittlich lineare Bass-Wiedergabe (10.1% Delta zum Vorgänger)
Mitteltöne 400 - 2000 Hz
(+) | ausgeglichene Mitten, vom Median nur 1.4% abweichend
(+) | lineare Mitten (2.6% Delta zum Vorgänger)
Hochtöne 2 - 16 kHz
(+) | ausgeglichene Hochtöne, vom Median nur 1% abweichend
(+) | sehr lineare Hochtöne (3.4% Delta zum Vorgänger)
Gesamt im hörbaren Bereich 100 - 16.000 Hz
(+) | hörbarer Bereich ist sehr linear (9.2% Abstand zum Median
Im Vergleich zu allen Geräten derselben Klasse
» 13% aller getesteten Geräte dieser Klasse waren besser, 0% vergleichbar, 87% schlechter
» Das beste Gerät hat einen Delta-Wert von 5%, durchschnittlich ist 17%, das schlechteste Gerät hat 45%
Im Vergleich zu allen Geräten im Test
» 3% aller getesteten Geräte waren besser, 1% vergleichbar, 96% schlechter
» Das beste Gerät hat einen Delta-Wert von 4%, durchschnittlich ist 24%, das schlechteste Gerät hat 134%
Apple MacBook Pro 16 2021 M1 Pro Audio Analyse
(+) | Die Lautsprecher können relativ laut spielen (84.7 dB)
Bass 100 - 315 Hz
(+) | guter Bass - nur 3.8% Abweichung vom Median
(+) | lineare Bass-Wiedergabe (5.2% Delta zum Vorgänger)
Mitteltöne 400 - 2000 Hz
(+) | ausgeglichene Mitten, vom Median nur 1.3% abweichend
(+) | lineare Mitten (2.1% Delta zum Vorgänger)
Hochtöne 2 - 16 kHz
(+) | ausgeglichene Hochtöne, vom Median nur 1.9% abweichend
(+) | sehr lineare Hochtöne (2.7% Delta zum Vorgänger)
Gesamt im hörbaren Bereich 100 - 16.000 Hz
(+) | hörbarer Bereich ist sehr linear (4.6% Abstand zum Median
Im Vergleich zu allen Geräten derselben Klasse
» 0% aller getesteten Geräte dieser Klasse waren besser, 0% vergleichbar, 100% schlechter
» Das beste Gerät hat einen Delta-Wert von 5%, durchschnittlich ist 17%, das schlechteste Gerät hat 45%
Im Vergleich zu allen Geräten im Test
» 0% aller getesteten Geräte waren besser, 0% vergleichbar, 100% schlechter
» Das beste Gerät hat einen Delta-Wert von 4%, durchschnittlich ist 24%, das schlechteste Gerät hat 134%
Energieverwaltung
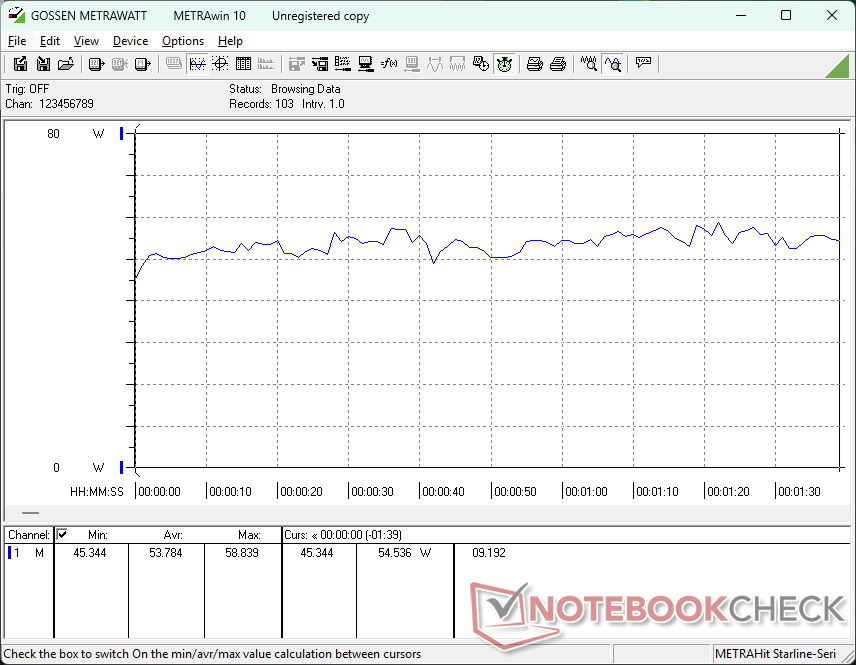
Stromverbrauch
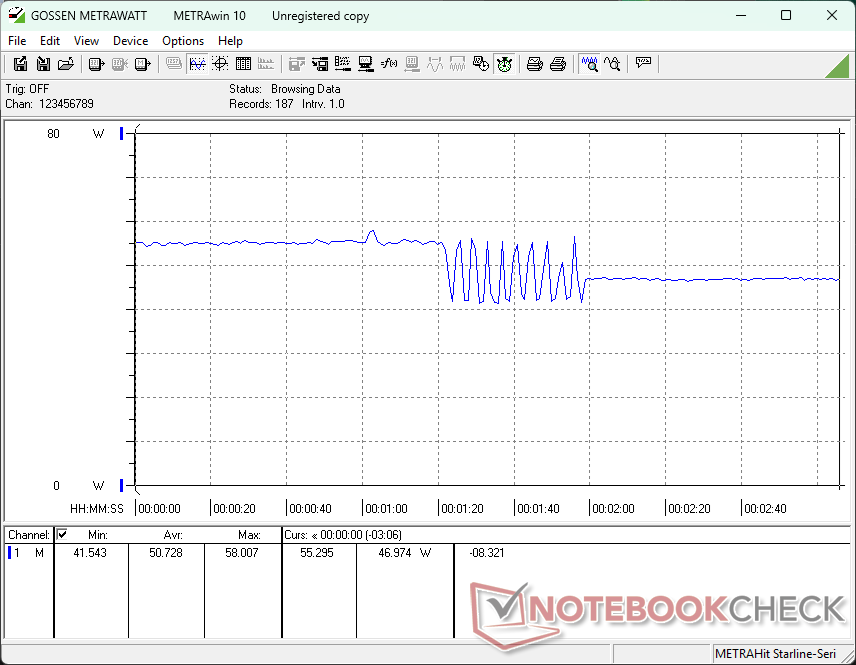
Der durchschnittliche Verbrauch ist höher als bei den meisten 14-Zoll-Subnotebooks, was vor allem auf die CPU der H-Serie zurückzuführen ist. Es gibt dennoch Schwankungen beim Energieverbrauch, wenn das System unter Last steht, die mit den oben genannten Schwankungen der Turbo-Boost-Taktraten übereinstimmen.


| Aus / Standby | |
| Idle | |
| Last |
|
Legende:
min: | |
| Dell 14 Premium Ultra 7 255H, Arc 140T, Kioxia BG6 KBG6AZNV1T02, OLED, 3200x2000, 14.5" | HP OmniBook Ultra 14 Ryzen AI 9 HX 375, Radeon 890M, SK hynix PC801 HFS002TEJ9X101N, IPS, 2240x1400, 14" | Asus Zenbook S 14 UX5406 Core Ultra 7 258V, Arc 140V, WD PC SN560 SDDPNQE-1T00, OLED, 2880x1800, 14" | Lenovo ThinkPad X9-14 Gen 1 Aura Edition Core Ultra 7 258V, Arc 140V, WD PC SN740 SDDQMQD-1T00, OLED, 1920x1200, 14" | Asus ZenBook Duo OLED UX8406CA Ultra 9 285H, Arc 140T, Western Digital PC SN5000S SDEQNSJ-1T00, OLED, 1920x1200, 14" | Dell XPS 14 2024 OLED Ultra 7 155H, GeForce RTX 4050 Laptop GPU, Samsung PM9A1 MZVL21T0HCLR, OLED, 3200x2000, 14.5" | |
|---|---|---|---|---|---|---|
| Stromverbrauch | -1% | 20% | 22% | 0% | -47% | |
| Idle min * (Watt) | 4.4 | 2.7 39% | 5.1 -16% | 3.6 18% | 4.1 7% | 8.1 -84% |
| Idle avg * (Watt) | 6.1 | 5.4 11% | 6.2 -2% | 4.6 25% | 8.2 -34% | 9.9 -62% |
| Idle max * (Watt) | 13.7 | 5.5 60% | 6.9 50% | 5.2 62% | 8.7 36% | 10.4 24% |
| Last avg * (Watt) | 53.8 | 67.4 -25% | 38.7 28% | 31.2 42% | 56.7 -5% | 75.6 -41% |
| Cyberpunk 2077 ultra external monitor * (Watt) | 46.5 | 67.8 -46% | 28.6 38% | 48.4 -4% | 47 -1% | |
| Cyberpunk 2077 ultra * (Watt) | 50.7 | 67.9 -34% | 33.1 35% | 47.3 7% | 48.7 4% | |
| Last max * (Watt) | 62.7 | 68.3 -9% | 60 4% | 61.8 1% | 65.1 -4% | 107.1 -71% |
| Witcher 3 ultra * (Watt) | 65.6 |
* ... kleinere Werte sind besser
Stromverbrauch Cyberpunk / Stresstest
Stromverbrauch externer Monitor
Akkulaufzeit
Die WLAN-Laufzeit ist ein paar Stunden länger als beim XPS 14, das mit einer diskreten RTX-4050-Grafik ausgestattet ist.
| Dell 14 Premium Ultra 7 255H, Arc 140T, 69.5 Wh | HP OmniBook Ultra 14 Ryzen AI 9 HX 375, Radeon 890M, 68 Wh | Asus Zenbook S 14 UX5406 Core Ultra 7 258V, Arc 140V, 72 Wh | Lenovo ThinkPad X9-14 Gen 1 Aura Edition Core Ultra 7 258V, Arc 140V, 55 Wh | Asus ZenBook Duo OLED UX8406CA Ultra 9 285H, Arc 140T, 75 Wh | Dell XPS 14 2024 OLED Ultra 7 155H, GeForce RTX 4050 Laptop GPU, 69.5 Wh | |
|---|---|---|---|---|---|---|
| Akkulaufzeit | 2% | 32% | 31% | 3% | -28% | |
| WLAN (h) | 10.8 | 11 2% | 14.3 32% | 14.2 31% | 11.1 3% | 7.8 -28% |
| Idle (h) | 36.6 | |||||
| Last (h) | 1.5 | 2.6 | 1.3 | 1.3 | ||
| H.264 (h) | 20 | 16.9 | 10.6 |
Notebookcheck Bewertung
Das Dell 14 Premium ist mehr oder weniger eine kleine Auffrischung des XPS 14 vom letzten Jahr mit neuen Prozessoroptionen, aber ohne neues Display oder diskrete GPU-Optionen.
Dell 14 Premium
- 29.08.2025 v8
Allen Ngo
 Total Sustainability Score:
 Potenzielle Wettbewerber im Vergleich
Bild | Modell / Test | Preis ab | Gewicht | Dicke | Display |
|---|---|---|---|---|---|
1. 82.5%  | Dell 14 Premium Intel Core Ultra 7 255H ⎘ Intel Arc Graphics 140T ⎘ 32 GB RAM, 1024 GB SSD | Amazon: Geizhals Suche | 1.7 kg | 18 mm | 14.50" 3200x2000 260 PPI OLED |
2. 86.4%  | Dell Pro 14 Premium Intel Core Ultra 7 268V ⎘ Intel Arc Graphics 140V ⎘ 32 GB RAM, 1024 GB SSD | Bestpreis 2174.64€ XITRA.de 2. 2201.97€ electronis.de 3. 2201.98€ Easynotebooks.de2500 USD | 1.3 kg | 17.95 mm | 14.00" 2880x1800 243 PPI OLED |
3. 88.1%  | Asus Zenbook S 14 UX5406 Intel Core Ultra 7 258V ⎘ Intel Arc Graphics 140V ⎘ 32 GB RAM, 1024 GB SSD | Amazon: 1.223,69 € Bestpreis 1678.78€ Teosmart 2. 2030.92€ Morelenet | 1.2 kg | 13 mm | 14.00" 2880x1800 243 PPI OLED |
4. 88.8%  | Lenovo ThinkPad X9-14 Gen 1 Aura Edition Intel Core Ultra 7 258V ⎘ Intel Arc Graphics 140V ⎘ 32 GB RAM, 1024 GB SSD | Amazon: 1.614,74 € Bestpreis 1520.49€ Easynotebooks.de 2. 1520.5€ Notebook.de 3. 1520.5€ TechnikDeals24 | 1.2 kg | 17.8 mm | 14.00" 1920x1200 162 PPI OLED |
5. 86.5%  | Asus ZenBook Duo OLED UX8406CA Intel Core Ultra 9 285H ⎘ Intel Arc Graphics 140T ⎘ 32 GB RAM, 1024 GB SSD | Amazon: 2.018,78 € Bestpreis 1859€ galaxus 2. 1859€ galaxus.at | 1.8 kg | 19.9 mm | 14.00" 1920x1200 162 PPI OLED |
6. 86.3% v7 (old)  | Dell XPS 14 2024 OLED Intel Core Ultra 7 155H ⎘ NVIDIA GeForce RTX 4050 Laptop GPU ⎘ 32 GB RAM, 1024 GB SSD | Amazon: 874,65 € Geizhals Suche | 1.8 kg | 19 mm | 14.50" 3200x2000 260 PPI OLED |
Transparenz
Die Auswahl der zu testenden Geräte erfolgt innerhalb der Redaktion. Das vorliegende Testmuster wurde dem Autor vom Hersteller oder einem Shop zu Testzwecken leihweise zur Verfügung gestellt. Eine Einflussnahme des Leihstellers auf den Testbericht gab es nicht, der Hersteller erhielt keine Version des Reviews vor der Veröffentlichung. Es bestand keine Verpflichtung zur Publikation. Als eigenständiges, unabhängiges Unternehmen unterliegt Notebookcheck keiner Diktion von Herstellern, Shops und Verlagen.
So testet Notebookcheck
Pro Jahr werden von Notebookcheck hunderte Laptops und Smartphones unabhängig in von uns standardisierten technischen Verfahren getestet, um eine Vergleichbarkeit aller Testergebnisse zu gewährleisten. Seit rund 20 Jahren entwickeln wir diese Testmethoden kontinuierlich weiter und setzen damit Branchenstandards. In unseren Testlaboren kommt ausschließlich hochwertiges Messequipment in die Hände erfahrener Techniker und Redakteure. Die Tests unterliegen einer mehrstufigen Kontrolle. Unsere komplexe Gesamtbewertung basiert auf hunderten fundierten Messergebnissen und Benchmarks, womit Ihnen Objektivität garantiert ist. Weitere Informationen zu unseren Testmethoden gibt es hier.

