Fazit - Schlanker und effizienter mit OLED als Zugabe
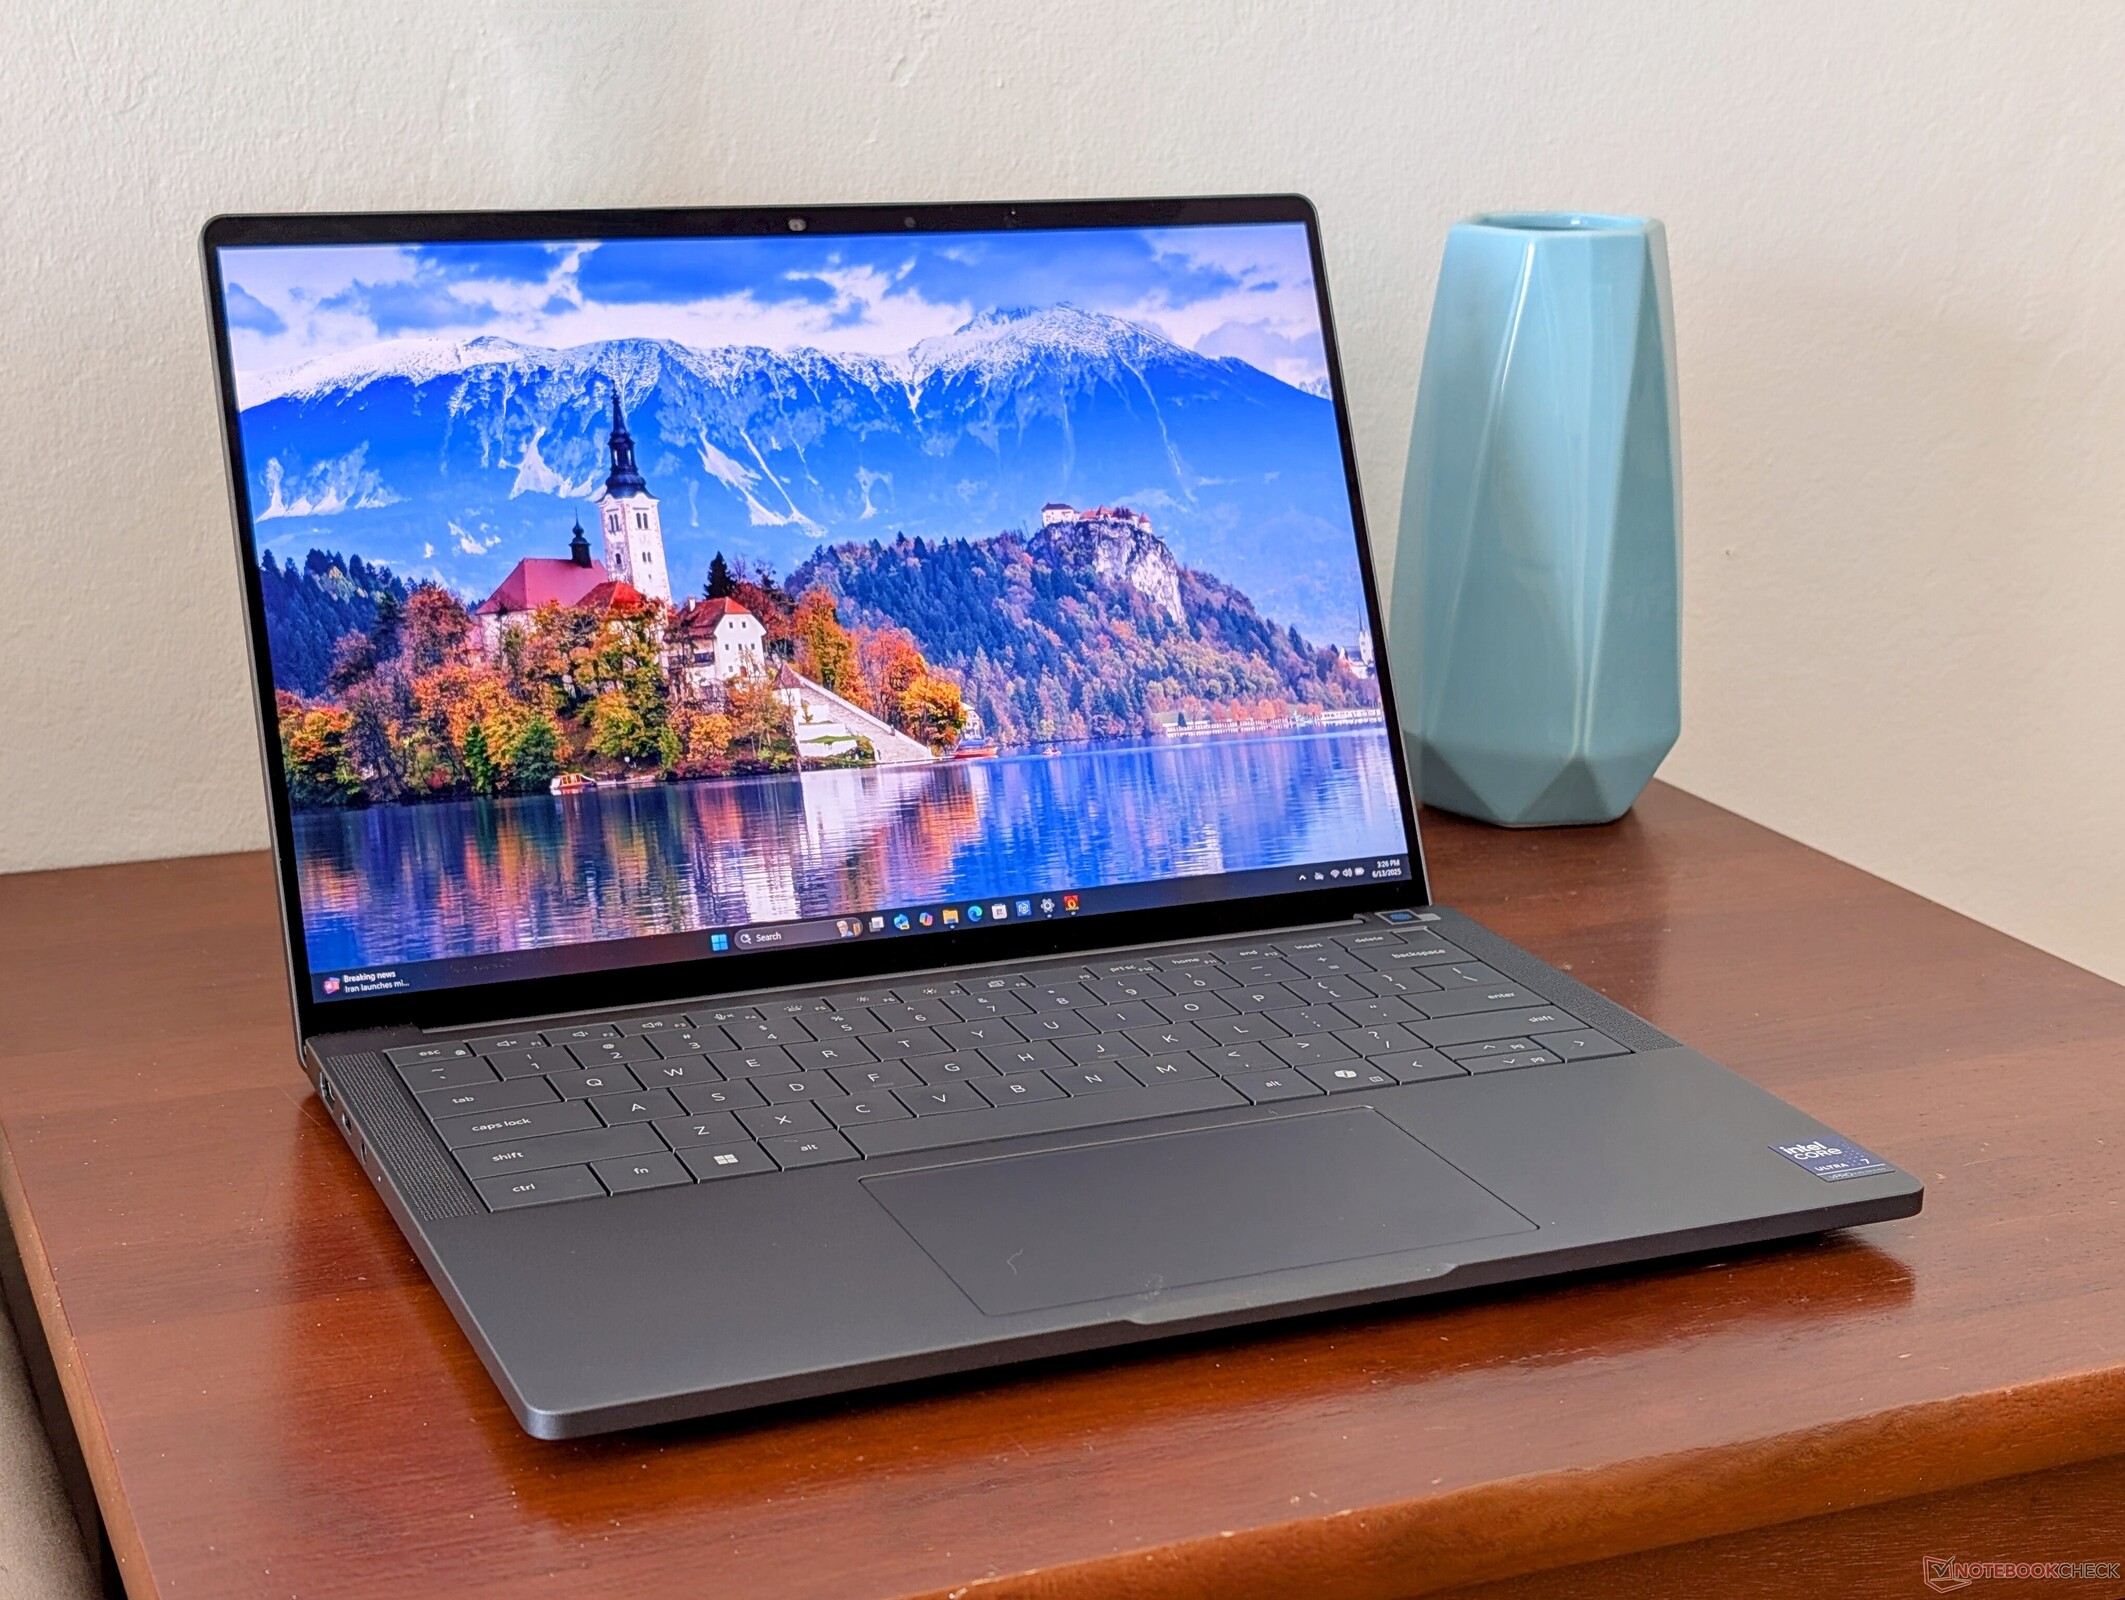
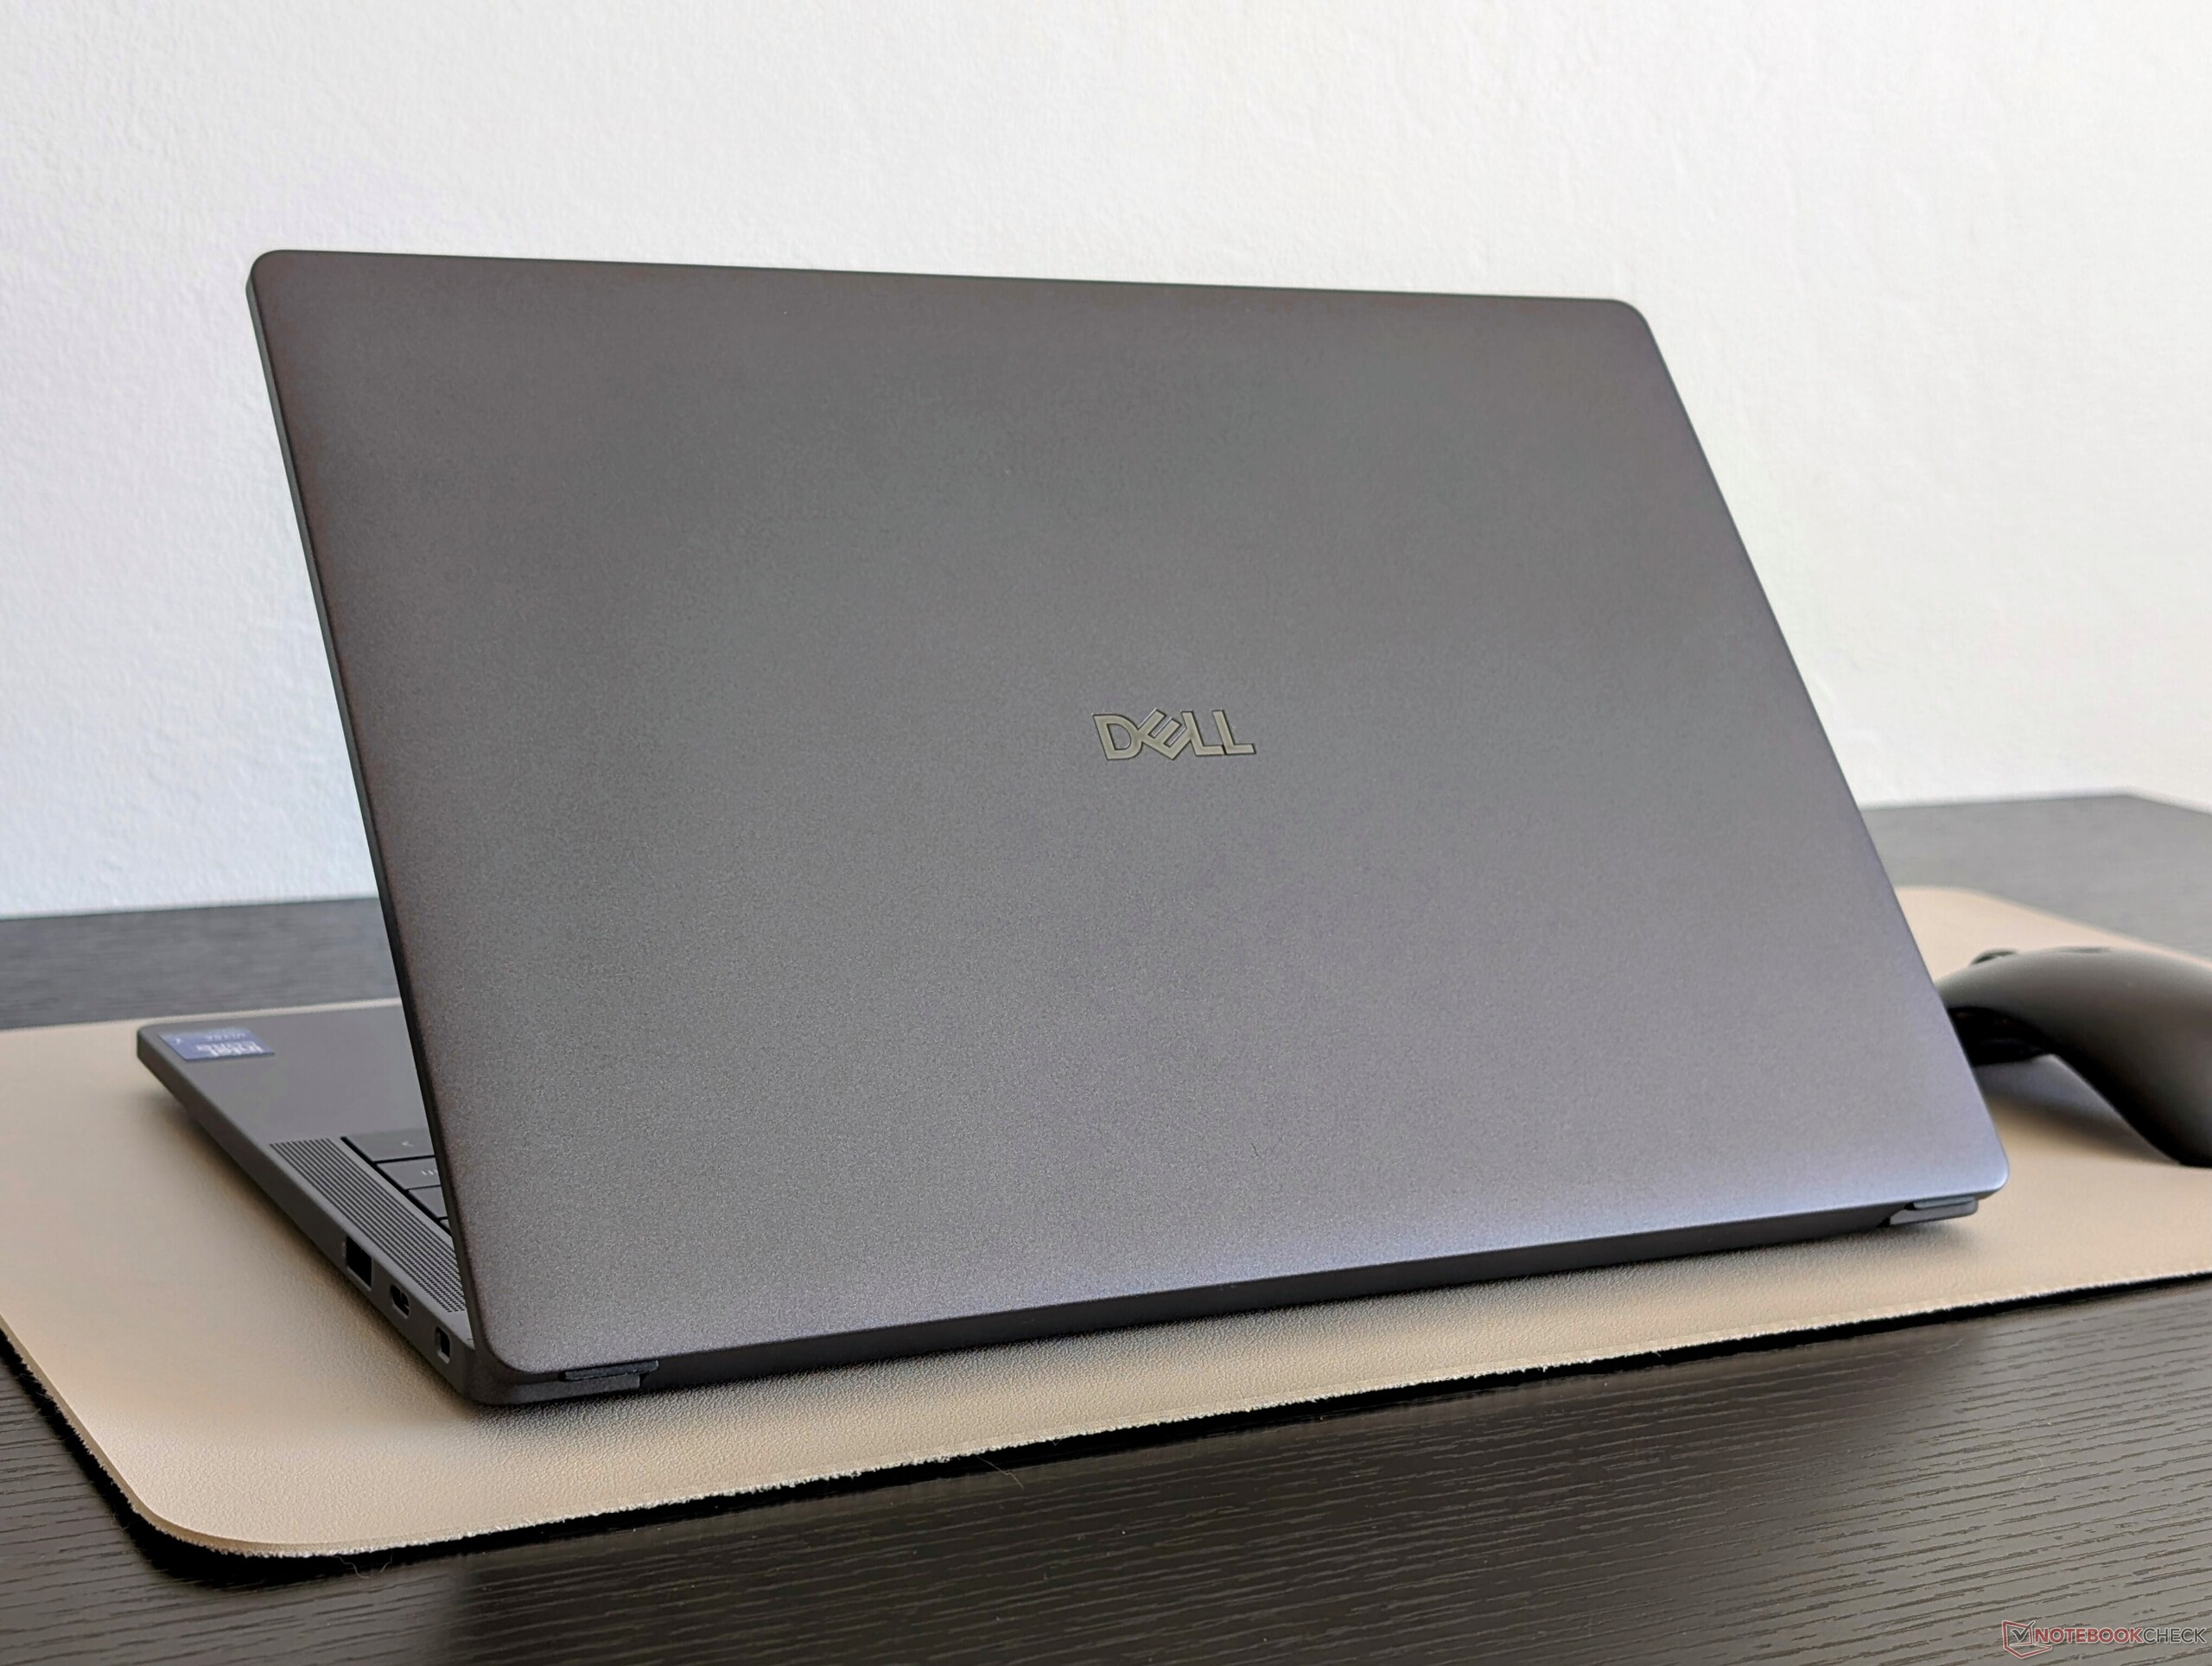
Seinem mattgrauen Äußeren sieht man es nicht an, aber das Dell Pro 14 Premium verbirgt eine Vielzahl von Verbesserungen und Änderungen gegenüber der letztjährigen Latitude-7440- oder Latitude-9440-Serie. Das bemerkenswerteste Merkmal ist wohl der neue OLED-Touchscreen, der ein Maß an Wiedergabetreue bietet, das beim älteren Latitude 14 noch nicht vorhanden war. In der Zwischenzeit bietet die Lunar-Lake-CPU signifikante Verbesserungen sowohl bei der Grafikleistung als auch bei der Energieeffizienz, so dass die Akkulaufzeit trotz der insgesamt schnelleren Leistung und dem anspruchsvolleren OLED-Panel spürbar länger ist als die vorherige Generation.
Es gibt zwar keine großen, aber eine Handvoll kleinerer Nachteile, die erwähnenswert sind. So schön das OLED-Panel auch sein mag, seine Bildwiederholfrequenz von 60 Hz ist nicht mehr zeitgemäß, wenn 90 Hz oder mehr zum Standard gehören. Die Aufrüstungsmöglichkeiten sind begrenzt, was den Speicherplatz angeht, und insbesondere Fotografen oder Redakteure werden das Fehlen eines integrierten SD-Kartenlesers vermissen, um die OLED-Farben und die schnellere integrierte Grafikleistung besser nutzen zu können. Das Tipperlebnis ist etwas flacher und schwammiger als bei einem HP EliteBook Ultra G1i 14, das außerdem dünner und leichter (wenn auch weniger reparabel) ist als unser Dell und gleichzeitig schnellere 120-Hz-OLED-Optionen bietet. Das Dell Pro 14 Premium ist immer noch eines der besten Subnotebooks von Dell für Unternehmen und eine Verbesserung gegenüber den Latitude-14-Vorgängern, aber es könnte etwas mehr Schwung gebrauchen, um sich noch weiter von der Konkurrenz abzusetzen.
Pro
Contra
Preis und Verfügbarkeit
Das Dell Pro 14 Premium wird ab sofort bei Dell ausgeliefert. Die Preise beginnen bei 2.018 Euro für die Basiskonfiguration Core Ultra 5 FHD+ und reichen bis zu 2.514 Euro für die Core-Ultra-7-QHD+-OLED-Konfiguration (siehe Test).
Das Dell Pro 14 Premium ist eine brandneue Business-Serie, die dieses Jahr eingeführt wurde und die älteren 14-Zoll-Modelle Latitude 14 7400 oder 9400 ersetzt. Auch wenn sich die Namensgebung geändert hat, hat das Modell noch viele Funktionen des letztjährigen Latitude 7440 oder 9440 2-in-1 für das vertraute Latitude Gefühl.
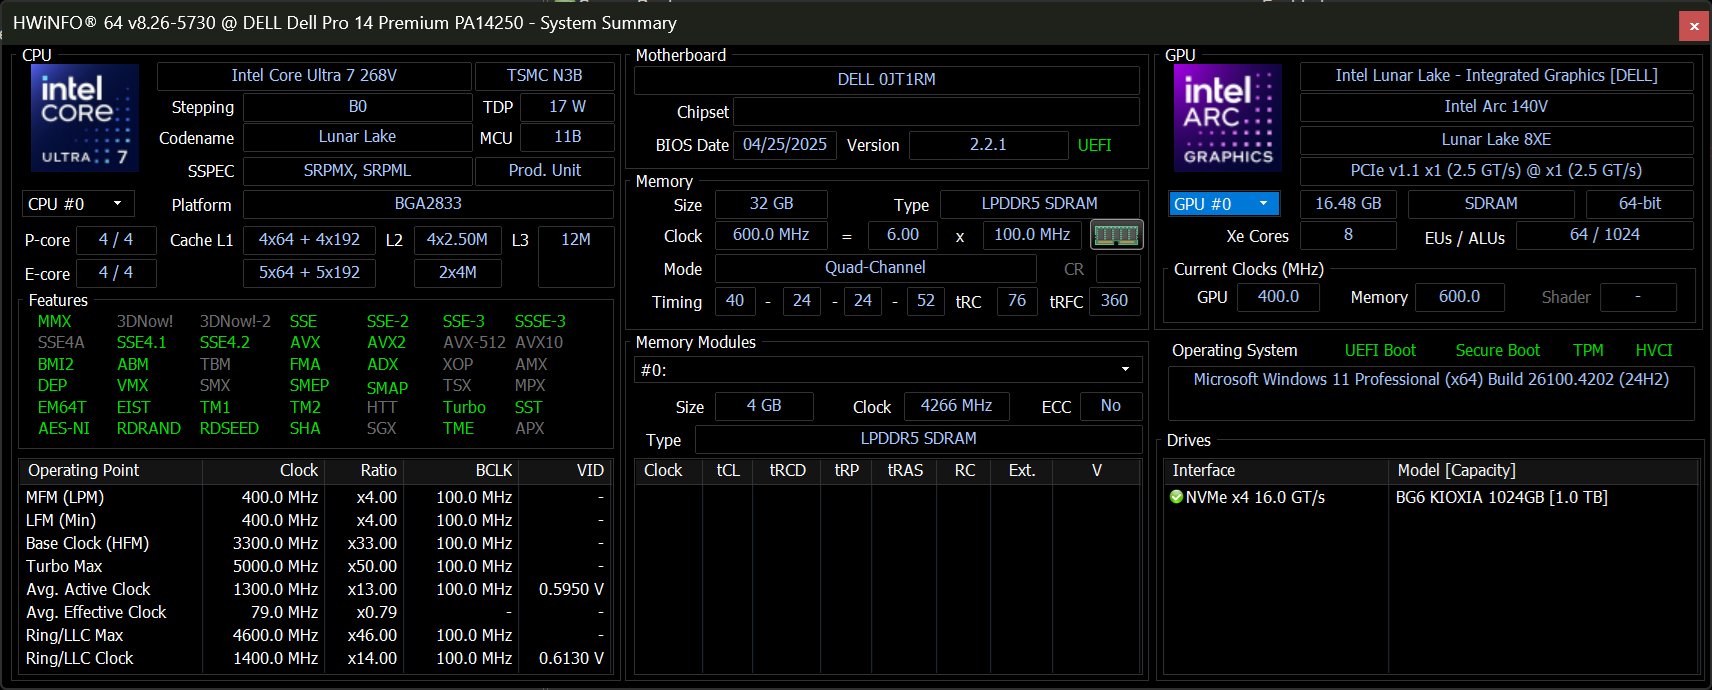
Bei unserem Testgerät handelt es sich um eine High-End-Konfiguration mit der Lunar Lake Core Ultra 7 268V CPU, 32 GB RAM und einem OLED-1.800p-Touchscreen für ca. 2.500 US-Dollar. Günstigere Optionen heben den Core Ultra 5 236V und ein 1.200p-IPS-Display ohne Touchscreen für 1.800 US-Dollar.
Zu den Alternativen zum Dell Pro 14 Premium gehören andere Flaggschiff-Subnotebooks für den Office-Bereich wie das HP EliteBook Ultra G1i 14 oder Lenovo ThinkPad T14s Gen 6.
Mehr Dell Bewertungen:
Spezifikationen
Preisvergleich
Gehäuse
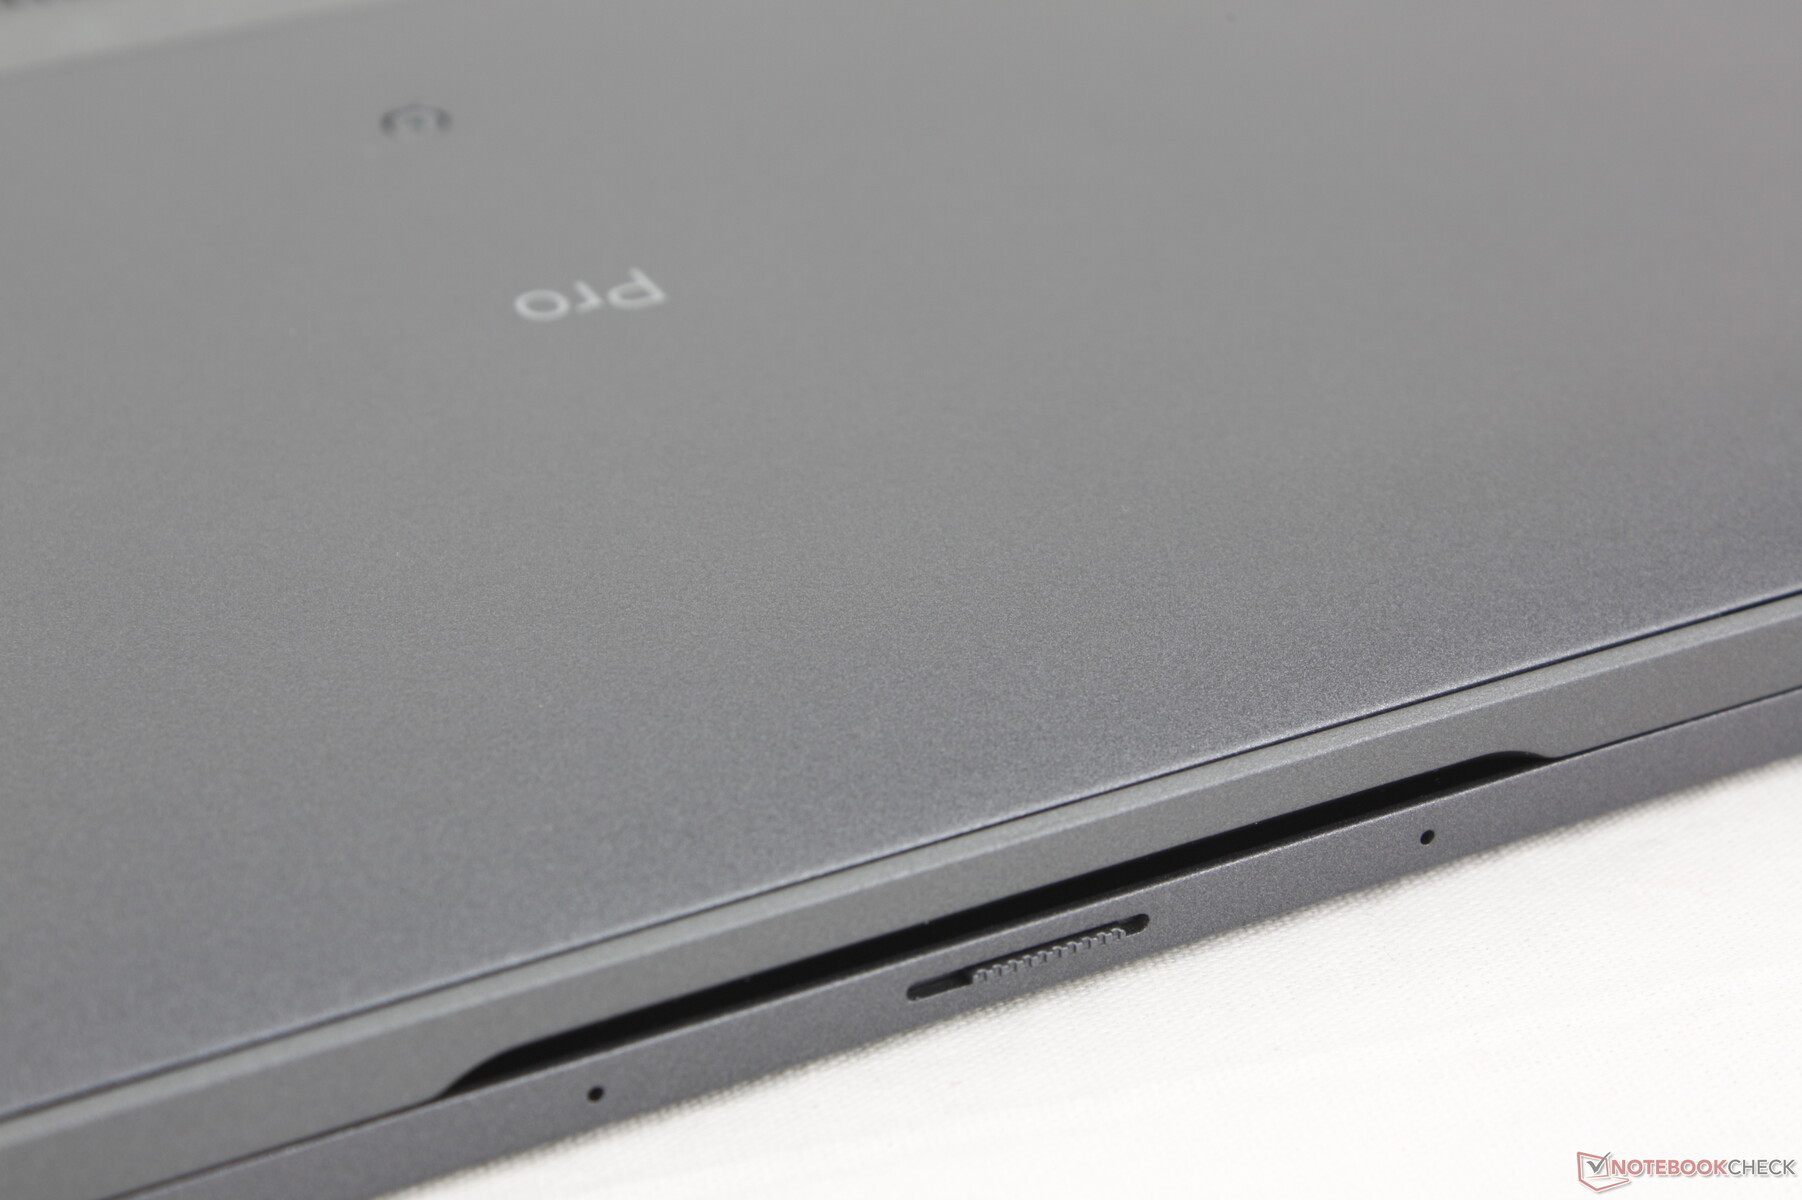
Das Gehäuse besteht größtenteils aus einer Magnesiumlegierung und bietet hervorragende Steifigkeit sowie Widerstandsfähigkeit gegen Verwindungen und Eindrückungen. Die Probleme, die wir beim Latitude 7440 beobachtet haben, sind beim Dell Pro 14 Premium nicht vorhanden, so dass der Gesamteindruck eher dem des Latitude 9440 entspricht.
Das System fühlt sich nicht besonders schwächer oder stärker an als konkurrierende Modelle wie das HP EliteBook Ultra G1i 14 oder das Lenovo ThinkPad T14s Gen 6, aber wir bevorzugen die steiferen Scharniere des Dell im Vergleich zum HP.
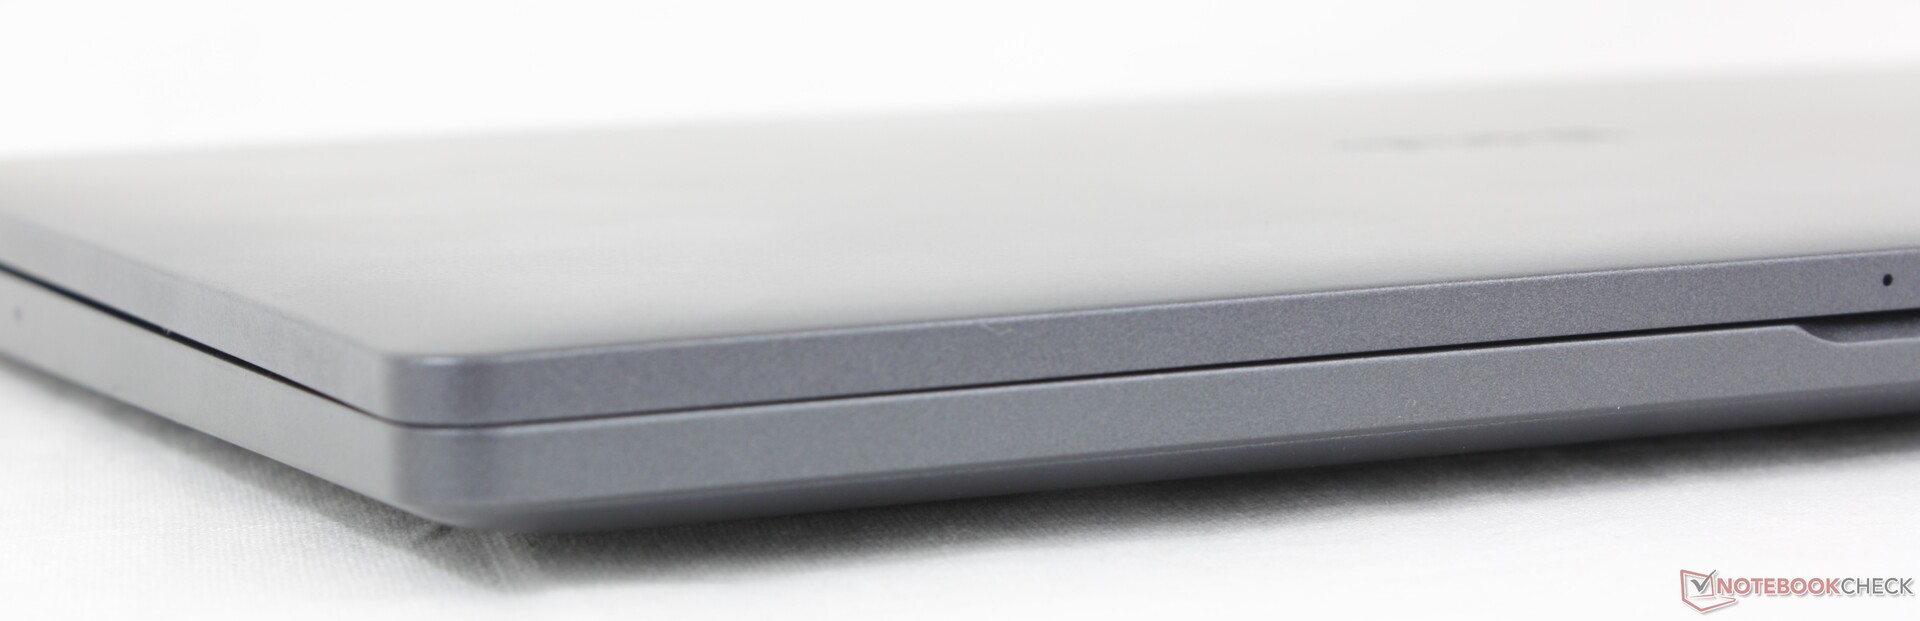
Abmessungen und Gewicht sind fast identisch mit dem Latitude 7440. Das Dell Pro 14 Premium ist vielleicht ein klein wenig kleiner und schwerer, wenn wir pingelig sein wollen, aber ansonsten ist die Dicke gleich.
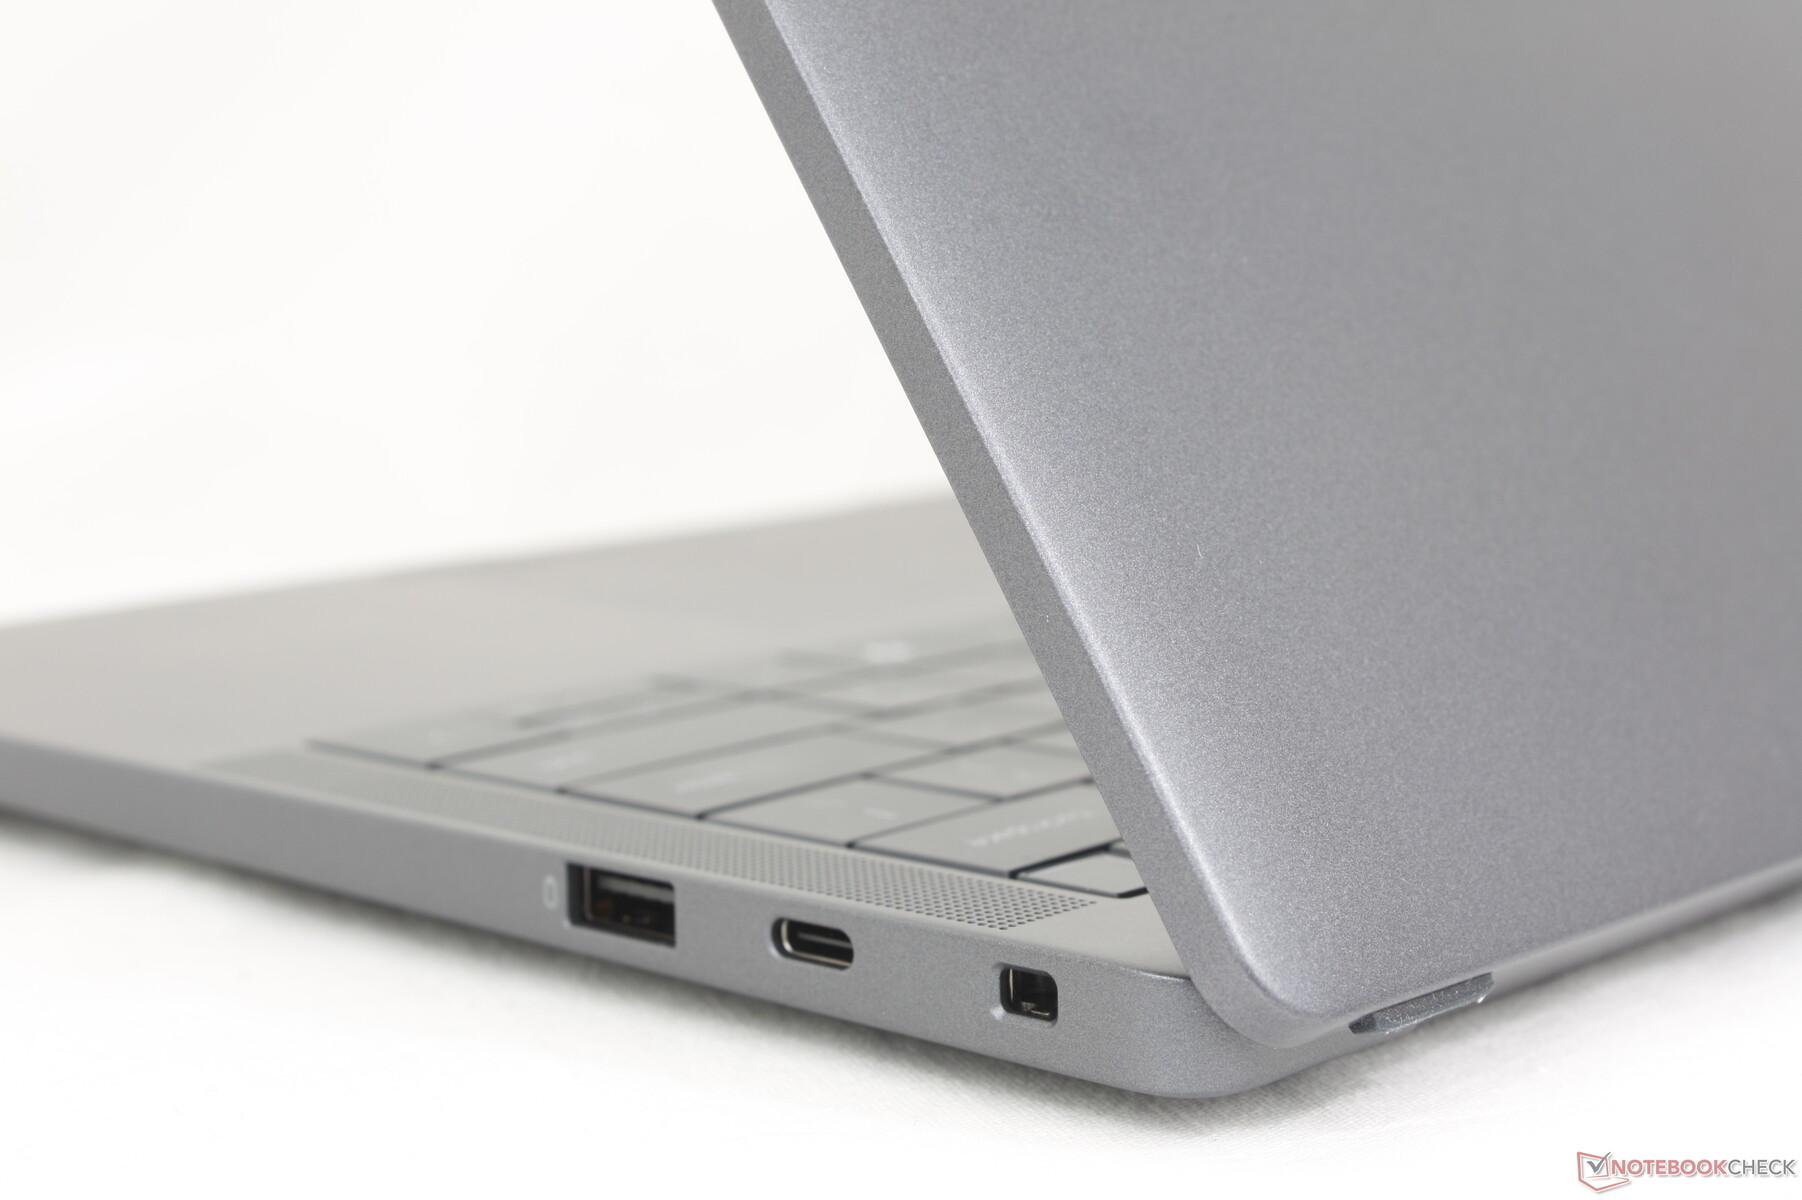

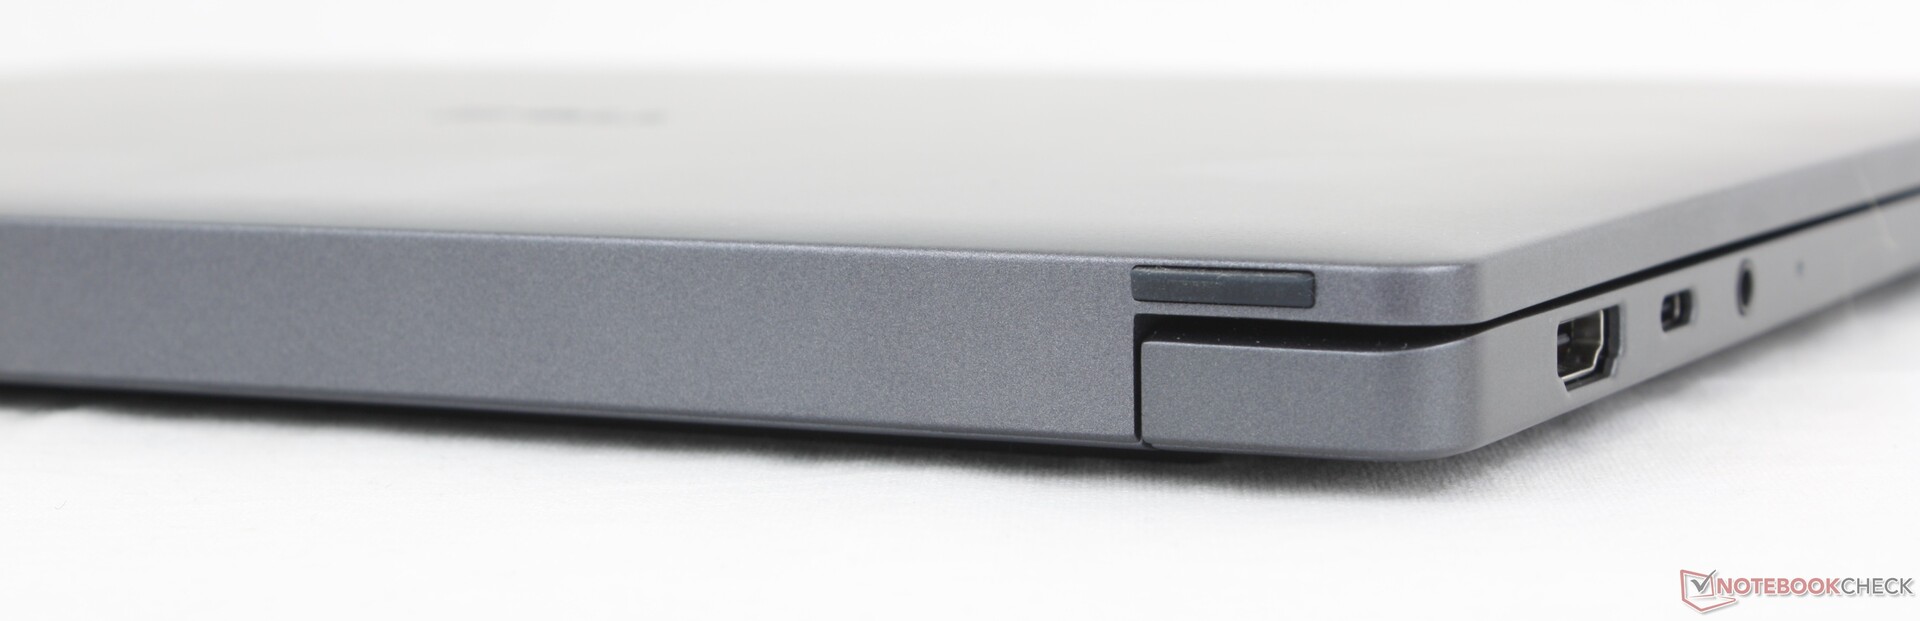
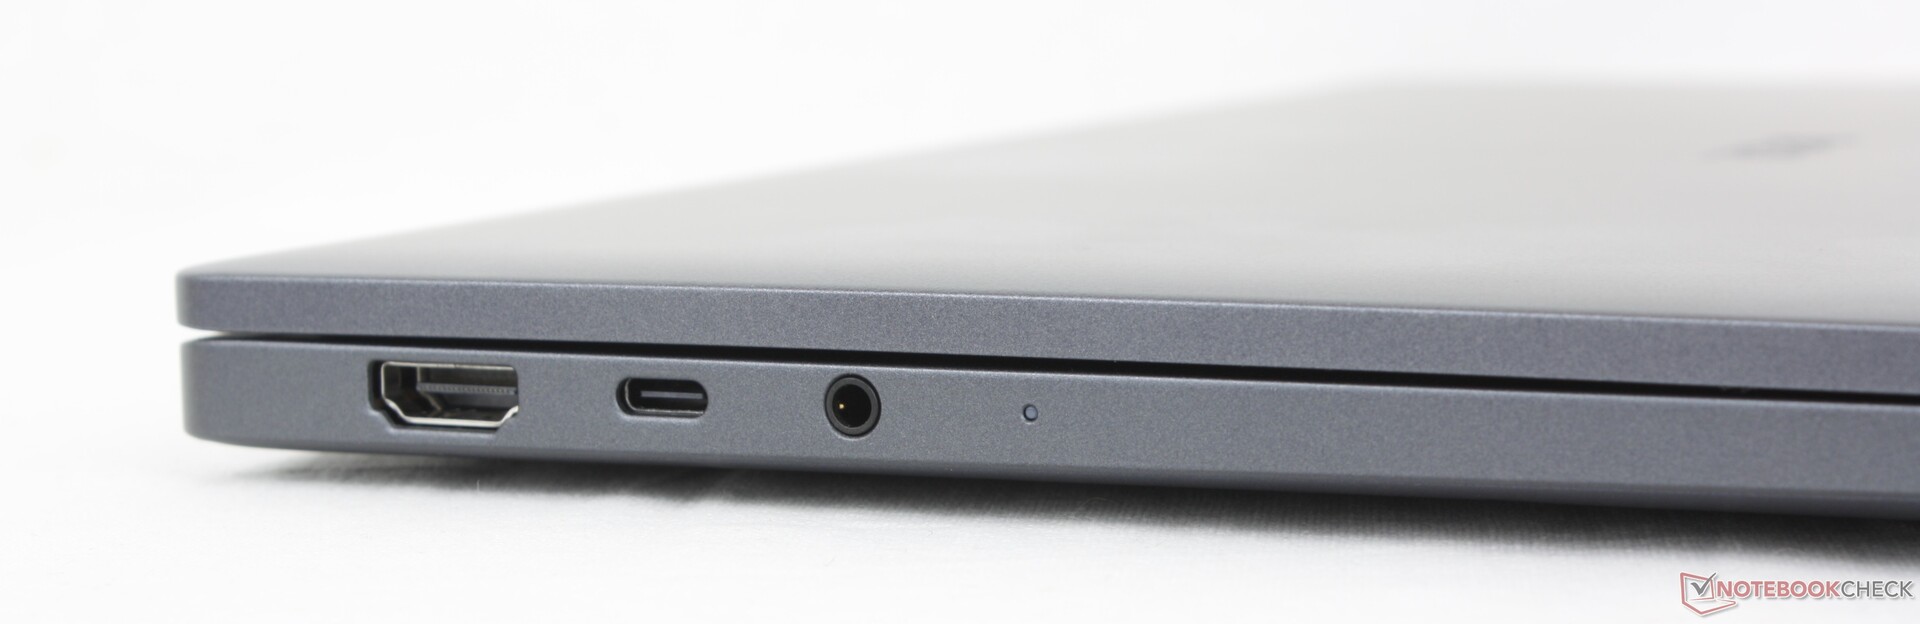
Anschlussausstattung
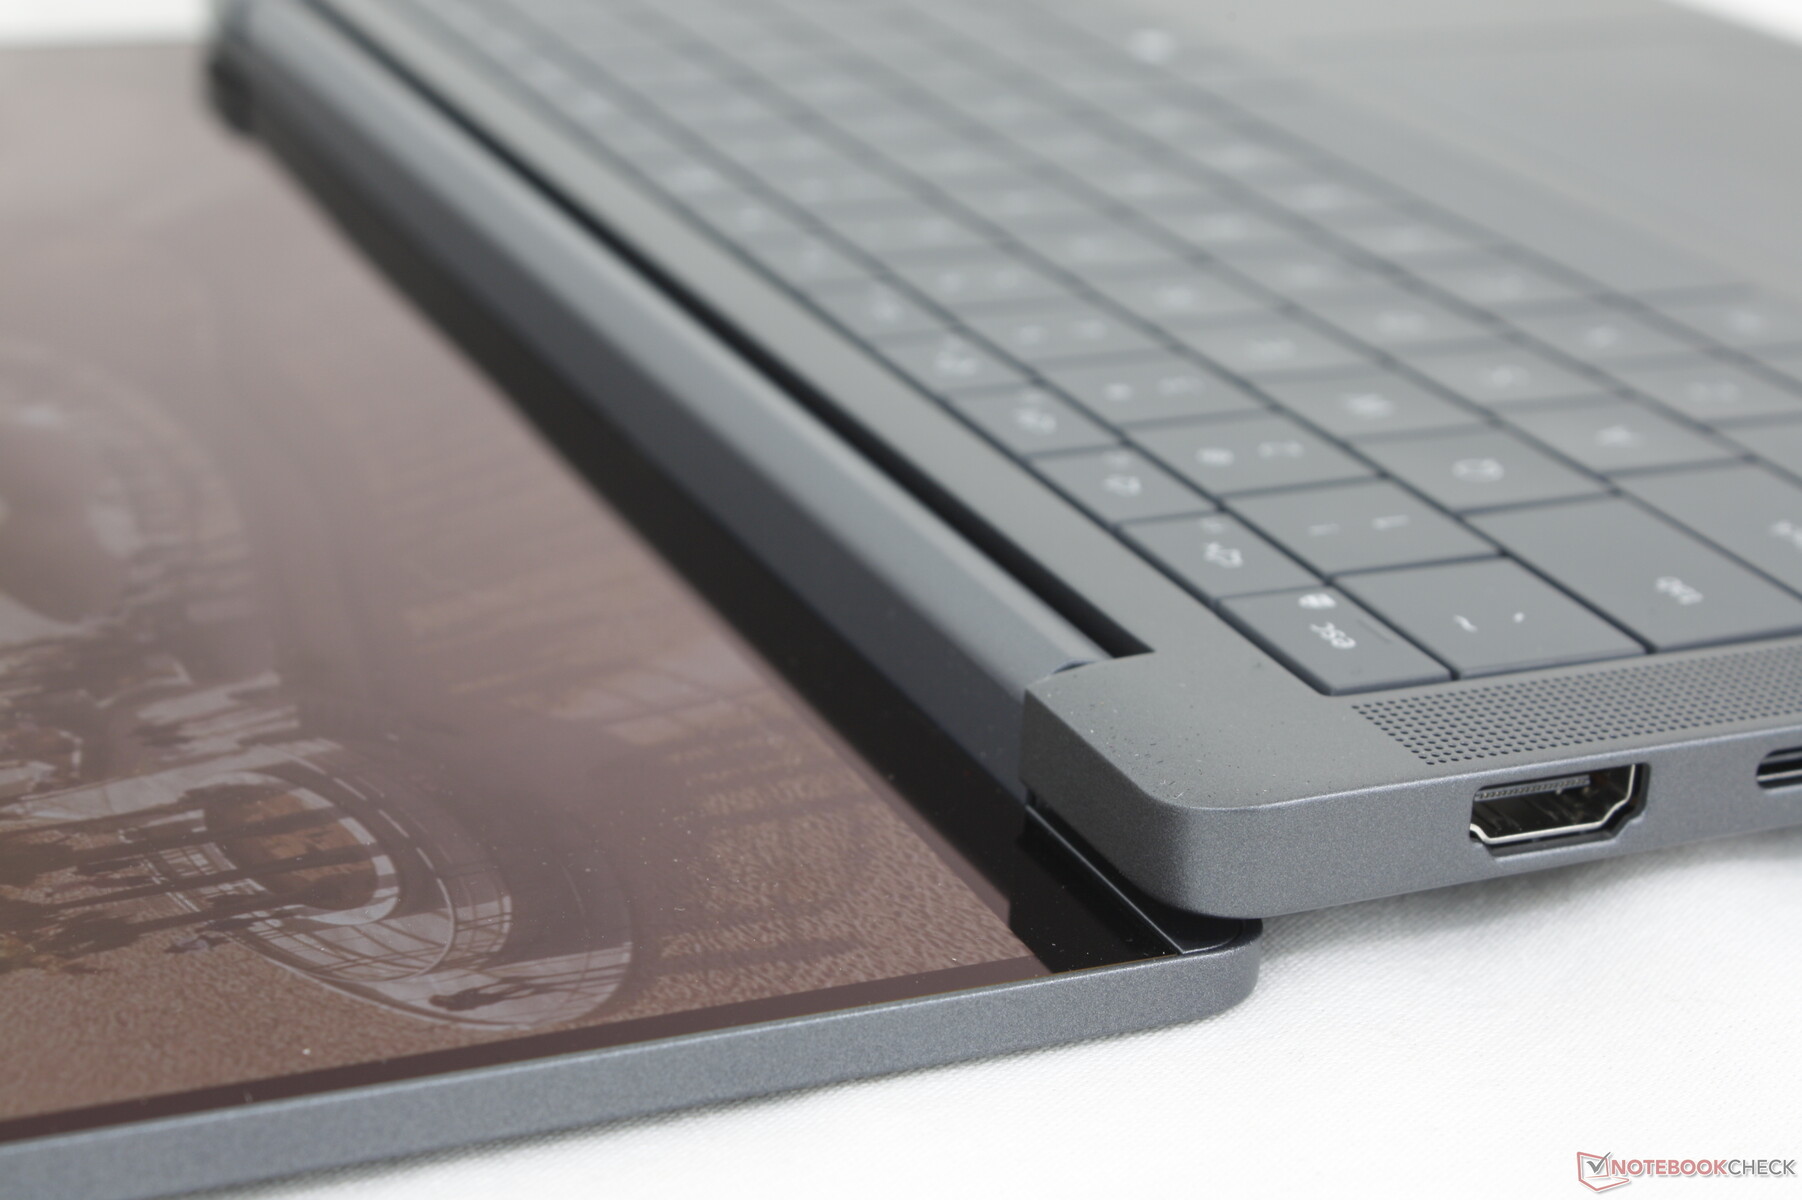
Es gibt einen USB-A-Anschluss weniger als beim Latitude 7440. Um dies auszugleichen, wurde einer der beiden USB-C-Ports an den rechten Rand des Gehäuses verlegt, um ein ergonomischeres Laden oder Andocken zu ermöglichen.

Kommunikation
Ein Intel BE201 kommt standardmäßig für Wi-Fi-7- und Bluetooth-5.4-Anschlüsse. WAN ist eine optionale Konfiguration neben einem nanoSIM-Steckplatz.
| Networking | |
| iperf3 transmit AXE11000 | |
| Dell XPS 14 2024 OLED | |
| HP EliteBook Ultra G1i 14 | |
| Asus ExpertBook B1 B1403CVA | |
| Lenovo ThinkPad T14s Gen 6 Intel | |
| Dell Pro 14 Premium | |
| Dell Latitude 7440 | |
| iperf3 receive AXE11000 | |
| Dell XPS 14 2024 OLED | |
| Asus ExpertBook B1 B1403CVA | |
| HP EliteBook Ultra G1i 14 | |
| Lenovo ThinkPad T14s Gen 6 Intel | |
| Dell Latitude 7440 | |
| Dell Pro 14 Premium | |
| iperf3 transmit AXE11000 6GHz | |
| Lenovo ThinkPad T14s Gen 6 Intel | |
| Dell Pro 14 Premium | |
| Dell Latitude 7440 | |
| iperf3 receive AXE11000 6GHz | |
| Lenovo ThinkPad T14s Gen 6 Intel | |
| Dell Pro 14 Premium | |
| Dell Latitude 7440 | |
Webcam
Eine 8-MP-Webcam ist im Lieferumfang enthalten sowie eine Infrarotkamera und ein physischer Auslöser. Die Anwesenheitserkennung ist optional.


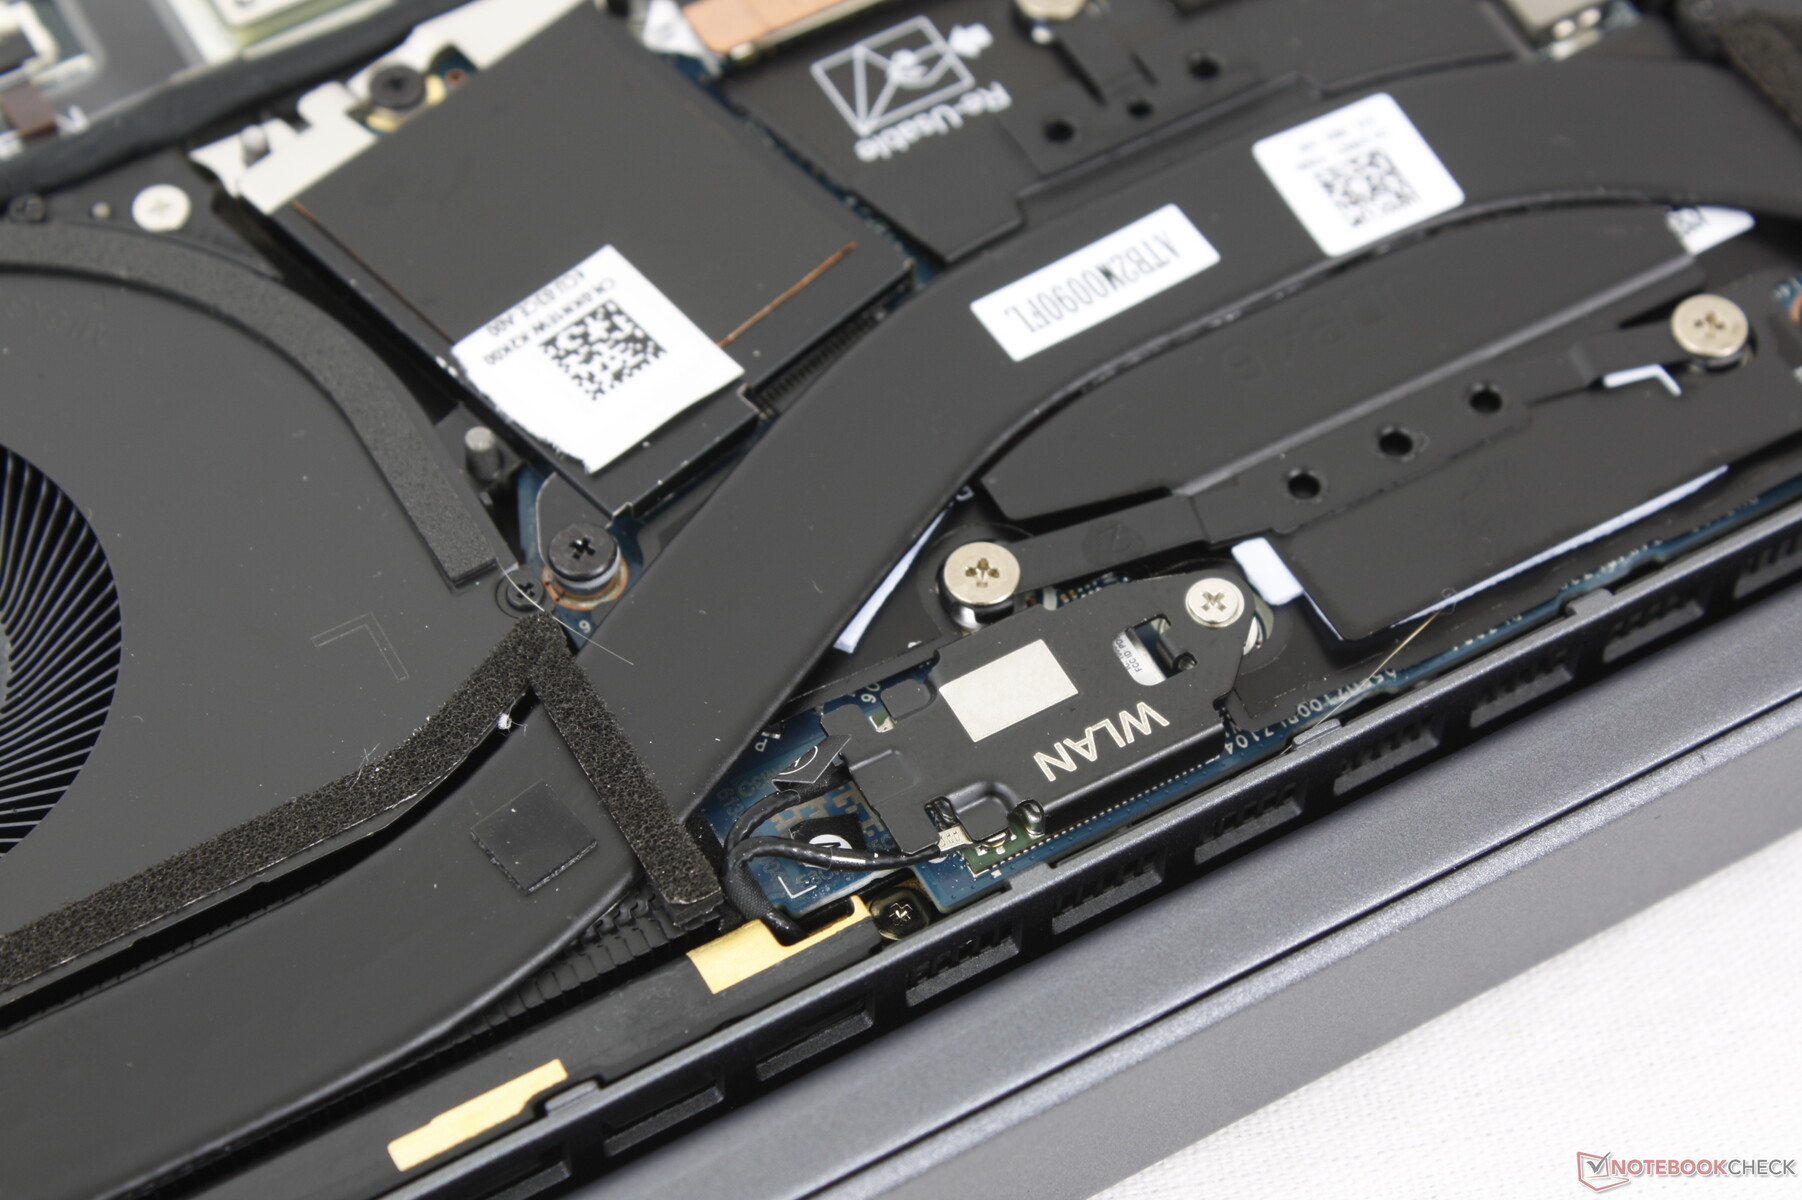
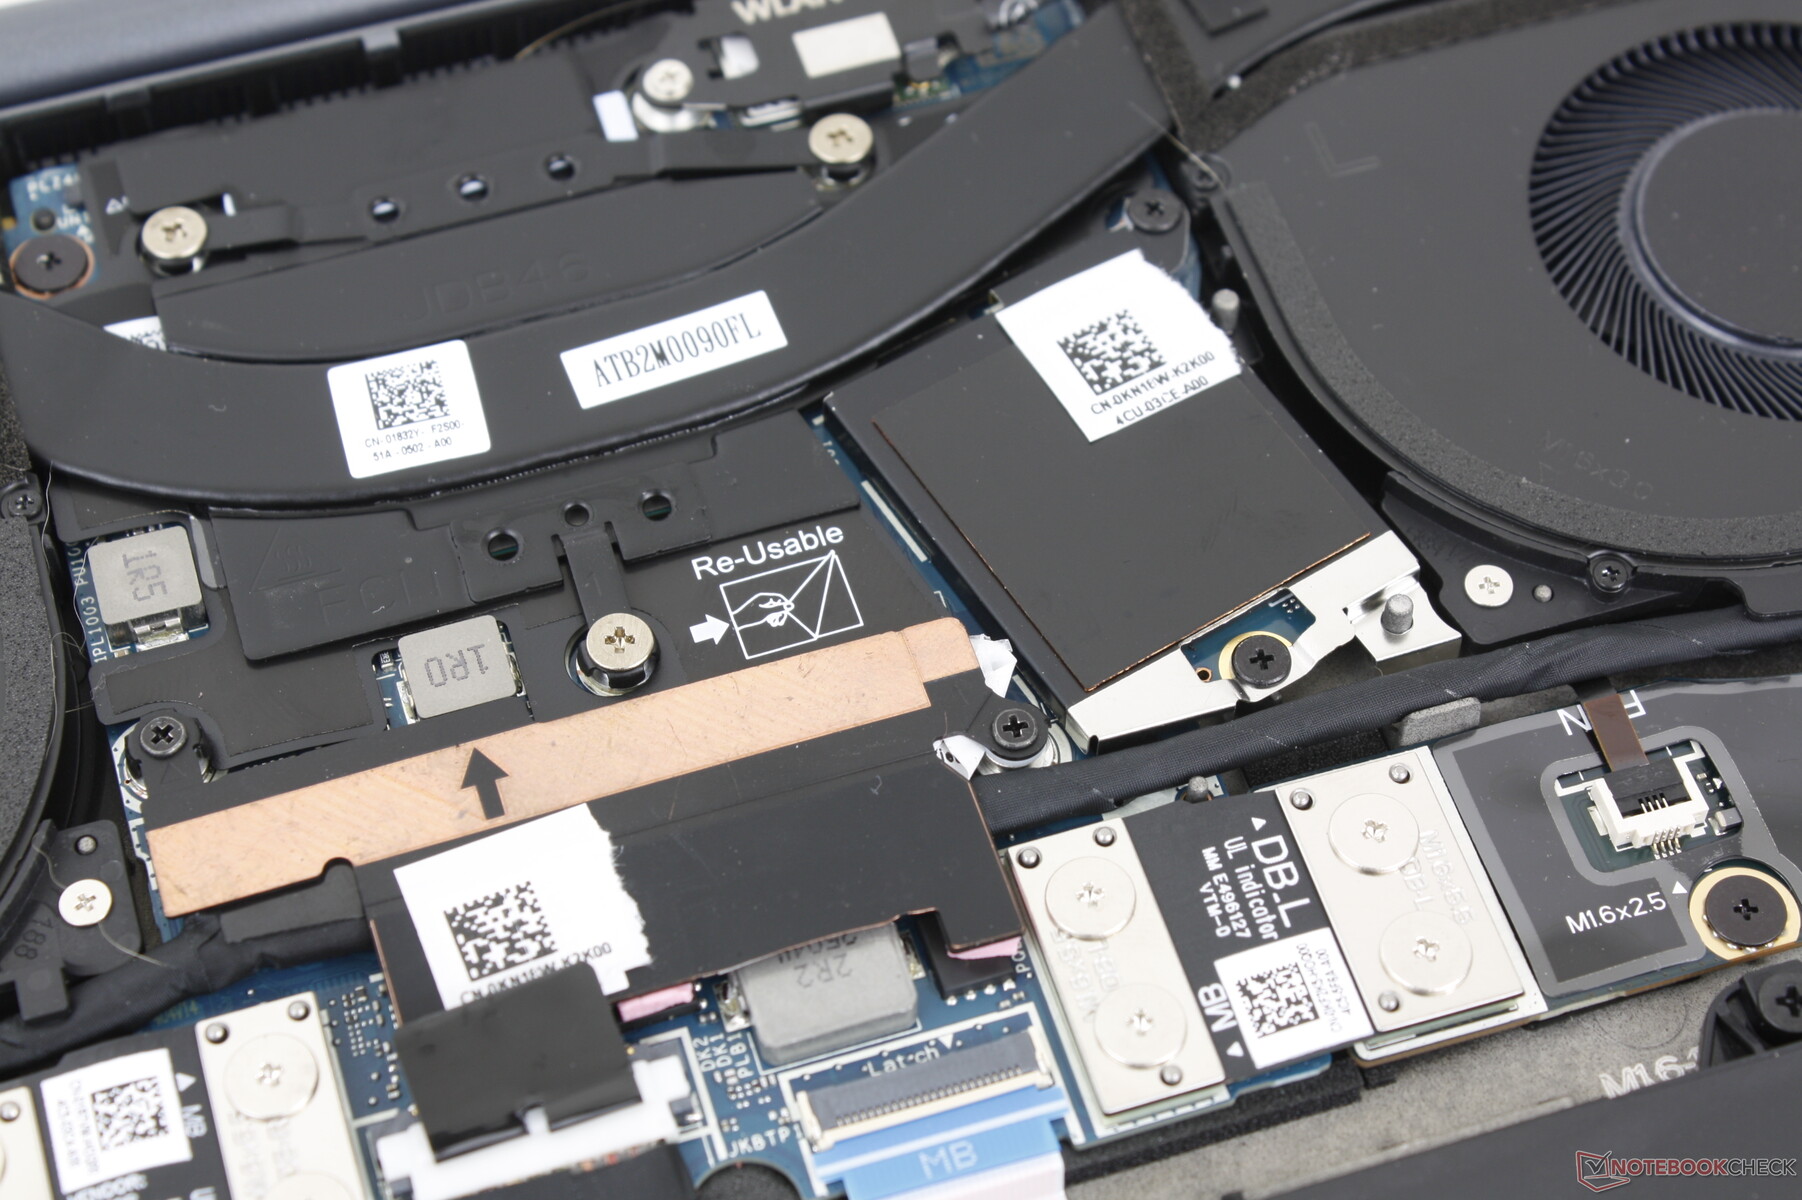
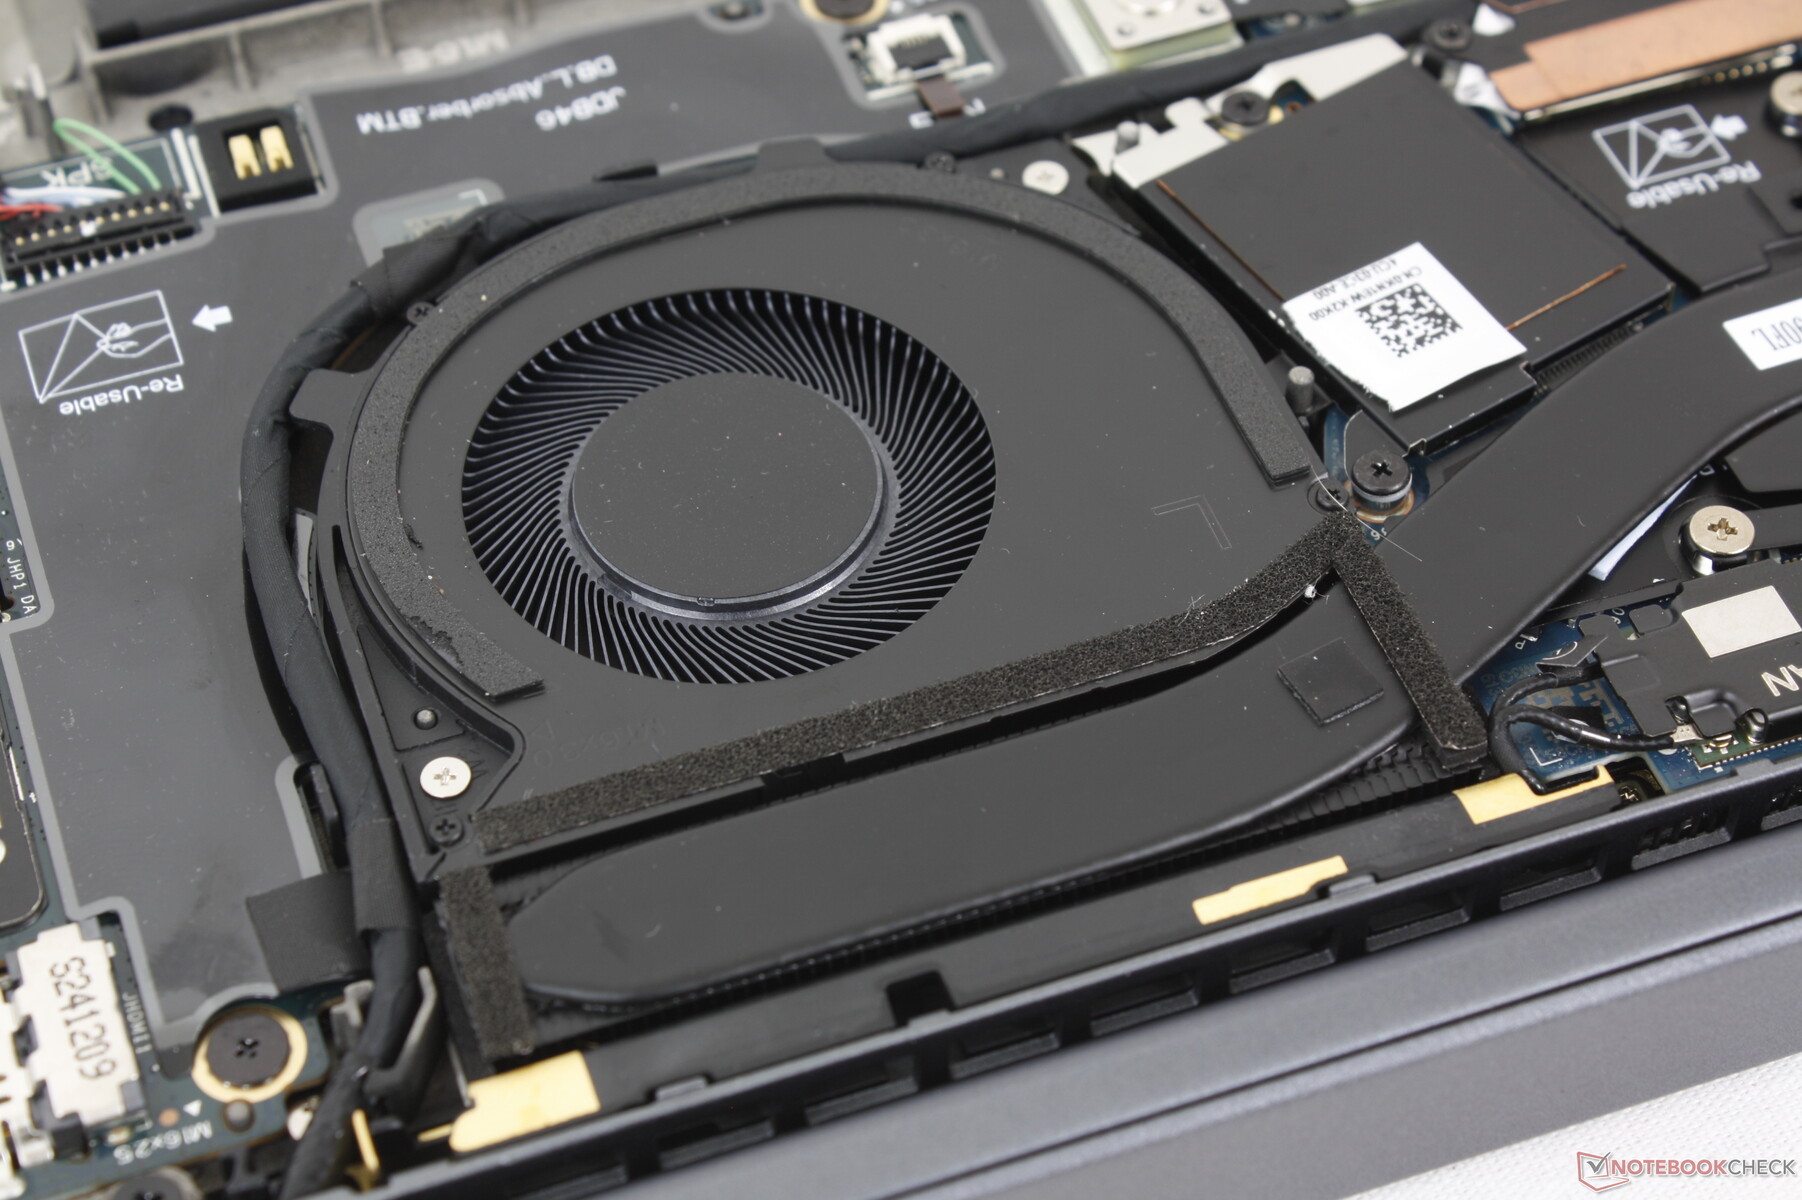
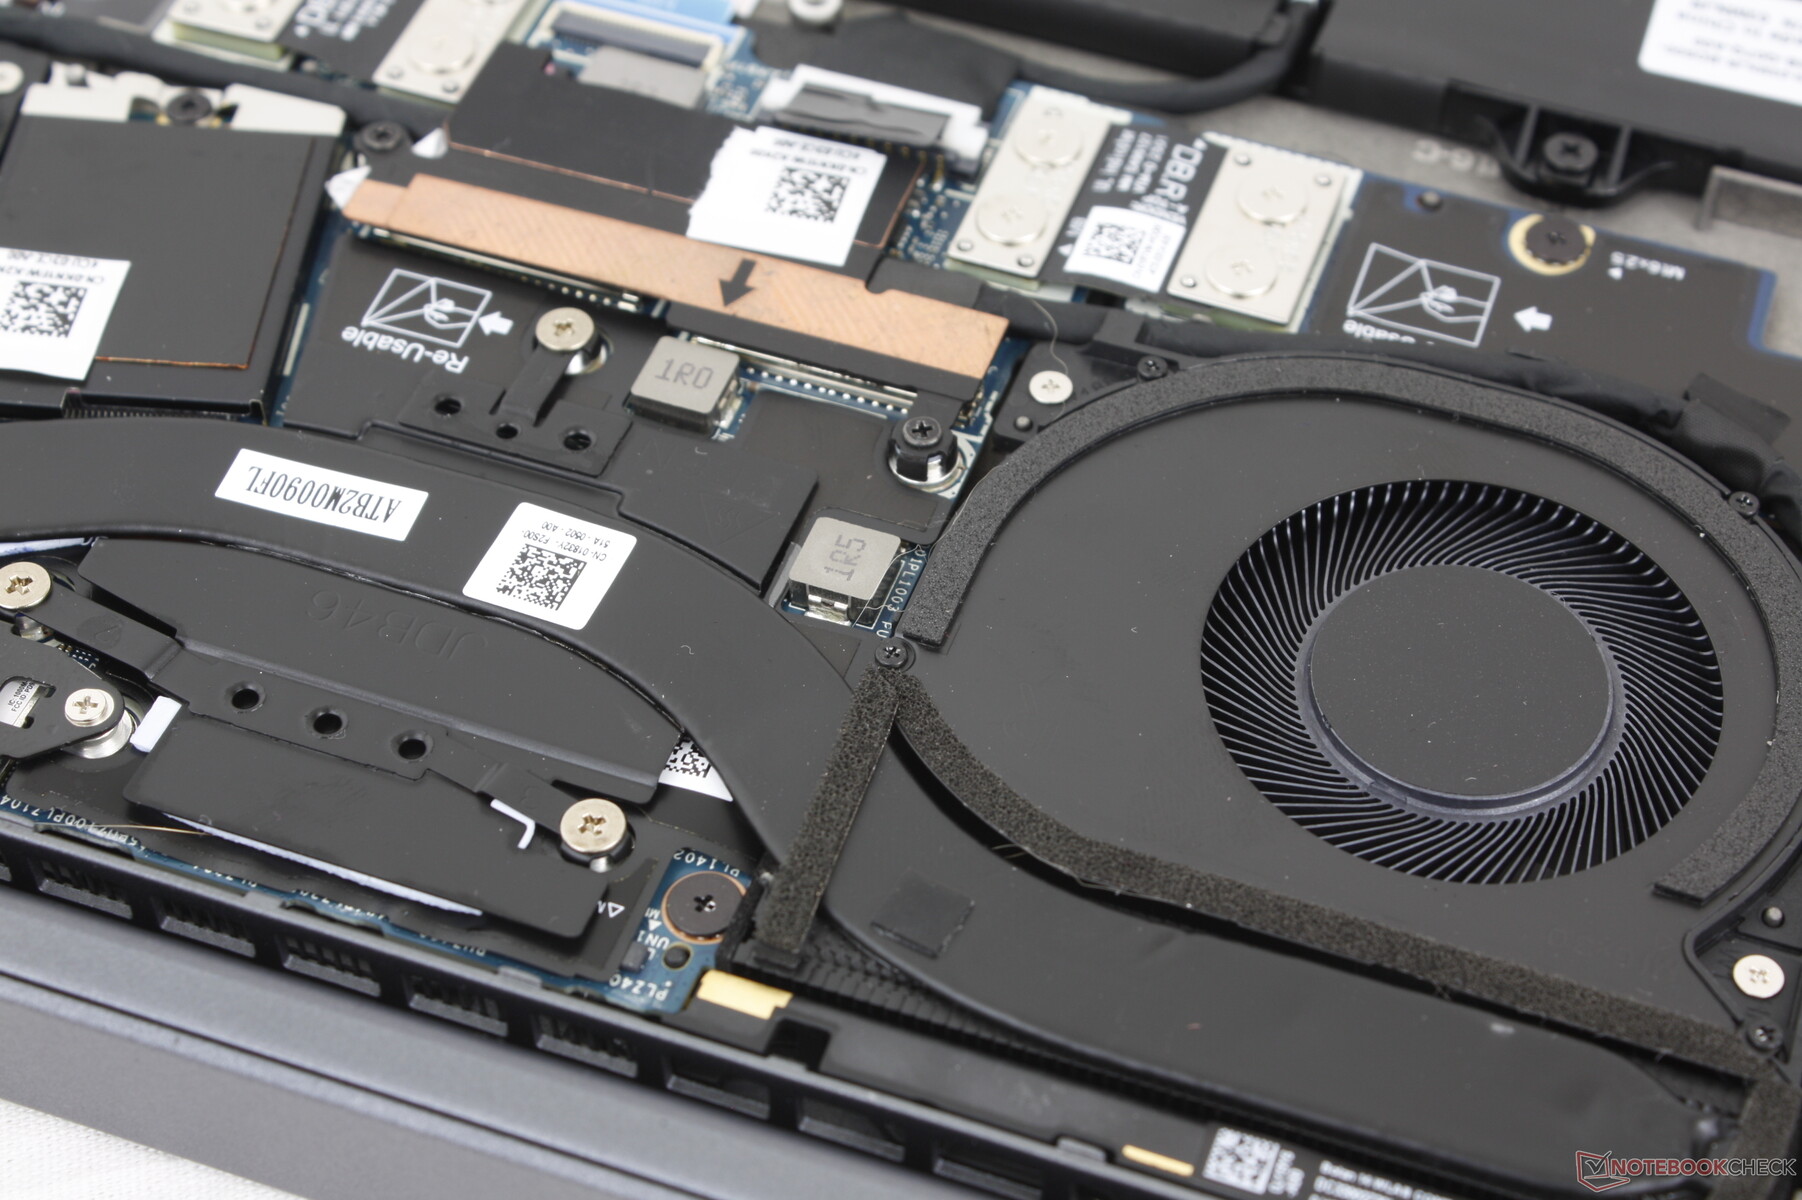
Wartung
Die Unterseite ist mit sieben Kreuzschlitzschrauben gesichert, um die Wartung zu erleichtern. Im Inneren sind nur der Akku und die primäre M.2-SSD abnehmbar, da die WLAN- und RAM-Module fest verlötet sind. Zu beachten ist, dass die beiden Lüfter etwas größer sind als die des Latitude 9440 2-in-1.

Nachhaltigkeit
Dies ist einer der ersten Business-PCs, die mit einem modularen USB-C-Anschluss ausgestattet sind, der bei Bedarf einfach ausgetauscht werden kann. Im Vergleich dazu sind USB-C-Ports bei den meisten anderen Laptops fest in die Hauptplatine integriert, was die Reparatur oder den Austausch im Falle eines Defekts erschweren kann.
Das Modell selbst besteht zu 90 Prozent seines Gewichts aus recyceltem Magnesium, während die Verpackung zu 100 Prozent aus recycelten oder erneuerten Materialien hergestellt wurde.
Zubehör und Garantie
In der Verpackung befinden sich außer dem Netzteil und dem Papierkram keine weiteren Extras. Eine 3-Jahres-Garantie mit Vor-Ort-Reparatur am nächsten Arbeitstag ist enthalten.
Eingabegeräte
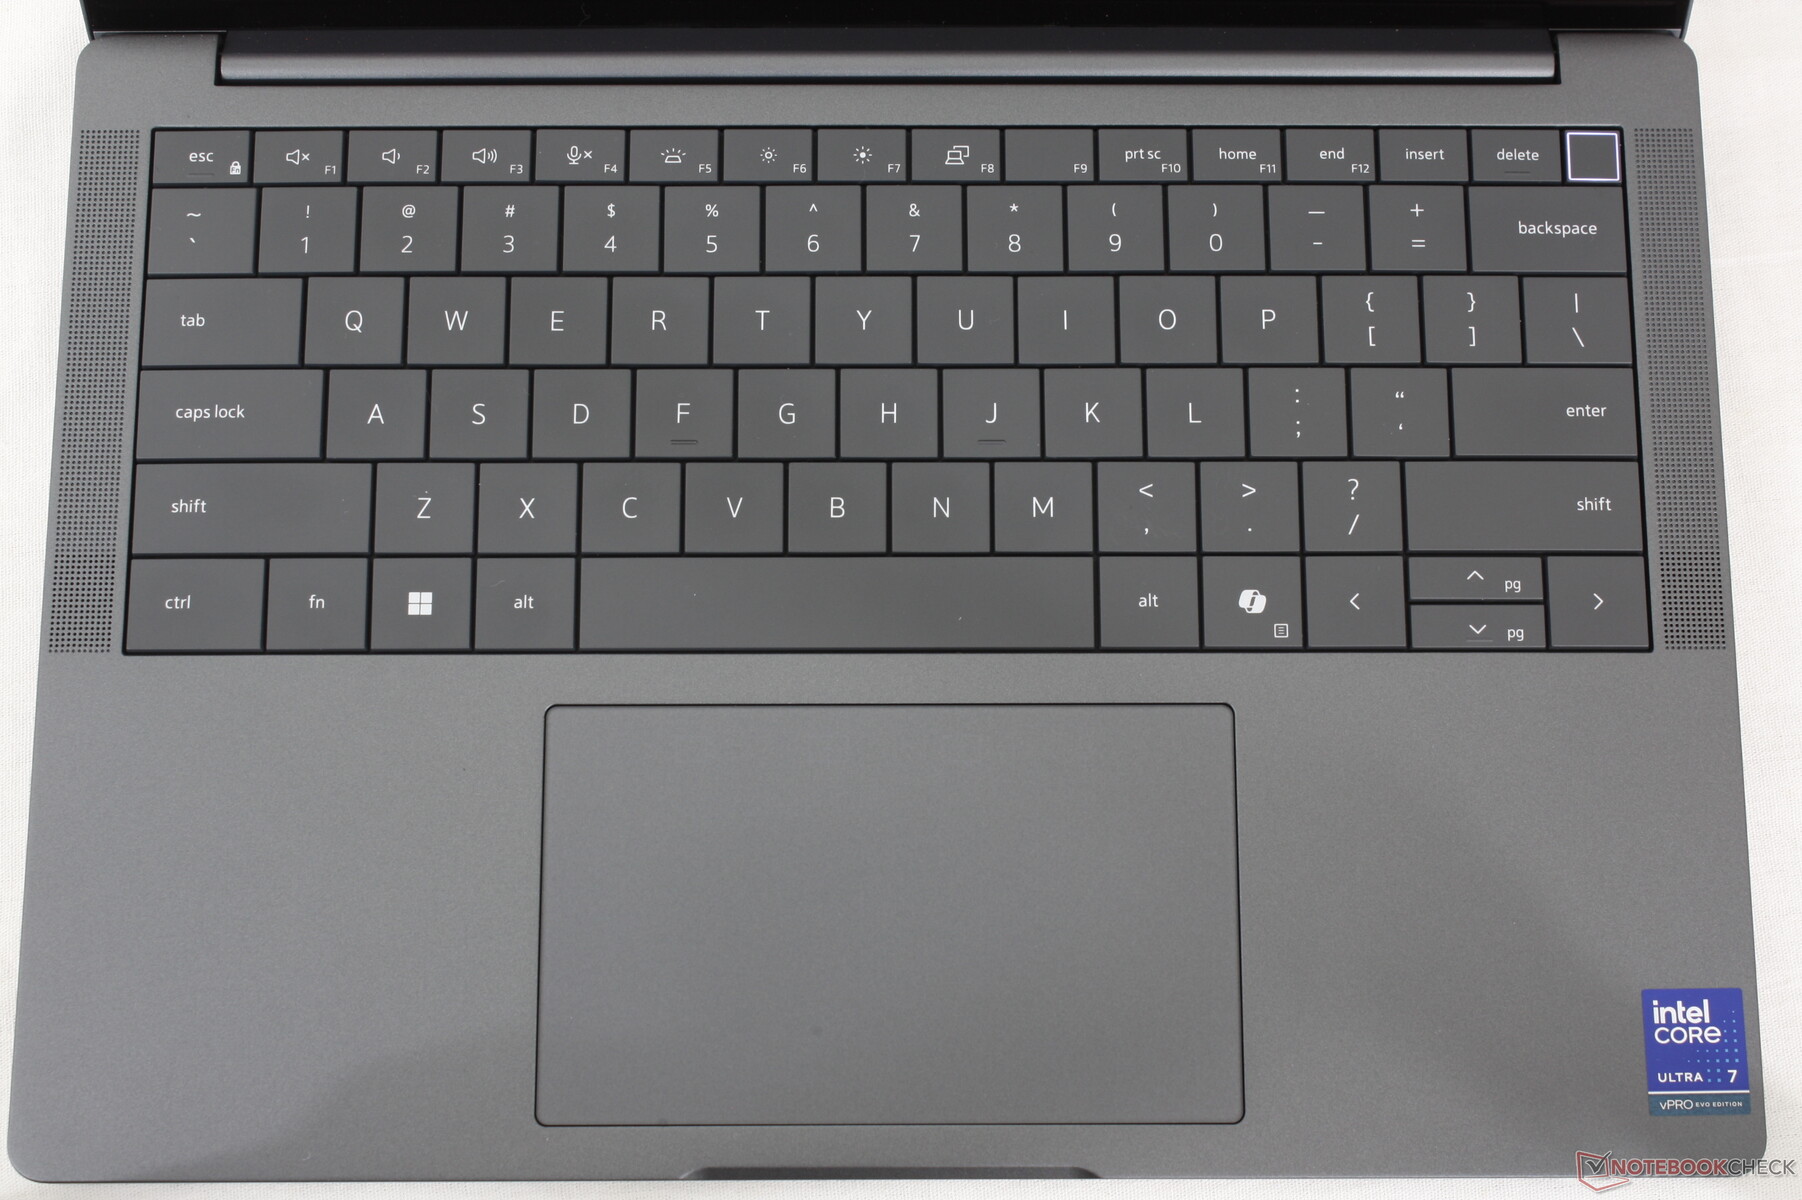
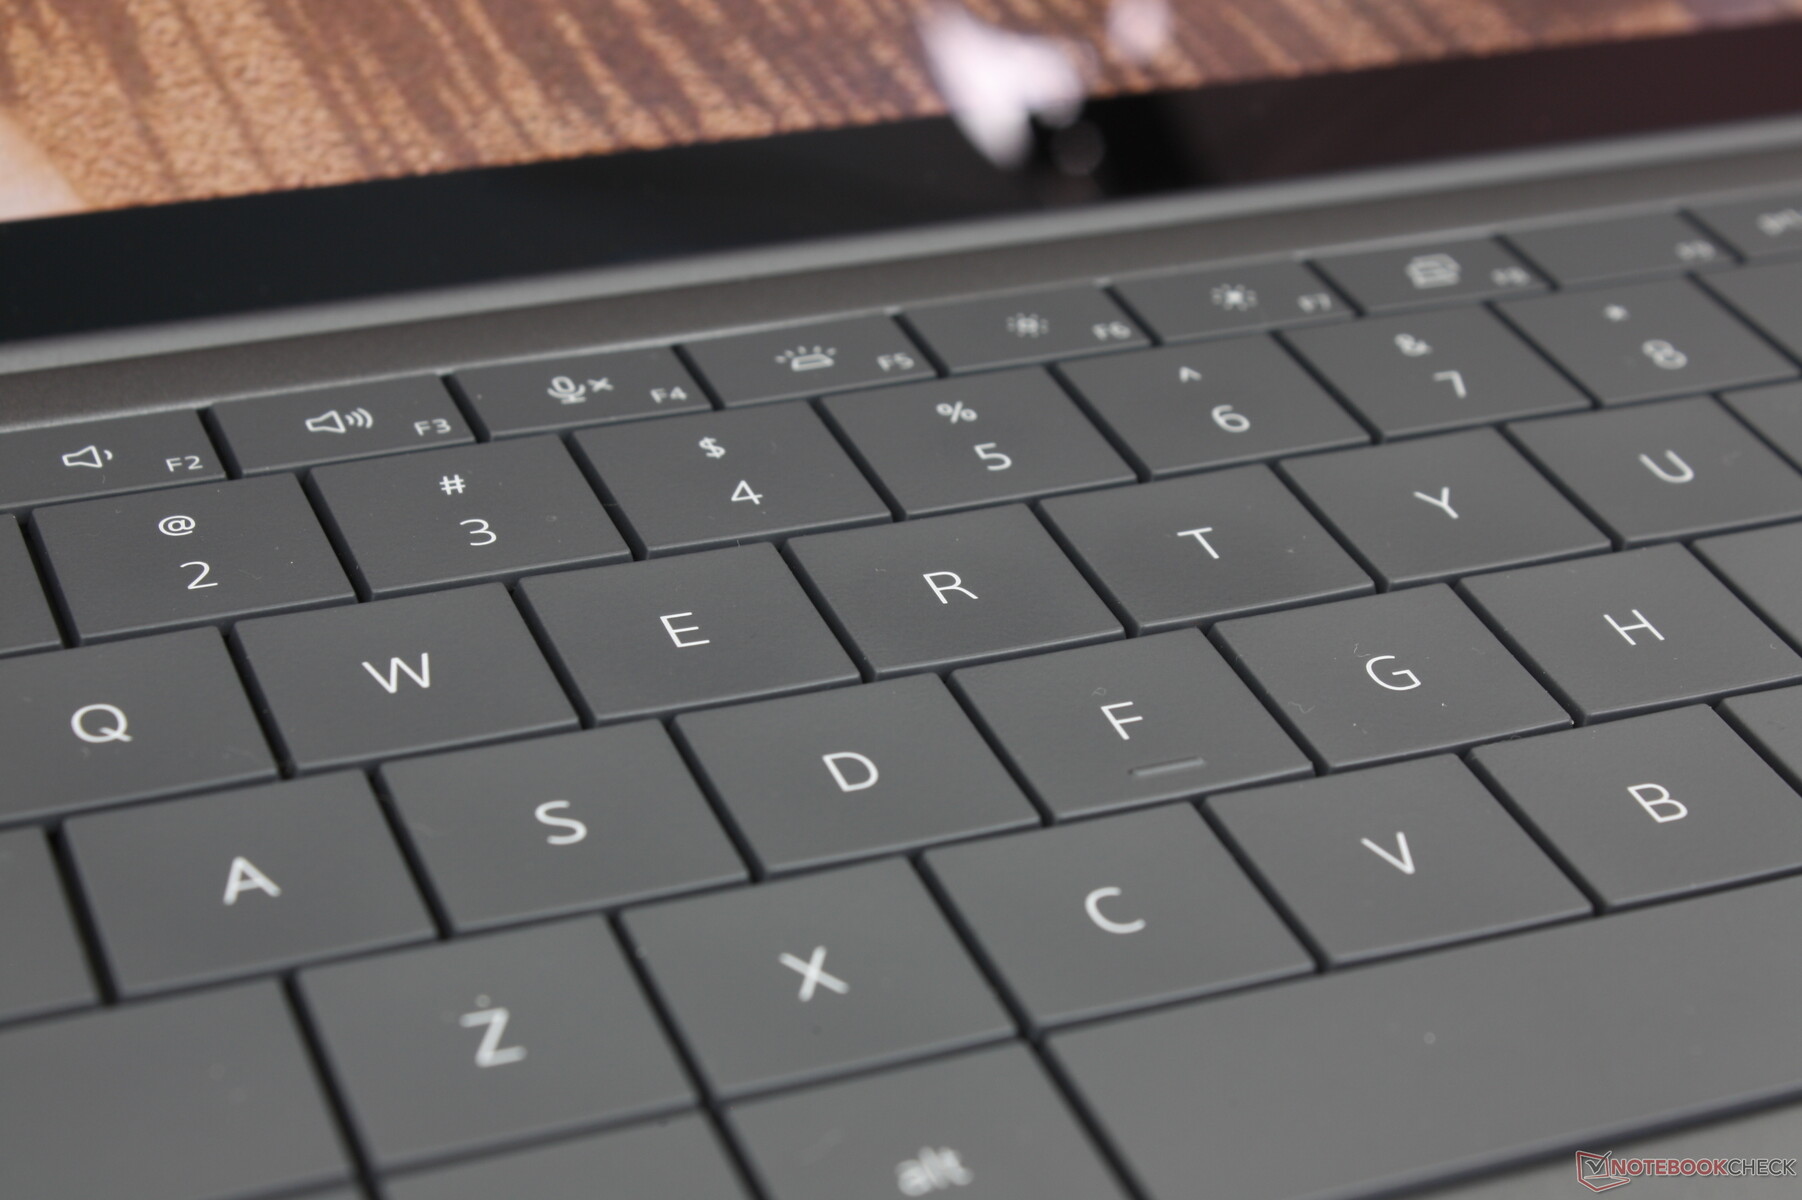
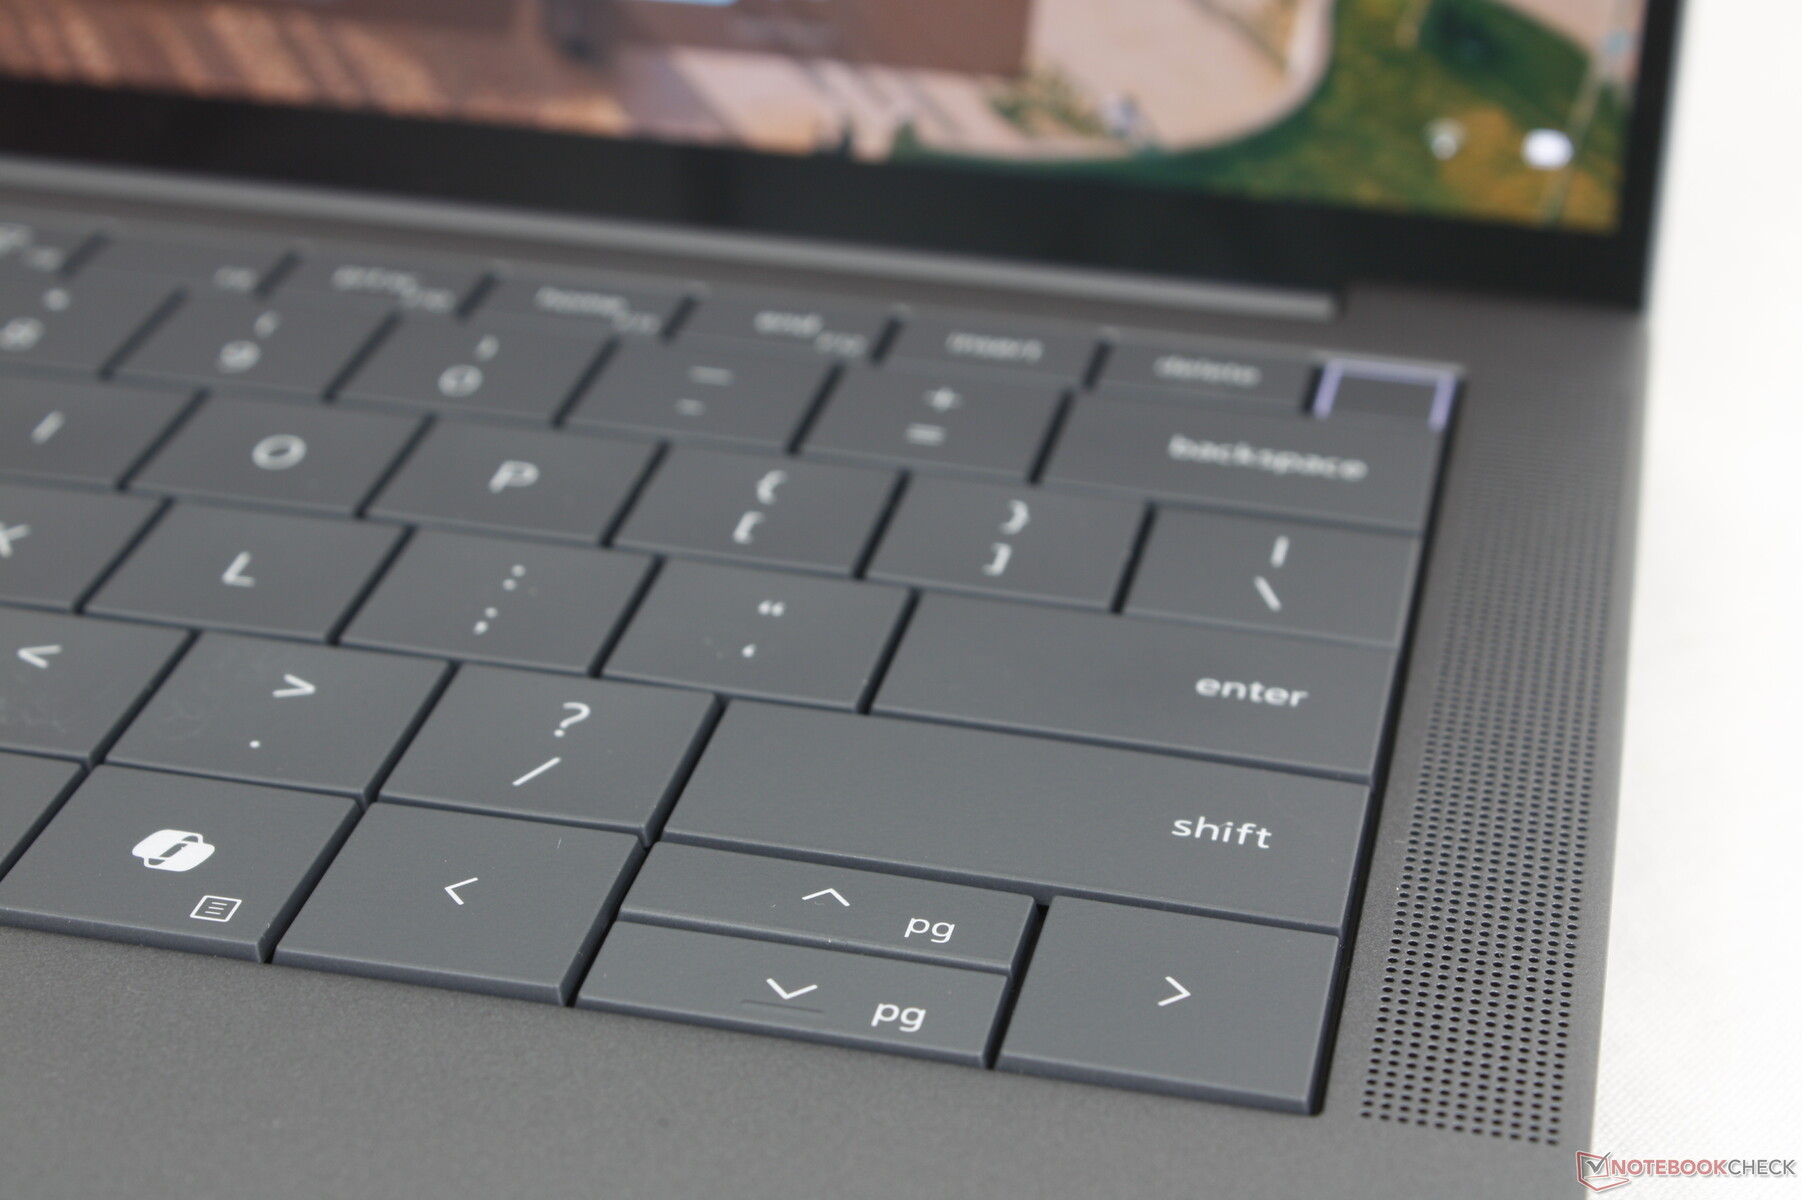
Tastatur
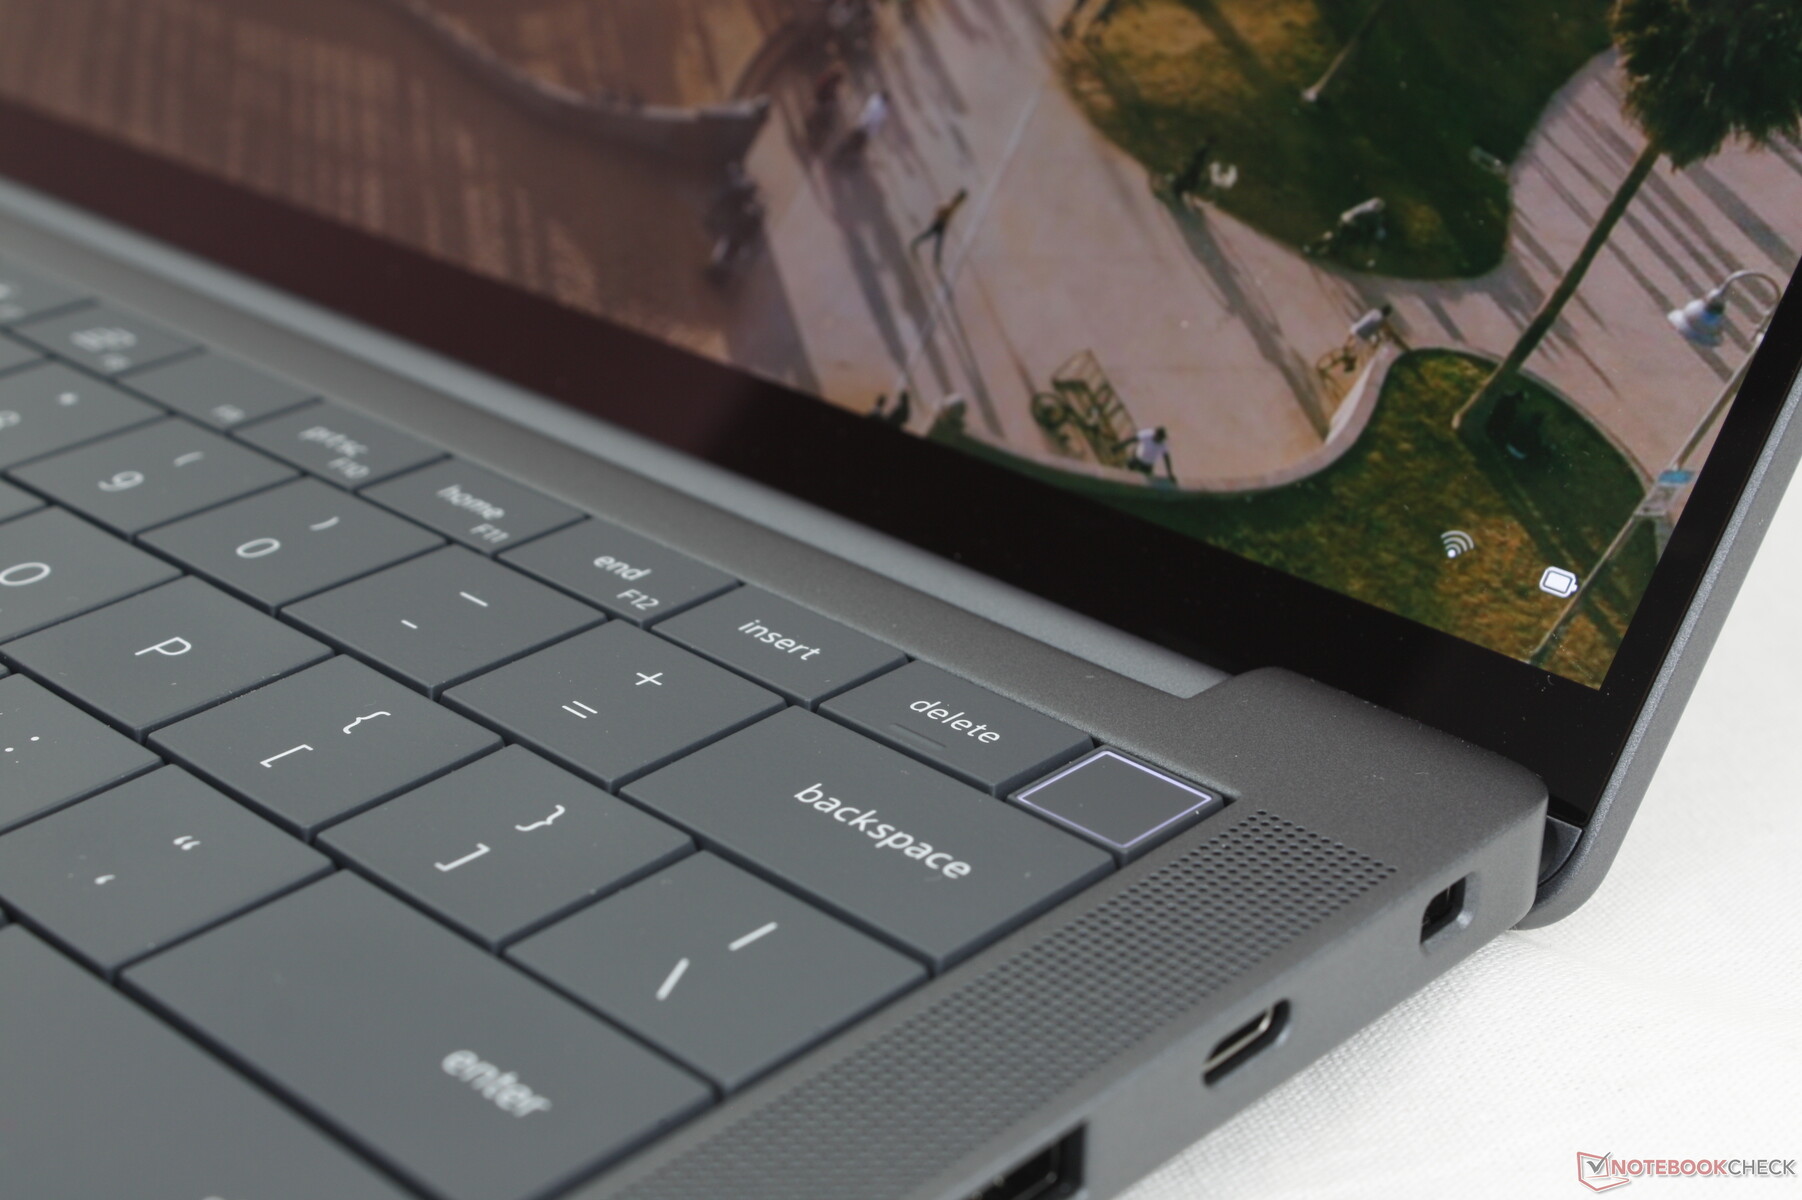
Die Zero-Lattice-Tastatur ist hier genau die gleiche wie beim Latitude 9440 2-in-1 für ein identisches Tipperlebnis. Auch wenn sie ästhetisch ansprechend ist, hätte das Feedback für die Enter-Taste besser sein können, und der Hubweg ist wohl eher gering.
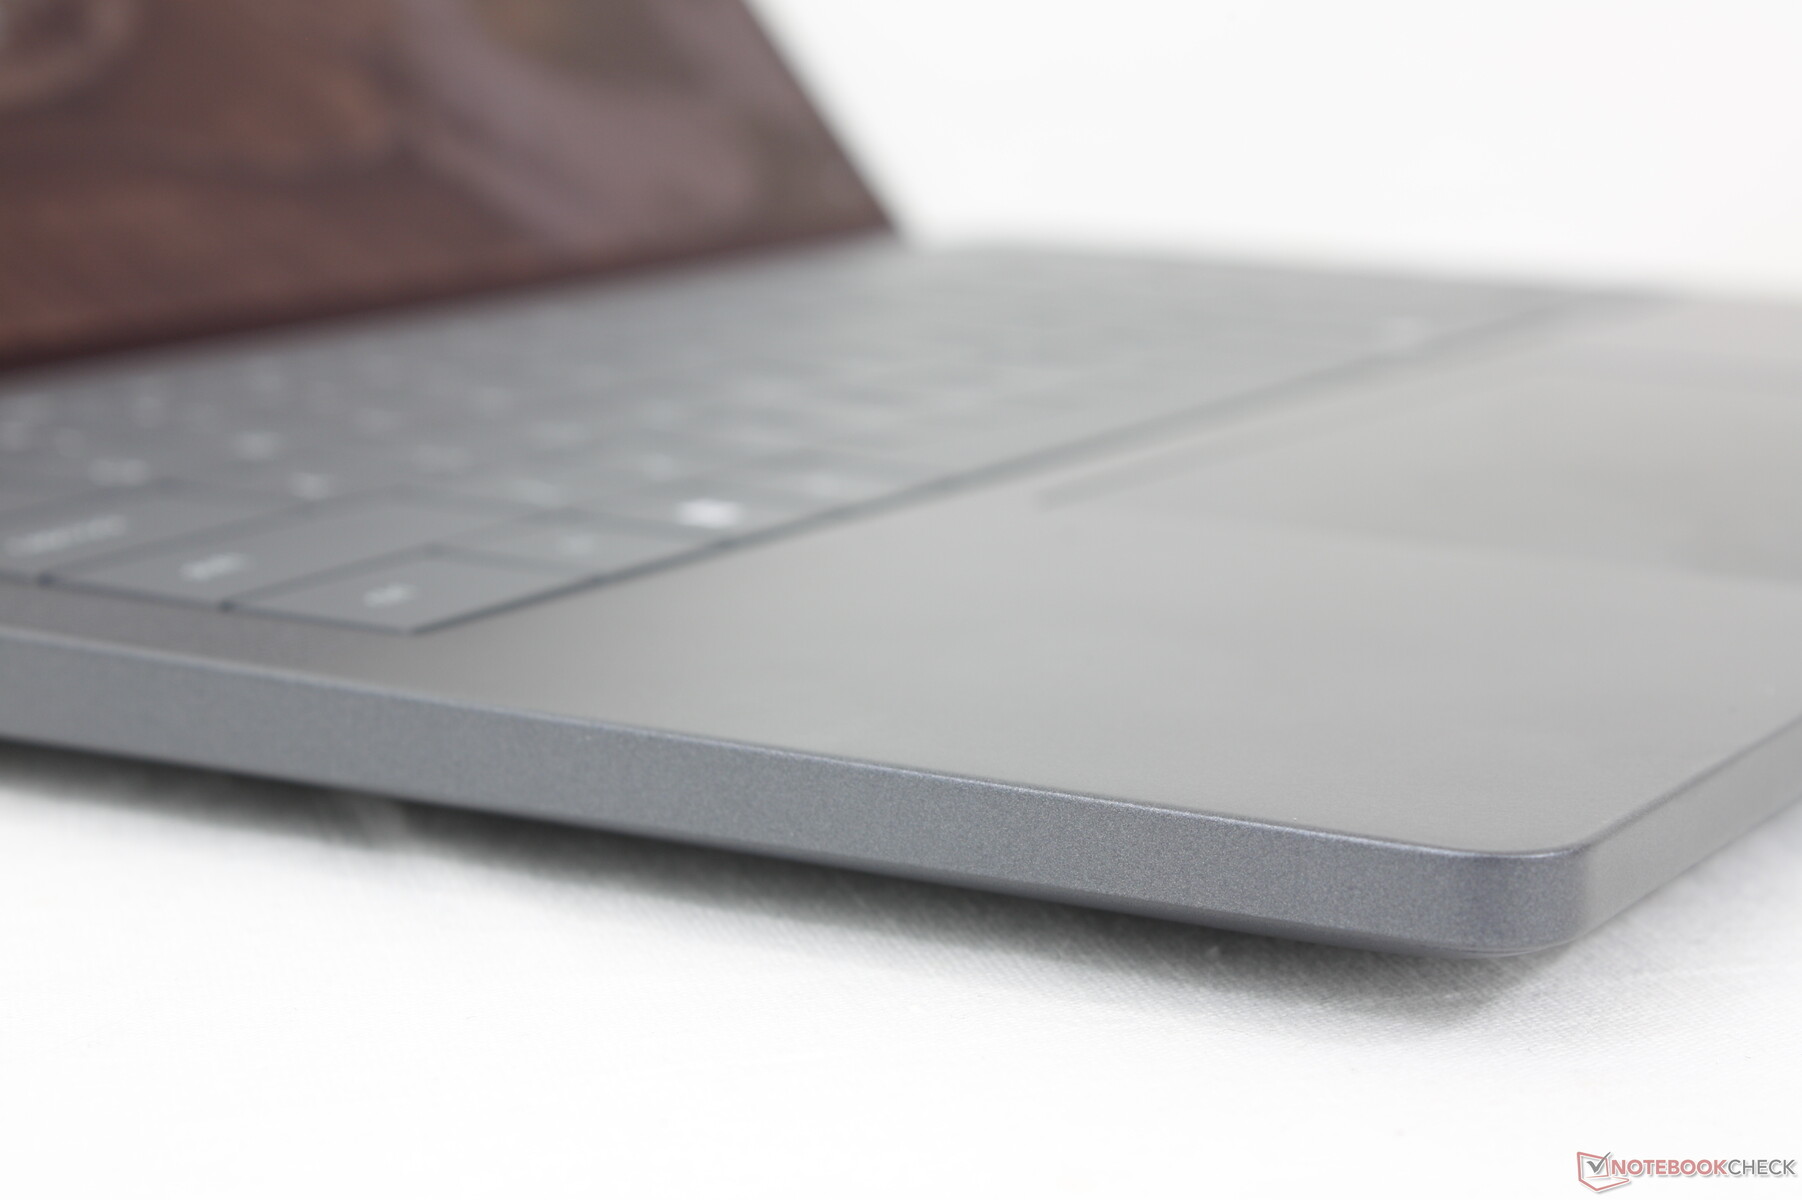
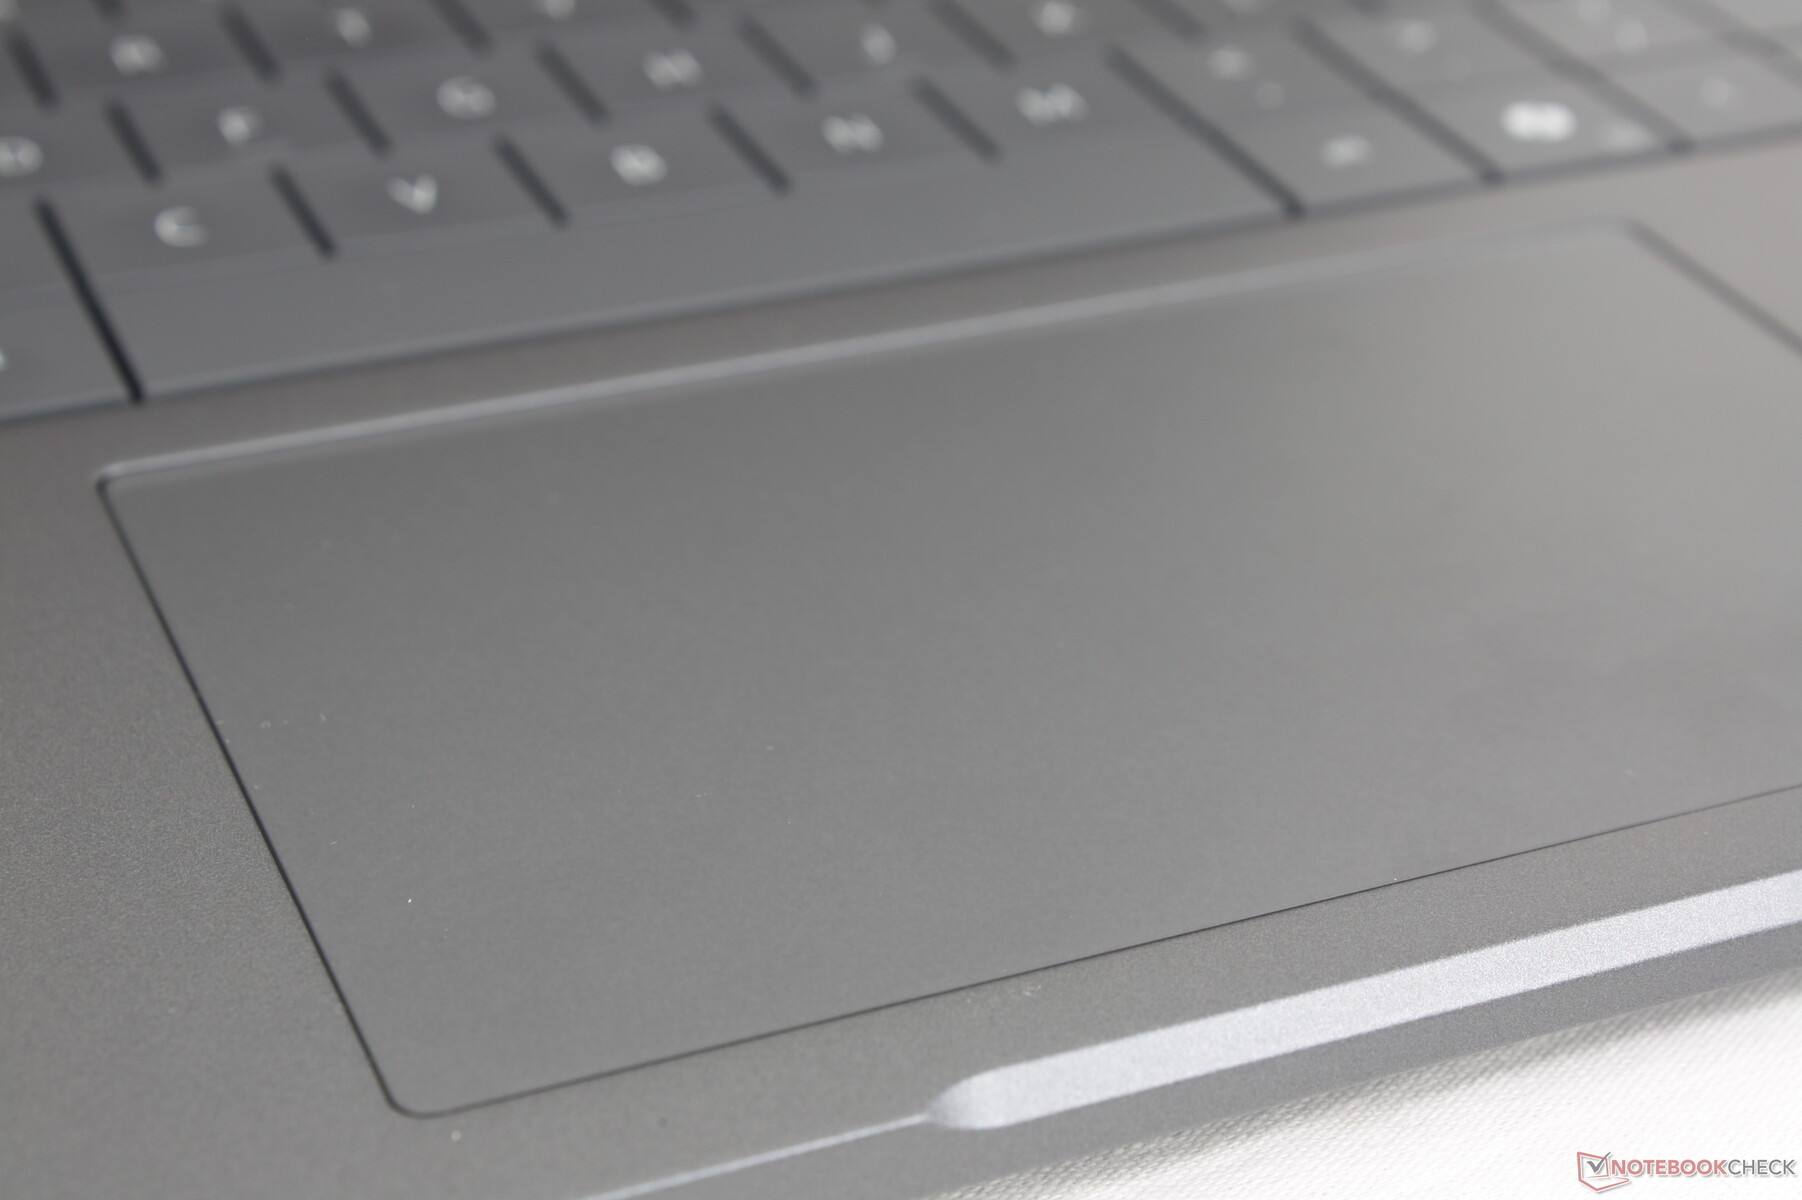
Touchpad
Das Clickpad hat sich gegenüber dem Latitude 9440 2-in-1 verändert und wirkt nun traditioneller. Es ist etwas kleiner (12,5 x 7,5 cm gegenüber 13,5 x 9 cm) und fühlt sich daher etwas beengter an als zuvor, aber ansonsten funktioniert es ohne Probleme. Das Klappern ist bemerkenswert leise und wohl eher schwammig, wenn man auf die Oberfläche drückt.
Display - Schönes OLED, aber nur 60 Hz
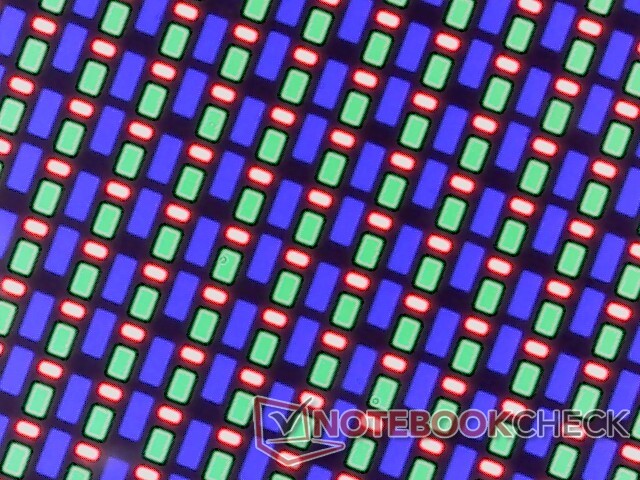
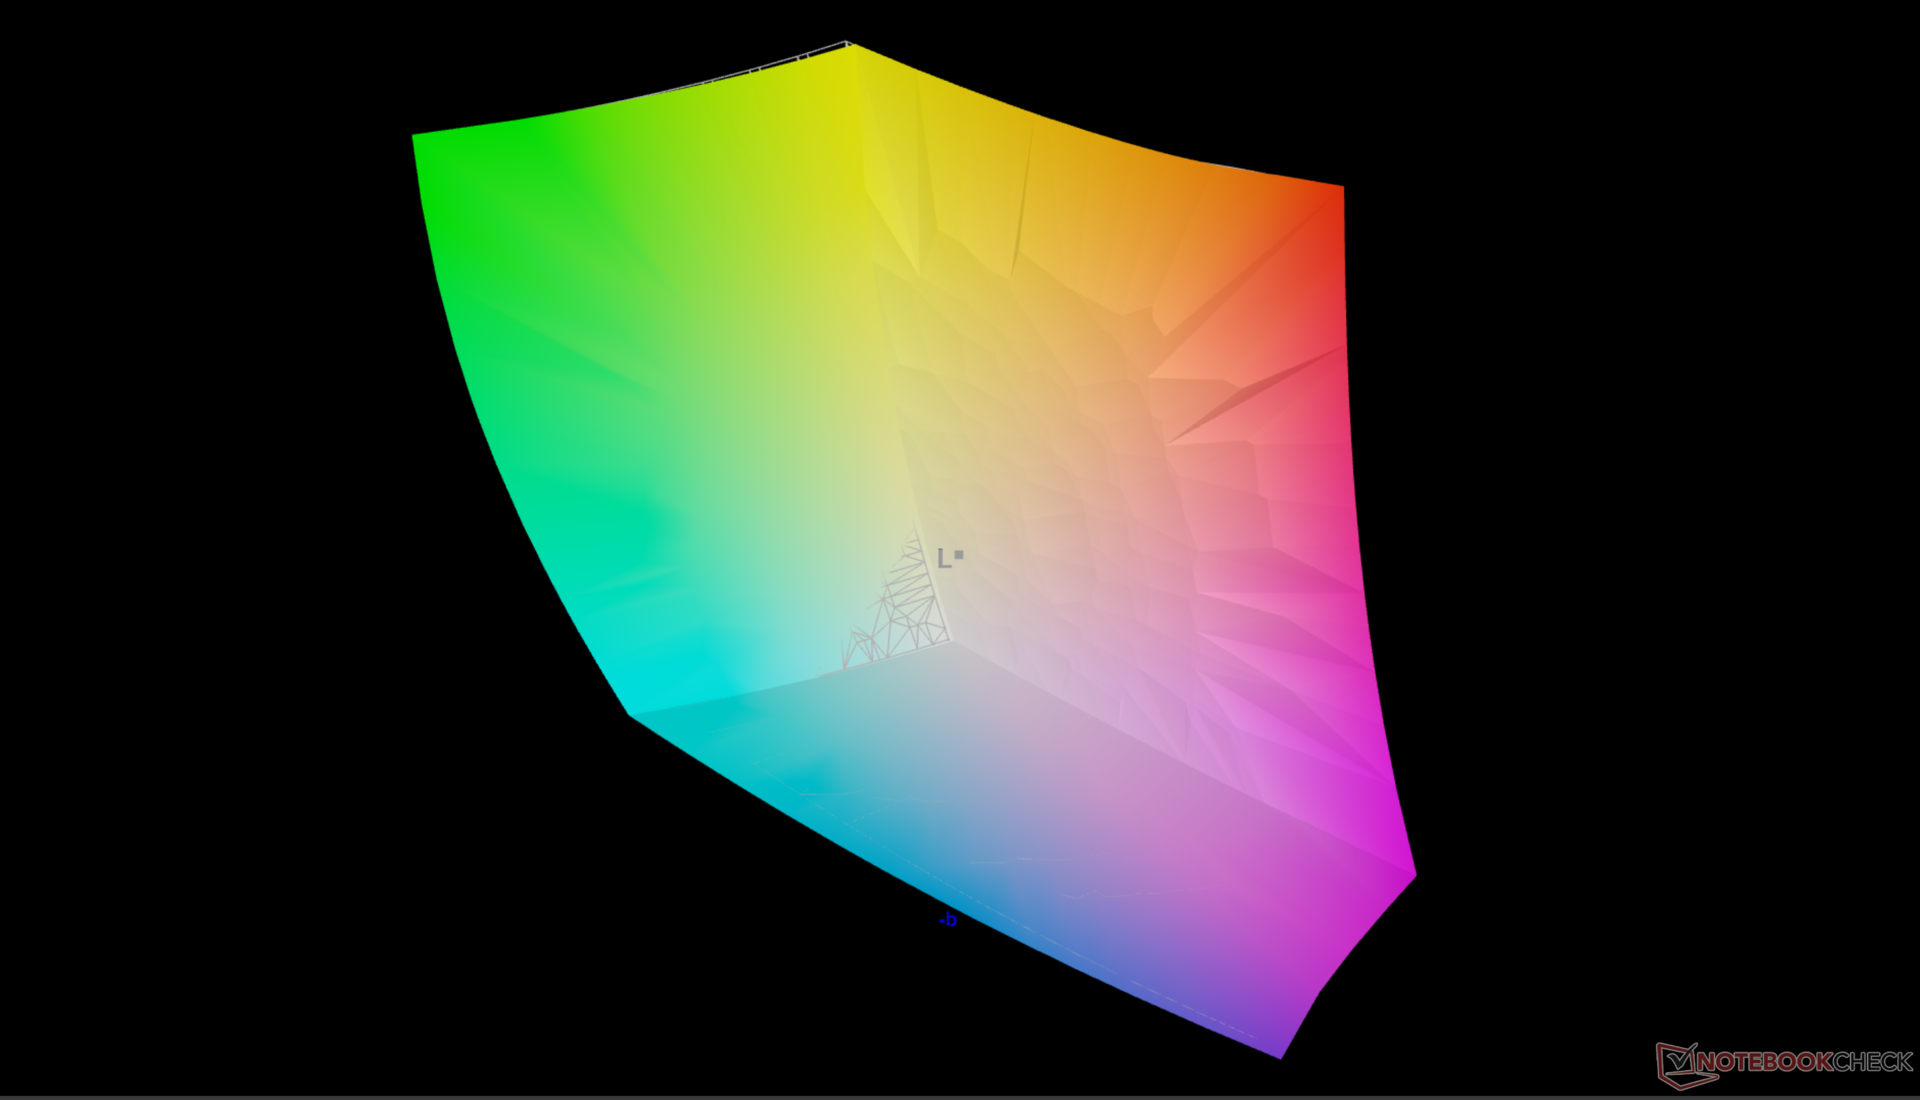
Der 1.800p OLED-Touchscreen ist ein einzigartiges Merkmal des Modells, das bei der vorherigen Generation der Latitude-14-Optionen nicht verfügbar war. Er bietet die üblichen Vorteile gegenüber der IPS-Basiskonfiguration wie tiefere Farben, ein pechschwarzes Kontrastverhältnis, HDR-Unterstützung, eine höhere Auflösung und schnellere Schwarz-Weiß-Reaktionszeiten für ein viel besseres Seherlebnis.
Die Hauptnachteile des Displays sind die niedrige Bildwiederholfrequenz von 60 Hz und die für ein OLED-Panel nur durchschnittliche Helligkeit. Im Vergleich dazu hat die OLED-Option des XPS 14 eine gleichmäßigere Bildwiederholfrequenz von 120 Hz, während Konkurrenzmodelle wie das Lenovo ThinkPad T14s oder das MacBook Pro 14 jeweils hellere Displays haben. Die maximale Helligkeit ist nach unseren Messungen auf 400 Nits im SDR-Modus oder 512 Nits im HDR-Modus begrenzt.

| |||||||||||||||||||||||||
Ausleuchtung: 95 %
Helligkeit Akku: 392.3 cd/m²
Kontrast: ∞:1 (Schwarzwert: 0 cd/m²)
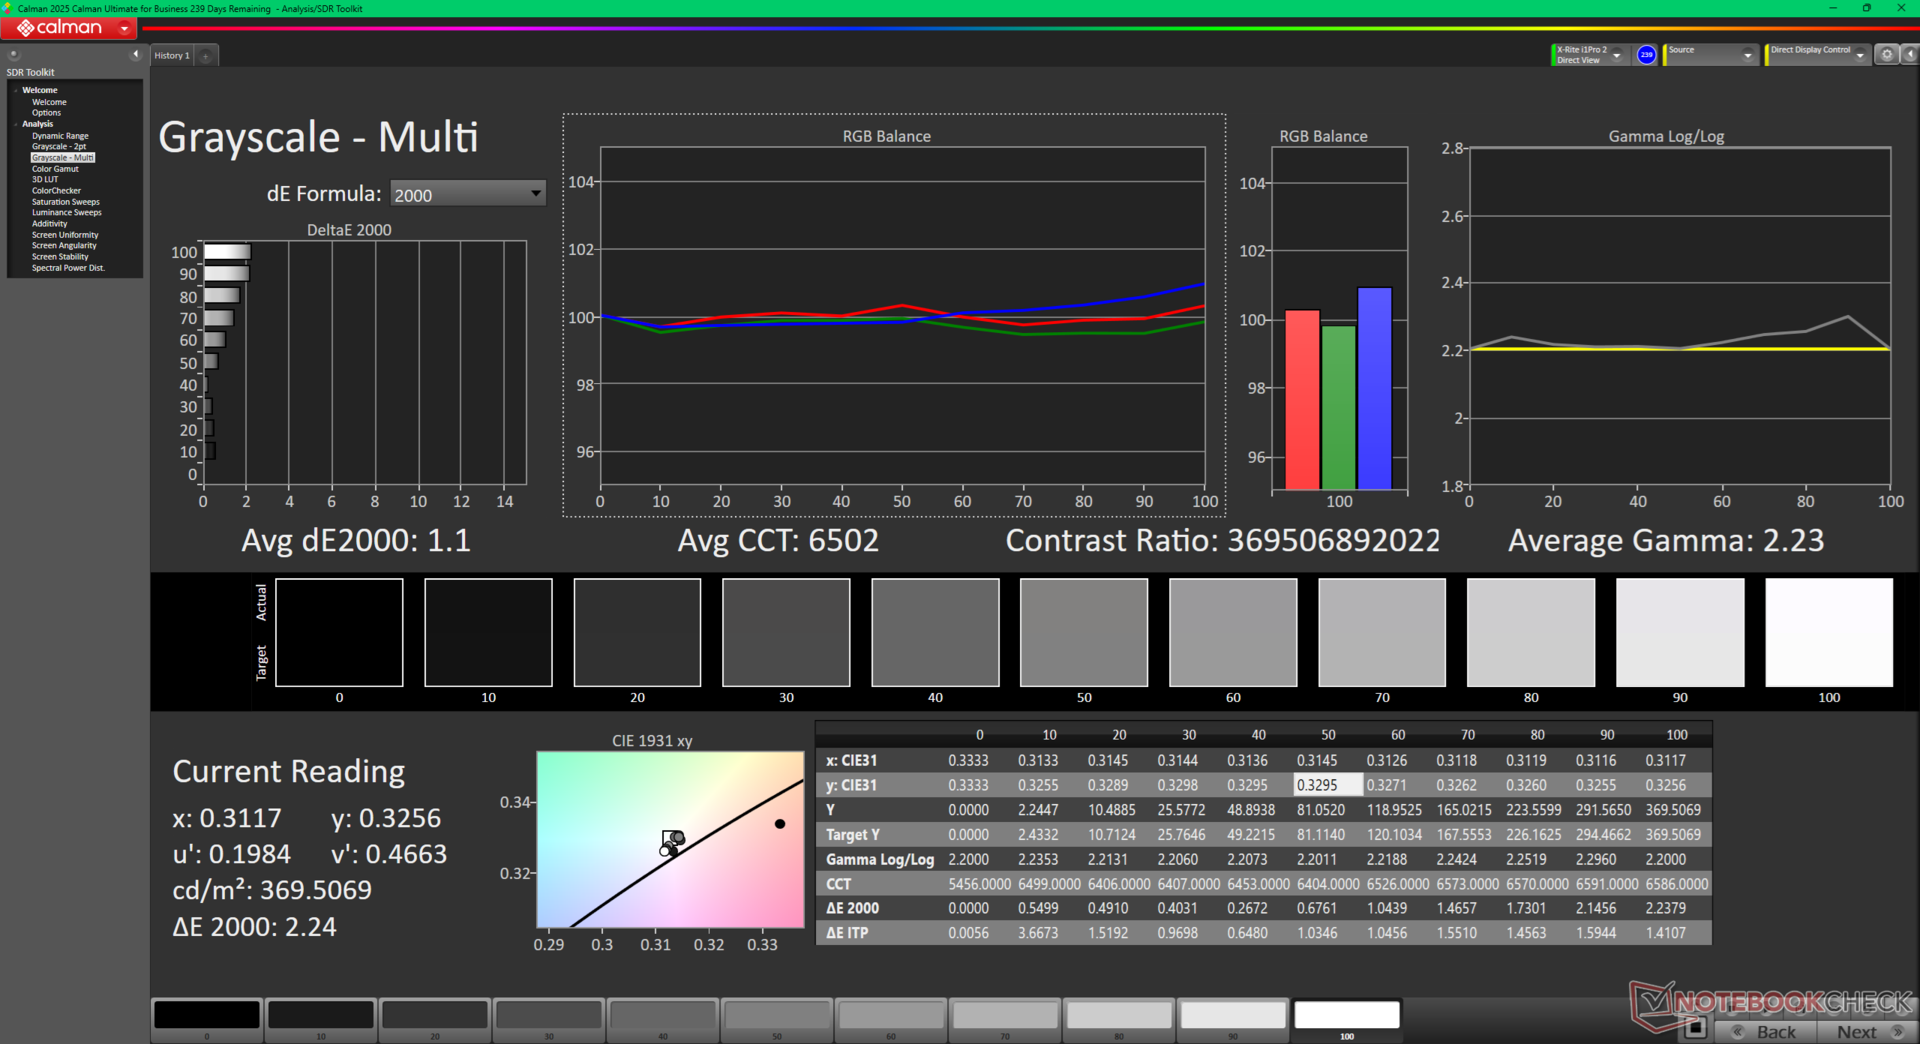
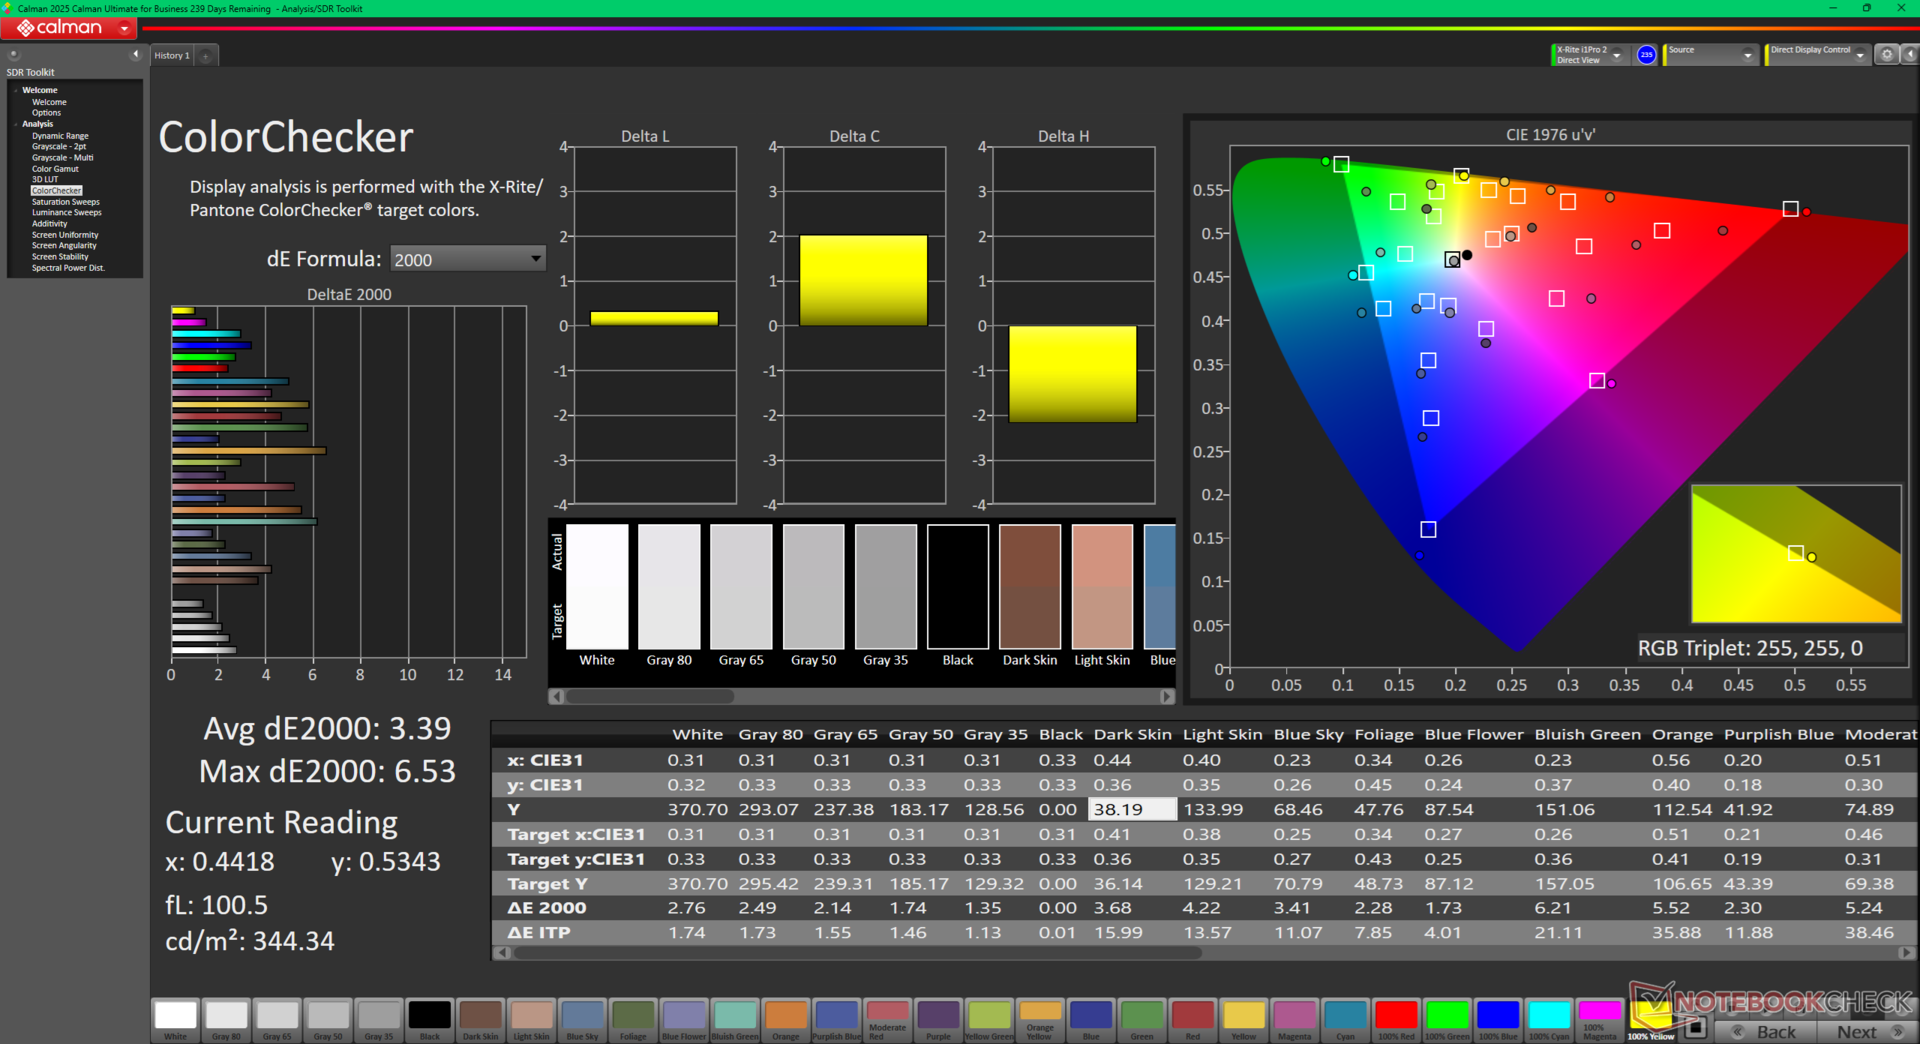
ΔE ColorChecker Calman: 3.39 | ∀{0.5-29.43 Ø4.73}
calibrated: 0.99
ΔE Greyscale Calman: 1.1 | ∀{0.09-98 Ø4.97}
95.8% AdobeRGB 1998 (Argyll 3D)
100% sRGB (Argyll 3D)
99% Display P3 (Argyll 3D)
Gamma: 2.23
CCT: 6502 K
| Dell Pro 14 Premium LG Phillips 140WT1, OLED, 2880x1800, 14", 60 Hz | Dell Latitude 7440 AU Optronics B140QAX, IPS, 2560x1600, 14", 60 Hz | Dell XPS 14 2024 OLED SDC41A2, OLED, 3200x2000, 14.5", 120 Hz | Lenovo ThinkPad T14s Gen 6 Intel B140UAN02.7, IPS LED, 1920x1200, 14", 60 Hz | HP EliteBook Ultra G1i 14 SDC41AA, OLED, 2880x1800, 14", 120 Hz | Asus ExpertBook B1 B1403CVA MNE001BS1-4, IPS, 1920x1080, 14", 60 Hz | |
|---|---|---|---|---|---|---|
| Display | -15% | -3% | -14% | 1% | -53% | |
| Display P3 Coverage (%) | 99 | 75.4 -24% | 98.5 -1% | 76.6 -23% | 99.7 1% | 39.6 -60% |
| sRGB Coverage (%) | 100 | 99.9 0% | 100 0% | 97 -3% | 100 0% | 58.9 -41% |
| AdobeRGB 1998 Coverage (%) | 95.8 | 76.2 -20% | 87.2 -9% | 80.7 -16% | 98 2% | 40.9 -57% |
| Response Times | -2471% | 61% | -1676% | 47% | -1135% | |
| Response Time Grey 50% / Grey 80% * (ms) | 1.4 ? | 56 ? -3900% | 0.7 ? 50% | 36.8 ? -2529% | 0.74 ? 47% | 26.6 ? -1800% |
| Response Time Black / White * (ms) | 2.7 ? | 30.8 ? -1041% | 0.77 ? 71% | 24.9 ? -822% | 0.7 ? 74% | 15.4 ? -470% |
| PWM Frequency (Hz) | 241.1 ? | 480 | 480 ? | |||
| PWM Amplitude * (%) | 32 | 26 19% | ||||
| Bildschirm | -54% | -9% | -59% | -8% | -172% | |
| Helligkeit Bildmitte (cd/m²) | 392.3 | 517.3 32% | 351 -11% | 509 30% | 392 0% | 331 -16% |
| Brightness (cd/m²) | 392 | 488 24% | 353 -10% | 475 21% | 378 -4% | 331 -16% |
| Brightness Distribution (%) | 95 | 88 -7% | 97 2% | 87 -8% | 95 0% | 91 -4% |
| Schwarzwert * (cd/m²) | 0.34 | 0.26 | 0.23 | |||
| Delta E Colorchecker * | 3.39 | 3.3 3% | 1.7 50% | 3.2 6% | 2.4 29% | 6.8 -101% |
| Colorchecker dE 2000 max. * | 6.53 | 7.81 -20% | 2.2 66% | 7.7 -18% | 6.6 -1% | 19.9 -205% |
| Colorchecker dE 2000 calibrated * | 0.99 | 1.02 -3% | 0.8 19% | 1.7 -72% | 4.9 -395% | |
| Delta E Graustufen * | 1.1 | 5.6 -409% | 3.1 -182% | 5.2 -373% | 1.9 -73% | 6.2 -464% |
| Gamma | 2.23 99% | 2.37 93% | 2.12 104% | 2.2 100% | 2.21 100% | 2.22 99% |
| CCT | 6502 100% | 6804 96% | 6616 98% | 6702 97% | 6463 101% | 6387 102% |
| Kontrast (:1) | 1521 | 1958 | 1439 | |||
| Durchschnitt gesamt (Programm / Settings) | -847% /
-447% | 16% /
4% | -583% /
-317% | 13% /
8% | -453% /
-302% |
* ... kleinere Werte sind besser

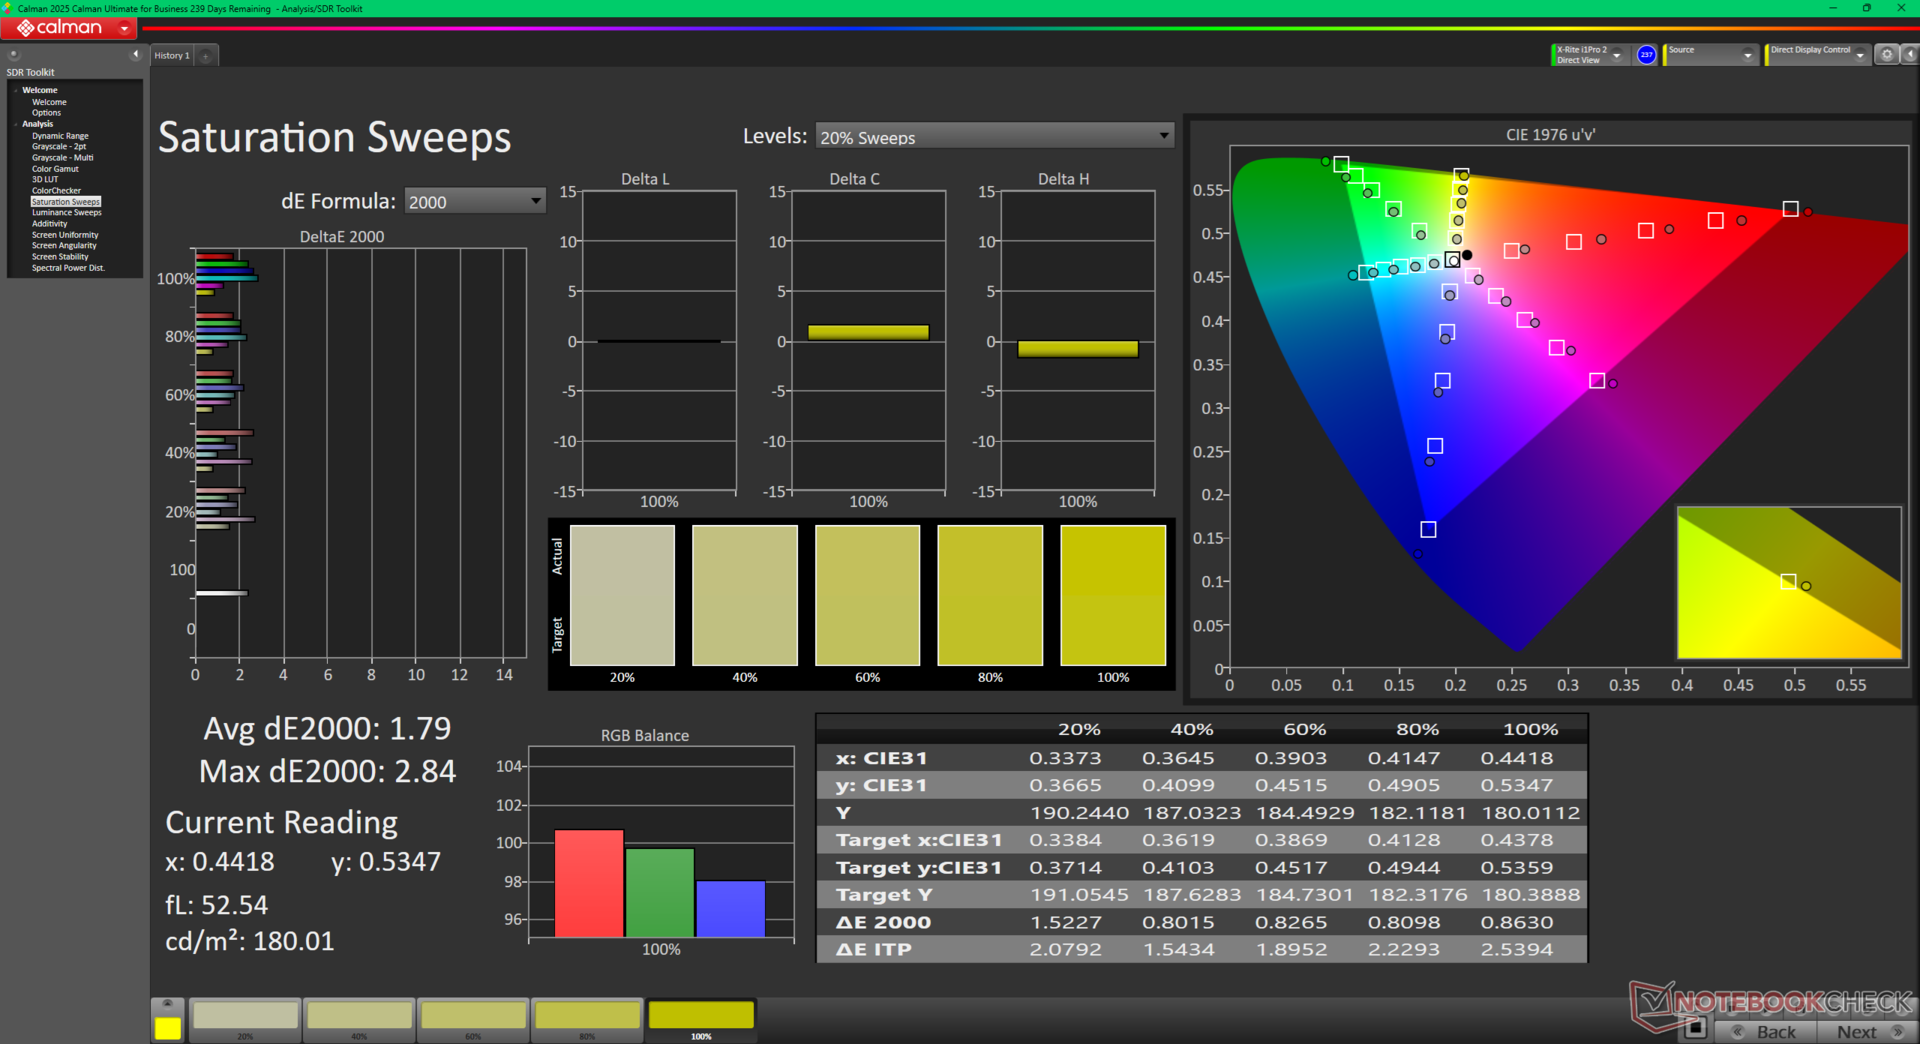
Das Display ist mit durchschnittlichen Graustufen- und Farb-DeltaE-Werten von nur 1,1 bzw. 3,39 gut auf den P3-Standard kalibriert.
Reaktionszeiten (Response Times) des Displays
| ↔ Reaktionszeiten Schwarz zu Weiß | ||
|---|---|---|
| 2.7 ms ... steigend ↗ und fallend ↘ kombiniert | ↗ 1.6 ms steigend | 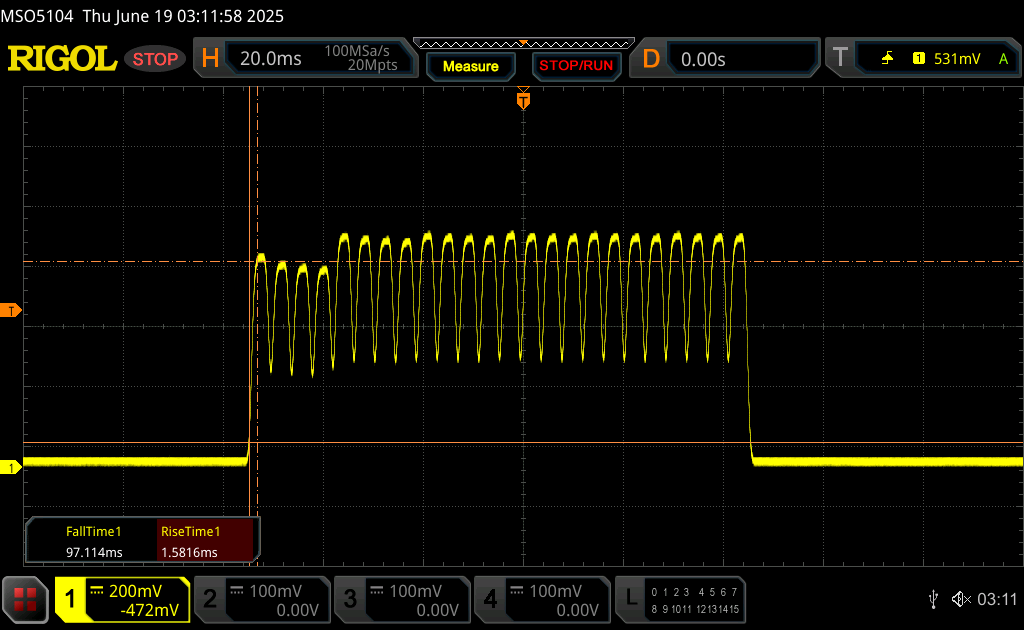 |
| ↘ 1.1 ms fallend | ||
| Die gemessenen Reaktionszeiten sind sehr kurz, wodurch sich der Bildschirm auch für schnelle 3D Spiele eignen sollte. Im Vergleich rangierten die bei uns getesteten Geräte von 0.1 (Minimum) zu 240 (Maximum) ms. » 14 % aller Screens waren schneller als der getestete. Daher sind die gemessenen Reaktionszeiten besser als der Durchschnitt aller vermessenen Geräte (19.9 ms). | ||
| ↔ Reaktionszeiten 50% Grau zu 80% Grau | ||
| 1.4 ms ... steigend ↗ und fallend ↘ kombiniert | ↗ 0.7 ms steigend | 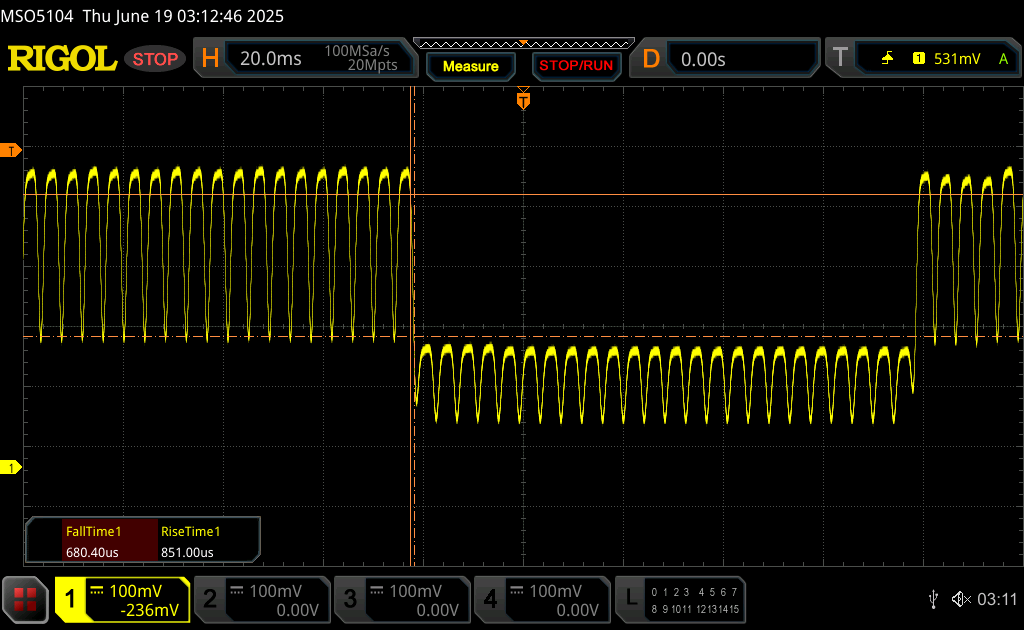 |
| ↘ 0.7 ms fallend | ||
| Die gemessenen Reaktionszeiten sind sehr kurz, wodurch sich der Bildschirm auch für schnelle 3D Spiele eignen sollte. Im Vergleich rangierten die bei uns getesteten Geräte von 0.165 (Minimum) zu 636 (Maximum) ms. » 6 % aller Screens waren schneller als der getestete. Daher sind die gemessenen Reaktionszeiten besser als der Durchschnitt aller vermessenen Geräte (31.1 ms). | ||
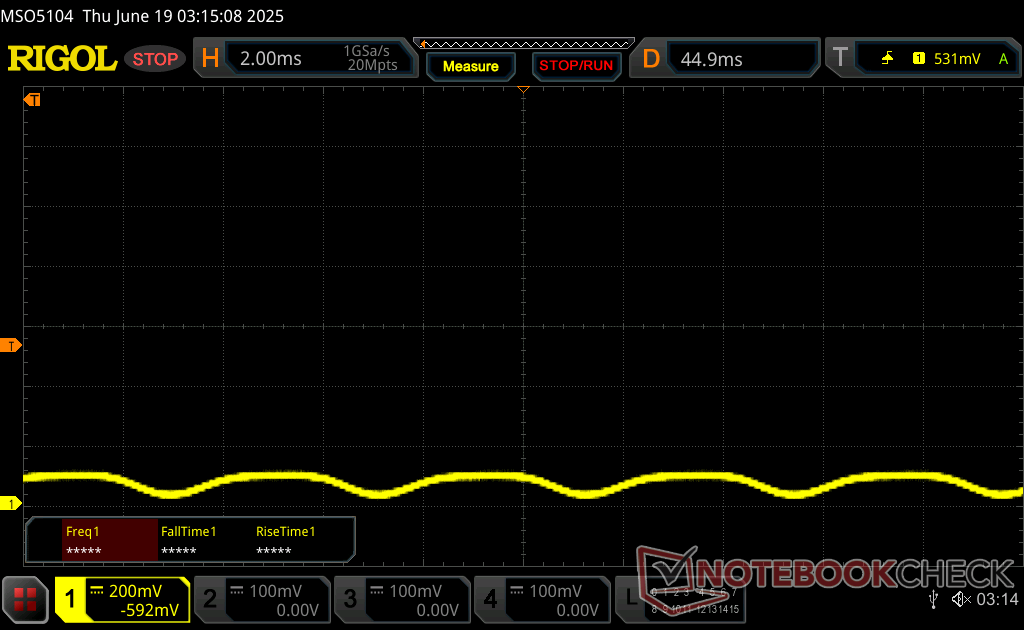
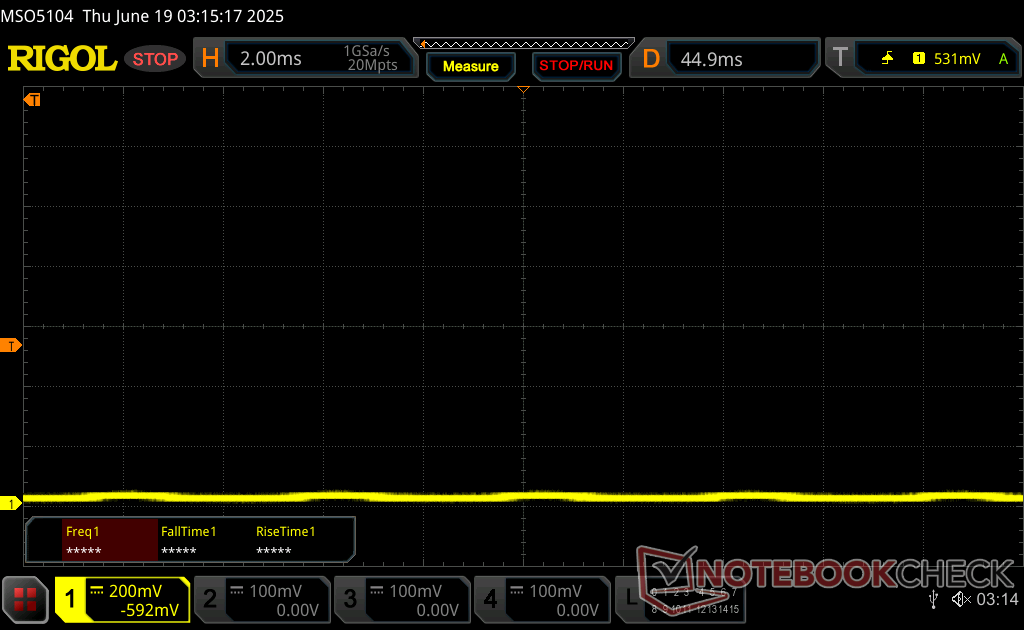
Bildschirm-Flackern / PWM (Pulse-Width Modulation)
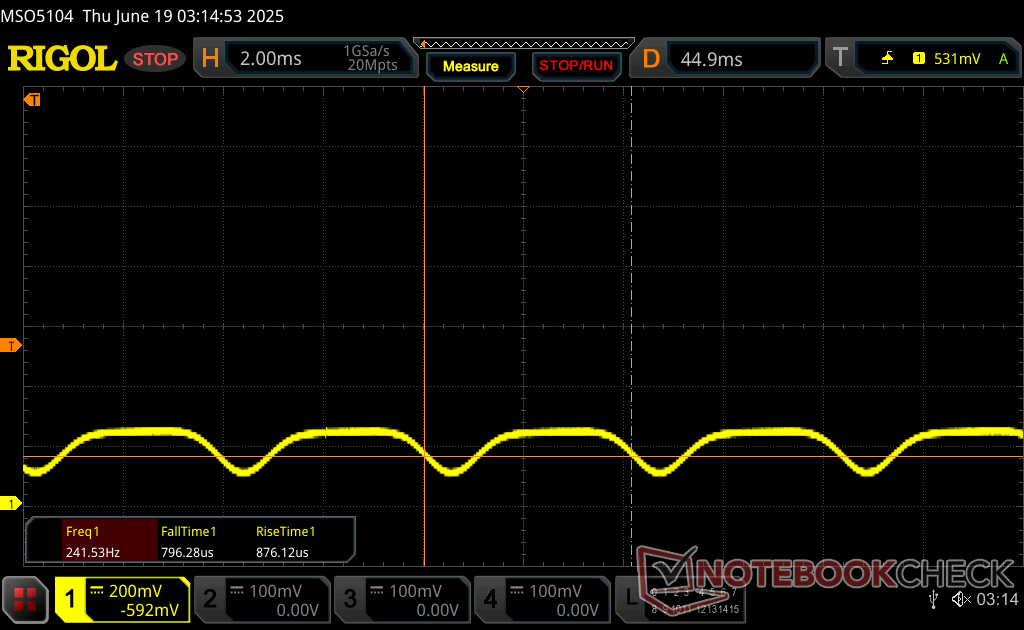
| Flackern / PWM festgestellt | 241.1 Hz Amplitude: 32 % | ≤ 100 % Helligkeit |  |
Das Display flackert mit 241.1 Hz (im schlimmsten Fall, eventuell durch Pulsweitenmodulation PWM) bei einer eingestellten Helligkeit von 100 % und darunter. Darüber sollte es zu keinem Flackern kommen. Die Frequenz von 241.1 Hz ist relativ gering und daher sollte es bei sensiblen Personen zu Problemen wie Flackern oder Augenbeschwerden führen. Im Vergleich: 52 % aller getesteten Geräte nutzten kein PWM um die Helligkeit zu reduzieren. Wenn PWM eingesetzt wurde, dann bei einer Frequenz von durchschnittlich 7794 (Minimum 5, Maximum 343500) Hz. | |||

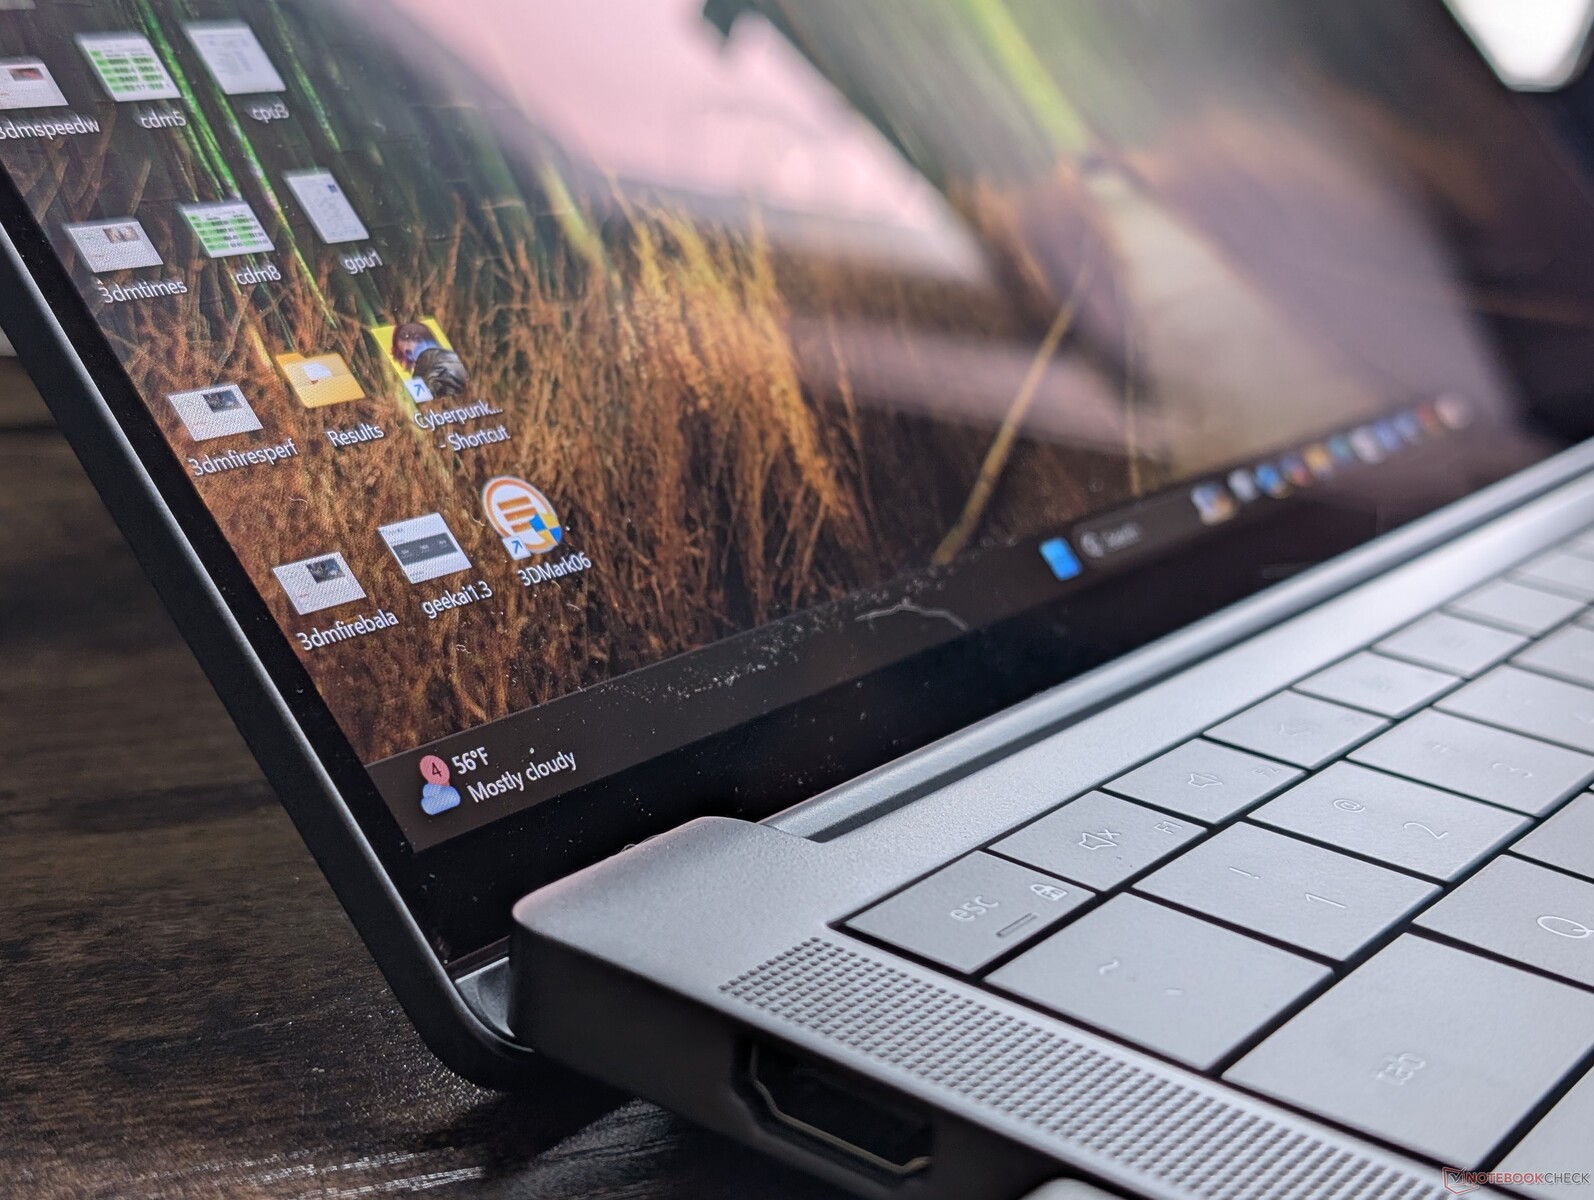
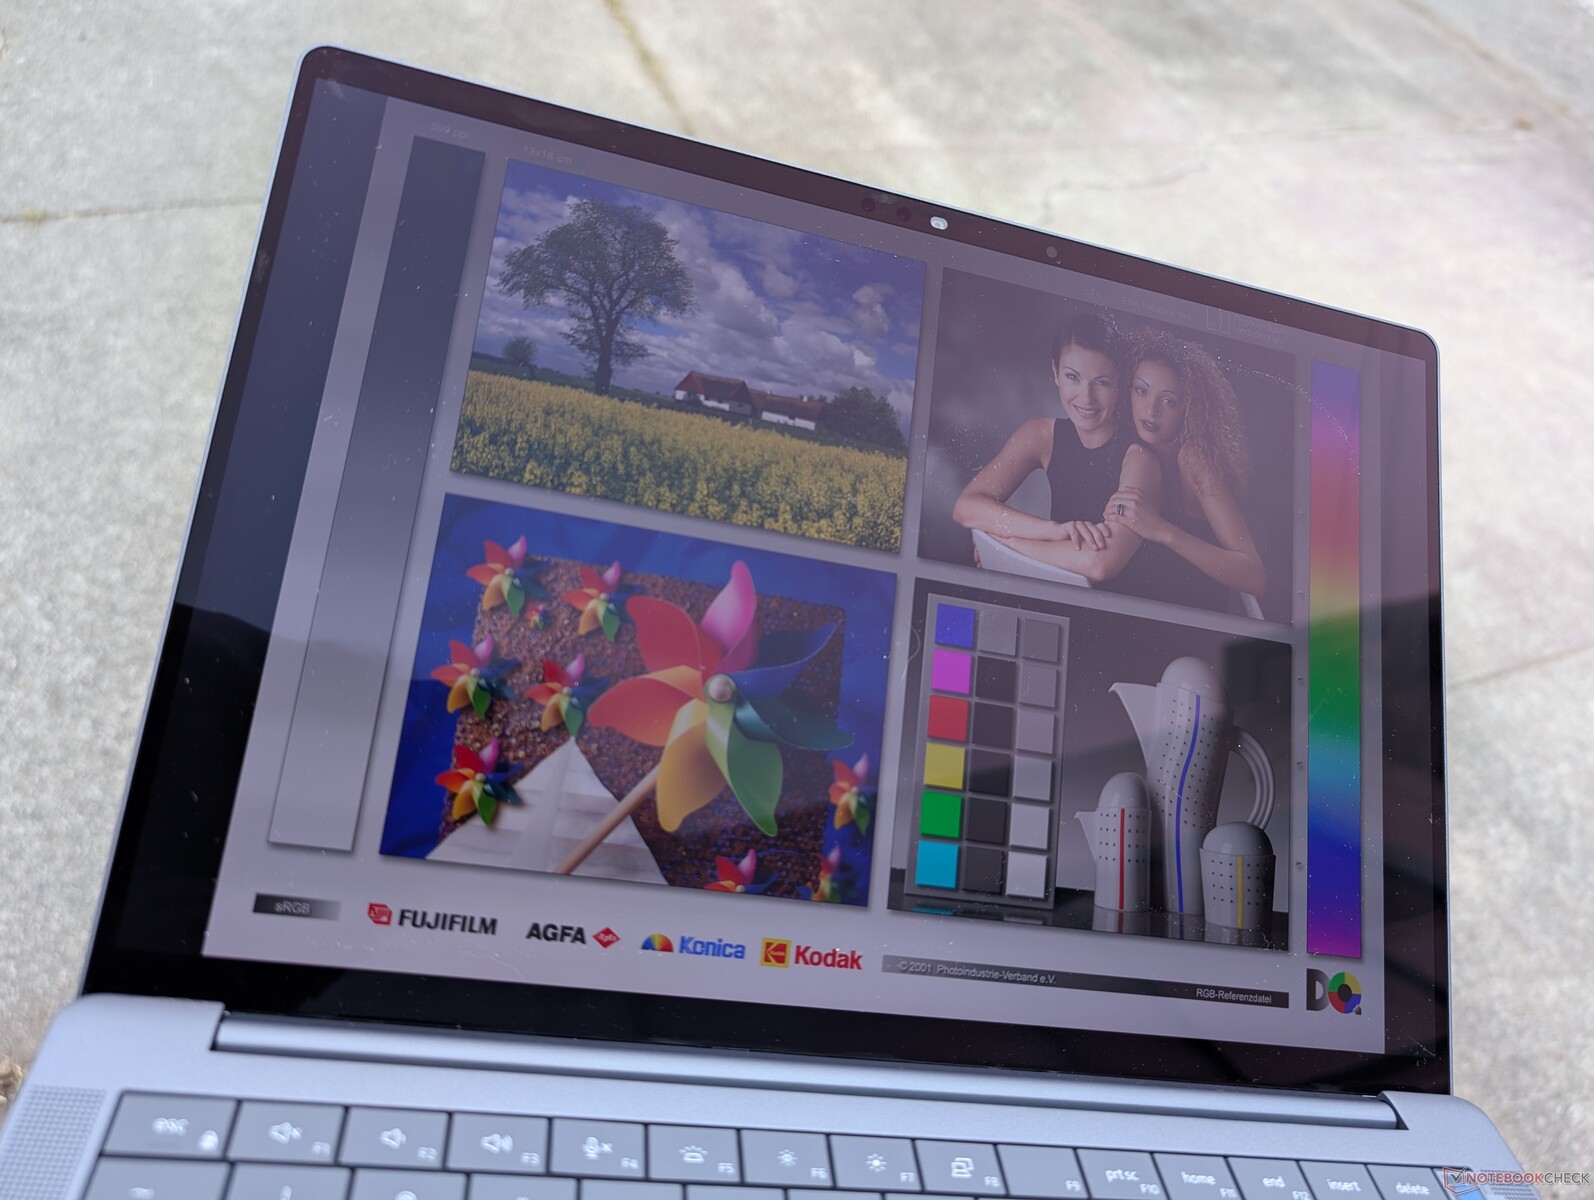
Der OLED-Touchscreen mag scharf und lebendig sein, aber er ist nicht hell genug, um im Freien bequem zu sehen. Die Farben sind verwaschen, und Blendeffekte sind unvermeidlich.


Performance - Effizienz ist der Name des Spiels
Testbedingungen
Wir haben Dell Optimizer auf den Modus Performance eingestellt, bevor wir die folgenden Benchmarks durchgeführt haben. Die Optimizer Energieprofile können automatisch mit den regulären Windows Energieprofilen synchronisiert werden, was bei Laptops von Lenovo oder HP nicht immer der Fall ist.
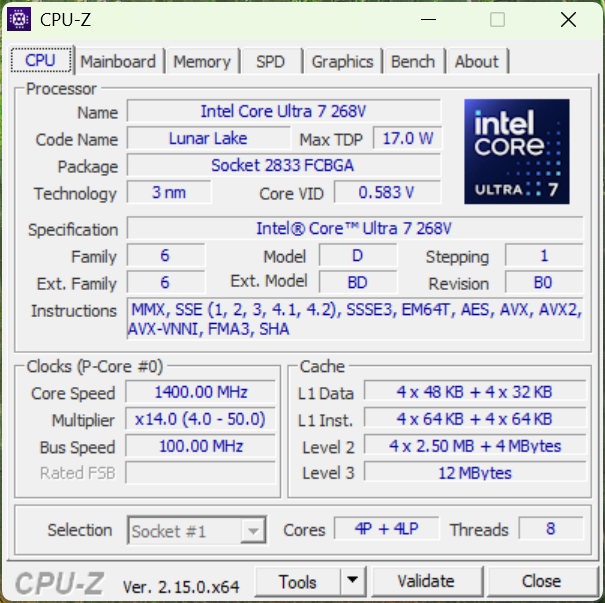
Prozessor
Der Core Ultra 7 268V ist nur geringfügig schneller als der Raptor Lake Core i5-1345U oder Core i7-1355U der Latitude-14-Serie vom letzten Jahr, wenn es um traditionelle CPU-Aufgaben geht. Das ist durchaus beabsichtigt, denn Lunar Lake-V konzentriert sich auf NPU, GPU, RAM und allgemeine Effizienzsteigerungen und nicht auf die rohe Prozessorleistung. Nichtsdestotrotz zeigt der Core Ultra 7 268V weniger Throttling, wenn er belastet wird, was zu einer gleichmäßigeren Leistung über die Zeit führt, wie unsere CineBench-R15-xT-Schleifentest-Ergebnisse unten zeigen.
Cinebench R15 Multi Loop
Cinebench R23: Multi Core | Single Core
Cinebench R20: CPU (Multi Core) | CPU (Single Core)
Cinebench R15: CPU Multi 64Bit | CPU Single 64Bit
Blender: v2.79 BMW27 CPU
7-Zip 18.03: 7z b 4 | 7z b 4 -mmt1
Geekbench 6.7: Multi-Core | Single-Core
Geekbench 5.5: Multi-Core | Single-Core
HWBOT x265 Benchmark v2.2: 4k Preset
LibreOffice : 20 Documents To PDF
R Benchmark 2.5: Overall mean
* ... kleinere Werte sind besser
AIDA64: FP32 Ray-Trace | FPU Julia | CPU SHA3 | CPU Queen | FPU SinJulia | FPU Mandel | CPU AES | CPU ZLib | FP64 Ray-Trace | CPU PhotoWorxx
| Performance Rating | |
| Dell XPS 14 2024 OLED | |
| Dell Pro 14 Premium | |
| Durchschnittliche Intel Core Ultra 7 268V | |
| Lenovo ThinkPad T14s Gen 6 Intel | |
| HP EliteBook Ultra G1i 14 | |
| Dell Latitude 7440 | |
| Asus ExpertBook B1 B1403CVA | |
| AIDA64 / FP32 Ray-Trace | |
| Dell Pro 14 Premium | |
| Durchschnittliche Intel Core Ultra 7 268V (10556 - 12759, n=5) | |
| Dell XPS 14 2024 OLED | |
| Lenovo ThinkPad T14s Gen 6 Intel | |
| HP EliteBook Ultra G1i 14 | |
| Dell Latitude 7440 | |
| Asus ExpertBook B1 B1403CVA | |
| AIDA64 / FPU Julia | |
| Dell XPS 14 2024 OLED | |
| Dell Pro 14 Premium | |
| Durchschnittliche Intel Core Ultra 7 268V (47659 - 62563, n=5) | |
| Lenovo ThinkPad T14s Gen 6 Intel | |
| HP EliteBook Ultra G1i 14 | |
| Dell Latitude 7440 | |
| Asus ExpertBook B1 B1403CVA | |
| AIDA64 / CPU SHA3 | |
| Dell XPS 14 2024 OLED | |
| Dell Pro 14 Premium | |
| Durchschnittliche Intel Core Ultra 7 268V (2117 - 2803, n=5) | |
| HP EliteBook Ultra G1i 14 | |
| Lenovo ThinkPad T14s Gen 6 Intel | |
| Dell Latitude 7440 | |
| Asus ExpertBook B1 B1403CVA | |
| AIDA64 / CPU Queen | |
| Dell XPS 14 2024 OLED | |
| Asus ExpertBook B1 B1403CVA | |
| Dell Latitude 7440 | |
| Dell Pro 14 Premium | |
| Durchschnittliche Intel Core Ultra 7 268V (49629 - 49759, n=5) | |
| HP EliteBook Ultra G1i 14 | |
| Lenovo ThinkPad T14s Gen 6 Intel | |
| AIDA64 / FPU SinJulia | |
| Dell XPS 14 2024 OLED | |
| Asus ExpertBook B1 B1403CVA | |
| Dell Latitude 7440 | |
| HP EliteBook Ultra G1i 14 | |
| Dell Pro 14 Premium | |
| Durchschnittliche Intel Core Ultra 7 268V (4351 - 4429, n=5) | |
| Lenovo ThinkPad T14s Gen 6 Intel | |
| AIDA64 / FPU Mandel | |
| Dell Pro 14 Premium | |
| Durchschnittliche Intel Core Ultra 7 268V (25929 - 33207, n=5) | |
| Dell XPS 14 2024 OLED | |
| Lenovo ThinkPad T14s Gen 6 Intel | |
| HP EliteBook Ultra G1i 14 | |
| Dell Latitude 7440 | |
| Asus ExpertBook B1 B1403CVA | |
| AIDA64 / CPU AES | |
| Dell XPS 14 2024 OLED | |
| Dell Latitude 7440 | |
| Dell Pro 14 Premium | |
| Durchschnittliche Intel Core Ultra 7 268V (33196 - 39140, n=5) | |
| HP EliteBook Ultra G1i 14 | |
| Lenovo ThinkPad T14s Gen 6 Intel | |
| Asus ExpertBook B1 B1403CVA | |
| AIDA64 / CPU ZLib | |
| Dell XPS 14 2024 OLED | |
| Dell Latitude 7440 | |
| Dell Pro 14 Premium | |
| Durchschnittliche Intel Core Ultra 7 268V (441 - 633, n=5) | |
| Lenovo ThinkPad T14s Gen 6 Intel | |
| HP EliteBook Ultra G1i 14 | |
| Asus ExpertBook B1 B1403CVA | |
| AIDA64 / FP64 Ray-Trace | |
| Dell Pro 14 Premium | |
| Durchschnittliche Intel Core Ultra 7 268V (5938 - 6960, n=5) | |
| Lenovo ThinkPad T14s Gen 6 Intel | |
| Dell XPS 14 2024 OLED | |
| HP EliteBook Ultra G1i 14 | |
| Dell Latitude 7440 | |
| Asus ExpertBook B1 B1403CVA | |
| AIDA64 / CPU PhotoWorxx | |
| Dell Pro 14 Premium | |
| Durchschnittliche Intel Core Ultra 7 268V (46733 - 55083, n=5) | |
| Lenovo ThinkPad T14s Gen 6 Intel | |
| HP EliteBook Ultra G1i 14 | |
| Dell XPS 14 2024 OLED | |
| Dell Latitude 7440 | |
| Asus ExpertBook B1 B1403CVA | |
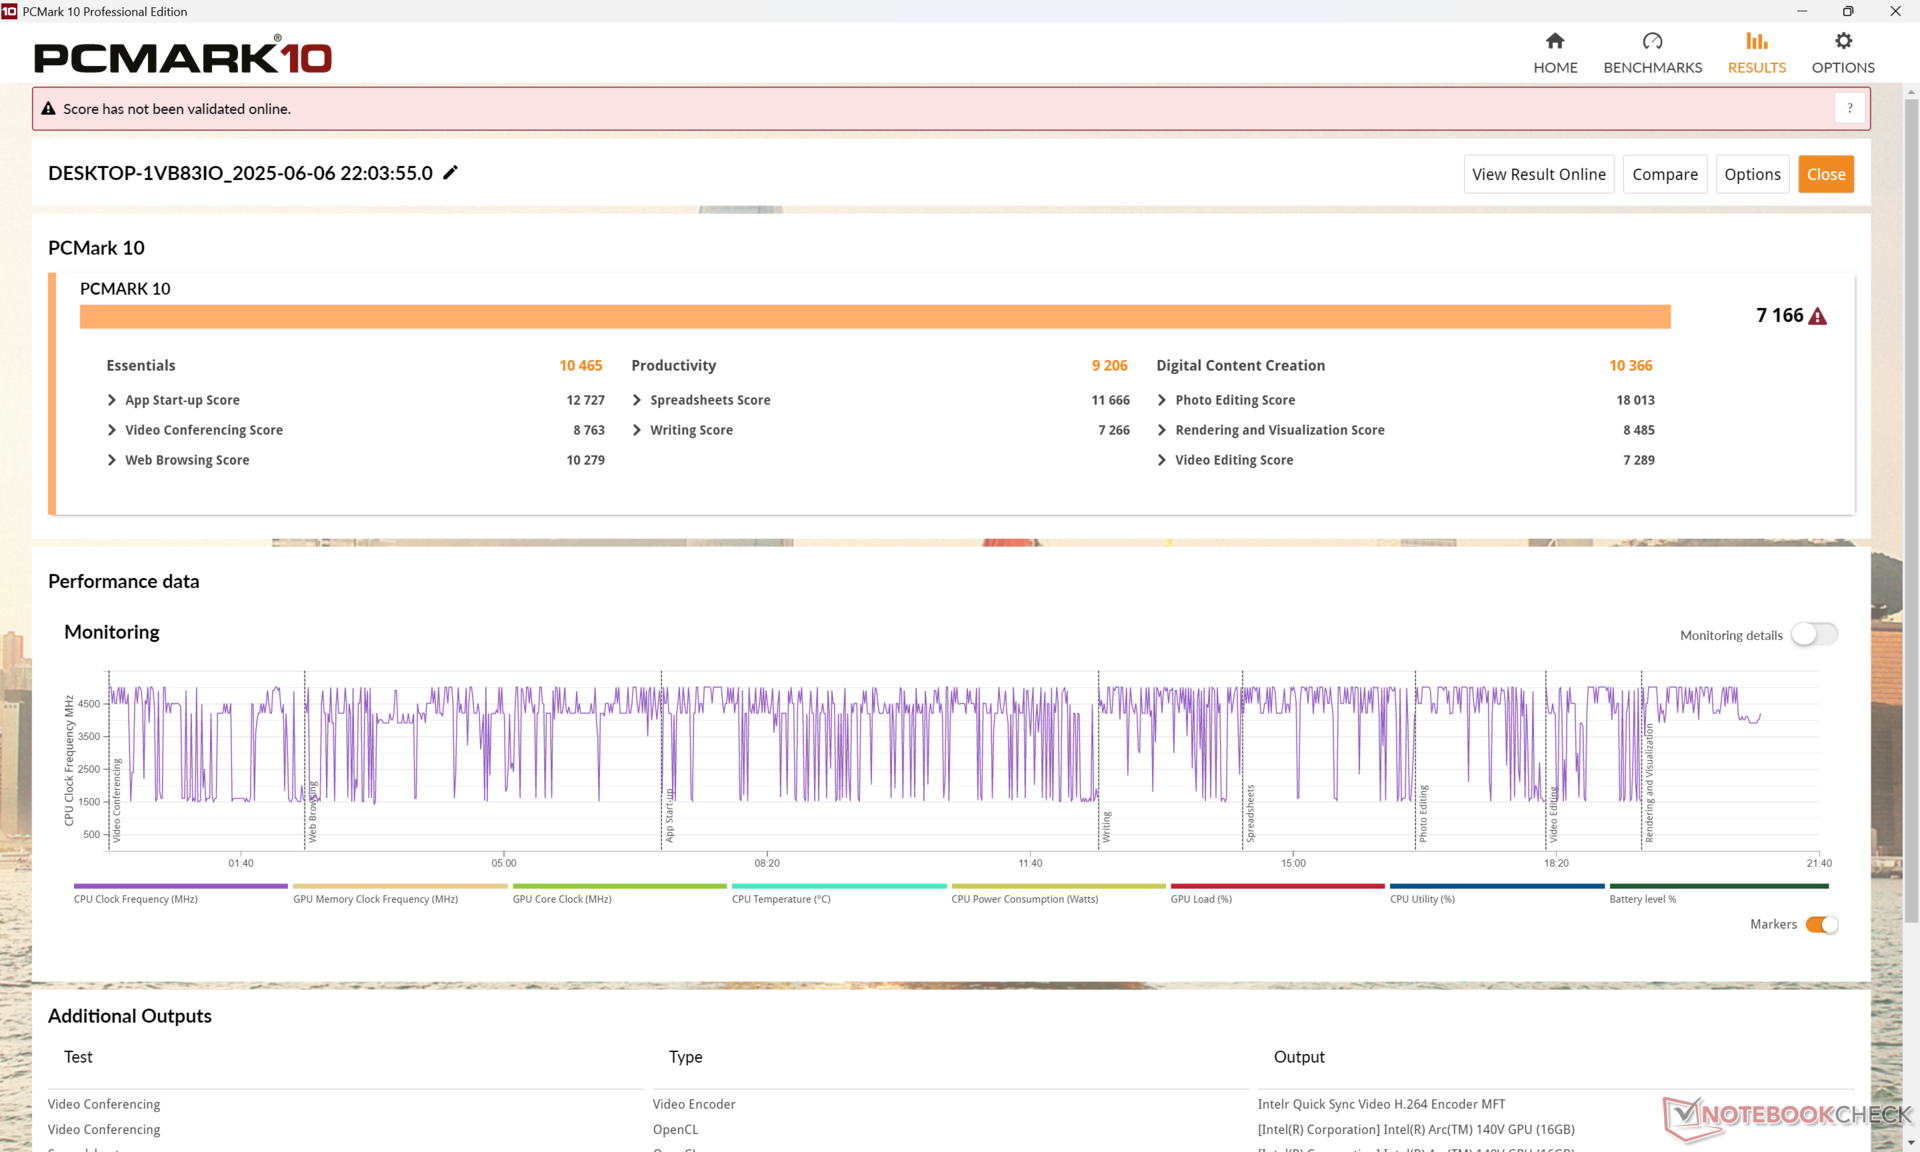
System Performance
Die PCMark Ergebnisse im Vergleich zum letztjährigen Latitude 7440 oder 9440 2-in-1 verbessern sich am meisten im Untertest "Erstellung digitaler Inhalte" aufgrund der deutlich schnelleren integrierten GPU von Lunar Lake. Ansonsten sind traditionelle Office-Aufgaben auf dem Dell Pro 14 Premium nicht viel schneller, wie der oben erwähnte relativ geringe Anstieg der Prozessor-Rohleistung zeigt.
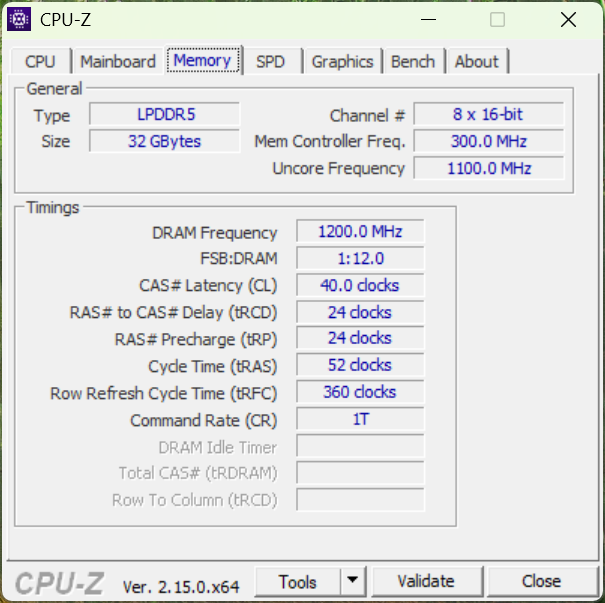
Die Leistung des Arbeitsspeichers ist dank der einzigartigen On-Die-RAM-Lösung von Lunar Lake im Vergleich zur älteren Raptor-Lake-Architektur fast doppelt so schnell.
PCMark 10: Score | Essentials | Productivity | Digital Content Creation
CrossMark: Overall | Productivity | Creativity | Responsiveness
WebXPRT 3: Overall
WebXPRT 4: Overall
Mozilla Kraken 1.1: Total
| Performance Rating | |
| Dell Pro 14 Premium | |
| HP EliteBook Ultra G1i 14 | |
| Durchschnittliche Intel Core Ultra 7 268V, Intel Arc Graphics 140V | |
| Dell XPS 14 2024 OLED | |
| Lenovo ThinkPad T14s Gen 6 Intel | |
| Asus ExpertBook B1 B1403CVA | |
| Dell Latitude 7440 -4! | |
| PCMark 10 / Score | |
| Dell Pro 14 Premium | |
| HP EliteBook Ultra G1i 14 | |
| Durchschnittliche Intel Core Ultra 7 268V, Intel Arc Graphics 140V (6729 - 7236, n=5) | |
| Lenovo ThinkPad T14s Gen 6 Intel | |
| Dell XPS 14 2024 OLED | |
| Dell Latitude 7440 | |
| Asus ExpertBook B1 B1403CVA | |
| PCMark 10 / Essentials | |
| Dell Latitude 7440 | |
| HP EliteBook Ultra G1i 14 | |
| Dell Pro 14 Premium | |
| Asus ExpertBook B1 B1403CVA | |
| Durchschnittliche Intel Core Ultra 7 268V, Intel Arc Graphics 140V (10007 - 10701, n=5) | |
| Dell XPS 14 2024 OLED | |
| Lenovo ThinkPad T14s Gen 6 Intel | |
| PCMark 10 / Productivity | |
| HP EliteBook Ultra G1i 14 | |
| Dell Pro 14 Premium | |
| Durchschnittliche Intel Core Ultra 7 268V, Intel Arc Graphics 140V (8766 - 9217, n=5) | |
| Dell XPS 14 2024 OLED | |
| Lenovo ThinkPad T14s Gen 6 Intel | |
| Dell Latitude 7440 | |
| Asus ExpertBook B1 B1403CVA | |
| PCMark 10 / Digital Content Creation | |
| Dell Pro 14 Premium | |
| Durchschnittliche Intel Core Ultra 7 268V, Intel Arc Graphics 140V (9425 - 10429, n=5) | |
| HP EliteBook Ultra G1i 14 | |
| Lenovo ThinkPad T14s Gen 6 Intel | |
| Dell XPS 14 2024 OLED | |
| Asus ExpertBook B1 B1403CVA | |
| Dell Latitude 7440 | |
| CrossMark / Overall | |
| Dell Pro 14 Premium | |
| HP EliteBook Ultra G1i 14 | |
| Durchschnittliche Intel Core Ultra 7 268V, Intel Arc Graphics 140V (1643 - 1763, n=5) | |
| Dell XPS 14 2024 OLED | |
| Lenovo ThinkPad T14s Gen 6 Intel | |
| Asus ExpertBook B1 B1403CVA | |
| CrossMark / Productivity | |
| Dell Pro 14 Premium | |
| HP EliteBook Ultra G1i 14 | |
| Durchschnittliche Intel Core Ultra 7 268V, Intel Arc Graphics 140V (1577 - 1696, n=5) | |
| Dell XPS 14 2024 OLED | |
| Lenovo ThinkPad T14s Gen 6 Intel | |
| Asus ExpertBook B1 B1403CVA | |
| CrossMark / Creativity | |
| Dell Pro 14 Premium | |
| HP EliteBook Ultra G1i 14 | |
| Durchschnittliche Intel Core Ultra 7 268V, Intel Arc Graphics 140V (1866 - 2021, n=5) | |
| Dell XPS 14 2024 OLED | |
| Lenovo ThinkPad T14s Gen 6 Intel | |
| Asus ExpertBook B1 B1403CVA | |
| CrossMark / Responsiveness | |
| Dell XPS 14 2024 OLED | |
| Asus ExpertBook B1 B1403CVA | |
| HP EliteBook Ultra G1i 14 | |
| Dell Pro 14 Premium | |
| Durchschnittliche Intel Core Ultra 7 268V, Intel Arc Graphics 140V (1239 - 1313, n=5) | |
| Lenovo ThinkPad T14s Gen 6 Intel | |
| WebXPRT 3 / Overall | |
| Dell Pro 14 Premium | |
| Durchschnittliche Intel Core Ultra 7 268V, Intel Arc Graphics 140V (266 - 317, n=5) | |
| HP EliteBook Ultra G1i 14 | |
| Lenovo ThinkPad T14s Gen 6 Intel | |
| Dell XPS 14 2024 OLED | |
| Dell Latitude 7440 | |
| Asus ExpertBook B1 B1403CVA | |
| WebXPRT 4 / Overall | |
| Dell Pro 14 Premium | |
| HP EliteBook Ultra G1i 14 | |
| Durchschnittliche Intel Core Ultra 7 268V, Intel Arc Graphics 140V (245 - 292, n=5) | |
| Lenovo ThinkPad T14s Gen 6 Intel | |
| Dell XPS 14 2024 OLED | |
| Asus ExpertBook B1 B1403CVA | |
| Dell Latitude 7440 | |
| Mozilla Kraken 1.1 / Total | |
| Asus ExpertBook B1 B1403CVA | |
| Dell Latitude 7440 | |
| Dell XPS 14 2024 OLED | |
| Lenovo ThinkPad T14s Gen 6 Intel | |
| HP EliteBook Ultra G1i 14 | |
| Durchschnittliche Intel Core Ultra 7 268V, Intel Arc Graphics 140V (460 - 476, n=5) | |
| Dell Pro 14 Premium | |
* ... kleinere Werte sind besser
| PCMark 10 Score | 7166 Punkte | |
Hilfe | ||
| AIDA64 / Memory Copy | |
| HP EliteBook Ultra G1i 14 | |
| Dell Pro 14 Premium | |
| Durchschnittliche Intel Core Ultra 7 268V (100445 - 108317, n=5) | |
| Lenovo ThinkPad T14s Gen 6 Intel | |
| Dell XPS 14 2024 OLED | |
| Asus ExpertBook B1 B1403CVA | |
| Dell Latitude 7440 | |
| AIDA64 / Memory Read | |
| HP EliteBook Ultra G1i 14 | |
| Dell Pro 14 Premium | |
| Durchschnittliche Intel Core Ultra 7 268V (82511 - 88341, n=5) | |
| Dell XPS 14 2024 OLED | |
| Lenovo ThinkPad T14s Gen 6 Intel | |
| Asus ExpertBook B1 B1403CVA | |
| Dell Latitude 7440 | |
| AIDA64 / Memory Write | |
| Dell Pro 14 Premium | |
| HP EliteBook Ultra G1i 14 | |
| Durchschnittliche Intel Core Ultra 7 268V (104206 - 117888, n=5) | |
| Lenovo ThinkPad T14s Gen 6 Intel | |
| Dell XPS 14 2024 OLED | |
| Dell Latitude 7440 | |
| Asus ExpertBook B1 B1403CVA | |
| AIDA64 / Memory Latency | |
| Dell XPS 14 2024 OLED | |
| Dell Latitude 7440 | |
| Dell Pro 14 Premium | |
| Durchschnittliche Intel Core Ultra 7 268V (94.4 - 101.5, n=5) | |
| Asus ExpertBook B1 B1403CVA | |
| Lenovo ThinkPad T14s Gen 6 Intel | |
| HP EliteBook Ultra G1i 14 | |
* ... kleinere Werte sind besser
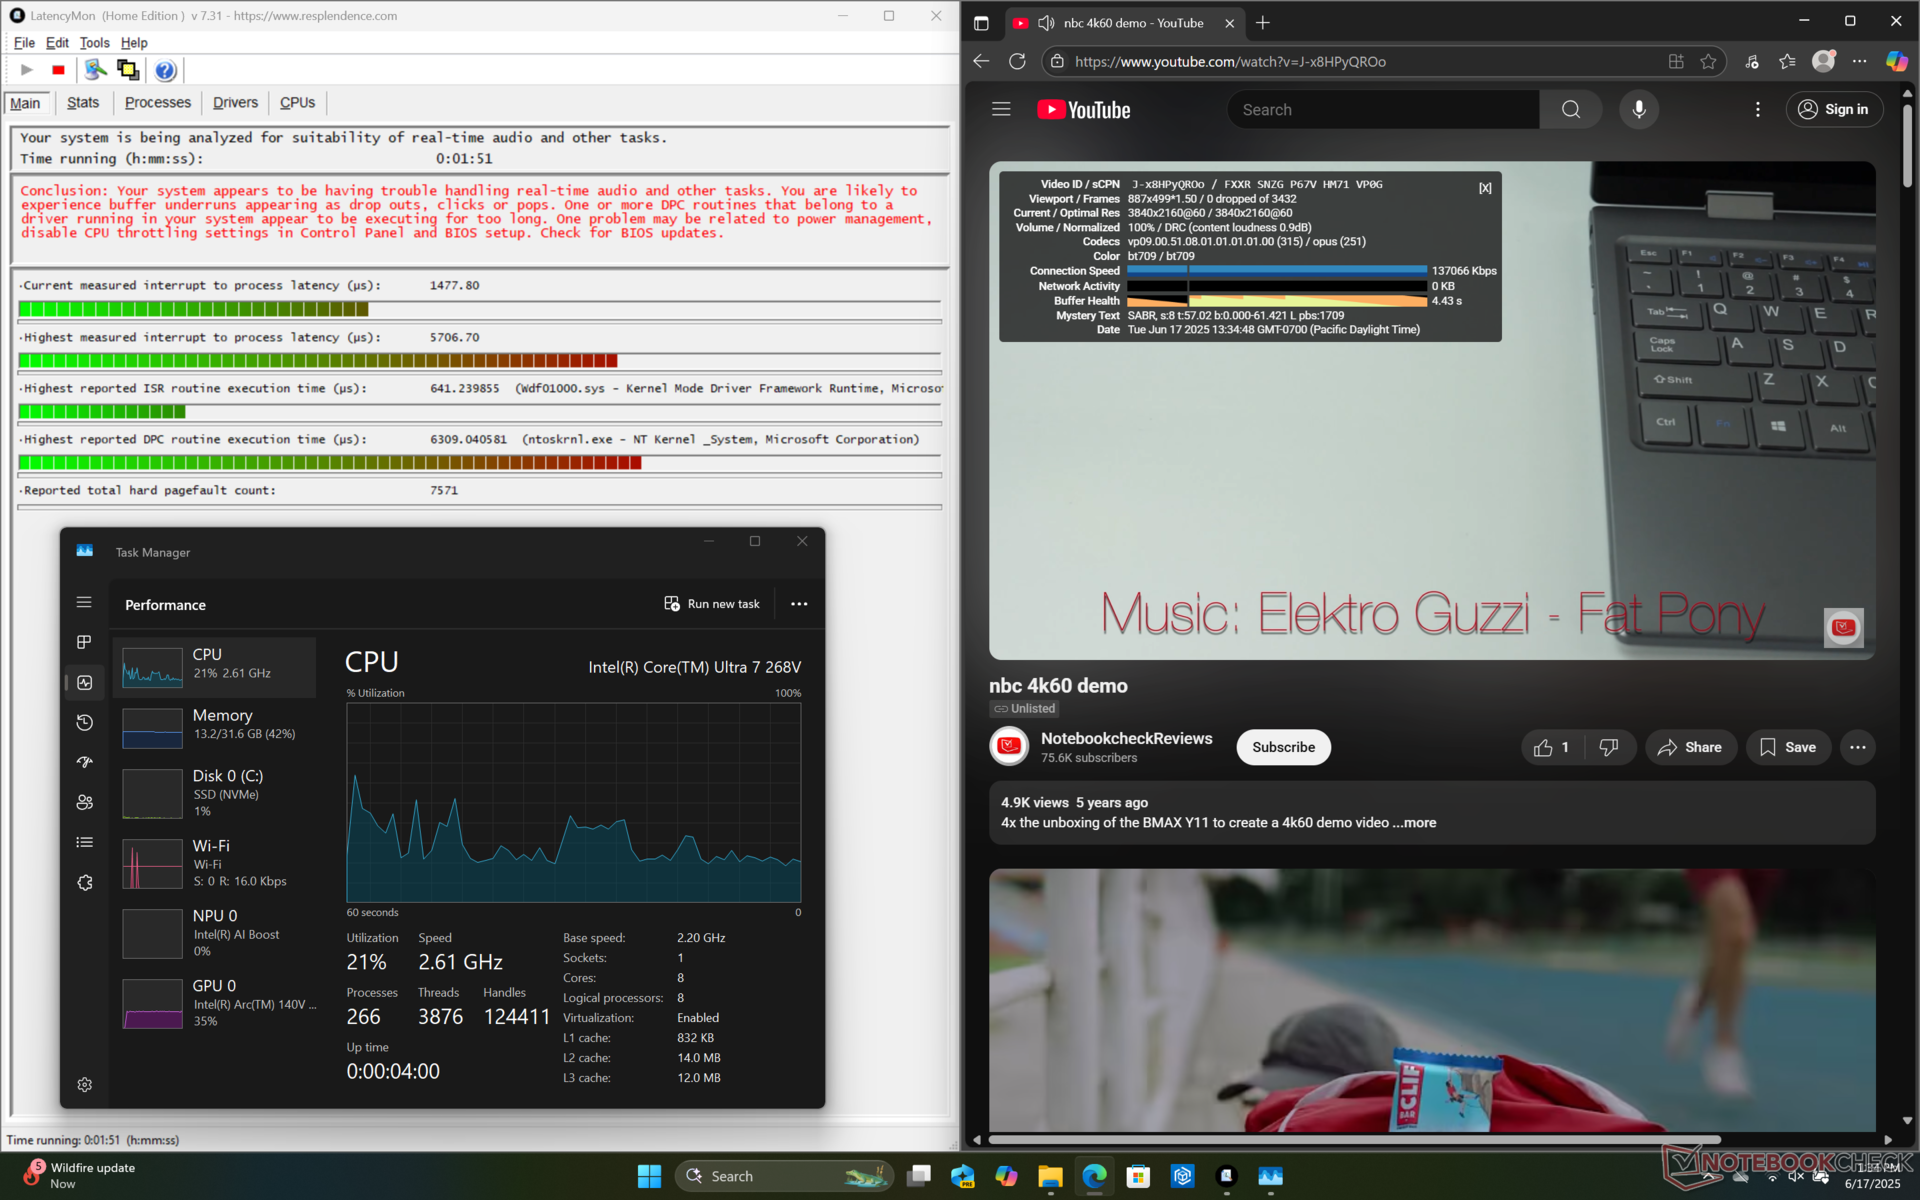
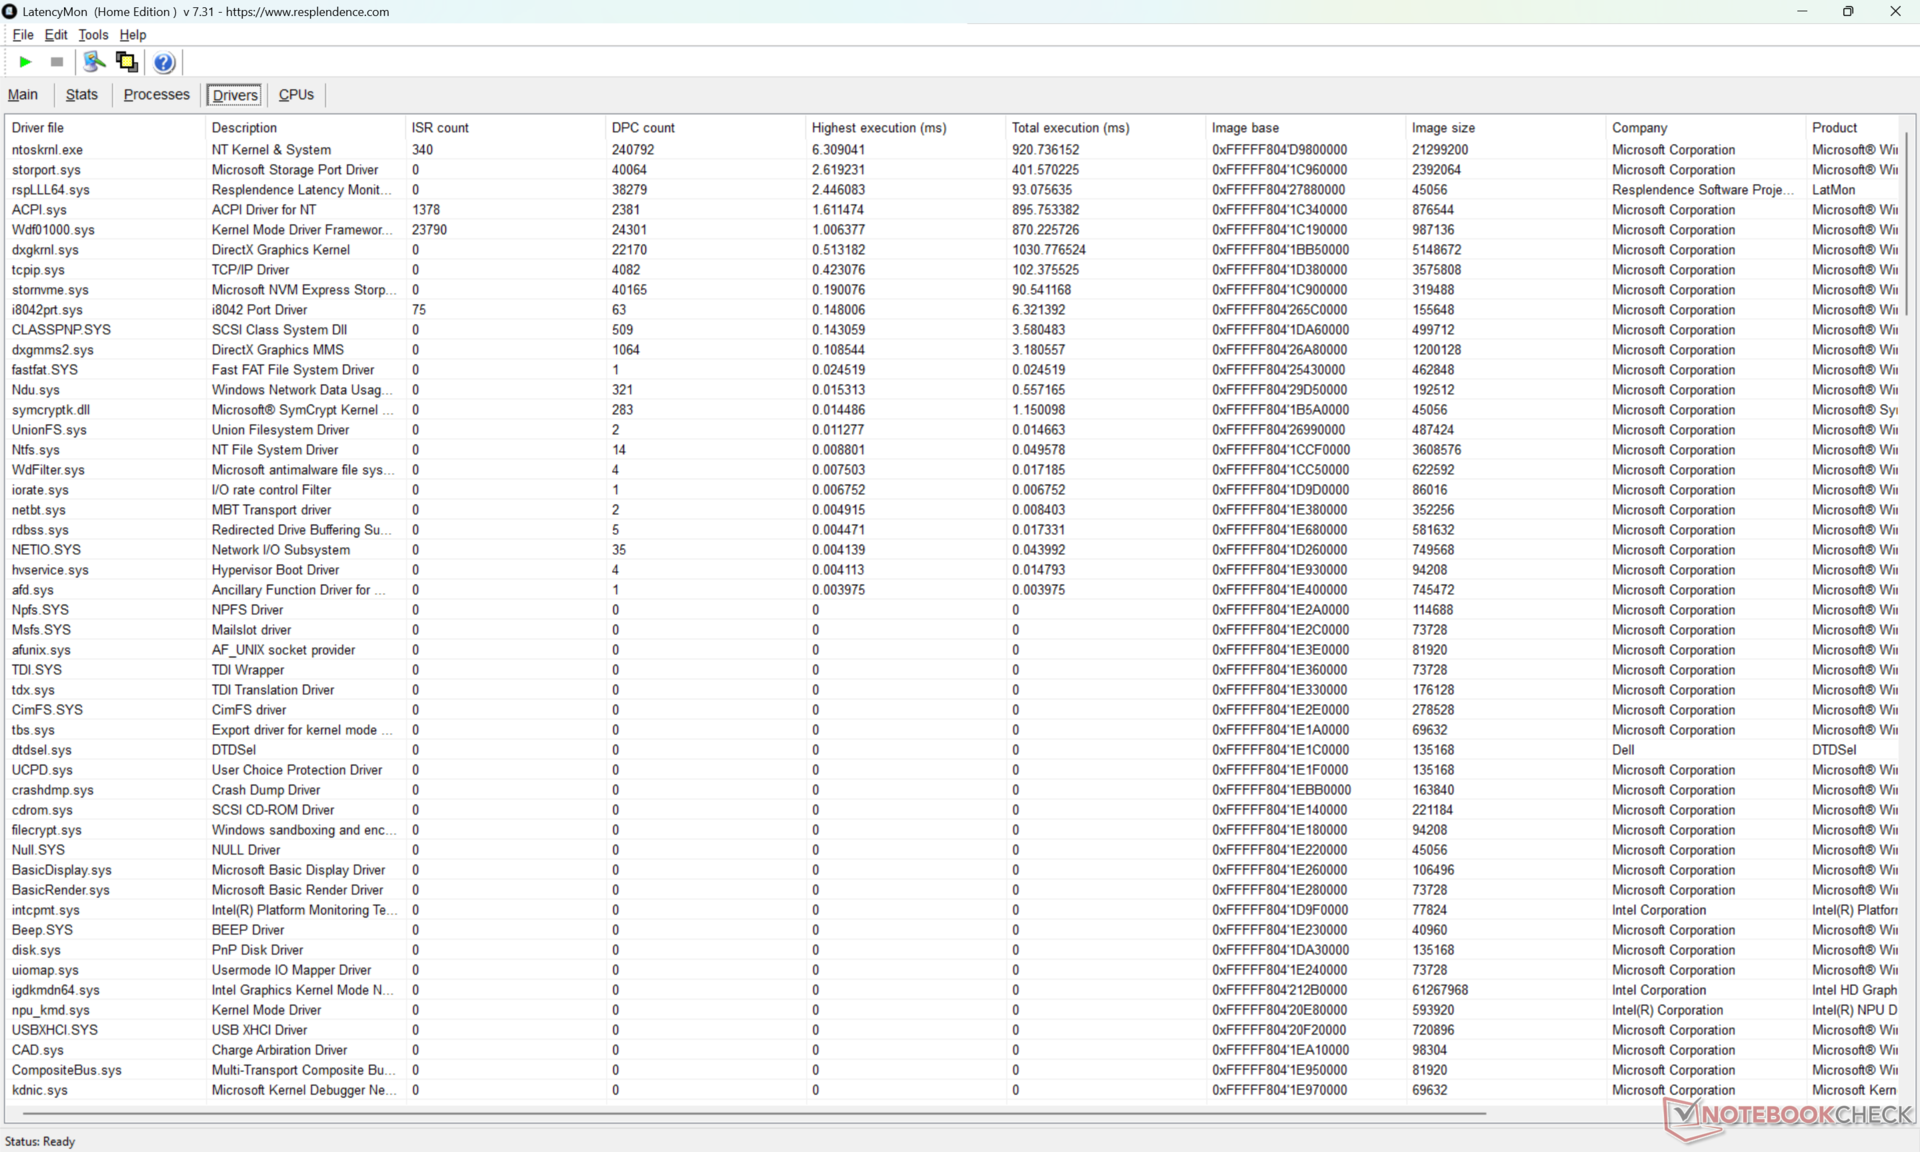
DPC-Latenzzeit
LatencyMon zeigt DPC-Probleme an, wenn Sie mehrere Browser Tabs unserer Homepage öffnen, aber ansonsten keine dropped frames beim Streaming von 4K60-Videoinhalten aufzeichnen.
| DPC Latencies / LatencyMon - interrupt to process latency (max), Web, Youtube, Prime95 | |
| Dell Pro 14 Premium | |
| Dell XPS 14 2024 OLED | |
| HP EliteBook Ultra G1i 14 | |
| Dell Latitude 7440 | |
| Asus ExpertBook B1 B1403CVA | |
| Lenovo ThinkPad T14s Gen 6 Intel | |
* ... kleinere Werte sind besser
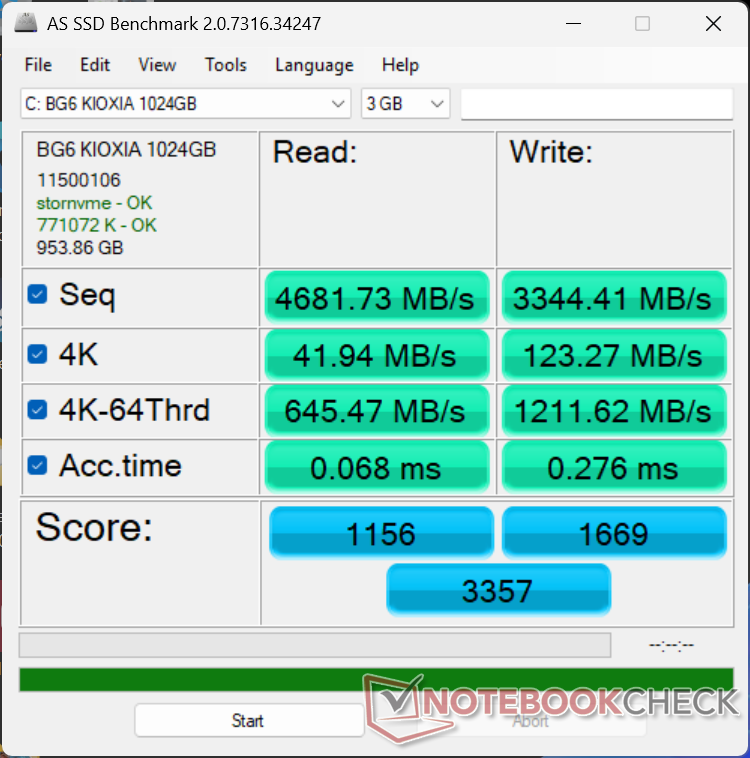
Speichergeräte
Die Kioxia BG6 in diesem System arbeitet sowohl schneller als auch konstanter als die Samsung Laufwerke in den Latitude-14-Modellen des letzten Jahres, wie die folgende Grafik zeigt. Die maximalen Übertragungsraten liegen stabil bei etwa 6.000 MB/s im Vergleich zu <3.500 MB/s auf dem Latitude 7440 oder 9440 2-in-1.


| Drive Performance Rating - Percent | |
| Asus ExpertBook B1 B1403CVA | |
| Lenovo ThinkPad T14s Gen 6 Intel | |
| Dell XPS 14 2024 OLED | |
| HP EliteBook Ultra G1i 14 | |
| Dell Latitude 7440 | |
| Dell Pro 14 Premium | |
* ... kleinere Werte sind besser
Disk Throttling: DiskSpd Read Loop, Queue Depth 8
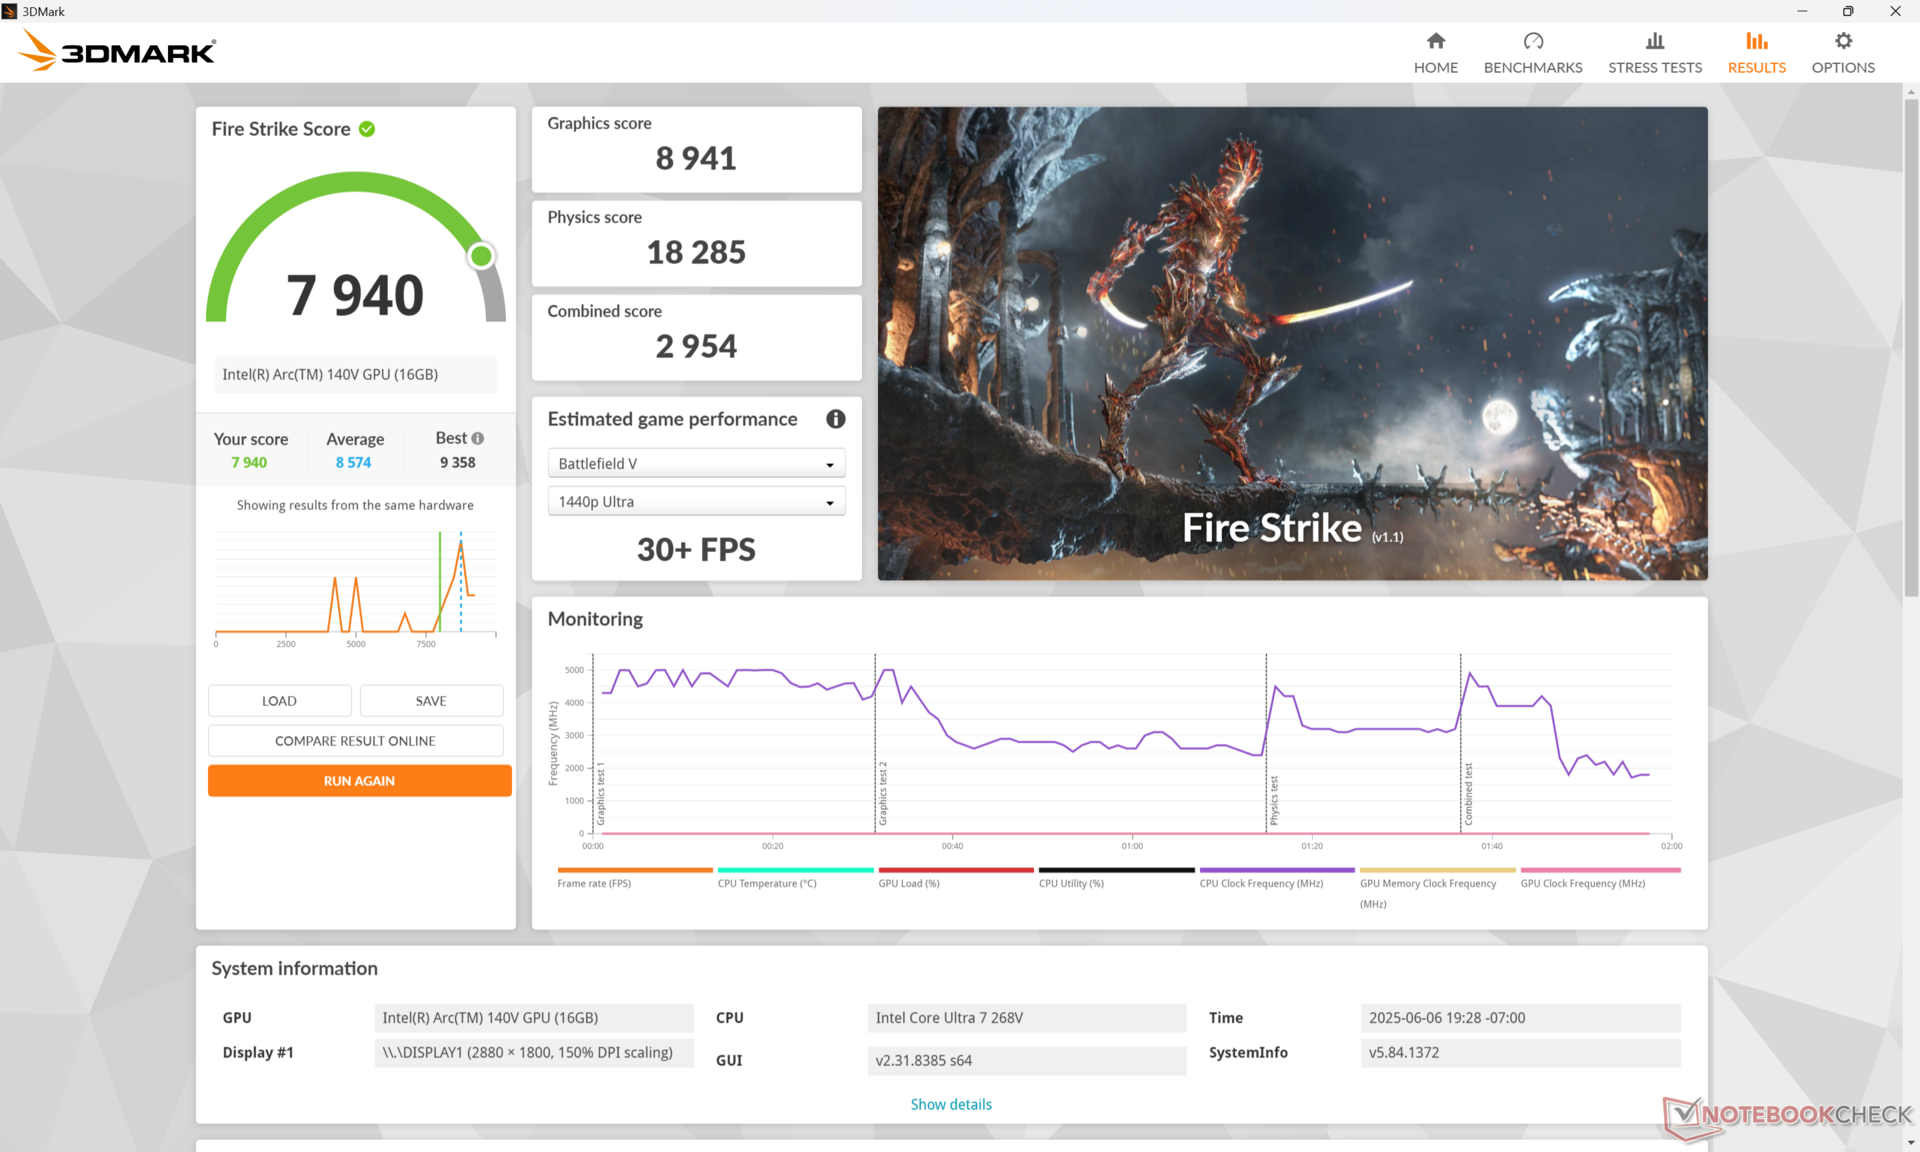
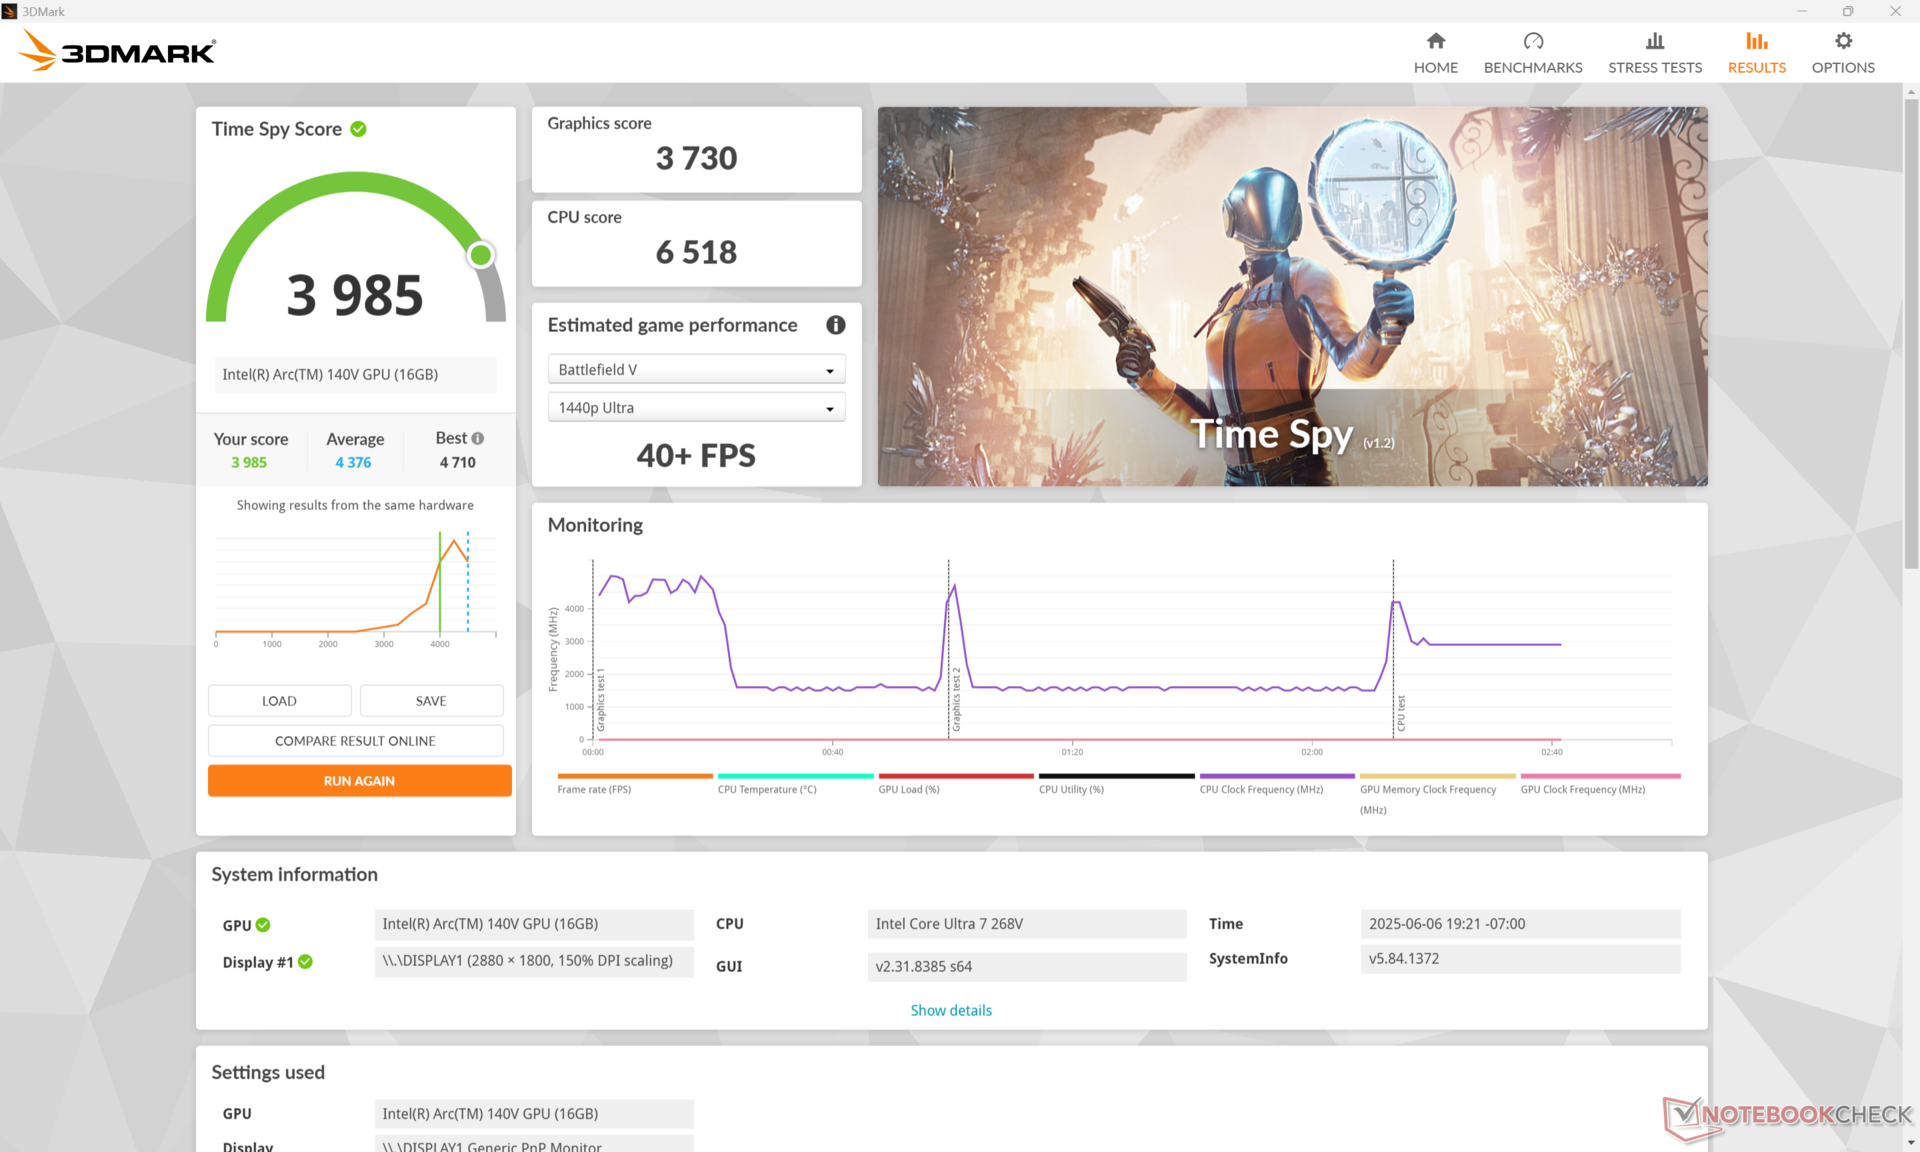
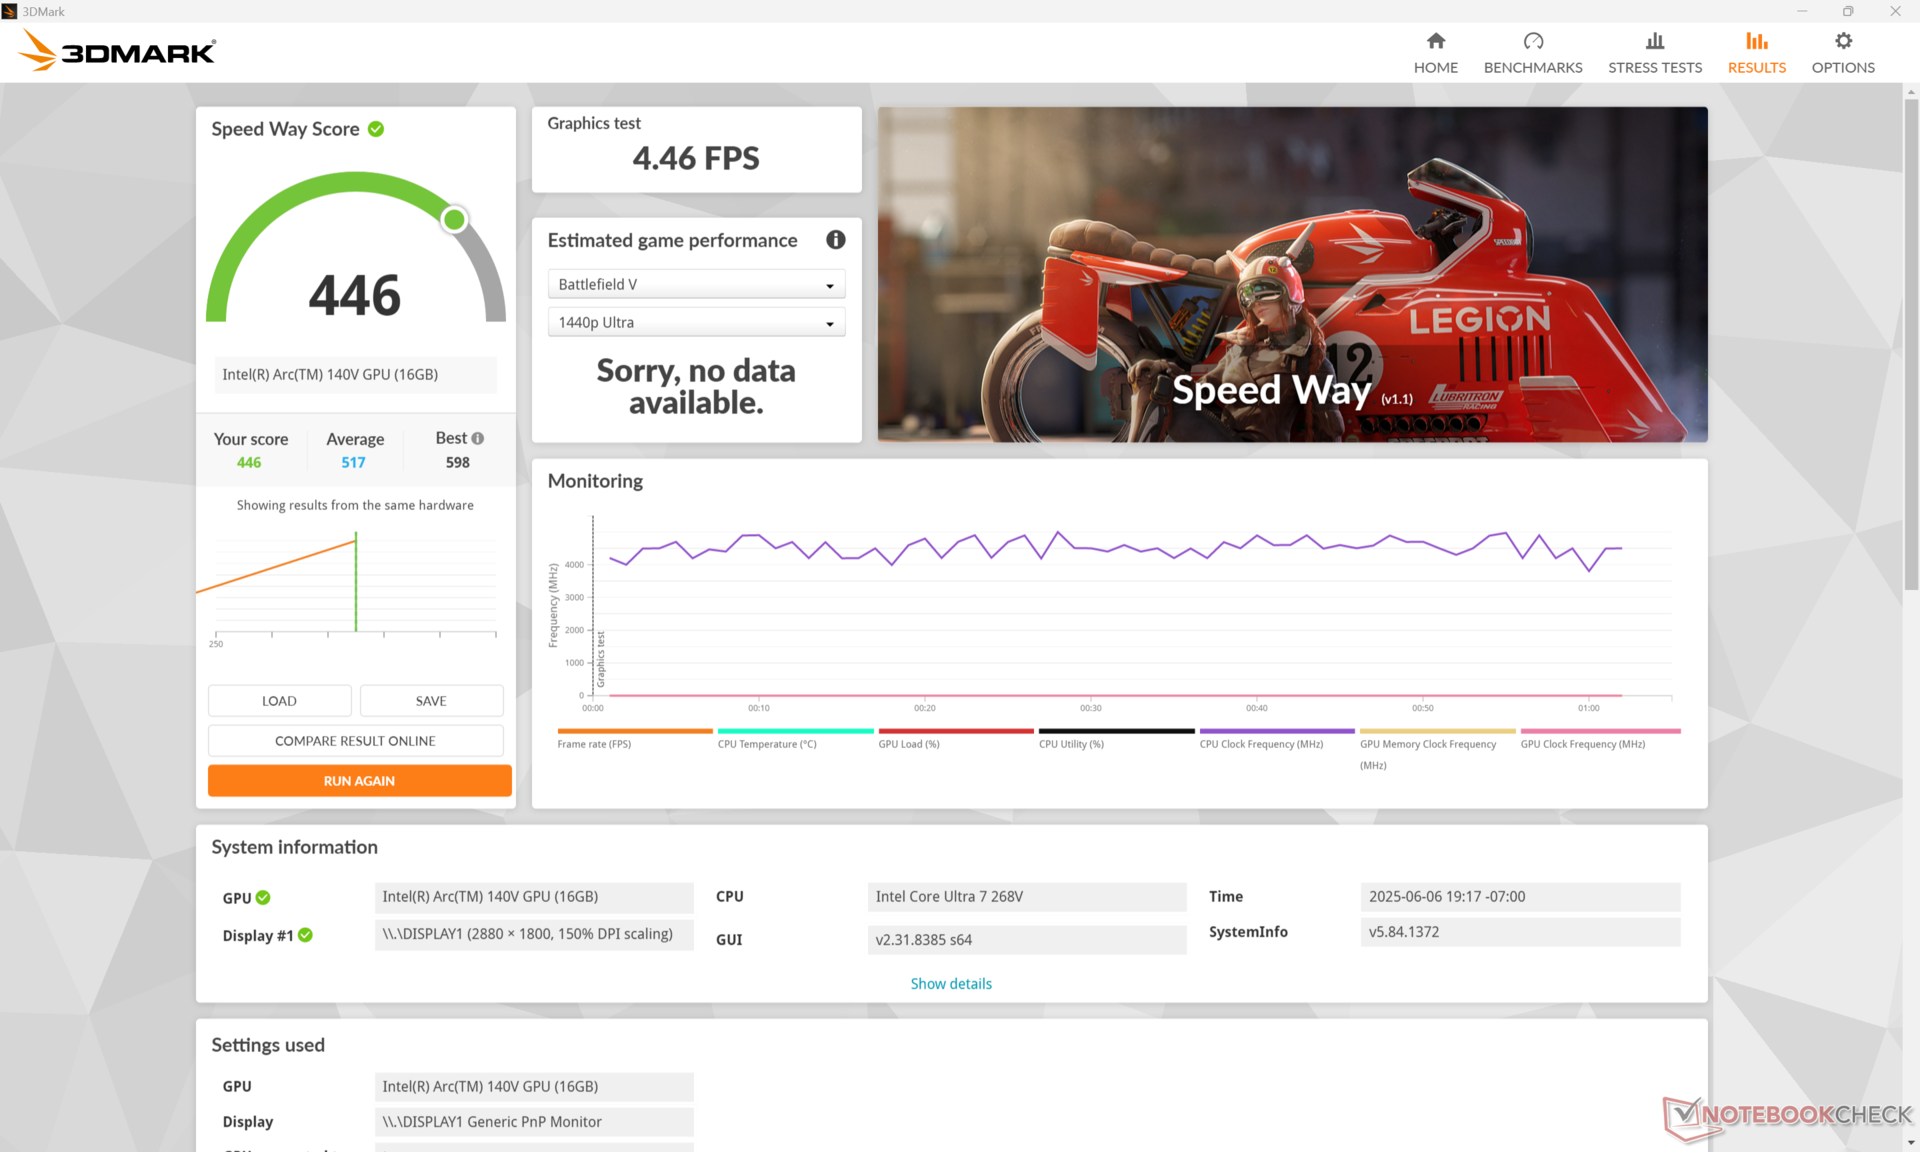
GPU Performance
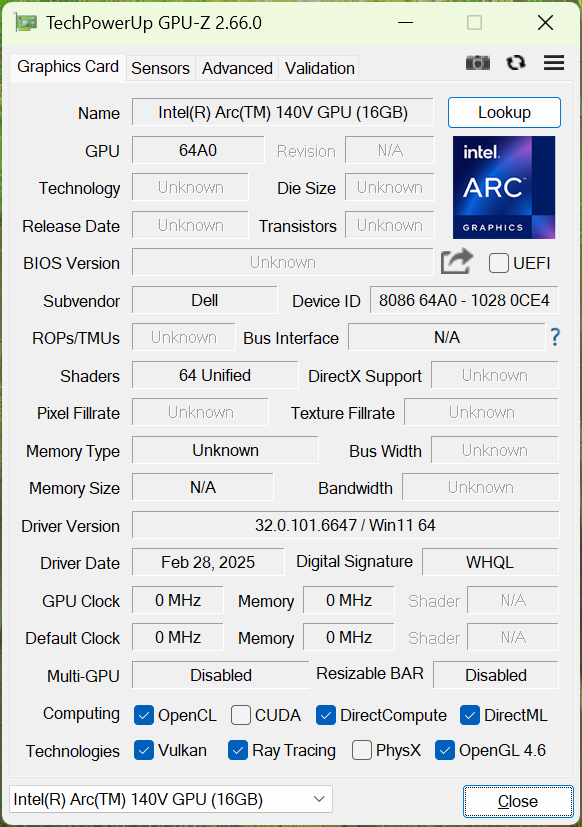
Der integrierte Arc 140V ist schneller als man erwarten würde, insbesondere für ein Business-Subnotebook. Der neuere Grafikprozessor ist eine deutliche Verbesserung gegenüber der Iris Xe-Serie des letztjährigen Latitude 7440 oder 9440 2-in-1 in vielen Fällen um mehr als das Doppelte. Anspruchsvolle Titel wie Cyberpunk 2077 sind bei 1.080p und 30 fps auf mittleren Einstellungen spielbar, während solche Spiele auf älteren Latitude Subnotebooks unabhängig von der Einstellung unspielbar wären.
| Leistungsprofil | Grafics Score | Physik-Wertung | Kombinierte Punktzahl |
| Performance-Modus | 8.941 | 18.285 | 2.954 |
| Ausgeglichener Modus | 8.402 (-6 %) | 16.811 (-8 %) | 2.313 (-22 %) |
| Akku-Leistung | 8.685 (-3 %) | 16.092 (-12 %) | 2.399 (-18 %) |
Wenn Sie das System im Modus "Ausbalanciert" oder im Akkubetrieb statt im Modus " Performance " betreiben, verringert sich die Leistung um einige Prozentpunkte, wie aus der obigen Ergebnistabelle Fire Strike hervorgeht.

| 3DMark 11 Performance | 12784 Punkte | |
| 3DMark Cloud Gate Standard Score | 30158 Punkte | |
| 3DMark Fire Strike Score | 7940 Punkte | |
| 3DMark Time Spy Score | 3985 Punkte | |
Hilfe | ||
* ... kleinere Werte sind besser
Cyberpunk 2077 ultra fps Chart
| min. | mittel | hoch | max. | |
|---|---|---|---|---|
| Dota 2 Reborn (2015) | 104.1 | 89.5 | 75 | 87.4 |
| Final Fantasy XV Benchmark (2018) | 88.5 | 49.5 | 36.5 | |
| X-Plane 11.11 (2018) | 46.2 | 39.6 | 34.9 | |
| Strange Brigade (2018) | 194.3 | 80.2 | 67.4 | 57.6 |
| Baldur's Gate 3 (2023) | 43.6 | 36.8 | 32.2 | 31.6 |
| Cyberpunk 2077 (2023) | 47.8 | 38.5 | 33.4 | 29 |
| F1 24 (2024) | 82.4 | 75.7 | 59.9 | 19.1 |
Emissionen
Systemrauschen
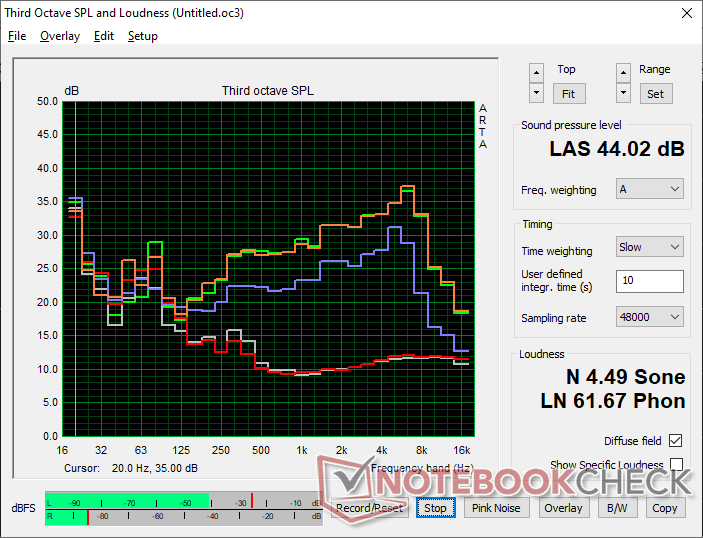
Das Geräuschprofil und das Verhalten des Lüfters ähneln dem, was wir beim Latitude 9440 2-in-1 gemessen haben, was vielleicht nicht weiter verwunderlich ist, wenn man bedenkt, dass beide viele ähnliche physische Merkmale aufweisen. Das Dell Pro 14 Premium ist bei alltäglicher Büroarbeit wie dem Surfen im Internet oder der Textverarbeitung im Wesentlichen geräuschlos und nur minimal pulsierend. Sollten die Lüfter an Geschwindigkeit gewinnen, werden sie relativ schnell wieder gedrosselt, wenn die zusätzliche Rechenleistung nicht mehr benötigt wird.
Die Lüftergeräuschgrenze von 44 dB(A) liegt nahe an dem, was wir auf dem Latitude 9440 2-in-1 gemessen haben und ist damit lauter als bei vielen anderen Business-Subnotebooks. Auch die Tonhöhe ist relativ scharf und damit auffälliger, als uns lieb ist.
Lautstärkediagramm
| Idle |
| 23.1 / 23.1 / 23.1 dB(A) |
| Last |
| 38.2 / 44.2 dB(A) |
 | ||
30 dB leise 40 dB(A) deutlich hörbar 50 dB(A) störend |
||
min: | ||
| Dell Pro 14 Premium Arc 140V, Core Ultra 7 268V, Kioxia BG6 KBG6AZNV1T02 | Dell Latitude 7440 Iris Xe G7 80EUs, i5-1345U, Samsung MZ9L4512HBLU-00BMV | Dell XPS 14 2024 OLED GeForce RTX 4050 Laptop GPU, Ultra 7 155H, Samsung PM9A1 MZVL21T0HCLR | Lenovo ThinkPad T14s Gen 6 Intel Arc 130V, Core Ultra 5 228V, SK hynix PCB01 HFS001TFM9X179N GL | HP EliteBook Ultra G1i 14 Arc 140V, Core Ultra 7 258V, Kioxia XG8 KXG80ZNV1T02 | Asus ExpertBook B1 B1403CVA UHD Graphics Xe G4 48EUs, i5-13420H, Western Digital PC SN5000S SDEQNSJ-512G-1002 | |
|---|---|---|---|---|---|---|
| Geräuschentwicklung | 8% | -7% | 3% | 10% | 6% | |
| aus / Umgebung * (dB) | 23.1 | 22.8 1% | 24.3 -5% | 24.2 -5% | 23.9 -3% | 23.6 -2% |
| Idle min * (dB) | 23.1 | 22.8 1% | 24.3 -5% | 24.2 -5% | 23.9 -3% | 23.6 -2% |
| Idle avg * (dB) | 23.1 | 22.8 1% | 26.5 -15% | 24.2 -5% | 23.9 -3% | 23.6 -2% |
| Idle max * (dB) | 23.1 | 22.8 1% | 28.5 -23% | 24.2 -5% | 23.9 -3% | 23.7 -3% |
| Last avg * (dB) | 38.2 | 26.3 31% | 37 3% | 30.2 21% | 28.4 26% | 28.7 25% |
| Cyberpunk 2077 ultra * (dB) | 44.2 | 39.3 11% | 31.5 29% | 34.3 22% | ||
| Last max * (dB) | 44.2 | 38.3 13% | 43.3 2% | 39.6 10% | 31.5 29% | 41.4 6% |
| Witcher 3 ultra * (dB) | 30 | 39.1 |
* ... kleinere Werte sind besser
Temperatur
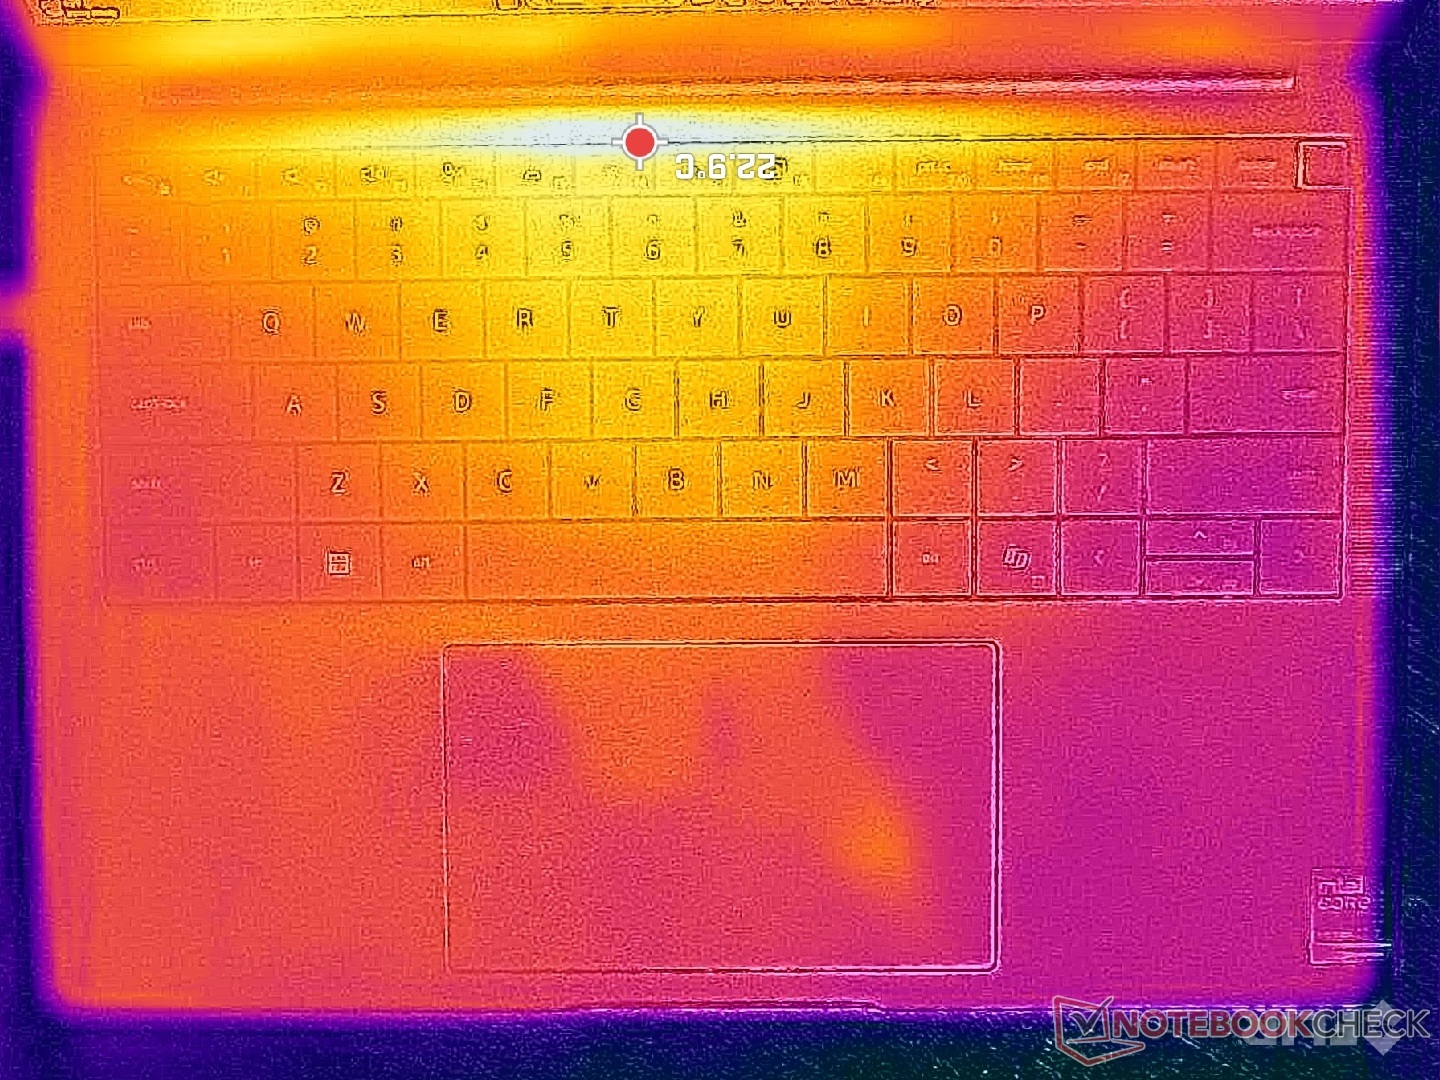
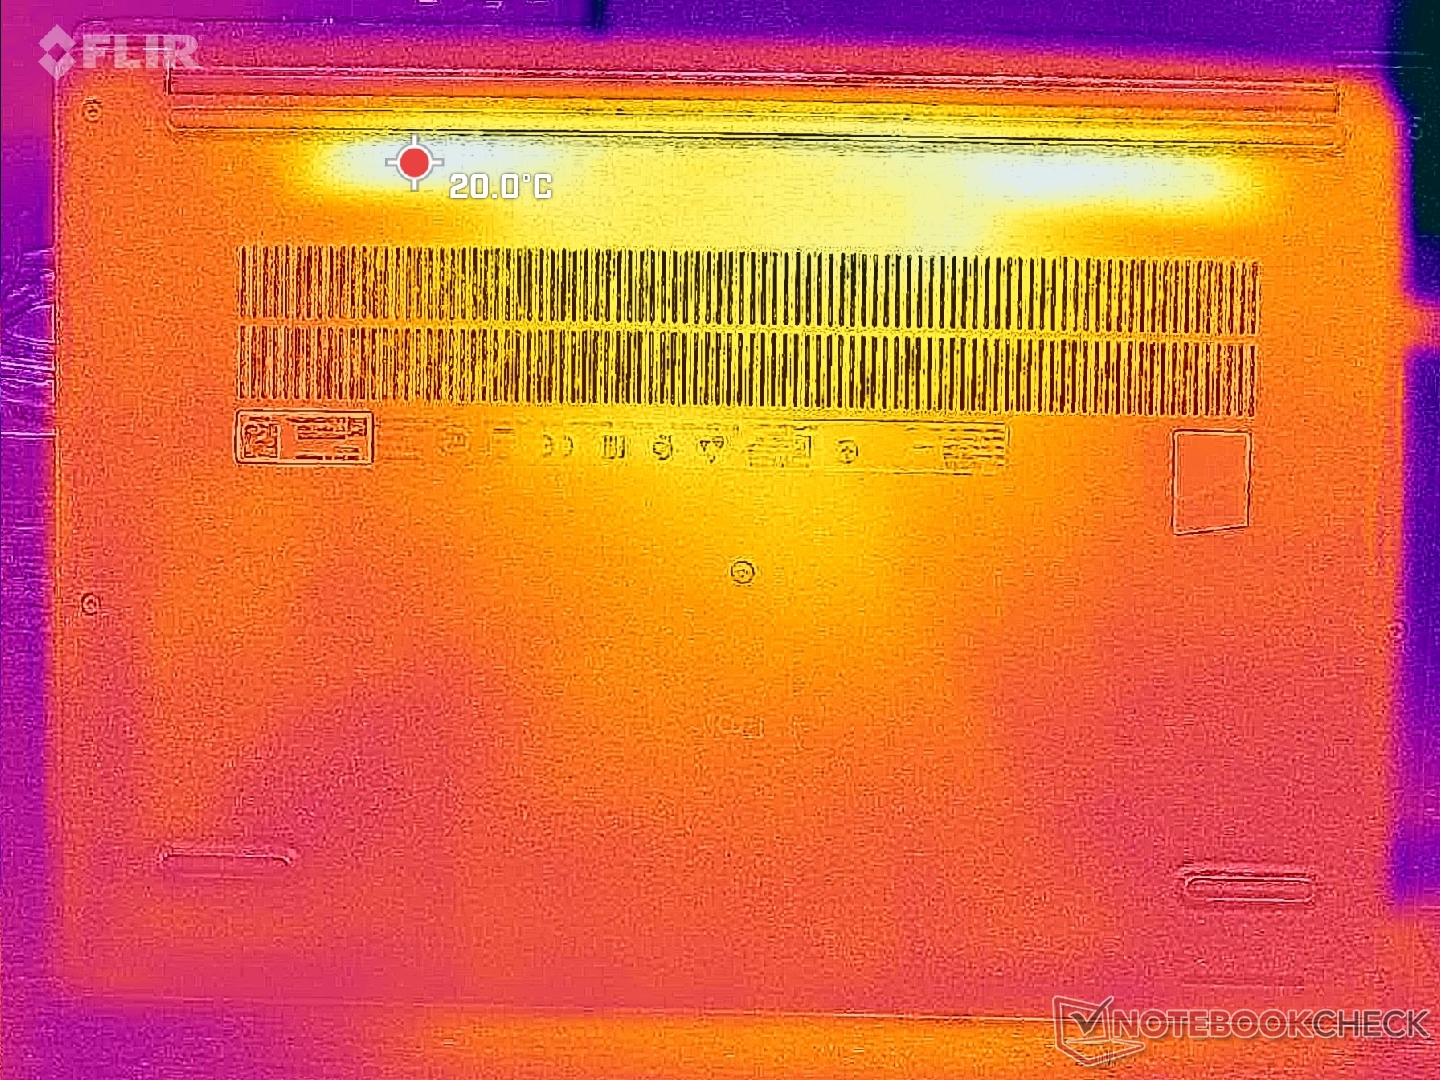
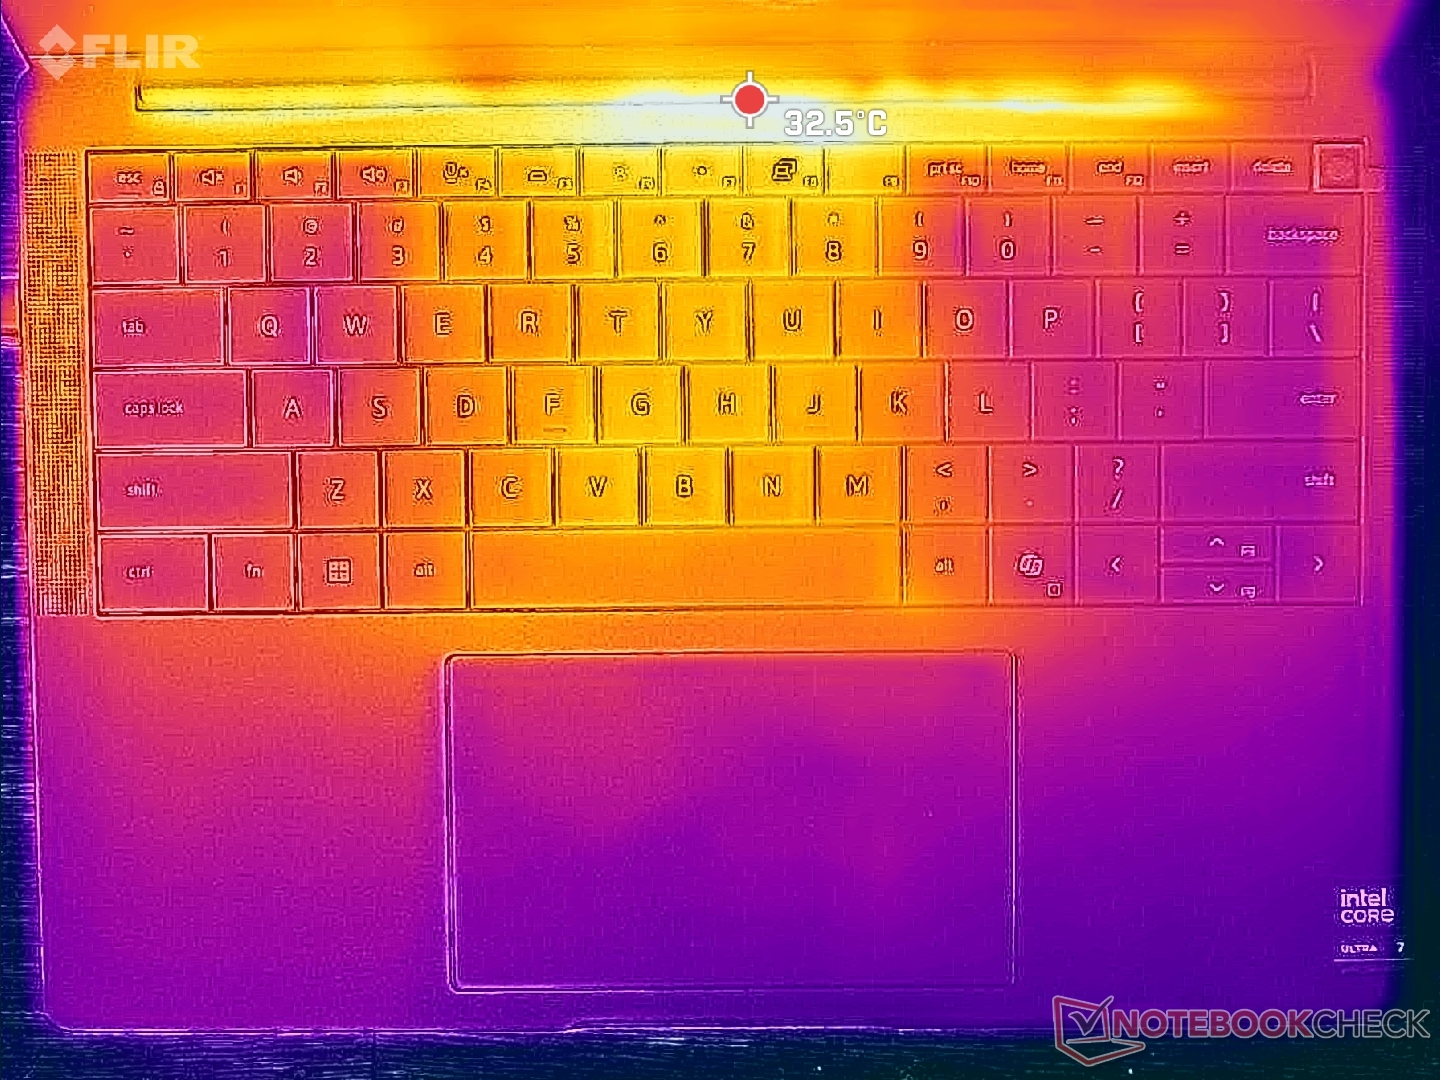
Die Oberflächentemperaturen sind viel kühler als die, die wir bei den Modellen Latitude 9440 2-in-1 und Latitude 7440 gemessen haben. Die heißen Stellen auf der Tastaturoberfläche und der Unterseite erreichen nur 33 bzw. 28 °C, verglichen mit 40 °C bei den oben genannten Latitude Modellen. Die Verbesserungen können größtenteils auf die effizientere Lunar-Lake-CPU zurückgeführt werden.
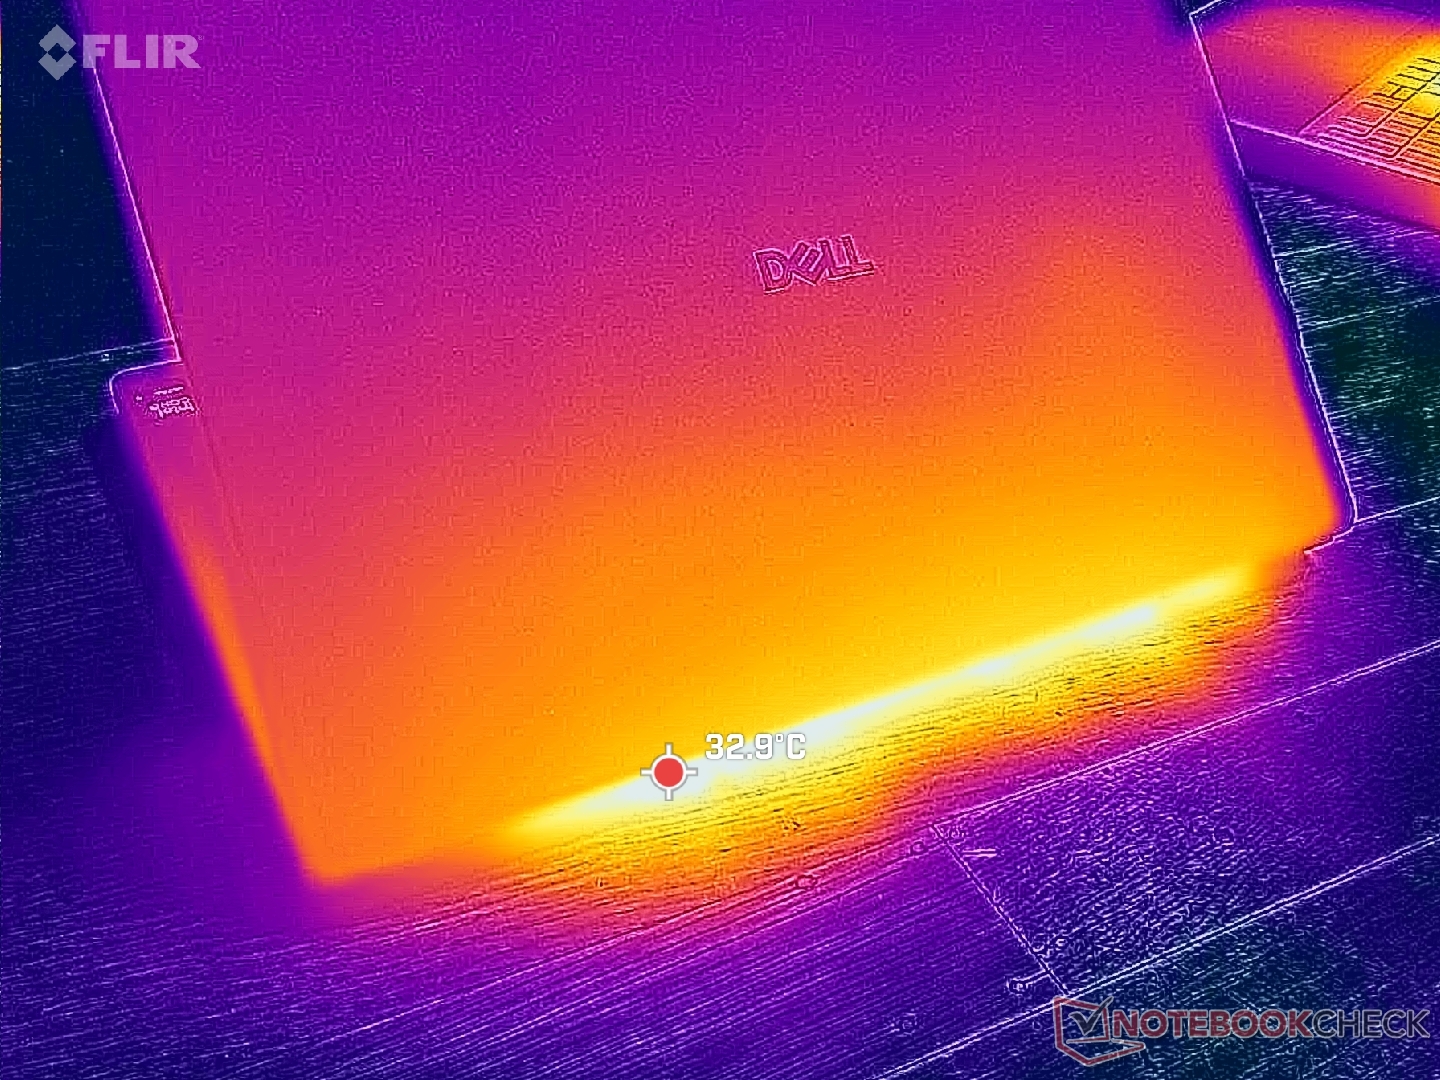
(+) Die maximale Temperatur auf der Oberseite ist 33 °C. Im Vergleich liegt der Klassendurchschnitt bei 34.3 °C (von 21.2 bis 62.5 °C für die Klasse Office).
(+) Auf der Unterseite messen wir eine maximalen Wert von 28 °C (im Vergleich zum Durchschnitt von 36.8 °C).
(+) Ohne Last messen wir eine durchschnittliche Temperatur von 26 °C auf der Oberseite. Der Klassendurchschnitt erreicht 29.5 °C.
(+) Die Handballen und der Touchpad-Bereich sind mit gemessenen 25.4 °C kühler als die typische Hauttemperatur und fühlen sich dadurch kühl an.
(+) Die durchschnittliche Handballen-Temperatur anderer getesteter Geräte war 27.5 °C (+2.1 °C).

| Dell Pro 14 Premium Intel Core Ultra 7 268V, Intel Arc Graphics 140V | Dell Latitude 7440 Intel Core i5-1345U, Intel Iris Xe Graphics G7 80EUs | Dell XPS 14 2024 OLED Intel Core Ultra 7 155H, NVIDIA GeForce RTX 4050 Laptop GPU | Lenovo ThinkPad T14s Gen 6 Intel Intel Core Ultra 5 228V, Intel Arc Graphics 130V | HP EliteBook Ultra G1i 14 Intel Core Ultra 7 258V, Intel Arc Graphics 140V | Asus ExpertBook B1 B1403CVA Intel Core i5-13420H, Intel UHD Graphics Xe G4 48EUs | |
|---|---|---|---|---|---|---|
| Hitze | -16% | -17% | -18% | -10% | -19% | |
| Last oben max * (°C) | 33 | 39 -18% | 40.5 -23% | 42.6 -29% | 37.9 -15% | 41.2 -25% |
| Last unten max * (°C) | 28 | 40.6 -45% | 42.6 -52% | 41.6 -49% | 44.3 -58% | 44.4 -59% |
| Idle oben max * (°C) | 28 | 28 -0% | 26.9 4% | 27.1 3% | 23.3 17% | 26.7 5% |
| Idle unten max * (°C) | 28.8 | 28.8 -0% | 27.8 3% | 27.6 4% | 23.6 18% | 28 3% |
* ... kleinere Werte sind besser
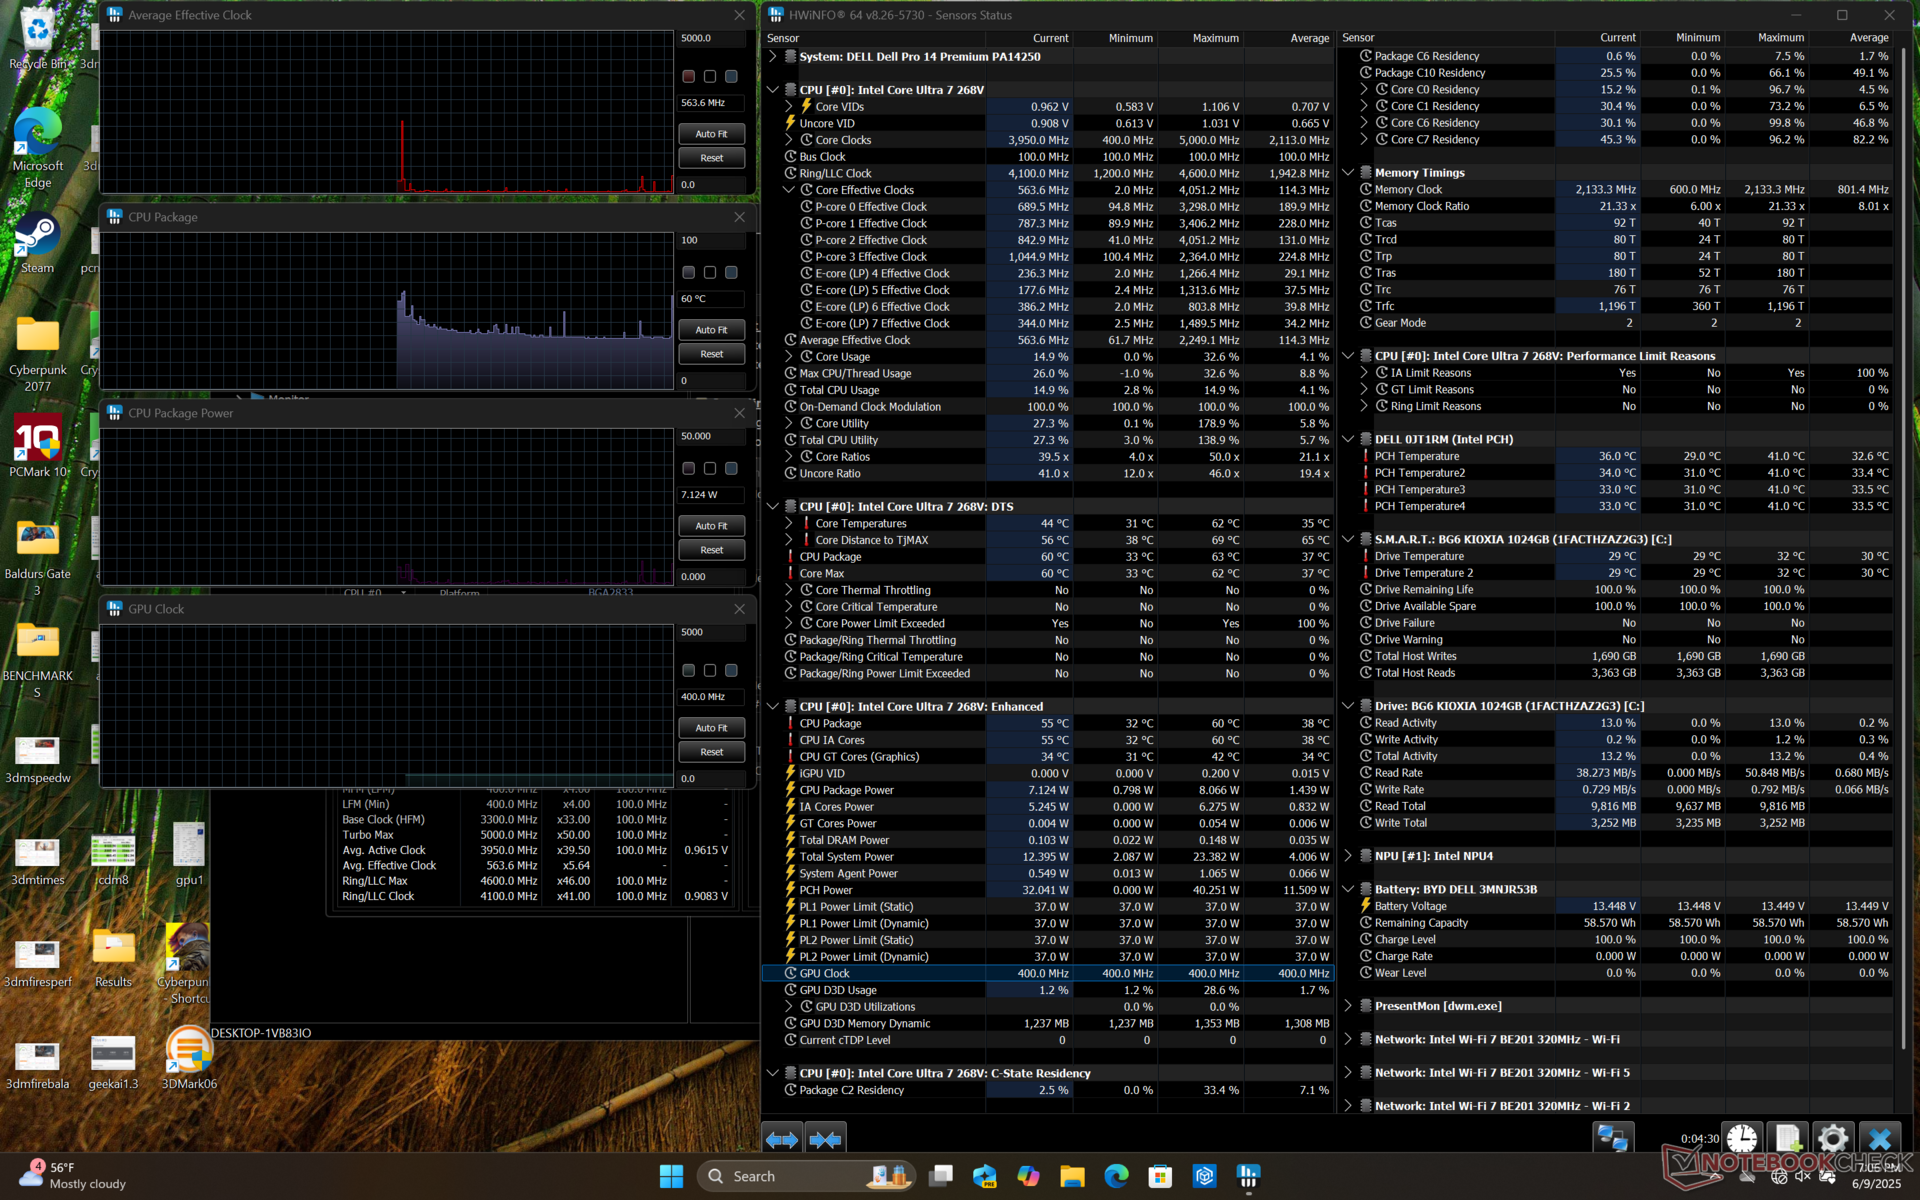
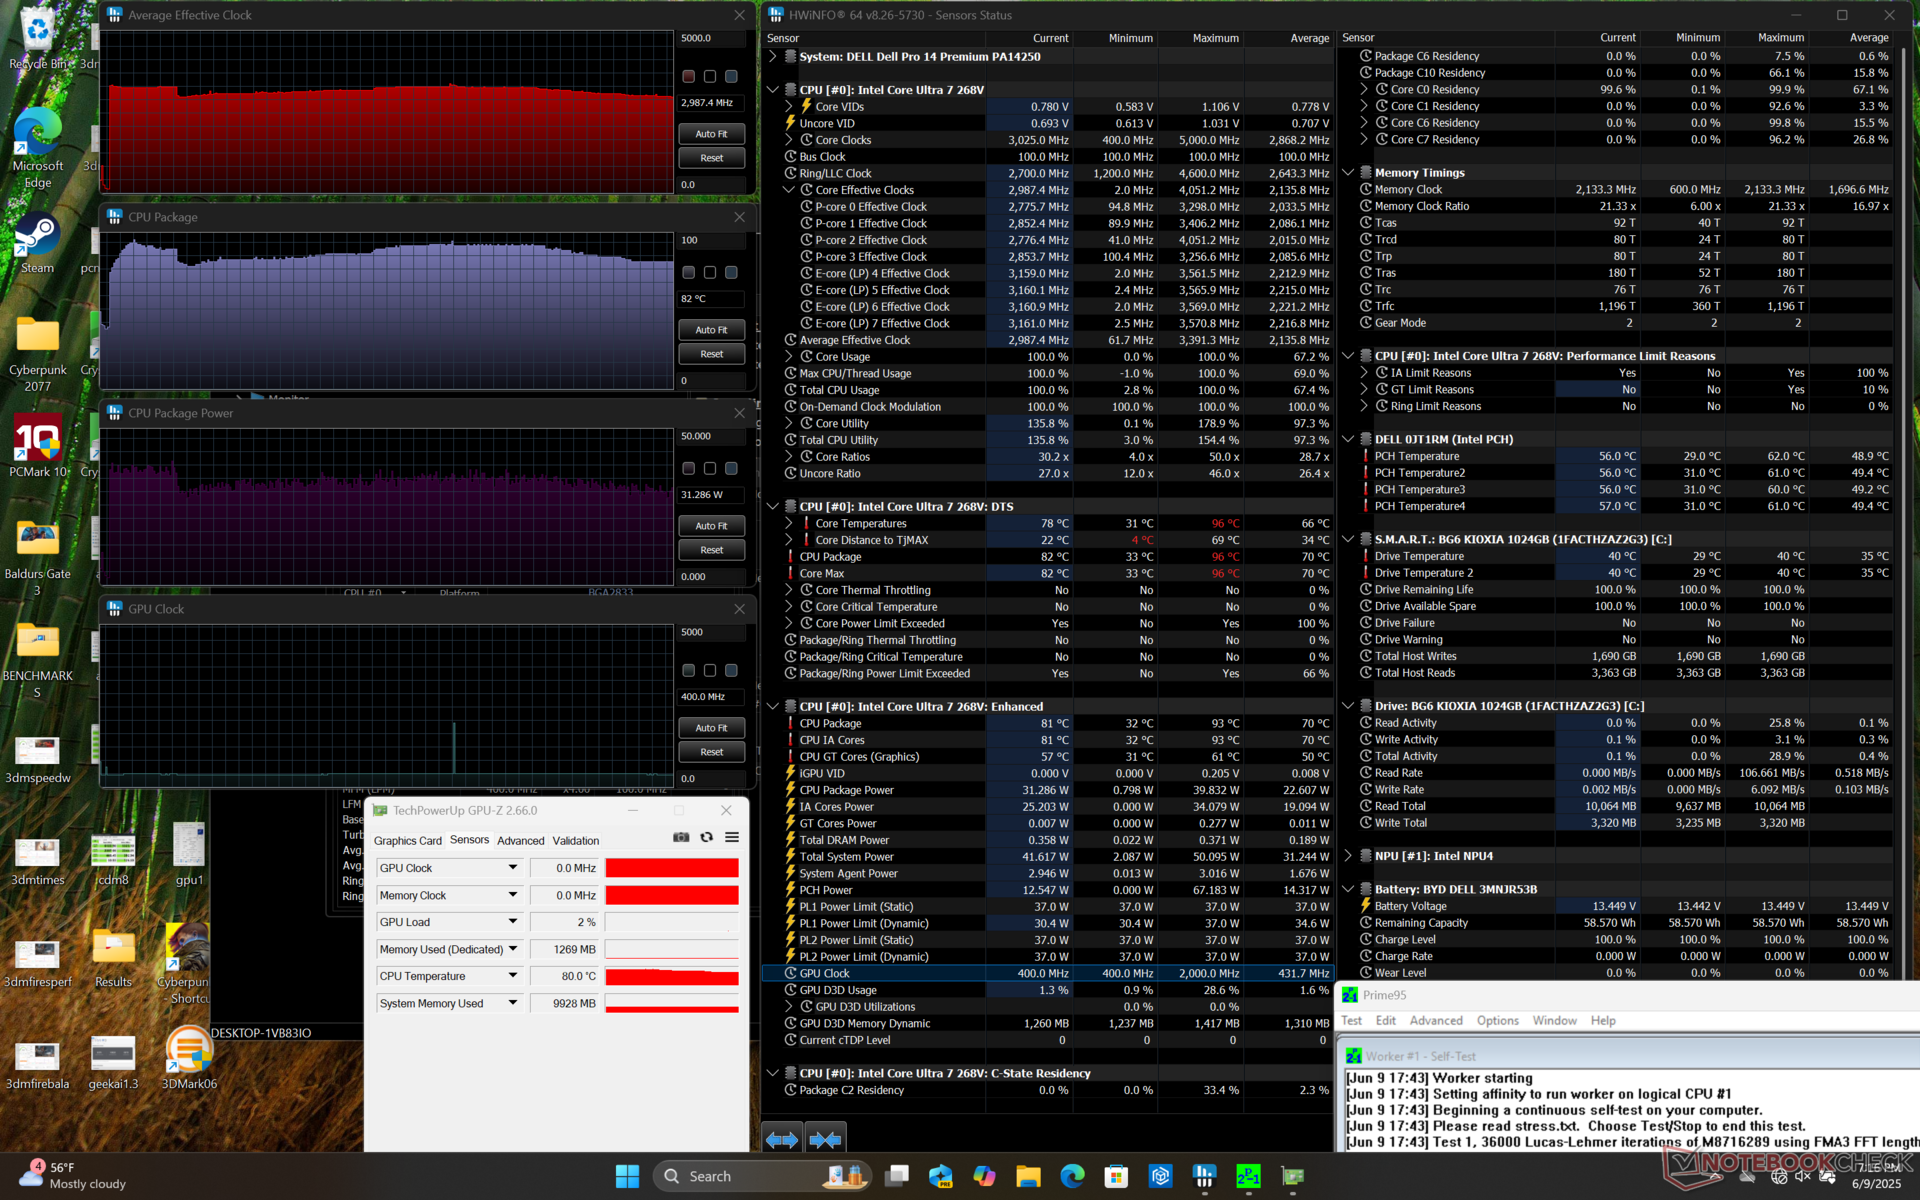
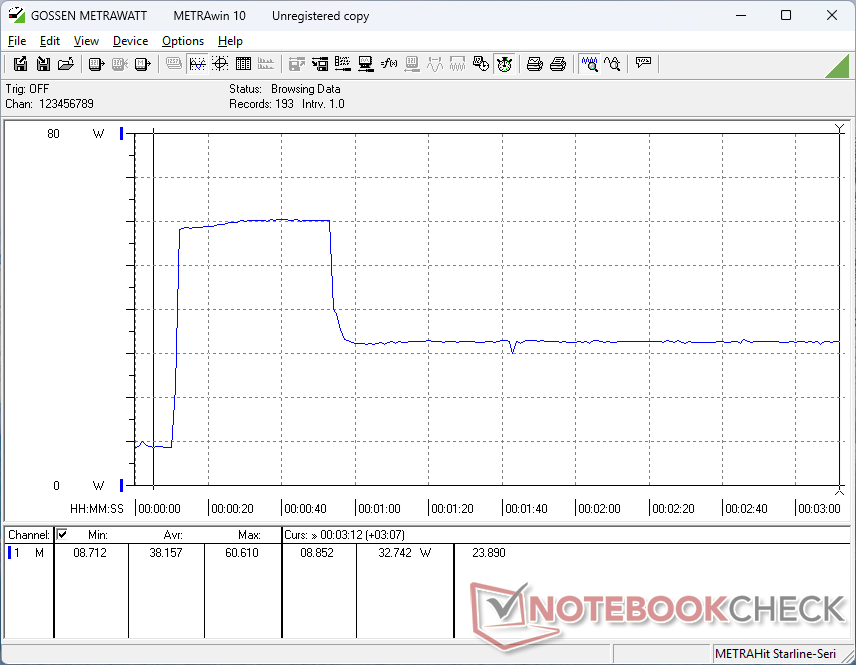
Stresstest
Die CPU wurde beim Starten von Prime95 Stress auf 3,3 GHz und 38 W hochgefahren, bis sie etwa 40 Sekunden später eine Kerntemperatur von 96 °C erreicht. Danach ging die Leistung leicht auf 3 GHz und 31 W zurück, um eine kühlere Temperatur im unteren Bereich von 80 °C zu halten. Der maximale Turbo Boost ist also begrenzt, wie man es von ULV-Laptops erwarten kann.
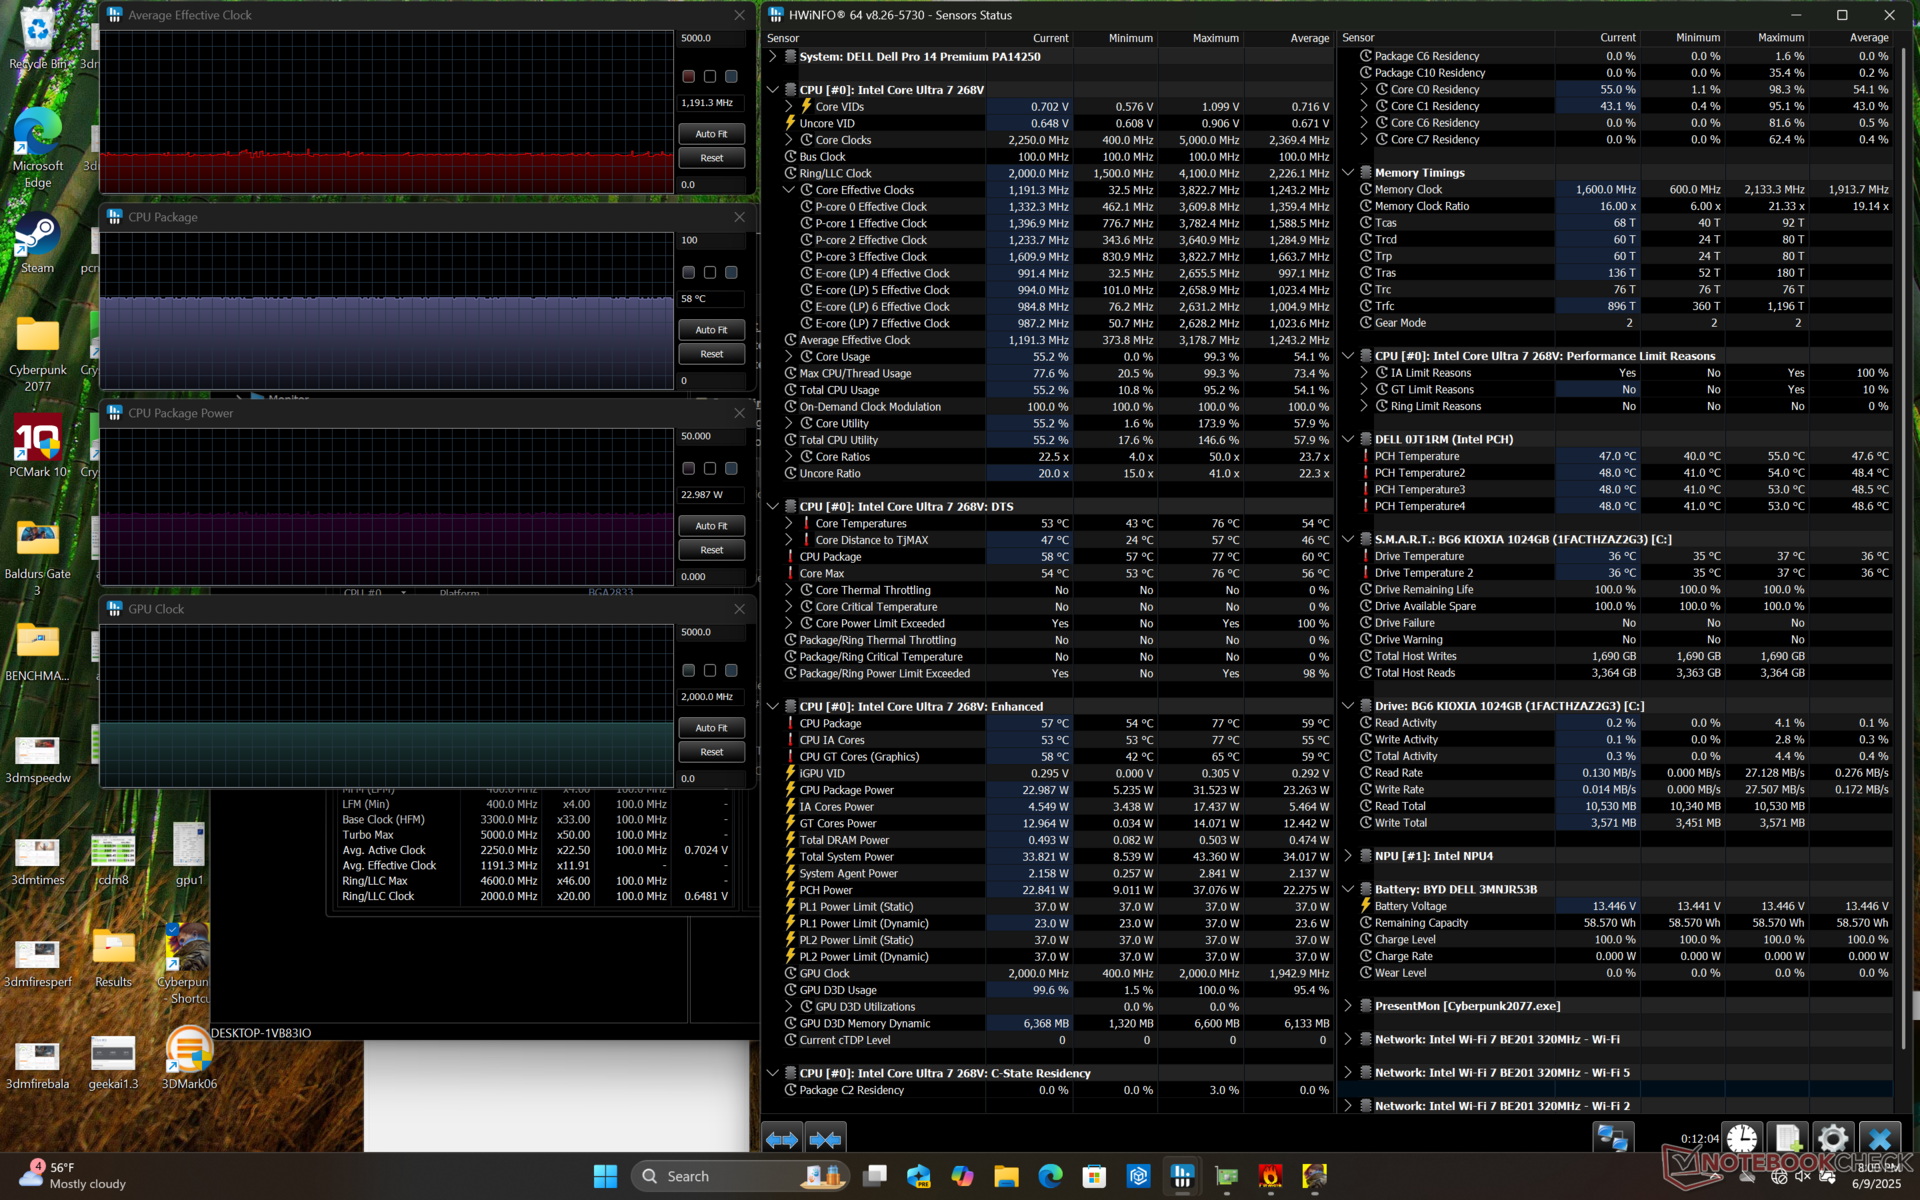
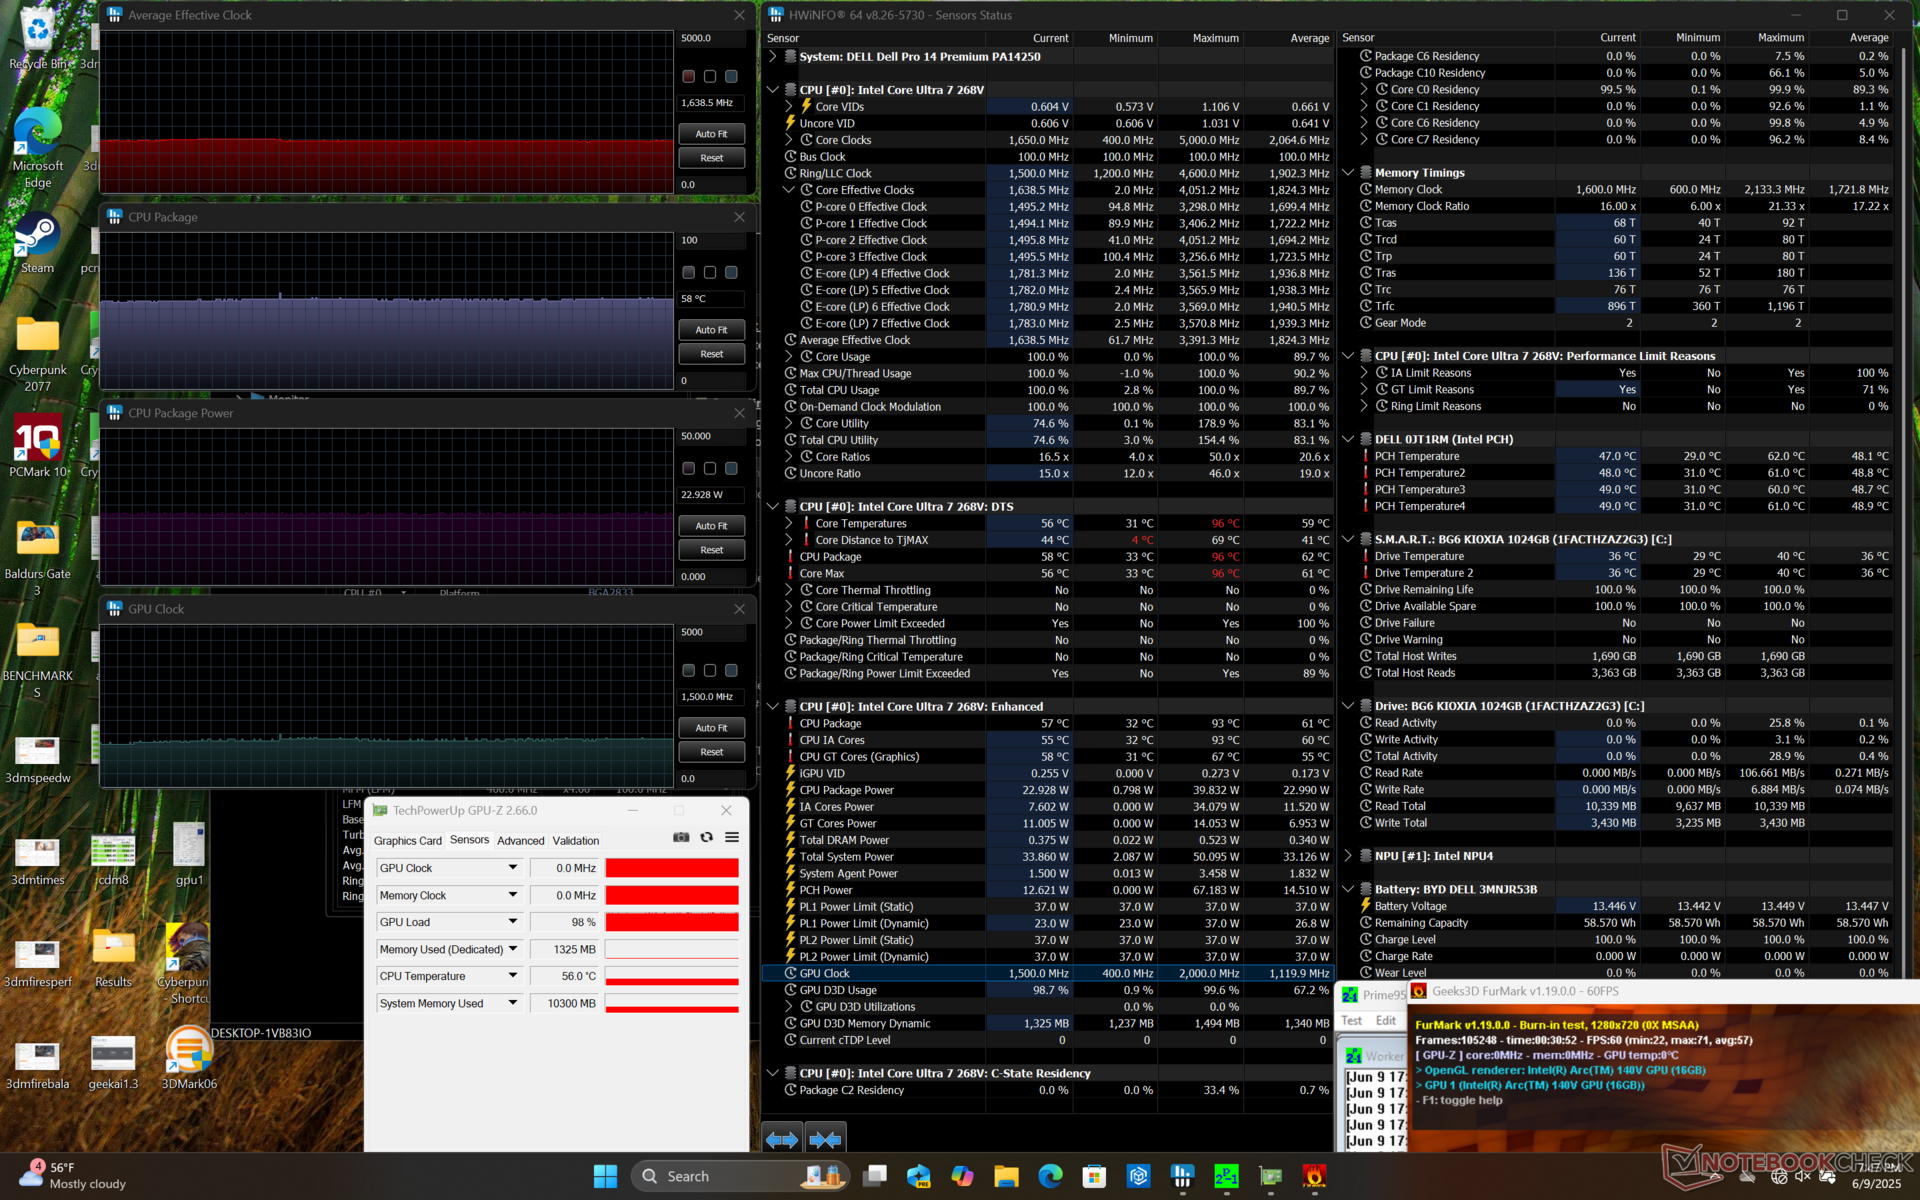
Die Kerntemperatur beim Spielen bleibt knapp unter 60 °C im Vergleich zu über 80 °C beim Latitude 9440 2-in-1. Unnötig zu erwähnen, dass das Dell Pro 14 Premium deutlich effizienter ist, wenn man GPU-lastige Aufgaben ausführt.
| durchschnittlicher CPU-Takt (GHz) | GPU-Takt (MHz) | durchschnittliche CPU-Temperatur (°C) | |
| System Leerlauf | -- | -- | 32 |
| Prime95 Stress | 3,0 | -- | 82 |
| Prime95 + FurMark Stress | 1,6 | 1.500 | 58 |
| Cyberpunk 2077 Stress | 1,2 | 2.000 | 58 |
Lautsprecher


Dell Pro 14 Premium Audio Analyse
(+) | Die Lautsprecher können relativ laut spielen (89.8 dB)
Bass 100 - 315 Hz
(±) | abgesenkter Bass - 8.2% geringer als der Median
(+) | lineare Bass-Wiedergabe (5.7% Delta zum Vorgänger)
Mitteltöne 400 - 2000 Hz
(±) | zu hohe Mitten, vom Median 6.3% abweichend
(+) | lineare Mitten (4.3% Delta zum Vorgänger)
Hochtöne 2 - 16 kHz
(+) | ausgeglichene Hochtöne, vom Median nur 3.1% abweichend
(+) | sehr lineare Hochtöne (6.4% Delta zum Vorgänger)
Gesamt im hörbaren Bereich 100 - 16.000 Hz
(+) | hörbarer Bereich ist sehr linear (11.3% Abstand zum Median
Im Vergleich zu allen Geräten derselben Klasse
» 2% aller getesteten Geräte dieser Klasse waren besser, 2% vergleichbar, 96% schlechter
» Das beste Gerät hat einen Delta-Wert von 7%, durchschnittlich ist 21%, das schlechteste Gerät hat 53%
Im Vergleich zu allen Geräten im Test
» 7% aller getesteten Geräte waren besser, 2% vergleichbar, 91% schlechter
» Das beste Gerät hat einen Delta-Wert von 4%, durchschnittlich ist 24%, das schlechteste Gerät hat 134%
Apple MacBook Pro 16 2021 M1 Pro Audio Analyse
(+) | Die Lautsprecher können relativ laut spielen (84.7 dB)
Bass 100 - 315 Hz
(+) | guter Bass - nur 3.8% Abweichung vom Median
(+) | lineare Bass-Wiedergabe (5.2% Delta zum Vorgänger)
Mitteltöne 400 - 2000 Hz
(+) | ausgeglichene Mitten, vom Median nur 1.3% abweichend
(+) | lineare Mitten (2.1% Delta zum Vorgänger)
Hochtöne 2 - 16 kHz
(+) | ausgeglichene Hochtöne, vom Median nur 1.9% abweichend
(+) | sehr lineare Hochtöne (2.7% Delta zum Vorgänger)
Gesamt im hörbaren Bereich 100 - 16.000 Hz
(+) | hörbarer Bereich ist sehr linear (4.6% Abstand zum Median
Im Vergleich zu allen Geräten derselben Klasse
» 0% aller getesteten Geräte dieser Klasse waren besser, 0% vergleichbar, 100% schlechter
» Das beste Gerät hat einen Delta-Wert von 5%, durchschnittlich ist 17%, das schlechteste Gerät hat 45%
Im Vergleich zu allen Geräten im Test
» 0% aller getesteten Geräte waren besser, 0% vergleichbar, 100% schlechter
» Das beste Gerät hat einen Delta-Wert von 4%, durchschnittlich ist 24%, das schlechteste Gerät hat 134%
Energieverwaltung
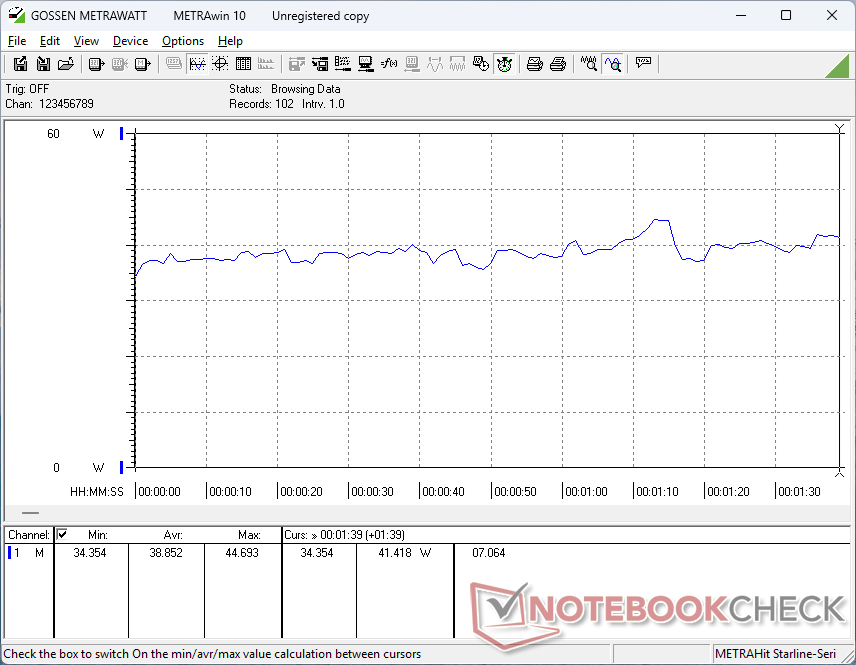
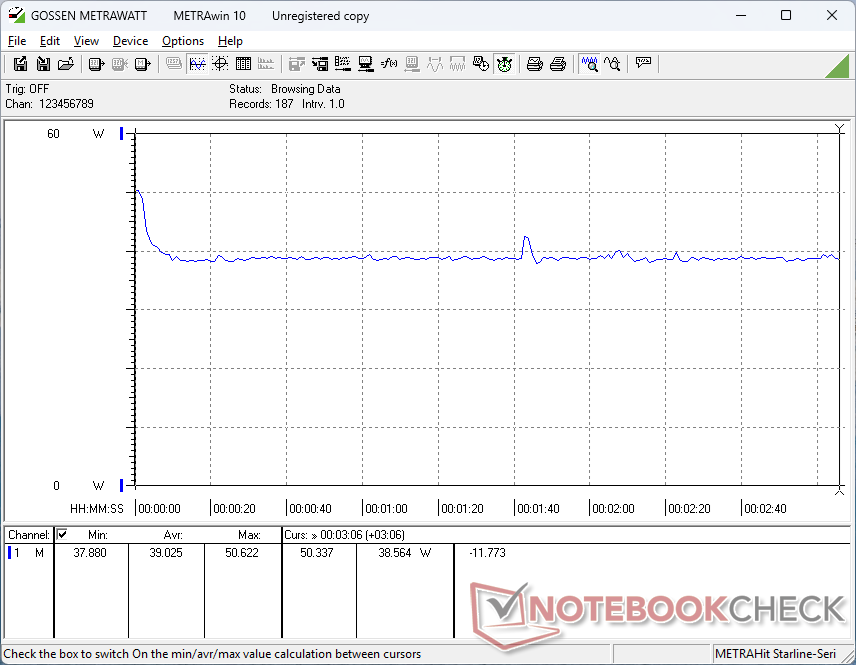
Stromverbrauch
Das System ist bei CPU-lastigen Aufgaben etwa 15 Prozent effizienter als das Latitude 7440 und bietet gleichzeitig eine bis zu 15 Prozent schnellere Leistung für ein besseres Leistungsverhältnis pro Watt. Die Vorteile sind deutlich größer bei KI-beschleunigten Aufgaben oder GPU-lastigen Workloads, bei denen Lunar Lake im Vergleich zu Raptor Lake brilliert.
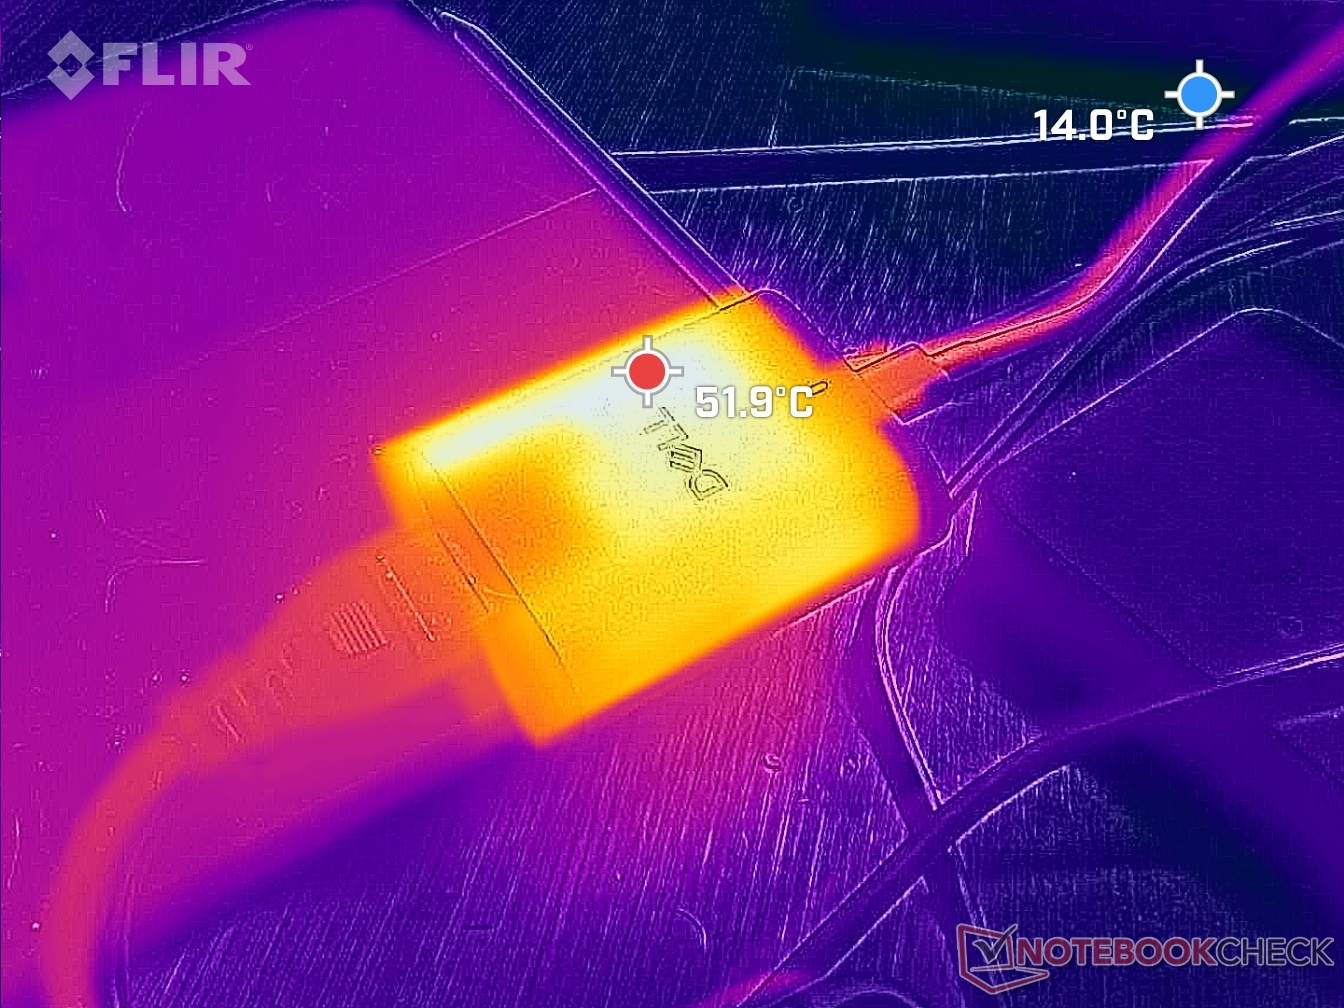
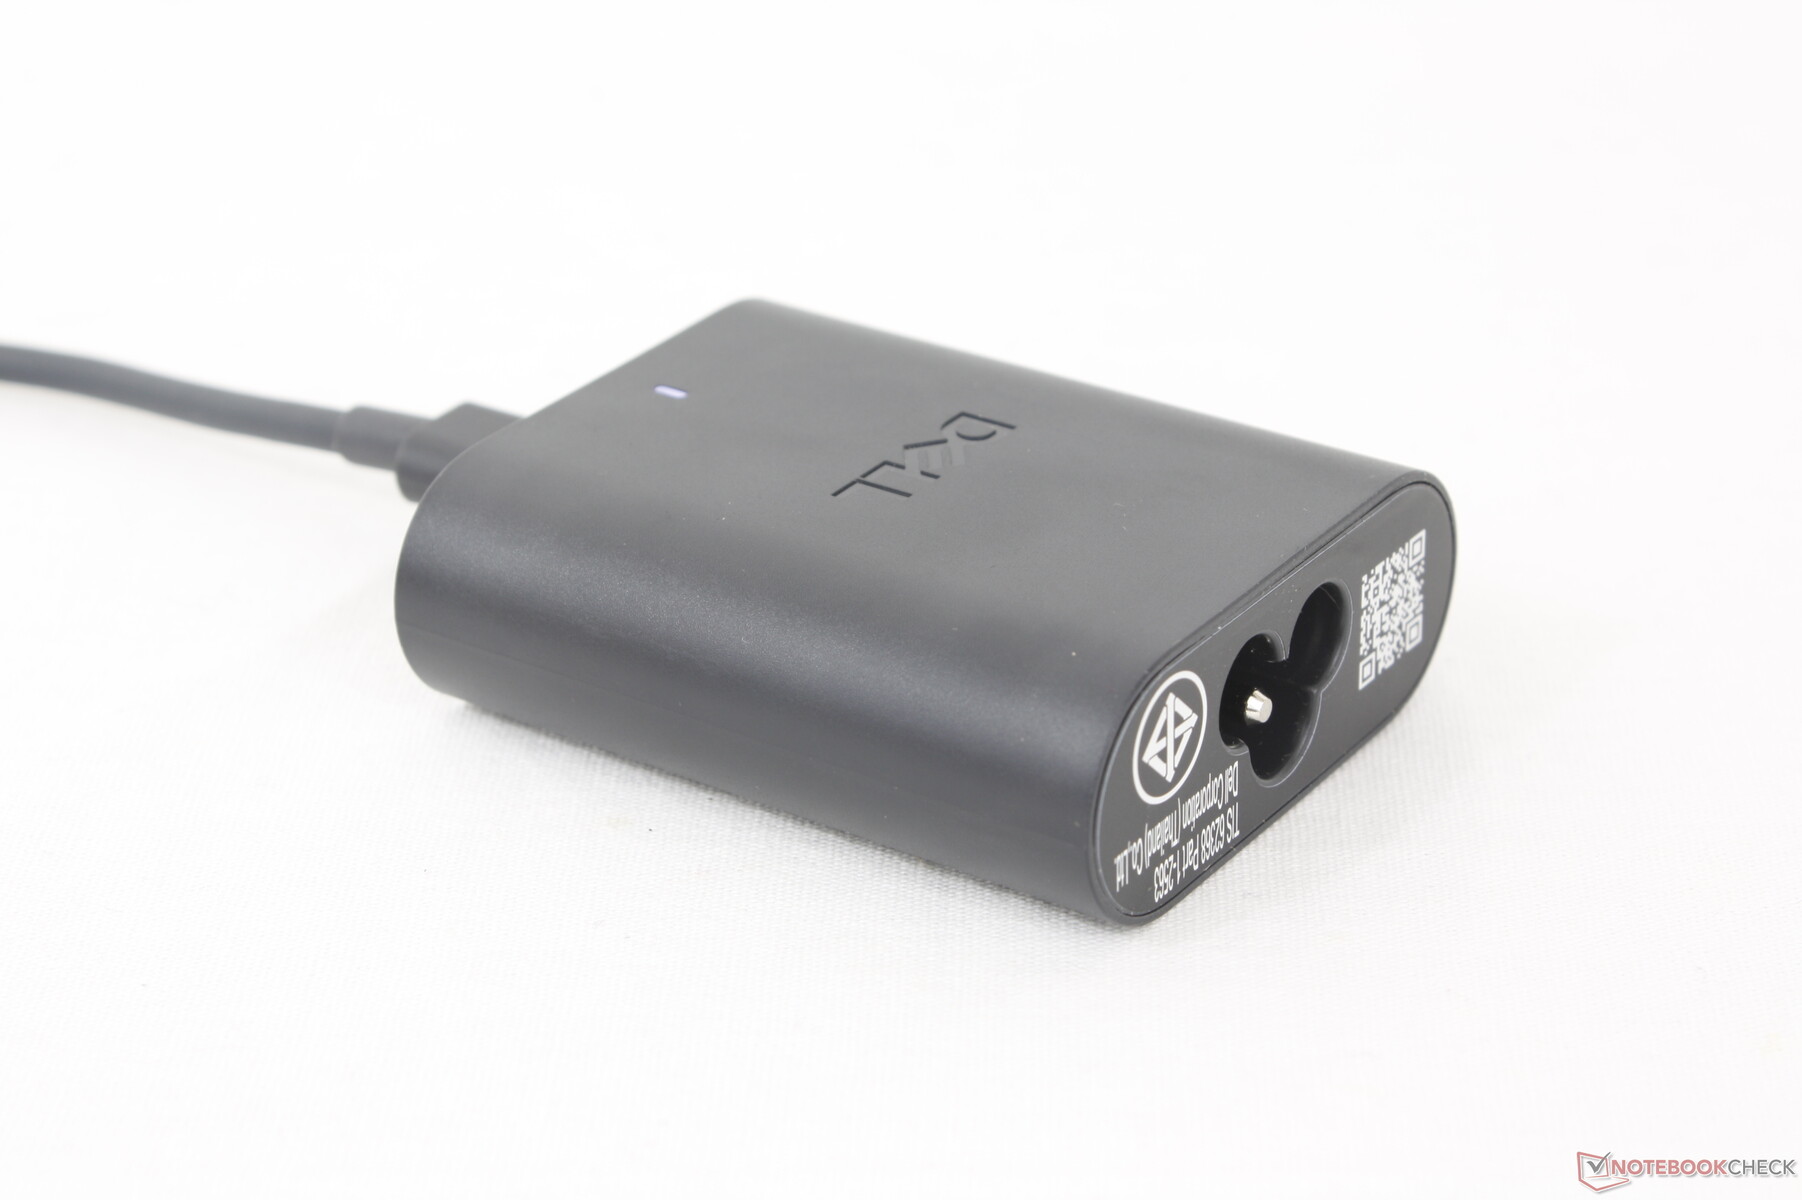
Wir konnten mit dem winzigen (~6,5 x 5,5 x 2,2 cm) 60-W-USB-C-Netzteil eine maximale Leistungsaufnahme von 61 W aufzeichnen, wenn die CPU zu 100 Prozent ausgelastet ist.

| Aus / Standby | |
| Idle | |
| Last |
|
Legende:
min: | |
| Dell Pro 14 Premium Core Ultra 7 268V, Arc 140V, Kioxia BG6 KBG6AZNV1T02, OLED, 2880x1800, 14" | Dell Latitude 7440 i5-1345U, Iris Xe G7 80EUs, Samsung MZ9L4512HBLU-00BMV, IPS, 2560x1600, 14" | Dell XPS 14 2024 OLED Ultra 7 155H, GeForce RTX 4050 Laptop GPU, Samsung PM9A1 MZVL21T0HCLR, OLED, 3200x2000, 14.5" | Lenovo ThinkPad T14s Gen 6 Intel Core Ultra 5 228V, Arc 130V, SK hynix PCB01 HFS001TFM9X179N GL, IPS LED, 1920x1200, 14" | HP EliteBook Ultra G1i 14 Core Ultra 7 258V, Arc 140V, Kioxia XG8 KXG80ZNV1T02, OLED, 2880x1800, 14" | Asus ExpertBook B1 B1403CVA i5-13420H, UHD Graphics Xe G4 48EUs, Western Digital PC SN5000S SDEQNSJ-512G-1002, IPS, 1920x1080, 14" | |
|---|---|---|---|---|---|---|
| Stromverbrauch | -22% | -93% | 9% | 2% | -23% | |
| Idle min * (Watt) | 3.5 | 4.5 -29% | 8.1 -131% | 3 14% | 3.7 -6% | 3.7 -6% |
| Idle avg * (Watt) | 4.3 | 6.5 -51% | 9.9 -130% | 4.7 -9% | 5.4 -26% | 8.3 -93% |
| Idle max * (Watt) | 7.9 | 7.3 8% | 10.4 -32% | 5.4 32% | 5.7 28% | 8.6 -9% |
| Last avg * (Watt) | 38.9 | 52.5 -35% | 75.6 -94% | 31.8 18% | 39.4 -1% | 52.5 -35% |
| Cyberpunk 2077 ultra external monitor * (Watt) | 38.7 | 37.1 4% | 32.4 16% | 41.1 -6% | ||
| Cyberpunk 2077 ultra * (Watt) | 39 | 38.7 1% | 35.3 9% | 42.8 -10% | ||
| Last max * (Watt) | 60.7 | 63 -4% | 107.1 -76% | 58.9 3% | 62.9 -4% | 63.2 -4% |
| Witcher 3 ultra * (Watt) | 46.2 | 65.6 |
* ... kleinere Werte sind besser
Power Consumption Cyberpunk / Stress Test
Energieverbrauch externer Monitor
Akkulaufzeit
Die Laufzeiten haben sich im Vergleich zur letzten Generation der Latitude-14-Serie verbessert, obwohl sich die Akkukapazität nicht sehr stark verändert hat. Wir konnten etwas mehr als 15 Stunden reales WLAN-Browsing aufzeichnen, bevor das Gerät automatisch abgeschaltet wurde. Das sind mindestens zwei Stunden länger als beim Latitude 7440 unter ähnlichen Bedingungen. Die Akkulaufzeit dürfte sogar noch länger sein, wenn man das Basis-IPS-Panel anstelle unseres OLED-Panels verwendet.
Das Aufladen von leer auf voll dauert etwas mehr als 90 Minuten.
| Dell Pro 14 Premium Core Ultra 7 268V, Arc 140V, 60 Wh | Dell Latitude 7440 i5-1345U, Iris Xe G7 80EUs, 57 Wh | Dell XPS 14 2024 OLED Ultra 7 155H, GeForce RTX 4050 Laptop GPU, 69.5 Wh | Lenovo ThinkPad T14s Gen 6 Intel Core Ultra 5 228V, Arc 130V, 58 Wh | HP EliteBook Ultra G1i 14 Core Ultra 7 258V, Arc 140V, 64 Wh | Asus ExpertBook B1 B1403CVA i5-13420H, UHD Graphics Xe G4 48EUs, 50 Wh | |
|---|---|---|---|---|---|---|
| Akkulaufzeit | -14% | -49% | 43% | -21% | -54% | |
| WLAN (h) | 15.2 | 13 -14% | 7.8 -49% | 21.8 43% | 12 -21% | 7 -54% |
| Idle (h) | 23.8 | |||||
| Last (h) | 2.7 | 1.3 | 1.8 | |||
| H.264 (h) | 10.6 |
Notebookcheck Bewertung
Dell Pro 14 Premium
- 19.06.2025 v8
Allen Ngo
 Total Sustainability Score:
 Potentielle Konkurrenten im Vergleich
Bild | Modell / Test | Preis ab | Gewicht | Dicke | Display |
|---|---|---|---|---|---|
1. 86.4%  | Dell Pro 14 Premium Intel Core Ultra 7 268V ⎘ Intel Arc Graphics 140V ⎘ 32 GB RAM, 1024 GB SSD | Bestpreis 2174.64€ XITRA.de 2. 2204.97€ electronis.de 3. 2204.98€ Easynotebooks.de2500 USD | 1.3 kg | 17.95 mm | 14.00" 2880x1800 243 PPI OLED |
2. 90.3% v7 (old) 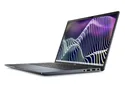 | Dell Latitude 7440 Intel Core i5-1345U ⎘ Intel Iris Xe Graphics G7 80EUs ⎘ 16 GB RAM, 512 GB SSD | Amazon: 1. 649,00 € Dell 16 Laptop DC16250-16 In... 2. 989,90 € Dell Latitude 5450 14 Zoll F... 3. 579,00 € Dell Latitude 7420 14 Zoll 1... Listenpreis: 1900 USD | 1.2 kg | 17.95 mm | 14.00" 2560x1600 216 PPI IPS |
3. 86.3% v7 (old)  | Dell XPS 14 2024 OLED Intel Core Ultra 7 155H ⎘ NVIDIA GeForce RTX 4050 Laptop GPU ⎘ 32 GB RAM, 1024 GB SSD | Amazon: 874,65 € Geizhals Suche | 1.8 kg | 19 mm | 14.50" 3200x2000 260 PPI OLED |
4. 88.6%  | Lenovo ThinkPad T14s Gen 6 Intel Intel Core Ultra 5 228V ⎘ Intel Arc Graphics 130V ⎘ 32 GB RAM, 1024 GB SSD | Amazon: 1.971,99 € Bestpreis 1815.85€ minaxum.it 2. 1815.9€ lapstars 3. 1816€ MetaComp | 1.3 kg | 19 mm | 14.00" 1920x1200 162 PPI IPS LED |
5. 89.6%  | HP EliteBook Ultra G1i 14 Intel Core Ultra 7 258V ⎘ Intel Arc Graphics 140V ⎘ 32 GB RAM, 1024 GB SSD | Amazon: Bestpreis 1799€ MetaComp 2. 1807.63€ ITboost.de 3. 1818.33€ electronis.de | 1.2 kg | 12.1 mm | 14.00" 2880x1800 243 PPI OLED |
6. 80.9%  | Asus ExpertBook B1 B1403CVA Intel Core i5-13420H ⎘ Intel UHD Graphics Xe G4 48EUs ⎘ 16 GB RAM, 512 GB SSD | Amazon: 1. 627,03 € ASUS ExpertBook B1 B1403CVA-... 2. 789,90 € ASUS ExpertBook B1 BM1503CDA... 3. 483,86 € ASUS ExpertBook B1 14 Zoll, ... Listenpreis: 700€ | 1.5 kg | 19.7 mm | 14.00" 1920x1080 157 PPI IPS |
Transparenz
Die Auswahl der zu testenden Geräte erfolgt innerhalb der Redaktion. Das vorliegende Testmuster wurde dem Autor vom Hersteller oder einem Shop zu Testzwecken leihweise zur Verfügung gestellt. Eine Einflussnahme des Leihstellers auf den Testbericht gab es nicht, der Hersteller erhielt keine Version des Reviews vor der Veröffentlichung. Es bestand keine Verpflichtung zur Publikation. Als eigenständiges, unabhängiges Unternehmen unterliegt Notebookcheck keiner Diktion von Herstellern, Shops und Verlagen.
So testet Notebookcheck
Pro Jahr werden von Notebookcheck hunderte Laptops und Smartphones unabhängig in von uns standardisierten technischen Verfahren getestet, um eine Vergleichbarkeit aller Testergebnisse zu gewährleisten. Seit rund 20 Jahren entwickeln wir diese Testmethoden kontinuierlich weiter und setzen damit Branchenstandards. In unseren Testlaboren kommt ausschließlich hochwertiges Messequipment in die Hände erfahrener Techniker und Redakteure. Die Tests unterliegen einer mehrstufigen Kontrolle. Unsere komplexe Gesamtbewertung basiert auf hunderten fundierten Messergebnissen und Benchmarks, womit Ihnen Objektivität garantiert ist. Weitere Informationen zu unseren Testmethoden gibt es hier.

