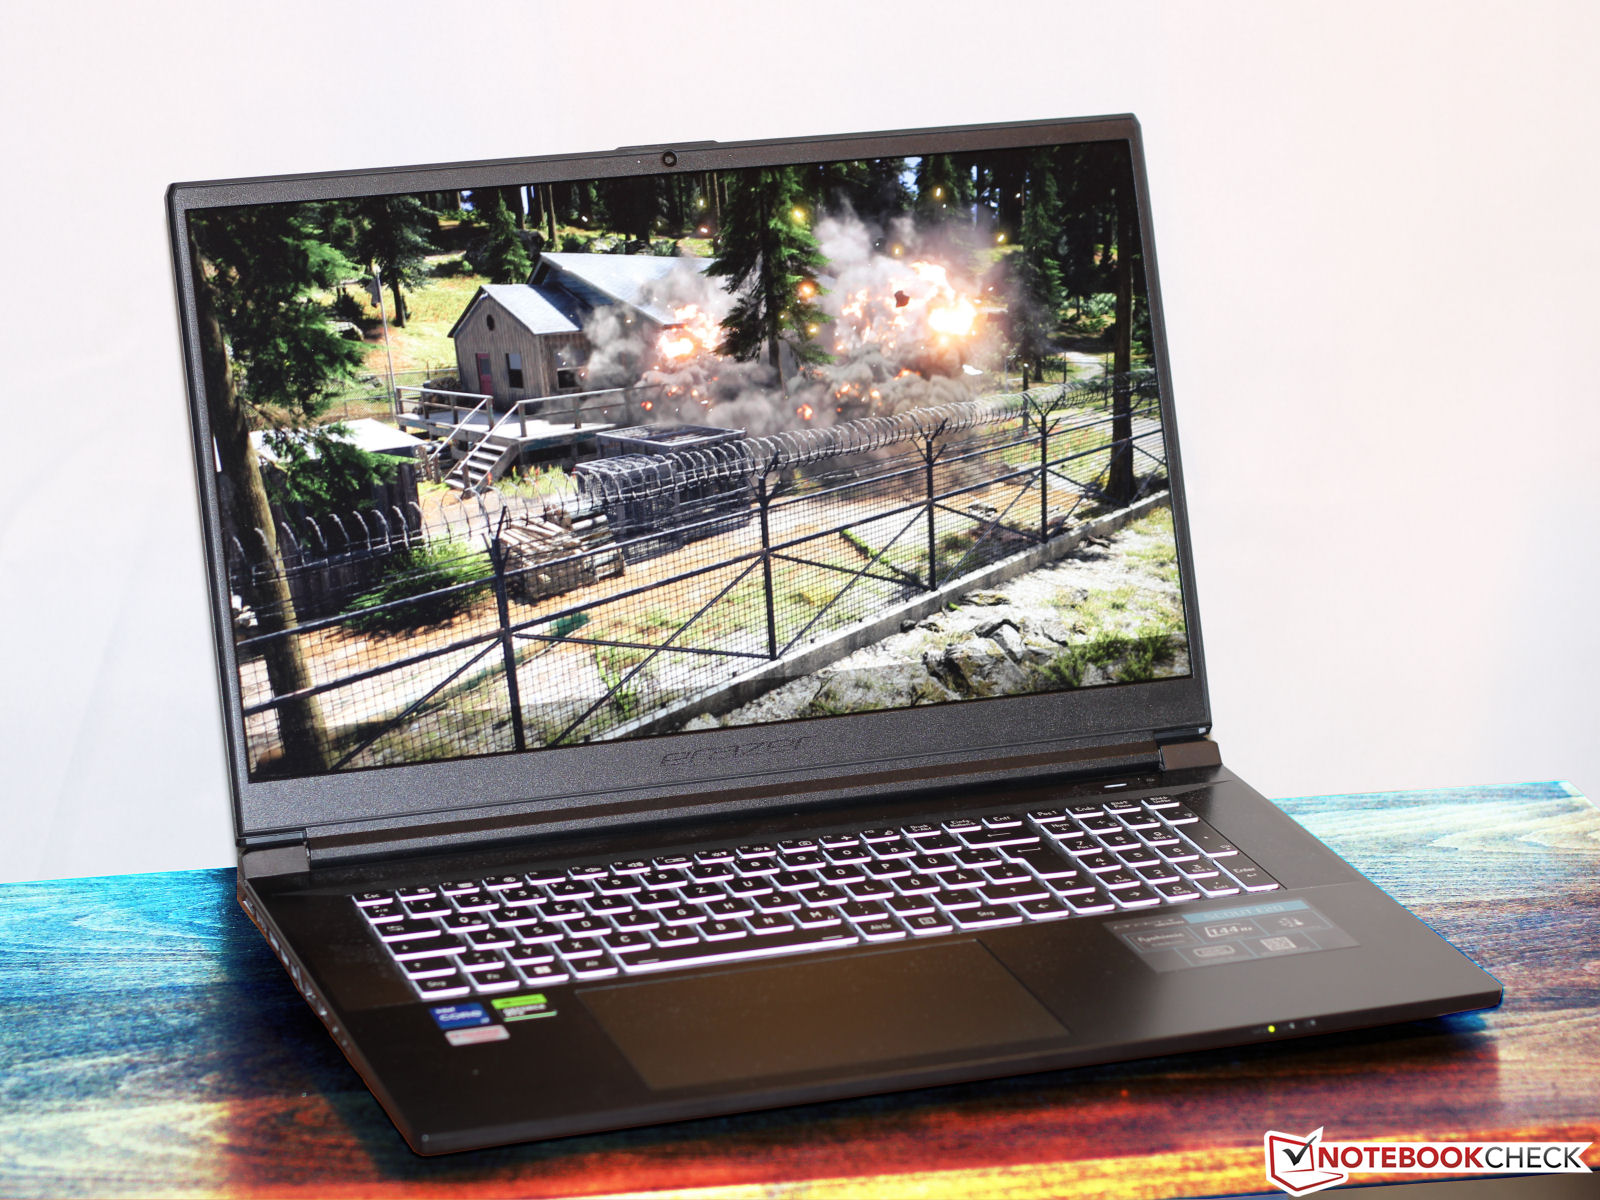
Medion Erazer Scout E20 im Test: Preiswertes FHD-Gaming-Notebook mit RTX 4050
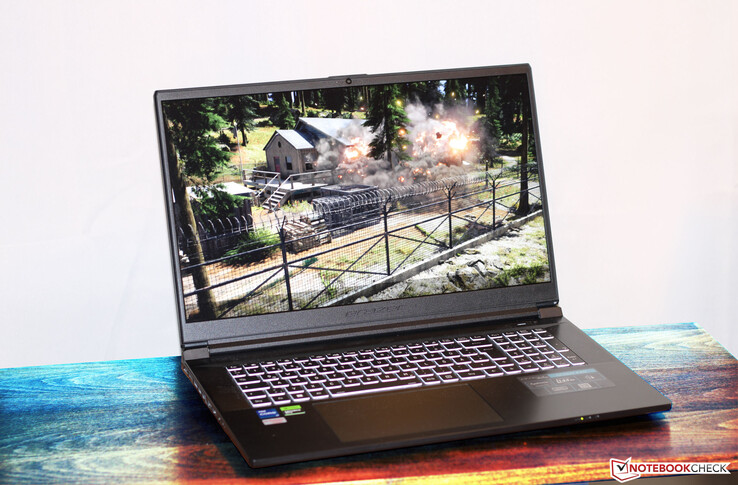
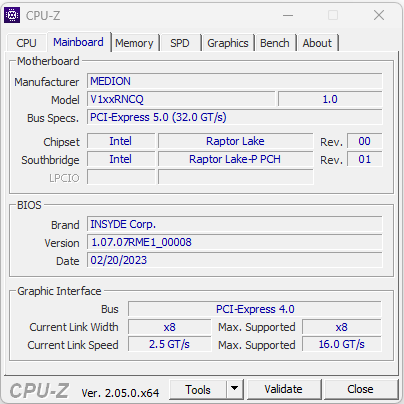
Das Erazer Scout E20 zählt primär zu den Gaming-Notebooks aus dem Einstiegssegment, dürfte aber auch in anderen leistungshungrigen Bereichen (Rendering, Videoschnitt) eingesetzt werden. Medion kombiniert einen Raptor-Lake-Prozessor mit einer GeForce-RTX-4050-Laptop-GPU und verlangt für das Gesamtpaket knapp 1.500 Euro. Der Computer basiert auf einem Barebone der Firma Clevo (V170RNCQ). Zu den Konkurrenten zählen Geräte wie das Gigabyte G7 KE, das MSI Katana 17 B13VFK, das Asus TUF Gaming A16 FA617, das Lenovo Legion 5 15IAH7H 82RB, das Acer Nitro 5 AN515-46-R1A1.
mögliche Konkurrenten im Vergleich
Bew. | Datum | Modell | Gewicht | Dicke | Größe | Auflösung | Preis ab |
|---|---|---|---|---|---|---|---|
| 83 % v7 (old) | 05 / 2023 | Medion Erazer Scout E20 i7-13700H, GeForce RTX 4050 Laptop GPU | 2.8 kg | 29 mm | 17.30" | 1920x1080 | |
| 83.3 % v7 (old) | 01 / 2023 | Gigabyte G7 KE i5-12500H, GeForce RTX 3060 Laptop GPU | 2.6 kg | 25 mm | 17.30" | 1920x1080 | |
| 82.1 % v7 (old) | 02 / 2023 | MSI Katana 17 B13VFK i7-13620H, GeForce RTX 4060 Laptop GPU | 2.8 kg | 25.2 mm | 17.30" | 1920x1080 | |
| 86.2 % v7 (old) | 02 / 2023 | Asus TUF Gaming A16 FA617 R7 7735HS, Radeon RX 7600S | 2.2 kg | 27 mm | 16.00" | 1920x1200 | |
| 87.5 % v7 (old) | 11 / 2022 | Lenovo Legion 5 15IAH7H 82RB i7-12700H, GeForce RTX 3060 Laptop GPU | 2.4 kg | 19.99 mm | 15.60" | 1920x1080 | |
| 83.9 % v7 (old) | 11 / 2022 | Acer Nitro 5 AN515-46-R1A1 R7 6800H, GeForce RTX 3070 Ti Laptop GPU | 2.5 kg | 26.8 mm | 15.60" | 1920x1080 |
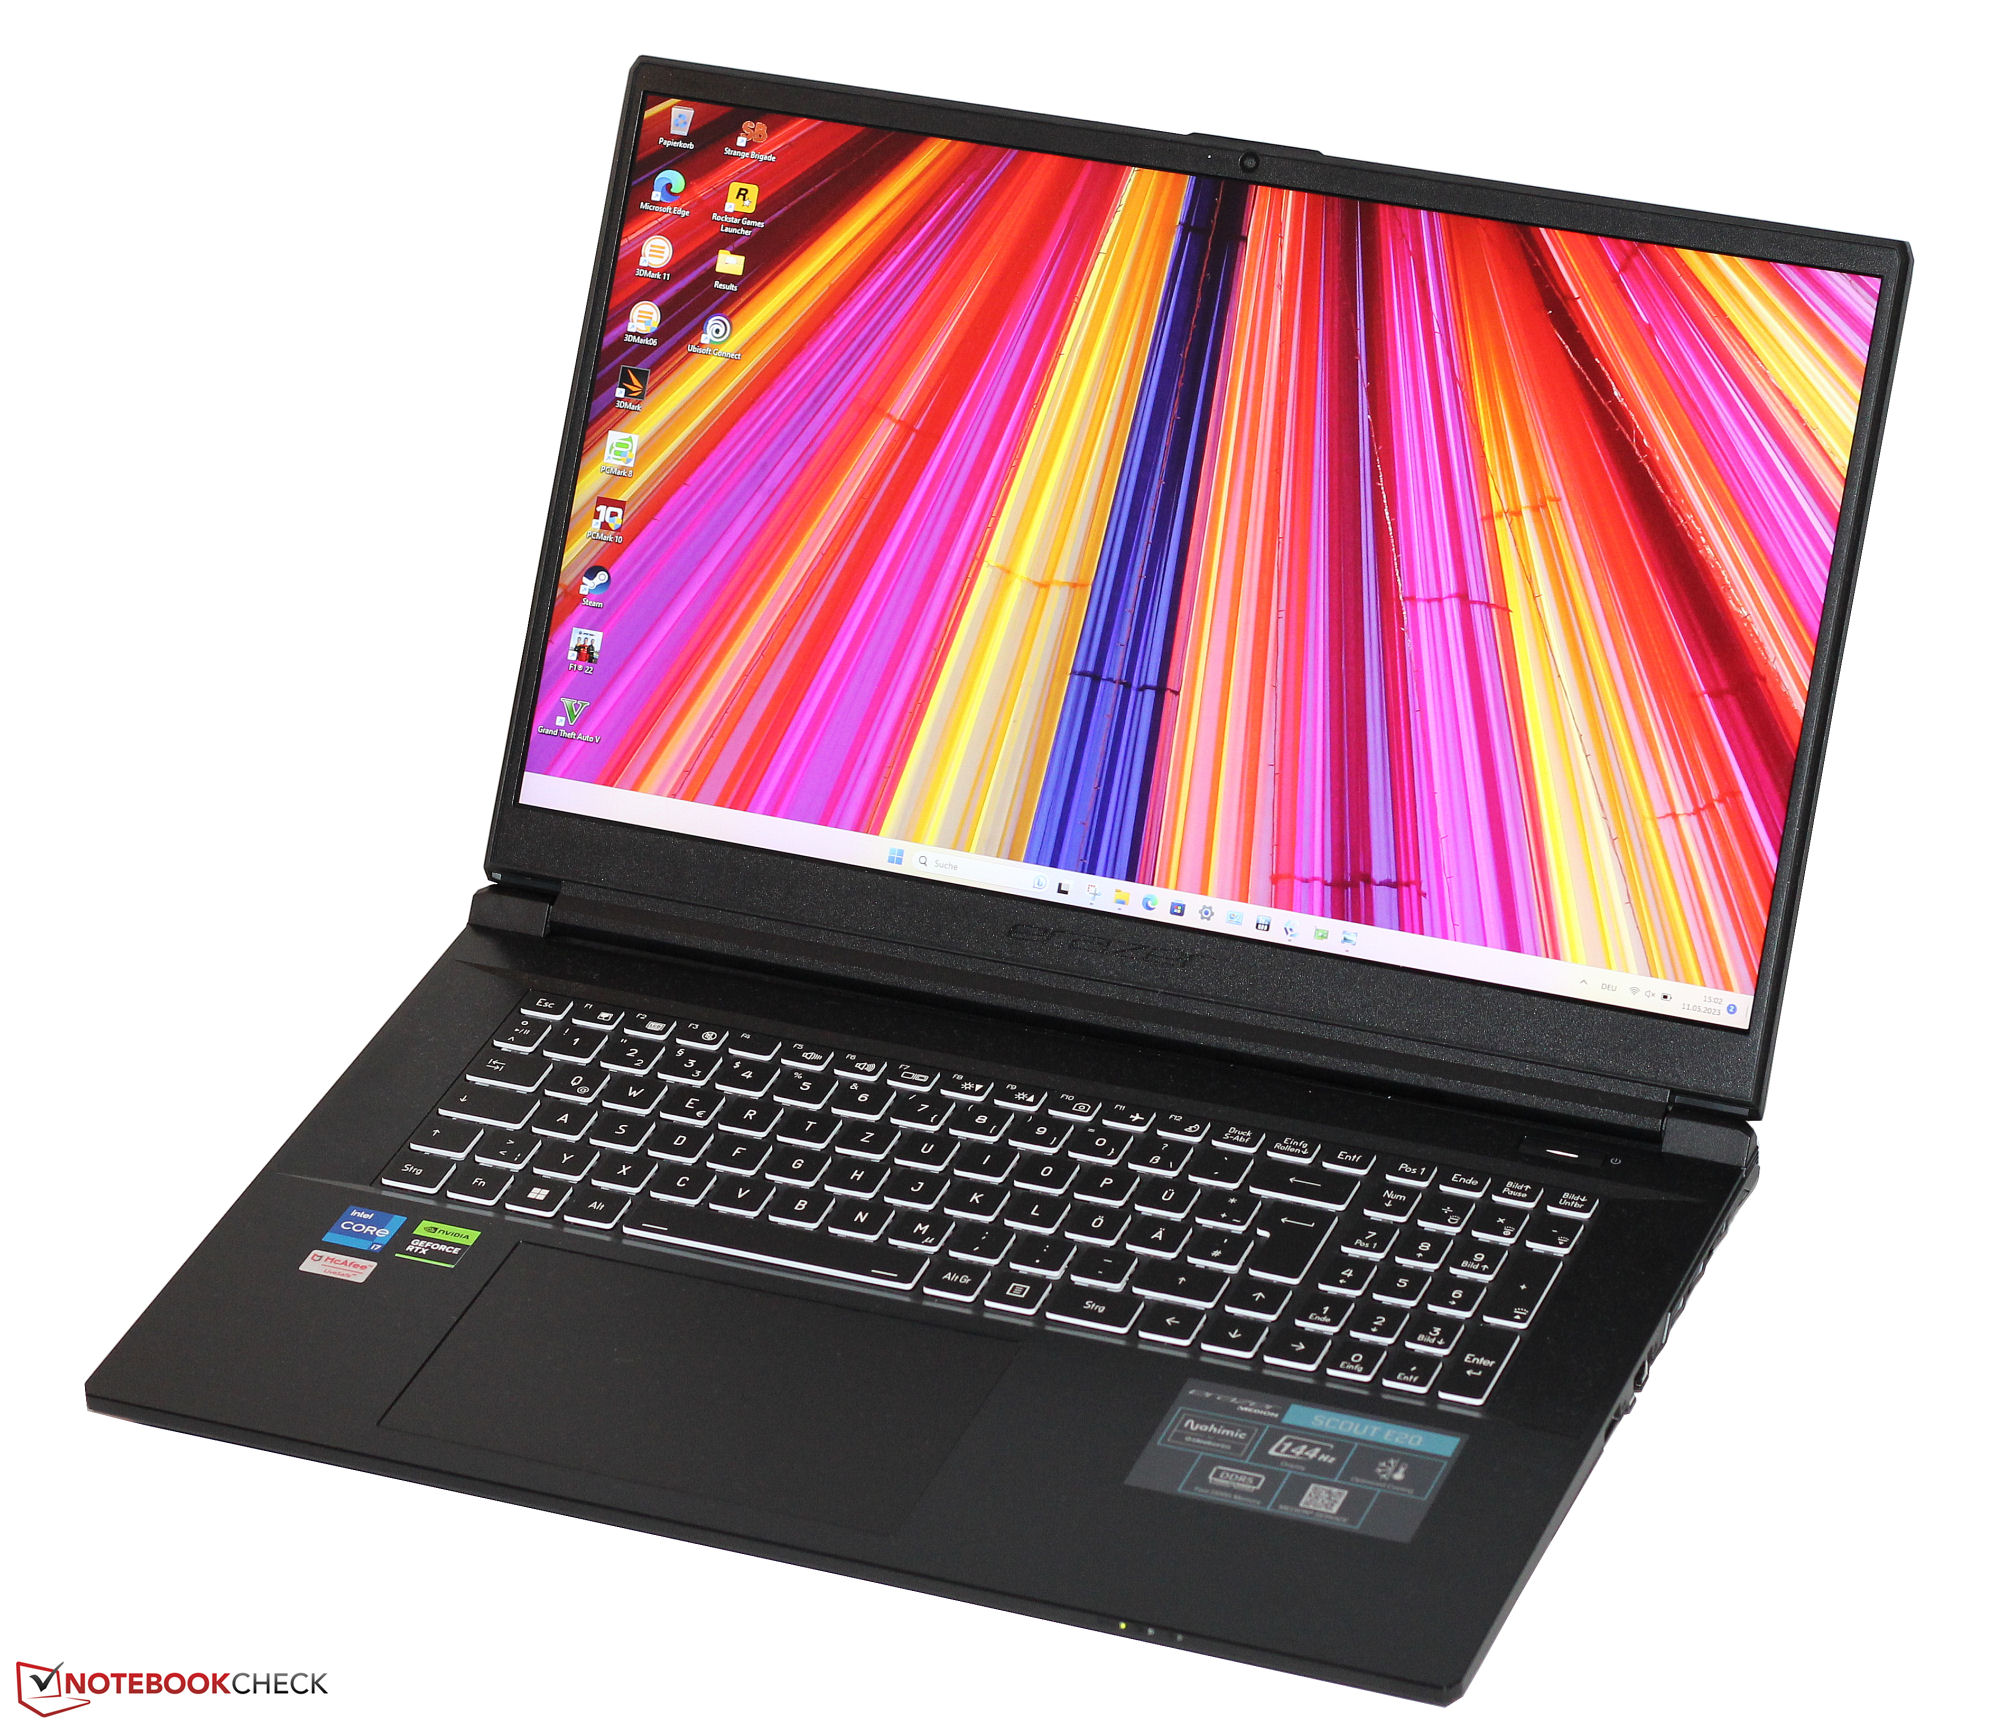
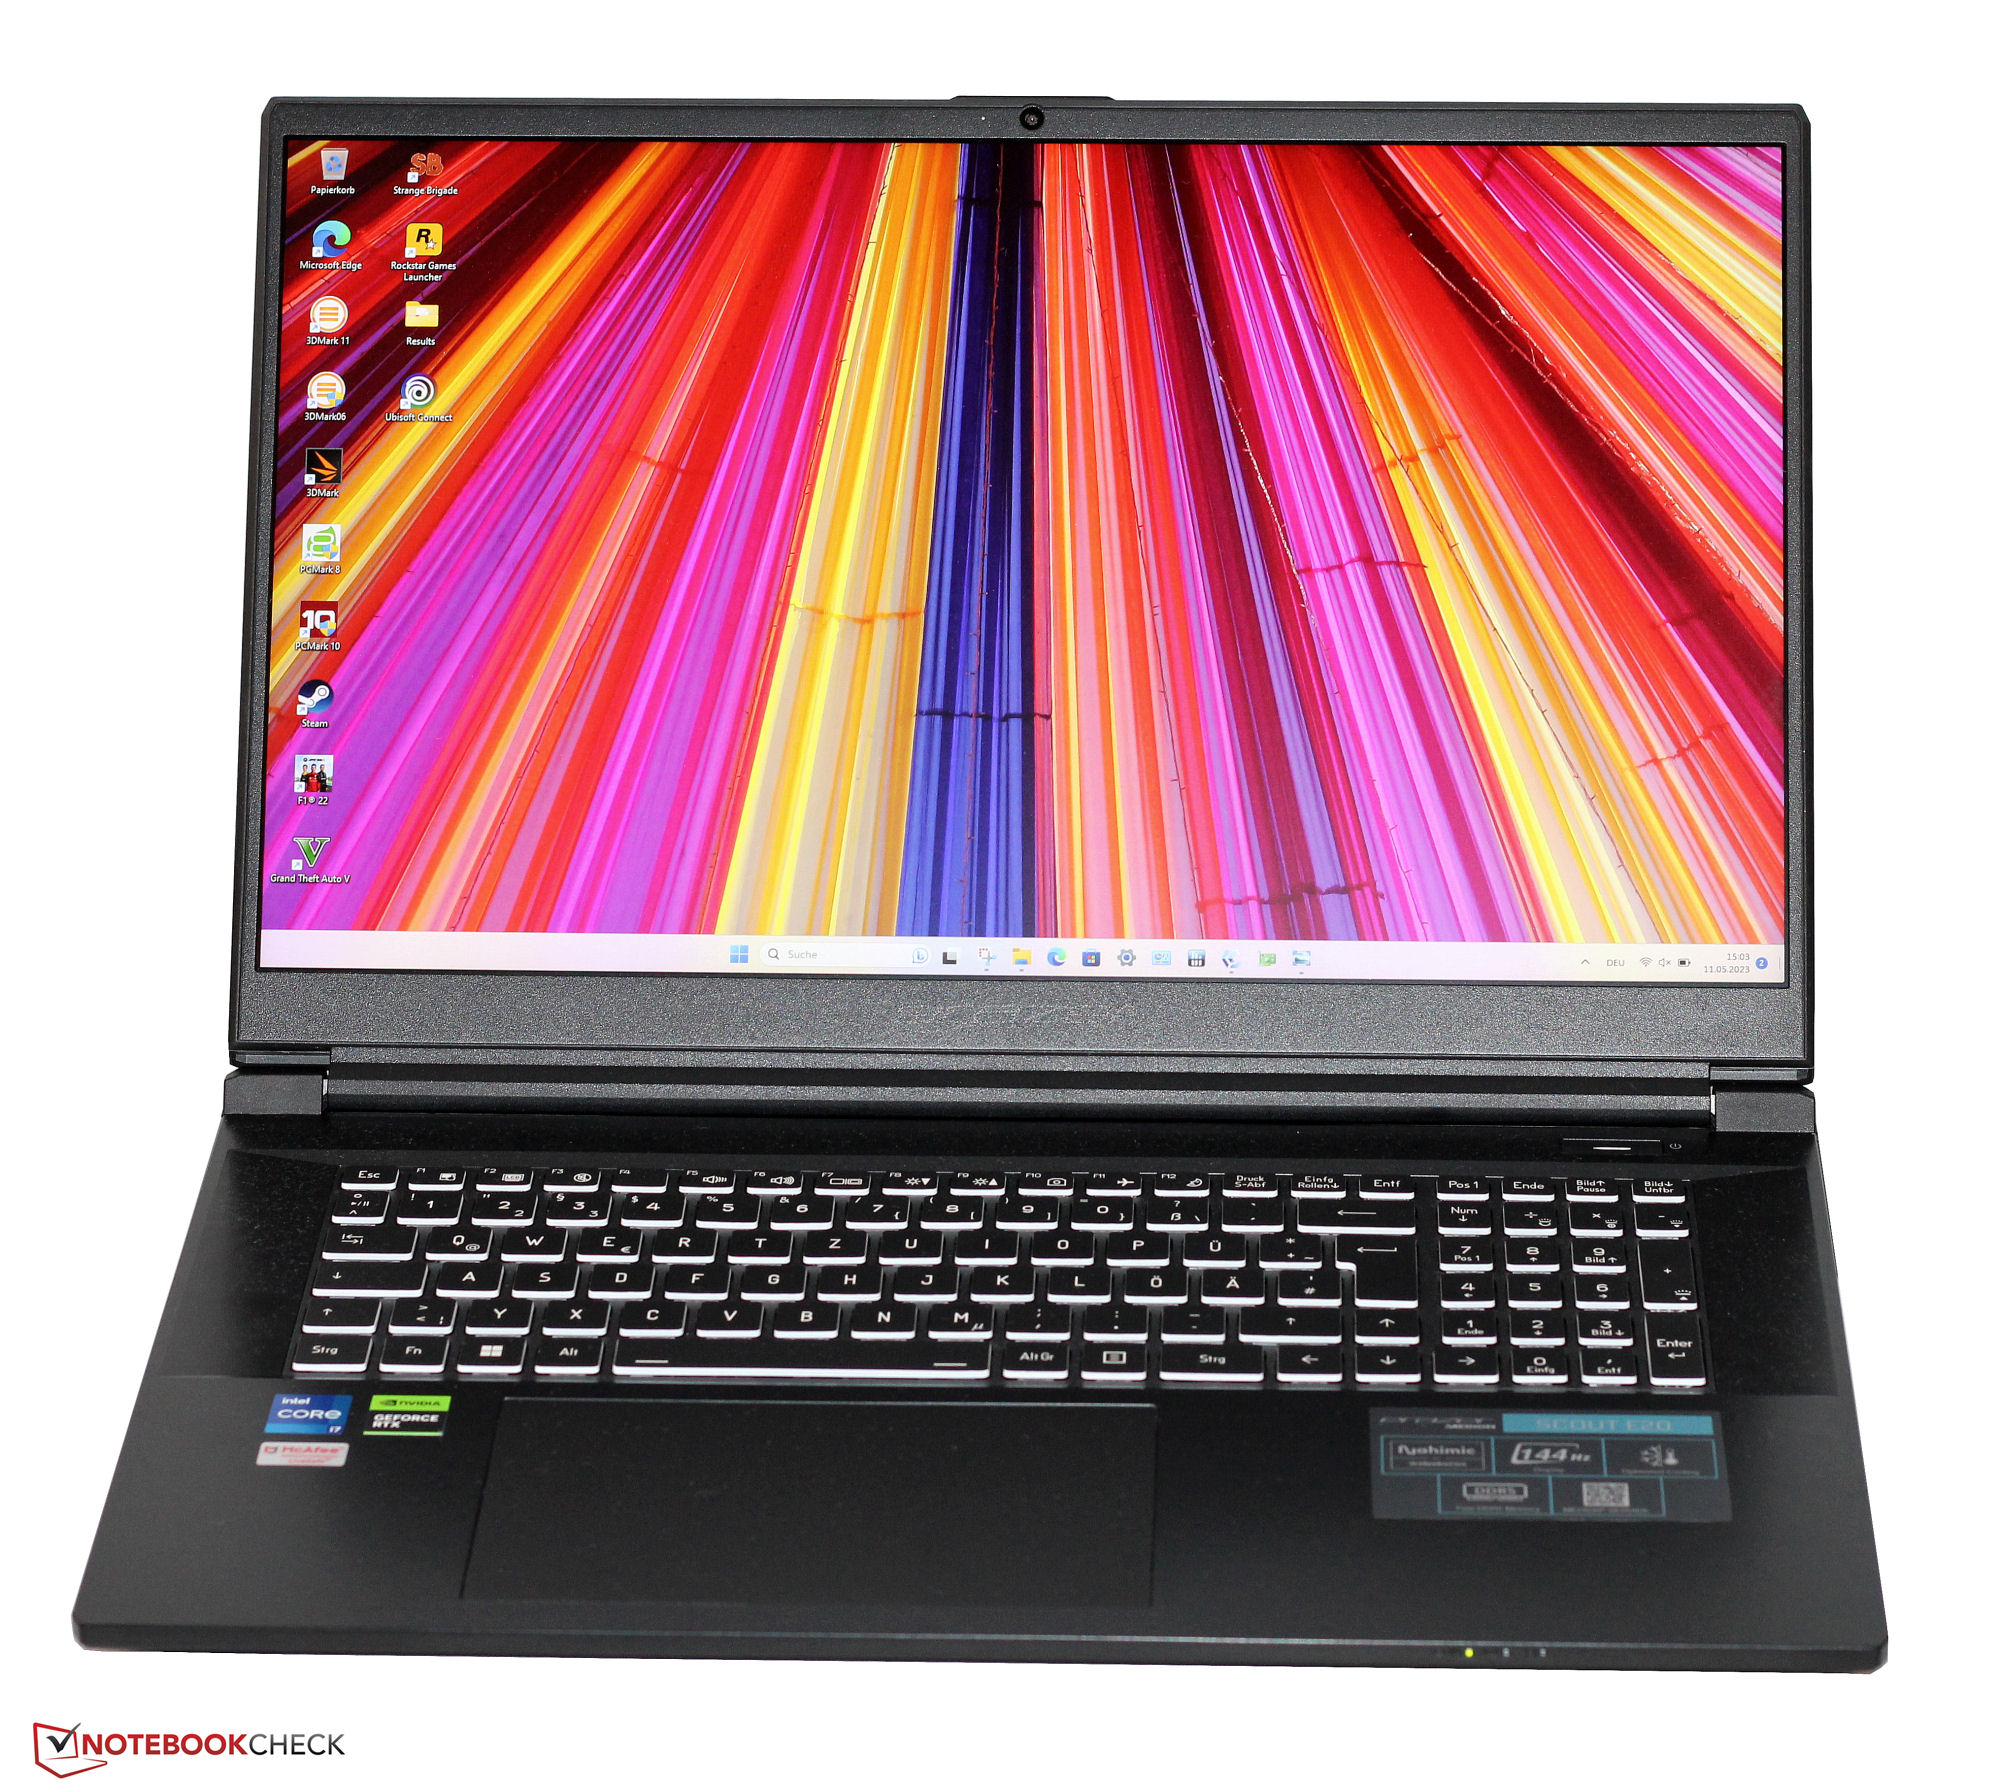
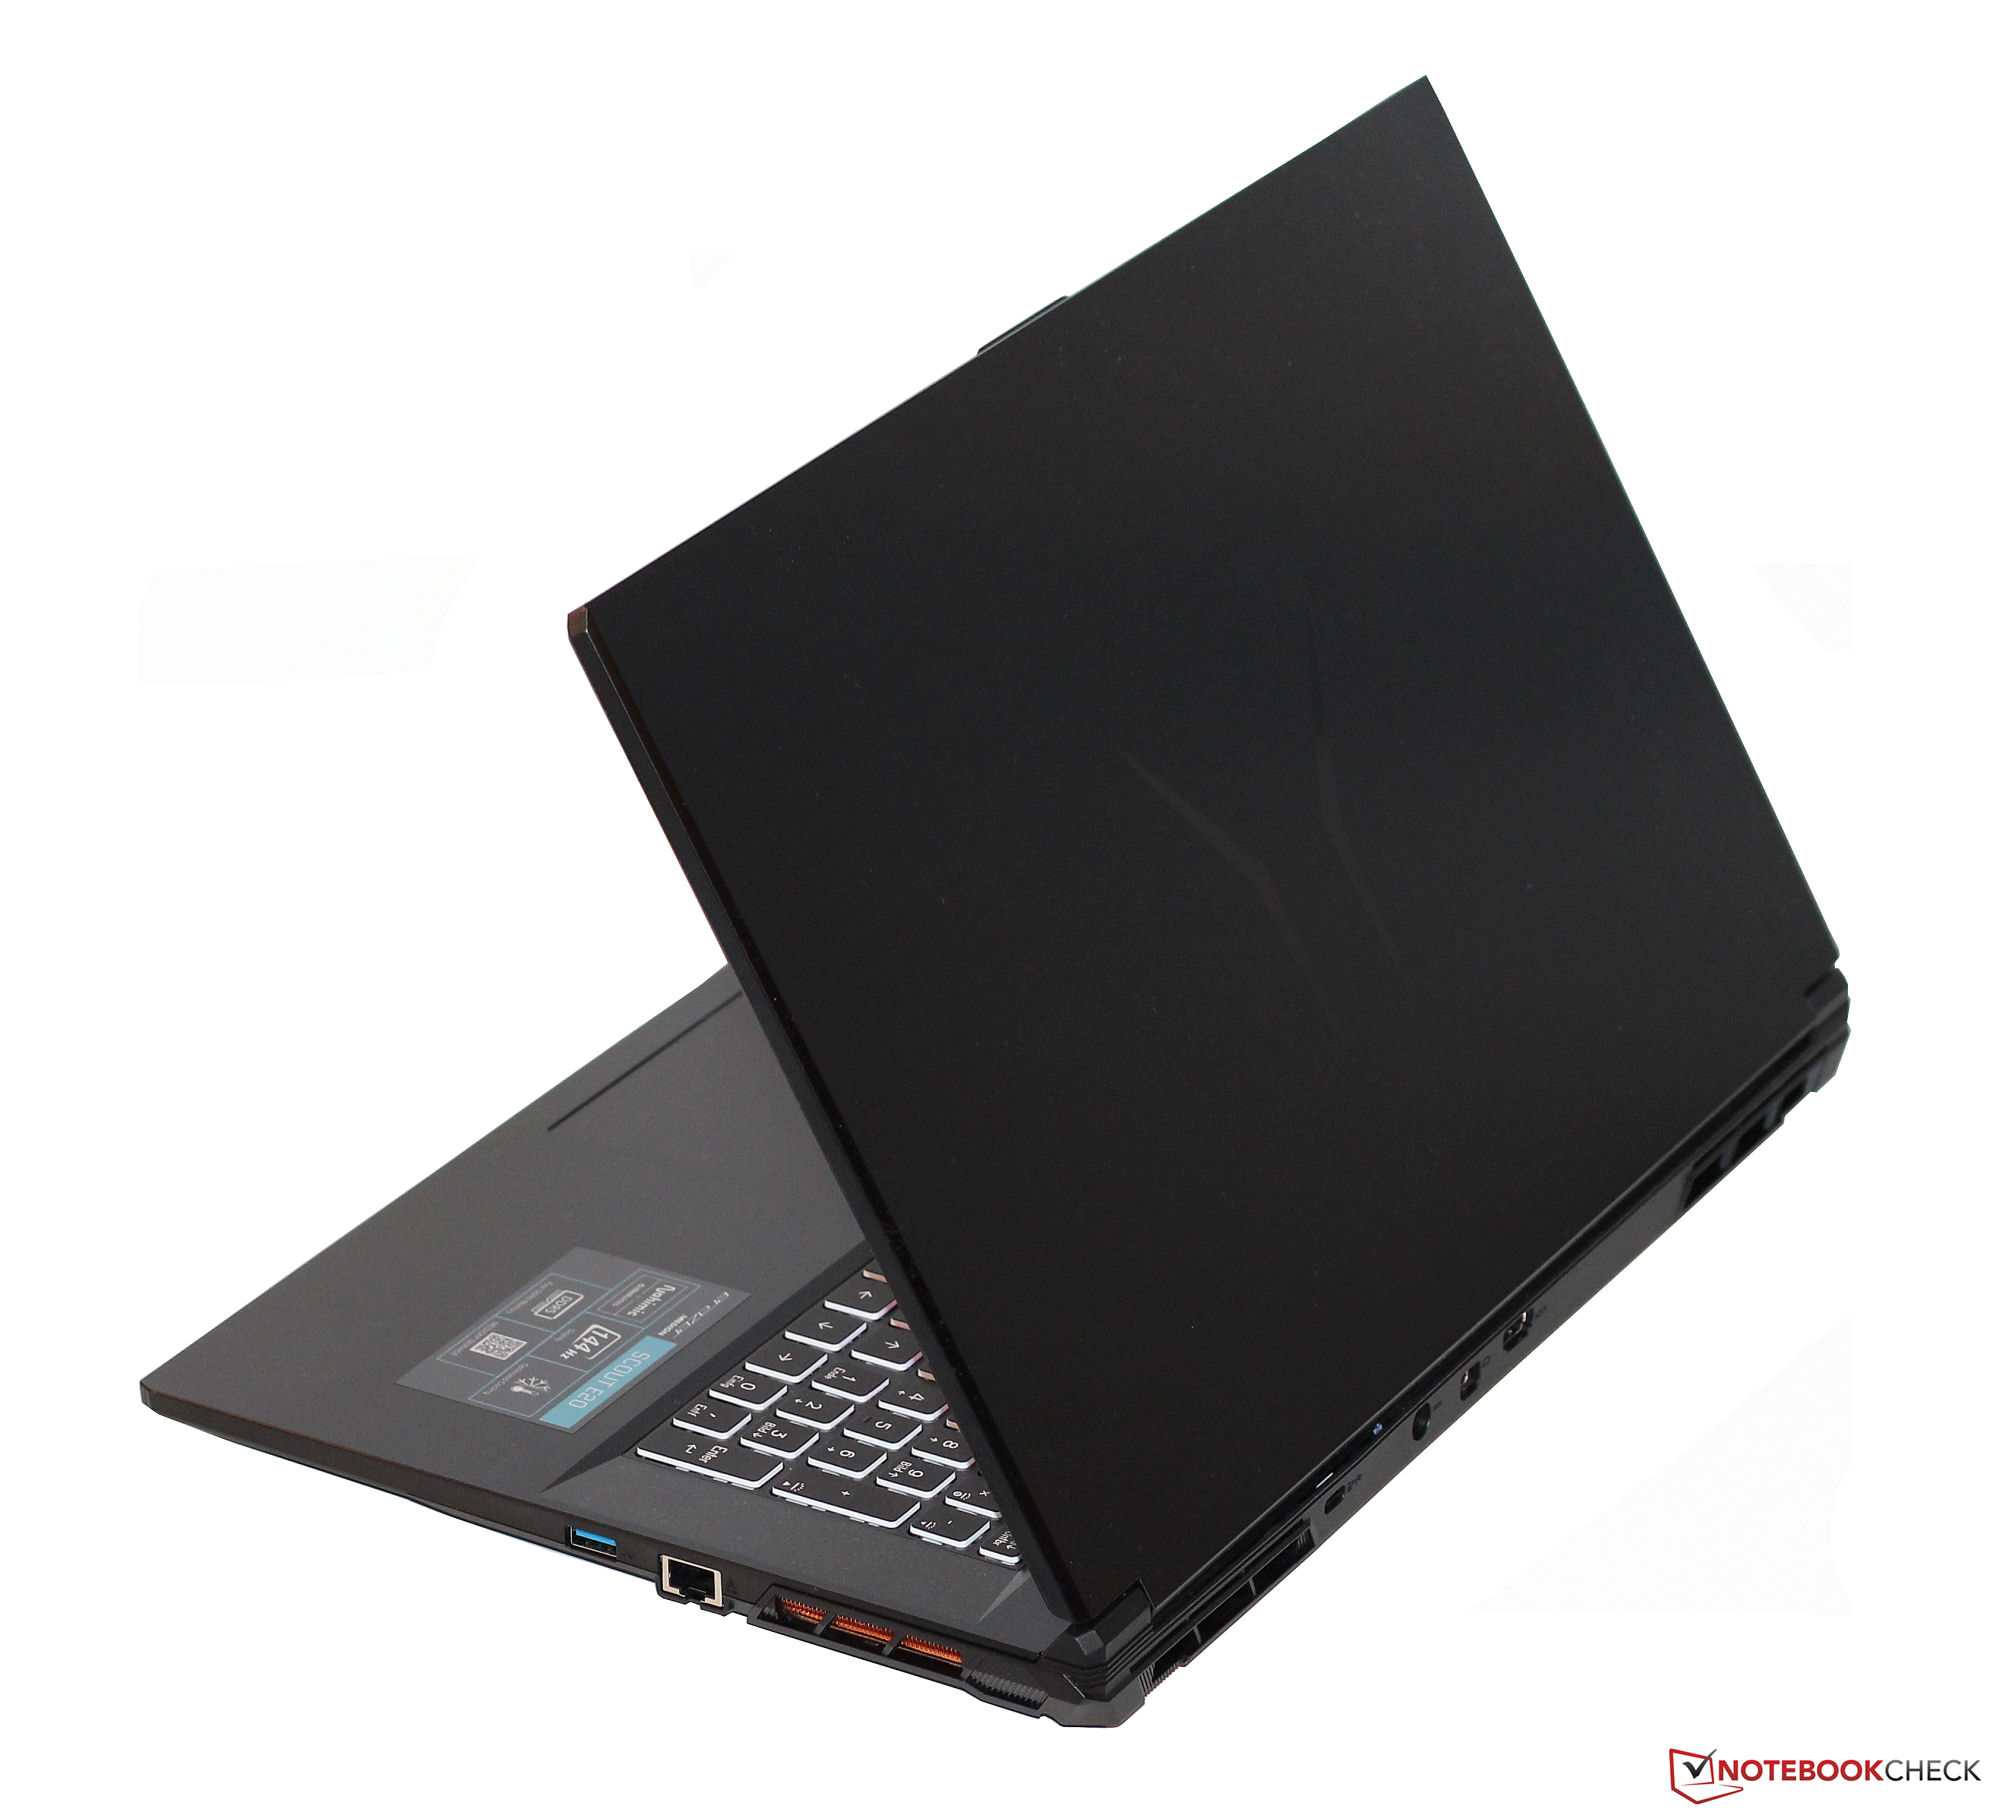
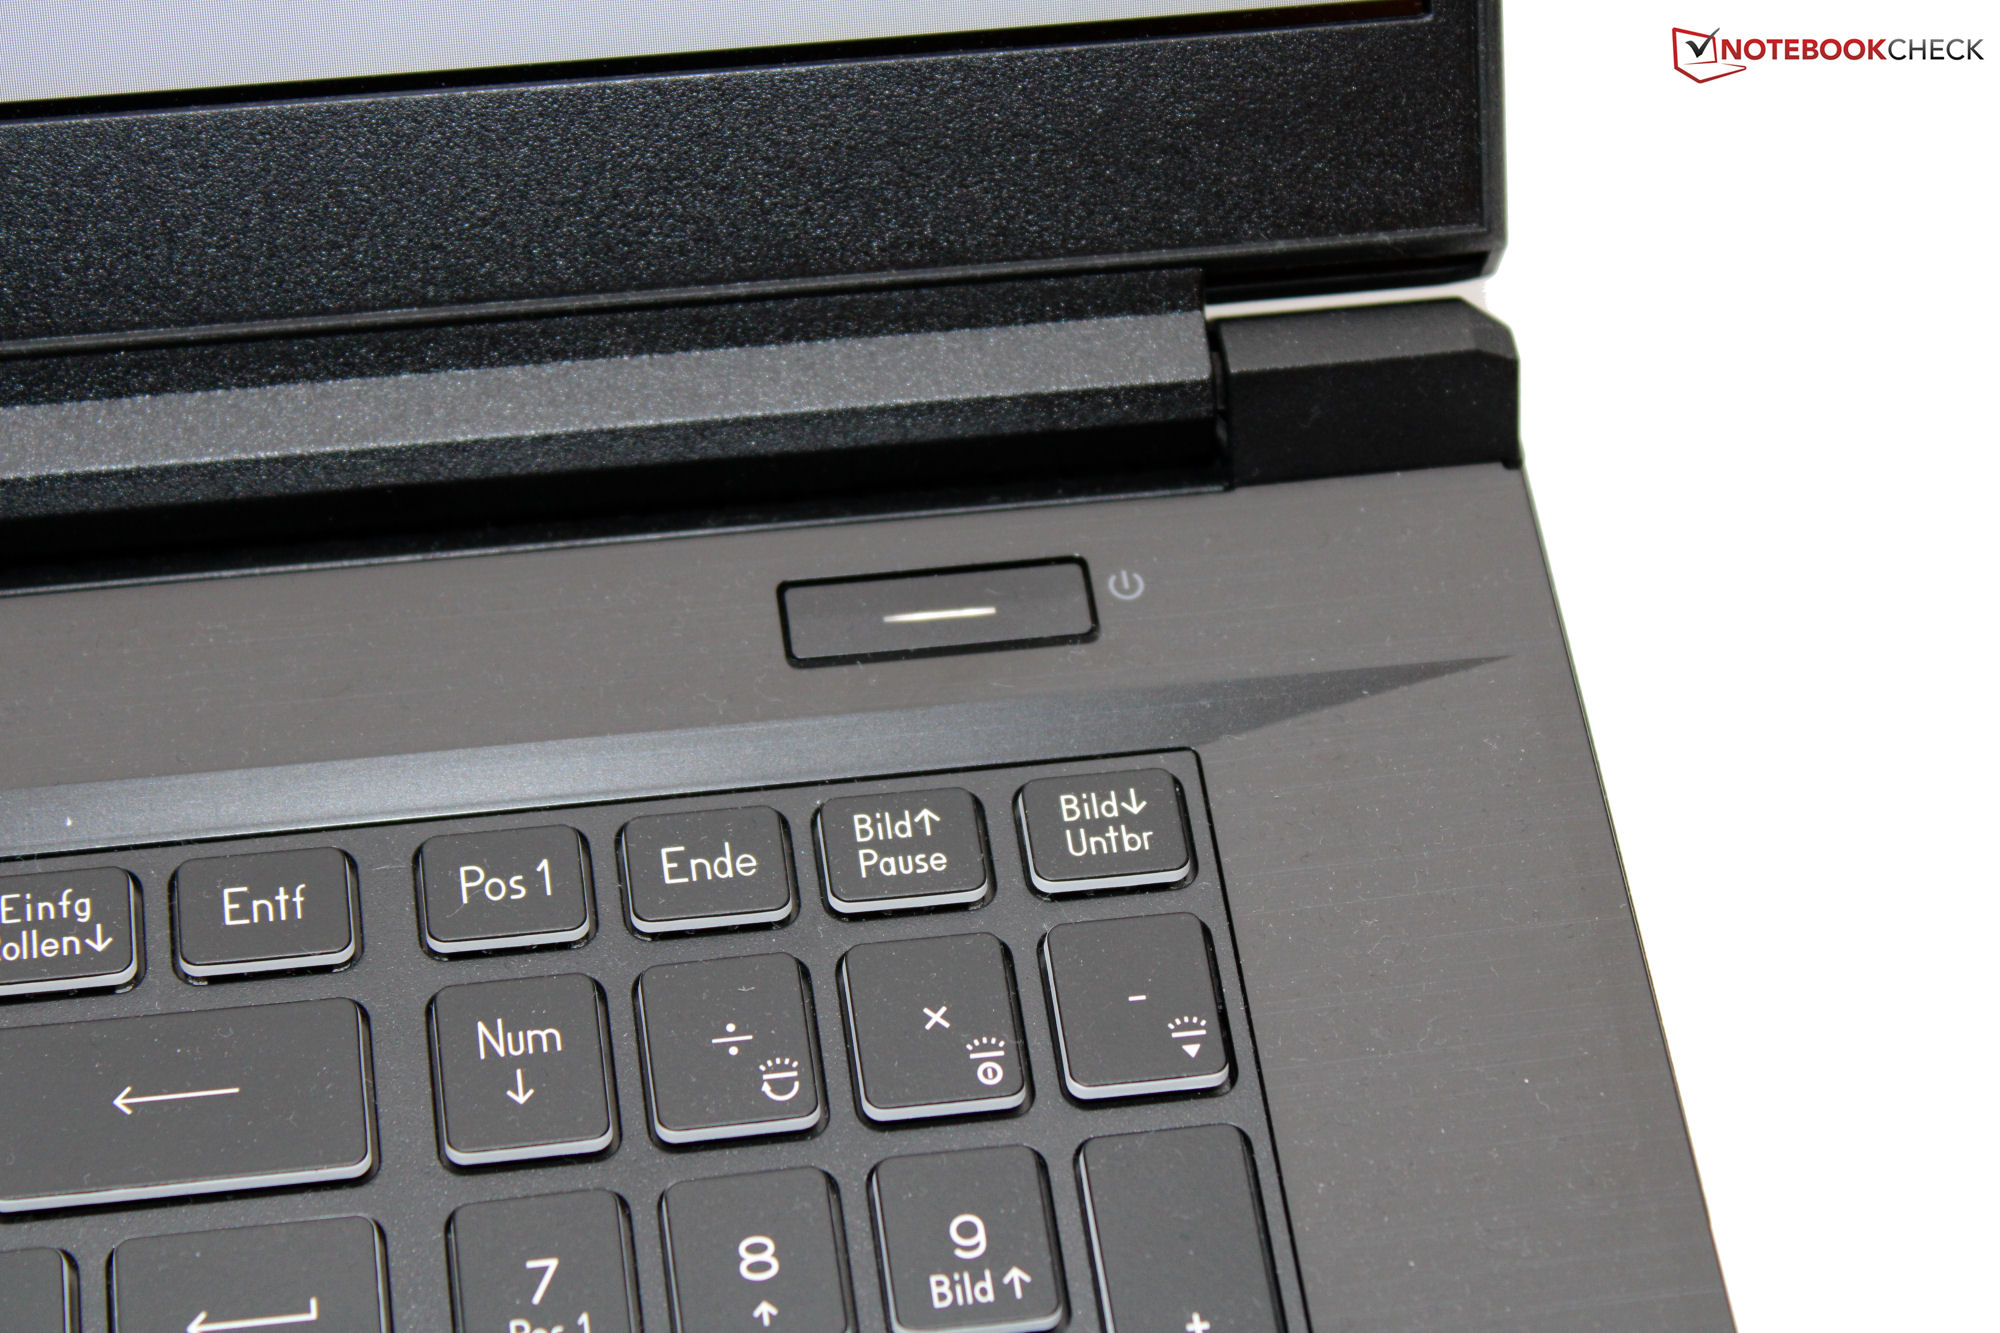
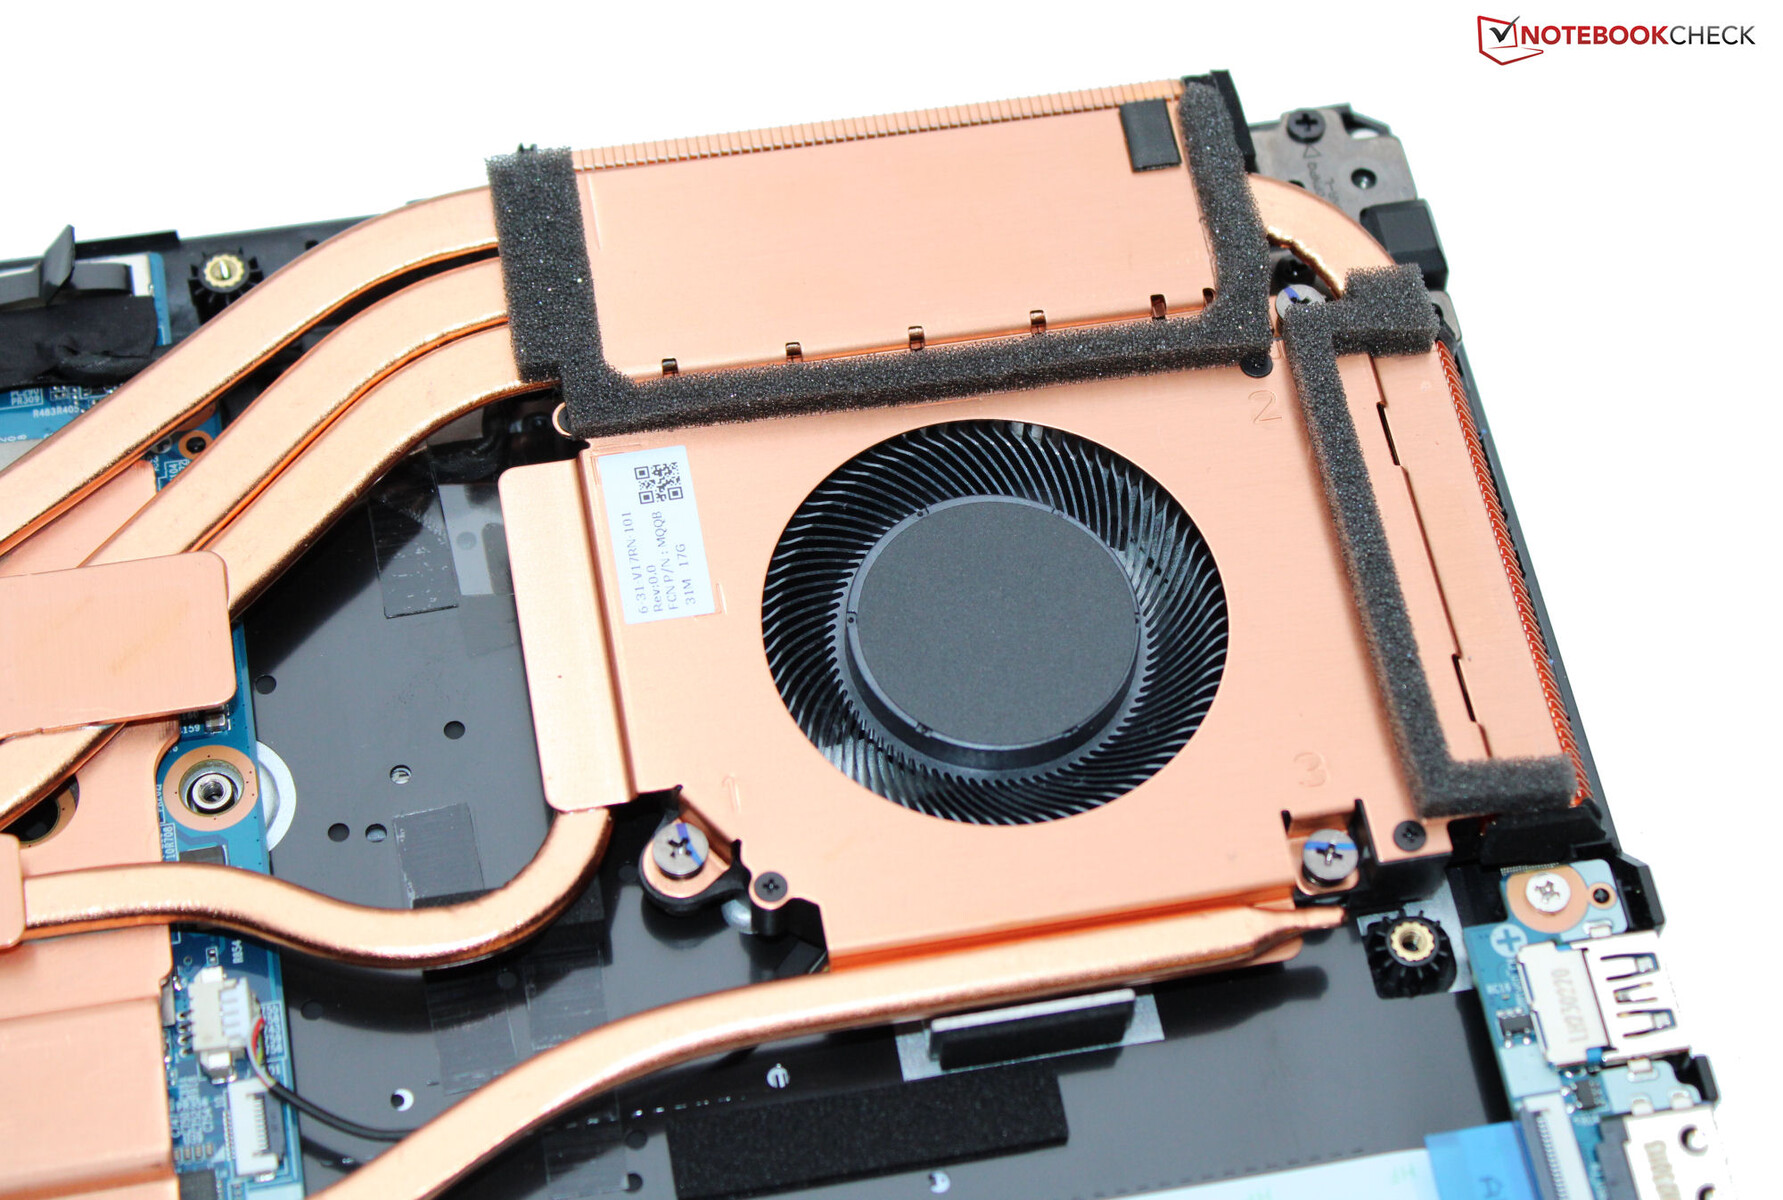
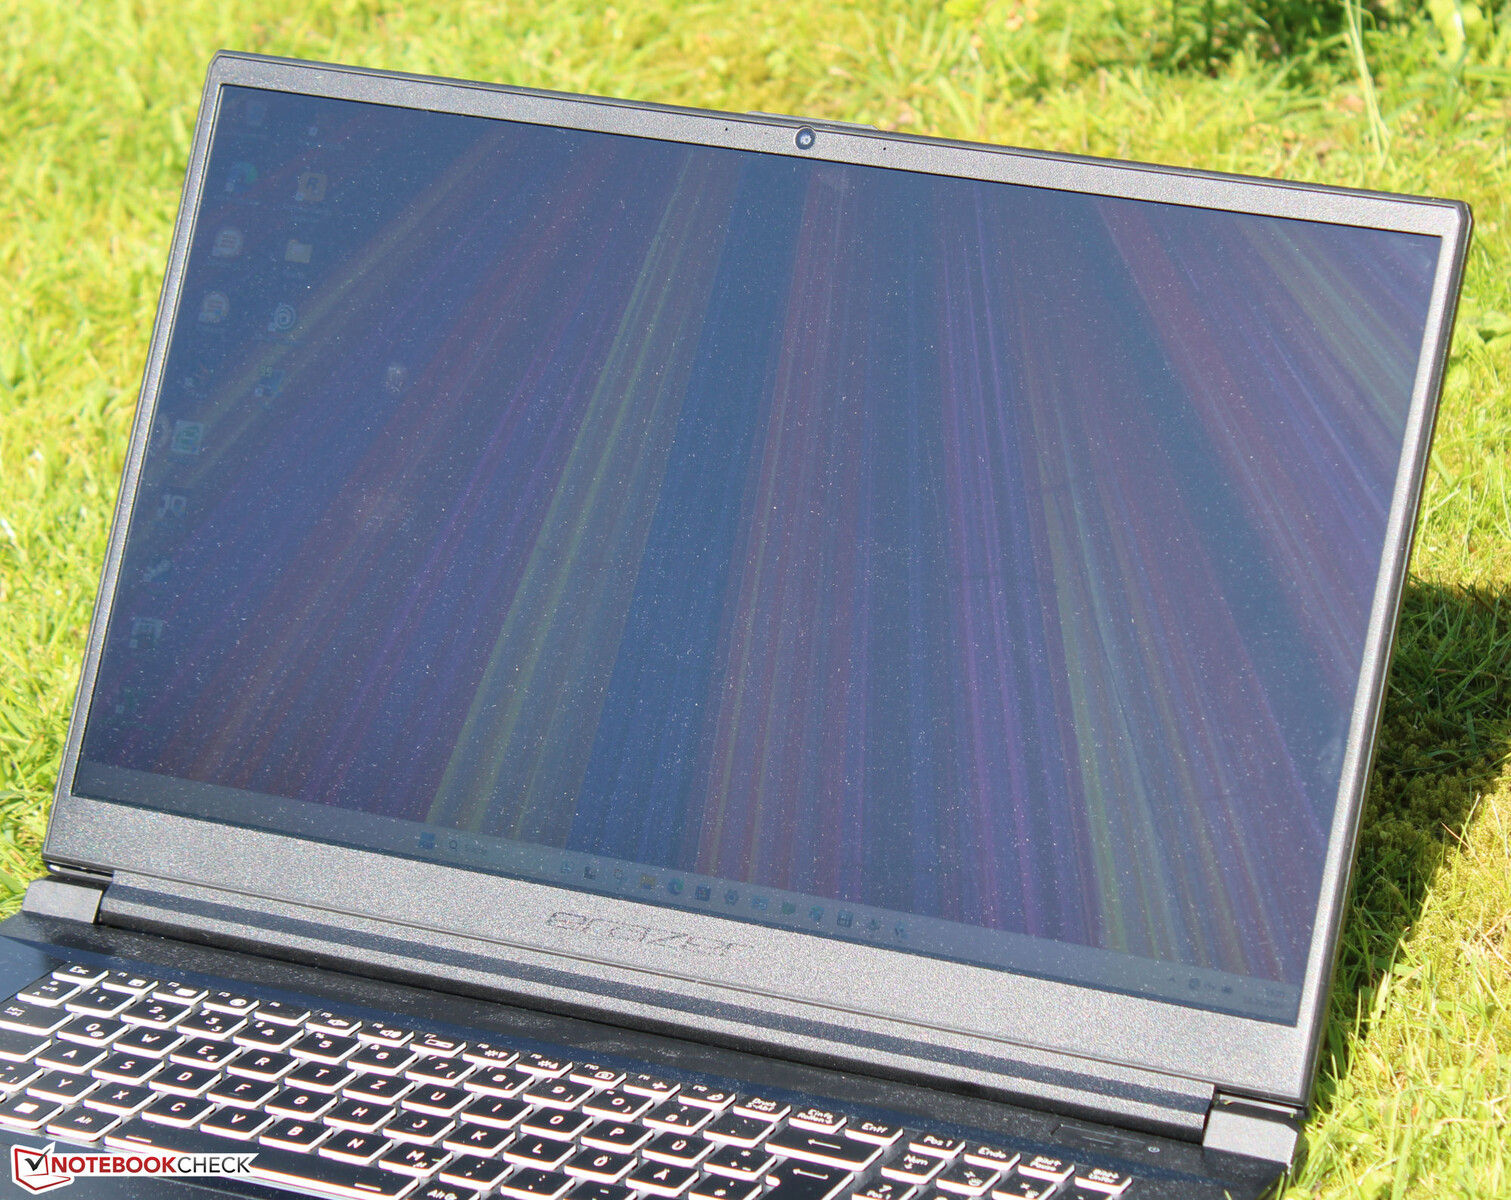
Gehäuse - Der Medion Computer nutzt ein Kunststoffchassis
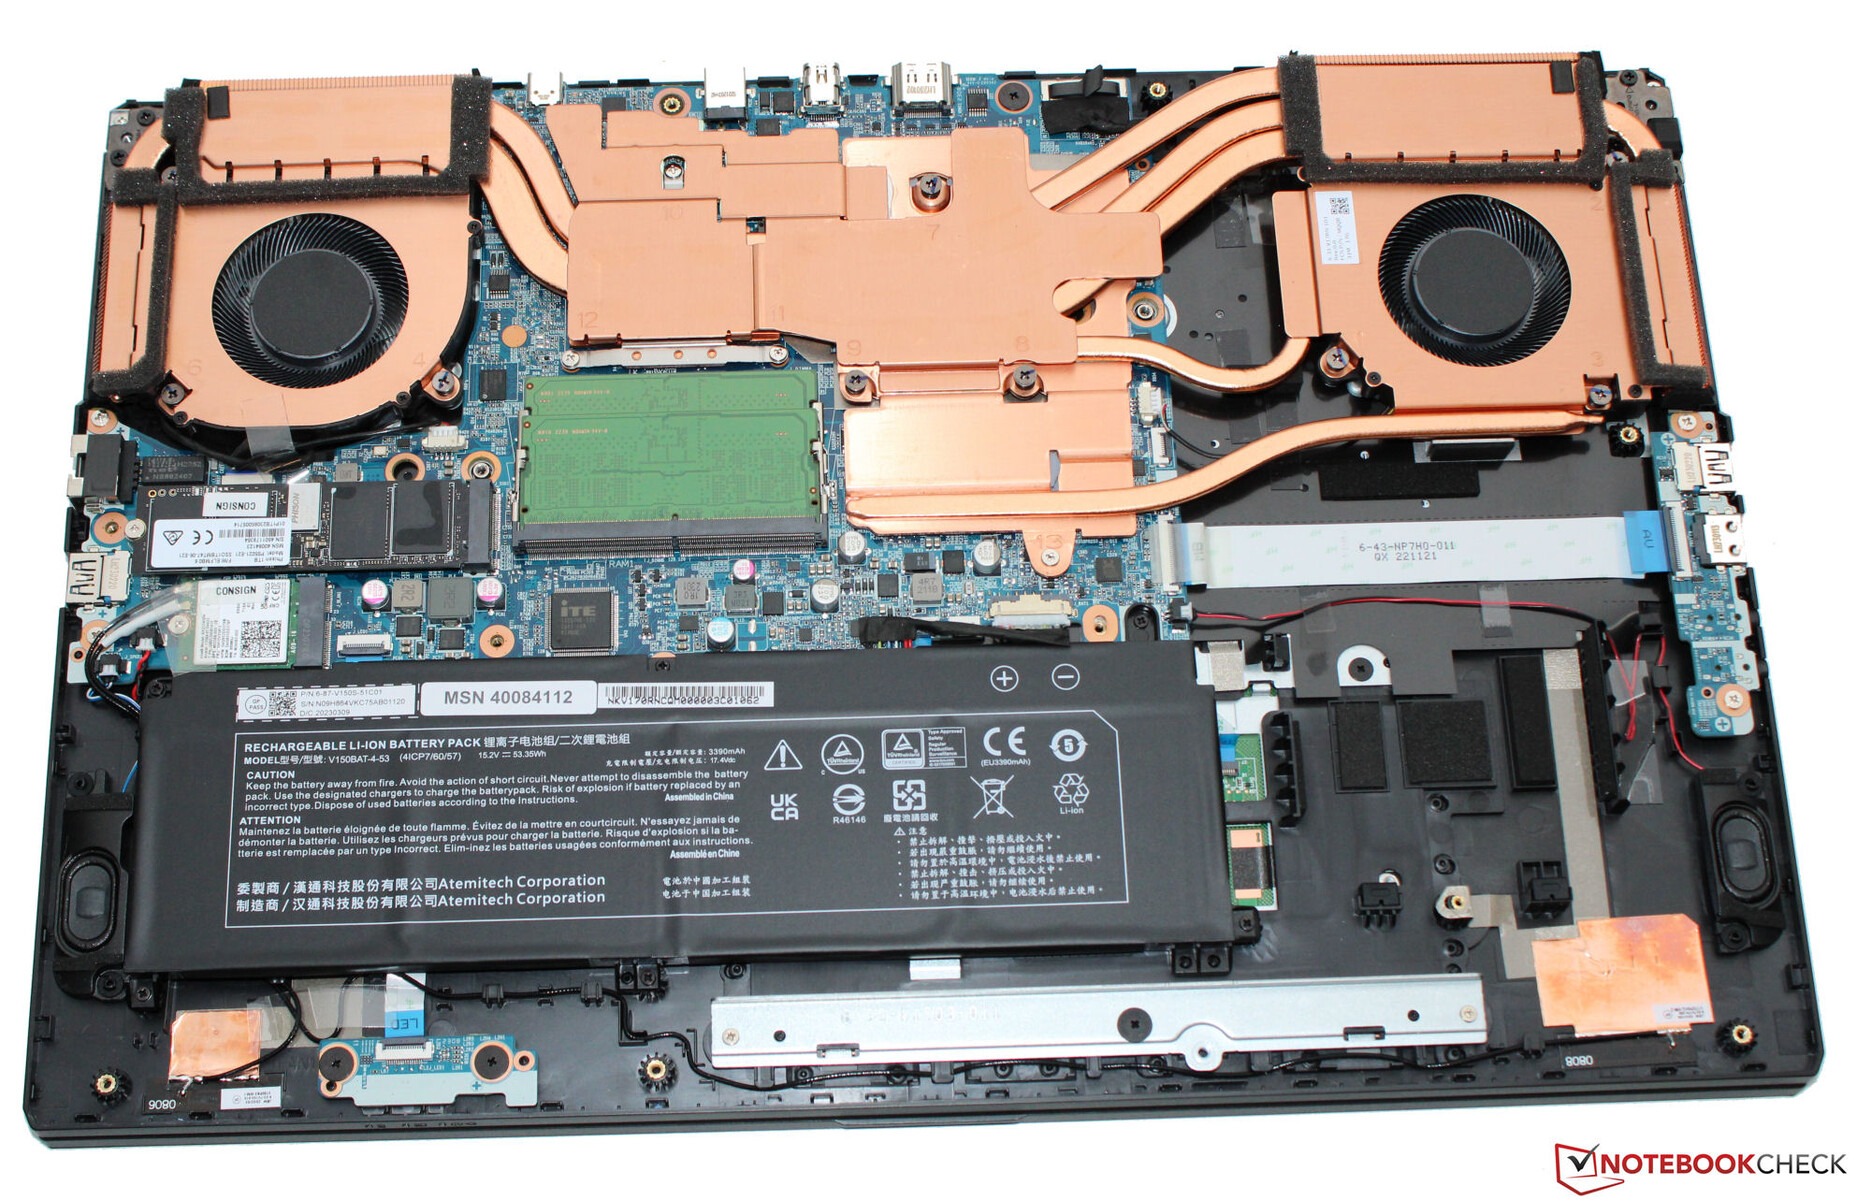
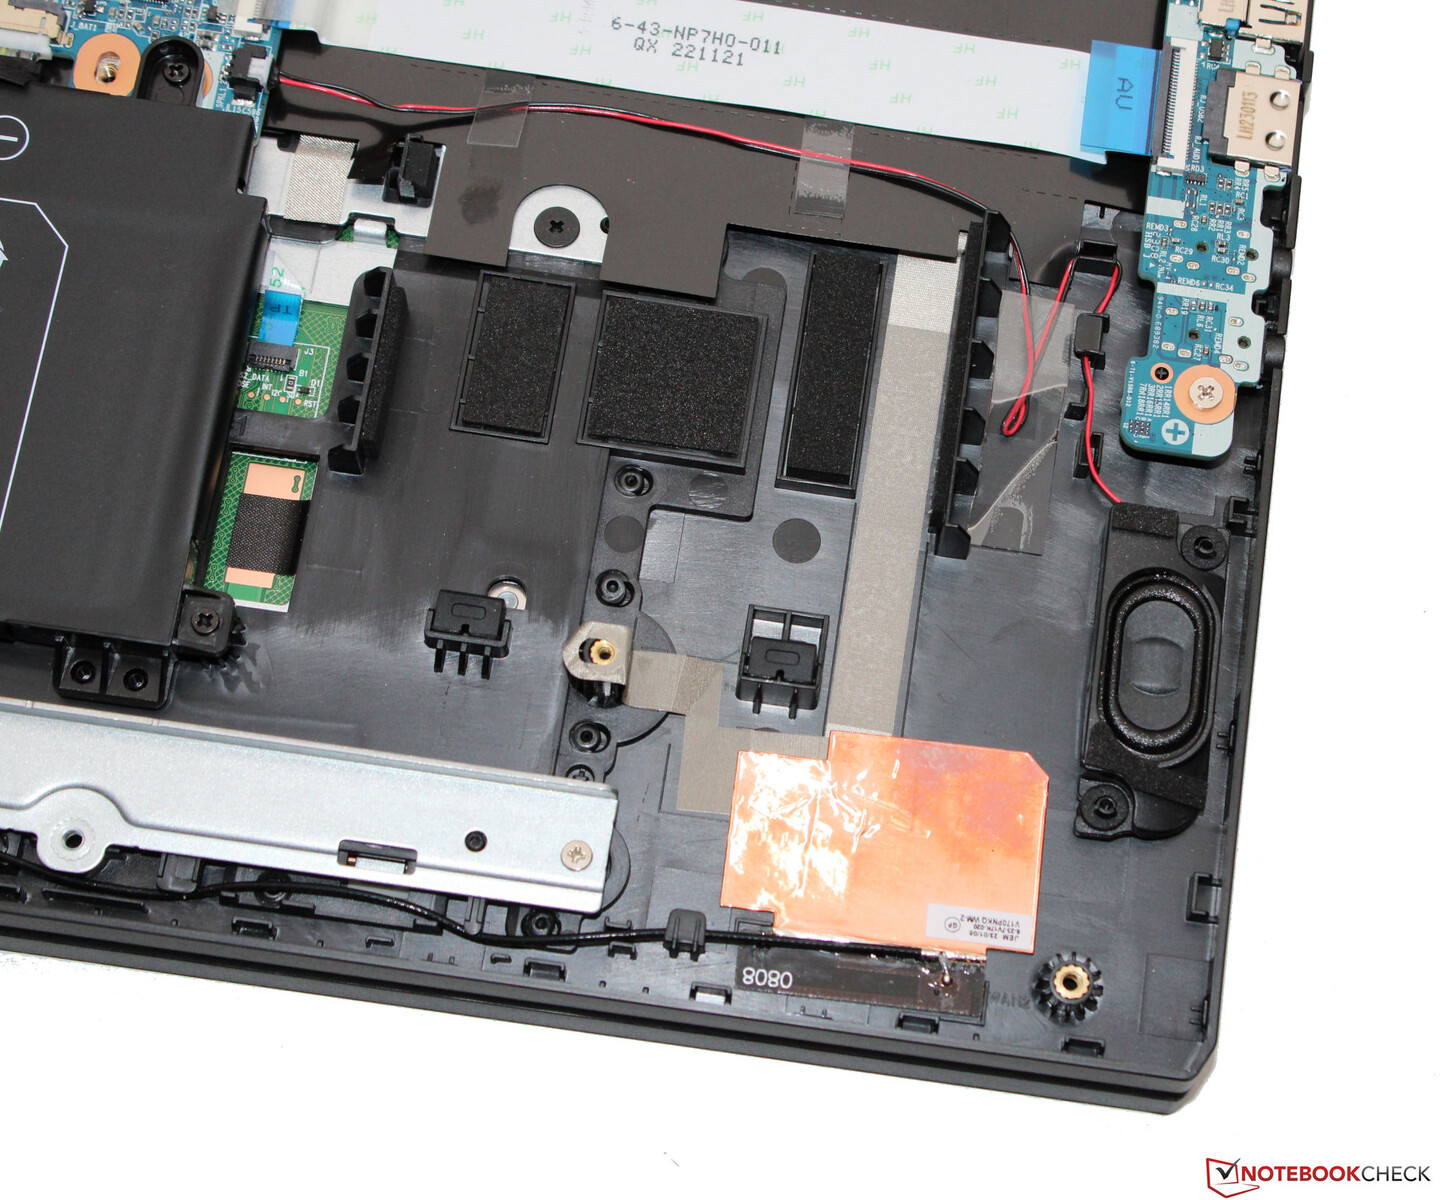
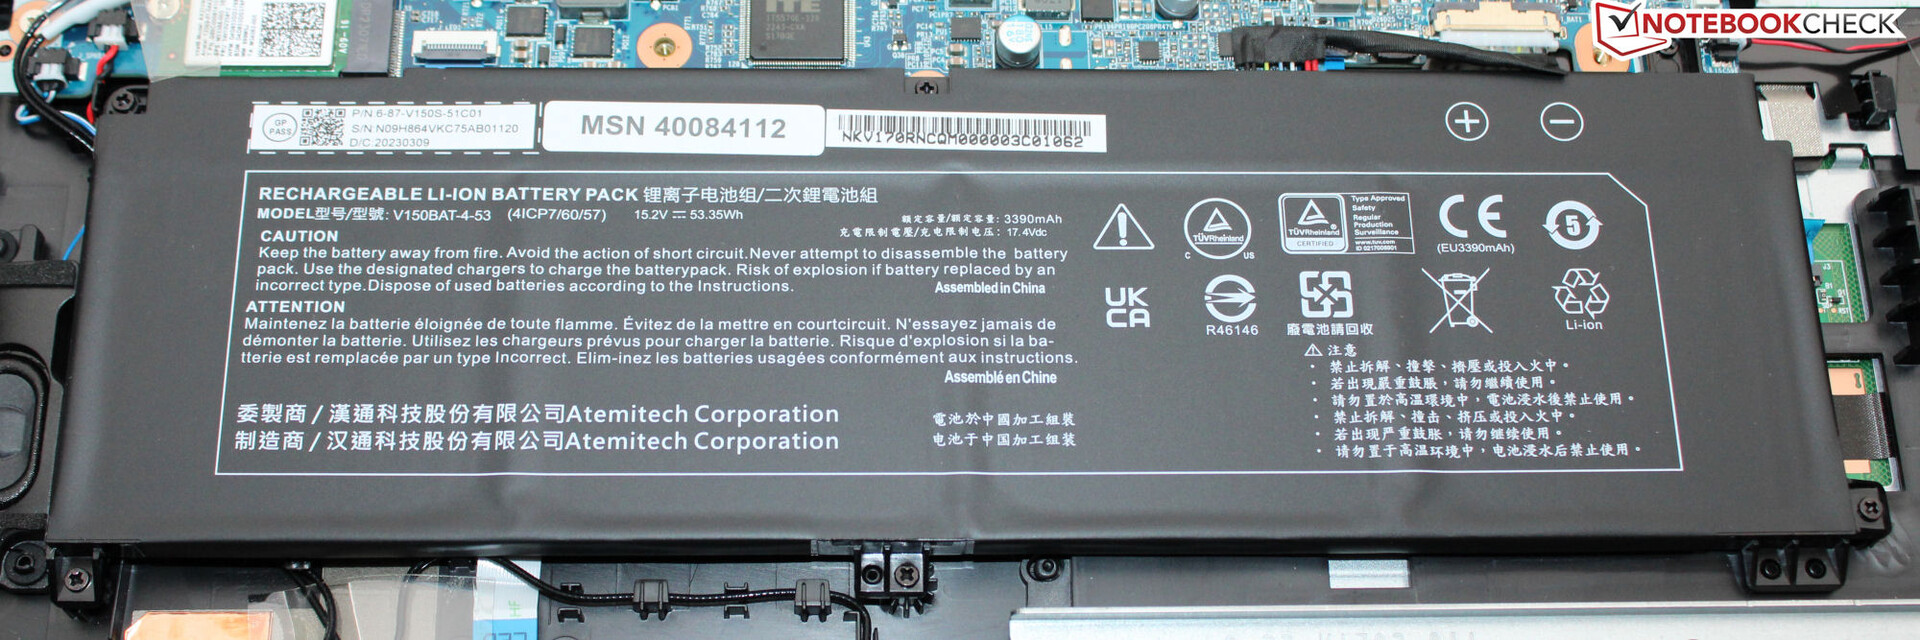
Hochwertig anmutende Gehäusematerialien hat das E20 nicht zu bieten. Das gesamte Chassis besteht aus schwarzem Kunststoff. Medion setzt auf glatte, matt-reflektierende Oberflächen. Das unauffällige Design des Rechners ließe auch einen Einsatz in seriösen Umgebungen zu. Farbliche Auflockerung in Form von LED-Bändern bietet das Notebook jenseits der Tastenbeleuchtung nicht. Der Akku (verschraubt, nicht verklebt) sowie die übrigen Innereien sind nach der Demontage der Unterschale zugänglich.
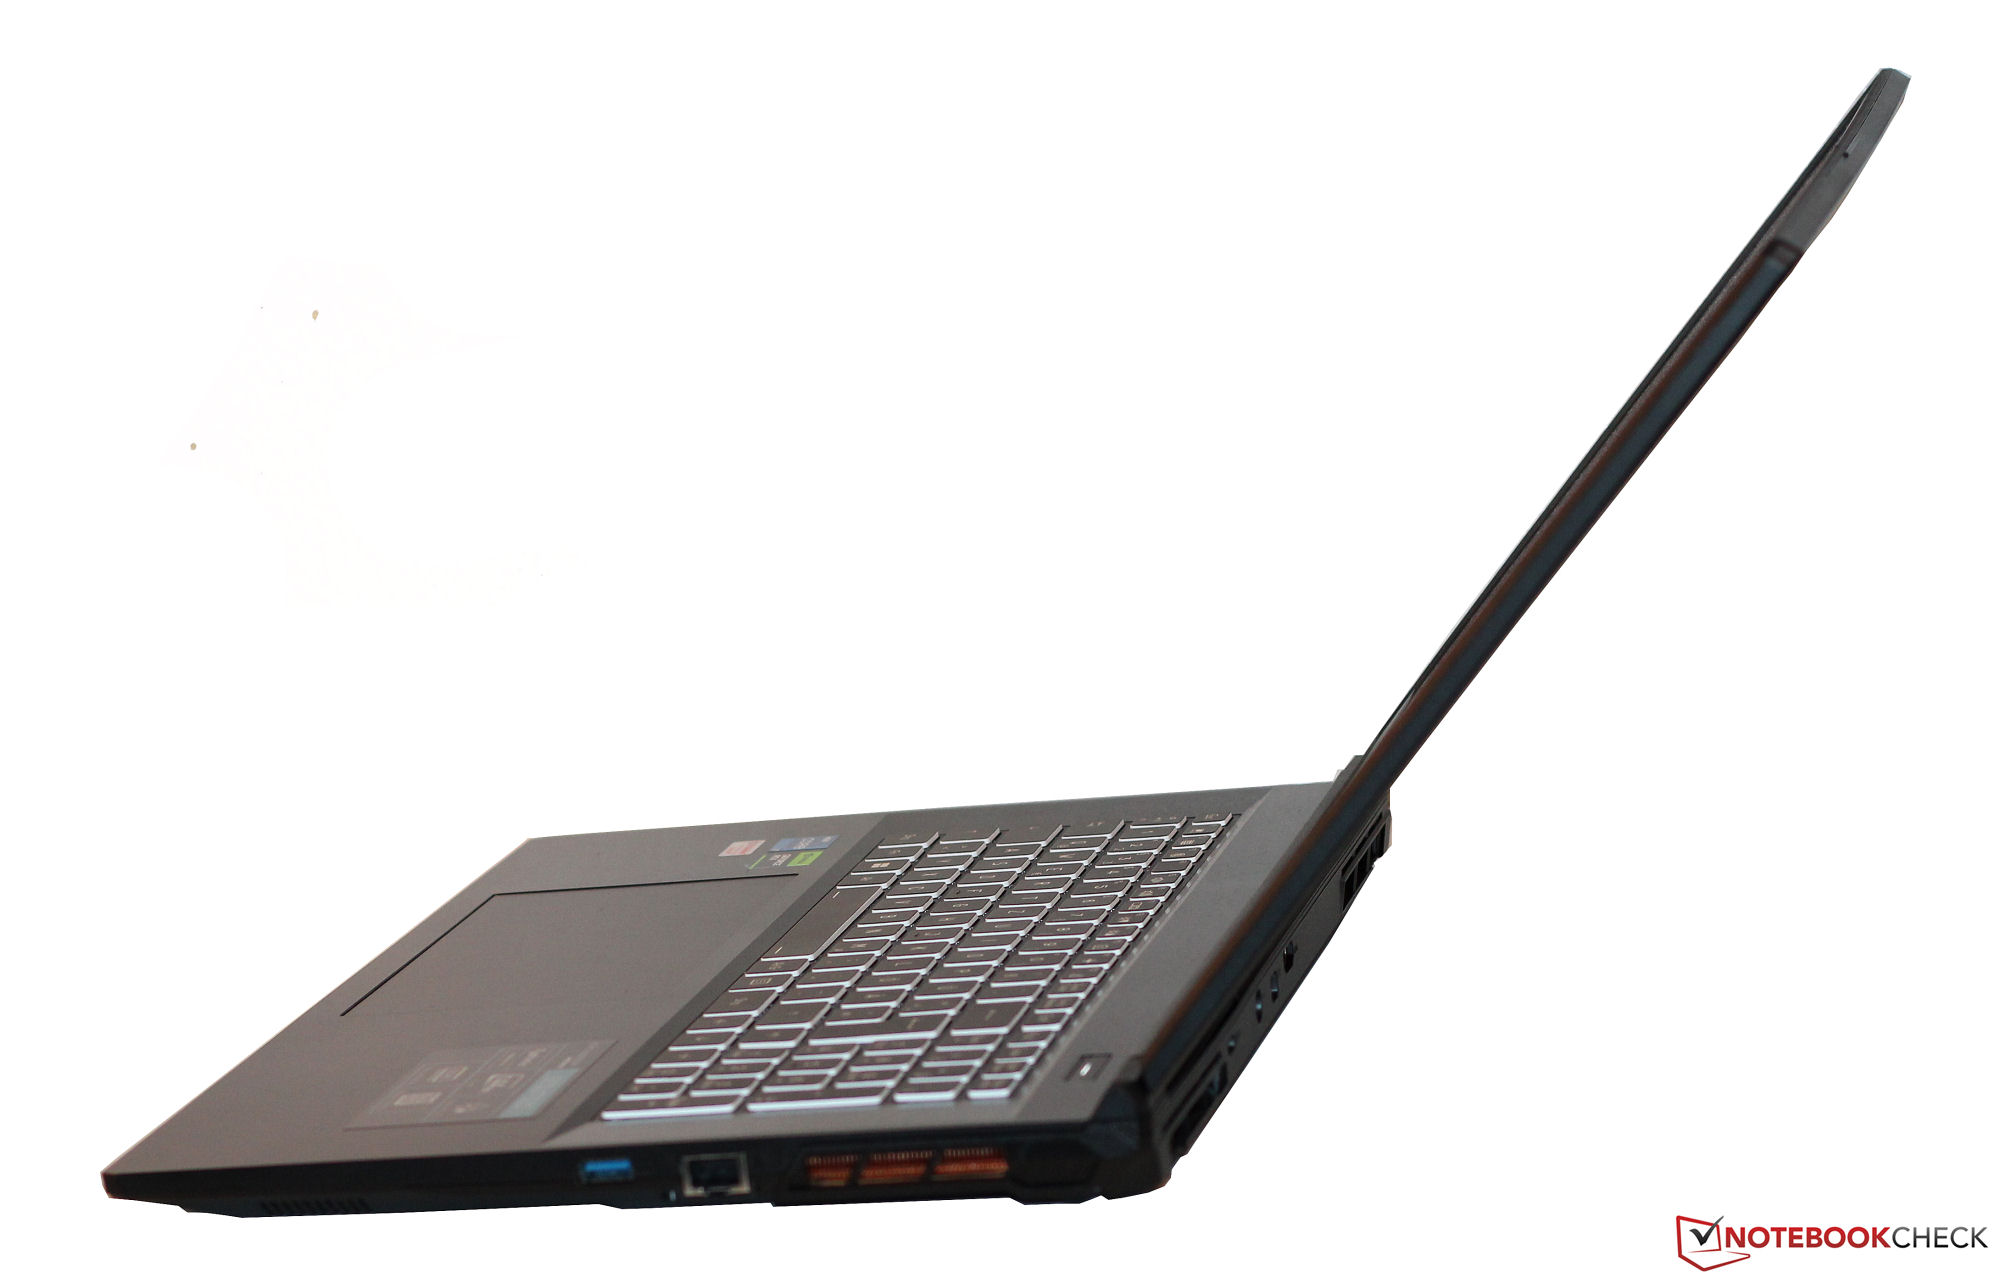
Verarbeitungsmängel zeigt das Scout nicht. Die Spaltmaße stimmen, es sind keine Materialüberstände auffindbar. Die Baseunit kann in geringem Maße verdreht werden, der Deckel deutlicher. Das Ganze bewegt sich noch im Rahmen. Die Scharniere halten den Deckel fest in Position, der maximale Öffnungswinkel beträgt ca. 135 Grad. Eine Ein-Hand-Öffnung des Deckels ist möglich.

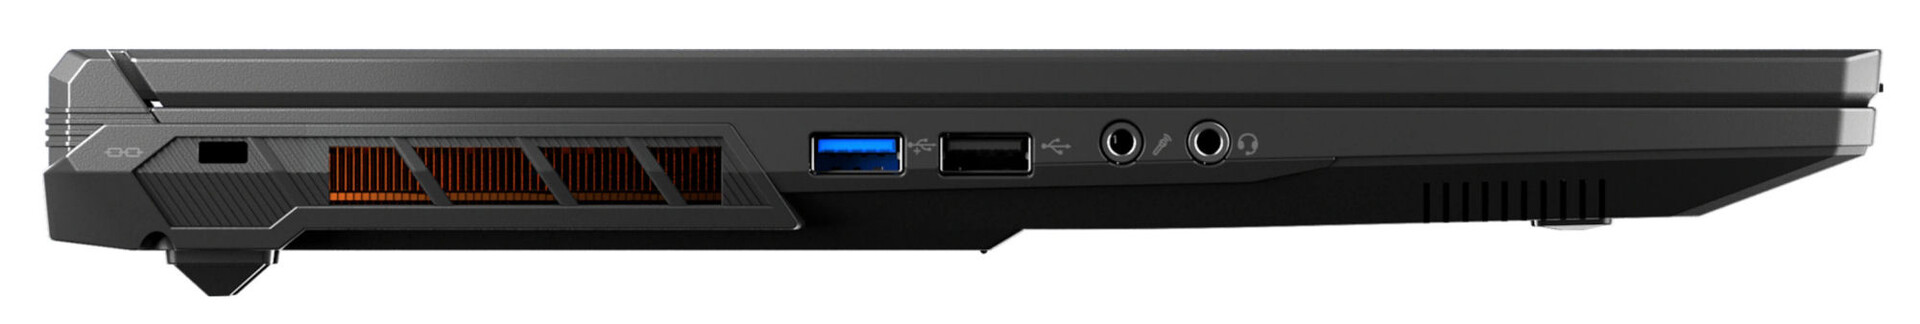
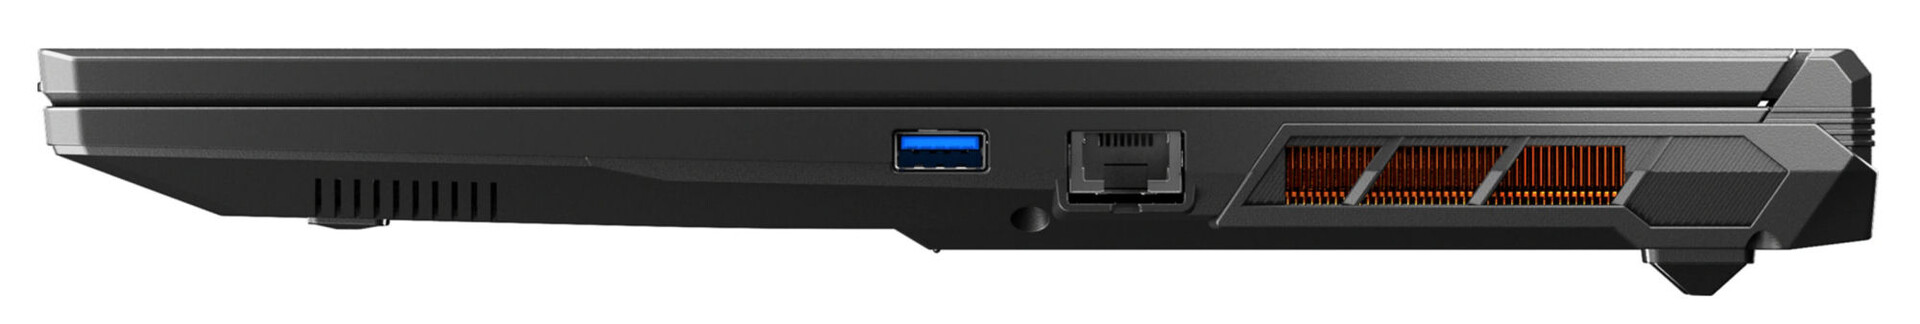
Ausstattung - Kein Thunderbolt für das Erazer
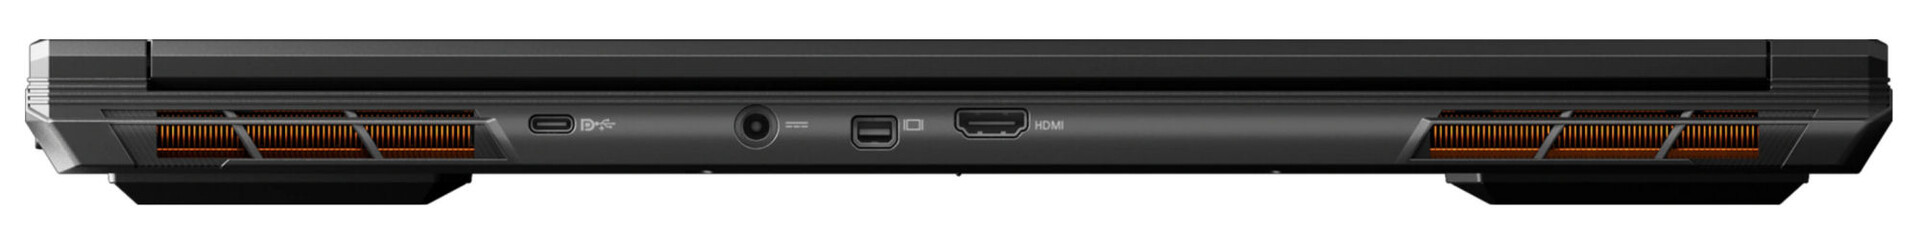
Das Erazer hält drei USB-A-Steckplätze (1x USB 2.0, 1x USB 3.2 Gen 1, 1x USB 3.2 Gen 2) und einen USB-C-Anschluss (USB 3.2 Gen 2) bereit. Letzterer kann ein Displayport-Signal ausgeben, bietet aber keine Power-Delivery-Unterstützung. Insgesamt wartet das Scout E20 mit drei Videoausgängen (HDMI 2.1, 2x DP) auf. Zwei Audiobuchsen und ein Gigabit-Ethernet-Port runden das Angebot ab. Einen Speicherkartenleser gibt es nicht.
Videoausgänge und Stromanschluss befinden sich auf der Rückseite des Geräts. Entsprechende Kabel würden nach hinten laufen und nicht im Weg liegen.
Kommunikation
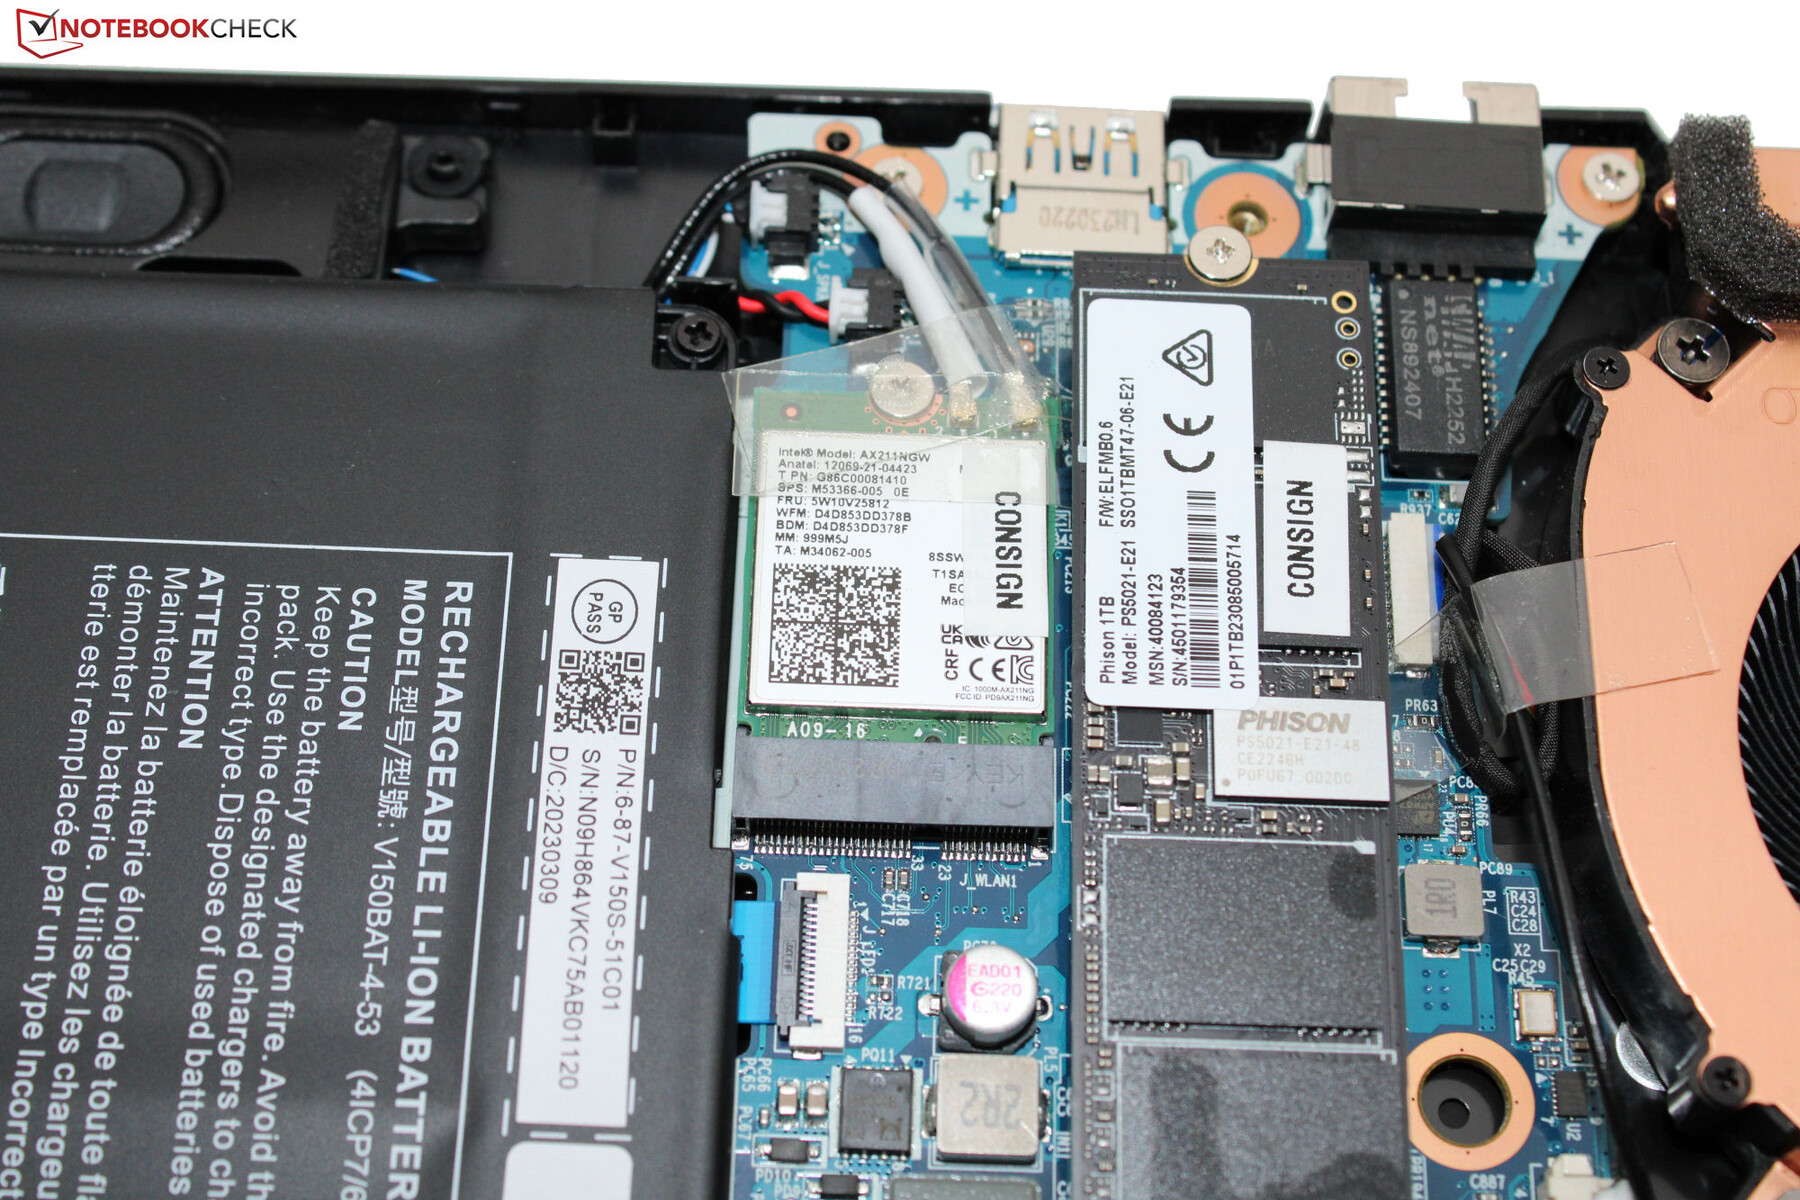
Unter optimalen Bedingungen (keine WLAN-Geräte in der näheren Umgebung, geringer Abstand zwischen Laptop und Server-PC) werden hervorragende WiFi-Datenraten erreicht. Das Medion Notebook nutzt einen WiFi-6E-Chip (Intel AX211). Drahtgebundene Verbindungen wickelt ebenfalls ein Chip (I219-V; 1 GBit/s) der Firma Intel ab.
Webcam
Eine mechanische Abdeckung hat die Webcam (0,9 MP, max. 1.280 x 720 Pixel) nicht zu bieten. Qualitativ liefert sie Standardkost. Immerhin: Die Ergebnisse zeigen nur eine verhältnismäßig geringe Farbabweichung.


Zubehör
Neben den üblichen Dokumenten (Schnellstartanleitung und Garantieinformationen) liegt dem Notebook kein weiteres Zubehör bei.
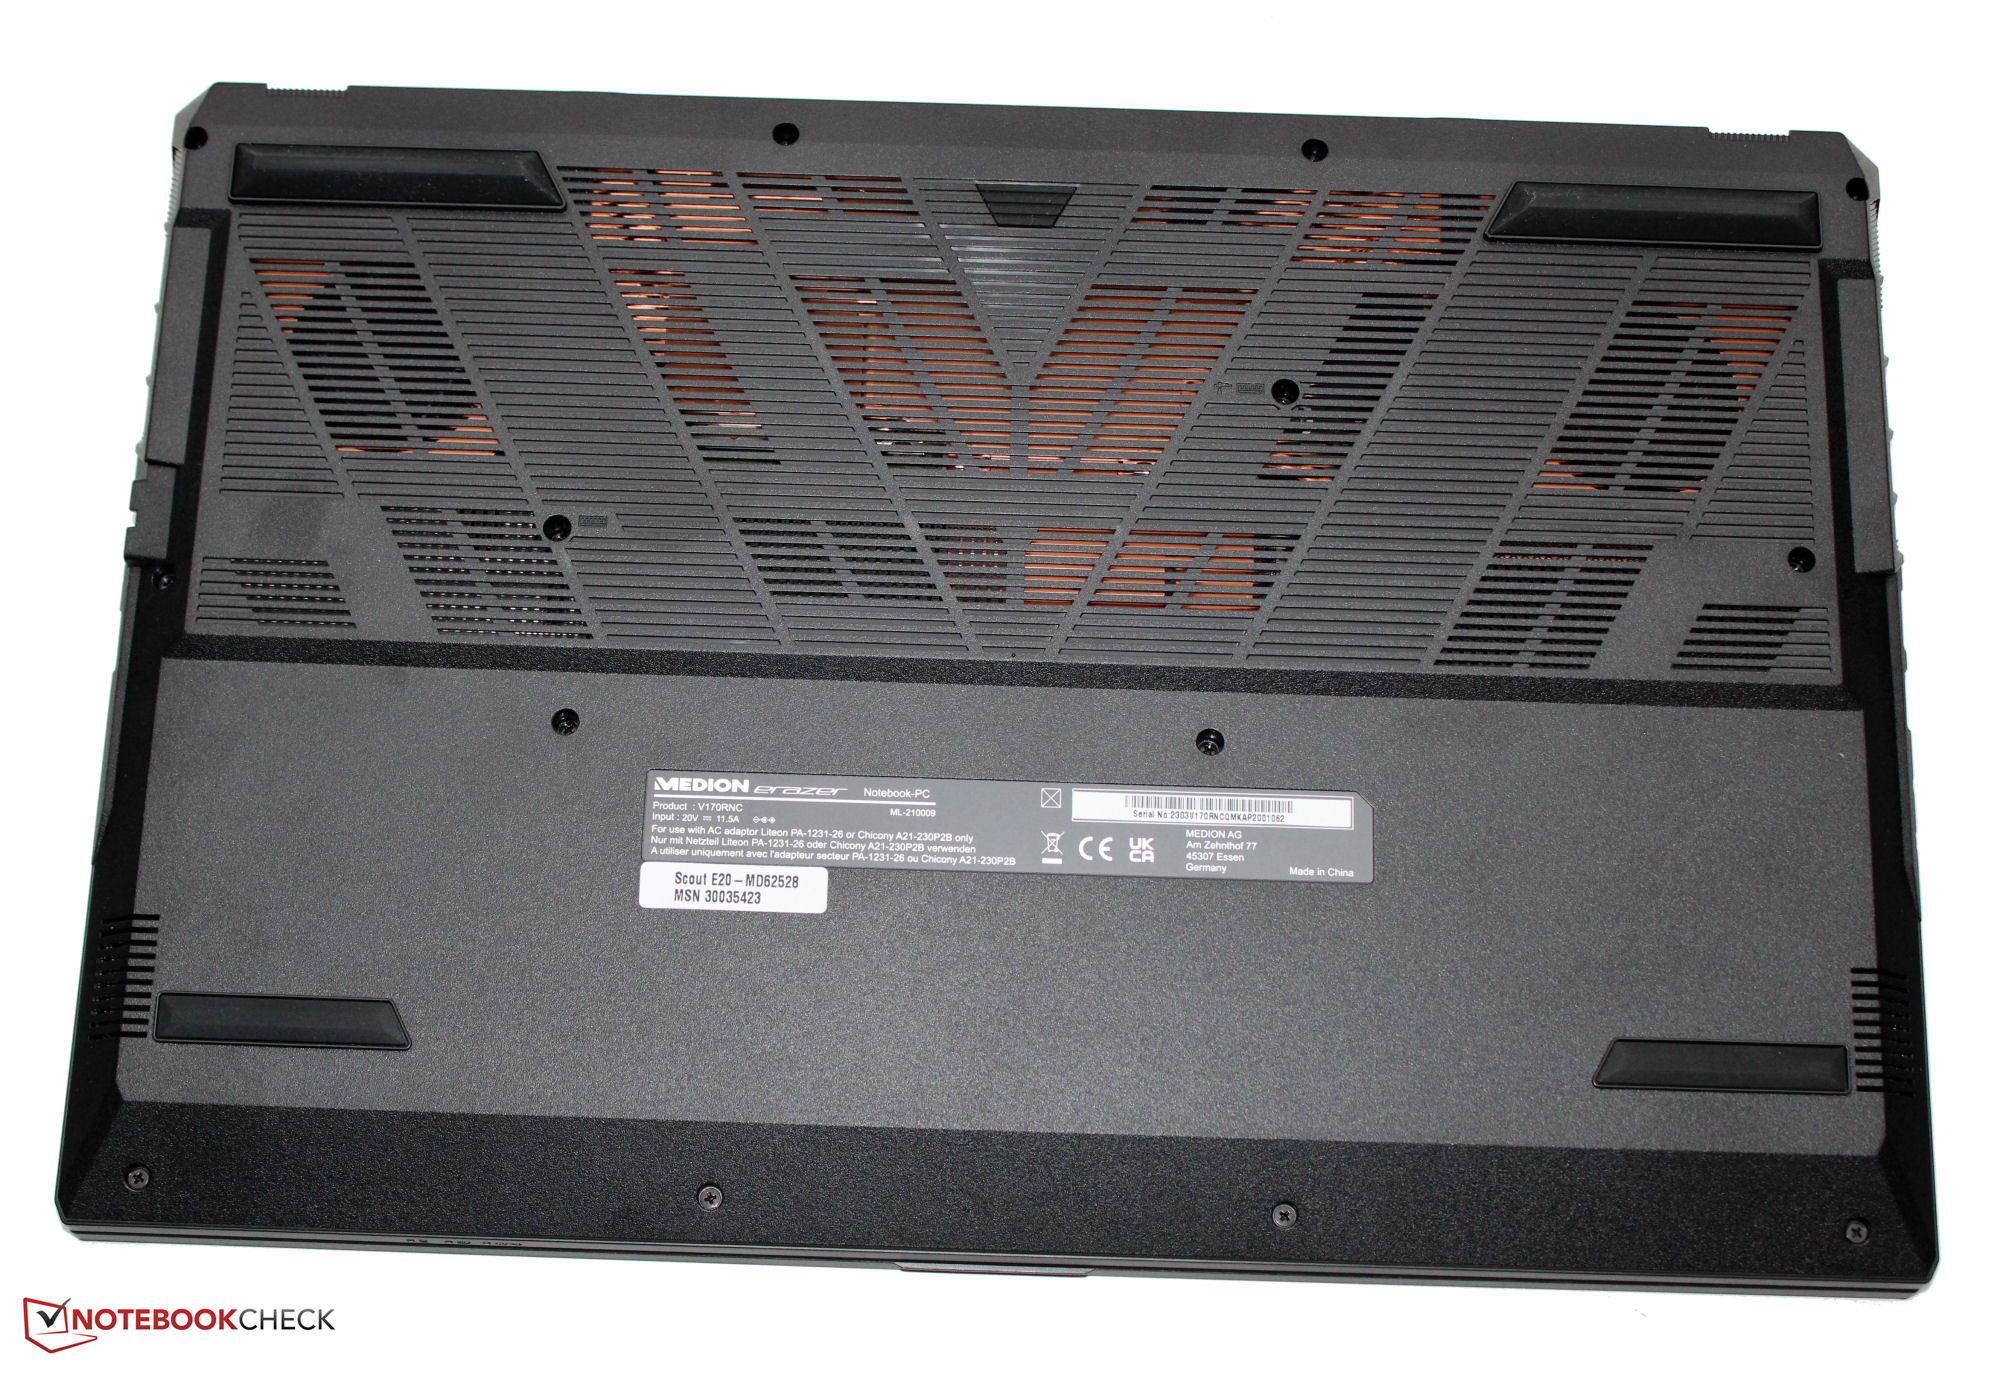
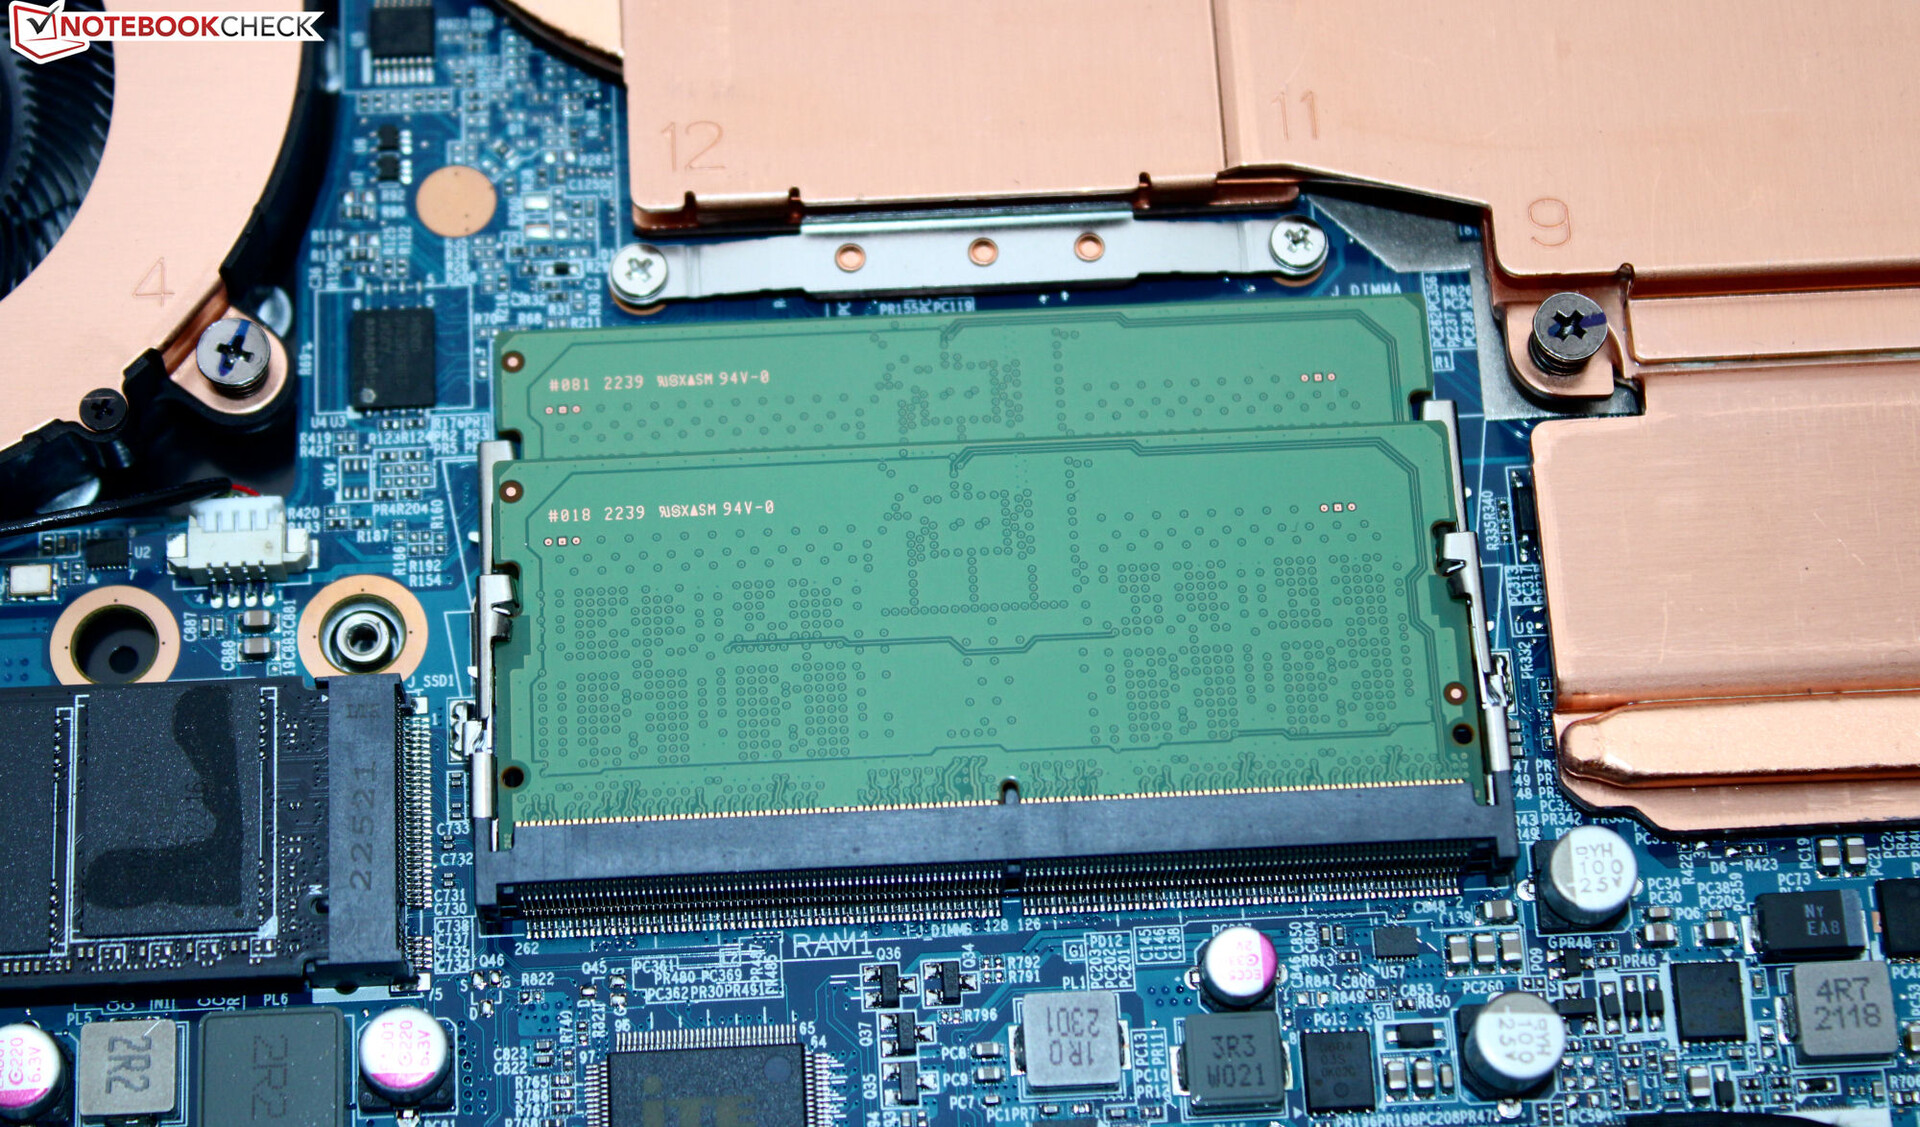
Wartung
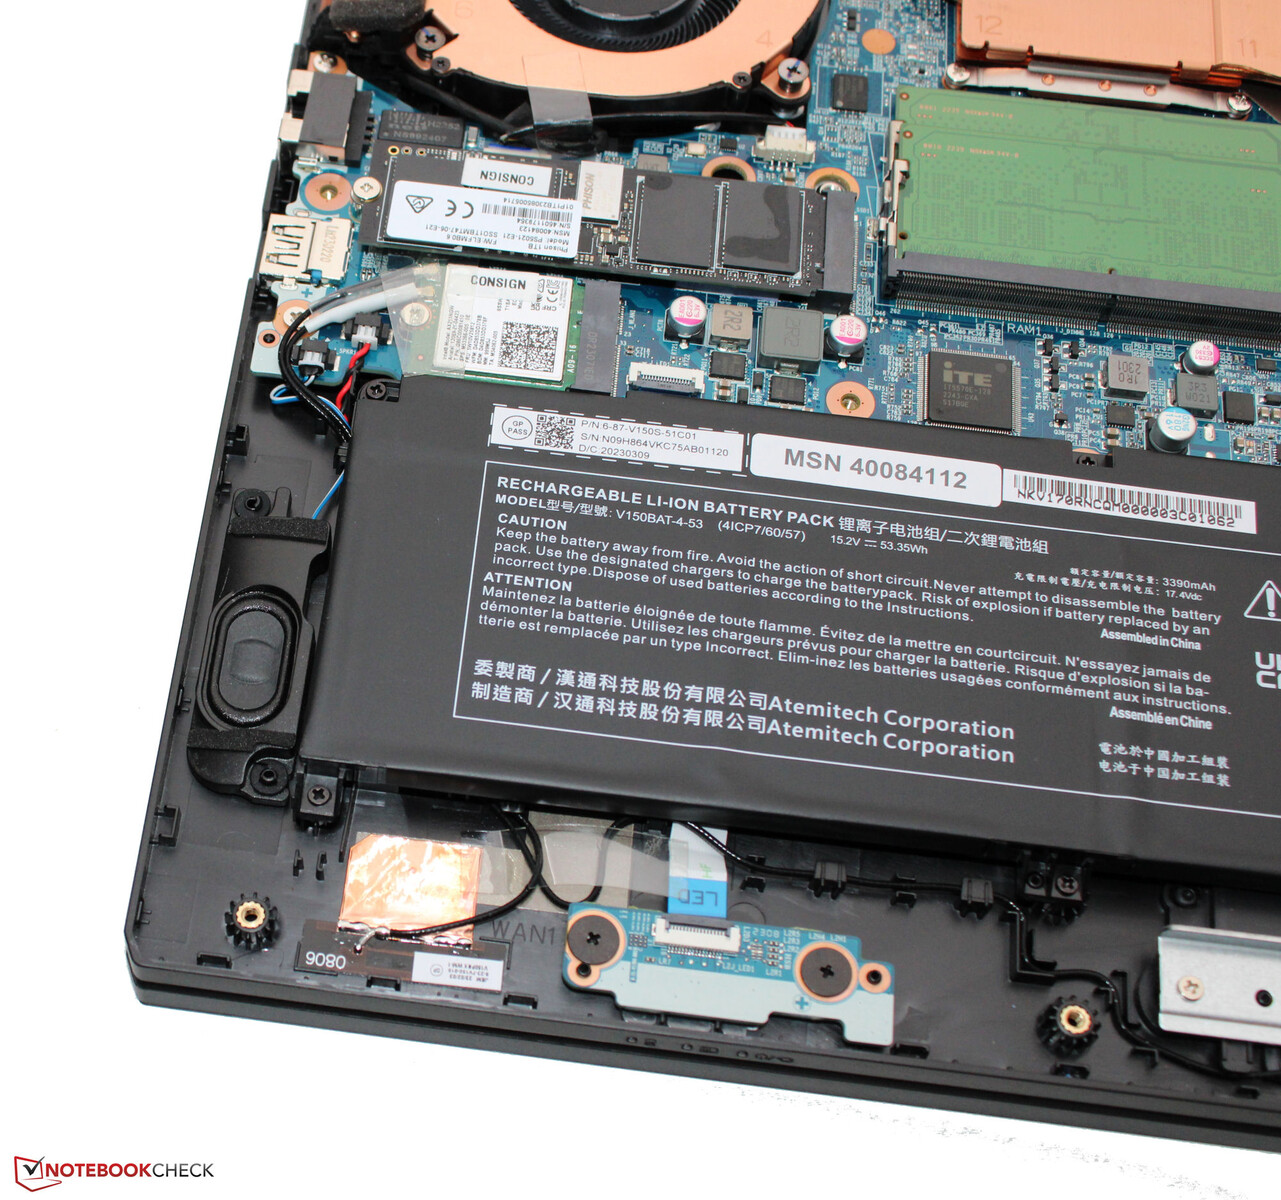
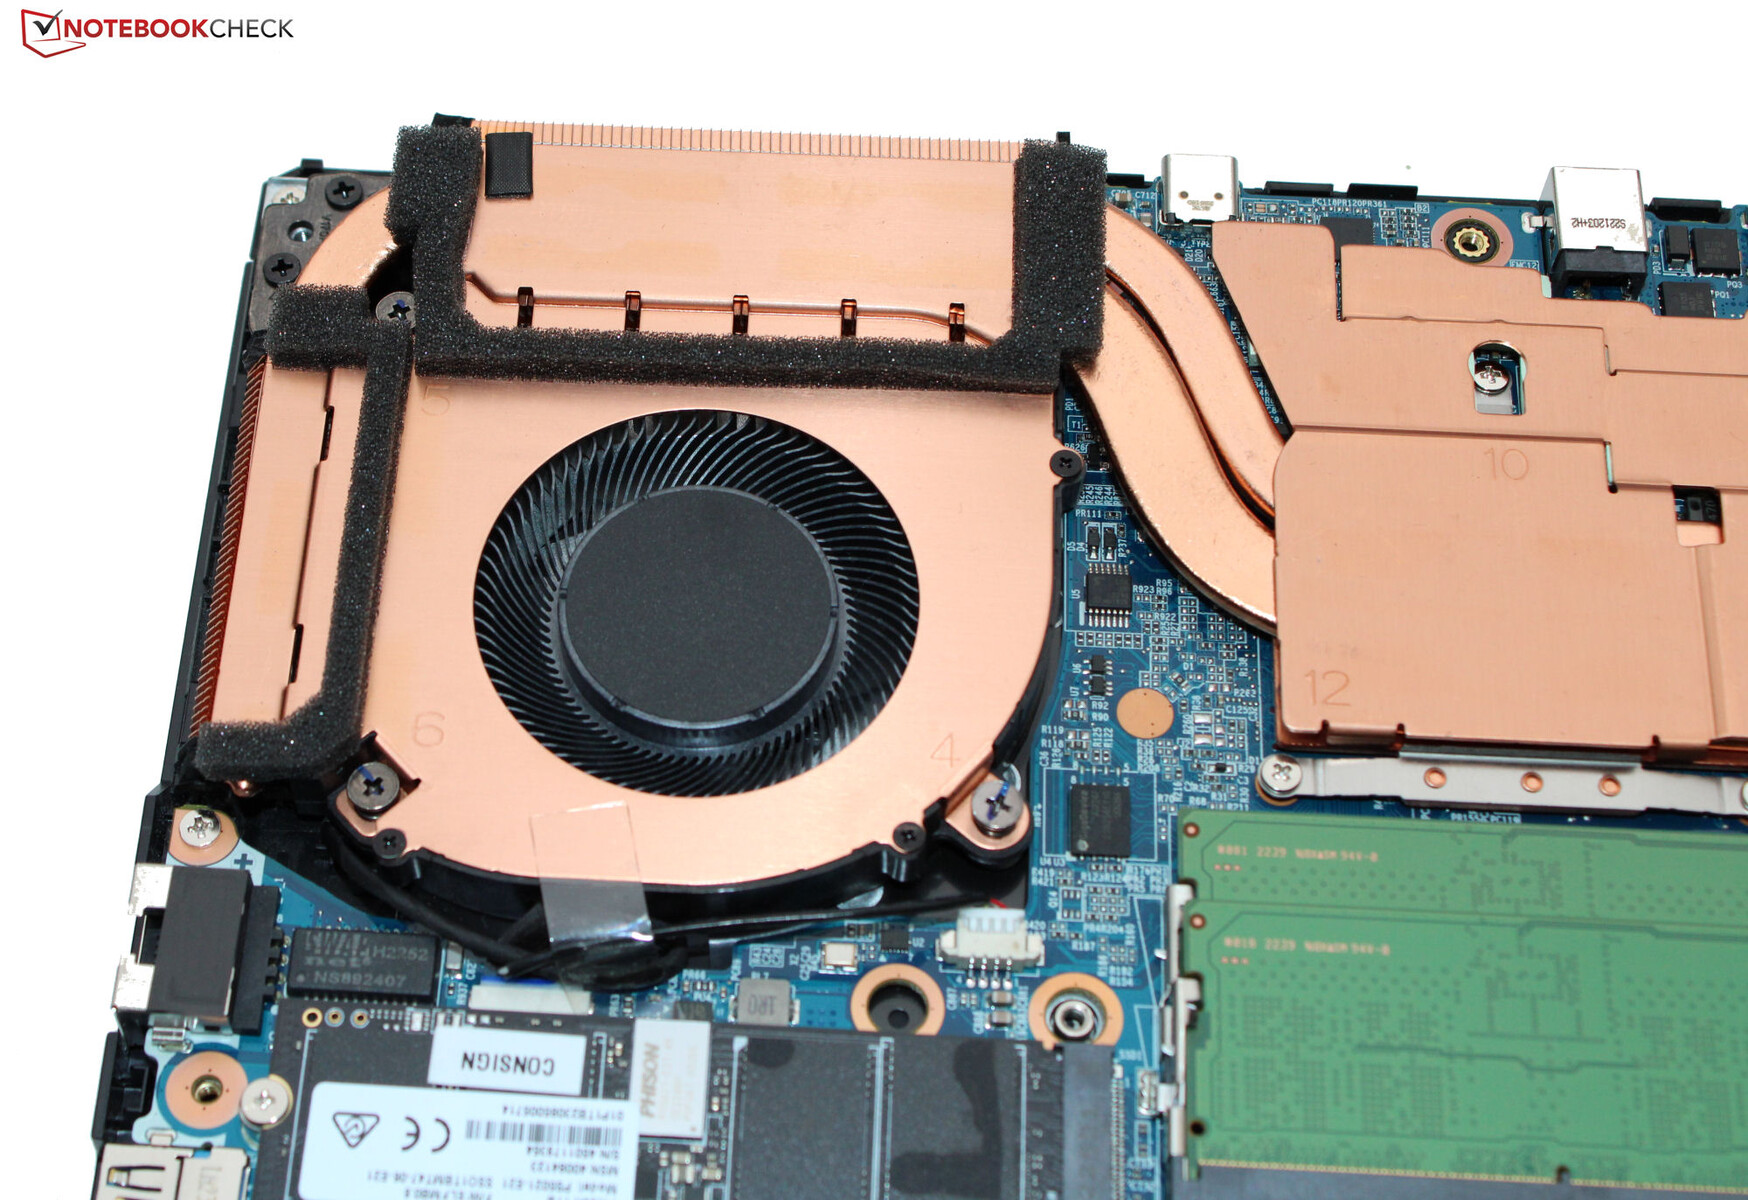
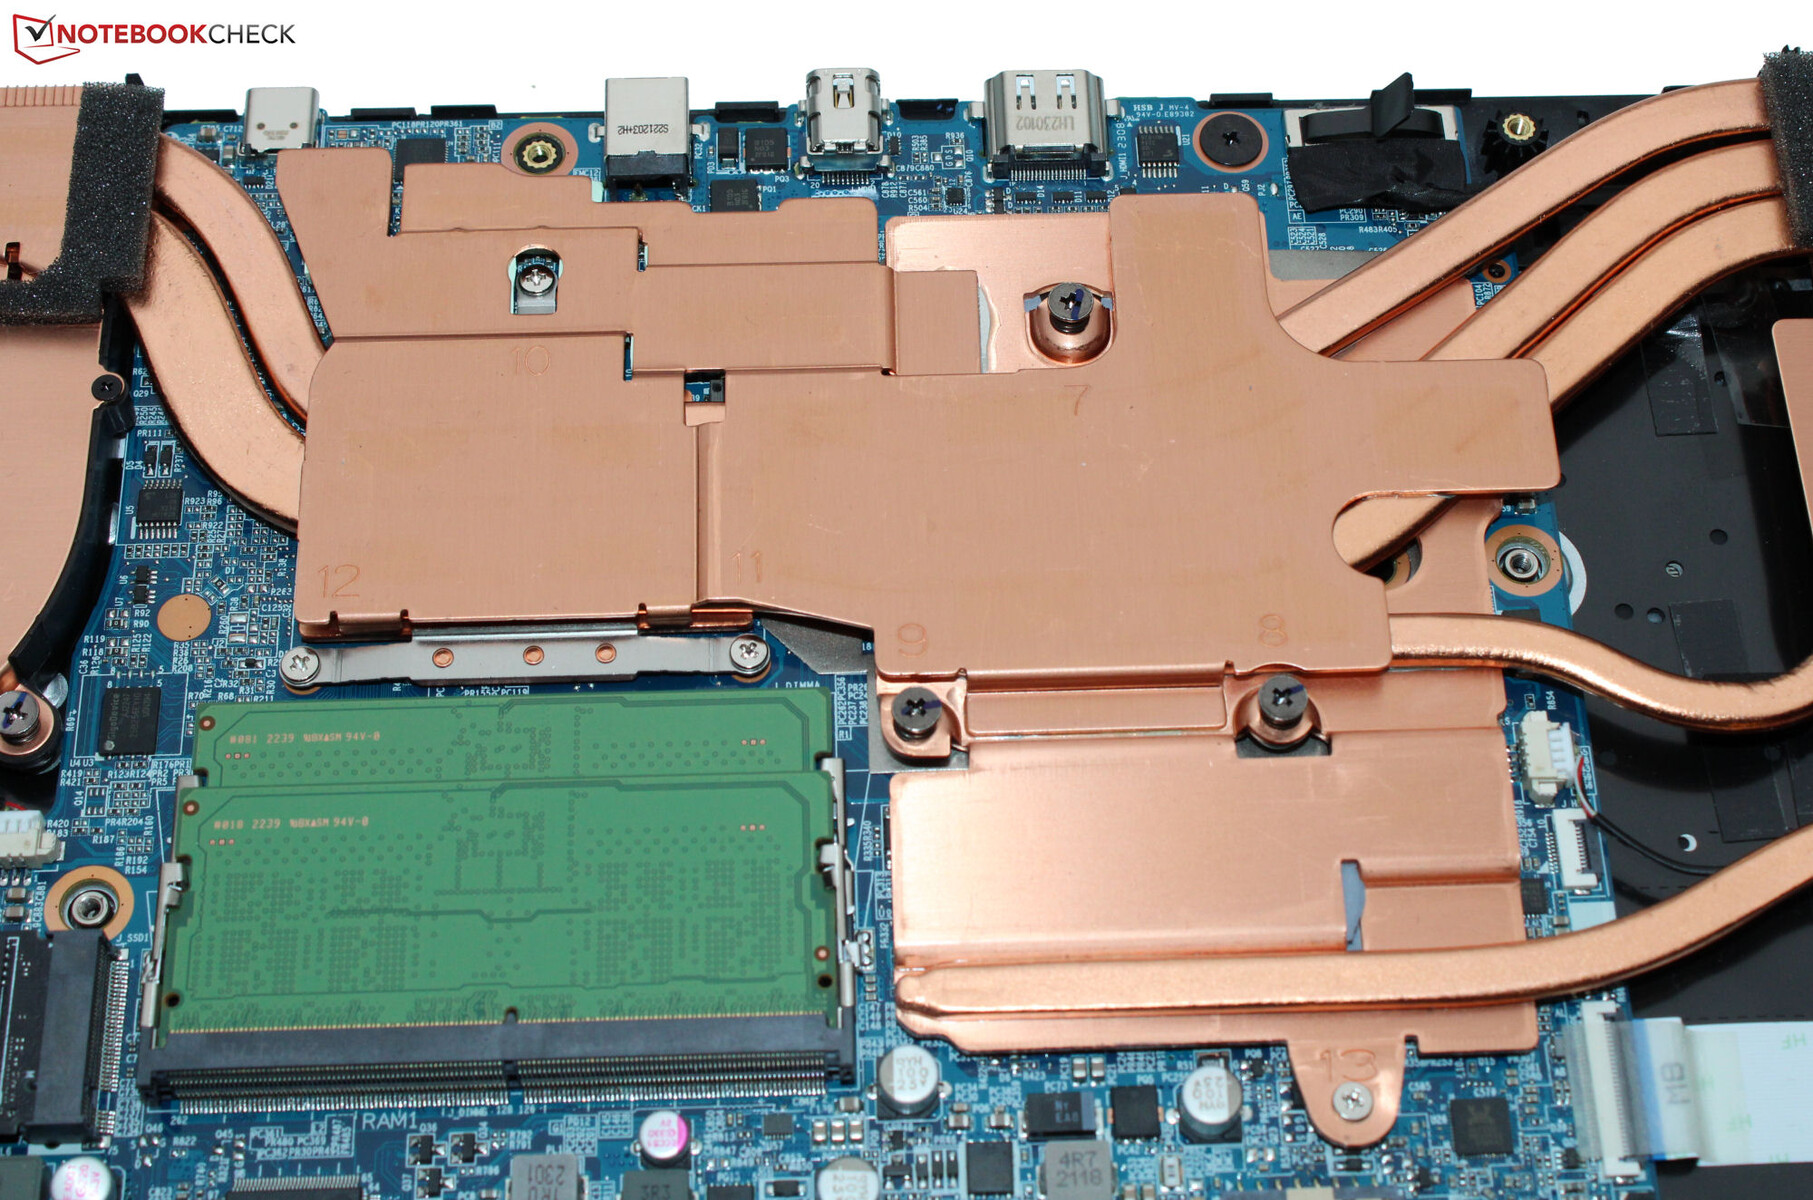
Nach Entfernung unzähliger Schrauben auf der Geräteunterseite kann die Unterschale mit Hilfe eines flachen Spatels oder eines Plektrums abgelöst werden. Es besteht dann Zugriff auf die Arbeitsspeicherbänke (beide belegt), die SSD (PCIe 4, M.2-2280), das WLAN-Modul, die Lüfter und den Akku.
Garantie
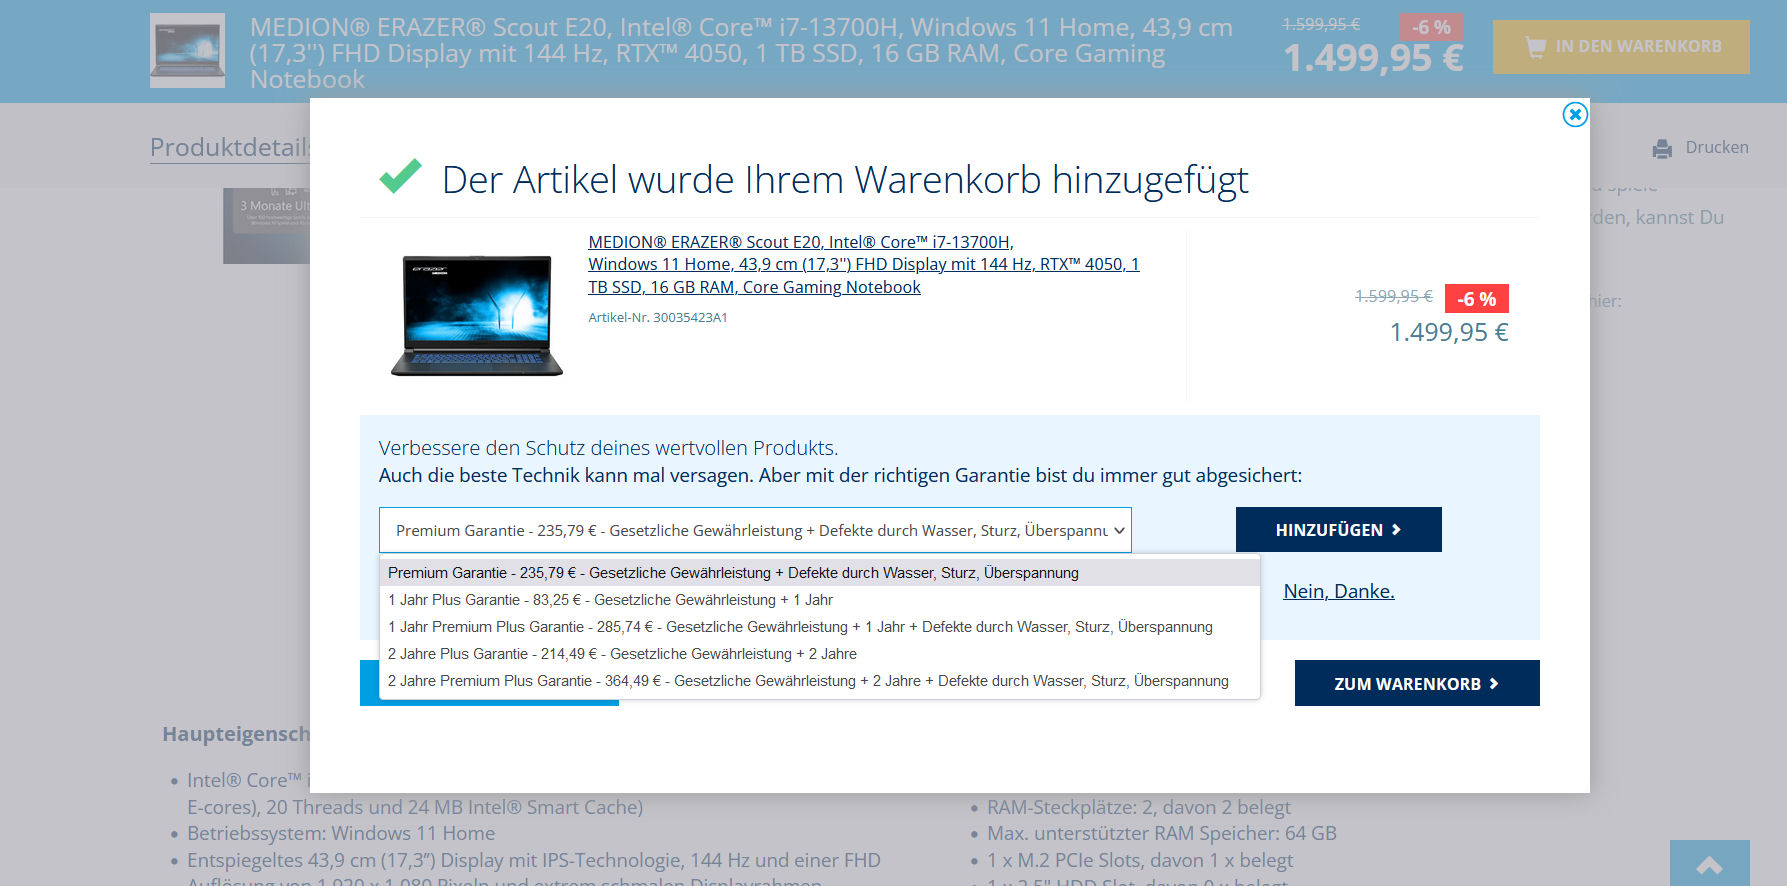
Medion gewährt dem Erazer eine zweijährige Garantie. Garantieerweiterungen sind verfügbar, müssen aber zusammen mit dem Notebook im Medion Onlineshop erworben werden. Ein nachträglicher Kauf ist nicht möglich.
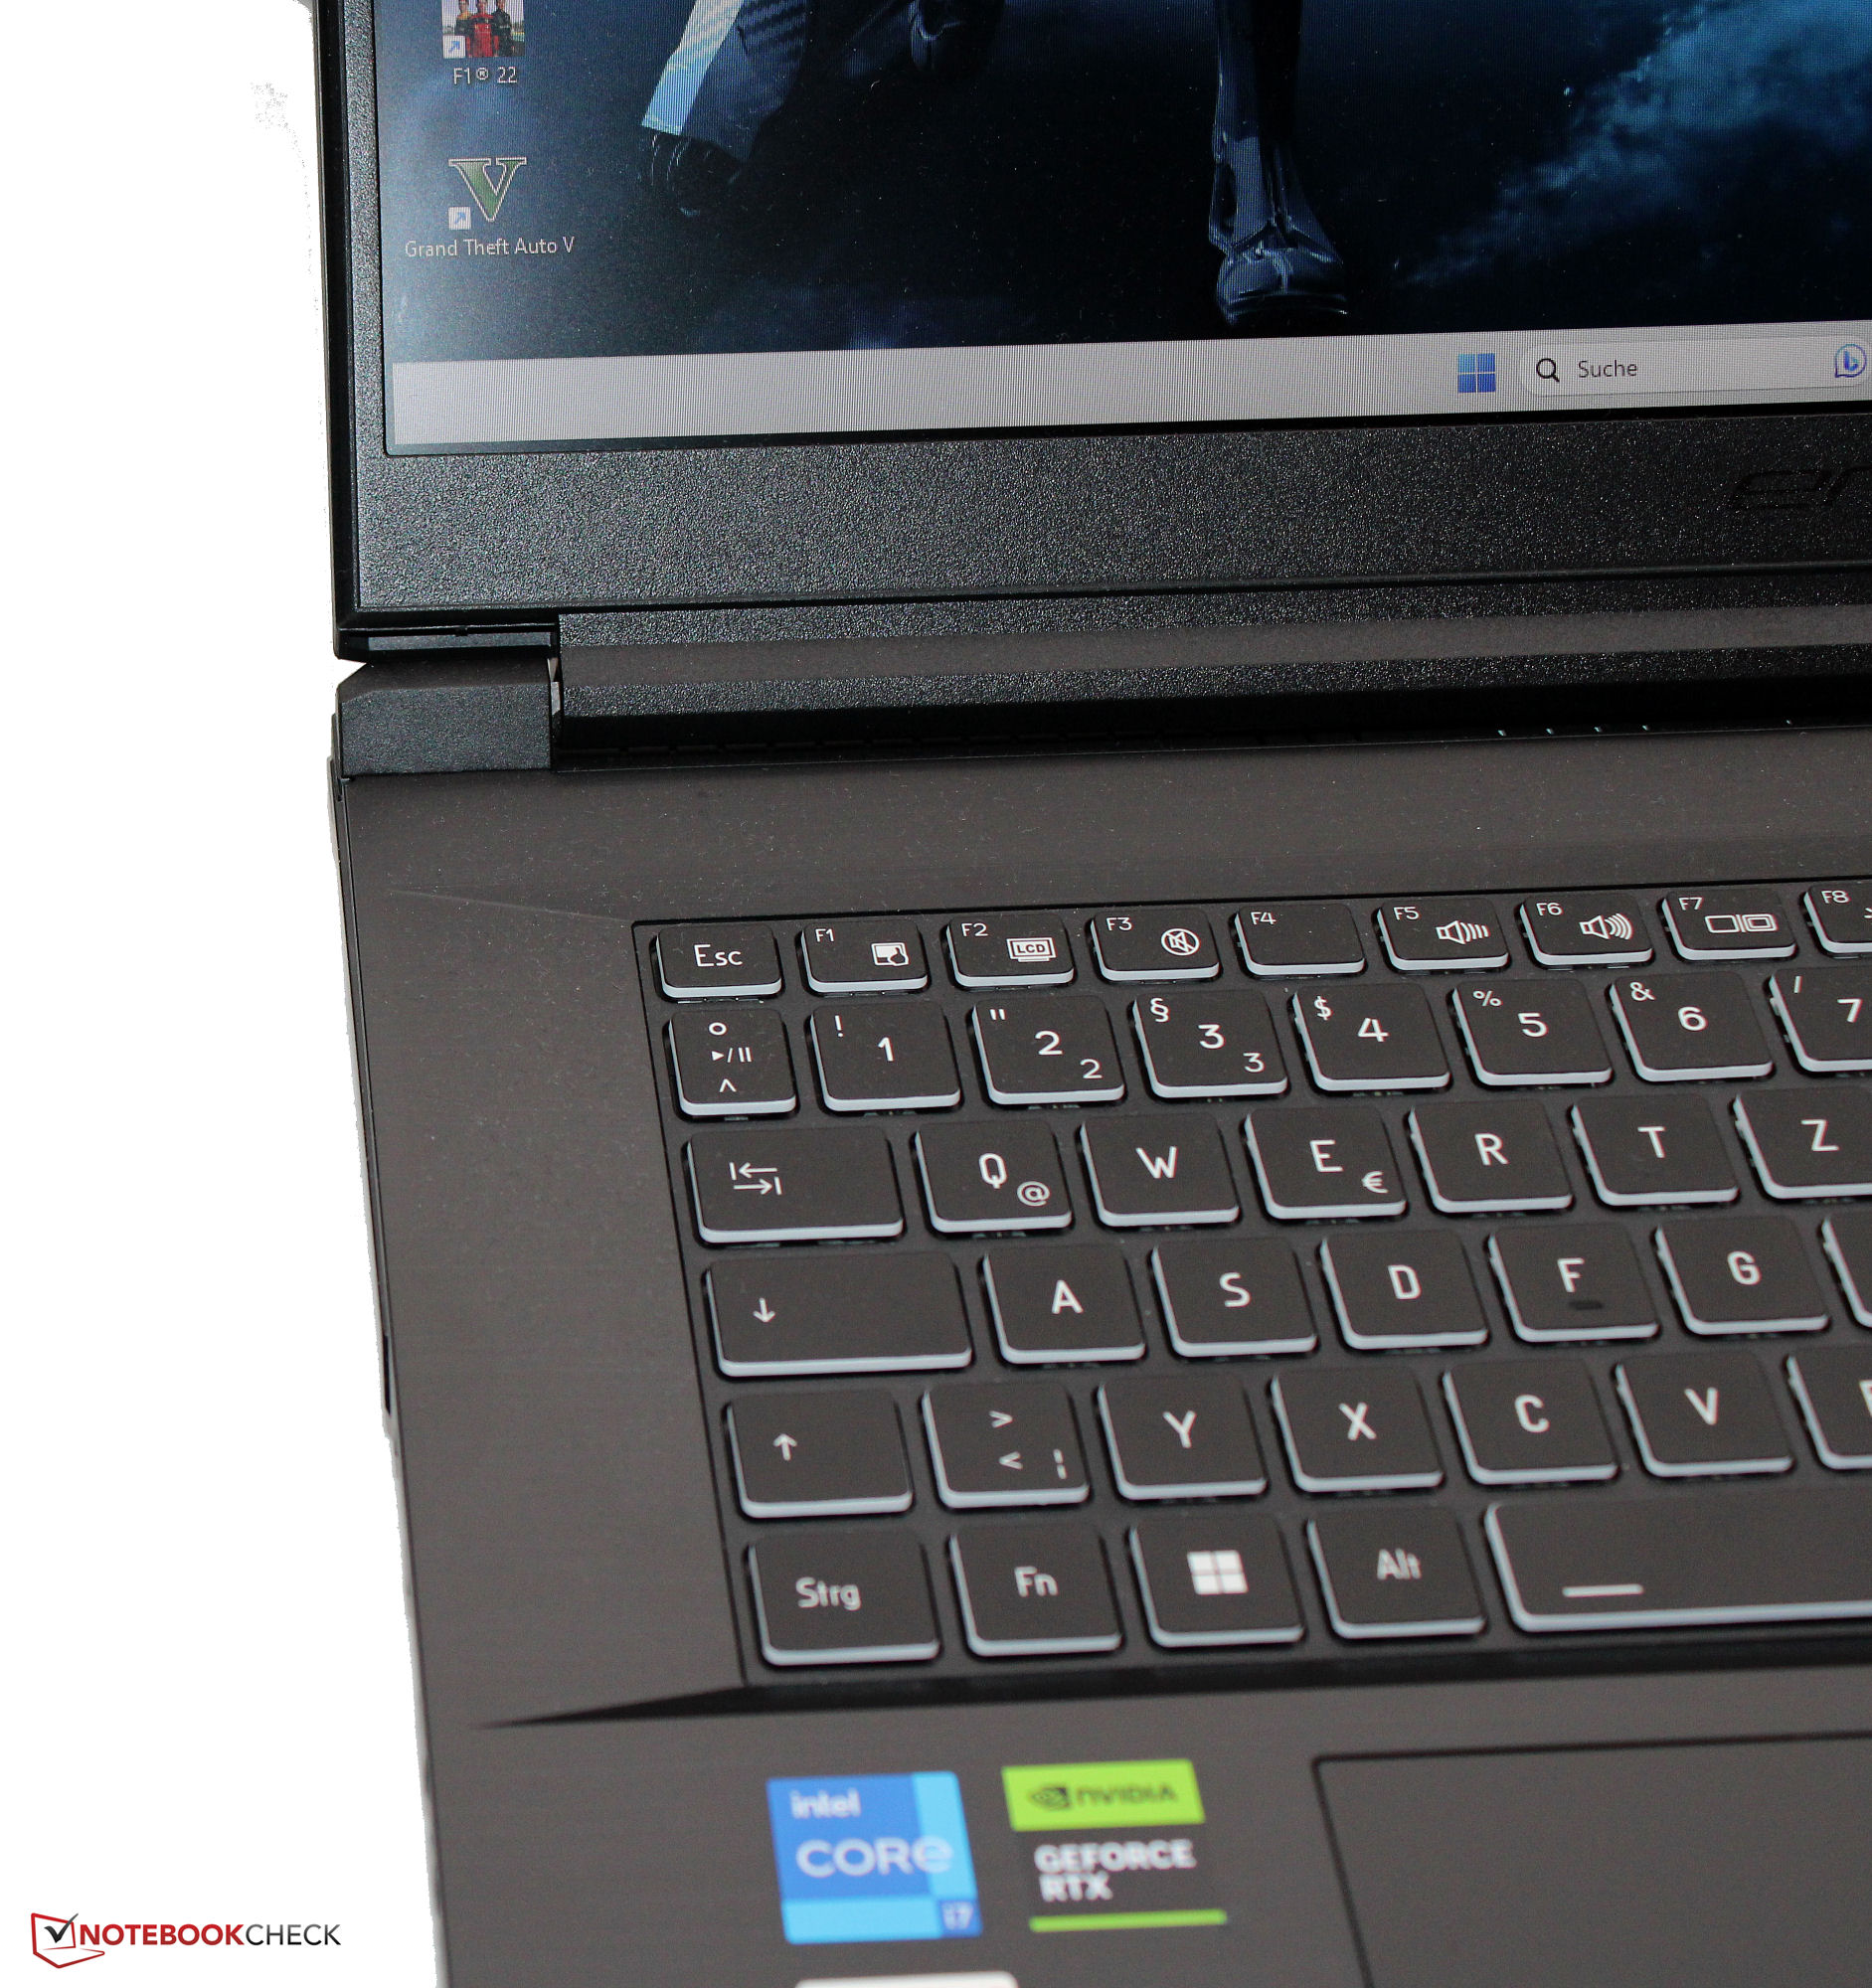
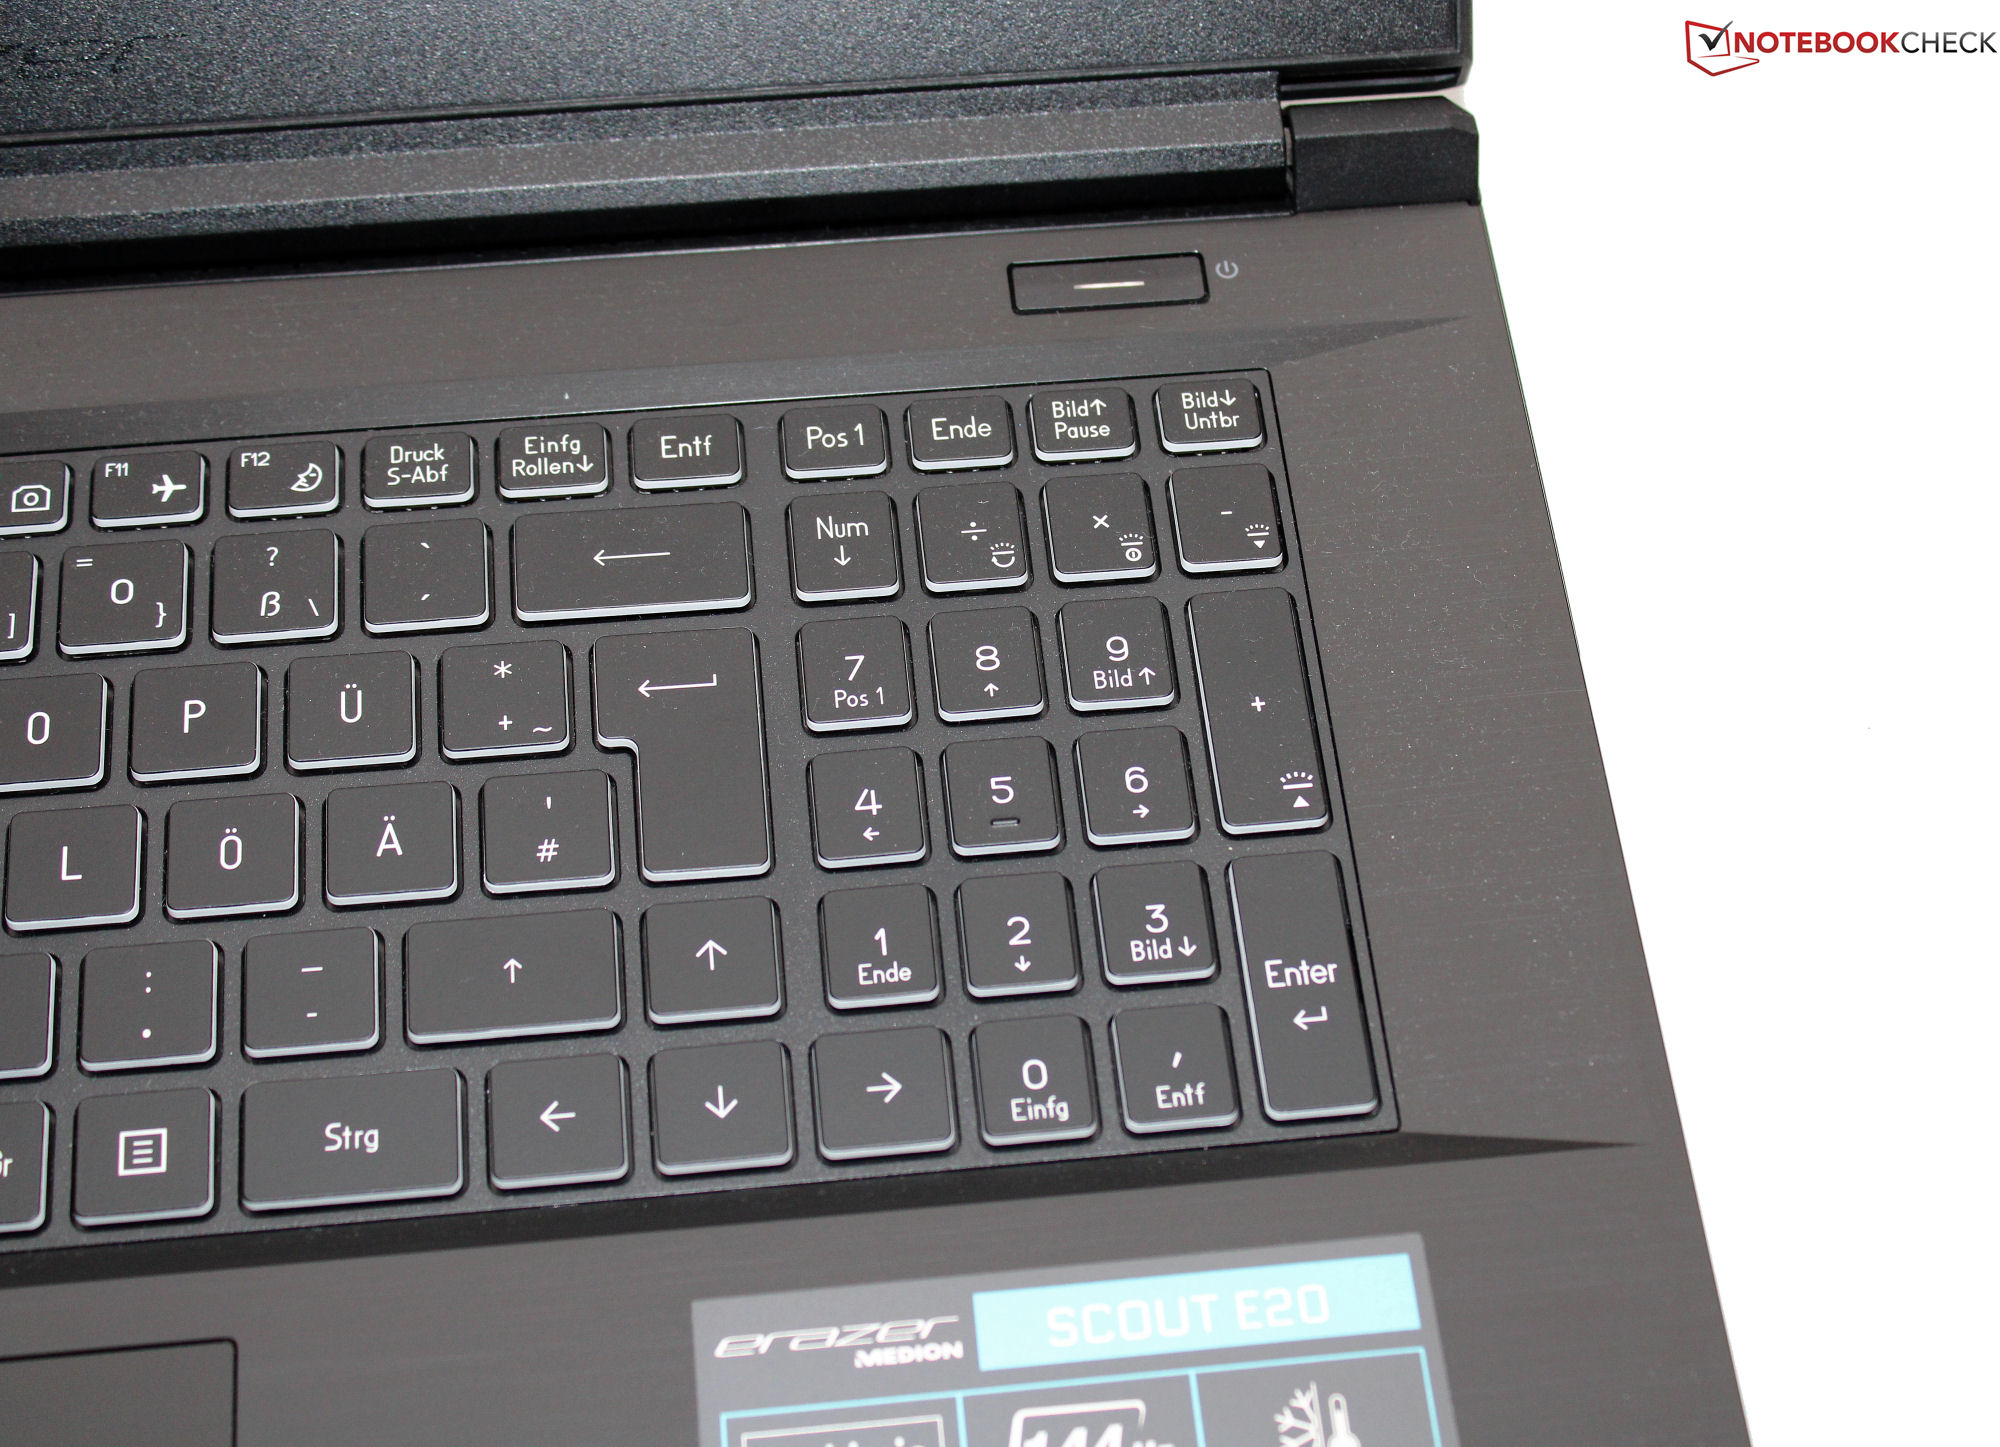
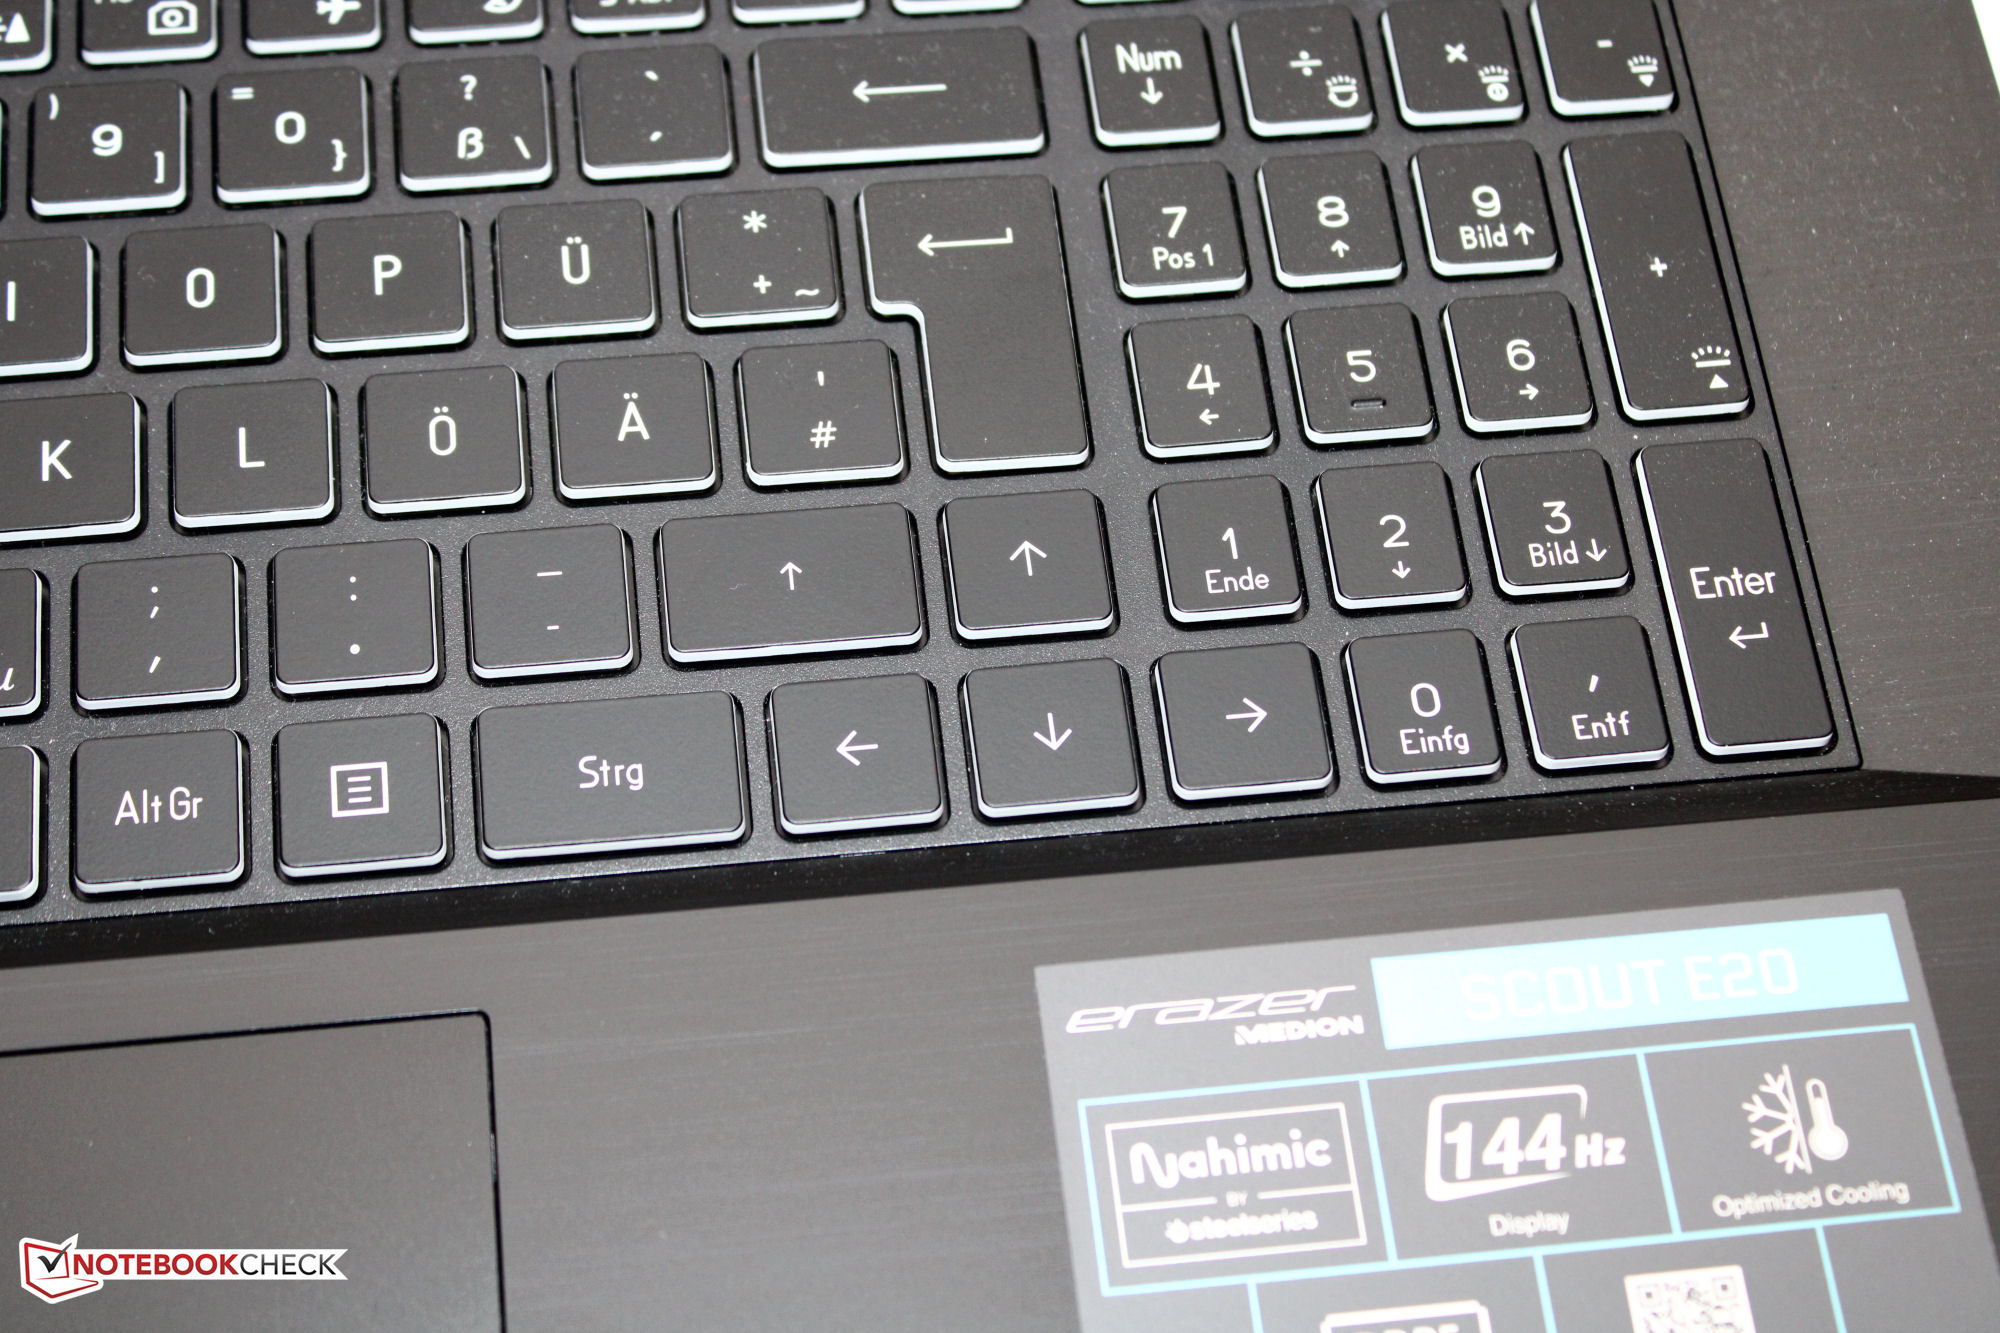
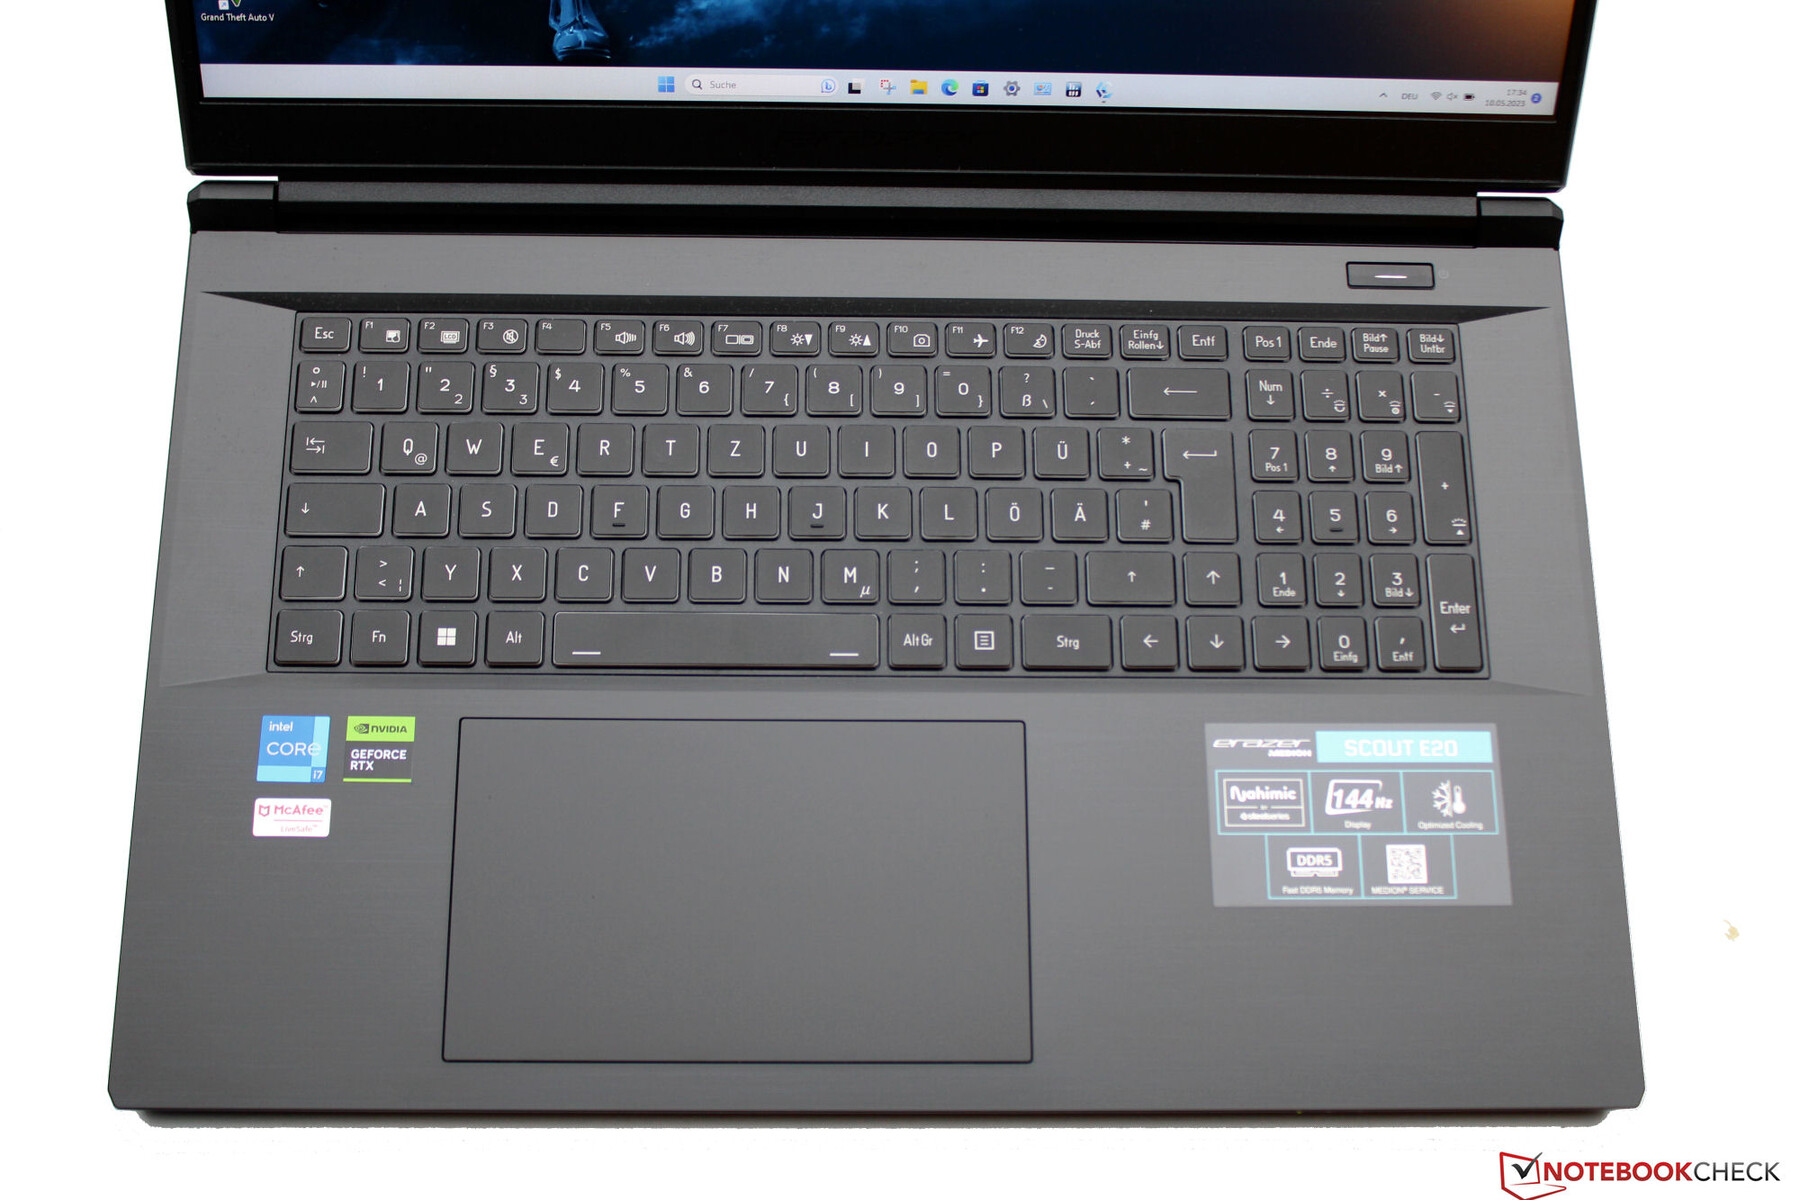
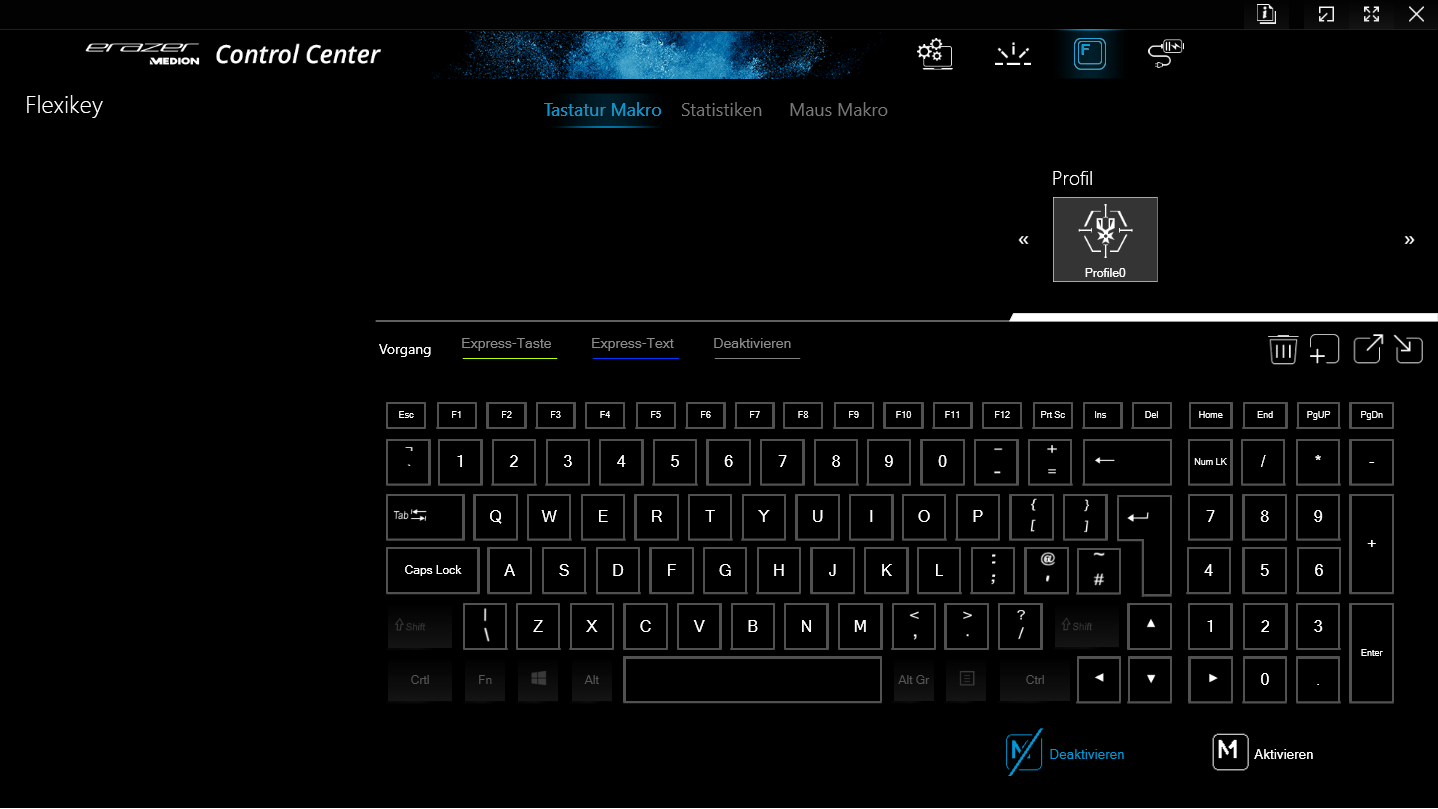
Eingabegeräte - E20-Tastatur mit RGB-Beleuchtung
Tastatur
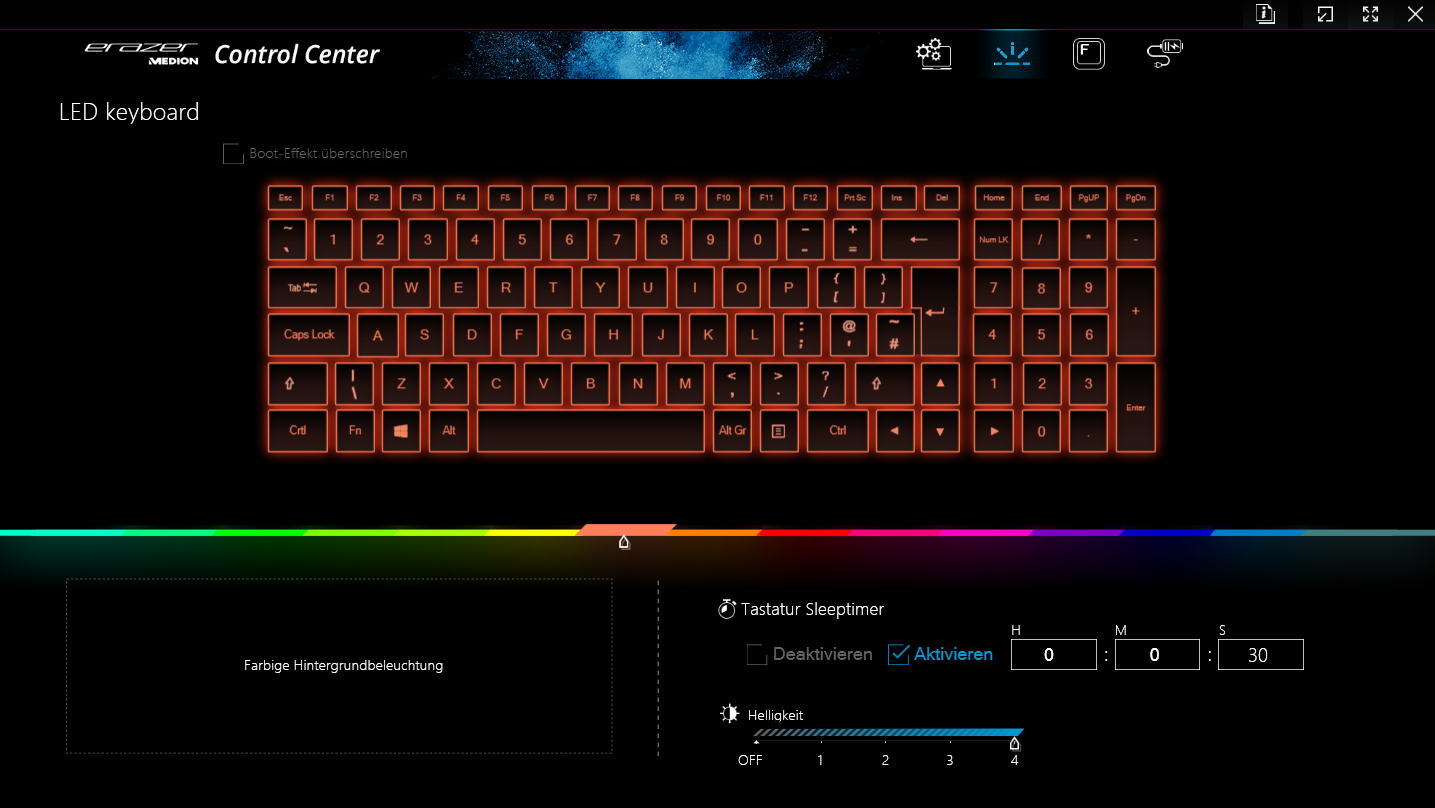
Die ebenen, glatten Tasten der Chiclet-Tastatur (inkl. Nummernblock) verfügen über einen kurzen Hub und einen klaren Druckpunkt. Ihr Widerstand geht in Ordnung. Während des Tippens gibt die Tastatur bestenfalls minimal nach, als störend hat es sich nicht erwiesen. Die Tastenbeleuchtung bietet vier Helligkeitsstufen. Alles in allem liefert Medion hier eine alltagstaugliche Tastatur.
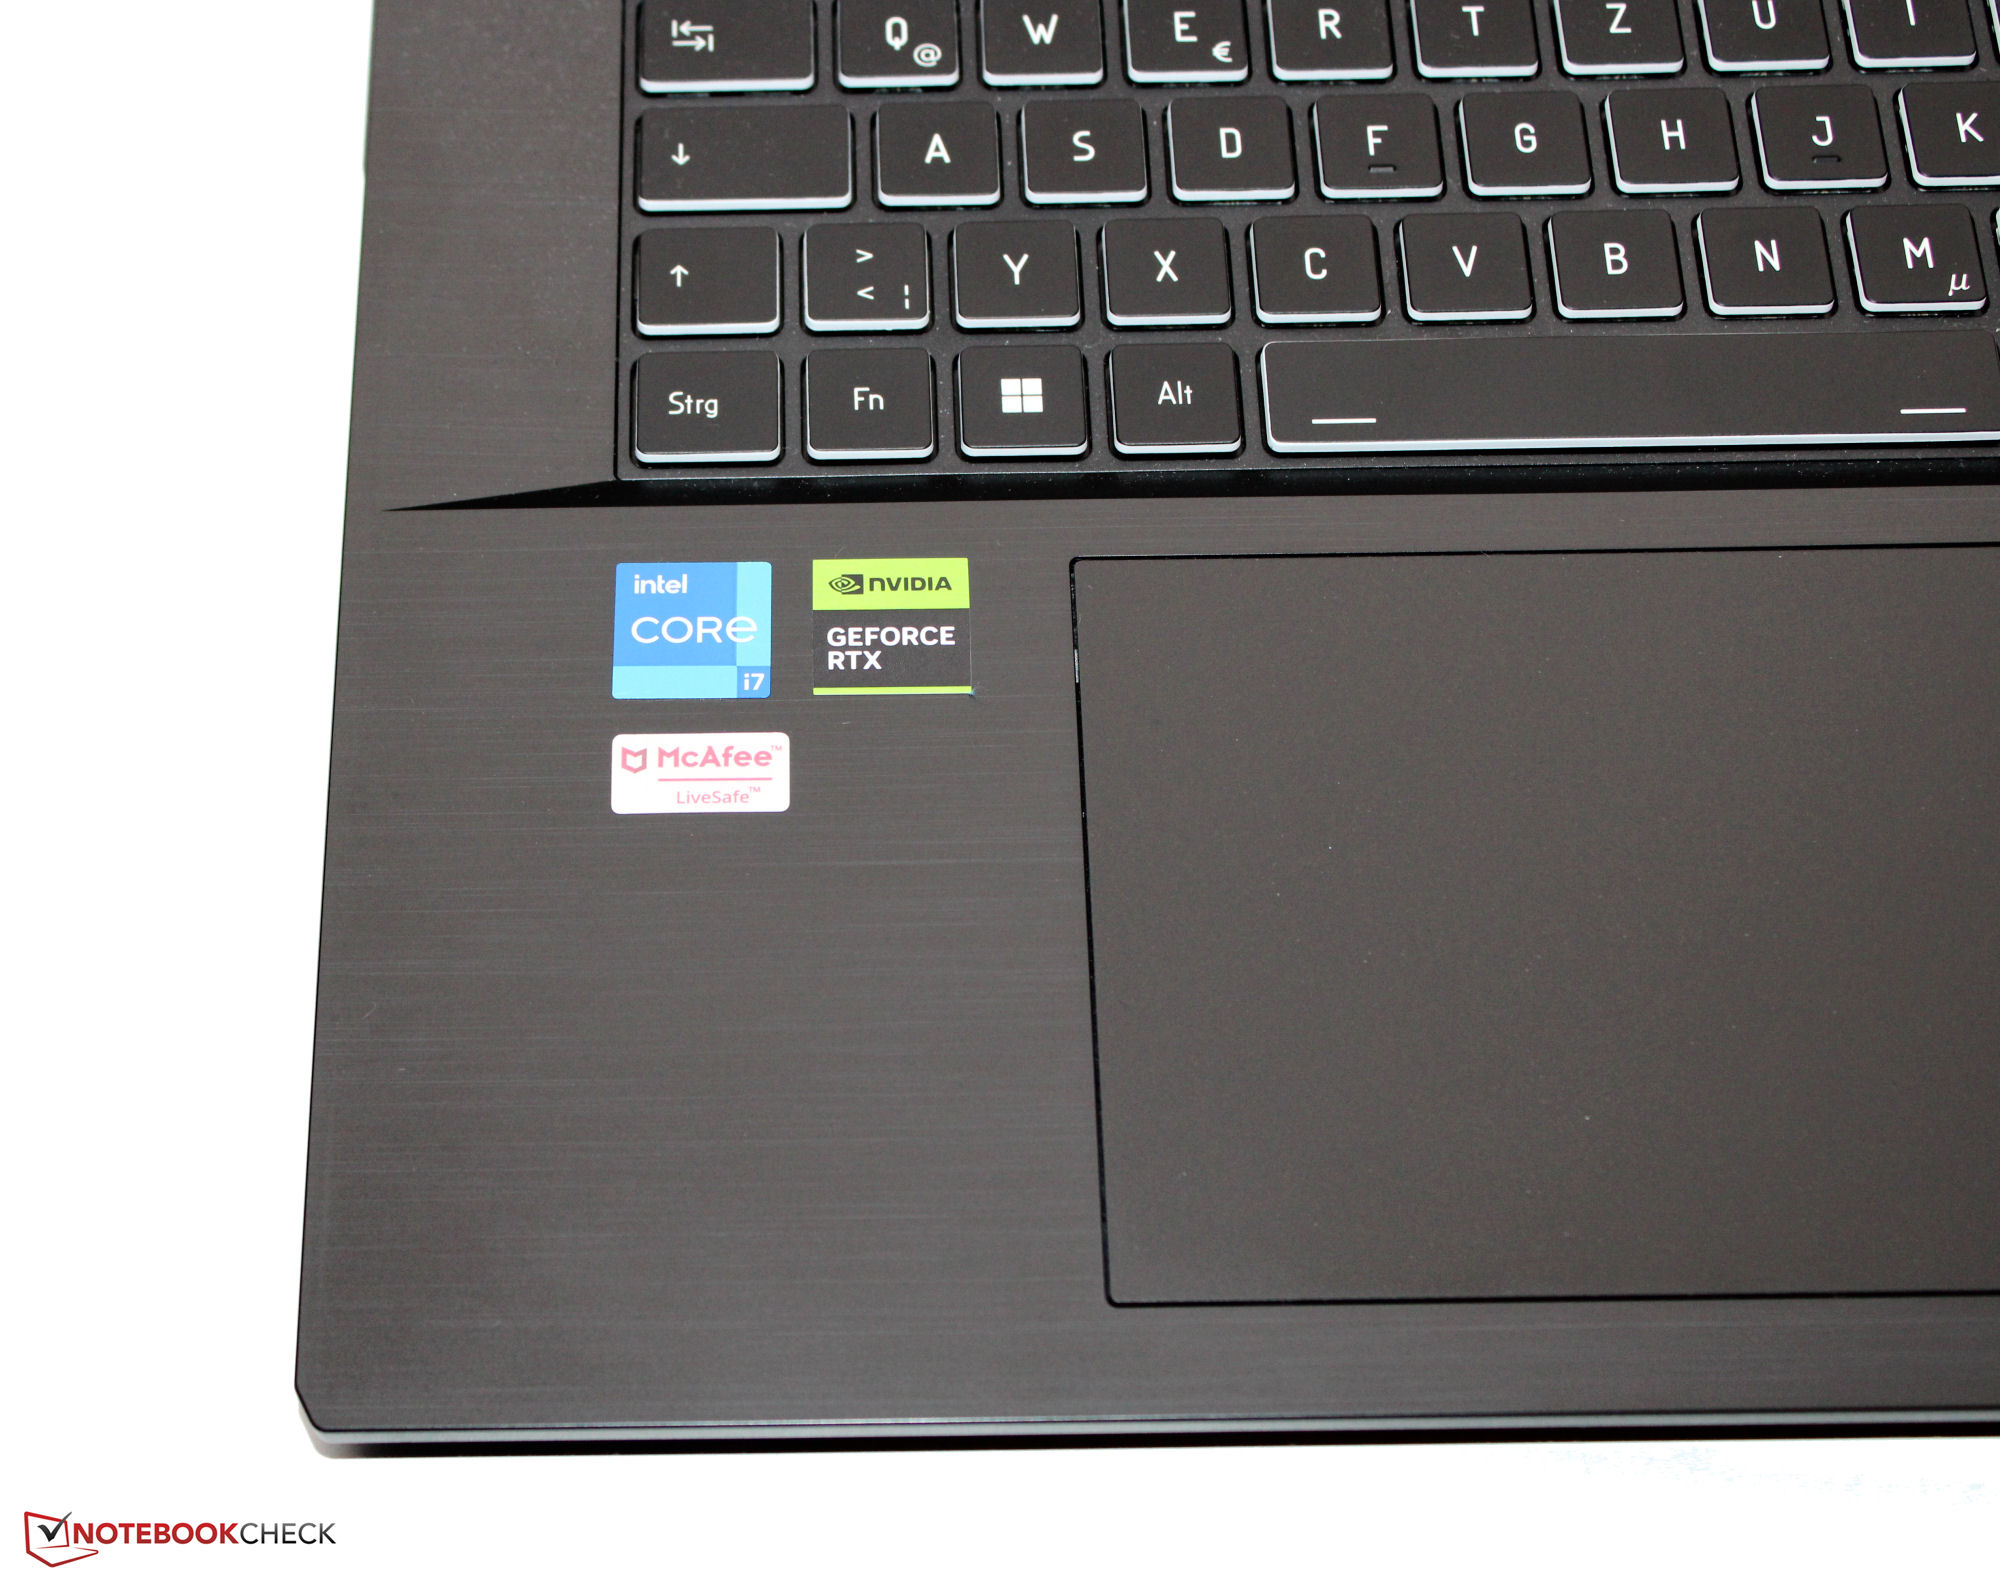
Touchpad
Als Mausersatz dient ein Clickpad (etwa 15,1 x 9,2 cm) dessen glatte Oberfläche den Fingern das Gleiten leicht macht. Es reagiert in den Ecken auf Eingaben, bietet einen kurzen Hub und einen deutlichen Druckpunkt.
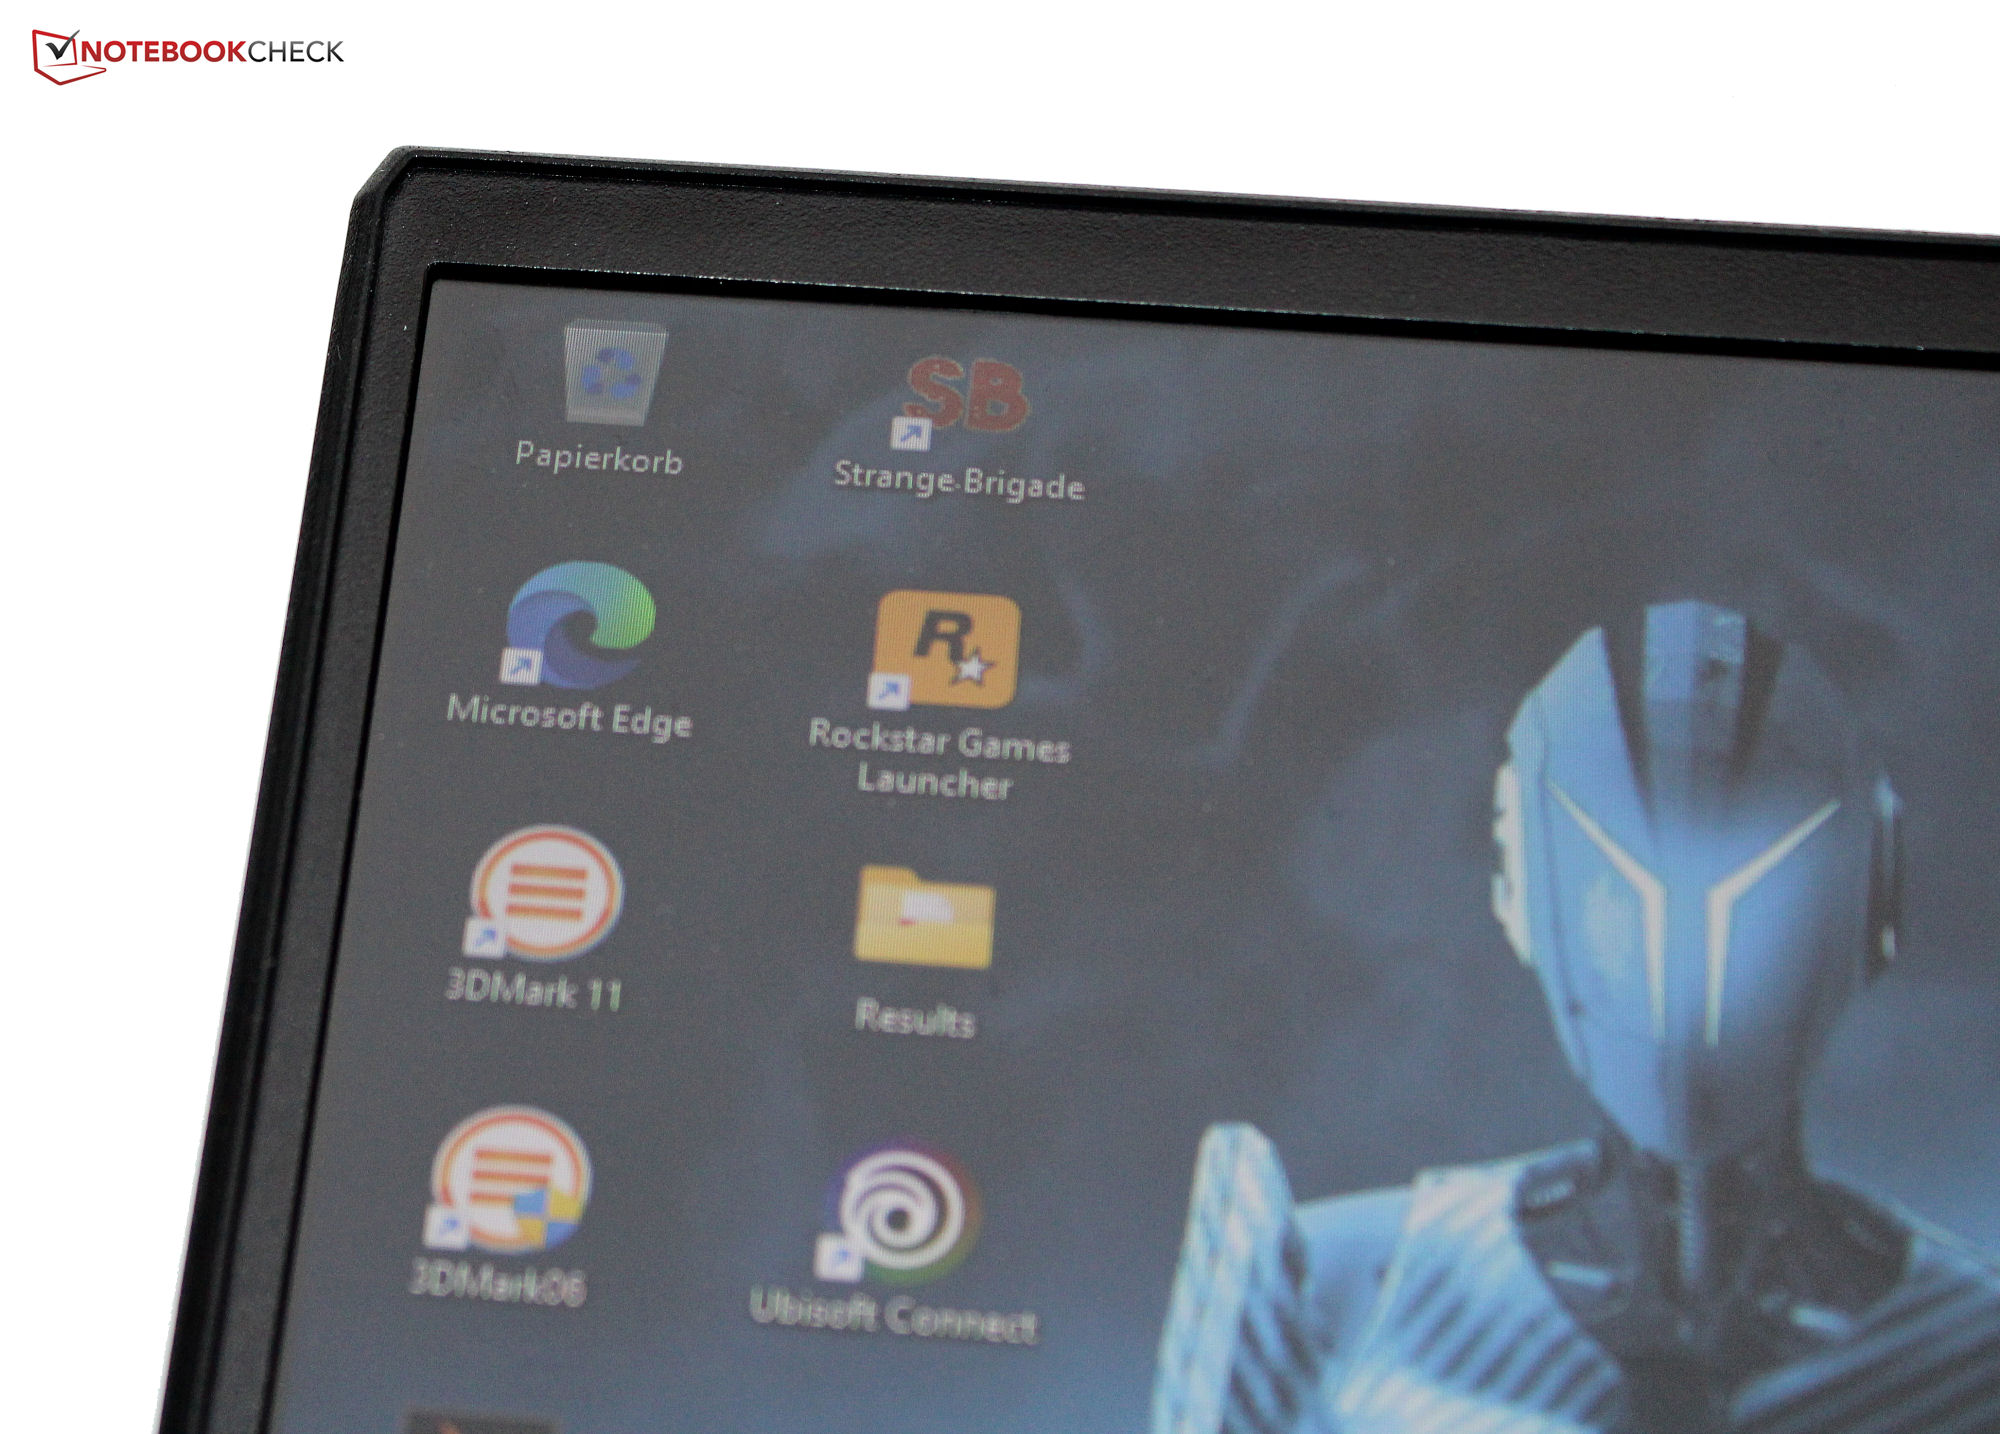
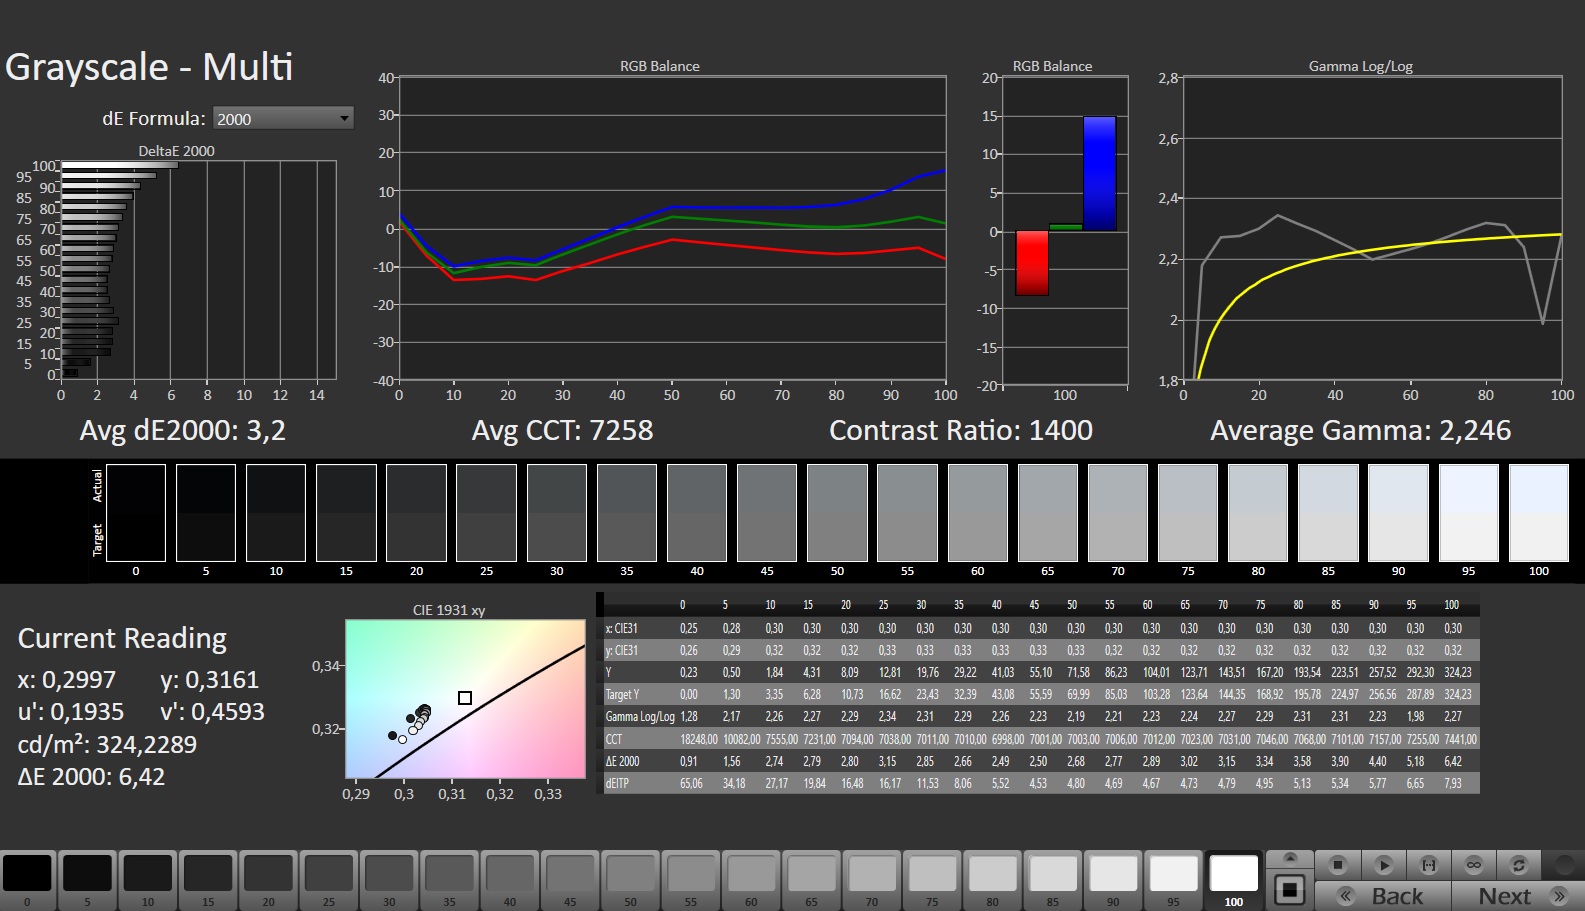
Display - FHD-Panel mit sRGB-Abdeckung
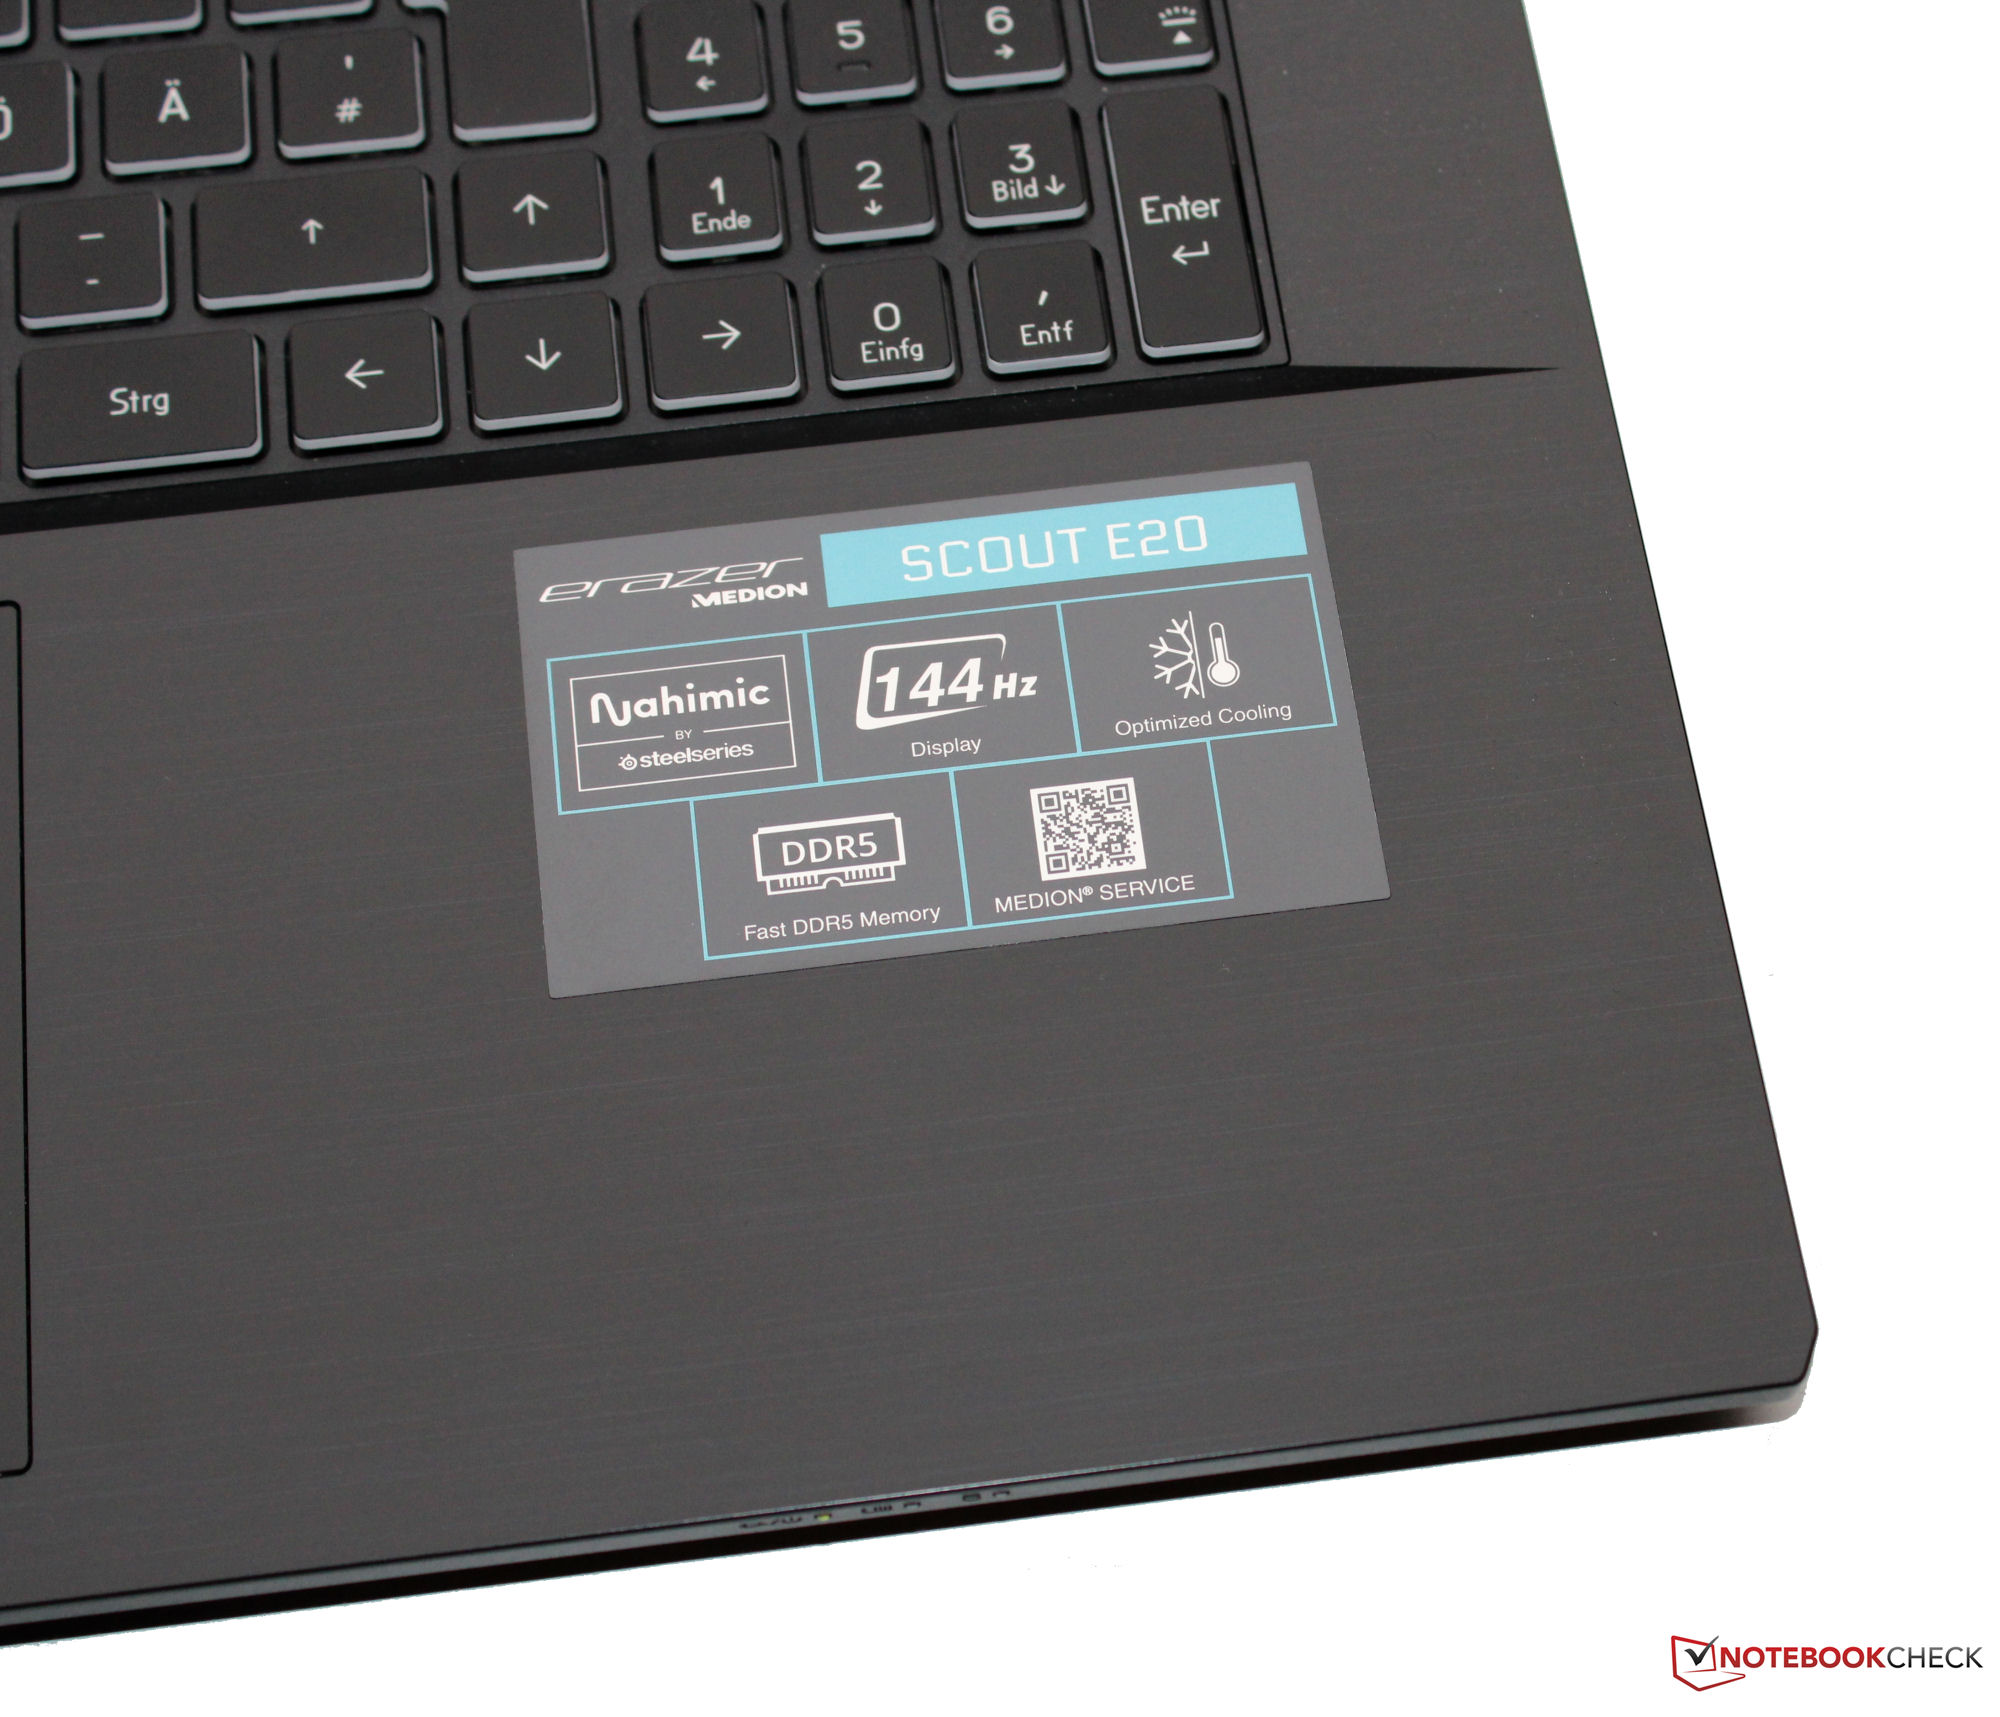
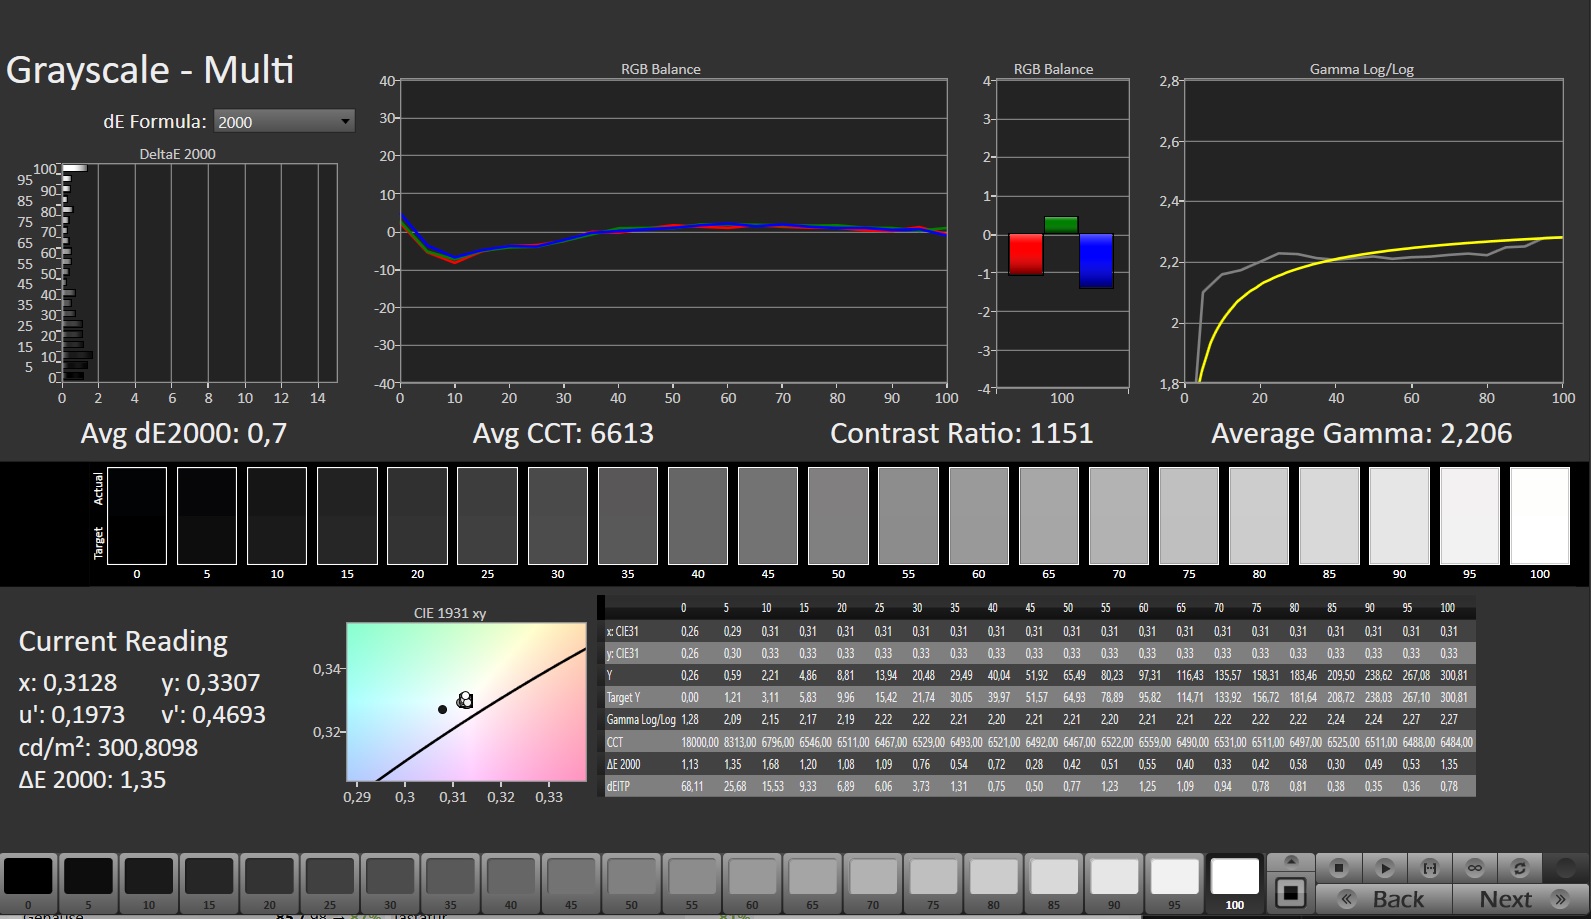
Medion verpasst dem E20 ein reaktionsschnelles 144-Hz-Panel im 16:9-Format, das bei keiner Helligkeitseinstellung PWM-Flimmern zeigt. Helligkeit und Kontrast des matten 17,3-Zoll-Displays (1.920 x 1.080 Pixel) erfüllen das jeweilige Soll (> 300 cd/m² bzw. 1.000:1).
| |||||||||||||||||||||||||
Ausleuchtung: 91 %
Helligkeit Akku: 312 cd/m²
Kontrast: 1248:1 (Schwarzwert: 0.25 cd/m²)
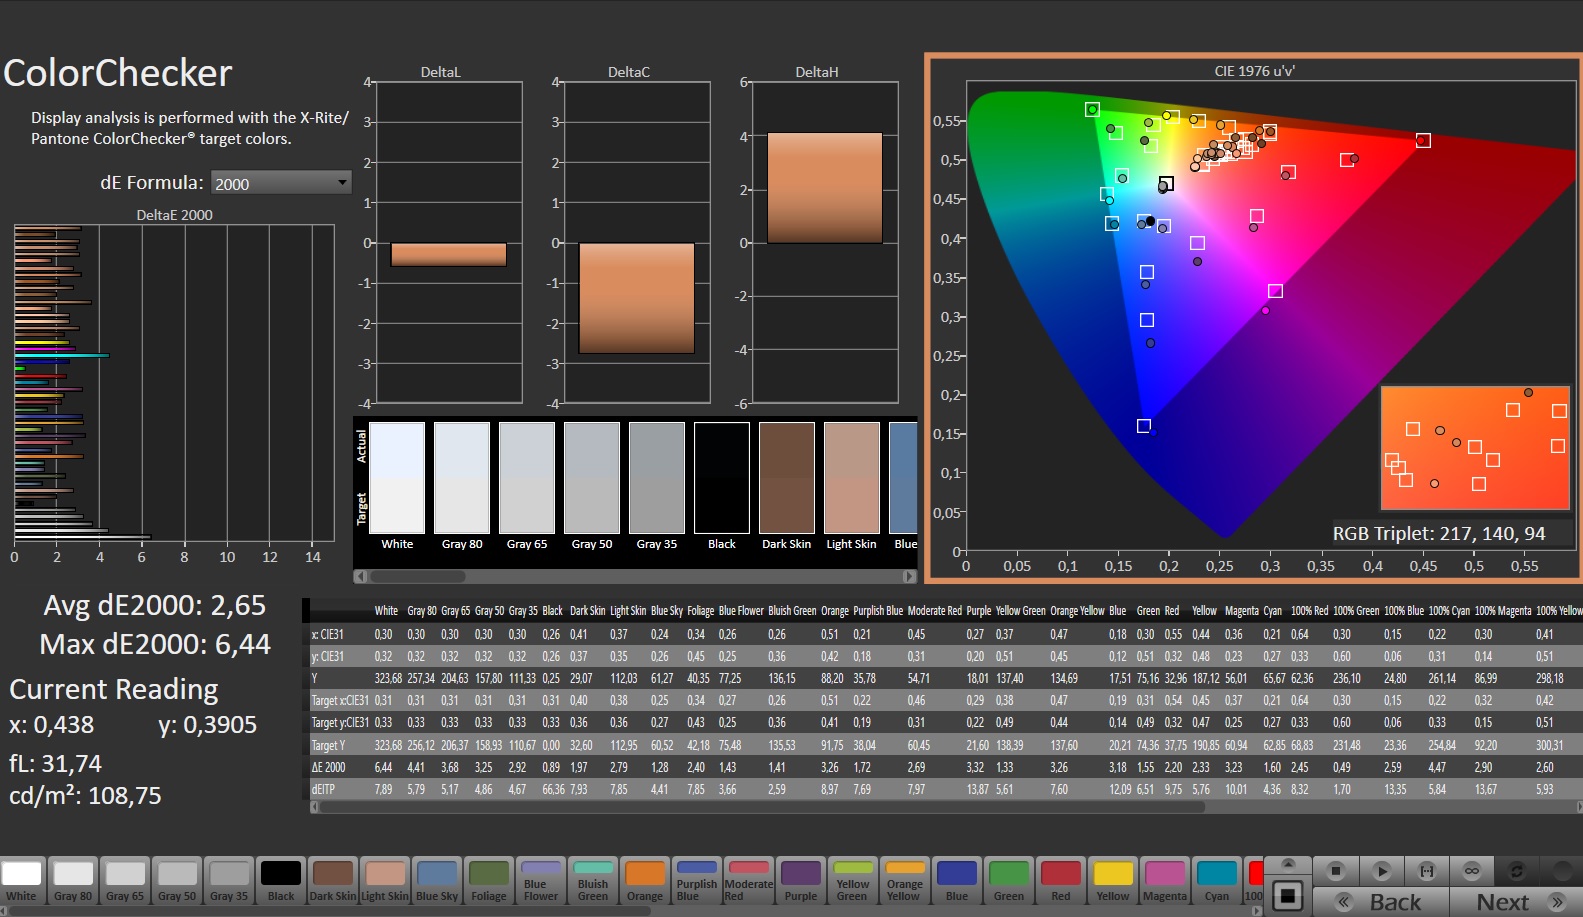
ΔE ColorChecker Calman: 2.65 | ∀{0.5-29.43 Ø4.73}
calibrated: 0.96
ΔE Greyscale Calman: 3.2 | ∀{0.09-98 Ø4.97}
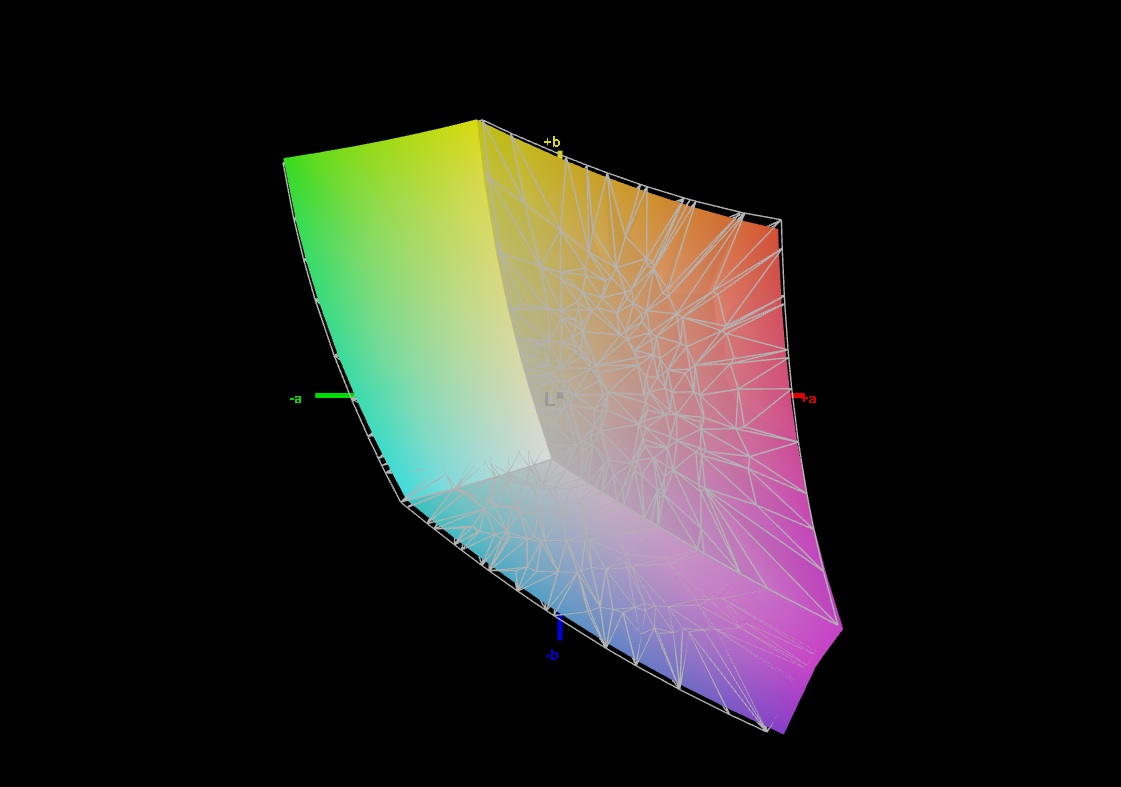
66.5% AdobeRGB 1998 (Argyll 3D)
96.7% sRGB (Argyll 3D)
65.1% Display P3 (Argyll 3D)
Gamma: 2.246
CCT: 7258 K
| Medion Erazer Scout E20 LG Philips LGD0611, IPS, 1920x1080, 17.3" | Gigabyte G7 KE AU Optronics B173HAN05.1, IPS, 1920x1080, 17.3" | MSI Katana 17 B13VFK B173HAN04.9, IPS LED, 1920x1080, 17.3" | Asus TUF Gaming A16 FA617 NE160WUM-NX2 (BOE0B33), IPS-Level, 1920x1200, 16" | Lenovo Legion 5 15IAH7H 82RB CSOT MNF601CA1-3, IPS, 1920x1080, 15.6" | Acer Nitro 5 AN515-46-R1A1 AU Optronics B156HAN12.H, IPS, 1920x1080, 15.6" | |
|---|---|---|---|---|---|---|
| Display | 6% | -37% | 5% | 5% | 4% | |
| Display P3 Coverage (%) | 65.1 | 70.4 8% | 40.8 -37% | 69.4 7% | 69.1 6% | 68.8 6% |
| sRGB Coverage (%) | 96.7 | 99.8 3% | 61 -37% | 97.8 1% | 99.5 3% | 98.1 1% |
| AdobeRGB 1998 Coverage (%) | 66.5 | 71.7 8% | 42.2 -37% | 70.9 7% | 70 5% | 69.7 5% |
| Response Times | 43% | -137% | -6% | -8% | 18% | |
| Response Time Grey 50% / Grey 80% * (ms) | 14.8 ? | 5 ? 66% | 33 ? -123% | 17 ? -15% | 14.8 ? -0% | 13 ? 12% |
| Response Time Black / White * (ms) | 10.4 ? | 8.3 ? 20% | 26 ? -150% | 10.1 ? 3% | 12 ? -15% | 8 ? 23% |
| PWM Frequency (Hz) | ||||||
| Bildschirm | 16% | -69% | 15% | -21% | -8% | |
| Helligkeit Bildmitte (cd/m²) | 312 | 307 -2% | 267 -14% | 308 -1% | 363.5 17% | 327 5% |
| Brightness (cd/m²) | 303 | 301 -1% | 256 -16% | 293 -3% | 350 16% | 320 6% |
| Brightness Distribution (%) | 91 | 93 2% | 93 2% | 90 -1% | 89 -2% | 93 2% |
| Schwarzwert * (cd/m²) | 0.25 | 0.2 20% | 0.21 16% | 0.23 8% | 0.39 -56% | 0.24 4% |
| Kontrast (:1) | 1248 | 1535 23% | 1271 2% | 1339 7% | 932 -25% | 1363 9% |
| Delta E Colorchecker * | 2.65 | 1.32 50% | 4.7 -77% | 1.47 45% | 3.68 -39% | 3.26 -23% |
| Colorchecker dE 2000 max. * | 6.44 | 4.6 29% | 20.4 -217% | 2.98 54% | 8.92 -39% | 8.73 -36% |
| Colorchecker dE 2000 calibrated * | 0.96 | 1.03 -7% | 4.5 -369% | 1.02 -6% | 0.53 45% | 0.87 9% |
| Delta E Graustufen * | 3.2 | 2.1 34% | 1.5 53% | 2.2 31% | 6.5 -103% | 4.87 -52% |
| Gamma | 2.246 98% | 2.247 98% | 2.12 104% | 2.228 99% | 2.2 100% | 2.3 96% |
| CCT | 7258 90% | 6815 95% | 6552 99% | 6228 104% | 5995 108% | 7070 92% |
| Durchschnitt gesamt (Programm / Settings) | 22% /
18% | -81% /
-72% | 5% /
10% | -8% /
-13% | 5% /
-2% |
* ... kleinere Werte sind besser
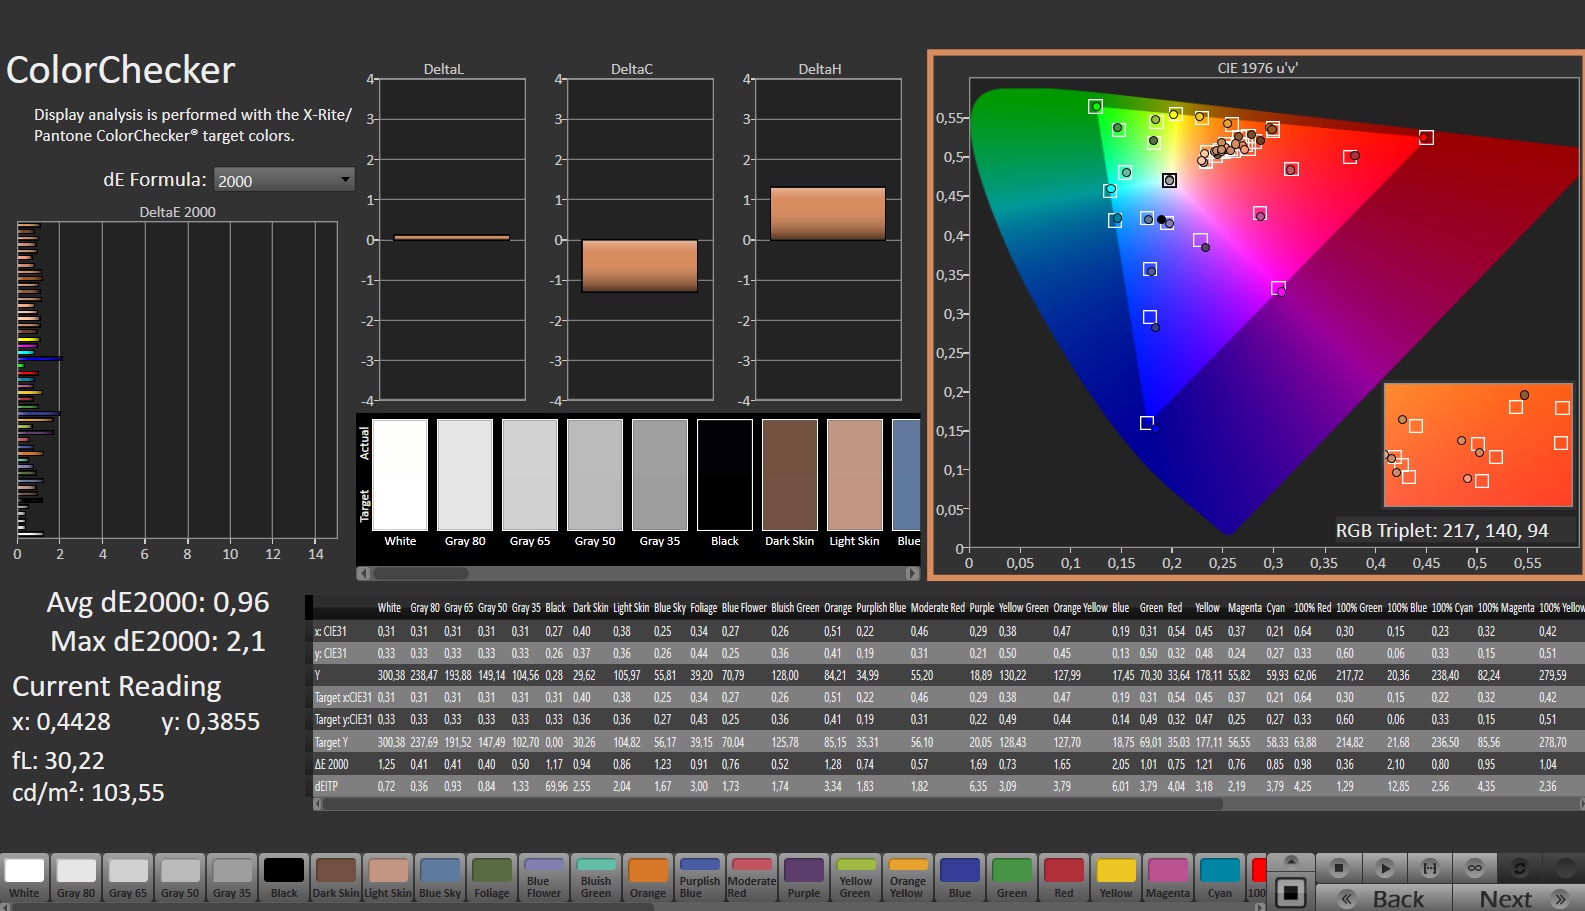
Der Bildschirm zeigt bereits im Auslieferungszustand eine gute Farbdarstellung: Mit einer Abweichung von etwa 2,65 wird das Soll (DeltaE < 3) erfüllt. Eine Kalibrierung verringert die Abweichung auf 0,96 und sorgt für ausgewogenere Graustufen.
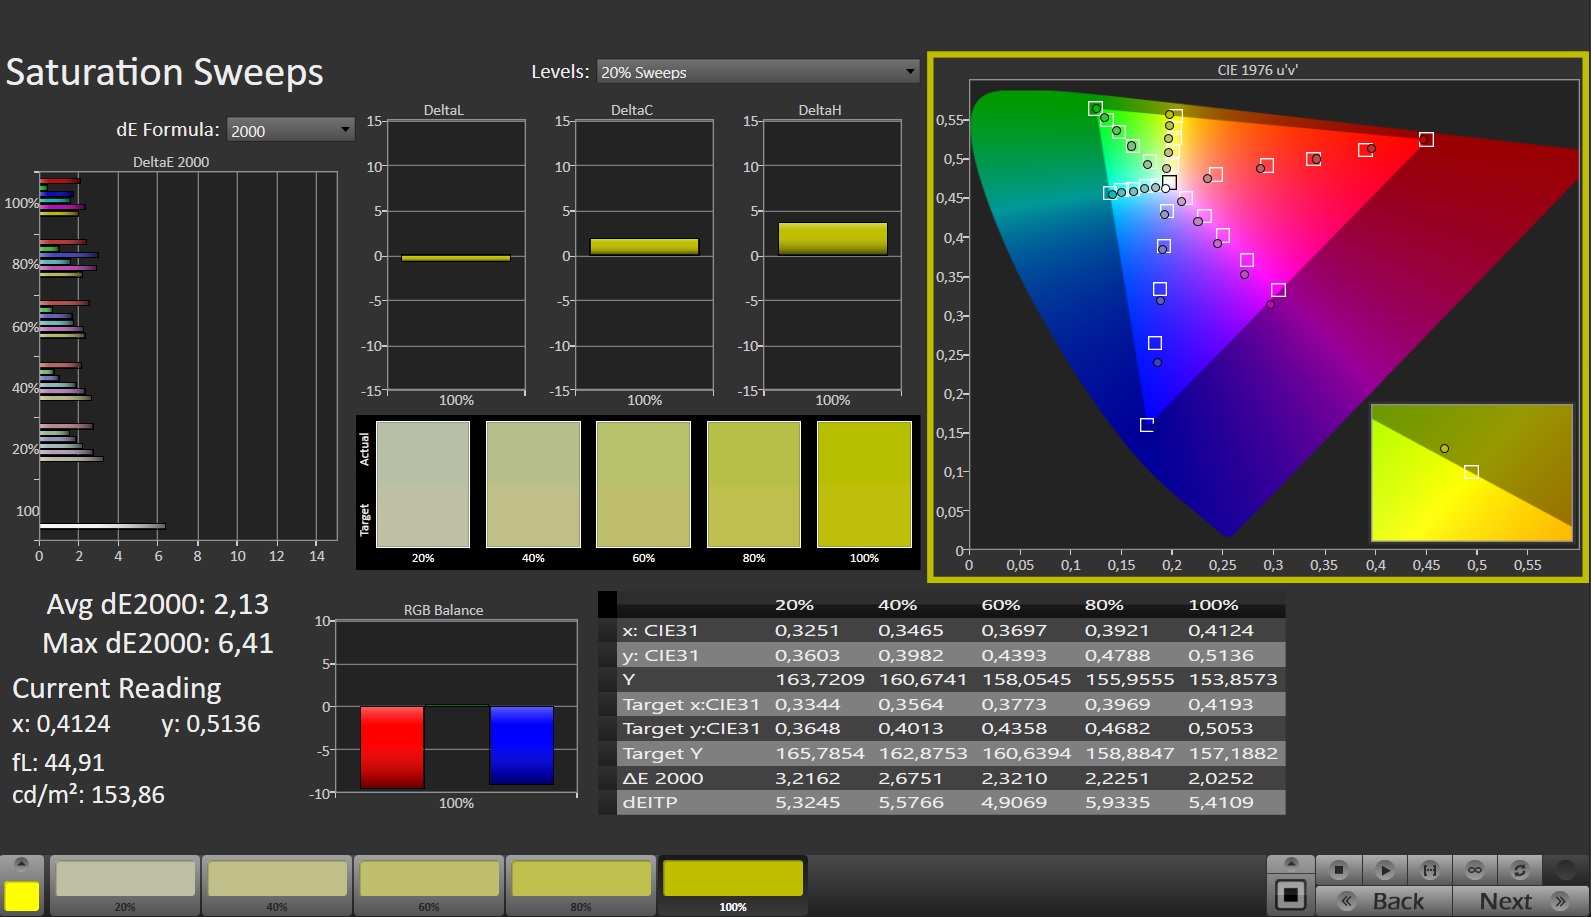
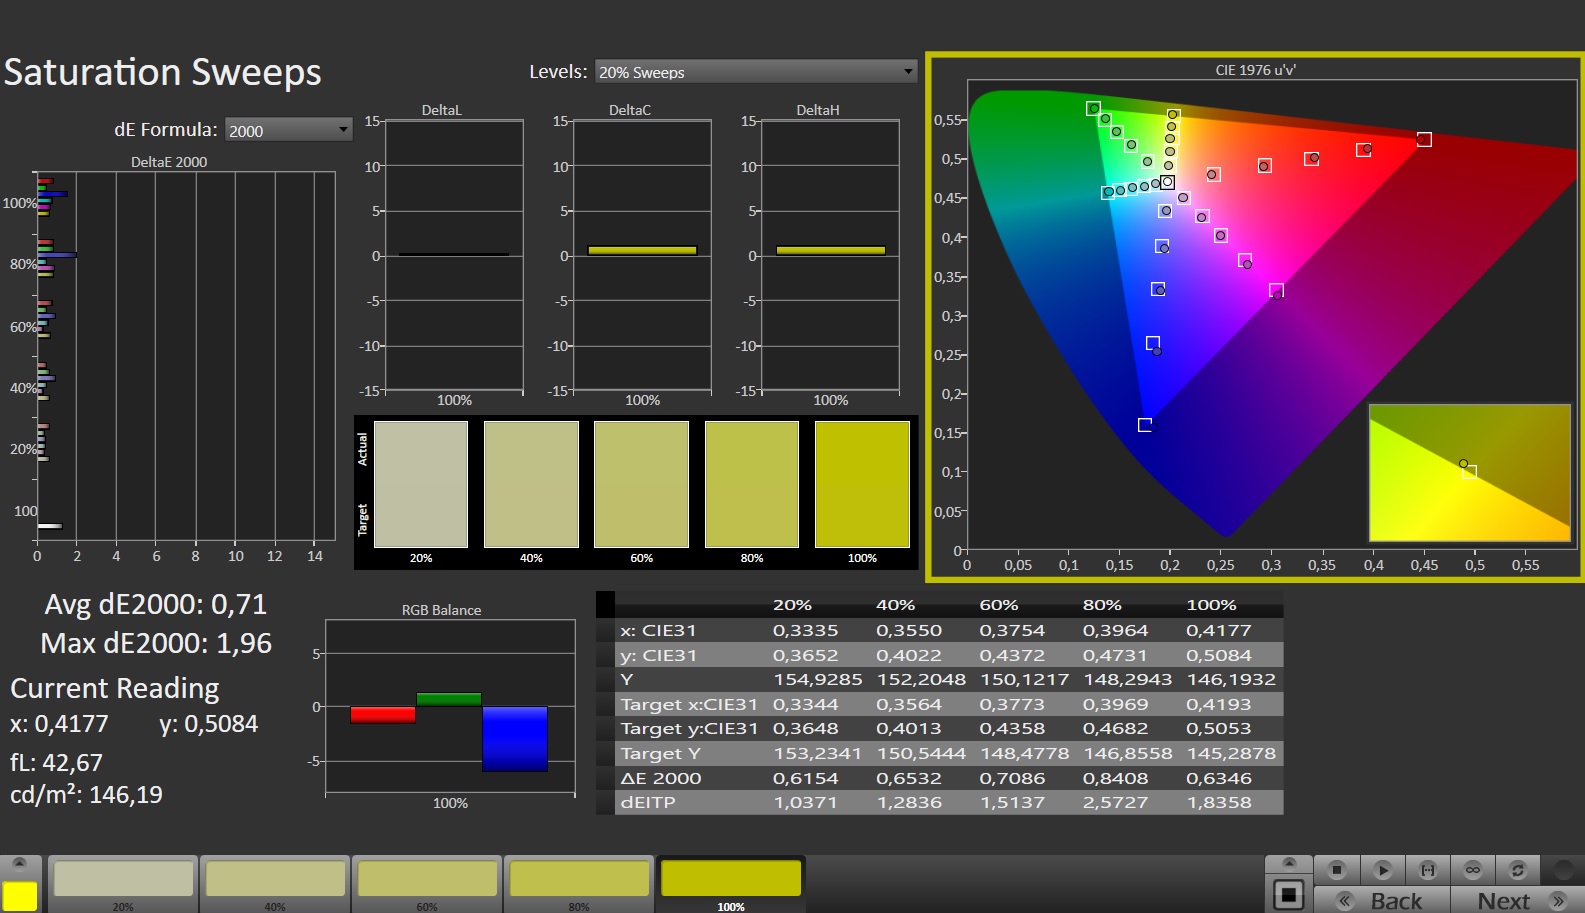
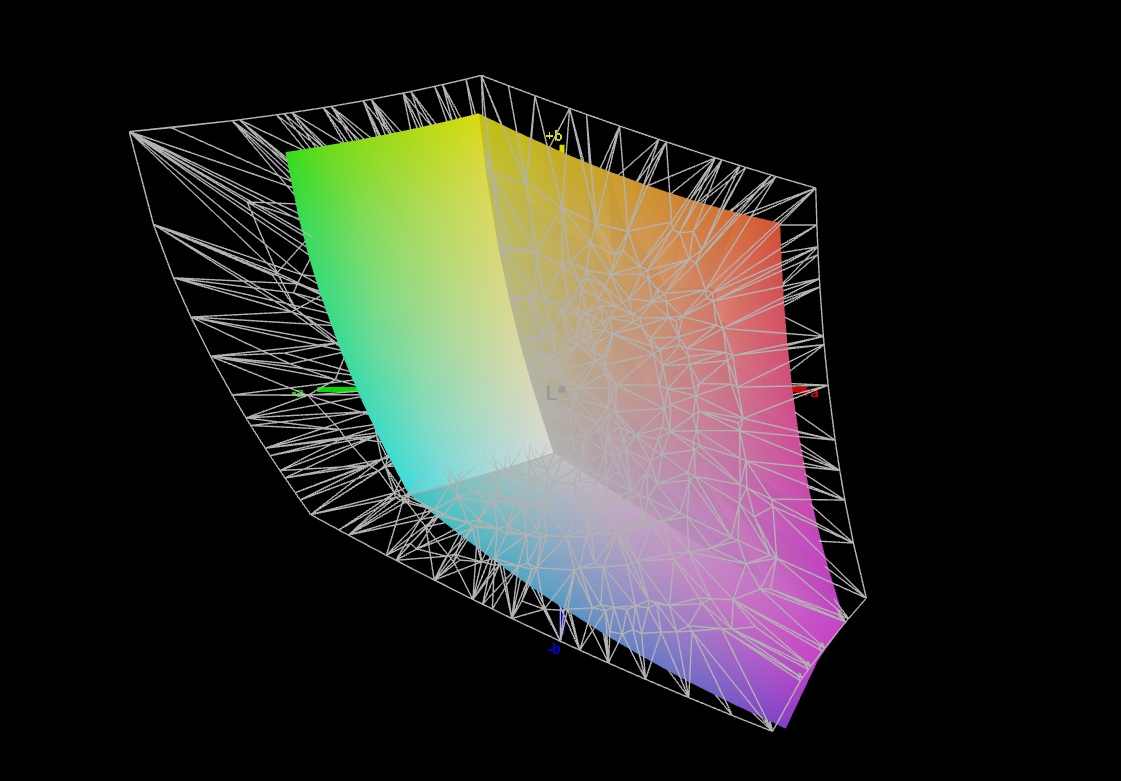
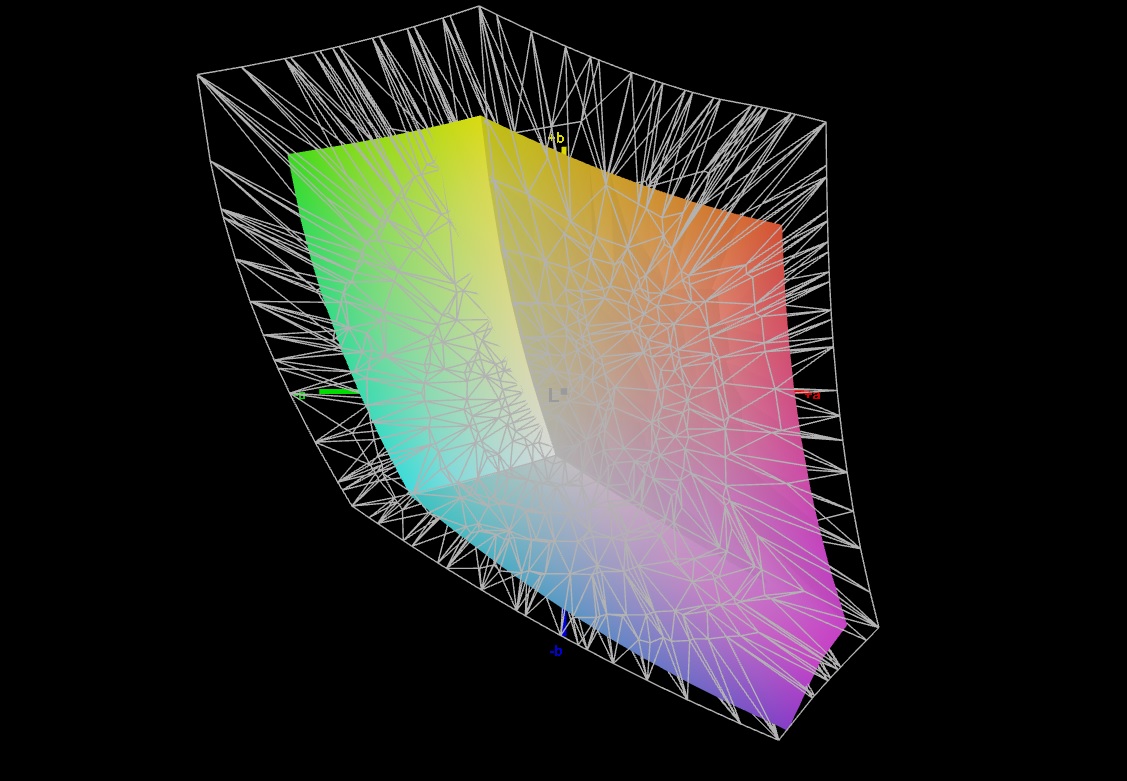
Das Panel kann den sRGB-Farbraum komplett abbilden, die Farbräume AdobeRGB und DCI P3 hingegen nicht. Ein ähnliches Bild zeigen die Bildschirme der meisten Konkurrenten.
Reaktionszeiten (Response Times) des Displays
| ↔ Reaktionszeiten Schwarz zu Weiß | ||
|---|---|---|
| 10.4 ms ... steigend ↗ und fallend ↘ kombiniert | ↗ 5.4 ms steigend | 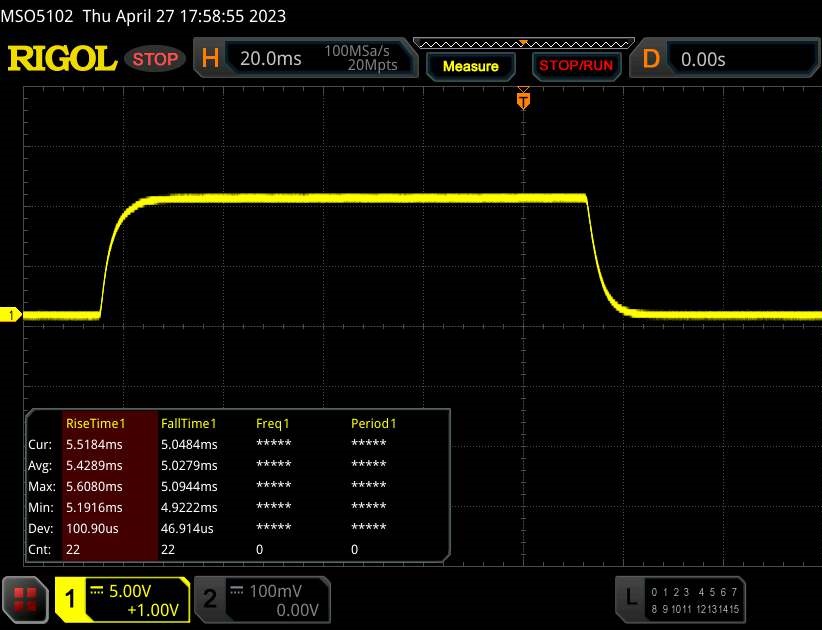 |
| ↘ 5 ms fallend | ||
| Die gemessenen Reaktionszeiten sind gut, für anspruchsvolle Spieler könnten der Bildschirm jedoch zu langsam sein. Im Vergleich rangierten die bei uns getesteten Geräte von 0.1 (Minimum) zu 240 (Maximum) ms. » 28 % aller Screens waren schneller als der getestete. Daher sind die gemessenen Reaktionszeiten besser als der Durchschnitt aller vermessenen Geräte (19.9 ms). | ||
| ↔ Reaktionszeiten 50% Grau zu 80% Grau | ||
| 14.8 ms ... steigend ↗ und fallend ↘ kombiniert | ↗ 7.2 ms steigend | 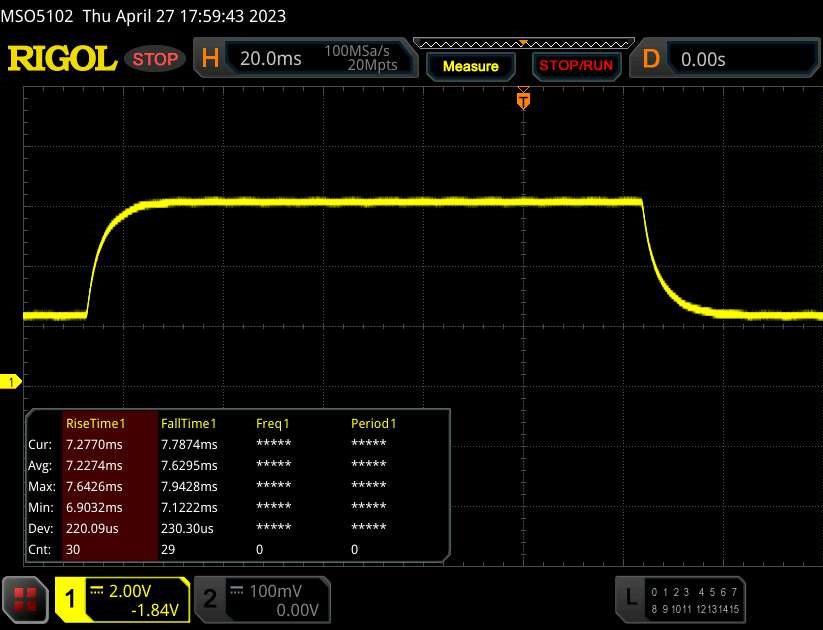 |
| ↘ 7.6 ms fallend | ||
| Die gemessenen Reaktionszeiten sind gut, für anspruchsvolle Spieler könnten der Bildschirm jedoch zu langsam sein. Im Vergleich rangierten die bei uns getesteten Geräte von 0.165 (Minimum) zu 636 (Maximum) ms. » 29 % aller Screens waren schneller als der getestete. Daher sind die gemessenen Reaktionszeiten besser als der Durchschnitt aller vermessenen Geräte (31.1 ms). | ||
Bildschirm-Flackern / PWM (Pulse-Width Modulation)
| Flackern / PWM nicht festgestellt |  | ||
Im Vergleich: 52 % aller getesteten Geräte nutzten kein PWM um die Helligkeit zu reduzieren. Wenn PWM eingesetzt wurde, dann bei einer Frequenz von durchschnittlich 7798 (Minimum 5, Maximum 343500) Hz. | |||
Das blickwinkelstabile IPS-Panel ist aus jeder Position heraus ablesbar. Im Freien ist ein Ablesen des Bildschirms durchaus möglich, wenn die Sonne nicht allzu hell strahlt.

Leistung - Das Scout setzt auf Raptor Lake und Ada Lovelace
Das Erazer Scout E20 stellt ein Gaming-Notebook aus dem Einstiegssegment dar. Die nötige Rechenleistung liefern Raptor Lake und Ada Lovelace. Das vorliegende Modell ist für etwa 1.500 Euro zu haben. Andere Ausstattungsvarianten sind zum Testzeitpunkt nicht ausfindig zu machen.
Testbedingungen
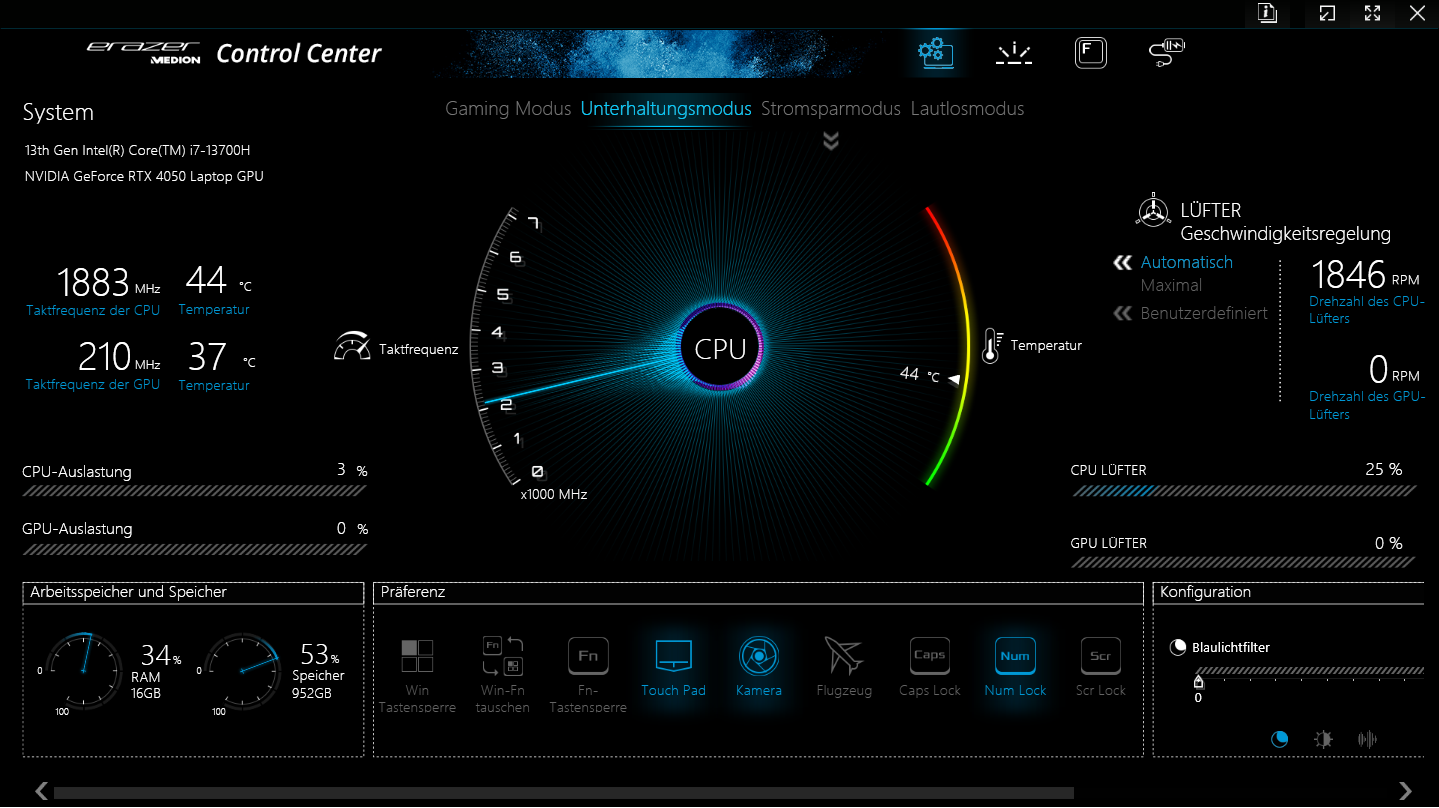
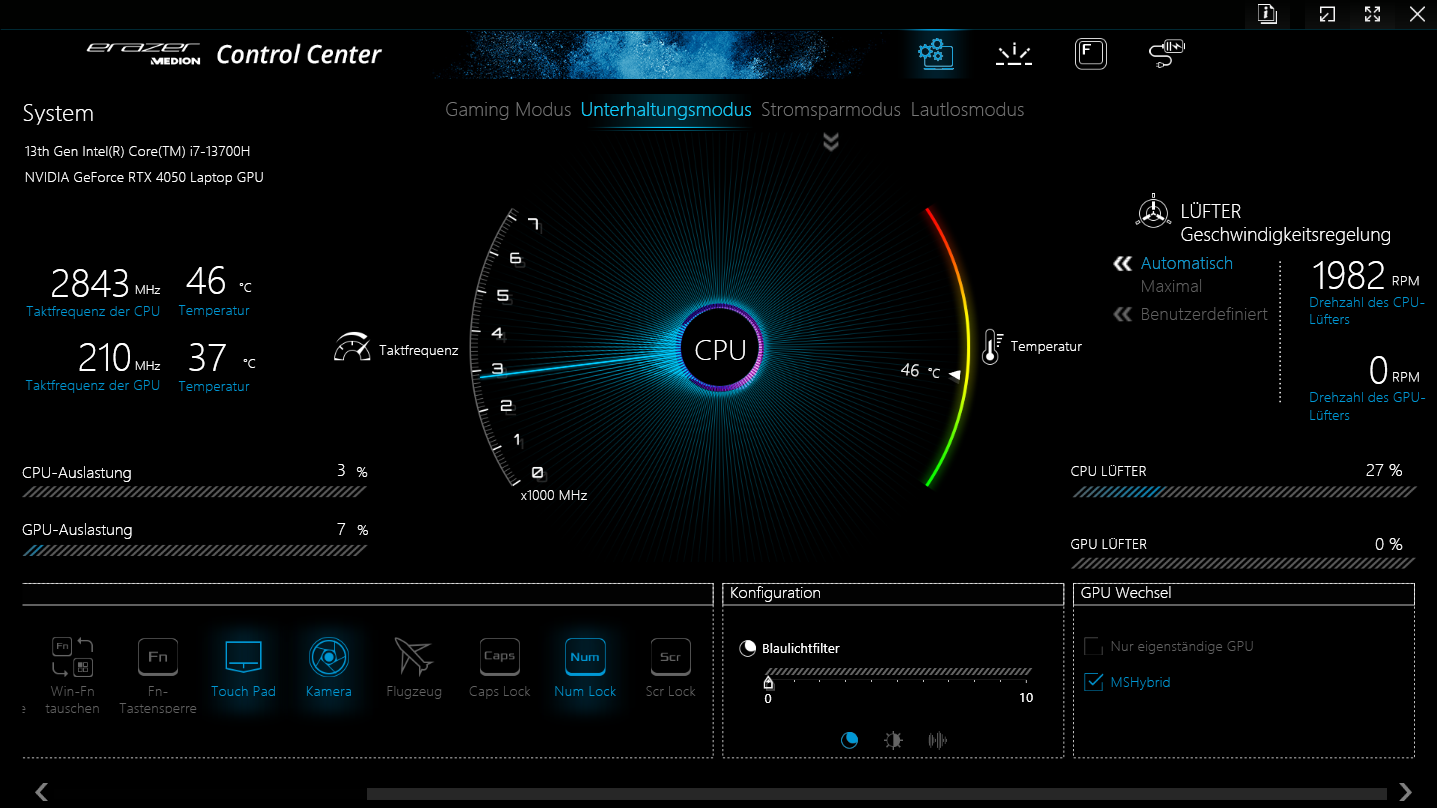
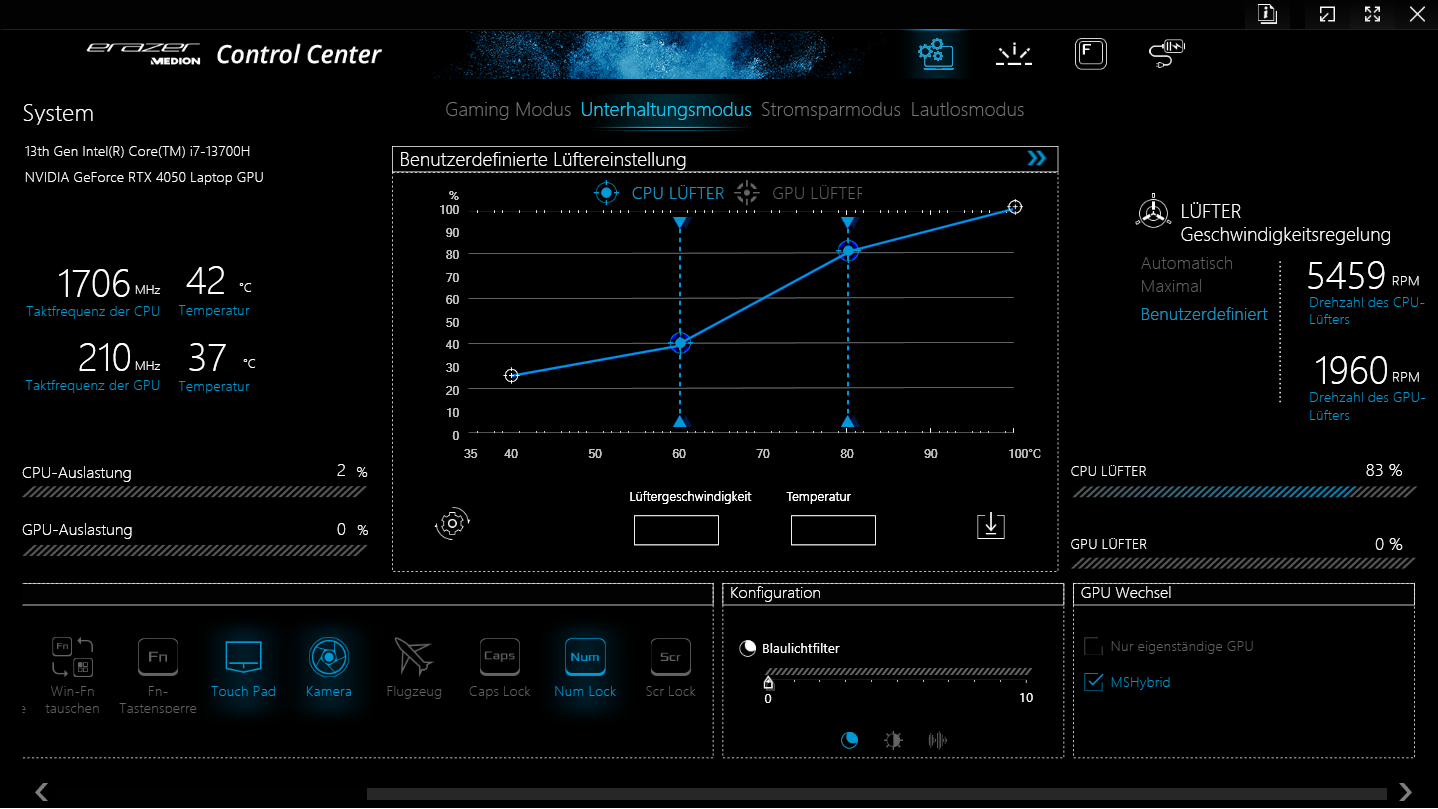
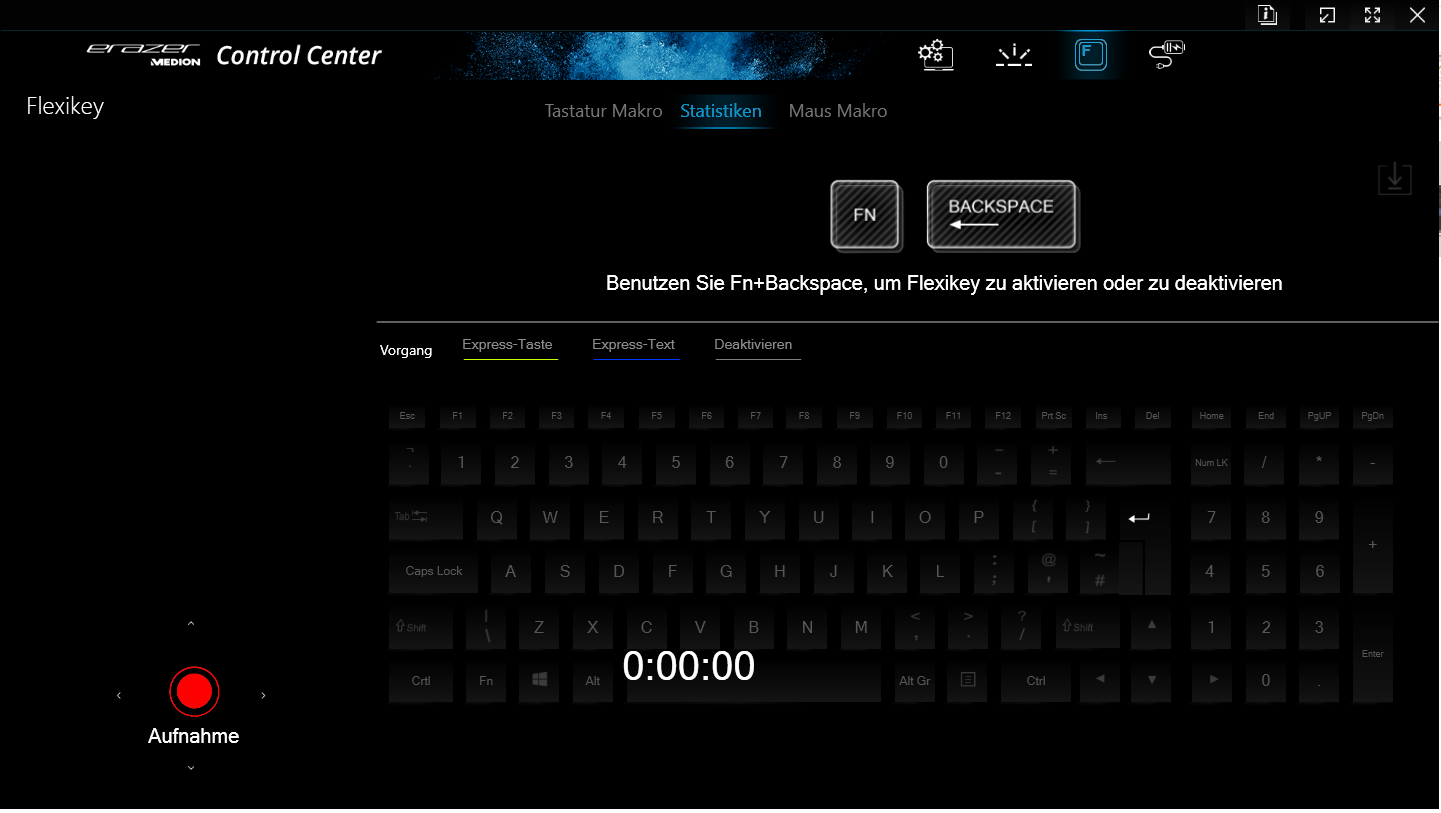
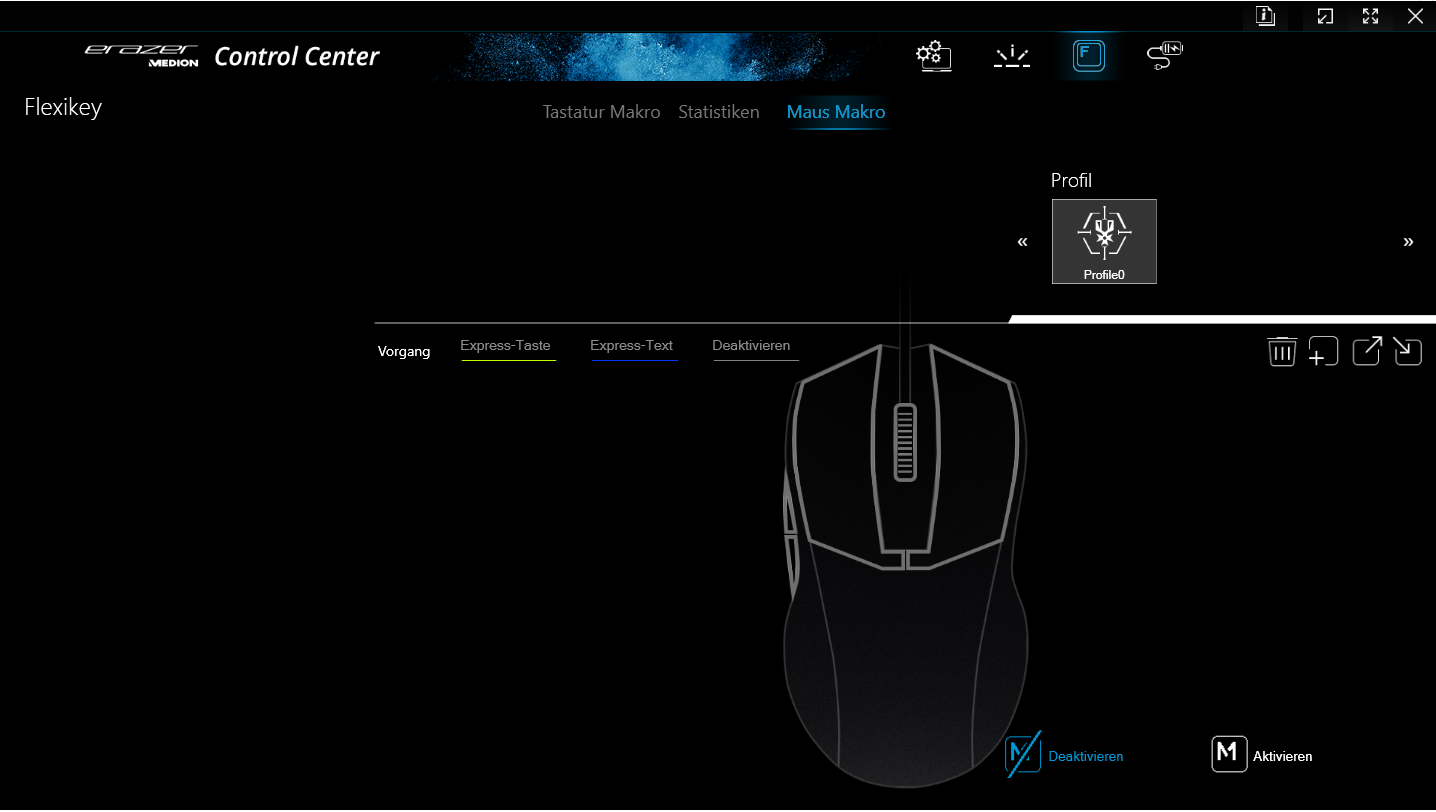
Das E20 bietet vier herstellerspezifische Leistungsmodi (siehe Tabelle), zwischen denen per Control-Center-Software (das Kontrollzentrum des Rechners) umgeschaltet werden kann. Es wurden der "Unterhaltungsmodus" (Benchmarks) und der "Stromsparmodus" (Akkutests) genutzt. Optimus war aktiv. Unter den Modi stellt der Stromsparmodus eine Besonderheit dar: Er deaktiviert den GeForce-Grafikkern.
| Gaming Modus | Unterhaltungsmodus | Stromsparmodus | Lautlosmodus | |
|---|---|---|---|---|
| Power Limit 1 (HWInfo) | 110 Watt | 50 Watt | 20 Watt | 15 Watt |
| Power Limit 2 (HWInfo) | 115 Watt | 115 Watt | 30 Watt | 30 Watt |
| Noise (Witcher 3) | 57 dB(A) | 50 dB(A) | - | 34 dB(A) |
| Performance (Witcher 3) | ~83 fps | ~80 fps | - | 30-50 fps |
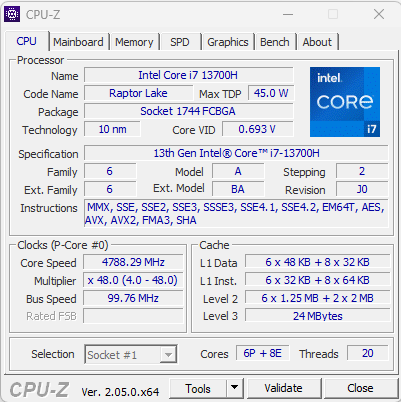
Prozessor
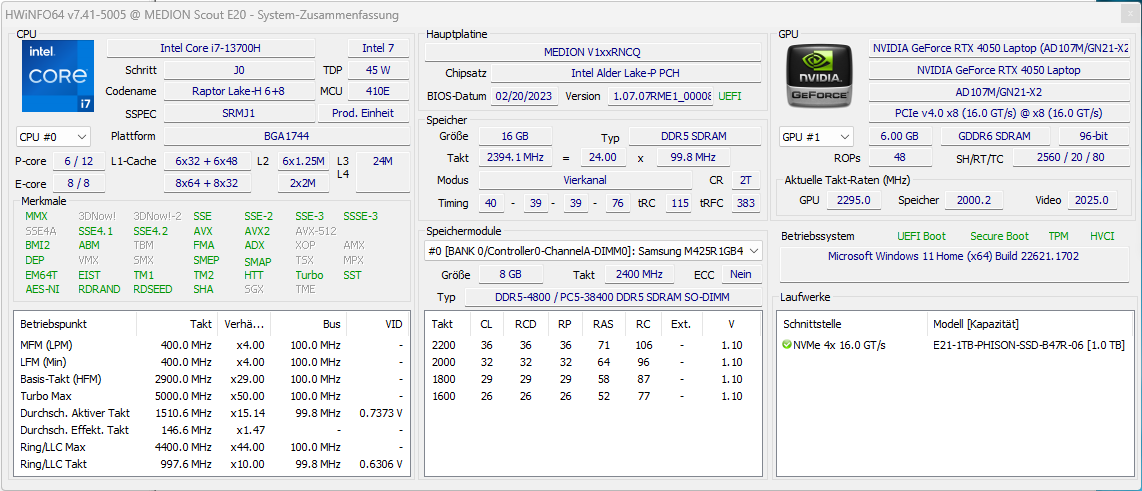
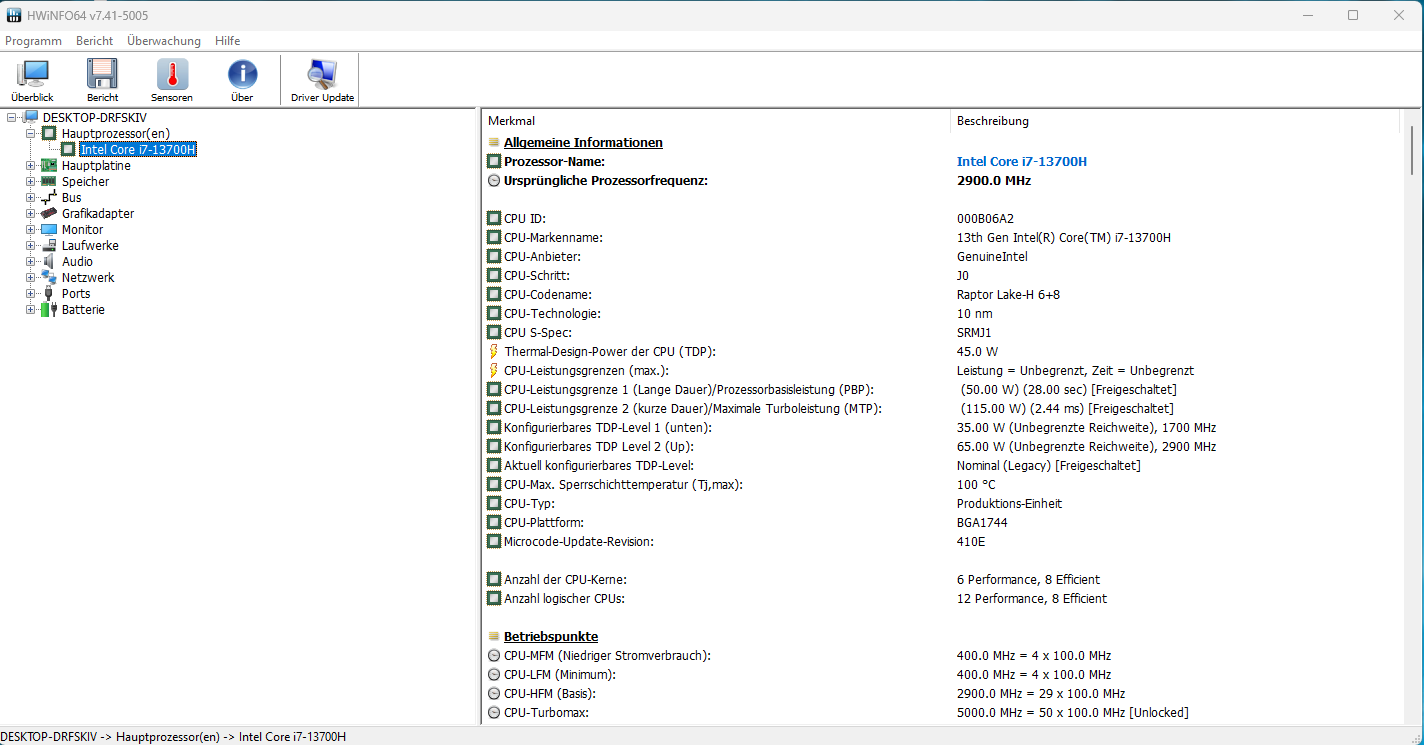
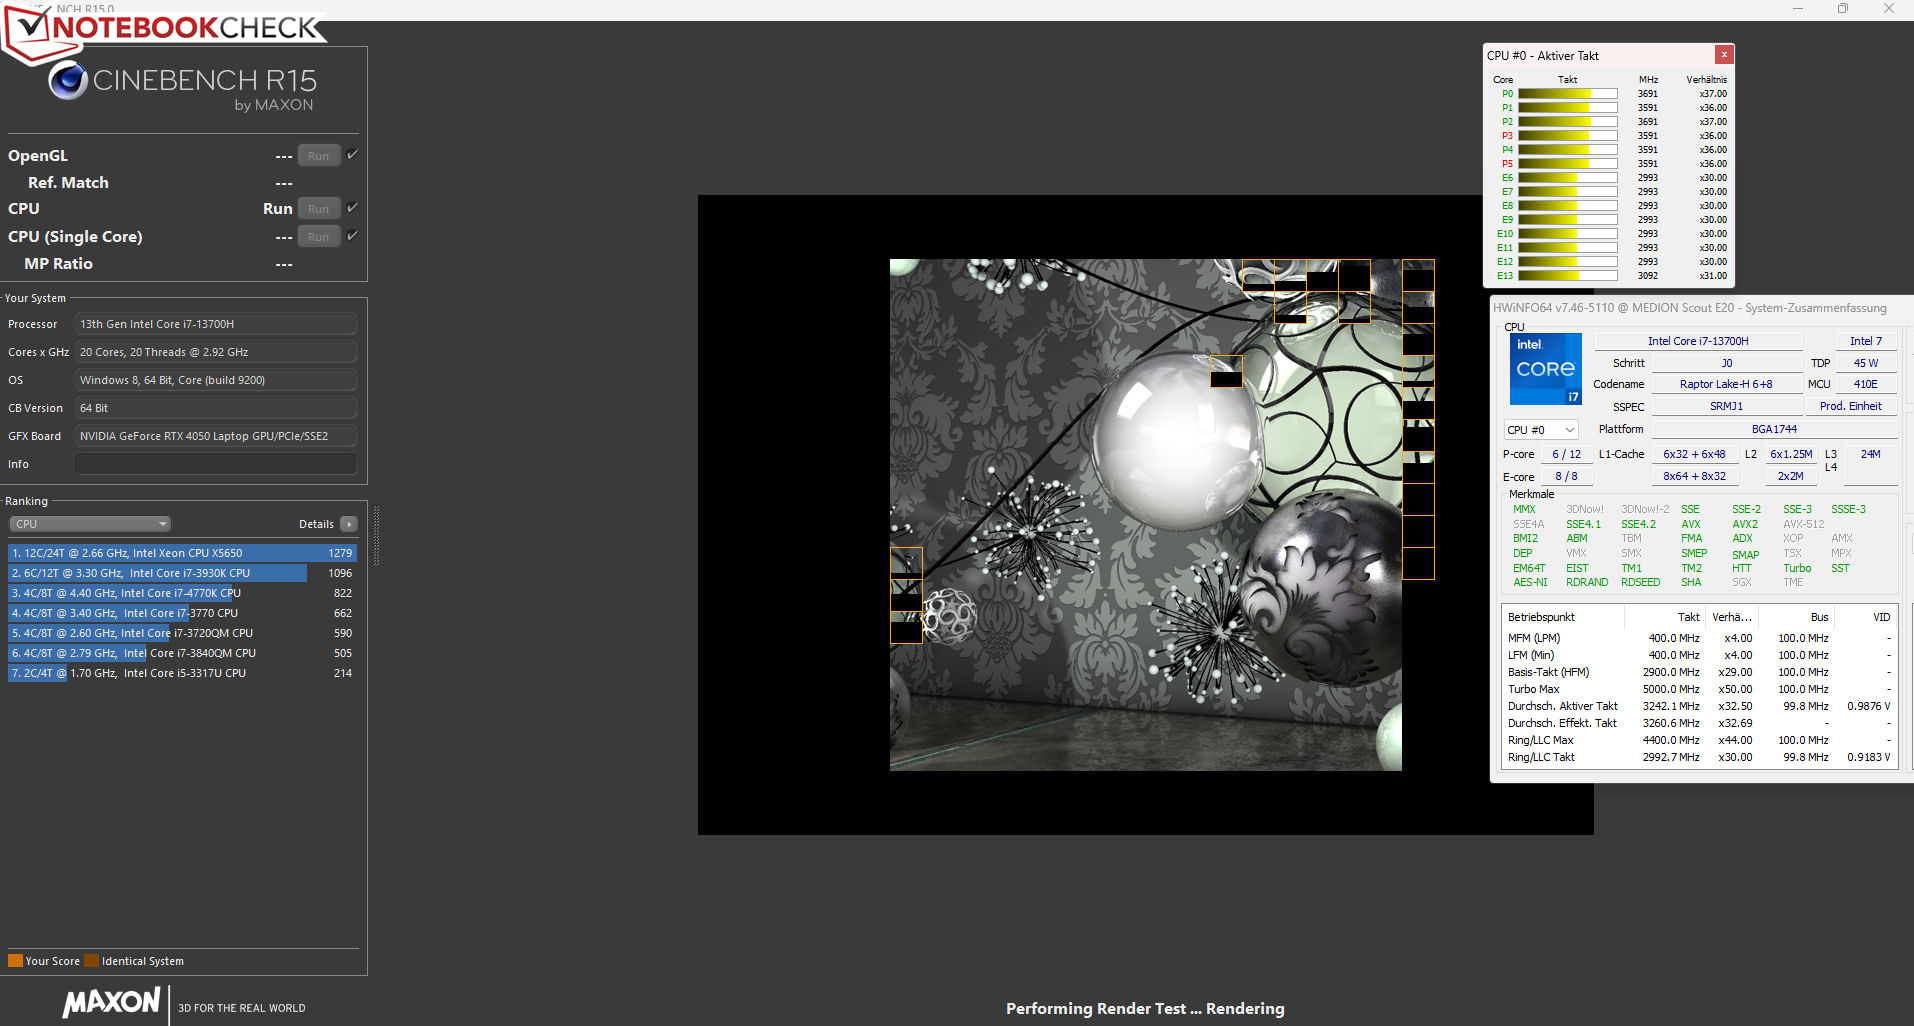
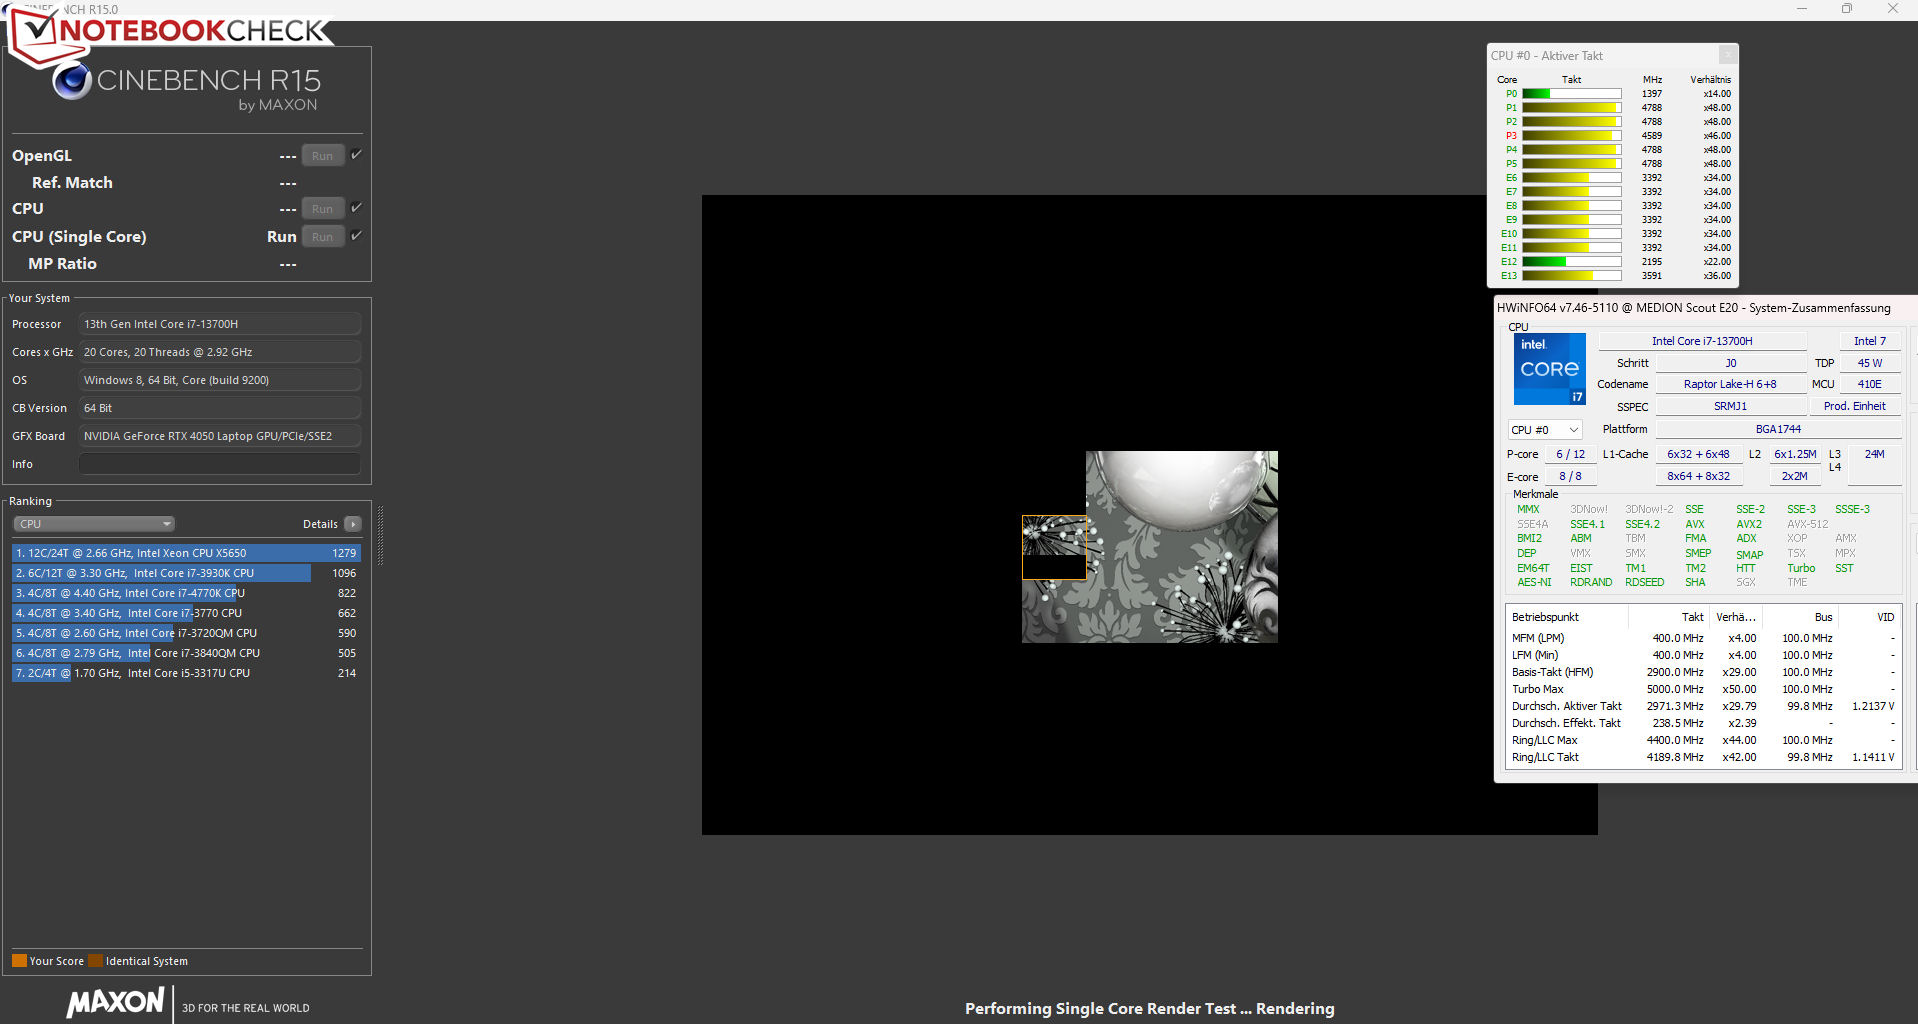
Der Core-i7-13700H-Prozessor (Raptor Lake) setzt sich aus acht Effizienzkernen (kein Hyperthreading, 1,8 bis 3,7 GHz) und sechs Performancekernen (Hyperthreading, 2,4 bis 5 GHz) zusammen. In der Summe ergeben sich 20 logische CPU-Kerne.
Die Benchmarks liefern Resultate oberhalb (Gaming Modus, Unterhaltungsmodus) bzw. unterhalb (übrige Profile) des bisherigen Durchschnitts der CPU. Die relevantere Single-Thread-Leistung (170 Punkte) reduziert sich im Akkubetrieb in geringerem Maße als die Multi-Thread-Leistung (1.335 Punkte).
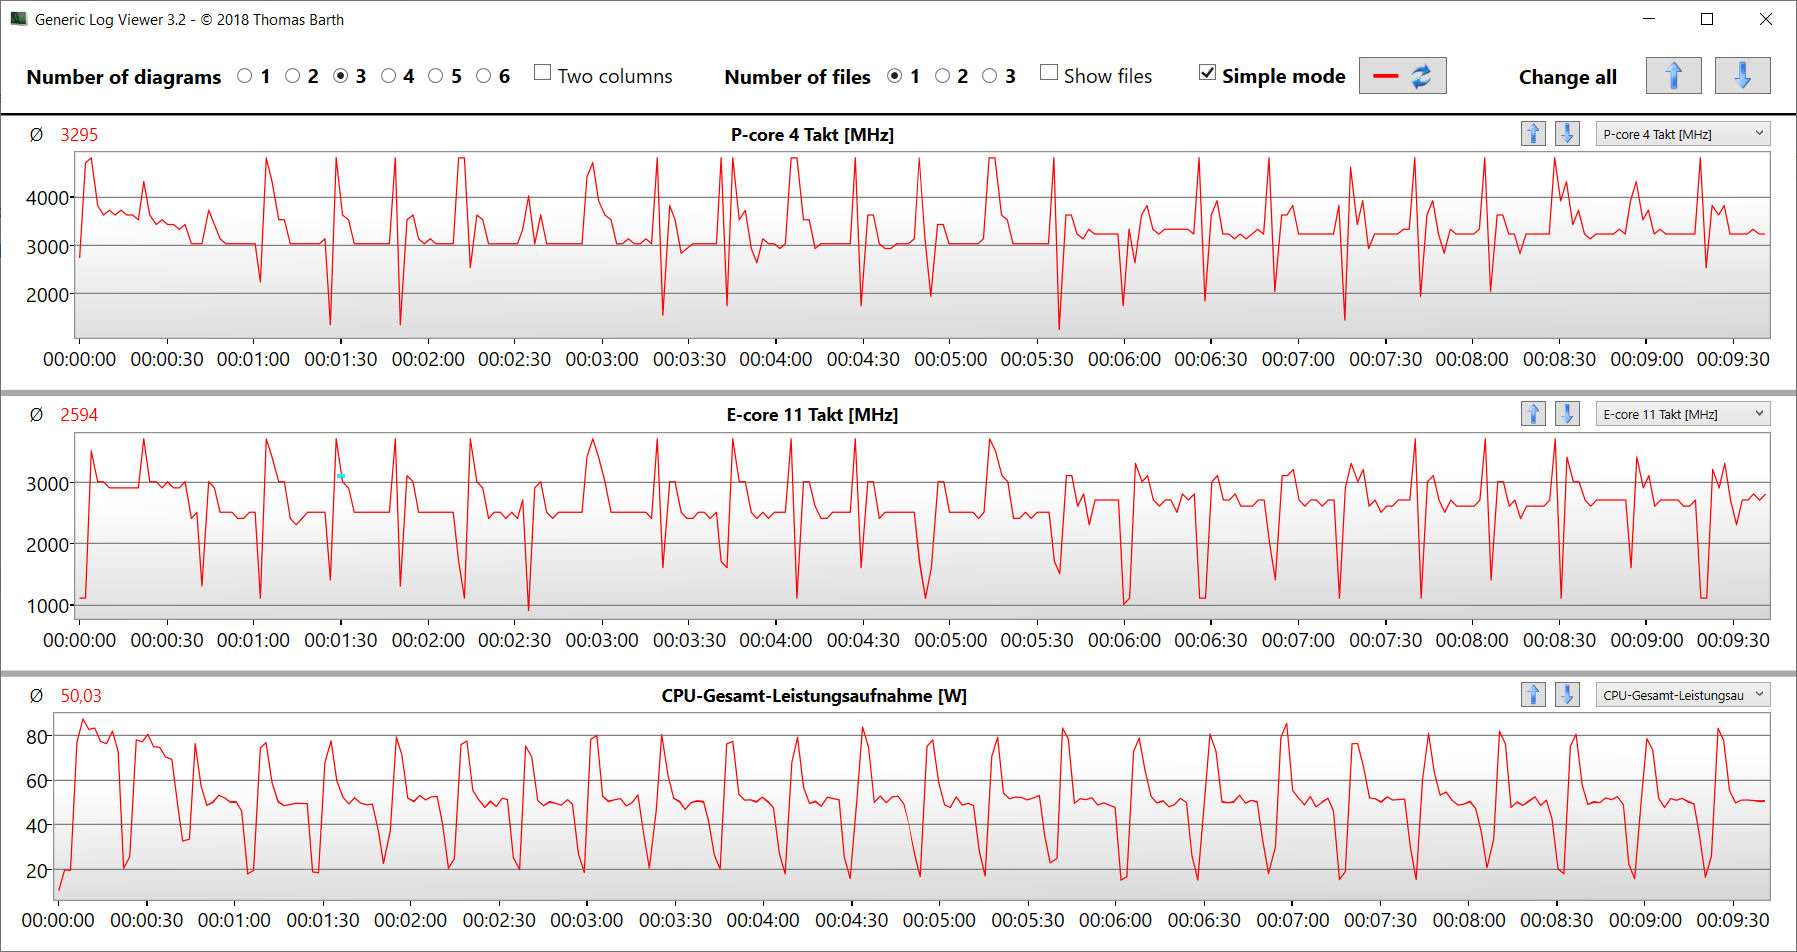
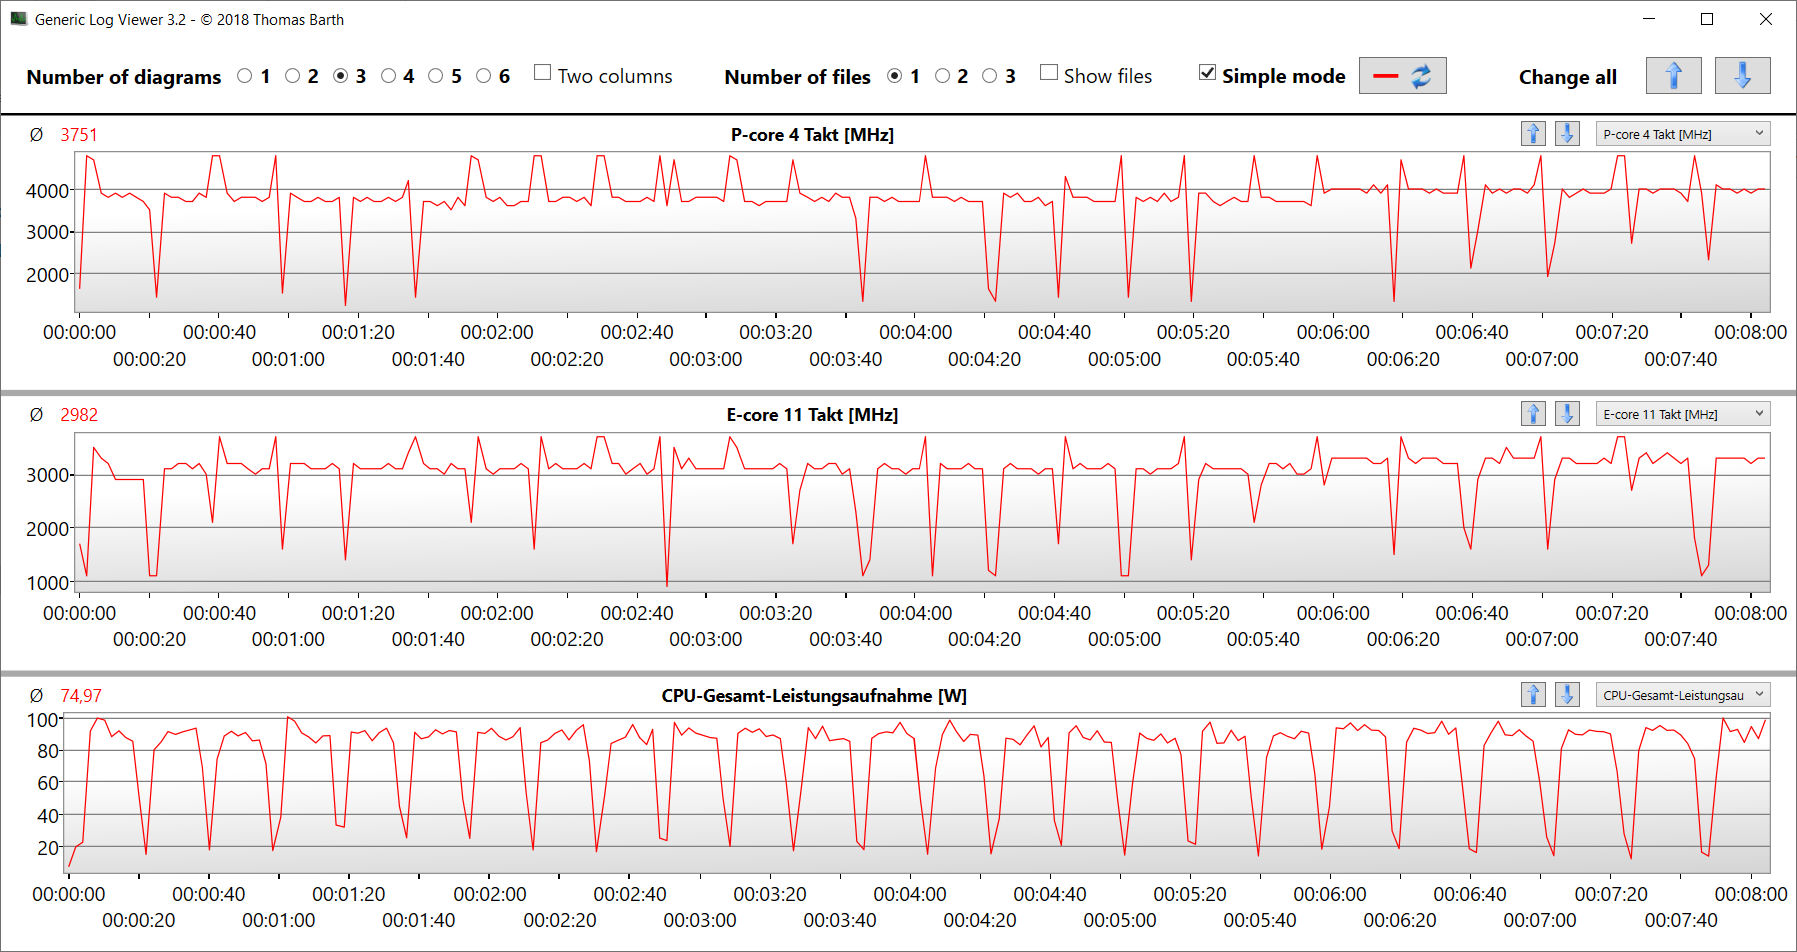
Der CB15-Schleifentest zeigt: Dauerhafte Multi-Thread-Last lässt den Turbo-Takt vom ersten bis zum dritten Durchlauf sinken. Anschließend wird - zumindest für eine Weile - ein konstantes Niveau gehalten. Der "Gaming Modus" sorgt für einen dauerhaft höheren Takt.
Cinebench R15 Multi Dauertest
| CPU Performance Rating - Percent | |
| Durchschnitt der Klasse Gaming | |
| Lenovo Legion 5 15IAH7H 82RB | |
| Medion Erazer Scout E20 | |
| Medion Erazer Scout E20 | |
| Durchschnittliche Intel Core i7-13700H | |
| MSI Katana 17 B13VFK | |
| Gigabyte G7 KE | |
| Asus TUF Gaming A16 FA617 | |
| Acer Nitro 5 AN515-46-R1A1 | |
| Medion Erazer Scout E20 | |
| Cinebench R23 | |
| Multi Core | |
| Durchschnitt der Klasse Gaming (10488 - 40970, n=113, der letzten 2 Jahre) | |
| Lenovo Legion 5 15IAH7H 82RB | |
| Medion Erazer Scout E20 (Gaming Modus) | |
| Medion Erazer Scout E20 | |
| MSI Katana 17 B13VFK | |
| Durchschnittliche Intel Core i7-13700H (5890 - 20034, n=29) | |
| Gigabyte G7 KE | |
| Asus TUF Gaming A16 FA617 | |
| Acer Nitro 5 AN515-46-R1A1 | |
| Medion Erazer Scout E20 (Lautlosmodus) | |
| Single Core | |
| Durchschnitt der Klasse Gaming (1166 - 2356, n=113, der letzten 2 Jahre) | |
| Medion Erazer Scout E20 (Gaming Modus) | |
| Medion Erazer Scout E20 | |
| Lenovo Legion 5 15IAH7H 82RB | |
| MSI Katana 17 B13VFK | |
| Durchschnittliche Intel Core i7-13700H (1323 - 1914, n=29) | |
| Gigabyte G7 KE | |
| Asus TUF Gaming A16 FA617 | |
| Acer Nitro 5 AN515-46-R1A1 | |
| Medion Erazer Scout E20 (Lautlosmodus) | |
| Cinebench R20 | |
| CPU (Multi Core) | |
| Durchschnitt der Klasse Gaming (4029 - 16108, n=112, der letzten 2 Jahre) | |
| Lenovo Legion 5 15IAH7H 82RB | |
| Medion Erazer Scout E20 (Gaming Modus) | |
| Medion Erazer Scout E20 | |
| MSI Katana 17 B13VFK | |
| Durchschnittliche Intel Core i7-13700H (2322 - 7674, n=29) | |
| Asus TUF Gaming A16 FA617 | |
| Gigabyte G7 KE | |
| Acer Nitro 5 AN515-46-R1A1 | |
| Medion Erazer Scout E20 (Lautlosmodus) | |
| CPU (Single Core) | |
| Durchschnitt der Klasse Gaming (442 - 895, n=112, der letzten 2 Jahre) | |
| Medion Erazer Scout E20 | |
| Medion Erazer Scout E20 (Gaming Modus) | |
| Lenovo Legion 5 15IAH7H 82RB | |
| Durchschnittliche Intel Core i7-13700H (508 - 741, n=29) | |
| MSI Katana 17 B13VFK | |
| Gigabyte G7 KE | |
| Asus TUF Gaming A16 FA617 | |
| Acer Nitro 5 AN515-46-R1A1 | |
| Medion Erazer Scout E20 (Lautlosmodus) | |
| Cinebench R15 | |
| CPU Multi 64Bit | |
| Durchschnitt der Klasse Gaming (1578 - 6271, n=113, der letzten 2 Jahre) | |
| Lenovo Legion 5 15IAH7H 82RB | |
| Medion Erazer Scout E20 (Gaming Modus) | |
| Medion Erazer Scout E20 | |
| Durchschnittliche Intel Core i7-13700H (905 - 2982, n=29) | |
| MSI Katana 17 B13VFK | |
| Asus TUF Gaming A16 FA617 | |
| Acer Nitro 5 AN515-46-R1A1 | |
| Gigabyte G7 KE | |
| Medion Erazer Scout E20 (Lautlosmodus) | |
| CPU Single 64Bit | |
| Durchschnitt der Klasse Gaming (188.8 - 343, n=112, der letzten 2 Jahre) | |
| Medion Erazer Scout E20 | |
| Medion Erazer Scout E20 (Gaming Modus) | |
| Lenovo Legion 5 15IAH7H 82RB | |
| Durchschnittliche Intel Core i7-13700H (213 - 278, n=29) | |
| MSI Katana 17 B13VFK | |
| Gigabyte G7 KE | |
| Acer Nitro 5 AN515-46-R1A1 | |
| Asus TUF Gaming A16 FA617 | |
| Medion Erazer Scout E20 (Lautlosmodus) | |
| Blender - v2.79 BMW27 CPU | |
| Medion Erazer Scout E20 (Lautlosmodus) | |
| Acer Nitro 5 AN515-46-R1A1 | |
| Durchschnittliche Intel Core i7-13700H (169 - 555, n=29) | |
| Gigabyte G7 KE | |
| Asus TUF Gaming A16 FA617 | |
| MSI Katana 17 B13VFK | |
| Medion Erazer Scout E20 | |
| Medion Erazer Scout E20 (Gaming Modus) | |
| Lenovo Legion 5 15IAH7H 82RB | |
| Durchschnitt der Klasse Gaming (80 - 330, n=110, der letzten 2 Jahre) | |
| 7-Zip 18.03 | |
| 7z b 4 | |
| Durchschnitt der Klasse Gaming (33491 - 148086, n=111, der letzten 2 Jahre) | |
| Lenovo Legion 5 15IAH7H 82RB | |
| Medion Erazer Scout E20 (Gaming Modus) | |
| Medion Erazer Scout E20 | |
| MSI Katana 17 B13VFK | |
| Acer Nitro 5 AN515-46-R1A1 | |
| Asus TUF Gaming A16 FA617 | |
| Durchschnittliche Intel Core i7-13700H (27322 - 76344, n=29) | |
| Gigabyte G7 KE | |
| Medion Erazer Scout E20 (Lautlosmodus) | |
| 7z b 4 -mmt1 | |
| Durchschnitt der Klasse Gaming (4199 - 7436, n=111, der letzten 2 Jahre) | |
| Medion Erazer Scout E20 | |
| Medion Erazer Scout E20 (Gaming Modus) | |
| Durchschnittliche Intel Core i7-13700H (4825 - 6238, n=29) | |
| Lenovo Legion 5 15IAH7H 82RB | |
| Asus TUF Gaming A16 FA617 | |
| MSI Katana 17 B13VFK | |
| Acer Nitro 5 AN515-46-R1A1 | |
| Gigabyte G7 KE | |
| Medion Erazer Scout E20 (Lautlosmodus) | |
| Geekbench 5.5 | |
| Multi-Core | |
| Durchschnitt der Klasse Gaming (6460 - 27010, n=111, der letzten 2 Jahre) | |
| Lenovo Legion 5 15IAH7H 82RB | |
| Medion Erazer Scout E20 (Gaming Modus) | |
| Medion Erazer Scout E20 | |
| Durchschnittliche Intel Core i7-13700H (6165 - 14215, n=29) | |
| MSI Katana 17 B13VFK | |
| Gigabyte G7 KE | |
| Asus TUF Gaming A16 FA617 | |
| Acer Nitro 5 AN515-46-R1A1 | |
| Medion Erazer Scout E20 (Lautlosmodus) | |
| Single-Core | |
| Durchschnitt der Klasse Gaming (986 - 2474, n=111, der letzten 2 Jahre) | |
| Medion Erazer Scout E20 (Gaming Modus) | |
| Medion Erazer Scout E20 | |
| Durchschnittliche Intel Core i7-13700H (1362 - 1919, n=29) | |
| MSI Katana 17 B13VFK | |
| Lenovo Legion 5 15IAH7H 82RB | |
| Gigabyte G7 KE | |
| Medion Erazer Scout E20 (Lautlosmodus) | |
| Asus TUF Gaming A16 FA617 | |
| Acer Nitro 5 AN515-46-R1A1 | |
| HWBOT x265 Benchmark v2.2 - 4k Preset | |
| Durchschnitt der Klasse Gaming (11.5 - 44.3, n=111, der letzten 2 Jahre) | |
| Lenovo Legion 5 15IAH7H 82RB | |
| Medion Erazer Scout E20 (Gaming Modus) | |
| Asus TUF Gaming A16 FA617 | |
| MSI Katana 17 B13VFK | |
| Medion Erazer Scout E20 | |
| Acer Nitro 5 AN515-46-R1A1 | |
| Gigabyte G7 KE | |
| Durchschnittliche Intel Core i7-13700H (6.72 - 21.2, n=29) | |
| Medion Erazer Scout E20 (Lautlosmodus) | |
| LibreOffice - 20 Documents To PDF | |
| Asus TUF Gaming A16 FA617 | |
| MSI Katana 17 B13VFK | |
| Acer Nitro 5 AN515-46-R1A1 | |
| Durchschnitt der Klasse Gaming (19 - 88.8, n=111, der letzten 2 Jahre) | |
| Durchschnittliche Intel Core i7-13700H (31.3 - 62.4, n=29) | |
| Medion Erazer Scout E20 (Lautlosmodus) | |
| Gigabyte G7 KE | |
| Medion Erazer Scout E20 | |
| Medion Erazer Scout E20 (Gaming Modus) | |
| Lenovo Legion 5 15IAH7H 82RB | |
| R Benchmark 2.5 - Overall mean | |
| Medion Erazer Scout E20 (Lautlosmodus) | |
| Asus TUF Gaming A16 FA617 | |
| Acer Nitro 5 AN515-46-R1A1 | |
| Gigabyte G7 KE | |
| Durchschnittliche Intel Core i7-13700H (0.4308 - 0.607, n=29) | |
| Lenovo Legion 5 15IAH7H 82RB | |
| Medion Erazer Scout E20 (Gaming Modus) | |
| Medion Erazer Scout E20 | |
| MSI Katana 17 B13VFK | |
| Durchschnitt der Klasse Gaming (0.3439 - 0.759, n=112, der letzten 2 Jahre) | |
* ... kleinere Werte sind besser
AIDA64: FP32 Ray-Trace | FPU Julia | CPU SHA3 | CPU Queen | FPU SinJulia | FPU Mandel | CPU AES | CPU ZLib | FP64 Ray-Trace | CPU PhotoWorxx
| Performance Rating | |
| Durchschnitt der Klasse Gaming | |
| Lenovo Legion 5 15IAH7H 82RB | |
| Acer Nitro 5 AN515-46-R1A1 | |
| Asus TUF Gaming A16 FA617 | |
| Medion Erazer Scout E20 | |
| Medion Erazer Scout E20 | |
| Durchschnittliche Intel Core i7-13700H | |
| Gigabyte G7 KE | |
| MSI Katana 17 B13VFK | |
| Medion Erazer Scout E20 | |
| AIDA64 / FP32 Ray-Trace | |
| Durchschnitt der Klasse Gaming (10227 - 85542, n=110, der letzten 2 Jahre) | |
| Lenovo Legion 5 15IAH7H 82RB (v6.75.6100) | |
| Asus TUF Gaming A16 FA617 (v6.85.6300) | |
| Medion Erazer Scout E20 (v6.75.6100, Gaming Modus) | |
| Acer Nitro 5 AN515-46-R1A1 (v6.75.6100) | |
| Medion Erazer Scout E20 (v6.75.6100) | |
| Durchschnittliche Intel Core i7-13700H (4986 - 18908, n=29) | |
| MSI Katana 17 B13VFK (v6.85.6300) | |
| Gigabyte G7 KE (v6.75.6100) | |
| Medion Erazer Scout E20 (v6.75.6100, Lautlosmodus) | |
| AIDA64 / FPU Julia | |
| Durchschnitt der Klasse Gaming (51376 - 238426, n=110, der letzten 2 Jahre) | |
| Asus TUF Gaming A16 FA617 (v6.85.6300) | |
| Acer Nitro 5 AN515-46-R1A1 (v6.75.6100) | |
| Lenovo Legion 5 15IAH7H 82RB (v6.75.6100) | |
| Medion Erazer Scout E20 (v6.75.6100, Gaming Modus) | |
| Medion Erazer Scout E20 | |
| Durchschnittliche Intel Core i7-13700H (25360 - 92359, n=29) | |
| MSI Katana 17 B13VFK (v6.85.6300) | |
| Gigabyte G7 KE (v6.75.6100) | |
| Medion Erazer Scout E20 (v6.75.6100, Lautlosmodus) | |
| AIDA64 / CPU SHA3 | |
| Durchschnitt der Klasse Gaming (2180 - 9817, n=110, der letzten 2 Jahre) | |
| Lenovo Legion 5 15IAH7H 82RB (v6.75.6100) | |
| Medion Erazer Scout E20 (v6.75.6100, Gaming Modus) | |
| Asus TUF Gaming A16 FA617 (v6.85.6300) | |
| Acer Nitro 5 AN515-46-R1A1 (v6.75.6100) | |
| Gigabyte G7 KE (v6.75.6100) | |
| Medion Erazer Scout E20 (v6.75.6100) | |
| Durchschnittliche Intel Core i7-13700H (1339 - 4224, n=29) | |
| MSI Katana 17 B13VFK (v6.85.6300) | |
| Medion Erazer Scout E20 (v6.75.6100, Lautlosmodus) | |
| AIDA64 / CPU Queen | |
| Durchschnitt der Klasse Gaming (49785 - 173351, n=101, der letzten 2 Jahre) | |
| Medion Erazer Scout E20 (v6.75.6100) | |
| Acer Nitro 5 AN515-46-R1A1 (v6.75.6100) | |
| Medion Erazer Scout E20 (v6.75.6100, Gaming Modus) | |
| Asus TUF Gaming A16 FA617 (v6.85.6300) | |
| Lenovo Legion 5 15IAH7H 82RB (v6.75.6100) | |
| Durchschnittliche Intel Core i7-13700H (59324 - 107159, n=29) | |
| Gigabyte G7 KE (v6.75.6100) | |
| MSI Katana 17 B13VFK | |
| Medion Erazer Scout E20 (v6.75.6100, Lautlosmodus) | |
| AIDA64 / FPU SinJulia | |
| Durchschnitt der Klasse Gaming (4424 - 33636, n=110, der letzten 2 Jahre) | |
| Acer Nitro 5 AN515-46-R1A1 (v6.75.6100) | |
| Asus TUF Gaming A16 FA617 (v6.85.6300) | |
| Medion Erazer Scout E20 (v6.75.6100, Gaming Modus) | |
| Lenovo Legion 5 15IAH7H 82RB (v6.75.6100) | |
| Medion Erazer Scout E20 (v6.75.6100) | |
| Durchschnittliche Intel Core i7-13700H (4800 - 11050, n=29) | |
| MSI Katana 17 B13VFK | |
| Gigabyte G7 KE (v6.75.6100) | |
| Medion Erazer Scout E20 (v6.75.6100, Lautlosmodus) | |
| AIDA64 / FPU Mandel | |
| Durchschnitt der Klasse Gaming (25115 - 128721, n=110, der letzten 2 Jahre) | |
| Acer Nitro 5 AN515-46-R1A1 (v6.75.6100) | |
| Asus TUF Gaming A16 FA617 (v6.85.6300) | |
| Lenovo Legion 5 15IAH7H 82RB (v6.75.6100) | |
| Medion Erazer Scout E20 (v6.75.6100, Gaming Modus) | |
| Medion Erazer Scout E20 (v6.75.6100) | |
| Durchschnittliche Intel Core i7-13700H (12321 - 45118, n=29) | |
| MSI Katana 17 B13VFK (v6.85.6300) | |
| Gigabyte G7 KE (v6.75.6100) | |
| Medion Erazer Scout E20 (v6.75.6100, Lautlosmodus) | |
| AIDA64 / CPU AES | |
| Lenovo Legion 5 15IAH7H 82RB (v6.75.6100) | |
| Acer Nitro 5 AN515-46-R1A1 | |
| Gigabyte G7 KE (v6.75.6100) | |
| Durchschnitt der Klasse Gaming (39258 - 247074, n=110, der letzten 2 Jahre) | |
| Medion Erazer Scout E20 (v6.75.6100, Gaming Modus) | |
| Durchschnittliche Intel Core i7-13700H (28769 - 151254, n=29) | |
| Medion Erazer Scout E20 (v6.75.6100) | |
| Asus TUF Gaming A16 FA617 (v6.85.6300) | |
| MSI Katana 17 B13VFK (v6.85.6300) | |
| Medion Erazer Scout E20 (v6.75.6100, Lautlosmodus) | |
| AIDA64 / CPU ZLib | |
| Durchschnitt der Klasse Gaming (574 - 2531, n=110, der letzten 2 Jahre) | |
| Lenovo Legion 5 15IAH7H 82RB (v6.75.6100) | |
| Medion Erazer Scout E20 (v6.75.6100, Gaming Modus) | |
| Medion Erazer Scout E20 (v6.75.6100) | |
| Durchschnittliche Intel Core i7-13700H (389 - 1215, n=29) | |
| Gigabyte G7 KE (v6.75.6100) | |
| Asus TUF Gaming A16 FA617 (v6.85.6300) | |
| Acer Nitro 5 AN515-46-R1A1 (v6.75.6100) | |
| MSI Katana 17 B13VFK (v6.85.6300) | |
| Medion Erazer Scout E20 (v6.75.6100, Lautlosmodus) | |
| AIDA64 / FP64 Ray-Trace | |
| Durchschnitt der Klasse Gaming (5509 - 45446, n=110, der letzten 2 Jahre) | |
| Lenovo Legion 5 15IAH7H 82RB (v6.75.6100) | |
| Asus TUF Gaming A16 FA617 (v6.85.6300) | |
| Medion Erazer Scout E20 (v6.75.6100, Gaming Modus) | |
| Acer Nitro 5 AN515-46-R1A1 (v6.75.6100) | |
| Medion Erazer Scout E20 (v6.75.6100) | |
| Durchschnittliche Intel Core i7-13700H (2540 - 10135, n=29) | |
| MSI Katana 17 B13VFK (v6.85.6300) | |
| Gigabyte G7 KE (v6.75.6100) | |
| Medion Erazer Scout E20 (v6.75.6100, Lautlosmodus) | |
| AIDA64 / CPU PhotoWorxx | |
| Durchschnitt der Klasse Gaming (12271 - 89891, n=110, der letzten 2 Jahre) | |
| Durchschnittliche Intel Core i7-13700H (12872 - 52727, n=29) | |
| Medion Erazer Scout E20 (v6.75.6100, Gaming Modus) | |
| Medion Erazer Scout E20 (v6.75.6100) | |
| Lenovo Legion 5 15IAH7H 82RB (v6.75.6100) | |
| MSI Katana 17 B13VFK (v6.85.6300) | |
| Medion Erazer Scout E20 (v6.75.6100, Lautlosmodus) | |
| Gigabyte G7 KE (v6.75.6100) | |
| Acer Nitro 5 AN515-46-R1A1 | |
| Asus TUF Gaming A16 FA617 (v6.85.6300) | |
System Performance
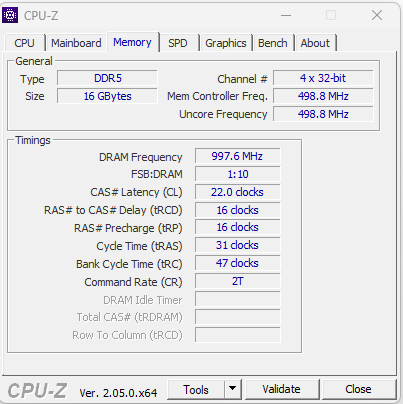
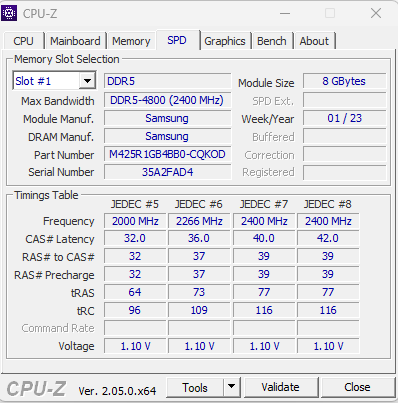
Das flüssig arbeitende System stellt genug Leistung für fordernde Anwendungsbereiche wie Rendering und Gaming bereit - das bestätigen nicht zuletzt die guten PC-Mark-Resultate. Die Transferraten des Arbeitsspeichers bewegen sich auf einem normalen Niveau für DDR5-4800-Speicher.
CrossMark: Overall | Productivity | Creativity | Responsiveness
| PCMark 10 / Score | |
| Durchschnitt der Klasse Gaming (5828 - 11574, n=96, der letzten 2 Jahre) | |
| Lenovo Legion 5 15IAH7H 82RB | |
| Medion Erazer Scout E20 | |
| Asus TUF Gaming A16 FA617 | |
| Durchschnittliche Intel Core i7-13700H, NVIDIA GeForce RTX 4050 Laptop GPU (6822 - 7556, n=7) | |
| MSI Katana 17 B13VFK | |
| Acer Nitro 5 AN515-46-R1A1 | |
| Gigabyte G7 KE | |
| PCMark 10 / Essentials | |
| Lenovo Legion 5 15IAH7H 82RB | |
| Medion Erazer Scout E20 | |
| Durchschnittliche Intel Core i7-13700H, NVIDIA GeForce RTX 4050 Laptop GPU (10283 - 11549, n=7) | |
| MSI Katana 17 B13VFK | |
| Durchschnitt der Klasse Gaming (8810 - 12600, n=100, der letzten 2 Jahre) | |
| Asus TUF Gaming A16 FA617 | |
| Acer Nitro 5 AN515-46-R1A1 | |
| Gigabyte G7 KE | |
| PCMark 10 / Productivity | |
| Durchschnitt der Klasse Gaming (6845 - 18766, n=98, der letzten 2 Jahre) | |
| Lenovo Legion 5 15IAH7H 82RB | |
| Medion Erazer Scout E20 | |
| Asus TUF Gaming A16 FA617 | |
| MSI Katana 17 B13VFK | |
| Durchschnittliche Intel Core i7-13700H, NVIDIA GeForce RTX 4050 Laptop GPU (8368 - 9836, n=7) | |
| Gigabyte G7 KE | |
| Acer Nitro 5 AN515-46-R1A1 | |
| PCMark 10 / Digital Content Creation | |
| Durchschnitt der Klasse Gaming (7602 - 19657, n=98, der letzten 2 Jahre) | |
| Lenovo Legion 5 15IAH7H 82RB | |
| Asus TUF Gaming A16 FA617 | |
| Medion Erazer Scout E20 | |
| Durchschnittliche Intel Core i7-13700H, NVIDIA GeForce RTX 4050 Laptop GPU (9527 - 10643, n=7) | |
| MSI Katana 17 B13VFK | |
| Acer Nitro 5 AN515-46-R1A1 | |
| Gigabyte G7 KE | |
| CrossMark / Overall | |
| Lenovo Legion 5 15IAH7H 82RB | |
| Durchschnitt der Klasse Gaming (1366 - 2409, n=98, der letzten 2 Jahre) | |
| Medion Erazer Scout E20 | |
| MSI Katana 17 B13VFK | |
| Gigabyte G7 KE | |
| Durchschnittliche Intel Core i7-13700H, NVIDIA GeForce RTX 4050 Laptop GPU (1205 - 1937, n=9) | |
| Acer Nitro 5 AN515-46-R1A1 | |
| CrossMark / Productivity | |
| Lenovo Legion 5 15IAH7H 82RB | |
| Medion Erazer Scout E20 | |
| Durchschnitt der Klasse Gaming (1386 - 2254, n=98, der letzten 2 Jahre) | |
| Gigabyte G7 KE | |
| MSI Katana 17 B13VFK | |
| Durchschnittliche Intel Core i7-13700H, NVIDIA GeForce RTX 4050 Laptop GPU (1158 - 1877, n=9) | |
| Acer Nitro 5 AN515-46-R1A1 | |
| CrossMark / Creativity | |
| Durchschnitt der Klasse Gaming (1343 - 2729, n=98, der letzten 2 Jahre) | |
| Medion Erazer Scout E20 | |
| Lenovo Legion 5 15IAH7H 82RB | |
| MSI Katana 17 B13VFK | |
| Durchschnittliche Intel Core i7-13700H, NVIDIA GeForce RTX 4050 Laptop GPU (1293 - 2044, n=9) | |
| Gigabyte G7 KE | |
| Acer Nitro 5 AN515-46-R1A1 | |
| CrossMark / Responsiveness | |
| Lenovo Legion 5 15IAH7H 82RB | |
| Gigabyte G7 KE | |
| Medion Erazer Scout E20 | |
| MSI Katana 17 B13VFK | |
| Durchschnitt der Klasse Gaming (1226 - 2334, n=98, der letzten 2 Jahre) | |
| Durchschnittliche Intel Core i7-13700H, NVIDIA GeForce RTX 4050 Laptop GPU (1097 - 1929, n=9) | |
| Acer Nitro 5 AN515-46-R1A1 | |
| PCMark 8 Home Score Accelerated v2 | 5486 Punkte | |
| PCMark 8 Work Score Accelerated v2 | 6205 Punkte | |
| PCMark 10 Score | 7556 Punkte | |
Hilfe | ||
| AIDA64 / Memory Copy | |
| Durchschnitt der Klasse Gaming (21750 - 129946, n=110, der letzten 2 Jahre) | |
| Durchschnittliche Intel Core i7-13700H (24334 - 78081, n=29) | |
| Medion Erazer Scout E20 | |
| MSI Katana 17 B13VFK | |
| Lenovo Legion 5 15IAH7H 82RB | |
| Acer Nitro 5 AN515-46-R1A1 | |
| Asus TUF Gaming A16 FA617 | |
| Gigabyte G7 KE | |
| AIDA64 / Memory Read | |
| Durchschnitt der Klasse Gaming (22956 - 118858, n=110, der letzten 2 Jahre) | |
| Medion Erazer Scout E20 | |
| Durchschnittliche Intel Core i7-13700H (23681 - 79656, n=29) | |
| MSI Katana 17 B13VFK | |
| Lenovo Legion 5 15IAH7H 82RB | |
| Acer Nitro 5 AN515-46-R1A1 | |
| Asus TUF Gaming A16 FA617 | |
| Gigabyte G7 KE | |
| AIDA64 / Memory Write | |
| Durchschnitt der Klasse Gaming (22297 - 135096, n=110, der letzten 2 Jahre) | |
| Durchschnittliche Intel Core i7-13700H (22986 - 99898, n=29) | |
| Medion Erazer Scout E20 | |
| Lenovo Legion 5 15IAH7H 82RB | |
| Acer Nitro 5 AN515-46-R1A1 | |
| Asus TUF Gaming A16 FA617 | |
| MSI Katana 17 B13VFK | |
| Gigabyte G7 KE | |
| AIDA64 / Memory Latency | |
| Durchschnitt der Klasse Gaming (75.3 - 259, n=110, der letzten 2 Jahre) | |
| MSI Katana 17 B13VFK | |
| Medion Erazer Scout E20 | |
| Lenovo Legion 5 15IAH7H 82RB | |
| Durchschnittliche Intel Core i7-13700H (82.4 - 136.8, n=29) | |
| Gigabyte G7 KE | |
| Acer Nitro 5 AN515-46-R1A1 | |
| Asus TUF Gaming A16 FA617 | |
* ... kleinere Werte sind besser
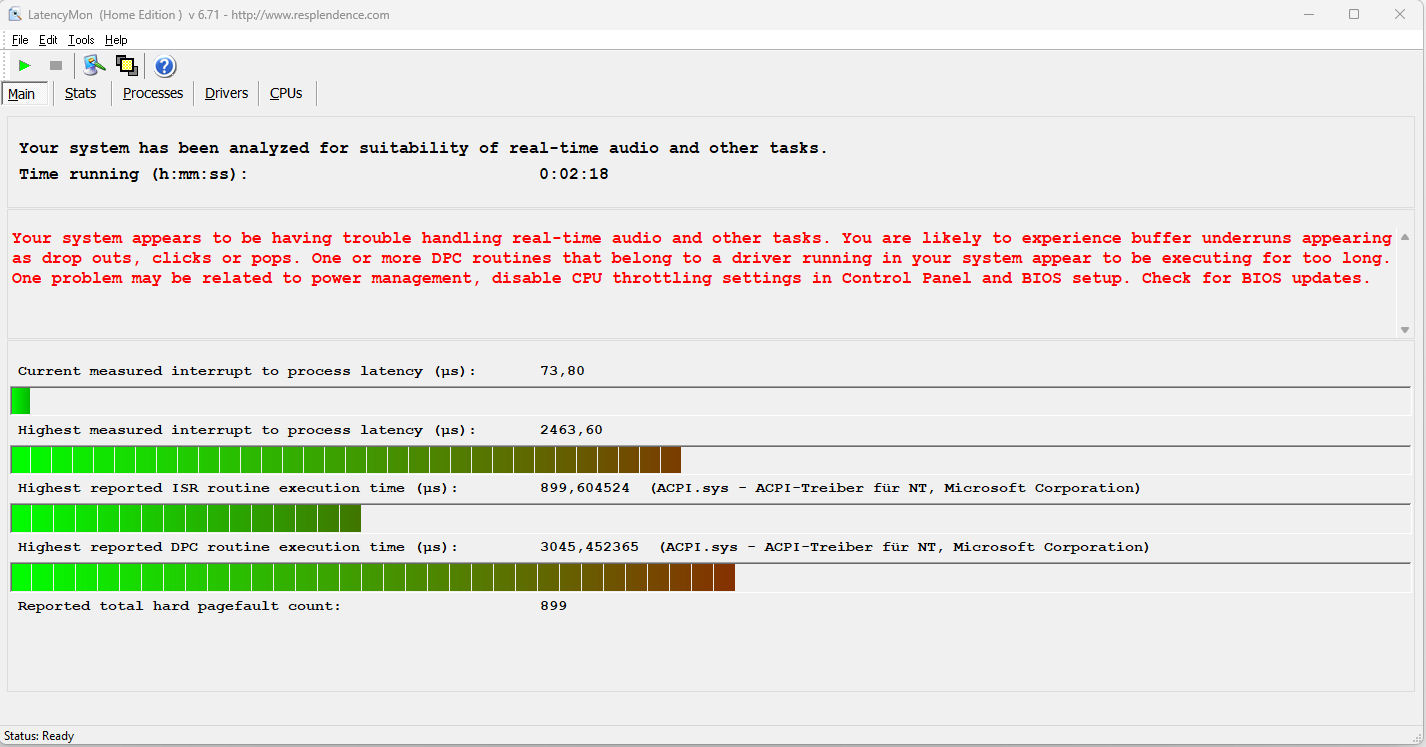
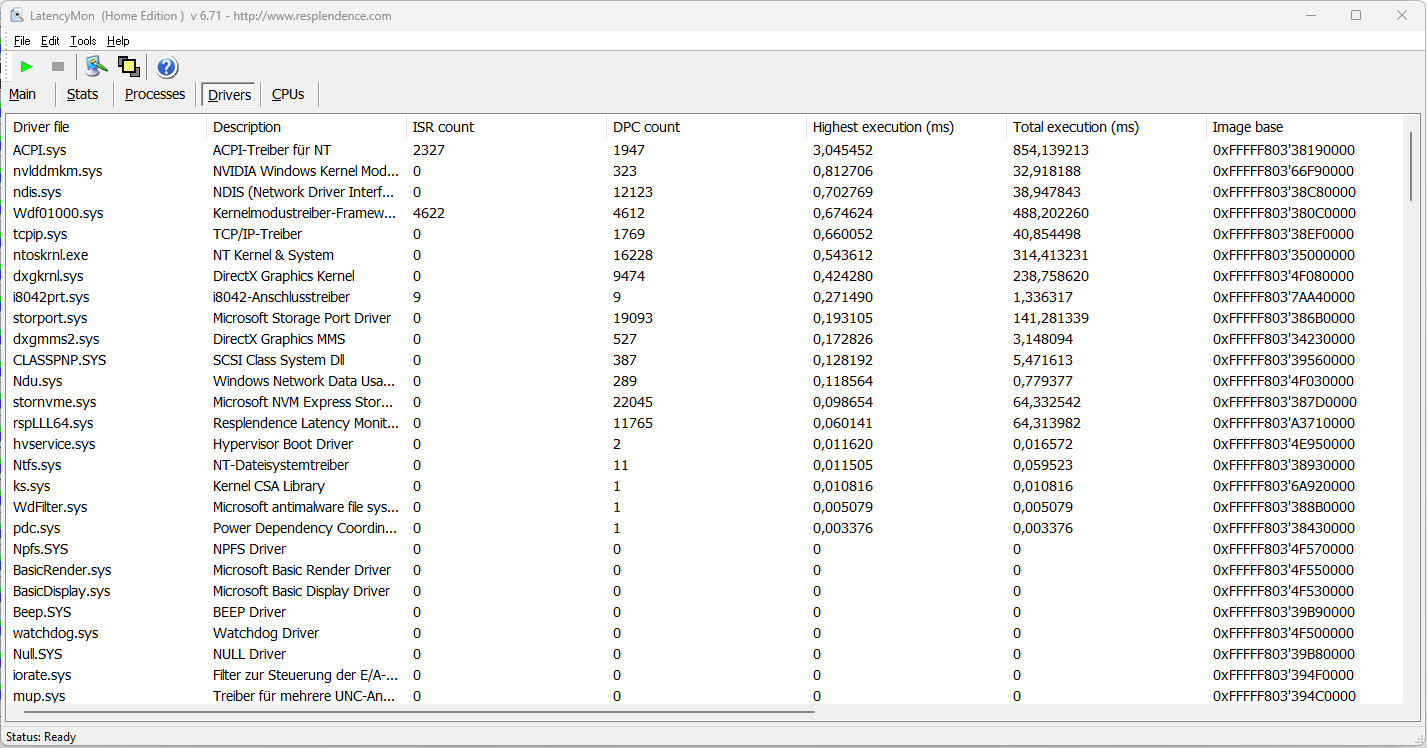
DPC-Latenzen
Der standardisierte Latency-Monitor-Test (Websurfen, 4k-Videowiedergabe, Prime95 High-Load) hat Auffälligkeiten offenbart. Das System scheint nicht für Video- und Audiobearbeitung in Echtzeit geeignet zu sein. Zukünftige Software-Updates könnten zu Verbesserungen oder auch Verschlechterungen führen.
| DPC Latencies / LatencyMon - interrupt to process latency (max), Web, Youtube, Prime95 | |
| Acer Nitro 5 AN515-46-R1A1 | |
| Medion Erazer Scout E20 | |
| MSI Katana 17 B13VFK | |
| Gigabyte G7 KE | |
| Lenovo Legion 5 15IAH7H 82RB | |
| Asus TUF Gaming A16 FA617 | |
* ... kleinere Werte sind besser
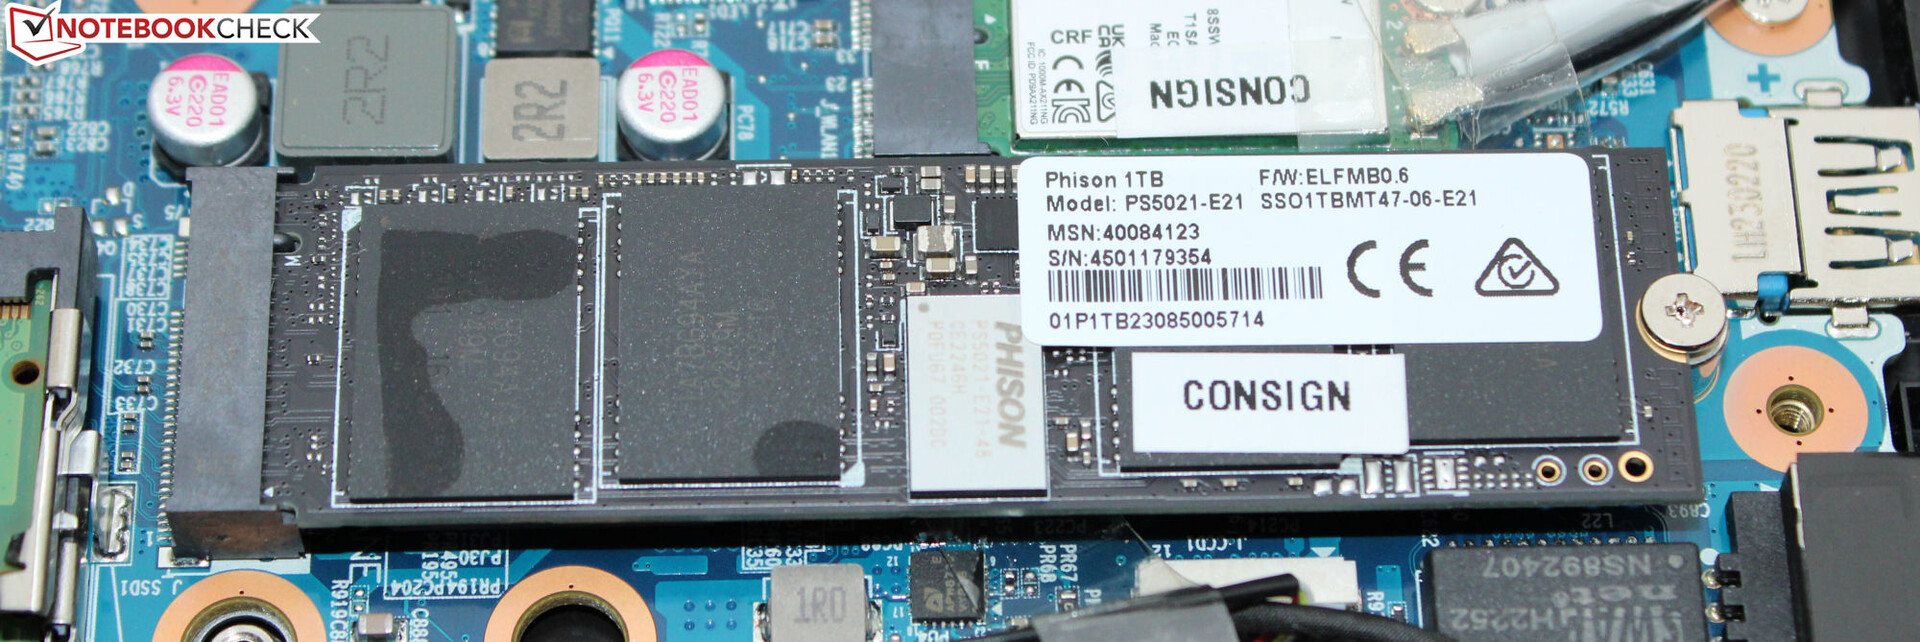
Massenspeicher
Als Systemlaufwerk dient eine PCIe-4-SSD (1 TB) im M.2-2280-Format der Firma Phison. Sie liefert sehr gute Transferraten, gehört aber nicht zu den Spitzenmodellen unter den SSDs. Leistungseinbrüche aufgrund thermischer Drosselung treten nicht auf.
Laut der Medion-Webseite kann das Notebook um ein 2,5-Zoll-Speichermedium erweitert werden. Unserem Testgerät liegen aber weder der nötige SATA-Steckplatz noch ein Einbaurahmen bei.

* ... kleinere Werte sind besser
Dauerleistung Lesen: DiskSpd Read Loop, Queue Depth 8
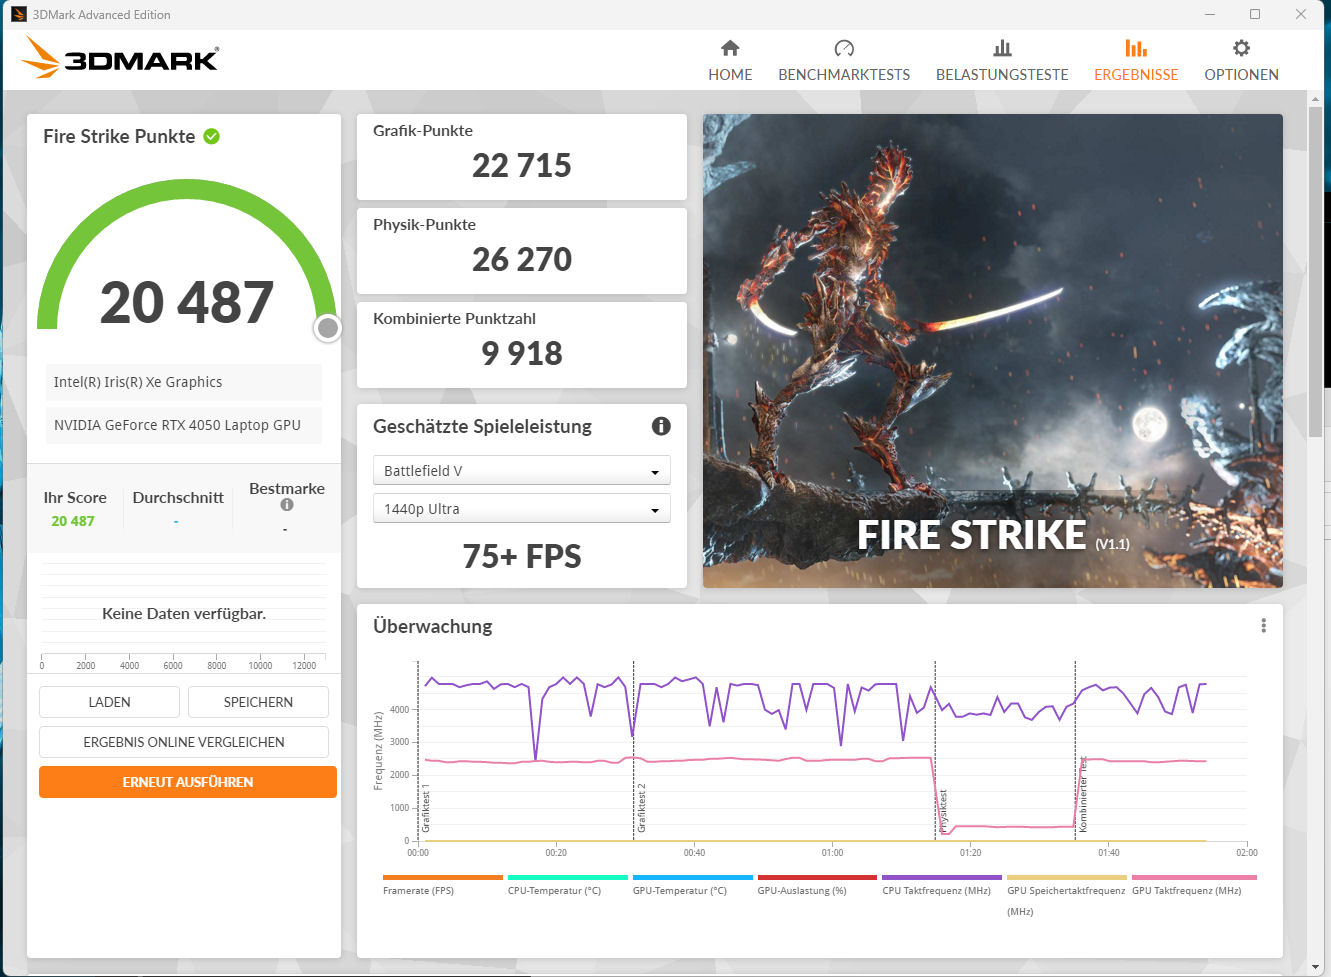
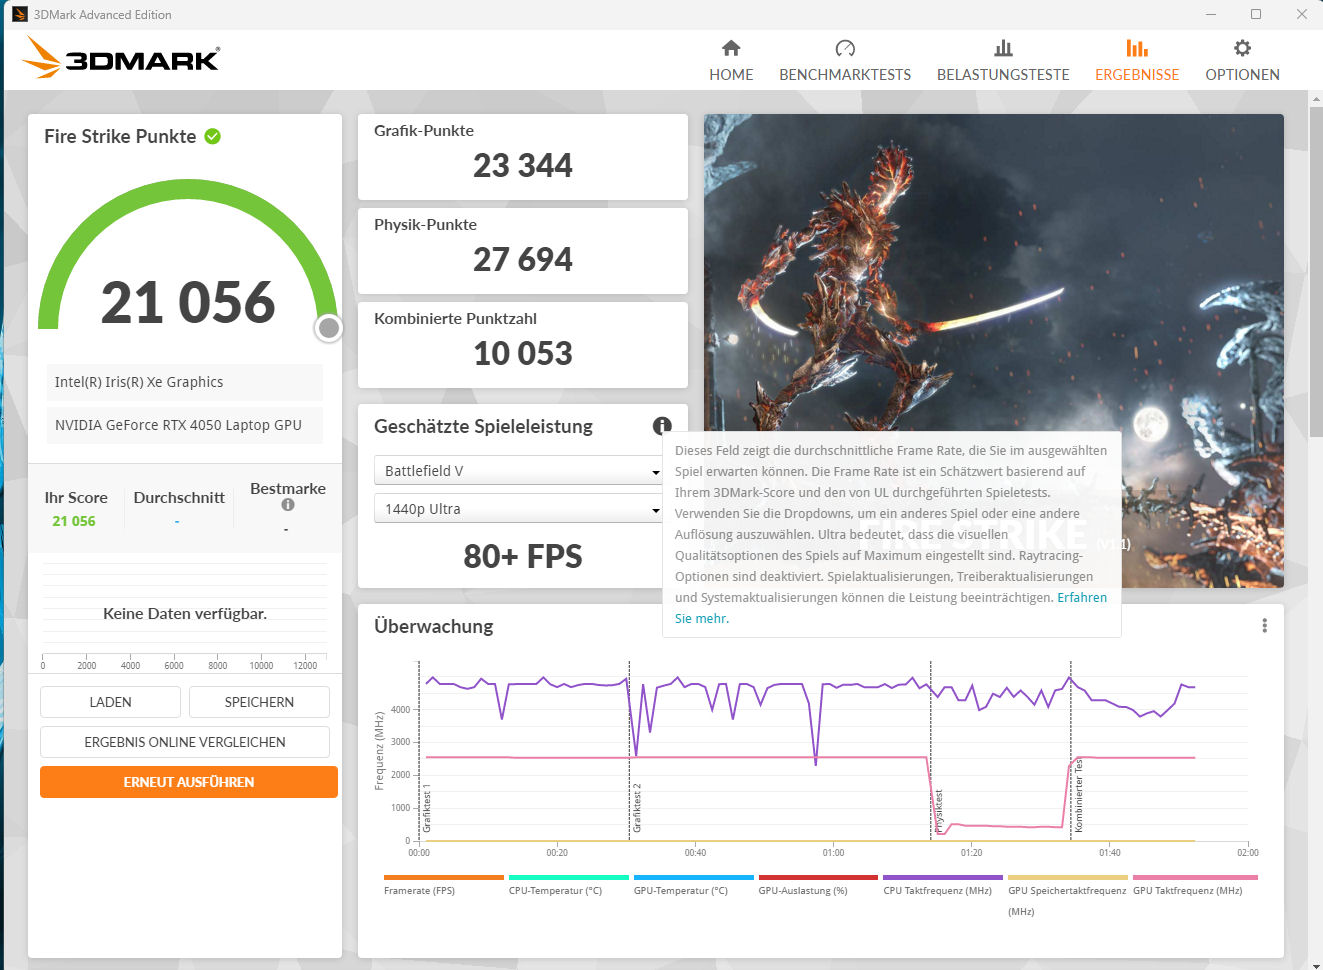
Grafikkarte
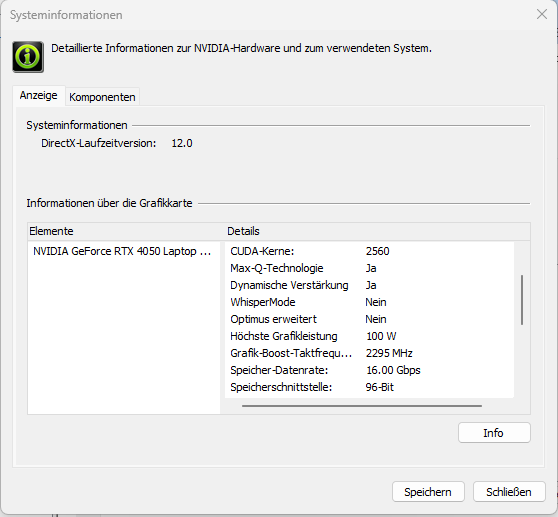
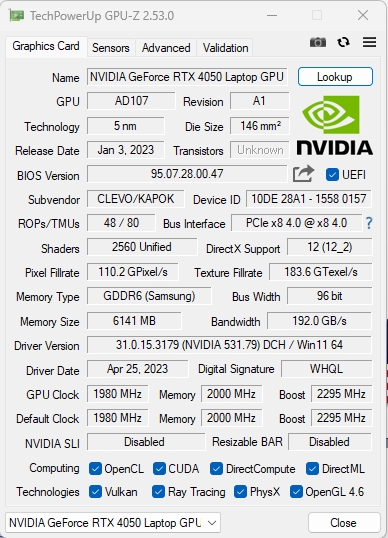
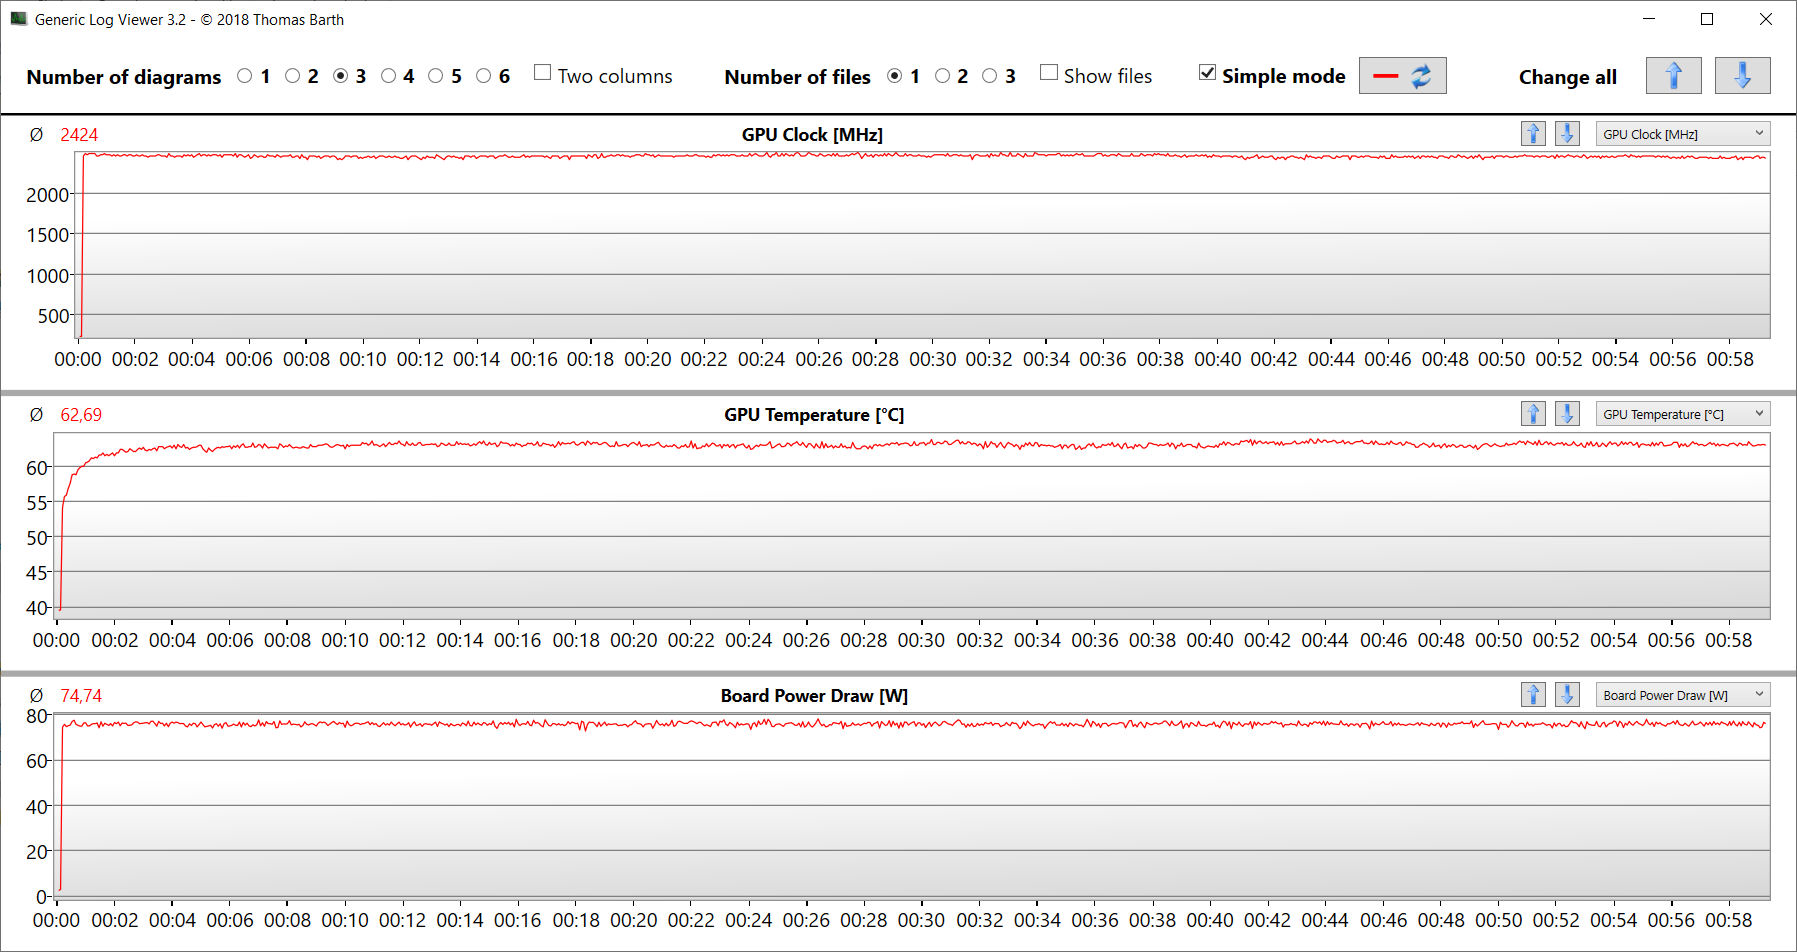
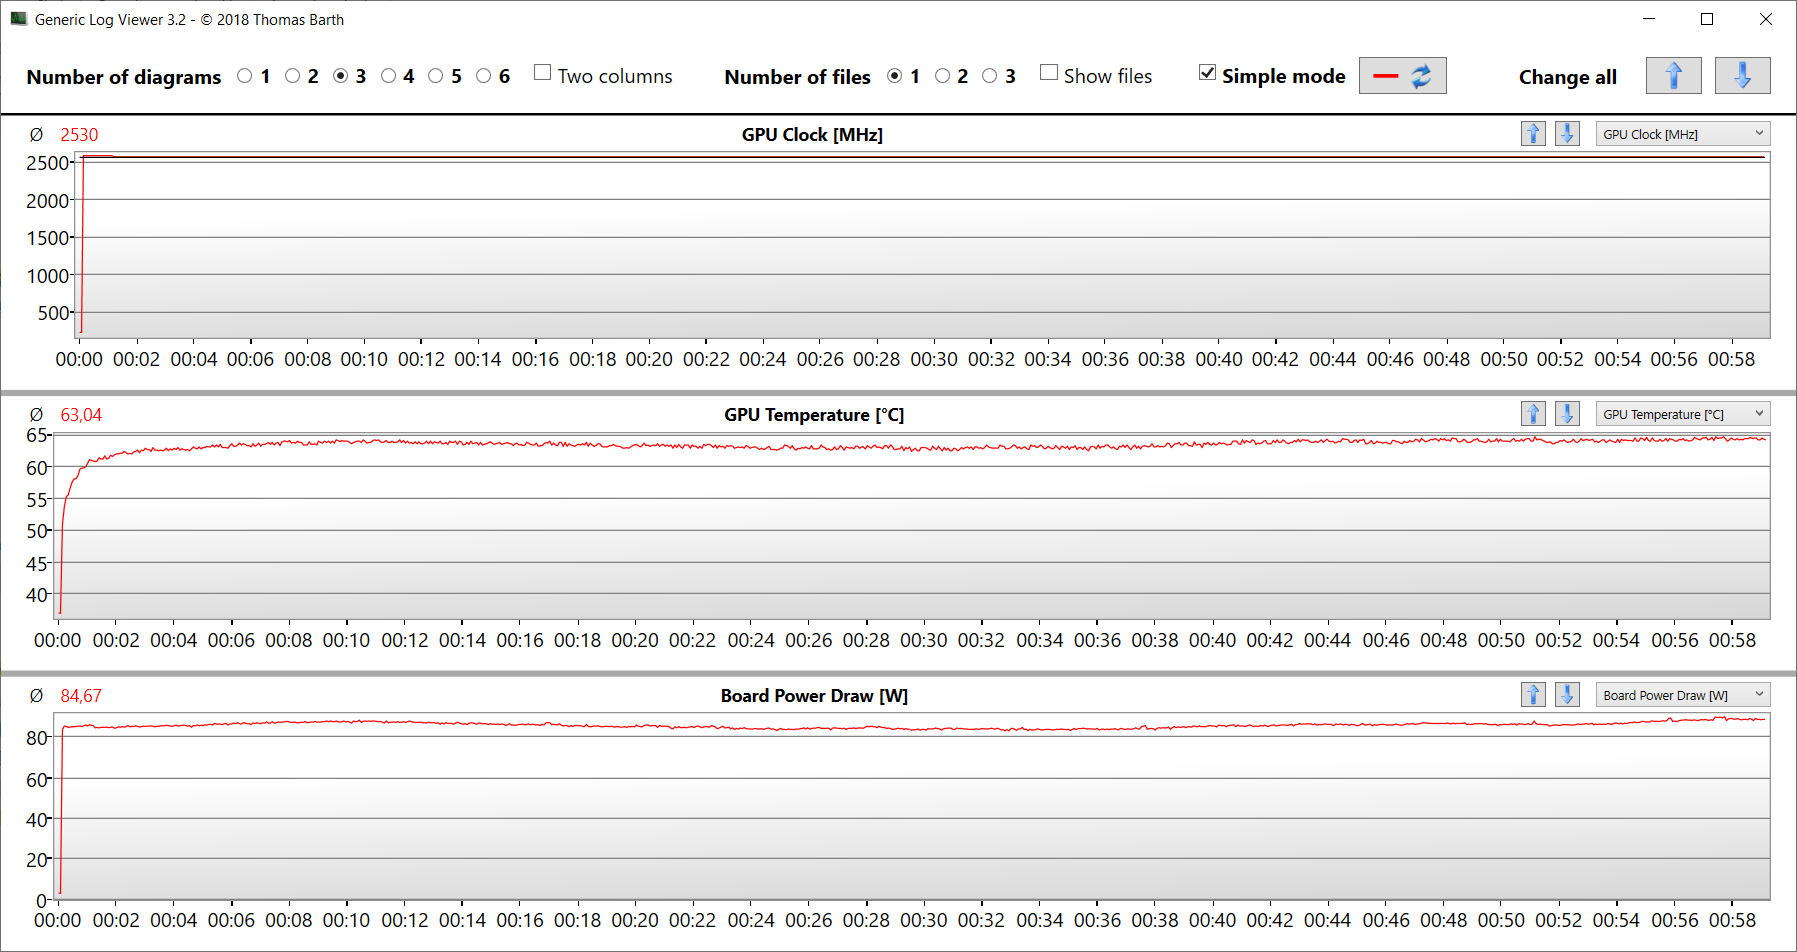
Die GeForce-RTX-4050-Laptop-GPU bietet 2.560 Shader, einen 96 Bit breiten Bus und schnellen GDDR6-Speicher (6.144 MB). Medion gesteht ihr eine maximale TGP von 100 Watt zu. Die TGP wird laut Witcher-3-Test nicht voll ausgereizt.
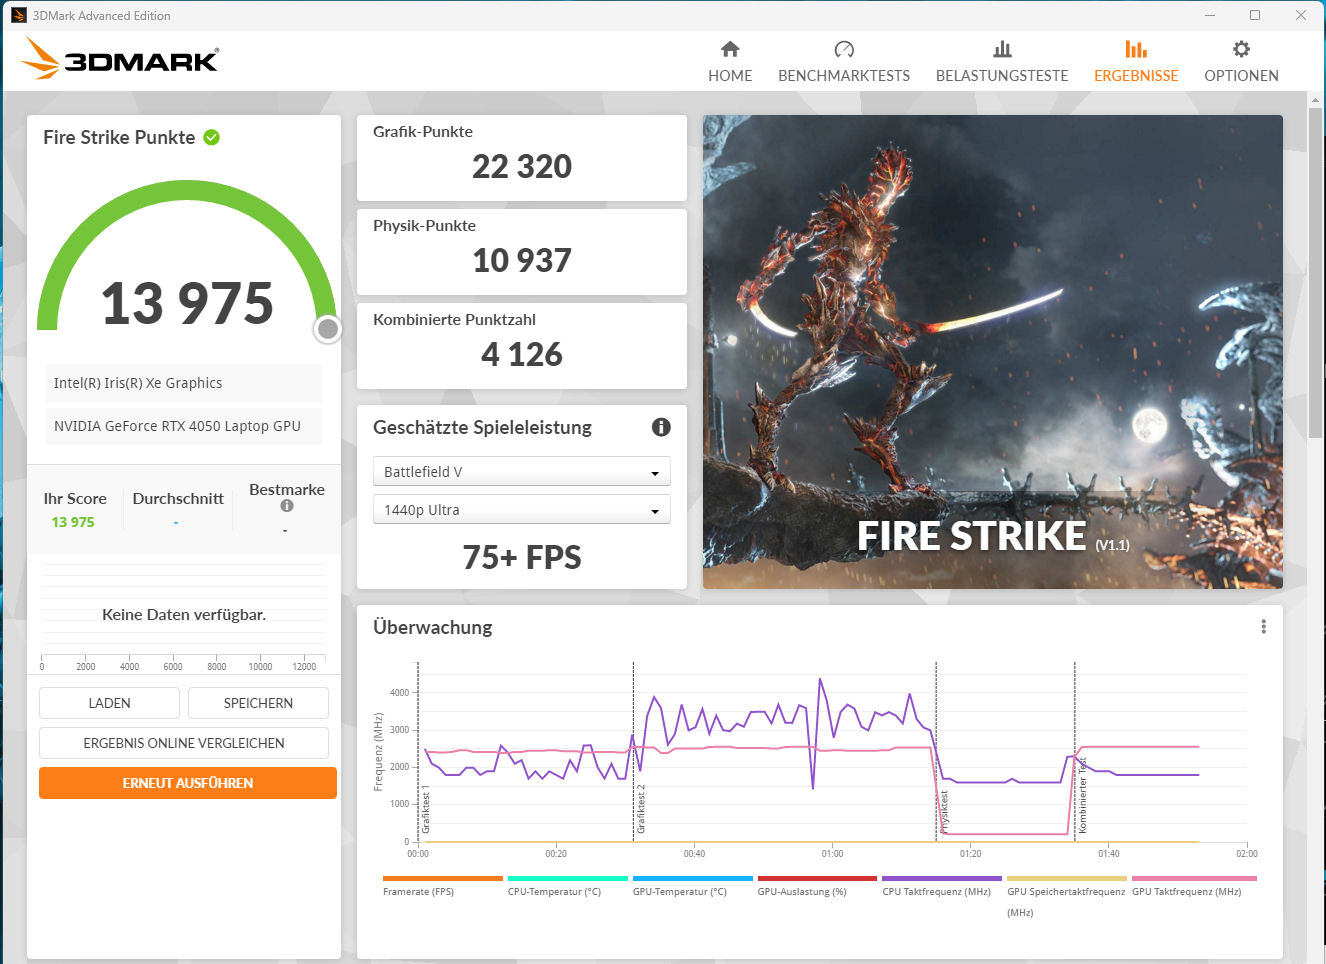
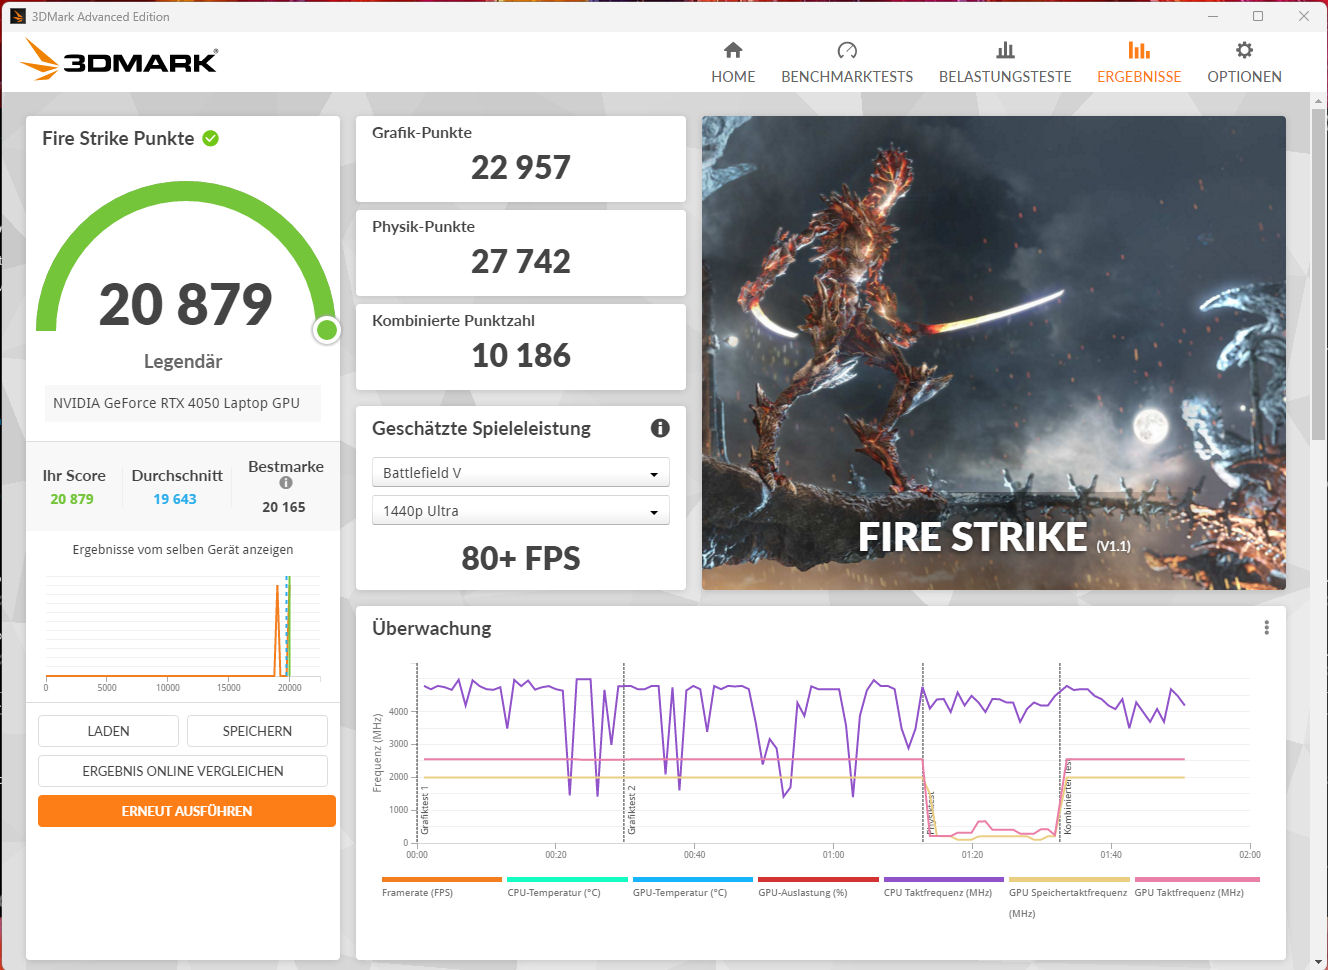
Die Benchmarkresultate bewegen sich oberhalb des RTX-4050-Durchschnitts. Unterhaltungs- und Gaming-Modus stellen nahezu die gleiche Grafikleistung bereit. Die direkte Bildausgabe per GeForce-GPU bietet keinen Leistungszuwachs. Die Umschaltung zwischen Optimus- und dGPU-Modus geschieht im BIOS oder per Control Center. Advanced Optimus wird nicht unterstützt.
| 3DMark Performance Rating - Percent | |
| Durchschnitt der Klasse Gaming | |
| MSI Katana 17 B13VFK | |
| Acer Nitro 5 AN515-46-R1A1 | |
| Asus TUF Gaming A16 FA617 | |
| Medion Erazer Scout E20 | |
| Medion Erazer Scout E20 | |
| Lenovo Legion 5 15IAH7H 82RB -1! | |
| Durchschnittliche NVIDIA GeForce RTX 4050 Laptop GPU | |
| Medion Erazer Scout E20 | |
| Gigabyte G7 KE | |
| 3DMark 11 - 1280x720 Performance GPU | |
| Durchschnitt der Klasse Gaming (21841 - 80022, n=109, der letzten 2 Jahre) | |
| Acer Nitro 5 AN515-46-R1A1 | |
| MSI Katana 17 B13VFK | |
| Asus TUF Gaming A16 FA617 | |
| Medion Erazer Scout E20 (Gaming Performance) | |
| Lenovo Legion 5 15IAH7H 82RB | |
| Medion Erazer Scout E20 | |
| Medion Erazer Scout E20 (Lautlosmodus) | |
| Gigabyte G7 KE | |
| Durchschnittliche NVIDIA GeForce RTX 4050 Laptop GPU (13339 - 32642, n=41) | |
| 3DMark 06 Standard Score | 51372 Punkte | |
| 3DMark 11 Performance | 27315 Punkte | |
| 3DMark Cloud Gate Standard Score | 52998 Punkte | |
| 3DMark Fire Strike Score | 20487 Punkte | |
| 3DMark Time Spy Score | 8594 Punkte | |
Hilfe | ||
| Blender | |
| v3.3 Classroom OPTIX/RTX | |
| Gigabyte G7 KE (3.3.2) | |
| Lenovo Legion 5 15IAH7H 82RB (3.3.0) | |
| Medion Erazer Scout E20 (3.3.3) | |
| Medion Erazer Scout E20 (3.3.3, Lautlosmodus) | |
| Durchschnittliche NVIDIA GeForce RTX 4050 Laptop GPU (25 - 37, n=40) | |
| Medion Erazer Scout E20 (3.3.3, Gaming Modus) | |
| Acer Nitro 5 AN515-46-R1A1 (3.3.0) | |
| MSI Katana 17 B13VFK (3.3.3) | |
| Durchschnitt der Klasse Gaming (9 - 32, n=112, der letzten 2 Jahre) | |
| v3.3 Classroom CUDA | |
| Durchschnittliche NVIDIA GeForce RTX 4050 Laptop GPU (47 - 68, n=39) | |
| Gigabyte G7 KE (3.3.2) | |
| Medion Erazer Scout E20 (3.3.3) | |
| Medion Erazer Scout E20 (3.3.3, Lautlosmodus) | |
| Lenovo Legion 5 15IAH7H 82RB (3.3.0) | |
| Medion Erazer Scout E20 (3.3.3, Gaming Modus) | |
| MSI Katana 17 B13VFK (3.3.3) | |
| Acer Nitro 5 AN515-46-R1A1 (3.3.0) | |
| Durchschnitt der Klasse Gaming (15 - 228, n=112, der letzten 2 Jahre) | |
| Geekbench 5.5 - OpenCL Score | |
| Durchschnitt der Klasse Gaming (80702 - 277970, n=108, der letzten 2 Jahre) | |
| Acer Nitro 5 AN515-46-R1A1 | |
| Gigabyte G7 KE | |
| Lenovo Legion 5 15IAH7H 82RB | |
| MSI Katana 17 B13VFK | |
| Medion Erazer Scout E20 (Gaming Modus) | |
| Medion Erazer Scout E20 (Lautlosmodus) | |
| Medion Erazer Scout E20 | |
| Durchschnittliche NVIDIA GeForce RTX 4050 Laptop GPU (63538 - 90075, n=38) | |
| Asus TUF Gaming A16 FA617 | |
| V-Ray Benchmark Next 4.10 | |
| GPU | |
| Durchschnitt der Klasse Gaming (427 - 1333, n=106, der letzten 2 Jahre) | |
| MSI Katana 17 B13VFK (v4.10.07 ) | |
| Acer Nitro 5 AN515-46-R1A1 (v4.10.07 ) | |
| Medion Erazer Scout E20 (v4.10.07, Gaming Modus) | |
| Medion Erazer Scout E20 (v4.10.07, Lautlosmodus) | |
| Medion Erazer Scout E20 (v4.10.07 ) | |
| Durchschnittliche NVIDIA GeForce RTX 4050 Laptop GPU (333 - 565, n=35) | |
| Gigabyte G7 KE (v4.10.07 ) | |
| Asus TUF Gaming A16 FA617 (v4.10.07 ) | |
| CPU | |
| Durchschnitt der Klasse Gaming (10048 - 45327, n=105, der letzten 2 Jahre) | |
| Medion Erazer Scout E20 (v4.10.07, Gaming Modus) | |
| MSI Katana 17 B13VFK (v4.10.07 ) | |
| Medion Erazer Scout E20 (v4.10.07 ) | |
| Durchschnittliche NVIDIA GeForce RTX 4050 Laptop GPU (5413 - 24181, n=35) | |
| Asus TUF Gaming A16 FA617 (v4.10.07 ) | |
| Gigabyte G7 KE (v4.10.07 ) | |
| Acer Nitro 5 AN515-46-R1A1 (v4.10.07 ) | |
| Medion Erazer Scout E20 (v4.10.07, Lautlosmodus) | |
* ... kleinere Werte sind besser
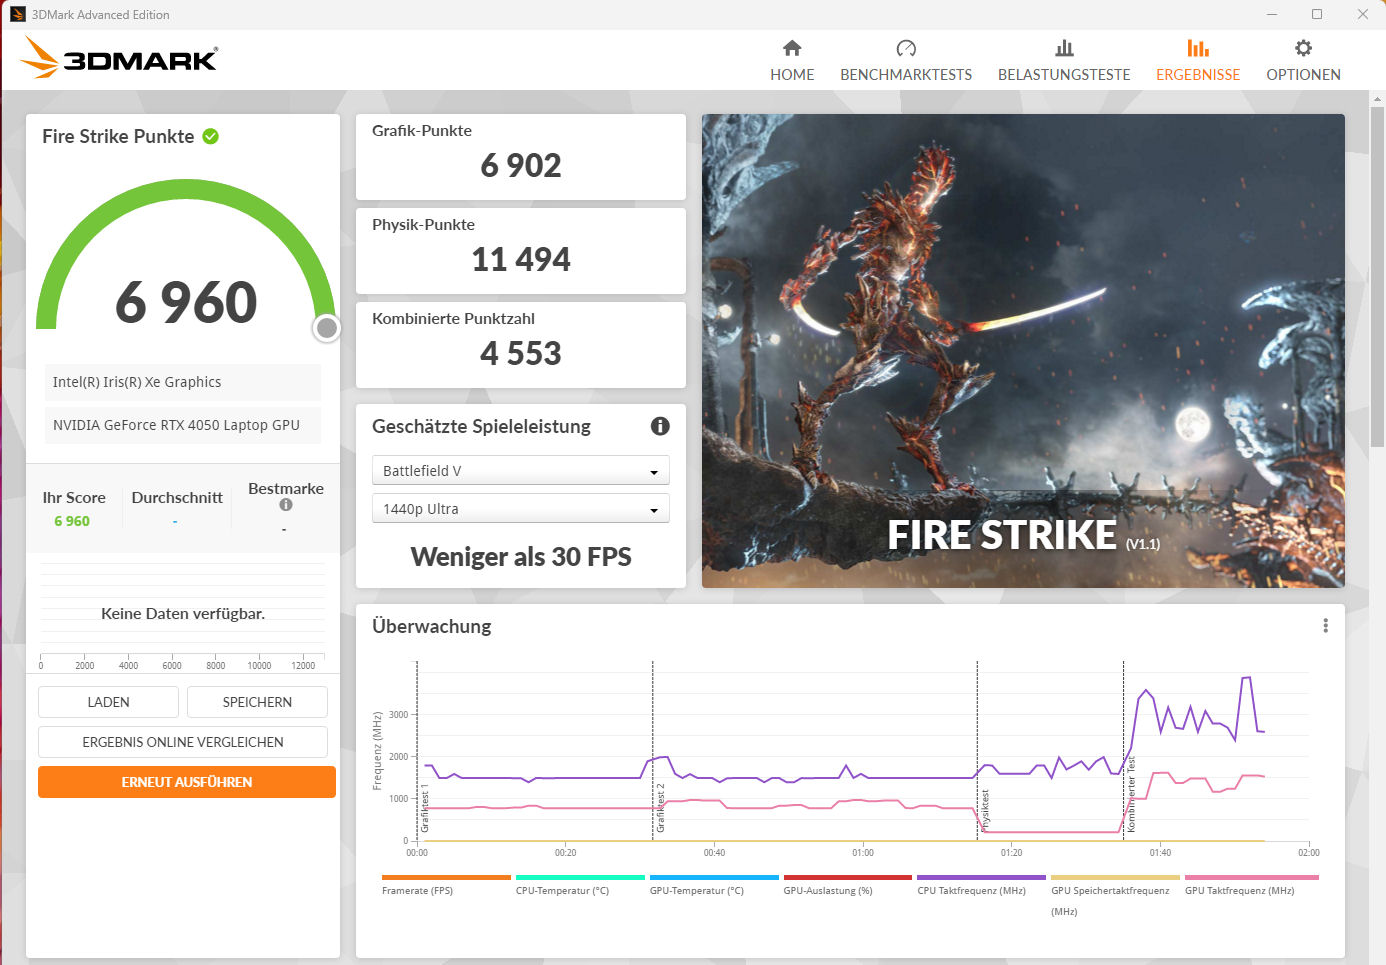
Gaming Performance
Das Scout ist auf FHD-Gaming bei hohen bis maximalen Settings ausgelegt. Der "Lautlosmodus" ermöglicht Gaming bei geringem Betriebsgeräusch. Hier sollten Auflösung und Settings entsprechend verringert werden. Es werden Bildwiederholraten oberhalb (Gaming Modus, Unterhaltungsmodus) bzw. unterhalb (Lautlosmodus) des ermittelten RTX-4050-Durchschnitts erreicht. Die direkte Bildausgabe per GeForce-GPU kann - je nach Spiel - zu einem minimalen Anstieg der Frameraten führen.
| Performance Rating - Percent | |
| Durchschnitt der Klasse Gaming | |
| MSI Katana 17 B13VFK | |
| Lenovo Legion 5 15IAH7H 82RB | |
| Medion Erazer Scout E20 | |
| Medion Erazer Scout E20 | |
| Acer Nitro 5 AN515-46-R1A1 | |
| Gigabyte G7 KE | |
| Durchschnittliche NVIDIA GeForce RTX 4050 Laptop GPU | |
| Asus TUF Gaming A16 FA617 | |
| Medion Erazer Scout E20 | |
| The Witcher 3 - 1920x1080 Ultra Graphics & Postprocessing (HBAO+) | |
| Durchschnitt der Klasse Gaming (95 - 240, n=8, der letzten 2 Jahre) | |
| Acer Nitro 5 AN515-46-R1A1 | |
| MSI Katana 17 B13VFK | |
| Asus TUF Gaming A16 FA617 | |
| Lenovo Legion 5 15IAH7H 82RB | |
| Medion Erazer Scout E20 (Gaming Modus) | |
| Medion Erazer Scout E20 | |
| Gigabyte G7 KE | |
| Medion Erazer Scout E20 (Lautlosmodus) | |
| Durchschnittliche NVIDIA GeForce RTX 4050 Laptop GPU (18.5 - 94.7, n=40) | |
| GTA V - 1920x1080 Highest AA:4xMSAA + FX AF:16x | |
| Durchschnitt der Klasse Gaming (48.3 - 186.9, n=103, der letzten 2 Jahre) | |
| MSI Katana 17 B13VFK | |
| Lenovo Legion 5 15IAH7H 82RB | |
| Gigabyte G7 KE | |
| Medion Erazer Scout E20 (Gaming Modus) | |
| Medion Erazer Scout E20 | |
| Acer Nitro 5 AN515-46-R1A1 | |
| Asus TUF Gaming A16 FA617 | |
| Durchschnittliche NVIDIA GeForce RTX 4050 Laptop GPU (14.9 - 101.7, n=35) | |
| Medion Erazer Scout E20 (Lautlosmodus) | |
| Final Fantasy XV Benchmark - 1920x1080 High Quality | |
| Durchschnitt der Klasse Gaming (41 - 215, n=104, der letzten 2 Jahre) | |
| Acer Nitro 5 AN515-46-R1A1 (1.3) | |
| Lenovo Legion 5 15IAH7H 82RB (1.3) | |
| MSI Katana 17 B13VFK (1.3) | |
| Gigabyte G7 KE (1.3) | |
| Medion Erazer Scout E20 (1.3) | |
| Medion Erazer Scout E20 (1.3, Gaming Modus) | |
| Asus TUF Gaming A16 FA617 (1.3) | |
| Durchschnittliche NVIDIA GeForce RTX 4050 Laptop GPU (15.5 - 122.3, n=39) | |
| Medion Erazer Scout E20 (1.3, Lautlosmodus) | |
| Strange Brigade - 1920x1080 ultra AA:ultra AF:16 | |
| Durchschnitt der Klasse Gaming (76.3 - 456, n=94, der letzten 2 Jahre) | |
| MSI Katana 17 B13VFK (1.47.22.14 D3D12) | |
| Acer Nitro 5 AN515-46-R1A1 (1.47.22.14 D3D12) | |
| Lenovo Legion 5 15IAH7H 82RB (1.47.22.14 D3D12) | |
| Asus TUF Gaming A16 FA617 (1.47.22.14 D3D12) | |
| Medion Erazer Scout E20 (1.47.22.14 D3D12, Gaming Modus) | |
| Gigabyte G7 KE (1.47.22.14 D3D12) | |
| Medion Erazer Scout E20 (1.47.22.14 D3D12) | |
| Medion Erazer Scout E20 (1.47.22.14 D3D12, Lautlosmodus) | |
| Durchschnittliche NVIDIA GeForce RTX 4050 Laptop GPU (21.2 - 156.6, n=38) | |
| Dota 2 Reborn - 1920x1080 ultra (3/3) best looking | |
| MSI Katana 17 B13VFK | |
| Lenovo Legion 5 15IAH7H 82RB | |
| Durchschnitt der Klasse Gaming (84.8 - 248, n=113, der letzten 2 Jahre) | |
| Medion Erazer Scout E20 (Gaming Modus) | |
| Medion Erazer Scout E20 | |
| Gigabyte G7 KE | |
| Durchschnittliche NVIDIA GeForce RTX 4050 Laptop GPU (73.5 - 175.6, n=39) | |
| Asus TUF Gaming A16 FA617 | |
| Acer Nitro 5 AN515-46-R1A1 | |
| Medion Erazer Scout E20 (Lautlosmodus) | |
| X-Plane 11.11 - 1920x1080 high (fps_test=3) | |
| MSI Katana 17 B13VFK | |
| Medion Erazer Scout E20 (Gaming Modus) | |
| Lenovo Legion 5 15IAH7H 82RB | |
| Medion Erazer Scout E20 | |
| Durchschnitt der Klasse Gaming (52.1 - 143.5, n=116, der letzten 2 Jahre) | |
| Durchschnittliche NVIDIA GeForce RTX 4050 Laptop GPU (55.5 - 117, n=40) | |
| Gigabyte G7 KE | |
| Acer Nitro 5 AN515-46-R1A1 | |
| Medion Erazer Scout E20 (Lautlosmodus) | |
| Asus TUF Gaming A16 FA617 | |
Um zu überprüfen, ob die Bildwiederholraten über einen längeren Zeitraum weitgehend konstant bleiben, lassen wir das Spiel "The Witcher 3" für etwa 60 Minuten mit Full-HD-Auflösung und maximalen Qualitätseinstellungen laufen. Die Spielfigur wird nicht bewegt. Ein Rückgang der Bildwiederholraten tritt nur bei aktivem "Lautlosmodus" ein.
Witcher 3 FPS-Diagramm
| min. | mittel | hoch | max. | |
|---|---|---|---|---|
| GTA V (2015) | 184.8 | 180.1 | 172.4 | 94.2 |
| The Witcher 3 (2015) | 382.6 | 265.3 | 150.9 | 83.4 |
| Dota 2 Reborn (2015) | 177.6 | 160.3 | 150.3 | 142.5 |
| Final Fantasy XV Benchmark (2018) | 187.5 | 116.9 | 82.6 | |
| X-Plane 11.11 (2018) | 153.9 | 132.7 | 104.4 | |
| Far Cry 5 (2018) | 172 | 136 | 126 | 119 |
| Strange Brigade (2018) | 447 | 206 | 166.5 | 144 |
| Gears Tactics (2020) | 341.6 | 204.1 | 133.9 | 96.7 |
| Death Stranding (2020) | 174.8 | 140.5 | 132 | 128.8 |
| Assassin´s Creed Valhalla (2020) | 184 | 117 | 92 | 70 |
| Immortals Fenyx Rising (2020) | 171 | 112 | 101 | 93 |
| Mass Effect Legendary Edition (2021) | 150.1 | 135.1 | ||
| Far Cry 6 (2021) | 153.2 | 125.3 | 107.3 | 76.7 |
| Back 4 Blood (2021) | 332 | 221 | 166.1 | 155.3 |
| Guardians of the Galaxy (2021) | 144 | 120 | 119 | 113 |
| Riders Republic (2021) | 164 | 131 | 107 | 96 |
| Halo Infinite (2021) | 122.8 | 104.6 | 85.9 | |
| Rainbow Six Extraction (2022) | 208 | 166 | 159 | 125 |
| GRID Legends (2022) | 206.2 | 171.4 | 140.9 | 109.8 |
| Elex 2 (2022) | 116.3 | 115.7 | 103.4 | 81.4 |
| F1 22 (2022) | 215 | 197.2 | 152.3 | 52.5 |
| Uncharted Legacy of Thieves Collection (2022) | 75.1 | 71.1 | 67.2 | 62.6 |
| Dead Island 2 (2023) | 196 | 171.7 | 133.1 | 120.6 |
| Star Wars Jedi Survivor (2023) | 99.2 | 86.3 | 62.9 | 49.4 |
| Anno 117: Pax Romana (2025) | 83.6 | 64 | 47.8 | 26.2 |
| Forza Horizon 6 (2026) | 147 | 96 | 50 | 18 |
Emissionen - Das Erazer Scout erwärmt sich kaum
Geräuschemissionen
Die Leistungsprofile beeinflussen die Lärmentwicklung in starkem Maße. Der "Gaming Modus" sorgt im Spiele-Betrieb für etwa 57 dB(A), bei aktivem "Unterhaltungsmodus" liegt der Pegel bei hörbar geringeren 50 dB(A). In jedem Fall sind die Werte zu hoch. CPU und GPU dürften auch bei langsamer agierenden Lüftern noch ausreichend gekühlt werden. Hier sollte Medion noch einmal an der Lüftersteuerung arbeiten.
Deutlich nutzerfreundlicher gestalten sich die beiden übrigen Modi. Sie lassen das E20 leiser zu Werke gehen. Der "Lautlosmodus" hält nicht, was der Name verspricht. Nichtsdestotrotz: Er ermöglicht Gaming bei geringer Geräuschkulisse. So wird der Witcher-3-Test mit etwa 34 dB(A) durchlaufen.
Im Leerlauf sowie im Alltagsbetrieb (Office, Internet) arbeitet das Notebook oftmals leise, manchmal lautlos. Allerdings: Gelegentlich drehen die Lüfter unnötigerweise auf (ein typisches Phänomen bei Clevo Barebones).
Lautstärkediagramm
| Idle |
| 26 / 27 / 32 dB(A) |
| Last |
| 57 / 57 dB(A) |
 | ||
30 dB leise 40 dB(A) deutlich hörbar 50 dB(A) störend |
||
min: | ||
| Medion Erazer Scout E20 i7-13700H, GeForce RTX 4050 Laptop GPU | Gigabyte G7 KE i5-12500H, GeForce RTX 3060 Laptop GPU | MSI Katana 17 B13VFK i7-13620H, GeForce RTX 4060 Laptop GPU | Asus TUF Gaming A16 FA617 R7 7735HS, Radeon RX 7600S | Lenovo Legion 5 15IAH7H 82RB i7-12700H, GeForce RTX 3060 Laptop GPU | Acer Nitro 5 AN515-46-R1A1 R7 6800H, GeForce RTX 3070 Ti Laptop GPU | |
|---|---|---|---|---|---|---|
| Geräuschentwicklung | -10% | -1% | 10% | 14% | -3% | |
| aus / Umgebung * (dB) | 25 | 27 -8% | 24.5 2% | 24 4% | 23.3 7% | 25 -0% |
| Idle min * (dB) | 26 | 27 -4% | 24.5 6% | 24 8% | 23.5 10% | 25 4% |
| Idle avg * (dB) | 27 | 35 -30% | 24.5 9% | 25 7% | 23.5 13% | 28.6 -6% |
| Idle max * (dB) | 32 | 38 -19% | 40 -25% | 28 12% | 26.8 16% | 44.3 -38% |
| Last avg * (dB) | 57 | 52 9% | 48.3 15% | 42 26% | 29.3 49% | 47.6 16% |
| Witcher 3 ultra * (dB) | 50 | 56 -12% | 56 -12% | 50 -0% | 51.4 -3% | |
| Last max * (dB) | 57 | 59 -4% | 59.1 -4% | 50 12% | 53 7% | 53.6 6% |
* ... kleinere Werte sind besser
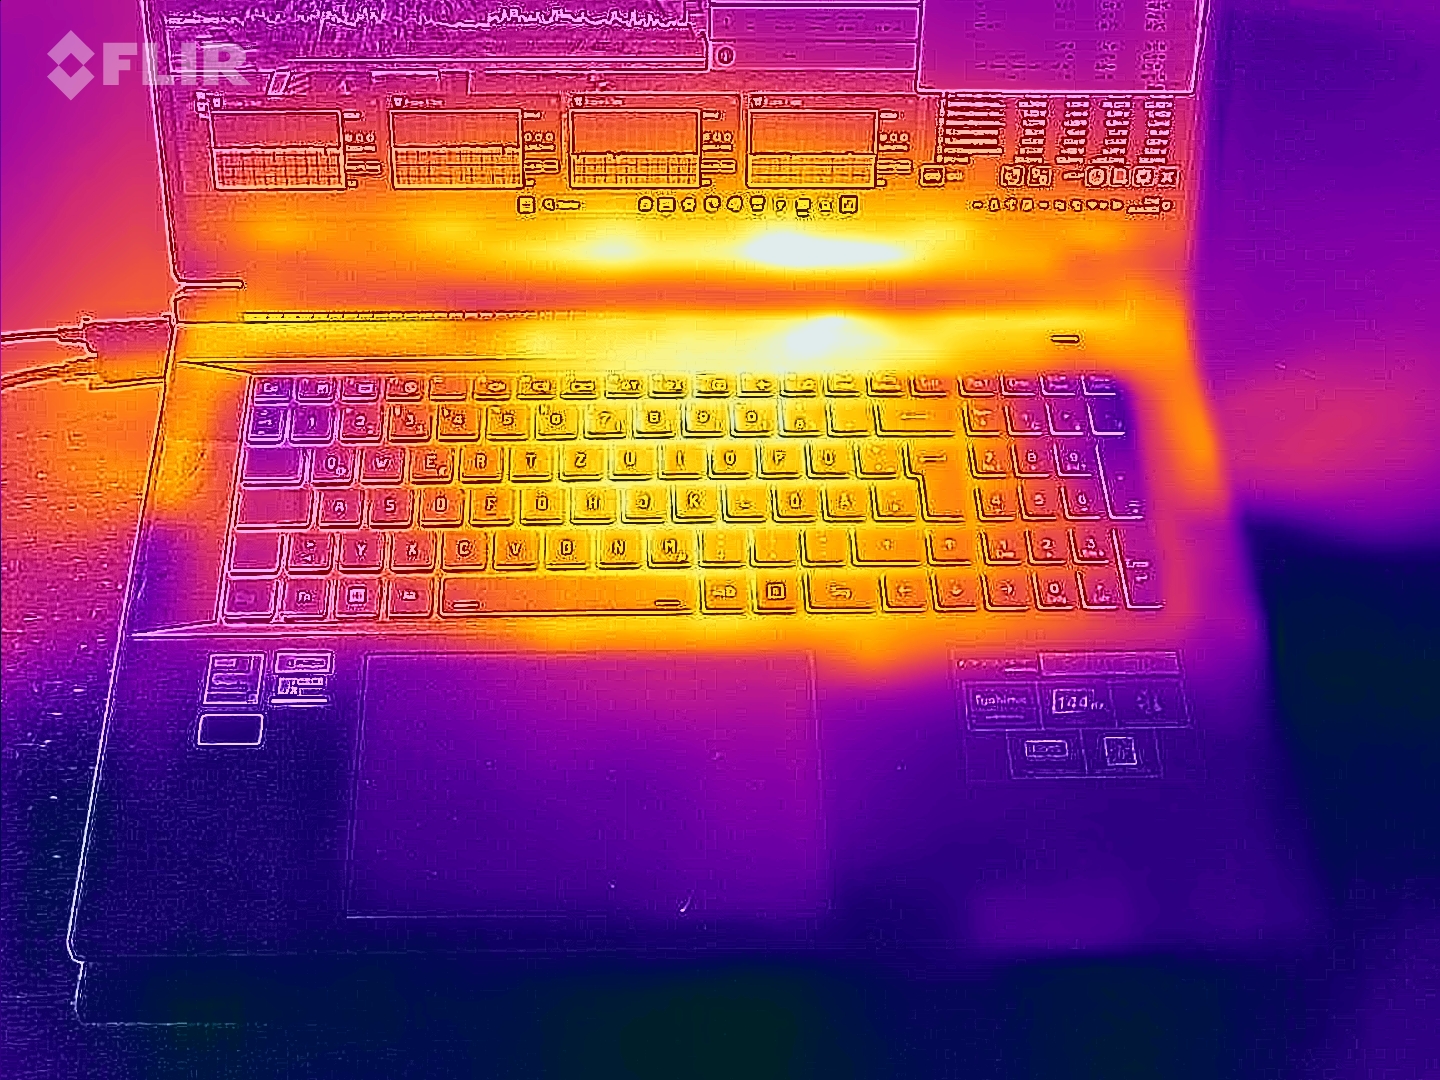
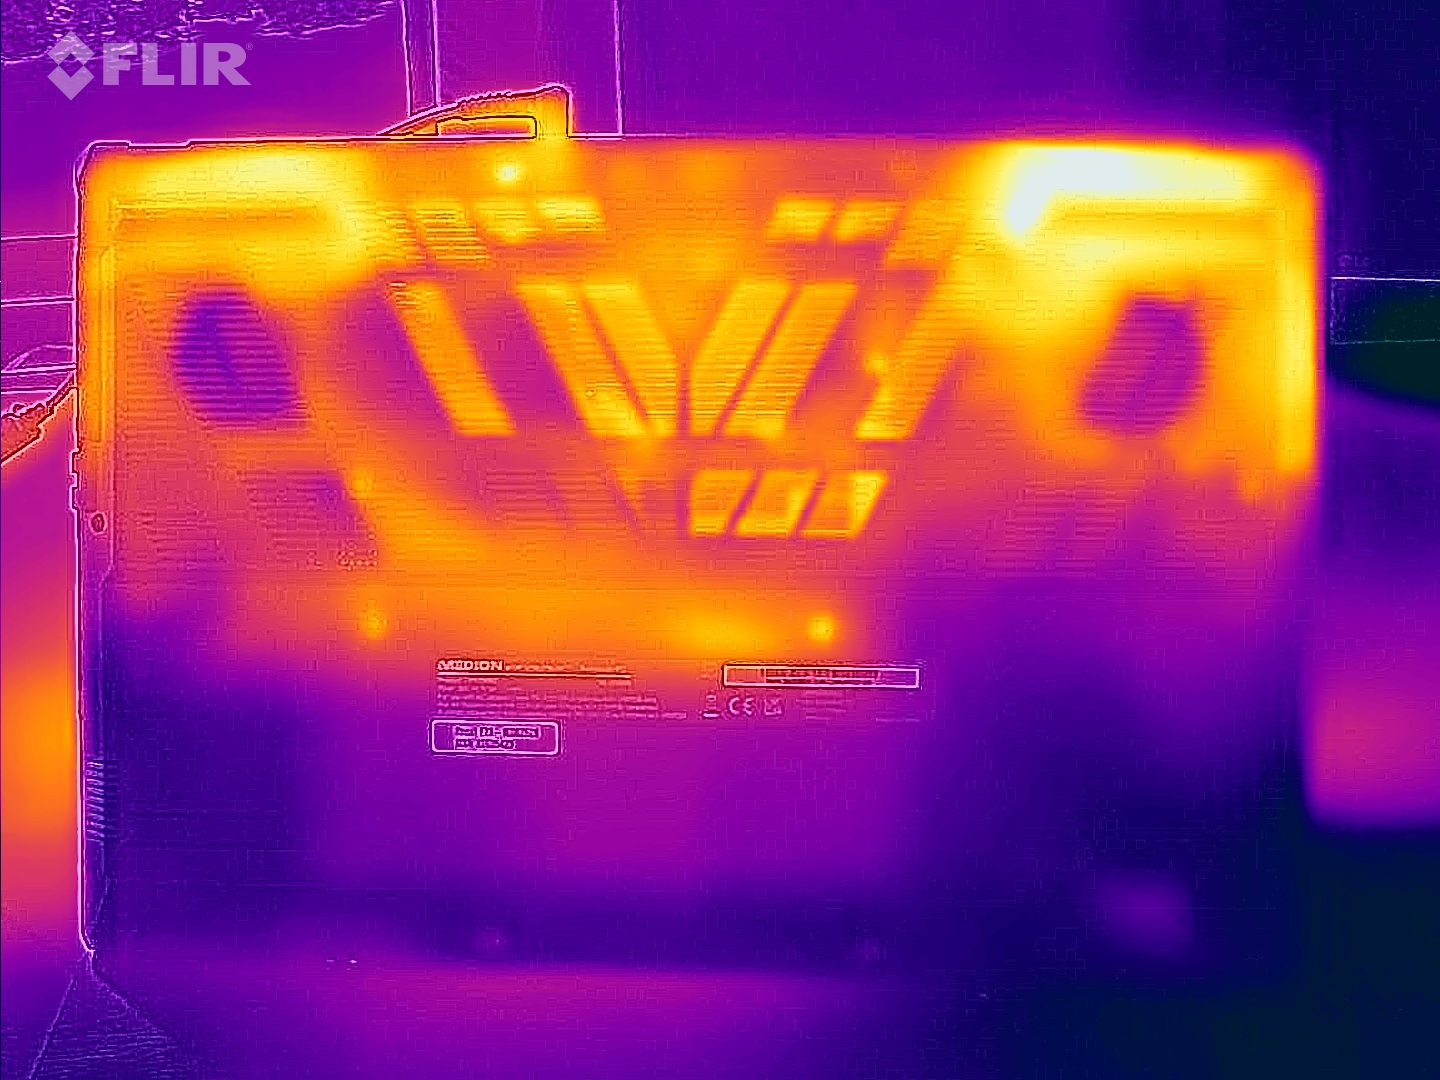
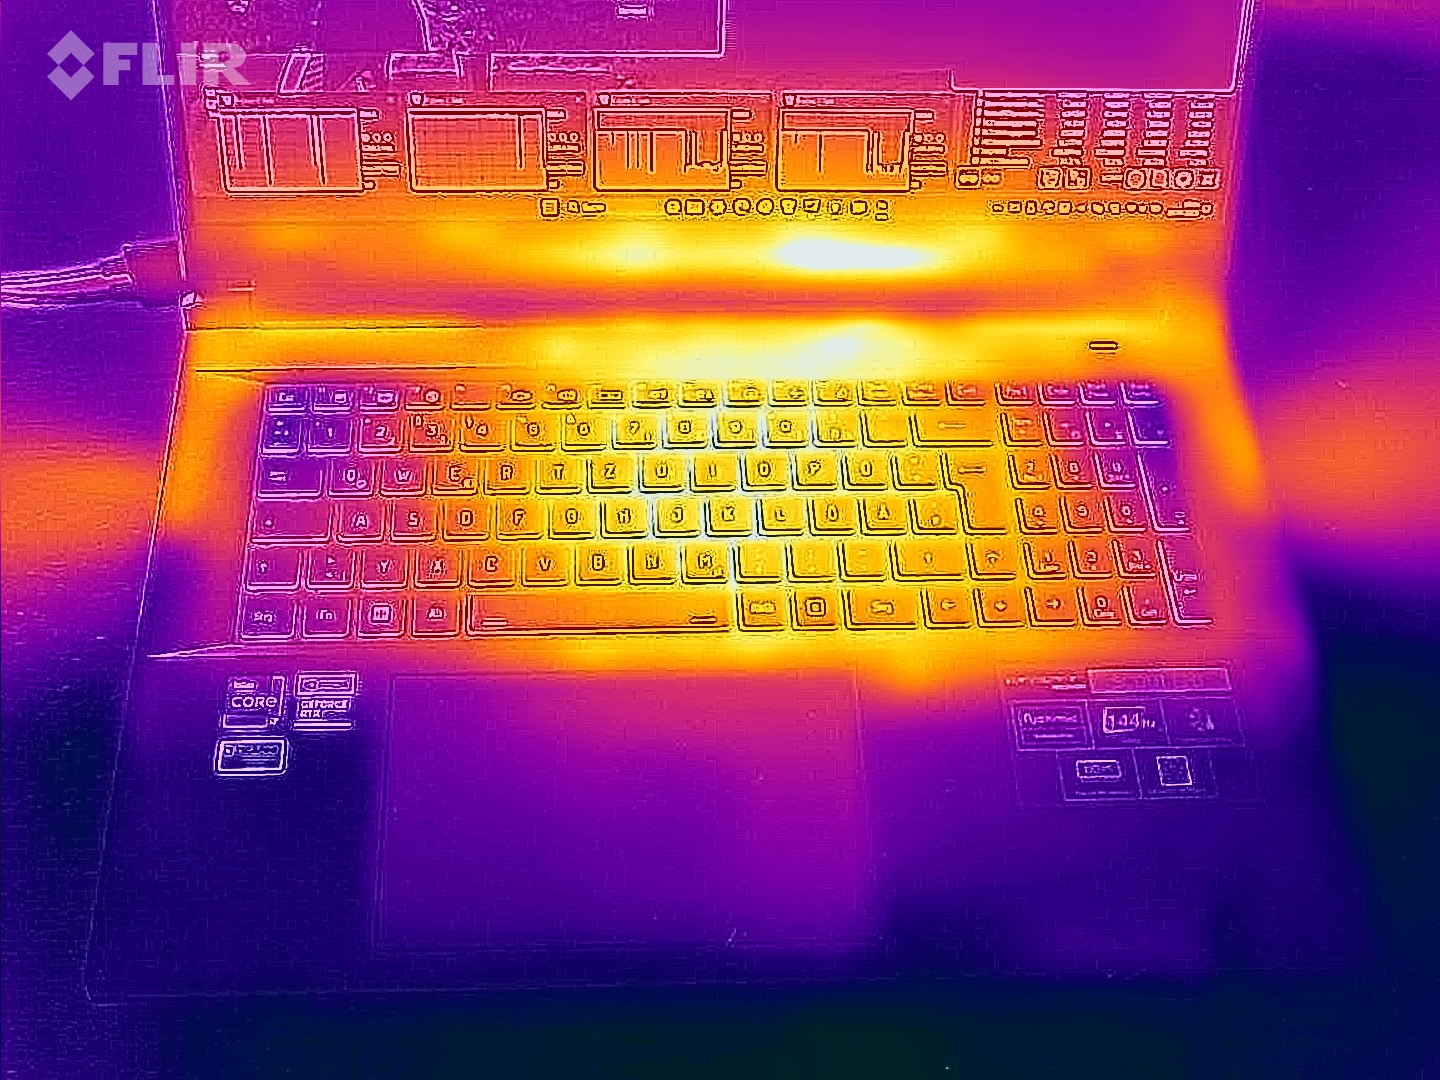
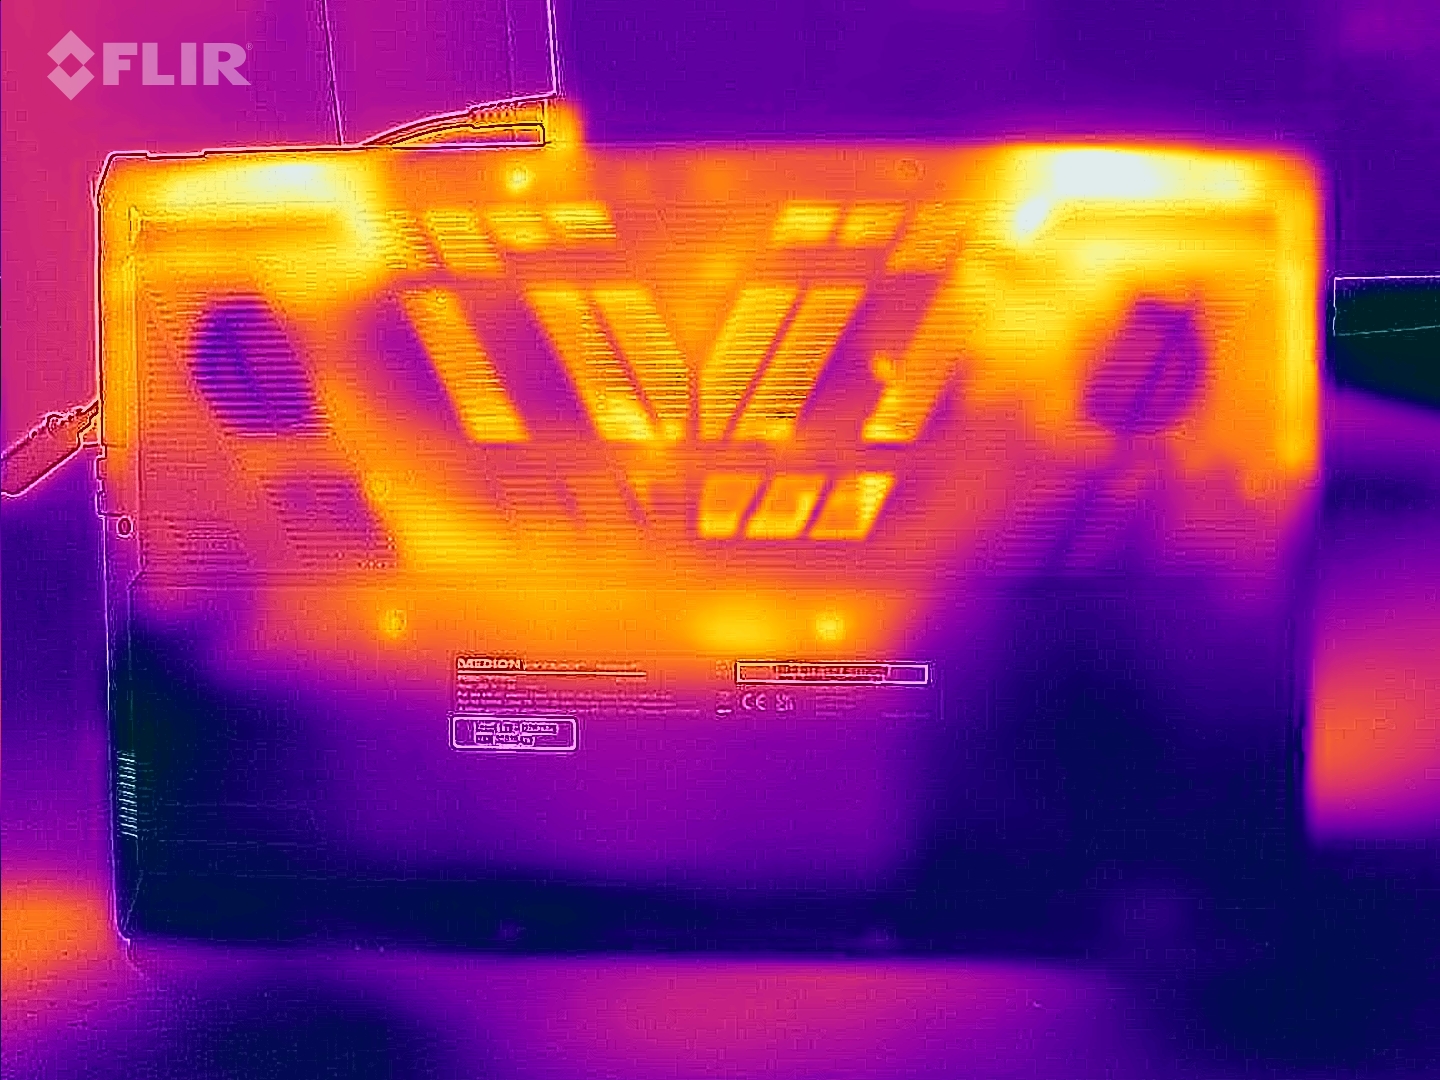
Temperatur
Das Notebook erwärmt sich bestenfalls moderat. Eine Höchsttemperatur von 41 °C wird während des Stresstests erreicht - an einem Messpunkt. Im Alltagsbetrieb bewegen sich die Werte im grünen Bereich.
(±) Die maximale Temperatur auf der Oberseite ist 41 °C. Im Vergleich liegt der Klassendurchschnitt bei 40.4 °C (von 21.2 bis 68.8 °C für die Klasse Gaming).
(+) Auf der Unterseite messen wir eine maximalen Wert von 39 °C (im Vergleich zum Durchschnitt von 43.2 °C).
(+) Ohne Last messen wir eine durchschnittliche Temperatur von 26.8 °C auf der Oberseite. Der Klassendurchschnitt erreicht 33.9 °C.
(±) Beim längeren Spielen von The Witcher 3 erhitzt sich das Gerät durchschnittlich auf 34.1 °C. Der Durchschnitt der Klasse ist derzeit 33.9 °C.
(+) Die Handballen und der Touchpad-Bereich sind mit gemessenen 26 °C kühler als die typische Hauttemperatur und fühlen sich dadurch kühl an.
(+) Die durchschnittliche Handballen-Temperatur anderer getesteter Geräte war 28.8 °C (+2.8 °C).
| Medion Erazer Scout E20 Intel Core i7-13700H, NVIDIA GeForce RTX 4050 Laptop GPU | Gigabyte G7 KE Intel Core i5-12500H, NVIDIA GeForce RTX 3060 Laptop GPU | MSI Katana 17 B13VFK Intel Core i7-13620H, NVIDIA GeForce RTX 4060 Laptop GPU | Asus TUF Gaming A16 FA617 AMD Ryzen 7 7735HS, AMD Radeon RX 7600S | Lenovo Legion 5 15IAH7H 82RB Intel Core i7-12700H, NVIDIA GeForce RTX 3060 Laptop GPU | Acer Nitro 5 AN515-46-R1A1 AMD Ryzen 7 6800H, NVIDIA GeForce RTX 3070 Ti Laptop GPU | |
|---|---|---|---|---|---|---|
| Hitze | -16% | -10% | -30% | -1% | -13% | |
| Last oben max * (°C) | 41 | 52 -27% | 41.6 -1% | 54 -32% | 37.8 8% | 48.1 -17% |
| Last unten max * (°C) | 39 | 54 -38% | 43.1 -11% | 47 -21% | 51 -31% | 49.7 -27% |
| Idle oben max * (°C) | 31 | 28 10% | 32 -3% | 40 -29% | 25.8 17% | 30 3% |
| Idle unten max * (°C) | 29 | 32 -10% | 35.8 -23% | 40 -38% | 28.8 1% | 31.7 -9% |
* ... kleinere Werte sind besser
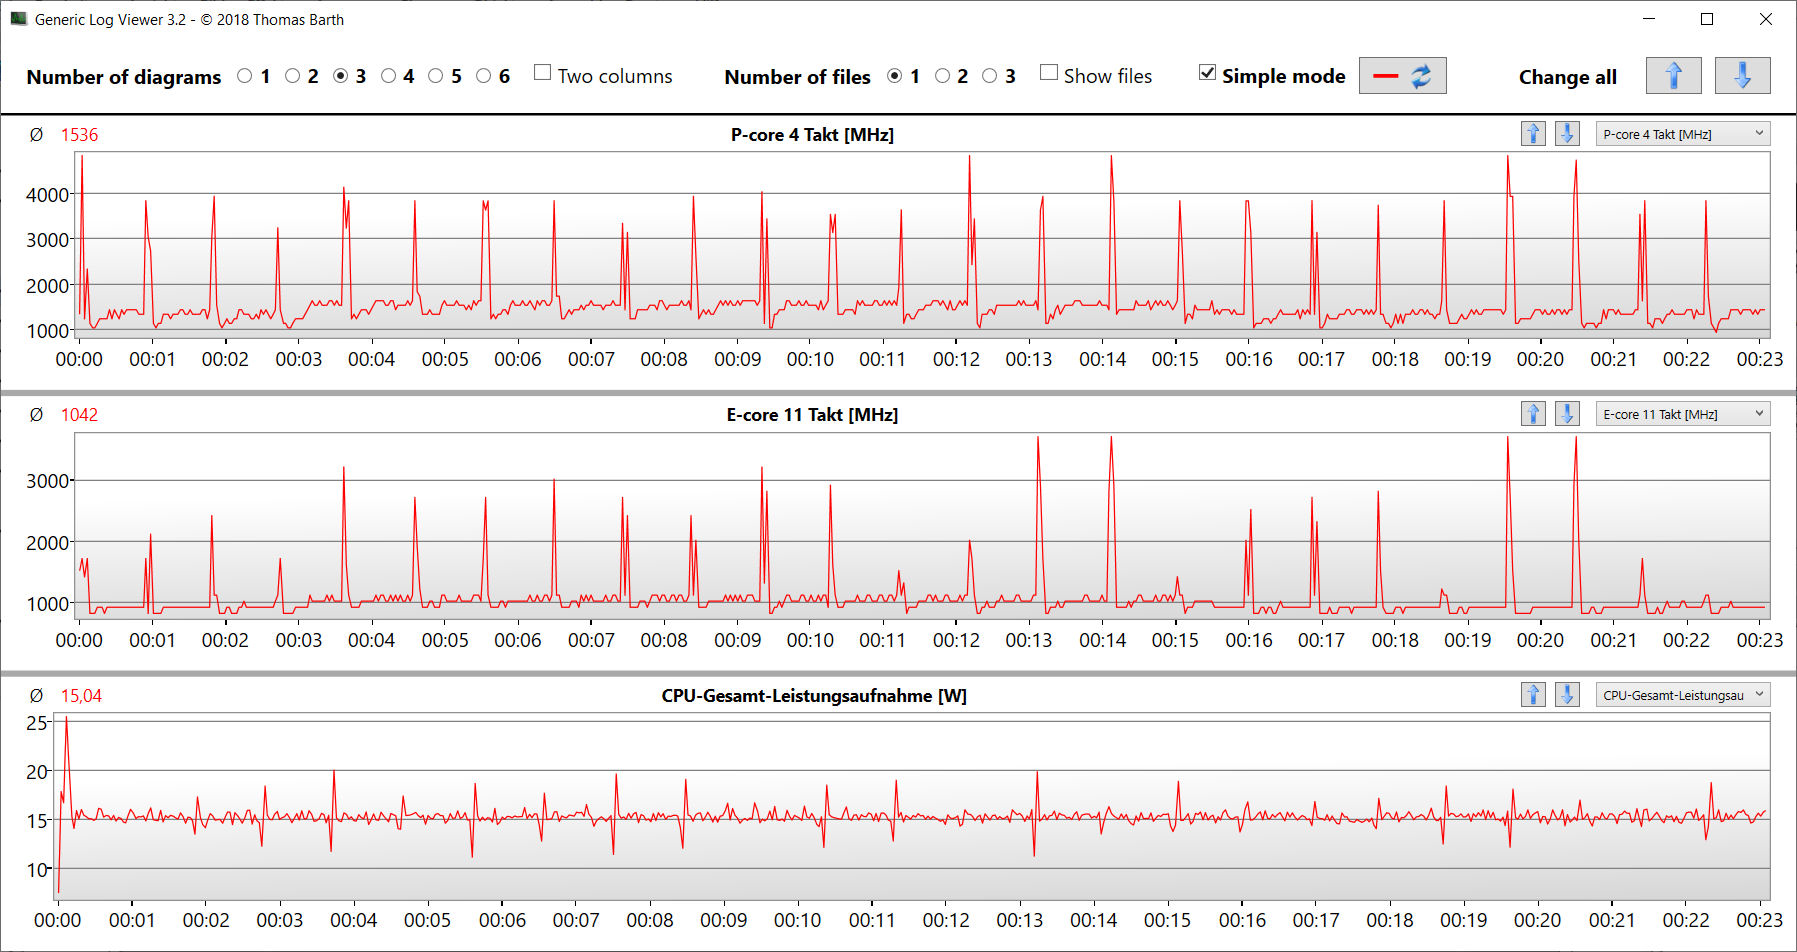
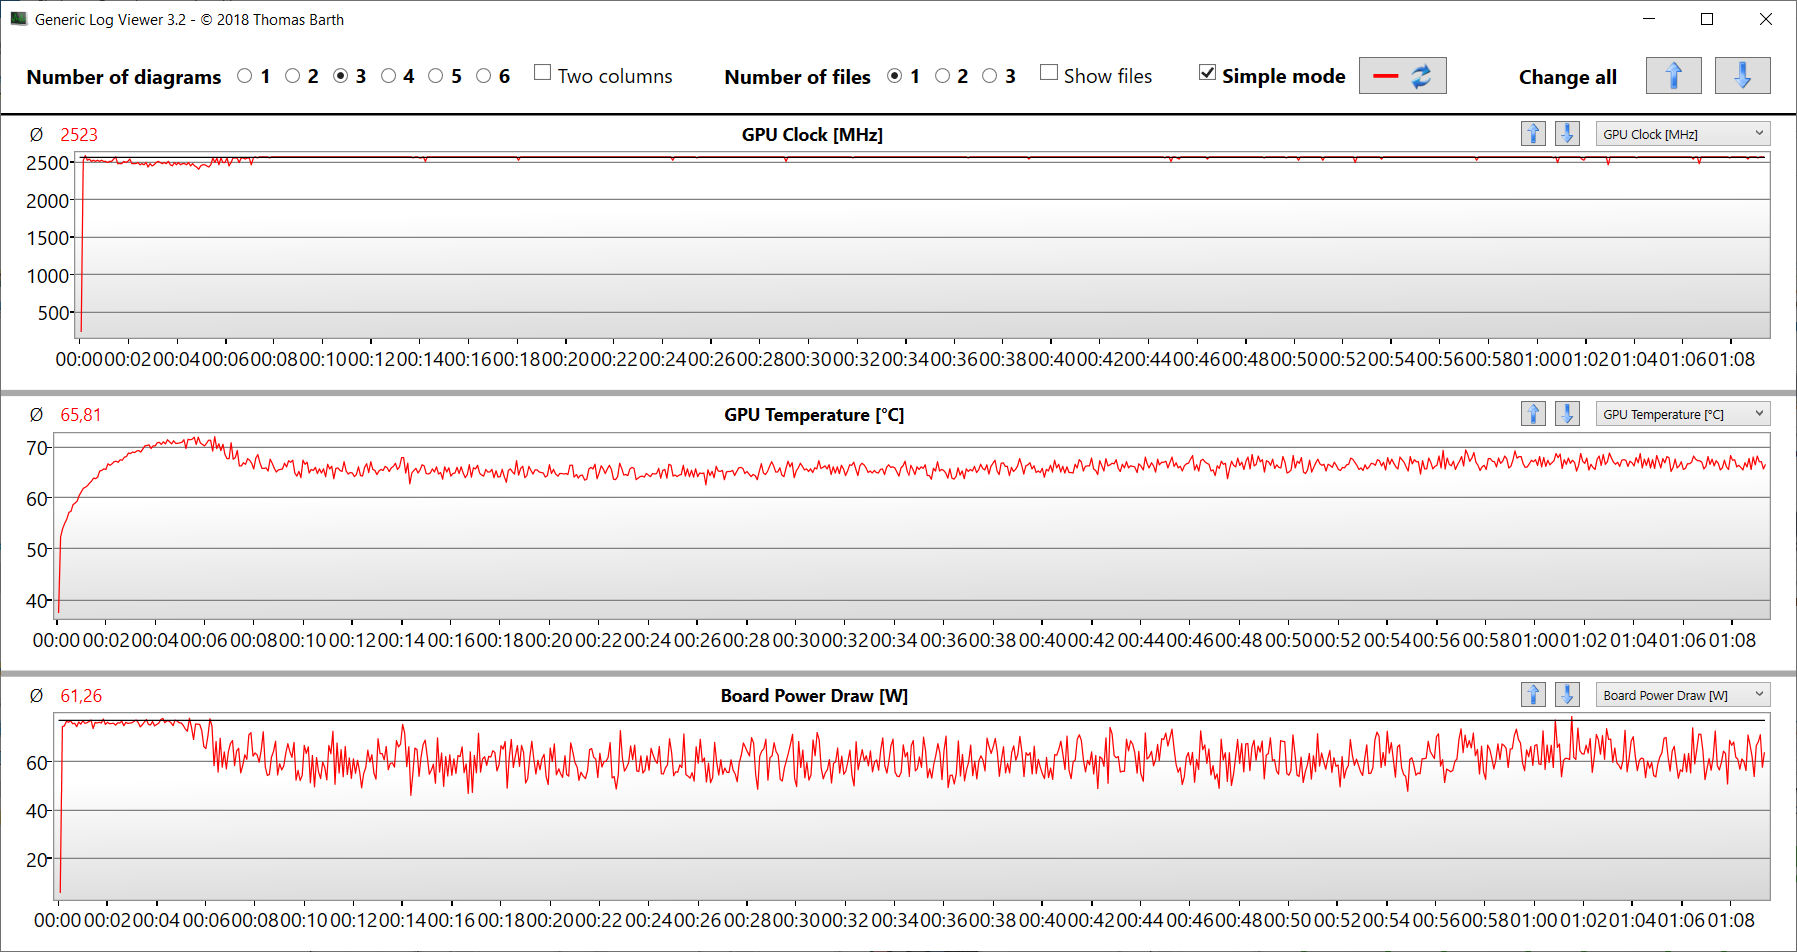
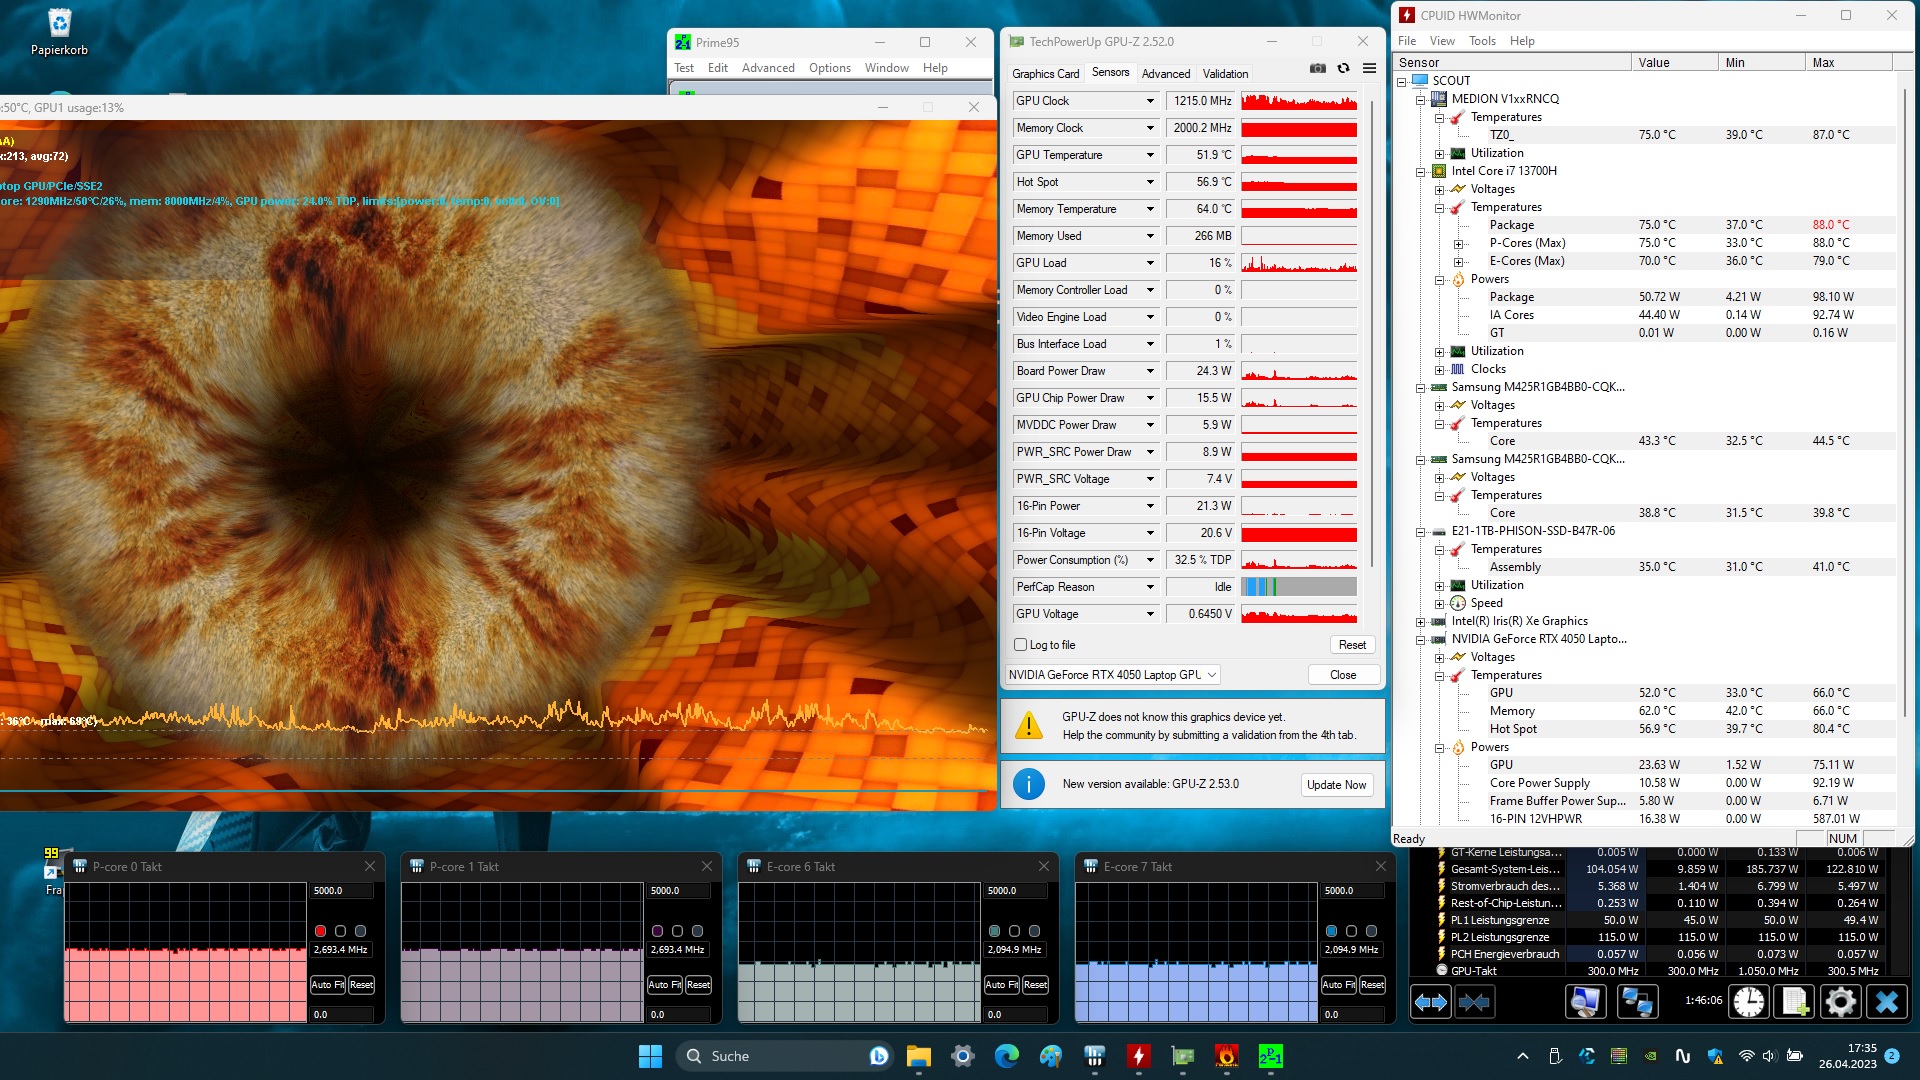
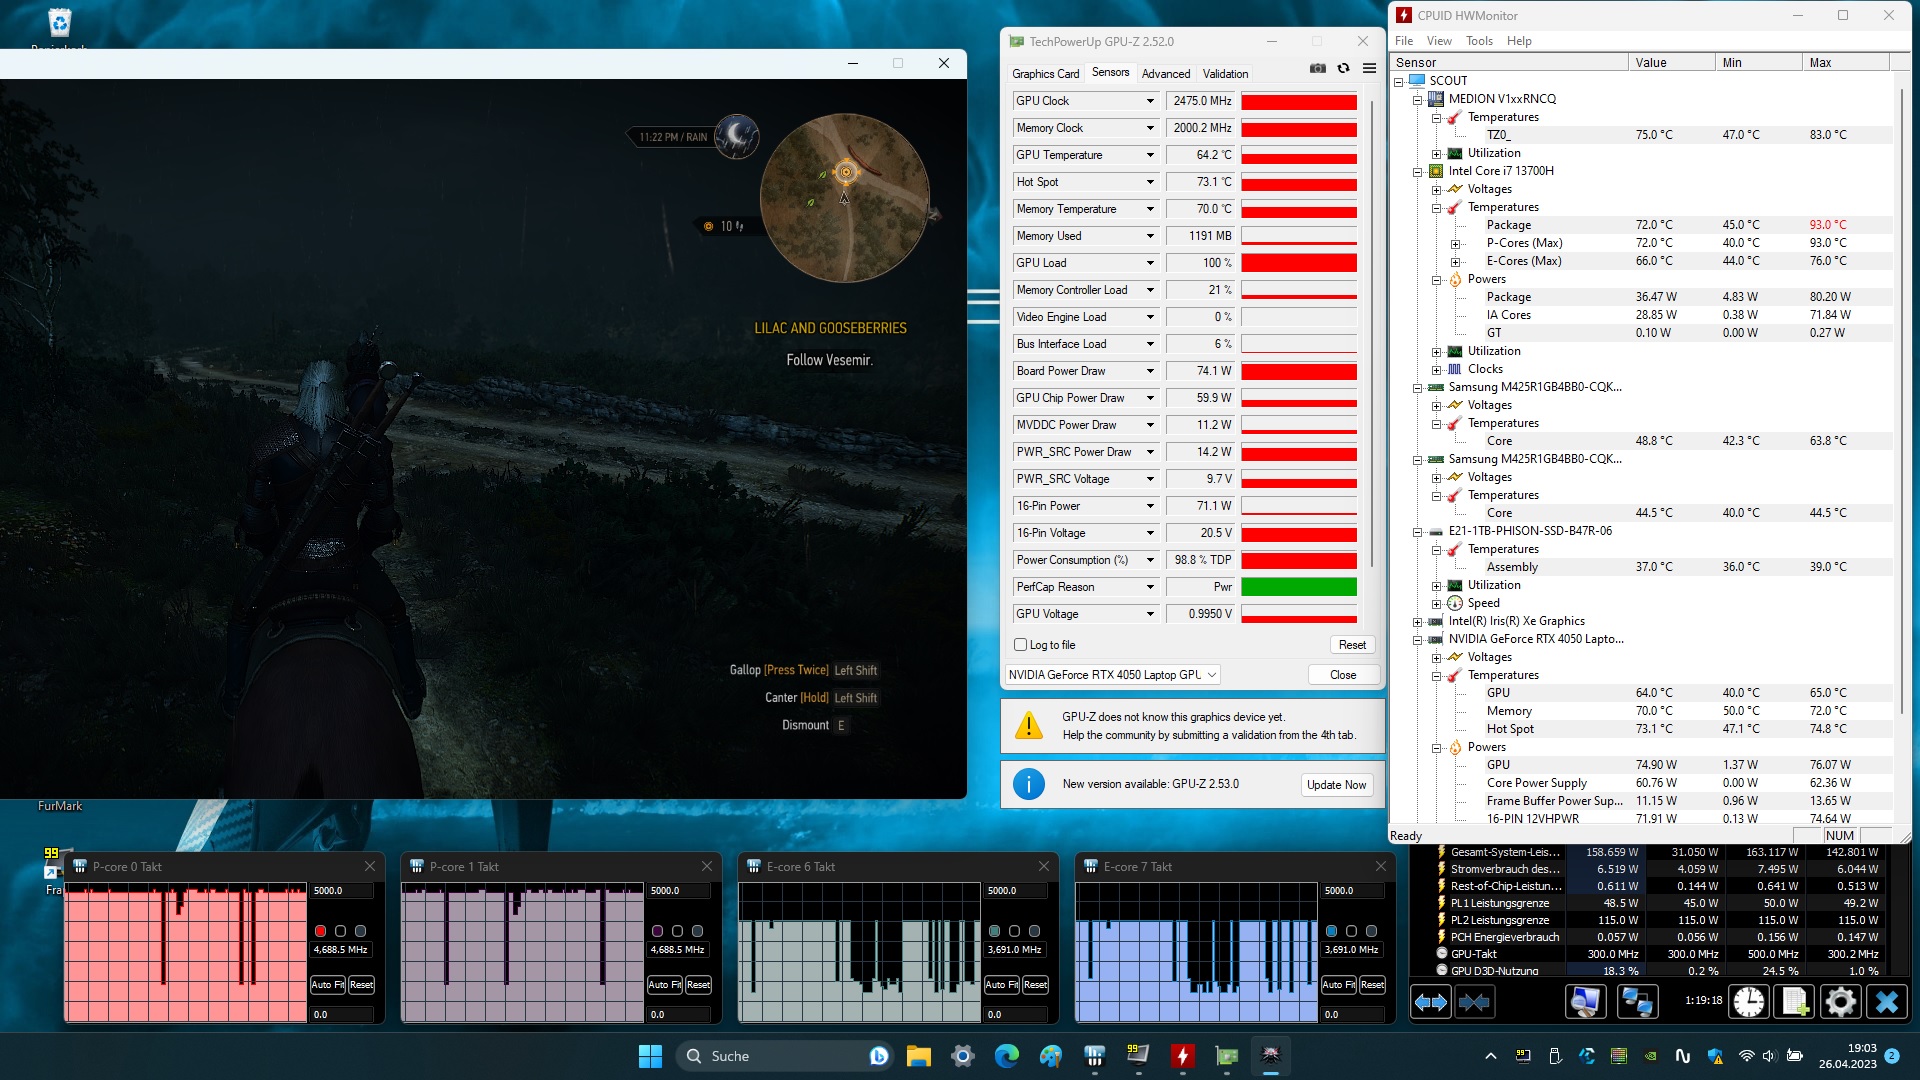
Stresstest
Der Stresstest (Prime95 und Furmark im Dauerbetrieb) stellt ein Extremszenario zur Überprüfung der Systemstabilität unter Volllast dar. Die CPU beginnt den Test mit mittelhohen Taktraten (P: 3,4 bis 3,7 GHz, E: 2,8 bis 2,9 GHz), die GPU geht mit 2,3 GHz zu Werke. Im weiteren Verlauf sinken die Taktraten von CPU und GPU.
Lautsprecher
Die Stereolautsprecher produzieren einen dürftigen Klang, der außerdem kaum Bass zu bieten hat. Für ein besseres Klangerlebnis empfehlen sich Kopfhörer oder externe Lautsprecher.
Medion Erazer Scout E20 Audio Analyse
(+) | Die Lautsprecher können relativ laut spielen (84 dB)
Bass 100 - 315 Hz
(-) | kaum Bass - 33.1% niedriger als der Median
(±) | durchschnittlich lineare Bass-Wiedergabe (9.9% Delta zum Vorgänger)
Mitteltöne 400 - 2000 Hz
(±) | zu hohe Mitten, vom Median 6.6% abweichend
(±) | Linearität der Mitten ist durchschnittlich (8.2% Delta zum Vorgänger)
Hochtöne 2 - 16 kHz
(+) | ausgeglichene Hochtöne, vom Median nur 2.1% abweichend
(±) | durchschnittlich lineare Hochtöne (7.5% Delta zum Vorgänger)
Gesamt im hörbaren Bereich 100 - 16.000 Hz
(±) | hörbarer Bereich ist durchschnittlich linear (22.2% Abstand zum Median)
Im Vergleich zu allen Geräten derselben Klasse
» 79% aller getesteten Geräte dieser Klasse waren besser, 6% vergleichbar, 14% schlechter
» Das beste Gerät hat einen Delta-Wert von 6%, durchschnittlich ist 18%, das schlechteste Gerät hat 132%
Im Vergleich zu allen Geräten im Test
» 64% aller getesteten Geräte waren besser, 6% vergleichbar, 29% schlechter
» Das beste Gerät hat einen Delta-Wert von 4%, durchschnittlich ist 24%, das schlechteste Gerät hat 134%
MSI Katana 17 B13VFK Audio Analyse
(±) | Mittelmäßig laut spielende Lautsprecher (78.5 dB)
Bass 100 - 315 Hz
(-) | kaum Bass - 17.7% niedriger als der Median
(±) | durchschnittlich lineare Bass-Wiedergabe (11.7% Delta zum Vorgänger)
Mitteltöne 400 - 2000 Hz
(±) | zu hohe Mitten, vom Median 6.8% abweichend
(+) | lineare Mitten (6.7% Delta zum Vorgänger)
Hochtöne 2 - 16 kHz
(+) | ausgeglichene Hochtöne, vom Median nur 3.2% abweichend
(±) | durchschnittlich lineare Hochtöne (7.2% Delta zum Vorgänger)
Gesamt im hörbaren Bereich 100 - 16.000 Hz
(±) | hörbarer Bereich ist durchschnittlich linear (19.4% Abstand zum Median)
Im Vergleich zu allen Geräten derselben Klasse
» 67% aller getesteten Geräte dieser Klasse waren besser, 7% vergleichbar, 26% schlechter
» Das beste Gerät hat einen Delta-Wert von 6%, durchschnittlich ist 18%, das schlechteste Gerät hat 132%
Im Vergleich zu allen Geräten im Test
» 48% aller getesteten Geräte waren besser, 7% vergleichbar, 45% schlechter
» Das beste Gerät hat einen Delta-Wert von 4%, durchschnittlich ist 24%, das schlechteste Gerät hat 134%
Energieverwaltung - Der Clevo Computer bietet nur maue Laufzeiten
Energieaufnahme
Auffälligkeiten bezüglich des Energiebedarfs zeigt das Medion Notebook nicht. Die Werte bewegen sich auf einem normalen Niveau für die verbaute Hardware. Witcher-3-Test und Stresstest werden mit konstanter Leistungsaufnahme durchlaufen. Das Netzteil (230 Watt) ist ausreichend dimensioniert.
| Aus / Standby | |
| Idle | |
| Last |
|
Legende:
min: | |
| Medion Erazer Scout E20 i7-13700H, GeForce RTX 4050 Laptop GPU | Gigabyte G7 KE i5-12500H, GeForce RTX 3060 Laptop GPU | MSI Katana 17 B13VFK i7-13620H, GeForce RTX 4060 Laptop GPU | Asus TUF Gaming A16 FA617 R7 7735HS, Radeon RX 7600S | Lenovo Legion 5 15IAH7H 82RB i7-12700H, GeForce RTX 3060 Laptop GPU | Acer Nitro 5 AN515-46-R1A1 R7 6800H, GeForce RTX 3070 Ti Laptop GPU | Durchschnittliche NVIDIA GeForce RTX 4050 Laptop GPU | Durchschnitt der Klasse Gaming | |
|---|---|---|---|---|---|---|---|---|
| Stromverbrauch | -51% | -25% | -5% | -104% | -25% | -23% | -58% | |
| Idle min * (Watt) | 5 | 15 -200% | 12.2 -144% | 8 -60% | 19.8 -296% | 7 -40% | 9.95 ? -99% | 13.3 ? -166% |
| Idle avg * (Watt) | 11 | 17 -55% | 14.9 -35% | 11 -0% | 26.2 -138% | 8.9 19% | 15.8 ? -44% | 19 ? -73% |
| Idle max * (Watt) | 22 | 24 -9% | 15.8 28% | 16 27% | 48.2 -119% | 14.4 35% | 20.1 ? 9% | 24.5 ? -11% |
| Last avg * (Watt) | 96 | 111 -16% | 85.22 11% | 97 -1% | 102.9 -7% | 202 -110% | 88 ? 8% | 108.1 ? -13% |
| Witcher 3 ultra * (Watt) | 145.2 | 174.1 -20% | 151.1 -4% | 161.5 -11% | 186.7 -29% | 203 -40% | ||
| Last max * (Watt) | 201 | 208 -3% | 212.8 -6% | 168 16% | 268 -33% | 230 -14% | 176.3 ? 12% | 254 ? -26% |
* ... kleinere Werte sind besser
Energieaufnahme Witcher 3 / Stresstest
Energieaufnahme mit externem Monitor
Akkulaufzeit
Der 17,3-Zöller erreicht im WLAN-Test (Aufruf von Webseiten mittels eines Skripts) bzw. Videotest (Kurzfilm Big Buck Bunny (H.264-Kodierung, FHD) in einer Schleife) Laufzeiten von 4:44 h bzw. 4:37 h. Während beider Tests sind die Energiesparfunktionen des Notebooks deaktiviert und die Displayhelligkeit wird auf etwa 150 cd/m² geregelt. Zur Durchführung des Videotests werden zudem die Funkmodule abgeschaltet.
| Medion Erazer Scout E20 i7-13700H, GeForce RTX 4050 Laptop GPU, 53.35 Wh | Gigabyte G7 KE i5-12500H, GeForce RTX 3060 Laptop GPU, 54 Wh | MSI Katana 17 B13VFK i7-13620H, GeForce RTX 4060 Laptop GPU, 53.5 Wh | Asus TUF Gaming A16 FA617 R7 7735HS, Radeon RX 7600S, 90 Wh | Lenovo Legion 5 15IAH7H 82RB i7-12700H, GeForce RTX 3060 Laptop GPU, 80 Wh | Acer Nitro 5 AN515-46-R1A1 R7 6800H, GeForce RTX 3070 Ti Laptop GPU, 57.5 Wh | Durchschnitt der Klasse Gaming | |
|---|---|---|---|---|---|---|---|
| Akkulaufzeit | -12% | -36% | 119% | 0% | 23% | 39% | |
| Idle (h) | 6.7 | 7.1 6% | 20.2 201% | 8.1 21% | 10.5 57% | 8.71 ? 30% | |
| H.264 (h) | 4.6 | 2.2 -52% | 5.7 24% | 8.26 ? 80% | |||
| WLAN (h) | 4.7 | 5.3 13% | 2.9 -38% | 12.1 157% | 5 6% | 5.8 23% | 7.01 ? 49% |
| Last (h) | 1.5 | 1.3 -13% | 1 -33% | 1.5 0% | 1.1 -27% | 1.3 -13% | 1.47 ? -2% |
Pro
Contra
Fazit - Ein rundes Gaming-Notebook aus dem Einstiegssegment
Der Fokus des Erazer Scout E20 liegt auf FHD-Gaming, das Gerät gibt aber auch in anderen Bereichen (Rendering, Videoschnitt) eine gute Figur ab. Core i7-13700H und GeForce RTX 4050 können mit hohem Takt arbeiten, eine 1-TB-SSD sorgt für kurze Ladezeiten und den nötigen Speicherplatz.
Medion liefert mit dem Erazer Scout E20 ein stimmiges Gaming-Notebook aus dem Einstiegssegment. Die Lüftersteuerung dürfte noch nachjustiert werden.
Der Rechner erwärmt sich unter Last nur moderat, kann dabei aber sehr viel Lärm produzieren. Löblicherweise bietet das Notebook einen "Lautlosmodus", der Gaming bei geringem Geräuschpegel (keine Lautlosigkeit) ermöglicht.
Praxisnahe Laufzeiten von knapp 4,5 bis 5 Stunden reißen niemanden vom Hocker - hier macht sich die verhältnismäßig geringe Akkukapazität (53,35 Wh) bemerkbar. Der Akku kann nicht per USB-C-Ladegerät mit Energie versorgt werden. Es müsste immer das Netzteil mitgeführt werden. Der matte 17,3-Zoll-Bildschirm (FHD, IPS, 144 Hz, sRGB) hat insgesamt einen guten Eindruck hinterlassen.
Eine Alternative zum E20 wäre das Asus TUF Gaming A16 Advantage Edition. Es bewegt sich auf einem ähnlichen Leistungsniveau, punktet aber mit deutlich besseren Laufzeiten und einem Bildschirm im 16:10-Format. Eine Budget-Alternative wäre das Gigabyte G7 KE. Einer vergleichbaren Grafikleistung stünde ein gut 450 Euro niedrigerer Kaufpreis entgegen. Allerdings: Ein Windows-Betriebssystem gehört nicht zum Lieferumfang.
Preis und Verfügbarkeit
Das Medion Erazer Scout E20 kann im Medion Onlineshop zu einem Preis von knapp 1.500 Euro erworben werden.
Medion Erazer Scout E20
- 16.05.2023 v7 (old)
Sascha Mölck
Transparenz
Die Auswahl der zu testenden Geräte erfolgt innerhalb der Redaktion. Das vorliegende Testmuster wurde dem Autor vom Hersteller oder einem Shop zu Testzwecken leihweise zur Verfügung gestellt. Eine Einflussnahme des Leihstellers auf den Testbericht gab es nicht, der Hersteller erhielt keine Version des Reviews vor der Veröffentlichung. Es bestand keine Verpflichtung zur Publikation. Als eigenständiges, unabhängiges Unternehmen unterliegt Notebookcheck keiner Diktion von Herstellern, Shops und Verlagen.
So testet Notebookcheck
Pro Jahr werden von Notebookcheck hunderte Laptops und Smartphones unabhängig in von uns standardisierten technischen Verfahren getestet, um eine Vergleichbarkeit aller Testergebnisse zu gewährleisten. Seit rund 20 Jahren entwickeln wir diese Testmethoden kontinuierlich weiter und setzen damit Branchenstandards. In unseren Testlaboren kommt ausschließlich hochwertiges Messequipment in die Hände erfahrener Techniker und Redakteure. Die Tests unterliegen einer mehrstufigen Kontrolle. Unsere komplexe Gesamtbewertung basiert auf hunderten fundierten Messergebnissen und Benchmarks, womit Ihnen Objektivität garantiert ist. Weitere Informationen zu unseren Testmethoden gibt es hier.
Preisvergleich
