Fazit - Meistens kleinere Upgrades
Das Dell 16 Premium ist im Wesentlichen ein leistungsgesteigertes XPS 16 9640. Es ist mit neueren, schnelleren und effizienteren Intel- und Nvidia Prozessoren ausgestattet, die Power User zu schätzen wissen könnten. Wird für das tägliche Arbeitspensum jedoch keine große Rechenleistung erfordert, kann man mit dem günstigeren XPS 16 9640 ein identisches Benutzererlebnis erzielen.
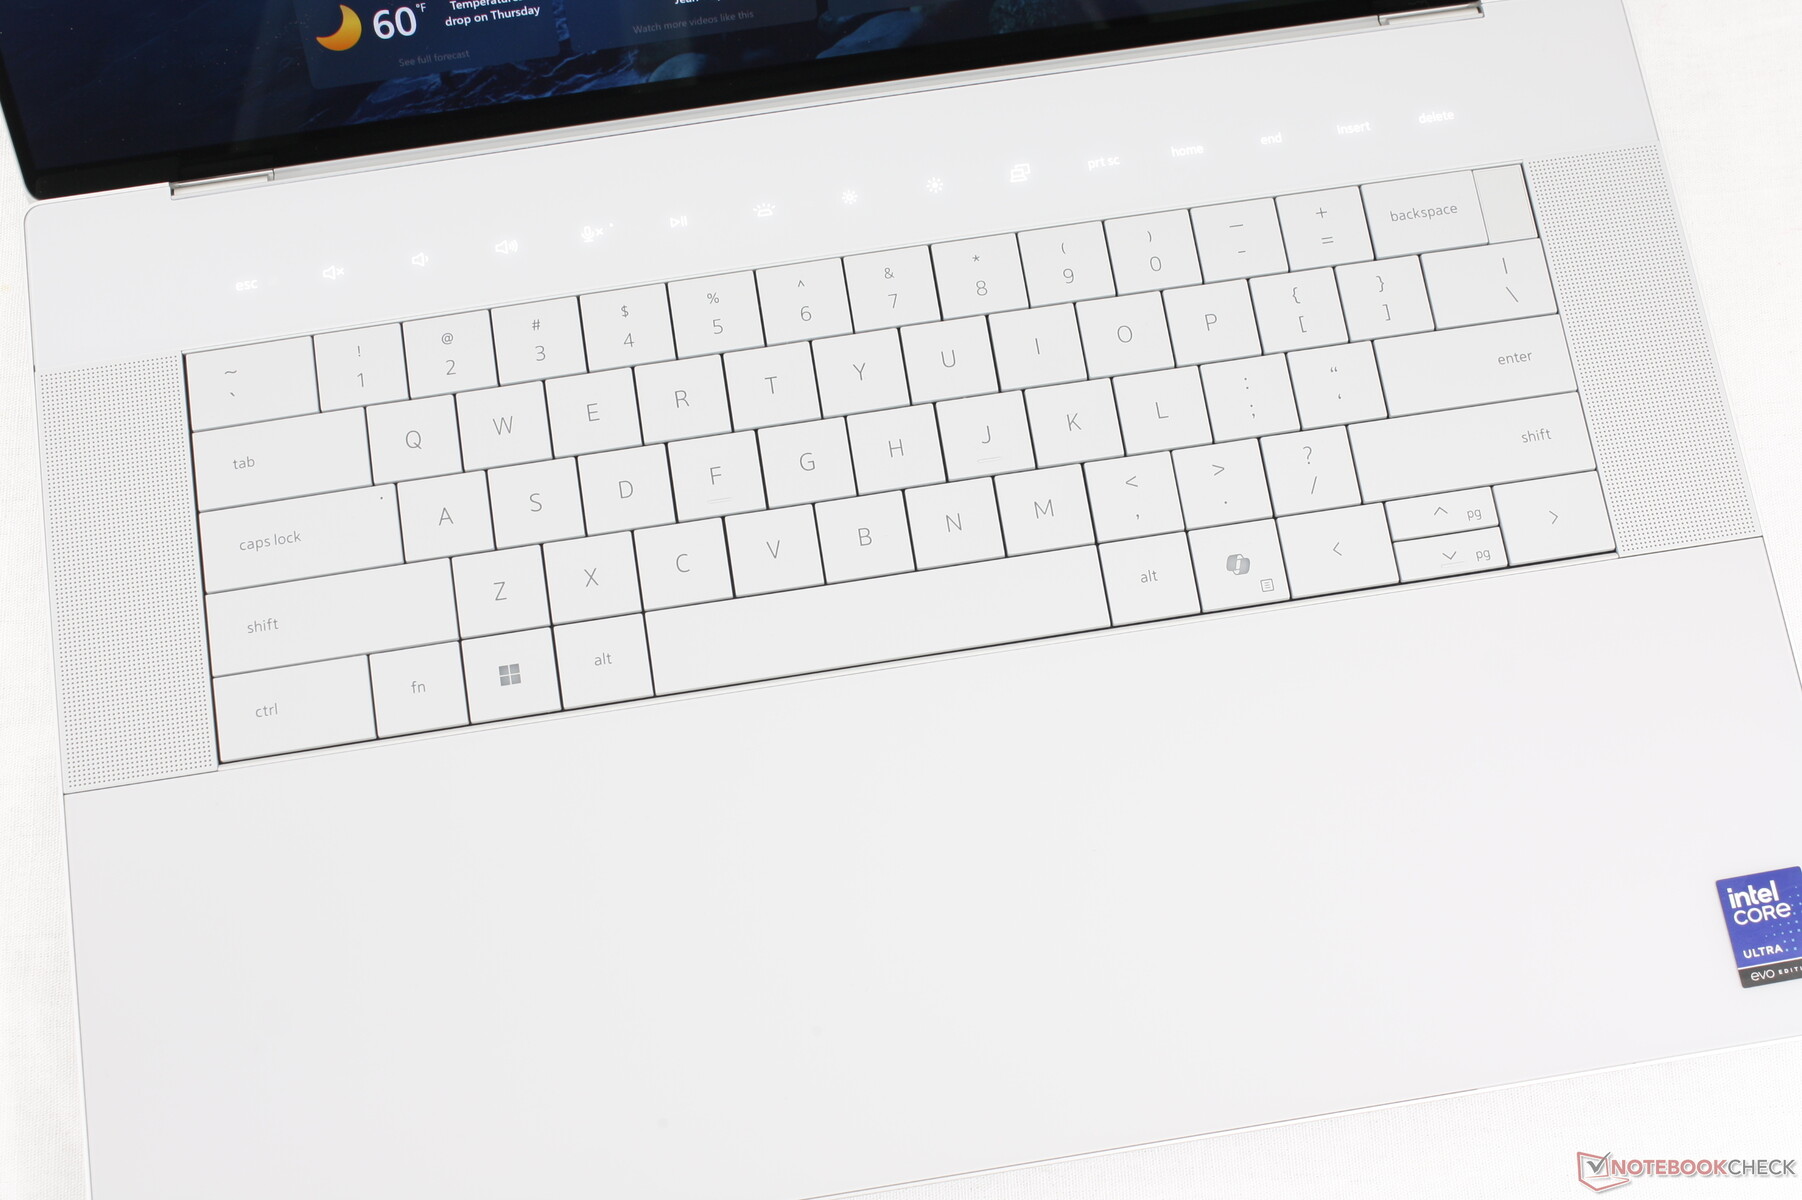
Das System behält die meisten, wenn nicht sogar alle Nachteile des XPS 16 9640 Redesigns bei, einschließlich der umstrittenen Änderungen an Tastatur und Clickpad. Das Dell 16 Premium weist außerdem eine etwas stärkere CPU-Leistungsdrosselung auf als zuvor. Potenzielle Käufer sollten bedenken, dass das System ein wenig Grafikleistung für die geringere Größe und das sehr kompakte Netzteil opfert. Benutzer, denen ein etwas größeres System nichts ausmacht, finden vielleicht im konkurrierenden Lenovo Yoga Pro 9i 16 eine schnellere Alternative, selbst wenn es mit ähnlichen CPU- und GPU-Spezifikationen konfiguriert ist.
Pro
Contra
Preis und Verfügbarkeit
Dell liefert das Dell 16 Premium jetzt ab 2.599 Euro für die Basiskonfiguration Core Ultra 7 RTX 5050 bis zu 3.299 Euro für die Konfiguration Core Ultra 9 RTX 5070.
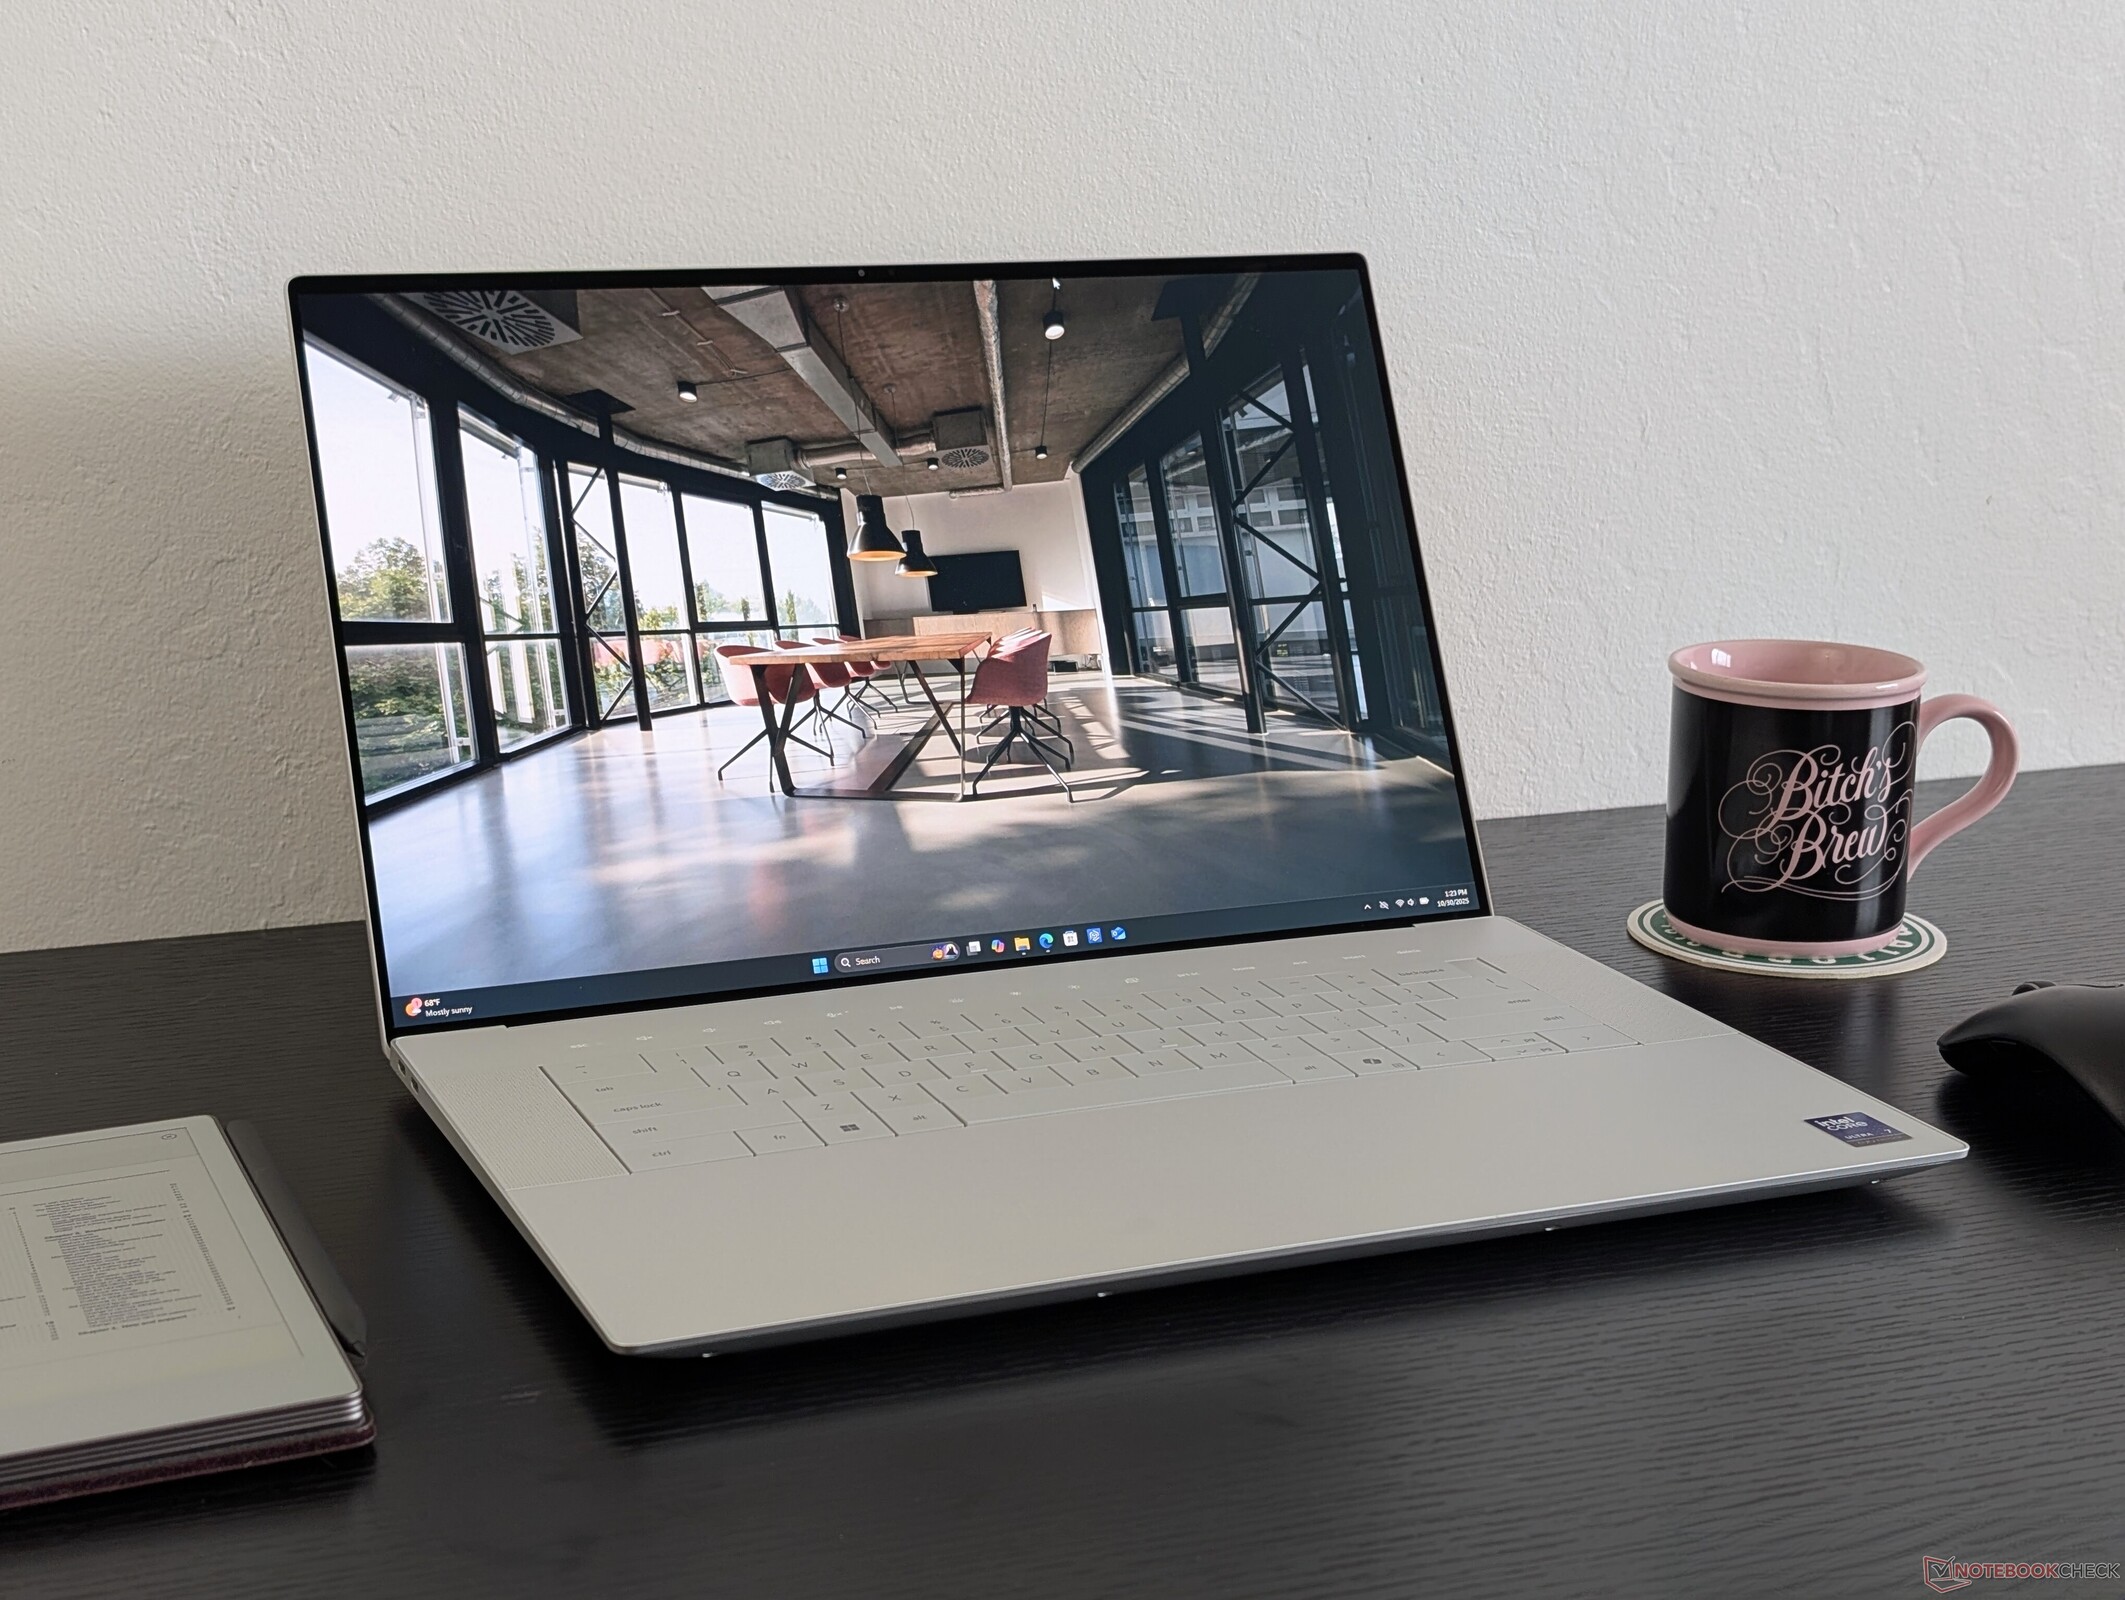
Das Dell 16 Premium ist der Nachfolger der XPS-16-Serie. Während sich der Name geändert hat, bleibt das vertraute Design erhalten und bietet ein im Wesentlichen identisches Benutzererlebnis wie die Version 2024. Viele unserer Kommentare zum XPS 16 9640 gelten hier für das Dell 16 Premium, da das neuere Modell nur interne Änderungen und keine größeren externen Aktualisierungen mit sich bringt.
Bei unserem Testgerät handelt es sich um eine High-End-Konfiguration mit Arrow Lake-H Core Ultra 7 255H CPU, 60 W Nvidia Blackwell GeForce RTX 5070 GPU und 16,3 Zoll 4K 2.400p 120 Hz OLED-Touchscreen für ca. 3.300 US-Dollar, die die letztjährigen Optionen Meteor Lake-H und Ada Lovelace Prozessor ersetzt. Niedrigere SKUs können nur mit integrierter Grafik, der RTX 5050 oder einem 2K 1.200p Display ohne Touchscreen geliefert werden, während die höchste Konfiguration mit der Core Ultra 9 285H CPU ausgeliefert wird.
Zu den Alternativen zum Dell 16 Premium gehören andere High-End-Multimedia-Laptops wie das Lenovo Yoga Pro 9i 16, HP Spectre x360 16 oder Apple MacBook Pro 16. Das Dell 16 Premium sollte nicht mit dem Dell Pro 16 Premium verwechselt werden.
Mehr Dell Bewertungen:
Spezifikationen
Preisvergleich
Gehäuse
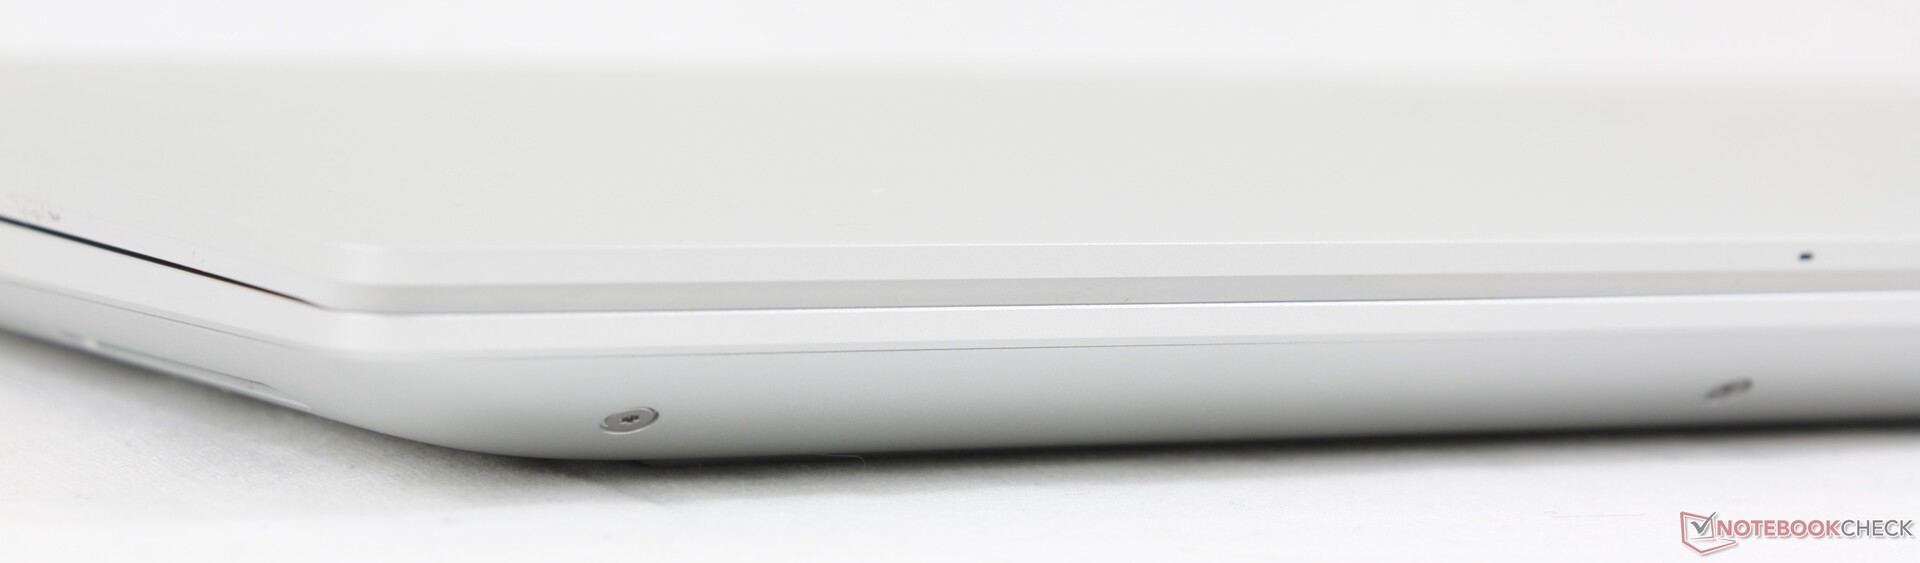
Obwohl das Dell 16 Premium das gleiche Gehäuse-Design wie das XPS 16 9640 verwendet, wurde das Logo auf dem äußeren Deckel so verändert, dass es ohne den Kreis erscheint. Dies ist auch eine der einfachsten Möglichkeiten, das Dell 16 Premium optisch von älteren XPS-Modellen zu unterscheiden.

Anschlussausstattung
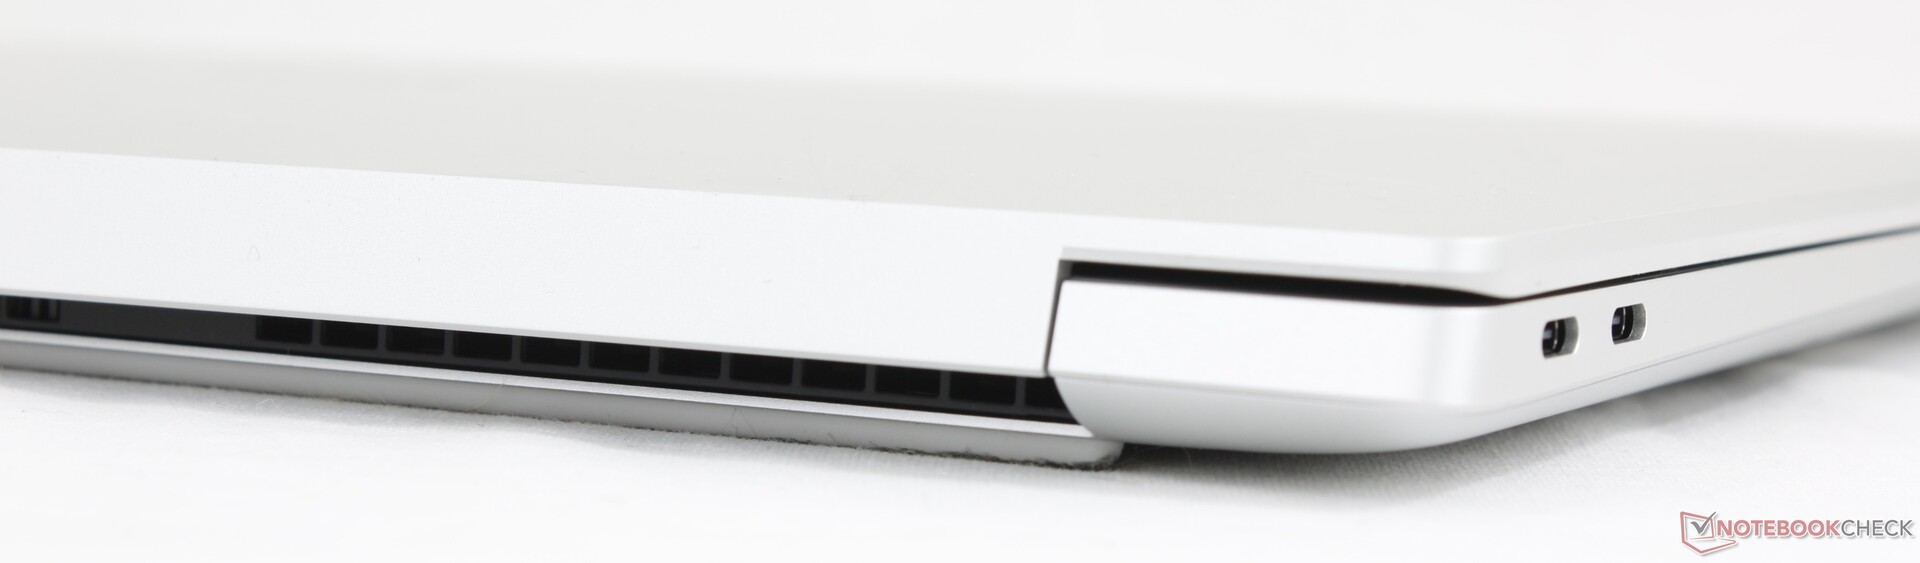
Alle USB-C-Ports sind jetzt Thunderbolt 4 mit 40 Gbit/s, während dies beim XPS 16 9640 nicht der Fall war.


Kommunikation
| Networking | |
| iperf3 transmit AXE11000 | |
| LG Gram Pro 16Z90TS-G.AU89G | |
| Asus Zenbook S 16 UM5606-RK333W | |
| Lenovo Yoga Pro 9i 16 RTX 5070 | |
| Dell XPS 16 9640 | |
| HP Spectre x360 16 RTX 4050 | |
| Dell 16 Premium DA16250 | |
| iperf3 receive AXE11000 | |
| Asus Zenbook S 16 UM5606-RK333W | |
| Lenovo Yoga Pro 9i 16 RTX 5070 | |
| LG Gram Pro 16Z90TS-G.AU89G | |
| Dell XPS 16 9640 | |
| HP Spectre x360 16 RTX 4050 | |
| Dell 16 Premium DA16250 | |
| iperf3 transmit AXE11000 6GHz | |
| LG Gram Pro 16Z90TS-G.AU89G | |
| Dell 16 Premium DA16250 | |
| HP Spectre x360 16 RTX 4050 | |
| iperf3 receive AXE11000 6GHz | |
| LG Gram Pro 16Z90TS-G.AU89G | |
| Dell 16 Premium DA16250 | |
| HP Spectre x360 16 RTX 4050 | |
Webcam


Wartung

Nachhaltigkeit
Das Gehäuse oder Skelett besteht zu 75 Prozent aus recyceltem Aluminium für die obere Abdeckung, zu 22 Prozent aus recyceltem Glas für den Bildschirm, zu 25 Prozent aus emissionsarmem Aluminium für die Handballenauflage, insgesamt zu 18,5 Prozent aus recyceltem Kunststoff und zu 100 Prozent aus recycelbarer Verpackung.
Garantie
Beim Kauf in den USA erhält man eine einjährige Herstellergarantie.
Eingabegeräte
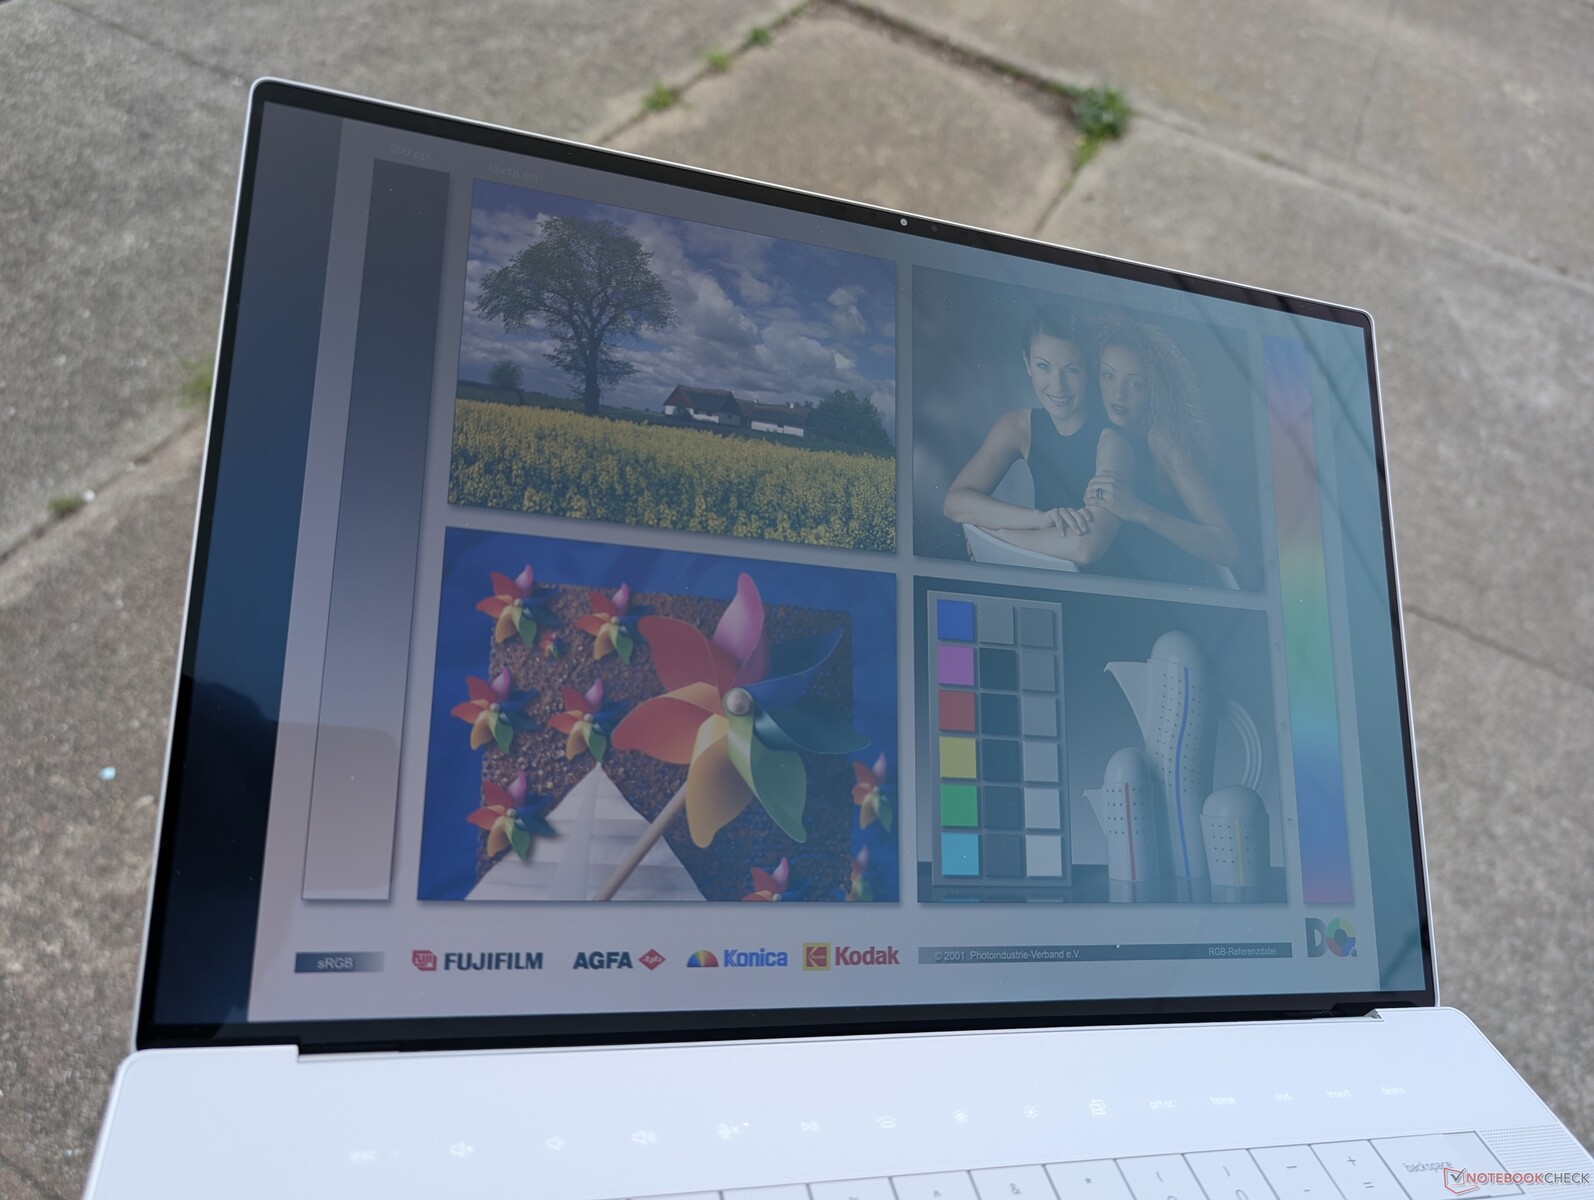
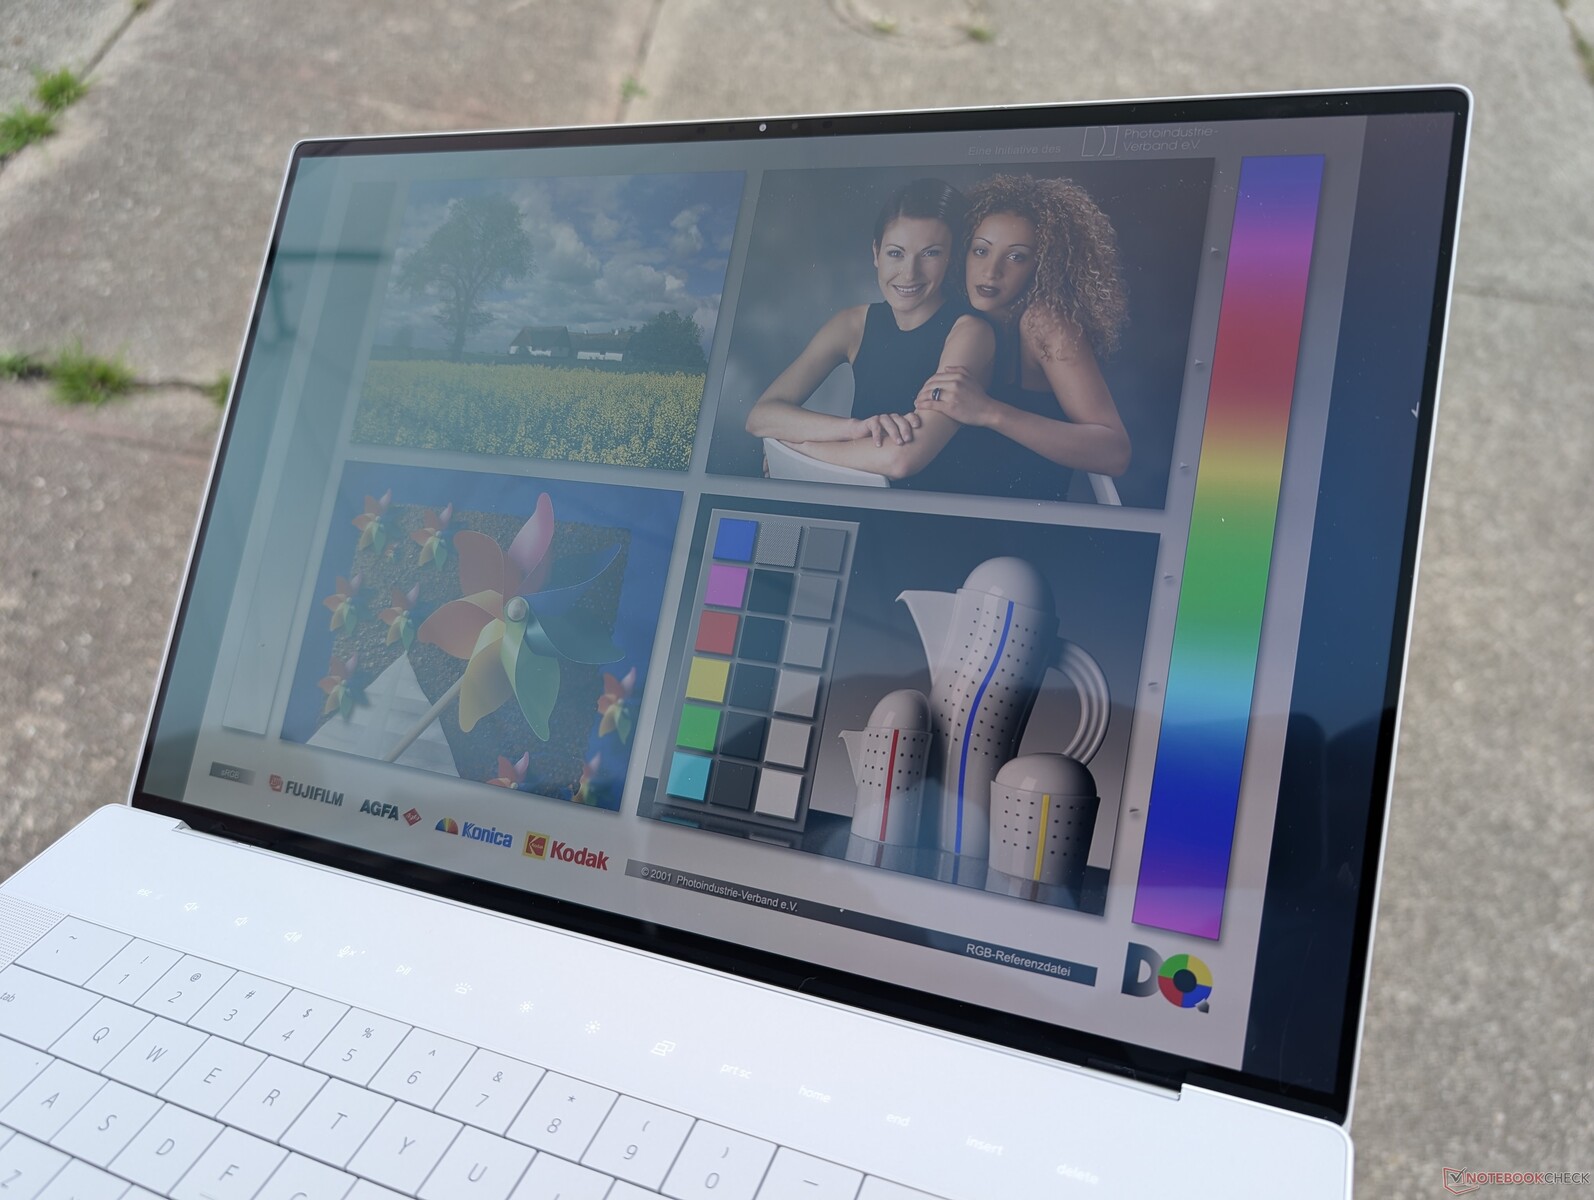
Display

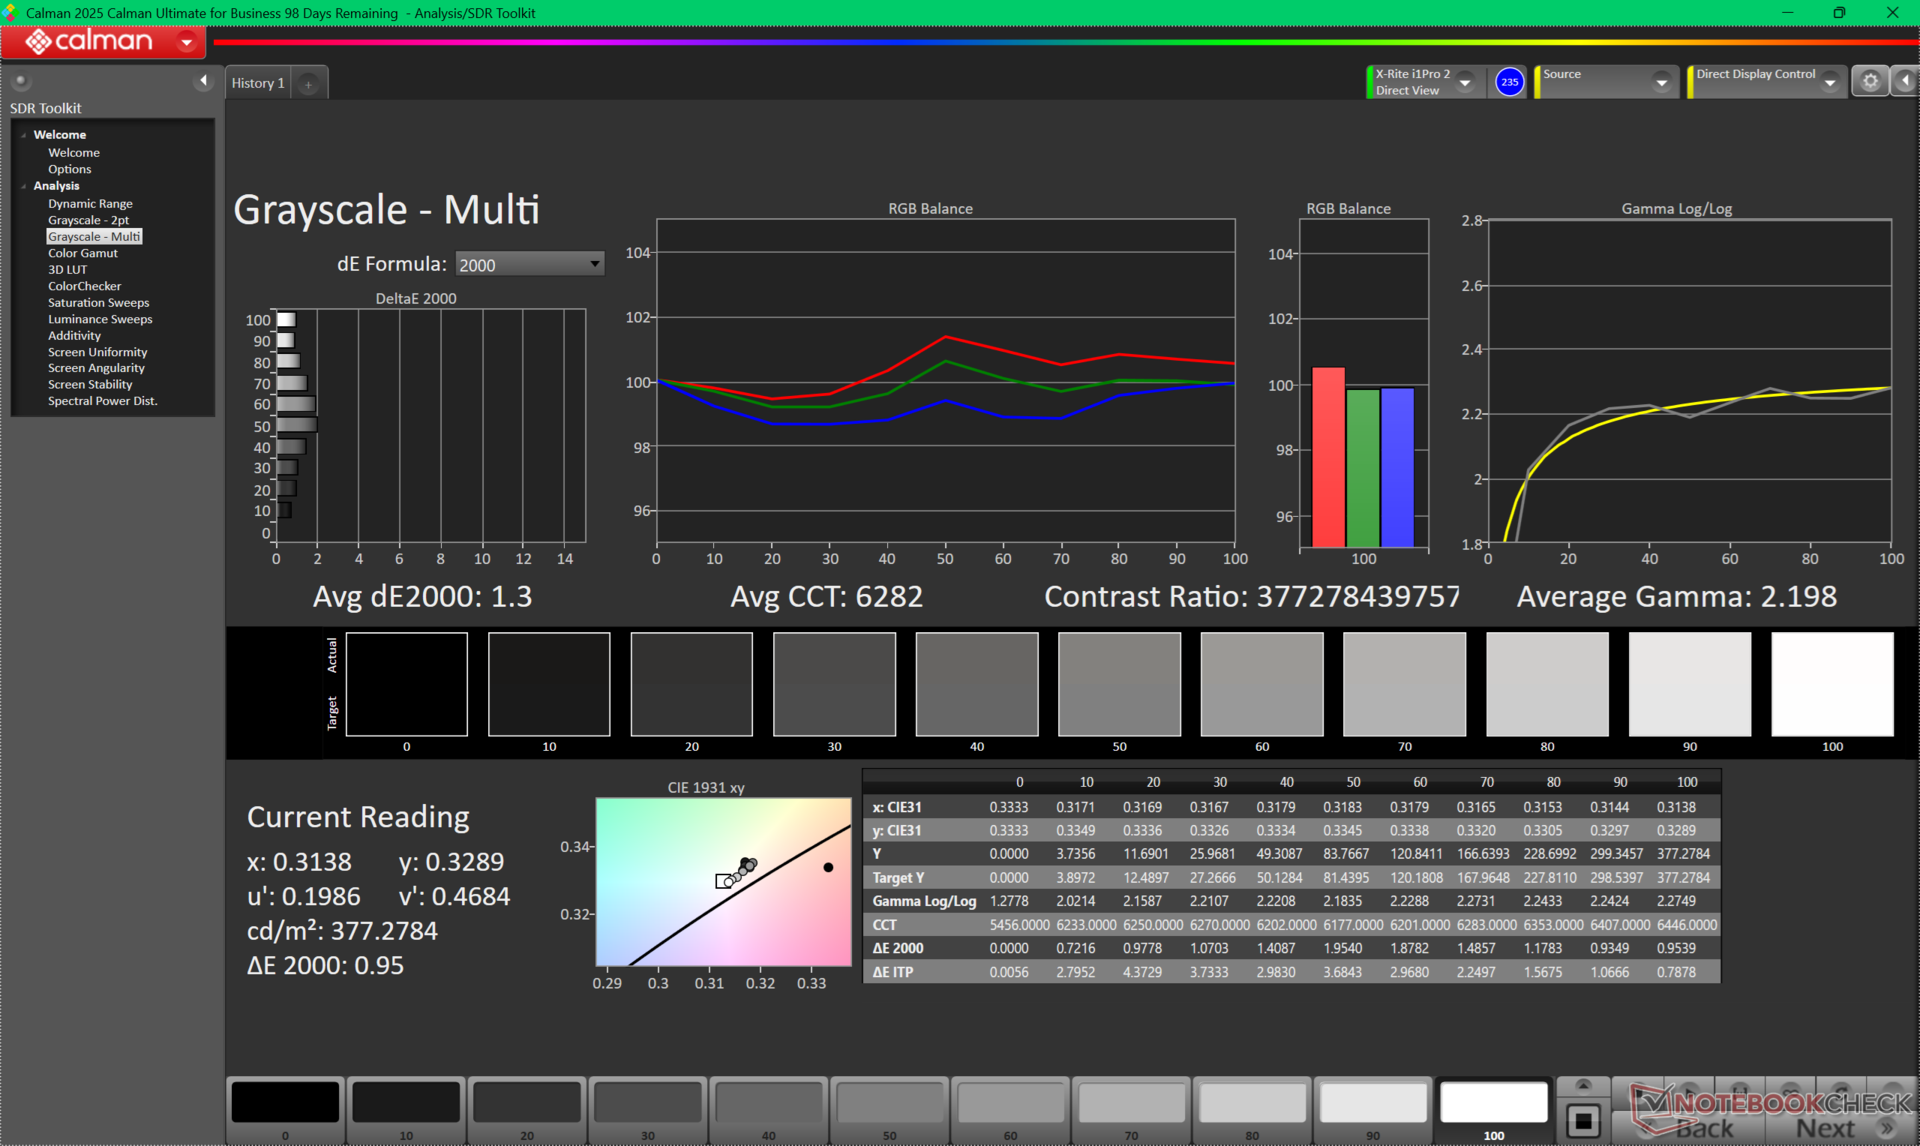
Dell hat das OLED-Panel des XPS 16 9640 aus dem letzten Jahr von 90 Hz auf 120 Hz verbessert, während die maximale Helligkeit mit ~400 nits gleich geblieben ist. Windows VRR wird bis zu 48 Hz unterstützt, um Batteriestrom zu sparen. Die Änderungen sind relativ unbedeutend, aber dennoch bemerkenswert, da 4K 2400p-Displays mit 120 Hz bei 16-Zoll-Notebooks relativ ungewöhnlich sind.
| |||||||||||||||||||||||||
Ausleuchtung: 98 %
Helligkeit Akku: 385.7 cd/m²
Kontrast: ∞:1 (Schwarzwert: 0 cd/m²)
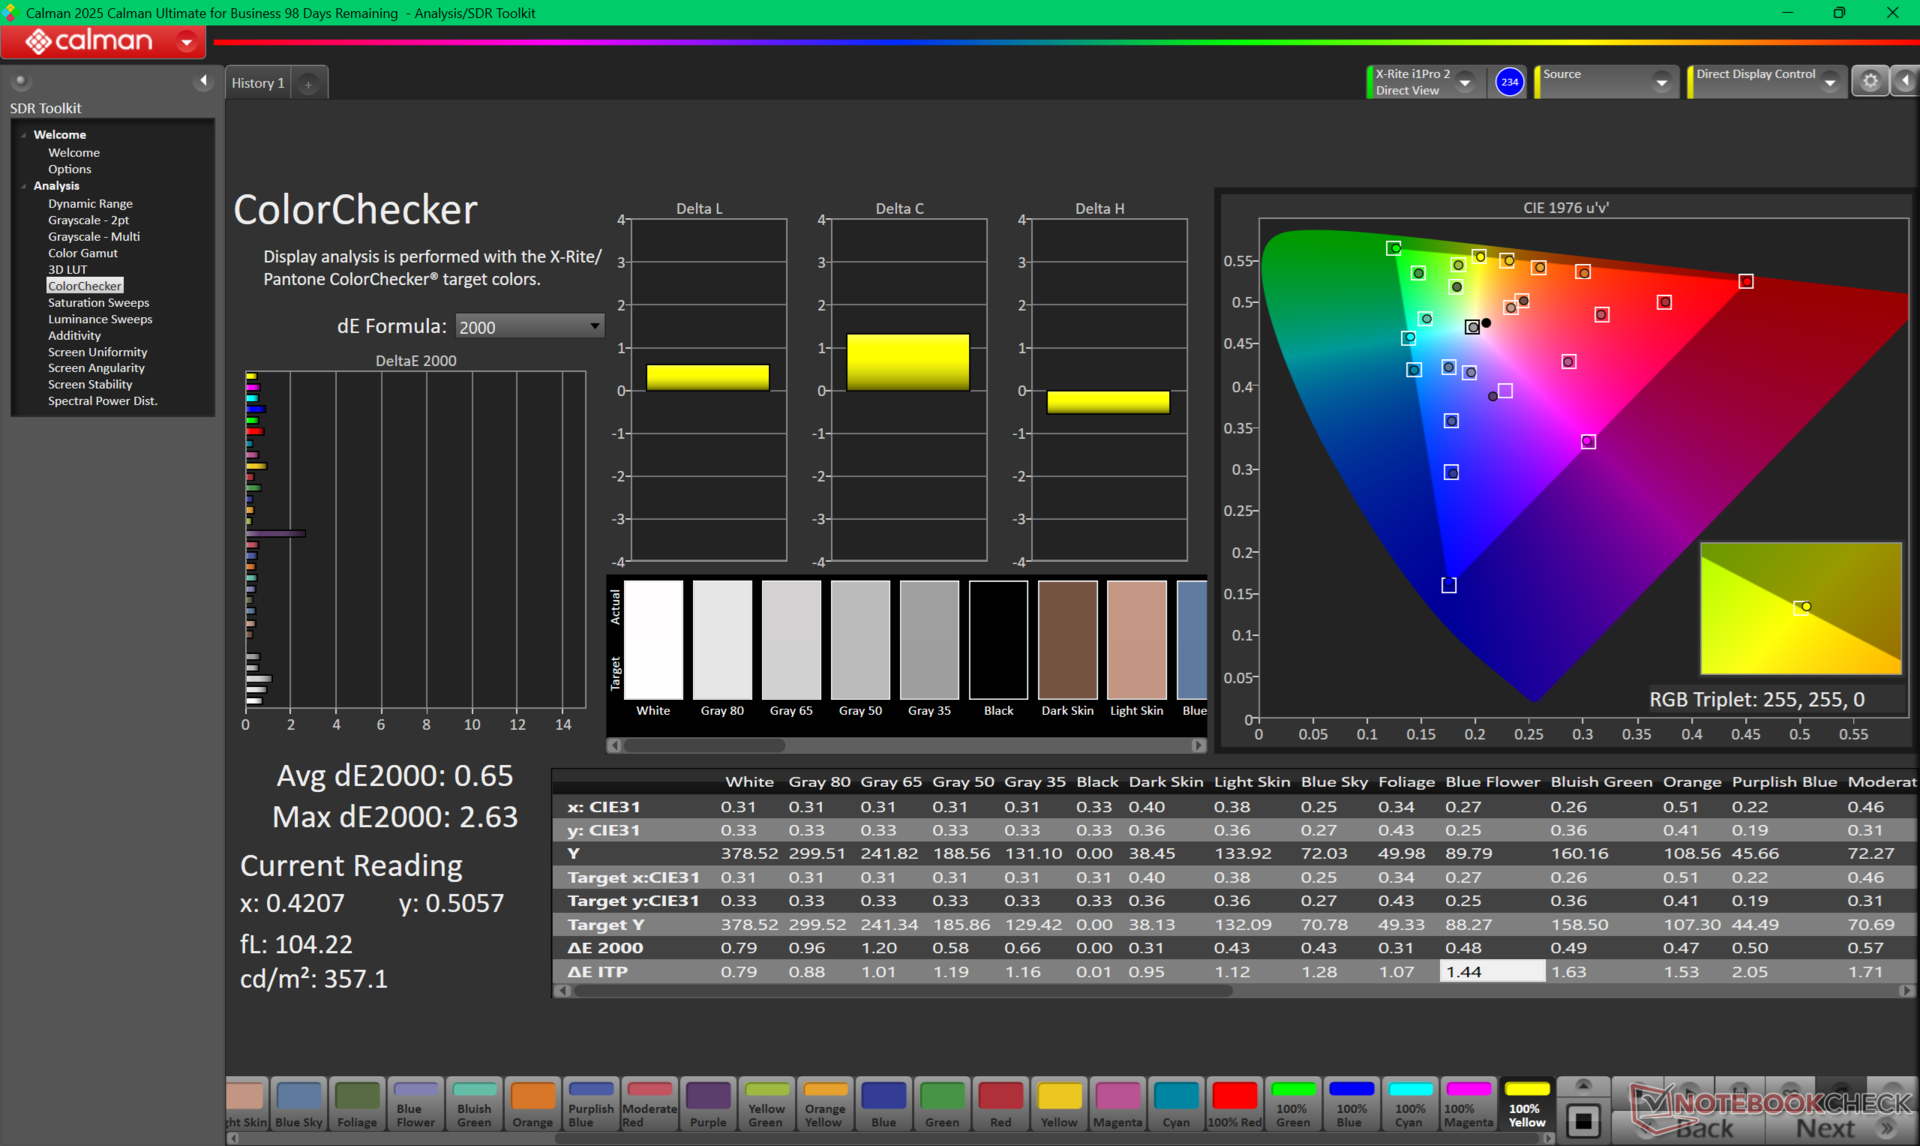
ΔE ColorChecker Calman: 1.36 | ∀{0.5-29.43 Ø4.72}
calibrated: 0.65
ΔE Greyscale Calman: 1.3 | ∀{0.09-98 Ø4.97}
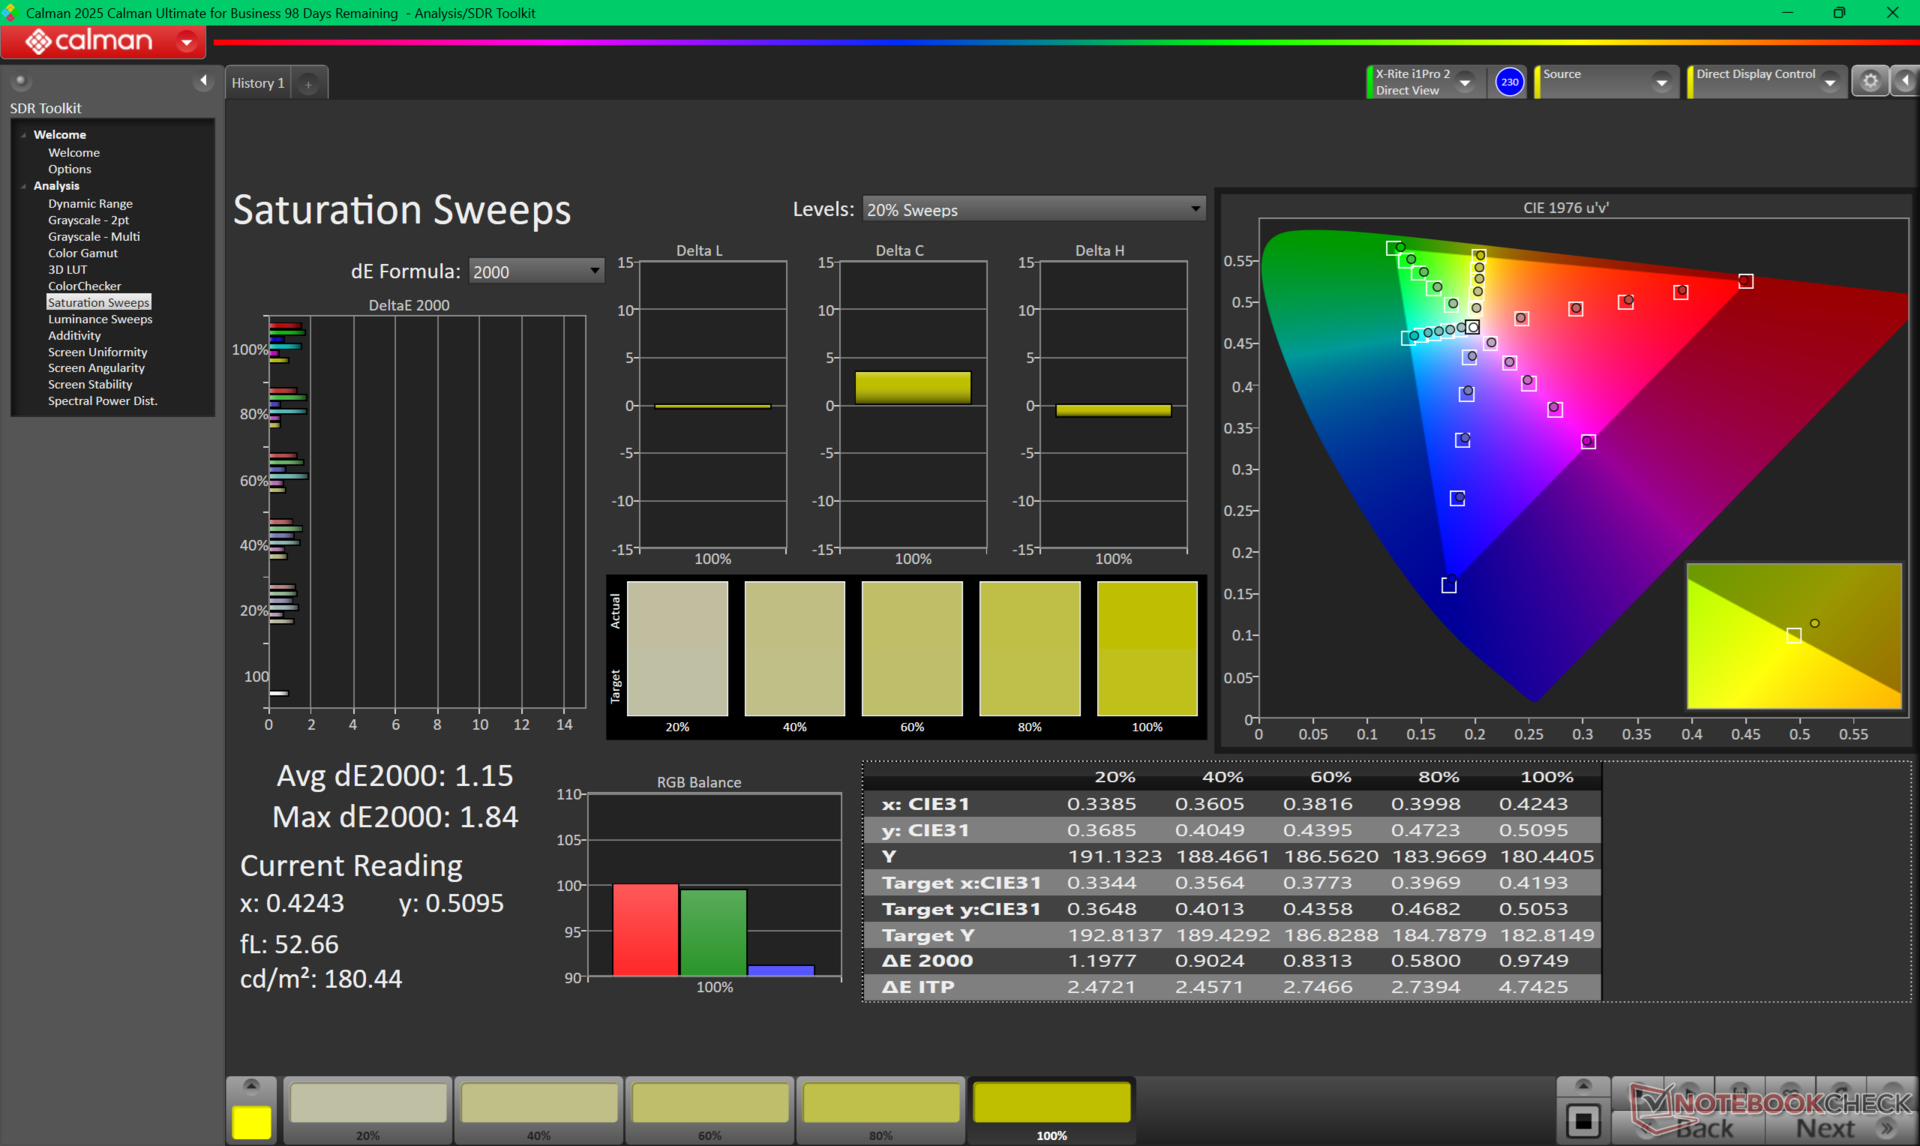
88.1% AdobeRGB 1998 (Argyll 3D)
100% sRGB (Argyll 3D)
99.7% Display P3 (Argyll 3D)
Gamma: 2.2
CCT: 6282 K
| Dell 16 Premium DA16250 Samsung 163DU02, OLED, 3840x2400, 16.3", 120 Hz | Dell XPS 16 9640 SDC4196, OLED, 3840x2400, 16.3", 90 Hz | HP Spectre x360 16 RTX 4050 Samsung SDC41A6, OLED, 2880x1800, 16", 120 Hz | Lenovo Yoga Pro 9i 16 RTX 5070 ATNA60KA01-0, OLED, 3200x2000, 16", 120 Hz | Asus Zenbook S 16 UM5606-RK333W ATNA60CL10-0, OLED, 2880x1800, 16", 120 Hz | LG Gram Pro 16Z90TS-G.AU89G LG DISPLAY LP160WQ2-SPF1, IPS, 2560x1600, 16", 144 Hz | |
|---|---|---|---|---|---|---|
| Display | -0% | 3% | 3% | 3% | -1% | |
| Display P3 Coverage (%) | 99.7 | 98.3 -1% | 99.6 0% | 97.4 -2% | 99.9 0% | 97.96 -2% |
| sRGB Coverage (%) | 100 | 100 0% | 100 0% | 100 0% | 100 0% | 100 0% |
| AdobeRGB 1998 Coverage (%) | 88.1 | 87.8 0% | 96.7 10% | 96.8 10% | 95.6 9% | 86.65 -2% |
| Response Times | -16% | -13% | 50% | 16% | -5457% | |
| Response Time Grey 50% / Grey 80% * (ms) | 0.61 ? | 0.82 ? -34% | 0.78 ? -28% | 0.27 ? 56% | 0.56 ? 8% | 47 ? -7605% |
| Response Time Black / White * (ms) | 0.88 ? | 0.85 ? 3% | 0.86 ? 2% | 0.37 ? 58% | 0.65 ? 26% | 30 ? -3309% |
| PWM Frequency (Hz) | 490.8 ? | 360 ? | 480 ? | 1200 | 480 | |
| PWM Amplitude * (%) | 35 | 22 37% | 30 14% | |||
| Bildschirm | -22% | -28% | 63% | 31% | 5% | |
| Helligkeit Bildmitte (cd/m²) | 385.7 | 366 -5% | 385.2 0% | 974 153% | 407 6% | 442 15% |
| Brightness (cd/m²) | 387 | 367 -5% | 387 0% | 979 153% | 405 5% | 406 5% |
| Brightness Distribution (%) | 98 | 96 -2% | 99 1% | 98 0% | 97 -1% | 86 -12% |
| Schwarzwert * (cd/m²) | 0.02 | 0.17 | ||||
| Delta E Colorchecker * | 1.36 | 1.3 4% | 1.73 -27% | 0.9 34% | 0.6 56% | 0.84 38% |
| Colorchecker dE 2000 max. * | 2.85 | 3.6 -26% | 3.95 -39% | 1.7 40% | 1.2 58% | 1.62 43% |
| Colorchecker dE 2000 calibrated * | 0.65 | 1 -54% | 0.88 -35% | |||
| Delta E Graustufen * | 1.3 | 2.2 -69% | 2.6 -100% | 1.3 -0% | 0.5 62% | 1.53 -18% |
| Gamma | 2.2 100% | 2.14 103% | 2.17 101% | 2.21 100% | 2.2 100% | 2.173 101% |
| CCT | 6282 103% | 6680 97% | 6133 106% | 6751 96% | 6453 101% | 6496 100% |
| Kontrast (:1) | 20350 | 2600 | ||||
| Durchschnitt gesamt (Programm / Settings) | -13% /
-16% | -13% /
-16% | 39% /
45% | 17% /
20% | -1818% /
-907% |
* ... kleinere Werte sind besser


Reaktionszeiten (Response Times) des Displays
| ↔ Reaktionszeiten Schwarz zu Weiß | ||
|---|---|---|
| 0.88 ms ... steigend ↗ und fallend ↘ kombiniert | ↗ 0.41 ms steigend | 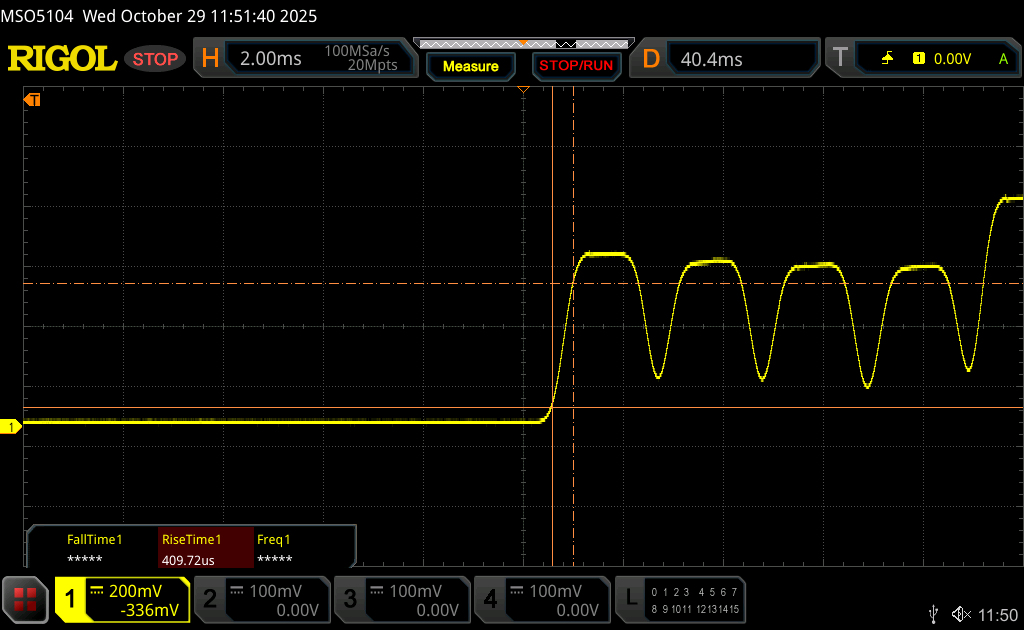 |
| ↘ 0.47 ms fallend | ||
| Die gemessenen Reaktionszeiten sind sehr kurz, wodurch sich der Bildschirm auch für schnelle 3D Spiele eignen sollte. Im Vergleich rangierten die bei uns getesteten Geräte von 0.1 (Minimum) zu 240 (Maximum) ms. » 3 % aller Screens waren schneller als der getestete. Daher sind die gemessenen Reaktionszeiten besser als der Durchschnitt aller vermessenen Geräte (19.8 ms). | ||
| ↔ Reaktionszeiten 50% Grau zu 80% Grau | ||
| 0.61 ms ... steigend ↗ und fallend ↘ kombiniert | ↗ 0.31 ms steigend | 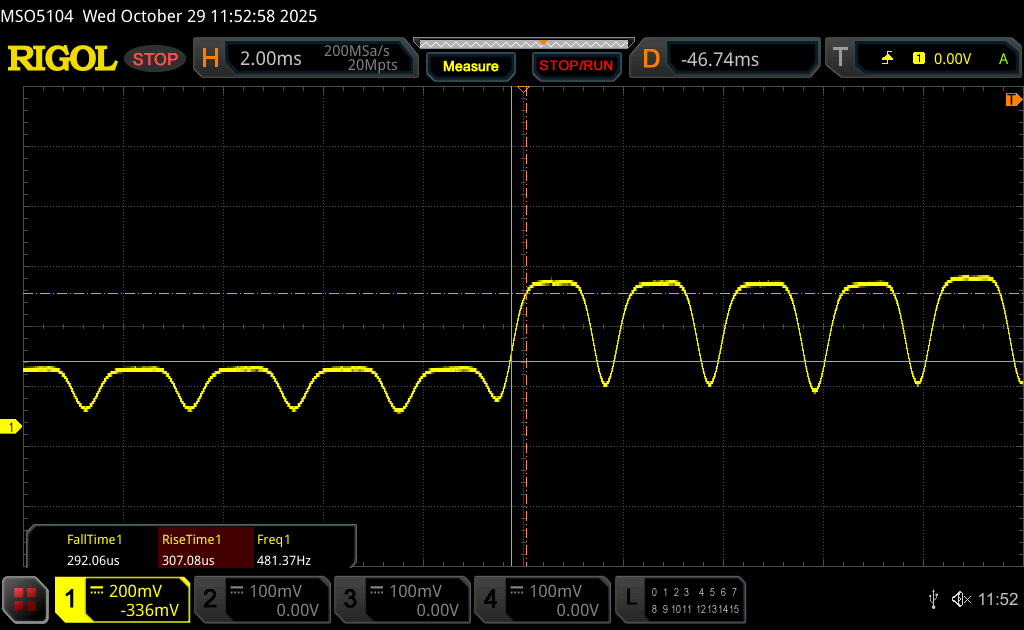 |
| ↘ 0.3 ms fallend | ||
| Die gemessenen Reaktionszeiten sind sehr kurz, wodurch sich der Bildschirm auch für schnelle 3D Spiele eignen sollte. Im Vergleich rangierten die bei uns getesteten Geräte von 0.165 (Minimum) zu 636 (Maximum) ms. » 2 % aller Screens waren schneller als der getestete. Daher sind die gemessenen Reaktionszeiten besser als der Durchschnitt aller vermessenen Geräte (31 ms). | ||
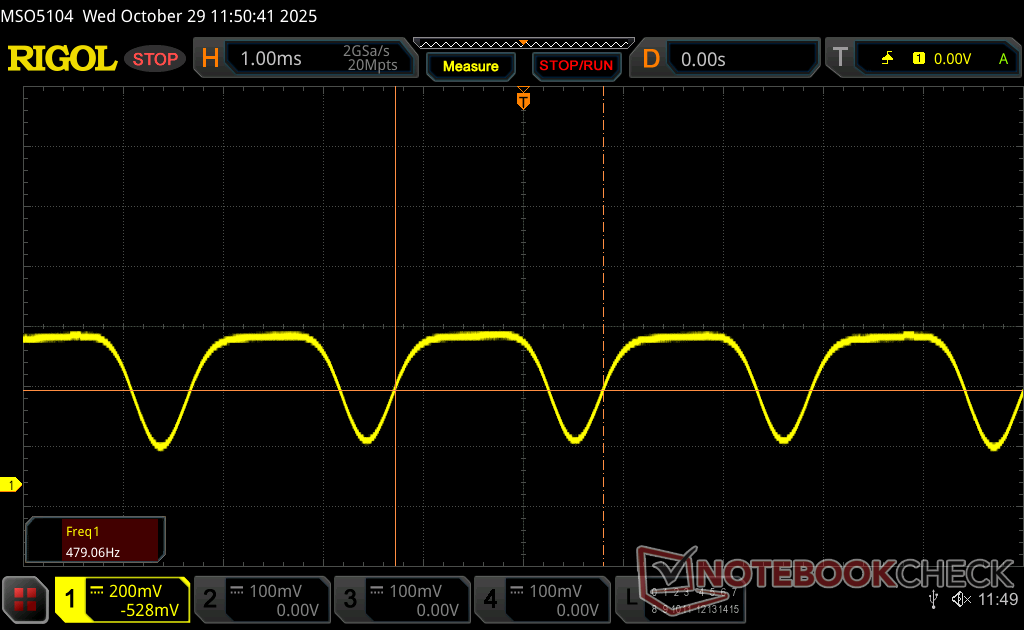
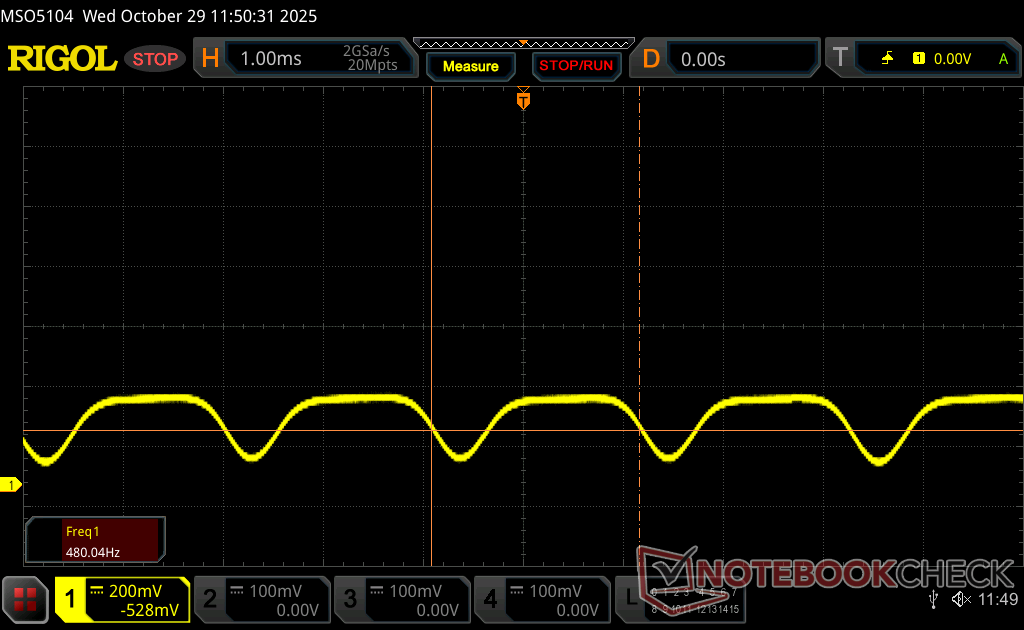
Bildschirm-Flackern / PWM (Pulse-Width Modulation)
| Flackern / PWM festgestellt | 490.8 Hz Amplitude: 35 % | ≤ 100 % Helligkeit | 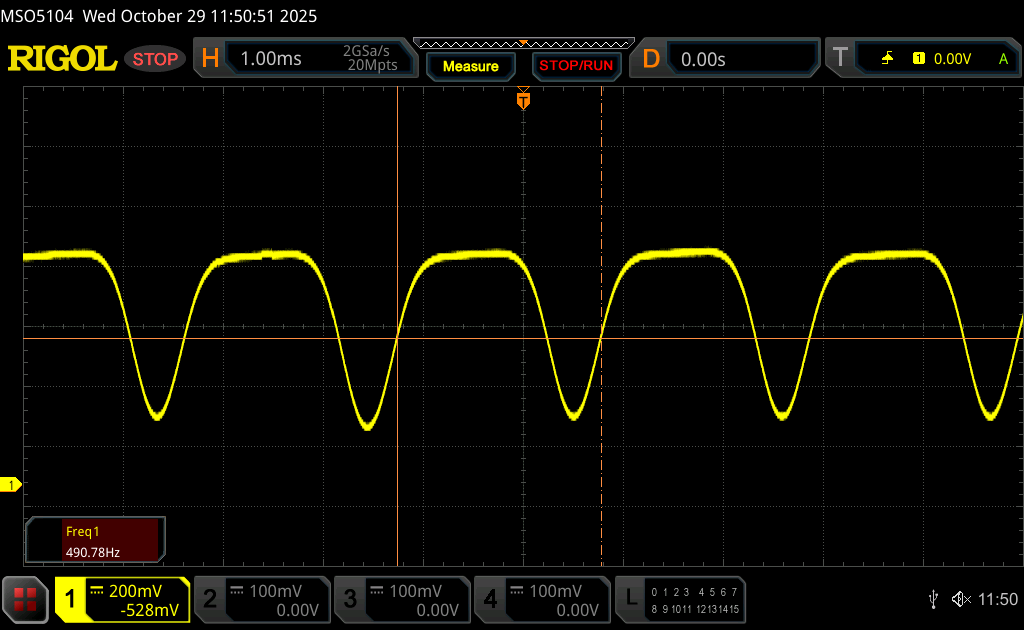 |
Das Display flackert mit 490.8 Hz (im schlimmsten Fall, eventuell durch Pulsweitenmodulation PWM) bei einer eingestellten Helligkeit von 100 % und darunter. Darüber sollte es zu keinem Flackern kommen. Die Frequenz von 490.8 Hz ist relativ hoch und sollte daher auch bei den meisten Personen zu keinen Problemen führen. Empfindliche User sollen laut Berichten aber sogar noch bei 500 Hz und darüber ein Flackern wahrnehmen. Im Vergleich: 52 % aller getesteten Geräte nutzten kein PWM um die Helligkeit zu reduzieren. Wenn PWM eingesetzt wurde, dann bei einer Frequenz von durchschnittlich 7778 (Minimum 5, Maximum 343500) Hz. | |||


Performance


Testbedingungen
Wir haben den Dell Optimizer auf den Modus Performance und das Nvidia Control Panel auf den diskreten Grafikmodus eingestellt, bevor wir die folgenden Benchmarks durchgeführt haben.
Prozessor
Der Core Ultra 7 255H läuft bis zu 20 Prozent schneller als der Core Ultra 7 155H im XPS 16 des letzten Jahres. Ein Upgrade auf die Konfiguration mit dem noch teureren Core Ultra 9 285H wird die Leistung voraussichtlich nur um ein paar Prozentpunkte steigern.
Die Nachhaltigkeit des Turbo Boost könnte besser sein. Wenn man CineBench R15 xT in einer Schleife laufen lässt, sinken die Ergebnisse im Laufe der Zeit um fast 15 Prozent, wie die Grafik unten zeigt. Der Leistungsunterschied zwischen dem Core Ultra 7 255H und dem Core Ultra 7 155H des letztjährigen Modells wird geringer, wenn die Systeme belastet werden.
Cinebench R15 Mehrfachschleife
Cinebench R23: Multi Core | Single Core
Cinebench R20: CPU (Multi Core) | CPU (Single Core)
Cinebench R15: CPU Multi 64Bit | CPU Single 64Bit
Blender: v2.79 BMW27 CPU
7-Zip 18.03: 7z b 4 | 7z b 4 -mmt1
Geekbench 6.7: Multi-Core | Single-Core
Geekbench 5.5: Multi-Core | Single-Core
HWBOT x265 Benchmark v2.2: 4k Preset
LibreOffice : 20 Documents To PDF
R Benchmark 2.5: Overall mean
* ... kleinere Werte sind besser
Stresstest

Die Kerntemperaturen können immer noch relativ hohe Werte erreichen, insbesondere bei der CPU. Bei der Ausführung von Prime95 Stress steigt die CPU beispielsweise auf 3,7 GHz, 105 °C und 115 W, bevor sie kurz darauf auf 3 GHz, 93 °C und 67 W fällt. Die maximale Nachhaltigkeit des Turbo Boosts ist also begrenzt, wie oben in unserem Abschnitt CPU Performance beschrieben.
Die Leistungsaufnahme der GPU-Platine bei Cyberpunk 2077 liegt im Durchschnitt bei 55 bis 65 W, verglichen mit 115 W bei einem Gaming-Laptop wie dem Alienware 16X Aurora mit der gleichen RTX-5070-GPU.


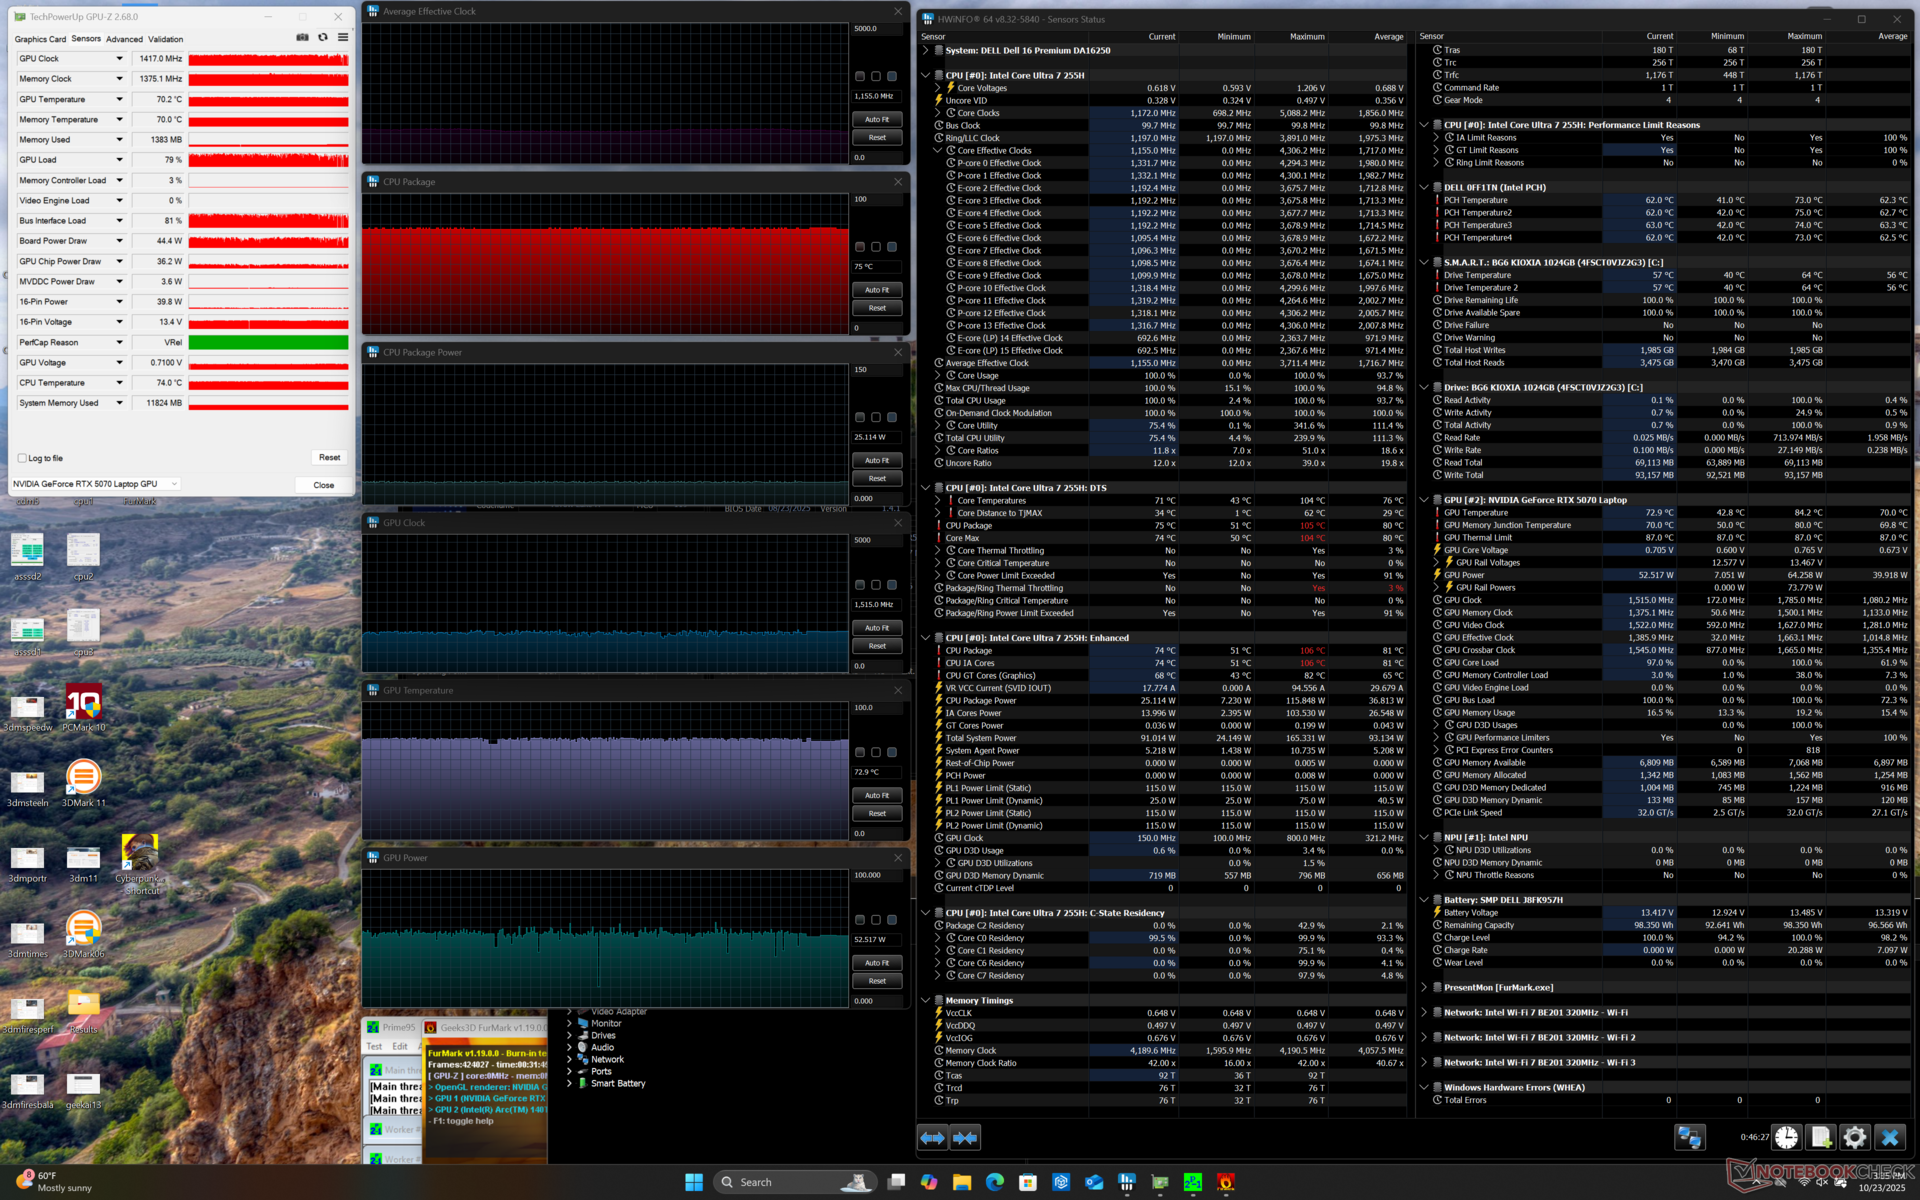
| durchschnittlicher CPU-Takt (GHz) | GPU-Takt (MHz) | durchschnittliche CPU-Temperatur (°C) | durchschnittliche GPU-Temperatur (°C) | |
| System Leerlauf | -- | -- | 59 | 43 |
| Prime95 Stress | 3,0 | -- | 93 | 65 |
| Cyberpunk 2077 Stress (Ausgewogener Modus) | 1,5 | 1.672 | 75 | 73 |
| Cyberpunk 2077 Stress (Performance-Modus) | 1,5 | 1.687 | 76 | 73 |
| Prime95 + FurMark Stress | 1,2 | 1.417 | 75 | 73 |
System Performance
Sowohl AIDA64 als auch PCMark 10 ließen sich auf unserem Gerät nicht ausführen, daher wurden die Ergebnisse unten weggelassen.
CrossMark: Overall | Productivity | Creativity | Responsiveness
WebXPRT 3: Overall
WebXPRT 4: Overall
Mozilla Kraken 1.1: Total
| Performance Rating | |
| Lenovo Yoga Pro 9i 16 RTX 5070 | |
| Dell XPS 16 9640 -1! | |
| Dell 16 Premium DA16250 | |
| Durchschnittliche Intel Core Ultra 7 255H, NVIDIA GeForce RTX 5070 Laptop | |
| Asus Zenbook S 16 UM5606-RK333W | |
| LG Gram Pro 16Z90TS-G.AU89G | |
| HP Spectre x360 16 RTX 4050 | |
| CrossMark / Overall | |
| Lenovo Yoga Pro 9i 16 RTX 5070 | |
| Dell 16 Premium DA16250 | |
| Durchschnittliche Intel Core Ultra 7 255H, NVIDIA GeForce RTX 5070 Laptop (n=1) | |
| Dell XPS 16 9640 | |
| Asus Zenbook S 16 UM5606-RK333W | |
| LG Gram Pro 16Z90TS-G.AU89G | |
| HP Spectre x360 16 RTX 4050 | |
| CrossMark / Productivity | |
| Lenovo Yoga Pro 9i 16 RTX 5070 | |
| Dell 16 Premium DA16250 | |
| Durchschnittliche Intel Core Ultra 7 255H, NVIDIA GeForce RTX 5070 Laptop (n=1) | |
| Dell XPS 16 9640 | |
| Asus Zenbook S 16 UM5606-RK333W | |
| LG Gram Pro 16Z90TS-G.AU89G | |
| HP Spectre x360 16 RTX 4050 | |
| CrossMark / Creativity | |
| Lenovo Yoga Pro 9i 16 RTX 5070 | |
| Dell 16 Premium DA16250 | |
| Durchschnittliche Intel Core Ultra 7 255H, NVIDIA GeForce RTX 5070 Laptop (n=1) | |
| Asus Zenbook S 16 UM5606-RK333W | |
| Dell XPS 16 9640 | |
| LG Gram Pro 16Z90TS-G.AU89G | |
| HP Spectre x360 16 RTX 4050 | |
| CrossMark / Responsiveness | |
| Dell 16 Premium DA16250 | |
| Durchschnittliche Intel Core Ultra 7 255H, NVIDIA GeForce RTX 5070 Laptop (n=1) | |
| Dell XPS 16 9640 | |
| Lenovo Yoga Pro 9i 16 RTX 5070 | |
| Asus Zenbook S 16 UM5606-RK333W | |
| LG Gram Pro 16Z90TS-G.AU89G | |
| HP Spectre x360 16 RTX 4050 | |
| WebXPRT 3 / Overall | |
| Lenovo Yoga Pro 9i 16 RTX 5070 | |
| Dell 16 Premium DA16250 | |
| Durchschnittliche Intel Core Ultra 7 255H, NVIDIA GeForce RTX 5070 Laptop (n=1) | |
| Asus Zenbook S 16 UM5606-RK333W | |
| Dell XPS 16 9640 | |
| HP Spectre x360 16 RTX 4050 | |
| LG Gram Pro 16Z90TS-G.AU89G | |
| WebXPRT 4 / Overall | |
| Lenovo Yoga Pro 9i 16 RTX 5070 | |
| Dell 16 Premium DA16250 | |
| Durchschnittliche Intel Core Ultra 7 255H, NVIDIA GeForce RTX 5070 Laptop (n=1) | |
| LG Gram Pro 16Z90TS-G.AU89G | |
| Asus Zenbook S 16 UM5606-RK333W | |
| HP Spectre x360 16 RTX 4050 | |
| Dell XPS 16 9640 | |
| Mozilla Kraken 1.1 / Total | |
| HP Spectre x360 16 RTX 4050 | |
| LG Gram Pro 16Z90TS-G.AU89G | |
| Dell 16 Premium DA16250 | |
| Durchschnittliche Intel Core Ultra 7 255H, NVIDIA GeForce RTX 5070 Laptop (n=1) | |
| Asus Zenbook S 16 UM5606-RK333W | |
| Lenovo Yoga Pro 9i 16 RTX 5070 | |
* ... kleinere Werte sind besser
DPC-Latenzzeit


| DPC Latencies / LatencyMon - interrupt to process latency (max), Web, Youtube, Prime95 | |
| HP Spectre x360 16 RTX 4050 | |
| Lenovo Yoga Pro 9i 16 RTX 5070 | |
| Dell XPS 16 9640 | |
| Dell 16 Premium DA16250 | |
* ... kleinere Werte sind besser
Speichergeräte


| Drive Performance Rating - Percent | |
| Dell XPS 16 9640 | |
| Dell 16 Premium DA16250 | |
| Lenovo Yoga Pro 9i 16 RTX 5070 | |
| HP Spectre x360 16 RTX 4050 | |
| LG Gram Pro 16Z90TS-G.AU89G -11! | |
| Asus Zenbook S 16 UM5606-RK333W | |
* ... kleinere Werte sind besser
Disk Throttling: DiskSpd Read Loop, Queue Depth 8
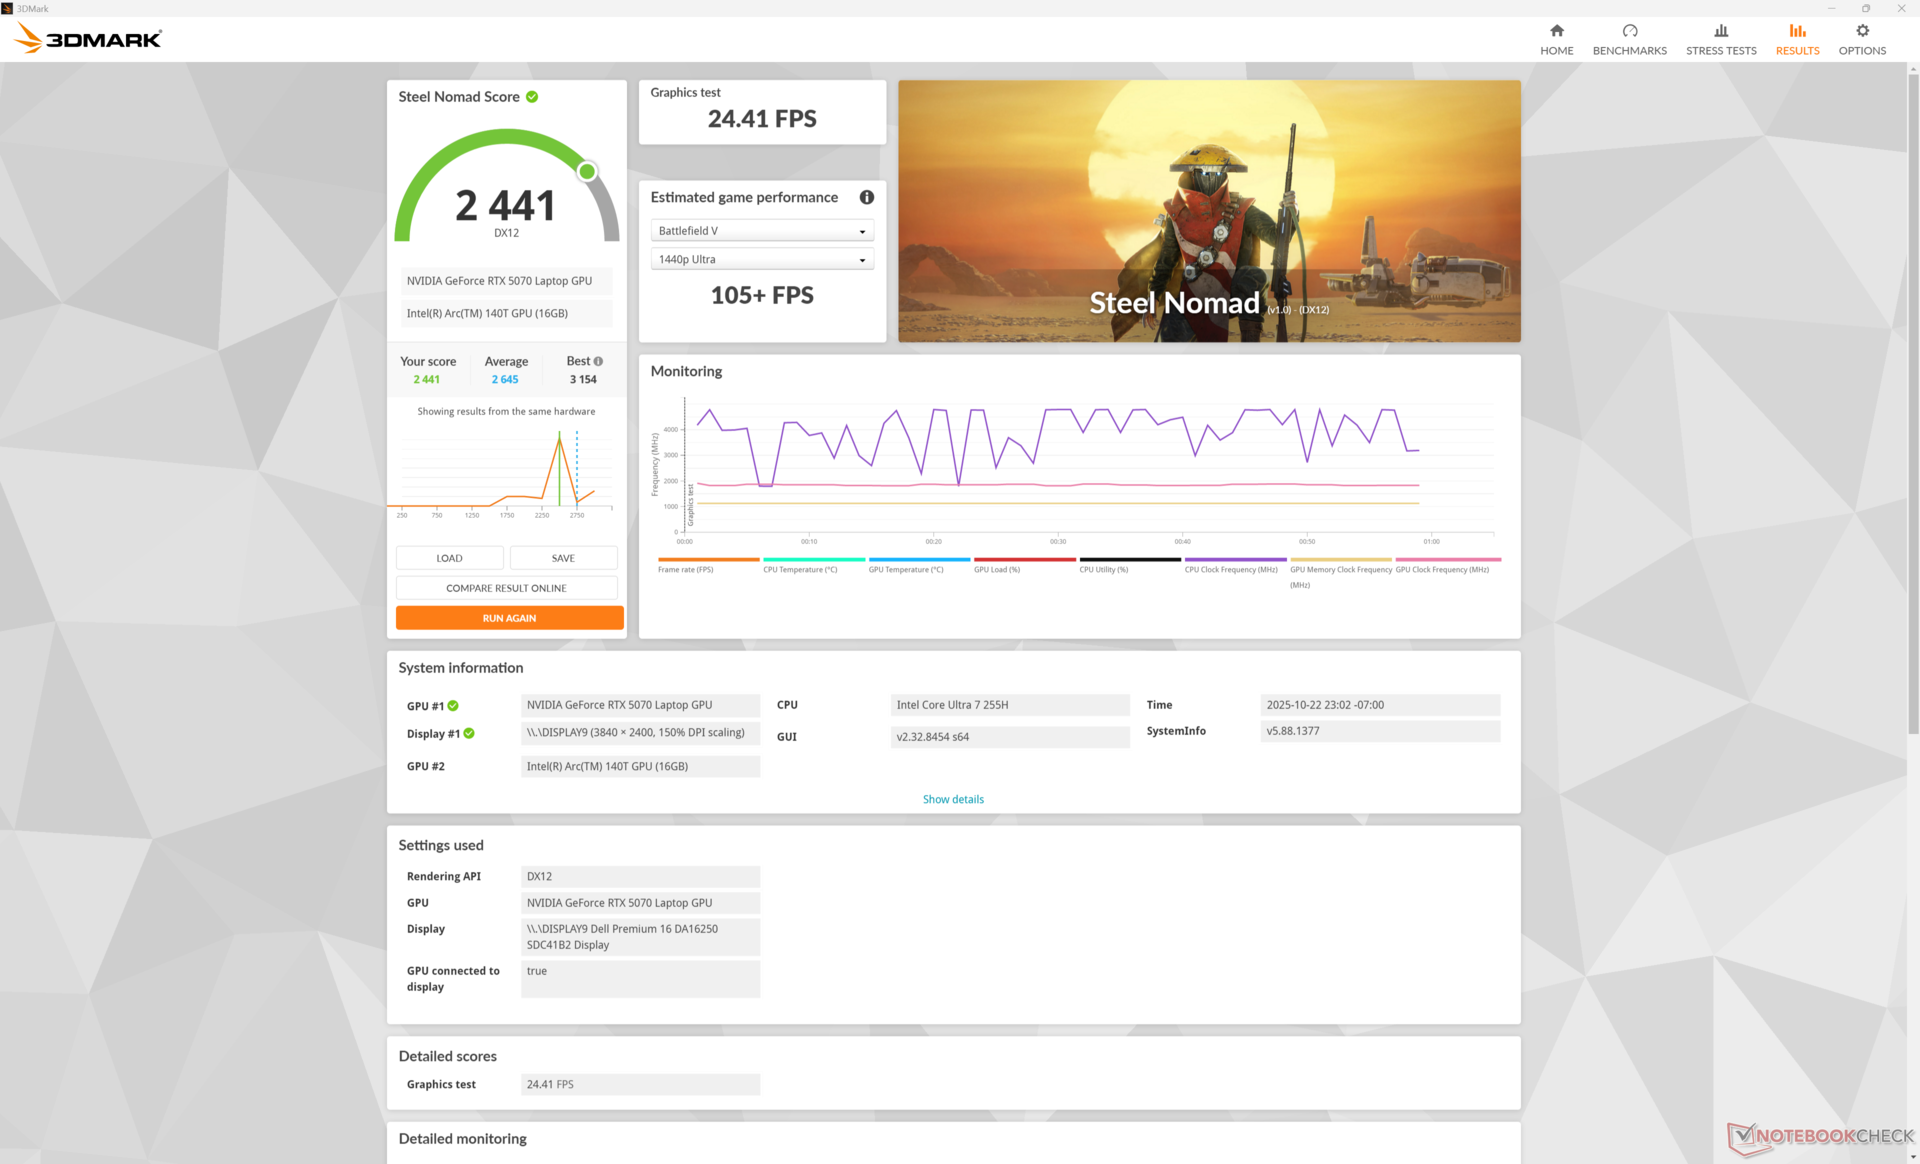
GPU Performance
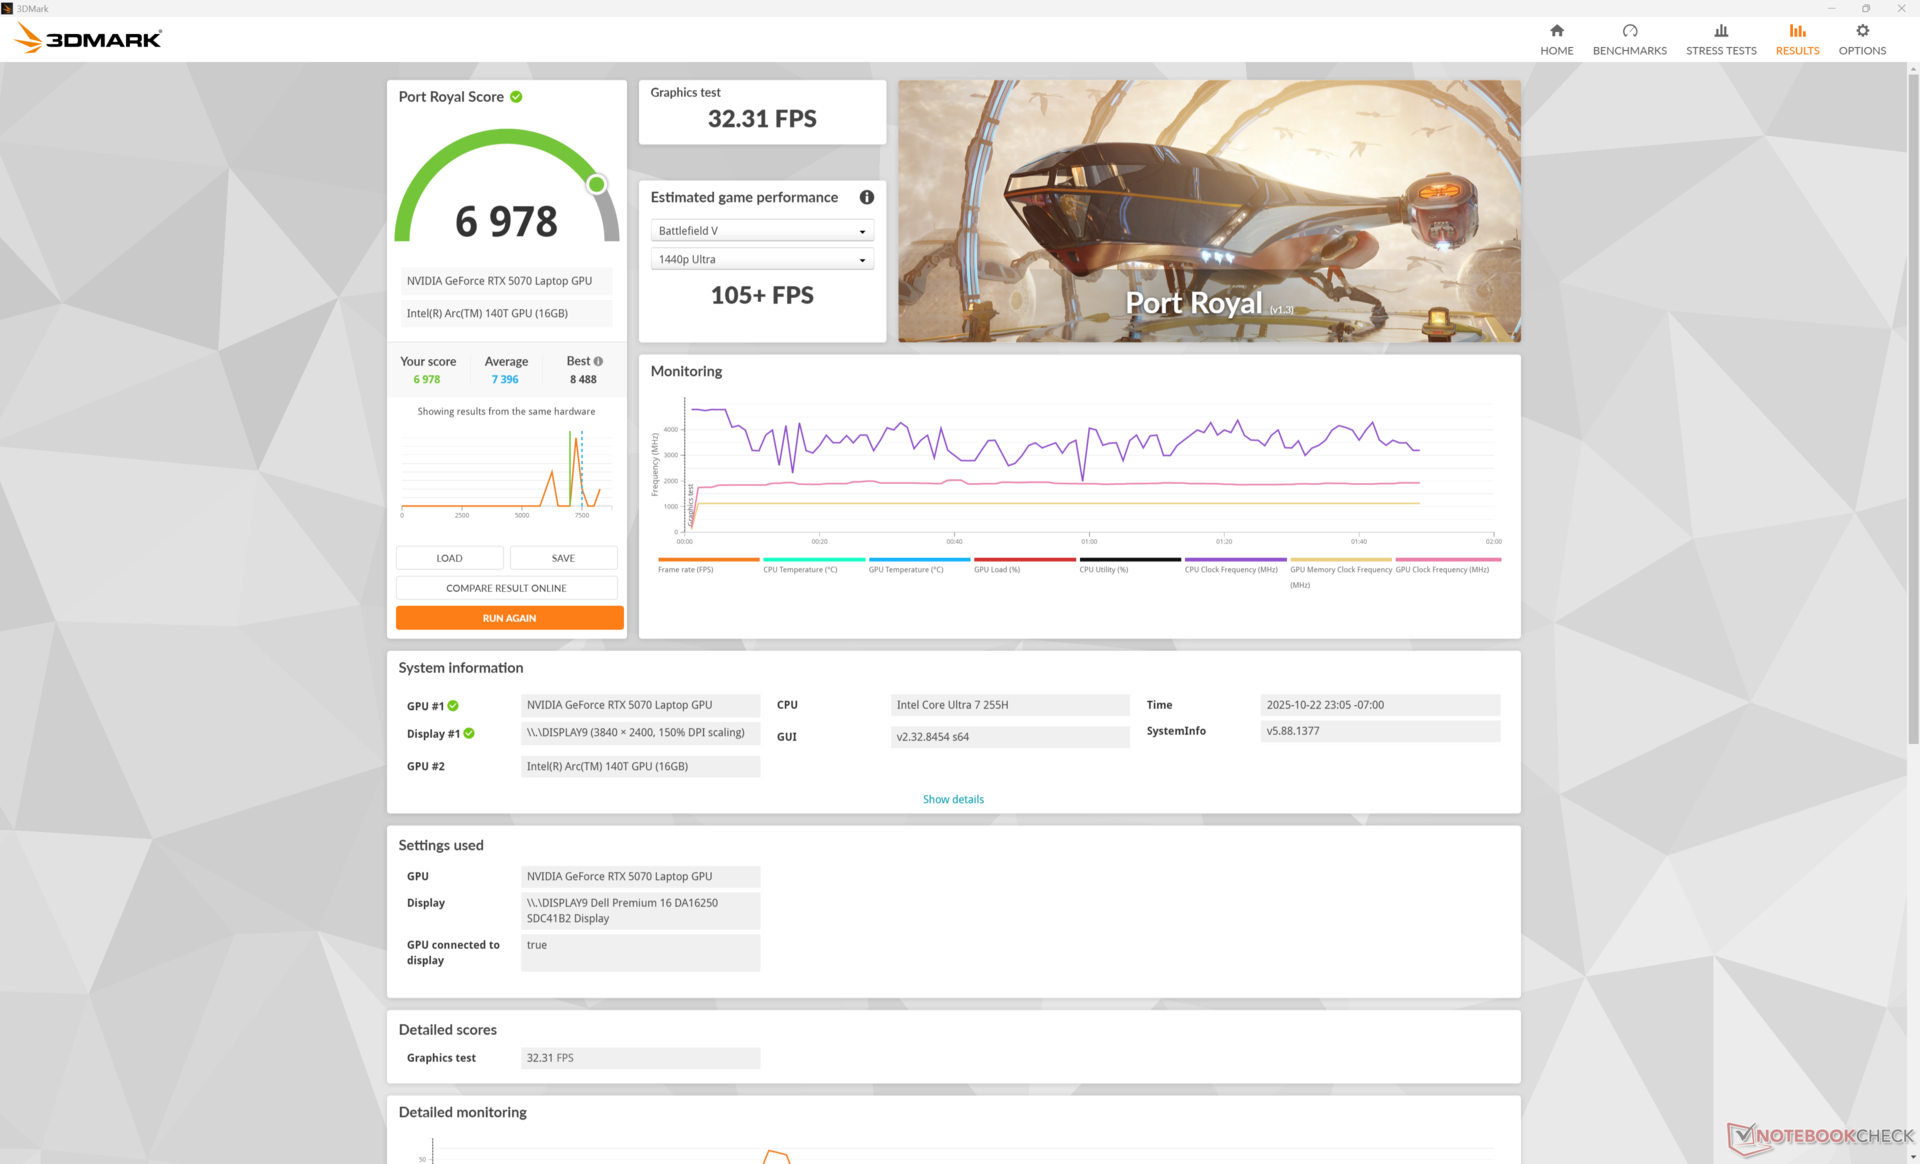
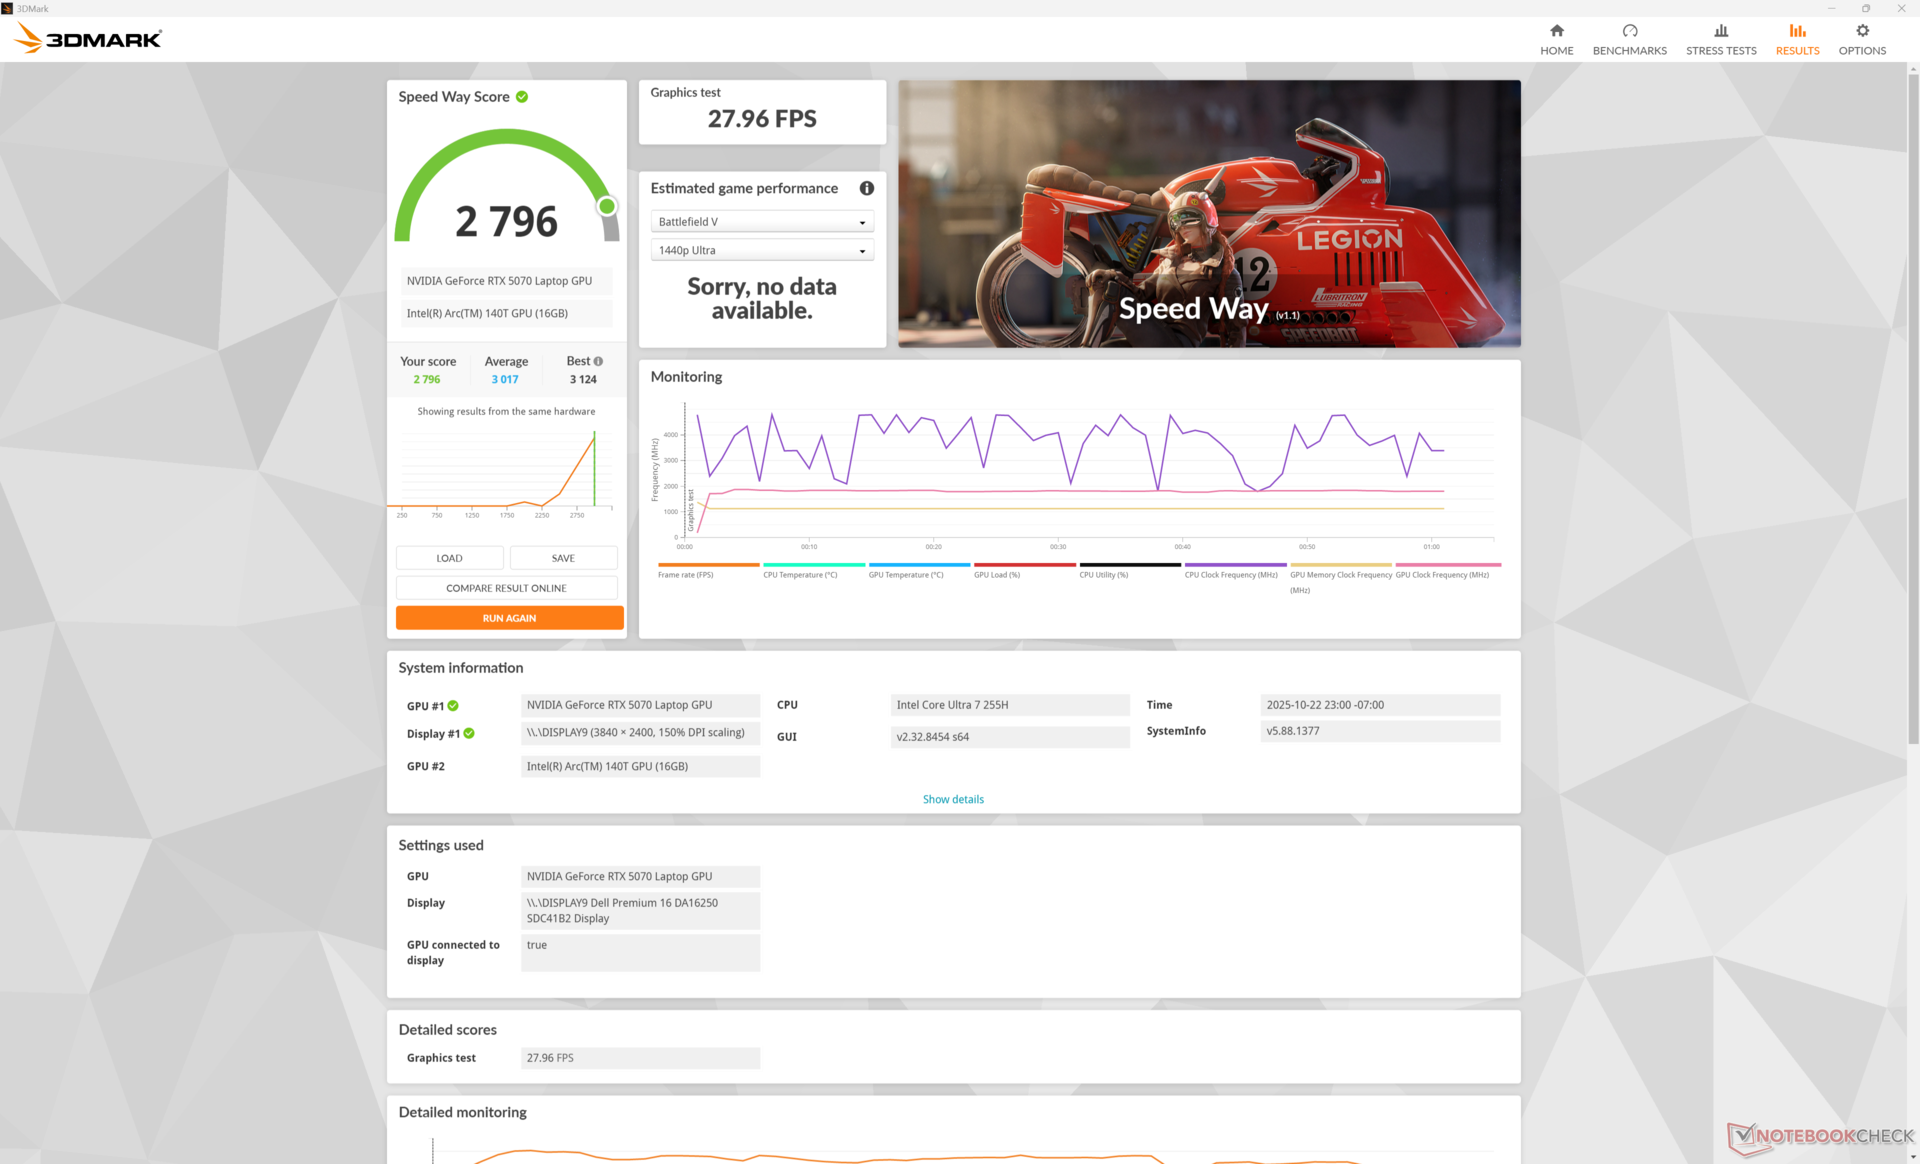
Die mobile GeForce-RTX-5070-GPU im Dell 16 Premium läuft fast 20 Prozent langsamer als der durchschnittliche Laptop in unserer Datenbank mit der gleichen RTX-5070-GPU, weil die meisten Laptops mit der gleichen GPU eher Gaming-Laptops mit höheren TGP-Zielen sind. Die herkömmliche Rasterisierungsleistung liegt daher näher an Laptops mit der RTX 5060.
Bei professionellen Aufgaben wie Blender ist die Leistungsdiskrepanz zu anderen RTX-5070-Laptops im Durchschnitt um etwa zehn Prozent geringer. Das Dell 16 Premium ist in erster Linie ein professioneller PC und erst in zweiter Linie ein Gaming-Laptop.
| Leistungsprofil | Grafics-Punktzahl | Physics-Punktzahl | Kombinierte Punktzahl |
| Performance-Modus | 28.759 | 37.491 | 11.209 |
| Ausgeglichener Modus | 27.915 (-3 %) | 35.948 (-4 %) | 9.874 (-12 %) |
| Akku-Leistung | 25.880 (-10 %) | 32.601 (-13 %) | 11.046 (-1 %) |


| 3DMark 11 Performance | 32410 Punkte | |
| 3DMark Cloud Gate Standard Score | 65334 Punkte | |
| 3DMark Fire Strike Score | 25640 Punkte | |
| 3DMark Time Spy Score | 11192 Punkte | |
| 3DMark Steel Nomad Score | 2441 Punkte | |
Hilfe | ||
* ... kleinere Werte sind besser
Gaming Performance
Spiele können bis zu 20 Prozent langsamer laufen als auf den meisten anderen Laptops mit der gleichen GPU. Assassin's Creed Shadows, zum Beispiel, lief auf dem Lenovo Yoga Pro 9i 16 in allen getesteten Einstellungen durchweg schneller.
| Performance Rating - Percent | |
| Lenovo Yoga Pro 9i 16 RTX 5070 | |
| Dell 16 Premium DA16250 | |
| Dell XPS 16 9640 | |
| HP Spectre x360 16 RTX 4050 | |
| Asus Zenbook S 16 UM5606-RK333W | |
| LG Gram Pro 16Z90TS-G.AU89G | |
| Cyberpunk 2077 - 1920x1080 Ultra Preset (FSR off) | |
| Lenovo Yoga Pro 9i 16 RTX 5070 | |
| Dell 16 Premium DA16250 | |
| Dell XPS 16 9640 | |
| HP Spectre x360 16 RTX 4050 | |
| Asus Zenbook S 16 UM5606-RK333W | |
| LG Gram Pro 16Z90TS-G.AU89G | |
| Baldur's Gate 3 - 1920x1080 Ultra Preset AA:T | |
| Dell 16 Premium DA16250 | |
| Dell XPS 16 9640 | |
| Lenovo Yoga Pro 9i 16 RTX 5070 | |
| HP Spectre x360 16 RTX 4050 | |
| Asus Zenbook S 16 UM5606-RK333W | |
| LG Gram Pro 16Z90TS-G.AU89G | |
| GTA V - 1920x1080 Highest AA:4xMSAA + FX AF:16x | |
| Lenovo Yoga Pro 9i 16 RTX 5070 | |
| Dell 16 Premium DA16250 | |
| Dell XPS 16 9640 | |
| HP Spectre x360 16 RTX 4050 | |
| Asus Zenbook S 16 UM5606-RK333W | |
| LG Gram Pro 16Z90TS-G.AU89G | |
| Final Fantasy XV Benchmark - 1920x1080 High Quality | |
| Lenovo Yoga Pro 9i 16 RTX 5070 | |
| Dell 16 Premium DA16250 | |
| Dell XPS 16 9640 | |
| HP Spectre x360 16 RTX 4050 | |
| LG Gram Pro 16Z90TS-G.AU89G | |
| Asus Zenbook S 16 UM5606-RK333W | |
| Strange Brigade - 1920x1080 ultra AA:ultra AF:16 | |
| Lenovo Yoga Pro 9i 16 RTX 5070 | |
| Dell 16 Premium DA16250 | |
| Dell XPS 16 9640 | |
| HP Spectre x360 16 RTX 4050 | |
| LG Gram Pro 16Z90TS-G.AU89G | |
| Asus Zenbook S 16 UM5606-RK333W | |
| Dota 2 Reborn - 1920x1080 ultra (3/3) best looking | |
| Lenovo Yoga Pro 9i 16 RTX 5070 | |
| Dell 16 Premium DA16250 | |
| HP Spectre x360 16 RTX 4050 | |
| Dell XPS 16 9640 | |
| LG Gram Pro 16Z90TS-G.AU89G | |
| Asus Zenbook S 16 UM5606-RK333W | |
| X-Plane 11.11 - 1920x1080 high (fps_test=3) | |
| Lenovo Yoga Pro 9i 16 RTX 5070 | |
| Dell 16 Premium DA16250 | |
| Dell XPS 16 9640 | |
| Dell XPS 16 9640 | |
| HP Spectre x360 16 RTX 4050 | |
| Asus Zenbook S 16 UM5606-RK333W | |
| LG Gram Pro 16Z90TS-G.AU89G | |
| Assassin's Creed Shadows | |
| 1920x1080 Low | |
| Durchschnittliche NVIDIA GeForce RTX 5070 Laptop (39 - 100, n=9) | |
| Lenovo Yoga Pro 9i 16 RTX 5070 | |
| Dell 16 Premium DA16250 | |
| 1920x1080 Medium | |
| Durchschnittliche NVIDIA GeForce RTX 5070 Laptop (36 - 93, n=10) | |
| Lenovo Yoga Pro 9i 16 RTX 5070 | |
| Dell 16 Premium DA16250 | |
| 1920x1080 High | |
| Durchschnittliche NVIDIA GeForce RTX 5070 Laptop (32 - 77, n=11) | |
| Lenovo Yoga Pro 9i 16 RTX 5070 | |
| Dell 16 Premium DA16250 | |
| 1920x1080 Ultra High | |
| Lenovo Yoga Pro 9i 16 RTX 5070 | |
| Durchschnittliche NVIDIA GeForce RTX 5070 Laptop (25 - 53, n=12) | |
| Dell 16 Premium DA16250 | |
| 2560x1440 Ultra High | |
| Durchschnittliche NVIDIA GeForce RTX 5070 Laptop (22 - 40, n=12) | |
| Lenovo Yoga Pro 9i 16 RTX 5070 | |
| Dell 16 Premium DA16250 | |
| 2560x1440 Ultra High + DLSS Quality | |
| Durchschnittliche NVIDIA GeForce RTX 5070 Laptop (25 - 45, n=6) | |
| Dell 16 Premium DA16250 | |
| 2560x1440 Ultra High + GI + DLSS Quality + FG | |
| Durchschnittliche NVIDIA GeForce RTX 5070 Laptop (33 - 57, n=4) | |
| Dell 16 Premium DA16250 | |
| Monster Hunter Wilds | |
| 1920x1080 lowest, no upscaling | |
| Durchschnittliche NVIDIA GeForce RTX 5070 Laptop (69.1 - 86.5, n=3) | |
| Dell 16 Premium DA16250 | |
| 1920x1080 medium, no upscaling | |
| Durchschnittliche NVIDIA GeForce RTX 5070 Laptop (61.6 - 78.2, n=4) | |
| Dell 16 Premium DA16250 | |
| Black Myth: Wukong | |
| 1280x720 low TSR 100 | |
| Durchschnittliche NVIDIA GeForce RTX 5070 Laptop (127 - 206, n=2) | |
| Dell 16 Premium DA16250 | |
| 1920x1080 low TSR 100 | |
| Durchschnittliche NVIDIA GeForce RTX 5070 Laptop (83 - 197, n=4) | |
| Dell 16 Premium DA16250 | |
| 1920x1080 medium TSR 100 | |
| Durchschnittliche NVIDIA GeForce RTX 5070 Laptop (63 - 112, n=4) | |
| Dell 16 Premium DA16250 | |
| 1920x1080 high TSR 100 | |
| Durchschnittliche NVIDIA GeForce RTX 5070 Laptop (49 - 86, n=5) | |
| Dell 16 Premium DA16250 | |
| 1920x1080 cinematic TSR 100 | |
| Durchschnittliche NVIDIA GeForce RTX 5070 Laptop (28 - 44, n=5) | |
| Dell 16 Premium DA16250 | |
| 2560x1440 cinematic TSR 100 | |
| Durchschnittliche NVIDIA GeForce RTX 5070 Laptop (20 - 27, n=5) | |
| Dell 16 Premium DA16250 | |
| 2560x1440 cinematic DLSS 68 | |
| Durchschnittliche NVIDIA GeForce RTX 5070 Laptop (31 - 41, n=5) | |
| Dell 16 Premium DA16250 | |
| 2560x1440 cinematic RT: Very High DLSS 68 FG | |
| Durchschnittliche NVIDIA GeForce RTX 5070 Laptop (18 - 45, n=4) | |
| Dell 16 Premium DA16250 | |
| Alan Wake 2 | |
| 1280x720 Low Preset | |
| Dell 16 Premium DA16250 | |
| Durchschnittliche NVIDIA GeForce RTX 5070 Laptop (106.8 - 115.2, n=2) | |
| 1920x1080 Low Preset | |
| Durchschnittliche NVIDIA GeForce RTX 5070 Laptop (68.8 - 86.1, n=4) | |
| Dell 16 Premium DA16250 | |
| 1920x1080 Medium Preset | |
| Durchschnittliche NVIDIA GeForce RTX 5070 Laptop (68.4 - 82.4, n=4) | |
| Dell 16 Premium DA16250 | |
| 1920x1080 High Preset | |
| Durchschnittliche NVIDIA GeForce RTX 5070 Laptop (60 - 72.5, n=6) | |
| Dell 16 Premium DA16250 | |
| 2560x1440 High Preset | |
| Durchschnittliche NVIDIA GeForce RTX 5070 Laptop (35.8 - 45.1, n=6) | |
| Dell 16 Premium DA16250 | |
Cyberpunk 2077 ultra fps Grafik
| min. | mittel | hoch | max. | QHD DLSS | QHD | 4K | |
|---|---|---|---|---|---|---|---|
| GTA V (2015) | 185.6 | 180.9 | 175.7 | 123.7 | 96.9 | ||
| Dota 2 Reborn (2015) | 168.4 | 152.9 | 147.8 | 140.4 | 106.4 | ||
| Final Fantasy XV Benchmark (2018) | 218 | 148.7 | 113.1 | 82.5 | |||
| X-Plane 11.11 (2018) | 114.3 | 110 | 91.9 | 65.7 | |||
| Strange Brigade (2018) | 507 | 282 | 232 | 204 | 140.2 | ||
| Baldur's Gate 3 (2023) | 149.5 | 125.5 | 109.8 | 109 | 107.3 | 73.8 | |
| Cyberpunk 2077 (2023) | 134.9 | 107.8 | 91 | 81.5 | 61.4 | 51.9 | |
| Alan Wake 2 (2023) | 68.8 | 68.4 | 60 | 35.8 | |||
| F1 24 (2024) | 242 | 241 | 186 | 63.8 | 62.9 | 40.3 | |
| Black Myth: Wukong (2024) | 83 | 63 | 49 | 28 | 31 | 20 | |
| Monster Hunter Wilds (2025) | 69.1 | 61.6 | |||||
| Assassin's Creed Shadows (2025) | 61 | 57 | 49 | 33 | 35 | 28 |
Emissionen
Systemrauschen
Das Lüftergeräusch und die Obergrenze sind im Wesentlichen identisch mit dem letztjährigen Modell, da die Kühllösung und die Leistungsaufnahme unverändert bleiben.

Lautstärkediagramm
| Idle |
| 23.2 / 23.2 / 26.6 dB(A) |
| Last |
| 39.4 / 48.9 dB(A) |
 | ||
30 dB leise 40 dB(A) deutlich hörbar 50 dB(A) störend |
||
min: | ||
| Dell 16 Premium DA16250 Ultra 7 255H, GeForce RTX 5070 Laptop | Dell XPS 16 9640 Ultra 7 155H, GeForce RTX 4070 Laptop GPU | HP Spectre x360 16 RTX 4050 Ultra 7 155H, GeForce RTX 4050 Laptop GPU | Lenovo Yoga Pro 9i 16 RTX 5070 Ultra 9 285H, GeForce RTX 5070 Laptop | Asus Zenbook S 16 UM5606-RK333W Ryzen AI 9 HX 370, Radeon 890M | LG Gram Pro 16Z90TS-G.AU89G Core Ultra 7 256V, Arc 140V | |
|---|---|---|---|---|---|---|
| Geräuschentwicklung | -4% | 11% | -5% | 6% | -1% | |
| aus / Umgebung * (dB) | 23.2 | 24.5 -6% | 23.3 -0% | 24.1 -4% | 24.7 -6% | 25.2 -9% |
| Idle min * (dB) | 23.2 | 24.5 -6% | 23.6 -2% | 24.1 -4% | 24.7 -6% | 25.2 -9% |
| Idle avg * (dB) | 23.2 | 24.5 -6% | 23.6 -2% | 24.1 -4% | 24.7 -6% | 25.2 -9% |
| Idle max * (dB) | 26.6 | 27.5 -3% | 23.6 11% | 25.1 6% | 26.4 1% | 27.7 -4% |
| Last avg * (dB) | 39.4 | 39.6 -1% | 29.2 26% | 44.2 -12% | 35.7 9% | |
| Cyberpunk 2077 ultra * (dB) | 47.3 | 52.7 -11% | 36.8 22% | 42.6 10% | ||
| Last max * (dB) | 48.9 | 49.7 -2% | 32.1 34% | 52.7 -8% | 36.8 25% | 42.7 13% |
| Witcher 3 ultra * (dB) | 49.7 | 32.1 |
* ... kleinere Werte sind besser
Temperatur
Heiße Stellen auf der Unterseite in der Nähe der Belüftungsöffnungen können bei anspruchsvoller Last fast 45 °C erreichen. Wir können nicht umhin, uns zu fragen, ob zusätzliche Lüftungsöffnungen die Gesamttemperaturen verbessert hätten, aber Dell legt eindeutig den Schwerpunkt auf ein sauberes Design ohne Lüftungsöffnungen, wie bei der MacBook Serie.


(+) Die maximale Temperatur auf der Oberseite ist 36.8 °C. Im Vergleich liegt der Klassendurchschnitt bei 36.8 °C (von 21 bis 71 °C für die Klasse Multimedia).
(+) Auf der Unterseite messen wir eine maximalen Wert von 34.8 °C (im Vergleich zum Durchschnitt von 39.1 °C).
(+) Ohne Last messen wir eine durchschnittliche Temperatur von 28.7 °C auf der Oberseite. Der Klassendurchschnitt erreicht 31.3 °C.
(+) Die Handballen und der Touchpad-Bereich sind mit gemessenen 28.6 °C kühler als die typische Hauttemperatur und fühlen sich dadurch kühl an.
(±) Die durchschnittliche Handballen-Temperatur anderer getesteter Geräte war 28.7 °C (+0.1 °C).


| Dell 16 Premium DA16250 Ultra 7 255H, GeForce RTX 5070 Laptop | Dell XPS 16 9640 Ultra 7 155H, GeForce RTX 4070 Laptop GPU | HP Spectre x360 16 RTX 4050 Ultra 7 155H, GeForce RTX 4050 Laptop GPU | Lenovo Yoga Pro 9i 16 RTX 5070 Ultra 9 285H, GeForce RTX 5070 Laptop | Asus Zenbook S 16 UM5606-RK333W Ryzen AI 9 HX 370, Radeon 890M | LG Gram Pro 16Z90TS-G.AU89G Core Ultra 7 256V, Arc 140V | |
|---|---|---|---|---|---|---|
| Hitze | 2% | -4% | -7% | -19% | -5% | |
| Last oben max * (°C) | 36.8 | 39.4 -7% | 39.6 -8% | 41.8 -14% | 46.9 -27% | 40.5 -10% |
| Last unten max * (°C) | 34.8 | 36.9 -6% | 39.2 -13% | 47.9 -38% | 53.5 -54% | 45 -29% |
| Idle oben max * (°C) | 31.2 | 28.2 10% | 29 7% | 26.3 16% | 29.5 5% | 27.1 13% |
| Idle unten max * (°C) | 30.8 | 27.4 11% | 31.6 -3% | 27.6 10% | 30.2 2% | 28.8 6% |
* ... kleinere Werte sind besser
Lautsprecher
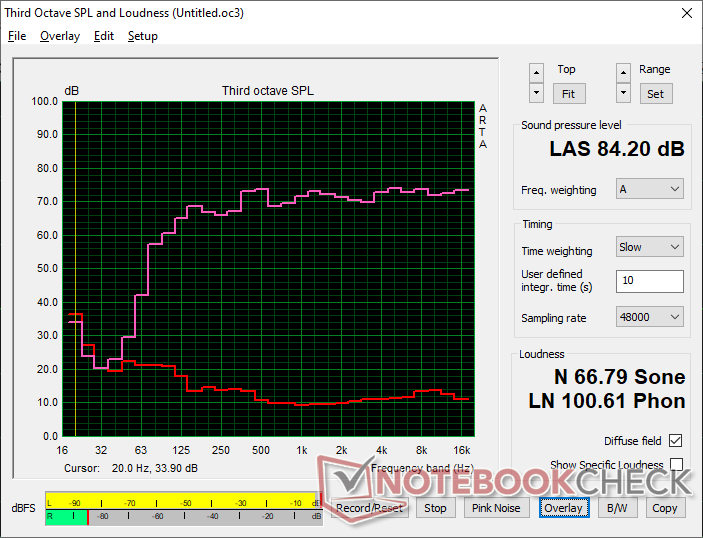
Dell 16 Premium DA16250 Audio Analyse
(+) | Die Lautsprecher können relativ laut spielen (84.2 dB)
Bass 100 - 315 Hz
(±) | abgesenkter Bass - 6.1% geringer als der Median
(+) | lineare Bass-Wiedergabe (4.2% Delta zum Vorgänger)
Mitteltöne 400 - 2000 Hz
(+) | ausgeglichene Mitten, vom Median nur 1.4% abweichend
(+) | lineare Mitten (3.6% Delta zum Vorgänger)
Hochtöne 2 - 16 kHz
(+) | ausgeglichene Hochtöne, vom Median nur 1.5% abweichend
(+) | sehr lineare Hochtöne (2.2% Delta zum Vorgänger)
Gesamt im hörbaren Bereich 100 - 16.000 Hz
(+) | hörbarer Bereich ist sehr linear (5.1% Abstand zum Median
Im Vergleich zu allen Geräten derselben Klasse
» 1% aller getesteten Geräte dieser Klasse waren besser, 0% vergleichbar, 99% schlechter
» Das beste Gerät hat einen Delta-Wert von 5%, durchschnittlich ist 17%, das schlechteste Gerät hat 45%
Im Vergleich zu allen Geräten im Test
» 0% aller getesteten Geräte waren besser, 0% vergleichbar, 100% schlechter
» Das beste Gerät hat einen Delta-Wert von 4%, durchschnittlich ist 24%, das schlechteste Gerät hat 134%
Apple MacBook Pro 16 2021 M1 Pro Audio Analyse
(+) | Die Lautsprecher können relativ laut spielen (84.7 dB)
Bass 100 - 315 Hz
(+) | guter Bass - nur 3.8% Abweichung vom Median
(+) | lineare Bass-Wiedergabe (5.2% Delta zum Vorgänger)
Mitteltöne 400 - 2000 Hz
(+) | ausgeglichene Mitten, vom Median nur 1.3% abweichend
(+) | lineare Mitten (2.1% Delta zum Vorgänger)
Hochtöne 2 - 16 kHz
(+) | ausgeglichene Hochtöne, vom Median nur 1.9% abweichend
(+) | sehr lineare Hochtöne (2.7% Delta zum Vorgänger)
Gesamt im hörbaren Bereich 100 - 16.000 Hz
(+) | hörbarer Bereich ist sehr linear (4.6% Abstand zum Median
Im Vergleich zu allen Geräten derselben Klasse
» 0% aller getesteten Geräte dieser Klasse waren besser, 0% vergleichbar, 100% schlechter
» Das beste Gerät hat einen Delta-Wert von 5%, durchschnittlich ist 17%, das schlechteste Gerät hat 45%
Im Vergleich zu allen Geräten im Test
» 0% aller getesteten Geräte waren besser, 0% vergleichbar, 100% schlechter
» Das beste Gerät hat einen Delta-Wert von 4%, durchschnittlich ist 24%, das schlechteste Gerät hat 134%
Energieverwaltung
Stromverbrauch
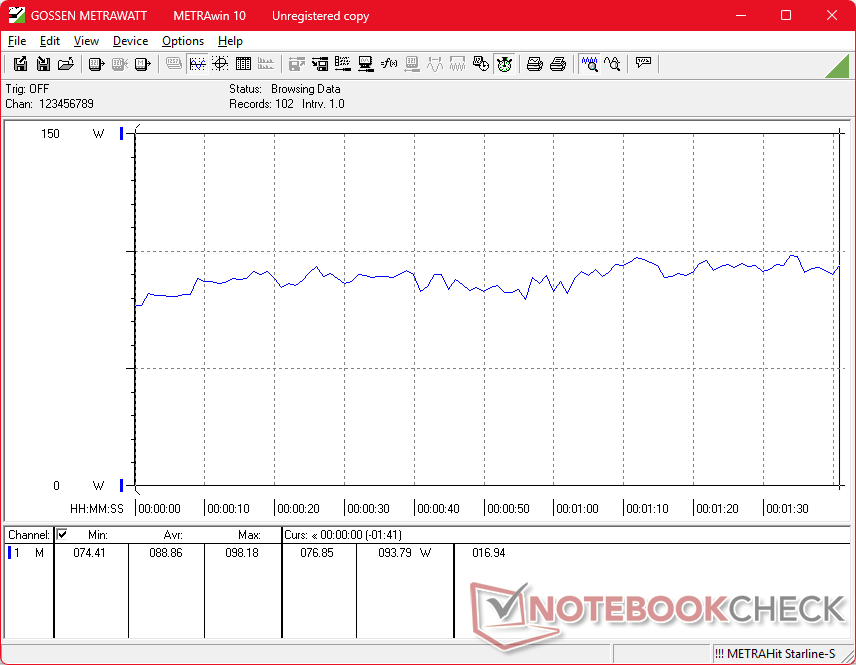
Im Leerlauf auf dem Desktop können bis zu 6 W im Energiesparmodus mit aktiver iGPU oder bis zu 33 W im Performance-Modus mit aktiver dGPU und einem OLED-Bildschirm, der hauptsächlich weiße Farben anzeigt (z. B. beim Browsen), verbraucht werden. Der Verbrauch bei anspruchsvolleren Lasten ist ansonsten ähnlich wie beim Vorjahresmodell, wenn nicht sogar etwas geringer, um die Leistung pro Watt zu verbessern, zumal das Dell 16 Premium mit dem gleichen 130-W-USB-C-Netzteil (~12,8 x 5,5 x 2,3 cm) wie zuvor ausgeliefert wird.
Zu beachten ist, dass der Stromverbrauch zu Beginn des Prime95 Stresstests höher ist, wenn das Turbo-Boost-Potenzial am höchsten ist.


| Aus / Standby | |
| Idle | |
| Last |
|
Legende:
min: | |
| Dell 16 Premium DA16250 Ultra 7 255H, GeForce RTX 5070 Laptop, Kioxia BG6 KBG6AZNV1T02, OLED, 3840x2400, 16.3" | Dell XPS 16 9640 Ultra 7 155H, GeForce RTX 4070 Laptop GPU, Kioxia XG8 KXG80ZNV1T02, OLED, 3840x2400, 16.3" | HP Spectre x360 16 RTX 4050 Ultra 7 155H, GeForce RTX 4050 Laptop GPU, SK hynix PC801 HFS001TEJ9X101N, OLED, 2880x1800, 16" | Lenovo Yoga Pro 9i 16 RTX 5070 Ultra 9 285H, GeForce RTX 5070 Laptop, WD PC SN7100S SDFPMSL-1T00-1101, OLED, 3200x2000, 16" | Asus Zenbook S 16 UM5606-RK333W Ryzen AI 9 HX 370, Radeon 890M, Micron 2400 MTFDKBA1T0QFM, OLED, 2880x1800, 16" | LG Gram Pro 16Z90TS-G.AU89G Core Ultra 7 256V, Arc 140V, Samsung PM9A1a MZVL21T0HDLU, IPS, 2560x1600, 16" | |
|---|---|---|---|---|---|---|
| Stromverbrauch | 7% | -5% | -29% | 39% | 50% | |
| Idle min * (Watt) | 6.5 | 7.7 -18% | 5.8 11% | 8.8 -35% | 5.4 17% | 4.15 36% |
| Idle avg * (Watt) | 8.1 | 10.3 -27% | 12.3 -52% | 16.1 -99% | 10.5 -30% | 5.4 33% |
| Idle max * (Watt) | 33 | 10.6 68% | 33.9 -3% | 16.5 50% | 10.9 67% | 12.4 62% |
| Last avg * (Watt) | 88.9 | 76.5 14% | 83.3 6% | 89.3 -0% | 47.8 46% | |
| Cyberpunk 2077 ultra external monitor * (Watt) | 108.9 | 157.9 -45% | 46.7 57% | 48.1 56% | ||
| Cyberpunk 2077 ultra * (Watt) | 108.7 | 160.6 -48% | 49.2 55% | 48.2 56% | ||
| Last max * (Watt) | 138.3 | 138.5 -0% | 120.8 13% | 177.4 -28% | 58.6 58% | 60.049 57% |
| Witcher 3 ultra * (Watt) | 126.4 | 89.1 |
* ... kleinere Werte sind besser
Stromverbrauch Cyberpunk / Stress Test
Stromverbrauch externer Monitor
Akkulaufzeit
Die Laufzeiten sind trotz der Prozessor-Upgrades und der schnelleren Bildwiederholrate von 120 Hz in etwa gleich wie zuvor.
| Dell 16 Premium DA16250 Ultra 7 255H, GeForce RTX 5070 Laptop, 99.5 Wh | Dell XPS 16 9640 Ultra 7 155H, GeForce RTX 4070 Laptop GPU, 99.5 Wh | HP Spectre x360 16 RTX 4050 Ultra 7 155H, GeForce RTX 4050 Laptop GPU, 83 Wh | Lenovo Yoga Pro 9i 16 RTX 5070 Ultra 9 285H, GeForce RTX 5070 Laptop, 84 Wh | Asus Zenbook S 16 UM5606-RK333W Ryzen AI 9 HX 370, Radeon 890M, 78 Wh | LG Gram Pro 16Z90TS-G.AU89G Core Ultra 7 256V, Arc 140V, 77 Wh | |
|---|---|---|---|---|---|---|
| Akkulaufzeit | -5% | 0% | 1% | -3% | 78% | |
| WLAN (h) | 11 | 10.5 -5% | 11 0% | 11.1 1% | 10.7 -3% | 19.6 78% |
| H.264 (h) | 16.5 | 14.4 | 20.1 | |||
| Last (h) | 1.5 | 1.8 |
Notebookcheck Bewertung
Das Dell 16 Premium bietet das gleiche Benutzererlebnis wie das XPS 16 9640, aber mit schnelleren und effizienteren Prozessoren und einer 120-Hz-OLED-Display-Option.
Dell 16 Premium DA16250
- 31.10.2025 v8
Allen Ngo
 Total Sustainability Score:
 Potenzielle Wettbewerber im Vergleich
Bild | Modell / Test | Preis ab | Gewicht | Dicke | Display |
|---|---|---|---|---|---|
1. 87.9%  | Dell 16 Premium DA16250 Intel Core Ultra 7 255H ⎘ NVIDIA GeForce RTX 5070 Laptop ⎘ 32 GB RAM, 1024 GB SSD | Amazon: Bestpreis 2097.53€ Easynotebooks.de 2. 2097.53€ XITRA.de 3. 2097.54€ Notebook.de | 2.3 kg | 18.7 mm | 16.30" 3840x2400 278 PPI OLED |
2. 88.6% v7 (old)  | Dell XPS 16 9640 Intel Core Ultra 7 155H ⎘ NVIDIA GeForce RTX 4070 Laptop GPU ⎘ 32 GB RAM, 1024 GB SSD | Amazon: 1. 2.517,61 € Dell XPS 16 9640 Laptop 16.3... 2. 2.322,29 € Dell XPS 16 (9640) Laptop 16... 3. 850,41 € Dell XPS 14 9440 Laptop 14.5... Geizhals Suche | 2.3 kg | 18.7 mm | 16.30" 3840x2400 139 PPI OLED |
3. 91.1% v7 (old) 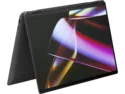 | HP Spectre x360 16 RTX 4050 Intel Core Ultra 7 155H ⎘ NVIDIA GeForce RTX 4050 Laptop GPU ⎘ 16 GB RAM, 1024 GB SSD | Amazon: Geizhals Suche | 2 kg | 19.8 mm | 16.00" 2880x1800 212 PPI OLED |
4. 90.4%  | Lenovo Yoga Pro 9i 16 RTX 5070 Intel Core Ultra 9 285H ⎘ NVIDIA GeForce RTX 5070 Laptop ⎘ 64 GB RAM, 1024 GB SSD | Amazon: Geizhals Suche | 1.9 kg | 17.9 mm | 16.00" 3200x2000 236 PPI OLED |
5. 84.7%  | Asus Zenbook S 16 UM5606-RK333W AMD Ryzen AI 9 HX 370 ⎘ AMD Radeon 890M ⎘ 32 GB RAM, 1024 GB SSD | Amazon: 1.257,42 € Geizhals Suche | 1.5 kg | 12.9 mm | 16.00" 2880x1800 212 PPI OLED |
6. 83.9%  | LG Gram Pro 16Z90TS-G.AU89G Intel Core Ultra 7 256V ⎘ Intel Arc Graphics 140V ⎘ 16 GB RAM, 1024 GB SSD | Amazon: Bestpreis 1299€ Easynotebooks.de 2. 1299€ LG Electronics DE 3. 1299.01€ Notebook.de | 1.2 kg | 13 mm | 16.00" 2560x1600 189 PPI IPS |
Transparenz
Die Auswahl der zu testenden Geräte erfolgt innerhalb der Redaktion. Das vorliegende Testmuster wurde dem Autor vom Hersteller oder einem Shop zu Testzwecken leihweise zur Verfügung gestellt. Eine Einflussnahme des Leihstellers auf den Testbericht gab es nicht, der Hersteller erhielt keine Version des Reviews vor der Veröffentlichung. Es bestand keine Verpflichtung zur Publikation. Als eigenständiges, unabhängiges Unternehmen unterliegt Notebookcheck keiner Diktion von Herstellern, Shops und Verlagen.
So testet Notebookcheck
Pro Jahr werden von Notebookcheck hunderte Laptops und Smartphones unabhängig in von uns standardisierten technischen Verfahren getestet, um eine Vergleichbarkeit aller Testergebnisse zu gewährleisten. Seit rund 20 Jahren entwickeln wir diese Testmethoden kontinuierlich weiter und setzen damit Branchenstandards. In unseren Testlaboren kommt ausschließlich hochwertiges Messequipment in die Hände erfahrener Techniker und Redakteure. Die Tests unterliegen einer mehrstufigen Kontrolle. Unsere komplexe Gesamtbewertung basiert auf hunderten fundierten Messergebnissen und Benchmarks, womit Ihnen Objektivität garantiert ist. Weitere Informationen zu unseren Testmethoden gibt es hier.

