Fazit - Grüner und schlanker als je zuvor
Die Core-Ultra-X7-CPU und der Arc-B390-Grafikprozessor sind bis zu 70 bzw. 150 Prozent schneller als die zugegebenermaßen enttäuschenden Optionen Core Ultra 5 bzw. Ultra 7, ohne dass sie wärmer laufen müssen. Diese High-End-Konfiguration kostet zwar zum Zeitpunkt der Erstellung dieses Artikels 400 US-Dollar mehr, aber sie verdoppelt sowohl den Arbeitsspeicher (16 auf 32 GB) als auch die Speicherkapazität (512 GB auf 1 TB) und ist damit vor allem für Grafikdesigner oder Content Creators eine Überlegung wert.
Für noch mehr Leistung, aber geringere Effizienz, sollte man das letztjährige Arrow-Lake-basierte Dell 16 Premium in Betracht ziehen, das eine 20 Prozent schnellere Multi-Thread-Leistung und eine 60 Prozent schnellere Grafikleistung bietet als die Spitzenkonfiguration des 2026 XPS 16. Zu beachten ist jedoch, dass das ältere Dell 16 Premium dicker und schwerer gebaut ist, um die Nvidia GPU unterzubringen.
Das beobachtete Throttling-Verhalten deutet darauf hin, dass die CPU wahrscheinlich von einer stärkeren Kühllösung profitiert hätte. Die Kerntemperatur erreichte bei Belastung bis zu 100 °C, bevor die Taktraten gedrosselt wurden, um die Temperaturen in Schach zu halten. Das konkurrierende Asus ExpertBook Ultra ist in der Lage, mit dem gleichen Panther-Lake-X7-Prozessor höhere Taktraten aufrechtzuerhalten und damit eine stärkere Leistung als unser Dell zu erzielen.
Das luxuriöse OLED-Panel kostet zusätzliche 150 US-Dollar zu den oben genannten 400 US-Dollar. Das Display-Upgrade ist weniger empfehlenswert als das Core-Ultra-X7-CPU-Upgrade, da das Basis-IPS-Panel in Bezug auf Farben, Kontrastverhältnis und Bildwiederholrate bereits ziemlich stark ist. Für Editing und Multimedia-Anwendungen, auf die CPU und GPU abzielen, sollte das IPS-Panel für die meisten Benutzer mit einem geringeren Budget ausreichen.
Pro
Contra
Preis und Verfügbarkeit
Die getestete Konfiguration mit dem Core Ultra X7 und dem 3,2K-OLED-Touchscreen ist für 2.749 Euro direkt bei Dell erhältlich.
- 3.599,00 €Dell XPS 16 9640 Laptop 16.3 Inch OLED UHD+ Touch Display, Intel Evo Edition – Intel Core Ultra 9, NVIDIA GeForce RTX 4070 Graphics, 32GB RAM, 1TB, Windows 11 Home, Fingerprint Reader, German Keyboard
- 2.526,06 €Dell XPS 16 9640 Laptop 16.3 Inch 16:10 FHD+ Display, Intel Evo Edition, Intel Core Ultra 7, NVIDIA GeForce RTX 4050 Graphics 16GB RAM 1TB, Windows 11 Home, Fingerprint Reader, Backlit German Keyboard
- 826,18 €Dell XPS 14 9440 Laptop 14.5 Inch FHD+ (1920 x 1200) Display, Intel Evo Edition, Intel Core Ultra 7 Series 1, Intel Arc Graphics, 16GB RAM 512GB SSD, Windows 11 Home, QWERTY Geman Backlit Keyboard
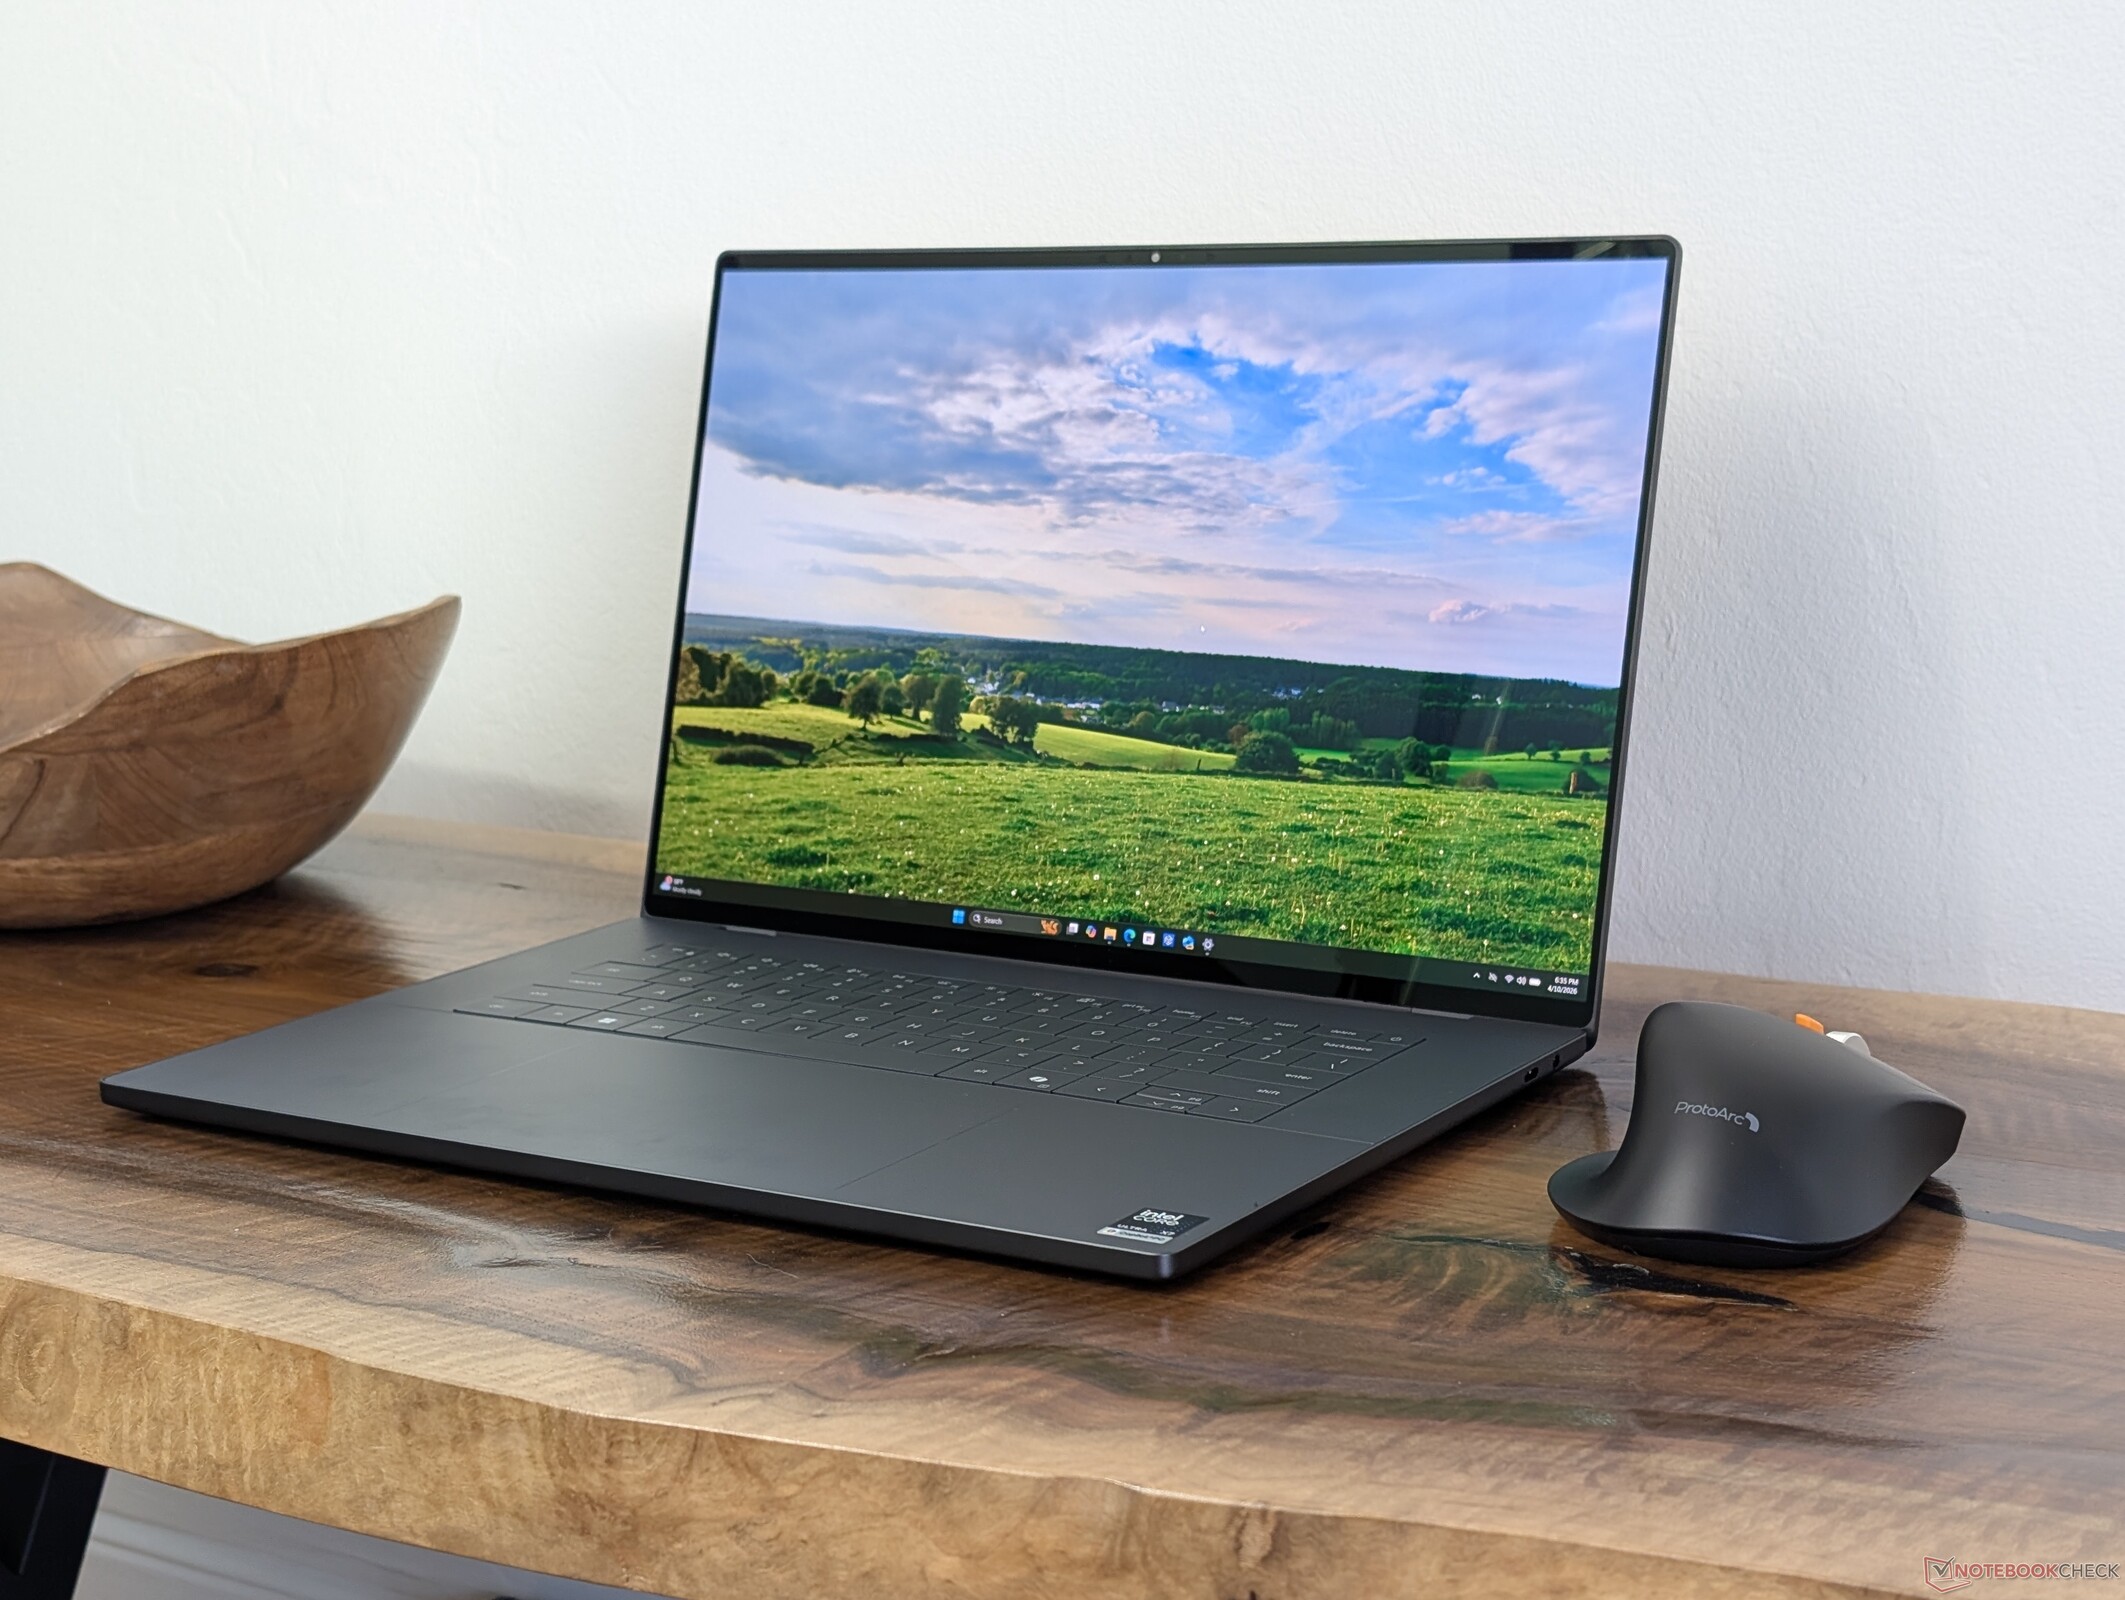
Nachdem wir kürzlich die Basis-Konfiguration Core Ultra 5 325 IPS des neuesten XPS 16 getestet haben, sind wir nun bereit, uns der Core-Ultra-X7-358H-OLED-Konfiguration zu widmen um zu sehen, welche Upgrades und Vorteile die teurere Option mit sich bringt. Ist die höherwertige SKU die zusätzlichen 500 bis 600 US-Dollar wert?
Alle unsere Kommentare zu den physikalischen Eigenschaften des neuen 2026 XPS 16 Designs finden Sie hier. Diese Seite konzentriert sich stattdessen auf die Unterschiede, die zu erwarten sind, wenn man sich zwischen den Konfigurationen Core Ultra 5 oder Core Ultra X7 des Modells entscheidet.
Mehr Dell Testberichte:
Spezifikationen
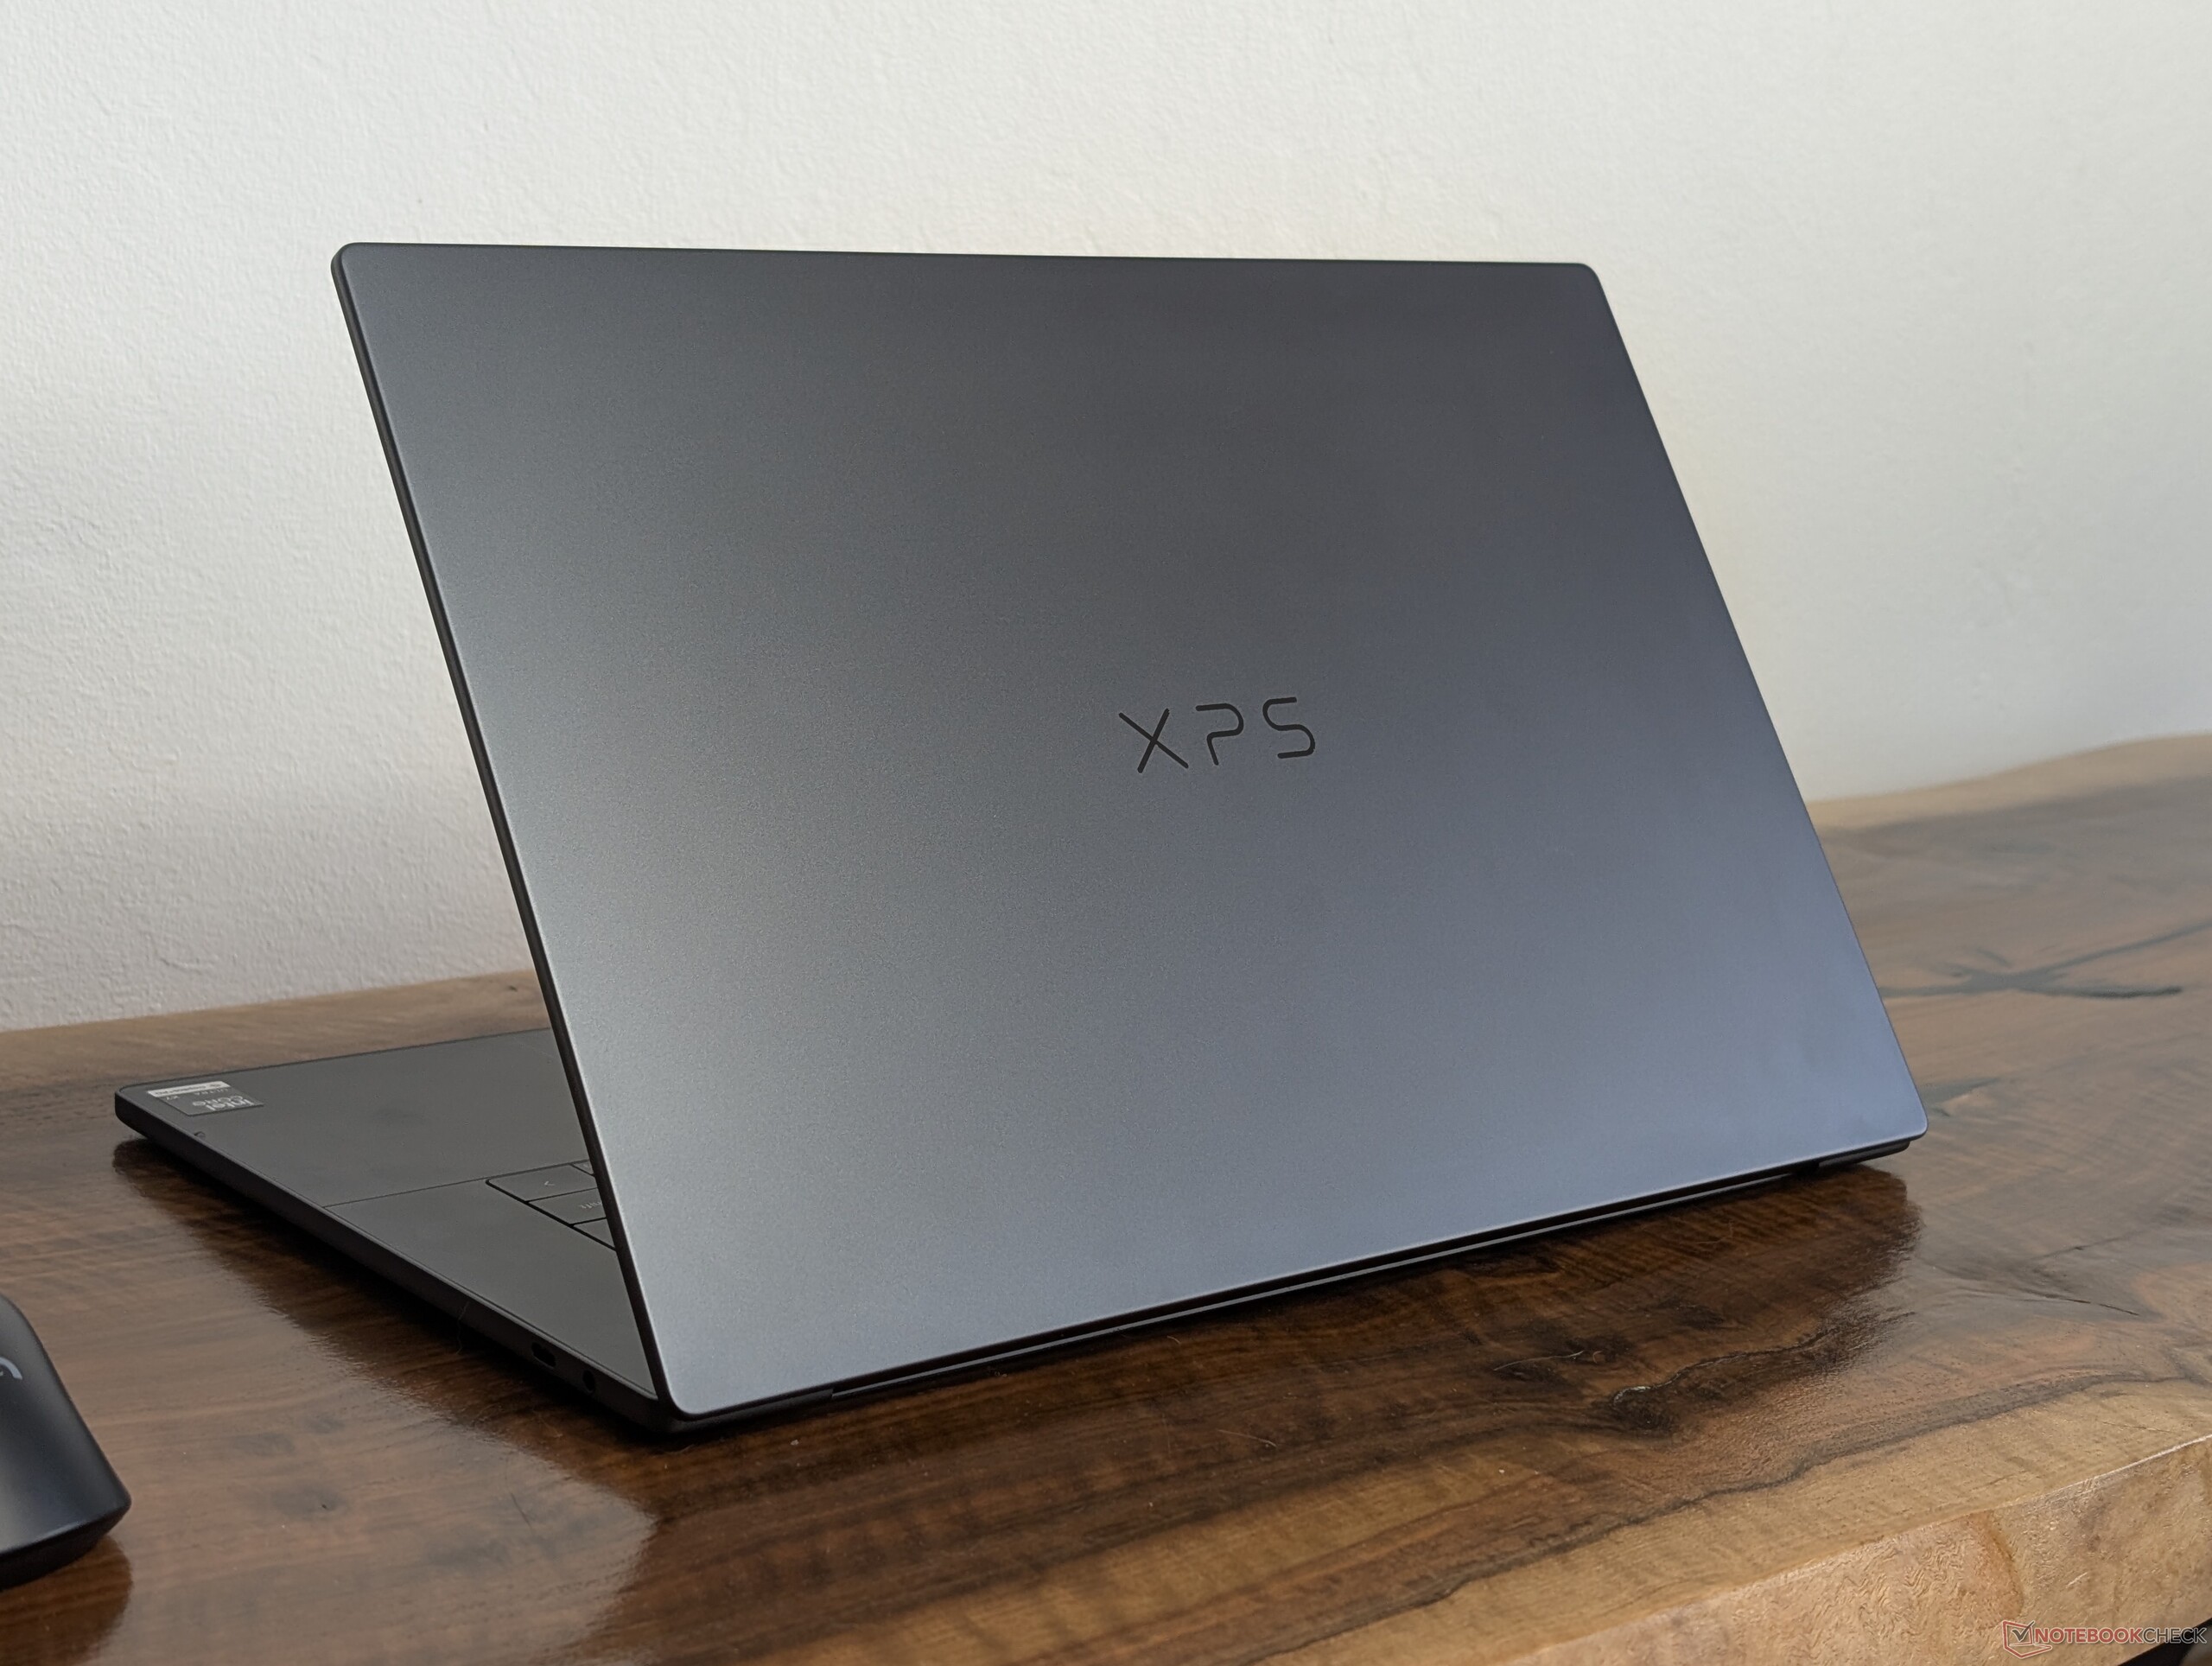
Gehäuse
Die OLED-Konfiguration ist etwas dünner und leichter als die IPS-Konfiguration, und zwar um fast 1 mm bzw. 100 g. Ansonsten sind beide Optionen identisch.
Anschlussausstattung


Kommunikation
Webcam


Wartung

Nachhaltigkeit
Das neue XPS 16 verwendet mehr recycelte Materialien als die meisten anderen Modelle im aktuellen Portfolio von Dell. Das Gehäuse besteht zu 25 bis 75 Prozent aus recyceltem Aluminium, zu 10 Prozent aus recyceltem Glas für den OLED-Touchscreen, zu 50 Prozent aus Kobalt für den Akku, zu 90 Prozent aus recyceltem Stahl für die Tastenkappen und zu 100 Prozent aus recyceltem Material für die Verpackung.
Display
Es stehen zwei Anzeigeoptionen zur Verfügung:
- 1.920 x 1.200, 100 % sRGB, IPS, Non-touch, 1-120 Hz, matt
- 3.200 x 2.000, 100 % DCI-P3, OLED, Touchscreen, 20-120 Hz, DisplayHDR 500, glänzend
Die OLED-Option bietet zahlreiche Verbesserungen gegenüber dem IPS-Basispanel, darunter eine höhere native Auflösung, tiefere P3-Farben, Touchscreen-Funktionalität, HDR500-Unterstützung und pechschwarze Kontraststufen. Auch die relativ langsamen Schwarz-Weiß-Reaktionszeiten des IPS-Panels werden nativ behoben, was zu einem besseren Benutzererlebnis führt.
Die Entscheidung für OLED bringt jedoch einige kleinere Nachteile mit sich, wie z. B. den höheren Stromverbrauch, die Pulsweitenmodulation und einen stark blendenden, glänzenden Bildschirm. Die native 3,2K-Auflösung ist auch deutlich niedriger als die des 4K-OLED-Panels des älteren XPS 16-Designs (3.200 x 2.000 vs. 3.840 x 2.400).
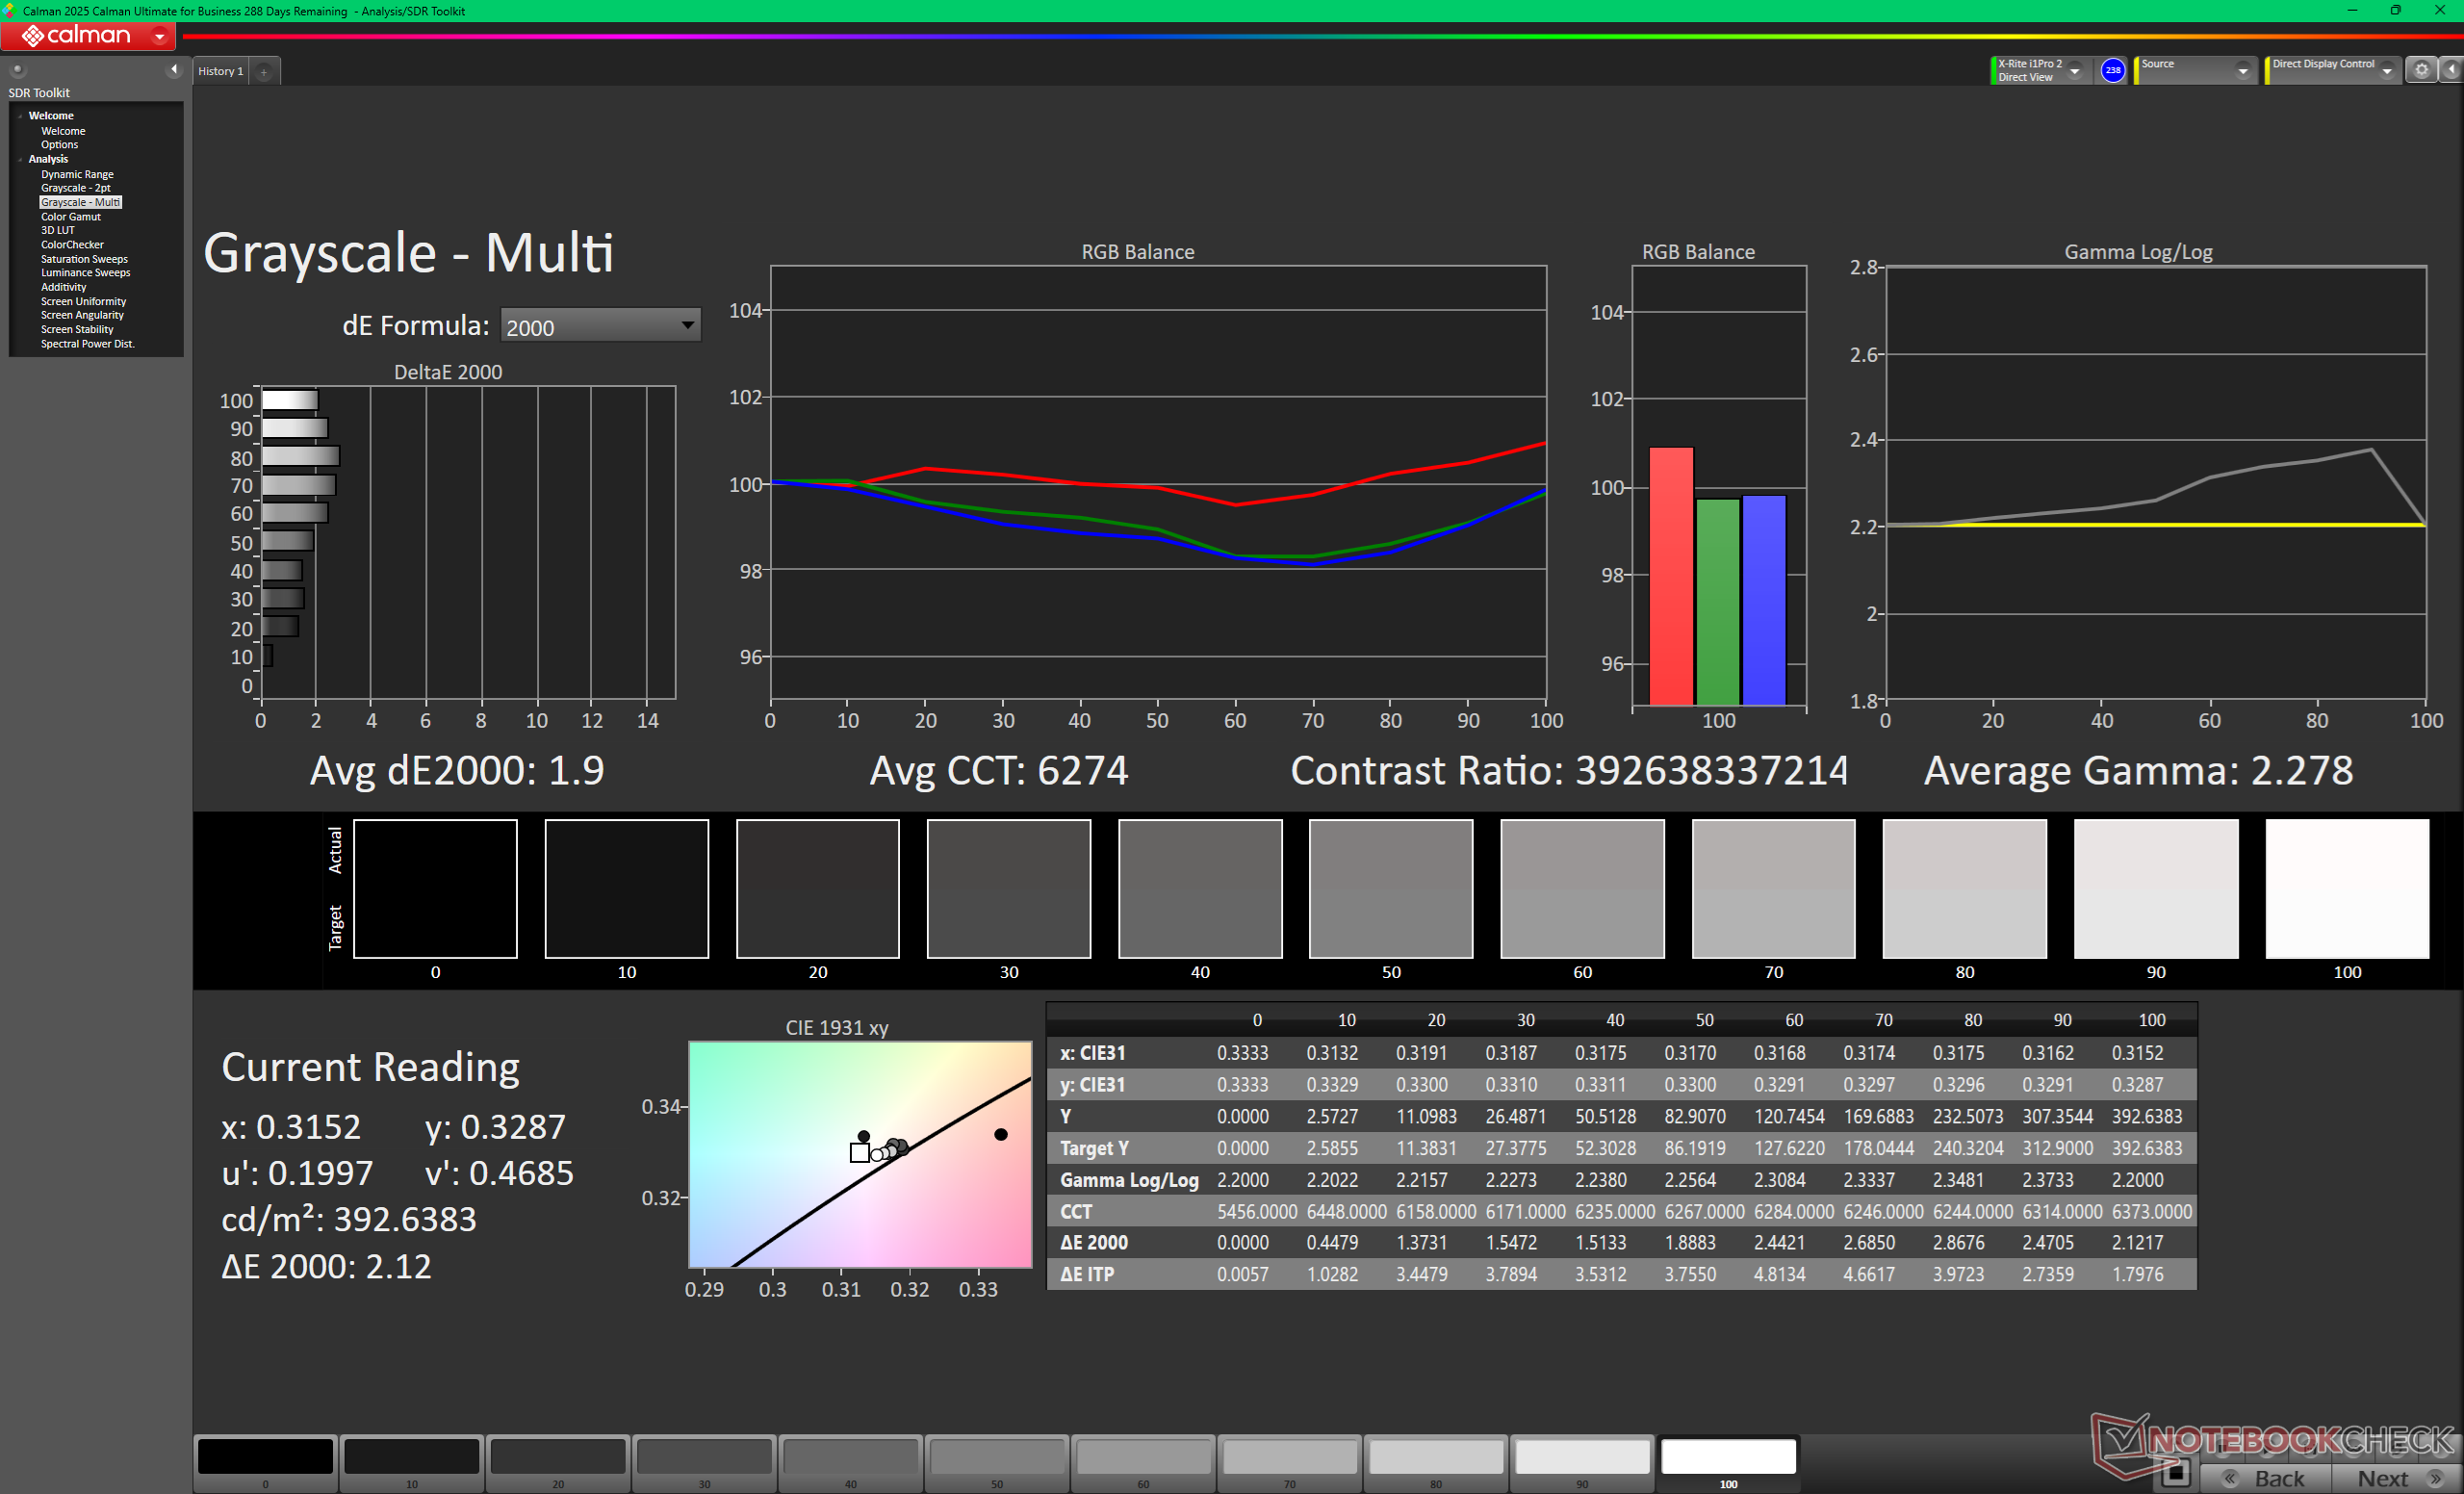
Die maximale Helligkeit des OLED-Panels liegt bei 400 nits im SDR-Modus oder 500 nits im HDR-Modus, wie unsere eigenen Messungen ergeben haben. Somit ist die günstigere IPS-Konfiguration bei der Anzeige von SDR-Inhalten tatsächlich etwas heller als die OLED-Konfiguration. Die Sichtbarkeit im Freien ist daher nicht unbedingt besser mit der glänzenden OLED-Option.
| |||||||||||||||||||||||||
Ausleuchtung: 95 %
Helligkeit Akku: 395.4 cd/m²
Kontrast: ∞:1 (Schwarzwert: 0 cd/m²)
ΔE ColorChecker Calman: 3.69 | ∀{0.5-29.43 Ø4.72}
calibrated: 0.68
ΔE Greyscale Calman: 1.9 | ∀{0.09-98 Ø4.97}
96.5% AdobeRGB 1998 (Argyll 3D)
100% sRGB (Argyll 3D)
99.5% Display P3 (Argyll 3D)
Gamma: 2.28
CCT: 6274 K
| Dell XPS 16 Core Ultra X7 358H LG Philips 160WV1, OLED, 3200x2000, 16", 120 Hz | Dell XPS 16 Core Ultra 5 325 LG Philips 160WUX, IPS, 1920x1200, 16", 120 Hz | Dell XPS 16 9640 SDC4196, OLED, 3840x2400, 16.3", 90 Hz | Samsung Galaxy Book6 Pro ATNA60HR05-0, OLED, 2880x1800, 16", 120 Hz | Lenovo Yoga Pro 9 16IAH10 RTX 5050 ATNA60HR04-0, OLED, 2880x1800, 16", 120 Hz | HP Omnibook 5 16-af1037nr BOE0C46, IPS, 1920x1200, 16", 60 Hz | |
|---|---|---|---|---|---|---|
| Display | -22% | -3% | -4% | -54% | ||
| Display P3 Coverage (%) | 99.5 | 66.2 -33% | 98.3 -1% | 98.3 -1% | 39.2 -61% | |
| sRGB Coverage (%) | 100 | 97.4 -3% | 100 0% | 99.9 0% | 57.7 -42% | |
| AdobeRGB 1998 Coverage (%) | 96.5 | 67.7 -30% | 87.8 -9% | 85.9 -11% | 40.5 -58% | |
| Response Times | -4418% | -12% | -49% | -19% | -3791% | |
| Response Time Grey 50% / Grey 80% * (ms) | 0.65 ? | 39.3 ? -5946% | 0.82 ? -26% | 0.51 ? 22% | 32.5 ? -4900% | |
| Response Time Black / White * (ms) | 0.87 ? | 26 ? -2889% | 0.85 ? 2% | 0.41 ? 53% | 24.2 ? -2682% | |
| PWM Frequency (Hz) | 240.2 ? | 360 ? | 240 ? | 1200 | ||
| PWM Amplitude * (%) | 31 | 100 -223% | 37 -19% | |||
| Bildschirm | 1% | 6% | 34% | 5% | -91% | |
| Helligkeit Bildmitte (cd/m²) | 395.4 | 534.6 35% | 366 -7% | 502 27% | 471.7 19% | 349.2 -12% |
| Brightness (cd/m²) | 392 | 515 31% | 367 -6% | 507 29% | 474 21% | 326 -17% |
| Brightness Distribution (%) | 95 | 92 -3% | 96 1% | 97 2% | 98 3% | 86 -9% |
| Schwarzwert * (cd/m²) | 0.26 | 0.33 | ||||
| Delta E Colorchecker * | 3.69 | 2.53 31% | 1.3 65% | 1 73% | 3.53 4% | 5.87 -59% |
| Colorchecker dE 2000 max. * | 7.94 | 4.57 42% | 3.6 55% | 2.4 70% | 6.31 21% | 20.58 -159% |
| Colorchecker dE 2000 calibrated * | 0.68 | 1.26 -85% | 1 -47% | 3.04 -347% | ||
| Delta E Graustufen * | 1.9 | 2.7 -42% | 2.2 -16% | 1.8 5% | 2.6 -37% | 2.6 -37% |
| Gamma | 2.28 96% | 2.32 95% | 2.14 103% | 2.24 98% | 2.24 98% | 2.14 103% |
| CCT | 6274 104% | 6860 95% | 6680 97% | 6435 101% | 6292 103% | 6411 101% |
| Kontrast (:1) | 2056 | 1058 | ||||
| Durchschnitt gesamt (Programm / Settings) | -1480% /
-741% | -3% /
1% | -6% /
4% | -7% /
2% | -1312% /
-699% |
* ... kleinere Werte sind besser


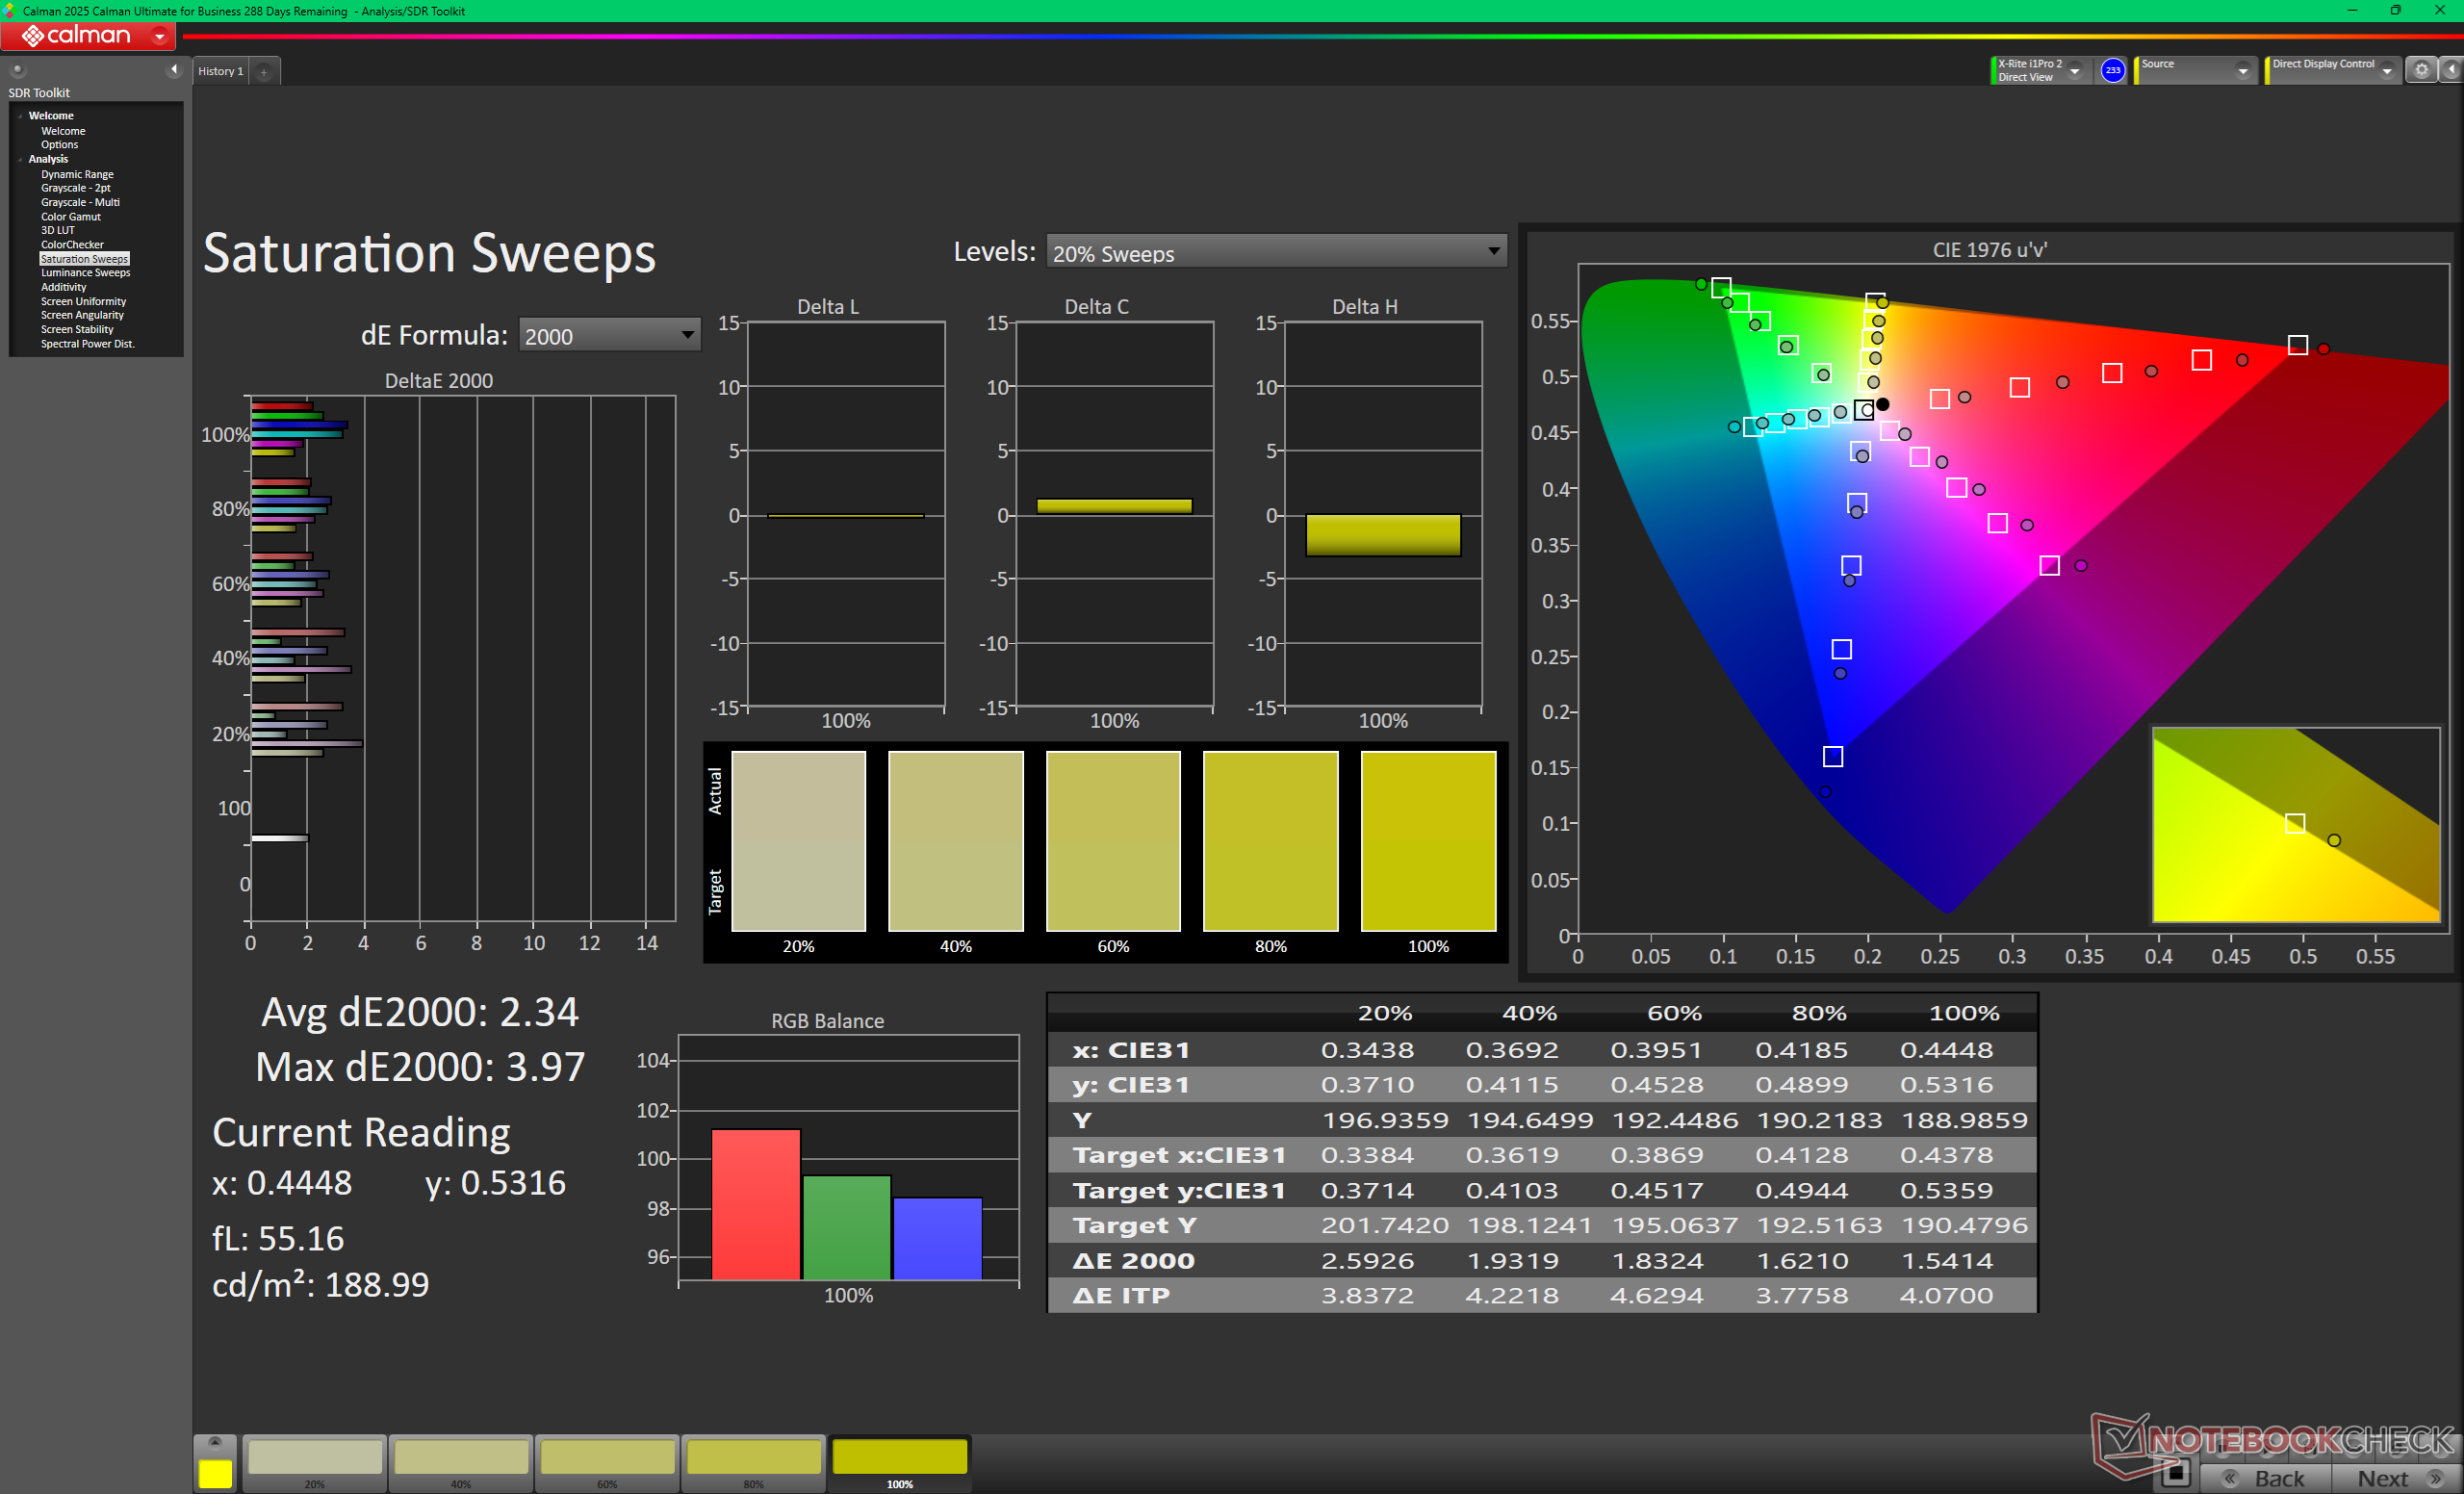
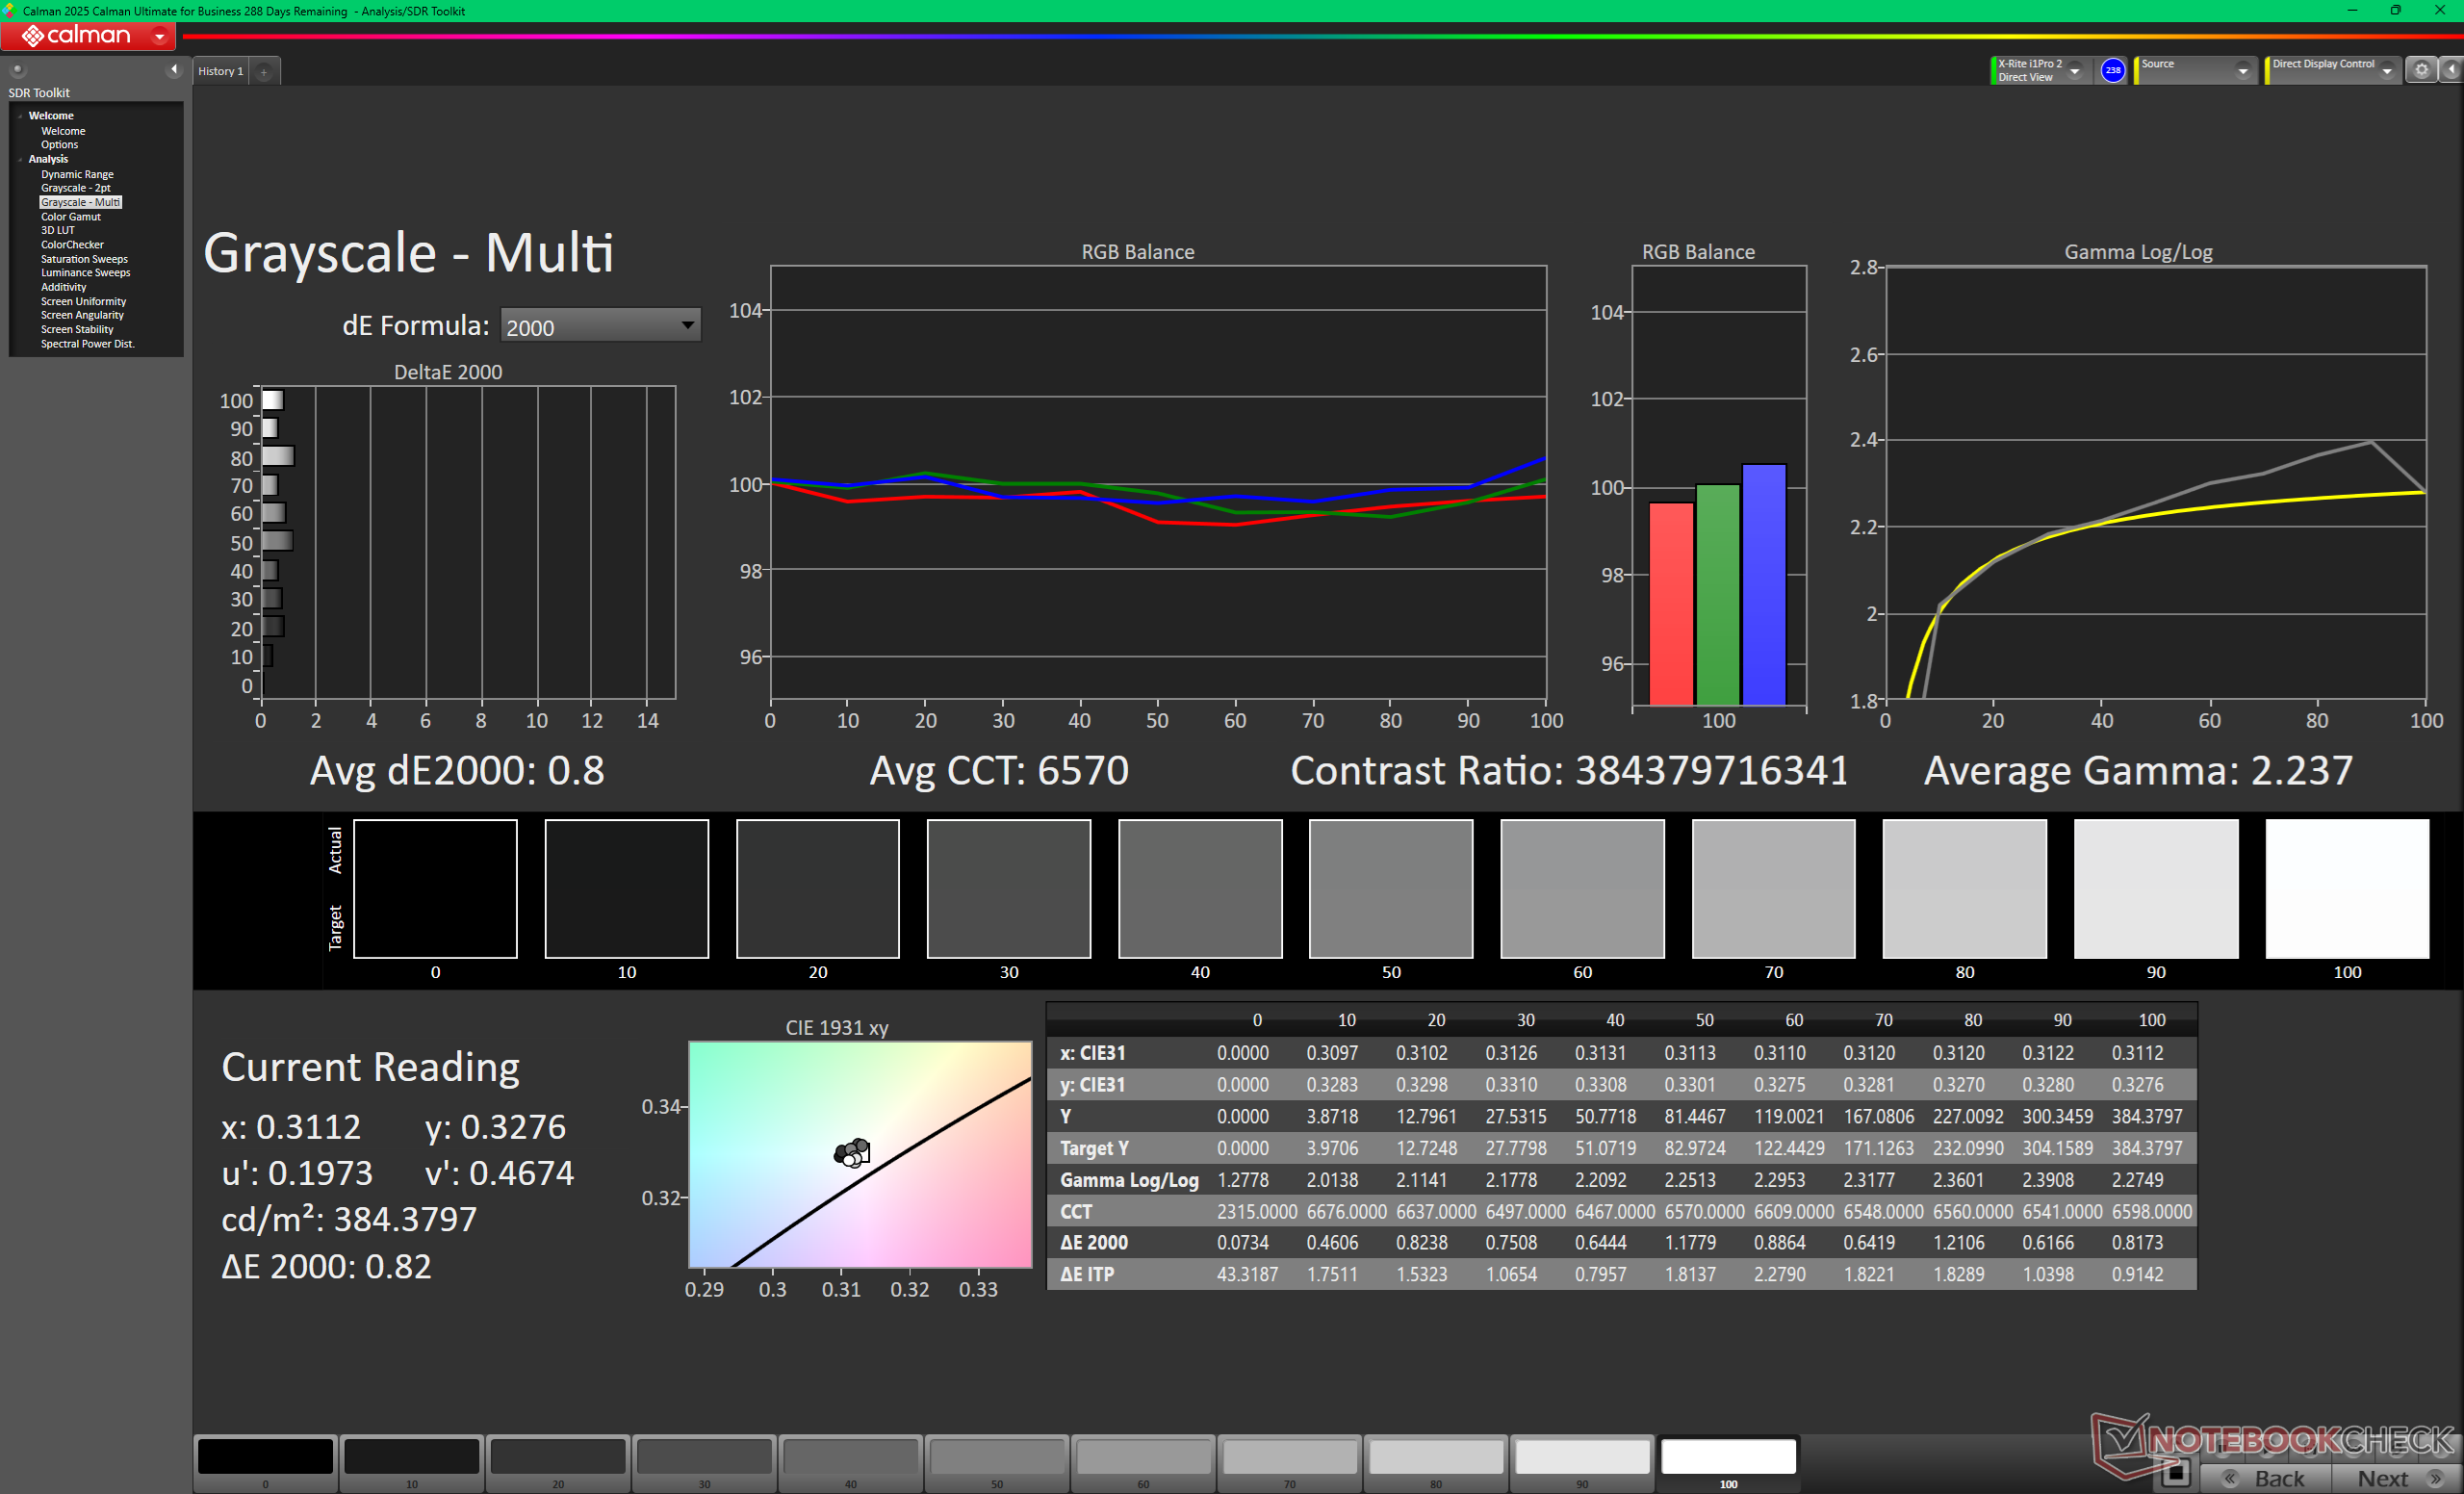
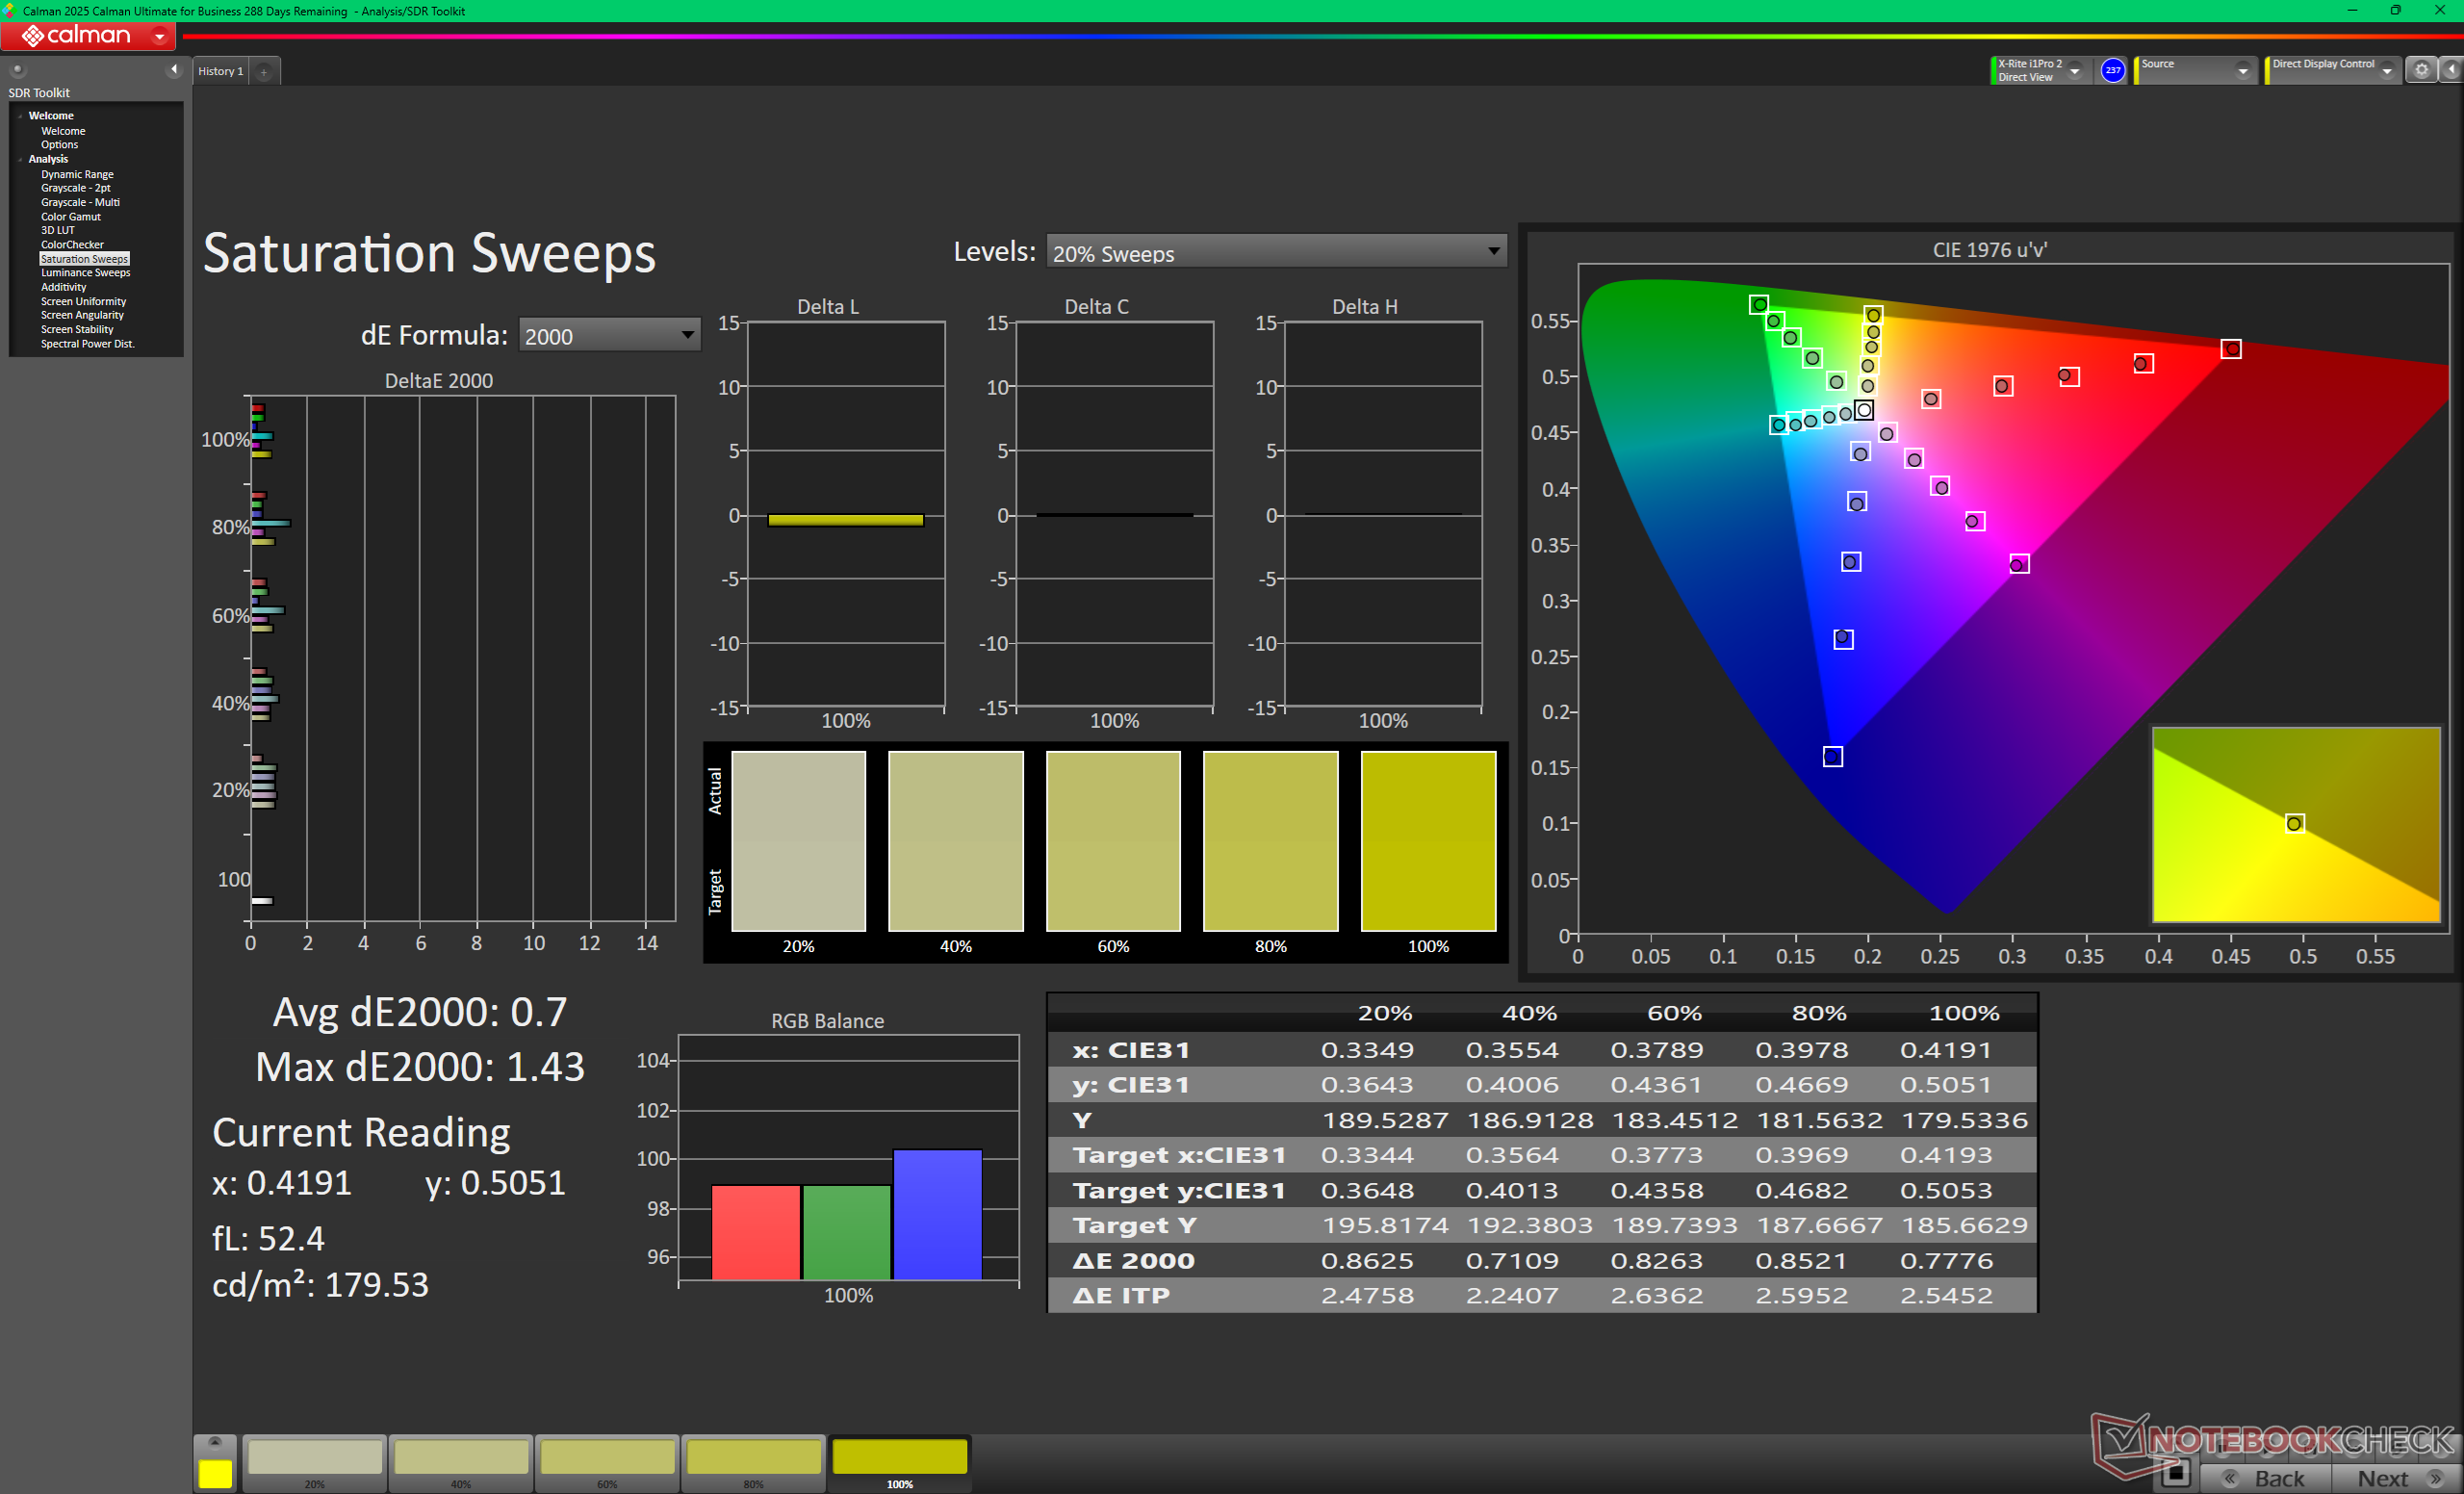
Das Panel ist ordentlich gegen den P3 Standard kalibriert, mit durchschnittlichen Graustufen- und Farb-DeltaE-Werten von 1,9 bzw. 3,69. Eine zusätzliche Kalibrierung ist daher für die meisten Endverbraucher nicht erforderlich.


Reaktionszeiten (Response Times) des Displays
| ↔ Reaktionszeiten Schwarz zu Weiß | ||
|---|---|---|
| 0.87 ms ... steigend ↗ und fallend ↘ kombiniert | ↗ 0.43 ms steigend | 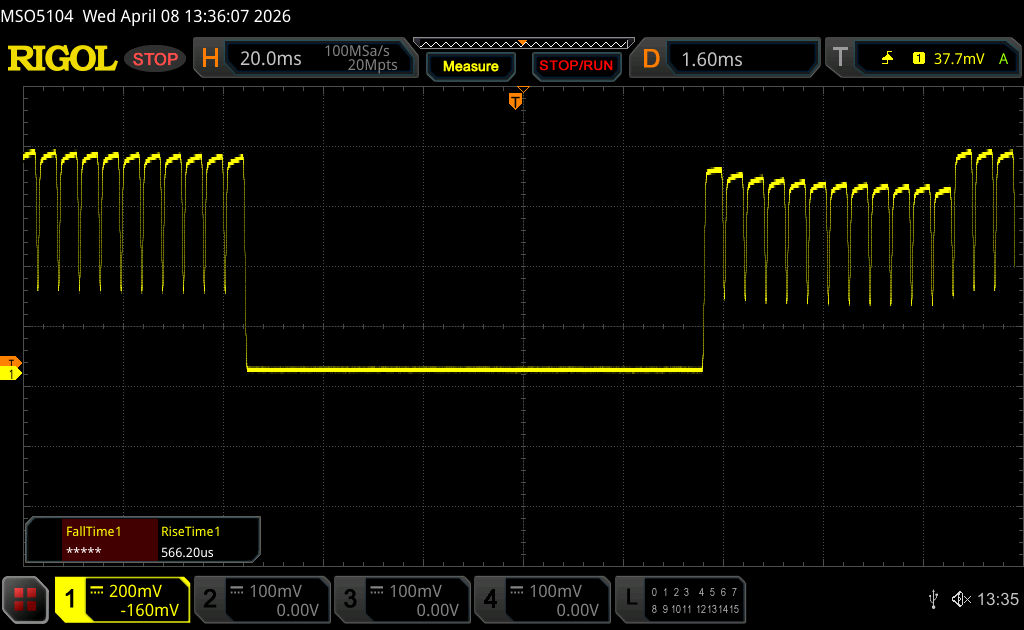 |
| ↘ 0.44 ms fallend | ||
| Die gemessenen Reaktionszeiten sind sehr kurz, wodurch sich der Bildschirm auch für schnelle 3D Spiele eignen sollte. Im Vergleich rangierten die bei uns getesteten Geräte von 0.1 (Minimum) zu 240 (Maximum) ms. » 3 % aller Screens waren schneller als der getestete. Daher sind die gemessenen Reaktionszeiten besser als der Durchschnitt aller vermessenen Geräte (19.8 ms). | ||
| ↔ Reaktionszeiten 50% Grau zu 80% Grau | ||
| 0.65 ms ... steigend ↗ und fallend ↘ kombiniert | ↗ 0.36 ms steigend | 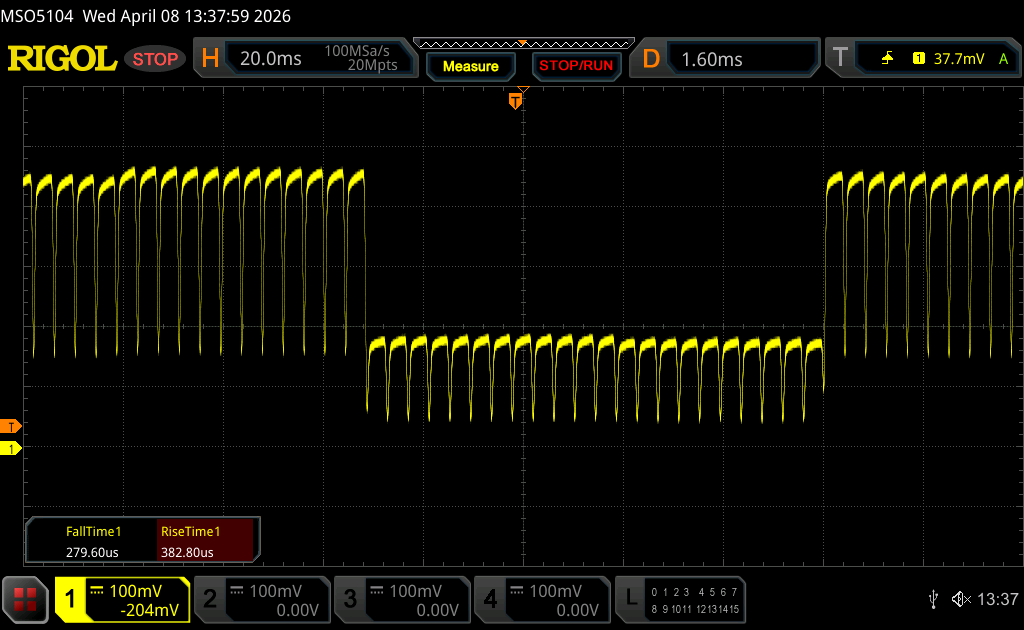 |
| ↘ 0.29 ms fallend | ||
| Die gemessenen Reaktionszeiten sind sehr kurz, wodurch sich der Bildschirm auch für schnelle 3D Spiele eignen sollte. Im Vergleich rangierten die bei uns getesteten Geräte von 0.165 (Minimum) zu 636 (Maximum) ms. » 2 % aller Screens waren schneller als der getestete. Daher sind die gemessenen Reaktionszeiten besser als der Durchschnitt aller vermessenen Geräte (31 ms). | ||
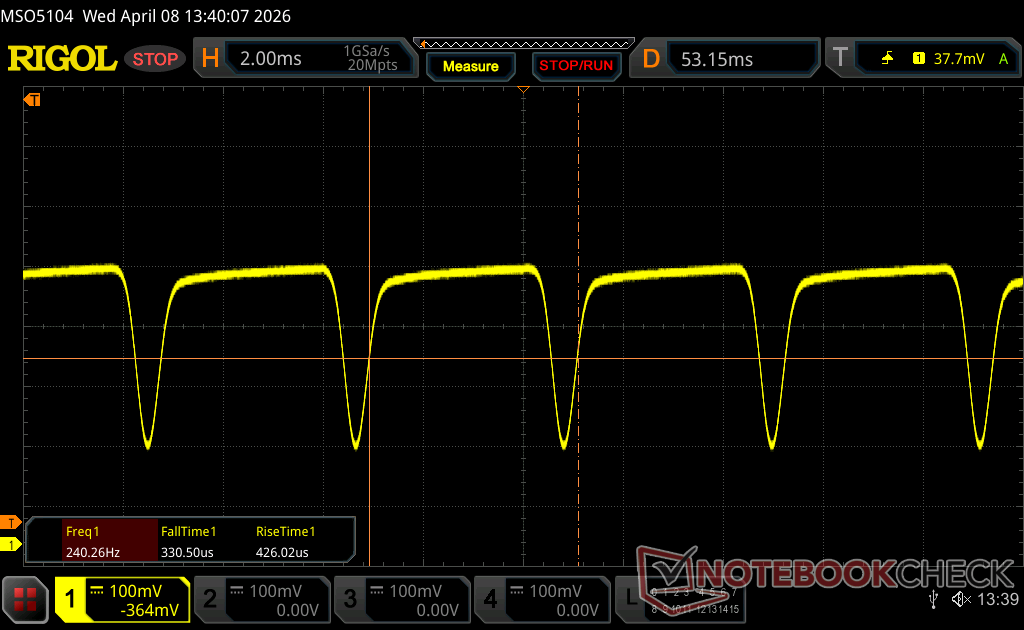
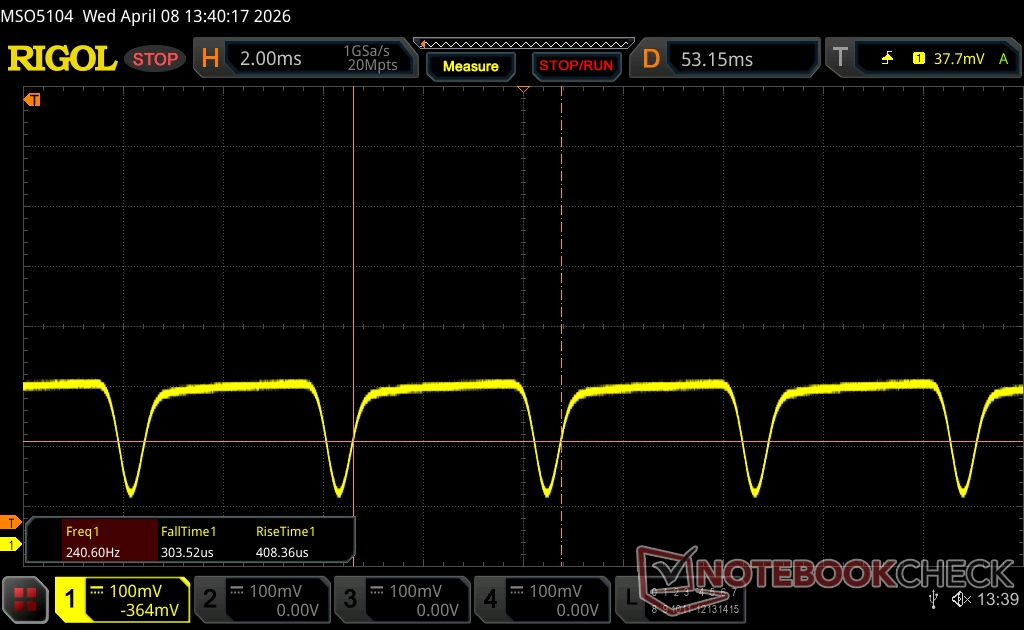
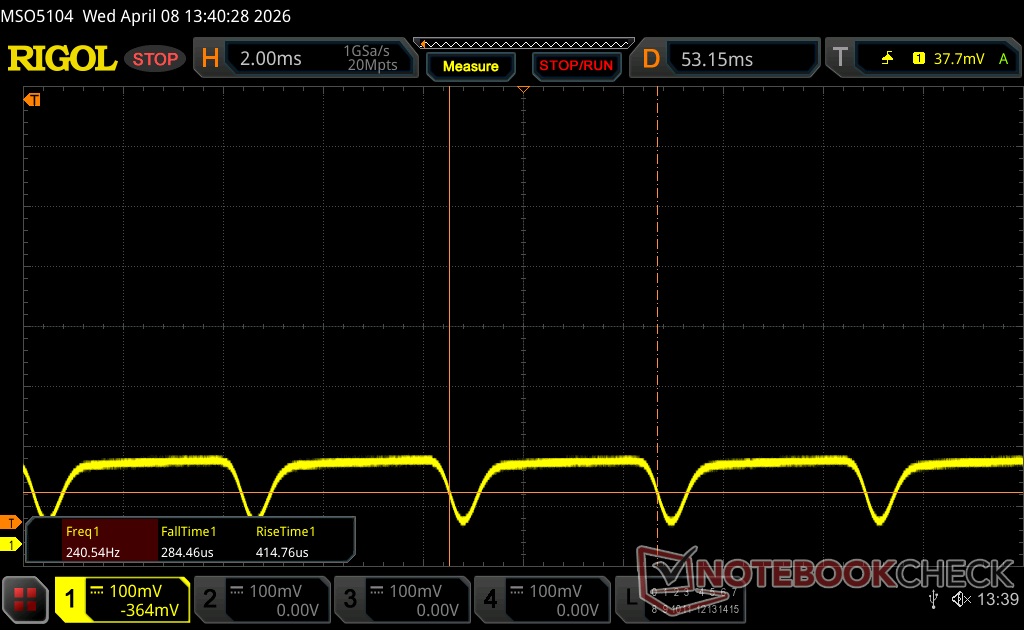
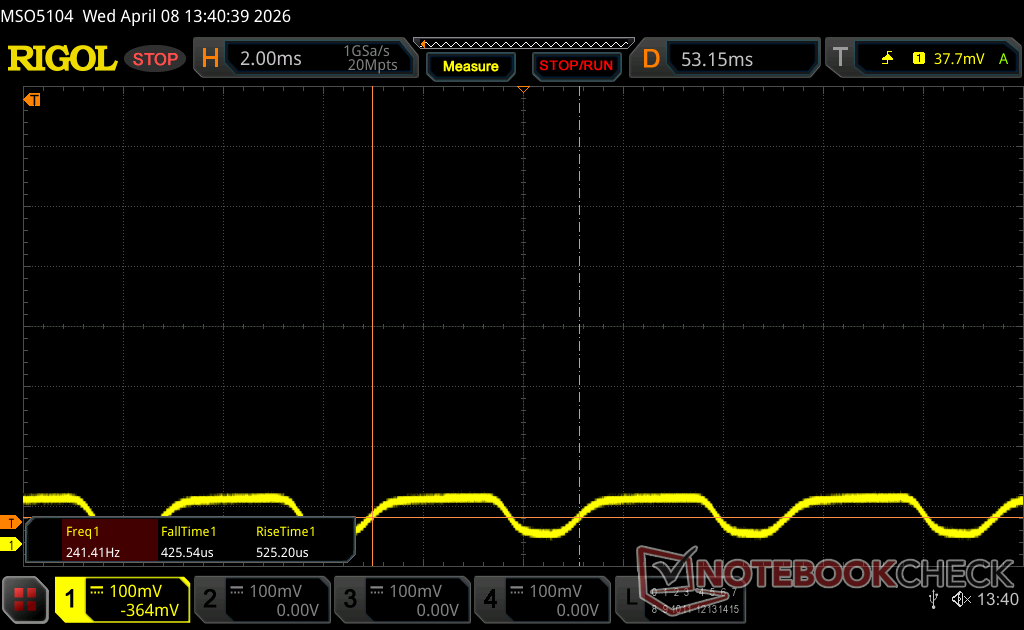
Bildschirm-Flackern / PWM (Pulse-Width Modulation)
| Flackern / PWM festgestellt | 240.2 Hz Amplitude: 31 % | ≤ 100 % Helligkeit | 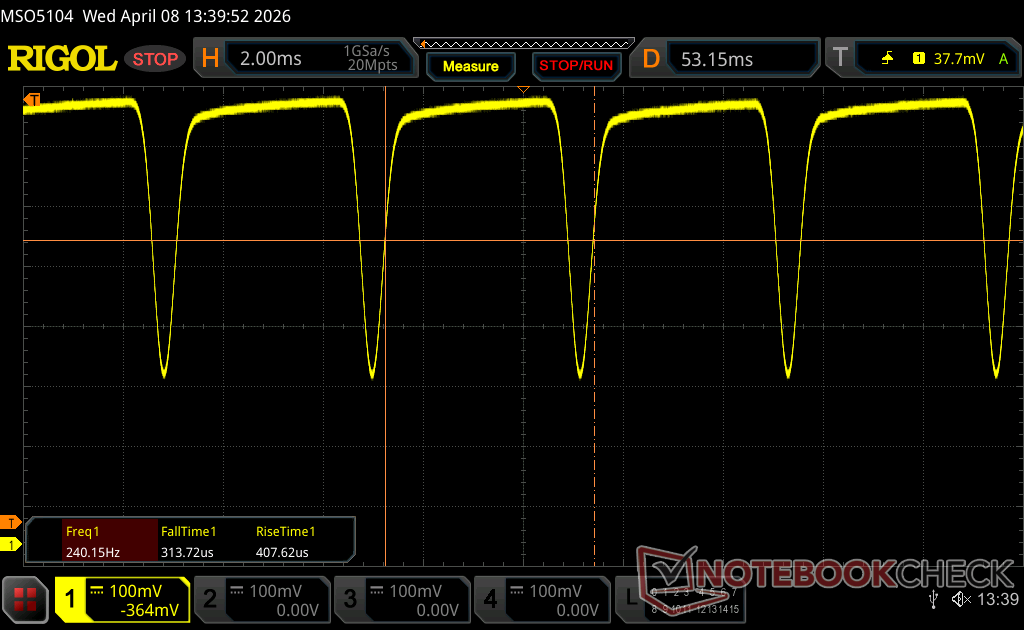 |
Das Display flackert mit 240.2 Hz (im schlimmsten Fall, eventuell durch Pulsweitenmodulation PWM) bei einer eingestellten Helligkeit von 100 % und darunter. Darüber sollte es zu keinem Flackern kommen. Die Frequenz von 240.2 Hz ist relativ gering und daher sollte es bei sensiblen Personen zu Problemen wie Flackern oder Augenbeschwerden führen. Im Vergleich: 52 % aller getesteten Geräte nutzten kein PWM um die Helligkeit zu reduzieren. Wenn PWM eingesetzt wurde, dann bei einer Frequenz von durchschnittlich 7763 (Minimum 5, Maximum 343500) Hz. | |||


Leistung
Testbedingungen
Wir haben Windows und Dell Optimizer auf den Modus Performance eingestellt, bevor wir die folgenden Benchmarks durchgeführt haben.
Prozessor
Der Core Ultra X7 358H bietet eine um 60 bis 70 Prozent höhere Multi-Thread-Leistung als die Basis Core Ultra 5 325 oder Core Ultra 7 355 Konfigurationen. Leider ist die Nachhaltigkeit des Turbo Boost nicht perfekt, wie unsere CineBench R15 xT Stressgrafik unten zeigt, wo die Leistung nach den ersten paar Schleifen um etwa 15 Prozent einbricht. Das konkurrierende Asus ExpertBook Ultra kann im Vergleich mit der gleichen Core-Ultra-X7-CPU höhere Taktraten und Leistungen aufrechterhalten.
Das Core Ultra 7 255H im älteren Dell 16 Premium ist deutlich schneller als der Core Ultra X7 358H im neueren XPS 16, wenn es um Multi-Thread-Lasten geht.
Cinebench R15 Mehrfachschleife
Cinebench R23: Multi Core | Single Core
Cinebench R20: CPU (Multi Core) | CPU (Single Core)
Cinebench R15: CPU Multi 64Bit | CPU Single 64Bit
Blender: v2.79 BMW27 CPU
7-Zip 18.03: 7z b 4 | 7z b 4 -mmt1
Geekbench 6.7: Multi-Core | Single-Core
Geekbench 5.5: Multi-Core | Single-Core
HWBOT x265 Benchmark v2.2: 4k Preset
LibreOffice : 20 Documents To PDF
R Benchmark 2.5: Overall mean
| HWBOT x265 Benchmark v2.2 / 4k Preset | |
| Lenovo Yoga Pro 9 16IAH10 RTX 5050 | |
| Dell 16 Premium DA16250 | |
| Lenovo ThinkPad P16s Gen 4 21RX000YGE | |
| MSI Venture 16 AI A2HMTG | |
| Durchschnittliche Intel Core Ultra X7 358H (19.5 - 23.1, n=8) | |
| Dell XPS 16 Core Ultra X7 358H | |
| Dell XPS 16 9640 | |
| Samsung Galaxy Book6 Pro | |
| Lenovo Yoga 7 2-in-1 16AGP11 | |
| Dell XPS 16 Core Ultra 5 325 | |
| HP OmniBook X Flip 16 | |
| HP Omnibook 5 16-af1037nr | |
| Lenovo Thinkpad X1 Fold 16 | |
Cinebench R23: Multi Core | Single Core
Cinebench R20: CPU (Multi Core) | CPU (Single Core)
Cinebench R15: CPU Multi 64Bit | CPU Single 64Bit
Blender: v2.79 BMW27 CPU
7-Zip 18.03: 7z b 4 | 7z b 4 -mmt1
Geekbench 6.7: Multi-Core | Single-Core
Geekbench 5.5: Multi-Core | Single-Core
HWBOT x265 Benchmark v2.2: 4k Preset
LibreOffice : 20 Documents To PDF
R Benchmark 2.5: Overall mean
* ... kleinere Werte sind besser
AIDA64: FP32 Ray-Trace | FPU Julia | CPU SHA3 | CPU Queen | FPU SinJulia | FPU Mandel | CPU AES | CPU ZLib | FP64 Ray-Trace | CPU PhotoWorxx | CPU CheckMate
| Performance Rating | |
| Lenovo Yoga Pro 9 16IAH10 RTX 5050 -1! | |
| Dell XPS 16 9640 -1! | |
| Samsung Galaxy Book6 Pro -1! | |
| Dell XPS 16 Core Ultra X7 358H -1! | |
| Durchschnittliche Intel Core Ultra X7 358H | |
| Dell XPS 16 Core Ultra 5 325 -1! | |
| HP Omnibook 5 16-af1037nr -1! | |
| AIDA64 / FP32 Ray-Trace | |
| Lenovo Yoga Pro 9 16IAH10 RTX 5050 (v6.92.6600) | |
| Dell XPS 16 9640 (v6.92.6600) | |
| Samsung Galaxy Book6 Pro (v8.20.8100) | |
| Dell XPS 16 Core Ultra X7 358H (v8.20.8100) | |
| Durchschnittliche Intel Core Ultra X7 358H (12221 - 17932, n=8) | |
| Dell XPS 16 Core Ultra 5 325 (v8.20.8100) | |
| HP Omnibook 5 16-af1037nr (v6.92.6600) | |
| AIDA64 / FPU Julia | |
| Lenovo Yoga Pro 9 16IAH10 RTX 5050 (v6.92.6600) | |
| Dell XPS 16 9640 (v6.92.6600) | |
| Dell XPS 16 Core Ultra X7 358H (v8.20.8100) | |
| Samsung Galaxy Book6 Pro (v8.20.8100) | |
| Durchschnittliche Intel Core Ultra X7 358H (29930 - 95525, n=8) | |
| Dell XPS 16 Core Ultra 5 325 (v8.20.8100) | |
| HP Omnibook 5 16-af1037nr (v6.92.6600) | |
| AIDA64 / CPU SHA3 | |
| Lenovo Yoga Pro 9 16IAH10 RTX 5050 (v6.92.6600) | |
| Durchschnittliche Intel Core Ultra X7 358H (3910 - 4911, n=8) | |
| Dell XPS 16 Core Ultra X7 358H (v8.20.8100) | |
| Samsung Galaxy Book6 Pro (v8.20.8100) | |
| Dell XPS 16 9640 (v6.92.6600) | |
| Dell XPS 16 Core Ultra 5 325 (v8.20.8100) | |
| HP Omnibook 5 16-af1037nr (v6.92.6600) | |
| AIDA64 / CPU Queen | |
| Dell XPS 16 9640 (v6.92.6600) | |
| Lenovo Yoga Pro 9 16IAH10 RTX 5050 (v6.92.6600) | |
| Durchschnittliche Intel Core Ultra X7 358H (63425 - 63827, n=2) | |
| HP Omnibook 5 16-af1037nr (v6.92.6600) | |
| AIDA64 / FPU SinJulia | |
| Dell XPS 16 9640 (v6.92.6600) | |
| Lenovo Yoga Pro 9 16IAH10 RTX 5050 (v6.92.6600) | |
| Samsung Galaxy Book6 Pro (v8.20.8100) | |
| Dell XPS 16 Core Ultra X7 358H (v8.20.8100) | |
| Durchschnittliche Intel Core Ultra X7 358H (4735 - 7038, n=8) | |
| Dell XPS 16 Core Ultra 5 325 (v8.20.8100) | |
| HP Omnibook 5 16-af1037nr (v6.92.6600) | |
| AIDA64 / FPU Mandel | |
| Lenovo Yoga Pro 9 16IAH10 RTX 5050 (v6.92.6600) | |
| Dell XPS 16 Core Ultra X7 358H (v8.20.8100) | |
| Samsung Galaxy Book6 Pro (v8.20.8100) | |
| Dell XPS 16 9640 (v6.92.6600) | |
| Durchschnittliche Intel Core Ultra X7 358H (14716 - 50734, n=8) | |
| Dell XPS 16 Core Ultra 5 325 (v8.20.8100) | |
| HP Omnibook 5 16-af1037nr (v6.92.6600) | |
| AIDA64 / CPU AES | |
| Dell XPS 16 9640 (v6.92.6600) | |
| Lenovo Yoga Pro 9 16IAH10 RTX 5050 (v6.92.6600) | |
| Samsung Galaxy Book6 Pro (v8.20.8100) | |
| Dell XPS 16 Core Ultra X7 358H (v8.20.8100) | |
| Durchschnittliche Intel Core Ultra X7 358H (5127 - 67510, n=8) | |
| Dell XPS 16 Core Ultra 5 325 (v8.20.8100) | |
| HP Omnibook 5 16-af1037nr (v6.92.6600) | |
| AIDA64 / CPU ZLib | |
| Lenovo Yoga Pro 9 16IAH10 RTX 5050 (v6.92.6600) | |
| Dell XPS 16 9640 (v6.92.6600) | |
| Samsung Galaxy Book6 Pro (v8.20.8100) | |
| Durchschnittliche Intel Core Ultra X7 358H (932 - 1179, n=8) | |
| Dell XPS 16 Core Ultra X7 358H (v8.20.8100) | |
| Dell XPS 16 Core Ultra 5 325 (v8.20.8100) | |
| HP Omnibook 5 16-af1037nr (v6.92.6600) | |
| AIDA64 / FP64 Ray-Trace | |
| Lenovo Yoga Pro 9 16IAH10 RTX 5050 (v6.92.6600) | |
| Dell XPS 16 9640 (v6.92.6600) | |
| Dell XPS 16 Core Ultra X7 358H (v8.20.8100) | |
| Samsung Galaxy Book6 Pro (v8.20.8100) | |
| Durchschnittliche Intel Core Ultra X7 358H (6506 - 9447, n=8) | |
| Dell XPS 16 Core Ultra 5 325 (v8.20.8100) | |
| HP Omnibook 5 16-af1037nr (v6.92.6600) | |
| AIDA64 / CPU PhotoWorxx | |
| Dell XPS 16 Core Ultra X7 358H (v8.20.8100) | |
| Samsung Galaxy Book6 Pro (v8.20.8100) | |
| Durchschnittliche Intel Core Ultra X7 358H (30538 - 88154, n=8) | |
| Lenovo Yoga Pro 9 16IAH10 RTX 5050 (v6.92.6600) | |
| Dell XPS 16 Core Ultra 5 325 (v8.20.8100) | |
| Dell XPS 16 9640 (v6.92.6600) | |
| HP Omnibook 5 16-af1037nr (v6.92.6600) | |
| AIDA64 / CPU CheckMate | |
| Durchschnittliche Intel Core Ultra X7 358H (4187 - 4475, n=7) | |
| Dell XPS 16 Core Ultra X7 358H (v8.20.8100) | |
| Samsung Galaxy Book6 Pro (v8.20.8100) | |
| Dell XPS 16 Core Ultra 5 325 (v8.20.8100) | |
Systemleistung
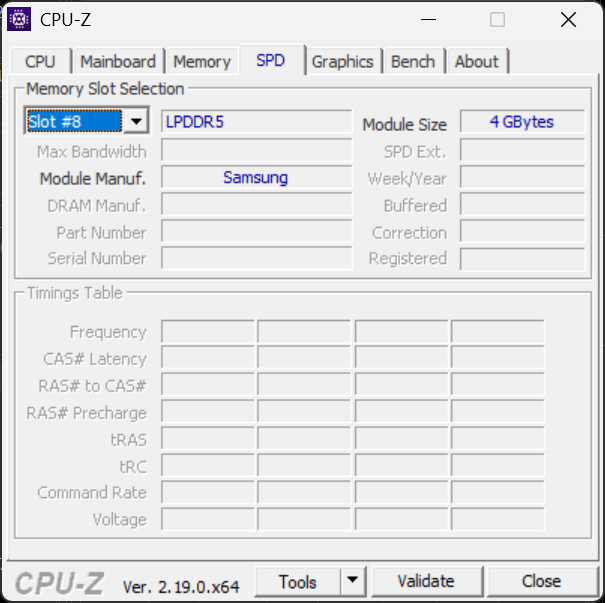
Die PCMark Ergebnisse sind deutlich besser als die der Core-Ultra-5-Basiskonfiguration, vor allem beim GPU-lastigen Subtest Digital Content Creation, da die integrierte Grafik der Core-Ultra-X7-Konfiguration viel schneller ist. Auch die RAM-Leistung ist laut AIDA64 um 25 bis 40 Prozent schneller, wenn die Konfiguration mit 32 statt 16 GB erfolgt.

PCMark 10: Score | Essentials | Productivity | Digital Content Creation
CrossMark: Overall | Productivity | Creativity | Responsiveness
WebXPRT 3: Overall
WebXPRT 4: Overall
Mozilla Kraken 1.1: Total
| Performance Rating | |
| Dell XPS 16 Core Ultra X7 358H | |
| Lenovo Yoga Pro 9 16IAH10 RTX 5050 | |
| Durchschnittliche Intel Core Ultra X7 358H, Intel Arc B390 12 Xe3 Panther Lake iGPU | |
| Samsung Galaxy Book6 Pro | |
| Dell XPS 16 9640 -1! | |
| Dell XPS 16 Core Ultra 5 325 | |
| HP Omnibook 5 16-af1037nr | |
| PCMark 10 / Score | |
| Dell XPS 16 Core Ultra X7 358H | |
| Lenovo Yoga Pro 9 16IAH10 RTX 5050 | |
| Durchschnittliche Intel Core Ultra X7 358H, Intel Arc B390 12 Xe3 Panther Lake iGPU (8834 - 9880, n=8) | |
| Samsung Galaxy Book6 Pro | |
| Dell XPS 16 Core Ultra 5 325 | |
| HP Omnibook 5 16-af1037nr | |
| Dell XPS 16 9640 | |
| PCMark 10 / Essentials | |
| Dell XPS 16 Core Ultra X7 358H | |
| Durchschnittliche Intel Core Ultra X7 358H, Intel Arc B390 12 Xe3 Panther Lake iGPU (10282 - 11263, n=7) | |
| Lenovo Yoga Pro 9 16IAH10 RTX 5050 | |
| Dell XPS 16 9640 | |
| Samsung Galaxy Book6 Pro | |
| Dell XPS 16 Core Ultra 5 325 | |
| HP Omnibook 5 16-af1037nr | |
| PCMark 10 / Productivity | |
| Lenovo Yoga Pro 9 16IAH10 RTX 5050 | |
| Dell XPS 16 Core Ultra X7 358H | |
| Samsung Galaxy Book6 Pro | |
| Durchschnittliche Intel Core Ultra X7 358H, Intel Arc B390 12 Xe3 Panther Lake iGPU (13908 - 16780, n=7) | |
| HP Omnibook 5 16-af1037nr | |
| Dell XPS 16 Core Ultra 5 325 | |
| Dell XPS 16 9640 | |
| PCMark 10 / Digital Content Creation | |
| Dell XPS 16 Core Ultra X7 358H | |
| Durchschnittliche Intel Core Ultra X7 358H, Intel Arc B390 12 Xe3 Panther Lake iGPU (13082 - 13893, n=7) | |
| Lenovo Yoga Pro 9 16IAH10 RTX 5050 | |
| Samsung Galaxy Book6 Pro | |
| Dell XPS 16 9640 | |
| Dell XPS 16 Core Ultra 5 325 | |
| HP Omnibook 5 16-af1037nr | |
| CrossMark / Overall | |
| Dell XPS 16 Core Ultra X7 358H | |
| Durchschnittliche Intel Core Ultra X7 358H, Intel Arc B390 12 Xe3 Panther Lake iGPU (1884 - 2119, n=8) | |
| Lenovo Yoga Pro 9 16IAH10 RTX 5050 | |
| Samsung Galaxy Book6 Pro | |
| Dell XPS 16 9640 | |
| Dell XPS 16 Core Ultra 5 325 | |
| HP Omnibook 5 16-af1037nr | |
| CrossMark / Productivity | |
| Dell XPS 16 Core Ultra X7 358H | |
| Lenovo Yoga Pro 9 16IAH10 RTX 5050 | |
| Durchschnittliche Intel Core Ultra X7 358H, Intel Arc B390 12 Xe3 Panther Lake iGPU (1678 - 1928, n=8) | |
| Samsung Galaxy Book6 Pro | |
| Dell XPS 16 9640 | |
| Dell XPS 16 Core Ultra 5 325 | |
| HP Omnibook 5 16-af1037nr | |
| CrossMark / Creativity | |
| Dell XPS 16 Core Ultra X7 358H | |
| Durchschnittliche Intel Core Ultra X7 358H, Intel Arc B390 12 Xe3 Panther Lake iGPU (2241 - 2529, n=8) | |
| Samsung Galaxy Book6 Pro | |
| Lenovo Yoga Pro 9 16IAH10 RTX 5050 | |
| Dell XPS 16 9640 | |
| Dell XPS 16 Core Ultra 5 325 | |
| HP Omnibook 5 16-af1037nr | |
| CrossMark / Responsiveness | |
| Dell XPS 16 Core Ultra X7 358H | |
| Dell XPS 16 9640 | |
| Durchschnittliche Intel Core Ultra X7 358H, Intel Arc B390 12 Xe3 Panther Lake iGPU (1560 - 1837, n=8) | |
| Lenovo Yoga Pro 9 16IAH10 RTX 5050 | |
| Samsung Galaxy Book6 Pro | |
| Dell XPS 16 Core Ultra 5 325 | |
| HP Omnibook 5 16-af1037nr | |
| WebXPRT 3 / Overall | |
| Lenovo Yoga Pro 9 16IAH10 RTX 5050 | |
| Durchschnittliche Intel Core Ultra X7 358H, Intel Arc B390 12 Xe3 Panther Lake iGPU (293 - 338, n=8) | |
| Dell XPS 16 Core Ultra X7 358H | |
| HP Omnibook 5 16-af1037nr | |
| Samsung Galaxy Book6 Pro | |
| Dell XPS 16 9640 | |
| Dell XPS 16 Core Ultra 5 325 | |
| WebXPRT 4 / Overall | |
| Lenovo Yoga Pro 9 16IAH10 RTX 5050 | |
| Dell XPS 16 Core Ultra X7 358H | |
| Durchschnittliche Intel Core Ultra X7 358H, Intel Arc B390 12 Xe3 Panther Lake iGPU (278 - 305, n=7) | |
| HP Omnibook 5 16-af1037nr | |
| Samsung Galaxy Book6 Pro | |
| Dell XPS 16 Core Ultra 5 325 | |
| Dell XPS 16 9640 | |
| Mozilla Kraken 1.1 / Total | |
| HP Omnibook 5 16-af1037nr | |
| Dell XPS 16 Core Ultra 5 325 | |
| Samsung Galaxy Book6 Pro | |
| Durchschnittliche Intel Core Ultra X7 358H, Intel Arc B390 12 Xe3 Panther Lake iGPU (445 - 460, n=8) | |
| Dell XPS 16 Core Ultra X7 358H | |
| Lenovo Yoga Pro 9 16IAH10 RTX 5050 | |
* ... kleinere Werte sind besser
| PCMark 10 Score | 9717 Punkte | |
Hilfe | ||
| AIDA64 / Memory Copy | |
| Dell XPS 16 Core Ultra X7 358H | |
| Samsung Galaxy Book6 Pro | |
| Durchschnittliche Intel Core Ultra X7 358H (102745 - 132135, n=7) | |
| Dell XPS 16 Core Ultra 5 325 | |
| Lenovo Yoga Pro 9 16IAH10 RTX 5050 | |
| Dell XPS 16 9640 | |
| HP Omnibook 5 16-af1037nr | |
| AIDA64 / Memory Read | |
| Dell XPS 16 Core Ultra X7 358H | |
| Samsung Galaxy Book6 Pro | |
| Durchschnittliche Intel Core Ultra X7 358H (97755 - 118888, n=8) | |
| Lenovo Yoga Pro 9 16IAH10 RTX 5050 | |
| Dell XPS 16 Core Ultra 5 325 | |
| Dell XPS 16 9640 | |
| HP Omnibook 5 16-af1037nr | |
| AIDA64 / Memory Write | |
| Dell XPS 16 Core Ultra X7 358H | |
| Durchschnittliche Intel Core Ultra X7 358H (105984 - 134998, n=8) | |
| Samsung Galaxy Book6 Pro | |
| Dell XPS 16 Core Ultra 5 325 | |
| Lenovo Yoga Pro 9 16IAH10 RTX 5050 | |
| Dell XPS 16 9640 | |
| HP Omnibook 5 16-af1037nr | |
| AIDA64 / Memory Latency | |
| HP Omnibook 5 16-af1037nr | |
| Dell XPS 16 9640 | |
| Lenovo Yoga Pro 9 16IAH10 RTX 5050 | |
| Dell XPS 16 Core Ultra 5 325 | |
| Samsung Galaxy Book6 Pro | |
| Dell XPS 16 Core Ultra X7 358H | |
| Durchschnittliche Intel Core Ultra X7 358H (84.6 - 101.9, n=8) | |
* ... kleinere Werte sind besser
DPC-Latenzzeit


| DPC Latencies / LatencyMon - interrupt to process latency (max), Web, Youtube, Prime95 | |
| Lenovo Yoga Pro 9 16IAH10 RTX 5050 | |
| Dell XPS 16 Core Ultra 5 325 | |
| HP Omnibook 5 16-af1037nr | |
| Dell XPS 16 9640 | |
| Dell XPS 16 Core Ultra X7 358H | |
| Samsung Galaxy Book6 Pro | |
* ... kleinere Werte sind besser
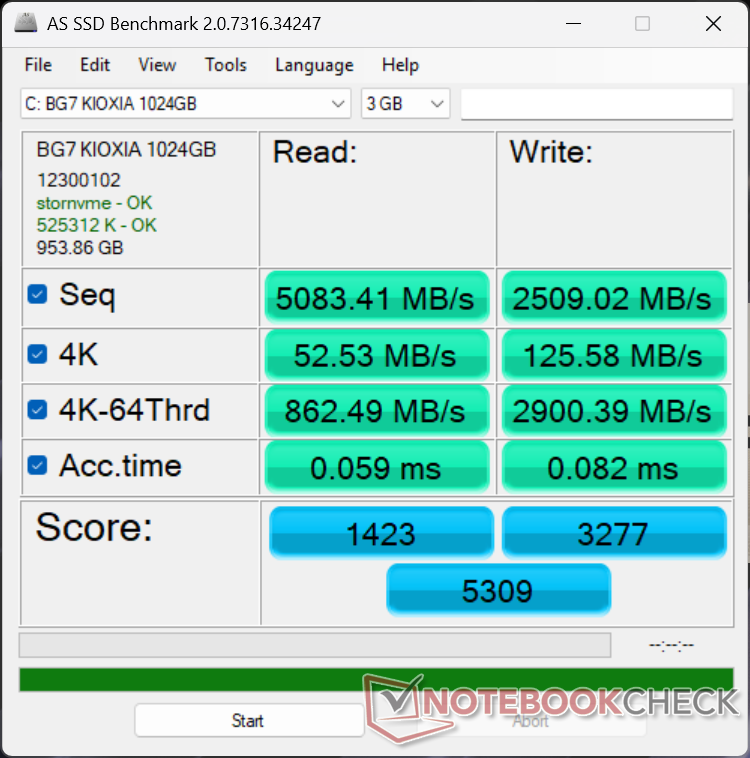
Speichergeräte
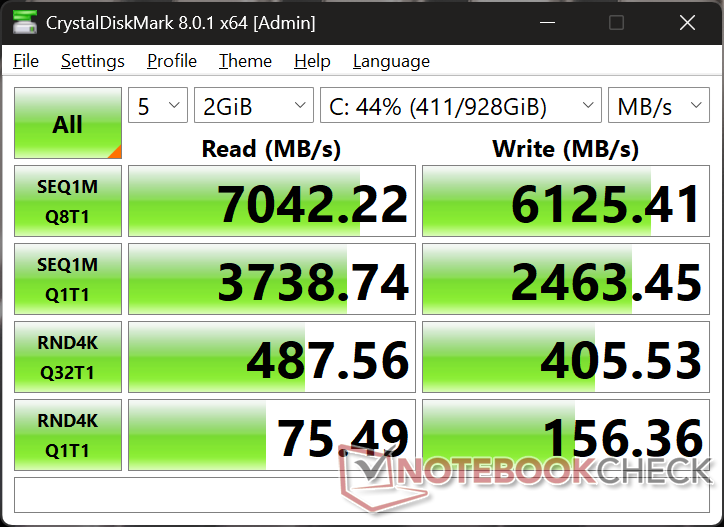
Unser Testgerät wird mit einem Kioxia BG7 anstelle der BG8 oder BG6, wie sie in unserer Core-Ultra-5-Konfiguration oder im Dell 16 Premium von 2025 zu finden ist. Die Leistung ist ansonsten nahezu identisch mit maximalen nachhaltigen Übertragungsraten von etwa 7.000 MB/s.


| Drive Performance Rating - Percent | |
| Dell XPS 16 9640 | |
| Lenovo Yoga Pro 9 16IAH10 RTX 5050 | |
| Dell XPS 16 Core Ultra X7 358H | |
| Samsung Galaxy Book6 Pro | |
| Dell XPS 16 Core Ultra 5 325 | |
| HP Omnibook 5 16-af1037nr | |
* ... kleinere Werte sind besser
Disk Throttling: DiskSpd Read Loop, Queue Depth 8
GPU-Leistung
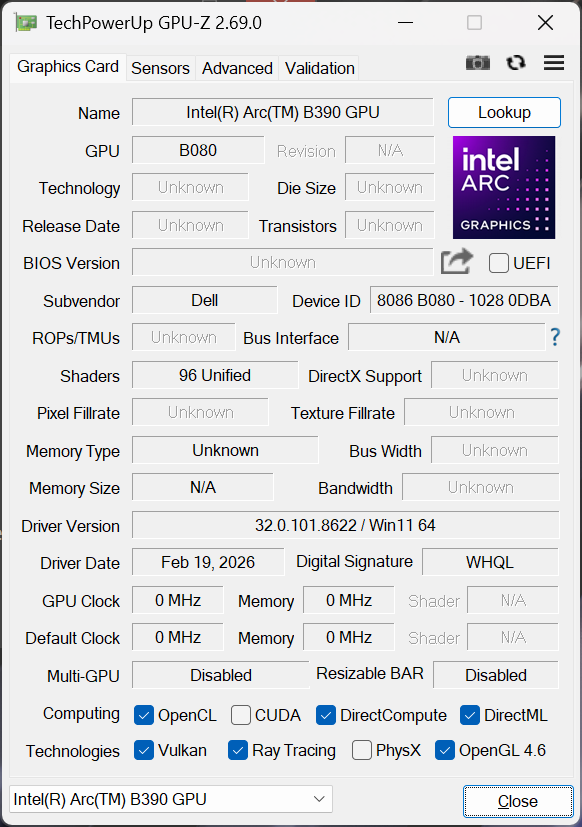
Der integrierte Arc B390 ist deutlich schneller als die Grafik 4 Xe3 Basisoption in der Core-Ultra-5-Konfiguration. Sie ist die schnellste GPU, die für das 2026 XPS 16 verfügbar ist, da diskrete Nvidia Optionen nicht mehr konfigurierbar sind. Benutzer können eine 2,5-fache Steigerung der Rohleistung gegenüber der Graphics 4 Xe3 erwarten oder ein 30-prozentiges Leistungsdefizit im Vergleich zum älteren XPS 16 mit RTX-4070-Grafik. Sie ist dennoch leistungsfähig genug, um die meisten modernen Titel bei 1.080p auf mittleren Einstellungen auszuführen, einschließlich Black Myth: Wukong.
Verwendet man den Modus "Ausgewogen" anstelle des Modus "Performance", hat dies keinen wesentlichen Einfluss auf die Leistung. Im Akkubetrieb hingegen verringert sich die Leistung nur geringfügig um bis zu zehn Prozent, wie unsere Fire-Strike-Ergebnistabelle unten zeigt.
| Energie-Profil | Graphics-Punktzahl | Physics-Punktzahl | Kombinierte Punktzahl |
| Performance-Modus | 17.018 | 22.086 | 4.859 |
| Ausgeglichener Modus | 16.785 (-1 %) | 22.887 (+4 %) | 4.467 (-8 %) |
| Akku-Betrieb | 15.685 (-8 %) | 20.760 (-6 %) | 4.269 (-12 %) |
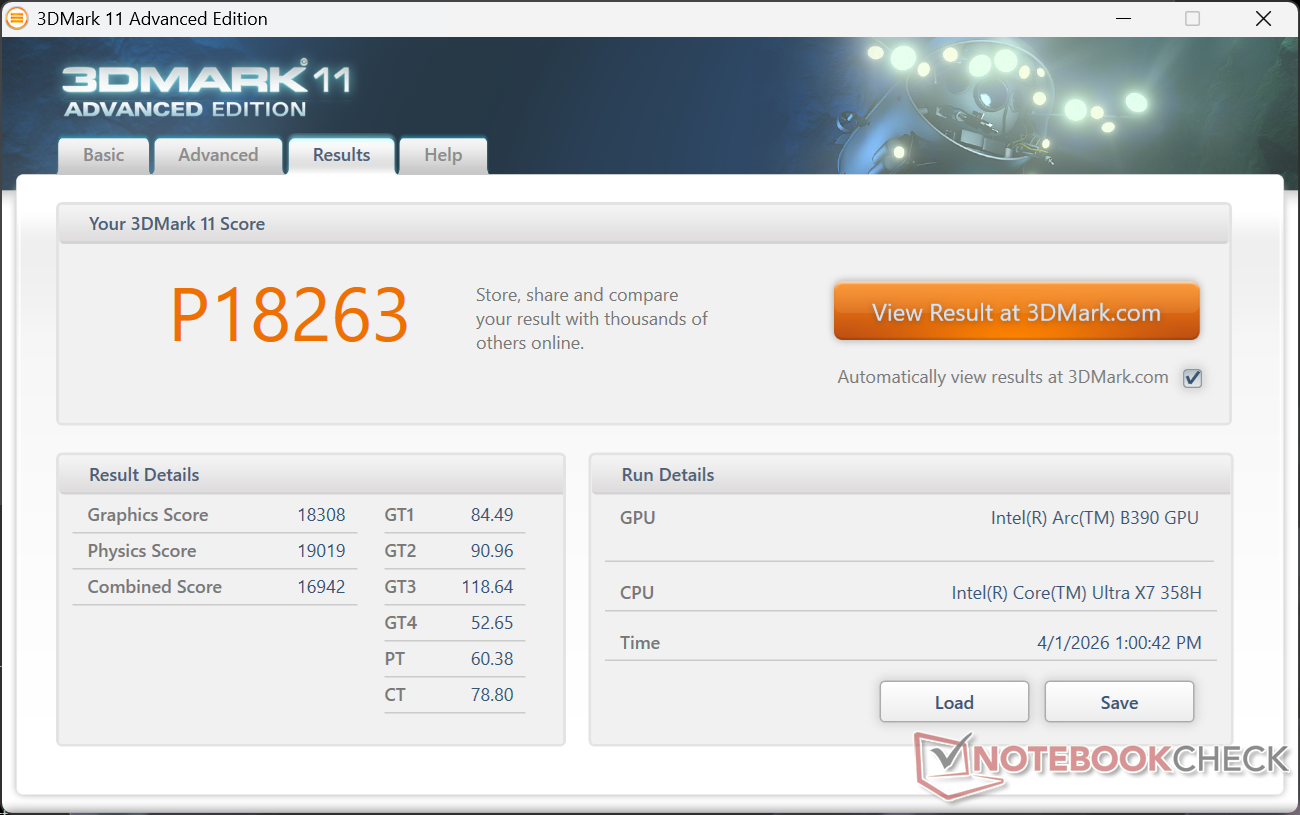


| 3DMark 11 Performance | 18263 Punkte | |
| 3DMark Cloud Gate Standard Score | 39015 Punkte | |
| 3DMark Fire Strike Score | 13997 Punkte | |
| 3DMark Time Spy Score | 7436 Punkte | |
Hilfe | ||
* ... kleinere Werte sind besser
| Performance Rating - Percent | |
| Lenovo Yoga Pro 9 16IAH10 RTX 5050 | |
| Dell XPS 16 9640 | |
| Dell XPS 16 Core Ultra X7 358H | |
| Samsung Galaxy Book6 Pro | |
| Dell XPS 16 Core Ultra 5 325 | |
| HP Omnibook 5 16-af1037nr | |
| Cyberpunk 2077 - 1920x1080 Ultra Preset (FSR off) | |
| Lenovo Yoga Pro 9 16IAH10 RTX 5050 | |
| Dell XPS 16 9640 | |
| Dell XPS 16 Core Ultra X7 358H | |
| Samsung Galaxy Book6 Pro | |
| Dell XPS 16 Core Ultra 5 325 | |
| HP Omnibook 5 16-af1037nr | |
| Baldur's Gate 3 - 1920x1080 Ultra Preset AA:T | |
| Lenovo Yoga Pro 9 16IAH10 RTX 5050 | |
| Dell XPS 16 9640 | |
| Dell XPS 16 Core Ultra X7 358H | |
| Samsung Galaxy Book6 Pro | |
| Dell XPS 16 Core Ultra 5 325 | |
| HP Omnibook 5 16-af1037nr | |
| GTA V - 1920x1080 Highest AA:4xMSAA + FX AF:16x | |
| Lenovo Yoga Pro 9 16IAH10 RTX 5050 | |
| Dell XPS 16 9640 | |
| Dell XPS 16 Core Ultra X7 358H | |
| Samsung Galaxy Book6 Pro | |
| Dell XPS 16 Core Ultra 5 325 | |
| HP Omnibook 5 16-af1037nr | |
| Final Fantasy XV Benchmark - 1920x1080 High Quality | |
| Lenovo Yoga Pro 9 16IAH10 RTX 5050 | |
| Dell XPS 16 9640 | |
| Dell XPS 16 Core Ultra X7 358H | |
| Samsung Galaxy Book6 Pro | |
| Dell XPS 16 Core Ultra 5 325 | |
| HP Omnibook 5 16-af1037nr | |
| Strange Brigade - 1920x1080 ultra AA:ultra AF:16 | |
| Lenovo Yoga Pro 9 16IAH10 RTX 5050 | |
| Dell XPS 16 9640 | |
| Dell XPS 16 Core Ultra X7 358H | |
| Samsung Galaxy Book6 Pro | |
| Dell XPS 16 Core Ultra 5 325 | |
| HP Omnibook 5 16-af1037nr | |
| Dota 2 Reborn - 1920x1080 ultra (3/3) best looking | |
| Lenovo Yoga Pro 9 16IAH10 RTX 5050 | |
| Dell XPS 16 Core Ultra X7 358H | |
| Dell XPS 16 9640 | |
| Samsung Galaxy Book6 Pro | |
| Dell XPS 16 Core Ultra 5 325 | |
| HP Omnibook 5 16-af1037nr | |
| X-Plane 11.11 - 1920x1080 high (fps_test=3) | |
| Lenovo Yoga Pro 9 16IAH10 RTX 5050 | |
| Dell XPS 16 9640 | |
| Dell XPS 16 9640 | |
| Dell XPS 16 Core Ultra X7 358H | |
| Samsung Galaxy Book6 Pro | |
| HP Omnibook 5 16-af1037nr | |
| Dell XPS 16 Core Ultra 5 325 | |
Cyberpunk 2077 ultra FPS Grafik
| min. | mittel | hoch | max. | |
|---|---|---|---|---|
| GTA V (2015) | 182 | 176.1 | 103.3 | 45.2 |
| Dota 2 Reborn (2015) | 112.9 | 91.6 | 100.2 | 96.9 |
| Final Fantasy XV Benchmark (2018) | 131.1 | 79.7 | 56.2 | |
| X-Plane 11.11 (2018) | 55.9 | 47.6 | 38.8 | |
| Strange Brigade (2018) | 359 | 130.5 | 104 | 90.6 |
| Baldur's Gate 3 (2023) | 72.3 | 62.3 | 55.6 | 54.3 |
| Cyberpunk 2077 (2023) | 80.4 | 65.4 | 56 | 48.7 |
| F1 24 (2024) | 142.7 | 135.3 | 103.4 | 36.8 |
| Black Myth: Wukong (2024) | 47 | 37 | 29 | 16 |
Emissionen
Systemgeräusche
Die Lüfterdrehzahl steigt im Vergleich zur Core-Ultra-5-Basiskonfiguration schneller an, was mit dem allgemein höheren Stromverbrauch des Core-Ultra-X7-Systems übereinstimmt. Bei der Ausführung des 3DMark 06 erreicht das Lüftergeräusch beispielsweise einen Spitzenwert von 38 dB(A) im Vergleich zu 34 dB(A) bei der Core-Ultra-5-SKU.
Lautstärkediagramm
| Idle |
| 23.4 / 23.4 / 25.8 dB(A) |
| Last |
| 38 / 48.6 dB(A) |
 | ||
30 dB leise 40 dB(A) deutlich hörbar 50 dB(A) störend |
||
min: | ||
| Dell XPS 16 Core Ultra X7 358H Ultra X7 358H, Arc B390 Panther Lake iGPU | Dell XPS 16 Core Ultra 5 325 Ultra 5 325, Intel Graphics 4 Xe3 PTL | Dell XPS 16 9640 Ultra 7 155H, GeForce RTX 4070 Laptop GPU | Samsung Galaxy Book6 Pro Ultra 7 356H, Intel Graphics 4 Xe3 PTL | Lenovo Yoga Pro 9 16IAH10 RTX 5050 Ultra 9 285H, GeForce RTX 5050 Laptop | HP Omnibook 5 16-af1037nr Ultra 7 255U, Graphics 4-Core iGPU (Arrow Lake) | |
|---|---|---|---|---|---|---|
| Geräuschentwicklung | 5% | -5% | 2% | -7% | 13% | |
| aus / Umgebung * (dB) | 23.3 | 22.8 2% | 24.5 -5% | 25.3 -9% | 24.6 -6% | 23.3 -0% |
| Idle min * (dB) | 23.4 | 22.9 2% | 24.5 -5% | 25.3 -8% | 24.6 -5% | 23.5 -0% |
| Idle avg * (dB) | 23.4 | 22.9 2% | 24.5 -5% | 25.3 -8% | 24.6 -5% | 23.5 -0% |
| Idle max * (dB) | 25.8 | 23.9 7% | 27.5 -7% | 25.3 2% | 26.8 -4% | 24.4 5% |
| Last avg * (dB) | 38 | 34.8 8% | 39.6 -4% | 31.8 16% | 32.8 14% | 25.8 32% |
| Cyberpunk 2077 ultra * (dB) | 38.1 | 38 -0% | 38.4 -1% | 51.8 -36% | 26.2 31% | |
| Last max * (dB) | 48.6 | 43.3 11% | 49.7 -2% | 38.4 21% | 51.8 -7% | 39 20% |
| Witcher 3 ultra * (dB) | 49.7 |
* ... kleinere Werte sind besser
Temperatur
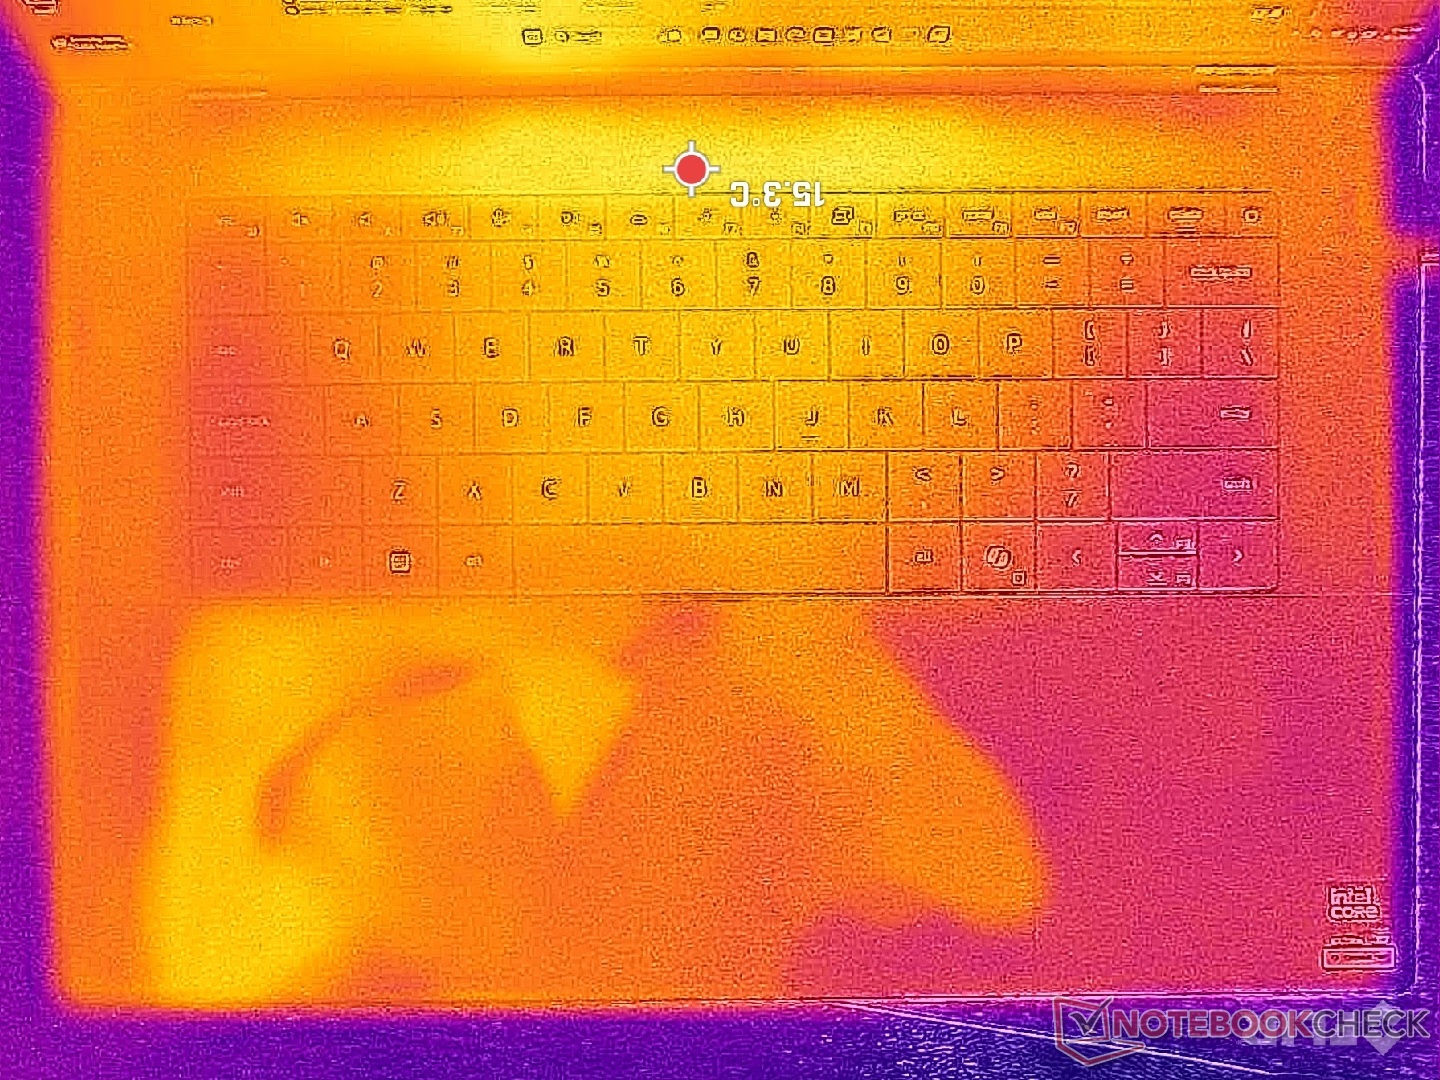
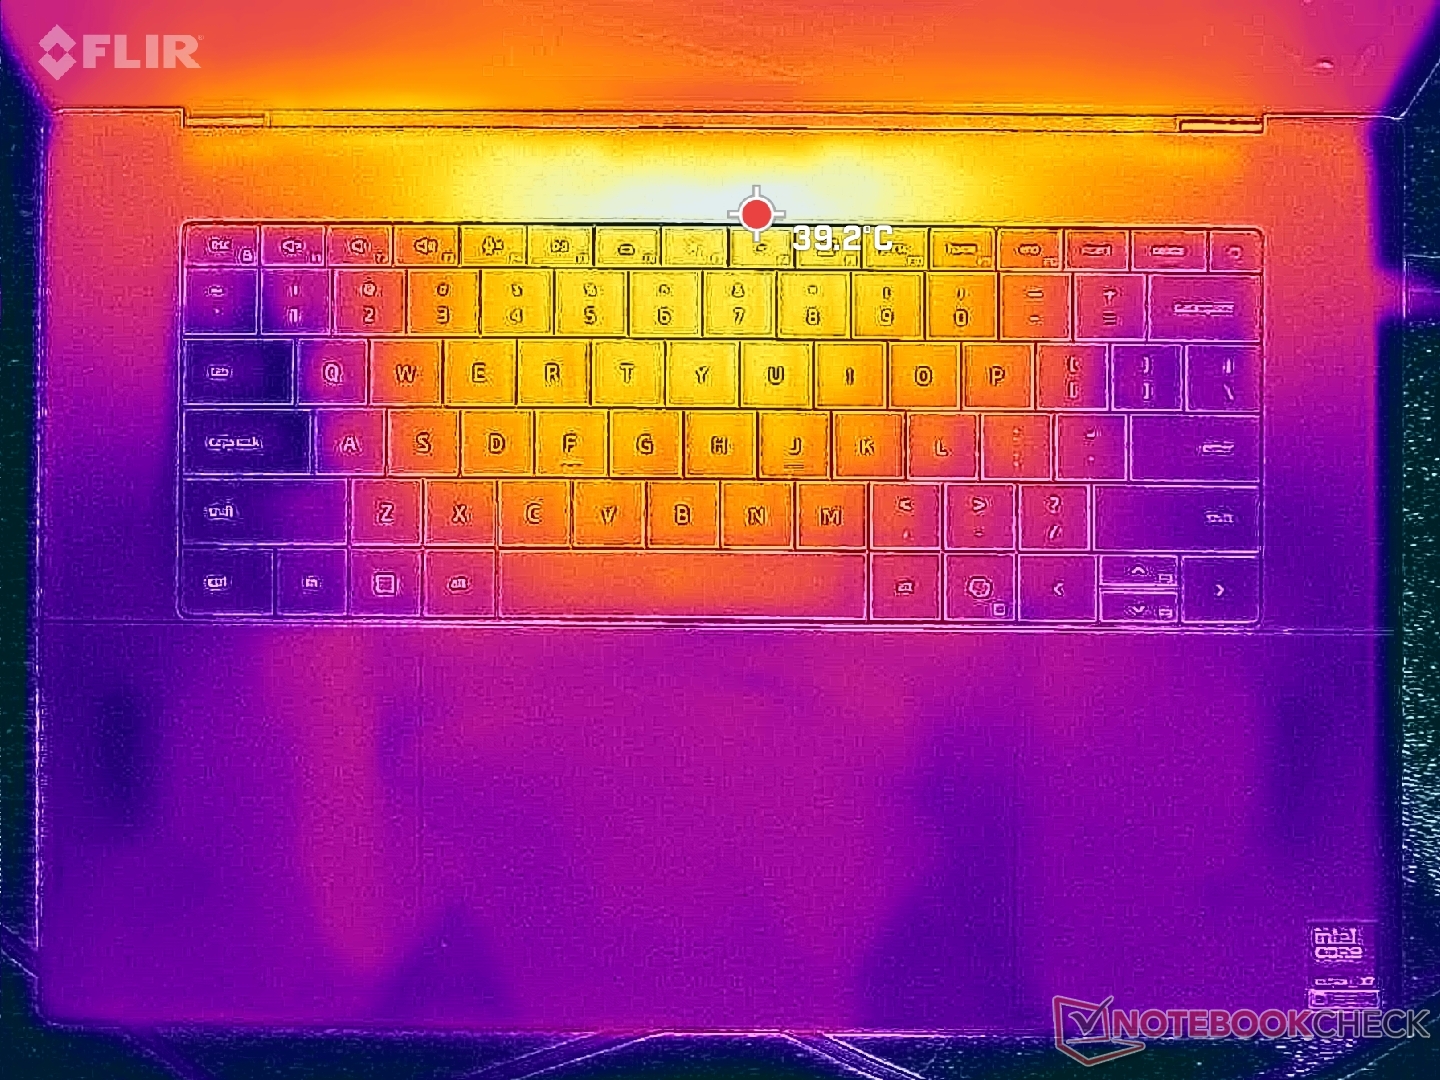
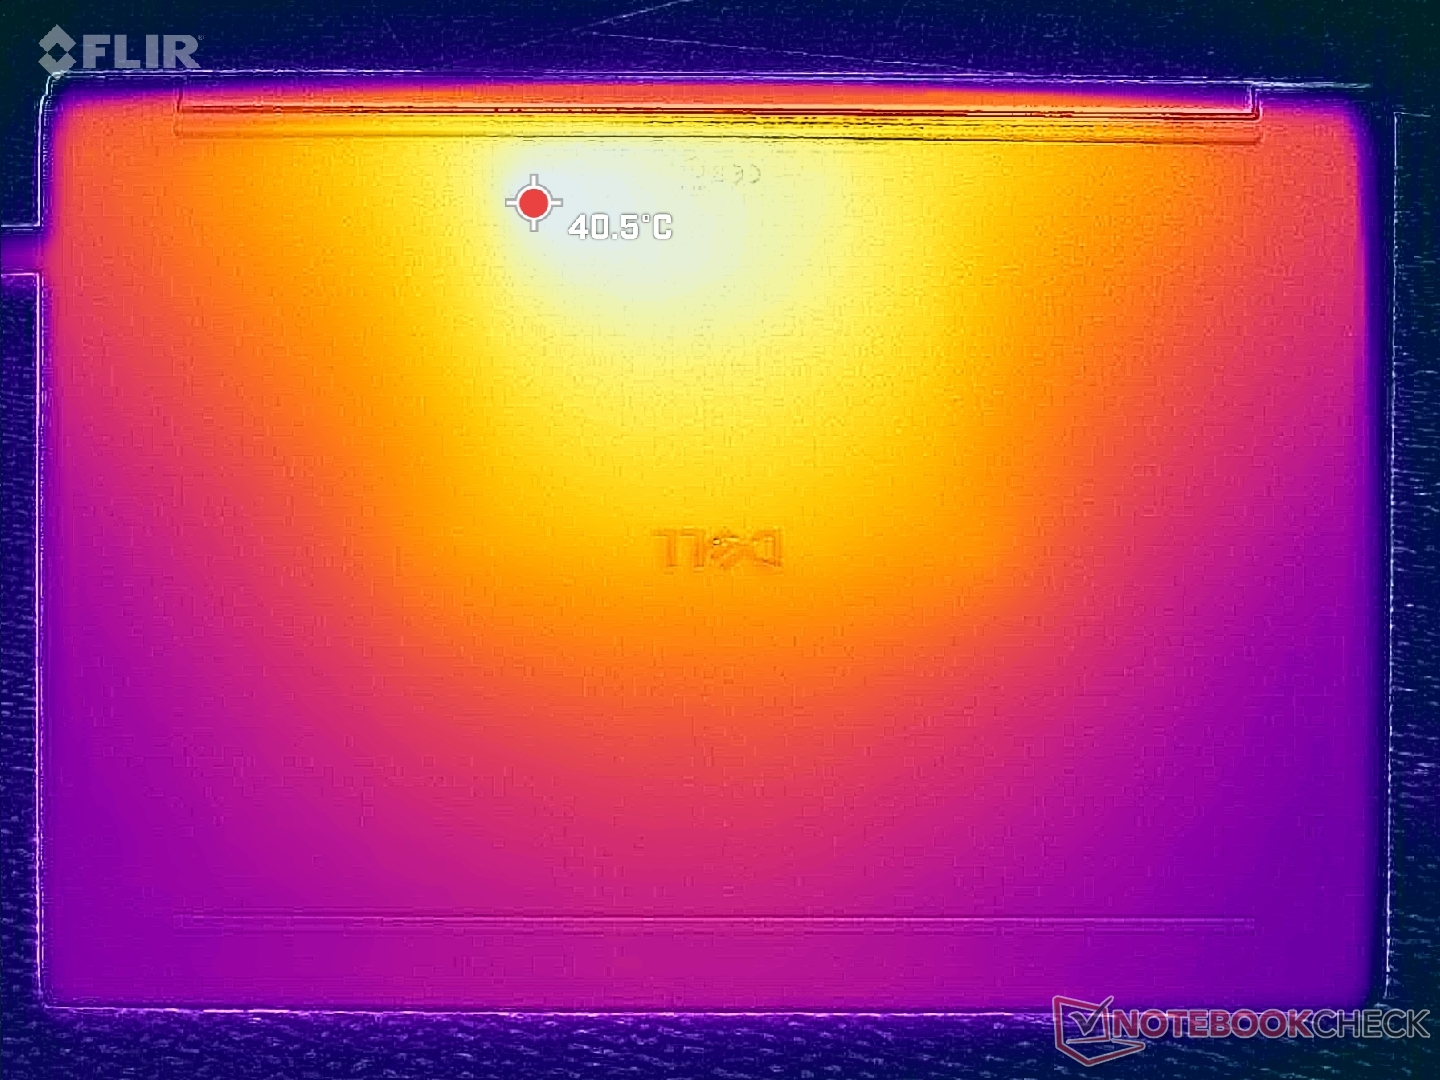
Die Oberflächentemperaturen sind im Durchschnitt kühler als beim älteren, aber dickeren XPS 16 9640 mit schnellerer RTX-4070-Grafik. Dennoch erreichen die Hotspots in der Nähe der Tastaturmitte einen ähnlichen Wert von 40 °C.
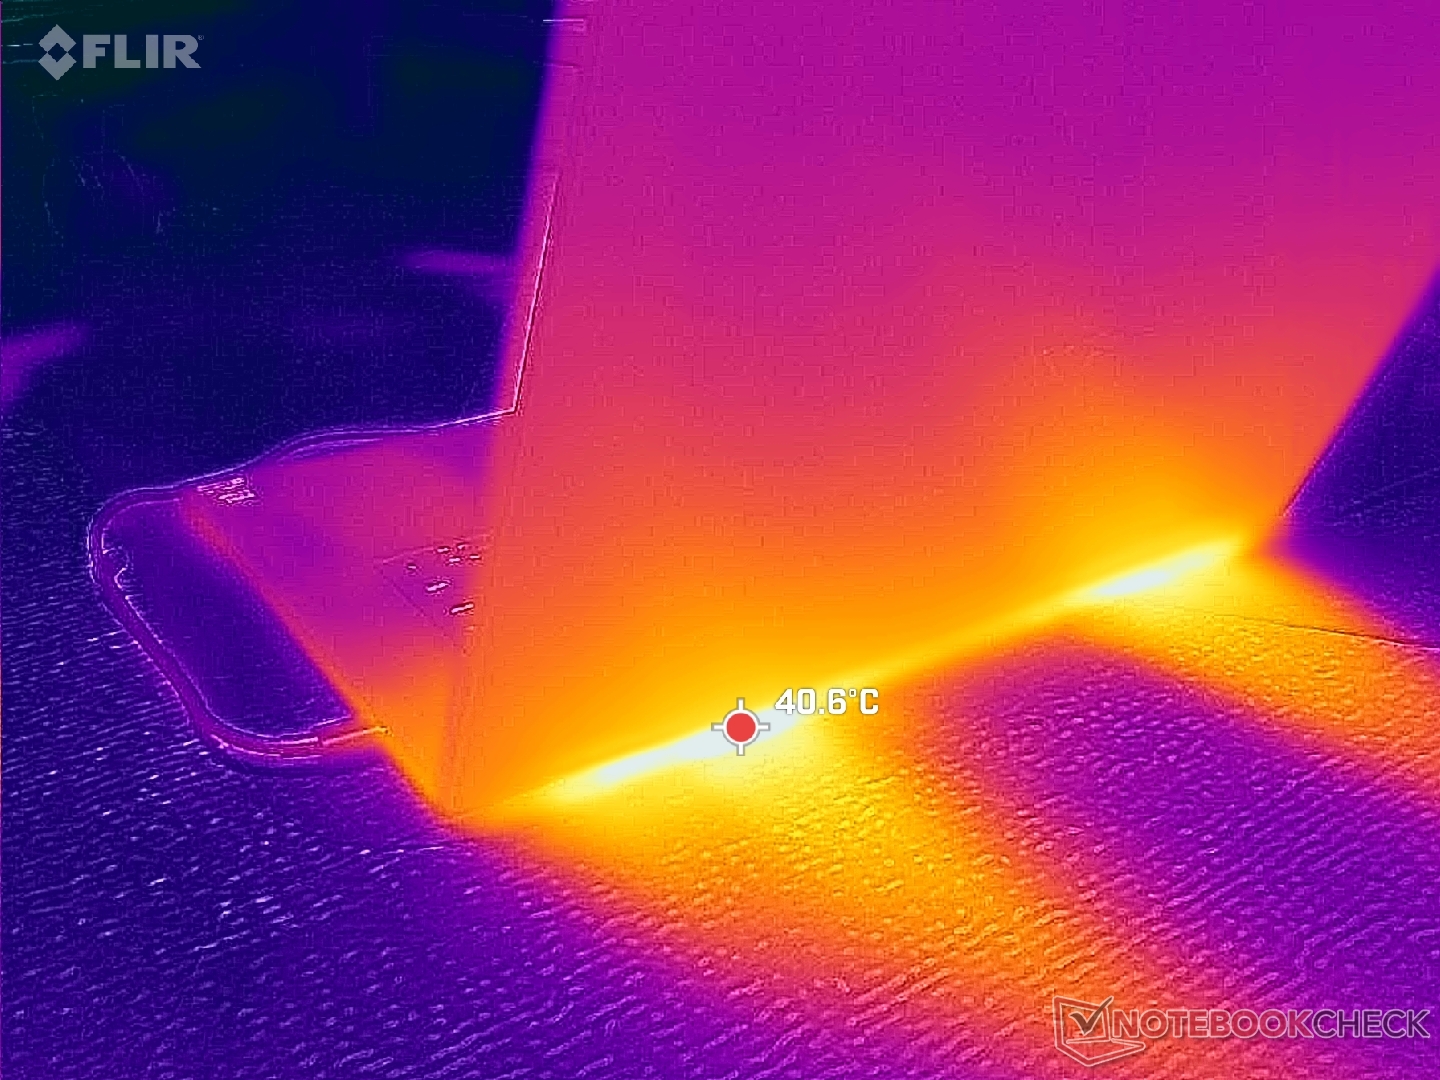
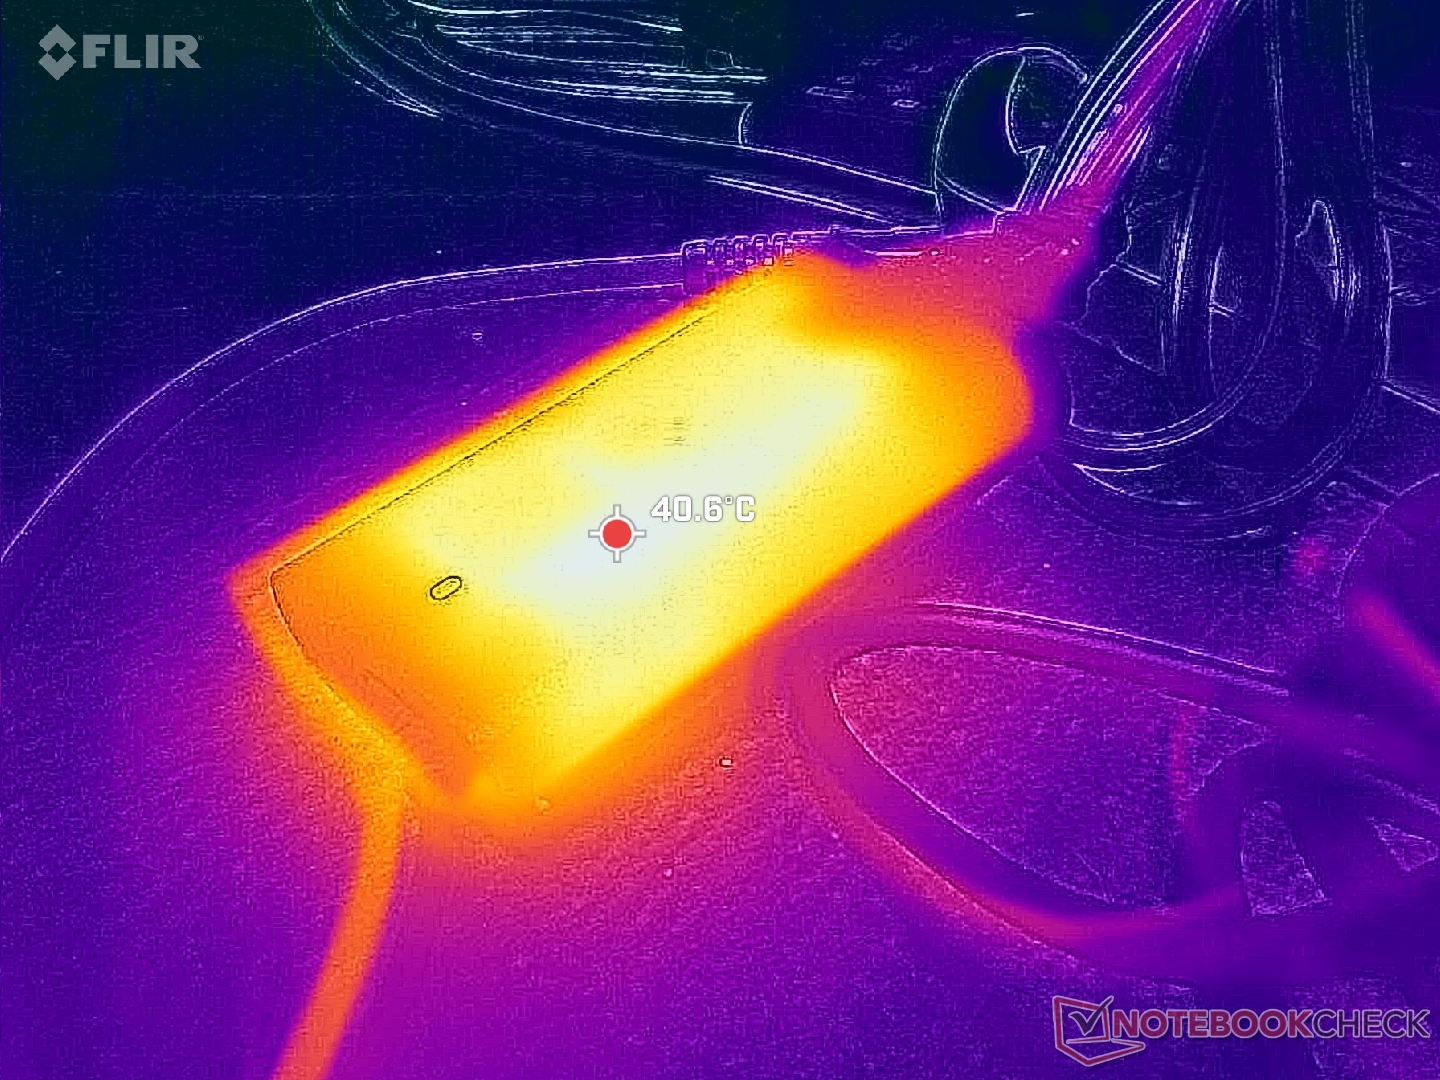
(±) Die maximale Temperatur auf der Oberseite ist 40.6 °C. Im Vergleich liegt der Klassendurchschnitt bei 36.8 °C (von 21 bis 71 °C für die Klasse Multimedia).
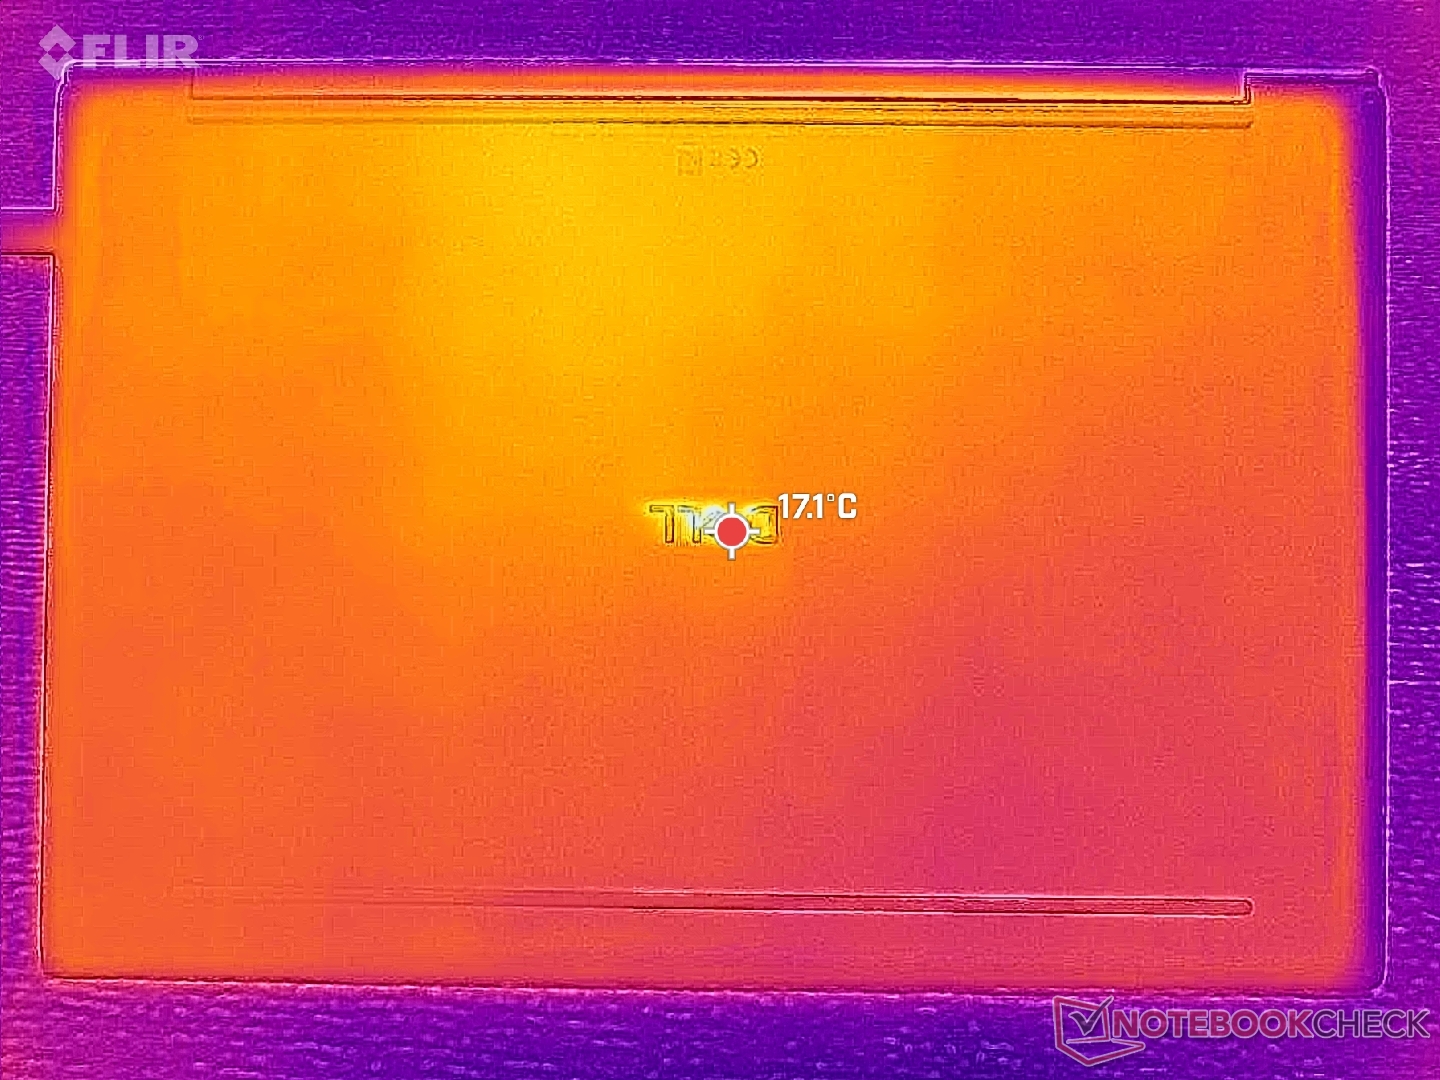
(+) Auf der Unterseite messen wir eine maximalen Wert von 39.8 °C (im Vergleich zum Durchschnitt von 39.1 °C).
(+) Ohne Last messen wir eine durchschnittliche Temperatur von 22.3 °C auf der Oberseite. Der Klassendurchschnitt erreicht 31.3 °C.
(+) Die Handballen und der Touchpad-Bereich sind mit gemessenen 25.6 °C kühler als die typische Hauttemperatur und fühlen sich dadurch kühl an.
(+) Die durchschnittliche Handballen-Temperatur anderer getesteter Geräte war 28.7 °C (+3.1 °C).
| Dell XPS 16 Core Ultra X7 358H Ultra X7 358H, Arc B390 Panther Lake iGPU | Dell XPS 16 Core Ultra 5 325 Ultra 5 325, Intel Graphics 4 Xe3 PTL | Dell XPS 16 9640 Ultra 7 155H, GeForce RTX 4070 Laptop GPU | Samsung Galaxy Book6 Pro Ultra 7 356H, Intel Graphics 4 Xe3 PTL | Lenovo Yoga Pro 9 16IAH10 RTX 5050 Ultra 9 285H, GeForce RTX 5050 Laptop | HP Omnibook 5 16-af1037nr Ultra 7 255U, Graphics 4-Core iGPU (Arrow Lake) | |
|---|---|---|---|---|---|---|
| Hitze | -3% | -7% | 3% | -12% | 6% | |
| Last oben max * (°C) | 40.6 | 43.8 -8% | 39.4 3% | 37.8 7% | 34.4 15% | 28 31% |
| Last unten max * (°C) | 39.8 | 42 -6% | 36.9 7% | 40.1 -1% | 41.4 -4% | 33.2 17% |
| Idle oben max * (°C) | 23.2 | 23.2 -0% | 28.2 -22% | 22.6 3% | 28.6 -23% | 24.6 -6% |
| Idle unten max * (°C) | 23.8 | 23.6 1% | 27.4 -15% | 22.8 4% | 31.8 -34% | 27.8 -17% |
* ... kleinere Werte sind besser
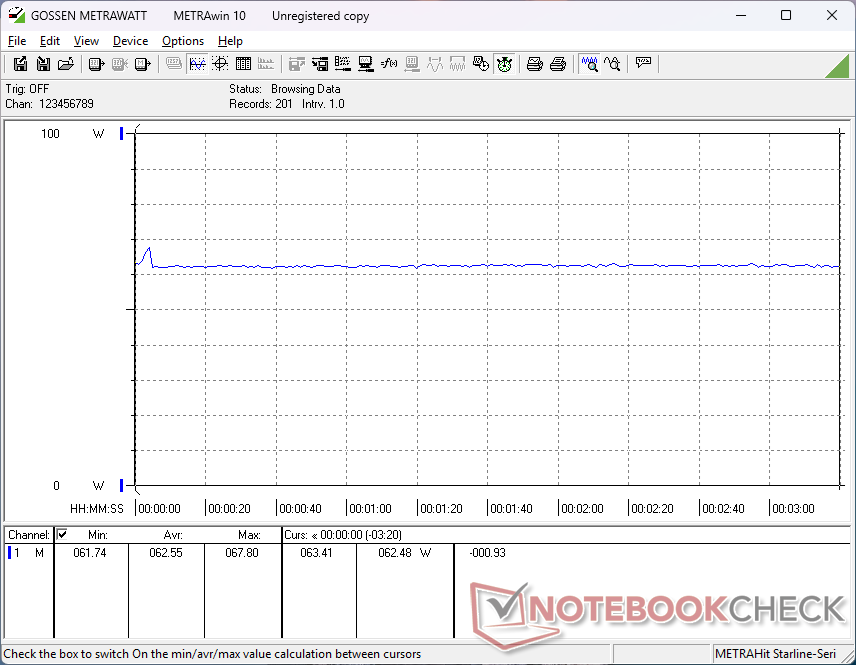
Stresstest
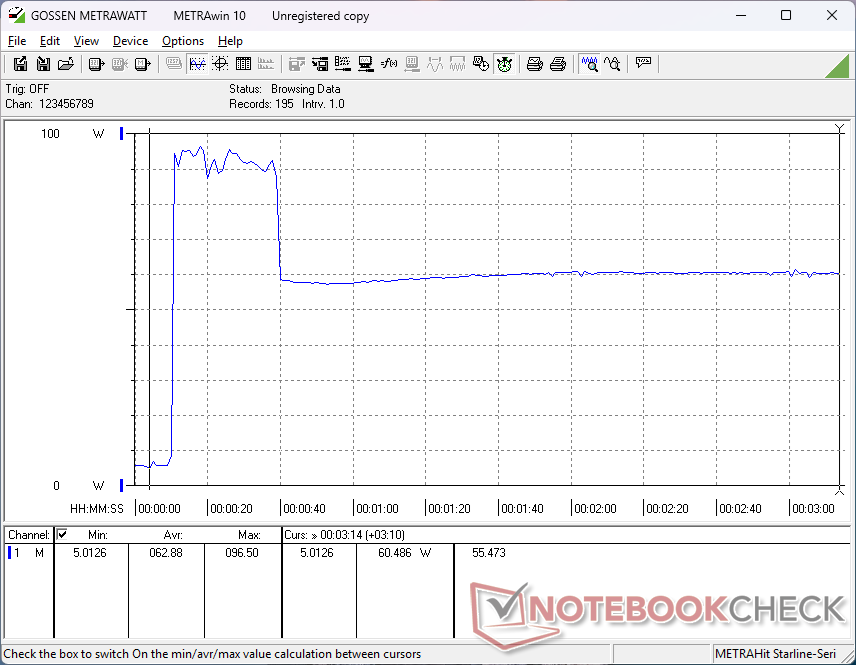
Die CPU wurde bei der Ausführung von Prime95 Stress auf 2,9 GHz, 69 W und 100 °C hochgefahren, bevor sie einige Sekunden später auf 2,2 GHz, 40 W und 78 °C zurückfiel, um die begrenzte Nachhaltigkeit des Turbo Boosts darzustellen. Die Drosselung ergänzt unsere CineBench-R15-xT-Schleifenergebnisse oben und das Energieverbrauchsverhalten unten.
Vielleicht noch bemerkenswerter ist, dass die Kerntemperatur unter Last kühler ist als bei der langsameren Core-Ultra-5-Konfiguration des XPS 16. Bei der Ausführung von Prime95 und Cyberpunk 2077 stabilisiert sich die CPU bei 78 bzw. 68 °C, verglichen mit 86 und 89 °C beim Core Ultra 5 XPS 16.


| CPU-Takt (GHz) | GPU-Takt (MHz) | durchschnittliche CPU-Temperatur (°C) | |
| System Leerlauf | -- | -- | 44 |
| Prime95 Stress | 2,1 | 900 | 78 |
| Prime95 + FurMark Stress | 1,7 | 1.350 | 71 |
| Cyberpunk 2077 Stress | 0,87 | 2.150 | 68 |
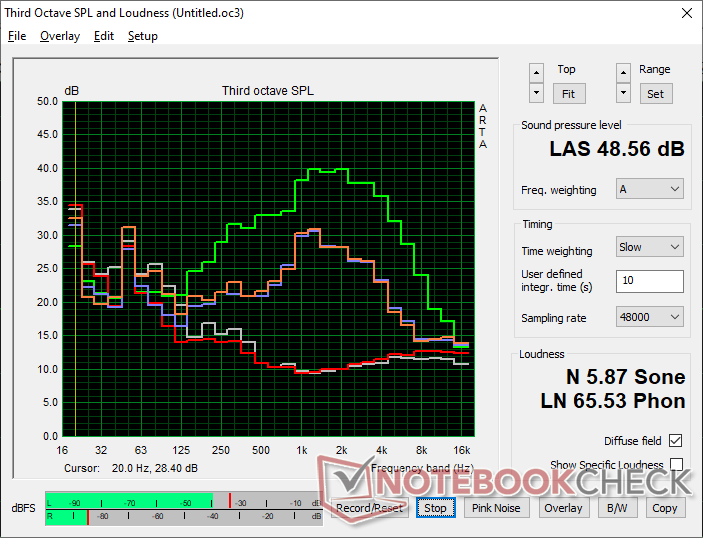
Lautsprecher
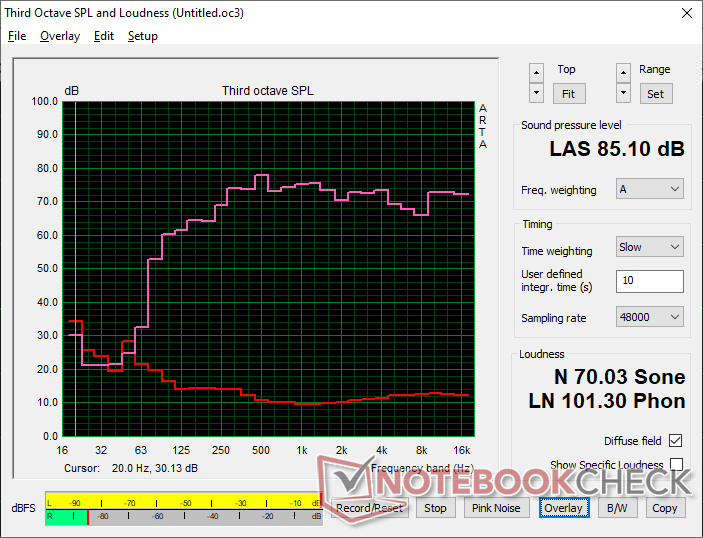
Dell XPS 16 Core Ultra X7 358H Audio Analyse
(+) | Die Lautsprecher können relativ laut spielen (85.1 dB)
Bass 100 - 315 Hz
(±) | abgesenkter Bass - 7.6% geringer als der Median
(+) | lineare Bass-Wiedergabe (6.1% Delta zum Vorgänger)
Mitteltöne 400 - 2000 Hz
(+) | ausgeglichene Mitten, vom Median nur 2.1% abweichend
(+) | lineare Mitten (3.4% Delta zum Vorgänger)
Hochtöne 2 - 16 kHz
(+) | ausgeglichene Hochtöne, vom Median nur 2.3% abweichend
(+) | sehr lineare Hochtöne (4.1% Delta zum Vorgänger)
Gesamt im hörbaren Bereich 100 - 16.000 Hz
(+) | hörbarer Bereich ist sehr linear (6.2% Abstand zum Median
Im Vergleich zu allen Geräten derselben Klasse
» 3% aller getesteten Geräte dieser Klasse waren besser, 0% vergleichbar, 96% schlechter
» Das beste Gerät hat einen Delta-Wert von 5%, durchschnittlich ist 17%, das schlechteste Gerät hat 45%
Im Vergleich zu allen Geräten im Test
» 0% aller getesteten Geräte waren besser, 0% vergleichbar, 99% schlechter
» Das beste Gerät hat einen Delta-Wert von 4%, durchschnittlich ist 24%, das schlechteste Gerät hat 134%
Apple MacBook Pro 16 2021 M1 Pro Audio Analyse
(+) | Die Lautsprecher können relativ laut spielen (84.7 dB)
Bass 100 - 315 Hz
(+) | guter Bass - nur 3.8% Abweichung vom Median
(+) | lineare Bass-Wiedergabe (5.2% Delta zum Vorgänger)
Mitteltöne 400 - 2000 Hz
(+) | ausgeglichene Mitten, vom Median nur 1.3% abweichend
(+) | lineare Mitten (2.1% Delta zum Vorgänger)
Hochtöne 2 - 16 kHz
(+) | ausgeglichene Hochtöne, vom Median nur 1.9% abweichend
(+) | sehr lineare Hochtöne (2.7% Delta zum Vorgänger)
Gesamt im hörbaren Bereich 100 - 16.000 Hz
(+) | hörbarer Bereich ist sehr linear (4.6% Abstand zum Median
Im Vergleich zu allen Geräten derselben Klasse
» 0% aller getesteten Geräte dieser Klasse waren besser, 0% vergleichbar, 100% schlechter
» Das beste Gerät hat einen Delta-Wert von 5%, durchschnittlich ist 17%, das schlechteste Gerät hat 45%
Im Vergleich zu allen Geräten im Test
» 0% aller getesteten Geräte waren besser, 0% vergleichbar, 100% schlechter
» Das beste Gerät hat einen Delta-Wert von 4%, durchschnittlich ist 24%, das schlechteste Gerät hat 134%
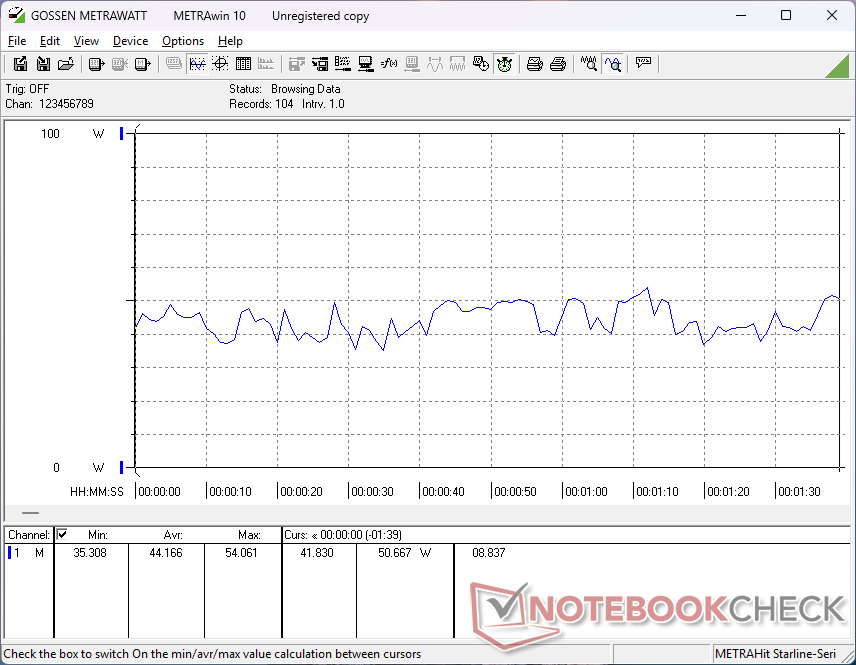
Energieverwaltung
Stromverbrauch
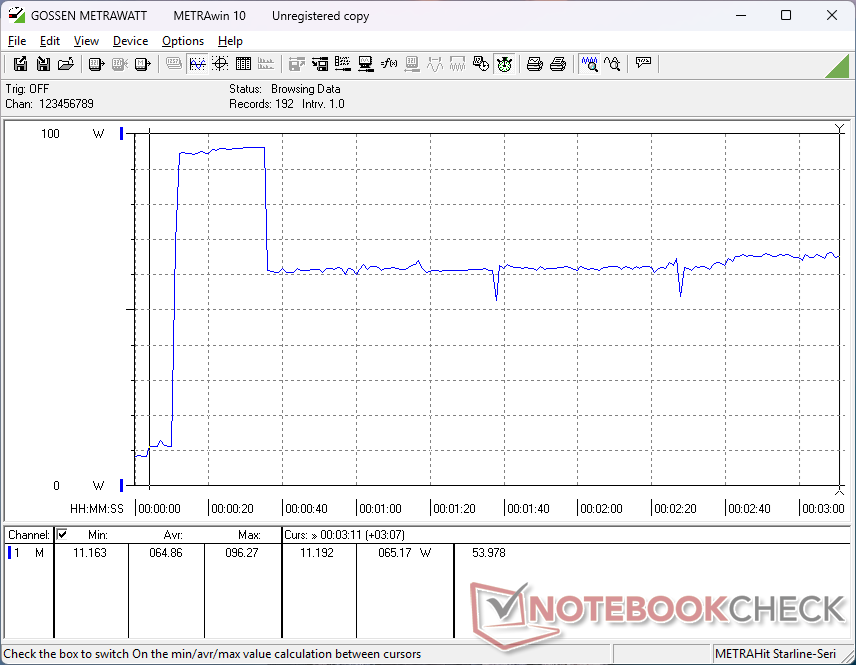
Die Core-Ultra-X7-OLED-Konfiguration ist im Allgemeinen anspruchsvoller als die Core-Ultra-5-IPS-Basiskonfiguration, selbst im Leerlauf aufgrund des OLED-Panels. Die Ausführung von Cyberpunk 2077 und Prime95 verbraucht etwa 38 bzw. 35 Prozent mehr Strom. Die Leistungssteigerung überwiegt jedoch bei weitem den höheren Energiebedarf, so dass die Leistung pro Watt bei der Core-Ultra-X7-Option immer noch höher ist.
| Aus / Standby | |
| Idle | |
| Last |
|
Legende:
min: | |
| Dell XPS 16 Core Ultra X7 358H Ultra X7 358H, Arc B390 Panther Lake iGPU, , OLED, 3200x2000, 16" | Dell XPS 16 Core Ultra 5 325 Ultra 5 325, Intel Graphics 4 Xe3 PTL, SK hynix PVC10 HFS512GEM4X182N, IPS, 1920x1200, 16" | Dell XPS 16 9640 Ultra 7 155H, GeForce RTX 4070 Laptop GPU, Kioxia XG8 KXG80ZNV1T02, OLED, 3840x2400, 16.3" | Samsung Galaxy Book6 Pro Ultra 7 356H, Intel Graphics 4 Xe3 PTL, Samsung PM9C1b MZVL8512HFLU-00BLL, OLED, 2880x1800, 16" | Lenovo Yoga Pro 9 16IAH10 RTX 5050 Ultra 9 285H, GeForce RTX 5050 Laptop, WD PC SN7100S SDFPMSL-1T00-1101, OLED, 2880x1800, 16" | HP Omnibook 5 16-af1037nr Ultra 7 255U, Graphics 4-Core iGPU (Arrow Lake), , IPS, 1920x1200, 16" | |
|---|---|---|---|---|---|---|
| Stromverbrauch | 28% | -70% | 25% | -142% | -2% | |
| Idle min * (Watt) | 4 | 1.3 67% | 7.7 -93% | 2.5 37% | 6.8 -70% | 4.8 -20% |
| Idle avg * (Watt) | 4.4 | 4.5 -2% | 10.3 -134% | 4.2 5% | 20.1 -357% | 9.4 -114% |
| Idle max * (Watt) | 10.2 | 4.6 55% | 10.6 -4% | 4.6 55% | 21.6 -112% | 9.7 5% |
| Last avg * (Watt) | 44.2 | 36.5 17% | 76.5 -73% | 42.2 5% | 87.6 -98% | 41.8 5% |
| Cyberpunk 2077 ultra * (Watt) | 62.6 | 47.9 23% | 52.7 16% | 148.2 -137% | 39.5 37% | |
| Cyberpunk 2077 ultra external monitor * (Watt) | 62.4 | 45.4 27% | 40.6 35% | 147.9 -137% | 35.9 42% | |
| Last max * (Watt) | 94.6 | 82.8 12% | 138.5 -46% | 70.8 25% | 173.5 -83% | 66.1 30% |
| Witcher 3 ultra * (Watt) | 126.4 |
* ... kleinere Werte sind besser
Stromverbrauch Cyberpunk/Stresstest
Stromverbrauch externer Monitor
Akkulaufzeit
Die Laufzeiten sind bei unserem Core Ultra X7 3.2K OLED SKU im Vergleich zum Core Ultra 5 FHD IPS SKU um mehr als die Hälfte kürzer, selbst wenn Windows VRR aktiviert ist. Obwohl 10+ Stunden für die meisten immer noch mehr als genug sind, ist der Unterschied bemerkenswert.
| Dell XPS 16 Core Ultra X7 358H Ultra X7 358H, Arc B390 Panther Lake iGPU, 70 Wh | Dell XPS 16 Core Ultra 5 325 Ultra 5 325, Intel Graphics 4 Xe3 PTL, 70 Wh | Dell XPS 16 9640 Ultra 7 155H, GeForce RTX 4070 Laptop GPU, 99.5 Wh | Samsung Galaxy Book6 Pro Ultra 7 356H, Intel Graphics 4 Xe3 PTL, 78 Wh | Lenovo Yoga Pro 9 16IAH10 RTX 5050 Ultra 9 285H, GeForce RTX 5050 Laptop, 84 Wh | HP Omnibook 5 16-af1037nr Ultra 7 255U, Graphics 4-Core iGPU (Arrow Lake), 59 Wh | |
|---|---|---|---|---|---|---|
| Akkulaufzeit | 158% | 2% | 58% | 4% | -8% | |
| WLAN (h) | 10.3 | 26.6 158% | 10.5 2% | 16.3 58% | 10.7 4% | 9.5 -8% |
| H.264 (h) | 16.5 | |||||
| Last (h) | 1.5 |
Notebookcheck Bewertung
Die Core-Ultra-X7-XPS-16-Konfiguration ist deutlich überzeugender als die schwächeren Core-Ultra-5- oder -Ultra-7-Optionen. Im Vergleich zum Dell 16 Premium des letzten Jahres verzichtet das Modell auf Leistung und sieht dafür viel dünner, schlanker und effizienter aus.
Dell XPS 16 Core Ultra X7 358H
- 11.04.2026 v8
Allen Ngo
 Total Sustainability Score:
 Potenzielle Wettbewerber im Vergleich
Bild | Modell / Test | Preis ab | Gewicht | Dicke | Display |
|---|---|---|---|---|---|
1. 87.2%  | Dell XPS 16 Core Ultra X7 358H Intel Core Ultra X7 358H ⎘ Intel Arc B390 12 Xe3 Panther Lake iGPU ⎘ 32 GB RAM | Amazon: 1. 3.599,00 € Dell XPS 16 9640 Laptop 16.3... 2. 2.526,06 € Dell XPS 16 9640 Laptop 16.3... 3. 826,18 € Dell XPS 14 9440 Laptop 14.5... Geizhals Suche | 1.7 kg | 14.62 mm | 16.00" 3200x2000 236 PPI OLED |
2. 84.2%  | Dell XPS 16 Core Ultra 5 325 Intel Core Ultra 5 325 ⎘ Intel Graphics 4 Xe3 Panther Lake iGPU ⎘ 16 GB RAM, 512 GB SSD | Amazon: 1. 3.599,00 € Dell XPS 16 9640 Laptop 16.3... 2. 1.301,00 € Lenovo ThinkBook 16 Gen 9 (1... 3. 2.526,06 € Dell XPS 16 9640 Laptop 16.3... Geizhals Suche | 1.7 kg | 15.4 mm | 16.00" 1920x1200 142 PPI IPS |
3. 88.6% v7 (old)  | Dell XPS 16 9640 Intel Core Ultra 7 155H ⎘ NVIDIA GeForce RTX 4070 Laptop GPU ⎘ 32 GB RAM, 1024 GB SSD | Amazon: 1. 3.599,00 € Dell XPS 16 9640 Laptop 16.3... 2. 2.526,06 € Dell XPS 16 9640 Laptop 16.3... 3. 2.263,11 € Dell XPS 16 (9640) Laptop 16... Geizhals Suche | 2.3 kg | 18.7 mm | 16.30" 3840x2400 139 PPI OLED |
4. 86.3%  | Samsung Galaxy Book6 Pro Intel Core Ultra 7 356H ⎘ Intel Graphics 4 Xe3 Panther Lake iGPU ⎘ 32 GB RAM, 512 GB SSD | Amazon: 1.870,55 € Bestpreis 2249€ saturn 2. 2249€ Saturn.de 3. 2249€ Mediamarkt.de | 1.6 kg | 11.9 mm | 16.00" 2880x1800 212 PPI OLED |
5. 88.8%  | Lenovo Yoga Pro 9 16IAH10 RTX 5050 Intel Core Ultra 9 285H ⎘ NVIDIA GeForce RTX 5050 Laptop ⎘ 32 GB RAM, 1024 GB SSD | Amazon: 3.366,65 € Geizhals Suche | 2 kg | 17.9 mm | 16.00" 2880x1800 212 PPI OLED |
6. 77.8%  | HP Omnibook 5 16-af1037nr Intel Core Ultra 7 255U ⎘ Intel Graphics 4-Core iGPU (Meteor / Arrow Lake) ⎘ 16 GB RAM | Amazon: 1.018,88 € Bestpreis 799€ TechnikDeals24 2. 799€ HEINZSOFT 3. 805.71€ TechnikDeals24 AT | 1.7 kg | 18.6 mm | 16.00" 1920x1200 142 PPI IPS |
Transparenz
Die Auswahl der zu testenden Geräte erfolgt innerhalb der Redaktion. Das vorliegende Testmuster wurde dem Autor vom Hersteller oder einem Shop zu Testzwecken leihweise zur Verfügung gestellt. Eine Einflussnahme des Leihstellers auf den Testbericht gab es nicht, der Hersteller erhielt keine Version des Reviews vor der Veröffentlichung. Es bestand keine Verpflichtung zur Publikation. Als eigenständiges, unabhängiges Unternehmen unterliegt Notebookcheck keiner Diktion von Herstellern, Shops und Verlagen.
So testet Notebookcheck
Pro Jahr werden von Notebookcheck hunderte Laptops und Smartphones unabhängig in von uns standardisierten technischen Verfahren getestet, um eine Vergleichbarkeit aller Testergebnisse zu gewährleisten. Seit rund 20 Jahren entwickeln wir diese Testmethoden kontinuierlich weiter und setzen damit Branchenstandards. In unseren Testlaboren kommt ausschließlich hochwertiges Messequipment in die Hände erfahrener Techniker und Redakteure. Die Tests unterliegen einer mehrstufigen Kontrolle. Unsere komplexe Gesamtbewertung basiert auf hunderten fundierten Messergebnissen und Benchmarks, womit Ihnen Objektivität garantiert ist. Weitere Informationen zu unseren Testmethoden gibt es hier.

