Fazit - Große Änderungen zum Guten
Die 2022 XPS Revision enthielt große Umstellungen der Serie von denen viele der neuen Funktionen von langjährigen XPS-Fans gemischt aufgenommen wurden. Die neueste Revision 2026 geht viele der Kritikpunkte an und bietet rundum deutliche Verbesserungen. Das Gehäuse ist steifer, die Touch-Funktionstasten sind verschwunden, das Clickpad ist besser zu sehen, die Lautsprecher liefern bessere Qualität und die Webcam hat jetzt mehr als 1080p und kann es mit den meisten Konkurrenten aufnehmen. Die Wartung ist etwas schwieriger, aber das ist ein kleiner Preis angesichts der vielen positiven Aspekte.
Hinsichtlich der Performance hat Panther Lake der XPS 14 Serie gutgetan, denn sie kommt der GeForce RTX 4050 ziemlich nahe, jedoch ohne das zusätzliche Gewicht oder den hohen Strombedarf. Selbst Gamer werden feststellen, dass der Arc B390 für eine integrierte GPU sehr leistungsstark ist.
Es gibt noch einige Aspekte des XPS 14, die verbessert werden können. Ein Kamerashutter fehlt beispielsweise nach wie vor und auch einen MicroSD-Steckplatz sucht man nun vergebens. Die Turbo Boost-Leistung und auch die HDR-Unterstützung sind schwächer als bei Konkurrenten wie dem Asus ExpertBook Ultra und das relativ weiche Tastenfeedback ist für Vielschreiber vielleicht nicht ideal. Es ist auch bedauerlich, dass das neue XPS 14 einen halben Zoll kleiner ist als das Vorgängermodell.
Dennoch ist das neue XPS 14 die bisher beste Überarbeitung der Serie und damit viel eher eine Empfehlung als das 2025 Dell 14 Premium.
Pro
Contra
- 3.188,95 €ASUS ExpertBook Ultra 14 Zoll Business Laptop, Intel® Core™ Ultra X7 Prozessor 358H, 32GB RAM, 1TB SSD, WiFi 7, Windows 11 Pro, Jet Fog, B9406CAA-XSP76T
- 850,41 €Dell XPS 14 9440 Laptop 14.5 Inch FHD+ (1920 x 1200) Display, Intel Evo Edition, Intel Core Ultra 7 Series 1, Intel Arc Graphics, 16GB RAM 512GB SSD, Windows 11 Home, QWERTY Geman Backlit Keyboard
- 1.799,00 €Dell XPS 13 (9350) Laptop Copilot+ PC 13.4 Inch FHD+ 120Hz, Intel Core Ultra 7 Series 2 Intel - Evo Edition, Intel Arc, 32GB RAM, 1TB SSD, Windows 11 Home, German QWERTZ Backlit Keyboard, Platinum
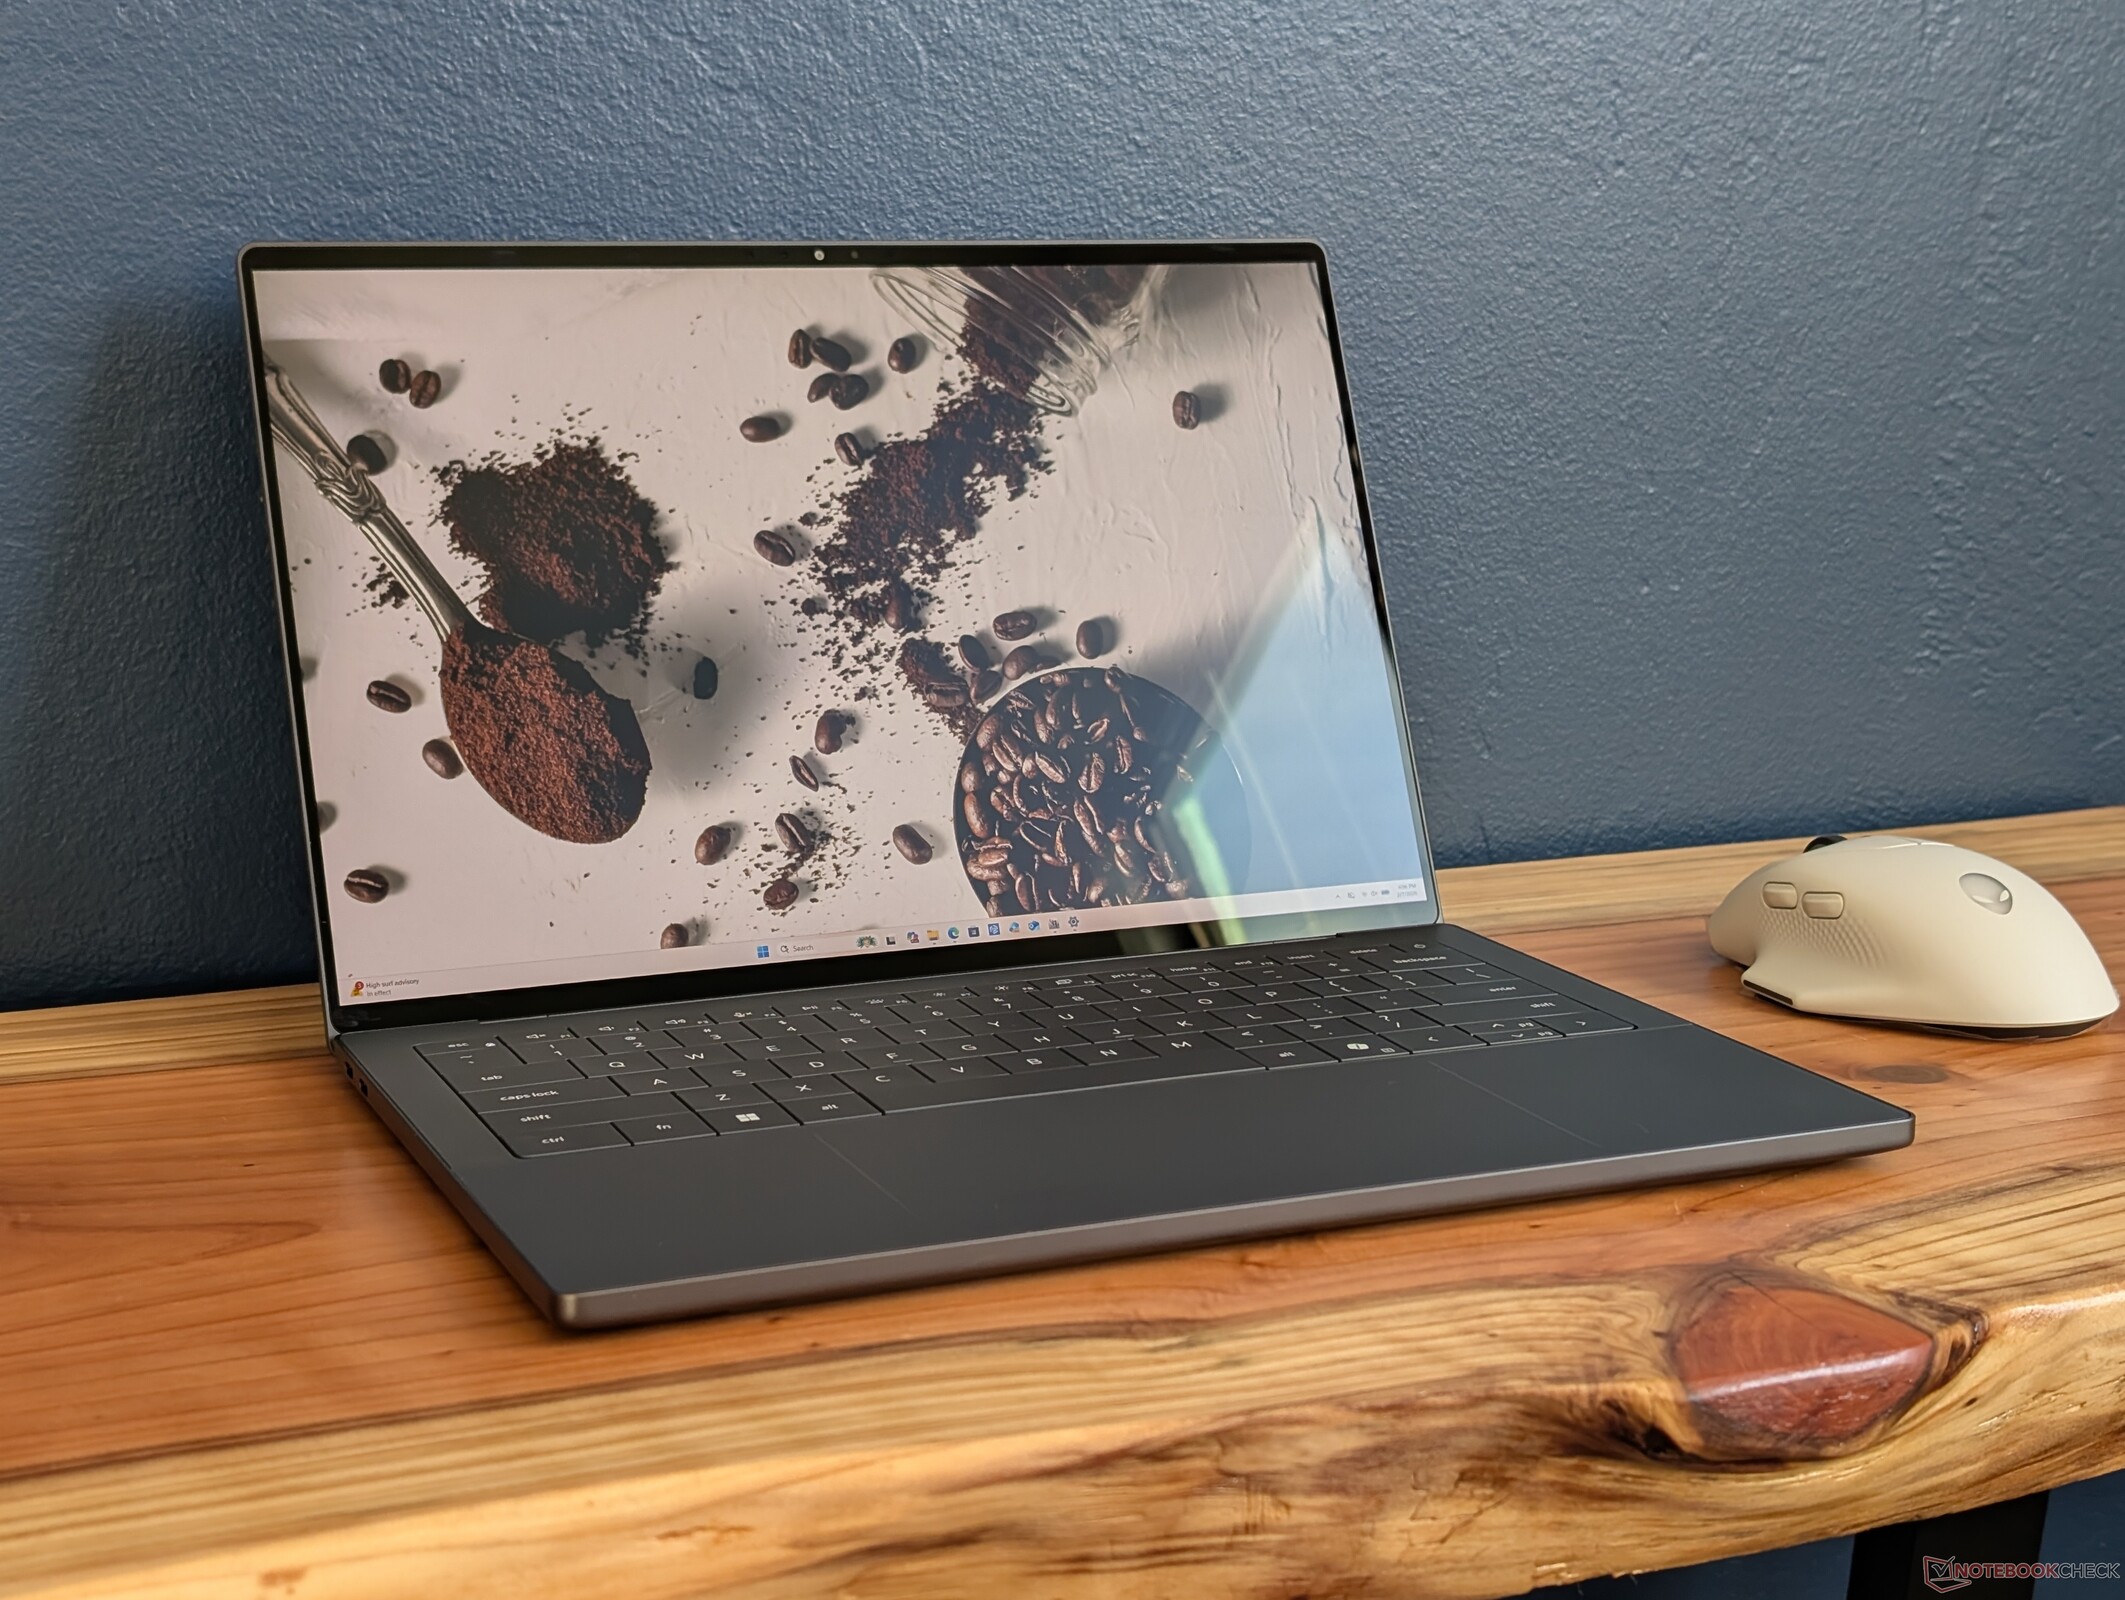
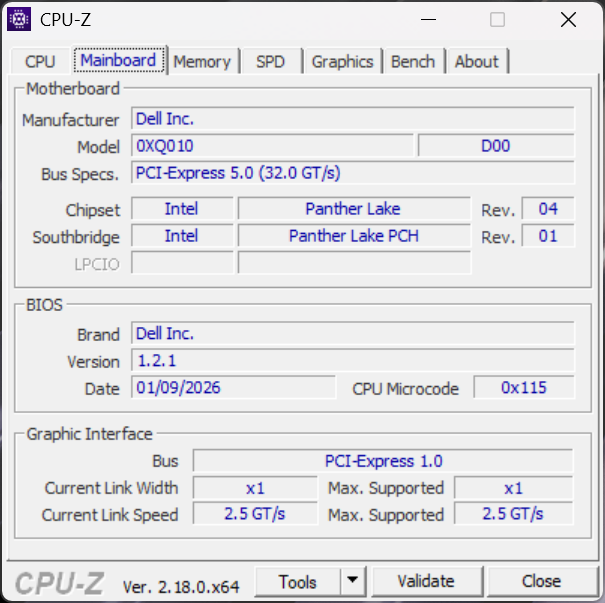
Nach einem - für manche sicher verwirrenden - Jahr der Abkehr vom XPS-Branding kehrt Dell mit dem 2026 XPS 14, das mit Intels neuester Panther Lake CPU ausgestattet ist, zu seinem bekannten Namen zurück. Das Modell hat ein völlig neues Außendesign im Vergleich zur vorherigen Generation des Dell 14 Premium 2025 oder zur XPS 14 Serie 2024.
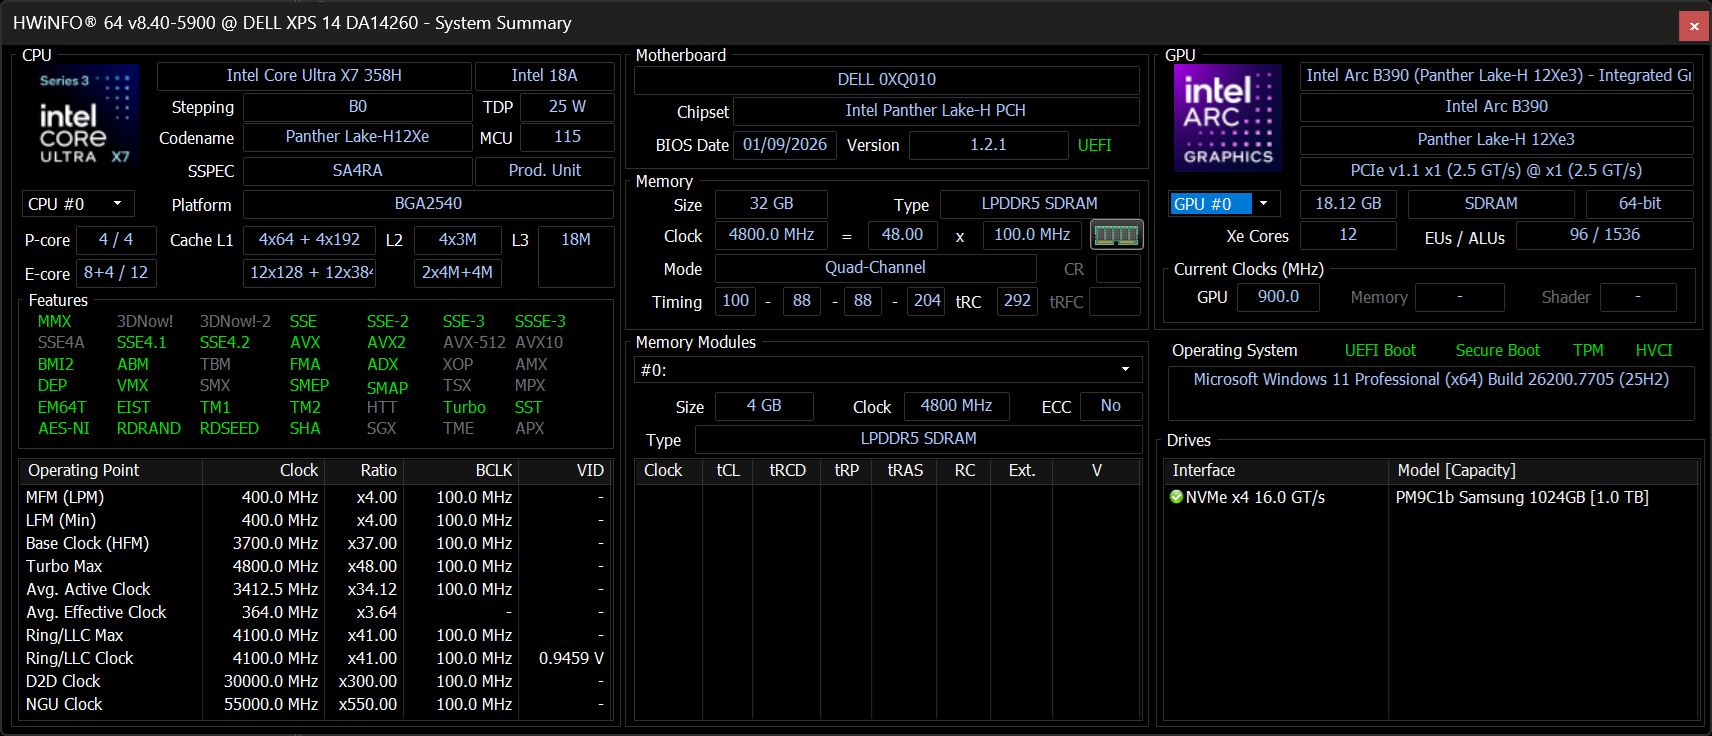
Bei unserem Testgerät handelt es sich um eine mittlere Konfiguration mit der Core Ultra X7 358H CPU und einem 2,8K OLED-Touchscreen für ca. $2.200 USD. Schwächere SKUs werden mit dem Core Ultra 5 325 und einem 2K-Display ohne Touchscreen geliefert, während die stärkste SKU den Core Ultra X9 388H enthält.
Zu den Alternativen zum XPS 14 gehören andere ultradünne Subnotebooks für Prosumer wie das Asus ExpertBook Ultra, das HP EliteBook X G1i 14 AI oder das Lenovo Yoga Pro 7 14IAH10.
Weitere Dell-Testberichte:
Spezifikationen
Gehäuse - Eine richtige Entwicklung
Das neu gestaltete Gehäuse wurde in unserem ursprünglichen Vorschauvideo ausführlich vorgestellt (siehe unten). Die auffälligste Änderung betrifft die Vorder- und Seitenkanten, die nun flacher sind und sich nicht mehr verjüngen. Die vordere Kante ist daher genauso dick wie die hintere Kante, ähnlich wie beim MacBook Pro oder beim Razer Blade Designs.
Außerdem wurden auch die Plätze der Logos getauscht. Während sich das "Dell"- und das "XPS"-Logo beim Modell 2025 auf der oberen bzw. unteren Abdeckung befanden, befindet sich das "Dell"-Logo jetzt auf der Unterseite und das "XPS"-Logo auf der Oberseite.
Das Modell 2026 ist gleichzeitig dünner und leichter als das Vorgängermodell und fühlt sich dennoch steifer an, insbesondere an der Vorderkante. Ein großer Teil dieses Unterschieds ist jedoch auf den Wechsel von einem größeren 14,5-Zoll-Bildschirm auf nur 14-Zoll zurückzuführen. Dennoch ist es um 200 bis 300 Gramm schwerer als Konkurrenten wie das HP EliteBook X G1i 14 oder ExpertBook Ultra.


Ausstattung
Der dreifache USB-C Thunderbolt 4 Ports aus dem letztjährigen Design sind wieder da. Leider haben die Nutzer von SD-Karten das Nachsehen, da das Lesegerät weggefallen ist.


Kommunikation

Webcam
Trotz des massiven Upgrades von nur 2 MP auf 8 MP beim Dell 14 Premium gibt es immer noch keine physische Kameraabdeckung.


Wartung
Die Wartungsarbeiten sind etwas schwieriger als beim vorherigen Design. Nachdem Sie die vier unteren T5-Schrauben entfernt haben, müssen Sie das Tastaturdeck vorsichtig mit einer scharfen Kante vom Sockel trennen, um die Komponenten der Hauptplatine freizulegen.
Die offizielle Wartungsanleitung finden Sie hier.

Nachhaltigkeit
Das System besteht zu 75 Prozent aus recyceltem Aluminium (Gehäuse), zu 50 Prozent aus recyceltem Kobalt (Akku), zu 90 Prozent aus recyceltem Stahl (Tasten), zu 10 Prozent aus recyceltem Glas (OLED-Touchscreen) und zu 100 Prozent aus recyceltem Kupfer (Teile der Leiterplatte).
Die Verpackung selbst ist vollständig recycelbar und enthält keine Kunststoffe.
Zubehör und Garantie
In der Verpackung befinden sich außer dem Netzadapter und den Unterlagen keine weiteren Extras. Für das Dell gilt die übliche Herstellergarantie mit diversen (kostenpflichtigen) Erweiterungsoptionen, wenn Sie direkt bei Dell kaufen.
Eingabegeräte - Schluss mit den Touchtasten!
Tastatur
Das neue XPS 14 behebt einige Probleme mit der älteren Tastatur und dem Clickpad-Design. Am offensichtlichsten ist der Wegfall der oberen Reihe "Touch-Tasten" zugunsten traditionellerer Tasten wie beim Dell Pro 13 Premium. Der Tastenhub und das Feedback sind ansonsten ähnlich wie beim letztjährigen Zero-Lattice-Layout, das wir als flacher und weicher empfinden als die Tasten des Lenovo ThinkPad T14 oder der HP EliteBook 14 Serie.
Touchpad
Das nahtlose Clickpad des letztjährigen Modells war zwar recht groß, aber es fehlte eine visuelle Begrenzung, so dass es schwierig war, zu erkennen, wo die berührungsempfindliche Oberfläche beginnt oder endet. Das neue XPS 14 bekommt Umrisslinien entlang der Seiten des Clickpads (~15,2 x 7,5 cm) hinzu, um die Benutzerfreundlichkeit zu verbessern, ohne optisch aufdringlich zu sein. Das haptische Feedback hätte stärker und klickfreudiger sein können, aber zumindest ist es nicht übermäßig empfindlich, wie das haptischen Clickpad des ExpertBook Ultra.


Display

Es stehen zwei Anzeigeoptionen zur Verfügung:
- 1920 x 1200, Non-Touch, matt, 500 nits, 100% sRGB, IPS, 1 - 120 Hz
- 2880 x 1800, Touchscreen, glänzend, 500 nits, 100% DCI-P3, OLED, 20 - 120 Hz
Das XPS 14 verwendet ein eher traditionelles Gorilla Glass 3 glänzendes OLED-Display im Gegensatz zum matten Gorilla Glass Victus Tandem OLED-Display des ExpertBook Ultra. Der OLED-Bildschirm hier ist definitiv nicht so körnig wie beim Asus, aber die maximale HDR-Helligkeit ist bestenfalls halb so schwach, was eine schwächere HDR-Unterstützung bedeutet.
Dell hat den OLED-Lieferanten gewechselt - LG Philips statt Samsung. Abgesehen vom Größenunterschied (14 Zoll vs. 14,5 Zoll) sind die Kerneigenschaften der beiden Panels sehr ähnlich.


| |||||||||||||||||||||||||
Ausleuchtung: 96 %
Helligkeit Akku: 393.8 cd/m²
Kontrast: ∞:1 (Schwarzwert: 0 cd/m²)
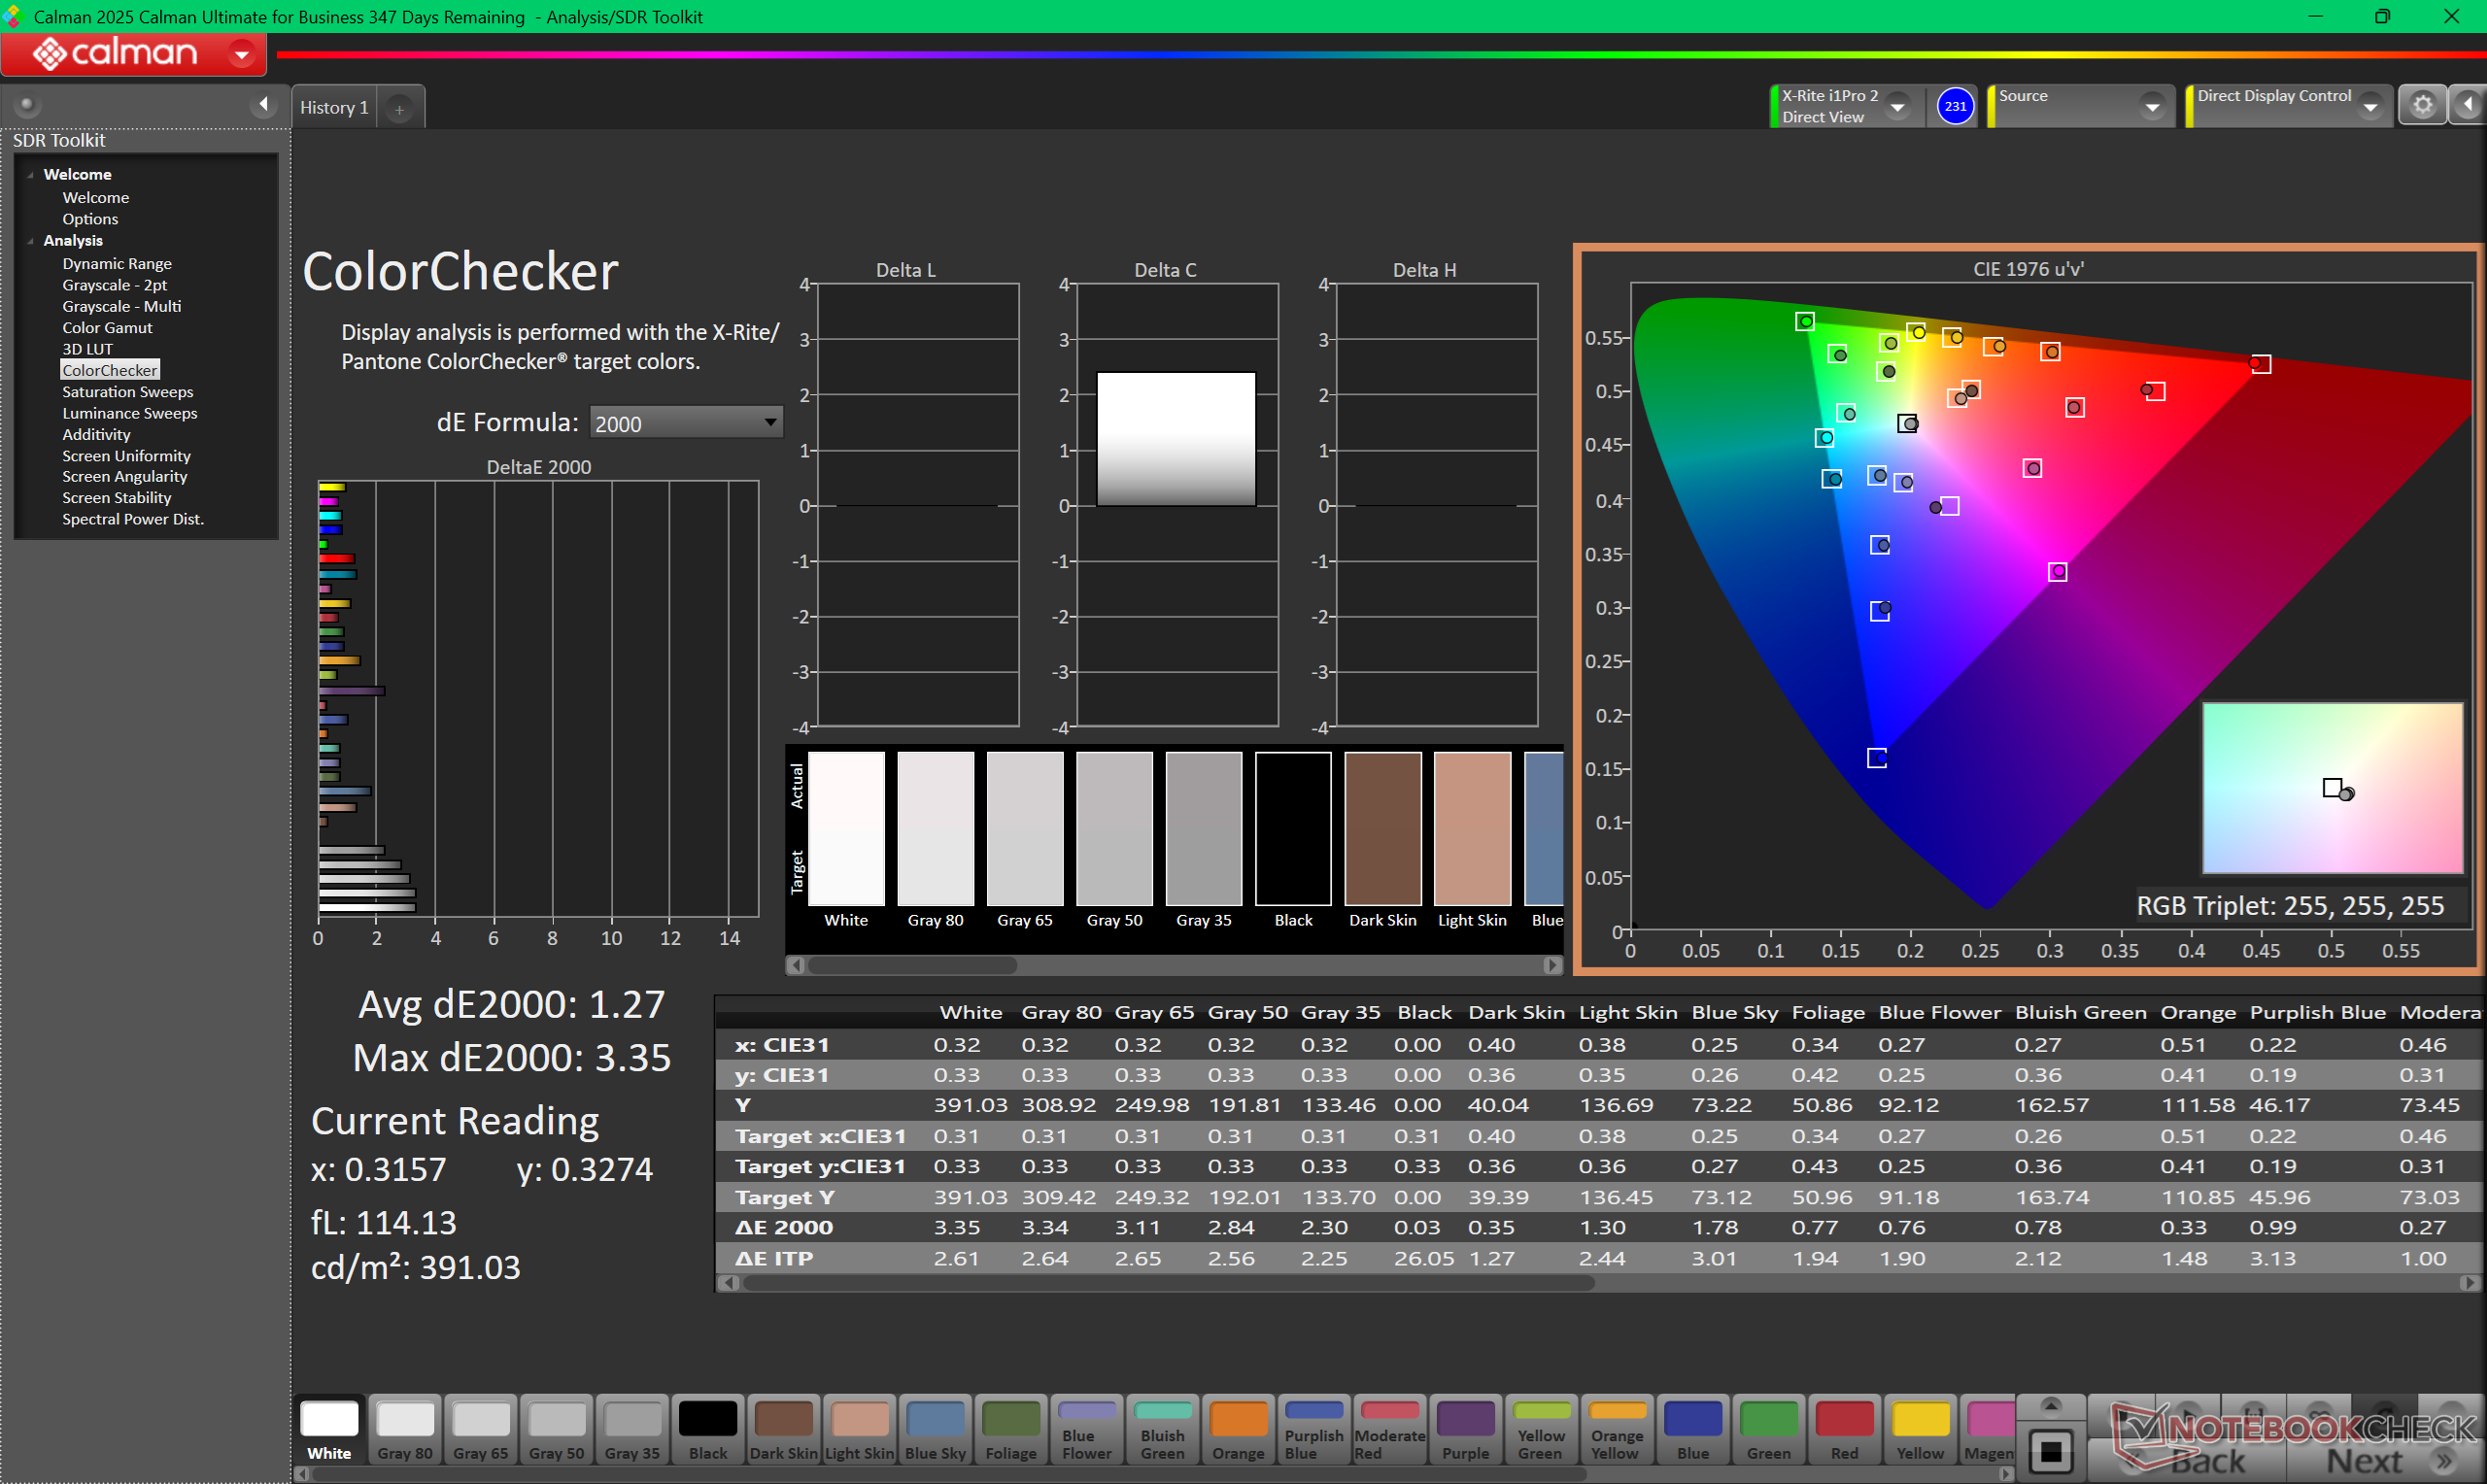
ΔE ColorChecker Calman: 1.27 | ∀{0.5-29.43 Ø4.72}
calibrated: 0.71
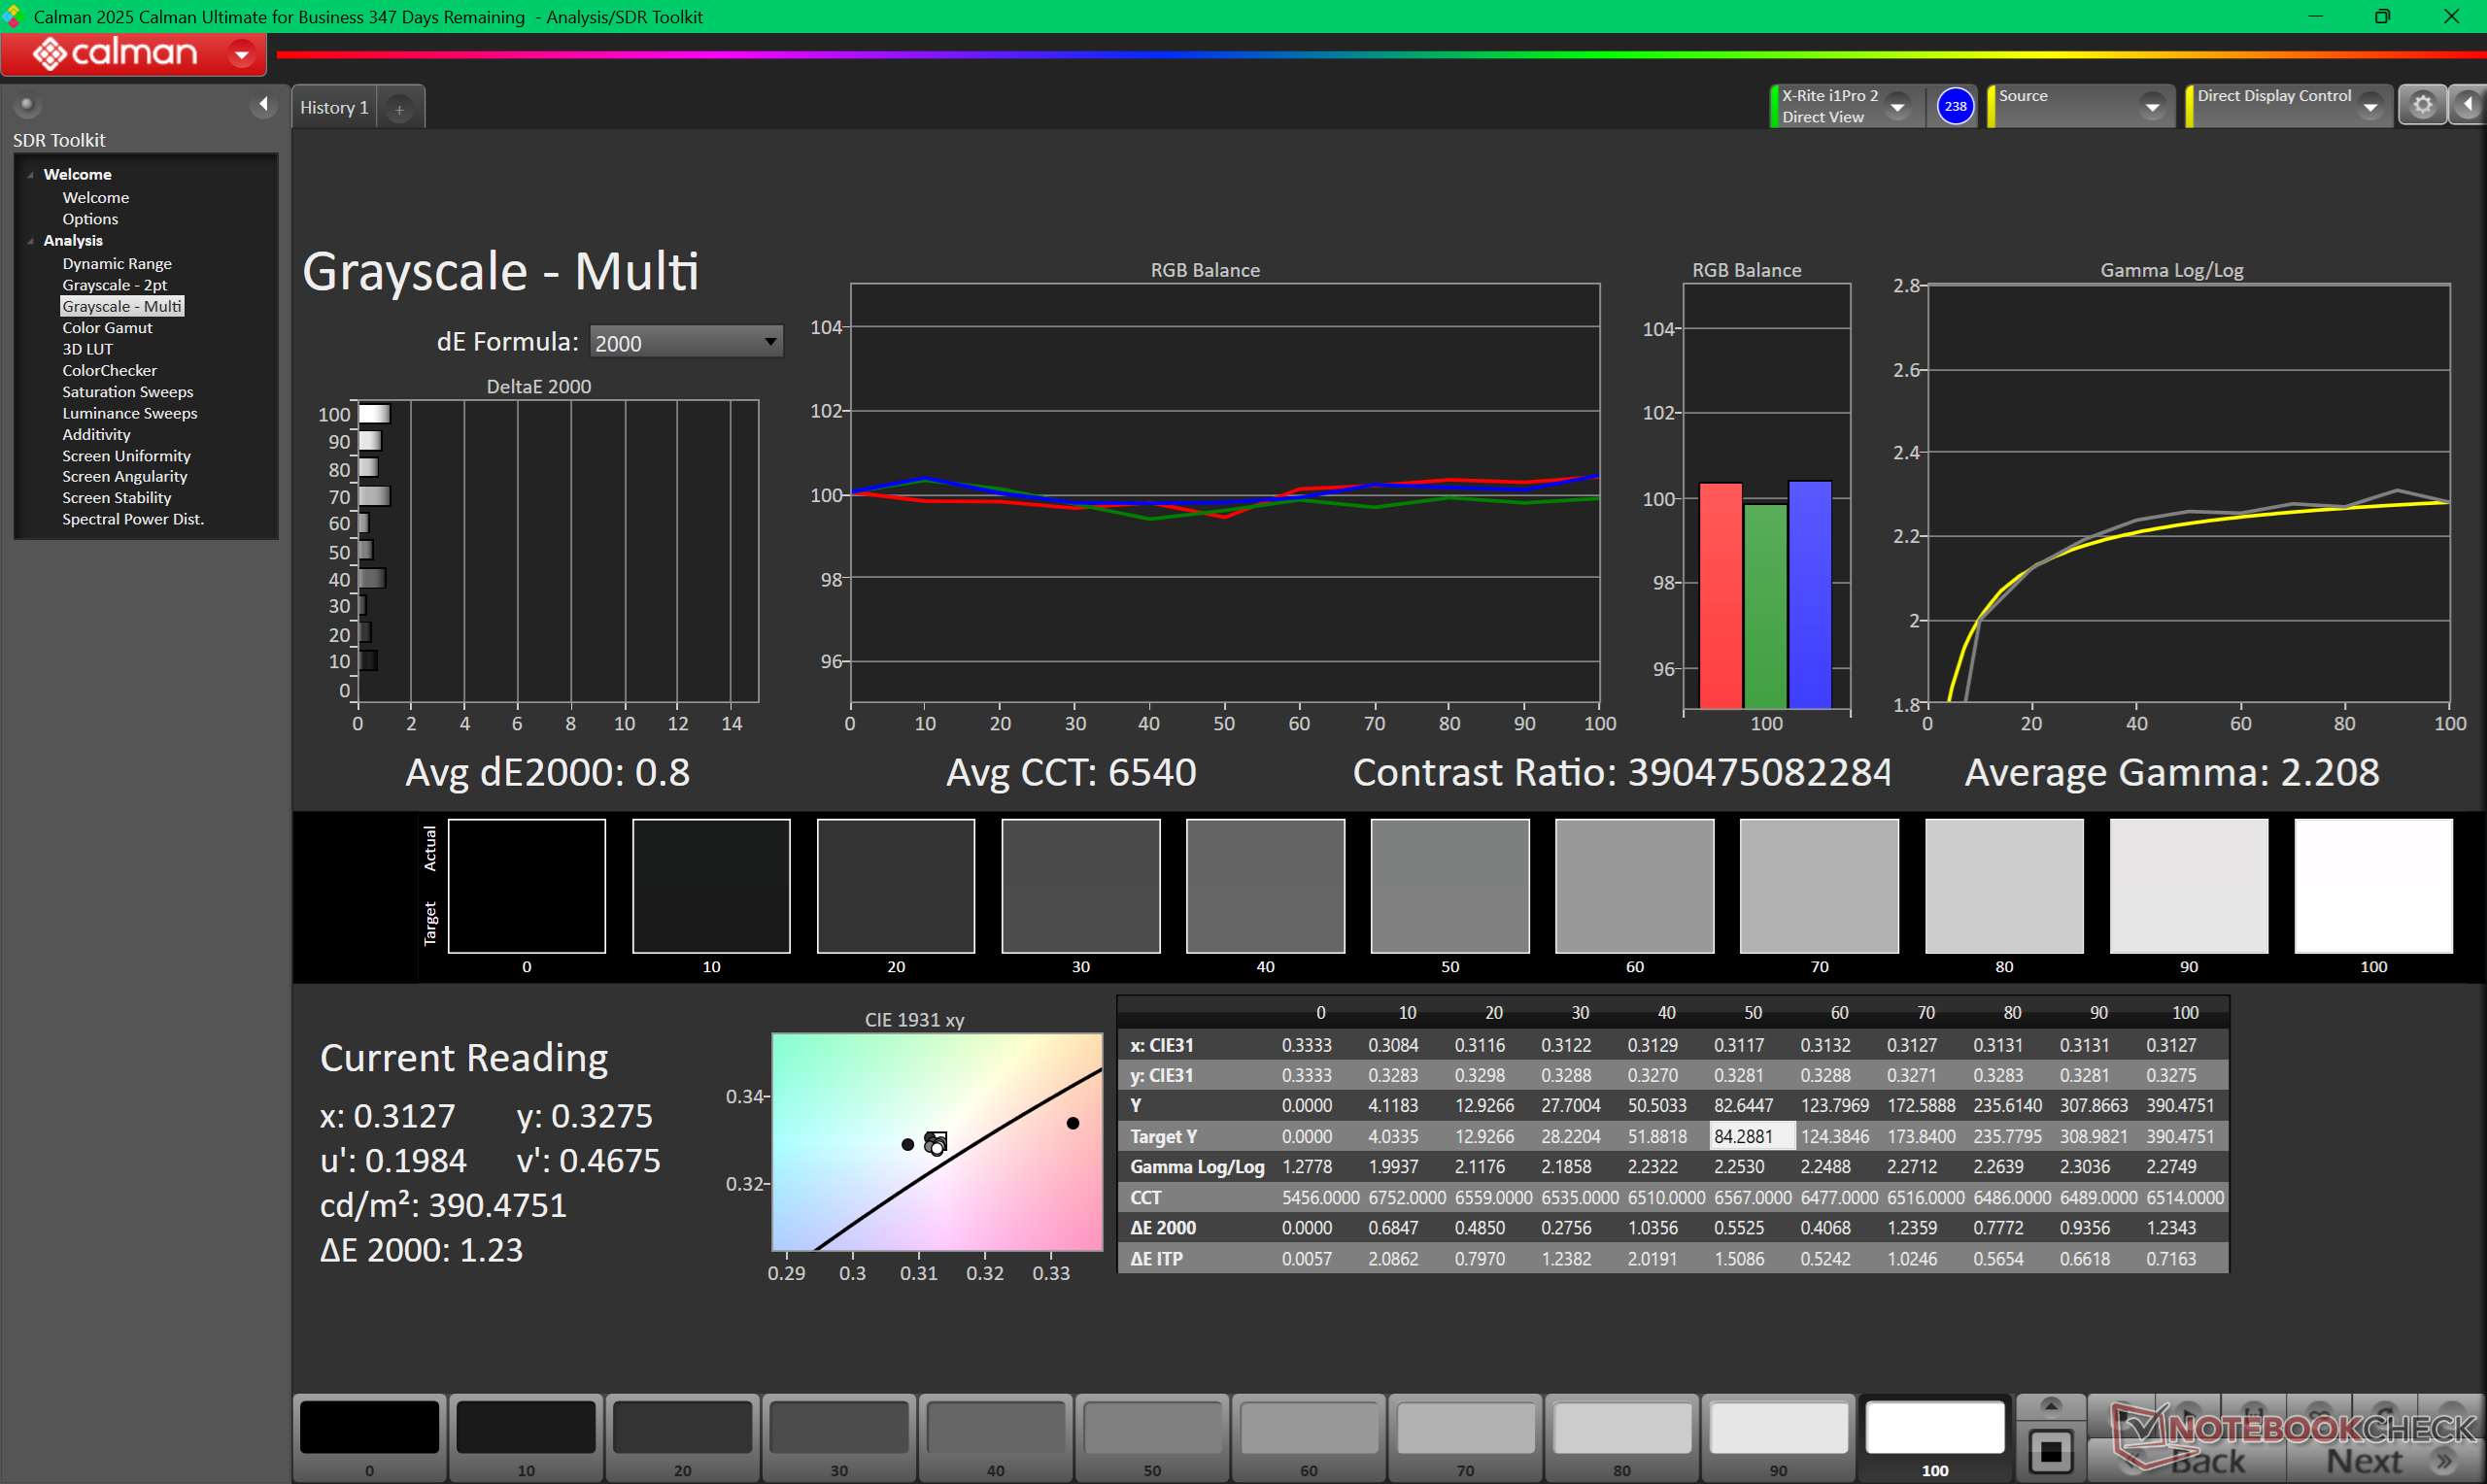
ΔE Greyscale Calman: 2 | ∀{0.09-98 Ø4.97}
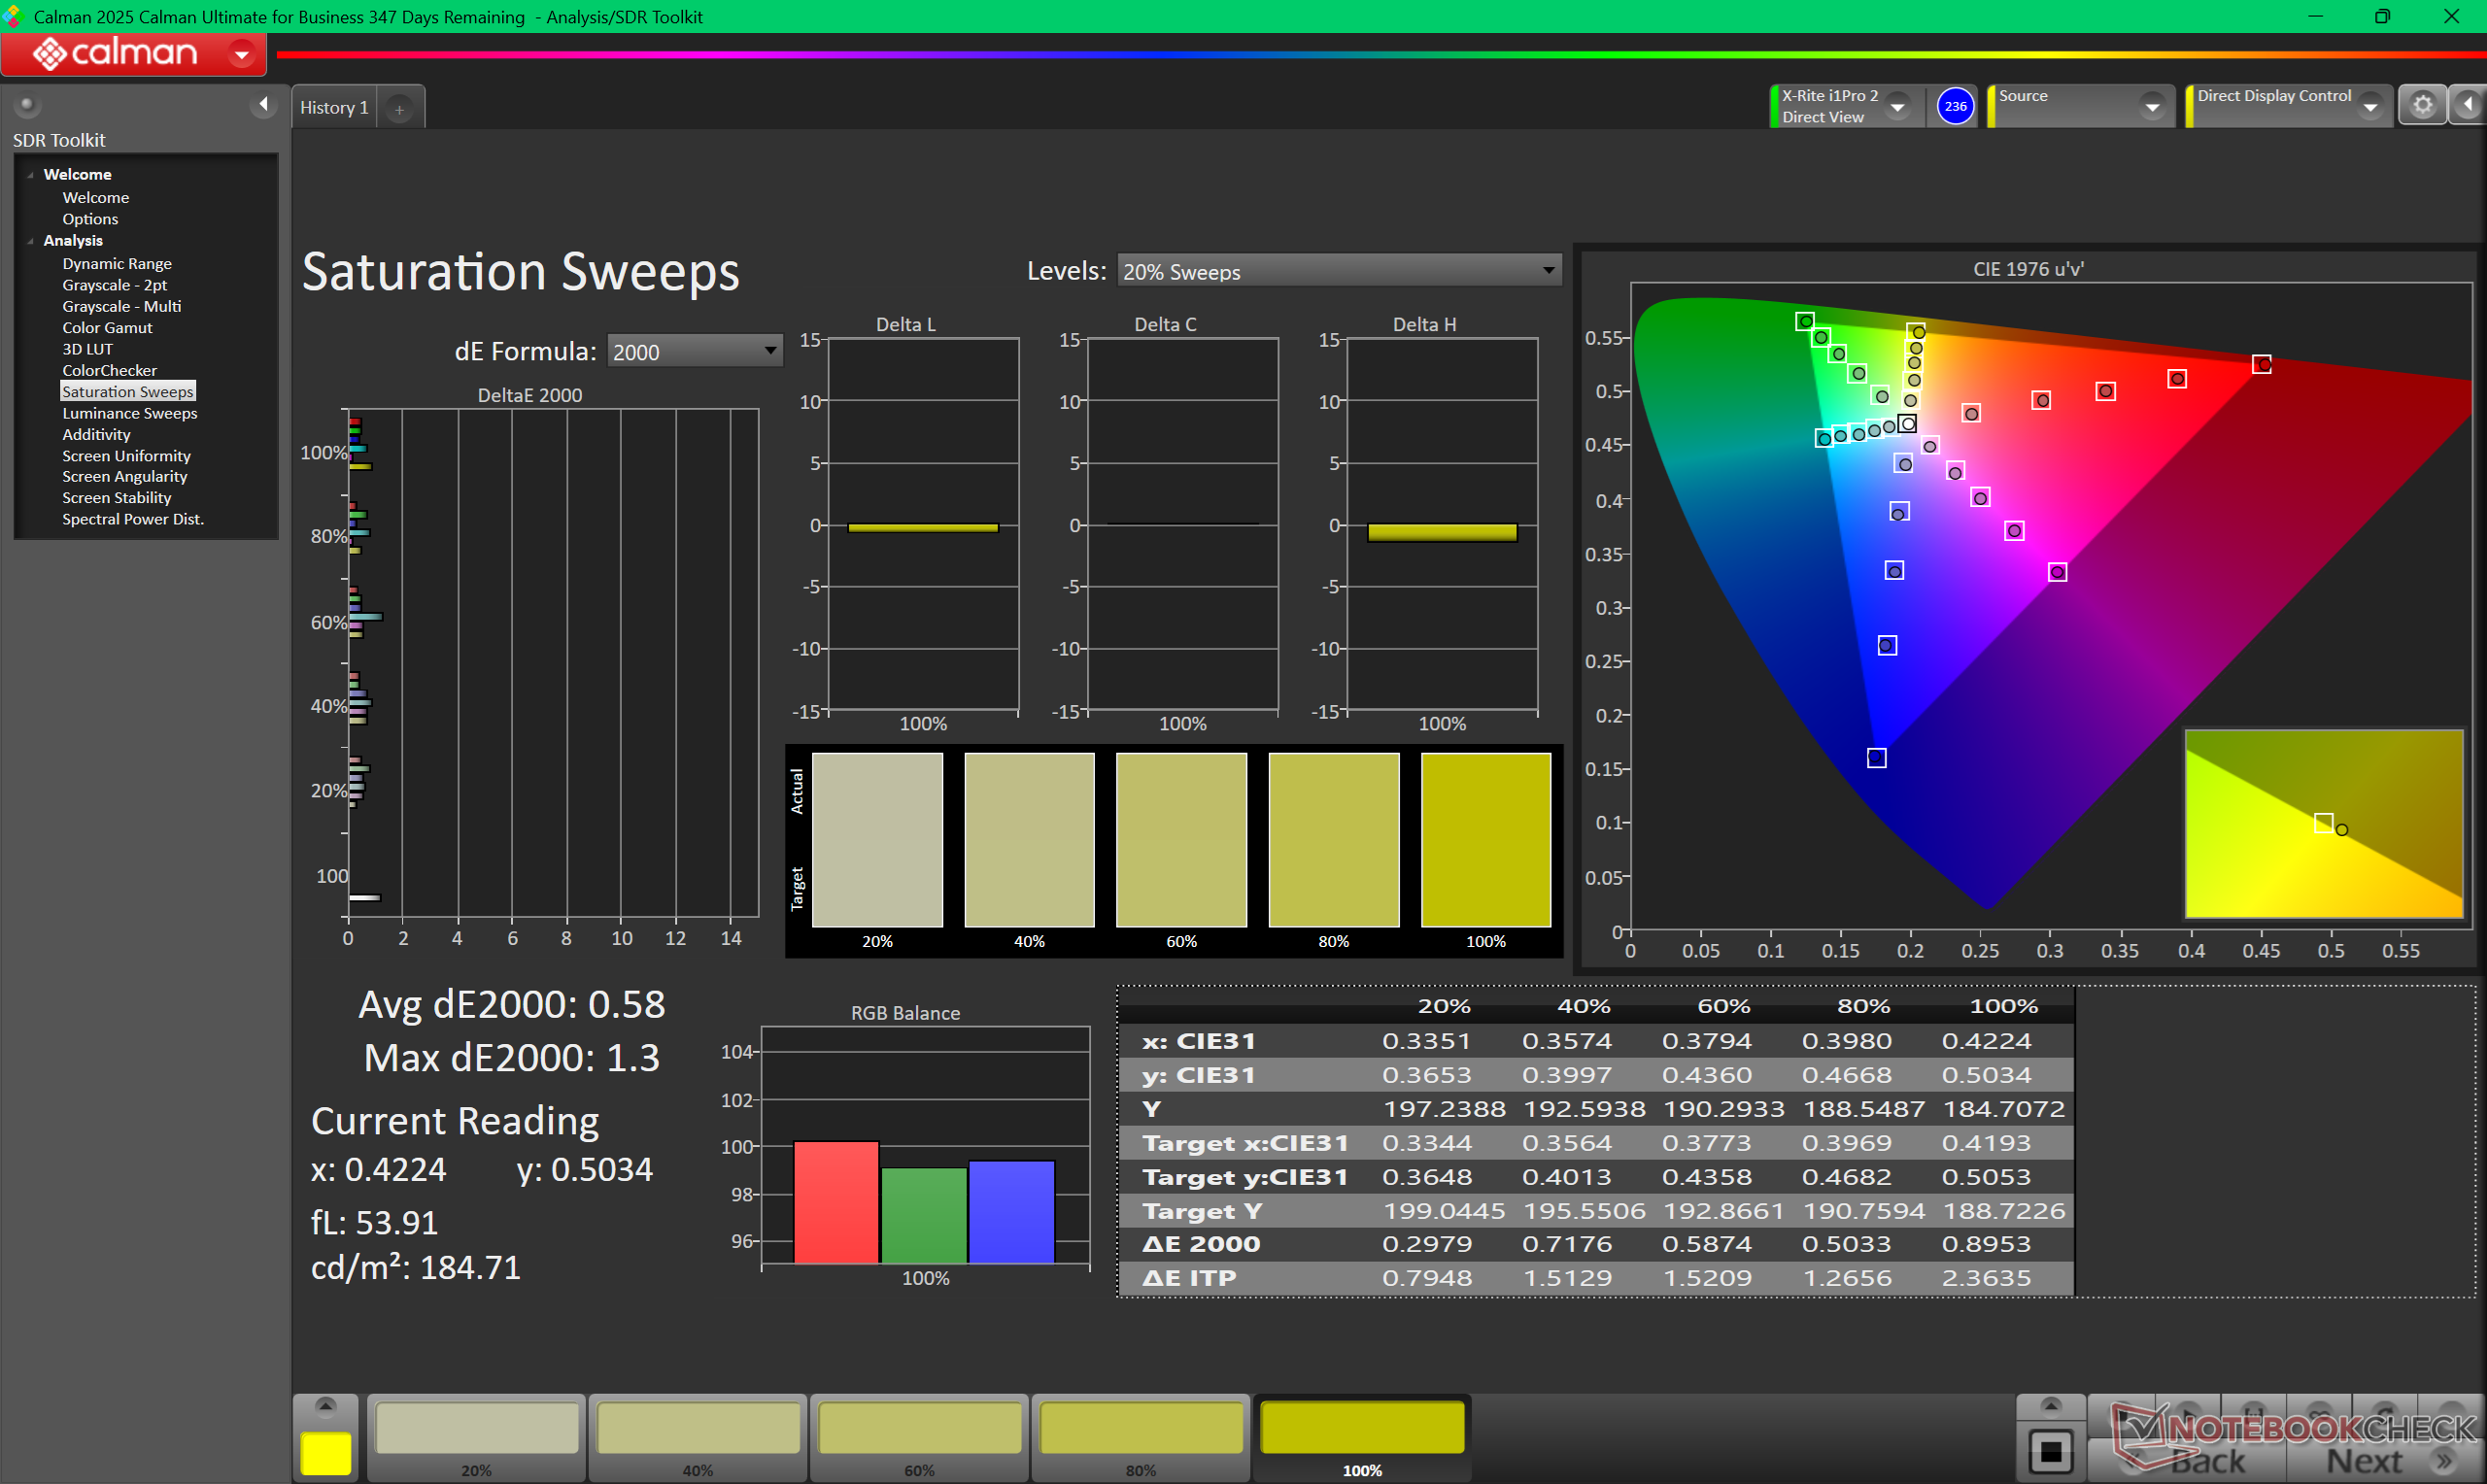
98.2% AdobeRGB 1998 (Argyll 3D)
100% sRGB (Argyll 3D)
99.7% Display P3 (Argyll 3D)
Gamma: 2.19
CCT: 6379 K
| Dell XPS 14 Core Ultra X7 358H LG Philips 140WT2, OLED, 2880x1800, 14", 120 Hz | Dell 14 Premium Samsung 145FB02, OLED, 3200x2000, 14.5", 120 Hz | Dell XPS 14 2024 OLED SDC41A2, OLED, 3200x2000, 14.5", 120 Hz | Asus ExpertBook Ultra B9406CAA Samsung ATNA40LE01-0, OLED, 2880x1800, 14", 120 Hz | Lenovo Yoga Pro 7 14IAH10 LEN145WQ+, OLED, 3000x1876, 14.5", 120 Hz | HP EliteBook X G1i 14 AI IPS, 1920x1200, 14", 60 Hz | |
|---|---|---|---|---|---|---|
| Display | -4% | -4% | -5% | -1% | -20% | |
| HDR Peak Brightness (cd/m²) | 1104 | |||||
| Display P3 Coverage (%) | 99.7 | 99.3 0% | 98.5 -1% | 96.2 -4% | 99.5 0% | 69.9 -30% |
| sRGB Coverage (%) | 100 | 100 0% | 100 0% | 100 0% | 99.4 -1% | 98.4 -2% |
| AdobeRGB 1998 Coverage (%) | 98.2 | 87.2 -11% | 87.2 -11% | 86.7 -12% | 95.5 -3% | 71.6 -27% |
| Response Times | 11% | 16% | 15% | 37% | -4079% | |
| Response Time Grey 50% / Grey 80% * (ms) | 0.75 ? | 0.72 ? 4% | 0.7 ? 7% | 0.71 ? 5% | 0.63 ? 16% | 42.3 ? -5540% |
| Response Time Black / White * (ms) | 1.03 ? | 0.96 ? 7% | 0.77 ? 25% | 0.94 ? 9% | 0.54 ? 48% | 28 ? -2618% |
| PWM Frequency (Hz) | 240.62 ? | 475 | 480 | 968.8 ? | 120 ? | |
| PWM Amplitude * (%) | 29 | 23 21% | 20 31% | 15 48% | ||
| Bildschirm | -61% | -12% | 23% | 33% | -33% | |
| Helligkeit Bildmitte (cd/m²) | 393.8 | 349.3 -11% | 351 -11% | 600.5 52% | 497 26% | 487.5 24% |
| Brightness (cd/m²) | 389 | 352 -10% | 353 -9% | 612 57% | 500 29% | 469 21% |
| Brightness Distribution (%) | 96 | 98 2% | 97 1% | 96 0% | 96 0% | 91 -5% |
| Schwarzwert * (cd/m²) | 0.26 | |||||
| Delta E Colorchecker * | 1.27 | 3.47 -173% | 1.7 -34% | 1.18 7% | 0.7 45% | 2.37 -87% |
| Colorchecker dE 2000 max. * | 3.35 | 7.38 -120% | 2.2 34% | 3.4 -1% | 1.7 49% | 5.77 -72% |
| Colorchecker dE 2000 calibrated * | 0.71 | 1.3 -83% | 0.8 -13% | 0.73 -3% | 0.86 -21% | |
| Delta E Graustufen * | 2 | 2.6 -30% | 3.1 -55% | 1 50% | 1 50% | 3.8 -90% |
| Gamma | 2.19 100% | 2.22 99% | 2.12 104% | 2.27 97% | 2.22 99% | 2.14 103% |
| CCT | 6379 102% | 6758 96% | 6616 98% | 6567 99% | 6404 101% | 6540 99% |
| Kontrast (:1) | 1875 | |||||
| Durchschnitt gesamt (Programm / Settings) | -18% /
-31% | 0% /
-6% | 11% /
15% | 23% /
26% | -1377% /
-704% |
* ... kleinere Werte sind besser


Das Display wird mit durchschnittlichen Graustufen- und Farb-DeltaE-Werten von 2 oder weniger gut kalibriert ausgeliefert. Eine weitere Kalibrierung des Bildschirms mit unserem Kolorimeter würde die Farben nur geringfügig verbessern.


Reaktionszeiten (Response Times) des Displays
| ↔ Reaktionszeiten Schwarz zu Weiß | ||
|---|---|---|
| 1.03 ms ... steigend ↗ und fallend ↘ kombiniert | ↗ 0.53 ms steigend | 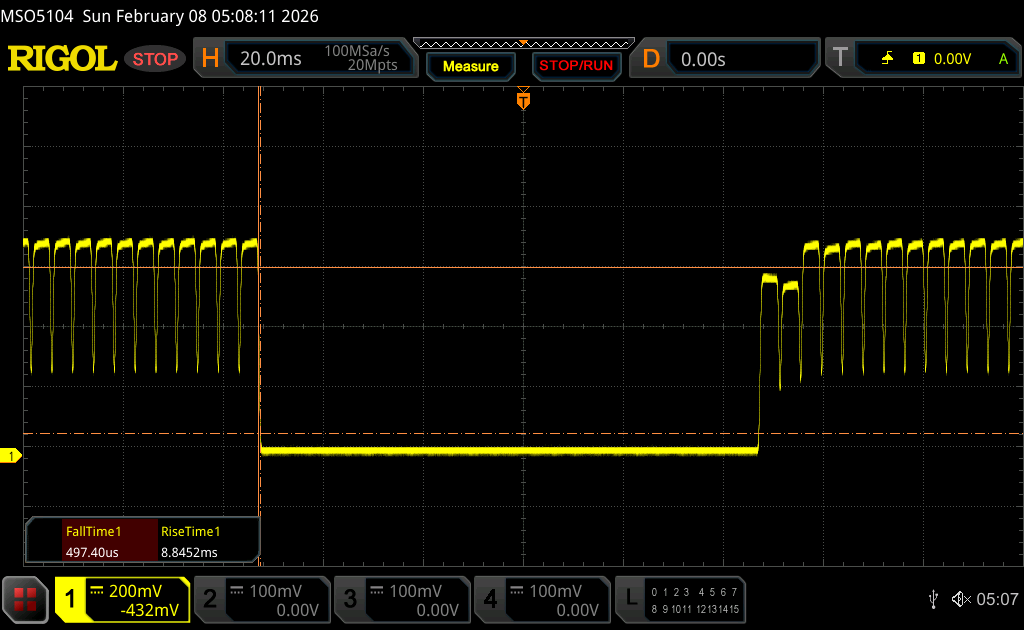 |
| ↘ 0.5 ms fallend | ||
| Die gemessenen Reaktionszeiten sind sehr kurz, wodurch sich der Bildschirm auch für schnelle 3D Spiele eignen sollte. Im Vergleich rangierten die bei uns getesteten Geräte von 0.1 (Minimum) zu 240 (Maximum) ms. » 4 % aller Screens waren schneller als der getestete. Daher sind die gemessenen Reaktionszeiten besser als der Durchschnitt aller vermessenen Geräte (19.8 ms). | ||
| ↔ Reaktionszeiten 50% Grau zu 80% Grau | ||
| 0.75 ms ... steigend ↗ und fallend ↘ kombiniert | ↗ 0.43 ms steigend |  |
| ↘ 0.32 ms fallend | ||
| Die gemessenen Reaktionszeiten sind sehr kurz, wodurch sich der Bildschirm auch für schnelle 3D Spiele eignen sollte. Im Vergleich rangierten die bei uns getesteten Geräte von 0.165 (Minimum) zu 636 (Maximum) ms. » 2 % aller Screens waren schneller als der getestete. Daher sind die gemessenen Reaktionszeiten besser als der Durchschnitt aller vermessenen Geräte (31 ms). | ||
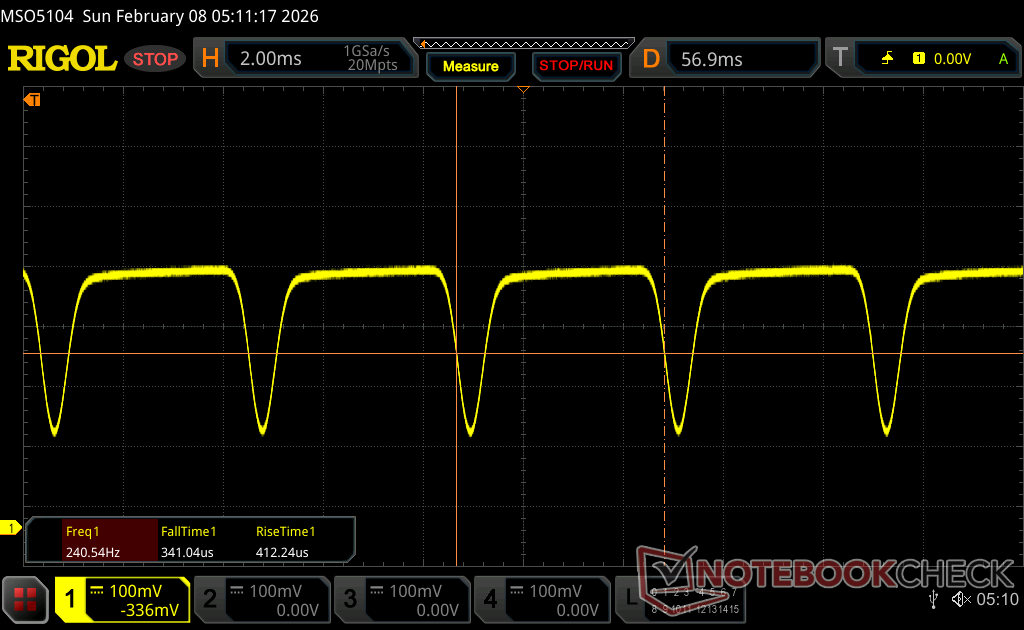
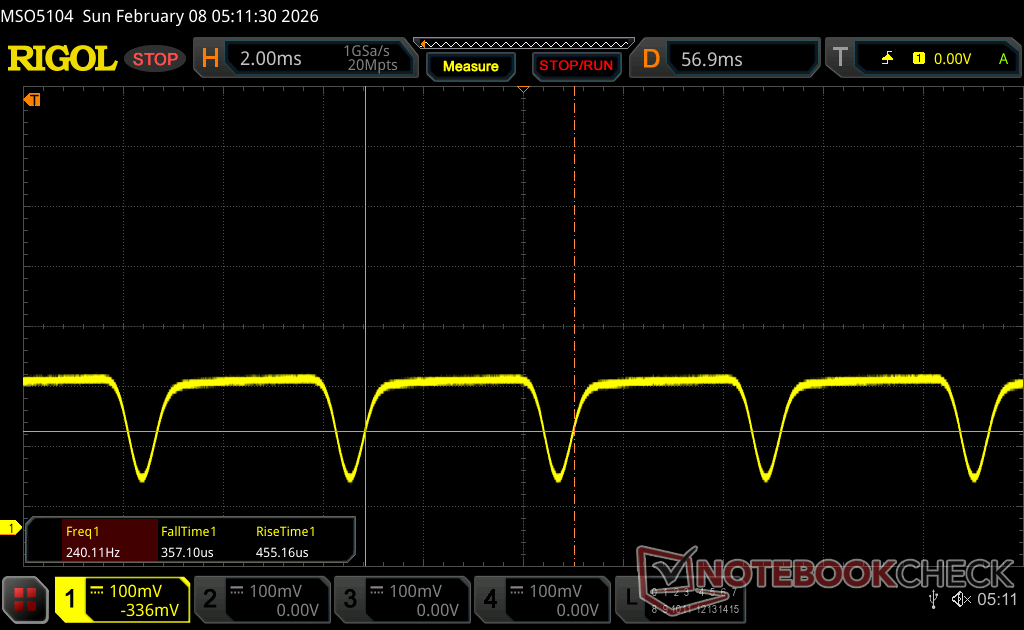
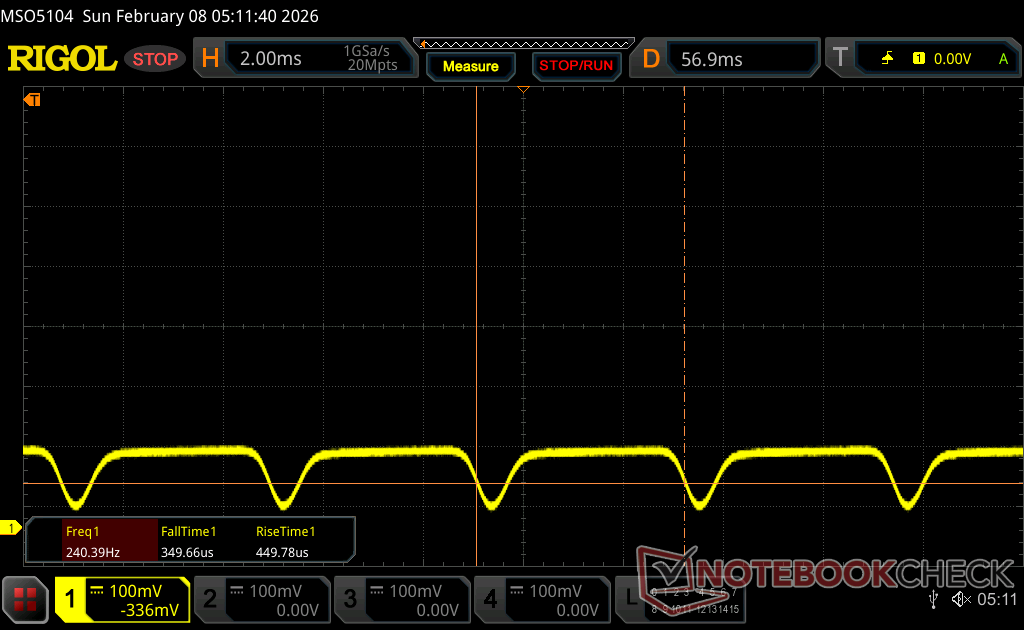
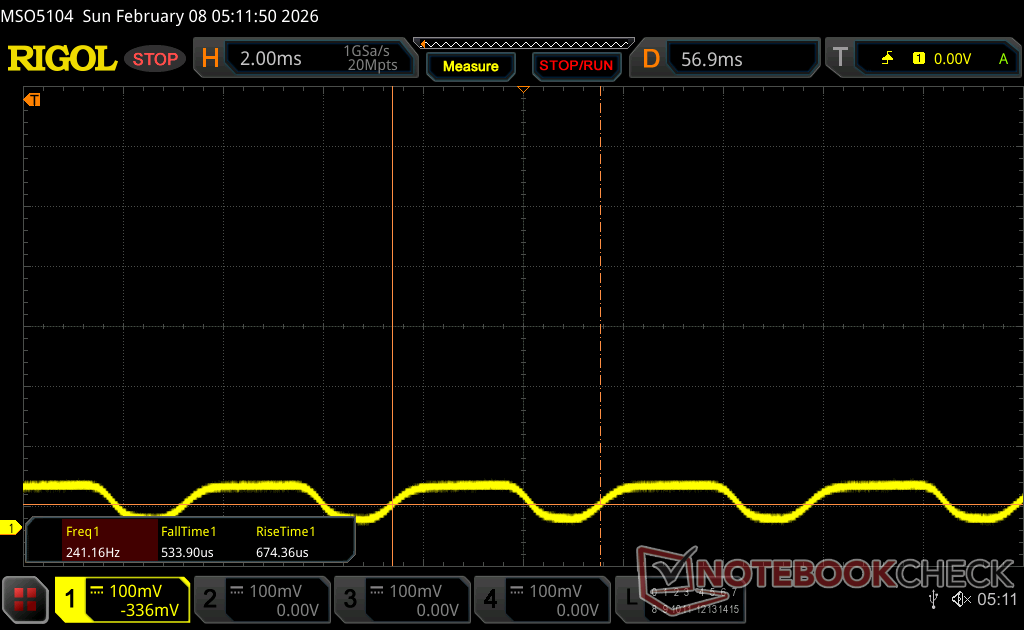
Bildschirm-Flackern / PWM (Pulse-Width Modulation)
| Flackern / PWM festgestellt | 240.62 Hz Amplitude: 29 % | ≤ 100 % Helligkeit | 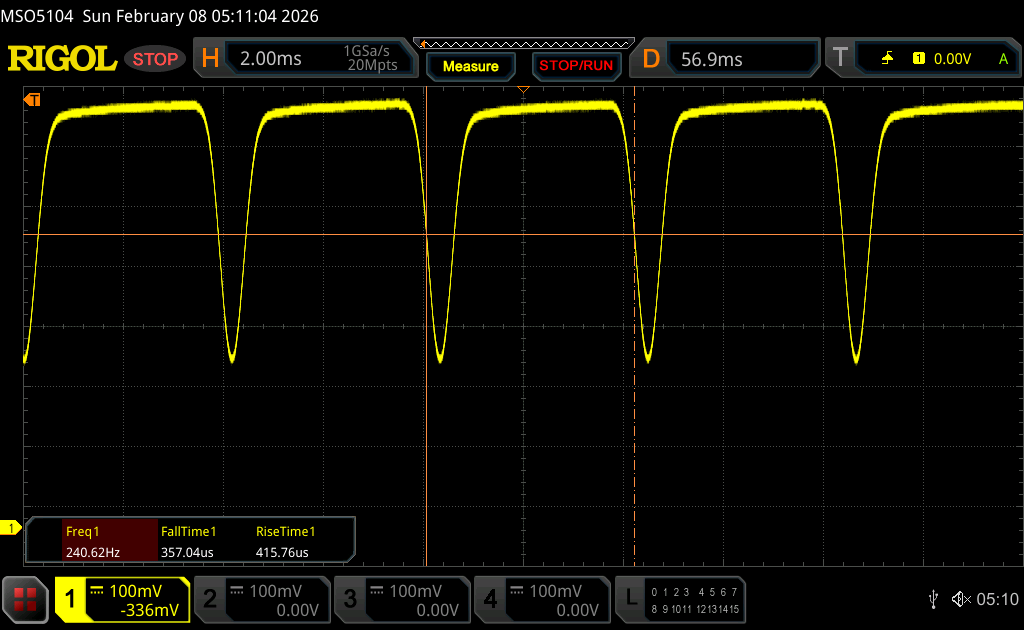 |
Das Display flackert mit 240.62 Hz (im schlimmsten Fall, eventuell durch Pulsweitenmodulation PWM) bei einer eingestellten Helligkeit von 100 % und darunter. Darüber sollte es zu keinem Flackern kommen. Die Frequenz von 240.62 Hz ist relativ gering und daher sollte es bei sensiblen Personen zu Problemen wie Flackern oder Augenbeschwerden führen. Im Vergleich: 52 % aller getesteten Geräte nutzten kein PWM um die Helligkeit zu reduzieren. Wenn PWM eingesetzt wurde, dann bei einer Frequenz von durchschnittlich 7778 (Minimum 5, Maximum 343500) Hz. | |||
Die Sichtbarkeit im Freien ist anständig, wenn sie im Schatten liegt, aber ansonsten zu schwach und reflektierend, wenn es heller ist.


Leistung - Panther Lake Boost

Testbedingungen
Wir haben Windows und Dell Optimizer im Modus "Performance2 eingestellt, bevor wir die folgenden Benchmarks durchgeführt haben.
Prozessor
Die reine CPU-Leistung liegt im Durchschnitt innerhalb von 5 Prozent des Core Ultra 7 255H im Dell 14 Premium des letzten Jahres, sodass in dieser Hinsicht keine signifikanten Verbesserungen erwarten sollten. Darüber hinaus würde die Multi-Thread-Leistung bei der Ausführung von CineBench R15 xT in einer Schleife um bis zu 25 Prozent gedrosselt werden, wie die Vergleichsgrafik unten zeigt. Das Asus ExpertBook Ultra, das mit derselben Core Ultra X7 358H-CPU wie unser Dell-Gerät ausgestattet ist, würde deutlich weniger gedrosselt werden und somit eine schnellere Leistung bieten.
Ein Upgrade auf die High-End-SKU Core Ultra X9 388H würde die Leistung nach unseren Erfahrungen mit dem Asus ZenBook Duo voraussichtlich nur um 5 bis 10 Prozent verbessern.
Cinebench R15 Mehrfachschleife
Cinebench R23: Multi Core | Single Core
Cinebench R20: CPU (Multi Core) | CPU (Single Core)
Cinebench R15: CPU Multi 64Bit | CPU Single 64Bit
Blender: v2.79 BMW27 CPU
7-Zip 18.03: 7z b 4 | 7z b 4 -mmt1
Geekbench 6.7: Multi-Core | Single-Core
Geekbench 5.5: Multi-Core | Single-Core
HWBOT x265 Benchmark v2.2: 4k Preset
LibreOffice : 20 Documents To PDF
R Benchmark 2.5: Overall mean
* ... kleinere Werte sind besser
AIDA64: FP32 Ray-Trace | FPU Julia | CPU SHA3 | CPU Queen | FPU SinJulia | FPU Mandel | CPU AES | CPU ZLib | FP64 Ray-Trace | CPU PhotoWorxx
| Performance Rating | |
| Lenovo Yoga Pro 7 14IAH10 | |
| Dell XPS 14 Core Ultra X7 358H | |
| Durchschnittliche Intel Core Ultra X7 358H | |
| Dell XPS 14 2024 OLED | |
| HP EliteBook X G1i 14 AI | |
| Asus ExpertBook Ultra B9406CAA | |
| AIDA64 / FP32 Ray-Trace | |
| Lenovo Yoga Pro 7 14IAH10 | |
| Durchschnittliche Intel Core Ultra X7 358H (12221 - 17932, n=8) | |
| Dell XPS 14 Core Ultra X7 358H | |
| HP EliteBook X G1i 14 AI | |
| Asus ExpertBook Ultra B9406CAA | |
| Dell XPS 14 2024 OLED | |
| AIDA64 / FPU Julia | |
| Lenovo Yoga Pro 7 14IAH10 | |
| Durchschnittliche Intel Core Ultra X7 358H (29930 - 95525, n=8) | |
| Dell XPS 14 Core Ultra X7 358H | |
| Dell XPS 14 2024 OLED | |
| HP EliteBook X G1i 14 AI | |
| Asus ExpertBook Ultra B9406CAA | |
| AIDA64 / CPU SHA3 | |
| Lenovo Yoga Pro 7 14IAH10 | |
| Asus ExpertBook Ultra B9406CAA | |
| Durchschnittliche Intel Core Ultra X7 358H (3910 - 4911, n=8) | |
| Dell XPS 14 Core Ultra X7 358H | |
| Dell XPS 14 2024 OLED | |
| HP EliteBook X G1i 14 AI | |
| AIDA64 / CPU Queen | |
| Dell XPS 14 2024 OLED | |
| Lenovo Yoga Pro 7 14IAH10 | |
| Dell XPS 14 Core Ultra X7 358H | |
| Durchschnittliche Intel Core Ultra X7 358H (63425 - 63827, n=2) | |
| Asus ExpertBook Ultra B9406CAA | |
| HP EliteBook X G1i 14 AI | |
| AIDA64 / FPU SinJulia | |
| Lenovo Yoga Pro 7 14IAH10 | |
| Dell XPS 14 2024 OLED | |
| Dell XPS 14 Core Ultra X7 358H | |
| Durchschnittliche Intel Core Ultra X7 358H (4735 - 7038, n=8) | |
| Asus ExpertBook Ultra B9406CAA | |
| HP EliteBook X G1i 14 AI | |
| AIDA64 / FPU Mandel | |
| Lenovo Yoga Pro 7 14IAH10 | |
| Durchschnittliche Intel Core Ultra X7 358H (14716 - 50734, n=8) | |
| Dell XPS 14 Core Ultra X7 358H | |
| HP EliteBook X G1i 14 AI | |
| Dell XPS 14 2024 OLED | |
| Asus ExpertBook Ultra B9406CAA | |
| AIDA64 / CPU AES | |
| Lenovo Yoga Pro 7 14IAH10 | |
| Dell XPS 14 Core Ultra X7 358H | |
| Dell XPS 14 2024 OLED | |
| Durchschnittliche Intel Core Ultra X7 358H (5127 - 67510, n=8) | |
| HP EliteBook X G1i 14 AI | |
| Asus ExpertBook Ultra B9406CAA | |
| AIDA64 / CPU ZLib | |
| Lenovo Yoga Pro 7 14IAH10 | |
| Asus ExpertBook Ultra B9406CAA | |
| Dell XPS 14 Core Ultra X7 358H | |
| Durchschnittliche Intel Core Ultra X7 358H (932 - 1179, n=8) | |
| Dell XPS 14 2024 OLED | |
| HP EliteBook X G1i 14 AI | |
| AIDA64 / FP64 Ray-Trace | |
| Lenovo Yoga Pro 7 14IAH10 | |
| Durchschnittliche Intel Core Ultra X7 358H (6506 - 9447, n=8) | |
| Dell XPS 14 Core Ultra X7 358H | |
| HP EliteBook X G1i 14 AI | |
| Asus ExpertBook Ultra B9406CAA | |
| Dell XPS 14 2024 OLED | |
| AIDA64 / CPU PhotoWorxx | |
| Dell XPS 14 Core Ultra X7 358H | |
| Durchschnittliche Intel Core Ultra X7 358H (30538 - 88154, n=8) | |
| Lenovo Yoga Pro 7 14IAH10 | |
| HP EliteBook X G1i 14 AI | |
| Dell XPS 14 2024 OLED | |
| Asus ExpertBook Ultra B9406CAA | |
System Performance
Die PCMark-Ergebnisse gehören zu den höchsten, die ein Subnotebook mit integrierter Grafik erzielt. Vor allem die Ergebnisse in den Untertests Produktivität und Erstellung digitaler Inhalte sind eine deutliche Verbesserung gegenüber den Modellen der vorherigen Generation.

PCMark 10: Score | Essentials | Productivity | Digital Content Creation
CrossMark: Overall | Productivity | Creativity | Responsiveness
WebXPRT 3: Overall
WebXPRT 4: Overall
Mozilla Kraken 1.1: Total
Geekbench AI: Single Precision GPU 1.7 | Half Precision GPU 1.7 | Quantized GPU 1.7
| Performance Rating | |
| Dell XPS 14 Core Ultra X7 358H | |
| Durchschnittliche Intel Core Ultra X7 358H, Intel Arc B390 12 Xe3 Panther Lake iGPU | |
| Asus ExpertBook Ultra B9406CAA | |
| Lenovo Yoga Pro 7 14IAH10 -3! | |
| HP EliteBook X G1i 14 AI | |
| Dell XPS 14 2024 OLED -3! | |
| Dell 14 Premium | |
| PCMark 10 / Score | |
| Dell XPS 14 Core Ultra X7 358H | |
| Durchschnittliche Intel Core Ultra X7 358H, Intel Arc B390 12 Xe3 Panther Lake iGPU (8834 - 9880, n=8) | |
| Asus ExpertBook Ultra B9406CAA | |
| Lenovo Yoga Pro 7 14IAH10 | |
| HP EliteBook X G1i 14 AI | |
| Dell 14 Premium | |
| Dell XPS 14 2024 OLED | |
| PCMark 10 / Essentials | |
| Dell XPS 14 Core Ultra X7 358H | |
| Durchschnittliche Intel Core Ultra X7 358H, Intel Arc B390 12 Xe3 Panther Lake iGPU (10282 - 11263, n=7) | |
| Lenovo Yoga Pro 7 14IAH10 | |
| Asus ExpertBook Ultra B9406CAA | |
| Dell 14 Premium | |
| HP EliteBook X G1i 14 AI | |
| Dell XPS 14 2024 OLED | |
| PCMark 10 / Productivity | |
| Dell XPS 14 Core Ultra X7 358H | |
| Durchschnittliche Intel Core Ultra X7 358H, Intel Arc B390 12 Xe3 Panther Lake iGPU (13908 - 16780, n=7) | |
| Asus ExpertBook Ultra B9406CAA | |
| HP EliteBook X G1i 14 AI | |
| Lenovo Yoga Pro 7 14IAH10 | |
| Dell XPS 14 2024 OLED | |
| Dell 14 Premium | |
| PCMark 10 / Digital Content Creation | |
| Dell XPS 14 Core Ultra X7 358H | |
| Durchschnittliche Intel Core Ultra X7 358H, Intel Arc B390 12 Xe3 Panther Lake iGPU (13082 - 13893, n=7) | |
| Asus ExpertBook Ultra B9406CAA | |
| Lenovo Yoga Pro 7 14IAH10 | |
| Dell 14 Premium | |
| HP EliteBook X G1i 14 AI | |
| Dell XPS 14 2024 OLED | |
| CrossMark / Overall | |
| Durchschnittliche Intel Core Ultra X7 358H, Intel Arc B390 12 Xe3 Panther Lake iGPU (1884 - 2119, n=8) | |
| Lenovo Yoga Pro 7 14IAH10 | |
| Dell XPS 14 Core Ultra X7 358H | |
| Asus ExpertBook Ultra B9406CAA | |
| Dell XPS 14 2024 OLED | |
| HP EliteBook X G1i 14 AI | |
| Dell 14 Premium | |
| CrossMark / Productivity | |
| Lenovo Yoga Pro 7 14IAH10 | |
| Durchschnittliche Intel Core Ultra X7 358H, Intel Arc B390 12 Xe3 Panther Lake iGPU (1678 - 1928, n=8) | |
| Dell XPS 14 Core Ultra X7 358H | |
| Asus ExpertBook Ultra B9406CAA | |
| HP EliteBook X G1i 14 AI | |
| Dell XPS 14 2024 OLED | |
| Dell 14 Premium | |
| CrossMark / Creativity | |
| Durchschnittliche Intel Core Ultra X7 358H, Intel Arc B390 12 Xe3 Panther Lake iGPU (2241 - 2529, n=8) | |
| Dell XPS 14 Core Ultra X7 358H | |
| Lenovo Yoga Pro 7 14IAH10 | |
| Asus ExpertBook Ultra B9406CAA | |
| Dell XPS 14 2024 OLED | |
| HP EliteBook X G1i 14 AI | |
| Dell 14 Premium | |
| CrossMark / Responsiveness | |
| Durchschnittliche Intel Core Ultra X7 358H, Intel Arc B390 12 Xe3 Panther Lake iGPU (1560 - 1837, n=8) | |
| Asus ExpertBook Ultra B9406CAA | |
| Lenovo Yoga Pro 7 14IAH10 | |
| Dell XPS 14 Core Ultra X7 358H | |
| Dell XPS 14 2024 OLED | |
| HP EliteBook X G1i 14 AI | |
| Dell 14 Premium | |
| WebXPRT 3 / Overall | |
| Dell XPS 14 Core Ultra X7 358H | |
| Lenovo Yoga Pro 7 14IAH10 | |
| Durchschnittliche Intel Core Ultra X7 358H, Intel Arc B390 12 Xe3 Panther Lake iGPU (293 - 338, n=8) | |
| HP EliteBook X G1i 14 AI | |
| Asus ExpertBook Ultra B9406CAA | |
| Dell 14 Premium | |
| Dell XPS 14 2024 OLED | |
| WebXPRT 4 / Overall | |
| Lenovo Yoga Pro 7 14IAH10 | |
| Dell XPS 14 Core Ultra X7 358H | |
| Durchschnittliche Intel Core Ultra X7 358H, Intel Arc B390 12 Xe3 Panther Lake iGPU (278 - 305, n=7) | |
| HP EliteBook X G1i 14 AI | |
| Asus ExpertBook Ultra B9406CAA | |
| Dell 14 Premium | |
| Dell XPS 14 2024 OLED | |
| Mozilla Kraken 1.1 / Total | |
| Dell XPS 14 2024 OLED | |
| Dell 14 Premium | |
| HP EliteBook X G1i 14 AI | |
| Durchschnittliche Intel Core Ultra X7 358H, Intel Arc B390 12 Xe3 Panther Lake iGPU (445 - 460, n=8) | |
| Asus ExpertBook Ultra B9406CAA | |
| Dell XPS 14 Core Ultra X7 358H | |
| Lenovo Yoga Pro 7 14IAH10 | |
| Geekbench AI / Single Precision GPU 1.7 | |
| Asus ExpertBook Ultra B9406CAA | |
| Dell XPS 14 Core Ultra X7 358H | |
| Durchschnittliche Intel Core Ultra X7 358H, Intel Arc B390 12 Xe3 Panther Lake iGPU (9783 - 12255, n=6) | |
| HP EliteBook X G1i 14 AI | |
| Dell 14 Premium | |
| Geekbench AI / Half Precision GPU 1.7 | |
| Asus ExpertBook Ultra B9406CAA | |
| Durchschnittliche Intel Core Ultra X7 358H, Intel Arc B390 12 Xe3 Panther Lake iGPU (16188 - 21963, n=6) | |
| Dell XPS 14 Core Ultra X7 358H | |
| HP EliteBook X G1i 14 AI | |
| Dell 14 Premium | |
| Geekbench AI / Quantized GPU 1.7 | |
| Asus ExpertBook Ultra B9406CAA | |
| Dell XPS 14 Core Ultra X7 358H | |
| Durchschnittliche Intel Core Ultra X7 358H, Intel Arc B390 12 Xe3 Panther Lake iGPU (6908 - 8011, n=6) | |
| HP EliteBook X G1i 14 AI | |
| Dell 14 Premium | |
* ... kleinere Werte sind besser
| PCMark 10 Score | 9880 Punkte | |
Hilfe | ||
| AIDA64 / Memory Copy | |
| Dell XPS 14 Core Ultra X7 358H | |
| Durchschnittliche Intel Core Ultra X7 358H (102745 - 132135, n=7) | |
| Lenovo Yoga Pro 7 14IAH10 | |
| HP EliteBook X G1i 14 AI | |
| Dell XPS 14 2024 OLED | |
| AIDA64 / Memory Read | |
| Asus ExpertBook Ultra B9406CAA | |
| Dell XPS 14 Core Ultra X7 358H | |
| Durchschnittliche Intel Core Ultra X7 358H (97755 - 118888, n=8) | |
| Dell XPS 14 2024 OLED | |
| Lenovo Yoga Pro 7 14IAH10 | |
| HP EliteBook X G1i 14 AI | |
| AIDA64 / Memory Write | |
| Dell XPS 14 Core Ultra X7 358H | |
| Durchschnittliche Intel Core Ultra X7 358H (105984 - 134998, n=8) | |
| Asus ExpertBook Ultra B9406CAA | |
| HP EliteBook X G1i 14 AI | |
| Lenovo Yoga Pro 7 14IAH10 | |
| Dell XPS 14 2024 OLED | |
| AIDA64 / Memory Latency | |
| Dell XPS 14 2024 OLED | |
| Lenovo Yoga Pro 7 14IAH10 | |
| HP EliteBook X G1i 14 AI | |
| Dell XPS 14 Core Ultra X7 358H | |
| Durchschnittliche Intel Core Ultra X7 358H (84.6 - 101.9, n=8) | |
* ... kleinere Werte sind besser
DPC-Latenzzeit
LatencyMon meldet nur geringfügige DPC-Probleme und keine Bildausfälle bei der Wiedergabe von 4K60-Videoinhalten.


| DPC Latencies / LatencyMon - interrupt to process latency (max), Web, Youtube, Prime95 | |
| Dell 14 Premium | |
| Dell XPS 14 2024 OLED | |
| Lenovo Yoga Pro 7 14IAH10 | |
| Dell XPS 14 Core Ultra X7 358H | |
| HP EliteBook X G1i 14 AI | |
| Asus ExpertBook Ultra B9406CAA | |
* ... kleinere Werte sind besser
Speichergeräte
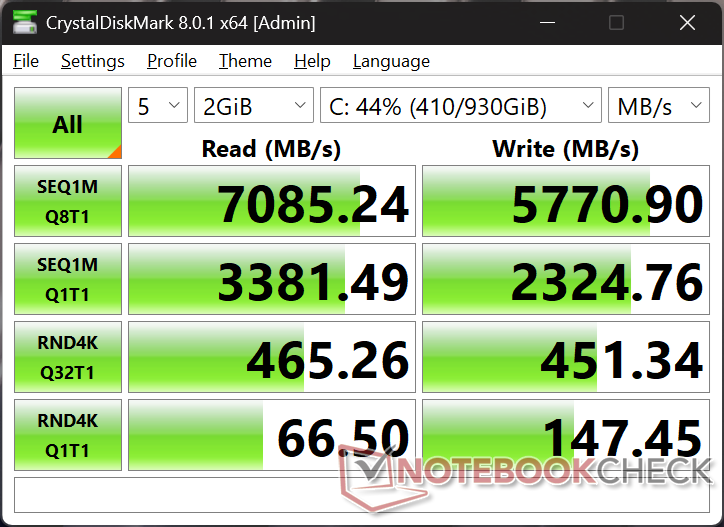
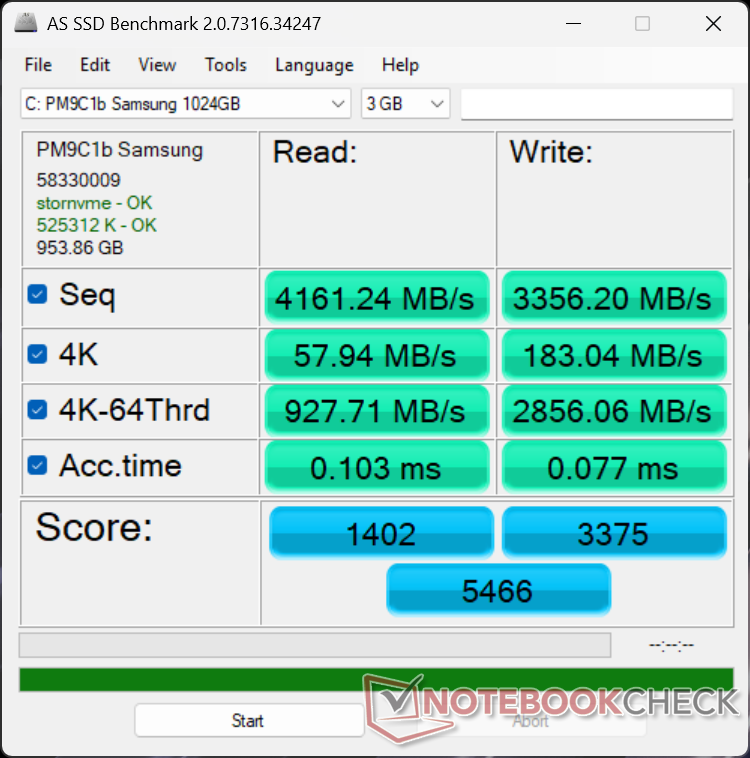
Die Samsung PM9C1b PCIe4 x4 NVMe SSD kann Übertragungsraten von 7000 MB/s ohne Drosselungsprobleme erreichen und ist damit etwas schneller als das Kioxia Laufwerk im Dell 14 Premium.


| Drive Performance Rating - Percent | |
| Asus ExpertBook Ultra B9406CAA | |
| Lenovo Yoga Pro 7 14IAH10 | |
| Dell XPS 14 Core Ultra X7 358H | |
| Dell XPS 14 2024 OLED | |
| Dell 14 Premium | |
| HP EliteBook X G1i 14 AI | |
* ... kleinere Werte sind besser
Drosselung der Festplatte: DiskSpd-Leseschleife, Warteschlangentiefe 8
GPU Performance
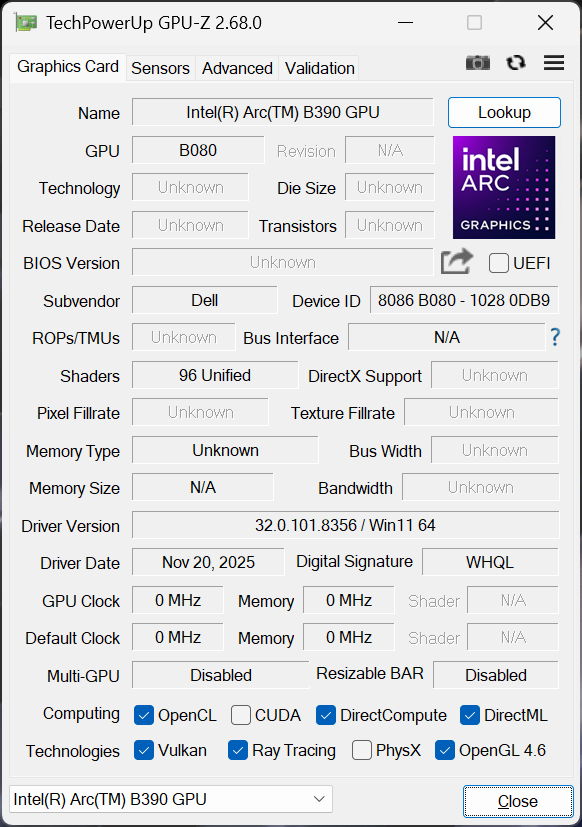
Der integrierte Arc B390 ist eines der wichtigsten Highlights des 2026 XPS 14. Die Leistung im Jahresvergleich ist gegenüber dem Arc 140T im 2025 Dell 14 Premium so enorm verbessert, dass er sogar mit dem 2024 XPS 14 mit dedizierter GeForce RTX 4050-Grafikkarte mithalten oder diesen sogar übertreffen kann. Die 3DMark-Ergebnisse sind etwa doppelt so hoch wie die des Arc 140T und liegen gleichzeitig 25 bis 40 Prozent über denen der RTX 4050. Für professionelle Rendering-Aufgaben sind die CUDA-Kerne der Nvidia-GPU jedoch immer noch die schnellere Option, und zwar um etwa 35 Prozent.
Der Betrieb auf Akku beeinträchtigt leider die Leistung geringfügig, wie unsere Fire Strike-Ergebnistabelle unten zeigt. Der Rückstand kann noch größer werden, wenn statt des Leistungsmodus der Balanced Modus eingestellt wird.
| Energie-Profil | Grafik Ergebnis | Physik-Punktzahl | Kombinierte Punktzahl |
| Performance Modus | 17324 | 25143 | 4879 |
| Balanced Modus | 14560 (-16%) | 21811 (-13%) | 4073 (-17%) |
| Battery Power | 15875 (-8%) | 27090 (-8%) | 4578 (-6%) |


| 3DMark 11 Performance | 18603 Punkte | |
| 3DMark Cloud Gate Standard Score | 48038 Punkte | |
| 3DMark Fire Strike Score | 14336 Punkte | |
| 3DMark Time Spy Score | 7546 Punkte | |
Hilfe | ||
* ... kleinere Werte sind besser
Gaming Performance
Das neue XPS 14 ist zwar kein Gaming-Notebook, kann aber anspruchsvolle Titel wie Black Myth Wukong mit ordentlichen 1080p-Einstellungen ausführen. Beachten Sie, dass die Gaming Performance im Durchschnitt nur innerhalb von 10 Prozent des RTX 4050-betriebenen XPS 14 abweicht, obwohl unsere synthetischen 3DMark-Ergebnisse auf größere Abweichungen hindeuten.
| Performance Rating - Percent | |
| Dell XPS 14 2024 OLED | |
| Asus ExpertBook Ultra B9406CAA | |
| Dell XPS 14 Core Ultra X7 358H | |
| HP EliteBook X G1i 14 AI | |
| Lenovo Yoga Pro 7 14IAH10 | |
| Dell 14 Premium | |
| Cyberpunk 2077 - 1920x1080 Ultra Preset (FSR off) | |
| Asus ExpertBook Ultra B9406CAA | |
| Dell XPS 14 Core Ultra X7 358H | |
| Dell XPS 14 2024 OLED | |
| HP EliteBook X G1i 14 AI | |
| Lenovo Yoga Pro 7 14IAH10 | |
| Dell 14 Premium | |
| Baldur's Gate 3 - 1920x1080 Ultra Preset AA:T | |
| Asus ExpertBook Ultra B9406CAA | |
| Dell XPS 14 Core Ultra X7 358H | |
| Dell XPS 14 2024 OLED | |
| HP EliteBook X G1i 14 AI | |
| Lenovo Yoga Pro 7 14IAH10 | |
| Dell 14 Premium | |
| GTA V - 1920x1080 Highest AA:4xMSAA + FX AF:16x | |
| Dell XPS 14 2024 OLED | |
| Asus ExpertBook Ultra B9406CAA | |
| Dell XPS 14 Core Ultra X7 358H | |
| HP EliteBook X G1i 14 AI | |
| Lenovo Yoga Pro 7 14IAH10 | |
| Dell 14 Premium | |
| Final Fantasy XV Benchmark - 1920x1080 High Quality | |
| Asus ExpertBook Ultra B9406CAA | |
| Dell XPS 14 Core Ultra X7 358H | |
| Dell XPS 14 2024 OLED | |
| HP EliteBook X G1i 14 AI | |
| Dell 14 Premium | |
| Lenovo Yoga Pro 7 14IAH10 | |
| Strange Brigade - 1920x1080 ultra AA:ultra AF:16 | |
| Asus ExpertBook Ultra B9406CAA | |
| Dell XPS 14 Core Ultra X7 358H | |
| Dell XPS 14 2024 OLED | |
| Lenovo Yoga Pro 7 14IAH10 | |
| HP EliteBook X G1i 14 AI | |
| Dell 14 Premium | |
| Dota 2 Reborn - 1920x1080 ultra (3/3) best looking | |
| Dell XPS 14 Core Ultra X7 358H | |
| Dell XPS 14 2024 OLED | |
| Asus ExpertBook Ultra B9406CAA | |
| HP EliteBook X G1i 14 AI | |
| Lenovo Yoga Pro 7 14IAH10 | |
| Dell 14 Premium | |
| X-Plane 11.11 - 1920x1080 high (fps_test=3) | |
| Dell XPS 14 2024 OLED | |
| Dell 14 Premium | |
| Dell XPS 14 Core Ultra X7 358H | |
| Asus ExpertBook Ultra B9406CAA | |
| Lenovo Yoga Pro 7 14IAH10 | |
| HP EliteBook X G1i 14 AI | |
Cyberpunk 2077 ultra FPS Grafik
| min. | mittel | hoch | max. | QHD | |
|---|---|---|---|---|---|
| GTA V (2015) | 176.7 | 171 | 98.2 | 43.3 | 30.9 |
| Dota 2 Reborn (2015) | 135 | 95.4 | 107.6 | 105.4 | |
| Final Fantasy XV Benchmark (2018) | 123.5 | 73.7 | 52.8 | 39 | |
| X-Plane 11.11 (2018) | 59.7 | 47.1 | 40.3 | ||
| Strange Brigade (2018) | 384 | 138.6 | 103.3 | 95.1 | 71.7 |
| Baldur's Gate 3 (2023) | 64.3 | 55.4 | 49 | 48.7 | 34.9 |
| Cyberpunk 2077 (2023) | 68.6 | 56.2 | 46.9 | 40.9 | 24.7 |
| F1 24 (2024) | 145.9 | 132.2 | 100.7 | 36.2 | 23.8 |
| Black Myth: Wukong (2024) | 43 | 34 | 26 | 14 | 11 |
| ARC Raiders (2025) | 104.3 | 57 | 42.4 | 28 | 19.2 |
Emissionen
Geräuschemissionen
Das neue XPS 14 ist in der Lage, länger leise zu bleiben als das letztjährige Modell. Beim 3DMark 06 zum Beispiel stabilisiert sich das Lüftergeräusch gegen Ende der ersten Benchmark-Szene bei 34 dB(A) im Vergleich zu 39 dB(A) beim älteren Arrow Lake Modell. Ansonsten liegt die Obergrenze für das Lüftergeräusch immer noch bei 45 dB(A) und ist damit ähnlich hoch wie zuvor.


Lautstärkediagramm
| Idle |
| 23.3 / 23.3 / 23.3 dB(A) |
| Last |
| 34 / 45.7 dB(A) |
 | ||
30 dB leise 40 dB(A) deutlich hörbar 50 dB(A) störend |
||
min: | ||
| Dell XPS 14 Core Ultra X7 358H Ultra X7 358H, Arc B390 Panther Lake iGPU | Dell 14 Premium Ultra 7 255H, Arc 140T | Dell XPS 14 2024 OLED Ultra 7 155H, GeForce RTX 4050 Laptop GPU | Asus ExpertBook Ultra B9406CAA Ultra X7 358H, Arc B390 Panther Lake iGPU | Lenovo Yoga Pro 7 14IAH10 Ultra 9 285H, Arc 140T | HP EliteBook X G1i 14 AI Core Ultra 7 268V, Arc 140V | |
|---|---|---|---|---|---|---|
| Geräuschentwicklung | -3% | -8% | 3% | -11% | -10% | |
| aus / Umgebung * (dB) | 22.9 | 23 -0% | 24.3 -6% | 22.9 -0% | 24.5 -7% | 28.2 -23% |
| Idle min * (dB) | 23.3 | 23.2 -0% | 24.3 -4% | 23.4 -0% | 24.5 -5% | 28.4 -22% |
| Idle avg * (dB) | 23.3 | 24 -3% | 26.5 -14% | 23.4 -0% | 24.5 -5% | 28.4 -22% |
| Idle max * (dB) | 23.3 | 24.7 -6% | 28.5 -22% | 23.4 -0% | 24.5 -5% | 28.8 -24% |
| Last avg * (dB) | 34 | 39 -15% | 37 -9% | 28.6 16% | 46.9 -38% | 33.5 1% |
| Cyberpunk 2077 ultra * (dB) | 43.5 | 43 1% | 42.8 2% | 46.9 -8% | 39.1 10% | |
| Last max * (dB) | 45.7 | 44.9 2% | 43.3 5% | 45.2 1% | 48.7 -7% | 40.4 12% |
| Witcher 3 ultra * (dB) | 39.1 |
* ... kleinere Werte sind besser
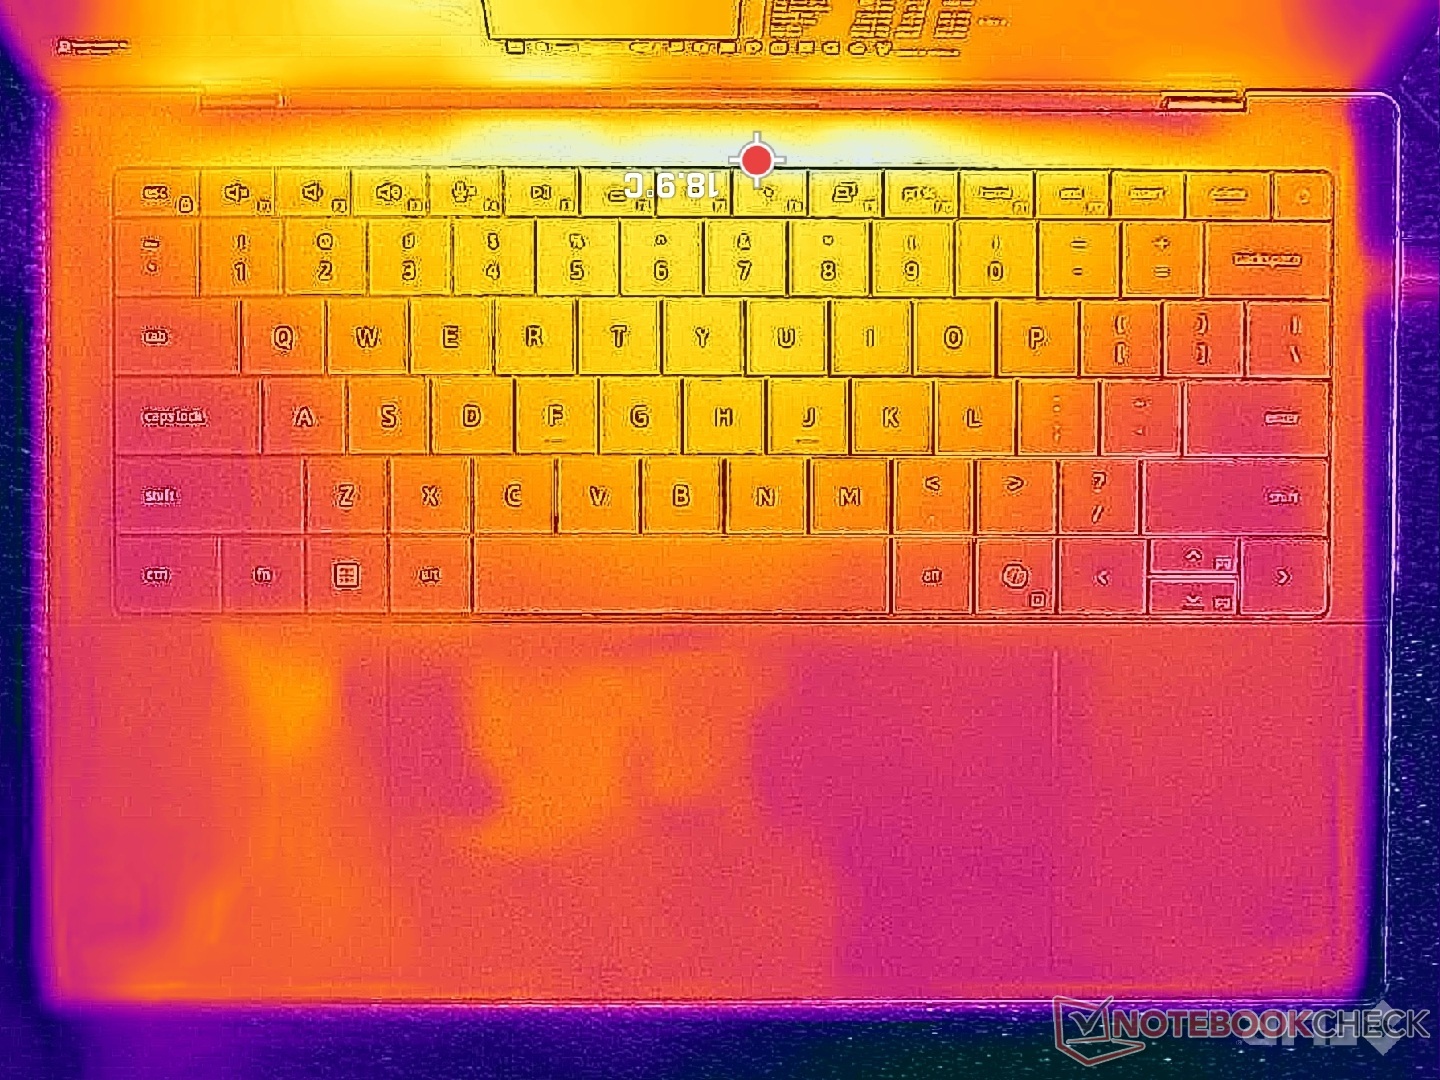
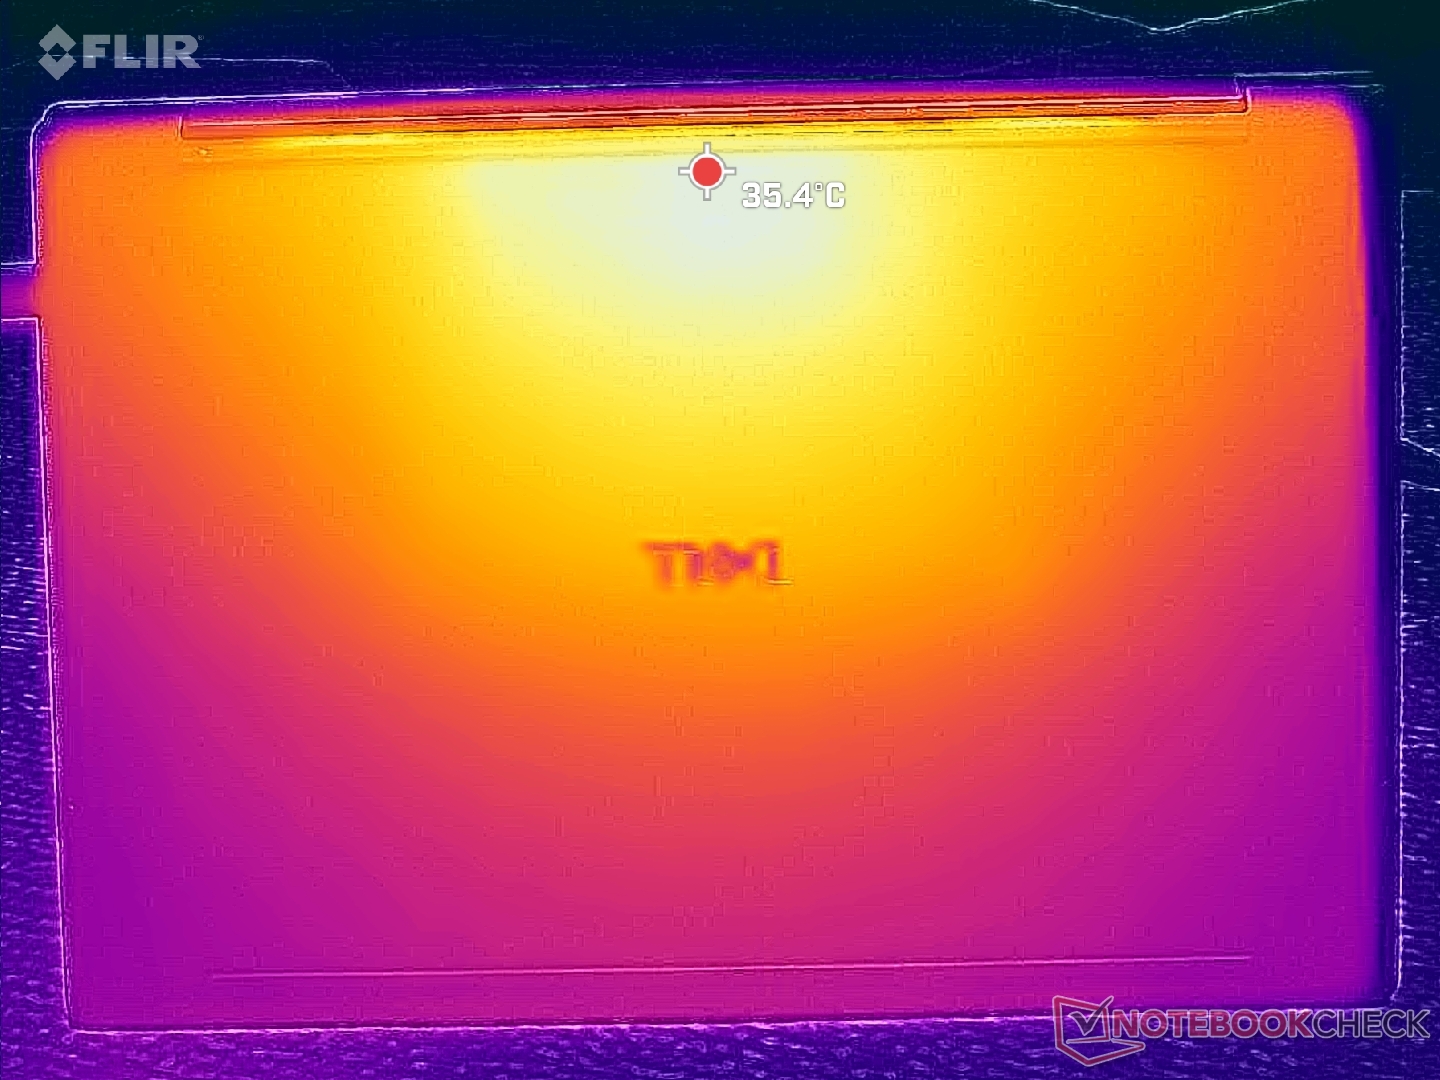
Temperatur
Die Oberflächentemperaturen sind etwas wärmer als beim Dell 14 Premium 2025, vor allem auf der Unterseite (D-Cover), wenn anspruchsvollere Aufgaben ausgeführt werden. Der Hot Spot erreicht 36° C bis 39° C im Vergleich zu 34° C beim letztjährigen Modell. Die Unterschiede sind ansonsten minimal und nicht warm genug, um bei der Nutzung zu stören.
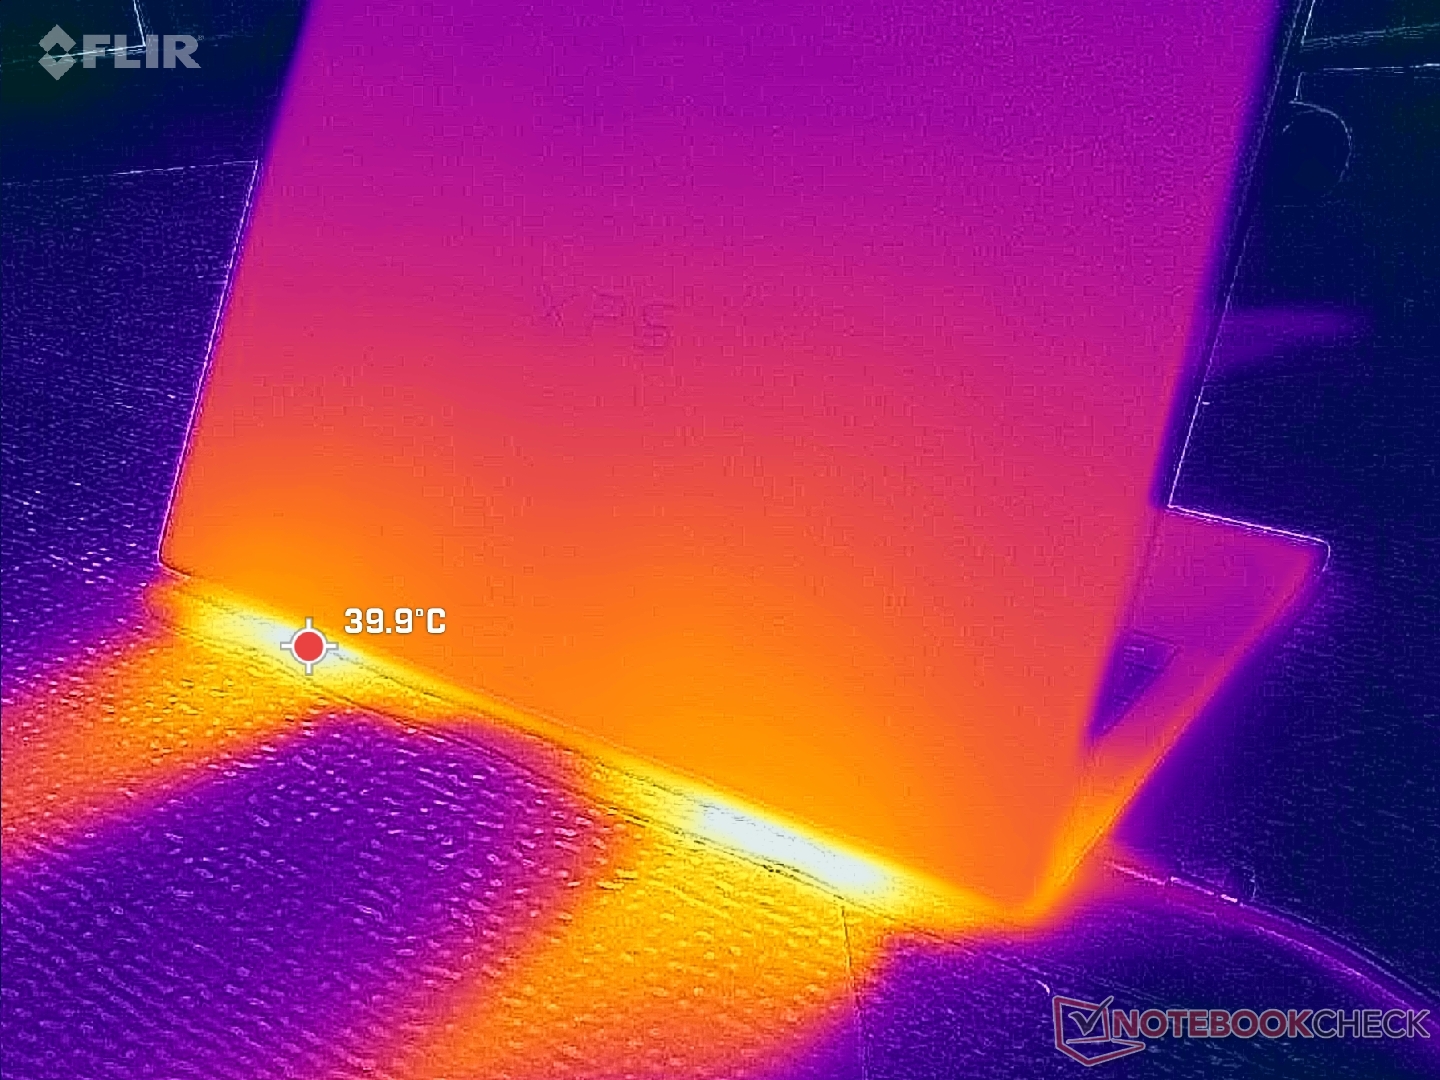
(+) Die maximale Temperatur auf der Oberseite ist 34 °C. Im Vergleich liegt der Klassendurchschnitt bei 36.8 °C (von 21 bis 71 °C für die Klasse Multimedia).
(+) Auf der Unterseite messen wir eine maximalen Wert von 35.8 °C (im Vergleich zum Durchschnitt von 39.1 °C).
(+) Ohne Last messen wir eine durchschnittliche Temperatur von 24.6 °C auf der Oberseite. Der Klassendurchschnitt erreicht 31.3 °C.
(+) 3: The average temperature for the upper side is 30.1 °C / 86 F, compared to the average of 31.3 °C / 88 F for the class Multimedia.
(+) Die Handballen und der Touchpad-Bereich sind mit gemessenen 31.2 °C kühler als die typische Hauttemperatur und fühlen sich dadurch kühl an.
(-) Die durchschnittliche Handballen-Temperatur anderer getesteter Geräte war 28.7 °C (-2.5 °C).


| Dell XPS 14 Core Ultra X7 358H Ultra X7 358H, Arc B390 Panther Lake iGPU | Dell 14 Premium Ultra 7 255H, Arc 140T | Dell XPS 14 2024 OLED Ultra 7 155H, GeForce RTX 4050 Laptop GPU | Asus ExpertBook Ultra B9406CAA Ultra X7 358H, Arc B390 Panther Lake iGPU | Lenovo Yoga Pro 7 14IAH10 Ultra 9 285H, Arc 140T | HP EliteBook X G1i 14 AI Core Ultra 7 268V, Arc 140V | |
|---|---|---|---|---|---|---|
| Hitze | 2% | -12% | -4% | -8% | 5% | |
| Last oben max * (°C) | 34 | 33 3% | 40.5 -19% | 38.6 -14% | 38.1 -12% | 35 -3% |
| Last unten max * (°C) | 35.8 | 33.6 6% | 42.6 -19% | 38.4 -7% | 36.5 -2% | 33.4 7% |
| Idle oben max * (°C) | 25.6 | 26.4 -3% | 26.9 -5% | 24.6 4% | 28.2 -10% | 23.8 7% |
| Idle unten max * (°C) | 26.4 | 25.6 3% | 27.8 -5% | 26 2% | 28.8 -9% | 24.2 8% |
* ... kleinere Werte sind besser
Stress Test

Beim Ausführen von Prime95 Stress stieg die CPU auf 3 GHz, 69 W und 100 °C, bevor sie etwa 30 Sekunden später auf 2 GHz, 30 W und 74 °C abfiel. Die Nachhaltigkeit von Turbo Boost ist somit begrenzt, was mit unseren oben genannten CineBench R15-Beobachtungen übereinstimmt. Im Vergleich dazu stabilisierte sich dieselbe CPU im ExpertBook Ultra bei höheren 48 W für eine schnellere Prozessorleistung.
Die GPU-Taktrate und -Temperatur stabilisierten sich bei 2000 MHz und 63 °C beim Ausführen von Cyberpunk 2077, verglichen mit 2500 MHz und 88 °C auf dem oben genannten Asus, selbst wenn dieser auf den Ultra-Performance-Modus eingestellt war.


| Durchschnittlicher CPU-Takt (GHz) | GPU-Takt (MHz) | Durchschnittliche CPU-Temperatur (°C) | |
| System Leerlauf | -- | -- | 41 |
| Prime95 Stress | 2.0 | -- | 74 |
| Prime95 + FurMark Stress | 1.5 | 1350 | 67 |
| Cyberpunk 2077 Stress (Performance Modus) | 0.8 | 2000 | 63 |
| Cyberpunk 2077 Stress (Balanced Modus) | 0.8 | 1950 | 62 |
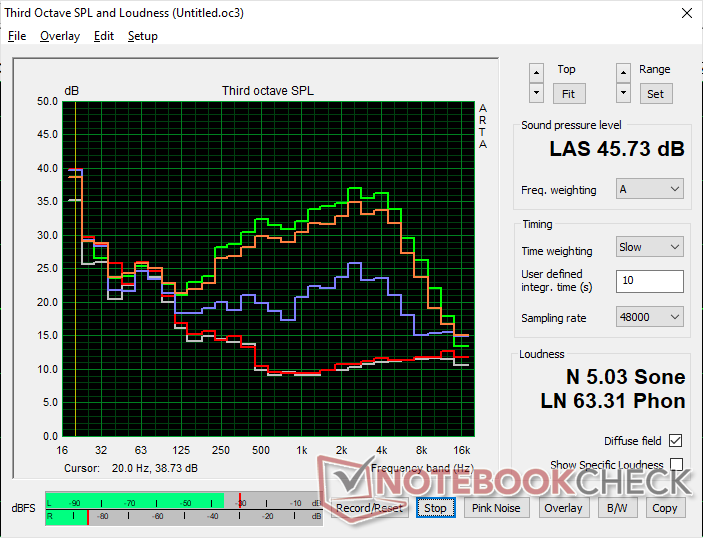
Lautsprecher
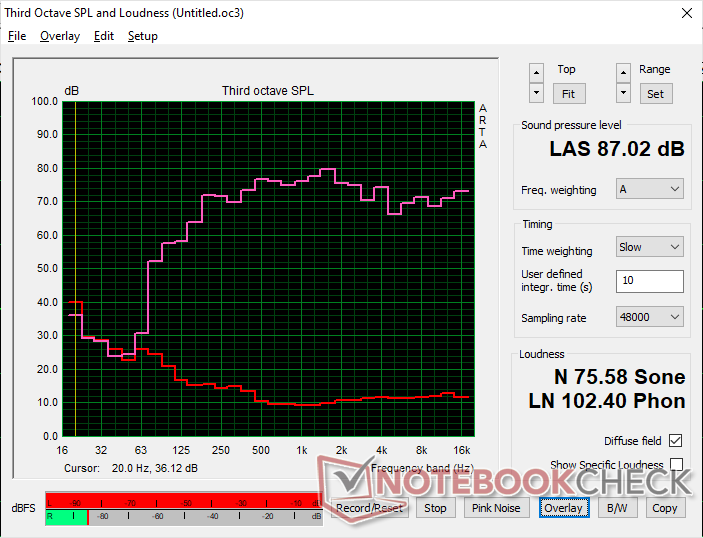

Dell XPS 14 Core Ultra X7 358H Audio Analyse
(+) | Die Lautsprecher können relativ laut spielen (87 dB)
Bass 100 - 315 Hz
(±) | abgesenkter Bass - 7.6% geringer als der Median
(+) | lineare Bass-Wiedergabe (5.9% Delta zum Vorgänger)
Mitteltöne 400 - 2000 Hz
(+) | ausgeglichene Mitten, vom Median nur 3.2% abweichend
(+) | lineare Mitten (3.6% Delta zum Vorgänger)
Hochtöne 2 - 16 kHz
(+) | ausgeglichene Hochtöne, vom Median nur 3.3% abweichend
(+) | sehr lineare Hochtöne (5.8% Delta zum Vorgänger)
Gesamt im hörbaren Bereich 100 - 16.000 Hz
(+) | hörbarer Bereich ist sehr linear (7.3% Abstand zum Median
Im Vergleich zu allen Geräten derselben Klasse
» 6% aller getesteten Geräte dieser Klasse waren besser, 1% vergleichbar, 94% schlechter
» Das beste Gerät hat einen Delta-Wert von 5%, durchschnittlich ist 17%, das schlechteste Gerät hat 45%
Im Vergleich zu allen Geräten im Test
» 1% aller getesteten Geräte waren besser, 0% vergleichbar, 99% schlechter
» Das beste Gerät hat einen Delta-Wert von 4%, durchschnittlich ist 24%, das schlechteste Gerät hat 134%
Apple MacBook Pro 16 2021 M1 Pro Audio Analyse
(+) | Die Lautsprecher können relativ laut spielen (84.7 dB)
Bass 100 - 315 Hz
(+) | guter Bass - nur 3.8% Abweichung vom Median
(+) | lineare Bass-Wiedergabe (5.2% Delta zum Vorgänger)
Mitteltöne 400 - 2000 Hz
(+) | ausgeglichene Mitten, vom Median nur 1.3% abweichend
(+) | lineare Mitten (2.1% Delta zum Vorgänger)
Hochtöne 2 - 16 kHz
(+) | ausgeglichene Hochtöne, vom Median nur 1.9% abweichend
(+) | sehr lineare Hochtöne (2.7% Delta zum Vorgänger)
Gesamt im hörbaren Bereich 100 - 16.000 Hz
(+) | hörbarer Bereich ist sehr linear (4.6% Abstand zum Median
Im Vergleich zu allen Geräten derselben Klasse
» 0% aller getesteten Geräte dieser Klasse waren besser, 0% vergleichbar, 100% schlechter
» Das beste Gerät hat einen Delta-Wert von 5%, durchschnittlich ist 17%, das schlechteste Gerät hat 45%
Im Vergleich zu allen Geräten im Test
» 0% aller getesteten Geräte waren besser, 0% vergleichbar, 100% schlechter
» Das beste Gerät hat einen Delta-Wert von 4%, durchschnittlich ist 24%, das schlechteste Gerät hat 134%
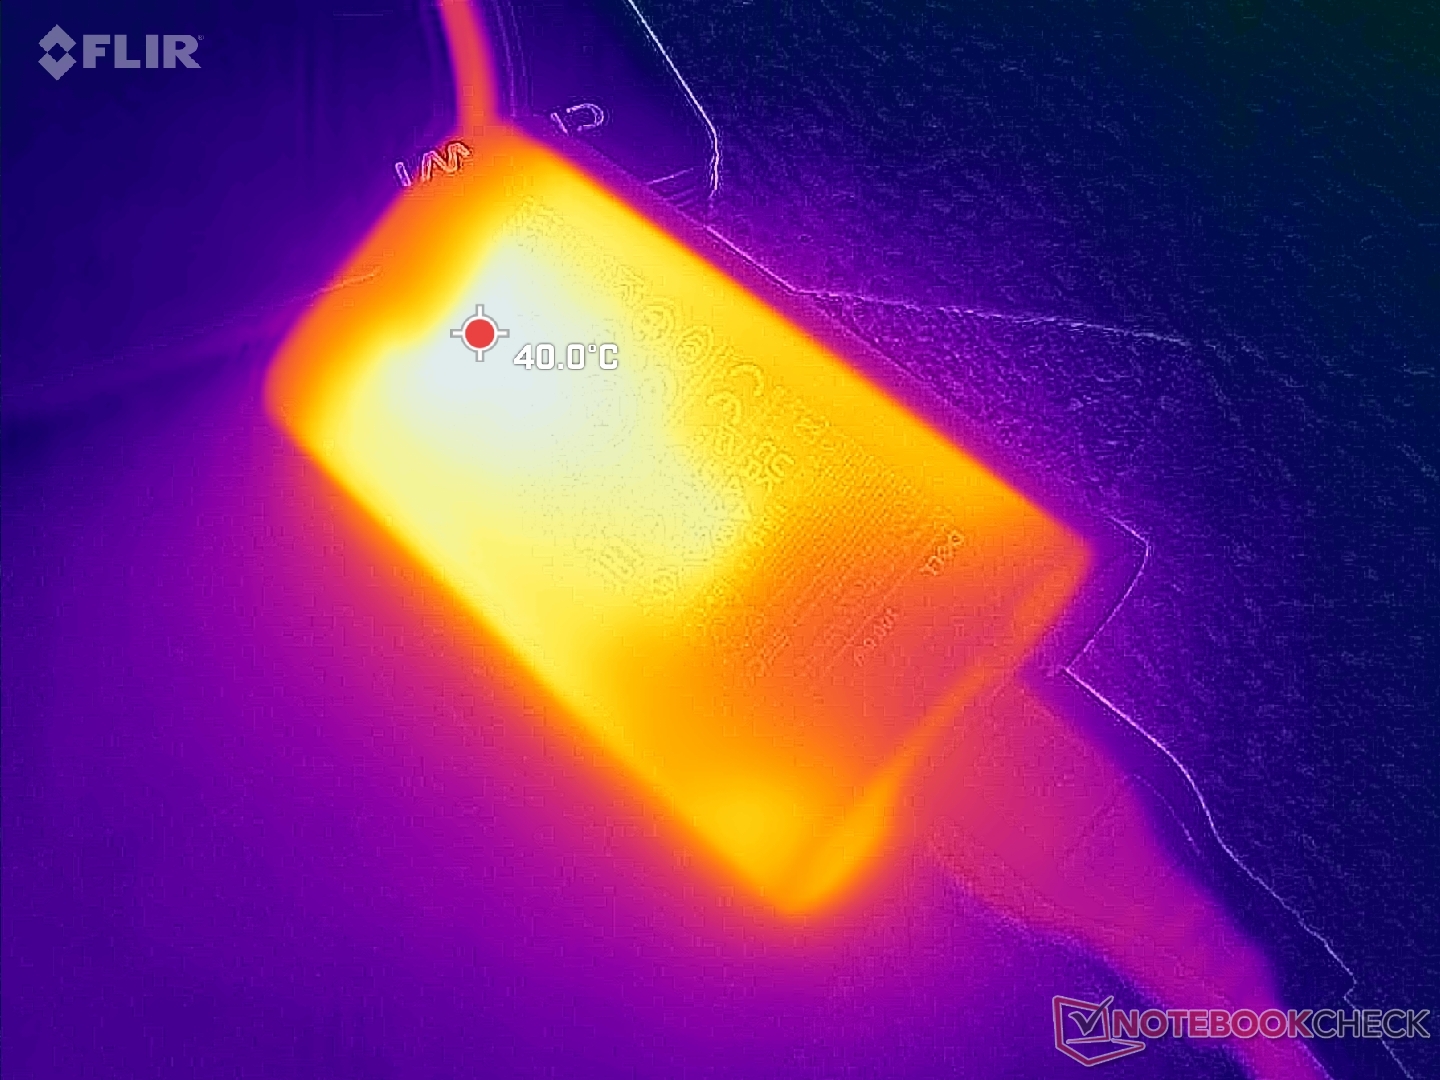
Energieverwaltung
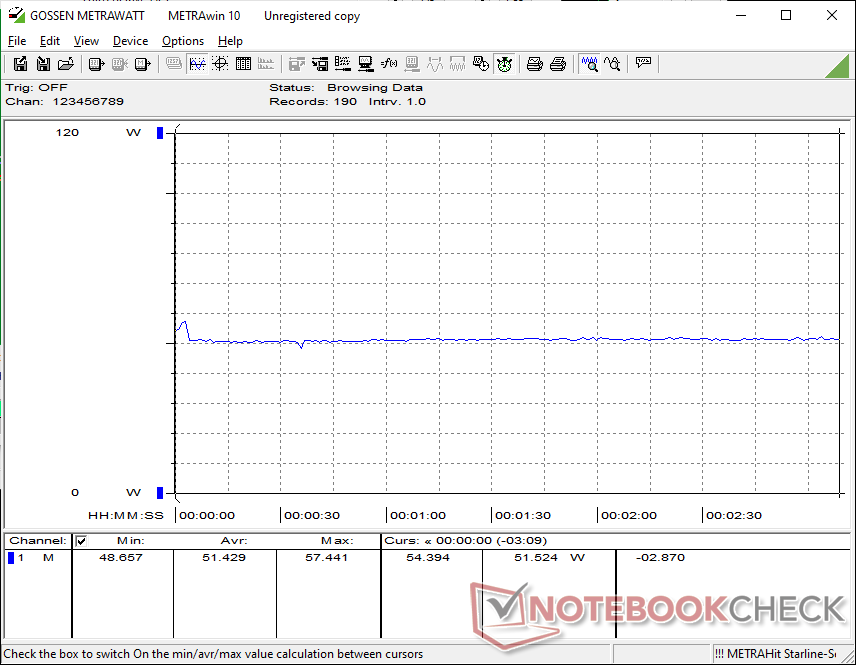
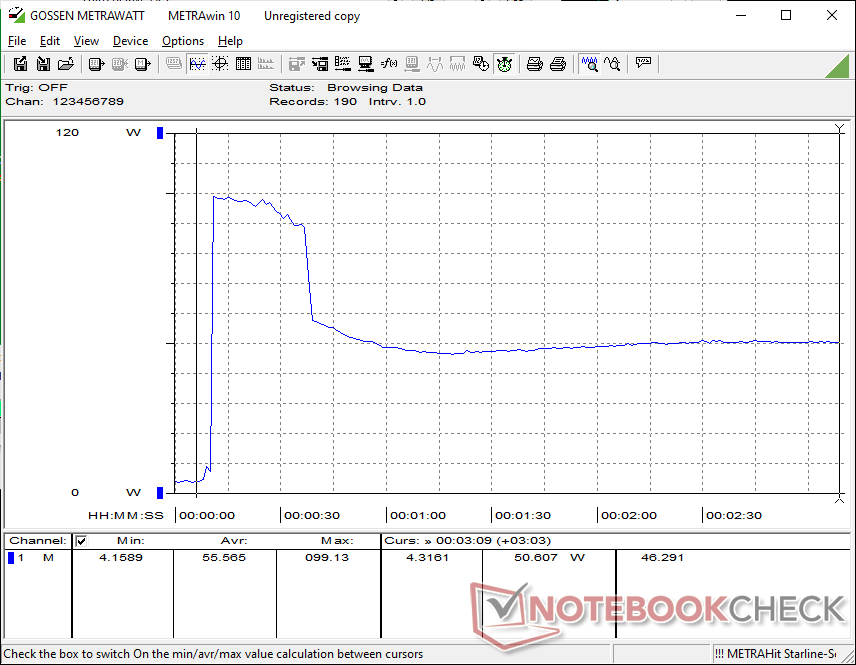
Stromverbrauch
Die Grafikleistung pro Watt ist einer der stärksten Aspekte des 2026 XPS 14 - dank Panther Lake. Wenn Sie beispielsweise Cyberpunk 2077 spielen, sind die Anforderungen in etwa die gleichen wie beim 2025 XPS 14 und dennoch ist die Leistung etwa 80 Prozent schneller, was eine deutliche Verbesserung gegenüber dem Vorjahr darstellt. Dennoch ist der Zuwachs an CPU-Leistung pro Watt gegenüber dem letztjährigen Core Ultra 7 255H vergleichsweise gering.
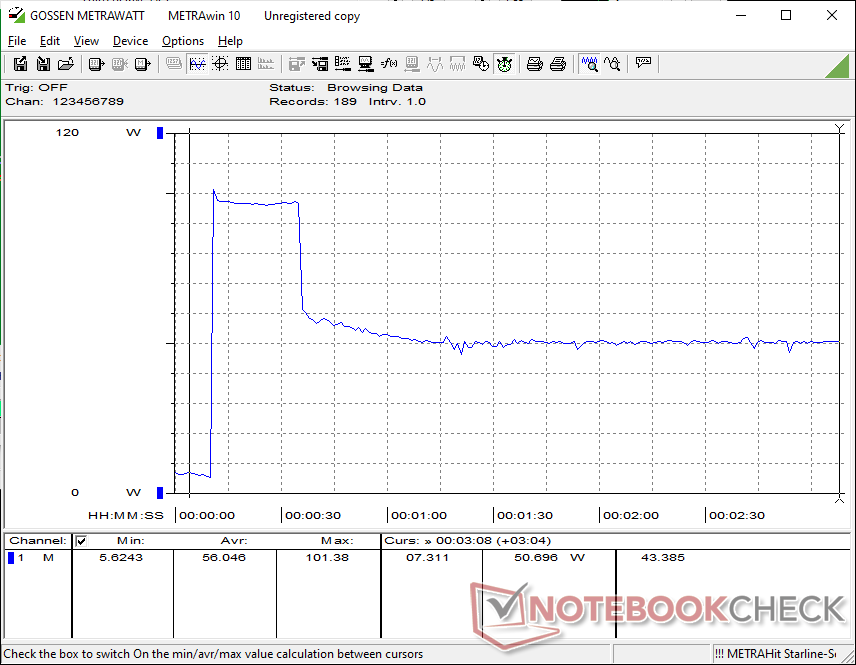
Wir konnten eine temporäre maximale Leistungsaufnahme von 102 W aus dem kleinen (~10,2 x 5,5 x 2,2 cm) 100-W-USB-C-Netzteil aufzeichnen, wenn die CPU voll ausgelastet ist, was deutlich höher ist als beim 2025 XPS 14 unter ähnlichen Bedingungen. Die höhere Leistungsgrenze verdeutlicht die höhere Turbo-Boost-Obergrenze von Panther Lake-H im Vergleich zu Arrow Lake-H.

| Aus / Standby | |
| Idle | |
| Last |
|
Legende:
min: | |
| Dell XPS 14 Core Ultra X7 358H Ultra X7 358H, Arc B390 Panther Lake iGPU, Samsung PM9C1b MZVL81T0HFLB-00BH1, OLED, 2880x1800, 14" | Dell 14 Premium Ultra 7 255H, Arc 140T, Kioxia BG6 KBG6AZNV1T02, OLED, 3200x2000, 14.5" | Dell XPS 14 2024 OLED Ultra 7 155H, GeForce RTX 4050 Laptop GPU, Samsung PM9A1 MZVL21T0HCLR, OLED, 3200x2000, 14.5" | Asus ExpertBook Ultra B9406CAA Ultra X7 358H, Arc B390 Panther Lake iGPU, Samsung PM9E1 MZVLC2T0HBLD, OLED, 2880x1800, 14" | Lenovo Yoga Pro 7 14IAH10 Ultra 9 285H, Arc 140T, WD PC SN7100S SDFPMSL-1T00-1101, OLED, 3000x1876, 14.5" | HP EliteBook X G1i 14 AI Core Ultra 7 268V, Arc 140V, Kioxia XG8 KXG80ZNV512G, IPS, 1920x1200, 14" | |
|---|---|---|---|---|---|---|
| Stromverbrauch | -20% | -88% | 1% | -73% | 12% | |
| Idle min * (Watt) | 3.1 | 4.4 -42% | 8.1 -161% | 3.5 -13% | 7.9 -155% | 2.5 19% |
| Idle avg * (Watt) | 3.6 | 6.1 -69% | 9.9 -175% | 4 -11% | 10.5 -192% | 5.4 -50% |
| Idle max * (Watt) | 10 | 13.7 -37% | 10.4 -4% | 5.3 47% | 10.8 -8% | 5.8 42% |
| Last avg * (Watt) | 39.2 | 53.8 -37% | 75.6 -93% | 43.7 -11% | 64 -63% | 36.9 6% |
| Cyberpunk 2077 ultra * (Watt) | 51.4 | 50.7 1% | 61.3 -19% | 76.3 -48% | 48.5 6% | |
| Cyberpunk 2077 ultra external monitor * (Watt) | 51.2 | 46.5 9% | 61.4 -20% | 72.6 -42% | 44.9 12% | |
| Last max * (Watt) | 101.4 | 62.7 38% | 107.1 -6% | 63.4 37% | 103.2 -2% | 54.6 46% |
| Witcher 3 ultra * (Watt) | 65.6 |
* ... kleinere Werte sind besser
Stromverbrauch Cyberpunk / Stress Test
Stromverbrauch externer Monitor
Akkulaufzeit

Die WLAN-Laufzeit beträgt im Modus Ausbalanciert fast 17 Stunden, was sehr nahe an dem liegt, was wir auf dem ähnlich ausgestatteten ExpertBook Ultra gemessen haben. Beachten Sie jedoch, dass Windows VRR nicht automatisch für die standardmäßig festgelegte Bildwiederholfrequenz von 120 Hz aktiviert ist. Wenn Sie dies manuell aktivieren, würde die Bildwiederholfrequenz im statischen Modus auf nur 20 Hz sinken, was zu potenziell längeren Laufzeiten führt.
Das Aufladen von der leeren auf die volle Kapazität mit dem mitgelieferten Netzteil dauert zwischen 1,5 und 2 Stunden.
| Dell XPS 14 Core Ultra X7 358H Ultra X7 358H, Arc B390 Panther Lake iGPU, 70 Wh | Dell 14 Premium Ultra 7 255H, Arc 140T, 69.5 Wh | Dell XPS 14 2024 OLED Ultra 7 155H, GeForce RTX 4050 Laptop GPU, 69.5 Wh | Asus ExpertBook Ultra B9406CAA Ultra X7 358H, Arc B390 Panther Lake iGPU, 70 Wh | Lenovo Yoga Pro 7 14IAH10 Ultra 9 285H, Arc 140T, 84 Wh | HP EliteBook X G1i 14 AI Core Ultra 7 268V, Arc 140V, 68 Wh | |
|---|---|---|---|---|---|---|
| Akkulaufzeit | -36% | -54% | -4% | -39% | 10% | |
| WLAN (h) | 16.8 | 10.8 -36% | 7.8 -54% | 16.1 -4% | 10.3 -39% | 18.5 10% |
| H.264 (h) | 10.6 | |||||
| Last (h) | 1.3 |
Notebookcheck Bewertung
Das 2026 XPS 14 ist eine deutliche Verbesserung gegenüber der vorherigen Generation, vor allem in Bezug auf die Leistung pro Watt, aber die Wartungsfreundlichkeit leidet ein wenig darunter.
Dell XPS 14 Core Ultra X7 358H
- 07.02.2026 v8
Allen Ngo
 Total Sustainability Score:
 Potenzielle Wettbewerber im Vergleich
Bild | Modell / Test | Preis ab | Gewicht | Dicke | Display |
|---|---|---|---|---|---|
1. 87.4%  | Dell XPS 14 Core Ultra X7 358H Intel Core Ultra X7 358H ⎘ Intel Arc B390 12 Xe3 Panther Lake iGPU ⎘ 32 GB RAM, 1000 GB SSD | Amazon: 1. 3.188,95 € ASUS ExpertBook Ultra 14 Zol... 2. 850,41 € Dell XPS 14 9440 Laptop 14.5... 3. 1.799,00 € Dell XPS 13 (9350) Laptop Co... Geizhals Suche | 1.4 kg | 14.62 mm | 14.00" 2880x1800 243 PPI OLED |
2. 82.5%  | Dell 14 Premium Intel Core Ultra 7 255H ⎘ Intel Arc Graphics 140T ⎘ 32 GB RAM, 1024 GB SSD | Amazon: 1.230,68 € Geizhals Suche | 1.7 kg | 18 mm | 14.50" 3200x2000 260 PPI OLED |
3. 86.3% v7 (old)  | Dell XPS 14 2024 OLED Intel Core Ultra 7 155H ⎘ NVIDIA GeForce RTX 4050 Laptop GPU ⎘ 32 GB RAM, 1024 GB SSD | Amazon: 850,41 € Geizhals Suche | 1.8 kg | 19 mm | 14.50" 3200x2000 260 PPI OLED |
4. 87.6%  | Asus ExpertBook Ultra B9406CAA Intel Core Ultra X7 358H ⎘ Intel Arc B390 12 Xe3 Panther Lake iGPU ⎘ 32 GB RAM, 2048 GB SSD | Amazon: 1.613,57 € Bestpreis 3536.29€ playox.de 2. 3536.3€ office-partner.de 3. 3536.3€ Cyberport.de | 1.1 kg | 15.9 mm | 14.00" 2880x1800 243 PPI OLED |
5. 87.3%  | Lenovo Yoga Pro 7 14IAH10 Intel Core Ultra 9 285H ⎘ Intel Arc Graphics 140T ⎘ 32 GB RAM, 1024 GB SSD | Amazon: Bestpreis 1884.64€ Teknoraks | 1.6 kg | 18.9 mm | 14.50" 3000x1876 244 PPI OLED |
6. 85.1%  | HP EliteBook X G1i 14 AI Intel Core Ultra 7 268V ⎘ Intel Arc Graphics 140V ⎘ 32 GB RAM, 512 GB SSD | Amazon: 1.610,85 € Bestpreis 1899€ MetaComp 2. 2015.8€ 1ashop.at 3. 2039.54€ haym.infotec | 1.2 kg | 15 mm | 14.00" 1920x1200 162 PPI IPS |
Transparenz
Die Auswahl der zu testenden Geräte erfolgt innerhalb der Redaktion. Das vorliegende Testmuster wurde dem Autor vom Hersteller oder einem Shop zu Testzwecken leihweise zur Verfügung gestellt. Eine Einflussnahme des Leihstellers auf den Testbericht gab es nicht, der Hersteller erhielt keine Version des Reviews vor der Veröffentlichung. Es bestand keine Verpflichtung zur Publikation. Als eigenständiges, unabhängiges Unternehmen unterliegt Notebookcheck keiner Diktion von Herstellern, Shops und Verlagen.
So testet Notebookcheck
Pro Jahr werden von Notebookcheck hunderte Laptops und Smartphones unabhängig in von uns standardisierten technischen Verfahren getestet, um eine Vergleichbarkeit aller Testergebnisse zu gewährleisten. Seit rund 20 Jahren entwickeln wir diese Testmethoden kontinuierlich weiter und setzen damit Branchenstandards. In unseren Testlaboren kommt ausschließlich hochwertiges Messequipment in die Hände erfahrener Techniker und Redakteure. Die Tests unterliegen einer mehrstufigen Kontrolle. Unsere komplexe Gesamtbewertung basiert auf hunderten fundierten Messergebnissen und Benchmarks, womit Ihnen Objektivität garantiert ist. Weitere Informationen zu unseren Testmethoden gibt es hier.

