Colorful EVOL X15 AT 23 im Test: Beeindruckender QHD-Gamer mit Raptor Lake-HX und ein paar unübersehbaren Macken

Colorful, eher bekannt für sein Angebot an Hauptplatinen und GPUs, hat begonnen, seinen Horizont zu erweitern und bietet nun auch Intel Alder Lake-Laptops der 12. Generation an. In diesem Jahr hat der chinesische Tech-Gigant sein Sortiment um mehrere Modelle der 13. Generation mit Raptor-Lake-Prozessoren erweitert.
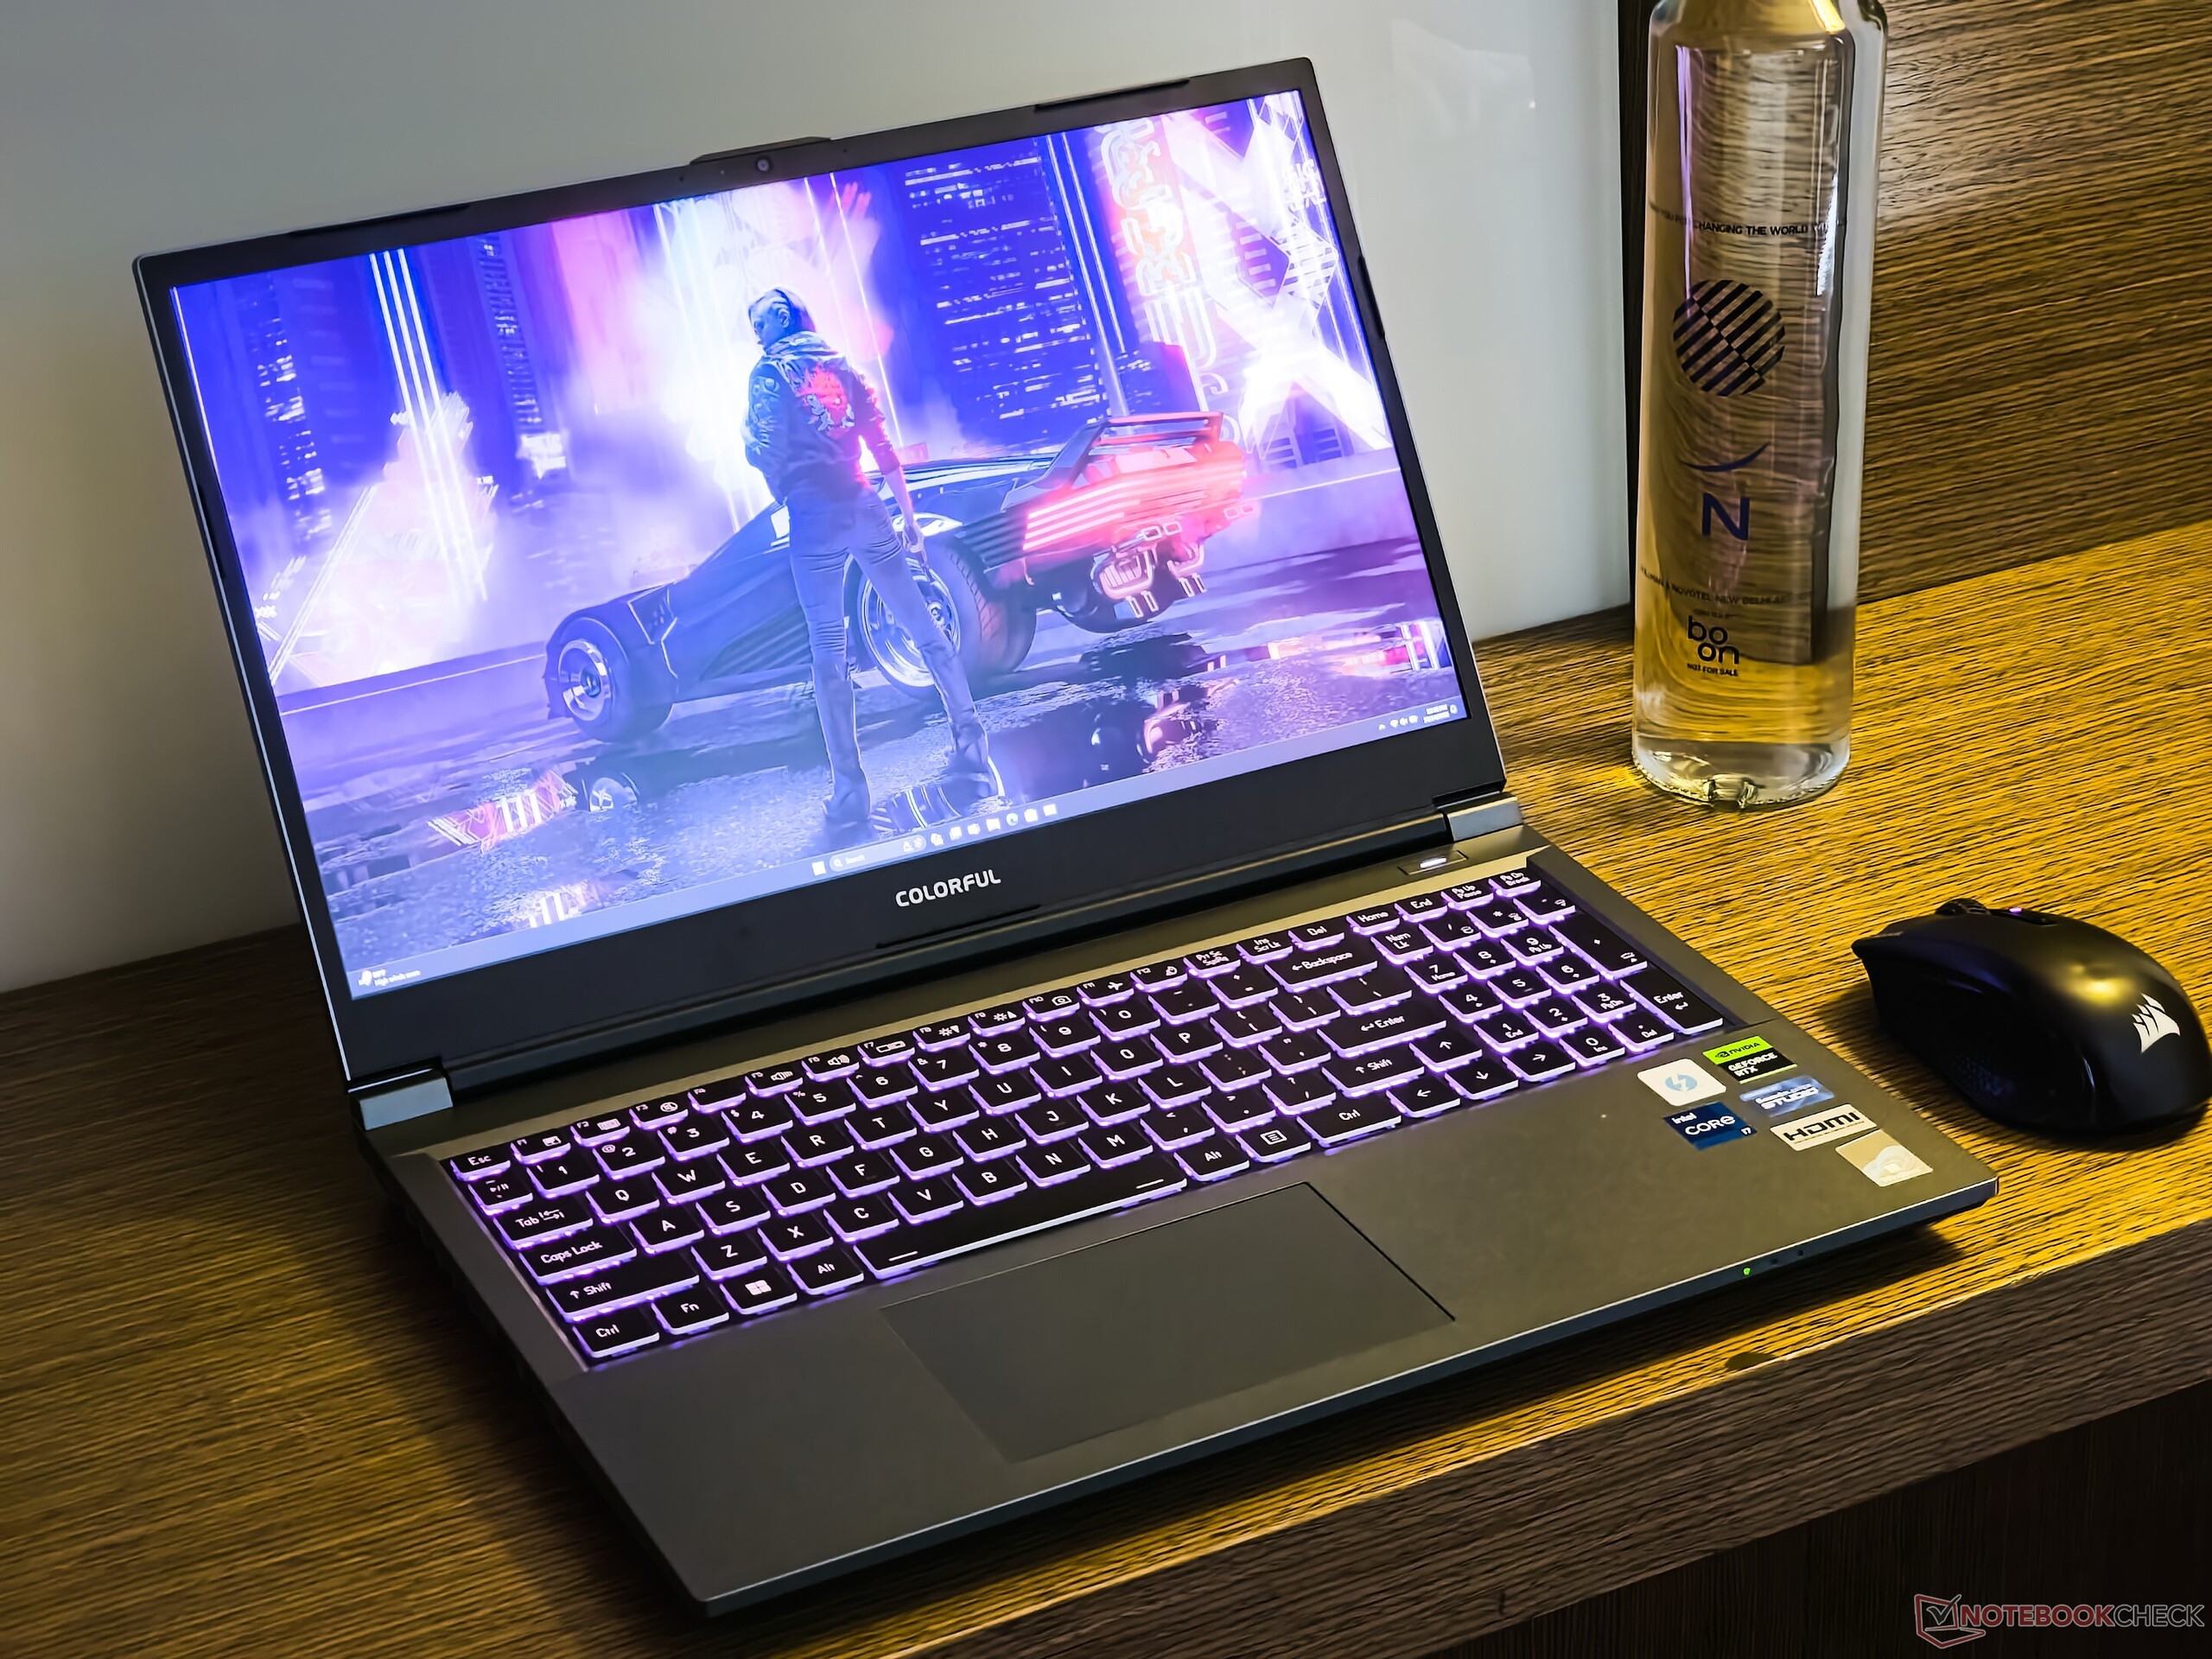
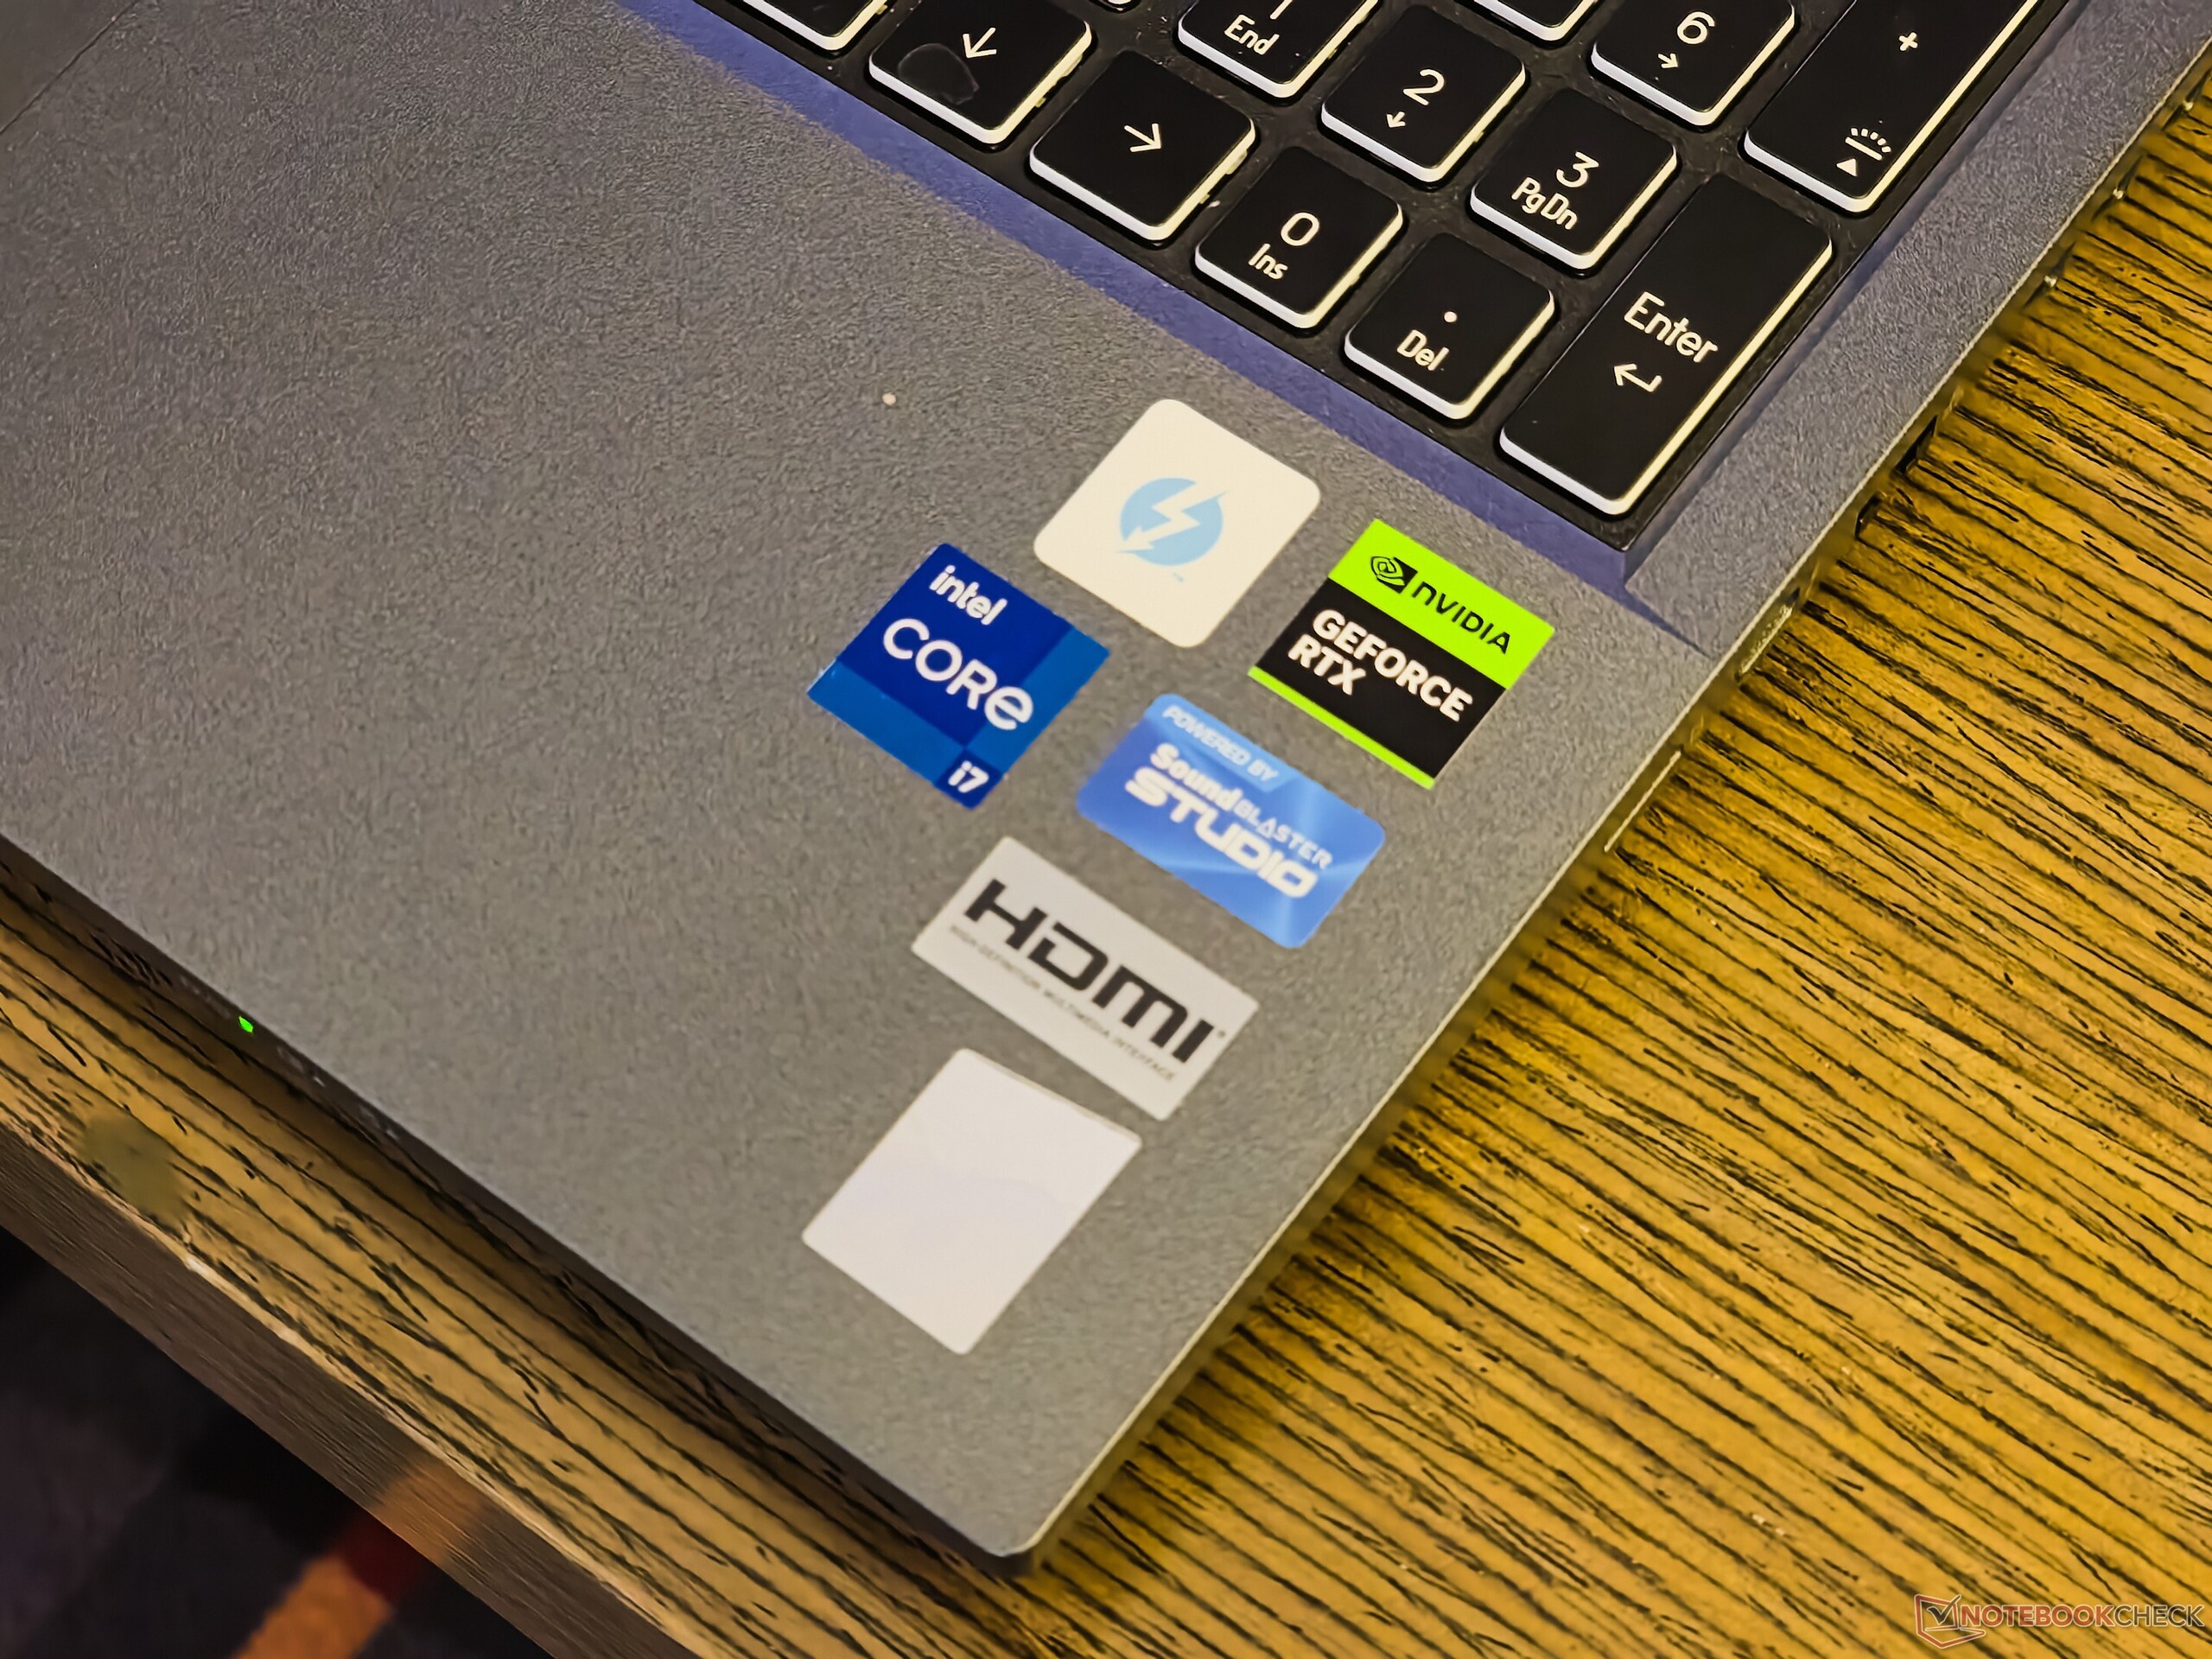
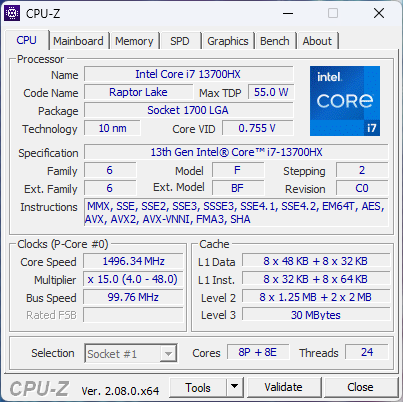
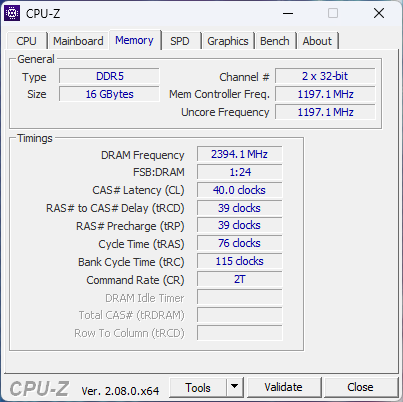
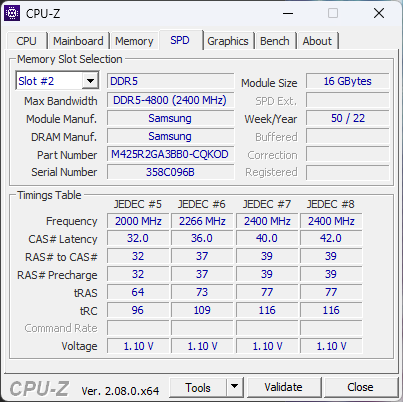
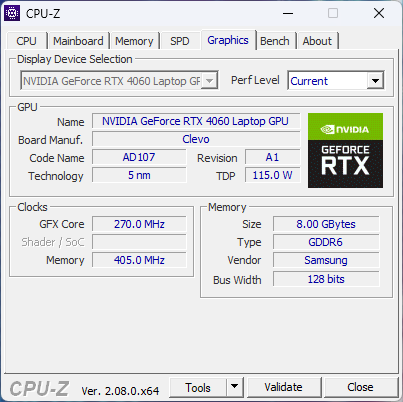
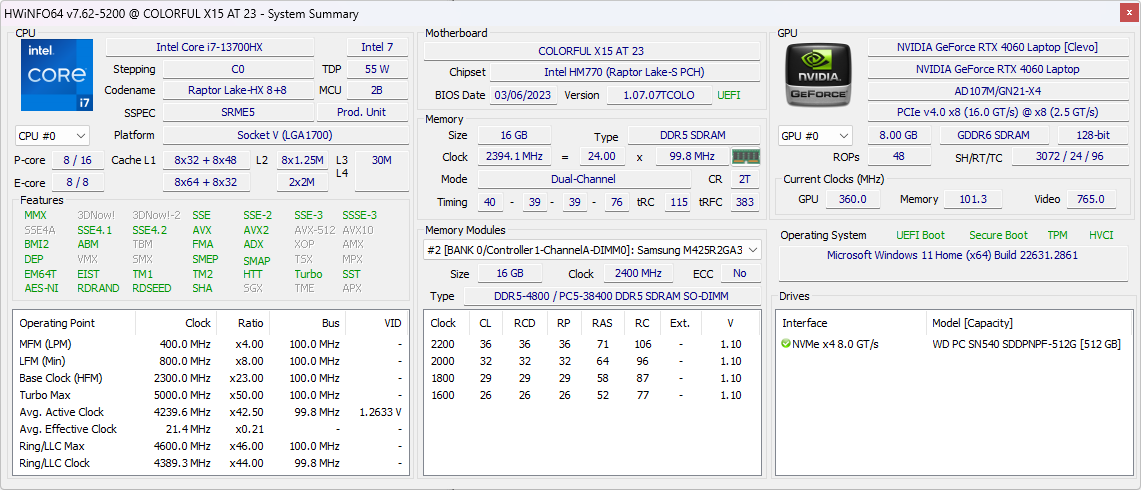
In diesem Kontext ist das neue Colorful EVOL X15 AT 23 kürzlich in unserem Testlabor eingetroffen. Unser EVOL X15 AT-Muster wird von einem Intel Core i7-13700HX, einer Nvidia GeForce RTX 4060 Laptop GPU, 16 GB DDR5-4800-Speicher (Single-Stick) und einer 512 GB NVMe-SSD angetrieben.
Das Gerät bietet beeindruckende Spezifikationen, darunter ein QHD-Display mit 165 Hz und einen 73-Wh-Akku.
In diesem Test haben wir einen Blick auf das neue Colorful EVOL X15 AT geworfen und geprüft, ob es einige seiner etablierten Konkurrenten übertreffen kann.
Potential competitors in comparison
Bew. | Datum | Modell | Gewicht | Dicke | Größe | Auflösung | Preis ab |
|---|---|---|---|---|---|---|---|
| 84.9 % v7 (old) | 12 / 2023 | Colorful EVOL X15 AT 23 i7-13700HX, GeForce RTX 4060 Laptop GPU | 2.3 kg | 26.9 mm | 15.60" | 2560x1440 | |
| 88.3 % v7 (old) | 09 / 2023 | Alienware m16 R1 Intel i7-13700HX, GeForce RTX 4060 Laptop GPU | 3 kg | 25.4 mm | 16.00" | 2560x1600 | |
| 87.4 % v7 (old) | 07 / 2023 | HP Omen 16-wf000 i7-13700HX, GeForce RTX 4080 Laptop GPU | 2.4 kg | 23.6 mm | 16.10" | 2560x1440 | |
| 89.5 % v7 (old) | 07 / 2023 | Acer Predator Helios 16 PH16-71-731Q i7-13700HX, GeForce RTX 4060 Laptop GPU | 2.6 kg | 26.9 mm | 16.00" | 2560x1600 | |
| 84.2 % v7 (old) | 06 / 2023 | Dell G15 5530 i7-13650HX, GeForce RTX 4060 Laptop GPU | 3 kg | 26.95 mm | 15.60" | 1920x1080 | |
| 86.2 % v7 (old) | 07 / 2023 | Schenker XMG Pro 15 (E23) i9-13900HX, GeForce RTX 4060 Laptop GPU | 2.4 kg | 24.9 mm | 15.60" | 2560x1440 | |
| 89.2 % v7 (old) | 08 / 2023 | Alienware m16 R1 AMD R9 7845HX, GeForce RTX 4080 Laptop GPU | 3.1 kg | 25.4 mm | 16.00" | 2560x1600 | |
| 88.2 % v7 (old) | Uniwill GM6PX7X RTX 4070 i7-13700HX, GeForce RTX 4070 Laptop GPU | 2.2 kg | 22 mm | 16.00" | 2560x1600 |
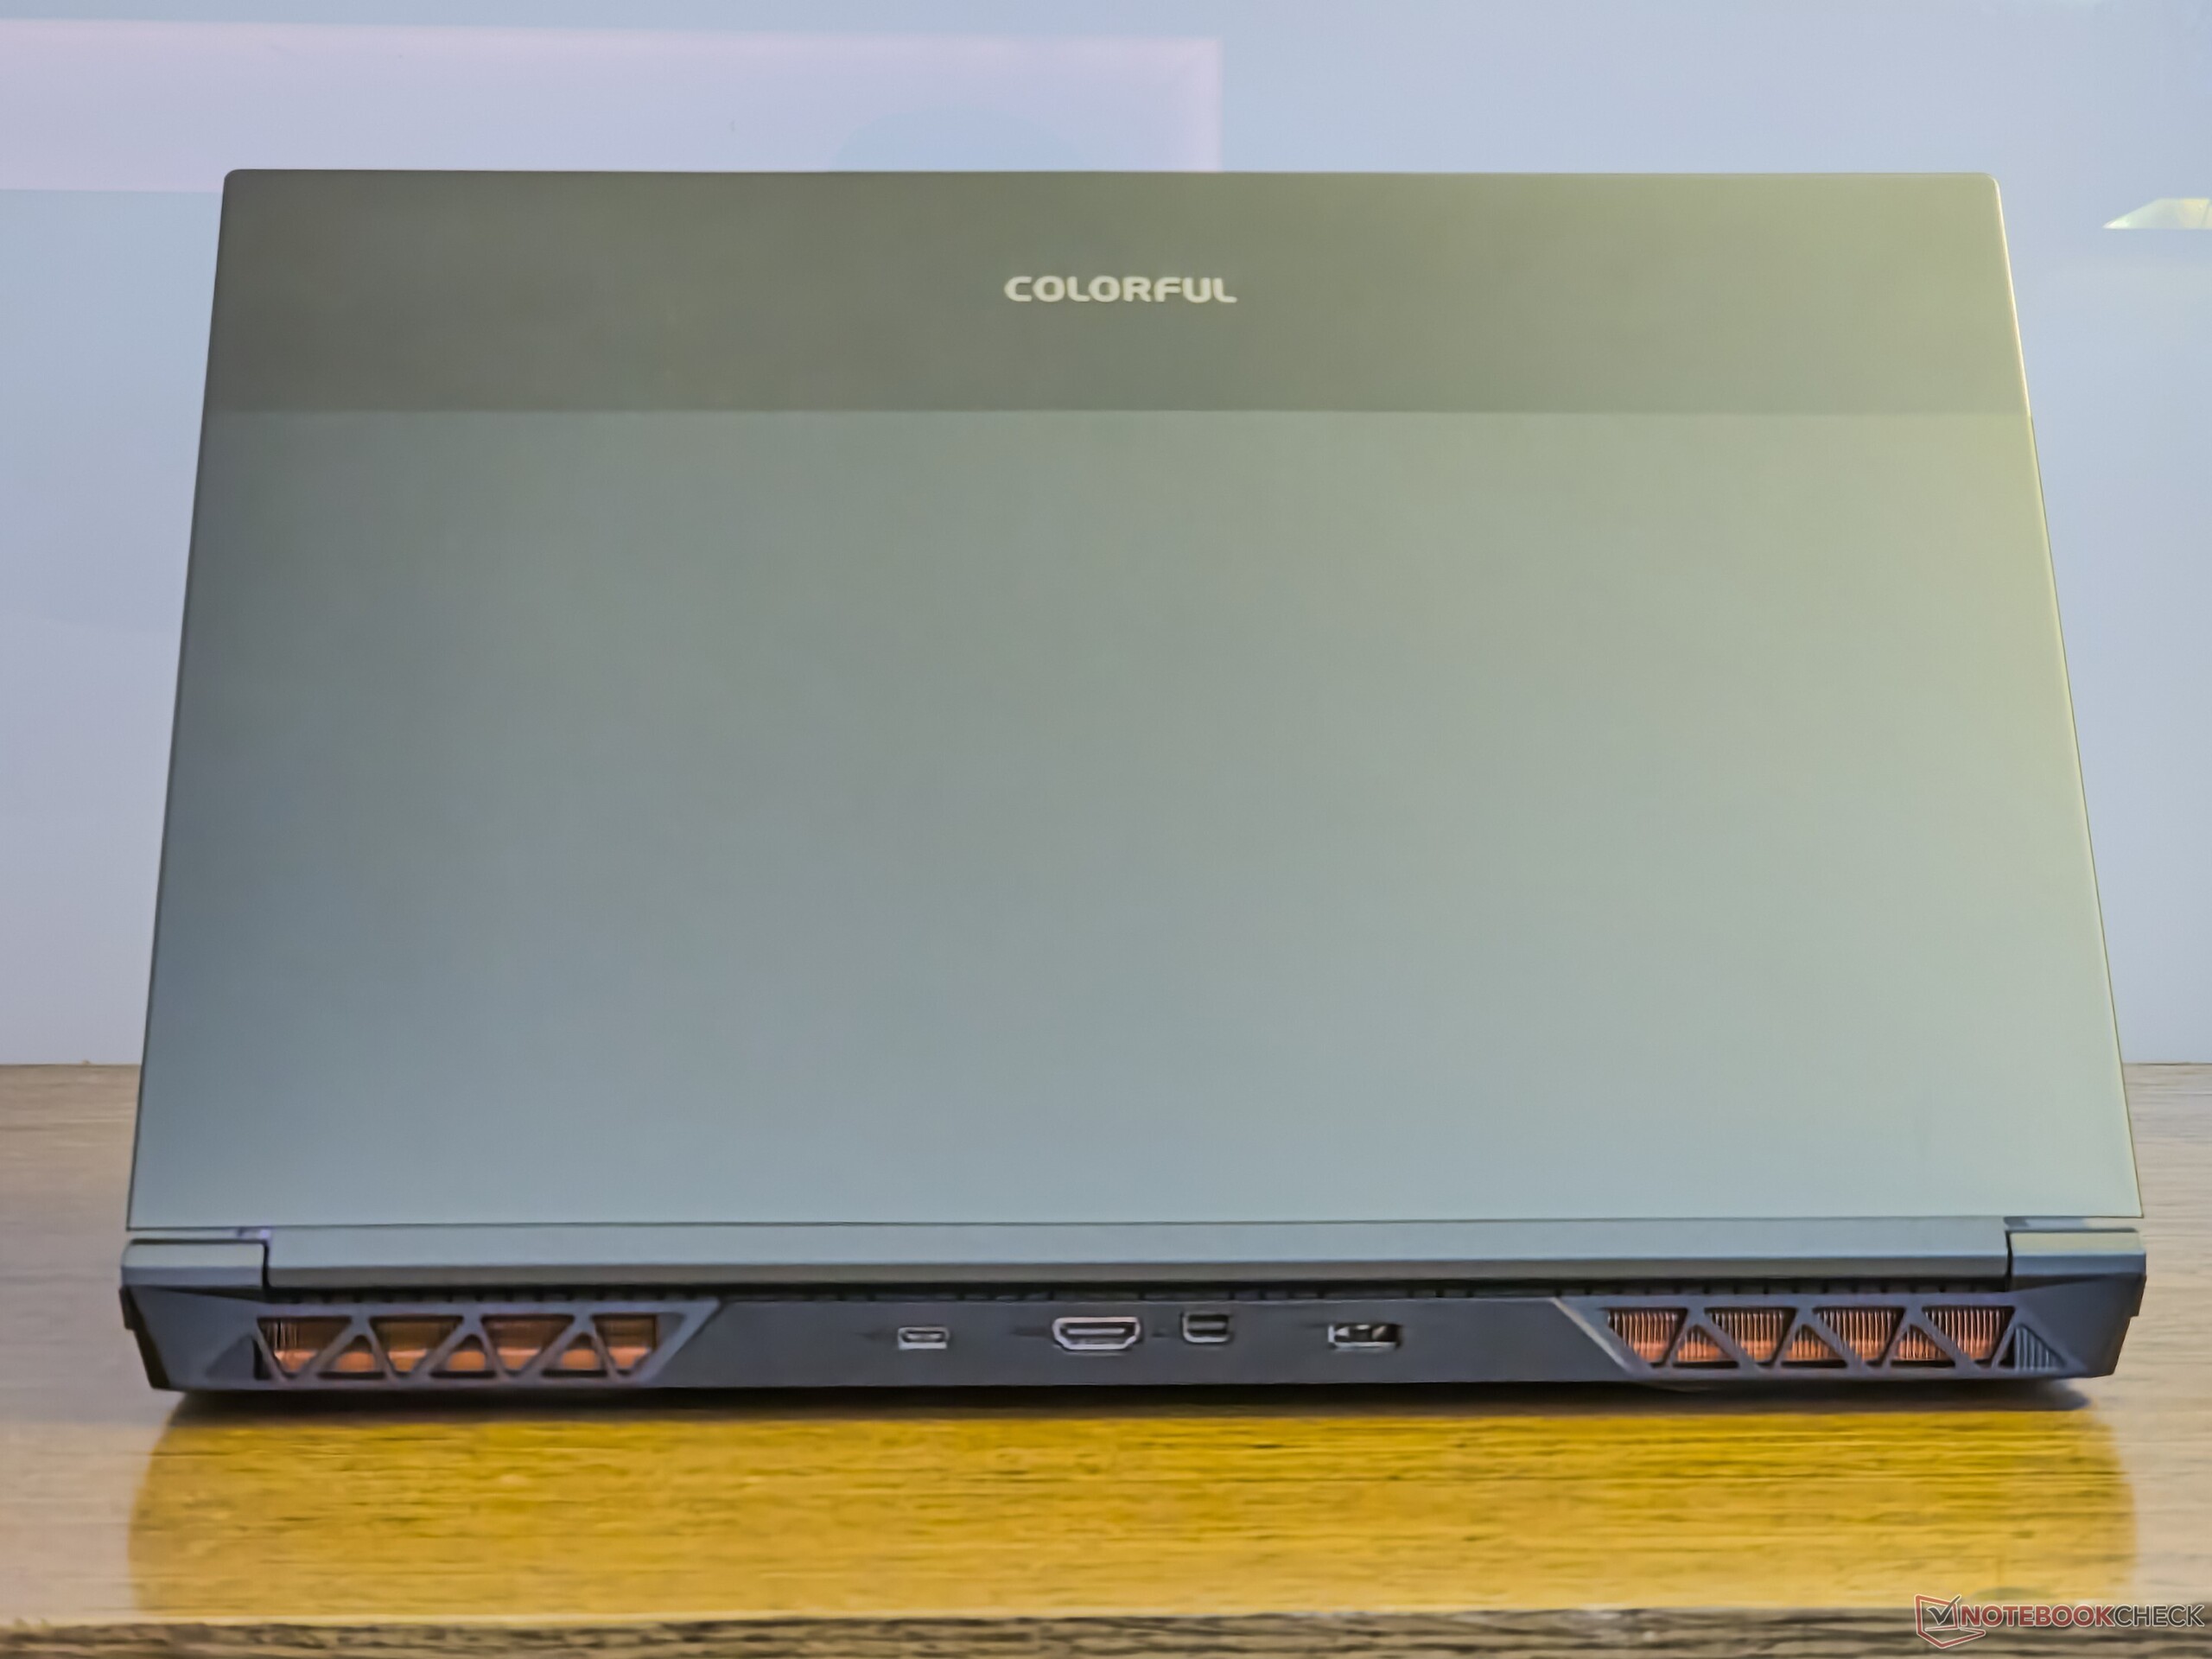
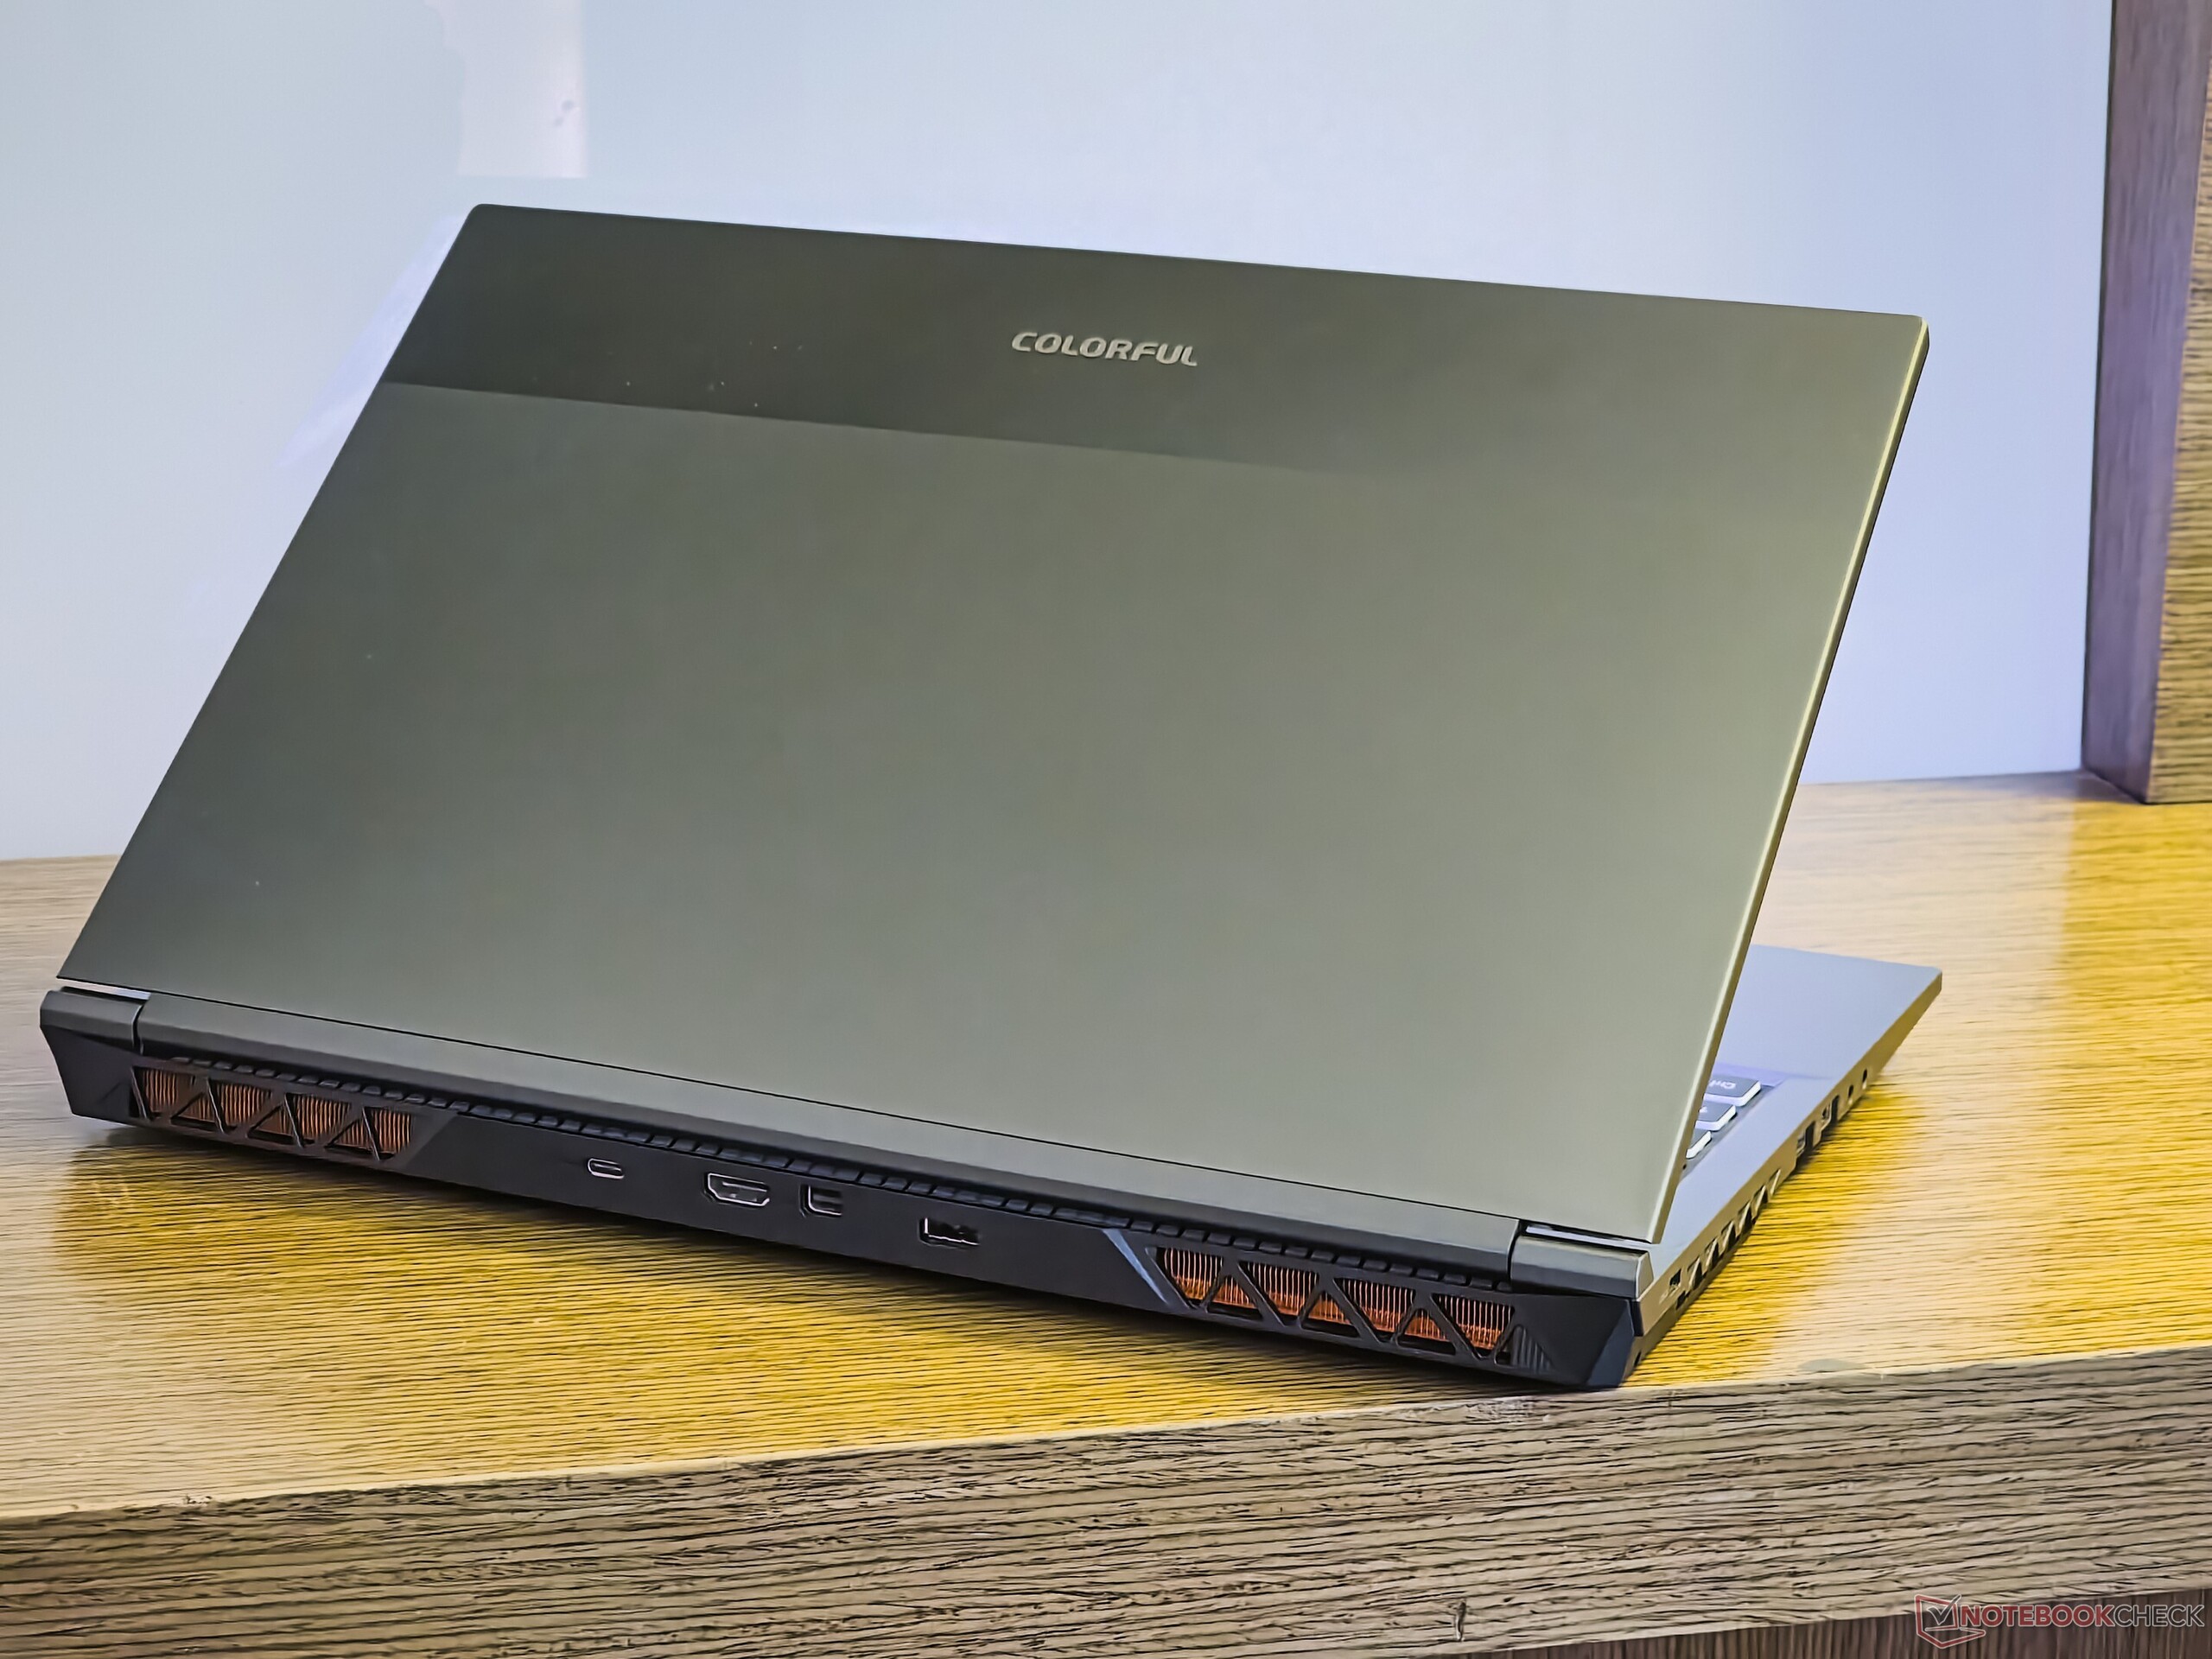
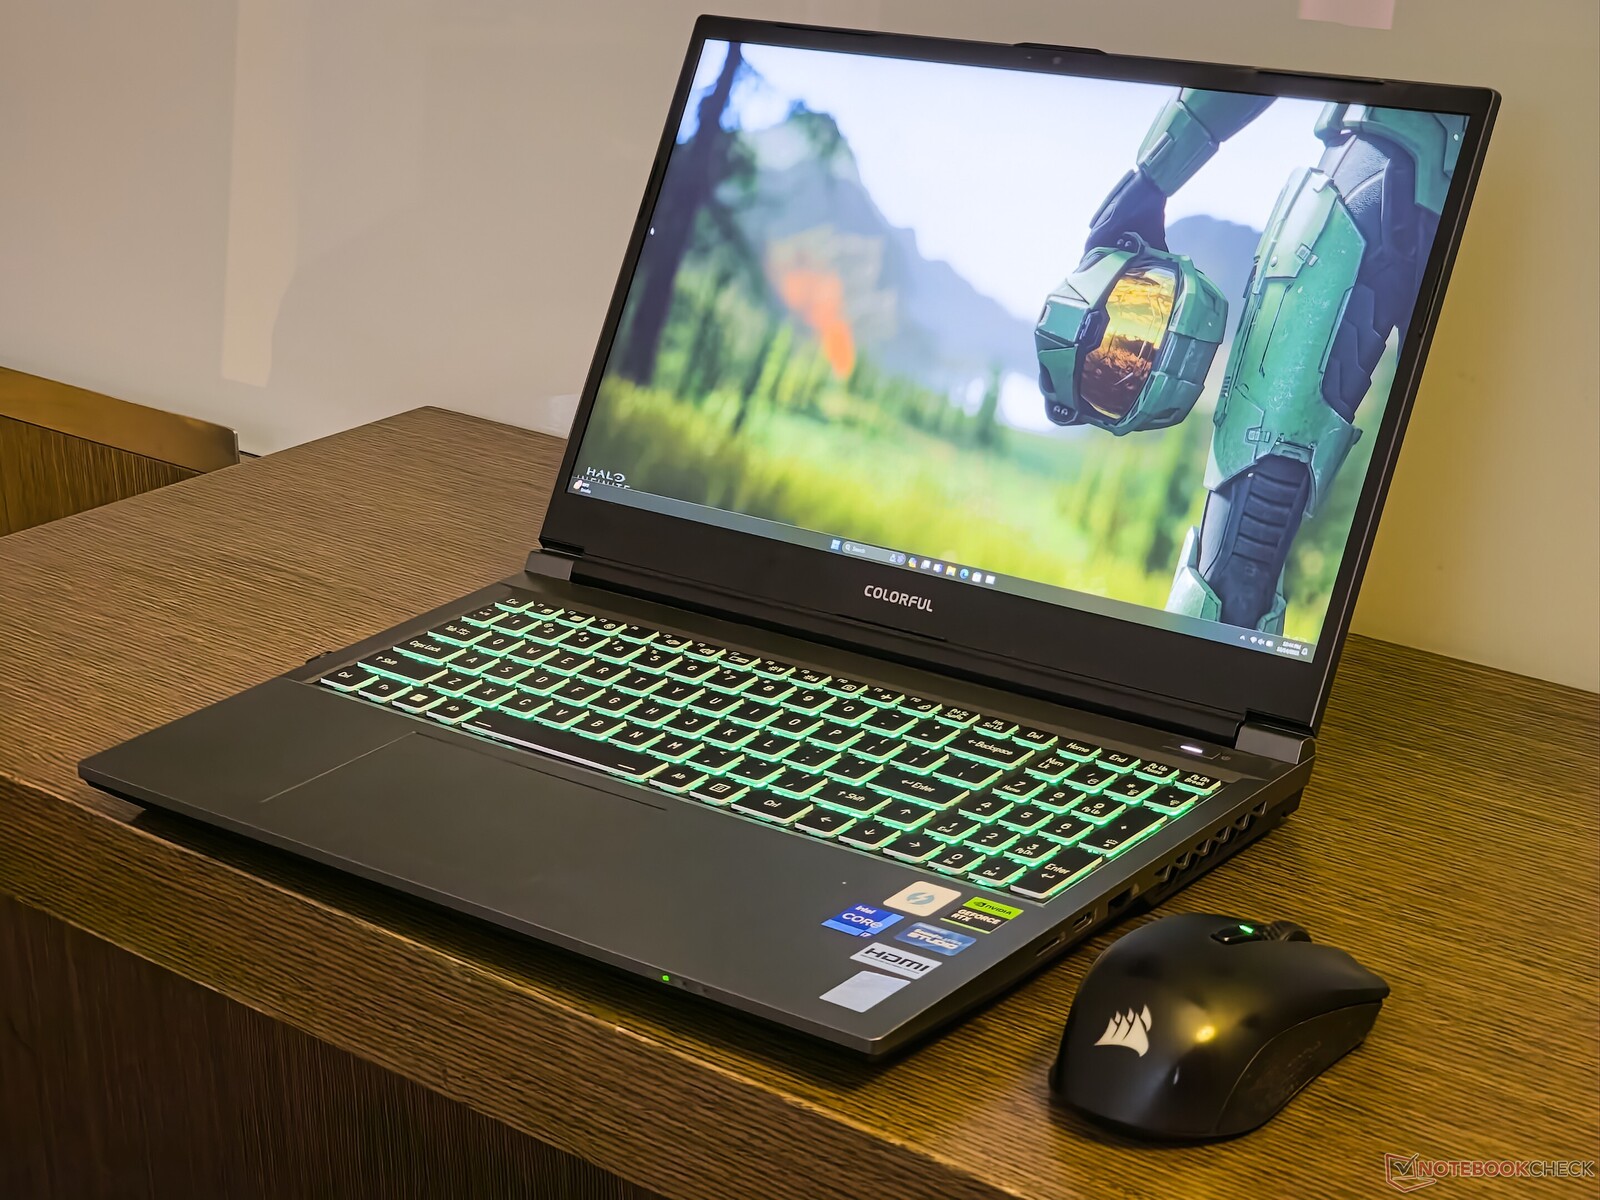
Gehäuse: Funktion anstatt Form in der Kunststoffästhetik von Clevo
Colorful bietet das EVOL X15 AT in drei Farbvarianten an - Grape Purple, Pine Blue und Mist Grey (unser Testgerät). Mit einer Dicke von 27,1 mm und einem Gewicht von 2,3 kg wird das EVOL X15 AT keinen Schlankheitspreis gewinnen. Dennoch ist es deutlich handlicher als das Dell G15 5530 und das Alienware m16 R1.
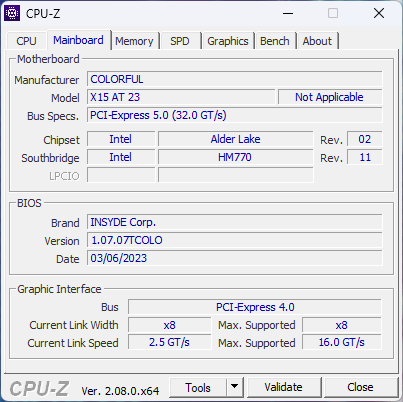
Das EVOL X15 AT ist ein Design von Clevo und besteht hauptsächlich aus einem robusten Kunststoffgehäuse. Die Konstruktion erinnert stark an das Gigabyte G5 KE, das ebenfalls eine Clevo-Marke ist. Trotz der robusten Bauweise konnten wir ein deutliches Nachgeben des Tastaturdecks feststellen.
Der Display-Deckel ist aus Metall und wackelt nicht viel. Die Scharniere haben eine ideale Spannung, so dass der Deckel mit einem Finger geöffnet werden kann, ohne dass die Basis rutscht.
Alles in allem zielt das EVOL X15 AT nicht darauf ab, mit einer eleganten Designsprache zu beeindrucken, sondern ist als Gaming-Laptop zweckmäßig genug.

Ausstattung: Typ-C-Anschlüsse ohne Stromanschluss
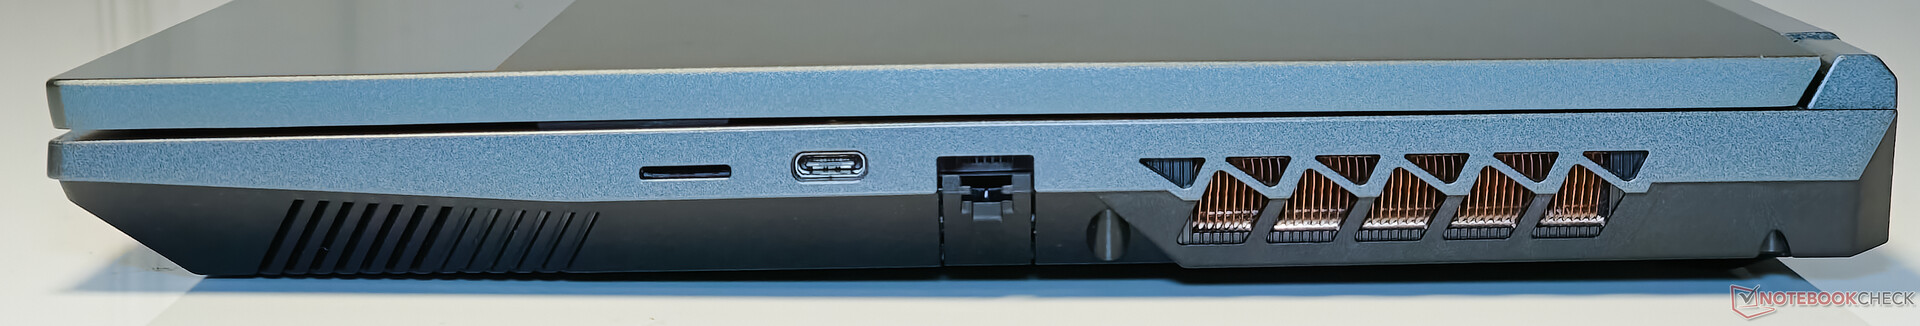
Das EVOL X15 AT von Colorful verfügt über eine ziemlich große Auswahl an Anschlüssen. Auf der linken Seite gibt es zwei USB-A-Anschlüsse, nämlich USB 2.0 und USB 3.2 Gen 1, sowie eine spezielle Line-In-Buchse für analoge Audioeingänge. Auf der rechten Seite sind Gigabit-LAN, Thunderbolt 4 und ein Slot für microSD-Karten vorhanden.
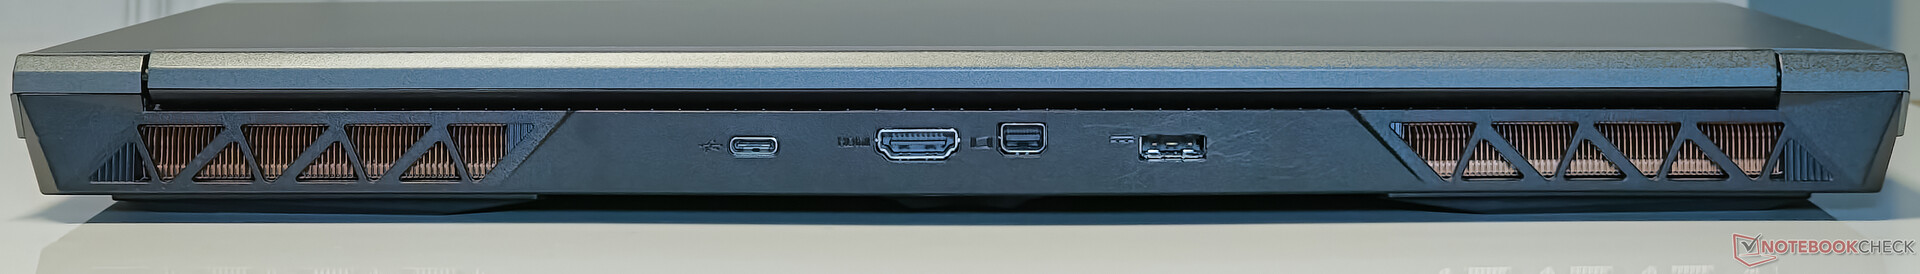
Die Rückseite des Laptops beherbergt USB 3.2 Gen2 Typ-C, einen Mini-DisplayPort-Ausgang und einen HDMI-Ausgang.
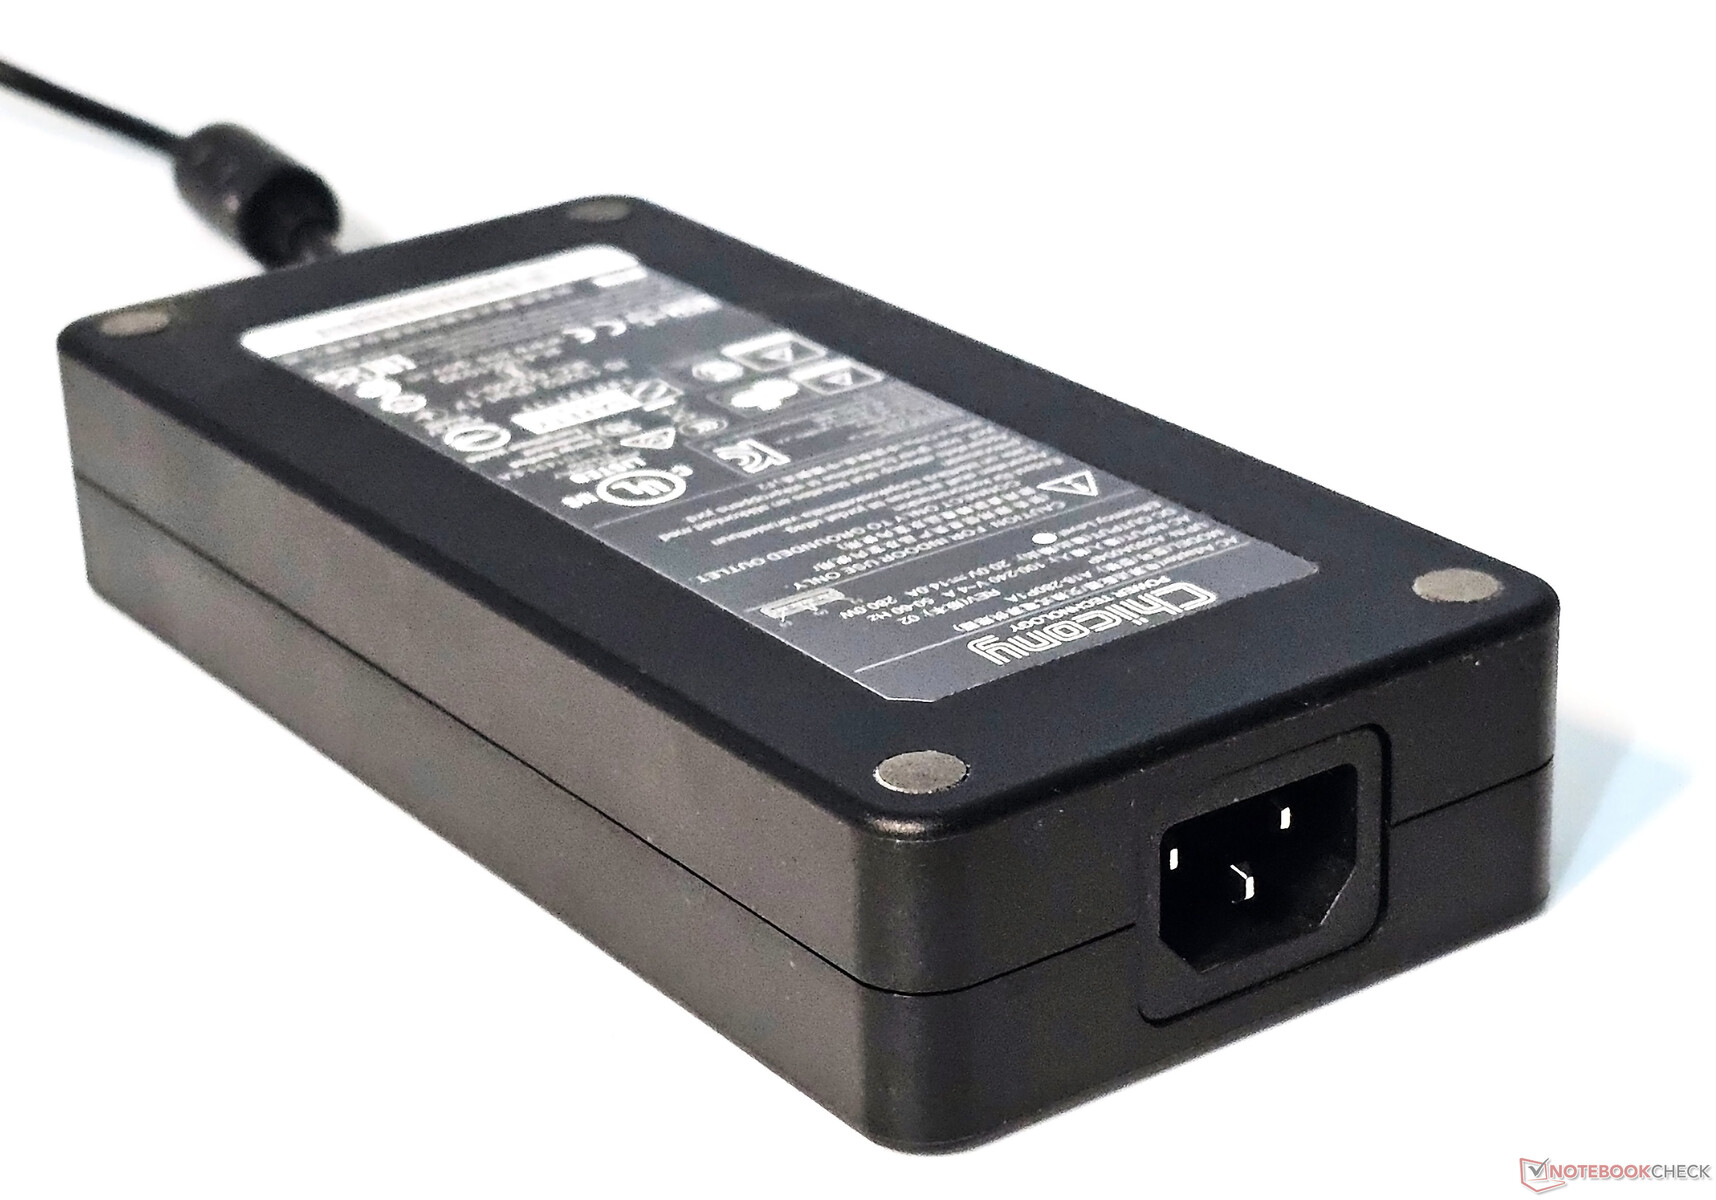
Es ist jedoch zu beachten, dass die Type-C-Anschlüsse leider nur den Stromausgang unterstützen. Daher ist es notwendig, das fast 1 kg schwere Netzteil mitzuführen, um das Notebook überall mit Strom zu versorgen.

SD Card Reader
Der microSD-Kartenleser des EVOL X15 bricht keine Geschwindigkeitsrekorde und ist bei den Tests zum Kopieren von JPGs und zum sequentiellen Lesen von AS SSDs etwa 28% langsamer als der Durchschnitt in seiner Klasse.
| SD Card Reader | |
| average JPG Copy Test (av. of 3 runs) | |
| Alienware m16 R1 AMD (Toshiba Exceria Pro SDXC 64 GB UHS-II) | |
| Alienware m16 R1 Intel (AV PRO microSD 128 GB V60) | |
| Durchschnitt der Klasse Gaming (20.9 - 210, n=54, der letzten 2 Jahre) | |
| Schenker XMG Pro 15 (E23) | |
| Colorful EVOL X15 AT 23 (AV PRO microSD 128 GB V60) | |
| Acer Predator Helios 16 PH16-71-731Q | |
| Uniwill GM6PX7X RTX 4070 (AV PRO microSD 128 GB V60) | |
| maximum AS SSD Seq Read Test (1GB) | |
| Alienware m16 R1 AMD (Toshiba Exceria Pro SDXC 64 GB UHS-II) | |
| Alienware m16 R1 Intel (AV PRO microSD 128 GB V60) | |
| Durchschnitt der Klasse Gaming (25.5 - 261, n=51, der letzten 2 Jahre) | |
| Schenker XMG Pro 15 (E23) | |
| Colorful EVOL X15 AT 23 (AV PRO microSD 128 GB V60) | |
| Uniwill GM6PX7X RTX 4070 (AV PRO microSD 128 GB V60) | |
| Acer Predator Helios 16 PH16-71-731Q | |
Kommunikation

Das EVOL X15 AT ist mit einem Intel Wi-Fi 6E AX211 WLAN-Chip ausgestattet. Die Übertragungsraten sind sowohl im 5-GHz- als auch im 6-GHz-Band ziemlich konsistent, wenn sie mit unserem Referenz-Router Asus ROG Rapture GT-AXE11000 getestet werden.
Das Notebook bietet einen hervorragenden Sende- und Empfangsdurchsatz im 5-GHz-Band. Im 6-GHz-Bereich bleibt das EVOL X15 in den iPerf3-Sendetests hinter dem Alienware m16 R1 AMD zurück, macht diesen Rückstand aber in den Empfangstests mit einem Spitzendurchsatz von 1,7 Gbit/s wieder gut.
| Networking / iperf3 transmit AXE11000 | |
| Colorful EVOL X15 AT 23 | |
| Dell G15 5530 | |
| Alienware m16 R1 AMD | |
| Acer Predator Helios 16 PH16-71-731Q | |
| Alienware m16 R1 Intel | |
| Durchschnitt der Klasse Gaming (560 - 1862, n=92, der letzten 2 Jahre) | |
| Durchschnittliche Intel Wi-Fi 6E AX211 (64 - 1921, n=276) | |
| Uniwill GM6PX7X RTX 4070 | |
| HP Omen 16-wf000 | |
| Schenker XMG Pro 15 (E23) | |
| Networking / iperf3 receive AXE11000 | |
| Colorful EVOL X15 AT 23 | |
| Alienware m16 R1 Intel | |
| Dell G15 5530 | |
| Durchschnitt der Klasse Gaming (680 - 1745, n=92, der letzten 2 Jahre) | |
| Acer Predator Helios 16 PH16-71-731Q | |
| Alienware m16 R1 AMD | |
| Durchschnittliche Intel Wi-Fi 6E AX211 (582 - 1890, n=276) | |
| HP Omen 16-wf000 | |
| Uniwill GM6PX7X RTX 4070 | |
| Schenker XMG Pro 15 (E23) | |
| Networking / iperf3 transmit AXE11000 6GHz | |
| Alienware m16 R1 AMD | |
| Acer Predator Helios 16 PH16-71-731Q | |
| Schenker XMG Pro 15 (E23) | |
| Colorful EVOL X15 AT 23 | |
| Durchschnitt der Klasse Gaming (723 - 2355, n=38, der letzten 2 Jahre) | |
| Durchschnittliche Intel Wi-Fi 6E AX211 (385 - 1851, n=226) | |
| HP Omen 16-wf000 | |
| Networking / iperf3 receive AXE11000 6GHz | |
| Colorful EVOL X15 AT 23 | |
| Schenker XMG Pro 15 (E23) | |
| Durchschnitt der Klasse Gaming (975 - 1775, n=37, der letzten 2 Jahre) | |
| Alienware m16 R1 AMD | |
| Durchschnittliche Intel Wi-Fi 6E AX211 (700 - 1857, n=226) | |
| Acer Predator Helios 16 PH16-71-731Q | |
| HP Omen 16-wf000 | |
Webcam
Da das EVOL X15 in erster Linie auf Spiele ausgerichtet ist, begnügt es sich mit einer herkömmlichen 720p-Webcam. Die Webcam ist für schnelle Videochats ausreichend, lässt jedoch in Bezug auf Farbgenauigkeit, Detailwiedergabe und Gesamtschärfe zu wünschen übrig.


Sicherheit
Es werden keine besonderen Sicherheitsfunktionen wie biometrische Anmeldungen eingebaut. Ein TPM 2.0-Modul ist vorhanden, um die Sicherheitsanforderungen von Windows 11 zu erfüllen.
Zubehör & Garantie
Außer dem 280-Watt-Netzteil und dem üblichen Papierkram befindet sich kein weiteres Zubehör im Karton. Das Colorful EVOL X15 AT wird mit einer zweijährigen Standardgarantie geliefert.
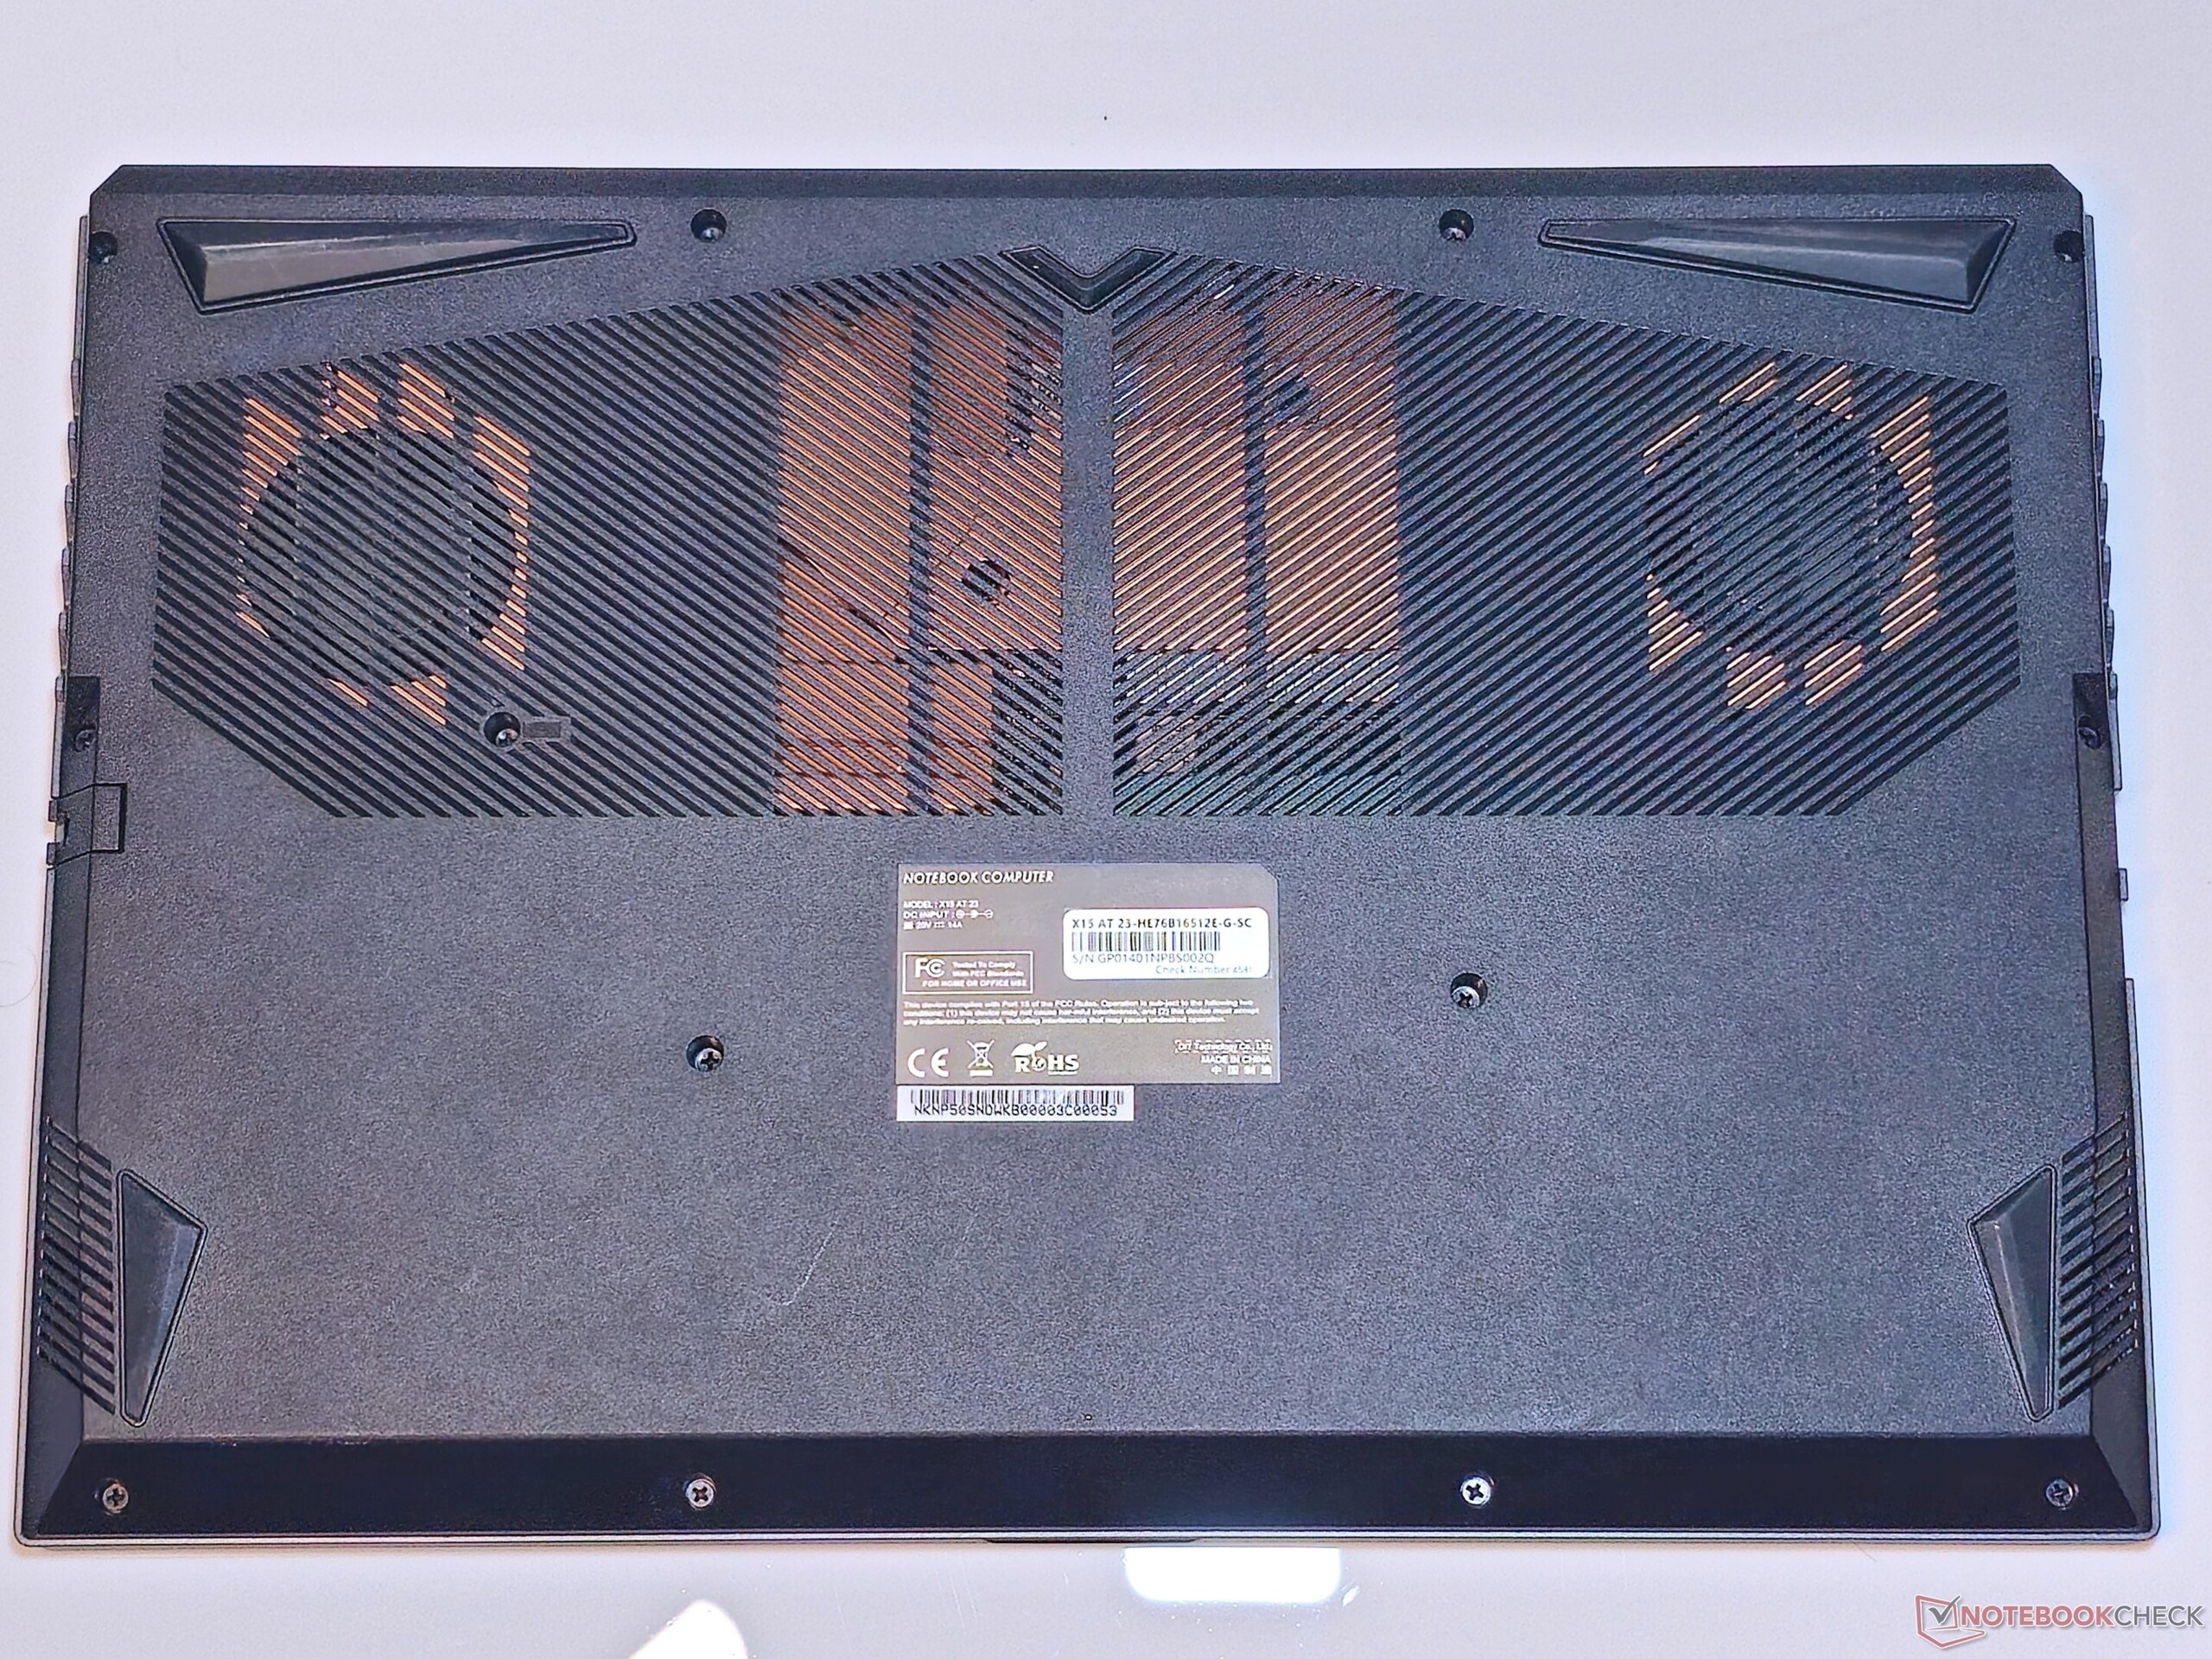
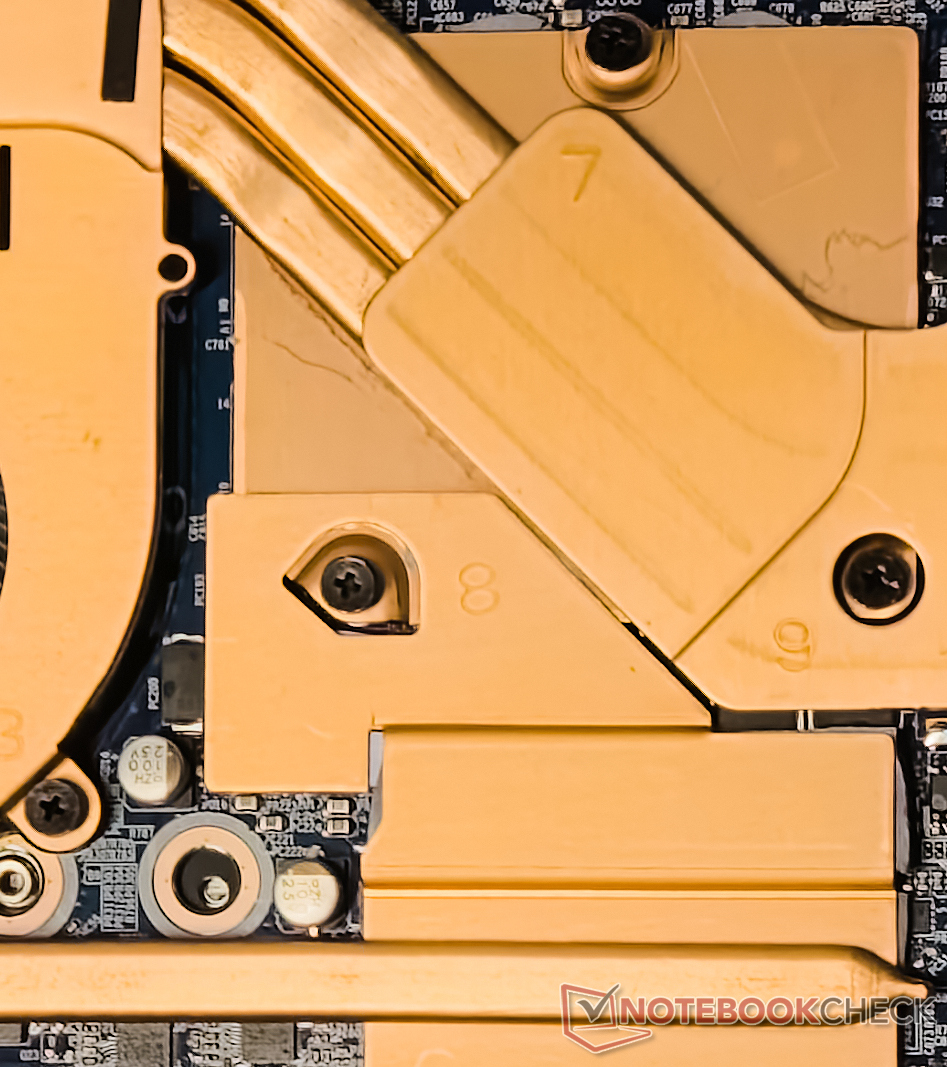
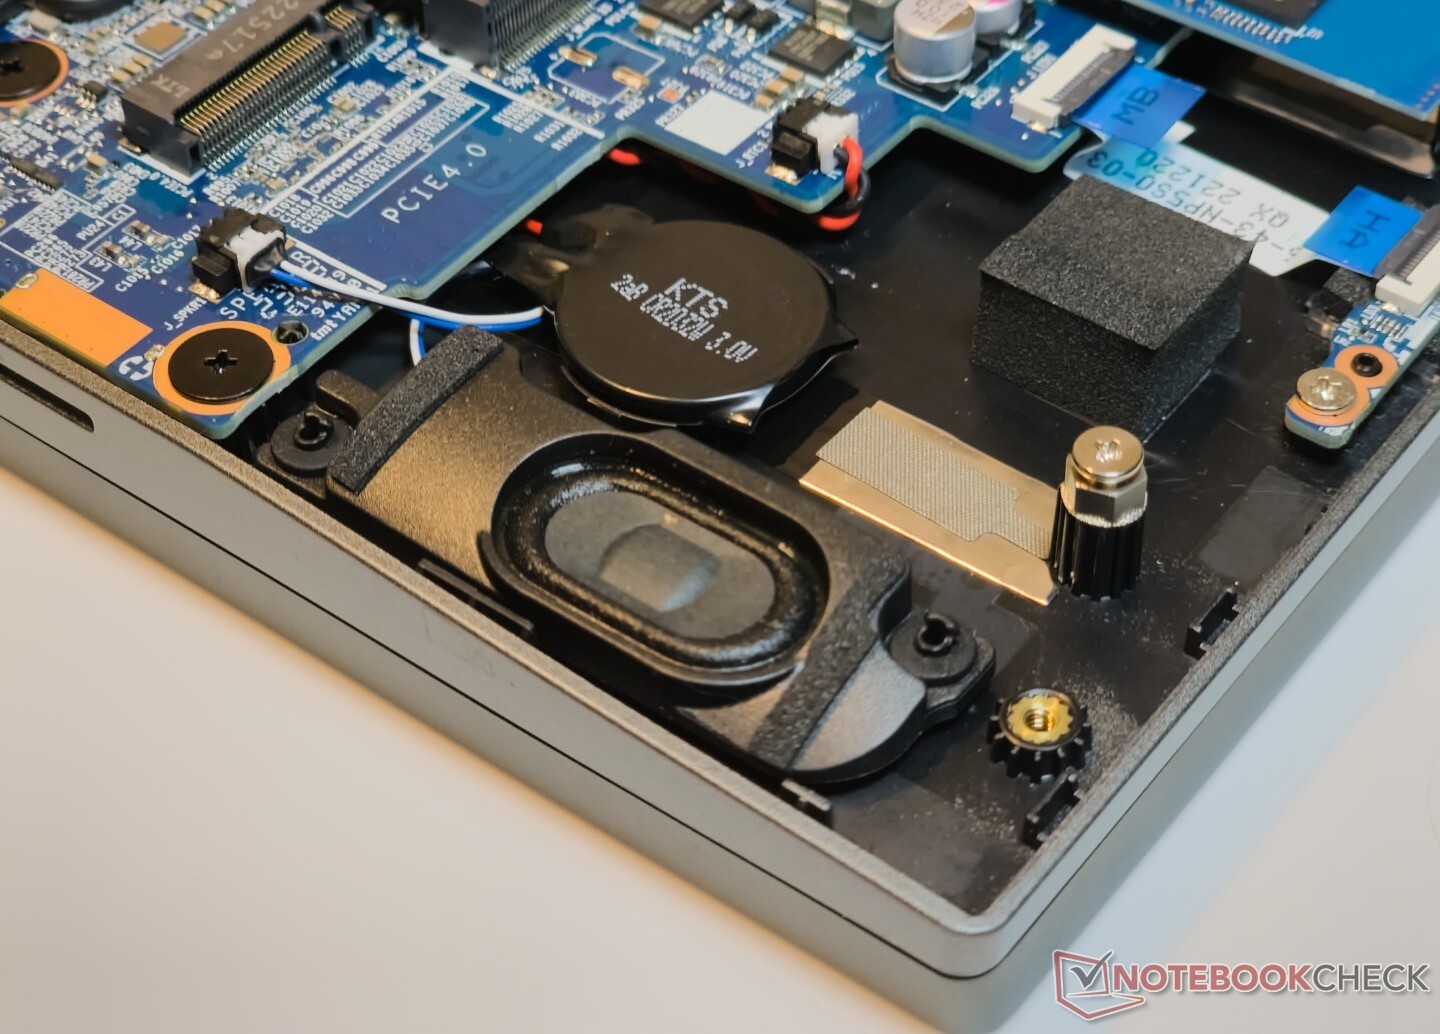
Wartung
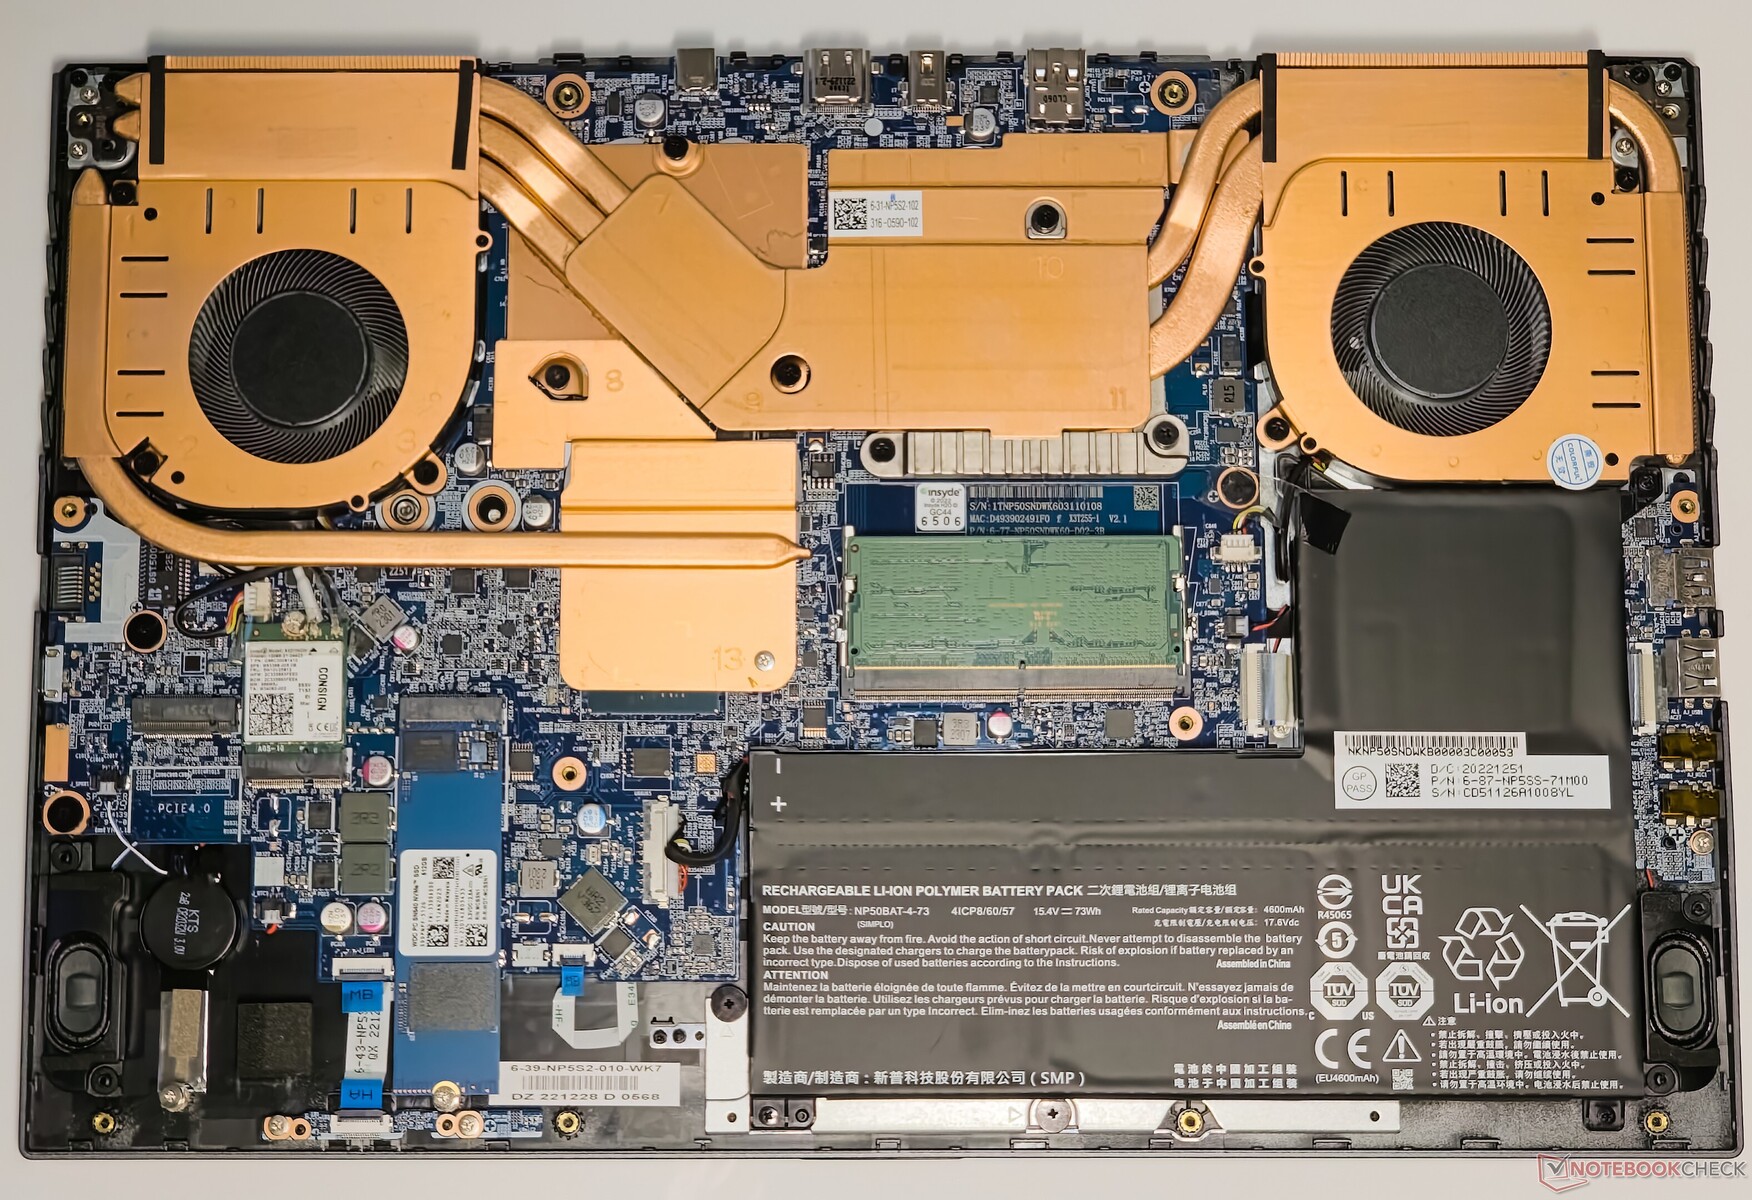
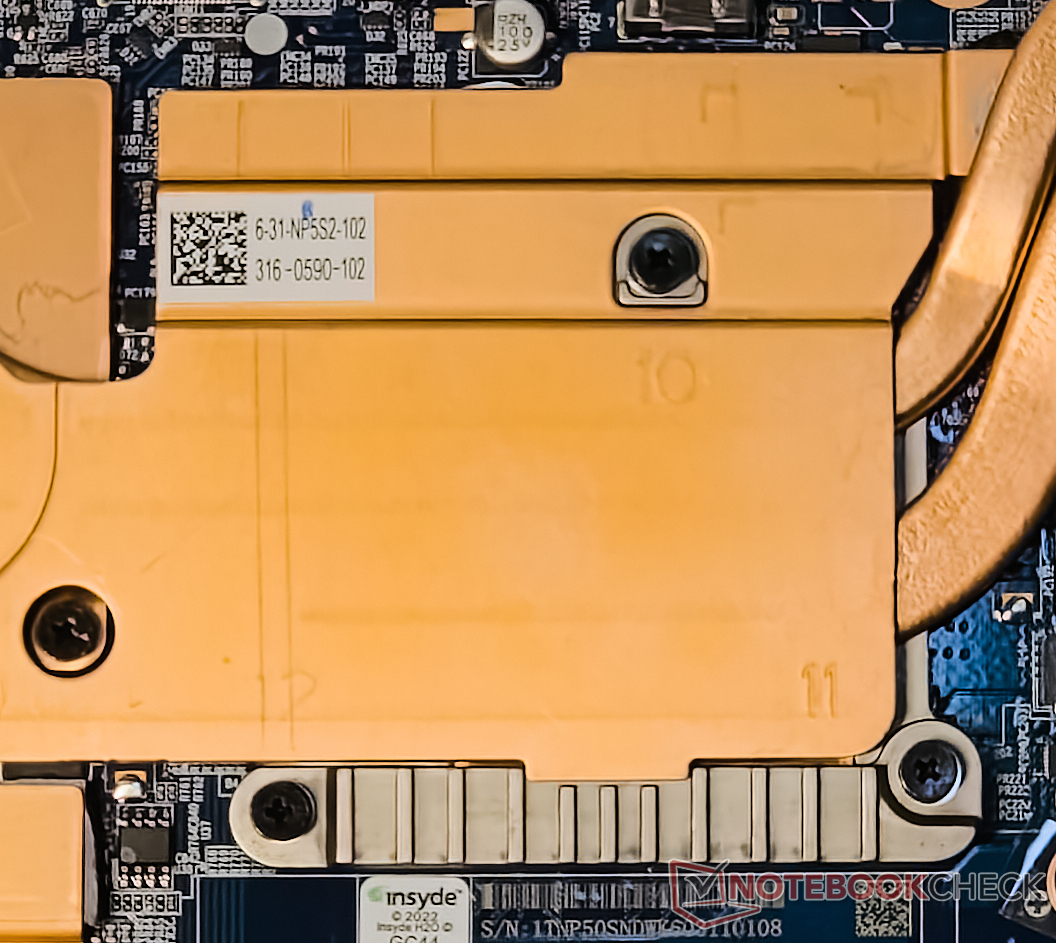
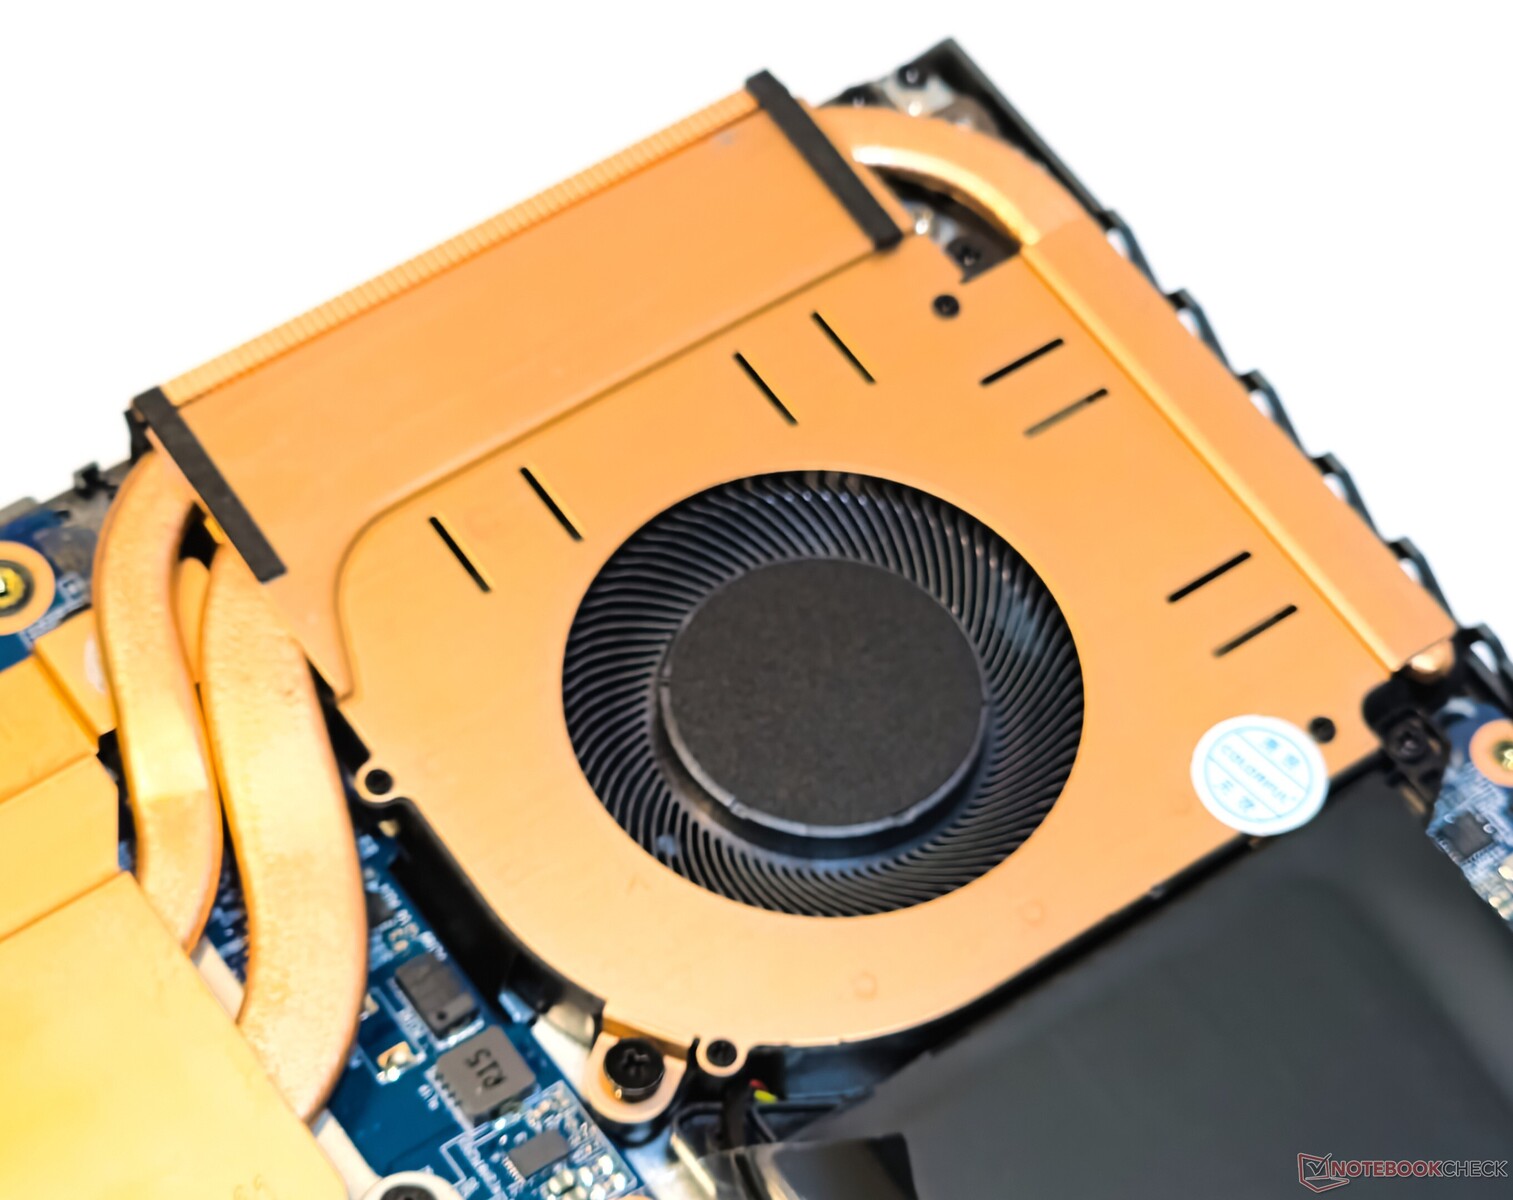
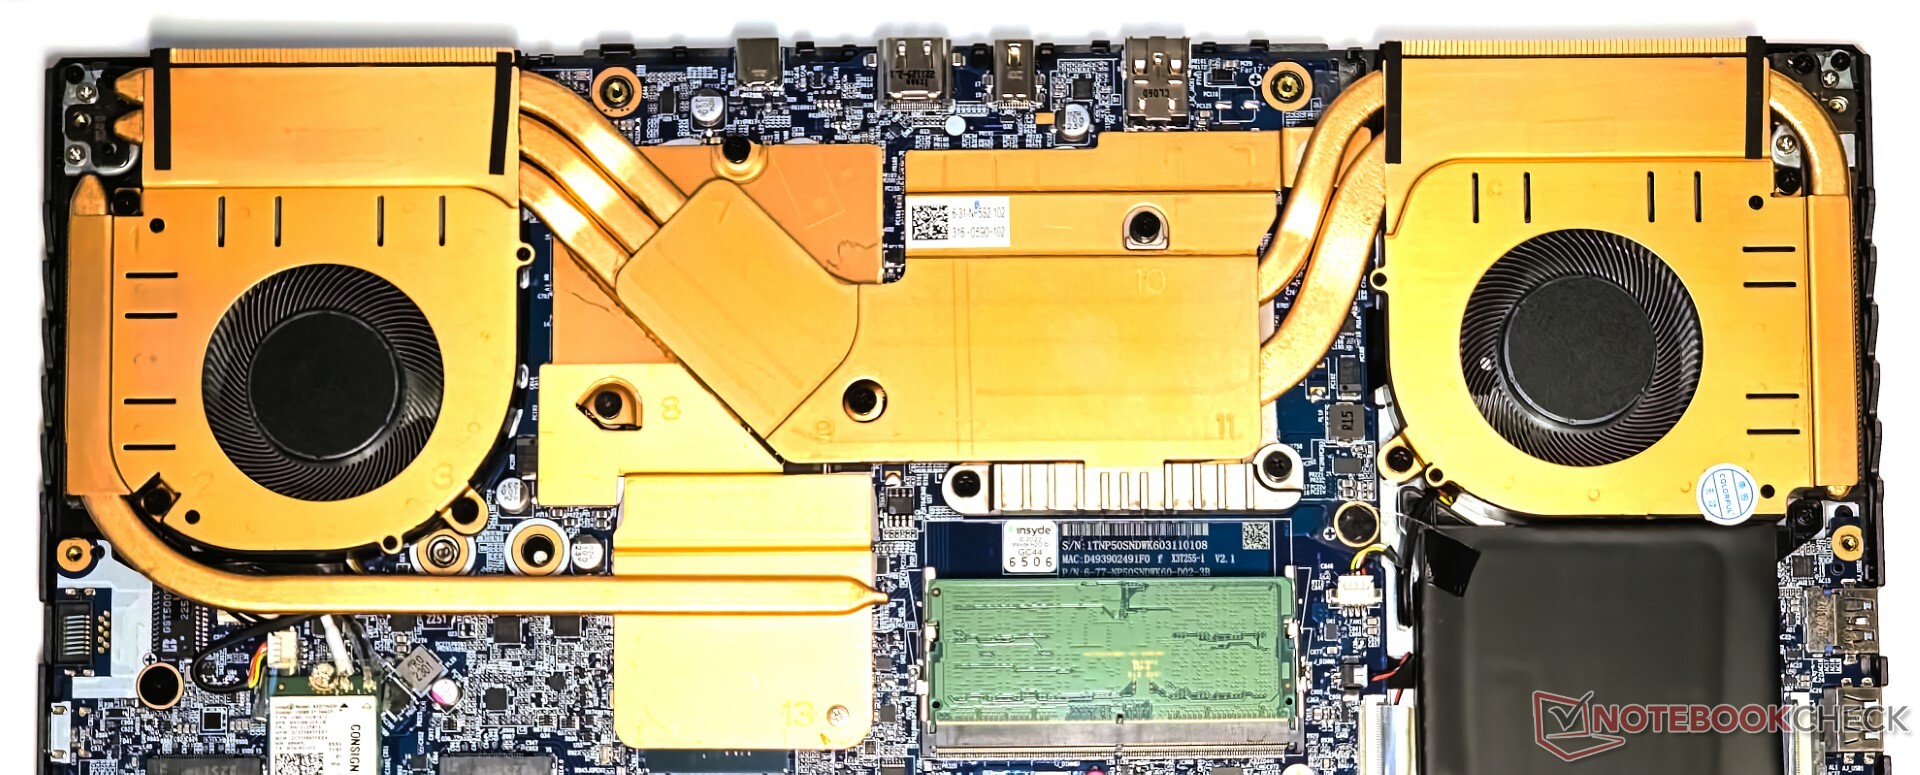
Die Rückwand lässt sich nach dem Entfernen der 13 PH0-Schrauben leicht abnehmen. Das EVOL X15 verfügt über ein gut durchdachtes internes Layout und ein umfangreiches Kühlsystem aus Kupfer für die CPU und die GPU.
Unser Gerät war nur mit einem einzigen 16 GB DDR5-4800-Stick im Dual-Channel-Modus ausgestattet. Die WLAN-Karte, der Arbeitsspeicher und die NVMe-SSD können bei Bedarf ausgetauscht oder aufgerüstet werden, und der L-förmige Akkupack kann abgeschraubt werden.
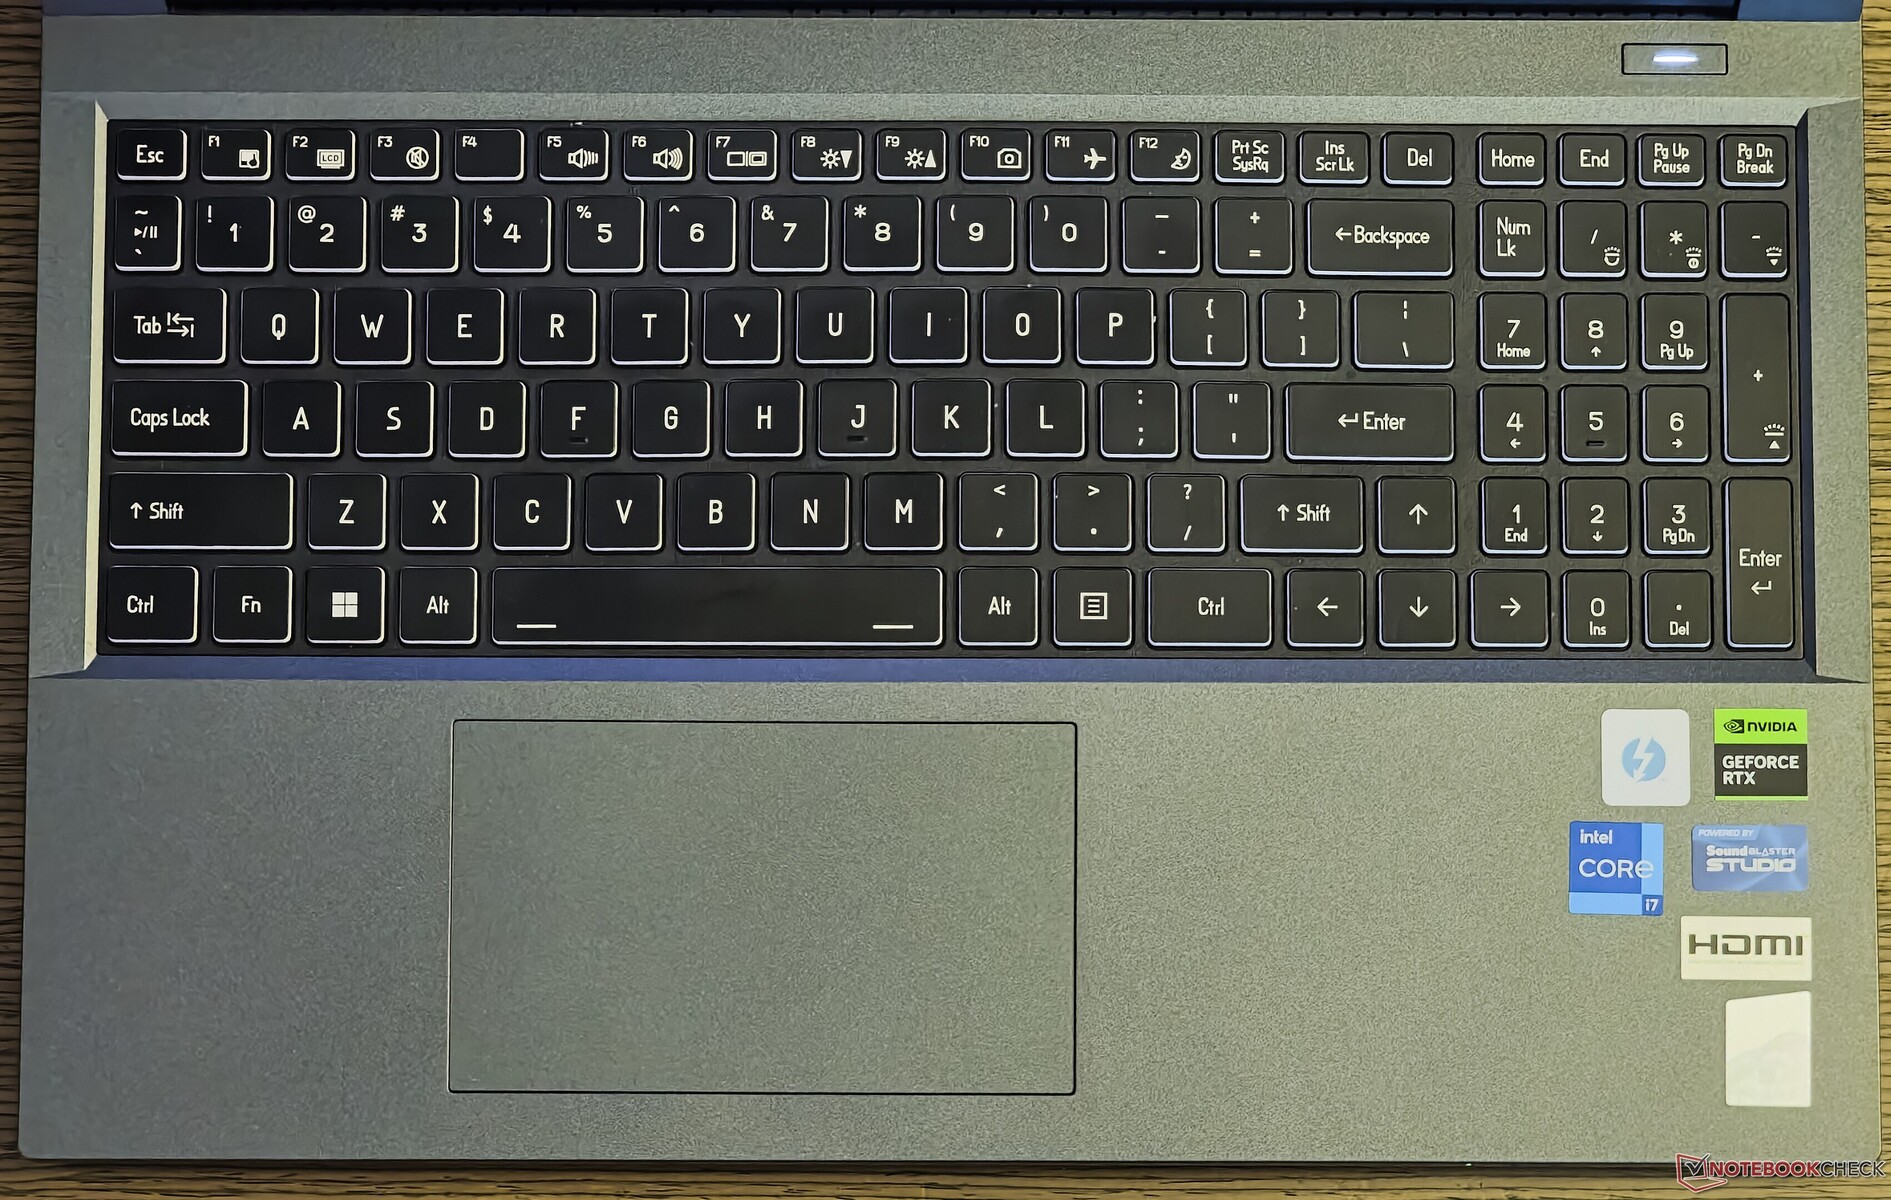
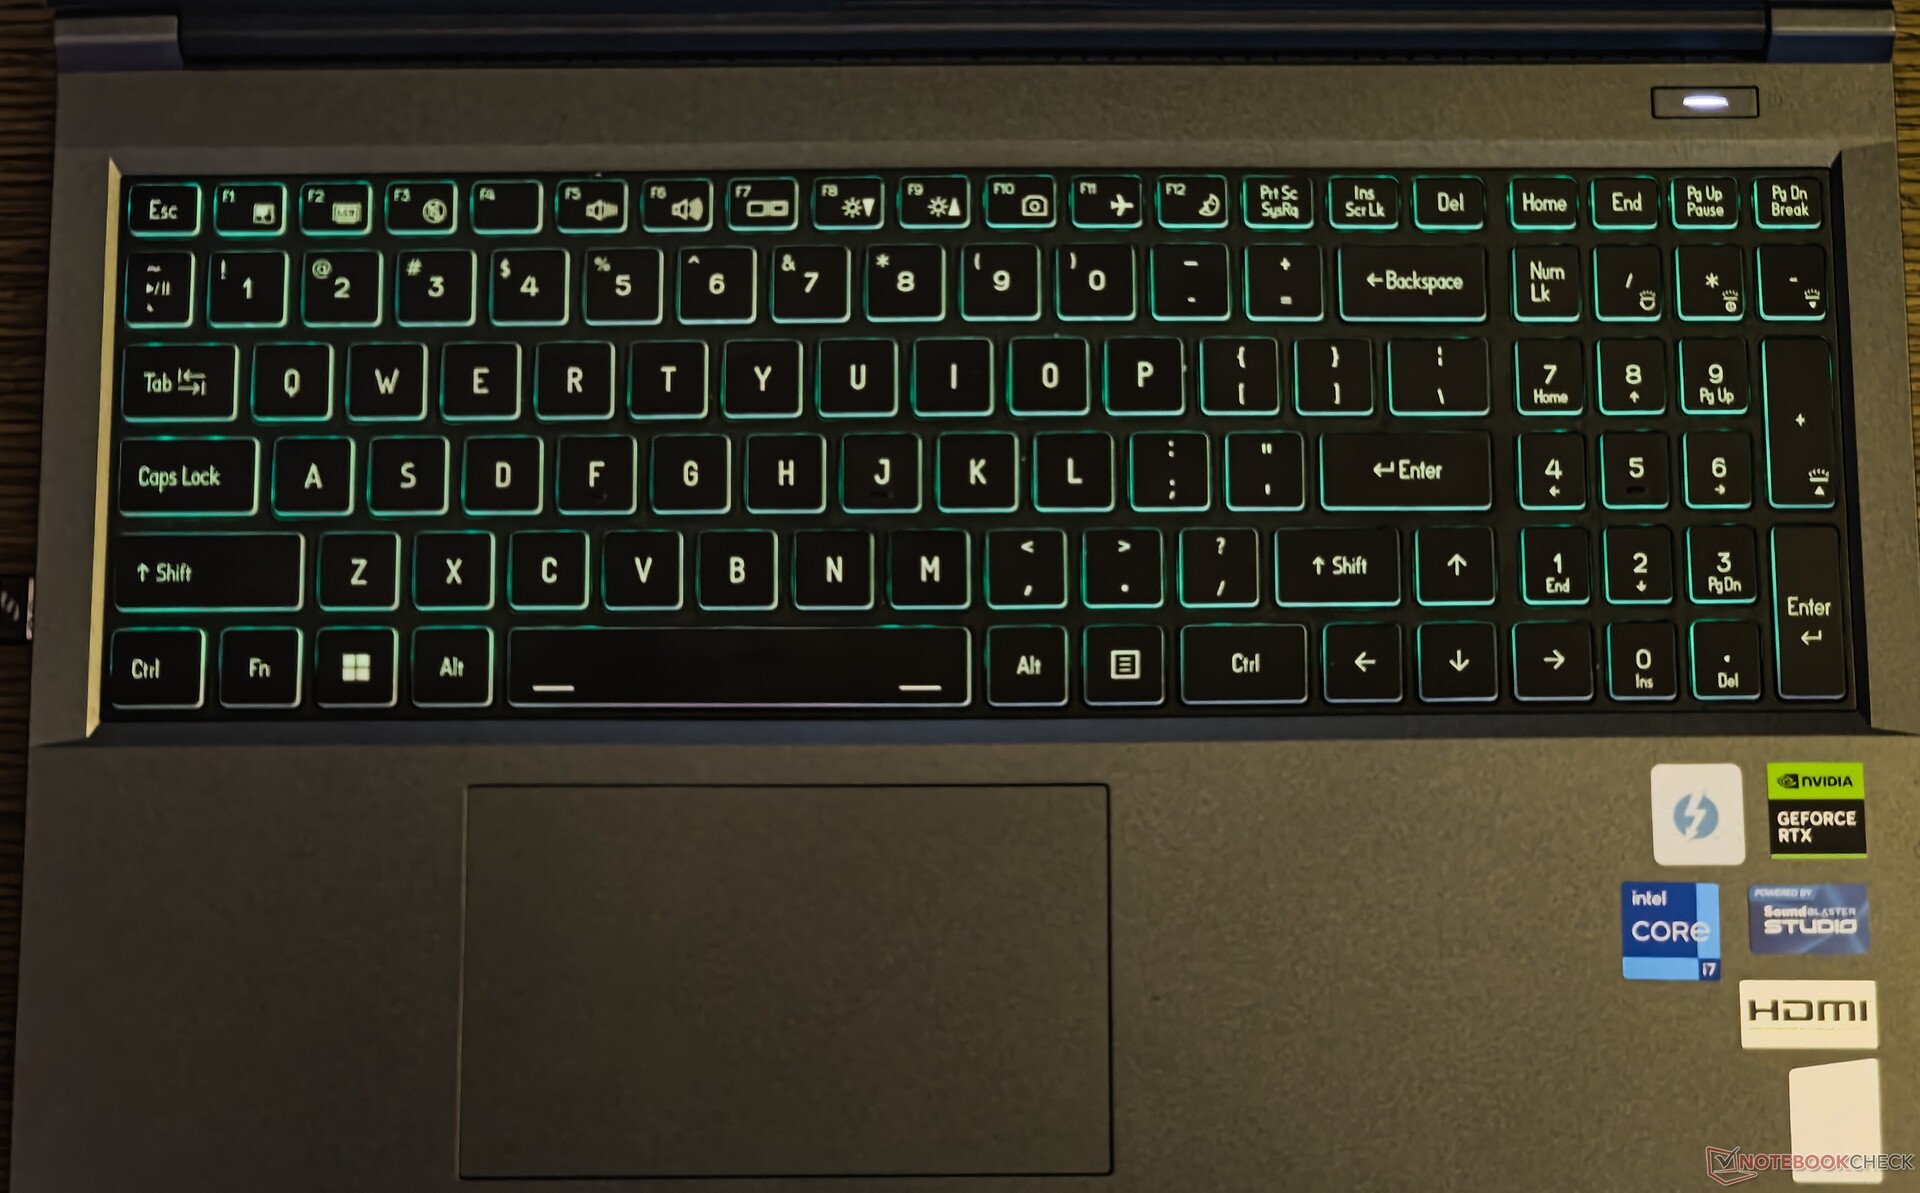
Eingabegeräte: Schwammige Tasten mit ordentlicher Taktilität
Tastatur
Die vollwertige Tastatur des EVOL X15 verfügt über einen Nummernblock und Platz für Pfeiltasten in angemessener Größe, was besonders für Rennspiele vorteilhaft ist. Ein Nachteil dieses Layouts ist die verkürzte rechte Umschalttaste, die Nutzer stören könnte, die von einer typischen Desktop- oder sogar Laptop-Tastatur umsteigen.
Der Tastenhub fühlt sich anfangs etwas schwammig an, aber die Taktilität ist für Spiele und das Tippen ausreichend. Die Control-Center-App von Colorful (bzw. Clevo) ermöglicht die Aufzeichnung von Tastatur- und Mausmakros, was für MMORPG- und MOBA-Spieler sehr nützlich sein dürfte.
Es gibt keine Mehrzonen- oder RGB-Hintergrundbeleuchtung pro Taste, sodass Sie sich mit einer begrenzten Farbpalette in der Control Center-App begnügen müssen. Die Hintergrundbeleuchtung kann in vier Stufen eingestellt werden, aber die Tasten filtern eine gute Menge an Licht aus dem Durchgang heraus.
Touchpad
Das 12cm x 7cm große Touchpad ist nicht das größte, das wir in diesem Jahr bei Gaming-Laptops gesehen haben, aber es bietet ein relativ sanftes Gleiten und unterstützt Windows Precision-Gesten vollständig.
Die gesamte Touchpad-Oberfläche dient als linke Maustaste. Allerdings sind Klicks in der Mitte und am unteren Rand des Touchpads einfacher und weniger geräuschvoll als in den oberen Ecken.
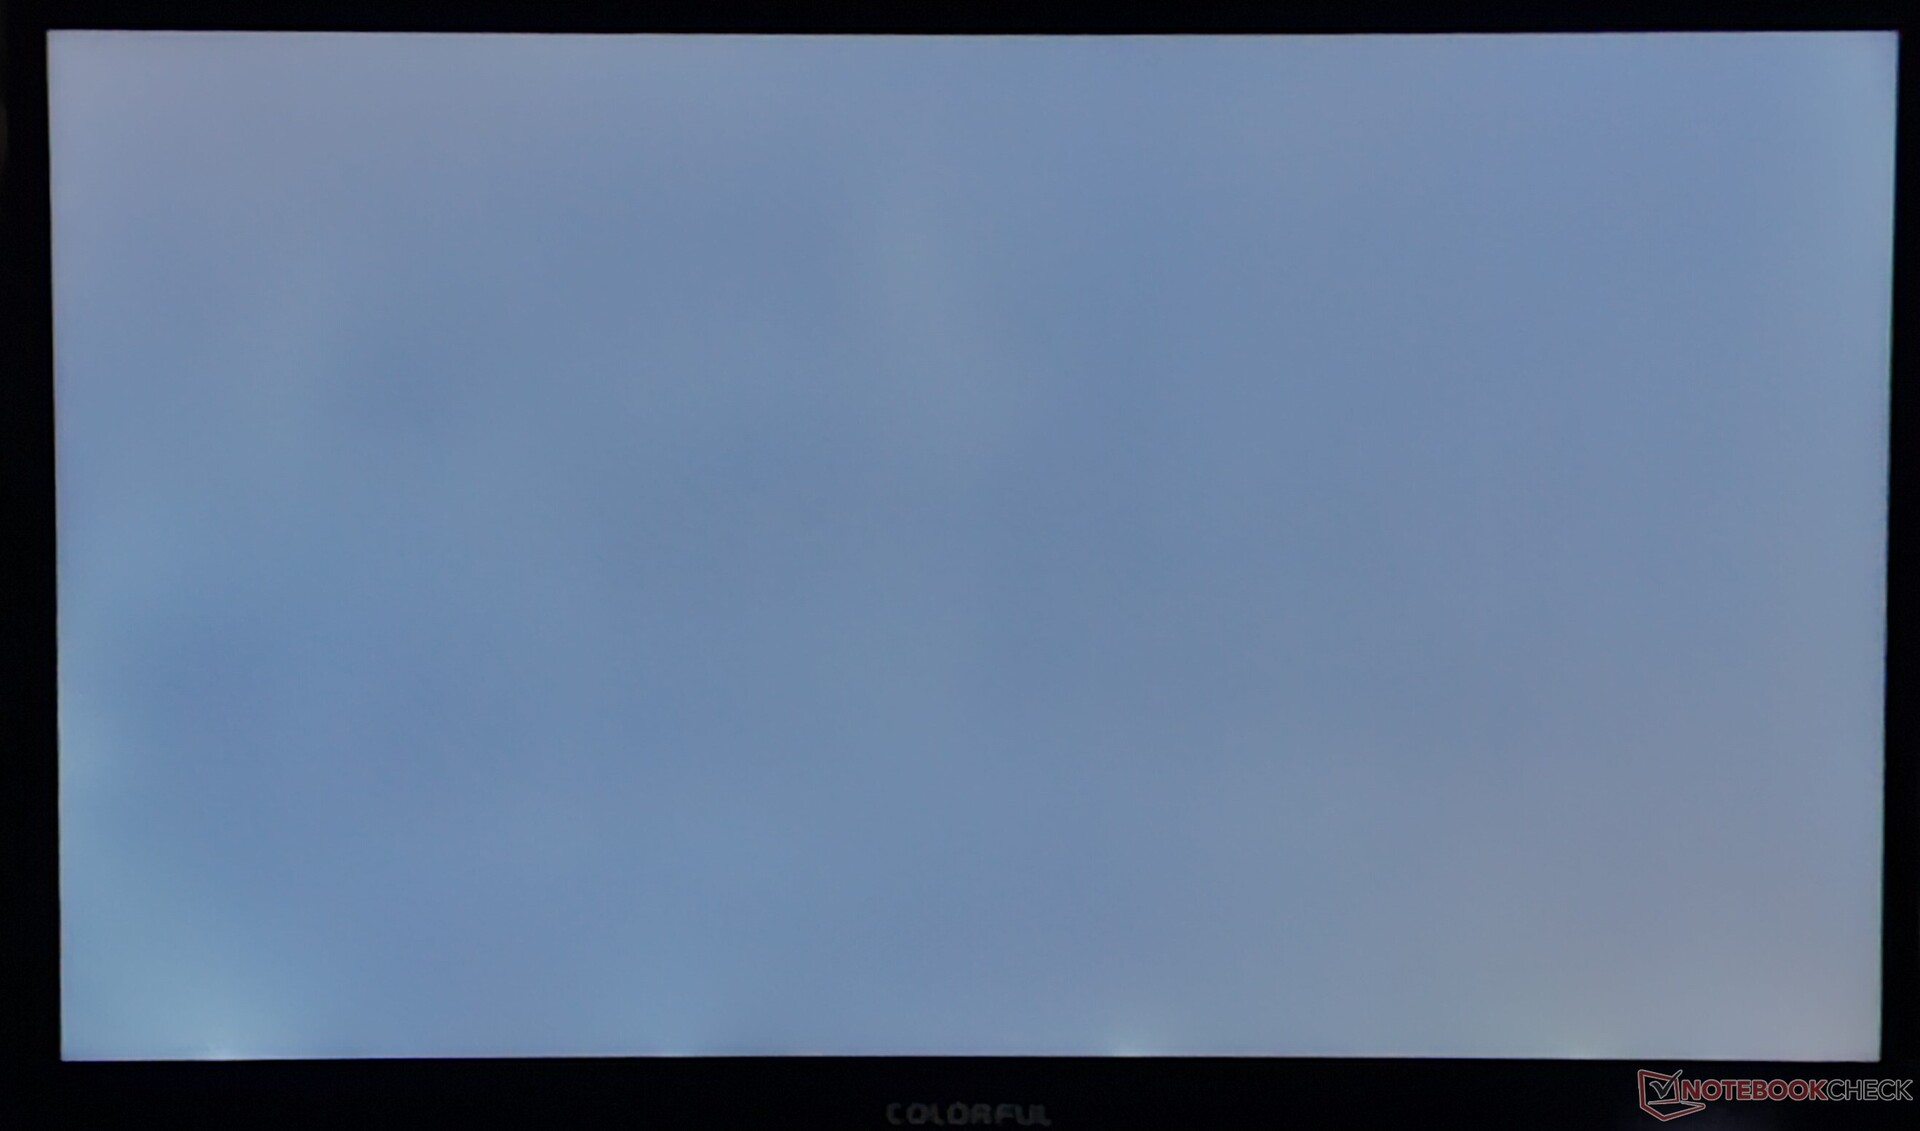
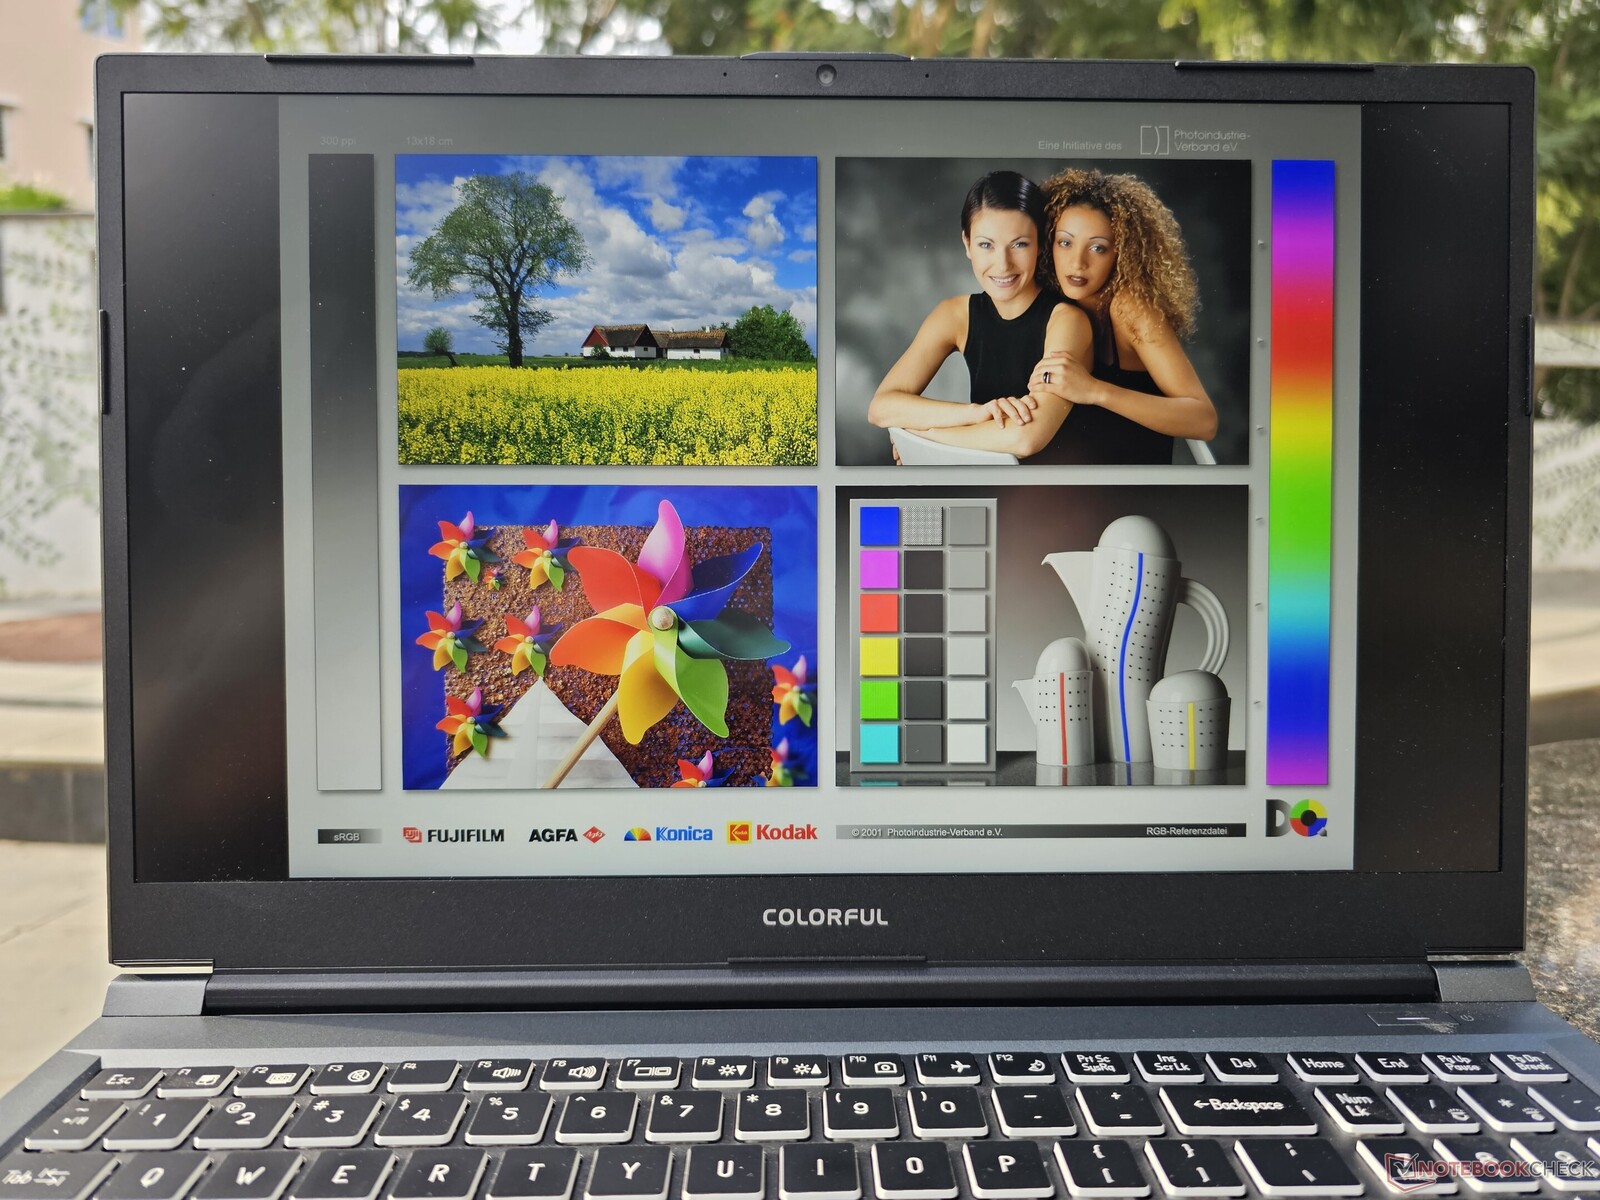
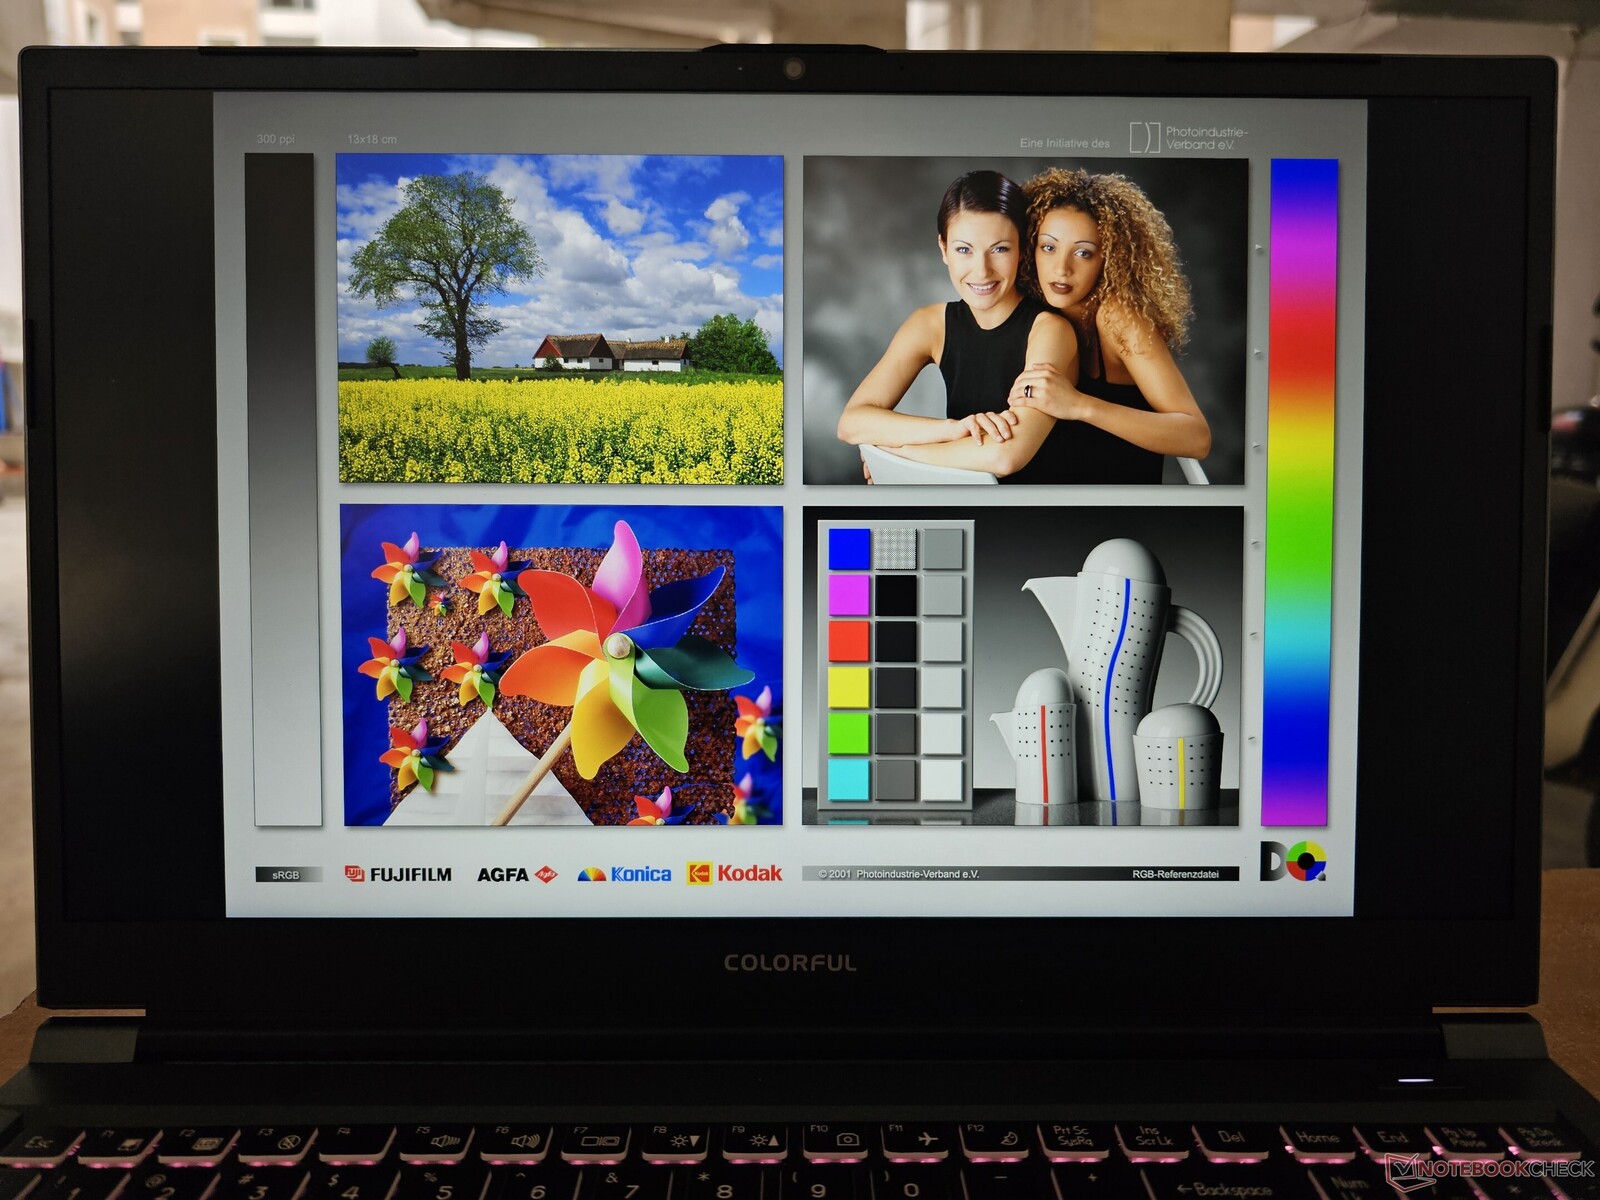
Display: 165 Hz QHD-Panel ohne PWM
Das Laptop ist mit einem 15,6 Zoll großen QHD 165 Hz BOE-Panel ausgestattet. Mit 345 nits Spitzenwert und 318 nits durchschnittlicher Luminanz kann das Display nicht gerade begeistern, liegt aber auf dem Niveau der meisten Gaming-Laptops in dieser Preisklasse. In den Ecken ist minimales Backlight Bleeding zu beobachten.
Das Panel weist eine ordentliche Helligkeitsverteilung von 81% auf, aber das gemessene Kontrastverhältnis von 607:1 liegt am unteren Ende, insbesondere im Vergleich zu anderen BOE-Panels in diesem Vergleich.

| |||||||||||||||||||||||||
Ausleuchtung: 81 %
Helligkeit Akku: 251 cd/m²
Kontrast: 607:1 (Schwarzwert: 0.57 cd/m²)
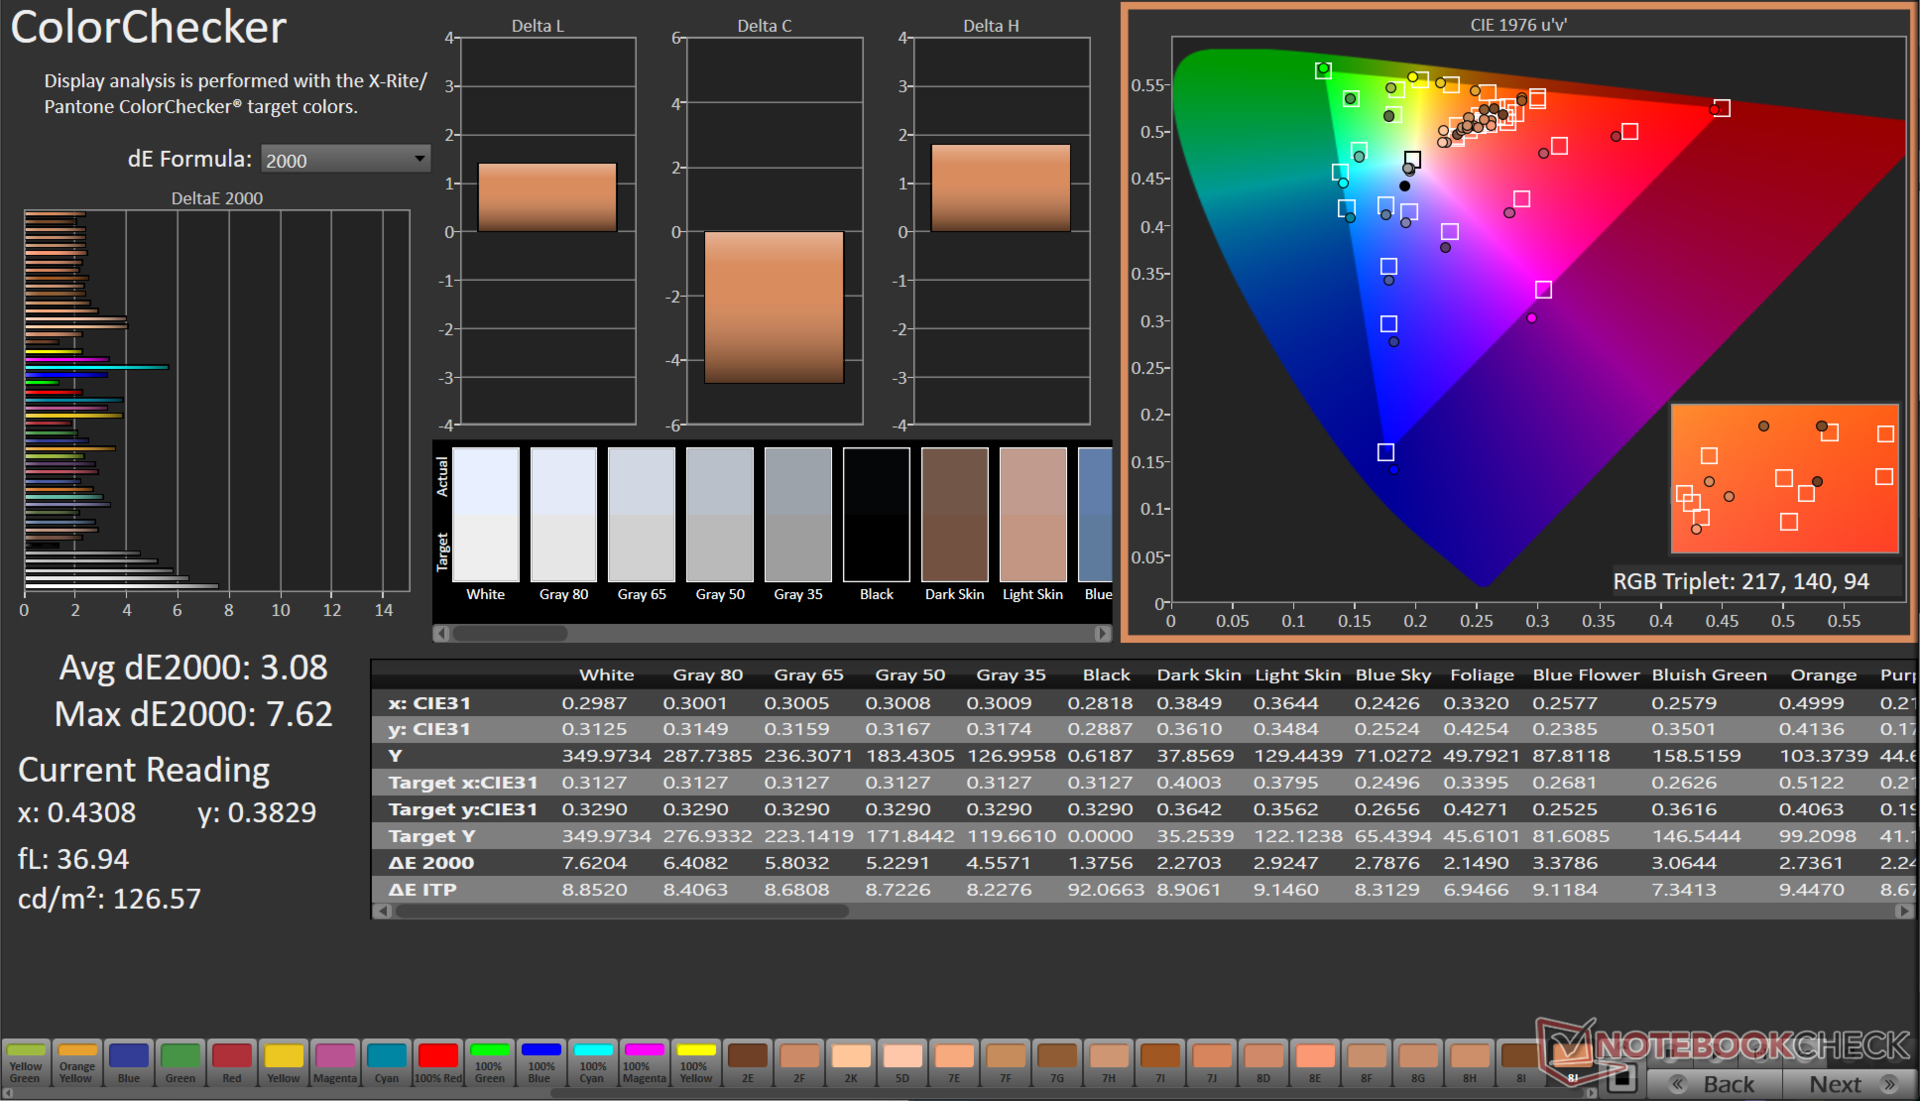
ΔE ColorChecker Calman: 3.08 | ∀{0.5-29.43 Ø4.72}
calibrated: 1.12
ΔE Greyscale Calman: 4.3 | ∀{0.09-98 Ø4.97}
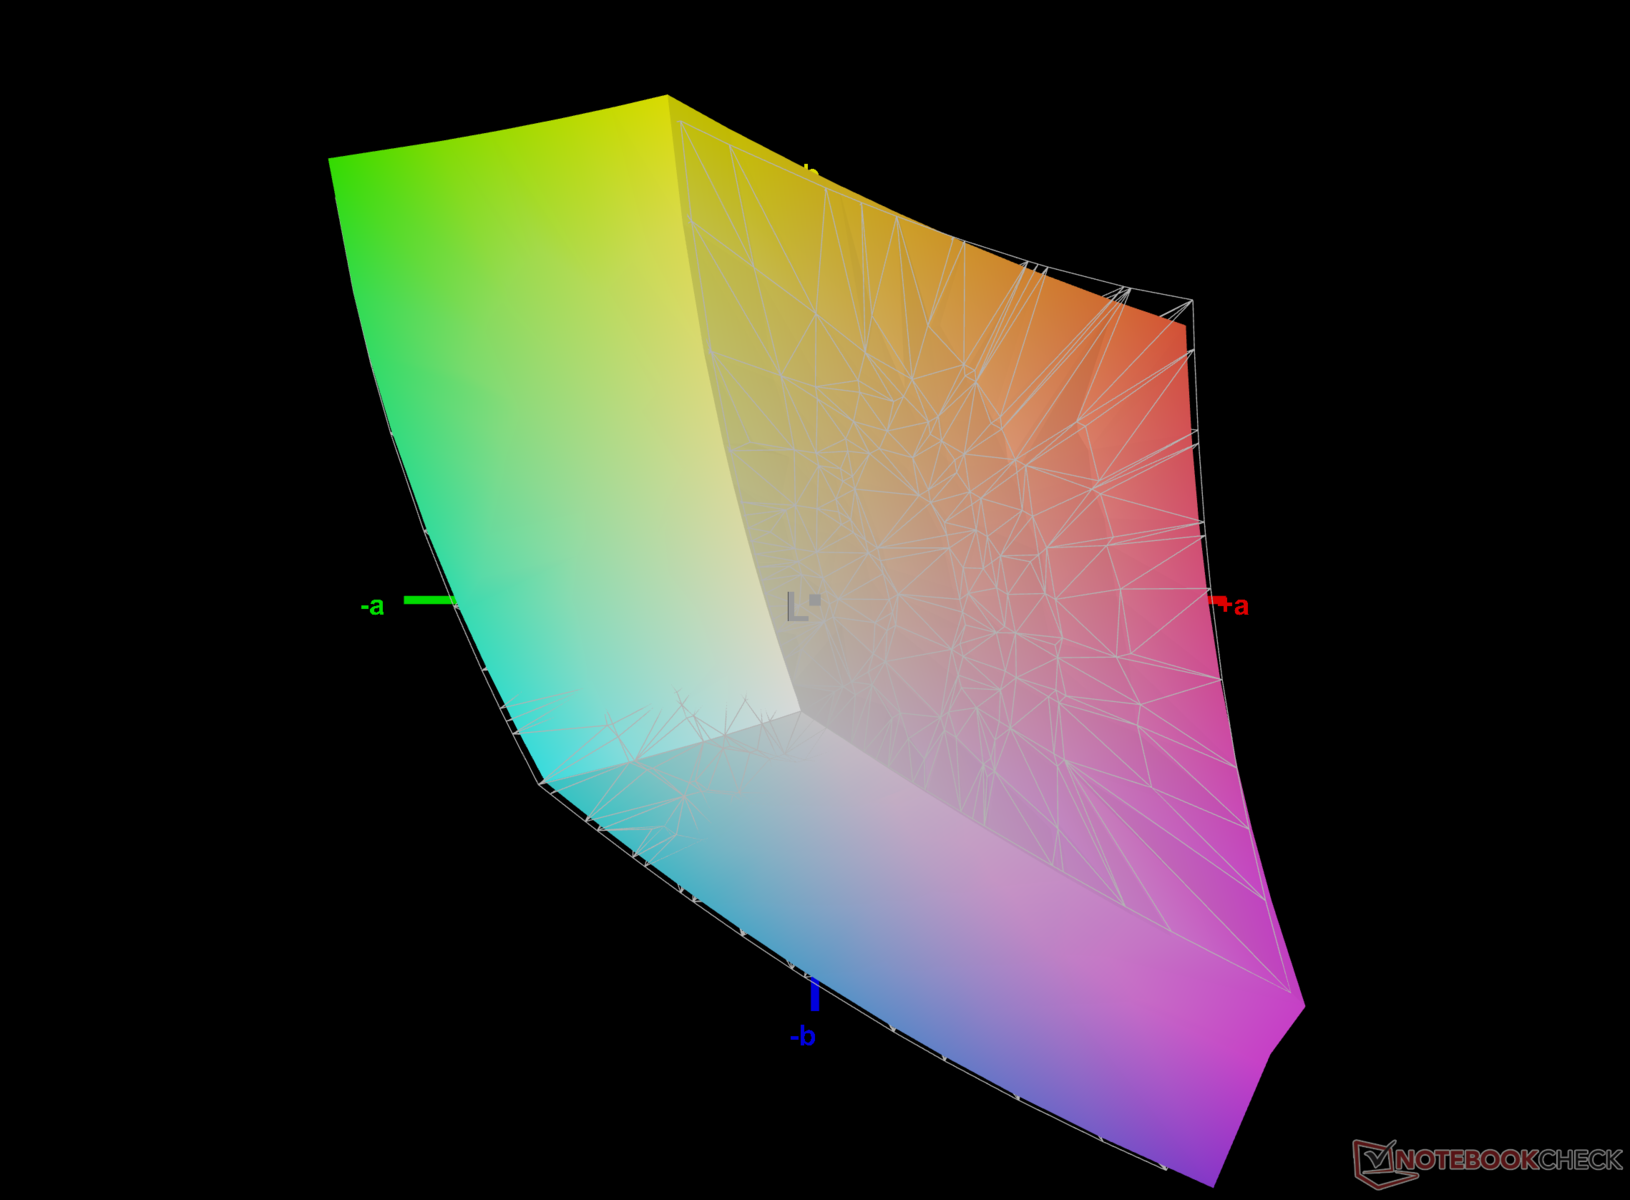
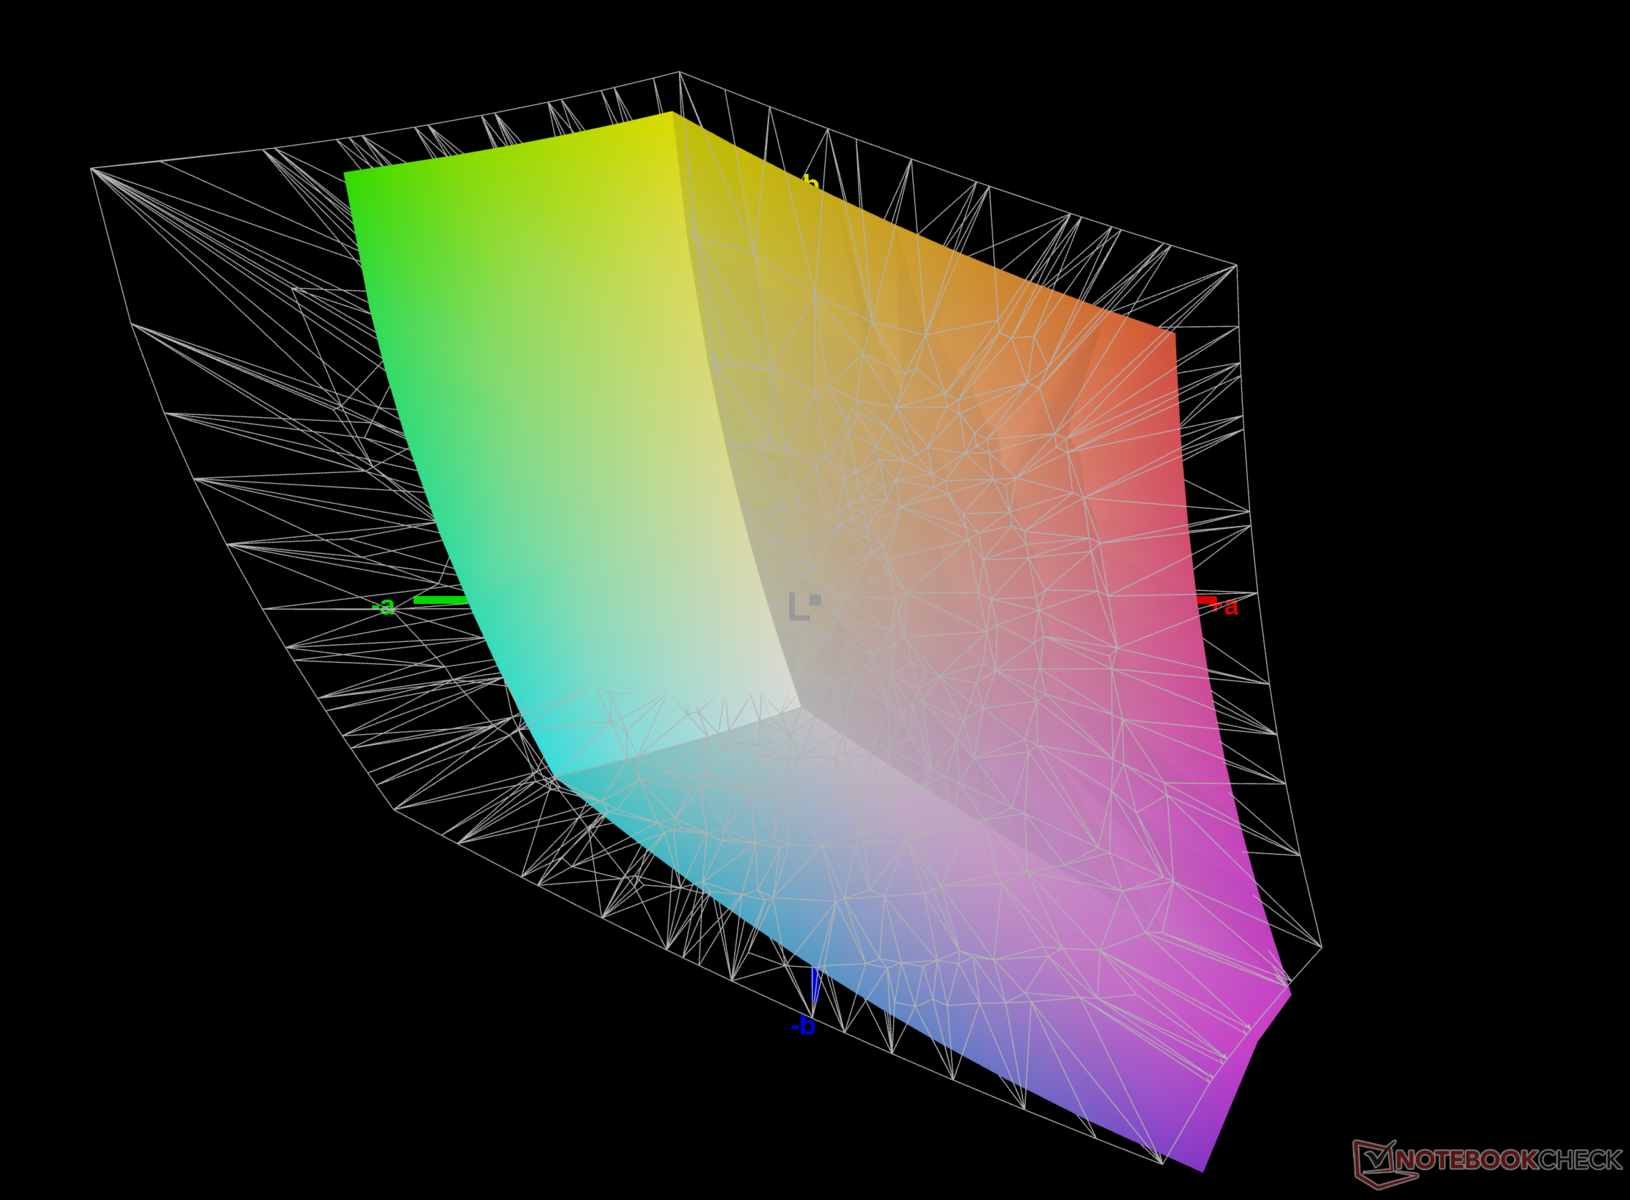
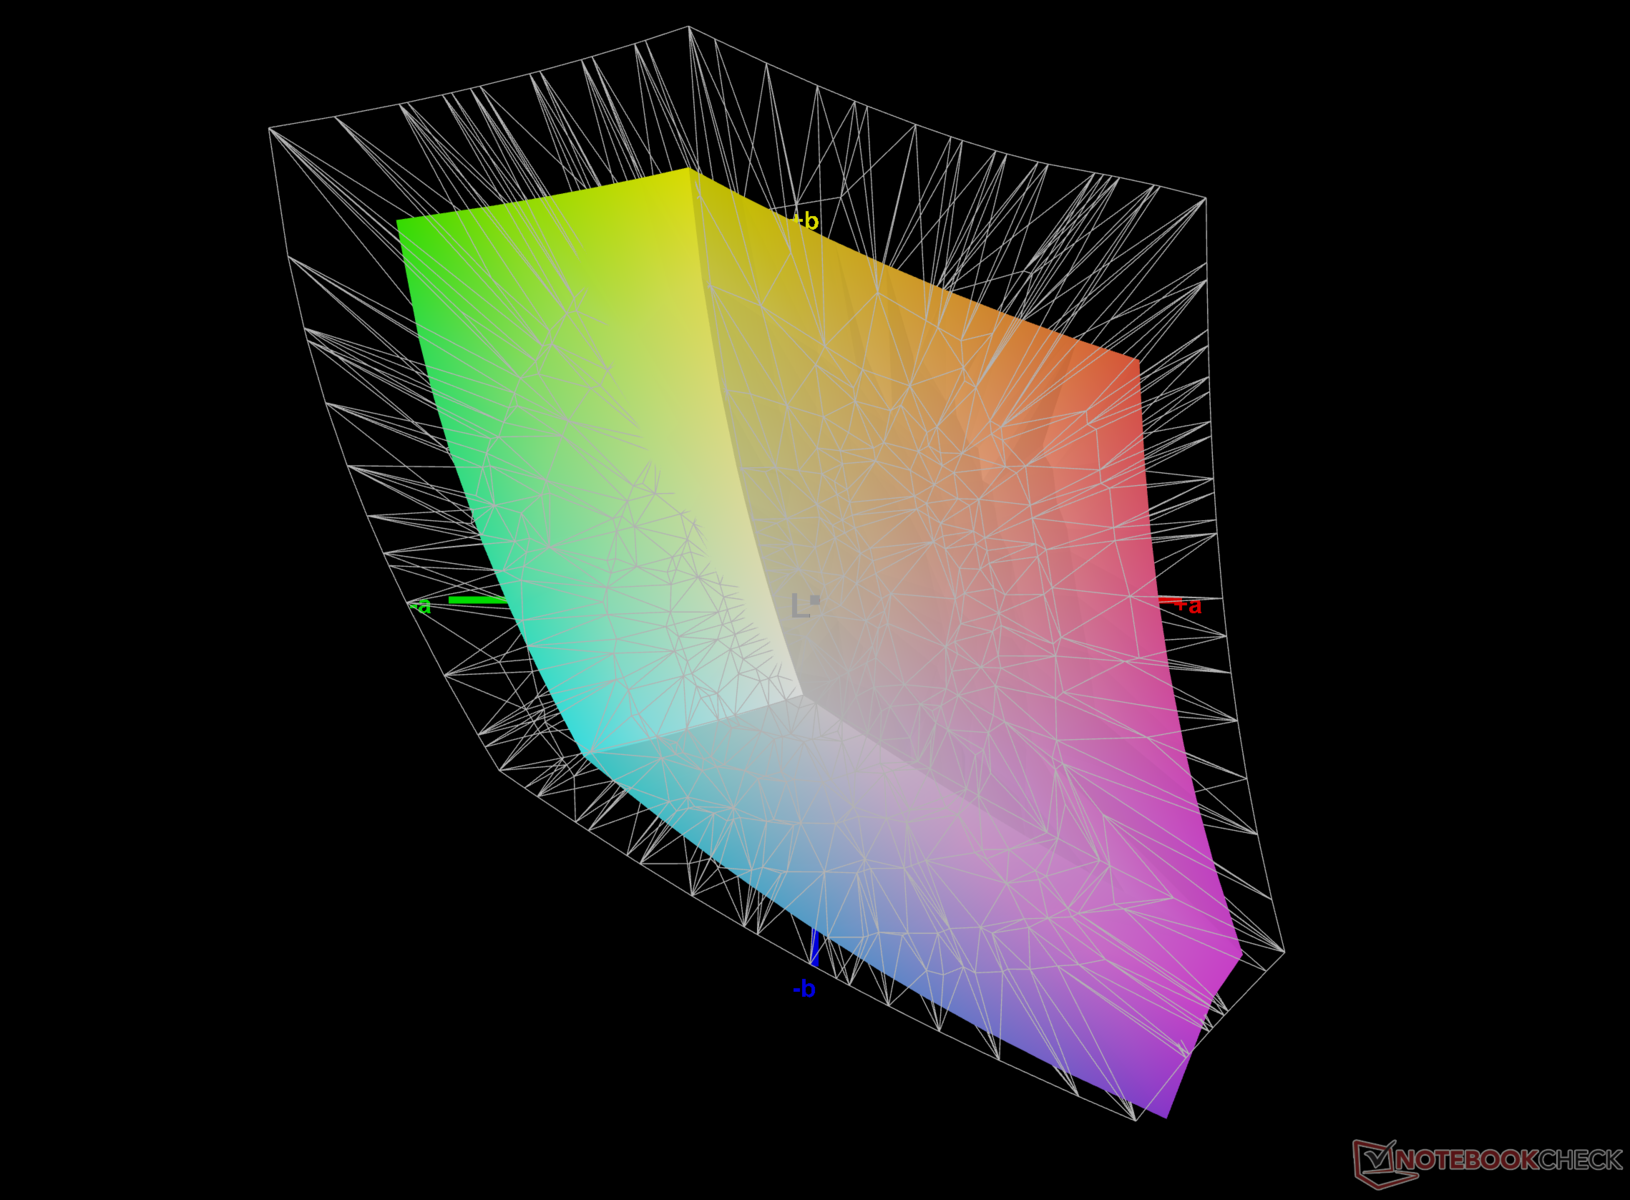
68.2% AdobeRGB 1998 (Argyll 3D)
97.4% sRGB (Argyll 3D)
66.9% Display P3 (Argyll 3D)
Gamma: 2.02
CCT: 7438 K
| Colorful EVOL X15 AT 23 BOE CQ NE156QHM-NY2, IPS, 2560x1440, 15.6" | Alienware m16 R1 Intel BOE NE16NYB, IPS, 2560x1600, 16" | HP Omen 16-wf000 BOE0B7D, IPS, 2560x1440, 16.1" | Acer Predator Helios 16 PH16-71-731Q BOE NE160QDM-NZ2, IPS-LED, 2560x1600, 16" | Dell G15 5530 AUO B156HAN, IPS, 1920x1080, 15.6" | Schenker XMG Pro 15 (E23) BOE0AD1, IPS, 2560x1440, 15.6" | Alienware m16 R1 AMD BOE NE16NZ4, IPS, 2560x1600, 16" | Uniwill GM6PX7X RTX 4070 BOE CQ NE160QDM-NZ1, IPS, 2560x1600, 16" | |
|---|---|---|---|---|---|---|---|---|
| Display | 1% | 3% | 24% | 6% | 25% | 27% | 0% | |
| Display P3 Coverage (%) | 66.9 | 67.7 1% | 69 3% | 97.1 45% | 73.1 9% | 97.8 46% | 98.6 47% | 67.5 1% |
| sRGB Coverage (%) | 97.4 | 97.2 0% | 99.2 2% | 100 3% | 98.4 1% | 99.9 3% | 99.9 3% | 96.4 -1% |
| AdobeRGB 1998 Coverage (%) | 68.2 | 70 3% | 71.2 4% | 84.7 24% | 74.4 9% | 85.4 25% | 88.9 30% | 68.6 1% |
| Response Times | 35% | 16% | -7% | 49% | -29% | 18% | -23% | |
| Response Time Grey 50% / Grey 80% * (ms) | 10.42 ? | 4 ? 62% | 4.6 ? 56% | 13.6 ? -31% | 3.39 ? 67% | 14 ? -34% | 5.1 ? 51% | 12.6 ? -21% |
| Response Time Black / White * (ms) | 7.81 ? | 7.3 ? 7% | 9.7 ? -24% | 6.4 ? 18% | 5.35 ? 31% | 9.6 ? -23% | 9 ? -15% | 9.8 ? -25% |
| PWM Frequency (Hz) | 21620 ? | |||||||
| Bildschirm | 24% | 28% | 42% | 7% | 12% | 0% | 22% | |
| Helligkeit Bildmitte (cd/m²) | 346 | 306 -12% | 310.9 -10% | 511 48% | 320 -8% | 322 -7% | 329 -5% | 338.6 -2% |
| Brightness (cd/m²) | 318 | 302 -5% | 296 -7% | 498 57% | 316 -1% | 301 -5% | 317 0% | 328 3% |
| Brightness Distribution (%) | 81 | 89 10% | 91 12% | 94 16% | 94 16% | 85 5% | 89 10% | 89 10% |
| Schwarzwert * (cd/m²) | 0.57 | 0.3 47% | 0.35 39% | 0.36 37% | 0.21 63% | 0.36 37% | 0.32 44% | 0.32 44% |
| Kontrast (:1) | 607 | 1020 68% | 888 46% | 1419 134% | 1524 151% | 894 47% | 1028 69% | 1058 74% |
| Delta E Colorchecker * | 3.08 | 2.57 17% | 2.18 29% | 1.76 43% | 4.55 -48% | 1.98 36% | 3.71 -20% | 2.18 29% |
| Colorchecker dE 2000 max. * | 7.62 | 4.26 44% | 3.58 53% | 3.7 51% | 9.83 -29% | 5.24 31% | 7.23 5% | 7.14 6% |
| Colorchecker dE 2000 calibrated * | 1.12 | 0.85 24% | 0.52 54% | 1.56 -39% | 1.51 -35% | 1.98 -77% | 2.82 -152% | 0.93 17% |
| Delta E Graustufen * | 4.3 | 3.3 23% | 2.8 35% | 3 30% | 6.2 -44% | 2.44 43% | 2.2 49% | 3.7 14% |
| Gamma | 2.02 109% | 1.997 110% | 2.18 101% | 2.33 94% | 2.07 106% | 2.42 91% | 2.3 96% | 2.18 101% |
| CCT | 7438 87% | 6895 94% | 6002 108% | 6341 103% | 6479 100% | 6984 93% | 6270 104% | 7245 90% |
| Durchschnitt gesamt (Programm / Settings) | 20% /
21% | 16% /
21% | 20% /
31% | 21% /
13% | 3% /
9% | 15% /
8% | -0% /
11% |
* ... kleinere Werte sind besser
Obwohl das EVOL X15 keine Inhalte erstellt, eignet sich die 97%ige sRGB-Abdeckung für Spiele, das Internet und einfache Aufgaben. Kreative, die die leistungsstarke Hardware des EVOL X15 nutzen möchten, können die Farbleistung durch den Einsatz eines externen Bildschirms verbessern.
Die Farbwiedergabe des Displays ist insgesamt akzeptabel, wobei die durchschnittlichen Graustufen- und ColorChecker Delta E 2000-Werte 4,3 bzw. 3,08 betragen.
Diese Werte wurden durch unsere Kalibrierungsroutine mit dem X-Rite i1Basic Pro 3 Spektralfotometer und der Calman Ultimate Software von Portrait Display erheblich auf 1 und 1,12 verbessert.
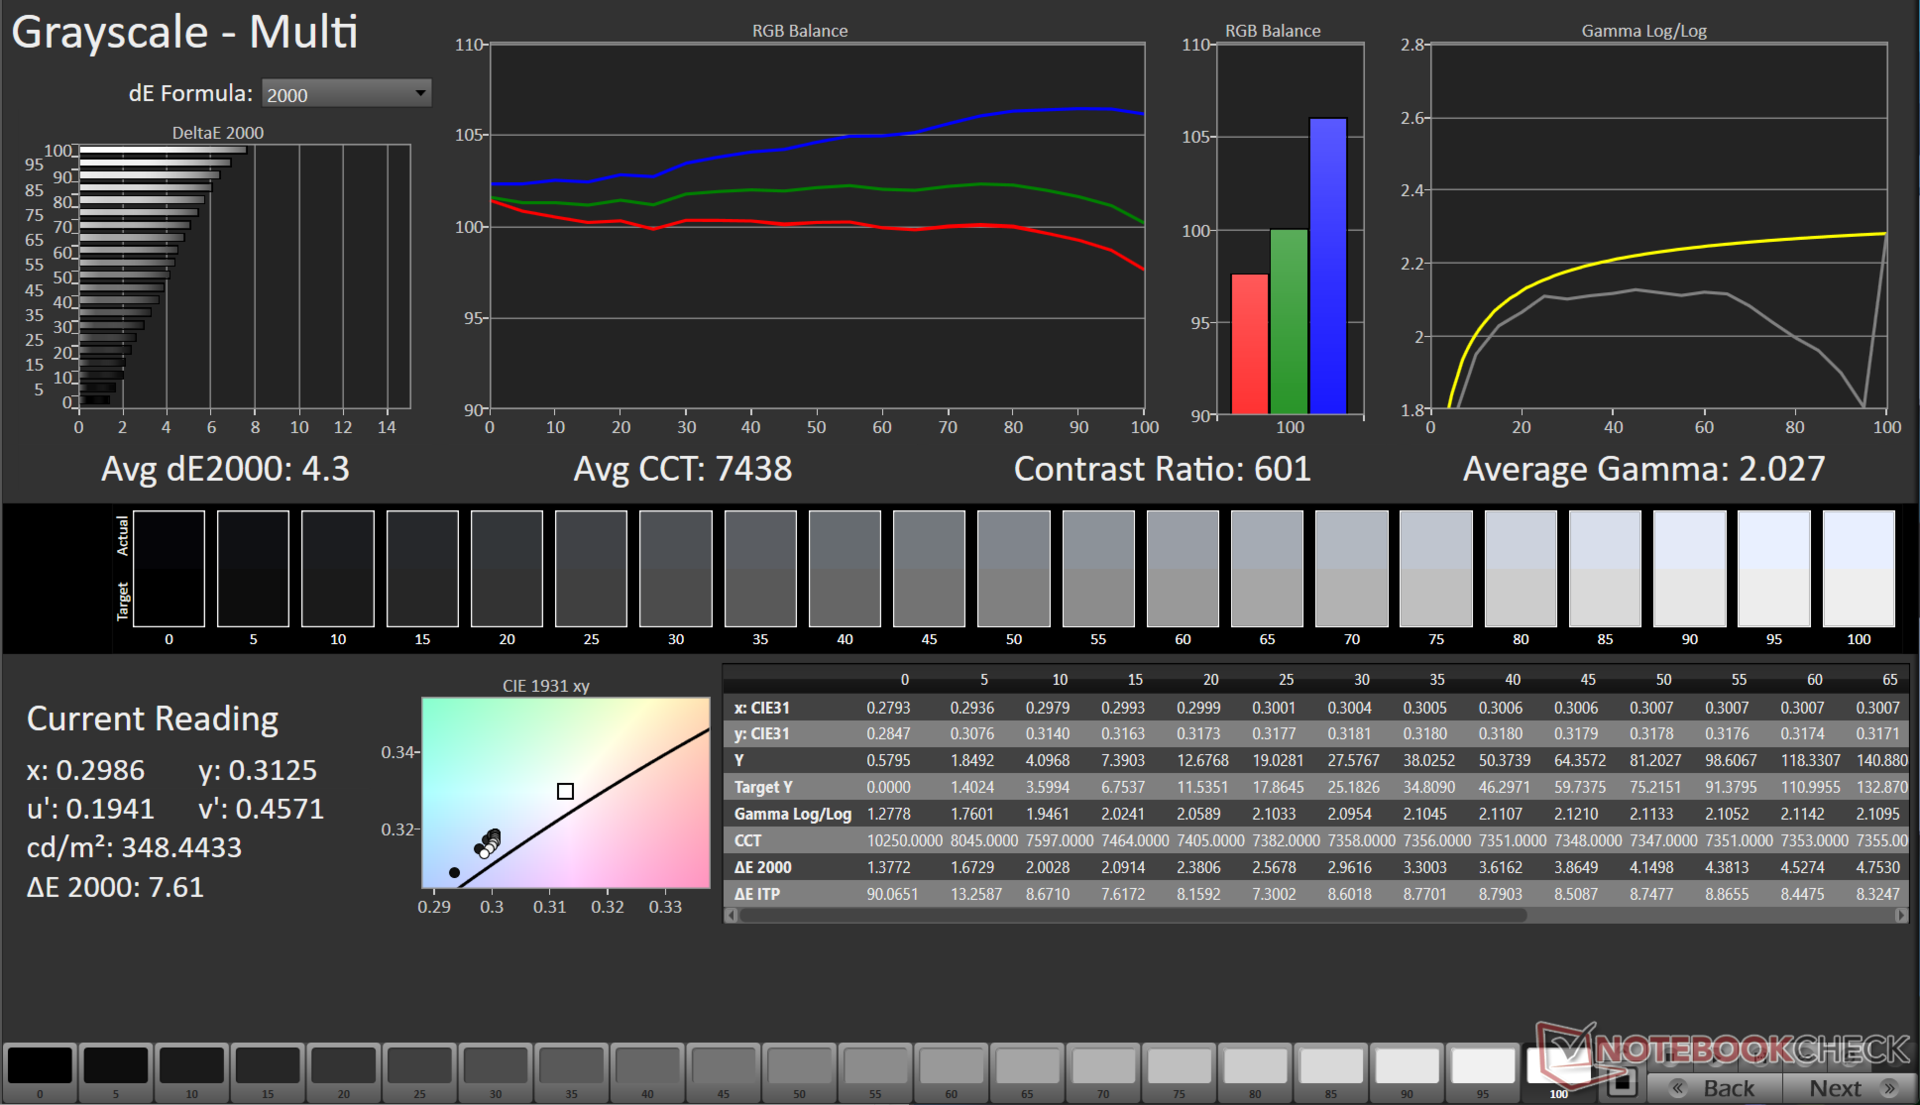
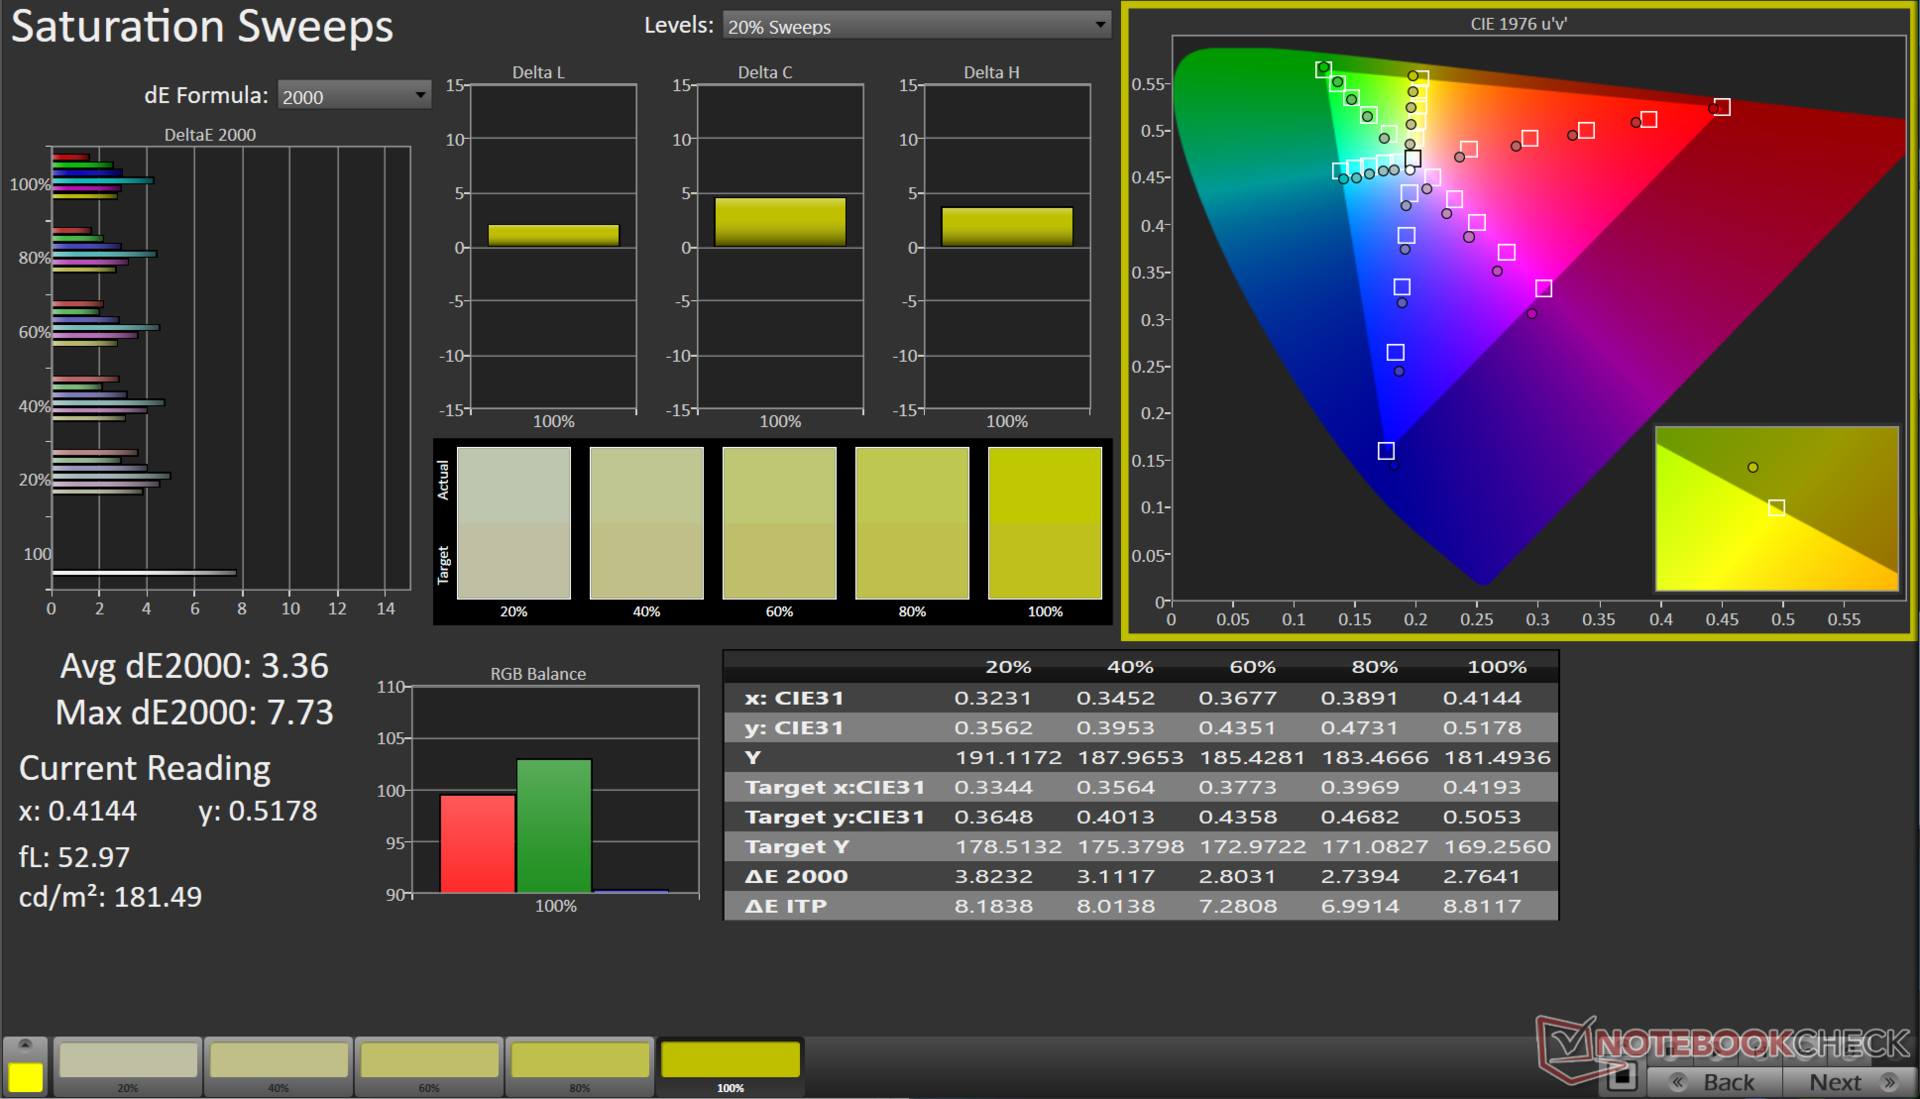
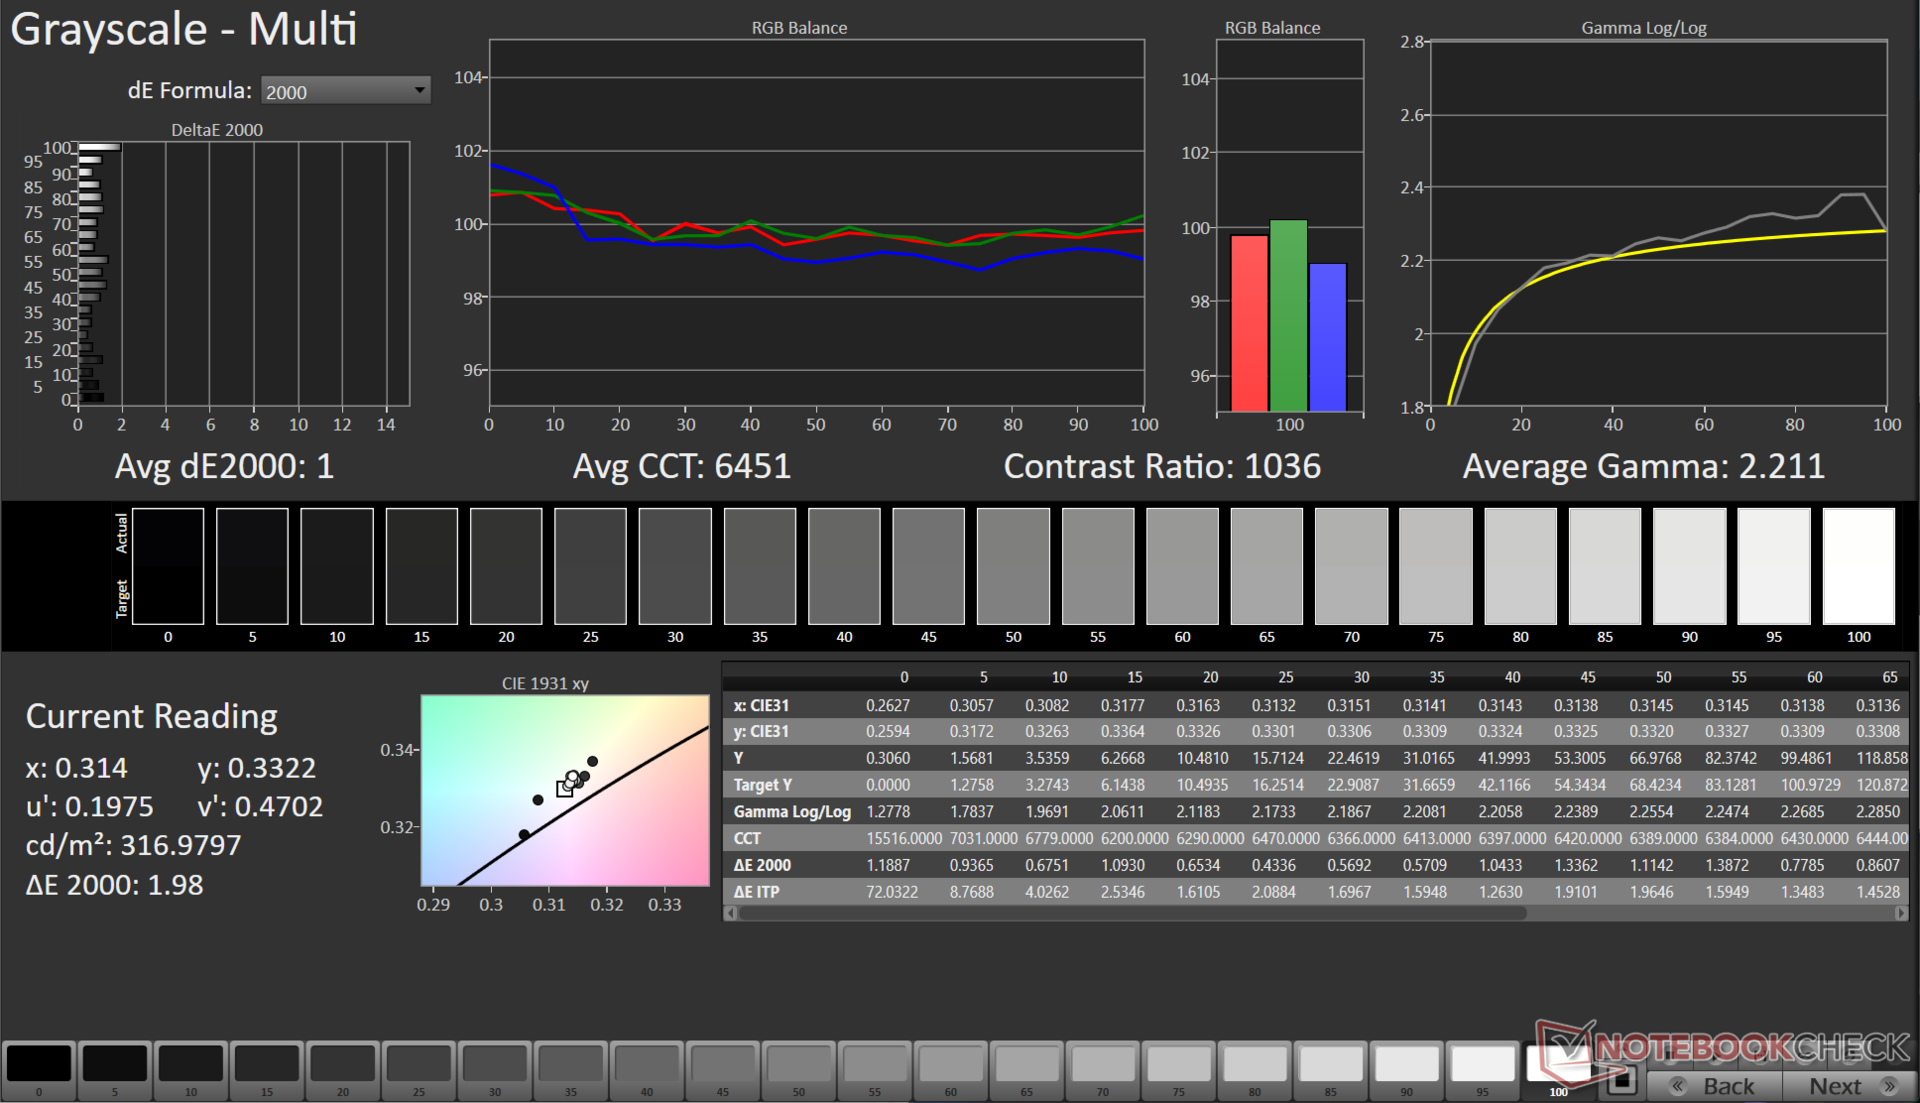

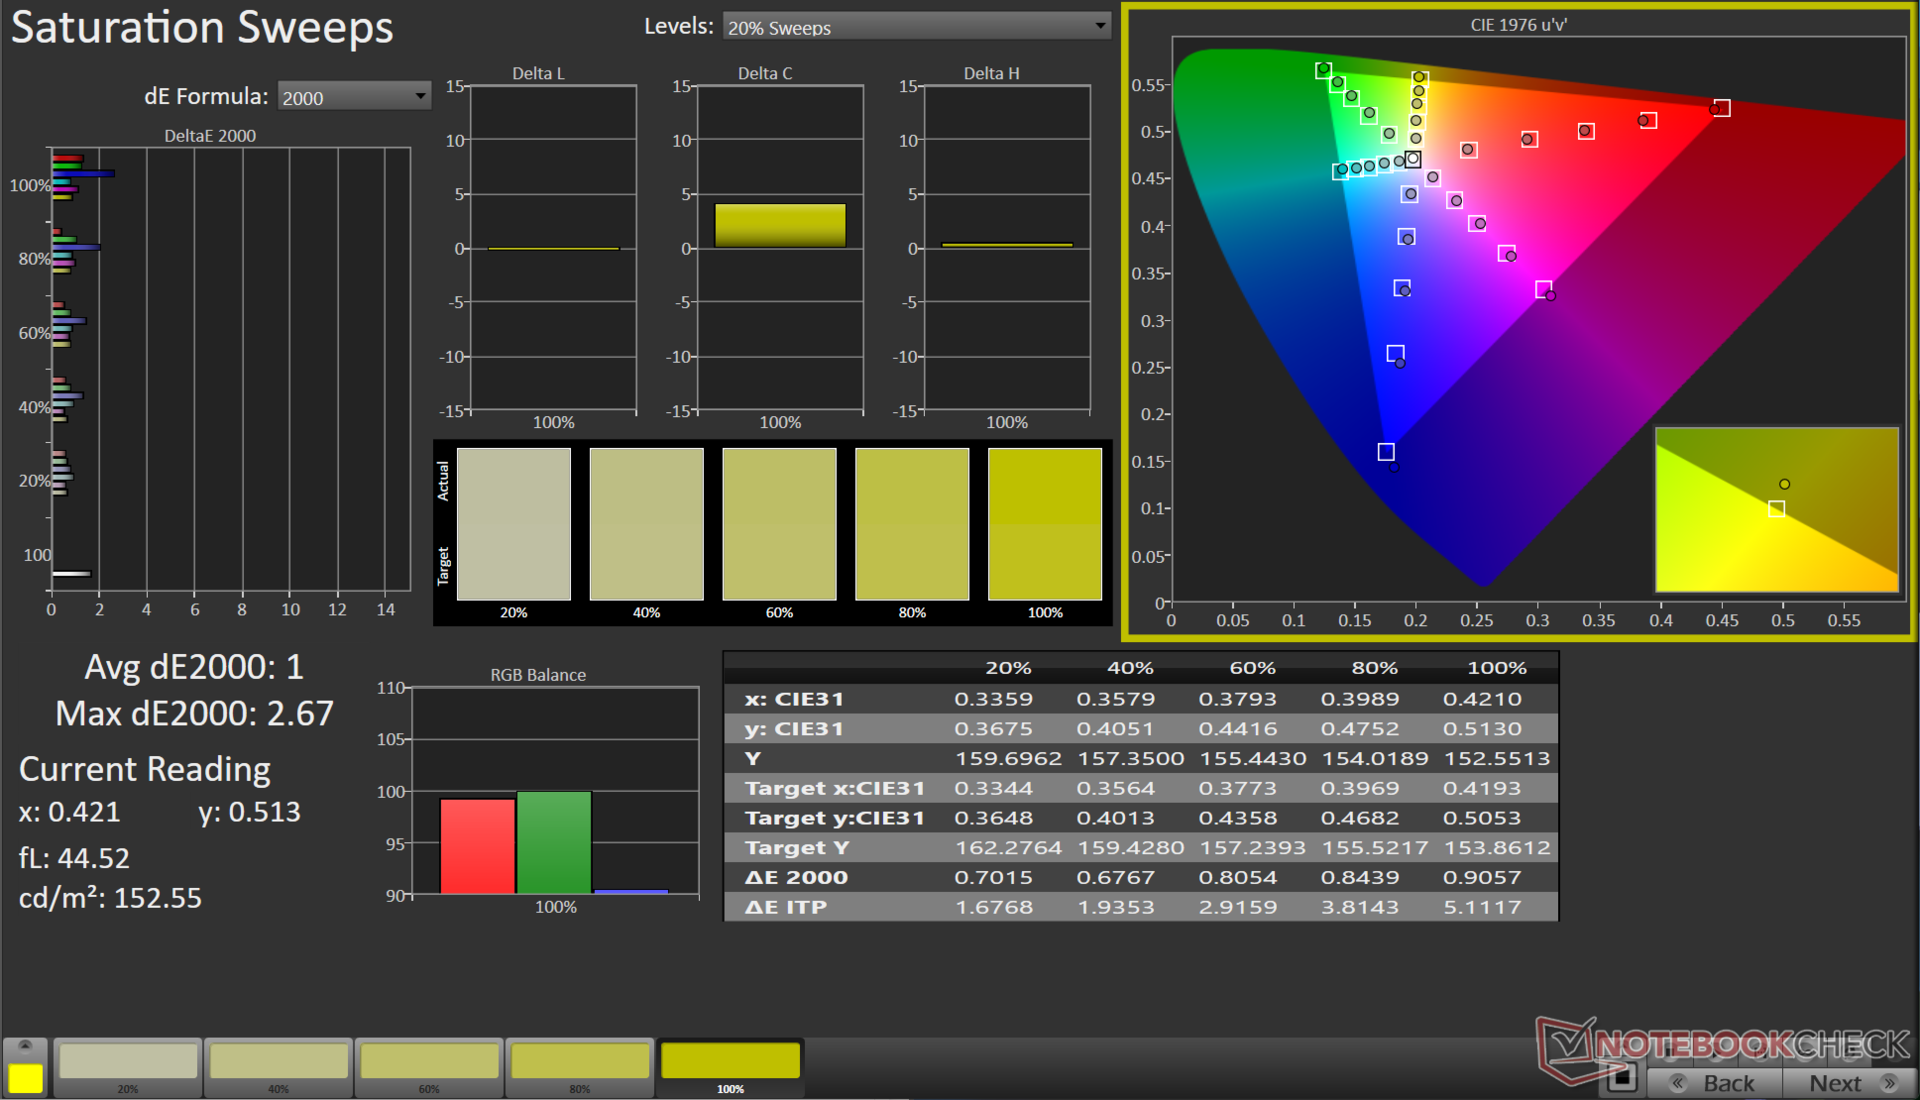
Die kalibrierte ICC-Datei kann über den obigen Link heruntergeladen werden.
Reaktionszeiten (Response Times) des Displays
| ↔ Reaktionszeiten Schwarz zu Weiß | ||
|---|---|---|
| 7.81 ms ... steigend ↗ und fallend ↘ kombiniert | ↗ 4.01 ms steigend | 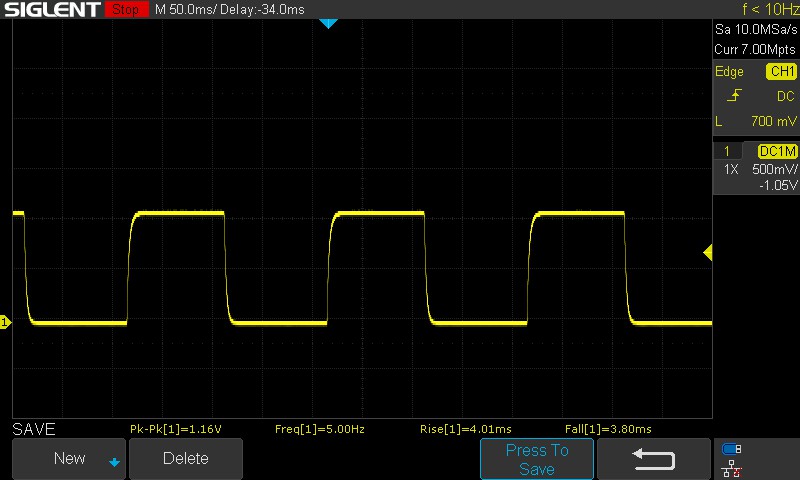 |
| ↘ 3.8 ms fallend | ||
| Die gemessenen Reaktionszeiten sind sehr kurz, wodurch sich der Bildschirm auch für schnelle 3D Spiele eignen sollte. Im Vergleich rangierten die bei uns getesteten Geräte von 0.1 (Minimum) zu 240 (Maximum) ms. » 22 % aller Screens waren schneller als der getestete. Daher sind die gemessenen Reaktionszeiten besser als der Durchschnitt aller vermessenen Geräte (19.8 ms). | ||
| ↔ Reaktionszeiten 50% Grau zu 80% Grau | ||
| 10.42 ms ... steigend ↗ und fallend ↘ kombiniert | ↗ 4.73 ms steigend | 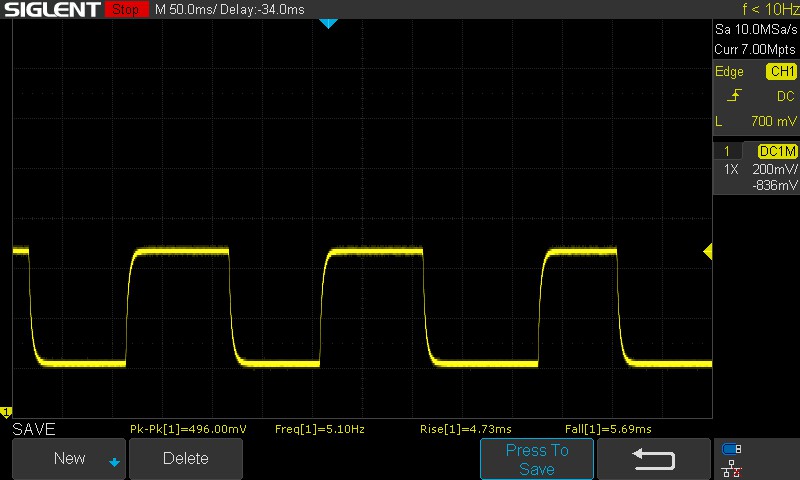 |
| ↘ 5.69 ms fallend | ||
| Die gemessenen Reaktionszeiten sind gut, für anspruchsvolle Spieler könnten der Bildschirm jedoch zu langsam sein. Im Vergleich rangierten die bei uns getesteten Geräte von 0.165 (Minimum) zu 636 (Maximum) ms. » 24 % aller Screens waren schneller als der getestete. Daher sind die gemessenen Reaktionszeiten besser als der Durchschnitt aller vermessenen Geräte (31 ms). | ||
Die Reaktionszeiten sind für die meisten Gaming-Anforderungen akzeptabel. Das Panel des EVOL X15 AT nutzt keinen Overdrive, und es gibt auch keine Option, diesen zu aktivieren, was die Übergangszeiten von 50% Grau auf 80% Grau weiter verkürzt hätte.
Bildschirm-Flackern / PWM (Pulse-Width Modulation)
| Flackern / PWM nicht festgestellt | ≤ 100 % Helligkeit | 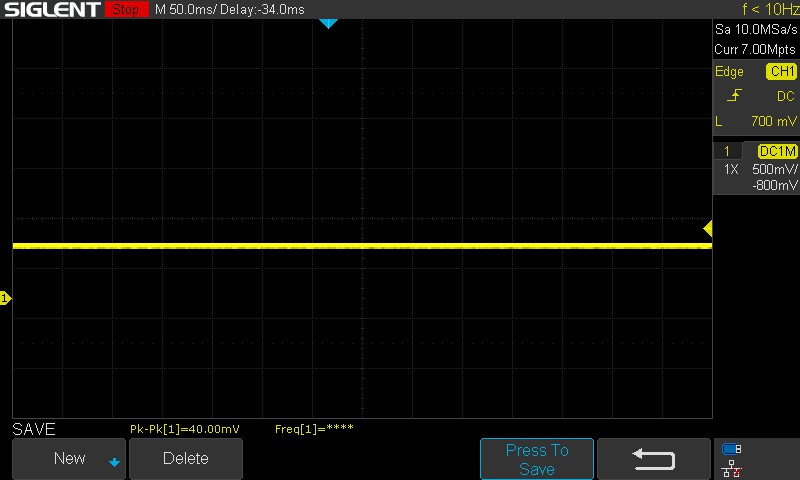 | |
Im Vergleich: 52 % aller getesteten Geräte nutzten kein PWM um die Helligkeit zu reduzieren. Wenn PWM eingesetzt wurde, dann bei einer Frequenz von durchschnittlich 7763 (Minimum 5, Maximum 343500) Hz. | |||
Wir haben bei keiner der getesteten Helligkeitsstufen PWM oder Flackern festgestellt.
Die Anzeige im Freien ist in Ordnung, aber die Helligkeit des Bildschirms ist möglicherweise nicht ausreichend für die Verwendung in direktem, grellem Sonnenlicht. Die Betrachtungswinkel sind relativ stabil, mit nur geringem Helligkeitsverlust an den Extremen.

Leistung: Core i7-13700HX und RTX 4060 versprechen gute Voraussetzungen für AAA-Spiele der Mittelklasse
Das Colorful EVOL X15 AT ist sowohl mit dem Intel Core i5-13500HX als auch mit dem Core i7-13700HX erhältlich. Die entsprechenden GPU-Optionen sind die Nvidia GeForce RTX 4050 Laptop GPU und die RTX 4060 Laptop GPU.
Testbedingungen
Colorful bietet die Control Center App von Clevo zur Leistungsoptimierung und Einstellung verschiedener RGB-Effekte. Es werden insgesamt vier Leistungsmodi angeboten.
Alle Benchmarks wurden im Performance-Modus durchgeführt, in dem der Core i7-13700HX seine Muskeln voll ausspielen kann. Der diskrete GPU-Modus wurde für Grafik- und Spieletests verwendet.
Die Akkutests wurden im Profil 'Quiet' mit aktiviertem MSHybrid durchgeführt.
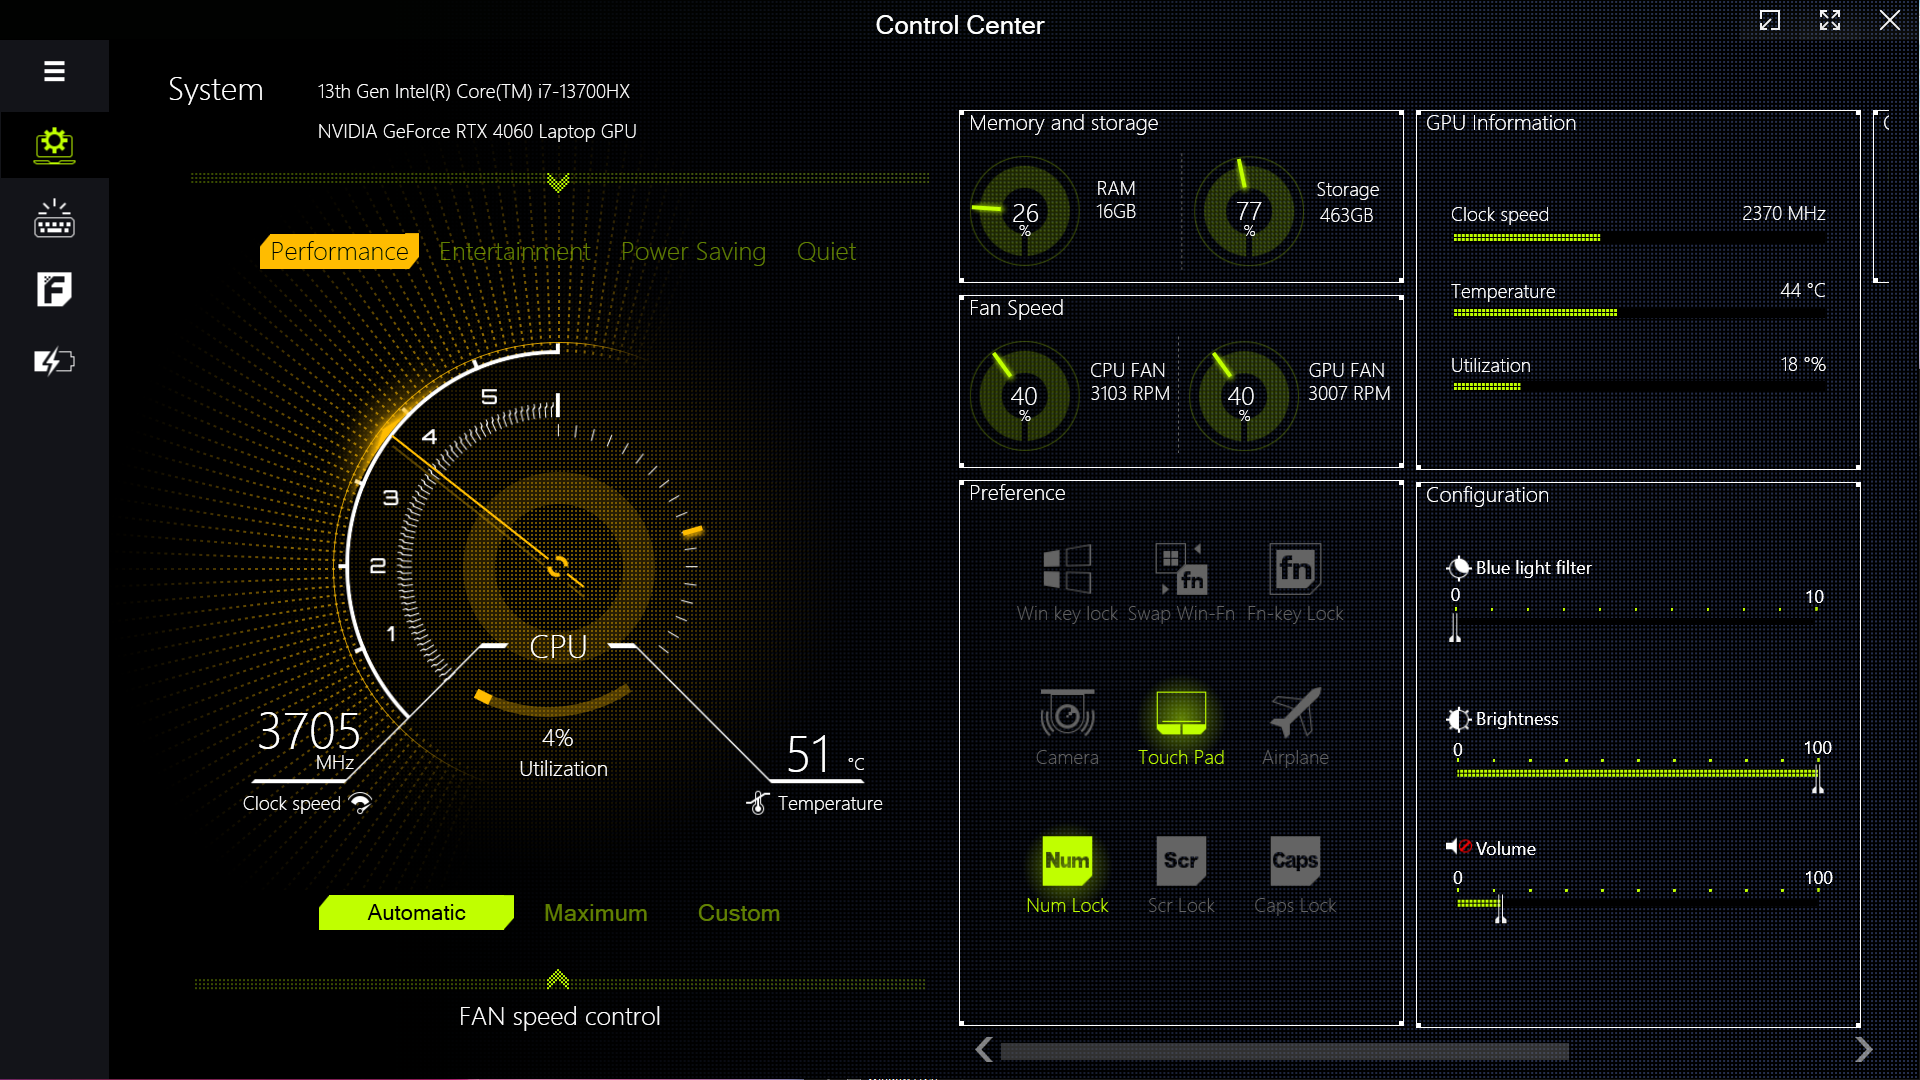
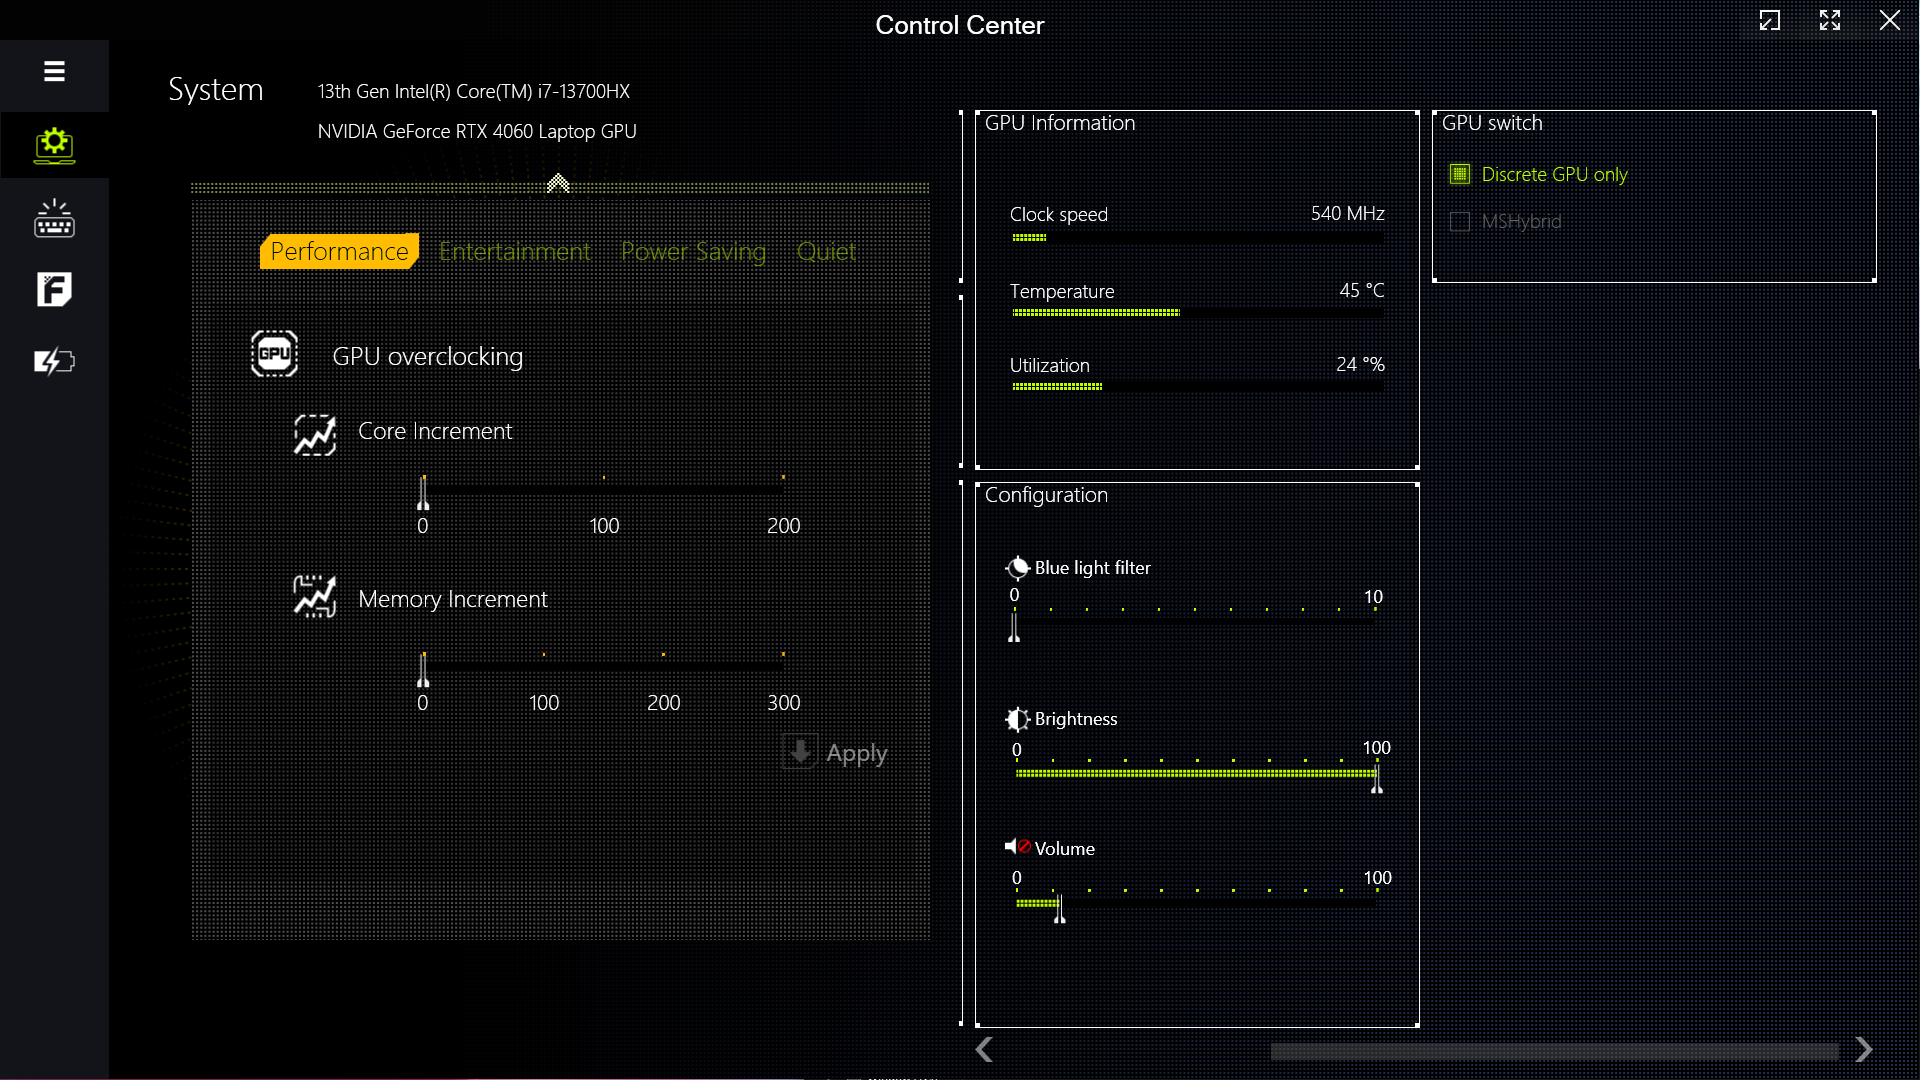
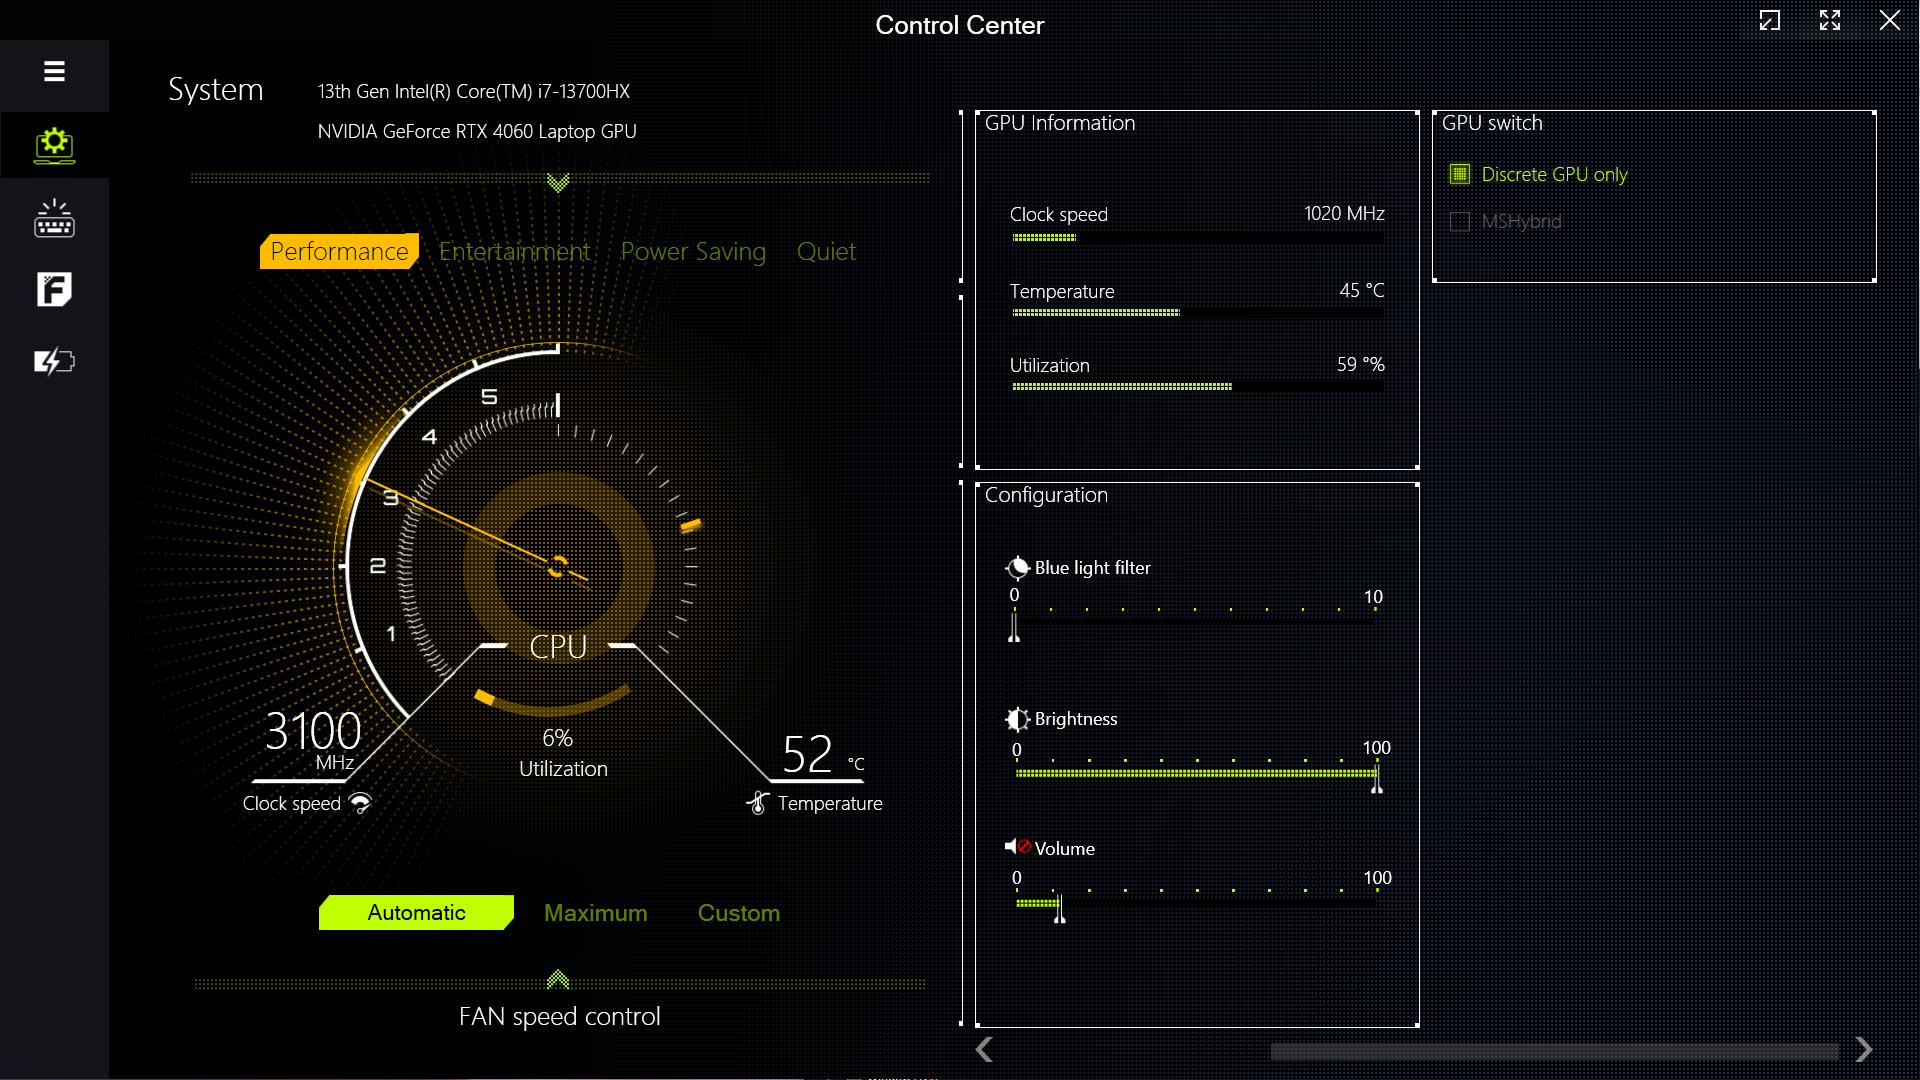
Colorful begrenzt die PL2-Leistung in den Modi "Leise" und "Energiesparen" auf 30 W, was im Vergleich zu den anderen Modi zu einer deutlichen Leistungsreduktion führt. Dies zeigt sich in den drastisch gesunkenen Cinebench-R15-Ergebnissen, wie in der unten stehenden Tabelle ersichtlich.
| Performance-Modus | PL1 (PBP) / Tau | PL2 (MTP) / Tau | Cinebench R15 Multi-Score | Cinebench R15 Multi-Score (30 Schleifen) |
|---|---|---|---|---|
| Leise | 15 W / 8 s | 30 W / 2.44 ms | 567 (-83%) | 542 (-82.28%) |
| Energiesparen | 45 W / 8 s | 30 W / 2.44 ms | 557 (-84%) | 548 (-82.08%) |
| Entertainment | 65 W / 56 s | 130 W / 2.44 ms | 2814 (-19.18%) | 2168 (-29.12%) |
| Performance | 135 W / 96 s | 162 W / 2.44 ms | 3482 (100%) | 3059 (100%) |
Prozessor
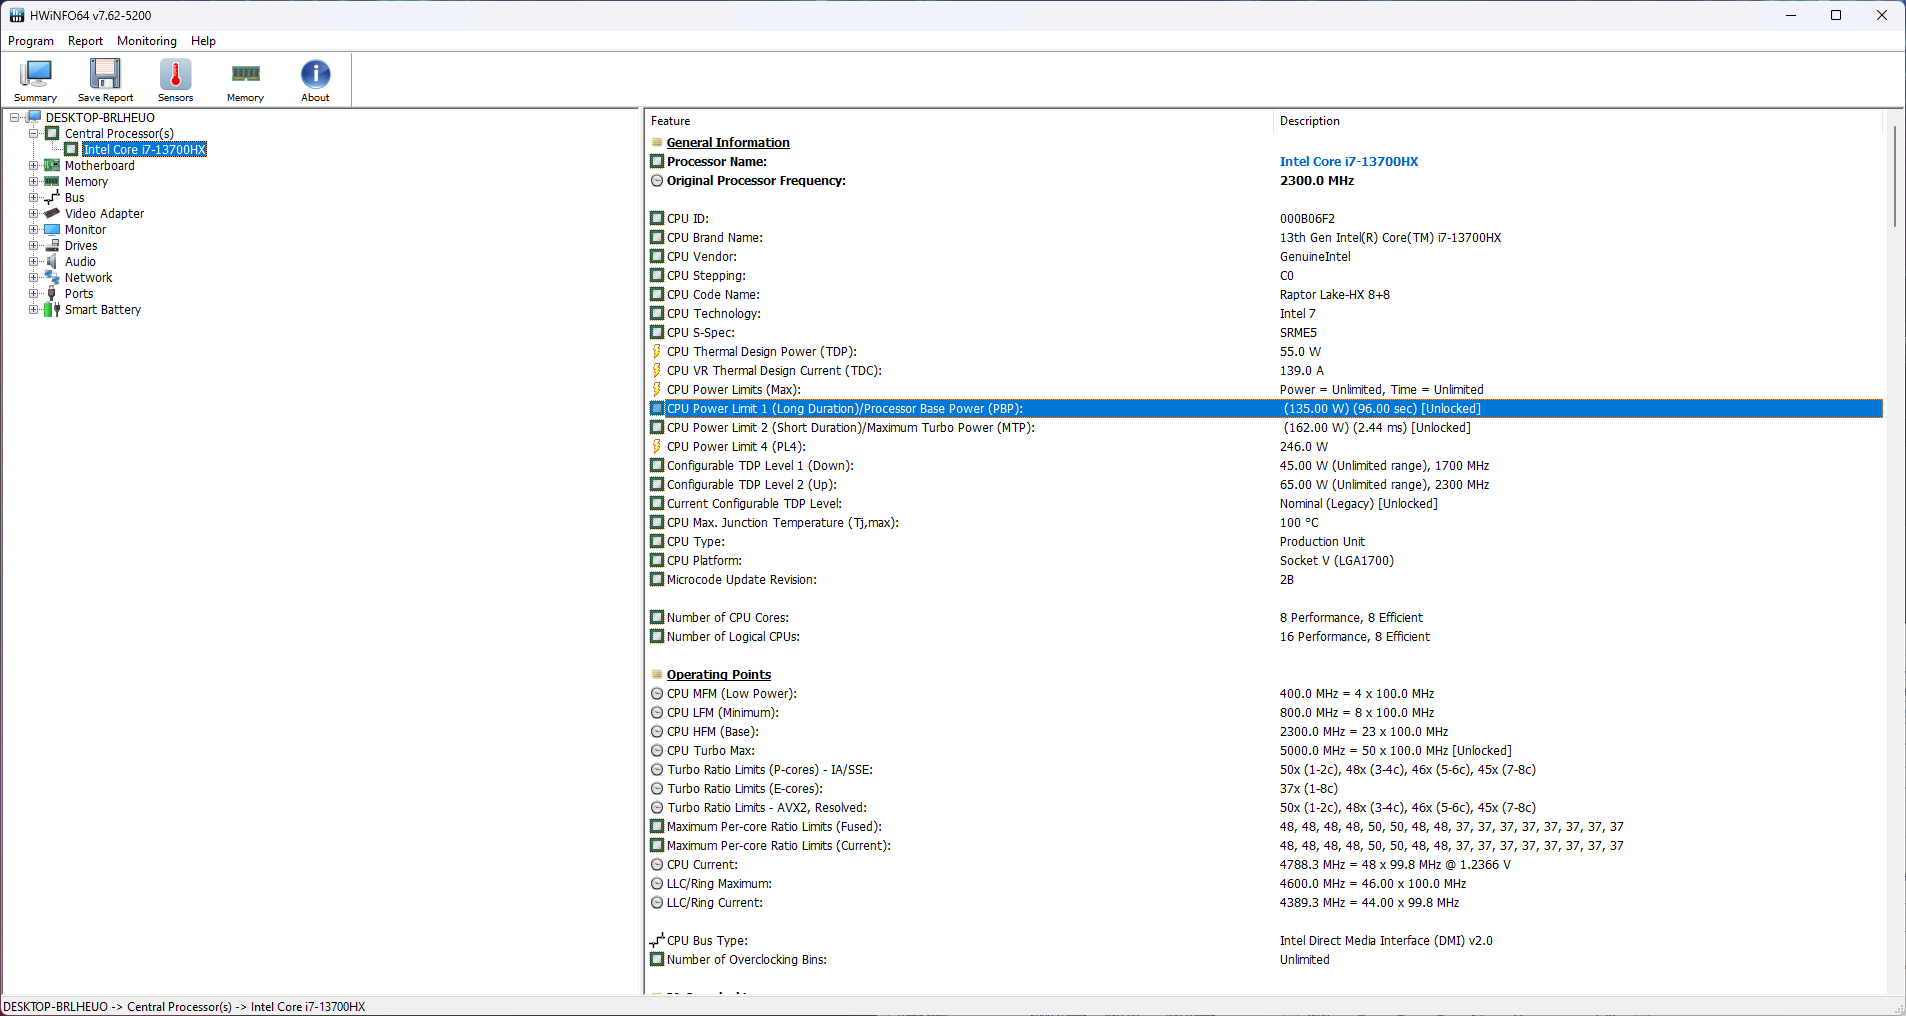
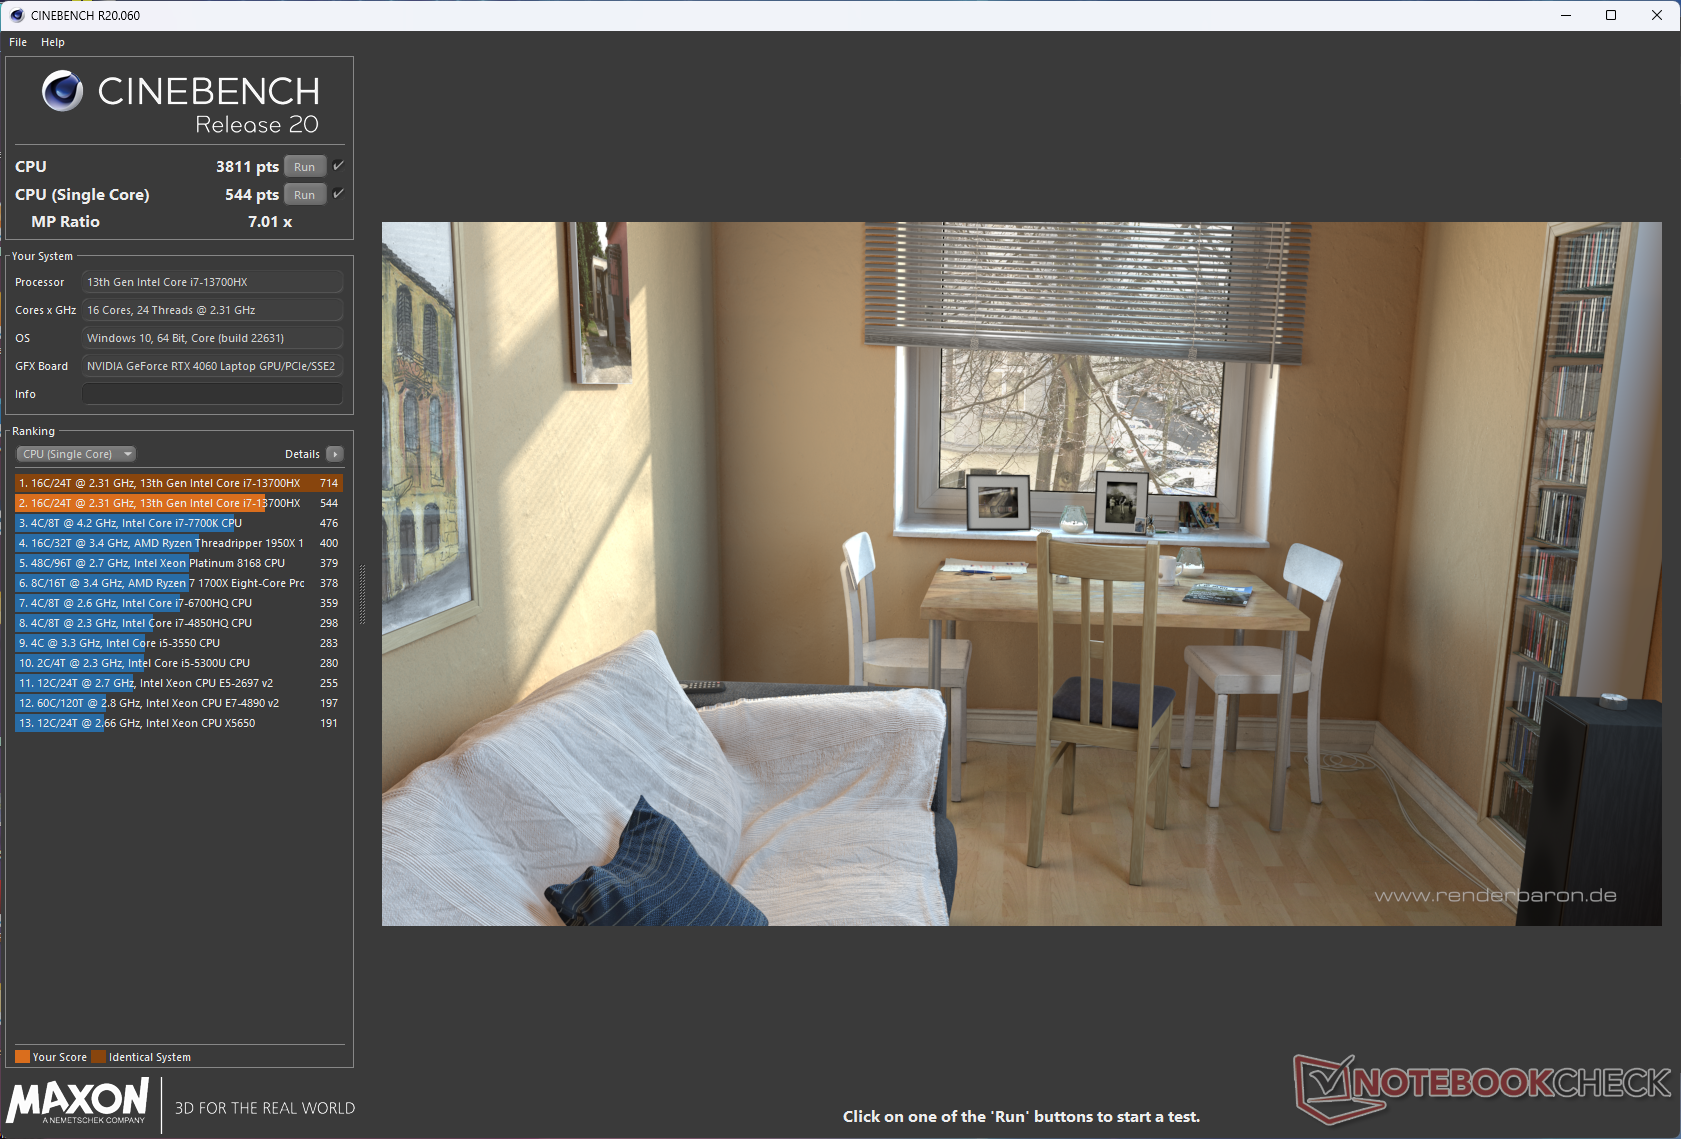
Der Core i7-13700HX ist mit 16 Kernen und 24 Threads ausgestattet, erreicht einen Boost-Takt von bis zu 5 GHz und zeigt im EVOL X15 AT eine vergleichbare Leistung wie sein Pendant im Alienware m16 R1 und anderen Laptops. In Multi-Core-Tests hinkt er jedoch dem AMD Ryzen 9 7845HX mit 12 Kernen und 24 Threads deutlich hinterher.
Obwohl der Core i7-13700HX mit 162 W angegeben ist, kann er im Performance-Modus bis zu 145 W verbrauchen. Dies bietet jedoch nur einen minimalen Vorteil in der Single-Core-Leistung gegenüber dem 115-W-PL2 im HP Omen 16.
Abgesehen von einem anfänglichen, allmählichen Rückgang der Scores zeigt sich während des Cinebench R15 Multi-Core-Dauertest kein Throttling.
Cinebench R15 Multi Dauertest
Cinebench R23: Multi Core | Single Core
Cinebench R20: CPU (Multi Core) | CPU (Single Core)
Cinebench R15: CPU Multi 64Bit | CPU Single 64Bit
Blender: v2.79 BMW27 CPU
7-Zip 18.03: 7z b 4 | 7z b 4 -mmt1
Geekbench 5.5: Multi-Core | Single-Core
HWBOT x265 Benchmark v2.2: 4k Preset
LibreOffice : 20 Documents To PDF
R Benchmark 2.5: Overall mean
| CPU Performance Rating | |
| Alienware m16 R1 AMD | |
| Durchschnitt der Klasse Gaming | |
| Schenker XMG Pro 15 (E23) | |
| Acer Predator Helios 16 PH16-71-731Q | |
| HP Omen 16-wf000 -1! | |
| Uniwill GM6PX7X RTX 4070 | |
| Alienware m16 R1 Intel | |
| Colorful EVOL X15 AT 23 | |
| Dell G15 5530 | |
| Durchschnittliche Intel Core i7-13700HX | |
| Cinebench R23 / Multi Core | |
| Alienware m16 R1 AMD | |
| Durchschnitt der Klasse Gaming (10488 - 40970, n=110, der letzten 2 Jahre) | |
| Schenker XMG Pro 15 (E23) | |
| Acer Predator Helios 16 PH16-71-731Q | |
| Colorful EVOL X15 AT 23 | |
| Alienware m16 R1 Intel | |
| Uniwill GM6PX7X RTX 4070 | |
| Dell G15 5530 | |
| Durchschnittliche Intel Core i7-13700HX (15558 - 22598, n=11) | |
| HP Omen 16-wf000 | |
| Cinebench R23 / Single Core | |
| Durchschnitt der Klasse Gaming (1166 - 2356, n=110, der letzten 2 Jahre) | |
| Alienware m16 R1 Intel | |
| Colorful EVOL X15 AT 23 | |
| Acer Predator Helios 16 PH16-71-731Q | |
| Schenker XMG Pro 15 (E23) | |
| HP Omen 16-wf000 | |
| Alienware m16 R1 AMD | |
| Dell G15 5530 | |
| Durchschnittliche Intel Core i7-13700HX (1666 - 1933, n=11) | |
| Uniwill GM6PX7X RTX 4070 | |
| Cinebench R20 / CPU (Multi Core) | |
| Alienware m16 R1 AMD | |
| Durchschnitt der Klasse Gaming (4029 - 16108, n=109, der letzten 2 Jahre) | |
| Schenker XMG Pro 15 (E23) | |
| Acer Predator Helios 16 PH16-71-731Q | |
| Colorful EVOL X15 AT 23 | |
| Uniwill GM6PX7X RTX 4070 | |
| Alienware m16 R1 Intel | |
| Dell G15 5530 | |
| Durchschnittliche Intel Core i7-13700HX (6160 - 8610, n=11) | |
| HP Omen 16-wf000 | |
| Cinebench R20 / CPU (Single Core) | |
| Durchschnitt der Klasse Gaming (442 - 895, n=109, der letzten 2 Jahre) | |
| Colorful EVOL X15 AT 23 | |
| Alienware m16 R1 Intel | |
| Acer Predator Helios 16 PH16-71-731Q | |
| Schenker XMG Pro 15 (E23) | |
| HP Omen 16-wf000 | |
| Alienware m16 R1 AMD | |
| Dell G15 5530 | |
| Uniwill GM6PX7X RTX 4070 | |
| Durchschnittliche Intel Core i7-13700HX (644 - 740, n=11) | |
| Cinebench R15 / CPU Multi 64Bit | |
| Alienware m16 R1 AMD | |
| Durchschnitt der Klasse Gaming (1578 - 6271, n=108, der letzten 2 Jahre) | |
| Schenker XMG Pro 15 (E23) | |
| Colorful EVOL X15 AT 23 | |
| Acer Predator Helios 16 PH16-71-731Q | |
| Acer Predator Helios 16 PH16-71-731Q | |
| Uniwill GM6PX7X RTX 4070 | |
| Durchschnittliche Intel Core i7-13700HX (2548 - 3482, n=12) | |
| Alienware m16 R1 Intel | |
| Dell G15 5530 | |
| HP Omen 16-wf000 | |
| Cinebench R15 / CPU Single 64Bit | |
| Alienware m16 R1 AMD | |
| Durchschnitt der Klasse Gaming (188.8 - 343, n=109, der letzten 2 Jahre) | |
| Alienware m16 R1 Intel | |
| Colorful EVOL X15 AT 23 | |
| Dell G15 5530 | |
| Acer Predator Helios 16 PH16-71-731Q | |
| Durchschnittliche Intel Core i7-13700HX (243 - 279, n=11) | |
| HP Omen 16-wf000 | |
| Uniwill GM6PX7X RTX 4070 | |
| Schenker XMG Pro 15 (E23) | |
| Blender / v2.79 BMW27 CPU | |
| Durchschnittliche Intel Core i7-13700HX (138 - 207, n=10) | |
| Dell G15 5530 | |
| Acer Predator Helios 16 PH16-71-731Q | |
| Alienware m16 R1 Intel | |
| Colorful EVOL X15 AT 23 | |
| Durchschnitt der Klasse Gaming (80 - 330, n=107, der letzten 2 Jahre) | |
| Uniwill GM6PX7X RTX 4070 | |
| Schenker XMG Pro 15 (E23) | |
| Alienware m16 R1 AMD | |
| 7-Zip 18.03 / 7z b 4 | |
| Alienware m16 R1 AMD | |
| Schenker XMG Pro 15 (E23) | |
| Durchschnitt der Klasse Gaming (33491 - 148086, n=108, der letzten 2 Jahre) | |
| Uniwill GM6PX7X RTX 4070 | |
| Alienware m16 R1 Intel | |
| Acer Predator Helios 16 PH16-71-731Q | |
| HP Omen 16-wf000 | |
| Dell G15 5530 | |
| Durchschnittliche Intel Core i7-13700HX (58912 - 89294, n=11) | |
| Colorful EVOL X15 AT 23 | |
| 7-Zip 18.03 / 7z b 4 -mmt1 | |
| Alienware m16 R1 AMD | |
| Alienware m16 R1 Intel | |
| Durchschnitt der Klasse Gaming (4199 - 7436, n=108, der letzten 2 Jahre) | |
| Colorful EVOL X15 AT 23 | |
| Schenker XMG Pro 15 (E23) | |
| Acer Predator Helios 16 PH16-71-731Q | |
| Durchschnittliche Intel Core i7-13700HX (5552 - 6409, n=11) | |
| Uniwill GM6PX7X RTX 4070 | |
| HP Omen 16-wf000 | |
| Dell G15 5530 | |
| Geekbench 5.5 / Multi-Core | |
| Schenker XMG Pro 15 (E23) | |
| Durchschnitt der Klasse Gaming (6460 - 27010, n=108, der letzten 2 Jahre) | |
| Acer Predator Helios 16 PH16-71-731Q | |
| Uniwill GM6PX7X RTX 4070 | |
| Alienware m16 R1 AMD | |
| HP Omen 16-wf000 | |
| Alienware m16 R1 Intel | |
| Dell G15 5530 | |
| Durchschnittliche Intel Core i7-13700HX (10156 - 15850, n=12) | |
| Colorful EVOL X15 AT 23 | |
| Geekbench 5.5 / Single-Core | |
| Durchschnitt der Klasse Gaming (986 - 2474, n=108, der letzten 2 Jahre) | |
| Alienware m16 R1 AMD | |
| Acer Predator Helios 16 PH16-71-731Q | |
| HP Omen 16-wf000 | |
| Dell G15 5530 | |
| Alienware m16 R1 Intel | |
| Colorful EVOL X15 AT 23 | |
| Uniwill GM6PX7X RTX 4070 | |
| Schenker XMG Pro 15 (E23) | |
| Durchschnittliche Intel Core i7-13700HX (1666 - 1899, n=12) | |
| HWBOT x265 Benchmark v2.2 / 4k Preset | |
| Alienware m16 R1 AMD | |
| Durchschnitt der Klasse Gaming (11.5 - 44.3, n=108, der letzten 2 Jahre) | |
| Uniwill GM6PX7X RTX 4070 | |
| Acer Predator Helios 16 PH16-71-731Q | |
| Schenker XMG Pro 15 (E23) | |
| Dell G15 5530 | |
| Alienware m16 R1 Intel | |
| Durchschnittliche Intel Core i7-13700HX (17.1 - 25.5, n=11) | |
| Colorful EVOL X15 AT 23 | |
| HP Omen 16-wf000 | |
| LibreOffice / 20 Documents To PDF | |
| Colorful EVOL X15 AT 23 | |
| Schenker XMG Pro 15 (E23) | |
| Durchschnitt der Klasse Gaming (19 - 88.8, n=108, der letzten 2 Jahre) | |
| Dell G15 5530 | |
| HP Omen 16-wf000 | |
| Alienware m16 R1 Intel | |
| Durchschnittliche Intel Core i7-13700HX (36.5 - 52.9, n=11) | |
| Alienware m16 R1 AMD | |
| Uniwill GM6PX7X RTX 4070 | |
| Acer Predator Helios 16 PH16-71-731Q | |
| R Benchmark 2.5 / Overall mean | |
| Uniwill GM6PX7X RTX 4070 | |
| Durchschnittliche Intel Core i7-13700HX (0.4274 - 0.513, n=11) | |
| Schenker XMG Pro 15 (E23) | |
| HP Omen 16-wf000 | |
| Colorful EVOL X15 AT 23 | |
| Alienware m16 R1 Intel | |
| Durchschnitt der Klasse Gaming (0.3439 - 0.759, n=109, der letzten 2 Jahre) | |
| Acer Predator Helios 16 PH16-71-731Q | |
| Dell G15 5530 | |
| Alienware m16 R1 AMD | |
* ... kleinere Werte sind besser
Der Core i7-13700HX des EVOL X15 kann im Performance-Modus maximal 145 W verbrauchen, wobei ein Boost von bis zu 4,2 GHz möglich ist, während die Cinebench R15 Multi-Core-Schleife läuft. Im Unterhaltungsmodus kann der Core i7-13700HX immer noch 4,2 GHz bei 113 W erreichen, aber der durchschnittliche Stromverbrauch sinkt während des Laufs auf nur etwa 21 W.
Im Quiet-Modus erreicht das EVOL X15 einen Spitzenwert von 4 GHz und verbraucht dabei nur 30 W. Der durchschnittliche Takt sinkt jedoch auf knapp unter 1 GHz, und der Verbrauch beträgt 15 W.
Die Cinebench R20-Ergebnisse im Akkubetrieb sinken um 26,5% bzw. 54% im Single-Core- und Multi-Core-Modus.

AIDA64: FP32 Ray-Trace | FPU Julia | CPU SHA3 | CPU Queen | FPU SinJulia | FPU Mandel | CPU AES | CPU ZLib | FP64 Ray-Trace | CPU PhotoWorxx
| Performance Rating | |
| Alienware m16 R1 AMD | |
| Durchschnitt der Klasse Gaming | |
| Uniwill GM6PX7X RTX 4070 | |
| Alienware m16 R1 Intel | |
| Acer Predator Helios 16 PH16-71-731Q | |
| Schenker XMG Pro 15 (E23) | |
| Durchschnittliche Intel Core i7-13700HX | |
| HP Omen 16-wf000 | |
| Colorful EVOL X15 AT 23 | |
| Dell G15 5530 | |
| AIDA64 / FP32 Ray-Trace | |
| Alienware m16 R1 AMD | |
| Durchschnitt der Klasse Gaming (10227 - 85542, n=107, der letzten 2 Jahre) | |
| Uniwill GM6PX7X RTX 4070 | |
| Alienware m16 R1 Intel | |
| Acer Predator Helios 16 PH16-71-731Q | |
| Colorful EVOL X15 AT 23 | |
| Durchschnittliche Intel Core i7-13700HX (14261 - 21999, n=11) | |
| HP Omen 16-wf000 | |
| Dell G15 5530 | |
| Schenker XMG Pro 15 (E23) | |
| AIDA64 / FPU Julia | |
| Alienware m16 R1 AMD | |
| Durchschnitt der Klasse Gaming (51376 - 238426, n=107, der letzten 2 Jahre) | |
| Uniwill GM6PX7X RTX 4070 | |
| Alienware m16 R1 Intel | |
| Colorful EVOL X15 AT 23 | |
| Acer Predator Helios 16 PH16-71-731Q | |
| HP Omen 16-wf000 | |
| Durchschnittliche Intel Core i7-13700HX (74636 - 109364, n=11) | |
| Schenker XMG Pro 15 (E23) | |
| Dell G15 5530 | |
| AIDA64 / CPU SHA3 | |
| Alienware m16 R1 AMD | |
| Durchschnitt der Klasse Gaming (2180 - 9817, n=107, der letzten 2 Jahre) | |
| Uniwill GM6PX7X RTX 4070 | |
| Alienware m16 R1 Intel | |
| Schenker XMG Pro 15 (E23) | |
| Colorful EVOL X15 AT 23 | |
| Acer Predator Helios 16 PH16-71-731Q | |
| Dell G15 5530 | |
| Durchschnittliche Intel Core i7-13700HX (3359 - 5053, n=11) | |
| HP Omen 16-wf000 | |
| AIDA64 / CPU Queen | |
| Alienware m16 R1 AMD | |
| Schenker XMG Pro 15 (E23) | |
| Durchschnitt der Klasse Gaming (49785 - 173351, n=94, der letzten 2 Jahre) | |
| Alienware m16 R1 Intel | |
| Acer Predator Helios 16 PH16-71-731Q | |
| Colorful EVOL X15 AT 23 | |
| Uniwill GM6PX7X RTX 4070 | |
| Durchschnittliche Intel Core i7-13700HX (86532 - 114717, n=11) | |
| Dell G15 5530 | |
| HP Omen 16-wf000 | |
| AIDA64 / FPU SinJulia | |
| Alienware m16 R1 AMD | |
| Durchschnitt der Klasse Gaming (4424 - 33636, n=107, der letzten 2 Jahre) | |
| Alienware m16 R1 Intel | |
| Uniwill GM6PX7X RTX 4070 | |
| Acer Predator Helios 16 PH16-71-731Q | |
| Colorful EVOL X15 AT 23 | |
| Schenker XMG Pro 15 (E23) | |
| Durchschnittliche Intel Core i7-13700HX (9290 - 13519, n=11) | |
| HP Omen 16-wf000 | |
| Dell G15 5530 | |
| AIDA64 / FPU Mandel | |
| Alienware m16 R1 AMD | |
| Durchschnitt der Klasse Gaming (25115 - 128721, n=107, der letzten 2 Jahre) | |
| Uniwill GM6PX7X RTX 4070 | |
| Alienware m16 R1 Intel | |
| Acer Predator Helios 16 PH16-71-731Q | |
| Colorful EVOL X15 AT 23 | |
| HP Omen 16-wf000 | |
| Durchschnittliche Intel Core i7-13700HX (35751 - 53484, n=11) | |
| Schenker XMG Pro 15 (E23) | |
| Dell G15 5530 | |
| AIDA64 / CPU AES | |
| Uniwill GM6PX7X RTX 4070 | |
| Alienware m16 R1 Intel | |
| Acer Predator Helios 16 PH16-71-731Q | |
| Durchschnittliche Intel Core i7-13700HX (67846 - 182575, n=11) | |
| Alienware m16 R1 AMD | |
| Durchschnitt der Klasse Gaming (39258 - 247074, n=107, der letzten 2 Jahre) | |
| Colorful EVOL X15 AT 23 | |
| Schenker XMG Pro 15 (E23) | |
| HP Omen 16-wf000 | |
| Dell G15 5530 | |
| AIDA64 / CPU ZLib | |
| Alienware m16 R1 AMD | |
| Durchschnitt der Klasse Gaming (574 - 2531, n=107, der letzten 2 Jahre) | |
| Acer Predator Helios 16 PH16-71-731Q | |
| Schenker XMG Pro 15 (E23) | |
| Uniwill GM6PX7X RTX 4070 | |
| Alienware m16 R1 Intel | |
| HP Omen 16-wf000 | |
| Colorful EVOL X15 AT 23 | |
| Dell G15 5530 | |
| Durchschnittliche Intel Core i7-13700HX (981 - 1451, n=11) | |
| AIDA64 / FP64 Ray-Trace | |
| Alienware m16 R1 AMD | |
| Durchschnitt der Klasse Gaming (5509 - 45446, n=107, der letzten 2 Jahre) | |
| Uniwill GM6PX7X RTX 4070 | |
| Alienware m16 R1 Intel | |
| Colorful EVOL X15 AT 23 | |
| Acer Predator Helios 16 PH16-71-731Q | |
| Durchschnittliche Intel Core i7-13700HX (7728 - 11837, n=11) | |
| HP Omen 16-wf000 | |
| Dell G15 5530 | |
| Schenker XMG Pro 15 (E23) | |
| AIDA64 / CPU PhotoWorxx | |
| Schenker XMG Pro 15 (E23) | |
| Durchschnitt der Klasse Gaming (12271 - 89891, n=107, der letzten 2 Jahre) | |
| Uniwill GM6PX7X RTX 4070 | |
| HP Omen 16-wf000 | |
| Dell G15 5530 | |
| Alienware m16 R1 Intel | |
| Acer Predator Helios 16 PH16-71-731Q | |
| Durchschnittliche Intel Core i7-13700HX (19678 - 42415, n=11) | |
| Alienware m16 R1 AMD | |
| Colorful EVOL X15 AT 23 | |
System Performance
Das EVOL X15 AT erzielt im PCMark 10 bessere Ergebnisse als im CrossMark. Die AIDA64-Speicher-Scores sind aufgrund des einzelnen Dual-Channel-DDR5-4800-Sticks im EVOL X15 im Vergleich zu den Dual-Quad-Channel-Implementierungen seiner Konkurrenten auf der niedrigeren Seite.
Nichtsdestotrotz hatten wir bei der Verwendung des EVOL X15 für routinemäßige Produktivitäts- und Web-Browsing-Aufgaben keine Probleme.
CrossMark: Overall | Productivity | Creativity | Responsiveness
AIDA64: Memory Copy | Memory Read | Memory Write | Memory Latency
| PCMark 10 / Score | |
| Alienware m16 R1 AMD | |
| Uniwill GM6PX7X RTX 4070 | |
| Durchschnitt der Klasse Gaming (5828 - 11574, n=95, der letzten 2 Jahre) | |
| HP Omen 16-wf000 | |
| Acer Predator Helios 16 PH16-71-731Q | |
| Colorful EVOL X15 AT 23 | |
| Schenker XMG Pro 15 (E23) | |
| Durchschnittliche Intel Core i7-13700HX, NVIDIA GeForce RTX 4060 Laptop GPU (6909 - 7743, n=5) | |
| Alienware m16 R1 Intel | |
| Dell G15 5530 | |
| PCMark 10 / Essentials | |
| Uniwill GM6PX7X RTX 4070 | |
| Alienware m16 R1 AMD | |
| Schenker XMG Pro 15 (E23) | |
| Acer Predator Helios 16 PH16-71-731Q | |
| Dell G15 5530 | |
| Alienware m16 R1 Intel | |
| Durchschnittliche Intel Core i7-13700HX, NVIDIA GeForce RTX 4060 Laptop GPU (9760 - 11313, n=5) | |
| Durchschnitt der Klasse Gaming (8810 - 12600, n=99, der letzten 2 Jahre) | |
| Colorful EVOL X15 AT 23 | |
| HP Omen 16-wf000 | |
| PCMark 10 / Productivity | |
| Acer Predator Helios 16 PH16-71-731Q | |
| Durchschnitt der Klasse Gaming (6845 - 21327, n=97, der letzten 2 Jahre) | |
| Uniwill GM6PX7X RTX 4070 | |
| Schenker XMG Pro 15 (E23) | |
| Alienware m16 R1 AMD | |
| Dell G15 5530 | |
| Durchschnittliche Intel Core i7-13700HX, NVIDIA GeForce RTX 4060 Laptop GPU (9131 - 11018, n=5) | |
| Alienware m16 R1 Intel | |
| Colorful EVOL X15 AT 23 | |
| HP Omen 16-wf000 | |
| PCMark 10 / Digital Content Creation | |
| Alienware m16 R1 AMD | |
| Durchschnitt der Klasse Gaming (7602 - 19657, n=97, der letzten 2 Jahre) | |
| Uniwill GM6PX7X RTX 4070 | |
| HP Omen 16-wf000 | |
| Colorful EVOL X15 AT 23 | |
| Durchschnittliche Intel Core i7-13700HX, NVIDIA GeForce RTX 4060 Laptop GPU (9393 - 12434, n=5) | |
| Acer Predator Helios 16 PH16-71-731Q | |
| Alienware m16 R1 Intel | |
| Schenker XMG Pro 15 (E23) | |
| Dell G15 5530 | |
| CrossMark / Overall | |
| Acer Predator Helios 16 PH16-71-731Q | |
| Alienware m16 R1 Intel | |
| Alienware m16 R1 AMD | |
| Durchschnitt der Klasse Gaming (1366 - 2409, n=96, der letzten 2 Jahre) | |
| Uniwill GM6PX7X RTX 4070 | |
| Schenker XMG Pro 15 (E23) | |
| Durchschnittliche Intel Core i7-13700HX, NVIDIA GeForce RTX 4060 Laptop GPU (1663 - 2105, n=5) | |
| Dell G15 5530 | |
| Colorful EVOL X15 AT 23 | |
| HP Omen 16-wf000 | |
| CrossMark / Productivity | |
| Acer Predator Helios 16 PH16-71-731Q | |
| Alienware m16 R1 Intel | |
| Alienware m16 R1 AMD | |
| Durchschnitt der Klasse Gaming (1386 - 2254, n=96, der letzten 2 Jahre) | |
| Uniwill GM6PX7X RTX 4070 | |
| Schenker XMG Pro 15 (E23) | |
| Durchschnittliche Intel Core i7-13700HX, NVIDIA GeForce RTX 4060 Laptop GPU (1618 - 1989, n=5) | |
| Dell G15 5530 | |
| Colorful EVOL X15 AT 23 | |
| HP Omen 16-wf000 | |
| CrossMark / Creativity | |
| Acer Predator Helios 16 PH16-71-731Q | |
| Alienware m16 R1 Intel | |
| Durchschnitt der Klasse Gaming (1343 - 2729, n=96, der letzten 2 Jahre) | |
| Schenker XMG Pro 15 (E23) | |
| Alienware m16 R1 AMD | |
| Uniwill GM6PX7X RTX 4070 | |
| Dell G15 5530 | |
| Durchschnittliche Intel Core i7-13700HX, NVIDIA GeForce RTX 4060 Laptop GPU (1710 - 2274, n=5) | |
| HP Omen 16-wf000 | |
| Colorful EVOL X15 AT 23 | |
| CrossMark / Responsiveness | |
| Acer Predator Helios 16 PH16-71-731Q | |
| Alienware m16 R1 Intel | |
| Uniwill GM6PX7X RTX 4070 | |
| Schenker XMG Pro 15 (E23) | |
| Alienware m16 R1 AMD | |
| Durchschnitt der Klasse Gaming (1226 - 2334, n=96, der letzten 2 Jahre) | |
| Durchschnittliche Intel Core i7-13700HX, NVIDIA GeForce RTX 4060 Laptop GPU (1269 - 1983, n=5) | |
| Dell G15 5530 | |
| HP Omen 16-wf000 | |
| Colorful EVOL X15 AT 23 | |
| AIDA64 / Memory Copy | |
| Schenker XMG Pro 15 (E23) | |
| Durchschnitt der Klasse Gaming (21750 - 129946, n=107, der letzten 2 Jahre) | |
| Uniwill GM6PX7X RTX 4070 | |
| HP Omen 16-wf000 | |
| Dell G15 5530 | |
| Alienware m16 R1 Intel | |
| Acer Predator Helios 16 PH16-71-731Q | |
| Durchschnittliche Intel Core i7-13700HX, NVIDIA GeForce RTX 4060 Laptop GPU (36504 - 58458, n=5) | |
| Alienware m16 R1 AMD | |
| Colorful EVOL X15 AT 23 | |
| AIDA64 / Memory Read | |
| Schenker XMG Pro 15 (E23) | |
| Durchschnitt der Klasse Gaming (22956 - 118858, n=107, der letzten 2 Jahre) | |
| Uniwill GM6PX7X RTX 4070 | |
| Dell G15 5530 | |
| Alienware m16 R1 Intel | |
| HP Omen 16-wf000 | |
| Acer Predator Helios 16 PH16-71-731Q | |
| Durchschnittliche Intel Core i7-13700HX, NVIDIA GeForce RTX 4060 Laptop GPU (36510 - 67644, n=5) | |
| Alienware m16 R1 AMD | |
| Colorful EVOL X15 AT 23 | |
| AIDA64 / Memory Write | |
| Acer Predator Helios 16 PH16-71-731Q | |
| Durchschnitt der Klasse Gaming (22297 - 135096, n=107, der letzten 2 Jahre) | |
| Schenker XMG Pro 15 (E23) | |
| HP Omen 16-wf000 | |
| Uniwill GM6PX7X RTX 4070 | |
| Durchschnittliche Intel Core i7-13700HX, NVIDIA GeForce RTX 4060 Laptop GPU (33598 - 85675, n=5) | |
| Dell G15 5530 | |
| Alienware m16 R1 Intel | |
| Alienware m16 R1 AMD | |
| Colorful EVOL X15 AT 23 | |
| AIDA64 / Memory Latency | |
| Durchschnitt der Klasse Gaming (75.3 - 259, n=107, der letzten 2 Jahre) | |
| Alienware m16 R1 AMD | |
| Dell G15 5530 | |
| Alienware m16 R1 Intel | |
| Uniwill GM6PX7X RTX 4070 | |
| HP Omen 16-wf000 | |
| Durchschnittliche Intel Core i7-13700HX, NVIDIA GeForce RTX 4060 Laptop GPU (81.9 - 93, n=5) | |
| Acer Predator Helios 16 PH16-71-731Q | |
| Schenker XMG Pro 15 (E23) | |
| Colorful EVOL X15 AT 23 | |
* ... kleinere Werte sind besser
| PCMark 8 Home Score Accelerated v2 | 5769 Punkte | |
| PCMark 8 Work Score Accelerated v2 | 5995 Punkte | |
| PCMark 10 Score | 7655 Punkte | |
Hilfe | ||
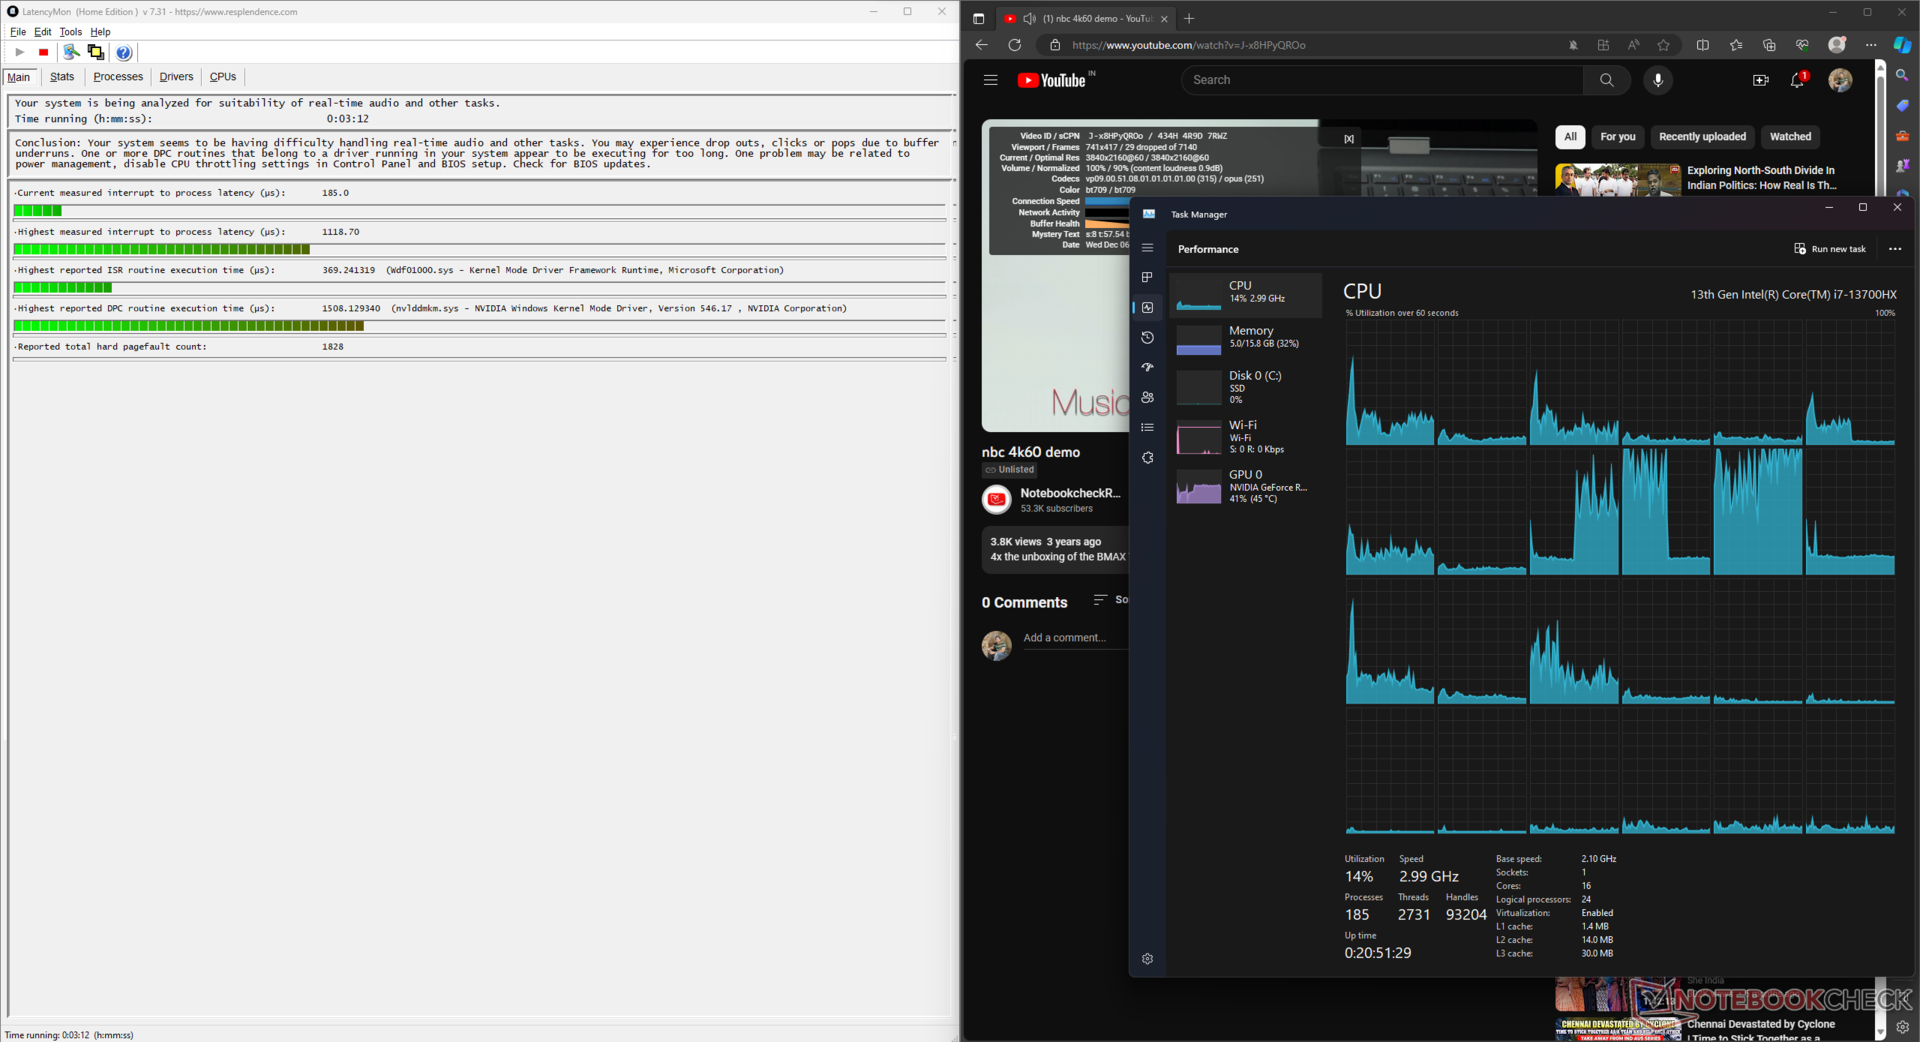
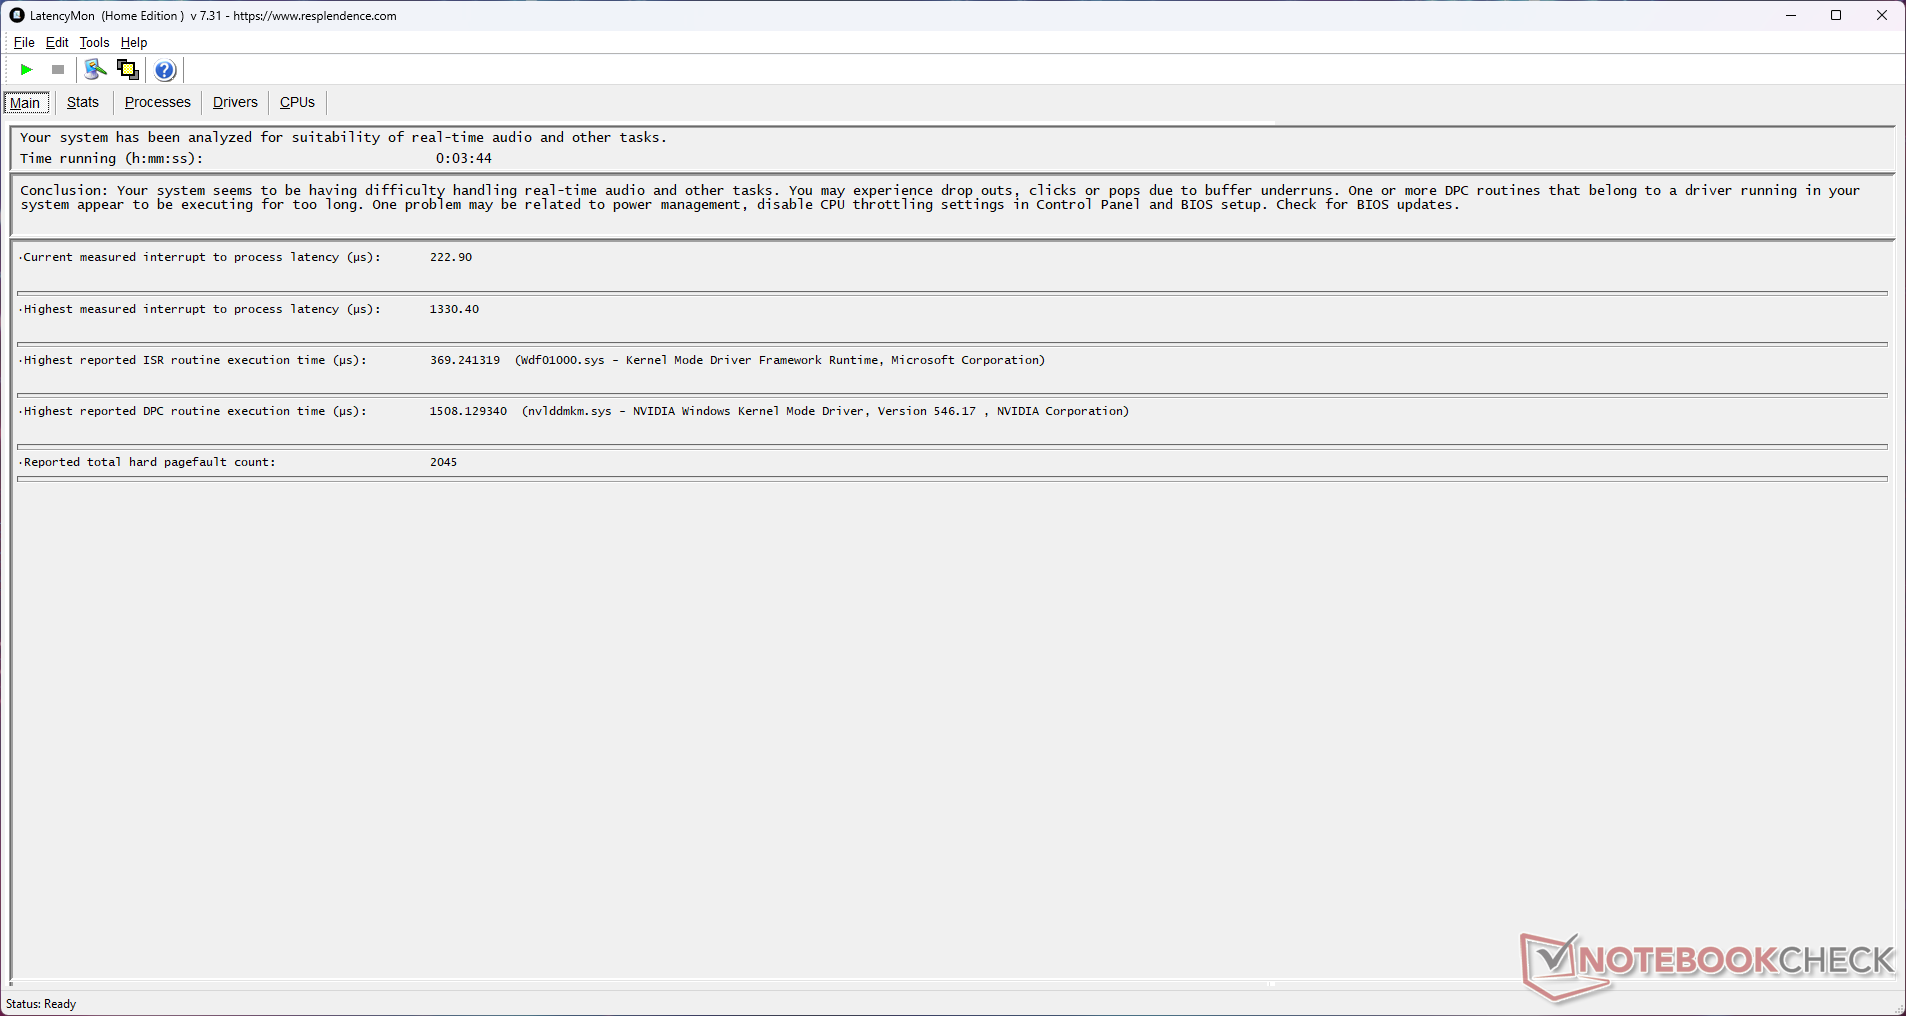
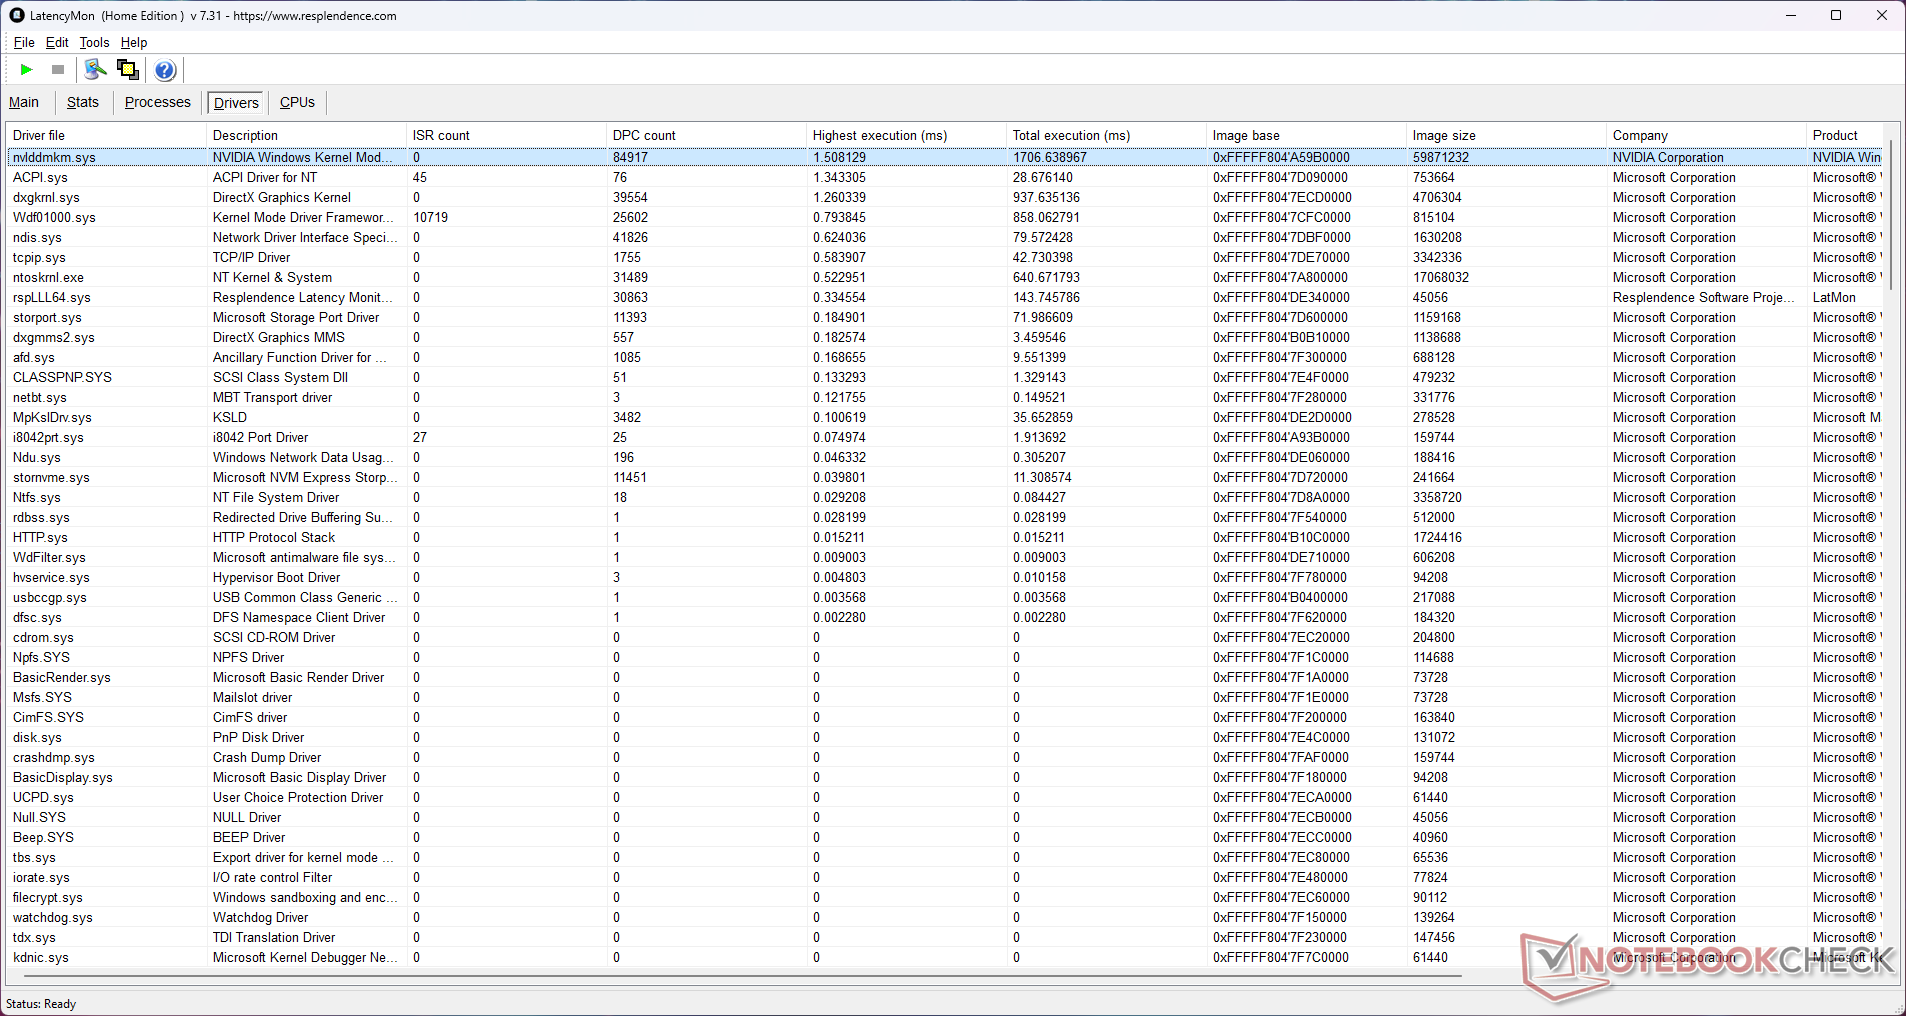
DPC-Latenzen
Hohe DPC-Latenzen sind ein bekanntes Problem bei Laptops mit Nvidia-Karten, und das EVOL X15 ist keine Ausnahme, obwohl es besser abschneidet als seine Konkurrenten.
Wir haben mit LatencyMon eine Interrupt-to-Process-Latenz von 1.330,4 µs aufgezeichnet, nachdem wir eine YouTube 4K60-Wiedergabe und einen 10-sekündigen Prime95-Stresstest durchgeführt haben. Der Nvidia Windows Kernel Mode Driver Framework (nvlddmkm.sys) trägt zu dieser hohen Latenz bei.
| DPC Latencies / LatencyMon - interrupt to process latency (max), Web, Youtube, Prime95 | |
| Dell G15 5530 | |
| Alienware m16 R1 Intel | |
| HP Omen 16-wf000 | |
| Alienware m16 R1 AMD | |
| Acer Predator Helios 16 PH16-71-731Q | |
| Colorful EVOL X15 AT 23 | |
| Uniwill GM6PX7X RTX 4070 | |
| Schenker XMG Pro 15 (E23) | |
* ... kleinere Werte sind besser
Massenspeicher
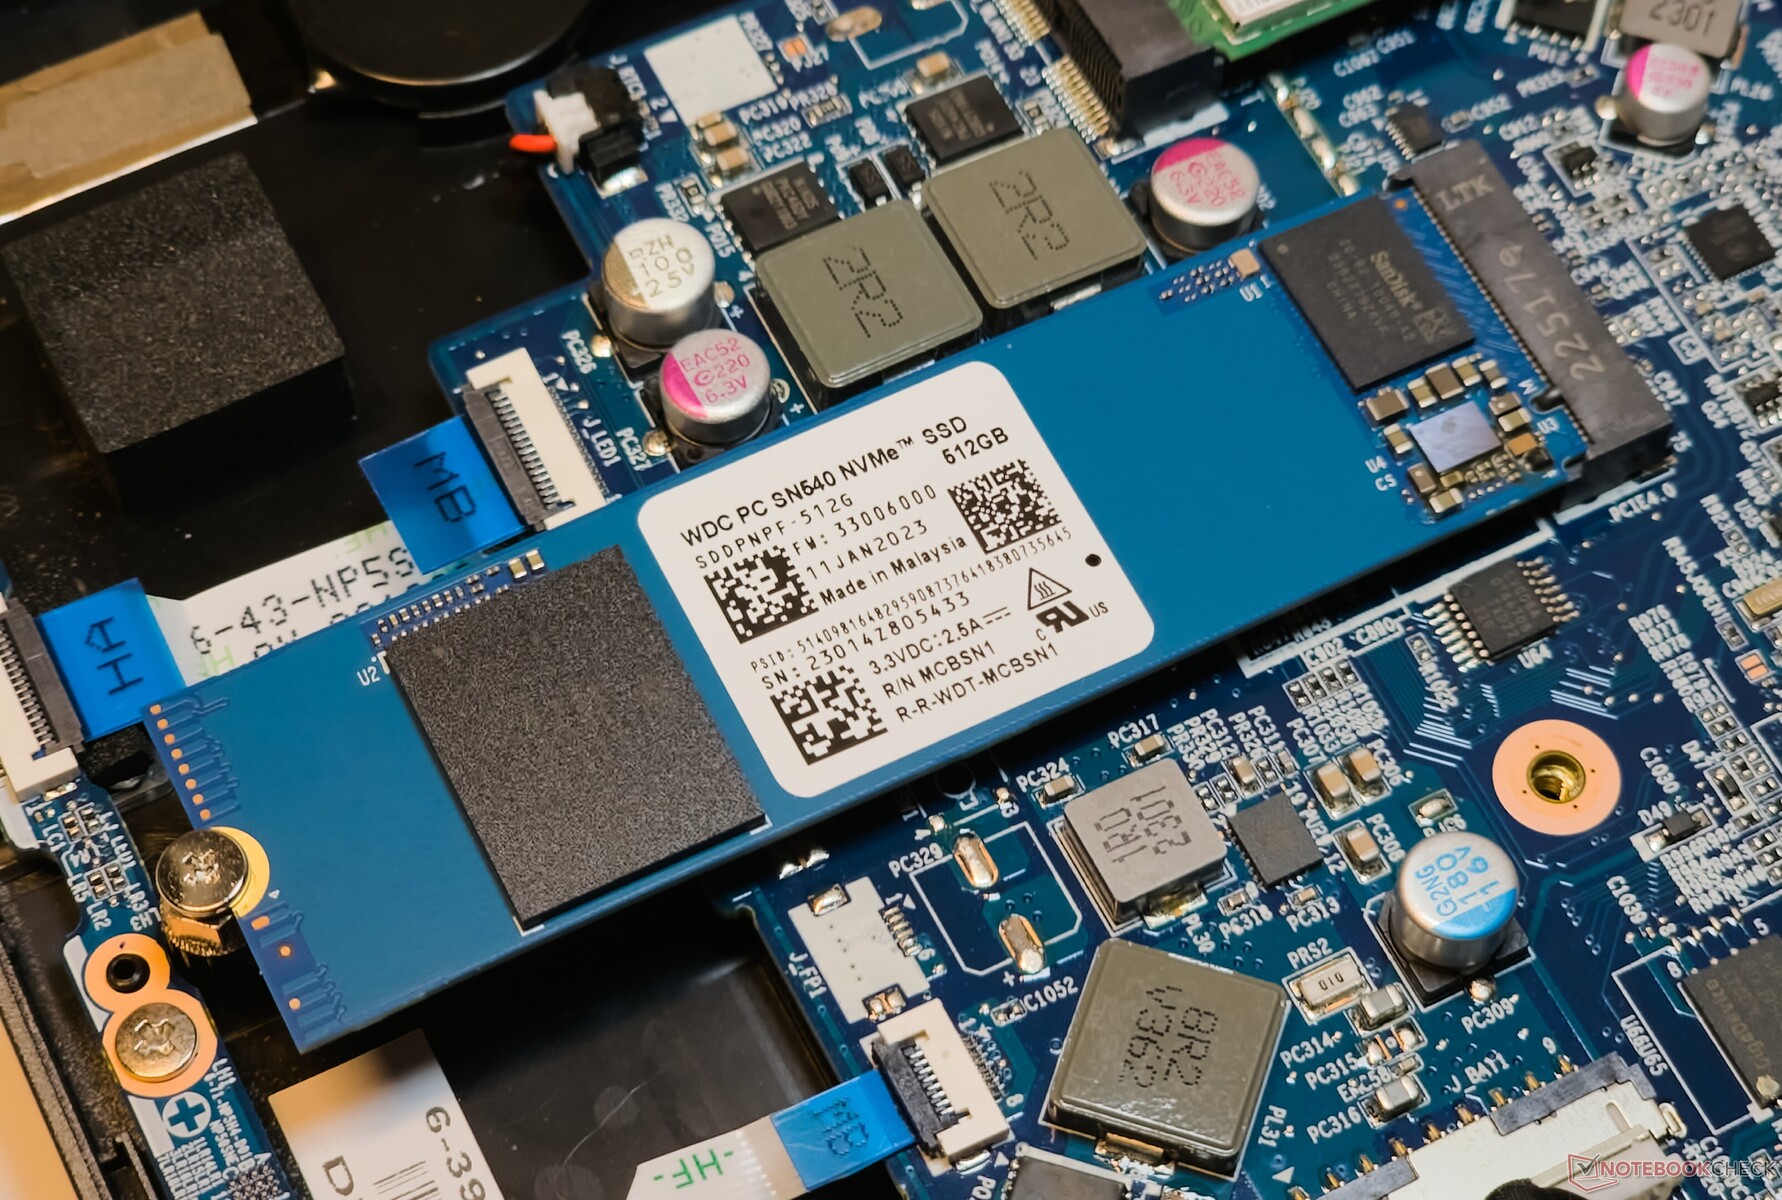
Die 512 GB Western Digital SN540 NVMe SSD des EVOL X15 kann nicht mit den Laufwerken von Kioxia und SK Hynix konkurrieren. Dennoch übertreffen die 4K Q1 T1 Lese- und Schreibwerte die der Kioxia XG8 im Alienware m16 R1 AMD.
Colorful ermöglicht das Hinzufügen eines weiteren PCIe Gen4 NVMe-Laufwerks. Es gibt jedoch keine Möglichkeit, 2,5-Zoll-SATA-Massenspeicher hinzuzufügen.

| Drive Performance Rating - Percent | |
| Uniwill GM6PX7X RTX 4070 | |
| Acer Predator Helios 16 PH16-71-731Q | |
| Alienware m16 R1 AMD | |
| Durchschnitt der Klasse Gaming | |
| HP Omen 16-wf000 | |
| Schenker XMG Pro 15 (E23) | |
| Alienware m16 R1 Intel | |
| Colorful EVOL X15 AT 23 | |
| Durchschnittliche WDC PC SN540 SDDPNPF-512G | |
| Dell G15 5530 | |
* ... kleinere Werte sind besser
Disk-Throttling: DiskSpd Read Loop, 8 Runden
Das Laufwerk beginnt nach der 17. Schleife während des DiskSpd-Leseschleifentests bei einer Warteschlangentiefe von 8 zu drosseln. Das Laufwerk verfügt über keine thermische Abdeckung oder Polsterung.
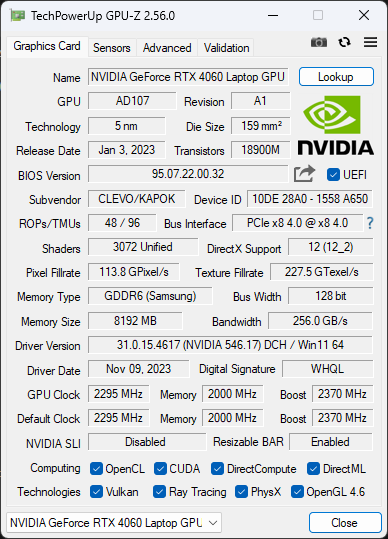
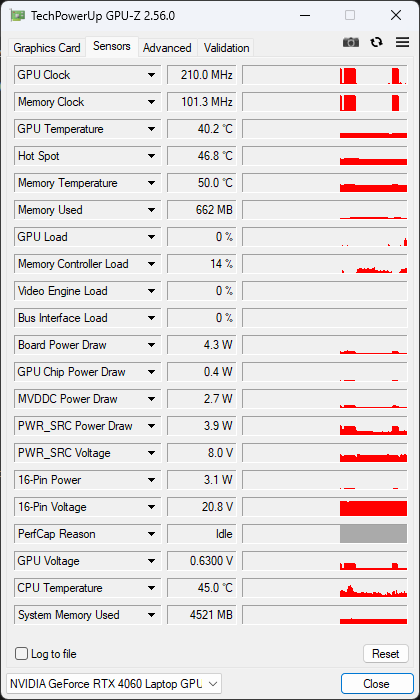
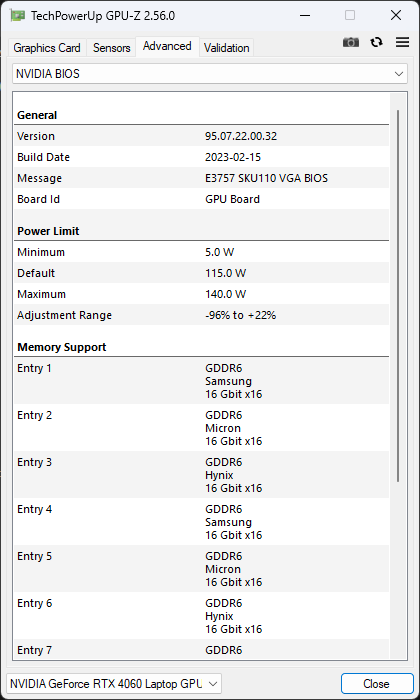
GPU Performance
Die Nvidia GeForce RTX 4060 Laptop-GPU im EVOL X15 AT arbeitet mit einem TGP von 140 W. Die Gesamtleistung im 3DMark ist vergleichbar mit anderen Laptops, die die gleiche GPU verwenden.
Wir sahen auch, dass der RTX 4060 in Schlagdistanz zum 140 W RTX 4070 Laptop-Grafikprozessor im Uniwill GM6PX7X ist, aber im Vergleich zum 175 W RTX 4080 Laptop-Grafikprozessor, der das Alienware m16 R1 AMD antreibt, fällt er um 31% zurück.
Die 3DMark Time Spy Grafik-Scores können im Akkubetrieb um fast 54% sinken.
| 3DMark Performance Rating - Percent | |
| Alienware m16 R1 AMD -1! | |
| HP Omen 16-wf000 -1! | |
| Durchschnitt der Klasse Gaming | |
| Uniwill GM6PX7X RTX 4070 -1! | |
| Dell G15 5530 | |
| Alienware m16 R1 Intel | |
| Colorful EVOL X15 AT 23 | |
| Acer Predator Helios 16 PH16-71-731Q | |
| Durchschnittliche NVIDIA GeForce RTX 4060 Laptop GPU | |
| Schenker XMG Pro 15 (E23) | |
| 3DMark 11 Performance | 30245 Punkte | |
| 3DMark Ice Storm Standard Score | 278340 Punkte | |
| 3DMark Cloud Gate Standard Score | 63582 Punkte | |
| 3DMark Fire Strike Score | 24674 Punkte | |
| 3DMark Fire Strike Extreme Score | 12089 Punkte | |
| 3DMark Time Spy Score | 10590 Punkte | |
Hilfe | ||
| Blender / v3.3 Classroom OPTIX/RTX | |
| Schenker XMG Pro 15 (E23) | |
| Colorful EVOL X15 AT 23 | |
| Alienware m16 R1 Intel | |
| Durchschnittliche NVIDIA GeForce RTX 4060 Laptop GPU (19 - 28, n=53) | |
| Acer Predator Helios 16 PH16-71-731Q | |
| Dell G15 5530 | |
| Uniwill GM6PX7X RTX 4070 | |
| Durchschnitt der Klasse Gaming (9 - 32, n=109, der letzten 2 Jahre) | |
| HP Omen 16-wf000 | |
| Alienware m16 R1 AMD | |
| Blender / v3.3 Classroom CUDA | |
| Schenker XMG Pro 15 (E23) | |
| Durchschnittliche NVIDIA GeForce RTX 4060 Laptop GPU (39 - 53, n=53) | |
| Colorful EVOL X15 AT 23 | |
| Acer Predator Helios 16 PH16-71-731Q | |
| Dell G15 5530 | |
| Alienware m16 R1 Intel | |
| Durchschnitt der Klasse Gaming (15 - 233, n=110, der letzten 2 Jahre) | |
| Uniwill GM6PX7X RTX 4070 | |
| Alienware m16 R1 AMD | |
| HP Omen 16-wf000 | |
| Blender / v3.3 Classroom CPU | |
| Durchschnittliche NVIDIA GeForce RTX 4060 Laptop GPU (189 - 452, n=53) | |
| HP Omen 16-wf000 | |
| Dell G15 5530 | |
| Acer Predator Helios 16 PH16-71-731Q | |
| Colorful EVOL X15 AT 23 | |
| Schenker XMG Pro 15 (E23) | |
| Alienware m16 R1 Intel | |
| Uniwill GM6PX7X RTX 4070 | |
| Durchschnitt der Klasse Gaming (122 - 565, n=105, der letzten 2 Jahre) | |
| Alienware m16 R1 AMD | |
* ... kleinere Werte sind besser
Gaming Performance
Das EVOL X15 hat einen kleinen Vorsprung gegenüber konkurrierenden Laptops mit ähnlichen Spezifikationen, darunter das Acer Predator Helios 16 und das Alienware m16 R1 Intel, was die allgemeine Spieleleistung bei 1080p Ultra angeht.
QHD-Spiele mit 60 fps sind in vielen AAA-Titeln möglich, und mithilfe von Upscalern wie Nvidia DLSS, AMD FSR oder Intel XeSS können sogar noch höhere Bildraten erzielt werden.
| Performance Rating - Percent | |
| Alienware m16 R1 AMD -1! | |
| HP Omen 16-wf000 | |
| Durchschnitt der Klasse Gaming | |
| Uniwill GM6PX7X RTX 4070 | |
| Schenker XMG Pro 15 (E23) -1! | |
| Colorful EVOL X15 AT 23 | |
| Dell G15 5530 | |
| Alienware m16 R1 Intel -1! | |
| Acer Predator Helios 16 PH16-71-731Q | |
| The Witcher 3 - 1920x1080 Ultra Graphics & Postprocessing (HBAO+) | |
| Durchschnitt der Klasse Gaming (95 - 240, n=7, der letzten 2 Jahre) | |
| Alienware m16 R1 AMD | |
| HP Omen 16-wf000 | |
| Schenker XMG Pro 15 (E23) | |
| Uniwill GM6PX7X RTX 4070 | |
| Alienware m16 R1 Intel | |
| Dell G15 5530 | |
| Colorful EVOL X15 AT 23 | |
| Acer Predator Helios 16 PH16-71-731Q | |
| GTA V - 1920x1080 Highest AA:4xMSAA + FX AF:16x | |
| Durchschnitt der Klasse Gaming (48.3 - 186.9, n=97, der letzten 2 Jahre) | |
| Uniwill GM6PX7X RTX 4070 | |
| Colorful EVOL X15 AT 23 | |
| HP Omen 16-wf000 | |
| Acer Predator Helios 16 PH16-71-731Q | |
| Dell G15 5530 | |
| Schenker XMG Pro 15 (E23) | |
| Final Fantasy XV Benchmark - 1920x1080 High Quality | |
| Alienware m16 R1 AMD | |
| HP Omen 16-wf000 | |
| Durchschnitt der Klasse Gaming (41 - 215, n=98, der letzten 2 Jahre) | |
| Uniwill GM6PX7X RTX 4070 | |
| Alienware m16 R1 Intel | |
| Colorful EVOL X15 AT 23 | |
| Acer Predator Helios 16 PH16-71-731Q | |
| Dell G15 5530 | |
| Strange Brigade - 1920x1080 ultra AA:ultra AF:16 | |
| Alienware m16 R1 AMD | |
| HP Omen 16-wf000 | |
| Durchschnitt der Klasse Gaming (76.3 - 456, n=88, der letzten 2 Jahre) | |
| Uniwill GM6PX7X RTX 4070 | |
| Colorful EVOL X15 AT 23 | |
| Alienware m16 R1 Intel | |
| Dell G15 5530 | |
| Acer Predator Helios 16 PH16-71-731Q | |
| Schenker XMG Pro 15 (E23) | |
| Dota 2 Reborn - 1920x1080 ultra (3/3) best looking | |
| Uniwill GM6PX7X RTX 4070 | |
| Alienware m16 R1 AMD | |
| Schenker XMG Pro 15 (E23) | |
| HP Omen 16-wf000 | |
| Alienware m16 R1 Intel | |
| Colorful EVOL X15 AT 23 | |
| Acer Predator Helios 16 PH16-71-731Q | |
| Durchschnitt der Klasse Gaming (84.8 - 248, n=110, der letzten 2 Jahre) | |
| Dell G15 5530 | |
| X-Plane 11.11 - 1920x1080 high (fps_test=3) | |
| Uniwill GM6PX7X RTX 4070 | |
| Alienware m16 R1 Intel | |
| HP Omen 16-wf000 | |
| Colorful EVOL X15 AT 23 | |
| Dell G15 5530 | |
| Alienware m16 R1 AMD | |
| Schenker XMG Pro 15 (E23) | |
| Durchschnitt der Klasse Gaming (52.1 - 143.5, n=113, der letzten 2 Jahre) | |
| Acer Predator Helios 16 PH16-71-731Q | |
The Witcher 3 FPS-Diagramm
Die Kühlung des Grafiksubsystems des EVOL X15 scheint recht effizient zu sein, wie die stabilen Frameraten unter Belastung mit The Witcher 3 bei 1080p Ultra belegen.
| min. | mittel | hoch | max. | QHD | |
|---|---|---|---|---|---|
| GTA V (2015) | 185.6 | 182.3 | 177.3 | 114.6 | 85.6 |
| The Witcher 3 (2015) | 450 | 333 | 205 | 103.4 | 75.7 |
| Dota 2 Reborn (2015) | 192.2 | 169.7 | 164.6 | 153.1 | |
| Final Fantasy XV Benchmark (2018) | 206 | 143.9 | 101 | 74 | |
| X-Plane 11.11 (2018) | 176.1 | 155.9 | 116.4 | ||
| Far Cry 5 (2018) | 162 | 146 | 141 | 135 | 101 |
| Strange Brigade (2018) | 480 | 288 | 225 | 192 | 127.4 |
| F1 22 (2022) | 253 | 253 | 194.5 | 65.8 | 42.3 |
| F1 23 (2023) | 248 | 250 | 184.1 | 58.3 | 37 |
| Cyberpunk 2077 (2023) | 119.4 | 96.5 | 82.8 | 71.1 | 42.8 |
| Assassin's Creed Mirage (2023) | 137 | 125 | 116 | 89 | 65 |
| Call of Duty Modern Warfare 3 2023 (2023) | 128 | 114 | 86 | 65 | 56 |
| Avatar Frontiers of Pandora (2023) | 77.3 | 71.1 | 60.8 | 45.2 | 29.8 |
Emissionen: Niedrige Oberflächentemperaturen bei gleichzeitig hohem Lüftergeräusch
Geräuschemissionen
Colorful begrenzt das Lüftergeräusch des EVOL X15 AT im Modus "Leise" auf unter 30 db(A).
Im Unterhaltungs- und Leistungsmodus nähert sich der Geräuschpegel jedoch selbst bei durchschnittlicher 3DMark 06-Last der 55 db(A)-Marke.
Die bereitgestellten Energieprofile haben einen spürbaren Einfluss auf die Spieleleistung. Zum Beispiel sehen wir in The Witcher 3 bei 1080p Ultra einen durchschnittlichen Einbruch der Framerate um 33%, wenn wir vom Leistungsmodus in den Performance-Modus wechseln.
Lautstärkediagramm
| Idle |
| 33.16 / 33.16 / 33.16 dB(A) |
| Last |
| 54.62 / 54.53 dB(A) |
 | ||
30 dB leise 40 dB(A) deutlich hörbar 50 dB(A) störend |
||
min: | ||
| Performance-Modus | Leerlauf dB(A) | Lastdurchschnitt dB(A) | Maximale Last dB(A) | The Witcher 3 1080p Ultra dB(A) |
|---|---|---|---|---|
| Quiet | 24.73 | 26.61 | 26.08 | 26.82 / 67 fps |
| Power Saving | 24.85 | 26.02 | 41.05 | 46.10 / 75 fps |
| Entertainment | 25.07 | 54.06 | 54.56 | 53.29 / 97 fps |
| Performance | 33.16 | 54.62 | 54.53 | 54.62 / 100 fps |
| Colorful EVOL X15 AT 23 i7-13700HX, GeForce RTX 4060 Laptop GPU | Alienware m16 R1 Intel i7-13700HX, GeForce RTX 4060 Laptop GPU | HP Omen 16-wf000 i7-13700HX, GeForce RTX 4080 Laptop GPU | Acer Predator Helios 16 PH16-71-731Q i7-13700HX, GeForce RTX 4060 Laptop GPU | Dell G15 5530 i7-13650HX, GeForce RTX 4060 Laptop GPU | Schenker XMG Pro 15 (E23) i9-13900HX, GeForce RTX 4060 Laptop GPU | Alienware m16 R1 AMD R9 7845HX, GeForce RTX 4080 Laptop GPU | Uniwill GM6PX7X RTX 4070 i7-13700HX, GeForce RTX 4070 Laptop GPU | |
|---|---|---|---|---|---|---|---|---|
| Geräuschentwicklung | 9% | 7% | 14% | 19% | 11% | 13% | 13% | |
| aus / Umgebung * (dB) | 21.32 | 25 -17% | 23 -8% | 24 -13% | 20.41 4% | 24 -13% | 22.9 -7% | 22.4 -5% |
| Idle min * (dB) | 33.16 | 25 25% | 29.6 11% | 24 28% | 26.85 19% | 24 28% | 22.9 31% | 22.9 31% |
| Idle avg * (dB) | 33.16 | 26 22% | 29.8 10% | 24 28% | 26.85 19% | 24 28% | 29.7 10% | 29 13% |
| Idle max * (dB) | 33.16 | 27 19% | 30.4 8% | 32.32 3% | 26.85 19% | 24 28% | 29.7 10% | 29 13% |
| Last avg * (dB) | 54.62 | 52 5% | 33.8 38% | 36.66 33% | 27.65 49% | 53.65 2% | 29.8 45% | 40.2 26% |
| Witcher 3 ultra * (dB) | 54.6 | 51 7% | 57 -4% | 49.06 10% | 47.9 12% | 53.53 2% | 54.7 -0% | 48.7 11% |
| Last max * (dB) | 54.53 | 53 3% | 58.3 -7% | 49.49 9% | 47.86 12% | 53.65 2% | 54.7 -0% | 55 -1% |
* ... kleinere Werte sind besser
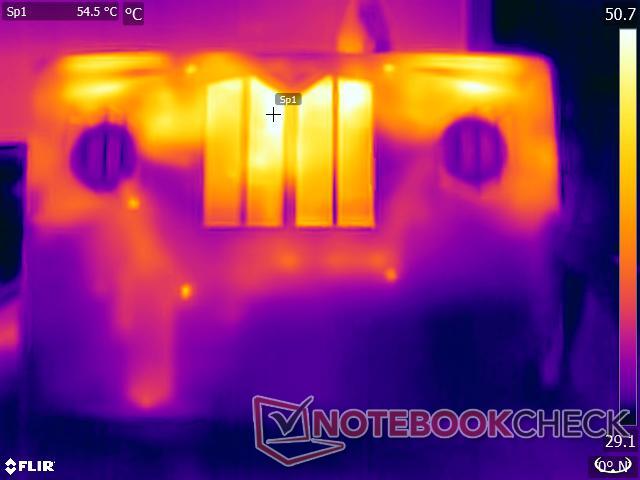
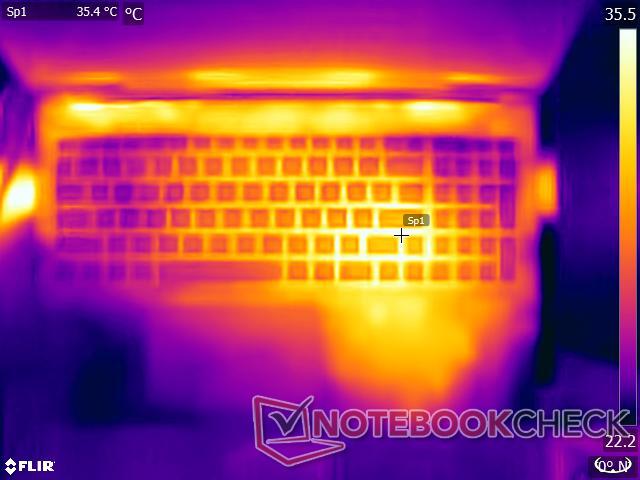
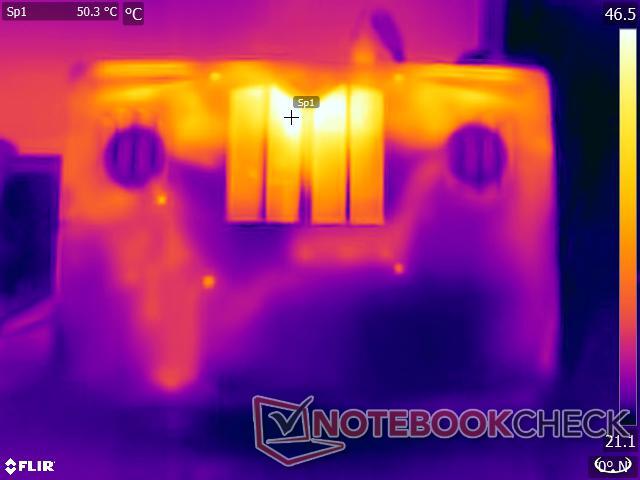
Temperatur
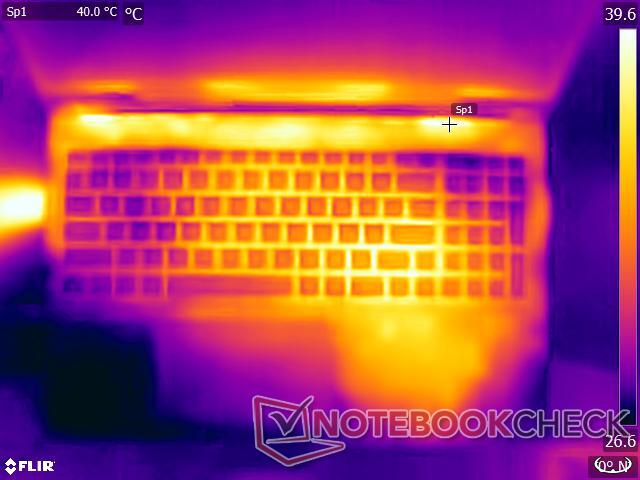
Das EVOL X15 verfügt über ein robustes Kühlsystem, das die CPU, die GPU und den Chipsatz vollständig abdeckt. Die Oberflächentemperaturen sind dank der soliden Kunststoffkonstruktion und des großen Abstands der Rückwand zum Mainboard auch unter starker Belastung beherrschbar. Nur ein Hotspot auf der Unterseite erreicht 51°C.
Trotz seines Gewichts kann das EVOL X15 auf dem Schoß verwendet werden, solange man es nicht zu stark belastet. Das Touchpad und die Handballenablage bleiben relativ kühl und werden nur bei extremer Belastung leicht warm.
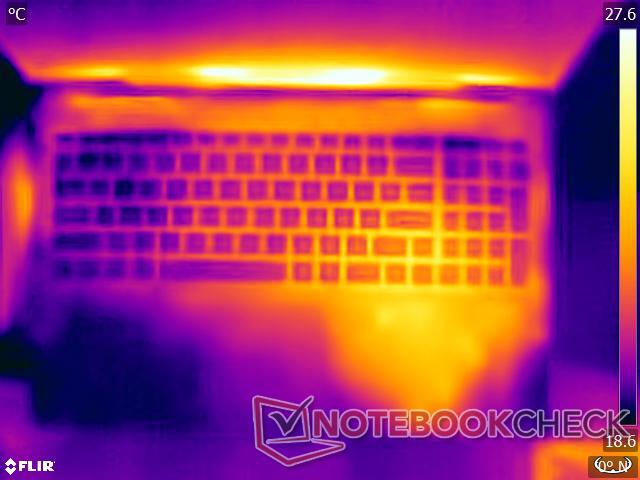
(+) Die maximale Temperatur auf der Oberseite ist 37 °C. Im Vergleich liegt der Klassendurchschnitt bei 40.4 °C (von 21.2 bis 68.8 °C für die Klasse Gaming).
(-) Auf der Unterseite messen wir eine maximalen Wert von 51.2 °C (im Vergleich zum Durchschnitt von 43.2 °C).
(+) Ohne Last messen wir eine durchschnittliche Temperatur von 29.3 °C auf der Oberseite. Der Klassendurchschnitt erreicht 33.9 °C.
(+) Beim längeren Spielen von The Witcher 3 erhitzt sich das Gerät durchschnittlich auf 31.7 °C. Der Durchschnitt der Klasse ist derzeit 33.9 °C.
(+) Die Handballen und der Touchpad-Bereich erreichen maximal 34.8 °C und damit die typische Hauttemperatur und fühlen sich daher nicht heiß an.
(-) Die durchschnittliche Handballen-Temperatur anderer getesteter Geräte war 28.8 °C (-6 °C).

| Colorful EVOL X15 AT 23 Intel Core i7-13700HX, NVIDIA GeForce RTX 4060 Laptop GPU | Alienware m16 R1 Intel Intel Core i7-13700HX, NVIDIA GeForce RTX 4060 Laptop GPU | HP Omen 16-wf000 Intel Core i7-13700HX, NVIDIA GeForce RTX 4080 Laptop GPU | Acer Predator Helios 16 PH16-71-731Q Intel Core i7-13700HX, NVIDIA GeForce RTX 4060 Laptop GPU | Dell G15 5530 Intel Core i7-13650HX, NVIDIA GeForce RTX 4060 Laptop GPU | Schenker XMG Pro 15 (E23) Intel Core i9-13900HX, NVIDIA GeForce RTX 4060 Laptop GPU | Alienware m16 R1 AMD AMD Ryzen 9 7845HX, NVIDIA GeForce RTX 4080 Laptop GPU | Uniwill GM6PX7X RTX 4070 Intel Core i7-13700HX, NVIDIA GeForce RTX 4070 Laptop GPU | |
|---|---|---|---|---|---|---|---|---|
| Hitze | -18% | 0% | -17% | -19% | -9% | -9% | -5% | |
| Last oben max * (°C) | 37 | 49 -32% | 45 -22% | 41 -11% | 54 -46% | 50 -35% | 48 -30% | 38.2 -3% |
| Last unten max * (°C) | 51.2 | 48 6% | 48.8 5% | 66 -29% | 62.2 -21% | 50 2% | 39 24% | 45 12% |
| Idle oben max * (°C) | 31.2 | 40 -28% | 29.2 6% | 36 -15% | 33.4 -7% | 33 -6% | 37 -19% | 33.6 -8% |
| Idle unten max * (°C) | 32.8 | 39 -19% | 28.8 12% | 37 -13% | 33.4 -2% | 32 2% | 36.2 -10% | 39.6 -21% |
* ... kleinere Werte sind besser
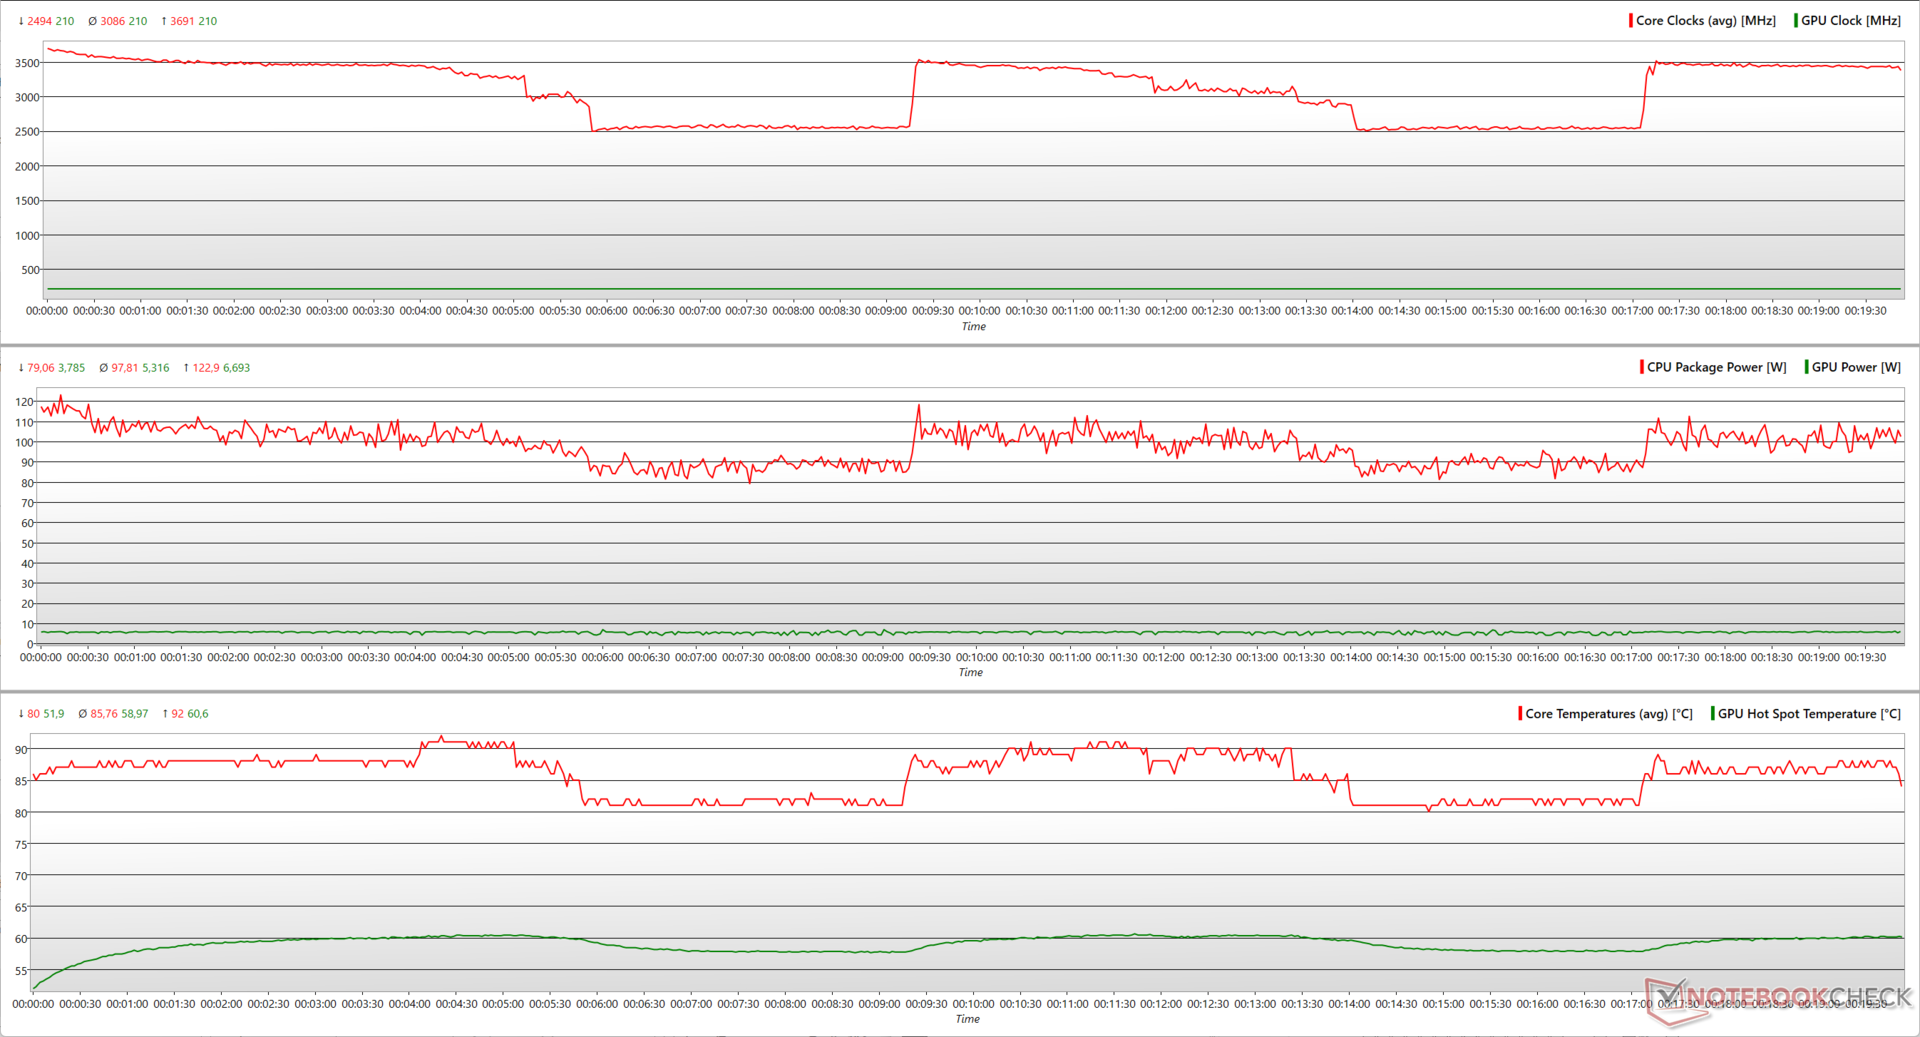
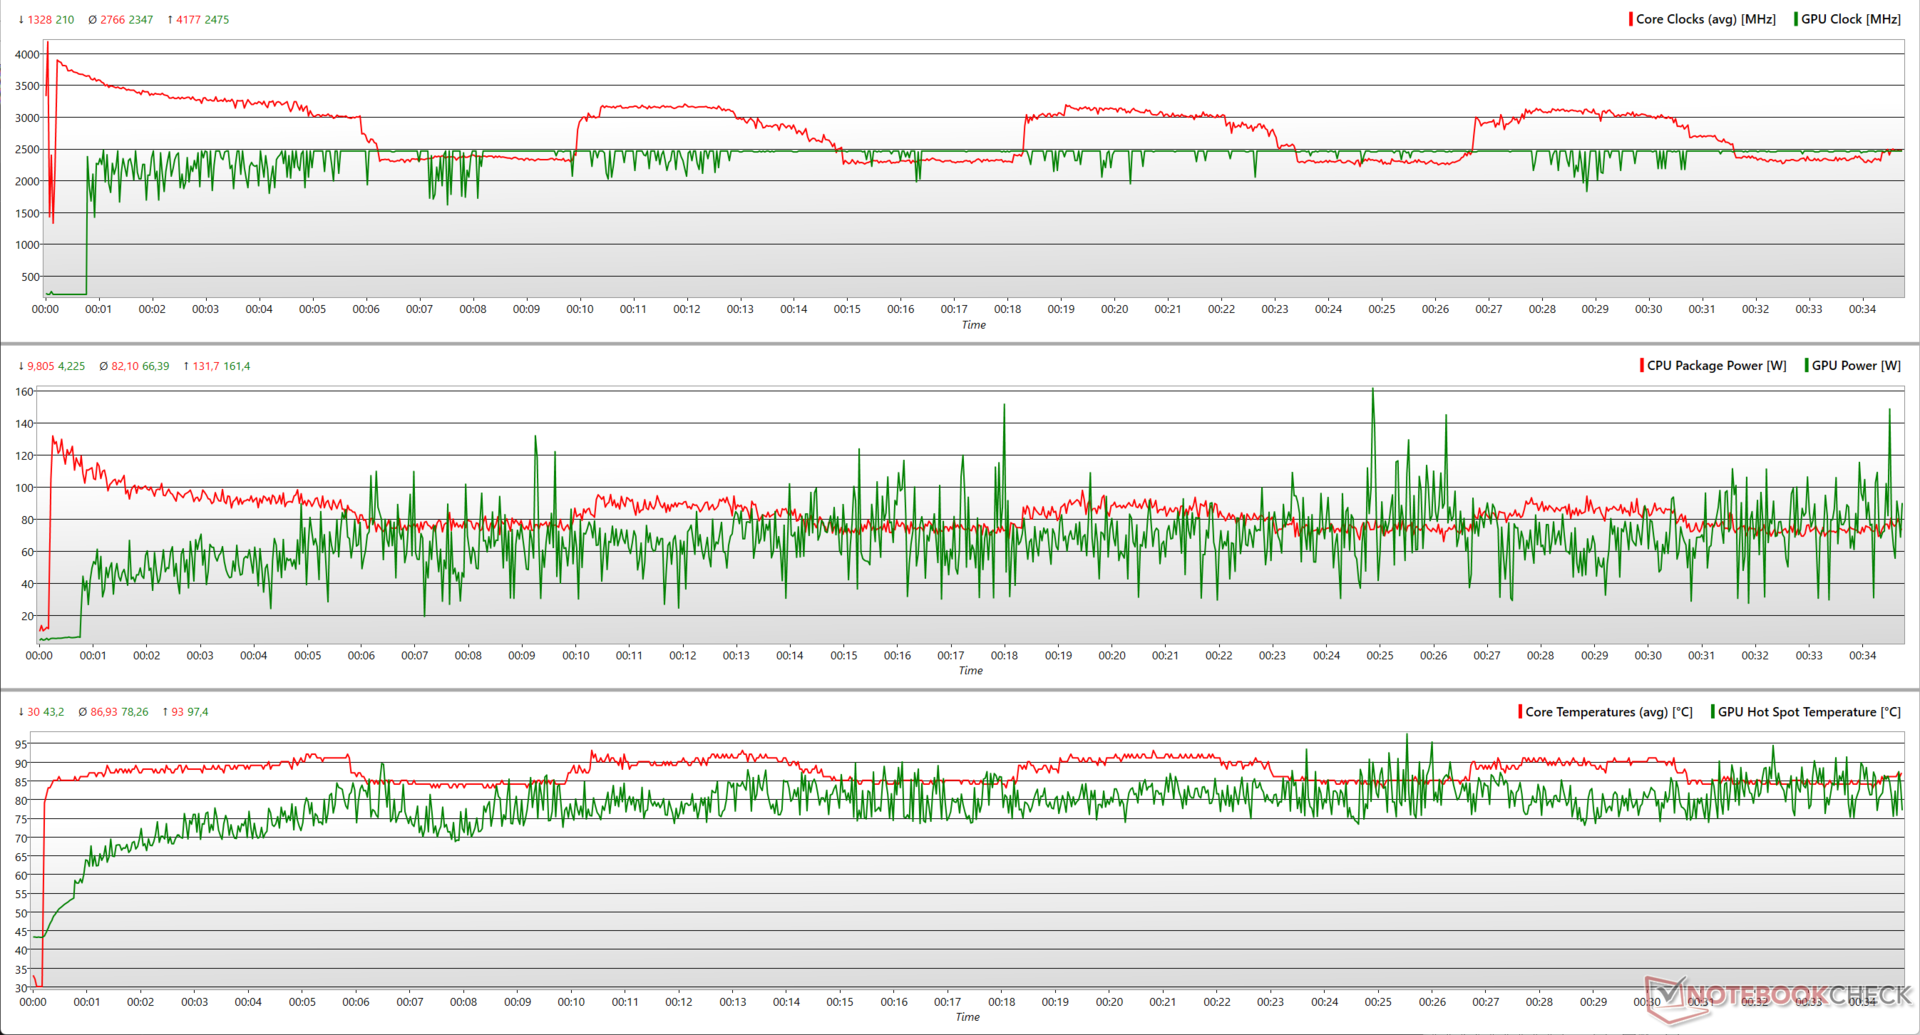
Stresstest
Unter Belastung mit Prime95 In-Place Large FFTs erreicht der Core i7-13700HX im EVOL X15 Spitzenwerte von bis zu 3,7 GHz bei einem Verbrauch von 123 W. Trotz einer effektiven Kühlung fällt die CPU bei 80 W regelmäßig auf 2,5 GHz zurück, bevor sie versucht, wieder auf 3,7 GHz zu steigen.
Durch die Hinzufügung von FurMark kann der Core i7-13700HX nun bis zu 132 W verbrauchen, um 4,2 GHz zu erreichen, doch tritt weiterhin gelegentlich eine Drosselung nahe der 2,5-GHz-Marke auf. Die RTX 4060 kann den verfügbaren Leistungsspielraum nutzen und erreicht einen Spitzenwert von 2.475 MHz bei einem Verbrauch von 161 W.
| Stresstest | CPU-Takt (GHz) | GPU-Takt (MHz) | Durchschnittliche CPU-Temperatur (°C) | Durchschnittliche GPU-Temperatur (°C) |
| System im Leerlauf | 1.42 | 210 | 31 | 37.1 |
| Prime95 Stresstest | 3.42 | 210 | 85 | 50.8 |
| Prime95 + FurMark Stresstest | 2.99 | 2,460 | 86 | 70.8 |
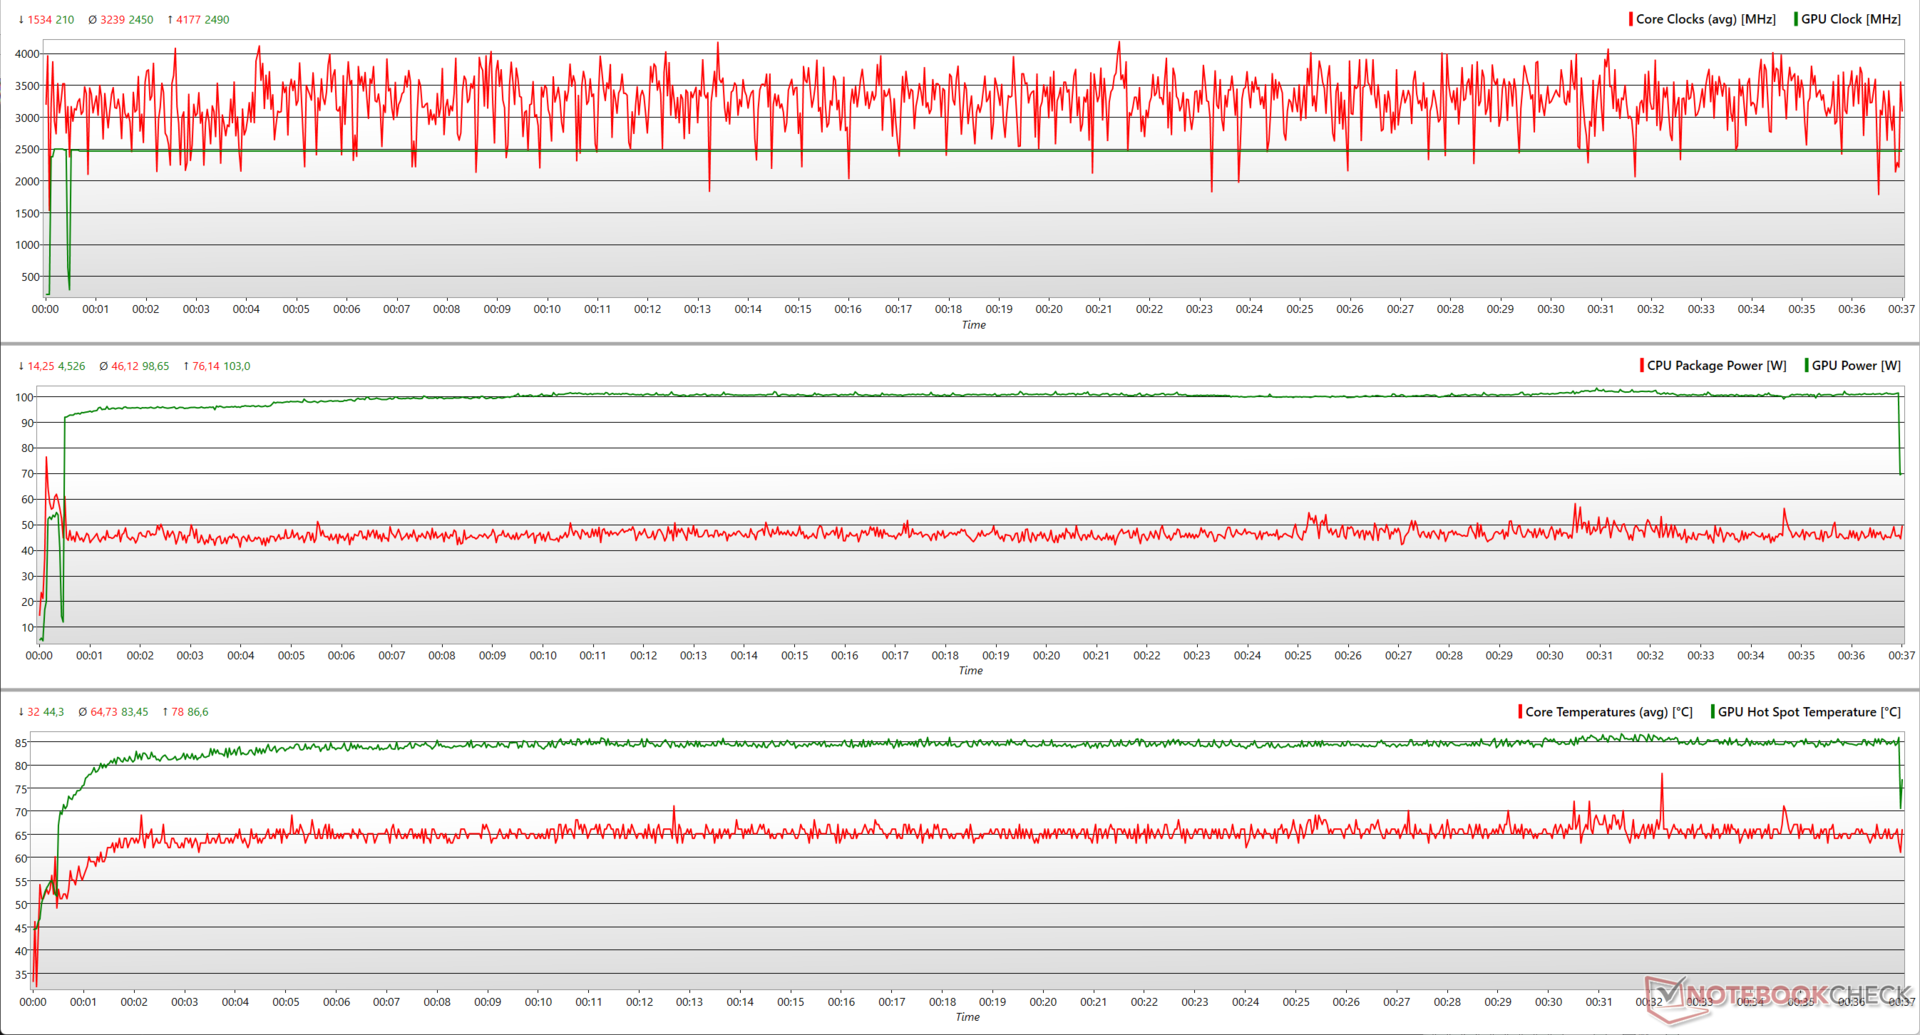
| Witcher 3 1080p Ultra | 3.12 | 2,460 | 64 | 73.7 |
Der Core i7-13700HX hat in The Witcher 3 mit 1080p Ultra einen Spitzenwert von 4,2 GHz und verbraucht nur 76 W, während er im Durchschnitt einen Takt von 3,2 GHz bei 46 W beibehält. Die RTX 4060 hat genug Platz, um einen fast konstanten Boost von 2.490 MHz bei 103 W zu erreichen.
Lautsprecher
Die Stereolautsprecher des EVOL X15 sind für einen mittelgroßen Raum ausreichend laut. Obwohl Colorful mit Creative SoundBlaster Studio Tuning wirbt, klingt der Ton aufgrund fehlender Basswiedergabe und durchschnittlicher Mitten blechern. Im Gegensatz dazu sind höhere Frequenzen sehr gut wiedergegeben.
Das große Gehäuse hätte Colorful helfen können, stärkere passive Radiatoren einzubauen. Trotzdem haben Benutzer die Möglichkeit, die Audioqualität durch die 3,5-mm-Kombibuchse oder Bluetooth 5.2 zu verbessern.
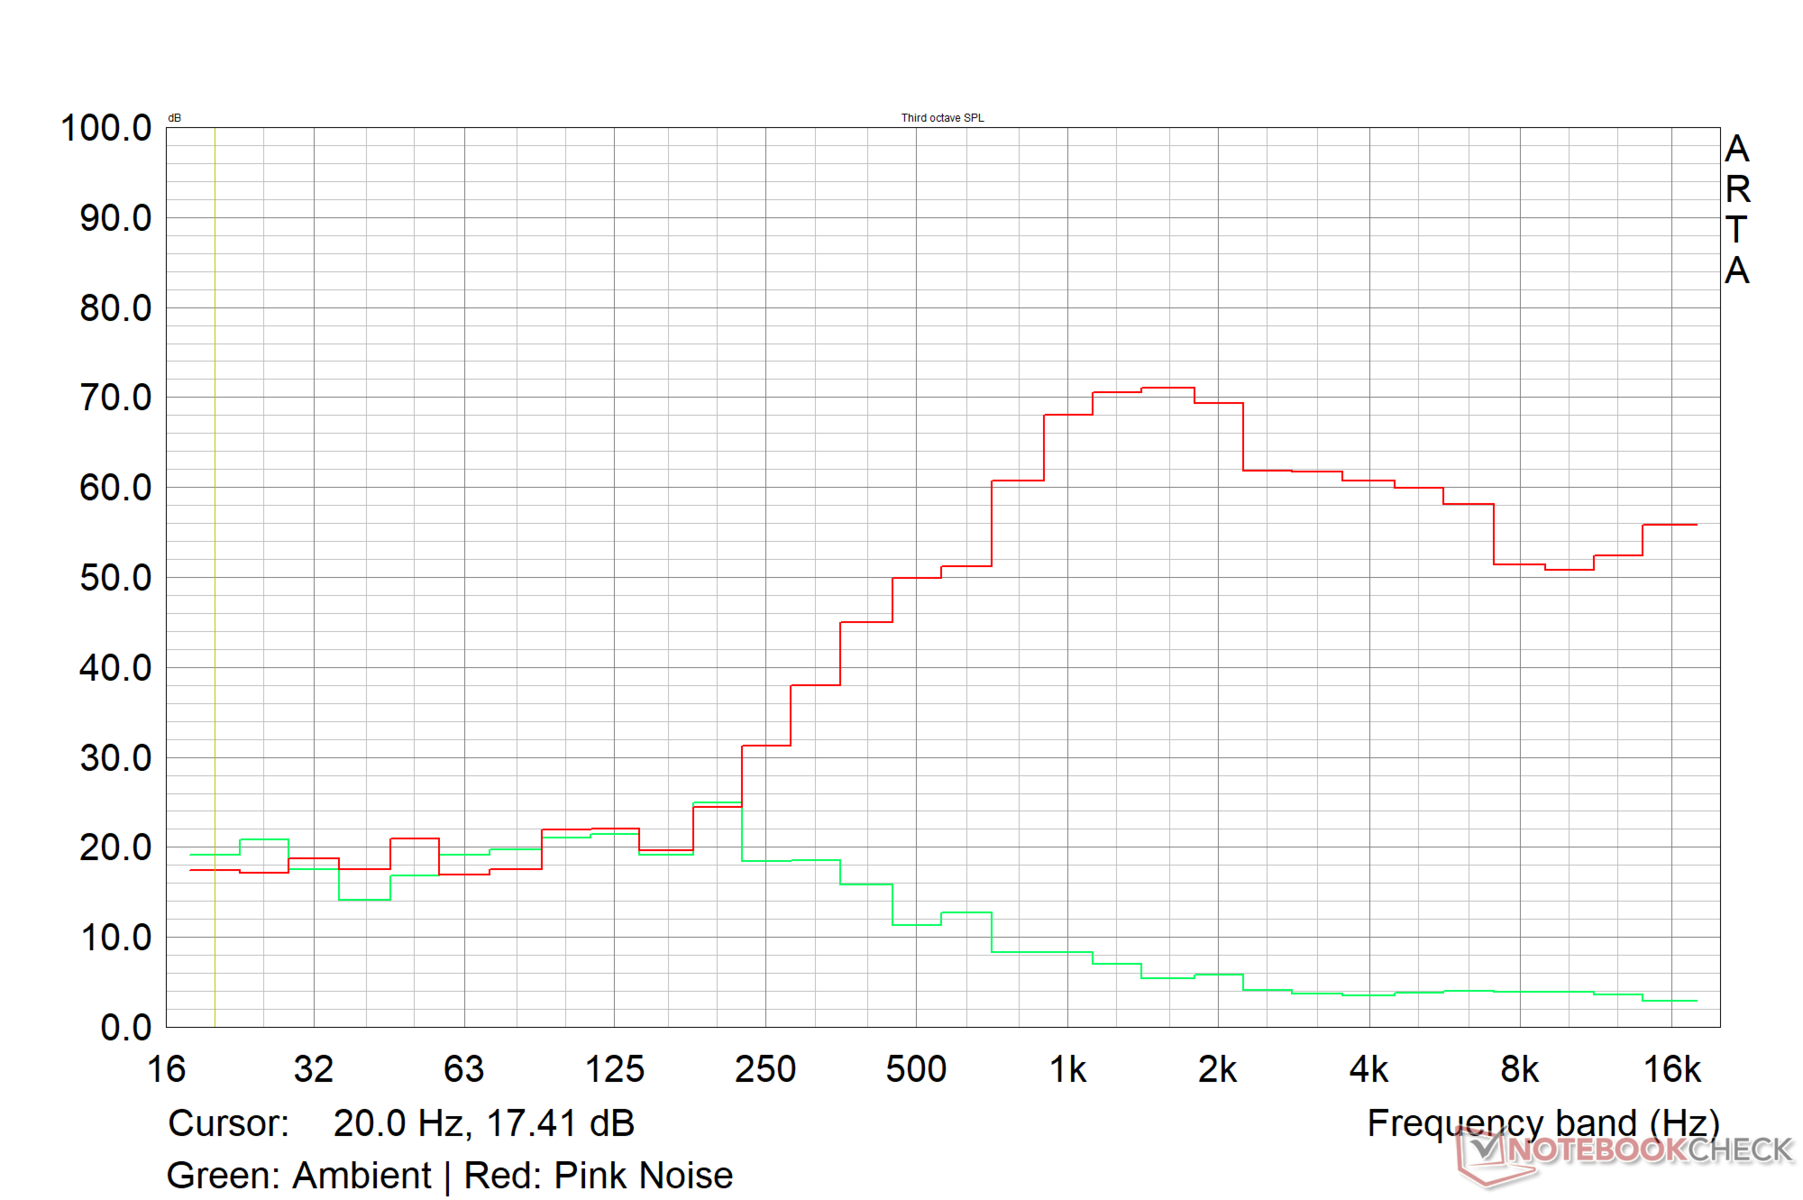
Colorful EVOL X15 AT 23 Audio Analyse
(±) | Mittelmäßig laut spielende Lautsprecher (77.5 dB)
Bass 100 - 315 Hz
(-) | kaum Bass - 26.2% niedriger als der Median
(±) | durchschnittlich lineare Bass-Wiedergabe (9.2% Delta zum Vorgänger)
Mitteltöne 400 - 2000 Hz
(±) | zu hohe Mitten, vom Median 11.1% abweichend
(±) | Linearität der Mitten ist durchschnittlich (9.6% Delta zum Vorgänger)
Hochtöne 2 - 16 kHz
(±) | zu hohe Hochtöne, vom Median nur 6.1% abweichend
(+) | sehr lineare Hochtöne (5.8% Delta zum Vorgänger)
Gesamt im hörbaren Bereich 100 - 16.000 Hz
(±) | hörbarer Bereich ist durchschnittlich linear (29.7% Abstand zum Median)
Im Vergleich zu allen Geräten derselben Klasse
» 95% aller getesteten Geräte dieser Klasse waren besser, 2% vergleichbar, 3% schlechter
» Das beste Gerät hat einen Delta-Wert von 6%, durchschnittlich ist 18%, das schlechteste Gerät hat 132%
Im Vergleich zu allen Geräten im Test
» 88% aller getesteten Geräte waren besser, 3% vergleichbar, 10% schlechter
» Das beste Gerät hat einen Delta-Wert von 4%, durchschnittlich ist 24%, das schlechteste Gerät hat 134%
Apple MacBook Pro 16 2021 M1 Pro Audio Analyse
(+) | Die Lautsprecher können relativ laut spielen (84.7 dB)
Bass 100 - 315 Hz
(+) | guter Bass - nur 3.8% Abweichung vom Median
(+) | lineare Bass-Wiedergabe (5.2% Delta zum Vorgänger)
Mitteltöne 400 - 2000 Hz
(+) | ausgeglichene Mitten, vom Median nur 1.3% abweichend
(+) | lineare Mitten (2.1% Delta zum Vorgänger)
Hochtöne 2 - 16 kHz
(+) | ausgeglichene Hochtöne, vom Median nur 1.9% abweichend
(+) | sehr lineare Hochtöne (2.7% Delta zum Vorgänger)
Gesamt im hörbaren Bereich 100 - 16.000 Hz
(+) | hörbarer Bereich ist sehr linear (4.6% Abstand zum Median
Im Vergleich zu allen Geräten derselben Klasse
» 0% aller getesteten Geräte dieser Klasse waren besser, 0% vergleichbar, 100% schlechter
» Das beste Gerät hat einen Delta-Wert von 5%, durchschnittlich ist 17%, das schlechteste Gerät hat 45%
Im Vergleich zu allen Geräten im Test
» 0% aller getesteten Geräte waren besser, 0% vergleichbar, 100% schlechter
» Das beste Gerät hat einen Delta-Wert von 4%, durchschnittlich ist 24%, das schlechteste Gerät hat 134%
Energieverwaltung: Sparsam bei maximaler Belastung
Energieaufnahme
Im Vergleich zu Konkurrenten wie Core i7-13700HX und RTX 4060 ist der Idle-Energieverbrauch des EVOL X15 höher. Jedoch ist die Leistungsaufnahme bei maximaler Last mit 224 W vergleichsweise gering.
Das Uniwill GM6PX7X mit RTX 4070 hat eine Leistungsaufnahme von 33% unter Volllast und ist dennoch 16% sparsamer als das EVOL X15.
Das mitgelieferte 280-Watt-Netzteil ist in der Lage, das Notebook auch bei hohen Belastungen ausreichend zu betreiben.
| Aus / Standby | |
| Idle | |
| Last |
|
Legende:
min: | |
| Colorful EVOL X15 AT 23 i7-13700HX, GeForce RTX 4060 Laptop GPU, IPS, 2560x1440, 15.6" | Alienware m16 R1 Intel i7-13700HX, GeForce RTX 4060 Laptop GPU, IPS, 2560x1600, 16" | HP Omen 16-wf000 i7-13700HX, GeForce RTX 4080 Laptop GPU, IPS, 2560x1440, 16.1" | Acer Predator Helios 16 PH16-71-731Q i7-13700HX, GeForce RTX 4060 Laptop GPU, IPS-LED, 2560x1600, 16" | Dell G15 5530 i7-13650HX, GeForce RTX 4060 Laptop GPU, IPS, 1920x1080, 15.6" | Schenker XMG Pro 15 (E23) i9-13900HX, GeForce RTX 4060 Laptop GPU, IPS, 2560x1440, 15.6" | Alienware m16 R1 AMD R9 7845HX, GeForce RTX 4080 Laptop GPU, IPS, 2560x1600, 16" | Uniwill GM6PX7X RTX 4070 i7-13700HX, GeForce RTX 4070 Laptop GPU, IPS, 2560x1600, 16" | Durchschnittliche NVIDIA GeForce RTX 4060 Laptop GPU | Durchschnitt der Klasse Gaming | |
|---|---|---|---|---|---|---|---|---|---|---|
| Stromverbrauch | 20% | 2% | 20% | 30% | -11% | -45% | 16% | 36% | 25% | |
| Idle min * (Watt) | 28.3 | 10 65% | 21.8 23% | 15.9 44% | 8.4 70% | 21.6 24% | 39 -38% | 12.6 55% | 11.5 ? 59% | 13 ? 54% |
| Idle avg * (Watt) | 32.2 | 14 57% | 26 19% | 20.5 36% | 14.98 53% | 29 10% | 44.6 -39% | 17.7 45% | 16 ? 50% | 18.7 ? 42% |
| Idle max * (Watt) | 36.5 | 21 42% | 36 1% | 20.9 43% | 15.56 57% | 42.7 -17% | 68.1 -87% | 31.8 13% | 20.3 ? 44% | 24.3 ? 33% |
| Last avg * (Watt) | 119 | 119 -0% | 115.5 3% | 106 11% | 96.8 19% | 190 -60% | 129.8 -9% | 101.4 15% | 92.9 ? 22% | 108.2 ? 9% |
| Witcher 3 ultra * (Watt) | 189.6 | 186.7 2% | 214 -13% | 175 8% | 186 2% | 189 -0% | 285 -50% | 185.3 2% | ||
| Last max * (Watt) | 224.3 | 323 -44% | 269.7 -20% | 276 -23% | 271.42 -21% | 269 -20% | 327.3 -46% | 298 -33% | 210 ? 6% | 254 ? -13% |
* ... kleinere Werte sind besser
Power Consumption: The Witcher 3 / Stress test
Power Consumption: External monitor
Akkulaufzeit
In Anbetracht der recht leistungsstarken Innereien des EVOL X15 kann der 73-Wh-Akku nur durchschnittliche Laufzeiten bieten. Bei einer Helligkeit von 150 cd/m² hielt das Notebook in unserem Standard-WiFi-Webbrowsing-Test fast 5,5 Stunden und bei der H.264-1080p-Videowiedergabe etwa 6,5 Stunden durch.
| Colorful EVOL X15 AT 23 i7-13700HX, GeForce RTX 4060 Laptop GPU, 73 Wh | Alienware m16 R1 Intel i7-13700HX, GeForce RTX 4060 Laptop GPU, 86 Wh | HP Omen 16-wf000 i7-13700HX, GeForce RTX 4080 Laptop GPU, 83 Wh | Acer Predator Helios 16 PH16-71-731Q i7-13700HX, GeForce RTX 4060 Laptop GPU, 90 Wh | Dell G15 5530 i7-13650HX, GeForce RTX 4060 Laptop GPU, 86 Wh | Schenker XMG Pro 15 (E23) i9-13900HX, GeForce RTX 4060 Laptop GPU, 80 Wh | Alienware m16 R1 AMD R9 7845HX, GeForce RTX 4080 Laptop GPU, 86 Wh | Uniwill GM6PX7X RTX 4070 i7-13700HX, GeForce RTX 4070 Laptop GPU, 62 Wh | Durchschnitt der Klasse Gaming | |
|---|---|---|---|---|---|---|---|---|---|
| Akkulaufzeit | -15% | -11% | 5% | -11% | 26% | -35% | -26% | 29% | |
| H.264 (h) | 6.3 | 5.6 -11% | 4.8 -24% | 6.8 8% | 8.9 ? 41% | ||||
| WLAN (h) | 5.4 | 4.8 -11% | 5.1 -6% | 5.6 4% | 6.5 20% | 5.7 6% | 3.7 -31% | 4 -26% | 7 ? 30% |
| Witcher 3 ultra (h) | 1.2 | 1.5 25% | 0.8 -33% | ||||||
| Last (h) | 1.3 | 1 -23% | 1.1 -15% | 1.5 15% | 0.8 -38% | 1.9 46% | 0.8 -38% | 1.51 ? 16% | |
| Idle (h) | 6.4 | 5.5 | 4 | 8.71 ? |
Pro
Contra
Fazit: Gute Wahl, wenn Sie es für unter 1.000 Euro bekommen können
Das Ziel von Colorful war es, ein leistungsstarkes QHD-Gaming-Notebook für unter 1.000 Euro anzubieten, und sie haben es größtenteils geschafft. Hauptsächlich besteht das Gehäuse aus Clevo-Kunststoff. Obwohl die Tastatur biegbar ist, ist das EVOL X15 AT insgesamt stabil.
Das EVOL X15 AT hat eine Menge zu bieten. Potenzielle Käufer werden die umfassende Anschlussauswahl, schnelle Wi-Fi 6E-Geschwindigkeiten und den einfachen Zugang zu den Innereien schätzen.
Die Kombination aus einem Intel Core i7-13700HX Desktop-CPU und der Nvidia GeForce RTX 4060 Laptop-GPU ermöglicht es dem EVOL X15 AT, effektiv mit höherpreisigen Modellen wie dem Alienware m16 R1 und dem Acer Predator Helios 16 zu konkurrieren.
Das Colorful EVOL X15 AT erfüllt die grundlegenden Anforderungen, auch wenn es nicht alle Funktionen der etablierten Konkurrenz bietet, und weist keine wesentlichen Leistungseinschränkungen auf.
Trotzdem gibt es einige Bedenken, darunter etwas längere Reaktionszeiten und keine Stromversorgung für Typ-C-Anschlüsse. Die Feinabstimmung der Lüfterkurven mit Standardleistungsprofilen und der Stromverbrauch im Leerlauf müssen die Hauptpriorität von Colorful sein.
Insgesamt ist das Colorful EVOL X15 AT eine Überlegung wert, solange es für weniger als 1.000 Euro erhältlich ist und kein erheblicher Aufpreis fällig wird.
Laptops mit der RTX 3070 Ti Laptop GPU oder sogar der Radeon RX 6800M können jedoch ein verbessertes Gesamtpaket zu ähnlichen Preisen bieten, vor allem wenn Sie bereit sind, auf die DLSS 3-Frame-Generierung und die Effizienzgewinne von Ada Lovelace zu verzichten.
Preis und Verfügbarkeit
Das Colorful EVOL X15 AT 23 ist direkt über lokale Händler von Colorful-Produkten erhältlich.
Eine alternative Option ist die QHD-Variante des Acer Nitro 5 mit einem AMD Ryzen 7 6800H und einer RTX 3070 Ti Laptop-GPU, die bei Amazon für weniger als 1.400 Euro erhältlich ist.
Für diejenigen, bei denen rohe CPU-Leistung keine oberste Priorität hat, bietet das Asus ROG Strix G15 mit AMD Ryzen 9 5900HX und Radeon RX 6800M eine attraktive Wahl, die bei Amazon für weniger als 1.700 Euro erhältlich ist.
Colorful EVOL X15 AT 23
- 20.12.2023 v7 (old)
Vaidyanathan Subramaniam
Transparenz
Die Auswahl der zu testenden Geräte erfolgt innerhalb der Redaktion. Das vorliegende Testmuster wurde dem Autor vom Hersteller unentgeltlich zu Testzwecken überlassen. Eine Einflussnahme auf den Testbericht gab es nicht, der Hersteller erhielt keine Version des Reviews vor der Veröffentlichung. Es bestand keine Verpflichtung zur Publikation. Als eigenständiges, unabhängiges Unternehmen unterliegt Notebookcheck keiner Diktion von Herstellern, Shops und Verlagen.
So testet Notebookcheck
Pro Jahr werden von Notebookcheck hunderte Laptops und Smartphones unabhängig in von uns standardisierten technischen Verfahren getestet, um eine Vergleichbarkeit aller Testergebnisse zu gewährleisten. Seit rund 20 Jahren entwickeln wir diese Testmethoden kontinuierlich weiter und setzen damit Branchenstandards. In unseren Testlaboren kommt ausschließlich hochwertiges Messequipment in die Hände erfahrener Techniker und Redakteure. Die Tests unterliegen einer mehrstufigen Kontrolle. Unsere komplexe Gesamtbewertung basiert auf hunderten fundierten Messergebnissen und Benchmarks, womit Ihnen Objektivität garantiert ist. Weitere Informationen zu unseren Testmethoden gibt es hier.
Preisvergleich

