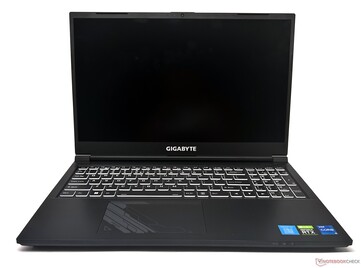
Gigabyte G5 KE Test: Mittelklasse-Gaming-Laptop, der die meisten Anforderungen erfüllt
Gigabyte bietet mehrere Notebook-Klassen an, die sich nach Leistung und Budget richten. Während die Aorus- und Aero Serien auf das Premium-Gaming- und Content-Creation-Segment abzielen, richten sich die traditionellen Gigabyte-Varianten wie das G5 und G7 eher an ein Mainstream-Gaming-Publikum.
Wir haben bereits einen Test des 17,3-Zoll-Gigabyte G7 KE getestet, und nun dürfen wir das 15,6-Zoll-Gigabyte G5 KE mit weitgehend ähnlichen Spezifikationen testen.
Unser Gigabyte-G5-KE-Gerät ist mit einem Intel-Core-i5-12500H-Prozessor der 12. Generation, einer Nvidia-GeForce-RTX-3060-Laptop-GPU, 16 GB RAM, einer 512-GB-SSD und einem 15,6-Zoll-IPS-Panel mit 144 Hz ausgestattet.
Diese Konfiguration kostet auf dem indischen Markt ₹94.990 (1.155 US-Dollar). In diesem Test nehmen wir das Gigabyte G5 KE unter die Lupe, um zu sehen, ob es mit seinen Konkurrenten aus dem Gaming-Mittelklasse-Segment mithalten kann.
Mögliche Konkurrenten im Vergleich
Bew. | Datum | Modell | Gewicht | Dicke | Größe | Auflösung | Preis ab |
|---|---|---|---|---|---|---|---|
| 81.8 % v7 (old) | 04 / 2023 | Gigabyte G5 KE i5-12500H, GeForce RTX 3060 Laptop GPU | 2 kg | 23.9 mm | 15.60" | 1920x1080 | |
| 82.8 % v7 (old) | 10 / 2022 | Lenovo IdeaPad Gaming 3 15IAH7 i5-12500H, GeForce RTX 3050 Ti Laptop GPU | 2.4 kg | 26 mm | 15.60" | 1920x1080 | |
| 83.3 % v7 (old) | 01 / 2023 | Gigabyte G7 KE i5-12500H, GeForce RTX 3060 Laptop GPU | 2.6 kg | 25 mm | 17.30" | 1920x1080 | |
| 87.4 % v7 (old) | 09 / 2022 | Honor MagicBook 14 2022 i5-12500H, GeForce RTX 2050 Mobile | 1.6 kg | 16.9 mm | 14.00" | 2160x1440 | |
| 87.9 % v7 (old) | 01 / 2023 | Schenker XMG Core 15 (M22) R7 6800H, GeForce RTX 3060 Laptop GPU | 2.1 kg | 23 mm | 15.60" | 2560x1440 | |
| 86.1 % v7 (old) | 10 / 2022 | Dell G16 7620 i7-12700H, GeForce RTX 3060 Laptop GPU | 2.6 kg | 26.9 mm | 16.00" | 2560x1600 | |
| 82.3 % v7 (old) | 09 / 2022 | Gigabyte A5 K1 R5 5600H, GeForce RTX 3060 Laptop GPU | 2.2 kg | 34 mm | 15.60" | 1920x1080 | |
| 87.2 % v7 (old) | 03 / 2022 | Asus TUF Gaming F15 FX507ZM i7-12700H, GeForce RTX 3060 Laptop GPU | 2.1 kg | 24.95 mm | 15.60" | 1920x1080 | |
| 84.3 % v7 (old) | 09 / 2021 | HP Victus 16-e0179ng R7 5800H, GeForce RTX 3060 Laptop GPU | 2.5 kg | 23.5 mm | 16.10" | 1920x1080 |
Gehäuse: Hauptsächlich Kunststoff mit etwas Flexibilität
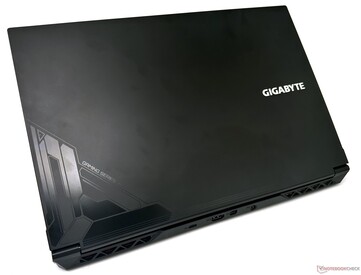
Die Konstruktion des Gigabyte G5 KE entspricht den Erwartungen in dieser Preisklasse. Es handelt sich im Wesentlichen um ein Clevo Design, das vollständig aus Kunststoff besteht und glatte, matte Oberflächen mit einigen subtilen Akzenten auf der Rückseite des Deckels und des Touchpads aufweist.
Mit 23,9 mm ist das G5 KE ähnlich dick wie die Konkurrenz in diesem Segment, aber deutlich dünner als das Gigabyte A5 K1.
Das Gehäuse des G5 KE ist nicht das stabilste Modell, das wir je gesehen haben - unter Druck gibt das Tastaturdeck deutlich nach, und der Deckel kann sich verwinden. Im täglichen Gebrauch wird der Benutzer dies jedoch wahrscheinlich nicht erleben.
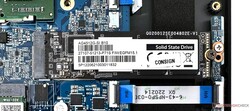
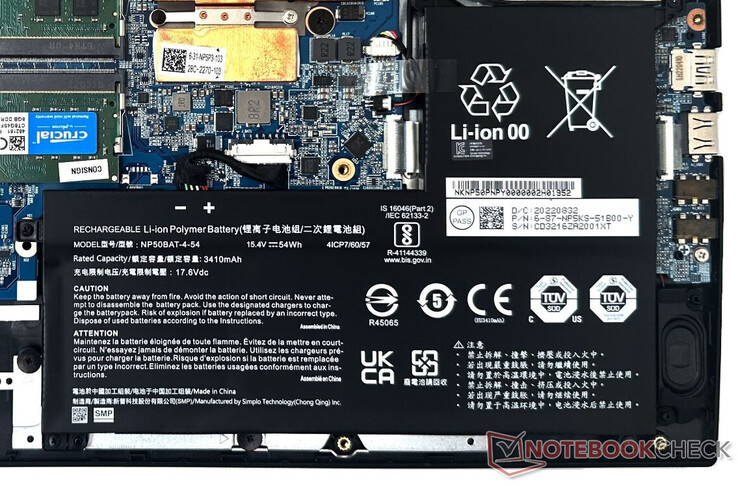
Nach dem Öffnen der 13 Kreuzschlitzschrauben kommen die Innereien zum Vorschein. Der DDR4-RAM, die WLAN-Karte und die SSDs können bei Bedarf ausgetauscht und aufgerüstet werden.
Anschlussausstattung: Angemessene Anschlussauswahl und stabiles Wi-Fi
Das G5 KE bietet eine gut abgerundete Anschlussauswahl mit einer Kombination aus USB-Typ-A- und Typ-C-Ports einschließlich Thunderbolt 4. Der Mini-DisplayPort 1.4 und der HDMI-2.1-Ausgang erleichtern den Anschluss von 4K-Bildschirmen mit hohen Bildwiederholraten.
Die Ports stellen beim Anschluss mehrerer Geräte kein Hindernis dar. Ein dedizierter Mikrofoneingang - heutzutage eine Seltenheit - ist praktisch, um hochwertige Mikrofone anzuschließen, oder er kann zur Unterstützung von Mehrkanal-Audio umkonfiguriert werden.
Die Lesegeschwindigkeit für microSD-Karten hätte besser sein können, aber das G5 KE hat in dieser Hinsicht nicht viel Konkurrenz.
| SD Card Reader | |
| average JPG Copy Test (av. of 3 runs) | |
| Durchschnitt der Klasse Gaming (20 - 210, n=63, der letzten 2 Jahre) | |
| Gigabyte G5 KE (AV PRO microSD 128 GB V60) | |
| Schenker XMG Core 15 (M22) (AV PRO microSD 128 GB V60) | |
| HP Victus 16-e0179ng (AV PRO microSD 128 GB V60) | |
| maximum AS SSD Seq Read Test (1GB) | |
| Durchschnitt der Klasse Gaming (25.5 - 261, n=60, der letzten 2 Jahre) | |
| Gigabyte G5 KE (AV PRO microSD 128 GB V60) | |
| Gigabyte G7 KE (AV PRO microSD 128 GB V60) | |
| Schenker XMG Core 15 (M22) (AV PRO microSD 128 GB V60) | |
| HP Victus 16-e0179ng (AV PRO microSD 128 GB V60) | |
Das G5 KE bietet kein Wi-Fi 6E. Nichtsdestotrotz beobachteten wir einen sehr guten und ziemlich konstanten Durchsatz im 5-GHz-Band, als wir es mit unserem Referenz-Router Asus ROG Rapture GT-AXE11000 testeten.
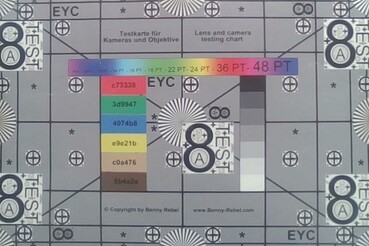
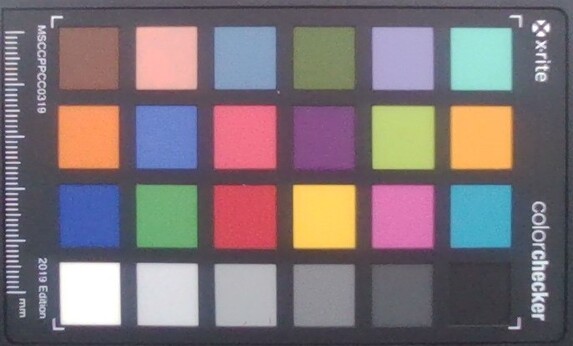
Die 720p-Webcam zeigt große Farbabweichungen, und die Bilder sind insgesamt nicht sehr scharf. Für den einen oder anderen Videotelefonanruf sollte sie dennoch brauchbar sein.
Eingabegeräte: Pfeiltasten in voller Größe
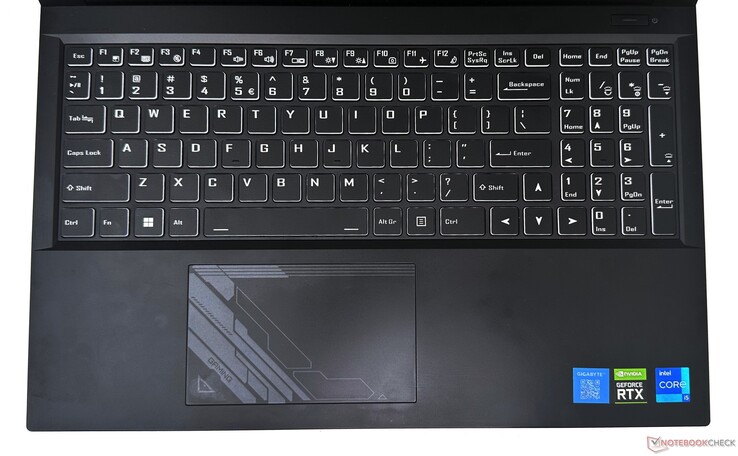
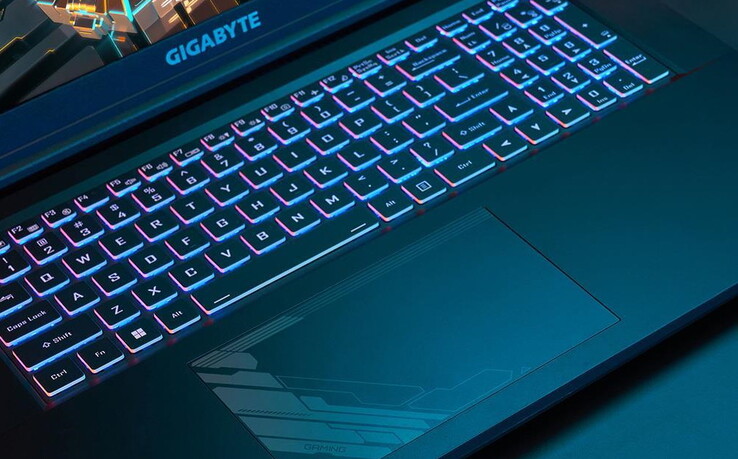
Die Chiclet-Tastatur bietet einen ordentlichen Hubweg und Druckpunkt. Allerdings fühlt sich das Tippen etwas schwammig an, und das taktile Feedback ist etwas mangelhaft. Die Pfeiltasten in voller Größe ermöglichen eine komfortable Navigation in Dokumenten und Tabellenkalkulationen.
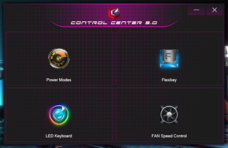
Die RGB-Hintergrundbeleuchtung kann in vier Stufen eingestellt werden. Es handelt sich nicht um eine Multizonen-RGB-Tastatur, aber einige Anpassungen sind über die Control Center 3.0 Software möglich.
Das 12 x 7,5 cm große Touchpad ist geräumig genug, unterstützt Windows-Precision-Gesten und bietet ein gutes Gleitgefühl mit minimalem Widerstand. Die gesamte Oberfläche fungiert als linke Maustaste. Die Klicks haben einen kurzen Hub und eine gute Taktilität.
Display: Schlechte Farbraumabdeckung, hohe Reaktionszeiten und keine PWM
Das 1.080p-144-Hz-Chi-Mei-Panel des Gigabyte G5 KE ist langsam in die Jahre gekommen. Wir haben dieses Panel bereits im 2021er Gigabyte G5 GD und Asus TUF Gaming F15 FX506HM gesehen. Die Konkurrenz hat bessere Panels mit einem viel größeren Farbraum entwickelt.
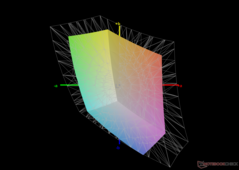
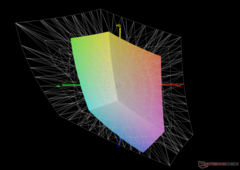
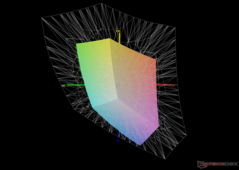
Die Helligkeitsverteilung ist mit 85 % anständig, aber der Farbraum ist für ein 2023er Notebook mit einer sRGB-Abdeckung von nur etwa 61 % schlecht.
| |||||||||||||||||||||||||
Ausleuchtung: 85 %
Helligkeit Akku: 266 cd/m²
Kontrast: 538:1 (Schwarzwert: 0.5 cd/m²)
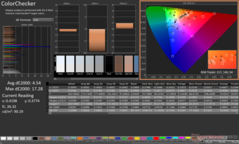
ΔE ColorChecker Calman: 4.54 | ∀{0.5-29.43 Ø4.76}
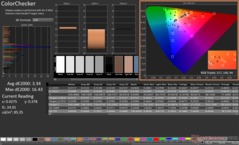
calibrated: 3.34
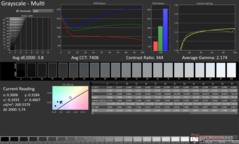
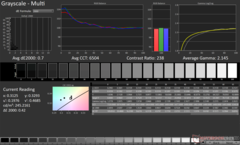
ΔE Greyscale Calman: 3.8 | ∀{0.09-98 Ø5}
42.1% AdobeRGB 1998 (Argyll 3D)
61% sRGB (Argyll 3D)
40.7% Display P3 (Argyll 3D)
Gamma: 2.17
CCT: 7408 K
| Gigabyte G5 KE Chi Mei N156HRA-EA1, , 1920x1080, 15.6" | Lenovo IdeaPad Gaming 3 15IAH7 Lenovo LEN156FHD, , 1920x1080, 15.6" | Gigabyte G7 KE AU Optronics B173HAN05.1, , 1920x1080, 17.3" | Honor MagicBook 14 2022 HD140ZB-01A, , 2160x1440, 14" | Schenker XMG Core 15 (M22) CSOT MNF601CA1-1, , 2560x1440, 15.6" | Dell G16 7620 BOE NE16QDM, , 2560x1600, 16" | Gigabyte A5 K1 BOEhydis NV156FHM-N4K (BOE08B3), , 1920x1080, 15.6" | Asus TUF Gaming F15 FX507ZM TL156VDXP0101, , 1920x1080, 15.6" | HP Victus 16-e0179ng BOE09BE, , 1920x1080, 16.1" | |
|---|---|---|---|---|---|---|---|---|---|
| Display | 66% | 69% | 64% | 66% | 65% | 56% | 62% | 72% | |
| Display P3 Coverage (%) | 40.7 | 69.1 70% | 70.4 73% | 67.9 67% | 68.8 69% | 68.3 68% | 64.4 58% | 66.4 63% | 72.6 78% |
| sRGB Coverage (%) | 61 | 99.2 63% | 99.8 64% | 98.5 61% | 99.3 63% | 98 61% | 92.5 52% | 97 59% | 100 64% |
| AdobeRGB 1998 Coverage (%) | 42.1 | 69.9 66% | 71.7 70% | 68.7 63% | 69.9 66% | 70.5 67% | 66.1 57% | 68.5 63% | 73.5 75% |
| Response Times | 53% | 68% | -41% | 50% | 56% | 48% | 55% | 44% | |
| Response Time Grey 50% / Grey 80% * (ms) | 26.64 ? | 13 ? 51% | 5 ? 81% | 37.2 ? -40% | 16 ? 40% | 8.6 ? 68% | 14.5 ? 46% | 5.6 ? 79% | 9.6 ? 64% |
| Response Time Black / White * (ms) | 18.65 ? | 8.4 ? 55% | 8.3 ? 55% | 26.3 ? -41% | 7.6 ? 59% | 10.4 ? 44% | 9.5 ? 49% | 12.8 ? 31% | 14.4 ? 23% |
| PWM Frequency (Hz) | 28400 ? | ||||||||
| Bildschirm | 40% | 61% | 57% | 40% | 49% | 31% | 52% | 43% | |
| Helligkeit Bildmitte (cd/m²) | 269 | 338 26% | 307 14% | 330 23% | 378 41% | 369.4 37% | 295 10% | 353.7 31% | 361 34% |
| Brightness (cd/m²) | 248 | 329 33% | 301 21% | 320 29% | 371 50% | 348 40% | 281 13% | 340 37% | 341 38% |
| Brightness Distribution (%) | 85 | 92 8% | 93 9% | 90 6% | 93 9% | 83 -2% | 83 -2% | 89 5% | 88 4% |
| Schwarzwert * (cd/m²) | 0.5 | 0.27 46% | 0.2 60% | 0.21 58% | 0.33 34% | 0.32 36% | 0.29 42% | 0.34 32% | 0.3 40% |
| Kontrast (:1) | 538 | 1252 133% | 1535 185% | 1571 192% | 1145 113% | 1154 114% | 1017 89% | 1040 93% | 1203 124% |
| Delta E Colorchecker * | 4.54 | 2.88 37% | 1.32 71% | 1.8 60% | 2.84 37% | 1.78 61% | 4.36 4% | 1.74 62% | 2.44 46% |
| Colorchecker dE 2000 max. * | 17.28 | 9.35 46% | 4.6 73% | 4.7 73% | 5.51 68% | 4.41 74% | 6.92 60% | 3.63 79% | 6.37 63% |
| Colorchecker dE 2000 calibrated * | 3.34 | 1.22 63% | 1.03 69% | 1.6 52% | 2.75 18% | 1.22 63% | 1.2 64% | 0.5 85% | 1.26 62% |
| Delta E Graustufen * | 3.8 | 5 -32% | 2.1 45% | 3 21% | 4.08 -7% | 3.2 16% | 3.9 -3% | 2.1 45% | 4.6 -21% |
| Gamma | 2.17 101% | 2.162 102% | 2.247 98% | 2.18 101% | 2.4 92% | 2.2 100% | 2.106 104% | 2.3 96% | 2.268 97% |
| CCT | 7408 88% | 7497 87% | 6815 95% | 6697 97% | 5841 111% | 6750 96% | 7300 89% | 6257 104% | 6609 98% |
| Durchschnitt gesamt (Programm / Settings) | 53% /
48% | 66% /
64% | 27% /
45% | 52% /
47% | 57% /
53% | 45% /
39% | 56% /
55% | 53% /
50% |
* ... kleinere Werte sind besser
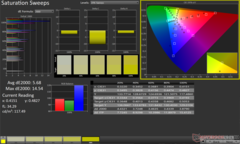
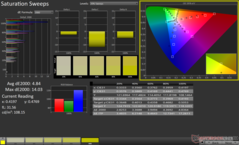
Unsere Kalibrierungsroutine mit dem X-Rite-i1Basic-Pro-3-Spektralphotometer und der Calman-Ultimate-Farbkalibrierungssoftware von Portrait Displays führt zu einem deutlich verbesserten Graustufen-Delta-E-2000-Wert.
Bei den ColorChecker-Werten gibt es jedoch nicht viel Spielraum für Verbesserungen. Die Farben 100 % Blau und 100 % Magenta tragen zu großen Abweichungen in der Farbgenauigkeit bei.
Das kalibrierte ICC-Profil kann unter dem obigen Link heruntergeladen werden.
Reaktionszeiten (Response Times) des Displays
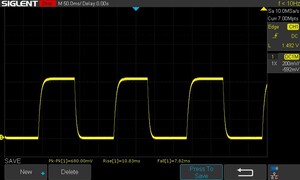
| ↔ Reaktionszeiten Schwarz zu Weiß | ||
|---|---|---|
| 18.65 ms ... steigend ↗ und fallend ↘ kombiniert | ↗ 10.83 ms steigend | |
| ↘ 7.82 ms fallend | ||
| Die gemessenen Reaktionszeiten sind gut, für anspruchsvolle Spieler könnten der Bildschirm jedoch zu langsam sein. Im Vergleich rangierten die bei uns getesteten Geräte von 0.1 (Minimum) zu 240 (Maximum) ms. » 41 % aller Screens waren schneller als der getestete. Daher sind die gemessenen Reaktionszeiten durchschnittlich (20.1 ms). | ||
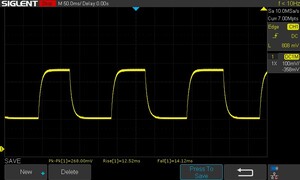
| ↔ Reaktionszeiten 50% Grau zu 80% Grau | ||
| 26.64 ms ... steigend ↗ und fallend ↘ kombiniert | ↗ 12.52 ms steigend | |
| ↘ 14.12 ms fallend | ||
| Die gemessenen Reaktionszeiten sind mittelmäßig und dadurch für Spieler eventuell zu langsam. Im Vergleich rangierten die bei uns getesteten Geräte von 0.165 (Minimum) zu 636 (Maximum) ms. » 36 % aller Screens waren schneller als der getestete. Daher sind die gemessenen Reaktionszeiten besser als der Durchschnitt aller vermessenen Geräte (31.4 ms). | ||
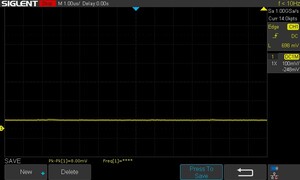
Bildschirm-Flackern / PWM (Pulse-Width Modulation)
| Flackern / PWM nicht festgestellt | |||
| ≤ 100 cd/m² Helligkeit | |||
Im Vergleich: 53 % aller getesteten Geräte nutzten kein PWM um die Helligkeit zu reduzieren. Wenn PWM eingesetzt wurde, dann bei einer Frequenz von durchschnittlich 8013 (Minimum 5, Maximum 343500) Hz. | |||
Display-Reaktionszeiten, vor allem die Übergänge von 50 % Grau zu 80 % Grau, sind für ein Gaming-Notebook etwas zu lang. Bei allen getesteten Helligkeitsstufen konnten wir kein PWM beobachten.
Siehe auch unseren Artikel über PWM und auch unsere Ranking-Tabelle für weitere Informationen und Vergleiche zwischen den getesteten Geräten.
Die Anzeige im Freien ist gut lesbar, solange kein direktes Sonnenlicht auf den Bildschirm fällt. Bei extremen Betrachtungswinkeln kommt es zu einem Verlust an Helligkeit und Farbinformationen.
Performance: Die Kombination aus Core i5-12500H und RTX 3060 sorgt für keine großen Überraschungen
Gigabyte bietet das G5 in zwei Varianten an: das G5 KE und das G5 ME mit der 12C/16T Intel Core i5-12500H CPU. Während das G5 KE eine Nvidia-GeForce-RTX-3060-Laptop-GPU bietet, begnügt sich das G5 ME mit einer RTX-3050-Ti-Laptop-GPU und verfügt nicht über einen Thunderbolt-4-Anschluss.
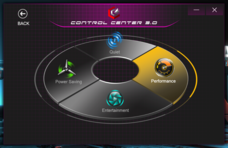
Das G5 KE bietet vier Leistungsmodi, wie in der Tabelle unten beschrieben:
| Performance-Modus | PL1 (PBP) / Tau | PL2 (MTP) / Tau |
|---|---|---|
| Leise | 15 W/8 s | 30 W/2,44 ms |
| Energiesparen | 30 W/8 s | 30 W/2,44 ms |
| Unterhaltung | 50 W/28 s | 115 W/2,44 ms |
| Performance | 115 W/80 s | 135 W/2,44 ms |
Prozessor
Der Core i5-12500H des G5 KE liegt in unmittelbarer Nähe zum Core i5-12500H des G7 KE und auch zum AMD Ryzen 7 6800H im XMG Core 15 (M22) bei den kumulativen CPU-Ergebnissen. Allerdings liegt er um 15 % hinter dem Core i7-12700H im Asus TUF Gaming F15.
Die anhaltende Leistung in unserem Cinebench-R15-Multicore-Loop-Test ist größtenteils in Ordnung, abgesehen von einem minimalen, kurzzeitigen Einbruch der Scores in der Mitte des Durchlaufs.
Cinebench R15 Multi Loop
Cinebench R20: CPU (Single Core) | CPU (Multi Core)
Cinebench R15: CPU Single 64Bit | CPU Multi 64Bit
Blender: v2.79 BMW27 CPU
7-Zip 18.03: 7z b 4 -mmt1 | 7z b 4
Geekbench 5.5: Single-Core | Multi-Core
HWBOT x265 Benchmark v2.2: 4k Preset
LibreOffice : 20 Documents To PDF
R Benchmark 2.5: Overall mean
| CPU Performance Rating | |
| Durchschnitt der Klasse Gaming | |
| Asus TUF Gaming F15 FX507ZM | |
| Dell G16 7620 | |
| Gigabyte G7 KE | |
| Schenker XMG Core 15 (M22) | |
| Gigabyte G5 KE | |
| Honor MagicBook 14 2022 | |
| Lenovo IdeaPad Gaming 3 15IAH7 | |
| Durchschnittliche Intel Core i5-12500H | |
| HP Victus 16-e0179ng | |
| Gigabyte A5 K1 | |
| Cinebench R20 / CPU (Single Core) | |
| Durchschnitt der Klasse Gaming (439 - 870, n=135, der letzten 2 Jahre) | |
| Asus TUF Gaming F15 FX507ZM | |
| Dell G16 7620 | |
| Gigabyte G7 KE | |
| Lenovo IdeaPad Gaming 3 15IAH7 | |
| Honor MagicBook 14 2022 | |
| Durchschnittliche Intel Core i5-12500H (602 - 656, n=9) | |
| Gigabyte G5 KE | |
| Schenker XMG Core 15 (M22) | |
| HP Victus 16-e0179ng | |
| Gigabyte A5 K1 | |
| Cinebench R20 / CPU (Multi Core) | |
| Durchschnitt der Klasse Gaming (2179 - 16108, n=135, der letzten 2 Jahre) | |
| Asus TUF Gaming F15 FX507ZM | |
| Dell G16 7620 | |
| Lenovo IdeaPad Gaming 3 15IAH7 | |
| Schenker XMG Core 15 (M22) | |
| Gigabyte G7 KE | |
| Durchschnittliche Intel Core i5-12500H (4687 - 5640, n=9) | |
| Gigabyte G5 KE | |
| Honor MagicBook 14 2022 | |
| HP Victus 16-e0179ng | |
| Gigabyte A5 K1 | |
| Cinebench R15 / CPU Single 64Bit | |
| Durchschnitt der Klasse Gaming (188.8 - 343, n=134, der letzten 2 Jahre) | |
| Asus TUF Gaming F15 FX507ZM | |
| Schenker XMG Core 15 (M22) | |
| Gigabyte G7 KE | |
| Lenovo IdeaPad Gaming 3 15IAH7 | |
| Dell G16 7620 | |
| Gigabyte G5 KE | |
| Honor MagicBook 14 2022 | |
| Durchschnittliche Intel Core i5-12500H (220 - 250, n=9) | |
| HP Victus 16-e0179ng | |
| Gigabyte A5 K1 | |
| Cinebench R15 / CPU Multi 64Bit | |
| Durchschnitt der Klasse Gaming (1537 - 6271, n=135, der letzten 2 Jahre) | |
| Asus TUF Gaming F15 FX507ZM | |
| Dell G16 7620 | |
| Schenker XMG Core 15 (M22) | |
| Lenovo IdeaPad Gaming 3 15IAH7 | |
| Gigabyte G7 KE | |
| Durchschnittliche Intel Core i5-12500H (1970 - 2283, n=10) | |
| Gigabyte G5 KE | |
| Honor MagicBook 14 2022 | |
| Honor MagicBook 14 2022 | |
| HP Victus 16-e0179ng | |
| Gigabyte A5 K1 | |
| Blender / v2.79 BMW27 CPU | |
| Gigabyte A5 K1 | |
| Honor MagicBook 14 2022 | |
| HP Victus 16-e0179ng | |
| Durchschnittliche Intel Core i5-12500H (223 - 288, n=9) | |
| Gigabyte G5 KE | |
| Gigabyte G7 KE | |
| Lenovo IdeaPad Gaming 3 15IAH7 | |
| Schenker XMG Core 15 (M22) | |
| Dell G16 7620 | |
| Asus TUF Gaming F15 FX507ZM | |
| Durchschnitt der Klasse Gaming (80 - 517, n=132, der letzten 2 Jahre) | |
| 7-Zip 18.03 / 7z b 4 -mmt1 | |
| Durchschnitt der Klasse Gaming (4199 - 7508, n=133, der letzten 2 Jahre) | |
| Schenker XMG Core 15 (M22) | |
| HP Victus 16-e0179ng | |
| Gigabyte G7 KE | |
| Lenovo IdeaPad Gaming 3 15IAH7 | |
| Gigabyte A5 K1 | |
| Gigabyte G5 KE | |
| Asus TUF Gaming F15 FX507ZM | |
| Dell G16 7620 | |
| Durchschnittliche Intel Core i5-12500H (5151 - 5563, n=9) | |
| Honor MagicBook 14 2022 | |
| 7-Zip 18.03 / 7z b 4 | |
| Durchschnitt der Klasse Gaming (23795 - 148086, n=133, der letzten 2 Jahre) | |
| Asus TUF Gaming F15 FX507ZM | |
| Dell G16 7620 | |
| Schenker XMG Core 15 (M22) | |
| HP Victus 16-e0179ng | |
| Gigabyte G5 KE | |
| Gigabyte G7 KE | |
| Honor MagicBook 14 2022 | |
| Durchschnittliche Intel Core i5-12500H (44105 - 54380, n=9) | |
| Gigabyte A5 K1 | |
| Lenovo IdeaPad Gaming 3 15IAH7 | |
| Geekbench 5.5 / Single-Core | |
| Durchschnitt der Klasse Gaming (986 - 2474, n=133, der letzten 2 Jahre) | |
| Asus TUF Gaming F15 FX507ZM | |
| Honor MagicBook 14 2022 | |
| Gigabyte G7 KE | |
| Dell G16 7620 | |
| Gigabyte G5 KE | |
| Lenovo IdeaPad Gaming 3 15IAH7 | |
| Durchschnittliche Intel Core i5-12500H (1471 - 1693, n=9) | |
| Schenker XMG Core 15 (M22) | |
| HP Victus 16-e0179ng | |
| Gigabyte A5 K1 | |
| Geekbench 5.5 / Multi-Core | |
| Durchschnitt der Klasse Gaming (4557 - 27010, n=133, der letzten 2 Jahre) | |
| Asus TUF Gaming F15 FX507ZM | |
| Dell G16 7620 | |
| Honor MagicBook 14 2022 | |
| Gigabyte G7 KE | |
| Gigabyte G5 KE | |
| Schenker XMG Core 15 (M22) | |
| Durchschnittliche Intel Core i5-12500H (7962 - 10828, n=9) | |
| Lenovo IdeaPad Gaming 3 15IAH7 | |
| HP Victus 16-e0179ng | |
| Gigabyte A5 K1 | |
| HWBOT x265 Benchmark v2.2 / 4k Preset | |
| Durchschnitt der Klasse Gaming (7.7 - 44.3, n=133, der letzten 2 Jahre) | |
| Asus TUF Gaming F15 FX507ZM | |
| Dell G16 7620 | |
| Schenker XMG Core 15 (M22) | |
| Gigabyte G7 KE | |
| Gigabyte G5 KE | |
| Lenovo IdeaPad Gaming 3 15IAH7 | |
| HP Victus 16-e0179ng | |
| Durchschnittliche Intel Core i5-12500H (12 - 16.6, n=9) | |
| Honor MagicBook 14 2022 | |
| Gigabyte A5 K1 | |
| LibreOffice / 20 Documents To PDF | |
| Gigabyte A5 K1 | |
| Schenker XMG Core 15 (M22) | |
| Gigabyte G5 KE | |
| HP Victus 16-e0179ng | |
| Dell G16 7620 | |
| Asus TUF Gaming F15 FX507ZM | |
| Lenovo IdeaPad Gaming 3 15IAH7 | |
| Durchschnitt der Klasse Gaming (19 - 88.8, n=133, der letzten 2 Jahre) | |
| Durchschnittliche Intel Core i5-12500H (40.1 - 58.5, n=9) | |
| Gigabyte G7 KE | |
| Honor MagicBook 14 2022 | |
| R Benchmark 2.5 / Overall mean | |
| Gigabyte A5 K1 | |
| HP Victus 16-e0179ng | |
| Lenovo IdeaPad Gaming 3 15IAH7 | |
| Durchschnittliche Intel Core i5-12500H (0.4748 - 0.535, n=9) | |
| Dell G16 7620 | |
| Honor MagicBook 14 2022 | |
| Gigabyte G5 KE | |
| Schenker XMG Core 15 (M22) | |
| Gigabyte G7 KE | |
| Asus TUF Gaming F15 FX507ZM | |
| Durchschnitt der Klasse Gaming (0.3439 - 0.759, n=134, der letzten 2 Jahre) | |
* ... kleinere Werte sind besser
Unser Test des Intel Core i5-12500H bietet weitere Informationen und Benchmark-Vergleiche.
System Performance
Die Gesamtleistung des G5 KE im PCMark 10 liegt auf dem Niveau von Laptops mit Core i7-12700H und hat einen spürbaren Vorsprung im CrossMark gegenüber dem Ryzen 7 6800H betriebenen Schenker XMG Core 15 (M22).
CrossMark: Overall | Productivity | Creativity | Responsiveness
| PCMark 10 / Score | |
| Durchschnitt der Klasse Gaming (5776 - 10060, n=113, der letzten 2 Jahre) | |
| Asus TUF Gaming F15 FX507ZM | |
| Schenker XMG Core 15 (M22) | |
| Dell G16 7620 | |
| Gigabyte G5 KE | |
| Lenovo IdeaPad Gaming 3 15IAH7 | |
| Durchschnittliche Intel Core i5-12500H, NVIDIA GeForce RTX 3060 Laptop GPU (6126 - 7201, n=2) | |
| HP Victus 16-e0179ng | |
| Honor MagicBook 14 2022 | |
| Gigabyte A5 K1 | |
| Gigabyte G7 KE | |
| PCMark 10 / Essentials | |
| Gigabyte G5 KE | |
| Schenker XMG Core 15 (M22) | |
| Durchschnittliche Intel Core i5-12500H, NVIDIA GeForce RTX 3060 Laptop GPU (10301 - 11150, n=2) | |
| Durchschnitt der Klasse Gaming (8810 - 12600, n=117, der letzten 2 Jahre) | |
| Honor MagicBook 14 2022 | |
| Asus TUF Gaming F15 FX507ZM | |
| Gigabyte G7 KE | |
| Dell G16 7620 | |
| Gigabyte A5 K1 | |
| Lenovo IdeaPad Gaming 3 15IAH7 | |
| HP Victus 16-e0179ng | |
| PCMark 10 / Productivity | |
| Durchschnitt der Klasse Gaming (6662 - 16716, n=115, der letzten 2 Jahre) | |
| Schenker XMG Core 15 (M22) | |
| Lenovo IdeaPad Gaming 3 15IAH7 | |
| Gigabyte G5 KE | |
| Durchschnittliche Intel Core i5-12500H, NVIDIA GeForce RTX 3060 Laptop GPU (9038 - 9475, n=2) | |
| Asus TUF Gaming F15 FX507ZM | |
| Gigabyte G7 KE | |
| HP Victus 16-e0179ng | |
| Dell G16 7620 | |
| Honor MagicBook 14 2022 | |
| Gigabyte A5 K1 | |
| PCMark 10 / Digital Content Creation | |
| Durchschnitt der Klasse Gaming (7440 - 19351, n=115, der letzten 2 Jahre) | |
| Asus TUF Gaming F15 FX507ZM | |
| Dell G16 7620 | |
| Schenker XMG Core 15 (M22) | |
| Gigabyte G5 KE | |
| Lenovo IdeaPad Gaming 3 15IAH7 | |
| HP Victus 16-e0179ng | |
| Durchschnittliche Intel Core i5-12500H, NVIDIA GeForce RTX 3060 Laptop GPU (6703 - 9593, n=2) | |
| Honor MagicBook 14 2022 | |
| Gigabyte A5 K1 | |
| Gigabyte G7 KE | |
| CrossMark / Overall | |
| Durchschnitt der Klasse Gaming (1247 - 2344, n=113, der letzten 2 Jahre) | |
| Gigabyte G7 KE | |
| Honor MagicBook 14 2022 | |
| Durchschnittliche Intel Core i5-12500H, NVIDIA GeForce RTX 3060 Laptop GPU (1752 - 1824, n=2) | |
| Dell G16 7620 | |
| Gigabyte G5 KE | |
| Schenker XMG Core 15 (M22) | |
| CrossMark / Productivity | |
| Durchschnitt der Klasse Gaming (1299 - 2211, n=113, der letzten 2 Jahre) | |
| Gigabyte G7 KE | |
| Durchschnittliche Intel Core i5-12500H, NVIDIA GeForce RTX 3060 Laptop GPU (1720 - 1804, n=2) | |
| Honor MagicBook 14 2022 | |
| Gigabyte G5 KE | |
| Dell G16 7620 | |
| Schenker XMG Core 15 (M22) | |
| CrossMark / Creativity | |
| Honor MagicBook 14 2022 | |
| Durchschnitt der Klasse Gaming (1275 - 2729, n=113, der letzten 2 Jahre) | |
| Dell G16 7620 | |
| Gigabyte G7 KE | |
| Durchschnittliche Intel Core i5-12500H, NVIDIA GeForce RTX 3060 Laptop GPU (1778 - 1800, n=2) | |
| Gigabyte G5 KE | |
| Schenker XMG Core 15 (M22) | |
| CrossMark / Responsiveness | |
| Gigabyte G7 KE | |
| Durchschnittliche Intel Core i5-12500H, NVIDIA GeForce RTX 3060 Laptop GPU (1771 - 1966, n=2) | |
| Gigabyte G5 KE | |
| Honor MagicBook 14 2022 | |
| Durchschnitt der Klasse Gaming (1030 - 2330, n=113, der letzten 2 Jahre) | |
| Dell G16 7620 | |
| Schenker XMG Core 15 (M22) | |
| PCMark 8 Home Score Accelerated v2 | 5554 Punkte | |
| PCMark 8 Work Score Accelerated v2 | 5937 Punkte | |
| PCMark 10 Score | 7201 Punkte | |
Hilfe | ||
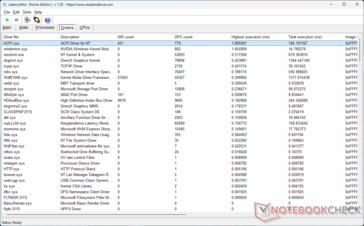
DPC-Latenzzeit
| DPC Latencies / LatencyMon - interrupt to process latency (max), Web, Youtube, Prime95 | |
| Schenker XMG Core 15 (M22) | |
| Gigabyte G7 KE | |
| Lenovo IdeaPad Gaming 3 15IAH7 | |
| HP Victus 16-e0179ng | |
| Gigabyte A5 K1 | |
| Gigabyte G5 KE | |
| Dell G16 7620 | |
| Asus TUF Gaming F15 FX507ZM | |
| Honor MagicBook 14 2022 | |
* ... kleinere Werte sind besser
Siehe auch unsere DPC-Latenzzeit-Vergleichsseite für weitere Latenzvergleiche zwischen getesteten Geräten.
Speichergeräte
Unser G5 KE war mit einer 512-GB-Gigabyte-NVMe-SSD ausgestattet. Wir finden jedoch, dass die 1-TB-Variante dieses Laufwerks im G7 KE in fast jeder Hinsicht besser abschneidet. In unserem DiskSpd-Leseschleifentest leidet die SSD unter drastischem Throttling.
Eine zweite NVMe-SSD kann installiert werden, aber es gibt keine Möglichkeit, ein 2,5-Zoll-SATA-Laufwerk hinzuzufügen.
| Gigabyte G5 KE Gigabyte AG4512G-SI B10 | Lenovo IdeaPad Gaming 3 15IAH7 Intel SSD 660p SSDPEKNW512G8 | Gigabyte G7 KE Gigabyte AG470S1TB-SI B10 | Honor MagicBook 14 2022 Samsung PM9A1 MZVL2512HCJQ | Asus TUF Gaming F15 FX507ZM SK Hynix HFM001TD3JX013N | HP Victus 16-e0179ng WDC PC SN730 SDBPNTY-1T00 | Durchschnittliche Gigabyte AG4512G-SI B10 | Durchschnitt der Klasse Gaming | |
|---|---|---|---|---|---|---|---|---|
| CrystalDiskMark 5.2 / 6 | -42% | 22% | 43% | -8% | -16% | 0% | 23% | |
| Write 4K (MB/s) | 303.3 | 64 -79% | 363.1 20% | 229.88 -24% | 217.7 -28% | 157.3 -48% | 303 ? 0% | 202 ? -33% |
| Read 4K (MB/s) | 64.25 | 77.05 20% | 59.23 -8% | 91.45 42% | 70.1 9% | 49 -24% | 64.3 ? 0% | 75.2 ? 17% |
| Write Seq (MB/s) | 2258 | 93.07 -96% | 2605 15% | 2844 26% | 2983 32% | 2258 ? 0% | 3717 ? 65% | |
| Read Seq (MB/s) | 2561 | 2570 0% | 2337 -9% | 2492 -3% | 2247 -12% | 2561 ? 0% | 3534 ? 38% | |
| Write 4K Q32T1 (MB/s) | 620.6 | 184.6 -70% | 806.9 30% | 627.94 1% | 408.3 -34% | 395 -36% | 621 ? 0% | 584 ? -6% |
| Read 4K Q32T1 (MB/s) | 866.2 | 461.5 -47% | 1019 18% | 868.92 0% | 524 -40% | 557 -36% | 866 ? 0% | 700 ? -19% |
| Write Seq Q32T1 (MB/s) | 2264.3 | 1659 -27% | 3612 60% | 5118.5 126% | 3011 33% | 3094 37% | 2264 ? 0% | 5095 ? 125% |
| Read Seq Q32T1 (MB/s) | 4717.3 | 2936 -38% | 7067 50% | 6866.5 46% | 3553 -25% | 2871 -39% | 4717 ? 0% | 6803 ? 44% |
| Write 4K Q8T8 (MB/s) | 2239.2 | 2910.25 30% | 2239 ? 0% | 1285 ? -43% | ||||
| Read 4K Q8T8 (MB/s) | 1188.1 | 2687.03 126% | 1188 ? 0% | 1651 ? 39% | ||||
| AS SSD | -48% | 39% | 28% | -23% | -21% | 0% | 20% | |
| Seq Read (MB/s) | 3697.92 | 2432.02 -34% | 4540.75 23% | 5233 42% | 3013 -19% | 2383 -36% | 3698 ? 0% | 5335 ? 44% |
| Seq Write (MB/s) | 2106.21 | 1229.14 -42% | 3805.55 81% | 3857 83% | 2768 31% | 2466 17% | 2106 ? 0% | 3893 ? 85% |
| 4K Read (MB/s) | 82.5 | 75.66 -8% | 99.79 21% | 85.14 3% | 66.9 -19% | 44.14 -46% | 82.5 ? 0% | 69.4 ? -16% |
| 4K Write (MB/s) | 312.09 | 242.19 -22% | 325.41 4% | 216.33 -31% | 184.8 -41% | 117.5 -62% | 312 ? 0% | 217 ? -30% |
| 4K-64 Read (MB/s) | 1675.54 | 441.63 -74% | 2914.54 74% | 2468.58 47% | 1923 15% | 1734 3% | 1676 ? 0% | 1710 ? 2% |
| 4K-64 Write (MB/s) | 1865.08 | 1218.61 -35% | 2915.33 56% | 3003.26 61% | 2198 18% | 2088 12% | 1865 ? 0% | 2859 ? 53% |
| Access Time Read * (ms) | 0.066 | 0.073 -11% | 0.094 -42% | 0.023 65% | 0.03 55% | 0.049 26% | 0.066 ? -0% | 0.06095 ? 8% |
| Access Time Write * (ms) | 0.013 | 0.033 -154% | 0.012 8% | 0.02 -54% | 0.081 -523% | 0.032 -146% | 0.013 ? -0% | 0.03679 ? -183% |
| Score Read (Points) | 2128 | 760 -64% | 3468 63% | 3077 45% | 2291 8% | 2017 -5% | 2128 ? 0% | 2312 ? 9% |
| Score Write (Points) | 2388 | 1584 -34% | 3621 52% | 3605 51% | 2660 11% | 2452 3% | 2388 ? 0% | 3464 ? 45% |
| Score Total (Points) | 5541 | 2702 -51% | 8837 59% | 8195 48% | 6117 10% | 5503 -1% | 5541 ? 0% | 6894 ? 24% |
| Copy ISO MB/s (MB/s) | 1077.37 | 1949.01 81% | 2093.45 94% | 2143 99% | 1077 ? 0% | 3020 ? 180% | ||
| Copy Program MB/s (MB/s) | 827.5 | 1079.42 30% | 447.36 -46% | 871 5% | 828 ? 0% | 964 ? 16% | ||
| Copy Game MB/s (MB/s) | 1460.58 | 2042.84 40% | 1195.09 -18% | 1840 26% | 1461 ? 0% | 2067 ? 42% | ||
| Durchschnitt gesamt (Programm / Settings) | -45% /
-46% | 31% /
33% | 36% /
34% | -16% /
-18% | -19% /
-19% | 0% /
0% | 22% /
21% |
* ... kleinere Werte sind besser
Disk Throttling: DiskSpd Read Loop, Queue Depth 8
Sehen Sie sich unsere speziellen SSD- und HDD-Benchmark-Seite für weitere Vergleiche von Speichergeräten an.
GPU-Performance
Die 115-W-Nvidia-GeForce-RTX-3060-Laptop-GPU schneidet in den 3DMark-Tests auf Augenhöhe ab. Das G5 KE zeigt einen guten Vorsprung gegenüber dem HP Victus in den synthetischen Tests aufgrund der 95-W-TGP-Konfiguration von Letzterem.
| 3DMark 11 Performance | 26505 Punkte | |
| 3DMark Ice Storm Standard Score | 188480 Punkte | |
| 3DMark Cloud Gate Standard Score | 53162 Punkte | |
| 3DMark Fire Strike Score | 19966 Punkte | |
| 3DMark Fire Strike Extreme Score | 10252 Punkte | |
| 3DMark Time Spy Score | 8922 Punkte | |
Hilfe | ||
Gaming Performance
Die Gaming Performance des Gigabyte G5 KE ist ähnlich wie die anderer RTX 3060 basierter Laptops, die wir getestet haben, und schafft es sogar, das G7 KE mit der gleichen Konfiguration in einigen Spielen zu überholen.
Wir bemerkten keine wahrnehmbaren Frame-Einbrüche, während wir das Notebook mit The Witcher 3 bei 1.080p Ultra belasteten.
The Witcher 3 FPS Chart
| Cyberpunk 2077 1.6 | |
| 1920x1080 High Preset | |
| Dell G16 7620 | |
| Gigabyte G5 KE | |
| Durchschnittliche NVIDIA GeForce RTX 3060 Laptop GPU (42.2 - 87.7, n=14) | |
| Gigabyte G7 KE | |
| Honor MagicBook 14 2022 | |
| 1920x1080 Ultra Preset | |
| Gigabyte G5 KE | |
| Dell G16 7620 | |
| Durchschnittliche NVIDIA GeForce RTX 3060 Laptop GPU (40 - 78.8, n=16) | |
| Gigabyte G7 KE | |
| Honor MagicBook 14 2022 | |
| F1 2021 | |
| 1920x1080 High Preset AA:T AF:16x | |
| Gigabyte G5 KE | |
| Durchschnittliche NVIDIA GeForce RTX 3060 Laptop GPU (119 - 227, n=9) | |
| Honor MagicBook 14 2022 | |
| 1920x1080 Ultra High Preset + Raytracing AA:T AF:16x | |
| Gigabyte G5 KE | |
| Durchschnittliche NVIDIA GeForce RTX 3060 Laptop GPU (67 - 112.8, n=9) | |
| Honor MagicBook 14 2022 | |
| min. | mittel | hoch | max. | |
|---|---|---|---|---|
| GTA V (2015) | 183.4 | 179.9 | 172.8 | 103 |
| The Witcher 3 (2015) | 333 | 255 | 168.7 | 87.6 |
| Dota 2 Reborn (2015) | 168.5 | 153.1 | 144.8 | 137.5 |
| Final Fantasy XV Benchmark (2018) | 179.3 | 118.9 | 90.3 | |
| X-Plane 11.11 (2018) | 118.4 | 105.6 | 86.7 | |
| Far Cry 5 (2018) | 159 | 134 | 129 | 118 |
| Strange Brigade (2018) | 385 | 216 | 175.3 | 153.3 |
| F1 2021 (2021) | 303 | 200 | 177.9 | 105.1 |
| Cyberpunk 2077 1.6 (2022) | 105.4 | 85.3 | 72.5 | 68 |
| F1 22 (2022) | 197 | 189.4 | 153.3 | 55.9 |
Sehen Sie sich unsere spezielle Seite zur Nvidia-GeForce-RTX-3060-Laptop-GPU und auch unsere ausführliche Gaming-Vergleichsliste für weitere Informationen und Leistungsvergleiche an.
Emissions: High surface temperatures and fan noise under load
Systemrauschen
Im getesteten Performance-Modus liegt das Systemgeräusch im Leerlauf mit ca. 31 dB(A) etwas höher. Das Lüftergeräusch erreicht unabhängig von der Last die 55-dB(A)-Marke.
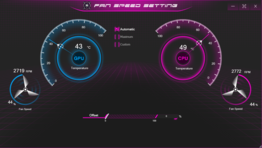
Gigabyte scheint das Lüftergeräusch im Quiet Profil unter 30 dB(A) gedeckelt zu haben. Nur der Witcher-3-Test führt zu einem hohen Lüftergeräuschemissionen im Energiesparprofil, wie in der Tabelle unten dargestellt.
| Performance-Modus | Leerlauf dB(A) | Last durchschnittlich dB(A) | Last maximal dB(A) | The Witcher 3 dB(A) |
|---|---|---|---|---|
| Leise | 22,21 | 25,73 | 24,64 | 27,62 |
| Stromsparen | 22,65 | 24,75 | 24,62 | 49,05 |
| Unterhaltung | 22,63 | 54,67 | 55,52 | 53,11 |
| Performance | 31,05 | 55,66 | 55,51 | 55,65 |
Lautstärkediagramm
| Idle |
| 31.05 / 31.05 / 31.05 dB(A) |
| Last |
| 55.66 / 55.51 dB(A) |
 | ||
30 dB leise 40 dB(A) deutlich hörbar 50 dB(A) störend |
||
min: | ||
Temperatur
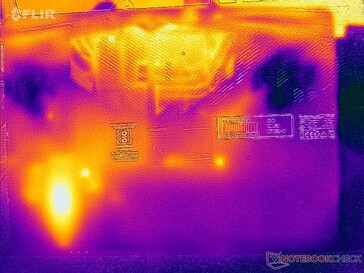
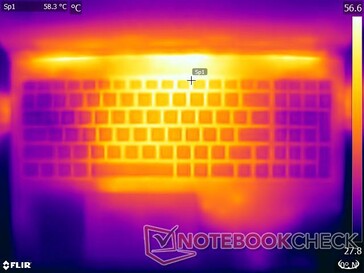
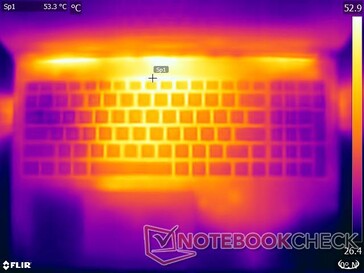
Das Dual-Lüfter-Quad-Heatpipe-System des Gigabyte G5 KE leistet gute Arbeit, wenn es darum geht, die Kerntemperaturen unter Kontrolle zu halten. Die Oberflächentemperaturen jedoch können unter starker Belastung auf bis zu 52,6 °C an der Oberseite und bis zu 62,4 °C an der Unterseite steigen.
Auch der Bereich des Touchpads kann recht warm werden.
(-) Die maximale Temperatur auf der Oberseite ist 52.6 °C. Im Vergleich liegt der Klassendurchschnitt bei 40.4 °C (von 21.2 bis 68.8 °C für die Klasse Gaming).
(-) Auf der Unterseite messen wir eine maximalen Wert von 62.4 °C (im Vergleich zum Durchschnitt von 43.3 °C).
(±) Ohne Last messen wir eine durchschnittliche Temperatur von 32 °C auf der Oberseite. Der Klassendurchschnitt erreicht 33.9 °C.
(-) Beim längeren Spielen von The Witcher 3 erhitzt sich das Gerät durchschnittlich auf 42.9 °C. Der Durchschnitt der Klasse ist derzeit 33.9 °C.
(-) Die Handballen und der Touchpad-Bereich können sehr heiß werden mit maximal 41.2 °C.
(-) Die durchschnittliche Handballen-Temperatur anderer getesteter Geräte war 28.8 °C (-12.4 °C).
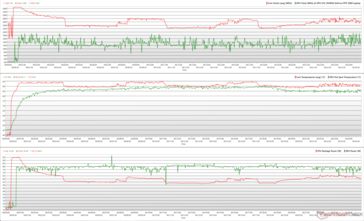
Bei Kombination aus Prime95 und FurMark Stress erreicht der Core i5-12500H kurzzeitig eine Spitze von etwa 3,5 GHz bei 95 W, bevor er sich auf etwa 2,5 GHz bei durchschnittlich 60 W einpendelt. Die RTX-3060-Laptop-GPU kommt mit durchschnittlich 75,6 W aus, erreicht aber eine Spitze von 98 W, was zu einem maximalen Kerntakt von 1,9 GHz führt.
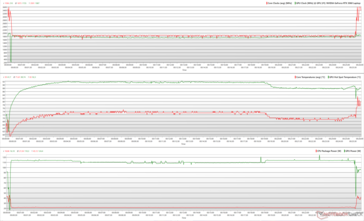
Wir sehen ähnliche Spitzenwerte bei The Witcher 3 Stress, der durchschnittliche Stromverbrauch des CPU-Pakets sinkt jedoch weiter auf etwa 21,5 W, sodass die RTX 3060 im Durchschnitt bis zu 110 W verbrauchen kann.
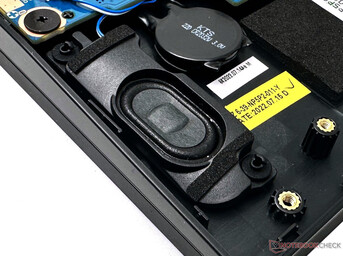
Lautsprecher
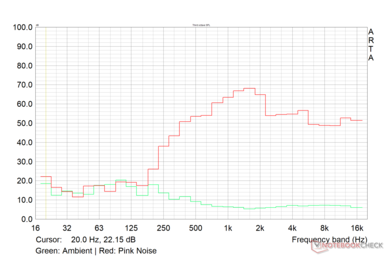
Gigabyte G5 KE Audio Analyse
(±) | Mittelmäßig laut spielende Lautsprecher (73.6 dB)
Bass 100 - 315 Hz
(-) | kaum Bass - 25.5% niedriger als der Median
(±) | durchschnittlich lineare Bass-Wiedergabe (12% Delta zum Vorgänger)
Mitteltöne 400 - 2000 Hz
(±) | zu hohe Mitten, vom Median 8.1% abweichend
(±) | Linearität der Mitten ist durchschnittlich (7.7% Delta zum Vorgänger)
Hochtöne 2 - 16 kHz
(+) | ausgeglichene Hochtöne, vom Median nur 2.9% abweichend
(+) | sehr lineare Hochtöne (6.7% Delta zum Vorgänger)
Gesamt im hörbaren Bereich 100 - 16.000 Hz
(±) | hörbarer Bereich ist durchschnittlich linear (25.1% Abstand zum Median)
Im Vergleich zu allen Geräten derselben Klasse
» 90% aller getesteten Geräte dieser Klasse waren besser, 3% vergleichbar, 7% schlechter
» Das beste Gerät hat einen Delta-Wert von 6%, durchschnittlich ist 18%, das schlechteste Gerät hat 132%
Im Vergleich zu allen Geräten im Test
» 76% aller getesteten Geräte waren besser, 5% vergleichbar, 18% schlechter
» Das beste Gerät hat einen Delta-Wert von 4%, durchschnittlich ist 24%, das schlechteste Gerät hat 134%
Apple MacBook Pro 16 2021 M1 Pro Audio Analyse
(+) | Die Lautsprecher können relativ laut spielen (84.7 dB)
Bass 100 - 315 Hz
(+) | guter Bass - nur 3.8% Abweichung vom Median
(+) | lineare Bass-Wiedergabe (5.2% Delta zum Vorgänger)
Mitteltöne 400 - 2000 Hz
(+) | ausgeglichene Mitten, vom Median nur 1.3% abweichend
(+) | lineare Mitten (2.1% Delta zum Vorgänger)
Hochtöne 2 - 16 kHz
(+) | ausgeglichene Hochtöne, vom Median nur 1.9% abweichend
(+) | sehr lineare Hochtöne (2.7% Delta zum Vorgänger)
Gesamt im hörbaren Bereich 100 - 16.000 Hz
(+) | hörbarer Bereich ist sehr linear (4.6% Abstand zum Median
Im Vergleich zu allen Geräten derselben Klasse
» 0% aller getesteten Geräte dieser Klasse waren besser, 0% vergleichbar, 100% schlechter
» Das beste Gerät hat einen Delta-Wert von 5%, durchschnittlich ist 17%, das schlechteste Gerät hat 45%
Im Vergleich zu allen Geräten im Test
» 0% aller getesteten Geräte waren besser, 0% vergleichbar, 100% schlechter
» Das beste Gerät hat einen Delta-Wert von 4%, durchschnittlich ist 24%, das schlechteste Gerät hat 134%
Energieverwaltung: Sparsame Leistungsaufnahme im Leerlauf bei mittelmäßiger Akkulaufzeit
Stromverbrauch
Das Gigabyte G5 KE ist im Vergleich zum G7 KE um einiges sparsamer im Stromverbrauch, vor allem im Leerlauf.
Die RTX-3050-Ti-Laptop-GPU des Lenovo IdeaPad Gaming 3 und die Kombination aus 95-W-RTX 3060 und Ryzen 7 58H des HP Victus Ryzen 7 5800H tragen dazu bei, dass diese Geräte insgesamt vergleichsweise wenig Strom verbrauchen.
| Aus / Standby | |
| Idle | |
| Last |
|
Legende:
min: | |
| Gigabyte G5 KE i5-12500H, GeForce RTX 3060 Laptop GPU, IPS, 1920x1080, 15.6" | Lenovo IdeaPad Gaming 3 15IAH7 i5-12500H, GeForce RTX 3050 Ti Laptop GPU, IPS, 1920x1080, 15.6" | Gigabyte G7 KE i5-12500H, GeForce RTX 3060 Laptop GPU, IPS, 1920x1080, 17.3" | Schenker XMG Core 15 (M22) R7 6800H, GeForce RTX 3060 Laptop GPU, IPS, 2560x1440, 15.6" | Dell G16 7620 i7-12700H, GeForce RTX 3060 Laptop GPU, IPS, 2560x1600, 16" | Asus TUF Gaming F15 FX507ZM i7-12700H, GeForce RTX 3060 Laptop GPU, IPS, 1920x1080, 15.6" | HP Victus 16-e0179ng R7 5800H, GeForce RTX 3060 Laptop GPU, IPS, 1920x1080, 16.1" | Durchschnittliche NVIDIA GeForce RTX 3060 Laptop GPU | Durchschnitt der Klasse Gaming | |
|---|---|---|---|---|---|---|---|---|---|
| Stromverbrauch | 9% | -33% | -14% | -42% | -8% | 9% | -18% | -47% | |
| Idle min * (Watt) | 7.66 | 8 -4% | 15 -96% | 11.8 -54% | 14.4 -88% | 6.3 18% | 5 35% | 10.4 ? -36% | 13.8 ? -80% |
| Idle avg * (Watt) | 10.3 | 10 3% | 17 -65% | 14.7 -43% | 17.8 -73% | 9.8 5% | 10 3% | 14.5 ? -41% | 19.5 ? -89% |
| Idle max * (Watt) | 16.05 | 16 -0% | 24 -50% | 15 7% | 31.5 -96% | 26.5 -65% | 20 -25% | 21.4 ? -33% | 25.5 ? -59% |
| Last avg * (Watt) | 115.8 | 99 15% | 111 4% | 100 14% | 101.2 13% | 103.8 10% | 108 7% | 109.3 ? 6% | 110.6 ? 4% |
| Witcher 3 ultra * (Watt) | 168.7 | 144.6 14% | 174.1 -3% | 184 -9% | 176.9 -5% | 189 -12% | 145 14% | ||
| Last max * (Watt) | 234.6 | 168 28% | 208 11% | 237 -1% | 242.9 -4% | 241.9 -3% | 189 19% | 206 ? 12% | 257 ? -10% |
* ... kleinere Werte sind besser
Power Consumption: The Witcher 3 / Stress test
Power Consumption: External monitor
Akkulaufzeit
Die Akkulaufzeiten des Gigabyte G5 KE liegen selbst bei einer reduzierten Helligkeit von 150 cd/m² auf der unteren Seite. Das ist aber bei Gaming-Notebooks nicht ungewöhnlich.
Ähnlich wie beim G7 KE konnten wir in unserem H.264-1080p-Videowiedergabe-Loop-Test bei 150 cd/m² eine drastisch niedrige Laufzeit von knapp über zwei Stunden feststellen, obwohl alle Laufwerke und Betriebssystem-Patches auf dem neuesten Stand waren.
Pro
Contra
Fazit: Mainstream-Gamer mit unvermeidlichen Kompromissen
Während Gigabyte in den kommenden Wochen eine Reihe von aktualisierten Intel-13.-Gen- und RTX-40-Notebooks der Aorus-, Aero- und Gigabyte-Serie auf den Markt bringen wird, ist das G5 KE mit einer Intel Core-i5-12500H-CPU und Nvidia-RTX-3060 Laptop-GPU immer noch eine gute Option für Mainstream-Gamer.
Gigabyte nutzt die Kombination aus Core i5-12500H und RTX 3060 Laptop-GPU gut aus, und wir konnten keine unerwünschten Probleme mit der Gesamtleistung feststellen. Die Dual-Lüfter-Quad-Heatpipe-Kühlung sorgt dafür, dass die zugrunde liegende Hardware unter Last nicht gedrosselt wird.
Das Gigabyte G5 KE ist ein fähiges Mainstream-Notebook für 1.080p-Ultra-Gaming mit sehr guter CPU- und GPU-Leistung. Allerdings gibt es in anderen Bereichen Schwächen, die je nach Ihren Prioritäten kritisch sein können oder auch nicht.
Abgesehen davon ist das Display im Vergleich zu den 2023er-Standards unterdurchschnittlich, vor allem wenn konkurrierende Geräte wie das Lenovo IdeaPad Gaming 3, das Schenker XMG Core 15 (M22), das Asus TUF Gaming F15 und das Gigabyte G7 KE deutlich bessere Panels mit großem Farbraum und schnellen Reaktionszeiten bieten.
Andere auffällige Mängel sind eine SSD, die unter Last drastisch drosselt, hohe Oberflächentemperaturen, laute Lüfter und eine schlechte Akkulaufzeit während der Videowiedergabe.
Wenn diese Kompromisse für Sie keine Rolle spielen, ist das Gigabyte G5 KE aus reiner Leistungssicht ein anständiges Mittelklasse-Notebook für FHD-Spiele, das Ihnen bis ins Jahr 2023 gute Dienste leisten sollte.
Preis und Verfügbarkeit
Das Gigabyte G5 KE in der von uns getesteten Variante kostet 1.152 Euro bei Amazon und ist für bereits 999 Euro bei notebooksbilliger.de erhältlich.
Gigabyte G5 KE
- 24.04.2023 v7 (old)
Vaidyanathan Subramaniam
Transparenz
Die Auswahl der zu testenden Geräte erfolgt innerhalb der Redaktion. Das vorliegende Testmuster wurde dem Autor vom Hersteller oder einem Shop zu Testzwecken leihweise zur Verfügung gestellt. Eine Einflussnahme des Leihstellers auf den Testbericht gab es nicht, der Hersteller erhielt keine Version des Reviews vor der Veröffentlichung. Es bestand keine Verpflichtung zur Publikation. Als eigenständiges, unabhängiges Unternehmen unterliegt Notebookcheck keiner Diktion von Herstellern, Shops und Verlagen.
So testet Notebookcheck
Pro Jahr werden von Notebookcheck hunderte Laptops und Smartphones unabhängig in von uns standardisierten technischen Verfahren getestet, um eine Vergleichbarkeit aller Testergebnisse zu gewährleisten. Seit rund 20 Jahren entwickeln wir diese Testmethoden kontinuierlich weiter und setzen damit Branchenstandards. In unseren Testlaboren kommt ausschließlich hochwertiges Messequipment in die Hände erfahrener Techniker und Redakteure. Die Tests unterliegen einer mehrstufigen Kontrolle. Unsere komplexe Gesamtbewertung basiert auf hunderten fundierten Messergebnissen und Benchmarks, womit Ihnen Objektivität garantiert ist. Weitere Informationen zu unseren Testmethoden gibt es hier.


