Fazit - Eines der besten 16-Zoll-Convertibles für 1.000 US-Dollar
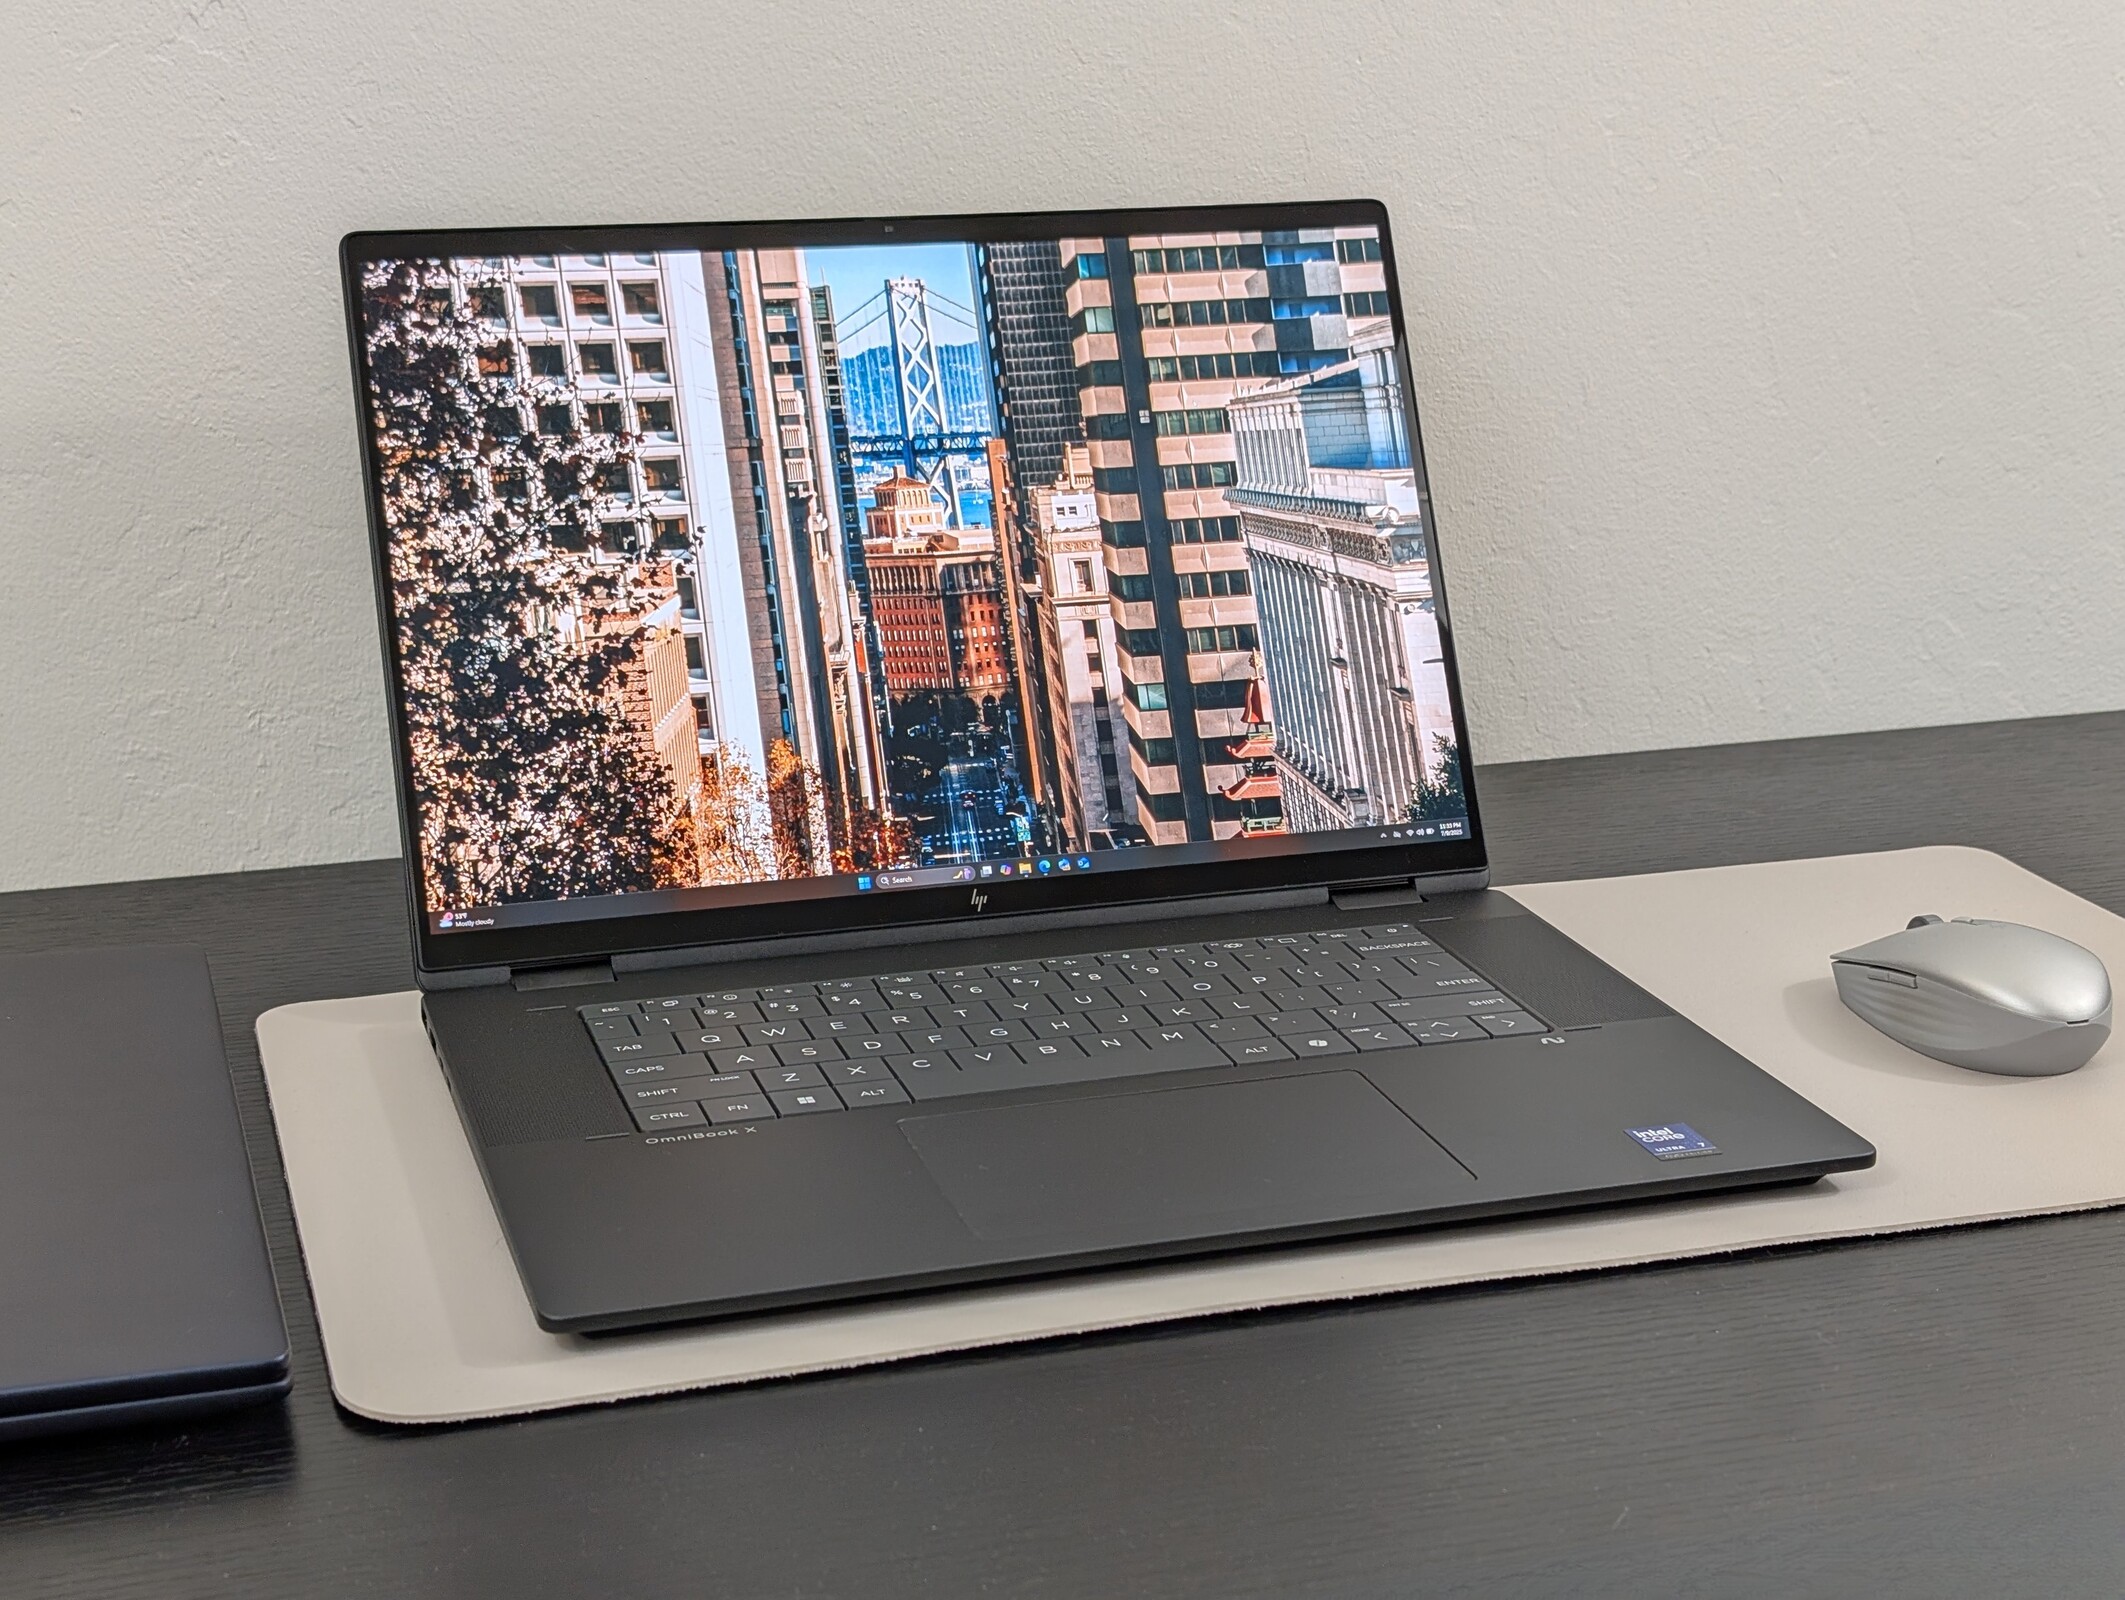
Das OmniBook X Flip 16 hat mehr Gemeinsamkeiten mit der Flaggschiff-Serie Spectre als mit der günstigeren Pavilion-Reihe. Sein hochwertiges Metallgehäuse, der OLED-Touchscreen und der moderne Lunar-Lake-Prozessor bieten eine ausgezeichnete Balance aus Portabilität und Alltagstauglichkeit – besonders im Vergleich zum konkurrierenden Dell 16 Plus 2-in-1, das vergleichsweise weniger hochwertig wirkt. Die Bauform und die brillanten OLED-Farben eignen sich für unterschiedlichste Einsatzbereiche – von Multimedia zu Hause bis hin zum mobilen Videoschnitt – ganz im Sinne des „Omni“-Namens.
Einige Nutzer könnten sich nur schwer an das ungewohnte Tippgefühl gewöhnen, da sich die Tastatur spürbar von den meisten anderen HP Laptops unterscheidet. Das Tippen erfordert daher möglicherweise eine gewisse Eingewöhnungszeit. Außerdem ist die Leistung langsamer als bei vielen 16-Zoll-Clamshells wie HPs Envy 16, die in der Regel mit Prozessoren der H-Serie und diskreter Grafik ausgestattet sind. Power-User sollten sich vielleicht bei der Spectre x360 16 Serie umsehen für zusätzliche Leistung bei der Bearbeitung und beim Spielen. Für alle anderen ist das OmniBook X Flip 16 eines der besten und vielseitigsten 16-Zoll-Convertibles im niedrigen 1.000-US-Dollar-Bereich.
Pro
Contra
Preis und Verfügbarkeit
Amazon liefert das OmniBook X Flip 16 derzeit für 2.099 Euro in der von uns getesteten Konfiguration mit dem Core Ultra 7 258V, allerdings mit einer 2-TB-SSD. Alternativ kann man das Gerät auch direkt bei HP für 1.249 Euro mit dem Core Ultra 256V und einer 512-GB-SSD kaufen.
Inhaltsverzeichnis
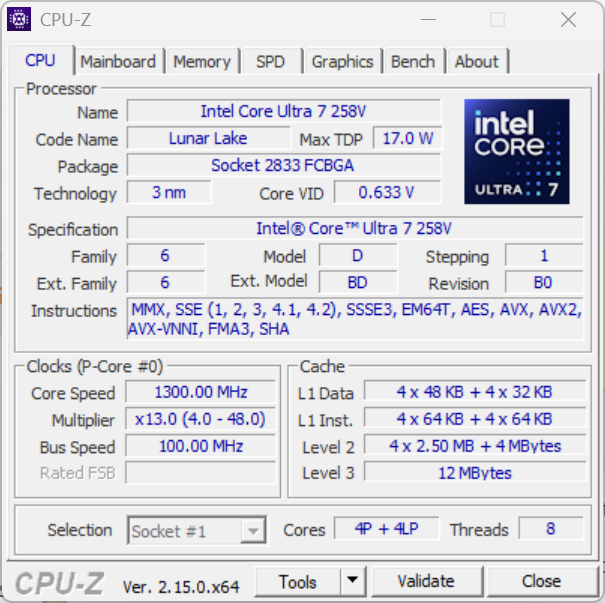
Das HP OmniBook X Flip 16 ist ein Prosumer-Convertible mit 16 Zoll Bildschirmdiagonale und positioniert sich preislich und ausstattungsmäßig knapp unterhalb der Spectre x360 16 Serie. Bei unserem Testgerät handelt es sich um eine High-End-Konfiguration mit der Core Ultra 7 258V Lunar Lake Intel CPU und einem 3K-120-Hz OLED-Touchscreen für ca. 1.300 US-Dollar oder knapp 1.000 US-Dollar im Handel.
Eine AMD Variante des Modells ist auch mit dem Ryzen AI 5 340 und einem 1.200p-Touchscreen mit geringerer Auflösung für rund 700 US-Dollar erhältlich. Alle Intel Konfigurationen sind derzeit jedoch mit dem 1.800p-120-Hz-OLED-Touchscreen ausgestattet.
Zu den Konkurrenten in diesem Bereich gehören andere 16-Zoll-Convertibles für Prosumer wie das Lenovo Yoga 7 2-in-1 16, Samsung Galaxy Book5 Pro 360 oder Dell 16 Plus 2-in-1.
Weitere HP Bewertungen:
Spezifikationen
Preisvergleich
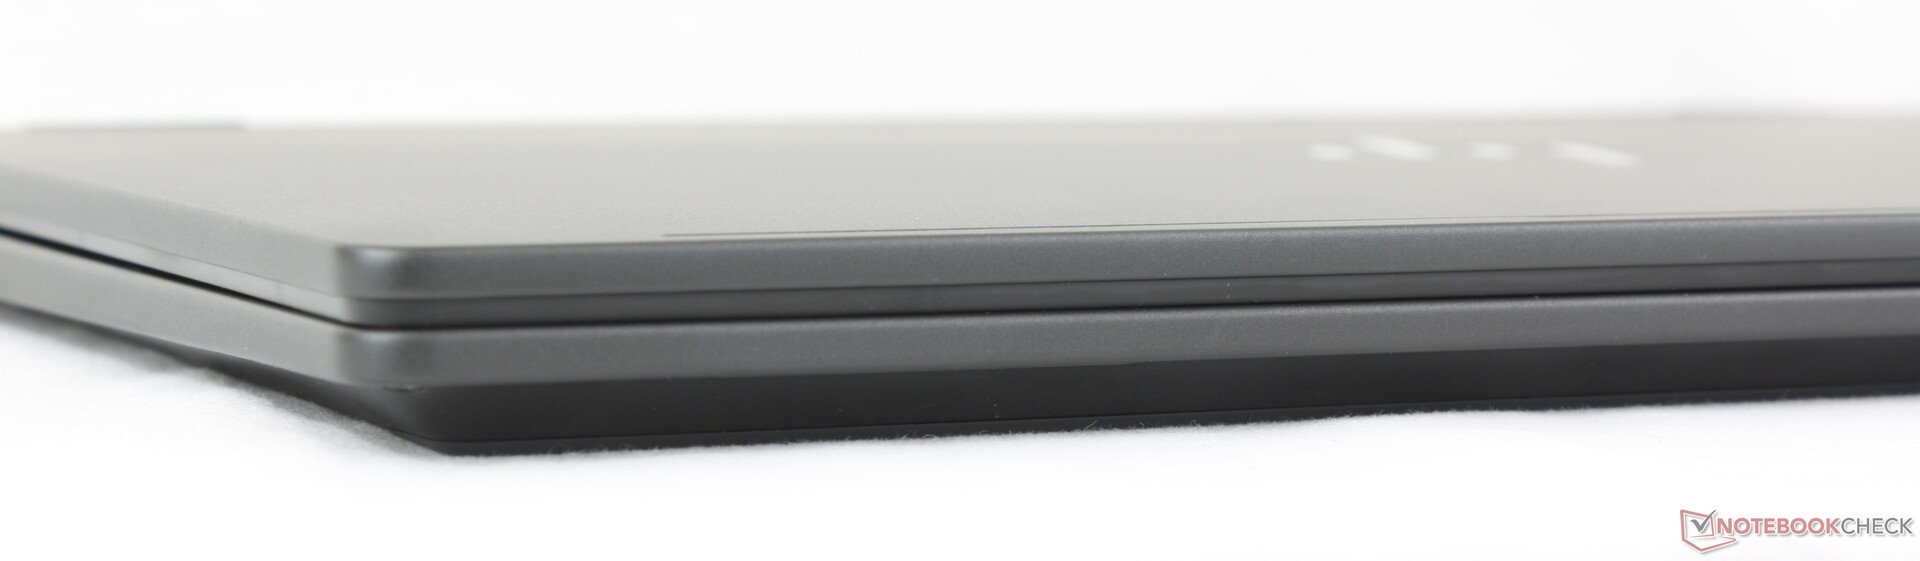
Gehäuse - Schlanker als ein Dell
Das einfarbige, matte Metalldesign fühlt sich stabiler und luxuriöser an als das ähnlich teure Dell 16 Plus 2-in-1. Es weist zwar etwas mehr Flexibilität auf als das teurere Spectre x360 16, doch Nutzer, die bereit sind, mehrere Hundert Euro mehr auszugeben, finden im Samsung Galaxy Book5 Pro 360 eine spürbar leichtere Alternative.

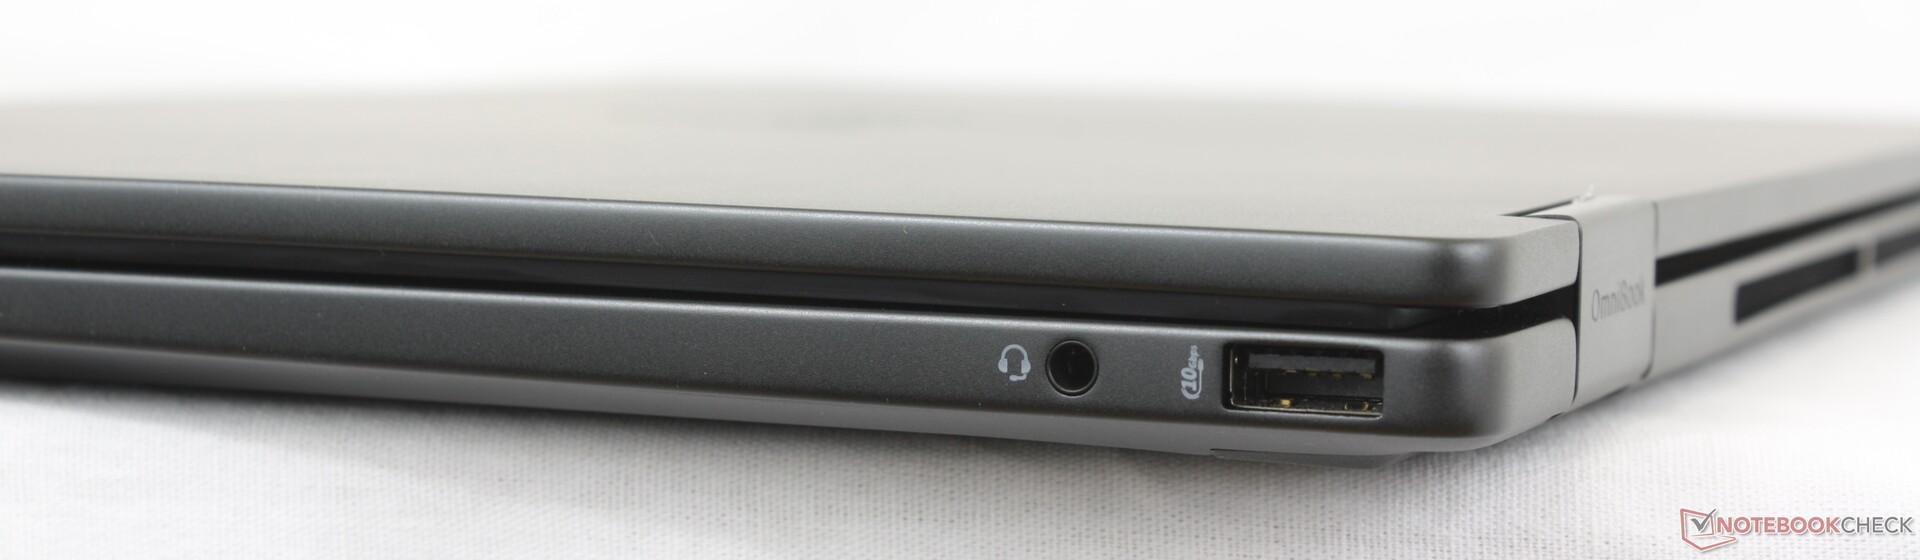
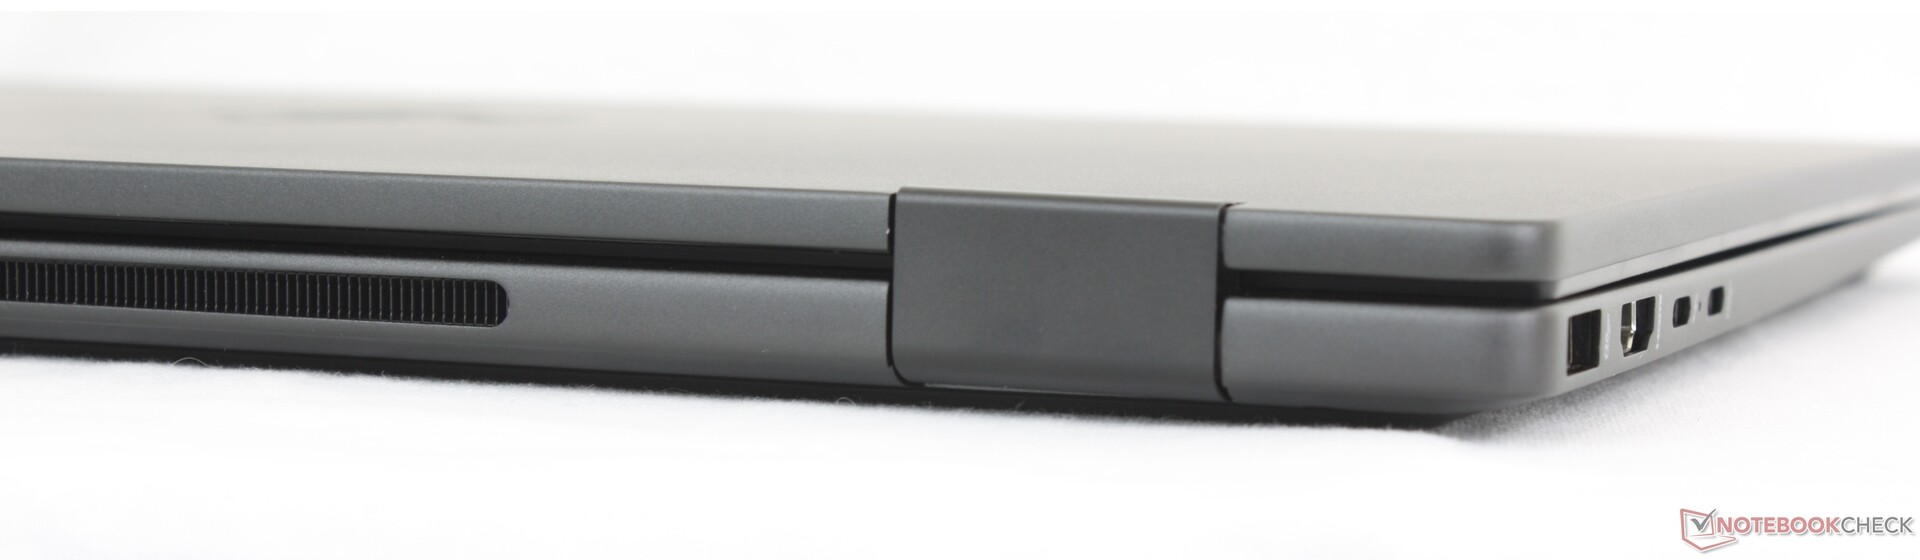
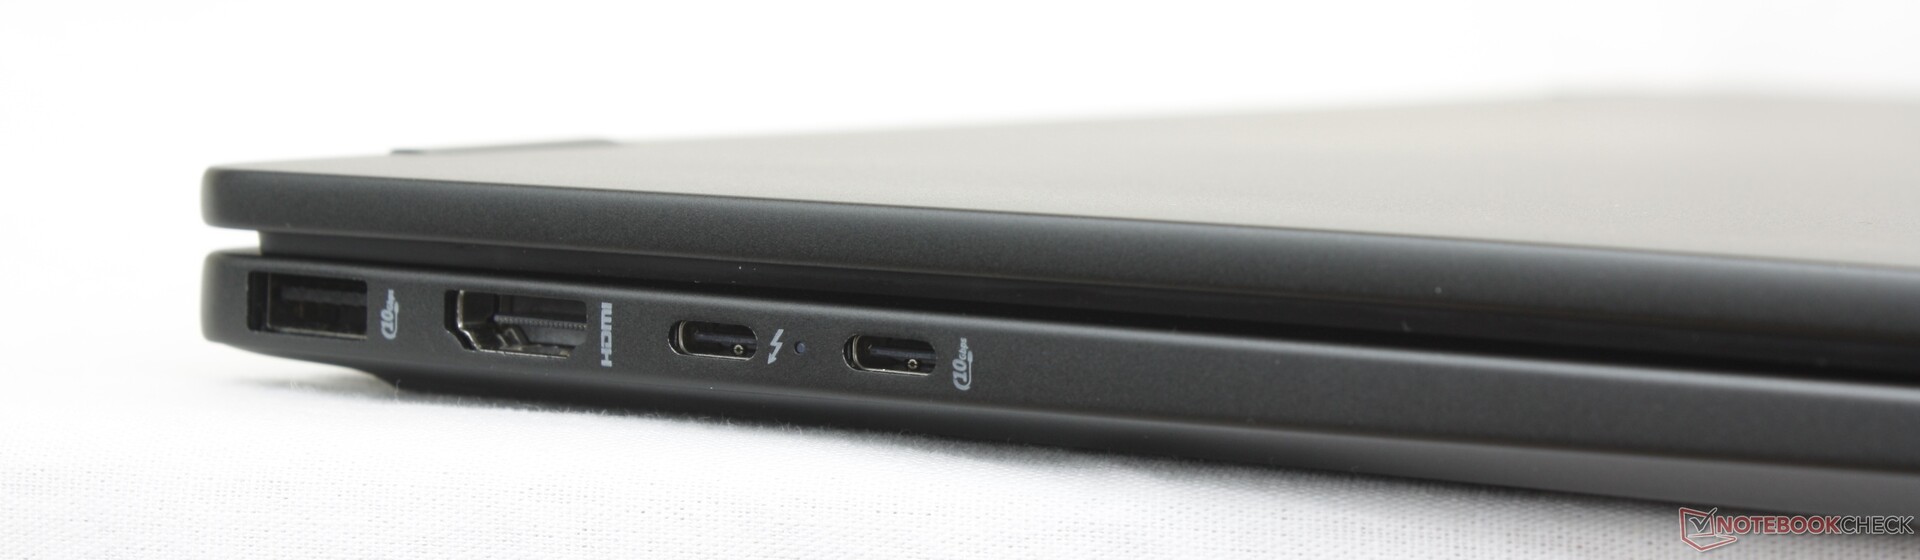
Anschlussausstattung
Das HP verfügt über alle Anschlüsse wie das Dell Plus 16 2-in-1 plus einen zusätzlichen USB-A-Anschluss an der linken Seite. Man beachte, dass nur einer der beiden USB-C-Ports Thunderbolt 4 und DisplayPort 2.1 unterstützt, während der andere USB-C-Port nur 10 Gbit/s mit DisplayPort 1.4 bietet.
Kommunikation
Webcam
Die 5-MP-Webcam verfügt über IR und einen physischen Auslöser.


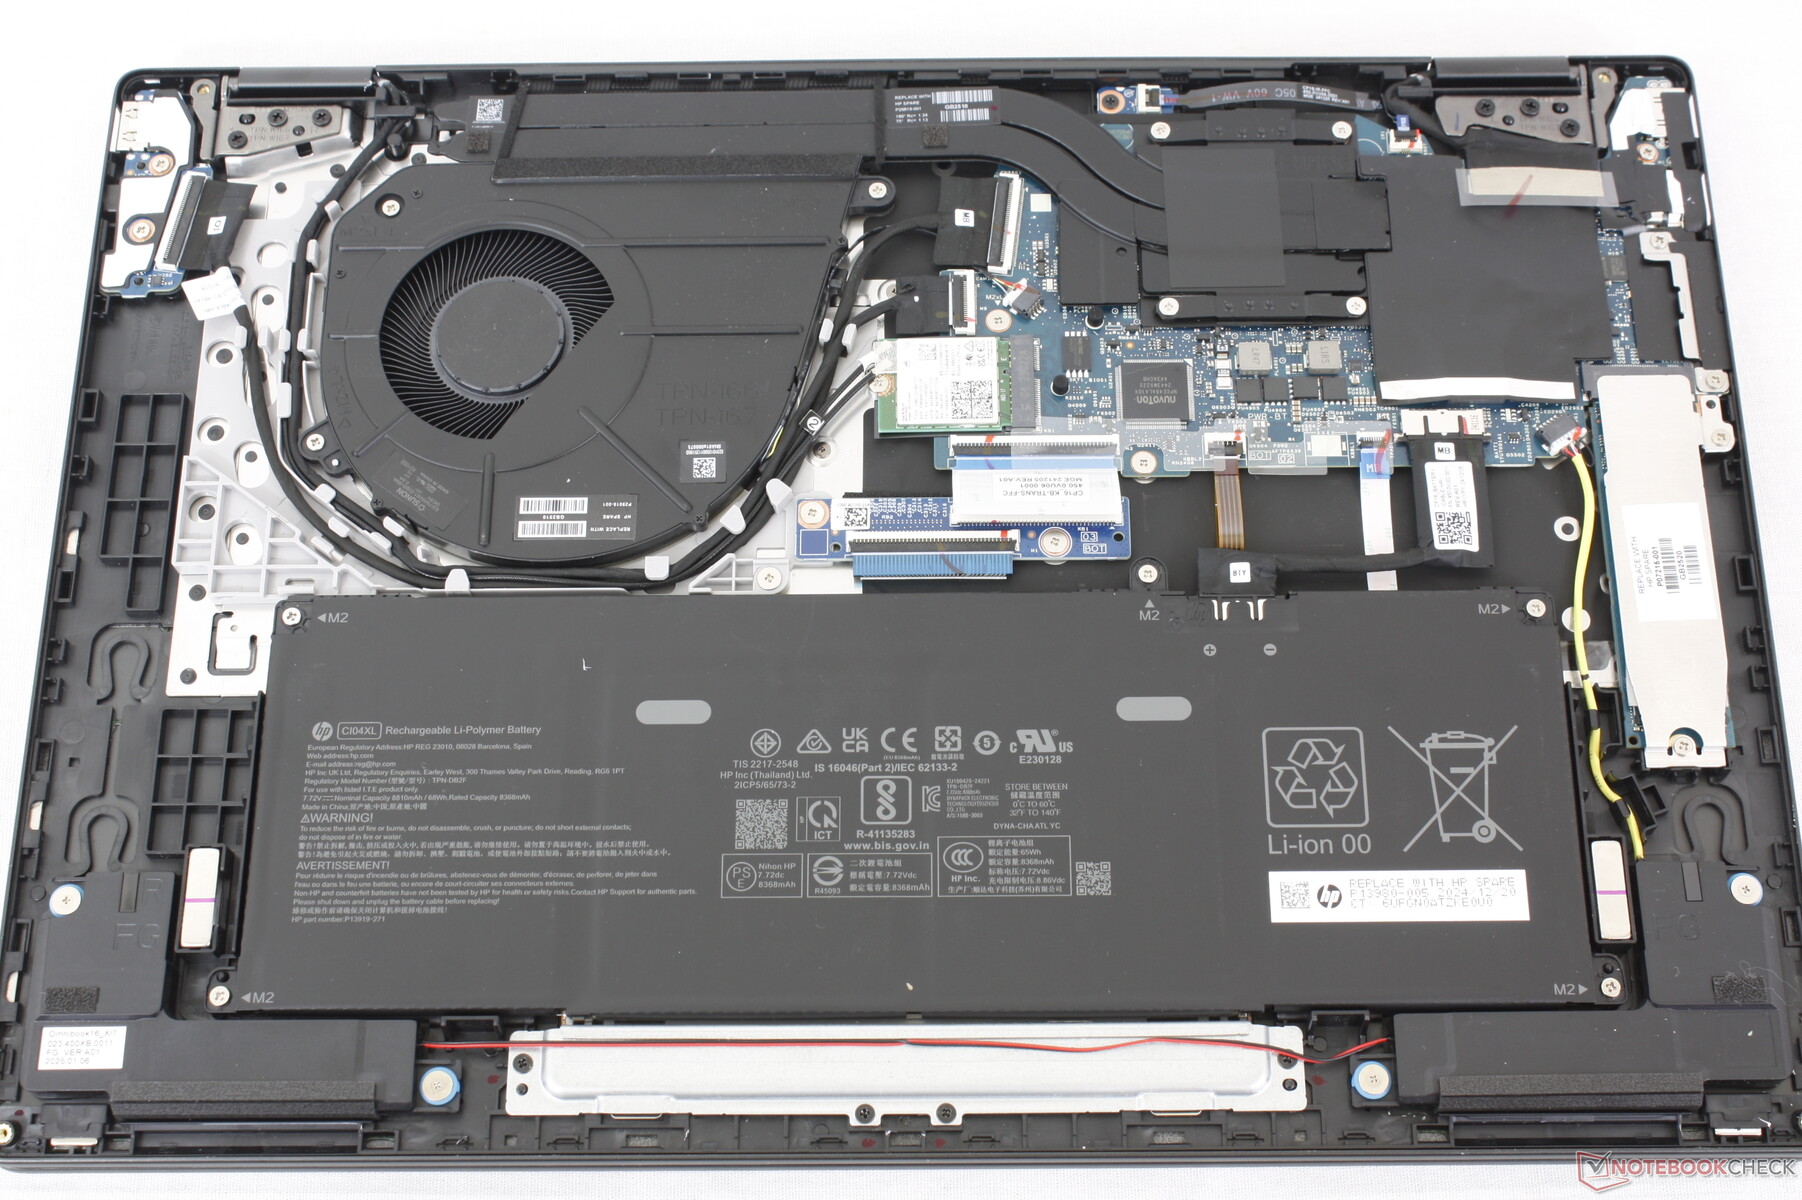
Wartung
Nachhaltigkeit
HP setzt bei der Herstellung des OmniBook X Flip 16 verschiedene Mengen an recycelten und erneuerbaren Metallen und Kunststoffen ein.
Zubehör und Garantie
Die Verkaufsverpackung enthält neben den üblichen Unterlagen und dem USB-C-Netzteil auch einen aktiven Stylus-Stift (TPA-M005P). Wird das Gerät in den USA gekauft, gilt die eingeschränkte einjährige Herstellergarantie.
Eingabegeräte
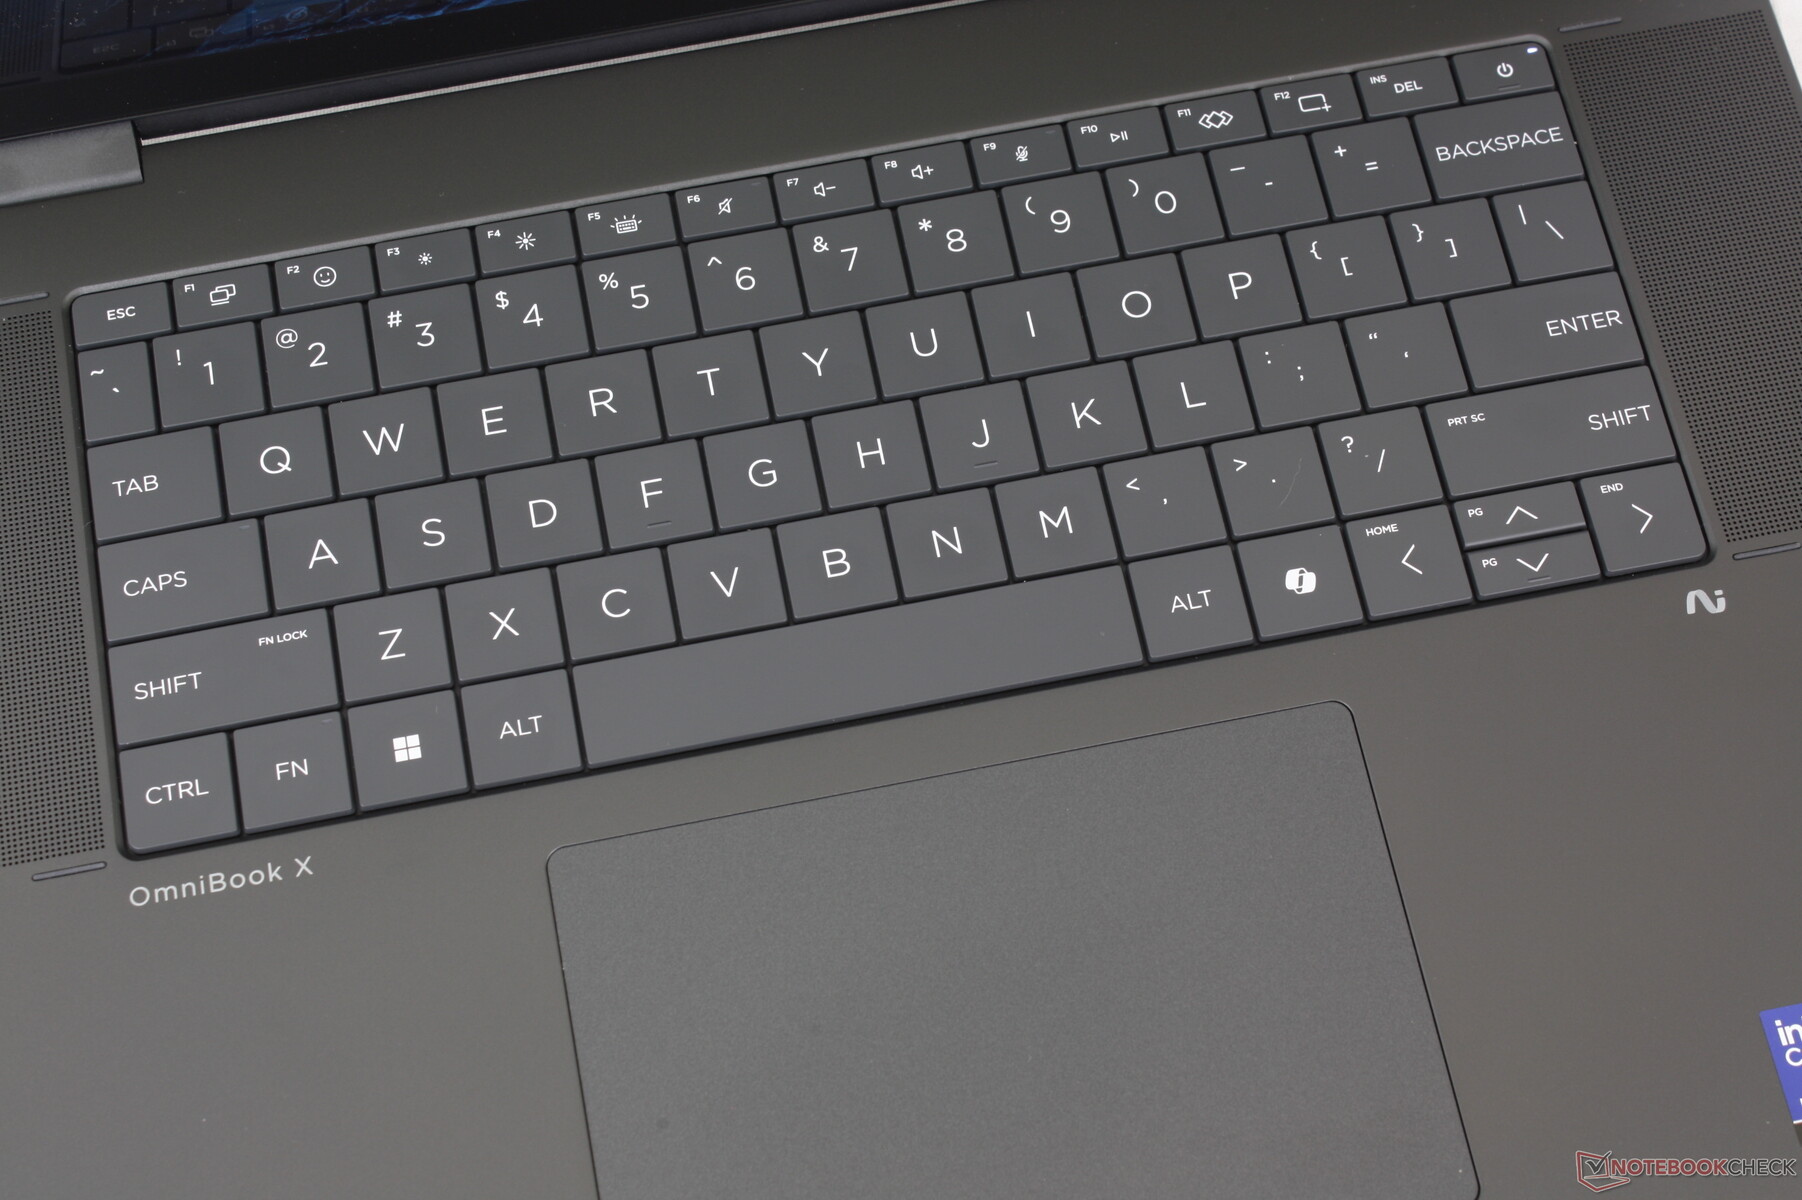
Tastatur
Die Zero-Lattice-Tastatur ist eine Veränderung gegenüber der aktuellen Spectre Serie, der EliteBook Serie und der vorherigen Generation der Envy-Serie. Obwohl die Tastenkappen größer sind, ist das Feedback leider sowohl leichter als auch flacher als bei den traditionelleren Tastaturen der meisten anderen HP Laptops.
Touchpad
Das Clickpad hat ungefähr die gleiche Größe wie das des Dell 16 Plus 2-in-1 (13,5 x 8,7 cm vs. 13,3 x 9 cm). Das Klicken ist einfacher, da es weniger Kraft erfordert als beim Dell Convertible, aber das Feedback ist eher schwammig.
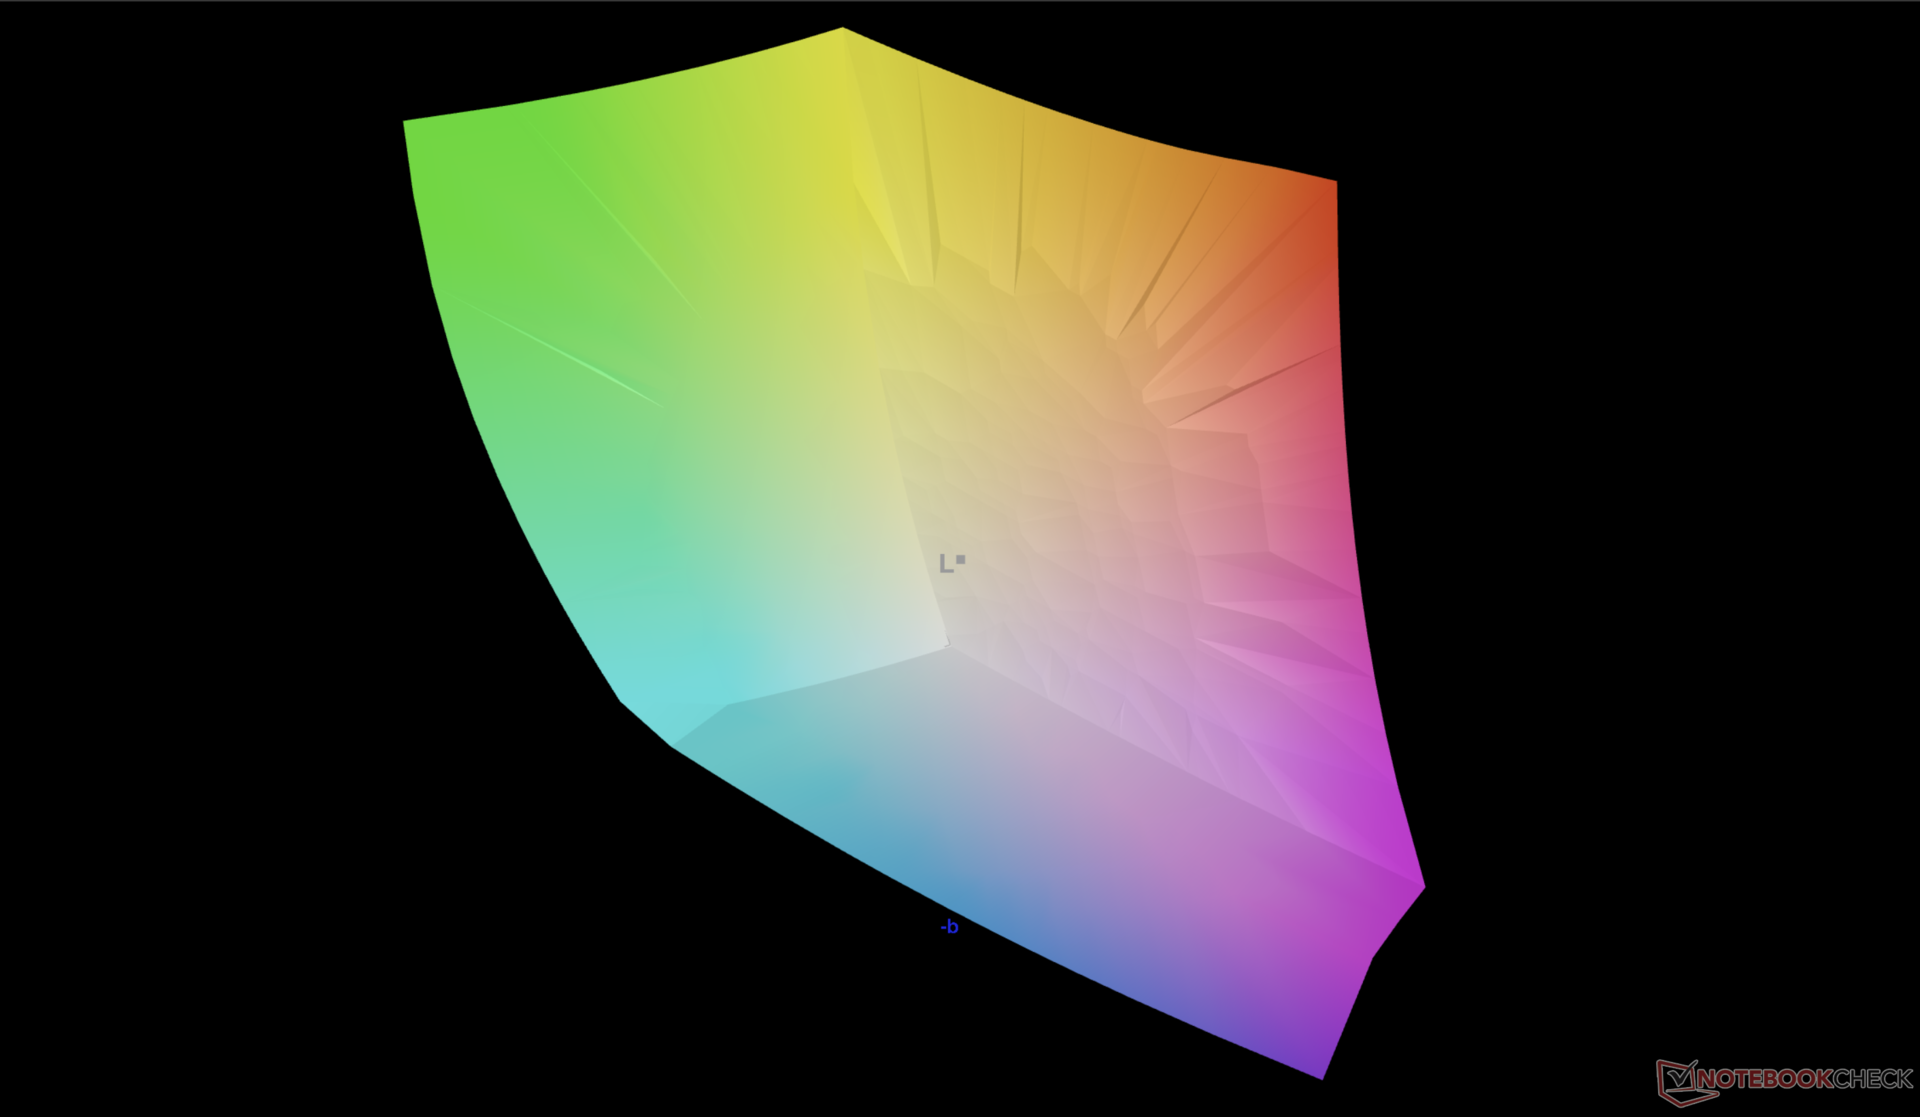
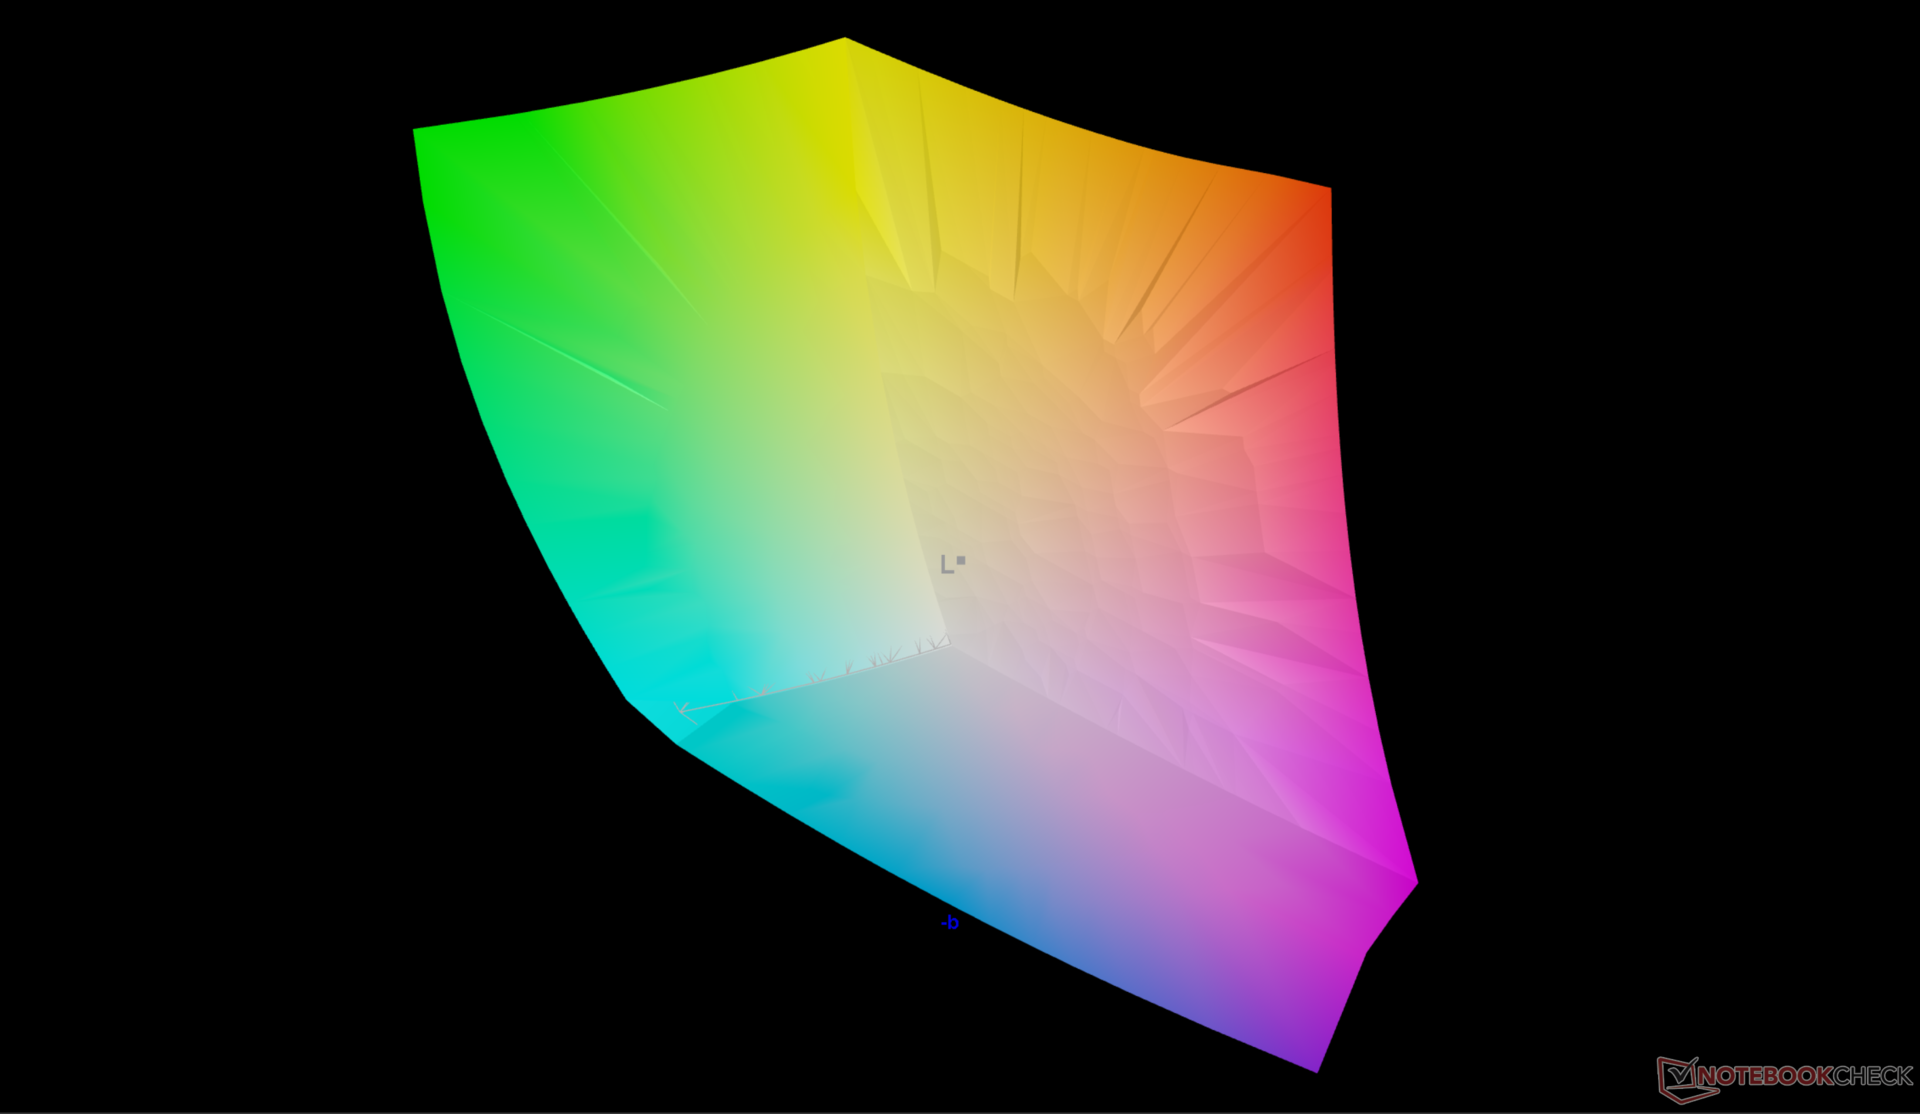
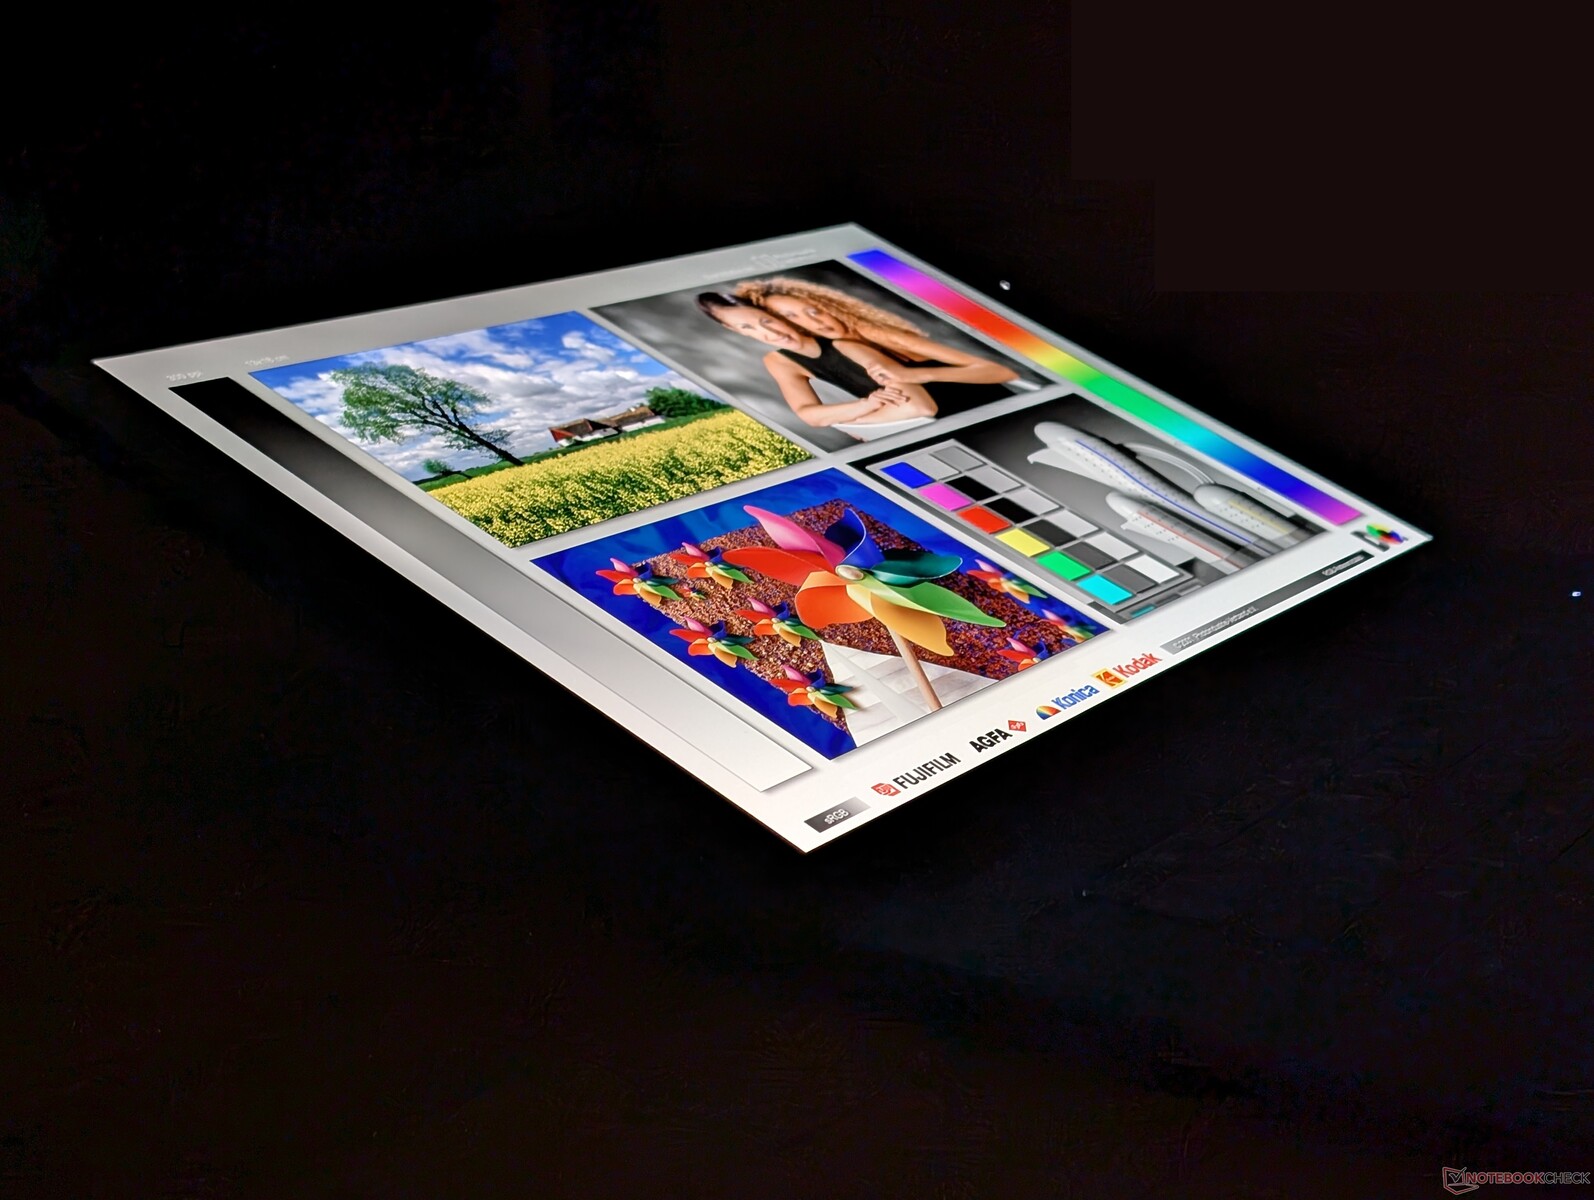
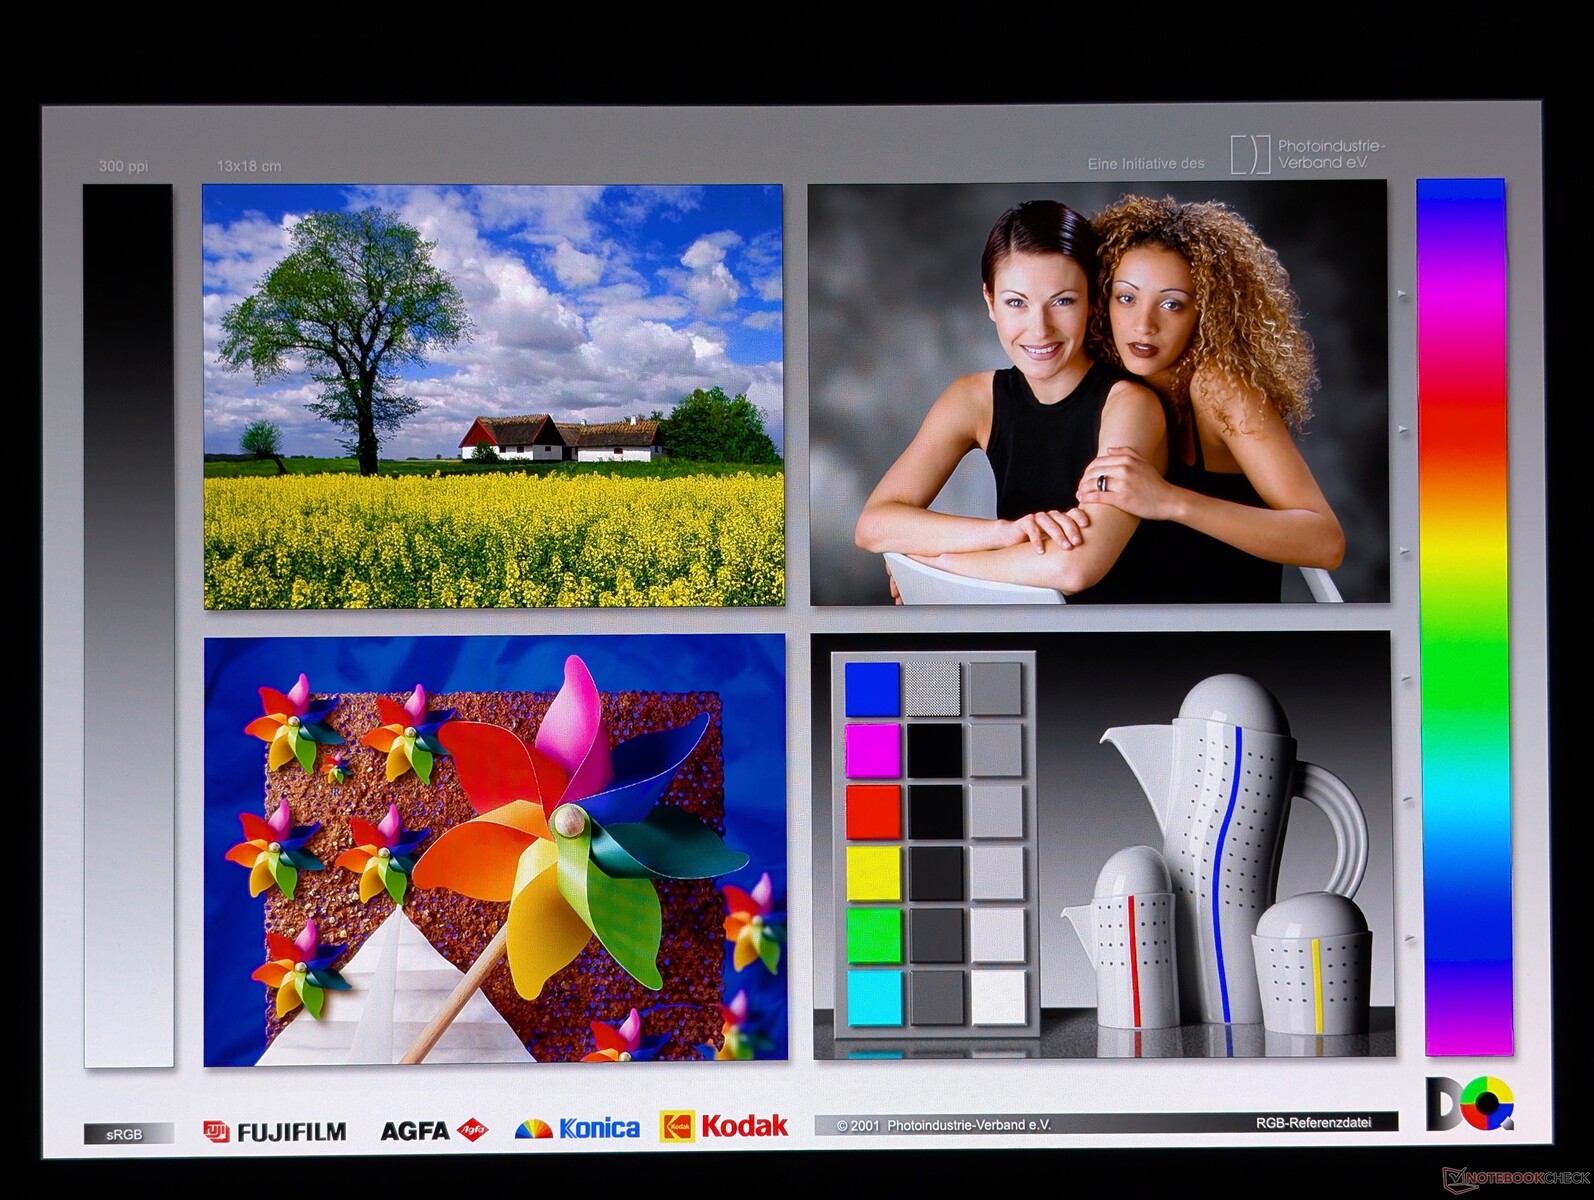
Display - 3K-120-Hz-OLED

Das OmniBook X Flip 16 verwendet einen ähnlichen 1.800p-120-Hz-Samsung-OLED-Touchscreen wie das Galaxy Book5 Pro 360 oder HP Spectre x360 16. Es bietet eine höhere native Auflösung als die Mini-LED- oder IPS-Panels des Dell Plus 16 2-in-1 oder des MSI Summit A16 AI Plus. Die maximale Helligkeit erreicht 561 Nits im HDR-Modus, um HDR500 zu unterstützen, ist aber ansonsten auf 381 Nits im SDR-Modus begrenzt.


| |||||||||||||||||||||||||
Ausleuchtung: 98 %
Helligkeit Akku: 381.1 cd/m²
Kontrast: ∞:1 (Schwarzwert: 0 cd/m²)
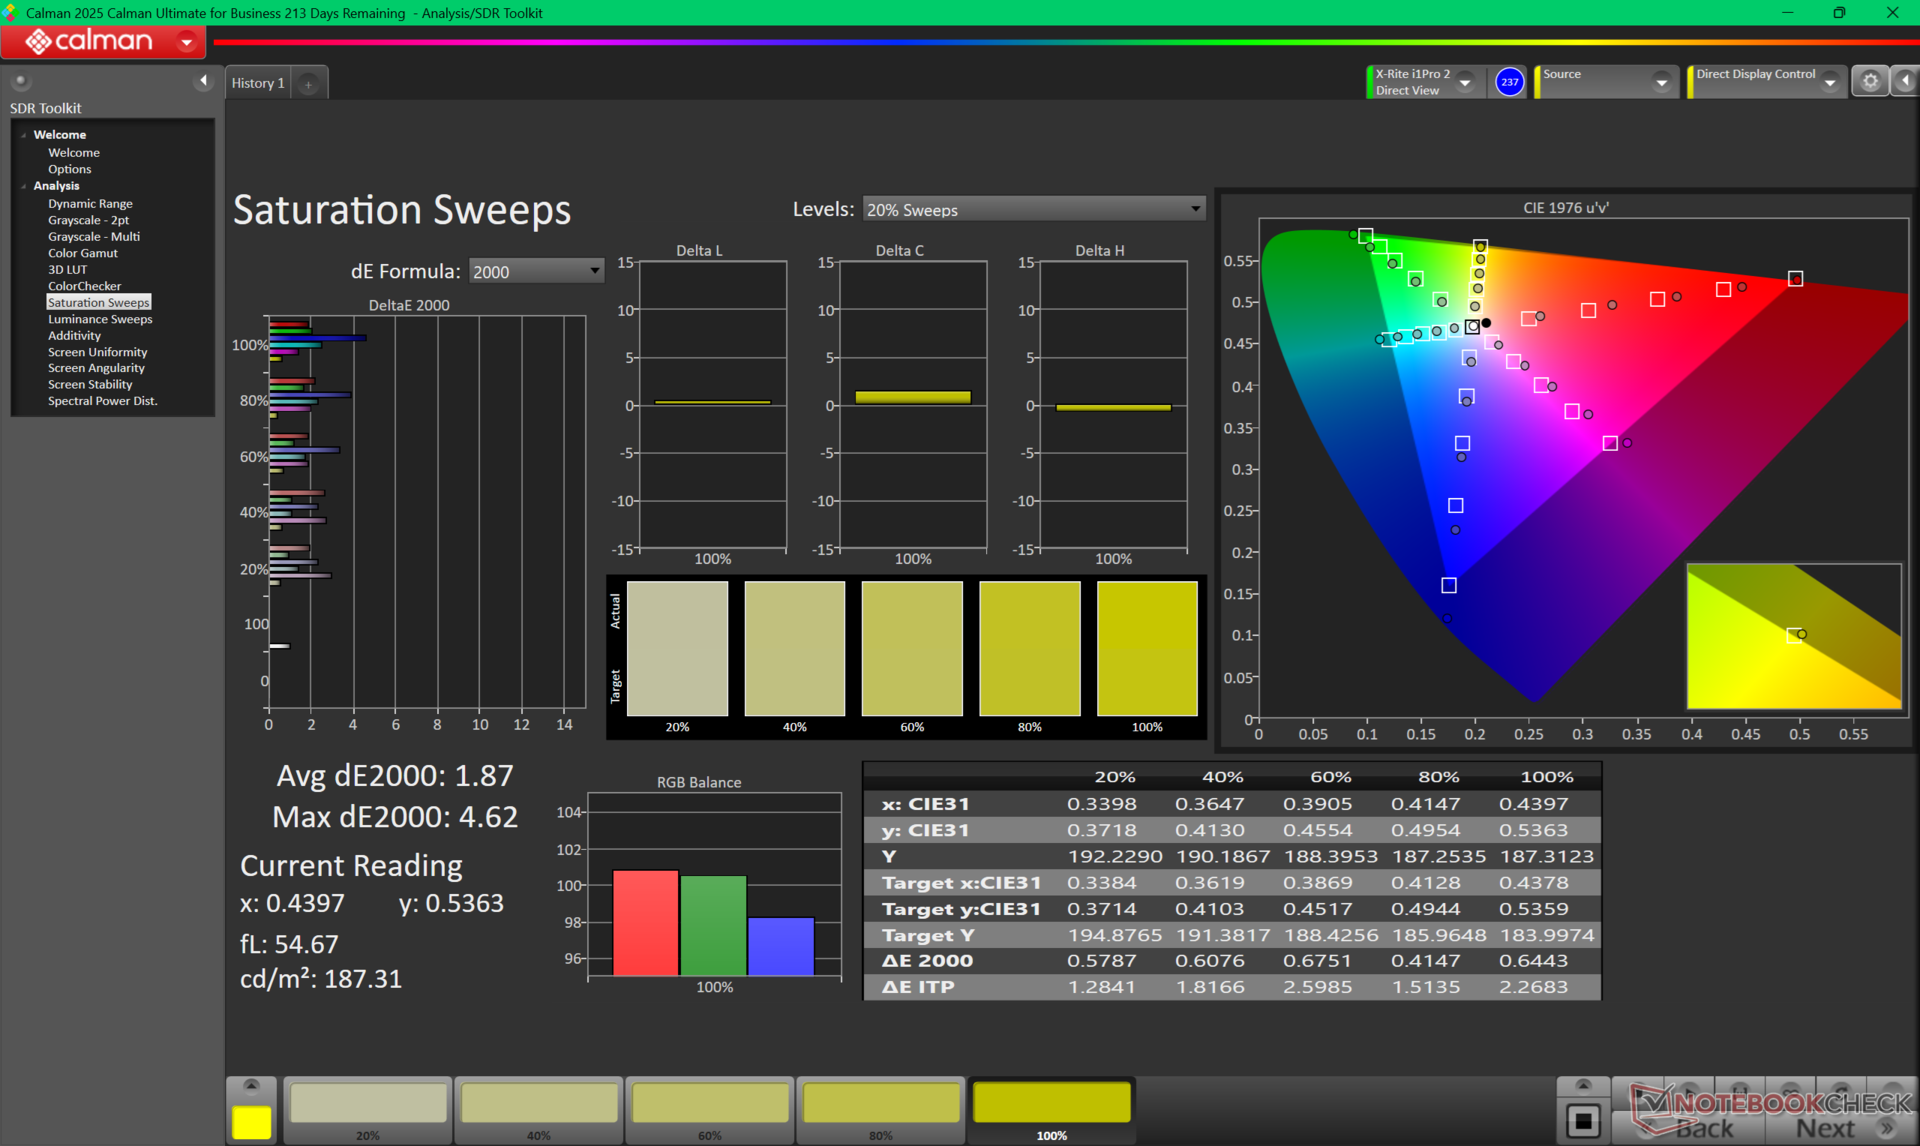
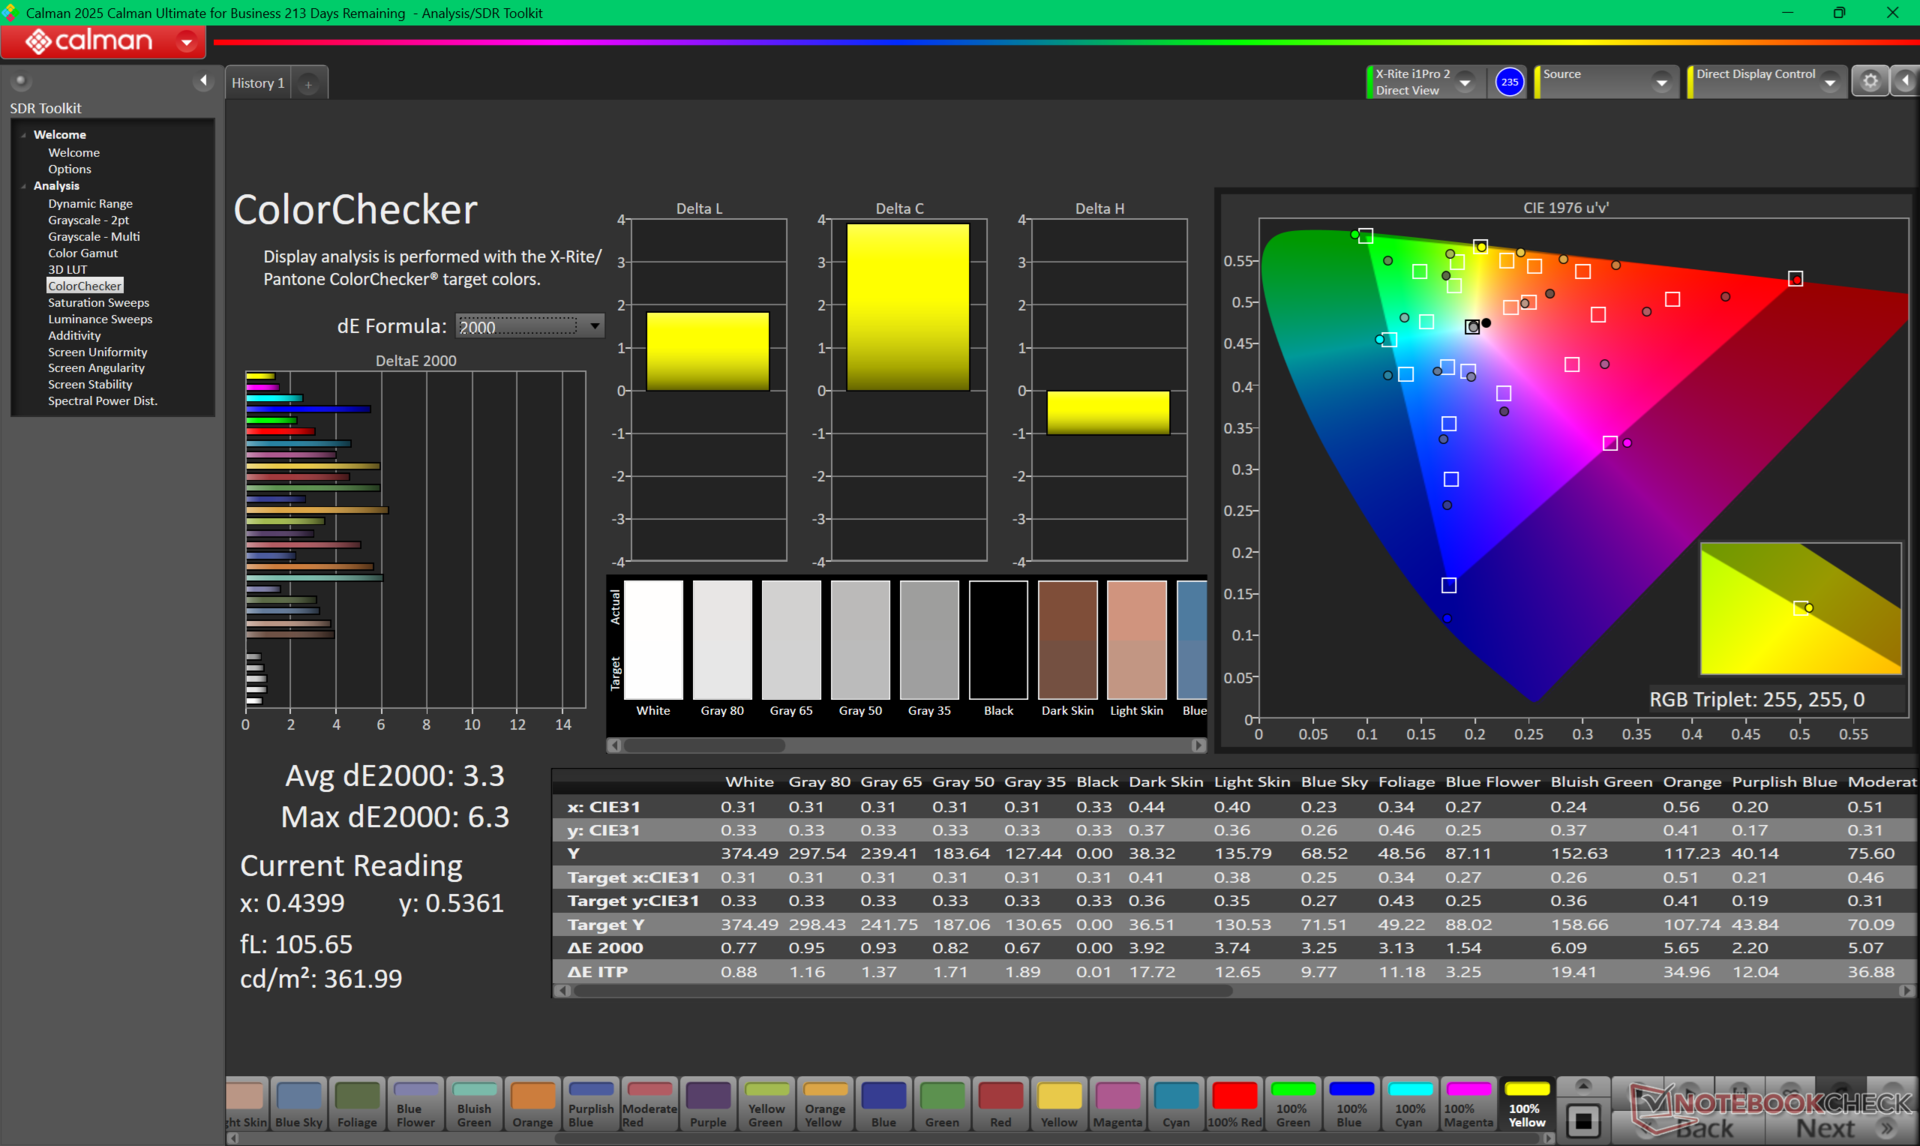
ΔE ColorChecker Calman: 3.3 | ∀{0.5-29.43 Ø4.72}
ΔE Greyscale Calman: 0.9 | ∀{0.09-98 Ø4.97}
95.2% AdobeRGB 1998 (Argyll 3D)
100% sRGB (Argyll 3D)
99.9% Display P3 (Argyll 3D)
Gamma: 2.23
CCT: 6369 K
| HP OmniBook X Flip 16 Samsung SDC41BA, OLED, 2880x1800, 16", 120 Hz | Dell 16 Plus 2-in-1 AU Optronics B160QAT, Mini-LED, 2560x1600, 16", 90 Hz | Lenovo Yoga 7 2-in-1 16ILL10 LEN160WUM, IPS, 1920x1200, 16", 60 Hz | Samsung Galaxy Book5 Pro 360 ATNA60CL09-0, OLED, 2880x1800, 16", 120 Hz | MSI Summit A16 AI Plus A3HMTG AU Optronics B16QAN02.N, IPS, 2560x1600, 16", 165 Hz | HP Spectre x360 16 RTX 4050 Samsung SDC41A6, OLED, 2880x1800, 16", 120 Hz | |
|---|---|---|---|---|---|---|
| Display | -0% | -53% | 0% | -5% | 1% | |
| Display P3 Coverage (%) | 99.9 | 99.5 0% | 39.7 -60% | 99.9 0% | 96.8 -3% | 99.6 0% |
| sRGB Coverage (%) | 100 | 100 0% | 57.9 -42% | 100 0% | 99.8 0% | 100 0% |
| AdobeRGB 1998 Coverage (%) | 95.2 | 94.2 -1% | 41 -57% | 96.6 1% | 84.7 -11% | 96.7 2% |
| Response Times | -4178% | -3025% | -33% | -1201% | 3% | |
| Response Time Grey 50% / Grey 80% * (ms) | 0.8 ? | 48.8 ? -6000% | 30 ? -3650% | 0.48 ? 40% | 12.9 ? -1513% | 0.78 ? 2% |
| Response Time Black / White * (ms) | 0.9 ? | 57.6 ? -6300% | 22.5 ? -2400% | 0.64 ? 29% | 8.9 ? -889% | 0.86 ? 4% |
| PWM Frequency (Hz) | 473.8 ? | 2807 ? | 240 ? | 480 ? | ||
| PWM Amplitude * (%) | 15 | 50 -233% | 40 -167% | |||
| Bildschirm | -3% | -172% | 9% | -34% | -17% | |
| Helligkeit Bildmitte (cd/m²) | 381.1 | 432.1 13% | 317.9 -17% | 387 2% | 475.4 25% | 385.2 1% |
| Brightness (cd/m²) | 381 | 426 12% | 304 -20% | 392 3% | 440 15% | 387 2% |
| Brightness Distribution (%) | 98 | 97 -1% | 90 -8% | 98 0% | 89 -9% | 99 1% |
| Schwarzwert * (cd/m²) | 0.25 | 0.36 | ||||
| Delta E Colorchecker * | 3.3 | 1.95 41% | 7.39 -124% | 1 70% | 2.99 9% | 1.73 48% |
| Colorchecker dE 2000 max. * | 6.3 | 3.87 39% | 21.43 -240% | 1.9 70% | 7.64 -21% | 3.95 37% |
| Delta E Graustufen * | 0.9 | 2 -122% | 6.5 -622% | 1.7 -89% | 2.9 -222% | 2.6 -189% |
| Gamma | 2.23 99% | 2.3 96% | 2.22 99% | 2.25 98% | 2.31 95% | 2.17 101% |
| CCT | 6369 102% | 6222 104% | 6140 106% | 6325 103% | 6472 100% | 6133 106% |
| Colorchecker dE 2000 calibrated * | 1.16 | 3.06 | 0.74 | |||
| Kontrast (:1) | 1272 | 1321 | ||||
| Durchschnitt gesamt (Programm / Settings) | -1394% /
-1046% | -1083% /
-658% | -8% /
-3% | -413% /
-238% | -4% /
-8% |
* ... kleinere Werte sind besser

Reaktionszeiten (Response Times) des Displays
| ↔ Reaktionszeiten Schwarz zu Weiß | ||
|---|---|---|
| 0.9 ms ... steigend ↗ und fallend ↘ kombiniert | ↗ 0.4 ms steigend | 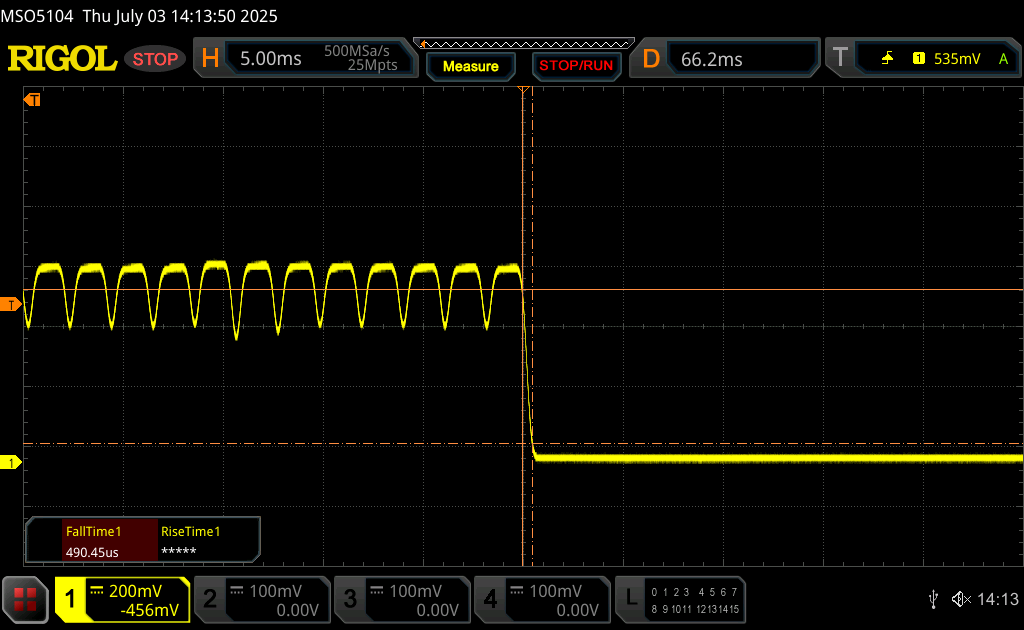 |
| ↘ 0.5 ms fallend | ||
| Die gemessenen Reaktionszeiten sind sehr kurz, wodurch sich der Bildschirm auch für schnelle 3D Spiele eignen sollte. Im Vergleich rangierten die bei uns getesteten Geräte von 0.1 (Minimum) zu 240 (Maximum) ms. » 3 % aller Screens waren schneller als der getestete. Daher sind die gemessenen Reaktionszeiten besser als der Durchschnitt aller vermessenen Geräte (19.8 ms). | ||
| ↔ Reaktionszeiten 50% Grau zu 80% Grau | ||
| 0.8 ms ... steigend ↗ und fallend ↘ kombiniert | ↗ 0.4 ms steigend | 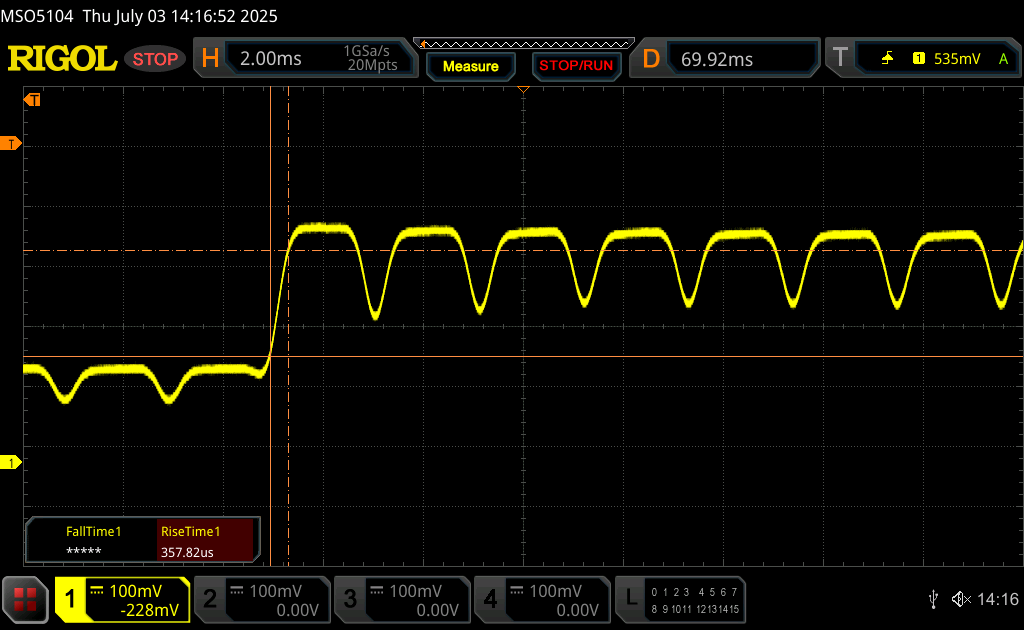 |
| ↘ 0.4 ms fallend | ||
| Die gemessenen Reaktionszeiten sind sehr kurz, wodurch sich der Bildschirm auch für schnelle 3D Spiele eignen sollte. Im Vergleich rangierten die bei uns getesteten Geräte von 0.165 (Minimum) zu 636 (Maximum) ms. » 3 % aller Screens waren schneller als der getestete. Daher sind die gemessenen Reaktionszeiten besser als der Durchschnitt aller vermessenen Geräte (31 ms). | ||
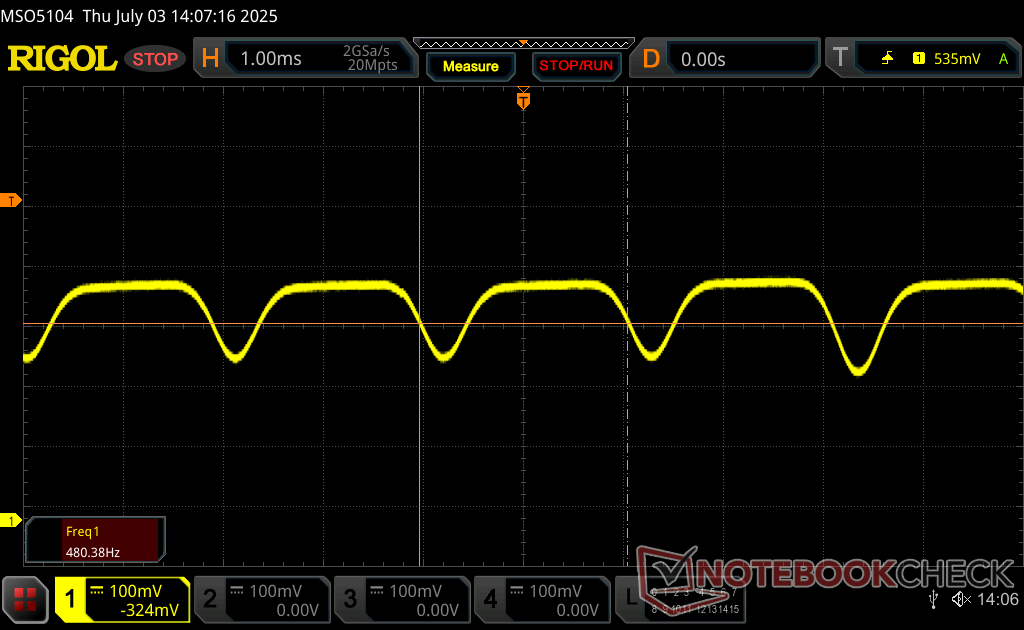
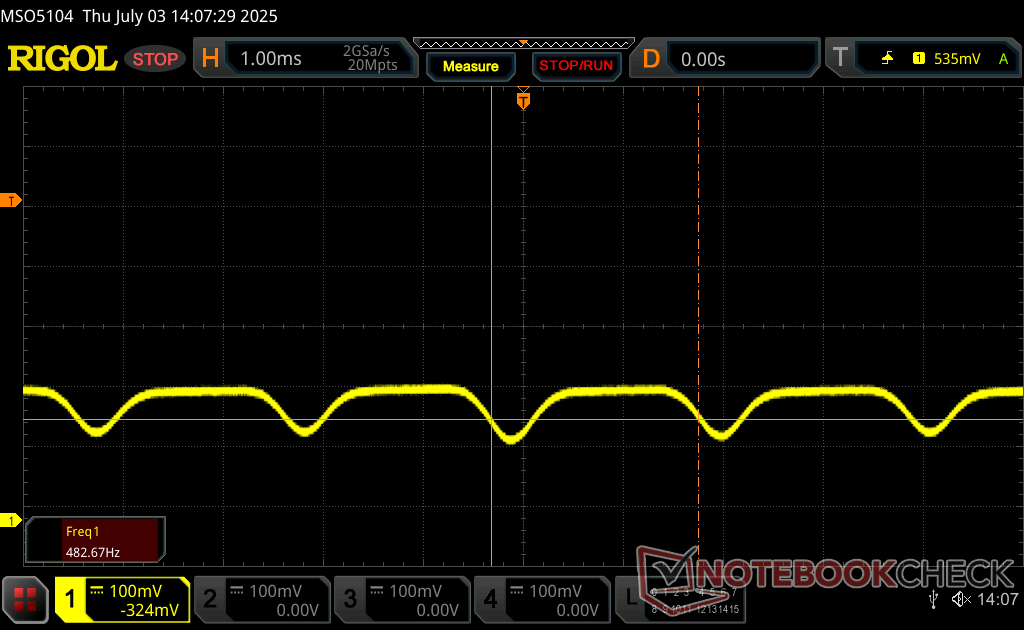
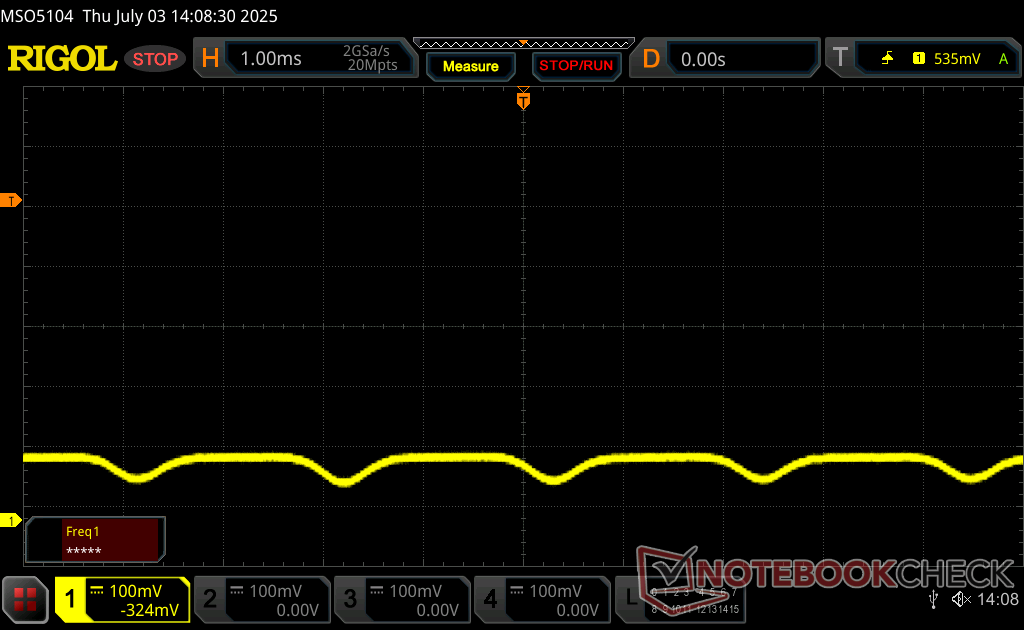
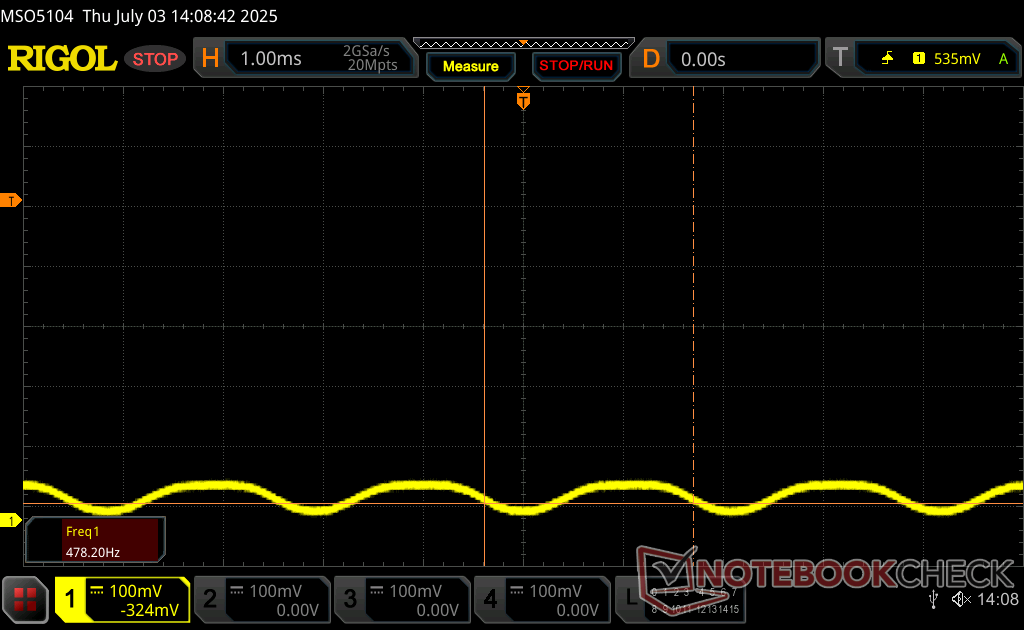
Bildschirm-Flackern / PWM (Pulse-Width Modulation)
| Flackern / PWM festgestellt | 473.8 Hz Amplitude: 15 % | ≤ 100 % Helligkeit | 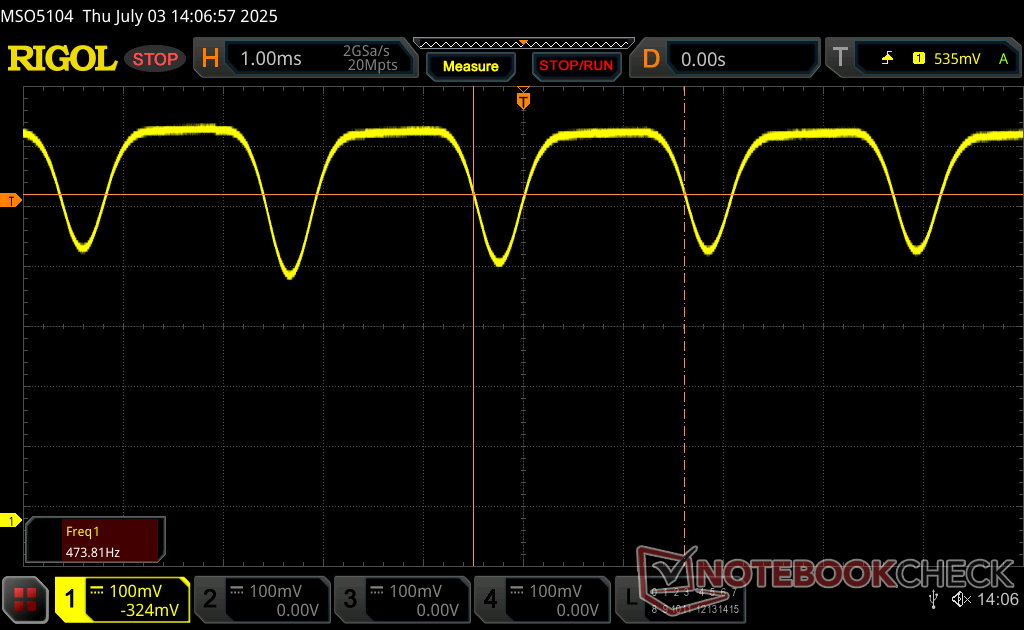 |
Das Display flackert mit 473.8 Hz (im schlimmsten Fall, eventuell durch Pulsweitenmodulation PWM) bei einer eingestellten Helligkeit von 100 % und darunter. Darüber sollte es zu keinem Flackern kommen. Die Frequenz von 473.8 Hz ist relativ hoch und sollte daher auch bei den meisten Personen zu keinen Problemen führen. Empfindliche User sollen laut Berichten aber sogar noch bei 500 Hz und darüber ein Flackern wahrnehmen. Im Vergleich: 52 % aller getesteten Geräte nutzten kein PWM um die Helligkeit zu reduzieren. Wenn PWM eingesetzt wurde, dann bei einer Frequenz von durchschnittlich 7769 (Minimum 5, Maximum 343500) Hz. | |||


Performance - Effizienz durch Lunar Lake
Testbedingungen
Wir haben Windows in den Performance-Modus versetzt, bevor wir die folgenden Benchmarks durchgeführt haben.
Prozessor
Der Core Ultra 7 258V bietet eine ähnliche Multi-Thread-Leistung wie der preiswertere Core Ultra 5 125U. Die Performance-Nachhaltigkeit ist auch anständig mit einem Defizit von etwa zehn Prozent, wenn CineBench R15 xT in einer Schleife läuft.
Cinebench R15 Multi Loop
Cinebench R23: Multi Core | Single Core
Cinebench R20: CPU (Multi Core) | CPU (Single Core)
Cinebench R15: CPU Multi 64Bit | CPU Single 64Bit
Blender: v2.79 BMW27 CPU
7-Zip 18.03: 7z b 4 | 7z b 4 -mmt1
Geekbench 6.7: Multi-Core | Single-Core
Geekbench 5.5: Multi-Core | Single-Core
HWBOT x265 Benchmark v2.2: 4k Preset
LibreOffice : 20 Documents To PDF
R Benchmark 2.5: Overall mean
| Cinebench R20 / CPU (Multi Core) | |
| MSI Summit A16 AI Plus A3HMTG | |
| Asus V16 V3607V | |
| HP Spectre x360 16 RTX 4050 | |
| Asus Vivobook 16 M1606K | |
| Asus Zenbook S 16 UM5606WA-RK052W | |
| Lenovo Yoga 7 2-in-1 16ILL10 | |
| HP OmniBook X Flip 16 | |
| Lenovo ThinkBook 16 G7 IML | |
| Durchschnittliche Intel Core Ultra 7 258V (3130 - 4314, n=24) | |
| Dell 16 Plus 2-in-1 | |
| Samsung Galaxy Book5 Pro 360 | |
| Acer Aspire 16 A16-51GM-77G2 | |
| Cinebench R20 / CPU (Single Core) | |
| Acer Aspire 16 A16-51GM-77G2 | |
| MSI Summit A16 AI Plus A3HMTG | |
| Asus Vivobook 16 M1606K | |
| Asus Zenbook S 16 UM5606WA-RK052W | |
| Asus V16 V3607V | |
| Lenovo Yoga 7 2-in-1 16ILL10 | |
| HP OmniBook X Flip 16 | |
| Durchschnittliche Intel Core Ultra 7 258V (643 - 749, n=24) | |
| Dell 16 Plus 2-in-1 | |
| Samsung Galaxy Book5 Pro 360 | |
| HP Spectre x360 16 RTX 4050 | |
| Lenovo ThinkBook 16 G7 IML | |
| Cinebench R15 / CPU Multi 64Bit | |
| MSI Summit A16 AI Plus A3HMTG | |
| Asus Vivobook 16 M1606K | |
| Asus V16 V3607V | |
| HP Spectre x360 16 RTX 4050 | |
| Asus Zenbook S 16 UM5606WA-RK052W | |
| Lenovo ThinkBook 16 G7 IML | |
| HP OmniBook X Flip 16 | |
| Dell 16 Plus 2-in-1 | |
| Lenovo Yoga 7 2-in-1 16ILL10 | |
| Durchschnittliche Intel Core Ultra 7 258V (1280 - 1656, n=24) | |
| Acer Aspire 16 A16-51GM-77G2 | |
| Samsung Galaxy Book5 Pro 360 | |
| Cinebench R15 / CPU Single 64Bit | |
| MSI Summit A16 AI Plus A3HMTG | |
| Asus Vivobook 16 M1606K | |
| Asus Zenbook S 16 UM5606WA-RK052W | |
| Acer Aspire 16 A16-51GM-77G2 | |
| Lenovo Yoga 7 2-in-1 16ILL10 | |
| Durchschnittliche Intel Core Ultra 7 258V (258 - 298, n=24) | |
| HP OmniBook X Flip 16 | |
| Dell 16 Plus 2-in-1 | |
| Asus V16 V3607V | |
| Samsung Galaxy Book5 Pro 360 | |
| HP Spectre x360 16 RTX 4050 | |
| Lenovo ThinkBook 16 G7 IML | |
| Blender / v2.79 BMW27 CPU | |
| Dell 16 Plus 2-in-1 | |
| Durchschnittliche Intel Core Ultra 7 258V (315 - 484, n=24) | |
| Acer Aspire 16 A16-51GM-77G2 | |
| Samsung Galaxy Book5 Pro 360 | |
| HP OmniBook X Flip 16 | |
| Lenovo Yoga 7 2-in-1 16ILL10 | |
| Lenovo ThinkBook 16 G7 IML | |
| Asus Zenbook S 16 UM5606WA-RK052W | |
| Asus Vivobook 16 M1606K | |
| Asus V16 V3607V | |
| MSI Summit A16 AI Plus A3HMTG | |
| HWBOT x265 Benchmark v2.2 / 4k Preset | |
| MSI Summit A16 AI Plus A3HMTG | |
| Asus Vivobook 16 M1606K | |
| Asus Zenbook S 16 UM5606WA-RK052W | |
| Asus V16 V3607V | |
| HP Spectre x360 16 RTX 4050 | |
| Lenovo Yoga 7 2-in-1 16ILL10 | |
| Samsung Galaxy Book5 Pro 360 | |
| Dell 16 Plus 2-in-1 | |
| HP OmniBook X Flip 16 | |
| Durchschnittliche Intel Core Ultra 7 258V (7.11 - 14.2, n=24) | |
| Lenovo ThinkBook 16 G7 IML | |
| Acer Aspire 16 A16-51GM-77G2 | |
| LibreOffice / 20 Documents To PDF | |
| Asus Vivobook 16 M1606K | |
| Asus Zenbook S 16 UM5606WA-RK052W | |
| MSI Summit A16 AI Plus A3HMTG | |
| Asus V16 V3607V | |
| Durchschnittliche Intel Core Ultra 7 258V (41.1 - 62.8, n=24) | |
| Dell 16 Plus 2-in-1 | |
| Lenovo ThinkBook 16 G7 IML | |
| HP Spectre x360 16 RTX 4050 | |
| Samsung Galaxy Book5 Pro 360 | |
| Lenovo Yoga 7 2-in-1 16ILL10 | |
| HP OmniBook X Flip 16 | |
| Acer Aspire 16 A16-51GM-77G2 | |
| R Benchmark 2.5 / Overall mean | |
| Lenovo ThinkBook 16 G7 IML | |
| HP Spectre x360 16 RTX 4050 | |
| Samsung Galaxy Book5 Pro 360 | |
| Dell 16 Plus 2-in-1 | |
| Durchschnittliche Intel Core Ultra 7 258V (0.443 - 0.542, n=24) | |
| Lenovo Yoga 7 2-in-1 16ILL10 | |
| HP OmniBook X Flip 16 | |
| Acer Aspire 16 A16-51GM-77G2 | |
| Asus V16 V3607V | |
| Asus Zenbook S 16 UM5606WA-RK052W | |
| MSI Summit A16 AI Plus A3HMTG | |
| Asus Vivobook 16 M1606K | |
* ... kleinere Werte sind besser
AIDA64: FP32 Ray-Trace | FPU Julia | CPU SHA3 | CPU Queen | FPU SinJulia | FPU Mandel | CPU AES | CPU ZLib | FP64 Ray-Trace | CPU PhotoWorxx
| Performance Rating | |
| MSI Summit A16 AI Plus A3HMTG | |
| HP Spectre x360 16 RTX 4050 | |
| Dell 16 Plus 2-in-1 | |
| HP OmniBook X Flip 16 | |
| Lenovo Yoga 7 2-in-1 16ILL10 | |
| Durchschnittliche Intel Core Ultra 7 258V | |
| Samsung Galaxy Book5 Pro 360 | |
| AIDA64 / FP32 Ray-Trace | |
| MSI Summit A16 AI Plus A3HMTG | |
| HP Spectre x360 16 RTX 4050 | |
| Dell 16 Plus 2-in-1 | |
| Samsung Galaxy Book5 Pro 360 | |
| Lenovo Yoga 7 2-in-1 16ILL10 | |
| Durchschnittliche Intel Core Ultra 7 258V (8454 - 12781, n=26) | |
| HP OmniBook X Flip 16 | |
| AIDA64 / FPU Julia | |
| MSI Summit A16 AI Plus A3HMTG | |
| HP Spectre x360 16 RTX 4050 | |
| Samsung Galaxy Book5 Pro 360 | |
| HP OmniBook X Flip 16 | |
| Lenovo Yoga 7 2-in-1 16ILL10 | |
| Dell 16 Plus 2-in-1 | |
| Durchschnittliche Intel Core Ultra 7 258V (40875 - 63401, n=26) | |
| AIDA64 / CPU SHA3 | |
| MSI Summit A16 AI Plus A3HMTG | |
| HP Spectre x360 16 RTX 4050 | |
| Lenovo Yoga 7 2-in-1 16ILL10 | |
| HP OmniBook X Flip 16 | |
| Durchschnittliche Intel Core Ultra 7 258V (1930 - 2817, n=26) | |
| Samsung Galaxy Book5 Pro 360 | |
| Dell 16 Plus 2-in-1 | |
| AIDA64 / CPU Queen | |
| MSI Summit A16 AI Plus A3HMTG | |
| HP Spectre x360 16 RTX 4050 | |
| Dell 16 Plus 2-in-1 | |
| HP OmniBook X Flip 16 | |
| Lenovo Yoga 7 2-in-1 16ILL10 | |
| Durchschnittliche Intel Core Ultra 7 258V (48816 - 49818, n=24) | |
| Samsung Galaxy Book5 Pro 360 | |
| AIDA64 / FPU SinJulia | |
| MSI Summit A16 AI Plus A3HMTG | |
| HP Spectre x360 16 RTX 4050 | |
| Lenovo Yoga 7 2-in-1 16ILL10 | |
| HP OmniBook X Flip 16 | |
| Dell 16 Plus 2-in-1 | |
| Durchschnittliche Intel Core Ultra 7 258V (3817 - 4440, n=26) | |
| Samsung Galaxy Book5 Pro 360 | |
| AIDA64 / FPU Mandel | |
| MSI Summit A16 AI Plus A3HMTG | |
| HP Spectre x360 16 RTX 4050 | |
| Samsung Galaxy Book5 Pro 360 | |
| Lenovo Yoga 7 2-in-1 16ILL10 | |
| HP OmniBook X Flip 16 | |
| Dell 16 Plus 2-in-1 | |
| Durchschnittliche Intel Core Ultra 7 258V (21670 - 33565, n=26) | |
| AIDA64 / CPU AES | |
| MSI Summit A16 AI Plus A3HMTG | |
| HP Spectre x360 16 RTX 4050 | |
| HP OmniBook X Flip 16 | |
| Dell 16 Plus 2-in-1 | |
| Lenovo Yoga 7 2-in-1 16ILL10 | |
| Durchschnittliche Intel Core Ultra 7 258V (30957 - 40753, n=26) | |
| Samsung Galaxy Book5 Pro 360 | |
| AIDA64 / CPU ZLib | |
| MSI Summit A16 AI Plus A3HMTG | |
| HP Spectre x360 16 RTX 4050 | |
| Lenovo Yoga 7 2-in-1 16ILL10 | |
| Dell 16 Plus 2-in-1 | |
| HP OmniBook X Flip 16 | |
| Durchschnittliche Intel Core Ultra 7 258V (422 - 632, n=26) | |
| Samsung Galaxy Book5 Pro 360 | |
| AIDA64 / FP64 Ray-Trace | |
| MSI Summit A16 AI Plus A3HMTG | |
| HP Spectre x360 16 RTX 4050 | |
| Samsung Galaxy Book5 Pro 360 | |
| Dell 16 Plus 2-in-1 | |
| Lenovo Yoga 7 2-in-1 16ILL10 | |
| Durchschnittliche Intel Core Ultra 7 258V (4258 - 6930, n=26) | |
| HP OmniBook X Flip 16 | |
| AIDA64 / CPU PhotoWorxx | |
| Dell 16 Plus 2-in-1 | |
| HP OmniBook X Flip 16 | |
| Durchschnittliche Intel Core Ultra 7 258V (44223 - 59245, n=26) | |
| Lenovo Yoga 7 2-in-1 16ILL10 | |
| MSI Summit A16 AI Plus A3HMTG | |
| Samsung Galaxy Book5 Pro 360 | |
| HP Spectre x360 16 RTX 4050 | |
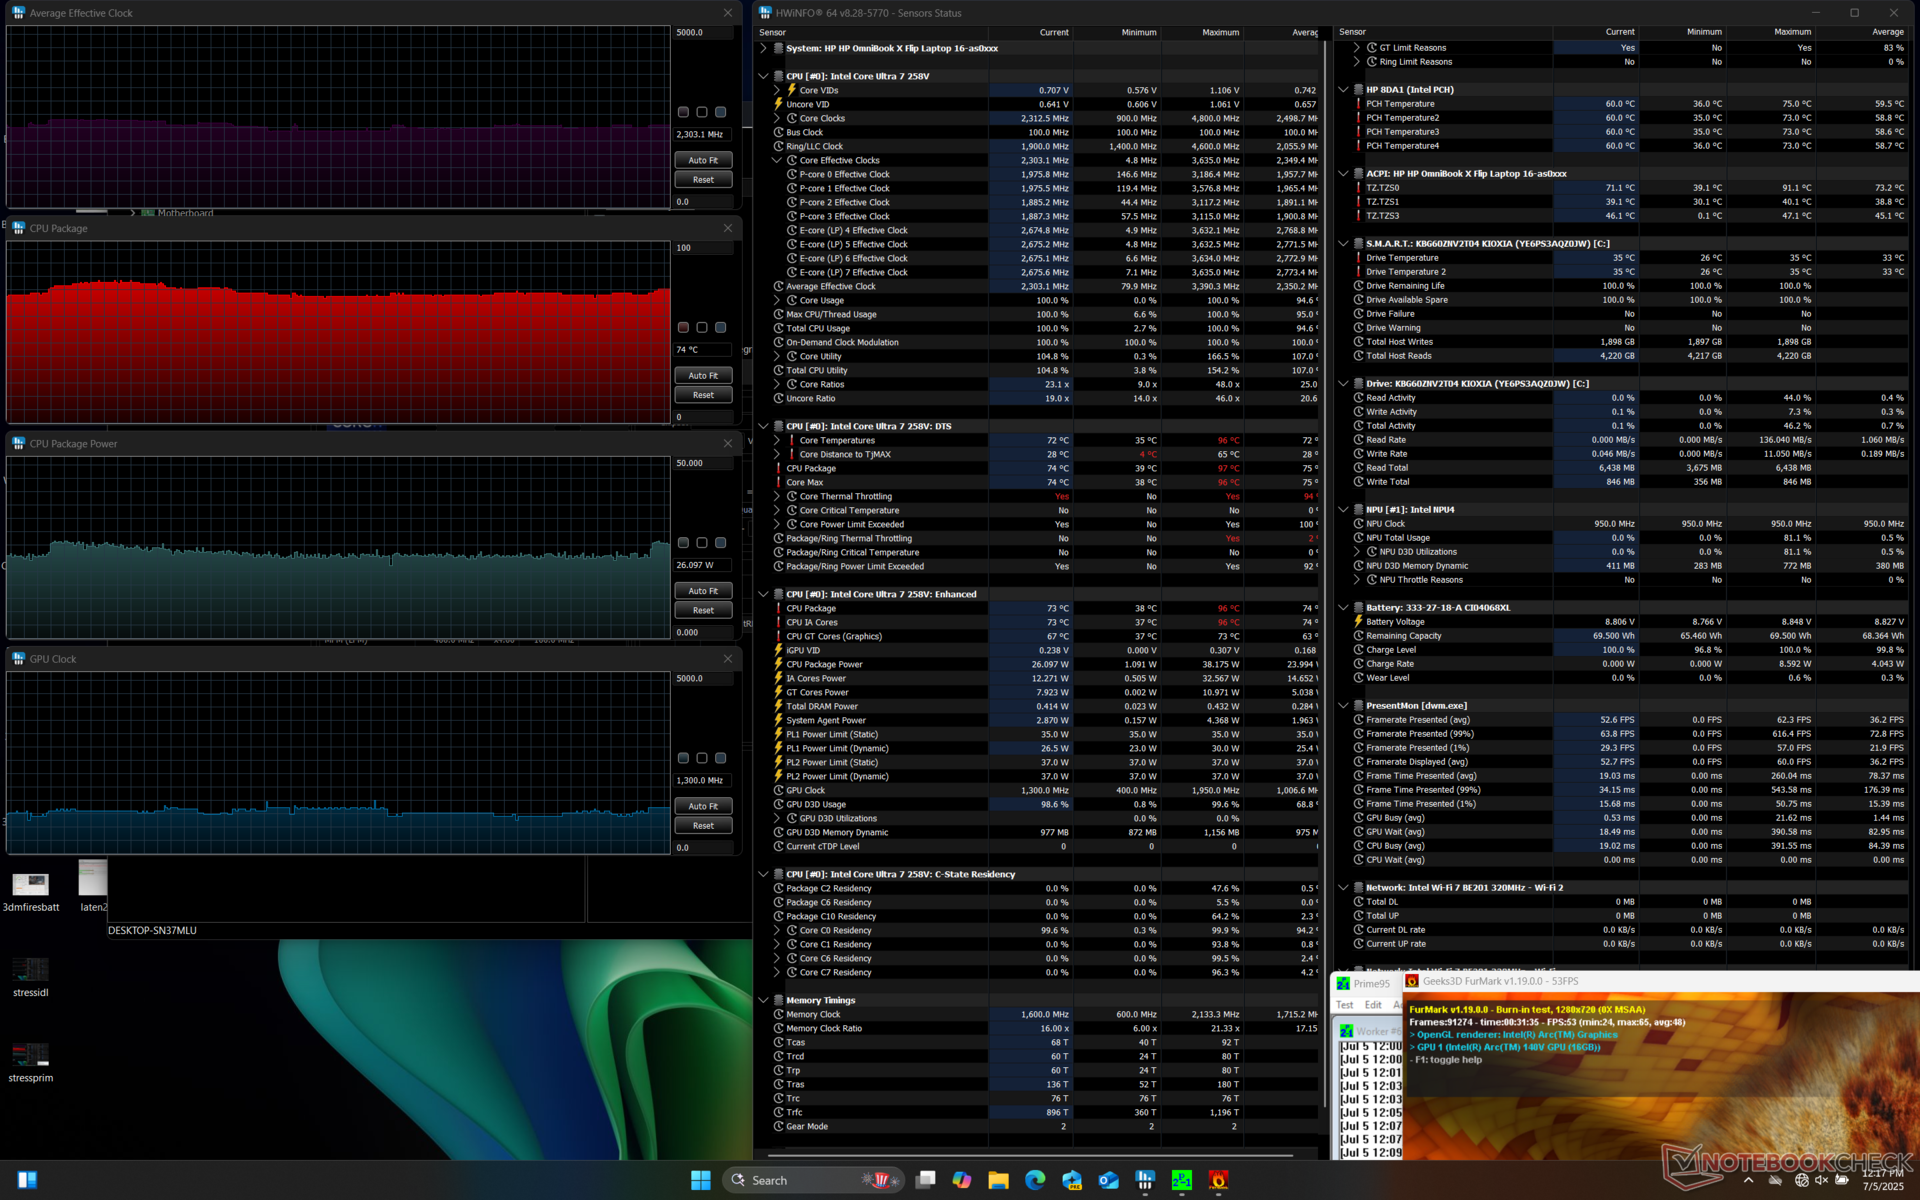
Stresstest
Die CPU stabilisiert sich bei 2,9 GHz, 82 °C und 26 W, wenn Prime95 Stress läuft verglichen mit 2,5 GHz, 72 °C und 22 W auf dem Dell Plus 16 2-in-1 mit dem gleichen Core-Ultra-7-258V-Prozessor.
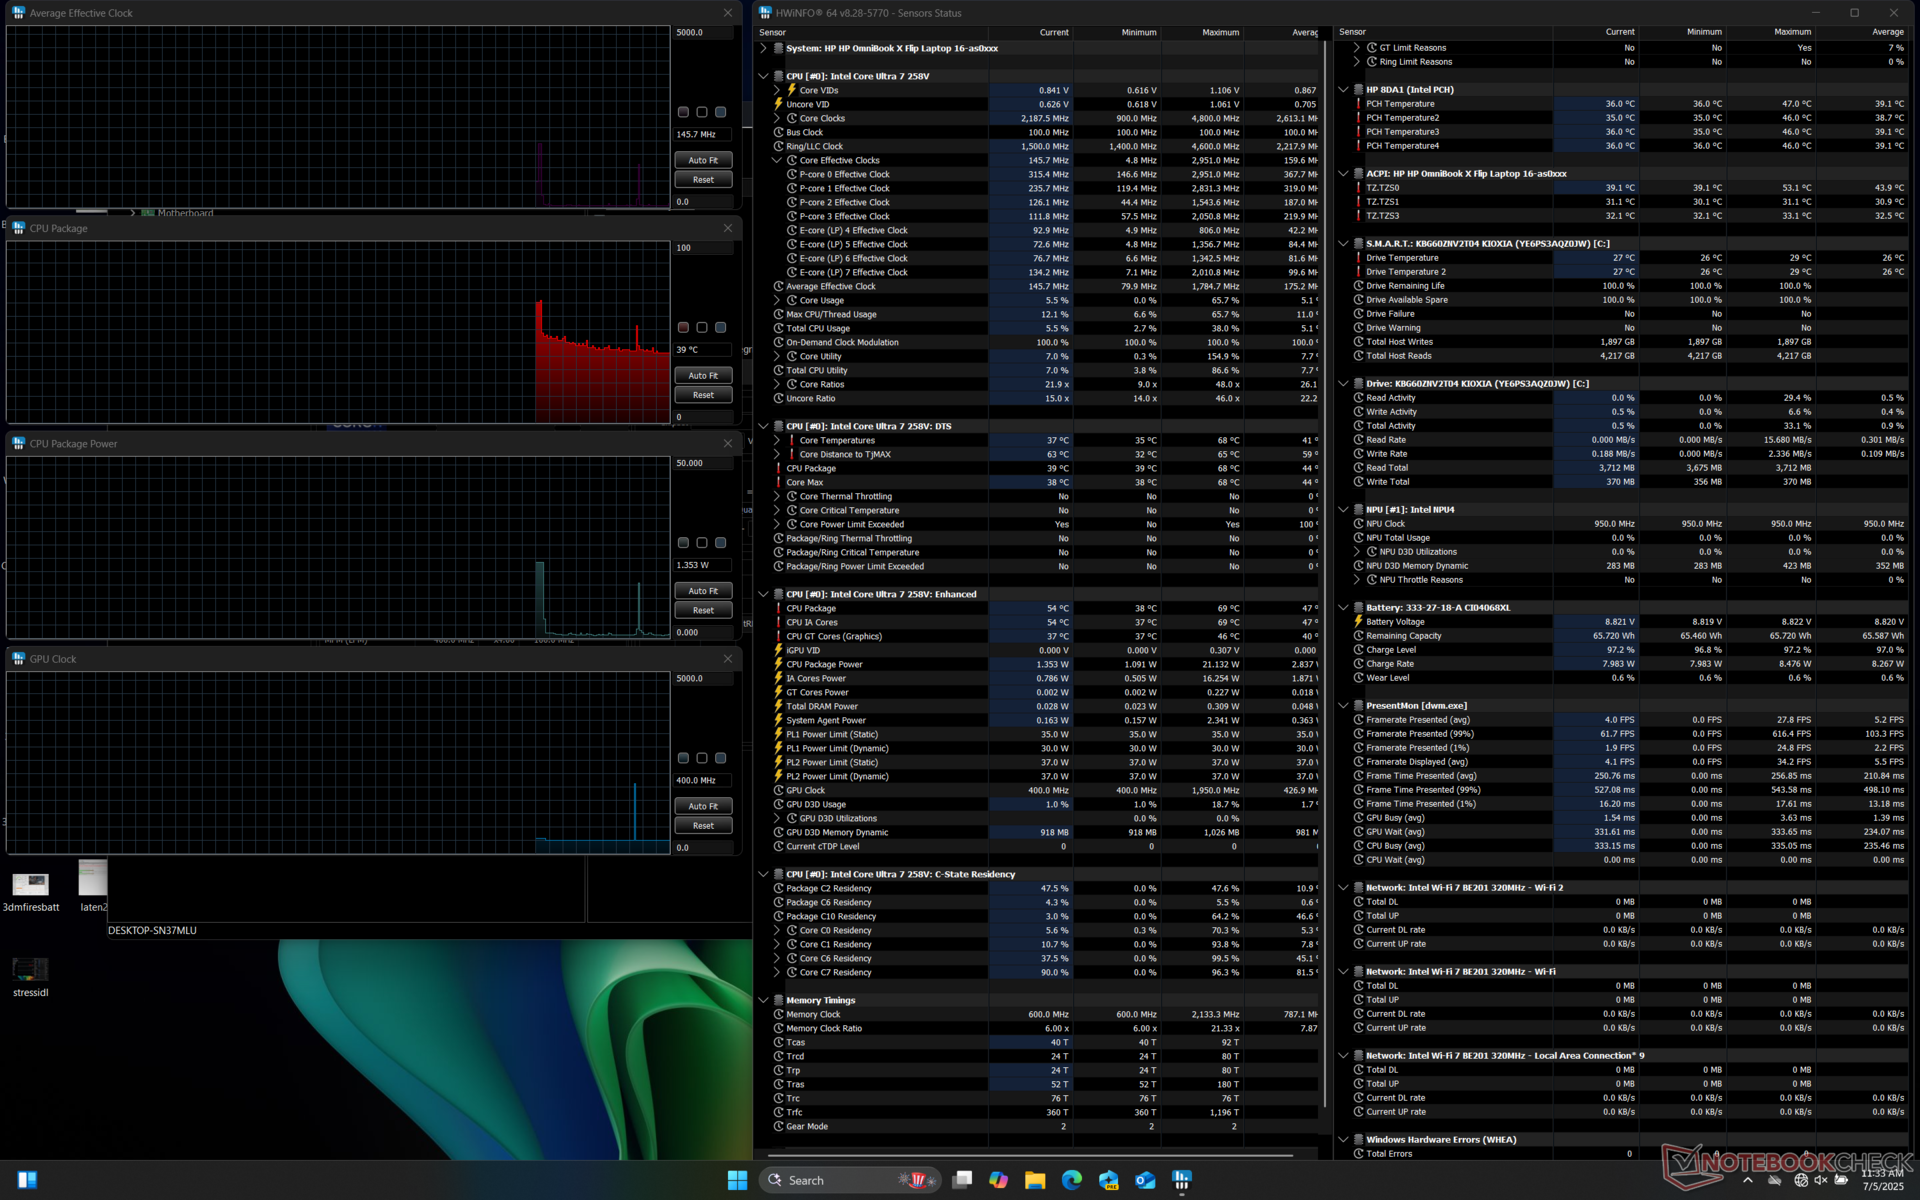

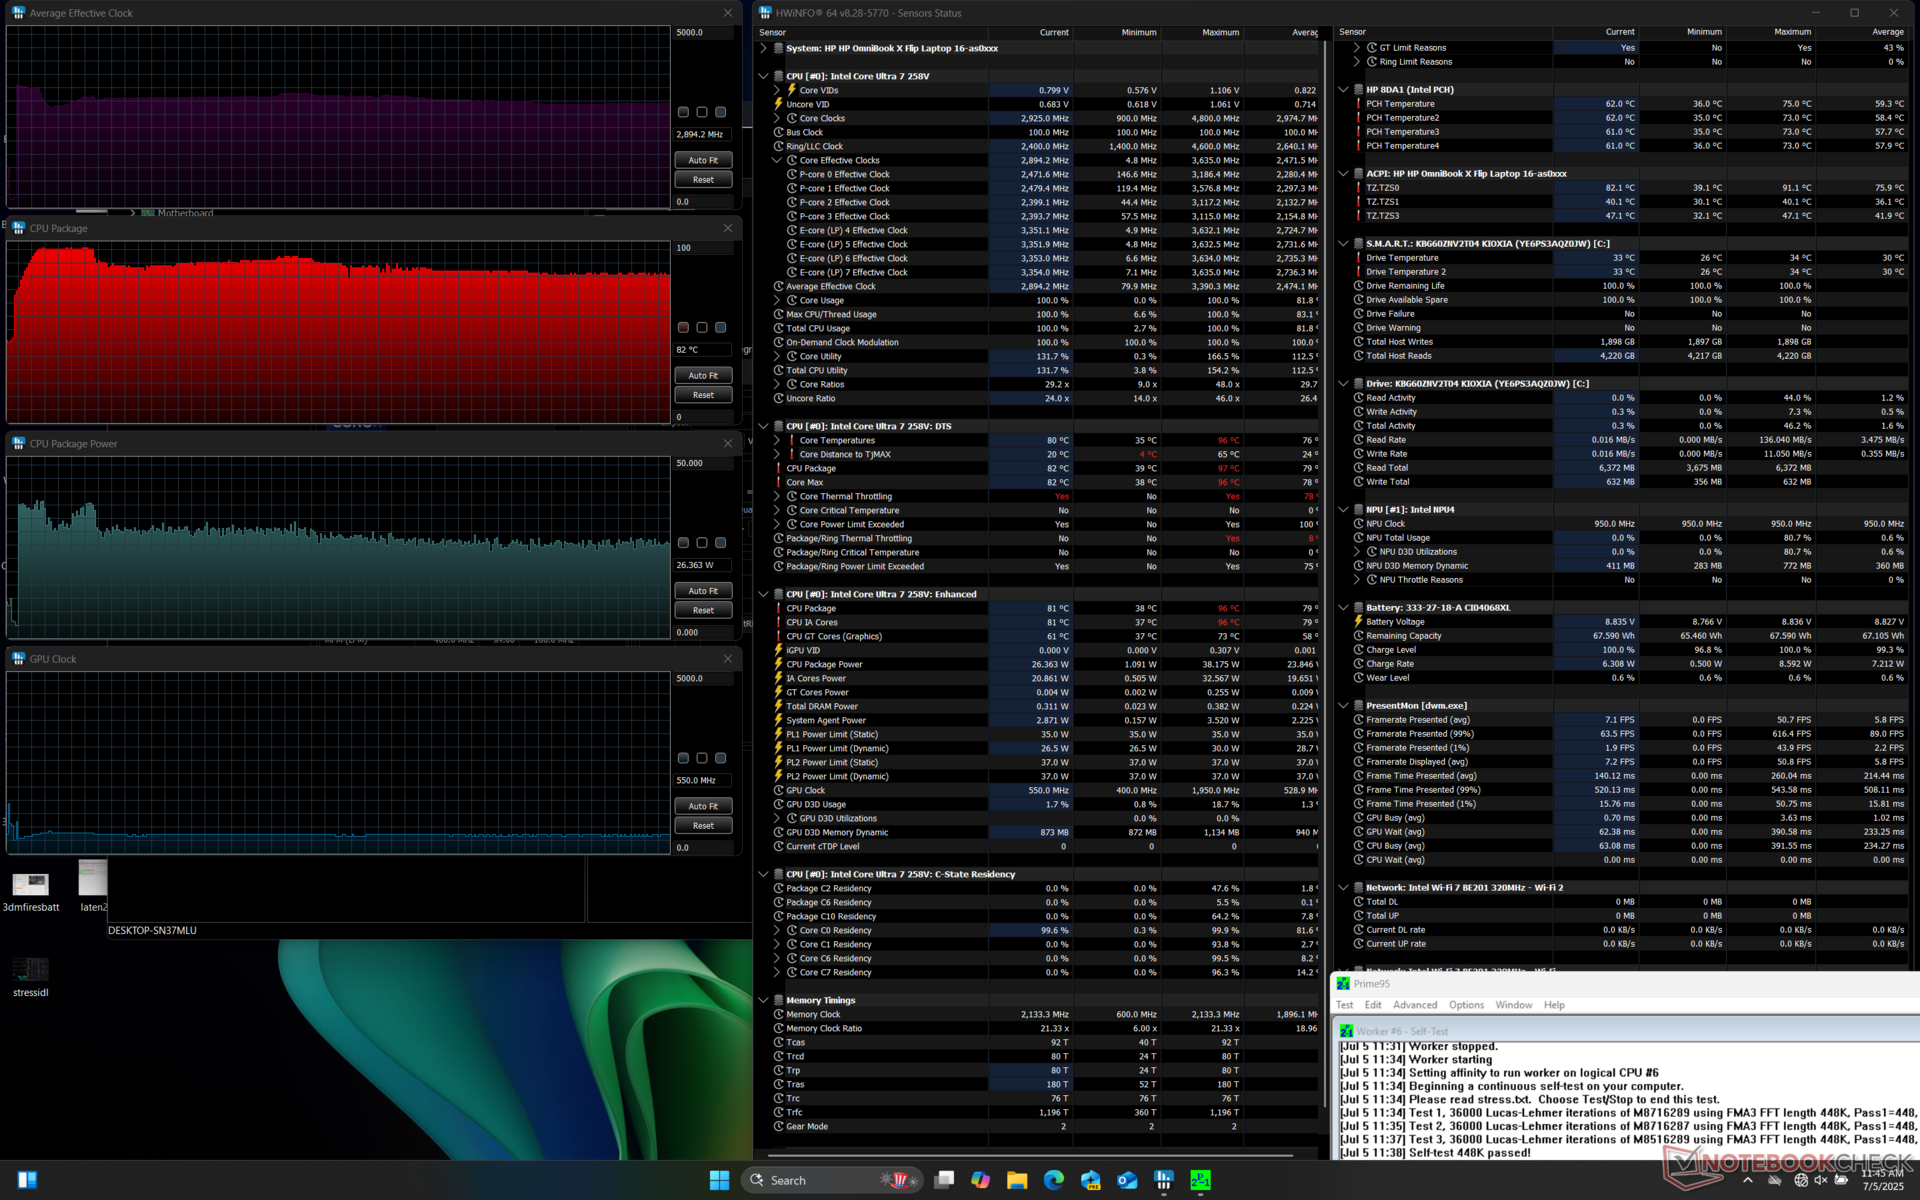
| durchschnittlicher CPU-Takt (GHz) | GPU-Takt (MHz) | durchschnittliche CPU-Temperatur (°C) | |
| System Leerlauf | -- | -- | 39 |
| Prime95 Stress | 2,9 | -- | 82 |
| Prime95 + FurMark Stress | 2,3 | 1.300 | 74 |
| Cyberpunk 2077 Stress | 1,3 | 1.750 | 68 |
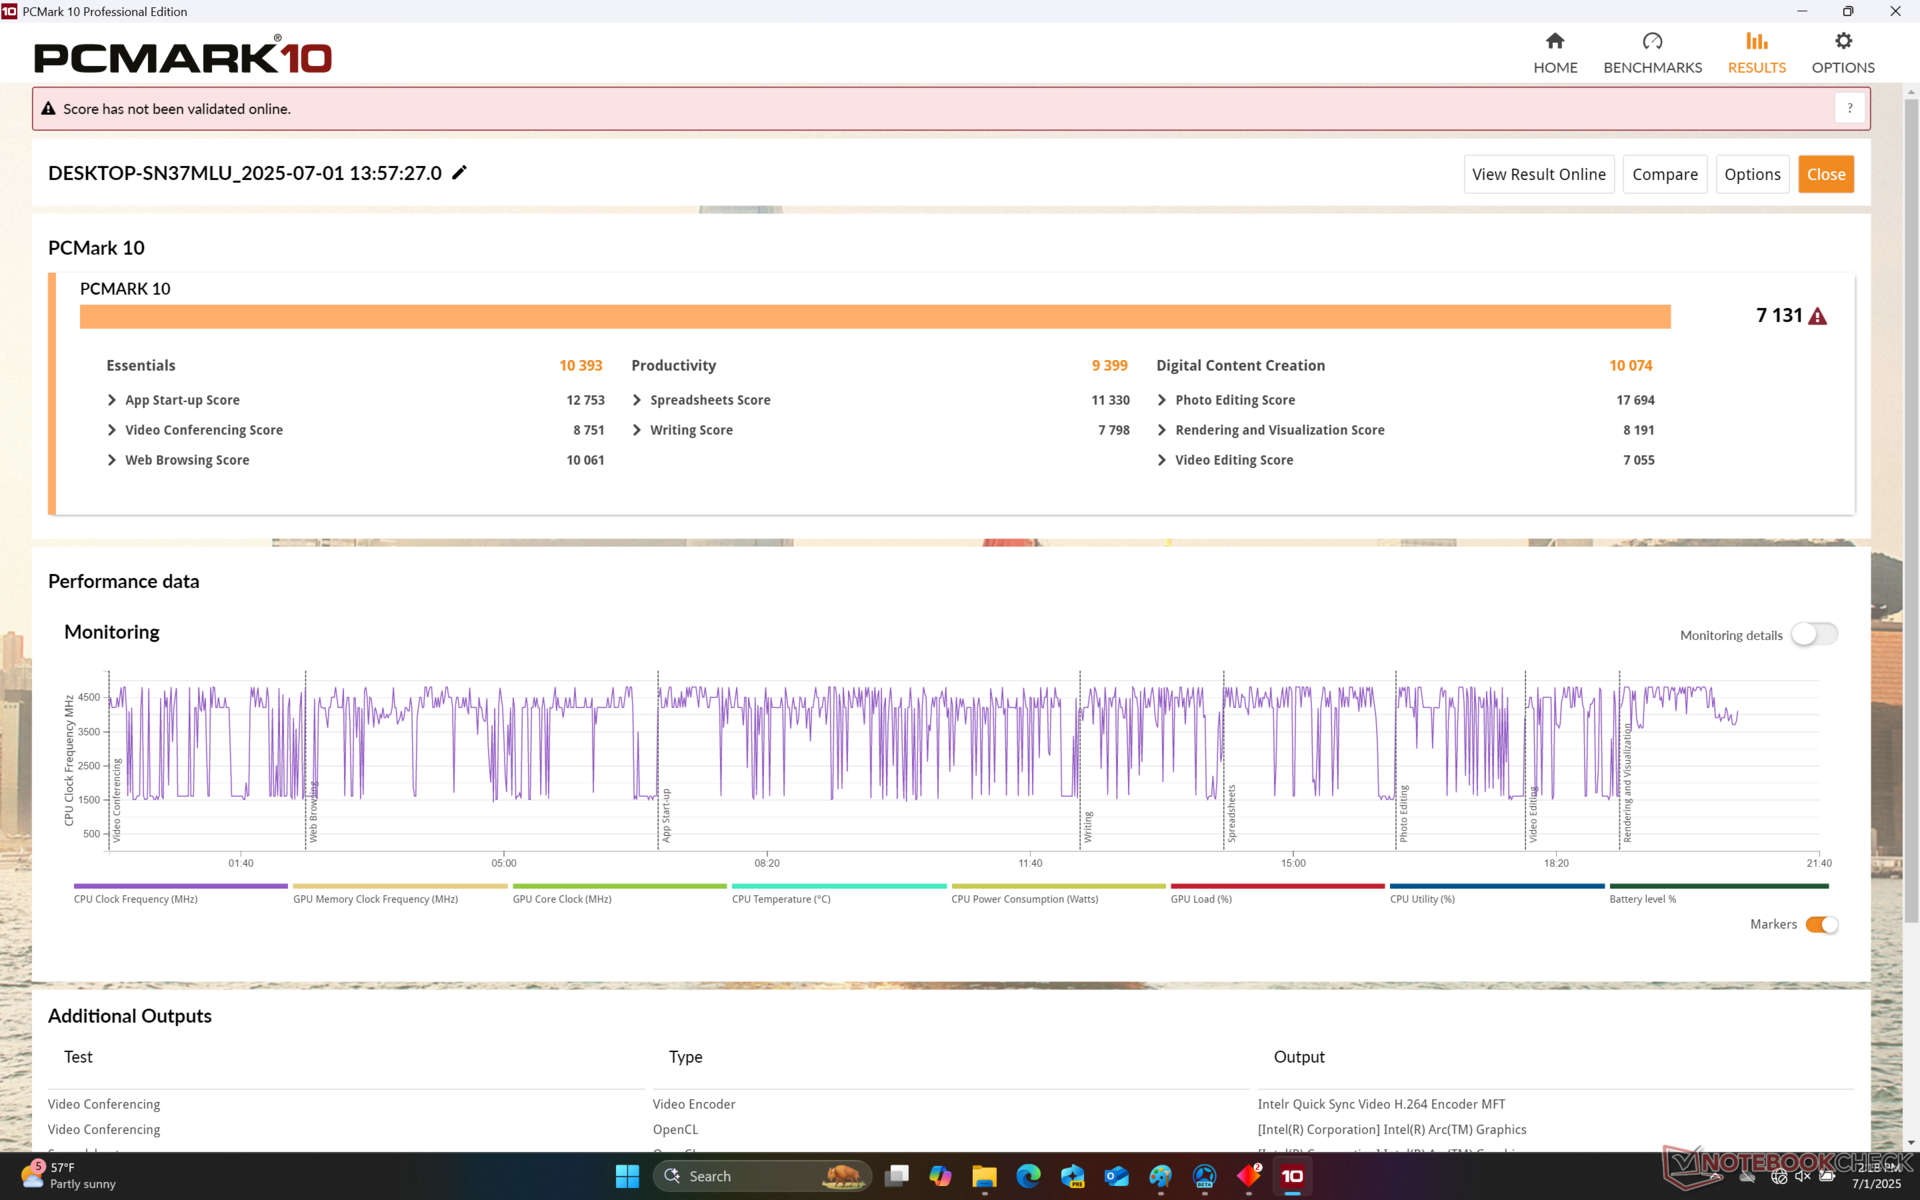
System Performance
PCMark 10: Score | Essentials | Productivity | Digital Content Creation
CrossMark: Overall | Productivity | Creativity | Responsiveness
WebXPRT 3: Overall
WebXPRT 4: Overall
Mozilla Kraken 1.1: Total
| Performance Rating | |
| MSI Summit A16 AI Plus A3HMTG | |
| Lenovo Yoga 7 2-in-1 16ILL10 | |
| HP OmniBook X Flip 16 | |
| Dell 16 Plus 2-in-1 | |
| Durchschnittliche Intel Core Ultra 7 258V, Intel Arc Graphics 140V | |
| Samsung Galaxy Book5 Pro 360 | |
| HP Spectre x360 16 RTX 4050 | |
| PCMark 10 / Score | |
| MSI Summit A16 AI Plus A3HMTG | |
| Lenovo Yoga 7 2-in-1 16ILL10 | |
| HP OmniBook X Flip 16 | |
| Durchschnittliche Intel Core Ultra 7 258V, Intel Arc Graphics 140V (6265 - 7420, n=23) | |
| Dell 16 Plus 2-in-1 | |
| HP Spectre x360 16 RTX 4050 | |
| Samsung Galaxy Book5 Pro 360 | |
| PCMark 10 / Essentials | |
| Lenovo Yoga 7 2-in-1 16ILL10 | |
| MSI Summit A16 AI Plus A3HMTG | |
| HP OmniBook X Flip 16 | |
| Durchschnittliche Intel Core Ultra 7 258V, Intel Arc Graphics 140V (9295 - 11467, n=23) | |
| HP Spectre x360 16 RTX 4050 | |
| Dell 16 Plus 2-in-1 | |
| Samsung Galaxy Book5 Pro 360 | |
| PCMark 10 / Productivity | |
| MSI Summit A16 AI Plus A3HMTG | |
| Lenovo Yoga 7 2-in-1 16ILL10 | |
| HP OmniBook X Flip 16 | |
| HP Spectre x360 16 RTX 4050 | |
| Durchschnittliche Intel Core Ultra 7 258V, Intel Arc Graphics 140V (7357 - 13600, n=23) | |
| Samsung Galaxy Book5 Pro 360 | |
| Dell 16 Plus 2-in-1 | |
| PCMark 10 / Digital Content Creation | |
| MSI Summit A16 AI Plus A3HMTG | |
| Lenovo Yoga 7 2-in-1 16ILL10 | |
| HP OmniBook X Flip 16 | |
| Durchschnittliche Intel Core Ultra 7 258V, Intel Arc Graphics 140V (8160 - 10308, n=23) | |
| Dell 16 Plus 2-in-1 | |
| Samsung Galaxy Book5 Pro 360 | |
| HP Spectre x360 16 RTX 4050 | |
| CrossMark / Overall | |
| MSI Summit A16 AI Plus A3HMTG | |
| HP OmniBook X Flip 16 | |
| Lenovo Yoga 7 2-in-1 16ILL10 | |
| Dell 16 Plus 2-in-1 | |
| Durchschnittliche Intel Core Ultra 7 258V, Intel Arc Graphics 140V (1275 - 1742, n=22) | |
| Samsung Galaxy Book5 Pro 360 | |
| HP Spectre x360 16 RTX 4050 | |
| CrossMark / Productivity | |
| HP OmniBook X Flip 16 | |
| Lenovo Yoga 7 2-in-1 16ILL10 | |
| Dell 16 Plus 2-in-1 | |
| Durchschnittliche Intel Core Ultra 7 258V, Intel Arc Graphics 140V (1267 - 1684, n=22) | |
| MSI Summit A16 AI Plus A3HMTG | |
| Samsung Galaxy Book5 Pro 360 | |
| HP Spectre x360 16 RTX 4050 | |
| CrossMark / Creativity | |
| MSI Summit A16 AI Plus A3HMTG | |
| Lenovo Yoga 7 2-in-1 16ILL10 | |
| HP OmniBook X Flip 16 | |
| Dell 16 Plus 2-in-1 | |
| Durchschnittliche Intel Core Ultra 7 258V, Intel Arc Graphics 140V (1393 - 1977, n=22) | |
| HP Spectre x360 16 RTX 4050 | |
| Samsung Galaxy Book5 Pro 360 | |
| CrossMark / Responsiveness | |
| MSI Summit A16 AI Plus A3HMTG | |
| HP OmniBook X Flip 16 | |
| Lenovo Yoga 7 2-in-1 16ILL10 | |
| Samsung Galaxy Book5 Pro 360 | |
| Durchschnittliche Intel Core Ultra 7 258V, Intel Arc Graphics 140V (999 - 1411, n=22) | |
| Dell 16 Plus 2-in-1 | |
| HP Spectre x360 16 RTX 4050 | |
| WebXPRT 3 / Overall | |
| MSI Summit A16 AI Plus A3HMTG | |
| HP OmniBook X Flip 16 | |
| Lenovo Yoga 7 2-in-1 16ILL10 | |
| Dell 16 Plus 2-in-1 | |
| Durchschnittliche Intel Core Ultra 7 258V, Intel Arc Graphics 140V (219 - 317, n=22) | |
| HP Spectre x360 16 RTX 4050 | |
| Samsung Galaxy Book5 Pro 360 | |
| WebXPRT 4 / Overall | |
| Lenovo Yoga 7 2-in-1 16ILL10 | |
| Dell 16 Plus 2-in-1 | |
| HP OmniBook X Flip 16 | |
| Durchschnittliche Intel Core Ultra 7 258V, Intel Arc Graphics 140V (199.5 - 291, n=22) | |
| MSI Summit A16 AI Plus A3HMTG | |
| Samsung Galaxy Book5 Pro 360 | |
| HP Spectre x360 16 RTX 4050 | |
| Mozilla Kraken 1.1 / Total | |
| HP Spectre x360 16 RTX 4050 | |
| Samsung Galaxy Book5 Pro 360 | |
| HP OmniBook X Flip 16 | |
| Durchschnittliche Intel Core Ultra 7 258V, Intel Arc Graphics 140V (468 - 559, n=24) | |
| Dell 16 Plus 2-in-1 | |
| Lenovo Yoga 7 2-in-1 16ILL10 | |
| MSI Summit A16 AI Plus A3HMTG | |
* ... kleinere Werte sind besser
| PCMark 10 Score | 7131 Punkte | |
Hilfe | ||
| AIDA64 / Memory Copy | |
| Durchschnittliche Intel Core Ultra 7 258V (104408 - 114336, n=24) | |
| HP OmniBook X Flip 16 | |
| Dell 16 Plus 2-in-1 | |
| Samsung Galaxy Book5 Pro 360 | |
| Lenovo Yoga 7 2-in-1 16ILL10 | |
| MSI Summit A16 AI Plus A3HMTG | |
| HP Spectre x360 16 RTX 4050 | |
| AIDA64 / Memory Read | |
| MSI Summit A16 AI Plus A3HMTG | |
| Lenovo Yoga 7 2-in-1 16ILL10 | |
| Dell 16 Plus 2-in-1 | |
| Durchschnittliche Intel Core Ultra 7 258V (82846 - 89417, n=24) | |
| HP Spectre x360 16 RTX 4050 | |
| HP OmniBook X Flip 16 | |
| Samsung Galaxy Book5 Pro 360 | |
| AIDA64 / Memory Write | |
| Lenovo Yoga 7 2-in-1 16ILL10 | |
| HP OmniBook X Flip 16 | |
| Dell 16 Plus 2-in-1 | |
| Durchschnittliche Intel Core Ultra 7 258V (108824 - 117989, n=24) | |
| Samsung Galaxy Book5 Pro 360 | |
| MSI Summit A16 AI Plus A3HMTG | |
| HP Spectre x360 16 RTX 4050 | |
| AIDA64 / Memory Latency | |
| HP Spectre x360 16 RTX 4050 | |
| MSI Summit A16 AI Plus A3HMTG | |
| Dell 16 Plus 2-in-1 | |
| Lenovo Yoga 7 2-in-1 16ILL10 | |
| HP OmniBook X Flip 16 | |
| Durchschnittliche Intel Core Ultra 7 258V (95 - 101.7, n=24) | |
| Samsung Galaxy Book5 Pro 360 | |
* ... kleinere Werte sind besser
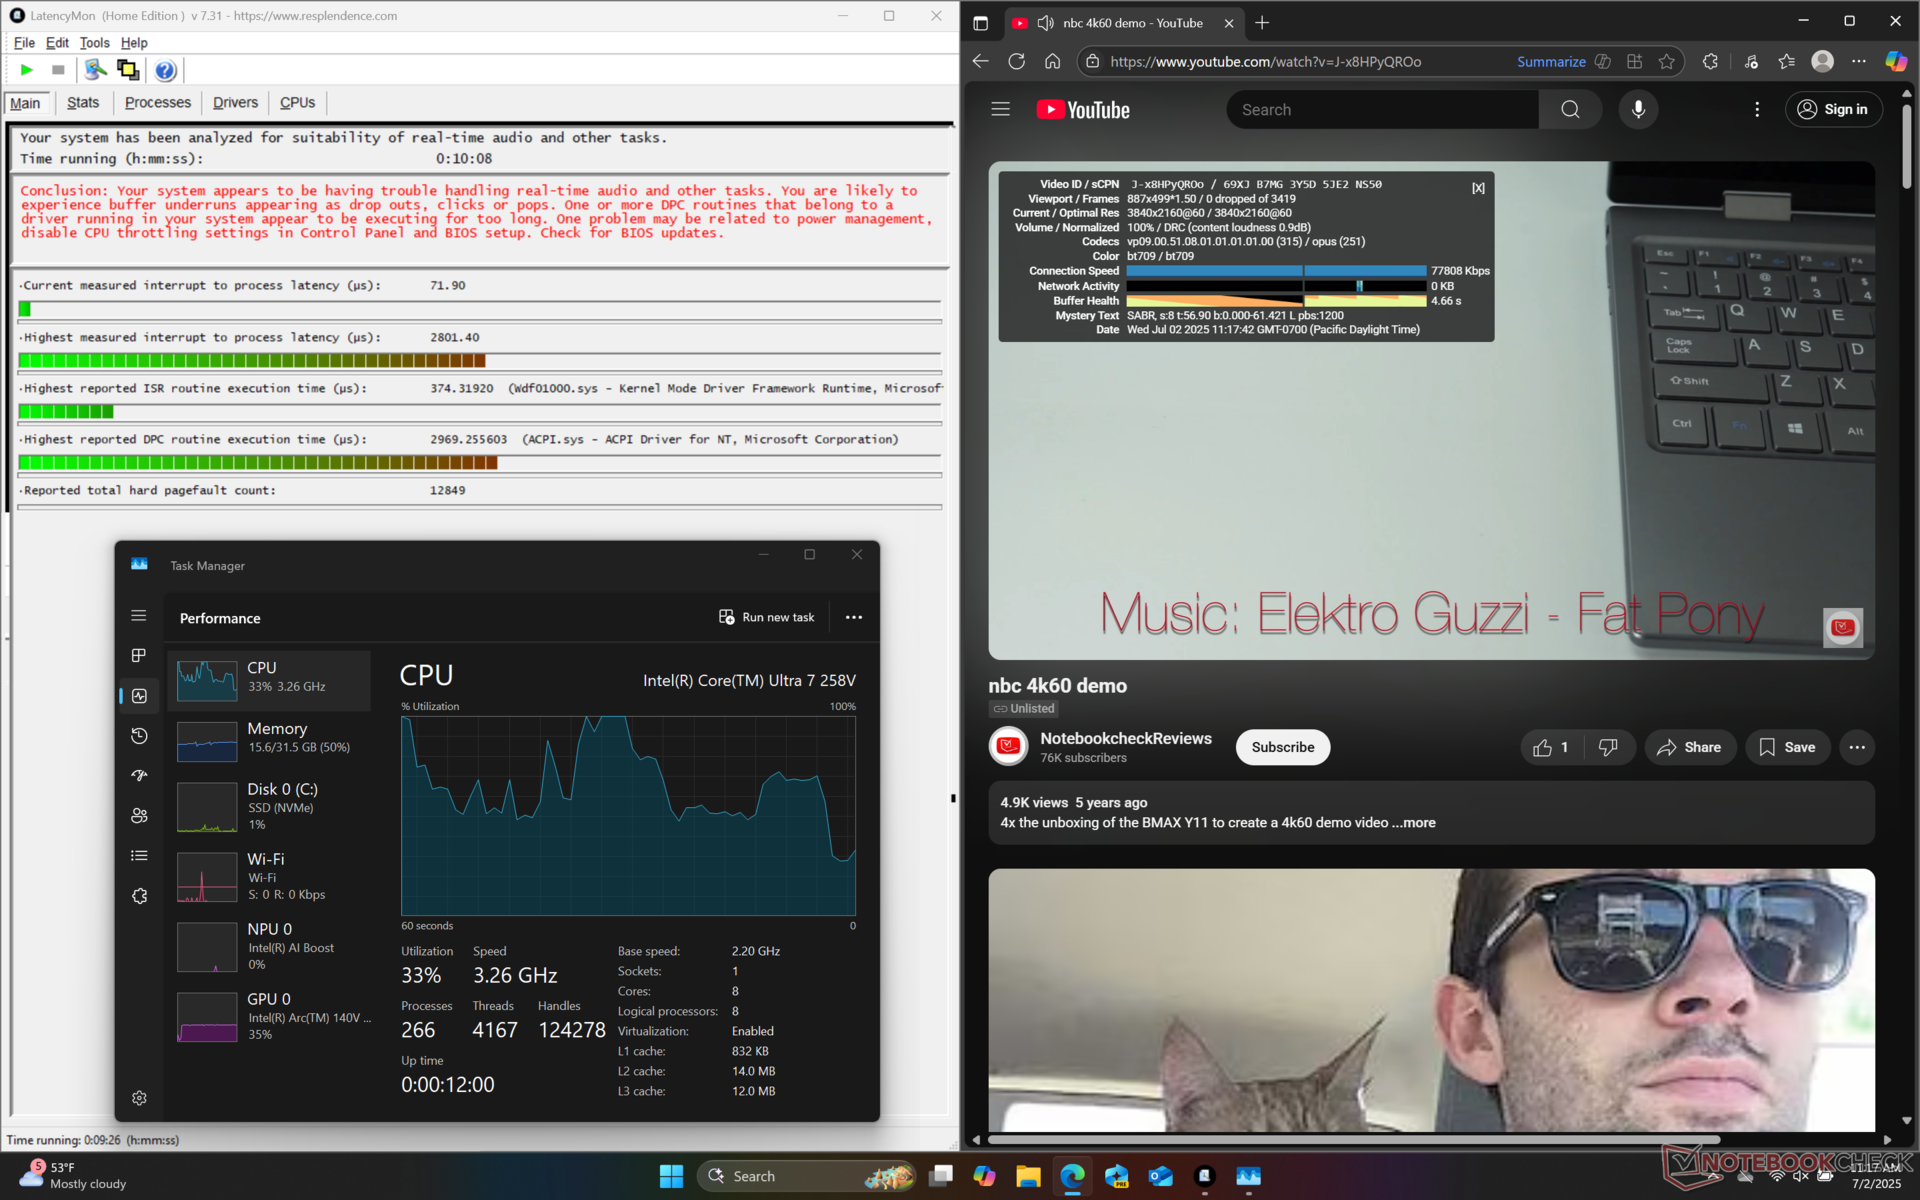
DPC-Latenzzeit
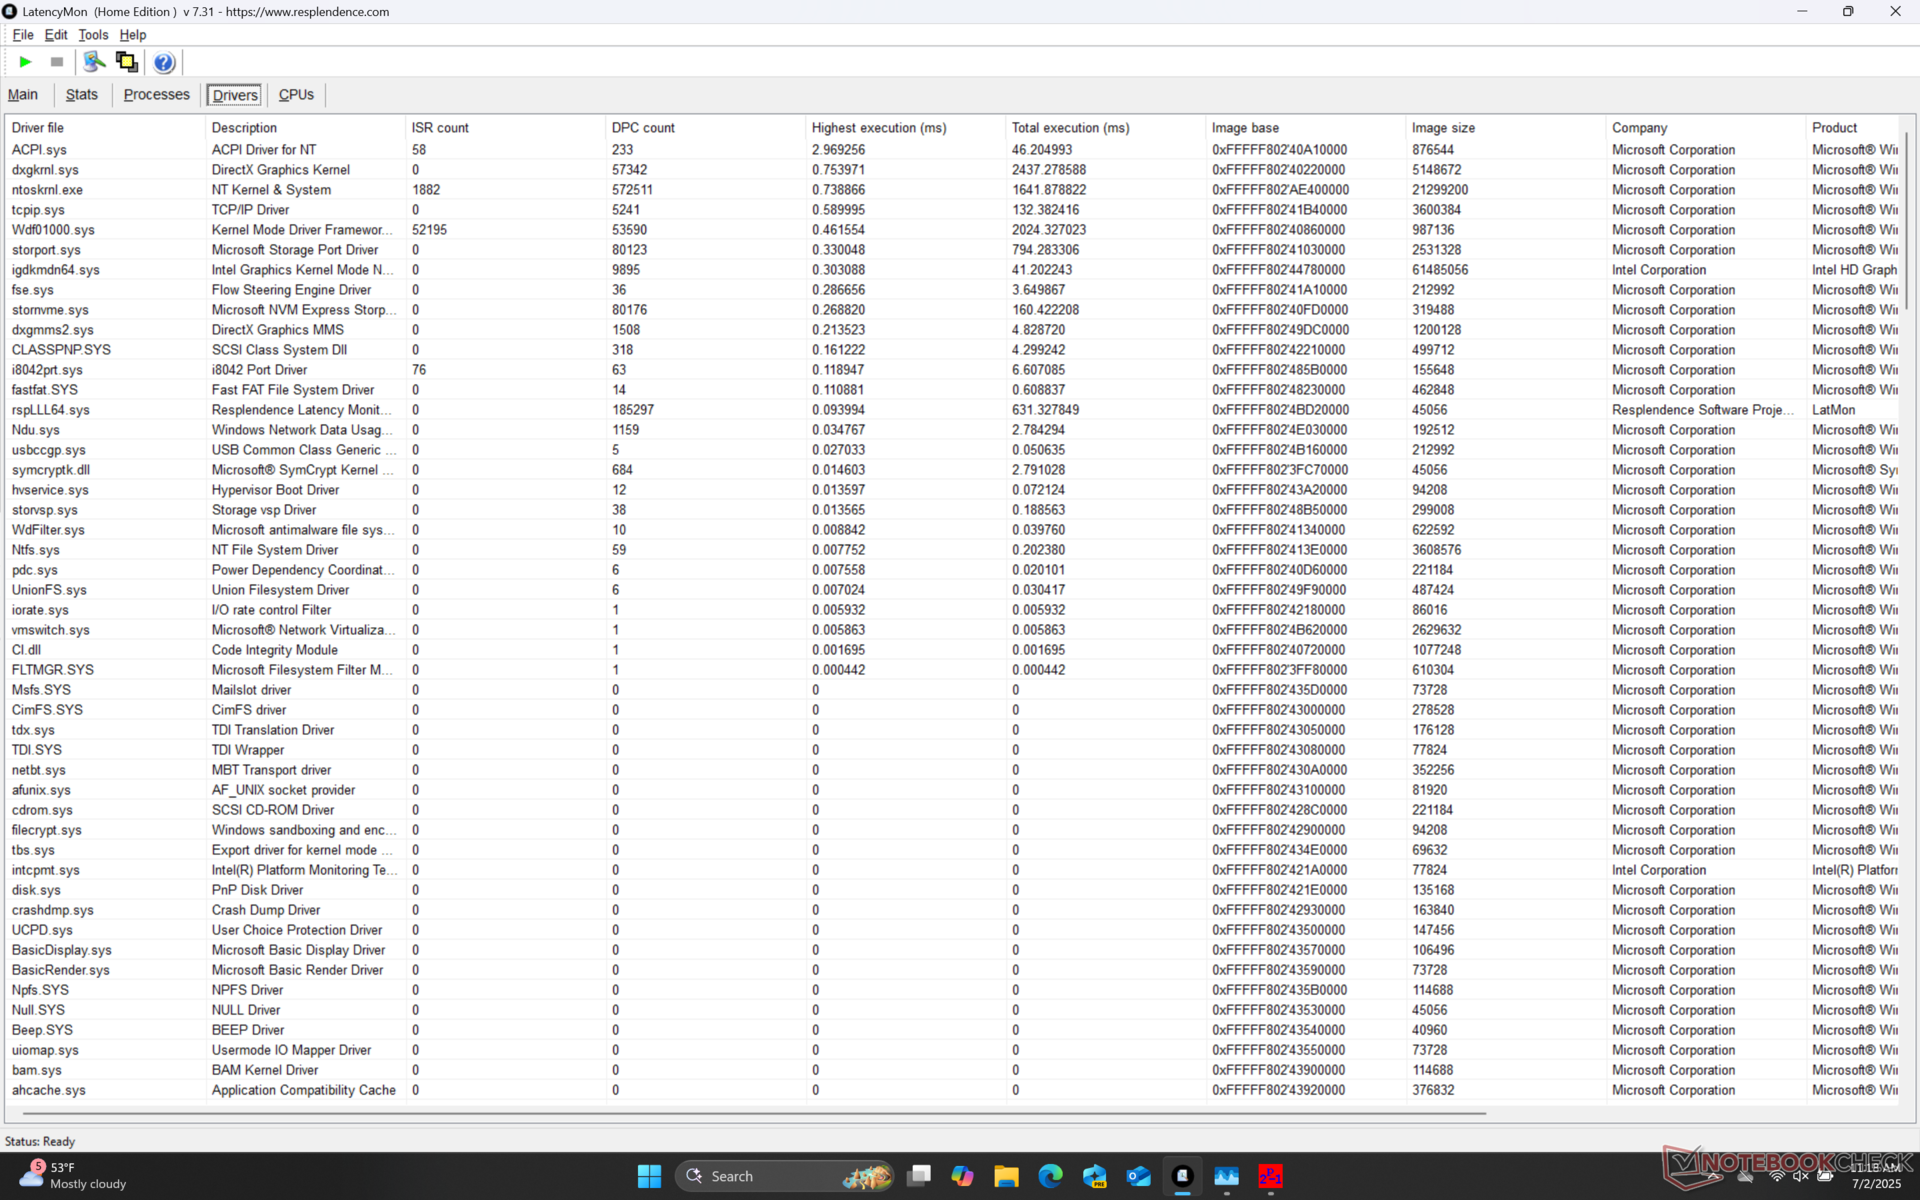
| DPC Latencies / LatencyMon - interrupt to process latency (max), Web, Youtube, Prime95 | |
| HP Spectre x360 16 RTX 4050 | |
| MSI Summit A16 AI Plus A3HMTG | |
| HP OmniBook X Flip 16 | |
| Dell 16 Plus 2-in-1 | |
| Samsung Galaxy Book5 Pro 360 | |
| Lenovo Yoga 7 2-in-1 16ILL10 | |
* ... kleinere Werte sind besser
Speichergeräte
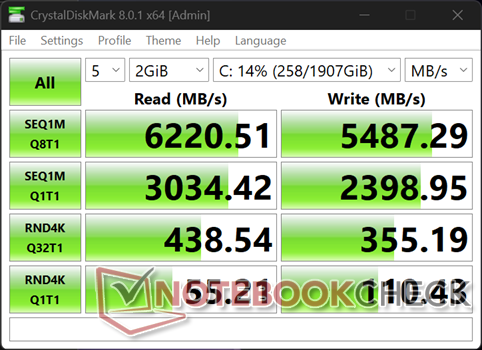
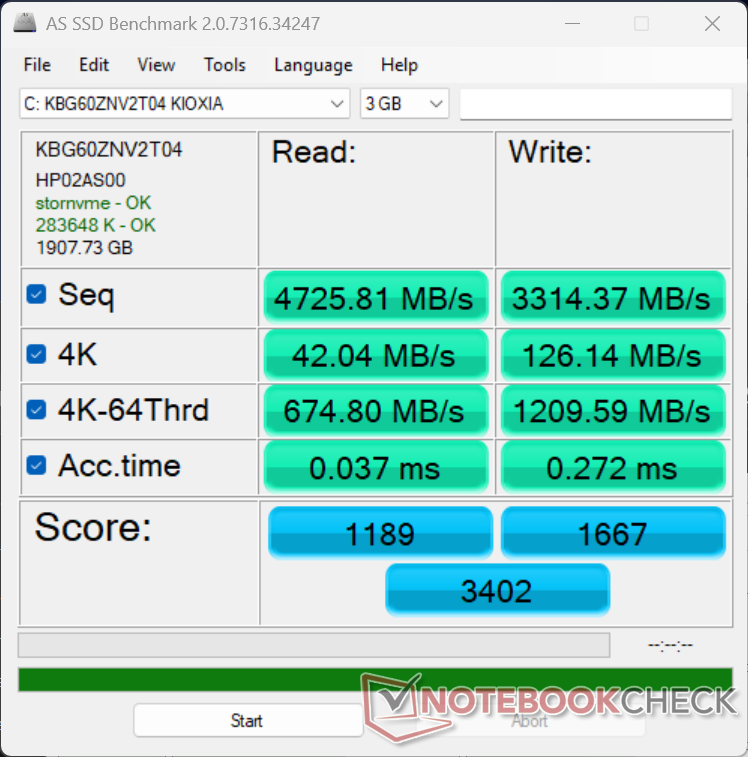

| Drive Performance Rating - Percent | |
| Samsung Galaxy Book5 Pro 360 | |
| HP Spectre x360 16 RTX 4050 | |
| Lenovo Yoga 7 2-in-1 16ILL10 | |
| MSI Summit A16 AI Plus A3HMTG | |
| HP OmniBook X Flip 16 | |
| Dell 16 Plus 2-in-1 | |
* ... kleinere Werte sind besser
Disk Throttling: DiskSpd Read Loop, Queue Depth 8
GPU Performance
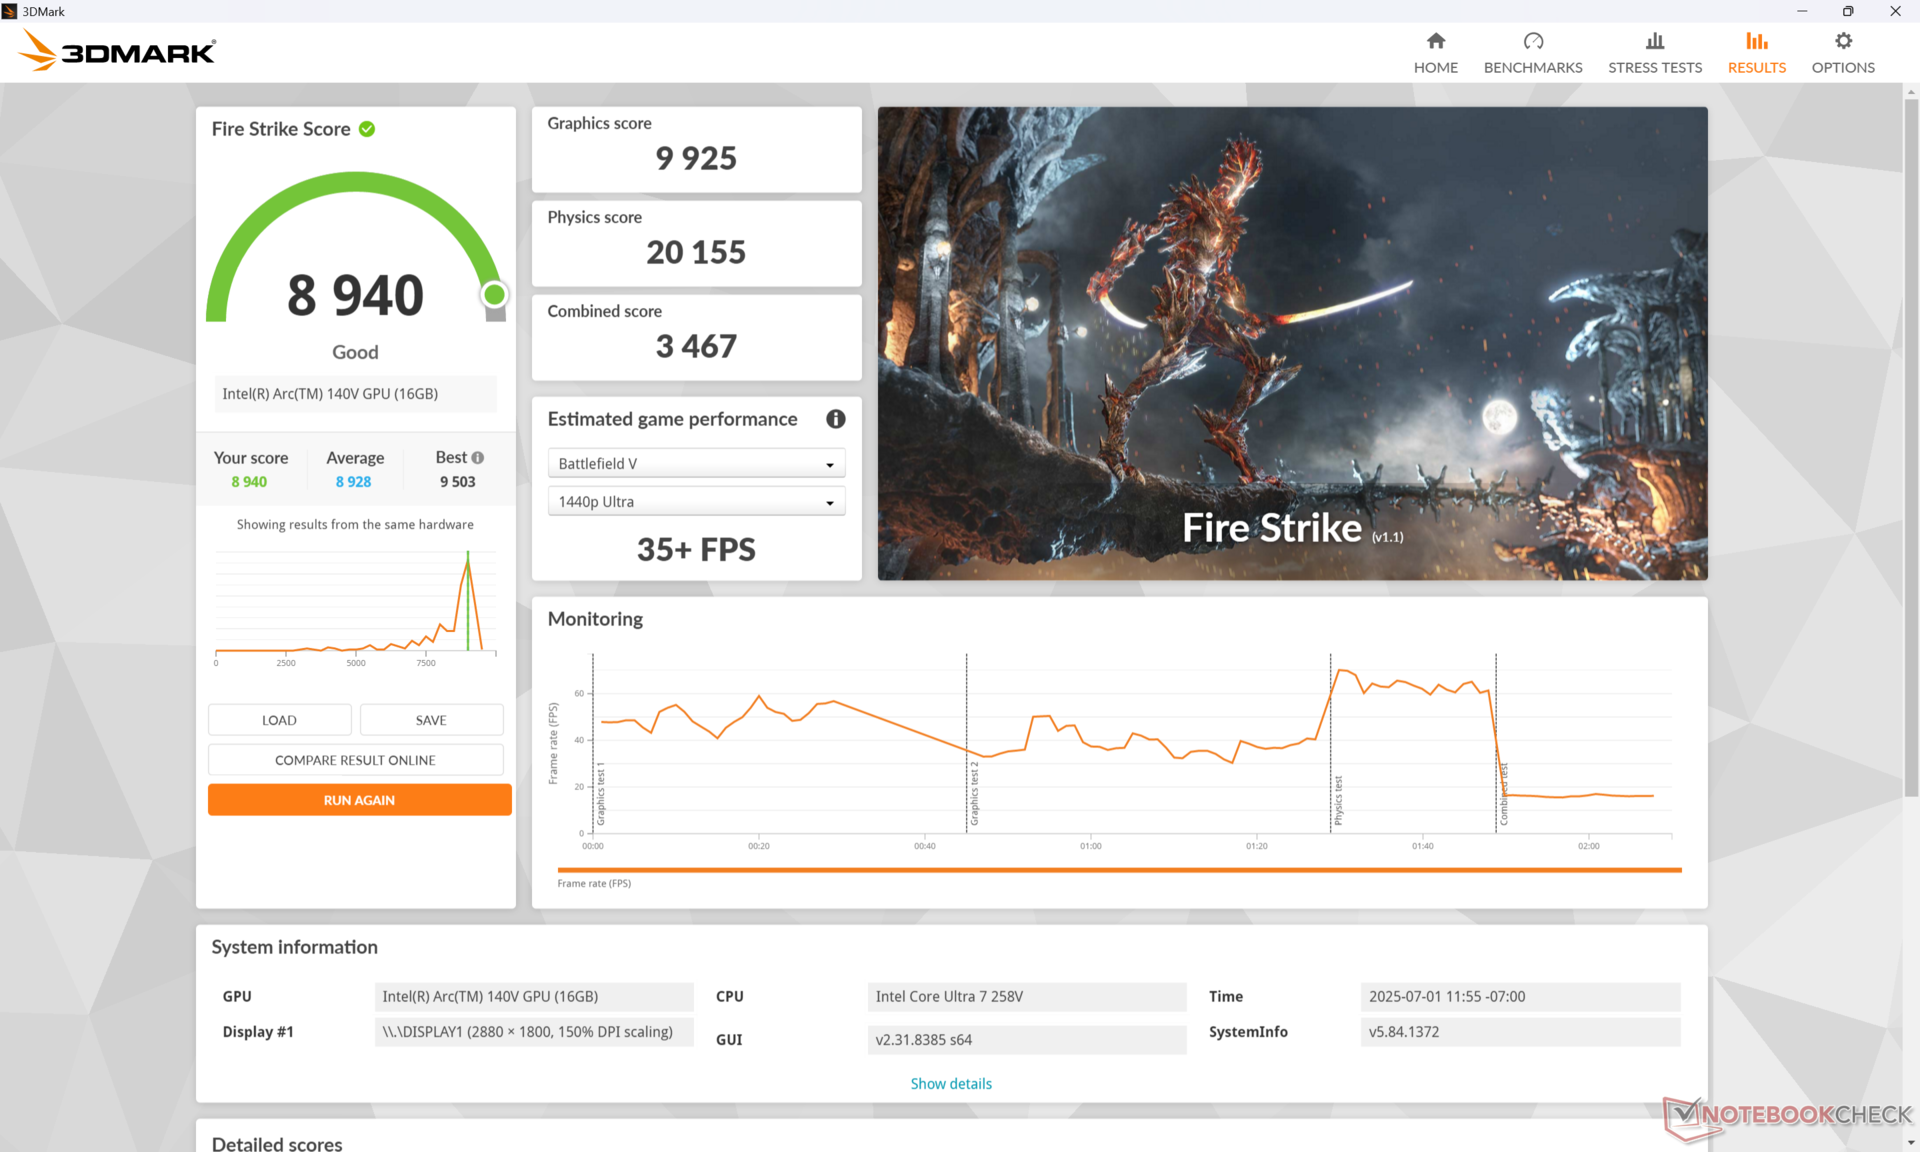
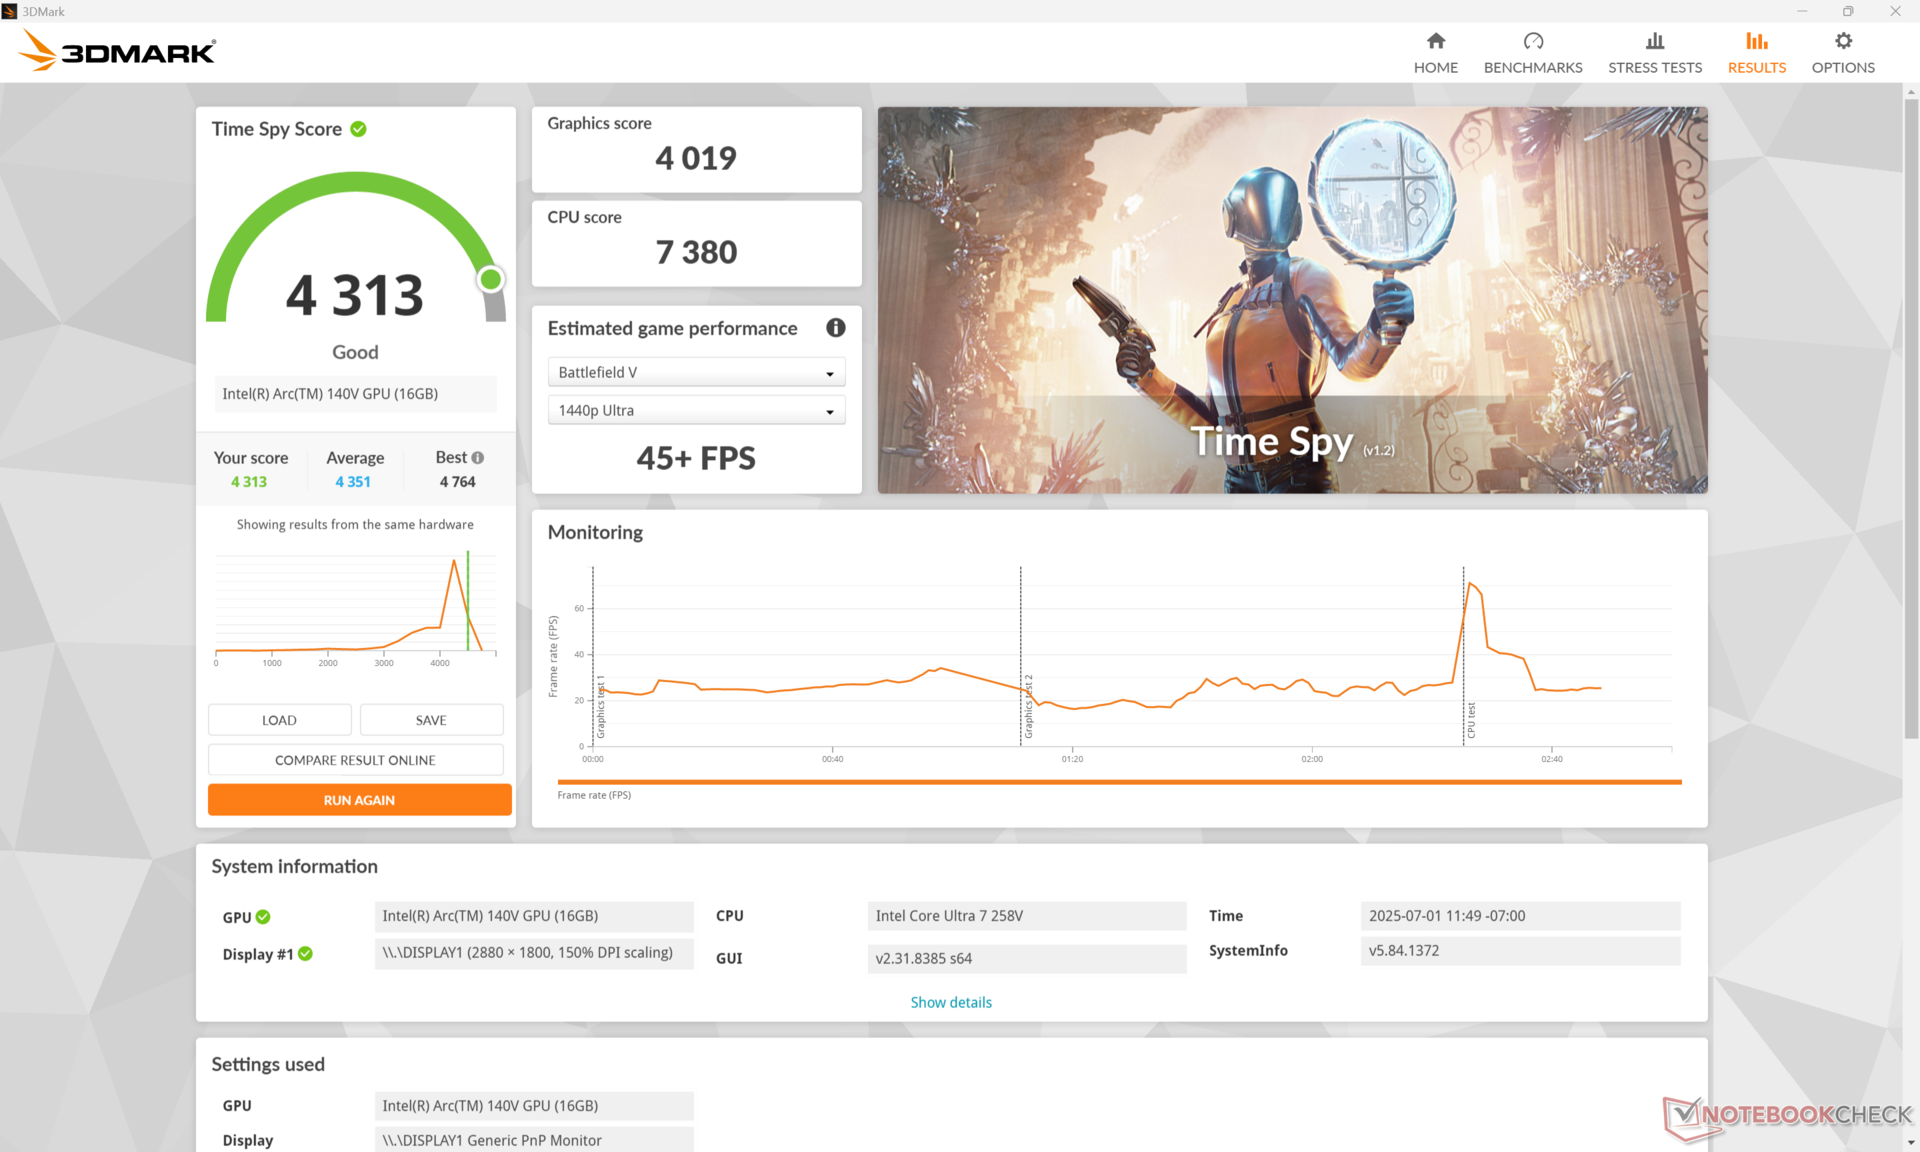
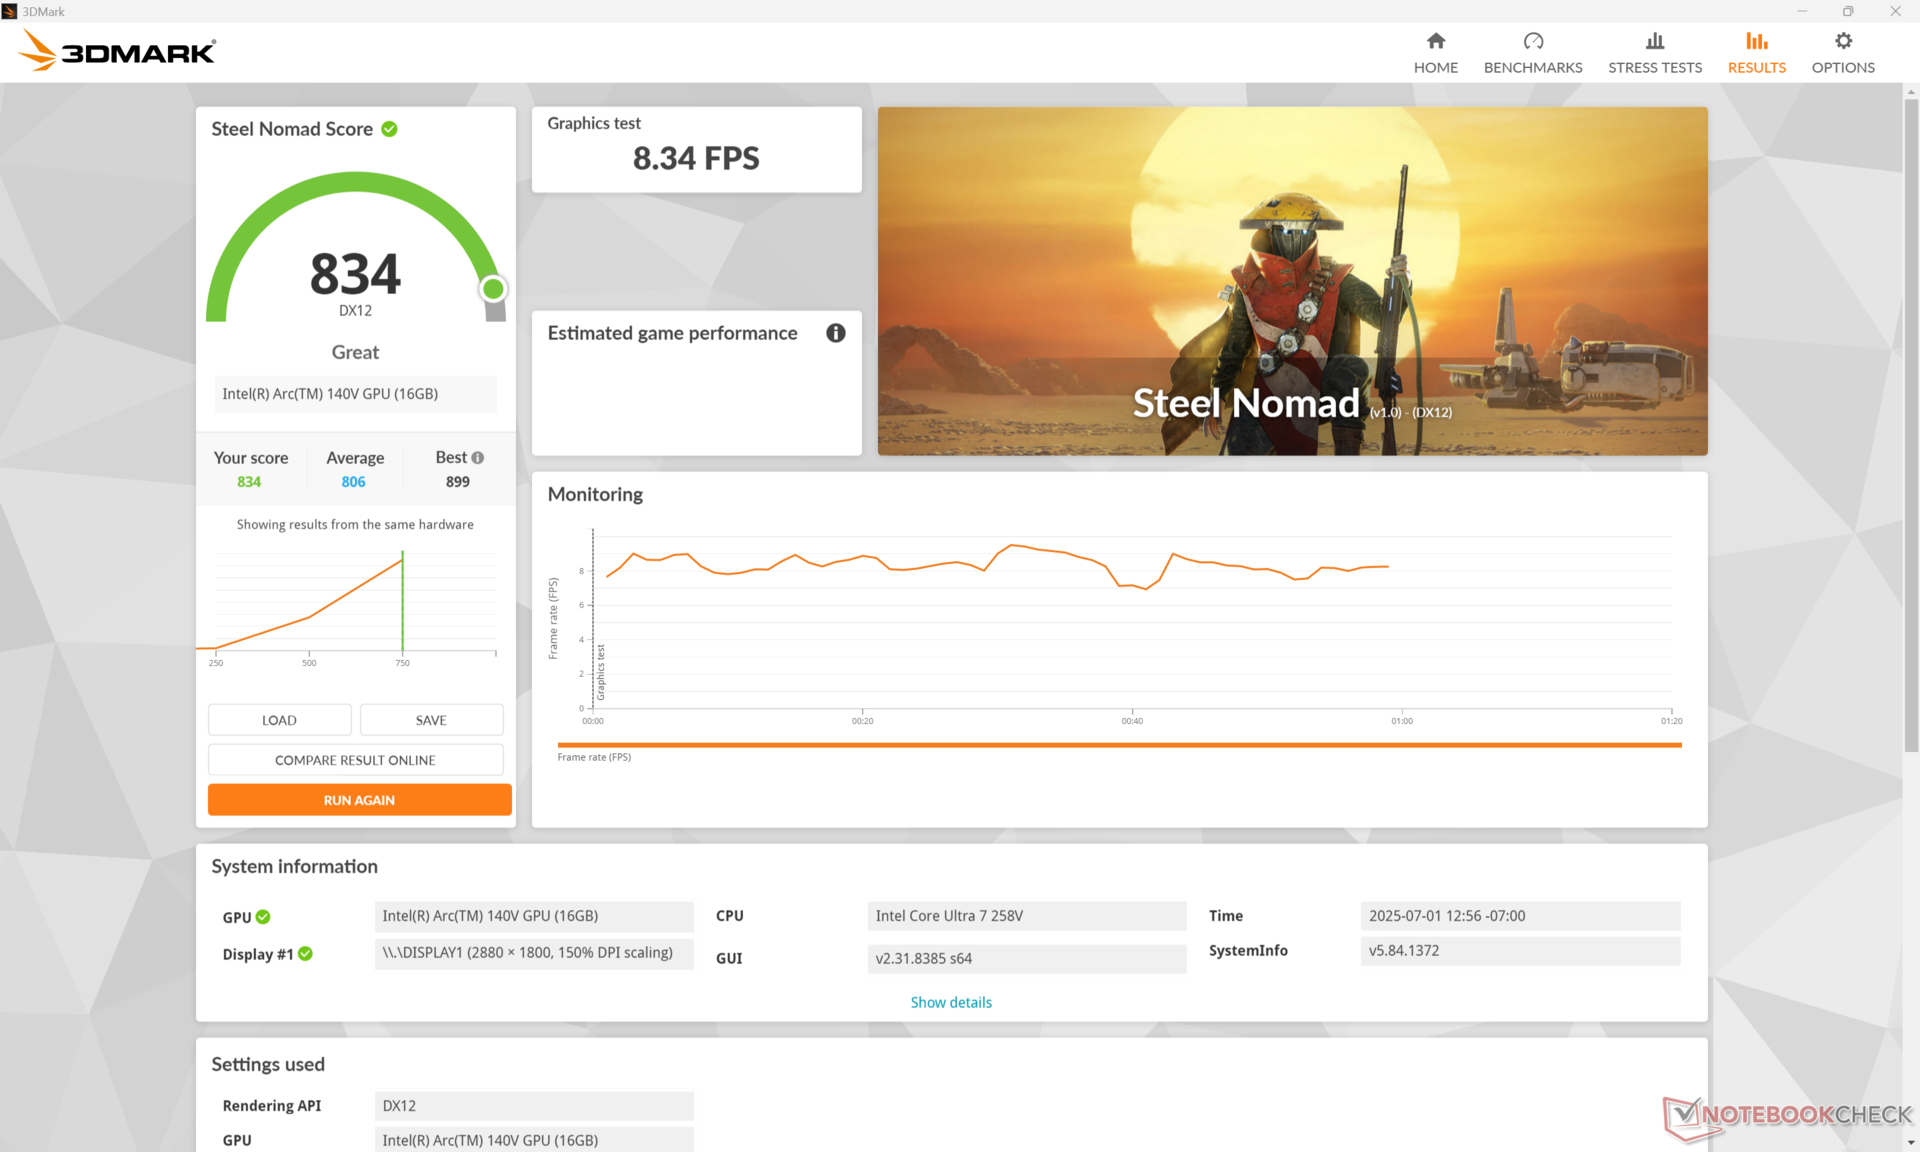
Die Arc Grafik 140V ist eine bemerkenswerte Verbesserung gegenüber der letzten Generation der Iris-Xe-Serie und ist dabei etwa 15 Prozent schneller als die schwächere Arc-130V-Konfiguration. Sie ist allerdings noch immer keine Konkurrenz für die diskrete Nvidia GPU im HP Spectre x360 16.
Im Akkubetrieb sinkt die Leistung um bis zu 20 Prozent.
| Energie-Profil | Grafics-Punktzahl | Physics-Punktzahl | kombinierte Punktzahl |
| Performance-Modus | 9.925 | 2.0155 | 3.467 |
| Ausgeglichener Modus | 9.910 (-0 %) | 20.635 (-0 %) | 3.466 (-0 %) |
| Akku-Leistung | 8.048 (-19 %) | 16.246 (-19 %) | 2.499 (-28 %) |
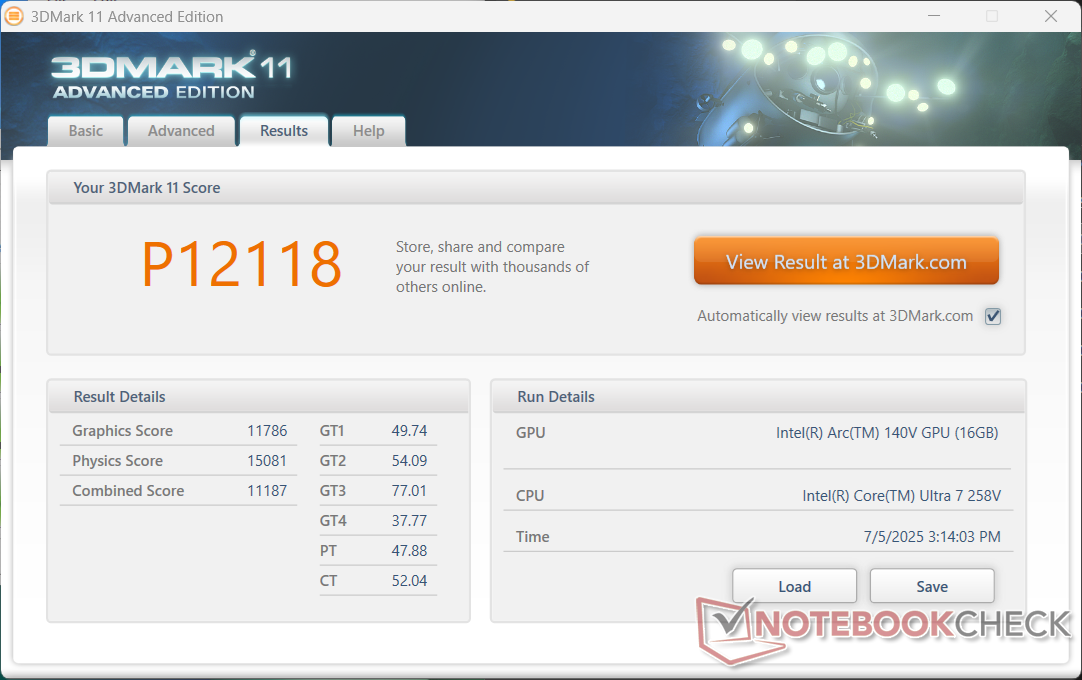
| 3DMark 11 Performance | 12118 Punkte | |
| 3DMark Cloud Gate Standard Score | 32872 Punkte | |
| 3DMark Fire Strike Score | 8940 Punkte | |
| 3DMark Time Spy Score | 4313 Punkte | |
| 3DMark Steel Nomad Score | 834 Punkte | |
Hilfe | ||
* ... kleinere Werte sind besser
Cyberpunk 2077 ultra fps-Chart
| min. | mittel | hoch | max. | |
|---|---|---|---|---|
| Dota 2 Reborn (2015) | 97.2 | 88.4 | 63.5 | 84.9 |
| Final Fantasy XV Benchmark (2018) | 92.9 | 48.8 | 35.5 | |
| X-Plane 11.11 (2018) | 41.8 | 37.9 | 31.9 | |
| Strange Brigade (2018) | 246 | 79.6 | 67.7 | 58.7 |
| Baldur's Gate 3 (2023) | 43 | 36.1 | 29.7 | 29.1 |
| Cyberpunk 2077 (2023) | 46.4 | 37.5 | 32.9 | 23.3 |
| F1 24 (2024) | 91.9 | 83.9 | 64.6 | 20.9 |
Emissionen
Systemrauschen
Das Lüftergeräusch liegt im Allgemeinen bei 28,6 dB(A) vor einem leisen Hintergrund von 27,5 dB(A), wenn man im Internet surft oder Videos streamt. Der Maximalwert von knapp 38 dB(A) wird recht schnell erreicht, wenn höhere Belastungen wie Spiele hinzukommen.
Lautstärkediagramm
| Idle |
| 28 / 28.3 / 28.3 dB(A) |
| Last |
| 37.7 / 37.6 dB(A) |
 | ||
30 dB leise 40 dB(A) deutlich hörbar 50 dB(A) störend |
||
min: | ||
| HP OmniBook X Flip 16 Arc 140V, Core Ultra 7 258V | Dell 16 Plus 2-in-1 Arc 140V, Core Ultra 7 258V, Samsung BM9C1 1024GB | Lenovo Yoga 7 2-in-1 16ILL10 Arc 140V, Core Ultra 7 256V, WD PC SN7100S SDFPMSL-512G-1101 | Samsung Galaxy Book5 Pro 360 Arc 130V, Core Ultra 5 226V, Samsung PM9B1 512GB MZVL4512HBLU | MSI Summit A16 AI Plus A3HMTG Radeon 880M, Ryzen AI 9 365, Samsung PM9C1 MZVL81T0HELB-00BTW | HP Spectre x360 16 RTX 4050 GeForce RTX 4050 Laptop GPU, Ultra 7 155H, SK hynix PC801 HFS001TEJ9X101N | |
|---|---|---|---|---|---|---|
| Geräuschentwicklung | 6% | 4% | 9% | -6% | 17% | |
| aus / Umgebung * (dB) | 27.5 | 23.2 16% | 23.3 15% | 23.6 14% | 23.8 13% | 23.3 15% |
| Idle min * (dB) | 28 | 23 18% | 23.3 17% | 23.6 16% | 25 11% | 23.6 16% |
| Idle avg * (dB) | 28.3 | 23 19% | 23.3 18% | 23.6 17% | 25 12% | 23.6 17% |
| Idle max * (dB) | 28.3 | 24.7 13% | 25.7 9% | 23.6 17% | 29.5 -4% | 23.6 17% |
| Last avg * (dB) | 37.7 | 32.5 14% | 40.2 -7% | 29.4 22% | 37.5 1% | 29.2 23% |
| Cyberpunk 2077 ultra * (dB) | 36.2 | 42.6 -18% | 41.6 -15% | 40.6 -12% | 46.5 -28% | |
| Last max * (dB) | 37.6 | 45.6 -21% | 41.6 -11% | 40.6 -8% | 56.1 -49% | 32.1 15% |
| Witcher 3 ultra * (dB) | 32.1 |
* ... kleinere Werte sind besser
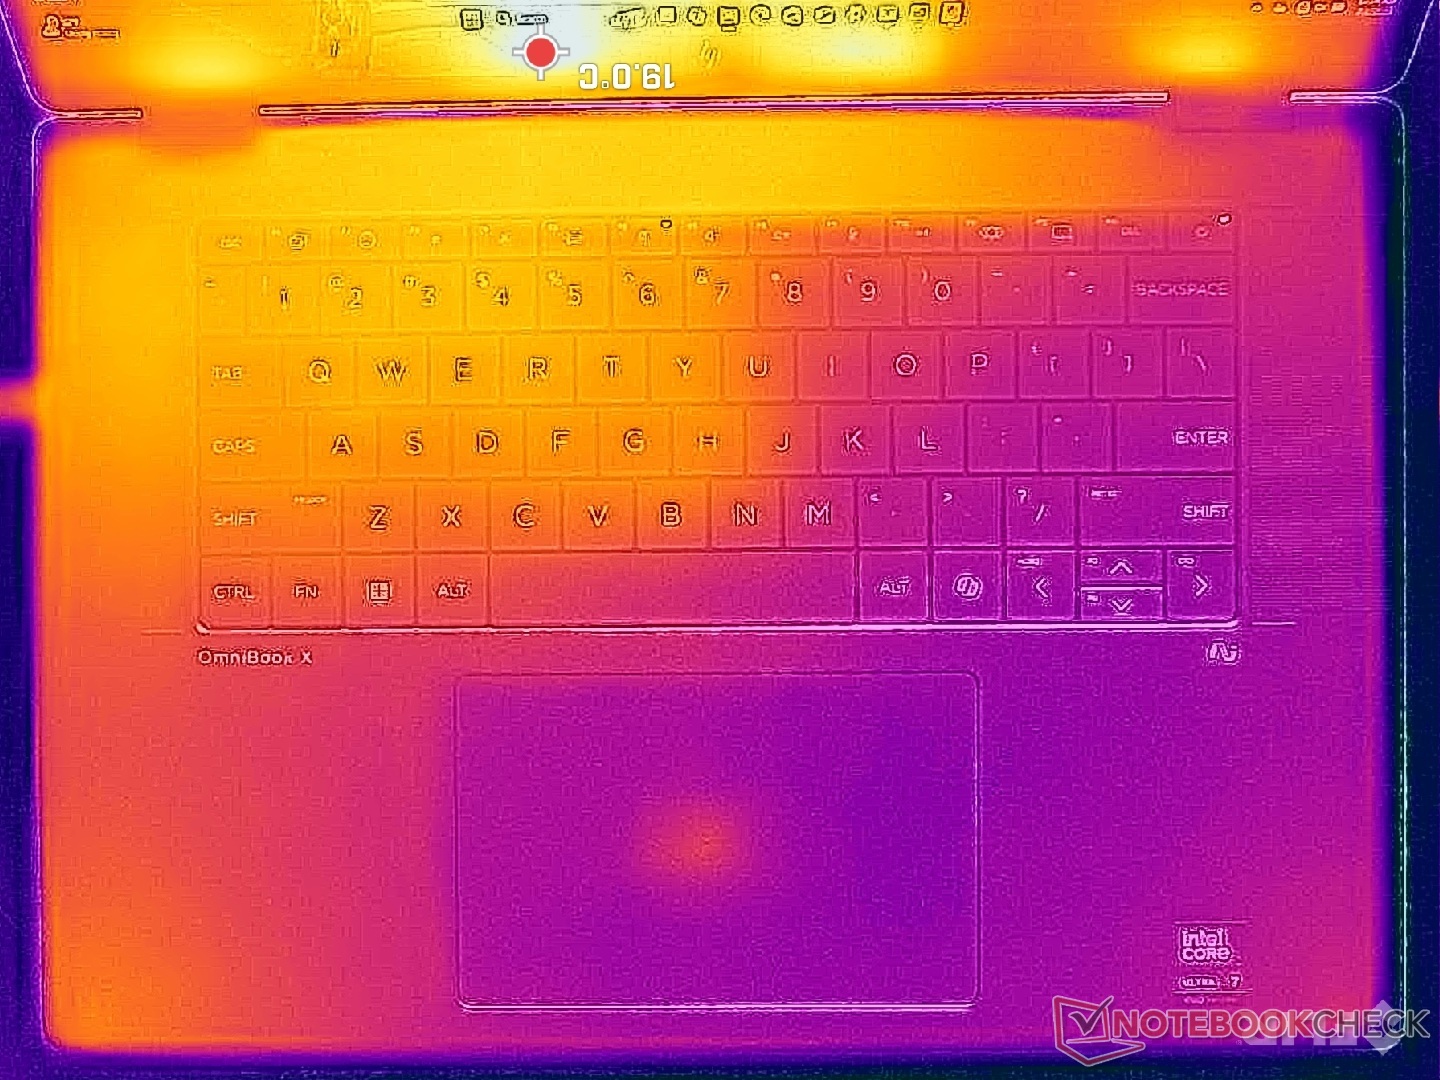
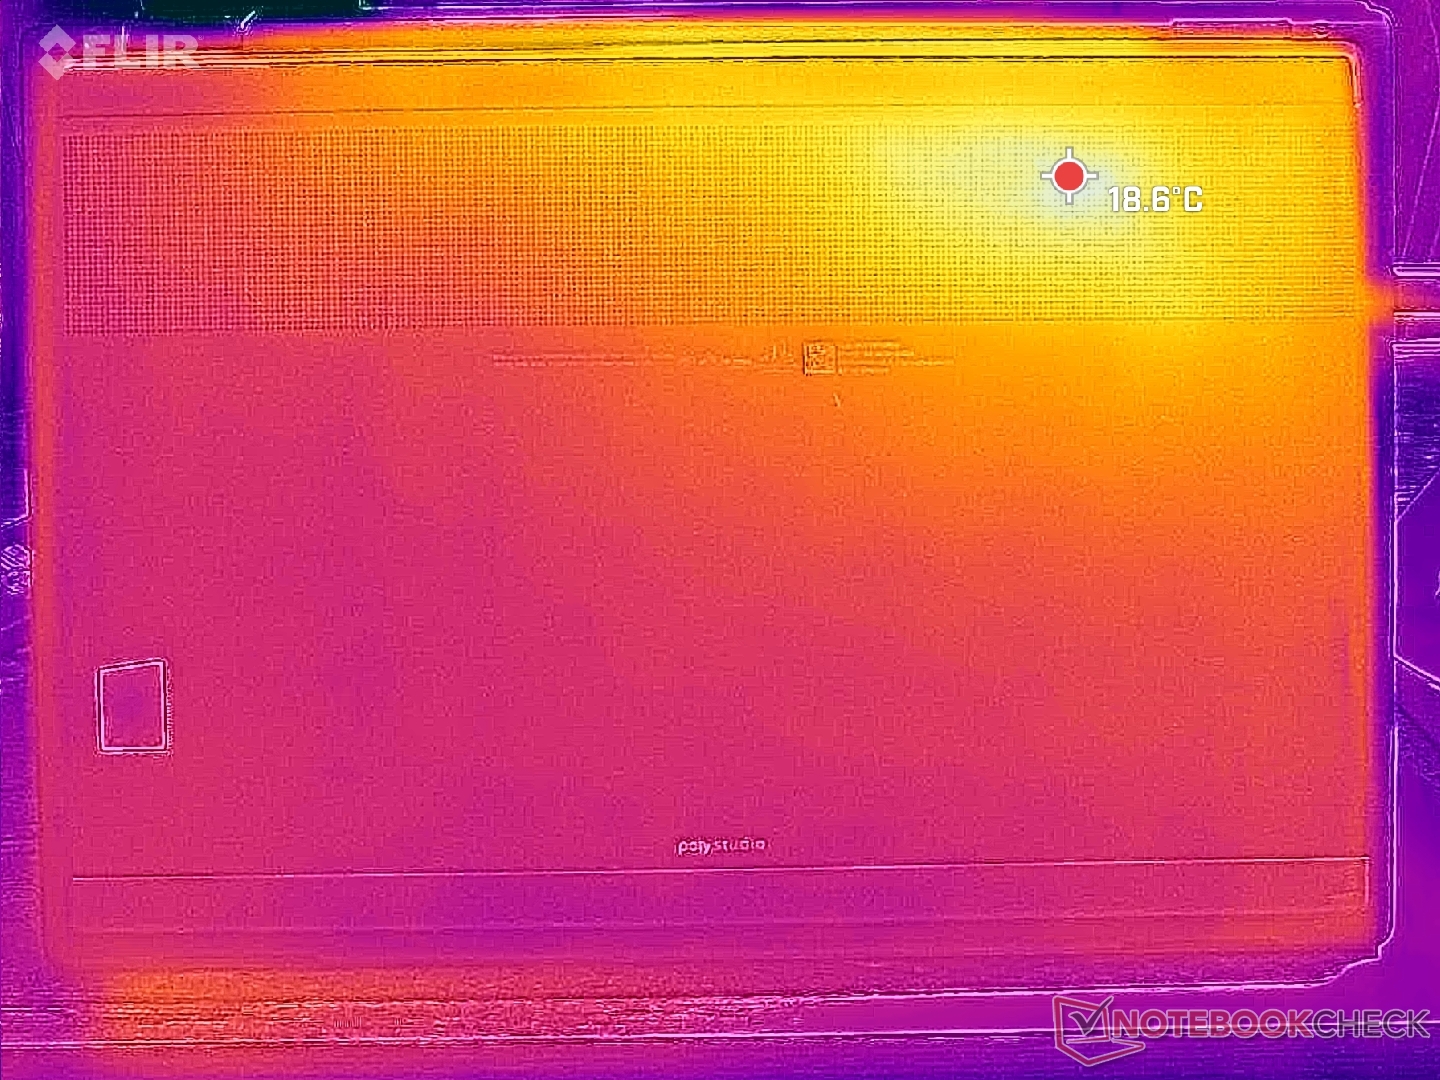
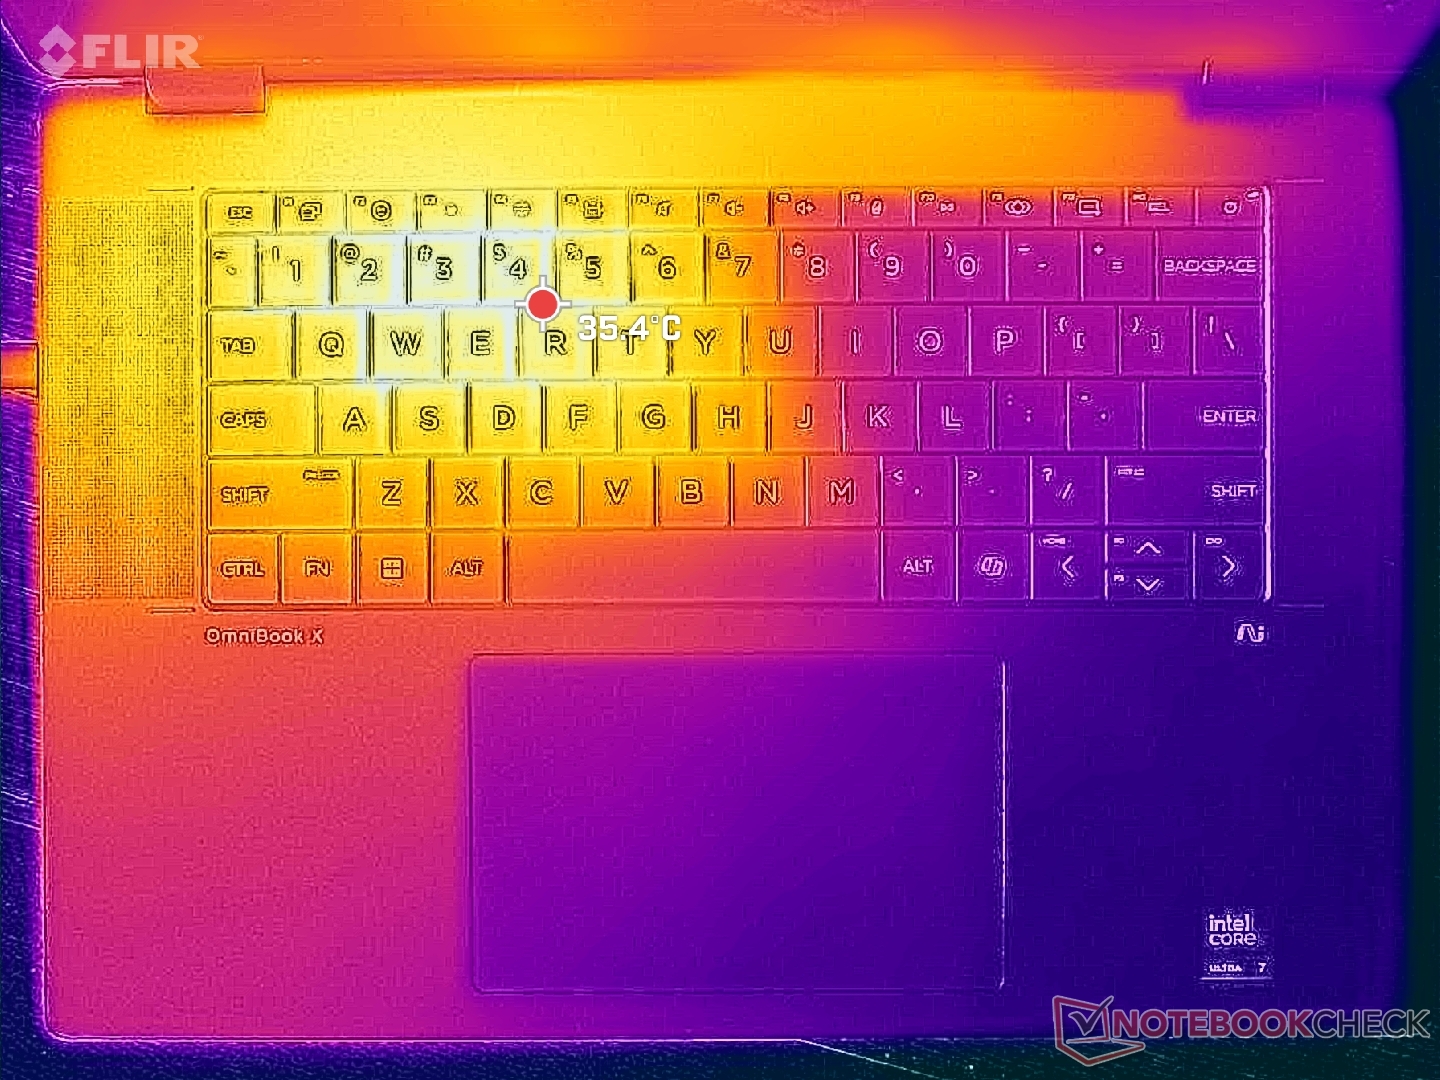
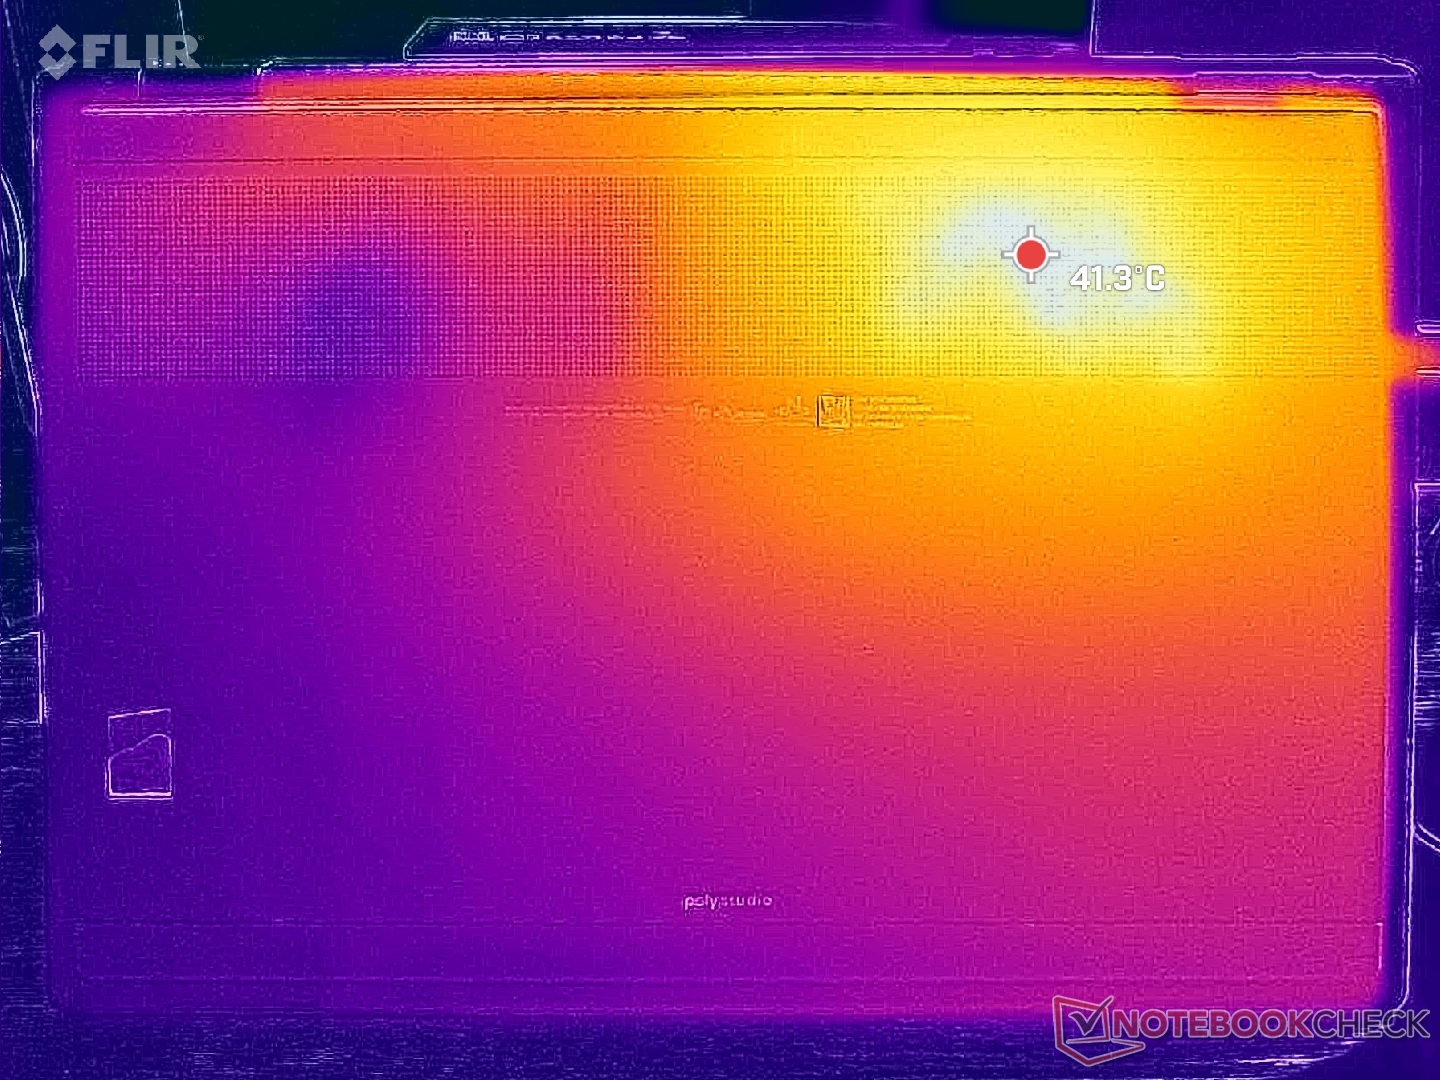
Temperatur
Die Hotspots auf der Oberfläche ähneln denen, die wir beim Dell Plus 16 2-in-1 der Konkurrenz beobachtet haben. Beim HP sind die Hotspots jedoch deutlich kühler, und zwar um einige Grad Celsius.
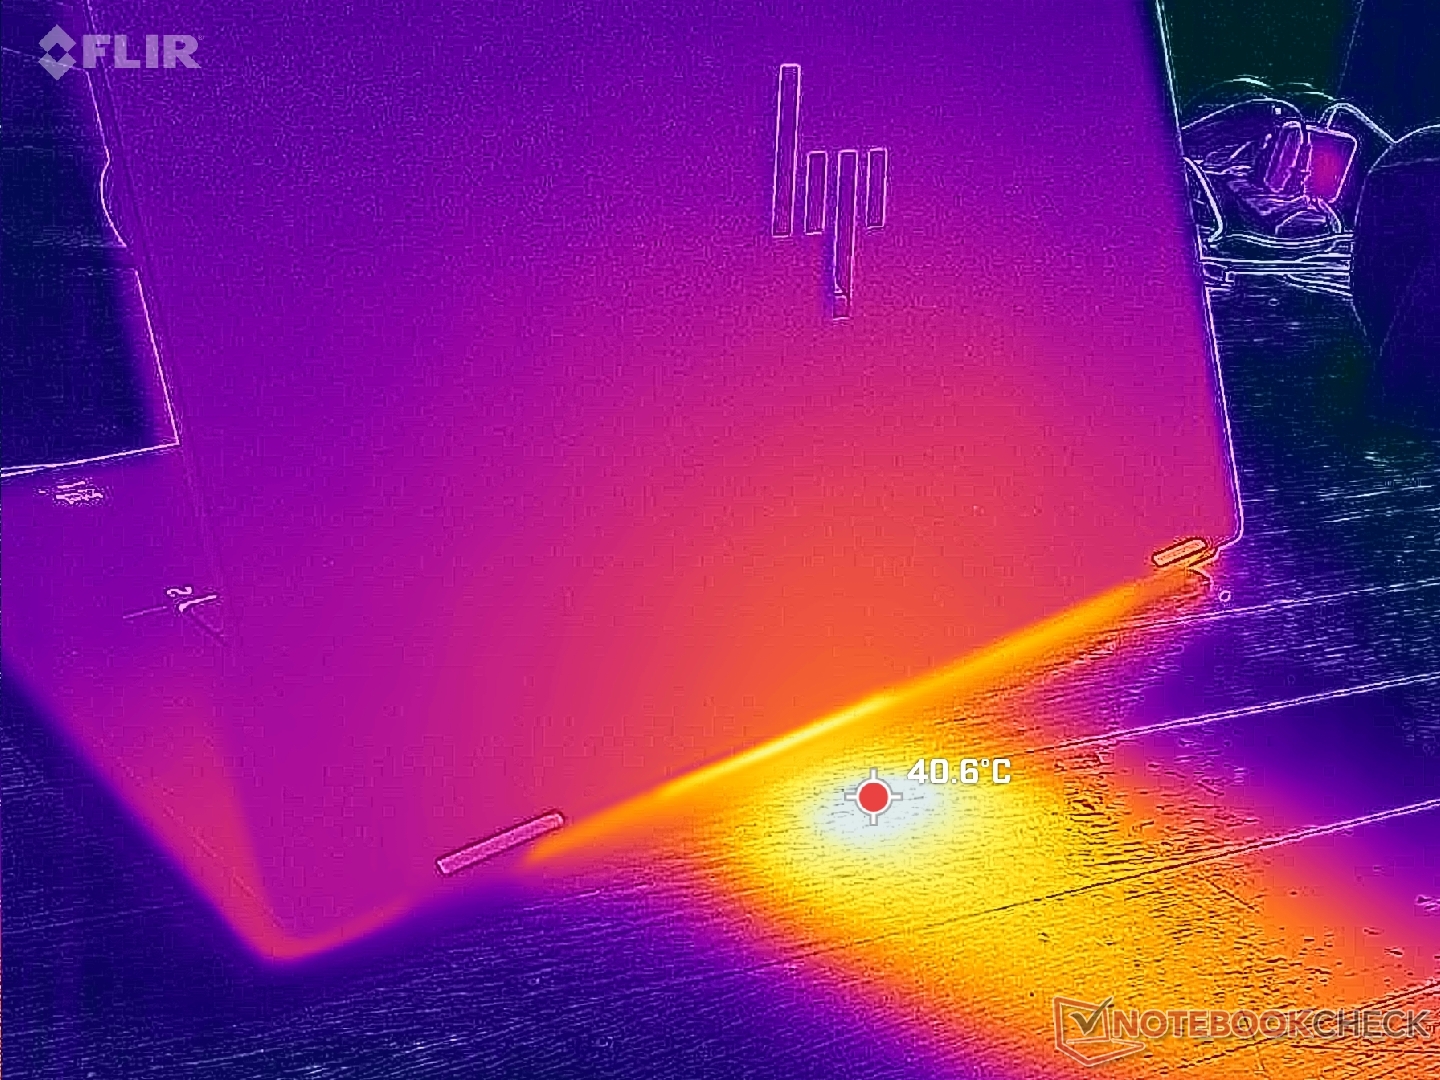
(+) Die maximale Temperatur auf der Oberseite ist 38 °C. Im Vergleich liegt der Klassendurchschnitt bei 35.4 °C (von 19.6 bis 60 °C für die Klasse Convertible).
(+) Auf der Unterseite messen wir eine maximalen Wert von 39.4 °C (im Vergleich zum Durchschnitt von 36.9 °C).
(+) Ohne Last messen wir eine durchschnittliche Temperatur von 23 °C auf der Oberseite. Der Klassendurchschnitt erreicht 30.3 °C.
(+) Die Handballen und der Touchpad-Bereich sind mit gemessenen 27.2 °C kühler als die typische Hauttemperatur und fühlen sich dadurch kühl an.
(±) Die durchschnittliche Handballen-Temperatur anderer getesteter Geräte war 28 °C (+0.8 °C).
| HP OmniBook X Flip 16 Intel Core Ultra 7 258V, Intel Arc Graphics 140V | Dell 16 Plus 2-in-1 Intel Core Ultra 7 258V, Intel Arc Graphics 140V | Lenovo Yoga 7 2-in-1 16ILL10 Intel Core Ultra 7 256V, Intel Arc Graphics 140V | Samsung Galaxy Book5 Pro 360 Intel Core Ultra 5 226V, Intel Arc Graphics 130V | MSI Summit A16 AI Plus A3HMTG AMD Ryzen AI 9 365, AMD Radeon 880M | HP Spectre x360 16 RTX 4050 Intel Core Ultra 7 155H, NVIDIA GeForce RTX 4050 Laptop GPU | |
|---|---|---|---|---|---|---|
| Hitze | -20% | -4% | -3% | -22% | -11% | |
| Last oben max * (°C) | 38 | 44 -16% | 42.6 -12% | 40.9 -8% | 52.8 -39% | 39.6 -4% |
| Last unten max * (°C) | 39.4 | 39.4 -0% | 36.8 7% | 45.1 -14% | 42 -7% | 39.2 1% |
| Idle oben max * (°C) | 25 | 31.8 -27% | 26.4 -6% | 23.8 5% | 30.6 -22% | 29 -16% |
| Idle unten max * (°C) | 25 | 34.2 -37% | 26.6 -6% | 23.5 6% | 29.6 -18% | 31.6 -26% |
* ... kleinere Werte sind besser
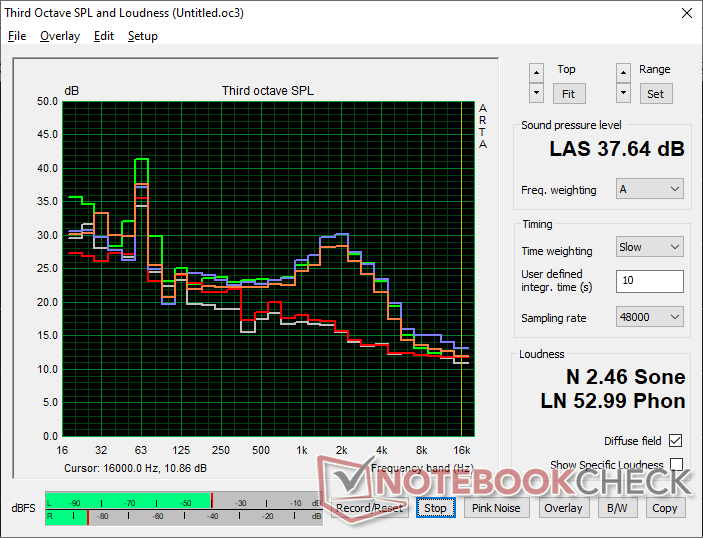
Lautsprecher
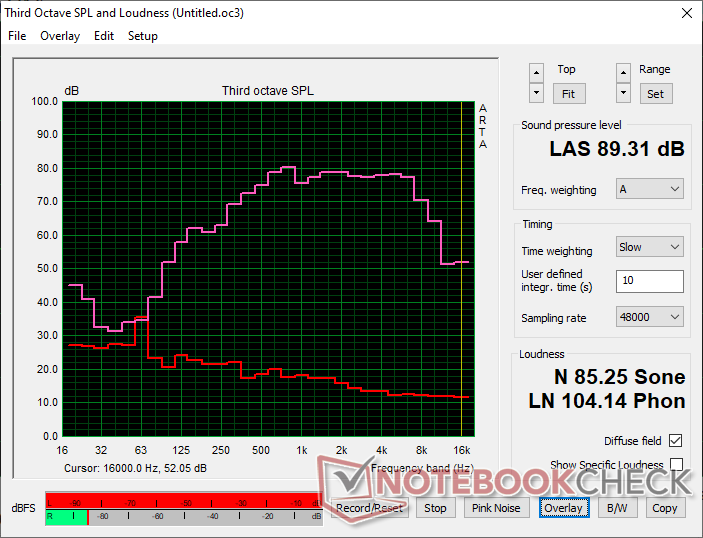
HP OmniBook X Flip 16 Audio Analyse
(+) | Die Lautsprecher können relativ laut spielen (89.3 dB)
Bass 100 - 315 Hz
(±) | abgesenkter Bass - 14.6% geringer als der Median
(±) | durchschnittlich lineare Bass-Wiedergabe (8.6% Delta zum Vorgänger)
Mitteltöne 400 - 2000 Hz
(+) | ausgeglichene Mitten, vom Median nur 2.5% abweichend
(+) | lineare Mitten (4.1% Delta zum Vorgänger)
Hochtöne 2 - 16 kHz
(+) | ausgeglichene Hochtöne, vom Median nur 3.9% abweichend
(+) | sehr lineare Hochtöne (4% Delta zum Vorgänger)
Gesamt im hörbaren Bereich 100 - 16.000 Hz
(+) | hörbarer Bereich ist sehr linear (14.2% Abstand zum Median
Im Vergleich zu allen Geräten derselben Klasse
» 21% aller getesteten Geräte dieser Klasse waren besser, 3% vergleichbar, 76% schlechter
» Das beste Gerät hat einen Delta-Wert von 6%, durchschnittlich ist 20%, das schlechteste Gerät hat 57%
Im Vergleich zu allen Geräten im Test
» 17% aller getesteten Geräte waren besser, 4% vergleichbar, 79% schlechter
» Das beste Gerät hat einen Delta-Wert von 4%, durchschnittlich ist 24%, das schlechteste Gerät hat 134%
Apple MacBook Pro 16 2021 M1 Pro Audio Analyse
(+) | Die Lautsprecher können relativ laut spielen (84.7 dB)
Bass 100 - 315 Hz
(+) | guter Bass - nur 3.8% Abweichung vom Median
(+) | lineare Bass-Wiedergabe (5.2% Delta zum Vorgänger)
Mitteltöne 400 - 2000 Hz
(+) | ausgeglichene Mitten, vom Median nur 1.3% abweichend
(+) | lineare Mitten (2.1% Delta zum Vorgänger)
Hochtöne 2 - 16 kHz
(+) | ausgeglichene Hochtöne, vom Median nur 1.9% abweichend
(+) | sehr lineare Hochtöne (2.7% Delta zum Vorgänger)
Gesamt im hörbaren Bereich 100 - 16.000 Hz
(+) | hörbarer Bereich ist sehr linear (4.6% Abstand zum Median
Im Vergleich zu allen Geräten derselben Klasse
» 0% aller getesteten Geräte dieser Klasse waren besser, 0% vergleichbar, 100% schlechter
» Das beste Gerät hat einen Delta-Wert von 5%, durchschnittlich ist 17%, das schlechteste Gerät hat 45%
Im Vergleich zu allen Geräten im Test
» 0% aller getesteten Geräte waren besser, 0% vergleichbar, 100% schlechter
» Das beste Gerät hat einen Delta-Wert von 4%, durchschnittlich ist 24%, das schlechteste Gerät hat 134%
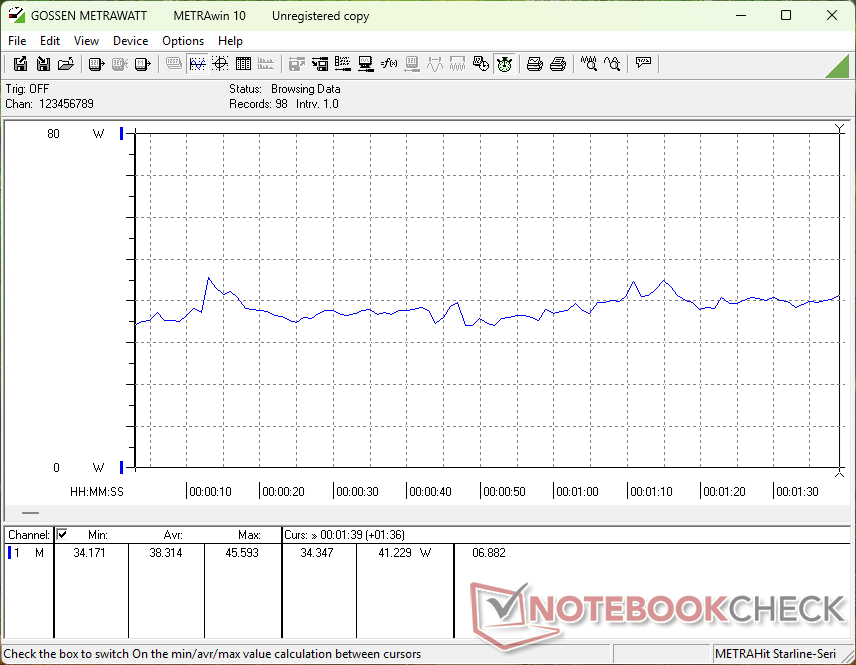
Energieverwaltung
Stromverbrauch
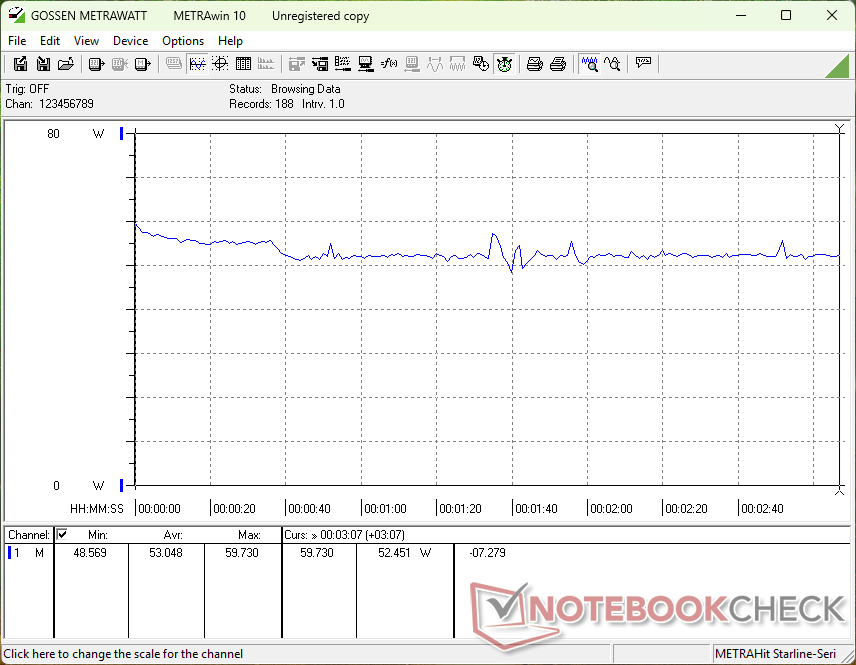
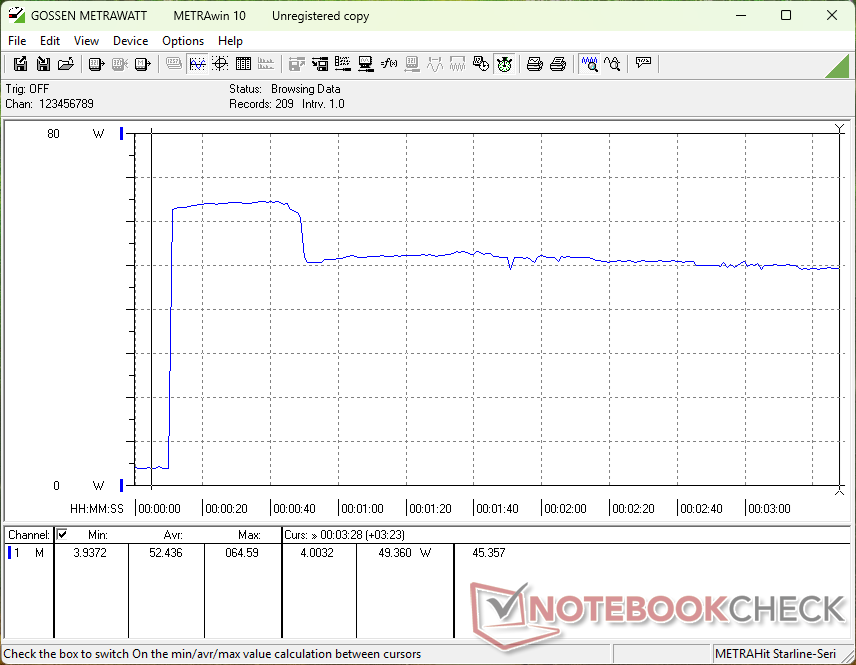
Intel Lunar Lake ist extrem effizient, und das gilt auch für das HP. Wenn man zum Beispiel Cyberpunk 2077 ausführt, benötigt das OmniBook X Flip 16 weniger Strom als das AMD betriebene MSI Summit A16 AI Plus und bietet dabei durchweg schnellere Bildraten. Die rohe Prozessorleistung ist jedoch immer noch nicht mit dem Ryzen AI 9 365 vergleichbar.
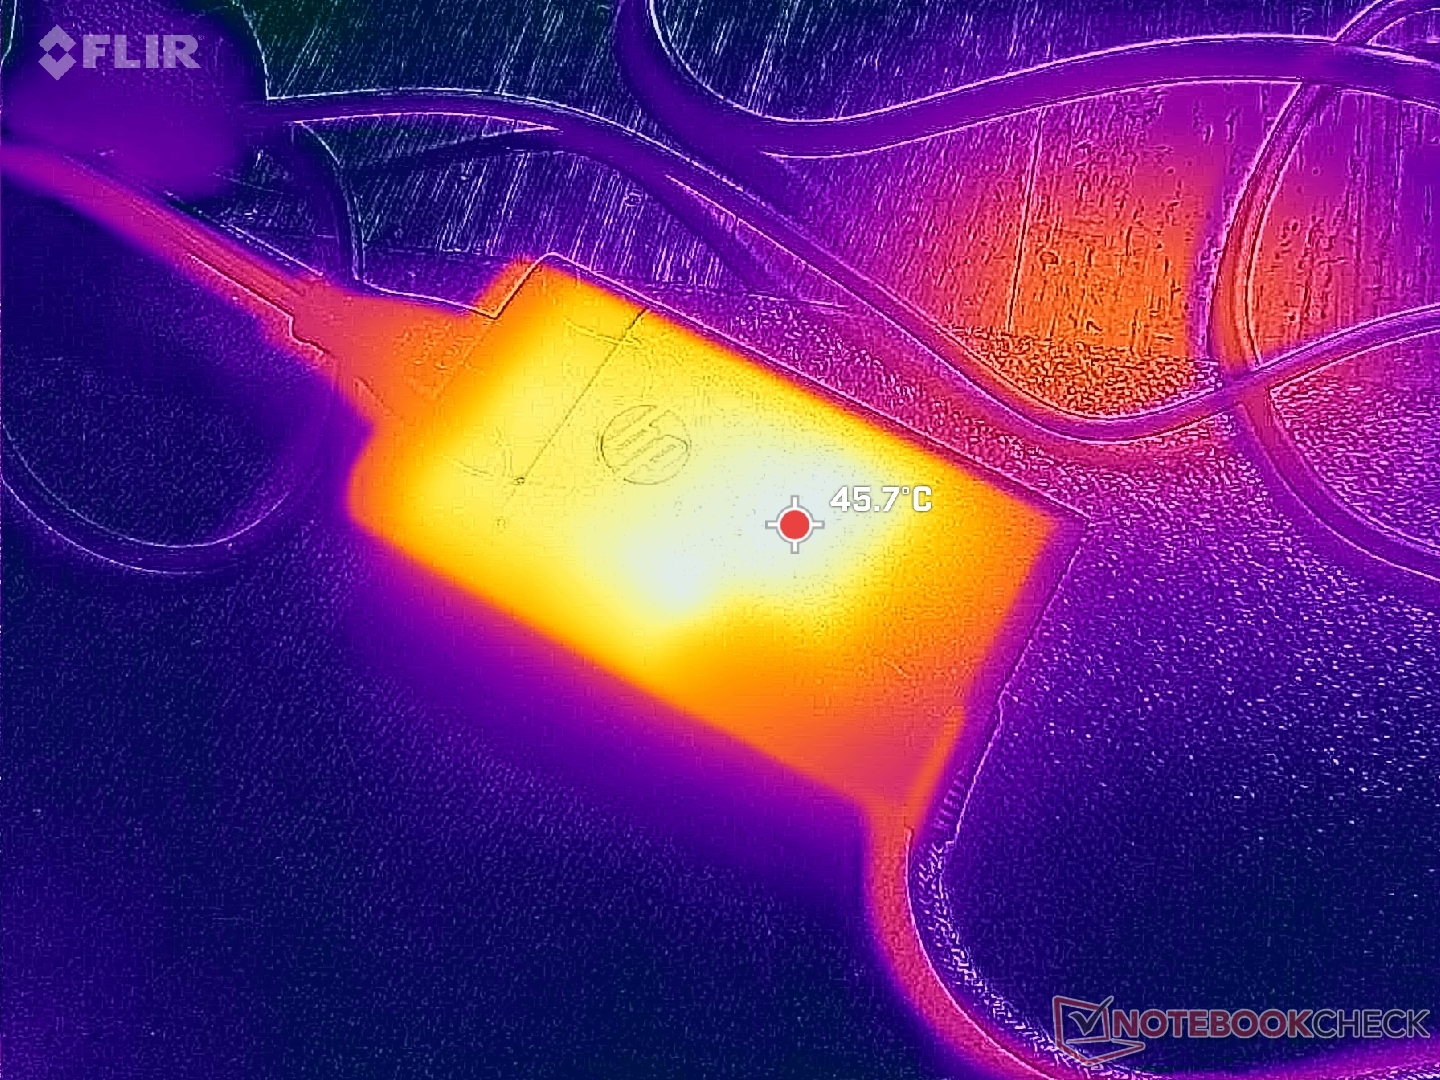
Wir konnten mit dem kleinen (~6,8 x 2,2 x 5,4 cm) 65-W-USB-C-Netzteil eine vorübergehende maximale Leistungsaufnahme von 65 W aufzeichnen, wenn die CPU zu 100 Prozent ausgelastet ist.

| Aus / Standby | |
| Idle | |
| Last |
|
Legende:
min: | |
| HP OmniBook X Flip 16 Core Ultra 7 258V, Arc 140V, , OLED, 2880x1800, 16" | Dell 16 Plus 2-in-1 Core Ultra 7 258V, Arc 140V, Samsung BM9C1 1024GB, Mini-LED, 2560x1600, 16" | Lenovo Yoga 7 2-in-1 16ILL10 Core Ultra 7 256V, Arc 140V, WD PC SN7100S SDFPMSL-512G-1101, IPS, 1920x1200, 16" | Samsung Galaxy Book5 Pro 360 Core Ultra 5 226V, Arc 130V, Samsung PM9B1 512GB MZVL4512HBLU, OLED, 2880x1800, 16" | MSI Summit A16 AI Plus A3HMTG Ryzen AI 9 365, Radeon 880M, Samsung PM9C1 MZVL81T0HELB-00BTW, IPS, 2560x1600, 16" | HP Spectre x360 16 RTX 4050 Ultra 7 155H, GeForce RTX 4050 Laptop GPU, SK hynix PC801 HFS001TEJ9X101N, OLED, 2880x1800, 16" | |
|---|---|---|---|---|---|---|
| Stromverbrauch | -47% | -11% | -8% | -54% | -133% | |
| Idle min * (Watt) | 3.1 | 7 -126% | 4.2 -35% | 5.3 -71% | 5.4 -74% | 5.8 -87% |
| Idle avg * (Watt) | 4.4 | 13.2 -200% | 8.3 -89% | 6.7 -52% | 11 -150% | 12.3 -180% |
| Idle max * (Watt) | 11.4 | 13.4 -18% | 9.5 17% | 7.3 36% | 11.2 2% | 33.9 -197% |
| Last avg * (Watt) | 38.3 | 43.9 -15% | 40.3 -5% | 37.6 2% | 76.6 -100% | 83.3 -117% |
| Cyberpunk 2077 ultra external monitor * (Watt) | 48.7 | 40.7 16% | 40.8 16% | 42.8 12% | 49.2 -1% | |
| Cyberpunk 2077 ultra * (Watt) | 53.1 | 44.9 15% | 47.4 11% | 44.6 16% | 61.1 -15% | |
| Last max * (Watt) | 64.9 | 67.8 -4% | 59 9% | 64.1 1% | 91.8 -41% | 120.8 -86% |
| Witcher 3 ultra * (Watt) | 89.1 |
* ... kleinere Werte sind besser
Energieverbrauch Cyberpunk / Stresstest
Energieverbrauch externer Monitor
Akkulaufzeit
| HP OmniBook X Flip 16 Core Ultra 7 258V, Arc 140V, 68 Wh | Dell 16 Plus 2-in-1 Core Ultra 7 258V, Arc 140V, 64 Wh | Lenovo Yoga 7 2-in-1 16ILL10 Core Ultra 7 256V, Arc 140V, 70 Wh | Samsung Galaxy Book5 Pro 360 Core Ultra 5 226V, Arc 130V, 76 Wh | MSI Summit A16 AI Plus A3HMTG Ryzen AI 9 365, Radeon 880M, 82 Wh | HP Spectre x360 16 RTX 4050 Ultra 7 155H, GeForce RTX 4050 Laptop GPU, 83 Wh | |
|---|---|---|---|---|---|---|
| Akkulaufzeit | -30% | 56% | -16% | -29% | -14% | |
| WLAN (h) | 12.8 | 8.9 -30% | 20 56% | 10.8 -16% | 9.1 -29% | 11 -14% |
| H.264 (h) | 19.7 | |||||
| Last (h) | 2.1 |
Notebookcheck Bewertung
HP OmniBook X Flip 16
- 10.07.2025 v8
Allen Ngo
 Total Sustainability Score:
 Potentielle Konkurrenten im Vergleich
Bild | Modell / Test | Preis ab | Gewicht | Dicke | Display |
|---|---|---|---|---|---|
1. 86.9%  | HP OmniBook X Flip 16 Intel Core Ultra 7 258V ⎘ Intel Arc Graphics 140V ⎘ 16 GB RAM | Amazon: 2.133,00 € Bestpreis 1899€ nullprozentshop.de 2. 1899€ notebooksbilliger.de 3. 1914.96€ notebooksbilliger.at | 1.9 kg | 15.5 mm | 16.00" 2880x1800 212 PPI OLED |
2. 83.5%  | Dell 16 Plus 2-in-1 Intel Core Ultra 7 258V ⎘ Intel Arc Graphics 140V ⎘ 32 GB RAM, 1024 GB SSD | Amazon: 2.891,45 € Geizhals Suche | 2 kg | 16.99 mm | 16.00" 2560x1600 189 PPI Mini-LED |
3. 84.3%  | Lenovo Yoga 7 2-in-1 16ILL10 Intel Core Ultra 7 256V ⎘ Intel Arc Graphics 140V ⎘ 16 GB RAM, 512 GB SSD | Amazon: Geizhals Suche | 1.9 kg | 15.85 mm | 16.00" 1920x1200 142 PPI IPS |
4. 85.9%  | Samsung Galaxy Book5 Pro 360 Intel Core Ultra 5 226V ⎘ Intel Arc Graphics 130V ⎘ 16 GB RAM, 512 GB SSD | Amazon: 899,00 € Bestpreis 1512.82€ galaxus 2. 1589€ galaxus.at 3. 1719€ saturn | 1.7 kg | 12.8 mm | 16.00" 2880x1800 212 PPI OLED |
5. 81.9%  | MSI Summit A16 AI Plus A3HMTG AMD Ryzen AI 9 365 ⎘ AMD Radeon 880M ⎘ 32 GB RAM, 1024 GB SSD | Amazon: 1.748,98 € Bestpreis 1699.89€ playox.de 2. 1699.9€ office-partner.de 3. 1701.6€ OTTO Office | 2.1 kg | 16.85 mm | 16.00" 2560x1600 189 PPI IPS |
6. 91.1% v7 (old)  | HP Spectre x360 16 RTX 4050 Intel Core Ultra 7 155H ⎘ NVIDIA GeForce RTX 4050 Laptop GPU ⎘ 16 GB RAM, 1024 GB SSD | Amazon: Geizhals Suche | 2 kg | 19.8 mm | 16.00" 2880x1800 212 PPI OLED |
Transparenz
Die Auswahl der zu testenden Geräte erfolgt innerhalb der Redaktion. Das vorliegende Testmuster wurde dem Autor vom Hersteller oder einem Shop zu Testzwecken leihweise zur Verfügung gestellt. Eine Einflussnahme des Leihstellers auf den Testbericht gab es nicht, der Hersteller erhielt keine Version des Reviews vor der Veröffentlichung. Es bestand keine Verpflichtung zur Publikation. Als eigenständiges, unabhängiges Unternehmen unterliegt Notebookcheck keiner Diktion von Herstellern, Shops und Verlagen.
So testet Notebookcheck
Pro Jahr werden von Notebookcheck hunderte Laptops und Smartphones unabhängig in von uns standardisierten technischen Verfahren getestet, um eine Vergleichbarkeit aller Testergebnisse zu gewährleisten. Seit rund 20 Jahren entwickeln wir diese Testmethoden kontinuierlich weiter und setzen damit Branchenstandards. In unseren Testlaboren kommt ausschließlich hochwertiges Messequipment in die Hände erfahrener Techniker und Redakteure. Die Tests unterliegen einer mehrstufigen Kontrolle. Unsere komplexe Gesamtbewertung basiert auf hunderten fundierten Messergebnissen und Benchmarks, womit Ihnen Objektivität garantiert ist. Weitere Informationen zu unseren Testmethoden gibt es hier.

