Fazit - Galaxy Book6 Pro: Gut, aber auch teurer
Samsung verwendet für das neue Galaxy Book6 Pro endlich hellere OLED-Bildschirme und der neue 120 Hz Touchscreen mit bis zu 1200 nits Spitzenhelligkeit bietet eine hervorragende Bildqualität. Der Nachteil daran ist das ständige PWM-Flackern, so dass empfindliche Benutzer aufpassen sollten. Außerdem gibt es die neuen Panther-Lake-Prozessoren von Intel, unser Testgerät ist jedoch nur mit dem Core Ultra 7 356H mit der langsamen iGPU ausgestattet, die ziemlich träge ist. Für alltägliche Aufgaben wie Videostreaming ist sie ausreichend, aber wenn Sie einige Spiele spielen möchten, empfehlen wir die SKU mit dem Core Ultra X7.
Das Aluminiumgehäuse ist wieder einmal sehr schlank und stabil und die Anschlussausstattung ausreichend, wenngleich ohne card reader. Die Lüfter sind leise, die Temperaturen sind niedrig und die Akkulaufzeiten sind sehr gut, auch wenn einige Konkurrenten mit günstigeren Bildschirmen, wie das Dell XPS 16, das wir getestet haben, mehr Ausdauer haben. Uns gefallen auch die neuen Eingabegeräte mit dem haptischen Trackpad, aber leider hat Samsung den dedizierten Ziffernblock entfernt.
Das große Problem hier ist der Preis, denn unser Gerät kostet 2.200 Euro und das beinhaltet noch nicht einmal den schnelleren Core Ultra X7 Prozessor mit der Arc B390 iGPU. Alles in allem ist das neue Galaxy Book6 Pro ein gutes, aber teures Gesamtpaket für den täglichen Gebrauch.
Pro
Contra
Preis und Verfügbarkeit
Sie können das neue Galaxy Book6 Pro direkt bei Samsung ab 2.200 Euro bestellen.
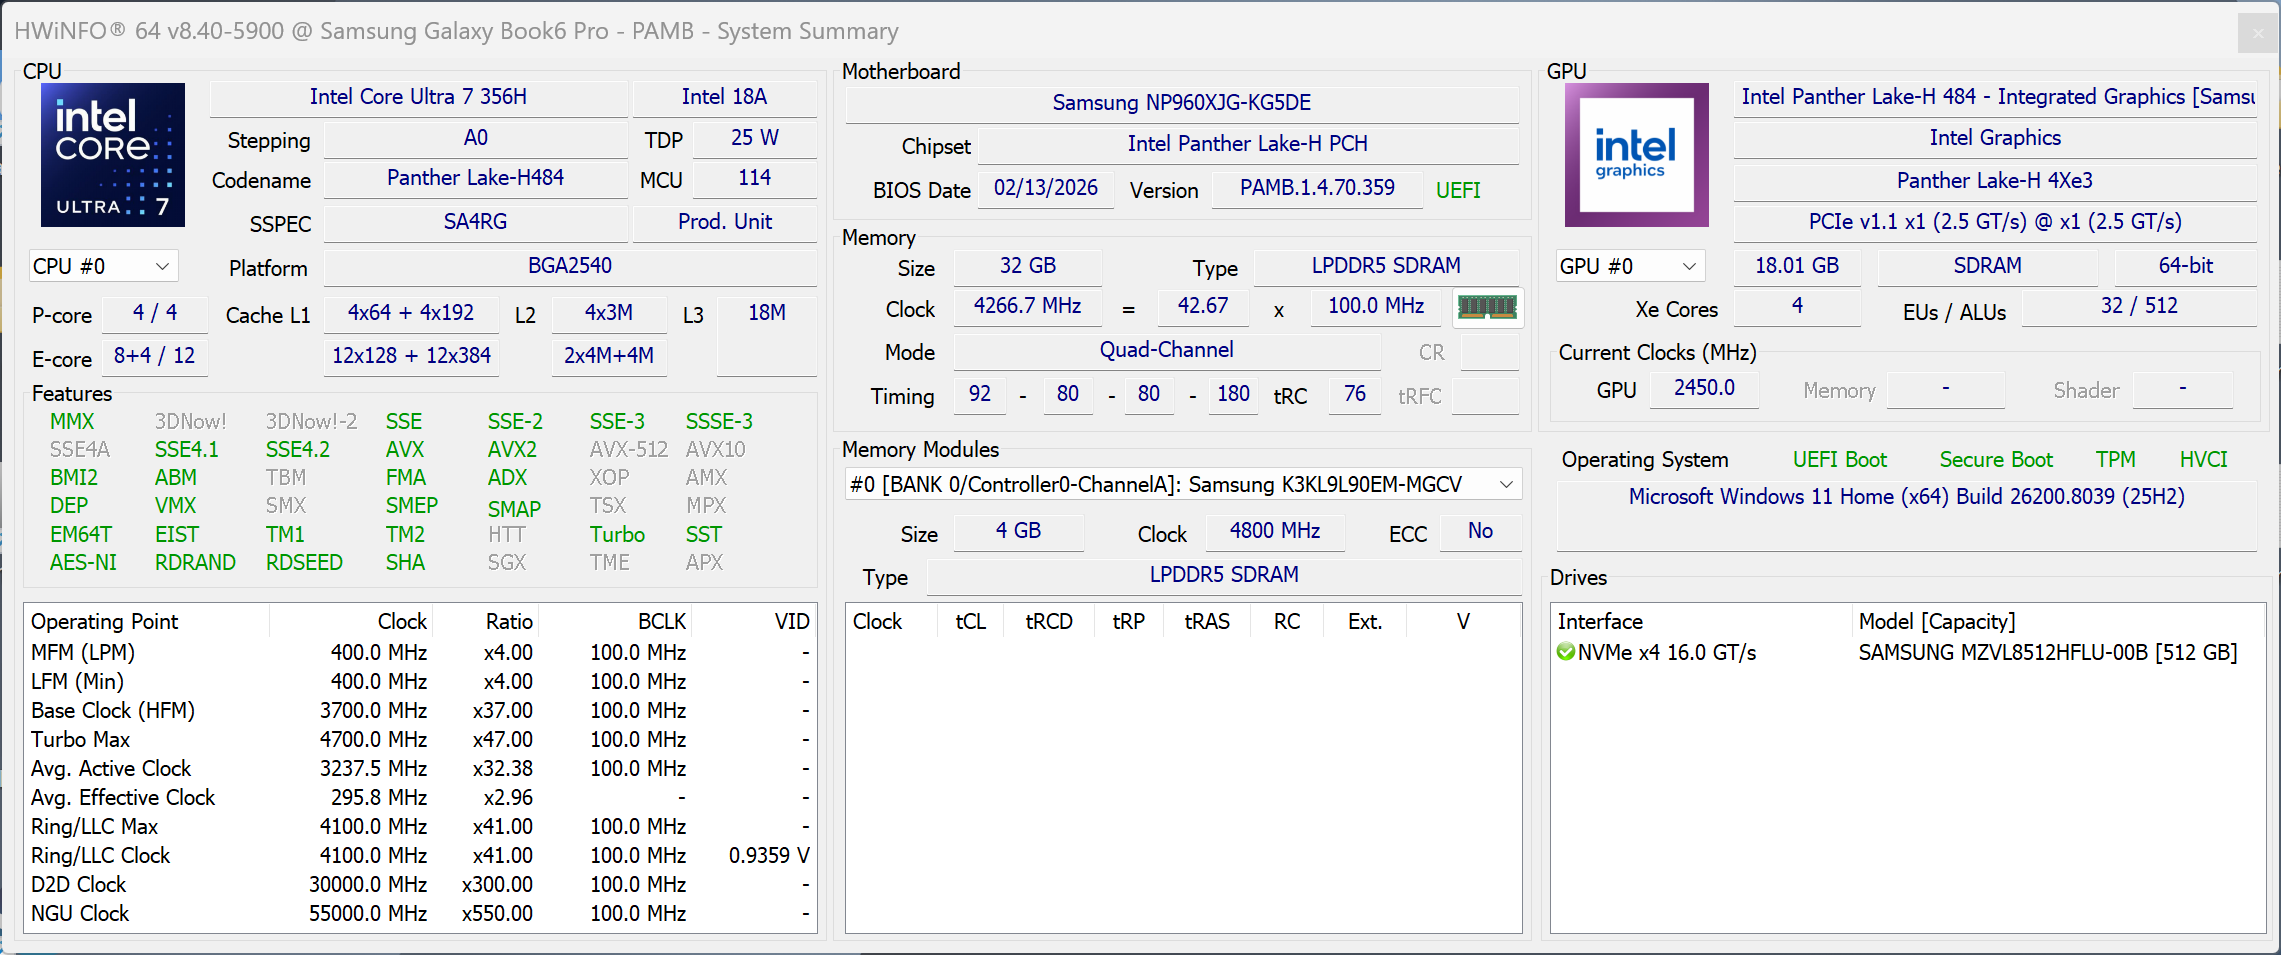
Samsung hat seine Galaxy Book6 Pro Modelle aufgefrischt und verwendet nun Intels neueste Panther Lake Prozessor Generation sowie aktualisierte OLED-Bildschirme. Wir testen das neue 16-Zoll-Modell mit dem Core Ultra 7 356H in Kombination mit der Standard Intel Graphics iGPU, 32 GB RAM sowie einer 512-GB-SSD. Das Retail-Modell erhält eine größere 1 TB SSD, die anderen Spezifikationen sind identisch mit unserem Testgerät.
Spezifikationen
Preisvergleich
Gehäuse und Anschlussausstattung
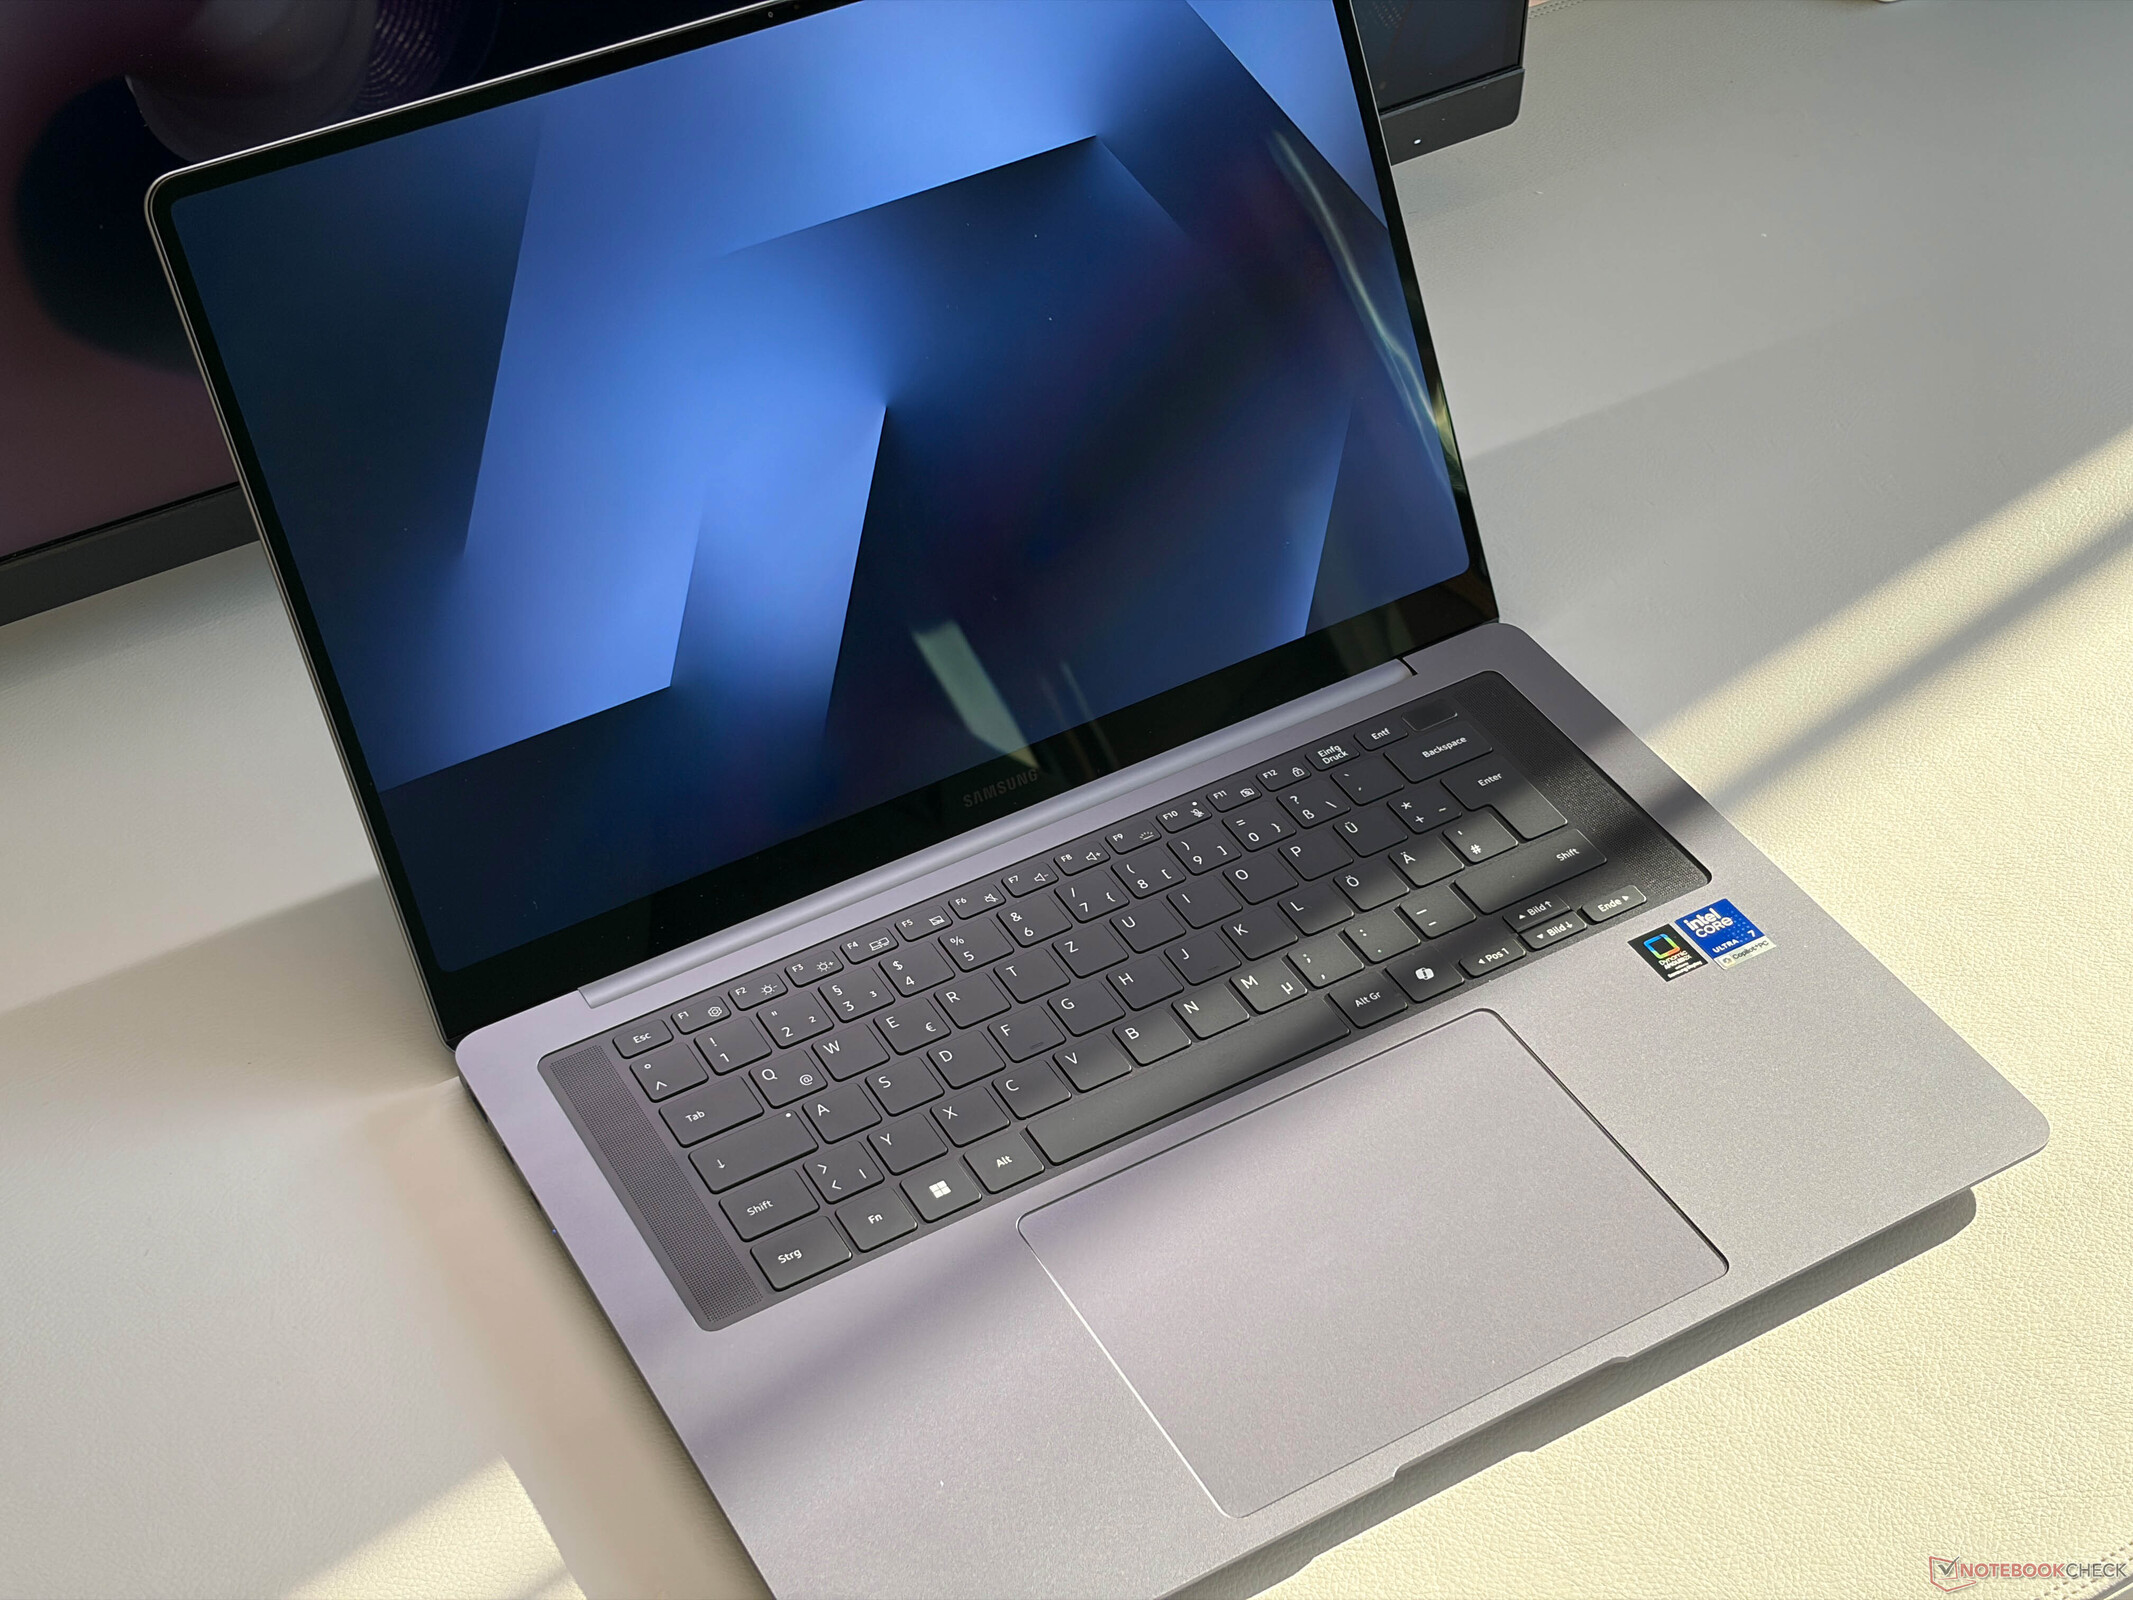
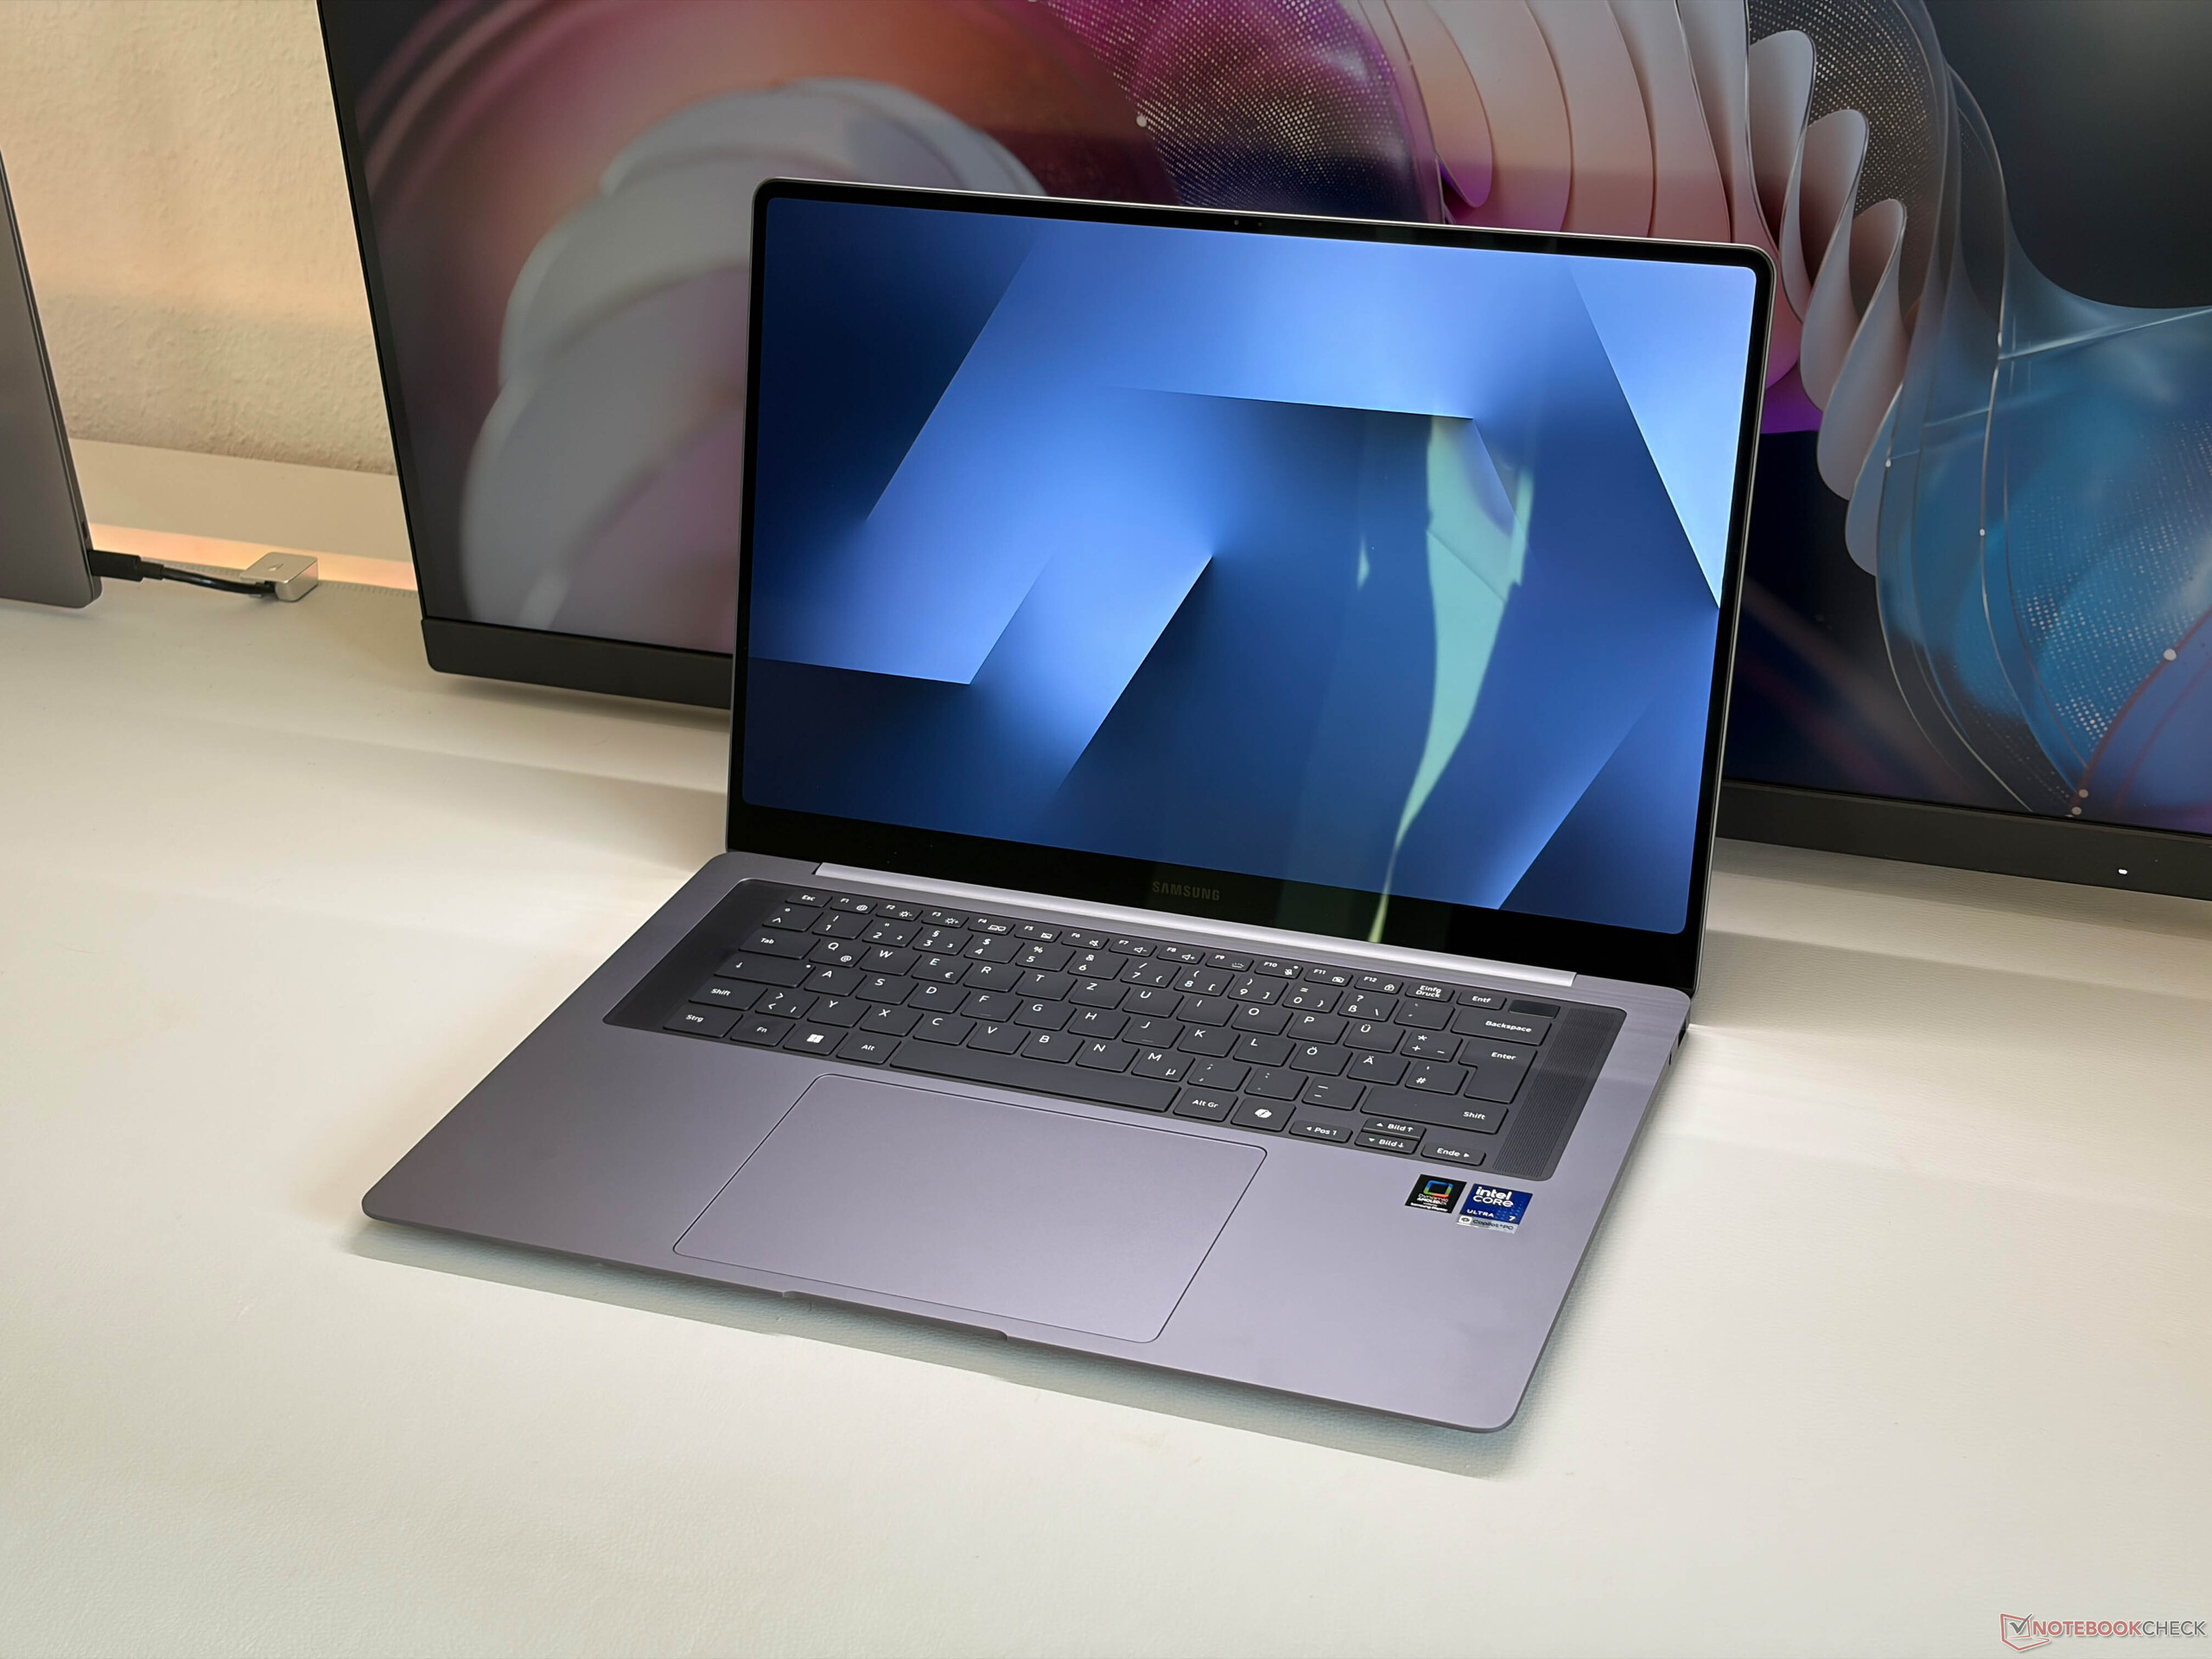
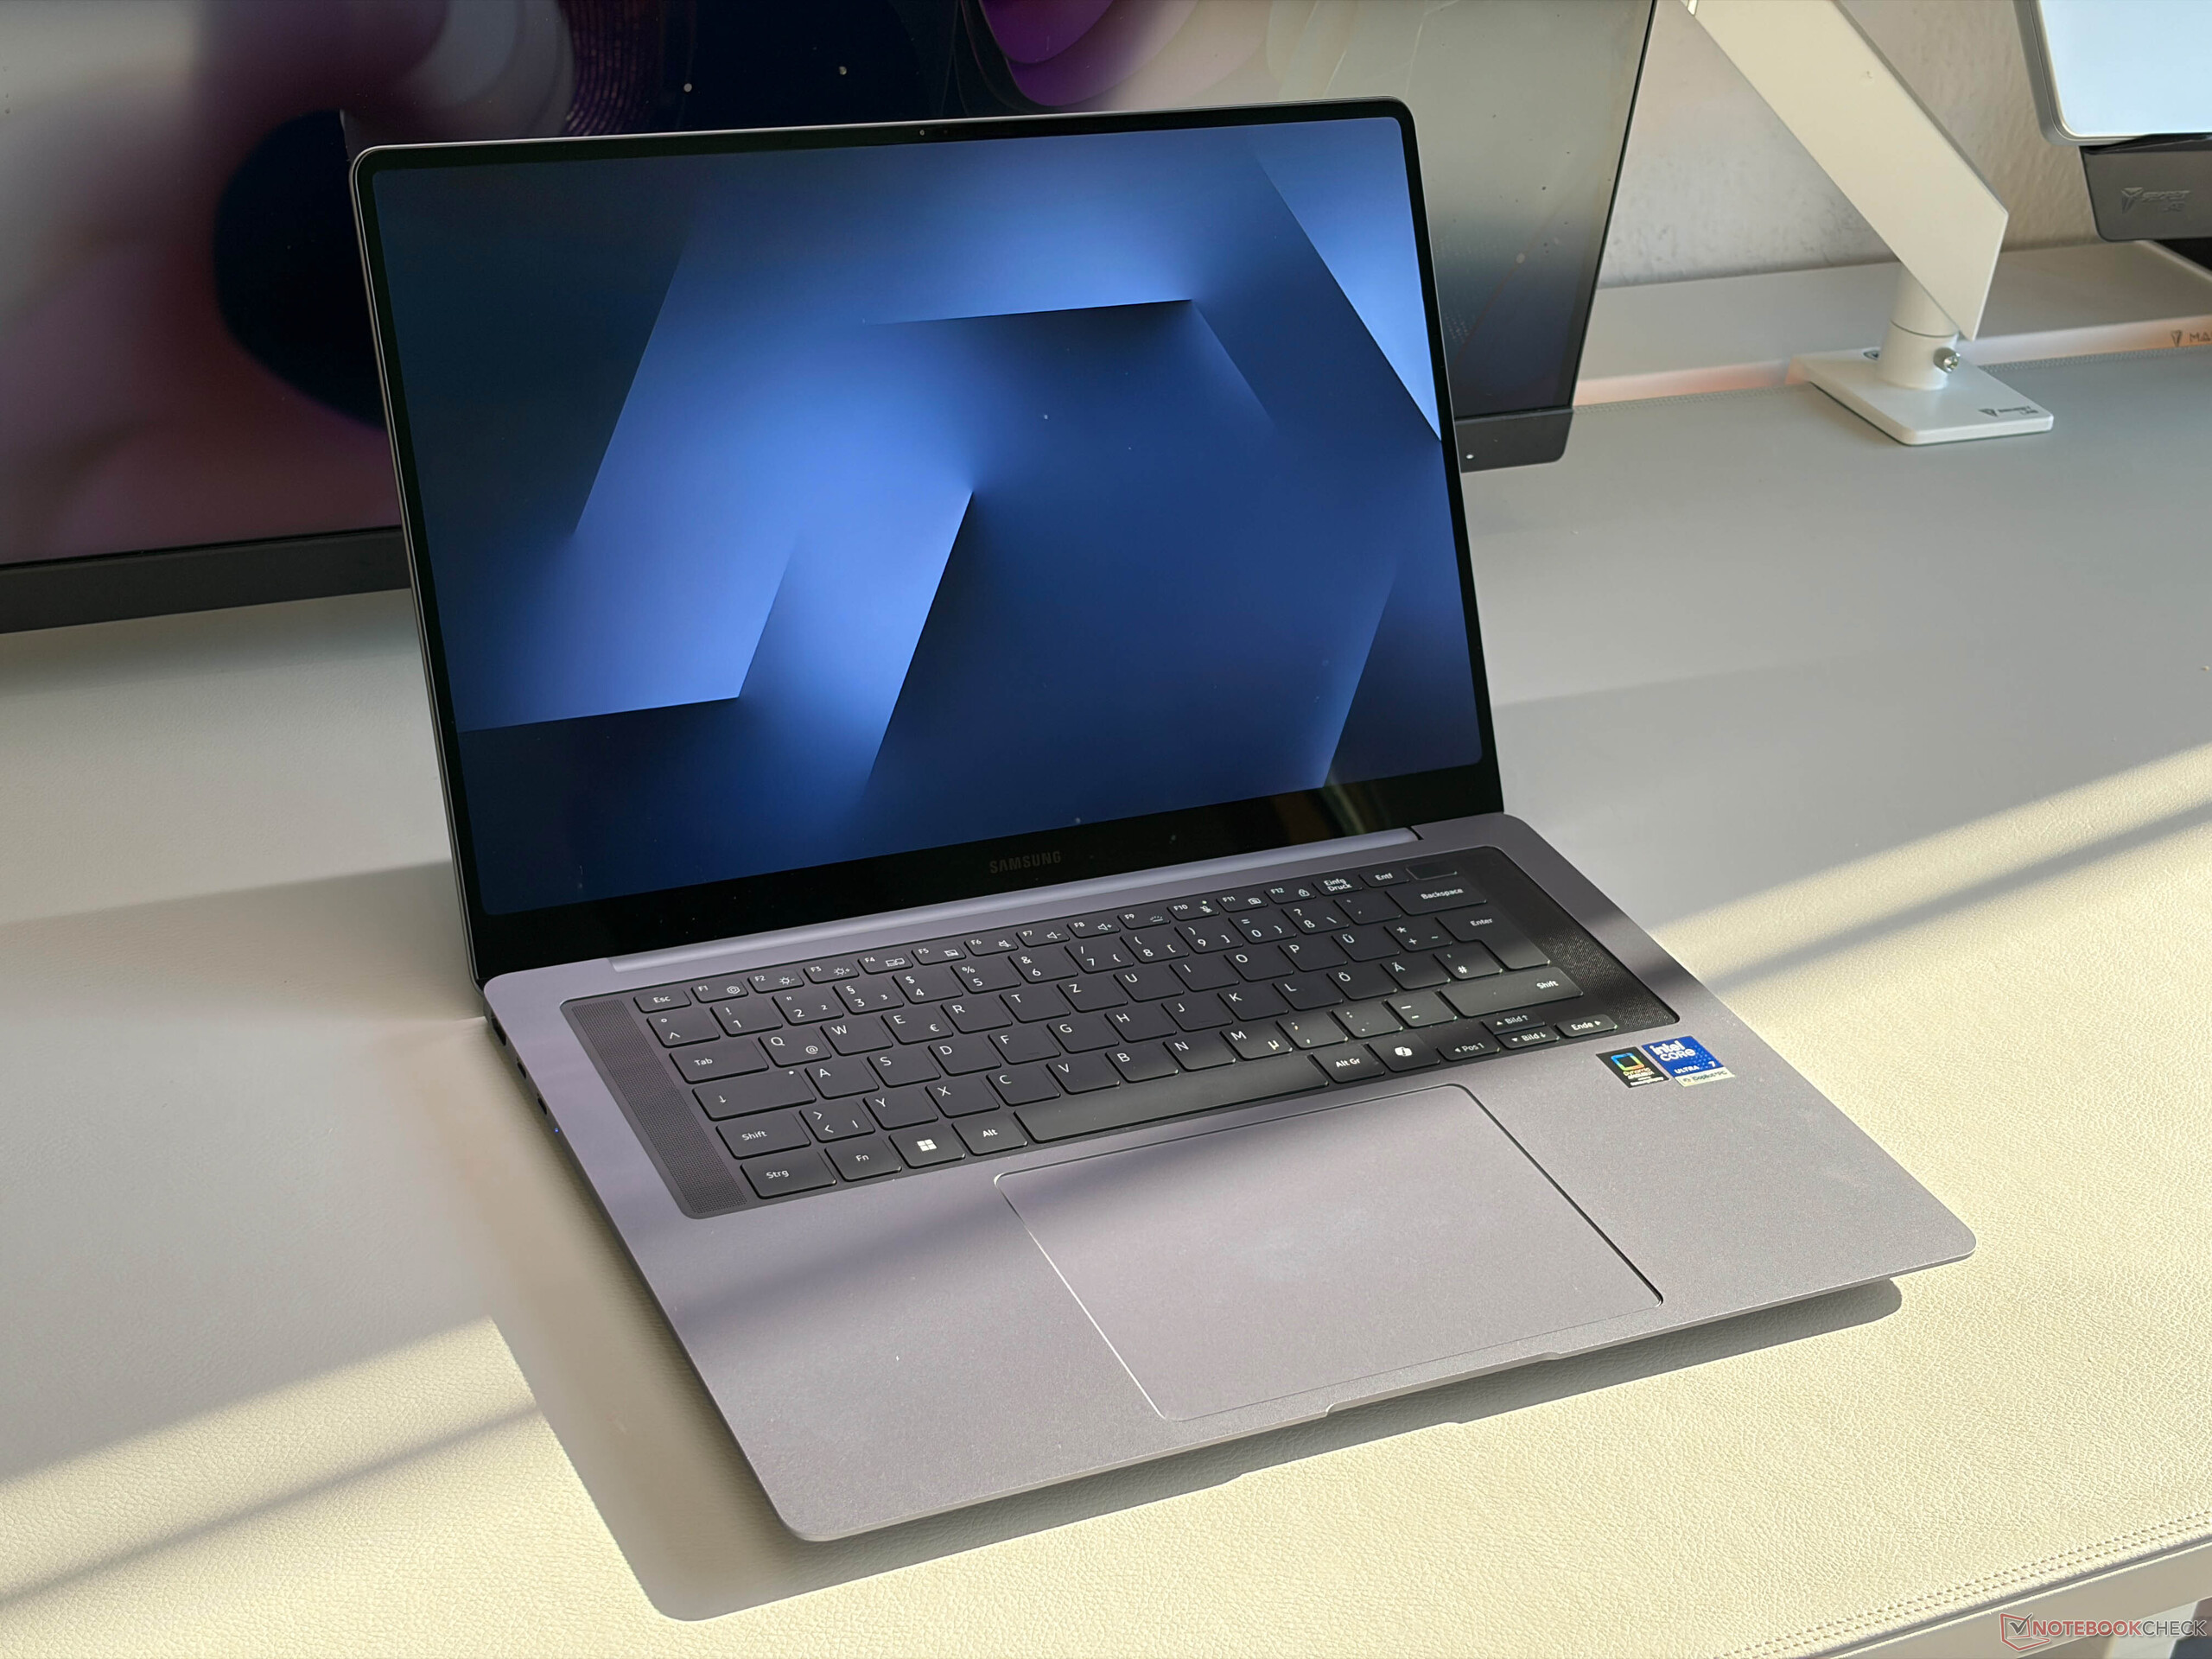
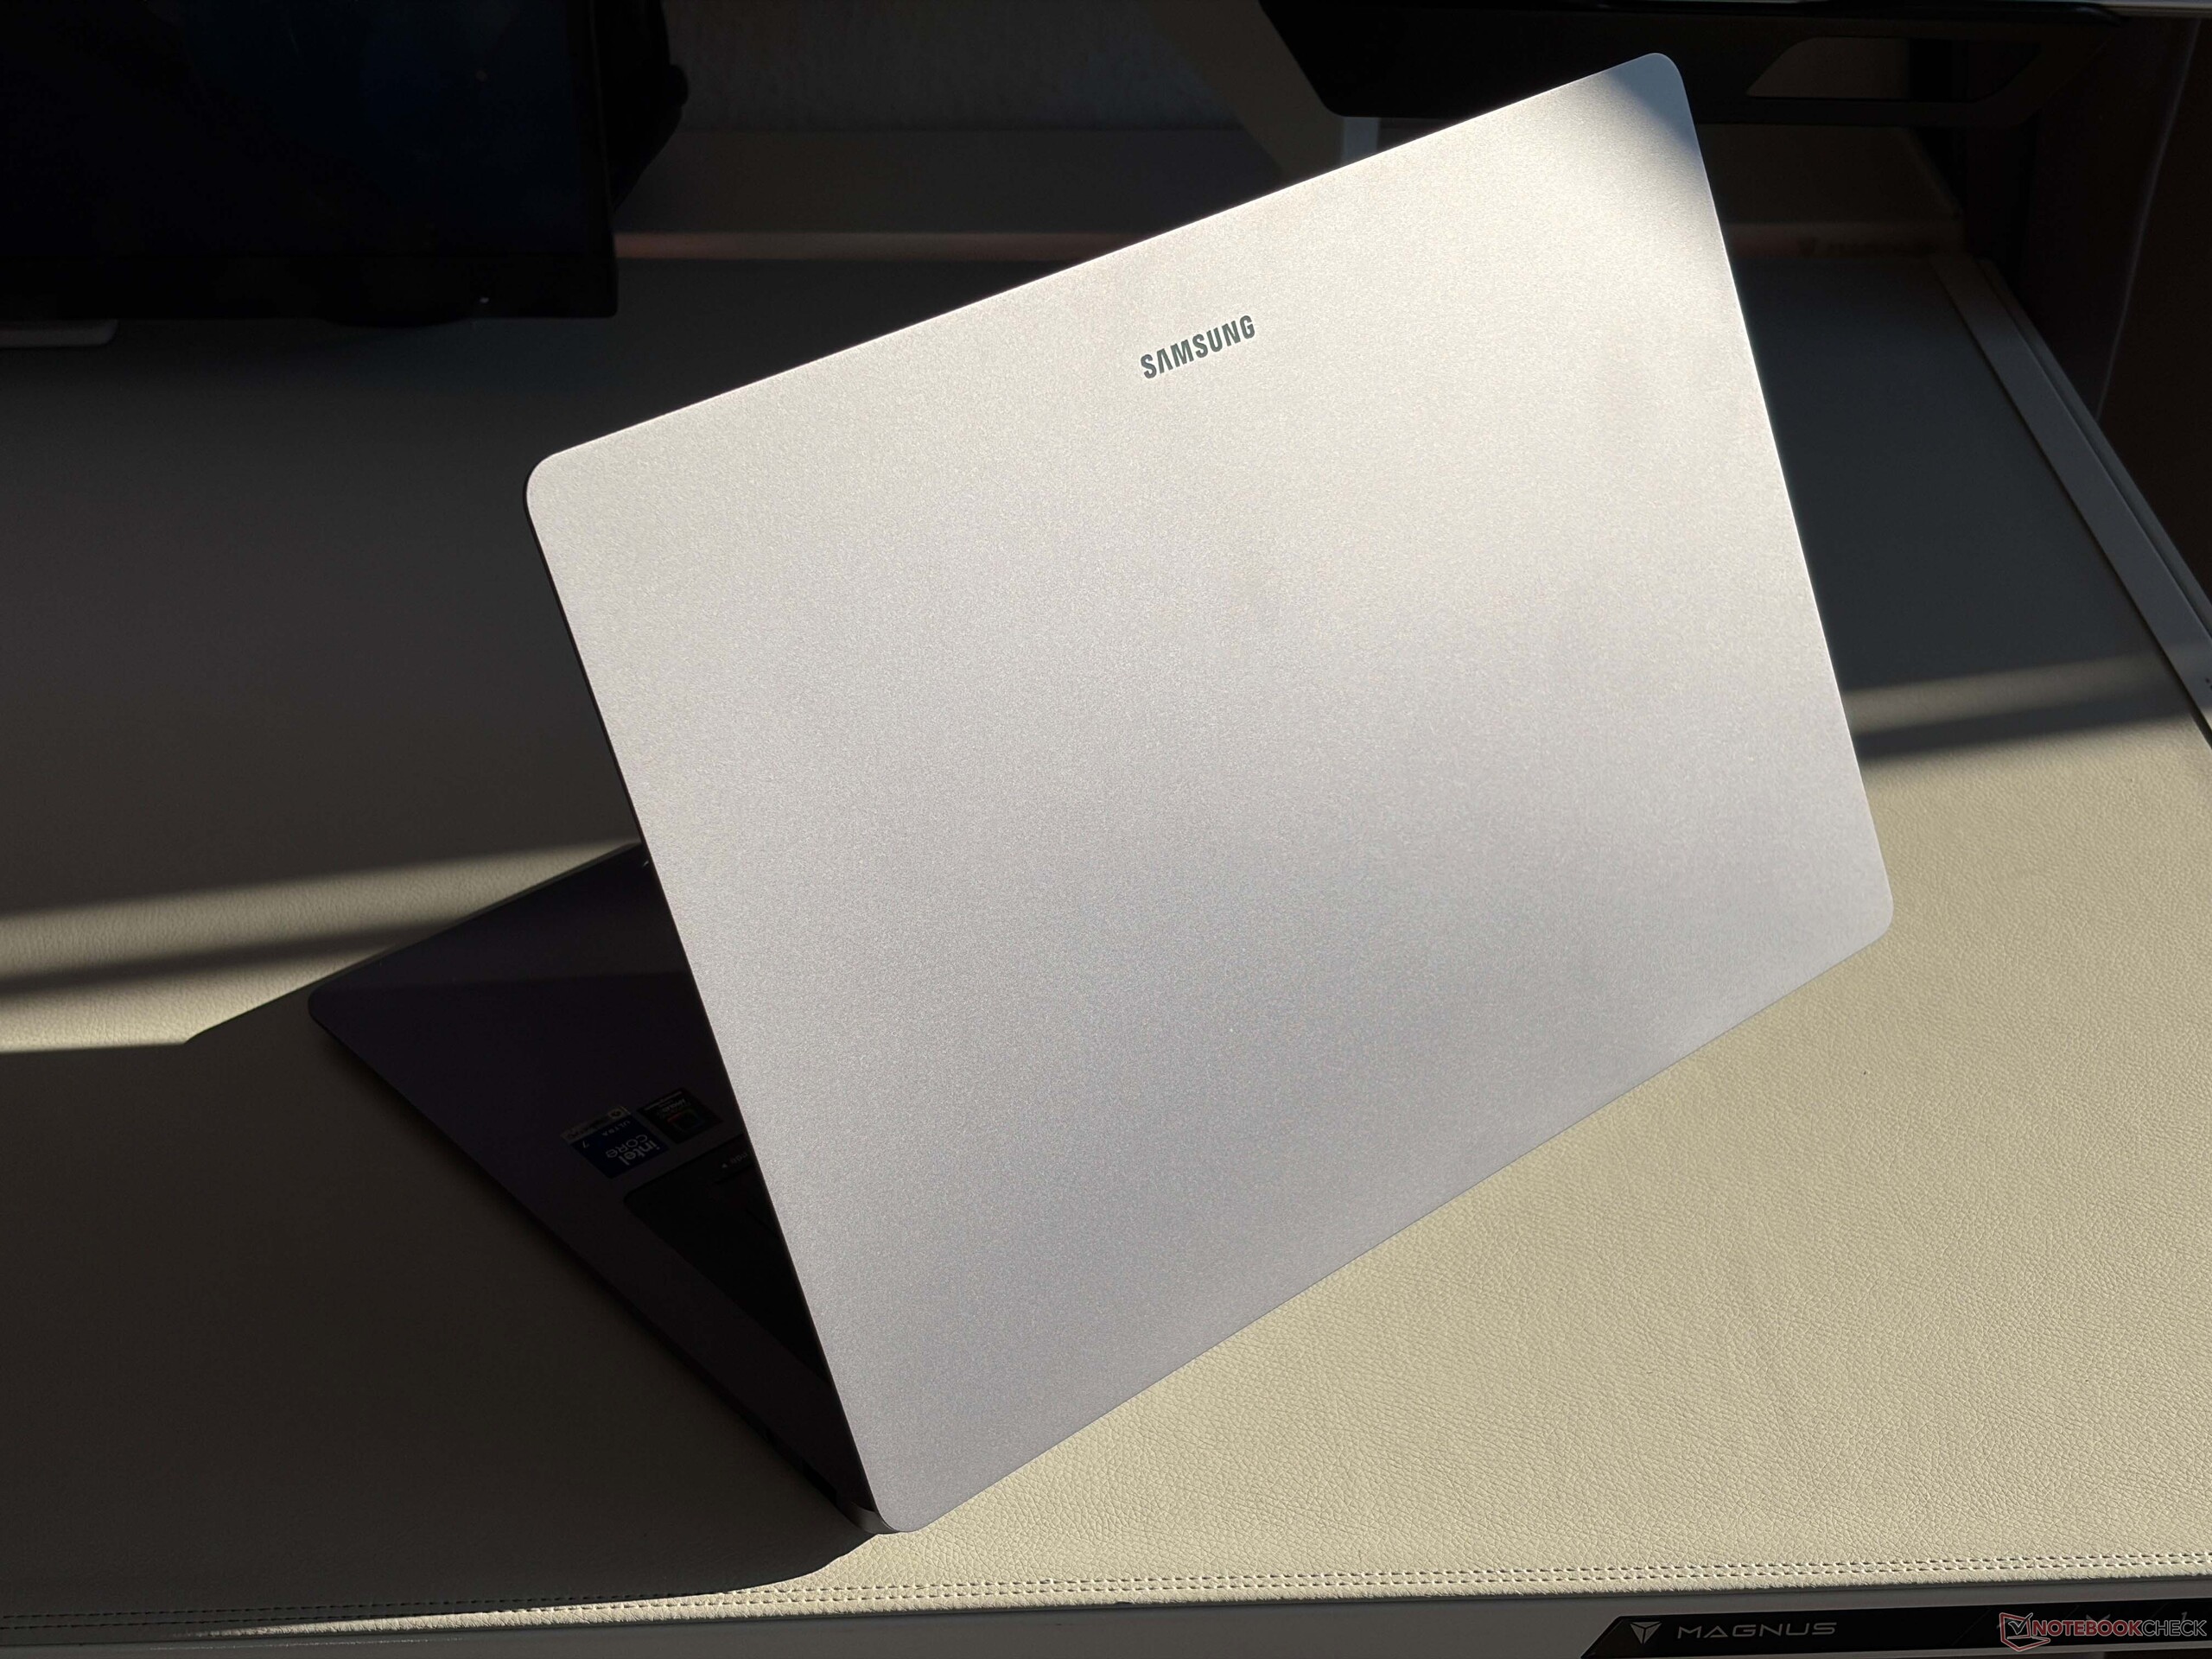
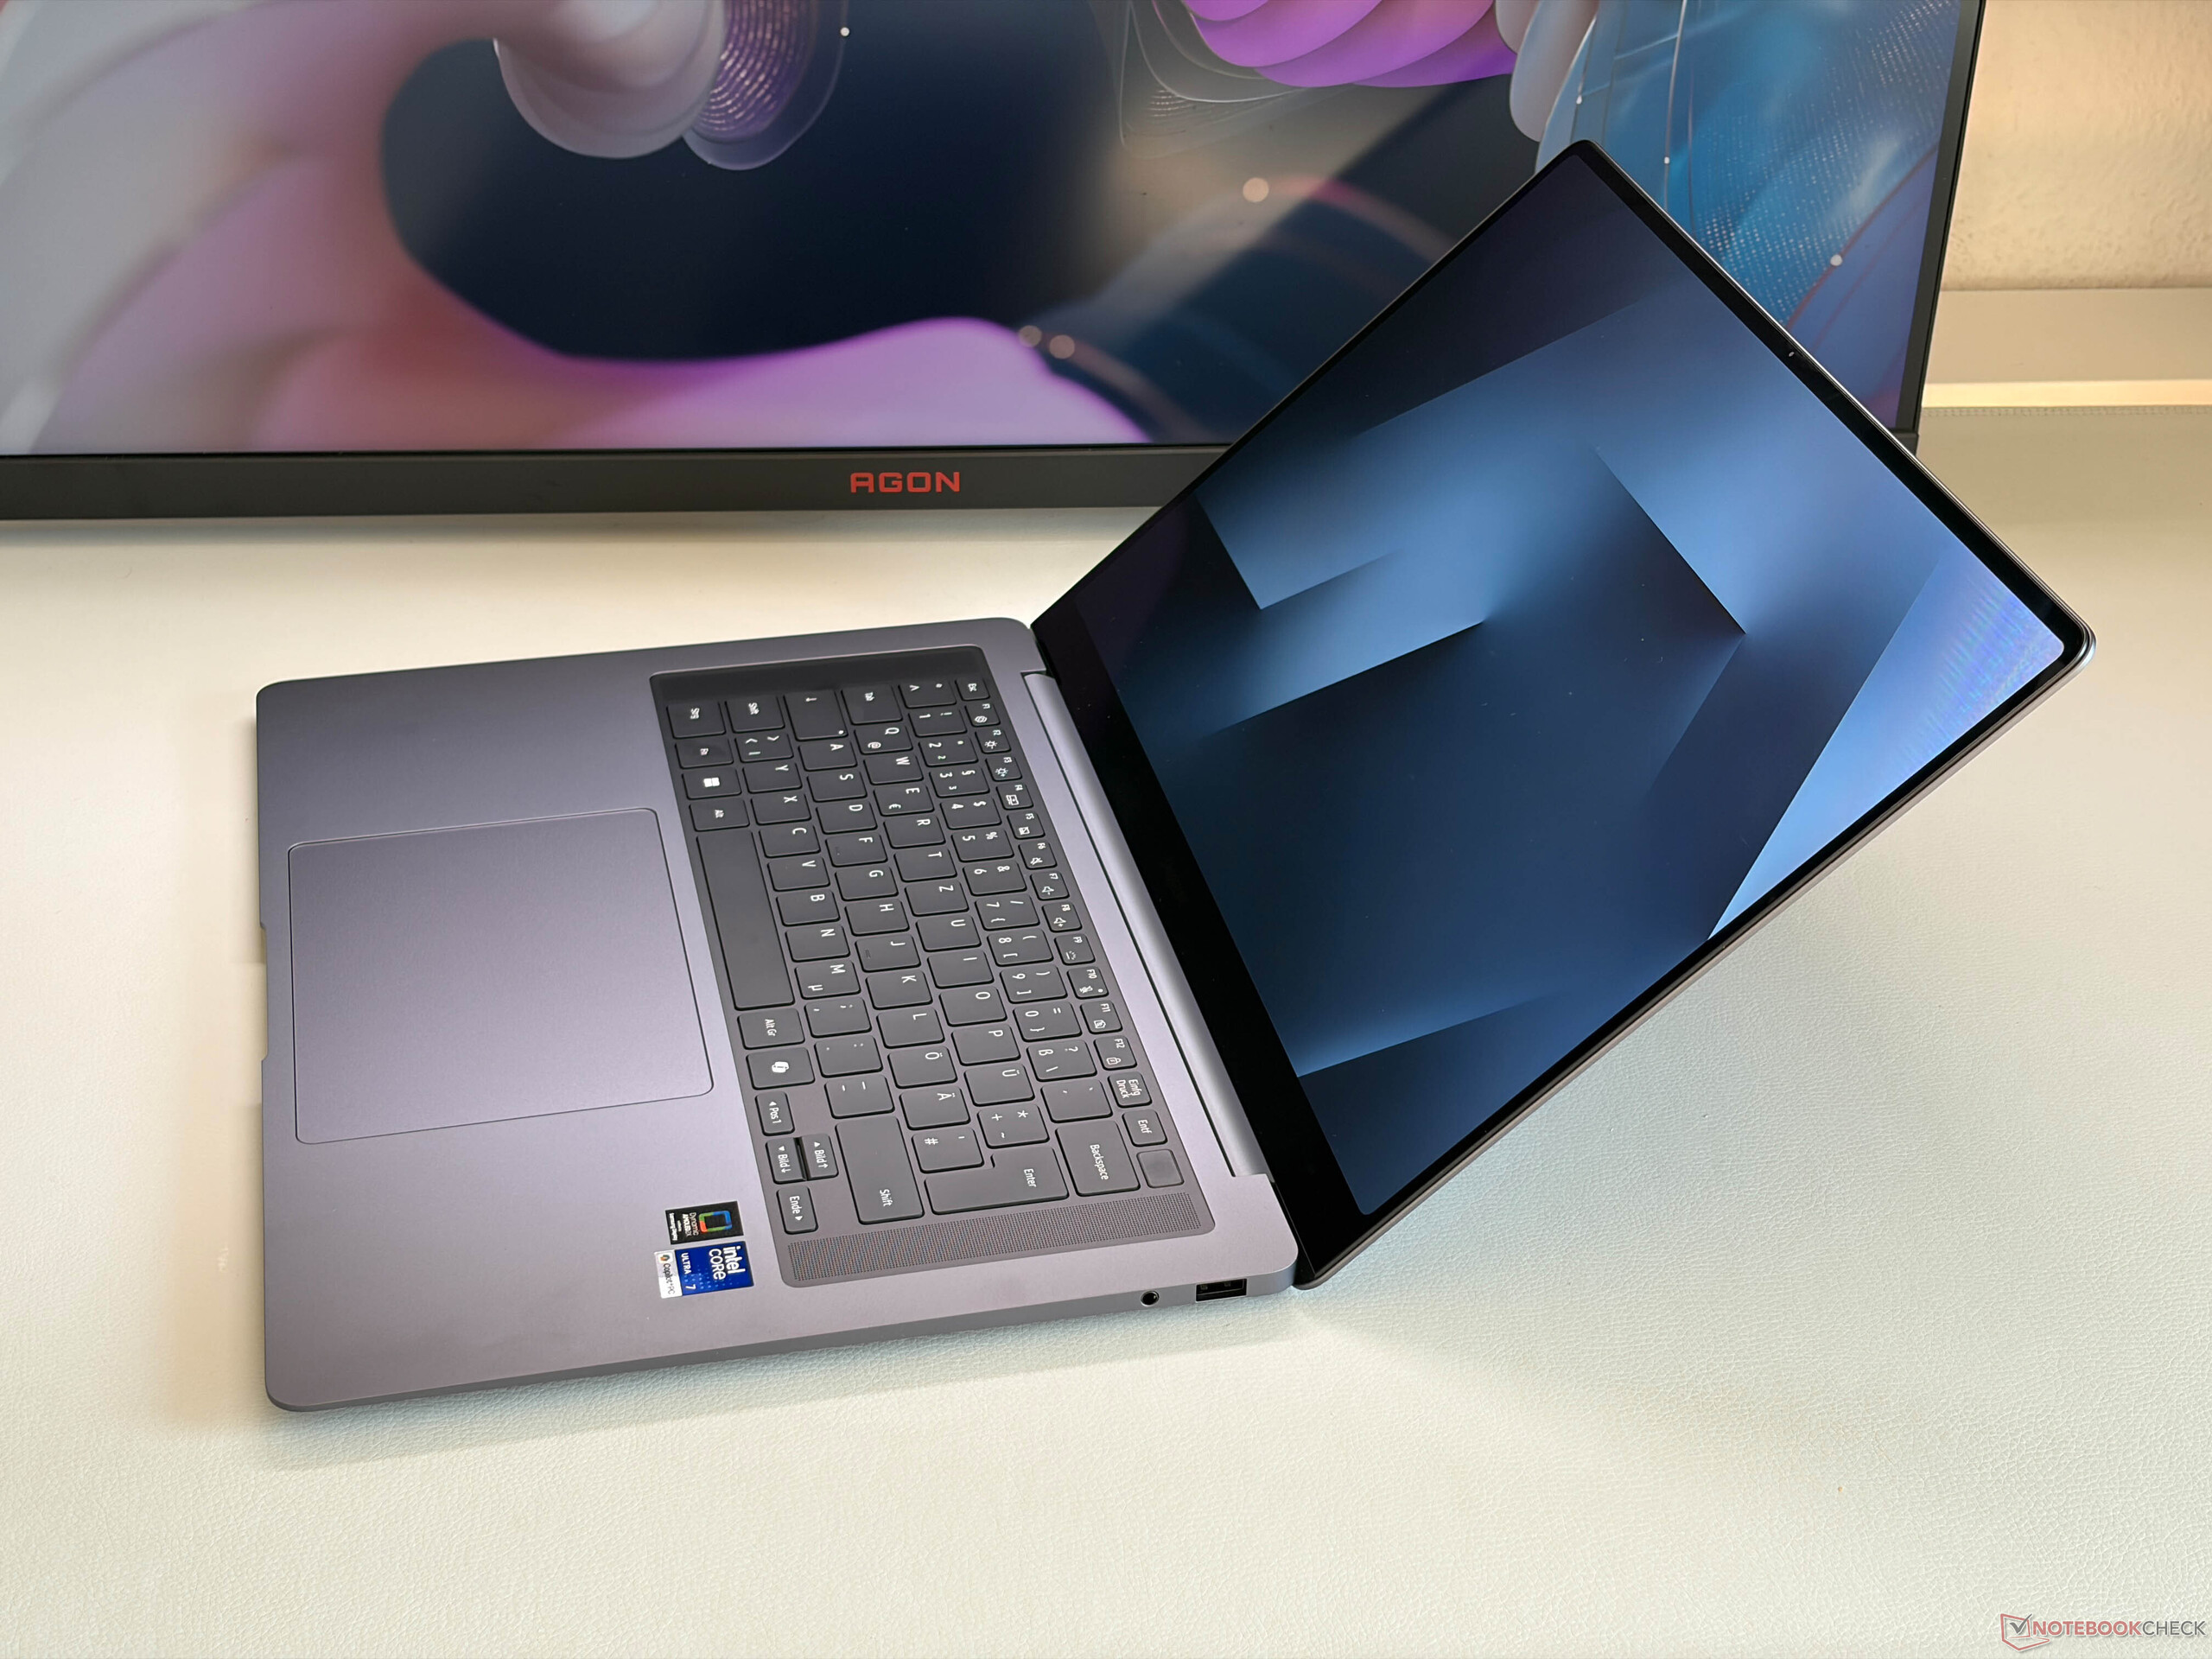
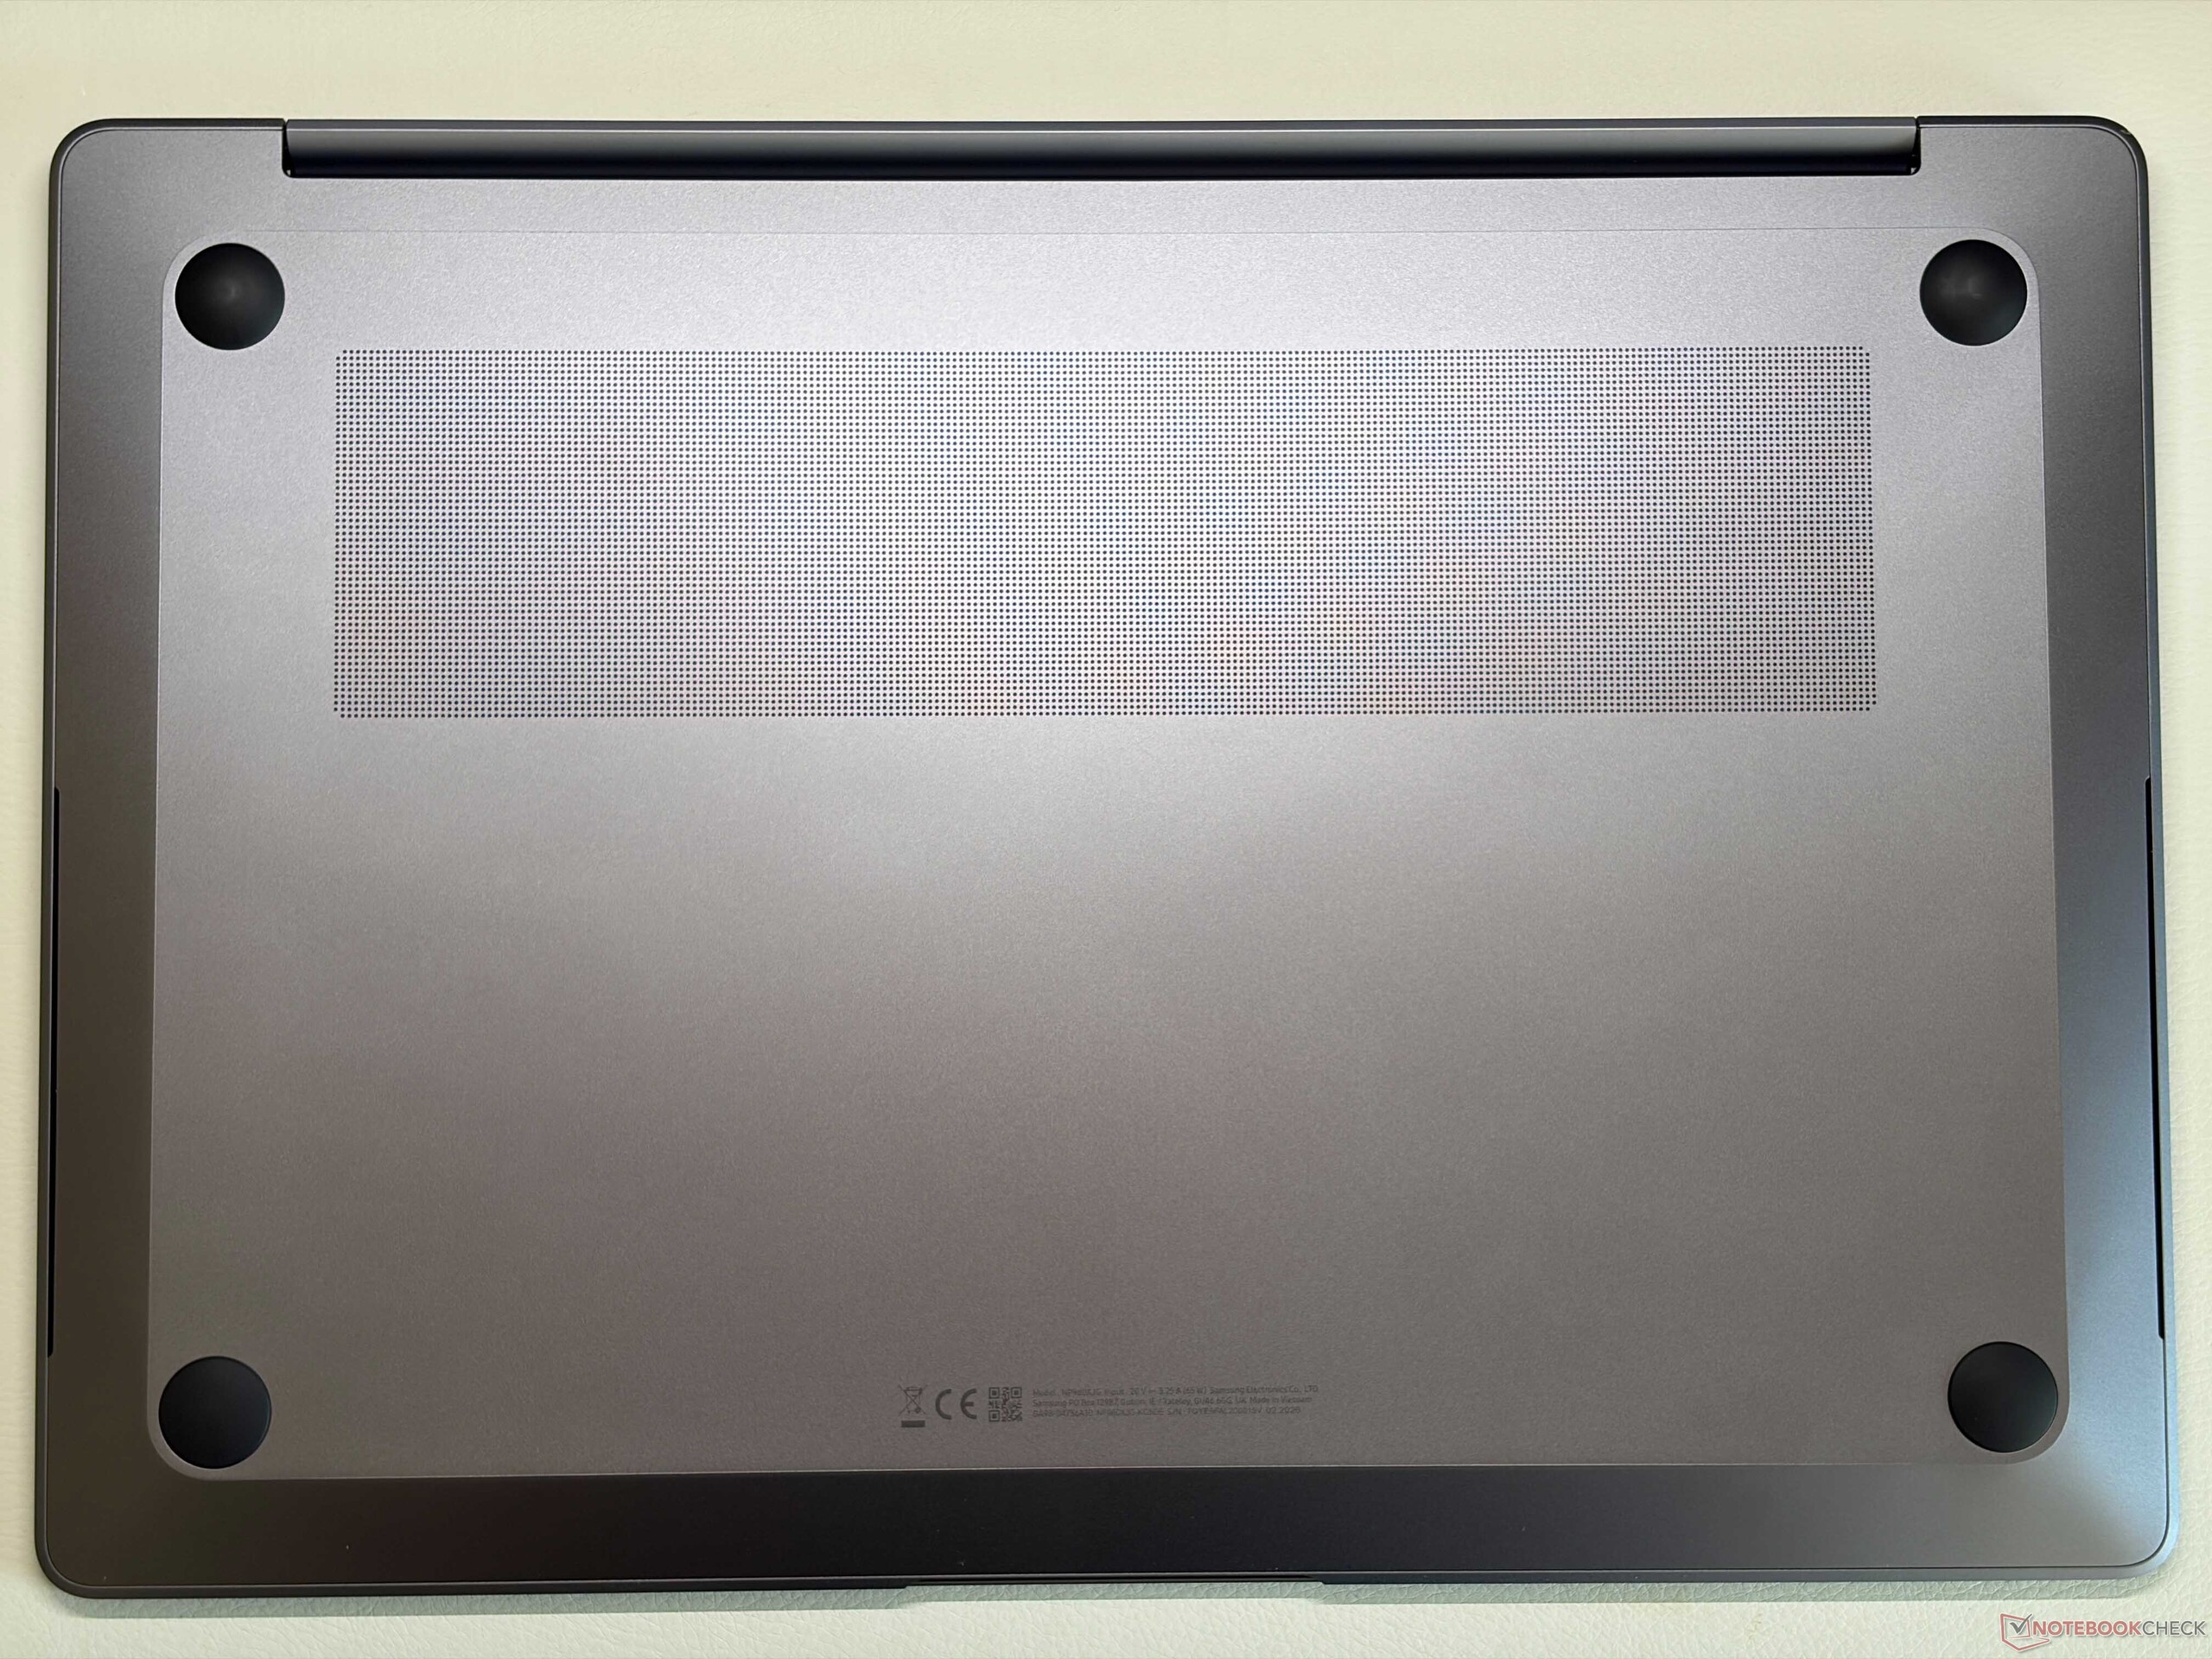
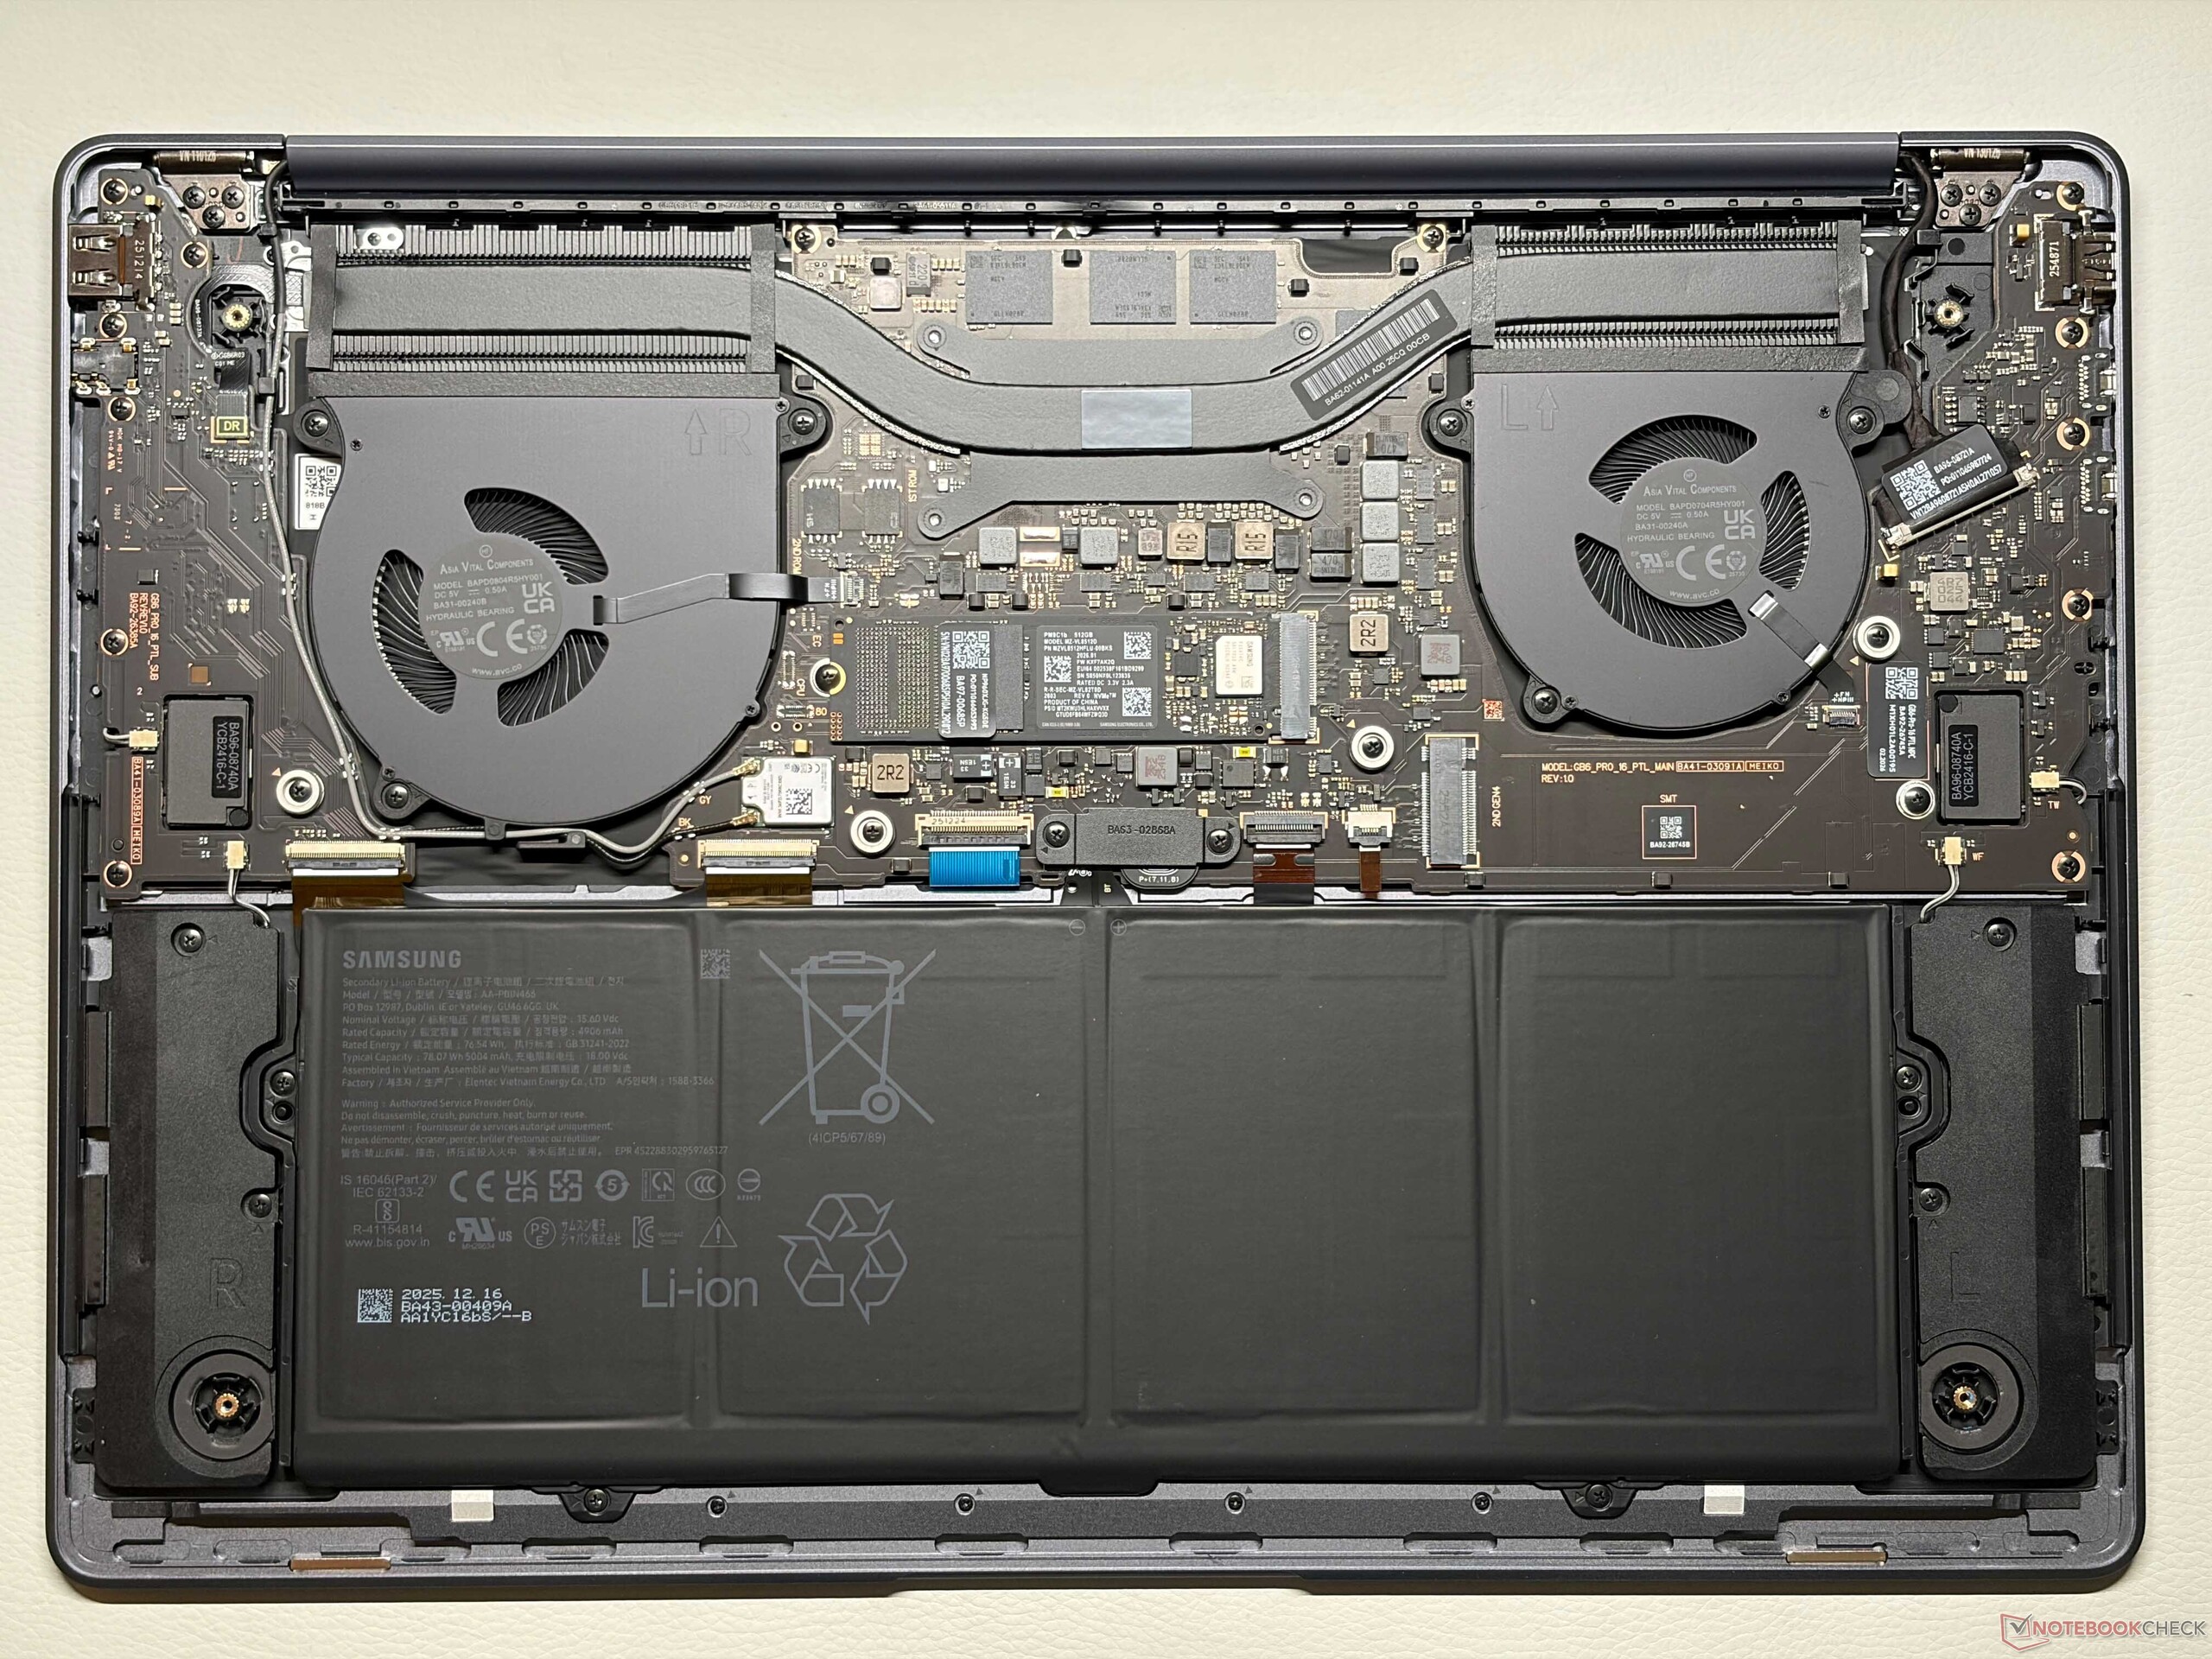
Das Design ist mit dem des Vorgängermodells so gut wie identisch, d.h. Sie erhalten wieder ein schlankes 16-Zoll-Notebook mit einem hochwertigen Aluminiumgehäuse. Die silberne Farbe zieht Fingerabdrücke nicht wirklich an und die Stabilität ist ausgezeichnet. Insbesondere der untere Bildschirmrand ist wieder sehr dick. Das neue Tastaturdesign sowie das neu angeordnete Samsung-Logo auf dem Deckel sind im Grunde die einzigen beiden sichtbaren Änderungen. Das interne Layout wurde ebenfalls leicht verändert, aber Sie erhalten weiterhin zwei M.2-2280 SSD-Steckplätze, alle anderen Komponenten sind onboard.
Was die Anschlüsse angeht, stehen weiterhin Thunderbolt 4 sowie ein herkömmlicher USB-A-Anschluss zur Verfügung, der microSD-cardreader fehlt jedoch. Das WLAN-Modul unterstützt nun den neuen WLAN-7-Standard, und wir messen Übertragungsraten von bis zu 4,5 Gbit/s. Die 1080p-Webcam hat sich nicht verändert.


| Networking | |
| Samsung Galaxy Book6 Pro | |
| iperf3 transmit AXE11000 | |
| iperf3 receive AXE11000 | |
| iperf3 transmit RT-BE96U WiFi7 | |
| iperf3 receive RT-BE96U WiFi7 | |
| Dell XPS 16 Core Ultra 5 325 | |
| iperf3 transmit AXE11000 | |
| iperf3 receive AXE11000 | |
| iperf3 transmit AXE11000 6GHz | |
| iperf3 receive AXE11000 6GHz | |
| Asus ZenBook S16 UM5606GA | |
| iperf3 transmit AXE11000 | |
| iperf3 receive AXE11000 | |
| Apple MacBook Air 15 M5 | |
| iperf3 transmit AXE11000 | |
| iperf3 receive AXE11000 | |
| Microsoft Surface Laptop 7 15 Lunar Lake | |
| iperf3 transmit AXE11000 | |
| iperf3 receive AXE11000 | |
| Lenovo ThinkPad X9-15 Aura Edition | |
| iperf3 transmit AXE11000 | |
| iperf3 receive AXE11000 | |


Eingabegeräte
Samsung hat die Eingabegeräte geändert und wir haben die neue Tastatur bereits auf dem Galaxy Book6 Ultra inspiziert. Der dedizierte Ziffernblock ist verschwunden und die Lautsprecher sitzen jetzt neben der Tastatur. Das Tipperlebnis ist in Ordnung und profitiert von einem präzisen Feedback, aber der Tastenhub ist ziemlich gering. Sowohl das Zenbook S16 als auch das ThinkPad X9 15 bieten komfortablere Tastaturen. Das riesige Trackpad (15 x 10,5 cm) hingegen ist hervorragend und Sie können auch den kapazitiven Touchscreen für Eingaben nutzen.


Display - Heller 120-Hz-OLED
Samsung verwendet für das Galaxy Book6 Pro einen helleren OLED-Touchscreen und es ist genau das gleiche Panel wie beim Galaxy Book6 Ultra. Die subjektive Bildqualität ist hervorragend mit satten Farben und scharfen Bildern und selbst helle Inhalte wirken nicht körnig. Die Bewegungen sind dank 120 Hz (adaptiv zwischen 30-120 Hz) flüssig und die Reaktionszeiten sind sehr schnell, aber es gibt PWM-Flimmern bei 240 Hz bei jeder Helligkeitsstufe mit einer großen Amplitude, so dass empfindliche Benutzer das Panel vor dem Kauf ausprobieren sollten.
Samsung hat die Helligkeit verbessert und wir messen 500 nits für SDR-Inhalte und bis zu 1200 nits für HDR-Inhalte (648 nits für ein komplett weißes Bild). Samsung implementiert auch genaue Farbprofile für P3 sowie sRGB ab Werk und unsere Analyse mit der professionellen Software CalMAN zeigt eine exzellente Farbgenauigkeit, so dass Bildbearbeitung kein Problem darstellt. Mit unserer eigenen Kalibrierung konnten wir die Genauigkeit nicht noch weiter verbessern.
| |||||||||||||||||||||||||
Ausleuchtung: 97 %
Helligkeit Akku: 502 cd/m²
Kontrast: ∞:1 (Schwarzwert: 0 cd/m²)
ΔE ColorChecker Calman: 1 | ∀{0.5-29.43 Ø4.72}
ΔE Greyscale Calman: 1.8 | ∀{0.09-98 Ø4.97}
85.9% AdobeRGB 1998 (Argyll 3D)
99.9% sRGB (Argyll 3D)
98.3% Display P3 (Argyll 3D)
Gamma: 2.24
CCT: 6435 K
| Samsung Galaxy Book6 Pro ATNA60HR05-0, OLED, 2880x1800, 16", 120 Hz | Dell XPS 16 Core Ultra 5 325 LG Philips 160WUX, IPS, 1920x1200, 16", 120 Hz | Asus ZenBook S16 UM5606GA ATNA60HR07-0, OLED, 2880x1800, 16", 120 Hz | Apple MacBook Air 15 M5 IPS, 2880x1864, 15.3", 60 Hz | Microsoft Surface Laptop 7 15 Lunar Lake LQ150P1JX61, IPS, 2496x1664, 15", 120 Hz | Lenovo ThinkPad X9-15 Aura Edition ATNA53JB01-0, OLED, 2880x1800, 15.3", 120 Hz | Samsung Galaxy Book4 Pro 16 ATNA60CL07-0, OLED, 2880x1800, 16", 120 Hz | |
|---|---|---|---|---|---|---|---|
| Display | -19% | 4% | -1% | 1% | 4% | 5% | |
| Display P3 Coverage (%) | 98.3 | 66.2 -33% | 99.8 2% | 97.5 -1% | 98.1 0% | 100 2% | 99.5 1% |
| sRGB Coverage (%) | 99.9 | 97.4 -3% | 100 0% | 98.3 -2% | 100 0% | 100 0% | 100 0% |
| AdobeRGB 1998 Coverage (%) | 85.9 | 67.7 -21% | 94 9% | 86.3 0% | 87.2 2% | 94.6 10% | 97.5 14% |
| Response Times | -6924% | -37% | -4477% | -4967% | -38% | -46% | |
| Response Time Grey 50% / Grey 80% * (ms) | 0.51 ? | 39.3 ? -7606% | 1.27 ? -149% | 26.9 ? -5175% | 33.4 ? -6449% | 1.46 ? -186% | 0.64 ? -25% |
| Response Time Black / White * (ms) | 0.41 ? | 26 ? -6241% | 0.43 ? -5% | 15.9 ? -3778% | 14.7 ? -3485% | 0.44 ? -7% | 0.68 ? -66% |
| PWM Frequency (Hz) | 240 ? | 960 ? | 1200 ? | 240 ? | |||
| PWM Amplitude * (%) | 100 | 56 44% | 22 78% | ||||
| Bildschirm | -48% | -7% | -42% | 35% | 1% | -2% | |
| Helligkeit Bildmitte (cd/m²) | 502 | 534.6 6% | 465 -7% | 538 7% | 599 19% | 509 1% | 385 -23% |
| Brightness (cd/m²) | 507 | 515 2% | 466 -8% | 521 3% | 590 16% | 508 0% | 391 -23% |
| Brightness Distribution (%) | 97 | 92 -5% | 99 2% | 90 -7% | 93 -4% | 97 0% | 97 0% |
| Schwarzwert * (cd/m²) | 0.26 | 0.44 | 0.4 | 0.01 | |||
| Delta E Colorchecker * | 1 | 2.53 -153% | 1 -0% | 2.1 -110% | 0.5 50% | 1.1 -10% | 1.1 -10% |
| Colorchecker dE 2000 max. * | 2.4 | 4.57 -90% | 3 -25% | 4.1 -71% | 0.9 62% | 2.5 -4% | 1.8 25% |
| Delta E Graustufen * | 1.8 | 2.7 -50% | 1.9 -6% | 3.1 -72% | 0.6 67% | 1.5 17% | 1.4 22% |
| Gamma | 2.24 98% | 2.32 95% | 2.19 100% | 2.19 100% | 2.16 102% | 2.28 96% | 2.24 98% |
| CCT | 6435 101% | 6860 95% | 6458 101% | 7075 92% | 6543 99% | 6294 103% | 6444 101% |
| Kontrast (:1) | 2056 | 1223 | 1498 | 50900 | |||
| Colorchecker dE 2000 calibrated * | 1.26 | 0.7 | |||||
| Durchschnitt gesamt (Programm / Settings) | -2330% /
-1290% | -13% /
-12% | -1507% /
-837% | -1644% /
-884% | -11% /
-8% | -14% /
-8% |
* ... kleinere Werte sind besser


Reaktionszeiten (Response Times) des Displays
| ↔ Reaktionszeiten Schwarz zu Weiß | ||
|---|---|---|
| 0.41 ms ... steigend ↗ und fallend ↘ kombiniert | ↗ 0.2 ms steigend | 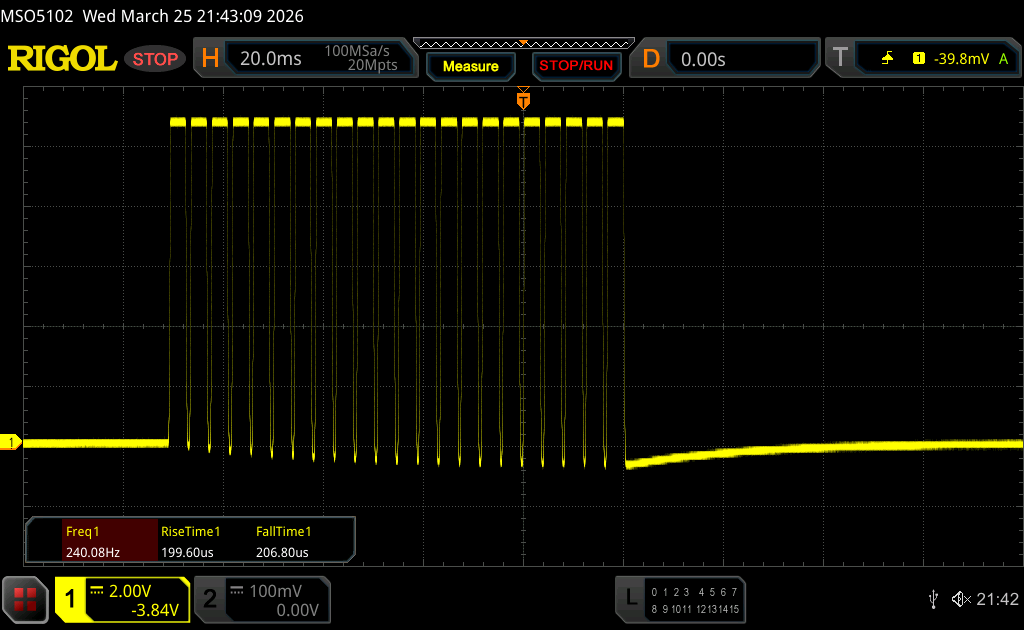 |
| ↘ 0.21 ms fallend | ||
| Die gemessenen Reaktionszeiten sind sehr kurz, wodurch sich der Bildschirm auch für schnelle 3D Spiele eignen sollte. Im Vergleich rangierten die bei uns getesteten Geräte von 0.1 (Minimum) zu 240 (Maximum) ms. » 0 % aller Screens waren schneller als der getestete. Daher sind die gemessenen Reaktionszeiten besser als der Durchschnitt aller vermessenen Geräte (19.8 ms). | ||
| ↔ Reaktionszeiten 50% Grau zu 80% Grau | ||
| 0.51 ms ... steigend ↗ und fallend ↘ kombiniert | ↗ 0.25 ms steigend | 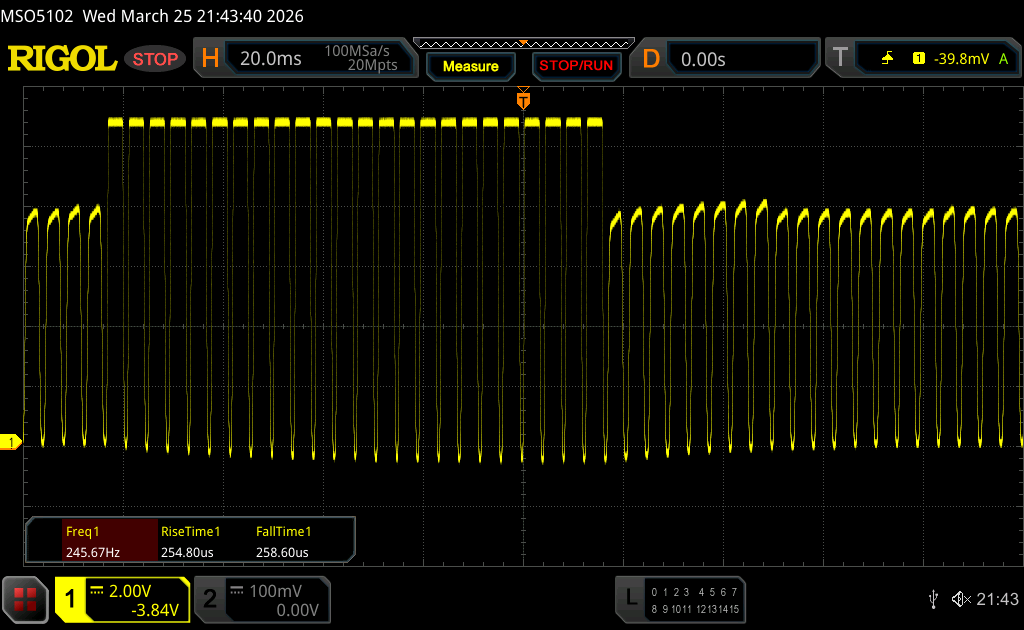 |
| ↘ 0.26 ms fallend | ||
| Die gemessenen Reaktionszeiten sind sehr kurz, wodurch sich der Bildschirm auch für schnelle 3D Spiele eignen sollte. Im Vergleich rangierten die bei uns getesteten Geräte von 0.165 (Minimum) zu 636 (Maximum) ms. » 1 % aller Screens waren schneller als der getestete. Daher sind die gemessenen Reaktionszeiten besser als der Durchschnitt aller vermessenen Geräte (31 ms). | ||
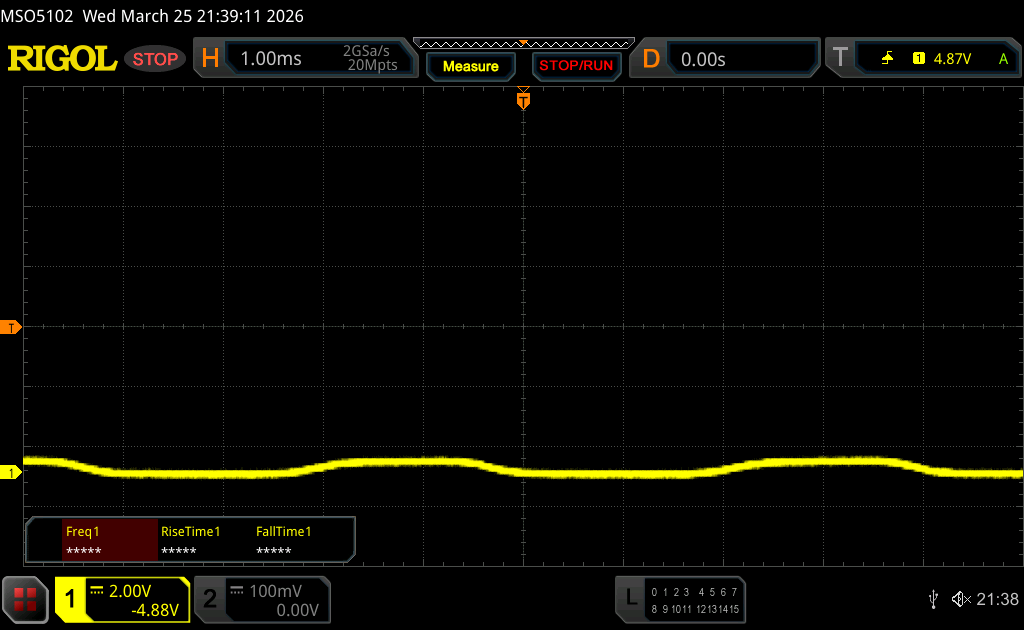
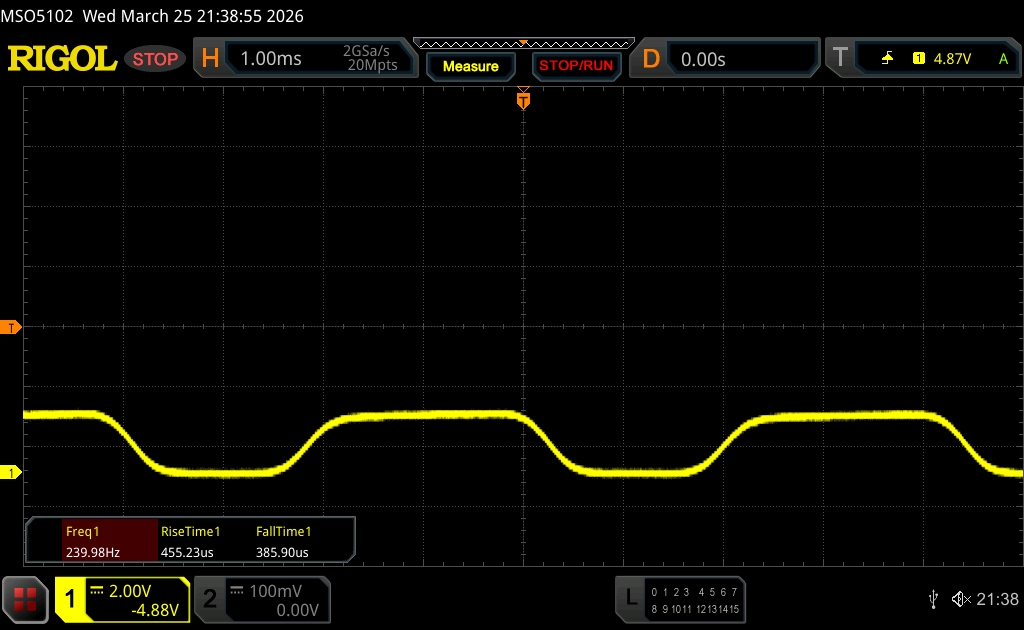
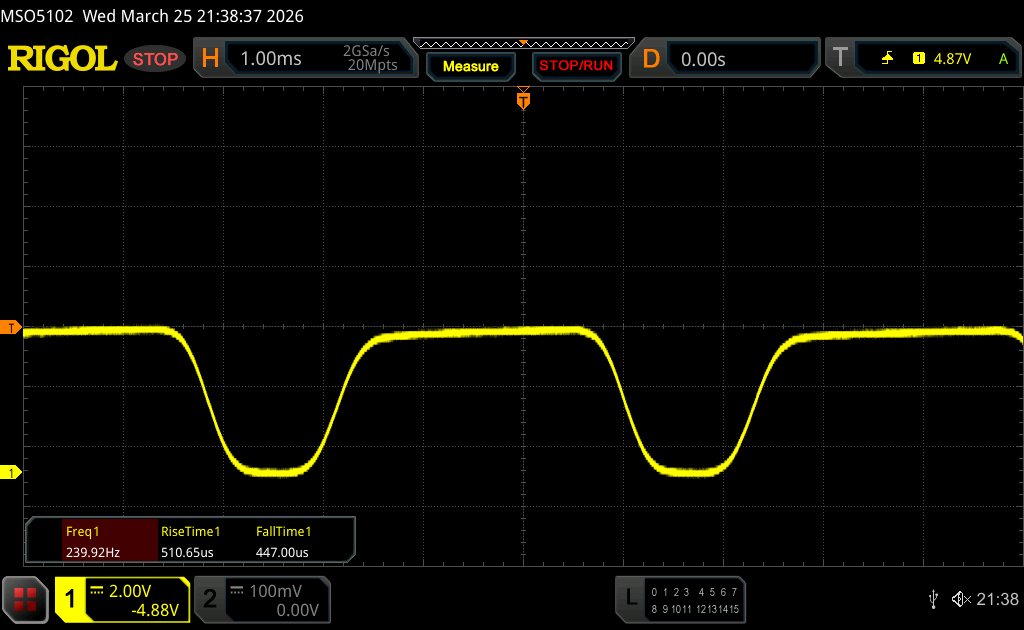
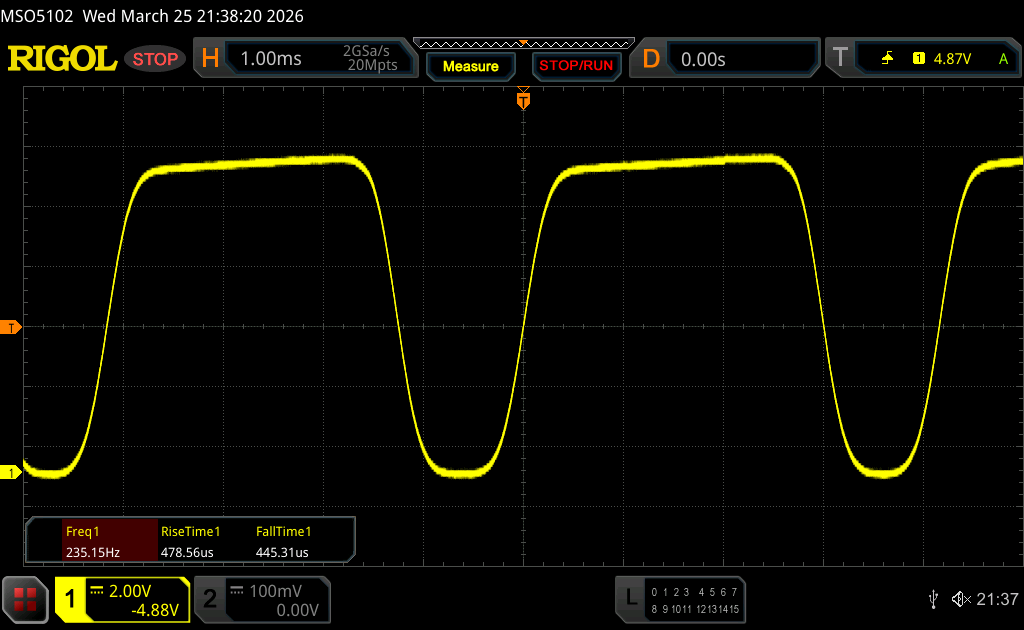
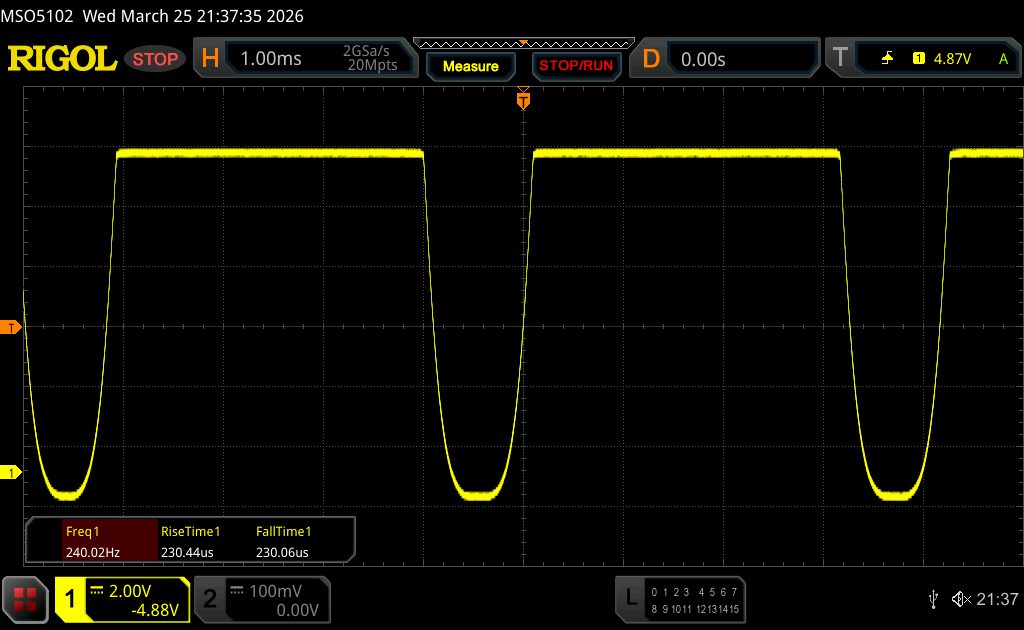
Bildschirm-Flackern / PWM (Pulse-Width Modulation)
| Flackern / PWM festgestellt | 240 Hz Amplitude: 100 % | ≤ 100 % Helligkeit | 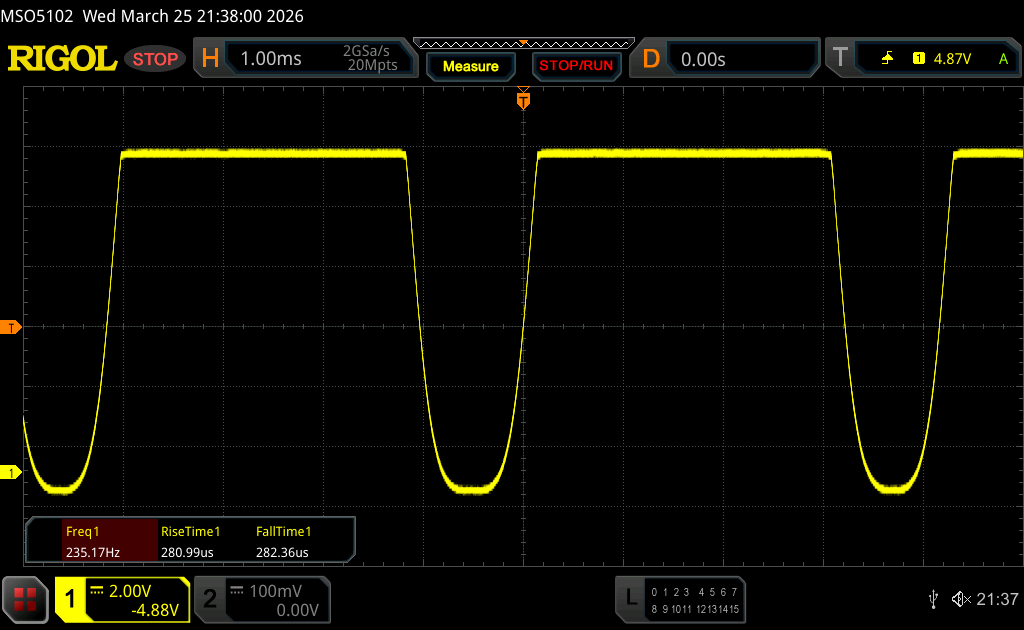 |
Das Display flackert mit 240 Hz (im schlimmsten Fall, eventuell durch Pulsweitenmodulation PWM) bei einer eingestellten Helligkeit von 100 % und darunter. Darüber sollte es zu keinem Flackern kommen. Die Frequenz von 240 Hz ist relativ gering und daher sollte es bei sensiblen Personen zu Problemen wie Flackern oder Augenbeschwerden führen. Im Vergleich: 52 % aller getesteten Geräte nutzten kein PWM um die Helligkeit zu reduzieren. Wenn PWM eingesetzt wurde, dann bei einer Frequenz von durchschnittlich 7781 (Minimum 5, Maximum 343500) Hz. | |||


Performance - Panther Lake
Samsung bietet derzeit nur das neue Galaxy Book6 Pro mit dem Core Ultra 7 356H in Kombination mit gelötetem RAM und der langsamen iGPU mit 4 Xe-Kernen an. Samsung hat auch eine SKU mit dem Core Ultra X7 358H und der schnelleren Arc B390 iGPU angekündigt.
Testbedingungen
Samsung bietet mehrere Energieprofile, die mit den Windows-Einstellungen synchronisiert werden. Für unser Testgerät macht es keinen Sinn, den Modus Hoch Performance zu verwenden, da die Leistungssteigerung fast nicht vorhanden und auf die CPU beschränkt ist, die Lüfter aber viel lauter sein würden. Für unsere Benchmarks haben wir den optimierten Modus verwendet.
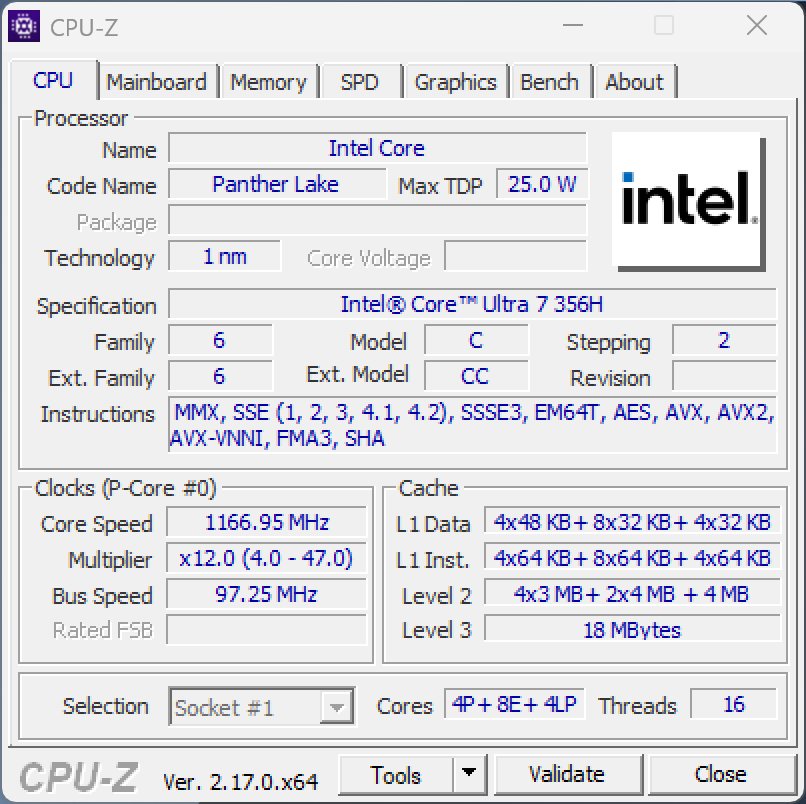
Prozessor
Samsung verwendet den neuen Core Ultra 7 356H (Panther Lake) mit insgesamt 16 Kernen. Die kurzfristige Leistungsgrenze ist mit 80 Watt sehr hoch, sinkt aber schnell auf nur 30 Watt. Das bedeutet, dass die Leistung in kurzen Spitzenlastszenarien gut ist, aber bei anhaltender Arbeitslast um etwa 25 % abfällt. Im Akkubetrieb sinkt die CPU-Leistung nur geringfügig (- 5 %, 60/30 W).
Cinebench R15 Mehrfachschleife
Cinebench 2024: CPU Multi Core | CPU Single Core
Cinebench R23: Multi Core | Single Core
Cinebench R20: CPU (Multi Core) | CPU (Single Core)
Cinebench R15: CPU Multi 64Bit | CPU Single 64Bit
Blender: v2.79 BMW27 CPU
7-Zip 18.03: 7z b 4 | 7z b 4 -mmt1
Geekbench 6.7: Multi-Core | Single-Core
Geekbench 5.5: Multi-Core | Single-Core
HWBOT x265 Benchmark v2.2: 4k Preset
LibreOffice : 20 Documents To PDF
R Benchmark 2.5: Overall mean
| CPU Performance Rating | |
| Apple MacBook Air 15 M5 -14! | |
| Durchschnittliche Intel Core Ultra 7 356H | |
| Samsung Galaxy Book6 Pro | |
| Asus ZenBook S16 UM5606GA | |
| Durchschnitt der Klasse Multimedia | |
| Samsung Galaxy Book4 Pro 16 -2! | |
| Microsoft Surface Laptop 7 15 Lunar Lake | |
| Dell XPS 16 Core Ultra 5 325 | |
| Lenovo ThinkPad X9-15 Aura Edition | |
| Cinebench 2024 / CPU Multi Core | |
| Durchschnittliche Intel Core Ultra 7 356H (1006 - 1232, n=3) | |
| Durchschnitt der Klasse Multimedia (327 - 2437, n=82, der letzten 2 Jahre) | |
| Samsung Galaxy Book6 Pro | |
| Apple MacBook Air 15 M5 | |
| Asus ZenBook S16 UM5606GA | |
| Dell XPS 16 Core Ultra 5 325 | |
| Microsoft Surface Laptop 7 15 Lunar Lake | |
| Lenovo ThinkPad X9-15 Aura Edition | |
| Cinebench 2024 / CPU Single Core | |
| Apple MacBook Air 15 M5 | |
| Durchschnitt der Klasse Multimedia (72.5 - 201, n=63, der letzten 2 Jahre) | |
| Microsoft Surface Laptop 7 15 Lunar Lake | |
| Samsung Galaxy Book6 Pro | |
| Durchschnittliche Intel Core Ultra 7 356H (116 - 122.4, n=3) | |
| Lenovo ThinkPad X9-15 Aura Edition | |
| Asus ZenBook S16 UM5606GA | |
| Dell XPS 16 Core Ultra 5 325 | |
| Cinebench R23 / Multi Core | |
| Durchschnittliche Intel Core Ultra 7 356H (18395 - 20650, n=2) | |
| Samsung Galaxy Book6 Pro | |
| Asus ZenBook S16 UM5606GA | |
| Durchschnitt der Klasse Multimedia (4861 - 33362, n=81, der letzten 2 Jahre) | |
| Samsung Galaxy Book4 Pro 16 | |
| Dell XPS 16 Core Ultra 5 325 | |
| Microsoft Surface Laptop 7 15 Lunar Lake | |
| Lenovo ThinkPad X9-15 Aura Edition | |
| Cinebench R23 / Single Core | |
| Durchschnittliche Intel Core Ultra 7 356H (2040 - 2045, n=2) | |
| Samsung Galaxy Book6 Pro | |
| Asus ZenBook S16 UM5606GA | |
| Durchschnitt der Klasse Multimedia (1128 - 2459, n=73, der letzten 2 Jahre) | |
| Microsoft Surface Laptop 7 15 Lunar Lake | |
| Lenovo ThinkPad X9-15 Aura Edition | |
| Dell XPS 16 Core Ultra 5 325 | |
| Samsung Galaxy Book4 Pro 16 | |
| Cinebench R20 / CPU (Multi Core) | |
| Durchschnittliche Intel Core Ultra 7 356H (7180 - 8074, n=2) | |
| Samsung Galaxy Book6 Pro | |
| Asus ZenBook S16 UM5606GA | |
| Durchschnitt der Klasse Multimedia (1887 - 12912, n=64, der letzten 2 Jahre) | |
| Samsung Galaxy Book4 Pro 16 | |
| Dell XPS 16 Core Ultra 5 325 | |
| Microsoft Surface Laptop 7 15 Lunar Lake | |
| Lenovo ThinkPad X9-15 Aura Edition | |
| Cinebench R20 / CPU (Single Core) | |
| Asus ZenBook S16 UM5606GA | |
| Samsung Galaxy Book6 Pro | |
| Durchschnittliche Intel Core Ultra 7 356H (773 - 774, n=2) | |
| Microsoft Surface Laptop 7 15 Lunar Lake | |
| Durchschnitt der Klasse Multimedia (425 - 853, n=64, der letzten 2 Jahre) | |
| Lenovo ThinkPad X9-15 Aura Edition | |
| Dell XPS 16 Core Ultra 5 325 | |
| Samsung Galaxy Book4 Pro 16 | |
| Cinebench R15 / CPU Multi 64Bit | |
| Durchschnittliche Intel Core Ultra 7 356H (2937 - 3201, n=2) | |
| Samsung Galaxy Book6 Pro | |
| Asus ZenBook S16 UM5606GA | |
| Durchschnitt der Klasse Multimedia (856 - 5224, n=68, der letzten 2 Jahre) | |
| Samsung Galaxy Book4 Pro 16 | |
| Dell XPS 16 Core Ultra 5 325 | |
| Microsoft Surface Laptop 7 15 Lunar Lake | |
| Lenovo ThinkPad X9-15 Aura Edition | |
| Cinebench R15 / CPU Single 64Bit | |
| Durchschnittliche Intel Core Ultra 7 356H (303 - 306, n=2) | |
| Samsung Galaxy Book6 Pro | |
| Lenovo ThinkPad X9-15 Aura Edition | |
| Microsoft Surface Laptop 7 15 Lunar Lake | |
| Durchschnitt der Klasse Multimedia (184.8 - 326, n=66, der letzten 2 Jahre) | |
| Dell XPS 16 Core Ultra 5 325 | |
| Samsung Galaxy Book4 Pro 16 | |
| Asus ZenBook S16 UM5606GA | |
| Blender / v2.79 BMW27 CPU | |
| Lenovo ThinkPad X9-15 Aura Edition | |
| Microsoft Surface Laptop 7 15 Lunar Lake | |
| Dell XPS 16 Core Ultra 5 325 | |
| Durchschnitt der Klasse Multimedia (100 - 557, n=65, der letzten 2 Jahre) | |
| Samsung Galaxy Book4 Pro 16 | |
| Samsung Galaxy Book6 Pro | |
| Asus ZenBook S16 UM5606GA | |
| Durchschnittliche Intel Core Ultra 7 356H (163 - 196, n=2) | |
| 7-Zip 18.03 / 7z b 4 | |
| Durchschnittliche Intel Core Ultra 7 356H (65579 - 69785, n=2) | |
| Asus ZenBook S16 UM5606GA | |
| Samsung Galaxy Book6 Pro | |
| Samsung Galaxy Book4 Pro 16 | |
| Durchschnitt der Klasse Multimedia (26062 - 130368, n=62, der letzten 2 Jahre) | |
| Dell XPS 16 Core Ultra 5 325 | |
| Microsoft Surface Laptop 7 15 Lunar Lake | |
| Lenovo ThinkPad X9-15 Aura Edition | |
| 7-Zip 18.03 / 7z b 4 -mmt1 | |
| Samsung Galaxy Book6 Pro | |
| Durchschnittliche Intel Core Ultra 7 356H (6305 - 6375, n=2) | |
| Asus ZenBook S16 UM5606GA | |
| Microsoft Surface Laptop 7 15 Lunar Lake | |
| Durchschnitt der Klasse Multimedia (3666 - 7545, n=63, der letzten 2 Jahre) | |
| Lenovo ThinkPad X9-15 Aura Edition | |
| Dell XPS 16 Core Ultra 5 325 | |
| Samsung Galaxy Book4 Pro 16 | |
| Geekbench 6.7 / Multi-Core | |
| Apple MacBook Air 15 M5 | |
| Samsung Galaxy Book6 Pro | |
| Durchschnittliche Intel Core Ultra 7 356H (15578 - 16676, n=3) | |
| Durchschnitt der Klasse Multimedia (4983 - 29415, n=76, der letzten 2 Jahre) | |
| Asus ZenBook S16 UM5606GA | |
| Samsung Galaxy Book4 Pro 16 | |
| Microsoft Surface Laptop 7 15 Lunar Lake | |
| Dell XPS 16 Core Ultra 5 325 | |
| Lenovo ThinkPad X9-15 Aura Edition | |
| Geekbench 6.7 / Single-Core | |
| Apple MacBook Air 15 M5 | |
| Durchschnitt der Klasse Multimedia (1534 - 4335, n=75, der letzten 2 Jahre) | |
| Microsoft Surface Laptop 7 15 Lunar Lake | |
| Samsung Galaxy Book6 Pro | |
| Asus ZenBook S16 UM5606GA | |
| Lenovo ThinkPad X9-15 Aura Edition | |
| Durchschnittliche Intel Core Ultra 7 356H (2532 - 2851, n=3) | |
| Dell XPS 16 Core Ultra 5 325 | |
| Samsung Galaxy Book4 Pro 16 | |
| Geekbench 5.5 / Multi-Core | |
| Durchschnittliche Intel Core Ultra 7 356H (16721 - 16761, n=2) | |
| Samsung Galaxy Book6 Pro | |
| Asus ZenBook S16 UM5606GA | |
| Durchschnitt der Klasse Multimedia (4652 - 20422, n=62, der letzten 2 Jahre) | |
| Samsung Galaxy Book4 Pro 16 | |
| Dell XPS 16 Core Ultra 5 325 | |
| Microsoft Surface Laptop 7 15 Lunar Lake | |
| Lenovo ThinkPad X9-15 Aura Edition | |
| Geekbench 5.5 / Single-Core | |
| Asus ZenBook S16 UM5606GA | |
| Samsung Galaxy Book6 Pro | |
| Durchschnittliche Intel Core Ultra 7 356H (2086 - 2098, n=2) | |
| Microsoft Surface Laptop 7 15 Lunar Lake | |
| Lenovo ThinkPad X9-15 Aura Edition | |
| Durchschnitt der Klasse Multimedia (805 - 2974, n=62, der letzten 2 Jahre) | |
| Dell XPS 16 Core Ultra 5 325 | |
| Samsung Galaxy Book4 Pro 16 | |
| HWBOT x265 Benchmark v2.2 / 4k Preset | |
| Durchschnittliche Intel Core Ultra 7 356H (20 - 25.1, n=2) | |
| Asus ZenBook S16 UM5606GA | |
| Samsung Galaxy Book6 Pro | |
| Durchschnitt der Klasse Multimedia (5.26 - 36.1, n=63, der letzten 2 Jahre) | |
| Samsung Galaxy Book4 Pro 16 | |
| Dell XPS 16 Core Ultra 5 325 | |
| Microsoft Surface Laptop 7 15 Lunar Lake | |
| Lenovo ThinkPad X9-15 Aura Edition | |
| LibreOffice / 20 Documents To PDF | |
| Samsung Galaxy Book6 Pro | |
| Asus ZenBook S16 UM5606GA | |
| Durchschnittliche Intel Core Ultra 7 356H (47.3 - 57.8, n=2) | |
| Durchschnitt der Klasse Multimedia (23.9 - 146.7, n=64, der letzten 2 Jahre) | |
| Dell XPS 16 Core Ultra 5 325 | |
| Microsoft Surface Laptop 7 15 Lunar Lake | |
| Lenovo ThinkPad X9-15 Aura Edition | |
| Samsung Galaxy Book4 Pro 16 | |
| R Benchmark 2.5 / Overall mean | |
| Lenovo ThinkPad X9-15 Aura Edition | |
| Samsung Galaxy Book4 Pro 16 | |
| Durchschnitt der Klasse Multimedia (0.3604 - 0.947, n=63, der letzten 2 Jahre) | |
| Samsung Galaxy Book6 Pro | |
| Dell XPS 16 Core Ultra 5 325 | |
| Microsoft Surface Laptop 7 15 Lunar Lake | |
| Durchschnittliche Intel Core Ultra 7 356H (0.4268 - 0.459, n=2) | |
| Asus ZenBook S16 UM5606GA | |
* ... kleinere Werte sind besser
AIDA64: FP32 Ray-Trace | FPU Julia | CPU SHA3 | CPU Queen | FPU SinJulia | FPU Mandel | CPU AES | CPU ZLib | FP64 Ray-Trace | CPU PhotoWorxx | CPU CheckMate
| Performance Rating | |
| Asus ZenBook S16 UM5606GA -1! | |
| Durchschnittliche Intel Core Ultra 7 356H -1! | |
| Samsung Galaxy Book6 Pro -1! | |
| Durchschnitt der Klasse Multimedia | |
| Samsung Galaxy Book4 Pro 16 -1! | |
| Dell XPS 16 Core Ultra 5 325 -1! | |
| Lenovo ThinkPad X9-15 Aura Edition | |
| Microsoft Surface Laptop 7 15 Lunar Lake -1! | |
| AIDA64 / FP32 Ray-Trace | |
| Asus ZenBook S16 UM5606GA (v6.92.6600) | |
| Durchschnittliche Intel Core Ultra 7 356H (16303 - 20528, n=2) | |
| Durchschnitt der Klasse Multimedia (2214 - 50388, n=60, der letzten 2 Jahre) | |
| Samsung Galaxy Book6 Pro (v8.20.8100) | |
| Samsung Galaxy Book4 Pro 16 (v6.92.6600) | |
| Lenovo ThinkPad X9-15 Aura Edition (v6.92.6600) | |
| Lenovo ThinkPad X9-15 Aura Edition (v6.92.6600) | |
| Lenovo ThinkPad X9-15 Aura Edition (v8.20.8100) | |
| Dell XPS 16 Core Ultra 5 325 (v8.20.8100) | |
| Microsoft Surface Laptop 7 15 Lunar Lake (v6.92.6600) | |
| AIDA64 / FPU Julia | |
| Asus ZenBook S16 UM5606GA (v6.92.6600) | |
| Durchschnittliche Intel Core Ultra 7 356H (81236 - 108092, n=2) | |
| Durchschnitt der Klasse Multimedia (12867 - 201874, n=61, der letzten 2 Jahre) | |
| Samsung Galaxy Book6 Pro (v8.20.8100) | |
| Samsung Galaxy Book4 Pro 16 (v6.92.6600) | |
| Dell XPS 16 Core Ultra 5 325 (v8.20.8100) | |
| Lenovo ThinkPad X9-15 Aura Edition (v6.92.6600) | |
| Lenovo ThinkPad X9-15 Aura Edition (v8.20.8100) | |
| Lenovo ThinkPad X9-15 Aura Edition (v6.92.6600) | |
| Microsoft Surface Laptop 7 15 Lunar Lake (v6.92.6600) | |
| AIDA64 / CPU SHA3 | |
| Durchschnittliche Intel Core Ultra 7 356H (4141 - 5284, n=2) | |
| Asus ZenBook S16 UM5606GA (v6.92.6600) | |
| Samsung Galaxy Book6 Pro (v8.20.8100) | |
| Durchschnitt der Klasse Multimedia (626 - 8623, n=61, der letzten 2 Jahre) | |
| Samsung Galaxy Book4 Pro 16 (v6.92.6600) | |
| Dell XPS 16 Core Ultra 5 325 (v8.20.8100) | |
| Lenovo ThinkPad X9-15 Aura Edition (v6.92.6600) | |
| Lenovo ThinkPad X9-15 Aura Edition (v8.20.8100) | |
| Lenovo ThinkPad X9-15 Aura Edition (v6.92.6600) | |
| Microsoft Surface Laptop 7 15 Lunar Lake (v6.92.6600) | |
| AIDA64 / CPU Queen | |
| Asus ZenBook S16 UM5606GA (v6.92.6600) | |
| Samsung Galaxy Book4 Pro 16 (v6.92.6600) | |
| Durchschnitt der Klasse Multimedia (13483 - 181505, n=48, der letzten 2 Jahre) | |
| Lenovo ThinkPad X9-15 Aura Edition (v6.92.6600) | |
| Lenovo ThinkPad X9-15 Aura Edition (v6.92.6600) | |
| Microsoft Surface Laptop 7 15 Lunar Lake (v6.92.6600) | |
| AIDA64 / FPU SinJulia | |
| Asus ZenBook S16 UM5606GA (v6.92.6600) | |
| Samsung Galaxy Book4 Pro 16 (v6.92.6600) | |
| Durchschnitt der Klasse Multimedia (886 - 28794, n=61, der letzten 2 Jahre) | |
| Samsung Galaxy Book6 Pro (v8.20.8100) | |
| Durchschnittliche Intel Core Ultra 7 356H (6960 - 6965, n=2) | |
| Lenovo ThinkPad X9-15 Aura Edition (v8.20.8100) | |
| Lenovo ThinkPad X9-15 Aura Edition (v6.92.6600) | |
| Lenovo ThinkPad X9-15 Aura Edition (v6.92.6600) | |
| Microsoft Surface Laptop 7 15 Lunar Lake (v6.92.6600) | |
| Dell XPS 16 Core Ultra 5 325 (v8.20.8100) | |
| AIDA64 / FPU Mandel | |
| Asus ZenBook S16 UM5606GA (v6.92.6600) | |
| Durchschnittliche Intel Core Ultra 7 356H (44538 - 58505, n=2) | |
| Samsung Galaxy Book6 Pro (v8.20.8100) | |
| Durchschnitt der Klasse Multimedia (6395 - 105740, n=60, der letzten 2 Jahre) | |
| Samsung Galaxy Book4 Pro 16 (v6.92.6600) | |
| Dell XPS 16 Core Ultra 5 325 (v8.20.8100) | |
| Lenovo ThinkPad X9-15 Aura Edition (v6.92.6600) | |
| Lenovo ThinkPad X9-15 Aura Edition (v6.92.6600) | |
| Lenovo ThinkPad X9-15 Aura Edition (v8.20.8100) | |
| Microsoft Surface Laptop 7 15 Lunar Lake (v6.92.6600) | |
| AIDA64 / CPU AES | |
| Asus ZenBook S16 UM5606GA (v6.92.6600) | |
| Samsung Galaxy Book4 Pro 16 (v6.92.6600) | |
| Durchschnitt der Klasse Multimedia (8171 - 126790, n=61, der letzten 2 Jahre) | |
| Durchschnittliche Intel Core Ultra 7 356H (64920 - 67037, n=2) | |
| Samsung Galaxy Book6 Pro (v8.20.8100) | |
| Lenovo ThinkPad X9-15 Aura Edition (v8.20.8100) | |
| Lenovo ThinkPad X9-15 Aura Edition (v6.92.6600) | |
| Lenovo ThinkPad X9-15 Aura Edition (v6.92.6600) | |
| Microsoft Surface Laptop 7 15 Lunar Lake (v6.92.6600) | |
| Dell XPS 16 Core Ultra 5 325 (v8.20.8100) | |
| AIDA64 / CPU ZLib | |
| Asus ZenBook S16 UM5606GA (v6.92.6600) | |
| Durchschnittliche Intel Core Ultra 7 356H (1086 - 1199, n=2) | |
| Samsung Galaxy Book6 Pro (v8.20.8100) | |
| Durchschnitt der Klasse Multimedia (143.8 - 2022, n=61, der letzten 2 Jahre) | |
| Samsung Galaxy Book4 Pro 16 (v6.92.6600) | |
| Dell XPS 16 Core Ultra 5 325 (v8.20.8100) | |
| Lenovo ThinkPad X9-15 Aura Edition (v6.92.6600) | |
| Lenovo ThinkPad X9-15 Aura Edition (v8.20.8100) | |
| Lenovo ThinkPad X9-15 Aura Edition (v6.92.6600) | |
| Microsoft Surface Laptop 7 15 Lunar Lake (v6.92.6600) | |
| AIDA64 / FP64 Ray-Trace | |
| Asus ZenBook S16 UM5606GA (v6.92.6600) | |
| Durchschnittliche Intel Core Ultra 7 356H (8201 - 11057, n=2) | |
| Durchschnitt der Klasse Multimedia (1014 - 26875, n=61, der letzten 2 Jahre) | |
| Samsung Galaxy Book6 Pro (v8.20.8100) | |
| Samsung Galaxy Book4 Pro 16 (v6.92.6600) | |
| Lenovo ThinkPad X9-15 Aura Edition (v6.92.6600) | |
| Lenovo ThinkPad X9-15 Aura Edition (v6.92.6600) | |
| Lenovo ThinkPad X9-15 Aura Edition (v8.20.8100) | |
| Dell XPS 16 Core Ultra 5 325 (v8.20.8100) | |
| Microsoft Surface Laptop 7 15 Lunar Lake (v6.92.6600) | |
| AIDA64 / CPU PhotoWorxx | |
| Samsung Galaxy Book6 Pro (v8.20.8100) | |
| Durchschnittliche Intel Core Ultra 7 356H (83099 - 83163, n=2) | |
| Lenovo ThinkPad X9-15 Aura Edition (v8.20.8100) | |
| Lenovo ThinkPad X9-15 Aura Edition (v6.92.6600) | |
| Lenovo ThinkPad X9-15 Aura Edition (v6.92.6600) | |
| Dell XPS 16 Core Ultra 5 325 (v8.20.8100) | |
| Microsoft Surface Laptop 7 15 Lunar Lake (v6.92.6600) | |
| Asus ZenBook S16 UM5606GA (v6.92.6600) | |
| Samsung Galaxy Book4 Pro 16 (v6.92.6600) | |
| Durchschnitt der Klasse Multimedia (8187 - 88154, n=61, der letzten 2 Jahre) | |
| AIDA64 / CPU CheckMate | |
| Durchschnittliche Intel Core Ultra 7 356H (4196 - 4629, n=2) | |
| Samsung Galaxy Book6 Pro (v8.20.8100) | |
| Durchschnitt der Klasse Multimedia (569 - 4742, n=16, der letzten 2 Jahre) | |
| Dell XPS 16 Core Ultra 5 325 (v8.20.8100) | |
| Lenovo ThinkPad X9-15 Aura Edition (v8.20.8100) | |
System Performance
Der subjektive Leistungseindruck ist ausgezeichnet und wir haben keine Ruckler oder Stabilitätsprobleme festgestellt.
PCMark 10: Score | Essentials | Productivity | Digital Content Creation
CrossMark: Overall | Productivity | Creativity | Responsiveness
WebXPRT 3: Overall
WebXPRT 4: Overall
Mozilla Kraken 1.1: Total
| Performance Rating | |
| Apple MacBook Air 15 M5 -4! | |
| Samsung Galaxy Book6 Pro | |
| Durchschnittliche Intel Core Ultra 7 356H, Intel Graphics 4 Xe3 Panther Lake iGPU | |
| Durchschnitt der Klasse Multimedia | |
| Asus ZenBook S16 UM5606GA | |
| Microsoft Surface Laptop 7 15 Lunar Lake | |
| Dell XPS 16 Core Ultra 5 325 | |
| Lenovo ThinkPad X9-15 Aura Edition | |
| Samsung Galaxy Book4 Pro 16 | |
| PCMark 10 / Score | |
| Samsung Galaxy Book6 Pro | |
| Durchschnittliche Intel Core Ultra 7 356H, Intel Graphics 4 Xe3 Panther Lake iGPU (n=1) | |
| Asus ZenBook S16 UM5606GA | |
| Dell XPS 16 Core Ultra 5 325 | |
| Durchschnitt der Klasse Multimedia (4325 - 10386, n=58, der letzten 2 Jahre) | |
| Microsoft Surface Laptop 7 15 Lunar Lake | |
| Lenovo ThinkPad X9-15 Aura Edition | |
| Samsung Galaxy Book4 Pro 16 | |
| PCMark 10 / Essentials | |
| Samsung Galaxy Book4 Pro 16 | |
| Microsoft Surface Laptop 7 15 Lunar Lake | |
| Lenovo ThinkPad X9-15 Aura Edition | |
| Asus ZenBook S16 UM5606GA | |
| Durchschnitt der Klasse Multimedia (8025 - 11664, n=57, der letzten 2 Jahre) | |
| Samsung Galaxy Book6 Pro | |
| Durchschnittliche Intel Core Ultra 7 356H, Intel Graphics 4 Xe3 Panther Lake iGPU (n=1) | |
| Dell XPS 16 Core Ultra 5 325 | |
| PCMark 10 / Productivity | |
| Samsung Galaxy Book6 Pro | |
| Durchschnittliche Intel Core Ultra 7 356H, Intel Graphics 4 Xe3 Panther Lake iGPU (n=1) | |
| Asus ZenBook S16 UM5606GA | |
| Dell XPS 16 Core Ultra 5 325 | |
| Durchschnitt der Klasse Multimedia (7323 - 18233, n=57, der letzten 2 Jahre) | |
| Microsoft Surface Laptop 7 15 Lunar Lake | |
| Lenovo ThinkPad X9-15 Aura Edition | |
| Samsung Galaxy Book4 Pro 16 | |
| PCMark 10 / Digital Content Creation | |
| Microsoft Surface Laptop 7 15 Lunar Lake | |
| Durchschnitt der Klasse Multimedia (3651 - 16240, n=57, der letzten 2 Jahre) | |
| Samsung Galaxy Book6 Pro | |
| Durchschnittliche Intel Core Ultra 7 356H, Intel Graphics 4 Xe3 Panther Lake iGPU (n=1) | |
| Asus ZenBook S16 UM5606GA | |
| Lenovo ThinkPad X9-15 Aura Edition | |
| Dell XPS 16 Core Ultra 5 325 | |
| Samsung Galaxy Book4 Pro 16 | |
| CrossMark / Overall | |
| Apple MacBook Air 15 M5 | |
| Samsung Galaxy Book6 Pro | |
| Durchschnittliche Intel Core Ultra 7 356H, Intel Graphics 4 Xe3 Panther Lake iGPU (n=1) | |
| Durchschnitt der Klasse Multimedia (866 - 2728, n=67, der letzten 2 Jahre) | |
| Samsung Galaxy Book4 Pro 16 | |
| Lenovo ThinkPad X9-15 Aura Edition | |
| Microsoft Surface Laptop 7 15 Lunar Lake | |
| Dell XPS 16 Core Ultra 5 325 | |
| Asus ZenBook S16 UM5606GA | |
| CrossMark / Productivity | |
| Apple MacBook Air 15 M5 | |
| Samsung Galaxy Book6 Pro | |
| Durchschnittliche Intel Core Ultra 7 356H, Intel Graphics 4 Xe3 Panther Lake iGPU (n=1) | |
| Durchschnitt der Klasse Multimedia (931 - 2489, n=67, der letzten 2 Jahre) | |
| Samsung Galaxy Book4 Pro 16 | |
| Lenovo ThinkPad X9-15 Aura Edition | |
| Microsoft Surface Laptop 7 15 Lunar Lake | |
| Asus ZenBook S16 UM5606GA | |
| Dell XPS 16 Core Ultra 5 325 | |
| CrossMark / Creativity | |
| Apple MacBook Air 15 M5 | |
| Samsung Galaxy Book6 Pro | |
| Durchschnittliche Intel Core Ultra 7 356H, Intel Graphics 4 Xe3 Panther Lake iGPU (n=1) | |
| Durchschnitt der Klasse Multimedia (907 - 3465, n=67, der letzten 2 Jahre) | |
| Lenovo ThinkPad X9-15 Aura Edition | |
| Microsoft Surface Laptop 7 15 Lunar Lake | |
| Samsung Galaxy Book4 Pro 16 | |
| Asus ZenBook S16 UM5606GA | |
| Dell XPS 16 Core Ultra 5 325 | |
| CrossMark / Responsiveness | |
| Apple MacBook Air 15 M5 | |
| Samsung Galaxy Book6 Pro | |
| Durchschnittliche Intel Core Ultra 7 356H, Intel Graphics 4 Xe3 Panther Lake iGPU (n=1) | |
| Samsung Galaxy Book4 Pro 16 | |
| Durchschnitt der Klasse Multimedia (605 - 2024, n=67, der letzten 2 Jahre) | |
| Asus ZenBook S16 UM5606GA | |
| Dell XPS 16 Core Ultra 5 325 | |
| Lenovo ThinkPad X9-15 Aura Edition | |
| Microsoft Surface Laptop 7 15 Lunar Lake | |
| WebXPRT 3 / Overall | |
| Apple MacBook Air 15 M5 | |
| Durchschnitt der Klasse Multimedia (136.4 - 596, n=70, der letzten 2 Jahre) | |
| Microsoft Surface Laptop 7 15 Lunar Lake | |
| Asus ZenBook S16 UM5606GA | |
| Lenovo ThinkPad X9-15 Aura Edition | |
| Samsung Galaxy Book6 Pro | |
| Durchschnittliche Intel Core Ultra 7 356H, Intel Graphics 4 Xe3 Panther Lake iGPU (n=1) | |
| Dell XPS 16 Core Ultra 5 325 | |
| Samsung Galaxy Book4 Pro 16 | |
| WebXPRT 4 / Overall | |
| Apple MacBook Air 15 M5 | |
| Durchschnitt der Klasse Multimedia (167.3 - 402, n=71, der letzten 2 Jahre) | |
| Microsoft Surface Laptop 7 15 Lunar Lake | |
| Lenovo ThinkPad X9-15 Aura Edition | |
| Samsung Galaxy Book6 Pro | |
| Durchschnittliche Intel Core Ultra 7 356H, Intel Graphics 4 Xe3 Panther Lake iGPU (n=1) | |
| Dell XPS 16 Core Ultra 5 325 | |
| Samsung Galaxy Book4 Pro 16 | |
| Asus ZenBook S16 UM5606GA | |
| Mozilla Kraken 1.1 / Total | |
| Samsung Galaxy Book4 Pro 16 | |
| Dell XPS 16 Core Ultra 5 325 | |
| Asus ZenBook S16 UM5606GA | |
| Microsoft Surface Laptop 7 15 Lunar Lake | |
| Lenovo ThinkPad X9-15 Aura Edition | |
| Samsung Galaxy Book6 Pro | |
| Durchschnittliche Intel Core Ultra 7 356H, Intel Graphics 4 Xe3 Panther Lake iGPU (n=1) | |
| Durchschnitt der Klasse Multimedia (228 - 835, n=73, der letzten 2 Jahre) | |
| Apple MacBook Air 15 M5 | |
* ... kleinere Werte sind besser
| PCMark 10 Score | 8644 Punkte | |
Hilfe | ||
| AIDA64 / Memory Copy | |
| Samsung Galaxy Book6 Pro | |
| Durchschnittliche Intel Core Ultra 7 356H (116043 - 121055, n=2) | |
| Lenovo ThinkPad X9-15 Aura Edition | |
| Microsoft Surface Laptop 7 15 Lunar Lake | |
| Dell XPS 16 Core Ultra 5 325 | |
| Asus ZenBook S16 UM5606GA | |
| Samsung Galaxy Book4 Pro 16 | |
| Durchschnitt der Klasse Multimedia (11299 - 132135, n=61, der letzten 2 Jahre) | |
| AIDA64 / Memory Read | |
| Samsung Galaxy Book6 Pro | |
| Durchschnittliche Intel Core Ultra 7 356H (107881 - 112376, n=2) | |
| Asus ZenBook S16 UM5606GA | |
| Samsung Galaxy Book4 Pro 16 | |
| Microsoft Surface Laptop 7 15 Lunar Lake | |
| Lenovo ThinkPad X9-15 Aura Edition | |
| Dell XPS 16 Core Ultra 5 325 | |
| Durchschnitt der Klasse Multimedia (11624 - 174586, n=61, der letzten 2 Jahre) | |
| AIDA64 / Memory Write | |
| Samsung Galaxy Book6 Pro | |
| Durchschnittliche Intel Core Ultra 7 356H (120431 - 120449, n=2) | |
| Microsoft Surface Laptop 7 15 Lunar Lake | |
| Lenovo ThinkPad X9-15 Aura Edition | |
| Asus ZenBook S16 UM5606GA | |
| Dell XPS 16 Core Ultra 5 325 | |
| Durchschnitt der Klasse Multimedia (11755 - 134998, n=61, der letzten 2 Jahre) | |
| Samsung Galaxy Book4 Pro 16 | |
| AIDA64 / Memory Latency | |
| Samsung Galaxy Book4 Pro 16 | |
| Durchschnitt der Klasse Multimedia (7 - 535, n=60, der letzten 2 Jahre) | |
| Asus ZenBook S16 UM5606GA | |
| Dell XPS 16 Core Ultra 5 325 | |
| Microsoft Surface Laptop 7 15 Lunar Lake | |
| Lenovo ThinkPad X9-15 Aura Edition | |
| Durchschnittliche Intel Core Ultra 7 356H (88.6 - 90, n=2) | |
| Samsung Galaxy Book6 Pro | |
* ... kleinere Werte sind besser
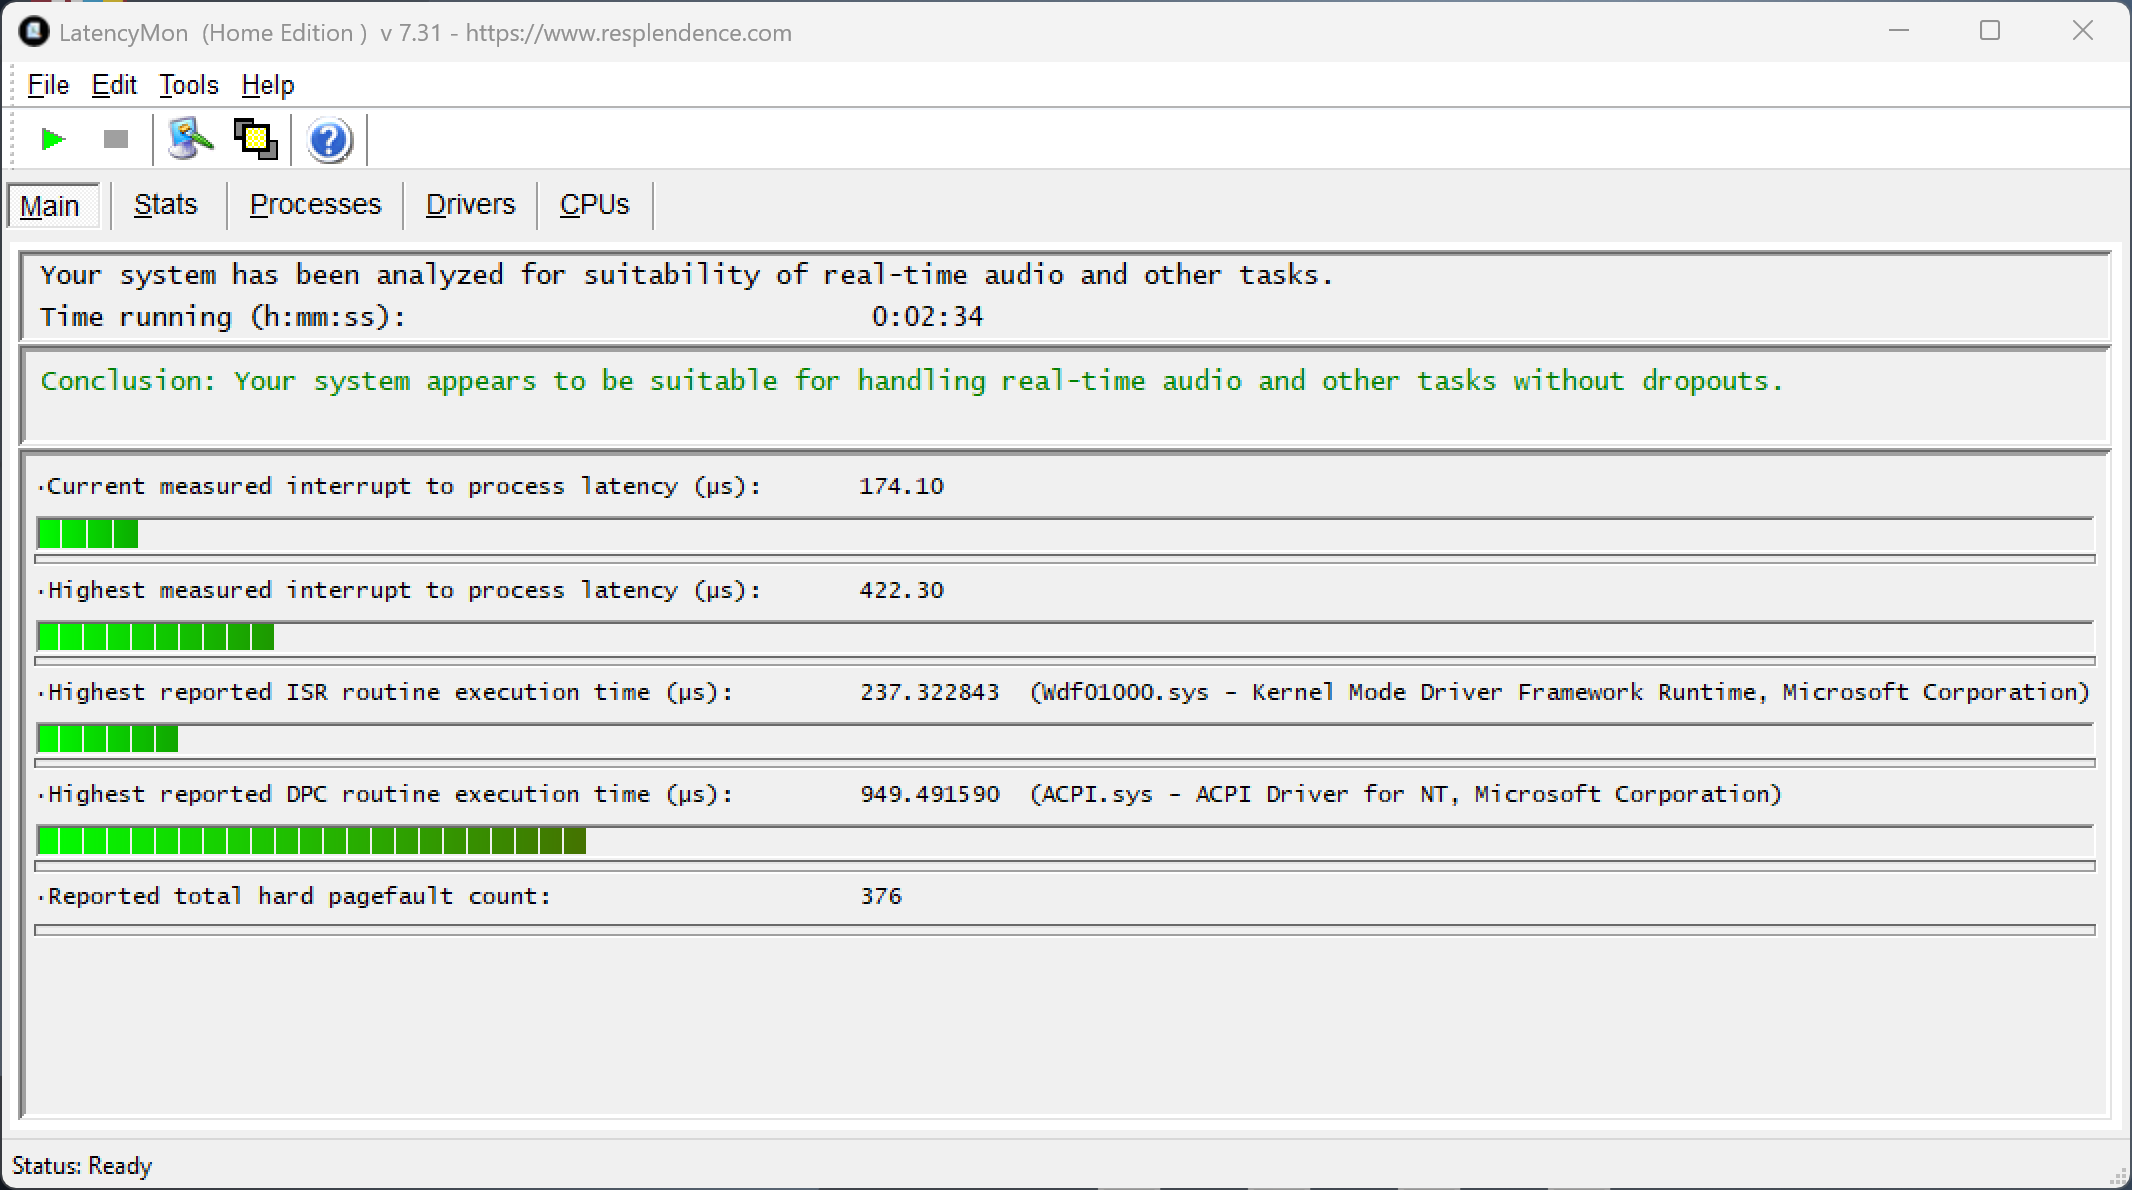
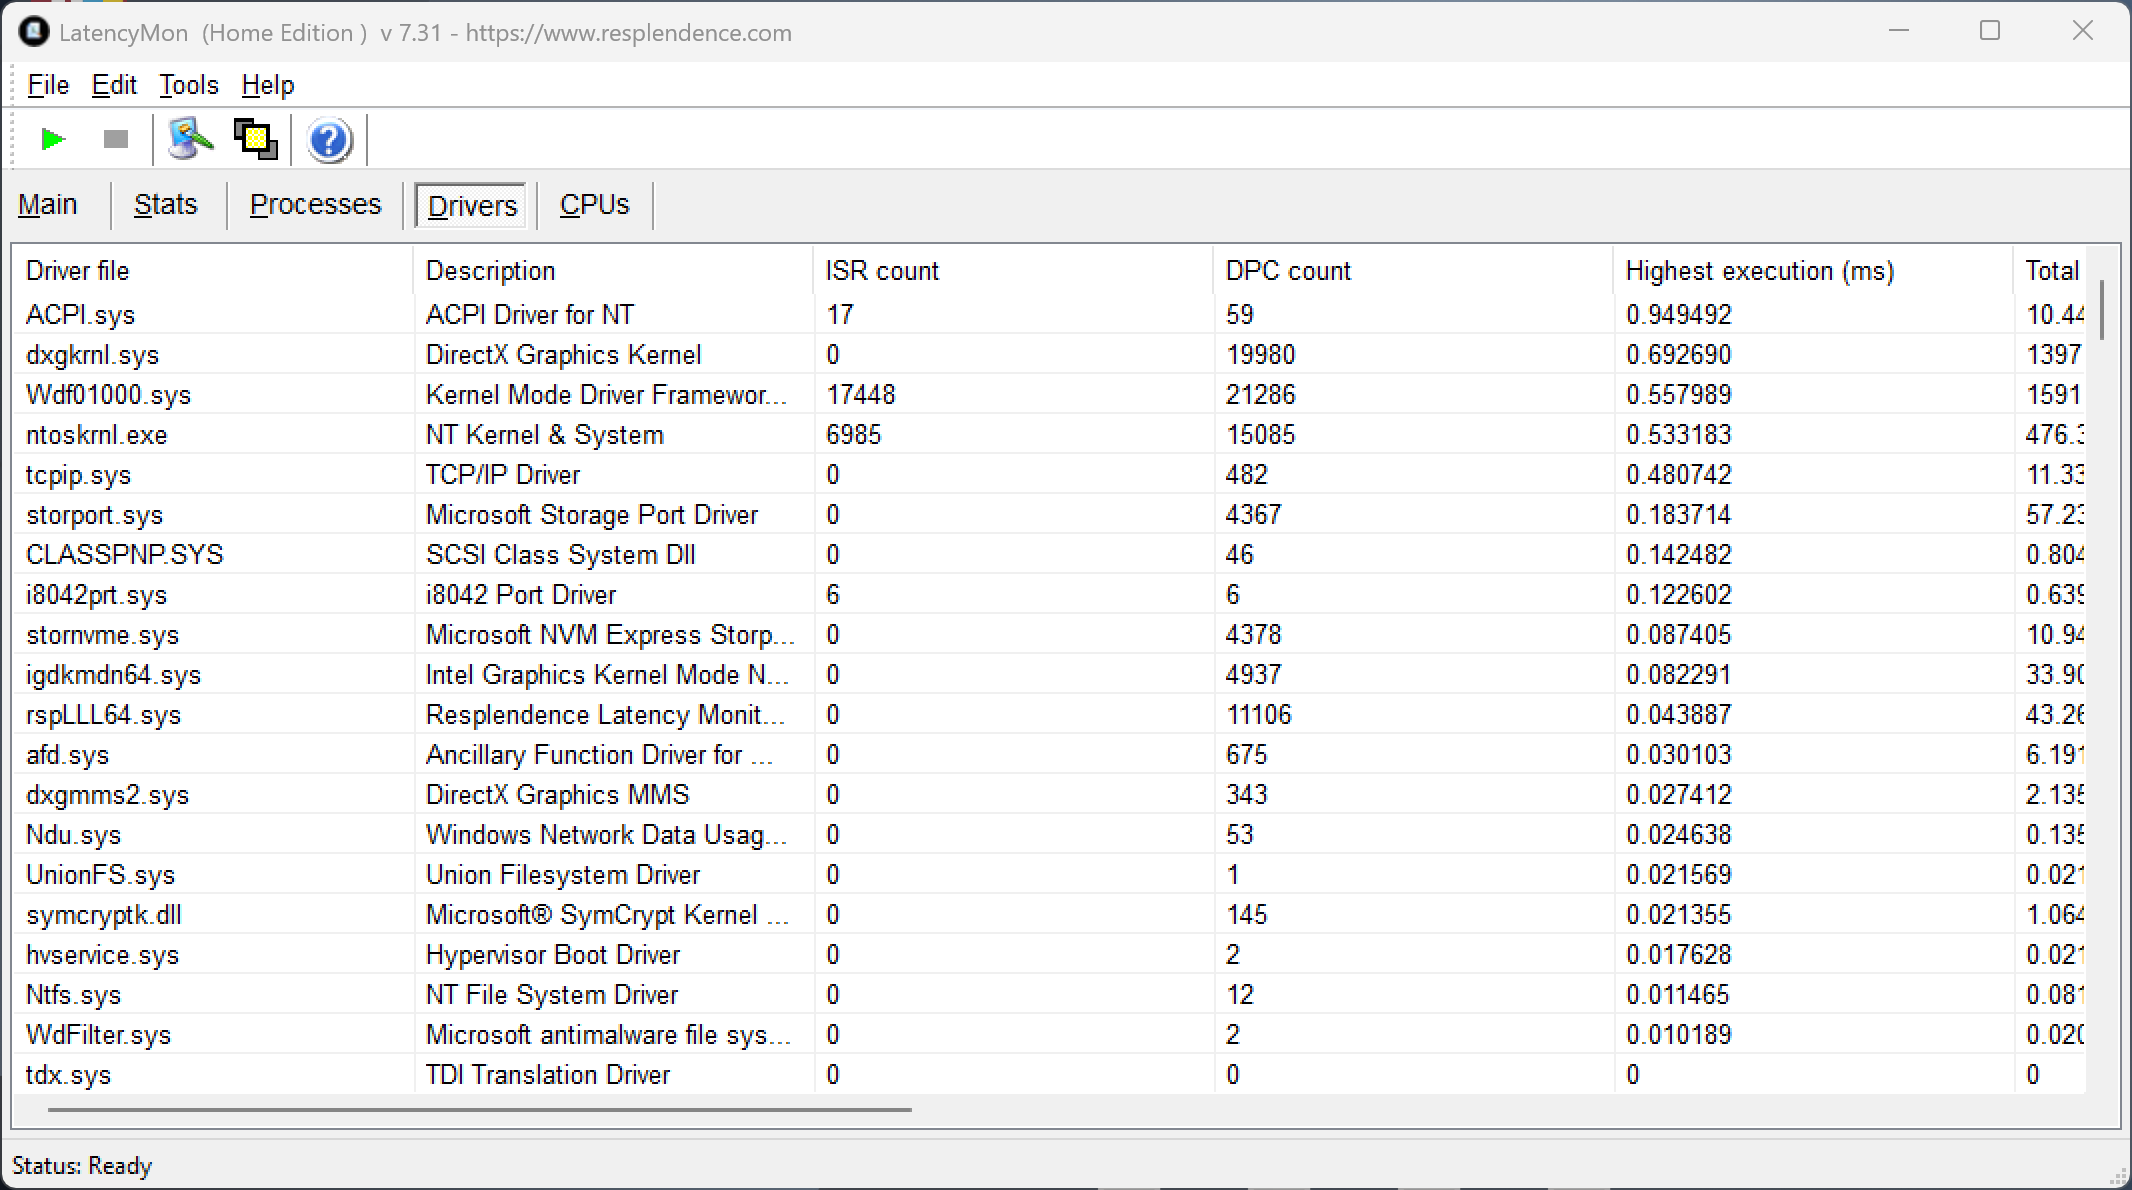
DPC-Latenzzeit
Unser standardisierter Latenztest zeigt keine Einschränkungen beim Galaxy Book6 Pro.
| DPC Latencies / LatencyMon - interrupt to process latency (max), Web, Youtube, Prime95 | |
| Dell XPS 16 Core Ultra 5 325 | |
| Samsung Galaxy Book4 Pro 16 | |
| Lenovo ThinkPad X9-15 Aura Edition | |
| Microsoft Surface Laptop 7 15 Lunar Lake | |
| Asus ZenBook S16 UM5606GA | |
| Samsung Galaxy Book6 Pro | |
* ... kleinere Werte sind besser
Speichergeräte
Unser Gerät ist mit einem 512-GB-Laufwerk ausgestattet (369 GB frei, Samsung PM9C1b) und die Übertragungsraten der PCIe 4.0 SSD sind gut und stabil. Dank des zusätzlichen M.2-2280 Steckplatzes ist es kein Problem, weitere Speicherkapazität hinzuzufügen.

* ... kleinere Werte sind besser
Drosselung der Festplatte: DiskSpd-Leseschleife, Warteschlangentiefe 8
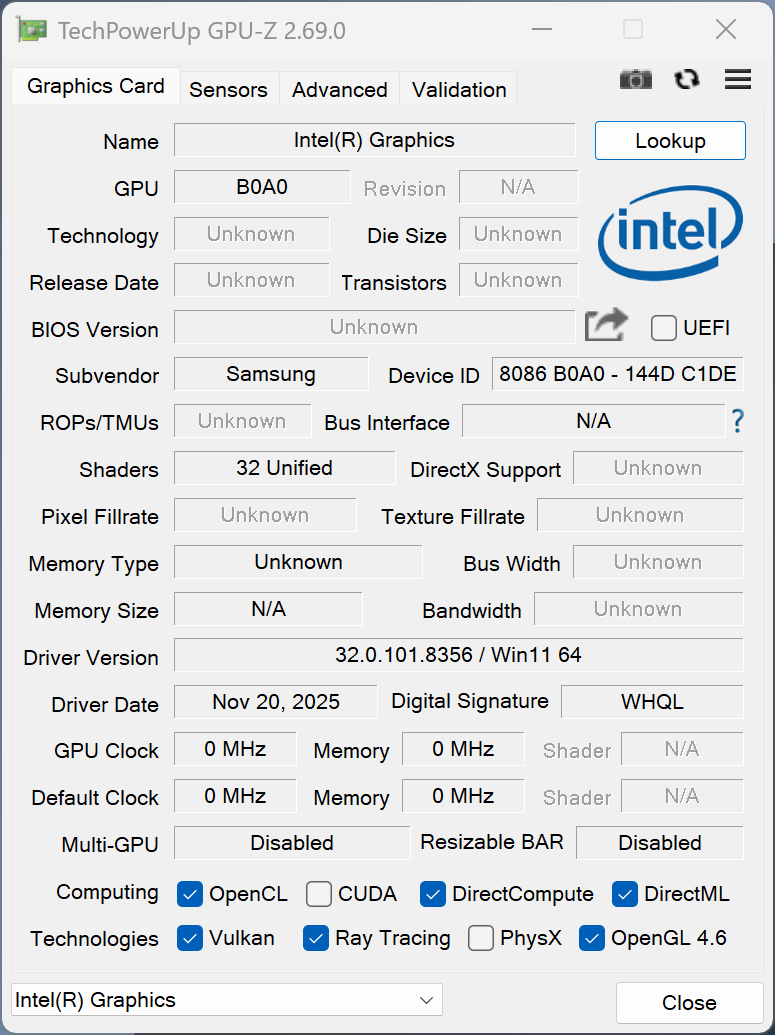
GPU Performance
Einige der Panther-Lake-Chips sind mit leistungsstarken iGPUs namens Arc B370/B390 ausgestattet, aber der Core Ultra 7 356H erhält nur die langsamere Arc Graphics mit 4 Xe-Kernen. Die GPU kann alltägliche Aufgaben wie das Streaming von hochauflösenden Videos mit Leichtigkeit bewältigen, dennoch ist die Leistung sogar noch schlechter im Vergleich zur alten 8-Kern Arc iGPU aus der Meteor Lake Generation im alten Galaxy Book4 Pro. Wenn Sie einige Spiele spielen möchten, empfehlen wir definitiv das Galaxy Book6 Pro mit dem Core Ultra X7 358H und der Arc B390 GPU.
| 3DMark 11 Performance | 8078 Punkte | |
| 3DMark Fire Strike Score | 6513 Punkte | |
| 3DMark Time Spy Score | 3395 Punkte | |
| 3DMark Steel Nomad Score | 622 Punkte | |
| 3DMark Steel Nomad Light Score | 2501 Punkte | |
Hilfe | ||
| Blender / v3.3 Classroom CPU | |
| Lenovo ThinkPad X9-15 Aura Edition | |
| Microsoft Surface Laptop 7 15 Lunar Lake | |
| Dell XPS 16 Core Ultra 5 325 | |
| Durchschnittliche Intel Graphics 4 Xe3 Panther Lake iGPU (332 - 569, n=9) | |
| Samsung Galaxy Book4 Pro 16 | |
| Durchschnitt der Klasse Multimedia (134.5 - 1042, n=67, der letzten 2 Jahre) | |
| Apple MacBook Air 15 M5 | |
| Samsung Galaxy Book6 Pro | |
| Asus ZenBook S16 UM5606GA | |
| Blender / v3.3 Classroom oneAPI/Intel | |
| Durchschnitt der Klasse Multimedia (105 - 492, n=18, der letzten 2 Jahre) | |
| Durchschnittliche Intel Graphics 4 Xe3 Panther Lake iGPU (235 - 257, n=5) | |
| Dell XPS 16 Core Ultra 5 325 | |
| Blender / v3.3 Classroom METAL | |
| Apple MacBook Air 15 M5 | |
| Durchschnitt der Klasse Multimedia (17.8 - 68, n=5, der letzten 2 Jahre) | |
* ... kleinere Werte sind besser
Cyberpunk 2077 ultra FPS Grafik
| min. | mittel | hoch | max. | |
|---|---|---|---|---|
| GTA V (2015) | 180.8 | 174.7 | 58.2 | 23.8 |
| Dota 2 Reborn (2015) | 109.6 | 91.5 | 81.8 | 77.4 |
| Final Fantasy XV Benchmark (2018) | 72.3 | 36.7 | 26.1 | |
| X-Plane 11.11 (2018) | 45.1 | 33 | 32.4 | |
| Strange Brigade (2018) | 197 | 70.5 | 59.1 | 51.1 |
| Baldur's Gate 3 (2023) | 31.5 | 23.9 | 21 | 20.3 |
| Cyberpunk 2077 (2023) | 36.8 | 28.2 | 24.4 | 20.5 |
| F1 24 (2024) | 66.8 | 64.3 | 46.5 | 14.8 |
Emissionen & Stromverbrauch
Systemrauschen

Das Galaxy Book6 Pro ist in der Regel ein (sehr) leiser Begleiter in Alltagsszenarien mit leichter Arbeitslast. Die ersten Lüfterstufen sind mit ca. 27-32 dB(A) ebenfalls recht leise und erst bei maximaler Last oder beim Spielen werden bis zu 38,4 dB(A) erreicht. Damit ist es eines der leisesten Modelle in unserer Vergleichsgruppe (mit Ausnahme des leisen MacBook Air). Im Modus High Performance messen wir bis zu 43,9 dB(A) und nur bis zu 29,1 dB(A) im Modus Leise. Wir haben bei unserem Gerät keine elektronischen Geräusche wahrgenommen.
Lautstärkediagramm
| Idle |
| 25.3 / 25.3 / 25.3 dB(A) |
| Last |
| 31.8 / 38.4 dB(A) |
 | ||
30 dB leise 40 dB(A) deutlich hörbar 50 dB(A) störend |
||
min: | ||
| Samsung Galaxy Book6 Pro Ultra 7 356H, Intel Graphics 4 Xe3 PTL | Dell XPS 16 Core Ultra 5 325 Ultra 5 325, Intel Graphics 4 Xe3 PTL | Asus ZenBook S16 UM5606GA Ryzen AI 9 465, Radeon 880M | Apple MacBook Air 15 M5 M5 10-Core, M5 10-Core GPU | Microsoft Surface Laptop 7 15 Lunar Lake Core Ultra 7 268V, Arc 140V | Lenovo ThinkPad X9-15 Aura Edition Core Ultra 7 258V, Arc 140V | Samsung Galaxy Book4 Pro 16 Ultra 7 155H, Arc 8-Core | |
|---|---|---|---|---|---|---|---|
| Geräuschentwicklung | 2% | -14% | 2% | -2% | -4% | ||
| aus / Umgebung * (dB) | 25.3 | 22.8 10% | 24.9 2% | 23.9 6% | 24.4 4% | 24.6 3% | |
| Idle min * (dB) | 25.3 | 22.9 9% | 24.9 2% | 23.9 6% | 24.4 4% | 24.6 3% | |
| Idle avg * (dB) | 25.3 | 22.9 9% | 24.9 2% | 23.9 6% | 24.4 4% | 24.6 3% | |
| Idle max * (dB) | 25.3 | 23.9 6% | 24.9 2% | 23.9 6% | 24.4 4% | 26.4 -4% | |
| Last avg * (dB) | 31.8 | 34.8 -9% | 45.7 -44% | 31.8 -0% | 35.8 -13% | 40 -26% | |
| Cyberpunk 2077 ultra * (dB) | 38.4 | 38 1% | 49 -28% | 38 1% | 39.4 -3% | ||
| Last max * (dB) | 38.4 | 43.3 -13% | 50.4 -31% | 41.9 -9% | 45 -17% | 40 -4% | |
| Witcher 3 ultra * (dB) | 40 |
* ... kleinere Werte sind besser
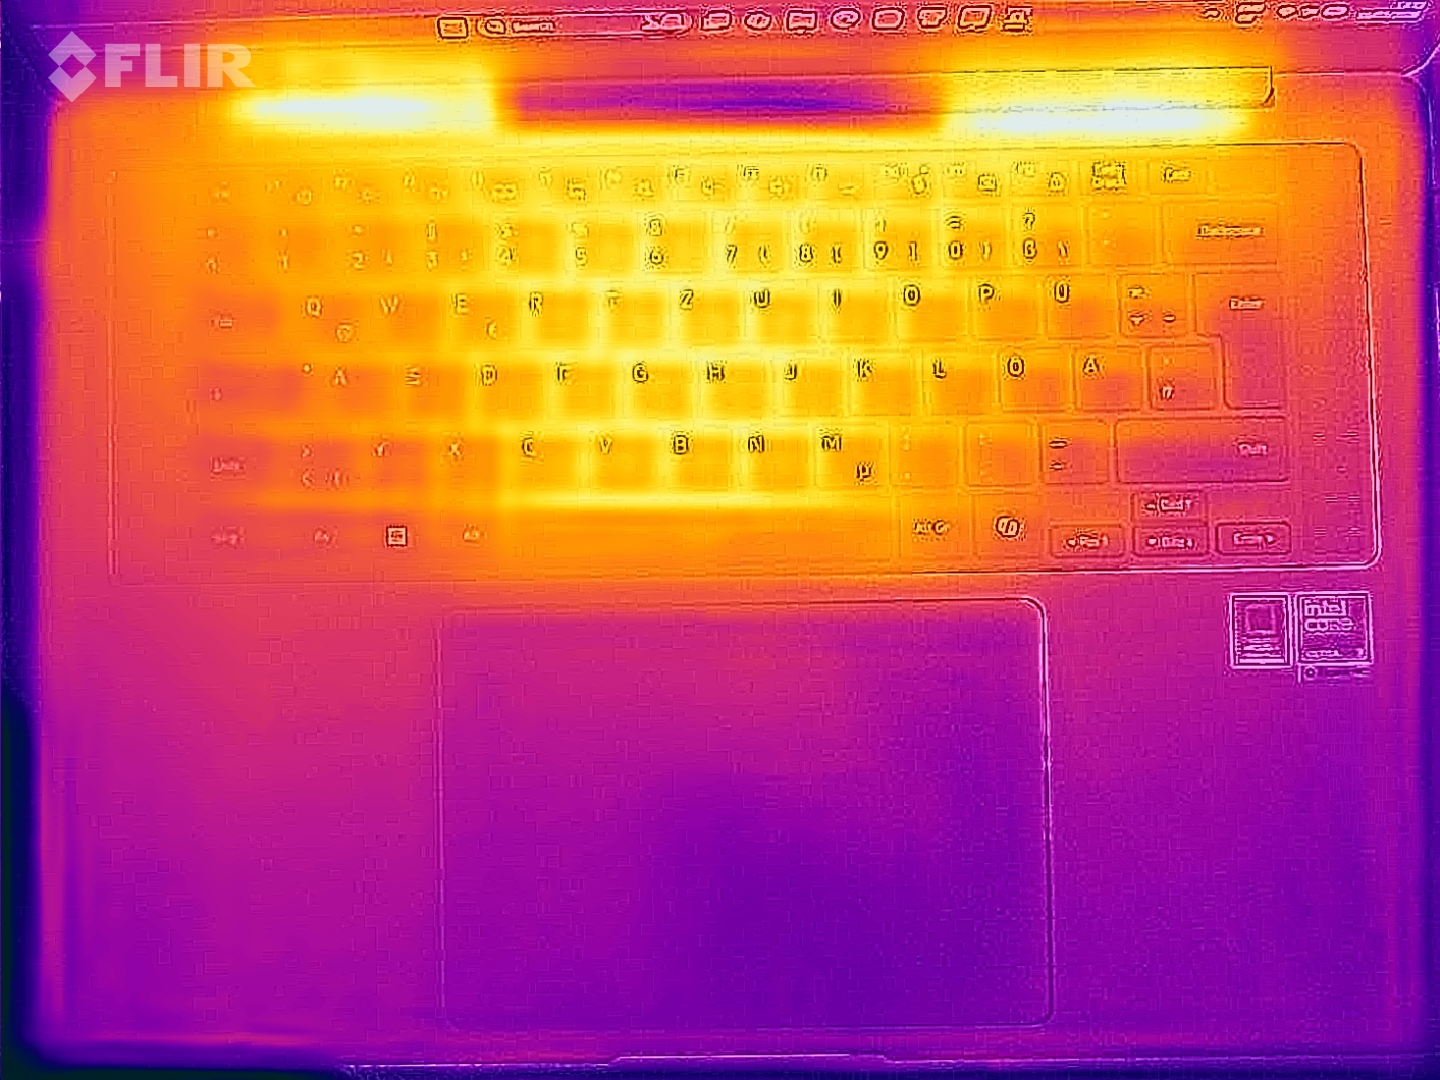
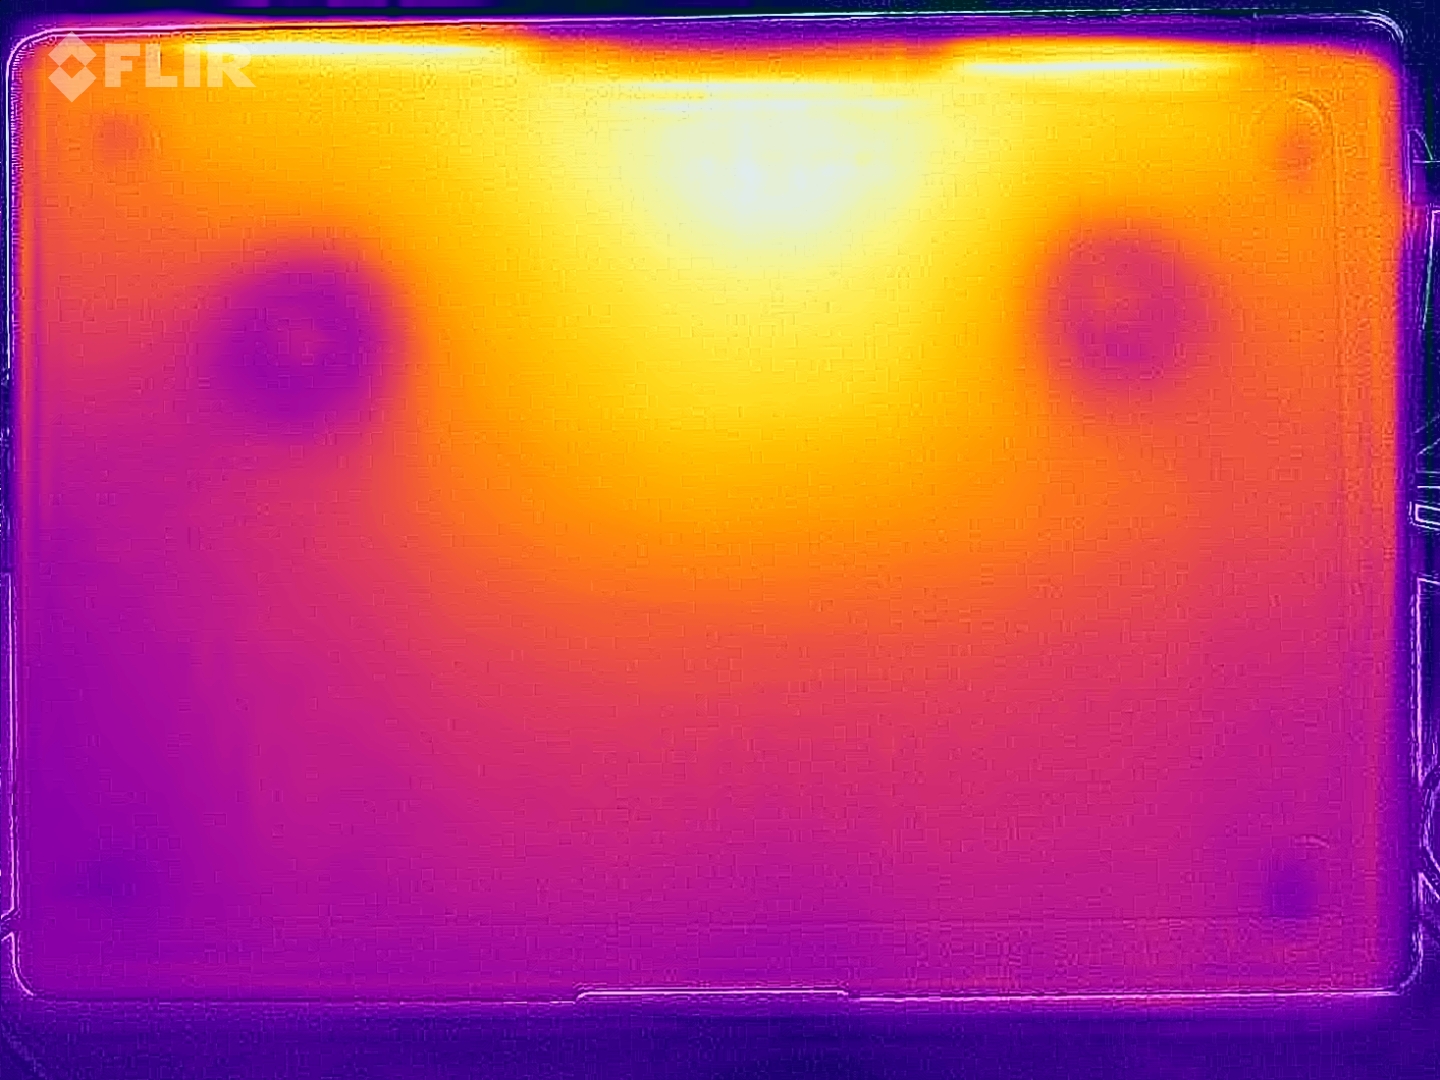
Temperatur
Die Oberflächen bleiben in Alltagsszenarien sehr kühl und wir können nur an einer Stelle mehr als 40 °C unter Last messen, es gibt also absolut keine Einschränkungen. Während unseres Stresstests pendelt sich der CPU-Verbrauch bei ~27 Watt ein.

(+) Die maximale Temperatur auf der Oberseite ist 37.8 °C. Im Vergleich liegt der Klassendurchschnitt bei 36.8 °C (von 21 bis 71 °C für die Klasse Multimedia).
(±) Auf der Unterseite messen wir eine maximalen Wert von 40.1 °C (im Vergleich zum Durchschnitt von 39.1 °C).
(+) Ohne Last messen wir eine durchschnittliche Temperatur von 22.4 °C auf der Oberseite. Der Klassendurchschnitt erreicht 31.3 °C.
(±) 3: The average temperature for the upper side is 32.8 °C / 91 F, compared to the average of 31.3 °C / 88 F for the class Multimedia.
(+) Die Handballen und der Touchpad-Bereich sind mit gemessenen 28.4 °C kühler als die typische Hauttemperatur und fühlen sich dadurch kühl an.
(±) Die durchschnittliche Handballen-Temperatur anderer getesteter Geräte war 28.7 °C (+0.3 °C).
| Samsung Galaxy Book6 Pro Ultra 7 356H, Intel Graphics 4 Xe3 PTL | Dell XPS 16 Core Ultra 5 325 Ultra 5 325, Intel Graphics 4 Xe3 PTL | Asus ZenBook S16 UM5606GA Ryzen AI 9 465, Radeon 880M | Apple MacBook Air 15 M5 M5 10-Core, M5 10-Core GPU | Microsoft Surface Laptop 7 15 Lunar Lake Core Ultra 7 268V, Arc 140V | Lenovo ThinkPad X9-15 Aura Edition Core Ultra 7 258V, Arc 140V | |
|---|---|---|---|---|---|---|
| Hitze | -7% | -16% | -9% | -8% | -6% | |
| Last oben max * (°C) | 37.8 | 43.8 -16% | 43.4 -15% | 44.1 -17% | 45.7 -21% | 42.1 -11% |
| Last unten max * (°C) | 40.1 | 42 -5% | 46.2 -15% | 43.1 -7% | 42.9 -7% | 39.5 1% |
| Idle oben max * (°C) | 22.6 | 23.2 -3% | 26.5 -17% | 24 -6% | 23.6 -4% | 24.5 -8% |
| Idle unten max * (°C) | 22.8 | 23.6 -4% | 27 -18% | 23.9 -5% | 23.1 -1% | 24.4 -7% |
* ... kleinere Werte sind besser
Lautsprecher
Das Vier-Lautsprecher-System bietet eine anständige Klangqualität, aber die Konkurrenz bietet bessere Soundsysteme. Den Modulen des Galaxy Book6 Pro fehlt es einfach an "Durchschlagskraft".
Samsung Galaxy Book6 Pro Audio Analyse
(±) | Mittelmäßig laut spielende Lautsprecher (81.1 dB)
Bass 100 - 315 Hz
(±) | abgesenkter Bass - 13.7% geringer als der Median
(±) | durchschnittlich lineare Bass-Wiedergabe (8.9% Delta zum Vorgänger)
Mitteltöne 400 - 2000 Hz
(+) | ausgeglichene Mitten, vom Median nur 3.1% abweichend
(+) | lineare Mitten (3.5% Delta zum Vorgänger)
Hochtöne 2 - 16 kHz
(+) | ausgeglichene Hochtöne, vom Median nur 1.3% abweichend
(+) | sehr lineare Hochtöne (2.7% Delta zum Vorgänger)
Gesamt im hörbaren Bereich 100 - 16.000 Hz
(+) | hörbarer Bereich ist sehr linear (11% Abstand zum Median
Im Vergleich zu allen Geräten derselben Klasse
» 16% aller getesteten Geräte dieser Klasse waren besser, 3% vergleichbar, 81% schlechter
» Das beste Gerät hat einen Delta-Wert von 5%, durchschnittlich ist 17%, das schlechteste Gerät hat 45%
Im Vergleich zu allen Geräten im Test
» 6% aller getesteten Geräte waren besser, 2% vergleichbar, 92% schlechter
» Das beste Gerät hat einen Delta-Wert von 4%, durchschnittlich ist 24%, das schlechteste Gerät hat 134%
Dell XPS 16 Core Ultra 5 325 Audio Analyse
(+) | Die Lautsprecher können relativ laut spielen (85.3 dB)
Bass 100 - 315 Hz
(±) | abgesenkter Bass - 6.1% geringer als der Median
(+) | lineare Bass-Wiedergabe (5.6% Delta zum Vorgänger)
Mitteltöne 400 - 2000 Hz
(+) | ausgeglichene Mitten, vom Median nur 3.2% abweichend
(+) | lineare Mitten (4.6% Delta zum Vorgänger)
Hochtöne 2 - 16 kHz
(+) | ausgeglichene Hochtöne, vom Median nur 2.4% abweichend
(+) | sehr lineare Hochtöne (3.3% Delta zum Vorgänger)
Gesamt im hörbaren Bereich 100 - 16.000 Hz
(+) | hörbarer Bereich ist sehr linear (7% Abstand zum Median
Im Vergleich zu allen Geräten derselben Klasse
» 5% aller getesteten Geräte dieser Klasse waren besser, 1% vergleichbar, 94% schlechter
» Das beste Gerät hat einen Delta-Wert von 5%, durchschnittlich ist 17%, das schlechteste Gerät hat 45%
Im Vergleich zu allen Geräten im Test
» 1% aller getesteten Geräte waren besser, 0% vergleichbar, 99% schlechter
» Das beste Gerät hat einen Delta-Wert von 4%, durchschnittlich ist 24%, das schlechteste Gerät hat 134%
Asus ZenBook S16 UM5606GA Audio Analyse
(±) | Mittelmäßig laut spielende Lautsprecher (78.2 dB)
Bass 100 - 315 Hz
(+) | guter Bass - nur 4.6% Abweichung vom Median
(+) | lineare Bass-Wiedergabe (6.2% Delta zum Vorgänger)
Mitteltöne 400 - 2000 Hz
(+) | ausgeglichene Mitten, vom Median nur 1.9% abweichend
(+) | lineare Mitten (5% Delta zum Vorgänger)
Hochtöne 2 - 16 kHz
(+) | ausgeglichene Hochtöne, vom Median nur 2.1% abweichend
(+) | sehr lineare Hochtöne (4.9% Delta zum Vorgänger)
Gesamt im hörbaren Bereich 100 - 16.000 Hz
(+) | hörbarer Bereich ist sehr linear (7.6% Abstand zum Median
Im Vergleich zu allen Geräten derselben Klasse
» 6% aller getesteten Geräte dieser Klasse waren besser, 2% vergleichbar, 92% schlechter
» Das beste Gerät hat einen Delta-Wert von 5%, durchschnittlich ist 17%, das schlechteste Gerät hat 45%
Im Vergleich zu allen Geräten im Test
» 1% aller getesteten Geräte waren besser, 0% vergleichbar, 98% schlechter
» Das beste Gerät hat einen Delta-Wert von 4%, durchschnittlich ist 24%, das schlechteste Gerät hat 134%
Apple MacBook Air 15 M5 Audio Analyse
(+) | Die Lautsprecher können relativ laut spielen (84.8 dB)
Bass 100 - 315 Hz
(±) | abgesenkter Bass - 6.8% geringer als der Median
(+) | lineare Bass-Wiedergabe (6.6% Delta zum Vorgänger)
Mitteltöne 400 - 2000 Hz
(+) | ausgeglichene Mitten, vom Median nur 2% abweichend
(+) | lineare Mitten (3.3% Delta zum Vorgänger)
Hochtöne 2 - 16 kHz
(+) | ausgeglichene Hochtöne, vom Median nur 3.6% abweichend
(+) | sehr lineare Hochtöne (3.2% Delta zum Vorgänger)
Gesamt im hörbaren Bereich 100 - 16.000 Hz
(+) | hörbarer Bereich ist sehr linear (7.7% Abstand zum Median
Im Vergleich zu allen Geräten derselben Klasse
» 2% aller getesteten Geräte dieser Klasse waren besser, 0% vergleichbar, 98% schlechter
» Das beste Gerät hat einen Delta-Wert von 5%, durchschnittlich ist 18%, das schlechteste Gerät hat 53%
Im Vergleich zu allen Geräten im Test
» 1% aller getesteten Geräte waren besser, 0% vergleichbar, 98% schlechter
» Das beste Gerät hat einen Delta-Wert von 4%, durchschnittlich ist 24%, das schlechteste Gerät hat 134%
Microsoft Surface Laptop 7 15 Lunar Lake Audio Analyse
(±) | Mittelmäßig laut spielende Lautsprecher (78.8 dB)
Bass 100 - 315 Hz
(±) | abgesenkter Bass - 9.3% geringer als der Median
(±) | durchschnittlich lineare Bass-Wiedergabe (8.4% Delta zum Vorgänger)
Mitteltöne 400 - 2000 Hz
(+) | ausgeglichene Mitten, vom Median nur 4.4% abweichend
(+) | lineare Mitten (3% Delta zum Vorgänger)
Hochtöne 2 - 16 kHz
(+) | ausgeglichene Hochtöne, vom Median nur 2.4% abweichend
(+) | sehr lineare Hochtöne (4.1% Delta zum Vorgänger)
Gesamt im hörbaren Bereich 100 - 16.000 Hz
(+) | hörbarer Bereich ist sehr linear (11.4% Abstand zum Median
Im Vergleich zu allen Geräten derselben Klasse
» 3% aller getesteten Geräte dieser Klasse waren besser, 2% vergleichbar, 95% schlechter
» Das beste Gerät hat einen Delta-Wert von 7%, durchschnittlich ist 21%, das schlechteste Gerät hat 53%
Im Vergleich zu allen Geräten im Test
» 7% aller getesteten Geräte waren besser, 2% vergleichbar, 91% schlechter
» Das beste Gerät hat einen Delta-Wert von 4%, durchschnittlich ist 24%, das schlechteste Gerät hat 134%
Lenovo ThinkPad X9-15 Aura Edition Audio Analyse
(+) | Die Lautsprecher können relativ laut spielen (87.5 dB)
Bass 100 - 315 Hz
(±) | abgesenkter Bass - 12.5% geringer als der Median
(+) | lineare Bass-Wiedergabe (6.8% Delta zum Vorgänger)
Mitteltöne 400 - 2000 Hz
(+) | ausgeglichene Mitten, vom Median nur 3.1% abweichend
(+) | lineare Mitten (5.3% Delta zum Vorgänger)
Hochtöne 2 - 16 kHz
(+) | ausgeglichene Hochtöne, vom Median nur 2.4% abweichend
(+) | sehr lineare Hochtöne (3.3% Delta zum Vorgänger)
Gesamt im hörbaren Bereich 100 - 16.000 Hz
(+) | hörbarer Bereich ist sehr linear (9.5% Abstand zum Median
Im Vergleich zu allen Geräten derselben Klasse
» 1% aller getesteten Geräte dieser Klasse waren besser, 0% vergleichbar, 99% schlechter
» Das beste Gerät hat einen Delta-Wert von 7%, durchschnittlich ist 21%, das schlechteste Gerät hat 53%
Im Vergleich zu allen Geräten im Test
» 4% aller getesteten Geräte waren besser, 1% vergleichbar, 95% schlechter
» Das beste Gerät hat einen Delta-Wert von 4%, durchschnittlich ist 24%, das schlechteste Gerät hat 134%
Stromverbrauch
Der neue OLED-Bildschirm (2,8K, 120 Hz) ist extrem effizient und der maximale Verbrauch im Leerlauf beträgt nur 4,6 Watt, was identisch ist mit dem neuen XPS 16 mit dem günstigeren FHD-Panel mit 60 Hz. Unter Last können wir bis zu 71 Watt messen, obwohl wir ein 180-W-Netzteil verwendet haben, da unser Gerät ohne Netzteil geliefert wurde. Es scheint, dass es eine Einschränkung gibt, denn der kurzfristige Verbrauch sollte höher sein, wenn man den kurzfristigen CPU-Verbrauch von 80 Watt bedenkt. Der Verbrauch pendelt sich schnell bei ~54W ein.
| Aus / Standby | |
| Idle | |
| Last |
|
Legende:
min: | |
| Samsung Galaxy Book6 Pro Ultra 7 356H, Intel Graphics 4 Xe3 PTL, Samsung PM9C1b MZVL8512HFLU-00BLL, OLED, 2880x1800, 16" | Dell XPS 16 Core Ultra 5 325 Ultra 5 325, Intel Graphics 4 Xe3 PTL, SK hynix PVC10 HFS512GEM4X182N, IPS, 1920x1200, 16" | Asus ZenBook S16 UM5606GA Ryzen AI 9 465, Radeon 880M, SanDisk PC SN5100S, OLED, 2880x1800, 16" | Apple MacBook Air 15 M5 M5 10-Core, M5 10-Core GPU, Apple SSD AP2048Z, IPS, 2880x1864, 15.3" | Microsoft Surface Laptop 7 15 Lunar Lake Core Ultra 7 268V, Arc 140V, Samsung PM9C1a MZ9L81T0HDLB, IPS, 2496x1664, 15" | Lenovo ThinkPad X9-15 Aura Edition Core Ultra 7 258V, Arc 140V, WD PC SN740 SDDQMQD-1T00, OLED, 2880x1800, 15.3" | Samsung Galaxy Book4 Pro 16 Ultra 7 155H, Arc 8-Core, Samsung PM9B1 512GB MZVL4512HBLU, OLED, 2880x1800, 16" | Durchschnittliche Intel Graphics 4 Xe3 Panther Lake iGPU | Durchschnitt der Klasse Multimedia | |
|---|---|---|---|---|---|---|---|---|---|
| Stromverbrauch | 5% | -47% | -23% | -35% | 4% | -26% | -15% | -108% | |
| Idle min * (Watt) | 2.5 | 1.3 48% | 3.7 -48% | 2.2 12% | 3.2 -28% | 2.4 4% | 3.6 -44% | 2.8 ? -12% | 5.64 ? -126% |
| Idle avg * (Watt) | 4.2 | 4.5 -7% | 7.4 -76% | 11.7 -179% | 8.7 -107% | 3.9 7% | 5.7 -36% | 5.08 ? -21% | 10 ? -138% |
| Idle max * (Watt) | 4.6 | 4.6 -0% | 9.5 -107% | 11.8 -157% | 9 -96% | 5.1 -11% | 6.1 -33% | 6.68 ? -45% | 12.2 ? -165% |
| Last avg * (Watt) | 42.2 | 36.5 14% | 57.9 -37% | 36.2 14% | 44.7 -6% | 42.5 -1% | 52.5 -24% | 40.1 ? 5% | 64.8 ? -54% |
| Cyberpunk 2077 ultra external monitor * (Watt) | 40.6 | 45.4 -12% | 57 -40% | 21.7 47% | 49.3 -21% | 40.2 1% | |||
| Cyberpunk 2077 ultra * (Watt) | 52.7 | 47.9 9% | 58.5 -11% | 23.5 55% | 51.1 3% | 43.5 17% | |||
| Last max * (Watt) | 70.8 | 82.8 -17% | 76.9 -9% | 37.4 47% | 64.6 9% | 64.4 9% | 64.7 9% | 72.3 ? -2% | 111.7 ? -58% |
| Witcher 3 ultra * (Watt) | 46.6 |
* ... kleinere Werte sind besser
Stromverbrauch Cyberpunk / Stress Test
Stromverbrauch externer Monitor
Akkulaufzeit
Der 80-Wh-Akku schafft gute Laufzeiten, aber bedenken Sie, dass unser Wi-Fi-Test hauptsächlich helle Webseiten verwendet, wo OLED-Bildschirme im Vergleich zu IPS-Panels im Nachteil sind. Wir ermitteln mehr als 16 Stunden in unserem Wi-Fi-Test und immer noch fast 9 Stunden bei voller Helligkeit. Die Konkurrenten schaffen sogar noch längere Laufzeiten, verwenden aber in der Regel auch weniger wertige Bildschirme. Die Ausnahme ist das ThinkPad X9 15, während das Zenbook S16 nicht so lange durchhält.

| Samsung Galaxy Book6 Pro Ultra 7 356H, Intel Graphics 4 Xe3 PTL, 78 Wh | Dell XPS 16 Core Ultra 5 325 Ultra 5 325, Intel Graphics 4 Xe3 PTL, 70 Wh | Asus ZenBook S16 UM5606GA Ryzen AI 9 465, Radeon 880M, 83 Wh | Apple MacBook Air 15 M5 M5 10-Core, M5 10-Core GPU, 66.5 Wh | Microsoft Surface Laptop 7 15 Lunar Lake Core Ultra 7 268V, Arc 140V, 64 Wh | Lenovo ThinkPad X9-15 Aura Edition Core Ultra 7 258V, Arc 140V, 80 Wh | Samsung Galaxy Book4 Pro 16 Ultra 7 155H, Arc 8-Core, 76 Wh | Durchschnitt der Klasse Multimedia | |
|---|---|---|---|---|---|---|---|---|
| Battery Runtime | 63% | -16% | -9% | 5% | 8% | -25% | -24% | |
| WiFi Websurfing (h) | 16.3 | 26.6 63% | 13.1 -20% | 17.2 6% | 17.7 9% | 17.5 7% | 10.7 -34% | 12 ? -26% |
| WiFi Websurfing max. Brightness (h) | 8.8 | 7.8 -11% | 6.7 -24% | 8.8 0% | 9.5 8% | 7.5 -15% | 6.95 ? -21% |
Notebookcheck Bewertung
Samsung Galaxy Book6 Pro
- 31.03.2026 v8
Andreas Osthoff
 Total Sustainability Score:
 Potenzielle Wettbewerber im Vergleich
Bild | Modell / Test | Preis ab | Gewicht | Dicke | Display |
|---|---|---|---|---|---|
1. 86.3%  | Samsung Galaxy Book6 Pro Intel Core Ultra 7 356H ⎘ Intel Graphics 4 Xe3 Panther Lake iGPU ⎘ 32 GB RAM, 512 GB SSD | Amazon: 1.949,50 € Bestpreis 2379€ saturn 2. 2379€ Saturn.de 3. 2379€ Mediamarkt.de | 1.6 kg | 11.9 mm | 16.00" 2880x1800 212 PPI OLED |
2. 84.2% 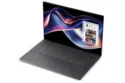 | Dell XPS 16 Core Ultra 5 325 Intel Core Ultra 5 325 ⎘ Intel Graphics 4 Xe3 Panther Lake iGPU ⎘ 16 GB RAM, 512 GB SSD | Amazon: 1. 1.295,00 € Lenovo ThinkBook 16 Gen 9 (1... 2. 2.517,61 € Dell XPS 16 9640 Laptop 16.3... 3. 1.165,70 € Lenovo ThinkBook 16 Gen 9 (1... Geizhals Suche | 1.7 kg | 15.4 mm | 16.00" 1920x1200 142 PPI IPS |
3. 86.6%  | Asus ZenBook S16 UM5606GA AMD Ryzen AI 9 465 ⎘ AMD Radeon 880M ⎘ 32 GB RAM, 1024 GB SSD | Amazon: 2.059,00 € Bestpreis 1699€ galaxus 2. 1799€ Cyberport.de 3. 1799€ computeruniverse.net | 1.5 kg | 12.9 mm | 16.00" 2880x1800 212 PPI OLED |
4. 91.6%  | Apple MacBook Air 15 M5 Apple M5 10-Core ⎘ Apple M5 10-Core GPU ⎘ 32 GB RAM, 2048 GB SSD | Amazon: Bestpreis 1372.57€ playox.de 2. 1372.58€ office-partner.de 3. 1384.1€ playox (AT) | 1.5 kg | 11.5 mm | 15.30" 2880x1864 224 PPI IPS |
5. 87.4% 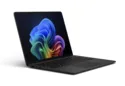 | Microsoft Surface Laptop 7 15 Lunar Lake Intel Core Ultra 7 268V ⎘ Intel Arc Graphics 140V ⎘ 32 GB RAM, 1024 GB SSD | Amazon: 2.343,17 € Bestpreis 2735.5€ Cyberport.de 2. 2758.49€ Cyberport.at 3. 2776€ Cyberport Stores Deutschland | 1.7 kg | 18.3 mm | 15.00" 2496x1664 200 PPI IPS |
6. 90.1% 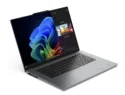 | Lenovo ThinkPad X9-15 Aura Edition Intel Core Ultra 7 258V ⎘ Intel Arc Graphics 140V ⎘ 32 GB RAM, 1024 GB SSD | Amazon: 1.839,68 € Bestpreis 1679€ notebookstore 2. 1682€ TechnikDeals24 3. 1682€ HEINZSOFT | 1.4 kg | 17.7 mm | 15.30" 2880x1800 222 PPI OLED |
Transparenz
Die Auswahl der zu testenden Geräte erfolgt innerhalb der Redaktion. Das vorliegende Testmuster wurde dem Autor vom Hersteller oder einem Shop zu Testzwecken leihweise zur Verfügung gestellt. Eine Einflussnahme des Leihstellers auf den Testbericht gab es nicht, der Hersteller erhielt keine Version des Reviews vor der Veröffentlichung. Es bestand keine Verpflichtung zur Publikation. Als eigenständiges, unabhängiges Unternehmen unterliegt Notebookcheck keiner Diktion von Herstellern, Shops und Verlagen.
So testet Notebookcheck
Pro Jahr werden von Notebookcheck hunderte Laptops und Smartphones unabhängig in von uns standardisierten technischen Verfahren getestet, um eine Vergleichbarkeit aller Testergebnisse zu gewährleisten. Seit rund 20 Jahren entwickeln wir diese Testmethoden kontinuierlich weiter und setzen damit Branchenstandards. In unseren Testlaboren kommt ausschließlich hochwertiges Messequipment in die Hände erfahrener Techniker und Redakteure. Die Tests unterliegen einer mehrstufigen Kontrolle. Unsere komplexe Gesamtbewertung basiert auf hunderten fundierten Messergebnissen und Benchmarks, womit Ihnen Objektivität garantiert ist. Weitere Informationen zu unseren Testmethoden gibt es hier.

