Fazit — Überzeugt in nahezu jeder Hinsicht
Als das ursprüngliche OmniBook Ultra 14 im Jahr 2024 als Nachfolger der Spectre Serie auf den Markt kam, lobten wir seine Leistung und Qualität, kritisierten jedoch sein 60-Hz-IPS-Display und seine relativ große Bauweise. Für das Jahr 2026 wurde das Modell komplett überarbeitet und verfügt nun in allen Konfigurationen über ein 120-Hz-OLED-Display sowie ein deutlich schlankeres Design, um gegenüber Alternativen wie dem Dell XPS 14 oder Asus ExpertBook Ultra besser bestehen zu können. HP hat mit fast allen Änderungen einen Volltreffer gelandet, da die verbesserte Stabilität und Qualität das Gerät ohne Weiteres als EliteBook Flaggschiffmodell ausweisen lassen.
Dennoch gibt es einige Aspekte, die verbessert werden könnten. Vor allem erscheint die überarbeitete Tastatur unnötig, da die Tastaturen der bestehenden EliteBook- und OmniBook Modelle ansonsten hervorragend oder zumindest mehr als zufriedenstellend sind. Eigenschaften wie Tastenhub, Rückmeldung und Klappergeräusche sind beim neuen OmniBook nicht unbedingt besser, sodass die Änderung des Tipperlebnisses fragwürdig erscheint. Leistungsmäßig ist der Core Ultra X9 sehr effizient, bietet auf dem HP Gerät jedoch ansonsten eine unterdurchschnittliche Leistung, da Konkurrenzmodelle mit dem Core Ultra X7 schneller laufen können. Leider bietet der Hersteller keine Konfigurationen mit dem Core Ultra X7 an, was die Preise gesenkt hätte, ohne die Leistung zu beeinträchtigen. Abgesehen von diesen wenigen Nachteilen ist das 2026 OmniBook Ultra 14 immer noch eines der besten Subnotebooks von HP, sofern man den hohen Preis von rund 2.500 US-Dollar in Kauf nehmen kann. Alternativ können sich Nutzer, die das neue Design und Display wünschen, aber auf die beeindruckende Arc-B390-iGPU verzichten können, für die schwächere Core-Ultra-7-Konfiguration entscheiden, die fast die Hälfte des Preises kostet.
Pro
Contra
Preis und Verfügbarkeit
Das OmniBook Ultra 14 mit Core Ultra X9, wie im Test beschrieben, ist zwar bei mehreren Online-Händlern bereits gelistet (z. B. bei Digitec), aber aktuell nicht verfügbar. Eine schwächere Version mit Core Ultra 7 ist beispielsweise bei Computeruniverse ab 899 Euro zu beziehen.
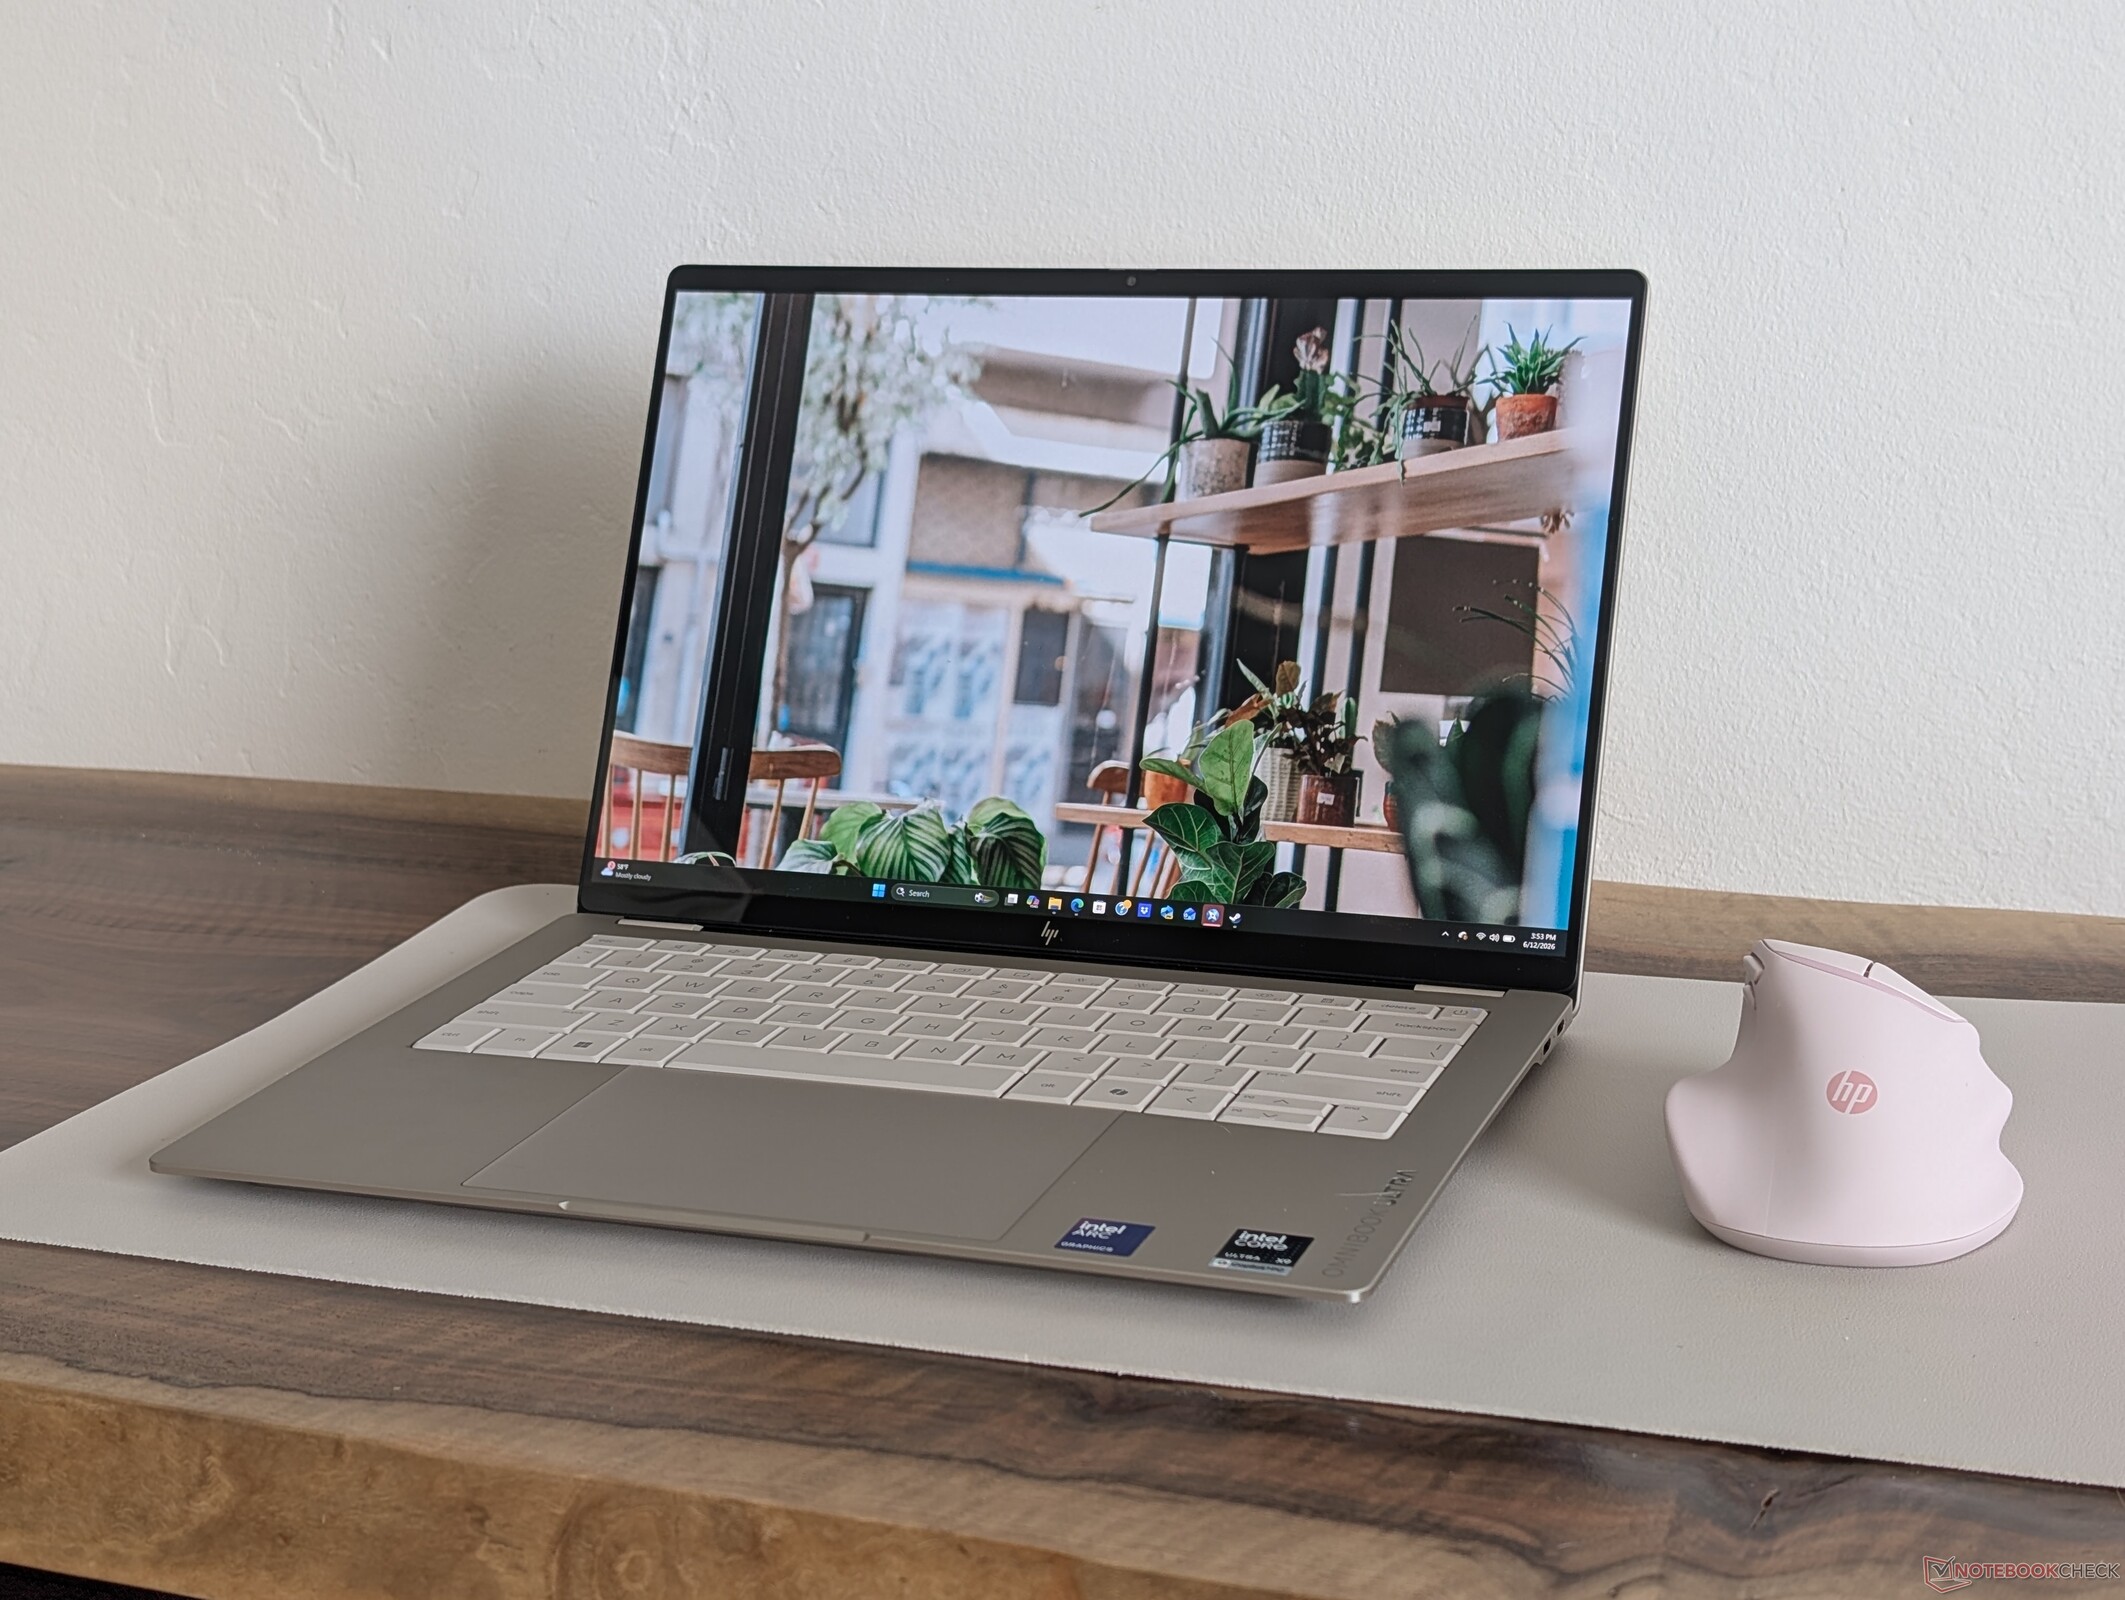
Das im Januar vorgestellte OmniBook Ultra 14 wurde in diesem Jahr komplett überarbeitet und bietet nun sowohl neue CPU-Optionen als auch ein neues Gehäuse-Design. Je nach Konfiguration können Nutzer zwischen Qualcomm-Snapdragon-X2- und Intel-Panther-Lake-Prozessoren sowie einer von drei Farbvarianten wählen.
Unser Testgerät ist die High-End-Intel-Version mit der Core-Ultra-X9-388H-CPU für etwa 2.800 US-Dollar. Eine langsamere Version mit dem Core Ultra 7 368H ist für etwa die Hälfte des Preises erhältlich, doch alle Modelle werden mit dem gleichen 1.800p-OLED-Touchscreen mit 120 Hz ausgeliefert, einschließlich der Qualcomm Modelle.
Zu den Konkurrenten in diesem Segment zählen andere Flaggschiff-Laptops der 14-Zoll-Klasse für den Prosumer-Bereich wie das Dell XPS 14, Asus ExpertBook Ultra, MSI Prestige 14 AI sowie das Lenovo Yoga Slim 7 Ultra 14.
Weitere HP-Testberichte:
Technische Daten
Preisvergleich
Gehäuse
Die OmniBook Serie ersetzt praktisch die Spectre Serie, und so weist das Metallgehäuse dieselben hervorragenden Eigenschaften wie sein Vorgänger auf, darunter die hohe Steifigkeit und die aufgerauten, fingerabdruckabweisenden Oberflächen. Das neue Design unterscheidet sich auf den ersten Blick vom älteren Modell 2024 durch die neu gestaltete Tastatur, die überarbeiteten hinteren Ecken und das schärfer geschnittene Chromprofil entlang der Kanten und Ecken. Es ist zudem deutlich leichter und kleiner als das Modell 2024, wie die untenstehende Vergleichstabelle zeigt.
Anschlussausstattung
Beim neuesten OmniBook wurde der USB-A-Anschluss weggelassen, der bei einigen älteren Modellen noch vorhanden war.


Kommunikation
Webcam
Das Gerät verfügt standardmäßig über eine 5-MP-Webcam mit IR-Funktion und physischem Verschluss.


Wartung
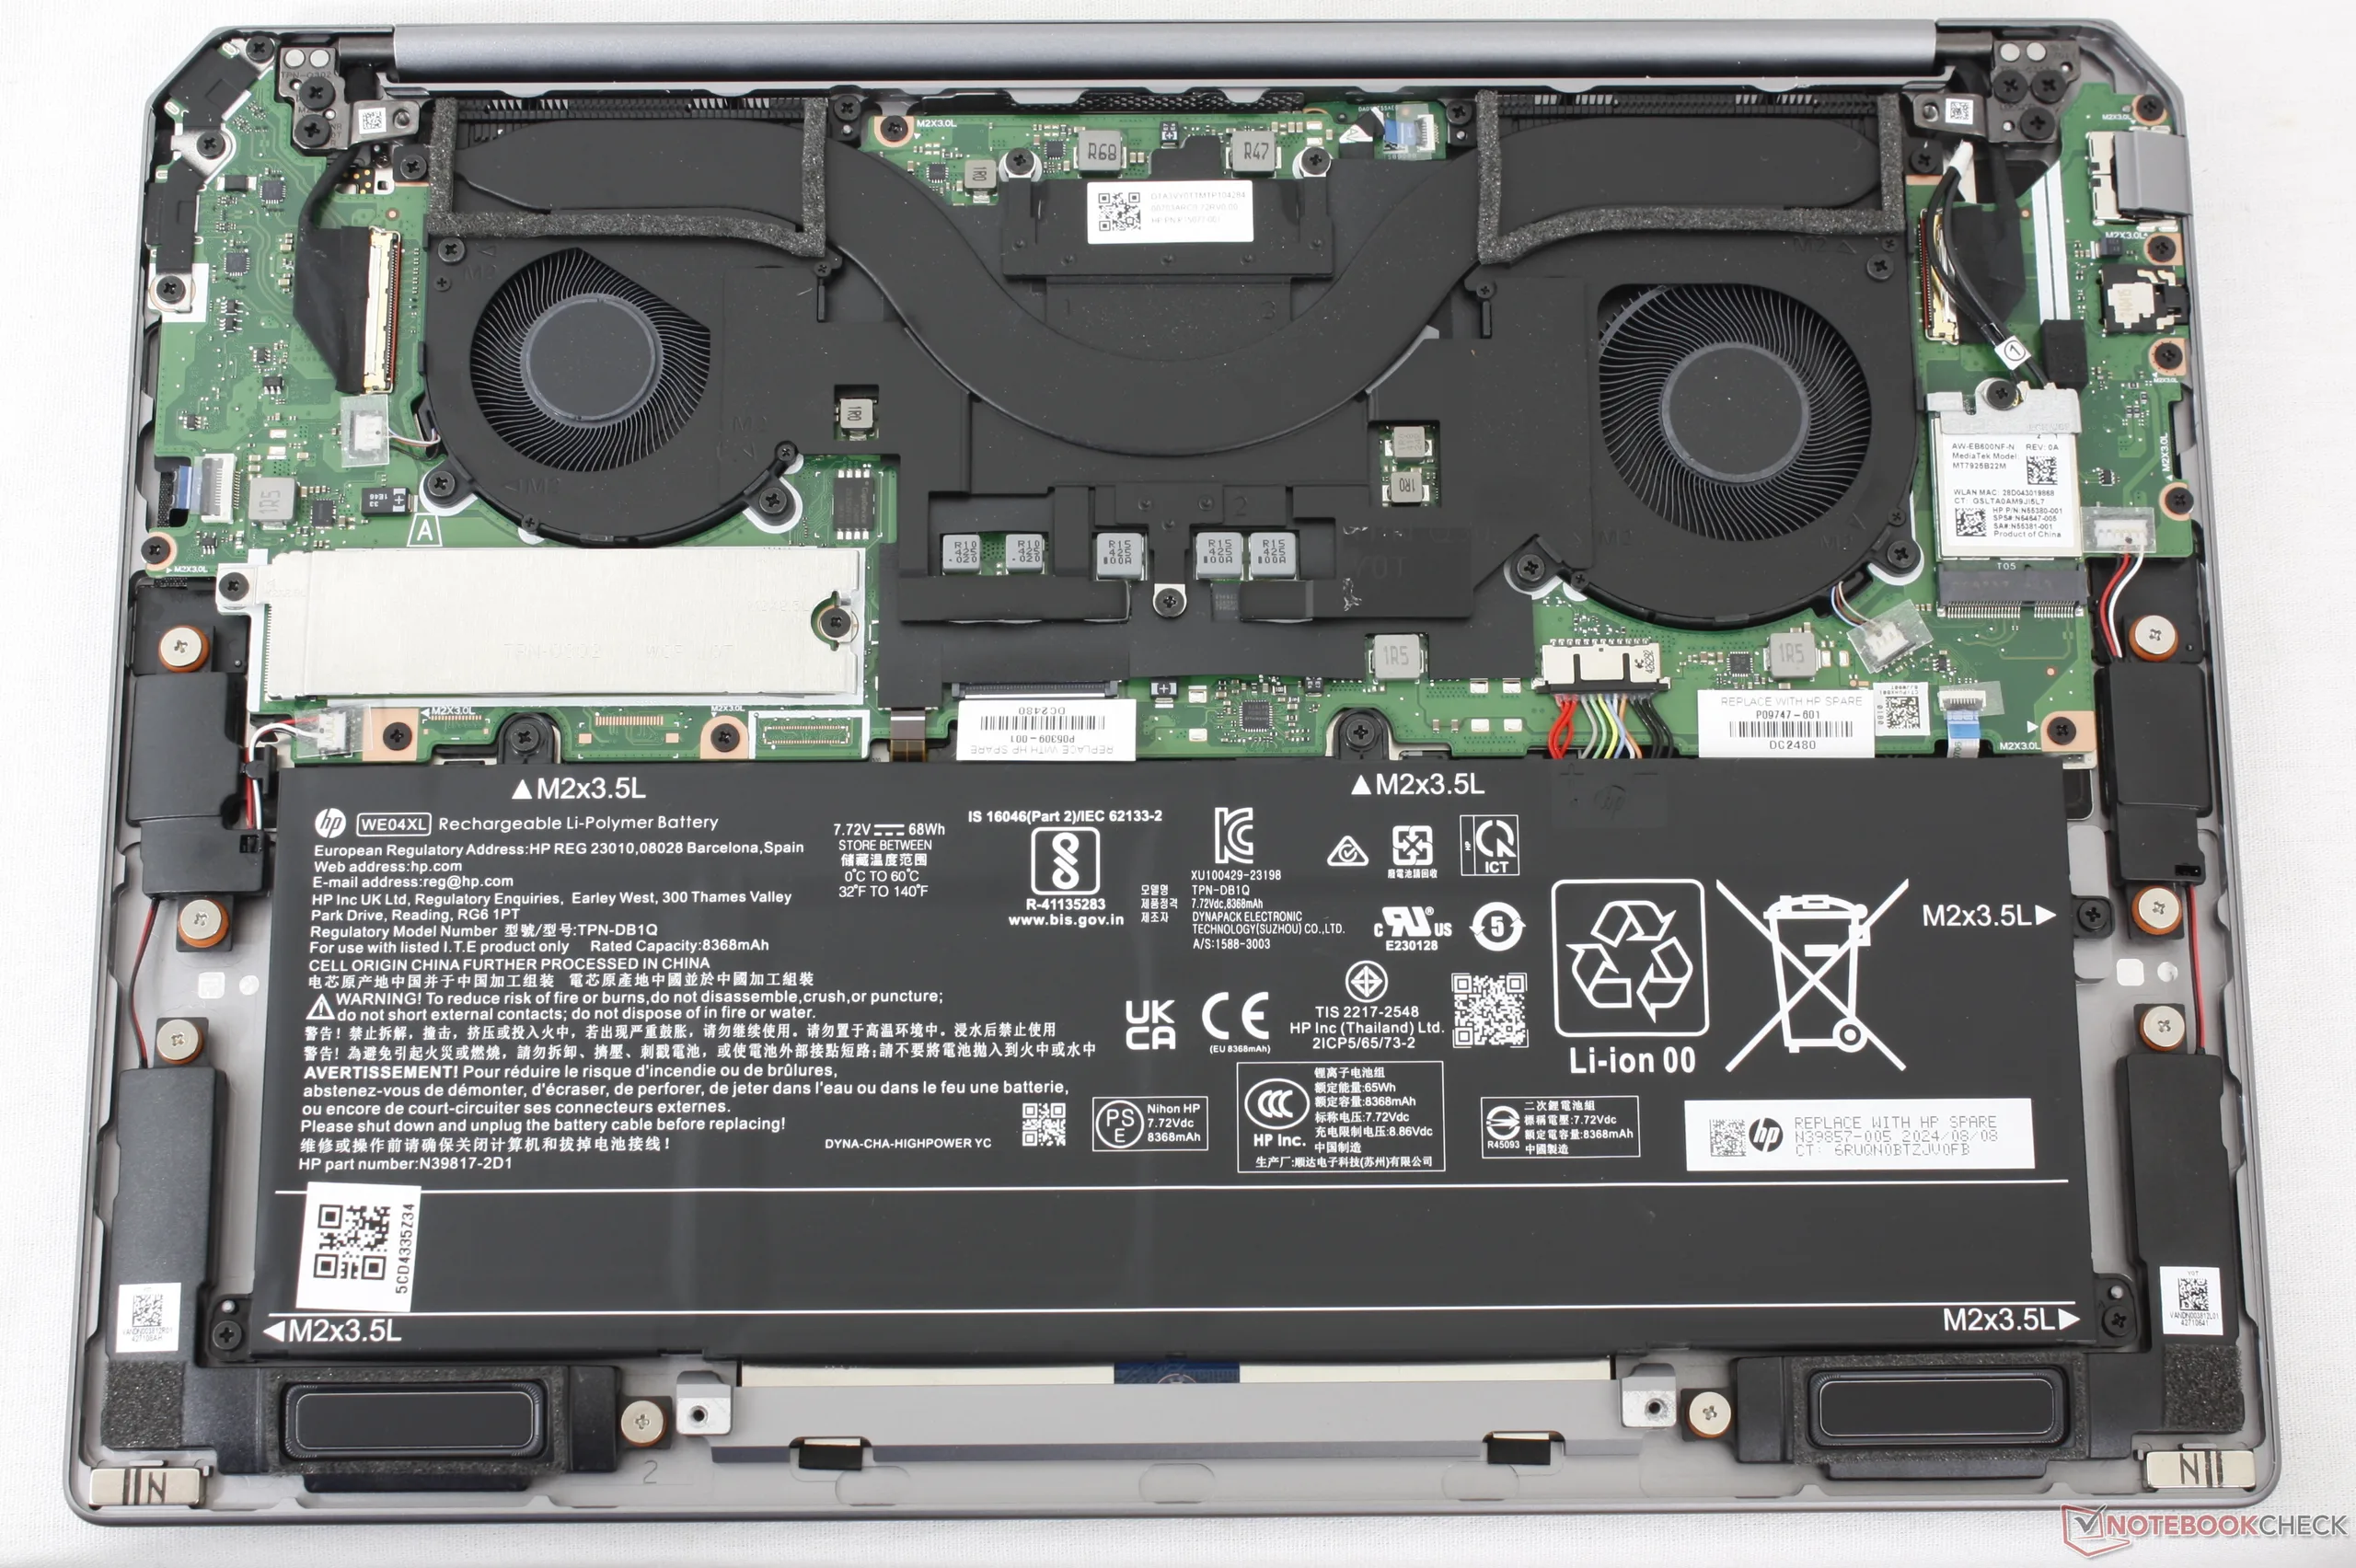
Der Boden ist zur Erleichterung der Wartung lediglich mit vier Kreuzschlitzschrauben befestigt. Allerdings lässt sich nur die M.2-2280-SSD austauschen, da der Arbeitsspeicher und die WLAN-Module fest verlötet sind.

Nachhaltigkeit
Das Gehäuse besteht bis zu 80 Prozent aus recyceltem Metall und über 40 Prozent aus recycelten Post-Consumer-Kunststoffen für die Tastatur- und Lautsprechergehäuse. Die Verpackung selbst kommt ganz ohne Kunststoffe aus.
Zubehör und Garantie
Die Verkaufsverpackung enthält außer dem Netzteil und den Unterlagen keine weiteren Extras. Bei Kauf in den USA gilt die übliche einjährige beschränkte Garantie.
Eingabegeräte
Tastatur
Die Tastatur wurde gegenüber dem Vorjahresmodell überarbeitet, obwohl sie bereits hervorragend war und ein ausgezeichnetes Tastgefühl sowie einen optimalen Tastenhub bot. Leider fühlt sich die neue Tastatur schwammiger an, sodass sie keineswegs als Verbesserung empfunden wird.

Display
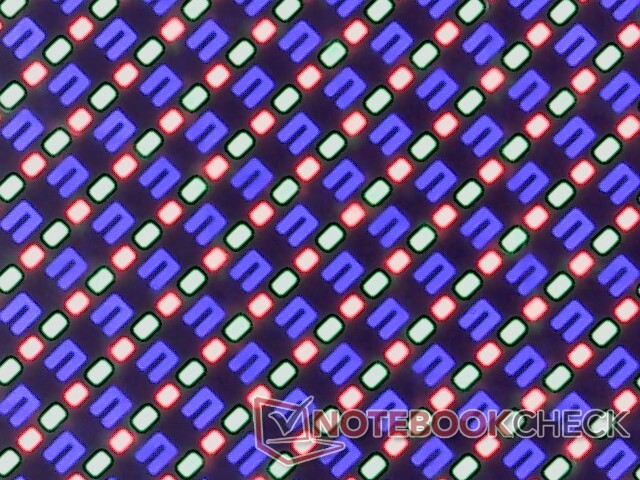
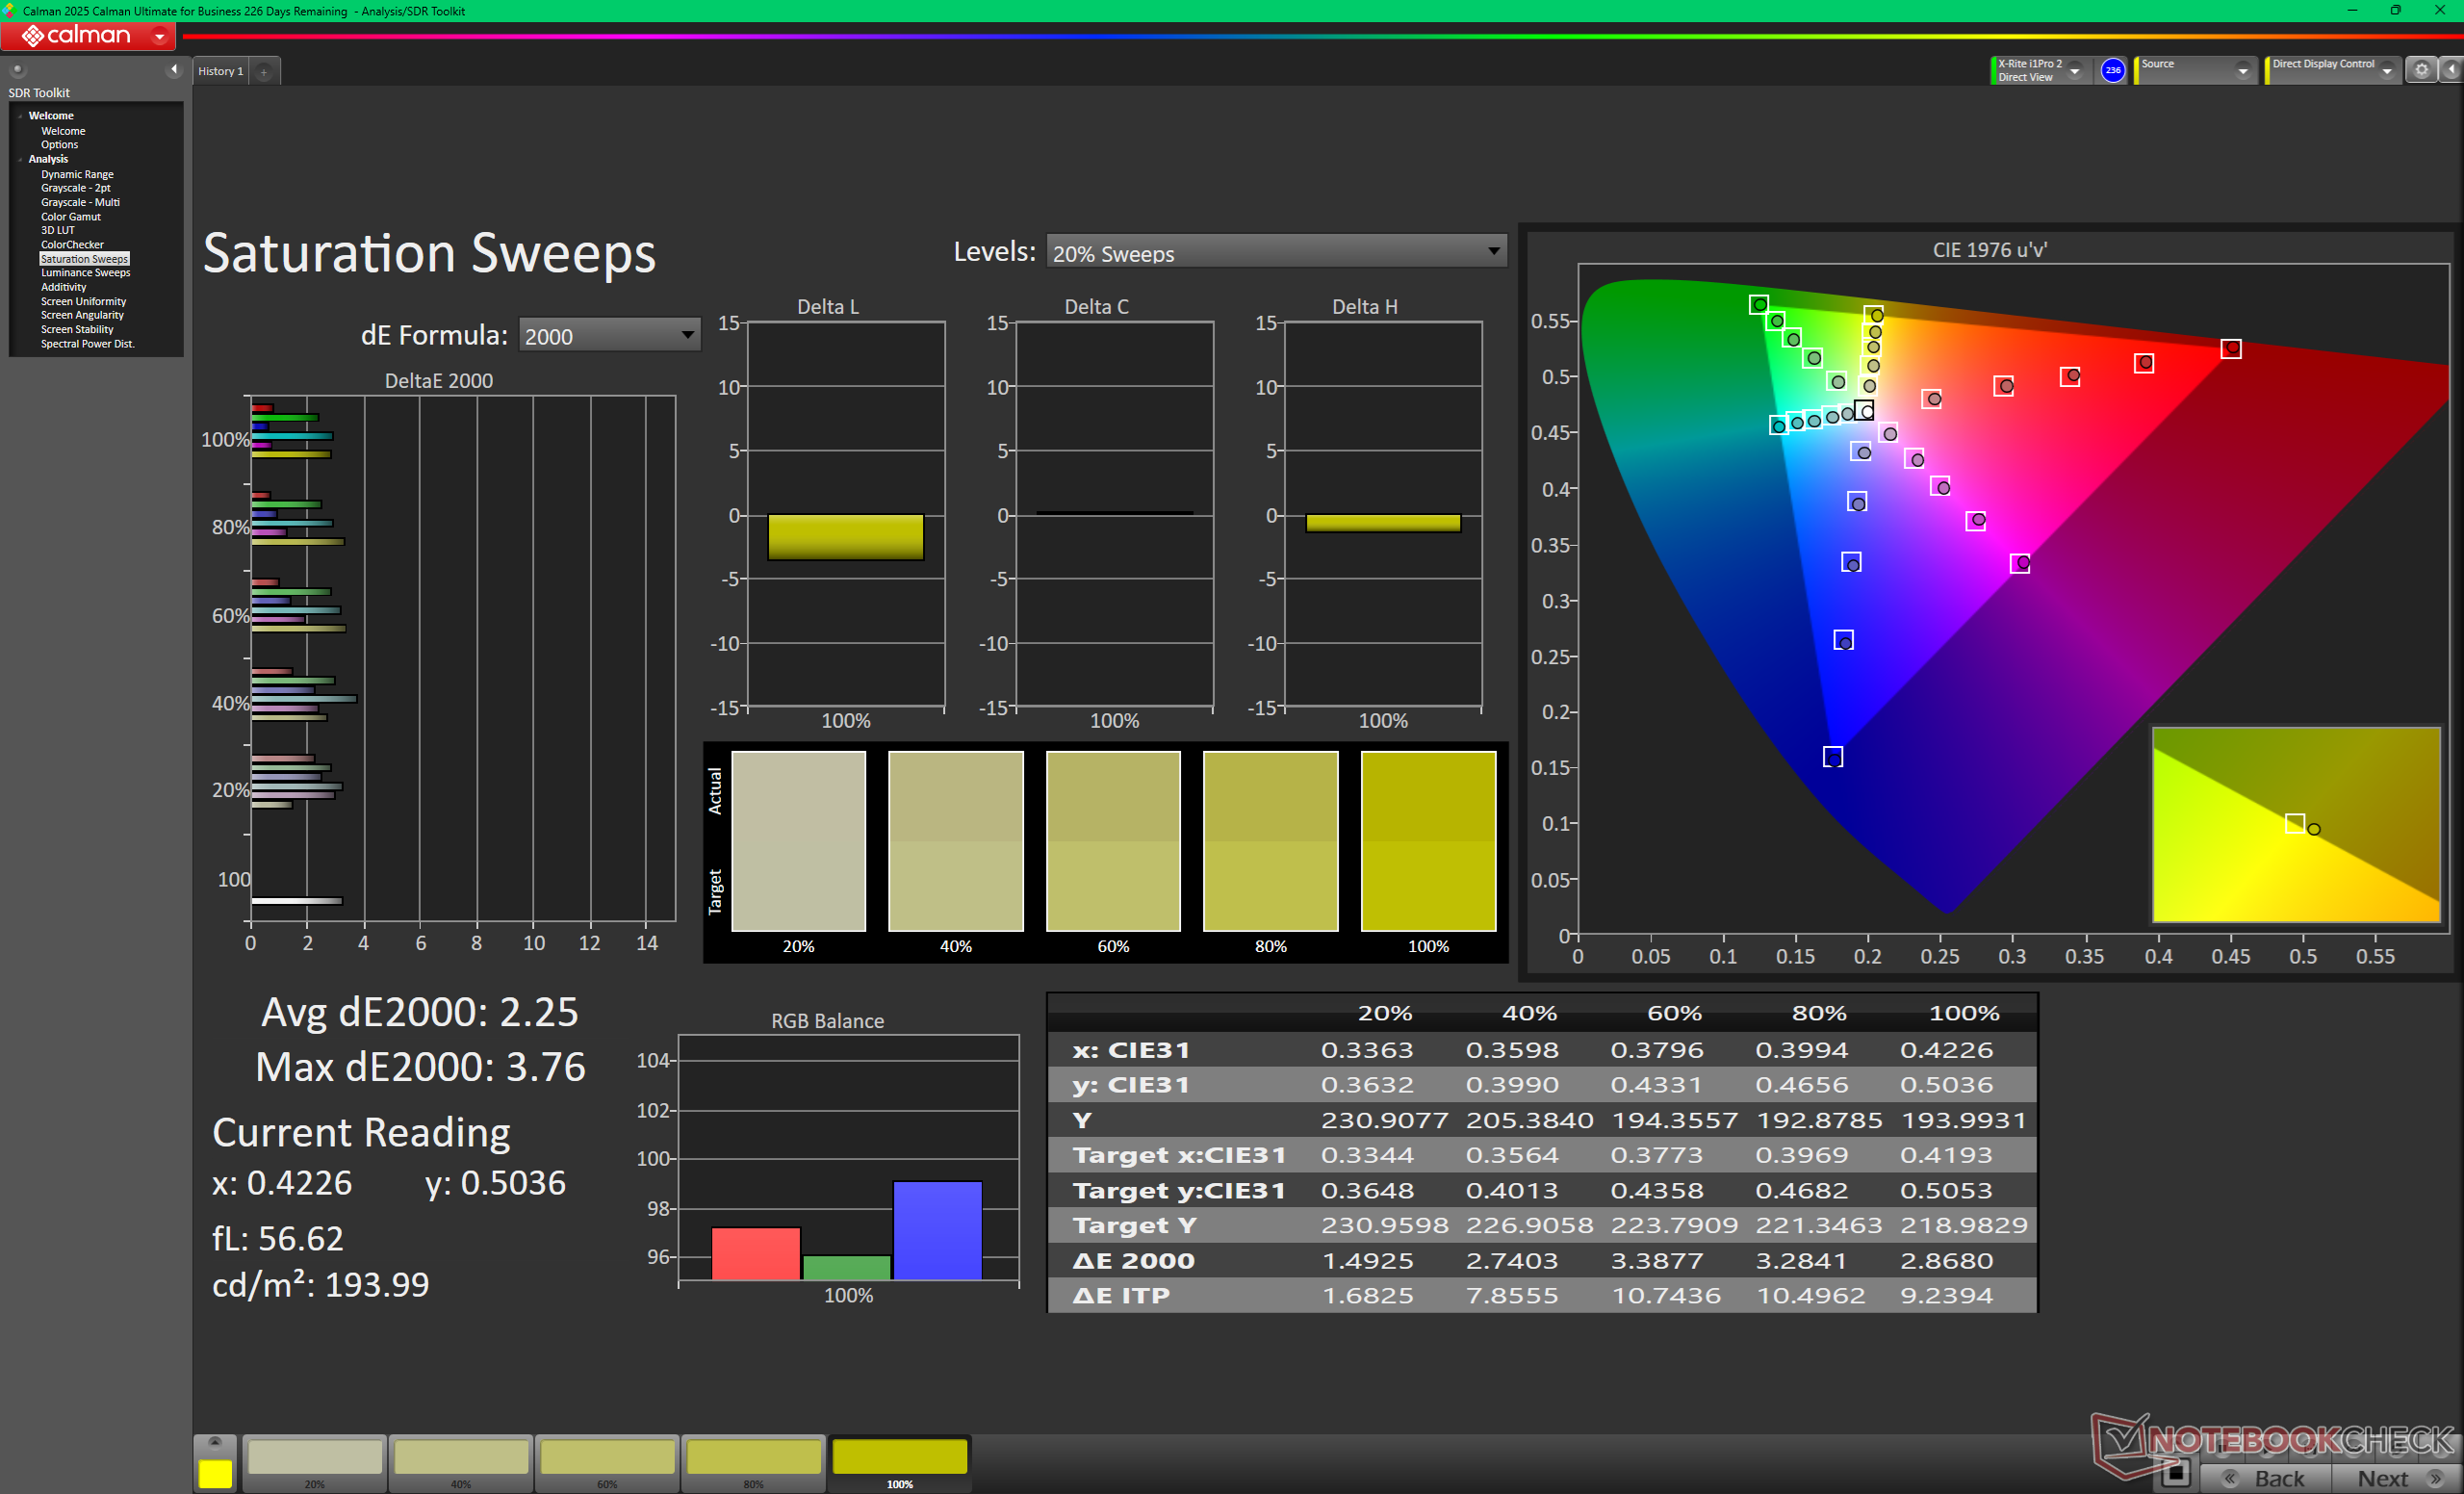
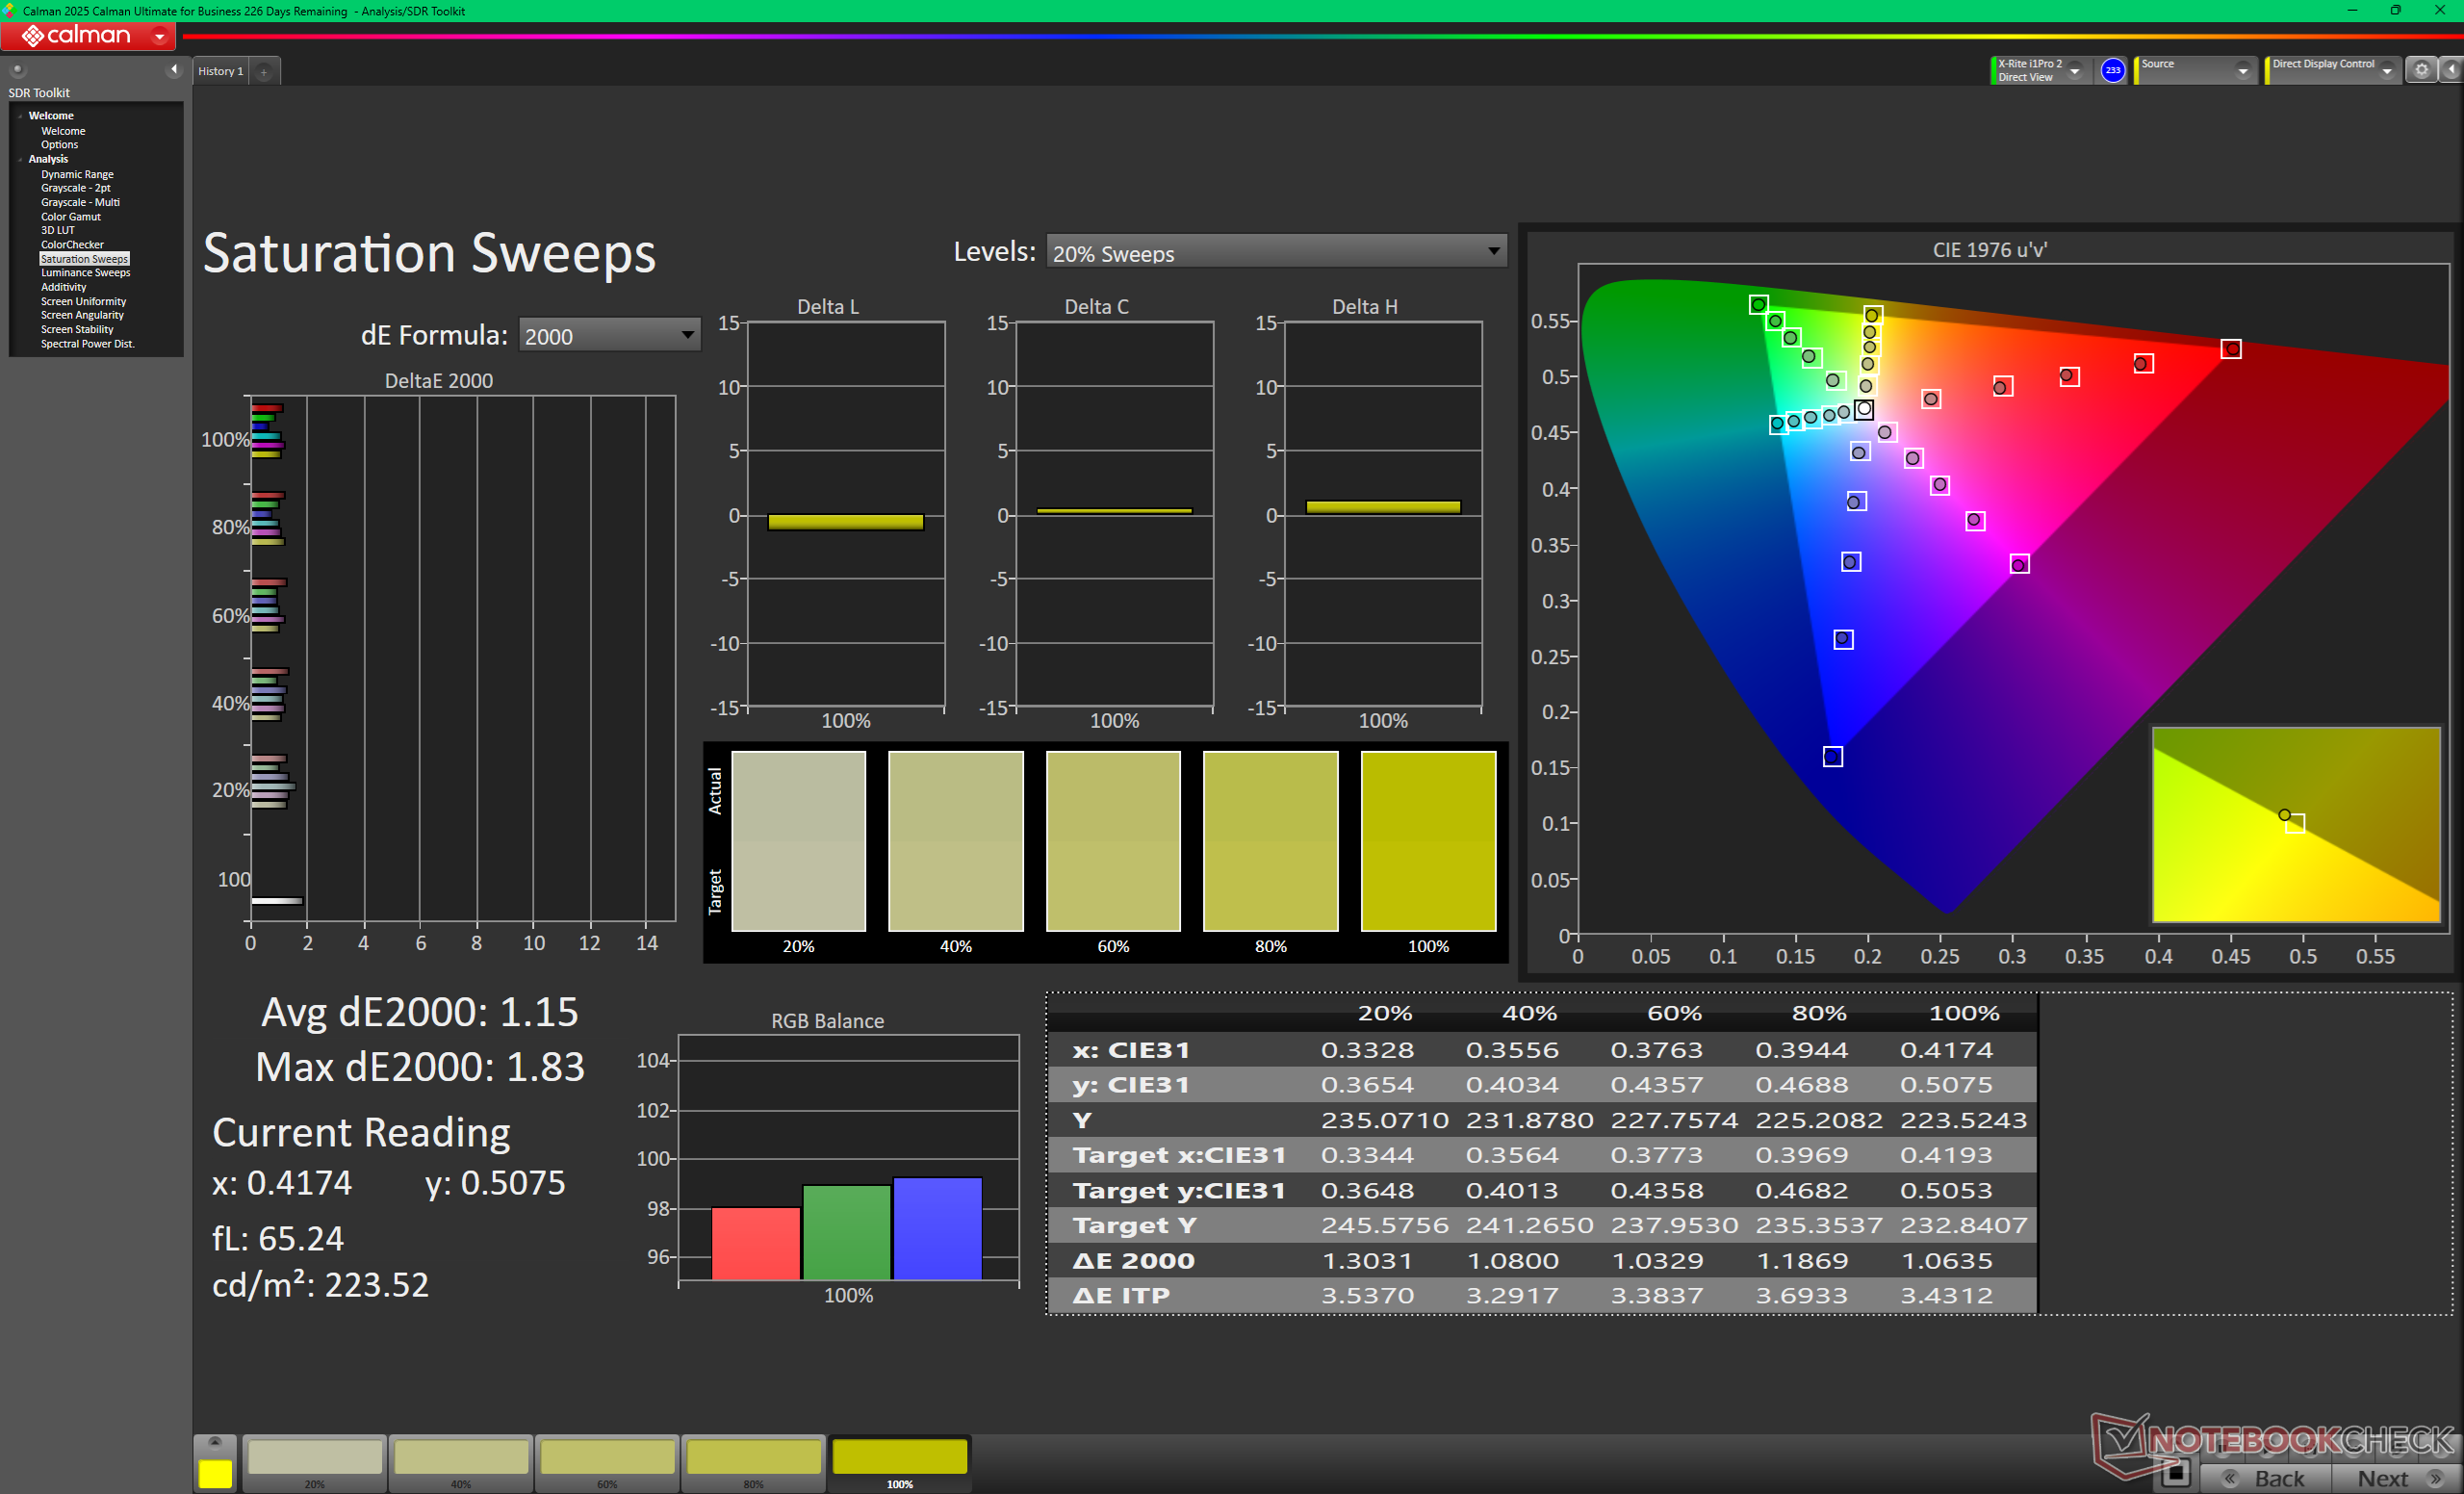
Der vorkalibrierte OLED-Touchscreen behebt unseren Hauptkritikpunkt am Modell 2024: die Bildwiederholfrequenz. Mit 120 Hz fühlt sich das System im Vergleich zum älteren 60-Hz-Display nun butterweich an. Auch andere Aspekte wurden durchweg verbessert, darunter der Wechsel von IPS zu OLED, tiefere Farben und eine bessere HDR-Unterstützung sowie eine höhere native Auflösung.
| |||||||||||||||||||||||||
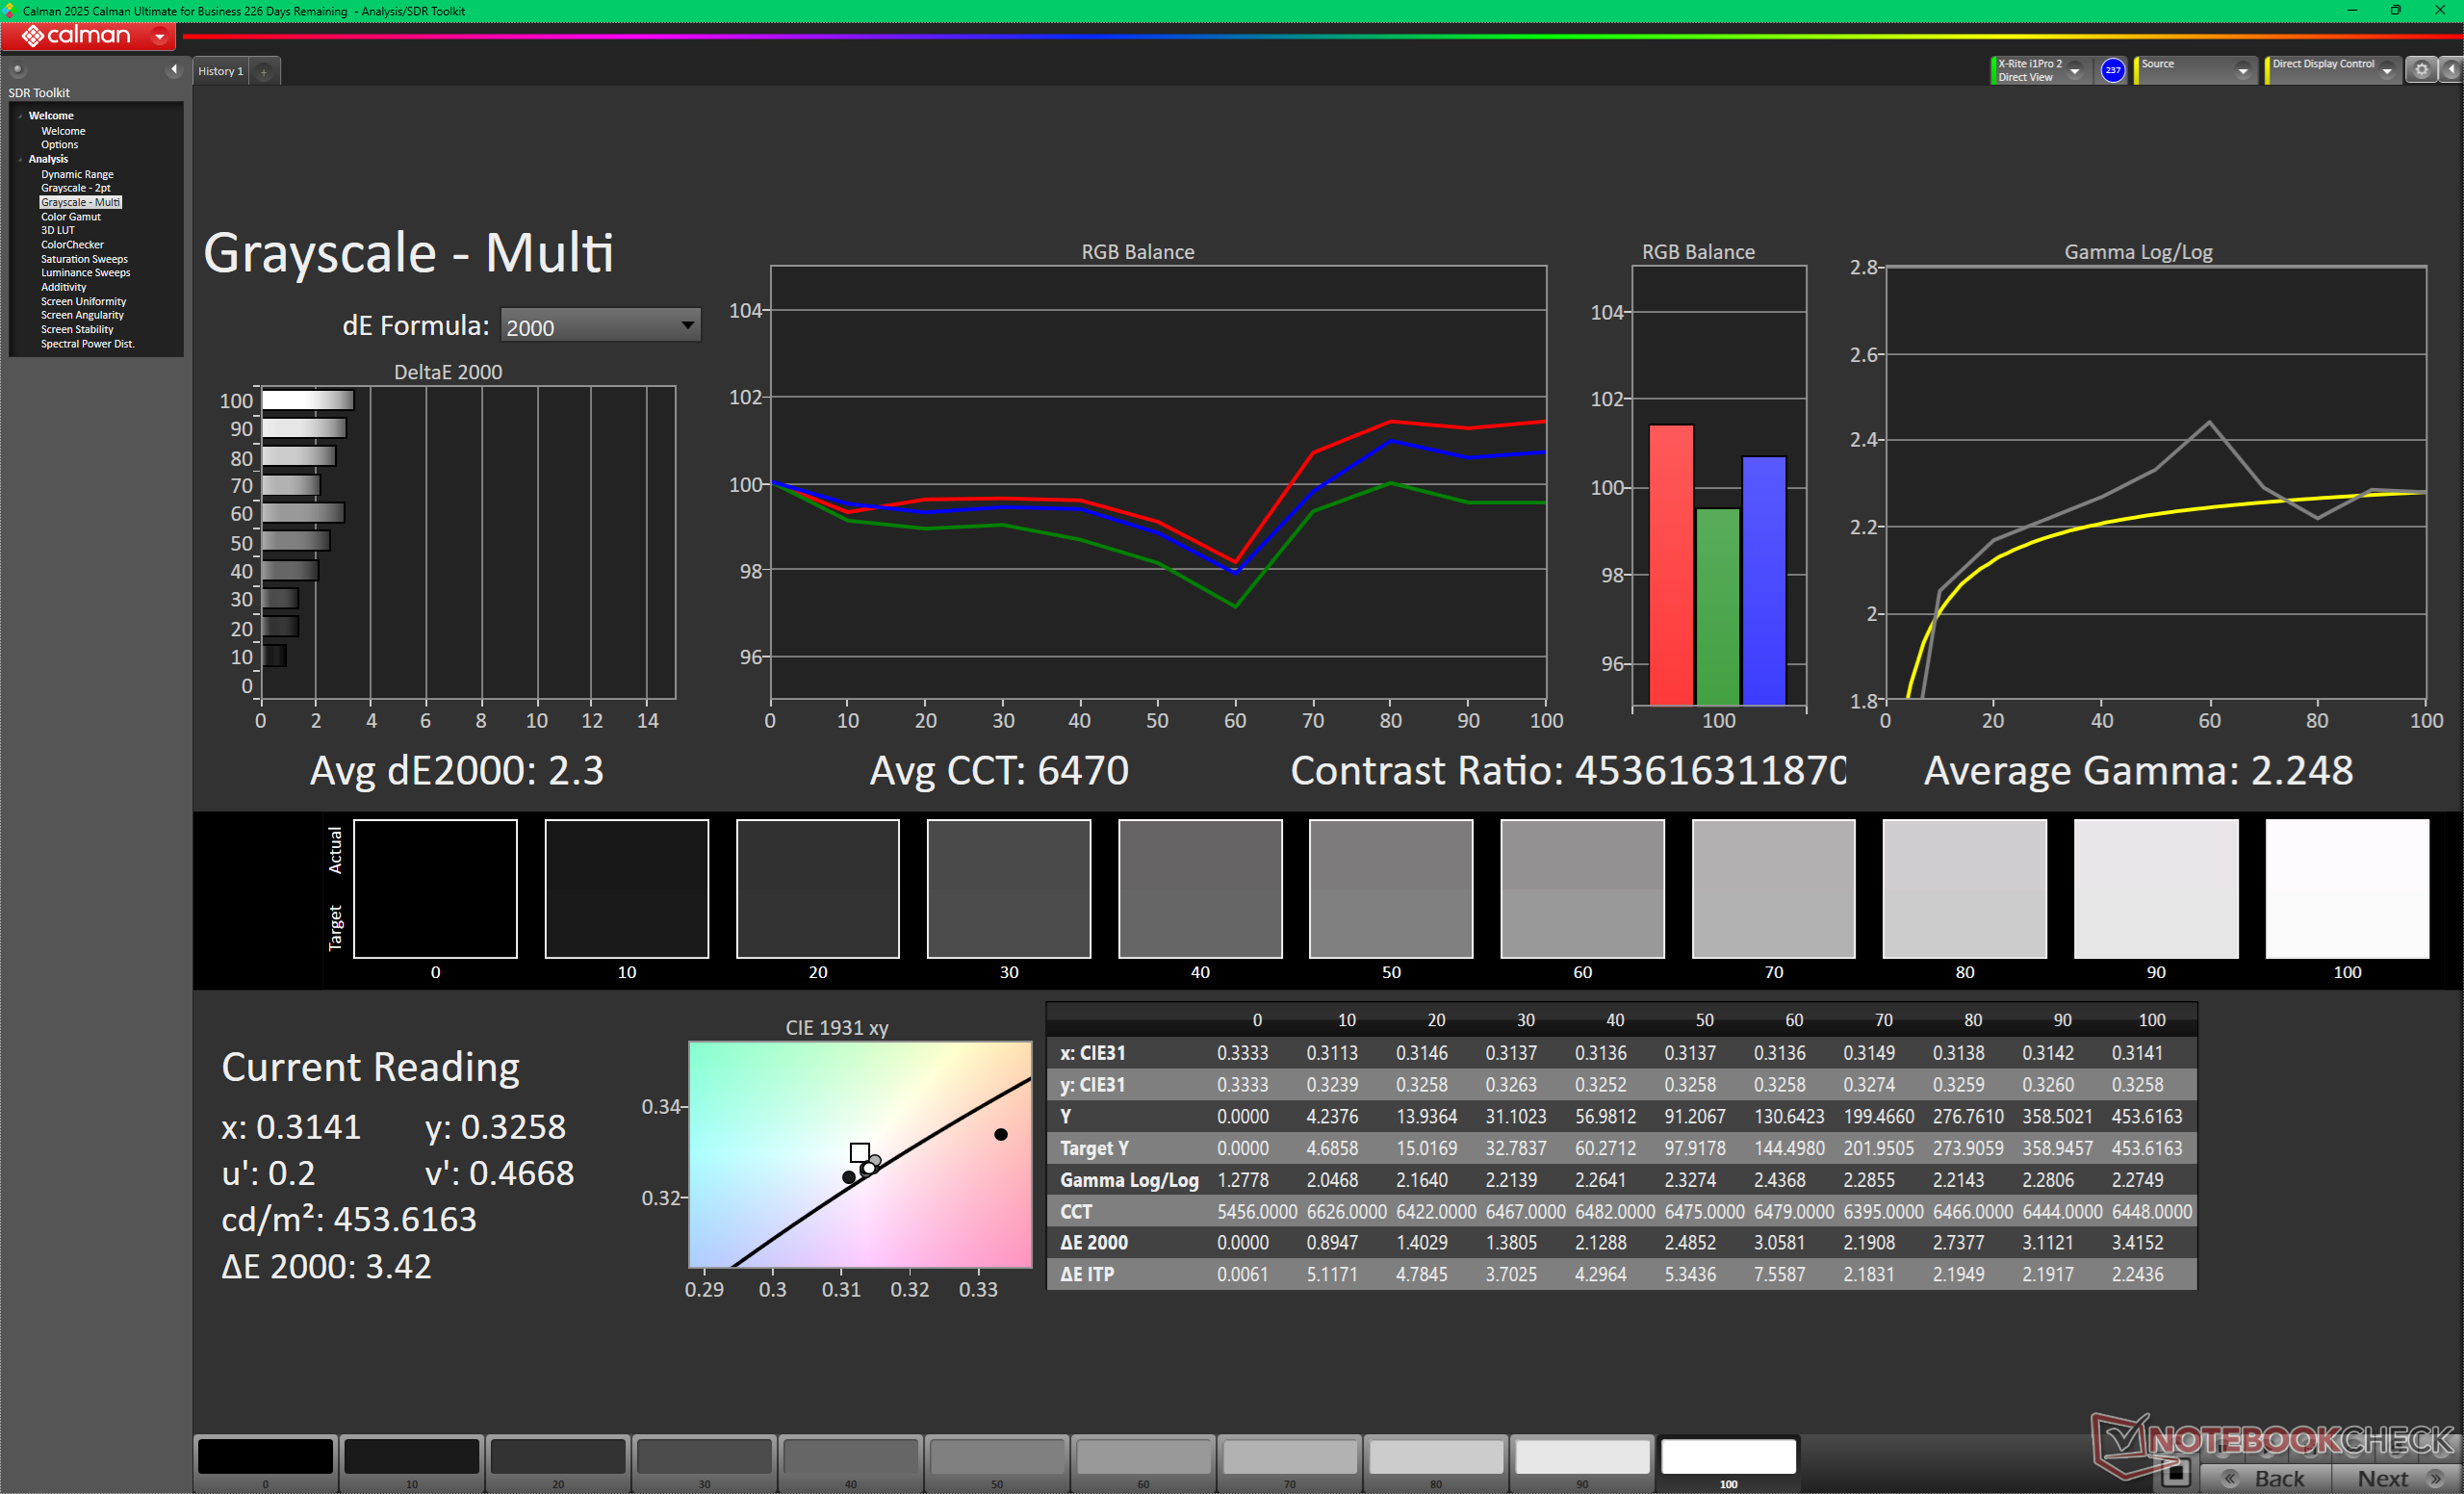
Ausleuchtung: 99 %
Helligkeit Akku: 446 cd/m²
Kontrast: ∞:1 (Schwarzwert: 0 cd/m²)
ΔE ColorChecker Calman: 1.76 | ∀{0.5-29.43 Ø4.71}
calibrated: 1.18
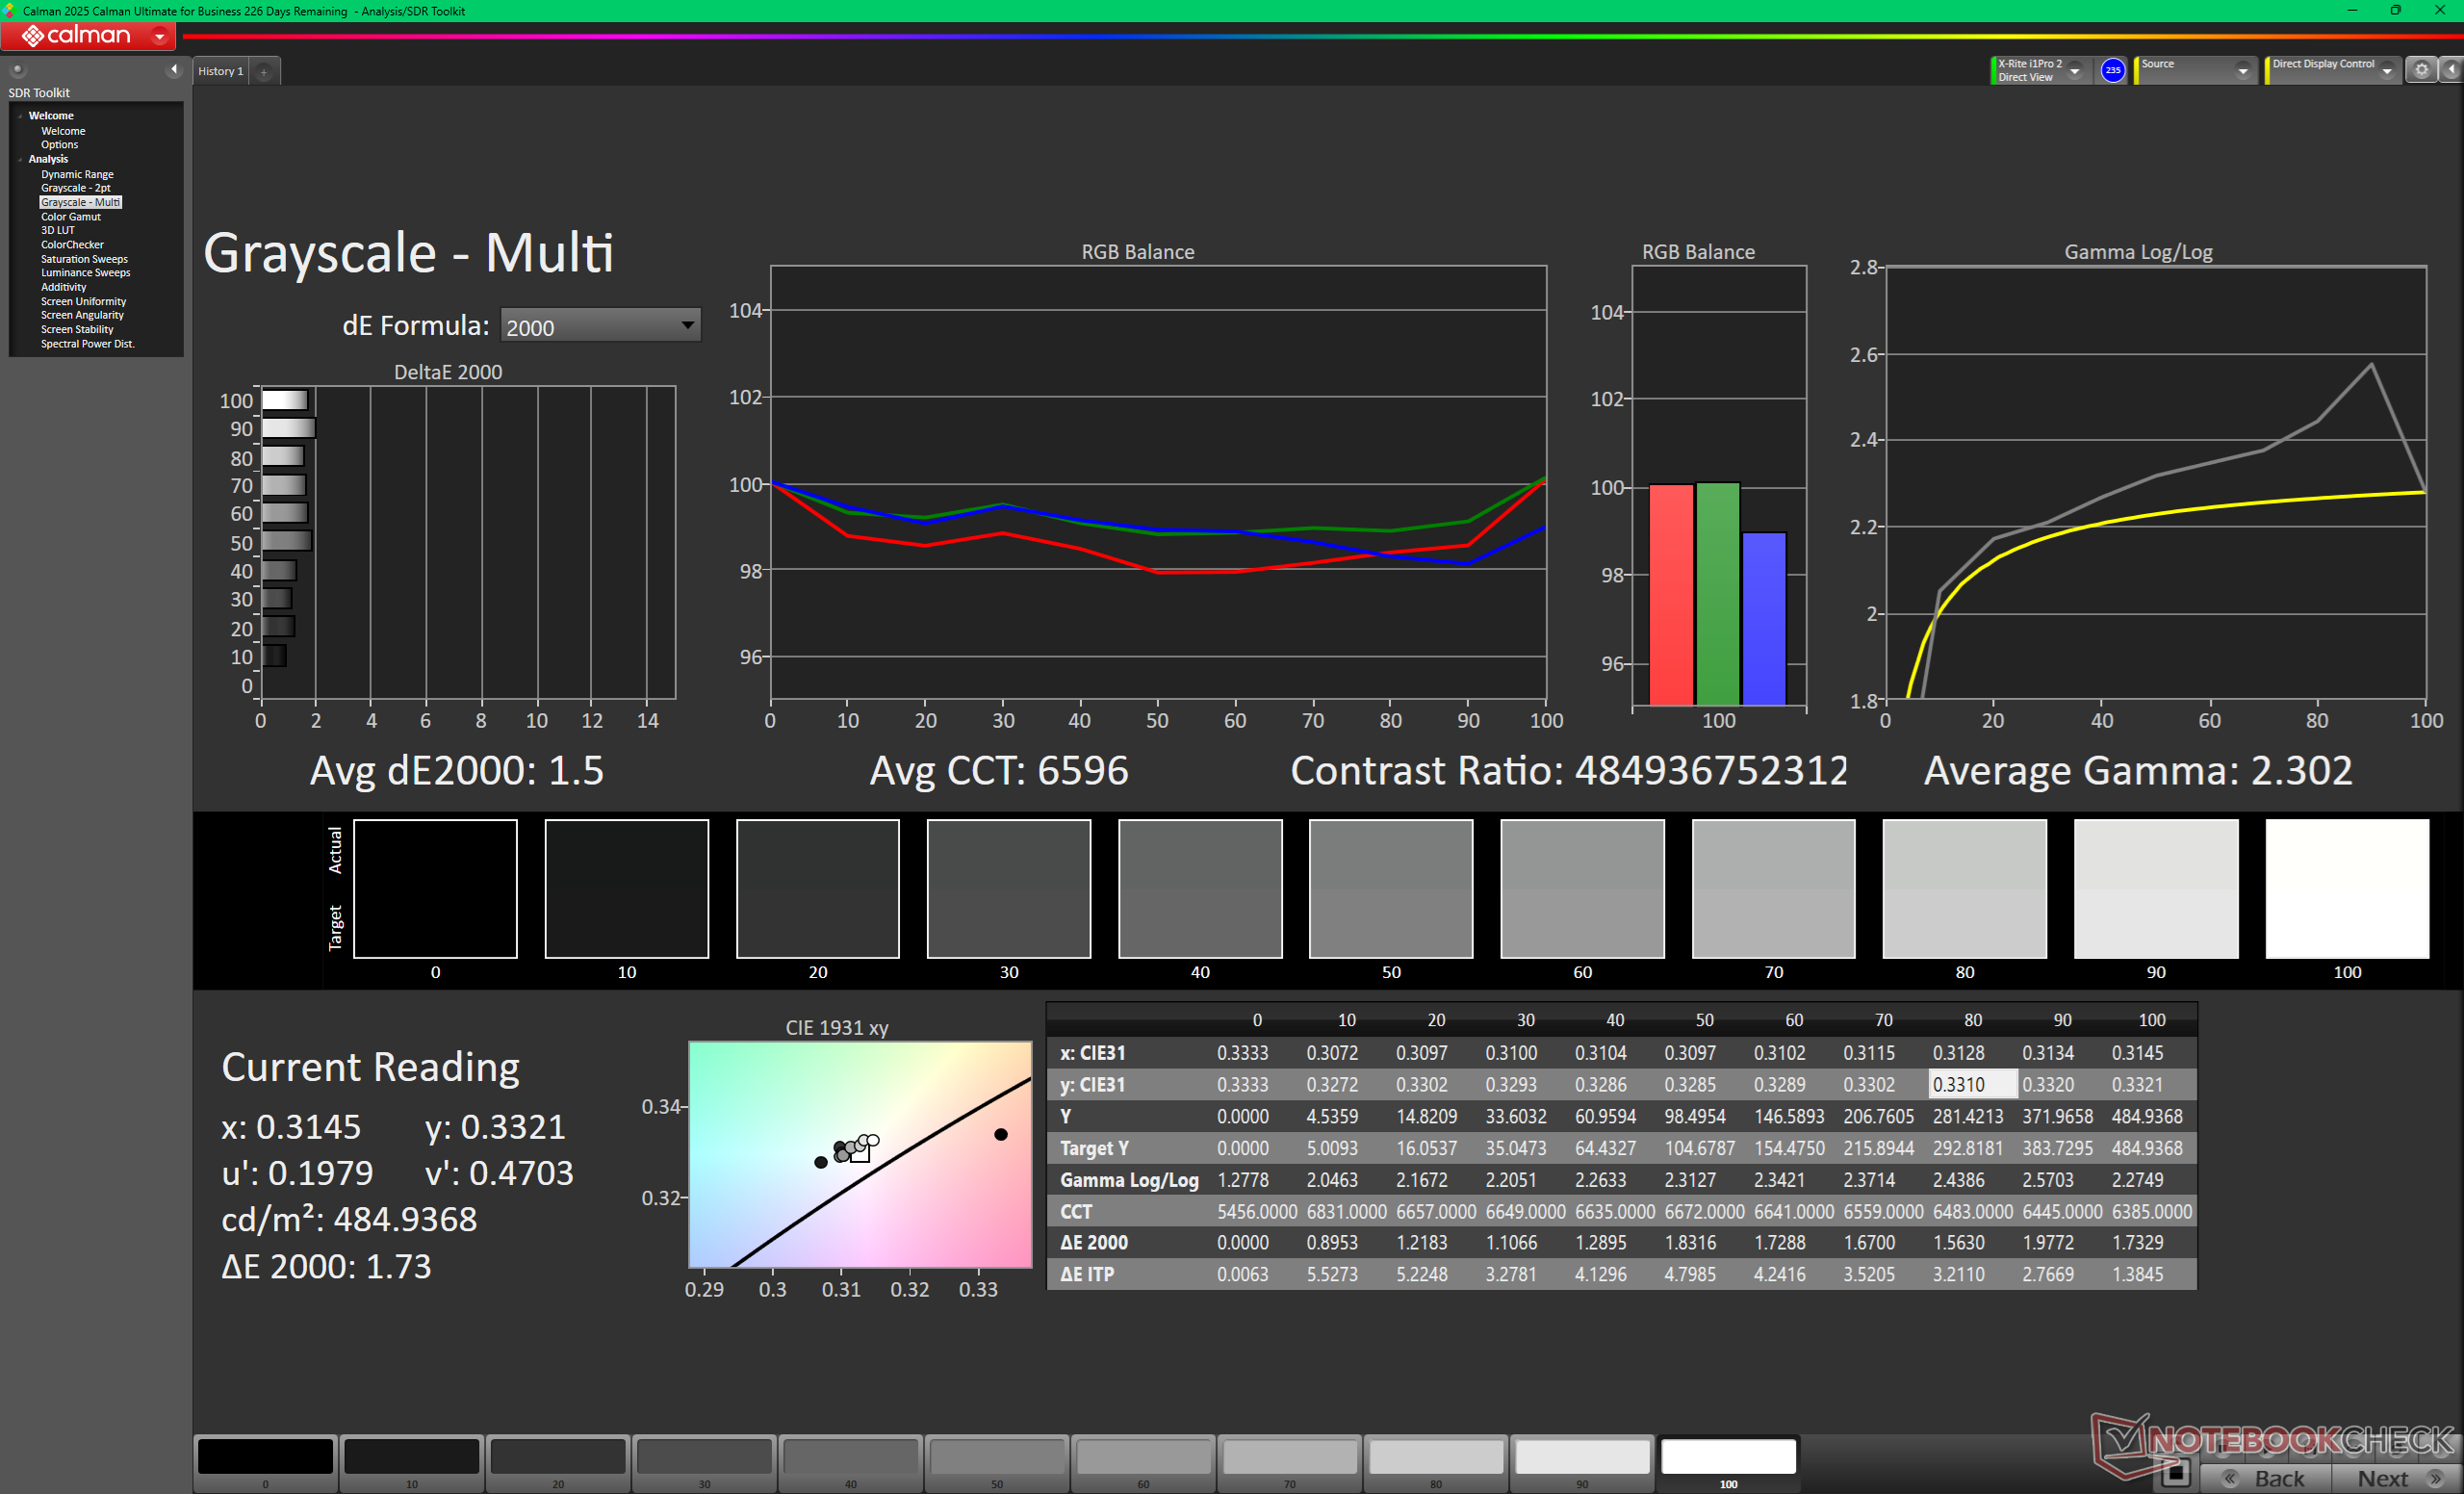
ΔE Greyscale Calman: 2.3 | ∀{0.09-98 Ø4.96}
92.3% AdobeRGB 1998 (Argyll 3D)
100% sRGB (Argyll 3D)
99.9% Display P3 (Argyll 3D)
Gamma: 2.25
CCT: 6470 K
| HP OmniBook Ultra 14 Core Ultra X9 Samsung SDC4215, OLED, 2880x1800, 14", 120 Hz | Lenovo Yoga Slim 7 Ultra 14IPH11 LEN140WQ+, OLED, 2880x1800, 14", 120 Hz | HP OmniBook Ultra Flip 14 Samsung SDC41AA, OLED, 2880x1800, 14", 120 Hz | Dell XPS 14 Core Ultra X7 358H LG Philips 140WT2, OLED, 2880x1800, 14", 120 Hz | MSI Prestige 14 Flip AI+ 2026 ATNA40KW05-0, OLED, 1920x1200, 14", 60 Hz | Asus ExpertBook Ultra B9406CAA Samsung ATNA40LE01-0, OLED, 2880x1800, 14", 120 Hz | |
|---|---|---|---|---|---|---|
| Display | -2% | 2% | 2% | -0% | -3% | |
| Display P3 Coverage (%) | 99.9 | 99.3 -1% | 99.8 0% | 99.7 0% | 100 0% | 96.2 -4% |
| sRGB Coverage (%) | 100 | 100 0% | 100 0% | 100 0% | 100 0% | 100 0% |
| AdobeRGB 1998 Coverage (%) | 92.3 | 87.7 -5% | 96.7 5% | 98.2 6% | 91.8 -1% | 86.7 -6% |
| Response Times | -39% | -32% | -21% | -95% | -3% | |
| Response Time Grey 50% / Grey 80% * (ms) | 0.58 ? | 0.64 ? -10% | 0.86 ? -48% | 0.75 ? -29% | 1.87 ? -222% | 0.71 ? -22% |
| Response Time Black / White * (ms) | 0.87 ? | 0.94 ? -8% | 1.01 ? -16% | 1.03 ? -18% | 1.53 ? -76% | 0.94 ? -8% |
| PWM Frequency (Hz) | 927.13 ? | 479.46 ? | 469 ? | 240.62 ? | 480 ? | 968.8 ? |
| PWM Amplitude * (%) | 25 | 50 -100% | 33.3 -33% | 29 -16% | 22 12% | 20 20% |
| Bildschirm | 5% | 17% | 7% | 1% | 28% | |
| Helligkeit Bildmitte (cd/m²) | 446 | 470.7 6% | 363.9 -18% | 393.8 -12% | 292 -35% | 600.5 35% |
| Brightness (cd/m²) | 447 | 488 9% | 366 -18% | 389 -13% | 292 -35% | 612 37% |
| Brightness Distribution (%) | 99 | 94 -5% | 99 0% | 96 -3% | 98 -1% | 96 -3% |
| Schwarzwert * (cd/m²) | 0.01 | |||||
| Delta E Colorchecker * | 1.76 | 2.21 -26% | 0.84 52% | 1.27 28% | 1.4 20% | 1.18 33% |
| Colorchecker dE 2000 max. * | 3.29 | 5.02 -53% | 2.72 17% | 3.35 -2% | 2.2 33% | 3.4 -3% |
| Colorchecker dE 2000 calibrated * | 1.18 | 0.82 31% | 0.82 31% | 0.71 40% | 0.73 38% | |
| Delta E Graustufen * | 2.3 | 0.6 74% | 1.1 52% | 2 13% | 1.7 26% | 1 57% |
| Gamma | 2.25 98% | 2.2 100% | 2.18 101% | 2.19 100% | 2.12 104% | 2.27 97% |
| CCT | 6470 100% | 6472 100% | 6330 103% | 6379 102% | 6510 100% | 6567 99% |
| Kontrast (:1) | 29200 | |||||
| Durchschnitt gesamt (Programm / Settings) | -12% /
-7% | -4% /
2% | -4% /
-0% | -31% /
-23% | 7% /
13% |
* ... kleinere Werte sind besser


Reaktionszeiten (Response Times) des Displays
| ↔ Reaktionszeiten Schwarz zu Weiß | ||
|---|---|---|
| 0.87 ms ... steigend ↗ und fallend ↘ kombiniert | ↗ 0.4 ms steigend | 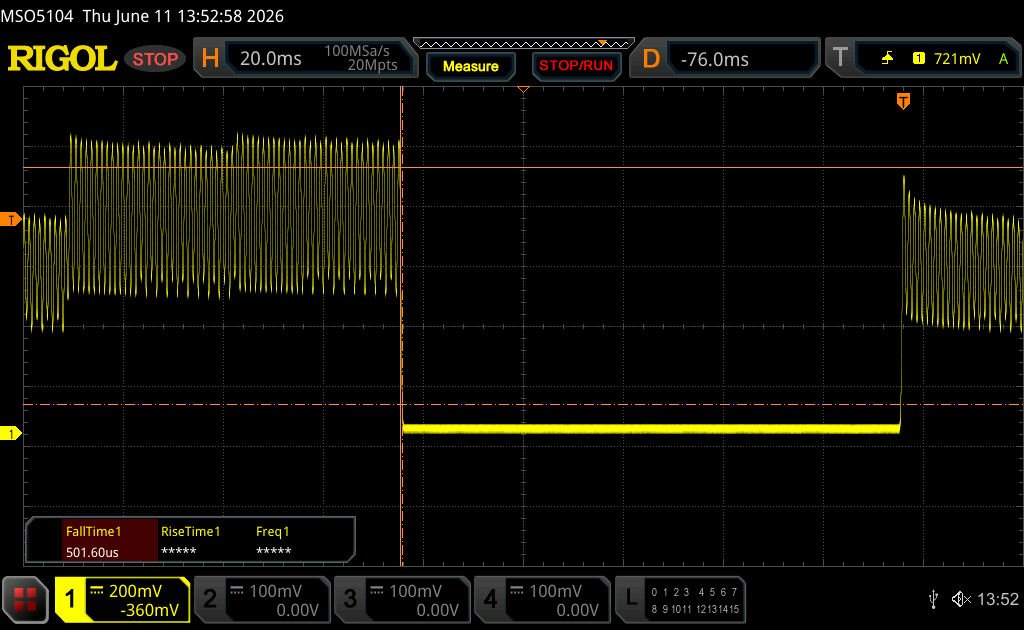 |
| ↘ 0.47 ms fallend | ||
| Die gemessenen Reaktionszeiten sind sehr kurz, wodurch sich der Bildschirm auch für schnelle 3D Spiele eignen sollte. Im Vergleich rangierten die bei uns getesteten Geräte von 0.1 (Minimum) zu 240 (Maximum) ms. » 3 % aller Screens waren schneller als der getestete. Daher sind die gemessenen Reaktionszeiten besser als der Durchschnitt aller vermessenen Geräte (19.8 ms). | ||
| ↔ Reaktionszeiten 50% Grau zu 80% Grau | ||
| 0.58 ms ... steigend ↗ und fallend ↘ kombiniert | ↗ 0.3 ms steigend | 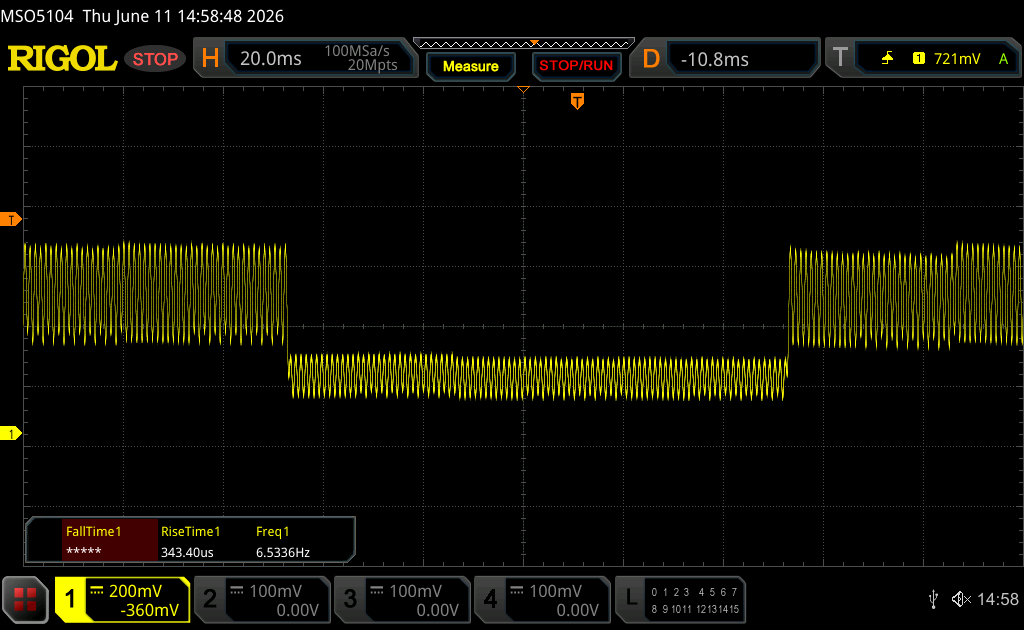 |
| ↘ 0.28 ms fallend | ||
| Die gemessenen Reaktionszeiten sind sehr kurz, wodurch sich der Bildschirm auch für schnelle 3D Spiele eignen sollte. Im Vergleich rangierten die bei uns getesteten Geräte von 0.165 (Minimum) zu 636 (Maximum) ms. » 1 % aller Screens waren schneller als der getestete. Daher sind die gemessenen Reaktionszeiten besser als der Durchschnitt aller vermessenen Geräte (31 ms). | ||
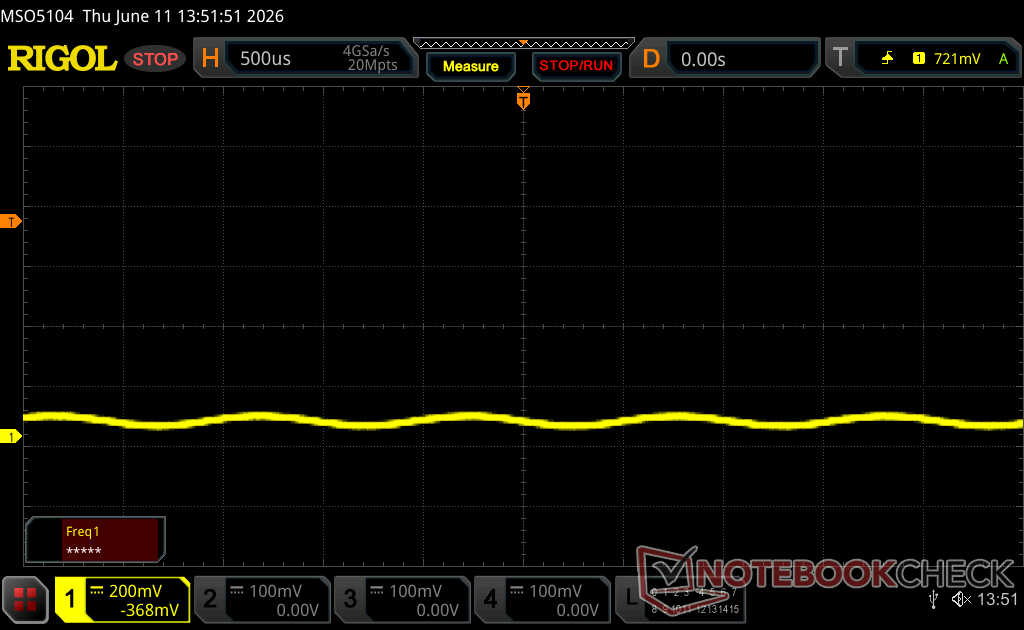
Bildschirm-Flackern / PWM (Pulse-Width Modulation)
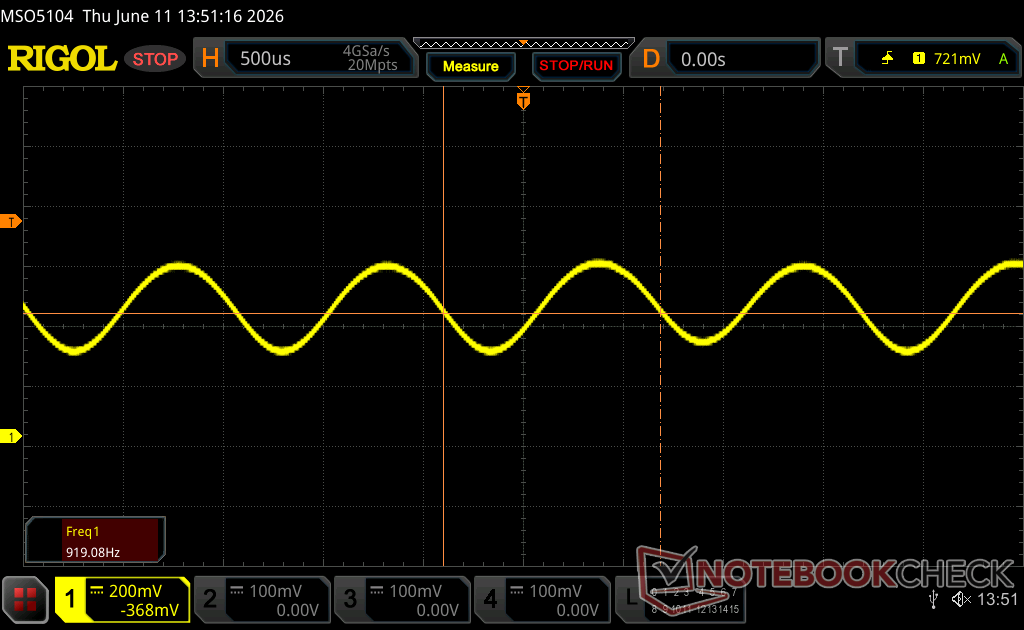
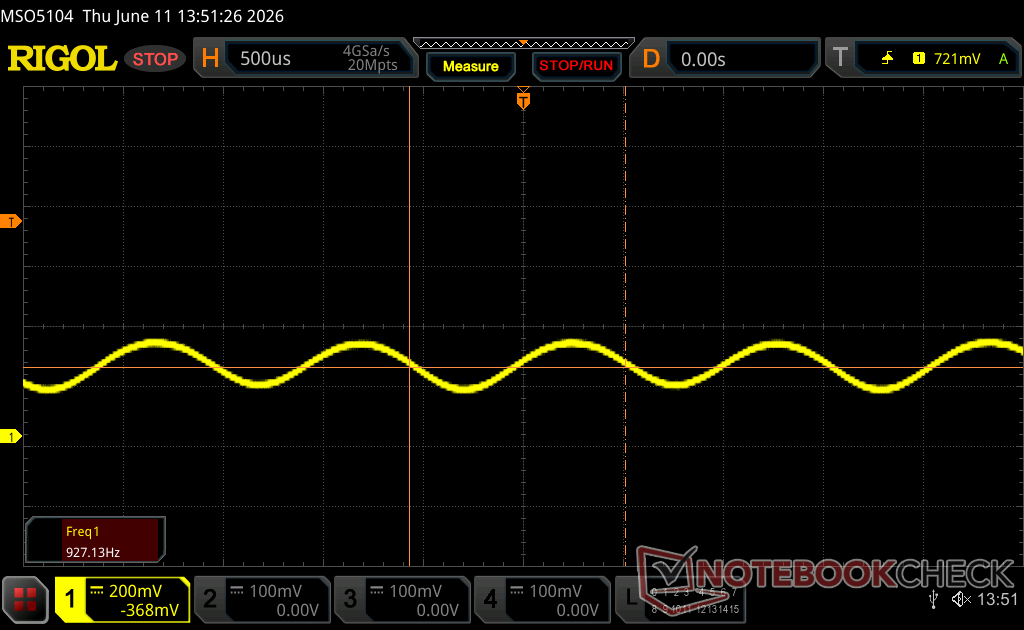
| Flackern / PWM festgestellt | 927.13 Hz Amplitude: 25 % | ≤ 100 % Helligkeit | 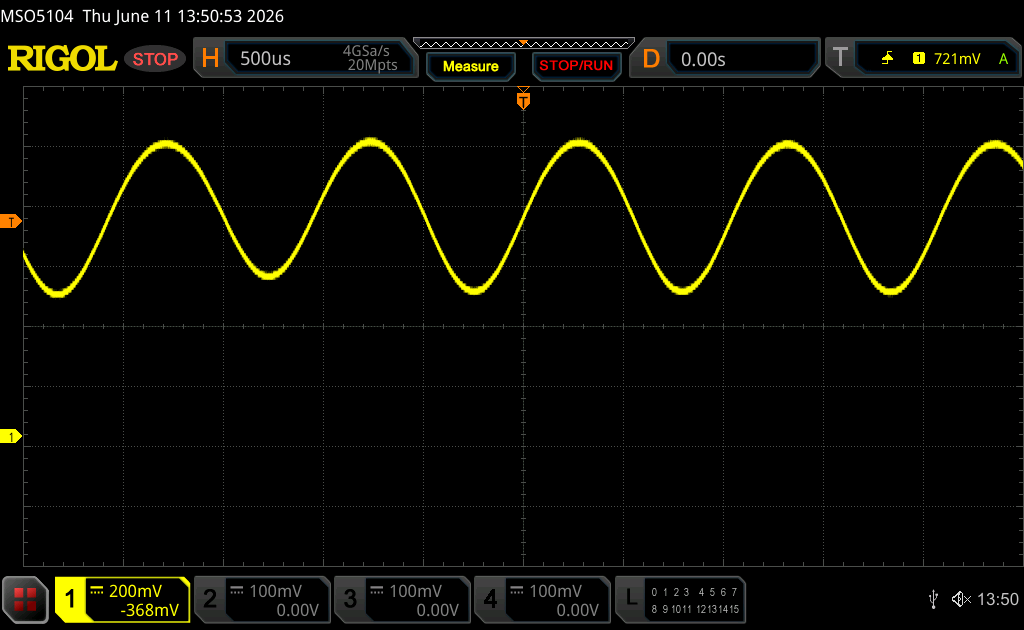 |
Das Display flackert mit 927.13 Hz (im schlimmsten Fall, eventuell durch Pulsweitenmodulation PWM) bei einer eingestellten Helligkeit von 100 % und darunter. Darüber sollte es zu keinem Flackern kommen. Die Frequenz von 927.13 Hz ist sehr hoch und sollte daher auch bei empfindlichen Personen zu keinen Problemen führen. Im Vergleich: 52 % aller getesteten Geräte nutzten kein PWM um die Helligkeit zu reduzieren. Wenn PWM eingesetzt wurde, dann bei einer Frequenz von durchschnittlich 7754 (Minimum 5, Maximum 343500) Hz. | |||


Leistung
Testbedingungen
Vor der Durchführung der folgenden Benchmarks haben wir die integrierte HP Software auf den Modus Performance eingestellt.
Prozessorleistung
Der Core Ultra X9 388H im HP läuft um etwa 5 bis 10 Prozent langsamer als erwartet. Tatsächlich arbeitet das Asus ExpertBook Ultra etwa zehn Prozent schneller, obwohl es mit dem schwächeren Core Ultra X7 358H ausgestattet ist. Das Leistungsdefizit lässt sich teilweise auf das begrenzte Turbo-Boost-Potenzial des OmniBook Ultra 14 zurückführen; die Leistung fällt im Laufe der Zeit um etwa 9 Prozent ab, wenn CineBench R15 in einer Schleife ausgeführt wird, wie die nachstehende Vergleichsgrafik zeigt.
Der Ryzen AI 9 HX 375 im 2024 OmniBook bietet eine um etwa 20 bis 25 Prozent höhere reine Multithread-Leistung.
Cinebench R15 Multi-Loop
Cinebench R23: Multi Core | Single Core
Cinebench R20: CPU (Multi Core) | CPU (Single Core)
Cinebench R15: CPU Multi 64Bit | CPU Single 64Bit
Blender: v2.79 BMW27 CPU
7-Zip 18.03: 7z b 4 | 7z b 4 -mmt1
Geekbench 6.7: Multi-Core | Single-Core
Geekbench 5.5: Multi-Core | Single-Core
HWBOT x265 Benchmark v2.2: 4k Preset
LibreOffice : 20 Documents To PDF
R Benchmark 2.5: Overall mean
* ... kleinere Werte sind besser
AIDA64: FP32 Ray-Trace | FPU Julia | CPU SHA3 | CPU Queen | FPU SinJulia | FPU Mandel | CPU AES | CPU ZLib | FP64 Ray-Trace | CPU PhotoWorxx | CPU CheckMate
| Performance Rating | |
| HP OmniBook Ultra 14 Core Ultra X9 -1! | |
| Dell XPS 14 Core Ultra X7 358H | |
| MSI Prestige 14 Flip AI+ 2026 -1! | |
| Durchschnittliche Intel Core Ultra X9 388H | |
| HP OmniBook Ultra Flip 14 -1! | |
| Lenovo Yoga Slim 7 Ultra 14IPH11 -1! | |
| Asus ExpertBook Ultra B9406CAA -1! | |
| AIDA64 / FP32 Ray-Trace | |
| HP OmniBook Ultra 14 Core Ultra X9 (v8.20.8100) | |
| MSI Prestige 14 Flip AI+ 2026 (v8.20.8100) | |
| Dell XPS 14 Core Ultra X7 358H (v8.20.8100) | |
| Durchschnittliche Intel Core Ultra X9 388H (12225 - 15651, n=2) | |
| HP OmniBook Ultra Flip 14 (v6.92.6600) | |
| Lenovo Yoga Slim 7 Ultra 14IPH11 (v8.20.8100) | |
| Asus ExpertBook Ultra B9406CAA (v6.92.6600) | |
| AIDA64 / FPU Julia | |
| HP OmniBook Ultra 14 Core Ultra X9 (v8.20.8100) | |
| MSI Prestige 14 Flip AI+ 2026 (v8.20.8100) | |
| Dell XPS 14 Core Ultra X7 358H (v8.20.8100) | |
| HP OmniBook Ultra Flip 14 (v6.92.6600) | |
| Lenovo Yoga Slim 7 Ultra 14IPH11 (v8.20.8100) | |
| Durchschnittliche Intel Core Ultra X9 388H (32079 - 82749, n=2) | |
| Asus ExpertBook Ultra B9406CAA (v6.92.6600) | |
| AIDA64 / CPU SHA3 | |
| Asus ExpertBook Ultra B9406CAA (v6.92.6600) | |
| Durchschnittliche Intel Core Ultra X9 388H (4178 - 4419, n=2) | |
| HP OmniBook Ultra 14 Core Ultra X9 (v8.20.8100) | |
| Dell XPS 14 Core Ultra X7 358H (v8.20.8100) | |
| MSI Prestige 14 Flip AI+ 2026 (v8.20.8100) | |
| Lenovo Yoga Slim 7 Ultra 14IPH11 (v8.20.8100) | |
| HP OmniBook Ultra Flip 14 (v6.92.6600) | |
| AIDA64 / CPU Queen | |
| Durchschnittliche Intel Core Ultra X9 388H (n=1) | |
| Dell XPS 14 Core Ultra X7 358H (v6.92.6600) | |
| Asus ExpertBook Ultra B9406CAA (v6.92.6600) | |
| HP OmniBook Ultra Flip 14 (v6.92.6600) | |
| AIDA64 / FPU SinJulia | |
| HP OmniBook Ultra 14 Core Ultra X9 (v8.20.8100) | |
| Dell XPS 14 Core Ultra X7 358H (v8.20.8100) | |
| MSI Prestige 14 Flip AI+ 2026 (v8.20.8100) | |
| Durchschnittliche Intel Core Ultra X9 388H (5099 - 7015, n=2) | |
| Asus ExpertBook Ultra B9406CAA (v6.92.6600) | |
| Lenovo Yoga Slim 7 Ultra 14IPH11 (v8.20.8100) | |
| HP OmniBook Ultra Flip 14 (v6.92.6600) | |
| AIDA64 / FPU Mandel | |
| HP OmniBook Ultra 14 Core Ultra X9 (v8.20.8100) | |
| MSI Prestige 14 Flip AI+ 2026 (v8.20.8100) | |
| Dell XPS 14 Core Ultra X7 358H (v8.20.8100) | |
| Lenovo Yoga Slim 7 Ultra 14IPH11 (v8.20.8100) | |
| HP OmniBook Ultra Flip 14 (v6.92.6600) | |
| Durchschnittliche Intel Core Ultra X9 388H (15864 - 44749, n=2) | |
| Asus ExpertBook Ultra B9406CAA (v6.92.6600) | |
| AIDA64 / CPU AES | |
| Dell XPS 14 Core Ultra X7 358H (v8.20.8100) | |
| HP OmniBook Ultra 14 Core Ultra X9 (v8.20.8100) | |
| MSI Prestige 14 Flip AI+ 2026 (v8.20.8100) | |
| HP OmniBook Ultra Flip 14 (v6.92.6600) | |
| Lenovo Yoga Slim 7 Ultra 14IPH11 (v8.20.8100) | |
| Durchschnittliche Intel Core Ultra X9 388H (5271 - 61890, n=2) | |
| Asus ExpertBook Ultra B9406CAA (v6.92.6600) | |
| AIDA64 / CPU ZLib | |
| Asus ExpertBook Ultra B9406CAA (v6.92.6600) | |
| Dell XPS 14 Core Ultra X7 358H (v8.20.8100) | |
| Durchschnittliche Intel Core Ultra X9 388H (984 - 1170, n=2) | |
| HP OmniBook Ultra 14 Core Ultra X9 (v8.20.8100) | |
| MSI Prestige 14 Flip AI+ 2026 (v8.20.8100) | |
| Lenovo Yoga Slim 7 Ultra 14IPH11 (v8.20.8100) | |
| HP OmniBook Ultra Flip 14 (v6.92.6600) | |
| AIDA64 / FP64 Ray-Trace | |
| HP OmniBook Ultra 14 Core Ultra X9 (v8.20.8100) | |
| MSI Prestige 14 Flip AI+ 2026 (v8.20.8100) | |
| Dell XPS 14 Core Ultra X7 358H (v8.20.8100) | |
| Durchschnittliche Intel Core Ultra X9 388H (6440 - 8317, n=2) | |
| HP OmniBook Ultra Flip 14 (v6.92.6600) | |
| Asus ExpertBook Ultra B9406CAA (v6.92.6600) | |
| Lenovo Yoga Slim 7 Ultra 14IPH11 (v8.20.8100) | |
| AIDA64 / CPU PhotoWorxx | |
| Dell XPS 14 Core Ultra X7 358H (v8.20.8100) | |
| HP OmniBook Ultra 14 Core Ultra X9 (v8.20.8100) | |
| MSI Prestige 14 Flip AI+ 2026 (v8.20.8100) | |
| Lenovo Yoga Slim 7 Ultra 14IPH11 (v8.20.8100) | |
| Durchschnittliche Intel Core Ultra X9 388H (33033 - 85600, n=2) | |
| HP OmniBook Ultra Flip 14 (v6.92.6600) | |
| Asus ExpertBook Ultra B9406CAA (v6.92.6600) | |
| AIDA64 / CPU CheckMate | |
| Dell XPS 14 Core Ultra X7 358H (v8.20.8100) | |
| MSI Prestige 14 Flip AI+ 2026 (v8.20.8100) | |
| HP OmniBook Ultra 14 Core Ultra X9 (v8.20.8100) | |
| Durchschnittliche Intel Core Ultra X9 388H (n=1) | |
| Lenovo Yoga Slim 7 Ultra 14IPH11 (v8.20.8100) | |
Systemleistung

PCMark 10: Score | Essentials | Productivity | Digital Content Creation
CrossMark: Overall | Productivity | Creativity | Responsiveness
WebXPRT 3: Overall
WebXPRT 4: Overall
Mozilla Kraken 1.1: Total
Geekbench AI: Single Precision GPU 1.7 | Half Precision GPU 1.7 | Quantized GPU 1.7
| Performance Rating | |
| Durchschnittliche Intel Core Ultra X9 388H, Intel Arc B390 12 Xe3 Panther Lake iGPU | |
| HP OmniBook Ultra 14 Core Ultra X9 | |
| Dell XPS 14 Core Ultra X7 358H | |
| MSI Prestige 14 Flip AI+ 2026 -3! | |
| Asus ExpertBook Ultra B9406CAA | |
| Lenovo Yoga Slim 7 Ultra 14IPH11 | |
| HP OmniBook Ultra Flip 14 -3! | |
| PCMark 10 / Score | |
| Durchschnittliche Intel Core Ultra X9 388H, Intel Arc B390 12 Xe3 Panther Lake iGPU (9939 - 10123, n=2) | |
| HP OmniBook Ultra 14 Core Ultra X9 | |
| Dell XPS 14 Core Ultra X7 358H | |
| MSI Prestige 14 Flip AI+ 2026 | |
| Asus ExpertBook Ultra B9406CAA | |
| Lenovo Yoga Slim 7 Ultra 14IPH11 | |
| HP OmniBook Ultra Flip 14 | |
| PCMark 10 / Essentials | |
| HP OmniBook Ultra 14 Core Ultra X9 | |
| Durchschnittliche Intel Core Ultra X9 388H, Intel Arc B390 12 Xe3 Panther Lake iGPU (11094 - 11646, n=2) | |
| Dell XPS 14 Core Ultra X7 358H | |
| MSI Prestige 14 Flip AI+ 2026 | |
| Asus ExpertBook Ultra B9406CAA | |
| Lenovo Yoga Slim 7 Ultra 14IPH11 | |
| HP OmniBook Ultra Flip 14 | |
| PCMark 10 / Productivity | |
| Durchschnittliche Intel Core Ultra X9 388H, Intel Arc B390 12 Xe3 Panther Lake iGPU (16606 - 17914, n=2) | |
| Dell XPS 14 Core Ultra X7 358H | |
| MSI Prestige 14 Flip AI+ 2026 | |
| HP OmniBook Ultra 14 Core Ultra X9 | |
| Asus ExpertBook Ultra B9406CAA | |
| Lenovo Yoga Slim 7 Ultra 14IPH11 | |
| HP OmniBook Ultra Flip 14 | |
| PCMark 10 / Digital Content Creation | |
| Durchschnittliche Intel Core Ultra X9 388H, Intel Arc B390 12 Xe3 Panther Lake iGPU (13779 - 14164, n=2) | |
| Dell XPS 14 Core Ultra X7 358H | |
| HP OmniBook Ultra 14 Core Ultra X9 | |
| MSI Prestige 14 Flip AI+ 2026 | |
| Asus ExpertBook Ultra B9406CAA | |
| HP OmniBook Ultra Flip 14 | |
| Lenovo Yoga Slim 7 Ultra 14IPH11 | |
| CrossMark / Overall | |
| Durchschnittliche Intel Core Ultra X9 388H, Intel Arc B390 12 Xe3 Panther Lake iGPU (2048 - 2155, n=2) | |
| MSI Prestige 14 Flip AI+ 2026 | |
| HP OmniBook Ultra 14 Core Ultra X9 | |
| Dell XPS 14 Core Ultra X7 358H | |
| Asus ExpertBook Ultra B9406CAA | |
| Lenovo Yoga Slim 7 Ultra 14IPH11 | |
| HP OmniBook Ultra Flip 14 | |
| CrossMark / Productivity | |
| MSI Prestige 14 Flip AI+ 2026 | |
| Durchschnittliche Intel Core Ultra X9 388H, Intel Arc B390 12 Xe3 Panther Lake iGPU (1834 - 1942, n=2) | |
| HP OmniBook Ultra 14 Core Ultra X9 | |
| Lenovo Yoga Slim 7 Ultra 14IPH11 | |
| Dell XPS 14 Core Ultra X7 358H | |
| Asus ExpertBook Ultra B9406CAA | |
| HP OmniBook Ultra Flip 14 | |
| CrossMark / Creativity | |
| Durchschnittliche Intel Core Ultra X9 388H, Intel Arc B390 12 Xe3 Panther Lake iGPU (2390 - 2613, n=2) | |
| MSI Prestige 14 Flip AI+ 2026 | |
| Dell XPS 14 Core Ultra X7 358H | |
| HP OmniBook Ultra 14 Core Ultra X9 | |
| Asus ExpertBook Ultra B9406CAA | |
| Lenovo Yoga Slim 7 Ultra 14IPH11 | |
| HP OmniBook Ultra Flip 14 | |
| CrossMark / Responsiveness | |
| HP OmniBook Ultra 14 Core Ultra X9 | |
| Durchschnittliche Intel Core Ultra X9 388H, Intel Arc B390 12 Xe3 Panther Lake iGPU (1651 - 1797, n=2) | |
| MSI Prestige 14 Flip AI+ 2026 | |
| Asus ExpertBook Ultra B9406CAA | |
| Dell XPS 14 Core Ultra X7 358H | |
| Lenovo Yoga Slim 7 Ultra 14IPH11 | |
| HP OmniBook Ultra Flip 14 | |
| WebXPRT 3 / Overall | |
| HP OmniBook Ultra 14 Core Ultra X9 | |
| Durchschnittliche Intel Core Ultra X9 388H, Intel Arc B390 12 Xe3 Panther Lake iGPU (339 - 354, n=2) | |
| Dell XPS 14 Core Ultra X7 358H | |
| MSI Prestige 14 Flip AI+ 2026 | |
| Asus ExpertBook Ultra B9406CAA | |
| Lenovo Yoga Slim 7 Ultra 14IPH11 | |
| HP OmniBook Ultra Flip 14 | |
| WebXPRT 4 / Overall | |
| HP OmniBook Ultra 14 Core Ultra X9 | |
| Durchschnittliche Intel Core Ultra X9 388H, Intel Arc B390 12 Xe3 Panther Lake iGPU (314 - 318, n=2) | |
| Dell XPS 14 Core Ultra X7 358H | |
| MSI Prestige 14 Flip AI+ 2026 | |
| Asus ExpertBook Ultra B9406CAA | |
| Lenovo Yoga Slim 7 Ultra 14IPH11 | |
| HP OmniBook Ultra Flip 14 | |
| Mozilla Kraken 1.1 / Total | |
| HP OmniBook Ultra Flip 14 | |
| Lenovo Yoga Slim 7 Ultra 14IPH11 | |
| Asus ExpertBook Ultra B9406CAA | |
| MSI Prestige 14 Flip AI+ 2026 | |
| Dell XPS 14 Core Ultra X7 358H | |
| HP OmniBook Ultra 14 Core Ultra X9 | |
| Durchschnittliche Intel Core Ultra X9 388H, Intel Arc B390 12 Xe3 Panther Lake iGPU (430 - 431, n=2) | |
| Geekbench AI / Single Precision GPU 1.7 | |
| Asus ExpertBook Ultra B9406CAA | |
| Dell XPS 14 Core Ultra X7 358H | |
| HP OmniBook Ultra 14 Core Ultra X9 | |
| Durchschnittliche Intel Core Ultra X9 388H, Intel Arc B390 12 Xe3 Panther Lake iGPU (n=1) | |
| Lenovo Yoga Slim 7 Ultra 14IPH11 | |
| Geekbench AI / Half Precision GPU 1.7 | |
| Asus ExpertBook Ultra B9406CAA | |
| Dell XPS 14 Core Ultra X7 358H | |
| HP OmniBook Ultra 14 Core Ultra X9 | |
| Durchschnittliche Intel Core Ultra X9 388H, Intel Arc B390 12 Xe3 Panther Lake iGPU (n=1) | |
| Lenovo Yoga Slim 7 Ultra 14IPH11 | |
| Geekbench AI / Quantized GPU 1.7 | |
| Asus ExpertBook Ultra B9406CAA | |
| Dell XPS 14 Core Ultra X7 358H | |
| HP OmniBook Ultra 14 Core Ultra X9 | |
| Durchschnittliche Intel Core Ultra X9 388H, Intel Arc B390 12 Xe3 Panther Lake iGPU (n=1) | |
| Lenovo Yoga Slim 7 Ultra 14IPH11 | |
* ... kleinere Werte sind besser
| PCMark 10 Score | 9939 Punkte | |
Hilfe | ||
| AIDA64 / Memory Copy | |
| Dell XPS 14 Core Ultra X7 358H | |
| HP OmniBook Ultra 14 Core Ultra X9 | |
| Durchschnittliche Intel Core Ultra X9 388H (129450 - 131023, n=2) | |
| MSI Prestige 14 Flip AI+ 2026 | |
| HP OmniBook Ultra Flip 14 | |
| Lenovo Yoga Slim 7 Ultra 14IPH11 | |
| AIDA64 / Memory Read | |
| Durchschnittliche Intel Core Ultra X9 388H (120487 - 131960, n=2) | |
| HP OmniBook Ultra 14 Core Ultra X9 | |
| Asus ExpertBook Ultra B9406CAA | |
| Dell XPS 14 Core Ultra X7 358H | |
| MSI Prestige 14 Flip AI+ 2026 | |
| HP OmniBook Ultra Flip 14 | |
| Lenovo Yoga Slim 7 Ultra 14IPH11 | |
| AIDA64 / Memory Write | |
| Durchschnittliche Intel Core Ultra X9 388H (135141 - 135182, n=2) | |
| HP OmniBook Ultra 14 Core Ultra X9 | |
| Dell XPS 14 Core Ultra X7 358H | |
| MSI Prestige 14 Flip AI+ 2026 | |
| Asus ExpertBook Ultra B9406CAA | |
| HP OmniBook Ultra Flip 14 | |
| Lenovo Yoga Slim 7 Ultra 14IPH11 | |
| AIDA64 / Memory Latency | |
| Lenovo Yoga Slim 7 Ultra 14IPH11 | |
| HP OmniBook Ultra Flip 14 | |
| MSI Prestige 14 Flip AI+ 2026 | |
| Dell XPS 14 Core Ultra X7 358H | |
| HP OmniBook Ultra 14 Core Ultra X9 | |
| Durchschnittliche Intel Core Ultra X9 388H (84 - 85, n=2) | |
* ... kleinere Werte sind besser
DPC-Latenz


| DPC Latencies / LatencyMon - interrupt to process latency (max), Web, Youtube, Prime95 | |
| MSI Prestige 14 Flip AI+ 2026 | |
| HP OmniBook Ultra 14 Core Ultra X9 | |
| Lenovo Yoga Slim 7 Ultra 14IPH11 | |
| Dell XPS 14 Core Ultra X7 358H | |
| Asus ExpertBook Ultra B9406CAA | |
* ... kleinere Werte sind besser
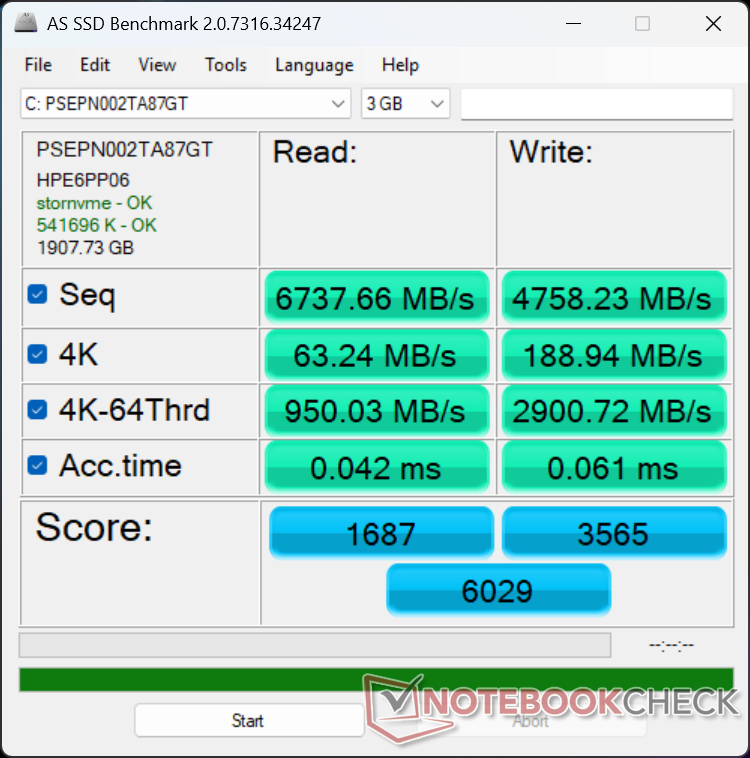
Speichergeräte
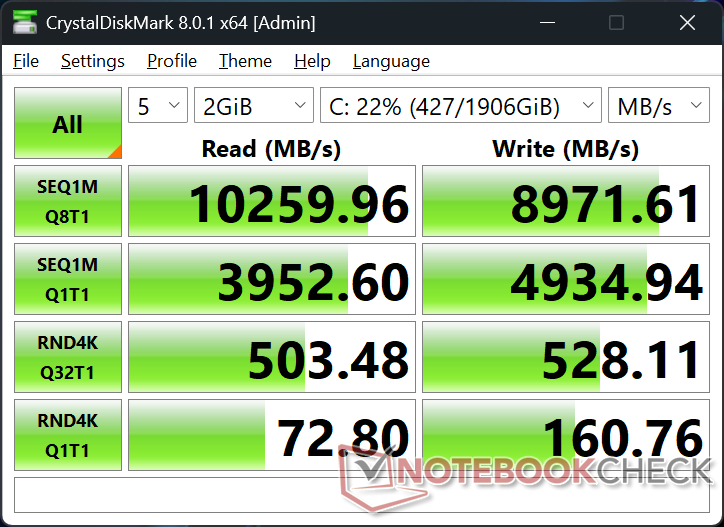
Die M.2 2280 Phison PSEPN002TA87GT PCIe5-SSD läuft stabil mit ~10.000 MB/s, während die Samsung PMPA1 im OmniBook Ultra 14 Flip unter demselben Stresstest drosseln würde.

* ... kleinere Werte sind besser
Disk Throttling: DiskSpd Read Loop, Queue Depth 8
GPU-Leistung
Zwar ist die reine CPU-Leistung geringer als beim mit AMD Prozessor ausgestatteten 2024 OmniBook Ultra 14, doch die Grafikleistung ist deutlich höher, was den Rückstand beim Prozessor ausgleicht. Das Arc B390 läuft bis zu doppelt so schnell wie die Radeon 890M und ermöglicht so das komfortable Spielen moderner, anspruchsvoller Titel bei 1.080p.
Leider schwanken die Bildraten beim Spielen, anstatt konstant zu bleiben. Im Leerlauf bei Cyberpunk 2077 mit 1.080p und Ultra-Einstellungen beispielsweise liegen die Bildraten zwischen 39 und 44 fps, verglichen mit konstanten 28 fps beim 2024 OmniBook Ultra 14.
Die Gesamtleistung ist im Balanced-Modus oder im Akkubetrieb geringer, wie unsere untenstehende Ergebnistabelle zu Fire Strike zeigt.
| Energieprofil | Grafics-Ergebnis | Physics-Ergebnis | Kombiniertes Ergebnis |
| Performance-Modus | 16.347 | 28.159 | 4.136 |
| Balanced-Modus | 13.753 (-16 %) | 23.251 (-17 %) | 3.550 (-14 %) |
| Batterie | 15.865 (-3 %) | 24.559 (-13 %) | 4.451 (-8 %) |
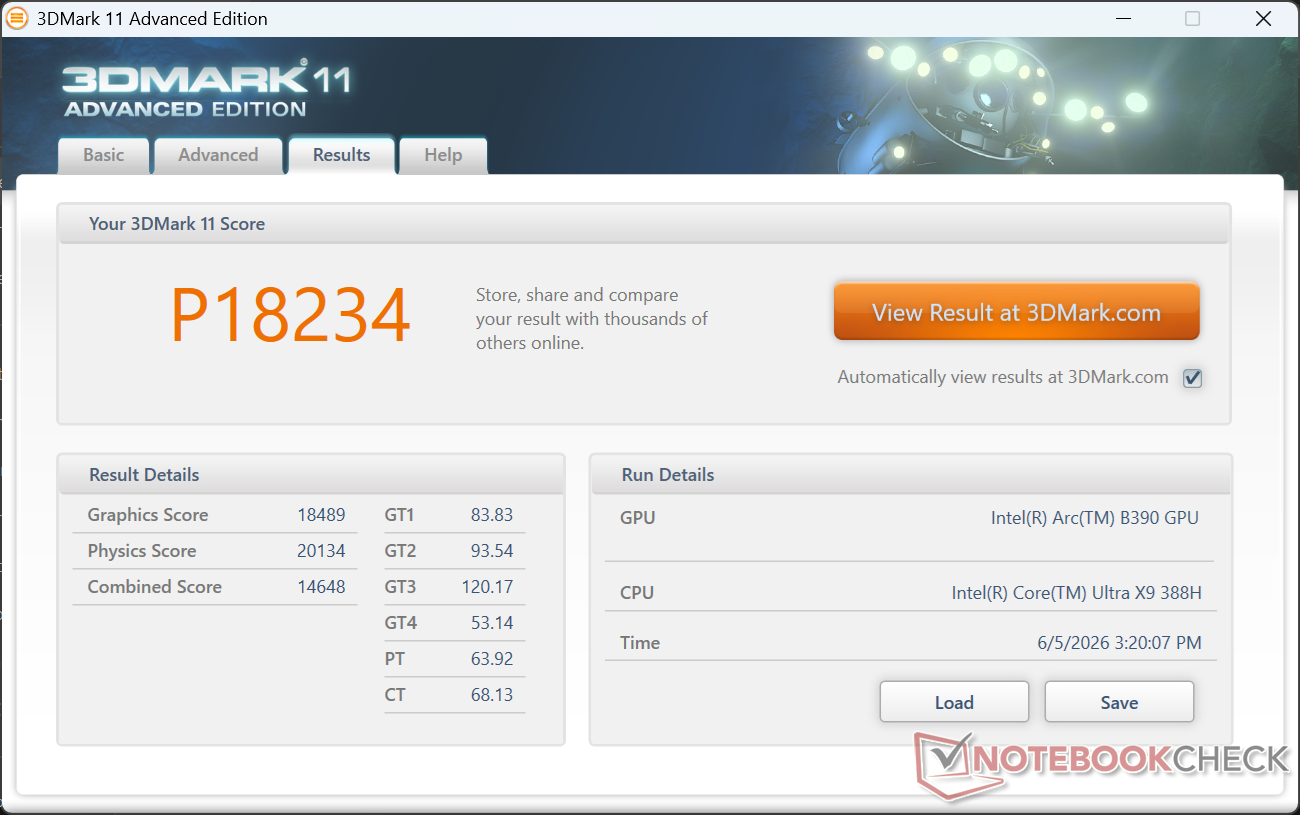


| 3DMark 11 Performance | 18234 Punkte | |
| 3DMark Cloud Gate Standard Score | 34003 Punkte | |
| 3DMark Fire Strike Score | 13265 Punkte | |
| 3DMark Time Spy Score | 6806 Punkte | |
Hilfe | ||
* ... kleinere Werte sind besser
| Cyberpunk 2077 - 1920x1080 Ultra Preset (FSR off) | |
| Asus ExpertBook Ultra B9406CAA | |
| MSI Prestige 14 Flip AI+ 2026 | |
| HP OmniBook Ultra 14 Core Ultra X9 | |
| Dell XPS 14 Core Ultra X7 358H | |
| HP OmniBook Ultra Flip 14 | |
| Lenovo Yoga Slim 7 Ultra 14IPH11 | |
| Baldur's Gate 3 - 1920x1080 Ultra Preset AA:T | |
| HP OmniBook Ultra 14 Core Ultra X9 | |
| Asus ExpertBook Ultra B9406CAA | |
| Dell XPS 14 Core Ultra X7 358H | |
| MSI Prestige 14 Flip AI+ 2026 | |
| HP OmniBook Ultra Flip 14 | |
| Lenovo Yoga Slim 7 Ultra 14IPH11 | |
| GTA V - 1920x1080 Highest AA:4xMSAA + FX AF:16x | |
| Asus ExpertBook Ultra B9406CAA | |
| HP OmniBook Ultra 14 Core Ultra X9 | |
| MSI Prestige 14 Flip AI+ 2026 | |
| Dell XPS 14 Core Ultra X7 358H | |
| HP OmniBook Ultra Flip 14 | |
| Lenovo Yoga Slim 7 Ultra 14IPH11 | |
| Final Fantasy XV Benchmark - 1920x1080 High Quality | |
| Asus ExpertBook Ultra B9406CAA | |
| HP OmniBook Ultra 14 Core Ultra X9 | |
| Dell XPS 14 Core Ultra X7 358H | |
| MSI Prestige 14 Flip AI+ 2026 | |
| HP OmniBook Ultra Flip 14 | |
| Lenovo Yoga Slim 7 Ultra 14IPH11 | |
| Strange Brigade - 1920x1080 ultra AA:ultra AF:16 | |
| HP OmniBook Ultra 14 Core Ultra X9 | |
| Asus ExpertBook Ultra B9406CAA | |
| Dell XPS 14 Core Ultra X7 358H | |
| MSI Prestige 14 Flip AI+ 2026 | |
| HP OmniBook Ultra Flip 14 | |
| Lenovo Yoga Slim 7 Ultra 14IPH11 | |
| Dota 2 Reborn - 1920x1080 ultra (3/3) best looking | |
| Dell XPS 14 Core Ultra X7 358H | |
| Asus ExpertBook Ultra B9406CAA | |
| HP OmniBook Ultra 14 Core Ultra X9 | |
| MSI Prestige 14 Flip AI+ 2026 | |
| HP OmniBook Ultra Flip 14 | |
| Lenovo Yoga Slim 7 Ultra 14IPH11 | |
Cyberpunk 2077 – Ultra-fps-Diagramm
| min. | mittel | hoch | max. | |
|---|---|---|---|---|
| GTA V (2015) | 181.8 | 176.9 | 99.6 | 43.7 |
| Dota 2 Reborn (2015) | 110.8 | 84.5 | 99 | 97 |
| Final Fantasy XV Benchmark (2018) | 129.8 | 75.2 | 54.5 | |
| X-Plane 11.11 (2018) | 62 | 51.4 | 42.2 | |
| Strange Brigade (2018) | 335 | 137.5 | 114.9 | 101.3 |
| Baldur's Gate 3 (2023) | 72.2 | 61.3 | 54 | 53.5 |
| Cyberpunk 2077 (2023) | 74.2 | 60.1 | 51.9 | 44.9 |
| F1 24 (2024) | 141.8 | 131.9 | 101.4 | 35.6 |
Emissionen
Systemgeräusche
Die Lüftergeräusche erreichen eine ähnliche Obergrenze wie bei früheren Modellen wie dem OmniBook Ultra 14 Flip oder dem ursprünglichen OmniBook Ultra 14 aus dem Jahr 2024, sodass das neueste Modell technisch gesehen weder lauter noch leiser ist. Die Lüfter fahren jedoch bei Belastung schneller hoch und erreichen somit früher ihre maximale Drehzahl.
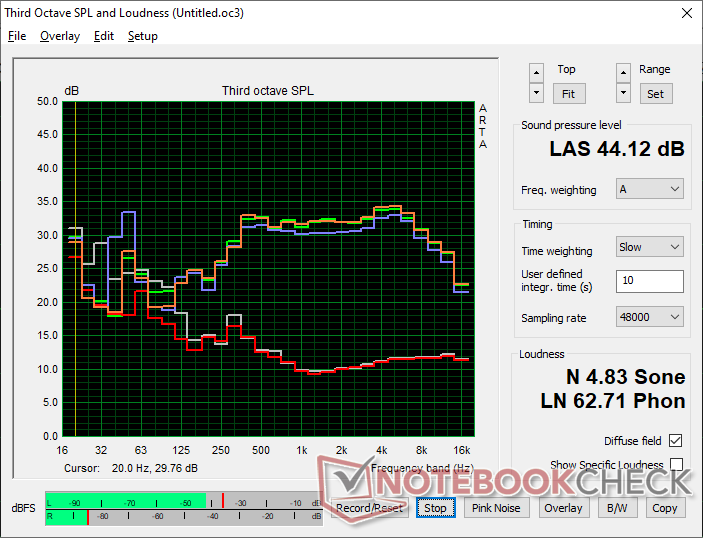
Lautstärkediagramm
| Idle |
| 23.3 / 23.3 / 23.3 dB(A) |
| Last |
| 42.9 / 44.1 dB(A) |
 | ||
30 dB leise 40 dB(A) deutlich hörbar 50 dB(A) störend |
||
min: | ||
| HP OmniBook Ultra 14 Core Ultra X9 Ultra X9 388H, Arc B390 Panther Lake iGPU | Lenovo Yoga Slim 7 Ultra 14IPH11 Ultra 7 355, Intel Graphics 4 Xe3 PTL | HP OmniBook Ultra Flip 14 Core Ultra 7 258V, Arc 140V | Dell XPS 14 Core Ultra X7 358H Ultra X7 358H, Arc B390 Panther Lake iGPU | MSI Prestige 14 Flip AI+ 2026 Ultra X7 358H, Arc B390 Panther Lake iGPU | Asus ExpertBook Ultra B9406CAA Ultra X7 358H, Arc B390 Panther Lake iGPU | |
|---|---|---|---|---|---|---|
| Geräuschentwicklung | -4% | 9% | 3% | -3% | 5% | |
| aus / Umgebung * (dB) | 23.3 | 23.1 1% | 22.9 2% | 22.9 2% | 25.4 -9% | 22.9 2% |
| Idle min * (dB) | 23.3 | 25.4 -9% | 23.2 -0% | 23.3 -0% | 25.4 -9% | 23.4 -0% |
| Idle avg * (dB) | 23.3 | 25.5 -9% | 23.2 -0% | 23.3 -0% | 25.4 -9% | 23.4 -0% |
| Idle max * (dB) | 23.3 | 25.5 -9% | 23.2 -0% | 23.3 -0% | 25.4 -9% | 23.4 -0% |
| Last avg * (dB) | 42.9 | 44.4 -3% | 27.8 35% | 34 21% | 33.1 23% | 28.6 33% |
| Cyberpunk 2077 ultra * (dB) | 44.4 | 43.4 2% | 33.6 24% | 43.5 2% | 46.5 -5% | 42.8 4% |
| Last max * (dB) | 44.1 | 45.5 -3% | 43.4 2% | 45.7 -4% | 46.5 -5% | 45.2 -2% |
* ... kleinere Werte sind besser
Temperatur
Die Hotspots bei der Oberflächentemperatur entsprechen trotz der höheren Leistung in etwa den Werten, die wir beim OmniBook Ultra 14 aus dem Jahr 2024 gemessen haben.


(±) Die maximale Temperatur auf der Oberseite ist 40.2 °C. Im Vergleich liegt der Klassendurchschnitt bei 35.9 °C (von 21.4 bis 59 °C für die Klasse Subnotebook).
(±) Auf der Unterseite messen wir eine maximalen Wert von 44.2 °C (im Vergleich zum Durchschnitt von 39.2 °C).
(+) Ohne Last messen wir eine durchschnittliche Temperatur von 22.2 °C auf der Oberseite. Der Klassendurchschnitt erreicht 30.8 °C.
(+) Die Handballen und der Touchpad-Bereich sind mit gemessenen 30 °C kühler als die typische Hauttemperatur und fühlen sich dadurch kühl an.
(±) Die durchschnittliche Handballen-Temperatur anderer getesteter Geräte war 28.2 °C (-1.8 °C).


| HP OmniBook Ultra 14 Core Ultra X9 Ultra X9 388H, Arc B390 Panther Lake iGPU | Lenovo Yoga Slim 7 Ultra 14IPH11 Ultra 7 355, Intel Graphics 4 Xe3 PTL | HP OmniBook Ultra Flip 14 Core Ultra 7 258V, Arc 140V | Dell XPS 14 Core Ultra X7 358H Ultra X7 358H, Arc B390 Panther Lake iGPU | MSI Prestige 14 Flip AI+ 2026 Ultra X7 358H, Arc B390 Panther Lake iGPU | Asus ExpertBook Ultra B9406CAA Ultra X7 358H, Arc B390 Panther Lake iGPU | |
|---|---|---|---|---|---|---|
| Hitze | 9% | 0% | 2% | -9% | -1% | |
| Last oben max * (°C) | 40.2 | 33.6 16% | 35.8 11% | 34 15% | 47.1 -17% | 38.6 4% |
| Last unten max * (°C) | 44.2 | 28.8 35% | 37.6 15% | 35.8 19% | 46.2 -5% | 38.4 13% |
| Idle oben max * (°C) | 22.8 | 25.2 -11% | 25.2 -11% | 25.6 -12% | 24.3 -7% | 24.6 -8% |
| Idle unten max * (°C) | 23.4 | 24.6 -5% | 26.6 -14% | 26.4 -13% | 24.5 -5% | 26 -11% |
* ... kleinere Werte sind besser
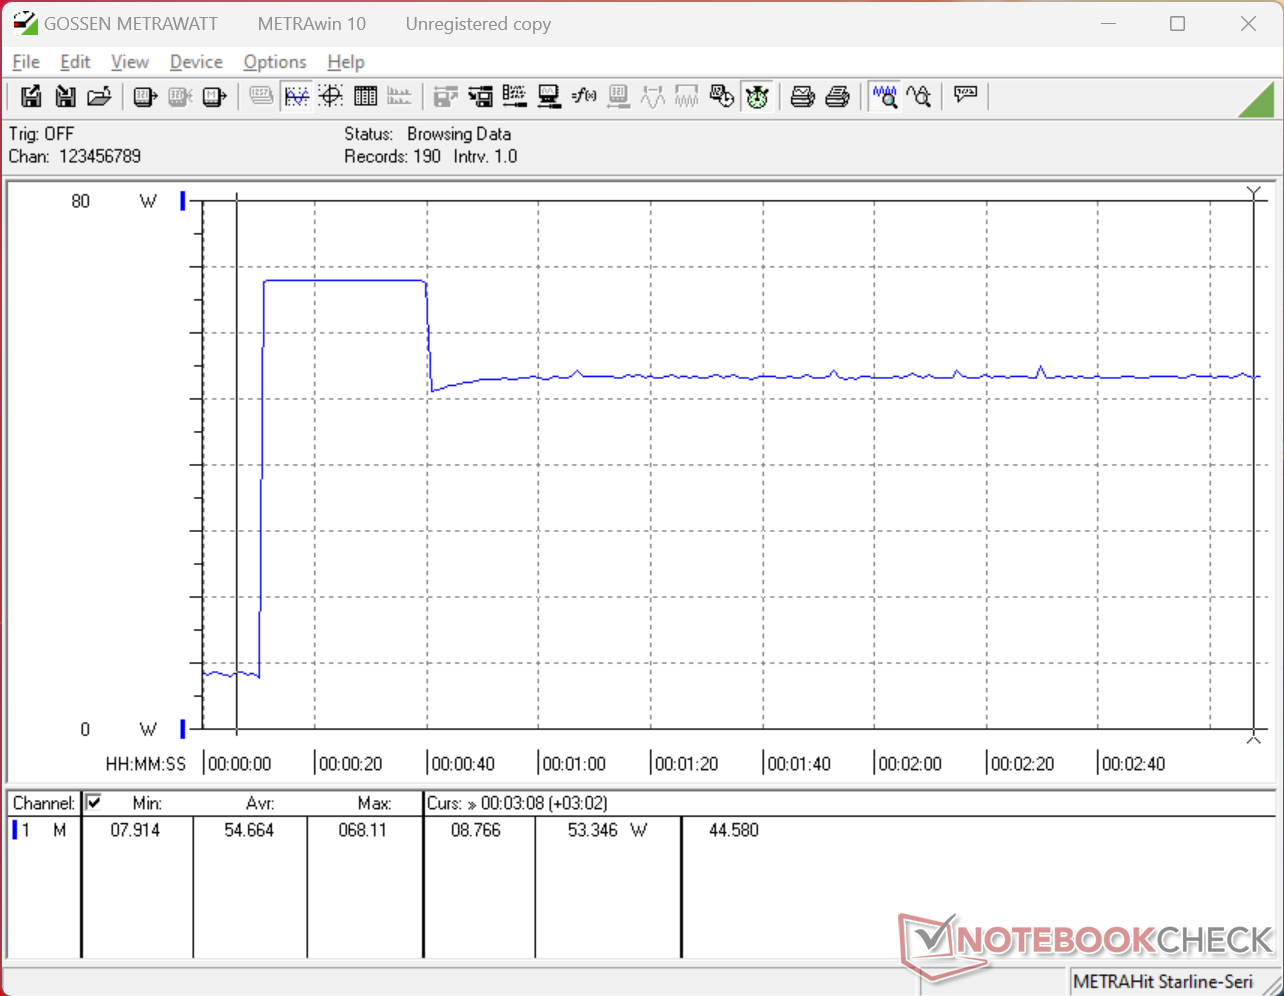
Stresstest
Beim Starten von Prime95 Stress stieg die CPU-Taktfrequenz auf 2,9 GHz, die Leistungsaufnahme auf 43 W und die Temperatur auf 86 °C, bevor sie etwa 30 Sekunden später auf 2,1 GHz, 26 W und 71 °C zurückfiel, was auf eine begrenzte Nachhaltigkeit des Turbo-Boost-Modus hindeutet. Das neue XPS 14, das mit ähnlichen Panther-Lake-CPU-Optionen ausgeliefert wird, stabilisiert sich ebenfalls auf ähnlichen Werten.
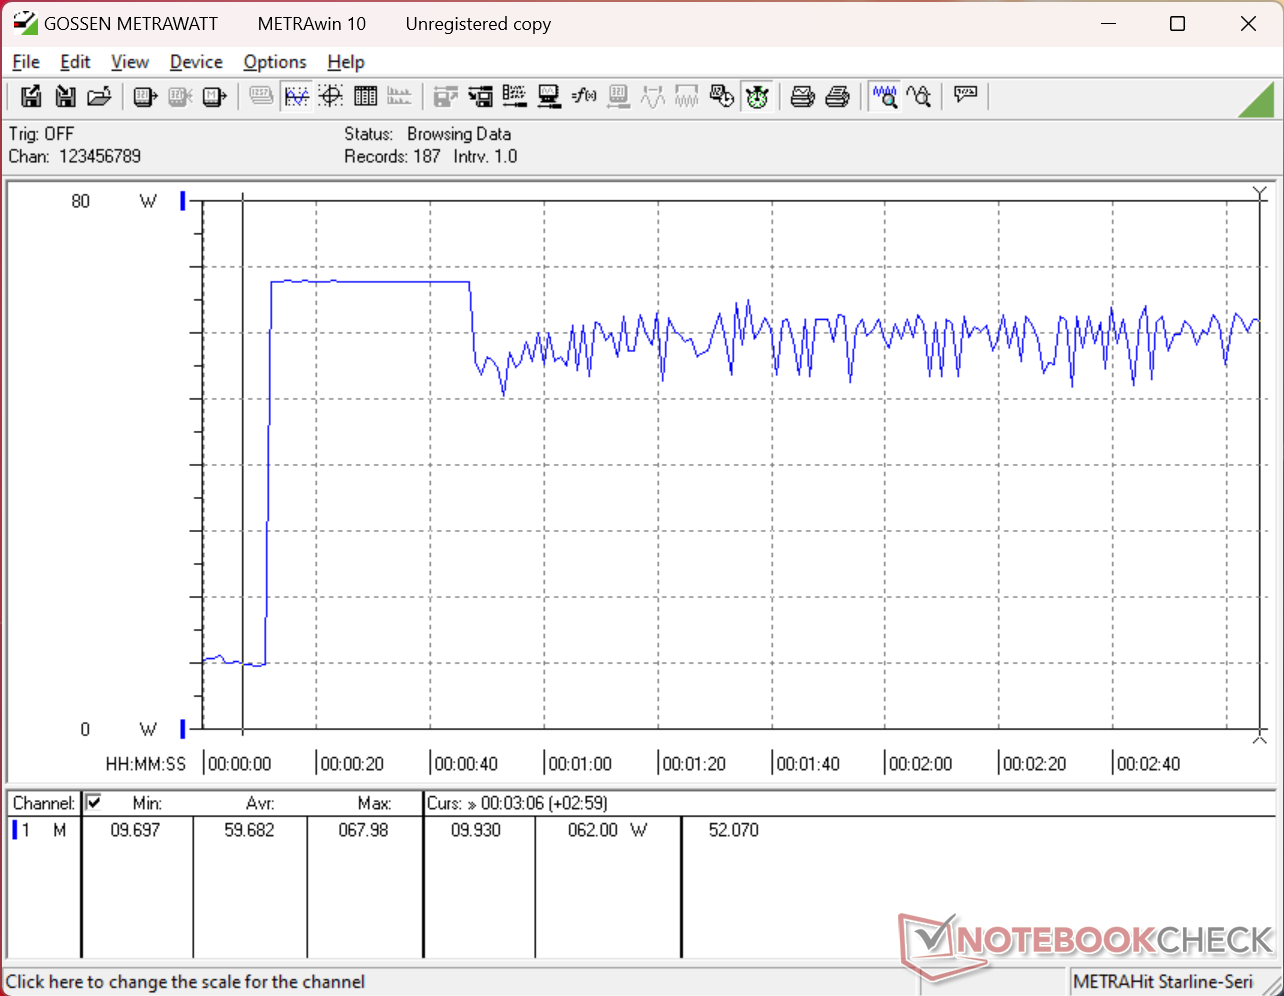
Die GPU-Taktfrequenzen schwanken beim Ausführen von Cyberpunk 2077 zwischen 1.750 und 2.200 MHz, selbst im Performance-Modus, was mit den schwankenden Bildraten korreliert, wie im Abschnitt „GPU- Performance“ oben beschrieben. Konstantere Taktfrequenzen wären für stabilere Gaming-Performance-Ergebnisse vorzuziehen gewesen, da solche Schwankungen bei anderen Laptops ungewöhnlich sind.


| durchschnittliche CPU-Taktfrequenz (GHz) | GPU-Taktfrequenz (MHz) | durchschnittliche CPU-Temperatur (°C) | |
| System im Leerlauf | -- | -- | 61 |
| Prime95 Stress | 2,0 | -- | 71 |
| Prime95 + FurMark Stress | 1,4–1,8 | 950–1.450 | 66–72 |
| Cyberpunk 2077 Stress | 0,8 | 1.750–2.200 | 64–70 |
Lautsprecher
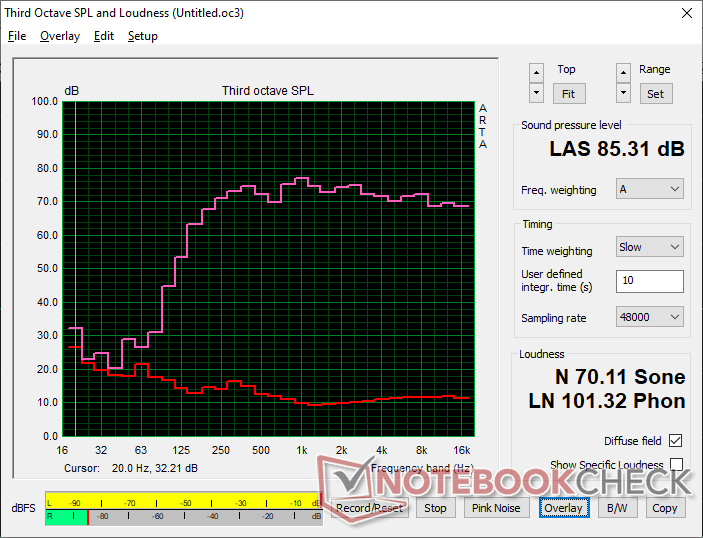
HP OmniBook Ultra 14 Core Ultra X9 Audio Analyse
(+) | Die Lautsprecher können relativ laut spielen (85.3 dB)
Bass 100 - 315 Hz
(±) | abgesenkter Bass - 10% geringer als der Median
(±) | durchschnittlich lineare Bass-Wiedergabe (11.6% Delta zum Vorgänger)
Mitteltöne 400 - 2000 Hz
(+) | ausgeglichene Mitten, vom Median nur 2.6% abweichend
(+) | lineare Mitten (4% Delta zum Vorgänger)
Hochtöne 2 - 16 kHz
(+) | ausgeglichene Hochtöne, vom Median nur 1.3% abweichend
(+) | sehr lineare Hochtöne (2.6% Delta zum Vorgänger)
Gesamt im hörbaren Bereich 100 - 16.000 Hz
(+) | hörbarer Bereich ist sehr linear (7.3% Abstand zum Median
Im Vergleich zu allen Geräten derselben Klasse
» 1% aller getesteten Geräte dieser Klasse waren besser, 1% vergleichbar, 98% schlechter
» Das beste Gerät hat einen Delta-Wert von 5%, durchschnittlich ist 18%, das schlechteste Gerät hat 53%
Im Vergleich zu allen Geräten im Test
» 1% aller getesteten Geräte waren besser, 0% vergleichbar, 99% schlechter
» Das beste Gerät hat einen Delta-Wert von 4%, durchschnittlich ist 23%, das schlechteste Gerät hat 134%
Apple MacBook Pro 16 2021 M1 Pro Audio Analyse
(+) | Die Lautsprecher können relativ laut spielen (84.7 dB)
Bass 100 - 315 Hz
(+) | guter Bass - nur 3.8% Abweichung vom Median
(+) | lineare Bass-Wiedergabe (5.2% Delta zum Vorgänger)
Mitteltöne 400 - 2000 Hz
(+) | ausgeglichene Mitten, vom Median nur 1.3% abweichend
(+) | lineare Mitten (2.1% Delta zum Vorgänger)
Hochtöne 2 - 16 kHz
(+) | ausgeglichene Hochtöne, vom Median nur 1.9% abweichend
(+) | sehr lineare Hochtöne (2.7% Delta zum Vorgänger)
Gesamt im hörbaren Bereich 100 - 16.000 Hz
(+) | hörbarer Bereich ist sehr linear (4.6% Abstand zum Median
Im Vergleich zu allen Geräten derselben Klasse
» 0% aller getesteten Geräte dieser Klasse waren besser, 0% vergleichbar, 100% schlechter
» Das beste Gerät hat einen Delta-Wert von 5%, durchschnittlich ist 17%, das schlechteste Gerät hat 45%
Im Vergleich zu allen Geräten im Test
» 0% aller getesteten Geräte waren besser, 0% vergleichbar, 100% schlechter
» Das beste Gerät hat einen Delta-Wert von 4%, durchschnittlich ist 23%, das schlechteste Gerät hat 134%
Energieverwaltung
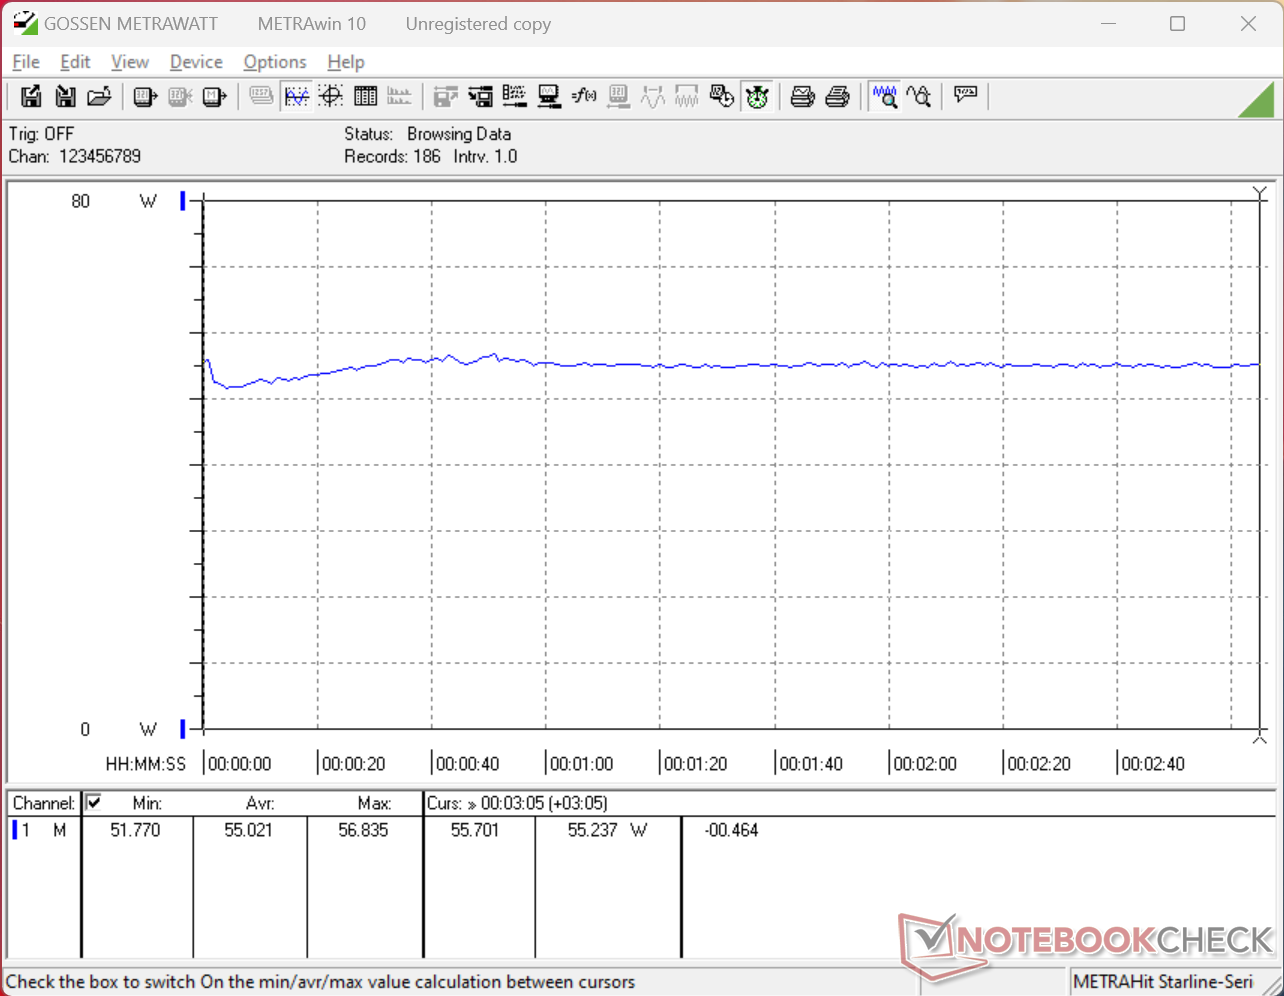
Stromverbrauch
Der Stromverbrauch unter Last liegt nur wenige Watt über dem des OmniBook Ultra 14 Flip, bietet jedoch eine deutlich verbesserte CPU- und GPU-Leistung. Die Leistungssteigerung pro Watt ist beim Wechsel von Lunar Lake zu Panther Lake-X9 enorm.
Das 65-W-Netzteil wurde ebenfalls überarbeitet und ist nun kleiner und handlicher als zuvor (6,5 x 3,2 x 3,2 cm gegenüber 9,8 x 5,4 x 2 cm).
| Aus / Standby | |
| Idle | |
| Last |
|
Legende:
min: | |
| HP OmniBook Ultra 14 Core Ultra X9 Ultra X9 388H, Arc B390 Panther Lake iGPU, , OLED, 2880x1800, 14" | Lenovo Yoga Slim 7 Ultra 14IPH11 Ultra 7 355, Intel Graphics 4 Xe3 PTL, SK hynix PVC10 HFS001TEM4X182N, OLED, 2880x1800, 14" | HP OmniBook Ultra Flip 14 Core Ultra 7 258V, Arc 140V, Samsung PM9A1 MZVL22T0HBLB, OLED, 2880x1800, 14" | Dell XPS 14 Core Ultra X7 358H Ultra X7 358H, Arc B390 Panther Lake iGPU, Samsung PM9C1b MZVL81T0HFLB-00BH1, OLED, 2880x1800, 14" | MSI Prestige 14 Flip AI+ 2026 Ultra X7 358H, Arc B390 Panther Lake iGPU, Phison 1 TB ESR01TBTCCZ-27J, OLED, 1920x1200, 14" | Asus ExpertBook Ultra B9406CAA Ultra X7 358H, Arc B390 Panther Lake iGPU, Samsung PM9E1 MZVLC2T0HBLD, OLED, 2880x1800, 14" | |
|---|---|---|---|---|---|---|
| Stromverbrauch | -11% | -5% | -12% | 3% | -2% | |
| Idle min * (Watt) | 2.5 | 3.2 -28% | 3 -20% | 3.1 -24% | 2.8 -12% | 3.5 -40% |
| Idle avg * (Watt) | 5.1 | 3.9 24% | 4.4 14% | 3.6 29% | 4.2 18% | 4 22% |
| Idle max * (Watt) | 5.8 | 12.3 -112% | 9.4 -62% | 10 -72% | 4.5 22% | 5.3 9% |
| Last avg * (Watt) | 49.8 | 36.5 27% | 42.3 15% | 39.2 21% | 48.9 2% | 43.7 12% |
| Cyberpunk 2077 ultra external monitor * (Watt) | 55.1 | 50.6 8% | 49.9 9% | 51.2 7% | 58.6 -6% | 61.4 -11% |
| Cyberpunk 2077 ultra * (Watt) | 55 | 51.1 7% | 51.1 7% | 51.4 7% | 59.9 -9% | 61.3 -11% |
| Last max * (Watt) | 68 | 69 -1% | 65 4% | 101.4 -49% | 64 6% | 63.4 7% |
* ... kleinere Werte sind besser
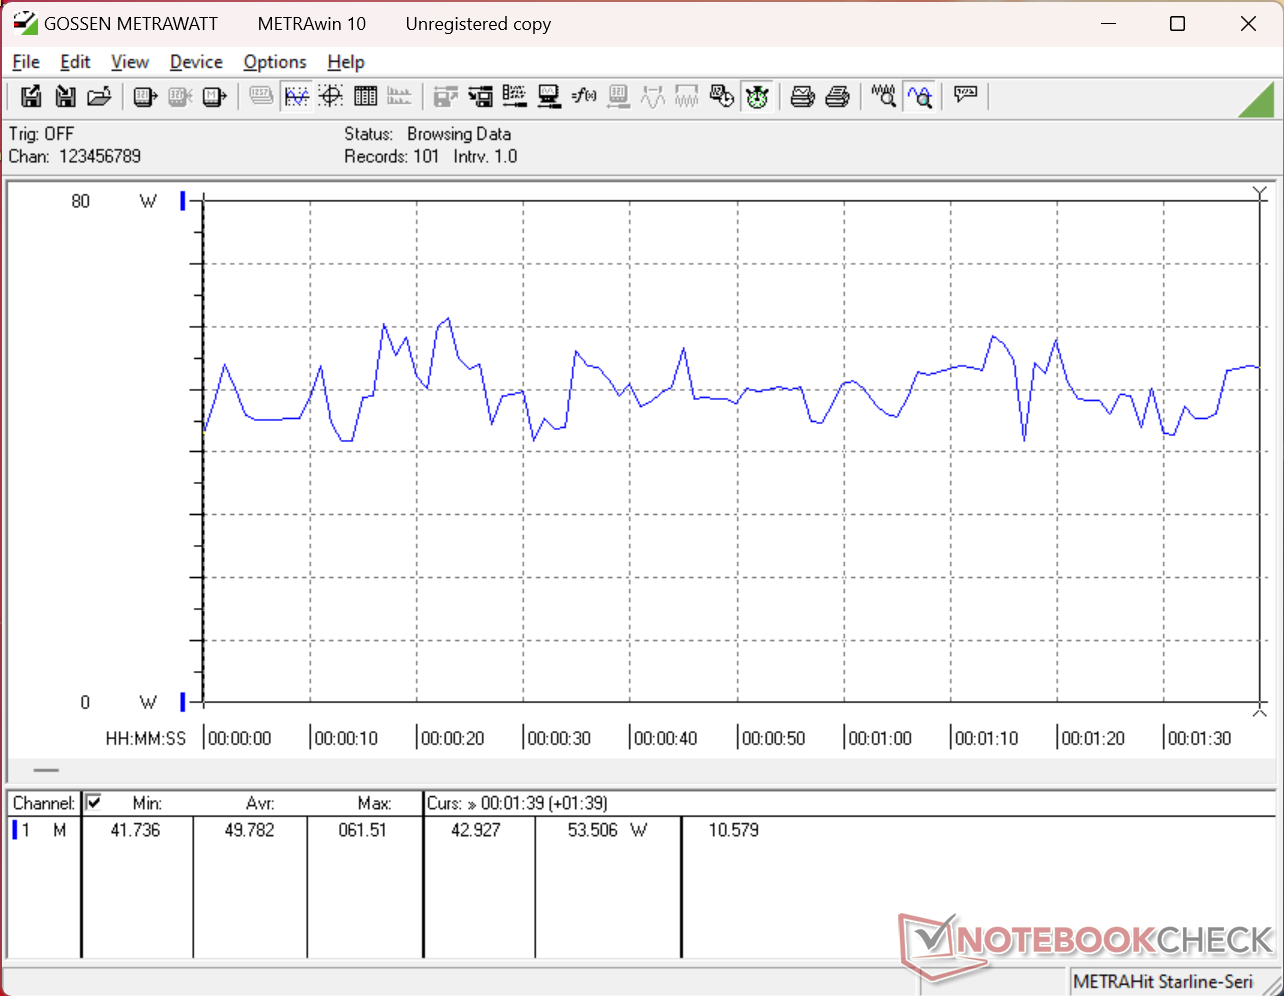
Stromverbrauch Cyberpunk/Stresstest
Stromverbrauch des externen Monitors
Akkulaufzeit
| HP OmniBook Ultra 14 Core Ultra X9 Ultra X9 388H, Arc B390 Panther Lake iGPU, 70 Wh | Lenovo Yoga Slim 7 Ultra 14IPH11 Ultra 7 355, Intel Graphics 4 Xe3 PTL, 75 Wh | HP OmniBook Ultra Flip 14 Core Ultra 7 258V, Arc 140V, 64 Wh | Dell XPS 14 Core Ultra X7 358H Ultra X7 358H, Arc B390 Panther Lake iGPU, 70 Wh | MSI Prestige 14 Flip AI+ 2026 Ultra X7 358H, Arc B390 Panther Lake iGPU, 81 Wh | Asus ExpertBook Ultra B9406CAA Ultra X7 358H, Arc B390 Panther Lake iGPU, 70 Wh | |
|---|---|---|---|---|---|---|
| Akkulaufzeit | ||||||
| WLAN (h) | 12.6 | 10.6 -16% | 14 11% | 16.8 33% | 19.6 56% | 16.1 28% |
Notebookcheck Bewertung
Das wohl beste HP Notebook für den professionellen Einsatz auf Reisen, zur Bildbearbeitung und sogar zum Zocken ist gleichzeitig auch eines der teuersten.
HP OmniBook Ultra 14 Core Ultra X9
- 12.06.2026 v8
Allen Ngo
 Total Sustainability Score:
 Potenzielle Wettbewerber im Vergleich
Bild | Modell / Test | Preis ab | Gewicht | Dicke | Display |
|---|---|---|---|---|---|
1. 87.9% 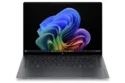 | HP OmniBook Ultra 14 Core Ultra X9 Intel Core Ultra X9 388H ⎘ Intel Arc B390 12 Xe3 Panther Lake iGPU ⎘ 32 GB RAM | Amazon: Bestpreis 1899€ nullprozentshop.de 2. 1899€ notebooksbilliger.de 3. 1914.96€ notebooksbilliger.at | 1.3 kg | 10.7 mm | 14.00" 2880x1800 243 PPI OLED |
2. 84.9% 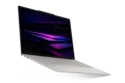 | Lenovo Yoga Slim 7 Ultra 14IPH11 Intel Core Ultra 7 355 ⎘ Intel Graphics 4 Xe3 Panther Lake iGPU ⎘ 32 GB RAM, 1024 GB SSD | Amazon: 933,69 € Geizhals Suche | 978 g | 13.9 mm | 14.00" 2880x1800 243 PPI OLED |
3. 88.7% 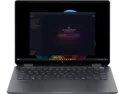 | HP OmniBook Ultra Flip 14 Intel Core Ultra 7 258V ⎘ Intel Arc Graphics 140V ⎘ 32 GB RAM, 2048 GB SSD | Amazon: 2.149,00 € Bestpreis 1899€ nullprozentshop.de 2. 1899€ notebooksbilliger.de 3. 1914.96€ notebooksbilliger.at | 1.3 kg | 15 mm | 14.00" 2880x1800 243 PPI OLED |
4. 87.4%  | Dell XPS 14 Core Ultra X7 358H Intel Core Ultra X7 358H ⎘ Intel Arc B390 12 Xe3 Panther Lake iGPU ⎘ 32 GB RAM, 1000 GB SSD | Amazon: 1. 3.283,34 € ASUS ExpertBook Ultra 14 Zol... 2. 1.479,98 € Dell Pro 14 Plus PB14250 - I... 3. 2.549,00 € Dell XPS 16 9640 Laptop 16.3... Geizhals Suche | 1.4 kg | 14.62 mm | 14.00" 2880x1800 243 PPI OLED |
5. 84.2% 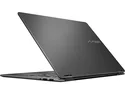 | MSI Prestige 14 Flip AI+ 2026 Intel Core Ultra X7 358H ⎘ Intel Arc B390 12 Xe3 Panther Lake iGPU ⎘ 32 GB RAM, 1000 GB SSD | Amazon: 1. 2.499,00 € MSI Prestige 14 Flip AI+ The... 2. 1.168,56 € MSI Prestige 14 AI Studio C1... 3. 1.479,00 € MSI Prestige 14 AI+, Busines... Bestpreis 1798€ deltatecc-prime 2. 1799€ nullprozentshop.de 3. 1799€ notebooksbilliger.de | 1.4 kg | 13.9 mm | 14.00" 1920x1200 162 PPI OLED |
6. 87.6%  | Asus ExpertBook Ultra B9406CAA Intel Core Ultra X7 358H ⎘ Intel Arc B390 12 Xe3 Panther Lake iGPU ⎘ 32 GB RAM, 2048 GB SSD | Amazon: 1.620,56 € Bestpreis 3556.89€ playox.de 2. 3556.9€ office-partner.de 3. 3556.9€ Cyberport.de | 1.1 kg | 15.9 mm | 14.00" 2880x1800 243 PPI OLED |
Transparenz
Die Auswahl der zu testenden Geräte erfolgt innerhalb der Redaktion. Das vorliegende Testmuster wurde dem Autor vom Hersteller oder einem Shop zu Testzwecken leihweise zur Verfügung gestellt. Eine Einflussnahme des Leihstellers auf den Testbericht gab es nicht, der Hersteller erhielt keine Version des Reviews vor der Veröffentlichung. Es bestand keine Verpflichtung zur Publikation. Als eigenständiges, unabhängiges Unternehmen unterliegt Notebookcheck keiner Diktion von Herstellern, Shops und Verlagen.
So testet Notebookcheck
Pro Jahr werden von Notebookcheck hunderte Laptops und Smartphones unabhängig in von uns standardisierten technischen Verfahren getestet, um eine Vergleichbarkeit aller Testergebnisse zu gewährleisten. Seit rund 20 Jahren entwickeln wir diese Testmethoden kontinuierlich weiter und setzen damit Branchenstandards. In unseren Testlaboren kommt ausschließlich hochwertiges Messequipment in die Hände erfahrener Techniker und Redakteure. Die Tests unterliegen einer mehrstufigen Kontrolle. Unsere komplexe Gesamtbewertung basiert auf hunderten fundierten Messergebnissen und Benchmarks, womit Ihnen Objektivität garantiert ist. Weitere Informationen zu unseren Testmethoden gibt es hier.

