Fazit - Die Wiedergeburt von XPS
Wie das neue XPS 14, so geht auch das XPS 16 2026 auf einige der größten Probleme des Modells 2025 ein und sorgt für ein insgesamt besseres Benutzererlebnis. Das System ist jetzt viel leichter und reisefreundlicher, mit einer aufgeräumten optischen Ästhetik und ohne frustrierende berührungsempfindliche Tasten. Die Umstellung auf Panther Lake hat auch die Leistung pro Watt deutlich verbessert, so dass die Laufzeiten zumindest um mehrere Stunden erhöht werden konnten.
Ein Hauptgrund für das schlankere, leisere und kompaktere Design in diesem Jahr ist eine wichtige Änderung: keine diskreten Grafikoptionen mehr. Keine dGPU bedeutet, dass das System mit kleineren Platinen, einer kleineren Kühllösung und einem dünneren Profil auskommen kann, so dass das Modell insgesamt leichter ist. Die Benutzer müssen jedoch Abstriche bei der Grafikleistung machen, da die integrierte GPU von Panther Lake - so effizient sie auch sein mag - nicht mit der Leistung einer GeForce RTX 5070 des Dell 16 Premium mithalten kann. Externe GPUs können diese Einschränkung umgehen, aber Content Creators oder Gamer, die unterwegs mehr Grafikleistung benötigen, werden mit dem 2025er Modell besser bedient.
Das schlankere und fokussiertere Design des neuen XPS 16 kann sich im Vergleich zu einigen Konkurrenten manchmal etwas karg anfühlen. Alternativen wie das Samsung Galaxy Book6 Ultra oder Asus Zenbook S16 bieten mehr integrierte Ports oder sogar Unterstützung für sekundäre M.2-SSDs, um die Abhängigkeit von Adaptern oder Dockingstationen zu verringern.
Pro
Contra
Preis und Verfügbarkeit
Dell liefert das XPS 16 jetzt ab 1.949 Euro für die Core-Ultra-5-325-Konfiguration (wie getestet) bis zu 2.499 Euro für die Core-Ultra-X7-358H-OLED-Touchscreen-Konfiguration aus.
- 1.295,00 €Lenovo ThinkBook 16 Gen 9 (16" Intel), Intel® Core™ Ultra 5 325 (E-cores up to 3.20GHz, 12MB), 16" WUXGA Non-Touch, W11P64 GER, 32.0GB, 1x1TB SSD M.2 2242 PCIe Gen4 QLC, Intel® Graphics, BT 5.4
- 1.216,68 €Lenovo ThinkBook 16 Gen 9 (16" Intel), Intel® Core™ Ultra 5 325 (E-cores up to 3.20GHz, 12MB), 16" WUXGA Non-Touch, W11P64 GER, 32.0GB, 1x512GB SSD M.2 2242 PCIe Gen4 QLC, Intel® Graphics, BT 5.4
- 2.549,00 €Dell XPS 16 9640 Laptop 16.3 Inch 16:10 FHD+ Display, Intel Evo Edition, Intel Core Ultra 7, NVIDIA GeForce RTX 4050 Graphics 16GB RAM 1TB, Windows 11 Home, Fingerprint Reader, Backlit German Keyboard
Inhaltsverzeichnis
- Fazit - Die Wiedergeburt von XPS
- Spezifikationen
- Gehäuse - So viel leichter als zuvor
- Anschlussausstattung
- Eingabegeräte - Der Abschied von berührungsempfindlichen Tasten
- Display - Eines der besten FHD+-IPS-Panels
- Performance - Alles auf Panther Lake setzen
- Emissionen - Leiser, aber immer noch recht warm
- Energieverwaltung - Panther Lake ist der König der Effizienz
- Notebookcheck Bewertung
- Potenzielle Wettbewerber im Vergleich
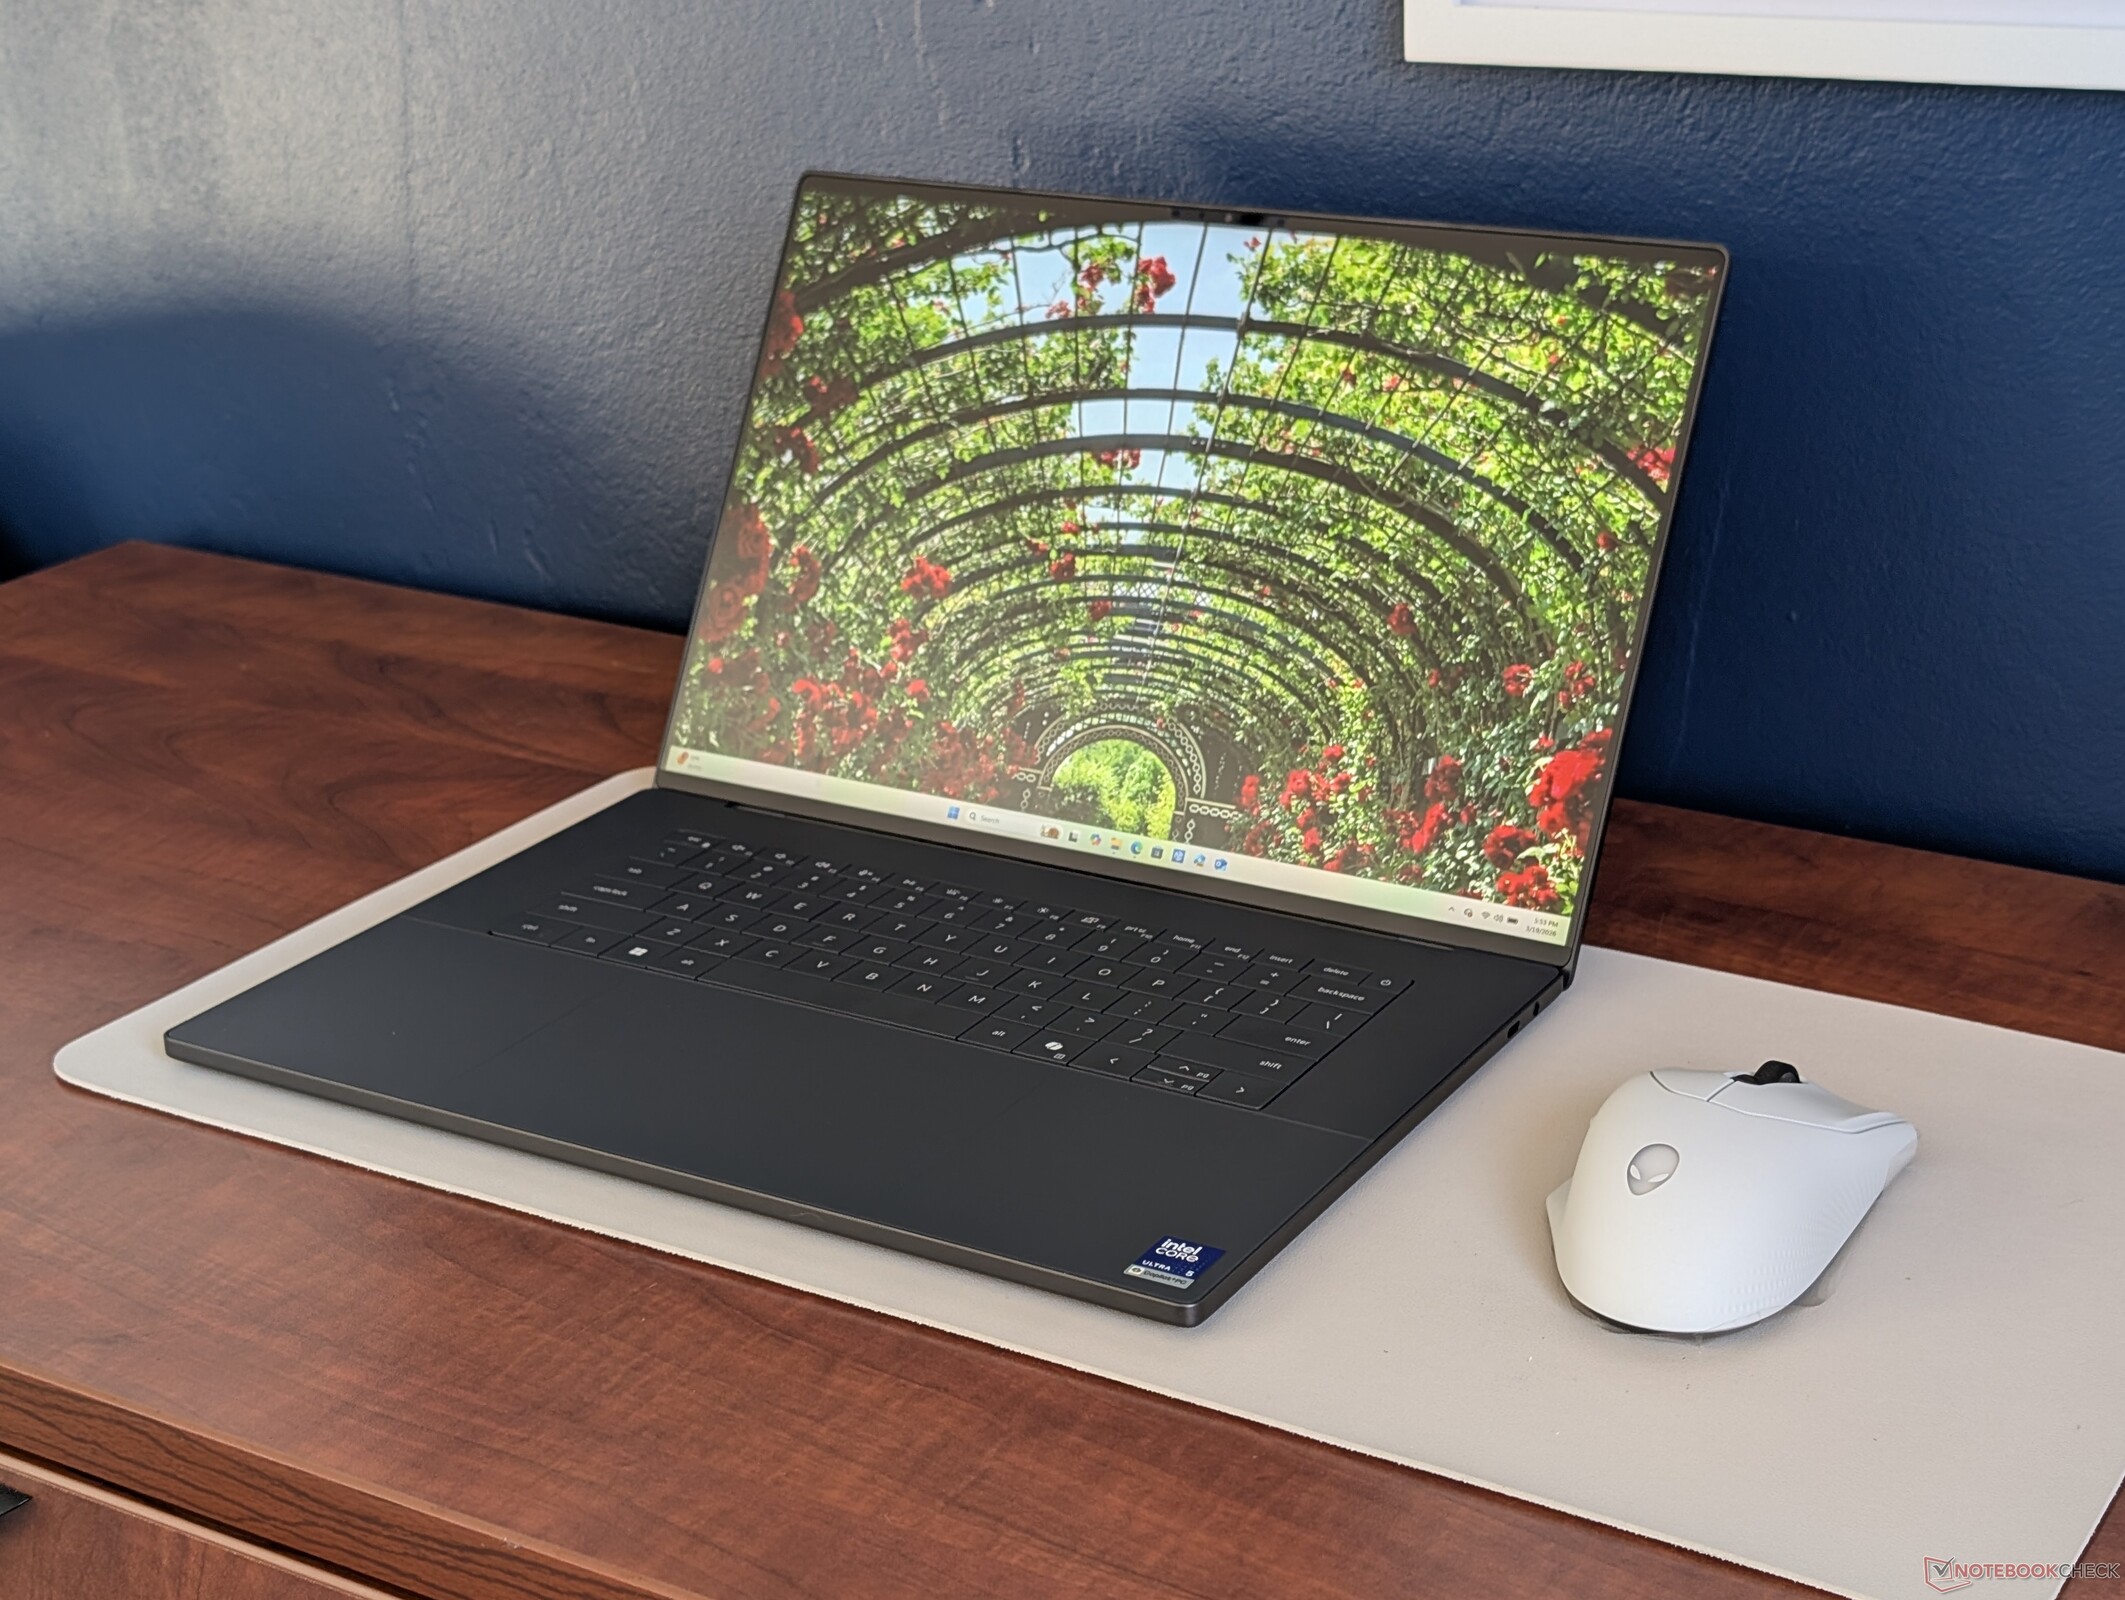
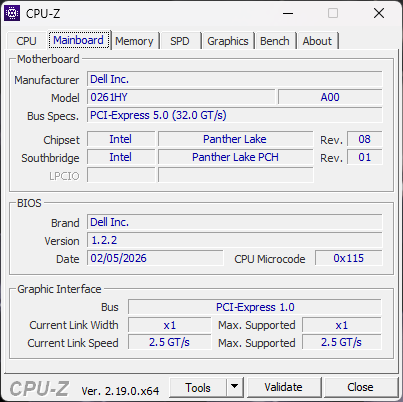
Vorgestellt auf der CES 2026 zusammen mit dem neuen XPS 14, markiert das 2026 XPS 16 eine Wiederbelebung der Serie, nachdem im vergangenen Jahr auf das „XPS“-Branding verzichtet und stattdessen der Name „Dell 16 Premium" entwickelt wurde. Das neue Modell verfügt nicht nur über die neuesten Intel-Panther-Lake-Prozessor-Optionen, sondern auch über ein aktualisiertes Gehäuse-Design für eine im Vergleich zu den Vorjahren überarbeitete Benutzererfahrung.
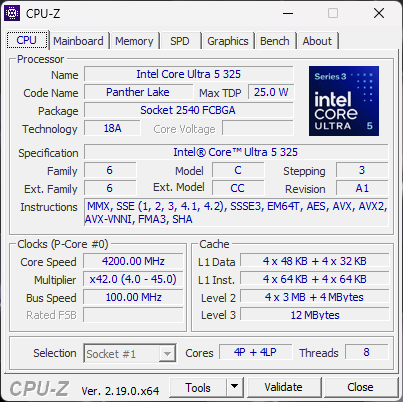
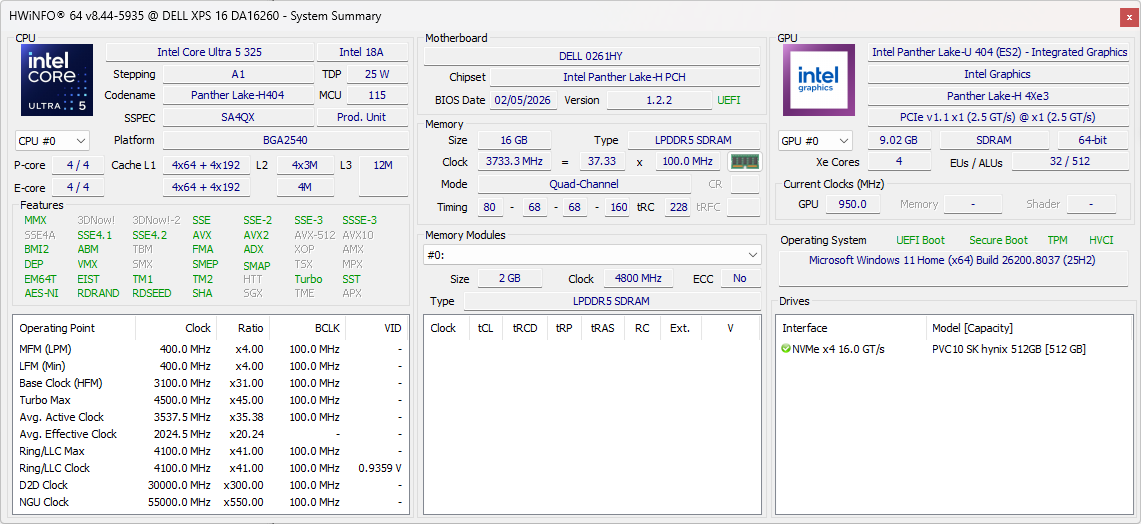
Bei unserem Testgerät handelt es sich um die Basiskonfiguration mit der Core Ultra 5 325 CPU und dem FHD+ 120 Hz IPS-Display für etwa 1.700 US-Dollar. Höhere Konfigurationen umfassen den Core Ultra 7 355, Core Ultra X7 358H sowie OLED-120-Hz-Touchscreen für fast 2.200 US-Dollar. Alle Optionen werden zum Zeitpunkt der Veröffentlichung nur mit integrierter Grafik ausgeliefert.
Zu den Alternativen zum Dell XPS 16 gehören andere hochwertige 16-Zoll-Multimedia-Geräte wie das Samsung Galaxy Book6 Ultra, Asus Zenbook S16 oder Lenovo Yoga Pro 9 16.
Weitere Dell Bewertungen:
Spezifikationen
Gehäuse - So viel leichter als zuvor
Das neu gestaltete Gehäuse hat wenig Ähnlichkeit mit dem bisherigen Dell 16 Premium oder 2024 XPS 16. Es besteht jedoch aus den gleichen Materialien wie das 2026 XPS 14, und so sind unsere Eindrücke des XPS 14 auf das neue XPS 16 übertragbar. Die Steifigkeit fühlt sich genauso gut an wie zuvor, aber mit kantigeren Kanten und Ecken, die den optischen Stil des MacBook Pro 16 noch stärker nachahmen.
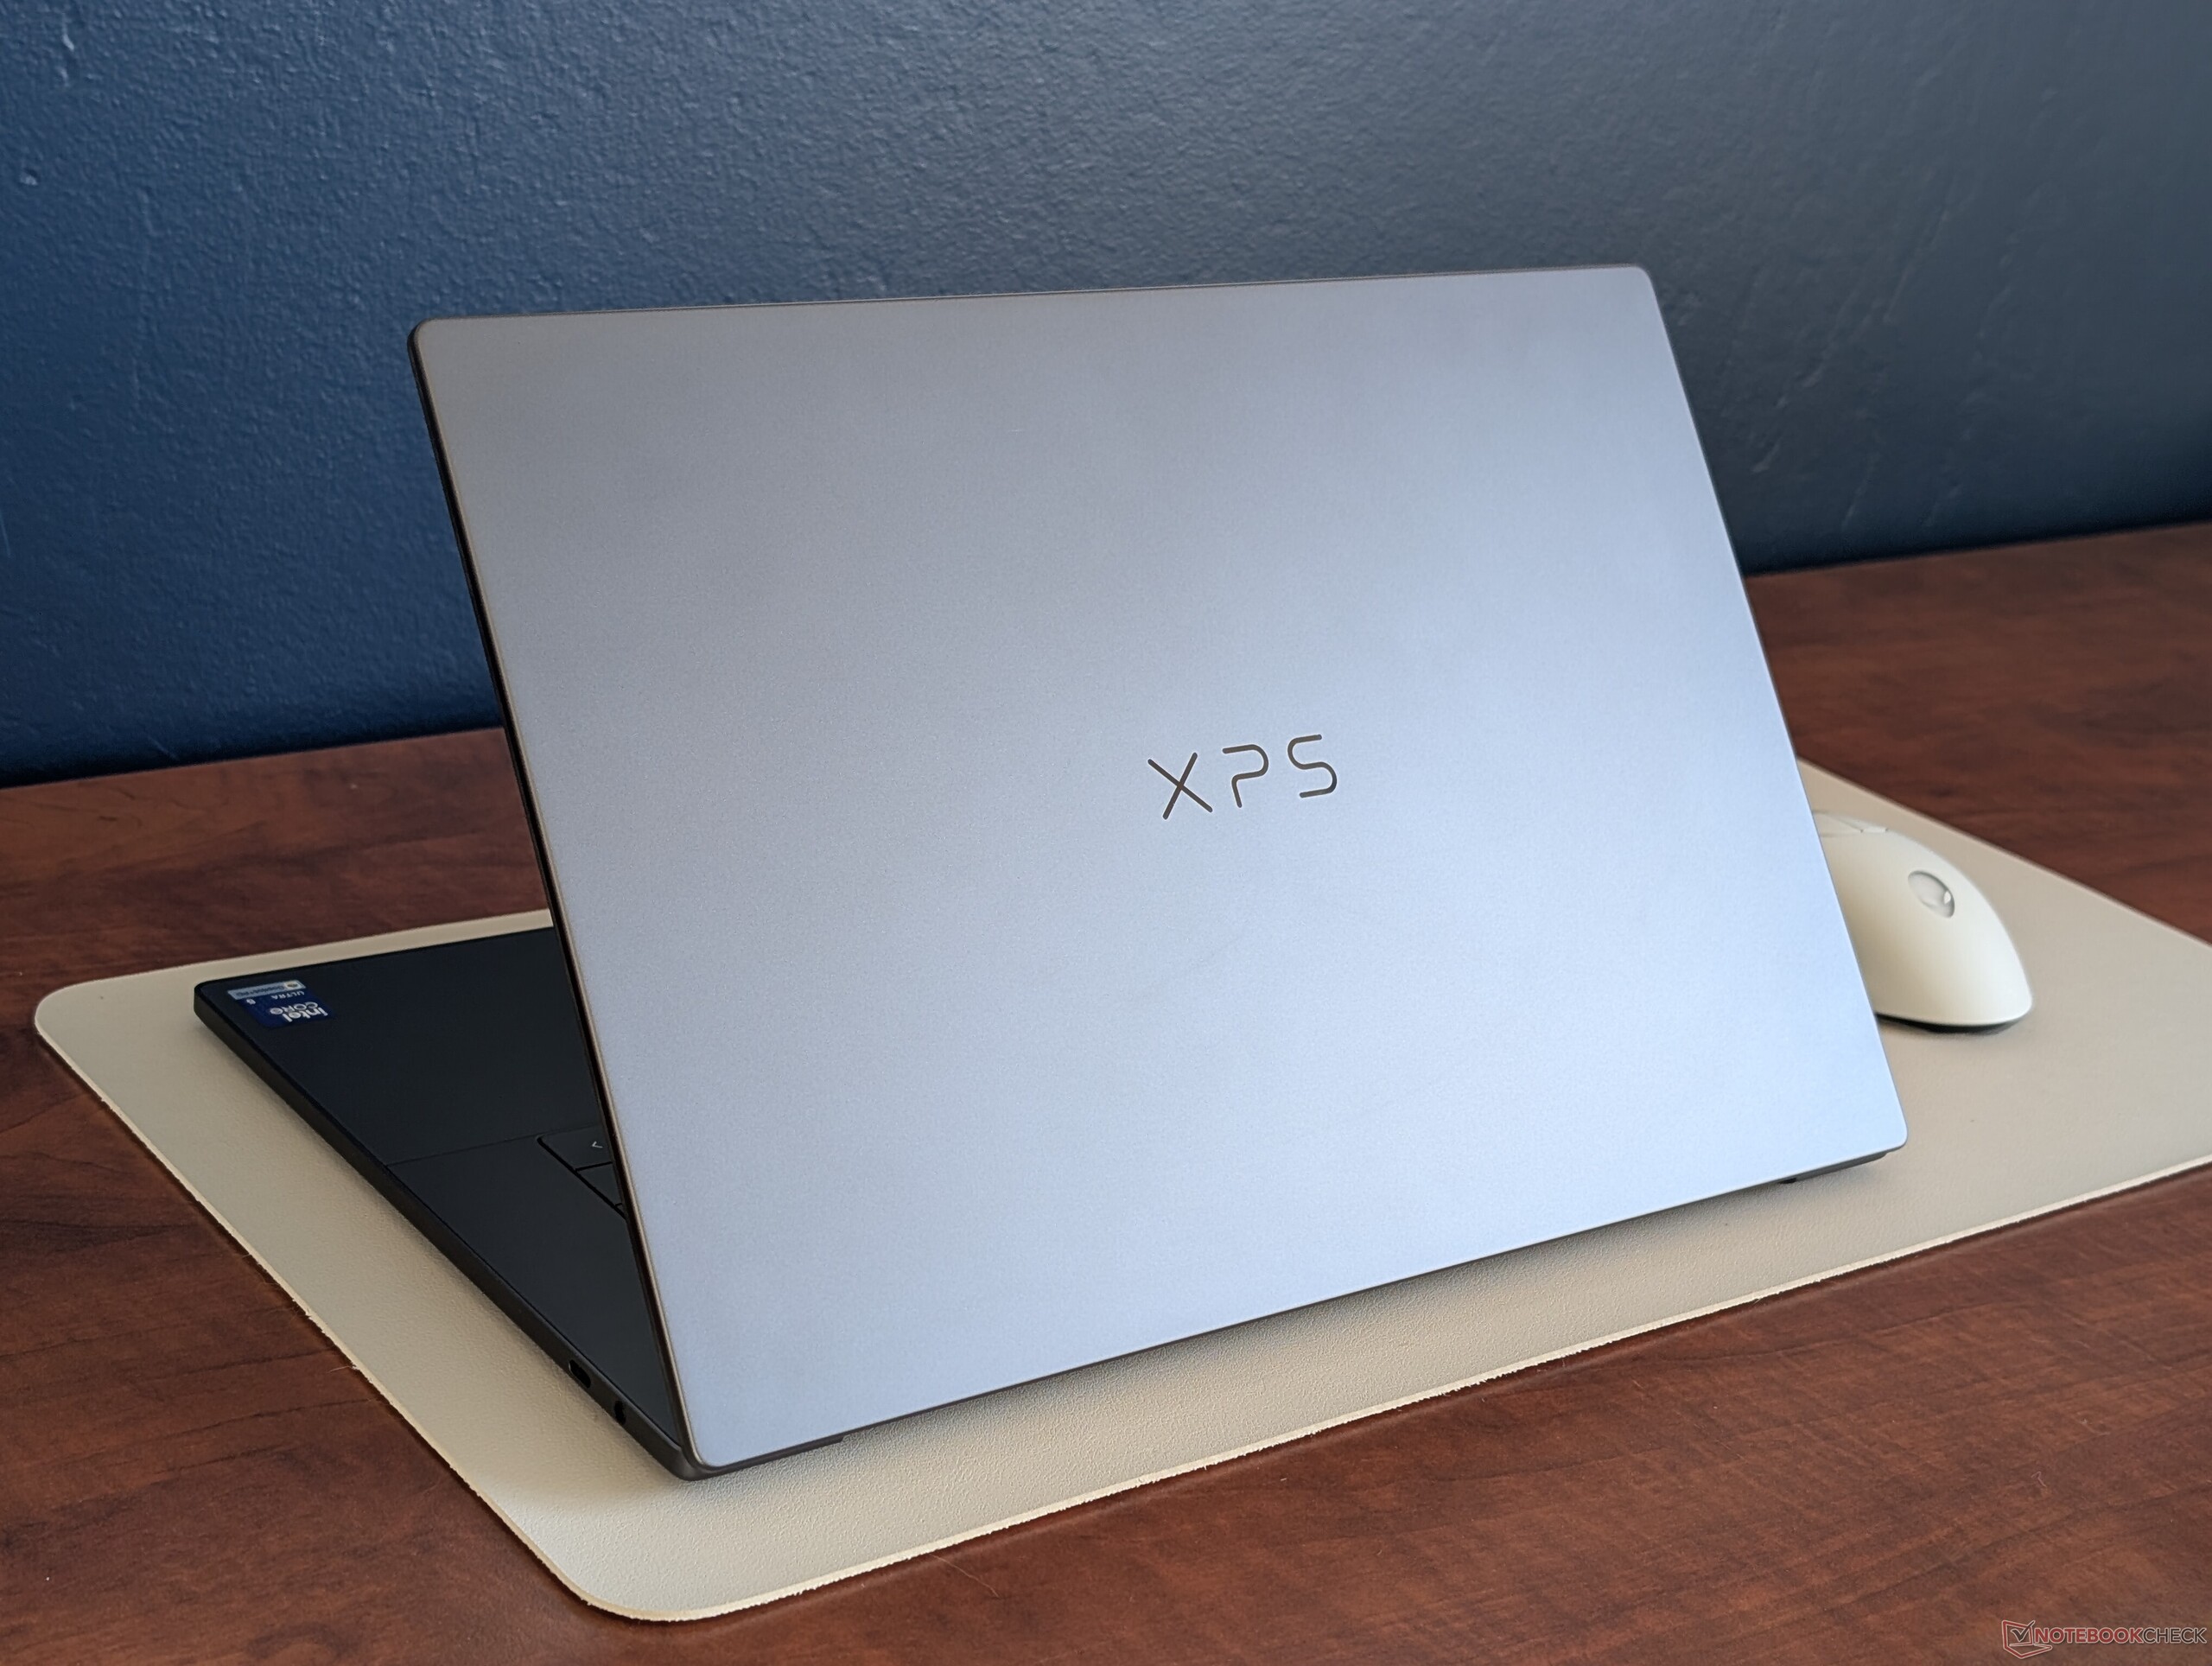
Die Größen- und Gewichtsunterschiede zwischen dem neuen XPS 16 und dem älteren XPS 16 (oder Dell 16 Premium) sind erheblich. Das aktualisierte Modell ist spürbar kleiner in Länge, Breite und Höhe und gleichzeitig um etwa 600 Gramm leichter. Diese Änderungen wurden vor allem durch den Verzicht auf diskrete Grafikoptionen und die Dampfkammerkühlung bei der Umstellung auf das neue XPS-16-Design ermöglicht. Auch die Bildschirmgröße wurde leicht von 16,3 auf 16,0 Zoll reduziert.


Anschlussausstattung
Alle drei USB-C Ports unterstützen jetzt Thunderbolt 4, während dies beim letztjährigen Modell nicht der Fall war. Leider hat Dell zum Leidwesen von DSLR-Besitzern den MicroSD-Kartensteckplatz weggelassen.
Konkurrierende Modelle wie das Asus Zenbook S16 oder Lenovo Yoga Pro 9 16IAH10 haben in der Regel mehr integrierte Ports und Optionen als das Dell.


Kommunikation

Webcam
Die Kamera wurde von 2 MP beim Dell 16 Premium auf 8 MP beim neuen XPS 16 aufgerüstet. Obwohl IR unterstützt wird, gibt es immer noch keinen physischen Kameraauslöser.


Wartung
Die Wartungsprozeduren sind völlig anders als beim XPS 16 aus dem letzten Jahr, aber ansonsten fast identisch mit dem neuen XPS 14 wie hier beschrieben. Anstatt die Unterseite zu entfernen, muss man die Tastatur vorsichtig abnehmen, um an die Hauptplatine heranzukommen, was den Vorgang etwas komplizierter macht.
Die Upgrade-Optionen sind leider sehr begrenzt. Das Modell unterstützt trotz dem großen 16-Zoll-Formfaktor nur eine einzige M.2-SSD und keine anderen aufrüstbaren Komponenten.

Nachhaltigkeit
Dell gibt an, dass die obere und untere Abdeckung zu 75 Prozent aus recyceltem Aluminium besteht, der Akku zu 50 Prozent aus recyceltem Kobalt, die Tastenkappen zu 90 Prozent aus recyceltem Stahl, die Akku-Platine zu 100 Prozent aus recyceltem Kupfer und die OLED-Konfiguration zu 10 Prozent aus recyceltem Glas. Die Verpackung ist vollständig recycelbar und plastikfrei.
Zubehör und Garantie
In der Verpackung befinden sich außer dem Netzteil und den Papieren keine weiteren Extras. Beim Kauf in den USA gilt die übliche einjährige Herstellergarantie mit Verlängerungsoptionen von bis zu vier Jahren.
Eingabegeräte - Der Abschied von berührungsempfindlichen Tasten
Tastatur
Dell hat (zum Glück) die umstrittenen berührungsempfindlichen Tasten des letztjährigen Modells zugunsten eines traditionelleren Ansatzes fallen gelassen. Tatsächlich sind die Tastengröße und das Feedback identisch mit dem neuen XPS 14, so dass man trotz dem größeren Formfaktor unseres XPS 16 das gleiche Tipperlebnis hat.
Touchpad
Im Gegensatz zur Tastatur nutzt das Clickpad den Vorteil des größeren 16-Zoll-Formfaktors, da seine Oberfläche etwas größer ist als die des XPS 14 (~15,2 x 9 cm vs. ~15,2 x 7,5 cm). Die Gleitbewegung ist extrem sanft, aber Multi-Touch- oder Drag&Drop-Aktionen sind aufgrund des flachen und schwachen Feedbacks immer noch schwierig. Das "unsichtbare" Clickpad ist wohl weiterhin eher der Form als der Funktion verpflichtet.


Display - Eines der besten FHD+-IPS-Panels
Es stehen zwei Anzeigeoptionen zur Verfügung:
- 1.920 x 1.200, 100 % sRGB, IPS, Non-Touch, 1-120 Hz, matt
- 3.200 x 2.000, 100 % DCI-P3, OLED, Touchscreen, 20-120 Hz, DisplayHDR 500, glänzend
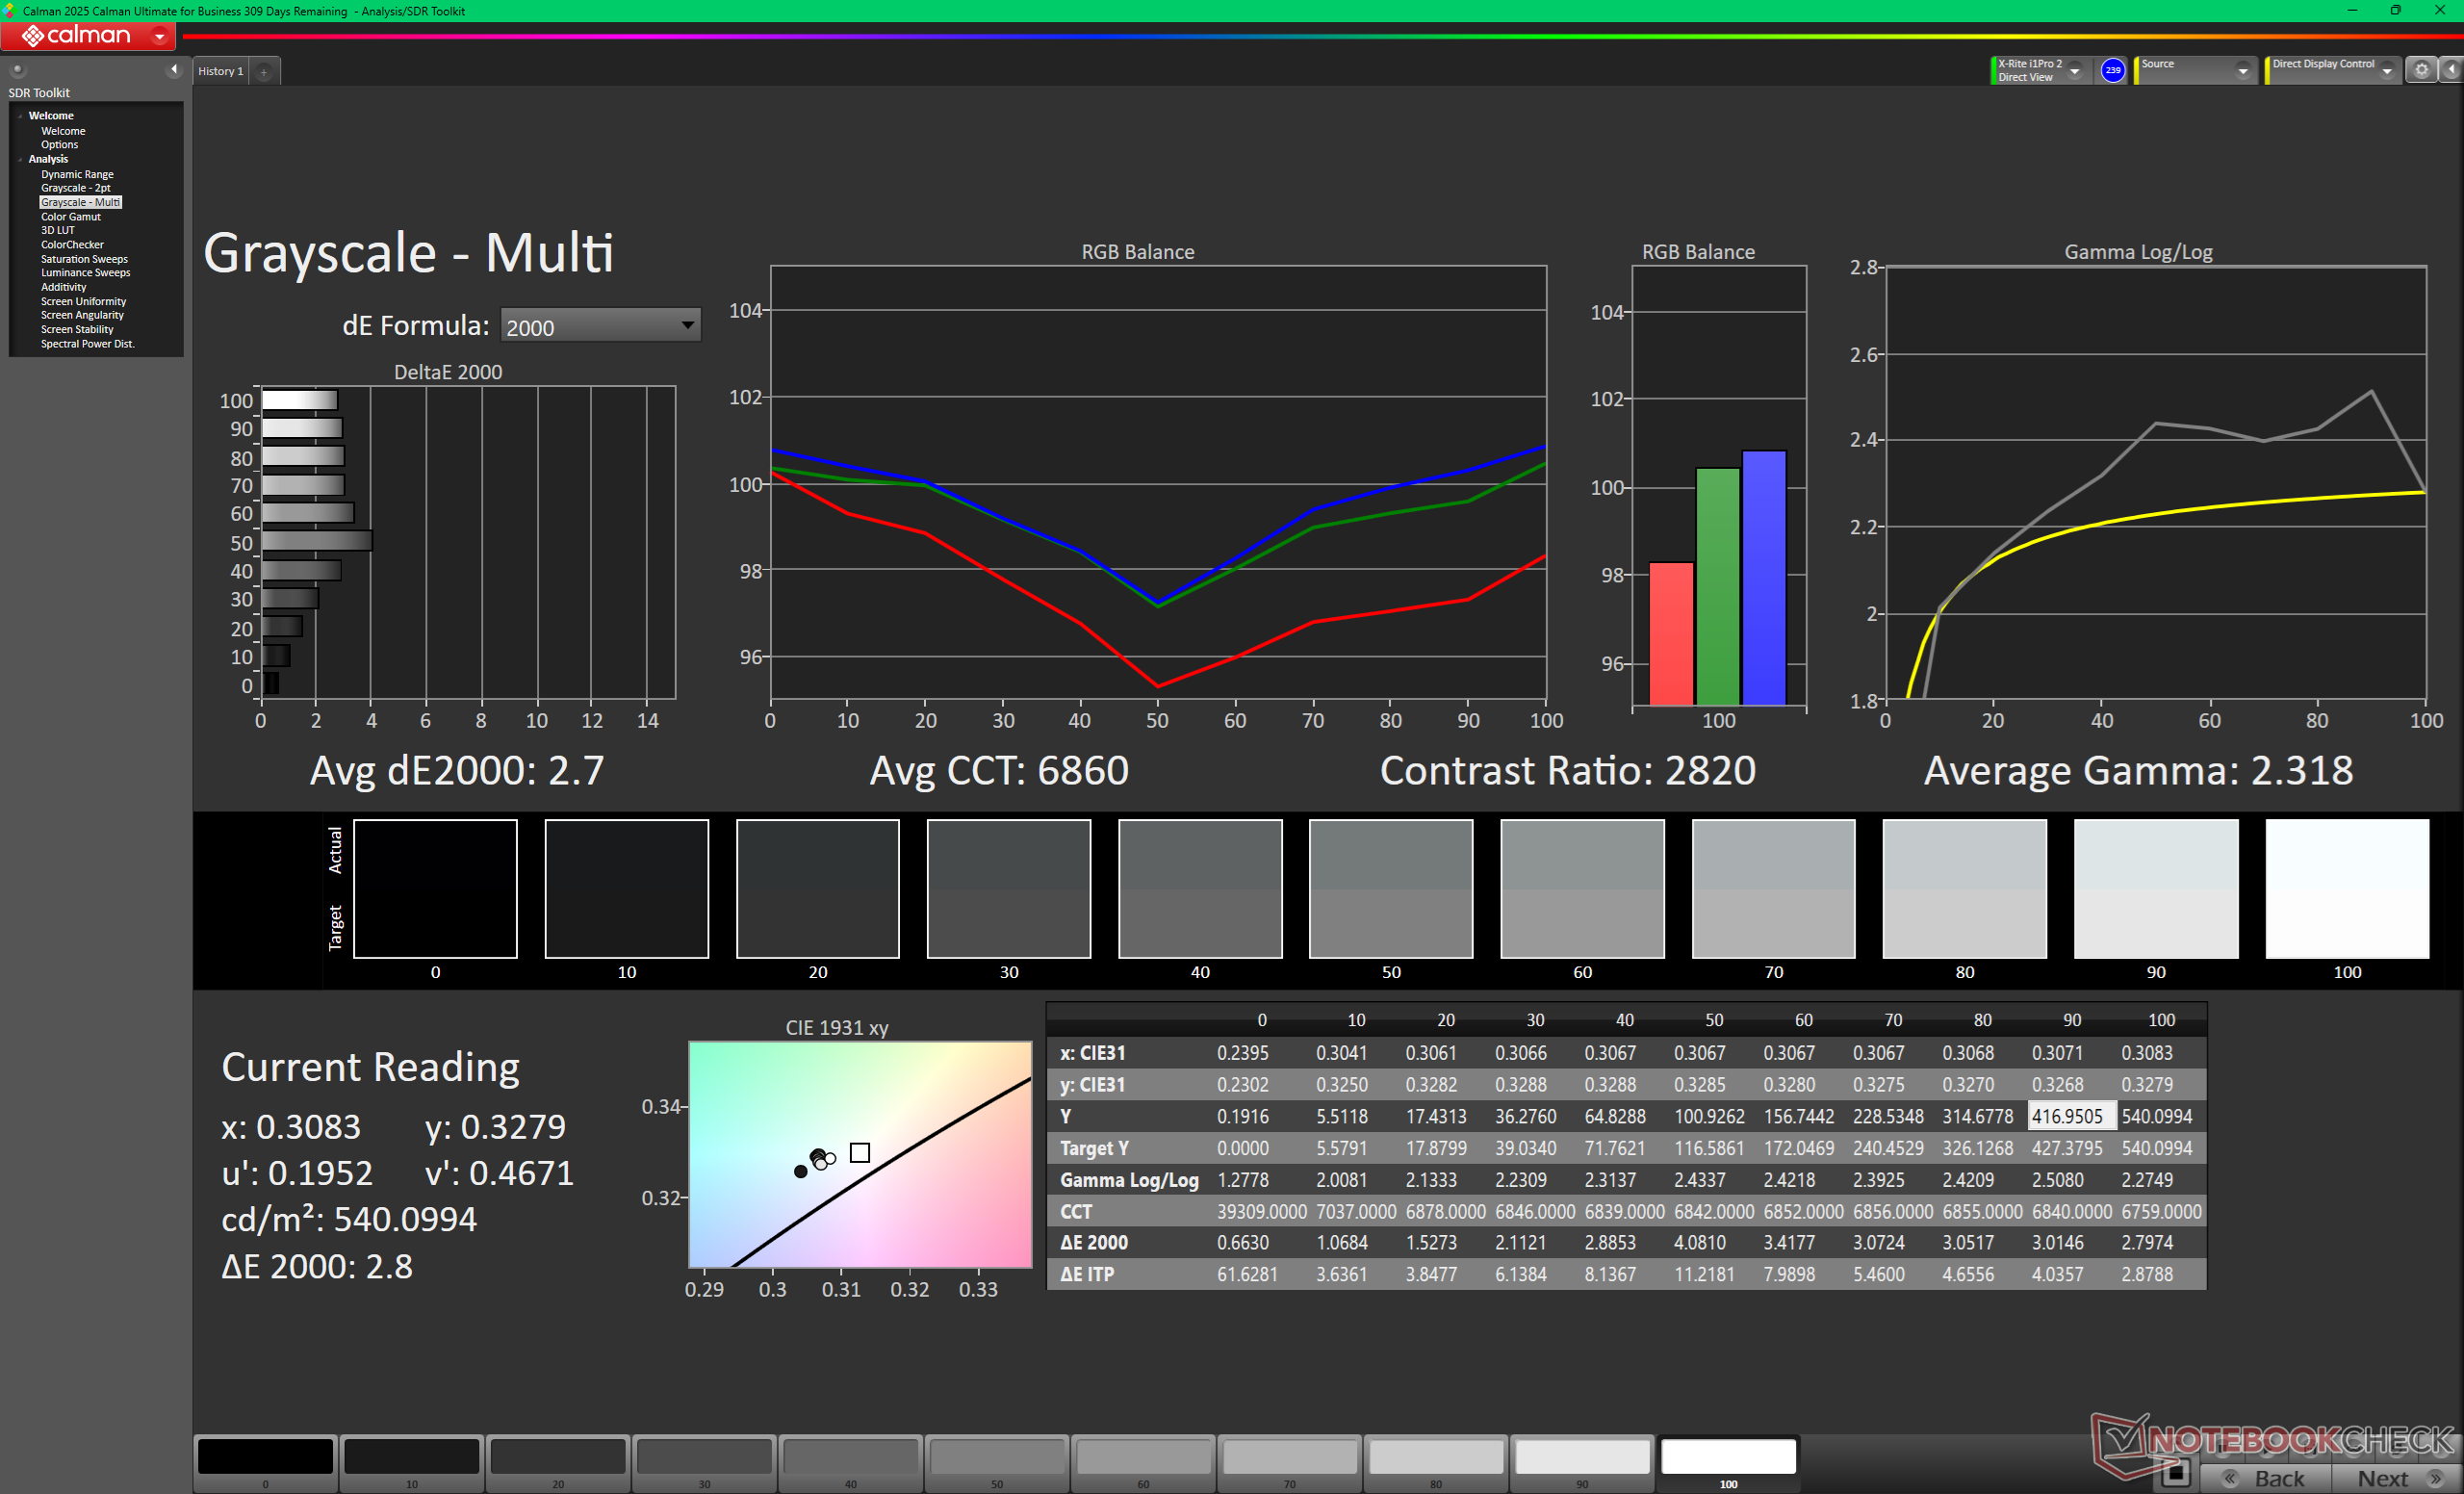
Das Basisdisplay bietet ein sehr hohes Kontrastverhältnis von ~2.000:1, insbesondere für ein IPS-Panel. Die Bildqualität ist überraschend scharf für ein mattes Overlay, während die vollen sRGB-Farben die meisten Normalanwender oder Gelegenheits-Content-Creators zufriedenstellen sollten. Tiefere P3-Farben, HDR-Unterstützung oder Touchscreen-Funktionen sind nur bei der teureren OLED-Konfiguration verfügbar.
Beachten Sie, dass VRR standardmäßig deaktiviert ist. Benutzer können VRR über die erweiterten Windows-Display-Optionen aktivieren. Die minimale Bildwiederholfrequenz von 1 Hz ist ein einzigartiges Merkmal des Basispanels, das man bei den meisten anderen Laptops nicht findet.


| |||||||||||||||||||||||||
Ausleuchtung: 92 %
Helligkeit Akku: 534.6 cd/m²
Kontrast: 2056:1 (Schwarzwert: 0.26 cd/m²)
ΔE ColorChecker Calman: 2.53 | ∀{0.5-29.43 Ø4.73}
calibrated: 1.26
ΔE Greyscale Calman: 2.7 | ∀{0.09-98 Ø4.97}
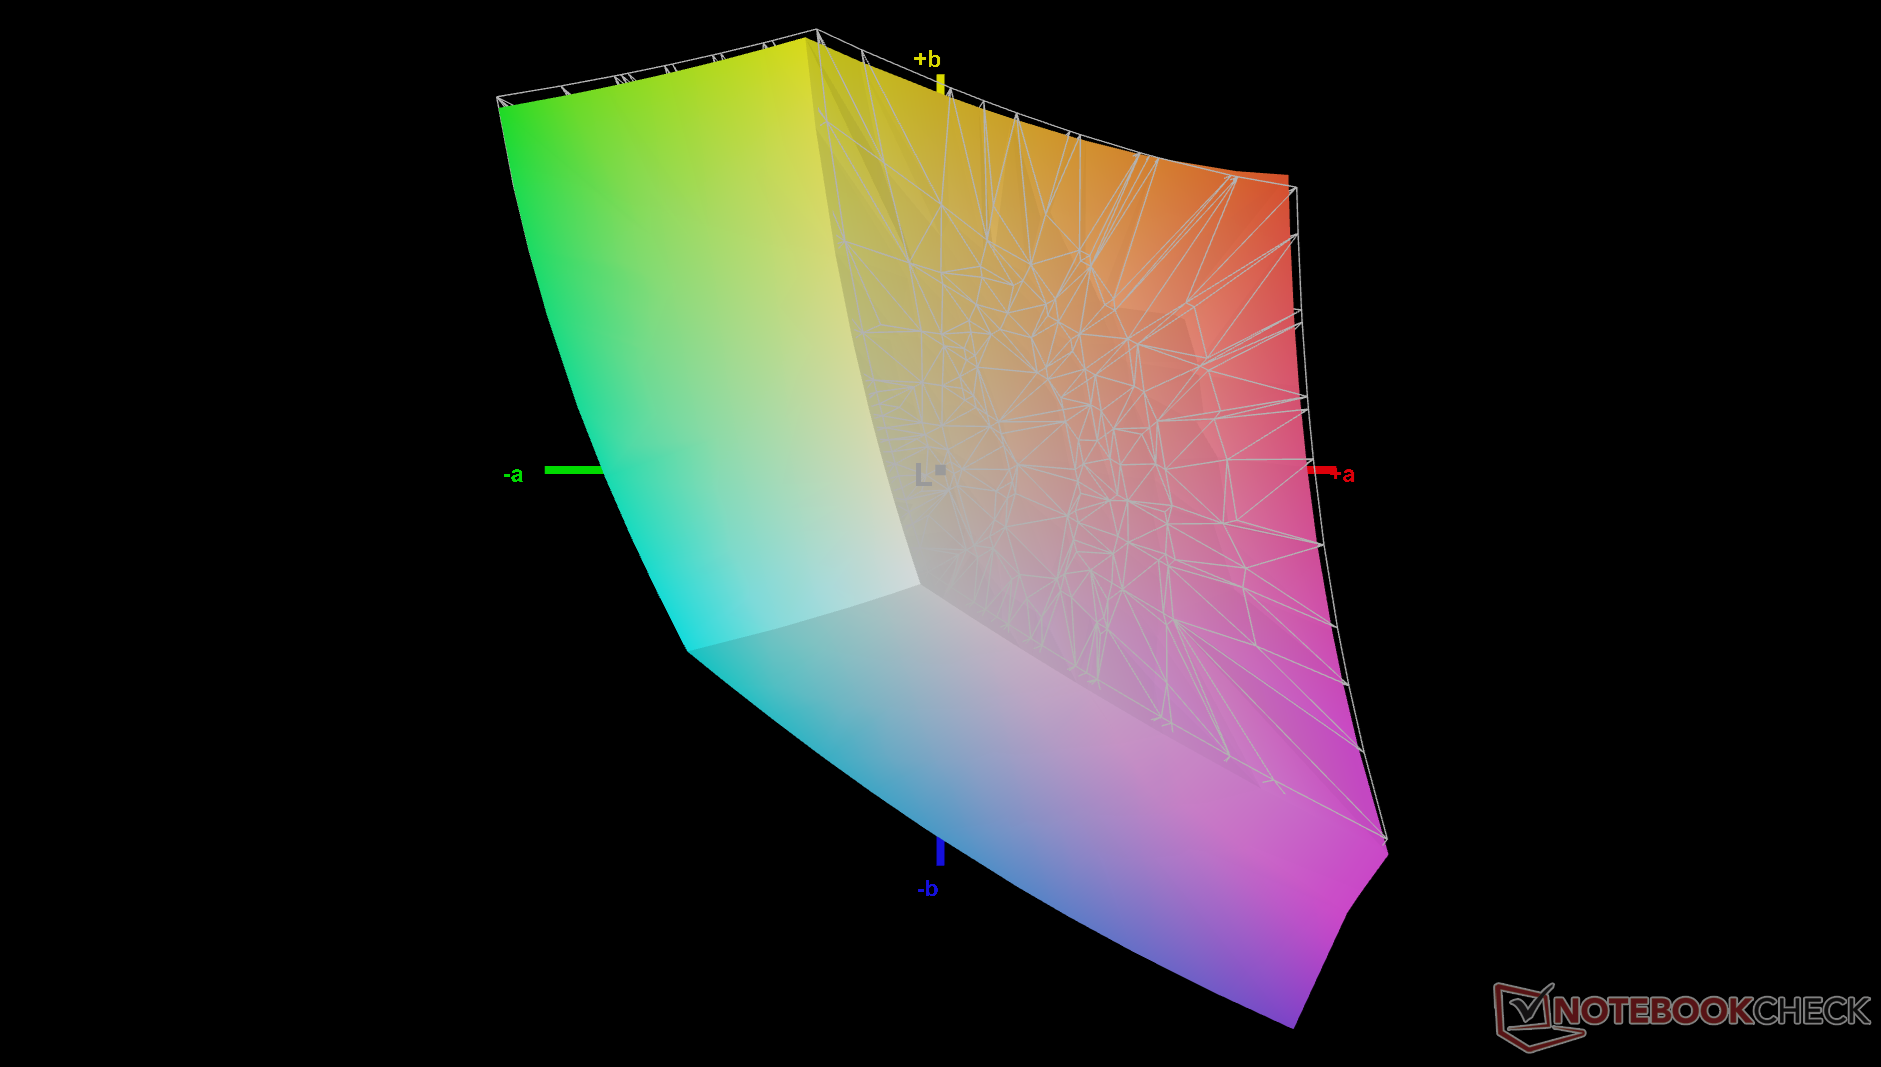
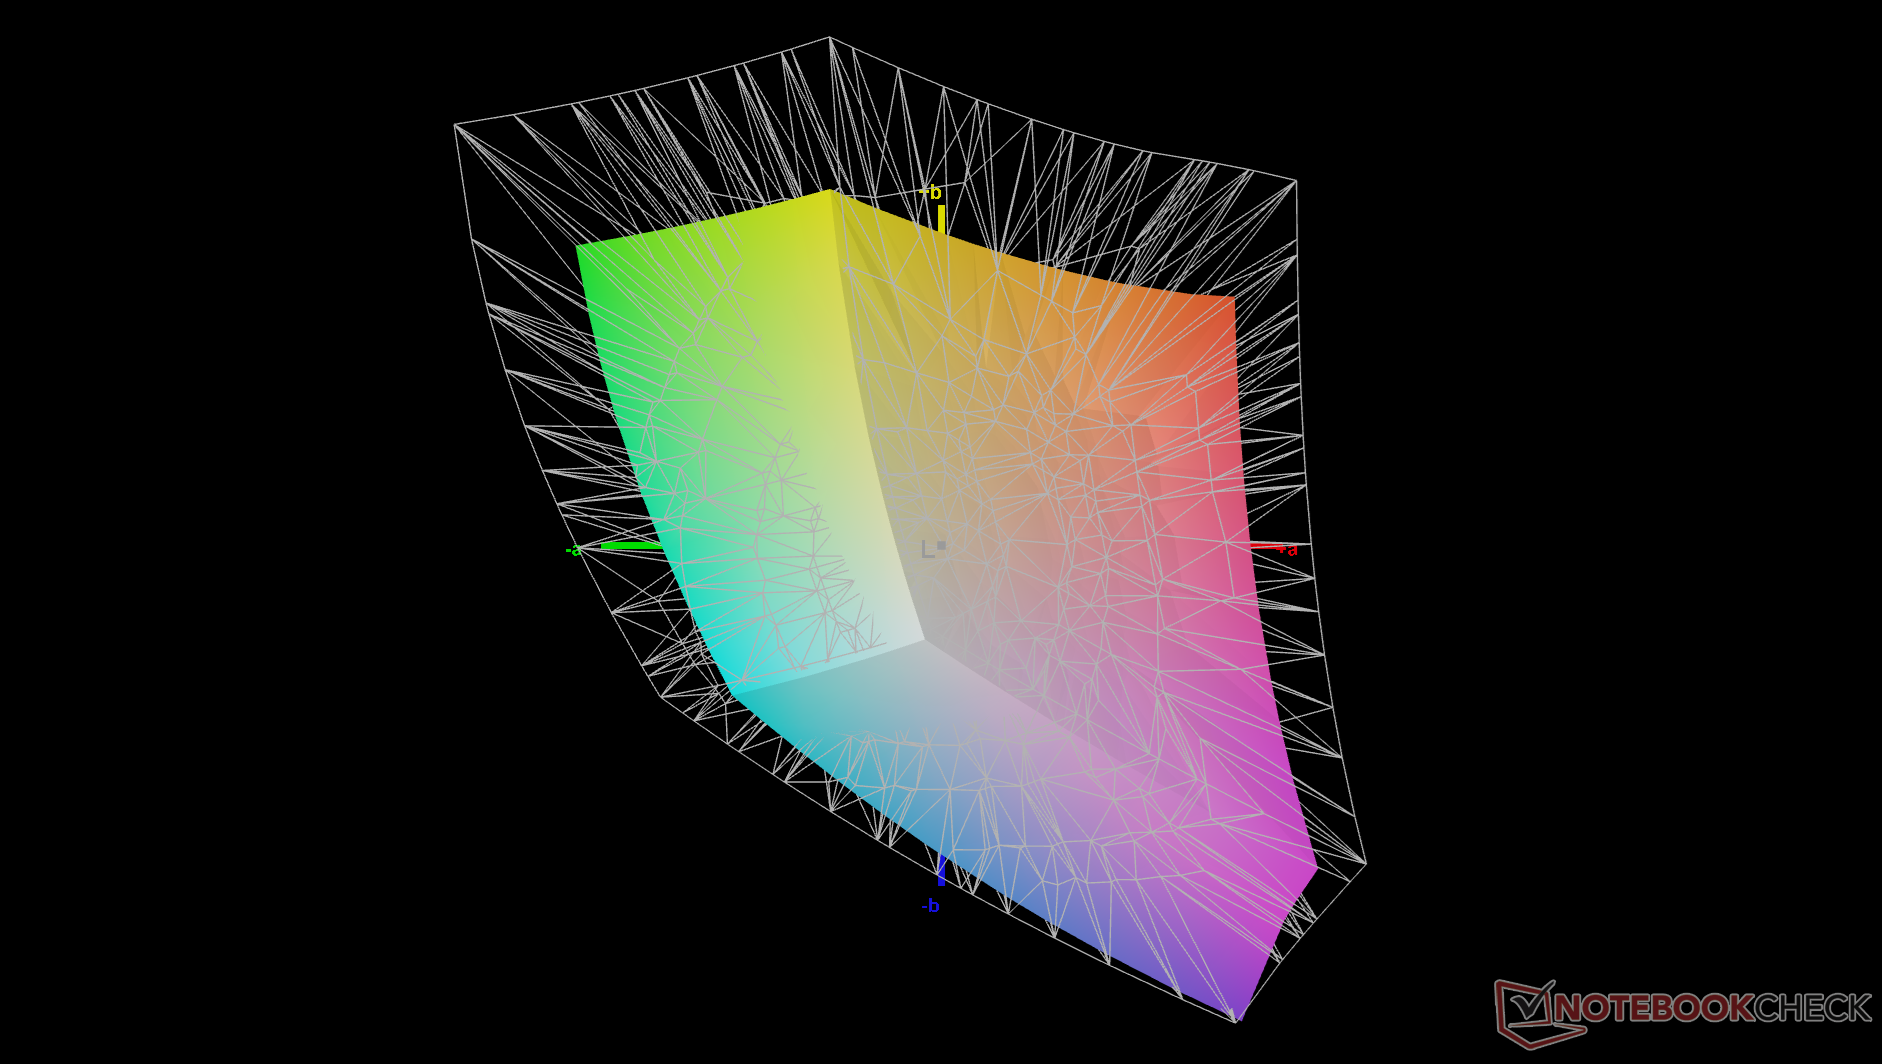
67.7% AdobeRGB 1998 (Argyll 3D)
97.4% sRGB (Argyll 3D)
66.2% Display P3 (Argyll 3D)
Gamma: 2.32
CCT: 6860 K
| Dell XPS 16 Core Ultra 5 325 LG Philips 160WUX, IPS, 1920x1200, 16", 120 Hz | Dell XPS 16 9640 SDC4196, OLED, 3840x2400, 16.3", 90 Hz | Lenovo Yoga Pro 9 16IAH10 RTX 5050 ATNA60HR04-0, OLED, 2880x1800, 16", 120 Hz | Samsung Galaxy Book6 Ultra ATNA60HR05-0, OLED, 2880x1800, 16", 120 Hz | Asus ZenBook S16 UM5606GA ATNA60HR07-0, OLED, 2880x1800, 16", 120 Hz | MSI Prestige 16 AI Evo B2HMG B160QAN03_R, IPS, 2560x1600, 16", 60 Hz | |
|---|---|---|---|---|---|---|
| Display | 27% | 25% | 31% | 24% | ||
| Display P3 Coverage (%) | 66.2 | 98.3 48% | 97 47% | 99.8 51% | 96.4 46% | |
| sRGB Coverage (%) | 97.4 | 100 3% | 99.9 3% | 100 3% | 99.7 2% | |
| AdobeRGB 1998 Coverage (%) | 67.7 | 87.8 30% | 85.3 26% | 94 39% | 84.3 25% | |
| Response Times | 98% | 99% | 98% | -12% | ||
| Response Time Grey 50% / Grey 80% * (ms) | 39.3 ? | 0.82 ? 98% | 0.5 ? 99% | 1.27 ? 97% | 51.5 ? -31% | |
| Response Time Black / White * (ms) | 26 ? | 0.85 ? 97% | 0.4 ? 98% | 0.43 ? 98% | 24.3 ? 7% | |
| PWM Frequency (Hz) | 360 ? | 1200 | 240 ? | 960 ? | ||
| PWM Amplitude * (%) | 37 | 100 | 56 | |||
| Bildschirm | 8% | -15% | 26% | 18% | -55% | |
| Helligkeit Bildmitte (cd/m²) | 534.6 | 366 -32% | 471.7 -12% | 499 -7% | 465 -13% | 471 -12% |
| Brightness (cd/m²) | 515 | 367 -29% | 474 -8% | 505 -2% | 466 -10% | 455 -12% |
| Brightness Distribution (%) | 92 | 96 4% | 98 7% | 97 5% | 99 8% | 92 0% |
| Schwarzwert * (cd/m²) | 0.26 | 0.2 23% | ||||
| Kontrast (:1) | 2056 | 2355 15% | ||||
| Delta E Colorchecker * | 2.53 | 1.3 49% | 3.53 -40% | 0.9 64% | 1 60% | 5.8 -129% |
| Colorchecker dE 2000 max. * | 4.57 | 3.6 21% | 6.31 -38% | 2.1 54% | 3 34% | 10.8 -136% |
| Colorchecker dE 2000 calibrated * | 1.26 | 1 21% | 1.9 -51% | |||
| Delta E Graustufen * | 2.7 | 2.2 19% | 2.6 4% | 1.6 41% | 1.9 30% | 7.8 -189% |
| Gamma | 2.32 95% | 2.14 103% | 2.24 98% | 2.22 99% | 2.19 100% | 2.07 106% |
| CCT | 6860 95% | 6680 97% | 6292 103% | 6445 101% | 6458 101% | 7262 90% |
| Durchschnitt gesamt (Programm / Settings) | 44% /
27% | -15% /
-15% | 50% /
39% | 49% /
36% | -14% /
-32% |
* ... kleinere Werte sind besser
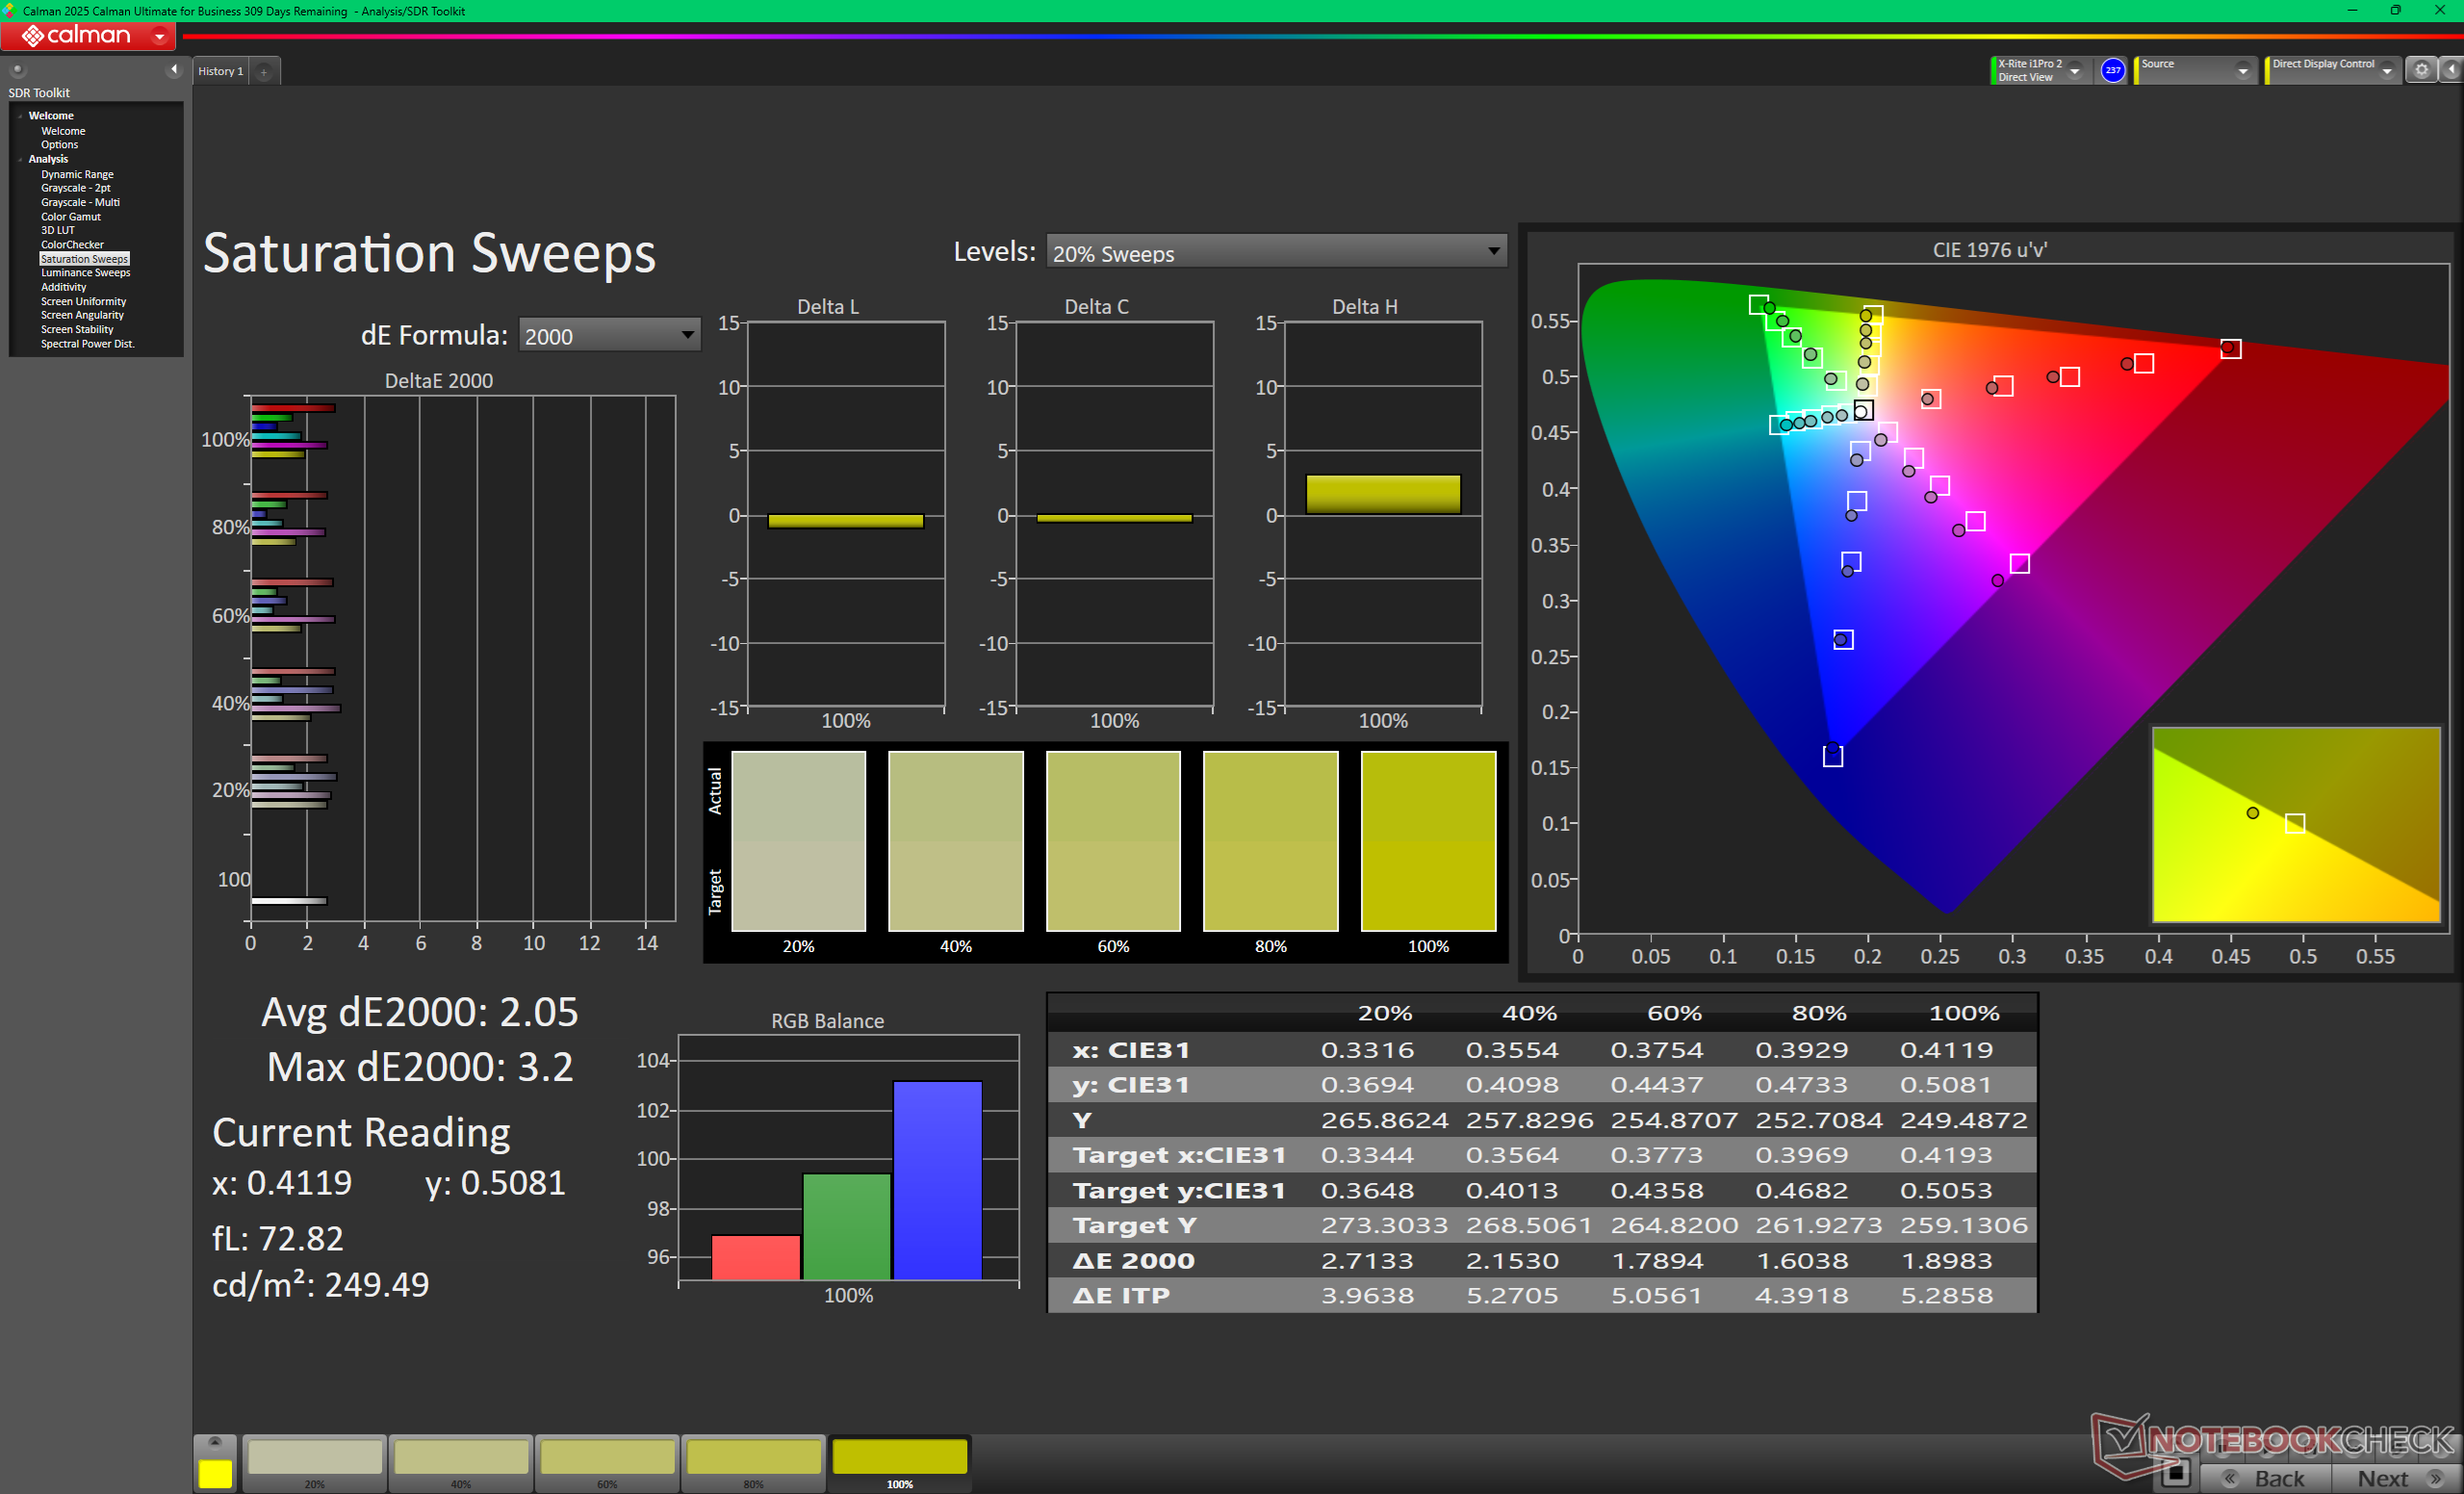
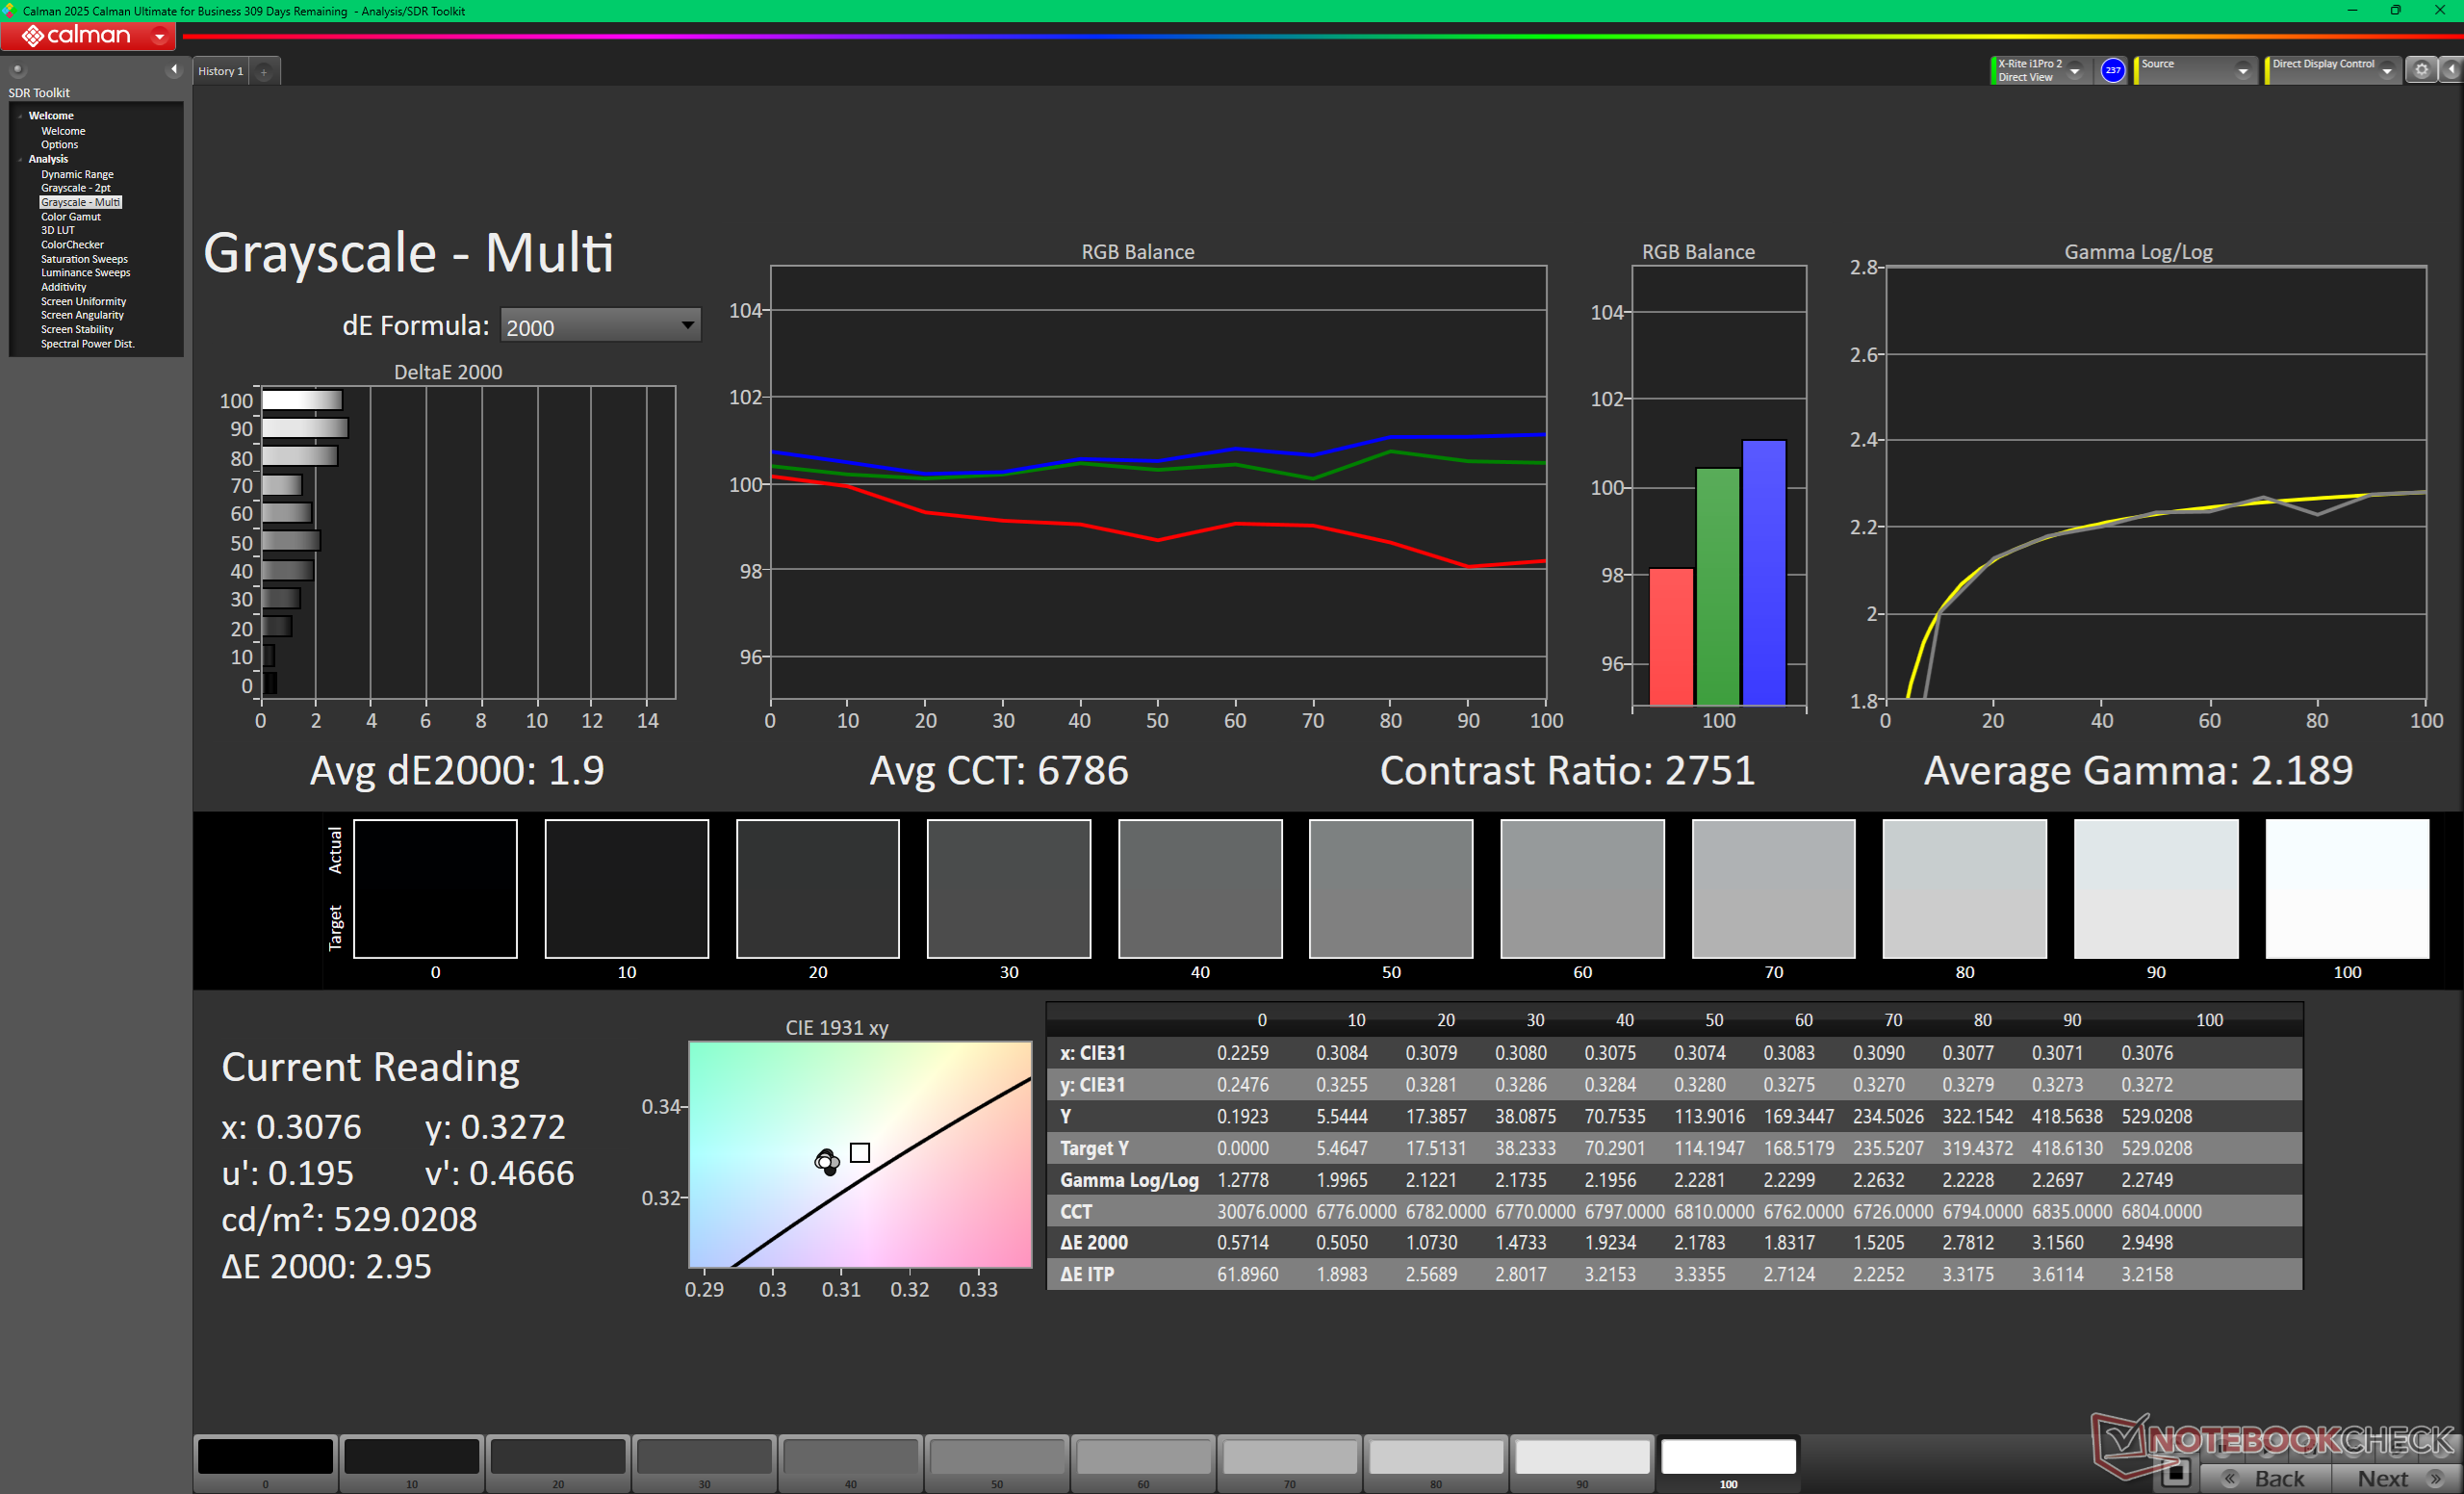
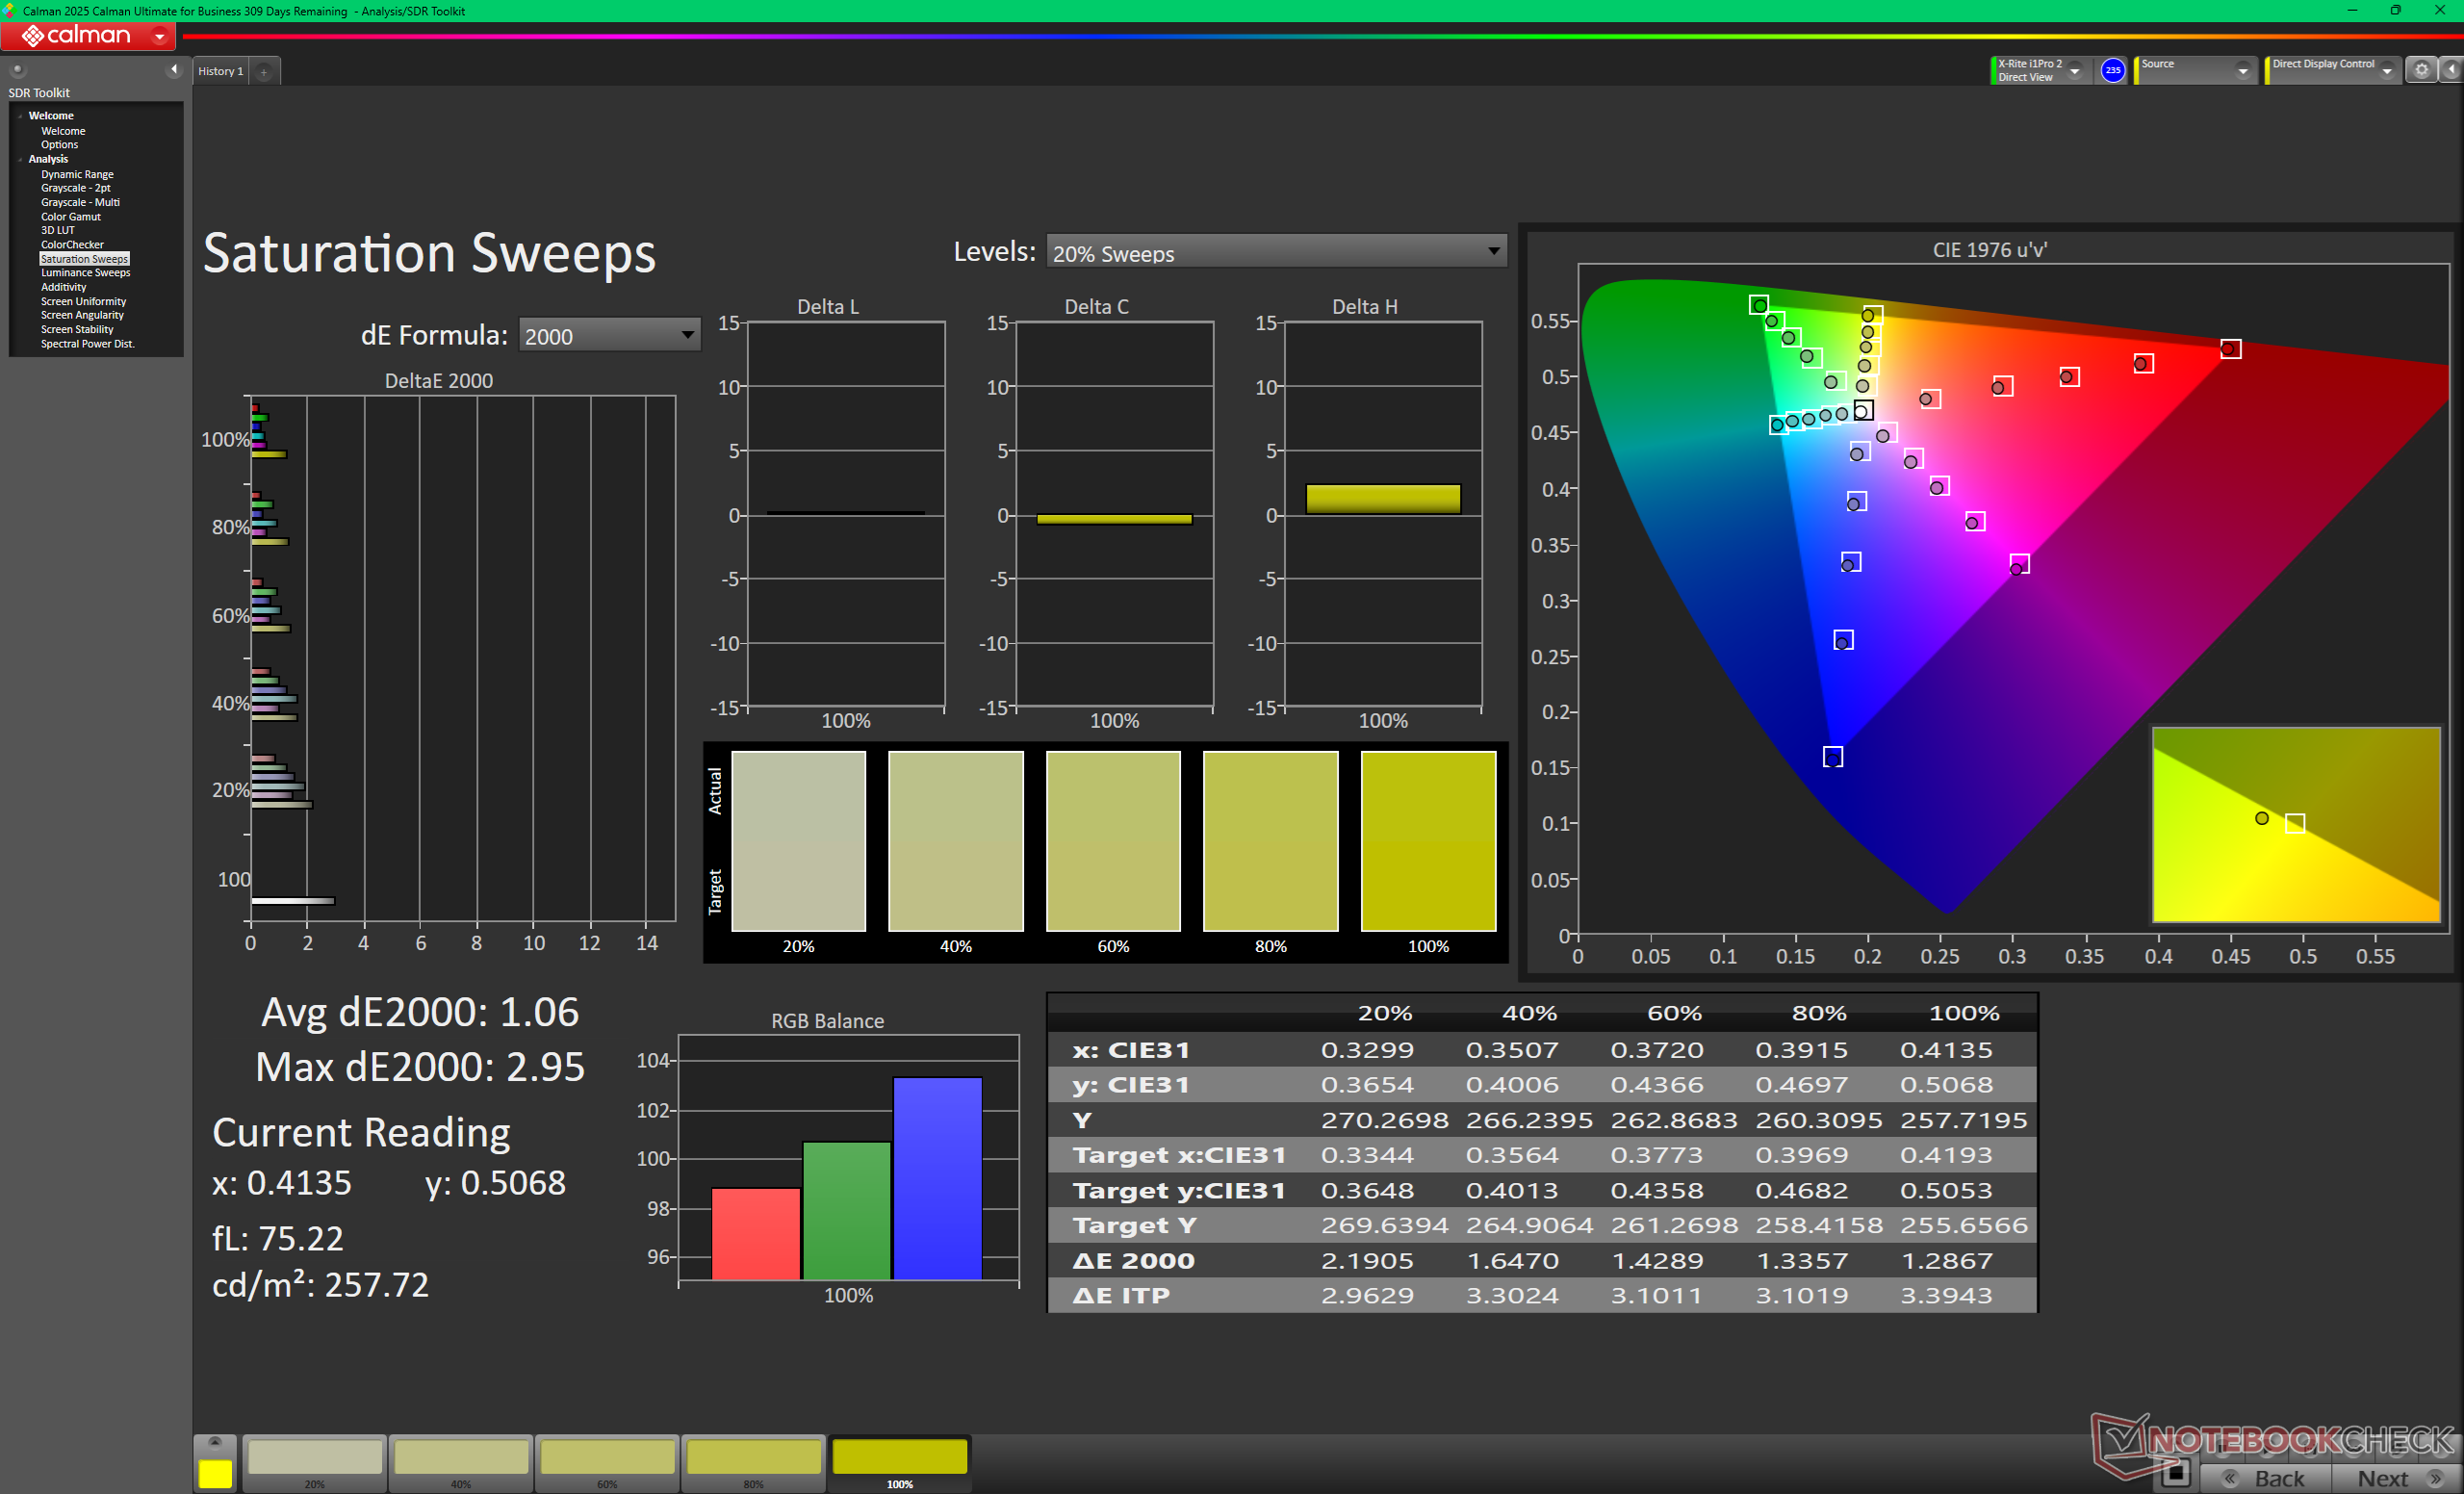
Das Display wird anständig kalibriert geliefert ab Werk mit etwas Spielraum für Verbesserungen. Eine Kalibrierung mit unserem eigenen X-Rite-Kolorimeter würde zum Beispiel die ohnehin schon niedrigen durchschnittlichen Graustufen- und Farb-DeltaE-Werte von 2,7 und 2,53 auf nur 1,9 bzw. 1,26 verbessern. Unser kalibriertes ICM-Profil können Sie oben kostenlos herunterladen.


Reaktionszeiten (Response Times) des Displays
| ↔ Reaktionszeiten Schwarz zu Weiß | ||
|---|---|---|
| 26 ms ... steigend ↗ und fallend ↘ kombiniert | ↗ 11.7 ms steigend | 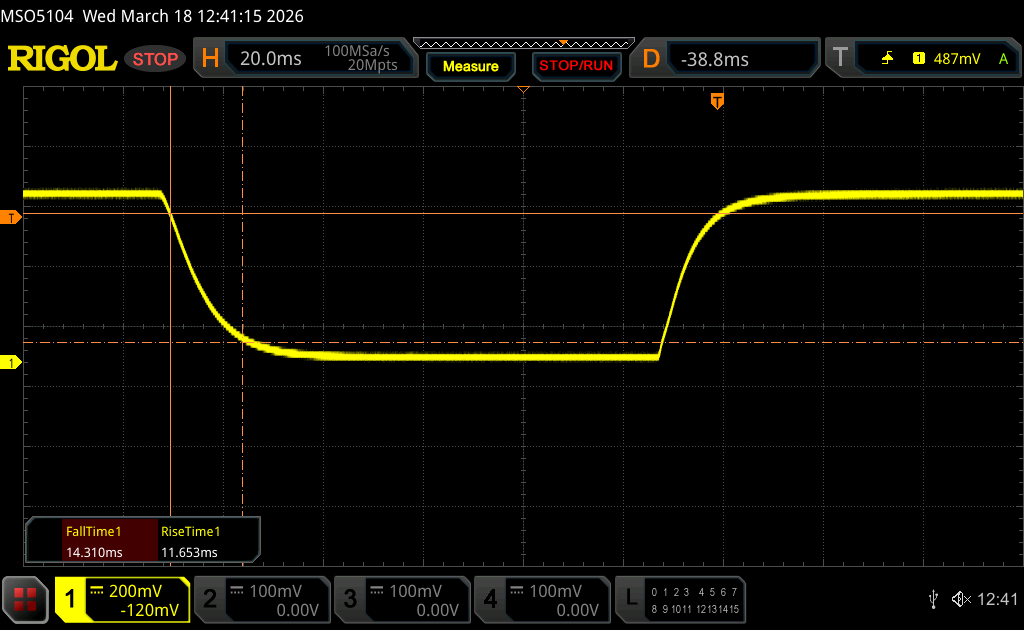 |
| ↘ 14.3 ms fallend | ||
| Die gemessenen Reaktionszeiten sind mittelmäßig und dadurch für Spieler eventuell zu langsam. Im Vergleich rangierten die bei uns getesteten Geräte von 0.1 (Minimum) zu 240 (Maximum) ms. » 62 % aller Screens waren schneller als der getestete. Daher sind die gemessenen Reaktionszeiten schlechter als der Durchschnitt aller vermessenen Geräte (19.9 ms). | ||
| ↔ Reaktionszeiten 50% Grau zu 80% Grau | ||
| 39.3 ms ... steigend ↗ und fallend ↘ kombiniert | ↗ 18.1 ms steigend | 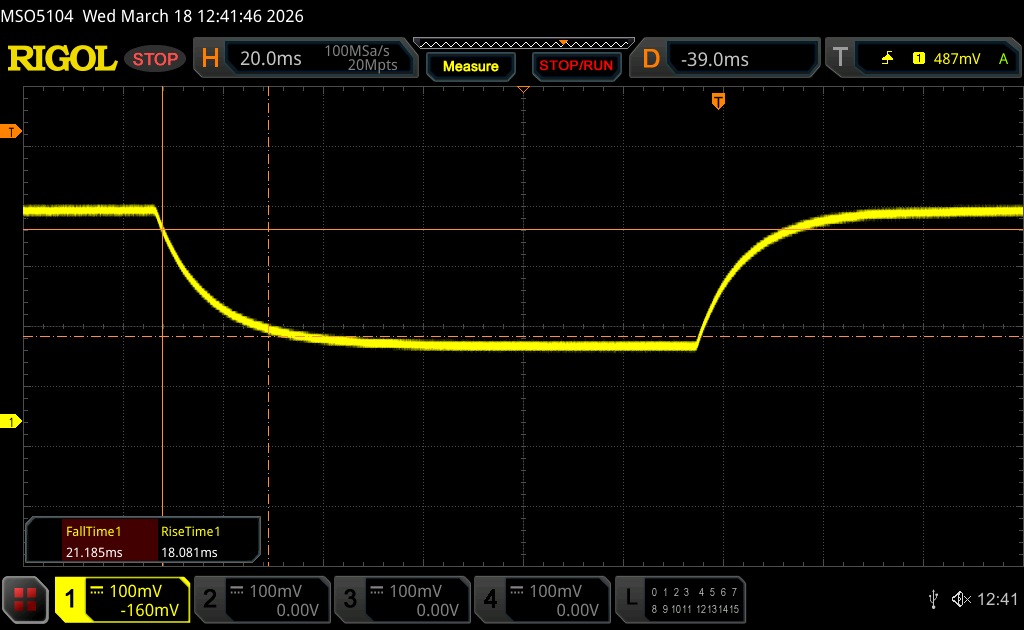 |
| ↘ 21.2 ms fallend | ||
| Die gemessenen Reaktionszeiten sind langsam und dadurch für viele Spieler wahrscheinlich zu langsam. Im Vergleich rangierten die bei uns getesteten Geräte von 0.165 (Minimum) zu 636 (Maximum) ms. » 60 % aller Screens waren schneller als der getestete. Daher sind die gemessenen Reaktionszeiten schlechter als der Durchschnitt aller vermessenen Geräte (31.1 ms). | ||
Bildschirm-Flackern / PWM (Pulse-Width Modulation)
| Flackern / PWM nicht festgestellt | 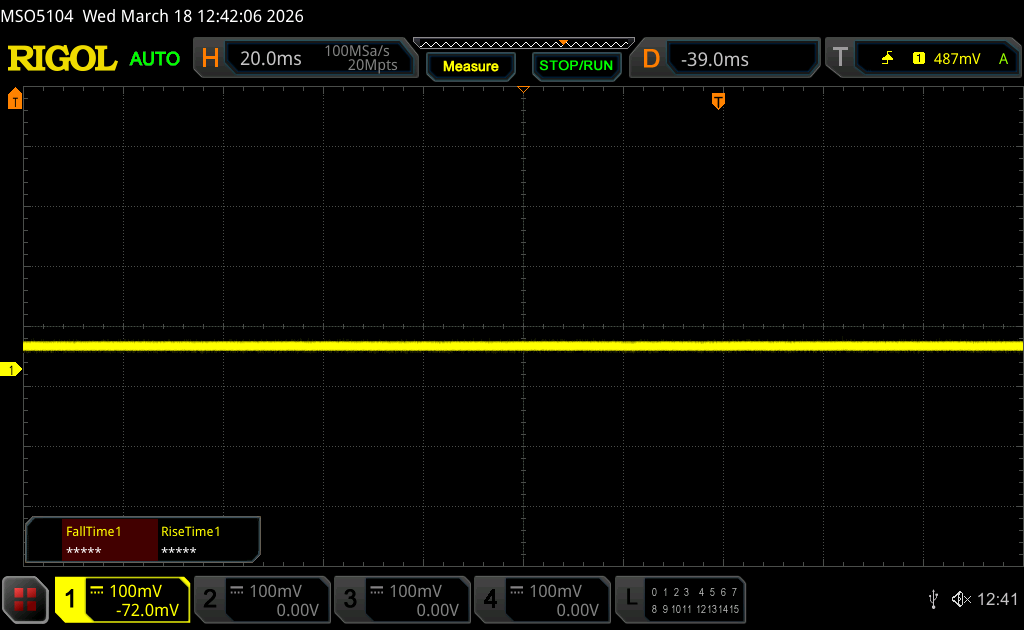 | ||
Im Vergleich: 52 % aller getesteten Geräte nutzten kein PWM um die Helligkeit zu reduzieren. Wenn PWM eingesetzt wurde, dann bei einer Frequenz von durchschnittlich 7798 (Minimum 5, Maximum 343500) Hz. | |||
Die Sichtbarkeit im Freien ist dank der relativ hellen 500-Nit-Hintergrundbeleuchtung und des matten Overlays gut, wenn es im Schatten liegt. Andernfalls werden die Farben bei direkter Sonneneinstrahlung zu sehr verwaschen.


Performance - Alles auf Panther Lake setzen
Testbedingungen
Wir haben Windows und Dell Optimizer auf den Modus Performance eingestellt, bevor wir die folgenden Benchmarks durchgeführt haben.
Prozessor
Die Basis Core Ultra 5 325 ist etwas langsam für eine CPU der H-Serie, da sie nur zehn Prozent schneller ist als die ULV Core Ultra 7 258V, wenn es um die Multi-Thread-Leistung geht. Ein Upgrade vom Core Ultra 5 325 auf die Core Ultra 7 355 Konfiguration wird die Leistung voraussichtlich nur um etwa fünf Prozent verbessern, da die Anzahl der Kerne und die Größe des Cache bei beiden identisch sind. Benutzer müssten auf die höherwertige Core Ultra X7 358H aufrüsten, um die reine Prozessorleistung um 70 Prozent zu steigern.
Cinebench R15 Mehrfachschleife
Cinebench R23: Multi Core | Single Core
Cinebench R20: CPU (Multi Core) | CPU (Single Core)
Cinebench R15: CPU Multi 64Bit | CPU Single 64Bit
Blender: v2.79 BMW27 CPU
7-Zip 18.03: 7z b 4 | 7z b 4 -mmt1
Geekbench 6.7: Multi-Core | Single-Core
Geekbench 5.5: Multi-Core | Single-Core
HWBOT x265 Benchmark v2.2: 4k Preset
LibreOffice : 20 Documents To PDF
R Benchmark 2.5: Overall mean
* ... kleinere Werte sind besser
AIDA64: FP32 Ray-Trace | FPU Julia | CPU SHA3 | CPU Queen | FPU SinJulia | FPU Mandel | CPU AES | CPU ZLib | FP64 Ray-Trace | CPU PhotoWorxx | CPU CheckMate
| Performance Rating | |
| Asus ZenBook S16 UM5606GA -1! | |
| Lenovo Yoga Pro 9 16IAH10 RTX 5050 -1! | |
| Samsung Galaxy Book6 Ultra -1! | |
| Dell XPS 16 9640 -1! | |
| MSI Prestige 16 AI Evo B2HMG -1! | |
| Dell XPS 16 Core Ultra 5 325 -1! | |
| Durchschnittliche Intel Core Ultra 5 325 -1! | |
| AIDA64 / FP32 Ray-Trace | |
| Asus ZenBook S16 UM5606GA (v6.92.6600) | |
| Lenovo Yoga Pro 9 16IAH10 RTX 5050 (v6.92.6600) | |
| Samsung Galaxy Book6 Ultra (v8.20.8100) | |
| MSI Prestige 16 AI Evo B2HMG (v6.92.6600) | |
| Dell XPS 16 9640 (v6.92.6600) | |
| Dell XPS 16 Core Ultra 5 325 (v8.20.8100) | |
| Durchschnittliche Intel Core Ultra 5 325 (11016 - 11977, n=2) | |
| AIDA64 / FPU Julia | |
| Lenovo Yoga Pro 9 16IAH10 RTX 5050 (v6.92.6600) | |
| Samsung Galaxy Book6 Ultra (v8.20.8100) | |
| Asus ZenBook S16 UM5606GA (v6.92.6600) | |
| MSI Prestige 16 AI Evo B2HMG (v6.92.6600) | |
| Dell XPS 16 9640 (v6.92.6600) | |
| Dell XPS 16 Core Ultra 5 325 (v8.20.8100) | |
| Durchschnittliche Intel Core Ultra 5 325 (57164 - 62102, n=2) | |
| AIDA64 / CPU SHA3 | |
| Samsung Galaxy Book6 Ultra (v8.20.8100) | |
| Lenovo Yoga Pro 9 16IAH10 RTX 5050 (v6.92.6600) | |
| Asus ZenBook S16 UM5606GA (v6.92.6600) | |
| MSI Prestige 16 AI Evo B2HMG (v6.92.6600) | |
| Dell XPS 16 9640 (v6.92.6600) | |
| Dell XPS 16 Core Ultra 5 325 (v8.20.8100) | |
| Durchschnittliche Intel Core Ultra 5 325 (2508 - 2718, n=2) | |
| AIDA64 / CPU Queen | |
| Asus ZenBook S16 UM5606GA (v6.92.6600) | |
| Dell XPS 16 9640 (v6.92.6600) | |
| MSI Prestige 16 AI Evo B2HMG (v6.92.6600) | |
| Lenovo Yoga Pro 9 16IAH10 RTX 5050 (v6.92.6600) | |
| AIDA64 / FPU SinJulia | |
| Asus ZenBook S16 UM5606GA (v6.92.6600) | |
| Dell XPS 16 9640 (v6.92.6600) | |
| Lenovo Yoga Pro 9 16IAH10 RTX 5050 (v6.92.6600) | |
| MSI Prestige 16 AI Evo B2HMG (v6.92.6600) | |
| Samsung Galaxy Book6 Ultra (v8.20.8100) | |
| Dell XPS 16 Core Ultra 5 325 (v8.20.8100) | |
| Durchschnittliche Intel Core Ultra 5 325 (4409 - 4414, n=2) | |
| AIDA64 / FPU Mandel | |
| Lenovo Yoga Pro 9 16IAH10 RTX 5050 (v6.92.6600) | |
| Samsung Galaxy Book6 Ultra (v8.20.8100) | |
| Asus ZenBook S16 UM5606GA (v6.92.6600) | |
| MSI Prestige 16 AI Evo B2HMG (v6.92.6600) | |
| Dell XPS 16 9640 (v6.92.6600) | |
| Dell XPS 16 Core Ultra 5 325 (v8.20.8100) | |
| Durchschnittliche Intel Core Ultra 5 325 (30237 - 33224, n=2) | |
| AIDA64 / CPU AES | |
| Asus ZenBook S16 UM5606GA (v6.92.6600) | |
| Dell XPS 16 9640 (v6.92.6600) | |
| Lenovo Yoga Pro 9 16IAH10 RTX 5050 (v6.92.6600) | |
| MSI Prestige 16 AI Evo B2HMG (v6.92.6600) | |
| Samsung Galaxy Book6 Ultra (v8.20.8100) | |
| Dell XPS 16 Core Ultra 5 325 (v8.20.8100) | |
| Durchschnittliche Intel Core Ultra 5 325 (37348 - 37641, n=2) | |
| AIDA64 / CPU ZLib | |
| Lenovo Yoga Pro 9 16IAH10 RTX 5050 (v6.92.6600) | |
| Dell XPS 16 9640 (v6.92.6600) | |
| Samsung Galaxy Book6 Ultra (v8.20.8100) | |
| Asus ZenBook S16 UM5606GA (v6.92.6600) | |
| MSI Prestige 16 AI Evo B2HMG (v6.92.6600) | |
| Dell XPS 16 Core Ultra 5 325 (v8.20.8100) | |
| Durchschnittliche Intel Core Ultra 5 325 (596 - 627, n=2) | |
| AIDA64 / FP64 Ray-Trace | |
| Asus ZenBook S16 UM5606GA (v6.92.6600) | |
| Lenovo Yoga Pro 9 16IAH10 RTX 5050 (v6.92.6600) | |
| Samsung Galaxy Book6 Ultra (v8.20.8100) | |
| MSI Prestige 16 AI Evo B2HMG (v6.92.6600) | |
| Dell XPS 16 9640 (v6.92.6600) | |
| Dell XPS 16 Core Ultra 5 325 (v8.20.8100) | |
| Durchschnittliche Intel Core Ultra 5 325 (5761 - 6324, n=2) | |
| AIDA64 / CPU PhotoWorxx | |
| Samsung Galaxy Book6 Ultra (v8.20.8100) | |
| Lenovo Yoga Pro 9 16IAH10 RTX 5050 (v6.92.6600) | |
| MSI Prestige 16 AI Evo B2HMG (v6.92.6600) | |
| Dell XPS 16 Core Ultra 5 325 (v8.20.8100) | |
| Durchschnittliche Intel Core Ultra 5 325 (53916 - 58393, n=2) | |
| Asus ZenBook S16 UM5606GA (v6.92.6600) | |
| Dell XPS 16 9640 (v6.92.6600) | |
| AIDA64 / CPU CheckMate | |
| Samsung Galaxy Book6 Ultra (v8.20.8100) | |
| Dell XPS 16 Core Ultra 5 325 (v8.20.8100) | |
| Durchschnittliche Intel Core Ultra 5 325 (2643 - 2730, n=2) | |
System Performance
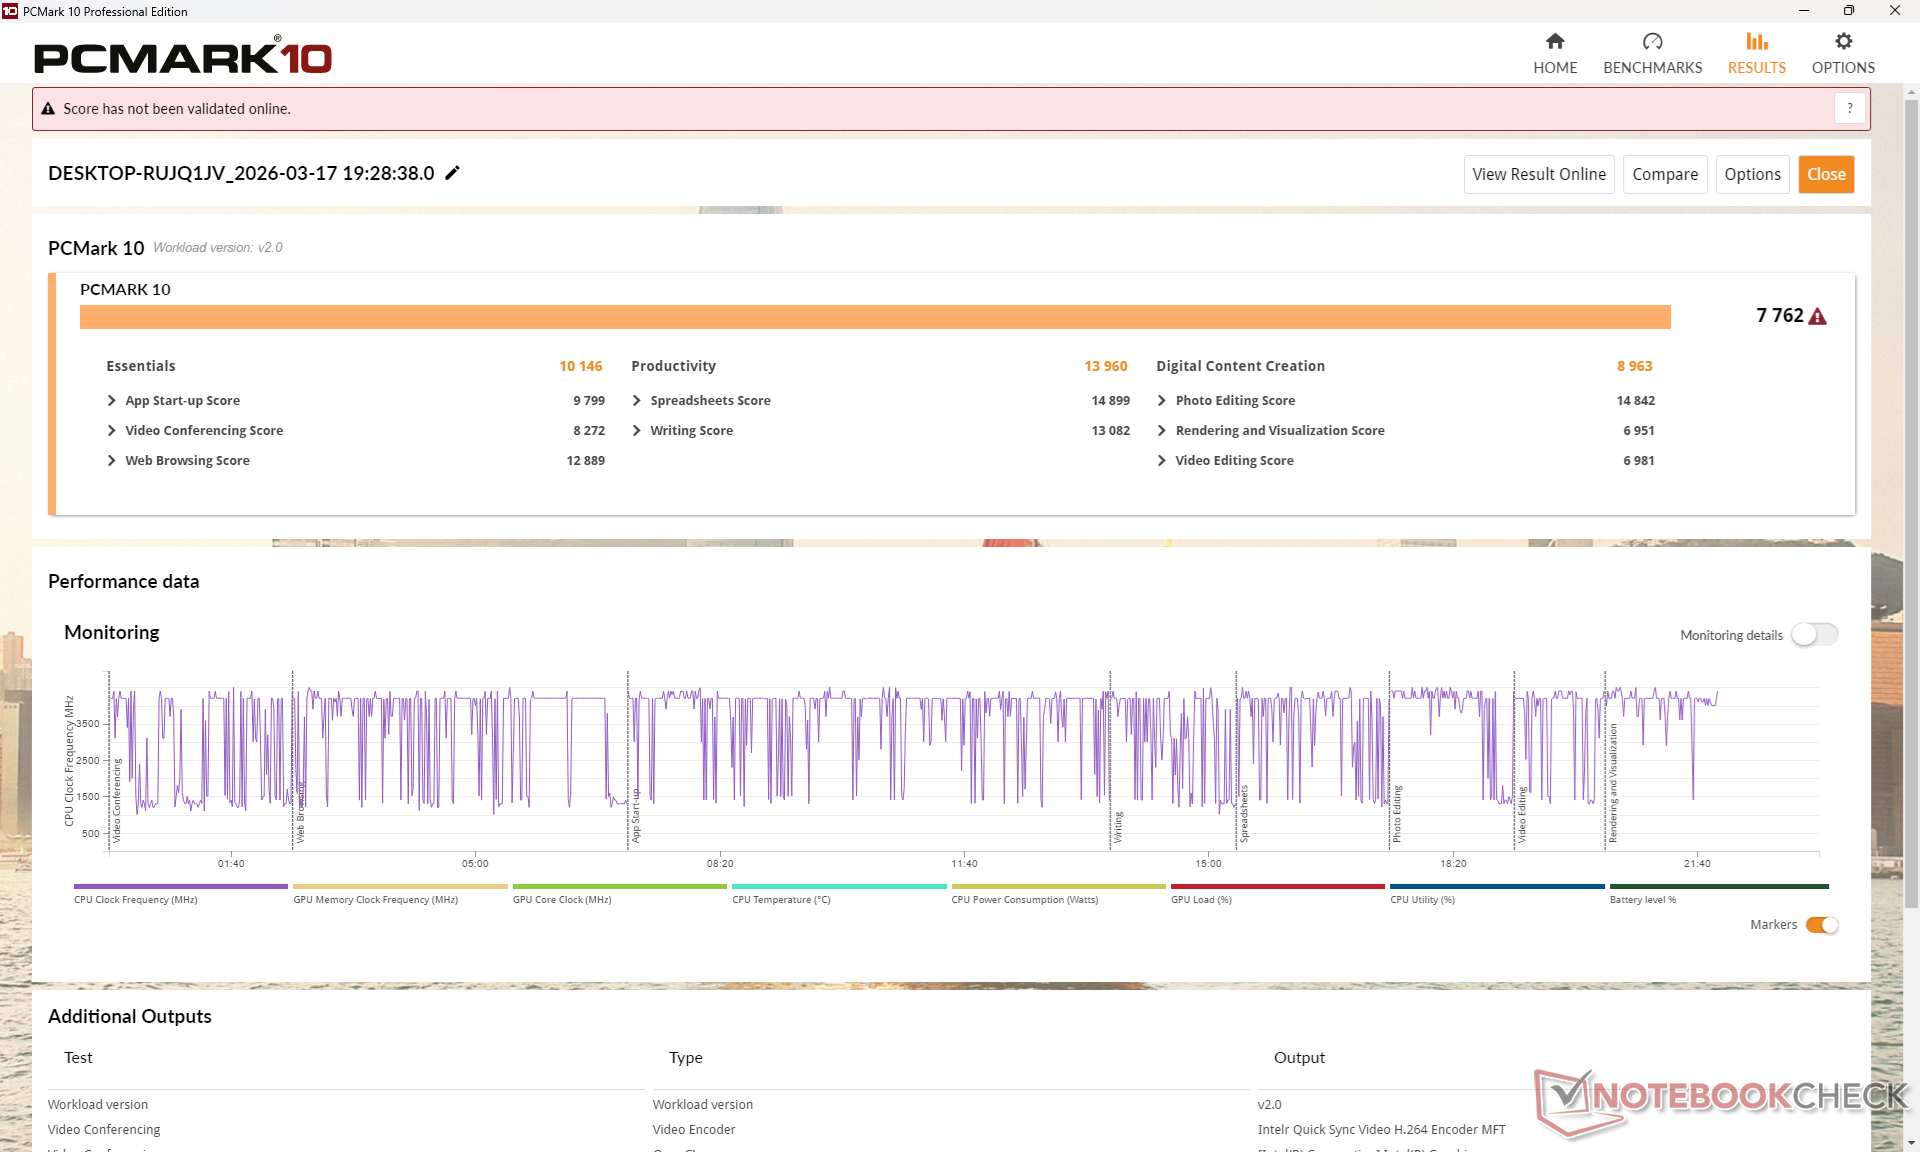
PCMark 10: Score | Essentials | Productivity | Digital Content Creation
CrossMark: Overall | Productivity | Creativity | Responsiveness
WebXPRT 3: Overall
WebXPRT 4: Overall
Mozilla Kraken 1.1: Total
Geekbench AI: Single Precision GPU 1.7 | Half Precision GPU 1.7 | Quantized GPU 1.7
| Performance Rating | |
| Lenovo Yoga Pro 9 16IAH10 RTX 5050 | |
| Samsung Galaxy Book6 Ultra | |
| MSI Prestige 16 AI Evo B2HMG -3! | |
| Dell XPS 16 9640 -4! | |
| Asus ZenBook S16 UM5606GA -3! | |
| Durchschnittliche Intel Core Ultra 5 325, Intel Graphics 4 Xe3 Panther Lake iGPU | |
| Dell XPS 16 Core Ultra 5 325 | |
| PCMark 10 / Score | |
| Lenovo Yoga Pro 9 16IAH10 RTX 5050 | |
| Samsung Galaxy Book6 Ultra | |
| Asus ZenBook S16 UM5606GA | |
| MSI Prestige 16 AI Evo B2HMG | |
| Dell XPS 16 Core Ultra 5 325 | |
| Durchschnittliche Intel Core Ultra 5 325, Intel Graphics 4 Xe3 Panther Lake iGPU (7532 - 7762, n=2) | |
| Dell XPS 16 9640 | |
| PCMark 10 / Essentials | |
| MSI Prestige 16 AI Evo B2HMG | |
| Lenovo Yoga Pro 9 16IAH10 RTX 5050 | |
| Asus ZenBook S16 UM5606GA | |
| Dell XPS 16 9640 | |
| Durchschnittliche Intel Core Ultra 5 325, Intel Graphics 4 Xe3 Panther Lake iGPU (10146 - 10402, n=2) | |
| Dell XPS 16 Core Ultra 5 325 | |
| Samsung Galaxy Book6 Ultra | |
| PCMark 10 / Productivity | |
| Samsung Galaxy Book6 Ultra | |
| Lenovo Yoga Pro 9 16IAH10 RTX 5050 | |
| Asus ZenBook S16 UM5606GA | |
| Dell XPS 16 Core Ultra 5 325 | |
| Durchschnittliche Intel Core Ultra 5 325, Intel Graphics 4 Xe3 Panther Lake iGPU (12413 - 13960, n=2) | |
| MSI Prestige 16 AI Evo B2HMG | |
| Dell XPS 16 9640 | |
| PCMark 10 / Digital Content Creation | |
| Lenovo Yoga Pro 9 16IAH10 RTX 5050 | |
| Samsung Galaxy Book6 Ultra | |
| MSI Prestige 16 AI Evo B2HMG | |
| Dell XPS 16 9640 | |
| Asus ZenBook S16 UM5606GA | |
| Durchschnittliche Intel Core Ultra 5 325, Intel Graphics 4 Xe3 Panther Lake iGPU (8963 - 8979, n=2) | |
| Dell XPS 16 Core Ultra 5 325 | |
| CrossMark / Overall | |
| MSI Prestige 16 AI Evo B2HMG | |
| Lenovo Yoga Pro 9 16IAH10 RTX 5050 | |
| Samsung Galaxy Book6 Ultra | |
| Dell XPS 16 9640 | |
| Durchschnittliche Intel Core Ultra 5 325, Intel Graphics 4 Xe3 Panther Lake iGPU (1666 - 1772, n=2) | |
| Dell XPS 16 Core Ultra 5 325 | |
| Asus ZenBook S16 UM5606GA | |
| CrossMark / Productivity | |
| MSI Prestige 16 AI Evo B2HMG | |
| Lenovo Yoga Pro 9 16IAH10 RTX 5050 | |
| Dell XPS 16 9640 | |
| Samsung Galaxy Book6 Ultra | |
| Durchschnittliche Intel Core Ultra 5 325, Intel Graphics 4 Xe3 Panther Lake iGPU (1581 - 1715, n=2) | |
| Asus ZenBook S16 UM5606GA | |
| Dell XPS 16 Core Ultra 5 325 | |
| CrossMark / Creativity | |
| MSI Prestige 16 AI Evo B2HMG | |
| Lenovo Yoga Pro 9 16IAH10 RTX 5050 | |
| Samsung Galaxy Book6 Ultra | |
| Dell XPS 16 9640 | |
| Asus ZenBook S16 UM5606GA | |
| Durchschnittliche Intel Core Ultra 5 325, Intel Graphics 4 Xe3 Panther Lake iGPU (1889 - 1917, n=2) | |
| Dell XPS 16 Core Ultra 5 325 | |
| CrossMark / Responsiveness | |
| MSI Prestige 16 AI Evo B2HMG | |
| Dell XPS 16 9640 | |
| Samsung Galaxy Book6 Ultra | |
| Lenovo Yoga Pro 9 16IAH10 RTX 5050 | |
| Durchschnittliche Intel Core Ultra 5 325, Intel Graphics 4 Xe3 Panther Lake iGPU (1338 - 1544, n=2) | |
| Asus ZenBook S16 UM5606GA | |
| Dell XPS 16 Core Ultra 5 325 | |
| WebXPRT 3 / Overall | |
| MSI Prestige 16 AI Evo B2HMG | |
| Lenovo Yoga Pro 9 16IAH10 RTX 5050 | |
| Samsung Galaxy Book6 Ultra | |
| Asus ZenBook S16 UM5606GA | |
| Durchschnittliche Intel Core Ultra 5 325, Intel Graphics 4 Xe3 Panther Lake iGPU (282 - 308, n=2) | |
| Dell XPS 16 9640 | |
| Dell XPS 16 Core Ultra 5 325 | |
| WebXPRT 4 / Overall | |
| MSI Prestige 16 AI Evo B2HMG | |
| Lenovo Yoga Pro 9 16IAH10 RTX 5050 | |
| Samsung Galaxy Book6 Ultra | |
| Durchschnittliche Intel Core Ultra 5 325, Intel Graphics 4 Xe3 Panther Lake iGPU (267 - 276, n=2) | |
| Dell XPS 16 Core Ultra 5 325 | |
| Dell XPS 16 9640 | |
| Asus ZenBook S16 UM5606GA | |
| Mozilla Kraken 1.1 / Total | |
| Dell XPS 16 Core Ultra 5 325 | |
| Durchschnittliche Intel Core Ultra 5 325, Intel Graphics 4 Xe3 Panther Lake iGPU (492 - 497, n=2) | |
| Asus ZenBook S16 UM5606GA | |
| Samsung Galaxy Book6 Ultra | |
| Lenovo Yoga Pro 9 16IAH10 RTX 5050 | |
| MSI Prestige 16 AI Evo B2HMG | |
| Geekbench AI / Single Precision GPU 1.7 | |
| Samsung Galaxy Book6 Ultra | |
| Lenovo Yoga Pro 9 16IAH10 RTX 5050 | |
| Dell XPS 16 Core Ultra 5 325 | |
| Durchschnittliche Intel Core Ultra 5 325, Intel Graphics 4 Xe3 Panther Lake iGPU (n=1) | |
| Geekbench AI / Half Precision GPU 1.7 | |
| Lenovo Yoga Pro 9 16IAH10 RTX 5050 | |
| Samsung Galaxy Book6 Ultra | |
| Dell XPS 16 Core Ultra 5 325 | |
| Durchschnittliche Intel Core Ultra 5 325, Intel Graphics 4 Xe3 Panther Lake iGPU (n=1) | |
| Geekbench AI / Quantized GPU 1.7 | |
| Samsung Galaxy Book6 Ultra | |
| Lenovo Yoga Pro 9 16IAH10 RTX 5050 | |
| Dell XPS 16 Core Ultra 5 325 | |
| Durchschnittliche Intel Core Ultra 5 325, Intel Graphics 4 Xe3 Panther Lake iGPU (n=1) | |
* ... kleinere Werte sind besser
| PCMark 10 Score | 7762 Punkte | |
Hilfe | ||
| AIDA64 / Memory Copy | |
| Samsung Galaxy Book6 Ultra | |
| Dell XPS 16 Core Ultra 5 325 | |
| Lenovo Yoga Pro 9 16IAH10 RTX 5050 | |
| MSI Prestige 16 AI Evo B2HMG | |
| Asus ZenBook S16 UM5606GA | |
| Durchschnittliche Intel Core Ultra 5 325 (89482 - 100226, n=2) | |
| Dell XPS 16 9640 | |
| AIDA64 / Memory Read | |
| Samsung Galaxy Book6 Ultra | |
| Asus ZenBook S16 UM5606GA | |
| Lenovo Yoga Pro 9 16IAH10 RTX 5050 | |
| Dell XPS 16 Core Ultra 5 325 | |
| Dell XPS 16 9640 | |
| Durchschnittliche Intel Core Ultra 5 325 (74747 - 86178, n=2) | |
| MSI Prestige 16 AI Evo B2HMG | |
| AIDA64 / Memory Write | |
| Samsung Galaxy Book6 Ultra | |
| Asus ZenBook S16 UM5606GA | |
| Dell XPS 16 Core Ultra 5 325 | |
| Lenovo Yoga Pro 9 16IAH10 RTX 5050 | |
| Durchschnittliche Intel Core Ultra 5 325 (92966 - 107858, n=2) | |
| Dell XPS 16 9640 | |
| MSI Prestige 16 AI Evo B2HMG | |
| AIDA64 / Memory Latency | |
| Dell XPS 16 9640 | |
| MSI Prestige 16 AI Evo B2HMG | |
| Lenovo Yoga Pro 9 16IAH10 RTX 5050 | |
| Durchschnittliche Intel Core Ultra 5 325 (102 - 108.4, n=2) | |
| Asus ZenBook S16 UM5606GA | |
| Dell XPS 16 Core Ultra 5 325 | |
| Samsung Galaxy Book6 Ultra | |
* ... kleinere Werte sind besser
DPC-Latenzzeit
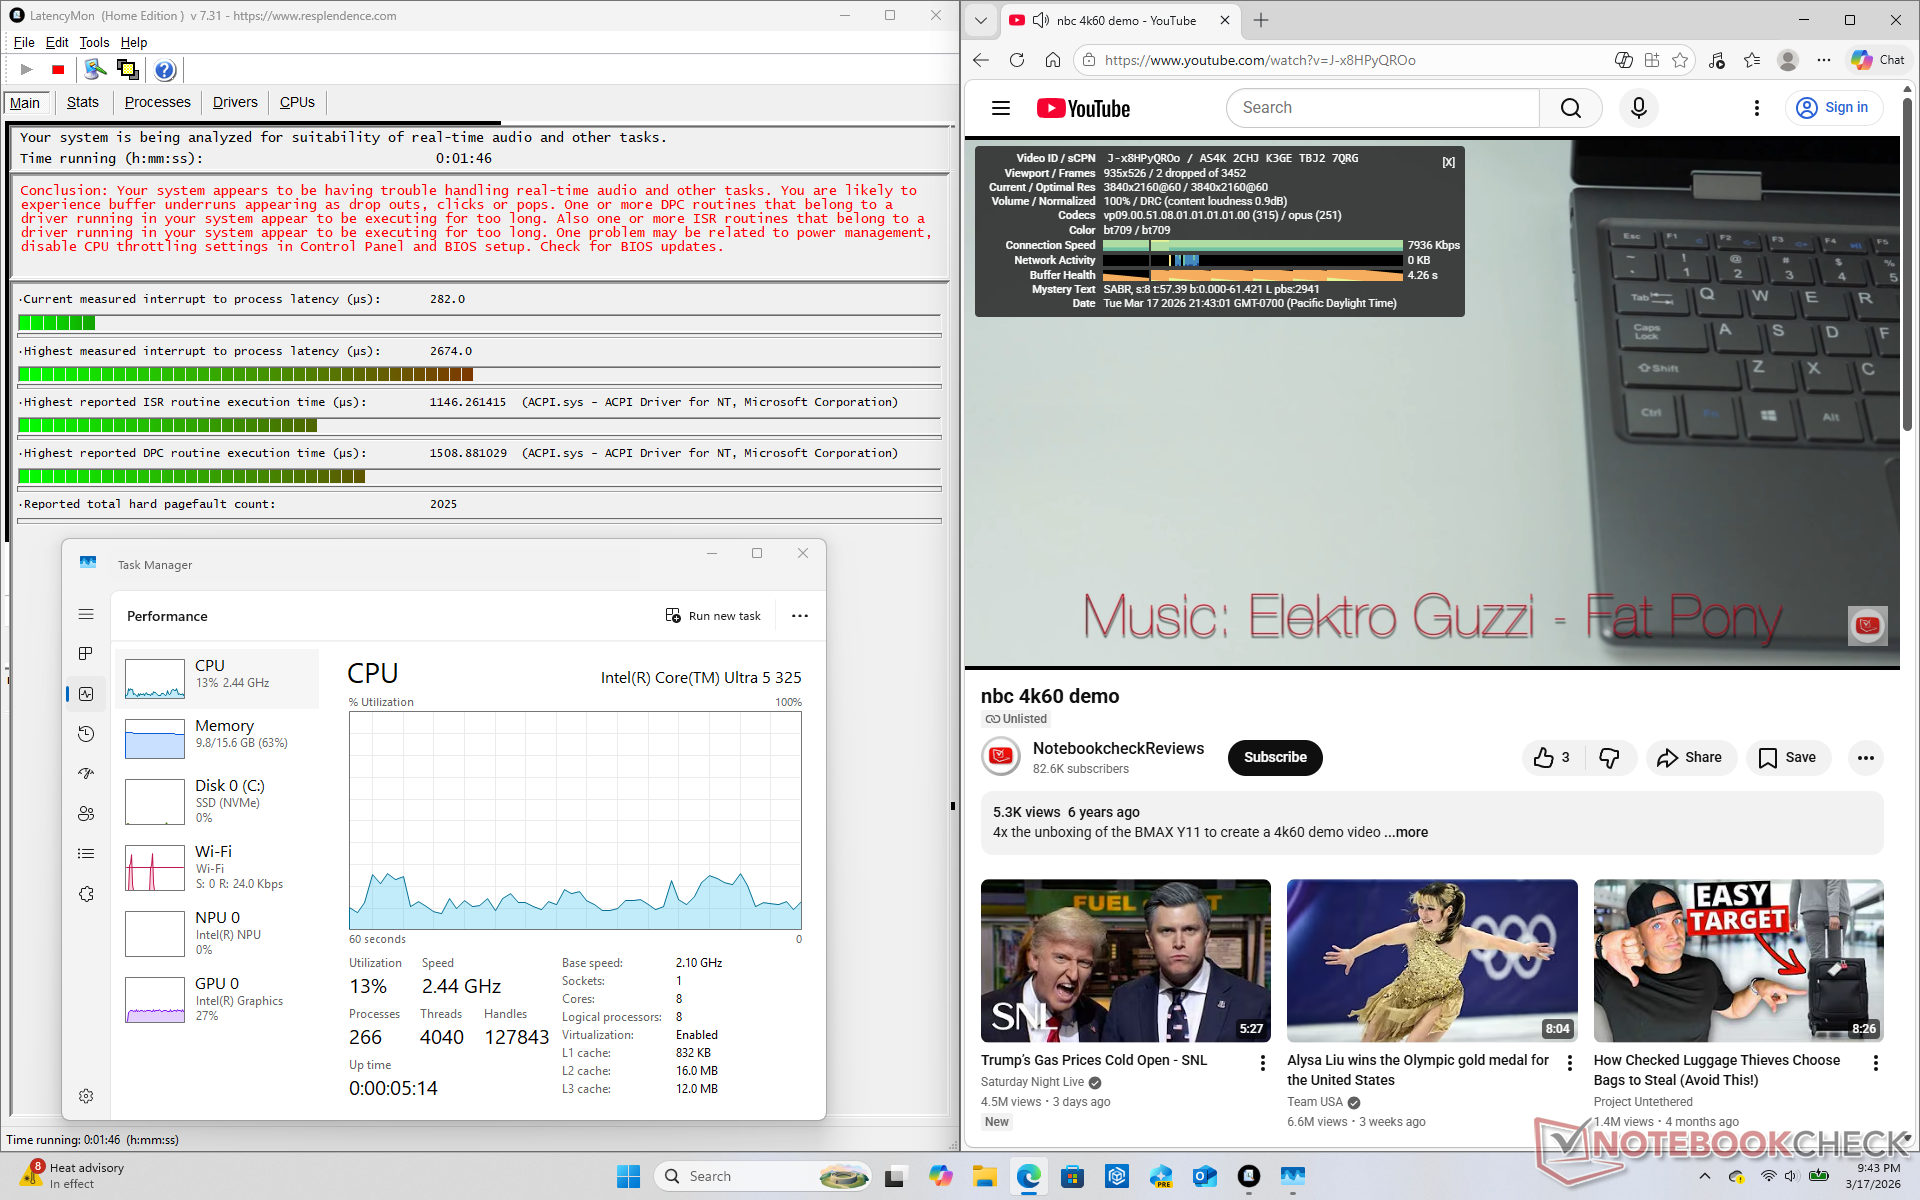
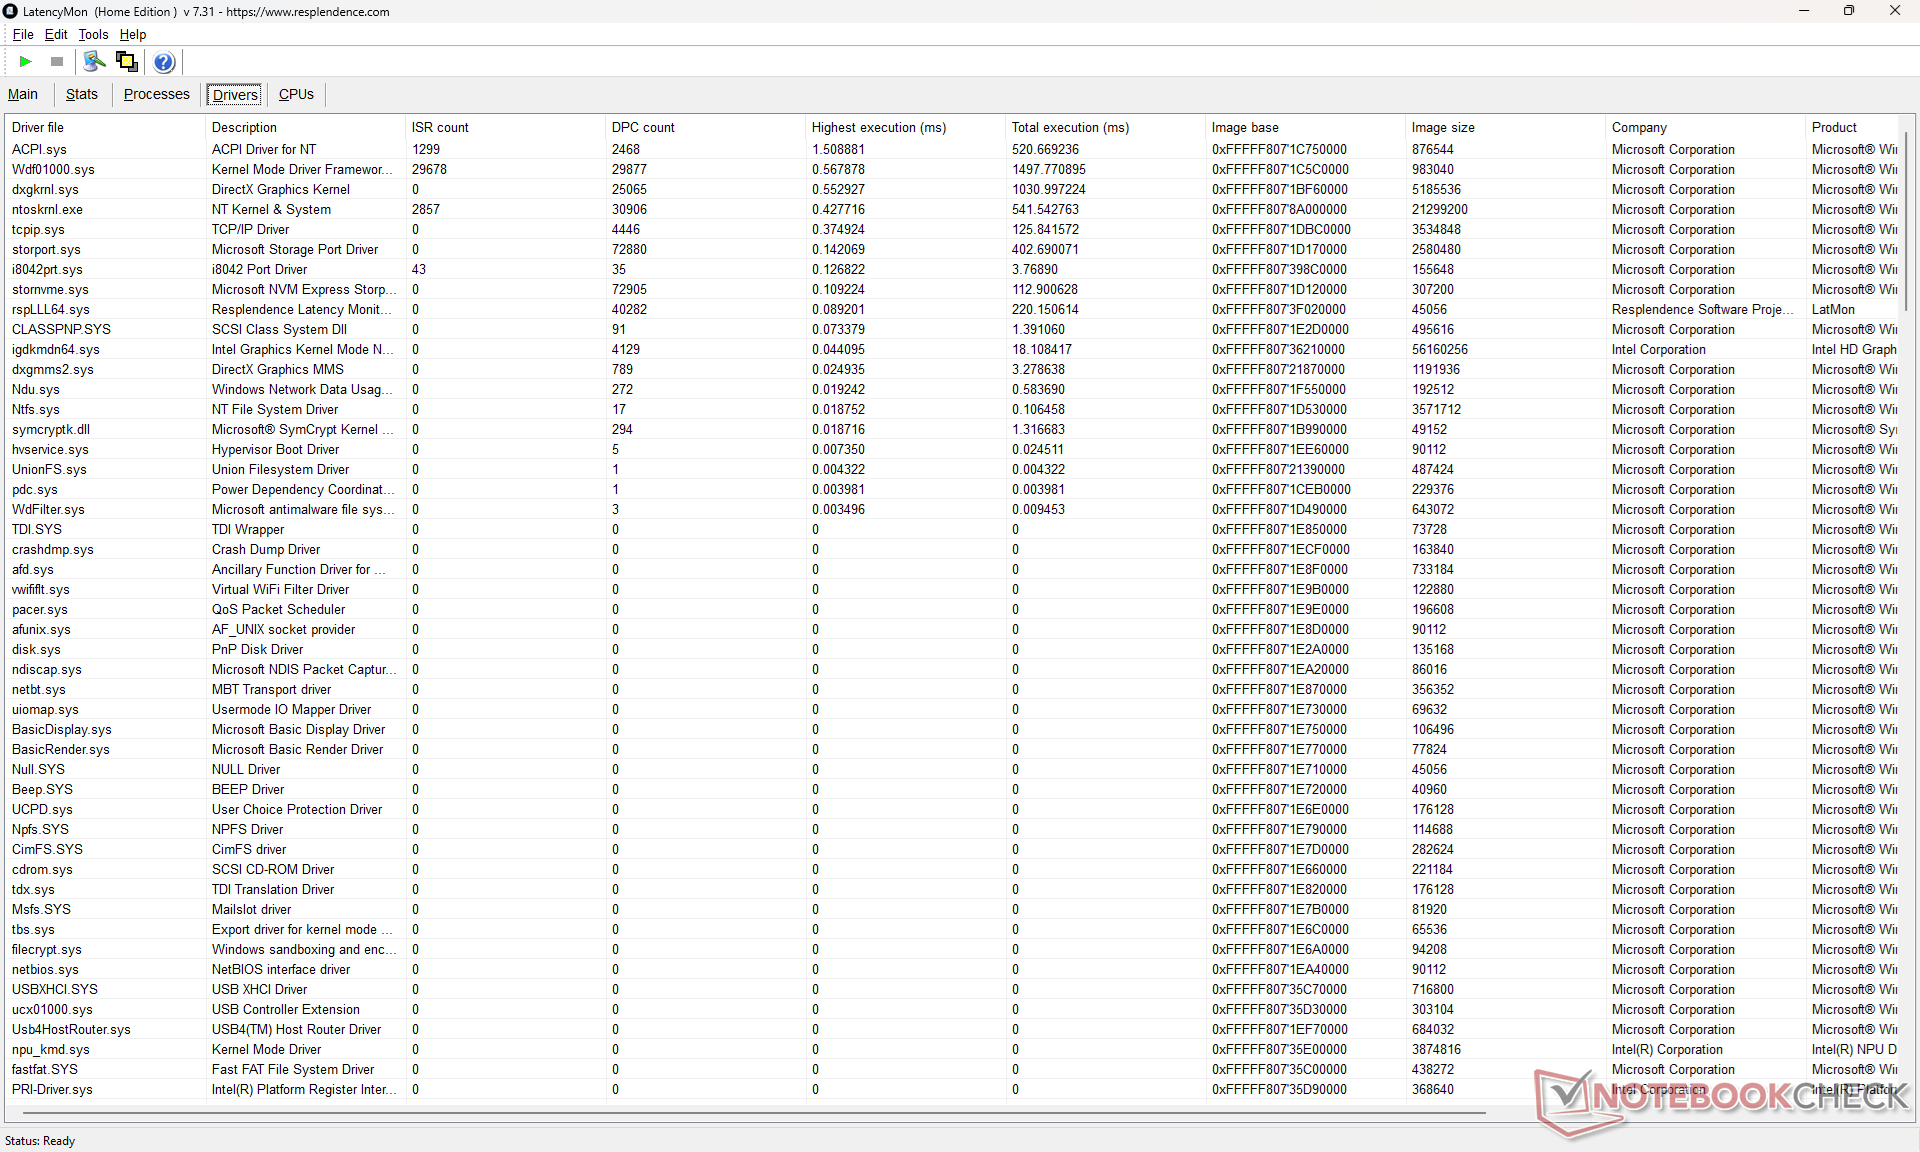
| DPC Latencies / LatencyMon - interrupt to process latency (max), Web, Youtube, Prime95 | |
| Lenovo Yoga Pro 9 16IAH10 RTX 5050 | |
| Dell XPS 16 Core Ultra 5 325 | |
| MSI Prestige 16 AI Evo B2HMG | |
| Dell XPS 16 9640 | |
| Samsung Galaxy Book6 Ultra | |
| Asus ZenBook S16 UM5606GA | |
* ... kleinere Werte sind besser
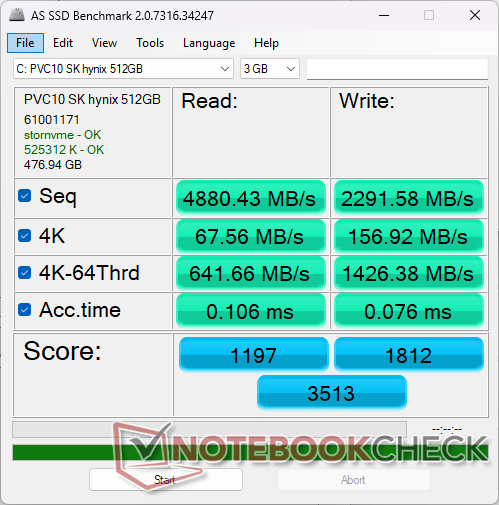
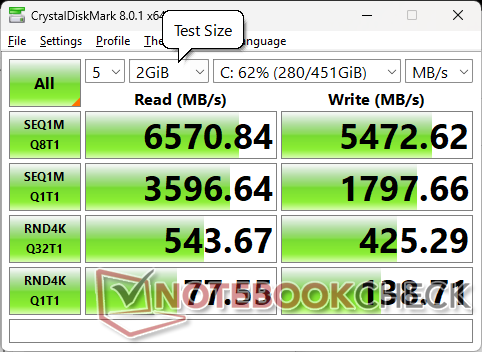
Speichergeräte
Die SK Hynix PVC10 PCIe4 x4 NVMe SSD kann Übertragungsraten von bis zu 6.600 MB/s ohne Drosselungsprobleme aufrechterhalten, wie die DiskSpd-Schleifentest-Ergebnisse unten zeigen. Beachten Sie, dass höhere Konfigurationen des XPS 16 stattdessen mit optionalen PCIe5-SSDs ausgestattet sind.


| Drive Performance Rating - Percent | |
| MSI Prestige 16 AI Evo B2HMG | |
| Dell XPS 16 9640 | |
| Lenovo Yoga Pro 9 16IAH10 RTX 5050 | |
| Asus ZenBook S16 UM5606GA | |
| Samsung Galaxy Book6 Ultra | |
| Dell XPS 16 Core Ultra 5 325 | |
* ... kleinere Werte sind besser
Drosselung der Festplatte: DDisk Throttling: DiskSpd Read Loop, Queue Depth 8
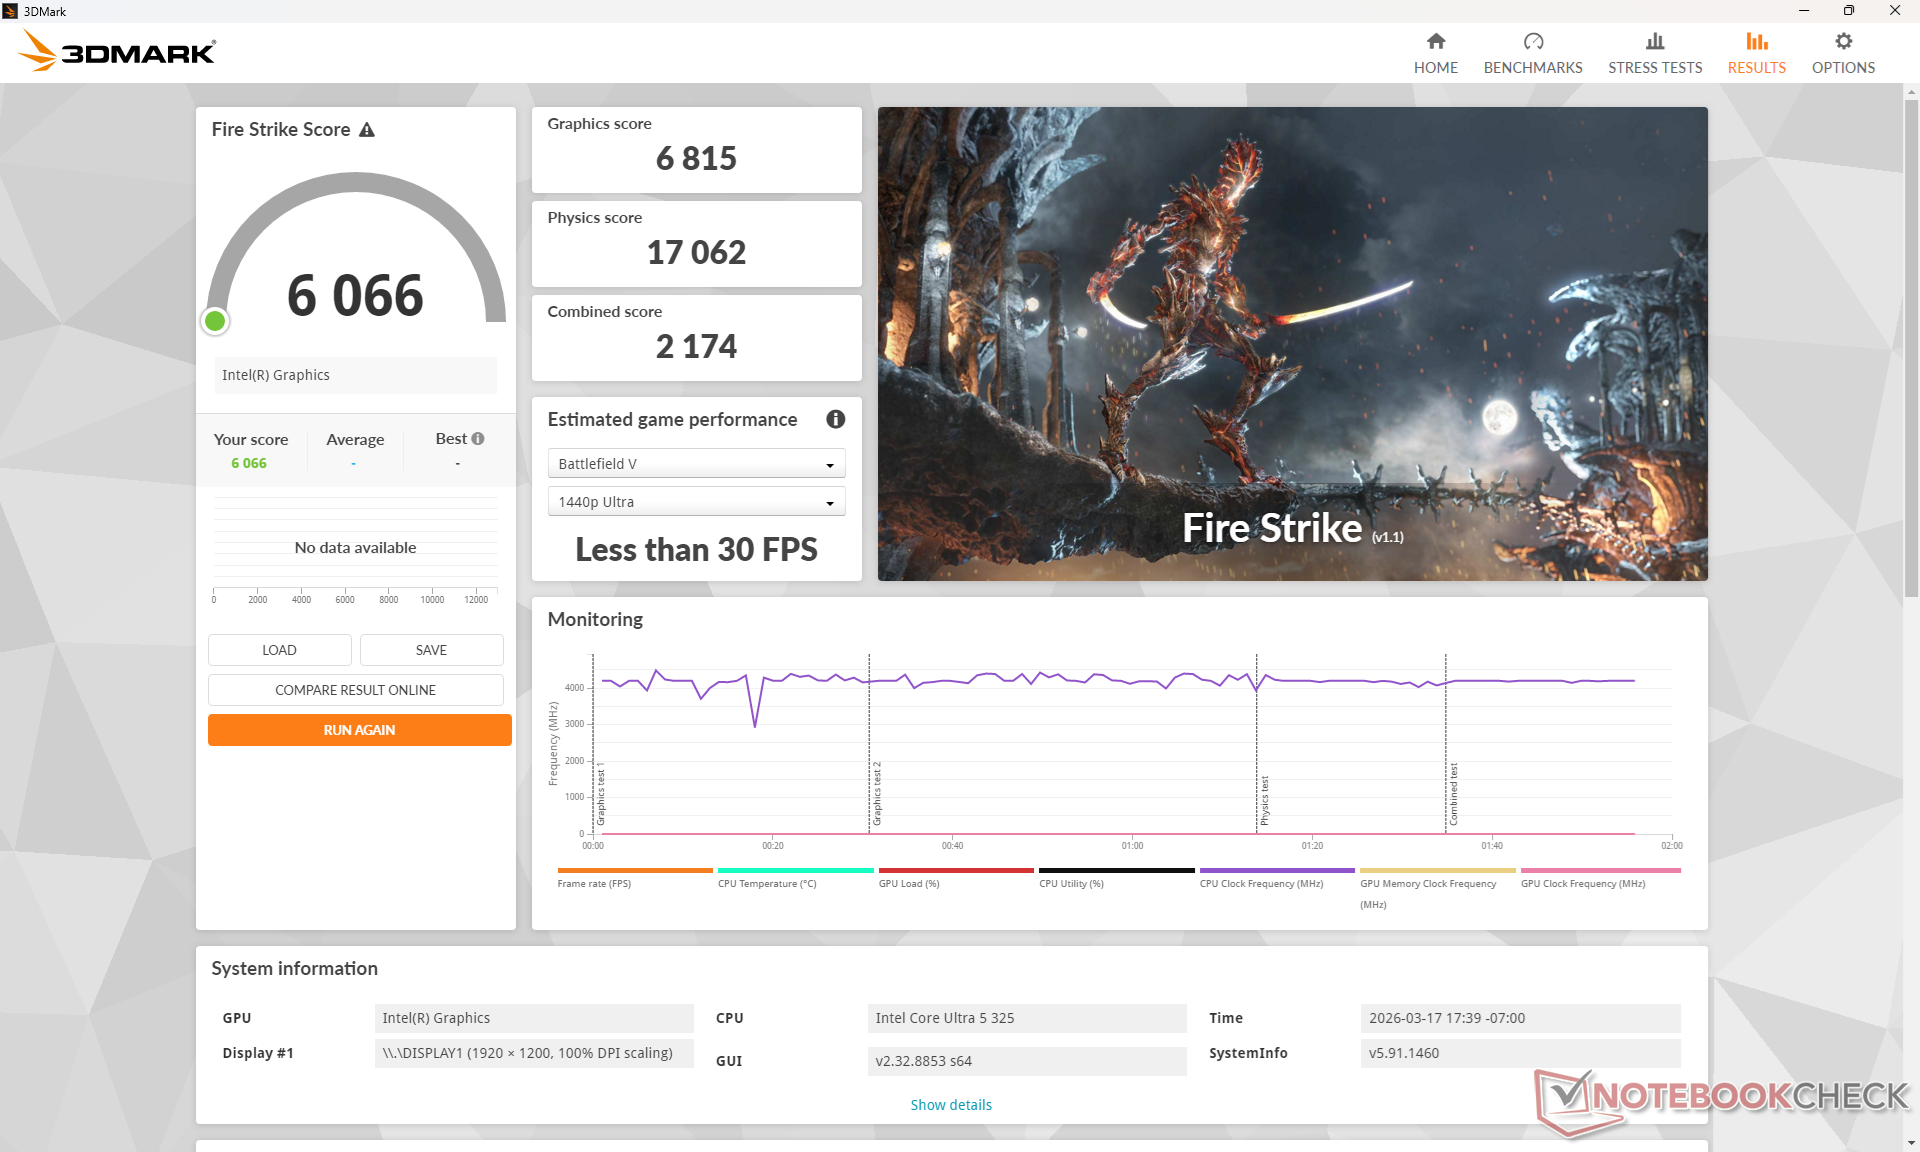
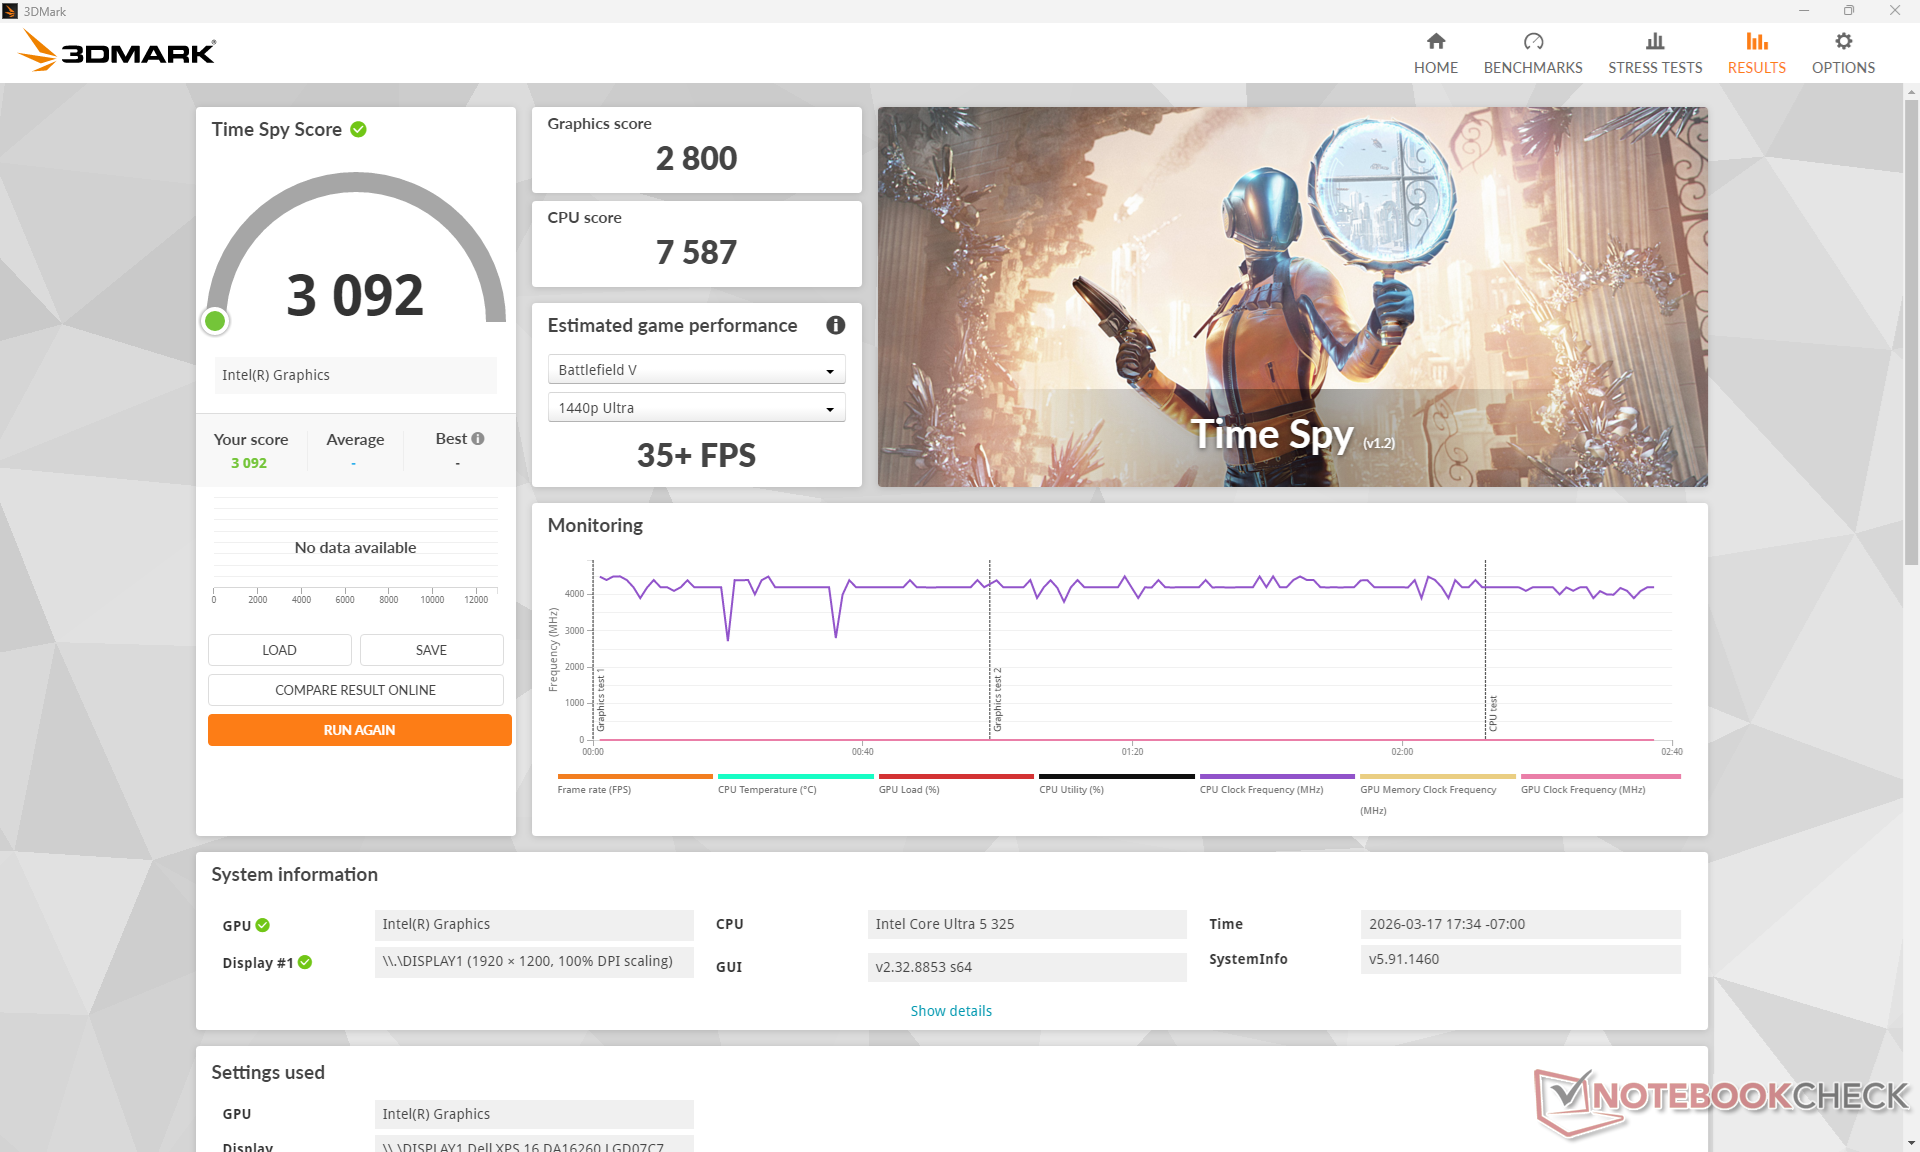
GPU Performance
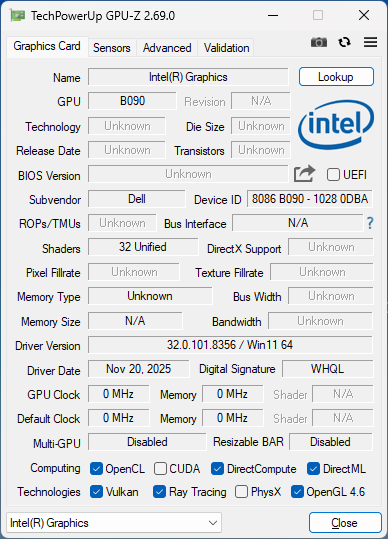
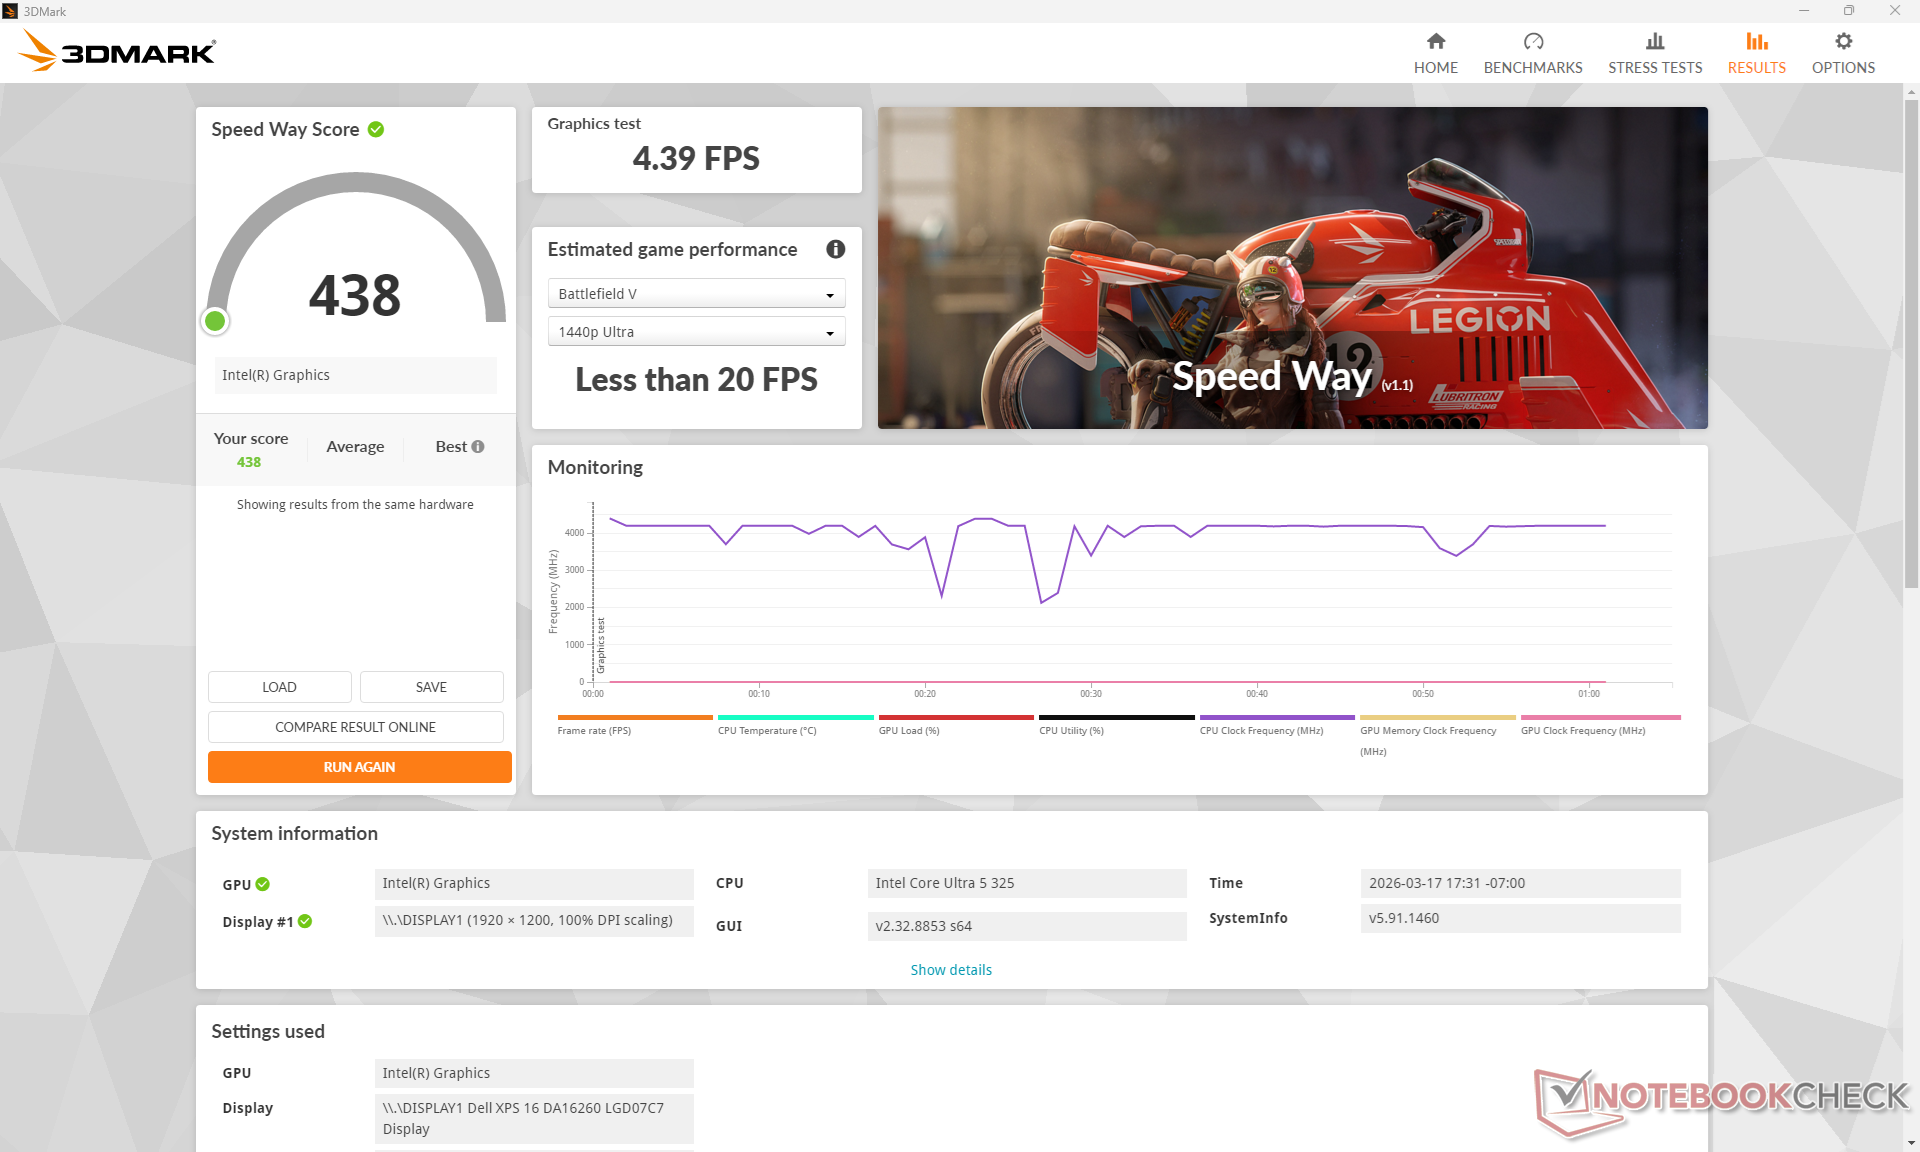
Die Panther Lake Xe3 4 ist eine der langsamsten integrierten Lösungen aus der Panther-Lake-Reihe. Die Performance ähnelt am meisten dem zwei Generationen alten Arc 8 oder dem AMD Radeon 680M. Ein Upgrade auf die Core Ultra 7 355 Konfiguration wird die Grafikleistung nicht wesentlich verbessern, da die CPU die gleiche Xe3-4-iGPU verwendet. Stattdessen müssen Benutzer auf den Core Ultra X7 358H mit integrierter Arc B390 Grafikkarte aufrüsten, um eine 2,5-fache Leistungssteigerung zu erzielen, wie die Tabellen unten zeigen.
| Leistungsprofil | Grafics-Score | Physics-Score | Kombinierte Punktzahl |
| Performance-Modus | 6.815 | 17.062 | 2.174 |
| Ausgeglichener Modus | 6.633 (-3 %) | 16.820 (-1 %) | 2.039 (-6 %) |
| Akku-Leistung | 6.480 (-5 %) | 17.601 (+3 %) | 2.140 (-2 %) |
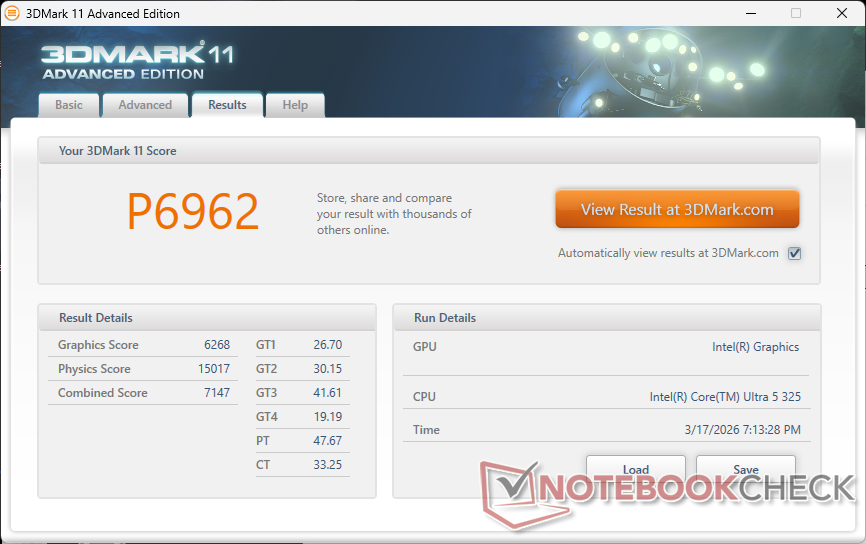
| 3DMark 11 Performance | 6962 Punkte | |
| 3DMark Cloud Gate Standard Score | 26419 Punkte | |
| 3DMark Fire Strike Score | 6066 Punkte | |
| 3DMark Time Spy Score | 3092 Punkte | |
Hilfe | ||
* ... kleinere Werte sind besser
| Performance Rating - Percent | |
| Samsung Galaxy Book6 Ultra | |
| Lenovo Yoga Pro 9 16IAH10 RTX 5050 | |
| Dell XPS 16 9640 | |
| Asus ZenBook S16 UM5606GA | |
| MSI Prestige 16 AI Evo B2HMG | |
| Dell XPS 16 Core Ultra 5 325 | |
| Cyberpunk 2077 - 1920x1080 Ultra Preset (FSR off) | |
| Samsung Galaxy Book6 Ultra | |
| Lenovo Yoga Pro 9 16IAH10 RTX 5050 | |
| Dell XPS 16 9640 | |
| MSI Prestige 16 AI Evo B2HMG | |
| Asus ZenBook S16 UM5606GA | |
| Dell XPS 16 Core Ultra 5 325 | |
| Baldur's Gate 3 - 1920x1080 Ultra Preset AA:T | |
| Samsung Galaxy Book6 Ultra | |
| Lenovo Yoga Pro 9 16IAH10 RTX 5050 | |
| Dell XPS 16 9640 | |
| Asus ZenBook S16 UM5606GA | |
| MSI Prestige 16 AI Evo B2HMG | |
| Dell XPS 16 Core Ultra 5 325 | |
| GTA V - 1920x1080 Highest AA:4xMSAA + FX AF:16x | |
| Samsung Galaxy Book6 Ultra | |
| Lenovo Yoga Pro 9 16IAH10 RTX 5050 | |
| Dell XPS 16 9640 | |
| Asus ZenBook S16 UM5606GA | |
| Dell XPS 16 Core Ultra 5 325 | |
| MSI Prestige 16 AI Evo B2HMG | |
| Final Fantasy XV Benchmark - 1920x1080 High Quality | |
| Samsung Galaxy Book6 Ultra | |
| Lenovo Yoga Pro 9 16IAH10 RTX 5050 | |
| Dell XPS 16 9640 | |
| MSI Prestige 16 AI Evo B2HMG | |
| Asus ZenBook S16 UM5606GA | |
| Dell XPS 16 Core Ultra 5 325 | |
| Strange Brigade - 1920x1080 ultra AA:ultra AF:16 | |
| Samsung Galaxy Book6 Ultra | |
| Lenovo Yoga Pro 9 16IAH10 RTX 5050 | |
| Dell XPS 16 9640 | |
| MSI Prestige 16 AI Evo B2HMG | |
| Asus ZenBook S16 UM5606GA | |
| Dell XPS 16 Core Ultra 5 325 | |
| Dota 2 Reborn - 1920x1080 ultra (3/3) best looking | |
| Lenovo Yoga Pro 9 16IAH10 RTX 5050 | |
| Samsung Galaxy Book6 Ultra | |
| Dell XPS 16 9640 | |
| Asus ZenBook S16 UM5606GA | |
| MSI Prestige 16 AI Evo B2HMG | |
| Dell XPS 16 Core Ultra 5 325 | |
| X-Plane 11.11 - 1920x1080 high (fps_test=3) | |
| Lenovo Yoga Pro 9 16IAH10 RTX 5050 | |
| Dell XPS 16 9640 | |
| Dell XPS 16 9640 | |
| Samsung Galaxy Book6 Ultra | |
| Asus ZenBook S16 UM5606GA | |
| MSI Prestige 16 AI Evo B2HMG | |
| Dell XPS 16 Core Ultra 5 325 | |
Cyberpunk 2077 ultra FPS Grafik
| min. | mittel | hoch | max. | |
|---|---|---|---|---|
| GTA V (2015) | 162.4 | 158.1 | 51.8 | 20.8 |
| Dota 2 Reborn (2015) | 102.9 | 89 | 72.6 | 68.4 |
| Final Fantasy XV Benchmark (2018) | 66.3 | 35.4 | 25.1 | |
| X-Plane 11.11 (2018) | 37.8 | 30.6 | 22.9 | |
| Strange Brigade (2018) | 107.3 | 38.2 | 35.9 | 43.3 |
| Baldur's Gate 3 (2023) | 27.4 | 22.2 | 19 | 18.7 |
| Cyberpunk 2077 (2023) | 35.2 | 27 | 23.8 | 19.9 |
| F1 24 (2024) | 55.6 | 52.7 | 40.8 | 13.2 |
Emissionen - Leiser, aber immer noch recht warm
Systemrauschen
Das Lüftergeräusch ist in fast allen Szenarien viel leiser als das des Dell 16 Premium. Im Vergleich zu den meisten anderen Laptops bleibt das System über einen längeren Zeitraum leise oder unhörbar. Zum Beispiel werden die Lüftergeräusche beim 3DMark06 erst nach mehr als zwei Dritteln der ersten Benchmark-Szene hörbar, während die Geräuschentwicklung beim ZenBook S16 deutlich früher und lauter einsetzt.
Das Lüftergeräusch beim Spielen pendelt sich zwischen 38 und 44 dB(A) ein, was immer noch leiser ist als das letztjährige Modell oder das oben erwähnte Asus unter ähnlichen Bedingungen.


Lautstärkediagramm
| Idle |
| 22.9 / 22.9 / 23.9 dB(A) |
| Last |
| 34.8 / 43.3 dB(A) |
 | ||
30 dB leise 40 dB(A) deutlich hörbar 50 dB(A) störend |
||
min: | ||
| Dell XPS 16 Core Ultra 5 325 Ultra 5 325, Intel Graphics 4 Xe3 PTL | Dell XPS 16 9640 Ultra 7 155H, GeForce RTX 4070 Laptop GPU | Lenovo Yoga Pro 9 16IAH10 RTX 5050 Ultra 9 285H, GeForce RTX 5050 Laptop | Samsung Galaxy Book6 Ultra Ultra 7 356H, GeForce RTX 5070 Laptop | Asus ZenBook S16 UM5606GA Ryzen AI 9 465, Radeon 880M | MSI Prestige 16 AI Evo B2HMG Ultra 9 285H, Arc 140T | |
|---|---|---|---|---|---|---|
| Geräuschentwicklung | -11% | -12% | -12% | -15% | -5% | |
| aus / Umgebung * (dB) | 22.8 | 24.5 -7% | 24.6 -8% | 25.1 -10% | 24.9 -9% | 23.6 -4% |
| Idle min * (dB) | 22.9 | 24.5 -7% | 24.6 -7% | 25.1 -10% | 24.9 -9% | 23.6 -3% |
| Idle avg * (dB) | 22.9 | 24.5 -7% | 24.6 -7% | 25.1 -10% | 24.9 -9% | 23.6 -3% |
| Idle max * (dB) | 23.9 | 27.5 -15% | 26.8 -12% | 25.1 -5% | 24.9 -4% | 26.2 -10% |
| Last avg * (dB) | 34.8 | 39.6 -14% | 32.8 6% | 36.9 -6% | 45.7 -31% | 37.1 -7% |
| Cyberpunk 2077 ultra * (dB) | 38 | 51.8 -36% | 48.5 -28% | 49 -29% | 42.1 -11% | |
| Last max * (dB) | 43.3 | 49.7 -15% | 51.8 -20% | 48.5 -12% | 50.4 -16% | 42.1 3% |
| Witcher 3 ultra * (dB) | 49.7 |
* ... kleinere Werte sind besser
Temperatur
Die Oberflächentemperaturen sind höher als erwartet, zumal das neue XPS 16 keine dedizierte Grafikkarte besitzt. Unter anspruchsvoller Last, etwa beim Spielen, können Hotspots über 43 °C erreichen, verglichen mit nur 37 °C beim letztjährigen, schwereren Dell 16 Premium mit dedizierter GeForce-RTX-5070‑Grafik.


(±) Die maximale Temperatur auf der Oberseite ist 43.8 °C. Im Vergleich liegt der Klassendurchschnitt bei 36.8 °C (von 21 bis 71 °C für die Klasse Multimedia).
(±) Auf der Unterseite messen wir eine maximalen Wert von 42 °C (im Vergleich zum Durchschnitt von 39.1 °C).
(+) Ohne Last messen wir eine durchschnittliche Temperatur von 22.4 °C auf der Oberseite. Der Klassendurchschnitt erreicht 31.3 °C.
(±) 3: The average temperature for the upper side is 35.3 °C / 96 F, compared to the average of 31.3 °C / 88 F for the class Multimedia.
(+) Die Handballen und der Touchpad-Bereich sind mit gemessenen 31.6 °C kühler als die typische Hauttemperatur und fühlen sich dadurch kühl an.
(-) Die durchschnittliche Handballen-Temperatur anderer getesteter Geräte war 28.7 °C (-2.9 °C).


| Dell XPS 16 Core Ultra 5 325 Ultra 5 325, Intel Graphics 4 Xe3 PTL | Dell XPS 16 9640 Ultra 7 155H, GeForce RTX 4070 Laptop GPU | Lenovo Yoga Pro 9 16IAH10 RTX 5050 Ultra 9 285H, GeForce RTX 5050 Laptop | Samsung Galaxy Book6 Ultra Ultra 7 356H, GeForce RTX 5070 Laptop | Asus ZenBook S16 UM5606GA Ryzen AI 9 465, Radeon 880M | MSI Prestige 16 AI Evo B2HMG Ultra 9 285H, Arc 140T | |
|---|---|---|---|---|---|---|
| Hitze | -4% | -9% | -8% | -9% | -13% | |
| Last oben max * (°C) | 43.8 | 39.4 10% | 34.4 21% | 42.7 3% | 43.4 1% | 48.1 -10% |
| Last unten max * (°C) | 42 | 36.9 12% | 41.4 1% | 49.1 -17% | 46.2 -10% | 51.6 -23% |
| Idle oben max * (°C) | 23.2 | 28.2 -22% | 28.6 -23% | 25.4 -9% | 26.5 -14% | 25.9 -12% |
| Idle unten max * (°C) | 23.6 | 27.4 -16% | 31.8 -35% | 25.5 -8% | 27 -14% | 25.2 -7% |
* ... kleinere Werte sind besser
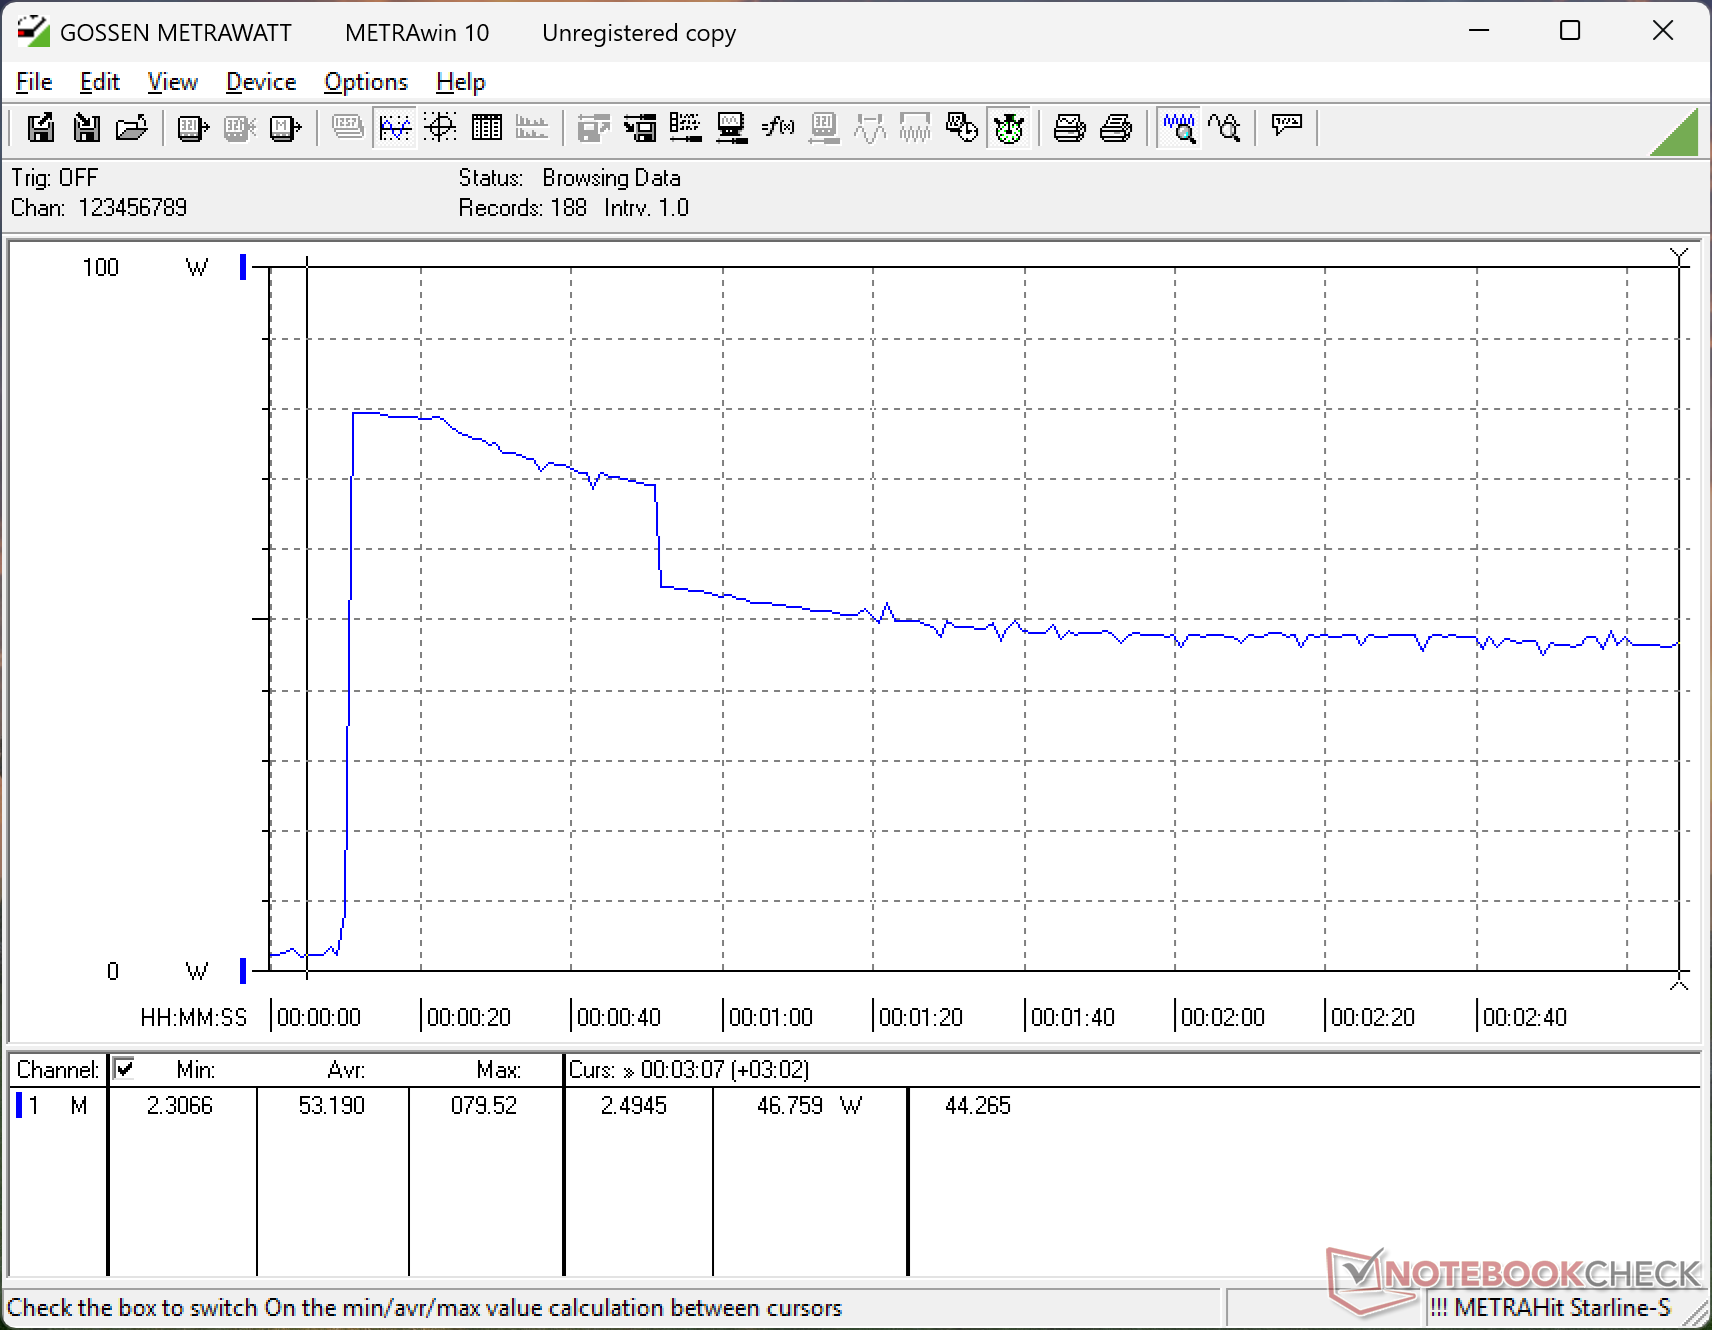
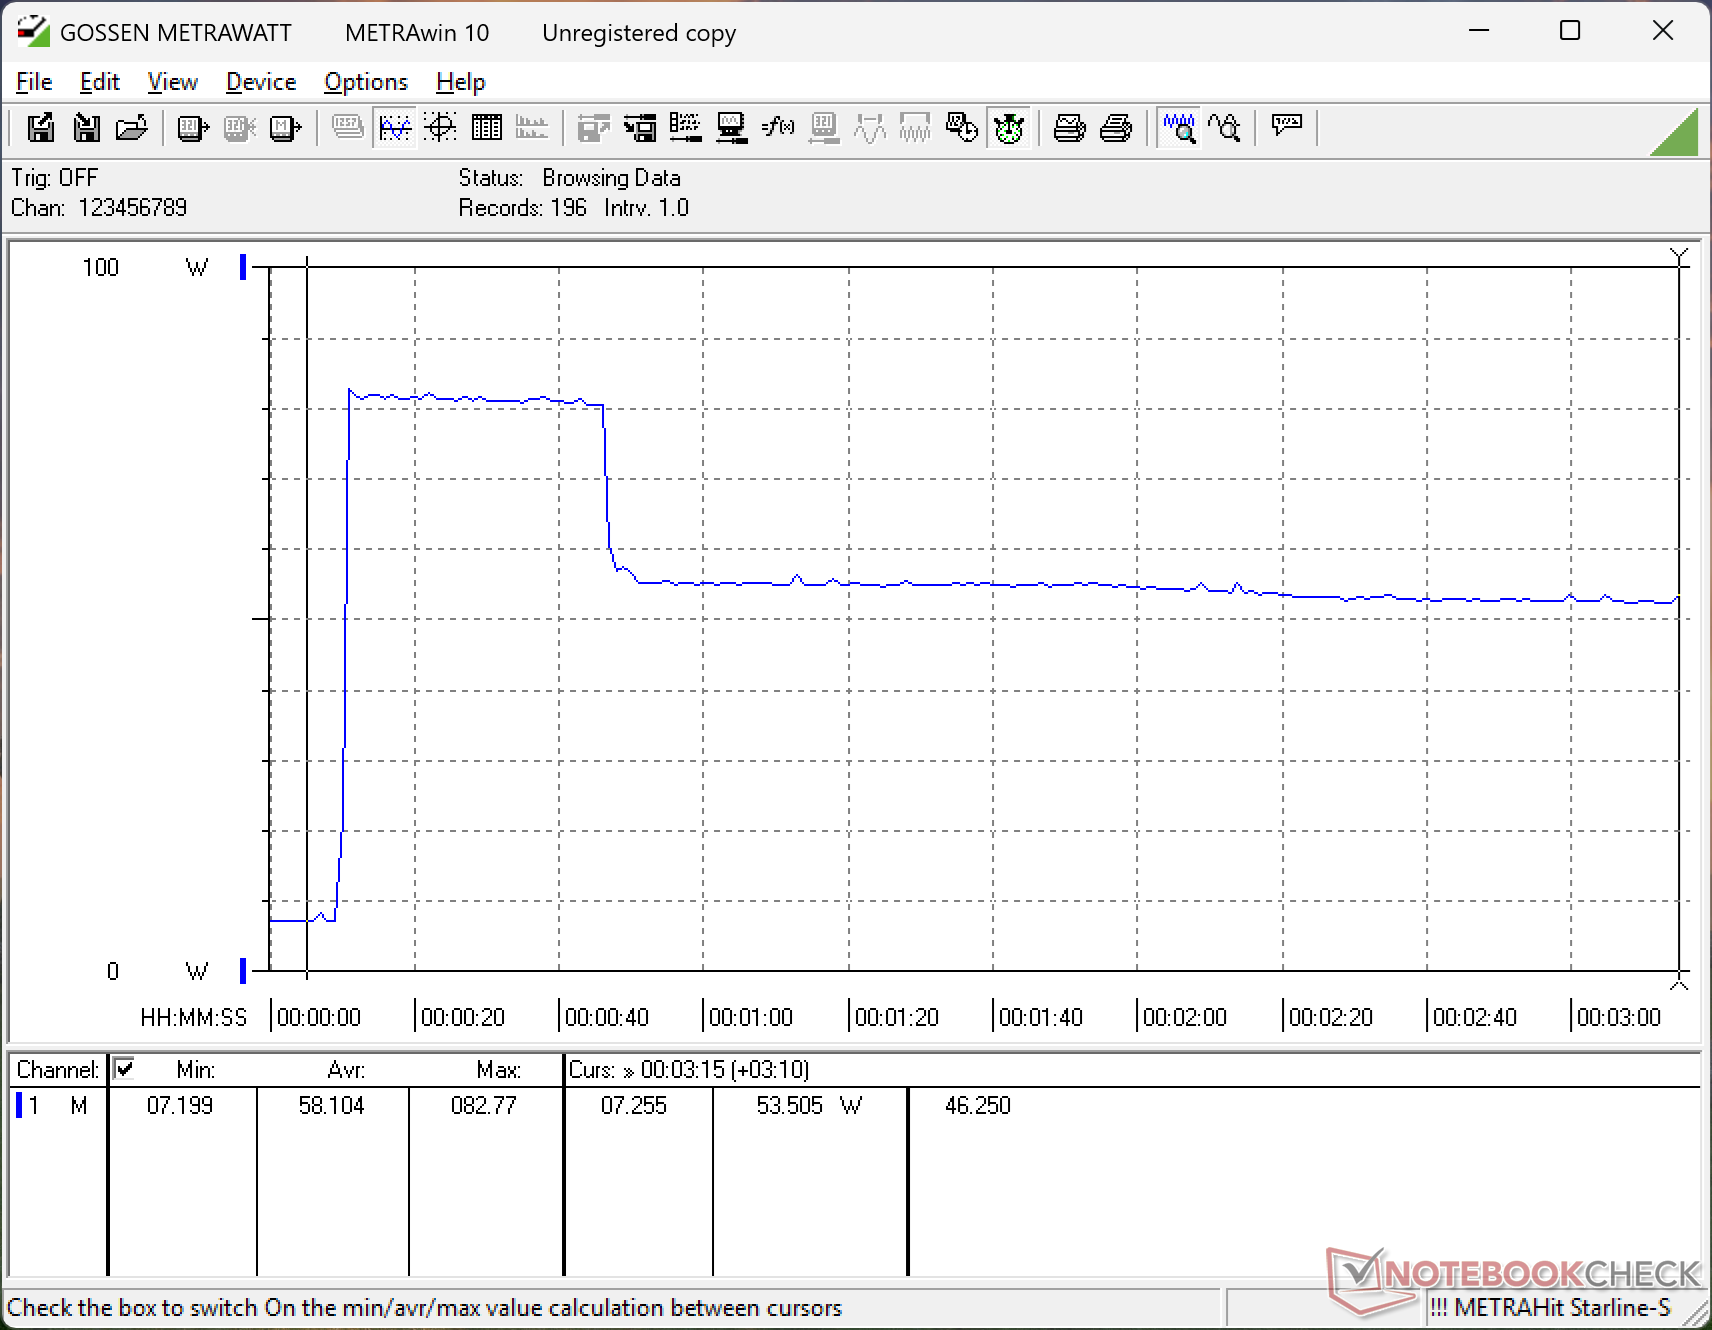
Stresstest
Die Prozessor kann bei Belastung ziemlich warm werden. Bei der Ausführung von Prime95 beispielsweise steigt die CPU für einige Sekunden auf 3,6 GHz, 54 W und 100 °C, bevor sie auf 3,0 GHz und 32 W fällt und sich bei einer angemessenen Kerntemperatur von 86 °C stabilisiert. Im Vergleich dazu stabilisiert sich der Core Ultra 7 im Dell 16 Premium von 2025 unter ähnlichen Bedingungen bei einer wärmeren Temperatur von 93 °C. Es ist wahrscheinlich, dass sich das neue XPS 16 auch bei Kerntemperaturen über 90 °C stabilisieren würde, wenn es mit dem viel schnelleren Core Ultra X7 anstelle unseres Core Ultra 5 konfiguriert wäre.
Wenn man Cyberpunk 2077 ausführt, um eine ausgewogenere CPU-GPU-Belastung darzustellen, stabilisiert sich die Kerntemperatur bei sehr angenehmen 89 °C im Vergleich zu 75 °C auf dem 2025 XPS 16 mit der schnelleren GeForce RTX-Grafik. Die allgemein wärmeren Kerntemperaturen sind wahrscheinlich für die oben erwähnten wärmeren Oberflächentemperaturen verantwortlich.
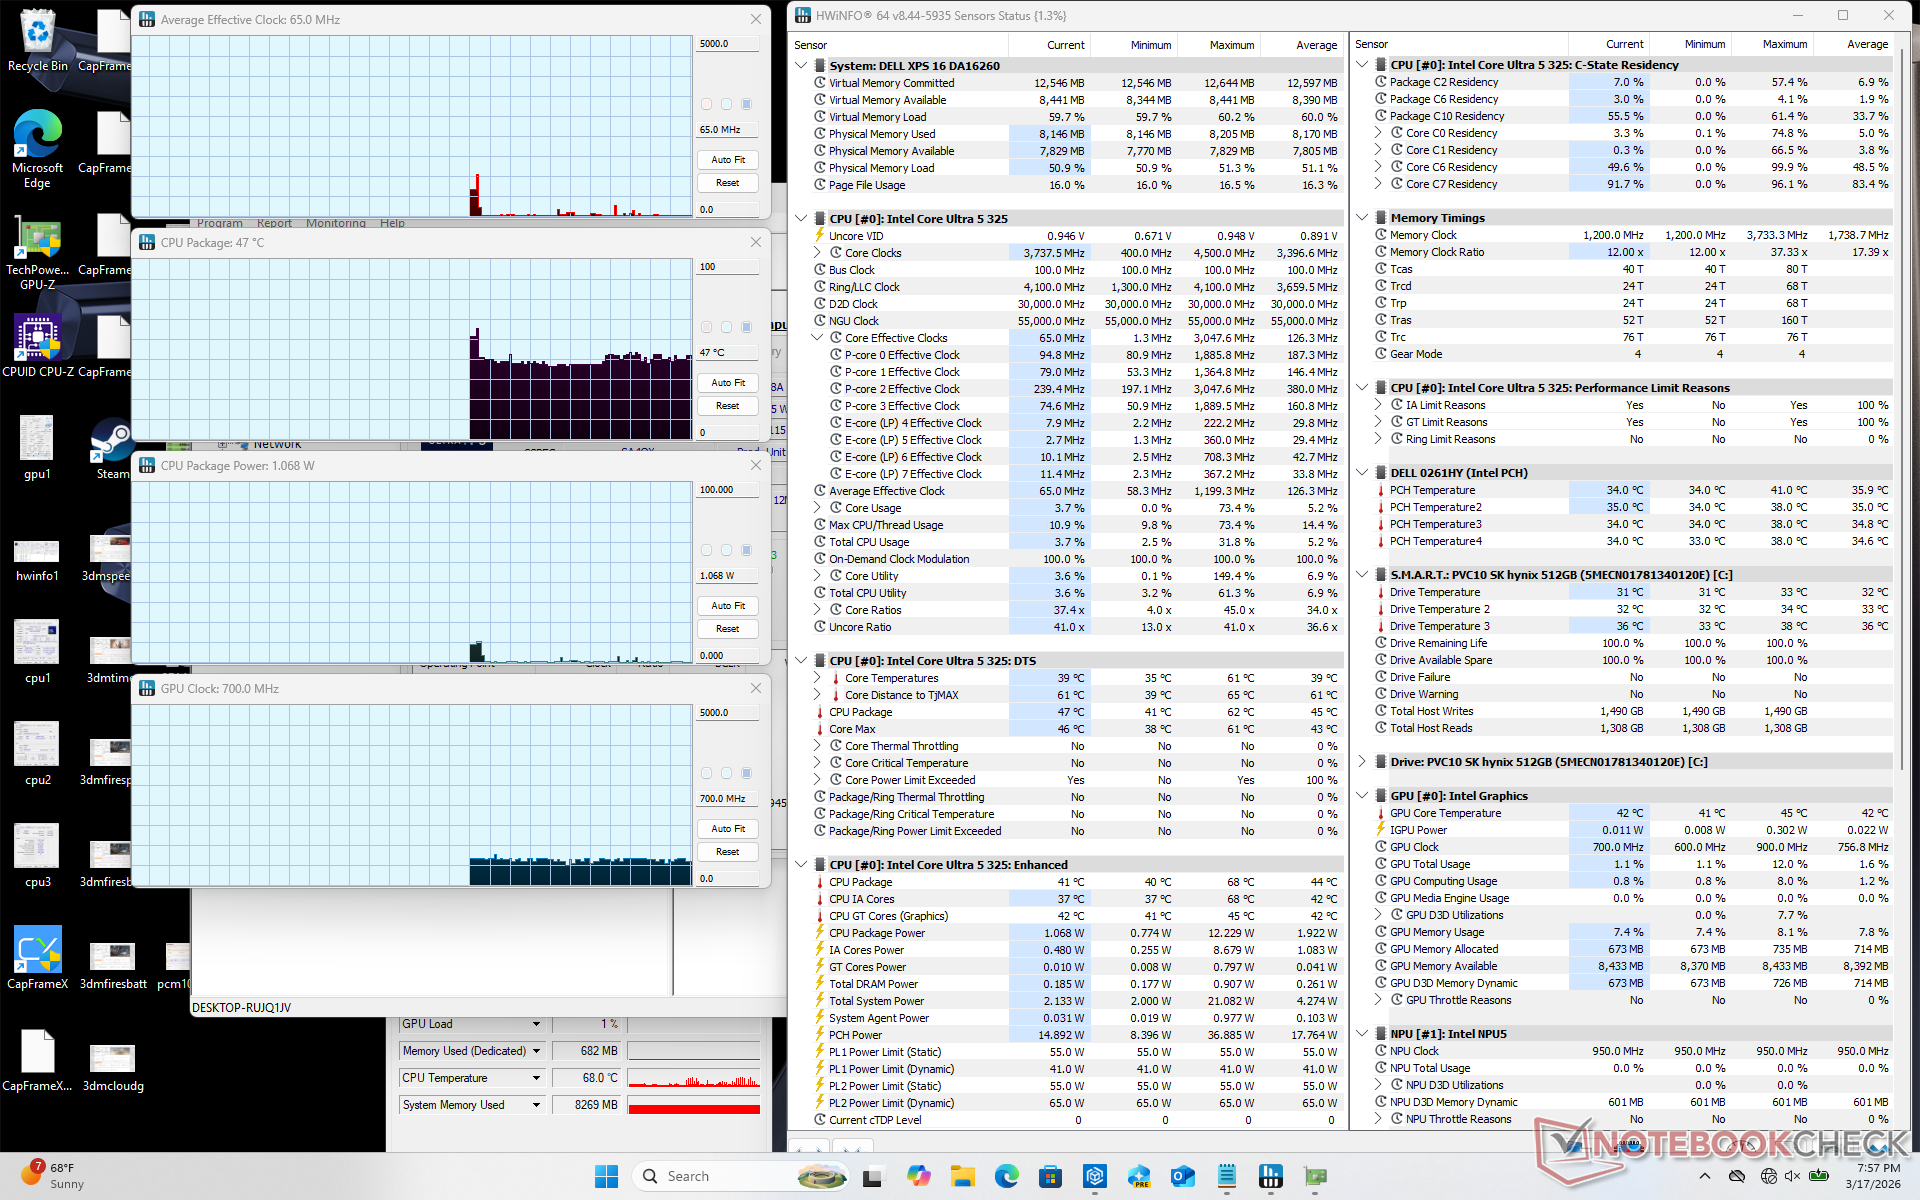
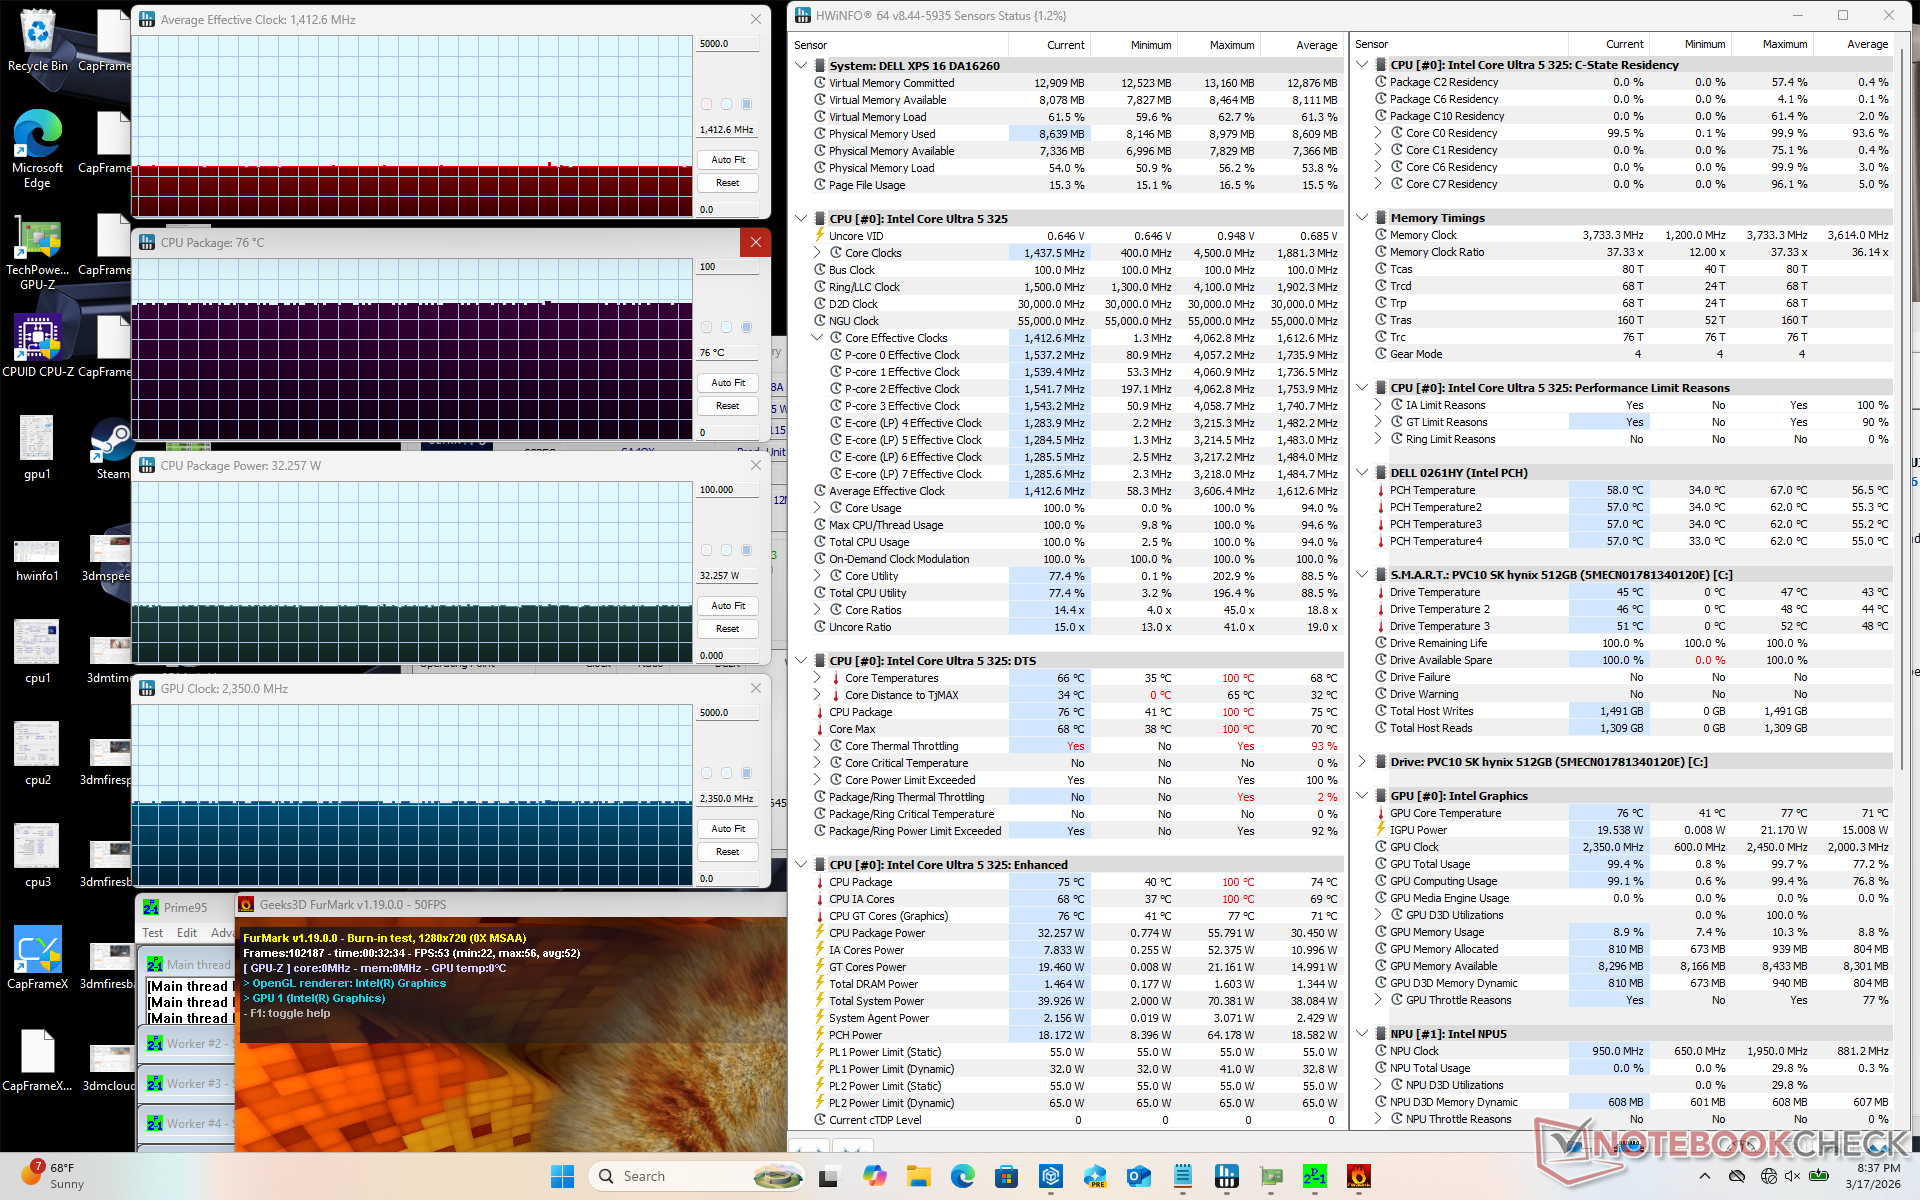
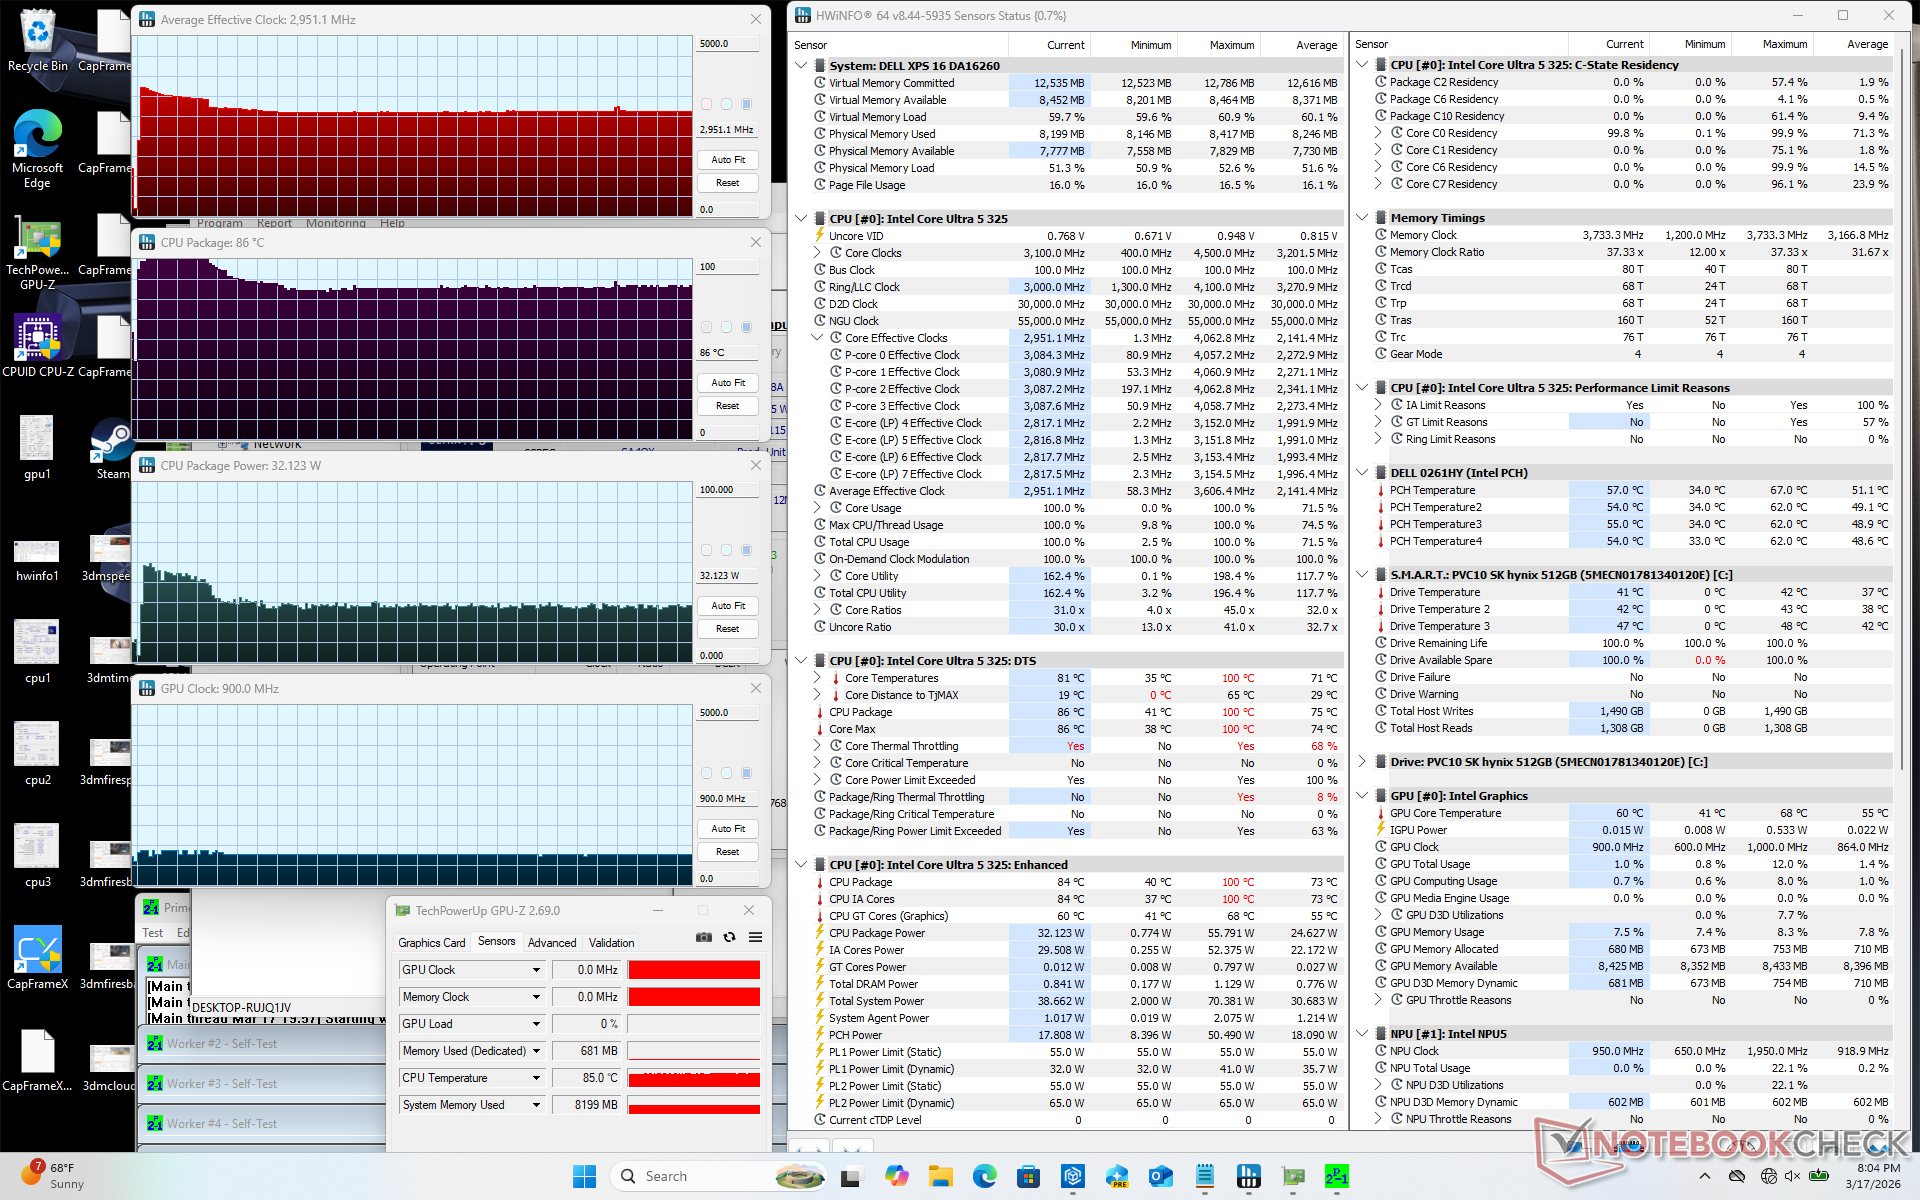
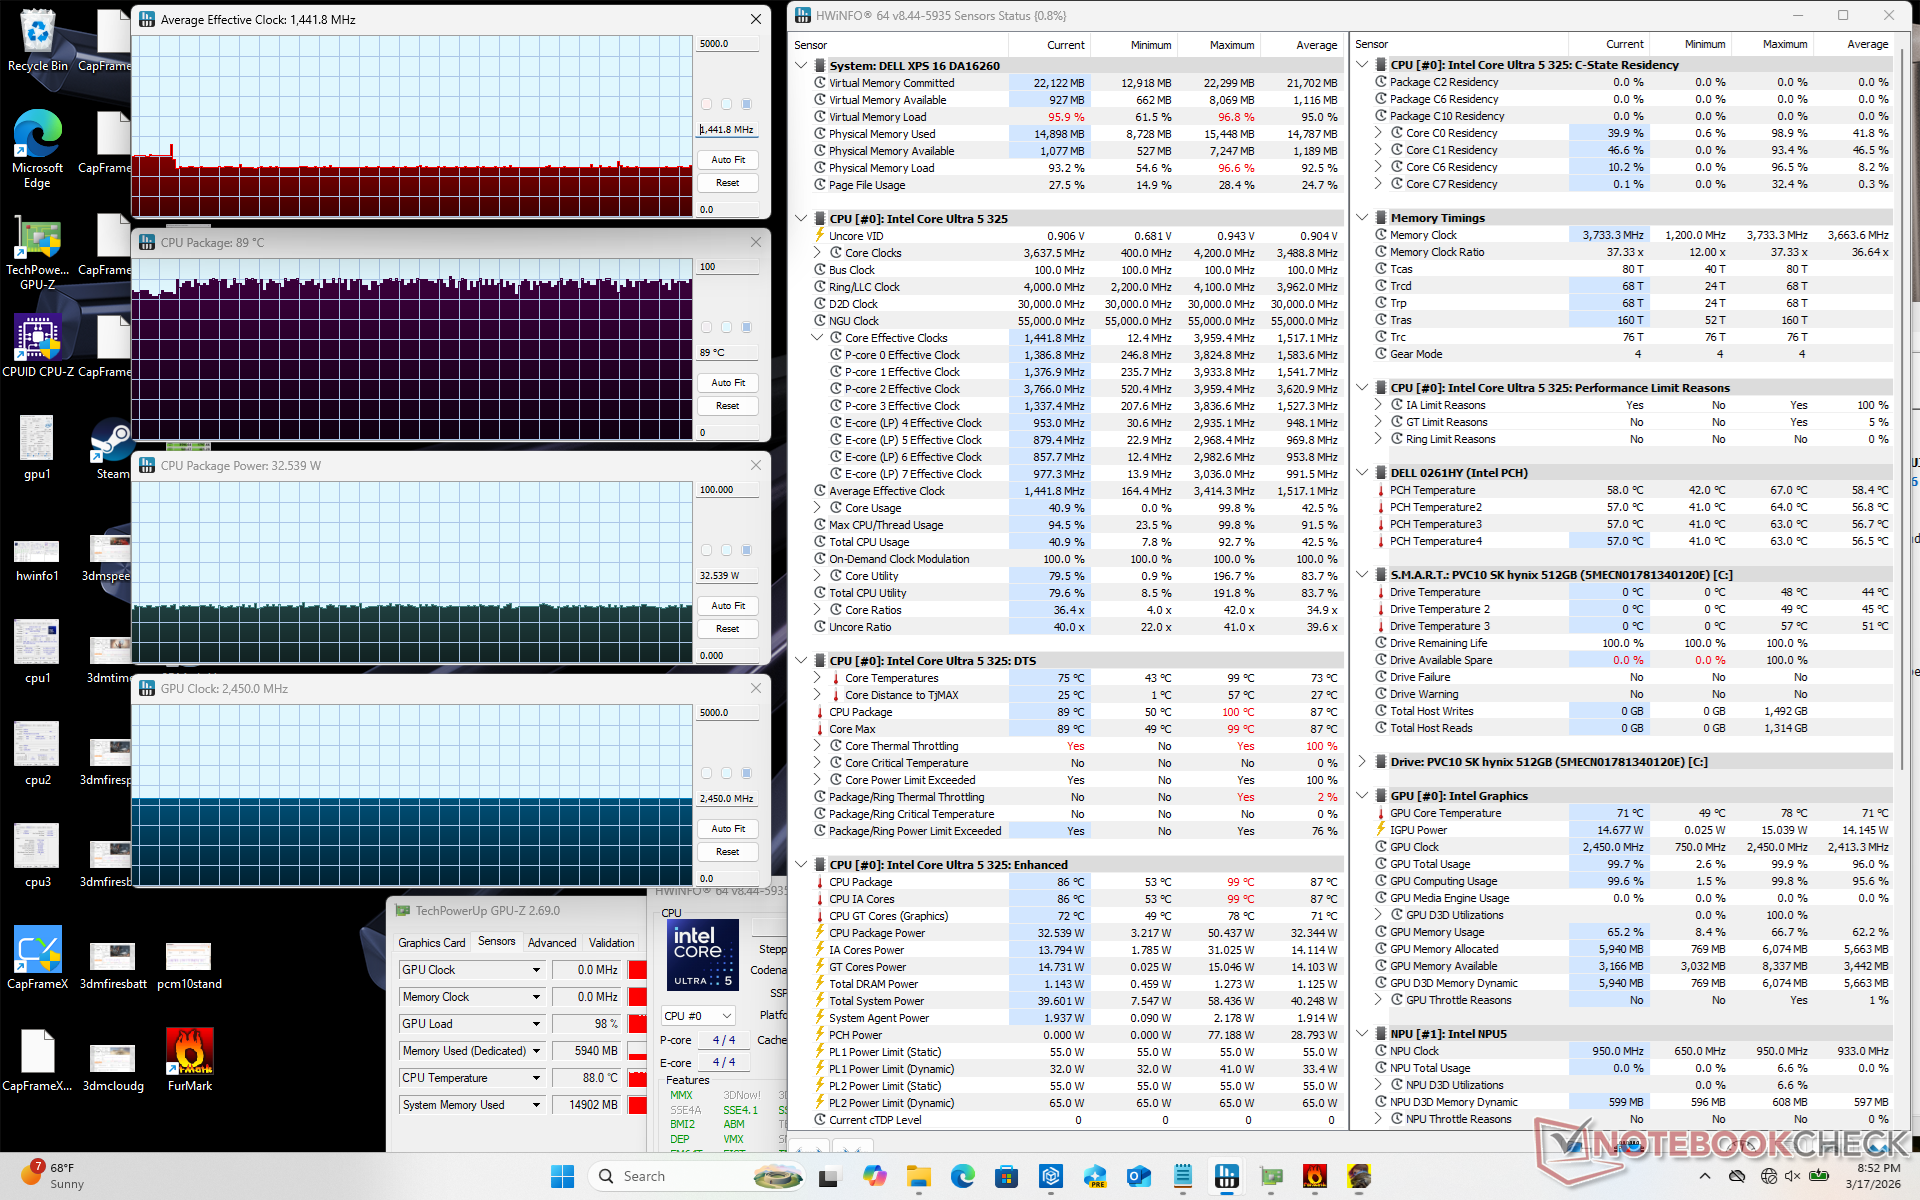
| durchschnittlicher CPU-Takt (GHz) | GPU-Takt (MHz) | durchschnittliche CPU-Temperatur (°C) | |
| System Leerlauf | -- | -- | 47 |
| Prime95 Stress | 3,0 | -- | 86 |
| Prime95 + FurMark Stress | 1,4 | 2.350 | 76 |
| Cyberpunk 2077 Stress | 1,4 | 2.450 | 89 |
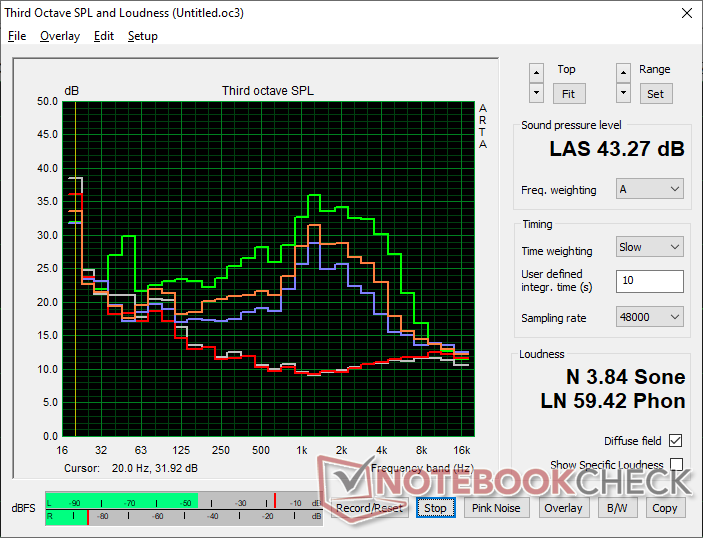
Lautsprecher

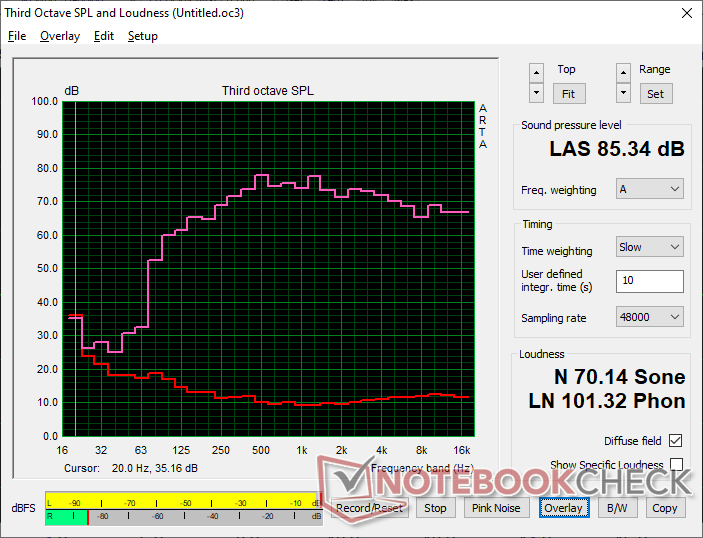
Dell XPS 16 Core Ultra 5 325 Audio Analyse
(+) | Die Lautsprecher können relativ laut spielen (85.3 dB)
Bass 100 - 315 Hz
(±) | abgesenkter Bass - 6.1% geringer als der Median
(+) | lineare Bass-Wiedergabe (5.6% Delta zum Vorgänger)
Mitteltöne 400 - 2000 Hz
(+) | ausgeglichene Mitten, vom Median nur 3.2% abweichend
(+) | lineare Mitten (4.6% Delta zum Vorgänger)
Hochtöne 2 - 16 kHz
(+) | ausgeglichene Hochtöne, vom Median nur 2.4% abweichend
(+) | sehr lineare Hochtöne (3.3% Delta zum Vorgänger)
Gesamt im hörbaren Bereich 100 - 16.000 Hz
(+) | hörbarer Bereich ist sehr linear (7% Abstand zum Median
Im Vergleich zu allen Geräten derselben Klasse
» 5% aller getesteten Geräte dieser Klasse waren besser, 1% vergleichbar, 94% schlechter
» Das beste Gerät hat einen Delta-Wert von 5%, durchschnittlich ist 17%, das schlechteste Gerät hat 45%
Im Vergleich zu allen Geräten im Test
» 1% aller getesteten Geräte waren besser, 0% vergleichbar, 99% schlechter
» Das beste Gerät hat einen Delta-Wert von 4%, durchschnittlich ist 24%, das schlechteste Gerät hat 134%
Apple MacBook Pro 16 2021 M1 Pro Audio Analyse
(+) | Die Lautsprecher können relativ laut spielen (84.7 dB)
Bass 100 - 315 Hz
(+) | guter Bass - nur 3.8% Abweichung vom Median
(+) | lineare Bass-Wiedergabe (5.2% Delta zum Vorgänger)
Mitteltöne 400 - 2000 Hz
(+) | ausgeglichene Mitten, vom Median nur 1.3% abweichend
(+) | lineare Mitten (2.1% Delta zum Vorgänger)
Hochtöne 2 - 16 kHz
(+) | ausgeglichene Hochtöne, vom Median nur 1.9% abweichend
(+) | sehr lineare Hochtöne (2.7% Delta zum Vorgänger)
Gesamt im hörbaren Bereich 100 - 16.000 Hz
(+) | hörbarer Bereich ist sehr linear (4.6% Abstand zum Median
Im Vergleich zu allen Geräten derselben Klasse
» 0% aller getesteten Geräte dieser Klasse waren besser, 0% vergleichbar, 100% schlechter
» Das beste Gerät hat einen Delta-Wert von 5%, durchschnittlich ist 17%, das schlechteste Gerät hat 45%
Im Vergleich zu allen Geräten im Test
» 0% aller getesteten Geräte waren besser, 0% vergleichbar, 100% schlechter
» Das beste Gerät hat einen Delta-Wert von 4%, durchschnittlich ist 24%, das schlechteste Gerät hat 134%
Energieverwaltung - Panther Lake ist der König der Effizienz
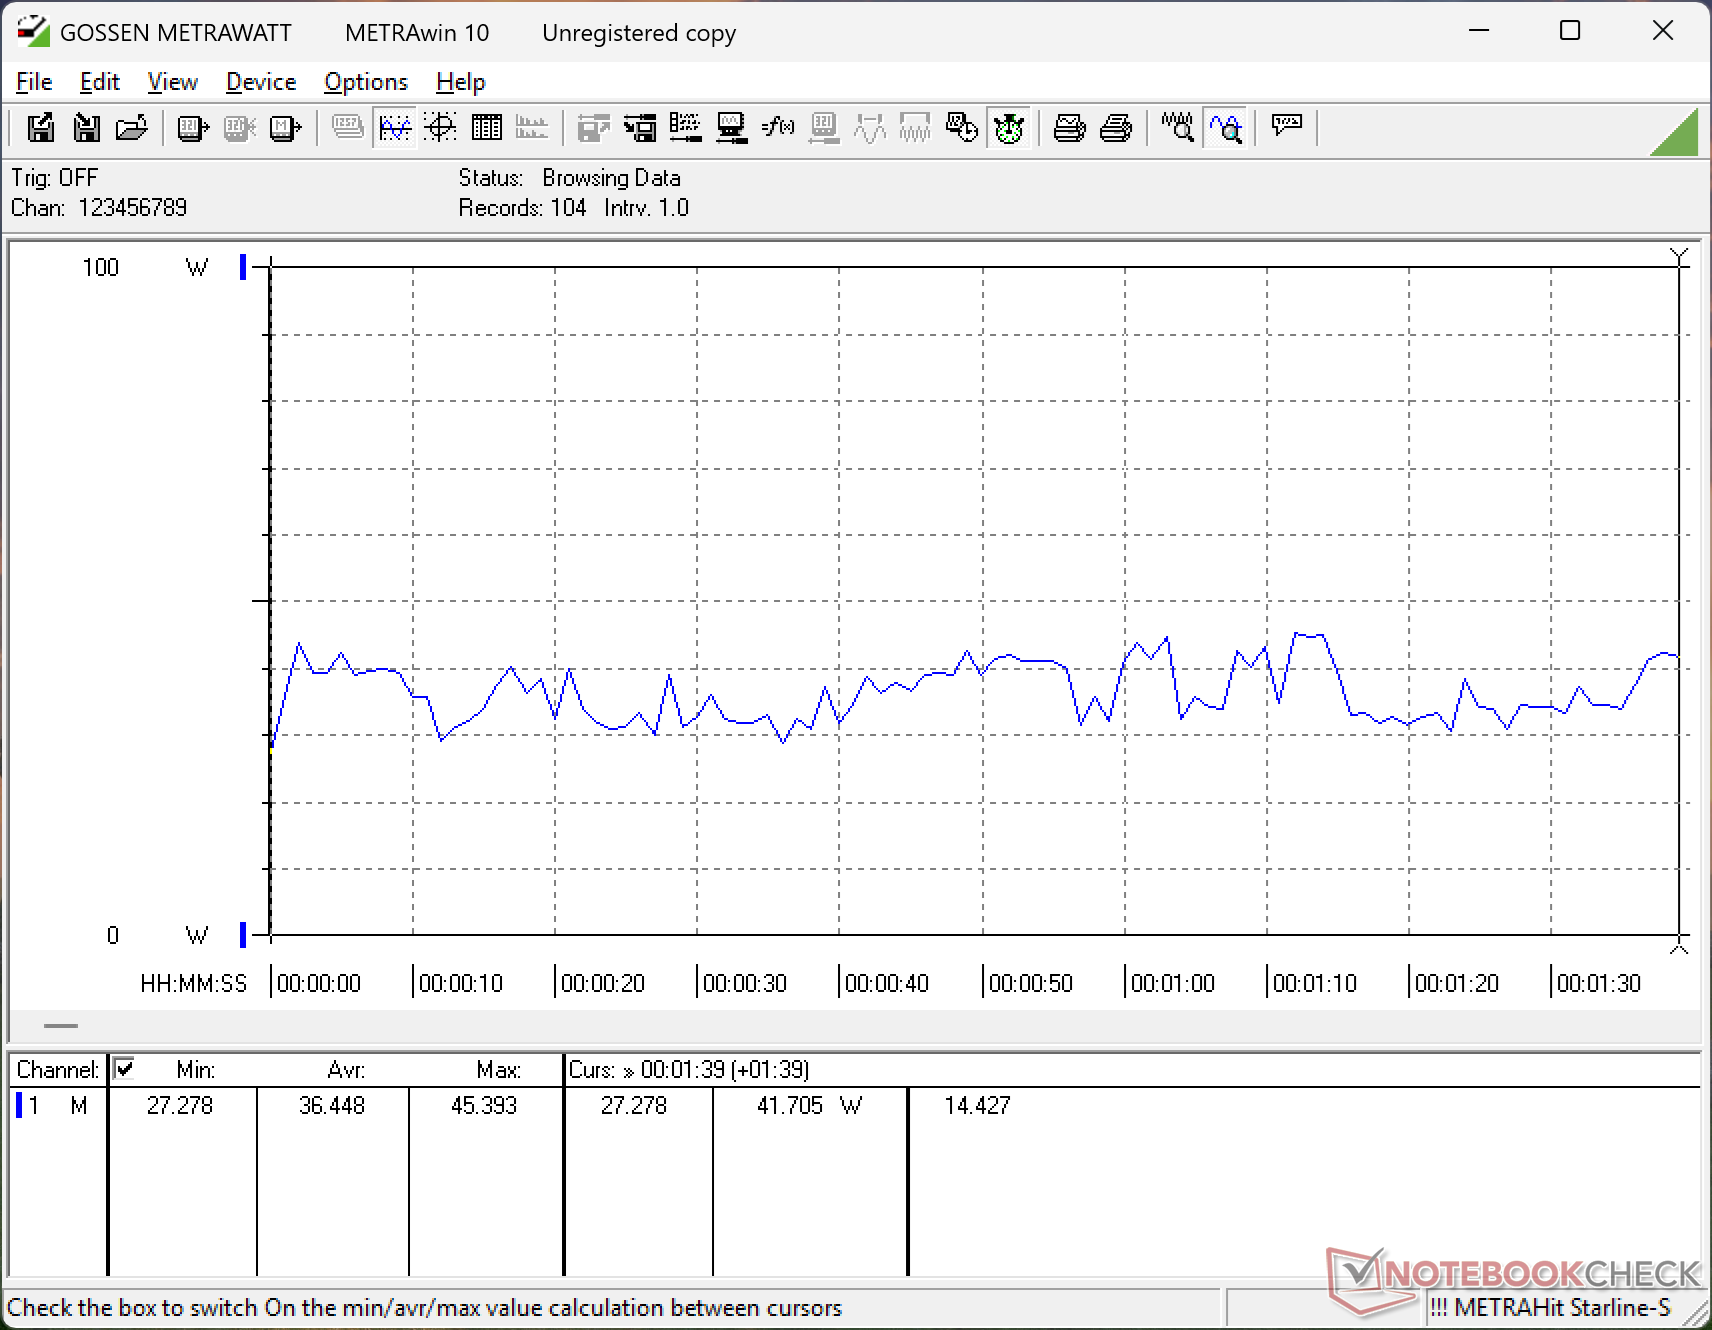
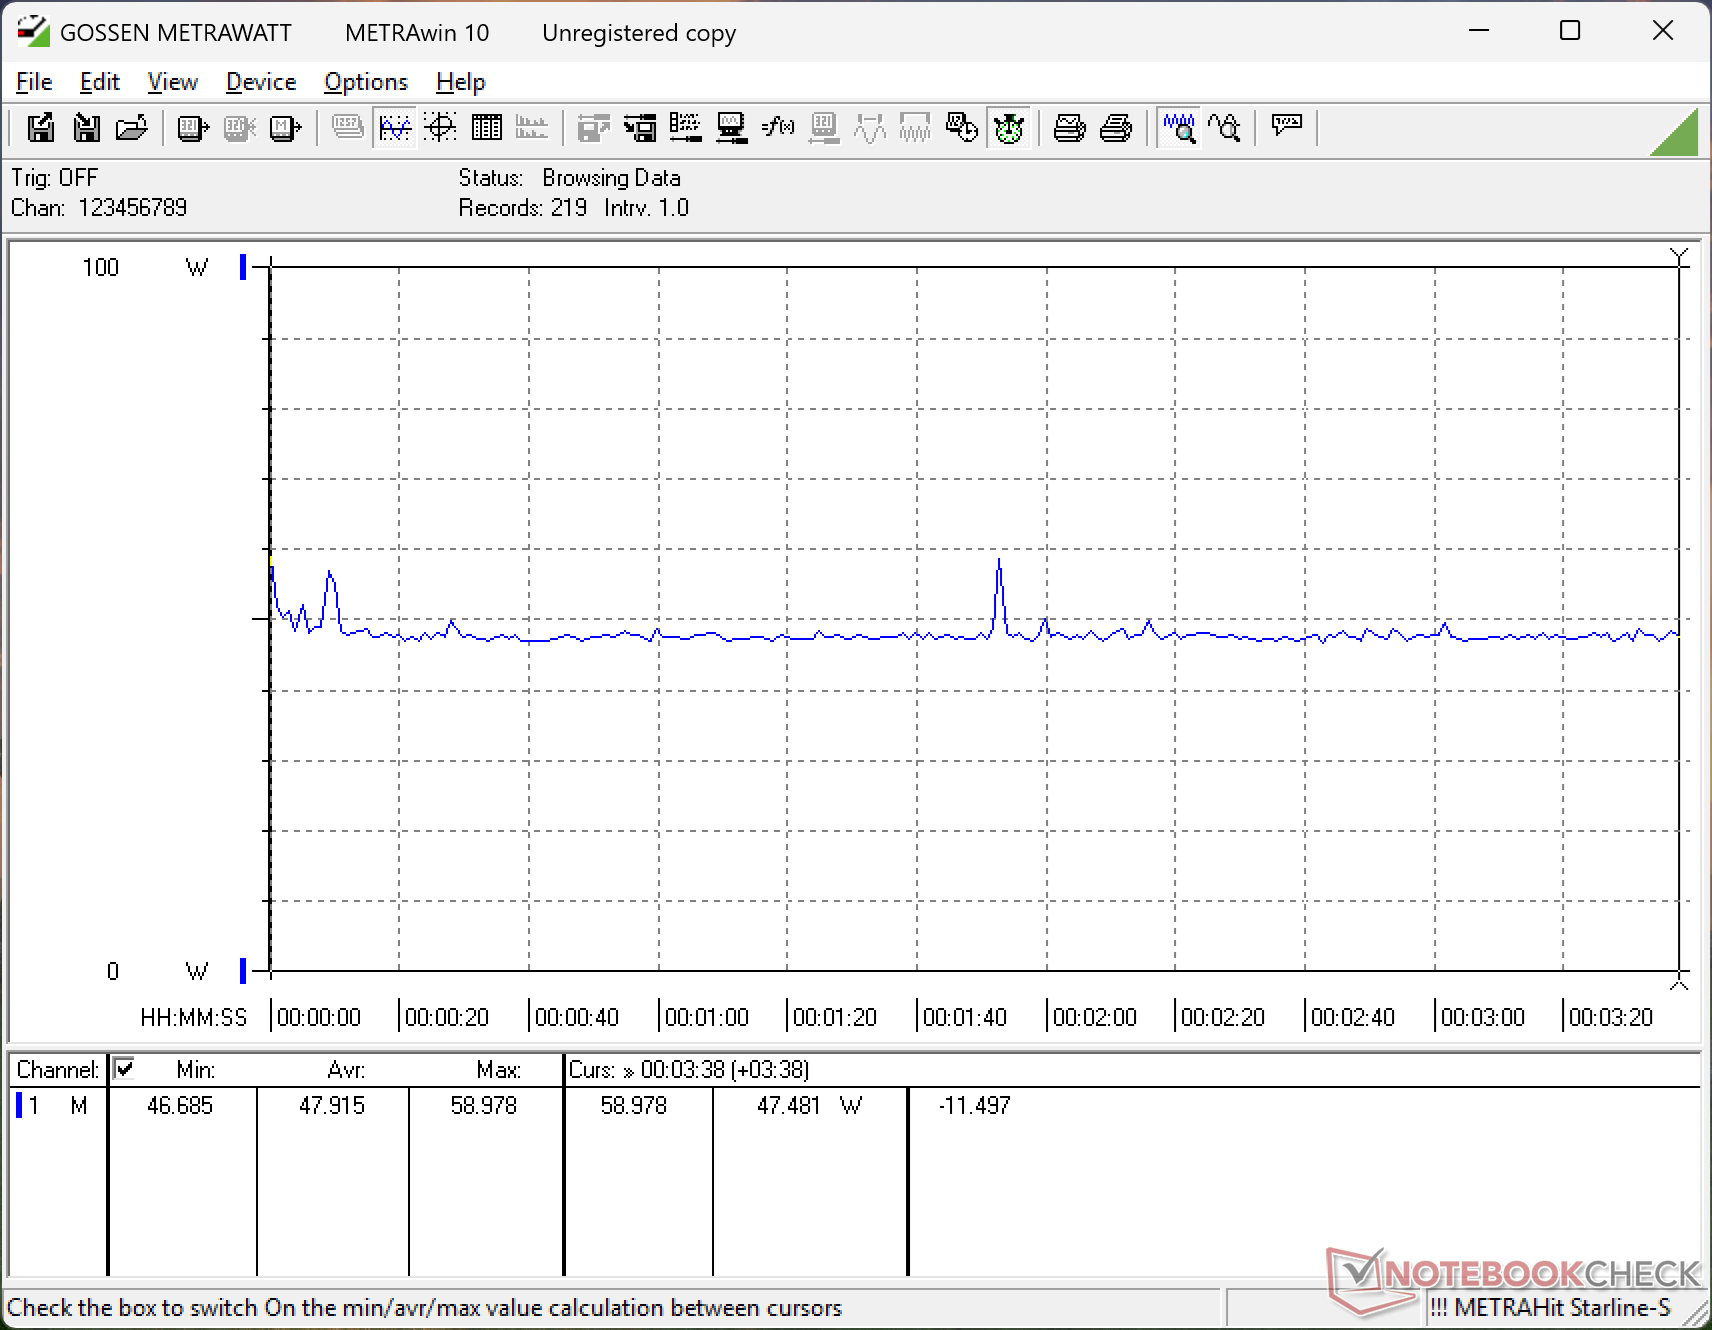
Stromverbrauch
Panther Lake kombiniert die Effizienz von Lunar Lake-V mit der Leistung von Arrow Lake-H und bietet so das Beste aus beiden Welten. Im Leerlauf auf dem Desktop bei niedrigster Helligkeitseinstellung verbraucht es nur 1,3 W, was besonders für einen 16-Zoll-Formfaktor extrem niedrig ist. Der Verbrauch bleibt mit knapp unter 50 W sehr niedrig, wenn man Spiele spielt, da keine diskrete GPU vorhanden ist. Bei einer Konfiguration mit dem Core Ultra X7 würde der Verbrauch beim Spielen nur ein paar Watt mehr betragen, basierend auf unserer Zeit mit dem XPS 14 für einige der höchsten Leistung-pro-Watt-Werte aller iGPU-Notebooks.
Mit dem kleinen (~10,2 x 5,5 x 2,2 cm) 100-W-USB-C-Universal-Netzteil konnten wir bei voller CPU-Belastung eine vorübergehende maximale Leistungsaufnahme von 83 W messen.
| Aus / Standby | |
| Idle | |
| Last |
|
Legende:
min: | |
| Dell XPS 16 Core Ultra 5 325 Ultra 5 325, Intel Graphics 4 Xe3 PTL, SK hynix PVC10 HFS512GEM4X182N, IPS, 1920x1200, 16" | Dell 16 Premium DA16250 Ultra 7 255H, GeForce RTX 5070 Laptop, Kioxia BG6 KBG6AZNV1T02, OLED, 3840x2400, 16.3" | Lenovo Yoga Pro 9 16IAH10 RTX 5050 Ultra 9 285H, GeForce RTX 5050 Laptop, WD PC SN7100S SDFPMSL-1T00-1101, OLED, 2880x1800, 16" | Samsung Galaxy Book6 Ultra Ultra 7 356H, GeForce RTX 5070 Laptop, Samsung PM9C1b MZVL81T0HFLB-00BH1, OLED, 2880x1800, 16" | Asus ZenBook S16 UM5606GA Ryzen AI 9 465, Radeon 880M, SanDisk PC SN5100S, OLED, 2880x1800, 16" | MSI Prestige 16 AI Evo B2HMG Ultra 9 285H, Arc 140T, Micron 2500 1TB MTFDKBA1T0QGN, IPS, 2560x1600, 16" | |
|---|---|---|---|---|---|---|
| Stromverbrauch | -225% | -261% | -119% | -65% | -93% | |
| Idle min * (Watt) | 1.3 | 6.5 -400% | 6.8 -423% | 4.4 -238% | 3.7 -185% | 4.4 -238% |
| Idle avg * (Watt) | 4.5 | 8.1 -80% | 20.1 -347% | 6.4 -42% | 7.4 -64% | 9.2 -104% |
| Idle max * (Watt) | 4.6 | 33 -617% | 21.6 -370% | 7.1 -54% | 9.5 -107% | 9.5 -107% |
| Last avg * (Watt) | 36.5 | 88.9 -144% | 87.6 -140% | 55.1 -51% | 57.9 -59% | 66.9 -83% |
| Cyberpunk 2077 ultra external monitor * (Watt) | 45.4 | 108.9 -140% | 147.9 -226% | 133 -193% | 57 -26% | 67.4 -48% |
| Cyberpunk 2077 ultra * (Watt) | 47.9 | 108.7 -127% | 148.2 -209% | 134.3 -180% | 58.5 -22% | 68.8 -44% |
| Last max * (Watt) | 82.8 | 138.3 -67% | 173.5 -110% | 143.9 -74% | 76.9 7% | 102.9 -24% |
* ... kleinere Werte sind besser
Stromverbrauch Cyberpunk/Stresstest
Stromverbrauch externer Monitor
Akkulaufzeit

Dell wirbt mit einer Akkulaufzeit von bis zu 31 Stunden, basierend auf den hauseigenen WLAN-Testkriterien. Beim Test unter unseren eigenen WLAN-Bedingungen konnten wir jedoch eine Laufzeit von fast 27 Stunden aufzeichnen, was immer noch wahnsinnig beeindruckend ist, wenn man bedenkt, dass die Akkukapazität von 70 Wh für einen 16-Zoll-Formfaktor eigentlich eher gering ist.
| Dell XPS 16 Core Ultra 5 325 Ultra 5 325, Intel Graphics 4 Xe3 PTL, 70 Wh | Dell XPS 16 9640 Ultra 7 155H, GeForce RTX 4070 Laptop GPU, 99.5 Wh | Lenovo Yoga Pro 9 16IAH10 RTX 5050 Ultra 9 285H, GeForce RTX 5050 Laptop, 84 Wh | Samsung Galaxy Book6 Ultra Ultra 7 356H, GeForce RTX 5070 Laptop, 80.2 Wh | Asus ZenBook S16 UM5606GA Ryzen AI 9 465, Radeon 880M, 83 Wh | MSI Prestige 16 AI Evo B2HMG Ultra 9 285H, Arc 140T, 99.9 Wh | |
|---|---|---|---|---|---|---|
| Akkulaufzeit | -61% | -60% | -37% | -51% | -38% | |
| WLAN (h) | 26.6 | 10.5 -61% | 10.7 -60% | 16.8 -37% | 13.1 -51% | 16.5 -38% |
| H.264 (h) | 16.5 | 20.8 | ||||
| Last (h) | 1.5 | 2.4 |
Notebookcheck Bewertung
Das 2026 XPS 16 verzichtet auf diskrete GPU-Optionen für ein schlankeres, leichteres, leiseres, langlebigeres und effizienteres Design.
Dell XPS 16 Core Ultra 5 325
- 20.03.2026 v8
Allen Ngo
 Total Sustainability Score:
 Potenzielle Wettbewerber im Vergleich
Bild | Modell / Test | Preis ab | Gewicht | Dicke | Display |
|---|---|---|---|---|---|
1. 84.2%  | Dell XPS 16 Core Ultra 5 325 Intel Core Ultra 5 325 ⎘ Intel Graphics 4 Xe3 Panther Lake iGPU ⎘ 16 GB RAM, 512 GB SSD | Amazon: 1. 1.295,00 € Lenovo ThinkBook 16 Gen 9 (1... 2. 1.216,68 € Lenovo ThinkBook 16 Gen 9 (1... 3. 2.549,00 € Dell XPS 16 9640 Laptop 16.3... Geizhals Suche | 1.7 kg | 15.4 mm | 16.00" 1920x1200 142 PPI IPS |
2. 87.9%  | Dell 16 Premium DA16250 Intel Core Ultra 7 255H ⎘ NVIDIA GeForce RTX 5070 Laptop ⎘ 32 GB RAM, 1024 GB SSD | Amazon: Bestpreis 2057.29€ XITRA.de 2. 2065.23€ MetaComp 3. 2098.91€ Jacob Elektronik direkt | 2.3 kg | 18.7 mm | 16.30" 3840x2400 278 PPI OLED |
3. 88.8%  | Lenovo Yoga Pro 9 16IAH10 RTX 5050 Intel Core Ultra 9 285H ⎘ NVIDIA GeForce RTX 5050 Laptop ⎘ 32 GB RAM, 1024 GB SSD | Amazon: Geizhals Suche | 2 kg | 17.9 mm | 16.00" 2880x1800 212 PPI OLED |
4. 90.7%  | Samsung Galaxy Book6 Ultra Intel Core Ultra 7 356H ⎘ NVIDIA GeForce RTX 5070 Laptop ⎘ 32 GB RAM, 1000 GB SSD | Amazon: 3.999,00 € Bestpreis 3549€ galaxus 2. 3549€ Cyberport Stores Deutschland 3. 3549€ Cyberport.de | 1.9 kg | 15.4 mm | 16.00" 2880x1800 212 PPI OLED |
5. 86.6%  | Asus ZenBook S16 UM5606GA AMD Ryzen AI 9 465 ⎘ AMD Radeon 880M ⎘ 32 GB RAM, 1024 GB SSD | Amazon: 2.059,00 € Bestpreis 1735€ TechnikLaden 2. 1753.85€ haym.infotec 3. 1797€ ARLT Computer | 1.5 kg | 12.9 mm | 16.00" 2880x1800 212 PPI OLED |
6. 82.8%  | MSI Prestige 16 AI Evo B2HMG Intel Core Ultra 9 285H ⎘ Intel Arc Graphics 140T ⎘ 32 GB RAM, 1024 GB SSD | Amazon: 1. 1.533,60 € MSI Prestige 16 AI+ Evo B2VM... 2. 1.127,15 € MSI Prestige 13 AI Evo Busin... 3. 1.168,56 € MSI Prestige 14 AI Studio C1... | 1.6 kg | 18.95 mm | 16.00" 2560x1600 189 PPI IPS |
Transparenz
Die Auswahl der zu testenden Geräte erfolgt innerhalb der Redaktion. Das vorliegende Testmuster wurde vom Autor auf eigene Kosten im freien Handel erworben. Der Hersteller erhielt keine Version des Reviews vor der Veröffentlichung, es bestand keine Verpflichtung zur Publikation. Als eigenständiges, unabhängiges Unternehmen unterliegt Notebookcheck keiner Diktion von Herstellern, Shops und Verlagen.
So testet Notebookcheck
Pro Jahr werden von Notebookcheck hunderte Laptops und Smartphones unabhängig in von uns standardisierten technischen Verfahren getestet, um eine Vergleichbarkeit aller Testergebnisse zu gewährleisten. Seit rund 20 Jahren entwickeln wir diese Testmethoden kontinuierlich weiter und setzen damit Branchenstandards. In unseren Testlaboren kommt ausschließlich hochwertiges Messequipment in die Hände erfahrener Techniker und Redakteure. Die Tests unterliegen einer mehrstufigen Kontrolle. Unsere komplexe Gesamtbewertung basiert auf hunderten fundierten Messergebnissen und Benchmarks, womit Ihnen Objektivität garantiert ist. Weitere Informationen zu unseren Testmethoden gibt es hier.

