
Fazit - Hohe Leistung mit praktischen Funktionen
Das Dell Pro Max 16 Plus ist ein deutlicher Fortschritt gegenüber der vorherigen Precision-7680- oder -7670-Generation. Abgesehen von der erwarteten Leistungssteigerung verfügt das überarbeitete Modell über zusätzliche Funktionen, die beim Vorgänger nicht zu finden waren, darunter 120-Hz-OLED, modulare USB-C-Ports für die Reparaturfähigkeit, PCIe5-SSD-Optionen, Thunderbolt-5-Unterstützung, kompaktes USB-C-Laden und eine höher auflösende Webcam. Die Verbesserungen überwiegen wohl die geringfügigen Zunahmen an Dicke und Grundfläche.
Die Nachteile sind im Allgemeinen gering. Die Leistungsaufnahme ist jetzt mit bis zu 280 W höher als zuvor, verglichen mit 240 W oder weniger beim Precision 7680. Während das Pro Max 16 Plus also sicherlich leistungsfähiger ist, stellt es auch höhere Anforderungen an die Kühllösung mit insgesamt kürzeren Akkulaufzeiten. Insbesondere die CPU-Temperatur kann bei Belastung den Bereich von 95 bis 105 °C erreichen, was sich auf die Turbo-Boost-Leistung des Systems auswirkt. Die GPU neigt dazu, sich bei 125 W zu stabilisieren, obwohl sie für bis zu 175 W ausgelegt ist. Es ist daher wahrscheinlich, dass die gleiche CPU und GPU auf dickeren oder größeren Formfaktoren wie dem 18-Zoll Pro Max 18 Plus schneller laufen. Das Pro-Max-16-Plus-System ist dennoch eine der schnellsten und praktischsten Workstations auf dem Markt, trotz der Einschränkungen bei der Kühlung.
Pro
Contra
Preis und Verfügbarkeit
Dell liefert das Pro Max 16 Plus jetzt ab 3.209 Euro für die Basiskonfiguration mit Core Ultra 7 und RTX Pro 1000 aus. Unser Core Ultra 9 mit RTX Pro 5000 Blackwell ist derzeit im deutschsprachigen Raum noch nicht erhältlich.
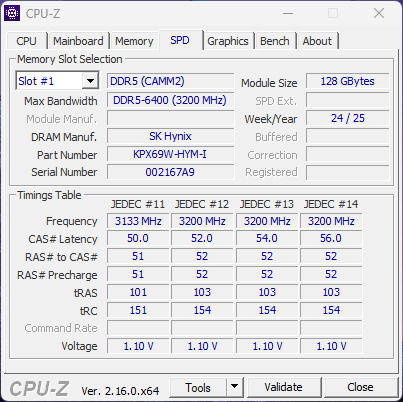
Das Dell Pro Max 16 Plus ist die neueste mobile 16-Zoll-Workstation des Herstellers, welche die Nachfolge der letzten Generation der Precision-7680-Serie antritt. Als solche ist sie eine High-End-Workstation mit fortschrittlichen Prozessoren und Funktionen wie Intel-Arrow-Lake-HX-CPUs, Nvidia-Pro-Blackwell-GPUs und Kompatibilität mit spezieller Hardware wie DGFF- und CAMM2-Modulen.
Unser Testgerät ist die High-End-Konfiguration mit Core Ultra 9 285HX, RTX Pro 5000 Blackwell, 4K-UHD-120-Hz-OLED-Touchscreen, 2-TB-PCIe5-SSD und 128 GB CAMM2-RAM für ca. 5.000 US-Dollar. Geringere SKUs beginnen mit dem Core Ultra 5 245HX, 16 GB CSoDIMM, nur integrierter Grafik und einem einfachen FHD+-Display ohne Touchscreen für ca. 3.700 US-Dollar.
Zu den Alternativen in diesem Bereich gehören andere leistungsorientierte 16-Zoll-Workstations wie das MSI CreatorPro Z16P, Lenovo ThinkPad P16 Gen 2 oder das HP ZBook Studio 16.
Weitere Dell Bewertungen:
Spezifikationen
Preisvergleich
Gehäuse
Das Modell ist tatsächlich etwas größer und dicker als das vier Jahre alte Precision 7670. Dennoch sind die solide Verarbeitungsqualität und die professionellen Funktionen wie CAMM2, DGFF und die modulare USB-C-Reparaturfähigkeit die größere Investition wert.


Anschlussausstattung
Die Anschlussoptionen sind weitgehend identisch mit denen des Precision 7680, allerdings mit einigen wichtigen Änderungen: So entfällt beim Pro Max 16 Plus zum Beispiel der spezielle Anschluss für das Netzteil, so dass einer der drei USB-C-Anschlüsse fast immer zum Laden verwendet wird. Außerdem ist Thunderbolt 5 jetzt standardmäßig verfügbar für erweiterte Docking-Funktionen.


SD-Kartenleser
| SD Card Reader | |
| average JPG Copy Test (av. of 3 runs) | |
| Dell Precision 5000 5680 (Toshiba Exceria Pro SDXC 64 GB UHS-II) | |
| Lenovo ThinkPad P16 Gen 2 (Toshiba Exceria Pro SDXC 64 GB UHS-II) | |
| MSI CreatorPro Z16P B12UKST (AV Pro V60) | |
| Dell Pro Max 16 Plus (Toshiba Exceria Pro SDXC 64 GB UHS-II) | |
| Lenovo ThinkPad P1 Gen 7 21KV001SGE (AV Pro V60) | |
| maximum AS SSD Seq Read Test (1GB) | |
| Dell Precision 5000 5680 (Toshiba Exceria Pro SDXC 64 GB UHS-II) | |
| Dell Pro Max 16 Plus (Toshiba Exceria Pro SDXC 64 GB UHS-II) | |
| Lenovo ThinkPad P1 Gen 7 21KV001SGE (AV Pro V60) | |
| Lenovo ThinkPad P16 Gen 2 (Toshiba Exceria Pro SDXC 64 GB UHS-II) | |
| MSI CreatorPro Z16P B12UKST (AV Pro V60) | |
Kommunikation
Webcam
Optionale 8-MP-Webcam mit IR und physischem Auslöser.


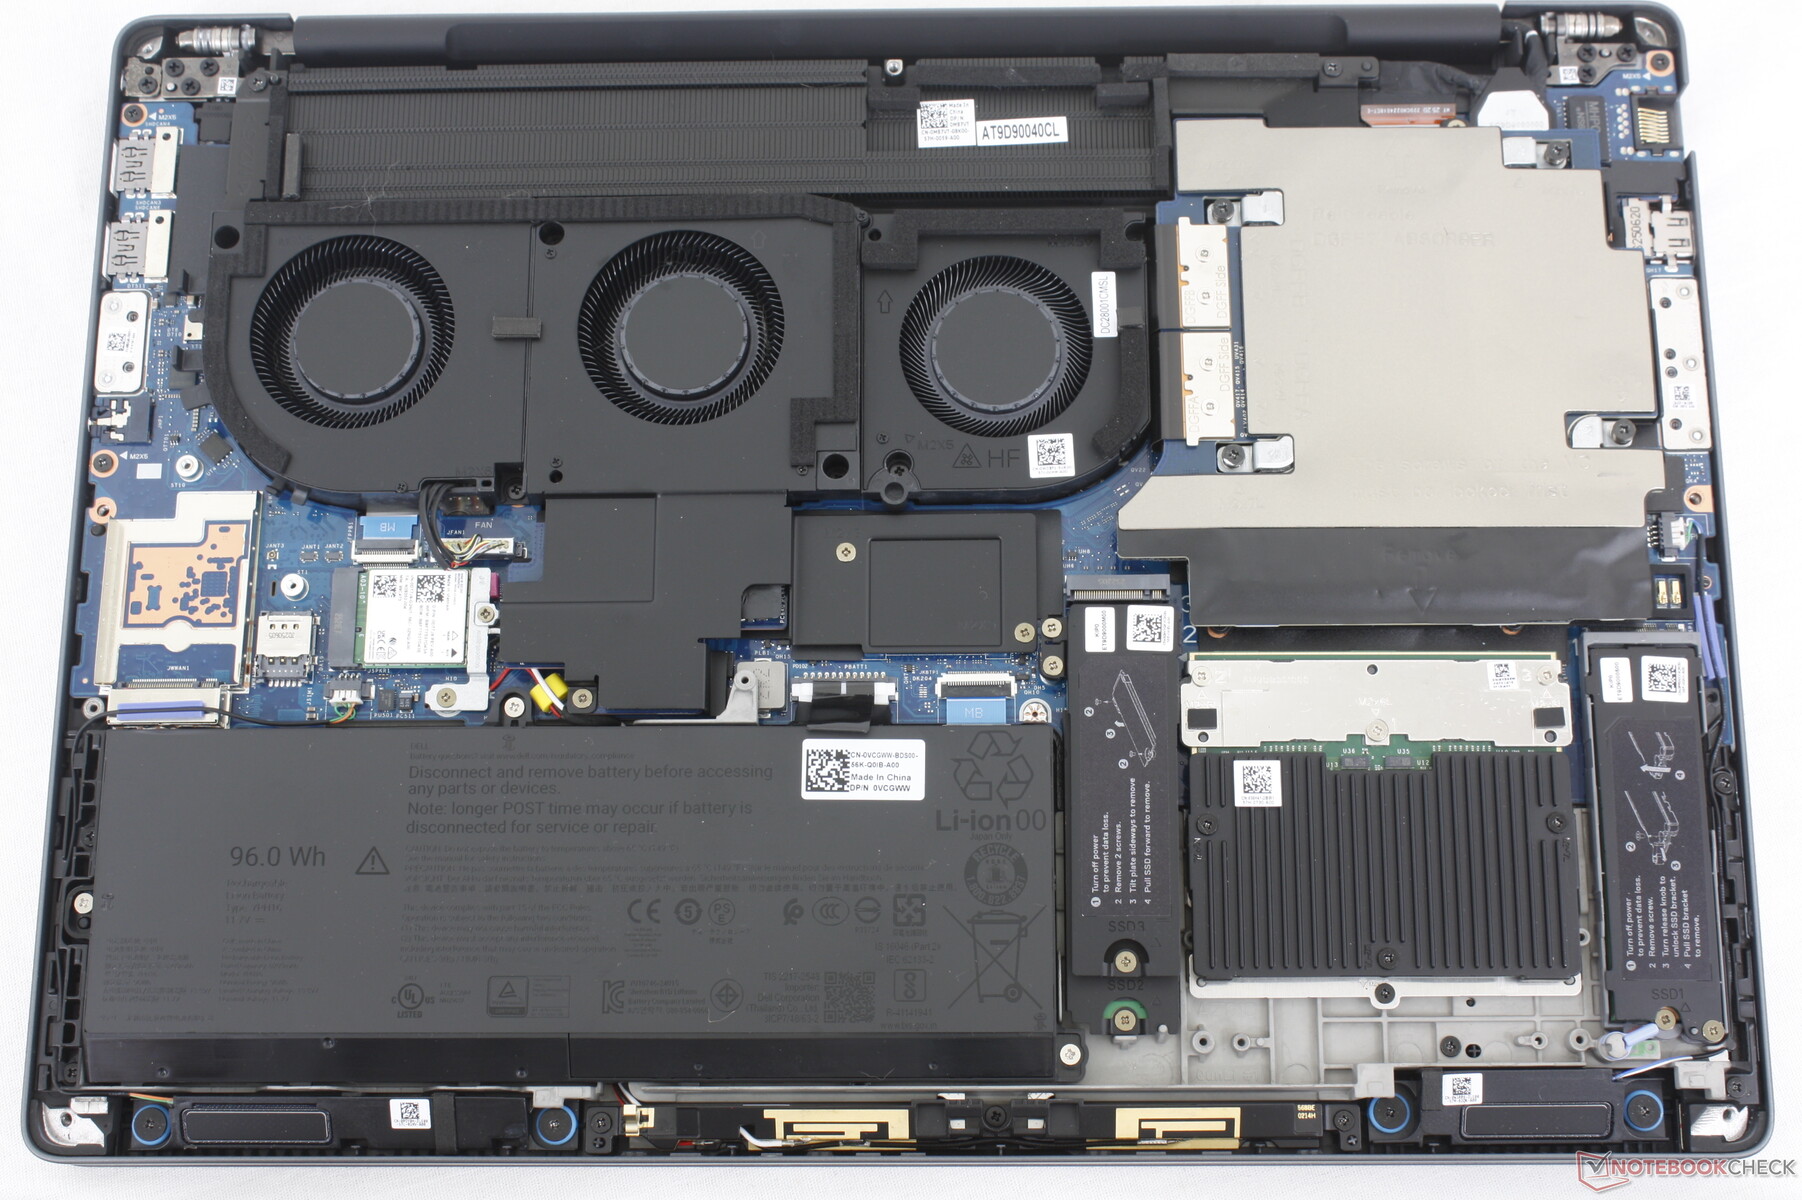
Wartung
Die Unterseite kann mit einem Kreuzschlitzschraubendreher entfernt werden, um einfachen Zugang zu den Innenteilen zu erhalten. Das CAMM2-Modul, zwei M.2-2280-SSD-Steckplätze, das WLAN-Modul und die Grafikkarte (DGFF) sind alle herausnehmbar.
Die SSD-"Laufwerksklappe", die beim älteren Precision-7670/7680-Design vorhanden war, ist entfallen.
Nachhaltigkeit
Das Gehäuse besteht zu 90 Prozent aus recyceltem Magnesium für die obere und untere Abdeckung, zu 30 Prozent aus PCC-Kunststoff für die Handballenablagen, zu 46 Prozent aus biobasiertem Kunststoff für die unteren Stoßstangen und zu 50 Prozent aus recyceltem Kobalt für den 96-Wh-Akku. Dieses Modell ist auch eines der ersten von Dell, das über modulare USB-C-Anschlüsse verfügt, die sich bei einem Defekt oder bei lockerer Verbindung aufgrund von übermäßiger Nutzung leicht austauschen lassen.
Zubehör und Garantie
In der Verpackung befinden sich außer dem Netzteil und den Papieren keine weiteren Extras. Sie erhalten eine dreijährige Herstellergarantie.
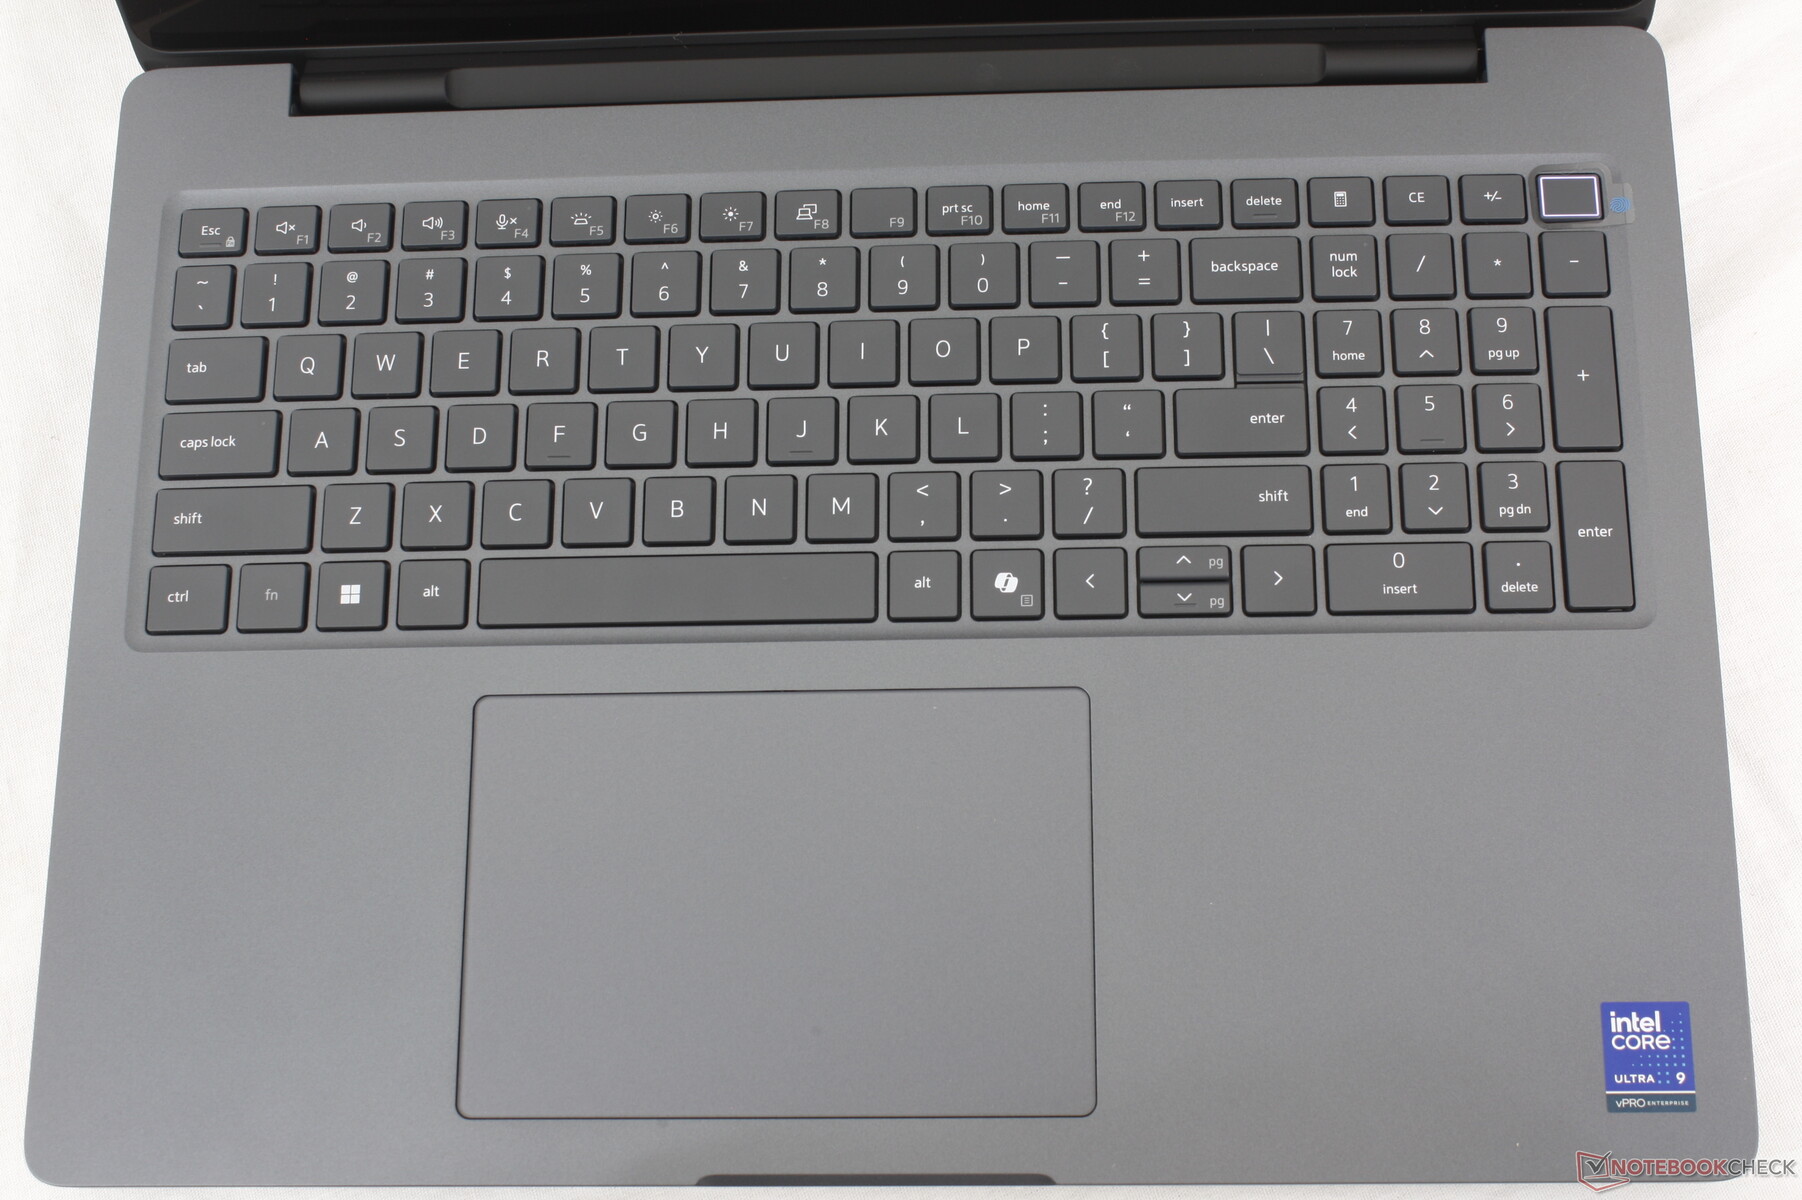
Eingabegeräte
Tastatur und Touchpad


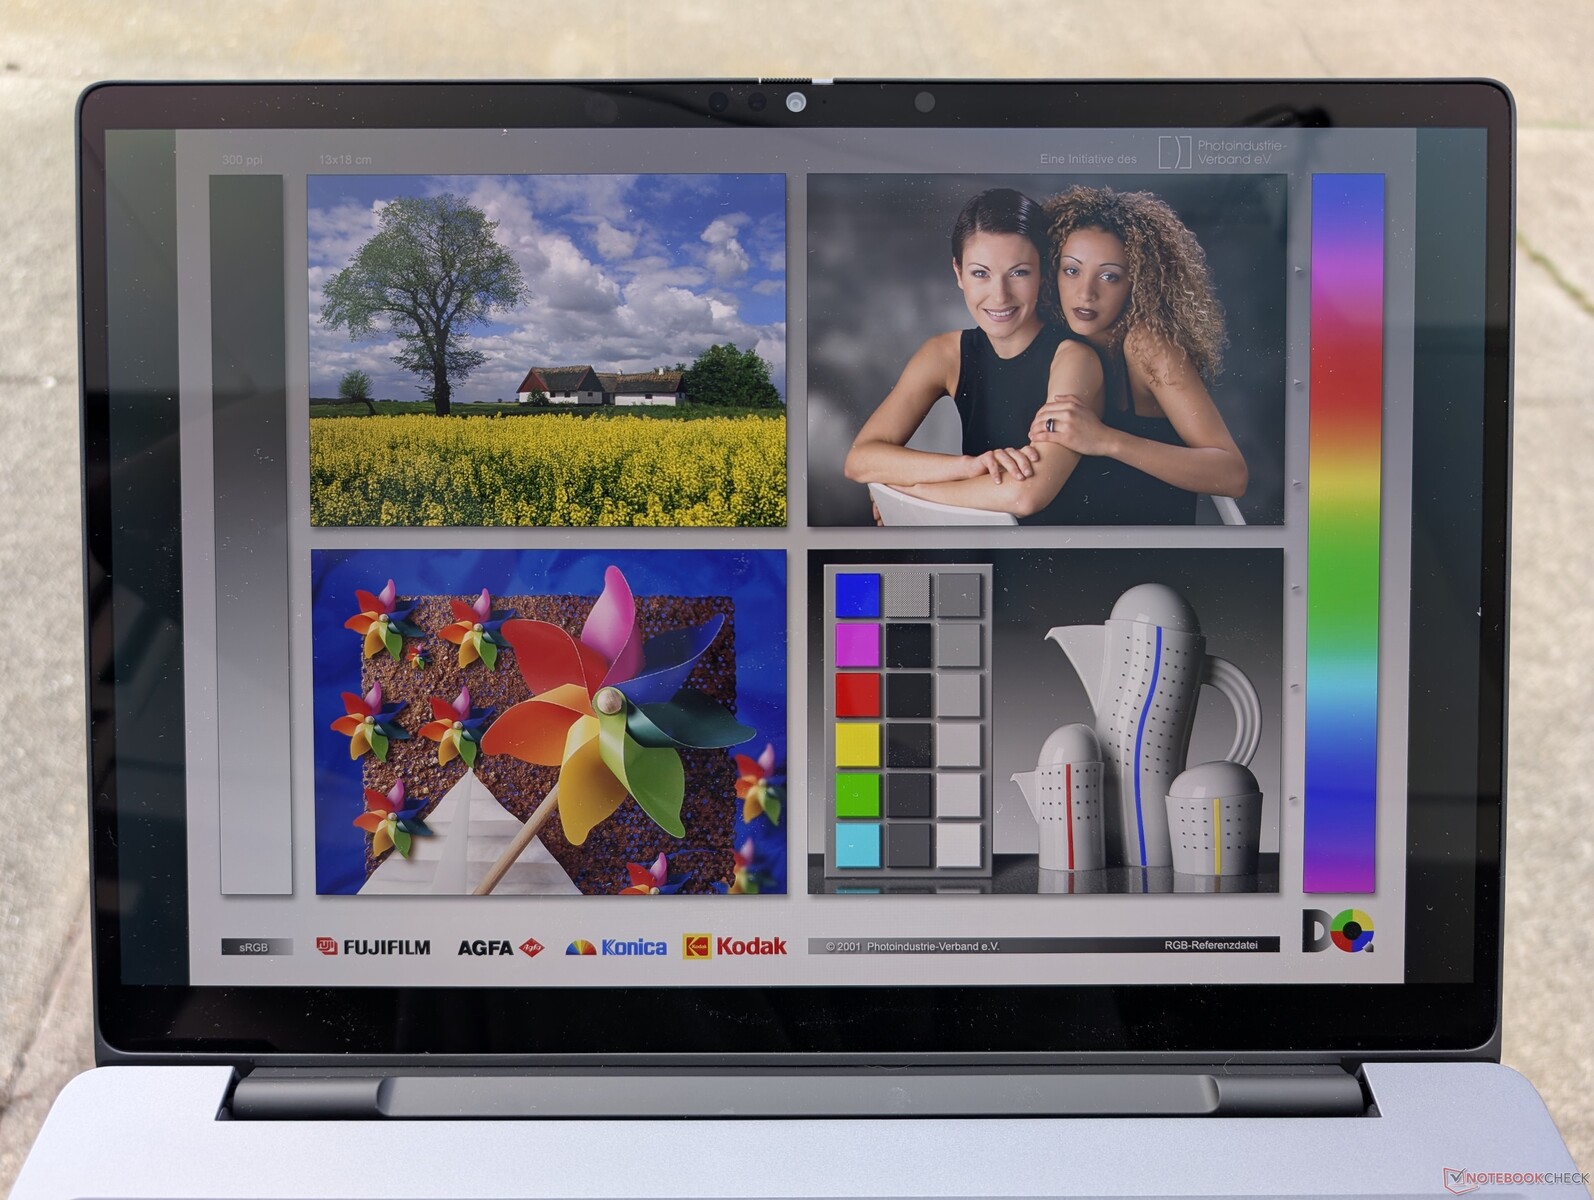
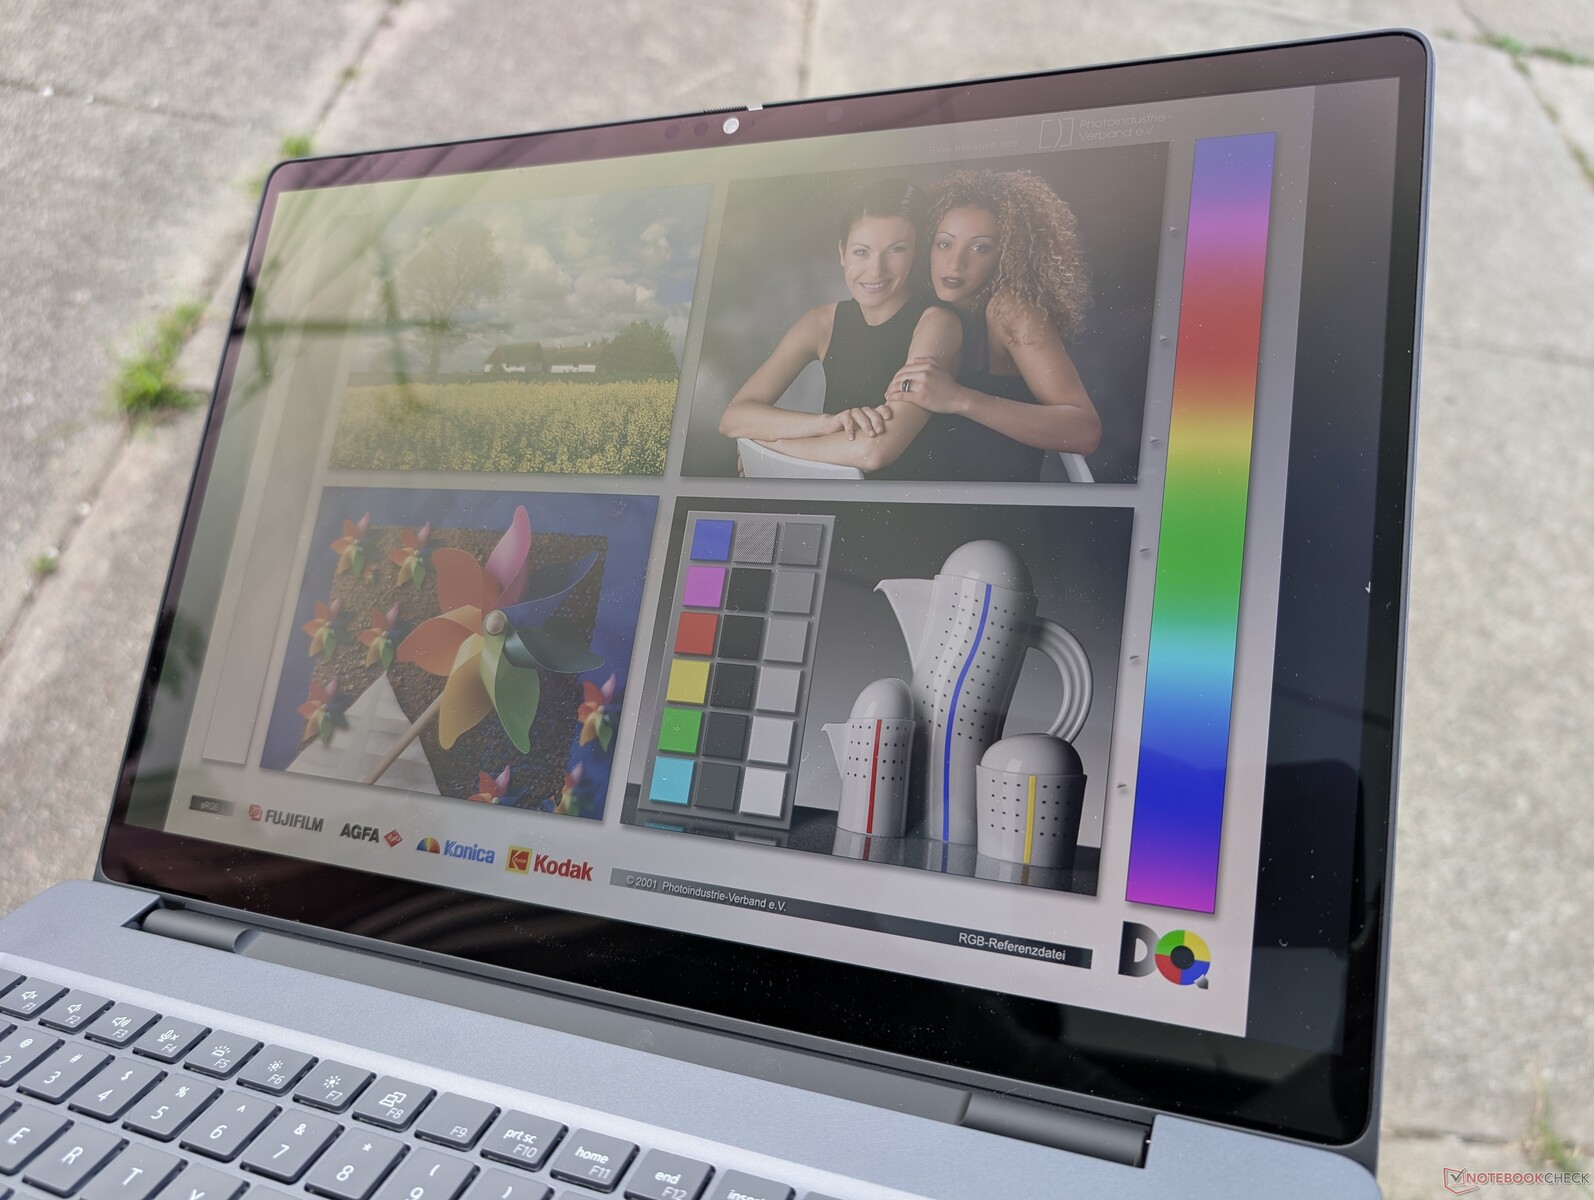
Display

Es stehen drei Anzeigeoptionen zur Verfügung:
- 1.920 x 1.200, 60 Hz, Non-Touch, 300 nits, ~60 % sRGB
- 1.920 x 1.200, 120 Hz, Non-Touch, 500 nits, 100 % DCI-P3
- 3.840 x 2.400, 120 Hz, OLED, Touch, 500 nits, 100 % DCI-P3
Unser Testgerät ist mit der oben fett gedruckten Option ausgestattet und gehört damit zu den wenigen 16-Zoll-Workstations, die mit 4K-120-Hz-OLED-Panels ausgeliefert werden.
Die maximale Helligkeit erreicht ~550 nits im SDR-Modus oder 1066 nits bei aktiviertem HDR-Modus. Die 4K-HDR-Wiedergabe ist damit genauso gut oder besser als bei den meisten Consumer-Laptops der gehobenen Klasse.
| |||||||||||||||||||||||||
Ausleuchtung: 95 %
Helligkeit Akku: 530.9 cd/m²
Kontrast: ∞:1 (Schwarzwert: 0 cd/m²)
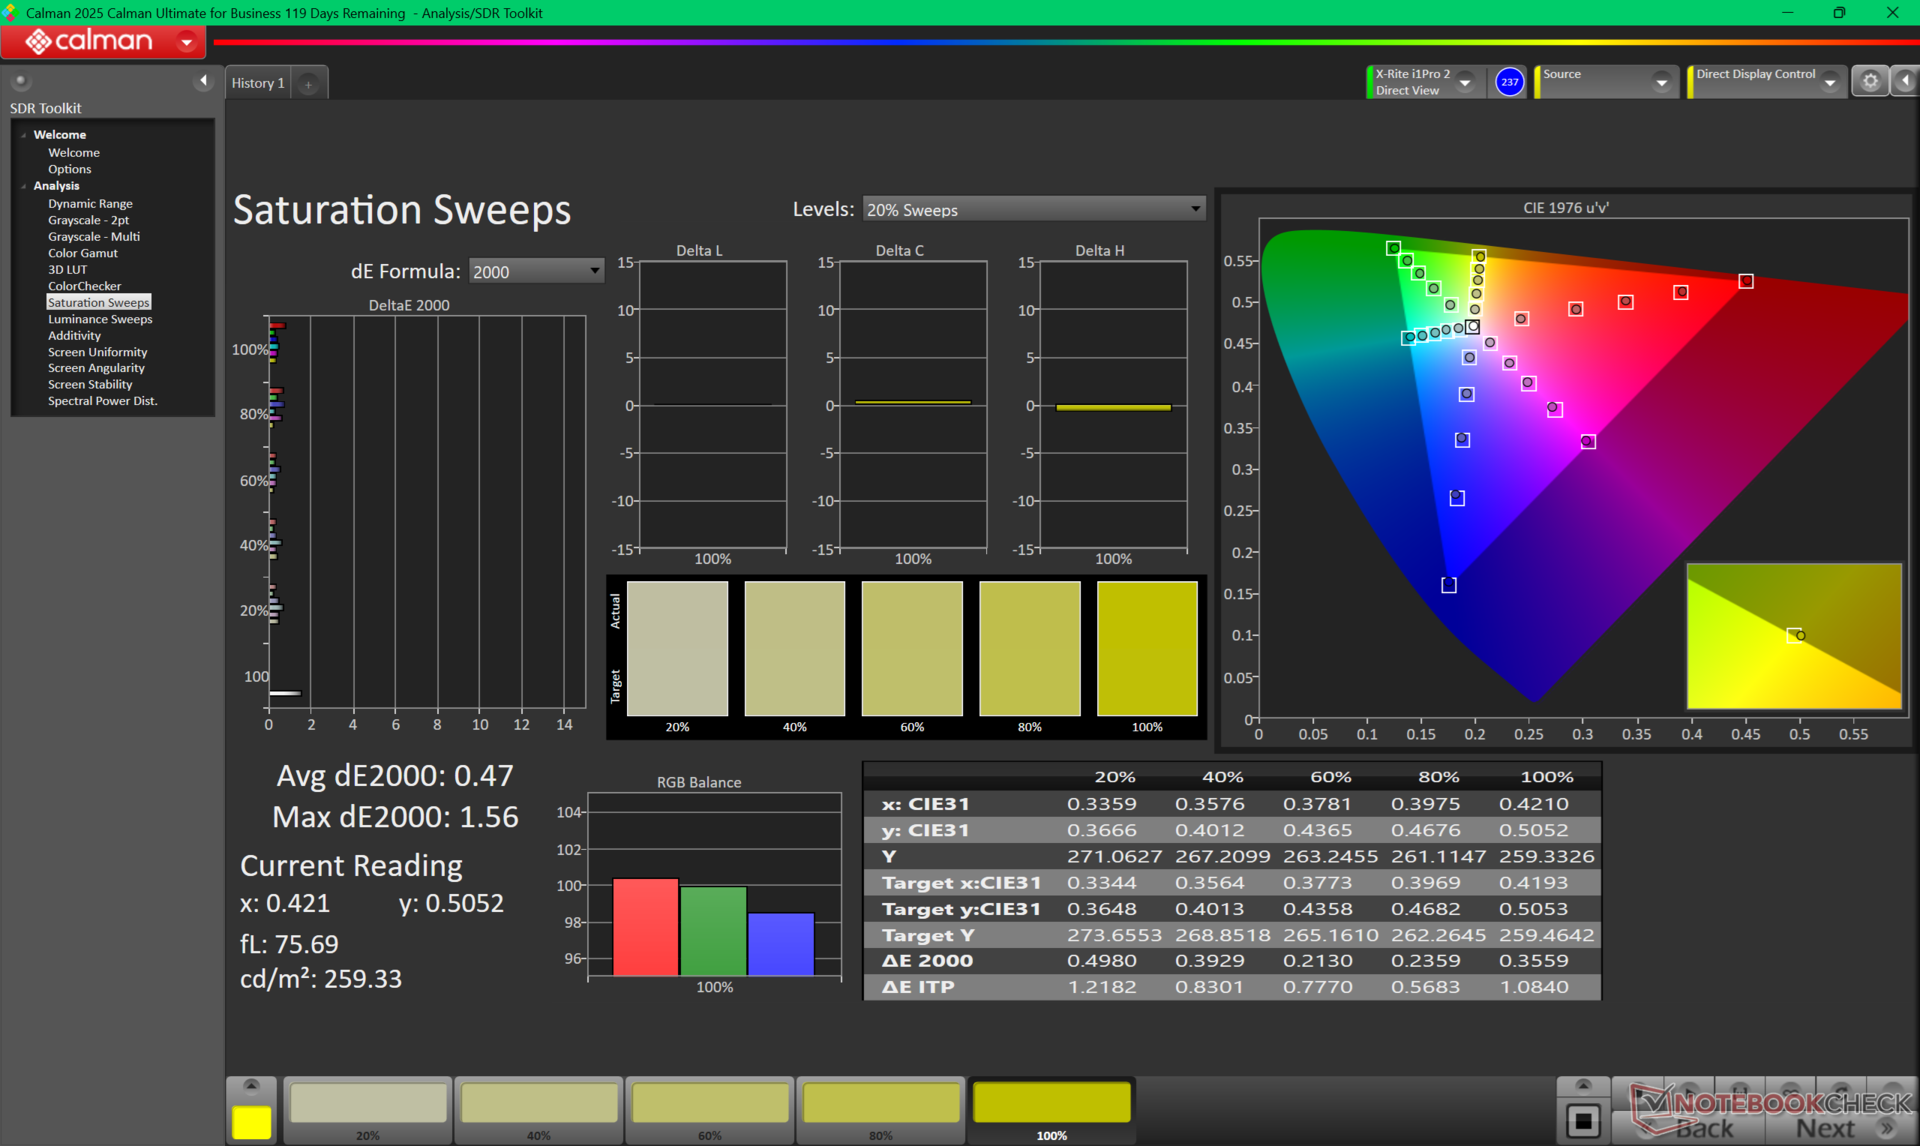
ΔE ColorChecker Calman: 2.42 | ∀{0.5-29.43 Ø4.73}
calibrated: 0.7
ΔE Greyscale Calman: 0.8 | ∀{0.09-98 Ø4.97}
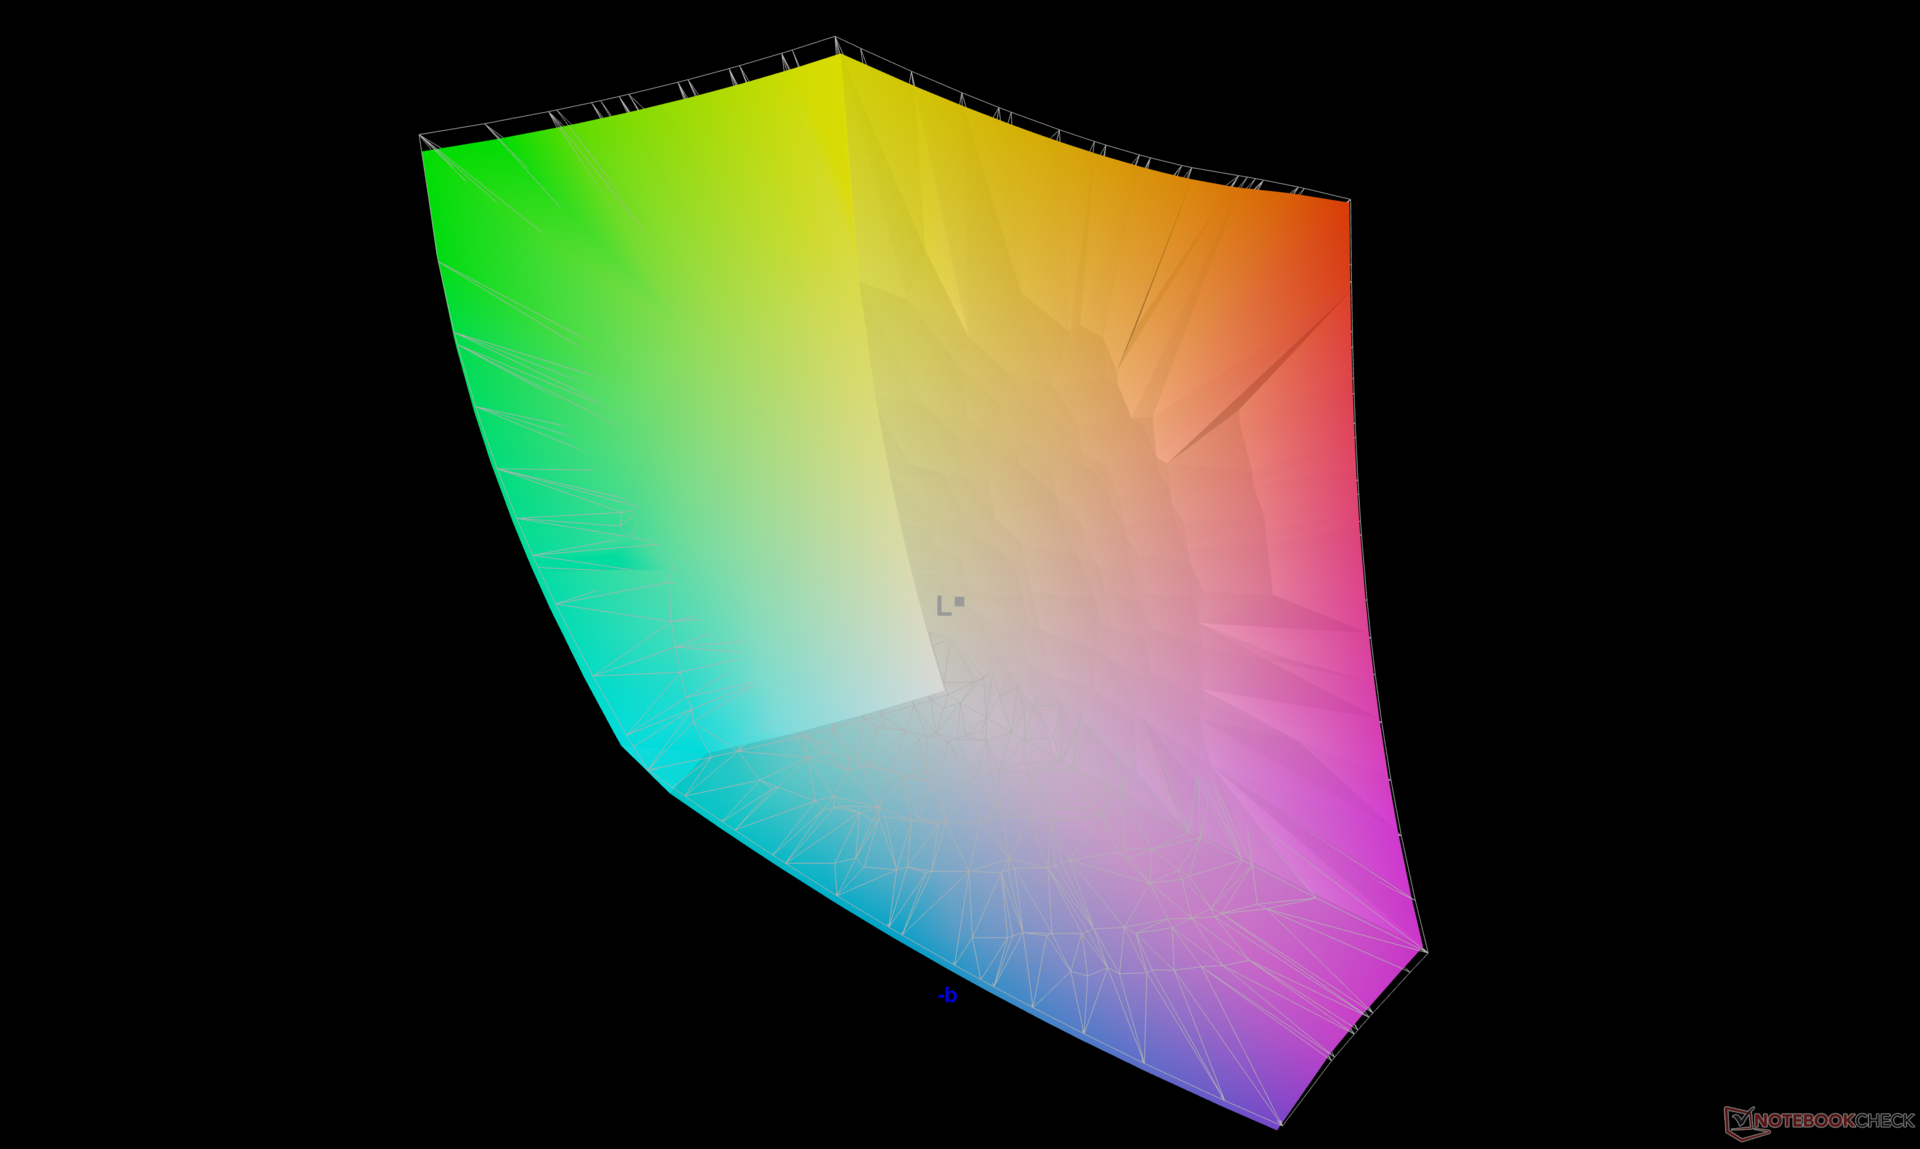
88.8% AdobeRGB 1998 (Argyll 3D)
100% sRGB (Argyll 3D)
97.3% Display P3 (Argyll 3D)
Gamma: 2.23
CCT: 6488 K
| Dell Pro Max 16 Plus Samsung 160HC01, OLED, 3840x2400, 16", 120 Hz | Dell Precision 5690 Samsung 160YV03, OLED, 3840x2400, 16", 60 Hz | Dell Precision 5000 5680 Samsung 160YV03, OLED, 3840x2400, 16", 60 Hz | Lenovo ThinkPad P16 Gen 2 NE160QDM-NY1, IPS, 2560x1600, 16", 165 Hz | Lenovo ThinkPad P1 Gen 7 21KV001SGE MNG007DA1-9 , IPS LED, 2560x1600, 16", 165 Hz | HP ZBook Studio 16 G11 AUO87A8, IPS, 3840x2400, 16", 120 Hz | MSI CreatorPro Z16P B12UKST B160QAN02.N, IPS, 2560x1600, 16", 165 Hz | |
|---|---|---|---|---|---|---|---|
| Display | 4% | 4% | -18% | -17% | -1% | -1% | |
| Display P3 Coverage (%) | 97.3 | 99.8 3% | 99.9 3% | 68.4 -30% | 69.4 -29% | 97.7 0% | 97.6 0% |
| sRGB Coverage (%) | 100 | 100 0% | 100 0% | 96.9 -3% | 97.6 -2% | 99.9 0% | 99.9 0% |
| AdobeRGB 1998 Coverage (%) | 88.8 | 96.6 9% | 97.5 10% | 70.6 -20% | 71.8 -19% | 85.7 -3% | 87.4 -2% |
| Response Times | -131% | -133% | -1575% | -1385% | -1623% | -1332% | |
| Response Time Grey 50% / Grey 80% * (ms) | 0.63 ? | 1.7 ? -170% | 1.68 ? -167% | 14.1 ? -2138% | 11.2 ? -1678% | 14.2 ? -2154% | 12.8 ? -1932% |
| Response Time Black / White * (ms) | 0.89 ? | 1.7 ? -91% | 1.77 ? -99% | 9.9 ? -1012% | 10.6 ? -1091% | 10.6 ? -1091% | 7.4 ? -731% |
| PWM Frequency (Hz) | 479.9 ? | 60 ? | 60 ? | ||||
| PWM Amplitude * (%) | 28 | ||||||
| Bildschirm | -44% | -67% | 0% | -112% | -44% | -17% | |
| Helligkeit Bildmitte (cd/m²) | 530.9 | 348.1 -34% | 345.7 -35% | 531.5 0% | 516 -3% | 404.3 -24% | 407 -23% |
| Brightness (cd/m²) | 540 | 351 -35% | 349 -35% | 499 -8% | 505 -6% | 405 -25% | 388 -28% |
| Brightness Distribution (%) | 95 | 97 2% | 98 3% | 89 -6% | 89 -6% | 92 -3% | 88 -7% |
| Schwarzwert * (cd/m²) | 0.38 | 0.41 | 0.28 | 0.36 | |||
| Delta E Colorchecker * | 2.42 | 4.18 -73% | 3.59 -48% | 1.82 25% | 3.5 -45% | 2.63 -9% | 1.3 46% |
| Colorchecker dE 2000 max. * | 5.76 | 6.68 -16% | 7.02 -22% | 4.1 29% | 8.8 -53% | 4.48 22% | 2.5 57% |
| Colorchecker dE 2000 calibrated * | 0.7 | 0.97 -39% | 0.99 -41% | 0.63 10% | 1.2 -71% | 1.46 -109% | 0.7 -0% |
| Delta E Graustufen * | 0.8 | 1.7 -113% | 3.1 -288% | 1.2 -50% | 5.6 -600% | 2.1 -163% | 2.1 -163% |
| Gamma | 2.23 99% | 2.2 100% | 2.13 103% | 2.15 102% | 2.27 97% | 2.3 96% | 2.26 97% |
| CCT | 6488 100% | 6198 105% | 6448 101% | 6484 100% | 6071 107% | 6810 95% | 6437 101% |
| Kontrast (:1) | 1399 | 1259 | 1444 | 1131 | |||
| Durchschnitt gesamt (Programm / Settings) | -57% /
-46% | -65% /
-60% | -531% /
-267% | -505% /
-300% | -556% /
-297% | -450% /
-232% |
* ... kleinere Werte sind besser

Das Display ist mit durchschnittlichen Graustufen- und Farb-DeltaE-Werten von nur 0,8 bzw. 2,42 gut auf den P3-Standard kalibriert.


Reaktionszeiten (Response Times) des Displays
| ↔ Reaktionszeiten Schwarz zu Weiß | ||
|---|---|---|
| 0.89 ms ... steigend ↗ und fallend ↘ kombiniert | ↗ 0.42 ms steigend | 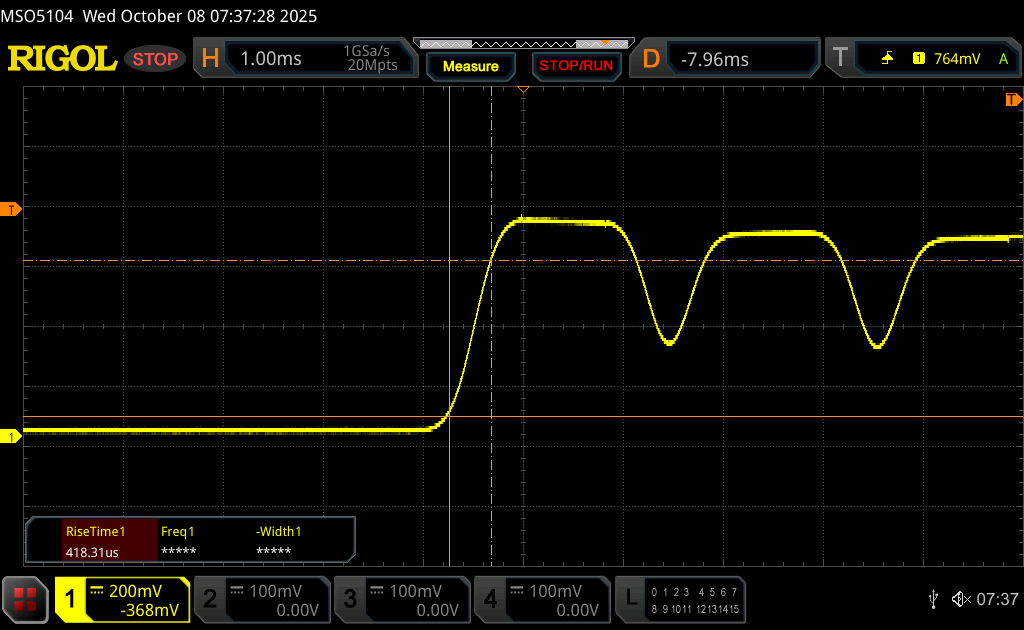 |
| ↘ 0.47 ms fallend | ||
| Die gemessenen Reaktionszeiten sind sehr kurz, wodurch sich der Bildschirm auch für schnelle 3D Spiele eignen sollte. Im Vergleich rangierten die bei uns getesteten Geräte von 0.1 (Minimum) zu 240 (Maximum) ms. » 3 % aller Screens waren schneller als der getestete. Daher sind die gemessenen Reaktionszeiten besser als der Durchschnitt aller vermessenen Geräte (19.9 ms). | ||
| ↔ Reaktionszeiten 50% Grau zu 80% Grau | ||
| 0.63 ms ... steigend ↗ und fallend ↘ kombiniert | ↗ 0.34 ms steigend |  |
| ↘ 0.29 ms fallend | ||
| Die gemessenen Reaktionszeiten sind sehr kurz, wodurch sich der Bildschirm auch für schnelle 3D Spiele eignen sollte. Im Vergleich rangierten die bei uns getesteten Geräte von 0.165 (Minimum) zu 636 (Maximum) ms. » 2 % aller Screens waren schneller als der getestete. Daher sind die gemessenen Reaktionszeiten besser als der Durchschnitt aller vermessenen Geräte (31.1 ms). | ||
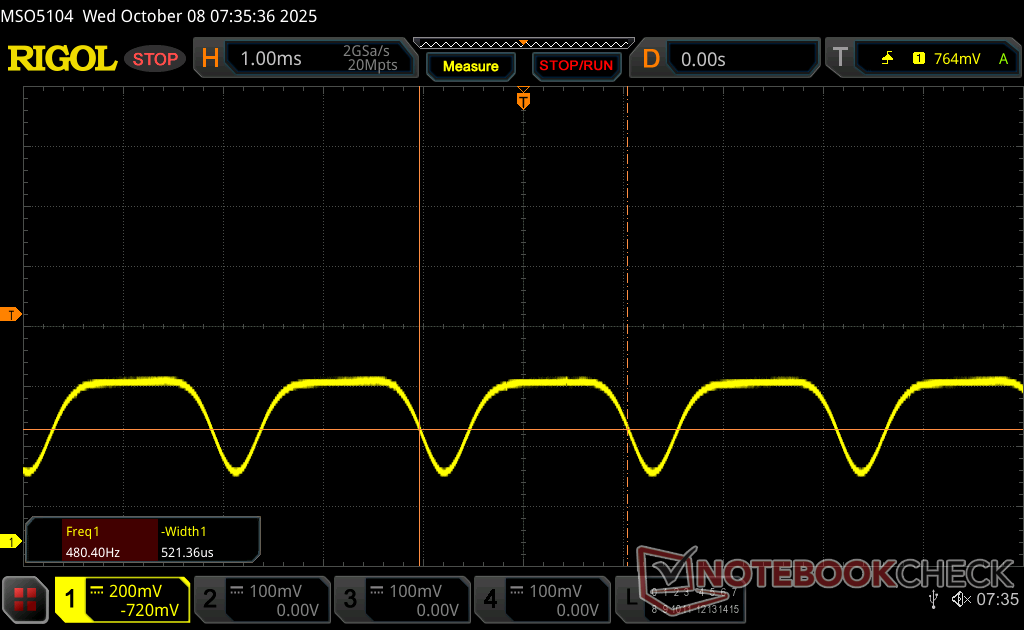
Bildschirm-Flackern / PWM (Pulse-Width Modulation)
| Flackern / PWM festgestellt | 479.9 Hz Amplitude: 28 % | ≤ 100 % Helligkeit | 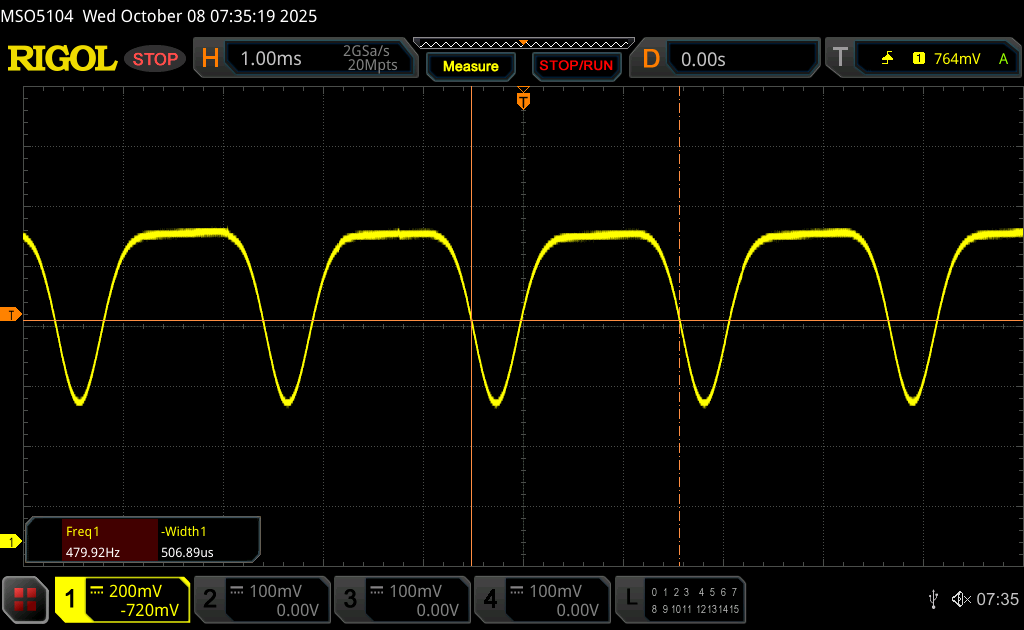 |
Das Display flackert mit 479.9 Hz (im schlimmsten Fall, eventuell durch Pulsweitenmodulation PWM) bei einer eingestellten Helligkeit von 100 % und darunter. Darüber sollte es zu keinem Flackern kommen. Die Frequenz von 479.9 Hz ist relativ hoch und sollte daher auch bei den meisten Personen zu keinen Problemen führen. Empfindliche User sollen laut Berichten aber sogar noch bei 500 Hz und darüber ein Flackern wahrnehmen. Im Vergleich: 52 % aller getesteten Geräte nutzten kein PWM um die Helligkeit zu reduzieren. Wenn PWM eingesetzt wurde, dann bei einer Frequenz von durchschnittlich 7784 (Minimum 5, Maximum 343500) Hz. | |||


Performance


Testbedingungen
Wir haben den Dell Optimizer auf den Modus Performance und das Nvidia Control Panel auf den diskreten Grafikmodus eingestellt, bevor wir die folgenden Benchmarks durchgeführt haben. Der Wechsel zwischen Optimus- und dGPU-Modus erfordert keinen Neustart.
Prozessor
Der Core Ultra 9 285HX ist einer der schnellsten Prozessoren, die für mobile Workstations verfügbar sind und bietet eine fast zweifache Leistungssteigerung gegenüber dem Core Ultra 9 185H im letztjährigen Precision 5690. Die Nachhaltigkeit der Leistung ist dennoch nicht perfekt. Wenn Sie beispielsweise CineBench R15 xT in einer Schleife laufen lassen, sinkt die Leistung mit der Zeit um etwa zehn Prozent, wie die Vergleichsgrafik unten zeigt.
Cinebench R15 Mehrfachschleife
Cinebench R23: Multi Core | Single Core
Cinebench R20: CPU (Multi Core) | CPU (Single Core)
Cinebench R15: CPU Multi 64Bit | CPU Single 64Bit
Blender: v2.79 BMW27 CPU
7-Zip 18.03: 7z b 4 | 7z b 4 -mmt1
Geekbench 6.7: Multi-Core | Single-Core
Geekbench 5.5: Multi-Core | Single-Core
HWBOT x265 Benchmark v2.2: 4k Preset
LibreOffice : 20 Documents To PDF
R Benchmark 2.5: Overall mean
| CPU Performance Rating | |
| Durchschnittliche Intel Core Ultra 9 285HX | |
| Dell Pro Max 16 Plus | |
| HP ZBook Fury 16 G10 | |
| Lenovo ThinkPad P16 Gen 2 | |
| Dell Precision 5000 5680 | |
| Lenovo ThinkPad P16 G2 21FA000FGE -2! | |
| Dell Precision 5690 | |
| HP ZBook Studio 16 G11 | |
| Lenovo ThinkPad P1 Gen 7 21KV001SGE | |
| HP ZBook Studio 16 G9 62U04EA -2! | |
| MSI CreatorPro Z16P B12UKST -2! | |
| Lenovo ThinkPad P16s G2 21K9000CGE | |
| Cinebench R20 / CPU (Multi Core) | |
| Durchschnittliche Intel Core Ultra 9 285HX (13152 - 15751, n=6) | |
| Dell Pro Max 16 Plus | |
| Lenovo ThinkPad P16 Gen 2 | |
| HP ZBook Fury 16 G10 | |
| Lenovo ThinkPad P16 G2 21FA000FGE | |
| Dell Precision 5690 | |
| Lenovo ThinkPad P1 Gen 7 21KV001SGE | |
| Dell Precision 5000 5680 | |
| HP ZBook Studio 16 G11 | |
| MSI CreatorPro Z16P B12UKST | |
| HP ZBook Studio 16 G9 62U04EA | |
| Lenovo ThinkPad P16s G2 21K9000CGE | |
| Cinebench R20 / CPU (Single Core) | |
| Durchschnittliche Intel Core Ultra 9 285HX (799 - 884, n=6) | |
| HP ZBook Fury 16 G10 | |
| Dell Pro Max 16 Plus | |
| Lenovo ThinkPad P16 Gen 2 | |
| Dell Precision 5000 5680 | |
| Lenovo ThinkPad P16 G2 21FA000FGE | |
| HP ZBook Studio 16 G9 62U04EA | |
| Dell Precision 5690 | |
| HP ZBook Studio 16 G11 | |
| Lenovo ThinkPad P1 Gen 7 21KV001SGE | |
| MSI CreatorPro Z16P B12UKST | |
| Lenovo ThinkPad P16s G2 21K9000CGE | |
| Cinebench R15 / CPU Multi 64Bit | |
| Durchschnittliche Intel Core Ultra 9 285HX (5427 - 6232, n=6) | |
| Dell Pro Max 16 Plus | |
| Lenovo ThinkPad P16 Gen 2 | |
| HP ZBook Fury 16 G10 | |
| Dell Precision 5690 | |
| Lenovo ThinkPad P16 G2 21FA000FGE | |
| Lenovo ThinkPad P1 Gen 7 21KV001SGE | |
| HP ZBook Studio 16 G11 | |
| HP ZBook Studio 16 G9 62U04EA | |
| Lenovo ThinkPad P16s G2 21K9000CGE | |
| Dell Precision 5000 5680 | |
| MSI CreatorPro Z16P B12UKST | |
| Cinebench R15 / CPU Single 64Bit | |
| Durchschnittliche Intel Core Ultra 9 285HX (307 - 340, n=6) | |
| Dell Pro Max 16 Plus | |
| HP ZBook Fury 16 G10 | |
| Lenovo ThinkPad P16 Gen 2 | |
| Dell Precision 5000 5680 | |
| Lenovo ThinkPad P16 G2 21FA000FGE | |
| Dell Precision 5690 | |
| HP ZBook Studio 16 G9 62U04EA | |
| Lenovo ThinkPad P1 Gen 7 21KV001SGE | |
| Lenovo ThinkPad P16s G2 21K9000CGE | |
| HP ZBook Studio 16 G11 | |
| MSI CreatorPro Z16P B12UKST | |
| Geekbench 6.7 / Multi-Core | |
| Dell Pro Max 16 Plus | |
| Durchschnittliche Intel Core Ultra 9 285HX (18212 - 22104, n=6) | |
| Lenovo ThinkPad P16 Gen 2 | |
| HP ZBook Fury 16 G10 | |
| Dell Precision 5000 5680 | |
| Dell Precision 5690 | |
| HP ZBook Studio 16 G11 | |
| Lenovo ThinkPad P1 Gen 7 21KV001SGE | |
| Lenovo ThinkPad P16s G2 21K9000CGE | |
| Geekbench 6.7 / Single-Core | |
| Durchschnittliche Intel Core Ultra 9 285HX (2907 - 3088, n=6) | |
| HP ZBook Fury 16 G10 | |
| Dell Pro Max 16 Plus | |
| Lenovo ThinkPad P16 Gen 2 | |
| Dell Precision 5000 5680 | |
| Dell Precision 5690 | |
| HP ZBook Studio 16 G11 | |
| Lenovo ThinkPad P16s G2 21K9000CGE | |
| Lenovo ThinkPad P1 Gen 7 21KV001SGE | |
| HWBOT x265 Benchmark v2.2 / 4k Preset | |
| Durchschnittliche Intel Core Ultra 9 285HX (35.3 - 44.3, n=6) | |
| Dell Pro Max 16 Plus | |
| HP ZBook Fury 16 G10 | |
| Lenovo ThinkPad P16 Gen 2 | |
| Lenovo ThinkPad P16 G2 21FA000FGE | |
| Dell Precision 5690 | |
| Lenovo ThinkPad P1 Gen 7 21KV001SGE | |
| HP ZBook Studio 16 G11 | |
| Dell Precision 5000 5680 | |
| HP ZBook Studio 16 G9 62U04EA | |
| MSI CreatorPro Z16P B12UKST | |
| Lenovo ThinkPad P16s G2 21K9000CGE | |
| LibreOffice / 20 Documents To PDF | |
| Lenovo ThinkPad P16s G2 21K9000CGE | |
| Lenovo ThinkPad P16 G2 21FA000FGE | |
| Lenovo ThinkPad P16 Gen 2 | |
| HP ZBook Studio 16 G11 | |
| Lenovo ThinkPad P1 Gen 7 21KV001SGE | |
| HP ZBook Fury 16 G10 | |
| HP ZBook Studio 16 G9 62U04EA | |
| Durchschnittliche Intel Core Ultra 9 285HX (38 - 49.1, n=6) | |
| Dell Pro Max 16 Plus | |
| Dell Precision 5690 | |
| Dell Precision 5000 5680 | |
| MSI CreatorPro Z16P B12UKST | |
* ... kleinere Werte sind besser
AIDA64: FP32 Ray-Trace | FPU Julia | CPU SHA3 | CPU Queen | FPU SinJulia | FPU Mandel | CPU AES | CPU ZLib | FP64 Ray-Trace | CPU PhotoWorxx
| Performance Rating | |
| Durchschnittliche Intel Core Ultra 9 285HX | |
| Dell Pro Max 16 Plus | |
| Lenovo ThinkPad P16 Gen 2 | |
| Dell Precision 5690 | |
| HP ZBook Studio 16 G11 | |
| Lenovo ThinkPad P1 Gen 7 21KV001SGE | |
| MSI CreatorPro Z16P B12UKST | |
| Dell Precision 5000 5680 | |
| AIDA64 / FP32 Ray-Trace | |
| Durchschnittliche Intel Core Ultra 9 285HX (29076 - 42341, n=6) | |
| Dell Pro Max 16 Plus | |
| Lenovo ThinkPad P16 Gen 2 | |
| Dell Precision 5690 | |
| Lenovo ThinkPad P1 Gen 7 21KV001SGE | |
| HP ZBook Studio 16 G11 | |
| Dell Precision 5000 5680 | |
| MSI CreatorPro Z16P B12UKST | |
| AIDA64 / FPU Julia | |
| Durchschnittliche Intel Core Ultra 9 285HX (161276 - 210885, n=6) | |
| Dell Pro Max 16 Plus | |
| Lenovo ThinkPad P16 Gen 2 | |
| Dell Precision 5690 | |
| HP ZBook Studio 16 G11 | |
| Lenovo ThinkPad P1 Gen 7 21KV001SGE | |
| Dell Precision 5000 5680 | |
| MSI CreatorPro Z16P B12UKST | |
| AIDA64 / CPU SHA3 | |
| Durchschnittliche Intel Core Ultra 9 285HX (7757 - 9815, n=6) | |
| Dell Pro Max 16 Plus | |
| Lenovo ThinkPad P16 Gen 2 | |
| Dell Precision 5690 | |
| HP ZBook Studio 16 G11 | |
| Lenovo ThinkPad P1 Gen 7 21KV001SGE | |
| MSI CreatorPro Z16P B12UKST | |
| Dell Precision 5000 5680 | |
| AIDA64 / CPU Queen | |
| Lenovo ThinkPad P16 Gen 2 | |
| Durchschnittliche Intel Core Ultra 9 285HX (134345 - 141681, n=6) | |
| Dell Pro Max 16 Plus | |
| Dell Precision 5000 5680 | |
| MSI CreatorPro Z16P B12UKST | |
| Dell Precision 5690 | |
| HP ZBook Studio 16 G11 | |
| Lenovo ThinkPad P1 Gen 7 21KV001SGE | |
| AIDA64 / FPU SinJulia | |
| Lenovo ThinkPad P16 Gen 2 | |
| Durchschnittliche Intel Core Ultra 9 285HX (12559 - 14431, n=6) | |
| Dell Pro Max 16 Plus | |
| Dell Precision 5690 | |
| HP ZBook Studio 16 G11 | |
| Lenovo ThinkPad P1 Gen 7 21KV001SGE | |
| Dell Precision 5000 5680 | |
| MSI CreatorPro Z16P B12UKST | |
| AIDA64 / FPU Mandel | |
| Durchschnittliche Intel Core Ultra 9 285HX (84053 - 108922, n=6) | |
| Dell Pro Max 16 Plus | |
| Lenovo ThinkPad P16 Gen 2 | |
| Dell Precision 5690 | |
| Lenovo ThinkPad P1 Gen 7 21KV001SGE | |
| HP ZBook Studio 16 G11 | |
| Dell Precision 5000 5680 | |
| MSI CreatorPro Z16P B12UKST | |
| AIDA64 / CPU AES | |
| MSI CreatorPro Z16P B12UKST | |
| Durchschnittliche Intel Core Ultra 9 285HX (119553 - 134195, n=6) | |
| Dell Pro Max 16 Plus | |
| Lenovo ThinkPad P16 Gen 2 | |
| Dell Precision 5690 | |
| HP ZBook Studio 16 G11 | |
| Lenovo ThinkPad P1 Gen 7 21KV001SGE | |
| Dell Precision 5000 5680 | |
| AIDA64 / CPU ZLib | |
| Durchschnittliche Intel Core Ultra 9 285HX (1886 - 2267, n=6) | |
| Dell Pro Max 16 Plus | |
| Lenovo ThinkPad P16 Gen 2 | |
| Dell Precision 5690 | |
| HP ZBook Studio 16 G11 | |
| Lenovo ThinkPad P1 Gen 7 21KV001SGE | |
| MSI CreatorPro Z16P B12UKST | |
| Dell Precision 5000 5680 | |
| AIDA64 / FP64 Ray-Trace | |
| Durchschnittliche Intel Core Ultra 9 285HX (15059 - 22312, n=6) | |
| Dell Pro Max 16 Plus | |
| Lenovo ThinkPad P16 Gen 2 | |
| Dell Precision 5690 | |
| Lenovo ThinkPad P1 Gen 7 21KV001SGE | |
| HP ZBook Studio 16 G11 | |
| Dell Precision 5000 5680 | |
| MSI CreatorPro Z16P B12UKST | |
| AIDA64 / CPU PhotoWorxx | |
| Dell Pro Max 16 Plus | |
| HP ZBook Studio 16 G11 | |
| Dell Precision 5690 | |
| Durchschnittliche Intel Core Ultra 9 285HX (39232 - 62611, n=6) | |
| Dell Precision 5000 5680 | |
| MSI CreatorPro Z16P B12UKST | |
| Lenovo ThinkPad P1 Gen 7 21KV001SGE | |
| Lenovo ThinkPad P16 Gen 2 | |
System Performance
Die Ergebnisse des PCMark 10 sind nicht enthalten, da der Benchmark immer wieder abstürzte, selbst wenn er auf die neueste Version aktualisiert wurde und verschiedene GPU-Konfigurationen ausprobiert wurden. Dank der Leistungsvorteile des CAMM2 RAM gehören die AIDA64-Speicherergebnisse zu den besten aller mobilen Workstations.
CrossMark: Overall | Productivity | Creativity | Responsiveness
WebXPRT 3: Overall
WebXPRT 4: Overall
Mozilla Kraken 1.1: Total
| Performance Rating | |
| Durchschnittliche Intel Core Ultra 9 285HX, NVIDIA RTX PRO 5000 Blackwell Generation Laptop | |
| Dell Pro Max 16 Plus | |
| Lenovo ThinkPad P16 Gen 2 | |
| Dell Precision 5000 5680 | |
| MSI CreatorPro Z16P B12UKST | |
| Dell Precision 5690 | |
| HP ZBook Studio 16 G11 | |
| Lenovo ThinkPad P1 Gen 7 21KV001SGE | |
| CrossMark / Overall | |
| Dell Pro Max 16 Plus | |
| Durchschnittliche Intel Core Ultra 9 285HX, NVIDIA RTX PRO 5000 Blackwell Generation Laptop (2142 - 2267, n=3) | |
| Lenovo ThinkPad P16 Gen 2 | |
| MSI CreatorPro Z16P B12UKST | |
| Dell Precision 5000 5680 | |
| Dell Precision 5690 | |
| HP ZBook Studio 16 G11 | |
| Lenovo ThinkPad P1 Gen 7 21KV001SGE | |
| CrossMark / Productivity | |
| Durchschnittliche Intel Core Ultra 9 285HX, NVIDIA RTX PRO 5000 Blackwell Generation Laptop (2016 - 2028, n=3) | |
| Dell Pro Max 16 Plus | |
| Lenovo ThinkPad P16 Gen 2 | |
| MSI CreatorPro Z16P B12UKST | |
| Dell Precision 5000 5680 | |
| Dell Precision 5690 | |
| HP ZBook Studio 16 G11 | |
| Lenovo ThinkPad P1 Gen 7 21KV001SGE | |
| CrossMark / Creativity | |
| Dell Pro Max 16 Plus | |
| Durchschnittliche Intel Core Ultra 9 285HX, NVIDIA RTX PRO 5000 Blackwell Generation Laptop (2395 - 2725, n=3) | |
| Lenovo ThinkPad P16 Gen 2 | |
| Dell Precision 5000 5680 | |
| MSI CreatorPro Z16P B12UKST | |
| Dell Precision 5690 | |
| HP ZBook Studio 16 G11 | |
| Lenovo ThinkPad P1 Gen 7 21KV001SGE | |
| CrossMark / Responsiveness | |
| MSI CreatorPro Z16P B12UKST | |
| Durchschnittliche Intel Core Ultra 9 285HX, NVIDIA RTX PRO 5000 Blackwell Generation Laptop (1806 - 1858, n=3) | |
| Dell Pro Max 16 Plus | |
| Lenovo ThinkPad P16 Gen 2 | |
| Dell Precision 5000 5680 | |
| Dell Precision 5690 | |
| HP ZBook Studio 16 G11 | |
| Lenovo ThinkPad P1 Gen 7 21KV001SGE | |
| WebXPRT 3 / Overall | |
| Durchschnittliche Intel Core Ultra 9 285HX, NVIDIA RTX PRO 5000 Blackwell Generation Laptop (327 - 360, n=3) | |
| Dell Precision 5000 5680 | |
| Lenovo ThinkPad P16 Gen 2 | |
| Dell Pro Max 16 Plus | |
| MSI CreatorPro Z16P B12UKST | |
| HP ZBook Studio 16 G11 | |
| Dell Precision 5690 | |
| Lenovo ThinkPad P1 Gen 7 21KV001SGE | |
| WebXPRT 4 / Overall | |
| Durchschnittliche Intel Core Ultra 9 285HX, NVIDIA RTX PRO 5000 Blackwell Generation Laptop (306 - 323, n=3) | |
| Dell Pro Max 16 Plus | |
| Lenovo ThinkPad P16 Gen 2 | |
| Dell Precision 5000 5680 | |
| Dell Precision 5690 | |
| MSI CreatorPro Z16P B12UKST | |
| HP ZBook Studio 16 G11 | |
| Lenovo ThinkPad P1 Gen 7 21KV001SGE | |
| Mozilla Kraken 1.1 / Total | |
| Lenovo ThinkPad P1 Gen 7 21KV001SGE | |
| MSI CreatorPro Z16P B12UKST | |
| HP ZBook Studio 16 G11 | |
| Dell Precision 5690 | |
| Dell Precision 5000 5680 | |
| Lenovo ThinkPad P16 Gen 2 | |
| Dell Pro Max 16 Plus | |
| Durchschnittliche Intel Core Ultra 9 285HX, NVIDIA RTX PRO 5000 Blackwell Generation Laptop (411 - 439, n=3) | |
* ... kleinere Werte sind besser
| AIDA64 / Memory Copy | |
| Dell Pro Max 16 Plus | |
| Dell Precision 5690 | |
| Durchschnittliche Intel Core Ultra 9 285HX (63431 - 93933, n=6) | |
| HP ZBook Studio 16 G11 | |
| Dell Precision 5000 5680 | |
| Lenovo ThinkPad P1 Gen 7 21KV001SGE | |
| Lenovo ThinkPad P16 Gen 2 | |
| MSI CreatorPro Z16P B12UKST | |
| AIDA64 / Memory Read | |
| Dell Pro Max 16 Plus | |
| Dell Precision 5690 | |
| Durchschnittliche Intel Core Ultra 9 285HX (67084 - 97565, n=6) | |
| HP ZBook Studio 16 G11 | |
| Lenovo ThinkPad P16 Gen 2 | |
| Dell Precision 5000 5680 | |
| MSI CreatorPro Z16P B12UKST | |
| Lenovo ThinkPad P1 Gen 7 21KV001SGE | |
| AIDA64 / Memory Write | |
| Dell Pro Max 16 Plus | |
| Dell Precision 5000 5680 | |
| Durchschnittliche Intel Core Ultra 9 285HX (64112 - 89691, n=6) | |
| HP ZBook Studio 16 G11 | |
| Dell Precision 5690 | |
| MSI CreatorPro Z16P B12UKST | |
| Lenovo ThinkPad P16 Gen 2 | |
| Lenovo ThinkPad P1 Gen 7 21KV001SGE | |
| AIDA64 / Memory Latency | |
| Dell Precision 5690 | |
| Lenovo ThinkPad P1 Gen 7 21KV001SGE | |
| Durchschnittliche Intel Core Ultra 9 285HX (104.8 - 151.7, n=6) | |
| HP ZBook Studio 16 G11 | |
| Dell Pro Max 16 Plus | |
| MSI CreatorPro Z16P B12UKST | |
| Lenovo ThinkPad P16 Gen 2 | |
| Dell Precision 5000 5680 | |
* ... kleinere Werte sind besser
DPC-Latenzzeit
LatencyMon zeigt geringfügige DPC-Probleme, aber ansonsten keine Bildaussetzer während unseres 4K60-Videowiedergabe-Tests.


| DPC Latencies / LatencyMon - interrupt to process latency (max), Web, Youtube, Prime95 | |
| Dell Pro Max 16 Plus | |
| Dell Precision 5000 5680 | |
| Lenovo ThinkPad P1 Gen 7 21KV001SGE | |
| HP ZBook Studio 16 G11 | |
| Lenovo ThinkPad P16 Gen 2 | |
| MSI CreatorPro Z16P B12UKST | |
| Dell Precision 5690 | |
* ... kleinere Werte sind besser
Speichergeräte
Unser Testgerät wird mit der SK Hynix PCB01 PCIe5 x4 NVMe SSD für Leseraten von bis zu ~16 GB/s ausgeliefert. Die Performance fiel nach ein paar Minuten in unserem DisKSpd Stresstest auf ~13 GB/s ab, wie die unten stehende Grafik zeigt.


* ... kleinere Werte sind besser
isk Throttling: DiskSpd Read Loop, Queue Depth 8
GPU Performance
Als erste Workstation in unserer Datenbank mit der RTX Pro 5000 Blackwell übertrifft die GPU mit Leichtigkeit die auslaufende RTX 5000 Ada, die in den Flaggschiff-Workstations der vorherigen Generation wie dem HP ZBook Fury 16 G10 weit verbreitet war, um etwa 35 bis 50 Prozent. Die Vorteile können sogar noch größer sein, wenn man die Specviewperf-Ergebnisse berücksichtigt. Wenn man das System im Modus "Ausgewogen" oder "Optimiert" statt im Modus " Performance " betreibt, hat dies laut den 3DMark Fire Strike Benchmarks nur minimale Auswirkungen auf die Leistung.
| Energie-Profil | Grafics Punktzahl | Physics Punktzahl | Kombinierte Punktzahl |
| Performance-Modus (~121 W) | 48.162 | 47.030 | 9.424 |
| Balanced Modus (~108 W) | 47.134 (-2 %) | 45.150 (-4 %) | 12.212 (+30 %) |
| Akku-Leistung | 25.838 (-46 %) | 34.253 (-27 %) | 6.186 (-34 %) |
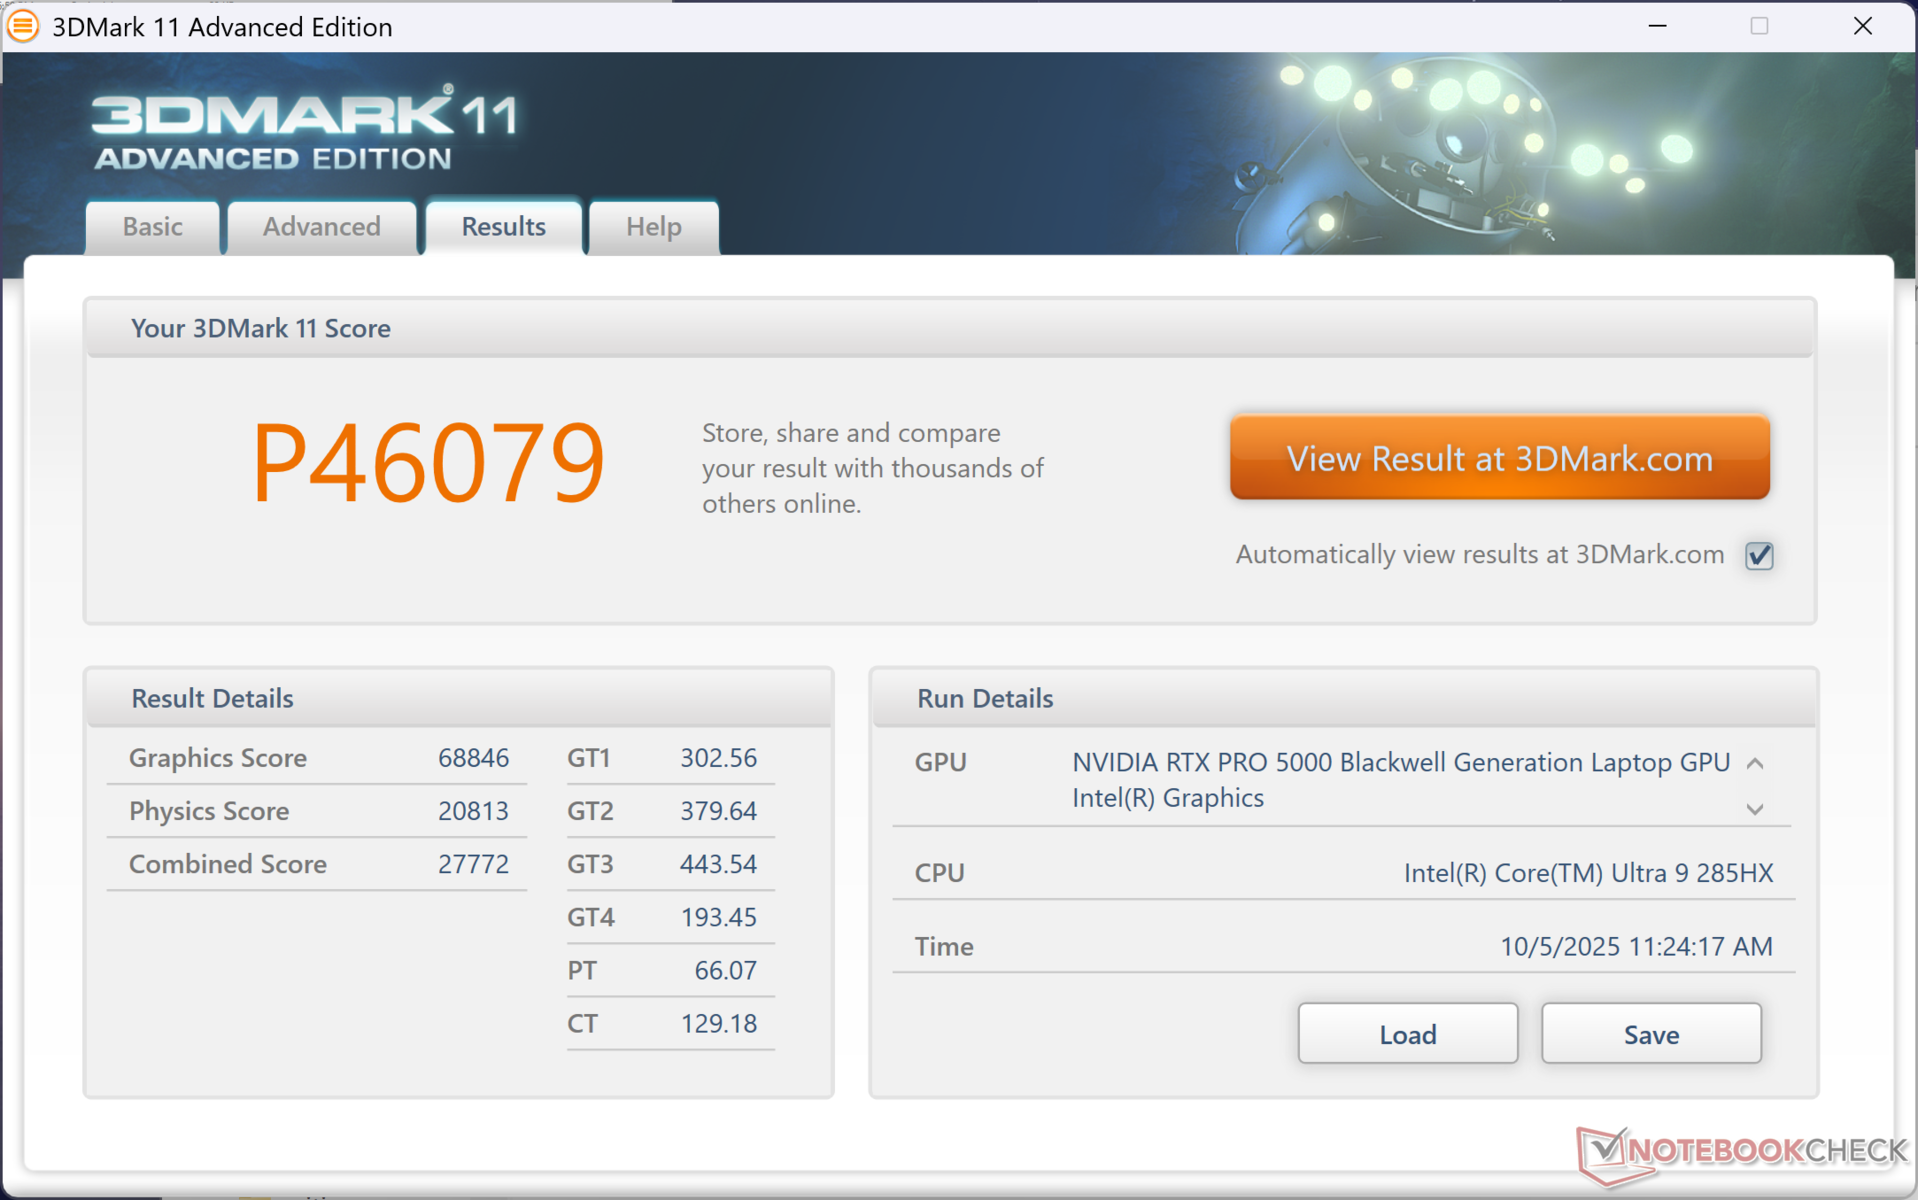


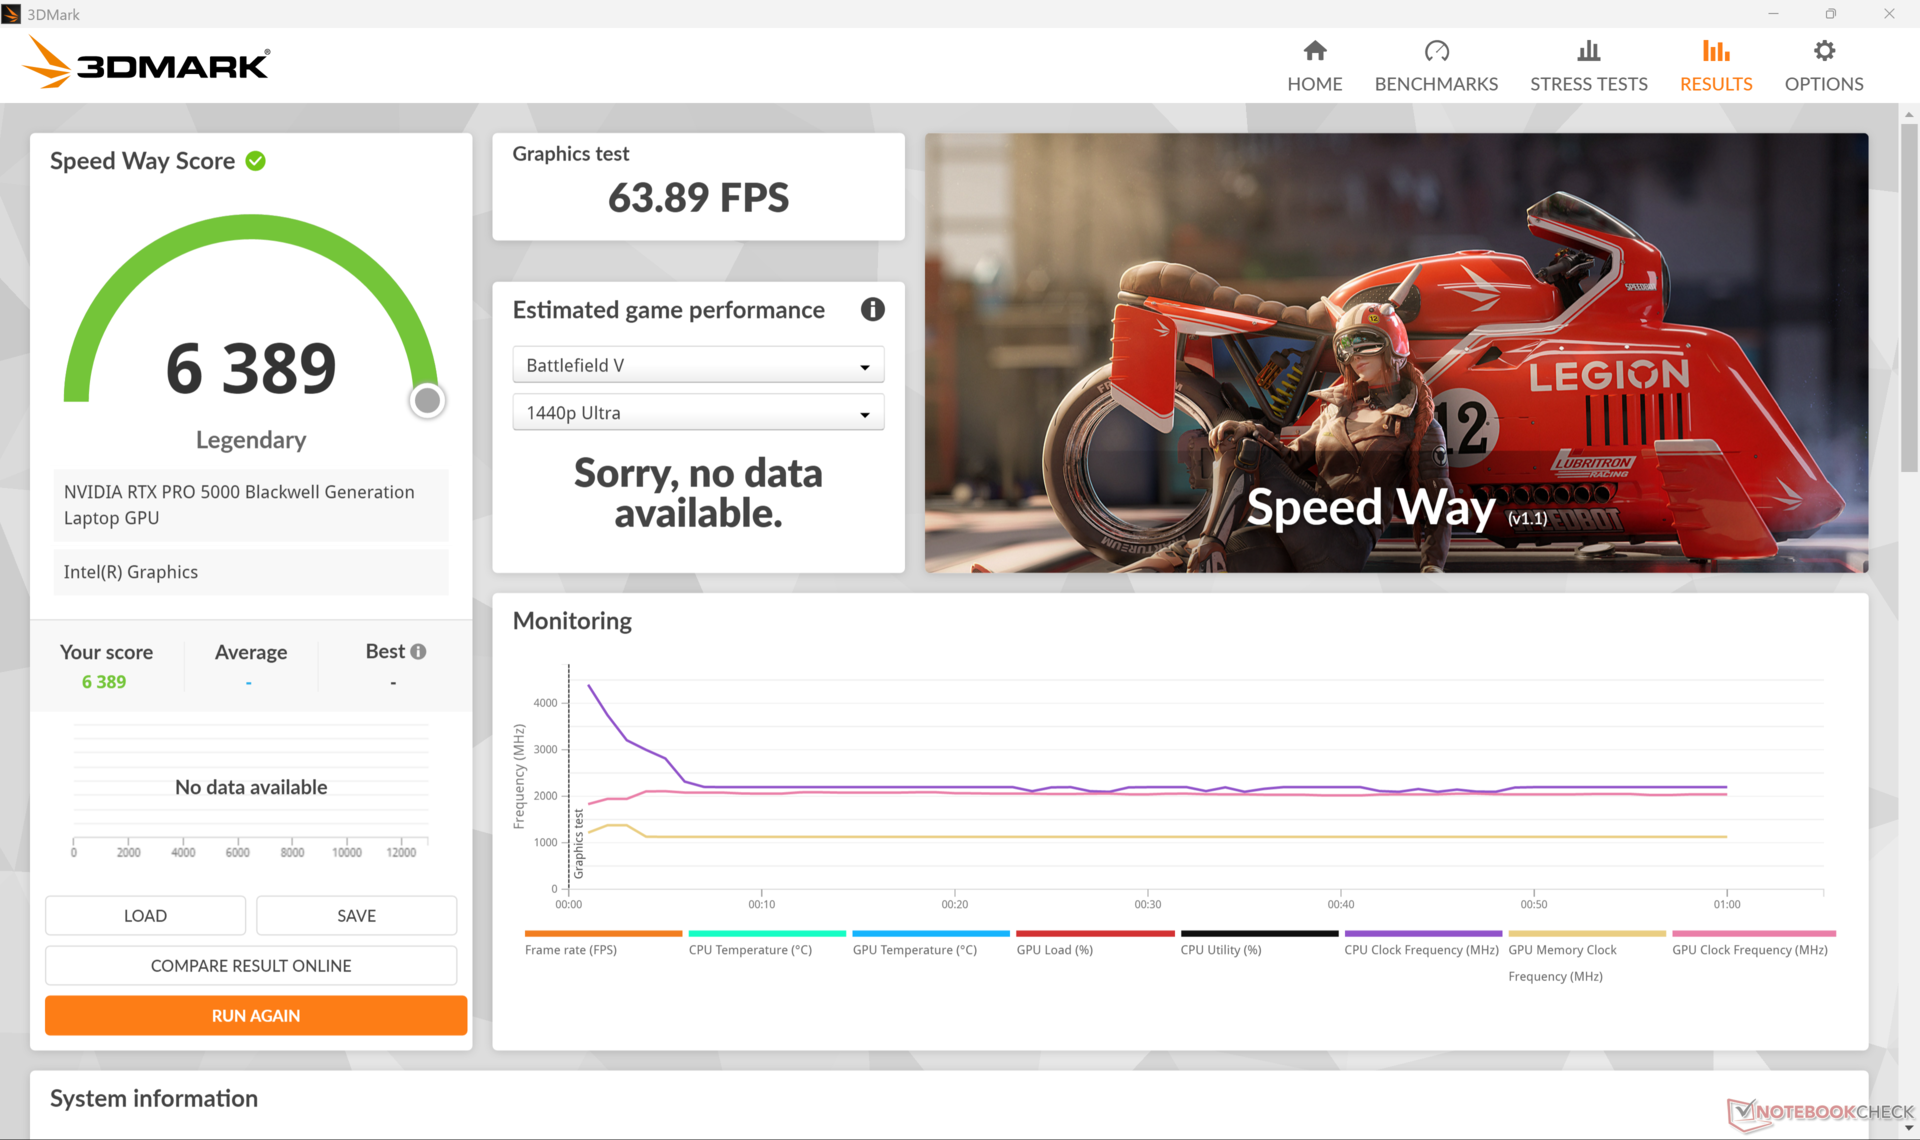

| 3DMark 11 Performance | 46079 Punkte | |
| 3DMark Cloud Gate Standard Score | 67837 Punkte | |
| 3DMark Fire Strike Score | 34044 Punkte | |
| 3DMark Time Spy Score | 22205 Punkte | |
| 3DMark Steel Nomad Score | 6021 Punkte | |
Hilfe | ||
* ... kleinere Werte sind besser
Gaming Performance
Die Spieleleistung ist weitgehend vergleichbar mit der mobilen GeForce RTX 5080, was zu erwarten ist, da die RTX Pro 5000 Blackwell auf dem mobilen RTX-5090-Chip basiert, jedoch ohne die Spieloptimierungen. Einige Titel laufen auf der RTX Pro 5000 Blackwell schlechter oder uneinheitlich, darunter Monster Hunter Wilds.
| Performance Rating - Percent | |
| Dell Pro Max 16 Plus | |
| Lenovo ThinkPad P16 Gen 2 | |
| Dell Precision 5000 5680 -3! | |
| Dell Precision 5690 -1! | |
| HP ZBook Studio 16 G11 | |
| MSI CreatorPro Z16P B12UKST -2! | |
| Lenovo ThinkPad P1 Gen 7 21KV001SGE -1! | |
| Cyberpunk 2077 - 1920x1080 Ultra Preset (FSR off) | |
| Dell Pro Max 16 Plus | |
| Dell Precision 5690 | |
| Lenovo ThinkPad P16 Gen 2 | |
| Lenovo ThinkPad P1 Gen 7 21KV001SGE | |
| HP ZBook Studio 16 G11 | |
| Baldur's Gate 3 - 1920x1080 Ultra Preset AA:T | |
| Dell Pro Max 16 Plus | |
| Lenovo ThinkPad P16 Gen 2 | |
| Dell Precision 5690 | |
| HP ZBook Studio 16 G11 | |
| Lenovo ThinkPad P1 Gen 7 21KV001SGE | |
| GTA V - 1920x1080 Highest AA:4xMSAA + FX AF:16x | |
| Dell Pro Max 16 Plus | |
| Lenovo ThinkPad P16 Gen 2 | |
| Dell Precision 5000 5680 | |
| Lenovo ThinkPad P1 Gen 7 21KV001SGE | |
| HP ZBook Studio 16 G11 | |
| MSI CreatorPro Z16P B12UKST | |
| Final Fantasy XV Benchmark - 1920x1080 High Quality | |
| Dell Pro Max 16 Plus | |
| Lenovo ThinkPad P16 Gen 2 | |
| Dell Precision 5690 | |
| Dell Precision 5000 5680 | |
| HP ZBook Studio 16 G11 | |
| Lenovo ThinkPad P1 Gen 7 21KV001SGE | |
| MSI CreatorPro Z16P B12UKST | |
| Strange Brigade - 1920x1080 ultra AA:ultra AF:16 | |
| Lenovo ThinkPad P16 Gen 2 | |
| Dell Pro Max 16 Plus | |
| Dell Precision 5690 | |
| HP ZBook Studio 16 G11 | |
| MSI CreatorPro Z16P B12UKST | |
| Dota 2 Reborn - 1920x1080 ultra (3/3) best looking | |
| Dell Pro Max 16 Plus | |
| Lenovo ThinkPad P16 Gen 2 | |
| MSI CreatorPro Z16P B12UKST | |
| Dell Precision 5000 5680 | |
| HP ZBook Studio 16 G11 | |
| Dell Precision 5690 | |
| Lenovo ThinkPad P1 Gen 7 21KV001SGE | |
| X-Plane 11.11 - 1920x1080 high (fps_test=3) | |
| Lenovo ThinkPad P16 Gen 2 | |
| Dell Pro Max 16 Plus | |
| Dell Precision 5000 5680 | |
| MSI CreatorPro Z16P B12UKST | |
| Dell Precision 5690 | |
| HP ZBook Studio 16 G11 | |
| Lenovo ThinkPad P1 Gen 7 21KV001SGE | |
Cyberpunk 2077 ultra FPS Grafik
| min. | mittel | hoch | max. | QHD DLSS | QHD | 4K DLSS | 4K | |
|---|---|---|---|---|---|---|---|---|
| GTA V (2015) | 184.7 | 183.5 | 178.1 | 142.5 | 138 | 170.3 | ||
| Dota 2 Reborn (2015) | 212 | 181 | 184.8 | 166 | 146.4 | |||
| Final Fantasy XV Benchmark (2018) | 233 | 220 | 184.2 | 162.8 | 102.2 | |||
| X-Plane 11.11 (2018) | 144.4 | 125.7 | 103.2 | 82.6 | ||||
| Strange Brigade (2018) | 382 | 285 | 261 | 288 | 300 | 177.3 | ||
| Baldur's Gate 3 (2023) | 204 | 201.8 | 155.2 | 128.1 | 80.1 | |||
| Cyberpunk 2077 (2023) | 133.9 | 121.6 | 120.6 | 119.8 | 116.3 | 105.1 | 51 | |
| F1 24 (2024) | 251 | 243 | 231 | 131.2 | 128.1 | 94.9 | 82 | 47.2 |
| Black Myth: Wukong (2024) | 142 | 72 | 54 | 42 | 36 | 37 | 32 | 26 |
| Monster Hunter Wilds (2025) | 25.4 | 27 | 27.8 | 43.3 | 39 | 33.9 | 35.3 | |
| Assassin's Creed Shadows (2025) | 103 | 98 | 86 | 68 | 67 | 57 | 56 | 42 |
Emissionen
Systemrauschen
Während die Lüfter fast immer aktiv sind, wird das pulsierende Verhalten im Allgemeinen auf ein Minimum reduziert, um einen starken Anstieg der Geräuschentwicklung zu vermeiden. Dennoch kann das System bei anspruchsvoller Last mit fast 55 dB(A) recht laut sein, was dem entspricht, was wir bei dem Lenovo ThinkPad P1 oder HP ZBook Studio 16 G11 erlebt haben.
Das Lüftergeräusch erreicht einen Spitzenwert von 49 bzw. 54,3 dB(A), wenn der Modus Balanced bzw. Performance eingestellt ist.


Lautstärkediagramm
| Idle |
| 26.7 / 30.5 / 34 dB(A) |
| Last |
| 39.8 / 54.3 dB(A) |
 | ||
30 dB leise 40 dB(A) deutlich hörbar 50 dB(A) störend |
||
min: | ||
| Dell Pro Max 16 Plus RTX PRO 5000 Blackwell Generation Laptop, Ultra 9 285HX, SK hynix PCB01 HFS001TFM9X186N | Dell Precision 5690 RTX 5000 Ada Generation Laptop, Ultra 9 185H, 2x Samsung PM9A1 1TB (RAID 0) | Dell Precision 5000 5680 RTX 5000 Ada Generation Laptop, i9-13900H, 2x SK hynix PC801 HFS512GEJ9X101N RAID 0 | Lenovo ThinkPad P16 Gen 2 RTX 4000 Ada Generation Laptop, i7-14700HX, SK hynix PC801 HFS001TEJ9X162N | Lenovo ThinkPad P1 Gen 7 21KV001SGE GeForce RTX 4060 Laptop GPU, Ultra 7 155H, Kioxia XG8 KXG8AZNV1T02 | HP ZBook Studio 16 G11 RTX 3000 Ada Generation Laptop, Ultra 9 185H, Kioxia XG8 KXG80ZNV1T02 | MSI CreatorPro Z16P B12UKST RTX A3000 Laptop GPU, i7-12700H, Samsung PM9A1 MZVL21T0HCLR | |
|---|---|---|---|---|---|---|---|
| Geräuschentwicklung | 7% | 14% | 1% | 6% | 11% | 5% | |
| aus / Umgebung * (dB) | 23.2 | 23.4 -1% | 22.8 2% | 23.9 -3% | 24.7 -6% | 23.8 -3% | 24.1 -4% |
| Idle min * (dB) | 26.7 | 23.6 12% | 23 14% | 29.1 -9% | 24.7 7% | 23.8 11% | 27.1 -1% |
| Idle avg * (dB) | 30.5 | 24.9 18% | 23 25% | 29.1 5% | 24.7 19% | 26.4 13% | 27.1 11% |
| Idle max * (dB) | 34 | 30.9 9% | 23 32% | 29.1 14% | 24.7 27% | 26.4 22% | 27.1 20% |
| Last avg * (dB) | 39.8 | 40.4 -2% | 37.2 7% | 41 -3% | 43.7 -10% | 33.7 15% | 42.9 -8% |
| Cyberpunk 2077 ultra * (dB) | 54.3 | 52.8 3% | 53.2 2% | 46.1 15% | |||
| Last max * (dB) | 54.3 | 51.9 4% | 51 6% | 52.9 3% | 53.3 2% | 53.2 2% | 47 13% |
| Witcher 3 ultra * (dB) | 48.3 | 51 | 44 |
* ... kleinere Werte sind besser
Temperatur
Die Oberflächentemperaturen sind fast immer warm, unabhängig von der Bildschirmauslastung, was wahrscheinlich auf die trägen Lüfter und die leistungsstarken Komponenten zurückzuführen ist. Die linke Hälfte des Gehäuses wird aufgrund der asymmetrischen Kühllösung merklich wärmer als die rechte.


(±) Die maximale Temperatur auf der Oberseite ist 40.4 °C. Im Vergleich liegt der Klassendurchschnitt bei 38.2 °C (von 22.2 bis 69.8 °C für die Klasse Workstation).
(-) Auf der Unterseite messen wir eine maximalen Wert von 45.6 °C (im Vergleich zum Durchschnitt von 41.1 °C).
(+) Ohne Last messen wir eine durchschnittliche Temperatur von 29.5 °C auf der Oberseite. Der Klassendurchschnitt erreicht 32 °C.
(±) 3: The average temperature for the upper side is 34.2 °C / 94 F, compared to the average of 32 °C / 90 F for the class Workstation.
(+) Die Handballen und der Touchpad-Bereich erreichen maximal 33.2 °C und damit die typische Hauttemperatur und fühlen sich daher nicht heiß an.
(-) Die durchschnittliche Handballen-Temperatur anderer getesteter Geräte war 27.8 °C (-5.4 °C).


| Dell Pro Max 16 Plus Intel Core Ultra 9 285HX, NVIDIA RTX PRO 5000 Blackwell Generation Laptop | Dell Precision 5690 Intel Core Ultra 9 185H, NVIDIA RTX 5000 Ada Generation Laptop | Dell Precision 5000 5680 Intel Core i9-13900H, NVIDIA RTX 5000 Ada Generation Laptop | Lenovo ThinkPad P16 Gen 2 Intel Core i7-14700HX, NVIDIA RTX 4000 Ada Generation Laptop | Lenovo ThinkPad P1 Gen 7 21KV001SGE Intel Core Ultra 7 155H, NVIDIA GeForce RTX 4060 Laptop GPU | HP ZBook Studio 16 G11 Intel Core Ultra 9 185H, NVIDIA RTX 3000 Ada Generation Laptop | MSI CreatorPro Z16P B12UKST Intel Core i7-12700H, NVIDIA RTX A3000 Laptop GPU | |
|---|---|---|---|---|---|---|---|
| Hitze | 6% | -1% | 5% | 6% | 0% | -11% | |
| Last oben max * (°C) | 40.4 | 46.6 -15% | 50.2 -24% | 46.6 -15% | 50.3 -25% | 36.6 9% | 56.3 -39% |
| Last unten max * (°C) | 45.6 | 33 28% | 32 30% | 51 -12% | 38 17% | 47.8 -5% | 68.3 -50% |
| Idle oben max * (°C) | 32.8 | 32.4 1% | 37.4 -14% | 24.8 24% | 28.3 14% | 31.4 4% | 25.2 23% |
| Idle unten max * (°C) | 33 | 29.4 11% | 31.2 5% | 25.6 22% | 27.3 17% | 35.6 -8% | 25.9 22% |
* ... kleinere Werte sind besser
Stresstest

Beim Starten von Prime95 Stress stieg die CPU auf 3,8 GHz, 159 W und 105 °C an, bevor sie schnell abfällt und sich bei 3,1 GHz, 90 W und 96 °C stabilisiert. Die Kerntemperatur wird bei voller Belastung höher, als uns lieb ist.
Wenn man Cyberpunk 2077 im Modus Performance laufen lassen, um typischere Stressbedingungen zu simulieren, stabilisiert sich die GPU bei ~121 W. Wechselt man in den Modus Balanced, sinkt die maximale Leistungsaufnahme der GPU auf ~108 W.


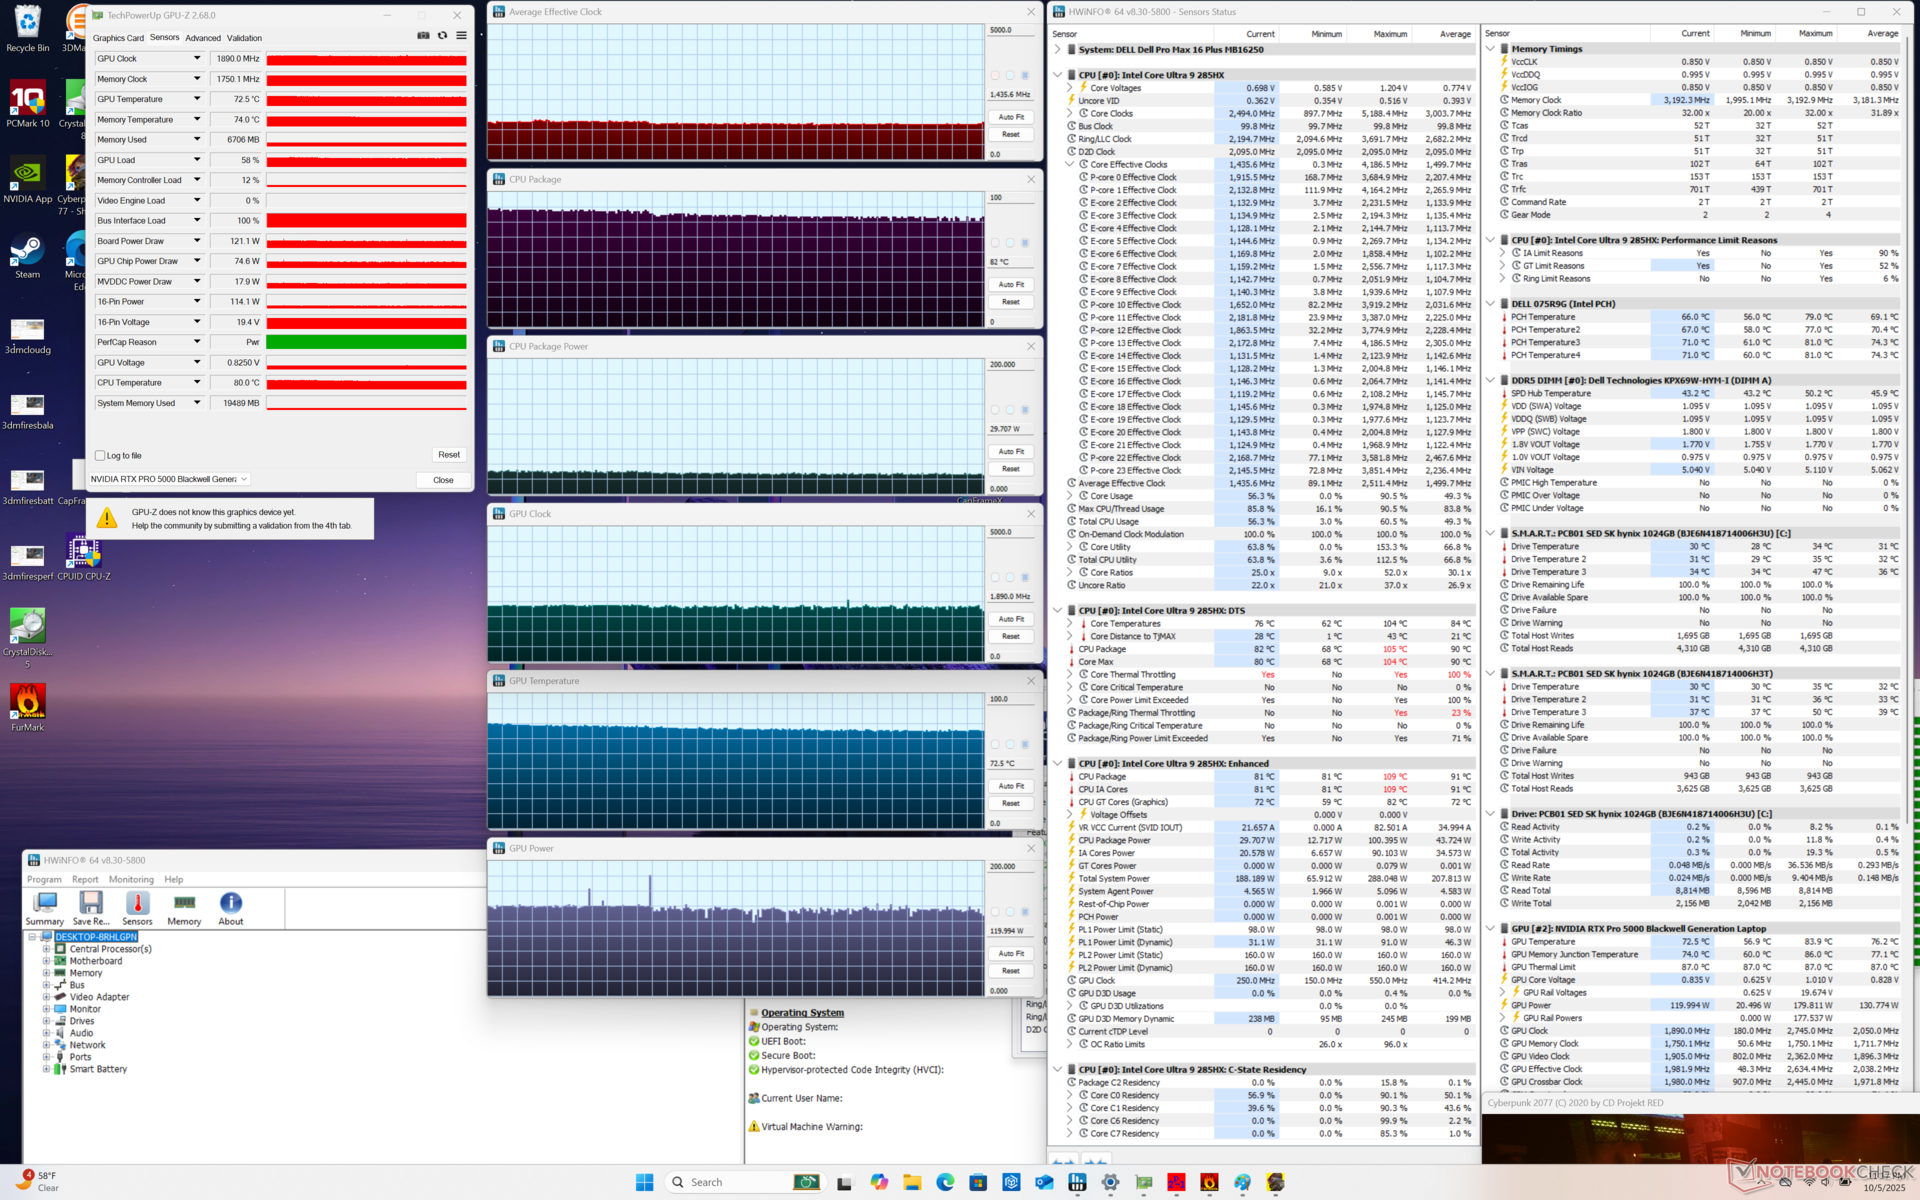
| durchschnittlicher CPU-Takt (GHz) | GPU-Takt (MHz) | durchschnittliche CPU-Temperatur (°C) | durchschnittliche GPU-Temperatur (°C) | |
| System Leerlauf | -- | -- | 55 | 41 |
| Prime95 Stress | 3,1 | -- | 96 | 55 |
| Prime95 + FurMark Stress | 0,5 - 2,8 | 1,7 - 2,2 | 75 - 105 | 70 - 78 |
| Cyberpunk 2077 Stress (Balanced-Modus) | ~1,6 | 1.545 | 82 | 71 |
| Cyberpunk 2077 Stress (Performance-Modus) | ~1,4 | 1.890 | 82 | 73 |
Lautsprecher


Dell Pro Max 16 Plus Audio Analyse
(+) | Die Lautsprecher können relativ laut spielen (91.6 dB)
Bass 100 - 315 Hz
(-) | kaum Bass - 20.9% niedriger als der Median
(+) | lineare Bass-Wiedergabe (5.9% Delta zum Vorgänger)
Mitteltöne 400 - 2000 Hz
(+) | ausgeglichene Mitten, vom Median nur 4.5% abweichend
(+) | lineare Mitten (4% Delta zum Vorgänger)
Hochtöne 2 - 16 kHz
(+) | ausgeglichene Hochtöne, vom Median nur 3.7% abweichend
(+) | sehr lineare Hochtöne (2.9% Delta zum Vorgänger)
Gesamt im hörbaren Bereich 100 - 16.000 Hz
(+) | hörbarer Bereich ist sehr linear (14.3% Abstand zum Median
Im Vergleich zu allen Geräten derselben Klasse
» 30% aller getesteten Geräte dieser Klasse waren besser, 4% vergleichbar, 67% schlechter
» Das beste Gerät hat einen Delta-Wert von 7%, durchschnittlich ist 17%, das schlechteste Gerät hat 35%
Im Vergleich zu allen Geräten im Test
» 17% aller getesteten Geräte waren besser, 4% vergleichbar, 79% schlechter
» Das beste Gerät hat einen Delta-Wert von 4%, durchschnittlich ist 24%, das schlechteste Gerät hat 134%
Apple MacBook Pro 16 2021 M1 Pro Audio Analyse
(+) | Die Lautsprecher können relativ laut spielen (84.7 dB)
Bass 100 - 315 Hz
(+) | guter Bass - nur 3.8% Abweichung vom Median
(+) | lineare Bass-Wiedergabe (5.2% Delta zum Vorgänger)
Mitteltöne 400 - 2000 Hz
(+) | ausgeglichene Mitten, vom Median nur 1.3% abweichend
(+) | lineare Mitten (2.1% Delta zum Vorgänger)
Hochtöne 2 - 16 kHz
(+) | ausgeglichene Hochtöne, vom Median nur 1.9% abweichend
(+) | sehr lineare Hochtöne (2.7% Delta zum Vorgänger)
Gesamt im hörbaren Bereich 100 - 16.000 Hz
(+) | hörbarer Bereich ist sehr linear (4.6% Abstand zum Median
Im Vergleich zu allen Geräten derselben Klasse
» 0% aller getesteten Geräte dieser Klasse waren besser, 0% vergleichbar, 100% schlechter
» Das beste Gerät hat einen Delta-Wert von 5%, durchschnittlich ist 17%, das schlechteste Gerät hat 45%
Im Vergleich zu allen Geräten im Test
» 0% aller getesteten Geräte waren besser, 0% vergleichbar, 100% schlechter
» Das beste Gerät hat einen Delta-Wert von 4%, durchschnittlich ist 24%, das schlechteste Gerät hat 134%
Energieverwaltung
Stromverbrauch
Die Verbrauchswerte sind erwartungsgemäß sehr hoch, selbst im Leerlauf auf dem Desktop, was zu den niedrigeren Akkulaufzeiten und den immer warmen Oberflächen beiträgt. Das System ist spürbar anspruchsvoller als das bisherige Precision 5690, aber die Leistung ist sowohl schneller als auch stabiler, was ein fairer Kompromiss ist.
Es ist erwähnenswert, dass dies eines der wenigen Notebooks ist, das mit einem schlanken 280-W-USB-C-Netzteil (~16 x 7,8 x 2,4 cm) ausgeliefert wird, da die meisten anderen USB-C-Netzteile im Bereich von 150 bis 240 W liegen.


| Aus / Standby | |
| Idle | |
| Last |
|
Legende:
min: | |
| Dell Pro Max 16 Plus Ultra 9 285HX, RTX PRO 5000 Blackwell Generation Laptop, SK hynix PCB01 HFS001TFM9X186N, OLED, 3840x2400, 16" | Dell Precision 5690 Ultra 9 185H, RTX 5000 Ada Generation Laptop, 2x Samsung PM9A1 1TB (RAID 0), OLED, 3840x2400, 16" | Dell Precision 5000 5680 i9-13900H, RTX 5000 Ada Generation Laptop, 2x SK hynix PC801 HFS512GEJ9X101N RAID 0, OLED, 3840x2400, 16" | Lenovo ThinkPad P16 Gen 2 i7-14700HX, RTX 4000 Ada Generation Laptop, SK hynix PC801 HFS001TEJ9X162N, IPS, 2560x1600, 16" | Lenovo ThinkPad P1 Gen 7 21KV001SGE Ultra 7 155H, GeForce RTX 4060 Laptop GPU, Kioxia XG8 KXG8AZNV1T02, IPS LED, 2560x1600, 16" | HP ZBook Studio 16 G11 Ultra 9 185H, RTX 3000 Ada Generation Laptop, Kioxia XG8 KXG80ZNV1T02, IPS, 3840x2400, 16" | MSI CreatorPro Z16P B12UKST i7-12700H, RTX A3000 Laptop GPU, Samsung PM9A1 MZVL21T0HCLR, IPS, 2560x1600, 16" | |
|---|---|---|---|---|---|---|---|
| Stromverbrauch | 52% | 55% | 31% | 55% | 47% | 50% | |
| Idle min * (Watt) | 35.1 | 7.9 77% | 8 77% | 7.9 77% | 7.3 79% | 14 60% | 10.8 69% |
| Idle avg * (Watt) | 39.2 | 12 69% | 10.4 73% | 13.1 67% | 12.3 69% | 22.4 43% | 16.3 58% |
| Idle max * (Watt) | 56 | 28.6 49% | 30.5 46% | 24.2 57% | 17.9 68% | 25.7 54% | 16.9 70% |
| Last avg * (Watt) | 130.2 | 98.8 24% | 75.4 42% | 127.4 2% | 78.2 40% | 90.2 31% | 111.7 14% |
| Cyberpunk 2077 ultra external monitor * (Watt) | 213 | 219 -3% | 117.7 45% | 120.3 44% | |||
| Cyberpunk 2077 ultra * (Watt) | 229 | 225 2% | 123.5 46% | 125.4 45% | |||
| Last max * (Watt) | 285.2 | 174.8 39% | 175 39% | 248.5 13% | 167.5 41% | 142 50% | 177.4 38% |
| Witcher 3 ultra * (Watt) | 144.5 | 134 | 152.1 |
* ... kleinere Werte sind besser
Stromverbrauch Cyberpunk / Stresstest
Stromverbrauch externer Monitor
Akkulaufzeit

Die WLAN-Laufzeit ist trotz der großen Akkukapazität mit nur 3,5 Stunden kurz. Die Ladegeschwindigkeit ist dennoch sehr schnell, insbesondere für ein USB-C-Netzteil, mit etwas mehr als einer Stunde von leer bis voll.
| Dell Pro Max 16 Plus Ultra 9 285HX, RTX PRO 5000 Blackwell Generation Laptop, 96 Wh | Dell Precision 5690 Ultra 9 185H, RTX 5000 Ada Generation Laptop, 98 Wh | Dell Precision 5000 5680 i9-13900H, RTX 5000 Ada Generation Laptop, 98 Wh | Lenovo ThinkPad P16 Gen 2 i7-14700HX, RTX 4000 Ada Generation Laptop, 94 Wh | Lenovo ThinkPad P1 Gen 7 21KV001SGE Ultra 7 155H, GeForce RTX 4060 Laptop GPU, 90 Wh | HP ZBook Studio 16 G11 Ultra 9 185H, RTX 3000 Ada Generation Laptop, 86 Wh | MSI CreatorPro Z16P B12UKST i7-12700H, RTX A3000 Laptop GPU, 90 Wh | |
|---|---|---|---|---|---|---|---|
| Akkulaufzeit | 156% | 175% | -31% | 175% | 33% | 61% | |
| WLAN (h) | 3.6 | 9.2 156% | 9.9 175% | 2.5 -31% | 9.9 175% | 4.8 33% | 5.8 61% |
| Idle (h) | 17.9 | ||||||
| Last (h) | 1.7 | 1.9 |
Notebookcheck Bewertung
Eine Flaggschiff-Workstation von Dell mit einzigartigen Spezifikationen wie CAMM2-Speicher, 4K-120-Hz-OLED, Arrow-Lake-HX-Prozessoren und RTX-5000-Blackwell-Grafik.
Dell Pro Max 16 Plus
- 14.10.2025 v8
Allen Ngo
 Total Sustainability Score:
 Potenzielle Konkurrenten im Vergleich
Bild | Modell / Test | Preis ab | Gewicht | Dicke | Display |
|---|---|---|---|---|---|
1. 88.4%  | Dell Pro Max 16 Plus Intel Core Ultra 9 285HX ⎘ NVIDIA RTX PRO 5000 Blackwell Generation Laptop ⎘ 128 GB RAM, SSD | Amazon: 3.959,06 € Bestpreis 3083.71€ Cyberport.de 2. 3083.71€ computeruniverse.net 3. 3109.62€ computeruniverse.at | 2.8 kg | 30.9 mm | 16.00" 3840x2400 283 PPI OLED |
2. 88.3% v7 (old)  | Dell Precision 5690 Intel Core Ultra 9 185H ⎘ NVIDIA RTX 5000 Ada Generation Laptop ⎘ 32 GB RAM, 2048 GB SSD | Amazon: 2.969,93 € Bestpreis 2727.27€ electronis.de 2. 2727.27€ Easynotebooks.de 3. 2727.27€ Jacob Elektronik direkt | 2.3 kg | 22.17 mm | 16.00" 3840x2400 283 PPI OLED |
3. 89% v7 (old)  | Dell Precision 5000 5680 Intel Core i9-13900H ⎘ NVIDIA RTX 5000 Ada Generation Laptop ⎘ 32 GB RAM, 1024 GB SSD | Amazon: 1. 35,99 € 100W USB-C Dell Ladegerät f... 2. 28,79 € 100W USB C Laptop Ladegerät... 3. 35,99 € 100W USB-C Laptop Ladegerät... Listenpreis: 6500 USD | 2.3 kg | 22.17 mm | 16.00" 3840x2400 283 PPI OLED |
4. 85.9%  | Lenovo ThinkPad P16 Gen 2 Intel Core i7-14700HX ⎘ NVIDIA RTX 4000 Ada Generation Laptop ⎘ 32 GB RAM, 1024 GB SSD | Amazon: 2.350,40 € Geizhals Suche | 3.1 kg | 30.23 mm | 16.00" 2560x1600 189 PPI IPS |
5. 83.5%  | Lenovo ThinkPad P1 Gen 7 21KV001SGE Intel Core Ultra 7 155H ⎘ NVIDIA GeForce RTX 4060 Laptop GPU ⎘ 32 GB RAM, 1024 GB SSD | Amazon: Geizhals Suche | 2 kg | 20.5 mm | 16.00" 2560x1600 189 PPI IPS LED |
6. 84.2%  | HP ZBook Studio 16 G11 Intel Core Ultra 9 185H ⎘ NVIDIA RTX 3000 Ada Generation Laptop ⎘ 64 GB RAM, 1024 GB SSD | Amazon: 3.081,37 € Geizhals Suche | 1.8 kg | 19 mm | 16.00" 3840x2400 283 PPI IPS |
7. 84.3% v7 (old)  | MSI CreatorPro Z16P B12UKST Intel Core i7-12700H ⎘ NVIDIA RTX A3000 Laptop GPU ⎘ 32 GB RAM, 1024 GB SSD | Amazon: Geizhals Suche | 2.4 kg | 19 mm | 16.00" 2560x1600 189 PPI IPS |
Transparenz
Die Auswahl der zu testenden Geräte erfolgt innerhalb der Redaktion. Das vorliegende Testmuster wurde dem Autor vom Hersteller oder einem Shop zu Testzwecken leihweise zur Verfügung gestellt. Eine Einflussnahme des Leihstellers auf den Testbericht gab es nicht, der Hersteller erhielt keine Version des Reviews vor der Veröffentlichung. Es bestand keine Verpflichtung zur Publikation. Als eigenständiges, unabhängiges Unternehmen unterliegt Notebookcheck keiner Diktion von Herstellern, Shops und Verlagen.
So testet Notebookcheck
Pro Jahr werden von Notebookcheck hunderte Laptops und Smartphones unabhängig in von uns standardisierten technischen Verfahren getestet, um eine Vergleichbarkeit aller Testergebnisse zu gewährleisten. Seit rund 20 Jahren entwickeln wir diese Testmethoden kontinuierlich weiter und setzen damit Branchenstandards. In unseren Testlaboren kommt ausschließlich hochwertiges Messequipment in die Hände erfahrener Techniker und Redakteure. Die Tests unterliegen einer mehrstufigen Kontrolle. Unsere komplexe Gesamtbewertung basiert auf hunderten fundierten Messergebnissen und Benchmarks, womit Ihnen Objektivität garantiert ist. Weitere Informationen zu unseren Testmethoden gibt es hier.

