HP ZBook Studio 16 G11 Workstation im Test: Leistungsstark und dabei super leicht
Work hard, carry light.
Eine der leichtesten 16-Zoll-Workstations von HP erhält neue Prozessoroptionen und eine RTX 3000 für eine spürbar schnellere Leistung als bisher. Wo sich die Nachteile des ZBooks verstecken, ermitteln wir in diesem Review.Allen Ngo, 👁 Allen Ngo, ✓ Andrea Grüblinger (übersetzt von DeepL / Ninh Duy) Veröffentlicht am 🇺🇸 🇫🇷 ...
Fazit - Leichter als erwartet für eine 16-Zoll-Workstation
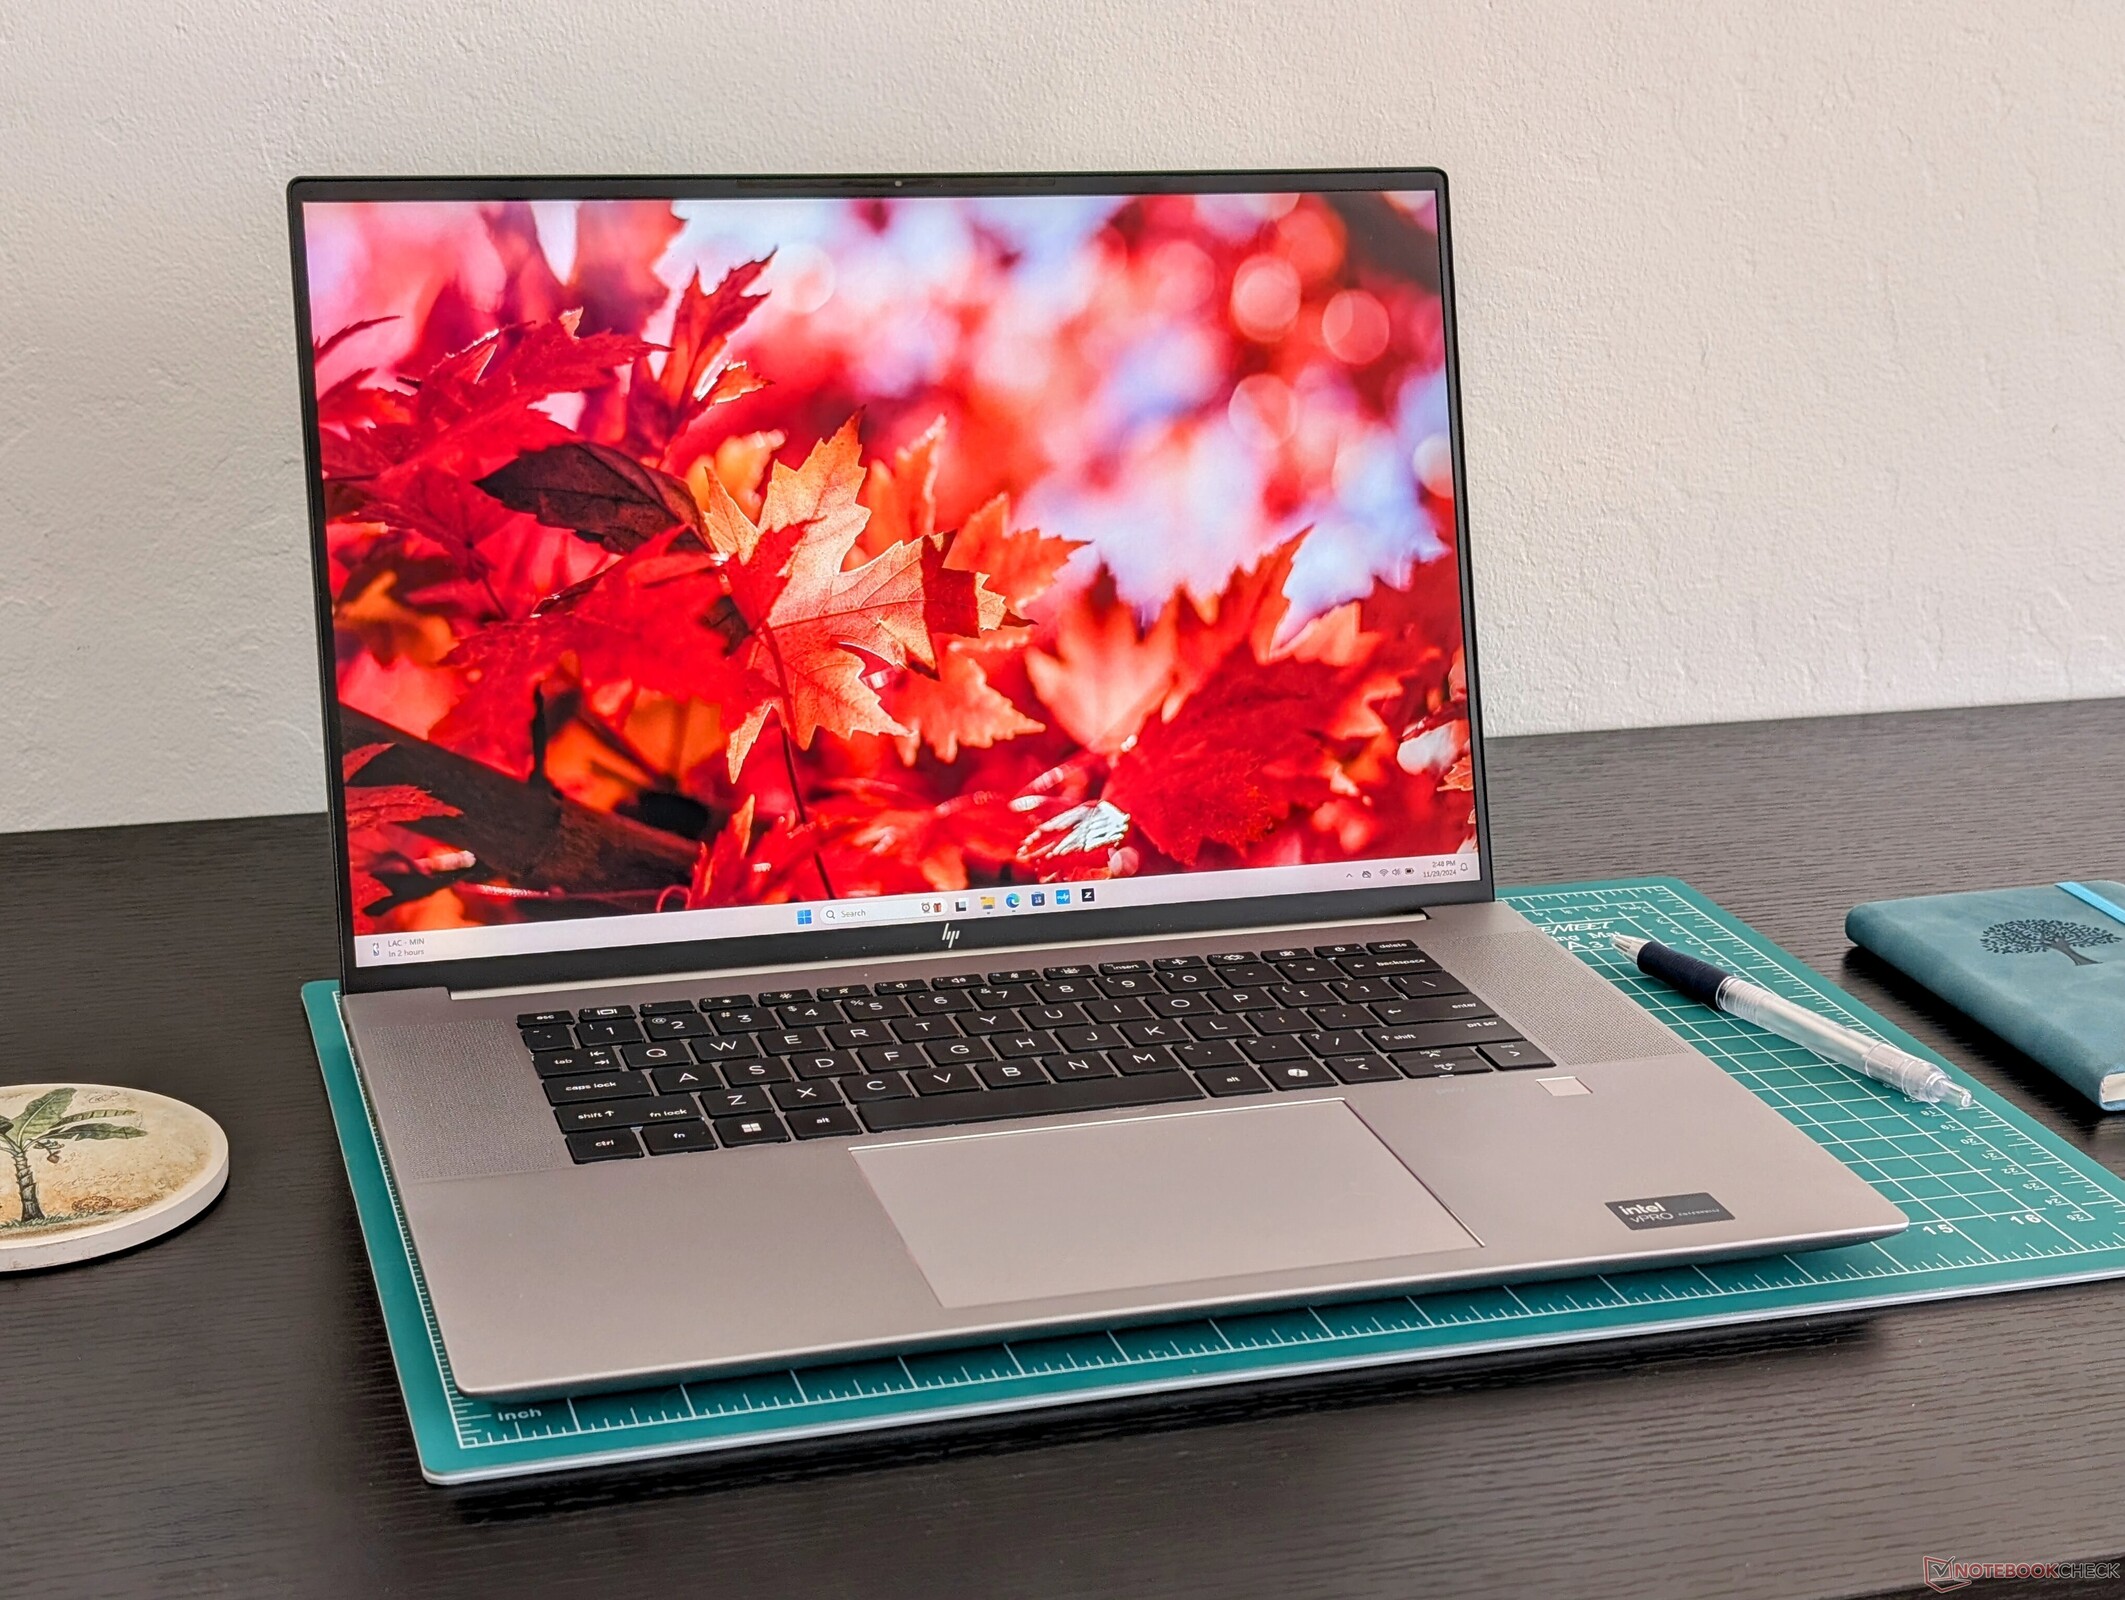
Das ZBook Studio 16 G11 zeichnet sich mit seiner geringen Dicke und dem großen 16-Zoll-Bildschirms in Sachen Portabilität und Verarbeitungsqualität aus. Businesskunden, die etwas suchen, das leicht genug ist, um es mit sich herumzutragen, ohne dabei auf eine angemessene Größe des Bildschirms oder zu viel Leistung verzichten zu müssen, werden am Studio 16 G11 viel Gefallen finden, insbesondere jetzt, da die neuen GPU-Optionen deutlich schneller und effizienter sind als die des G9-Modells.
Leider leidet das System immer noch unter vielen der Schwächen der Vorgängermodelle G10 oder G9. Die unscharfe 1 MP-Webcam und der fehlende Privacy Shutter sind unserer Meinung nach veraltet. Andere Faktoren wie die Kerntemperaturen und Akkulaufzeit sind wärmer bzw. kürzer als wir es uns wünschen würden, während das CPU-Upgrade von Alder Lake-H auf Meteor Lake-H nicht annähernd so groß ist wie das GPU-Upgrade. Nutzer, die zusätzliche Grafikleistung benötigen, die schneller als die RTX 3000 Ada ist, müssen sich nach dickeren Alternativen wie der ZBook Fury 16-Serie umsehen, weil diese mit RTX 5000 Ada Optionen konfiguriert werden können.
Wir sollten auch anmerken, dass wir bei unserem Testgerät mehrere Probleme mit dem Einfrieren hatten. Es kann sich lohnen, Ihr Gerät beim Kauf auf fehlerhaftes Verhalten zu überprüfen.
Pro
Contra
Preis und Verfügbarkeit
Das Gerät ist bei Amazon um rund 3.500 Euro gelistet. Eine kleinere SKU mit dem Core Ultra 9, RTX 2000 Ada und 32 GB RAM ist bei playox um rund 3.100 Euro erhältlich. Weitere SKUs sind direkt bei HP zu bekommen.
Mögliche Konkurrenten im Vergleich
Bild | Modell / Test | Preis ab | Gewicht | Dicke | Display |
|---|---|---|---|---|---|
1. 84.2%  | HP ZBook Studio 16 G11 Intel Core Ultra 9 185H ⎘ NVIDIA RTX 3000 Ada Generation Laptop ⎘ 64 GB RAM, 1024 GB SSD | Amazon: 3.139,31 € Geizhals Suche | 1.8 kg | 19 mm | 16.00" 3840x2400 283 PPI IPS |
2. 90.1% v7 (old)  | HP ZBook Studio 16 G9 62U04EA Intel Core i7-12800H ⎘ NVIDIA RTX A2000 Laptop GPU ⎘ 32 GB RAM, 1024 GB SSD | Amazon: 3.710,94 € Geizhals Suche | 1.8 kg | 19 mm | 16.00" 3840x2400 283 PPI IPS |
3. 85.4%  | HP ZBook Power 16 G11 A AMD Ryzen 7 8845HS ⎘ NVIDIA RTX 2000 Ada Generation Laptop ⎘ 64 GB RAM, 2048 GB SSD | Amazon: 2.276,01 € Bestpreis 2983.51€ Easynotebooks.de 2. 2983.51€ XITRA.de 3. 2983.52€ Notebook.de | 2.2 kg | 22.9 mm | 16.00" 2560x1600 189 PPI IPS |
4. 85.9%  | Lenovo ThinkPad P16 Gen 2 Intel Core i7-14700HX ⎘ NVIDIA RTX 4000 Ada Generation Laptop ⎘ 32 GB RAM, 1024 GB SSD | Amazon: 2.244,76 € Geizhals Suche | 3.1 kg | 30.23 mm | 16.00" 2560x1600 189 PPI IPS |
5. 88.3% v7 (old)  | Dell Precision 5690 Intel Core Ultra 9 185H ⎘ NVIDIA RTX 5000 Ada Generation Laptop ⎘ 32 GB RAM, 2048 GB SSD | Amazon: 2.983,39 € Bestpreis 2727.97€ electronis.de 2. 2727.98€ Office-Lieferant.de 3. 2730.7€ ITboost.de | 2.3 kg | 22.17 mm | 16.00" 3840x2400 283 PPI OLED |
6. 84.3% v7 (old)  | MSI CreatorPro Z16P B12UKST Intel Core i7-12700H ⎘ NVIDIA RTX A3000 Laptop GPU ⎘ 32 GB RAM, 1024 GB SSD | Amazon: Geizhals Suche | 2.4 kg | 19 mm | 16.00" 2560x1600 189 PPI IPS |
7. 83.5%  | Lenovo ThinkPad P1 Gen 7 21KV001SGE Intel Core Ultra 7 155H ⎘ NVIDIA GeForce RTX 4060 Laptop GPU ⎘ 32 GB RAM, 1024 GB SSD | Amazon: Geizhals Suche | 2 kg | 20.5 mm | 16.00" 2560x1600 189 PPI IPS LED |
Das letzte Mal, dass wir die ZBook Studio 16-Serie getestet haben, war das G9-Modell im Jahr 2022. Für 2024 ist das neueste Modell nun das G11, das sowohl mit der schnelleren Intel Meteor Lake CPU als auch mit der Nvidia Ada Lovelace GPU ausgestattet ist und die Alder Lake und Ampere Optionen der älteren Studio 16 Versionen ersetzt.
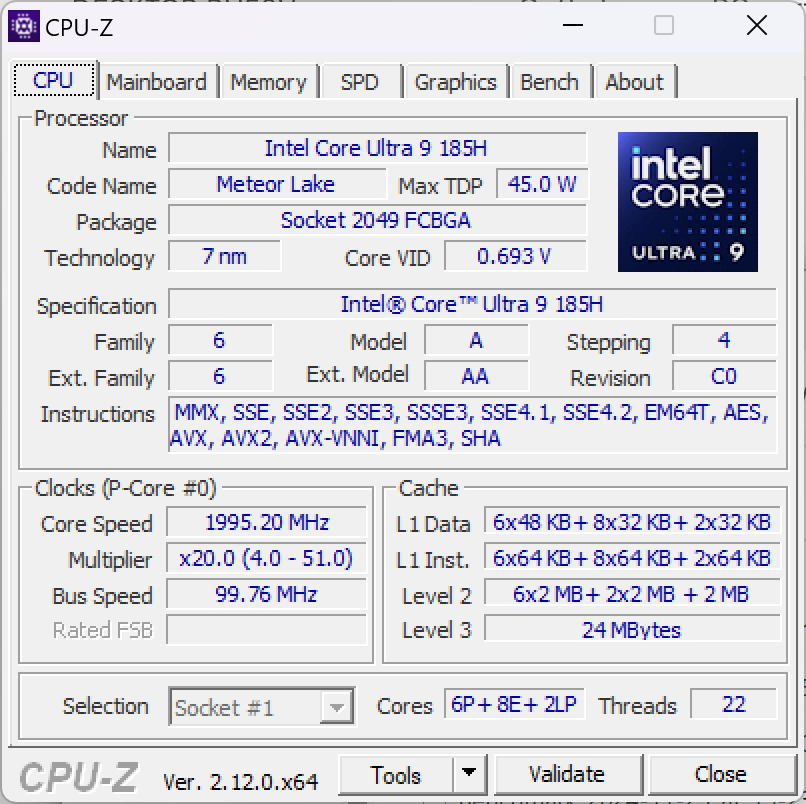
Bei unserem amerikanischen Testgerät handelt es sich um die High-End-Konfiguration mit Core Ultra 9 185H vPro CPU, RTX 3000 Ada GPU und 2400p 120 Hz IPS-Display für ca. 2.800 USD. Andere SKUs beginnen mit dem Core Ultra 7 155H, integrierter Arc-Grafik, GeForce RTX 4070 oder 1200p-Display.
OLED-Konfigurationen sind bei ausgewählten Drittanbietern erhältlich.
Zu den Alternativen zum ZBook Studio 16 G11 gehören andere mobile 16-Zoll-Workstations wie das Lenovo ThinkPad P16 Gen 2, das Dell Precision 5690 oder das MSI CreatorPro Z16P.
Weitere HP-Testberichte:
Spezifikationen
Gehäuse
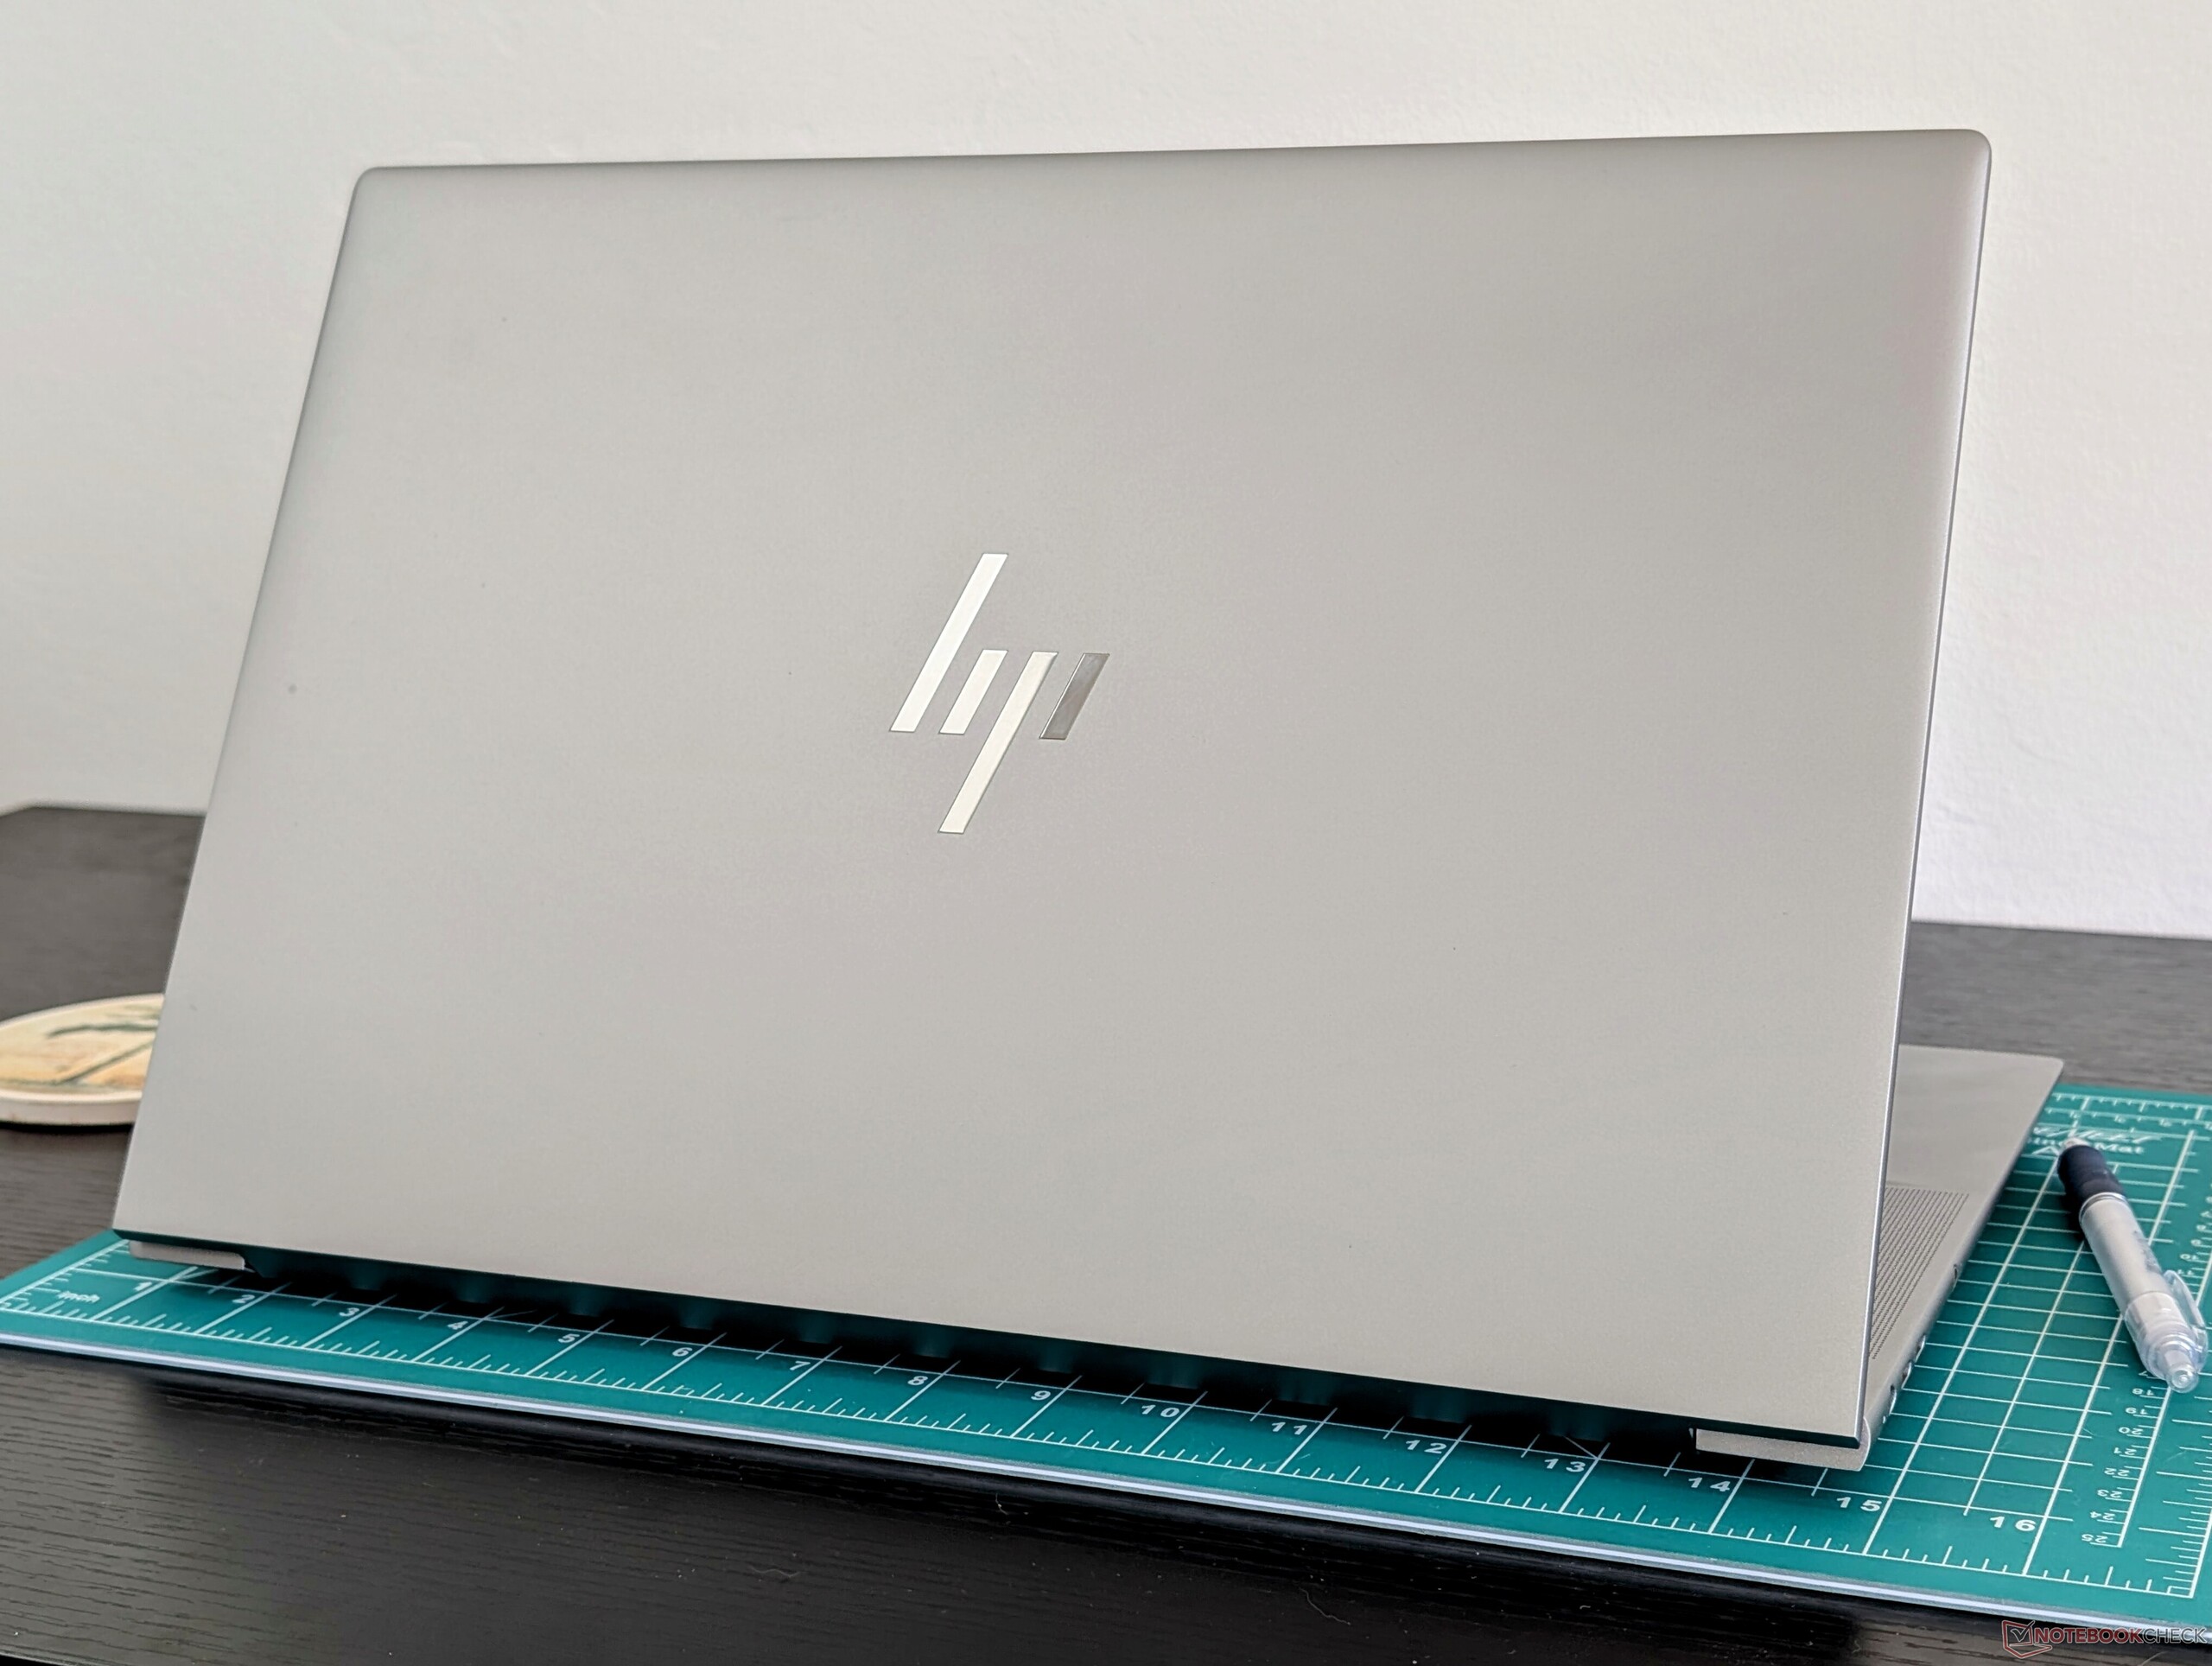
Das ZBook Studio 16 G11 steckt im gleichen Gehäuse wie das zwei Jahre alte ZBook Studio 16 G9. Trotz seines Alters ist es immer noch ein starkes Design, das sich vor allem durch seine Schlankheit und Portabilität auszeichnet. Das MSI CreatorPro Z16P oder das Dell Precision 5690 zum Beispiel sind größer und mindestens 400 Gramm schwerer.
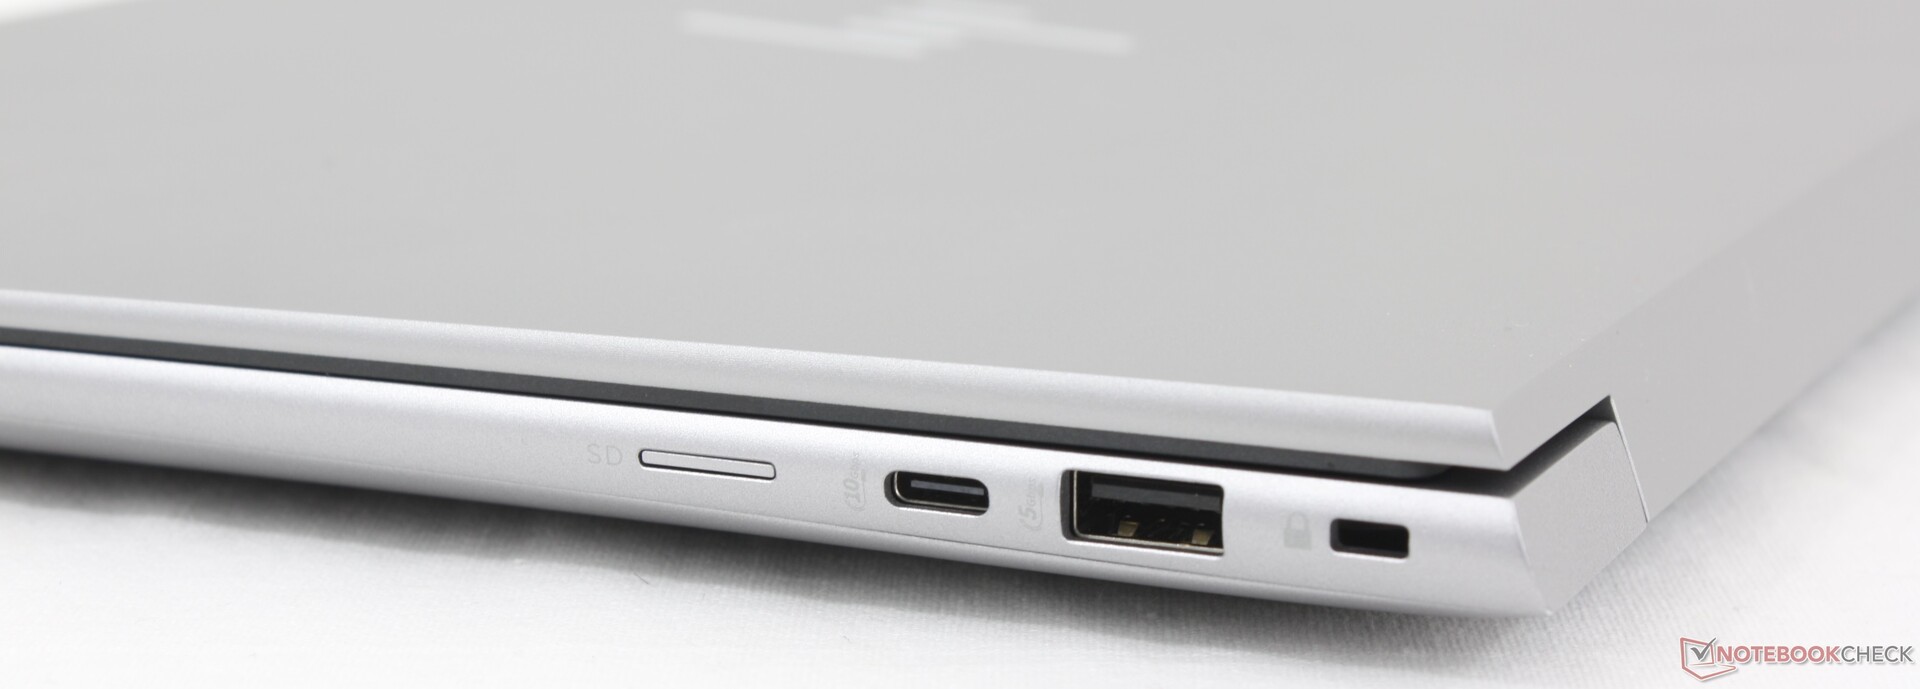
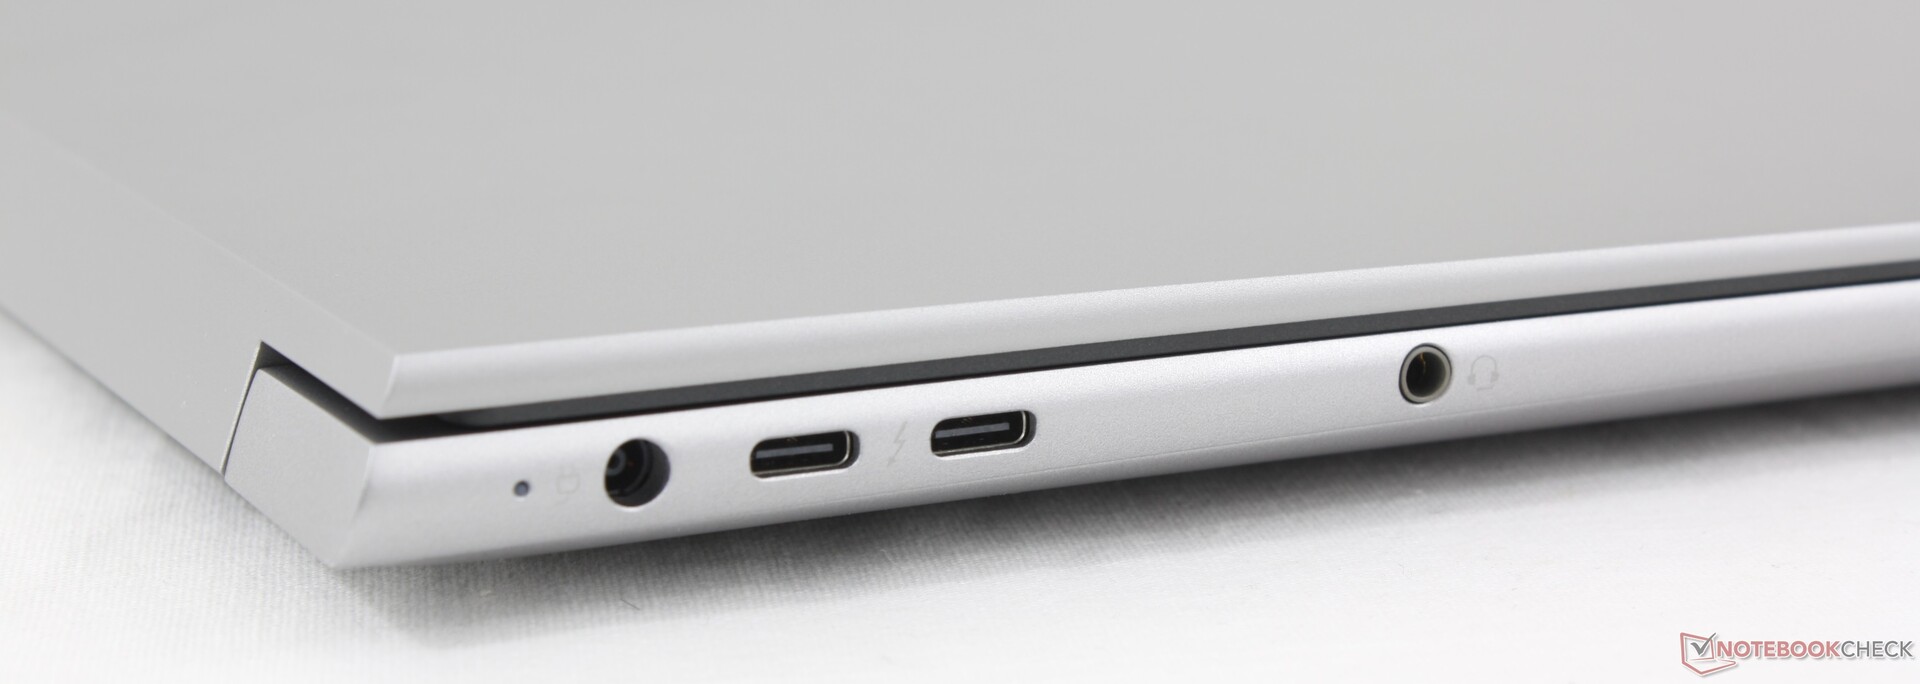
Anschlussausstattung
Während sich die Anschlussmöglichkeiten nicht geändert haben, war der integrierte MicroSD-Leser bei unserem Gerät defekt, so dass wir die Übertragungsgeschwindigkeit nicht testen konnten.
Kommunikation
Die Funkverbindung wurde vom MediaTek Wi-Fi 6E MT7922 auf den Intel BE200 aufgerüstet, um sowohl Wi-Fi 7 als auch Bluetooth 5.4 zu unterstützen.
Webcam
Leider bleibt die Webcam bei 720p oder nur 1 MP, während die große Mehrheit der anderen Laptops bereits von der 1 MP-Option abgerückt ist.


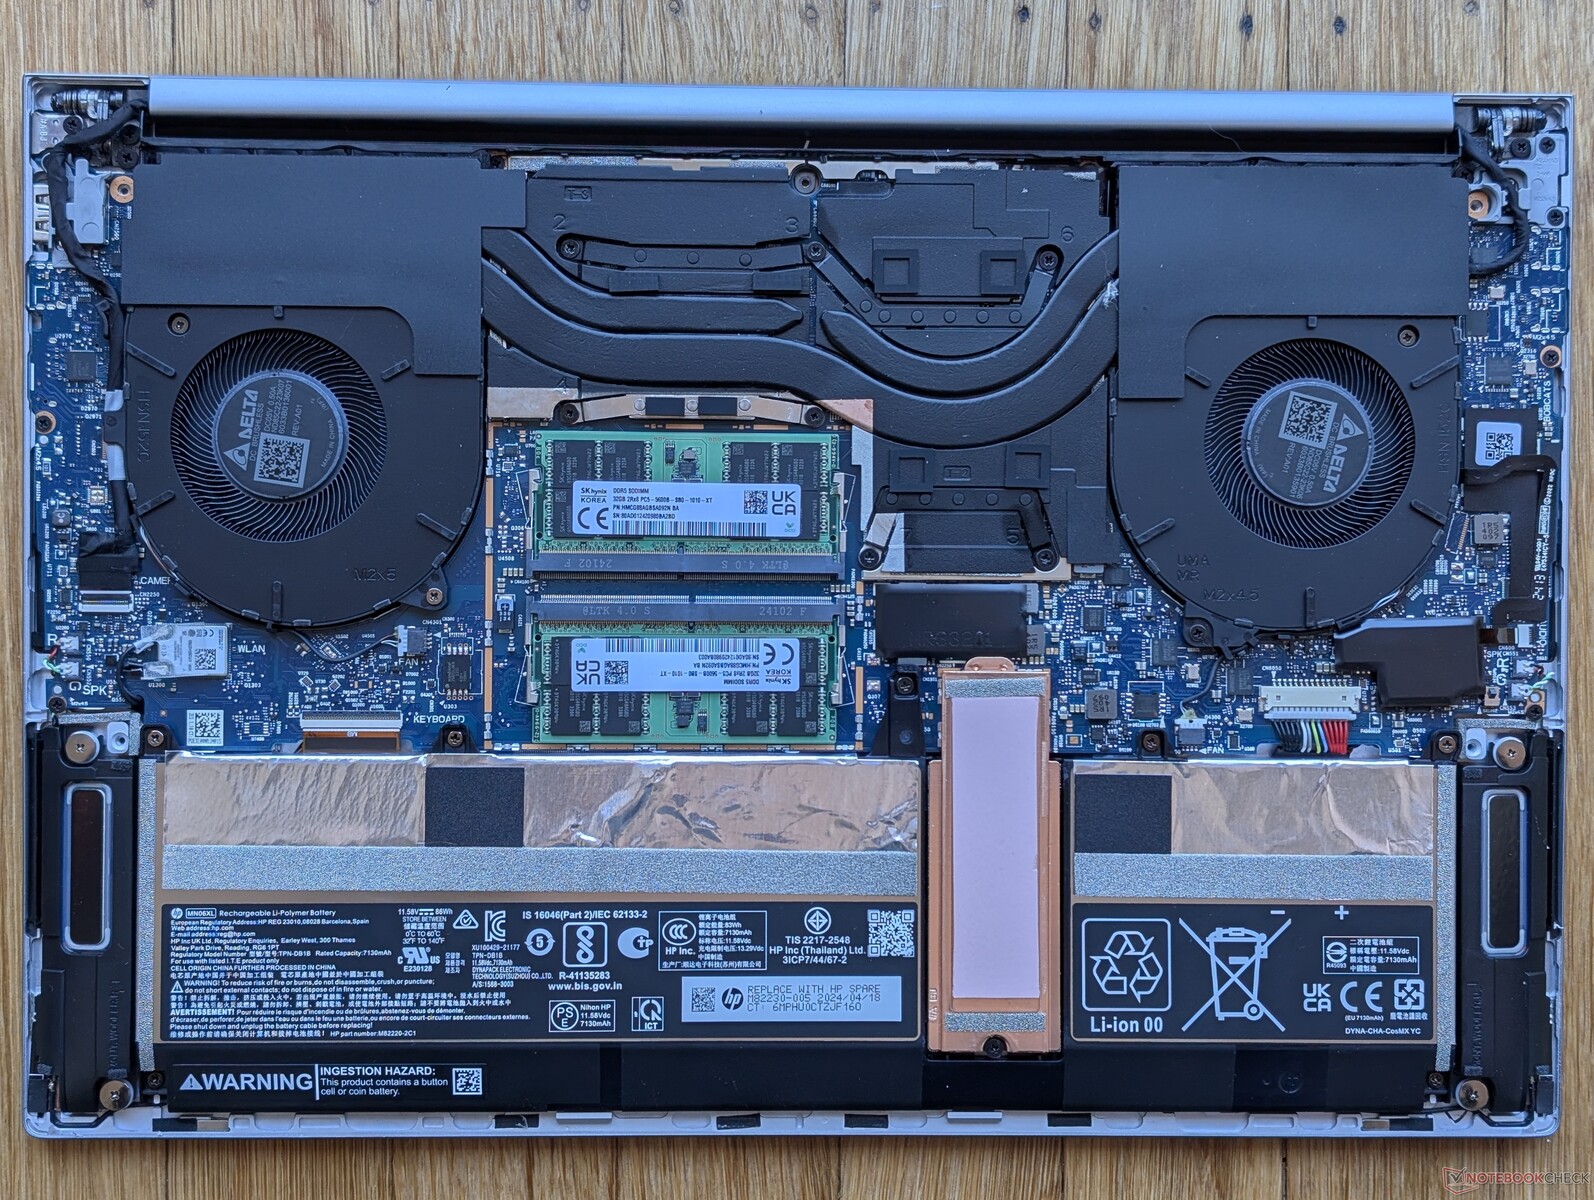
Wartung
Die Bodenplatte lässt sich mit einem Torx-Schraubendreher leicht entfernen. HP bietet ein offizielles Wartungsvideo für viele seiner Modelle, im Gegensatz zu anderen großen Herstellern.
Nachhaltigkeit
HP verwendet für alle seit 2022 hergestellten Laptops recycelte Kunststoffe und Metalle. Das Verhältnis von recycelten zu nicht recycelten Materialien variiert jedoch je nach Modell.
Die Verpackung besteht größtenteils aus Pappe und Papier mit einer Kunststoffhülle für das Notebook und den Netzadapter.
Garantie
Beim Kauf selbstverständlich die Herstellergarantie.
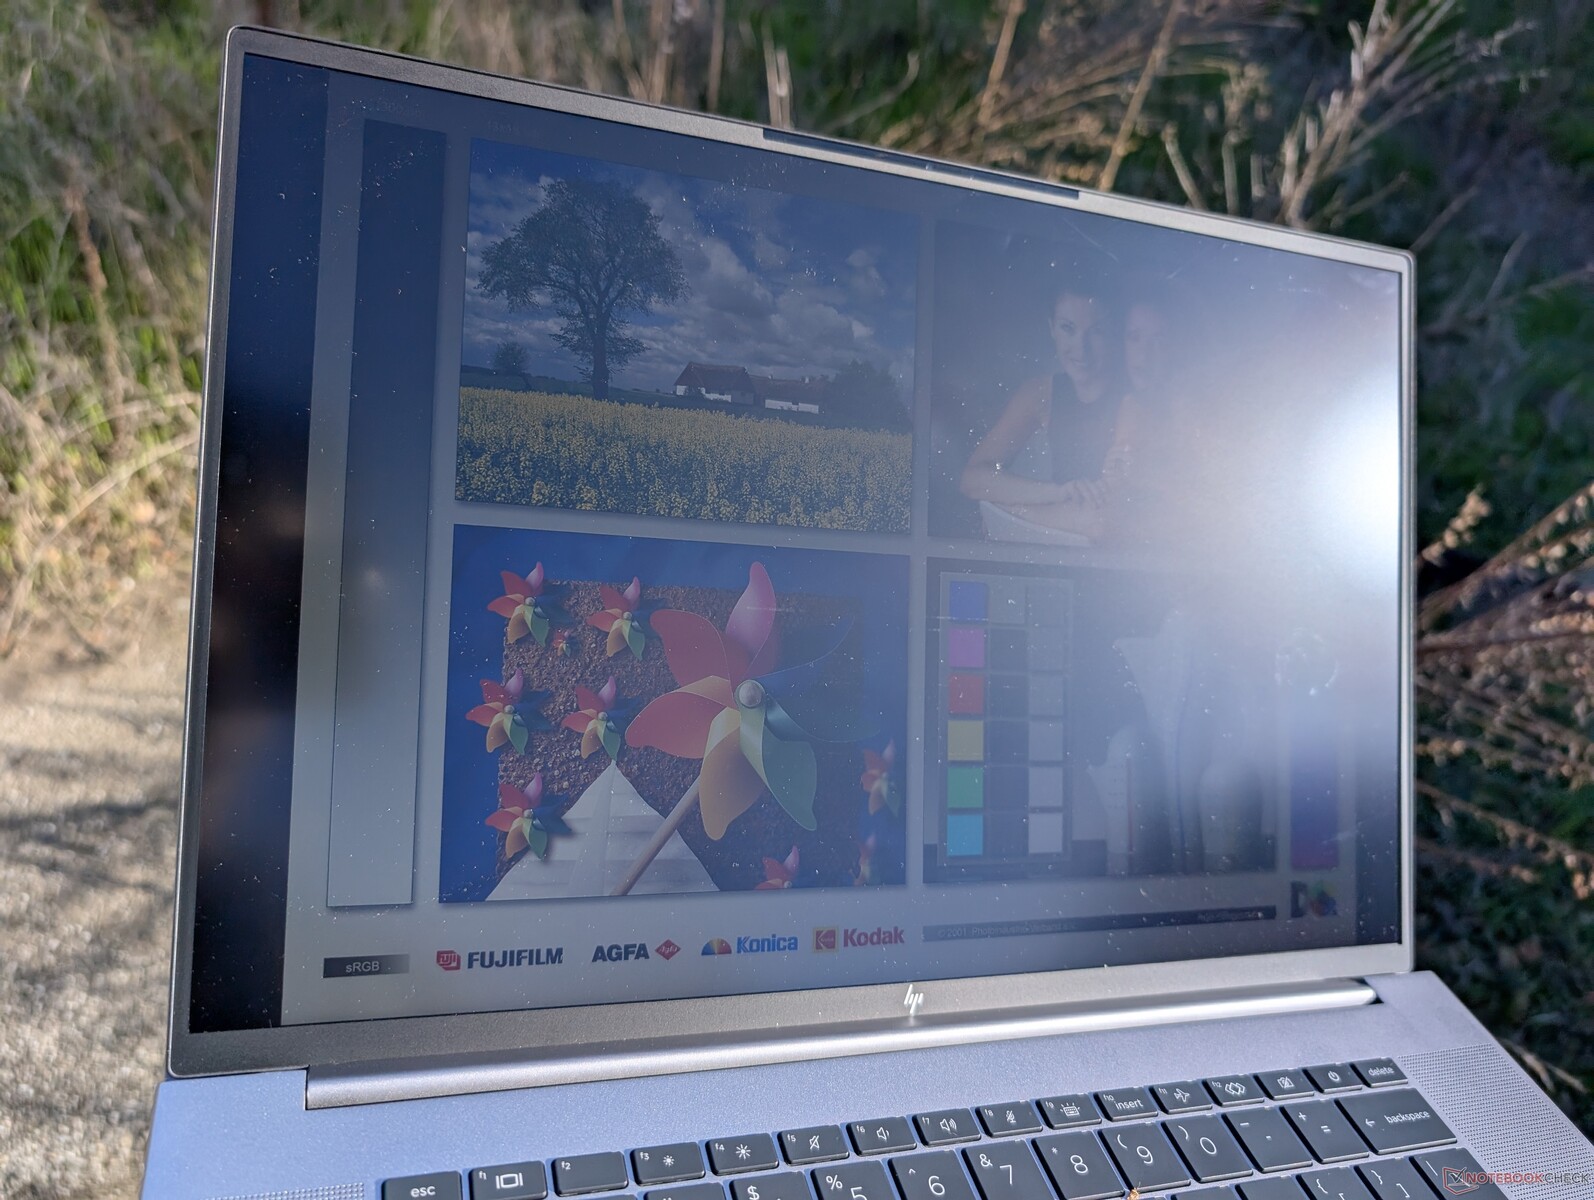
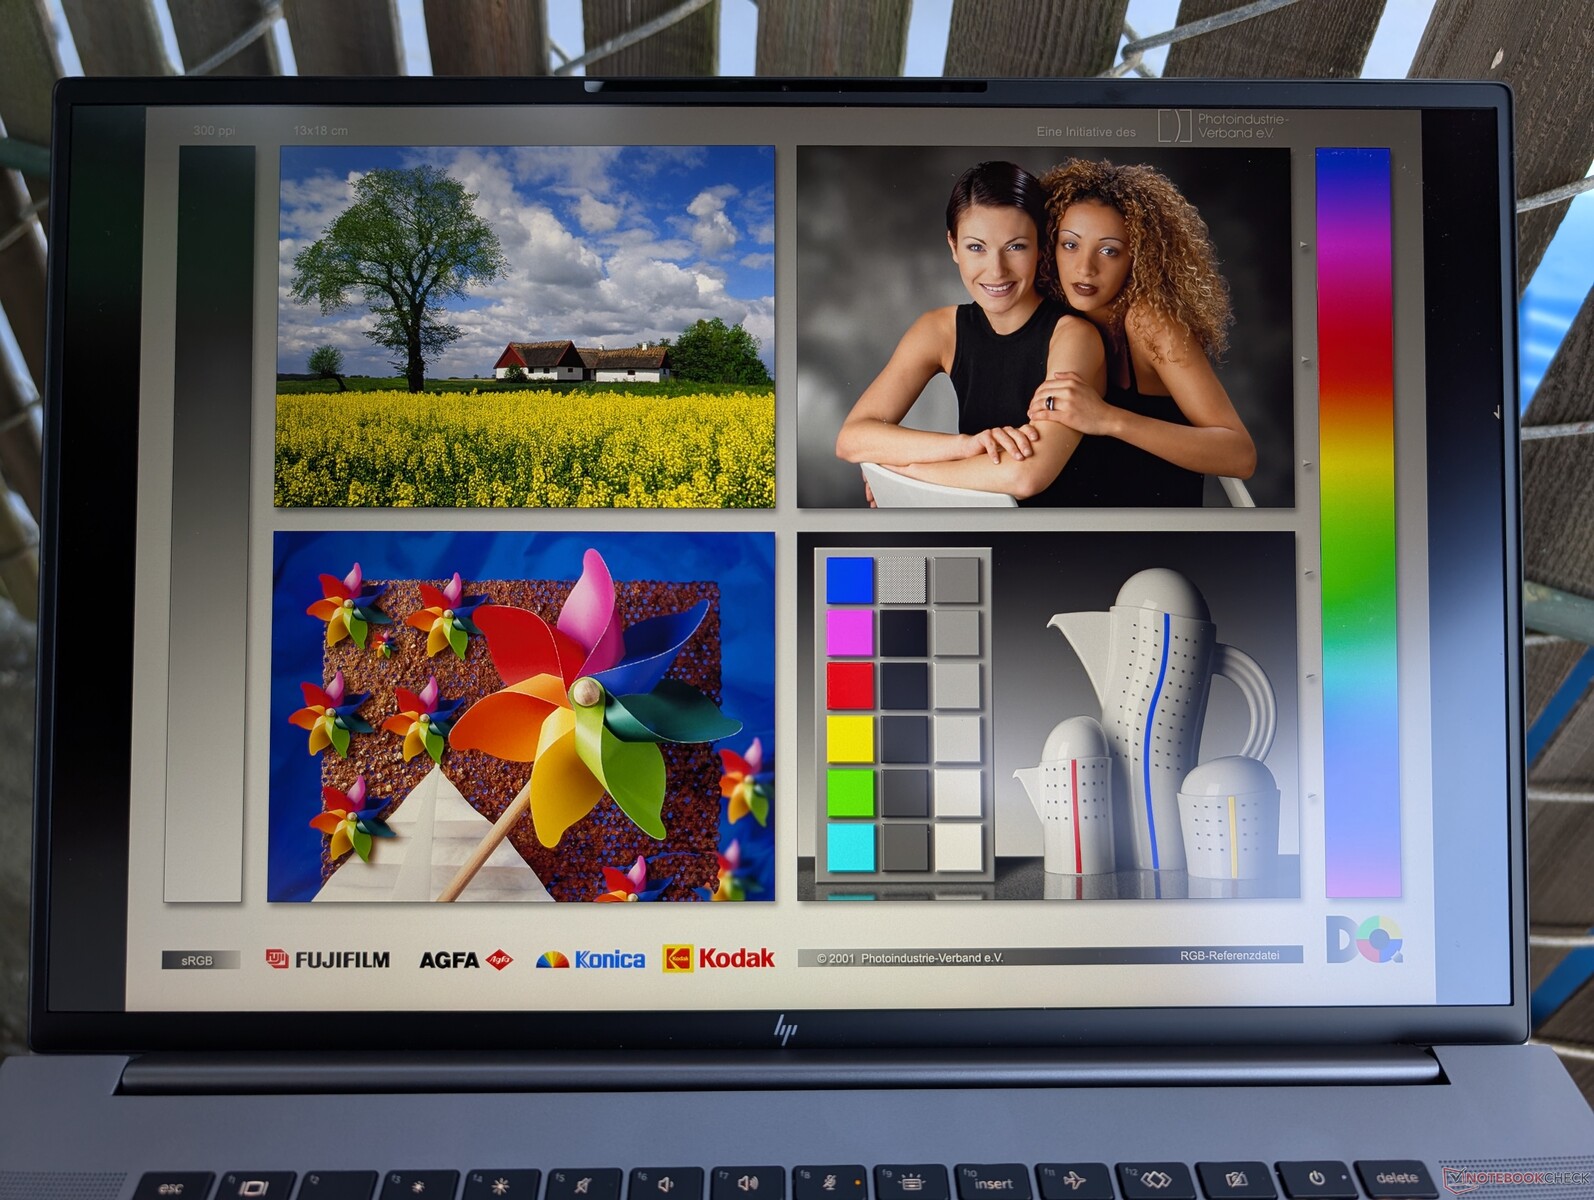
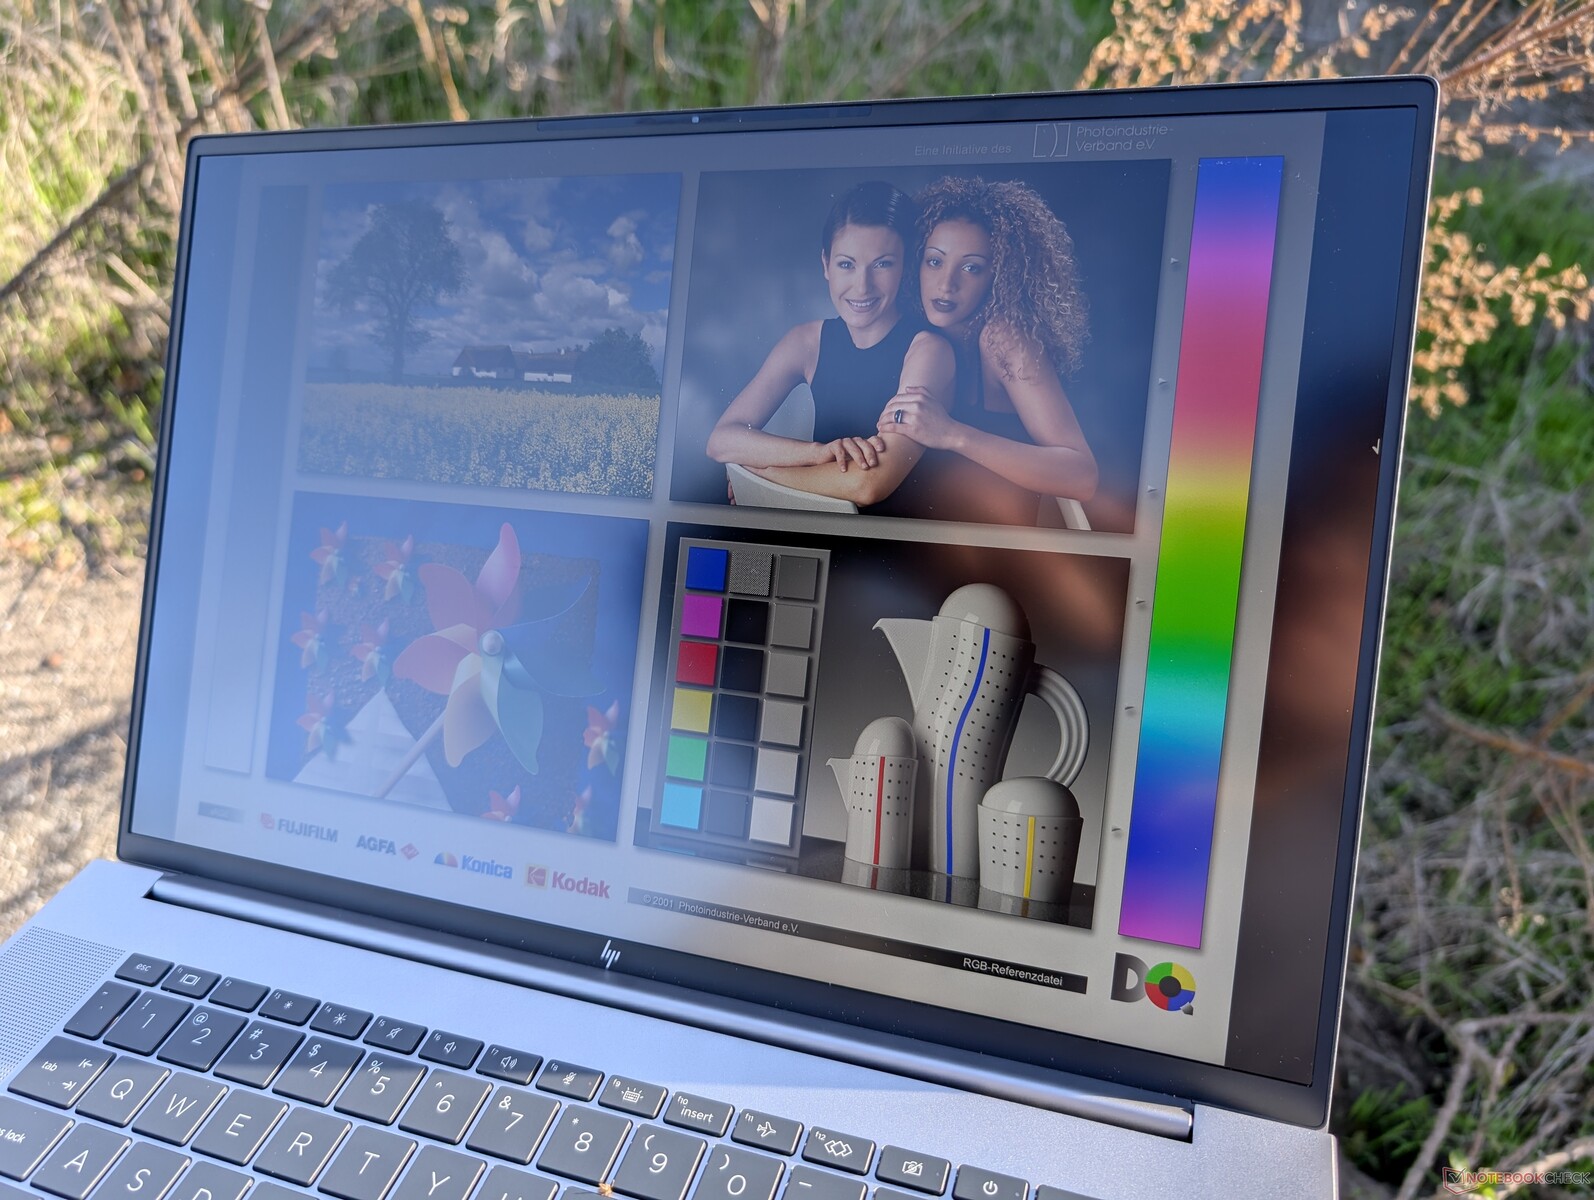
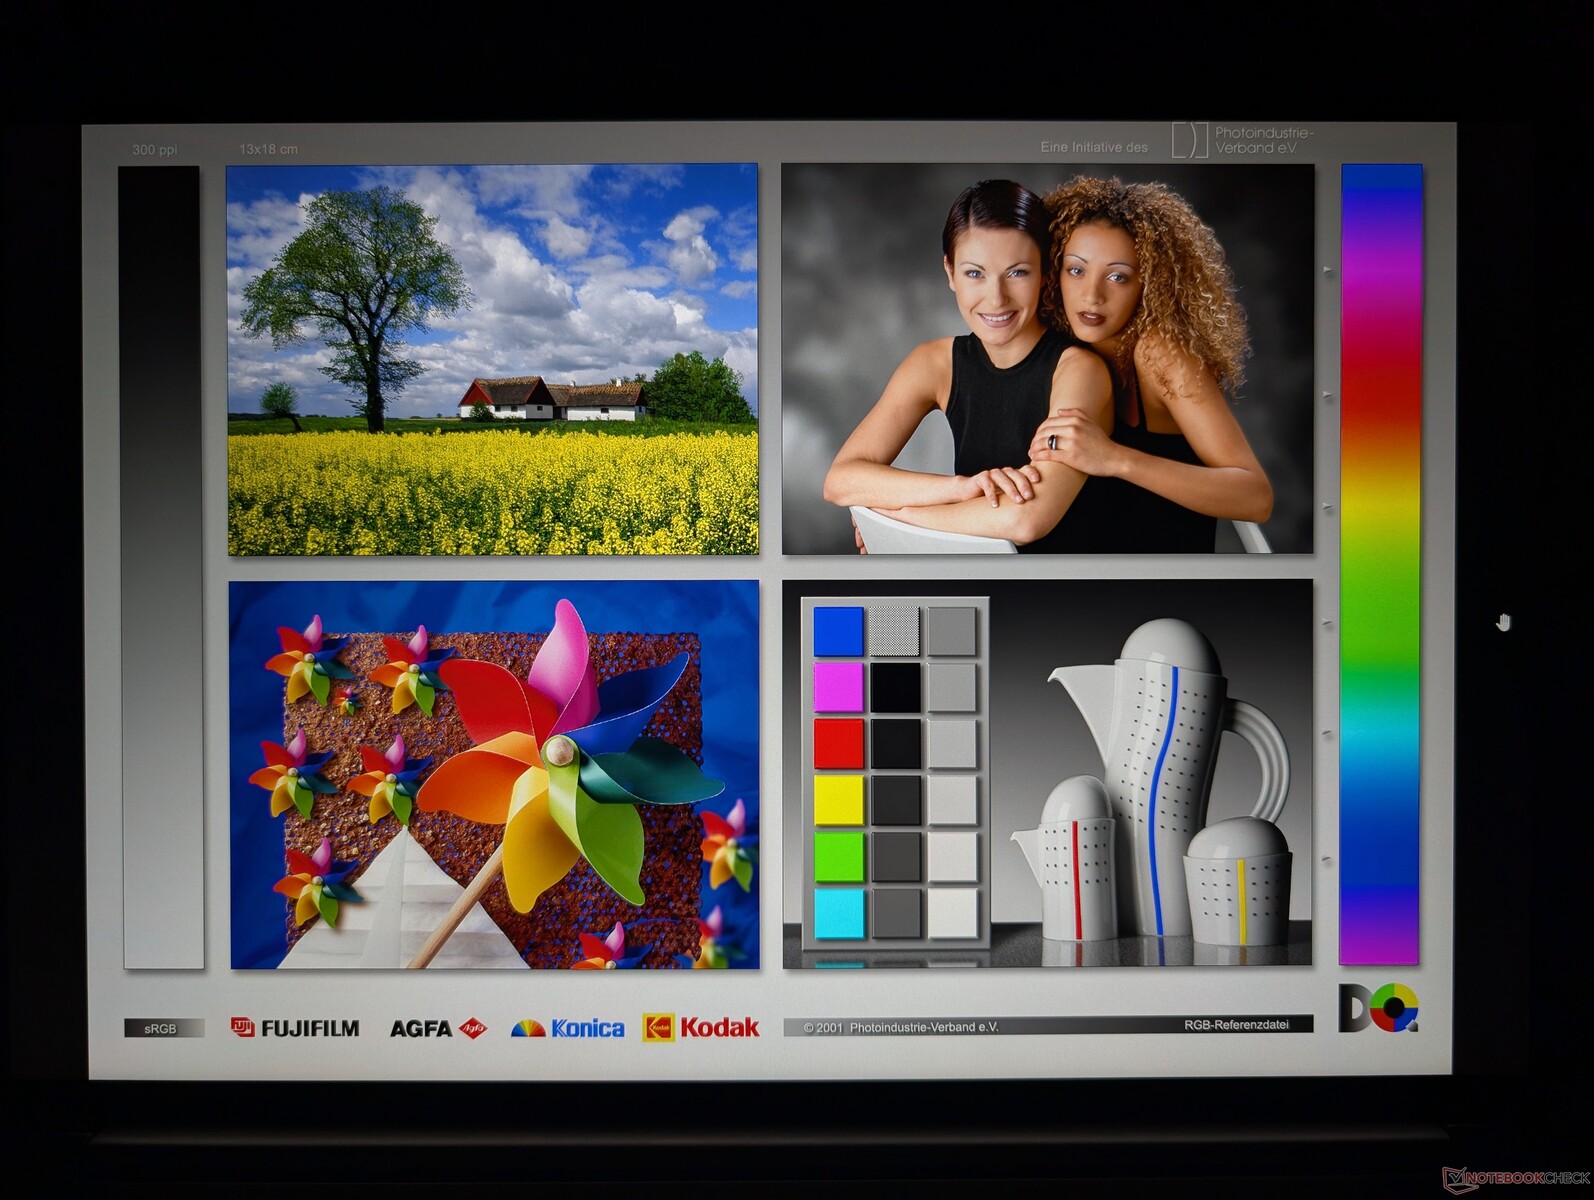
Display
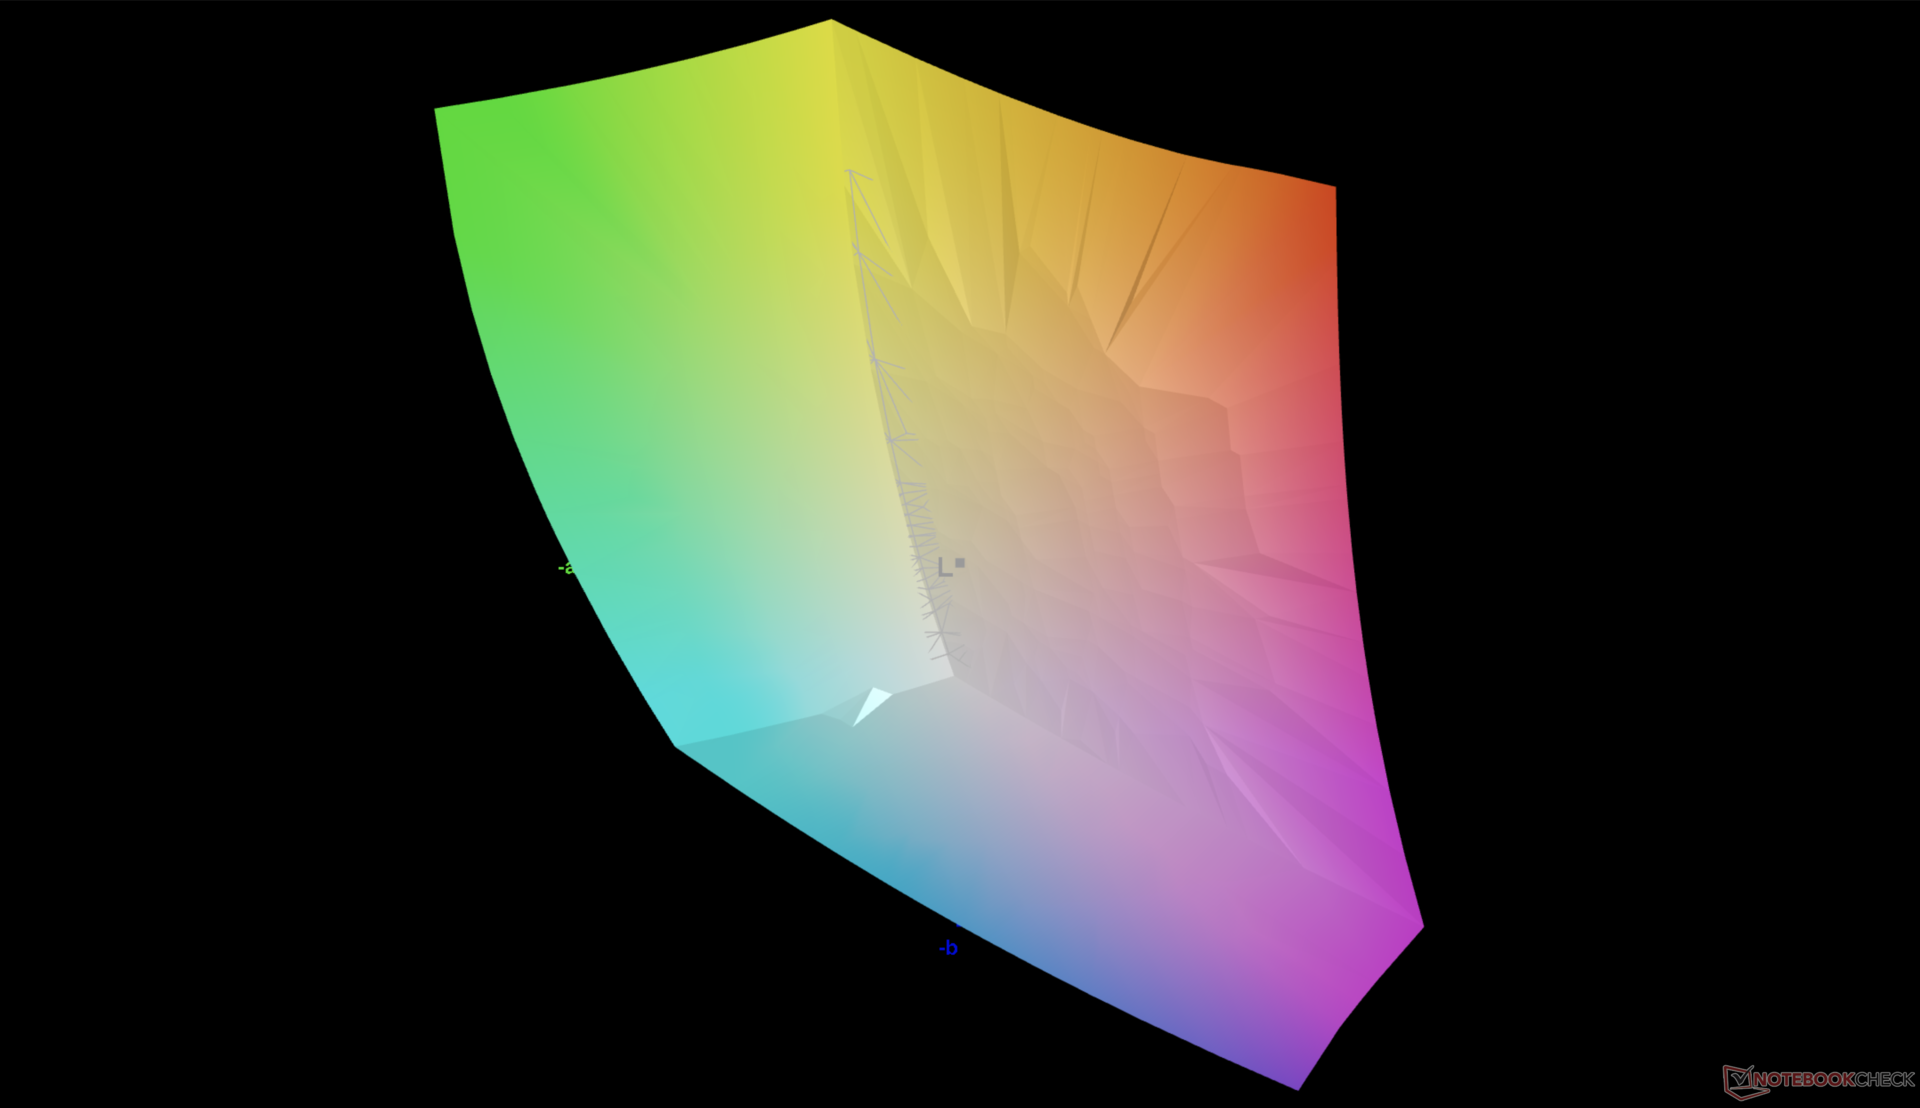
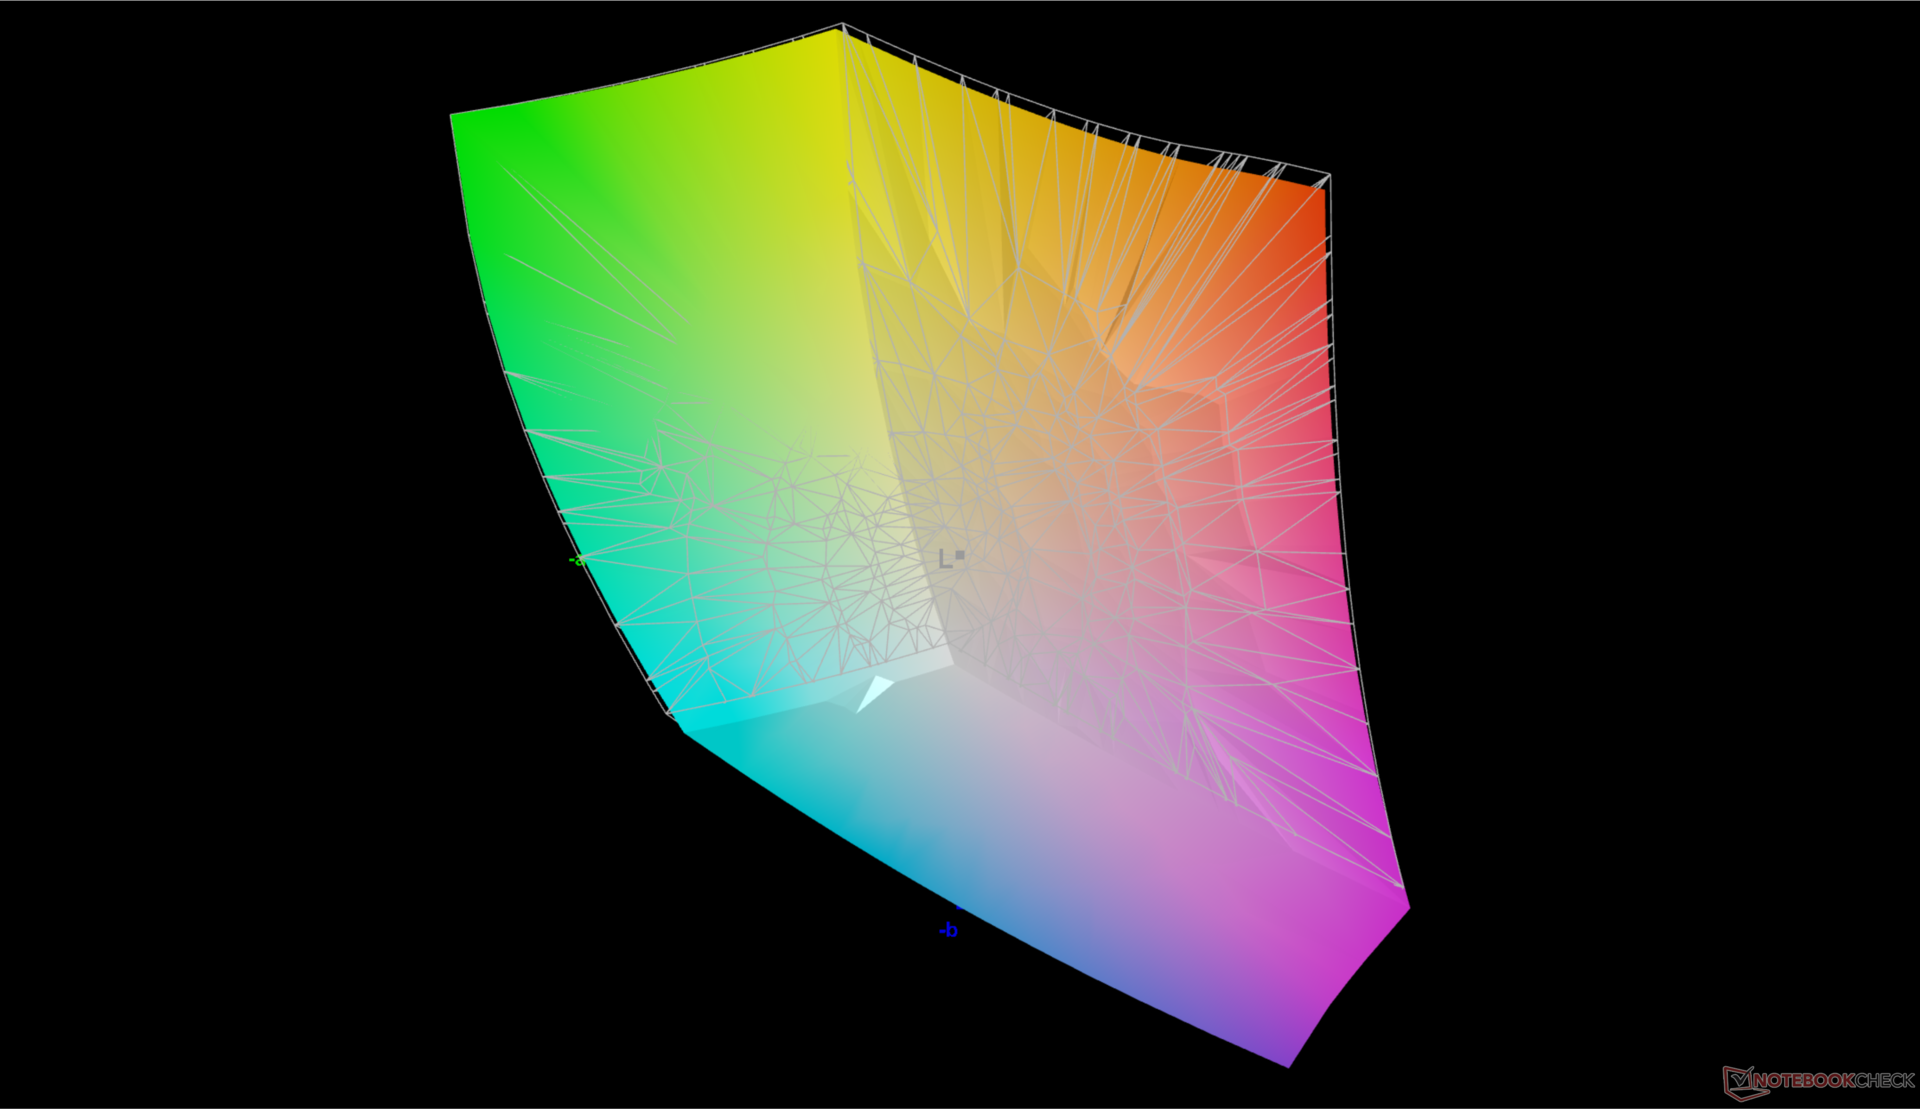
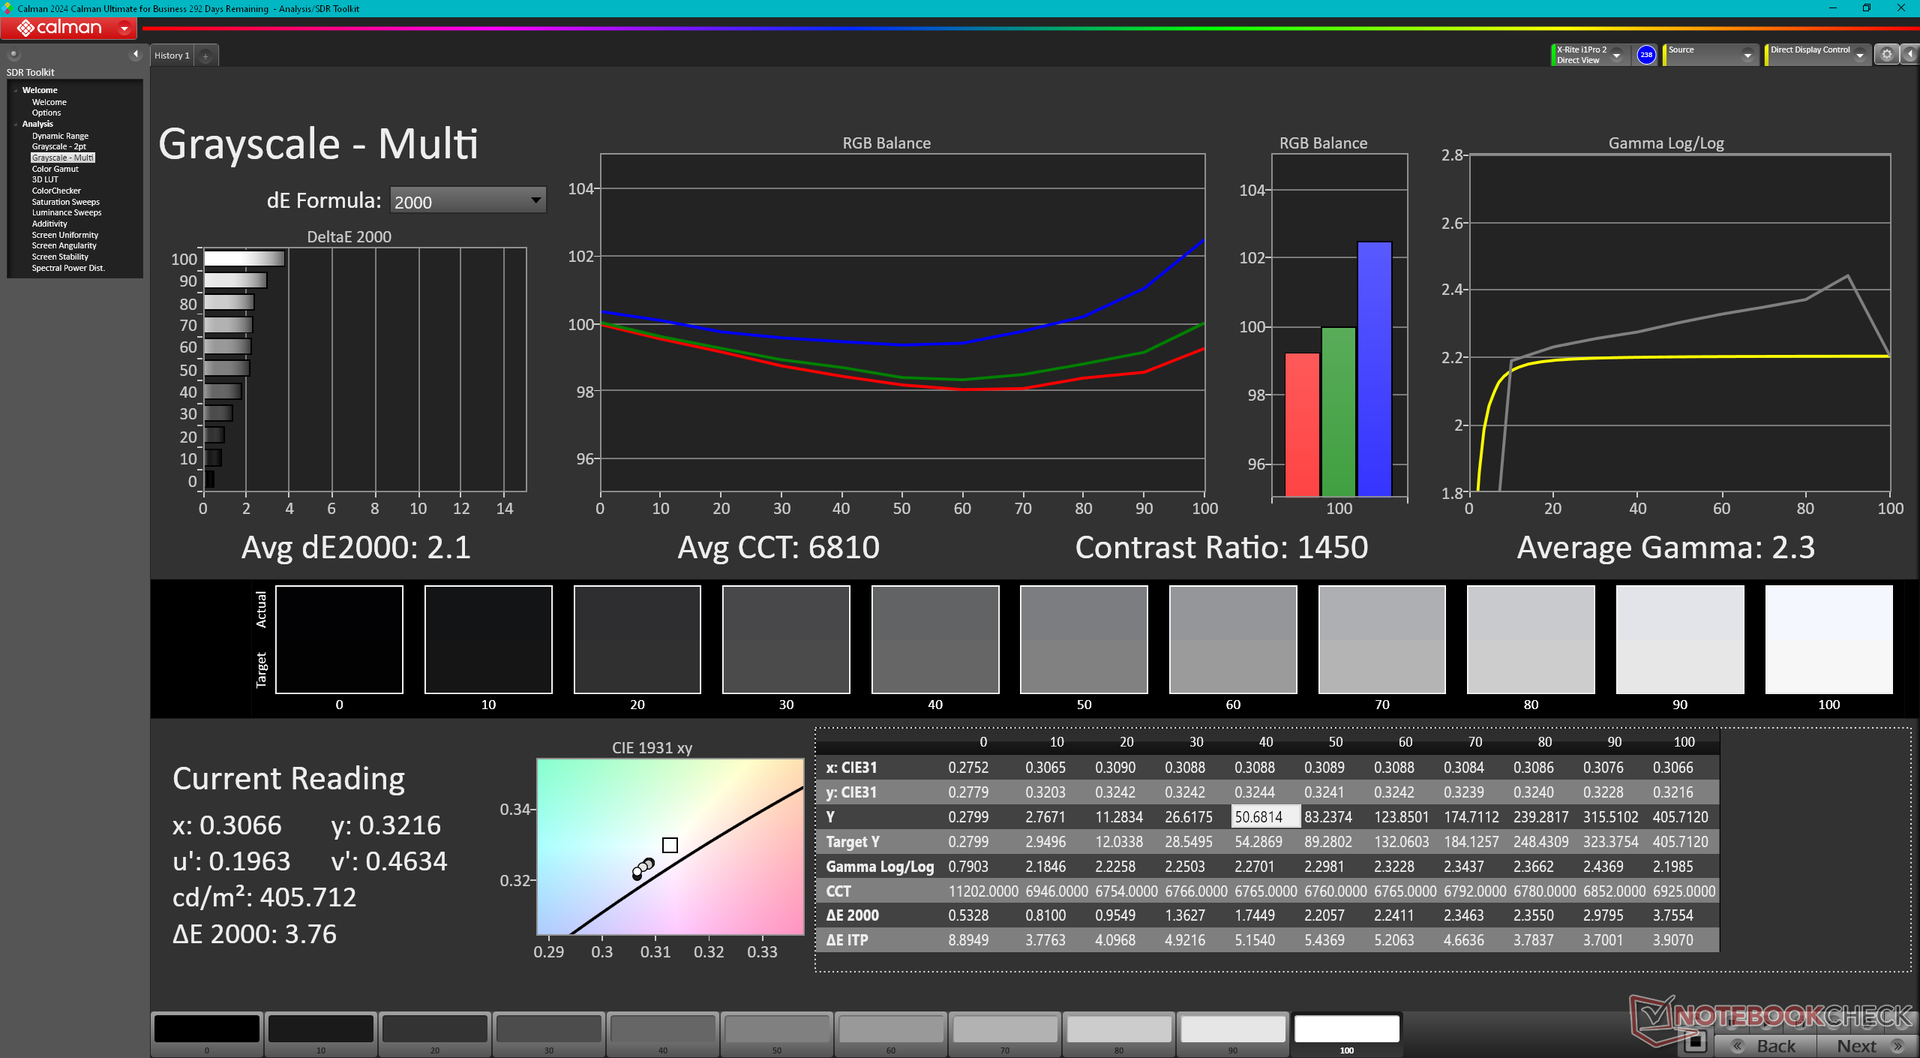
HP hat den Anbieter des 4K-Panels gewechselt. Während für den Studio 16 G9 ein Panel von BOE zum Einsatz kam, steckt nun eines von AU Optronics in unserem Studio 16 G11. Ihre Kerneigenschaften sind aber im Wesentlichen identisch, was die Bildwiederholfrequenz (120 Hz) und die Farbabdeckung (100 % DCI-P3) betrifft. Die Helligkeit ist diesmal jedoch um fast 30 Prozent geringer und HDR wird weiterhin nicht unterstützt. Dafür ist eine etwas hellere 500 Nit Option verfügbar.
| |||||||||||||||||||||||||
Ausleuchtung: 92 %
Helligkeit Akku: 404.3 cd/m²
Kontrast: 1444:1 (Schwarzwert: 0.28 cd/m²)
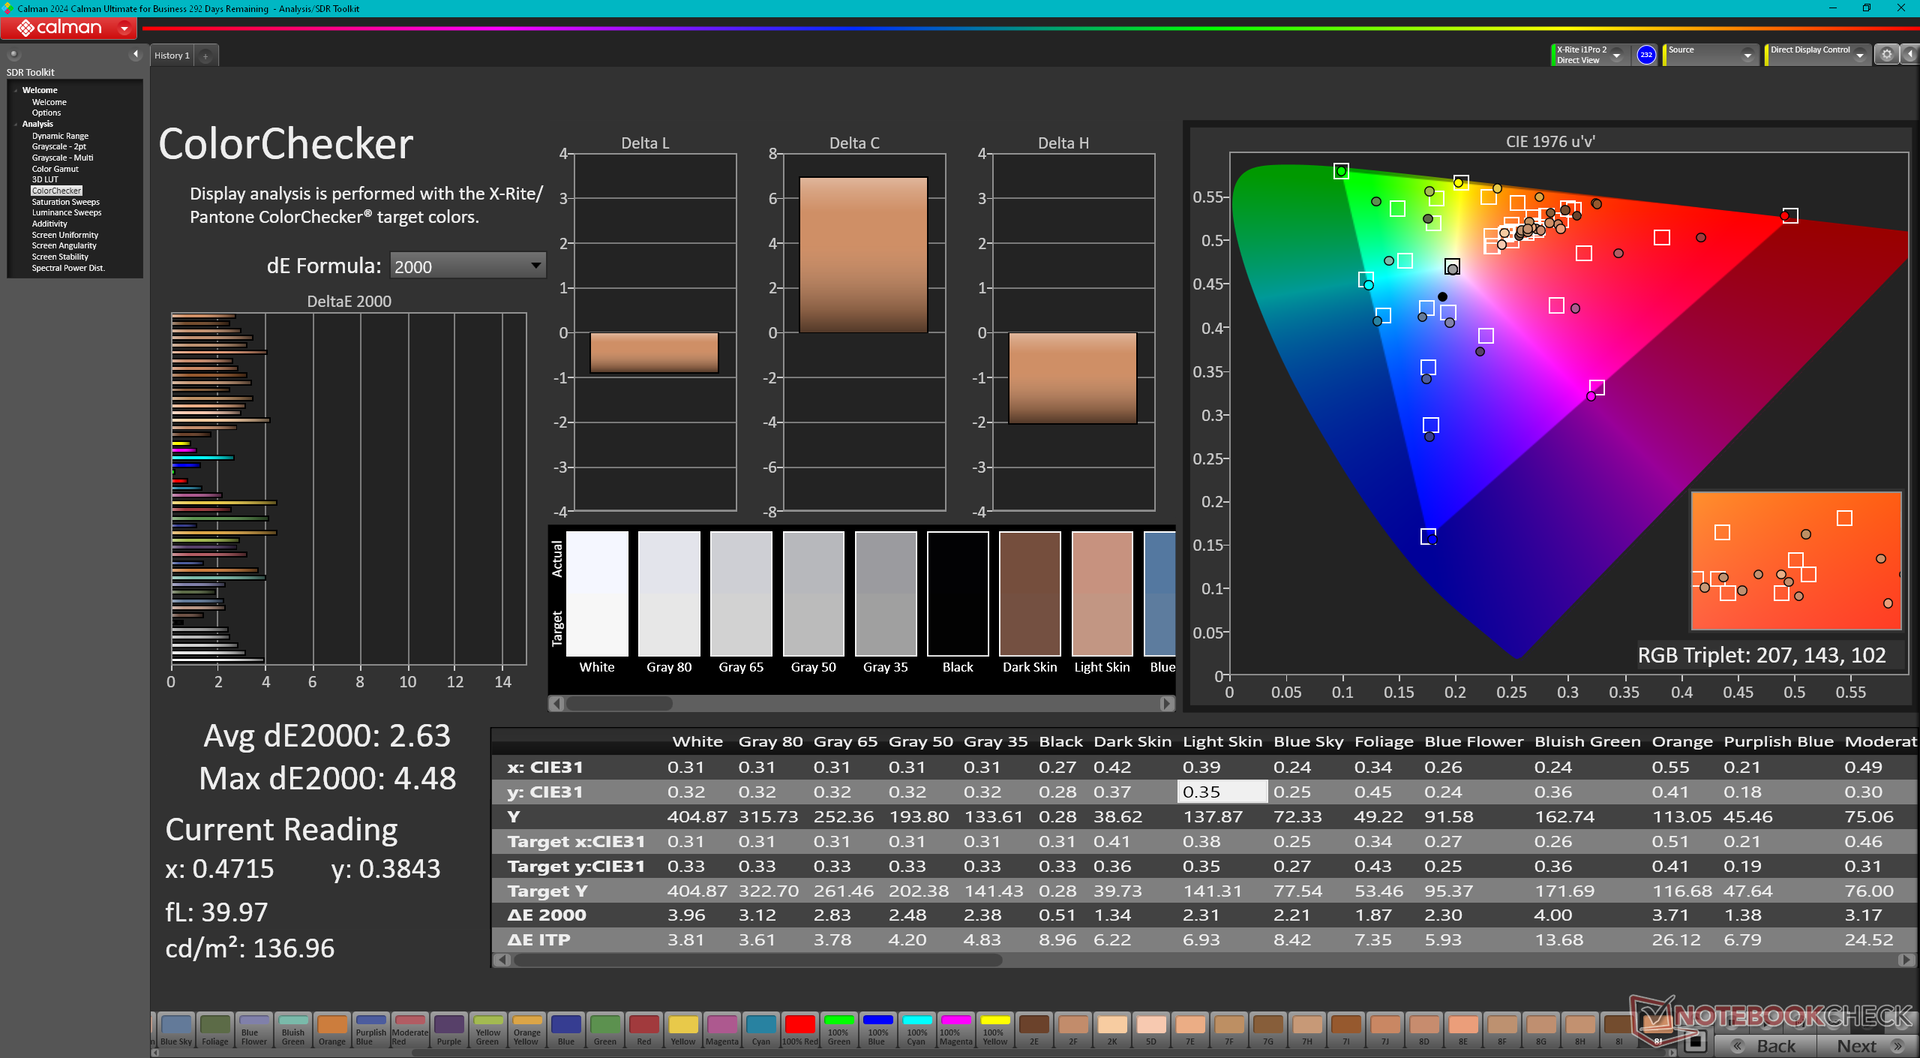
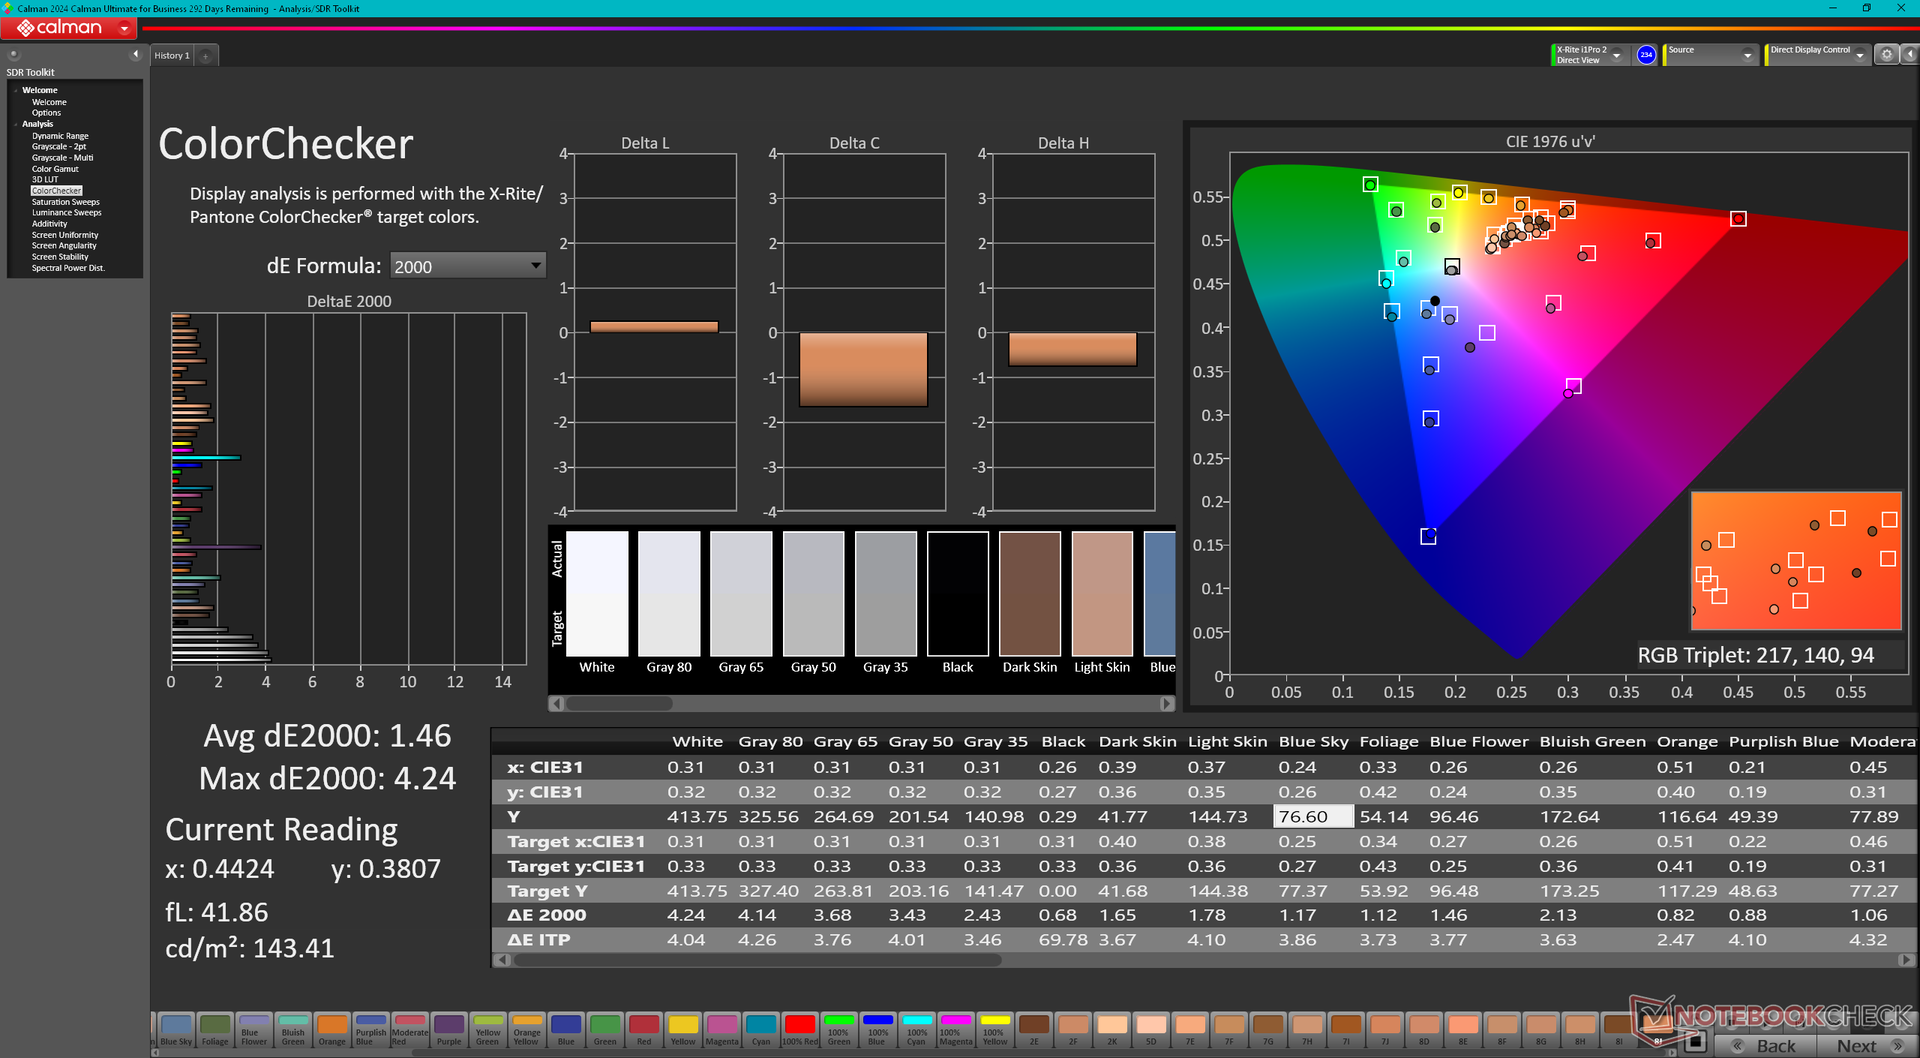
ΔE ColorChecker Calman: 2.63 | ∀{0.5-29.43 Ø4.72}
calibrated: 1.46
ΔE Greyscale Calman: 2.1 | ∀{0.09-98 Ø4.97}
85.7% AdobeRGB 1998 (Argyll 3D)
99.9% sRGB (Argyll 3D)
97.7% Display P3 (Argyll 3D)
Gamma: 2.3
CCT: 6810 K
| HP ZBook Studio 16 G11 AUO87A8, IPS, 3840x2400, 16", 120 Hz | HP ZBook Studio 16 G9 62U04EA BOE0A52, IPS, 3840x2400, 16", 120 Hz | HP ZBook Power 16 G11 A AUOA0A9, IPS, 2560x1600, 16", 120 Hz | Lenovo ThinkPad P16 Gen 2 NE160QDM-NY1, IPS, 2560x1600, 16", 165 Hz | Dell Precision 5690 Samsung 160YV03, OLED, 3840x2400, 16", 60 Hz | MSI CreatorPro Z16P B12UKST B160QAN02.N, IPS, 2560x1600, 16", 165 Hz | Lenovo ThinkPad P1 Gen 7 21KV001SGE MNG007DA1-9 , IPS LED, 2560x1600, 16", 165 Hz | |
|---|---|---|---|---|---|---|---|
| Display | 0% | -16% | -17% | 5% | 1% | -16% | |
| Display P3 Coverage (%) | 97.7 | 97.5 0% | 69.1 -29% | 68.4 -30% | 99.8 2% | 97.6 0% | 69.4 -29% |
| sRGB Coverage (%) | 99.9 | 99.9 0% | 97.7 -2% | 96.9 -3% | 100 0% | 99.9 0% | 97.6 -2% |
| AdobeRGB 1998 Coverage (%) | 85.7 | 86.3 1% | 71 -17% | 70.6 -18% | 96.6 13% | 87.4 2% | 71.8 -16% |
| Response Times | 17% | 13% | 4% | 86% | 20% | 11% | |
| Response Time Grey 50% / Grey 80% * (ms) | 14.2 ? | 15.3 ? -8% | 13.6 ? 4% | 14.1 ? 1% | 1.7 ? 88% | 12.8 ? 10% | 11.2 ? 21% |
| Response Time Black / White * (ms) | 10.6 ? | 6.1 ? 42% | 8.4 ? 21% | 9.9 ? 7% | 1.7 ? 84% | 7.4 ? 30% | 10.6 ? -0% |
| PWM Frequency (Hz) | 60 ? | ||||||
| Bildschirm | 18% | -20% | 17% | -11% | 10% | -32% | |
| Helligkeit Bildmitte (cd/m²) | 404.3 | 554 37% | 470.7 16% | 531.5 31% | 348.1 -14% | 407 1% | 516 28% |
| Brightness (cd/m²) | 405 | 516 27% | 431 6% | 499 23% | 351 -13% | 388 -4% | 505 25% |
| Brightness Distribution (%) | 92 | 84 -9% | 88 -4% | 89 -3% | 97 5% | 88 -4% | 89 -3% |
| Schwarzwert * (cd/m²) | 0.28 | 0.47 -68% | 0.57 -104% | 0.38 -36% | 0.36 -29% | 0.41 -46% | |
| Kontrast (:1) | 1444 | 1179 -18% | 826 -43% | 1399 -3% | 1131 -22% | 1259 -13% | |
| Delta E Colorchecker * | 2.63 | 1 62% | 2.16 18% | 1.82 31% | 4.18 -59% | 1.3 51% | 3.5 -33% |
| Colorchecker dE 2000 max. * | 4.48 | 2.4 46% | 4.39 2% | 4.1 8% | 6.68 -49% | 2.5 44% | 8.8 -96% |
| Colorchecker dE 2000 calibrated * | 1.46 | 0.6 59% | 1.37 6% | 0.63 57% | 0.97 34% | 0.7 52% | 1.2 18% |
| Delta E Graustufen * | 2.1 | 1.6 24% | 3.7 -76% | 1.2 43% | 1.7 19% | 2.1 -0% | 5.6 -167% |
| Gamma | 2.3 96% | 2.29 96% | 2.38 92% | 2.15 102% | 2.2 100% | 2.26 97% | 2.27 97% |
| CCT | 6810 95% | 6458 101% | 6765 96% | 6484 100% | 6198 105% | 6437 101% | 6071 107% |
| Durchschnitt gesamt (Programm / Settings) | 12% /
14% | -8% /
-14% | 1% /
8% | 27% /
9% | 10% /
9% | -12% /
-22% |
* ... kleinere Werte sind besser
Das Display ist vorkalibriert und hat einen niedrigen durchschnittlichen Graustufen- und Farb-DeltaE-Wert von nur 2,1 bzw. 2,63.

Reaktionszeiten (Response Times) des Displays
| ↔ Reaktionszeiten Schwarz zu Weiß | ||
|---|---|---|
| 10.6 ms ... steigend ↗ und fallend ↘ kombiniert | ↗ 6.1 ms steigend | 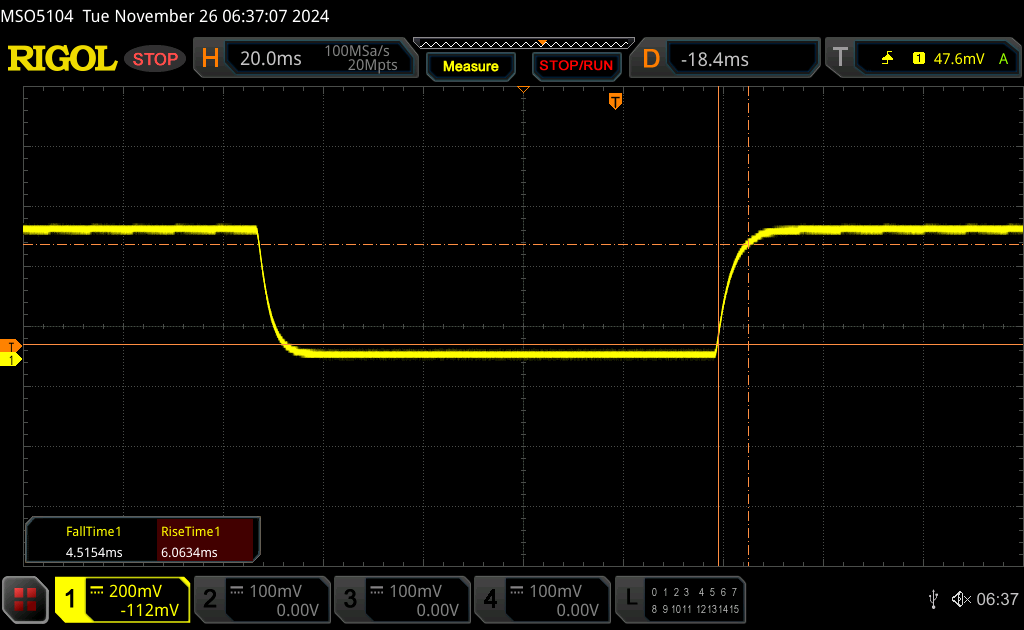 |
| ↘ 4.5 ms fallend | ||
| Die gemessenen Reaktionszeiten sind gut, für anspruchsvolle Spieler könnten der Bildschirm jedoch zu langsam sein. Im Vergleich rangierten die bei uns getesteten Geräte von 0.1 (Minimum) zu 240 (Maximum) ms. » 29 % aller Screens waren schneller als der getestete. Daher sind die gemessenen Reaktionszeiten besser als der Durchschnitt aller vermessenen Geräte (19.8 ms). | ||
| ↔ Reaktionszeiten 50% Grau zu 80% Grau | ||
| 14.2 ms ... steigend ↗ und fallend ↘ kombiniert | ↗ 6.9 ms steigend | 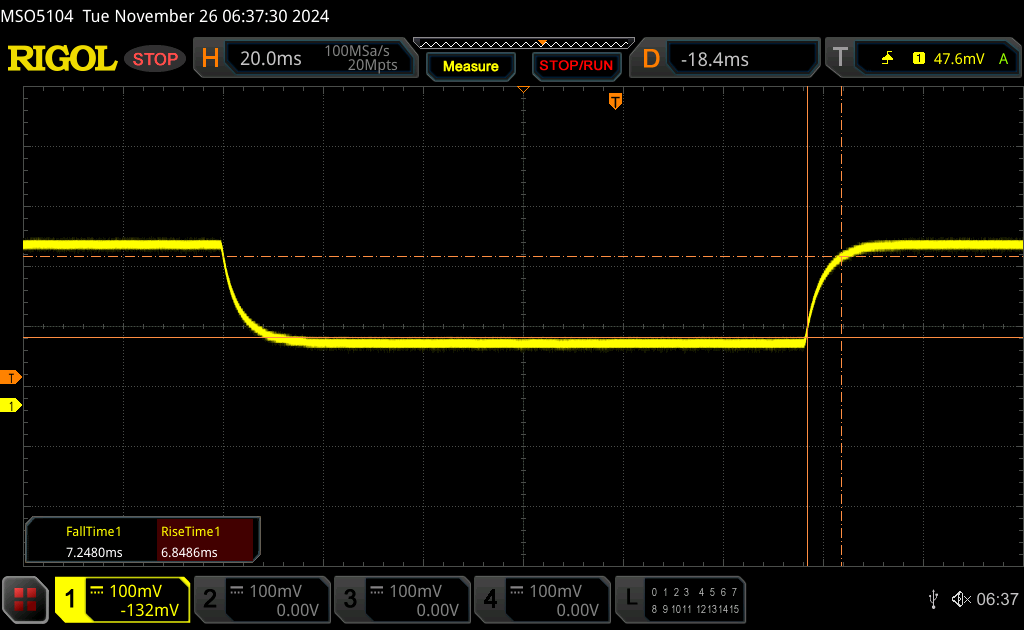 |
| ↘ 7.3 ms fallend | ||
| Die gemessenen Reaktionszeiten sind gut, für anspruchsvolle Spieler könnten der Bildschirm jedoch zu langsam sein. Im Vergleich rangierten die bei uns getesteten Geräte von 0.165 (Minimum) zu 636 (Maximum) ms. » 28 % aller Screens waren schneller als der getestete. Daher sind die gemessenen Reaktionszeiten besser als der Durchschnitt aller vermessenen Geräte (31 ms). | ||
Bildschirm-Flackern / PWM (Pulse-Width Modulation)
| Flackern / PWM nicht festgestellt | 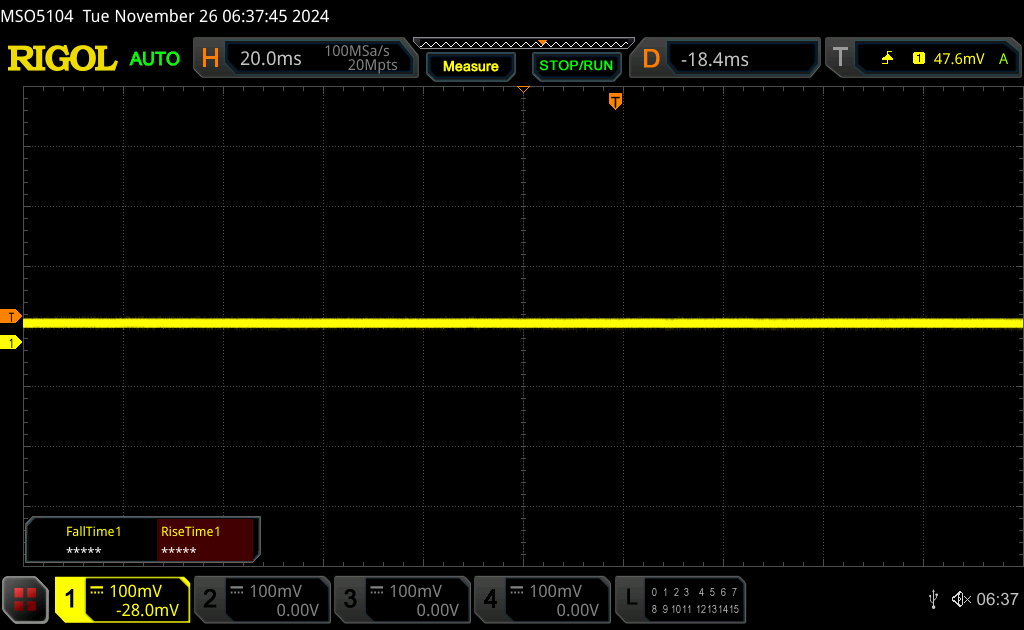 | ||
Im Vergleich: 52 % aller getesteten Geräte nutzten kein PWM um die Helligkeit zu reduzieren. Wenn PWM eingesetzt wurde, dann bei einer Frequenz von durchschnittlich 7778 (Minimum 5, Maximum 343500) Hz. | |||


Performance


Testbedingungen
Wir haben Windows und MyHP in den Performance-Modus versetzt, bevor wir die folgenden Benchmarks durchgeführt haben.
Prozessor
Obwohl sie nicht so schnell sind wie die Raptor Lake-HX-Serie, sind die Meteor Lake-basierten Core Ultra 9 185H ist immer noch ein leichtes Upgrade (etwa 10 Prozent) gegenüber dem Core i7-12800H im ZBook Studio 16 G9, wenn es um Multithreading-Aufgaben geht. Leider kann er die Turbo Boost-Taktraten trotz des relativ großen 16-Zoll-Formfaktors nicht sehr lange aufrechterhalten.
Cinebench R15 Multi Loop
Cinebench R23: Multi Core | Single Core
Cinebench R20: CPU (Multi Core) | CPU (Single Core)
Cinebench R15: CPU Multi 64Bit | CPU Single 64Bit
Blender: v2.79 BMW27 CPU
7-Zip 18.03: 7z b 4 | 7z b 4 -mmt1
Geekbench 6.7: Multi-Core | Single-Core
Geekbench 5.5: Multi-Core | Single-Core
HWBOT x265 Benchmark v2.2: 4k Preset
LibreOffice : 20 Documents To PDF
R Benchmark 2.5: Overall mean
| CPU Performance Rating | |
| HP ZBook Fury 16 G11 | |
| HP ZBook Fury 16 G10 | |
| Lenovo ThinkPad P16 Gen 2 | |
| Durchschnitt der Klasse Workstation | |
| Lenovo ThinkPad P16 G1 RTX A5500 -2! | |
| Dell Precision 5000 5680 | |
| Lenovo ThinkPad P1 G6 21FV001KUS | |
| Asus ExpertBook B6 Flip B6602FC2 -2! | |
| Lenovo ThinkPad P16 G2 21FA000FGE -2! | |
| Lenovo ThinkPad P1 G6-21FV000DGE | |
| Dell Precision 5690 | |
| HP ZBook Studio 16 G11 | |
| Lenovo ThinkPad P1 Gen 7 21KV001SGE | |
| HP ZBook Fury 16 G9 -2! | |
| Durchschnittliche Intel Core Ultra 9 185H | |
| HP ZBook Power 16 G11 A | |
| Lenovo ThinkPad P16 G1 21D6001DMB -2! | |
| HP ZBook Studio 16 G9 62U04EA -2! | |
| Lenovo ThinkPad P16v G1 AMD | |
| Lenovo ThinkPad P16s G2 21K9000CGE | |
| Geekbench 6.7 / Multi-Core | |
| Lenovo ThinkPad P16 Gen 2 | |
| Durchschnitt der Klasse Workstation (12196 - 20887, n=25, der letzten 2 Jahre) | |
| HP ZBook Fury 16 G10 | |
| HP ZBook Fury 16 G11 | |
| Dell Precision 5000 5680 | |
| Dell Precision 5690 | |
| HP ZBook Studio 16 G11 | |
| Durchschnittliche Intel Core Ultra 9 185H (9140 - 14540, n=20) | |
| Lenovo ThinkPad P1 Gen 7 21KV001SGE | |
| Lenovo ThinkPad P1 G6 21FV001KUS | |
| HP ZBook Power 16 G11 A | |
| Lenovo ThinkPad P1 G6-21FV000DGE | |
| Lenovo ThinkPad P16s G2 21K9000CGE | |
| Lenovo ThinkPad P16v G1 AMD | |
| Geekbench 6.7 / Single-Core | |
| HP ZBook Fury 16 G10 | |
| HP ZBook Fury 16 G11 | |
| Lenovo ThinkPad P16 Gen 2 | |
| Durchschnitt der Klasse Workstation (2389 - 3065, n=25, der letzten 2 Jahre) | |
| Lenovo ThinkPad P1 G6 21FV001KUS | |
| Lenovo ThinkPad P1 G6-21FV000DGE | |
| HP ZBook Power 16 G11 A | |
| Dell Precision 5000 5680 | |
| Lenovo ThinkPad P16v G1 AMD | |
| Dell Precision 5690 | |
| HP ZBook Studio 16 G11 | |
| Lenovo ThinkPad P16s G2 21K9000CGE | |
| Durchschnittliche Intel Core Ultra 9 185H (1490 - 2573, n=20) | |
| Lenovo ThinkPad P1 Gen 7 21KV001SGE | |
Cinebench R23: Multi Core | Single Core
Cinebench R20: CPU (Multi Core) | CPU (Single Core)
Cinebench R15: CPU Multi 64Bit | CPU Single 64Bit
Blender: v2.79 BMW27 CPU
7-Zip 18.03: 7z b 4 | 7z b 4 -mmt1
Geekbench 6.7: Multi-Core | Single-Core
Geekbench 5.5: Multi-Core | Single-Core
HWBOT x265 Benchmark v2.2: 4k Preset
LibreOffice : 20 Documents To PDF
R Benchmark 2.5: Overall mean
* ... kleinere Werte sind besser
AIDA64: FP32 Ray-Trace | FPU Julia | CPU SHA3 | CPU Queen | FPU SinJulia | FPU Mandel | CPU AES | CPU ZLib | FP64 Ray-Trace | CPU PhotoWorxx
| Performance Rating | |
| Lenovo ThinkPad P16 Gen 2 | |
| HP ZBook Power 16 G11 A | |
| Dell Precision 5690 | |
| HP ZBook Studio 16 G11 | |
| Lenovo ThinkPad P1 Gen 7 21KV001SGE | |
| Durchschnittliche Intel Core Ultra 9 185H | |
| MSI CreatorPro Z16P B12UKST | |
| HP ZBook Studio 16 G9 62U04EA | |
| AIDA64 / FP32 Ray-Trace | |
| HP ZBook Power 16 G11 A | |
| Lenovo ThinkPad P16 Gen 2 | |
| Dell Precision 5690 | |
| Lenovo ThinkPad P1 Gen 7 21KV001SGE | |
| HP ZBook Studio 16 G11 | |
| Durchschnittliche Intel Core Ultra 9 185H (9220 - 18676, n=20) | |
| HP ZBook Studio 16 G9 62U04EA | |
| MSI CreatorPro Z16P B12UKST | |
| AIDA64 / FPU Julia | |
| HP ZBook Power 16 G11 A | |
| Lenovo ThinkPad P16 Gen 2 | |
| Dell Precision 5690 | |
| HP ZBook Studio 16 G11 | |
| Lenovo ThinkPad P1 Gen 7 21KV001SGE | |
| Durchschnittliche Intel Core Ultra 9 185H (48865 - 96463, n=20) | |
| HP ZBook Studio 16 G9 62U04EA | |
| MSI CreatorPro Z16P B12UKST | |
| AIDA64 / CPU SHA3 | |
| Lenovo ThinkPad P16 Gen 2 | |
| HP ZBook Power 16 G11 A | |
| Dell Precision 5690 | |
| HP ZBook Studio 16 G11 | |
| Lenovo ThinkPad P1 Gen 7 21KV001SGE | |
| Durchschnittliche Intel Core Ultra 9 185H (2394 - 4534, n=20) | |
| HP ZBook Studio 16 G9 62U04EA | |
| MSI CreatorPro Z16P B12UKST | |
| AIDA64 / CPU Queen | |
| Lenovo ThinkPad P16 Gen 2 | |
| HP ZBook Power 16 G11 A | |
| HP ZBook Studio 16 G9 62U04EA | |
| MSI CreatorPro Z16P B12UKST | |
| Dell Precision 5690 | |
| HP ZBook Studio 16 G11 | |
| Lenovo ThinkPad P1 Gen 7 21KV001SGE | |
| Durchschnittliche Intel Core Ultra 9 185H (66785 - 95241, n=20) | |
| AIDA64 / FPU SinJulia | |
| HP ZBook Power 16 G11 A | |
| Lenovo ThinkPad P16 Gen 2 | |
| Dell Precision 5690 | |
| HP ZBook Studio 16 G11 | |
| Lenovo ThinkPad P1 Gen 7 21KV001SGE | |
| Durchschnittliche Intel Core Ultra 9 185H (7255 - 11392, n=20) | |
| HP ZBook Studio 16 G9 62U04EA | |
| MSI CreatorPro Z16P B12UKST | |
| AIDA64 / FPU Mandel | |
| HP ZBook Power 16 G11 A | |
| Lenovo ThinkPad P16 Gen 2 | |
| Dell Precision 5690 | |
| Lenovo ThinkPad P1 Gen 7 21KV001SGE | |
| HP ZBook Studio 16 G11 | |
| Durchschnittliche Intel Core Ultra 9 185H (24004 - 48020, n=20) | |
| HP ZBook Studio 16 G9 62U04EA | |
| MSI CreatorPro Z16P B12UKST | |
| AIDA64 / CPU AES | |
| MSI CreatorPro Z16P B12UKST | |
| Lenovo ThinkPad P16 Gen 2 | |
| Durchschnittliche Intel Core Ultra 9 185H (53116 - 154066, n=20) | |
| Dell Precision 5690 | |
| HP ZBook Studio 16 G11 | |
| Lenovo ThinkPad P1 Gen 7 21KV001SGE | |
| HP ZBook Power 16 G11 A | |
| HP ZBook Studio 16 G9 62U04EA | |
| AIDA64 / CPU ZLib | |
| Lenovo ThinkPad P16 Gen 2 | |
| Dell Precision 5690 | |
| HP ZBook Studio 16 G11 | |
| Lenovo ThinkPad P1 Gen 7 21KV001SGE | |
| Durchschnittliche Intel Core Ultra 9 185H (678 - 1341, n=20) | |
| HP ZBook Power 16 G11 A | |
| HP ZBook Studio 16 G9 62U04EA | |
| MSI CreatorPro Z16P B12UKST | |
| AIDA64 / FP64 Ray-Trace | |
| HP ZBook Power 16 G11 A | |
| Lenovo ThinkPad P16 Gen 2 | |
| Dell Precision 5690 | |
| Lenovo ThinkPad P1 Gen 7 21KV001SGE | |
| HP ZBook Studio 16 G9 62U04EA | |
| HP ZBook Studio 16 G11 | |
| Durchschnittliche Intel Core Ultra 9 185H (4428 - 10078, n=20) | |
| MSI CreatorPro Z16P B12UKST | |
| AIDA64 / CPU PhotoWorxx | |
| HP ZBook Studio 16 G11 | |
| Dell Precision 5690 | |
| Durchschnittliche Intel Core Ultra 9 185H (44547 - 53918, n=20) | |
| MSI CreatorPro Z16P B12UKST | |
| Lenovo ThinkPad P1 Gen 7 21KV001SGE | |
| HP ZBook Power 16 G11 A | |
| Lenovo ThinkPad P16 Gen 2 | |
| HP ZBook Studio 16 G9 62U04EA | |
Stresstest
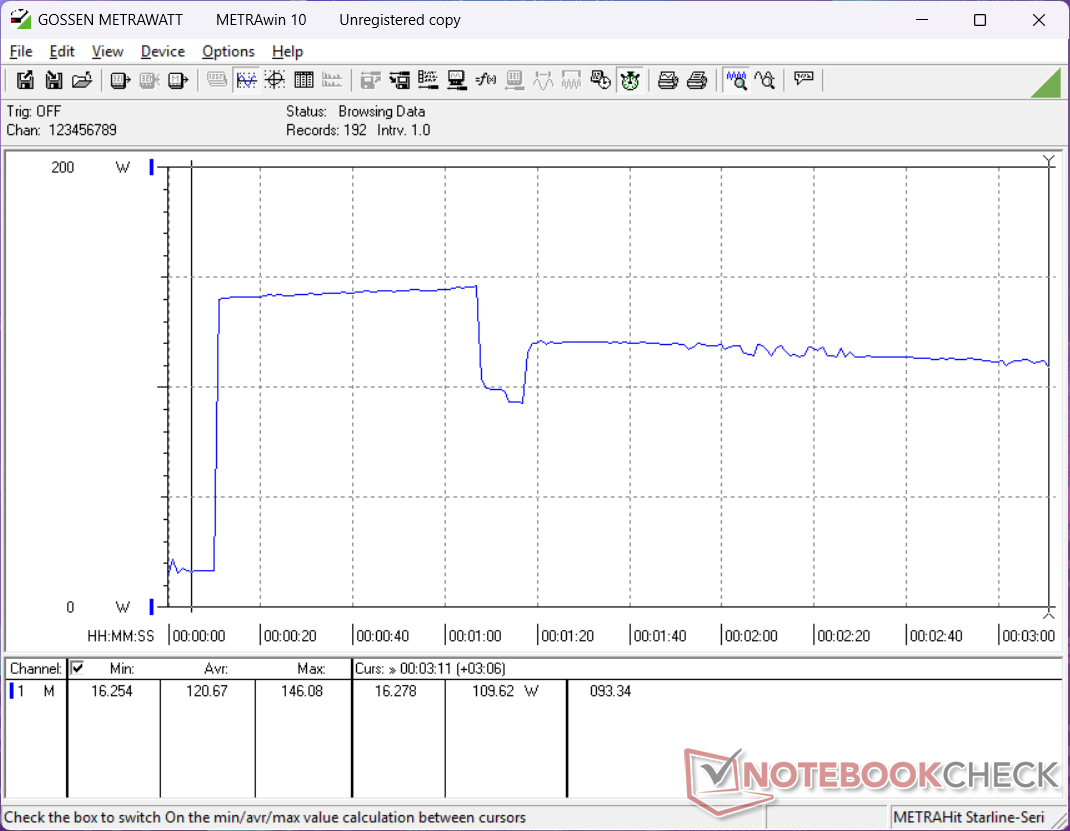
Das begrenzte Turbo-Boost-Potenzial des Systems wird deutlich, wenn man sich seine Vitalwerte in Echtzeit genauer ansieht. Bei der Ausführung von Prime95 Stress zum Beispiel erreicht die CPU in den ersten Sekunden des Tests fast instant 89 °C. Danach senkte sich die Leistung schnell von 3,3 GHz und 89 W auf nur 2,3 GHz und 70 W, um die Kerntemperatur unter 100 °C zu halten.
Die CPU- und GPU-Temperatur bei der Ausführung von Cyberpunk 2077 stabilisierte sich bei 68 °C bzw. 70 °C, verglichen mit 75 °C bzw. 62 °C auf dem leistungsstärkeren Dell Precision 5690.
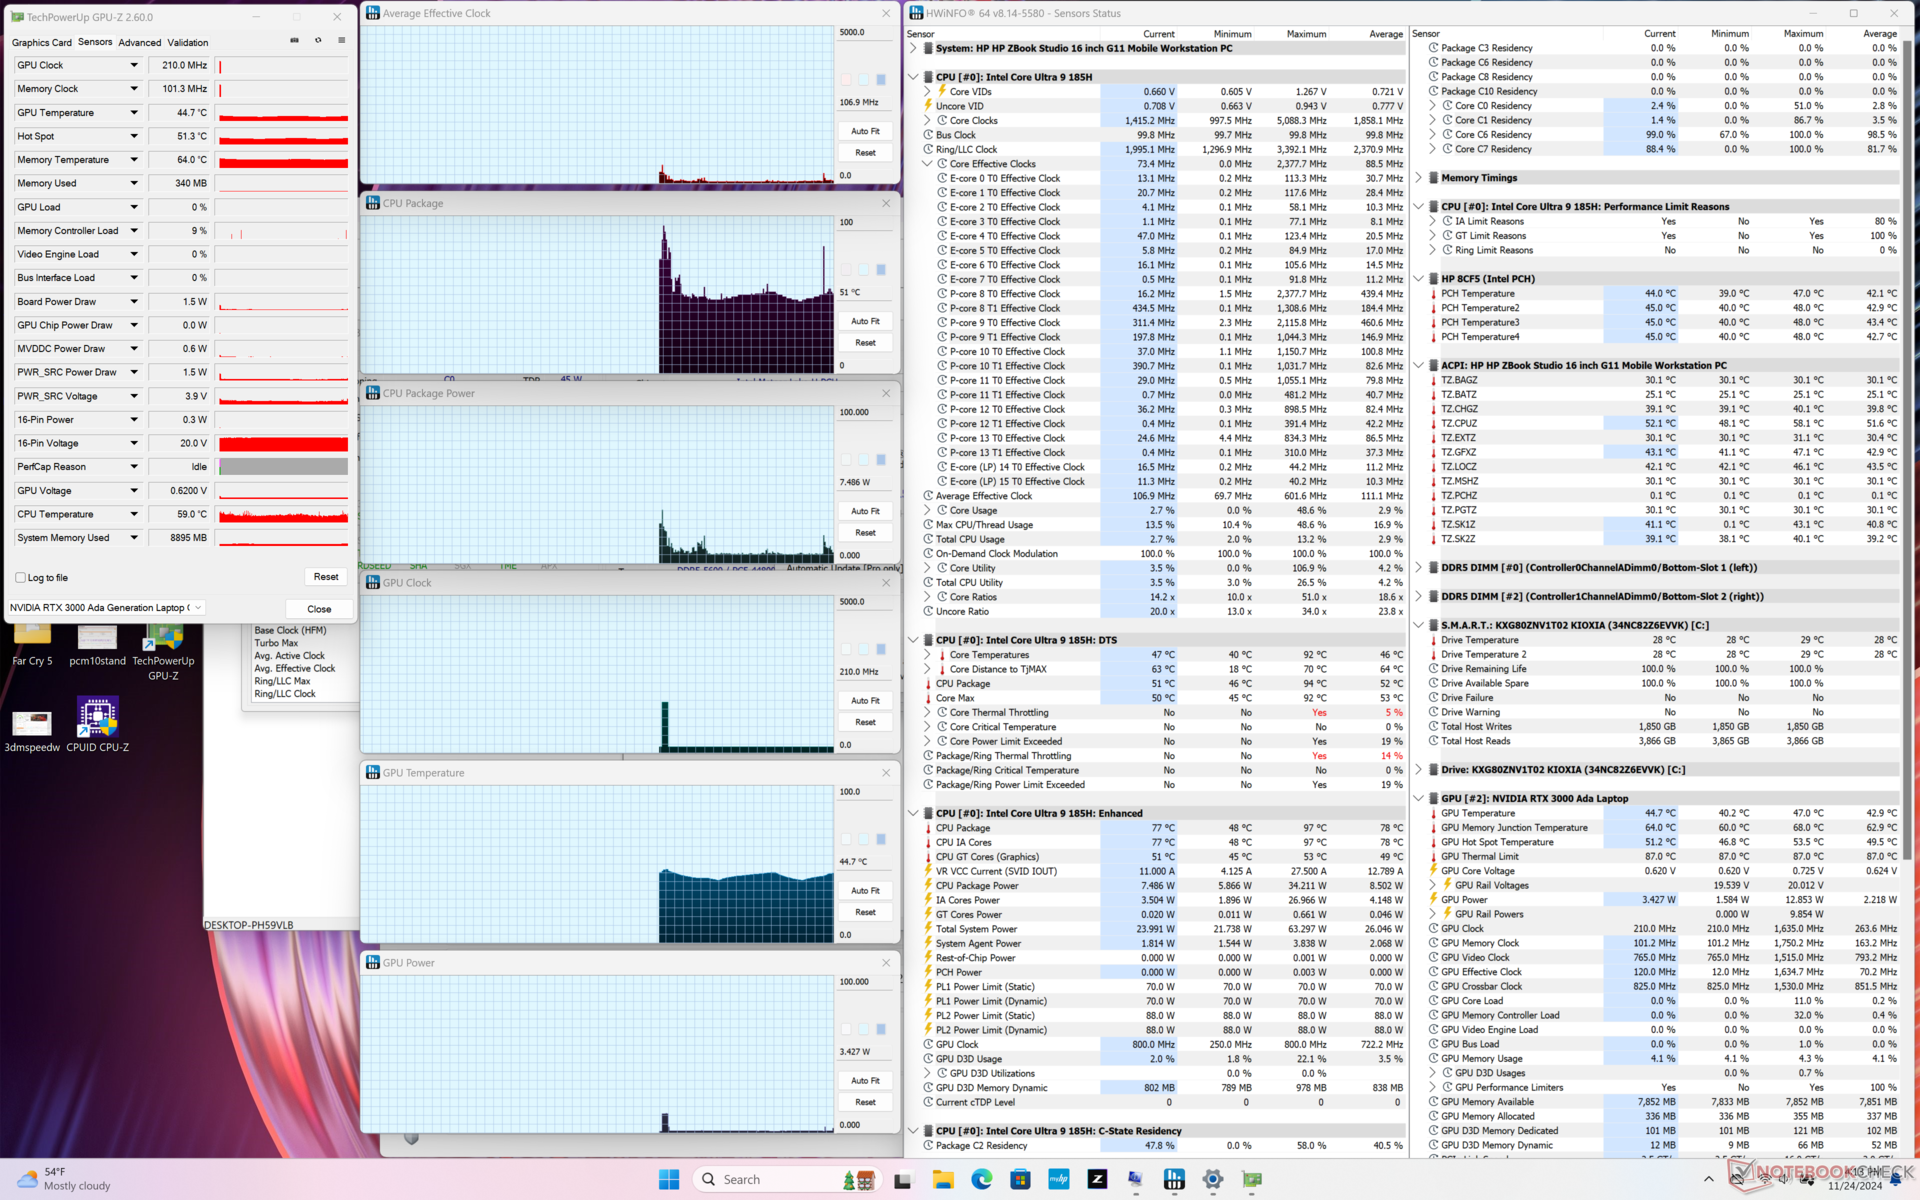
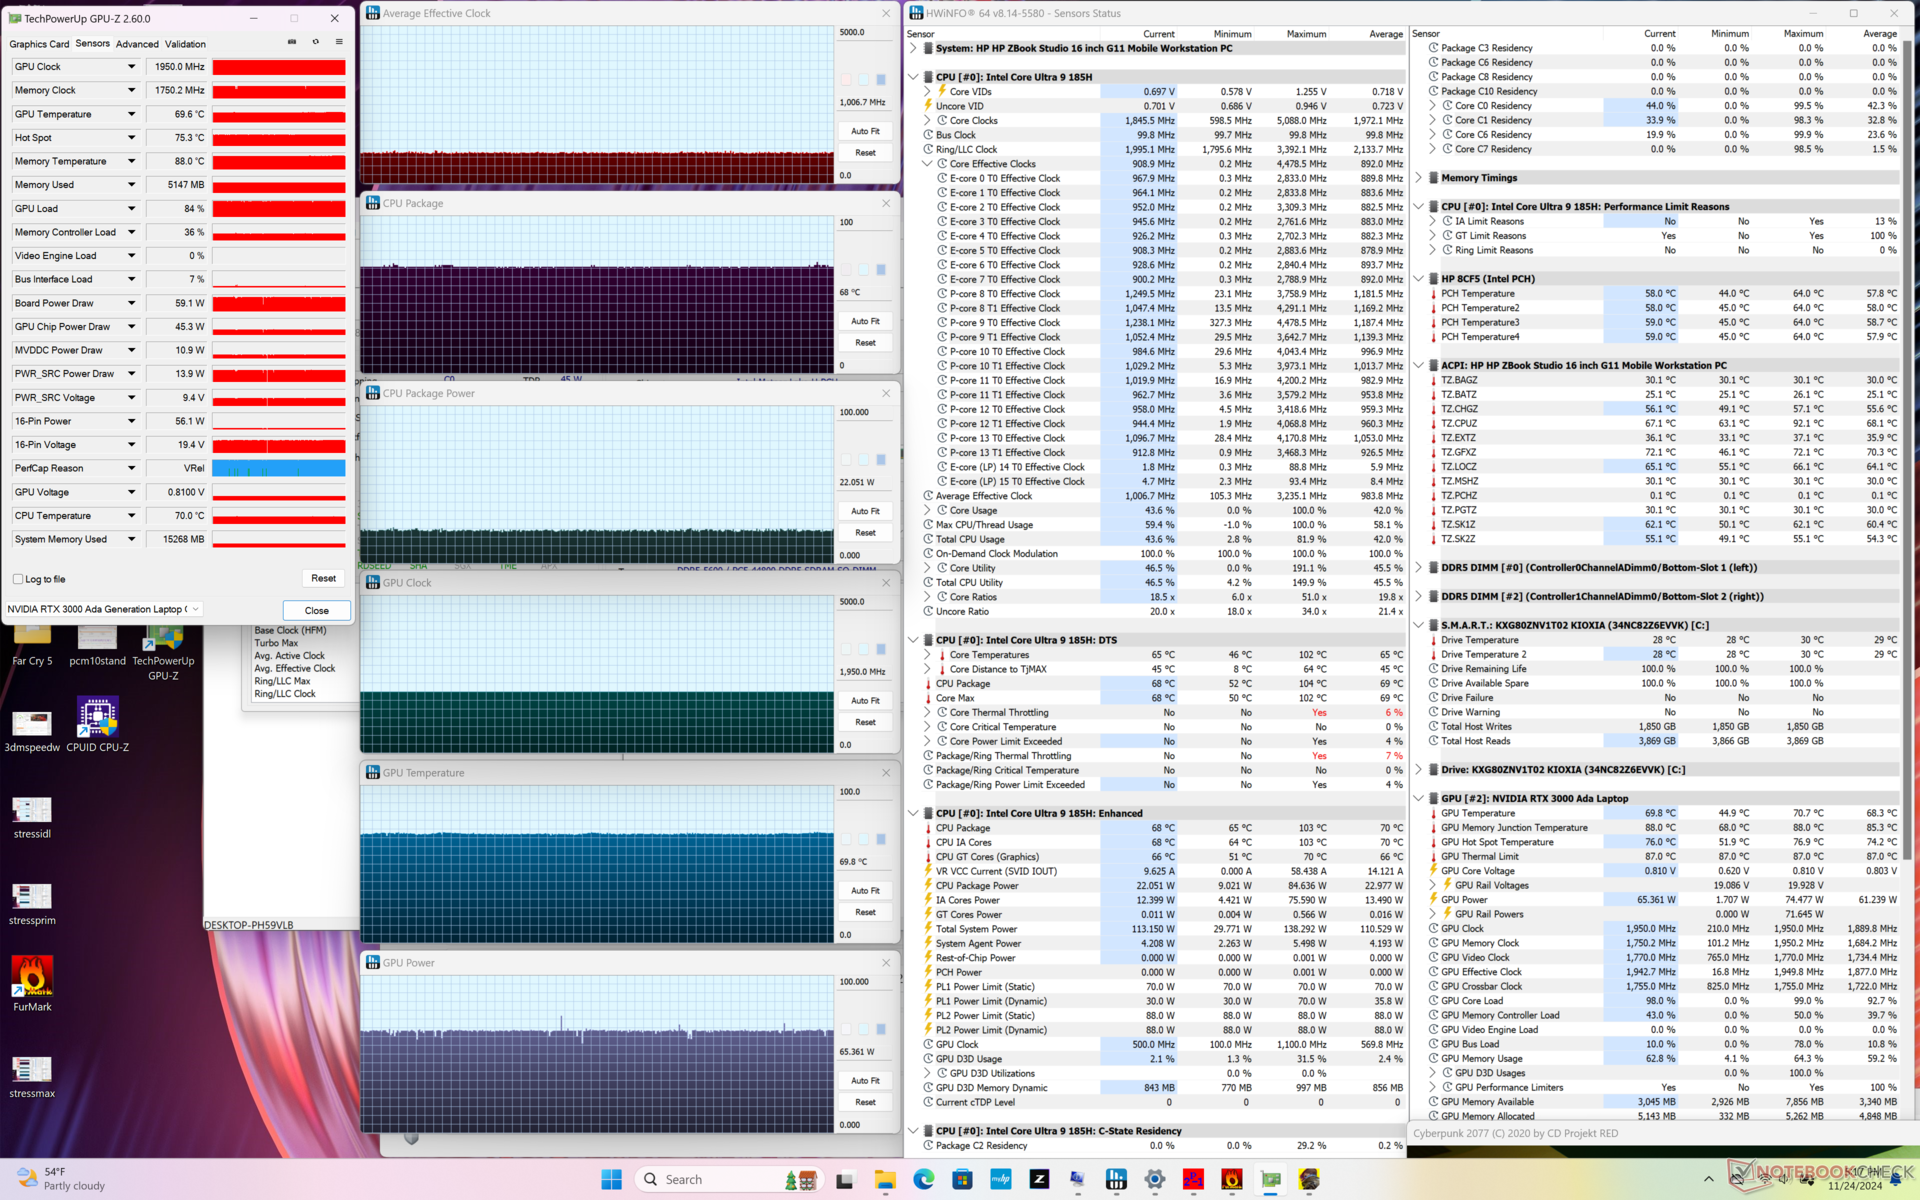
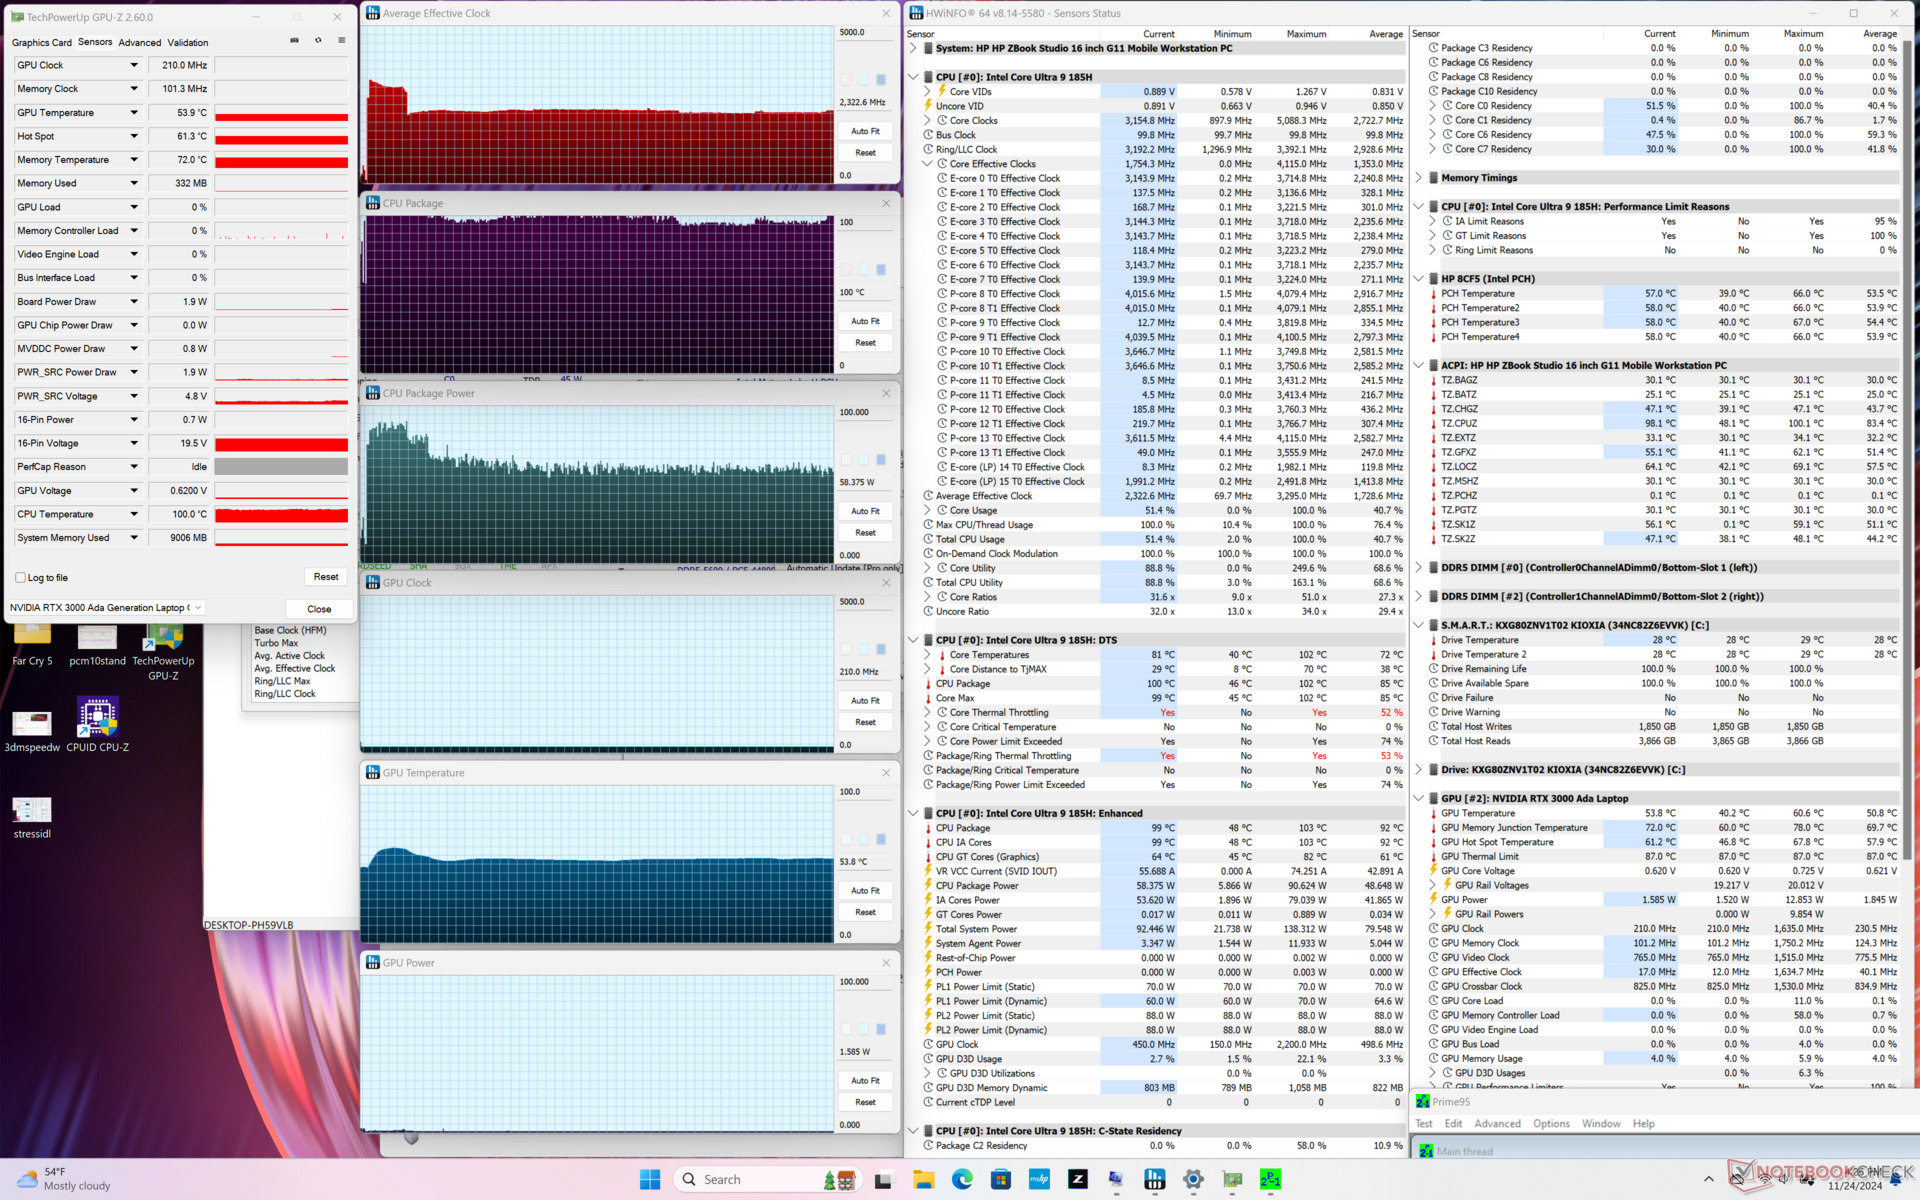
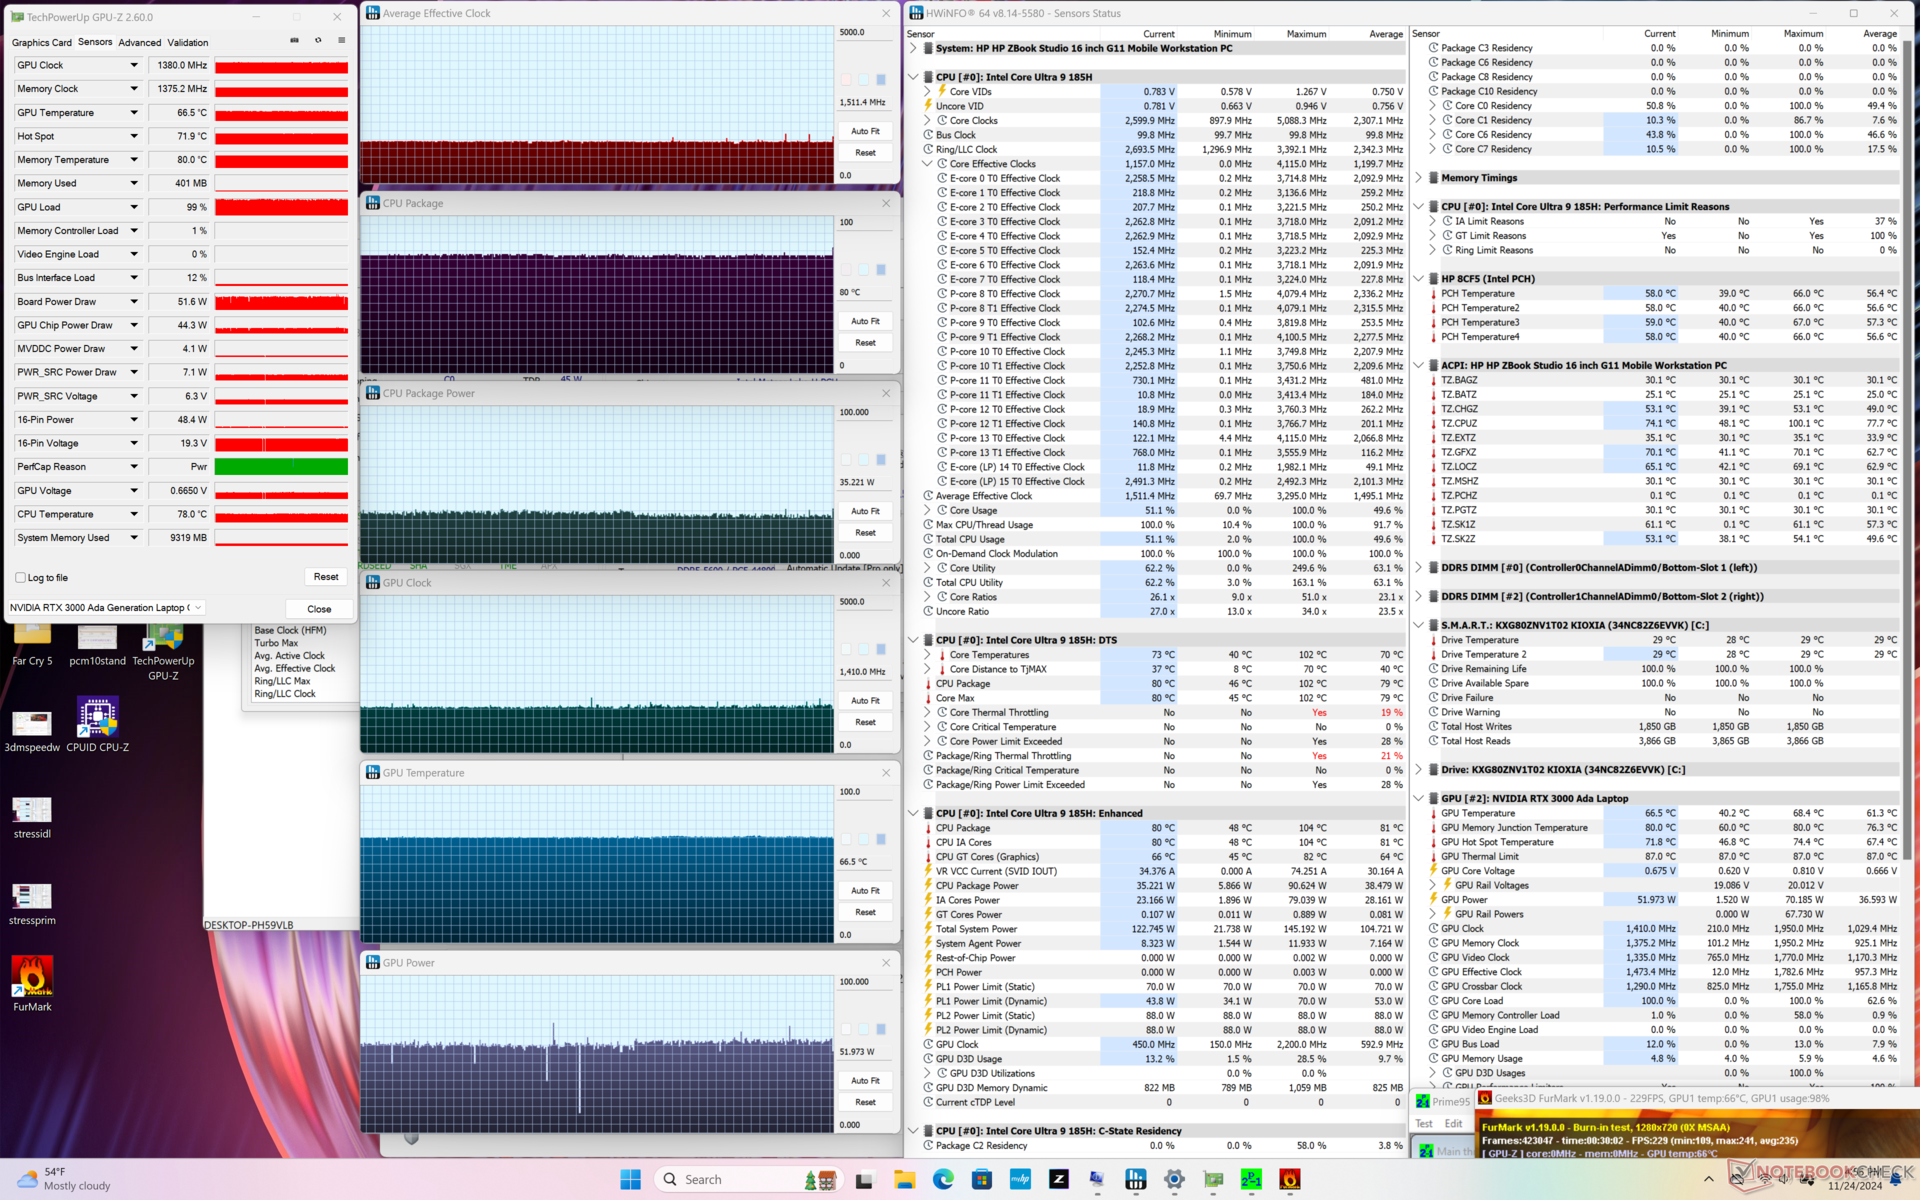
| Durchschnittlicher CPU-Takt (GHz) | GPU-Takt (MHz) | Durchschnittliche CPU-Temperatur (°C) | Durchschnittliche GPU-Temperatur (°C) | |
| System Leerlauf | -- | -- | 51 | 45 |
| Prime95 Stress | 2.3 | -- | 99 | 54 |
| Prime95 + FurMark Stress | 1.5 | 1410 | 80 | 67 |
| Cyberpunk 2077 Stress | 1.0 | 1950 | 68 | 70 |
System Performance
Die PCMark-Ergebnisse sind aufgrund der Verbesserungen bei CPU und GPU durchweg höher als beim ZBook Studio 16 G9. Es ist jedoch erwähnenswert, dass wir während der Tests mehrere Einfrierungen und schwarze Bildschirme erlebten, die jedes Mal einen harten Neustart erforderten.

CrossMark: Overall | Productivity | Creativity | Responsiveness
WebXPRT 3: Overall
WebXPRT 4: Overall
Mozilla Kraken 1.1: Total
| PCMark 10 / Score | |
| Lenovo ThinkPad P16 Gen 2 | |
| Dell Precision 5690 | |
| HP ZBook Studio 16 G11 | |
| Durchschnittliche Intel Core Ultra 9 185H, NVIDIA RTX 3000 Ada Generation Laptop (7383 - 7537, n=2) | |
| HP ZBook Power 16 G11 A | |
| Lenovo ThinkPad P1 Gen 7 21KV001SGE | |
| MSI CreatorPro Z16P B12UKST | |
| HP ZBook Studio 16 G9 62U04EA | |
| PCMark 10 / Essentials | |
| Lenovo ThinkPad P16 Gen 2 | |
| Dell Precision 5690 | |
| Durchschnittliche Intel Core Ultra 9 185H, NVIDIA RTX 3000 Ada Generation Laptop (10514 - 11137, n=2) | |
| MSI CreatorPro Z16P B12UKST | |
| HP ZBook Studio 16 G11 | |
| HP ZBook Power 16 G11 A | |
| Lenovo ThinkPad P1 Gen 7 21KV001SGE | |
| HP ZBook Studio 16 G9 62U04EA | |
| PCMark 10 / Productivity | |
| Dell Precision 5690 | |
| Lenovo ThinkPad P16 Gen 2 | |
| HP ZBook Power 16 G11 A | |
| HP ZBook Studio 16 G11 | |
| MSI CreatorPro Z16P B12UKST | |
| Durchschnittliche Intel Core Ultra 9 185H, NVIDIA RTX 3000 Ada Generation Laptop (9153 - 9356, n=2) | |
| Lenovo ThinkPad P1 Gen 7 21KV001SGE | |
| HP ZBook Studio 16 G9 62U04EA | |
| PCMark 10 / Digital Content Creation | |
| Lenovo ThinkPad P16 Gen 2 | |
| Dell Precision 5690 | |
| HP ZBook Studio 16 G11 | |
| Lenovo ThinkPad P1 Gen 7 21KV001SGE | |
| Durchschnittliche Intel Core Ultra 9 185H, NVIDIA RTX 3000 Ada Generation Laptop (10716 - 11811, n=2) | |
| HP ZBook Power 16 G11 A | |
| MSI CreatorPro Z16P B12UKST | |
| HP ZBook Studio 16 G9 62U04EA | |
| CrossMark / Overall | |
| Lenovo ThinkPad P16 Gen 2 | |
| MSI CreatorPro Z16P B12UKST | |
| HP ZBook Studio 16 G9 62U04EA | |
| Dell Precision 5690 | |
| HP ZBook Power 16 G11 A | |
| HP ZBook Studio 16 G11 | |
| Durchschnittliche Intel Core Ultra 9 185H, NVIDIA RTX 3000 Ada Generation Laptop (1754 - 1770, n=2) | |
| Lenovo ThinkPad P1 Gen 7 21KV001SGE | |
| CrossMark / Productivity | |
| Lenovo ThinkPad P16 Gen 2 | |
| MSI CreatorPro Z16P B12UKST | |
| Dell Precision 5690 | |
| HP ZBook Studio 16 G9 62U04EA | |
| HP ZBook Power 16 G11 A | |
| HP ZBook Studio 16 G11 | |
| Durchschnittliche Intel Core Ultra 9 185H, NVIDIA RTX 3000 Ada Generation Laptop (1643 - 1686, n=2) | |
| Lenovo ThinkPad P1 Gen 7 21KV001SGE | |
| CrossMark / Creativity | |
| Lenovo ThinkPad P16 Gen 2 | |
| HP ZBook Studio 16 G9 62U04EA | |
| MSI CreatorPro Z16P B12UKST | |
| HP ZBook Power 16 G11 A | |
| Dell Precision 5690 | |
| Durchschnittliche Intel Core Ultra 9 185H, NVIDIA RTX 3000 Ada Generation Laptop (1981 - 2001, n=2) | |
| HP ZBook Studio 16 G11 | |
| Lenovo ThinkPad P1 Gen 7 21KV001SGE | |
| CrossMark / Responsiveness | |
| MSI CreatorPro Z16P B12UKST | |
| Lenovo ThinkPad P16 Gen 2 | |
| HP ZBook Studio 16 G9 62U04EA | |
| Dell Precision 5690 | |
| HP ZBook Studio 16 G11 | |
| Durchschnittliche Intel Core Ultra 9 185H, NVIDIA RTX 3000 Ada Generation Laptop (1438 - 1458, n=2) | |
| HP ZBook Power 16 G11 A | |
| Lenovo ThinkPad P1 Gen 7 21KV001SGE | |
| WebXPRT 3 / Overall | |
| Lenovo ThinkPad P16 Gen 2 | |
| MSI CreatorPro Z16P B12UKST | |
| HP ZBook Power 16 G11 A | |
| HP ZBook Studio 16 G9 62U04EA | |
| HP ZBook Studio 16 G11 | |
| Dell Precision 5690 | |
| Durchschnittliche Intel Core Ultra 9 185H, NVIDIA RTX 3000 Ada Generation Laptop (286 - 295, n=2) | |
| Lenovo ThinkPad P1 Gen 7 21KV001SGE | |
| WebXPRT 4 / Overall | |
| Lenovo ThinkPad P16 Gen 2 | |
| Dell Precision 5690 | |
| MSI CreatorPro Z16P B12UKST | |
| HP ZBook Studio 16 G9 62U04EA | |
| Durchschnittliche Intel Core Ultra 9 185H, NVIDIA RTX 3000 Ada Generation Laptop (261 - 268, n=2) | |
| HP ZBook Studio 16 G11 | |
| Lenovo ThinkPad P1 Gen 7 21KV001SGE | |
| HP ZBook Power 16 G11 A | |
| Mozilla Kraken 1.1 / Total | |
| HP ZBook Power 16 G11 A | |
| Lenovo ThinkPad P1 Gen 7 21KV001SGE | |
| MSI CreatorPro Z16P B12UKST | |
| Durchschnittliche Intel Core Ultra 9 185H, NVIDIA RTX 3000 Ada Generation Laptop (515 - 522, n=2) | |
| HP ZBook Studio 16 G11 | |
| HP ZBook Studio 16 G9 62U04EA | |
| Dell Precision 5690 | |
| Lenovo ThinkPad P16 Gen 2 | |
* ... kleinere Werte sind besser
| PCMark 10 Score | 7537 Punkte | |
Hilfe | ||
| AIDA64 / Memory Copy | |
| Dell Precision 5690 | |
| Durchschnittliche Intel Core Ultra 9 185H (69929 - 95718, n=20) | |
| HP ZBook Studio 16 G11 | |
| Lenovo ThinkPad P1 Gen 7 21KV001SGE | |
| Lenovo ThinkPad P16 Gen 2 | |
| MSI CreatorPro Z16P B12UKST | |
| HP ZBook Studio 16 G9 62U04EA | |
| HP ZBook Power 16 G11 A | |
| AIDA64 / Memory Read | |
| Dell Precision 5690 | |
| HP ZBook Studio 16 G11 | |
| Durchschnittliche Intel Core Ultra 9 185H (64619 - 87768, n=20) | |
| Lenovo ThinkPad P16 Gen 2 | |
| MSI CreatorPro Z16P B12UKST | |
| HP ZBook Studio 16 G9 62U04EA | |
| Lenovo ThinkPad P1 Gen 7 21KV001SGE | |
| HP ZBook Power 16 G11 A | |
| AIDA64 / Memory Write | |
| HP ZBook Power 16 G11 A | |
| HP ZBook Studio 16 G11 | |
| Dell Precision 5690 | |
| Durchschnittliche Intel Core Ultra 9 185H (51114 - 93871, n=20) | |
| MSI CreatorPro Z16P B12UKST | |
| HP ZBook Studio 16 G9 62U04EA | |
| Lenovo ThinkPad P16 Gen 2 | |
| Lenovo ThinkPad P1 Gen 7 21KV001SGE | |
| AIDA64 / Memory Latency | |
| Durchschnittliche Intel Core Ultra 9 185H (121.4 - 259, n=20) | |
| Dell Precision 5690 | |
| Lenovo ThinkPad P1 Gen 7 21KV001SGE | |
| HP ZBook Studio 16 G11 | |
| HP ZBook Power 16 G11 A | |
| MSI CreatorPro Z16P B12UKST | |
| Lenovo ThinkPad P16 Gen 2 | |
| HP ZBook Studio 16 G9 62U04EA | |
* ... kleinere Werte sind besser
DPC-Latenzzeit
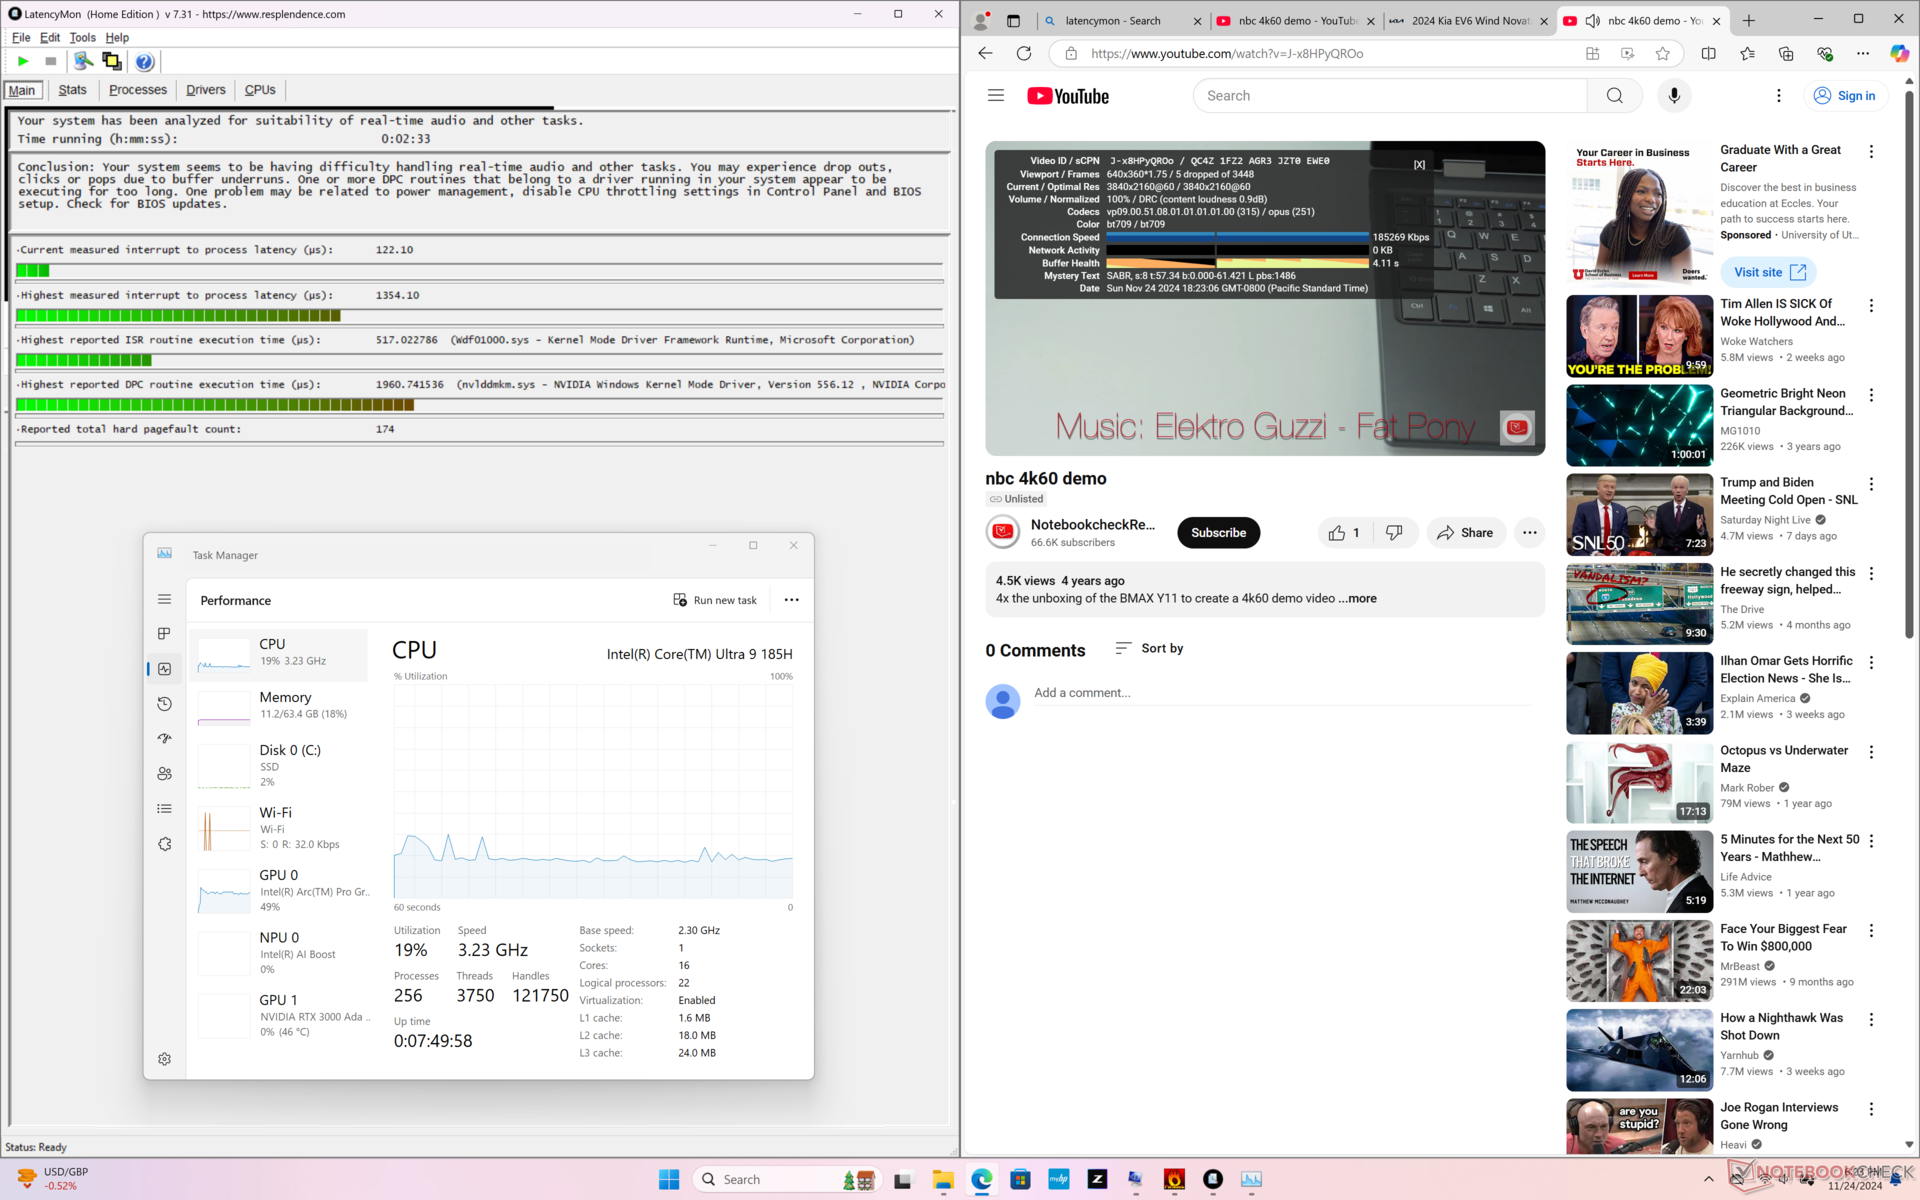
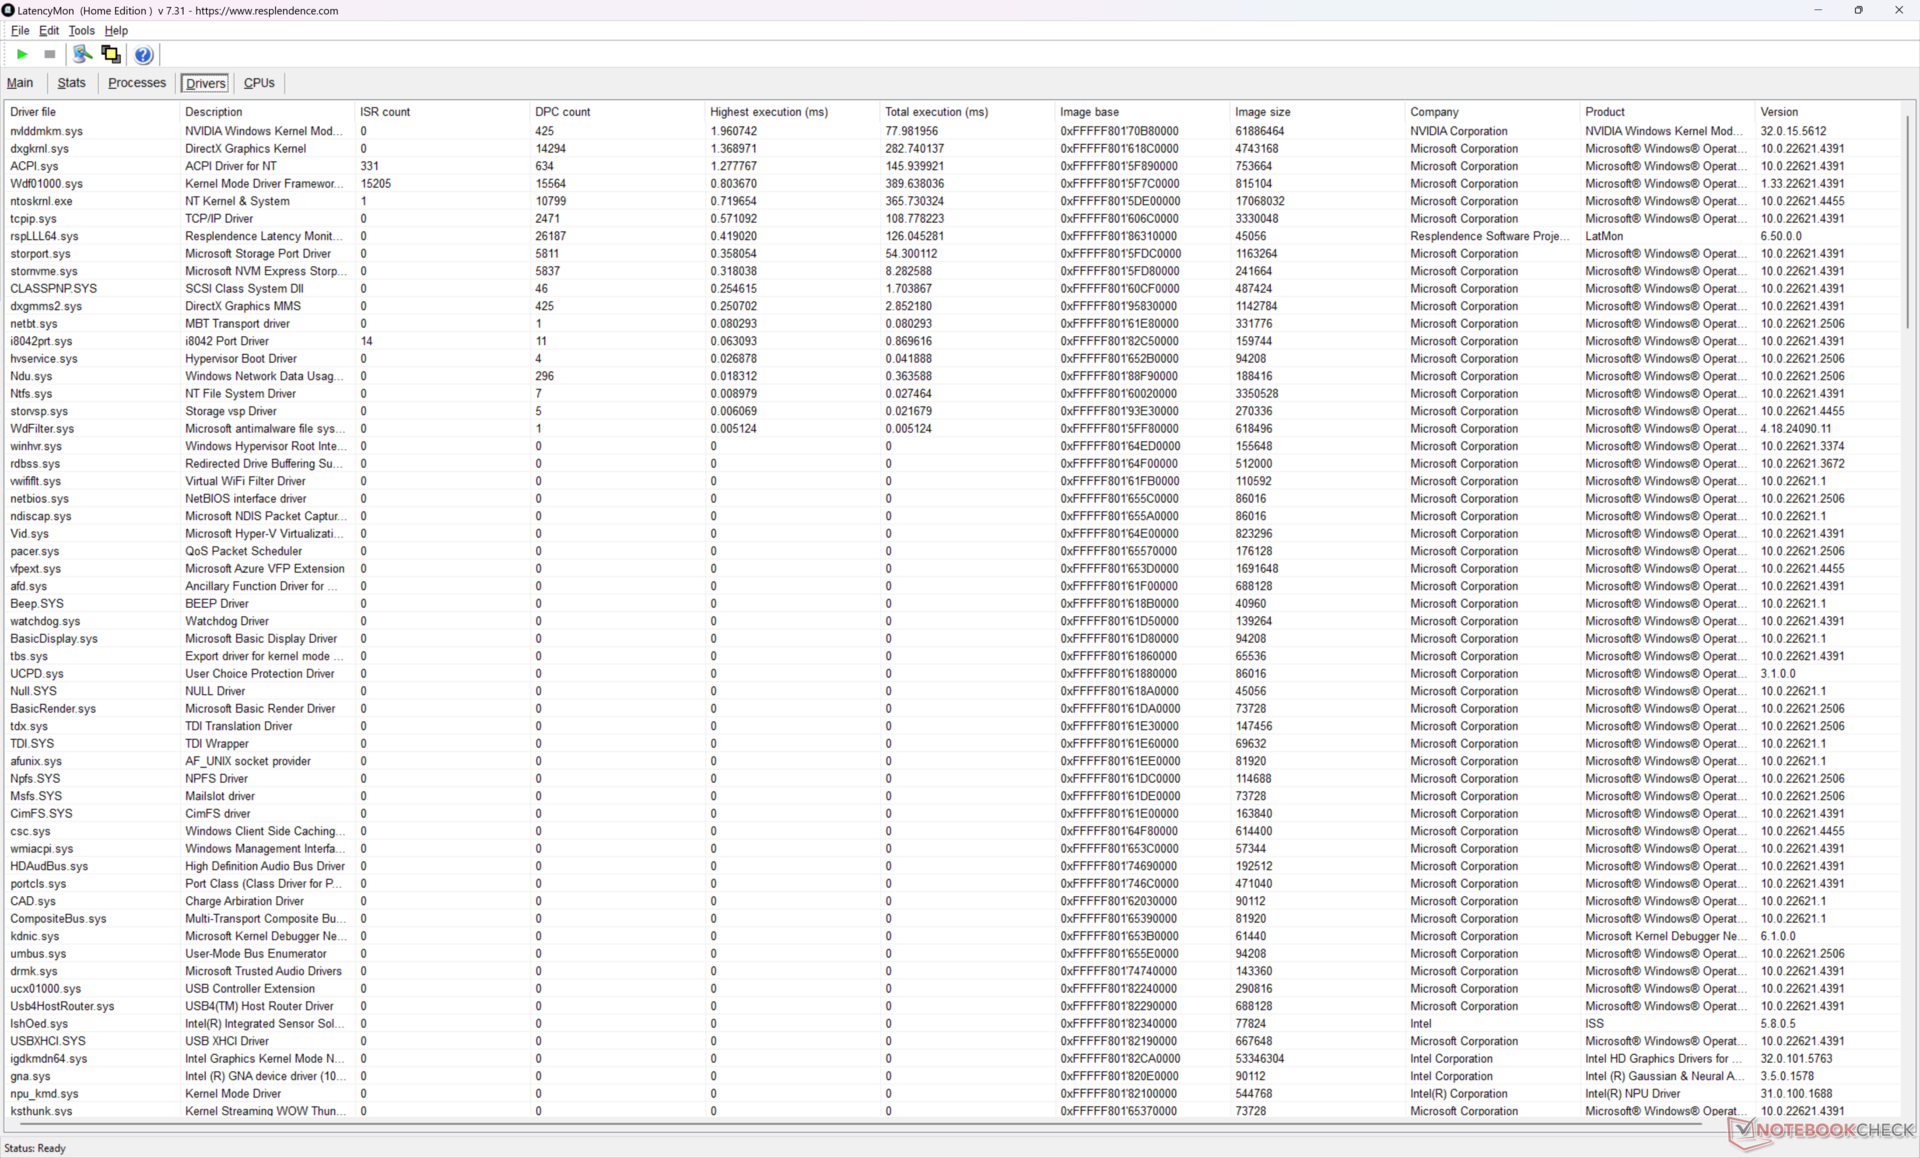
LatencyMon zeigt kleinere DPC-Probleme beim Öffnen mehrerer Browser Tabs unserer Homepage. Bei der Wiedergabe von 4K-Videos mit 60 FPS traten ebenfalls geringfügige Probleme auf. Innerhalb eines 60-Sekunden-Fensters wurden 5 dropped frames aufgezeichnet.
| DPC Latencies / LatencyMon - interrupt to process latency (max), Web, Youtube, Prime95 | |
| HP ZBook Power 16 G11 A | |
| Lenovo ThinkPad P1 Gen 7 21KV001SGE | |
| HP ZBook Studio 16 G11 | |
| HP ZBook Studio 16 G9 62U04EA | |
| Lenovo ThinkPad P16 Gen 2 | |
| MSI CreatorPro Z16P B12UKST | |
| Dell Precision 5690 | |
* ... kleinere Werte sind besser
Speichergeräte
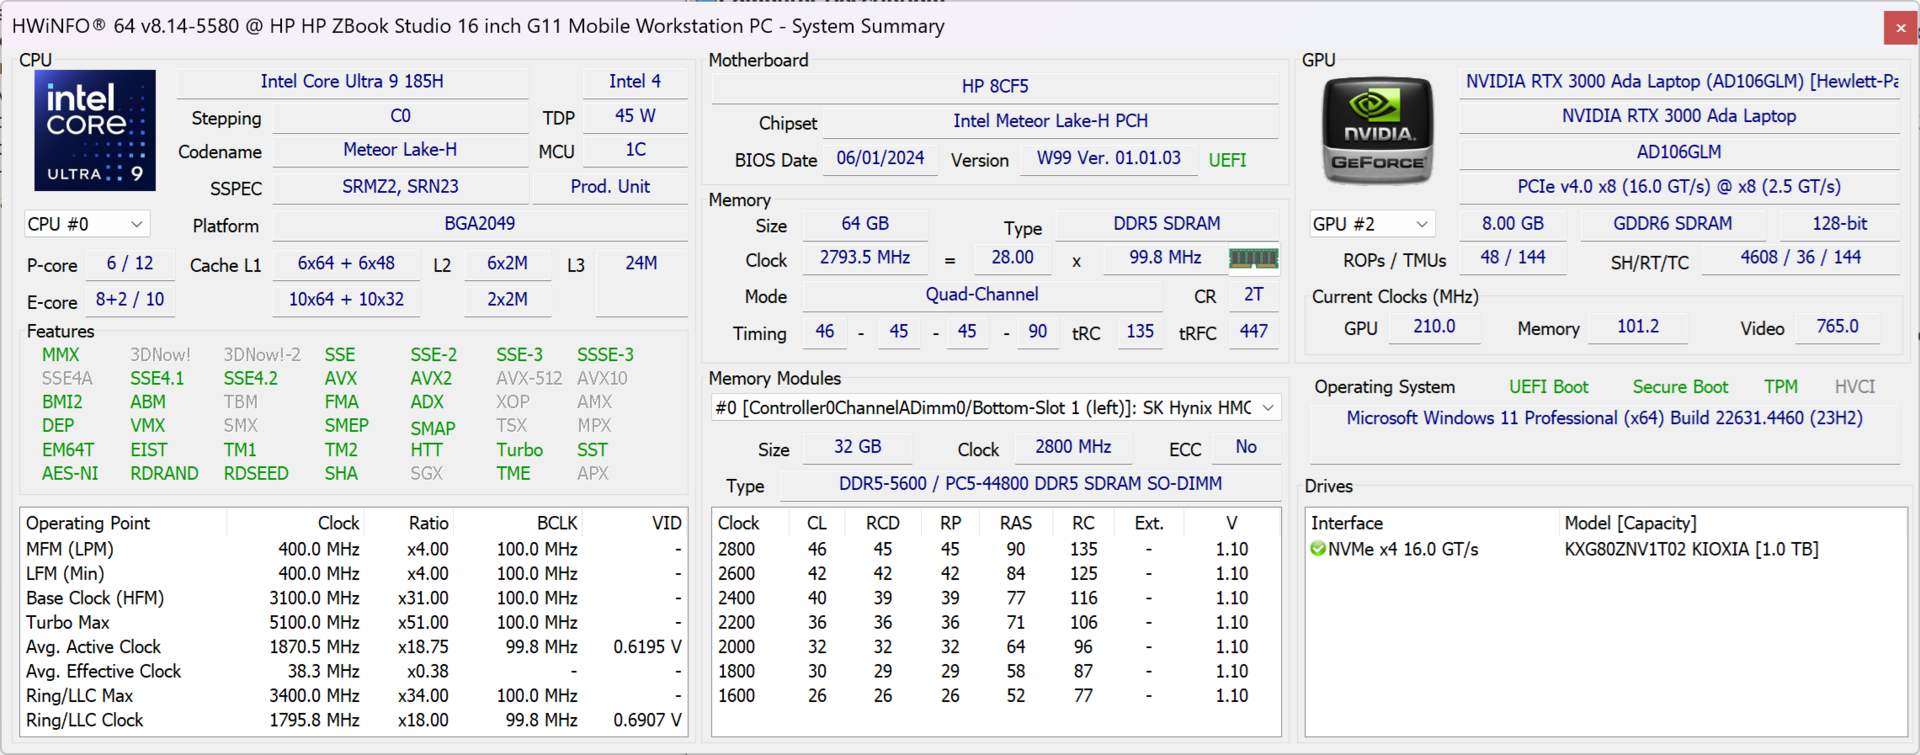
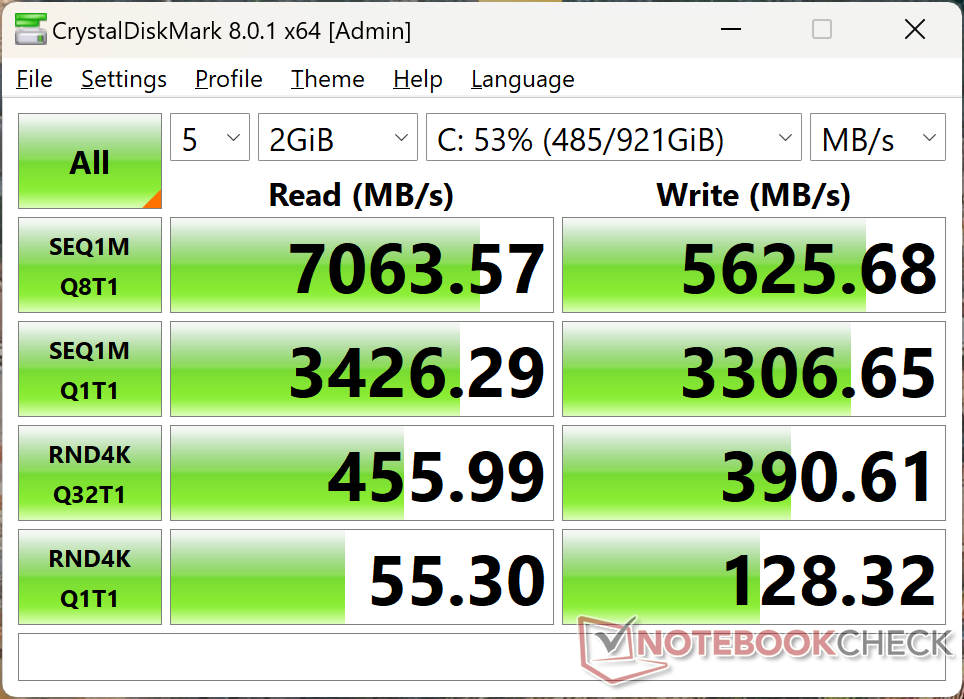
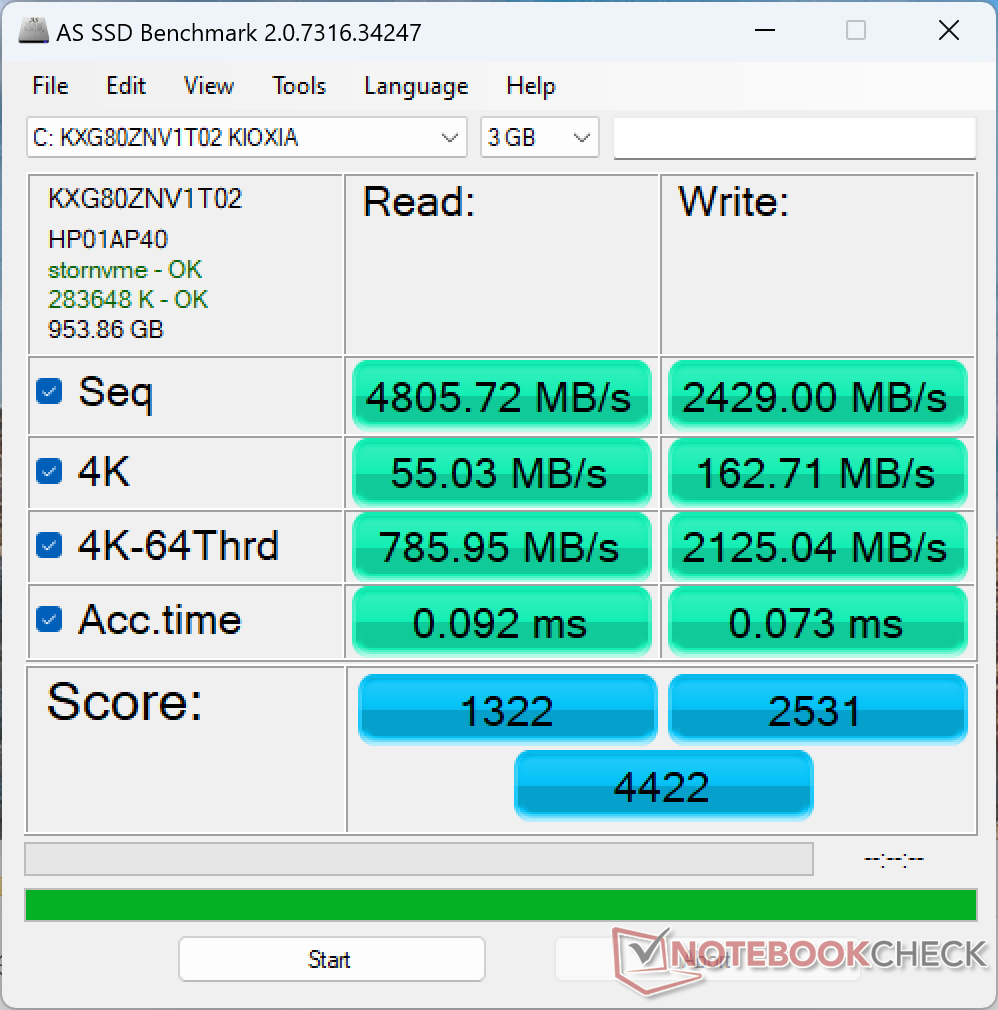
Unser System wird mit einem Kioxia XG8 PCIe4 NVMe-Laufwerk anstelle des Micron 3400, das im älteren ZBook Studio 16 G9 zu finden ist, geliefert. Die Leistung ist hervorragend und es wurden keine Throttling-Probleme festgestellt.

* ... kleinere Werte sind besser
Disk Throttling: DiskSpd Read Loop, Queue Depth 8
GPU Performance
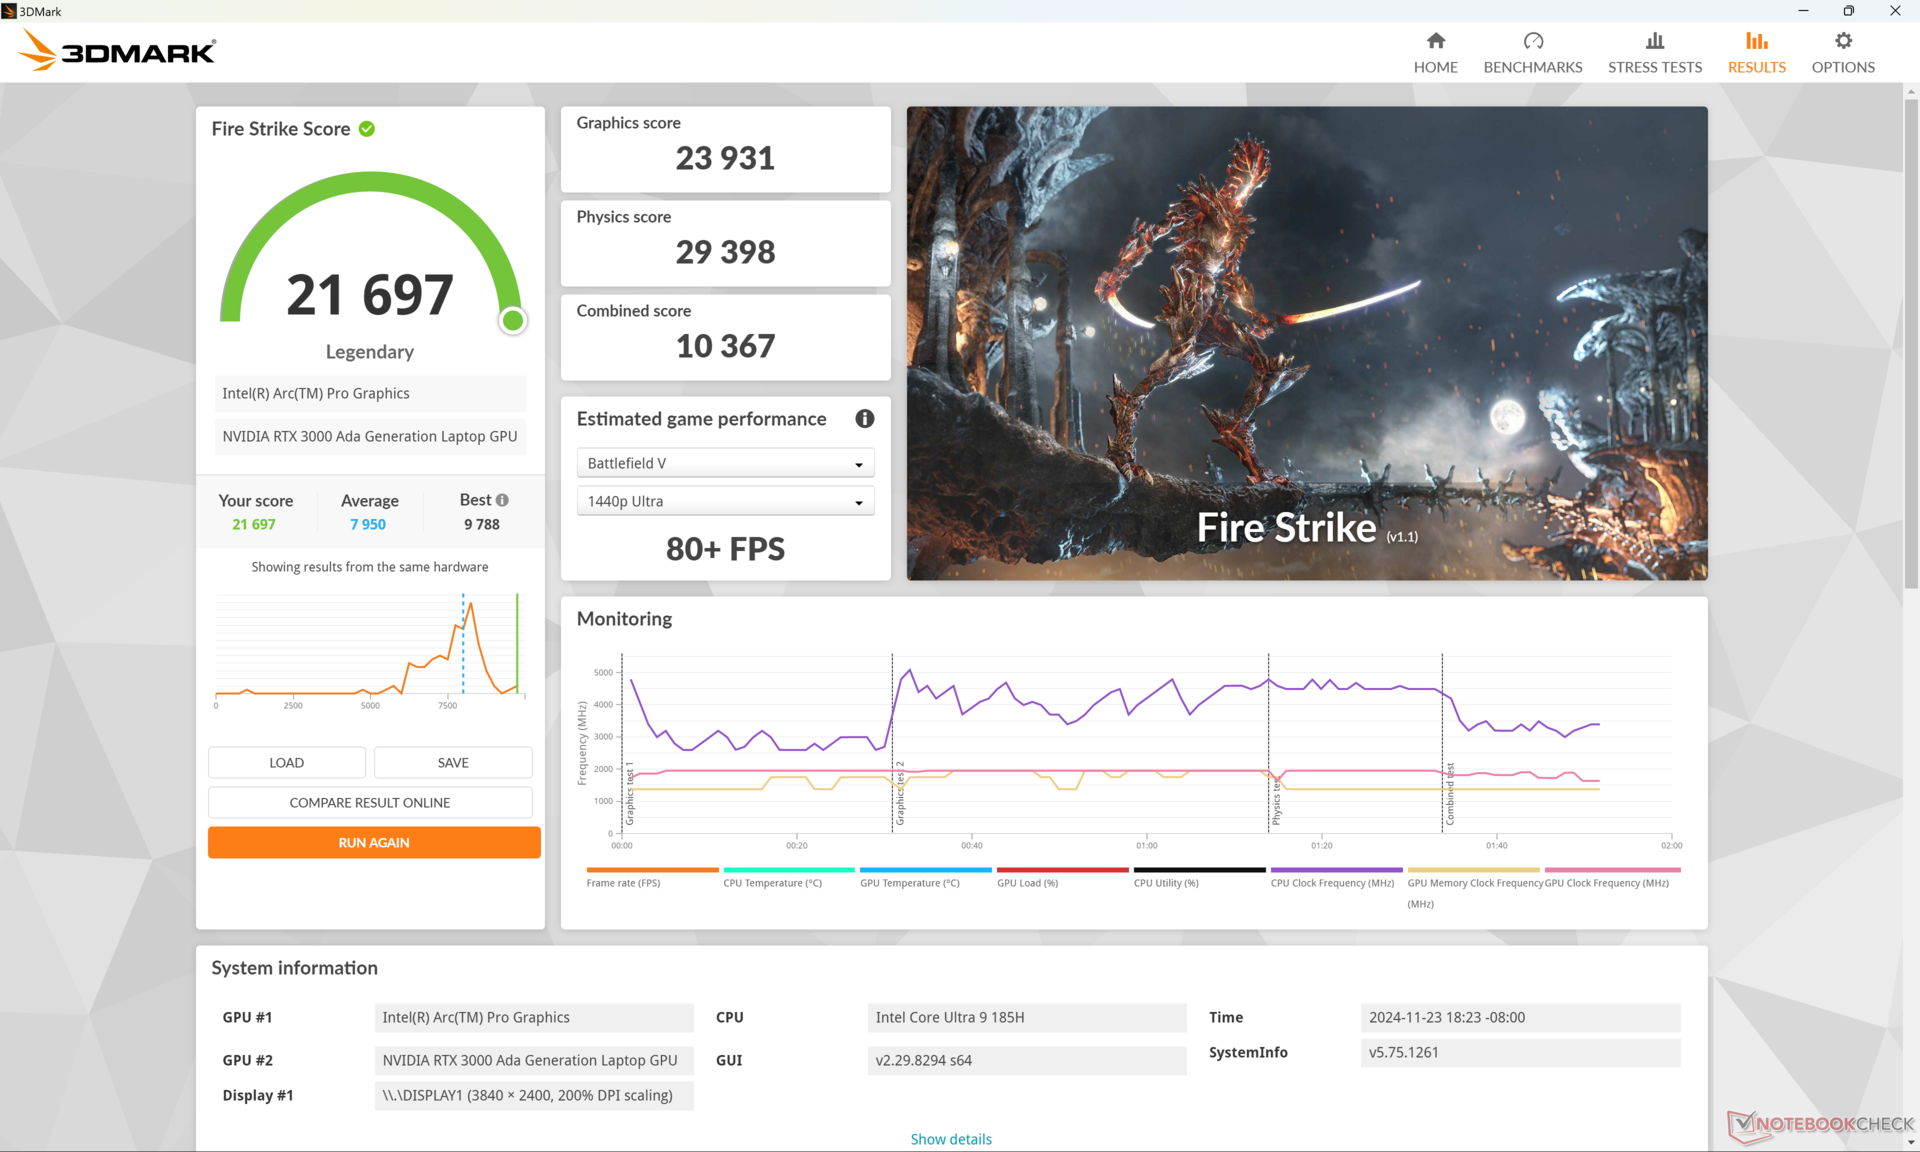
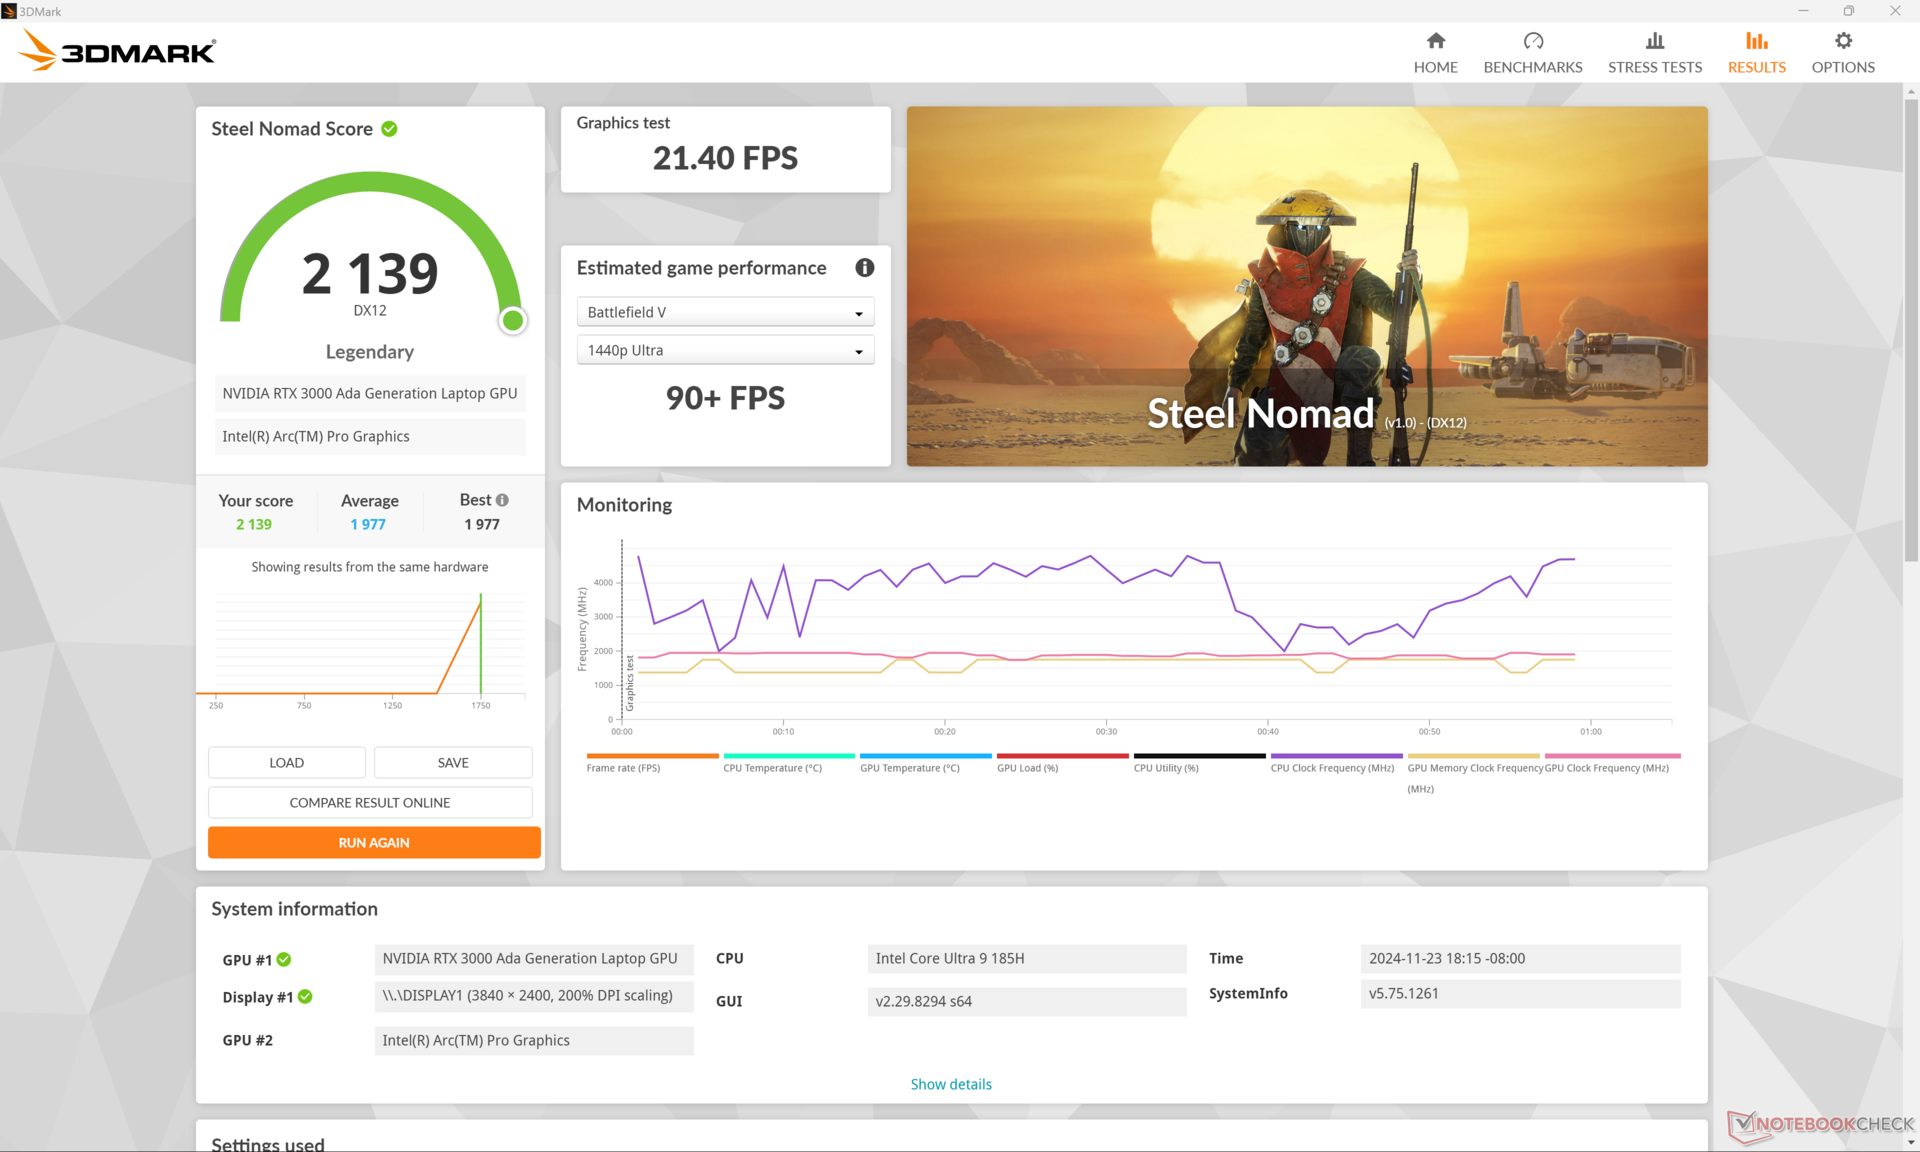
Der neuere Grafikprozessor ist einer der wichtigsten Gründe für ein Upgrade vom ZBook Studio 16 G9 auf das ZBook Studio 16 G11. Unser RTX 3000 Ada ist fast 2x schneller als die RTX A2000 bevor wir die Raytracing-Beschleunigungsfunktionen berücksichtigen.
| Leistungsprofil | Grafik-Punktzahl | Physik-Punktzahl | Kombinierte Punktzahl |
| Performance Modus | 23931 | 29398 | 10367 |
| Ausgeglichener Modus | 21021 (-12%) | 27903 (-5%) | 8545 (-18%) |
| Akku-Leistung | 14313 (-40%) | 12099 (-59%) | 5174 (-50%) |
Der Modus "Ausgewogen" wirkt sich leicht auf die Leistung aus, wie die obigen Ergebnisse von Fire Strike zeigen. Der Unterschied wird im Akkubetrieb noch deutlicher.
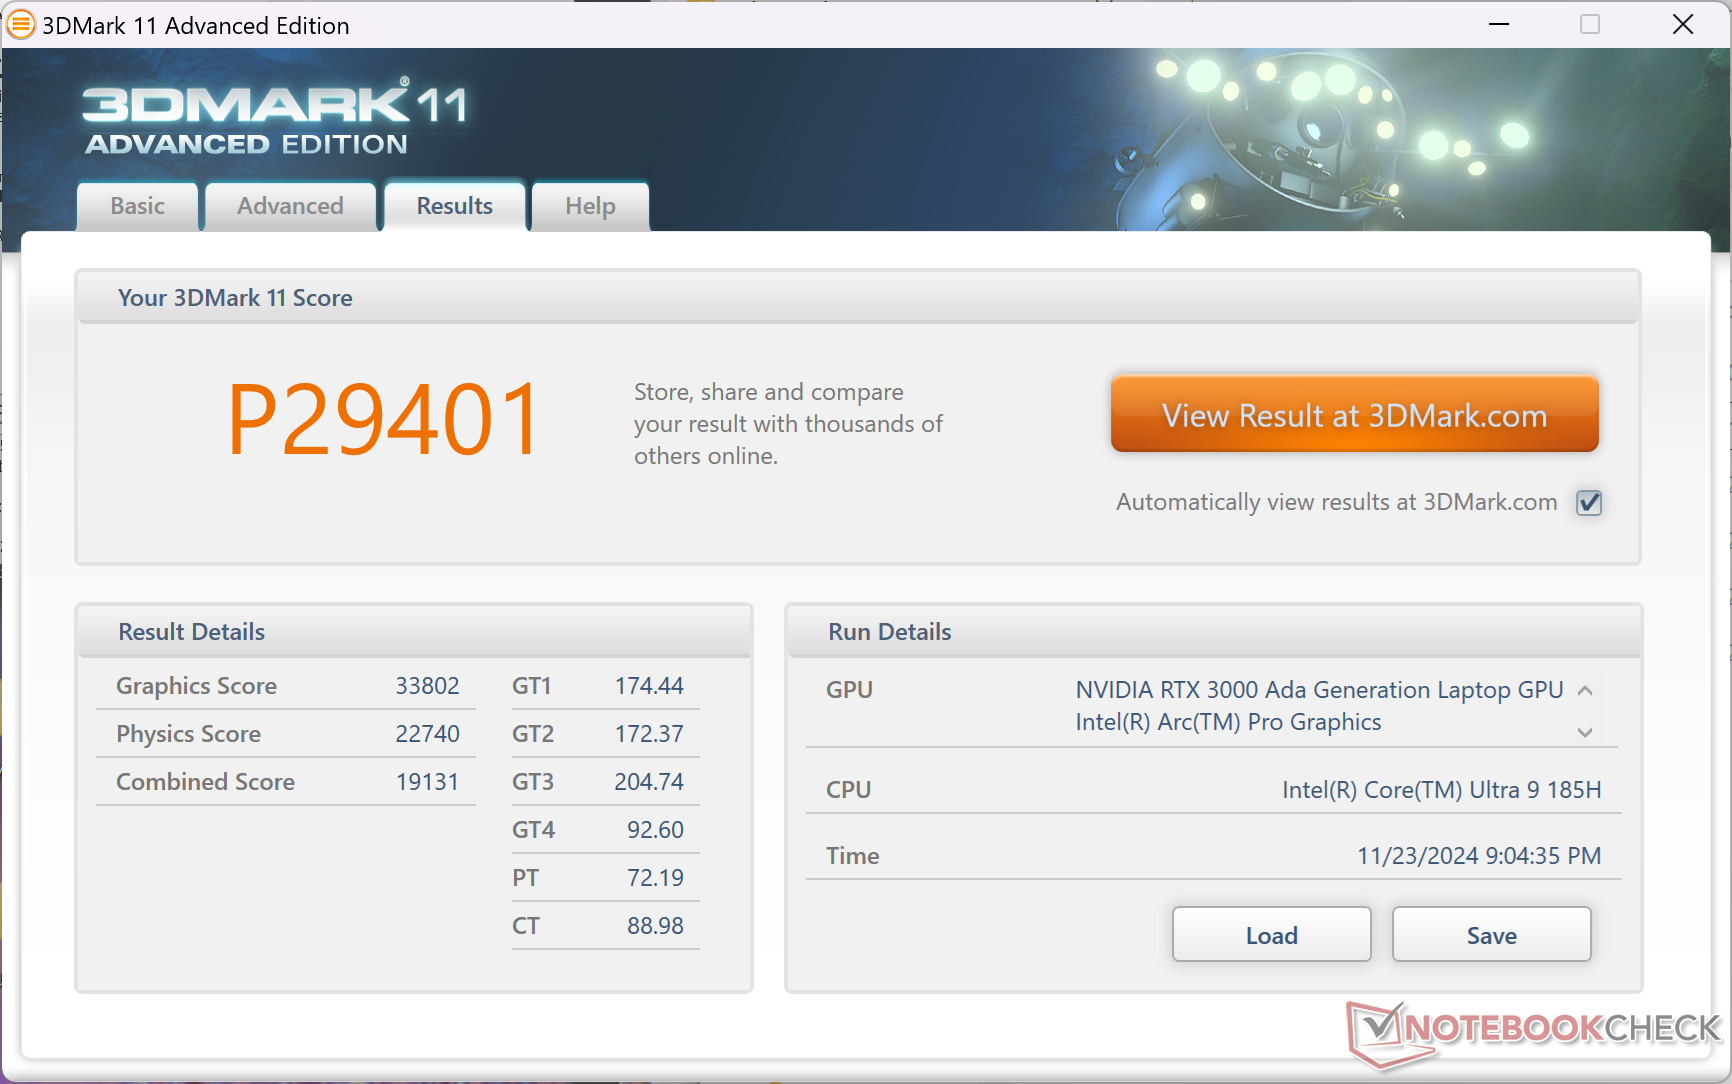
| 3DMark 11 Performance | 29401 Punkte | |
| 3DMark Cloud Gate Standard Score | 34703 Punkte | |
| 3DMark Fire Strike Score | 21697 Punkte | |
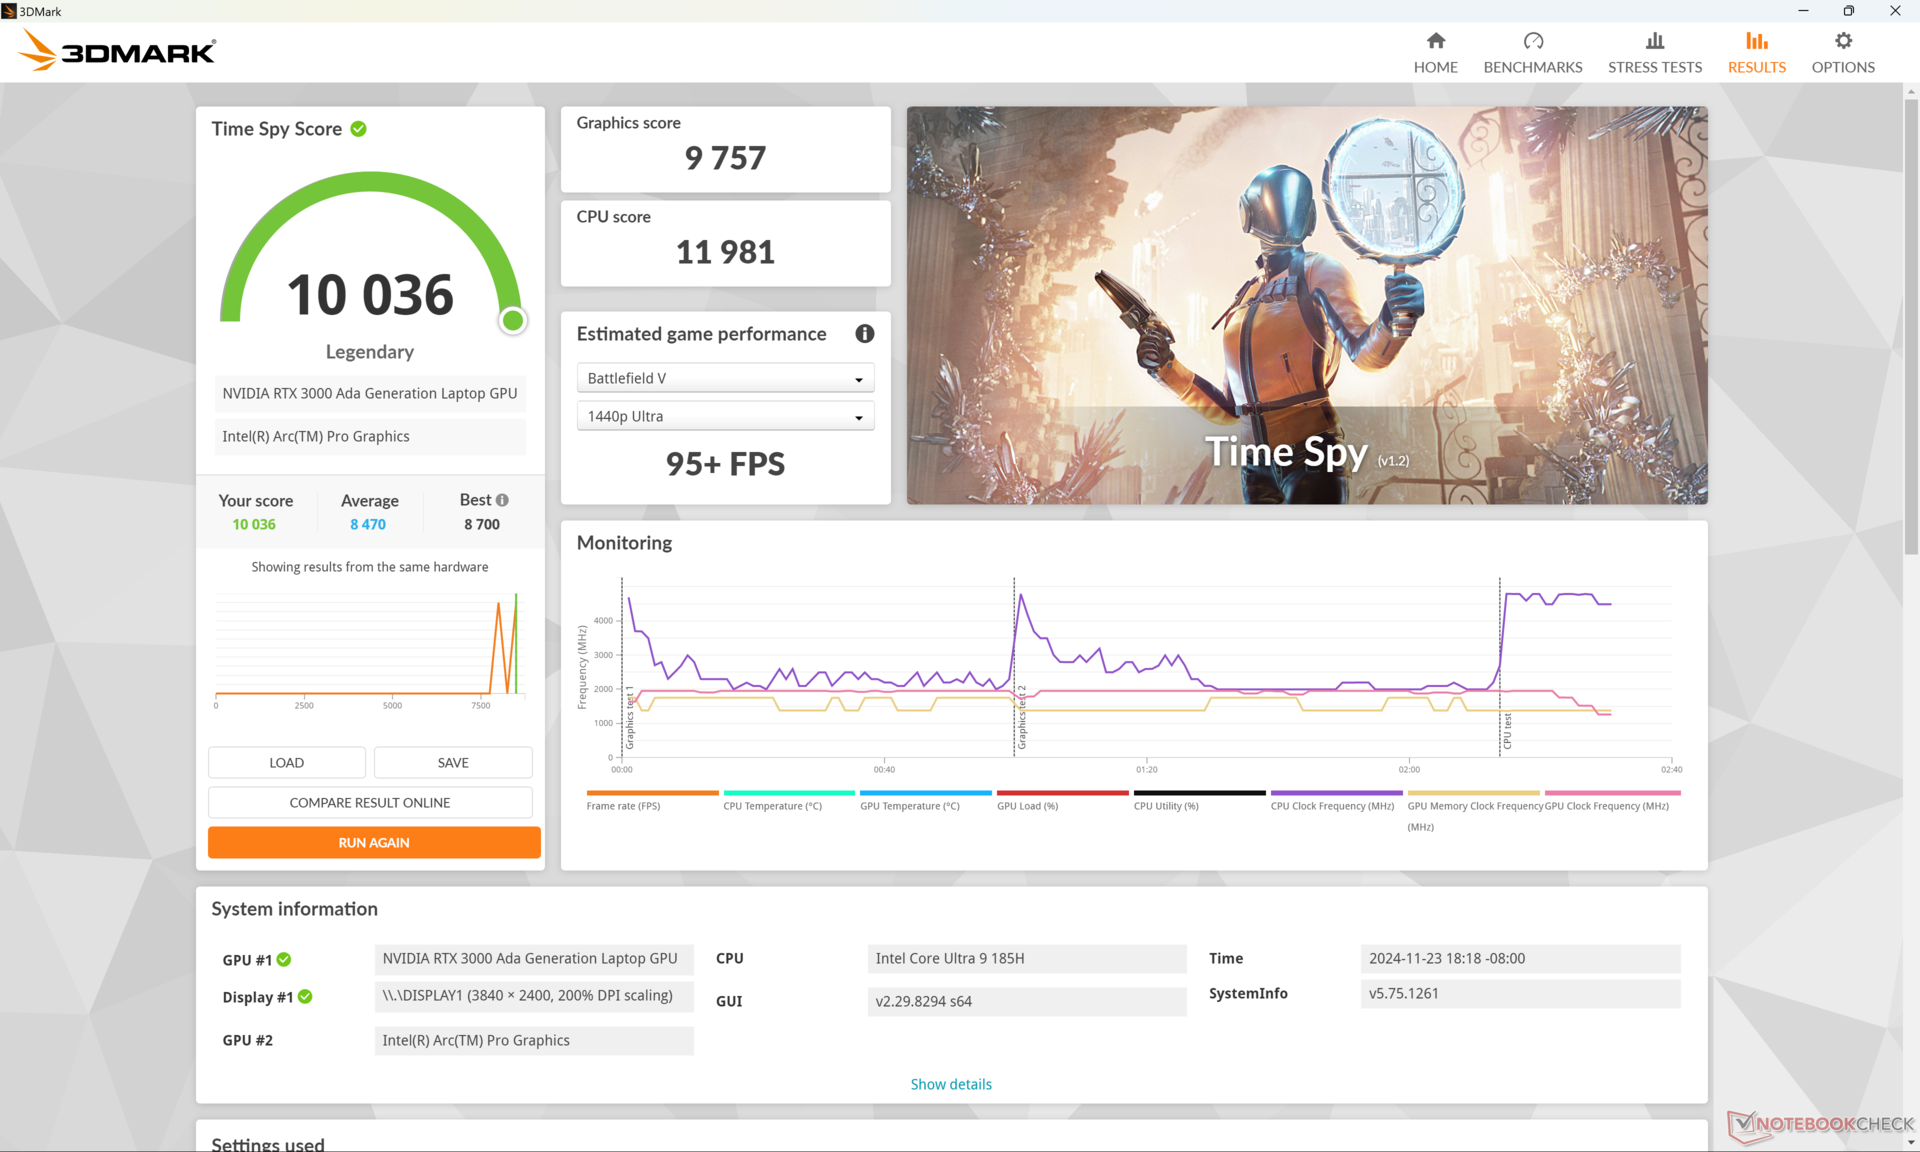
| 3DMark Time Spy Score | 10036 Punkte | |
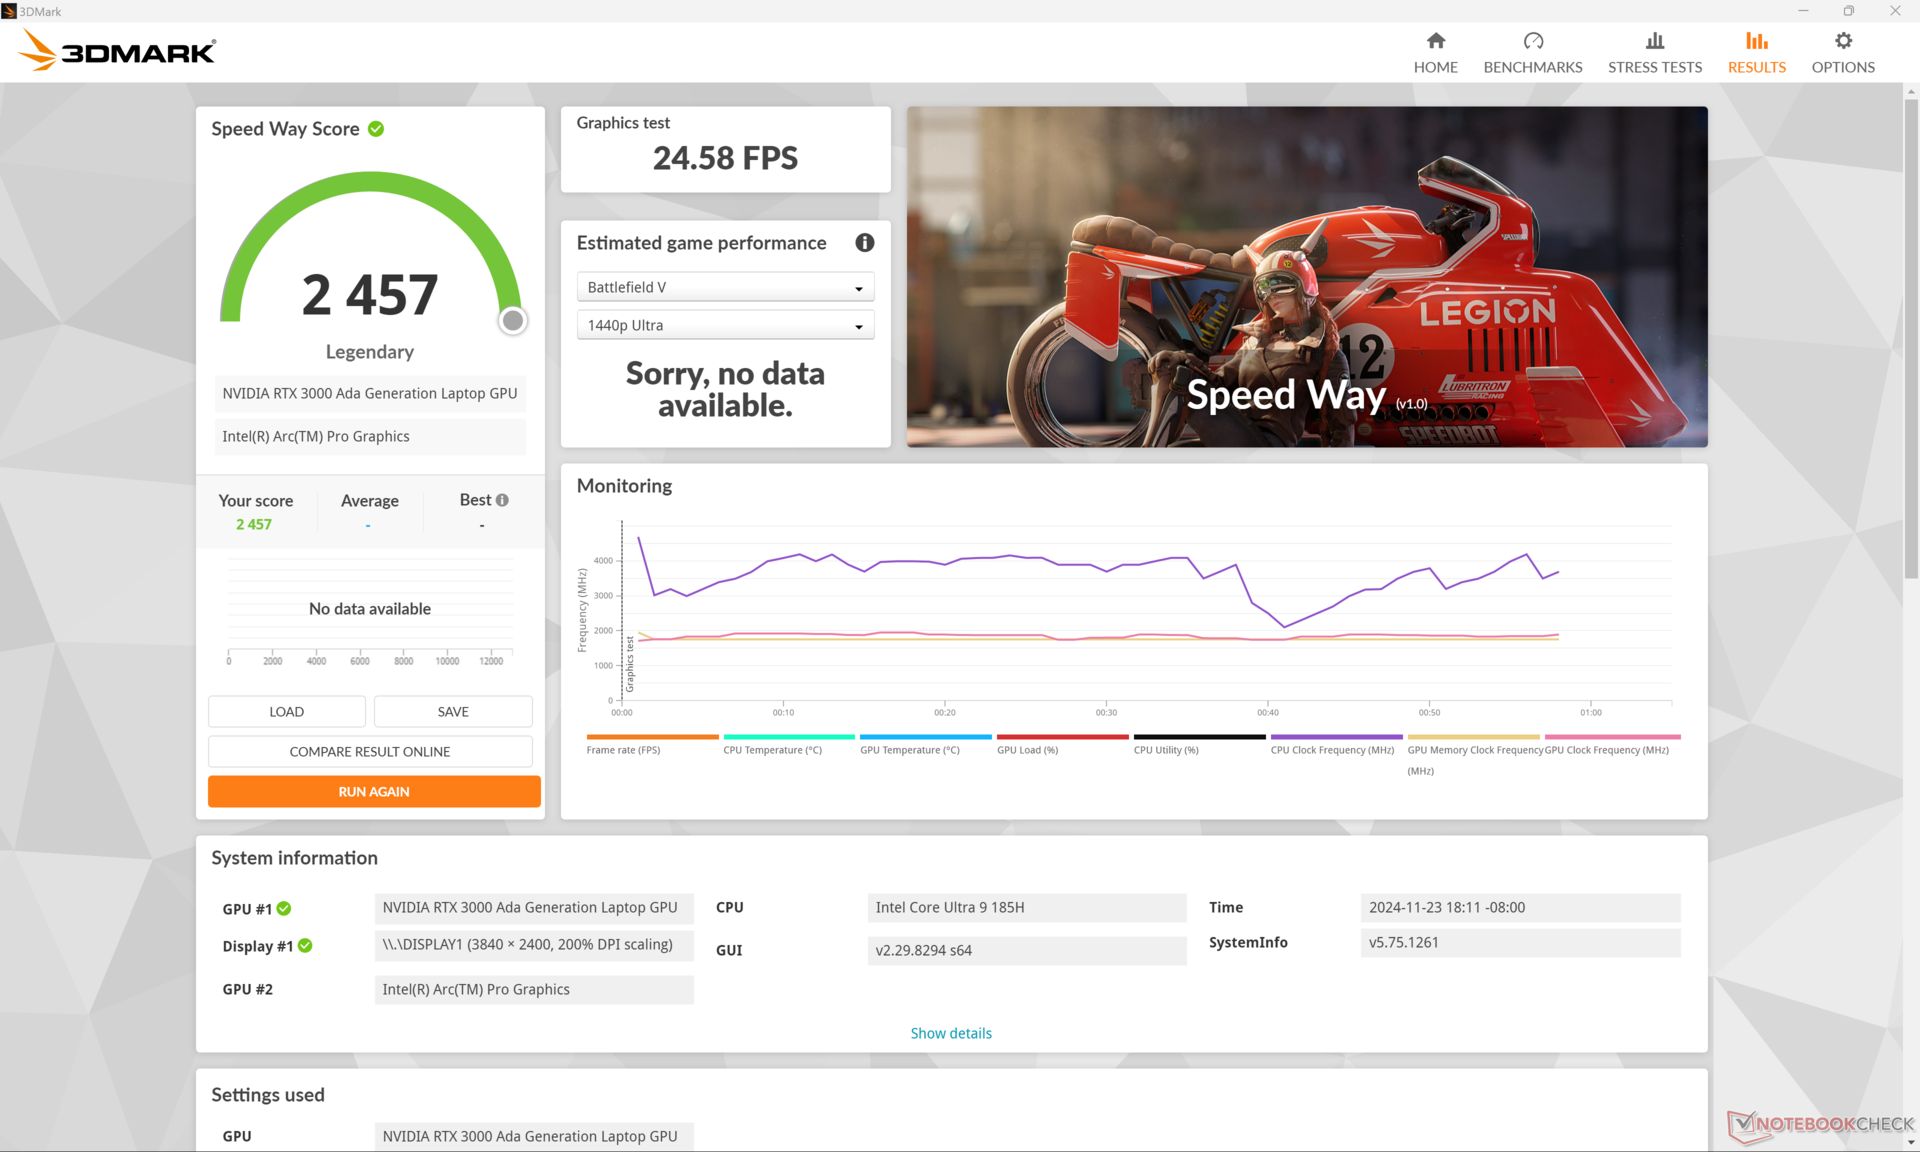
| 3DMark Steel Nomad Score | 2139 Punkte | |
Hilfe | ||
* ... kleinere Werte sind besser
| Performance Rating - Percent | |
| Lenovo ThinkPad P16 Gen 2 | |
| Dell Precision 5690 -1! | |
| HP ZBook Studio 16 G11 | |
| MSI CreatorPro Z16P B12UKST -2! | |
| HP ZBook Studio 16 G9 62U04EA -2! | |
| HP ZBook Power 16 G11 A | |
| Cyberpunk 2077 - 1920x1080 Ultra Preset (FSR off) | |
| Dell Precision 5690 | |
| Lenovo ThinkPad P16 Gen 2 | |
| HP ZBook Studio 16 G11 | |
| HP ZBook Power 16 G11 A | |
| Baldur's Gate 3 - 1920x1080 Ultra Preset AA:T | |
| Lenovo ThinkPad P16 Gen 2 | |
| Dell Precision 5690 | |
| HP ZBook Studio 16 G11 | |
| HP ZBook Power 16 G11 A | |
| GTA V - 1920x1080 Highest AA:4xMSAA + FX AF:16x | |
| Lenovo ThinkPad P16 Gen 2 | |
| HP ZBook Studio 16 G11 | |
| MSI CreatorPro Z16P B12UKST | |
| HP ZBook Power 16 G11 A | |
| HP ZBook Studio 16 G9 62U04EA | |
| Final Fantasy XV Benchmark - 1920x1080 High Quality | |
| Lenovo ThinkPad P16 Gen 2 | |
| Dell Precision 5690 | |
| HP ZBook Studio 16 G11 | |
| HP ZBook Power 16 G11 A | |
| MSI CreatorPro Z16P B12UKST | |
| HP ZBook Studio 16 G9 62U04EA | |
| Strange Brigade - 1920x1080 ultra AA:ultra AF:16 | |
| Lenovo ThinkPad P16 Gen 2 | |
| Dell Precision 5690 | |
| HP ZBook Studio 16 G11 | |
| HP ZBook Power 16 G11 A | |
| MSI CreatorPro Z16P B12UKST | |
| HP ZBook Studio 16 G9 62U04EA | |
| Dota 2 Reborn - 1920x1080 ultra (3/3) best looking | |
| Lenovo ThinkPad P16 Gen 2 | |
| HP ZBook Studio 16 G9 62U04EA | |
| MSI CreatorPro Z16P B12UKST | |
| HP ZBook Studio 16 G11 | |
| Dell Precision 5690 | |
| HP ZBook Power 16 G11 A | |
| X-Plane 11.11 - 1920x1080 high (fps_test=3) | |
| Lenovo ThinkPad P16 Gen 2 | |
| MSI CreatorPro Z16P B12UKST | |
| HP ZBook Studio 16 G9 62U04EA | |
| Dell Precision 5690 | |
| HP ZBook Studio 16 G11 | |
| HP ZBook Power 16 G11 A | |
Die Bildraten sind im Leerlauf von Cyberpunk 2077 auch nach wiederholter Testdurchführung leicht instabil.
Cyberpunk 2077 ultra FPS Chart
| min. | mittel | hoch | max. | QHD | |
|---|---|---|---|---|---|
| GTA V (2015) | 182.2 | 176 | 163.2 | 96.6 | 76.1 |
| Dota 2 Reborn (2015) | 176.2 | 159.9 | 148.2 | 143.3 | |
| Final Fantasy XV Benchmark (2018) | 189.4 | 128.7 | 97 | 71.3 | |
| X-Plane 11.11 (2018) | 131.3 | 109.7 | 87.1 | ||
| Far Cry 5 (2018) | 154 | 133 | 130 | 118 | 93 |
| Strange Brigade (2018) | 415 | 246 | 192.8 | 172.6 | 118.6 |
| Tiny Tina's Wonderlands (2022) | 194 | 157.7 | 110 | 87.9 | 60.5 |
| F1 22 (2022) | 226 | 212 | 161.1 | 62.8 | 40.7 |
| Baldur's Gate 3 (2023) | 130.6 | 111.8 | 98.4 | 96.7 | 68.7 |
| Cyberpunk 2077 (2023) | 104.6 | 87.9 | 74.2 | 64.3 | 39.6 |
Emissionen
Lautstärke
Lüftergeräusch und -verhalten haben sich im Vergleich zum älteren ZBook Studio 16 G9 nicht wesentlich verändert. Bei starker Belastung, z.B. bei Spielen, stabilisiert sich das Lüftergeräusch bei etwa 46 bis 48 dB(A). Beim neueren G11-Modell können wir jedoch ein lauteres Maximum von 53 dB(A) aufzeichnen, wenn CPU und GPU gleichermaßen belastet werden.
Lautstärkediagramm
| Idle |
| 23.8 / 26.4 / 26.4 dB(A) |
| Last |
| 33.7 / 53.2 dB(A) |
 | ||
30 dB leise 40 dB(A) deutlich hörbar 50 dB(A) störend |
||
min: | ||
| HP ZBook Studio 16 G11 RTX 3000 Ada Generation Laptop, Ultra 9 185H, Kioxia XG8 KXG80ZNV1T02 | HP ZBook Studio 16 G9 62U04EA RTX A2000 Laptop GPU, i7-12800H, Micron 3400 1TB MTFDKBA1T0TFH | HP ZBook Power 16 G11 A RTX 2000 Ada Generation Laptop, R7 8845HS, Samsung PM9A1 MZVL22T0HBLB | Lenovo ThinkPad P16 Gen 2 RTX 4000 Ada Generation Laptop, i7-14700HX, SK hynix PC801 HFS001TEJ9X162N | Dell Precision 5690 RTX 5000 Ada Generation Laptop, Ultra 9 185H, 2x Samsung PM9A1 1TB (RAID 0) | MSI CreatorPro Z16P B12UKST RTX A3000 Laptop GPU, i7-12700H, Samsung PM9A1 MZVL21T0HCLR | Lenovo ThinkPad P1 Gen 7 21KV001SGE GeForce RTX 4060 Laptop GPU, Ultra 7 155H, Kioxia XG8 KXG8AZNV1T02 | |
|---|---|---|---|---|---|---|---|
| Geräuschentwicklung | -3% | 9% | -11% | -4% | -6% | -6% | |
| aus / Umgebung * (dB) | 23.8 | 24 -1% | 23.5 1% | 23.9 -0% | 23.4 2% | 24.1 -1% | 24.7 -4% |
| Idle min * (dB) | 23.8 | 24 -1% | 23.8 -0% | 29.1 -22% | 23.6 1% | 27.1 -14% | 24.7 -4% |
| Idle avg * (dB) | 26.4 | 27.7 -5% | 24.2 8% | 29.1 -10% | 24.9 6% | 27.1 -3% | 24.7 6% |
| Idle max * (dB) | 26.4 | 27.7 -5% | 24.2 8% | 29.1 -10% | 30.9 -17% | 27.1 -3% | 24.7 6% |
| Last avg * (dB) | 33.7 | 39.8 -18% | 25.4 25% | 41 -22% | 40.4 -20% | 42.9 -27% | 43.7 -30% |
| Cyberpunk 2077 ultra * (dB) | 46.1 | 43 7% | 52.8 -15% | 53.2 -15% | |||
| Last max * (dB) | 53.2 | 47.7 10% | 45 15% | 52.9 1% | 51.9 2% | 47 12% | 53.3 -0% |
| Witcher 3 ultra * (dB) | 44.3 | 48.3 | 44 |
* ... kleinere Werte sind besser
Temperatur
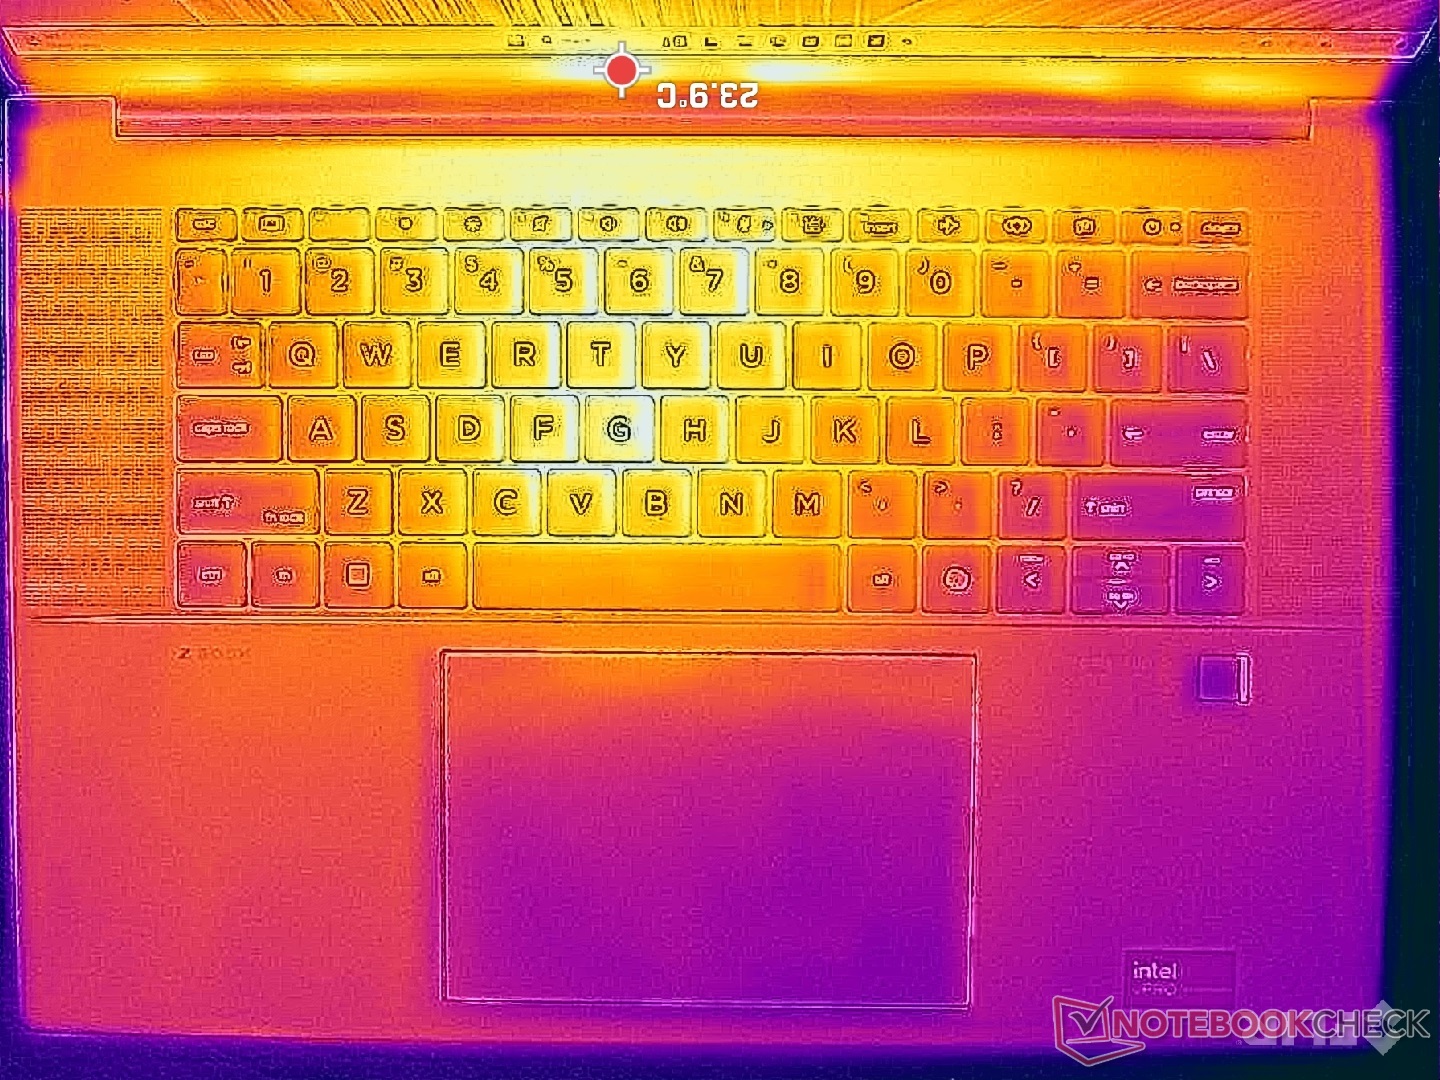
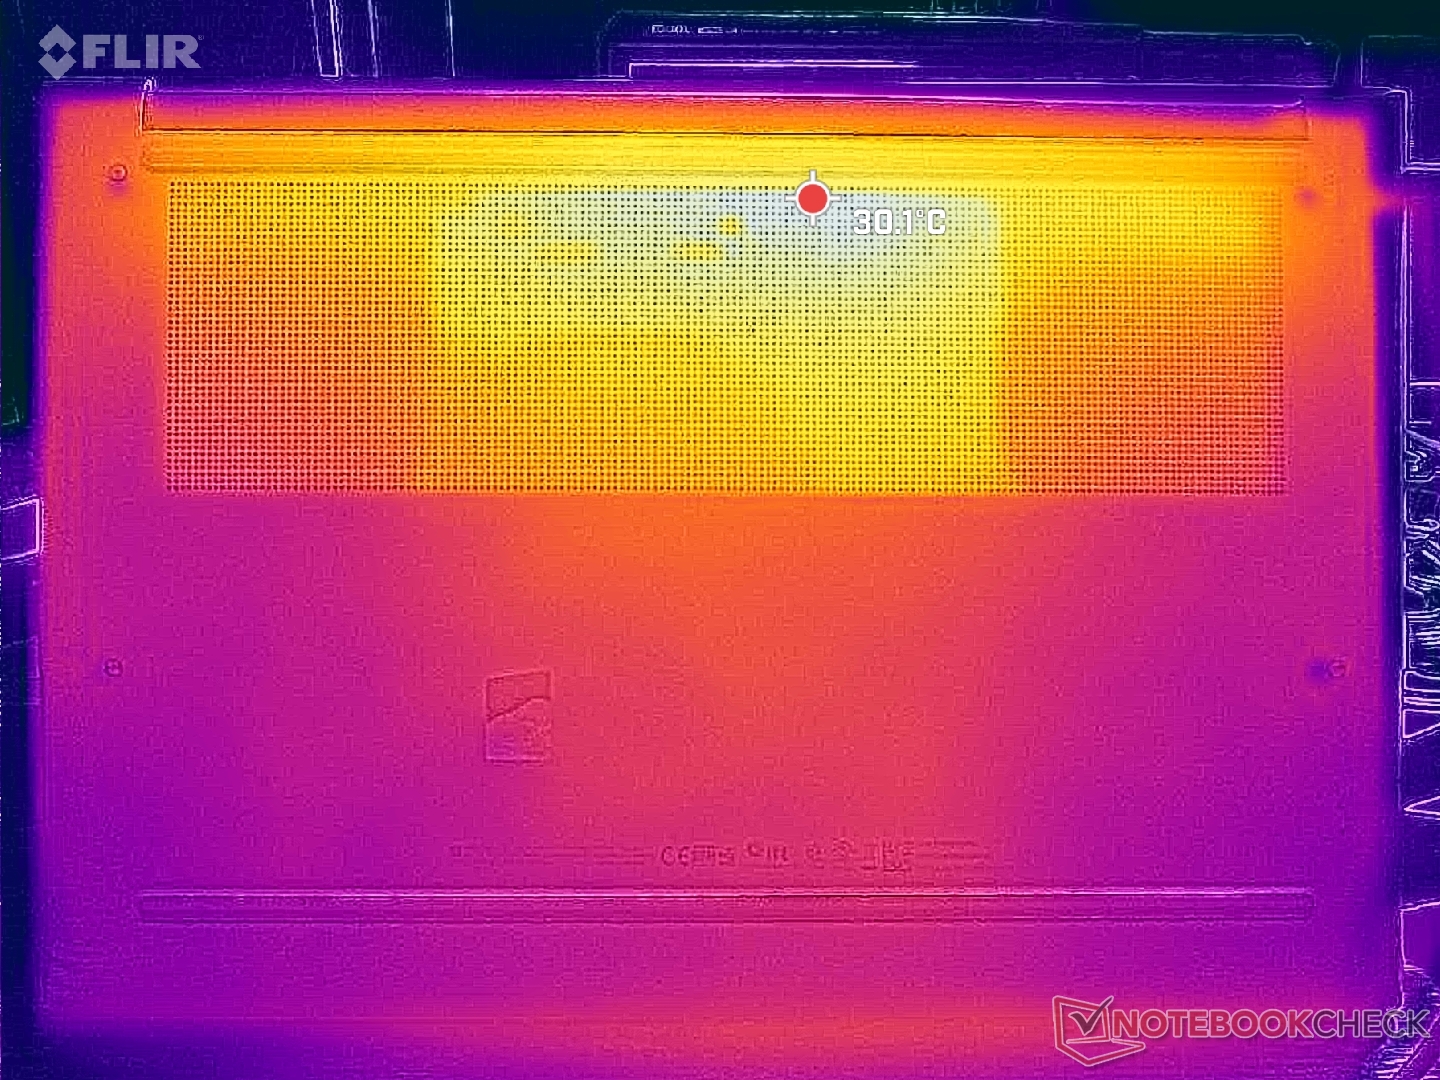
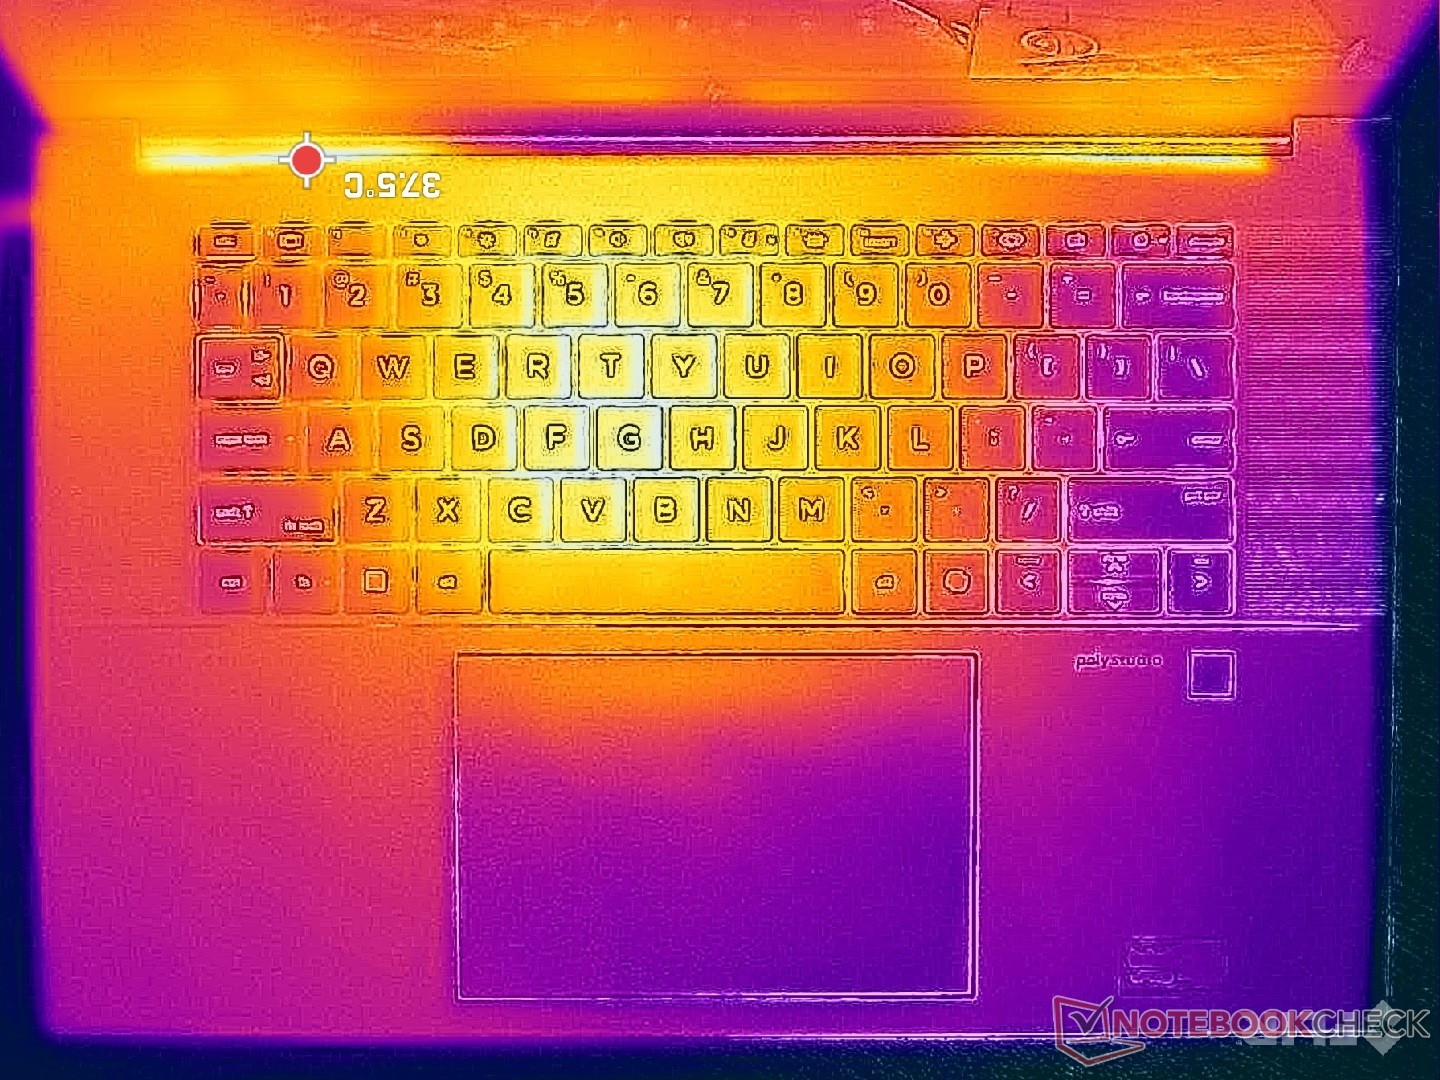
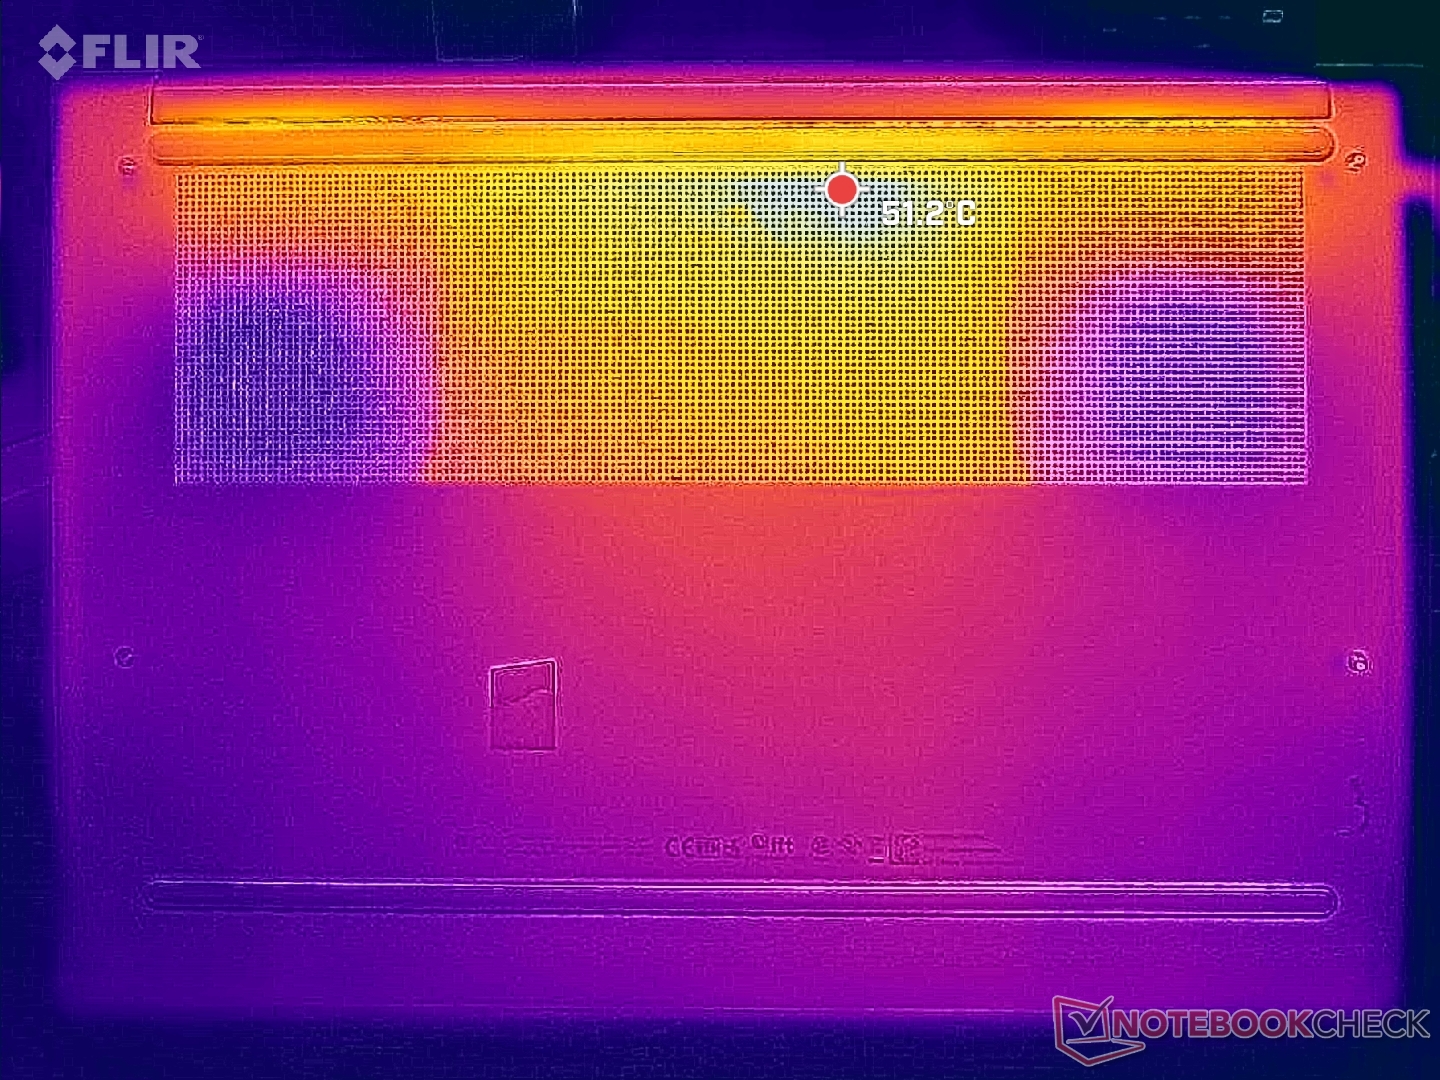
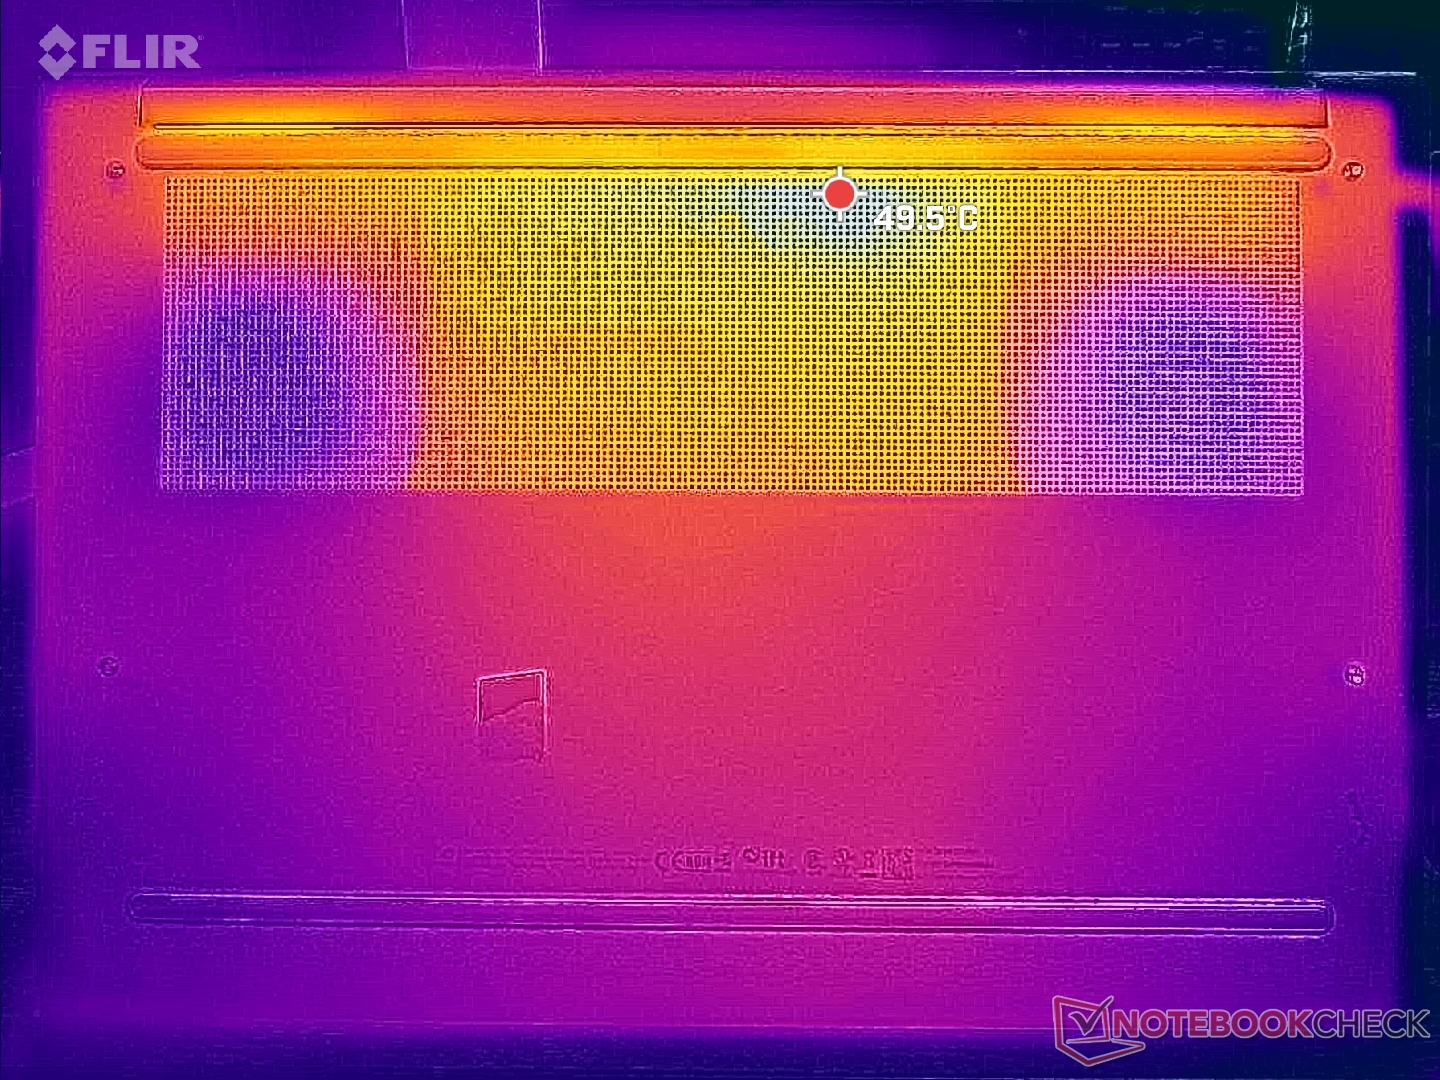
Die Oberflächentemperaturen sind an der unteren Rückseite des Geräts am wärmsten(über 48 °C). Glücklicherweise bleiben die Tastatur und die Handballenablagen mit bis zu 38 °C deutlich kühler und erträglicher.
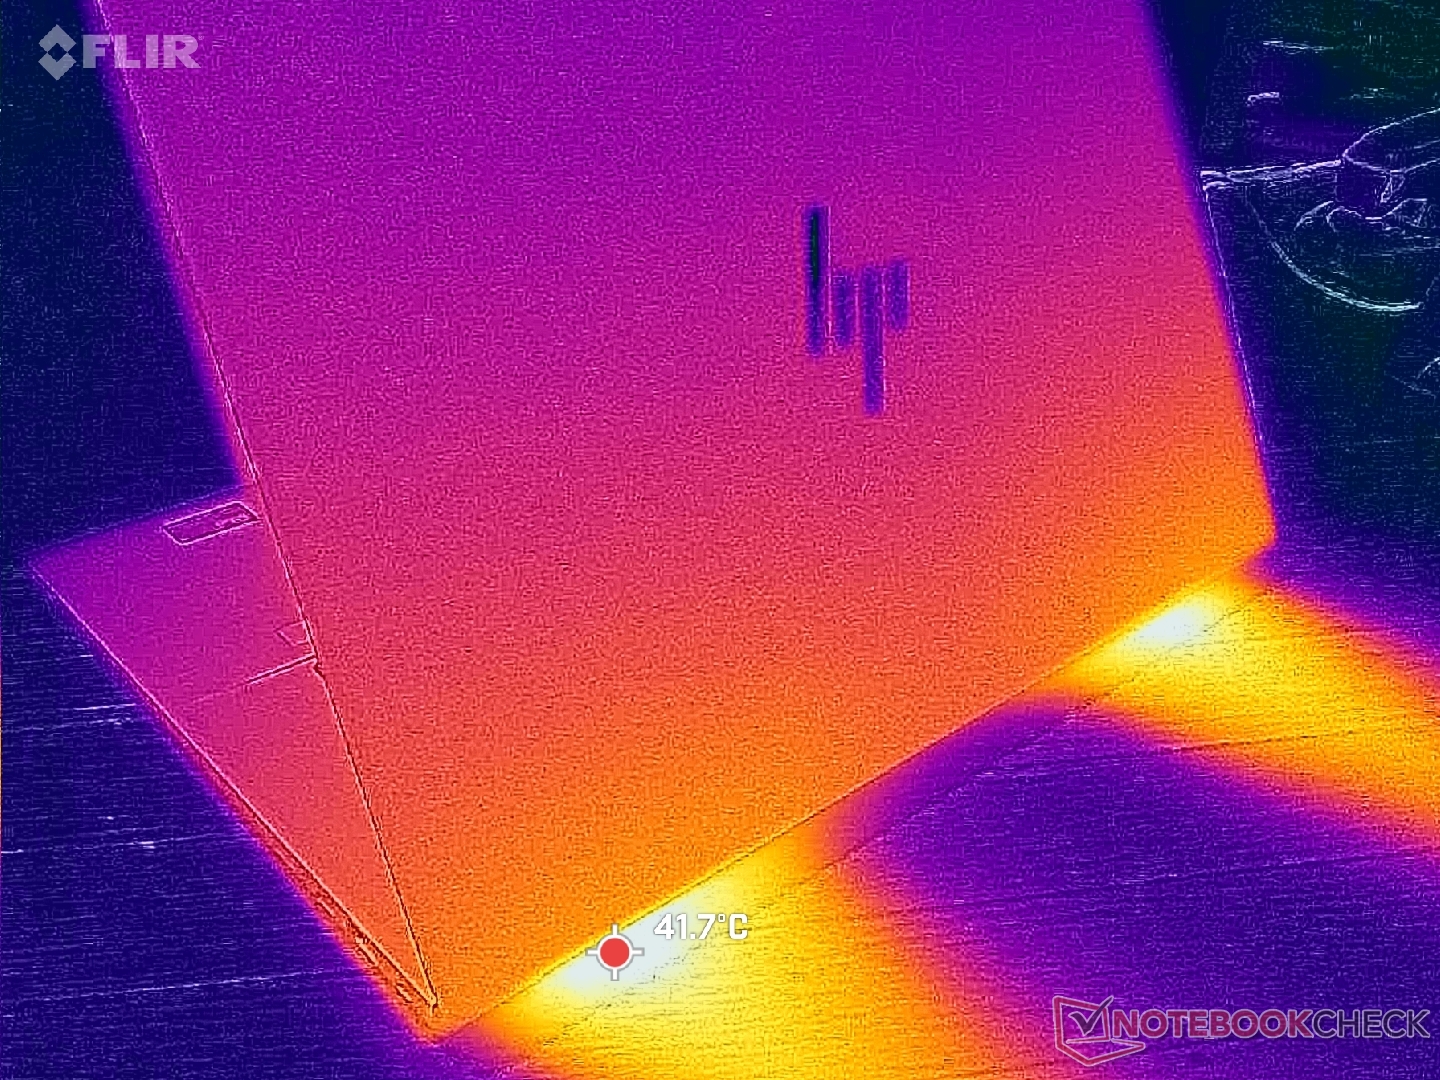
(+) Die maximale Temperatur auf der Oberseite ist 36.6 °C. Im Vergleich liegt der Klassendurchschnitt bei 38.2 °C (von 22.2 bis 69.8 °C für die Klasse Workstation).
(-) Auf der Unterseite messen wir eine maximalen Wert von 47.8 °C (im Vergleich zum Durchschnitt von 41.1 °C).
(+) Ohne Last messen wir eine durchschnittliche Temperatur von 27.2 °C auf der Oberseite. Der Klassendurchschnitt erreicht 32 °C.
(+) 3: The average temperature for the upper side is 30.3 °C / 87 F, compared to the average of 32 °C / 90 F for the class Workstation.
(+) Die Handballen und der Touchpad-Bereich sind mit gemessenen 27.4 °C kühler als die typische Hauttemperatur und fühlen sich dadurch kühl an.
(±) Die durchschnittliche Handballen-Temperatur anderer getesteter Geräte war 27.8 °C (+0.4 °C).

| HP ZBook Studio 16 G11 Intel Core Ultra 9 185H, NVIDIA RTX 3000 Ada Generation Laptop | HP ZBook Studio 16 G9 62U04EA Intel Core i7-12800H, NVIDIA RTX A2000 Laptop GPU | HP ZBook Power 16 G11 A AMD Ryzen 7 8845HS, NVIDIA RTX 2000 Ada Generation Laptop | Lenovo ThinkPad P16 Gen 2 Intel Core i7-14700HX, NVIDIA RTX 4000 Ada Generation Laptop | Dell Precision 5690 Intel Core Ultra 9 185H, NVIDIA RTX 5000 Ada Generation Laptop | MSI CreatorPro Z16P B12UKST Intel Core i7-12700H, NVIDIA RTX A3000 Laptop GPU | Lenovo ThinkPad P1 Gen 7 21KV001SGE Intel Core Ultra 7 155H, NVIDIA GeForce RTX 4060 Laptop GPU | |
|---|---|---|---|---|---|---|---|
| Hitze | 2% | 12% | 4% | 5% | -13% | 4% | |
| Last oben max * (°C) | 36.6 | 38.7 -6% | 40.6 -11% | 46.6 -27% | 46.6 -27% | 56.3 -54% | 50.3 -37% |
| Last unten max * (°C) | 47.8 | 53.4 -12% | 40.6 15% | 51 -7% | 33 31% | 68.3 -43% | 38 21% |
| Idle oben max * (°C) | 31.4 | 27.3 13% | 26 17% | 24.8 21% | 32.4 -3% | 25.2 20% | 28.3 10% |
| Idle unten max * (°C) | 35.6 | 31.6 11% | 26.6 25% | 25.6 28% | 29.4 17% | 25.9 27% | 27.3 23% |
* ... kleinere Werte sind besser
Lautsprecher
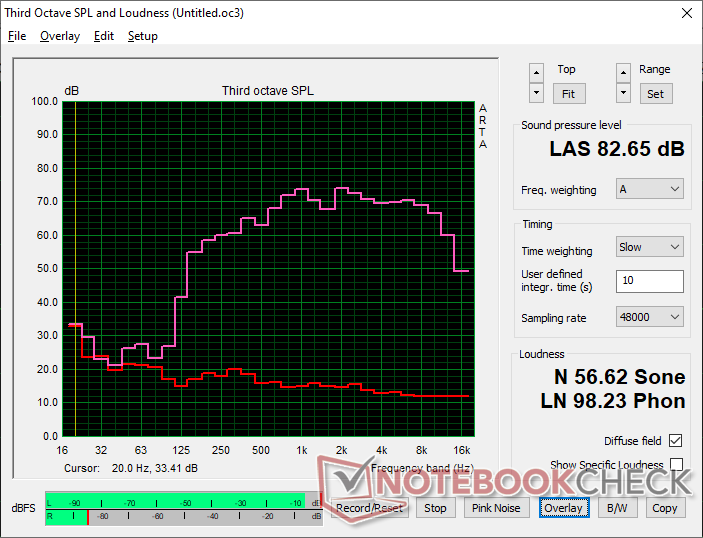
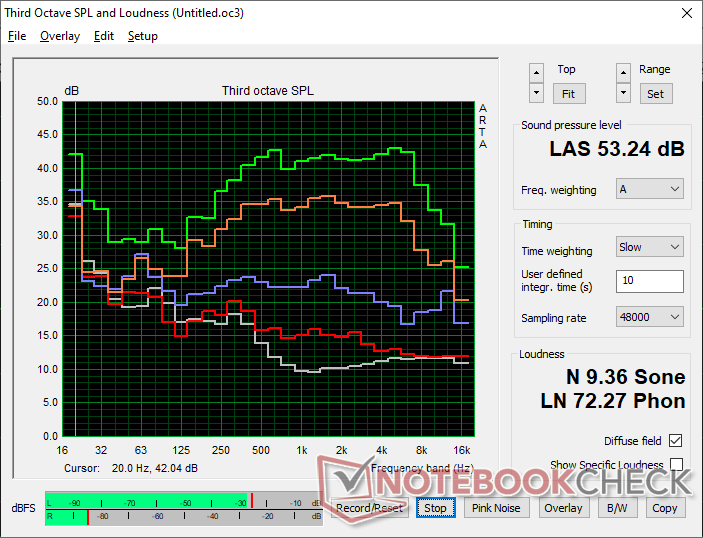
HP ZBook Studio 16 G11 Audio Analyse
(+) | Die Lautsprecher können relativ laut spielen (82.7 dB)
Bass 100 - 315 Hz
(-) | kaum Bass - 17.4% niedriger als der Median
(±) | durchschnittlich lineare Bass-Wiedergabe (11.8% Delta zum Vorgänger)
Mitteltöne 400 - 2000 Hz
(+) | ausgeglichene Mitten, vom Median nur 3.4% abweichend
(±) | Linearität der Mitten ist durchschnittlich (7% Delta zum Vorgänger)
Hochtöne 2 - 16 kHz
(+) | ausgeglichene Hochtöne, vom Median nur 2.4% abweichend
(+) | sehr lineare Hochtöne (2.6% Delta zum Vorgänger)
Gesamt im hörbaren Bereich 100 - 16.000 Hz
(±) | hörbarer Bereich ist durchschnittlich linear (15.2% Abstand zum Median)
Im Vergleich zu allen Geräten derselben Klasse
» 33% aller getesteten Geräte dieser Klasse waren besser, 10% vergleichbar, 57% schlechter
» Das beste Gerät hat einen Delta-Wert von 7%, durchschnittlich ist 17%, das schlechteste Gerät hat 35%
Im Vergleich zu allen Geräten im Test
» 21% aller getesteten Geräte waren besser, 4% vergleichbar, 74% schlechter
» Das beste Gerät hat einen Delta-Wert von 4%, durchschnittlich ist 24%, das schlechteste Gerät hat 134%
Apple MacBook Pro 16 2021 M1 Pro Audio Analyse
(+) | Die Lautsprecher können relativ laut spielen (84.7 dB)
Bass 100 - 315 Hz
(+) | guter Bass - nur 3.8% Abweichung vom Median
(+) | lineare Bass-Wiedergabe (5.2% Delta zum Vorgänger)
Mitteltöne 400 - 2000 Hz
(+) | ausgeglichene Mitten, vom Median nur 1.3% abweichend
(+) | lineare Mitten (2.1% Delta zum Vorgänger)
Hochtöne 2 - 16 kHz
(+) | ausgeglichene Hochtöne, vom Median nur 1.9% abweichend
(+) | sehr lineare Hochtöne (2.7% Delta zum Vorgänger)
Gesamt im hörbaren Bereich 100 - 16.000 Hz
(+) | hörbarer Bereich ist sehr linear (4.6% Abstand zum Median
Im Vergleich zu allen Geräten derselben Klasse
» 0% aller getesteten Geräte dieser Klasse waren besser, 0% vergleichbar, 100% schlechter
» Das beste Gerät hat einen Delta-Wert von 5%, durchschnittlich ist 17%, das schlechteste Gerät hat 45%
Im Vergleich zu allen Geräten im Test
» 0% aller getesteten Geräte waren besser, 0% vergleichbar, 100% schlechter
» Das beste Gerät hat einen Delta-Wert von 4%, durchschnittlich ist 24%, das schlechteste Gerät hat 134%
Energieverwaltung
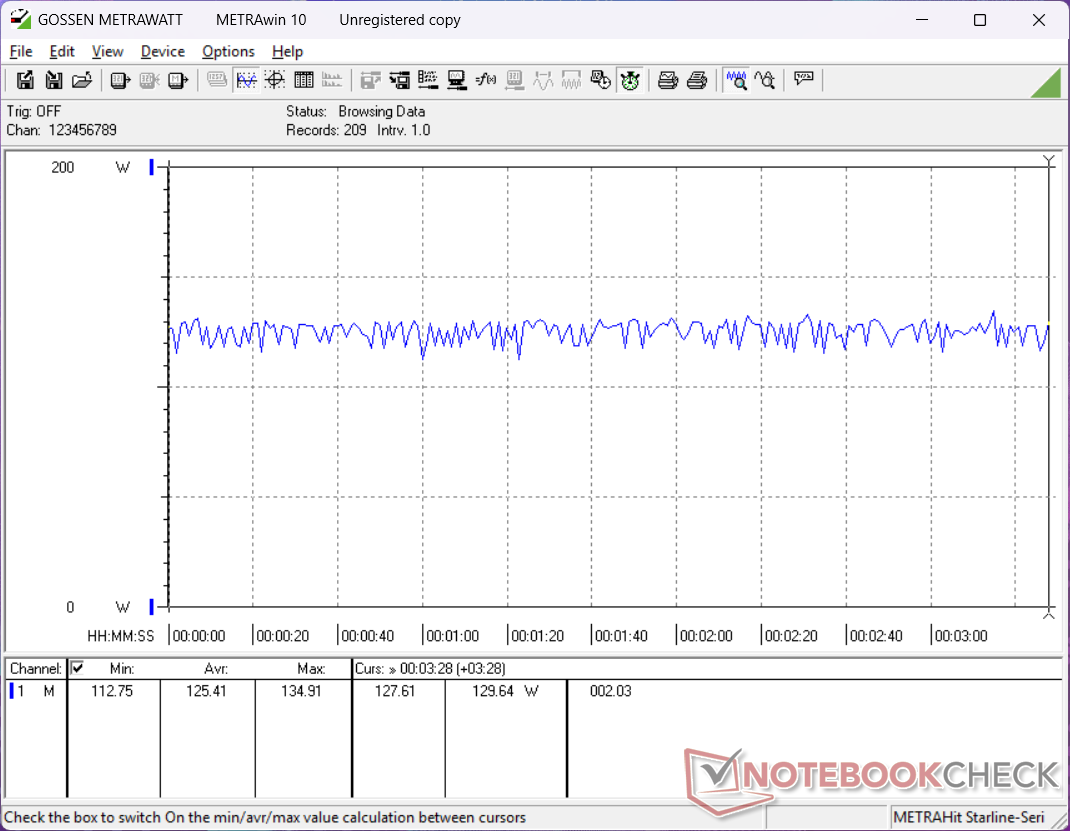
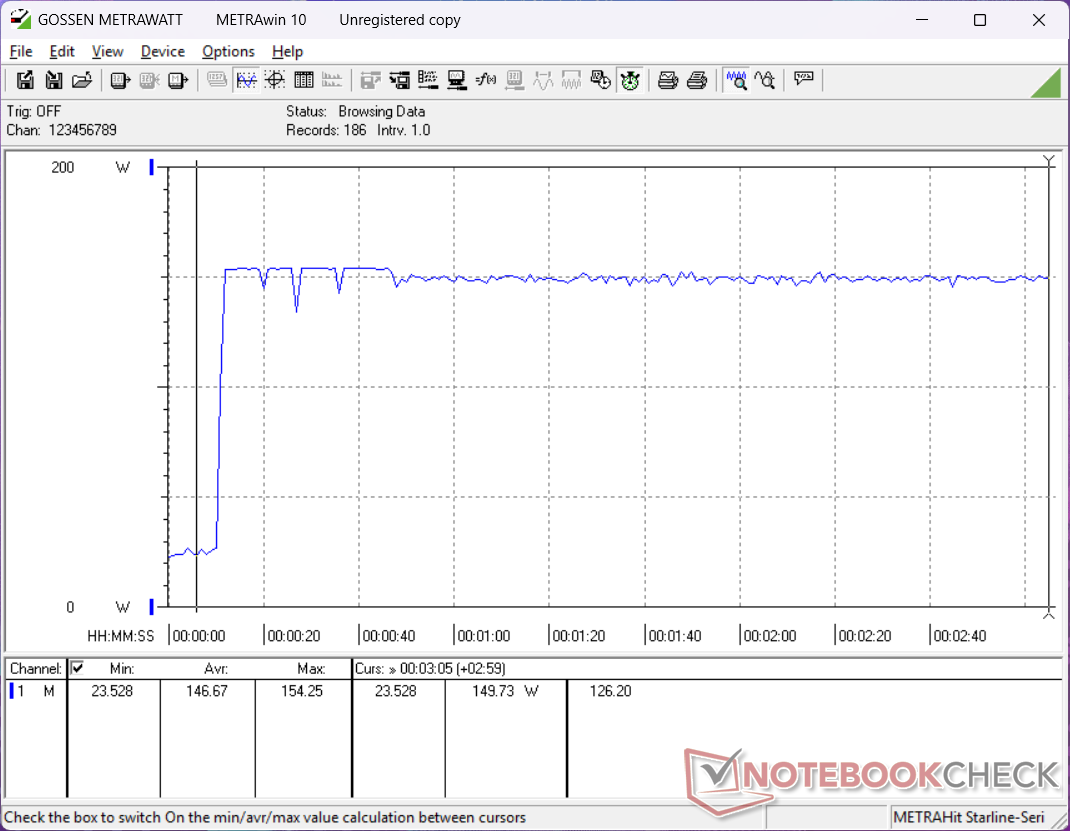
Stromverbrauch
Das Modell ist etwas anspruchsvoller als das ältere und langsamere ZBook Studio 16 G9. Die Leistung pro Watt ist jedoch immer noch deutlich höher, so dass sich der höhere Verbrauch lohnt.

| Aus / Standby | |
| Idle | |
| Last |
|
Legende:
min: | |
| HP ZBook Studio 16 G11 Ultra 9 185H, RTX 3000 Ada Generation Laptop, Kioxia XG8 KXG80ZNV1T02, IPS, 3840x2400, 16" | HP ZBook Studio 16 G9 62U04EA i7-12800H, RTX A2000 Laptop GPU, Micron 3400 1TB MTFDKBA1T0TFH, IPS, 3840x2400, 16" | HP ZBook Power 16 G11 A R7 8845HS, RTX 2000 Ada Generation Laptop, Samsung PM9A1 MZVL22T0HBLB, IPS, 2560x1600, 16" | Lenovo ThinkPad P16 Gen 2 i7-14700HX, RTX 4000 Ada Generation Laptop, SK hynix PC801 HFS001TEJ9X162N, IPS, 2560x1600, 16" | Dell Precision 5690 Ultra 9 185H, RTX 5000 Ada Generation Laptop, 2x Samsung PM9A1 1TB (RAID 0), OLED, 3840x2400, 16" | MSI CreatorPro Z16P B12UKST i7-12700H, RTX A3000 Laptop GPU, Samsung PM9A1 MZVL21T0HCLR, IPS, 2560x1600, 16" | Lenovo ThinkPad P1 Gen 7 21KV001SGE Ultra 7 155H, GeForce RTX 4060 Laptop GPU, Kioxia XG8 KXG8AZNV1T02, IPS LED, 2560x1600, 16" | |
|---|---|---|---|---|---|---|---|
| Stromverbrauch | 8% | 36% | -26% | 9% | 7% | 17% | |
| Idle min * (Watt) | 14 | 7.2 49% | 4.6 67% | 7.9 44% | 7.9 44% | 10.8 23% | 7.3 48% |
| Idle avg * (Watt) | 22.4 | 18.1 19% | 10 55% | 13.1 42% | 12 46% | 16.3 27% | 12.3 45% |
| Idle max * (Watt) | 25.7 | 18.5 28% | 10.6 59% | 24.2 6% | 28.6 -11% | 16.9 34% | 17.9 30% |
| Last avg * (Watt) | 90.2 | 112.8 -25% | 60.9 32% | 127.4 -41% | 98.8 -10% | 111.7 -24% | 78.2 13% |
| Cyberpunk 2077 ultra external monitor * (Watt) | 120.3 | 92.8 23% | 219 -82% | 117.7 2% | |||
| Cyberpunk 2077 ultra * (Watt) | 125.4 | 96.8 23% | 225 -79% | 123.5 2% | |||
| Last max * (Watt) | 142 | 186 -31% | 154.8 -9% | 248.5 -75% | 174.8 -23% | 177.4 -25% | 167.5 -18% |
| Witcher 3 ultra * (Watt) | 106.7 | 144.5 | 152.1 |
* ... kleinere Werte sind besser
Power Consumption Cyberpunk / Stress Test
Power Consumption external Monitor
Akkulaufzeit
Die Laufzeiten haben sich nicht verbessert.
| HP ZBook Studio 16 G11 Ultra 9 185H, RTX 3000 Ada Generation Laptop, 86 Wh | HP ZBook Studio 16 G9 62U04EA i7-12800H, RTX A2000 Laptop GPU, 86 Wh | HP ZBook Power 16 G11 A R7 8845HS, RTX 2000 Ada Generation Laptop, 83 Wh | Lenovo ThinkPad P16 Gen 2 i7-14700HX, RTX 4000 Ada Generation Laptop, 94 Wh | Dell Precision 5690 Ultra 9 185H, RTX 5000 Ada Generation Laptop, 98 Wh | MSI CreatorPro Z16P B12UKST i7-12700H, RTX A3000 Laptop GPU, 90 Wh | Lenovo ThinkPad P1 Gen 7 21KV001SGE Ultra 7 155H, GeForce RTX 4060 Laptop GPU, 90 Wh | |
|---|---|---|---|---|---|---|---|
| Akkulaufzeit | 31% | 102% | -48% | 92% | 21% | 106% | |
| WLAN (h) | 4.8 | 6.3 31% | 9.7 102% | 2.5 -48% | 9.2 92% | 5.8 21% | 9.9 106% |
| H.264 (h) | 8.5 | ||||||
| Last (h) | 1.1 | 1.7 | 1.9 | ||||
| Idle (h) | 26.1 |
Notebookcheck Bewertung
HP ZBook Studio 16 G11
- 30.11.2024 v8
Allen Ngo
 Total Sustainability Score:
 Transparenz
Die Auswahl der zu testenden Geräte erfolgt innerhalb der Redaktion. Das vorliegende Testmuster wurde dem Autor vom Hersteller oder einem Shop zu Testzwecken leihweise zur Verfügung gestellt. Eine Einflussnahme des Leihstellers auf den Testbericht gab es nicht, der Hersteller erhielt keine Version des Reviews vor der Veröffentlichung. Es bestand keine Verpflichtung zur Publikation. Als eigenständiges, unabhängiges Unternehmen unterliegt Notebookcheck keiner Diktion von Herstellern, Shops und Verlagen.
So testet Notebookcheck
Pro Jahr werden von Notebookcheck hunderte Laptops und Smartphones unabhängig in von uns standardisierten technischen Verfahren getestet, um eine Vergleichbarkeit aller Testergebnisse zu gewährleisten. Seit rund 20 Jahren entwickeln wir diese Testmethoden kontinuierlich weiter und setzen damit Branchenstandards. In unseren Testlaboren kommt ausschließlich hochwertiges Messequipment in die Hände erfahrener Techniker und Redakteure. Die Tests unterliegen einer mehrstufigen Kontrolle. Unsere komplexe Gesamtbewertung basiert auf hunderten fundierten Messergebnissen und Benchmarks, womit Ihnen Objektivität garantiert ist. Weitere Informationen zu unseren Testmethoden gibt es hier.

