
Fazit - Kein Pro im Gaming, aber vielleicht im ...
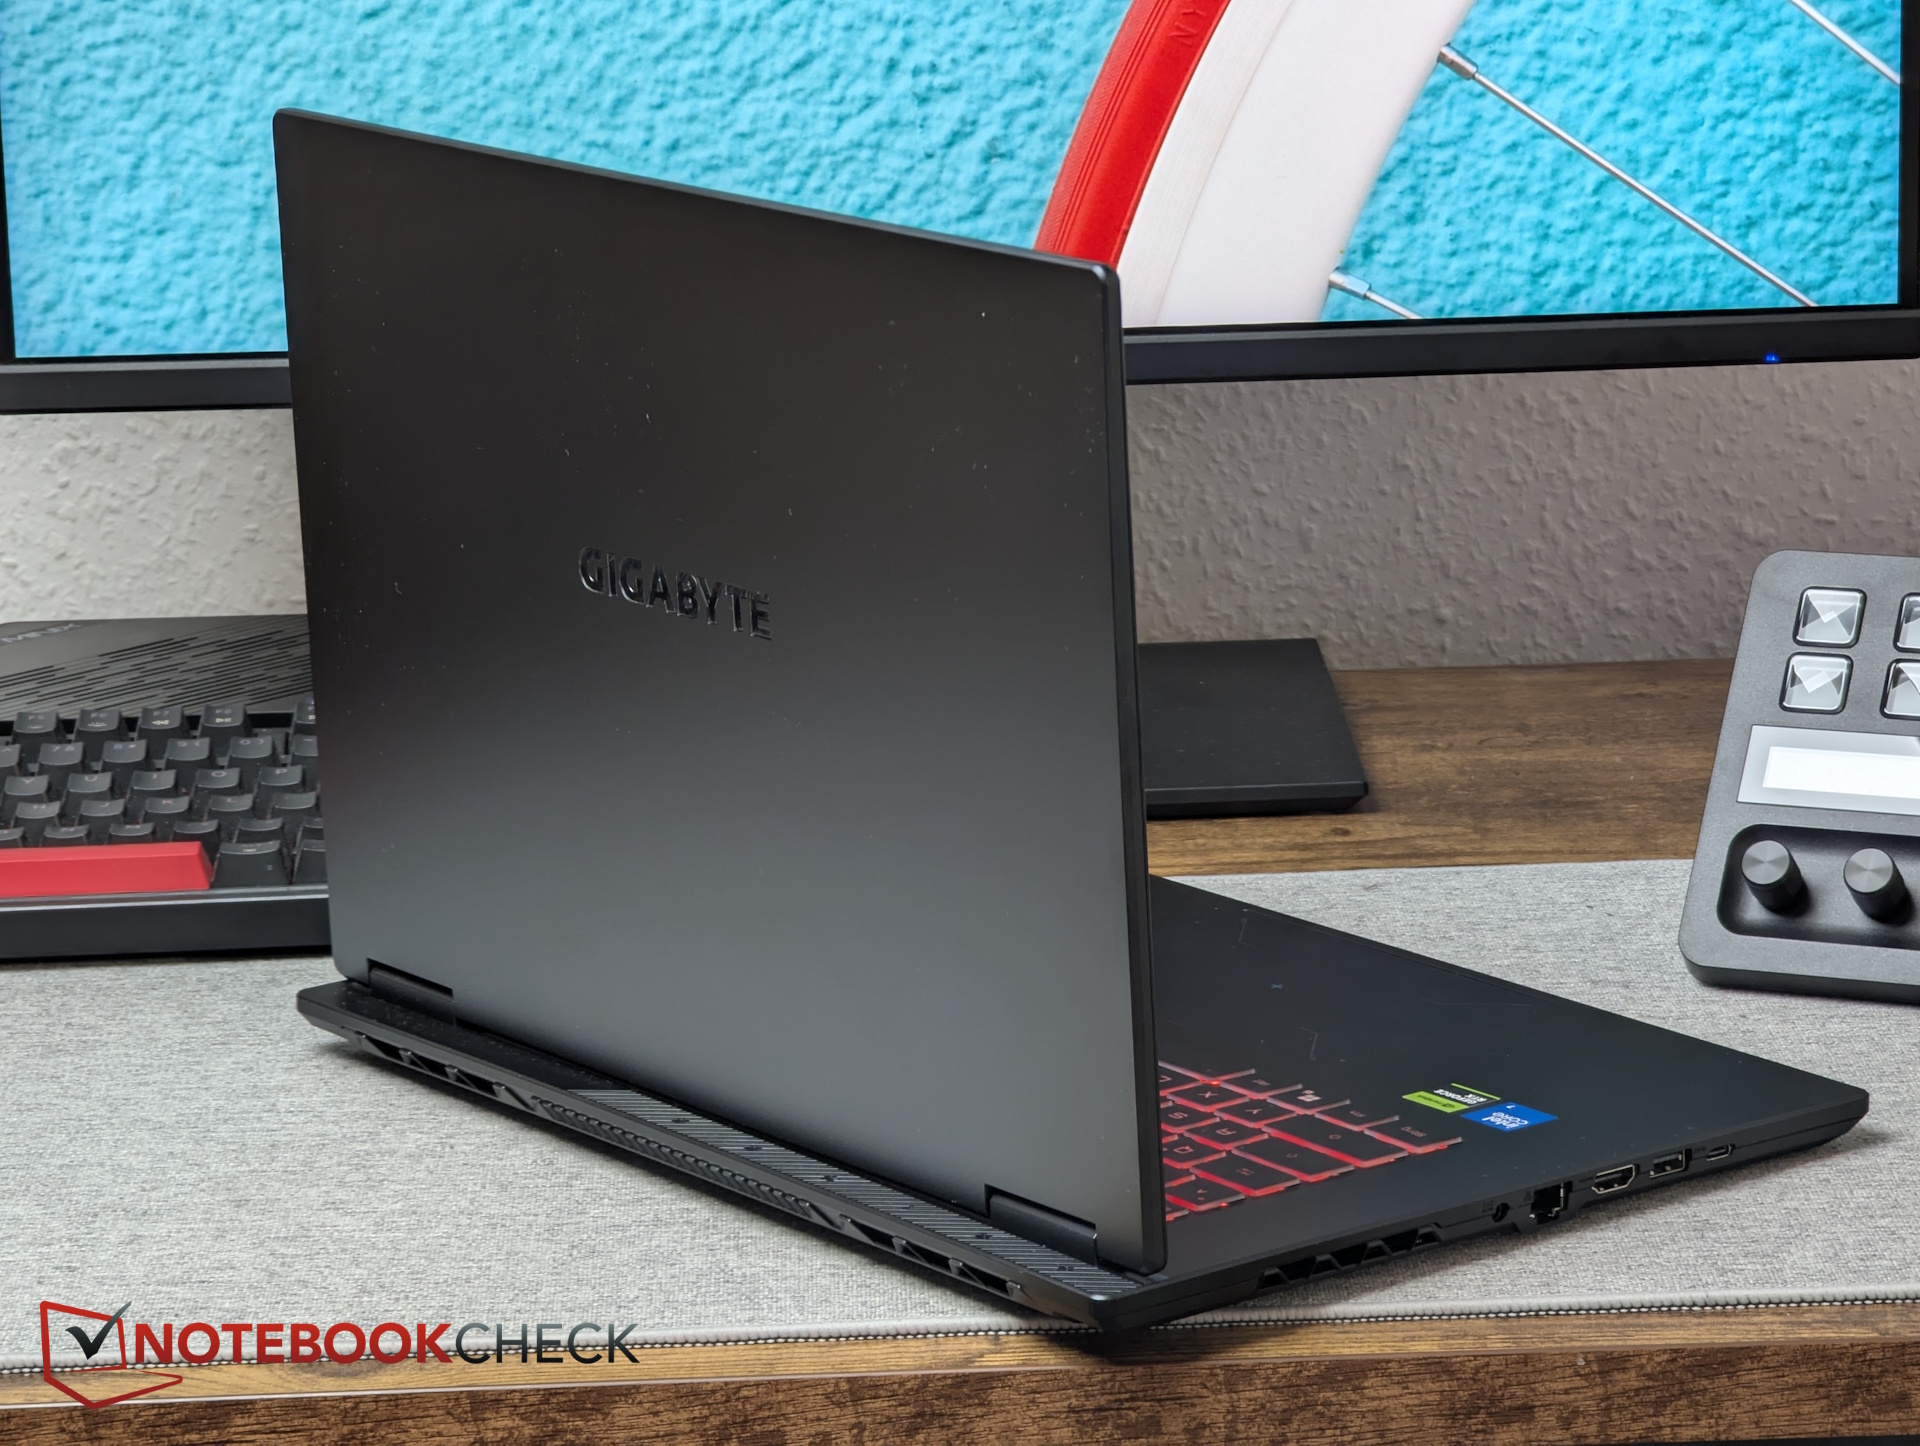
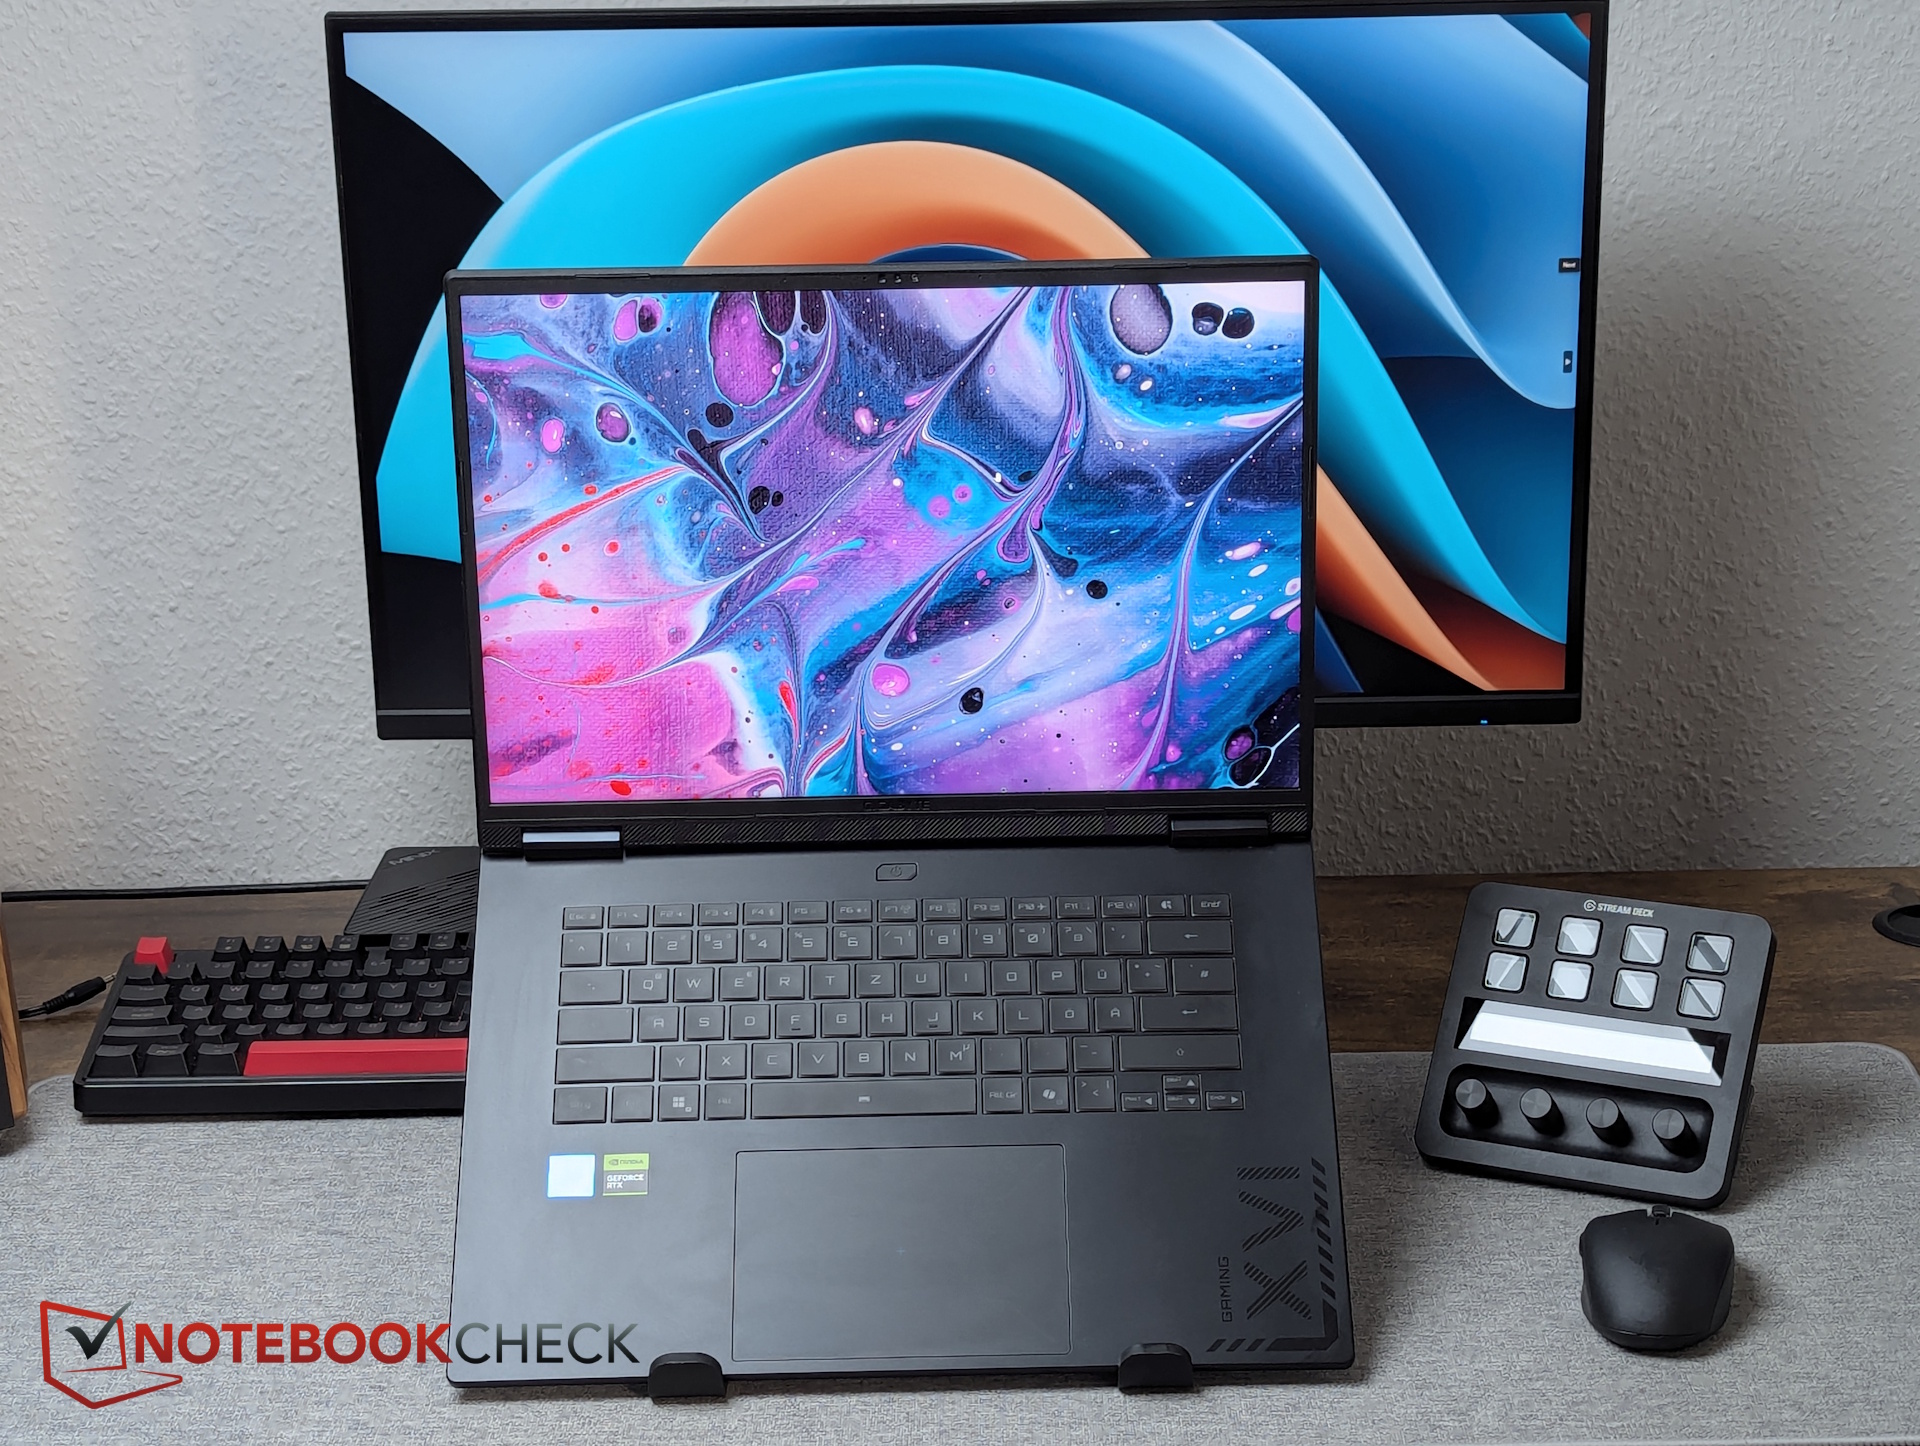
Typische RTX-5070-Ti-Laptops sind für gewöhnlich dicker und schwerer (und stärker) als das Gigabyte A16 Pro. Mit seinem dünnes Chassis, der guten Akkulaufzeit, dem geringem Lastverbrauch und dem hellen Display hat es zum recht günstigen Kurs eher Stärken als Einsteigergerät im Bereich mobiler Videoschnitt, lokale KI oder 3D-Modelling. Hier ist der zusätzliche VRAM der RTX 5070 Ti hilfreich.
Gerade bei der Ausstattung (nur 5-Gbps-USB) wünschen wir uns jedoch deutlich mehr "Pro". Vor allem aber fehlt die Optimierung. Die hohen Latenzen, das SSD-Throttling und der hohe Idle-Verbrauch lassen auf verpasste Potentiale schließen. Wir hoffen auf Updates seitens Gigabyte.
Pro
Contra
Inhaltsverzeichnis
- Fazit - Kein Pro im Gaming, aber vielleicht im ...
- Spezifikationen
- Gehäuse & Ausstattung - Dünn im Material und den Anschlüssen
- Eingabegeräte - Solides Tippen und Wischen
- Display - 500-Nits-WQXGA mit sRGB
- Leistung - Kaum schneller als das Non-Pro
- Emissionen & Energie - Hoher Idle-Verbrauch
- Mögliche Alternativen im Vergleich
Das letztjährige Gigabyte Gaming A16 bekommt nun das Gigabyte Gaming A16 Pro dazu - mit neuem Prozessor, besserer GPU und hoffentlich Verbesserungen bei der Austattung und dem Kühlsystem.
Spezifikationen
Preisvergleich
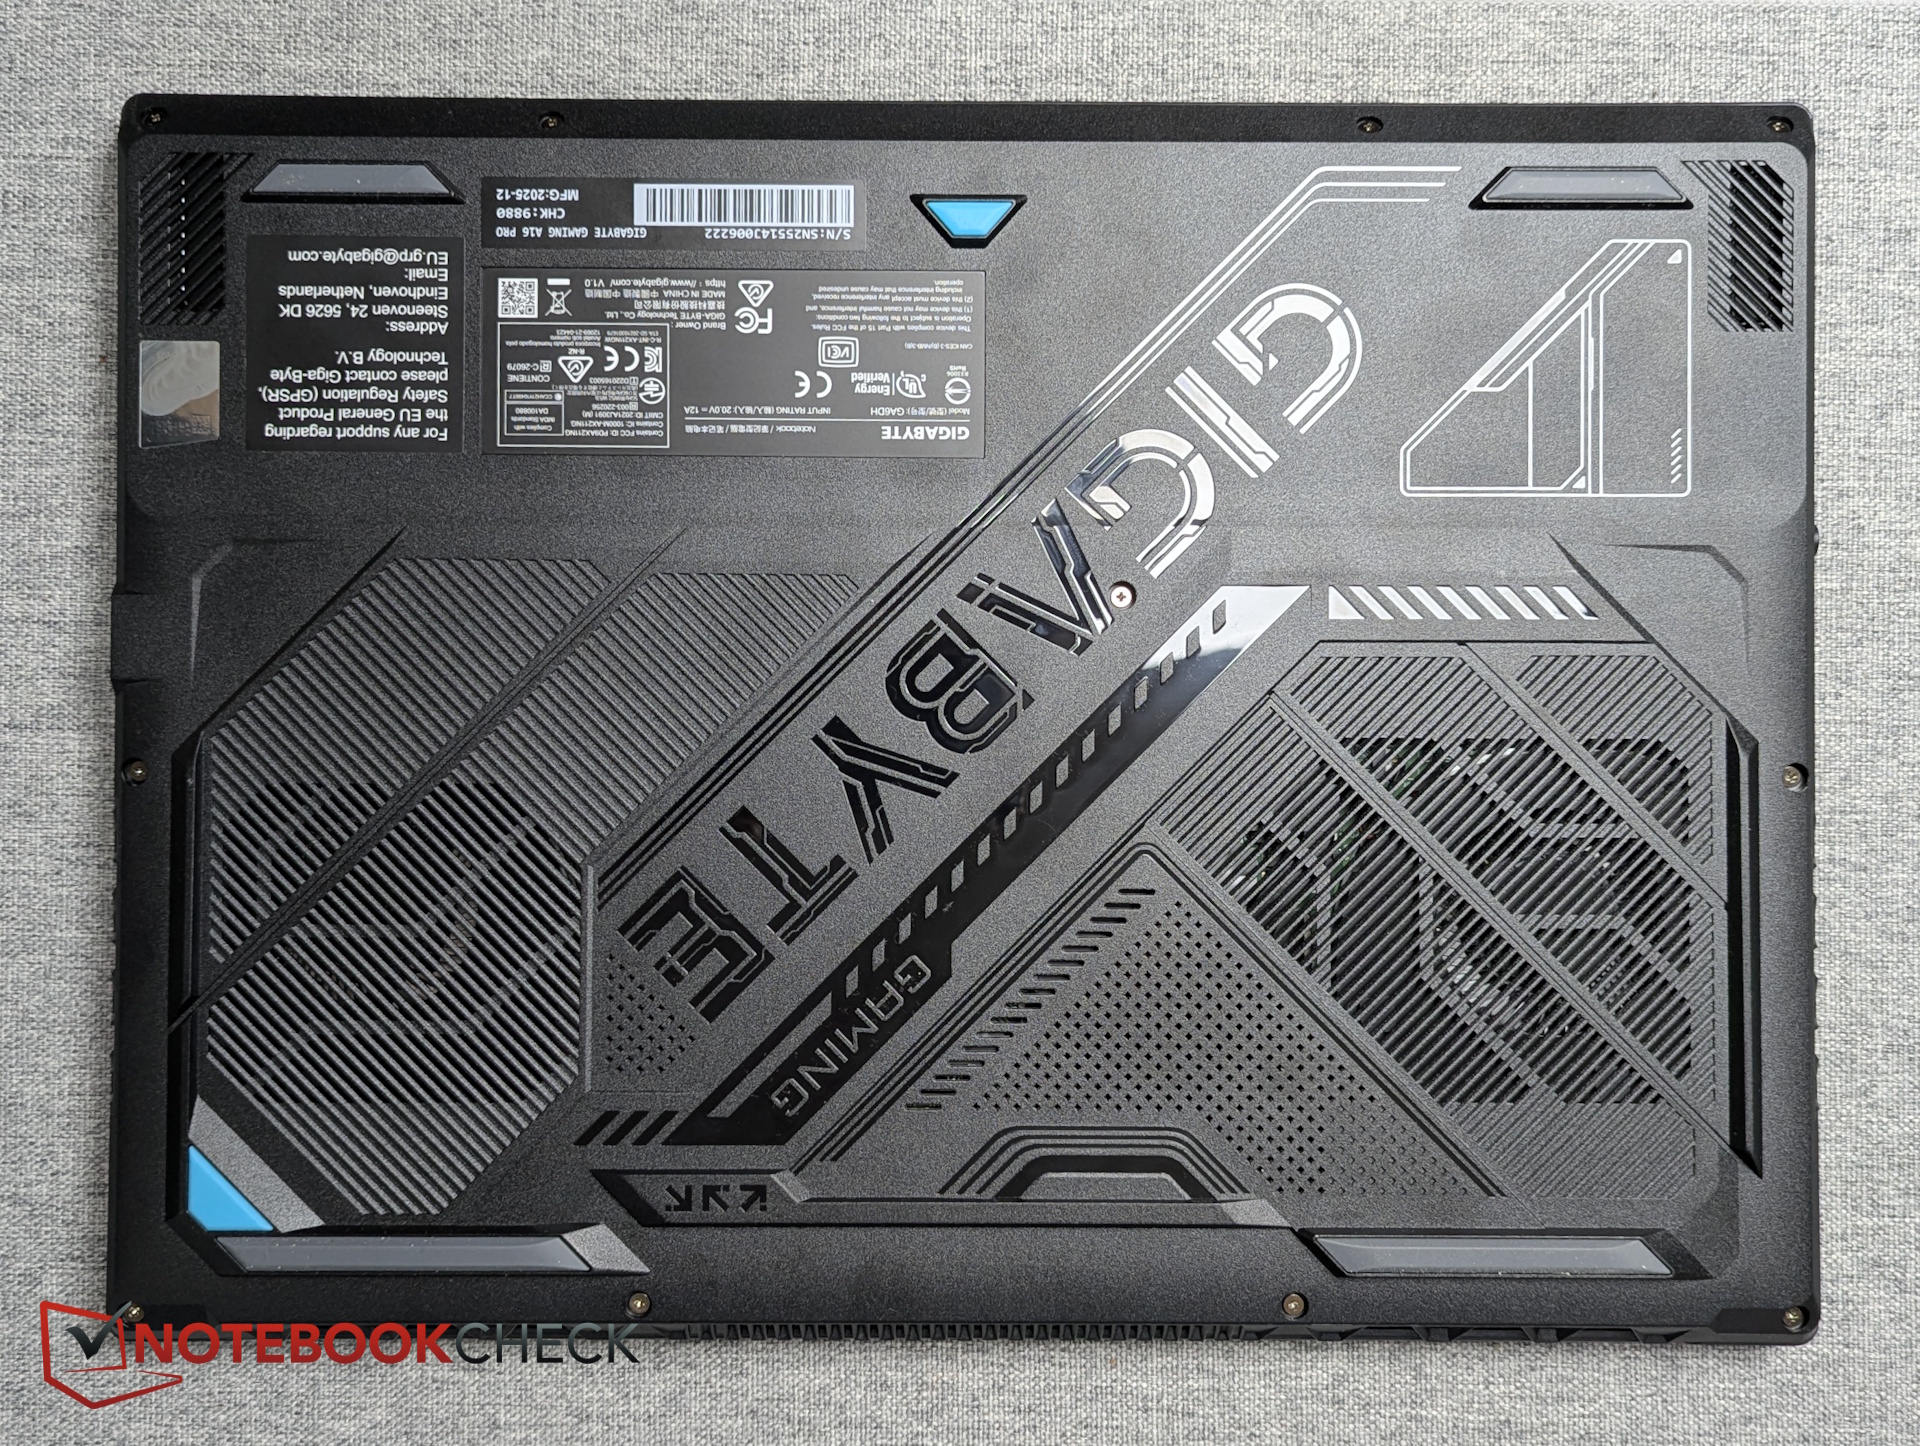
Gehäuse & Ausstattung - Dünn im Material und den Anschlüssen
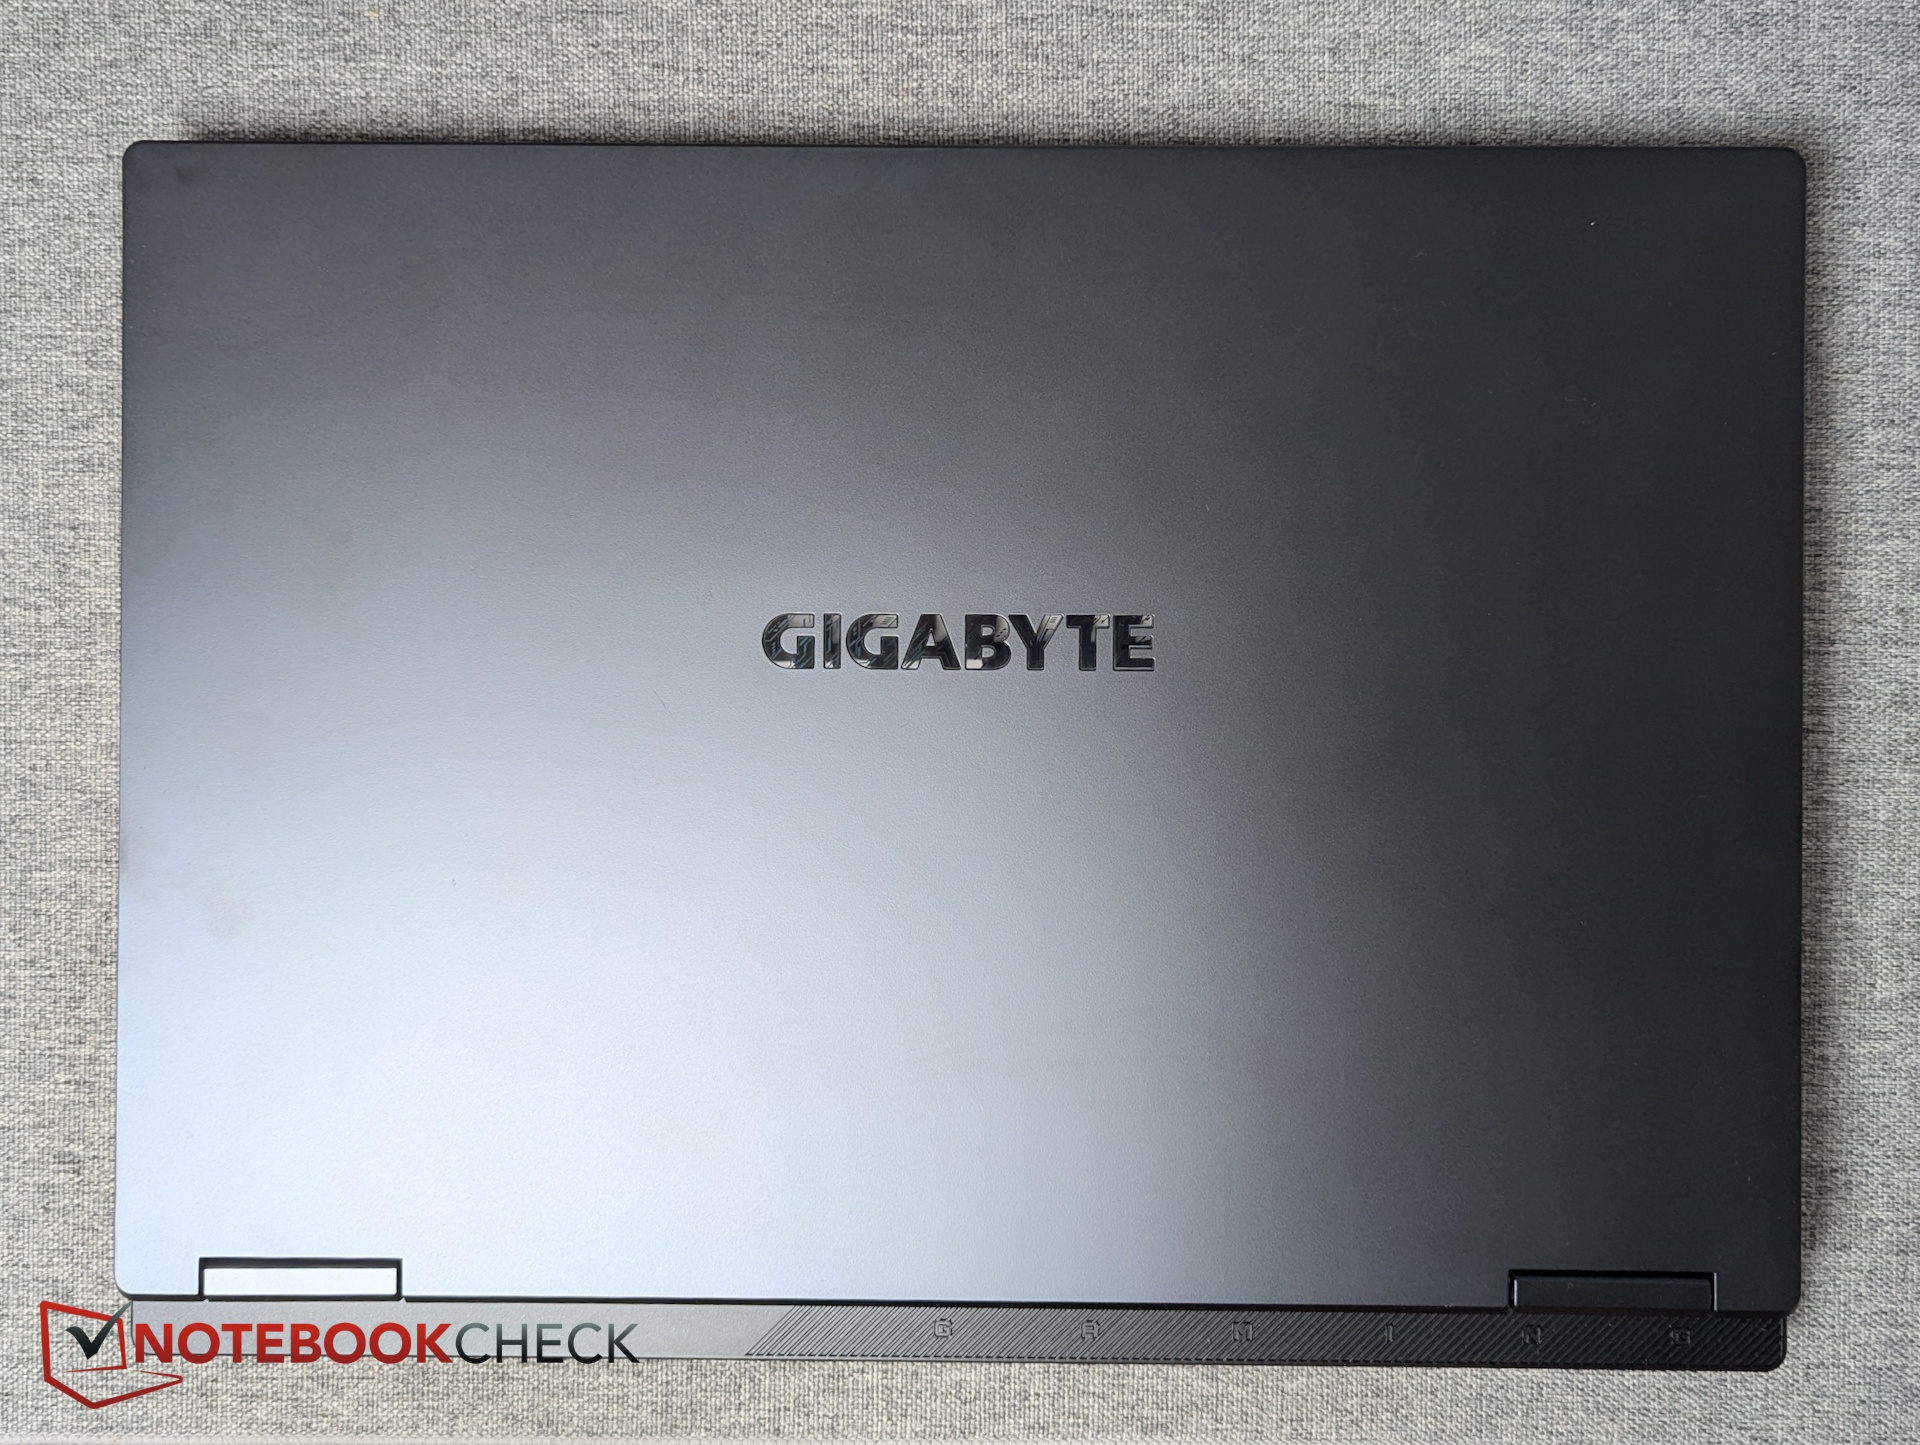
Trotz "Pro" entspricht das Design exakt dem A16 ohne "Pro". Der verwendete Kunststoff ist recht dünn, sodass sich auch die schwarze Basis inklusive Knackgeräusche verwinden lässt.
Die verspielte Unterseite ist aus besonders weichem Kunststoff, die dünnen Gitter können bei Druck die dahinterliegenden Lüfter berühren.
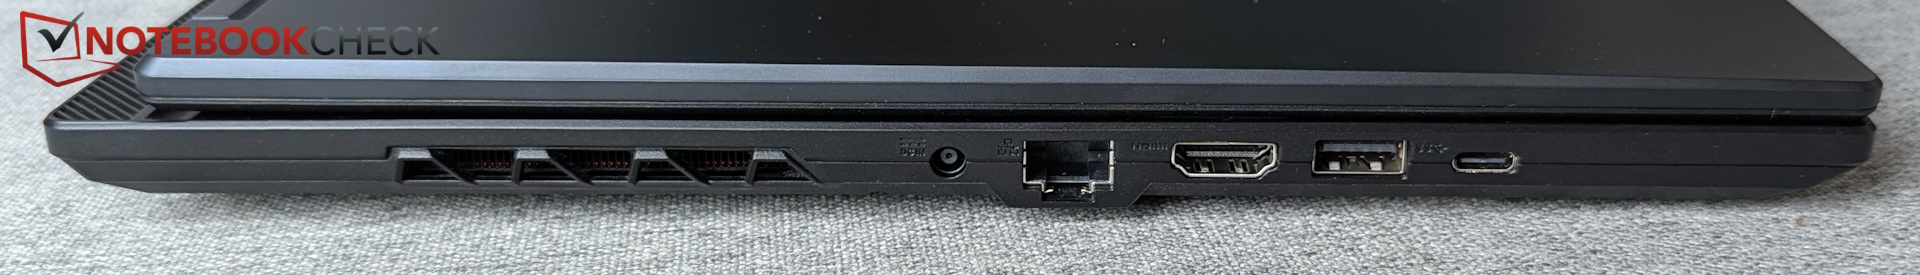
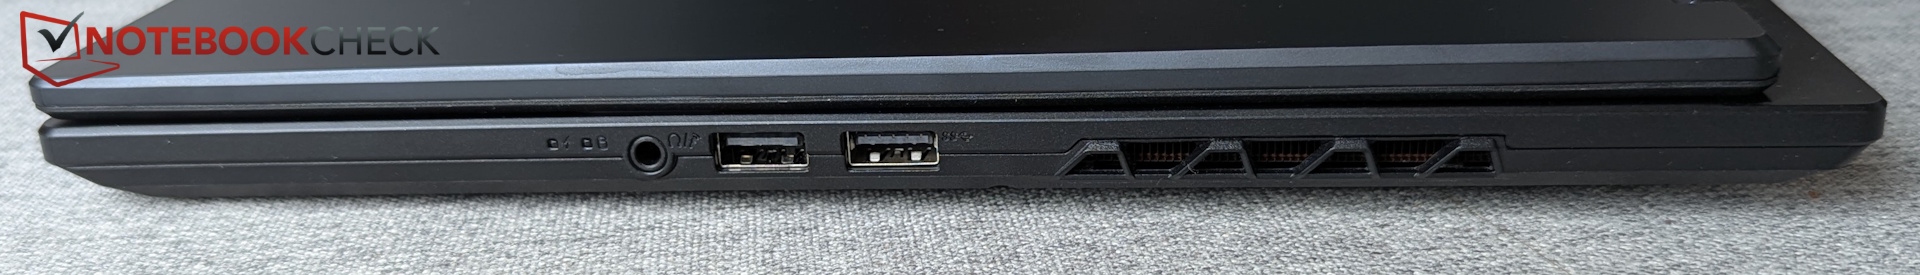
Schnittstellen
Neue Anschlüsse gibt es trotz "Pro"-Label nicht, sondern weiterhin USB 2.0, aber weder Thunderbolt, USB 4 oder wenigstens 3.2 Gen 2.
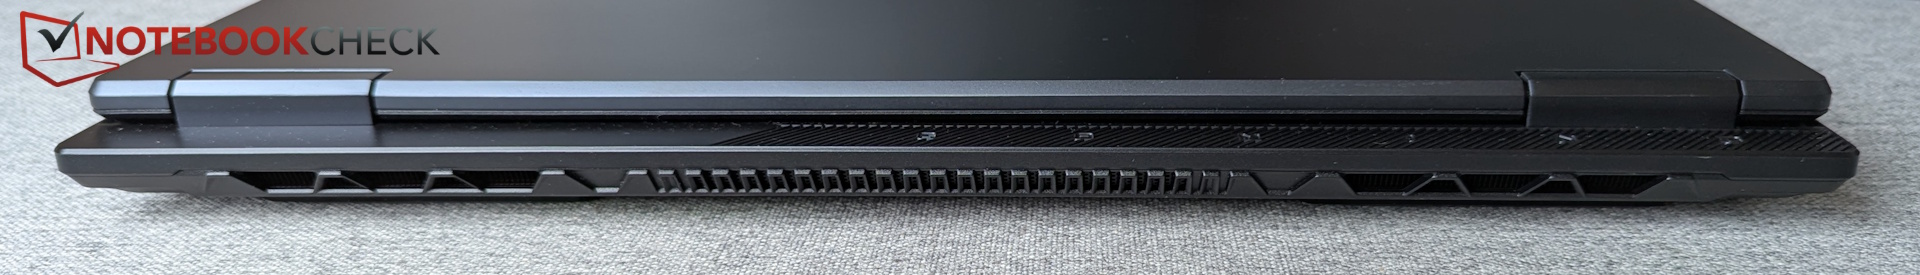
Hinten gibt es keine Ports und durch die seitlichen Luftausgänge liegen alle Anschlüsse recht weit vorne, was der Maushand in die Quere kommen kann.
Webcam
Die Farbabweichungen der FHD-IR-Webcam mit Windows-Hello-Support (ohne Shutter) sind recht hoch, die Schärfe geht in Ordnung.

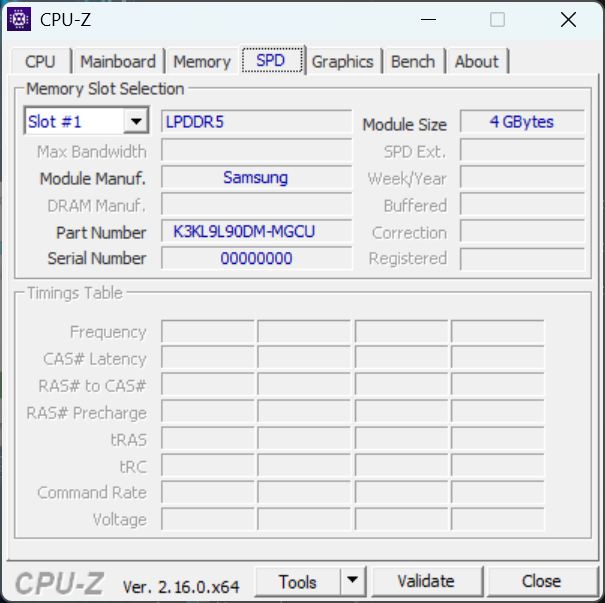
 GeForce RTX 5070 Ti Laptop, Core 7 240H, Samsung PM9C1b MZVL81T0HFLB-00BTW")
 GeForce RTX 5070 Ti Laptop, Core 7 240H, Samsung PM9C1b MZVL81T0HFLB-00BTW")
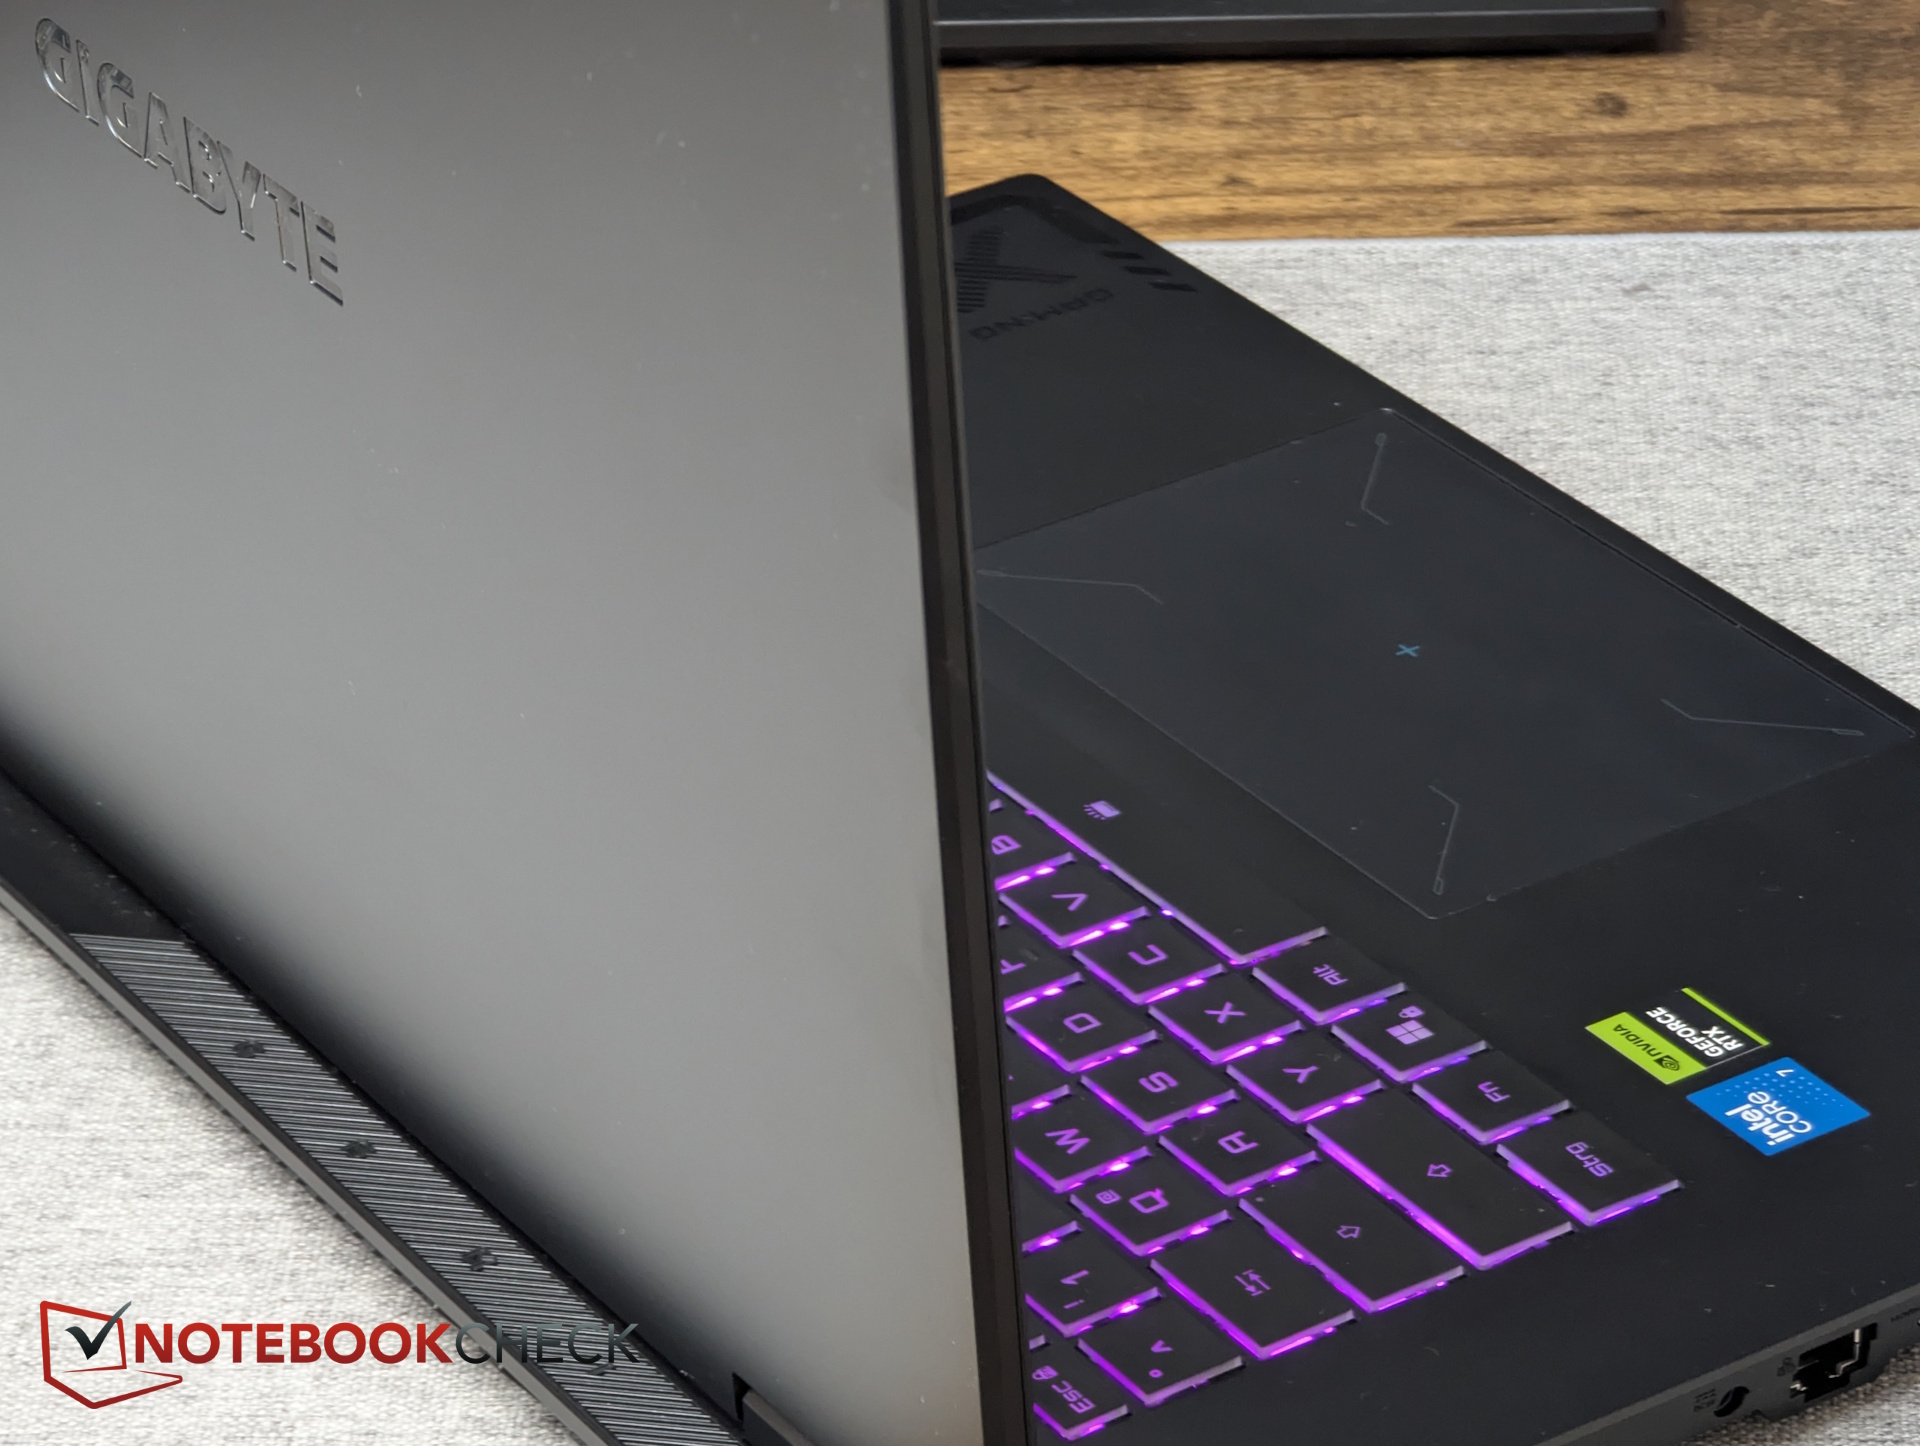
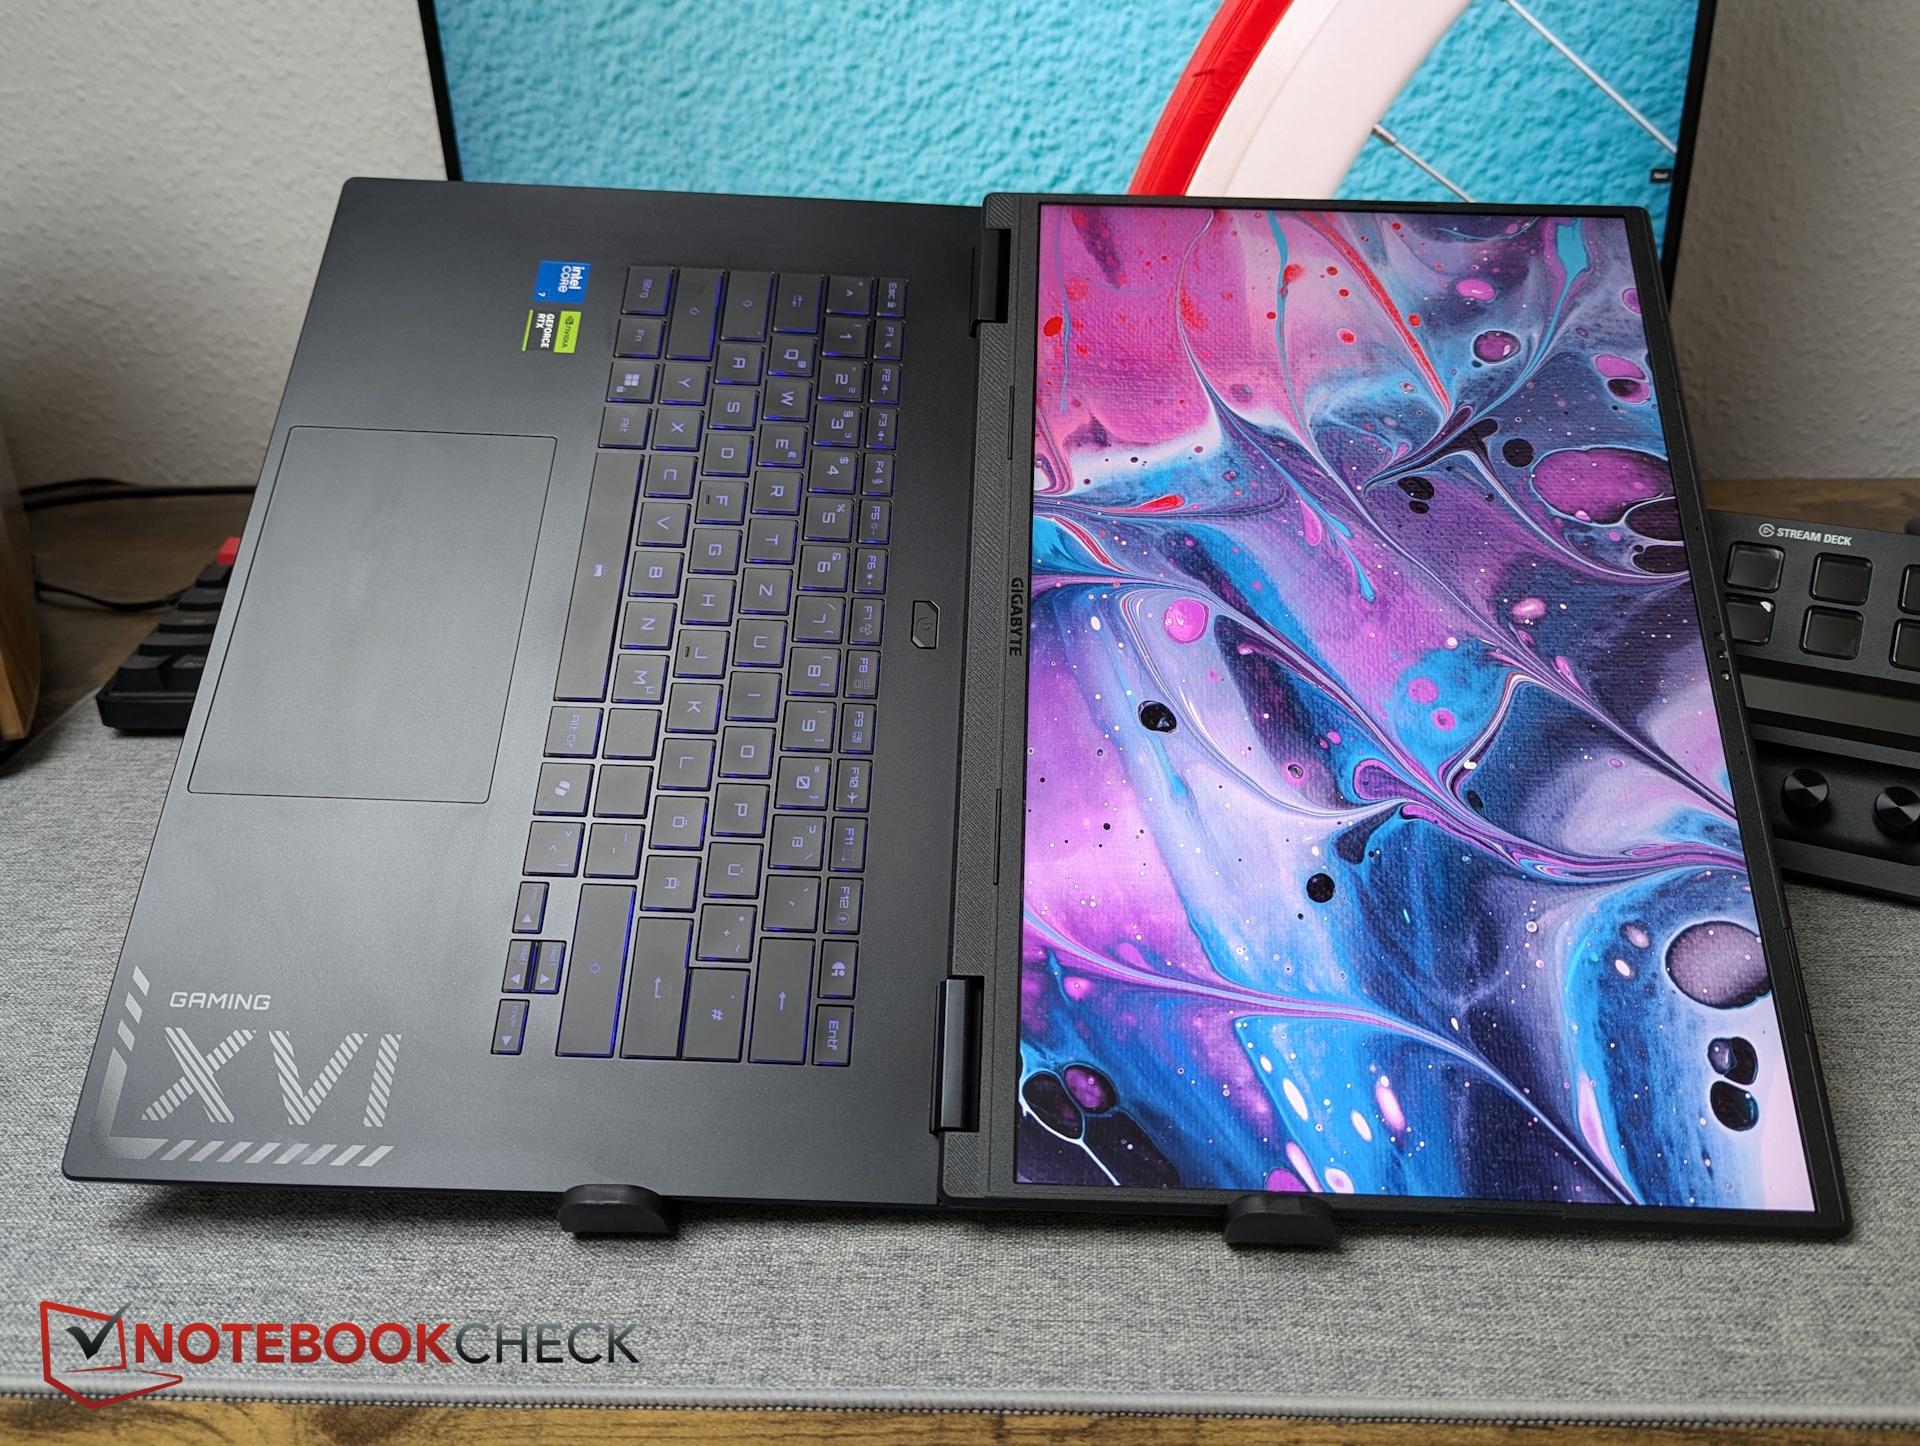
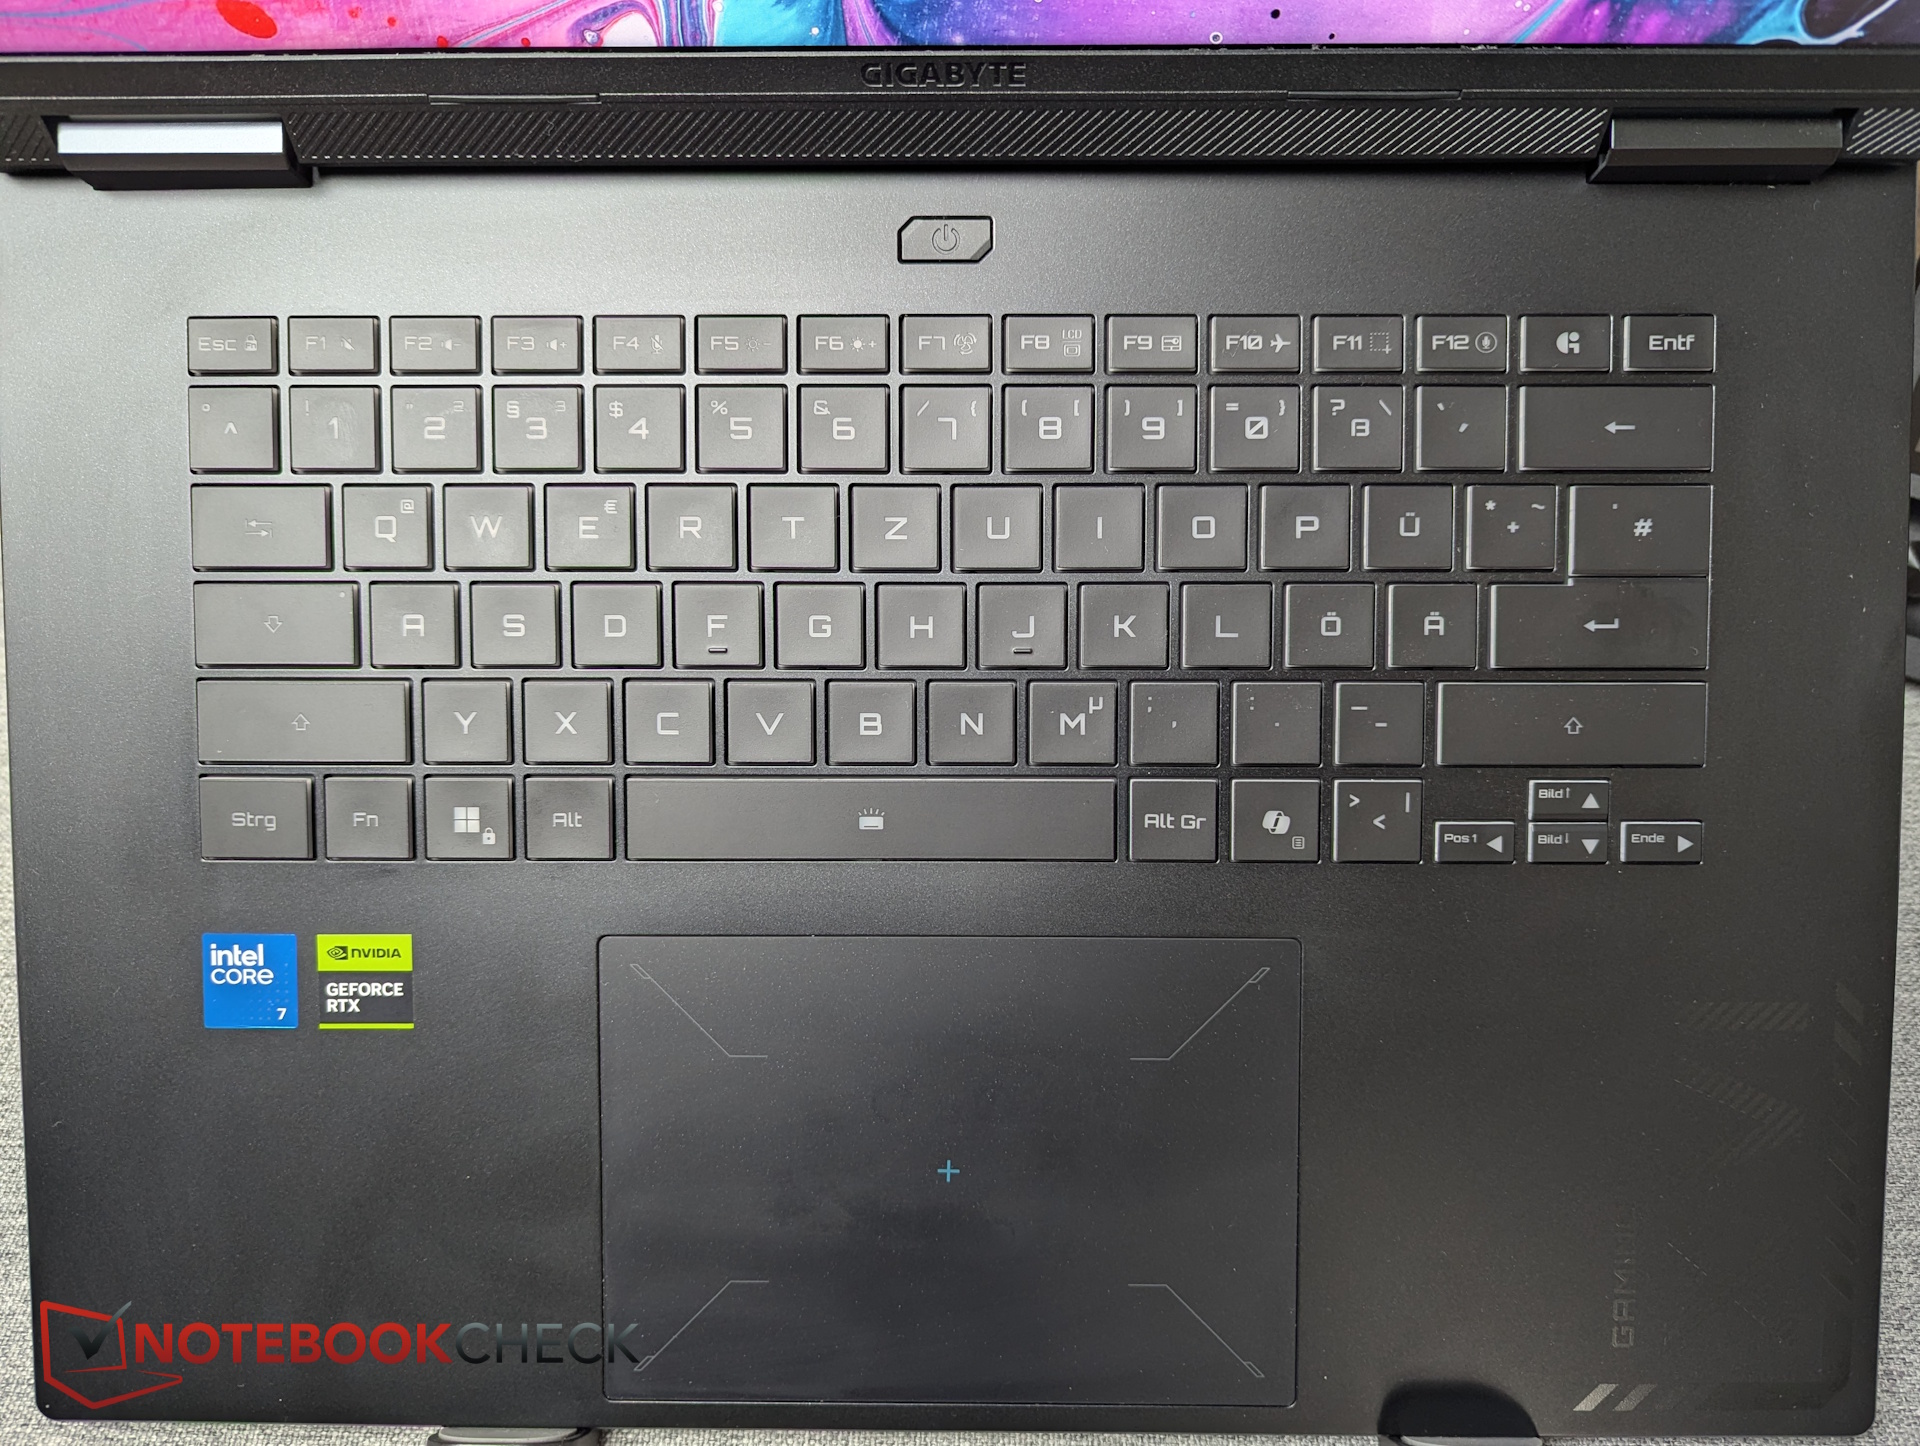
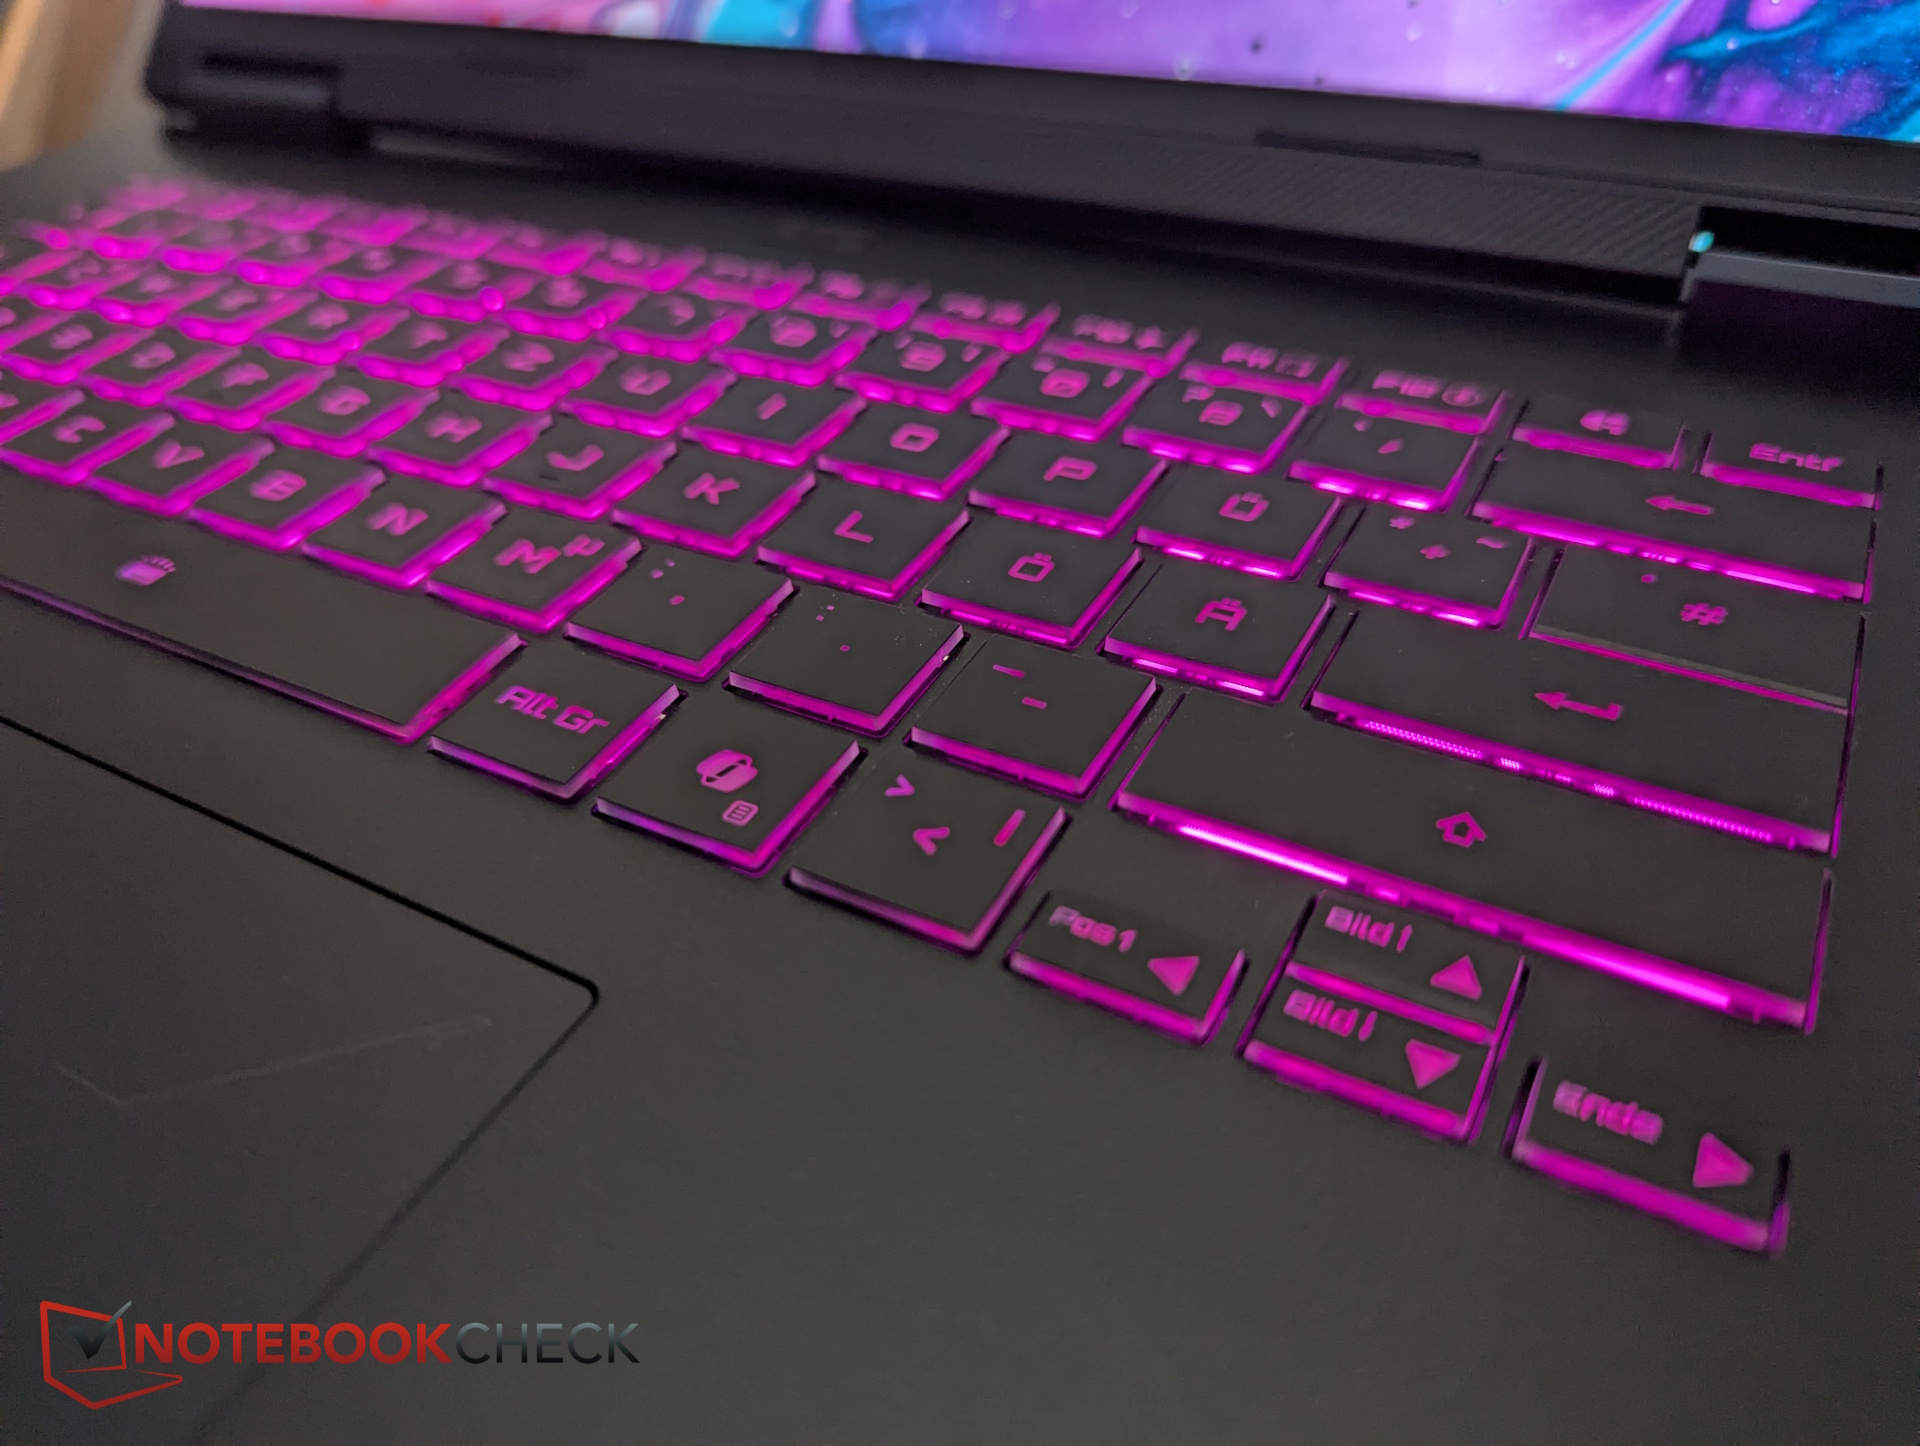
Eingabegeräte - Solides Tippen und Wischen
Ein Numpad bietet das A16 Pro nicht, dafür wirkt das Layout gut aufgeräumt. Nur die Pfeiltasten sind sehr klein geraten.
Der Tastenhub ist nicht zu knapp, das Feedback dürfte aber etwas knackiger sein (so wie bei der Leer- und Entertaste). Dennoch gelingt das Tippen flott und bei gemäßigtem Geräuschpegel.
Mit ca. 13,3 x 9 cm ist das Touchpad von gutem Ausmaß, die integrierten Tasten lösen zuverlässig mit gutem Feedback und bei mittlerer Lautstärke aus.
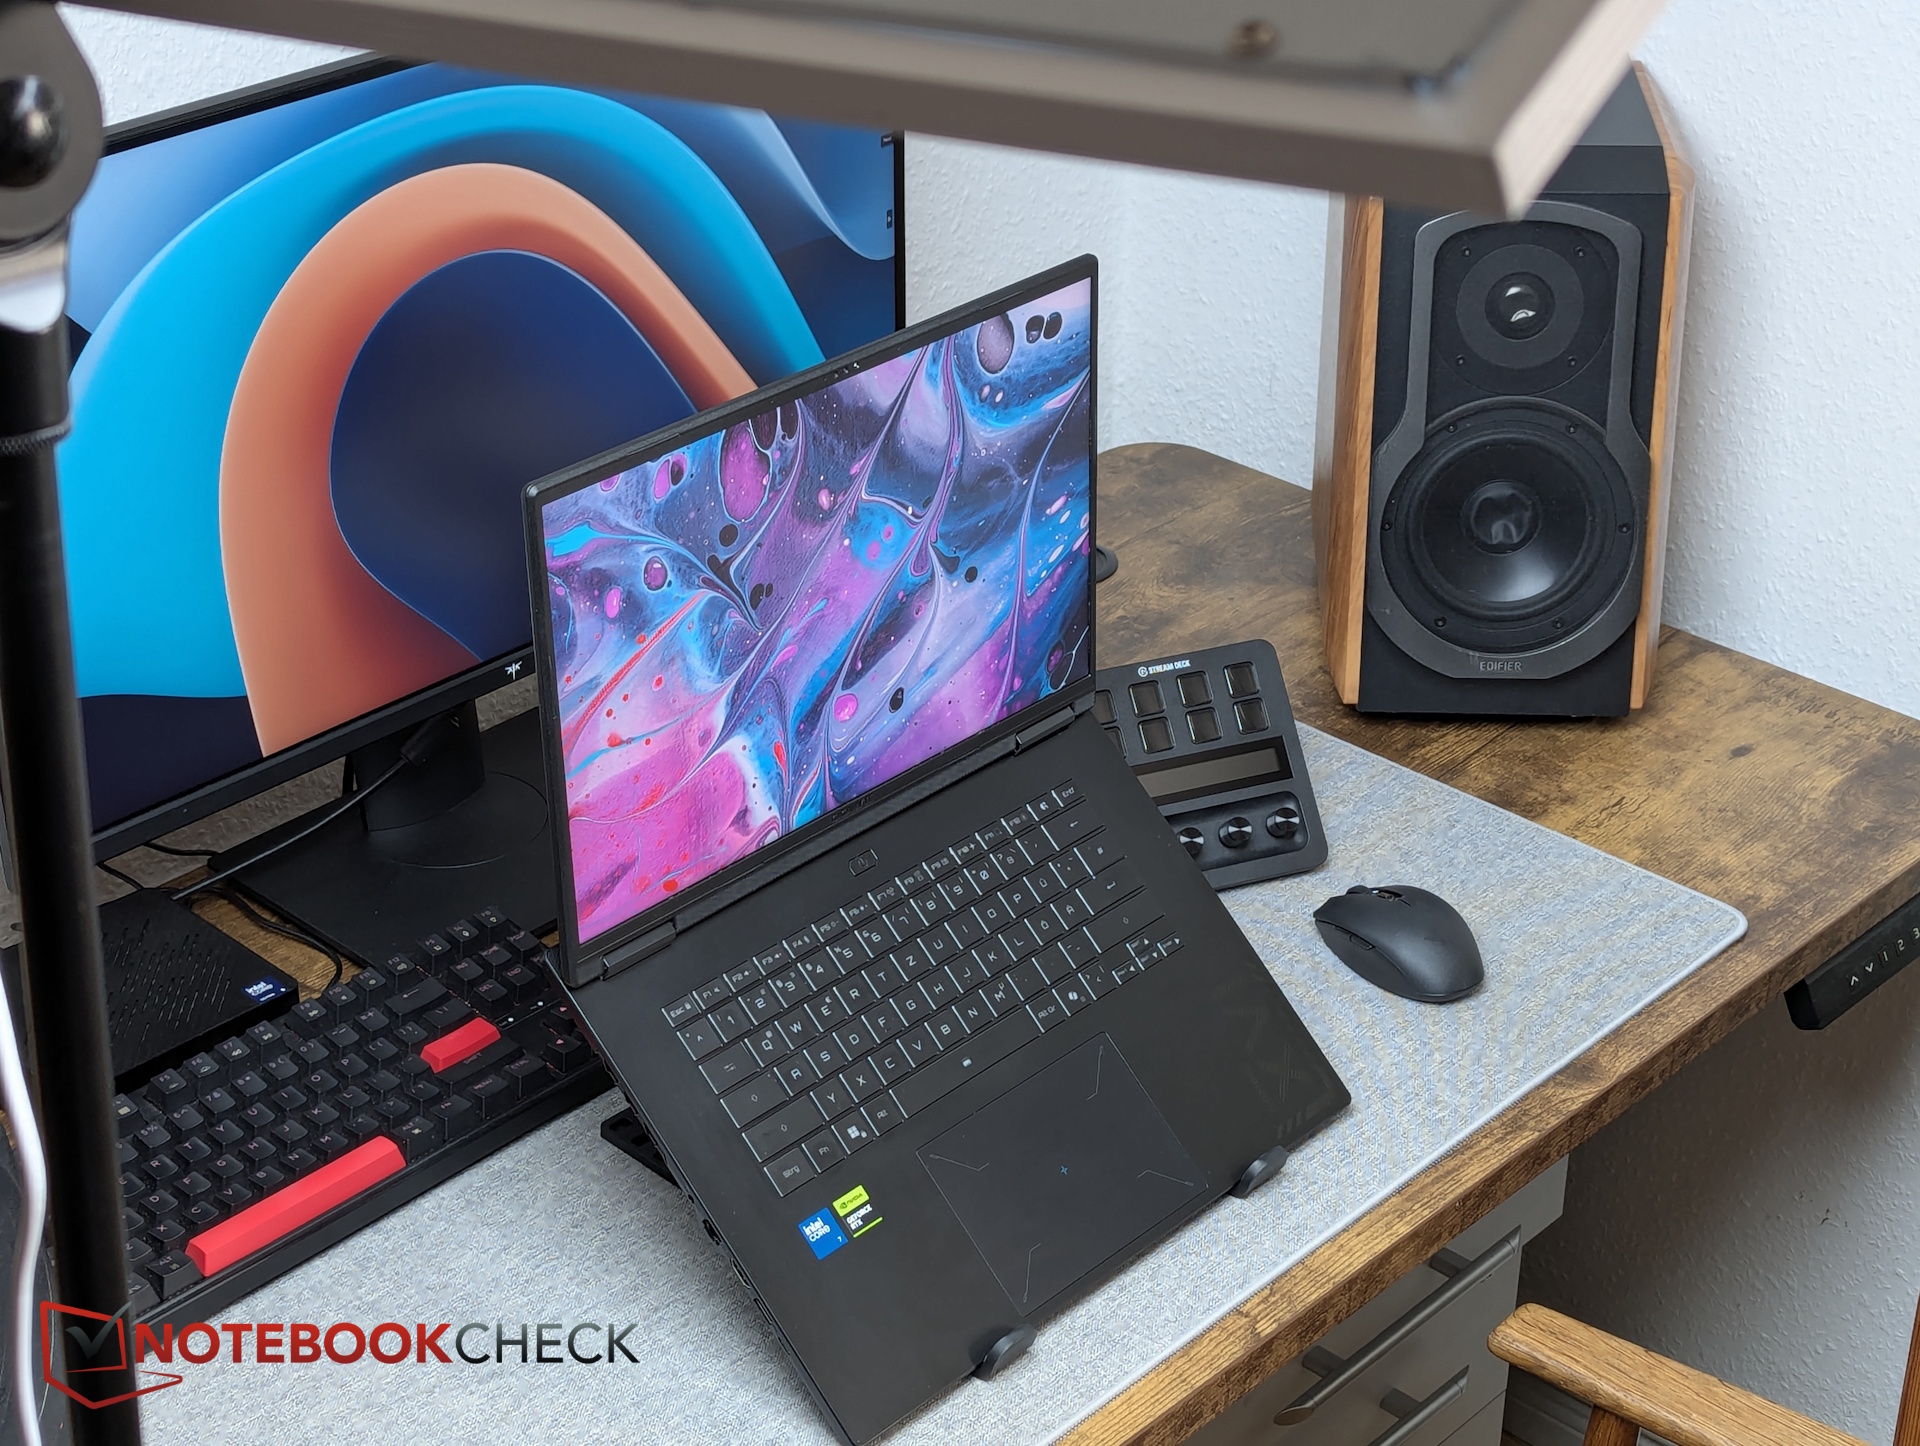
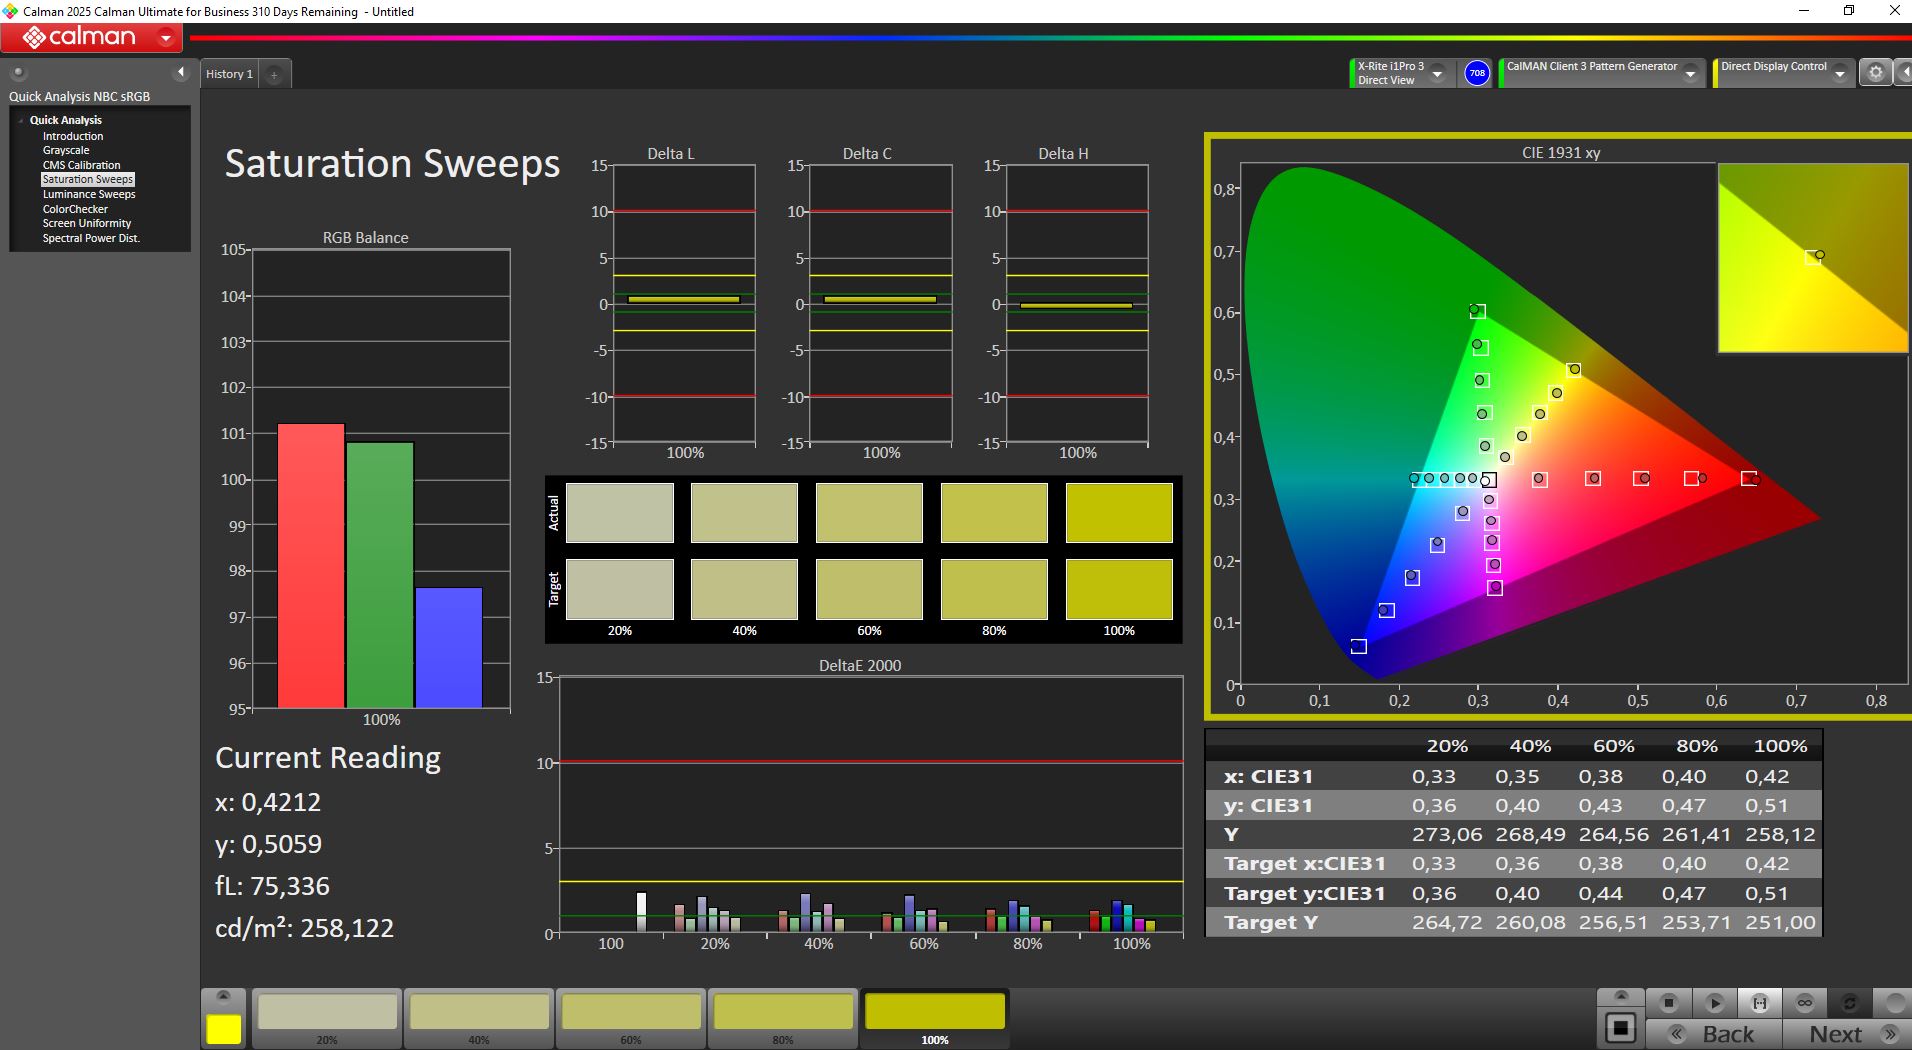
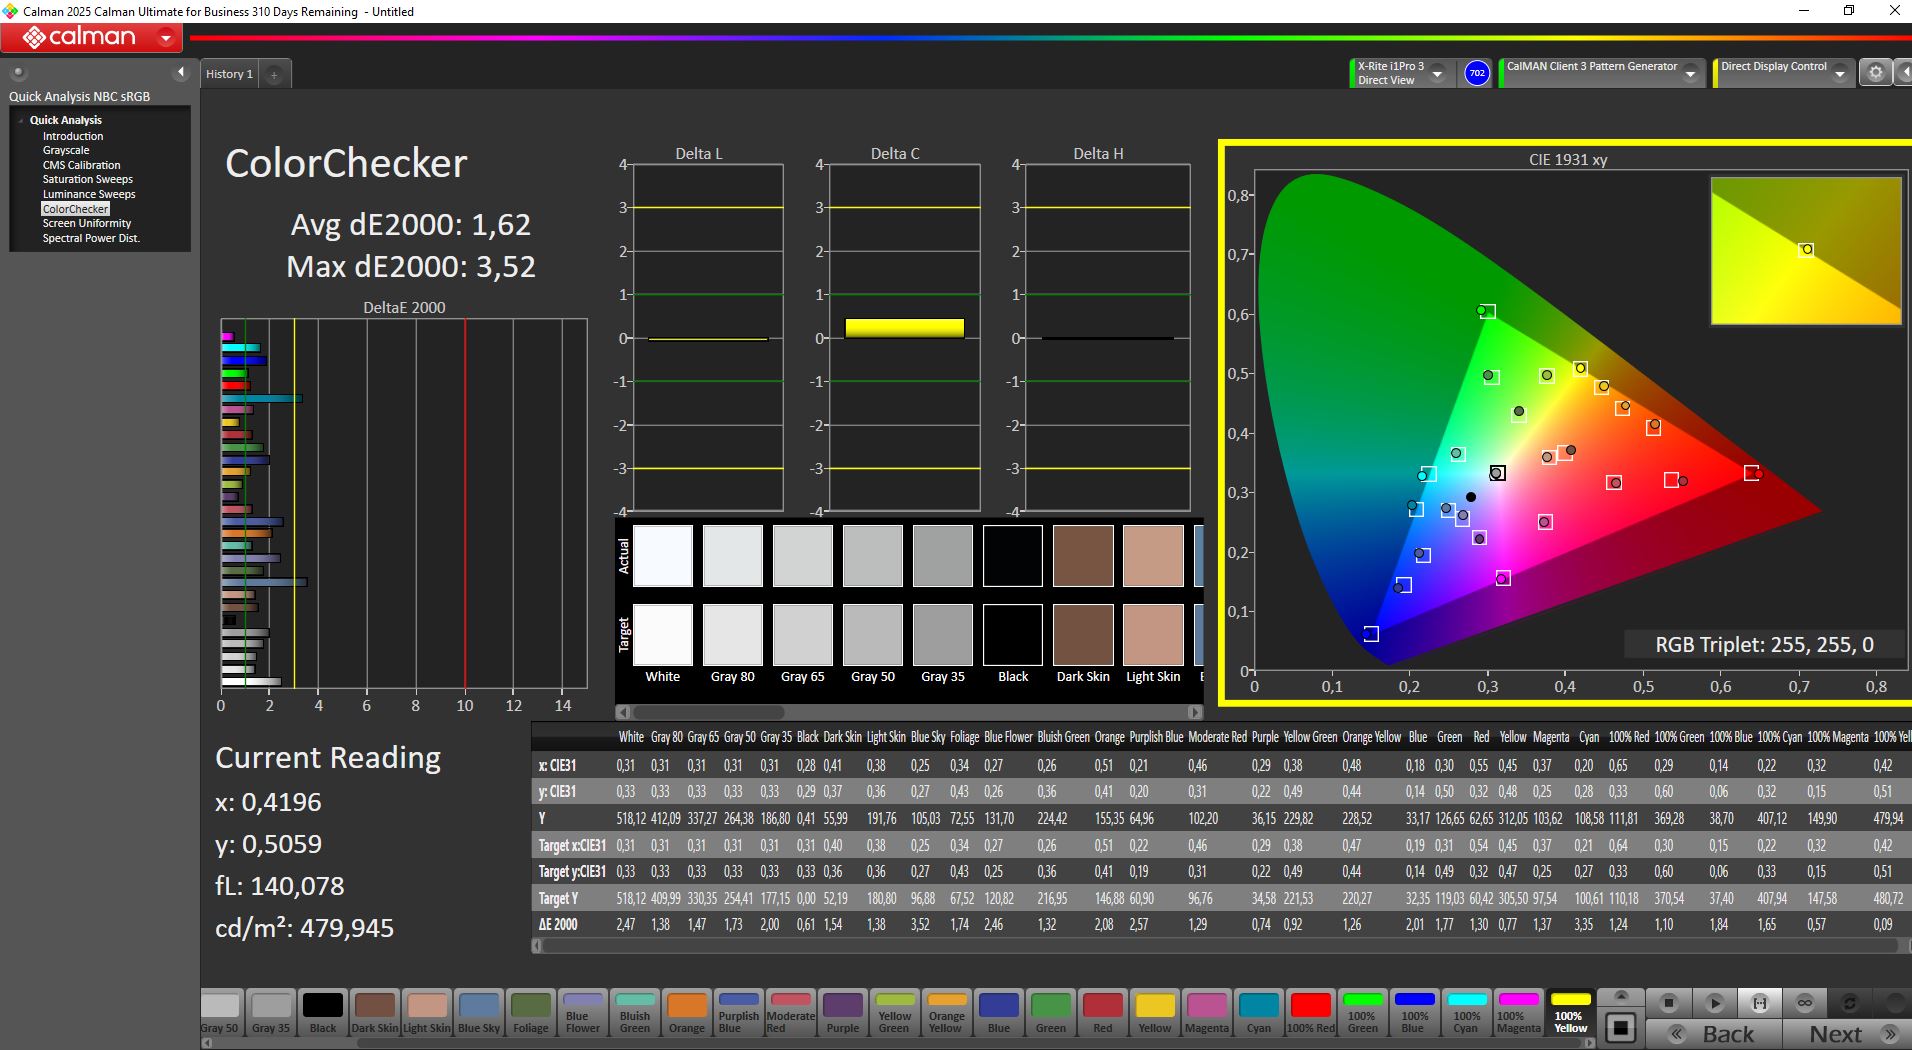
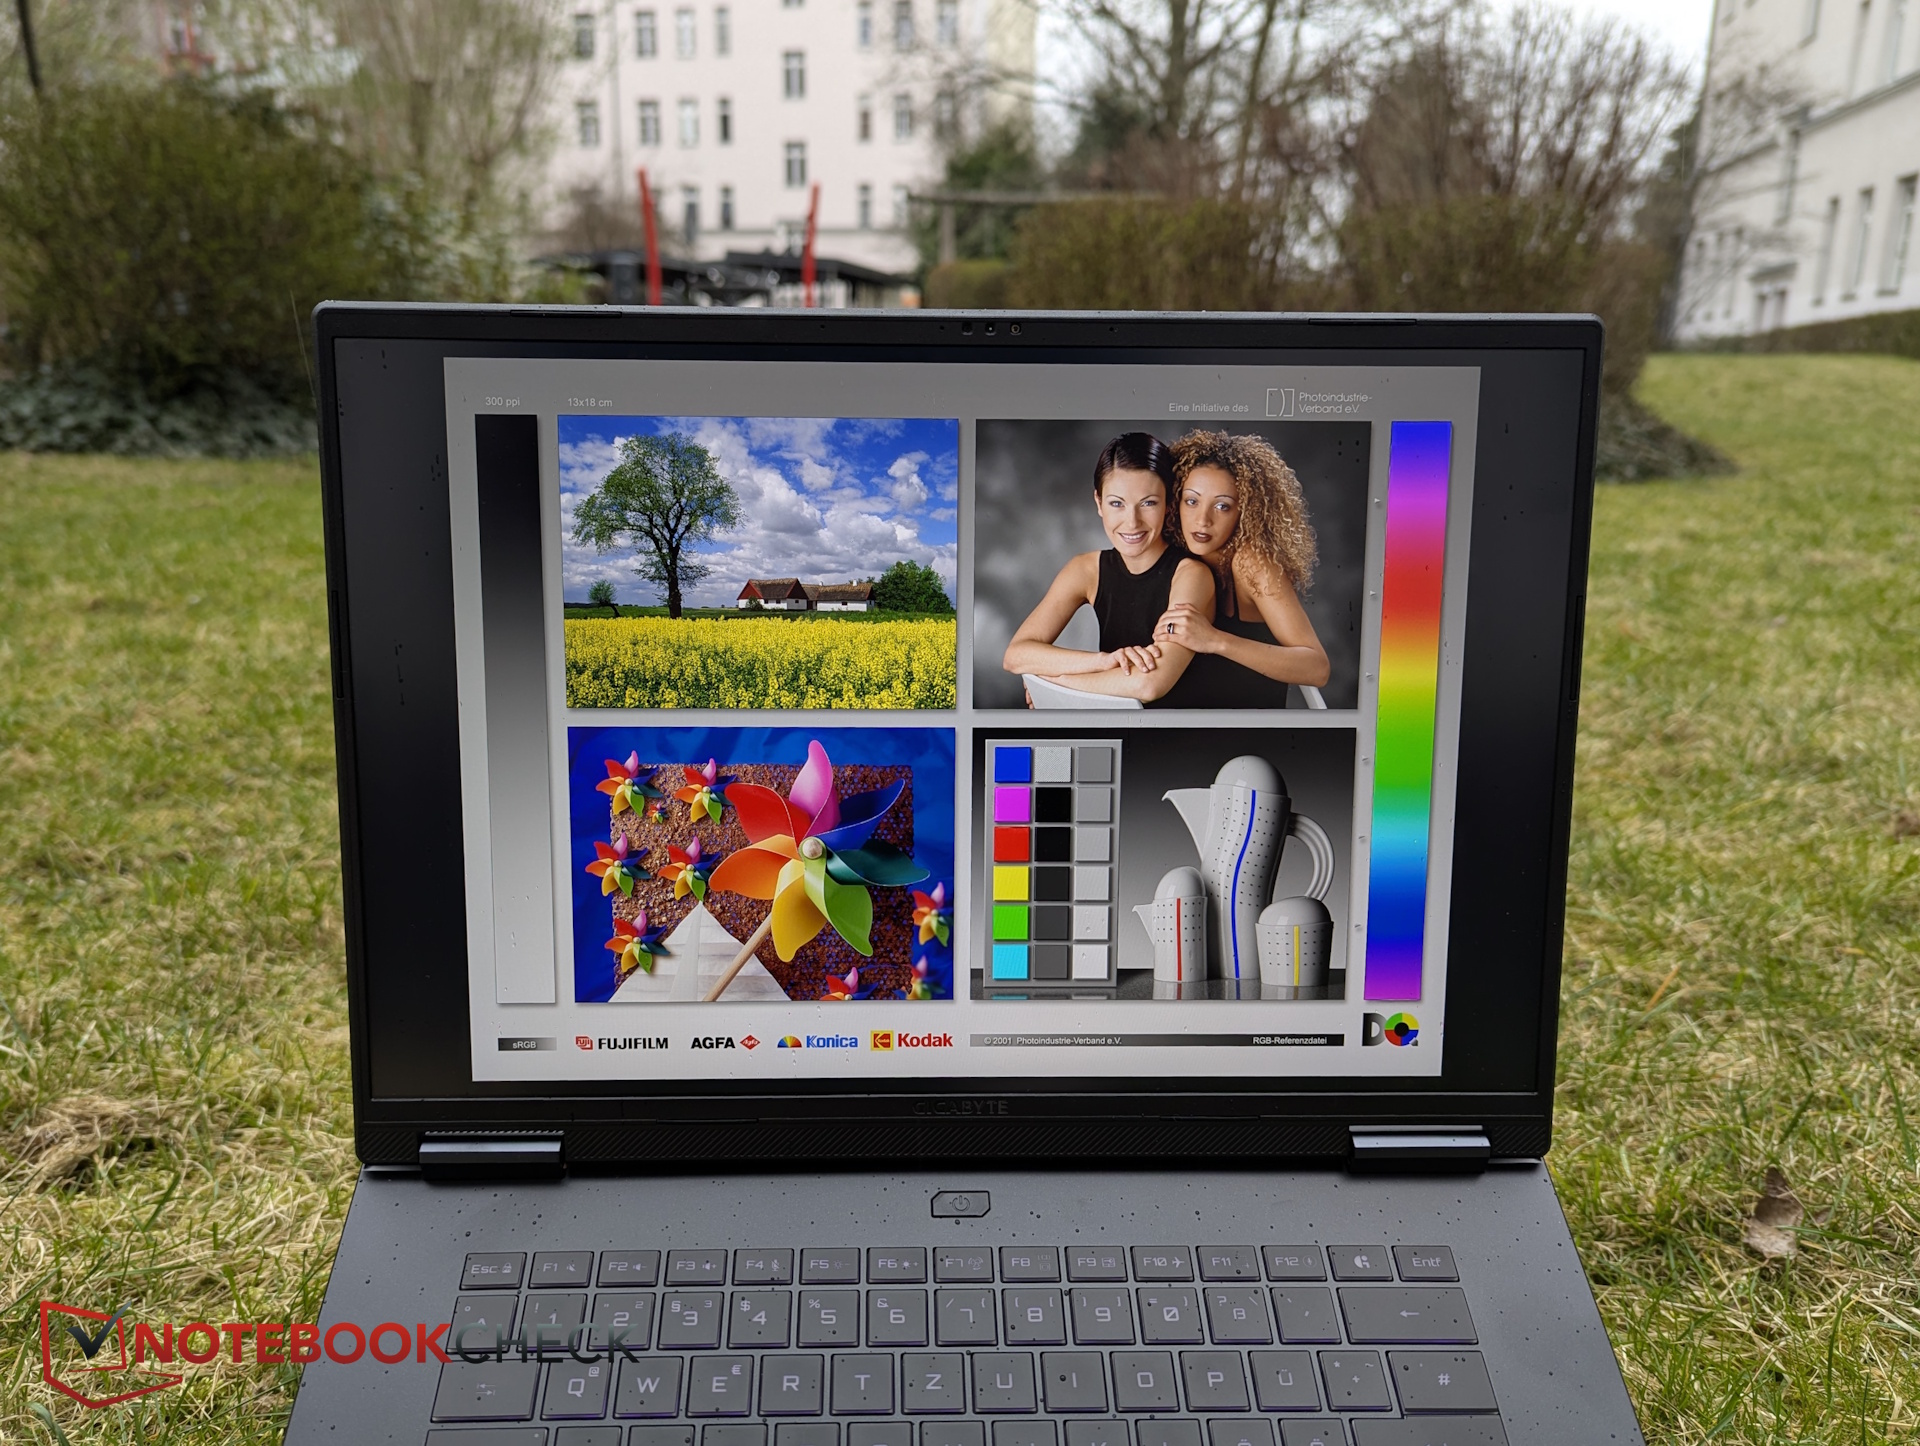
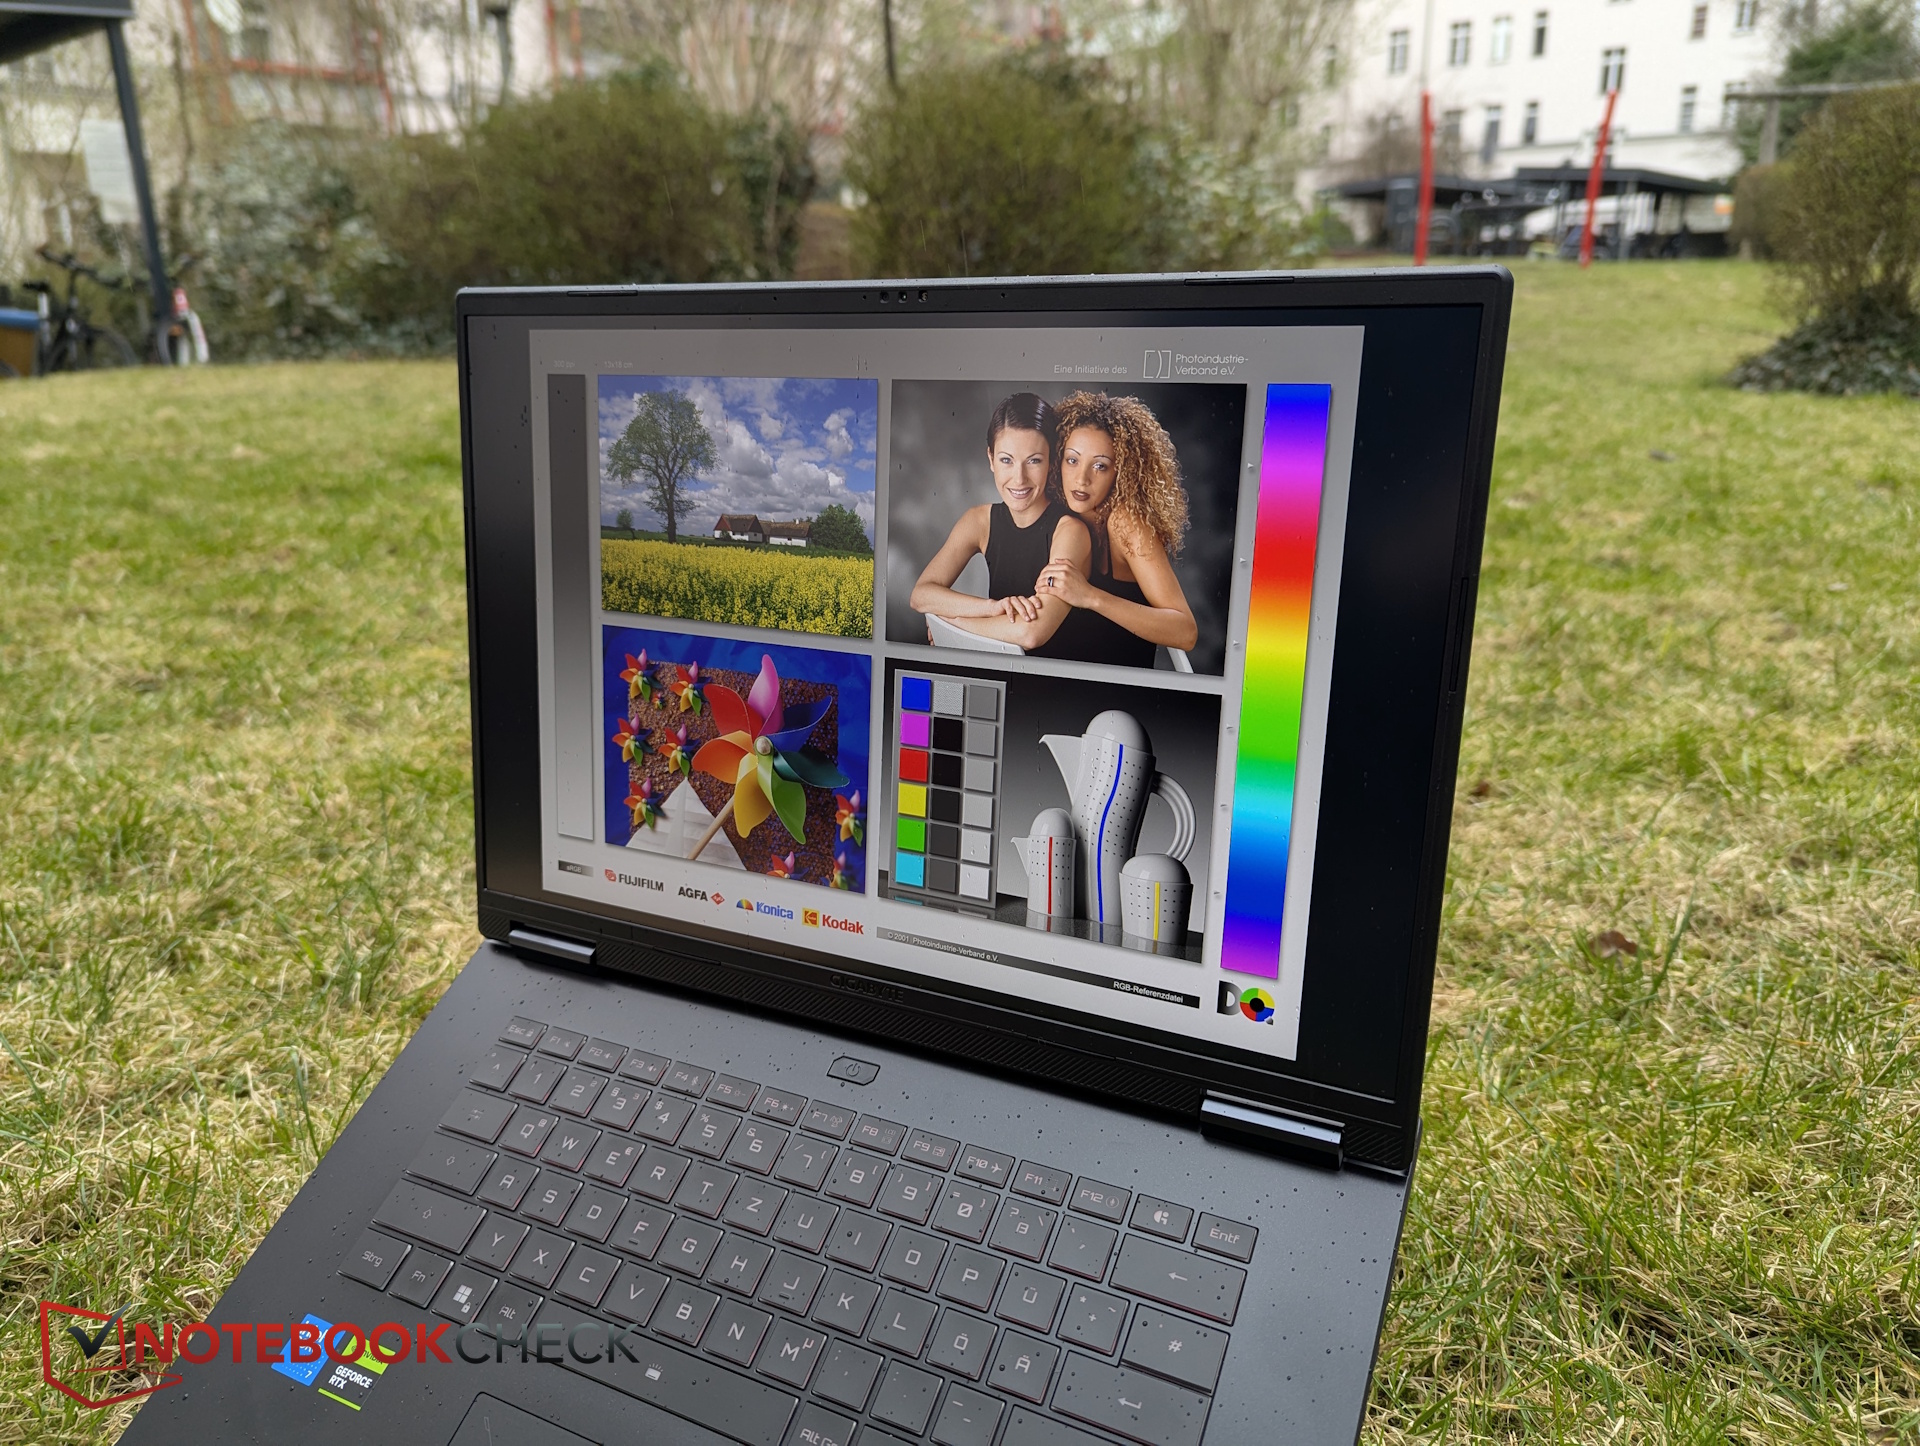
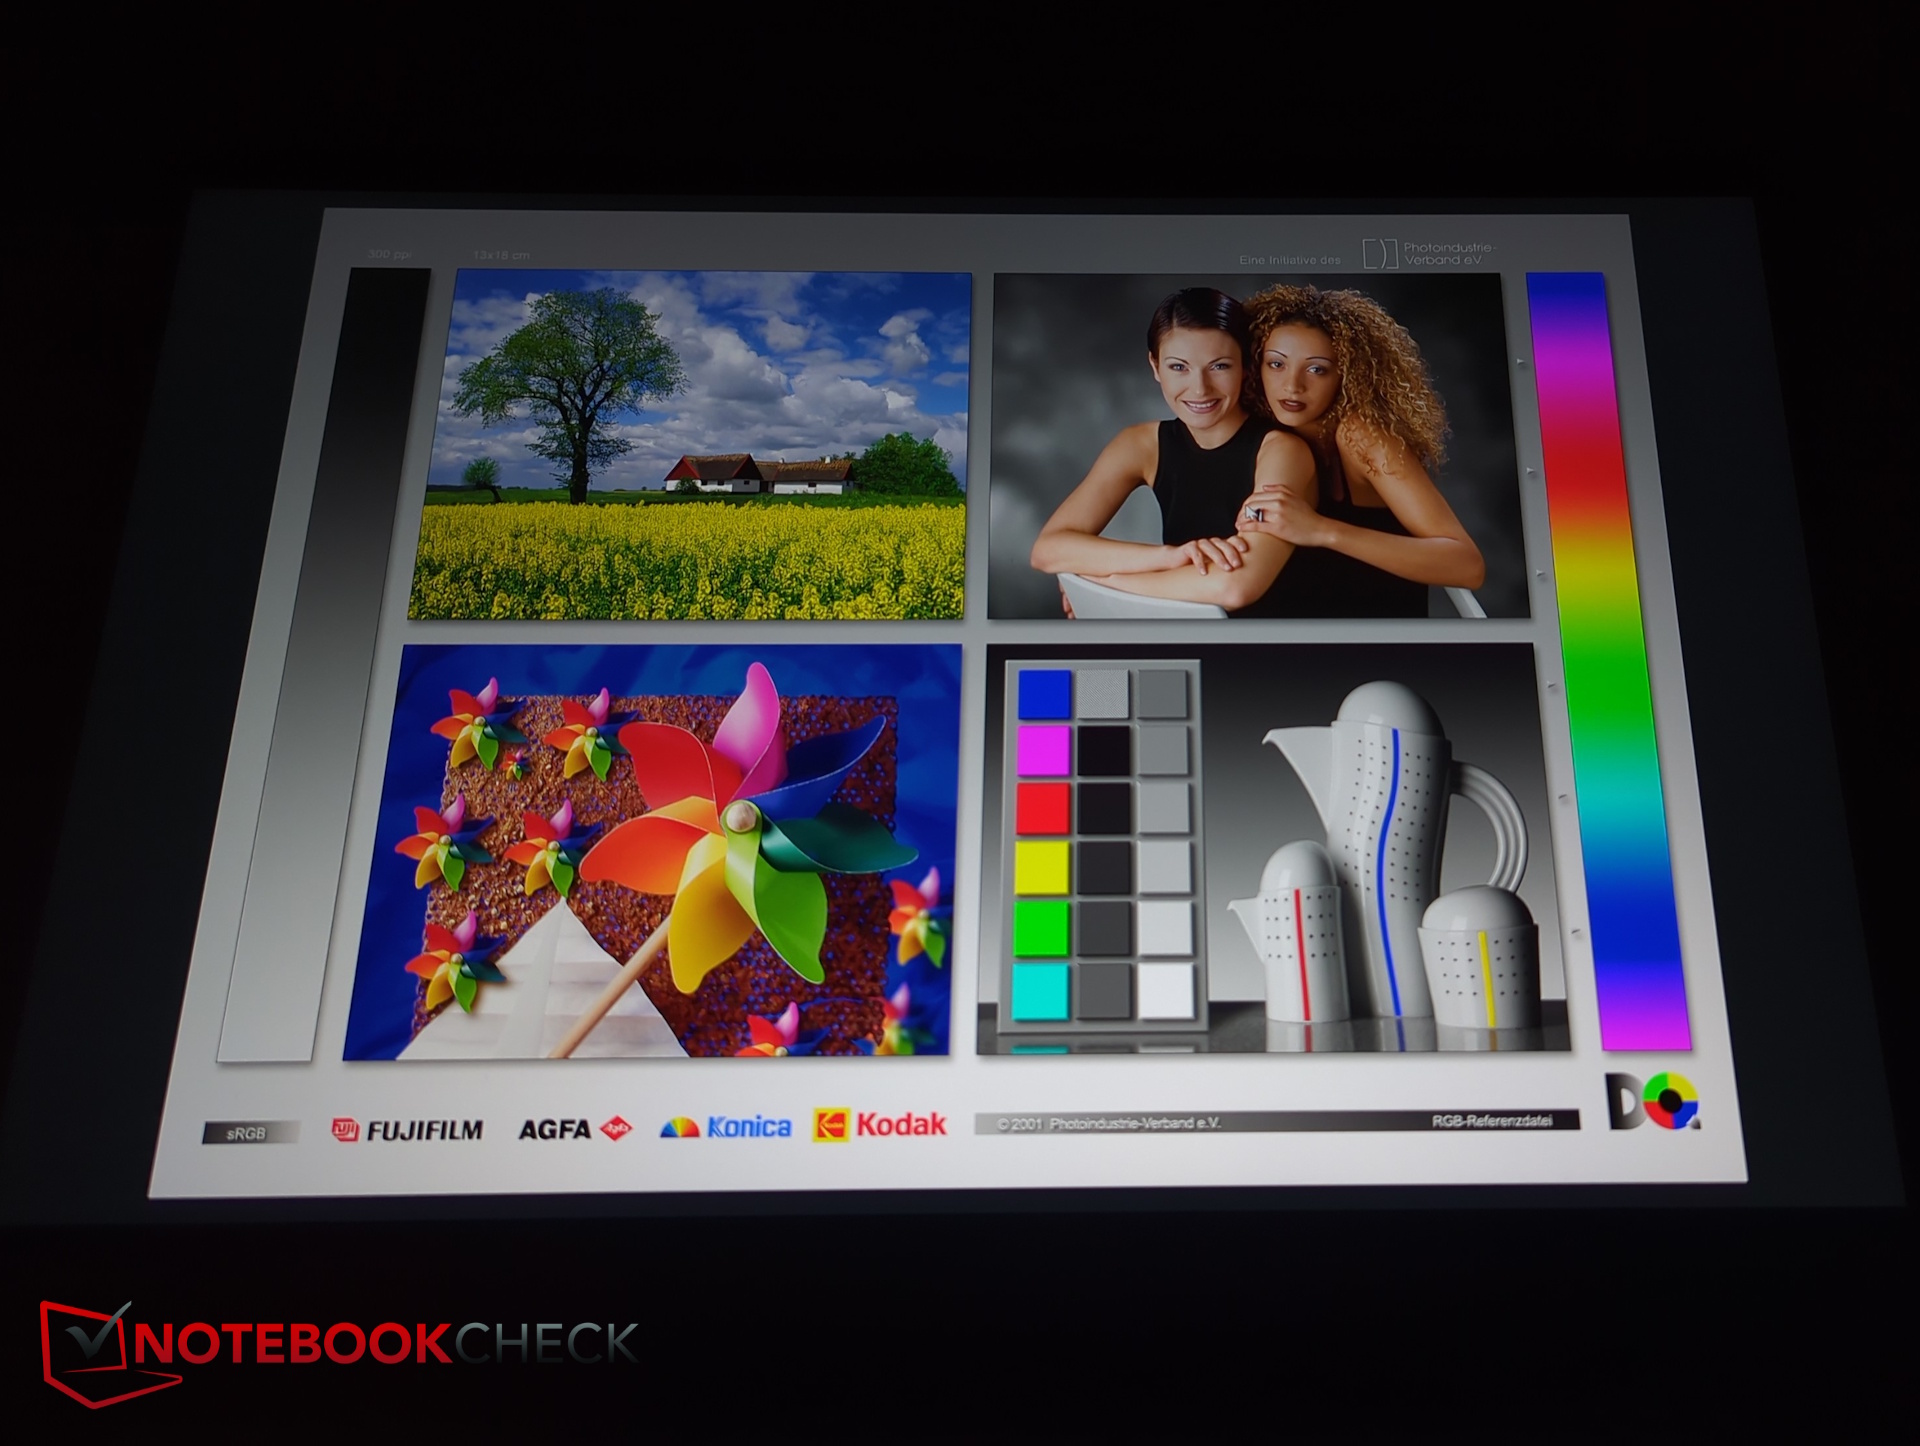
Display - 500-Nits-WQXGA mit sRGB
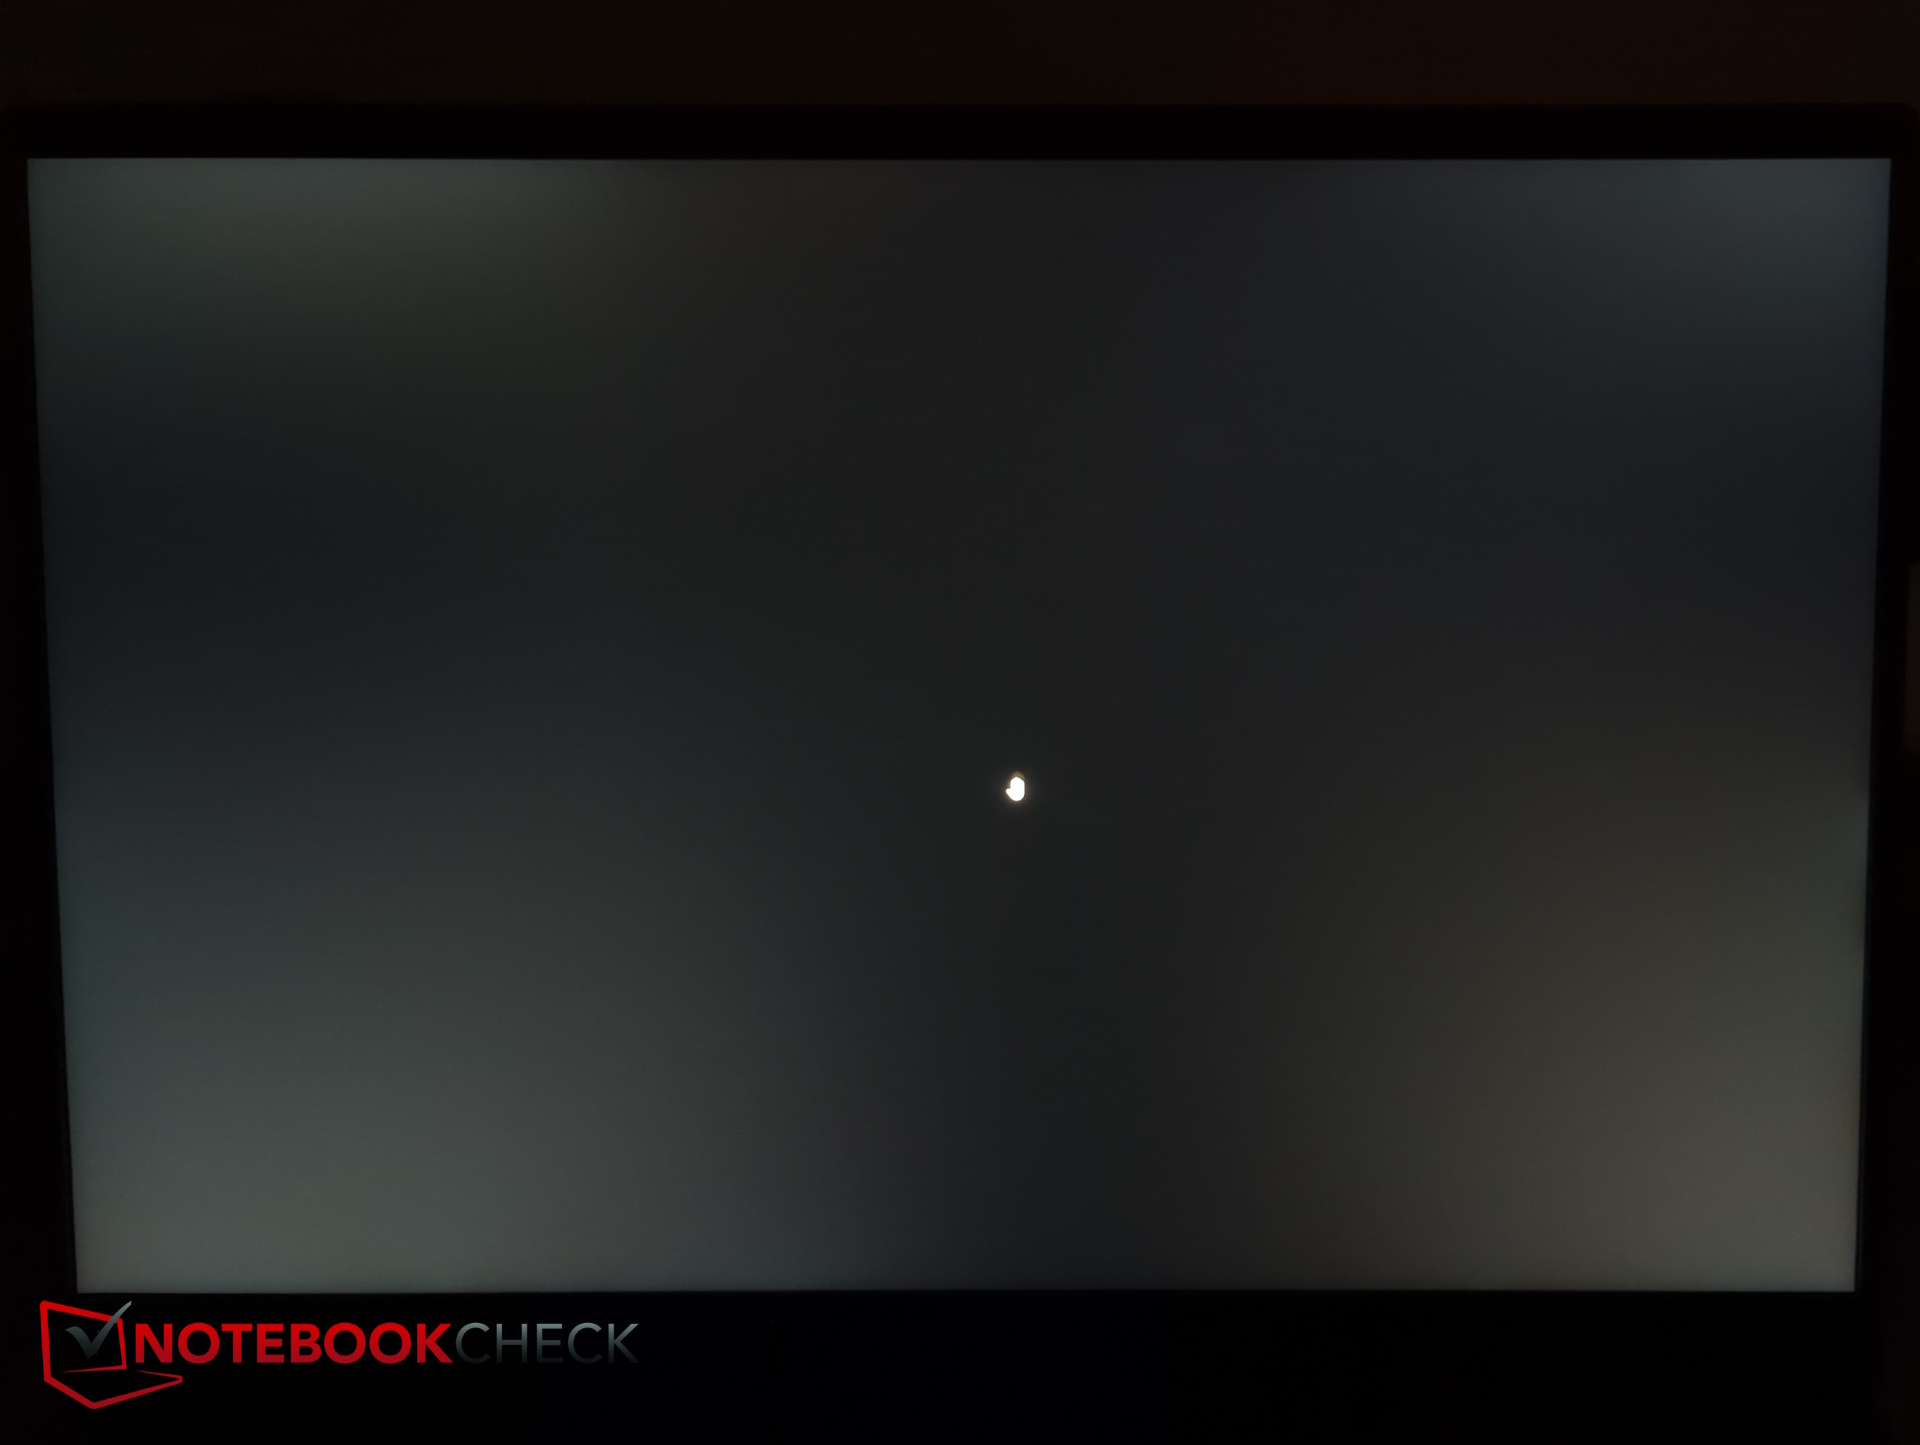
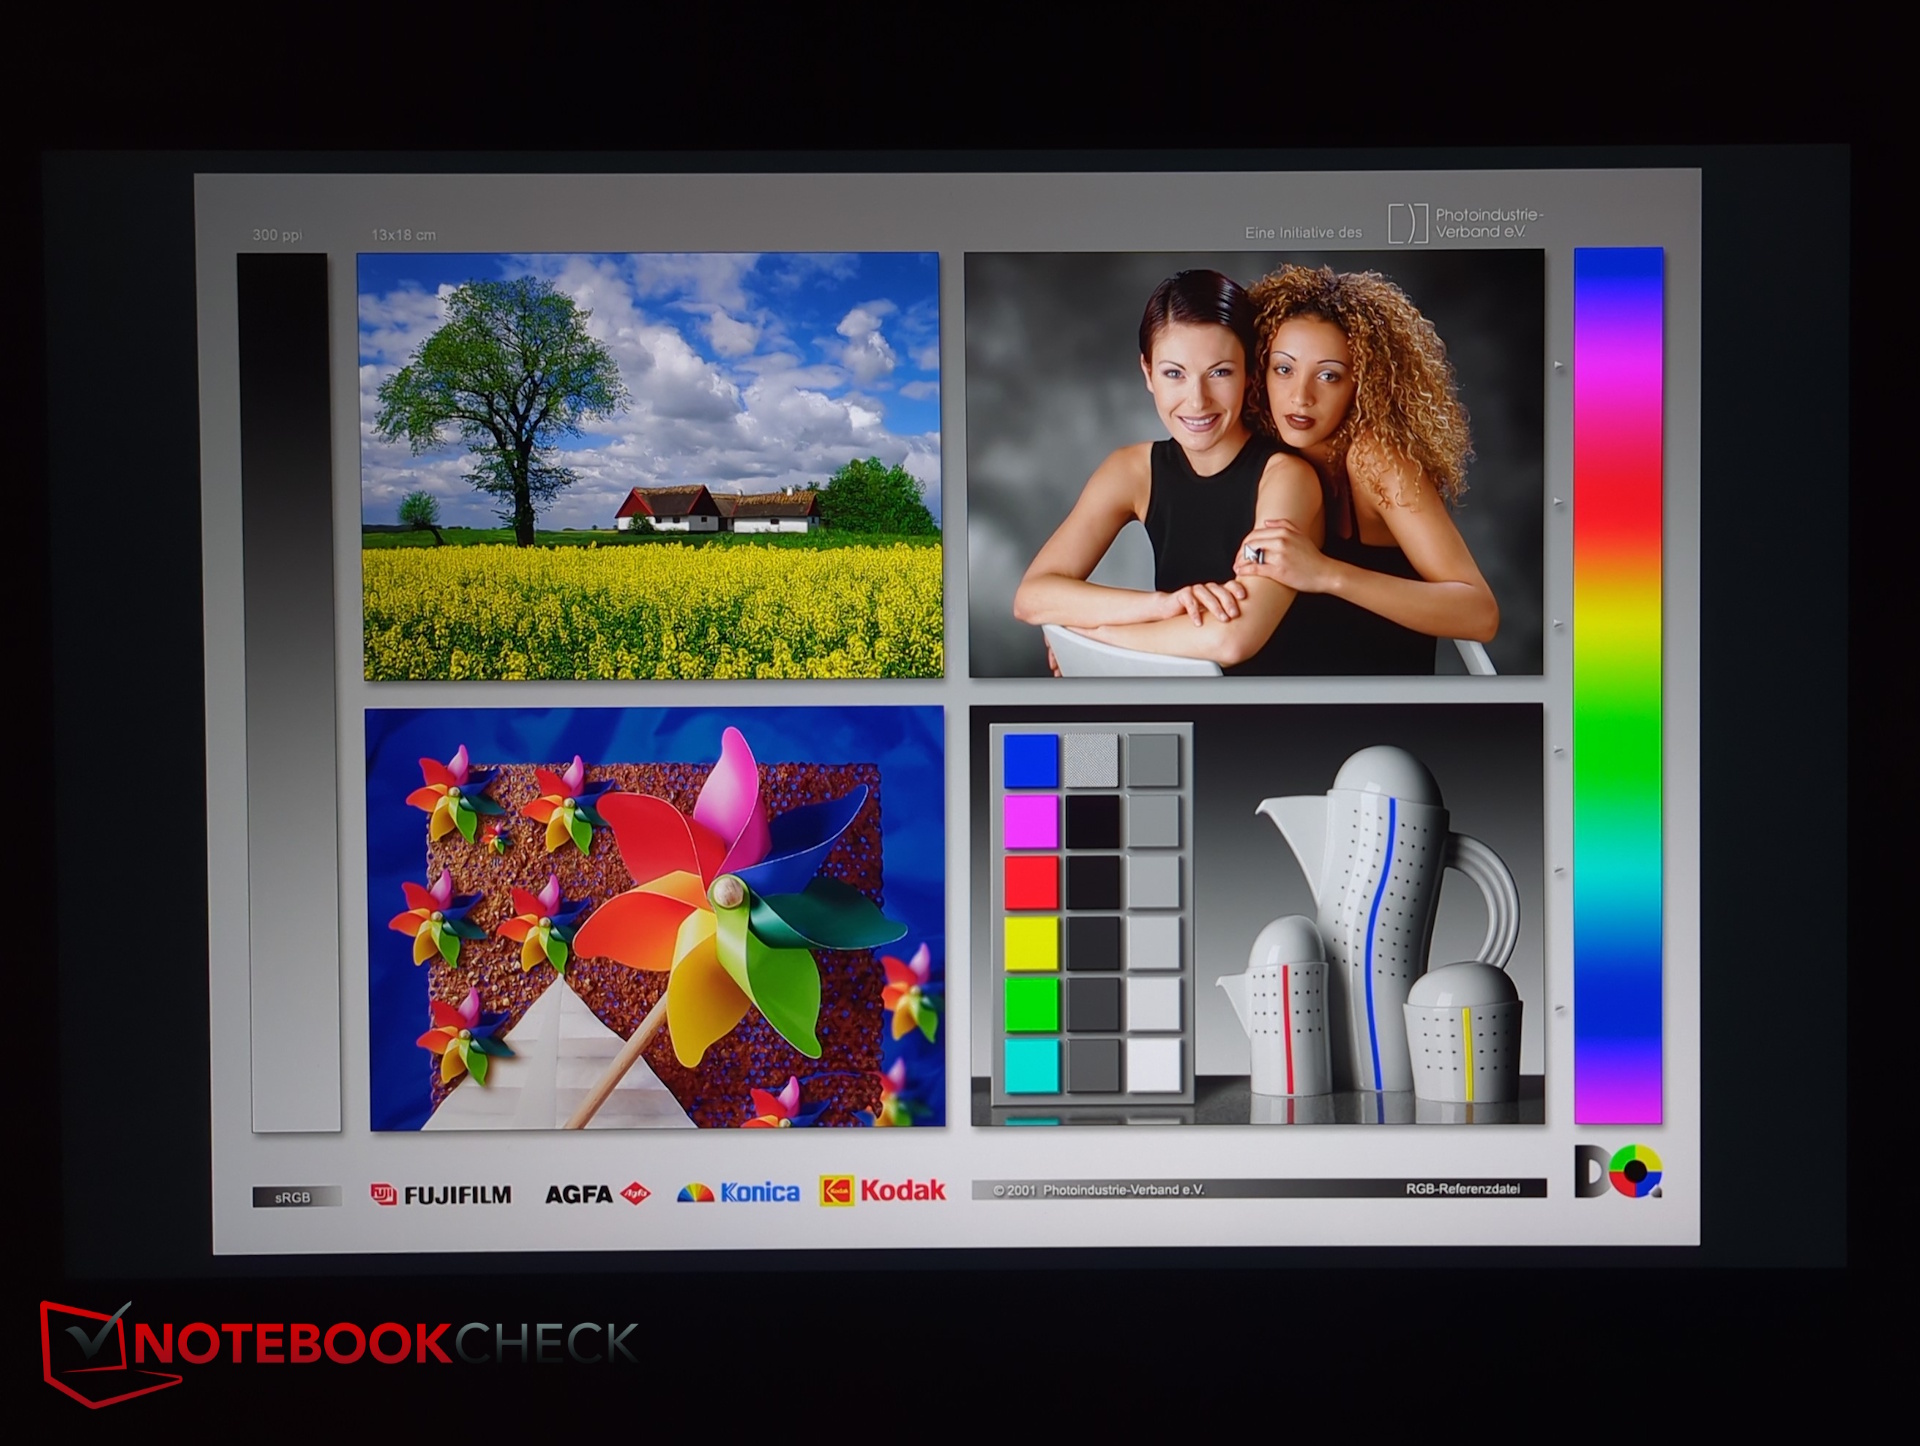
Das matte IPS-Panel (2.560 × 1.600) mit 165 Hz und sRGB leuchtet mit knapp unter 500 Nits. Der Schwarzwert ist etwas zu hoch, die Kontraste dennoch beachtlich. Alternative Displayoptionen gibt es nicht.
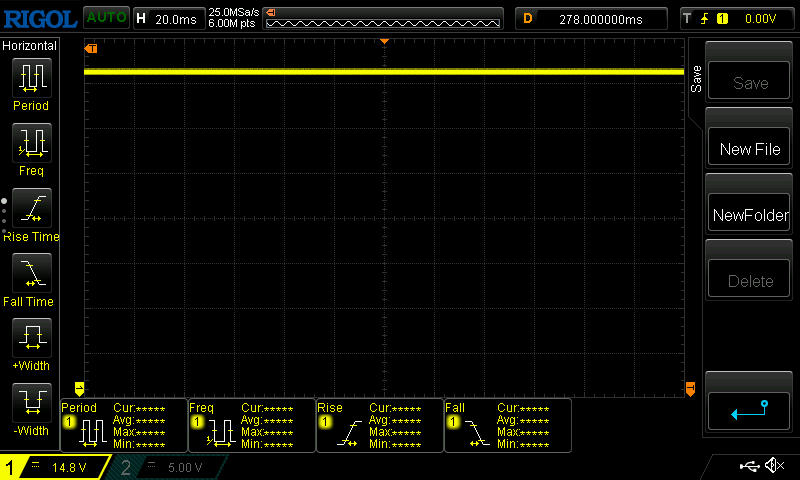
PWM spielt keine Rolle und die Reaktionszeiten sind verbessert worden. Leichte Lichthöfe sind sichtbar.

| |||||||||||||||||||||||||
Ausleuchtung: 92 %
Helligkeit Akku: 517 cd/m²
Kontrast: 1326:1 (Schwarzwert: 0.39 cd/m²)
ΔE ColorChecker Calman: 1.62 | ∀{0.5-29.43 Ø4.73}
calibrated: 1.62
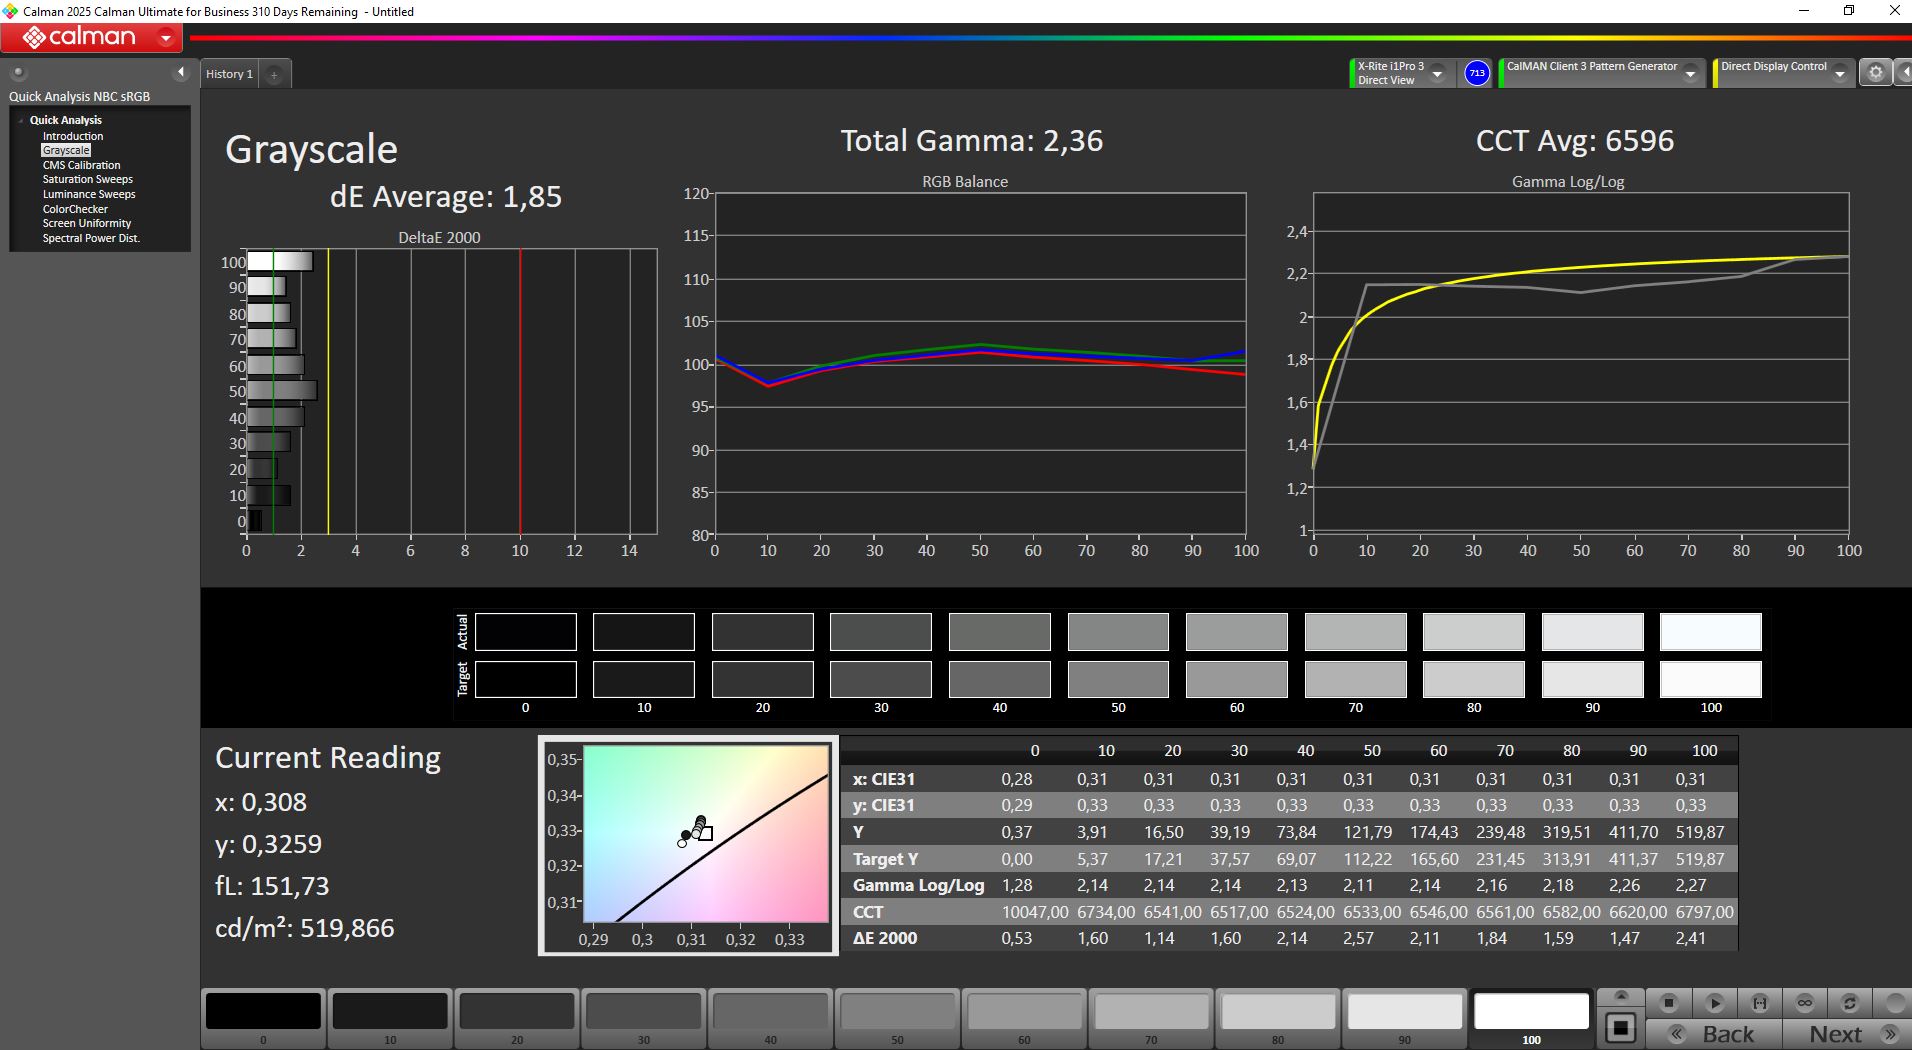
ΔE Greyscale Calman: 1.85 | ∀{0.09-98 Ø4.97}
70.4% AdobeRGB 1998 (Argyll 3D)
99.3% sRGB (Argyll 3D)
72.5% Display P3 (Argyll 3D)
Gamma: 2.36
CCT: 6596 K
| Gigabyte Gaming A16 Pro GA6DH (Core 7 240H, RTX 5070 Ti) BOE0D86 (NS160QDM-NY3), IPS, 2560x1600, 16", 165 Hz | Gigabyte Gaming A16 GA6H NE160QDM-NYJ (BOE0C80), IPS, 2560x1600, 16", 165 Hz | Schenker XMG APEX 16 MAX NE160QDM-NM9, Mini-LED, 2560x1600, 16", 300 Hz | Acer Predator Helios Neo 16S AI PHN16S-71-94L9 Samsung ATNA60DL03-0, OLED, 2560x1600, 16", 240 Hz | Medion Erazer Major 16 X1 MD62736 NE160QDM-NZL (BOE0D55), IPS, 2560x1600, 16", 300 Hz | Lenovo Legion 5 Pro 16IAX10H ATNA60HS01-0 (Samsung SDC420A), OLED, 2560x1600, 16", 165 Hz | |
|---|---|---|---|---|---|---|
| Display | -1% | 21% | 25% | 2% | 24% | |
| Display P3 Coverage (%) | 72.5 | 69.4 -4% | 99.7 38% | 99.9 38% | 73.2 1% | 99.9 38% |
| sRGB Coverage (%) | 99.3 | 99.5 0% | 100 1% | 100 1% | 99.8 1% | 100 1% |
| AdobeRGB 1998 Coverage (%) | 70.4 | 71.6 2% | 87.9 25% | 96.5 37% | 73.9 5% | 94.1 34% |
| Response Times | -78% | -164% | 96% | -28% | 71% | |
| Response Time Grey 50% / Grey 80% * (ms) | 6.8 ? | 14.3 ? -110% | 17.4 ? -156% | 0.2 ? 97% | 10 ? -47% | 2 ? 71% |
| Response Time Black / White * (ms) | 4.8 ? | 7 ? -46% | 13 ? -171% | 0.25 ? 95% | 5.2 ? -8% | 1.4 ? 71% |
| PWM Frequency (Hz) | 20253 ? | 960 | 1300 | |||
| PWM Amplitude * (%) | 75 | 50 | 16.7 | |||
| Bildschirm | -65% | 612% | 81% | -6% | -27% | |
| Helligkeit Bildmitte (cd/m²) | 517 | 432 -16% | 742 44% | 390 -25% | 577 12% | 518 0% |
| Brightness (cd/m²) | 490 | 425 -13% | 733 50% | 394 -20% | 539 10% | 522 7% |
| Brightness Distribution (%) | 92 | 91 -1% | 93 1% | 98 7% | 85 -8% | 97 5% |
| Schwarzwert * (cd/m²) | 0.39 | 0.37 5% | 0.01 97% | 0.04 90% | 0.5 -28% | |
| Kontrast (:1) | 1326 | 1168 -12% | 74200 5496% | 9750 635% | 1154 -13% | |
| Delta E Colorchecker * | 1.62 | 4.76 -194% | 3 -85% | 1.61 1% | 2.12 -31% | 2.49 -54% |
| Colorchecker dE 2000 max. * | 3.52 | 8.59 -144% | 4.3 -22% | 3.49 1% | 3.32 6% | 5.25 -49% |
| Colorchecker dE 2000 calibrated * | 1.62 | 1.18 27% | 1.2 26% | 1.59 2% | 1.33 18% | 2.15 -33% |
| Delta E Graustufen * | 1.85 | 6.2 -235% | 3.6 -95% | 1.2 35% | 2.2 -19% | 3.02 -63% |
| Gamma | 2.36 93% | 2.079 106% | 2.43 91% | 2.235 98% | 2.123 104% | 2.37 93% |
| CCT | 6596 99% | 6690 97% | 6559 99% | 6580 99% | 6457 101% | 6426 101% |
| Durchschnitt gesamt (Programm / Settings) | -48% /
-53% | 156% /
375% | 67% /
71% | -11% /
-7% | 23% /
2% |
* ... kleinere Werte sind besser
Schon ab Werk ist das Display gut gegen den sRGB-Farbraum kalibriert, die Abweichungen liegen unter 2, eine erneute Kalibrierung durch den Nutzer ist nicht notwendig.
Reaktionszeiten (Response Times) des Displays
| ↔ Reaktionszeiten Schwarz zu Weiß | ||
|---|---|---|
| 4.8 ms ... steigend ↗ und fallend ↘ kombiniert | ↗ 1.4 ms steigend | 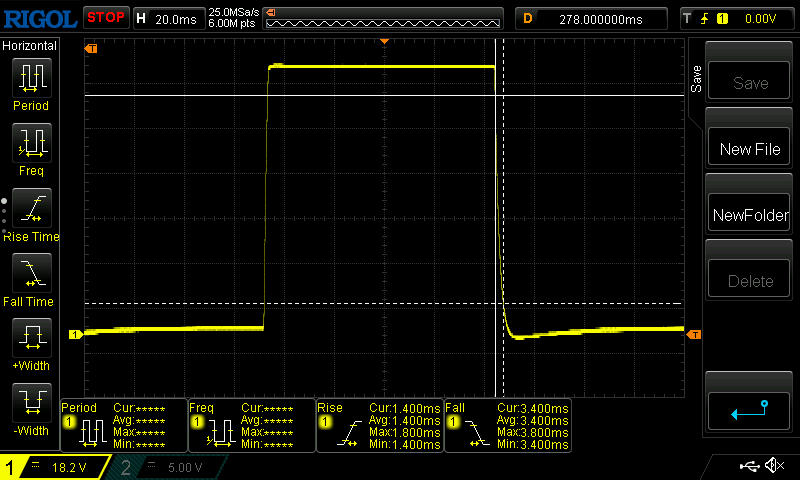 |
| ↘ 3.4 ms fallend | ||
| Die gemessenen Reaktionszeiten sind sehr kurz, wodurch sich der Bildschirm auch für schnelle 3D Spiele eignen sollte. Im Vergleich rangierten die bei uns getesteten Geräte von 0.1 (Minimum) zu 240 (Maximum) ms. » 17 % aller Screens waren schneller als der getestete. Daher sind die gemessenen Reaktionszeiten besser als der Durchschnitt aller vermessenen Geräte (19.9 ms). | ||
| ↔ Reaktionszeiten 50% Grau zu 80% Grau | ||
| 6.8 ms ... steigend ↗ und fallend ↘ kombiniert | ↗ 3 ms steigend | 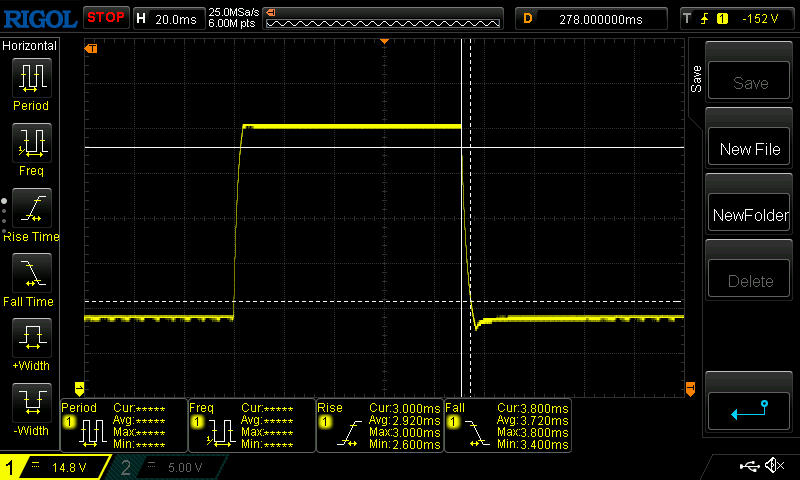 |
| ↘ 3.8 ms fallend | ||
| Die gemessenen Reaktionszeiten sind sehr kurz, wodurch sich der Bildschirm auch für schnelle 3D Spiele eignen sollte. Im Vergleich rangierten die bei uns getesteten Geräte von 0.165 (Minimum) zu 636 (Maximum) ms. » 19 % aller Screens waren schneller als der getestete. Daher sind die gemessenen Reaktionszeiten besser als der Durchschnitt aller vermessenen Geräte (31.1 ms). | ||
Bildschirm-Flackern / PWM (Pulse-Width Modulation)
| Flackern / PWM nicht festgestellt |  | ||
Im Vergleich: 52 % aller getesteten Geräte nutzten kein PWM um die Helligkeit zu reduzieren. Wenn PWM eingesetzt wurde, dann bei einer Frequenz von durchschnittlich 7798 (Minimum 5, Maximum 343500) Hz. | |||

Im Freien sind Inhalte noch gut zu erkennen, zumindest im Schatten.

Leistung - Kaum schneller als das Non-Pro
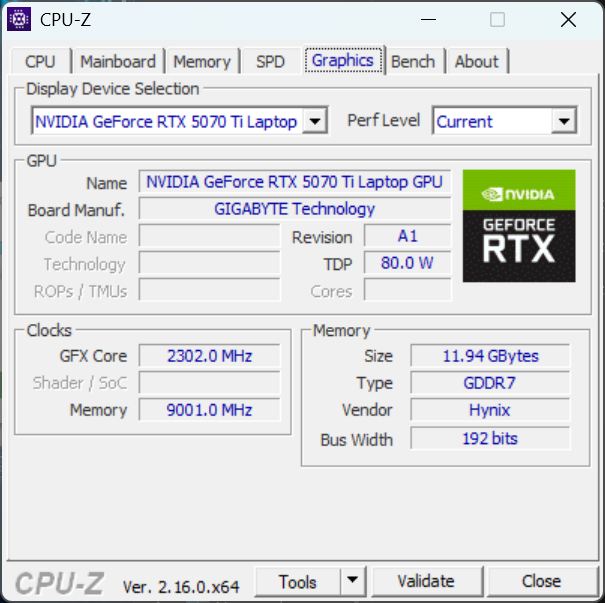
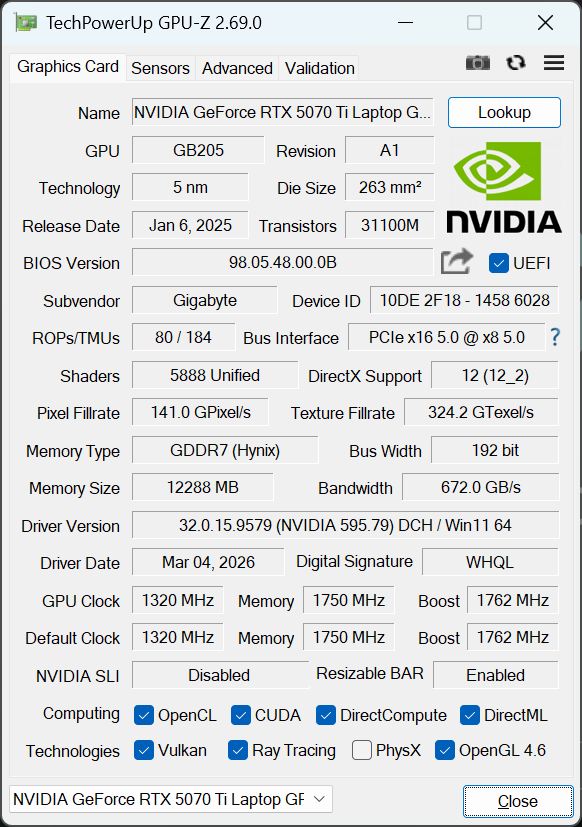
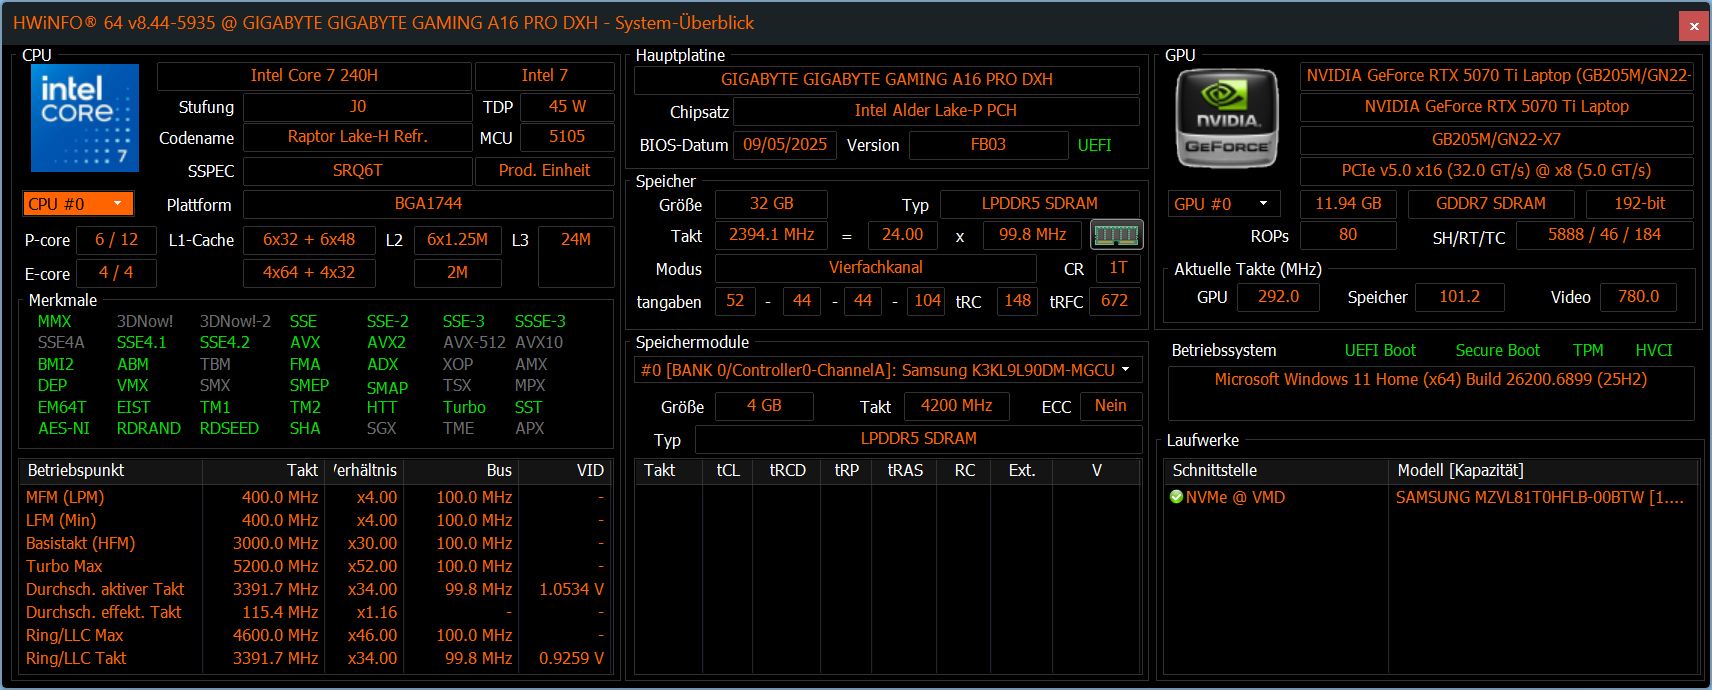
Gigabyte positioniert das A16 Pro mit RTX 5070 Ti, Core 7 240H und 32 GB RAM klar als Gamer. Das dünne Design und der helle Bildschirm machen es womöglich für Einsteiger in Videoschnitt und Co spannend.
Testbedingungen
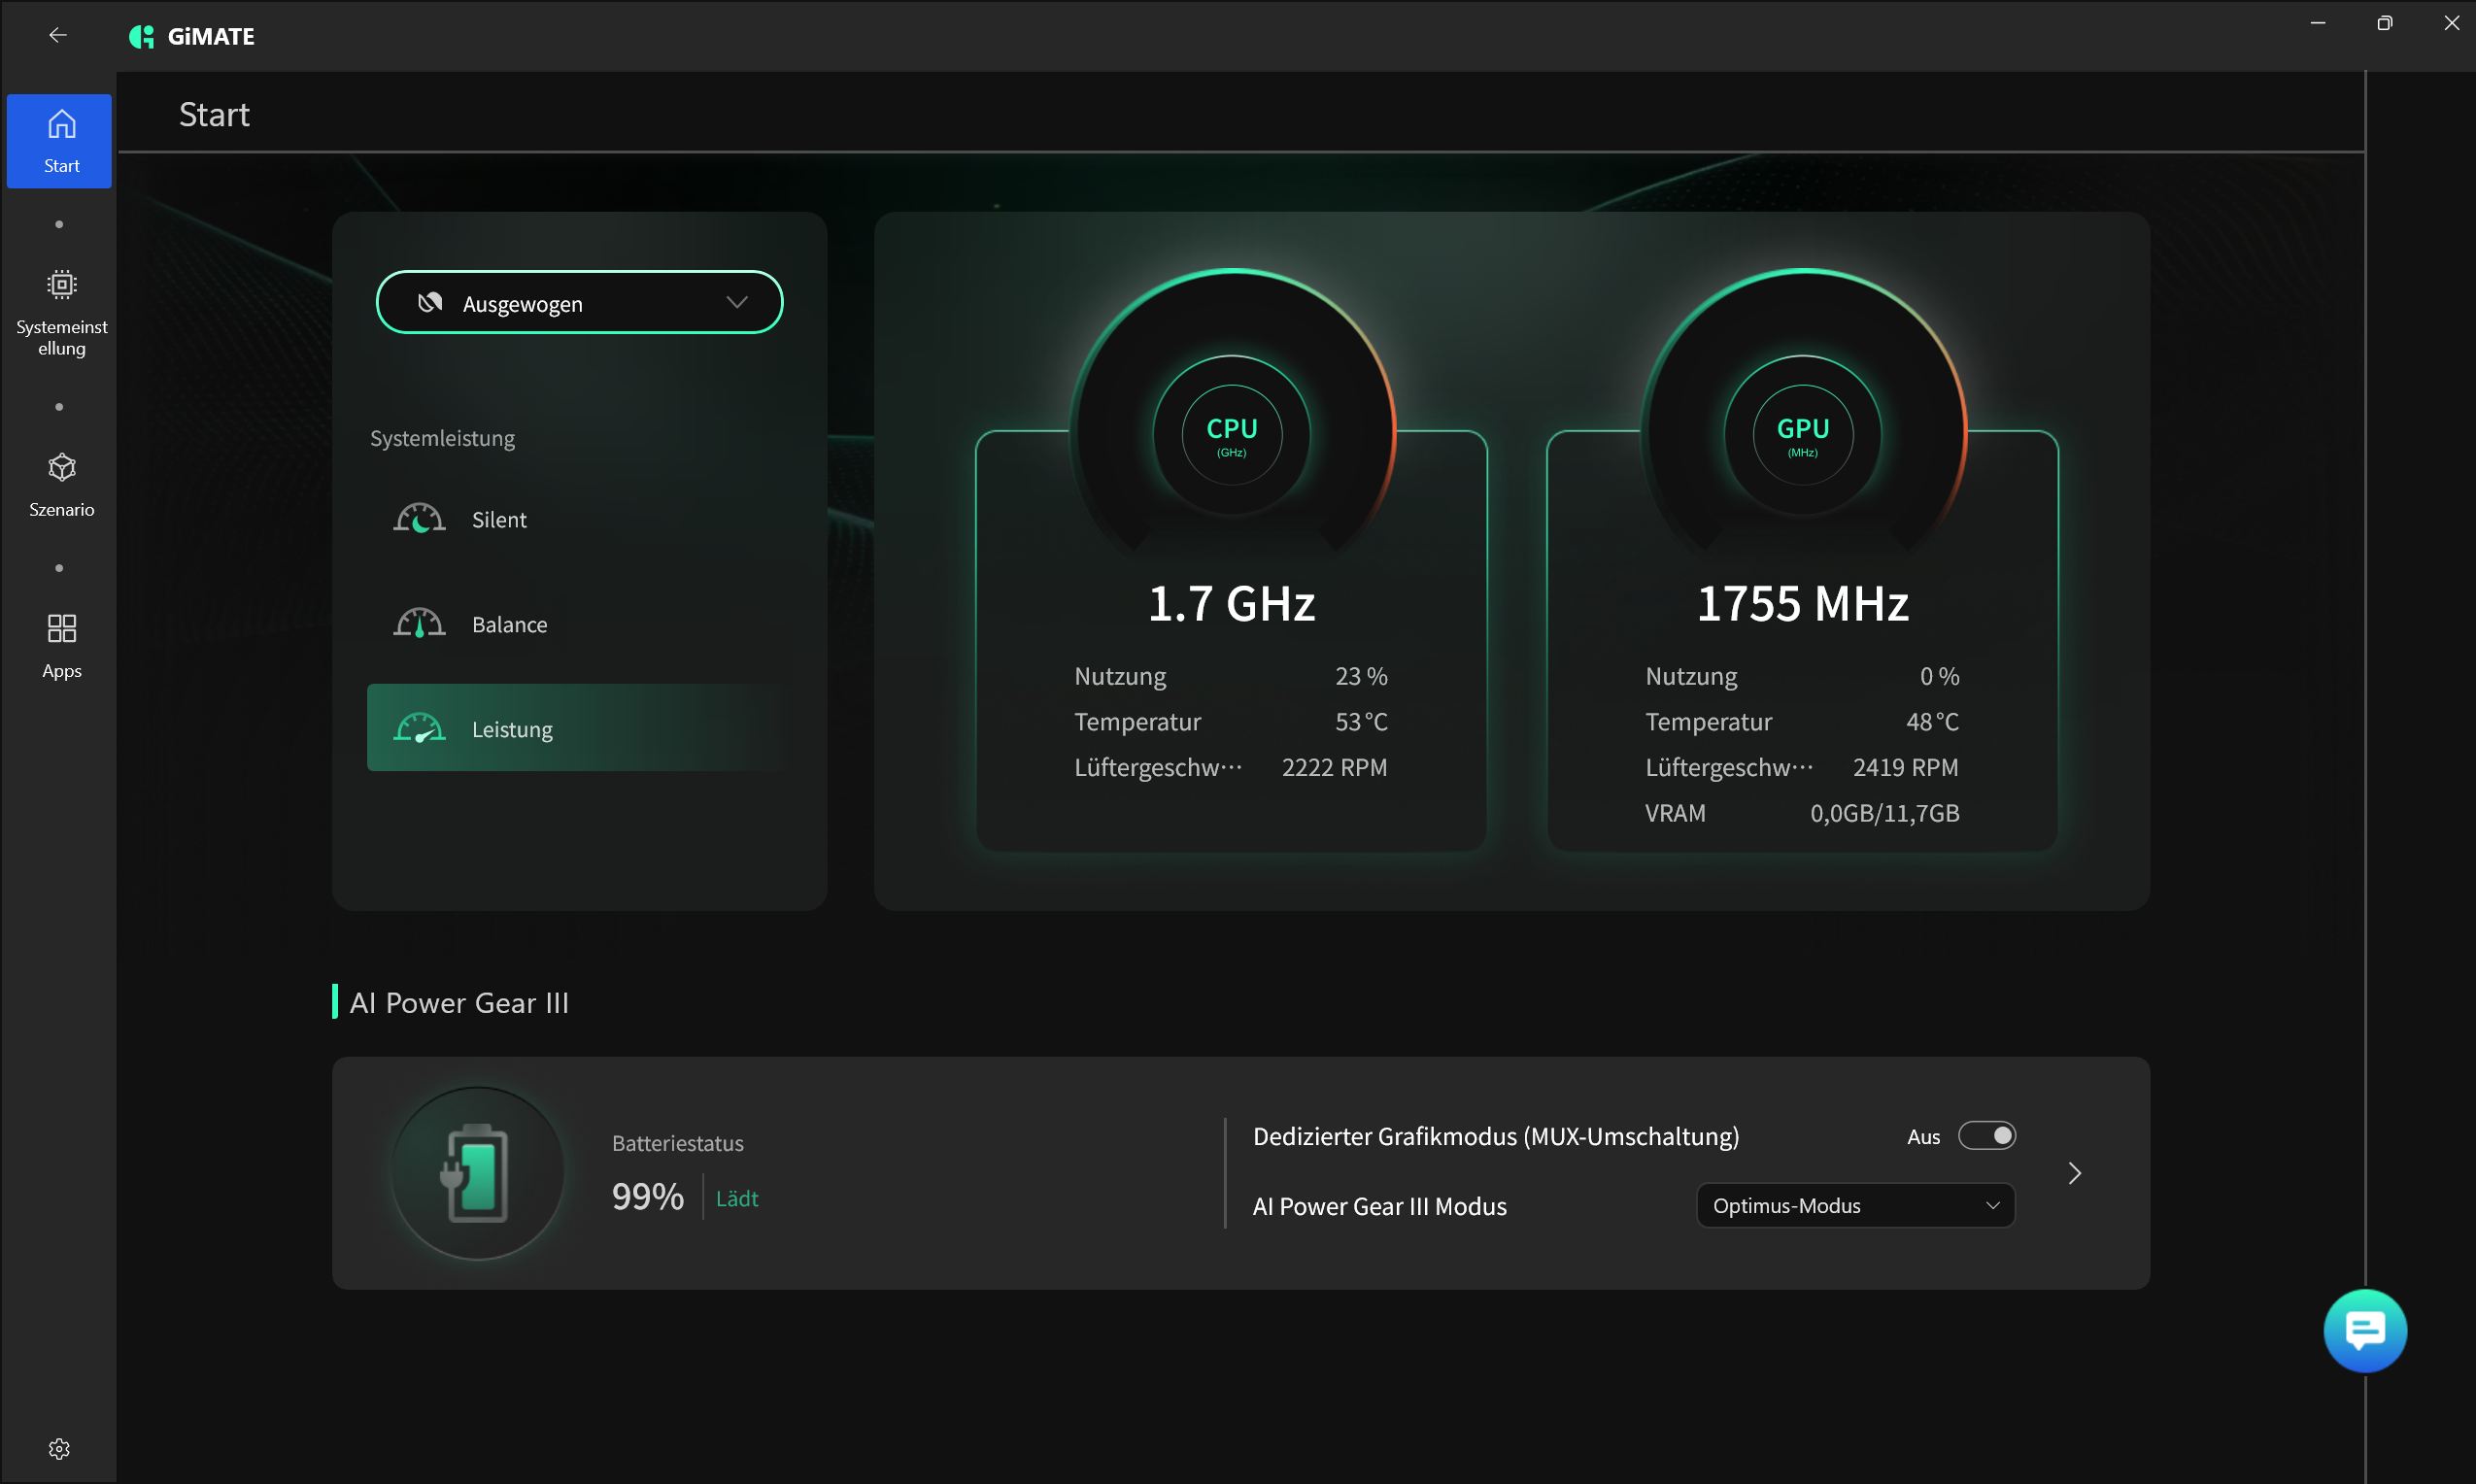
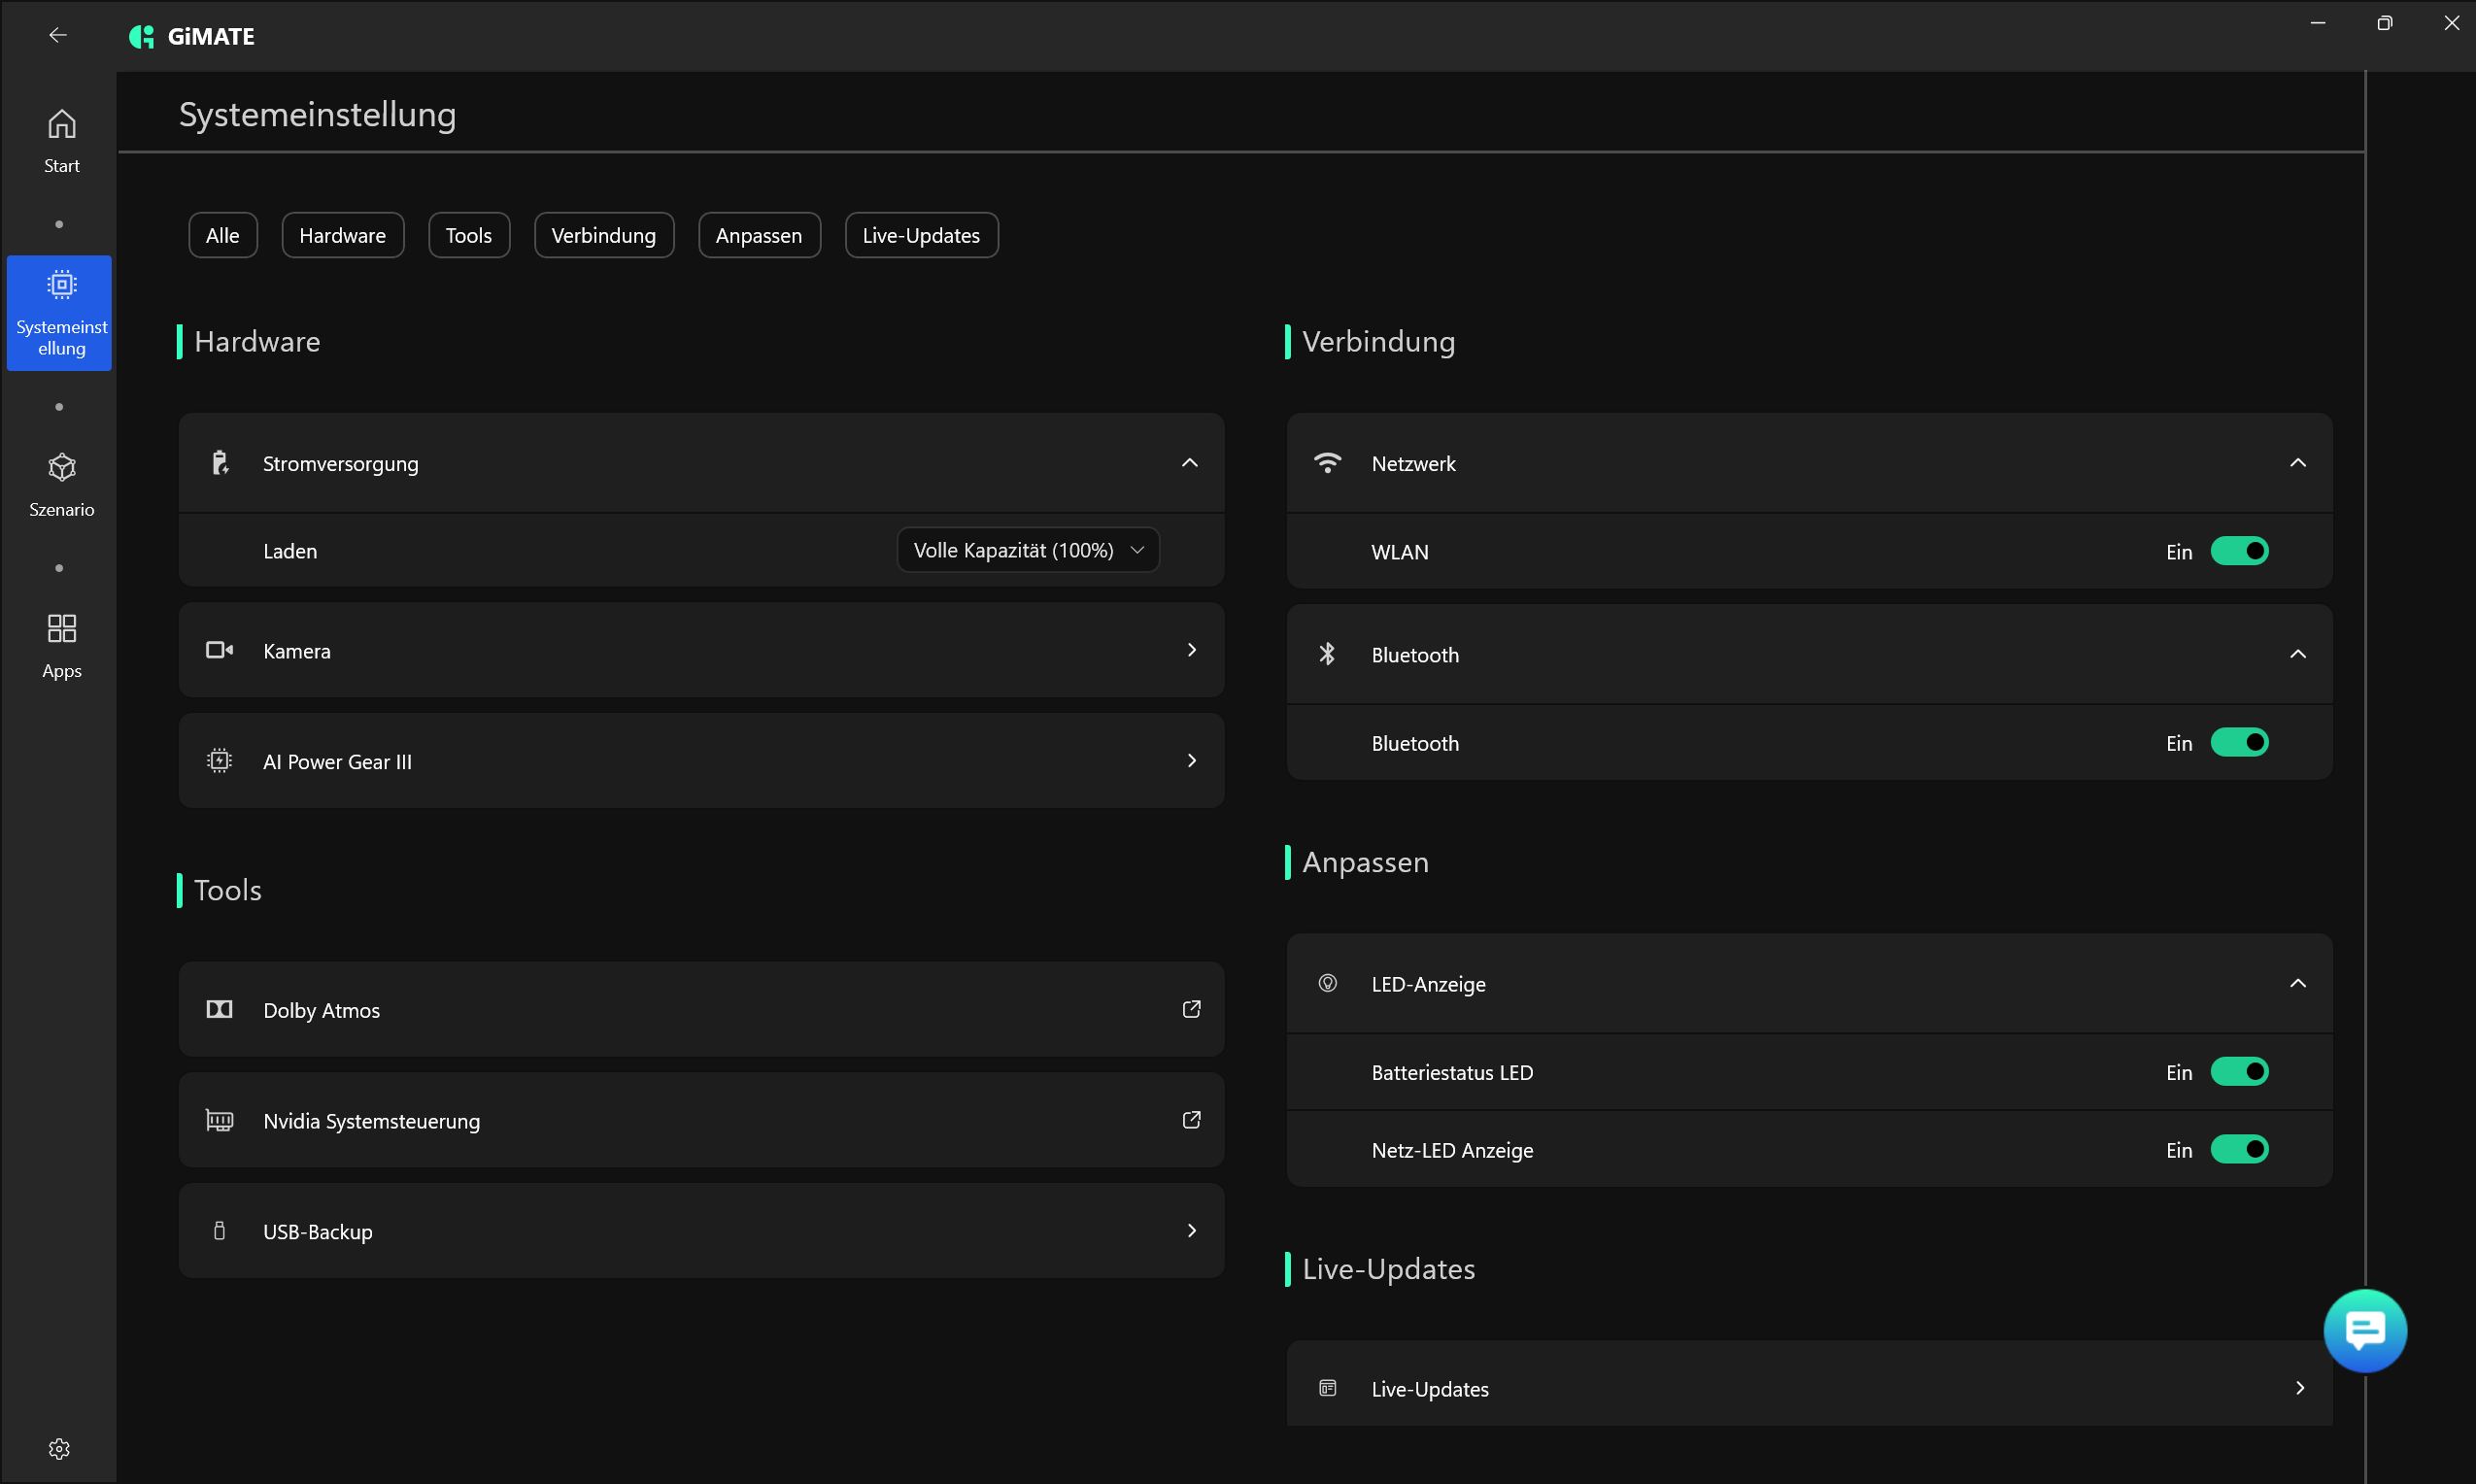
In GiMate wählen wir den Leistungsmodus (Silence, Balance, Leistung). Dazu gibt es einen MUX-Schalter.
| Performance Mode | Cinebench R15 Multi | Fire Strike Graphics | Cyberpunk 2077 FHD Ultra (fps) | Lautstärke Cyberpunk (dB) | Verbrauch Cyberpunk (W) |
|---|---|---|---|---|---|
| Leistung | 2401 | 42580 | 96.3 | 56.18 | 165 |
| Balanced | 2368 | 39276 | 89.4 | 47.62 | 140 |
| Silence | 2136 | 30977 | 56.4 | 33 | 86 |
| Akku (Leistung) | 1735 | 15631 | 30 |
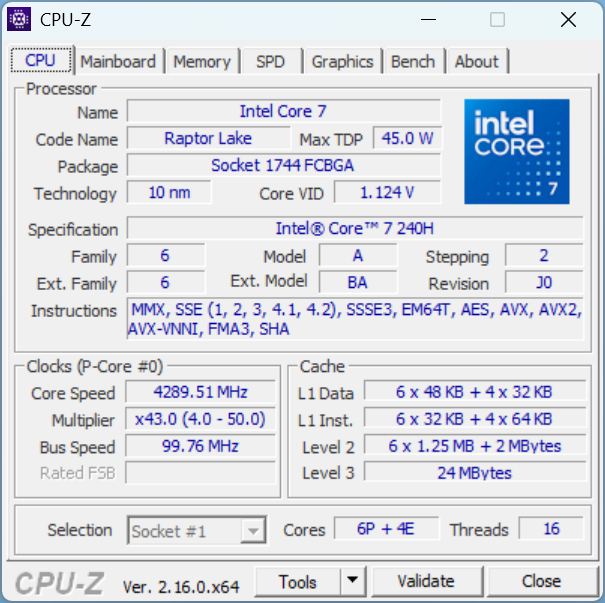
Prozessor
Der Intel Core 7 240H mit 6 P- und 4 E-Kerne ist eine eher günstige Gaming-CPU. Leider kann er sich nicht vom i7-13620H im Non-Pro absetzen. Die TDP ist selbst im Turbo auf 82 W begrenzt, bis zu 115 W wären möglich. In vielen RTX-5070-Ti-Gamern ist eine schnellere CPU verbaut. Das A16 Pro opfert CPU-Leistung für eine bessere Mobilität.
Abseits der Steckdose gehen ca. 28 Prozent CPU-Leistung verloren.
Cinebench R15 Multi Dauertest
Cinebench R23: Multi Core | Single Core
Cinebench R20: CPU (Multi Core) | CPU (Single Core)
Cinebench R15: CPU Multi 64Bit | CPU Single 64Bit
Blender: v2.79 BMW27 CPU
7-Zip 18.03: 7z b 4 | 7z b 4 -mmt1
Geekbench 6.7: Multi-Core | Single-Core
Geekbench 5.5: Multi-Core | Single-Core
HWBOT x265 Benchmark v2.2: 4k Preset
LibreOffice : 20 Documents To PDF
R Benchmark 2.5: Overall mean
| CPU Performance Rating | |
| Medion Erazer Major 16 X1 MD62736 | |
| Durchschnitt der Klasse Gaming | |
| Medion Erazer Deputy 15 P1 MD62761 | |
| Alienware 16 Aurora | |
| Gigabyte Gaming A16 GA6H | |
| Durchschnittliche Intel Core 7 240H | |
| Gigabyte Gaming A16 Pro GA6DH (Core 7 240H, RTX 5070 Ti) | |
| MSI Cyborg 15 B2RWEKG | |
| Cinebench R23 / Multi Core | |
| Medion Erazer Major 16 X1 MD62736 | |
| Durchschnitt der Klasse Gaming (10488 - 40970, n=112, der letzten 2 Jahre) | |
| Alienware 16 Aurora | |
| Medion Erazer Deputy 15 P1 MD62761 | |
| Gigabyte Gaming A16 Pro GA6DH (Core 7 240H, RTX 5070 Ti) | |
| Gigabyte Gaming A16 GA6H | |
| Durchschnittliche Intel Core 7 240H (10488 - 16588, n=5) | |
| MSI Cyborg 15 B2RWEKG | |
| Cinebench R23 / Single Core | |
| Medion Erazer Major 16 X1 MD62736 | |
| Durchschnitt der Klasse Gaming (1166 - 2356, n=112, der letzten 2 Jahre) | |
| Medion Erazer Deputy 15 P1 MD62761 | |
| Gigabyte Gaming A16 GA6H | |
| Alienware 16 Aurora | |
| Durchschnittliche Intel Core 7 240H (1649 - 1905, n=5) | |
| MSI Cyborg 15 B2RWEKG | |
| Gigabyte Gaming A16 Pro GA6DH (Core 7 240H, RTX 5070 Ti) | |
| Cinebench R20 / CPU (Multi Core) | |
| Medion Erazer Major 16 X1 MD62736 | |
| Durchschnitt der Klasse Gaming (4029 - 16108, n=111, der letzten 2 Jahre) | |
| Medion Erazer Deputy 15 P1 MD62761 | |
| Alienware 16 Aurora | |
| Gigabyte Gaming A16 Pro GA6DH (Core 7 240H, RTX 5070 Ti) | |
| Gigabyte Gaming A16 GA6H | |
| Durchschnittliche Intel Core 7 240H (4535 - 6386, n=5) | |
| MSI Cyborg 15 B2RWEKG | |
| Cinebench R20 / CPU (Single Core) | |
| Medion Erazer Major 16 X1 MD62736 | |
| Durchschnitt der Klasse Gaming (442 - 895, n=111, der letzten 2 Jahre) | |
| Medion Erazer Deputy 15 P1 MD62761 | |
| Gigabyte Gaming A16 GA6H | |
| Alienware 16 Aurora | |
| Durchschnittliche Intel Core 7 240H (633 - 730, n=5) | |
| MSI Cyborg 15 B2RWEKG | |
| Gigabyte Gaming A16 Pro GA6DH (Core 7 240H, RTX 5070 Ti) | |
| Cinebench R15 / CPU Multi 64Bit | |
| Medion Erazer Major 16 X1 MD62736 | |
| Durchschnitt der Klasse Gaming (1578 - 6271, n=111, der letzten 2 Jahre) | |
| Medion Erazer Deputy 15 P1 MD62761 | |
| Alienware 16 Aurora | |
| Gigabyte Gaming A16 Pro GA6DH (Core 7 240H, RTX 5070 Ti) | |
| Durchschnittliche Intel Core 7 240H (1800 - 2582, n=5) | |
| Gigabyte Gaming A16 GA6H | |
| MSI Cyborg 15 B2RWEKG | |
| Cinebench R15 / CPU Single 64Bit | |
| Medion Erazer Major 16 X1 MD62736 | |
| Medion Erazer Deputy 15 P1 MD62761 | |
| Durchschnitt der Klasse Gaming (188.8 - 343, n=111, der letzten 2 Jahre) | |
| Alienware 16 Aurora | |
| Gigabyte Gaming A16 GA6H | |
| Durchschnittliche Intel Core 7 240H (242 - 276, n=5) | |
| MSI Cyborg 15 B2RWEKG | |
| Gigabyte Gaming A16 Pro GA6DH (Core 7 240H, RTX 5070 Ti) | |
| Blender / v2.79 BMW27 CPU | |
| MSI Cyborg 15 B2RWEKG | |
| Durchschnittliche Intel Core 7 240H (195 - 281, n=5) | |
| Gigabyte Gaming A16 GA6H | |
| Gigabyte Gaming A16 Pro GA6DH (Core 7 240H, RTX 5070 Ti) | |
| Alienware 16 Aurora | |
| Medion Erazer Deputy 15 P1 MD62761 | |
| Durchschnitt der Klasse Gaming (80 - 330, n=109, der letzten 2 Jahre) | |
| Medion Erazer Major 16 X1 MD62736 | |
| 7-Zip 18.03 / 7z b 4 | |
| Medion Erazer Major 16 X1 MD62736 | |
| Durchschnitt der Klasse Gaming (33491 - 148086, n=110, der letzten 2 Jahre) | |
| Medion Erazer Deputy 15 P1 MD62761 | |
| Alienware 16 Aurora | |
| Gigabyte Gaming A16 Pro GA6DH (Core 7 240H, RTX 5070 Ti) | |
| Gigabyte Gaming A16 GA6H | |
| Durchschnittliche Intel Core 7 240H (45123 - 65058, n=5) | |
| MSI Cyborg 15 B2RWEKG | |
| 7-Zip 18.03 / 7z b 4 -mmt1 | |
| Medion Erazer Deputy 15 P1 MD62761 | |
| Medion Erazer Major 16 X1 MD62736 | |
| Durchschnitt der Klasse Gaming (4199 - 7436, n=110, der letzten 2 Jahre) | |
| Alienware 16 Aurora | |
| Gigabyte Gaming A16 GA6H | |
| Durchschnittliche Intel Core 7 240H (5061 - 6172, n=5) | |
| Gigabyte Gaming A16 Pro GA6DH (Core 7 240H, RTX 5070 Ti) | |
| MSI Cyborg 15 B2RWEKG | |
| Geekbench 6.7 / Multi-Core | |
| Medion Erazer Major 16 X1 MD62736 | |
| Durchschnitt der Klasse Gaming (6625 - 22104, n=111, der letzten 2 Jahre) | |
| Medion Erazer Deputy 15 P1 MD62761 | |
| Alienware 16 Aurora | |
| Gigabyte Gaming A16 Pro GA6DH (Core 7 240H, RTX 5070 Ti) | |
| Durchschnittliche Intel Core 7 240H (9713 - 13681, n=6) | |
| Gigabyte Gaming A16 GA6H | |
| MSI Cyborg 15 B2RWEKG | |
| Geekbench 6.7 / Single-Core | |
| Medion Erazer Major 16 X1 MD62736 | |
| Durchschnitt der Klasse Gaming (1490 - 3259, n=111, der letzten 2 Jahre) | |
| Medion Erazer Deputy 15 P1 MD62761 | |
| Alienware 16 Aurora | |
| Durchschnittliche Intel Core 7 240H (2348 - 2648, n=6) | |
| Gigabyte Gaming A16 GA6H | |
| MSI Cyborg 15 B2RWEKG | |
| Gigabyte Gaming A16 Pro GA6DH (Core 7 240H, RTX 5070 Ti) | |
| Geekbench 5.5 / Multi-Core | |
| Medion Erazer Major 16 X1 MD62736 | |
| Durchschnitt der Klasse Gaming (6460 - 27010, n=110, der letzten 2 Jahre) | |
| Medion Erazer Deputy 15 P1 MD62761 | |
| Alienware 16 Aurora | |
| Gigabyte Gaming A16 Pro GA6DH (Core 7 240H, RTX 5070 Ti) | |
| Durchschnittliche Intel Core 7 240H (8072 - 12276, n=5) | |
| Gigabyte Gaming A16 GA6H | |
| MSI Cyborg 15 B2RWEKG | |
| Geekbench 5.5 / Single-Core | |
| Medion Erazer Major 16 X1 MD62736 | |
| Durchschnitt der Klasse Gaming (986 - 2474, n=110, der letzten 2 Jahre) | |
| Medion Erazer Deputy 15 P1 MD62761 | |
| Alienware 16 Aurora | |
| Gigabyte Gaming A16 GA6H | |
| Durchschnittliche Intel Core 7 240H (1644 - 1862, n=5) | |
| MSI Cyborg 15 B2RWEKG | |
| Gigabyte Gaming A16 Pro GA6DH (Core 7 240H, RTX 5070 Ti) | |
| HWBOT x265 Benchmark v2.2 / 4k Preset | |
| Medion Erazer Major 16 X1 MD62736 | |
| Durchschnitt der Klasse Gaming (11.5 - 44.3, n=110, der letzten 2 Jahre) | |
| Medion Erazer Deputy 15 P1 MD62761 | |
| Alienware 16 Aurora | |
| Gigabyte Gaming A16 Pro GA6DH (Core 7 240H, RTX 5070 Ti) | |
| Gigabyte Gaming A16 GA6H | |
| Durchschnittliche Intel Core 7 240H (12.7 - 19, n=5) | |
| MSI Cyborg 15 B2RWEKG | |
| LibreOffice / 20 Documents To PDF | |
| MSI Cyborg 15 B2RWEKG | |
| Gigabyte Gaming A16 Pro GA6DH (Core 7 240H, RTX 5070 Ti) | |
| Medion Erazer Deputy 15 P1 MD62761 | |
| Durchschnittliche Intel Core 7 240H (51.2 - 72.8, n=5) | |
| Gigabyte Gaming A16 GA6H | |
| Alienware 16 Aurora | |
| Durchschnitt der Klasse Gaming (19 - 88.8, n=110, der letzten 2 Jahre) | |
| Medion Erazer Major 16 X1 MD62736 | |
| R Benchmark 2.5 / Overall mean | |
| Gigabyte Gaming A16 Pro GA6DH (Core 7 240H, RTX 5070 Ti) | |
| MSI Cyborg 15 B2RWEKG | |
| Alienware 16 Aurora | |
| Durchschnittliche Intel Core 7 240H (0.4329 - 0.4992, n=5) | |
| Gigabyte Gaming A16 GA6H | |
| Durchschnitt der Klasse Gaming (0.3439 - 0.759, n=111, der letzten 2 Jahre) | |
| Medion Erazer Deputy 15 P1 MD62761 | |
| Medion Erazer Major 16 X1 MD62736 | |
* ... kleinere Werte sind besser
AIDA64: FP32 Ray-Trace | FPU Julia | CPU SHA3 | CPU Queen | FPU SinJulia | FPU Mandel | CPU AES | CPU ZLib | FP64 Ray-Trace | CPU PhotoWorxx | CPU CheckMate
| Performance Rating | |
| Medion Erazer Major 16 X1 MD62736 -1! | |
| Durchschnitt der Klasse Gaming | |
| Medion Erazer Deputy 15 P1 MD62761 -1! | |
| Gigabyte Gaming A16 Pro GA6DH (Core 7 240H, RTX 5070 Ti) -1! | |
| Alienware 16 Aurora -1! | |
| Durchschnittliche Intel Core 7 240H | |
| MSI Cyborg 15 B2RWEKG -1! | |
| Gigabyte Gaming A16 GA6H -1! | |
| AIDA64 / FP32 Ray-Trace | |
| Medion Erazer Major 16 X1 MD62736 (v6.92.6600) | |
| Durchschnitt der Klasse Gaming (10227 - 85542, n=109, der letzten 2 Jahre) | |
| Medion Erazer Deputy 15 P1 MD62761 (v6.92.6600) | |
| Gigabyte Gaming A16 Pro GA6DH (Core 7 240H, RTX 5070 Ti) (v8.20.8100) | |
| Alienware 16 Aurora (v6.92.6600) | |
| Durchschnittliche Intel Core 7 240H (11867 - 15972, n=5) | |
| Gigabyte Gaming A16 GA6H (v6.92.6600) | |
| MSI Cyborg 15 B2RWEKG (v6.92.6600) | |
| AIDA64 / FPU Julia | |
| Medion Erazer Major 16 X1 MD62736 (v6.92.6600) | |
| Durchschnitt der Klasse Gaming (51376 - 238426, n=109, der letzten 2 Jahre) | |
| Medion Erazer Deputy 15 P1 MD62761 (v6.92.6600) | |
| Gigabyte Gaming A16 Pro GA6DH (Core 7 240H, RTX 5070 Ti) (v8.20.8100) | |
| Alienware 16 Aurora (v6.92.6600) | |
| Durchschnittliche Intel Core 7 240H (59260 - 80238, n=5) | |
| Gigabyte Gaming A16 GA6H (v6.92.6600) | |
| MSI Cyborg 15 B2RWEKG (v6.92.6600) | |
| AIDA64 / CPU SHA3 | |
| Medion Erazer Major 16 X1 MD62736 (v6.92.6600) | |
| Durchschnitt der Klasse Gaming (2180 - 9817, n=109, der letzten 2 Jahre) | |
| Medion Erazer Deputy 15 P1 MD62761 (v6.92.6600) | |
| Gigabyte Gaming A16 Pro GA6DH (Core 7 240H, RTX 5070 Ti) (v8.20.8100) | |
| Alienware 16 Aurora (v6.92.6600) | |
| Durchschnittliche Intel Core 7 240H (2455 - 3287, n=5) | |
| Gigabyte Gaming A16 GA6H (v6.92.6600) | |
| MSI Cyborg 15 B2RWEKG (v6.92.6600) | |
| AIDA64 / CPU Queen | |
| Medion Erazer Major 16 X1 MD62736 (v6.92.6600) | |
| Durchschnitt der Klasse Gaming (49785 - 173351, n=100, der letzten 2 Jahre) | |
| Medion Erazer Deputy 15 P1 MD62761 (v6.92.6600) | |
| Alienware 16 Aurora (v6.92.6600) | |
| Durchschnittliche Intel Core 7 240H (75356 - 86602, n=3) | |
| Gigabyte Gaming A16 GA6H (v6.92.6600) | |
| MSI Cyborg 15 B2RWEKG (v6.92.6600) | |
| AIDA64 / FPU SinJulia | |
| Durchschnitt der Klasse Gaming (4424 - 33636, n=109, der letzten 2 Jahre) | |
| Medion Erazer Major 16 X1 MD62736 (v6.92.6600) | |
| Medion Erazer Deputy 15 P1 MD62761 (v6.92.6600) | |
| Gigabyte Gaming A16 Pro GA6DH (Core 7 240H, RTX 5070 Ti) (v8.20.8100) | |
| Alienware 16 Aurora (v6.92.6600) | |
| Durchschnittliche Intel Core 7 240H (7777 - 9366, n=5) | |
| Gigabyte Gaming A16 GA6H (v6.92.6600) | |
| MSI Cyborg 15 B2RWEKG (v6.92.6600) | |
| AIDA64 / FPU Mandel | |
| Medion Erazer Major 16 X1 MD62736 (v6.92.6600) | |
| Durchschnitt der Klasse Gaming (25115 - 128721, n=109, der letzten 2 Jahre) | |
| Medion Erazer Deputy 15 P1 MD62761 (v6.92.6600) | |
| Gigabyte Gaming A16 Pro GA6DH (Core 7 240H, RTX 5070 Ti) (v8.20.8100) | |
| Alienware 16 Aurora (v6.92.6600) | |
| Durchschnittliche Intel Core 7 240H (29381 - 39967, n=5) | |
| Gigabyte Gaming A16 GA6H (v6.92.6600) | |
| MSI Cyborg 15 B2RWEKG (v6.92.6600) | |
| AIDA64 / CPU AES | |
| Medion Erazer Major 16 X1 MD62736 (v6.92.6600) | |
| Durchschnitt der Klasse Gaming (39258 - 247074, n=109, der letzten 2 Jahre) | |
| Medion Erazer Deputy 15 P1 MD62761 (v6.92.6600) | |
| Gigabyte Gaming A16 Pro GA6DH (Core 7 240H, RTX 5070 Ti) (v8.20.8100) | |
| Alienware 16 Aurora (v6.92.6600) | |
| Durchschnittliche Intel Core 7 240H (50528 - 67855, n=5) | |
| Gigabyte Gaming A16 GA6H (v6.92.6600) | |
| MSI Cyborg 15 B2RWEKG (v6.92.6600) | |
| AIDA64 / CPU ZLib | |
| Medion Erazer Major 16 X1 MD62736 (v6.92.6600) | |
| Durchschnitt der Klasse Gaming (574 - 2531, n=109, der letzten 2 Jahre) | |
| Medion Erazer Deputy 15 P1 MD62761 (v6.92.6600) | |
| Gigabyte Gaming A16 Pro GA6DH (Core 7 240H, RTX 5070 Ti) (v8.20.8100) | |
| Alienware 16 Aurora (v6.92.6600) | |
| Durchschnittliche Intel Core 7 240H (725 - 951, n=5) | |
| Gigabyte Gaming A16 GA6H (v6.92.6600) | |
| MSI Cyborg 15 B2RWEKG (v6.92.6600) | |
| AIDA64 / FP64 Ray-Trace | |
| Medion Erazer Major 16 X1 MD62736 (v6.92.6600) | |
| Durchschnitt der Klasse Gaming (5509 - 45446, n=109, der letzten 2 Jahre) | |
| Medion Erazer Deputy 15 P1 MD62761 (v6.92.6600) | |
| Gigabyte Gaming A16 Pro GA6DH (Core 7 240H, RTX 5070 Ti) (v8.20.8100) | |
| Alienware 16 Aurora (v6.92.6600) | |
| Durchschnittliche Intel Core 7 240H (6389 - 8569, n=5) | |
| Gigabyte Gaming A16 GA6H (v6.92.6600) | |
| MSI Cyborg 15 B2RWEKG (v6.92.6600) | |
| AIDA64 / CPU PhotoWorxx | |
| Medion Erazer Major 16 X1 MD62736 (v6.92.6600) | |
| Gigabyte Gaming A16 Pro GA6DH (Core 7 240H, RTX 5070 Ti) (v8.20.8100) | |
| Durchschnitt der Klasse Gaming (12271 - 89891, n=109, der letzten 2 Jahre) | |
| Medion Erazer Deputy 15 P1 MD62761 (v6.92.6600) | |
| Alienware 16 Aurora (v6.92.6600) | |
| Durchschnittliche Intel Core 7 240H (21710 - 44874, n=5) | |
| MSI Cyborg 15 B2RWEKG (v6.92.6600) | |
| Gigabyte Gaming A16 GA6H (v6.92.6600) | |
| AIDA64 / CPU CheckMate | |
| Durchschnitt der Klasse Gaming (2930 - 8322, n=9, der letzten 2 Jahre) | |
| Gigabyte Gaming A16 Pro GA6DH (Core 7 240H, RTX 5070 Ti) (v8.20.8100) | |
| Durchschnittliche Intel Core 7 240H (2930 - 2938, n=2) | |
System Performance
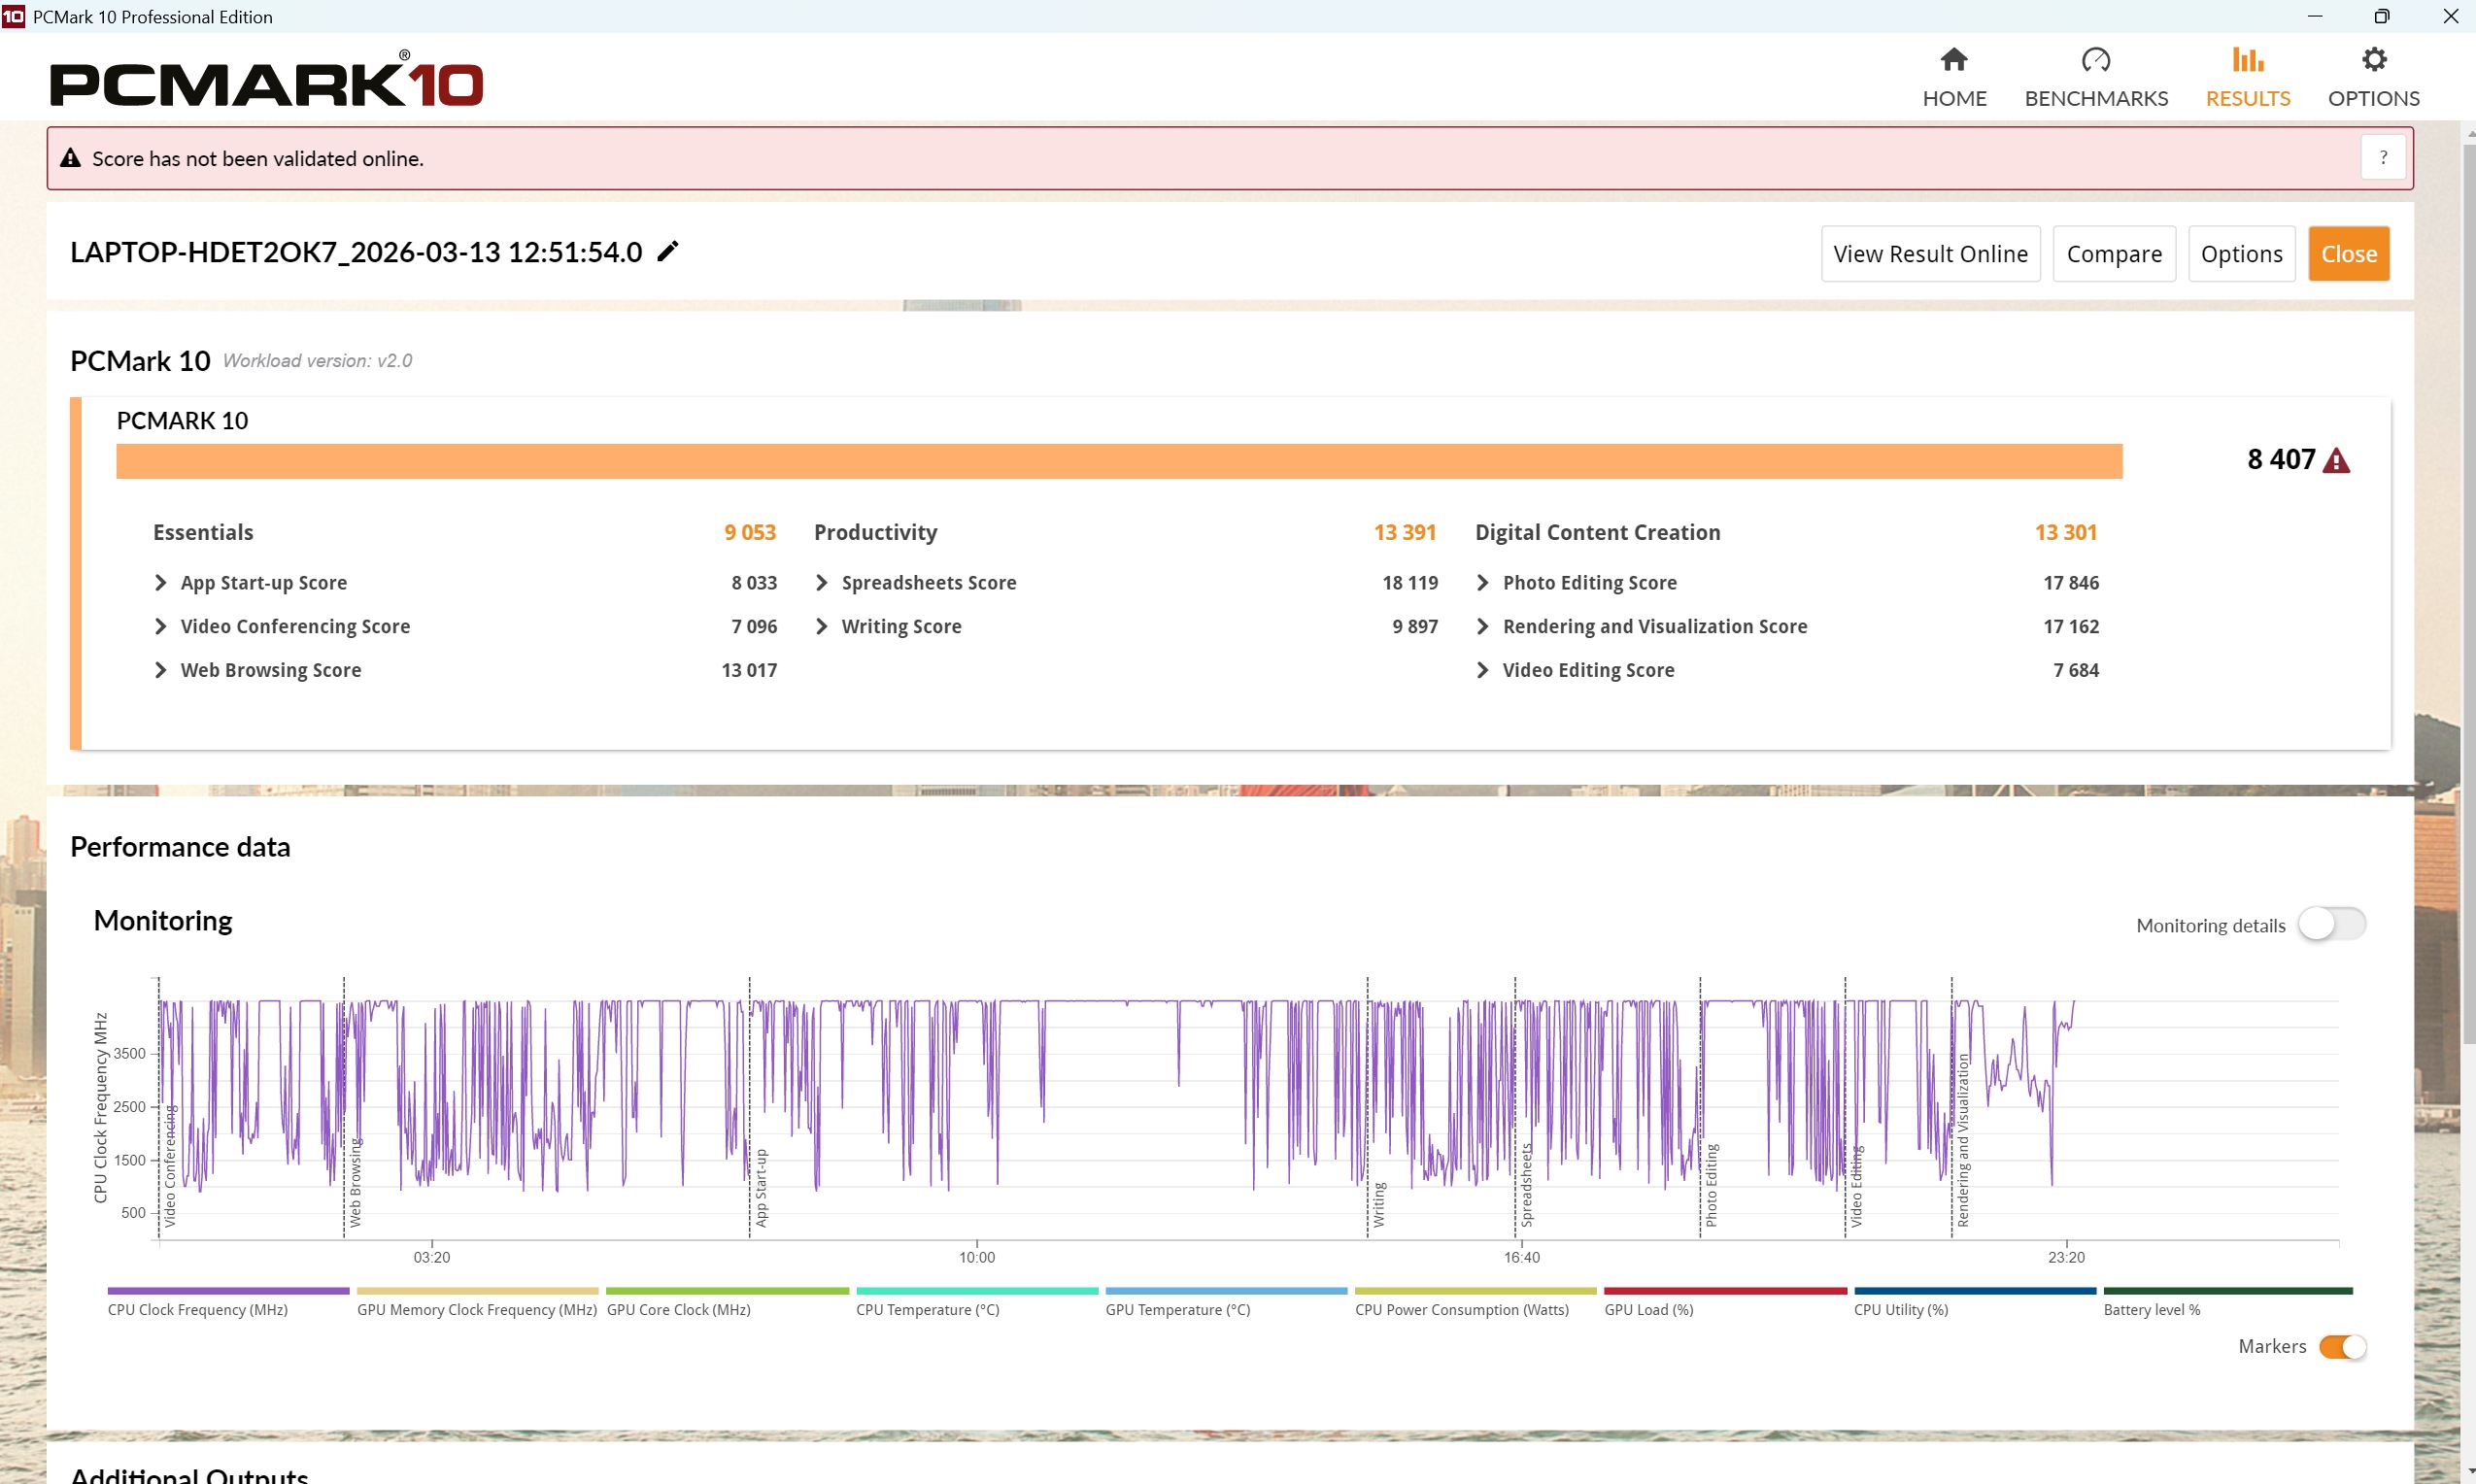
Auch in den System-Benchmarks ist das neue A16 Pro kaum schneller als das A16 und langsamer als viele anderen RTX-5070-Ti-Gamer.
PCMark 10: Score | Essentials | Productivity | Digital Content Creation
CrossMark: Overall | Productivity | Creativity | Responsiveness
WebXPRT 3: Overall
WebXPRT 4: Overall
Mozilla Kraken 1.1: Total
| Performance Rating | |
| Lenovo Legion 5 Pro 16IAX10H | |
| Acer Predator Helios Neo 16S AI PHN16S-71-94L9 | |
| Medion Erazer Major 16 X1 MD62736 | |
| Durchschnitt der Klasse Gaming | |
| Durchschnittliche Intel Core 7 240H, NVIDIA GeForce RTX 5070 Ti Laptop | |
| Gigabyte Gaming A16 Pro GA6DH (Core 7 240H, RTX 5070 Ti) | |
| Acer Nitro v 17 (ANV17-41-R4CJ) | |
| Gigabyte Gaming A16 GA6H | |
| PCMark 10 / Score | |
| Gigabyte Gaming A16 Pro GA6DH (Core 7 240H, RTX 5070 Ti) | |
| Acer Predator Helios Neo 16S AI PHN16S-71-94L9 | |
| Durchschnittliche Intel Core 7 240H, NVIDIA GeForce RTX 5070 Ti Laptop (8234 - 8407, n=2) | |
| Durchschnitt der Klasse Gaming (5828 - 11574, n=95, der letzten 2 Jahre) | |
| Lenovo Legion 5 Pro 16IAX10H | |
| Acer Nitro v 17 (ANV17-41-R4CJ) | |
| Medion Erazer Major 16 X1 MD62736 | |
| Gigabyte Gaming A16 GA6H | |
| PCMark 10 / Essentials | |
| Acer Predator Helios Neo 16S AI PHN16S-71-94L9 | |
| Medion Erazer Major 16 X1 MD62736 | |
| Lenovo Legion 5 Pro 16IAX10H | |
| Durchschnitt der Klasse Gaming (8810 - 12600, n=99, der letzten 2 Jahre) | |
| Gigabyte Gaming A16 GA6H | |
| Acer Nitro v 17 (ANV17-41-R4CJ) | |
| Durchschnittliche Intel Core 7 240H, NVIDIA GeForce RTX 5070 Ti Laptop (9053 - 9807, n=2) | |
| Gigabyte Gaming A16 Pro GA6DH (Core 7 240H, RTX 5070 Ti) | |
| PCMark 10 / Productivity | |
| Durchschnittliche Intel Core 7 240H, NVIDIA GeForce RTX 5070 Ti Laptop (13391 - 13612, n=2) | |
| Gigabyte Gaming A16 Pro GA6DH (Core 7 240H, RTX 5070 Ti) | |
| Acer Nitro v 17 (ANV17-41-R4CJ) | |
| Durchschnitt der Klasse Gaming (6845 - 18766, n=97, der letzten 2 Jahre) | |
| Acer Predator Helios Neo 16S AI PHN16S-71-94L9 | |
| Lenovo Legion 5 Pro 16IAX10H | |
| Medion Erazer Major 16 X1 MD62736 | |
| Gigabyte Gaming A16 GA6H | |
| PCMark 10 / Digital Content Creation | |
| Lenovo Legion 5 Pro 16IAX10H | |
| Acer Predator Helios Neo 16S AI PHN16S-71-94L9 | |
| Durchschnitt der Klasse Gaming (7602 - 19657, n=97, der letzten 2 Jahre) | |
| Gigabyte Gaming A16 Pro GA6DH (Core 7 240H, RTX 5070 Ti) | |
| Medion Erazer Major 16 X1 MD62736 | |
| Durchschnittliche Intel Core 7 240H, NVIDIA GeForce RTX 5070 Ti Laptop (11348 - 13301, n=2) | |
| Gigabyte Gaming A16 GA6H | |
| Acer Nitro v 17 (ANV17-41-R4CJ) | |
| CrossMark / Overall | |
| Lenovo Legion 5 Pro 16IAX10H | |
| Acer Predator Helios Neo 16S AI PHN16S-71-94L9 | |
| Medion Erazer Major 16 X1 MD62736 | |
| Durchschnitt der Klasse Gaming (1366 - 2409, n=97, der letzten 2 Jahre) | |
| Gigabyte Gaming A16 GA6H | |
| Durchschnittliche Intel Core 7 240H, NVIDIA GeForce RTX 5070 Ti Laptop (1740 - 1852, n=2) | |
| Gigabyte Gaming A16 Pro GA6DH (Core 7 240H, RTX 5070 Ti) | |
| Acer Nitro v 17 (ANV17-41-R4CJ) | |
| CrossMark / Productivity | |
| Lenovo Legion 5 Pro 16IAX10H | |
| Acer Predator Helios Neo 16S AI PHN16S-71-94L9 | |
| Medion Erazer Major 16 X1 MD62736 | |
| Durchschnitt der Klasse Gaming (1386 - 2254, n=97, der letzten 2 Jahre) | |
| Gigabyte Gaming A16 GA6H | |
| Acer Nitro v 17 (ANV17-41-R4CJ) | |
| Durchschnittliche Intel Core 7 240H, NVIDIA GeForce RTX 5070 Ti Laptop (1613 - 1732, n=2) | |
| Gigabyte Gaming A16 Pro GA6DH (Core 7 240H, RTX 5070 Ti) | |
| CrossMark / Creativity | |
| Lenovo Legion 5 Pro 16IAX10H | |
| Acer Predator Helios Neo 16S AI PHN16S-71-94L9 | |
| Medion Erazer Major 16 X1 MD62736 | |
| Durchschnitt der Klasse Gaming (1343 - 2729, n=97, der letzten 2 Jahre) | |
| Durchschnittliche Intel Core 7 240H, NVIDIA GeForce RTX 5070 Ti Laptop (1925 - 1996, n=2) | |
| Gigabyte Gaming A16 Pro GA6DH (Core 7 240H, RTX 5070 Ti) | |
| Gigabyte Gaming A16 GA6H | |
| Acer Nitro v 17 (ANV17-41-R4CJ) | |
| CrossMark / Responsiveness | |
| Lenovo Legion 5 Pro 16IAX10H | |
| Gigabyte Gaming A16 GA6H | |
| Acer Predator Helios Neo 16S AI PHN16S-71-94L9 | |
| Medion Erazer Major 16 X1 MD62736 | |
| Durchschnittliche Intel Core 7 240H, NVIDIA GeForce RTX 5070 Ti Laptop (1611 - 1809, n=2) | |
| Durchschnitt der Klasse Gaming (1226 - 2334, n=97, der letzten 2 Jahre) | |
| Gigabyte Gaming A16 Pro GA6DH (Core 7 240H, RTX 5070 Ti) | |
| Acer Nitro v 17 (ANV17-41-R4CJ) | |
| WebXPRT 3 / Overall | |
| Lenovo Legion 5 Pro 16IAX10H | |
| Acer Predator Helios Neo 16S AI PHN16S-71-94L9 | |
| Medion Erazer Major 16 X1 MD62736 | |
| Durchschnitt der Klasse Gaming (242 - 532, n=100, der letzten 2 Jahre) | |
| Acer Nitro v 17 (ANV17-41-R4CJ) | |
| Gigabyte Gaming A16 GA6H | |
| Gigabyte Gaming A16 Pro GA6DH (Core 7 240H, RTX 5070 Ti) | |
| Durchschnittliche Intel Core 7 240H, NVIDIA GeForce RTX 5070 Ti Laptop (257 - 264, n=2) | |
| WebXPRT 4 / Overall | |
| Lenovo Legion 5 Pro 16IAX10H | |
| Medion Erazer Major 16 X1 MD62736 | |
| Acer Predator Helios Neo 16S AI PHN16S-71-94L9 | |
| Durchschnitt der Klasse Gaming (176.4 - 354, n=100, der letzten 2 Jahre) | |
| Gigabyte Gaming A16 GA6H | |
| Durchschnittliche Intel Core 7 240H, NVIDIA GeForce RTX 5070 Ti Laptop (238 - 239, n=2) | |
| Gigabyte Gaming A16 Pro GA6DH (Core 7 240H, RTX 5070 Ti) | |
| Acer Nitro v 17 (ANV17-41-R4CJ) | |
| Mozilla Kraken 1.1 / Total | |
| Gigabyte Gaming A16 Pro GA6DH (Core 7 240H, RTX 5070 Ti) | |
| Durchschnittliche Intel Core 7 240H, NVIDIA GeForce RTX 5070 Ti Laptop (552 - 555, n=2) | |
| Acer Nitro v 17 (ANV17-41-R4CJ) | |
| Gigabyte Gaming A16 GA6H | |
| Durchschnitt der Klasse Gaming (391 - 590, n=105, der letzten 2 Jahre) | |
| Medion Erazer Major 16 X1 MD62736 | |
| Lenovo Legion 5 Pro 16IAX10H | |
| Acer Predator Helios Neo 16S AI PHN16S-71-94L9 | |
* ... kleinere Werte sind besser
| PCMark 10 Score | 8407 Punkte | |
Hilfe | ||
| AIDA64 / Memory Copy | |
| Acer Predator Helios Neo 16S AI PHN16S-71-94L9 | |
| Lenovo Legion 5 Pro 16IAX10H | |
| Medion Erazer Major 16 X1 MD62736 | |
| Durchschnitt der Klasse Gaming (21750 - 129946, n=109, der letzten 2 Jahre) | |
| Gigabyte Gaming A16 Pro GA6DH (Core 7 240H, RTX 5070 Ti) | |
| Durchschnittliche Intel Core 7 240H (34965 - 69215, n=5) | |
| Acer Nitro v 17 (ANV17-41-R4CJ) | |
| Gigabyte Gaming A16 GA6H | |
| AIDA64 / Memory Read | |
| Acer Predator Helios Neo 16S AI PHN16S-71-94L9 | |
| Lenovo Legion 5 Pro 16IAX10H | |
| Medion Erazer Major 16 X1 MD62736 | |
| Durchschnitt der Klasse Gaming (22956 - 118858, n=109, der letzten 2 Jahre) | |
| Gigabyte Gaming A16 Pro GA6DH (Core 7 240H, RTX 5070 Ti) | |
| Durchschnittliche Intel Core 7 240H (39706 - 71870, n=5) | |
| Gigabyte Gaming A16 GA6H | |
| Acer Nitro v 17 (ANV17-41-R4CJ) | |
| AIDA64 / Memory Write | |
| Medion Erazer Major 16 X1 MD62736 | |
| Acer Predator Helios Neo 16S AI PHN16S-71-94L9 | |
| Gigabyte Gaming A16 Pro GA6DH (Core 7 240H, RTX 5070 Ti) | |
| Lenovo Legion 5 Pro 16IAX10H | |
| Durchschnitt der Klasse Gaming (22297 - 135096, n=109, der letzten 2 Jahre) | |
| Durchschnittliche Intel Core 7 240H (33560 - 80488, n=5) | |
| Acer Nitro v 17 (ANV17-41-R4CJ) | |
| Gigabyte Gaming A16 GA6H | |
| AIDA64 / Memory Latency | |
| Lenovo Legion 5 Pro 16IAX10H | |
| Acer Predator Helios Neo 16S AI PHN16S-71-94L9 | |
| Medion Erazer Major 16 X1 MD62736 | |
| Durchschnitt der Klasse Gaming (75.3 - 259, n=109, der letzten 2 Jahre) | |
| Durchschnittliche Intel Core 7 240H (97.1 - 125.6, n=5) | |
| Gigabyte Gaming A16 GA6H | |
| Gigabyte Gaming A16 Pro GA6DH (Core 7 240H, RTX 5070 Ti) | |
| Acer Nitro v 17 (ANV17-41-R4CJ) | |
* ... kleinere Werte sind besser
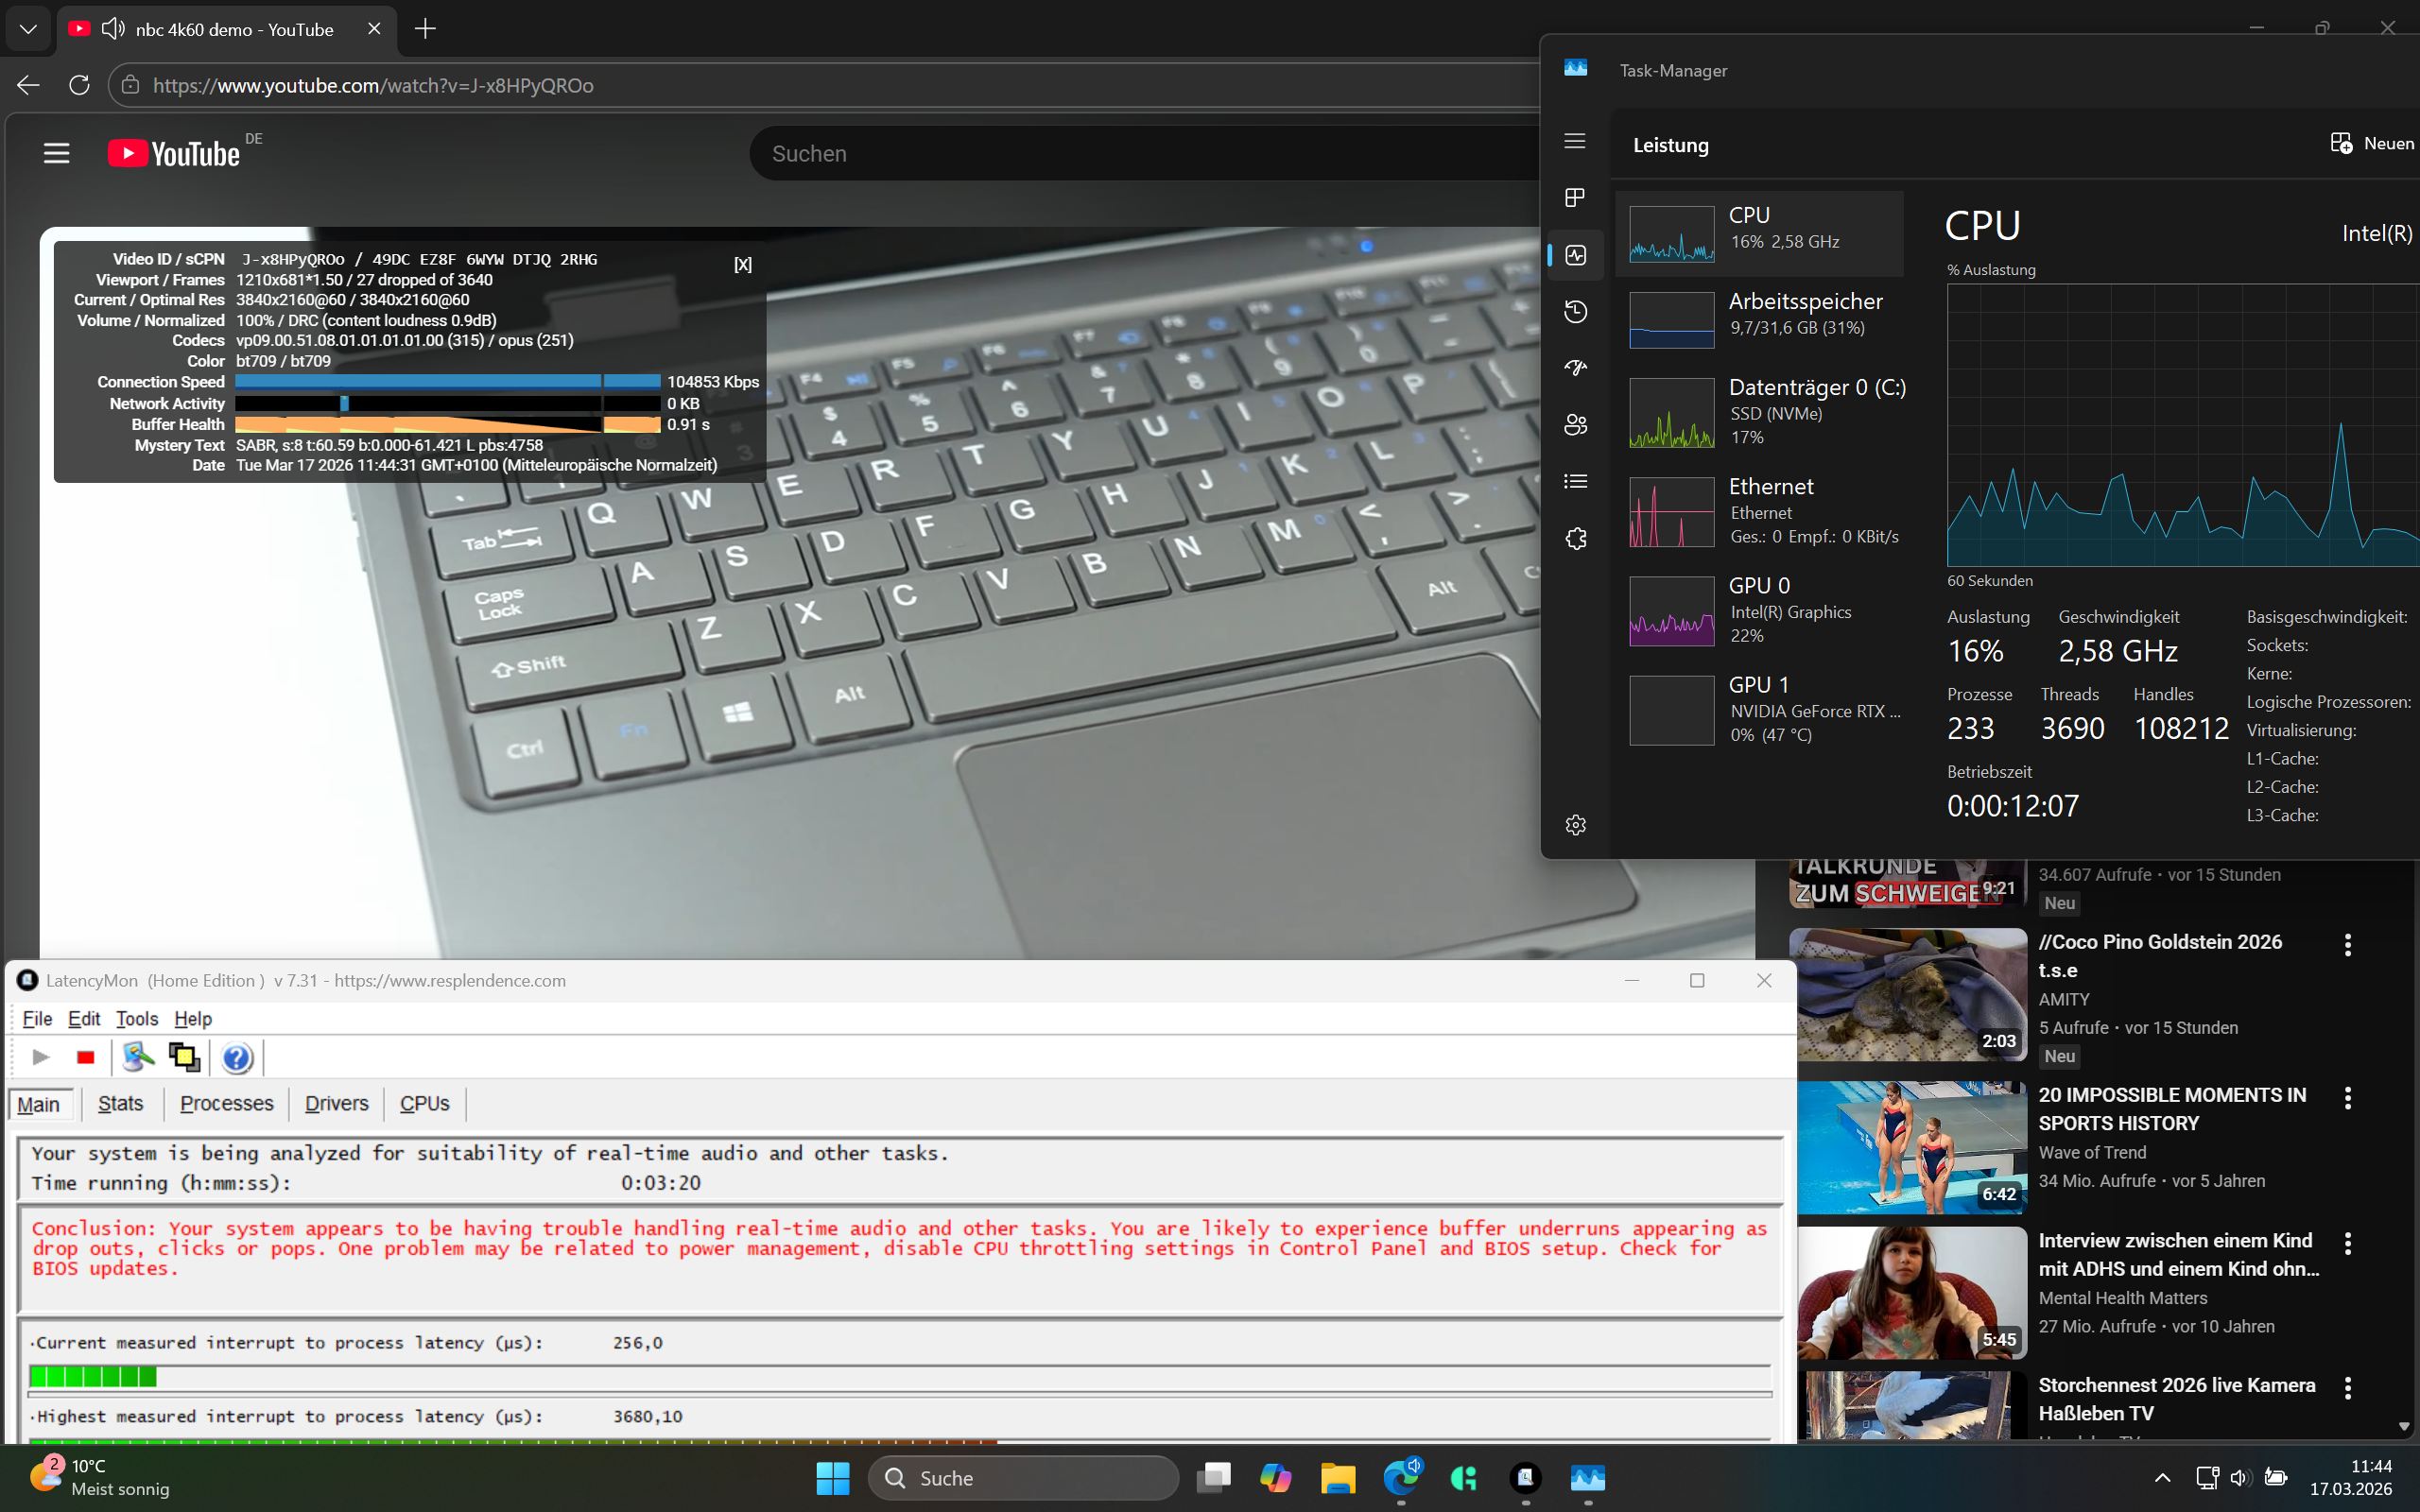
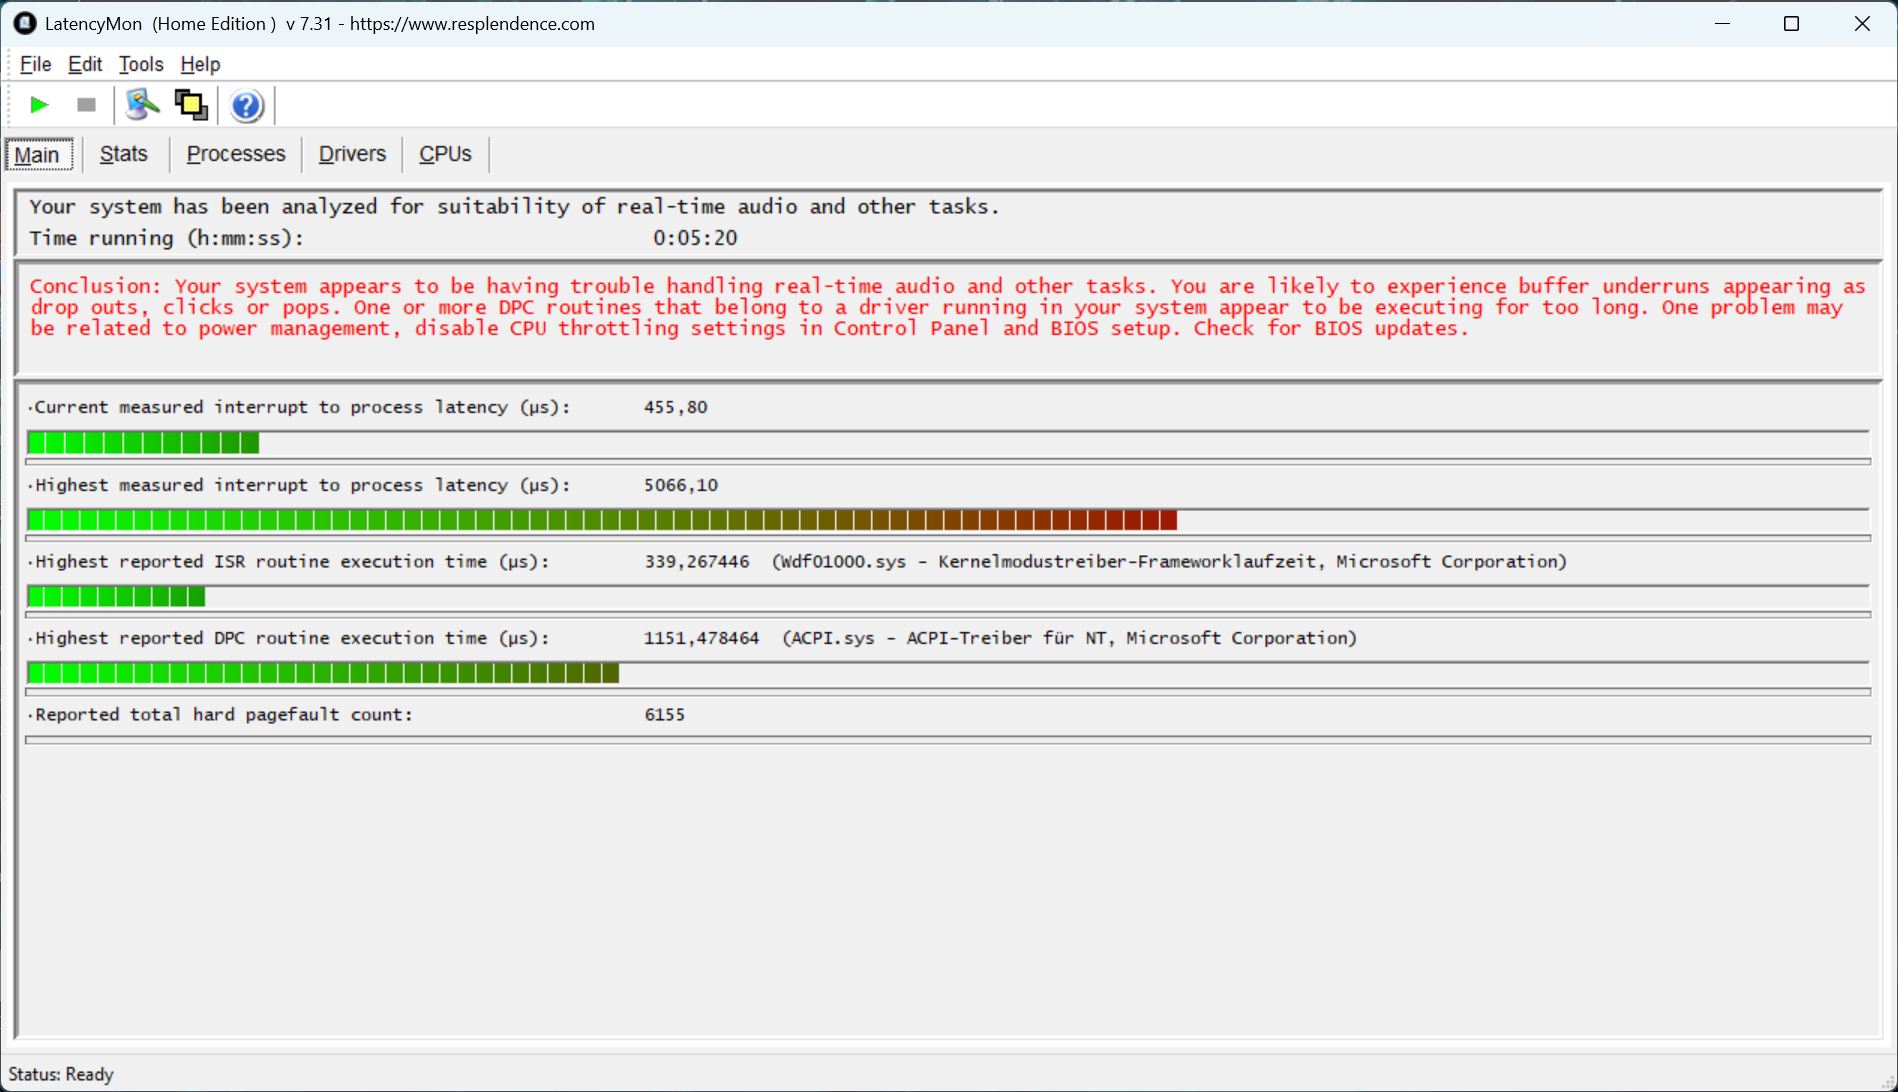
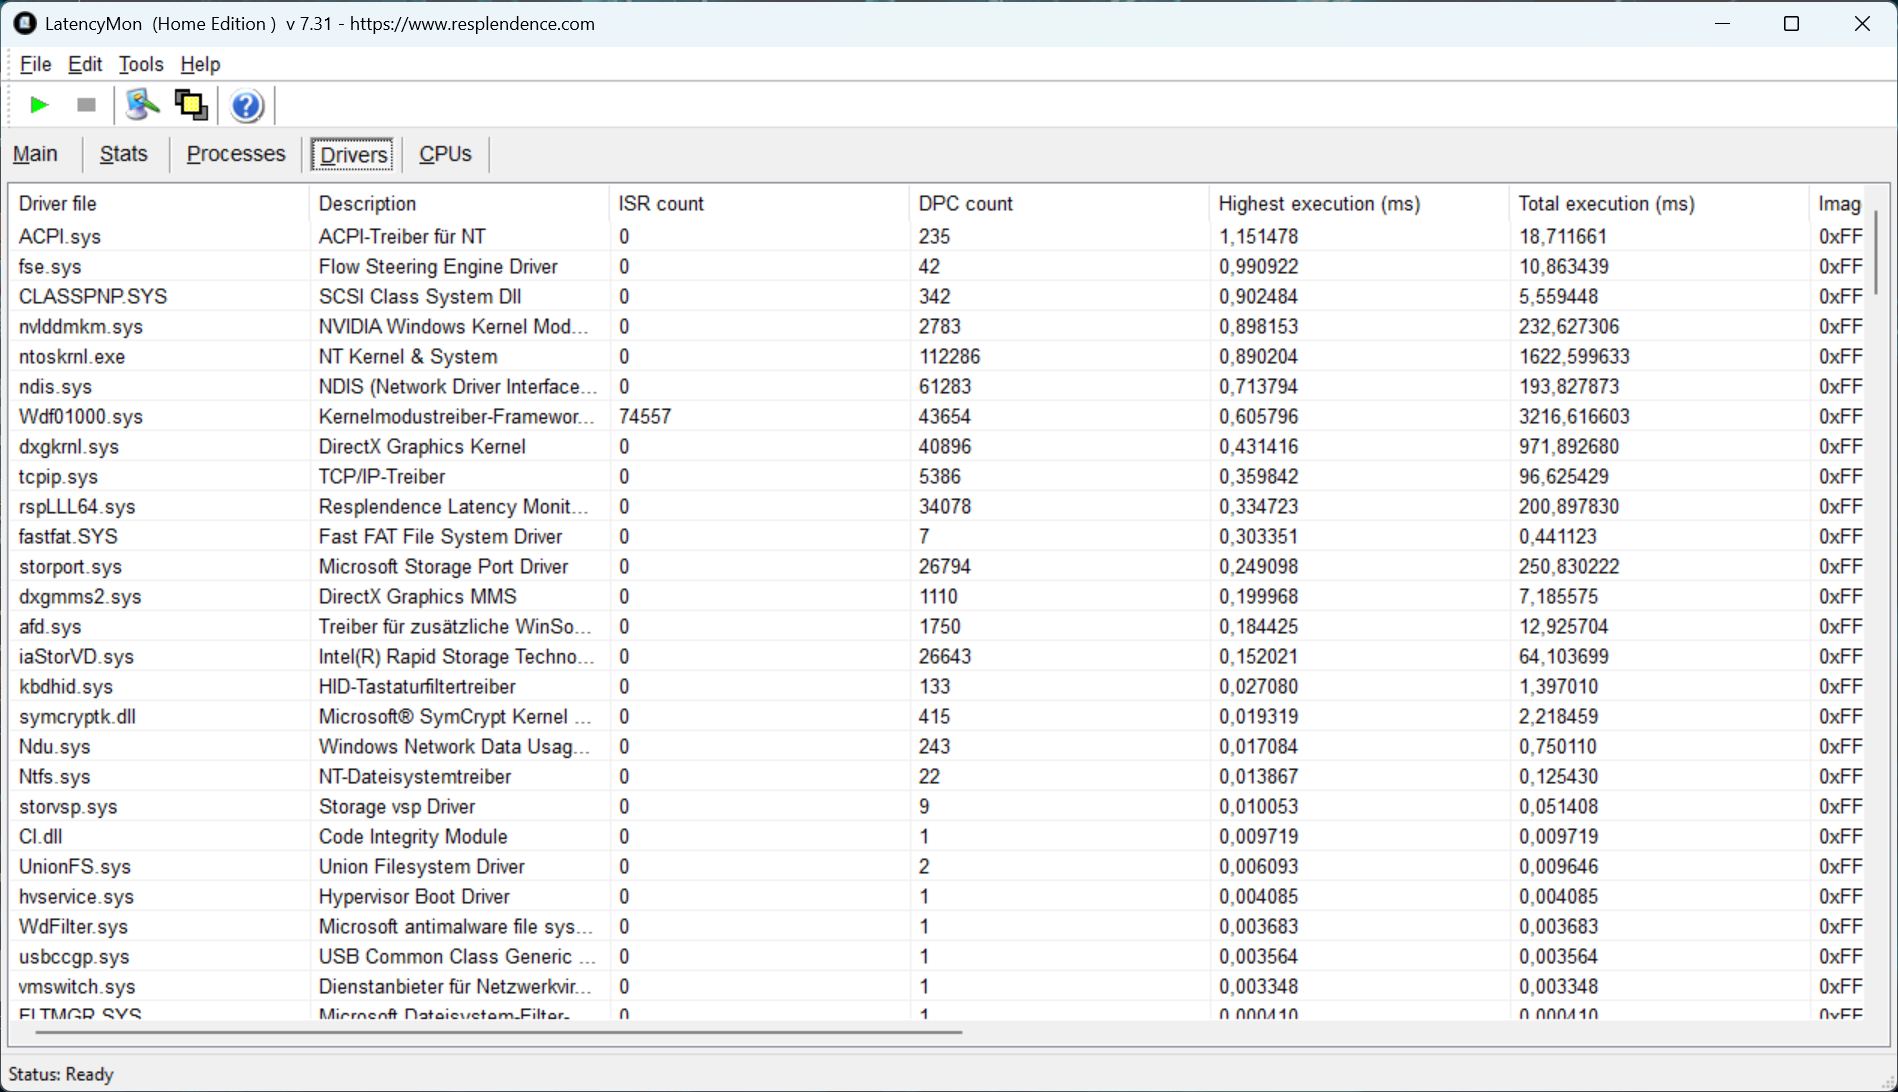
DPC-Latenzen
Latenzen stellen sich beim Öffnen mehrerer Browsertabs ein und erhöhen sich stark bei der YouTube-Wiedergabe. Hier werden auch 27 Bilder ausgelassen.
| DPC Latencies / LatencyMon - interrupt to process latency (max), Web, Youtube, Prime95 | |
| Gigabyte Gaming A16 Pro GA6DH (Core 7 240H, RTX 5070 Ti) | |
| Gigabyte Gaming A16 GA6H | |
| Medion Erazer Major 16 X1 MD62736 | |
| Acer Predator Helios Neo 16S AI PHN16S-71-94L9 | |
| Schenker XMG APEX 16 MAX | |
| Lenovo Legion 5 Pro 16IAX10H | |
* ... kleinere Werte sind besser
Massenspeicher
Die 1-TB-SSD von Samsung ist eigentlich sehr schnell, wird im A16 Pro jedoch leider thermisch gedrosselt, sodass die Transferrate stark schwankt.

* ... kleinere Werte sind besser
Dauerleistung Lesen: DiskSpd Read Loop, Queue Depth 8
GPU Leistung
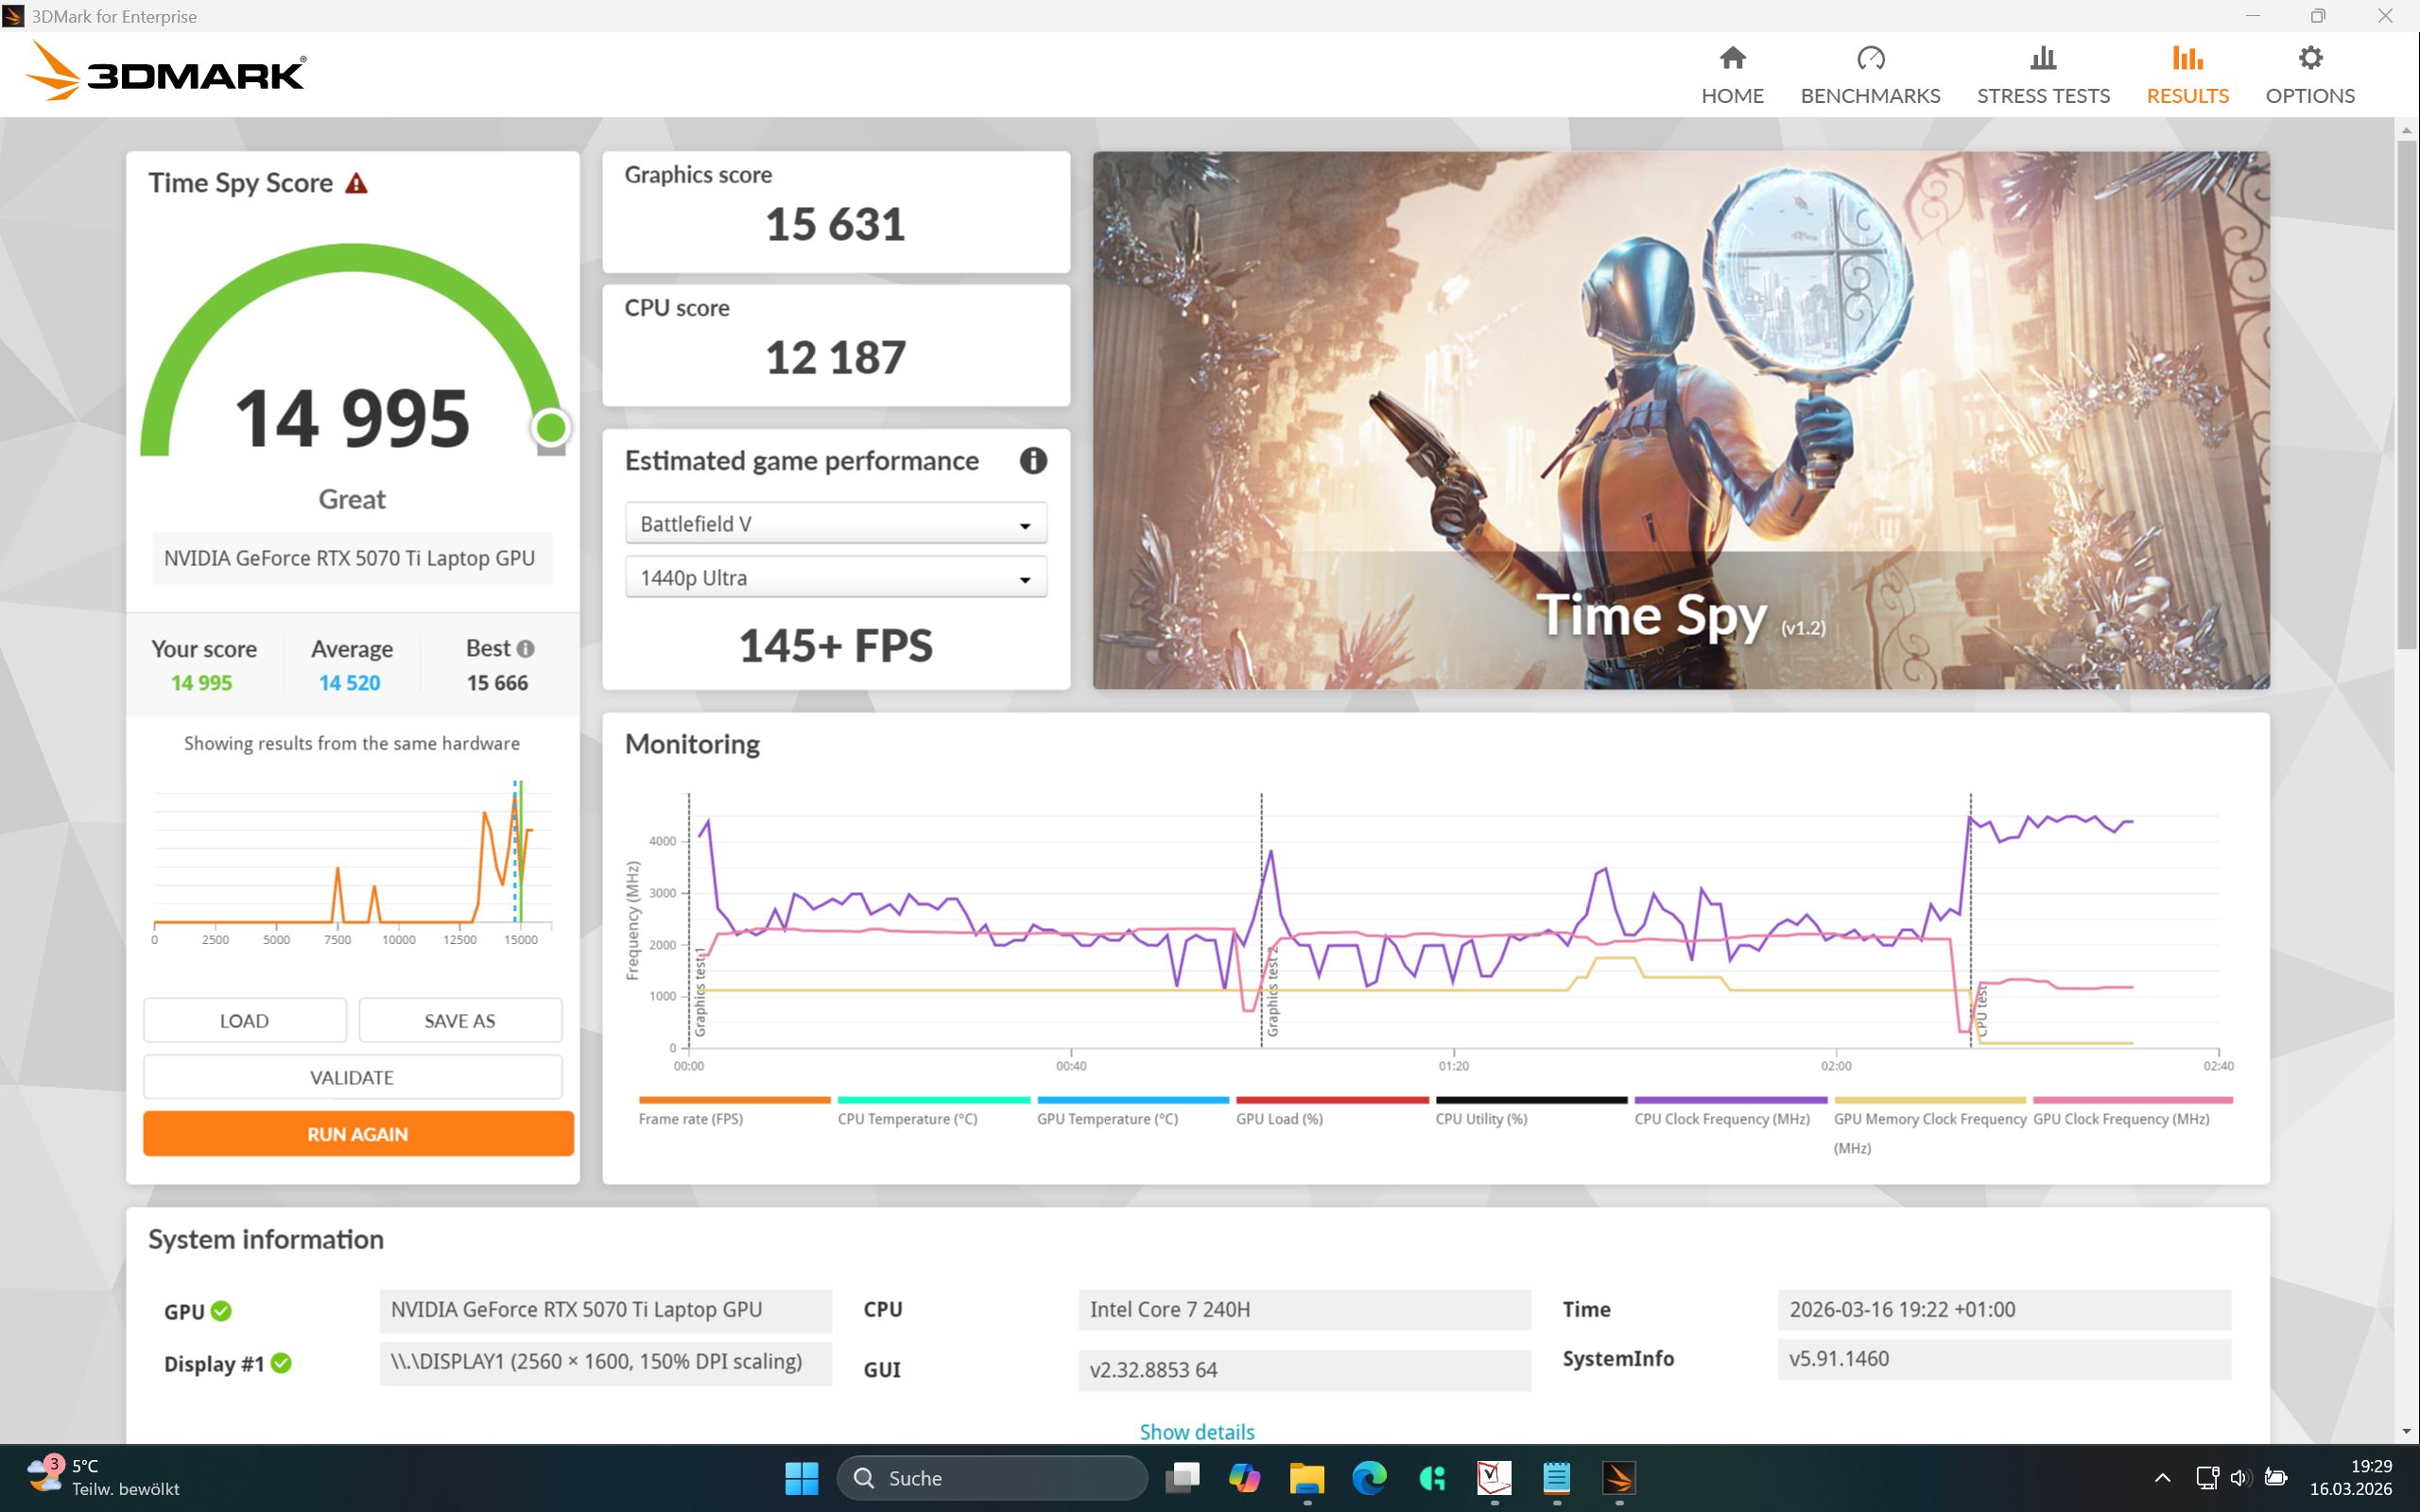
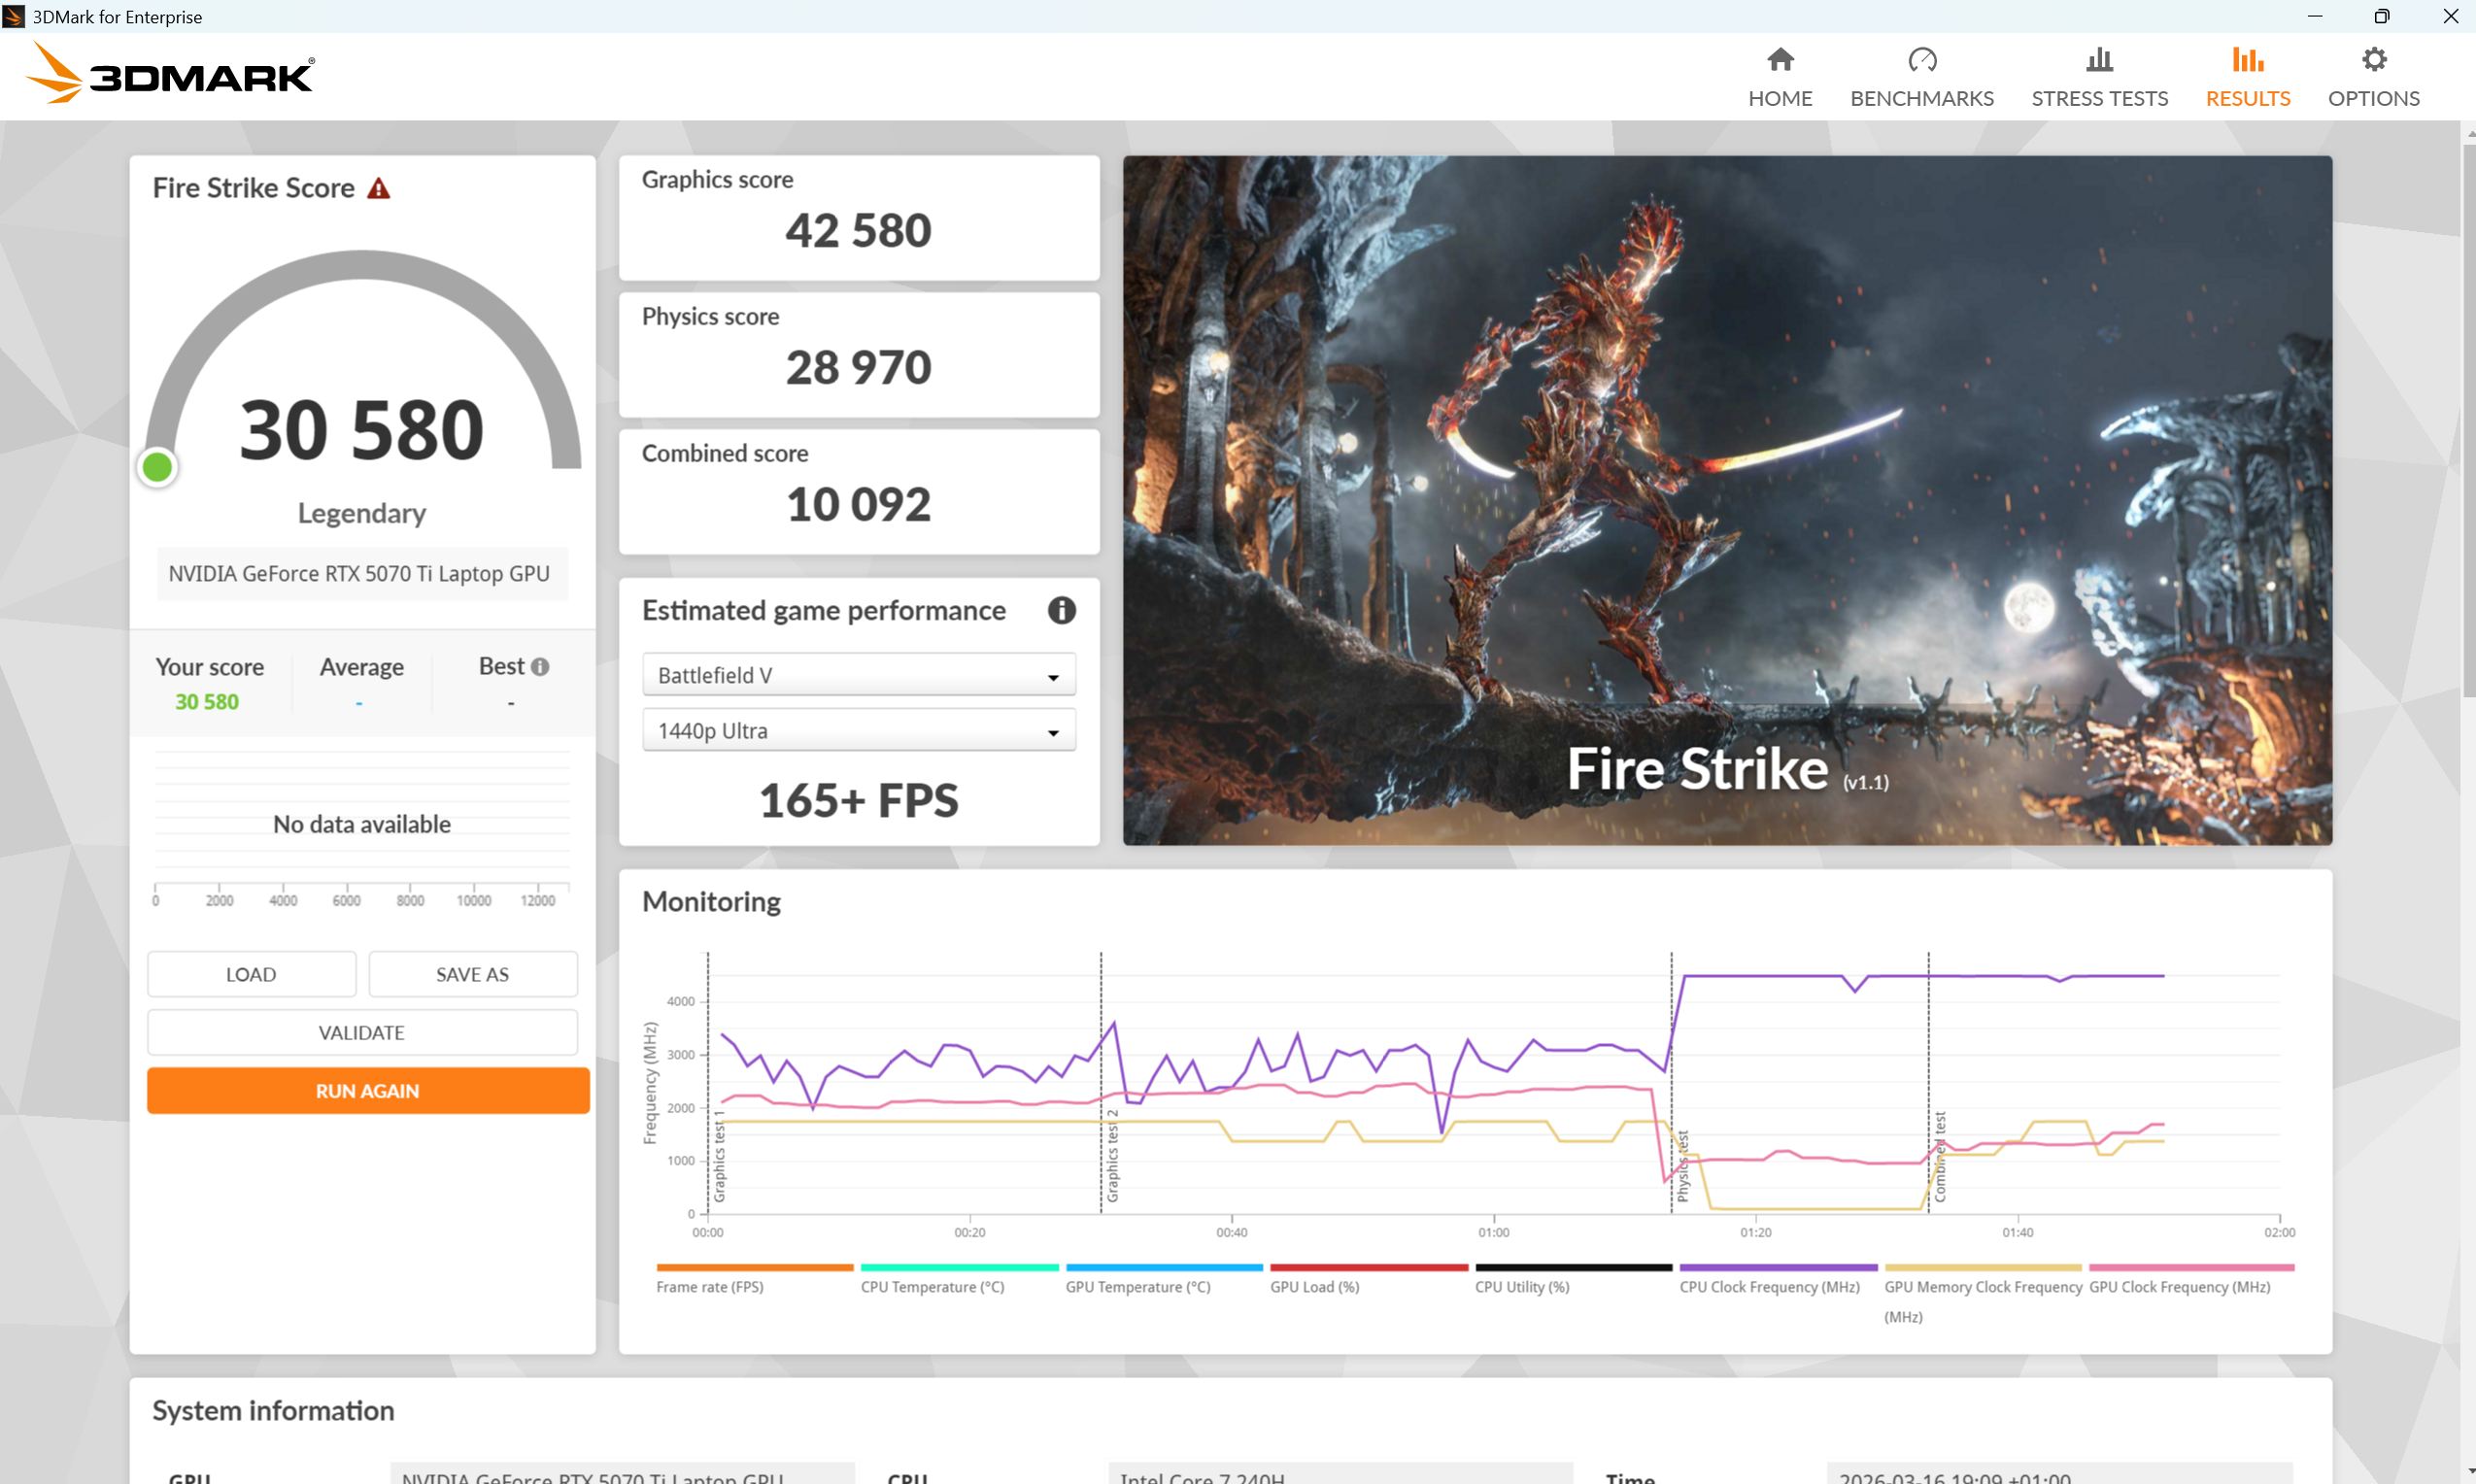
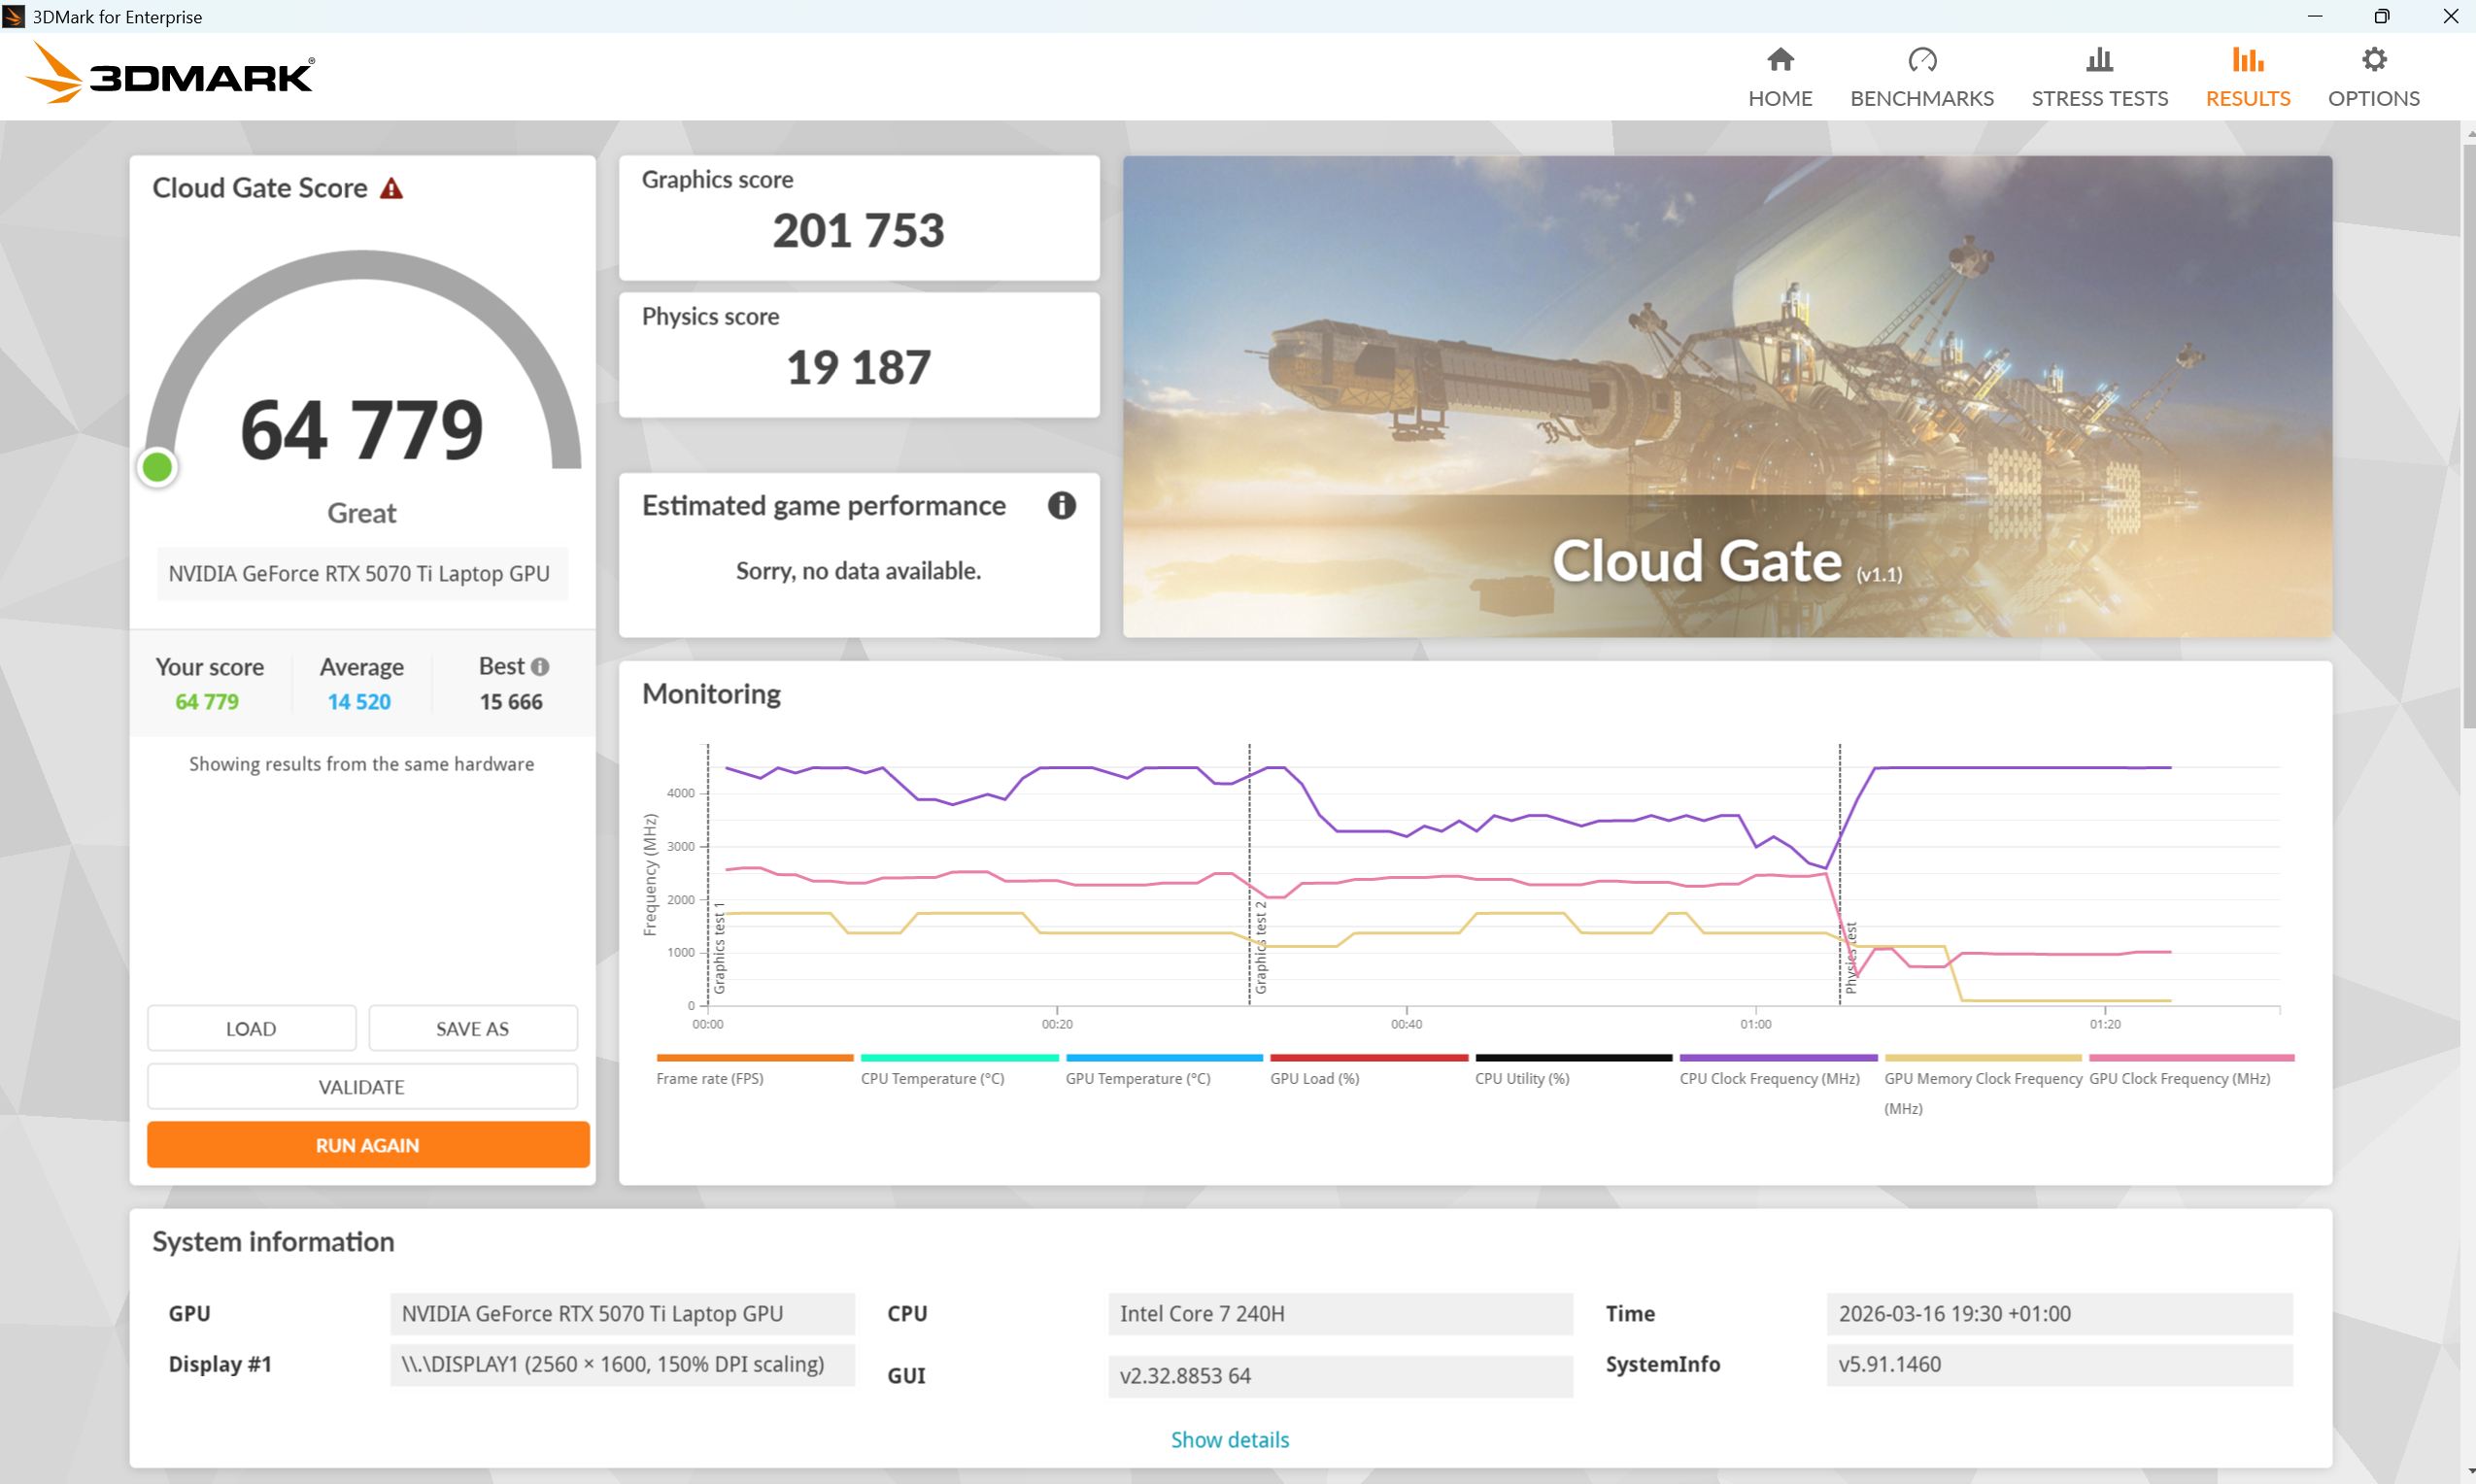
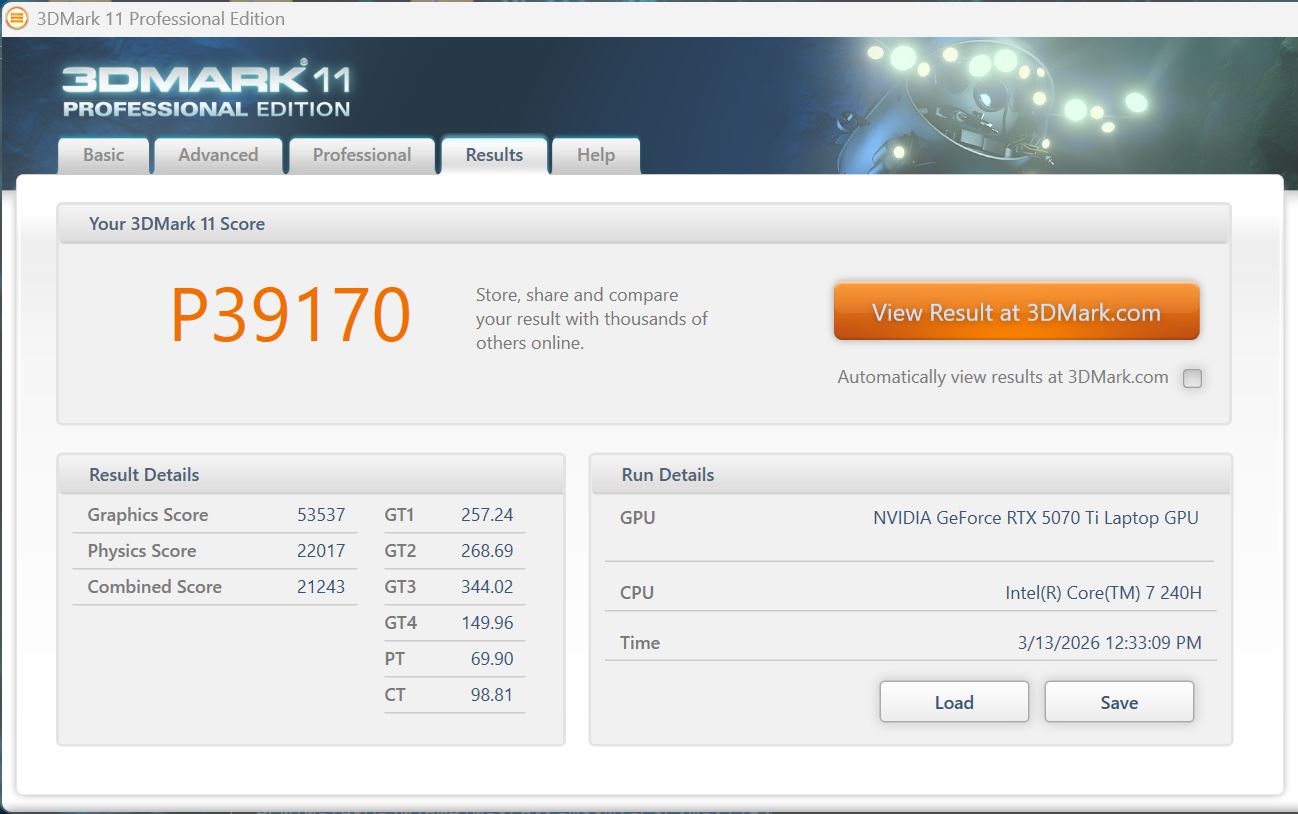
In den 3DMarks rechnet das A16 etwas unter dem Durchschnitt. Ohne Steckdose sinkt die 3D-Leistung um ca. 63 Prozent.
| 3DMark 11 Performance | 39170 Punkte | |
| 3DMark Cloud Gate Standard Score | 64779 Punkte | |
| 3DMark Fire Strike Score | 30580 Punkte | |
| 3DMark Time Spy Score | 14995 Punkte | |
Hilfe | ||
* ... kleinere Werte sind besser
Gaming Performance
Auch wenn die Leistung eher nahe den RTX-5070-Laptops rangiert, fühlt sich das A16 Pro in der nativen Auflösung wohl. Sofern kein Pathtracing dazu kommt (F1 25) bekommt der Laptop keine Probleme und wenn doch besorgt DLSS den Rest. Die 165 Hz des Bildschirms erreicht das A16 aber schon in Full-HD eher selten.
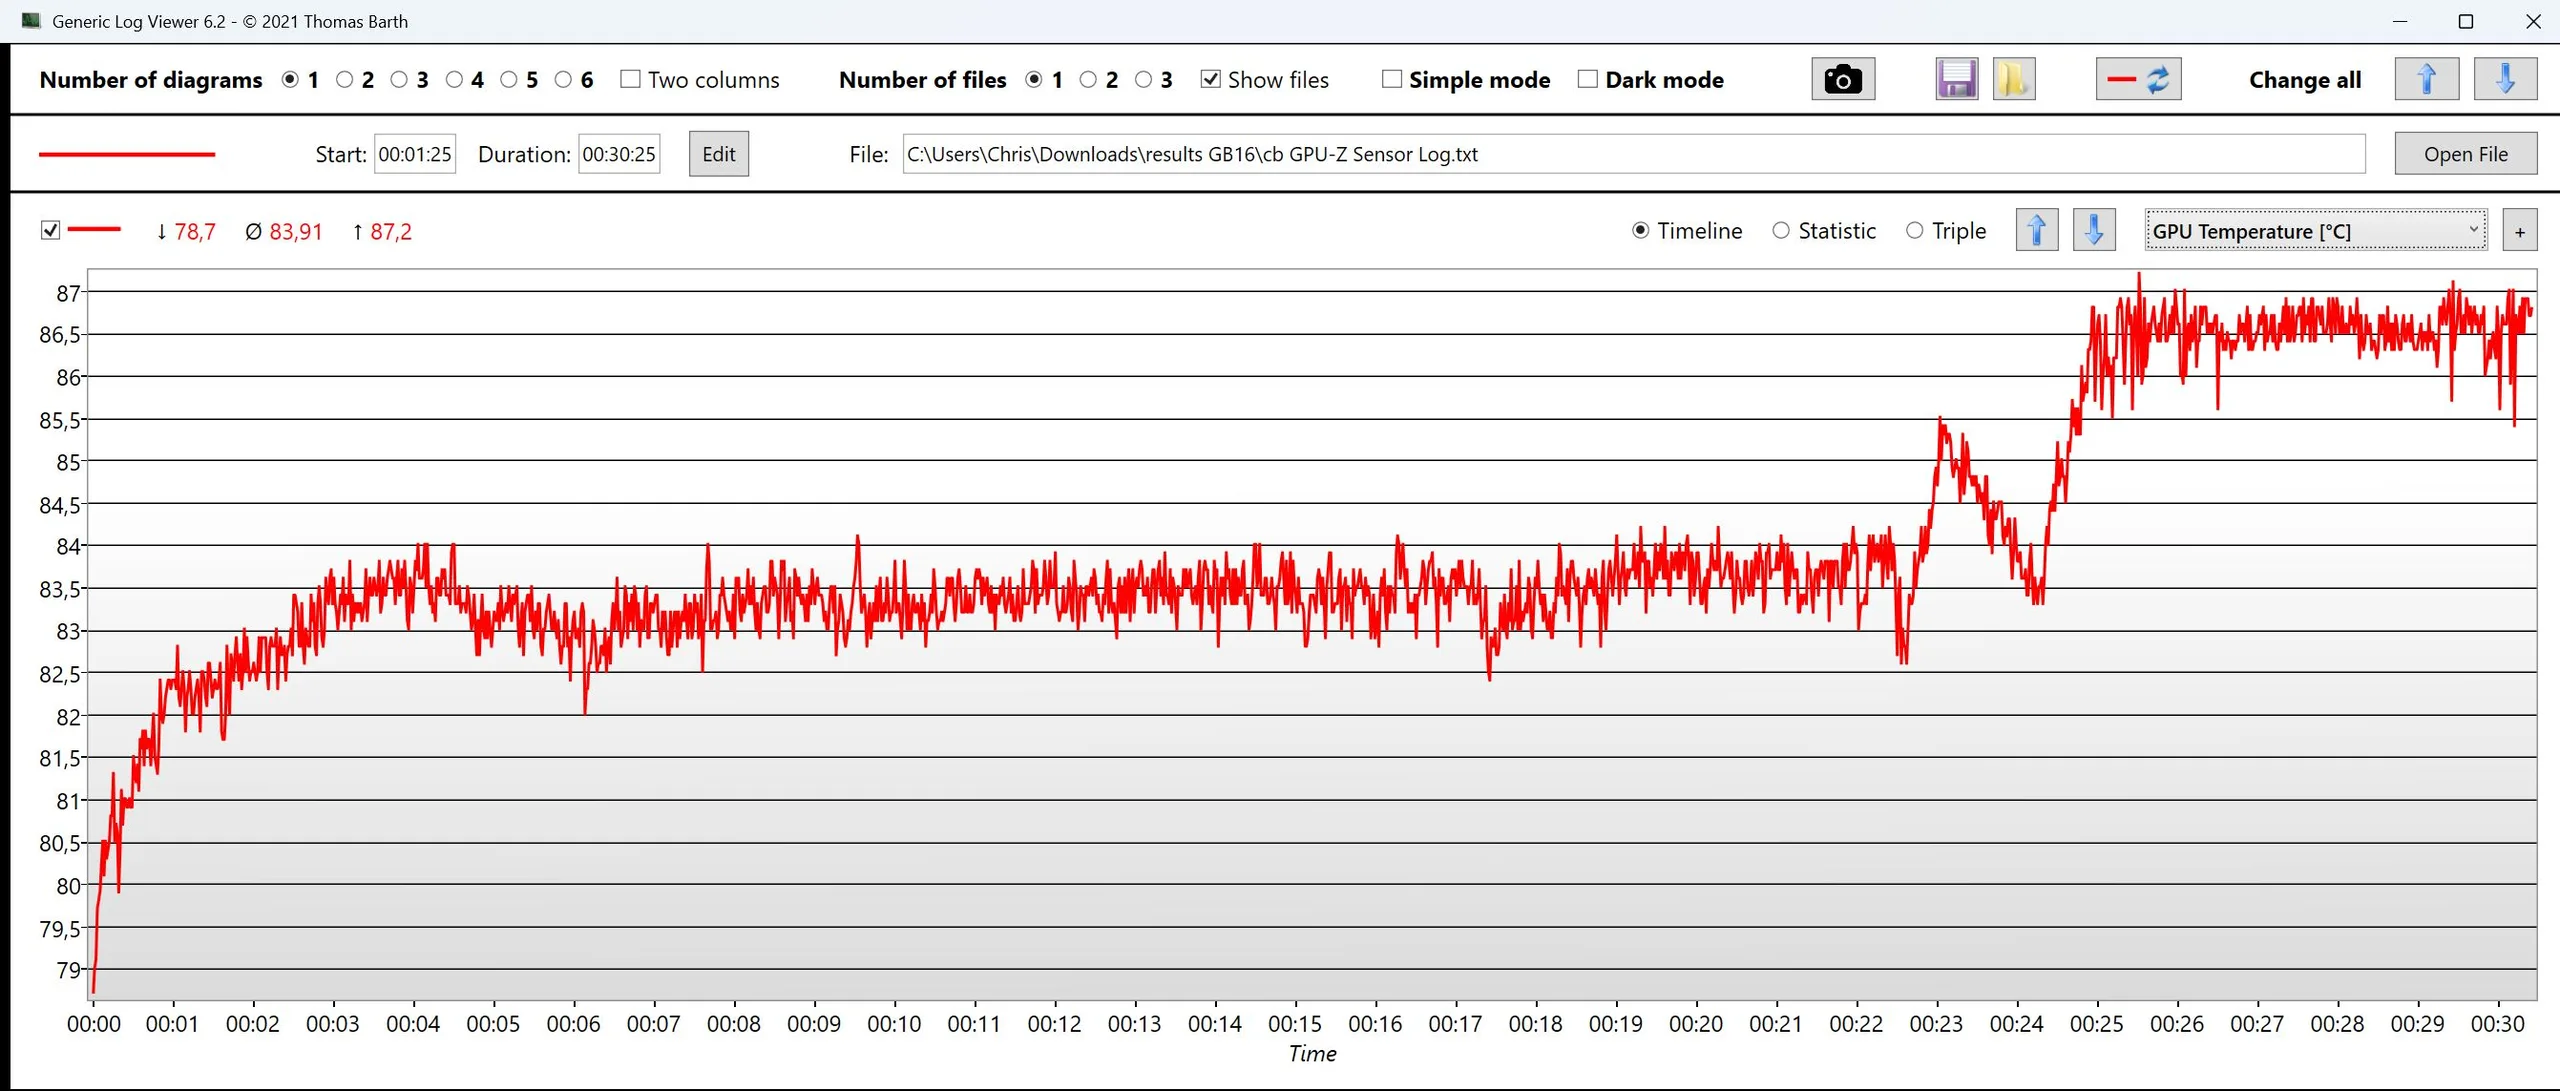
Die Cyberpunk-2077-Dauerleistung wirkt recht konstant, an unseren Daten sehen wir aber, dass die GPU-Temperatur kontinuierlich ansteigt und ab Minute 25 zur Drosselung führt. Die TGP ist auf 115 W beschränkt und liegt in Cyberpunk meist nur bei 95 W.
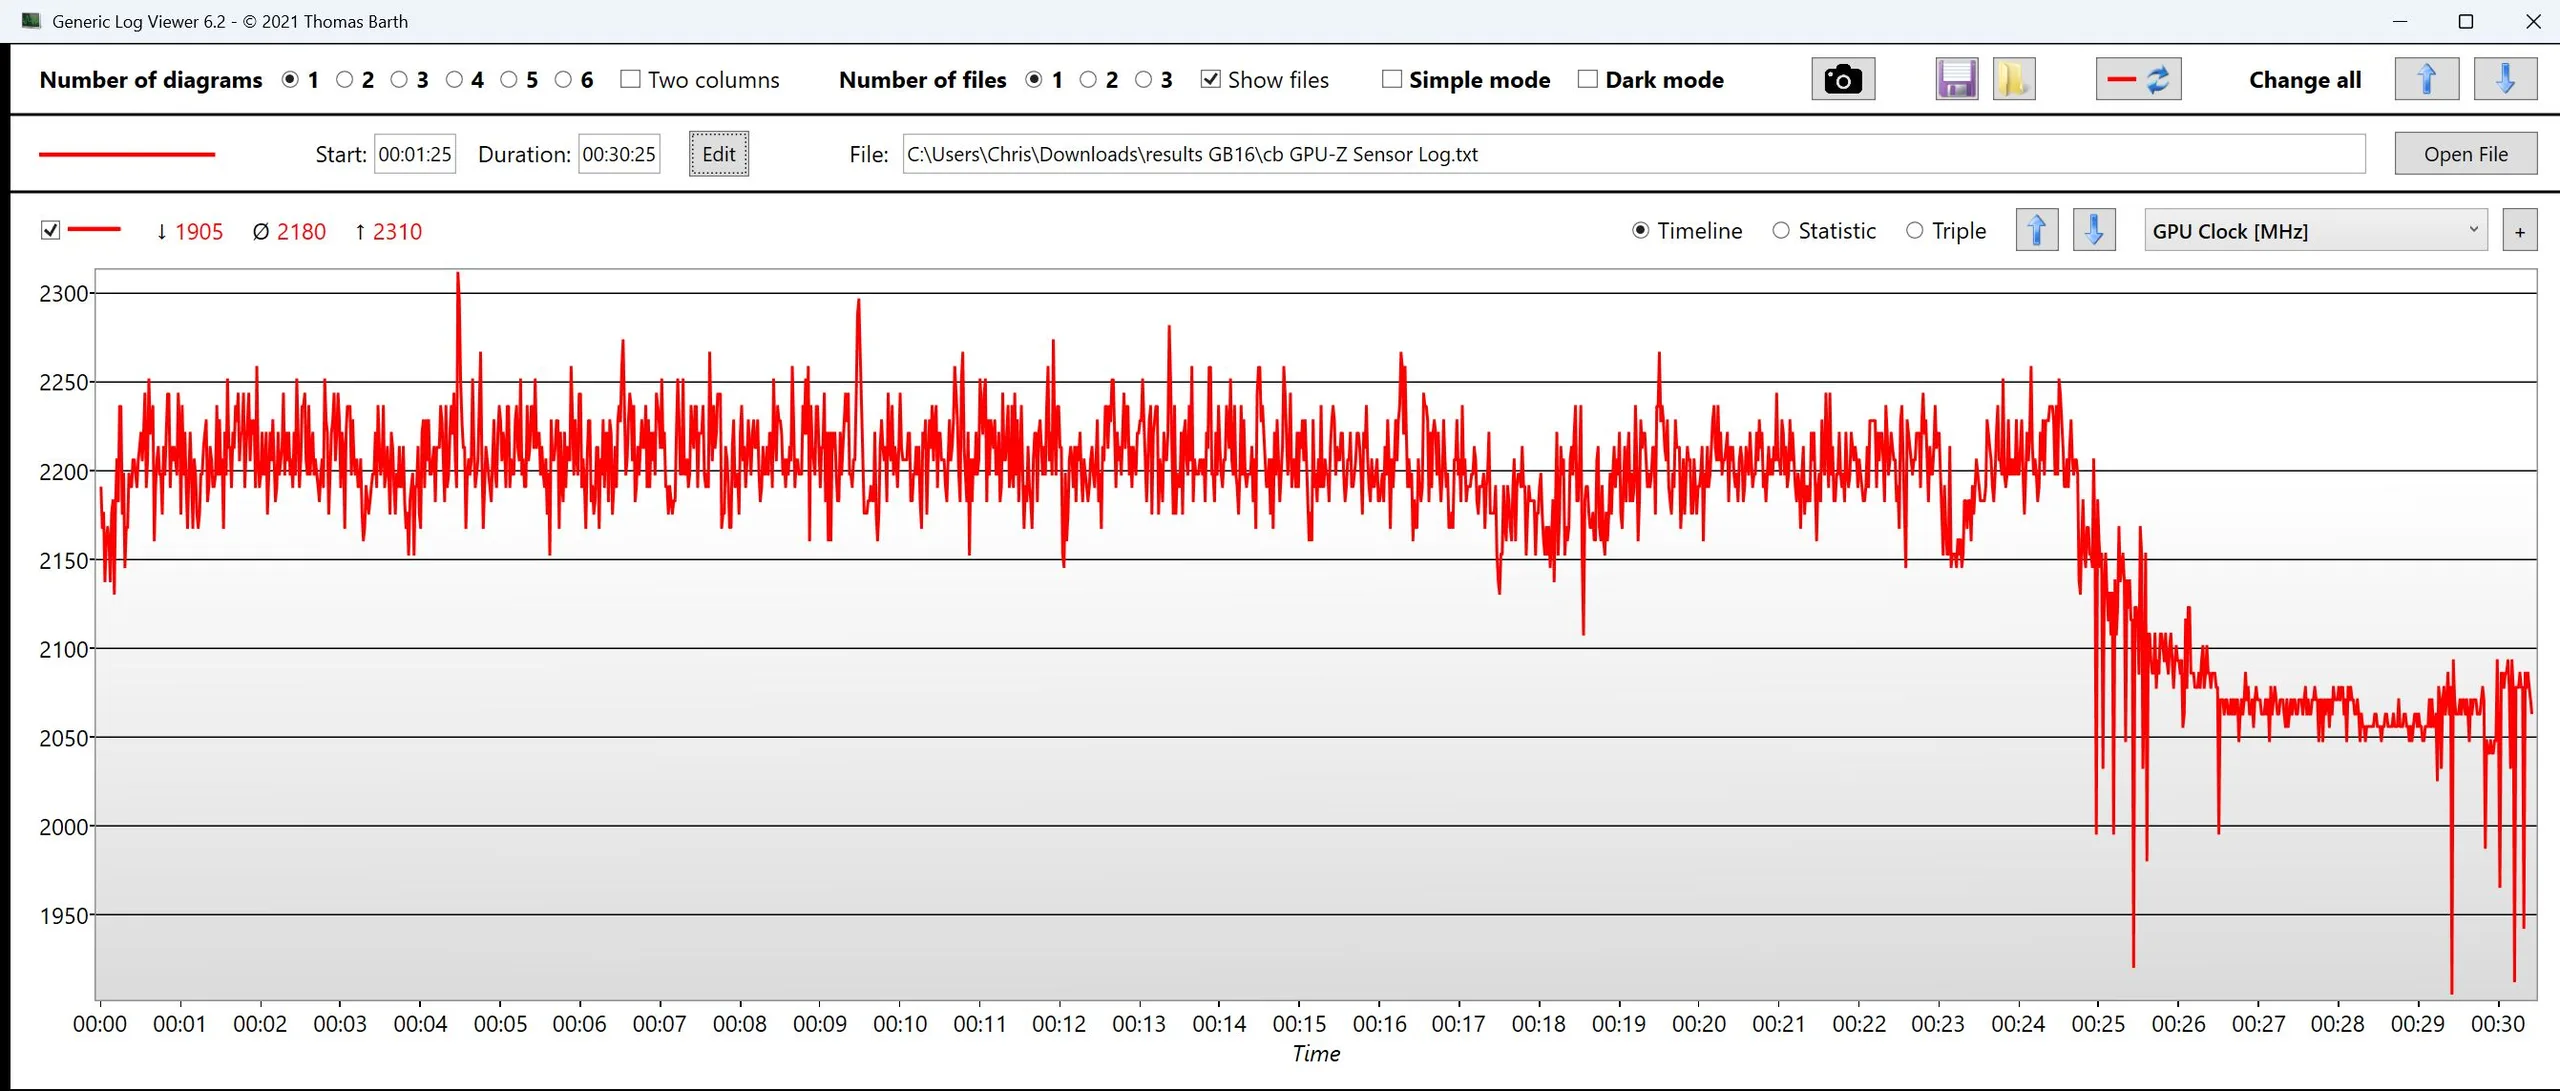
Cyberpunk 2077 ultra FPS-Diagramm
| min. | mittel | hoch | max. | QHD DLSS | QHD | 4K DLSS | 4K | |
|---|---|---|---|---|---|---|---|---|
| GTA V (2015) | 152 | 162.5 | 147.3 | 98 | 98.9 | |||
| Dota 2 Reborn (2015) | 160.8 | 137.5 | 133.1 | 123.6 | 120.1 | |||
| Final Fantasy XV Benchmark (2018) | 117.4 | 115.6 | 108.9 | 103.9 | ||||
| X-Plane 11.11 (2018) | 132.7 | 113.8 | 92.5 | 75.5 | ||||
| Strange Brigade (2018) | 422 | 335 | 305 | 274 | 201 | 113.5 | ||
| Baldur's Gate 3 (2023) | 156 | 144 | 130 | 127 | 128.4 | 91.4 | 86.4 | 52.5 |
| Cyberpunk 2077 (2023) | 130.4 | 126.8 | 114.7 | 105.1 | 84.8 | 72.7 | 127.2 | 128.8 |
| F1 25 (2025) | 127.9 | 123.2 | 117 | 37.6 | 41.1 | 22.6 | 20.4 | 8.92 |
Emissionen & Energie - Hoher Idle-Verbrauch
Geräuschemissionen
Im Idle sind die Lüfter entweder aus, oder drehen mit ca. 24 dB.
Unter hohen Lasten/Gaming kann es mit ca. 56 dB vergleichsweise laut werden, trotz mittelprächtiger Leistung.
Lautstärkediagramm
| Idle |
| 23 / 24.35 / 24.35 dB(A) |
| Last |
| 34.77 / 56.43 dB(A) |
 | ||
30 dB leise 40 dB(A) deutlich hörbar 50 dB(A) störend |
||
min: | ||
| Gigabyte Gaming A16 Pro GA6DH (Core 7 240H, RTX 5070 Ti) Core 7 240H, GeForce RTX 5070 Ti Laptop | Gigabyte Gaming A16 GA6H i7-13620H, GeForce RTX 5070 Laptop | Schenker XMG APEX 16 MAX R9 9955HX, GeForce RTX 5070 Ti Laptop | Acer Predator Helios Neo 16S AI PHN16S-71-94L9 Ultra 9 275HX, GeForce RTX 5070 Ti Laptop | Medion Erazer Major 16 X1 MD62736 Ultra 7 255HX, GeForce RTX 5070 Ti Laptop | Lenovo Legion 5 Pro 16IAX10H Ultra 9 275HX, GeForce RTX 5070 Ti Laptop | |
|---|---|---|---|---|---|---|
| Geräuschentwicklung | -11% | -7% | -17% | -14% | -14% | |
| aus / Umgebung * (dB) | 23 | 24 -4% | 25.9 -13% | 24 -4% | 25 -9% | 24 -4% |
| Idle min * (dB) | 23 | 25 -9% | 25.9 -13% | 24 -4% | 26 -13% | 24 -4% |
| Idle avg * (dB) | 24.35 | 26 -7% | 26.5 -9% | 30 -23% | 27 -11% | 24 1% |
| Idle max * (dB) | 24.35 | 27 -11% | 26.5 -9% | 35 -44% | 30 -23% | 30.9 -27% |
| Last avg * (dB) | 34.77 | 54 -55% | 42.1 -21% | 53 -52% | 53 -52% | 55.9 -61% |
| Cyberpunk 2077 ultra * (dB) | 56.18 | 54 4% | 51 9% | 52 7% | 54 4% | 56.72 -1% |
| Last max * (dB) | 56.43 | 55 3% | 51 10% | 54 4% | 54 4% | 56.72 -1% |
* ... kleinere Werte sind besser
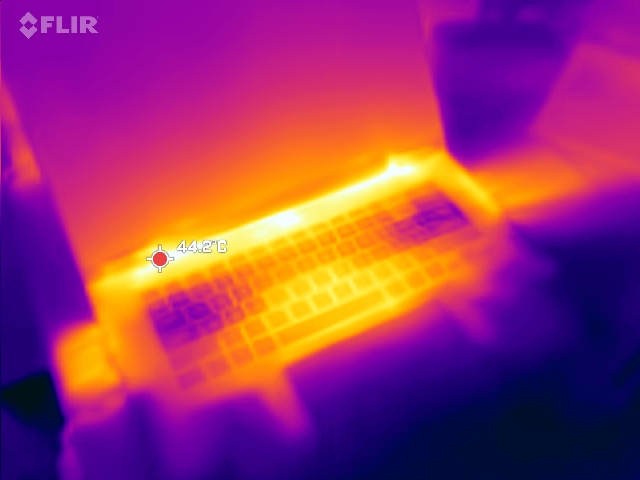
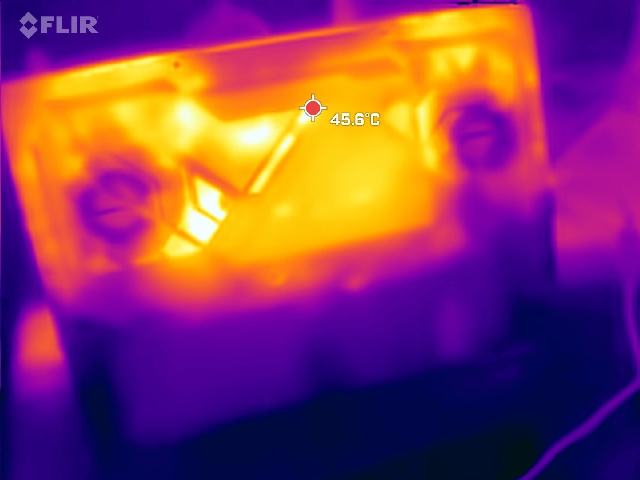
Temperatur
An der Oberseite bleiben die Temperaturen moderat. Heißer wird es an der Unterseite mit Hot Spots um die 50 °C.
(±) Die maximale Temperatur auf der Oberseite ist 42 °C. Im Vergleich liegt der Klassendurchschnitt bei 40.4 °C (von 21.2 bis 68.8 °C für die Klasse Gaming).
(-) Auf der Unterseite messen wir eine maximalen Wert von 49 °C (im Vergleich zum Durchschnitt von 43.2 °C).
(+) Ohne Last messen wir eine durchschnittliche Temperatur von 30.1 °C auf der Oberseite. Der Klassendurchschnitt erreicht 33.9 °C.
(±) 3: The average temperature for the upper side is 34.9 °C / 95 F, compared to the average of 33.9 °C / 93 F for the class Gaming.
(+) Die Handballen und der Touchpad-Bereich sind mit gemessenen 26 °C kühler als die typische Hauttemperatur und fühlen sich dadurch kühl an.
(+) Die durchschnittliche Handballen-Temperatur anderer getesteter Geräte war 28.8 °C (+2.8 °C).
| Gigabyte Gaming A16 Pro GA6DH (Core 7 240H, RTX 5070 Ti) Core 7 240H, GeForce RTX 5070 Ti Laptop | Gigabyte Gaming A16 GA6H i7-13620H, GeForce RTX 5070 Laptop | Schenker XMG APEX 16 MAX R9 9955HX, GeForce RTX 5070 Ti Laptop | Acer Predator Helios Neo 16S AI PHN16S-71-94L9 Ultra 9 275HX, GeForce RTX 5070 Ti Laptop | Medion Erazer Major 16 X1 MD62736 Ultra 7 255HX, GeForce RTX 5070 Ti Laptop | Lenovo Legion 5 Pro 16IAX10H Ultra 9 275HX, GeForce RTX 5070 Ti Laptop | |
|---|---|---|---|---|---|---|
| Hitze | -4% | 2% | 3% | -7% | -11% | |
| Last oben max * (°C) | 42 | 50 -19% | 46.5 -11% | 47 -12% | 49 -17% | 48 -14% |
| Last unten max * (°C) | 49 | 49 -0% | 46.4 5% | 55 -12% | 50 -2% | 50 -2% |
| Idle oben max * (°C) | 34 | 35 -3% | 32.1 6% | 28 18% | 36 -6% | 38 -12% |
| Idle unten max * (°C) | 36 | 34 6% | 33.5 7% | 29 19% | 37 -3% | 42 -17% |
* ... kleinere Werte sind besser
| CPU Clock (GHz) | GPU Clock (MHz) | Average CPU Temperature (°C) | Average GPU Temperature (°C) | |
| Prime95 + FurMark Stress | 1.9 | 1724 | 71 | 86 |
| Cyberpunk 2077 Stress | 2 | 2180 | 74 | 84 |
Lautsprecher
Den beiden 2-W-Lautsprechern fehlt es an Bass und Kraft, auch wenn die Höhen ausgeglichen sind. Für Kopfhörer und Verstärker gibt es einen Headset-Klinkenport.
Gigabyte Gaming A16 Pro GA6DH (Core 7 240H, RTX 5070 Ti) Audio Analyse
(±) | Mittelmäßig laut spielende Lautsprecher (78.63 dB)
Bass 100 - 315 Hz
(-) | kaum Bass - 26.9% niedriger als der Median
(±) | durchschnittlich lineare Bass-Wiedergabe (8.4% Delta zum Vorgänger)
Mitteltöne 400 - 2000 Hz
(+) | ausgeglichene Mitten, vom Median nur 4.2% abweichend
(±) | Linearität der Mitten ist durchschnittlich (7.8% Delta zum Vorgänger)
Hochtöne 2 - 16 kHz
(+) | ausgeglichene Hochtöne, vom Median nur 3.1% abweichend
(+) | sehr lineare Hochtöne (6.1% Delta zum Vorgänger)
Gesamt im hörbaren Bereich 100 - 16.000 Hz
(±) | hörbarer Bereich ist durchschnittlich linear (19.8% Abstand zum Median)
Im Vergleich zu allen Geräten derselben Klasse
» 69% aller getesteten Geräte dieser Klasse waren besser, 6% vergleichbar, 24% schlechter
» Das beste Gerät hat einen Delta-Wert von 6%, durchschnittlich ist 18%, das schlechteste Gerät hat 132%
Im Vergleich zu allen Geräten im Test
» 50% aller getesteten Geräte waren besser, 7% vergleichbar, 43% schlechter
» Das beste Gerät hat einen Delta-Wert von 4%, durchschnittlich ist 24%, das schlechteste Gerät hat 134%
Acer Predator Helios Neo 16S AI PHN16S-71-94L9 Audio Analyse
(+) | Die Lautsprecher können relativ laut spielen (86 dB)
Bass 100 - 315 Hz
(-) | kaum Bass - 24.8% niedriger als der Median
(±) | durchschnittlich lineare Bass-Wiedergabe (12.6% Delta zum Vorgänger)
Mitteltöne 400 - 2000 Hz
(±) | zu hohe Mitten, vom Median 5.9% abweichend
(+) | lineare Mitten (6.4% Delta zum Vorgänger)
Hochtöne 2 - 16 kHz
(+) | ausgeglichene Hochtöne, vom Median nur 2.8% abweichend
(+) | sehr lineare Hochtöne (5.9% Delta zum Vorgänger)
Gesamt im hörbaren Bereich 100 - 16.000 Hz
(±) | hörbarer Bereich ist durchschnittlich linear (17.3% Abstand zum Median)
Im Vergleich zu allen Geräten derselben Klasse
» 47% aller getesteten Geräte dieser Klasse waren besser, 12% vergleichbar, 41% schlechter
» Das beste Gerät hat einen Delta-Wert von 6%, durchschnittlich ist 18%, das schlechteste Gerät hat 132%
Im Vergleich zu allen Geräten im Test
» 32% aller getesteten Geräte waren besser, 8% vergleichbar, 59% schlechter
» Das beste Gerät hat einen Delta-Wert von 4%, durchschnittlich ist 24%, das schlechteste Gerät hat 134%
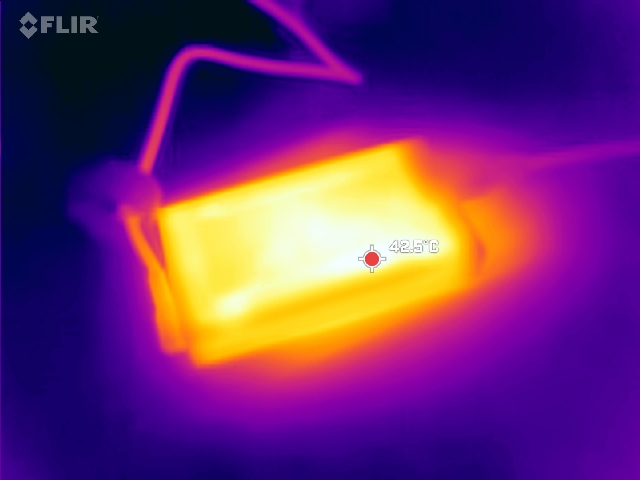
Energieaufnahme
Unter Last gehört das A16 Pro zu den sparsameren RTX-5070-Ti-Gamern. Die Idle-Verbrauchswerte sind jedoch viel zu hoch (dGPU inaktiv, keine störenden Prozesse) und sinken auch nach langer Zeit nicht. "Silence" und "Balanced" verbrauchen teils mehr als "Leistung". Hier muss der Hersteller nachbessern.
Über HDMI am externen Monitor ist dann die dGPU aktiv und der Verbrauch steigt im Idle nochmals leicht an.
| Aus / Standby | |
| Idle | |
| Last |
|
Legende:
min: | |
| Gigabyte Gaming A16 Pro GA6DH (Core 7 240H, RTX 5070 Ti) Core 7 240H, GeForce RTX 5070 Ti Laptop, Samsung PM9C1b MZVL81T0HFLB-00BTW, IPS, 2560x1600, 16" | Gigabyte Gaming A16 GA6H i7-13620H, GeForce RTX 5070 Laptop, Kingston OM8PGP41024Q-A0, IPS, 2560x1600, 16" | Schenker XMG APEX 16 MAX R9 9955HX, GeForce RTX 5070 Ti Laptop, Samsung 9100 Pro 2 TB, Mini-LED, 2560x1600, 16" | Acer Predator Helios Neo 16S AI PHN16S-71-94L9 Ultra 9 275HX, GeForce RTX 5070 Ti Laptop, Micron 3500 1TB MTFDKBA1T0TGD, OLED, 2560x1600, 16" | Medion Erazer Major 16 X1 MD62736 Ultra 7 255HX, GeForce RTX 5070 Ti Laptop, Phison E31 2 TB, IPS, 2560x1600, 16" | Lenovo Legion 5 Pro 16IAX10H Ultra 9 275HX, GeForce RTX 5070 Ti Laptop, Western Digital PC SN8000S SDEPNRK-1T00, OLED, 2560x1600, 16" | Durchschnittliche NVIDIA GeForce RTX 5070 Ti Laptop | Durchschnitt der Klasse Gaming | |
|---|---|---|---|---|---|---|---|---|
| Stromverbrauch | 28% | -26% | 21% | -15% | -21% | 1% | 7% | |
| Idle min * (Watt) | 21.5 | 9 58% | 15.4 28% | 3.9 82% | 17.8 17% | 14 35% | 12.4 ? 42% | 13.2 ? 39% |
| Idle avg * (Watt) | 28.3 | 11 61% | 29.9 -6% | 11 61% | 20.7 27% | 14.3 49% | 19.7 ? 30% | 18.9 ? 33% |
| Idle max * (Watt) | 26.3 | 23 13% | 30.1 -14% | 16.9 36% | 23.4 11% | 20.1 24% | 24.9 ? 5% | 24.3 ? 8% |
| Last avg * (Watt) | 92.5 | 91 2% | 136.4 -47% | 123 -33% | 110 -19% | 177 -91% | 123.6 ? -34% | 108 ? -17% |
| Cyberpunk 2077 ultra * (Watt) | 165 | 132.5 20% | 231 -40% | 152.7 7% | 233 -41% | 255 -55% | ||
| Cyberpunk 2077 ultra external monitor * (Watt) | 158 | 130 18% | 226 -43% | 144.9 8% | 232 -47% | 255 -61% | ||
| Last max * (Watt) | 195 | 155 21% | 315 -62% | 229 -17% | 297 -52% | 294 -51% | 272 ? -39% | 254 ? -30% |
* ... kleinere Werte sind besser
Energieaufnahme Cyberpunk / Stresstest
Energieaufnahme mit externem Monitor
Akkulaufzeit
76 Wh gehören im Vergleich eher zum unteren Ende in dieser Kategorie. Im WLAN-Test reicht es dennoch für sehr gute 8,3 Stunden.
| Gigabyte Gaming A16 Pro GA6DH (Core 7 240H, RTX 5070 Ti) Core 7 240H, GeForce RTX 5070 Ti Laptop, 76 Wh | Gigabyte Gaming A16 GA6H i7-13620H, GeForce RTX 5070 Laptop, 76 Wh | Schenker XMG APEX 16 MAX R9 9955HX, GeForce RTX 5070 Ti Laptop, 99.8 Wh | Acer Predator Helios Neo 16S AI PHN16S-71-94L9 Ultra 9 275HX, GeForce RTX 5070 Ti Laptop, 76 Wh | Medion Erazer Major 16 X1 MD62736 Ultra 7 255HX, GeForce RTX 5070 Ti Laptop, 80 Wh | Lenovo Legion 5 Pro 16IAX10H Ultra 9 275HX, GeForce RTX 5070 Ti Laptop, 80 Wh | Durchschnitt der Klasse Gaming | |
|---|---|---|---|---|---|---|---|
| Akkulaufzeit | -7% | -41% | -40% | -24% | -41% | -15% | |
| WLAN (h) | 8.3 | 7.7 -7% | 4.9 -41% | 5 -40% | 6.3 -24% | 4.9 -41% | 7.02 ? -15% |
| H.264 (h) | 4.8 | 8.26 ? | |||||
| Last (h) | 1.7 | 1.47 ? |
Gigabyte Gaming A16 Pro GA6DH (Core 7 240H, RTX 5070 Ti)
- 19.03.2026 v8
Christian Hintze
 Total Sustainability Score:
 Mögliche Alternativen im Vergleich
Bild | Modell / Test | Preis ab | Gewicht | Dicke | Display |
|---|---|---|---|---|---|
1. 81%  | Gigabyte Gaming A16 Pro GA6DH (Core 7 240H, RTX 5070 Ti) Intel Core 7 240H ⎘ NVIDIA GeForce RTX 5070 Ti Laptop ⎘ 32 GB RAM, 1000 GB SSD | Amazon: 2.690,55 € Bestpreis 1941.43€ Easynotebooks.de 2. 1941.43€ playox.de 3. 1941.44€ Notebook.de | 2.4 kg | 22.99 mm | 16.00" 2560x1600 189 PPI IPS |
2. 80.1%  | Gigabyte Gaming A16 GA6H Intel Core i7-13620H ⎘ NVIDIA GeForce RTX 5070 Laptop ⎘ 16 GB RAM, 1024 GB SSD | Amazon: 1. 1.576,31 € Gigabyte Gaming A16 CWH Gami... 2. Gigabyte Gaming A16 Gaming-L... 3. Gigabyte Gaming A16 Laptop �... Bestpreis 1369€ simac_gmbh 2. 1399€ Coolblue 3. 1399€ Easynotebooks.de | 2.3 kg | 23 mm | 16.00" 2560x1600 189 PPI IPS |
3. 76.2%  | Alienware 16 Aurora Intel Core 7 240H ⎘ NVIDIA GeForce RTX 5060 Laptop ⎘ 32 GB RAM | Amazon: 1.619,00 € Geizhals Suche | 2.6 kg | 15.2 mm | 16.00" 2560x1600 189 PPI IPS |
4. 85.2%  | Medion Erazer Major 16 X1 MD62736 Intel Core Ultra 7 255HX ⎘ NVIDIA GeForce RTX 5070 Ti Laptop ⎘ 32 GB RAM, SSD | Amazon: Geizhals Suche | 2.5 kg | 22.7 mm | 16.00" 2560x1600 189 PPI IPS |
5. 75.2%  | MSI Cyborg 15 B2RWEKG Intel Core 7 240H ⎘ NVIDIA GeForce RTX 5050 Laptop ⎘ 16 GB RAM, 512 GB SSD | Amazon: 1.049,00 € Bestpreis 995.5€ galaxus 2. 1003.87€ galaxus.at 3. 1049€ Alternate | 2.2 kg | 23.2 mm | 15.60" 1920x1080 141 PPI IPS |
6. 78.6%  | Medion Erazer Deputy 15 P1 MD62761 Intel Core 7 250H ⎘ NVIDIA GeForce RTX 5060 Laptop ⎘ 16 GB RAM, 1024 GB | Amazon: 1.324,86 € Bestpreis 1199€ nullprozentshop.de 2. 1199€ notebooksbilliger.de 3. 1199€ Cyberport Stores Deutschland | 2.2 kg | 29 mm | 15.60" 1920x1080 141 PPI IPS |
Transparenz
Die Auswahl der zu testenden Geräte erfolgt innerhalb der Redaktion. Das vorliegende Testmuster wurde dem Autor vom Hersteller oder einem Shop zu Testzwecken leihweise zur Verfügung gestellt. Eine Einflussnahme des Leihstellers auf den Testbericht gab es nicht, der Hersteller erhielt keine Version des Reviews vor der Veröffentlichung. Es bestand keine Verpflichtung zur Publikation. Als eigenständiges, unabhängiges Unternehmen unterliegt Notebookcheck keiner Diktion von Herstellern, Shops und Verlagen.
So testet Notebookcheck
Pro Jahr werden von Notebookcheck hunderte Laptops und Smartphones unabhängig in von uns standardisierten technischen Verfahren getestet, um eine Vergleichbarkeit aller Testergebnisse zu gewährleisten. Seit rund 20 Jahren entwickeln wir diese Testmethoden kontinuierlich weiter und setzen damit Branchenstandards. In unseren Testlaboren kommt ausschließlich hochwertiges Messequipment in die Hände erfahrener Techniker und Redakteure. Die Tests unterliegen einer mehrstufigen Kontrolle. Unsere komplexe Gesamtbewertung basiert auf hunderten fundierten Messergebnissen und Benchmarks, womit Ihnen Objektivität garantiert ist. Weitere Informationen zu unseren Testmethoden gibt es hier.
