
Fazit: Ein Schritt vorwärts, zwei Schritte zurück
Das ältere ThinkPad P16 war größer und schwerer als die Konkurrenz. Das neueste Modell, das Lenovo ThinkPad P16 Gen 3, scheint jedoch eine Überkorrektur zu sein: Es ist viel mobiler, bringt aber Abstriche bei der Leistung, wobei die 105 W TGP der GPU und das 180 W Ladegerät ins Auge fallen. Das erwarten wir bei einem Laptop, der die Performance priorisiert, eigentlich anders.
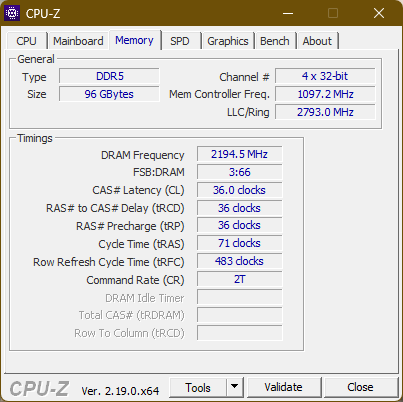
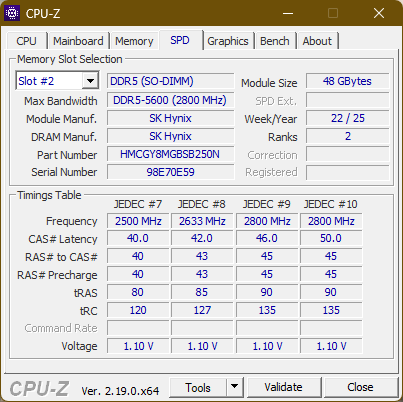
Die Gesamtleistung ist nach wie vor hoch, und das ThinkPad P16 G3 hat viele großartige Eigenschaften, die es zu einem guten Arbeitstier machen. Besonders erwähnenswert ist die Erweiterbarkeit, denn es ist möglich, dieses Notebook mit bis zu 192 GB RAM und drei 2280 SSD zu bestücken, sowie der RTX Pro 5000 im Maximalausbau. Für CAD oder lokale KI-Anwendungen ist dies ein großartiger Laptop.
Pro
Contra
Preis und Verfügbarkeit
Bei Lenovo kostet das ThinkPad P16 Gen 3 zum Zeitpunkt unseres Testberichts mindestens rund 3.779 Euro.
Inhaltsverzeichnis
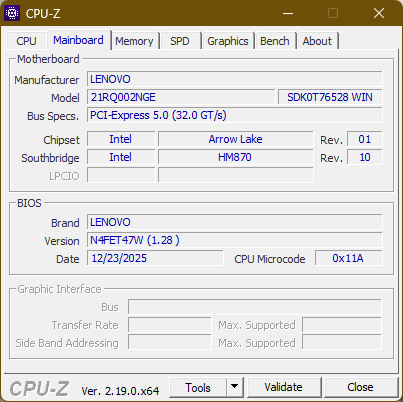
Lenovo nennt seine mobilen Workstations die ThinkPad P-Serie - wobei P für Power oder Performance steht. Unser Test Gerät, das Lenovo ThinkPad P16 Gen 3, steht dafür mehr als jedes andere Modell der Serie. Es gibt der Leistung den Vorrang vor anderen Aspekten, wie der Mobilität. Es ist das schwerste, dickste, aber auch leistungsstärkste ThinkPad Notebook in der Reihe, mit den meisten Konfigurationsoptionen und Aufrüstmöglichkeiten. Wenn man ein P16 Gen 3 kauft, brauchen man diese Leistung - und eine Menge Geld. Ob CAD oder lokale KI oder sogar als tragbarer Server, das ThinkPad P16 ist das Modell, das dafür geeignet ist.
Spezifikationen: Core Ultra 9 & RTX Pro 3000 Blackwell
Preisvergleich
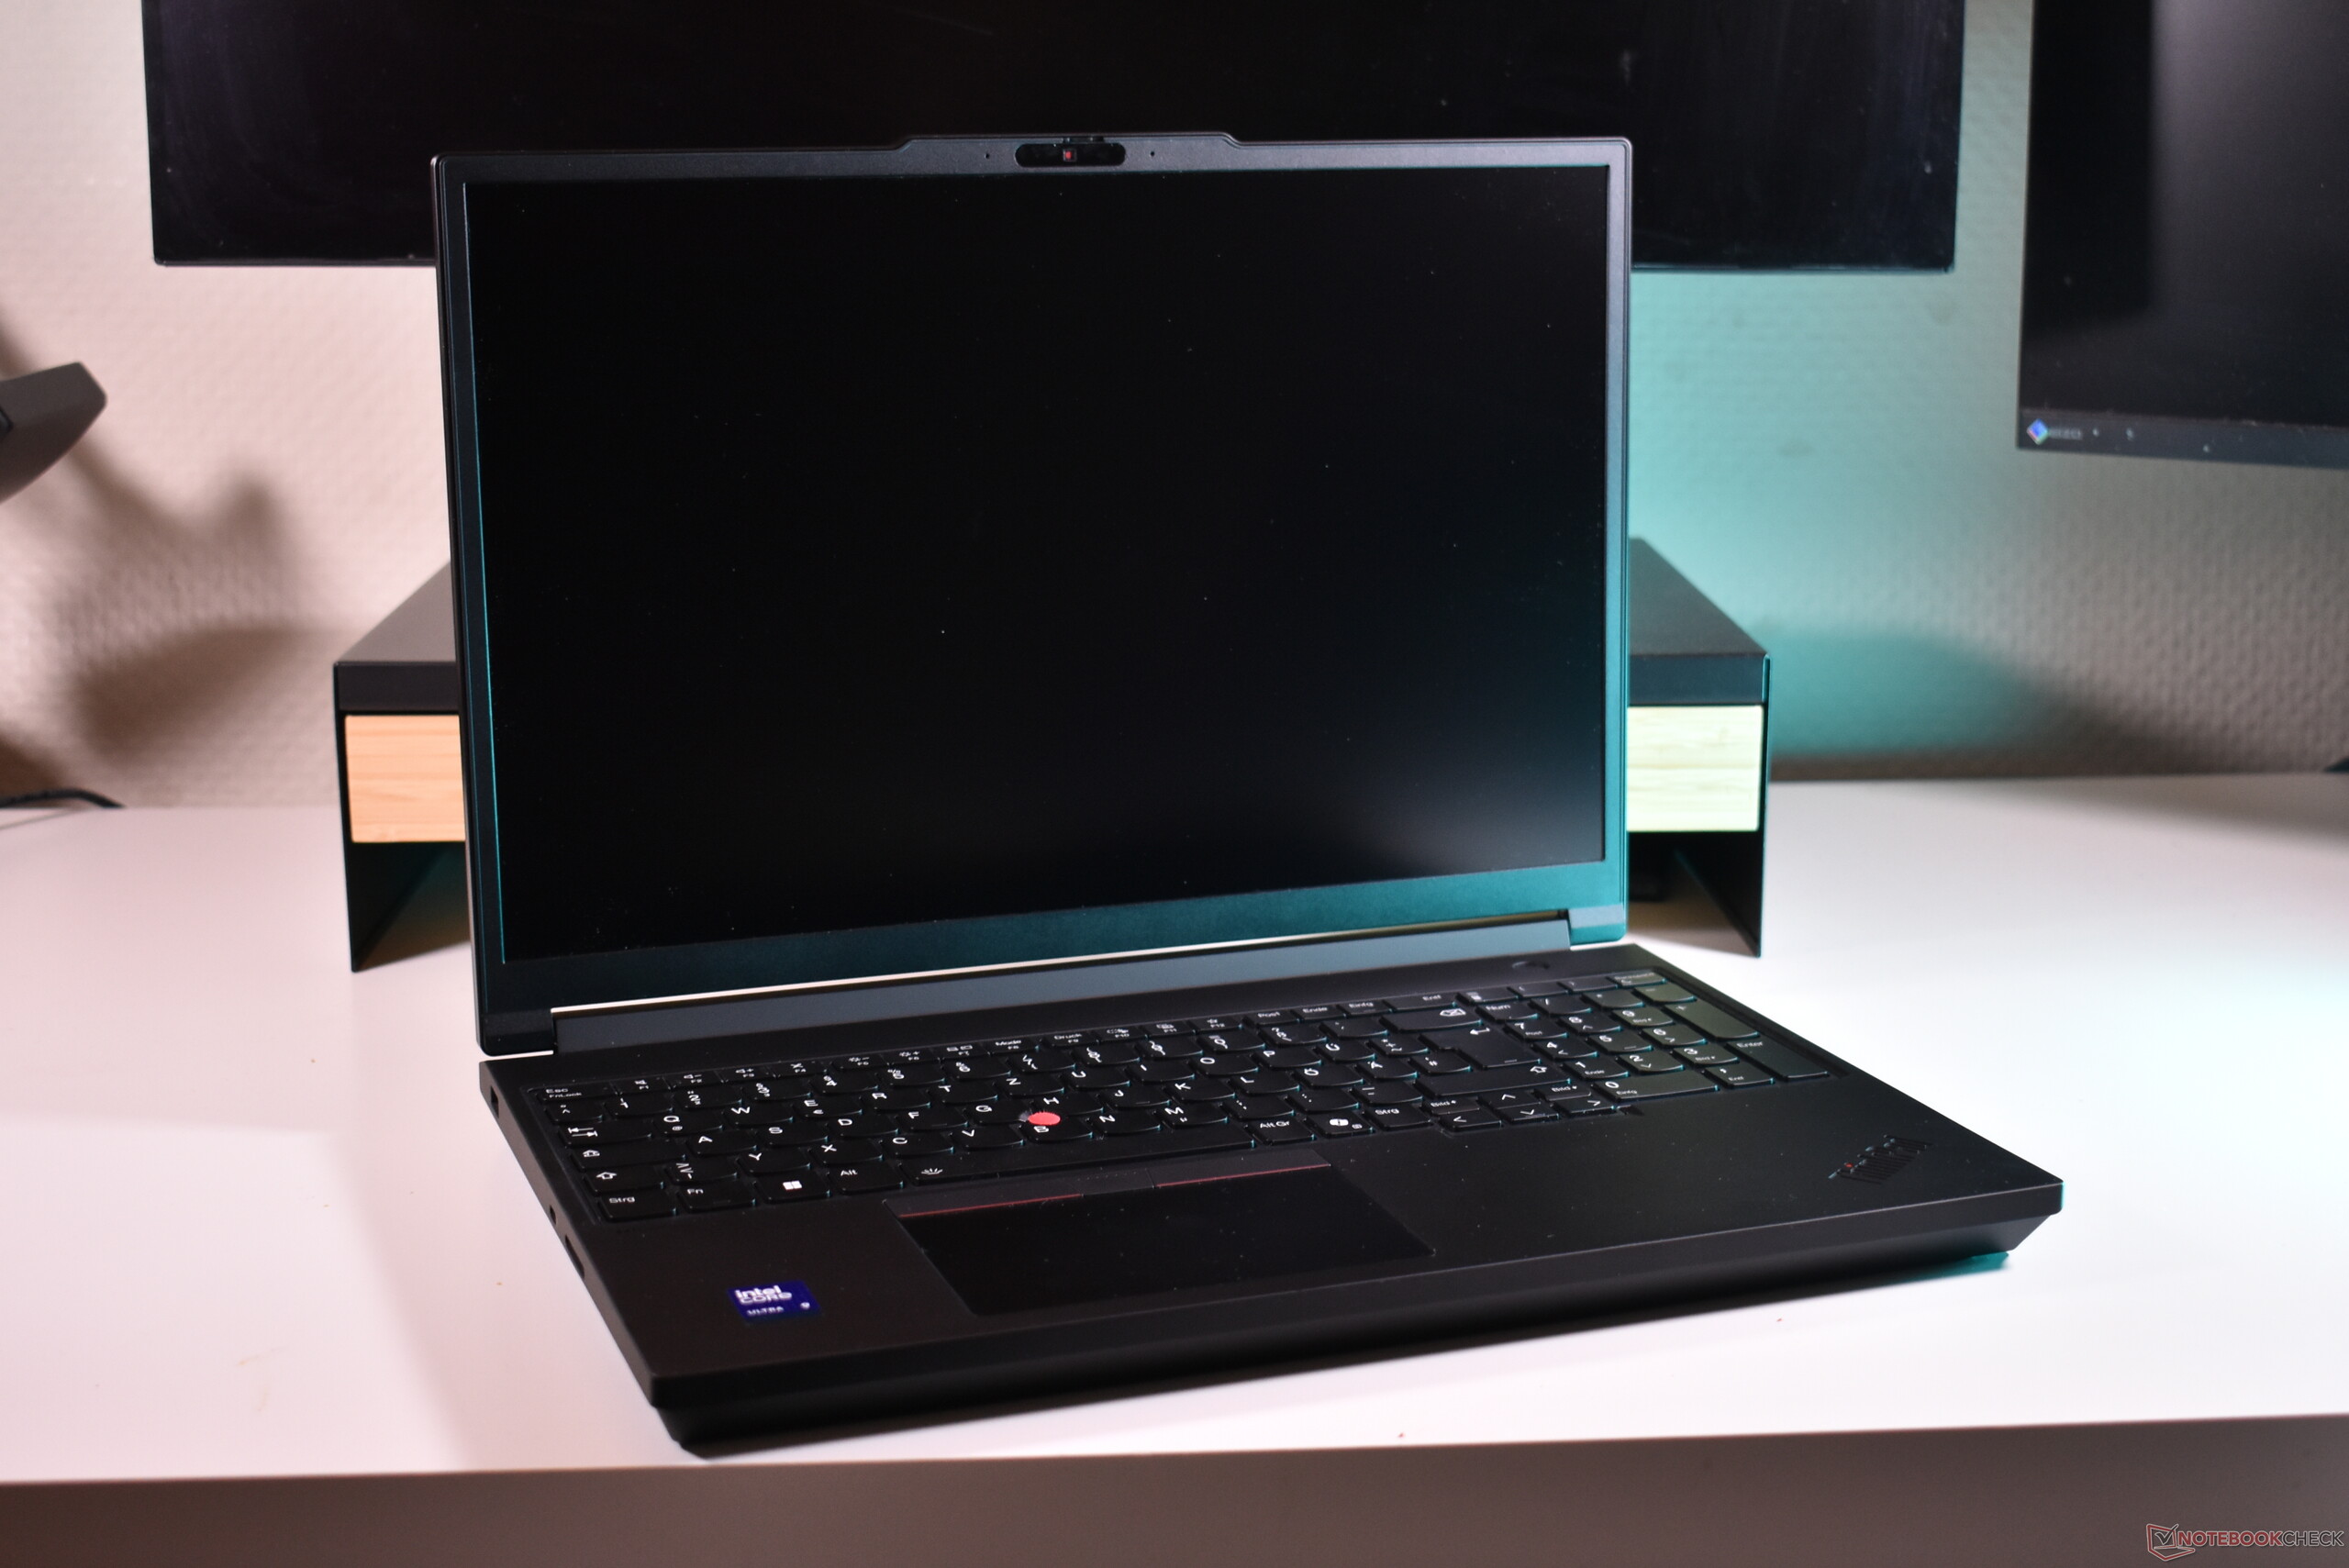
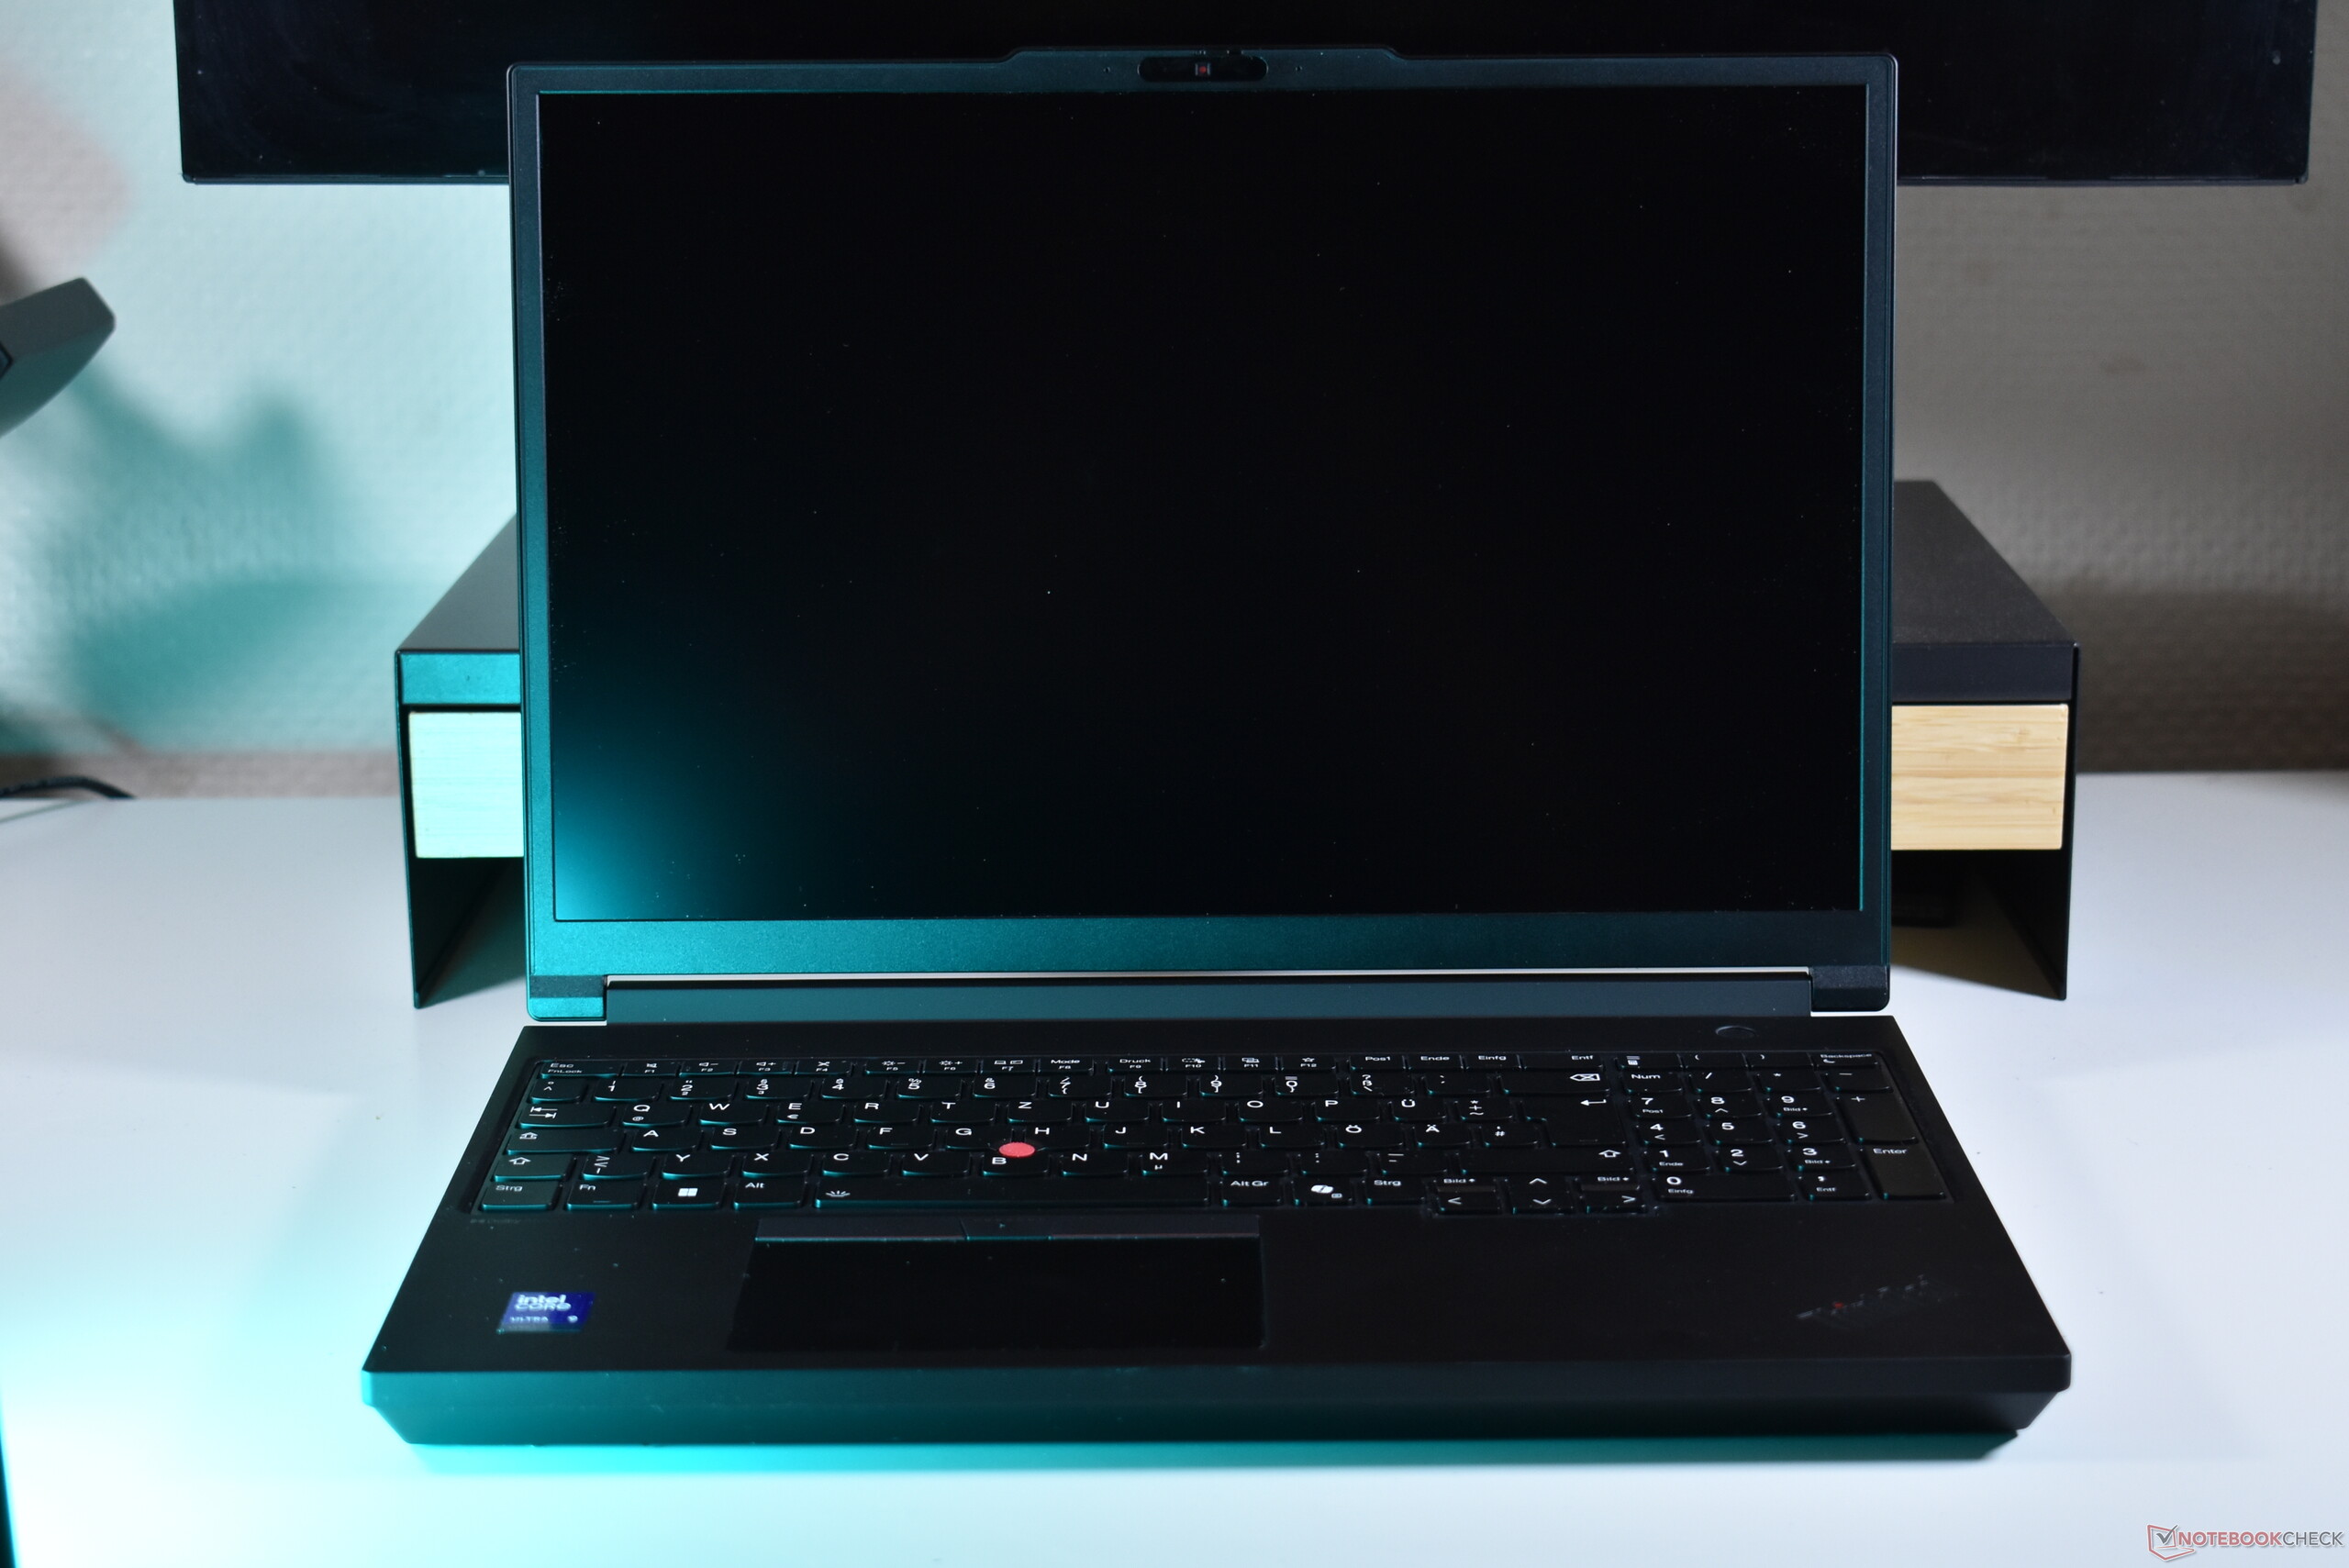
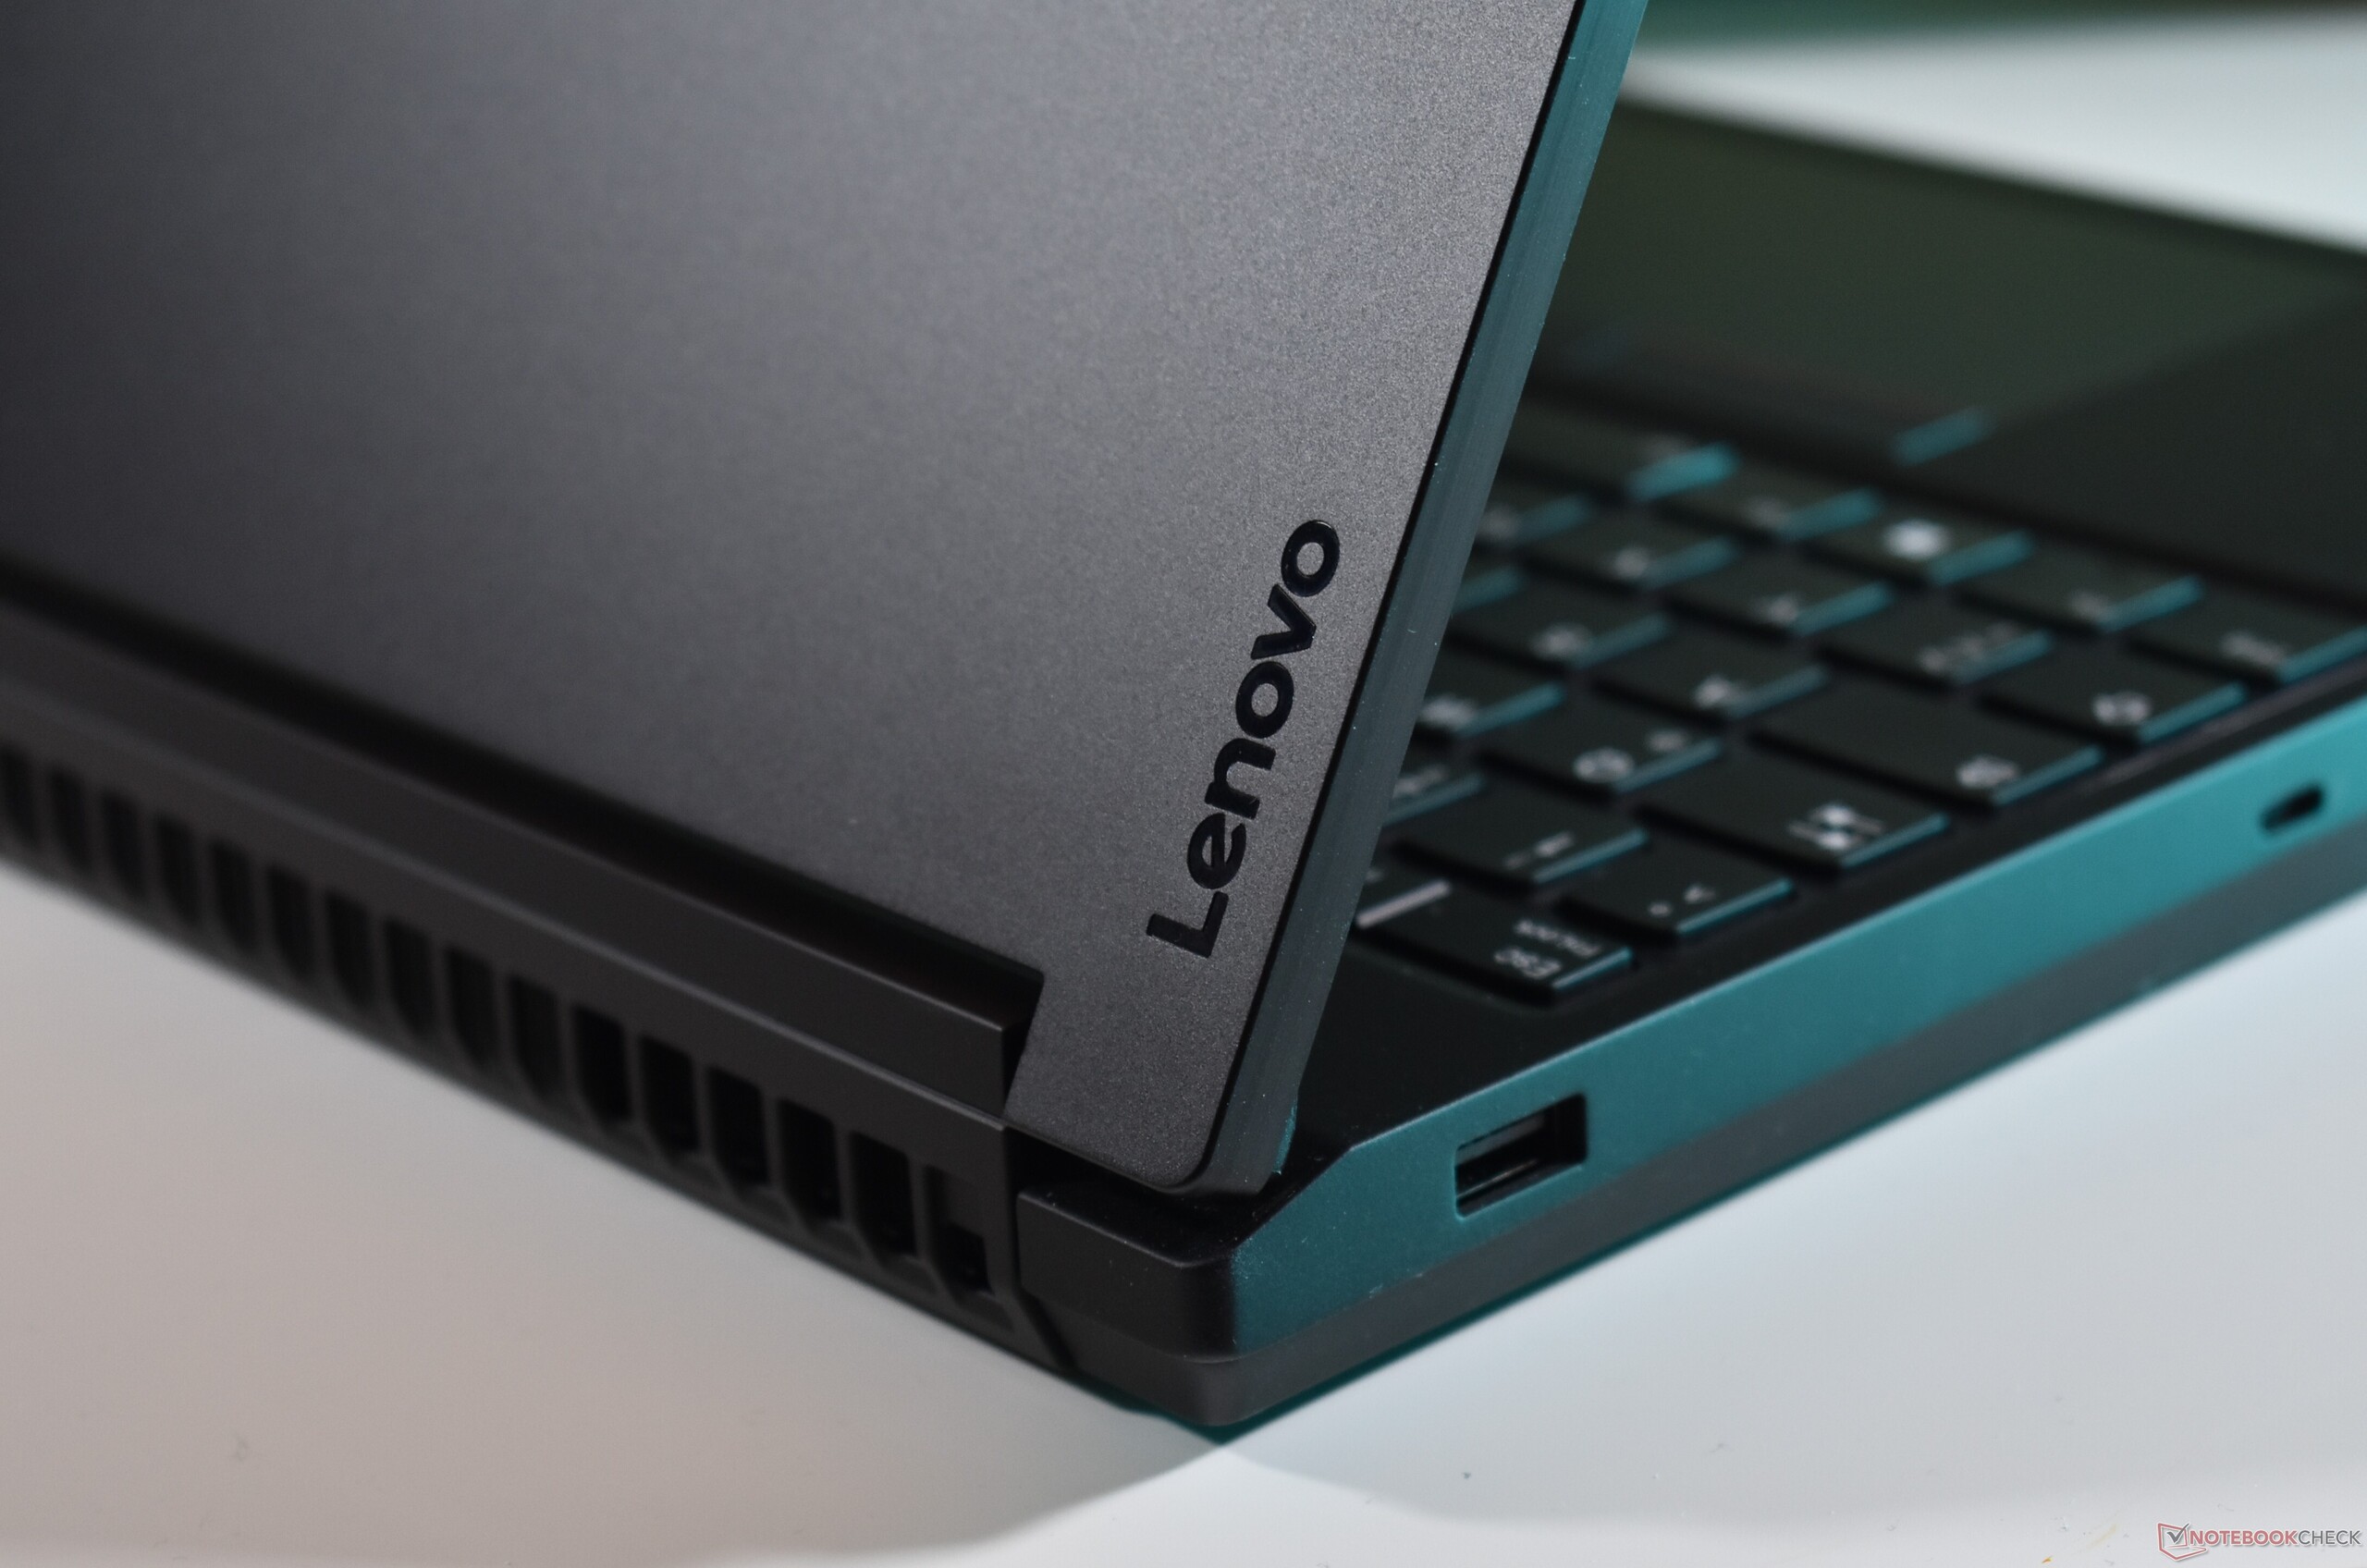
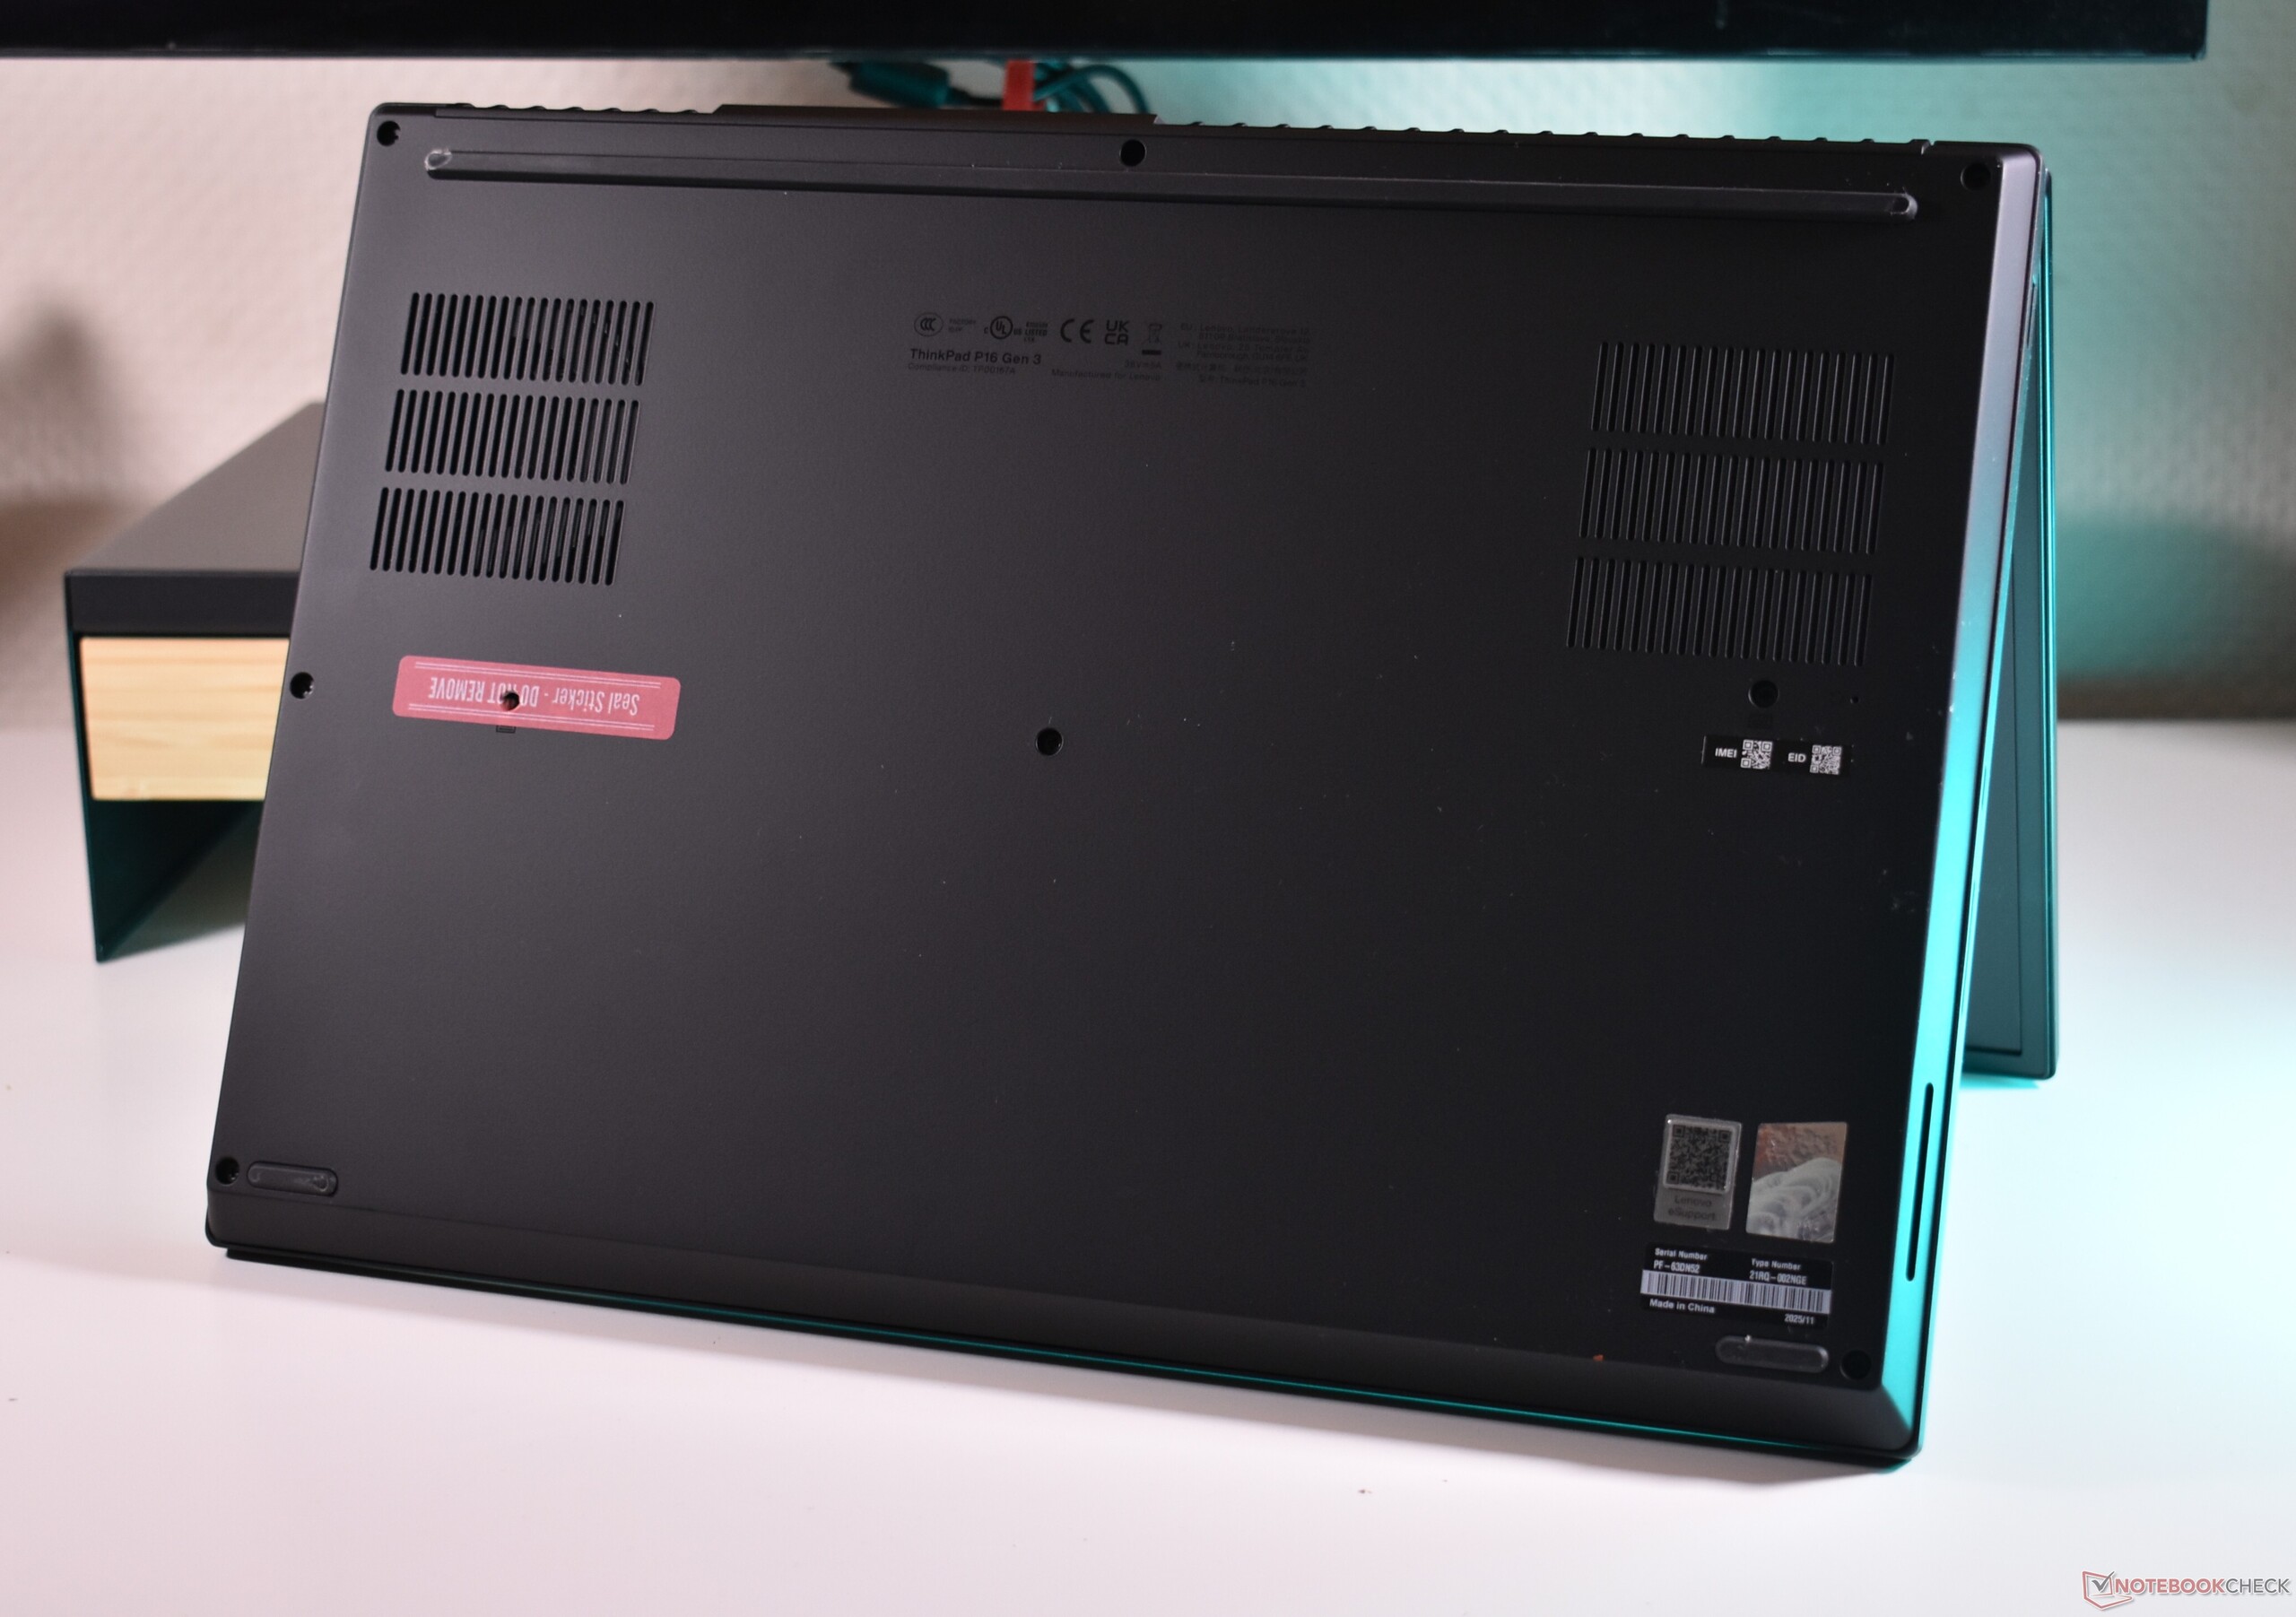
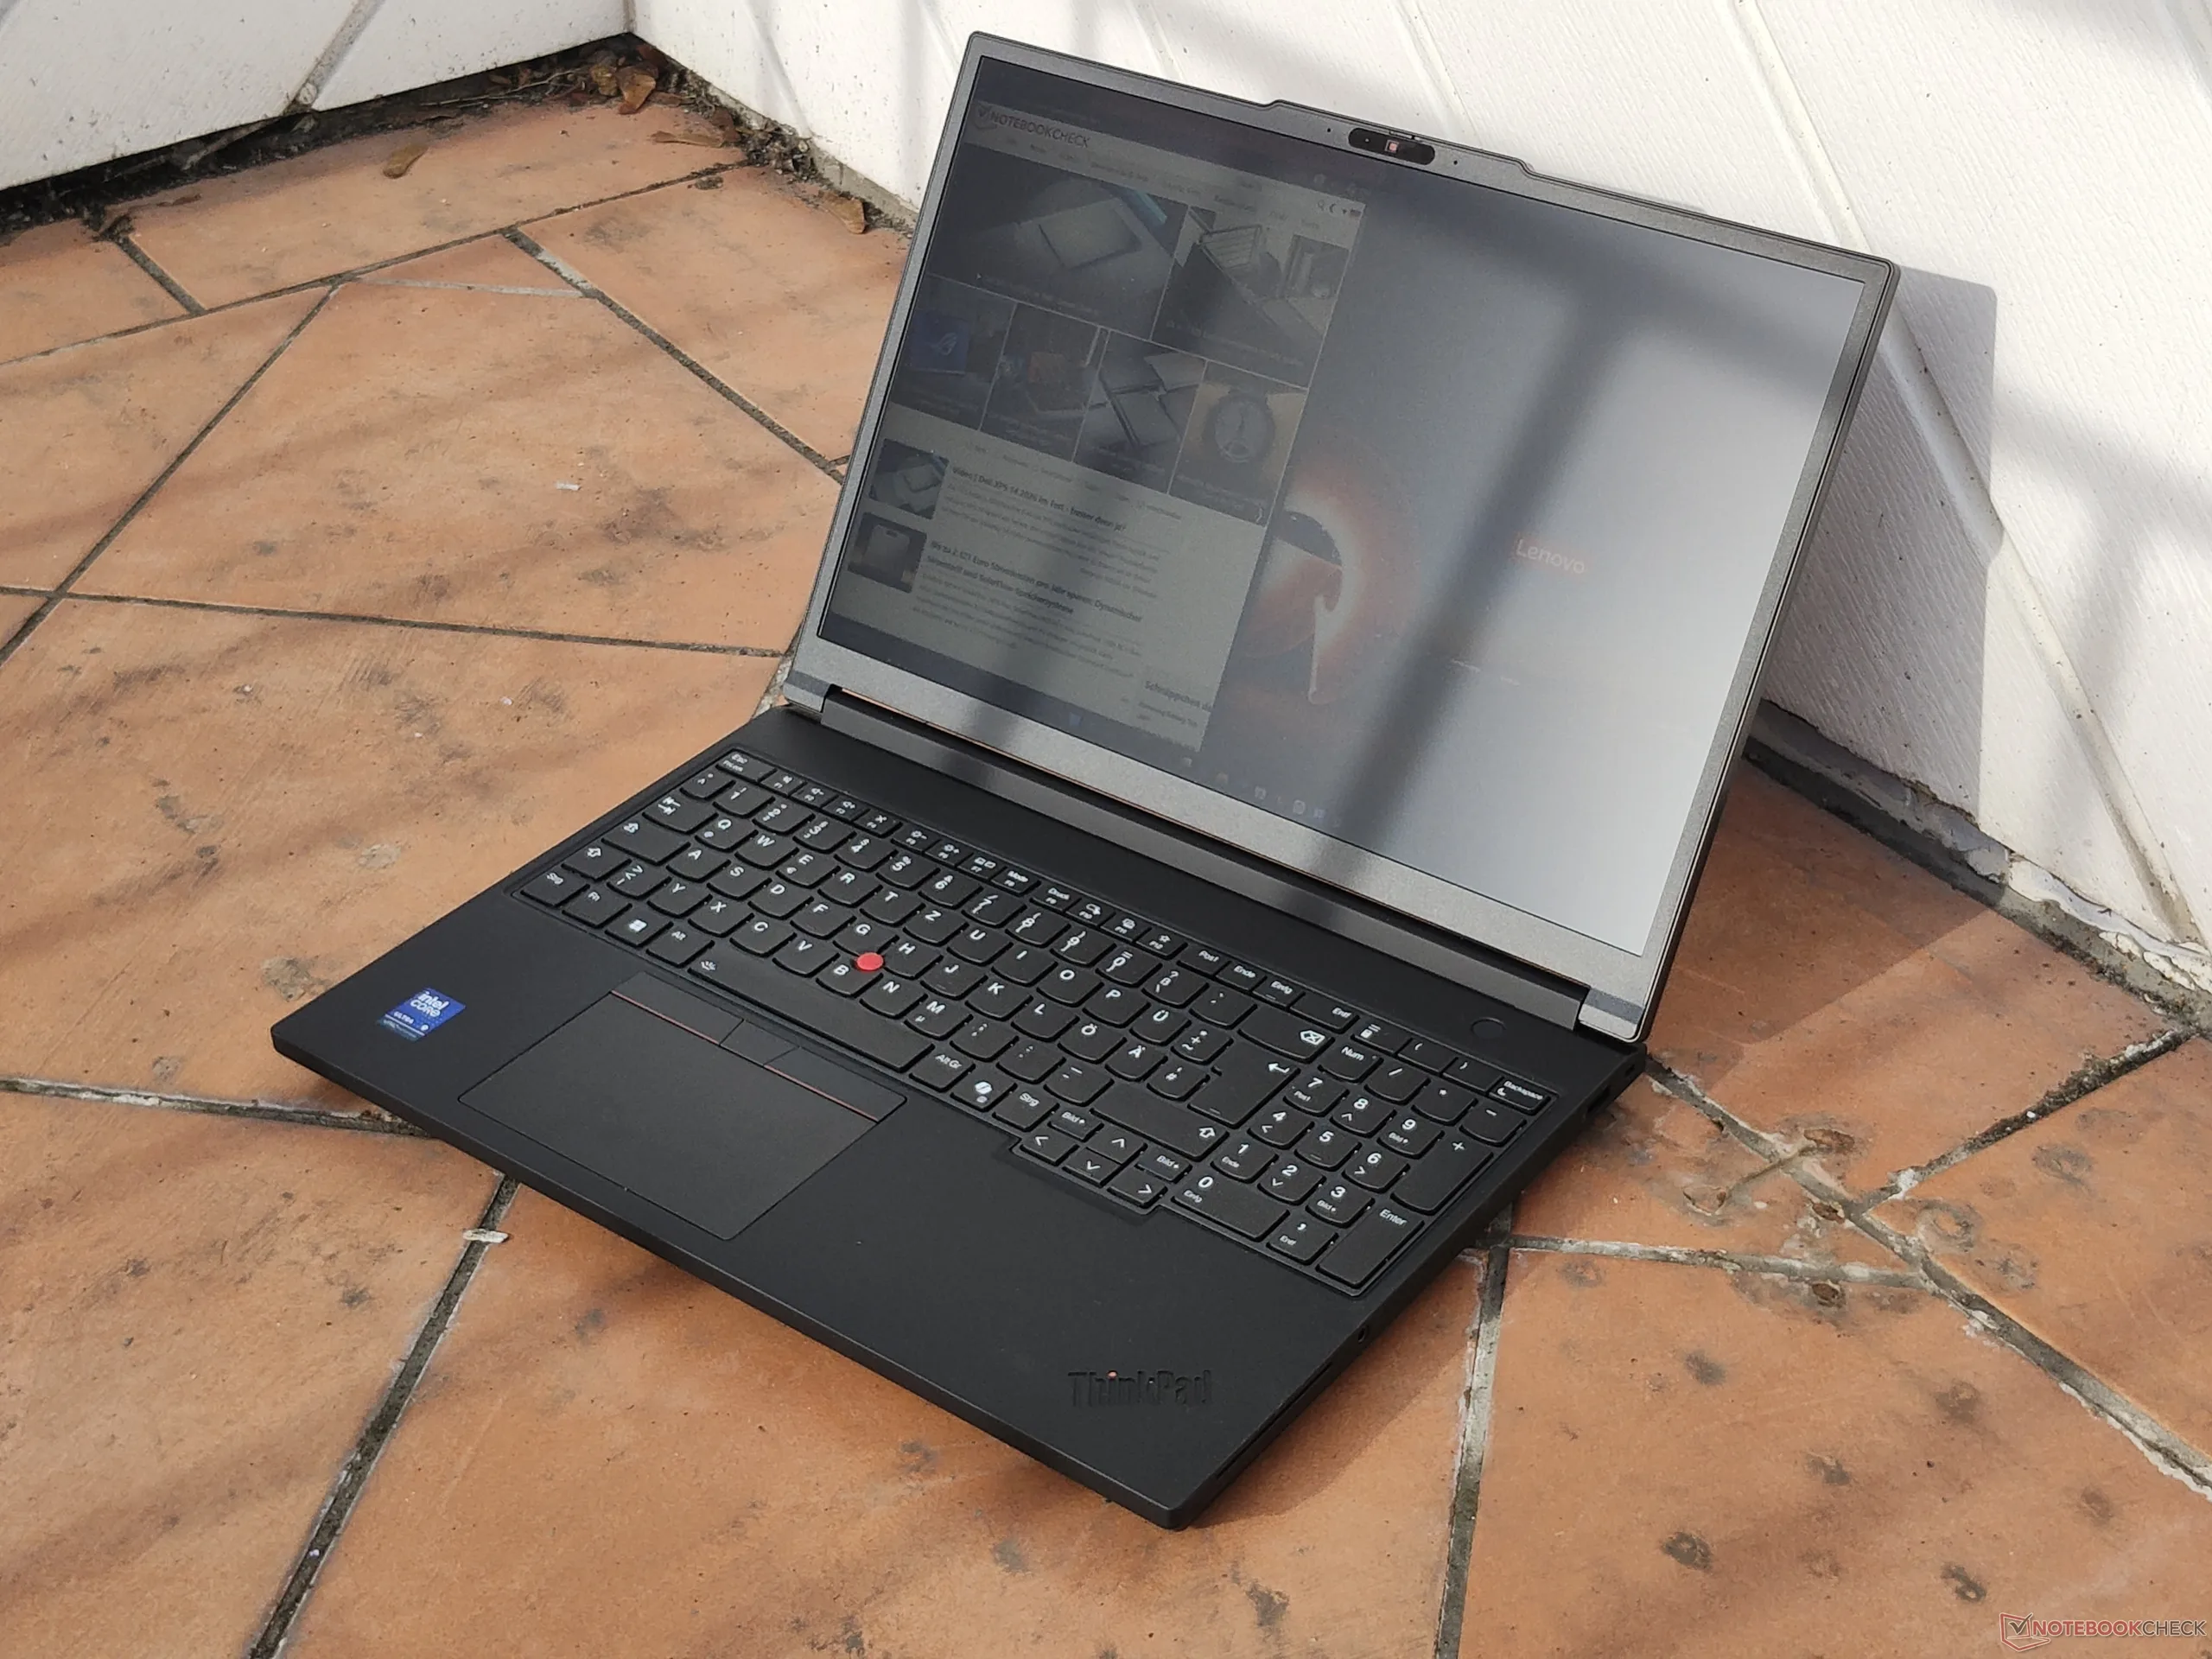
Gehäuse: Ein völlig neuer Start für das ThinkPad P16
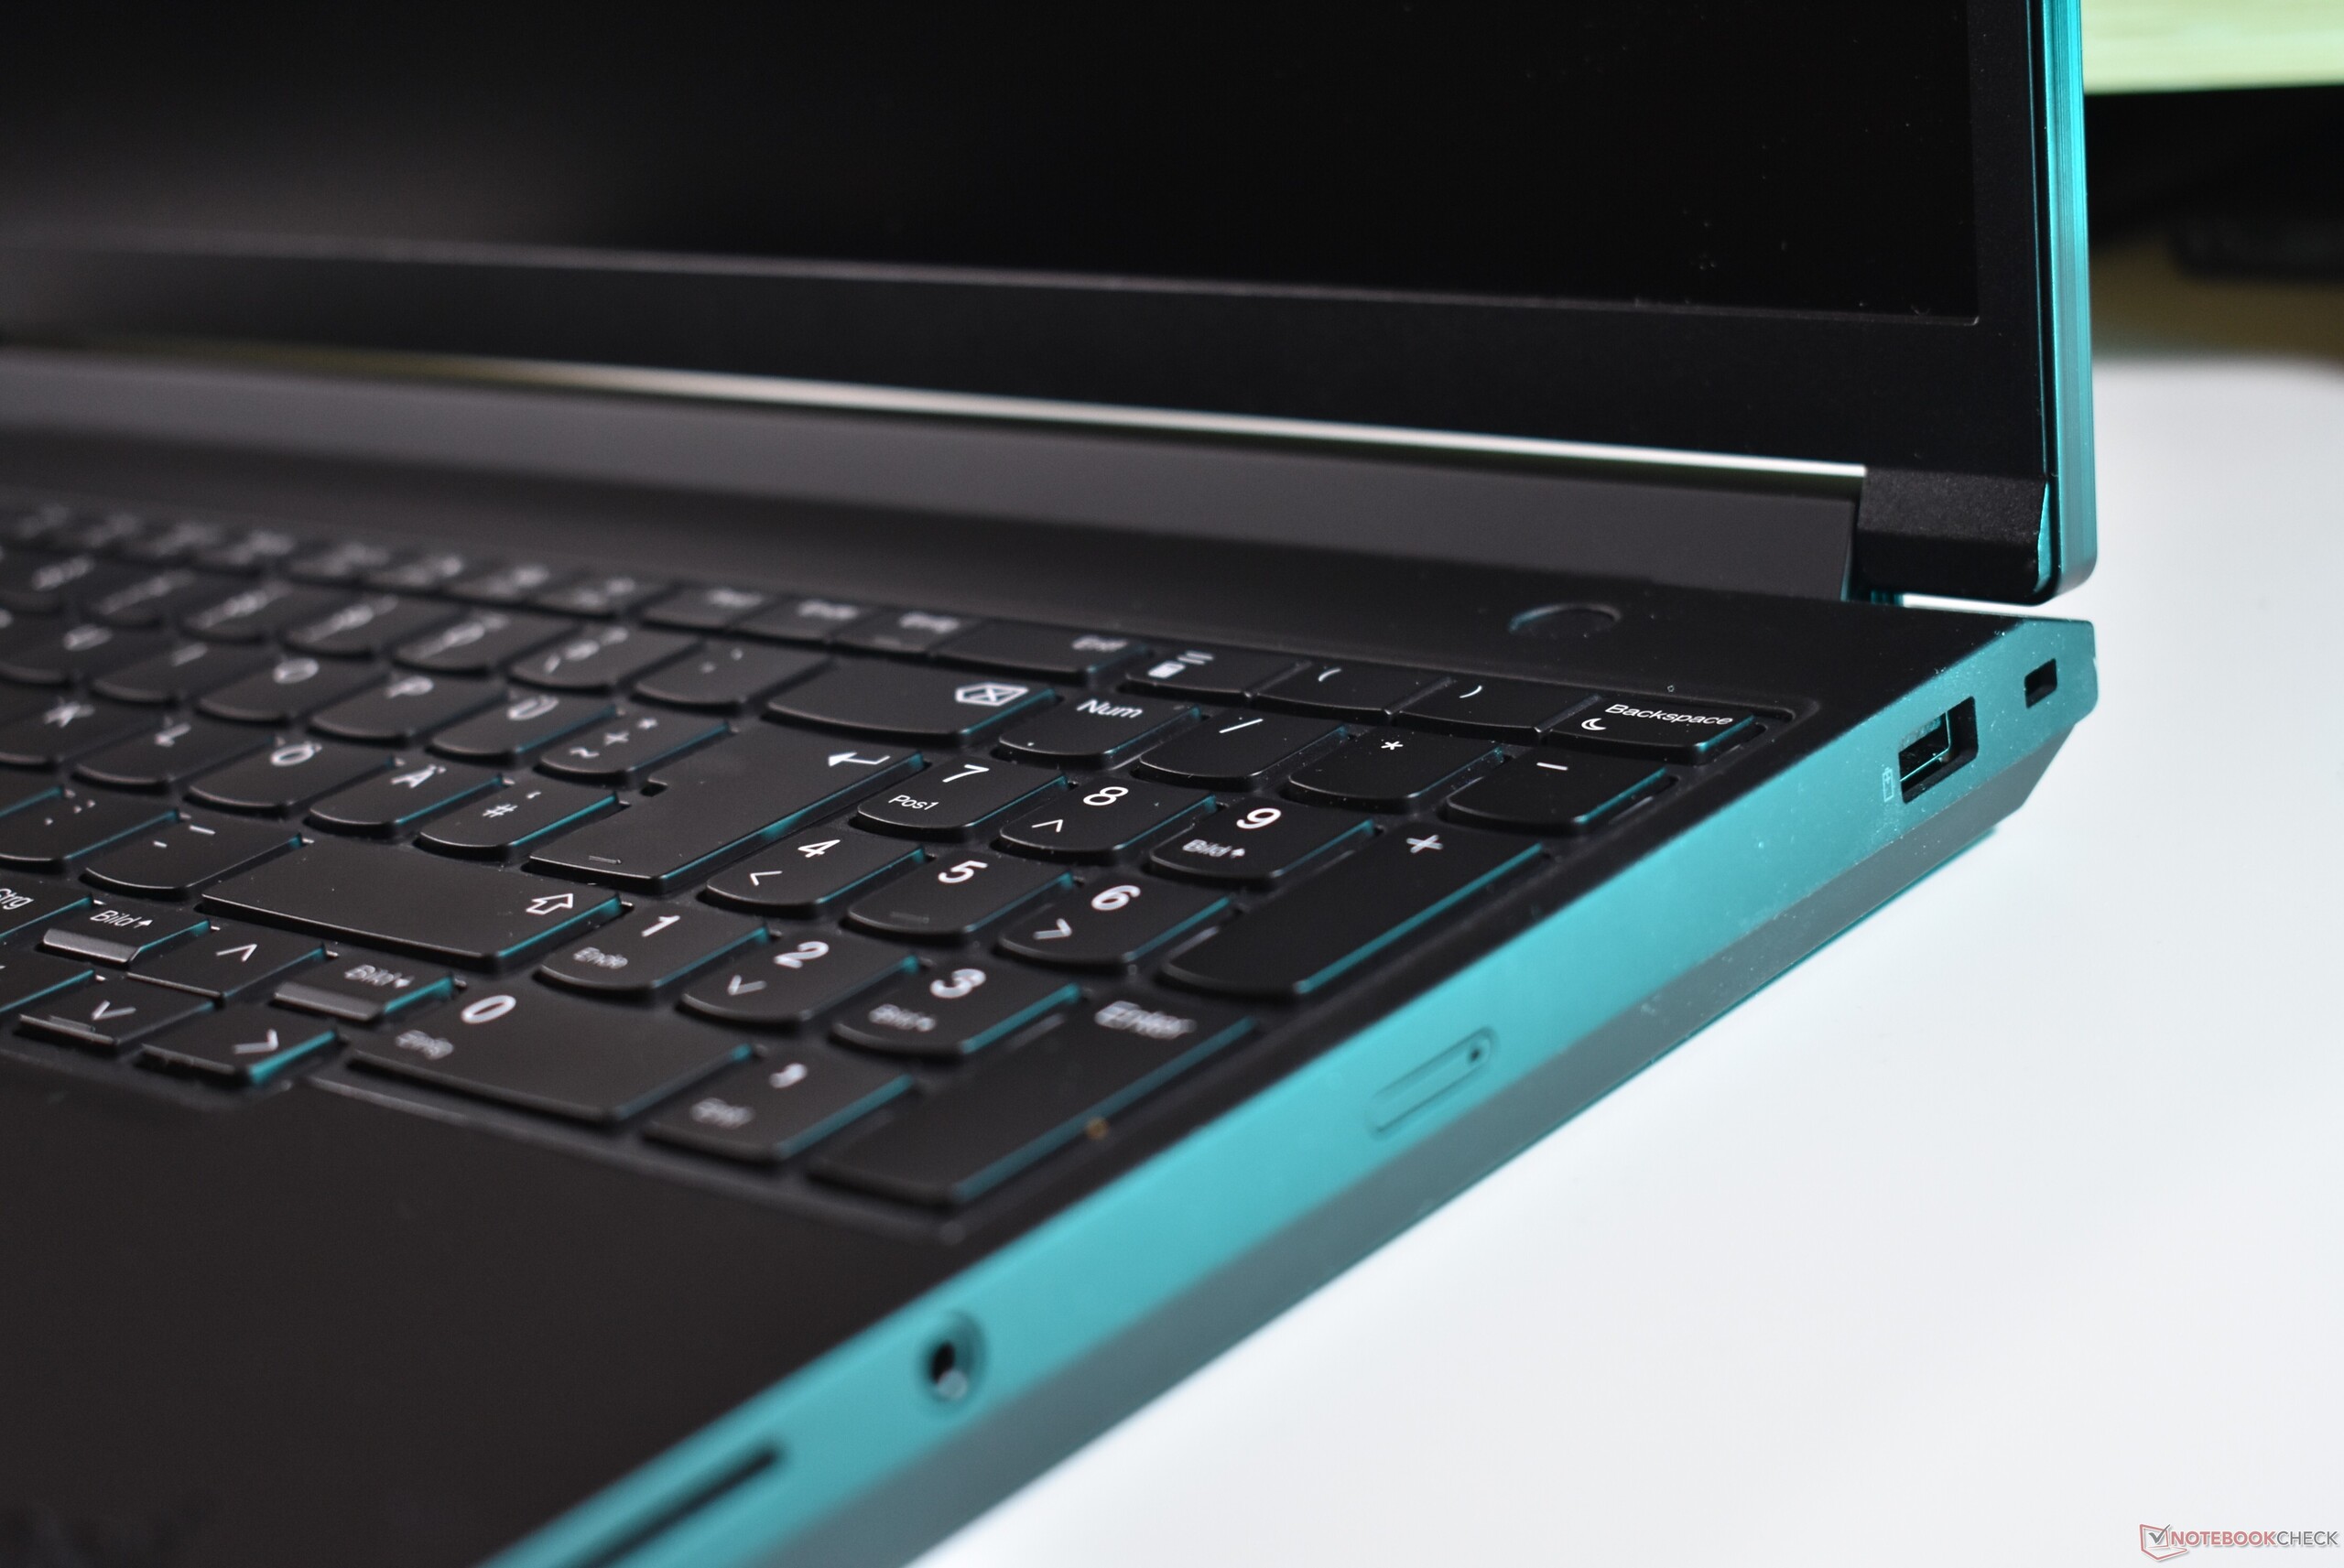
Mit dem Original ThinkPad P16 Gen 1 und dem ThinkPad P16 Gen 2 schlug Lenovo bei seinen Workstations eine neue Richtung ein: Grau statt schwarz, abgerundet statt kantig. All das ist beim neuen Lenovo ThinkPad P16 Gen 3 passé: Es ist kantig und schwarz wie ein klassisches ThinkPad. Aber es ist keine vollständige Abkehr vom alten P16 Design: Lenovo hat die obere Abdeckung aus Aluminium beibehalten, allerdings jetzt in eloxiertem Schwarz. Die untere Gehäusehälfte aus Aluminium und Magnesium verwendet die typische schwarze ThinkPad-Beschichtung, die glatt und leicht gummiert ist. Neu in diesem Jahr ist das breitere einteilige Scharnier, in dem Lenovo die Wi-Fi-Antennen platziert hat. Der Bildschirm wackelt kaum und lässt sich um 180 Grad öffnen. Das Aufklappen ist mit einer Hand möglich.

Das neuere P16 ist spürbar leichter und kompakter als die ältere Version. Es ist immer noch schwer und groß, aber es ist nicht mehr das größte und schwerste unter den vollfetten 16-Zoll-Workstation-Laptops. Offensichtlich war die Optimierung der Mobilität eine der Prioritäten von Lenovo.
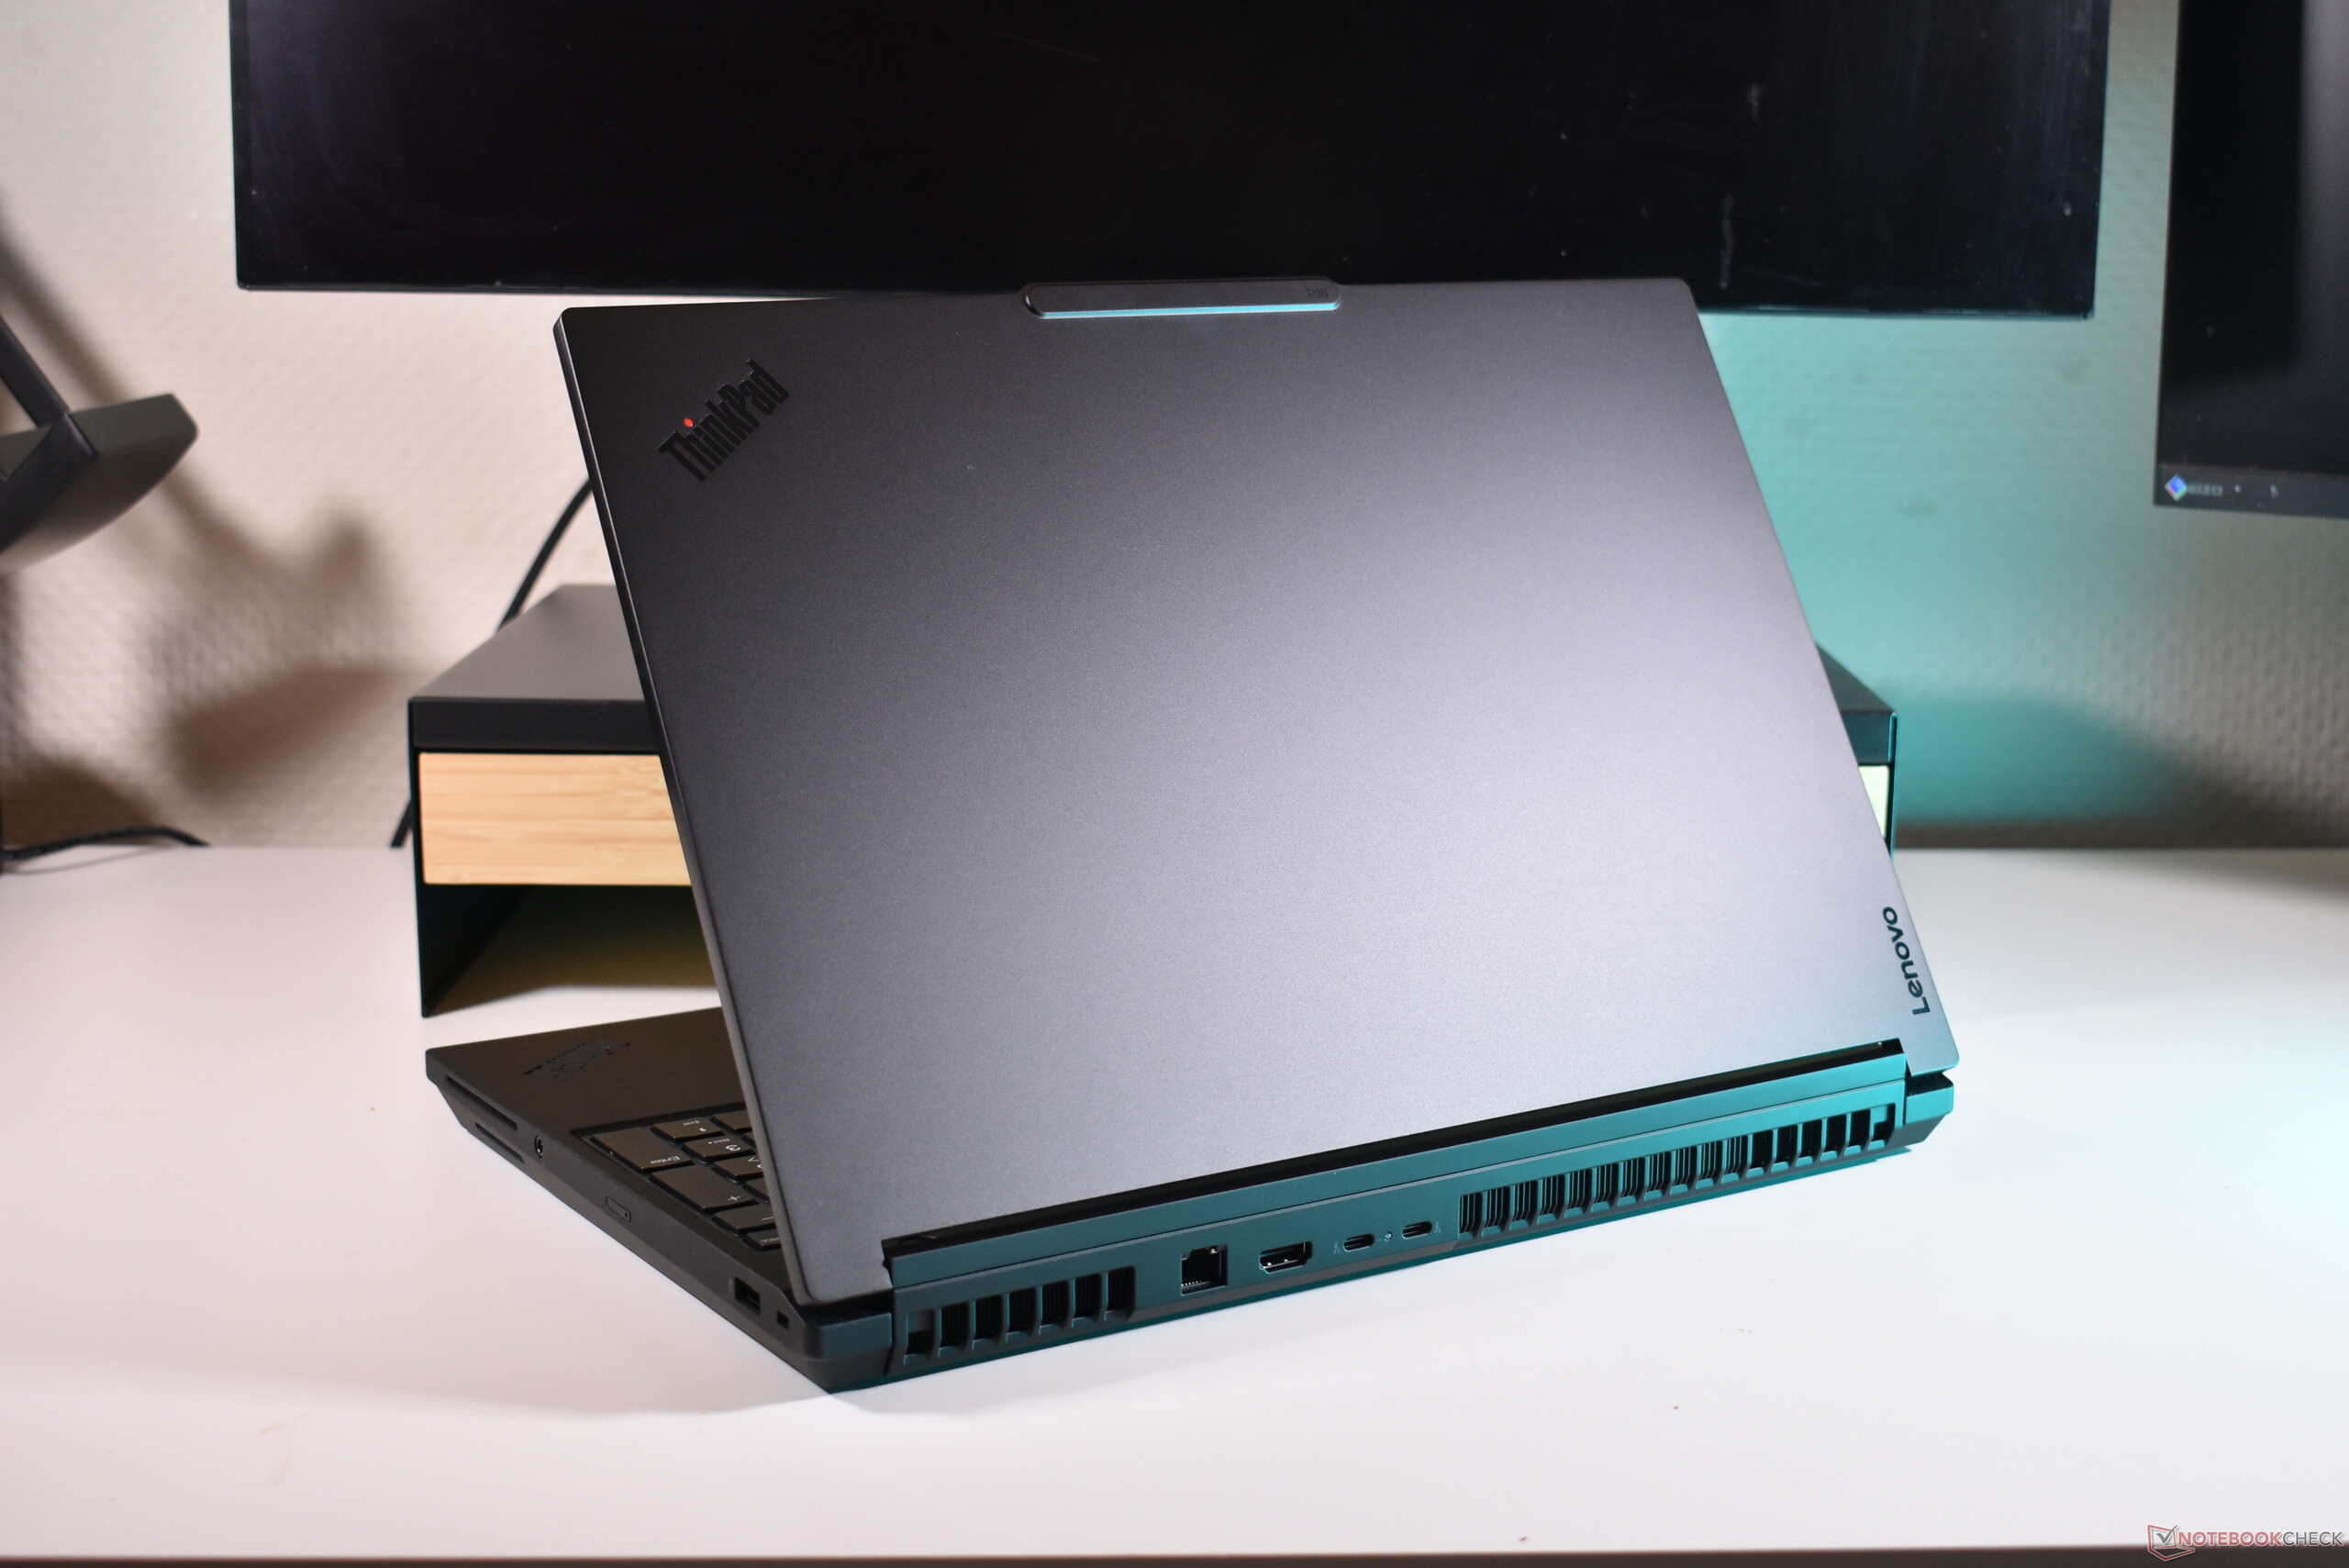
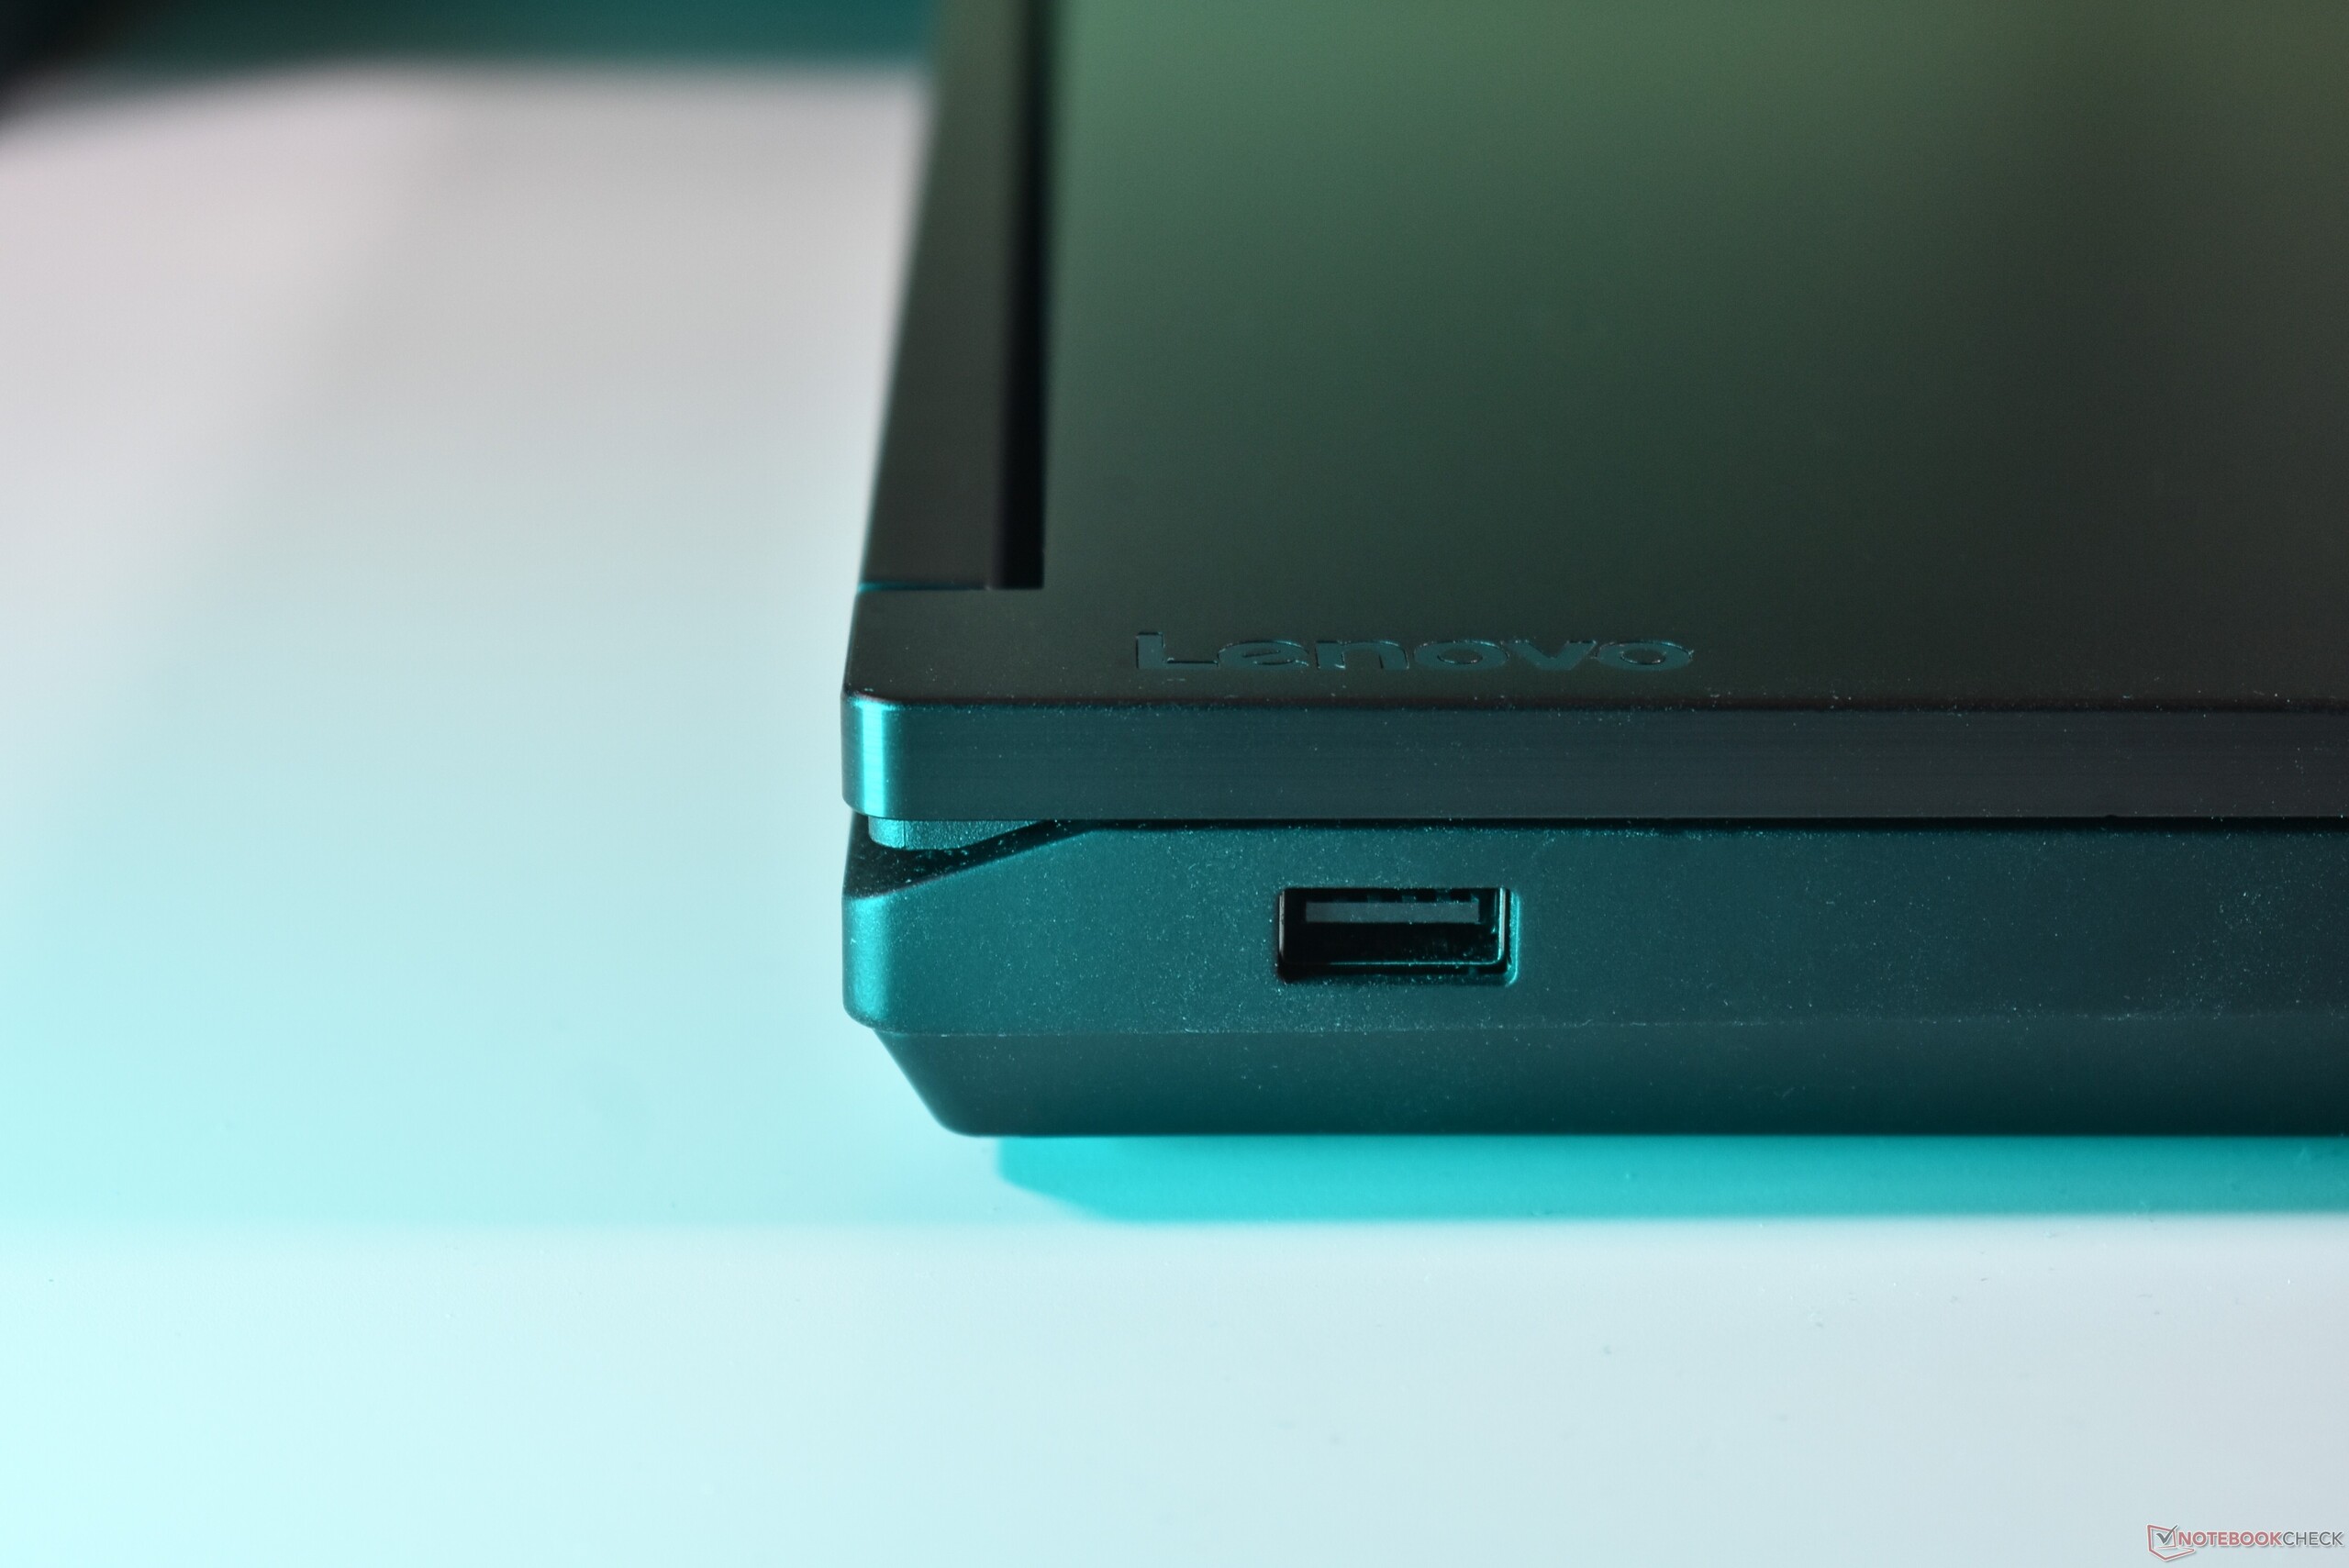
Anschlussausstattung
Das wichtigste neue Feature sind die Thunderbolt 5 Ports auf der Rückseite. Weiterhin unterstützt der dritte USB-C-Anschluss jetzt Thunderbolt 4. Zudem hat sich Lenovo entschieden, RJ45-Ethernet wieder einzuführen, mit 2,5 GBit-Geschwindigkeit. Außerdem wird das ThinkPad P16 jetzt über USB-C aufgeladen.


SD-Kartenleser
| SD Card Reader | |
| average JPG Copy Test (av. of 3 runs) | |
| Lenovo ThinkPad T16g Gen 3 RTX 5080 (ADATA SD8.0 Express 512 GB) | |
| Lenovo ThinkPad T16g Gen 3 RTX 5080 (Angelbird AV Pro V60) | |
| Durchschnitt der Klasse Workstation (49.6 - 681, n=14, der letzten 2 Jahre) | |
| HP ZBook Fury 16 G11 (Toshiba Exceria Pro SDXC 64 GB UHS-II) | |
| Lenovo ThinkPad P1 Gen 8 (Toshiba Exceria Pro SDXC 64 GB UHS-II) | |
| Lenovo ThinkPad P16 Gen 3 (AV Pro V60) | |
| Dell Pro Max 16 Plus (Toshiba Exceria Pro SDXC 64 GB UHS-II) | |
| Lenovo ThinkPad P16 G2 21FA000FGE | |
| maximum AS SSD Seq Read Test (1GB) | |
| Lenovo ThinkPad T16g Gen 3 RTX 5080 (ADATA SD8.0 Express 512 GB) | |
| Lenovo ThinkPad T16g Gen 3 RTX 5080 (Angelbird AV Pro V60) | |
| Durchschnitt der Klasse Workstation (87.6 - 1455, n=14, der letzten 2 Jahre) | |
| Lenovo ThinkPad P16 Gen 3 (AV Pro V60) | |
| HP ZBook Fury 16 G11 (Toshiba Exceria Pro SDXC 64 GB UHS-II) | |
| Dell Pro Max 16 Plus (Toshiba Exceria Pro SDXC 64 GB UHS-II) | |
| Lenovo ThinkPad P1 Gen 8 (Toshiba Exceria Pro SDXC 64 GB UHS-II) | |
| Lenovo ThinkPad P16 G2 21FA000FGE | |
Kommunikation


Wartung


Eingabegeräte
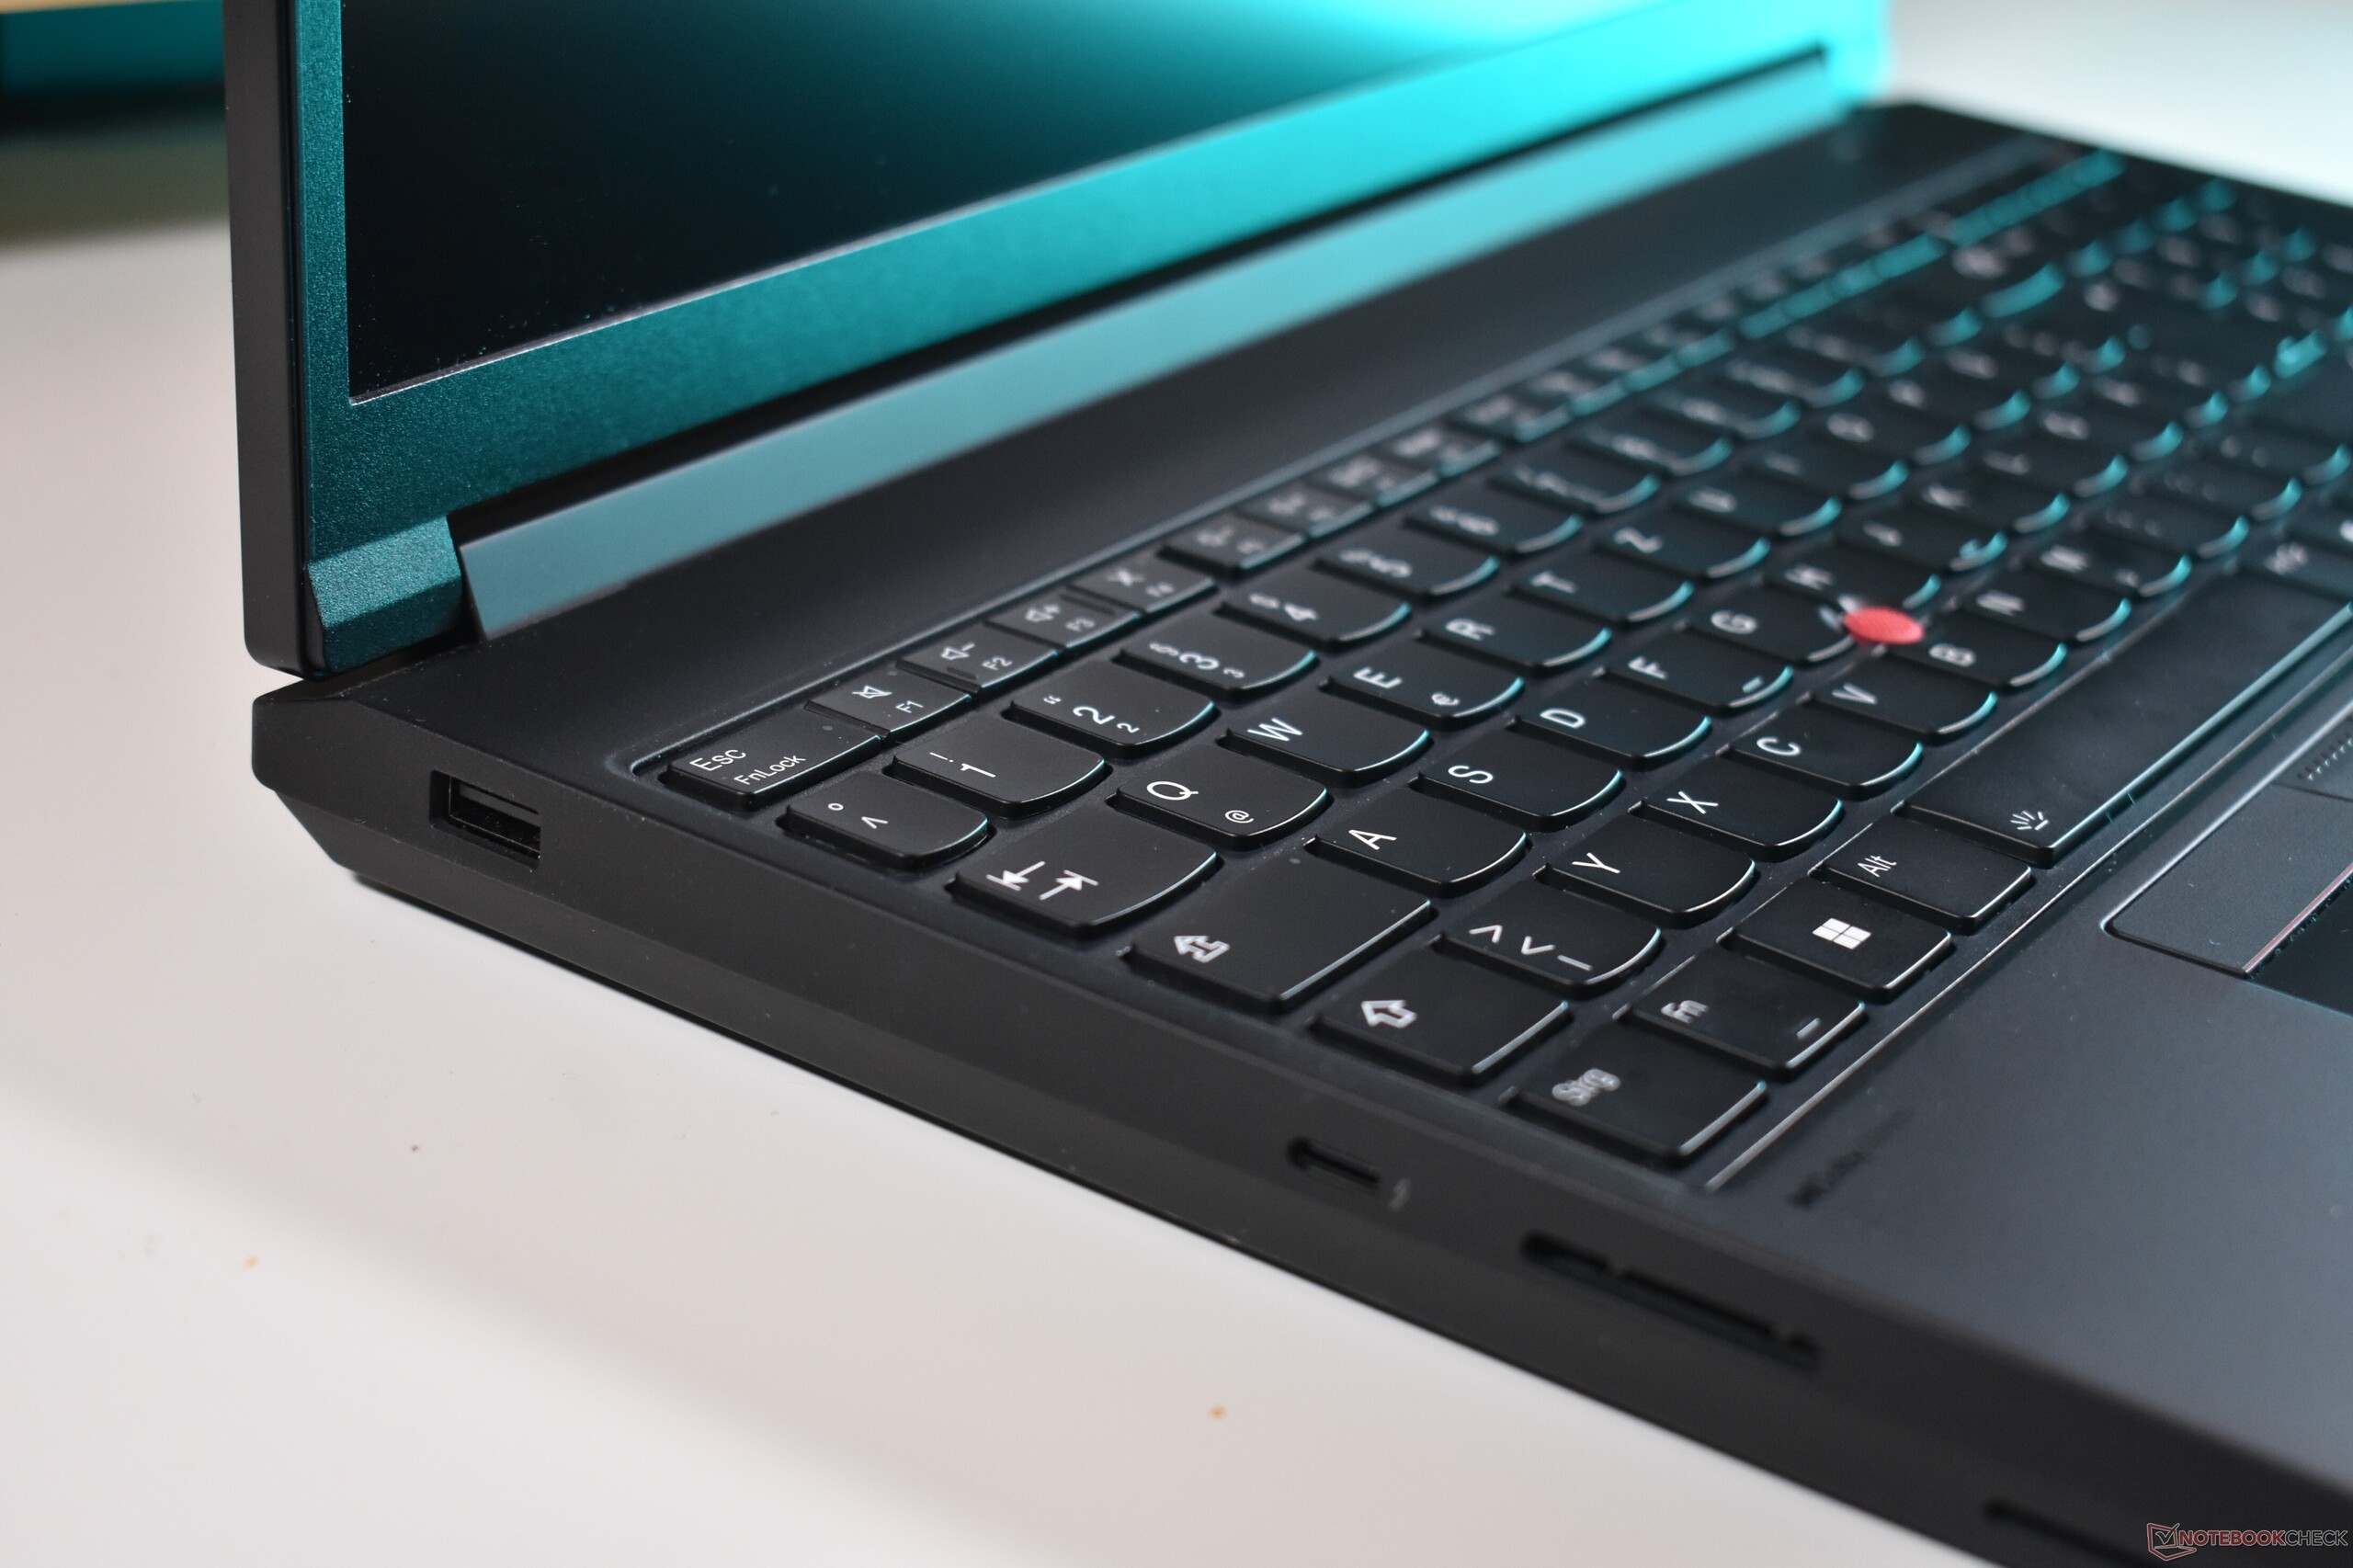
Tastatur
Während sich der Rest des Laptops neu ist, bleibt die zweistufige Tastatur mit LED-Hintergrundbeleuchtung unverändert. Die abgerundeten, leicht konkaven Tasten bieten einen weichen und dennoch definierten Anschlag mit einem langen Hubweg von 1,5 mm. Das Layout ist geräumig und mit dem dedizierten Nummernblock ideal für die Eingabe von Zahlen. Alles in allem ist es ein Vergnügen, die Tastatur zu benutzen, und sie gehört zu den besten in der aktuellen ThinkPad-Produktpalette.

Touchpad
Abgesehen von der Farbänderung von Silber zu Schwarz, bleibt das Touchpad identisch mit dem vorherigen ThinkPad P16 G2. Die Mylar-Oberfläche des mechanischen Clickpads misst 11,5 x 6,5 cm, hat ein gedämpftes Klickgeräusch und fühlt sich zwar nicht ganz so angenehm an wie Glas, aber die Oberfläche ist glatt, so dass sie sehr gut zu bedienen ist. Genauso gut, wenn nicht sogar noch besser, ist der ThinkPad-TrackPoint mit seinen drei dedizierten Tasten.


Display
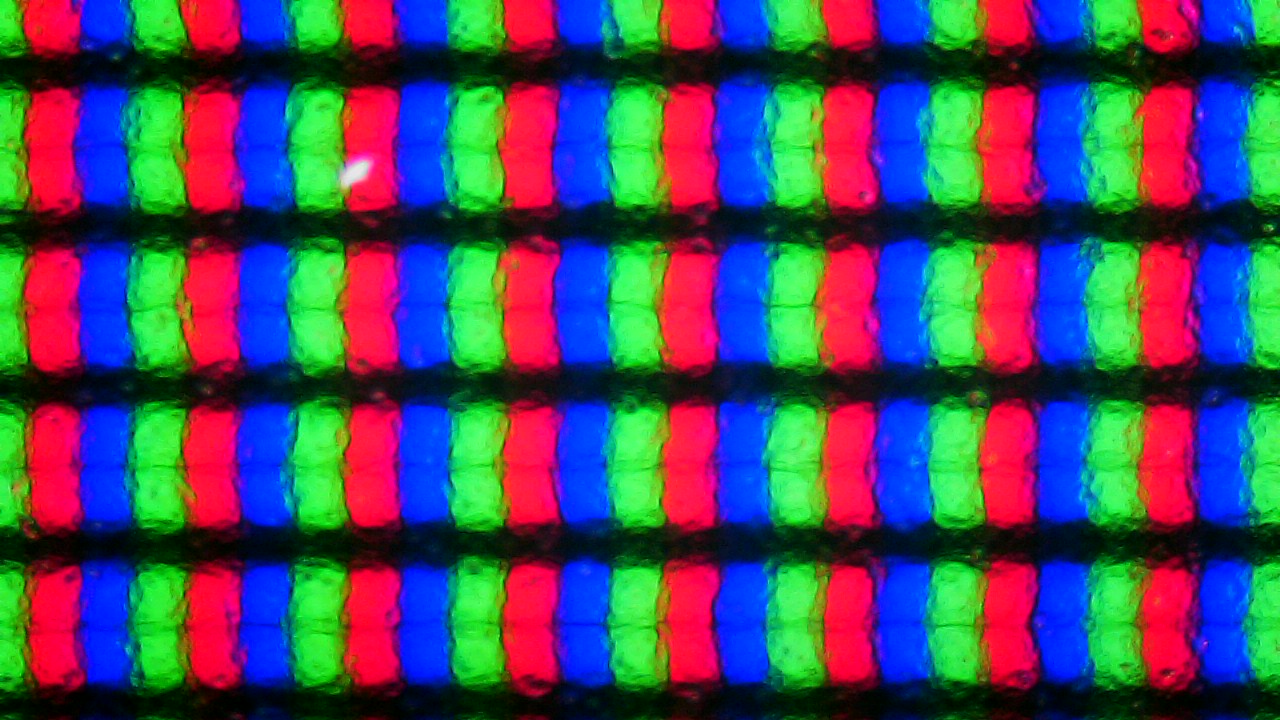
Käufer des Lenovo ThinkPad P16 Gen 3 haben die Wahl zwischen drei verschiedenen 16-Zoll großen 16:10 Bildschirmoptionen:
- WUXGA (1.920 x 1.200), IPS, 500 cd/m², 100 % sRGB, matt, 60 Hz
- 3.2K (3.200 x 2.000), Tandem OLED, 600 cd/m² (SDR) / 1500 cd/m² Spitze (HDR), 100 % DCI P3, halbglänzend, 40 - 120 Hz VRR, Dolby Vision
- 4K-WQUXGA (3.840 x 2.400), IPS, 800 cd/m², 100 % DCI P3, matt, Dolby Vision, 60 Hz
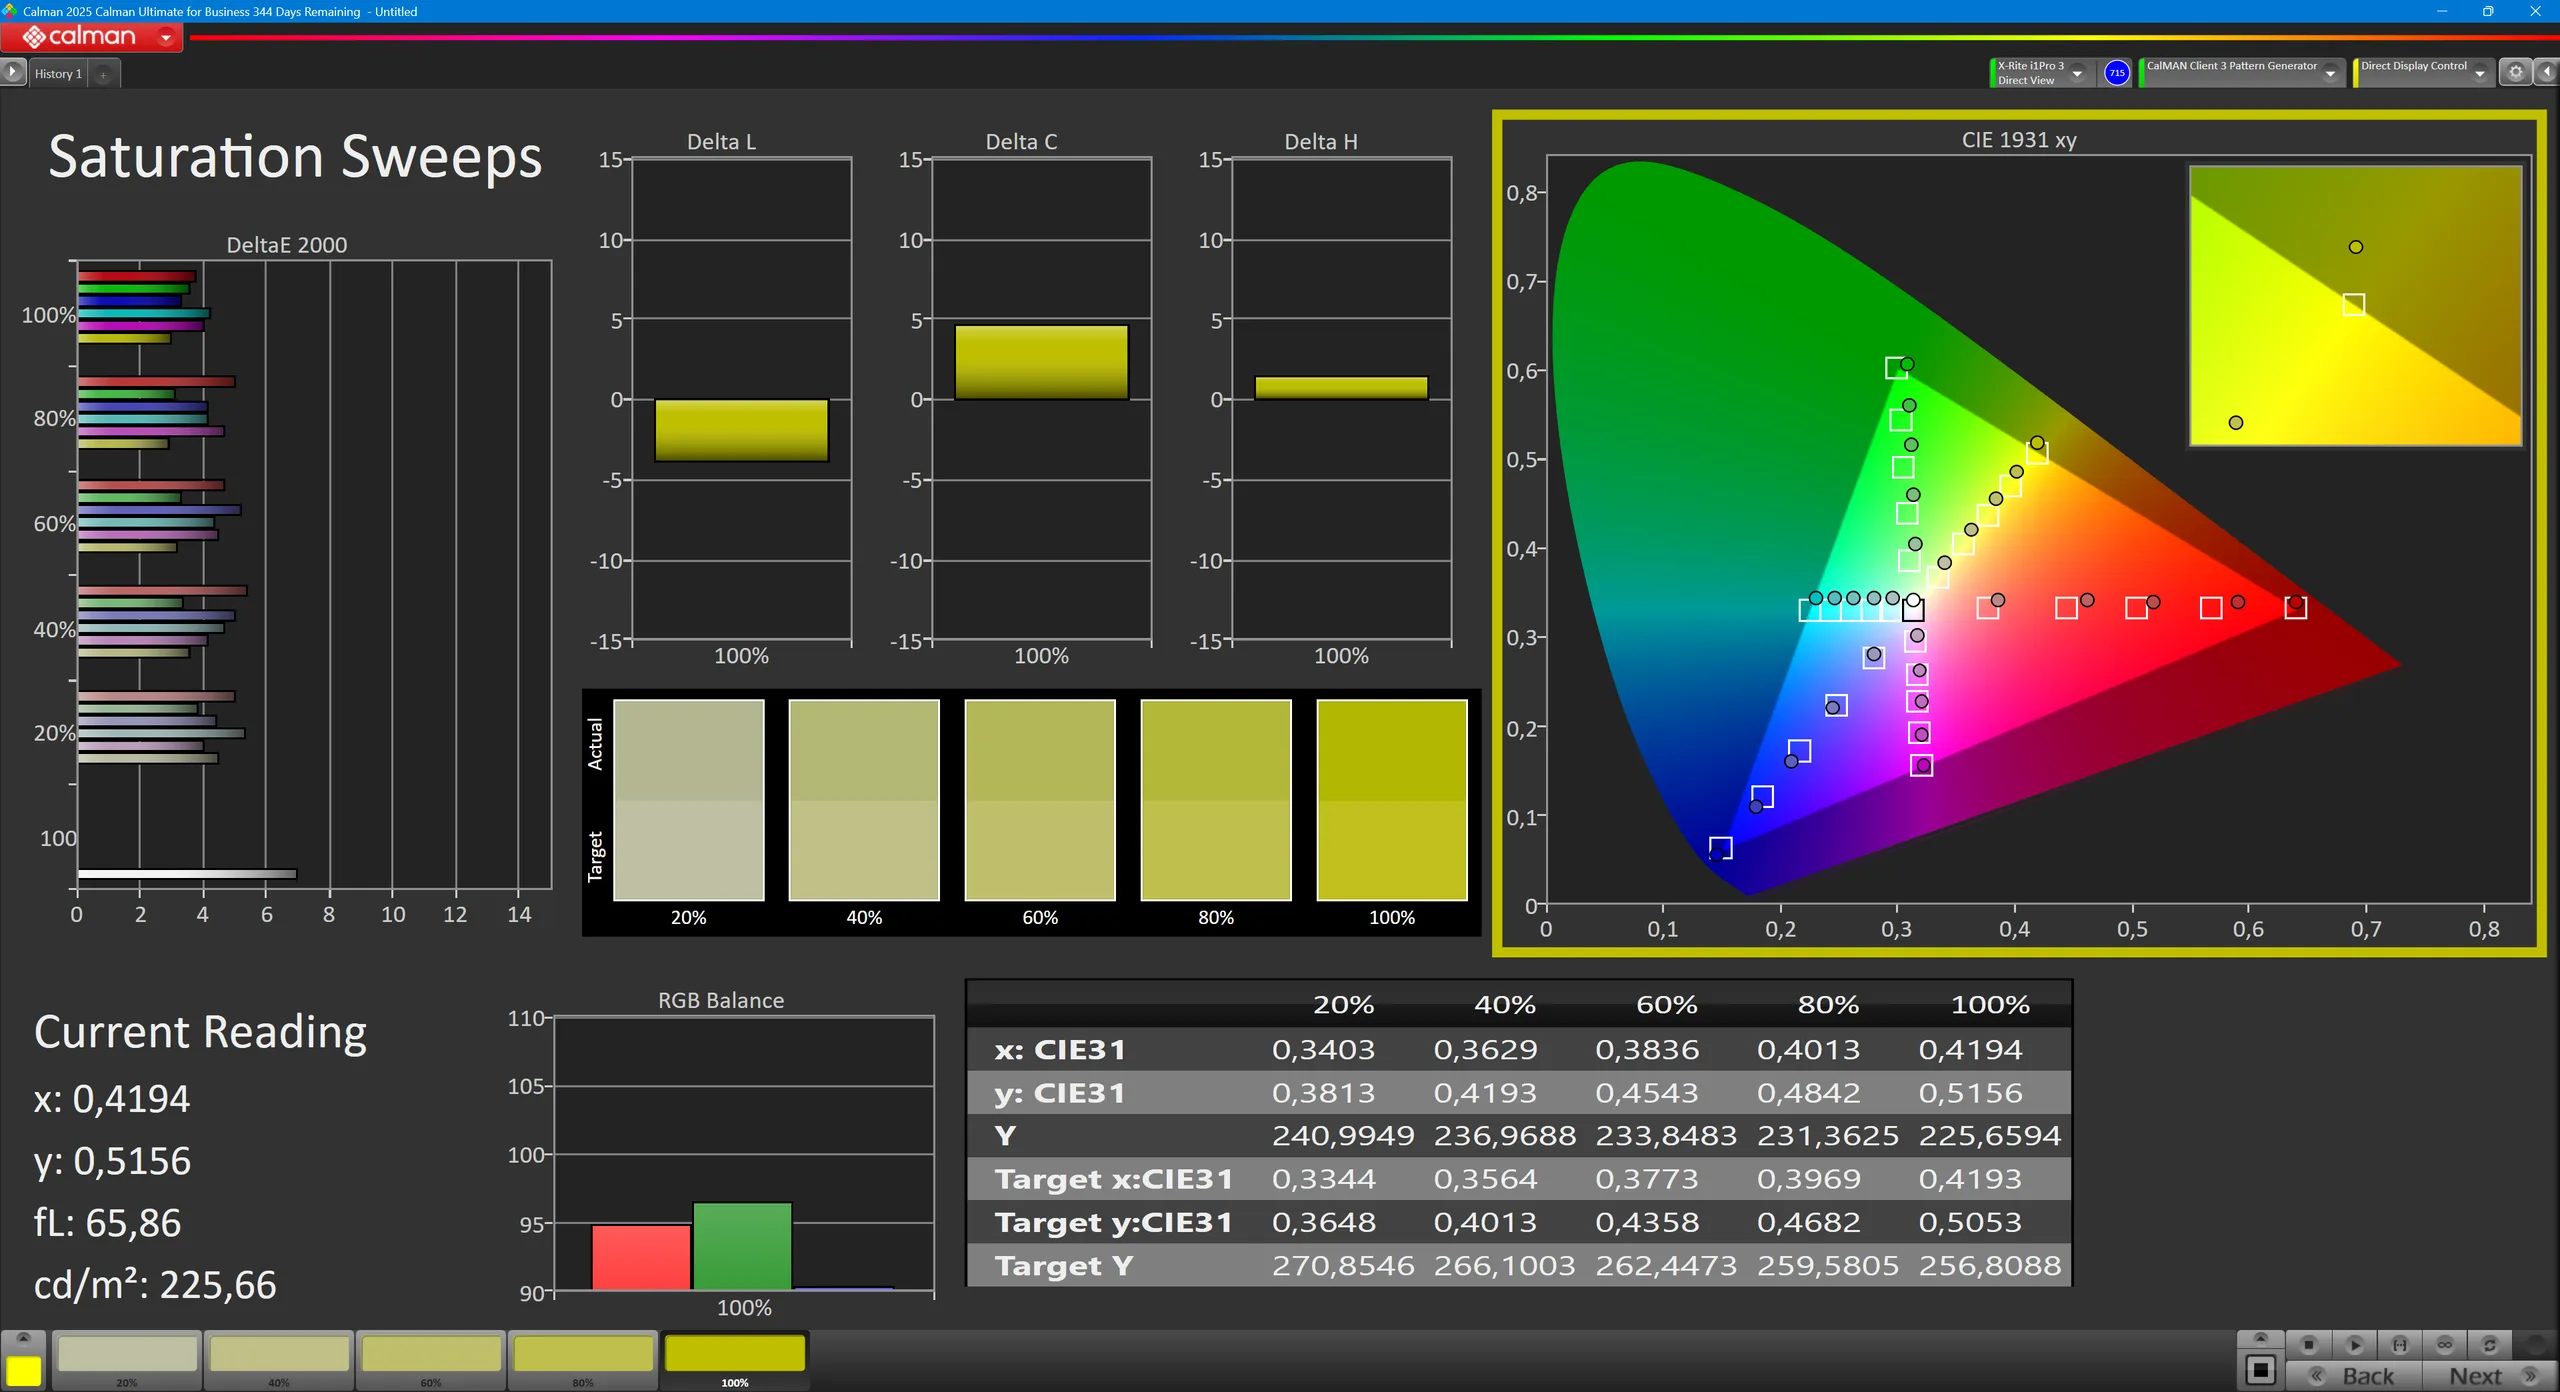
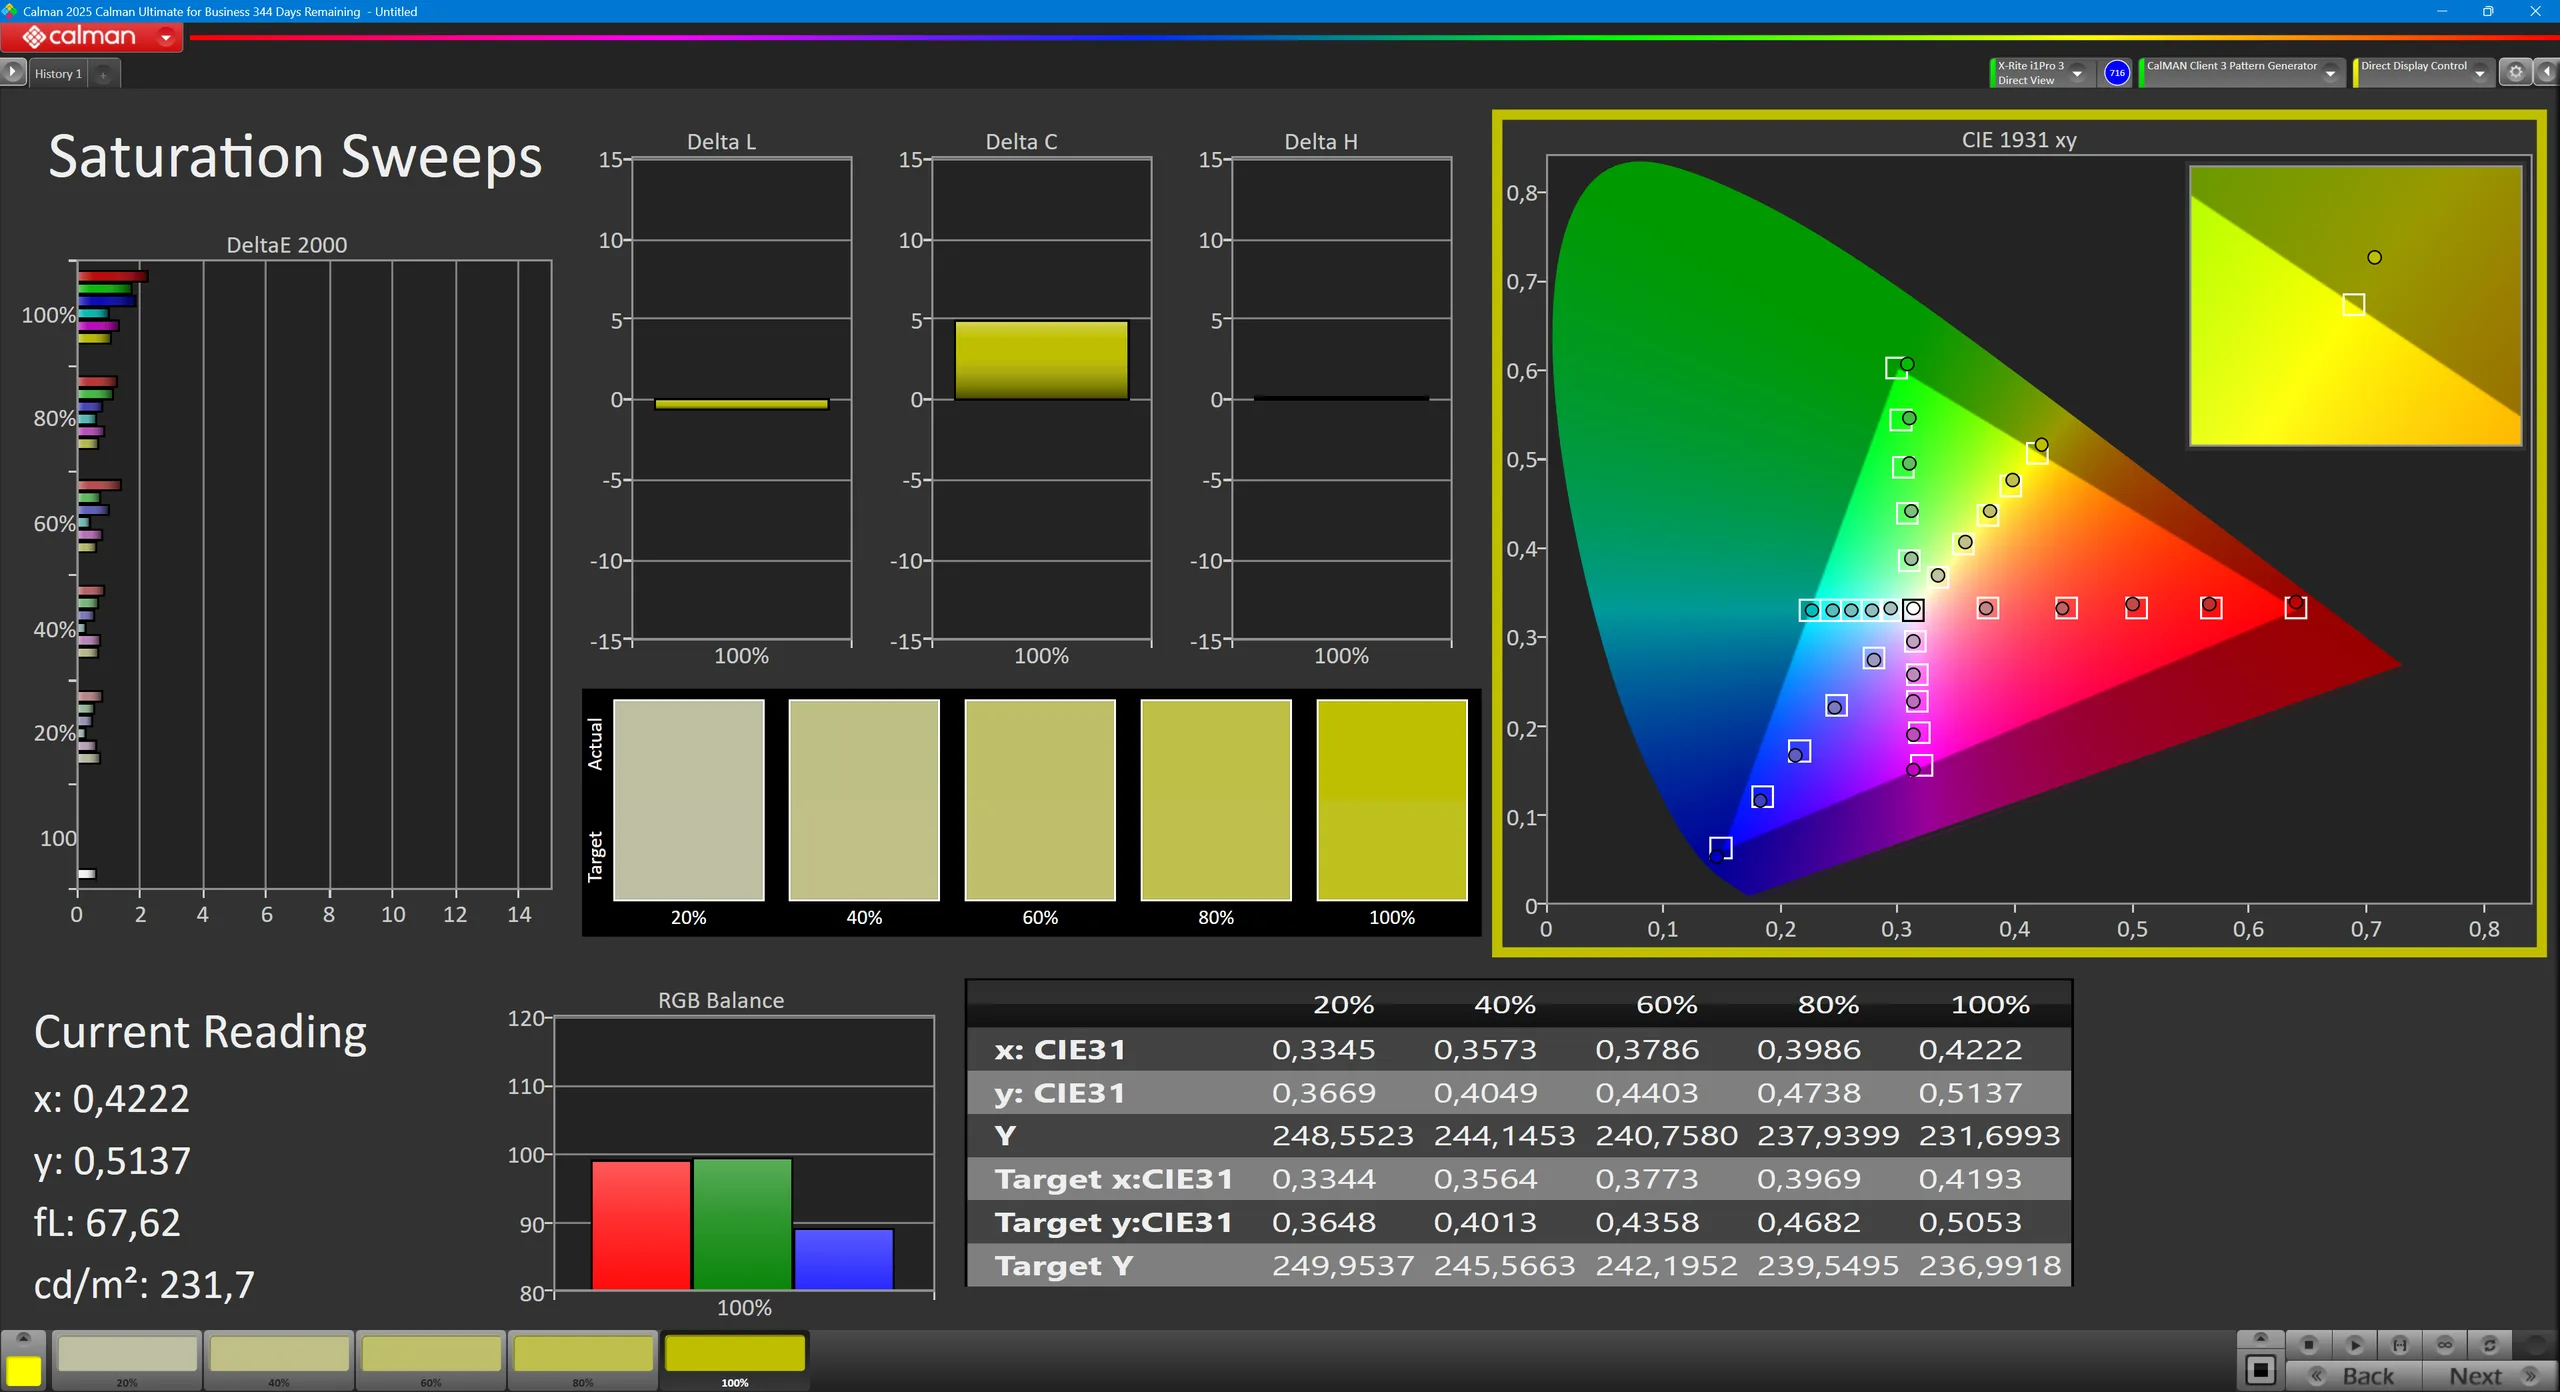
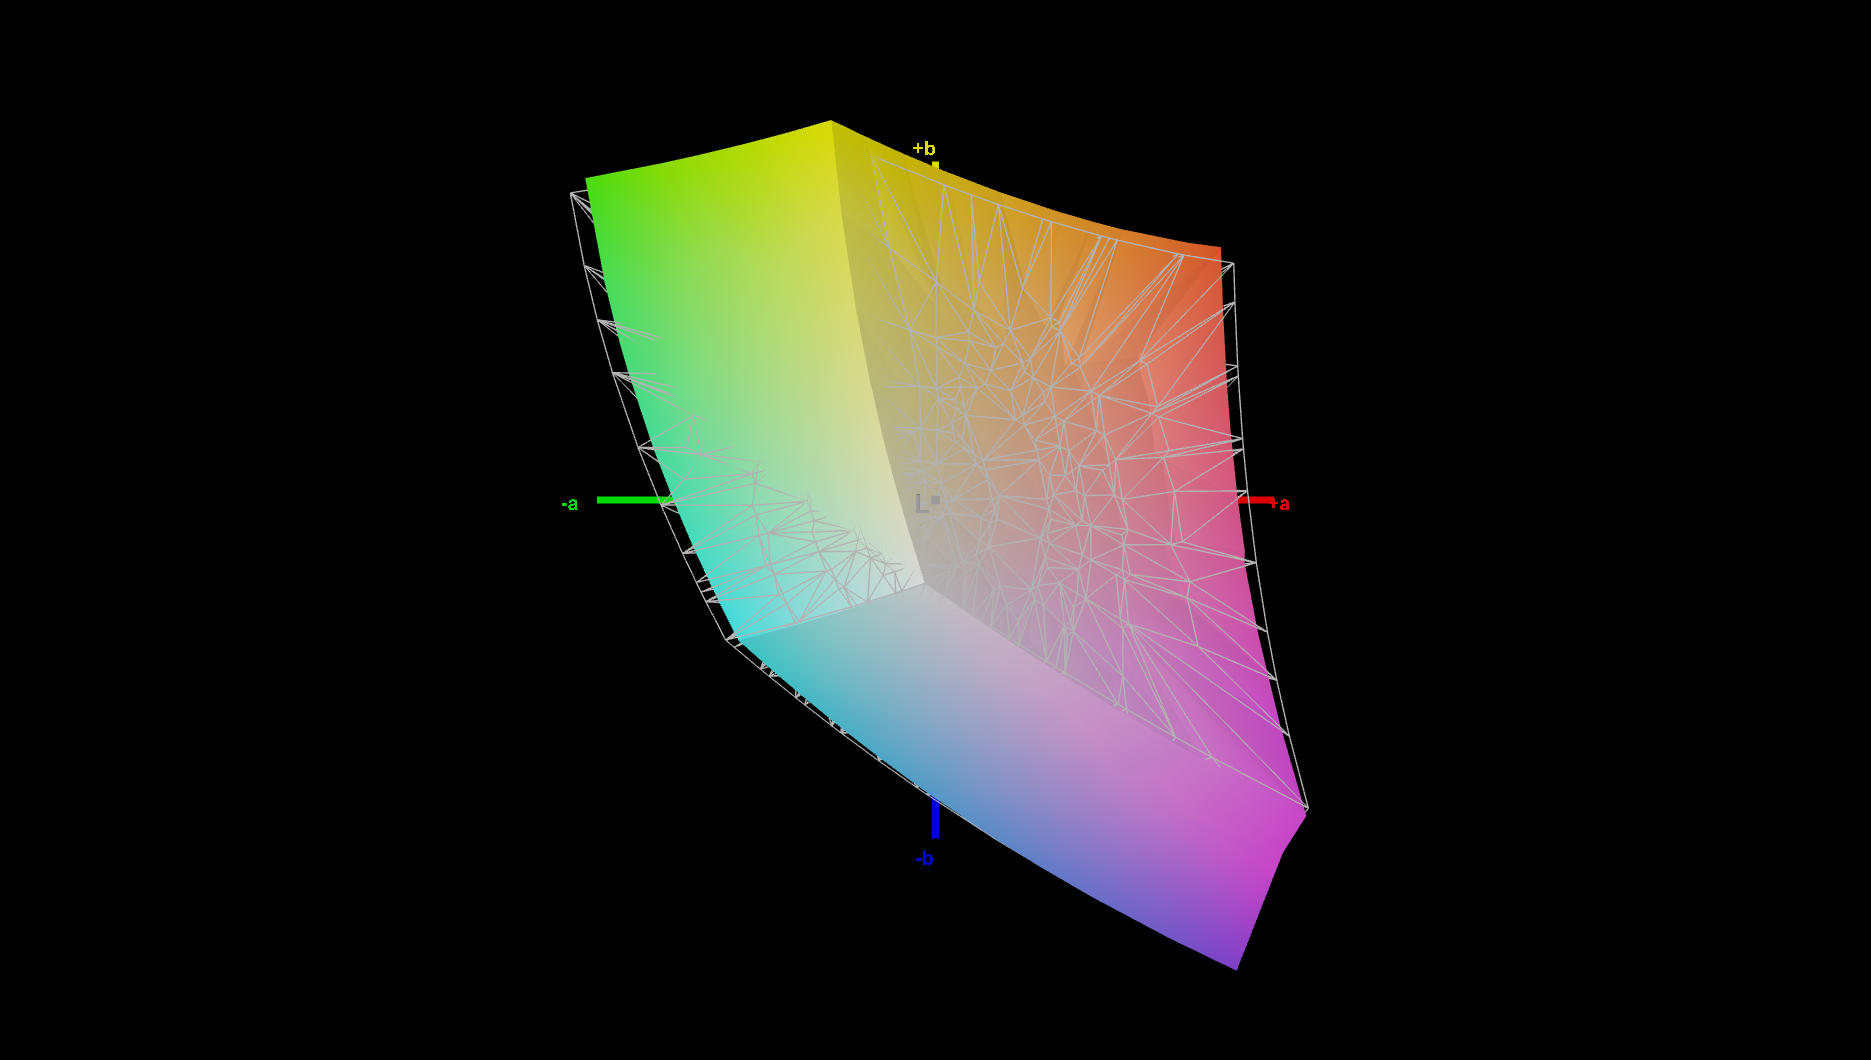
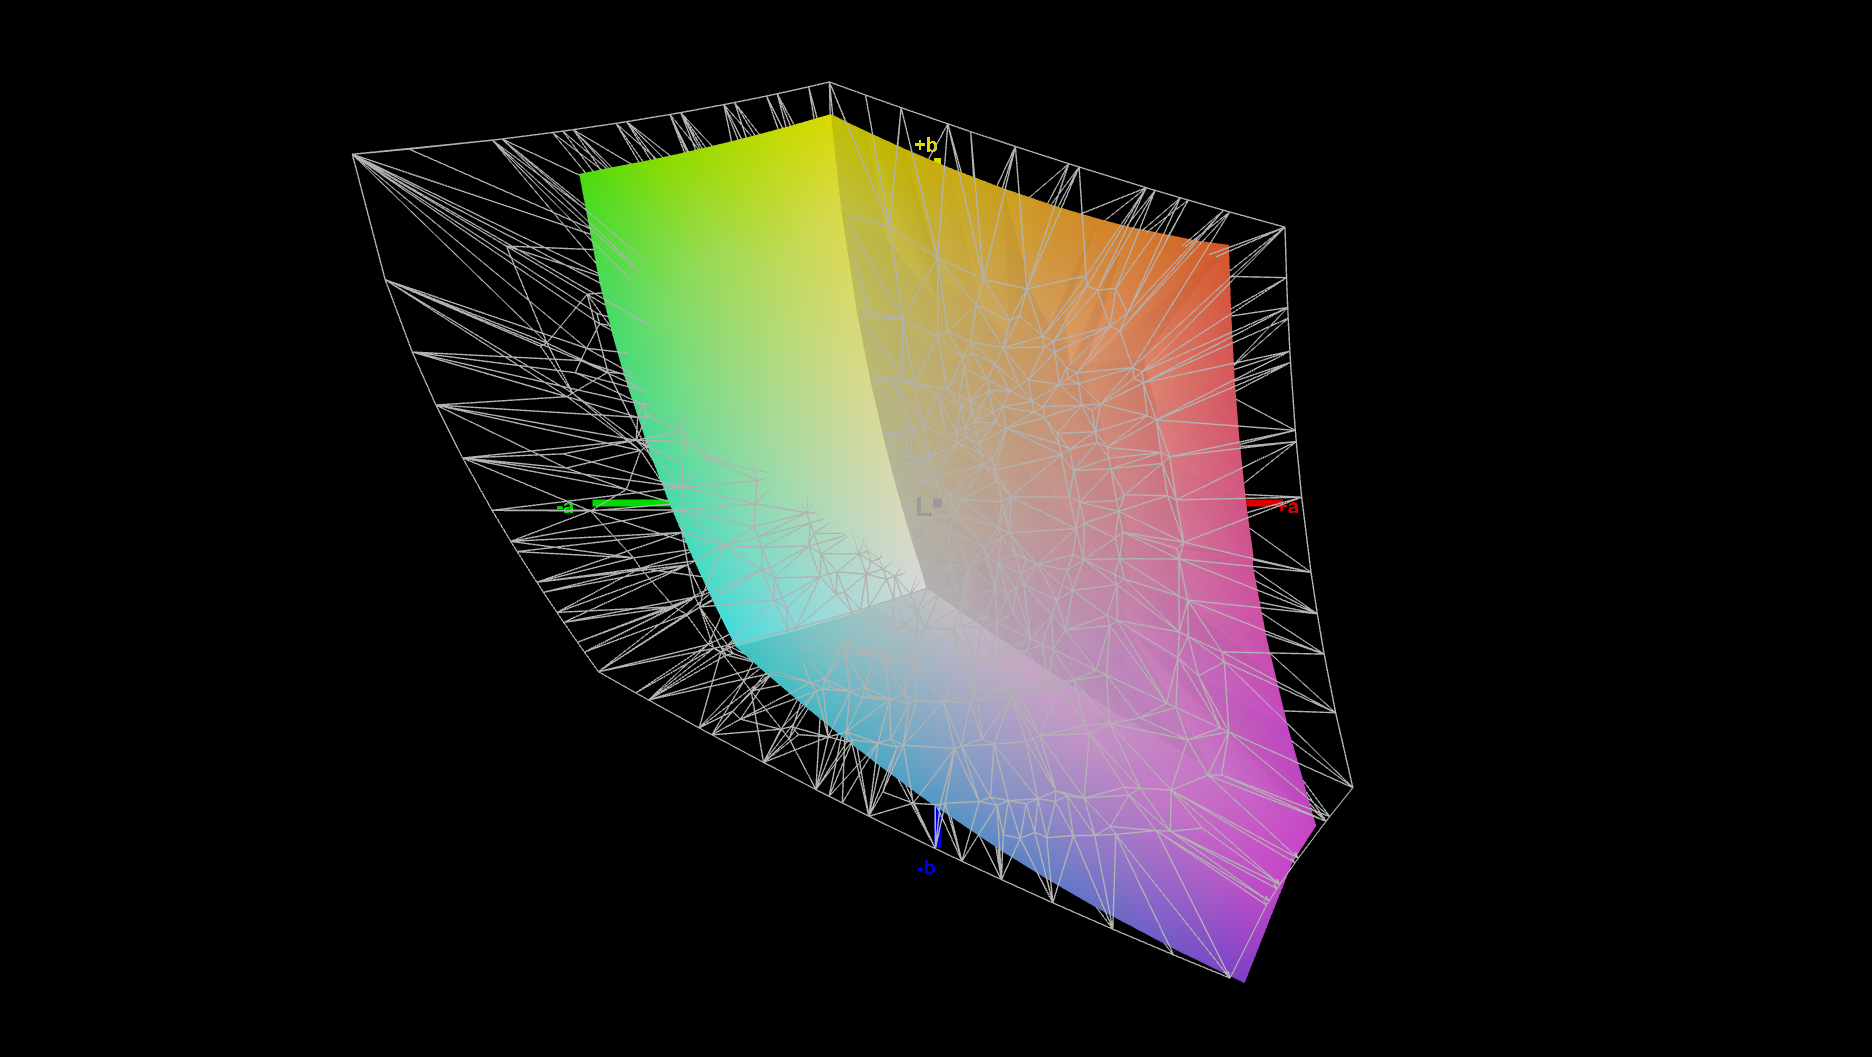
Die Basisvariante unseres Test Sample ist für Büroarbeiten und andere Aufgaben geeignet, bei denen ein großer Farbraum nicht benötigt wird. Für die Multimedia-Nutzung ist er nicht die beste Wahl, auch wegen der langsamen Bildwiederholrate von 60 Hz. Wenigstens gibt es kein PWM. Wir wünschten, die Auflösung wäre höher, denn WUXGA ist für eine so teure 16-Zoll-Workstation nicht gerade toll.
| |||||||||||||||||||||||||
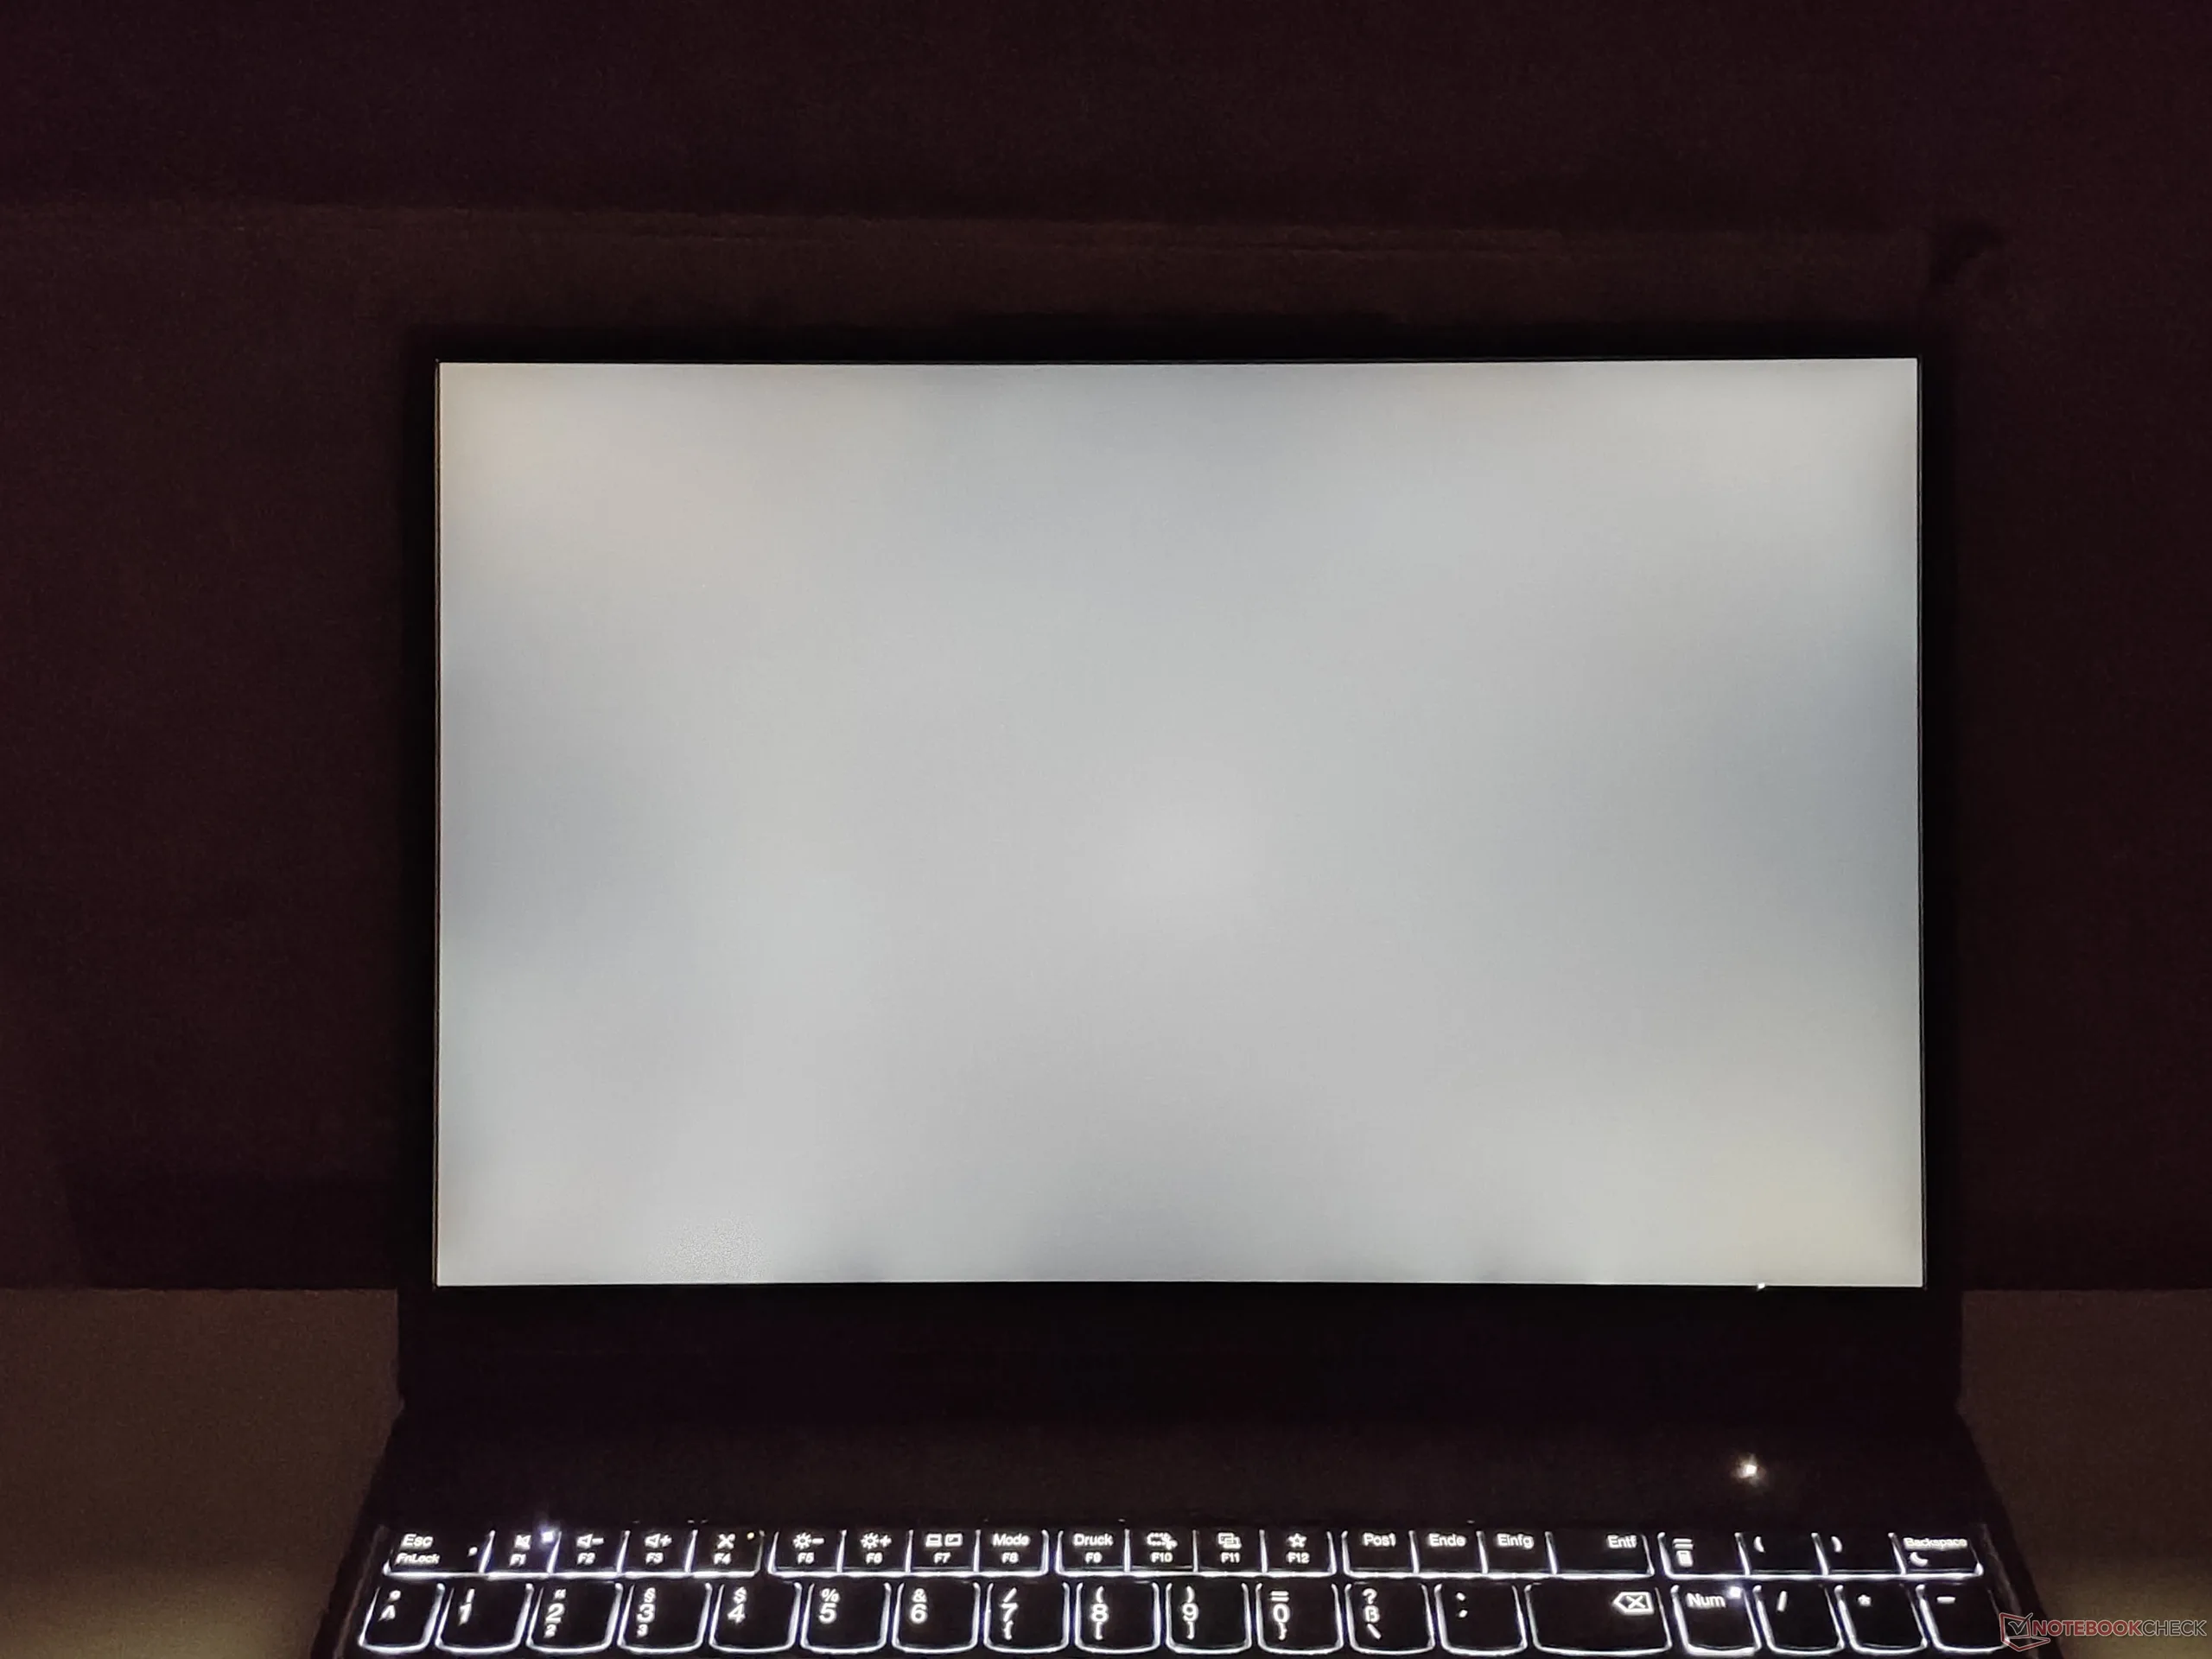
Ausleuchtung: 88 %
Helligkeit Akku: 532 cd/m²
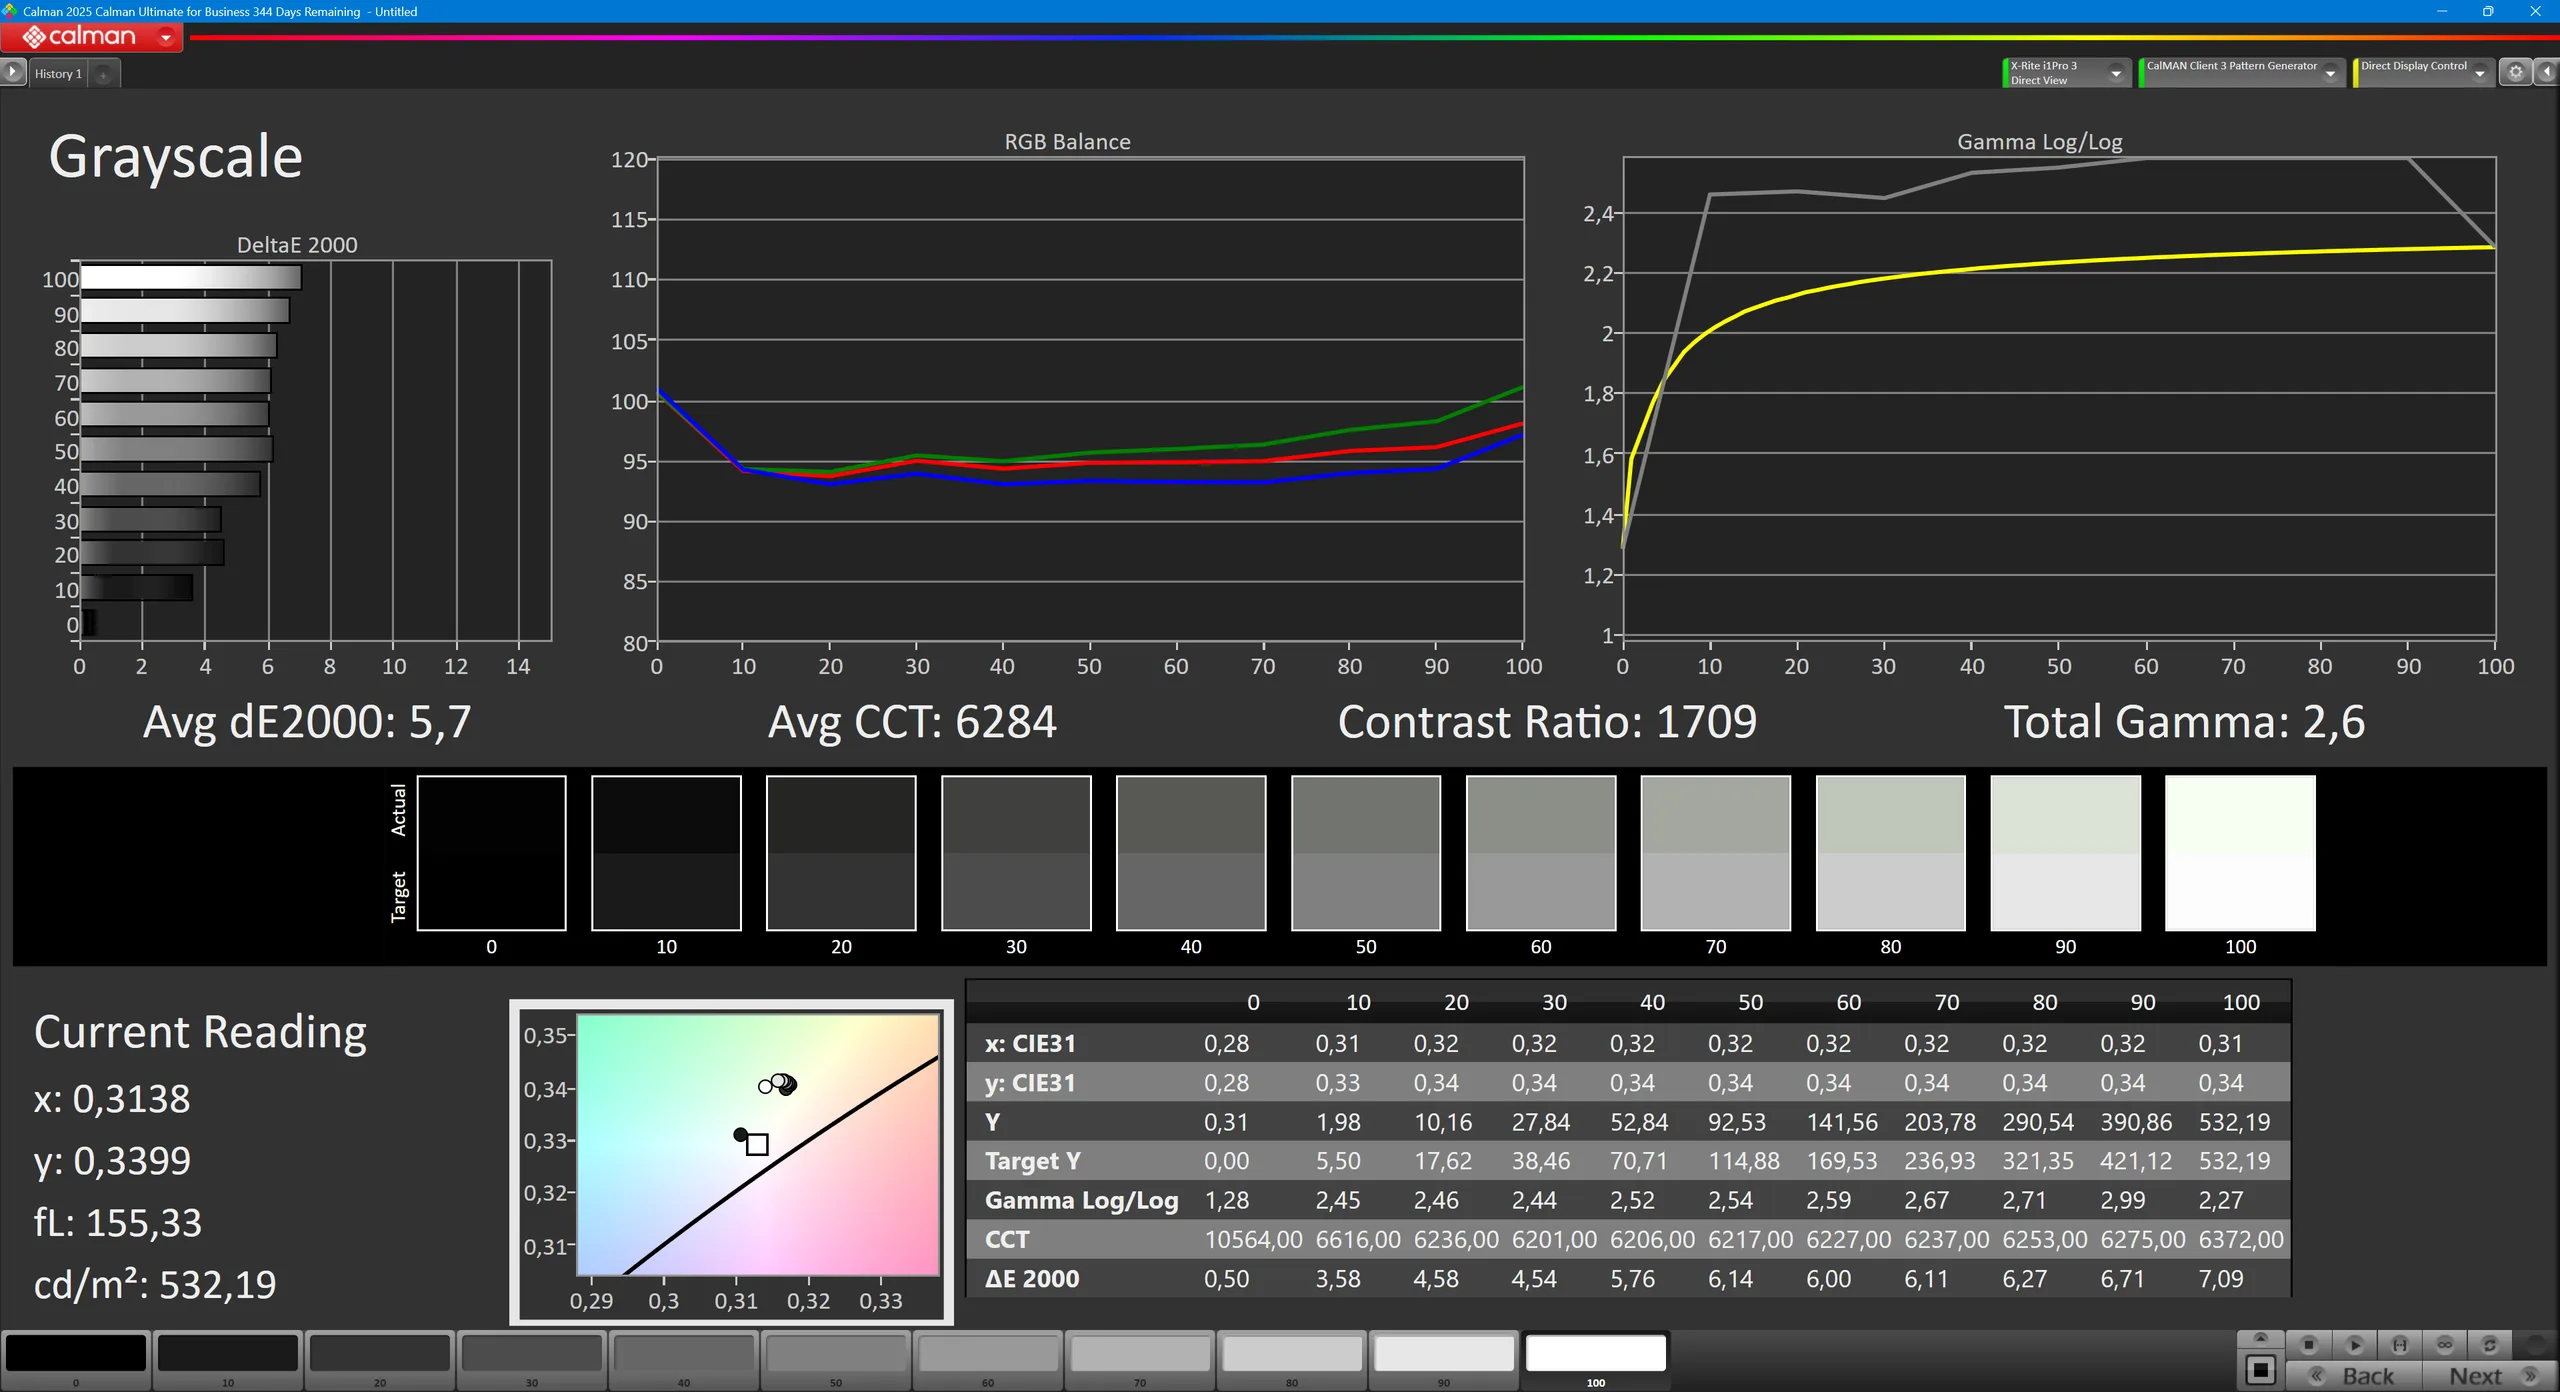
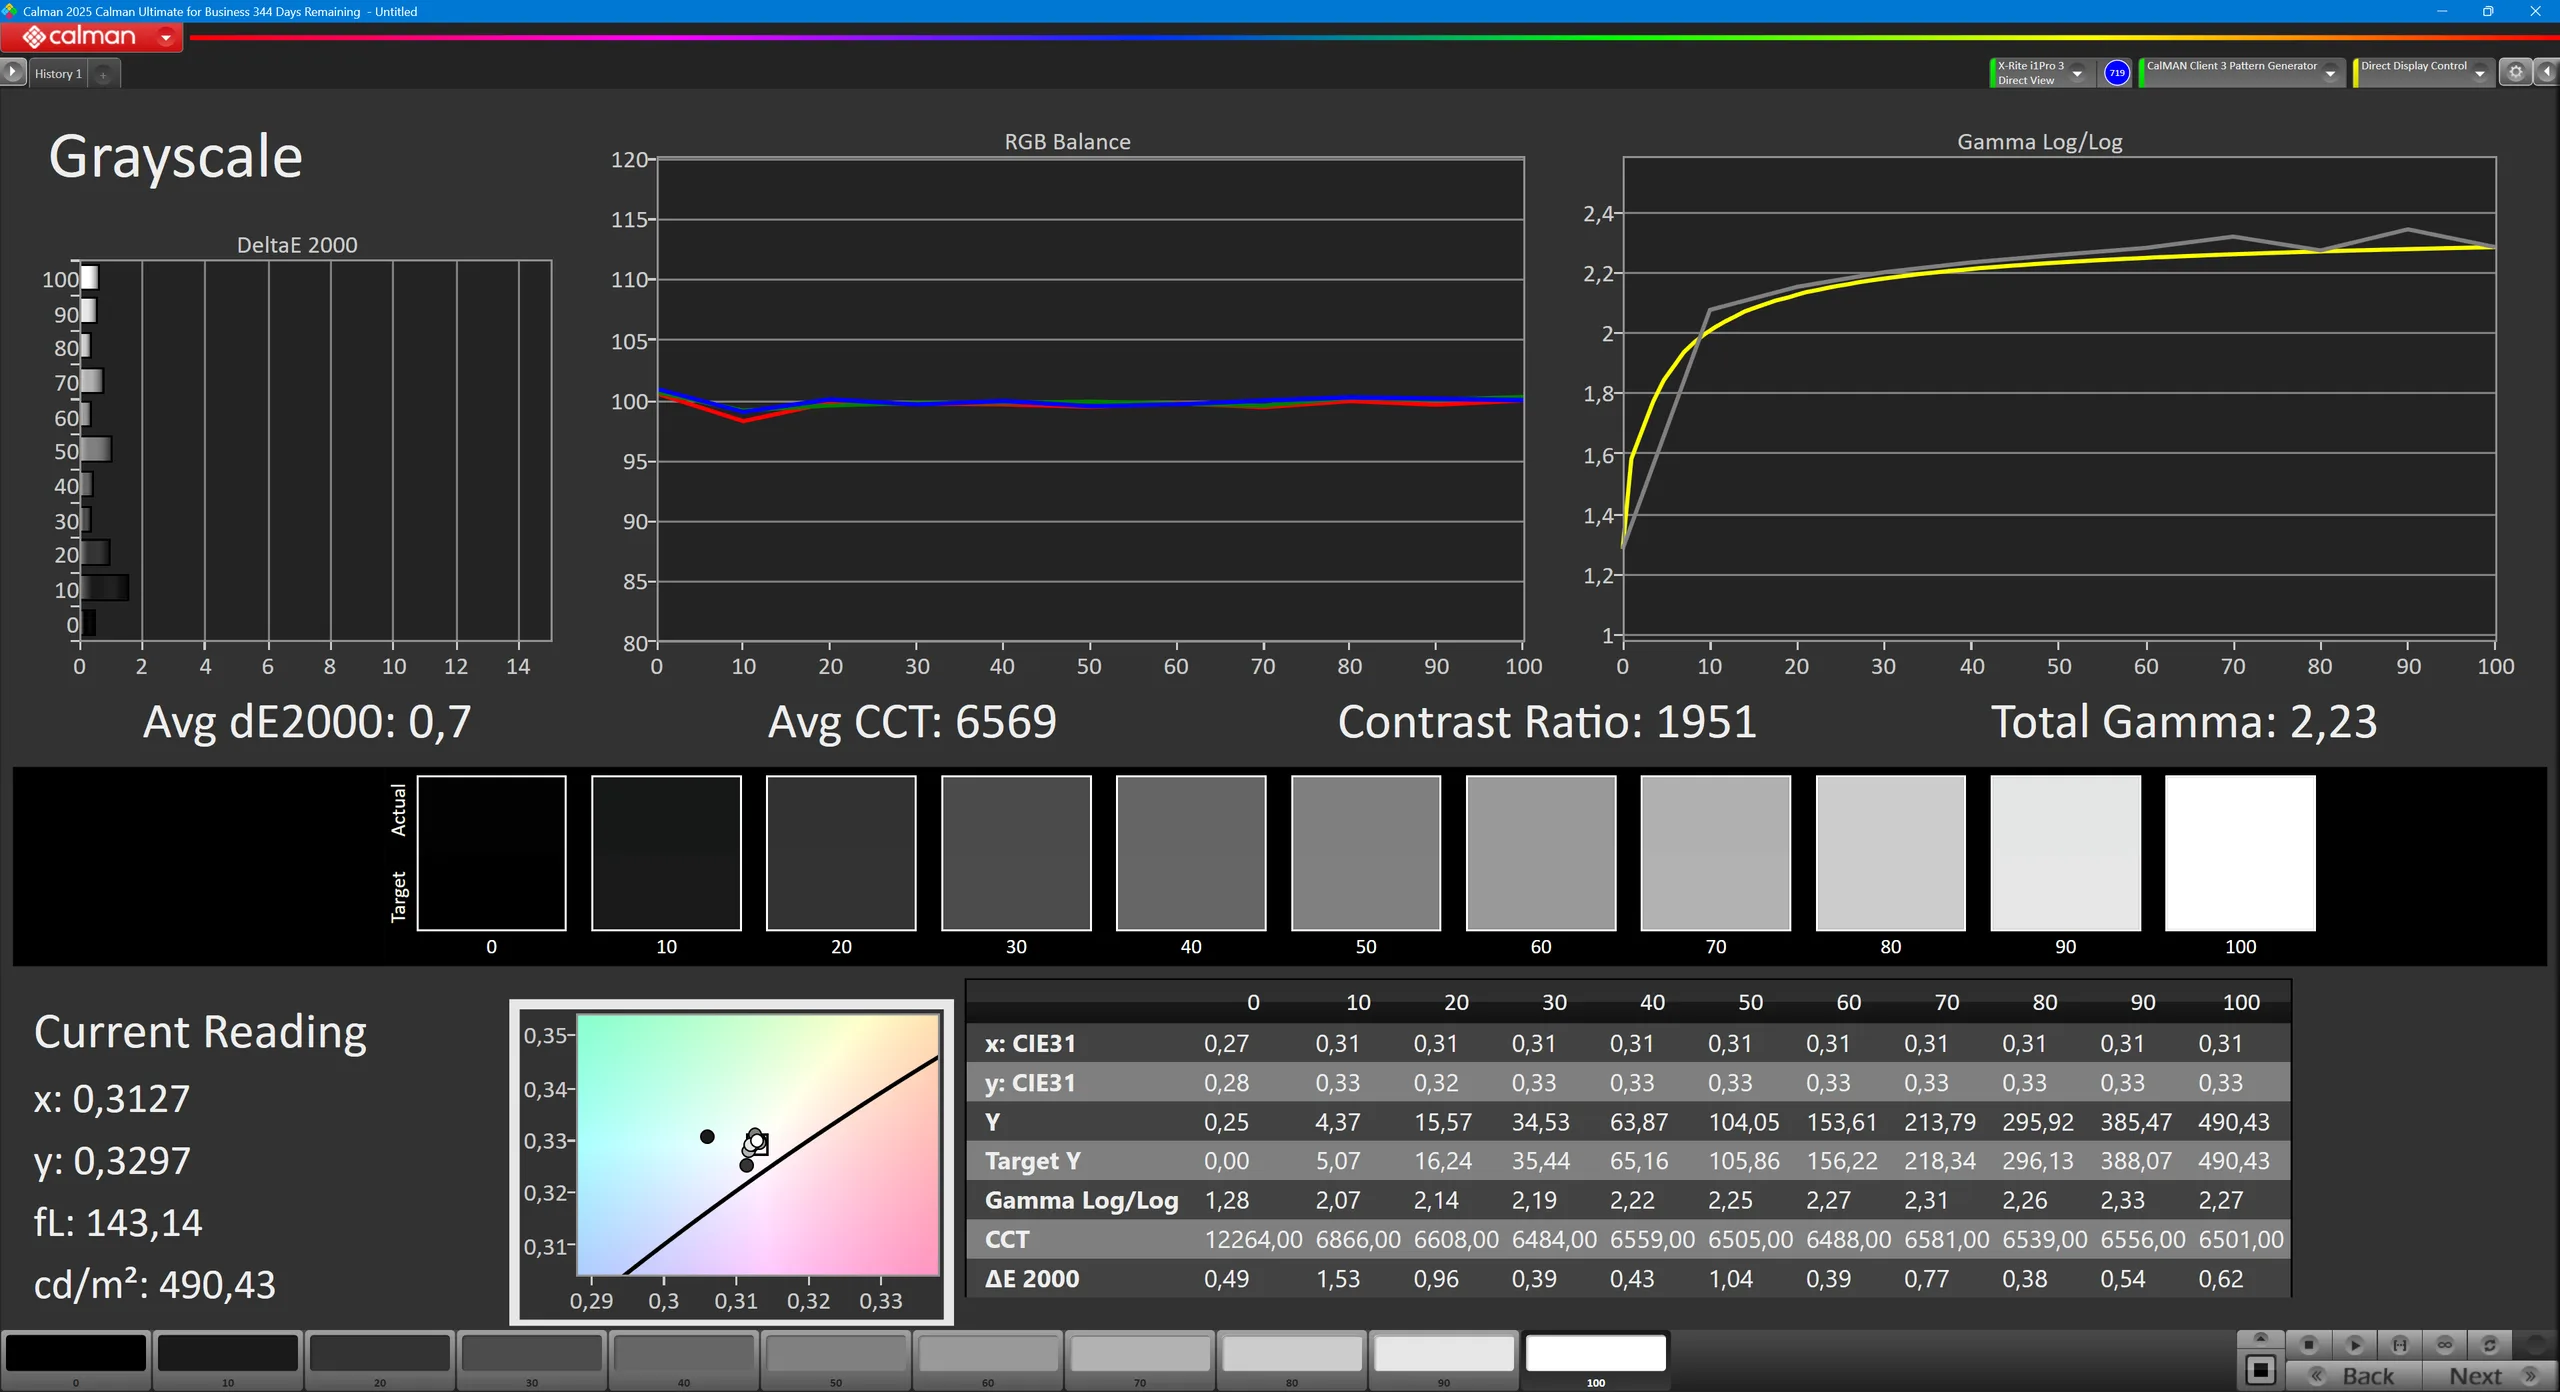
Kontrast: 1716:1 (Schwarzwert: 0.31 cd/m²)
ΔE ColorChecker Calman: 4.4 | ∀{0.5-29.43 Ø4.72}
calibrated: 1.1
ΔE Greyscale Calman: 5.7 | ∀{0.09-98 Ø4.97}
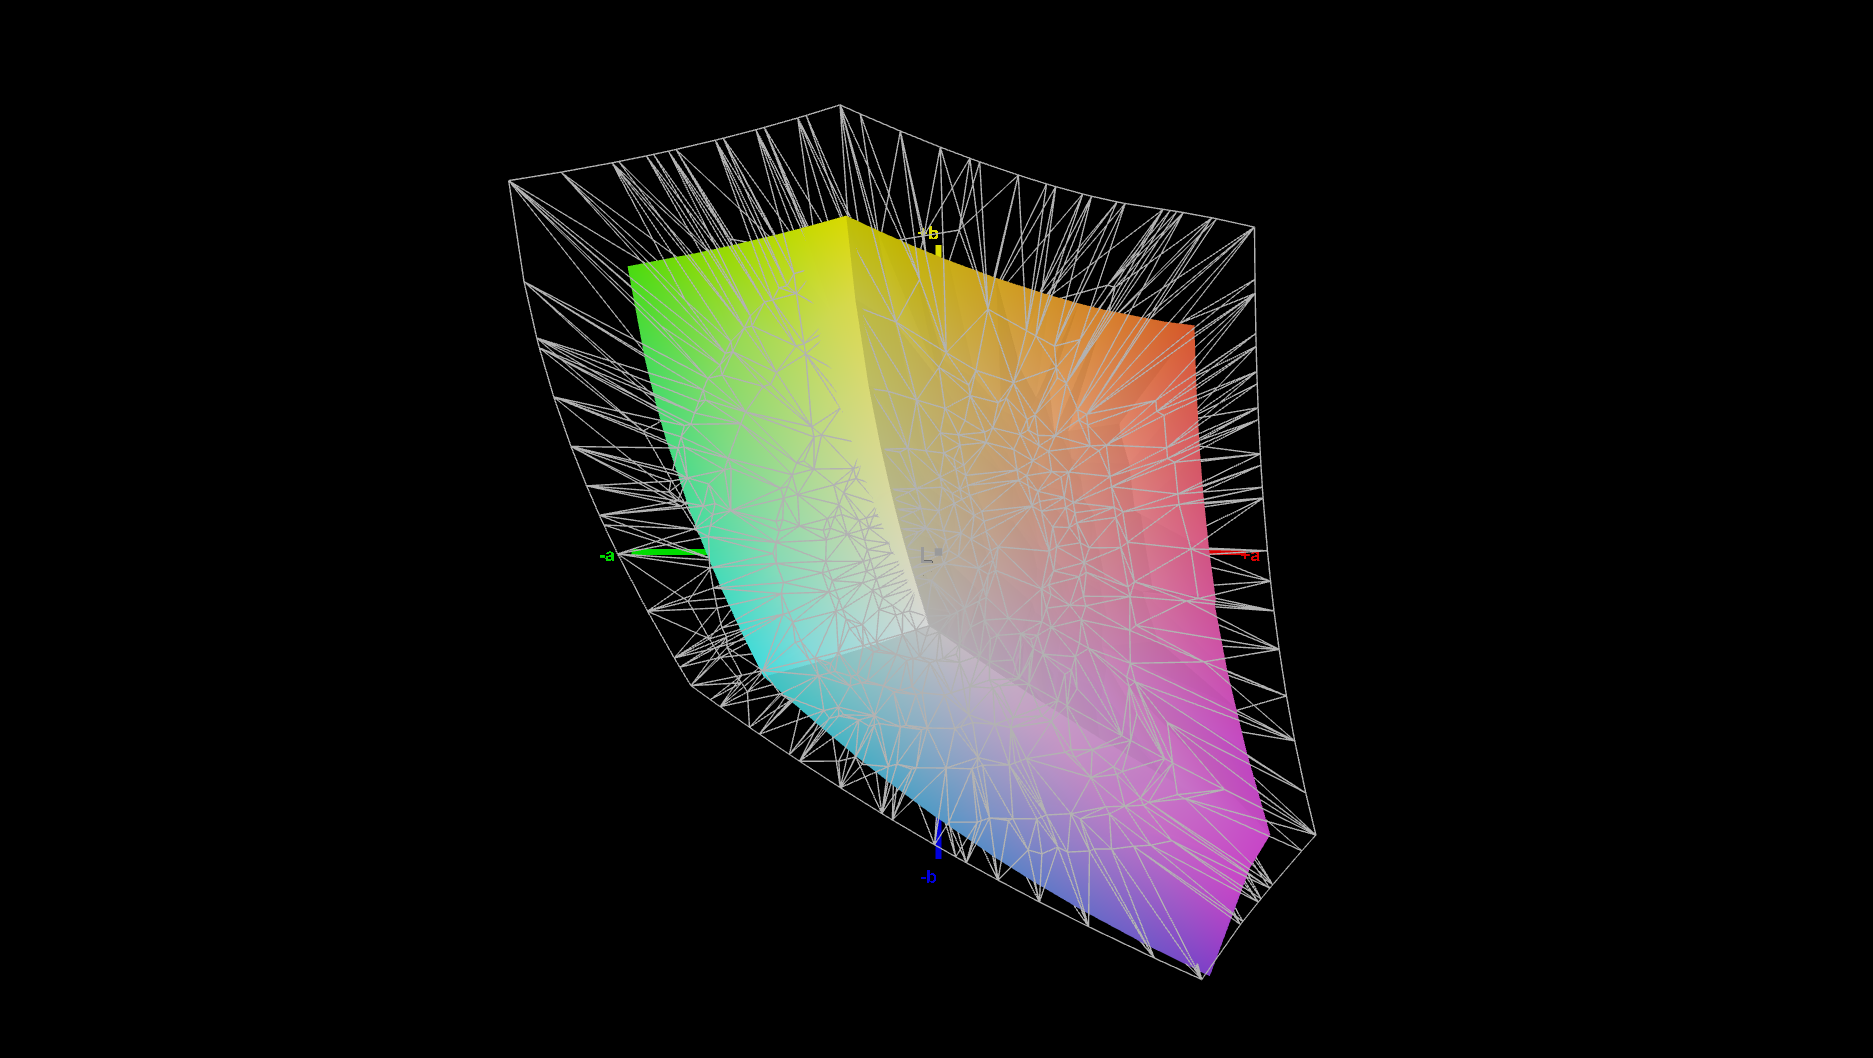
66.6% AdobeRGB 1998 (Argyll 3D)
95.2% sRGB (Argyll 3D)
64.9% Display P3 (Argyll 3D)
Gamma: 2.6
CCT: 6284 K
| Lenovo ThinkPad P16 Gen 3 N160JCA-GT1, IPS LED, 1920x1200, 16", 60 Hz | Lenovo ThinkPad P16 G2 21FA000FGE MNG007DA1-9, IPS LED, 2560x1600, 16", 165 Hz | Dell Pro Max 16 Plus Samsung 160HC01, OLED, 3840x2400, 16", 120 Hz | HP ZBook Fury 16 G11 AUO87A8, IPS, 3840x2400, 16", 120 Hz | Lenovo ThinkPad T16g Gen 3 RTX 5080 ATNA60KA02-0, OLED, 3200x2000, 16", 120 Hz | Lenovo ThinkPad P1 Gen 8 Samsung ATNA60KA02-0, Tandem OLED, 3200x2000, 16", 120 Hz | |
|---|---|---|---|---|---|---|
| Display | 8% | 29% | 29% | 30% | 34% | |
| Display P3 Coverage (%) | 64.9 | 71 9% | 97.3 50% | 98.4 52% | 98.8 52% | 98.8 52% |
| sRGB Coverage (%) | 95.2 | 99.2 4% | 100 5% | 99.9 5% | 100 5% | 100 5% |
| AdobeRGB 1998 Coverage (%) | 66.6 | 73.2 10% | 88.8 33% | 86 29% | 88.9 33% | 97.5 46% |
| Response Times | 52% | 97% | 59% | 97% | 97% | |
| Response Time Grey 50% / Grey 80% * (ms) | 29.8 ? | 12.8 ? 57% | 0.63 ? 98% | 11.4 ? 62% | 1.51 ? 95% | 0.57 ? 98% |
| Response Time Black / White * (ms) | 18.7 ? | 10.1 ? 46% | 0.89 ? 95% | 8.4 ? 55% | 0.44 ? 98% | 0.73 ? 96% |
| PWM Frequency (Hz) | 479.9 ? | 1200 ? | 1199 | |||
| PWM Amplitude * (%) | 28 | 22 | 18 | |||
| Bildschirm | -5% | 29% | -1% | 43% | 37% | |
| Helligkeit Bildmitte (cd/m²) | 532 | 510 -4% | 530.9 0% | 457.6 -14% | 585 10% | 561.8 6% |
| Brightness (cd/m²) | 497 | 517 4% | 540 9% | 466 -6% | 590 19% | 566 14% |
| Brightness Distribution (%) | 88 | 89 1% | 95 8% | 83 -6% | 98 11% | 99 13% |
| Schwarzwert * (cd/m²) | 0.31 | 0.37 -19% | 0.43 -39% | |||
| Kontrast (:1) | 1716 | 1378 -20% | 1064 -38% | |||
| Delta E Colorchecker * | 4.4 | 2.6 41% | 2.42 45% | 2.78 37% | 0.9 80% | 1.29 71% |
| Colorchecker dE 2000 max. * | 6.9 | 5.2 25% | 5.76 17% | 5.53 20% | 2.7 61% | 2.96 57% |
| Colorchecker dE 2000 calibrated * | 1.1 | 2.3 -109% | 0.7 36% | 1.37 -25% | 0.81 26% | |
| Delta E Graustufen * | 5.7 | 3.6 37% | 0.8 86% | 2 65% | 1.4 75% | 1.4 75% |
| Gamma | 2.6 85% | 2.26 97% | 2.23 99% | 2.28 96% | 2.18 101% | 2.23 99% |
| CCT | 6284 103% | 5969 109% | 6488 100% | 6806 96% | 6442 101% | 6319 103% |
| Durchschnitt gesamt (Programm / Settings) | 18% /
6% | 52% /
40% | 29% /
14% | 57% /
49% | 56% /
47% |
* ... kleinere Werte sind besser


Reaktionszeiten (Response Times) des Displays
| ↔ Reaktionszeiten Schwarz zu Weiß | ||
|---|---|---|
| 18.7 ms ... steigend ↗ und fallend ↘ kombiniert | ↗ 10.4 ms steigend | 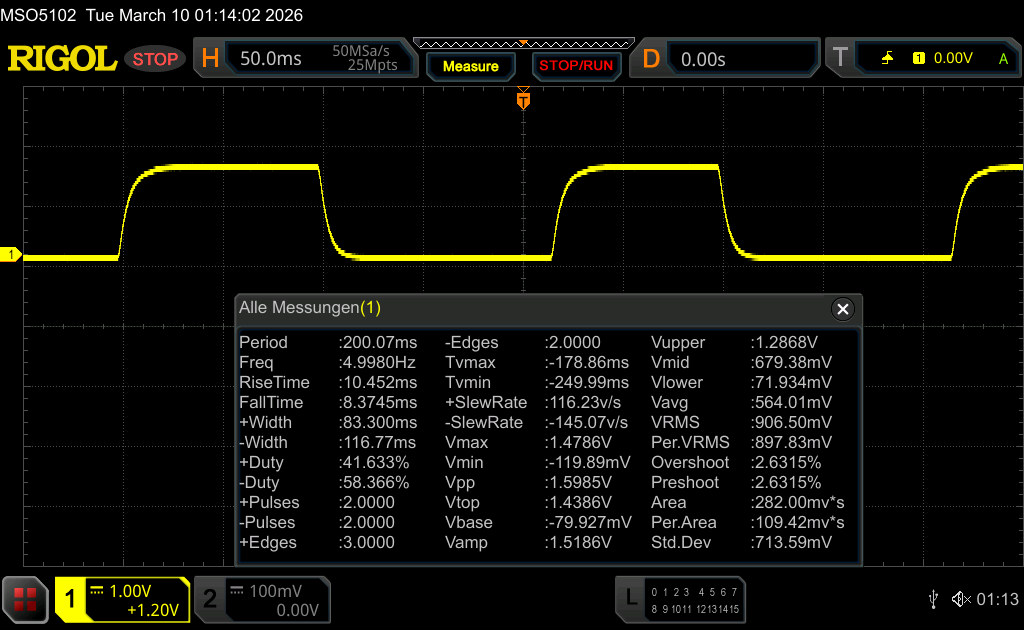 |
| ↘ 8.3 ms fallend | ||
| Die gemessenen Reaktionszeiten sind gut, für anspruchsvolle Spieler könnten der Bildschirm jedoch zu langsam sein. Im Vergleich rangierten die bei uns getesteten Geräte von 0.1 (Minimum) zu 240 (Maximum) ms. » 42 % aller Screens waren schneller als der getestete. Daher sind die gemessenen Reaktionszeiten durchschnittlich (19.8 ms). | ||
| ↔ Reaktionszeiten 50% Grau zu 80% Grau | ||
| 29.8 ms ... steigend ↗ und fallend ↘ kombiniert | ↗ 13.7 ms steigend | 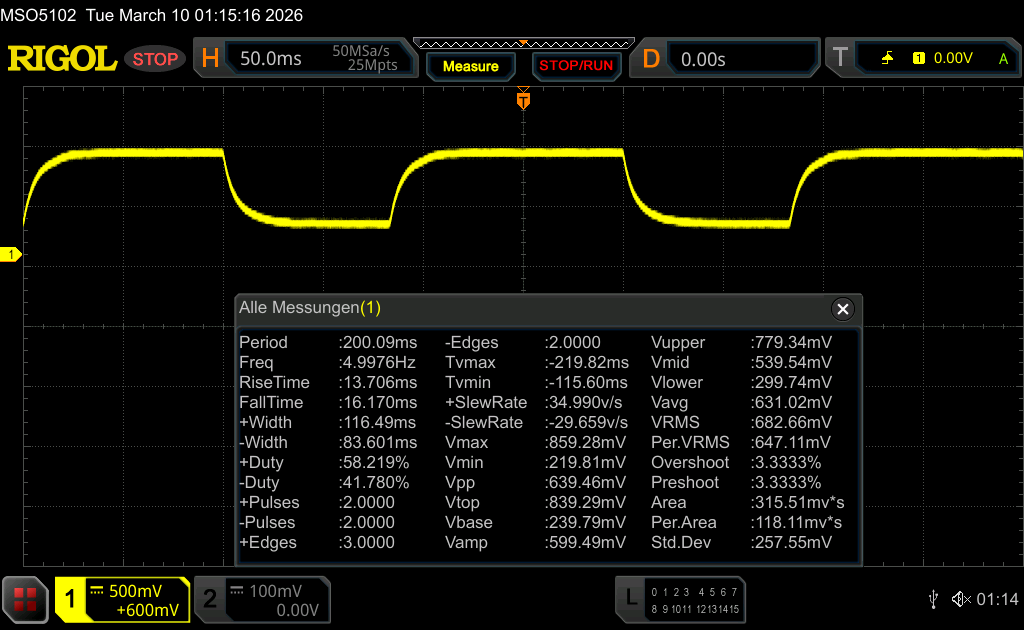 |
| ↘ 16.1 ms fallend | ||
| Die gemessenen Reaktionszeiten sind mittelmäßig und dadurch für Spieler eventuell zu langsam. Im Vergleich rangierten die bei uns getesteten Geräte von 0.165 (Minimum) zu 636 (Maximum) ms. » 40 % aller Screens waren schneller als der getestete. Daher sind die gemessenen Reaktionszeiten durchschnittlich (31 ms). | ||
Bildschirm-Flackern / PWM (Pulse-Width Modulation)
| Flackern / PWM nicht festgestellt |  | ||
Im Vergleich: 52 % aller getesteten Geräte nutzten kein PWM um die Helligkeit zu reduzieren. Wenn PWM eingesetzt wurde, dann bei einer Frequenz von durchschnittlich 7747 (Minimum 5, Maximum 343500) Hz. | |||


Leistung
Testbedingungen
- Beste Energieeeffizienz: PL1 45 W / PL2 160 W
- Ausbalanciert: PL1 100 W / PL2 160 W
- Beste Leistung: PL1 110 W / PL2 160 W
Alle unsere Benchmarks wurden im Modus "Beste Leistung" durchgeführt.
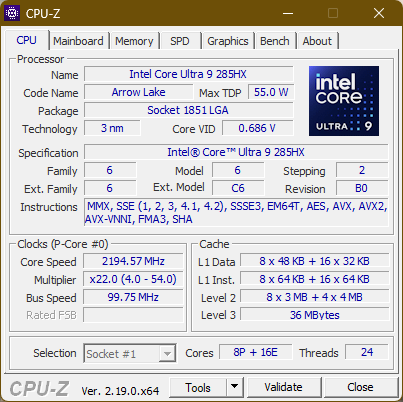
Prozessor
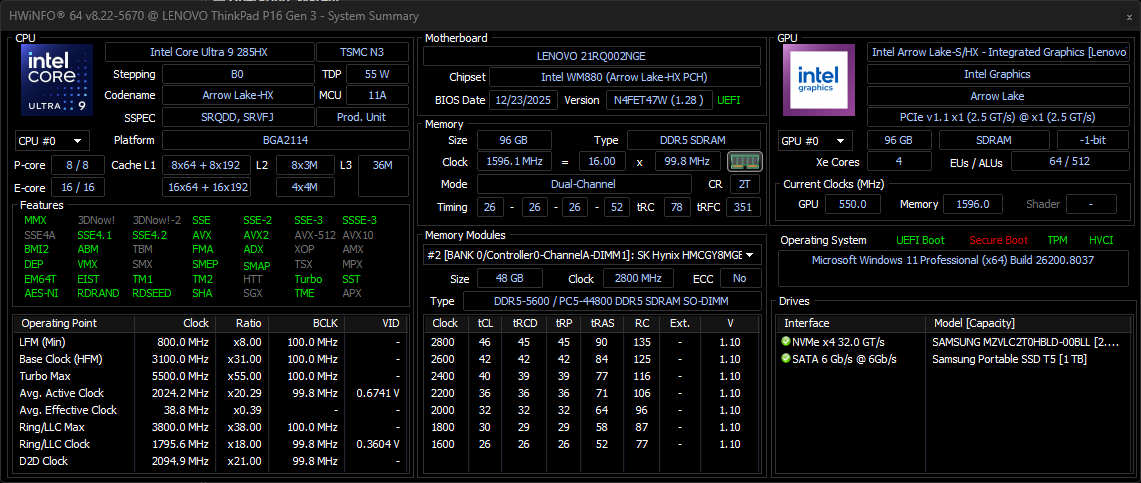
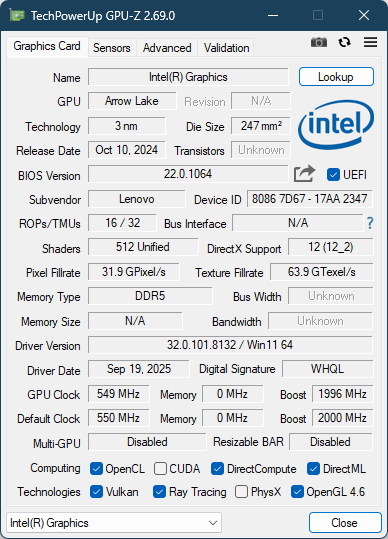
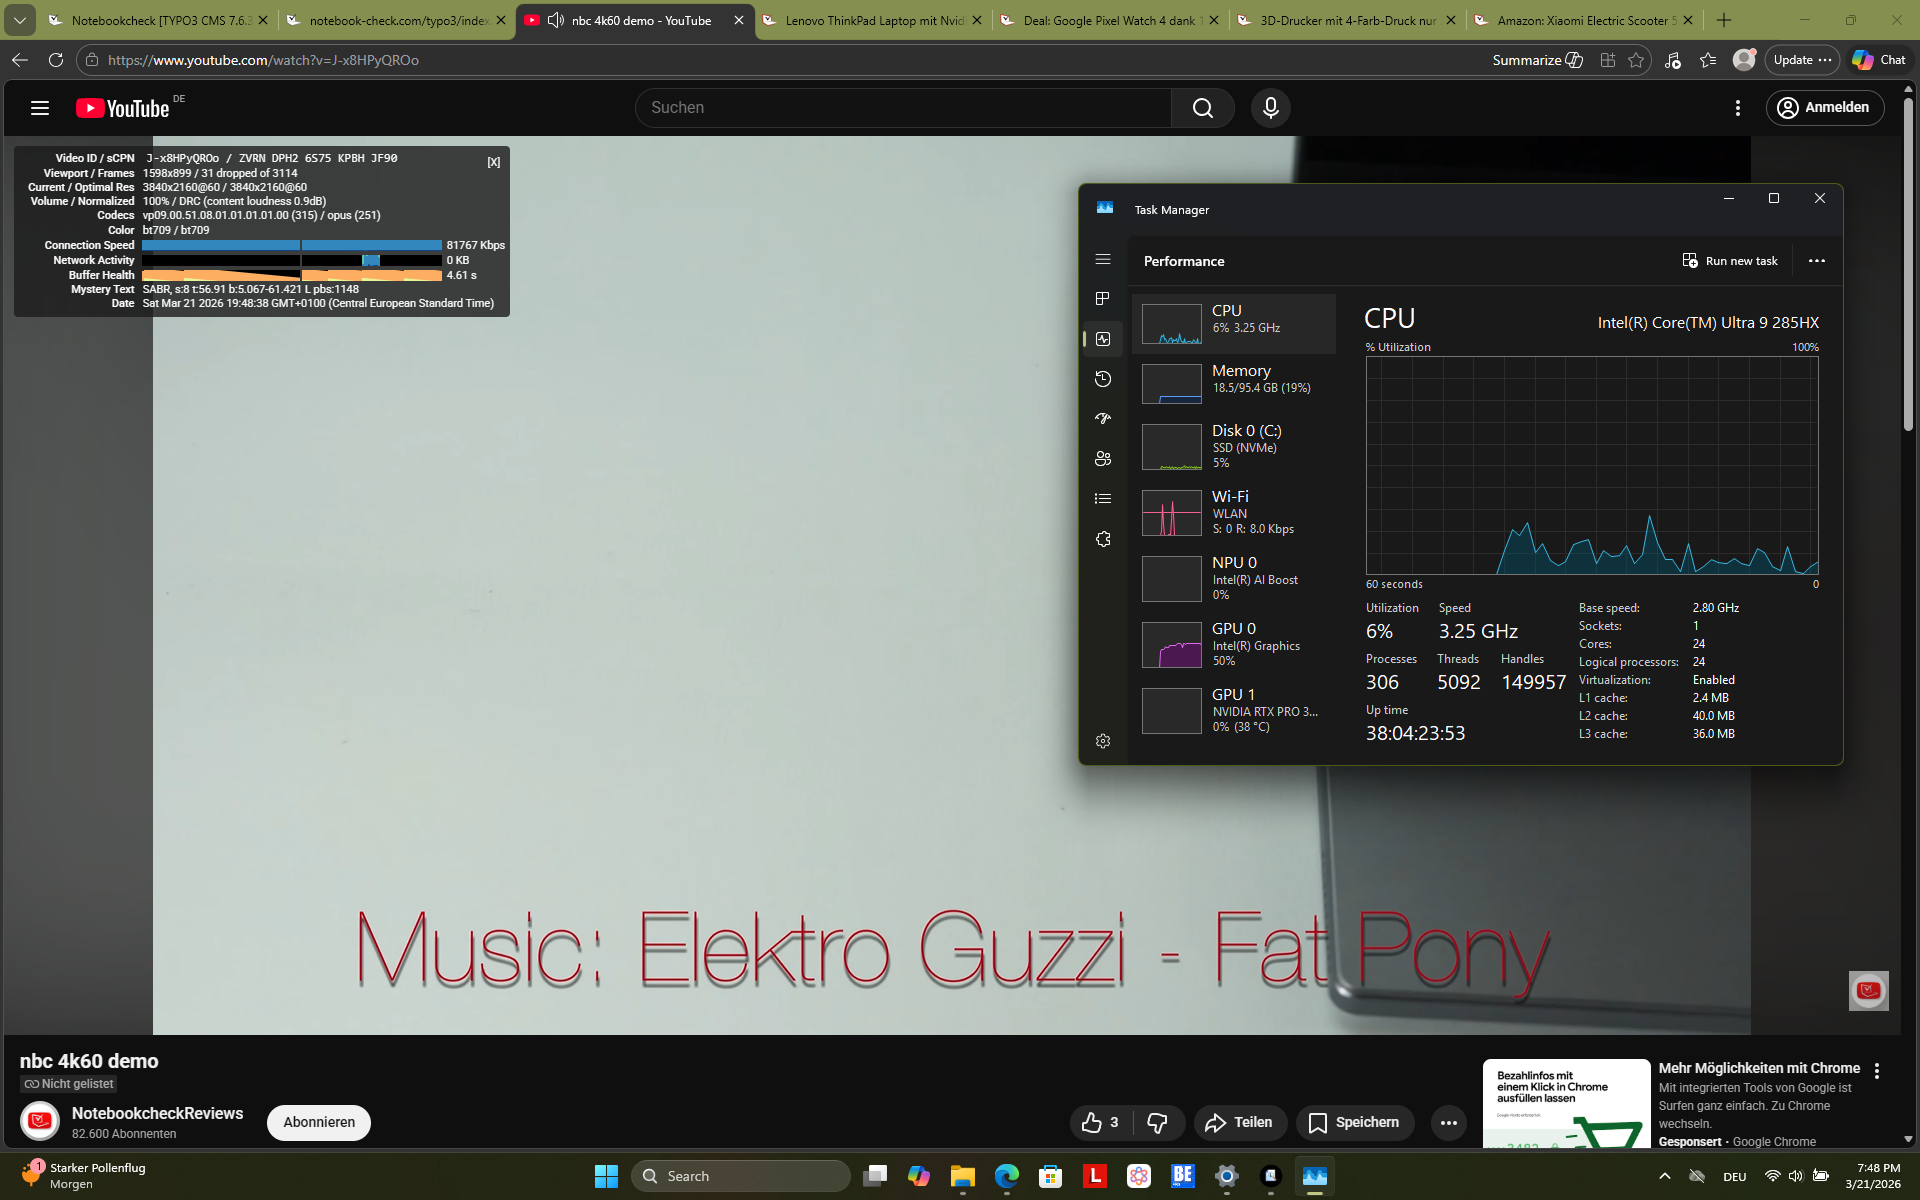
Die Intel Core Ultra 285HX ist ein leistungsstarker "Arrow Lake" Prozessor, der auf Intels neuester Desktop-CPU-Serie basiert. Mit insgesamt 24 Kernen, von denen acht bis zu 5,5 GHz erreichen können, ist dies eine der schnellsten Intel CPUs für Laptops. Weitere Vergleiche mit anderen Prozessoren sind möglich mit unserer CPU-Liste.
Im Durchschnitt ist das ThinkPad P16 Gen 3 43 Prozent schneller als das ThinkPad P16 Gen 2 wenn es um die Prozessor-Leistung geht. Trotz dieses großen Leistungssprungs liegt die Performance der CPU leicht unter dem Durchschnitt für diesen Chip.
Wenn das Notebook im Akkubetrieb läuft, sinkt die Leistung um 26 Prozent auf 27728 Punkte im Cinebench R23 Multicore-Test.
Cinebench R15 Multi Loop
Cinebench R23: Multi Core | Single Core
Cinebench R20: CPU (Multi Core) | CPU (Single Core)
Cinebench R15: CPU Multi 64Bit | CPU Single 64Bit
Blender: v2.79 BMW27 CPU
7-Zip 18.03: 7z b 4 | 7z b 4 -mmt1
Geekbench 6.7: Multi-Core | Single-Core
Geekbench 5.5: Multi-Core | Single-Core
HWBOT x265 Benchmark v2.2: 4k Preset
LibreOffice : 20 Documents To PDF
R Benchmark 2.5: Overall mean
| CPU Performance Rating | |
| Durchschnittliche Intel Core Ultra 9 285HX | |
| Lenovo ThinkPad T16g Gen 3 RTX 5080 | |
| Dell Pro Max 16 Plus | |
| Lenovo ThinkPad P16 Gen 3 | |
| HP ZBook Fury 16 G11 | |
| Durchschnitt der Klasse Workstation | |
| Lenovo ThinkPad P1 Gen 8 | |
| Lenovo ThinkPad P16 G2 21FA000FGE -2! | |
| Cinebench R23 / Multi Core | |
| Lenovo ThinkPad T16g Gen 3 RTX 5080 | |
| Durchschnittliche Intel Core Ultra 9 285HX (34955 - 40117, n=6) | |
| Dell Pro Max 16 Plus | |
| Lenovo ThinkPad P16 Gen 3 | |
| HP ZBook Fury 16 G11 | |
| Durchschnitt der Klasse Workstation (14621 - 38520, n=23, der letzten 2 Jahre) | |
| Lenovo ThinkPad P1 Gen 8 | |
| Lenovo ThinkPad P16 G2 21FA000FGE | |
| Cinebench R23 / Single Core | |
| Lenovo ThinkPad P16 Gen 3 | |
| Lenovo ThinkPad T16g Gen 3 RTX 5080 | |
| Durchschnittliche Intel Core Ultra 9 285HX (2057 - 2303, n=6) | |
| HP ZBook Fury 16 G11 | |
| Dell Pro Max 16 Plus | |
| Durchschnitt der Klasse Workstation (1712 - 2228, n=23, der letzten 2 Jahre) | |
| Lenovo ThinkPad P1 Gen 8 | |
| Lenovo ThinkPad P16 G2 21FA000FGE | |
| Cinebench R20 / CPU (Multi Core) | |
| Lenovo ThinkPad T16g Gen 3 RTX 5080 | |
| Durchschnittliche Intel Core Ultra 9 285HX (13152 - 15751, n=6) | |
| Dell Pro Max 16 Plus | |
| Lenovo ThinkPad P16 Gen 3 | |
| HP ZBook Fury 16 G11 | |
| Durchschnitt der Klasse Workstation (5760 - 15043, n=23, der letzten 2 Jahre) | |
| Lenovo ThinkPad P1 Gen 8 | |
| Lenovo ThinkPad P16 G2 21FA000FGE | |
| Cinebench R20 / CPU (Single Core) | |
| Lenovo ThinkPad P16 Gen 3 | |
| Lenovo ThinkPad T16g Gen 3 RTX 5080 | |
| Durchschnittliche Intel Core Ultra 9 285HX (799 - 884, n=6) | |
| HP ZBook Fury 16 G11 | |
| Dell Pro Max 16 Plus | |
| Durchschnitt der Klasse Workstation (671 - 857, n=23, der letzten 2 Jahre) | |
| Lenovo ThinkPad P1 Gen 8 | |
| Lenovo ThinkPad P16 G2 21FA000FGE | |
| Cinebench R15 / CPU Multi 64Bit | |
| Lenovo ThinkPad T16g Gen 3 RTX 5080 | |
| Durchschnittliche Intel Core Ultra 9 285HX (5427 - 6232, n=6) | |
| Lenovo ThinkPad P16 Gen 3 | |
| Dell Pro Max 16 Plus | |
| HP ZBook Fury 16 G11 | |
| Durchschnitt der Klasse Workstation (2489 - 5810, n=23, der letzten 2 Jahre) | |
| Lenovo ThinkPad P1 Gen 8 | |
| Lenovo ThinkPad P16 G2 21FA000FGE | |
| Cinebench R15 / CPU Single 64Bit | |
| Lenovo ThinkPad T16g Gen 3 RTX 5080 | |
| Durchschnittliche Intel Core Ultra 9 285HX (307 - 340, n=6) | |
| Lenovo ThinkPad P16 Gen 3 | |
| Dell Pro Max 16 Plus | |
| Lenovo ThinkPad P1 Gen 8 | |
| HP ZBook Fury 16 G11 | |
| Durchschnitt der Klasse Workstation (191.4 - 328, n=23, der letzten 2 Jahre) | |
| Lenovo ThinkPad P16 G2 21FA000FGE | |
| Blender / v2.79 BMW27 CPU | |
| Lenovo ThinkPad P1 Gen 8 | |
| Lenovo ThinkPad P16 G2 21FA000FGE | |
| Durchschnitt der Klasse Workstation (91 - 222, n=23, der letzten 2 Jahre) | |
| HP ZBook Fury 16 G11 | |
| Lenovo ThinkPad P16 Gen 3 | |
| Dell Pro Max 16 Plus | |
| Lenovo ThinkPad T16g Gen 3 RTX 5080 | |
| Durchschnittliche Intel Core Ultra 9 285HX (83 - 103, n=6) | |
| 7-Zip 18.03 / 7z b 4 | |
| Durchschnittliche Intel Core Ultra 9 285HX (99260 - 128778, n=6) | |
| Dell Pro Max 16 Plus | |
| Lenovo ThinkPad T16g Gen 3 RTX 5080 | |
| HP ZBook Fury 16 G11 | |
| Lenovo ThinkPad P16 Gen 3 | |
| Durchschnitt der Klasse Workstation (60489 - 116969, n=23, der letzten 2 Jahre) | |
| Lenovo ThinkPad P16 G2 21FA000FGE | |
| Lenovo ThinkPad P1 Gen 8 | |
| 7-Zip 18.03 / 7z b 4 -mmt1 | |
| HP ZBook Fury 16 G11 | |
| Lenovo ThinkPad T16g Gen 3 RTX 5080 | |
| Durchschnittliche Intel Core Ultra 9 285HX (6422 - 6822, n=6) | |
| Dell Pro Max 16 Plus | |
| Lenovo ThinkPad P16 Gen 3 | |
| Lenovo ThinkPad P16 G2 21FA000FGE | |
| Durchschnitt der Klasse Workstation (5126 - 6960, n=23, der letzten 2 Jahre) | |
| Lenovo ThinkPad P1 Gen 8 | |
| Geekbench 6.7 / Multi-Core | |
| Dell Pro Max 16 Plus | |
| Durchschnittliche Intel Core Ultra 9 285HX (18212 - 22104, n=6) | |
| Lenovo ThinkPad T16g Gen 3 RTX 5080 | |
| Lenovo ThinkPad P16 Gen 3 | |
| Lenovo ThinkPad P1 Gen 8 | |
| Durchschnitt der Klasse Workstation (12721 - 20887, n=23, der letzten 2 Jahre) | |
| HP ZBook Fury 16 G11 | |
| Geekbench 6.7 / Single-Core | |
| Lenovo ThinkPad T16g Gen 3 RTX 5080 | |
| Durchschnittliche Intel Core Ultra 9 285HX (2907 - 3088, n=6) | |
| Lenovo ThinkPad P16 Gen 3 | |
| HP ZBook Fury 16 G11 | |
| Dell Pro Max 16 Plus | |
| Durchschnitt der Klasse Workstation (2389 - 3065, n=23, der letzten 2 Jahre) | |
| Lenovo ThinkPad P1 Gen 8 | |
| Geekbench 5.5 / Multi-Core | |
| Dell Pro Max 16 Plus | |
| Durchschnittliche Intel Core Ultra 9 285HX (18992 - 27010, n=6) | |
| Lenovo ThinkPad T16g Gen 3 RTX 5080 | |
| Lenovo ThinkPad P16 Gen 3 | |
| HP ZBook Fury 16 G11 | |
| Durchschnitt der Klasse Workstation (11542 - 25554, n=23, der letzten 2 Jahre) | |
| Lenovo ThinkPad P1 Gen 8 | |
| Lenovo ThinkPad P16 G2 21FA000FGE | |
| Geekbench 5.5 / Single-Core | |
| Lenovo ThinkPad T16g Gen 3 RTX 5080 | |
| Durchschnittliche Intel Core Ultra 9 285HX (2121 - 2232, n=6) | |
| Lenovo ThinkPad P16 Gen 3 | |
| Dell Pro Max 16 Plus | |
| Durchschnitt der Klasse Workstation (1783 - 2183, n=23, der letzten 2 Jahre) | |
| HP ZBook Fury 16 G11 | |
| Lenovo ThinkPad P1 Gen 8 | |
| Lenovo ThinkPad P16 G2 21FA000FGE | |
| HWBOT x265 Benchmark v2.2 / 4k Preset | |
| Durchschnittliche Intel Core Ultra 9 285HX (35.3 - 44.3, n=6) | |
| Lenovo ThinkPad T16g Gen 3 RTX 5080 | |
| Dell Pro Max 16 Plus | |
| Lenovo ThinkPad P16 Gen 3 | |
| Durchschnitt der Klasse Workstation (17.8 - 40.5, n=23, der letzten 2 Jahre) | |
| HP ZBook Fury 16 G11 | |
| Lenovo ThinkPad P1 Gen 8 | |
| Lenovo ThinkPad P16 G2 21FA000FGE | |
| LibreOffice / 20 Documents To PDF | |
| Lenovo ThinkPad P16 G2 21FA000FGE | |
| HP ZBook Fury 16 G11 | |
| Durchschnitt der Klasse Workstation (37.1 - 74.7, n=23, der letzten 2 Jahre) | |
| Lenovo ThinkPad T16g Gen 3 RTX 5080 | |
| Durchschnittliche Intel Core Ultra 9 285HX (38 - 49.1, n=6) | |
| Dell Pro Max 16 Plus | |
| Lenovo ThinkPad P16 Gen 3 | |
| Lenovo ThinkPad P1 Gen 8 | |
| R Benchmark 2.5 / Overall mean | |
| Lenovo ThinkPad P16 G2 21FA000FGE | |
| Lenovo ThinkPad P1 Gen 8 | |
| Durchschnitt der Klasse Workstation (0.3825 - 0.603, n=23, der letzten 2 Jahre) | |
| Dell Pro Max 16 Plus | |
| Durchschnittliche Intel Core Ultra 9 285HX (0.4012 - 0.4444, n=6) | |
| Lenovo ThinkPad P16 Gen 3 | |
| Lenovo ThinkPad T16g Gen 3 RTX 5080 | |
| HP ZBook Fury 16 G11 | |
* ... kleinere Werte sind besser
AIDA64: FP32 Ray-Trace | FPU Julia | CPU SHA3 | CPU Queen | FPU SinJulia | FPU Mandel | CPU AES | CPU ZLib | FP64 Ray-Trace | CPU PhotoWorxx
| Performance Rating | |
| Durchschnittliche Intel Core Ultra 9 285HX | |
| Lenovo ThinkPad T16g Gen 3 RTX 5080 | |
| Dell Pro Max 16 Plus | |
| Lenovo ThinkPad P16 Gen 3 | |
| Durchschnitt der Klasse Workstation | |
| HP ZBook Fury 16 G11 | |
| Lenovo ThinkPad P1 Gen 8 | |
| Lenovo ThinkPad P16 G2 21FA000FGE | |
| AIDA64 / FP32 Ray-Trace | |
| Lenovo ThinkPad T16g Gen 3 RTX 5080 (v6.92.6600) | |
| Durchschnittliche Intel Core Ultra 9 285HX (29076 - 42341, n=6) | |
| Dell Pro Max 16 Plus (v6.92.6600) | |
| Lenovo ThinkPad P16 Gen 3 (v6.92.6600) | |
| Durchschnitt der Klasse Workstation (16730 - 61611, n=23, der letzten 2 Jahre) | |
| Lenovo ThinkPad P1 Gen 8 (v6.92.6600) | |
| HP ZBook Fury 16 G11 (v6.92.6600) | |
| Lenovo ThinkPad P16 G2 21FA000FGE (v6.75.6100) | |
| AIDA64 / FPU Julia | |
| Durchschnittliche Intel Core Ultra 9 285HX (161276 - 210885, n=6) | |
| Lenovo ThinkPad T16g Gen 3 RTX 5080 (v6.92.6600) | |
| Lenovo ThinkPad P16 Gen 3 (v6.92.6600) | |
| Dell Pro Max 16 Plus (v6.92.6600) | |
| Durchschnitt der Klasse Workstation (89597 - 186971, n=23, der letzten 2 Jahre) | |
| Lenovo ThinkPad P1 Gen 8 (v6.92.6600) | |
| HP ZBook Fury 16 G11 (v6.92.6600) | |
| Lenovo ThinkPad P16 G2 21FA000FGE (v6.75.6100) | |
| AIDA64 / CPU SHA3 | |
| Lenovo ThinkPad T16g Gen 3 RTX 5080 (v6.92.6600) | |
| Durchschnittliche Intel Core Ultra 9 285HX (7757 - 9815, n=6) | |
| Lenovo ThinkPad P16 Gen 3 (v6.92.6600) | |
| Dell Pro Max 16 Plus (v6.92.6600) | |
| Durchschnitt der Klasse Workstation (4178 - 8975, n=23, der letzten 2 Jahre) | |
| Lenovo ThinkPad P1 Gen 8 (v6.92.6600) | |
| HP ZBook Fury 16 G11 (v6.92.6600) | |
| Lenovo ThinkPad P16 G2 21FA000FGE (v6.75.6100) | |
| AIDA64 / CPU Queen | |
| Lenovo ThinkPad T16g Gen 3 RTX 5080 (v6.92.6600) | |
| HP ZBook Fury 16 G11 (v6.92.6600) | |
| Lenovo ThinkPad P16 Gen 3 (v6.92.6600) | |
| Durchschnittliche Intel Core Ultra 9 285HX (134345 - 141681, n=6) | |
| Dell Pro Max 16 Plus (v6.92.6600) | |
| Lenovo ThinkPad P16 G2 21FA000FGE (v6.75.6100) | |
| Durchschnitt der Klasse Workstation (60778 - 144411, n=23, der letzten 2 Jahre) | |
| Lenovo ThinkPad P1 Gen 8 (v6.92.6600) | |
| AIDA64 / FPU SinJulia | |
| Durchschnitt der Klasse Workstation (8165 - 29343, n=23, der letzten 2 Jahre) | |
| Lenovo ThinkPad T16g Gen 3 RTX 5080 (v6.92.6600) | |
| HP ZBook Fury 16 G11 (v6.92.6600) | |
| Durchschnittliche Intel Core Ultra 9 285HX (12559 - 14431, n=6) | |
| Dell Pro Max 16 Plus (v6.92.6600) | |
| Lenovo ThinkPad P16 Gen 3 (v6.92.6600) | |
| Lenovo ThinkPad P16 G2 21FA000FGE (v6.75.6100) | |
| Lenovo ThinkPad P1 Gen 8 (v6.92.6600) | |
| AIDA64 / FPU Mandel | |
| Lenovo ThinkPad T16g Gen 3 RTX 5080 (v6.92.6600) | |
| Durchschnittliche Intel Core Ultra 9 285HX (84053 - 108922, n=6) | |
| Lenovo ThinkPad P16 Gen 3 (v6.92.6600) | |
| Dell Pro Max 16 Plus (v6.92.6600) | |
| Durchschnitt der Klasse Workstation (44497 - 98153, n=23, der letzten 2 Jahre) | |
| Lenovo ThinkPad P1 Gen 8 (v6.92.6600) | |
| HP ZBook Fury 16 G11 (v6.92.6600) | |
| Lenovo ThinkPad P16 G2 21FA000FGE (v6.75.6100) | |
| AIDA64 / CPU AES | |
| Lenovo ThinkPad T16g Gen 3 RTX 5080 (v6.92.6600) | |
| Durchschnittliche Intel Core Ultra 9 285HX (119553 - 134195, n=6) | |
| Lenovo ThinkPad P16 Gen 3 (v6.92.6600) | |
| Dell Pro Max 16 Plus (v6.92.6600) | |
| Durchschnitt der Klasse Workstation (73133 - 187841, n=23, der letzten 2 Jahre) | |
| HP ZBook Fury 16 G11 (v6.92.6600) | |
| Lenovo ThinkPad P16 G2 21FA000FGE (v6.75.6100) | |
| Lenovo ThinkPad P1 Gen 8 (v6.92.6600) | |
| AIDA64 / CPU ZLib | |
| Lenovo ThinkPad T16g Gen 3 RTX 5080 (v6.92.6600) | |
| Durchschnittliche Intel Core Ultra 9 285HX (1886 - 2267, n=6) | |
| Lenovo ThinkPad P16 Gen 3 (v6.92.6600) | |
| Dell Pro Max 16 Plus (v6.92.6600) | |
| Durchschnitt der Klasse Workstation (929 - 2148, n=23, der letzten 2 Jahre) | |
| HP ZBook Fury 16 G11 (v6.92.6600) | |
| Lenovo ThinkPad P1 Gen 8 (v6.92.6600) | |
| Lenovo ThinkPad P16 G2 21FA000FGE (v6.75.6100) | |
| AIDA64 / FP64 Ray-Trace | |
| Lenovo ThinkPad T16g Gen 3 RTX 5080 (v6.92.6600) | |
| Durchschnittliche Intel Core Ultra 9 285HX (15059 - 22312, n=6) | |
| Dell Pro Max 16 Plus (v6.92.6600) | |
| Durchschnitt der Klasse Workstation (8545 - 32891, n=23, der letzten 2 Jahre) | |
| Lenovo ThinkPad P16 Gen 3 (v6.92.6600) | |
| Lenovo ThinkPad P1 Gen 8 (v6.92.6600) | |
| HP ZBook Fury 16 G11 (v6.92.6600) | |
| Lenovo ThinkPad P16 G2 21FA000FGE (v6.75.6100) | |
| AIDA64 / CPU PhotoWorxx | |
| Dell Pro Max 16 Plus (v6.92.6600) | |
| Lenovo ThinkPad P1 Gen 8 (v6.92.6600) | |
| Durchschnitt der Klasse Workstation (37151 - 93684, n=23, der letzten 2 Jahre) | |
| Durchschnittliche Intel Core Ultra 9 285HX (39232 - 62611, n=6) | |
| Lenovo ThinkPad T16g Gen 3 RTX 5080 (v6.92.6600) | |
| Lenovo ThinkPad P16 Gen 3 (v6.92.6600) | |
| HP ZBook Fury 16 G11 (v6.92.6600) | |
| Lenovo ThinkPad P16 G2 21FA000FGE (v6.75.6100) | |
System Performance
PCMark 10: Score | Essentials | Productivity | Digital Content Creation
CrossMark: Overall | Productivity | Creativity | Responsiveness
WebXPRT 3: Overall
WebXPRT 4: Overall
Mozilla Kraken 1.1: Total
| Performance Rating | |
| Lenovo ThinkPad T16g Gen 3 RTX 5080 | |
| Lenovo ThinkPad P16 Gen 3 | |
| Durchschnittliche Intel Core Ultra 9 285HX, NVIDIA RTX PRO 3000 Blackwell Generation Laptop | |
| Dell Pro Max 16 Plus -4! | |
| Lenovo ThinkPad P1 Gen 8 | |
| HP ZBook Fury 16 G11 | |
| Durchschnitt der Klasse Workstation | |
| Lenovo ThinkPad P16 G2 21FA000FGE -1! | |
| PCMark 10 / Score | |
| Lenovo ThinkPad T16g Gen 3 RTX 5080 | |
| Lenovo ThinkPad P16 Gen 3 | |
| Durchschnittliche Intel Core Ultra 9 285HX, NVIDIA RTX PRO 3000 Blackwell Generation Laptop (n=1) | |
| Lenovo ThinkPad P1 Gen 8 | |
| Durchschnitt der Klasse Workstation (6563 - 10409, n=19, der letzten 2 Jahre) | |
| HP ZBook Fury 16 G11 | |
| Lenovo ThinkPad P16 G2 21FA000FGE | |
| PCMark 10 / Essentials | |
| Lenovo ThinkPad P16 G2 21FA000FGE | |
| Lenovo ThinkPad P1 Gen 8 | |
| Durchschnitt der Klasse Workstation (9622 - 11157, n=19, der letzten 2 Jahre) | |
| Lenovo ThinkPad P16 Gen 3 | |
| Durchschnittliche Intel Core Ultra 9 285HX, NVIDIA RTX PRO 3000 Blackwell Generation Laptop (n=1) | |
| Lenovo ThinkPad T16g Gen 3 RTX 5080 | |
| HP ZBook Fury 16 G11 | |
| PCMark 10 / Productivity | |
| Lenovo ThinkPad T16g Gen 3 RTX 5080 | |
| Lenovo ThinkPad P16 Gen 3 | |
| Durchschnittliche Intel Core Ultra 9 285HX, NVIDIA RTX PRO 3000 Blackwell Generation Laptop (n=1) | |
| Lenovo ThinkPad P1 Gen 8 | |
| Durchschnitt der Klasse Workstation (8789 - 20616, n=19, der letzten 2 Jahre) | |
| HP ZBook Fury 16 G11 | |
| Lenovo ThinkPad P16 G2 21FA000FGE | |
| PCMark 10 / Digital Content Creation | |
| Lenovo ThinkPad T16g Gen 3 RTX 5080 | |
| Lenovo ThinkPad P16 Gen 3 | |
| Durchschnittliche Intel Core Ultra 9 285HX, NVIDIA RTX PRO 3000 Blackwell Generation Laptop (n=1) | |
| HP ZBook Fury 16 G11 | |
| Durchschnitt der Klasse Workstation (8108 - 15631, n=19, der letzten 2 Jahre) | |
| Lenovo ThinkPad P1 Gen 8 | |
| Lenovo ThinkPad P16 G2 21FA000FGE | |
| CrossMark / Overall | |
| Lenovo ThinkPad T16g Gen 3 RTX 5080 | |
| Dell Pro Max 16 Plus | |
| Lenovo ThinkPad P16 Gen 3 | |
| Durchschnittliche Intel Core Ultra 9 285HX, NVIDIA RTX PRO 3000 Blackwell Generation Laptop (n=1) | |
| HP ZBook Fury 16 G11 | |
| Lenovo ThinkPad P1 Gen 8 | |
| Durchschnitt der Klasse Workstation (1307 - 2267, n=22, der letzten 2 Jahre) | |
| Lenovo ThinkPad P16 G2 21FA000FGE | |
| CrossMark / Productivity | |
| Lenovo ThinkPad T16g Gen 3 RTX 5080 | |
| Lenovo ThinkPad P16 Gen 3 | |
| Durchschnittliche Intel Core Ultra 9 285HX, NVIDIA RTX PRO 3000 Blackwell Generation Laptop (n=1) | |
| Dell Pro Max 16 Plus | |
| HP ZBook Fury 16 G11 | |
| Lenovo ThinkPad P1 Gen 8 | |
| Durchschnitt der Klasse Workstation (1130 - 2122, n=22, der letzten 2 Jahre) | |
| Lenovo ThinkPad P16 G2 21FA000FGE | |
| CrossMark / Creativity | |
| Dell Pro Max 16 Plus | |
| Lenovo ThinkPad T16g Gen 3 RTX 5080 | |
| Lenovo ThinkPad P16 Gen 3 | |
| Durchschnittliche Intel Core Ultra 9 285HX, NVIDIA RTX PRO 3000 Blackwell Generation Laptop (n=1) | |
| HP ZBook Fury 16 G11 | |
| Durchschnitt der Klasse Workstation (1657 - 2725, n=22, der letzten 2 Jahre) | |
| Lenovo ThinkPad P1 Gen 8 | |
| Lenovo ThinkPad P16 G2 21FA000FGE | |
| CrossMark / Responsiveness | |
| Lenovo ThinkPad T16g Gen 3 RTX 5080 | |
| Lenovo ThinkPad P16 Gen 3 | |
| Durchschnittliche Intel Core Ultra 9 285HX, NVIDIA RTX PRO 3000 Blackwell Generation Laptop (n=1) | |
| Dell Pro Max 16 Plus | |
| HP ZBook Fury 16 G11 | |
| Lenovo ThinkPad P1 Gen 8 | |
| Durchschnitt der Klasse Workstation (993 - 2096, n=22, der letzten 2 Jahre) | |
| Lenovo ThinkPad P16 G2 21FA000FGE | |
| WebXPRT 3 / Overall | |
| Lenovo ThinkPad T16g Gen 3 RTX 5080 | |
| Lenovo ThinkPad P16 Gen 3 | |
| Durchschnittliche Intel Core Ultra 9 285HX, NVIDIA RTX PRO 3000 Blackwell Generation Laptop (n=1) | |
| Lenovo ThinkPad P1 Gen 8 | |
| Dell Pro Max 16 Plus | |
| Lenovo ThinkPad P16 G2 21FA000FGE | |
| HP ZBook Fury 16 G11 | |
| Durchschnitt der Klasse Workstation (260 - 360, n=23, der letzten 2 Jahre) | |
| WebXPRT 4 / Overall | |
| Lenovo ThinkPad P16 Gen 3 | |
| Durchschnittliche Intel Core Ultra 9 285HX, NVIDIA RTX PRO 3000 Blackwell Generation Laptop (n=1) | |
| Lenovo ThinkPad T16g Gen 3 RTX 5080 | |
| Dell Pro Max 16 Plus | |
| HP ZBook Fury 16 G11 | |
| Lenovo ThinkPad P1 Gen 8 | |
| Durchschnitt der Klasse Workstation (189.2 - 326, n=23, der letzten 2 Jahre) | |
| Mozilla Kraken 1.1 / Total | |
| Lenovo ThinkPad P16 G2 21FA000FGE | |
| Lenovo ThinkPad P1 Gen 8 | |
| Durchschnitt der Klasse Workstation (411 - 538, n=23, der letzten 2 Jahre) | |
| HP ZBook Fury 16 G11 | |
| Dell Pro Max 16 Plus | |
| Lenovo ThinkPad T16g Gen 3 RTX 5080 | |
| Lenovo ThinkPad P16 Gen 3 | |
| Durchschnittliche Intel Core Ultra 9 285HX, NVIDIA RTX PRO 3000 Blackwell Generation Laptop (n=1) | |
* ... kleinere Werte sind besser
| PCMark 10 Score | 10149 Punkte | |
Hilfe | ||
| AIDA64 / Memory Copy | |
| Lenovo ThinkPad P1 Gen 8 | |
| Dell Pro Max 16 Plus | |
| Durchschnitt der Klasse Workstation (56003 - 164795, n=23, der letzten 2 Jahre) | |
| Durchschnittliche Intel Core Ultra 9 285HX (63431 - 93933, n=6) | |
| Lenovo ThinkPad T16g Gen 3 RTX 5080 | |
| Lenovo ThinkPad P16 Gen 3 | |
| HP ZBook Fury 16 G11 | |
| Lenovo ThinkPad P16 G2 21FA000FGE | |
| AIDA64 / Memory Read | |
| Dell Pro Max 16 Plus | |
| Durchschnittliche Intel Core Ultra 9 285HX (67084 - 97565, n=6) | |
| Durchschnitt der Klasse Workstation (55795 - 121563, n=23, der letzten 2 Jahre) | |
| Lenovo ThinkPad P1 Gen 8 | |
| Lenovo ThinkPad P16 Gen 3 | |
| Lenovo ThinkPad T16g Gen 3 RTX 5080 | |
| HP ZBook Fury 16 G11 | |
| Lenovo ThinkPad P16 G2 21FA000FGE | |
| AIDA64 / Memory Write | |
| Dell Pro Max 16 Plus | |
| Durchschnitt der Klasse Workstation (55663 - 214520, n=23, der letzten 2 Jahre) | |
| Durchschnittliche Intel Core Ultra 9 285HX (64112 - 89691, n=6) | |
| Lenovo ThinkPad P16 Gen 3 | |
| Lenovo ThinkPad T16g Gen 3 RTX 5080 | |
| Lenovo ThinkPad P1 Gen 8 | |
| Lenovo ThinkPad P16 G2 21FA000FGE | |
| HP ZBook Fury 16 G11 | |
| AIDA64 / Memory Latency | |
| Lenovo ThinkPad P16 Gen 3 | |
| Lenovo ThinkPad T16g Gen 3 RTX 5080 | |
| Lenovo ThinkPad P1 Gen 8 | |
| Durchschnittliche Intel Core Ultra 9 285HX (104.8 - 151.7, n=6) | |
| Durchschnitt der Klasse Workstation (84.5 - 165.2, n=23, der letzten 2 Jahre) | |
| Dell Pro Max 16 Plus | |
| Lenovo ThinkPad P16 G2 21FA000FGE | |
| HP ZBook Fury 16 G11 | |
* ... kleinere Werte sind besser
DPC-Latenzzeit
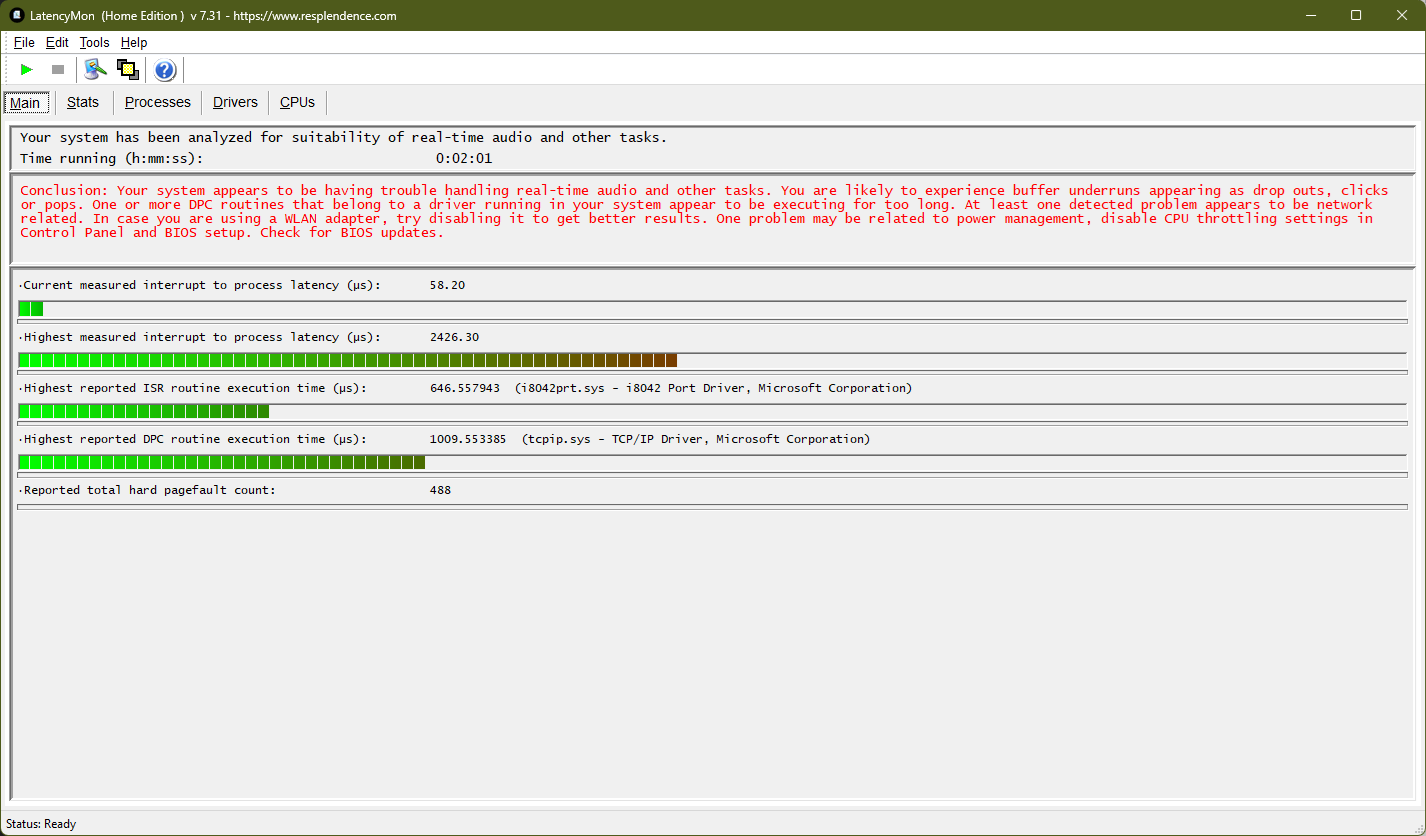
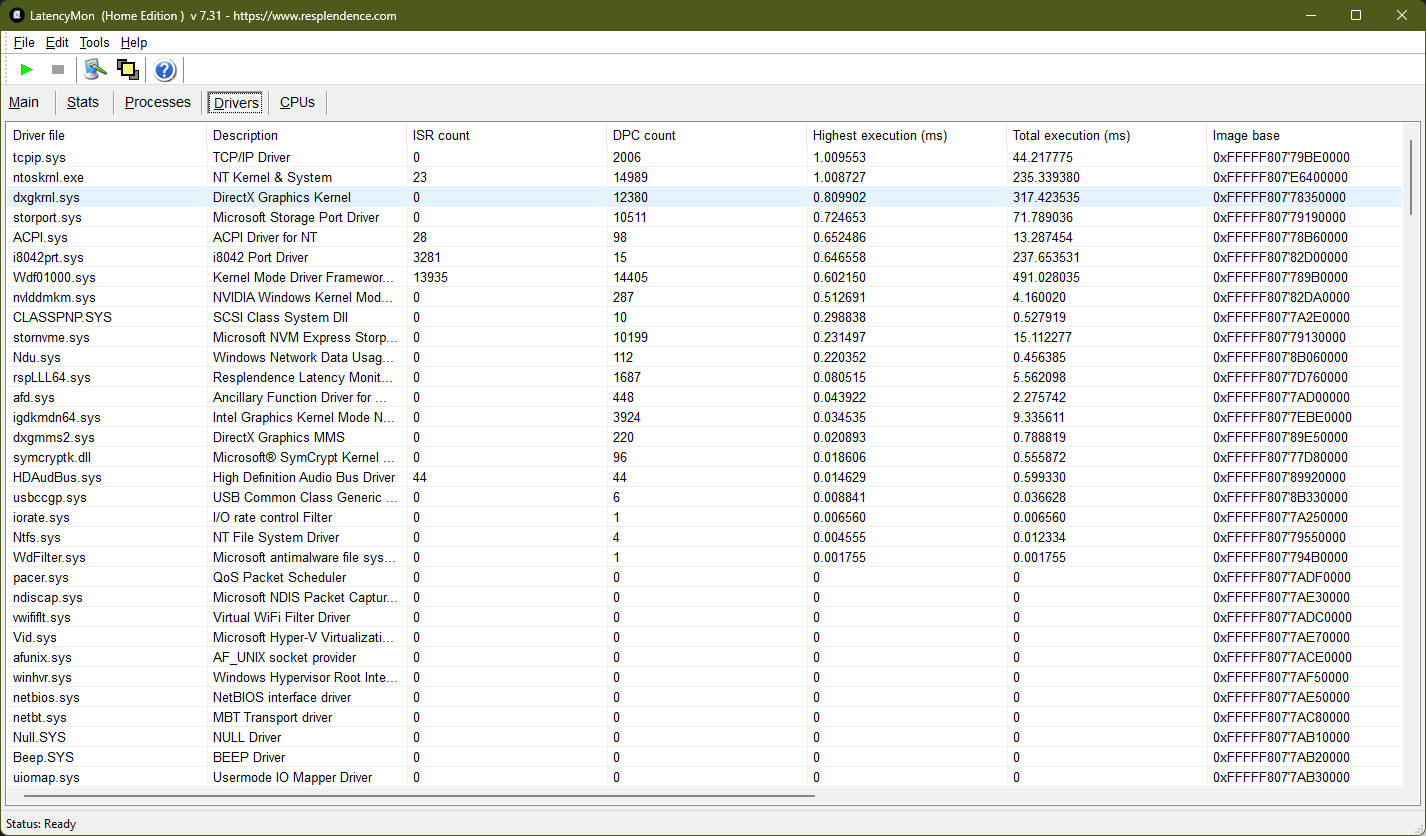
| DPC Latencies / LatencyMon - interrupt to process latency (max), Web, Youtube, Prime95 | |
| HP ZBook Fury 16 G11 | |
| Lenovo ThinkPad P1 Gen 8 | |
| Dell Pro Max 16 Plus | |
| Lenovo ThinkPad P16 Gen 3 | |
| Lenovo ThinkPad T16g Gen 3 RTX 5080 | |
| Lenovo ThinkPad P16 G2 21FA000FGE | |
* ... kleinere Werte sind besser
Massenspeicher
Lenovo verwendet eine schnelle PCIe 5.0 SSD von Samsung, die PM9E1, die eine Kapazität von 2 TB hat. Die M.2 2280 SSD schneidet in unseren Benchmarks gut ab und übertrifft die meisten anderen vergleichbaren Workstations. Allerdings wird die Leistung unter Last ein wenig gedrosselt.
Das ThinkPad verfügt über zwei zusätzliche NVMe 4.0 M.2 2280 Schächte unter der Tastatur, die eine umfangreiche Speichererweiterung ermöglichen.

* ... kleinere Werte sind besser
Drosselung der Festplatte: DiskSpd-Leseschleife, Warteschlangentiefe 8
GPU Performance
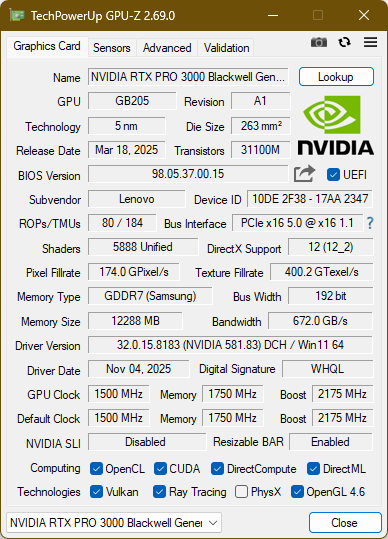
Lenovo setzt auf die Nvidia RTX Pro 3000 Blackwell, eine professionelle, ISV-zertifizierte GPU von Nvidia. Diese Grafikkarte ist vergleichbar mit der Nvidia GeForce RTX 5070 Ti. Im ThinkPad P16 Gen 3 beschränkt Lenovo die Leistung auf 105 W, was weit entfernt ist von den 175 W der TGP RTX 5000 Pro des Dell Pro Max 16 Plus. Dementsprechend leidet die Leistung, die sowohl bei professionellen (SPECviewperf) als auch bei Consumer-Benchmarks (3DMark) rund 24 Prozent hinter der des Konkurrenten zurückbleibt.
Insgesamt sinkt die GPU-Leistung, wenn das P16 Gen 3 im Akkubetrieb läuft, mit nur 37978 Punkten im 3DMark 11 GPU-Test um 23 Prozent.
| 3DMark 06 Standard Score | 63693 Punkte | |
| 3DMark Vantage P Result | 116321 Punkte | |
| 3DMark 11 Performance | 39176 Punkte | |
| 3DMark Cloud Gate Standard Score | 65135 Punkte | |
| 3DMark Fire Strike Score | 31208 Punkte | |
| 3DMark Time Spy Score | 14579 Punkte | |
Hilfe | ||
* ... kleinere Werte sind besser
Spielen Performance
| Cyberpunk 2077 - 1920x1080 Ultra Preset (FSR off) | |
| Dell Pro Max 16 Plus | |
| Lenovo ThinkPad T16g Gen 3 RTX 5080 | |
| Lenovo ThinkPad P16 Gen 3 | |
| HP ZBook Fury 16 G11 | |
| Durchschnitt der Klasse Workstation (21.5 - 152.4, n=23, der letzten 2 Jahre) | |
| Lenovo ThinkPad P1 Gen 8 | |
| Baldur's Gate 3 - 1920x1080 Ultra Preset AA:T | |
| Dell Pro Max 16 Plus | |
| Lenovo ThinkPad T16g Gen 3 RTX 5080 | |
| Lenovo ThinkPad P16 Gen 3 | |
| HP ZBook Fury 16 G11 | |
| Lenovo ThinkPad P1 Gen 8 | |
| Durchschnitt der Klasse Workstation (23.7 - 205, n=24, der letzten 2 Jahre) | |
Cyberpunk 2077 ultra FPS Grafik
| min. | mittel | hoch | max. | QHD | 4K DLSS | 4K FSR | 4K | |
|---|---|---|---|---|---|---|---|---|
| GTA V (2015) | 183.5 | 182.6 | 176.4 | 131.7 | 116.7 | |||
| Dota 2 Reborn (2015) | 204 | 181.7 | 167.3 | 157 | 128.7 | |||
| Final Fantasy XV Benchmark (2018) | 204 | 164 | 132 | 111 | 63.8 | |||
| X-Plane 11.11 (2018) | 136.1 | 118.7 | 92.1 | 73.5 | ||||
| Strange Brigade (2018) | 524 | 380 | 321 | 290 | 204 | 108.7 | ||
| Baldur's Gate 3 (2023) | 172.4 | 147.8 | 128.9 | 126.8 | 91.9 | 75.8 | 75.4 | 49.4 |
| Cyberpunk 2077 (2023) | 138.7 | 137 | 112.7 | 102.5 | 70.7 | 37.7 | 30.8 | |
| Kingdom Come Deliverance 2 (2025) | 166.7 | 131.2 | 106.4 | 80.2 | 56.3 | 44.8 | 30 | |
| Civilization 7 (2025) | 287 | 183.6 | 163.2 | 116.9 | 88.7 | 62.4 | ||
| Assassin's Creed Shadows (2025) | 79 | 74 | 62 | 47 | 39 | 37 | 26 | |
| The Elder Scrolls IV Oblivion Remastered (2025) | 87.8 | 81.6 | 76.4 | 35.3 | 23.6 | 21.6 | 24.3 | 13.3 |
| Doom: The Dark Ages (2025) | 98.2 | 80.3 | 73.4 | 69.7 | 46.9 | 35.1 | 24.9 | |
| F1 25 (2025) | 189.1 | 176.5 | 165.8 | 33.8 | 20.1 | 17.7 | 9.25 | |
| Borderlands 4 (2025) | 71.5 | 59 | 46.6 | 32.5 | 22 | 64.6 | 11.5 | |
| The Outer Worlds 2 (2025) | 101.1 | 97.1 | 83.4 | 50.3 | 32.6 | 27.2 | 17 | |
| ARC Raiders (2025) | 167.6 | 137 | 121.7 | 84.4 | 57.5 | 55.7 | 31.3 | |
| Anno 117: Pax Romana (2025) | 129 | 103.8 | 78 | 41.5 | 29 | 26 | 15.9 |
Emissionen
Geräuschemissionen
Die beiden Lüfter des ThinkPad Laptops sind im Bürobetrieb meist leise, können aber unter Last ziemlich laut werden - über 50 dB(a) sind selbst aus angrenzenden Räumen deutlich hörbar.
Wir konnten kein Spulenfiepen beim ThinkPad P16 Gen 3 feststellen.
Lautstärkediagramm
| Idle |
| 23.6 / 27.2 / 27.2 dB(A) |
| Last |
| 42.7 / 53.9 dB(A) |
 | ||
30 dB leise 40 dB(A) deutlich hörbar 50 dB(A) störend |
||
min: | ||
| Lenovo ThinkPad P16 Gen 3 Ultra 9 285HX, RTX PRO 3000 Blackwell Generation Laptop | Lenovo ThinkPad P16 G2 21FA000FGE i7-13700HX, RTX 2000 Ada Generation Laptop | Dell Pro Max 16 Plus Ultra 9 285HX, RTX PRO 5000 Blackwell Generation Laptop | HP ZBook Fury 16 G11 i9-14900HX, RTX 3500 Ada Generation Laptop | Lenovo ThinkPad T16g Gen 3 RTX 5080 Ultra 9 275HX, GeForce RTX 5080 Laptop | Lenovo ThinkPad P1 Gen 8 Ultra 7 255H, RTX PRO 2000 Blackwell Generation Laptop | |
|---|---|---|---|---|---|---|
| Geräuschentwicklung | 1% | -6% | 5% | -1% | 14% | |
| aus / Umgebung * (dB) | 23.6 | 23.5 -0% | 23.2 2% | 23.2 2% | 24.7 -5% | 23.1 2% |
| Idle min * (dB) | 23.6 | 23.5 -0% | 26.7 -13% | 23.2 2% | 24.7 -5% | 23.1 2% |
| Idle avg * (dB) | 27.2 | 29.2 -7% | 30.5 -12% | 23.2 15% | 28.9 -6% | 23.1 15% |
| Idle max * (dB) | 27.2 | 29.5 -8% | 34 -25% | 29.5 -8% | 28.9 -6% | 23.1 15% |
| Last avg * (dB) | 42.7 | 32.7 23% | 39.8 7% | 43 -1% | 30.4 29% | 27.3 36% |
| Cyberpunk 2077 ultra * (dB) | 53.9 | 54.3 -1% | 48.2 11% | 57.7 -7% | ||
| Last max * (dB) | 53.9 | 56.6 -5% | 54.3 -1% | 48.2 11% | 57.7 -7% | 47.9 11% |
| Witcher 3 ultra * (dB) | 50.6 |
* ... kleinere Werte sind besser
Temperatur
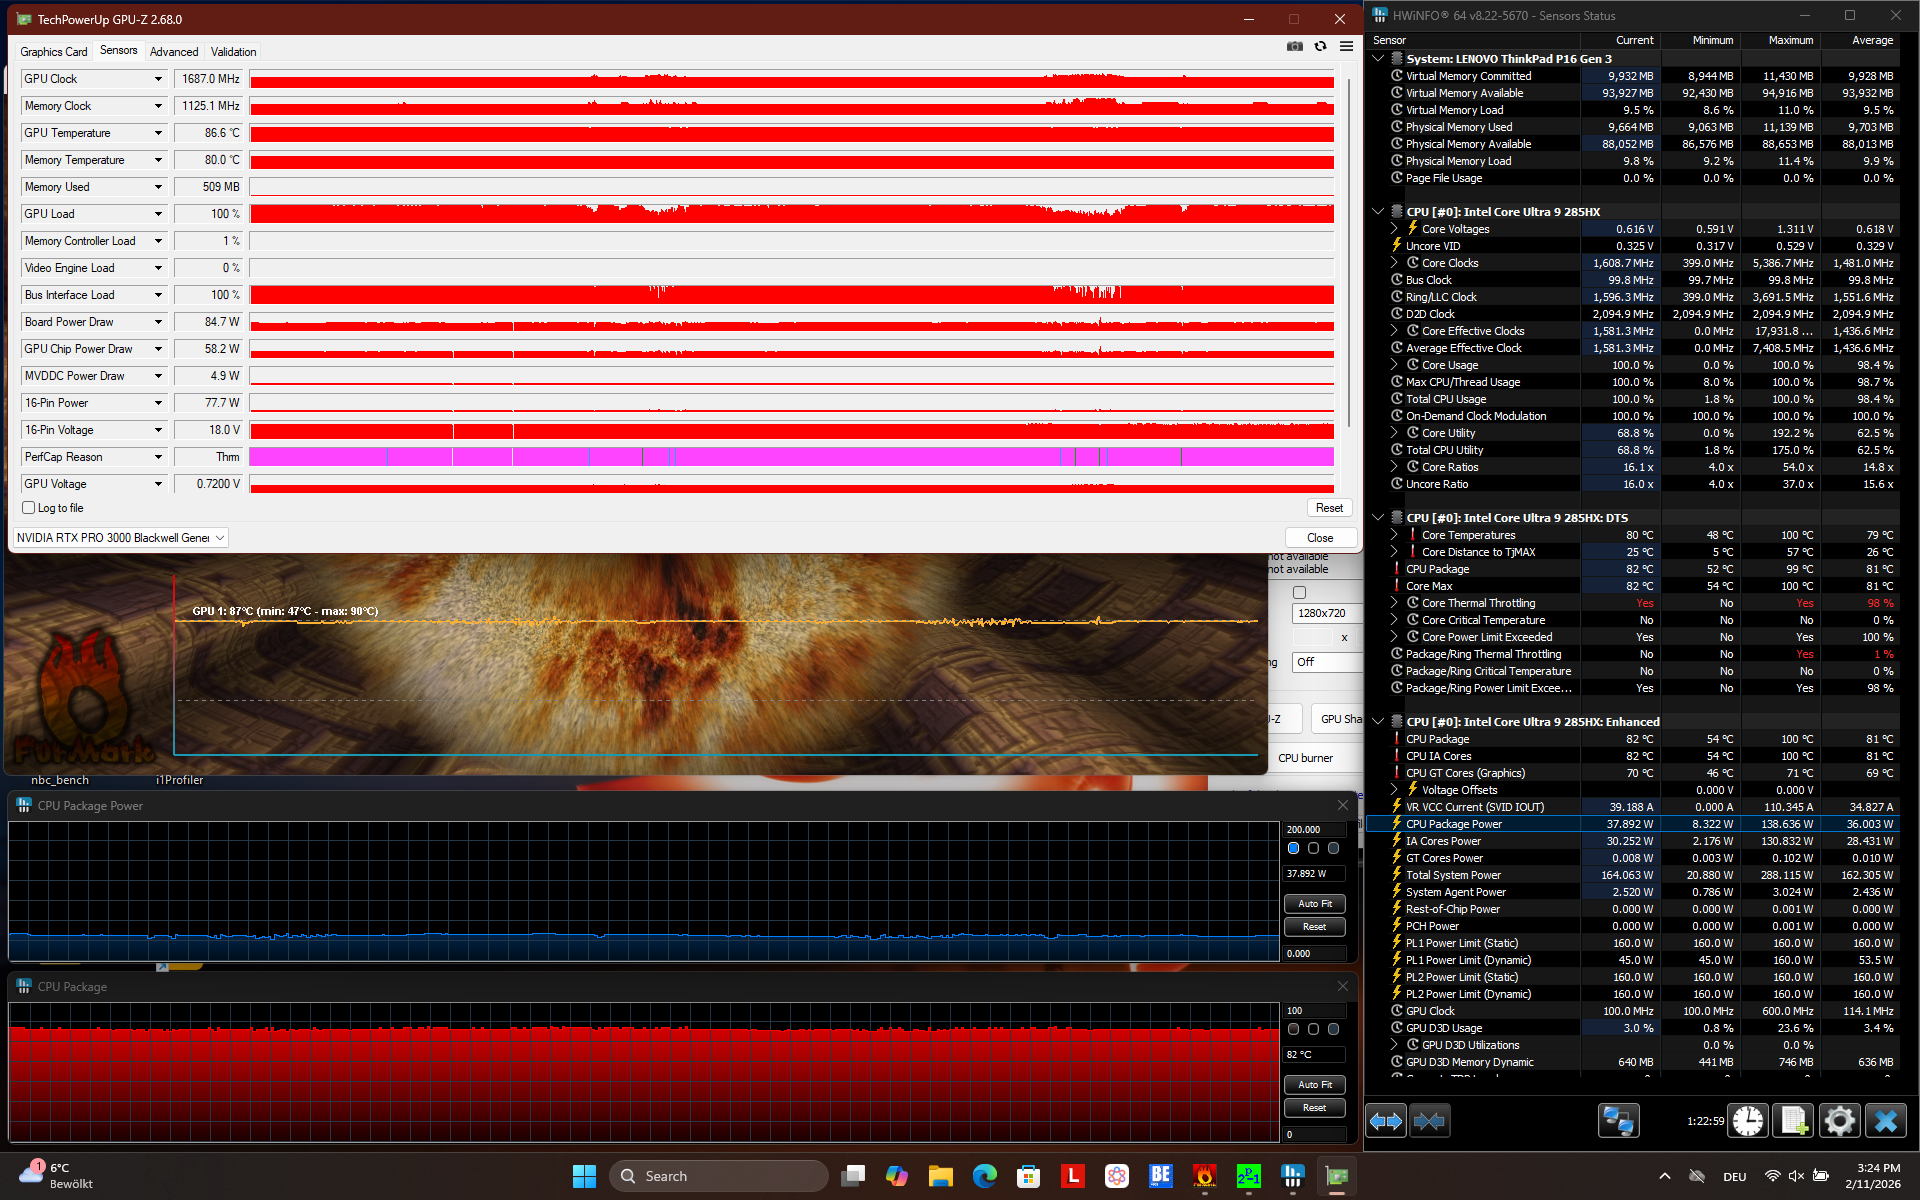
Da das ThinkPad P16 Gen 3 kompakter ist als sein Vorgänger, sind wir nicht überrascht, dass es auch etwas heißer wird. Das Maximum liegt bei 50,8 Grad Celsius oder 123 F, wobei sich auch die Handballenauflage etwas warm anfühlt.
Weder GPU noch CPU können ihre maximale Leistungsaufnahme unter kombinierter Last halten. Die CPU wird auf 37 W und die GPU auf 85 W begrenzt.
(-) Die maximale Temperatur auf der Oberseite ist 50.8 °C. Im Vergleich liegt der Klassendurchschnitt bei 38.2 °C (von 22.2 bis 69.8 °C für die Klasse Workstation).
(-) Auf der Unterseite messen wir eine maximalen Wert von 48 °C (im Vergleich zum Durchschnitt von 41.1 °C).
(+) Ohne Last messen wir eine durchschnittliche Temperatur von 26.9 °C auf der Oberseite. Der Klassendurchschnitt erreicht 32 °C.
(±) 3: The average temperature for the upper side is 35 °C / 95 F, compared to the average of 32 °C / 90 F for the class Workstation.
(+) Die Handballen und der Touchpad-Bereich erreichen maximal 32.4 °C und damit die typische Hauttemperatur und fühlen sich daher nicht heiß an.
(-) Die durchschnittliche Handballen-Temperatur anderer getesteter Geräte war 27.8 °C (-4.6 °C).
| Lenovo ThinkPad P16 Gen 3 Ultra 9 285HX, RTX PRO 3000 Blackwell Generation Laptop | Lenovo ThinkPad P16 G2 21FA000FGE i7-13700HX, RTX 2000 Ada Generation Laptop | Dell Pro Max 16 Plus Ultra 9 285HX, RTX PRO 5000 Blackwell Generation Laptop | HP ZBook Fury 16 G11 i9-14900HX, RTX 3500 Ada Generation Laptop | Lenovo ThinkPad T16g Gen 3 RTX 5080 Ultra 9 275HX, GeForce RTX 5080 Laptop | Lenovo ThinkPad P1 Gen 8 Ultra 7 255H, RTX PRO 2000 Blackwell Generation Laptop | |
|---|---|---|---|---|---|---|
| Hitze | 10% | -1% | -10% | 6% | 6% | |
| Last oben max * (°C) | 50.8 | 47.2 7% | 40.4 20% | 42.2 17% | 43.9 14% | 45 11% |
| Last unten max * (°C) | 48 | 39.5 18% | 45.6 5% | 48 -0% | 45.4 5% | 33 31% |
| Idle oben max * (°C) | 30.1 | 28.1 7% | 32.8 -9% | 37 -23% | 27.7 8% | 30.6 -2% |
| Idle unten max * (°C) | 27.5 | 25.3 8% | 33 -20% | 36.8 -34% | 28.6 -4% | 31.6 -15% |
* ... kleinere Werte sind besser
Lautsprecher
Trotz ihrer geringen Größe leisten die Lautsprecher des P16 G3, die sich an der Seite des Geräts befinden, gute Arbeit - sie sind laut und liefern sogar den gleichen Bass, sodass sie sich zum Musikhören eignen.
Lenovo ThinkPad P16 Gen 3 Audio Analyse
(+) | Die Lautsprecher können relativ laut spielen (83.5 dB)
Bass 100 - 315 Hz
(±) | abgesenkter Bass - 9.9% geringer als der Median
(±) | durchschnittlich lineare Bass-Wiedergabe (13% Delta zum Vorgänger)
Mitteltöne 400 - 2000 Hz
(+) | ausgeglichene Mitten, vom Median nur 4% abweichend
(+) | lineare Mitten (4% Delta zum Vorgänger)
Hochtöne 2 - 16 kHz
(+) | ausgeglichene Hochtöne, vom Median nur 2.2% abweichend
(+) | sehr lineare Hochtöne (4.8% Delta zum Vorgänger)
Gesamt im hörbaren Bereich 100 - 16.000 Hz
(+) | hörbarer Bereich ist sehr linear (10% Abstand zum Median
Im Vergleich zu allen Geräten derselben Klasse
» 6% aller getesteten Geräte dieser Klasse waren besser, 3% vergleichbar, 91% schlechter
» Das beste Gerät hat einen Delta-Wert von 7%, durchschnittlich ist 17%, das schlechteste Gerät hat 35%
Im Vergleich zu allen Geräten im Test
» 4% aller getesteten Geräte waren besser, 1% vergleichbar, 94% schlechter
» Das beste Gerät hat einen Delta-Wert von 4%, durchschnittlich ist 23%, das schlechteste Gerät hat 134%
Lenovo ThinkPad P1 Gen 8 Audio Analyse
(+) | Die Lautsprecher können relativ laut spielen (87.5 dB)
Bass 100 - 315 Hz
(±) | abgesenkter Bass - 9.8% geringer als der Median
(±) | durchschnittlich lineare Bass-Wiedergabe (11.2% Delta zum Vorgänger)
Mitteltöne 400 - 2000 Hz
(+) | ausgeglichene Mitten, vom Median nur 2.9% abweichend
(+) | lineare Mitten (2.8% Delta zum Vorgänger)
Hochtöne 2 - 16 kHz
(+) | ausgeglichene Hochtöne, vom Median nur 3% abweichend
(+) | sehr lineare Hochtöne (4.7% Delta zum Vorgänger)
Gesamt im hörbaren Bereich 100 - 16.000 Hz
(+) | hörbarer Bereich ist sehr linear (8.3% Abstand zum Median
Im Vergleich zu allen Geräten derselben Klasse
» 1% aller getesteten Geräte dieser Klasse waren besser, 1% vergleichbar, 97% schlechter
» Das beste Gerät hat einen Delta-Wert von 7%, durchschnittlich ist 17%, das schlechteste Gerät hat 35%
Im Vergleich zu allen Geräten im Test
» 2% aller getesteten Geräte waren besser, 1% vergleichbar, 97% schlechter
» Das beste Gerät hat einen Delta-Wert von 4%, durchschnittlich ist 23%, das schlechteste Gerät hat 134%
Energieverwaltung
Stromverbrauch
Der Stromverbrauch ist im Vergleich zum vorherigen ThinkPad P16 niedriger. Die Leistungsaufnahme unter Last übersteigt 180 W, was darauf hindeutet, dass sich der Akku des Laptops entladen kann, selbst wenn es an ein Ladegerät angeschlossen ist.
| Aus / Standby | |
| Idle | |
| Last |
|
Legende:
min: | |
| Lenovo ThinkPad P16 Gen 3 Ultra 9 285HX, RTX PRO 3000 Blackwell Generation Laptop, Samsung PM9E1 MZVLC2T0HBLD, IPS LED, 1920x1200, 16" | Lenovo ThinkPad P16 G2 21FA000FGE i7-13700HX, RTX 2000 Ada Generation Laptop, SK hynix PC801 HFS001TEJ9X162N, IPS LED, 2560x1600, 16" | Dell Pro Max 16 Plus Ultra 9 285HX, RTX PRO 5000 Blackwell Generation Laptop, SK hynix PCB01 HFS001TFM9X186N, OLED, 3840x2400, 16" | HP ZBook Fury 16 G11 i9-14900HX, RTX 3500 Ada Generation Laptop, SK hynix PC801 HFS001TEJ9X101N, IPS, 3840x2400, 16" | Lenovo ThinkPad T16g Gen 3 RTX 5080 Ultra 9 275HX, GeForce RTX 5080 Laptop, Samsung PM9E1 MZVLC2T0HBLD, OLED, 3200x2000, 16" | Lenovo ThinkPad P1 Gen 8 Ultra 7 255H, RTX PRO 2000 Blackwell Generation Laptop, Samsung PM9E1 1 TB MZVLC1T0HFLU, Tandem OLED, 3200x2000, 16" | Durchschnittliche NVIDIA RTX PRO 3000 Blackwell Generation Laptop | Durchschnitt der Klasse Workstation | |
|---|---|---|---|---|---|---|---|---|
| Stromverbrauch | -7% | -135% | -15% | -12% | -10% | 0% | -3% | |
| Idle min * (Watt) | 7.8 | 9.3 -19% | 35.1 -350% | 8.6 -10% | 9.9 -27% | 15.4 -97% | 7.8 ? -0% | 9.11 ? -17% |
| Idle avg * (Watt) | 12.6 | 14.1 -12% | 39.2 -211% | 14.8 -17% | 17.1 -36% | 16.5 -31% | 12.6 ? -0% | 13.8 ? -10% |
| Idle max * (Watt) | 16.5 | 15.5 6% | 56 -239% | 15.7 5% | 17.7 -7% | 23.1 -40% | 16.5 ? -0% | 17.9 ? -8% |
| Last avg * (Watt) | 118.7 | 133.6 -13% | 130.2 -10% | 129.4 -9% | 125.6 -6% | 86.6 27% | 118.7 ? -0% | 96 ? 19% |
| Cyberpunk 2077 ultra external monitor * (Watt) | 161.3 | 213 -32% | 192.6 -19% | 166.8 -3% | 121.8 24% | |||
| Cyberpunk 2077 ultra * (Watt) | 159.6 | 229 -43% | 199.4 -25% | 160.5 -1% | 123.1 23% | |||
| Last max * (Watt) | 181.4 | 179.6 1% | 285.2 -57% | 236.1 -30% | 182.8 -1% | 143.6 21% | 181.4 ? -0% | 180.3 ? 1% |
| Witcher 3 ultra * (Watt) | 144.9 |
* ... kleinere Werte sind besser
Stromverbrauch Cyberpunk / Stresstest
Stromverbrauch externer Monitor
Akkulaufzeit
Mit seinem großen 99-Wh-Akku und dem energieeffizienten WUXGA-Bildschirm schneidet das ThinkPad P16 Gen 3 in unserem Akkutest gut ab: 11.6 Stunden im Wi-Fi-Websurfing-Test (150 cd/m²) sind besser als bei allen anderen Workstations im Vergleich.
| Lenovo ThinkPad P16 Gen 3 Ultra 9 285HX, RTX PRO 3000 Blackwell Generation Laptop, 99 Wh | Lenovo ThinkPad P16 G2 21FA000FGE i7-13700HX, RTX 2000 Ada Generation Laptop, 94 Wh | Dell Pro Max 16 Plus Ultra 9 285HX, RTX PRO 5000 Blackwell Generation Laptop, 96 Wh | HP ZBook Fury 16 G11 i9-14900HX, RTX 3500 Ada Generation Laptop, 95 Wh | Lenovo ThinkPad T16g Gen 3 RTX 5080 Ultra 9 275HX, GeForce RTX 5080 Laptop, 99.9 Wh | Lenovo ThinkPad P1 Gen 8 Ultra 7 255H, RTX PRO 2000 Blackwell Generation Laptop, 90 Wh | Durchschnitt der Klasse Workstation | |
|---|---|---|---|---|---|---|---|
| Akkulaufzeit | -26% | -69% | -42% | -19% | -53% | -23% | |
| WLAN (h) | 11.6 | 8.6 -26% | 3.6 -69% | 6.7 -42% | 9.4 -19% | 5.5 -53% | 8.55 ? -26% |
| Last (h) | 1.8 | 1.441 ? -20% |
Notebookcheck Gesamtbewertung
Das ThinkPad P16 Gen 3 ist eine leistungsstarke und hochgradig erweiterbare mobile Workstation mit hervorragender Verarbeitungsqualität, Eingabegeräten, Anschlussmöglichkeiten und einem hellen, matten Bildschirm sowie einer guten Akkulaufzeit. Merkwürdigerweise ist die Leistung das größte Manko, denn sie könnte noch besser sein.
Lenovo ThinkPad P16 Gen 3
- 22.04.2026 v8
Benjamin Herzig
 Total Sustainability Score:
 Potenzielle Konkurrenten im Vergleich
Bild | Modell / Test | Preis ab | Gewicht | Dicke | Display |
|---|---|---|---|---|---|
1. 89%  | Lenovo ThinkPad P16 Gen 3 Intel Core Ultra 9 285HX ⎘ NVIDIA RTX PRO 3000 Blackwell Generation Laptop ⎘ 96 GB RAM, 2048 GB SSD | Amazon: Bestpreis 4658.41€ high-end-systems | 2.7 kg | 30 mm | 16.00" 1920x1200 142 PPI IPS LED |
2. 90.2% v7 (old)  | Lenovo ThinkPad P16 G2 21FA000FGE Intel Core i7-13700HX ⎘ NVIDIA RTX 2000 Ada Generation Laptop ⎘ 32 GB RAM, 1024 GB SSD | Amazon: Bestpreis 2978.4€ high-end-systems 2. 3579€ galaxus 3. 3609€ galaxus.at | 3 kg | 30.23 mm | 16.00" 2560x1600 189 PPI IPS LED |
3. 88.4%  | Dell Pro Max 16 Plus Intel Core Ultra 9 285HX ⎘ NVIDIA RTX PRO 5000 Blackwell Generation Laptop ⎘ 128 GB RAM, SSD | Amazon: 4.052,63 € Bestpreis 3083.71€ Cyberport.de 2. 3083.71€ computeruniverse.net 3. 3109.62€ computeruniverse.at | 2.8 kg | 30.9 mm | 16.00" 3840x2400 283 PPI OLED |
4. 85.9%  | HP ZBook Fury 16 G11 Intel Core i9-14900HX ⎘ NVIDIA RTX 3500 Ada Generation Laptop ⎘ 64 GB RAM, 1024 GB SSD | Amazon: Geizhals Suche | 2.6 kg | 28.5 mm | 16.00" 3840x2400 283 PPI IPS |
5. 87.3%  | Lenovo ThinkPad T16g Gen 3 RTX 5080 Intel Core Ultra 9 275HX ⎘ NVIDIA GeForce RTX 5080 Laptop ⎘ 64 GB RAM, 2048 GB SSD | Amazon: 1. 2.601,09 € Lenovo ThinkPad P16v Gen 3 2... 2. 1.275,10 € Lenovo ThinkPad E16 Gen 3 22... 3. 1.984,76 € Lenovo ThinkPad P16v Gen 2, ... Bestpreis 4529.65€ minaxum.it 2. 4529.66€ TechnikDeals24 3. 4529.81€ HEINZSOFT | 2.6 kg | 29.8 mm | 16.00" 3200x2000 236 PPI OLED |
6. 91.6%  | Lenovo ThinkPad P1 Gen 8 Intel Core Ultra 7 255H ⎘ NVIDIA RTX PRO 2000 Blackwell Generation Laptop ⎘ 32 GB RAM, 1024 GB SSD | Amazon: Geizhals Suche | 1.9 kg | 20.6 mm | 16.00" 3200x2000 236 PPI Tandem OLED |
Transparenz
Die Auswahl der zu testenden Geräte erfolgt innerhalb der Redaktion. Das vorliegende Testmuster wurde dem Autor vom Hersteller oder einem Shop zu Testzwecken leihweise zur Verfügung gestellt. Eine Einflussnahme des Leihstellers auf den Testbericht gab es nicht, der Hersteller erhielt keine Version des Reviews vor der Veröffentlichung. Es bestand keine Verpflichtung zur Publikation. Als eigenständiges, unabhängiges Unternehmen unterliegt Notebookcheck keiner Diktion von Herstellern, Shops und Verlagen.
So testet Notebookcheck
Pro Jahr werden von Notebookcheck hunderte Laptops und Smartphones unabhängig in von uns standardisierten technischen Verfahren getestet, um eine Vergleichbarkeit aller Testergebnisse zu gewährleisten. Seit rund 20 Jahren entwickeln wir diese Testmethoden kontinuierlich weiter und setzen damit Branchenstandards. In unseren Testlaboren kommt ausschließlich hochwertiges Messequipment in die Hände erfahrener Techniker und Redakteure. Die Tests unterliegen einer mehrstufigen Kontrolle. Unsere komplexe Gesamtbewertung basiert auf hunderten fundierten Messergebnissen und Benchmarks, womit Ihnen Objektivität garantiert ist. Weitere Informationen zu unseren Testmethoden gibt es hier.
