
Fazit - Feinabgestimmt und unter 2 kg
Das Legion 7 16IAX10 ist ein Modell, das sich schwer einordnen lässt. Es ist eines der wenigen 16-Zoll-Gaming-Notebooks mit einer Arrow-Lake-HX-CPU, aber ohne GPU-Optionen jenseits der RTX 5070. Gleichzeitig gehört es zu den leichtesten und schnellsten Gaming-Laptops mit derselben RTX-5060-GPU, was vor allem auf das hohe TGP-Limit von 115 W zurückzuführen ist. Das System maximiert die Portabilität und holt gleichzeitig so viel Leistung wie möglich aus seiner High-End-CPU und Mittelklasse-GPU heraus. Für Gamer oder Power-User, die gerne unterwegs sind, ist das Legion 7 16 Gen 10 sowohl eine leichtere als auch günstigere Alternative zum RTX 5060 Razer Blade 16 vor allem für Szenarien, in denen ein integrierter Ziffernblock nützlich sein kann.
Der größte Nachteil dieses Modells ist die bereits erwähnte RTX-5070-Begrenzung. Die RTX 5070 Ti ist deutlich schneller als die RTX 5070, aber ihr hoher Energiebedarf hat sie wahrscheinlich aus dem System ausgeschlossen. Benutzer, die eine leistungsfähigere Grafik benötigen, müssen sich nach dem Legion 7 16 umsehen, z. B. nach dem bereits erwähnten Blade 16 oder dem größeren und schwereren Legion Pro 5 16.
Andere Nachteile des Modells sind bei ultradünnen Hochleistungs-Gaming-Laptops an der Tagesordnung: Die Kerntemperaturen sind relativ hoch, die Akkulaufzeit ist bestenfalls durchschnittlich, und laute Lüfter sind unvermeidlich, wenn man im Performance-Modus spielt. Diese negativen Eigenschaften sind beim Legion 7 16 stärker ausgeprägt, da es leichter ist als die meisten anderen ultraleichten Konkurrenten.
Benutzer, die die zusätzliche Leistung des Arrow Lake-HX nicht benötigen, sollten das Lenovo Yoga Pro 9i 16IAH G10 Aura in Betracht ziehen, das eine ähnliche RTX-5060-Grafik und ein 1.800p-OLED-Display bietet, aber stattdessen mit Arrow-Lake-H-Prozessoren ausgestattet ist.
Pro
Contra
Preis und Verfügbarkeit
Amazon liefert jetzt das Lenovo Legion 7 16 genau in der Konfiguration für 1.999 Euro aus. Das Modell ist auch direkt bei Lenovo erhältlich für aktuell 1.956 Euro mit 5 % Rabatt vom Originalpreis.
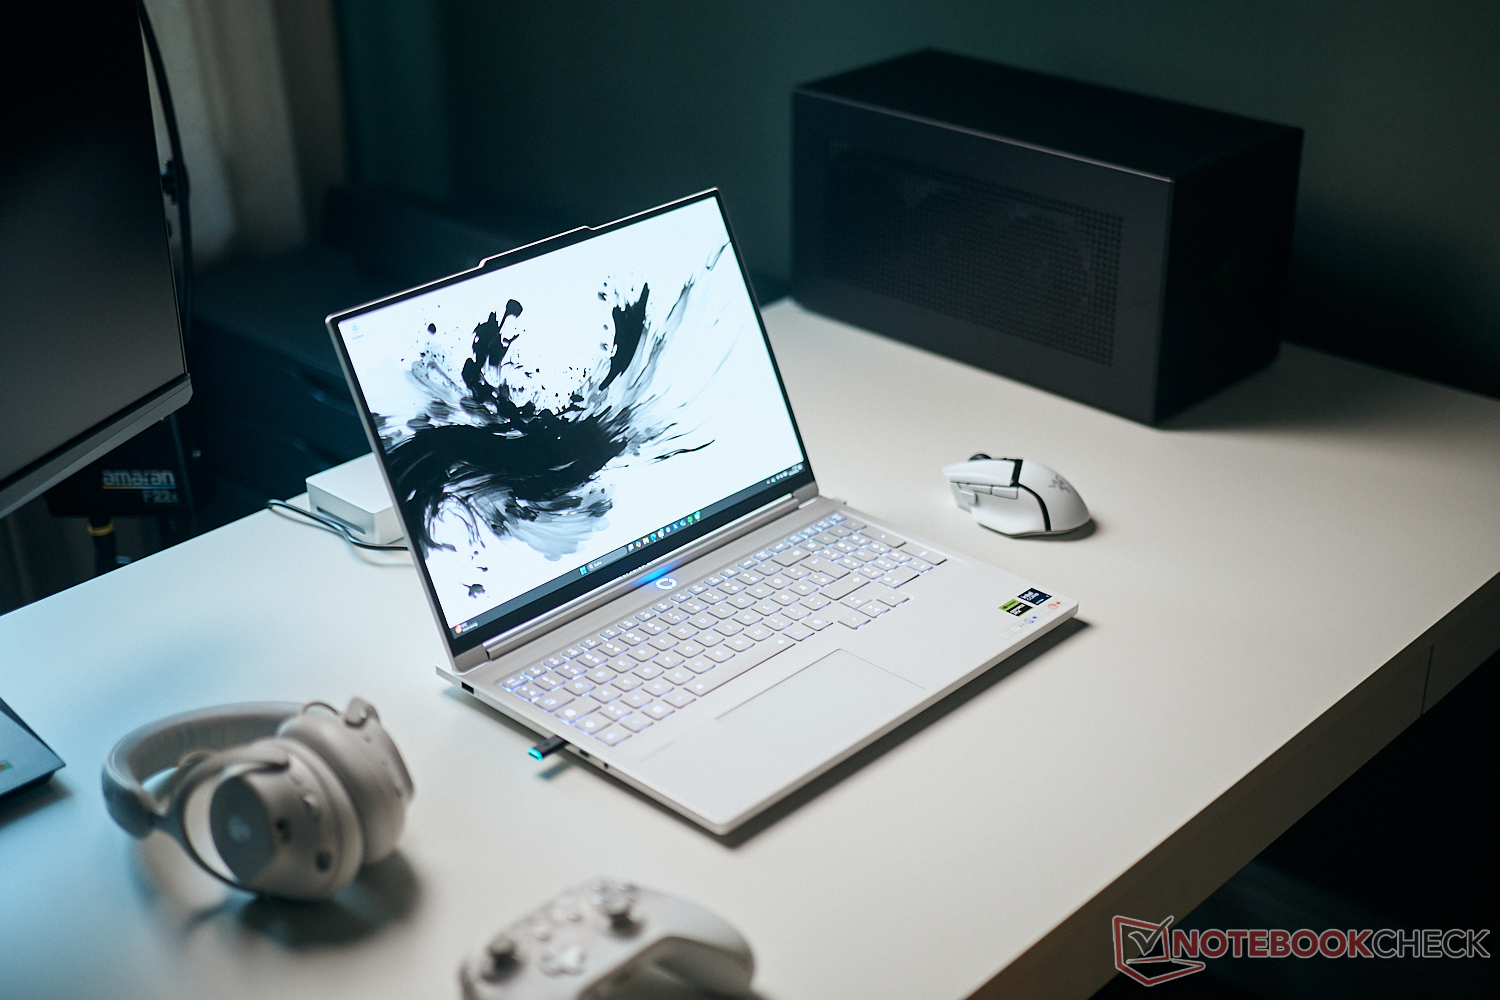
Das Legion 7 16IAX10 (auch bekannt als Legion 7i 16 Gen 10) ist eines von Lenovos dünnsten und leichtesten Gaming-Notebooks der Legion Serie. Es ist ein direkter Nachfolger des 2024 Legion 7 16IRX9 mit den beiden neuen Arrow-Lake-HX-Prozessoroptionen und einem aufgefrischten Gehäuse-Design.
Bei unserem Testgerät handelt es sich um eine niedrigere Konfiguration mit der Core Ultra 7 255HX CPU, 115 W GeForce RTX 5070 GPU und 165-Hz-1.600p-glossy-OLED-Display für etwa 1.650 US-Dollar. Höherwertige SKUs sind stattdessen mit dem Core Ultra 9 275HX, RTX 5070 und 240-Hz-OLED ausgestattet.
Zu den Alternativen zum Legion 7 16IAX10 gehören andere 16-Zoll-Gaming-Laptops der mittleren oder ultradünnen Klasse wie das Alienware 16X Aurora, das Razer Blade 16 in der Basiskonfiguration oder das Asus TUF Gaming A16 oder das Zephyrus G16. Das Legion 7 16 ist nicht zu verwechseln mit dem größeren und schwereren Legion Pro 7 16. Eine günstigere 15-Zoll-Version dieses Modells ist unter der Bezeichnung Legion 5 15AHP10 mit einer ähnlichen 115-W-RTX-5060-Grafik anzutreffen.
Weitere Lenovo Testberichte:
Spezifikationen
Gehäuse
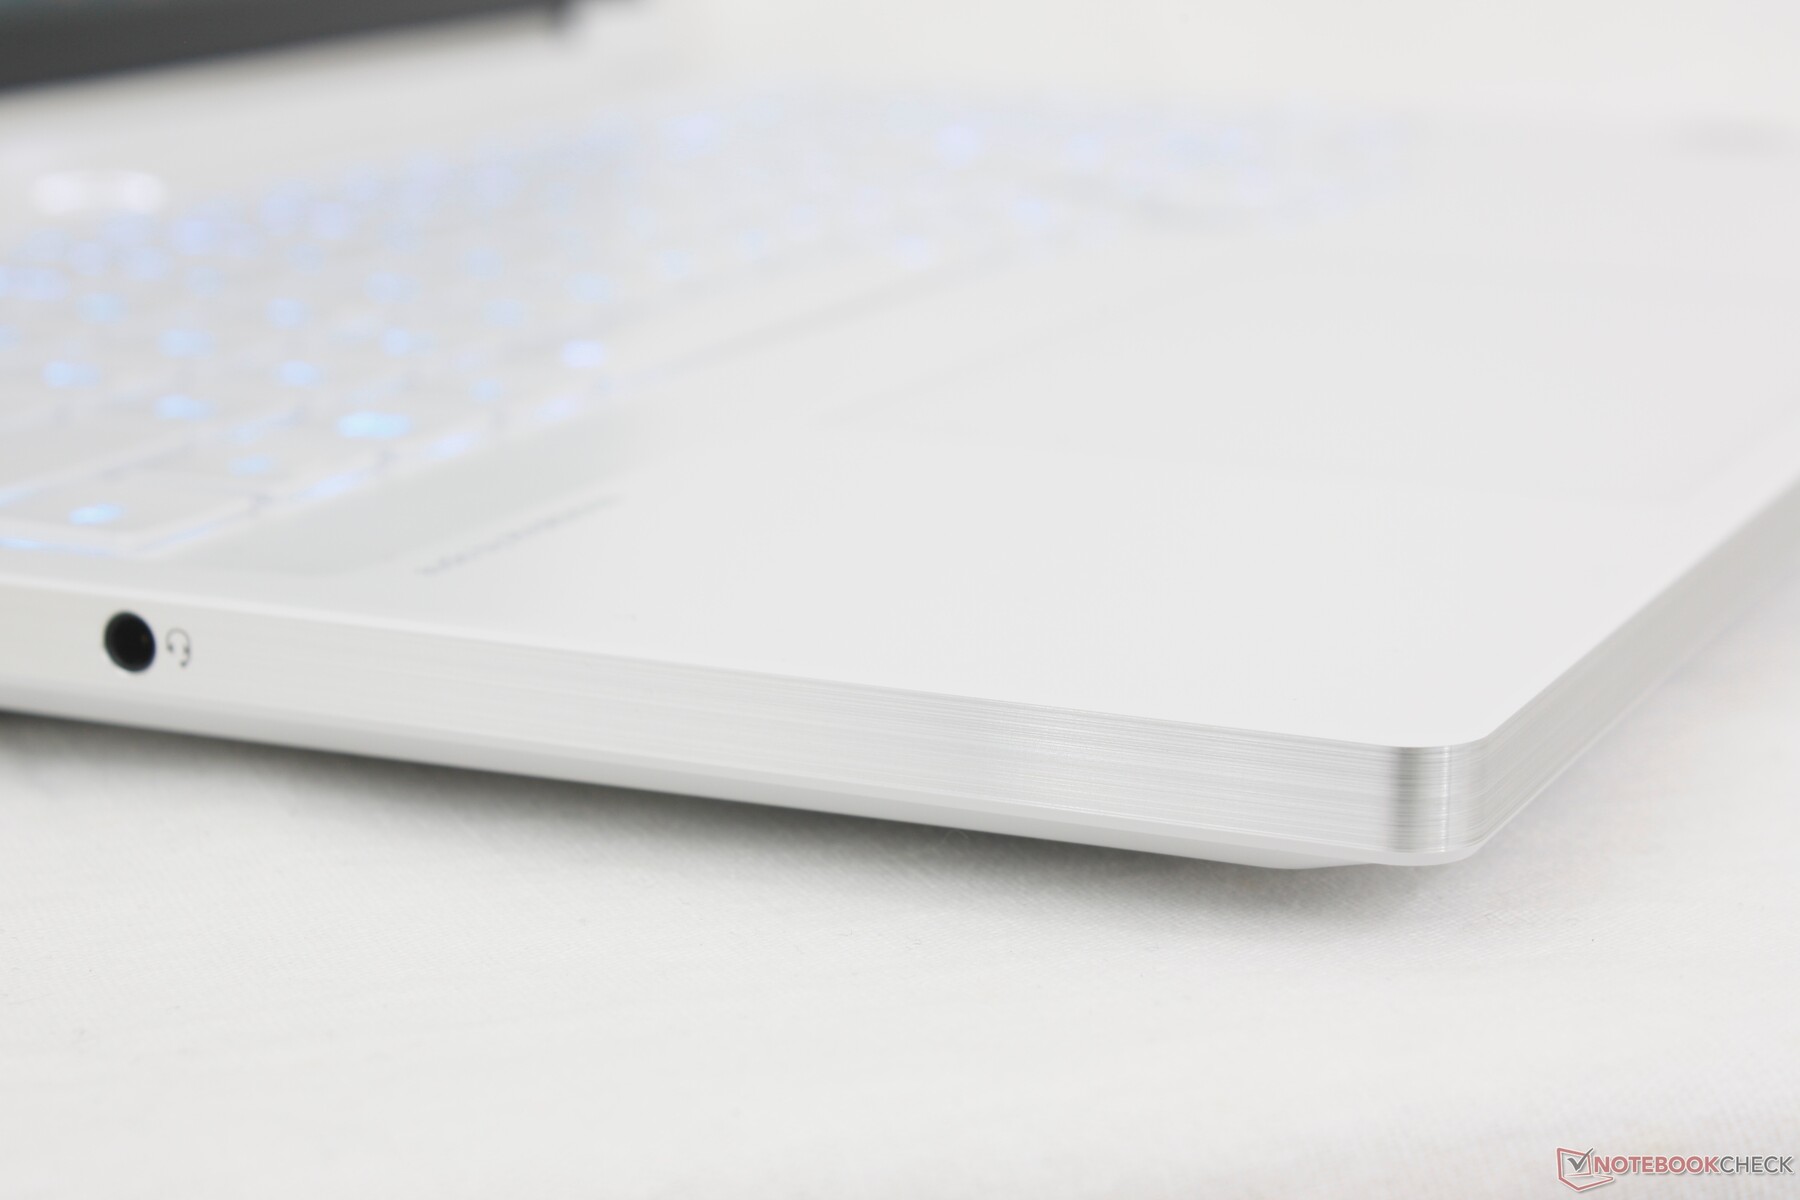
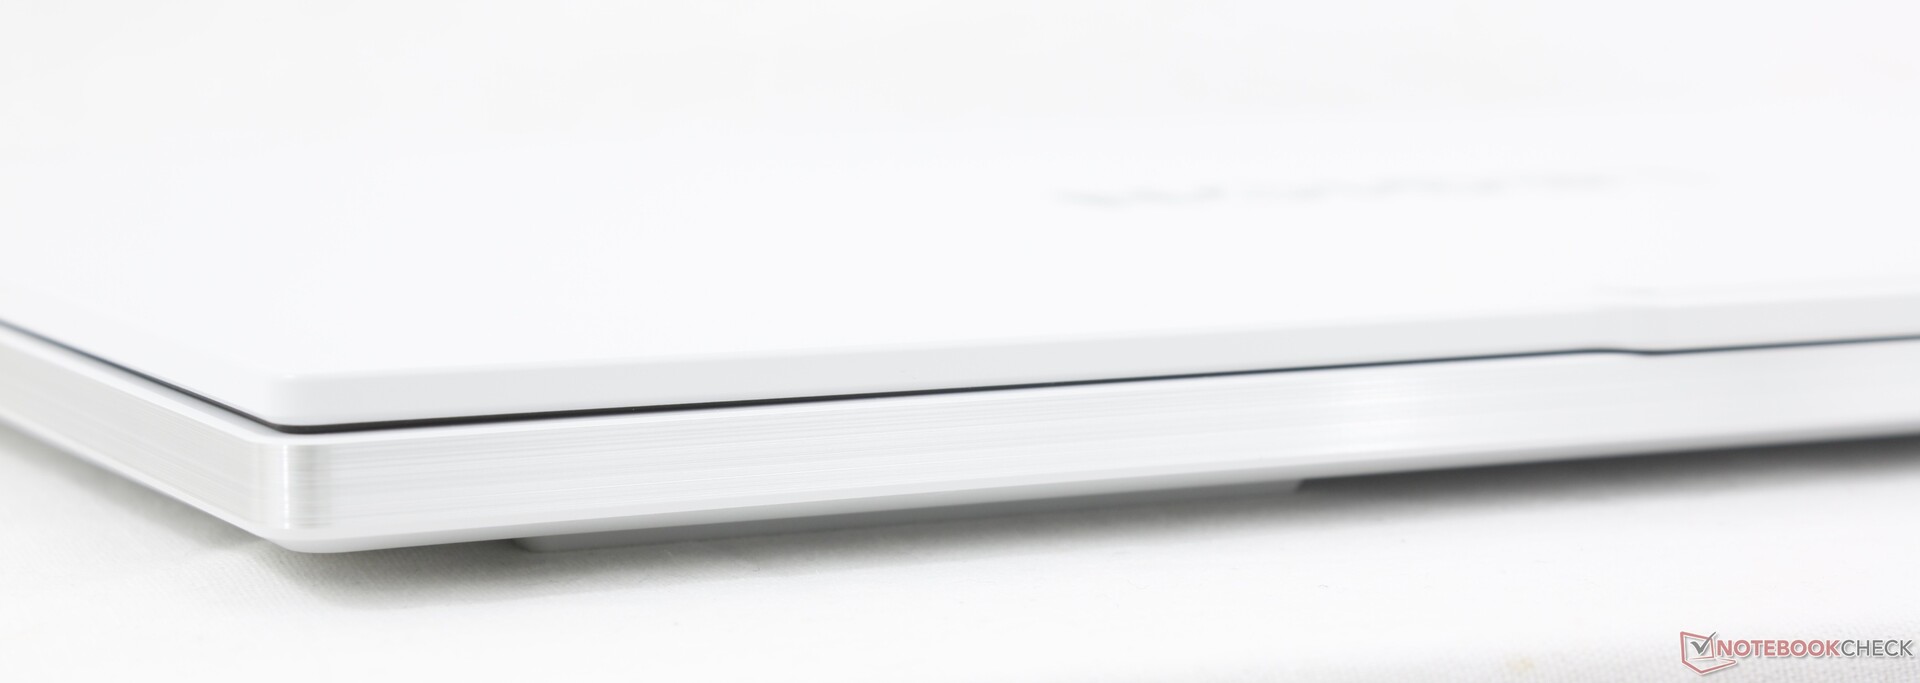
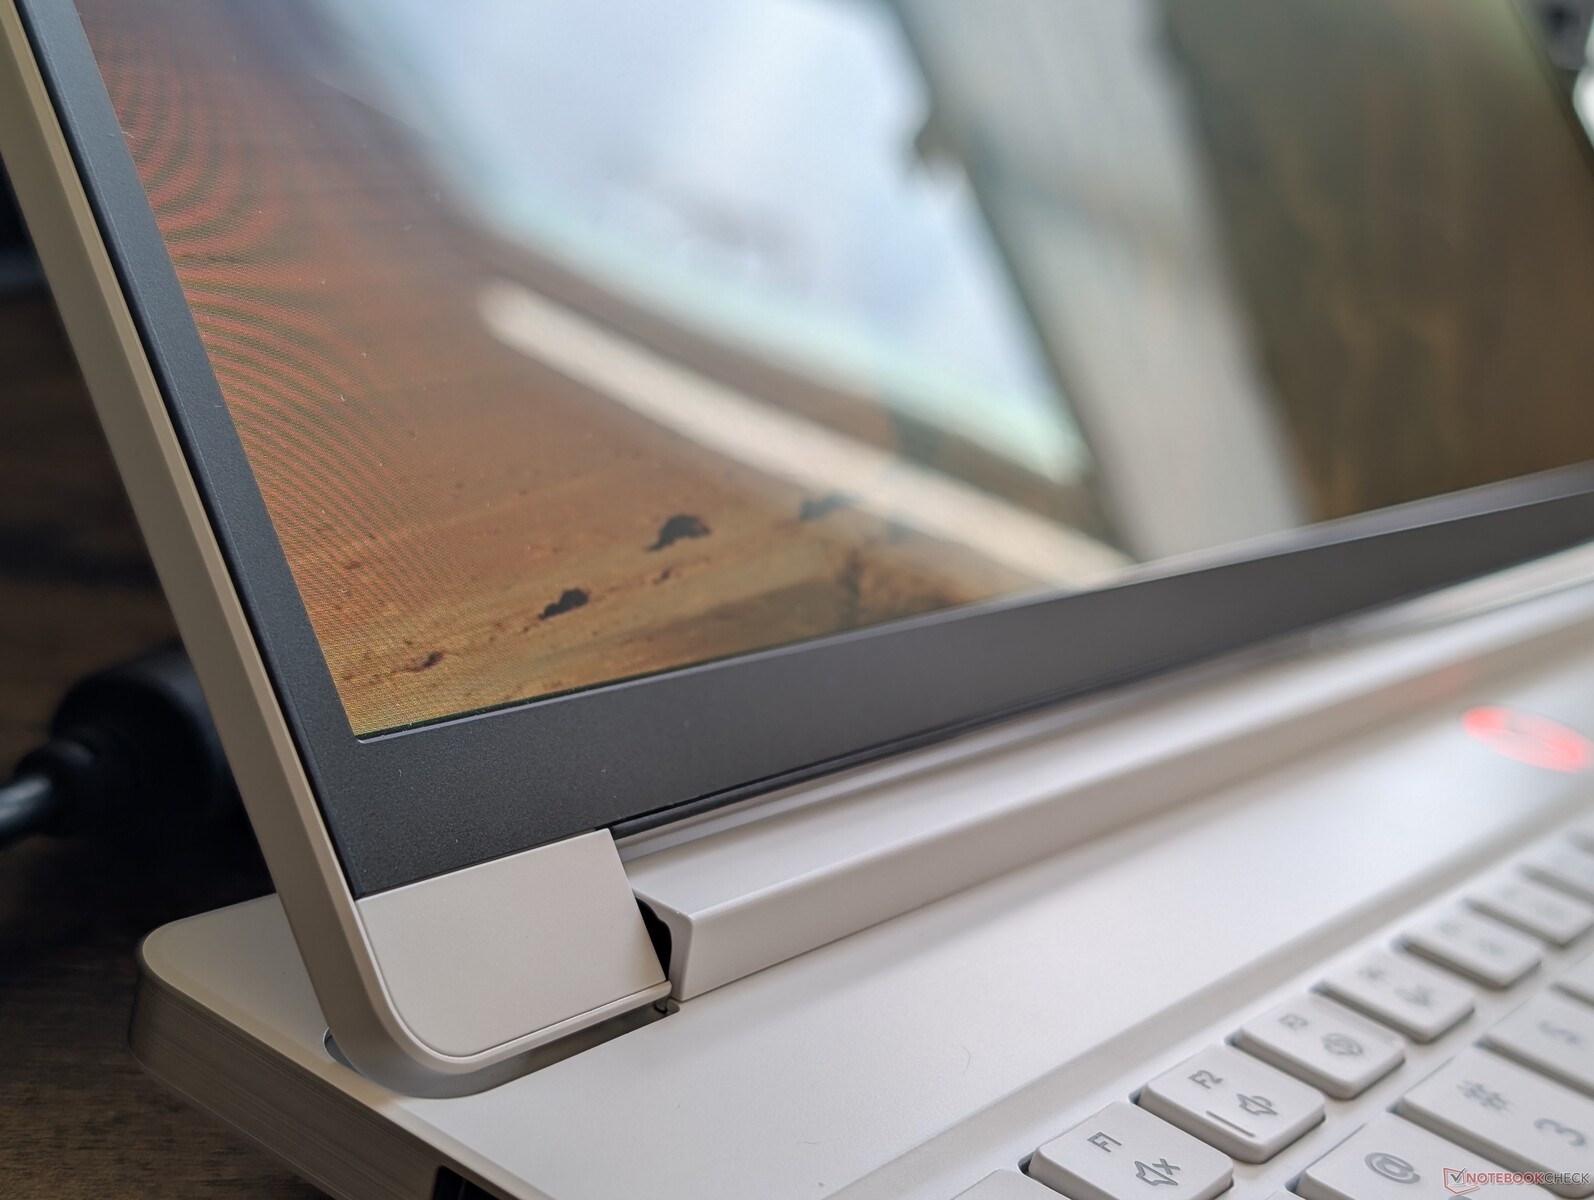
Das Gehäuse zeichnet sich durch seine mattweiße Farbgebung aus, die im Gegensatz zu den normalerweise dunkleren Tönen der meisten anderen Gaming-Laptops steht. Ästhetisch gesehen ist die weiße Farbe hervorragend geeignet, um Fingerabdrücke zu verbergen, aber Kratzer und Schrammen können leichter sichtbar werden. Das Gehäuse besteht ansonsten aus einer ähnlichen Aluminiumlegierung und einer eloxierten Außentextur wie bei den meisten anderen Legion Laptops.
Die Gehäusesteifigkeit ist entlang der Basis hervorragend und lässt sich fast nicht verformen. Die Scharniere sind klein, aber dennoch zufriedenstellend; sie lassen sich um volle 180 Grad öffnen, fühlen sich aber etwas schwächer an als die Scharniere des Blade 16.

Das geringe Gewicht von knapp unter 2 kg ist wohl der bemerkenswerteste Aspekt des Legion 7 16IAX10. Das ist viel leichter als die meisten 16-Zoll-Gaming-Laptops, darunter sogar das ultraleichte HP Omen Transcend 16 oder das Razer Blade 16 um jeweils bis zu 200 g. Dennoch ist das aktuelle Zephyrus G16 sogar noch 100 g leichter, und das Lenovo ist immer noch etwas größer bzw. dicker als einige Konkurrenten, darunter das bereits erwähnte Razer oder Alienware.


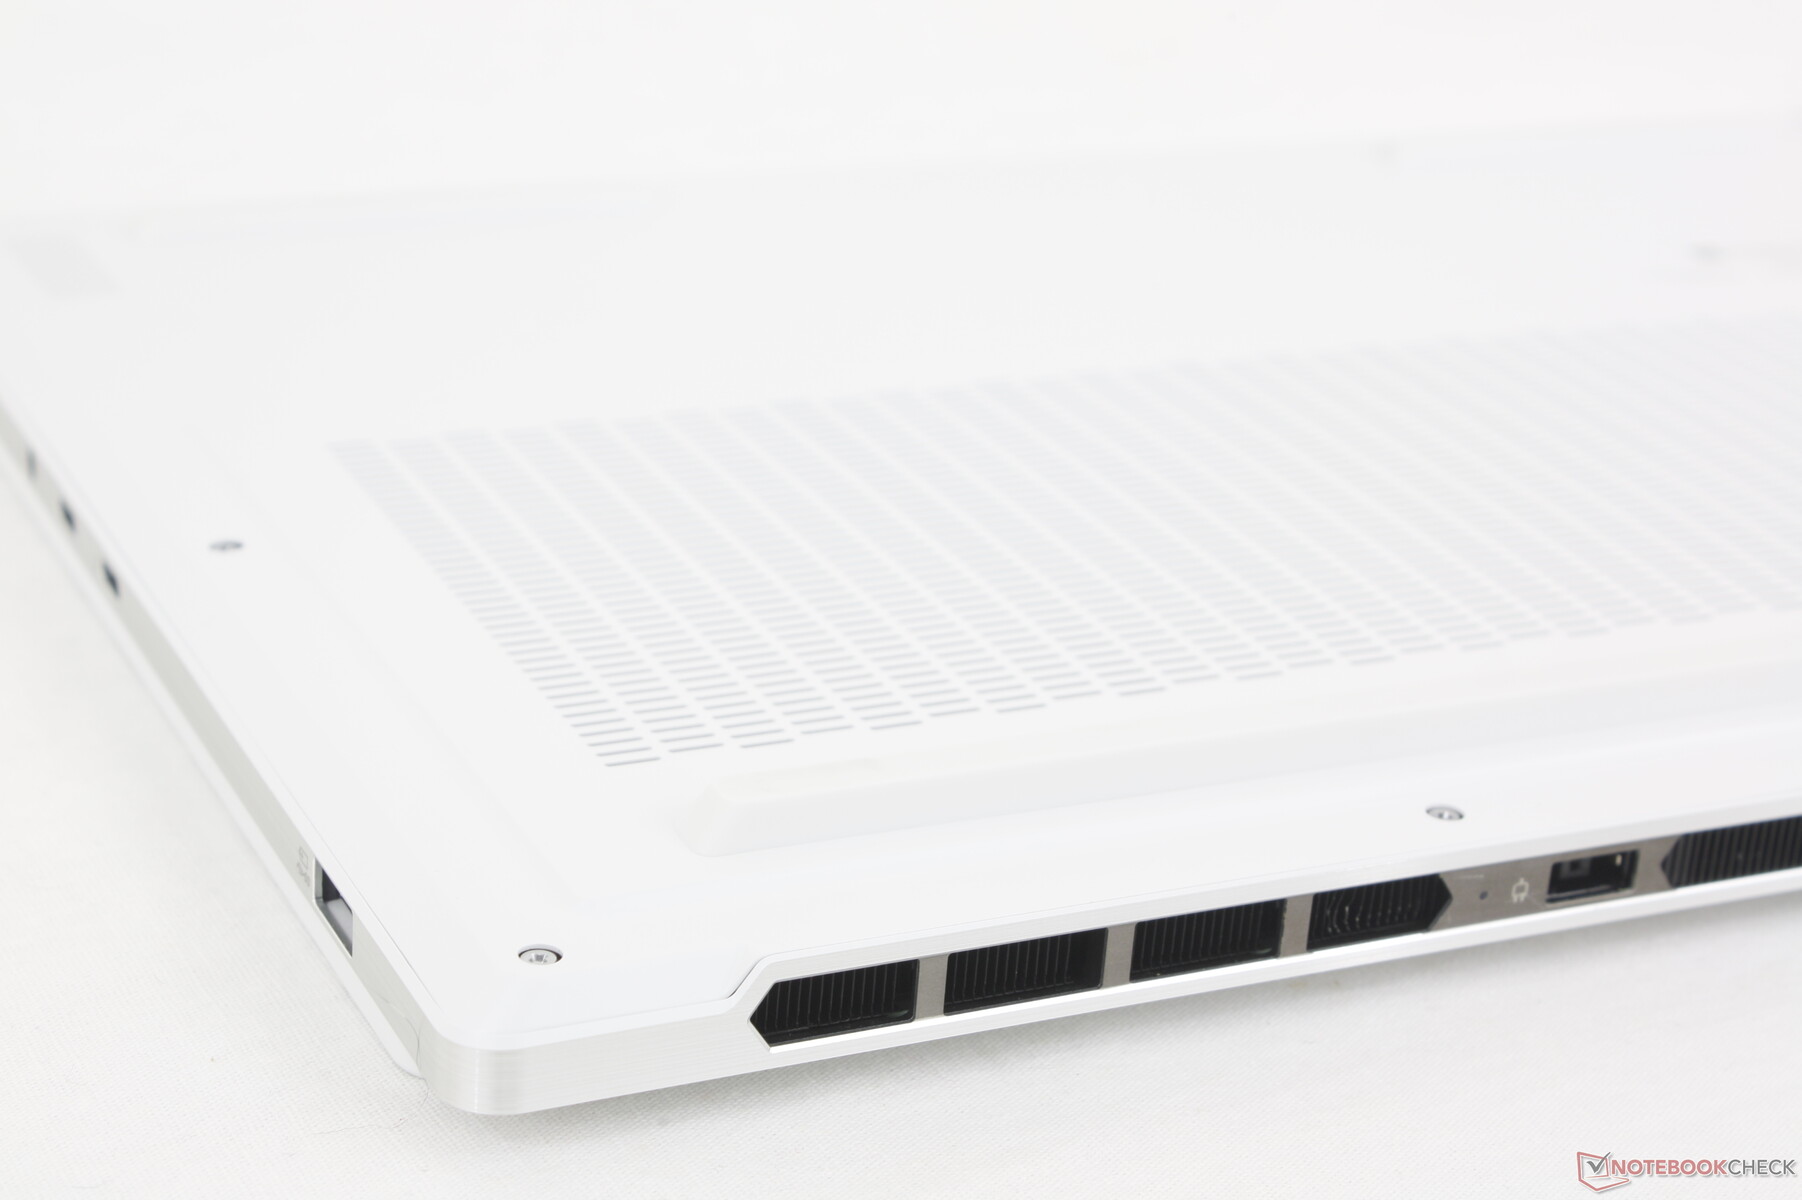
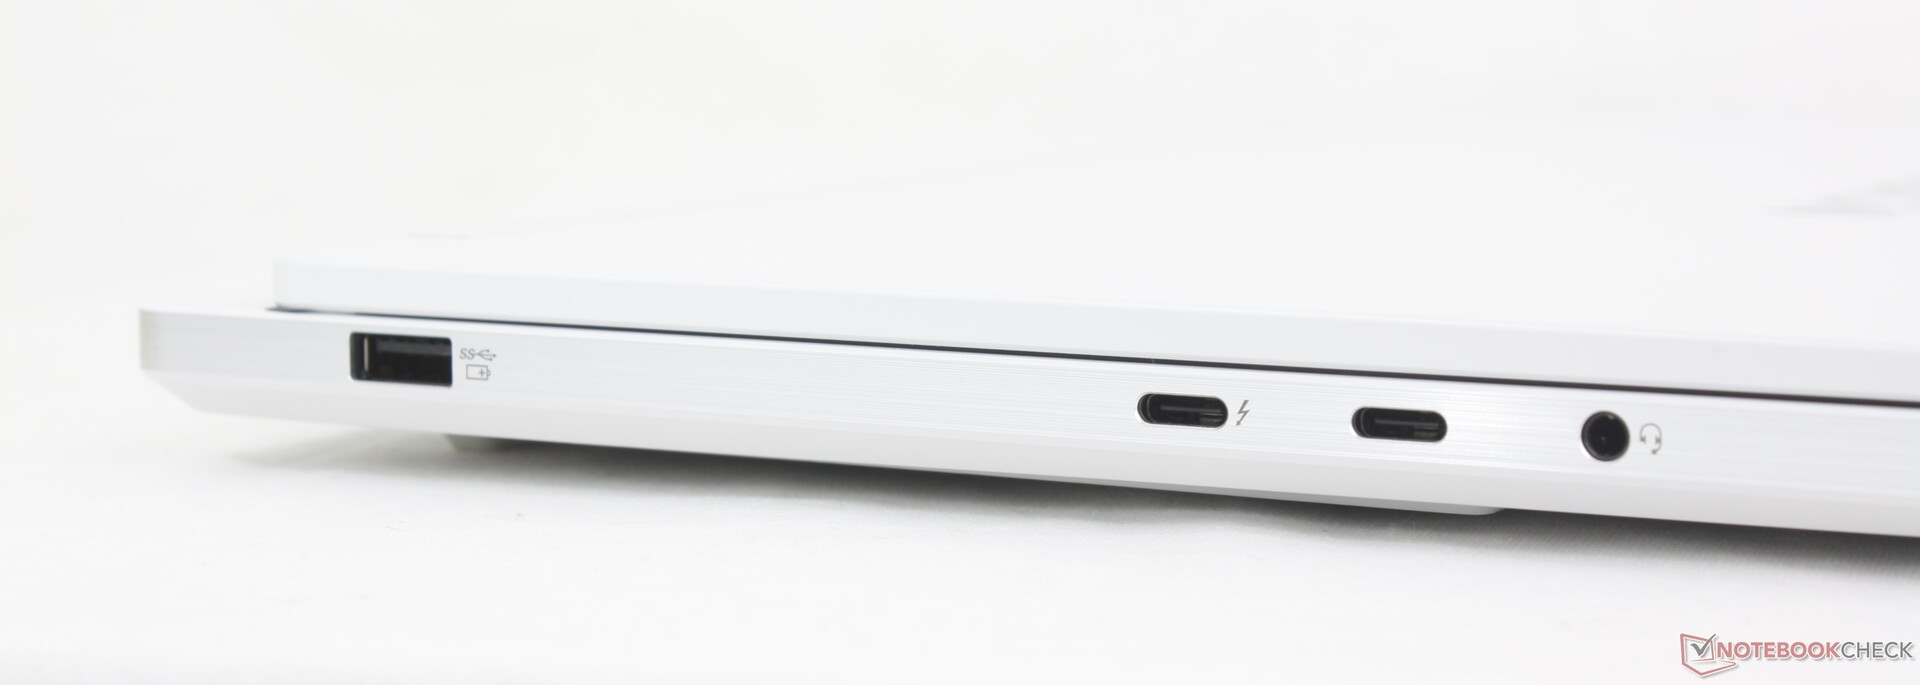
Anschlussausstattung
Das System erbt alle Ports des letztjährigen Legion 7 16IRX9 mit Ausnahme des dritten USB-C-Anschlusses an der rechten Kante. Im Vergleich zu konkurrierenden Modellen wie dem Asus TUF Gaming A16 hat das Lenovo weniger USB-A-Ports und keinen RJ-45-Anschluss.
Man beachte, dass nur einer der beiden USB-C-Ports uSB4 oder Thunderbolt-4-Zubehör unterstützt.
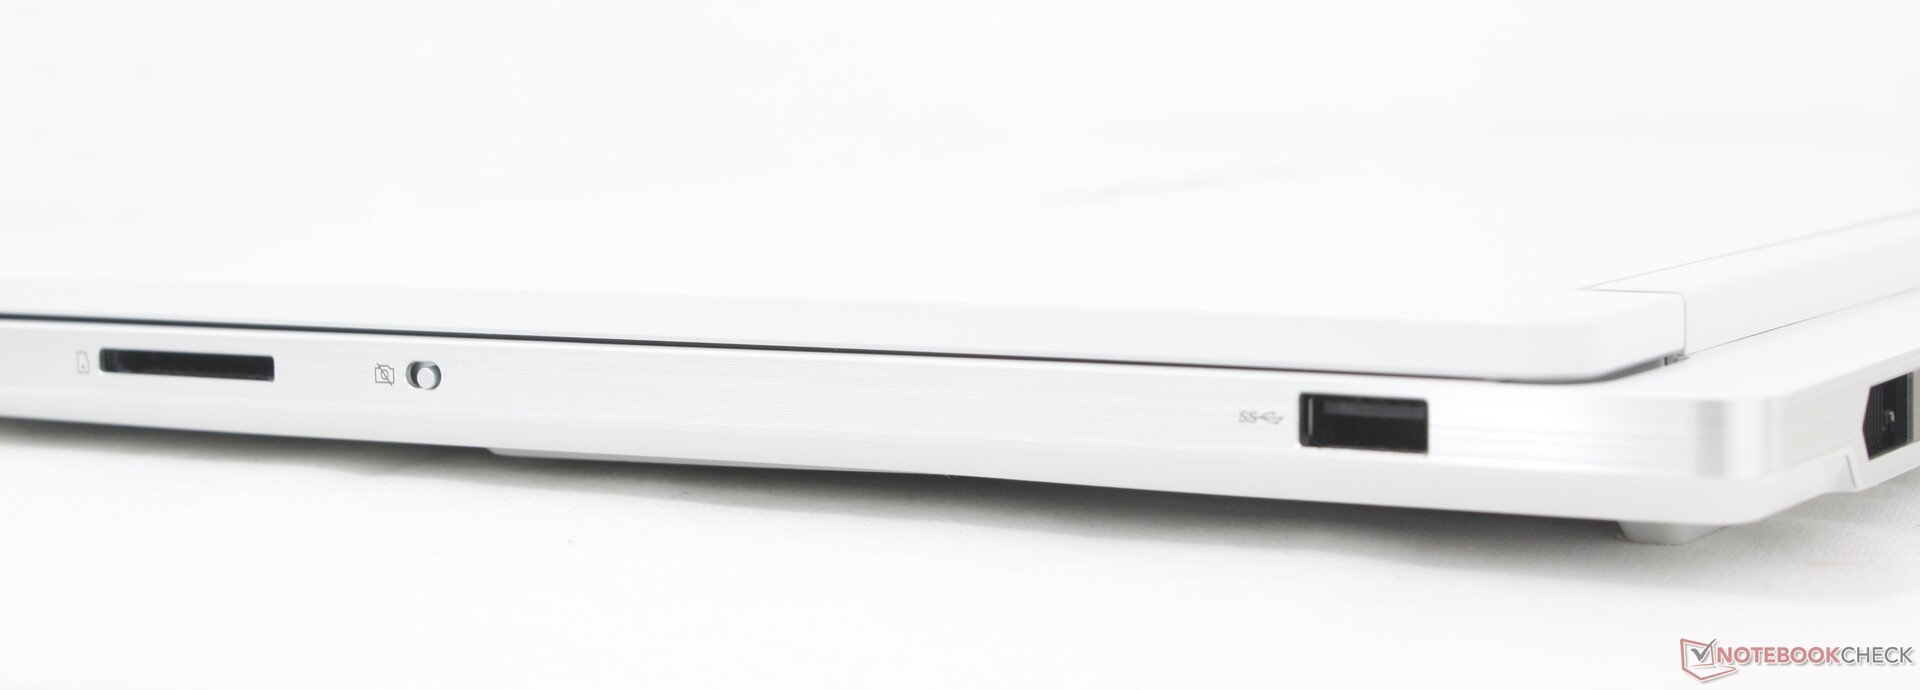

SD-Kartenleser
| SD Card Reader | |
| average JPG Copy Test (av. of 3 runs) | |
| Lenovo Legion 7 16IAX10 (Toshiba Exceria Pro SDXC 64 GB UHS-II) | |
| MSI Vector 16 HX AI A2XWHG (AV PRO microSD 128 GB V60) | |
| maximum AS SSD Seq Read Test (1GB) | |
| Lenovo Legion 7 16IAX10 (Toshiba Exceria Pro SDXC 64 GB UHS-II) | |
| MSI Vector 16 HX AI A2XWHG (AV PRO microSD 128 GB V60) | |
Kommunikation

| Networking | |
| iperf3 transmit AXE11000 | |
| Asus TUF Gaming A16 FA608UP | |
| Gigabyte Gaming A16 GA6H | |
| Lenovo Legion 7 16IAX10 | |
| MSI Vector 16 HX AI A2XWHG | |
| Lenovo Legion 5 Pro 16IAX10H | |
| iperf3 receive AXE11000 | |
| Asus TUF Gaming A16 FA608UP | |
| MSI Vector 16 HX AI A2XWHG | |
| Gigabyte Gaming A16 GA6H | |
| Lenovo Legion 7 16IAX10 | |
| Lenovo Legion 5 Pro 16IAX10H | |
| iperf3 transmit AXE11000 6GHz | |
| Lenovo Legion 7 16IAX10 | |
| iperf3 receive AXE11000 6GHz | |
| Lenovo Legion 7 16IAX10 | |
Webcam
Die 5-MP-Webcam verfügt über IR und einen elektronischen Verschluss.


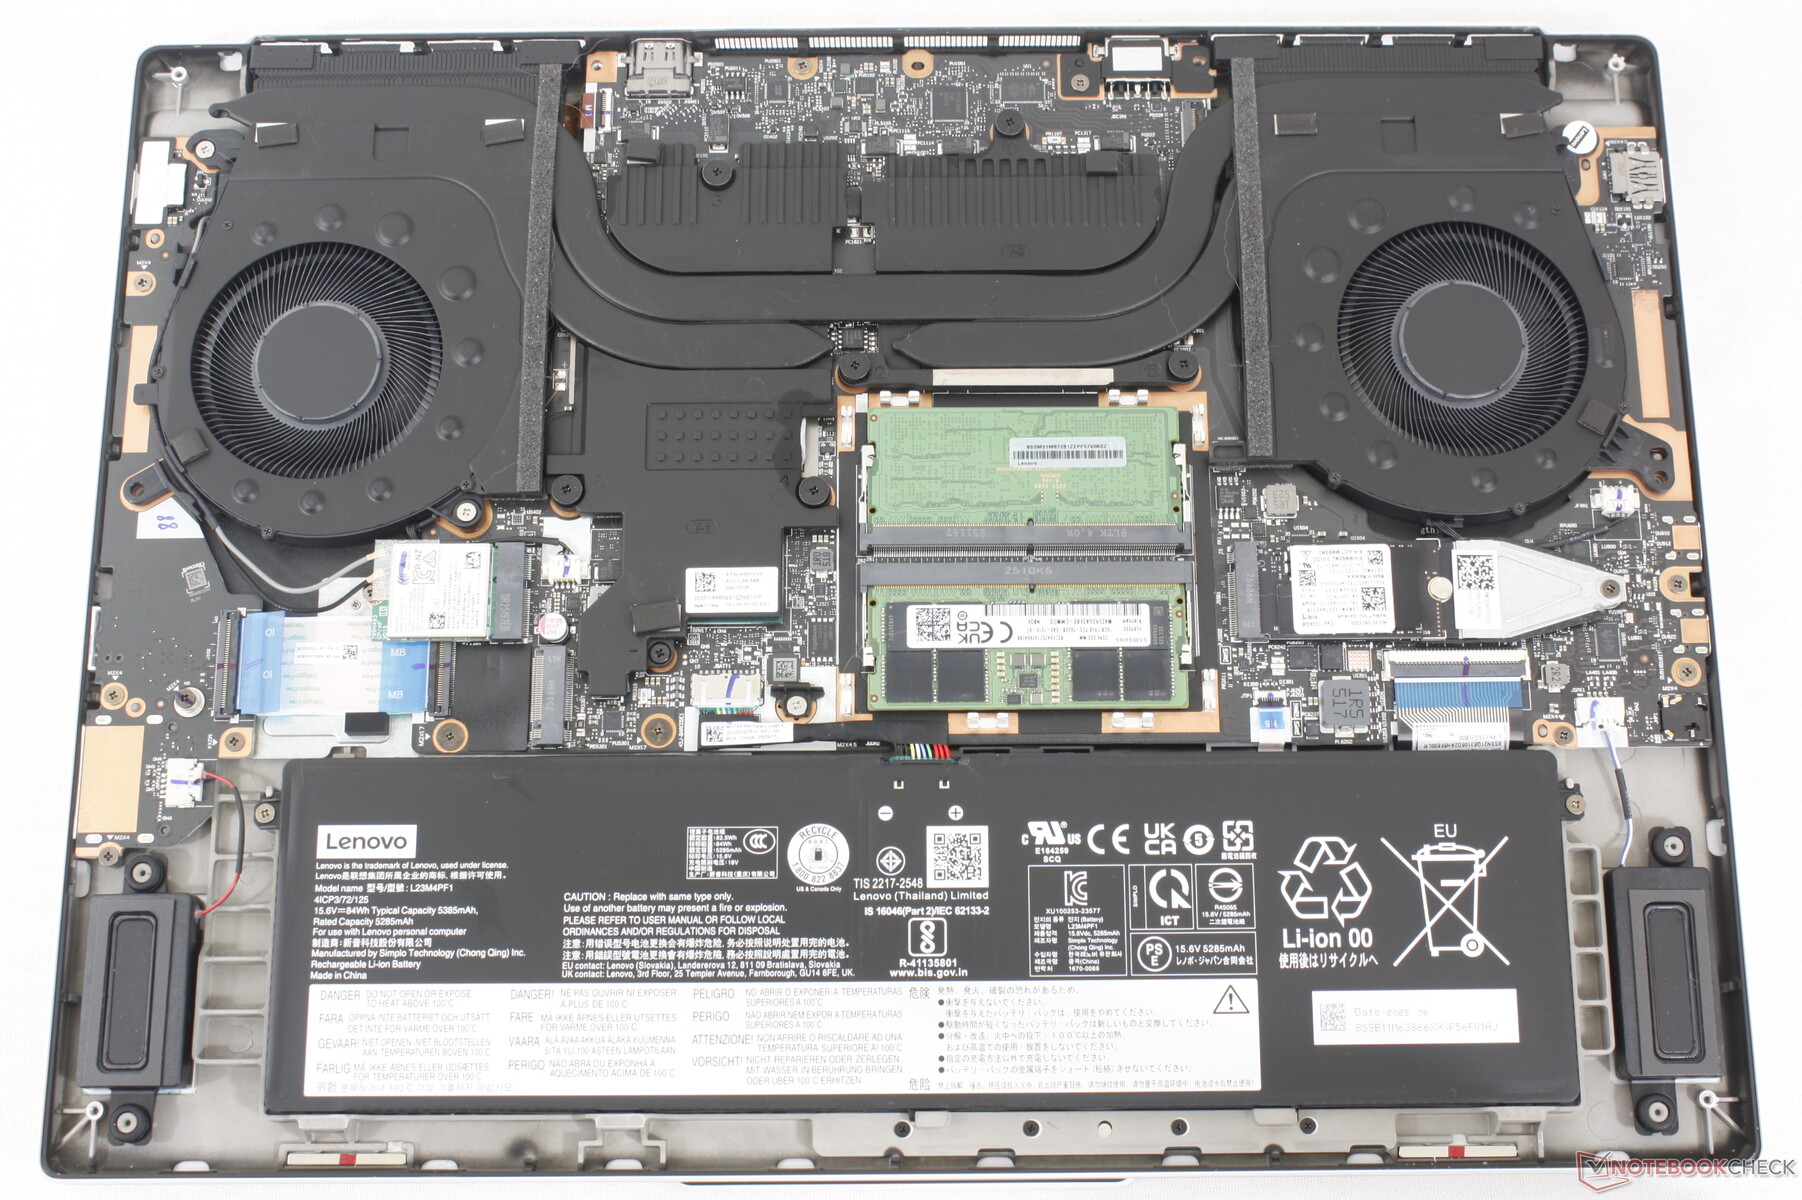
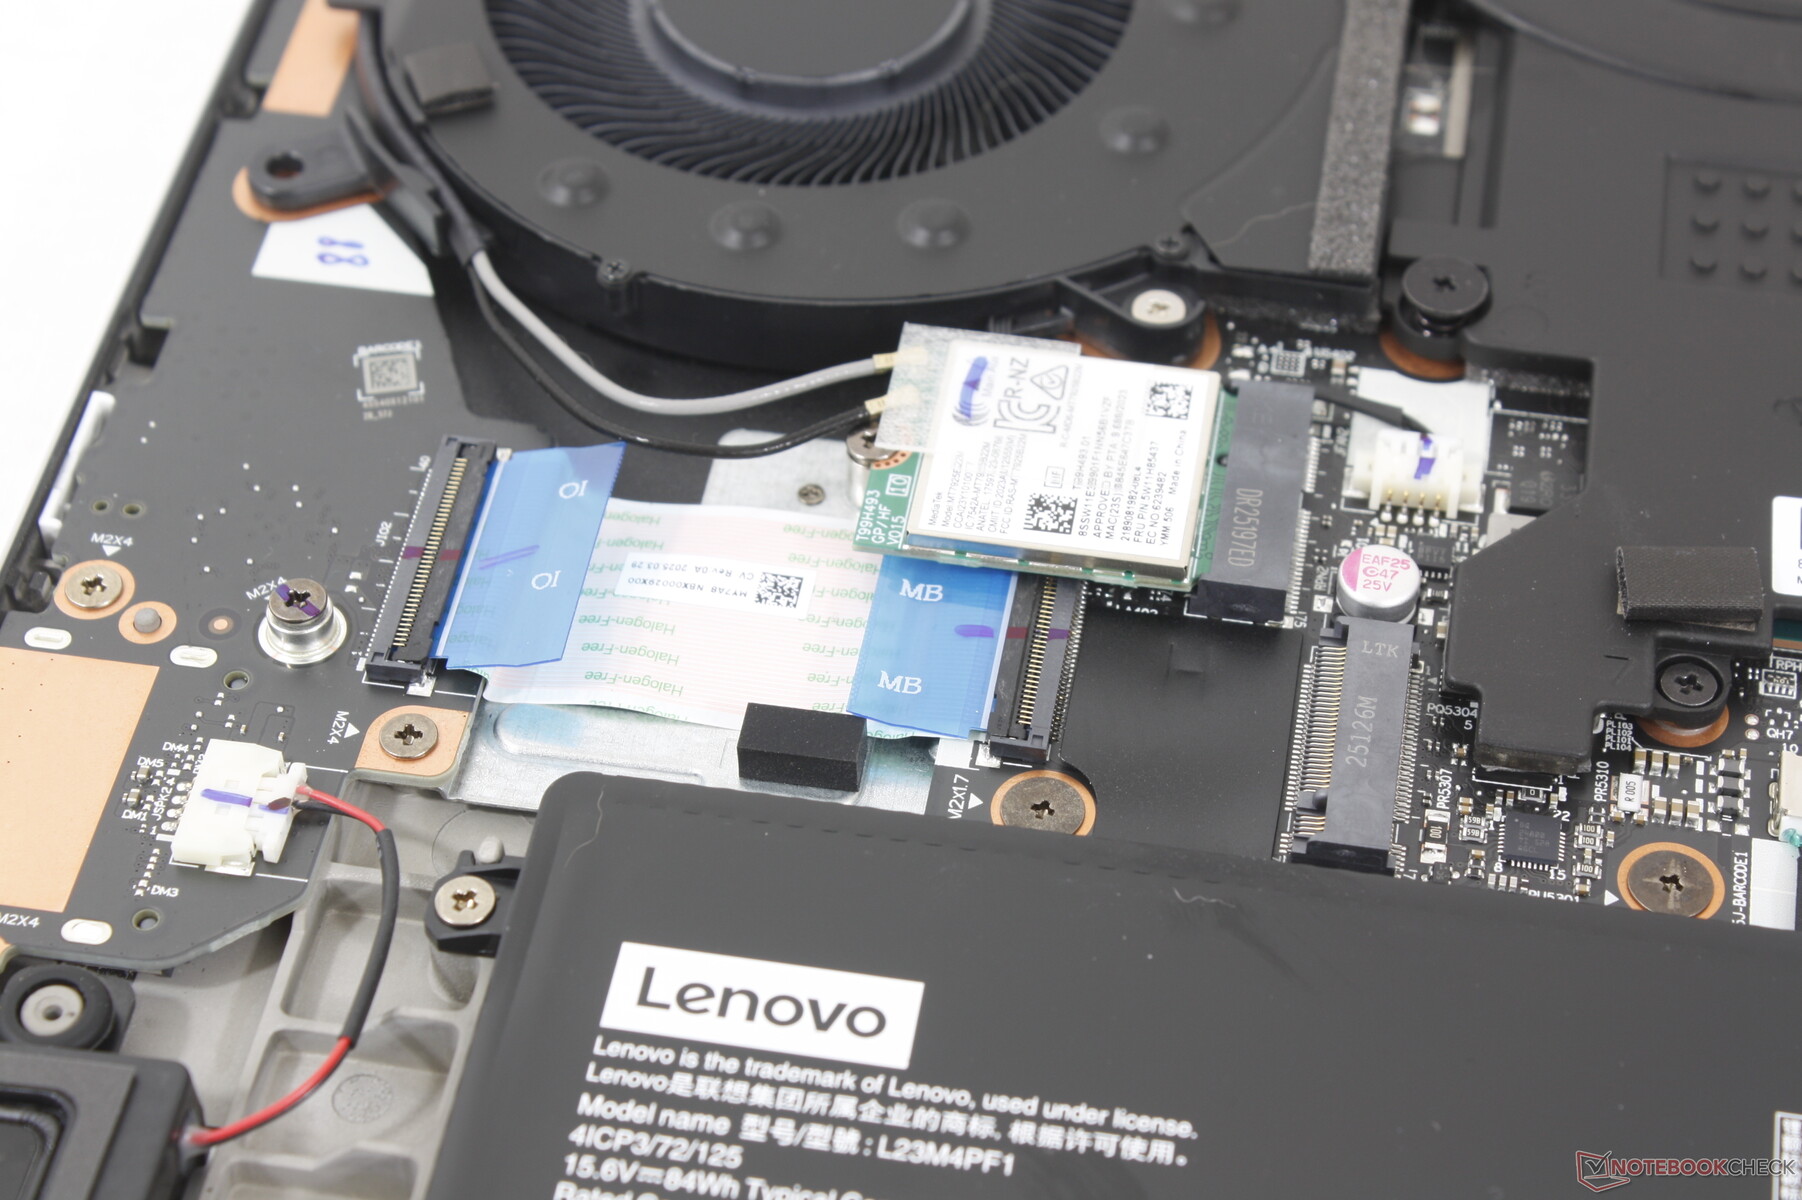
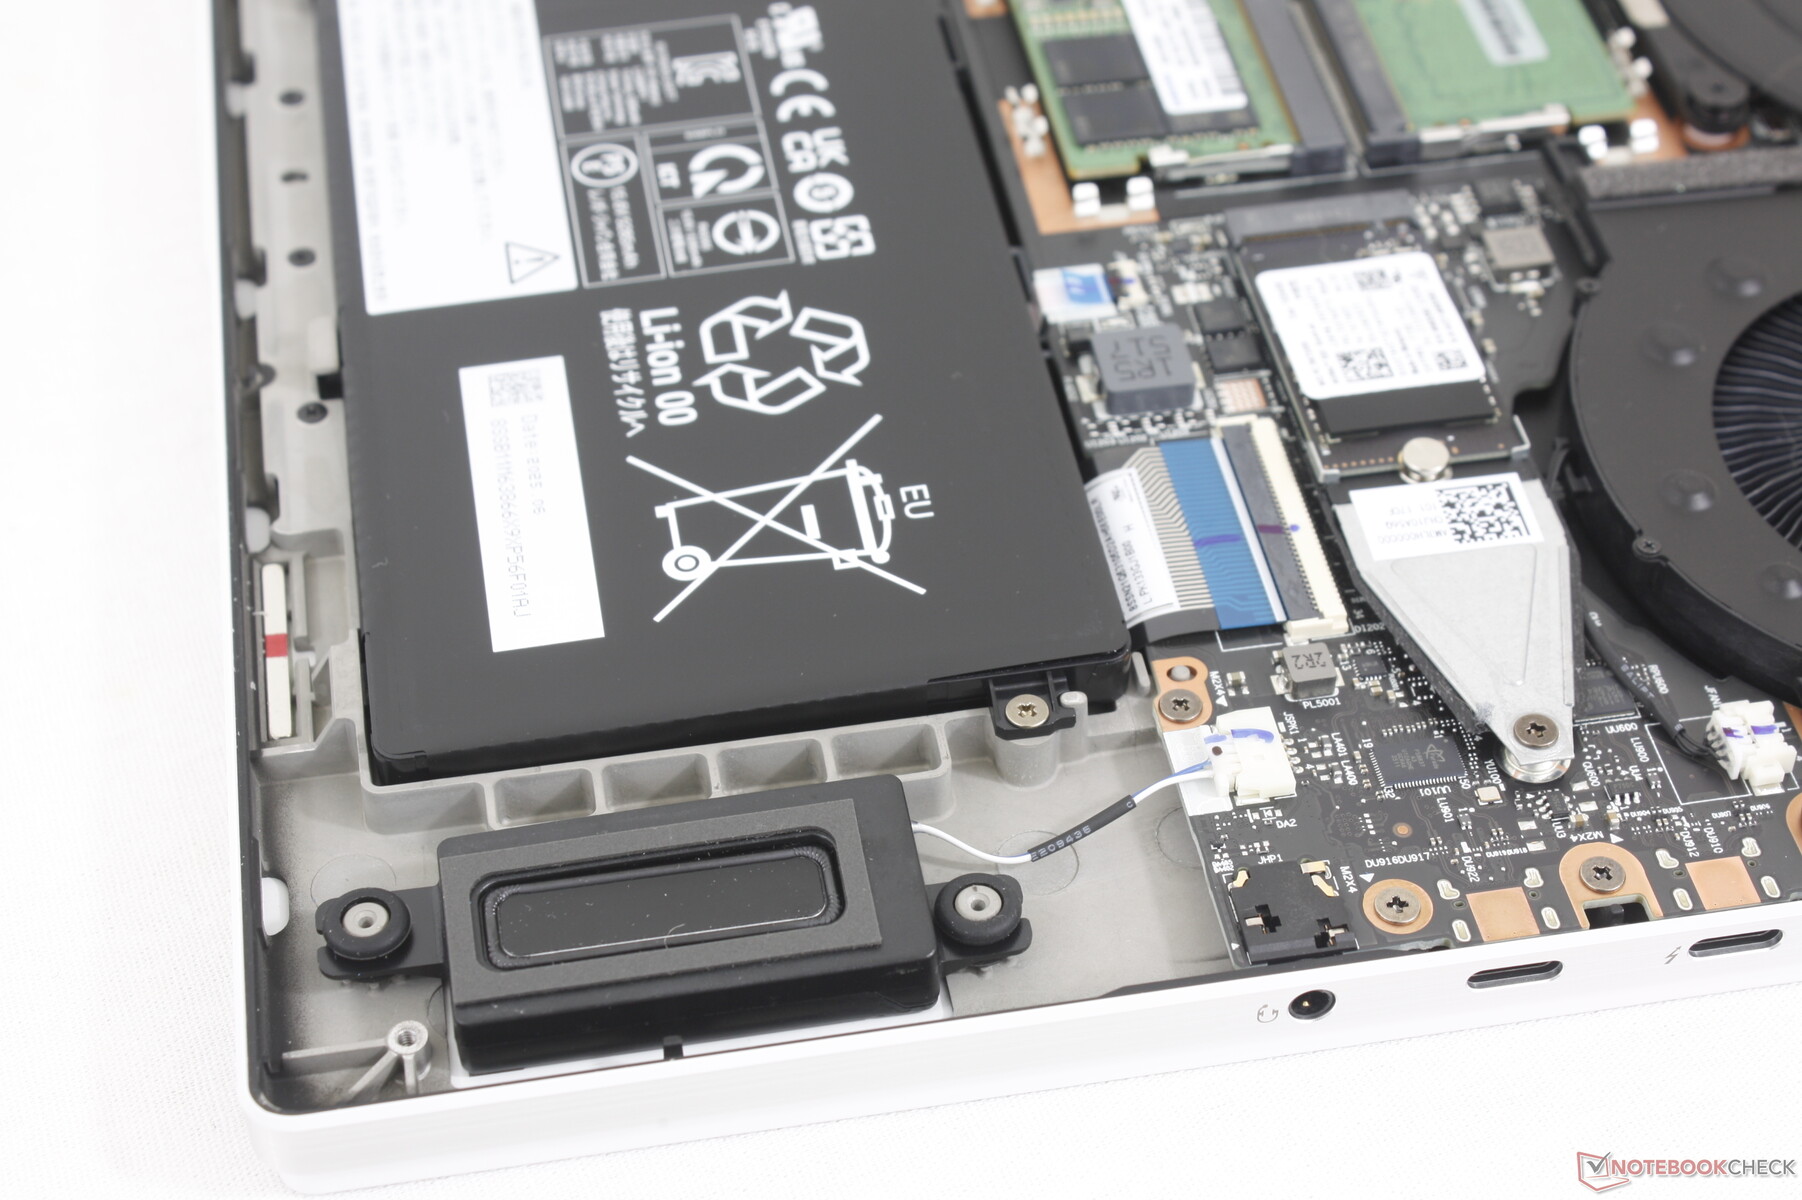
Wartung
Die Bodenplatte kann mit einem Kreuzschlitzschraubendreher leicht entfernt werden, um zwei DDR5-SODIMM-Steckplätze und zwei M.2-2280-PCIe4-x4-SSD-Steckplätze freizulegen.
Nachhaltigkeit
Lenovo macht keine Angaben zu den bei der Herstellung des Modells verwendeten recycelten Materialien. Die Verkaufsverpackung besteht sowohl aus Papier als auch aus Plastik, wobei Letzteres zu 90 Prozent aus Kunststoffen aus dem Meer besteht.
Zubehör und Garantie
In der Verpackung befinden sich außer dem Netzteil und dem Papierkram keine weiteren Extras. Beim Kauf des Gerätes in den USA gilt die übliche einjährige Herstellergarantie.
Eingabegeräte
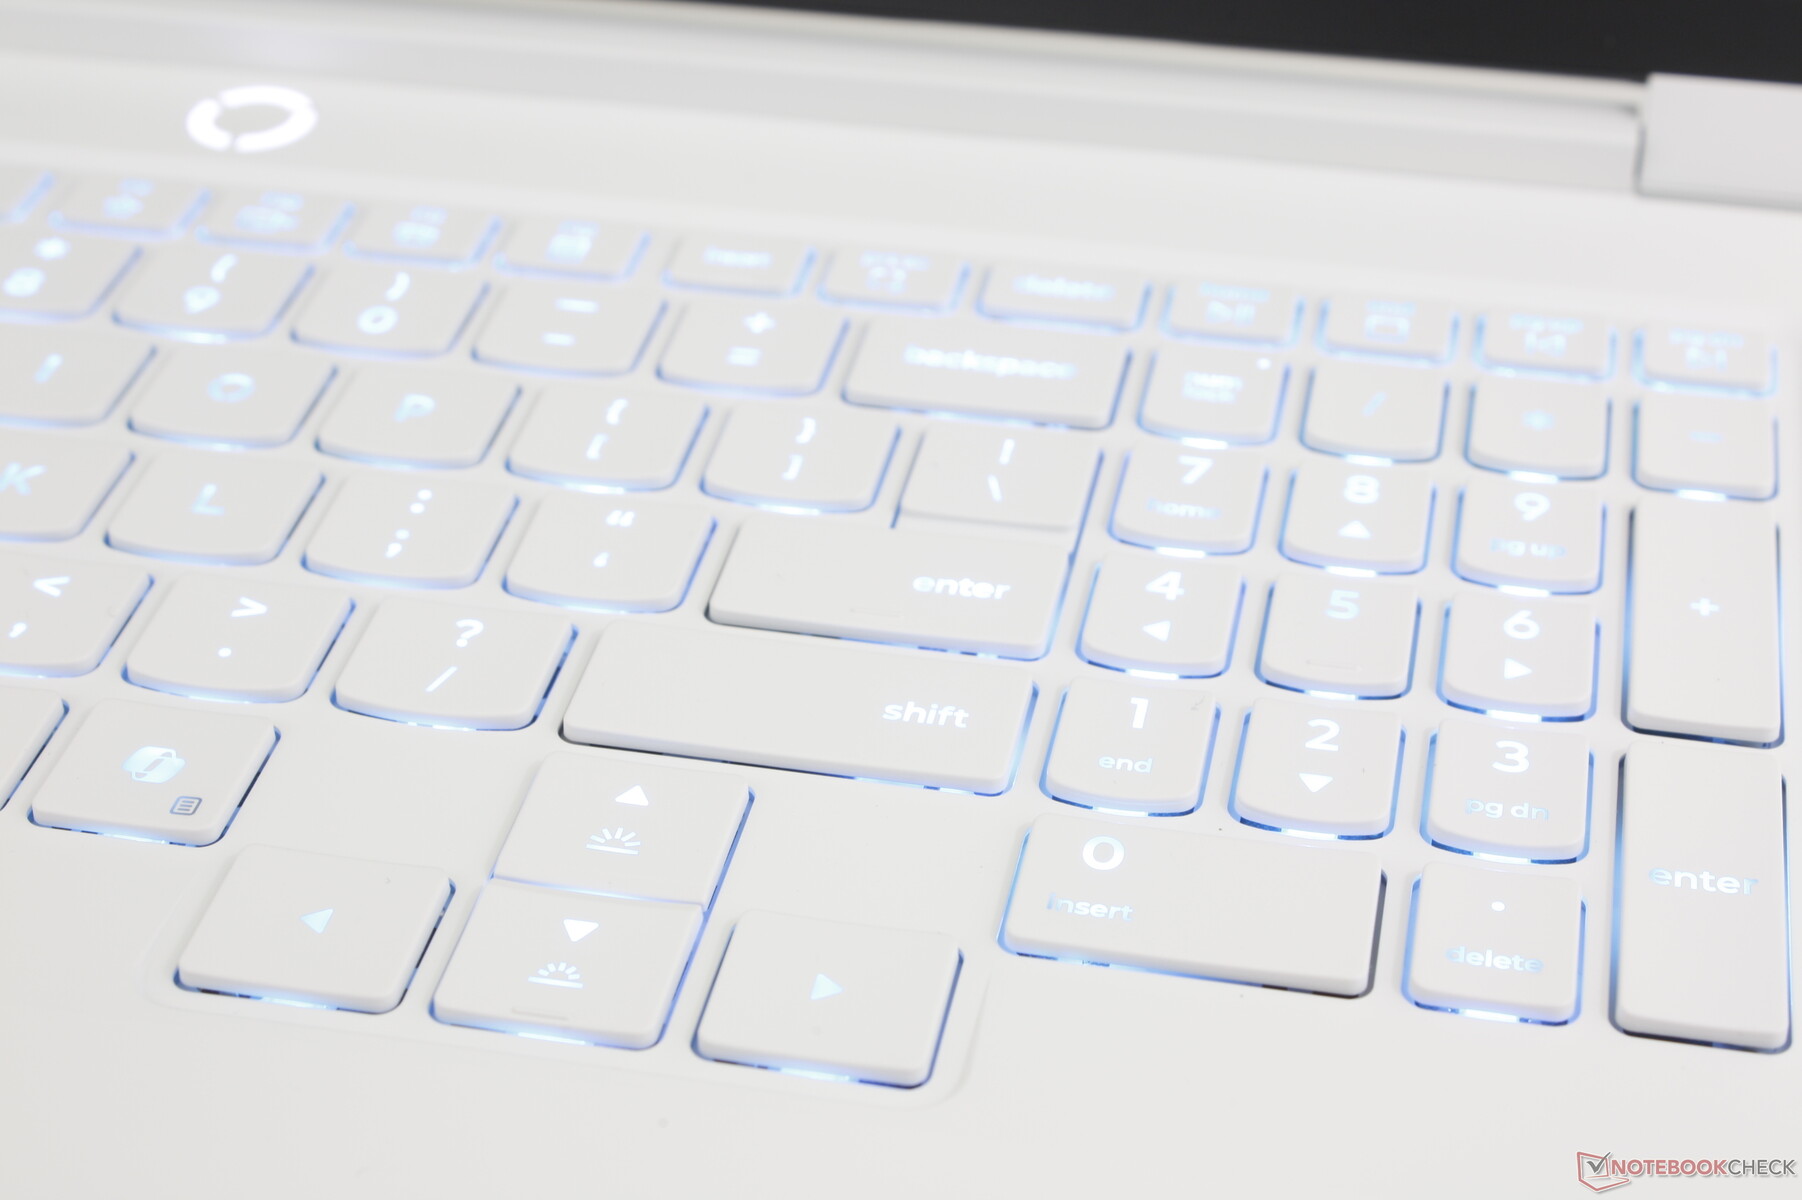
Tastatur
Das Tipperlebnis ist trotz der Größen- und Preisunterschiede identisch mit dem des aktuellen 18-Zoll-Flaggschiffs Legion 9 18. Tatsächlich sind die Tastatur und das Layout der beiden Modelle exakt identisch. Das Feedback der Tasten ist knackiger als bei den meisten anderen Gaming-Laptops, allerdings auf Kosten eines lauteren Klapperns.
Touchpad
Mit 12 x 7,5 cm ist das Clickpad identisch mit dem Clickpad des Legion 5 Pro 16 und nur geringfügig größer als das Clickpad des Alienware 16X Aurora. Dennoch ist es eher klein, vor allem für die vertikale Cursor-Steuerung. Zwischen der Leertaste und dem Clickpad ist viel ungenutzter Platz, der für ein größeres Clickpad hätte genutzt werden können.


Display - Nur OLED

Lenovo ist einer der wenigen großen Hersteller, der bei vielen seiner Gaming-Laptops auf glänzendes OLED setzt, so auch bei unserem Legion 7 16IAX10. Im Vergleich zu herkömmlichen IPS-Bildschirmen bietet OLED eine bessere HDR-Unterstützung, eine hellere Beleuchtung, P3-Farben und schnellere Schwarz-Weiß-Reaktionszeiten - allerdings auf Kosten eines höheren Stromverbrauchs und Preises. Das 165-Hz-Panel auf unserem Testgerät ist zufällig das gleiche Samsung ATNA60HS01-0-Panel wie auf dem Legion 5 Pro 16IAX10H für ein ähnliches Seherlebnis auf den beiden Geräten. Die zweite OLED-Option bietet eine noch schnellere Bildwiederholfrequenz von 240 Hz. Dabei handelt es sich wahrscheinlich um das gleiche Samsung Panel, das Razer für sein Blade 16 verwendet.
Die maximale Helligkeit erreicht ~867 Nits im HDR-Modus oder ~495 Nits im SDR-Modus.
G-Sync wird unterstützt, allerdings nur, wenn der dGPU-Modus eingestellt ist. Das Umschalten zwischen den Grafikmodi erfordert einen Soft-Neustart.

| |||||||||||||||||||||||||
Ausleuchtung: 95 %
Helligkeit Akku: 477.6 cd/m²
Kontrast: ∞:1 (Schwarzwert: 0 cd/m²)
ΔE ColorChecker Calman: 3.11 | ∀{0.5-29.43 Ø4.73}
calibrated: 0.79
ΔE Greyscale Calman: 0.9 | ∀{0.09-98 Ø4.97}
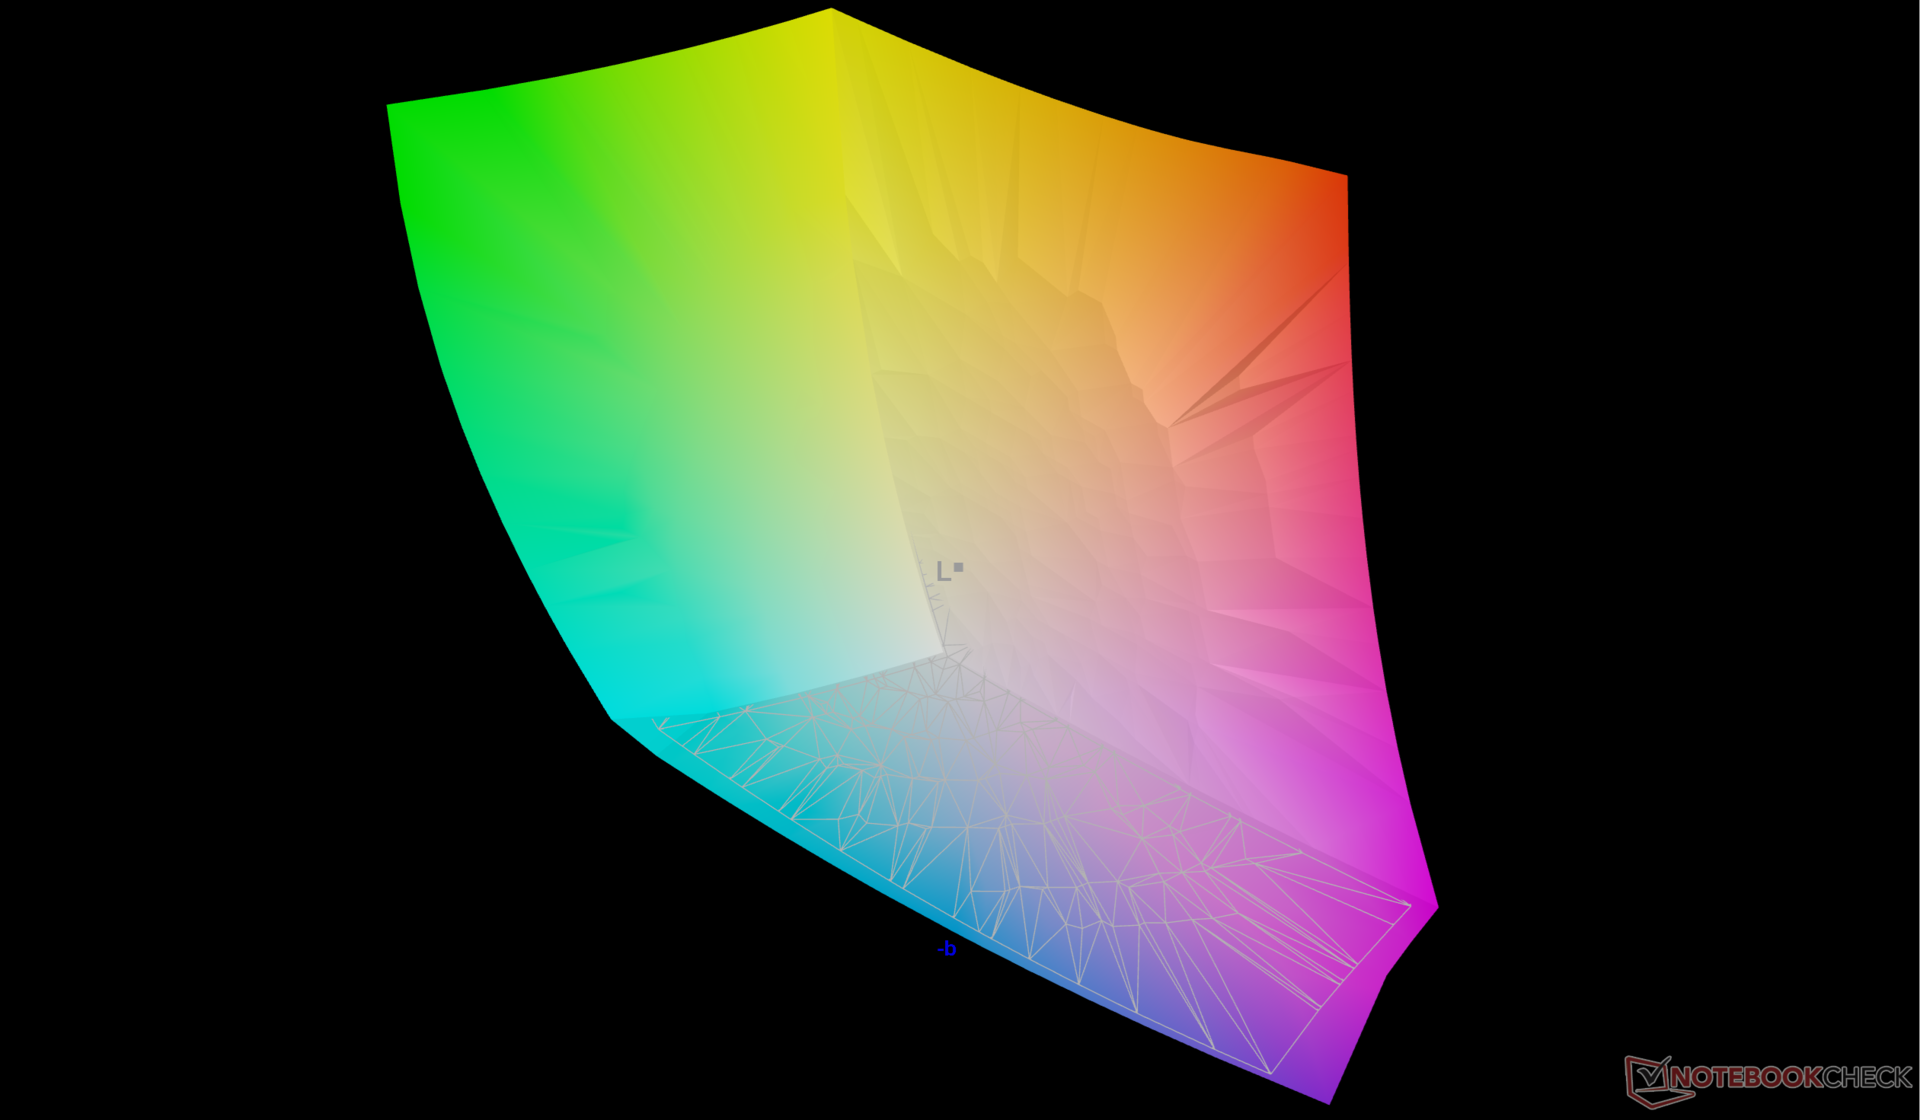
93.5% AdobeRGB 1998 (Argyll 3D)
100% sRGB (Argyll 3D)
99.6% Display P3 (Argyll 3D)
Gamma: 2.18
CCT: 6405 K
| Lenovo Legion 7 16IAX10 Samsung ATNA60HS01-0, OLED, 2560x1600, 16", 165 Hz | Alienware 16 Aurora BOE NE16N41, IPS, 2560x1600, 16", 120 Hz | Asus TUF Gaming A16 FA608UP MNG007DA5-3, IPS, 2560x1600, 16", 165 Hz | Gigabyte Gaming A16 GA6H NE160QDM-NYJ (BOE0C80), IPS, 2560x1600, 16", 165 Hz | MSI Vector 16 HX AI A2XWHG B160QAN02.3 (AUO7DB2), IPS, 2560x1600, 16", 240 Hz | Lenovo Legion 5 Pro 16IAX10H ATNA60HS01-0 (Samsung SDC420A), OLED, 2560x1600, 16", 165 Hz | |
|---|---|---|---|---|---|---|
| Display | -17% | -19% | -18% | -4% | 0% | |
| Display P3 Coverage (%) | 99.6 | 70.8 -29% | 69.4 -30% | 69.4 -30% | 96.6 -3% | 99.9 0% |
| sRGB Coverage (%) | 100 | 99.9 0% | 97.2 -3% | 99.5 0% | 99.8 0% | 100 0% |
| AdobeRGB 1998 Coverage (%) | 93.5 | 72.1 -23% | 71.9 -23% | 71.6 -23% | 84.4 -10% | 94.1 1% |
| Response Times | -5857% | -725% | -1529% | -634% | -94% | |
| Response Time Grey 50% / Grey 80% * (ms) | 0.6 ? | 49.5 ? -8150% | 6.3 ? -950% | 14.3 ? -2283% | 4.3 ? -617% | 2 ? -233% |
| Response Time Black / White * (ms) | 0.8 ? | 29.3 ? -3563% | 4.8 ? -500% | 7 ? -775% | 6 ? -650% | 1.4 ? -75% |
| PWM Frequency (Hz) | 1317 ? | 1300 | ||||
| PWM Amplitude * (%) | 23 | 16.7 27% | ||||
| Bildschirm | -69% | 1% | -109% | -53% | -51% | |
| Helligkeit Bildmitte (cd/m²) | 477.6 | 345.3 -28% | 480 1% | 432 -10% | 473 -1% | 518 8% |
| Brightness (cd/m²) | 483 | 324 -33% | 456 -6% | 425 -12% | 426 -12% | 522 8% |
| Brightness Distribution (%) | 95 | 88 -7% | 91 -4% | 91 -4% | 85 -11% | 97 2% |
| Schwarzwert * (cd/m²) | 0.23 | 0.32 | 0.37 | 0.42 | ||
| Delta E Colorchecker * | 3.11 | 3.22 -4% | 1.4 55% | 4.76 -53% | 3.47 -12% | 2.49 20% |
| Colorchecker dE 2000 max. * | 5.99 | 5.68 5% | 2.5 58% | 8.59 -43% | 7.24 -21% | 5.25 12% |
| Colorchecker dE 2000 calibrated * | 0.79 | 0.93 -18% | 1.3 -65% | 1.18 -49% | 1.36 -72% | 2.15 -172% |
| Delta E Graustufen * | 0.9 | 4.5 -400% | 1.2 -33% | 6.2 -589% | 3.1 -244% | 3.02 -236% |
| Gamma | 2.18 101% | 2.1 105% | 2.16 102% | 2.079 106% | 2.486 88% | 2.37 93% |
| CCT | 6405 101% | 7041 92% | 6620 98% | 6690 97% | 6832 95% | 6426 101% |
| Kontrast (:1) | 1501 | 1500 | 1168 | 1126 | ||
| Durchschnitt gesamt (Programm / Settings) | -1981% /
-1021% | -248% /
-125% | -552% /
-323% | -230% /
-138% | -48% /
-49% |
* ... kleinere Werte sind besser


Reaktionszeiten (Response Times) des Displays
| ↔ Reaktionszeiten Schwarz zu Weiß | ||
|---|---|---|
| 0.8 ms ... steigend ↗ und fallend ↘ kombiniert | ↗ 0.3 ms steigend |  |
| ↘ 0.5 ms fallend | ||
| Die gemessenen Reaktionszeiten sind sehr kurz, wodurch sich der Bildschirm auch für schnelle 3D Spiele eignen sollte. Im Vergleich rangierten die bei uns getesteten Geräte von 0.1 (Minimum) zu 240 (Maximum) ms. » 2 % aller Screens waren schneller als der getestete. Daher sind die gemessenen Reaktionszeiten besser als der Durchschnitt aller vermessenen Geräte (19.9 ms). | ||
| ↔ Reaktionszeiten 50% Grau zu 80% Grau | ||
| 0.6 ms ... steigend ↗ und fallend ↘ kombiniert | ↗ 0.2 ms steigend | 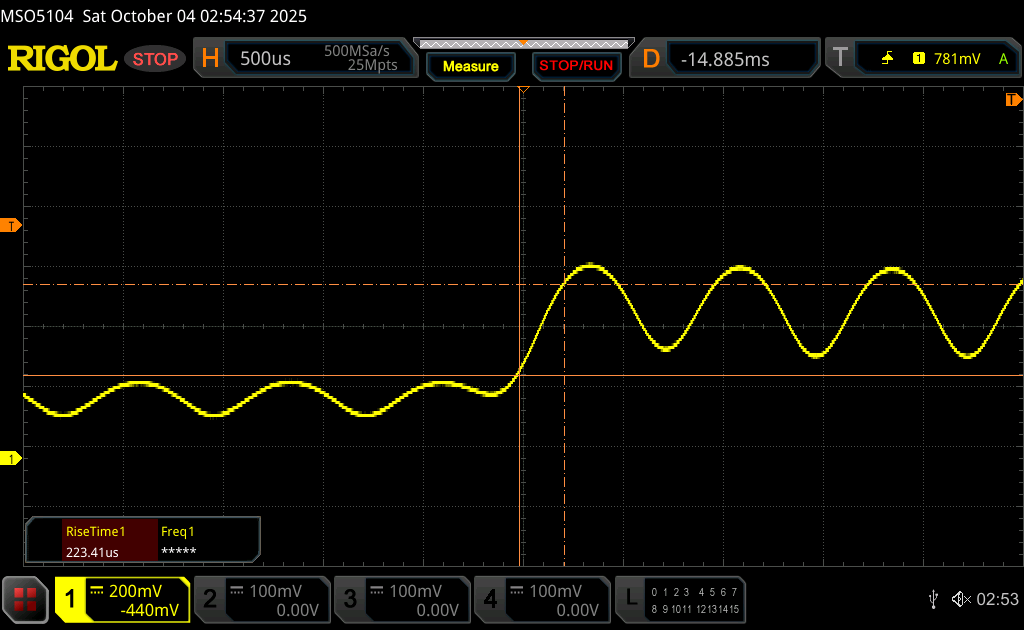 |
| ↘ 0.4 ms fallend | ||
| Die gemessenen Reaktionszeiten sind sehr kurz, wodurch sich der Bildschirm auch für schnelle 3D Spiele eignen sollte. Im Vergleich rangierten die bei uns getesteten Geräte von 0.165 (Minimum) zu 636 (Maximum) ms. » 1 % aller Screens waren schneller als der getestete. Daher sind die gemessenen Reaktionszeiten besser als der Durchschnitt aller vermessenen Geräte (31.1 ms). | ||
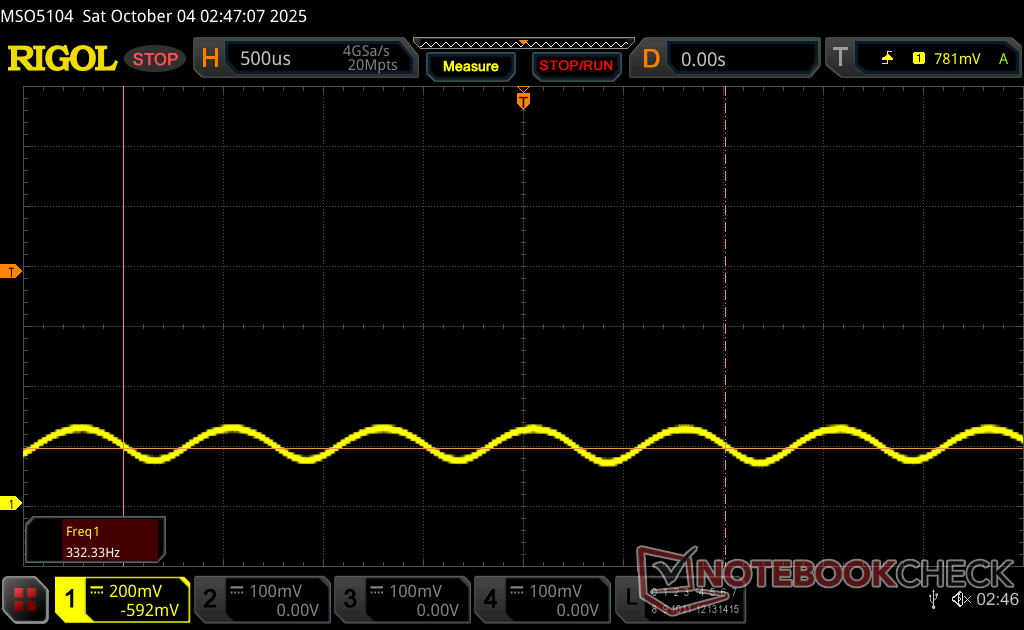
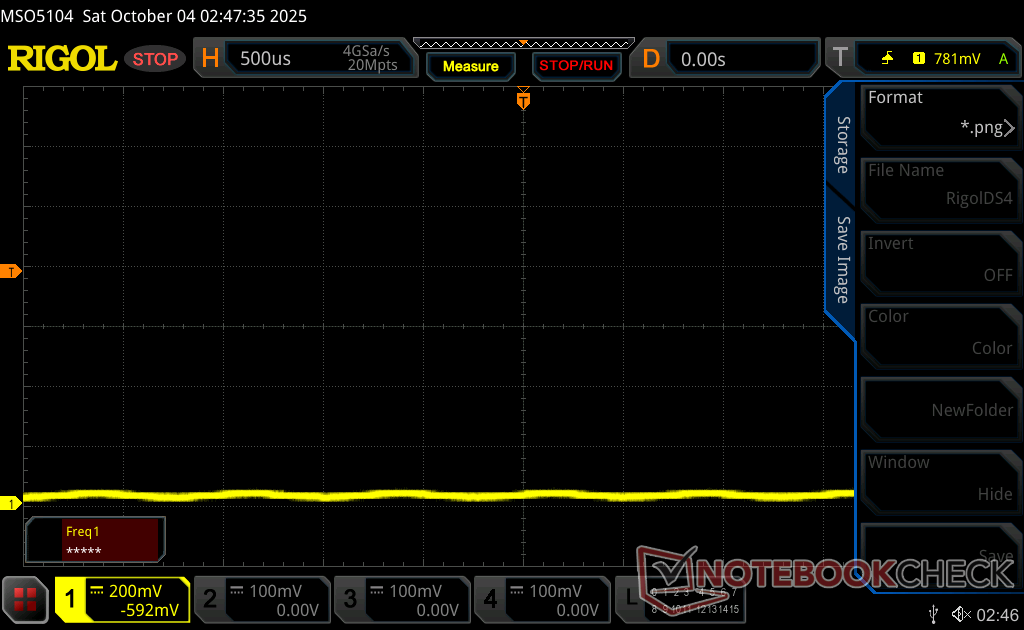
Bildschirm-Flackern / PWM (Pulse-Width Modulation)
| Flackern / PWM festgestellt | 1317 Hz Amplitude: 23 % | ≤ 100 % Helligkeit |  |
Das Display flackert mit 1317 Hz (im schlimmsten Fall, eventuell durch Pulsweitenmodulation PWM) bei einer eingestellten Helligkeit von 100 % und darunter. Darüber sollte es zu keinem Flackern kommen. Die Frequenz von 1317 Hz ist sehr hoch und sollte daher auch bei empfindlichen Personen zu keinen Problemen führen. Im Vergleich: 52 % aller getesteten Geräte nutzten kein PWM um die Helligkeit zu reduzieren. Wenn PWM eingesetzt wurde, dann bei einer Frequenz von durchschnittlich 7784 (Minimum 5, Maximum 343500) Hz. | |||


Die Sichtbarkeit im Freien ist aufgrund des glänzenden Overlays trotz dem relativ hellen OLED-Bildschirm schwierig. Das Gigabyte Gaming A16 oder das MSI Vector 16 HX sind zwar etwas dunkler, aber dennoch im Freien besser ablesbar, da die Blendwirkung nicht so ausgeprägt ist.


Performance


Testbedingungen
Wir haben LegionSpace auf den Modus Performance und den diskreten GPU-Modus eingestellt, bevor wir die folgenden Benchmarks durchgeführt haben.
Prozessor
Der Core Ultra 7 255HX bietet eine deutliche Leistungssteigerung von fast 50 Prozent gegenüber dem Core i7-14700HX des Vorjahres und eine ähnliche Steigerung gegenüber dem Core Ultra 9 285H im Zephyrus G16. Er übertrifft auch die meisten mobilen AMD CPUs, einschließlich des Ryzen AI 9 HX 370 im Razer Blade 16. Die bemerkenswerteste AMD CPU, die schneller ist als unser Core Ultra 7 255HX, ist der Ryzen 9 9955HX, aber dieser spezielle Prozessor ist nur in dickeren und schwereren Gaming-Laptops wie dem MSI Vector A18 HX zu finden.
Die Aufrüstung auf die Core Ultra 9 275HX Konfiguration würde die Leistung voraussichtlich um bis zu zehn Prozent verbessern, wie wir in unserer Zeit mit dem Alienware 16X Aurora festgestellt haben.
Die Leistungsnachhaltigkeit ist gut, aber nicht perfekt. Die CineBench R15 xT Scores fielen nach einigen Zyklen in unserem Stresstest um etwa 9 Prozent, wie die Grafik unten zeigt.
Cinebench R15 Mehrfachschleife
Cinebench R23: Multi Core | Single Core
Cinebench R20: CPU (Multi Core) | CPU (Single Core)
Cinebench R15: CPU Multi 64Bit | CPU Single 64Bit
Blender: v2.79 BMW27 CPU
7-Zip 18.03: 7z b 4 | 7z b 4 -mmt1
Geekbench 6.7: Multi-Core | Single-Core
Geekbench 5.5: Multi-Core | Single-Core
HWBOT x265 Benchmark v2.2: 4k Preset
LibreOffice : 20 Documents To PDF
R Benchmark 2.5: Overall mean
| CPU Performance Rating | |
| Alienware 16X Aurora, RTX 5070 | |
| Lenovo Legion 7 16IAX10 | |
| Durchschnittliche Intel Core Ultra 7 255HX | |
| Razer Blade 16 2025 RTX 5090 | |
| MSI Sword 16 HX B14VGKG | |
| Asus ROG Zephyrus G16 GU605CX | |
| Razer Blade 16 RTX 5080 | |
| Asus TUF Gaming A16 FA608UP | |
| Alienware 16 Aurora | |
| Dell G16 7620 -2! | |
| Asus TUF Gaming A16 FA617 -2! | |
| Cinebench R23 / Multi Core | |
| Alienware 16X Aurora, RTX 5070 | |
| Lenovo Legion 7 16IAX10 | |
| Durchschnittliche Intel Core Ultra 7 255HX (27129 - 34005, n=5) | |
| Razer Blade 16 2025 RTX 5090 | |
| MSI Sword 16 HX B14VGKG | |
| Asus ROG Zephyrus G16 GU605CX | |
| Razer Blade 16 RTX 5080 | |
| Asus TUF Gaming A16 FA608UP | |
| Dell G16 7620 | |
| Alienware 16 Aurora | |
| Asus TUF Gaming A16 FA617 | |
| Cinebench R23 / Single Core | |
| Alienware 16X Aurora, RTX 5070 | |
| Lenovo Legion 7 16IAX10 | |
| Durchschnittliche Intel Core Ultra 7 255HX (2111 - 2171, n=5) | |
| Asus ROG Zephyrus G16 GU605CX | |
| MSI Sword 16 HX B14VGKG | |
| Razer Blade 16 2025 RTX 5090 | |
| Razer Blade 16 RTX 5080 | |
| Alienware 16 Aurora | |
| Asus TUF Gaming A16 FA608UP | |
| Dell G16 7620 | |
| Asus TUF Gaming A16 FA617 | |
| Cinebench R20 / CPU (Multi Core) | |
| Alienware 16X Aurora, RTX 5070 | |
| Lenovo Legion 7 16IAX10 | |
| Durchschnittliche Intel Core Ultra 7 255HX (10626 - 13056, n=5) | |
| Razer Blade 16 2025 RTX 5090 | |
| MSI Sword 16 HX B14VGKG | |
| Asus ROG Zephyrus G16 GU605CX | |
| Razer Blade 16 RTX 5080 | |
| Asus TUF Gaming A16 FA608UP | |
| Dell G16 7620 | |
| Alienware 16 Aurora | |
| Asus TUF Gaming A16 FA617 | |
| Cinebench R20 / CPU (Single Core) | |
| Alienware 16X Aurora, RTX 5070 | |
| Lenovo Legion 7 16IAX10 | |
| Durchschnittliche Intel Core Ultra 7 255HX (822 - 835, n=5) | |
| Asus ROG Zephyrus G16 GU605CX | |
| MSI Sword 16 HX B14VGKG | |
| Razer Blade 16 2025 RTX 5090 | |
| Razer Blade 16 RTX 5080 | |
| Alienware 16 Aurora | |
| Asus TUF Gaming A16 FA608UP | |
| Dell G16 7620 | |
| Asus TUF Gaming A16 FA617 | |
| Cinebench R15 / CPU Multi 64Bit | |
| Alienware 16X Aurora, RTX 5070 | |
| Lenovo Legion 7 16IAX10 | |
| Durchschnittliche Intel Core Ultra 7 255HX (4114 - 5190, n=5) | |
| Razer Blade 16 2025 RTX 5090 | |
| Asus ROG Zephyrus G16 GU605CX | |
| MSI Sword 16 HX B14VGKG | |
| Razer Blade 16 RTX 5080 | |
| Asus TUF Gaming A16 FA608UP | |
| Dell G16 7620 | |
| Alienware 16 Aurora | |
| Asus TUF Gaming A16 FA617 | |
| Cinebench R15 / CPU Single 64Bit | |
| Alienware 16X Aurora, RTX 5070 | |
| Lenovo Legion 7 16IAX10 | |
| Durchschnittliche Intel Core Ultra 7 255HX (322 - 328, n=5) | |
| Asus ROG Zephyrus G16 GU605CX | |
| Razer Blade 16 2025 RTX 5090 | |
| Razer Blade 16 RTX 5080 | |
| MSI Sword 16 HX B14VGKG | |
| Asus TUF Gaming A16 FA608UP | |
| Alienware 16 Aurora | |
| Asus TUF Gaming A16 FA617 | |
| Dell G16 7620 | |
| Blender / v2.79 BMW27 CPU | |
| Asus TUF Gaming A16 FA617 | |
| Alienware 16 Aurora | |
| Dell G16 7620 | |
| Asus TUF Gaming A16 FA608UP | |
| Razer Blade 16 RTX 5080 | |
| Asus ROG Zephyrus G16 GU605CX | |
| MSI Sword 16 HX B14VGKG | |
| Razer Blade 16 2025 RTX 5090 | |
| Lenovo Legion 7 16IAX10 | |
| Durchschnittliche Intel Core Ultra 7 255HX (104 - 122, n=5) | |
| Alienware 16X Aurora, RTX 5070 | |
| 7-Zip 18.03 / 7z b 4 | |
| Alienware 16X Aurora, RTX 5070 | |
| Durchschnittliche Intel Core Ultra 7 255HX (87806 - 104055, n=5) | |
| Lenovo Legion 7 16IAX10 | |
| MSI Sword 16 HX B14VGKG | |
| Razer Blade 16 2025 RTX 5090 | |
| Asus TUF Gaming A16 FA608UP | |
| Razer Blade 16 RTX 5080 | |
| Asus ROG Zephyrus G16 GU605CX | |
| Alienware 16 Aurora | |
| Dell G16 7620 | |
| Asus TUF Gaming A16 FA617 | |
| 7-Zip 18.03 / 7z b 4 -mmt1 | |
| MSI Sword 16 HX B14VGKG | |
| Alienware 16X Aurora, RTX 5070 | |
| Lenovo Legion 7 16IAX10 | |
| Durchschnittliche Intel Core Ultra 7 255HX (6407 - 6576, n=5) | |
| Razer Blade 16 2025 RTX 5090 | |
| Asus ROG Zephyrus G16 GU605CX | |
| Asus TUF Gaming A16 FA608UP | |
| Razer Blade 16 RTX 5080 | |
| Alienware 16 Aurora | |
| Asus TUF Gaming A16 FA617 | |
| Dell G16 7620 | |
| Geekbench 6.7 / Multi-Core | |
| Alienware 16X Aurora, RTX 5070 | |
| Durchschnittliche Intel Core Ultra 7 255HX (16396 - 19623, n=6) | |
| Lenovo Legion 7 16IAX10 | |
| Asus ROG Zephyrus G16 GU605CX | |
| Razer Blade 16 2025 RTX 5090 | |
| MSI Sword 16 HX B14VGKG | |
| Razer Blade 16 RTX 5080 | |
| Alienware 16 Aurora | |
| Asus TUF Gaming A16 FA608UP | |
| Geekbench 6.7 / Single-Core | |
| Alienware 16X Aurora, RTX 5070 | |
| Durchschnittliche Intel Core Ultra 7 255HX (2917 - 3028, n=6) | |
| Razer Blade 16 2025 RTX 5090 | |
| Lenovo Legion 7 16IAX10 | |
| Asus ROG Zephyrus G16 GU605CX | |
| Razer Blade 16 RTX 5080 | |
| MSI Sword 16 HX B14VGKG | |
| Asus TUF Gaming A16 FA608UP | |
| Alienware 16 Aurora | |
| Geekbench 5.5 / Multi-Core | |
| Alienware 16X Aurora, RTX 5070 | |
| Durchschnittliche Intel Core Ultra 7 255HX (18263 - 21014, n=5) | |
| Lenovo Legion 7 16IAX10 | |
| Asus ROG Zephyrus G16 GU605CX | |
| MSI Sword 16 HX B14VGKG | |
| Razer Blade 16 2025 RTX 5090 | |
| Razer Blade 16 RTX 5080 | |
| Alienware 16 Aurora | |
| Asus TUF Gaming A16 FA608UP | |
| Dell G16 7620 | |
| Asus TUF Gaming A16 FA617 | |
| Geekbench 5.5 / Single-Core | |
| Alienware 16X Aurora, RTX 5070 | |
| Durchschnittliche Intel Core Ultra 7 255HX (2112 - 2211, n=5) | |
| Razer Blade 16 2025 RTX 5090 | |
| Lenovo Legion 7 16IAX10 | |
| Asus ROG Zephyrus G16 GU605CX | |
| Razer Blade 16 RTX 5080 | |
| MSI Sword 16 HX B14VGKG | |
| Asus TUF Gaming A16 FA608UP | |
| Alienware 16 Aurora | |
| Dell G16 7620 | |
| Asus TUF Gaming A16 FA617 | |
| HWBOT x265 Benchmark v2.2 / 4k Preset | |
| Alienware 16X Aurora, RTX 5070 | |
| Lenovo Legion 7 16IAX10 | |
| Durchschnittliche Intel Core Ultra 7 255HX (30.4 - 36.9, n=5) | |
| Razer Blade 16 2025 RTX 5090 | |
| Asus ROG Zephyrus G16 GU605CX | |
| Razer Blade 16 RTX 5080 | |
| MSI Sword 16 HX B14VGKG | |
| Asus TUF Gaming A16 FA608UP | |
| Alienware 16 Aurora | |
| Dell G16 7620 | |
| Asus TUF Gaming A16 FA617 | |
| LibreOffice / 20 Documents To PDF | |
| Razer Blade 16 RTX 5080 | |
| Asus TUF Gaming A16 FA617 | |
| Asus TUF Gaming A16 FA608UP | |
| Dell G16 7620 | |
| Alienware 16 Aurora | |
| Razer Blade 16 2025 RTX 5090 | |
| MSI Sword 16 HX B14VGKG | |
| Asus ROG Zephyrus G16 GU605CX | |
| Durchschnittliche Intel Core Ultra 7 255HX (35.4 - 45.9, n=5) | |
| Alienware 16X Aurora, RTX 5070 | |
| Lenovo Legion 7 16IAX10 | |
| R Benchmark 2.5 / Overall mean | |
| Dell G16 7620 | |
| Asus TUF Gaming A16 FA617 | |
| Alienware 16 Aurora | |
| Asus TUF Gaming A16 FA608UP | |
| Asus ROG Zephyrus G16 GU605CX | |
| Lenovo Legion 7 16IAX10 | |
| Durchschnittliche Intel Core Ultra 7 255HX (0.4209 - 0.4287, n=5) | |
| Alienware 16X Aurora, RTX 5070 | |
| Razer Blade 16 RTX 5080 | |
| Razer Blade 16 2025 RTX 5090 | |
| MSI Sword 16 HX B14VGKG | |
* ... kleinere Werte sind besser
AIDA64: FP32 Ray-Trace | FPU Julia | CPU SHA3 | CPU Queen | FPU SinJulia | FPU Mandel | CPU AES | CPU ZLib | FP64 Ray-Trace | CPU PhotoWorxx
| Performance Rating | |
| Lenovo Legion 5 Pro 16IAX10H | |
| Durchschnittliche Intel Core Ultra 7 255HX | |
| Lenovo Legion 7 16IAX10 | |
| MSI Vector 16 HX AI A2XWHG | |
| Asus TUF Gaming A16 FA608UP | |
| Alienware 16 Aurora | |
| Gigabyte Gaming A16 GA6H | |
| AIDA64 / FP32 Ray-Trace | |
| Lenovo Legion 5 Pro 16IAX10H | |
| Durchschnittliche Intel Core Ultra 7 255HX (27732 - 34250, n=5) | |
| Lenovo Legion 7 16IAX10 | |
| Asus TUF Gaming A16 FA608UP | |
| MSI Vector 16 HX AI A2XWHG | |
| Alienware 16 Aurora | |
| Gigabyte Gaming A16 GA6H | |
| AIDA64 / FPU Julia | |
| Lenovo Legion 5 Pro 16IAX10H | |
| Durchschnittliche Intel Core Ultra 7 255HX (140290 - 167758, n=5) | |
| Lenovo Legion 7 16IAX10 | |
| MSI Vector 16 HX AI A2XWHG | |
| Asus TUF Gaming A16 FA608UP | |
| Alienware 16 Aurora | |
| Gigabyte Gaming A16 GA6H | |
| AIDA64 / CPU SHA3 | |
| Lenovo Legion 5 Pro 16IAX10H | |
| Durchschnittliche Intel Core Ultra 7 255HX (6445 - 7694, n=5) | |
| Lenovo Legion 7 16IAX10 | |
| MSI Vector 16 HX AI A2XWHG | |
| Asus TUF Gaming A16 FA608UP | |
| Alienware 16 Aurora | |
| Gigabyte Gaming A16 GA6H | |
| AIDA64 / CPU Queen | |
| Lenovo Legion 5 Pro 16IAX10H | |
| Lenovo Legion 7 16IAX10 | |
| Durchschnittliche Intel Core Ultra 7 255HX (115802 - 135237, n=5) | |
| Asus TUF Gaming A16 FA608UP | |
| MSI Vector 16 HX AI A2XWHG | |
| Alienware 16 Aurora | |
| Gigabyte Gaming A16 GA6H | |
| AIDA64 / FPU SinJulia | |
| Asus TUF Gaming A16 FA608UP | |
| Lenovo Legion 5 Pro 16IAX10H | |
| Lenovo Legion 7 16IAX10 | |
| Durchschnittliche Intel Core Ultra 7 255HX (11066 - 12286, n=5) | |
| MSI Vector 16 HX AI A2XWHG | |
| Alienware 16 Aurora | |
| Gigabyte Gaming A16 GA6H | |
| AIDA64 / FPU Mandel | |
| Lenovo Legion 5 Pro 16IAX10H | |
| Durchschnittliche Intel Core Ultra 7 255HX (72938 - 87947, n=5) | |
| Lenovo Legion 7 16IAX10 | |
| MSI Vector 16 HX AI A2XWHG | |
| Asus TUF Gaming A16 FA608UP | |
| Alienware 16 Aurora | |
| Gigabyte Gaming A16 GA6H | |
| AIDA64 / CPU AES | |
| Lenovo Legion 5 Pro 16IAX10H | |
| Lenovo Legion 7 16IAX10 | |
| Durchschnittliche Intel Core Ultra 7 255HX (96832 - 116158, n=5) | |
| MSI Vector 16 HX AI A2XWHG | |
| Asus TUF Gaming A16 FA608UP | |
| Alienware 16 Aurora | |
| Gigabyte Gaming A16 GA6H | |
| AIDA64 / CPU ZLib | |
| Lenovo Legion 5 Pro 16IAX10H | |
| Lenovo Legion 7 16IAX10 | |
| Durchschnittliche Intel Core Ultra 7 255HX (1510 - 1850, n=5) | |
| MSI Vector 16 HX AI A2XWHG | |
| Asus TUF Gaming A16 FA608UP | |
| Alienware 16 Aurora | |
| Gigabyte Gaming A16 GA6H | |
| AIDA64 / FP64 Ray-Trace | |
| Lenovo Legion 5 Pro 16IAX10H | |
| Durchschnittliche Intel Core Ultra 7 255HX (15137 - 18315, n=5) | |
| Lenovo Legion 7 16IAX10 | |
| Asus TUF Gaming A16 FA608UP | |
| MSI Vector 16 HX AI A2XWHG | |
| Alienware 16 Aurora | |
| Gigabyte Gaming A16 GA6H | |
| AIDA64 / CPU PhotoWorxx | |
| Lenovo Legion 7 16IAX10 | |
| Lenovo Legion 5 Pro 16IAX10H | |
| Durchschnittliche Intel Core Ultra 7 255HX (39697 - 54070, n=5) | |
| Asus TUF Gaming A16 FA608UP | |
| Alienware 16 Aurora | |
| MSI Vector 16 HX AI A2XWHG | |
| Gigabyte Gaming A16 GA6H | |
Stresstest

Die CPU stieg beim Start von Prime95 Stress auf 3 GHz, 164 W und angenehme 105 °C und stabilisierte sich etwa 60 Sekunden später bei 3,3 GHz und 105 W, um eine vernünftige Kerntemperatur von 82 °C aufrechtzuerhalten. Es ist klar, dass die Arrow-Lake-HX-CPU die leichte Kühllösung an ihre Grenzen bringt. Die maximalen Turbo-Boost-Taktraten sind über längere Zeiträume nicht haltbar, was mit unseren oben erwähnten Beobachtungen der CineBench-R15-xT-Schleife übereinstimmt.
Die GPU würde sich bei 2.722 MHz, 105 W und 82 °C stabilisieren, wenn Cyberpunk 2077 im Performance-Modus läuft, verglichen mit 2.085 MHz und 74 °C auf dem Alienware 16 Aurora. Die GPU-Taktrate und die Temperatur sinken, wenn man im Modus Balanced spielt, wie unsere Screenshots und die Tabelle unten zeigen.


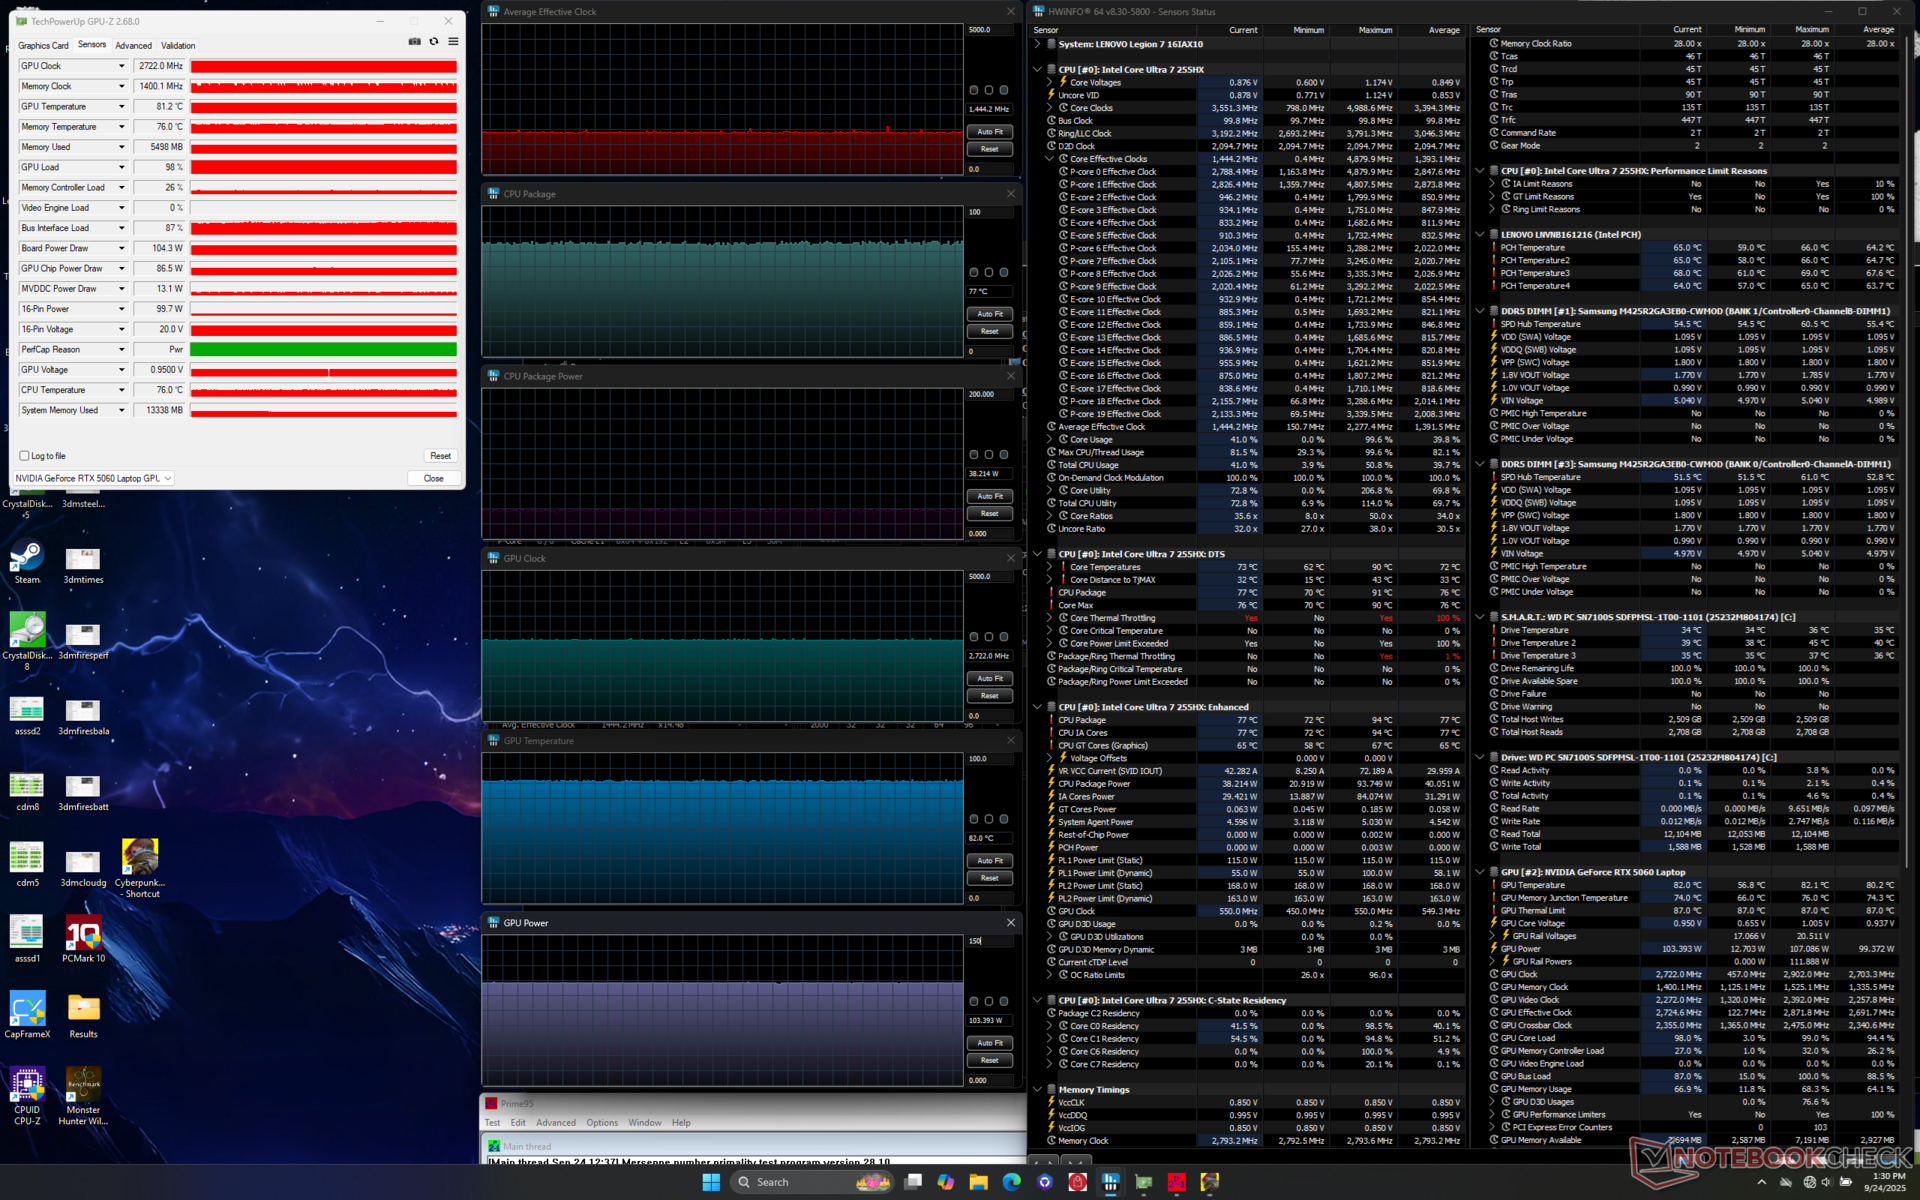
| durchschnittlicher CPU-Takt (GHz) | GPU-Takt (MHz) | durchschnittliche CPU-Temperatur (°C) | durchschnittliche GPU-Temperatur (°C) | |
| System Leerlauf | -- | -- | 50 | 43 |
| Prime95 Stress | 3,4 | -- | 82 | 54 |
| Prime95 + FurMark Stress | 2,4 | 2.197 | 80 | 81 |
| Cyberpunk 2077 Stress (Balanced Modus) | 1,3 | 2.385 | 75 | 77 |
| Cyberpunk 2077 Stress (Performance-Modus) | 1,4 | 2.722 | 77 | 82 |
System Performance
Der PCMark 10 würde nur im iGPU-Modus laufen, da er sonst abstürzt, und daher ist unser Ergebnis für die Erstellung digitaler Inhalte zu niedrig angesetzt. Abgesehen davon sind CPU-lastige Benchmarks wie PCMark Essentials oder Productivity dank der schnellen Arrow-Lake-HX-CPU höher als bei den meisten anderen 16-Zoll-Gaming-Laptops.

PCMark 10: Score | Essentials | Productivity | Digital Content Creation
CrossMark: Overall | Productivity | Creativity | Responsiveness
WebXPRT 3: Overall
WebXPRT 4: Overall
Mozilla Kraken 1.1: Total
| Performance Rating | |
| Lenovo Legion 5 Pro 16IAX10H | |
| Durchschnittliche Intel Core Ultra 7 255HX, NVIDIA GeForce RTX 5060 Laptop | |
| Lenovo Legion 7 16IAX10 | |
| MSI Vector 16 HX AI A2XWHG | |
| Alienware 16 Aurora -4! | |
| Gigabyte Gaming A16 GA6H | |
| Asus TUF Gaming A16 FA608UP -4! | |
| PCMark 10 / Score | |
| Durchschnittliche Intel Core Ultra 7 255HX, NVIDIA GeForce RTX 5060 Laptop (7536 - 10386, n=2) | |
| Lenovo Legion 5 Pro 16IAX10H | |
| MSI Vector 16 HX AI A2XWHG | |
| Lenovo Legion 7 16IAX10 | |
| Gigabyte Gaming A16 GA6H | |
| PCMark 10 / Essentials | |
| Durchschnittliche Intel Core Ultra 7 255HX, NVIDIA GeForce RTX 5060 Laptop (11509 - 11664, n=2) | |
| Lenovo Legion 7 16IAX10 | |
| Lenovo Legion 5 Pro 16IAX10H | |
| MSI Vector 16 HX AI A2XWHG | |
| Gigabyte Gaming A16 GA6H | |
| PCMark 10 / Productivity | |
| Durchschnittliche Intel Core Ultra 7 255HX, NVIDIA GeForce RTX 5060 Laptop (10232 - 16048, n=2) | |
| Lenovo Legion 7 16IAX10 | |
| Lenovo Legion 5 Pro 16IAX10H | |
| MSI Vector 16 HX AI A2XWHG | |
| Gigabyte Gaming A16 GA6H | |
| PCMark 10 / Digital Content Creation | |
| Lenovo Legion 5 Pro 16IAX10H | |
| Durchschnittliche Intel Core Ultra 7 255HX, NVIDIA GeForce RTX 5060 Laptop (9862 - 16240, n=2) | |
| MSI Vector 16 HX AI A2XWHG | |
| Gigabyte Gaming A16 GA6H | |
| Lenovo Legion 7 16IAX10 | |
| CrossMark / Overall | |
| Lenovo Legion 5 Pro 16IAX10H | |
| Durchschnittliche Intel Core Ultra 7 255HX, NVIDIA GeForce RTX 5060 Laptop (2059 - 2066, n=2) | |
| Lenovo Legion 7 16IAX10 | |
| Alienware 16 Aurora | |
| MSI Vector 16 HX AI A2XWHG | |
| Gigabyte Gaming A16 GA6H | |
| Asus TUF Gaming A16 FA608UP | |
| CrossMark / Productivity | |
| Lenovo Legion 5 Pro 16IAX10H | |
| Lenovo Legion 7 16IAX10 | |
| Durchschnittliche Intel Core Ultra 7 255HX, NVIDIA GeForce RTX 5060 Laptop (1943 - 1951, n=2) | |
| Alienware 16 Aurora | |
| MSI Vector 16 HX AI A2XWHG | |
| Gigabyte Gaming A16 GA6H | |
| Asus TUF Gaming A16 FA608UP | |
| CrossMark / Creativity | |
| Lenovo Legion 5 Pro 16IAX10H | |
| Durchschnittliche Intel Core Ultra 7 255HX, NVIDIA GeForce RTX 5060 Laptop (2288 - 2384, n=2) | |
| Lenovo Legion 7 16IAX10 | |
| MSI Vector 16 HX AI A2XWHG | |
| Alienware 16 Aurora | |
| Asus TUF Gaming A16 FA608UP | |
| Gigabyte Gaming A16 GA6H | |
| CrossMark / Responsiveness | |
| Alienware 16 Aurora | |
| Lenovo Legion 5 Pro 16IAX10H | |
| Gigabyte Gaming A16 GA6H | |
| Lenovo Legion 7 16IAX10 | |
| Durchschnittliche Intel Core Ultra 7 255HX, NVIDIA GeForce RTX 5060 Laptop (1617 - 1765, n=2) | |
| MSI Vector 16 HX AI A2XWHG | |
| Asus TUF Gaming A16 FA608UP | |
| WebXPRT 3 / Overall | |
| Lenovo Legion 5 Pro 16IAX10H | |
| Lenovo Legion 7 16IAX10 | |
| Durchschnittliche Intel Core Ultra 7 255HX, NVIDIA GeForce RTX 5060 Laptop (317 - 344, n=2) | |
| MSI Vector 16 HX AI A2XWHG | |
| Asus TUF Gaming A16 FA608UP | |
| Alienware 16 Aurora | |
| Gigabyte Gaming A16 GA6H | |
| WebXPRT 4 / Overall | |
| Lenovo Legion 5 Pro 16IAX10H | |
| Lenovo Legion 7 16IAX10 | |
| Durchschnittliche Intel Core Ultra 7 255HX, NVIDIA GeForce RTX 5060 Laptop (313 - 317, n=2) | |
| MSI Vector 16 HX AI A2XWHG | |
| Alienware 16 Aurora | |
| Gigabyte Gaming A16 GA6H | |
| Asus TUF Gaming A16 FA608UP | |
| Mozilla Kraken 1.1 / Total | |
| Asus TUF Gaming A16 FA608UP | |
| Alienware 16 Aurora | |
| Gigabyte Gaming A16 GA6H | |
| Lenovo Legion 7 16IAX10 | |
| Durchschnittliche Intel Core Ultra 7 255HX, NVIDIA GeForce RTX 5060 Laptop (423 - 436, n=2) | |
| MSI Vector 16 HX AI A2XWHG | |
| Lenovo Legion 5 Pro 16IAX10H | |
* ... kleinere Werte sind besser
| PCMark 10 Score | 7536 Punkte | |
Hilfe | ||
| AIDA64 / Memory Copy | |
| Lenovo Legion 7 16IAX10 | |
| Durchschnittliche Intel Core Ultra 7 255HX (68939 - 104987, n=5) | |
| Lenovo Legion 5 Pro 16IAX10H | |
| MSI Vector 16 HX AI A2XWHG | |
| Asus TUF Gaming A16 FA608UP | |
| Alienware 16 Aurora | |
| Gigabyte Gaming A16 GA6H | |
| AIDA64 / Memory Read | |
| Durchschnittliche Intel Core Ultra 7 255HX (82336 - 95821, n=5) | |
| Lenovo Legion 5 Pro 16IAX10H | |
| Lenovo Legion 7 16IAX10 | |
| MSI Vector 16 HX AI A2XWHG | |
| Alienware 16 Aurora | |
| Asus TUF Gaming A16 FA608UP | |
| Gigabyte Gaming A16 GA6H | |
| AIDA64 / Memory Write | |
| Durchschnittliche Intel Core Ultra 7 255HX (66479 - 133486, n=5) | |
| Asus TUF Gaming A16 FA608UP | |
| Lenovo Legion 5 Pro 16IAX10H | |
| Lenovo Legion 7 16IAX10 | |
| MSI Vector 16 HX AI A2XWHG | |
| Alienware 16 Aurora | |
| Gigabyte Gaming A16 GA6H | |
| AIDA64 / Memory Latency | |
| Lenovo Legion 5 Pro 16IAX10H | |
| Durchschnittliche Intel Core Ultra 7 255HX (104.2 - 110, n=5) | |
| Lenovo Legion 7 16IAX10 | |
| Alienware 16 Aurora | |
| MSI Vector 16 HX AI A2XWHG | |
| Gigabyte Gaming A16 GA6H | |
| Asus TUF Gaming A16 FA608UP | |
* ... kleinere Werte sind besser
DPC-Latenzzeit
LatencyMon zeigt nur geringfügige DPC-Probleme und keine unterbrochenen Frames während unseres 4K60-Videowiedergabe-Tests.
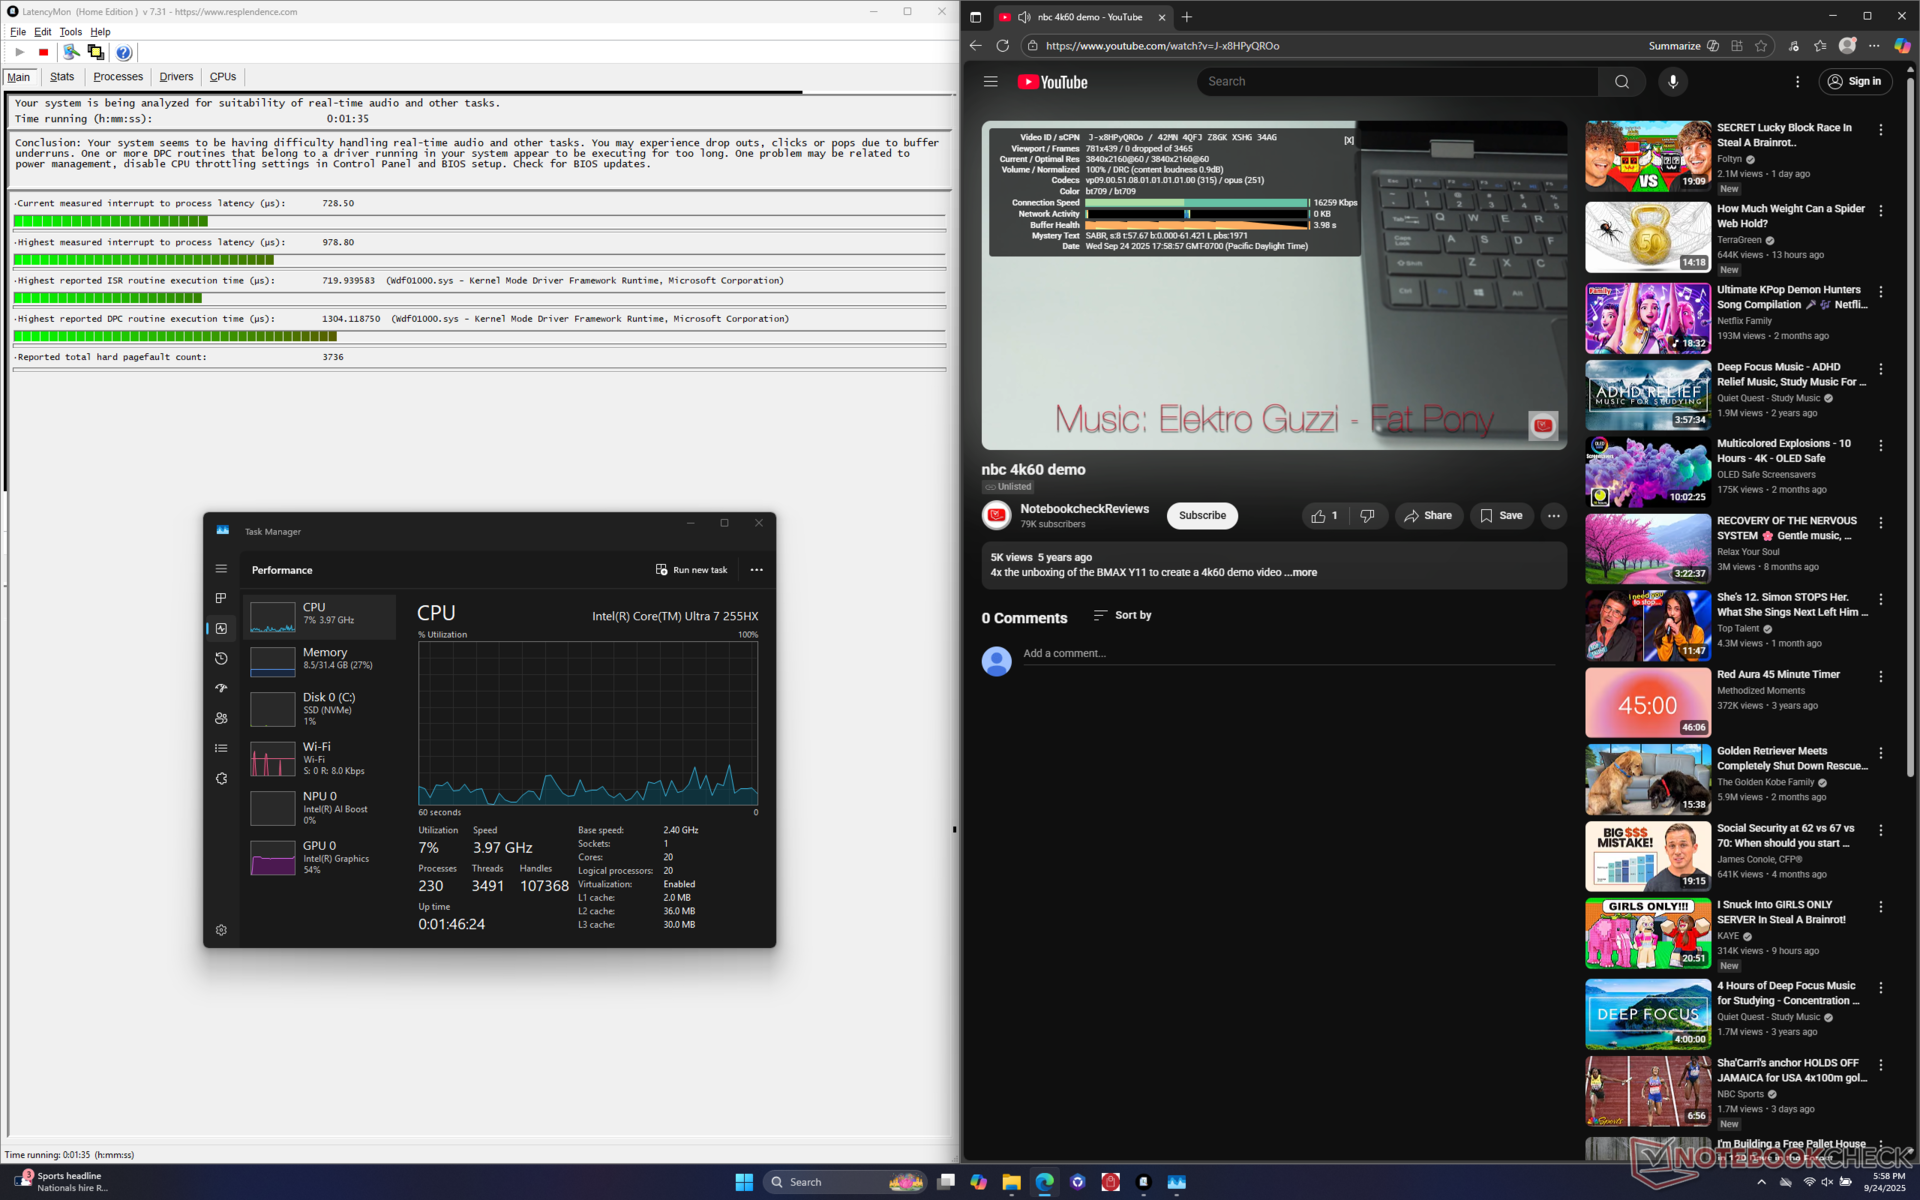
| DPC Latencies / LatencyMon - interrupt to process latency (max), Web, Youtube, Prime95 | |
| MSI Vector 16 HX AI A2XWHG | |
| Gigabyte Gaming A16 GA6H | |
| Lenovo Legion 5 Pro 16IAX10H | |
| Lenovo Legion 7 16IAX10 | |
| Asus TUF Gaming A16 FA608UP | |
* ... kleinere Werte sind besser
Speichergeräte
Im Lieferumfang der primären SSD sind ein Wärmeleitpad und ein Wärmeverteiler enthalten. Die Übertragungsraten liegen konstant bei 6.900 MB/s, wenn sie belastet werden, um keine Drosselungsprobleme zu verursachen.

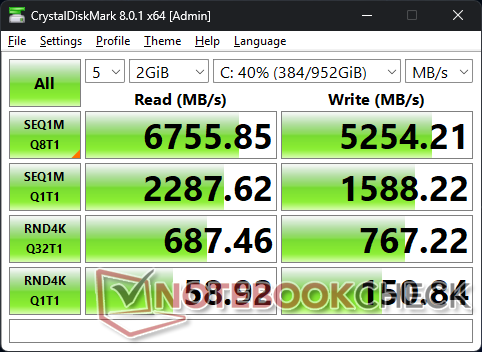


| Drive Performance Rating - Percent | |
| Gigabyte Gaming A16 GA6H | |
| Lenovo Legion 5 Pro 16IAX10H | |
| Lenovo Legion 7 16IAX10 | |
| Asus TUF Gaming A16 FA608UP | |
| MSI Vector 16 HX AI A2XWHG | |
* ... kleinere Werte sind besser
Drosselung der Festplatte: DiskSpd Read Loop, Queue Depth 8
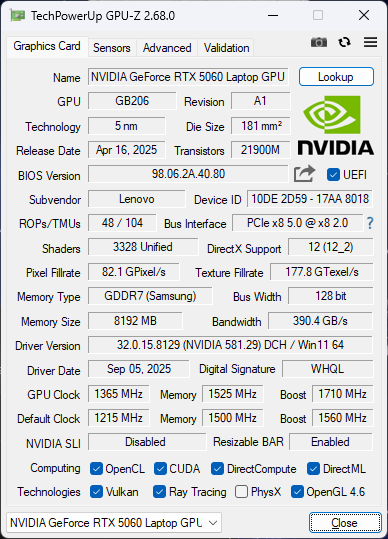
GPU Performance
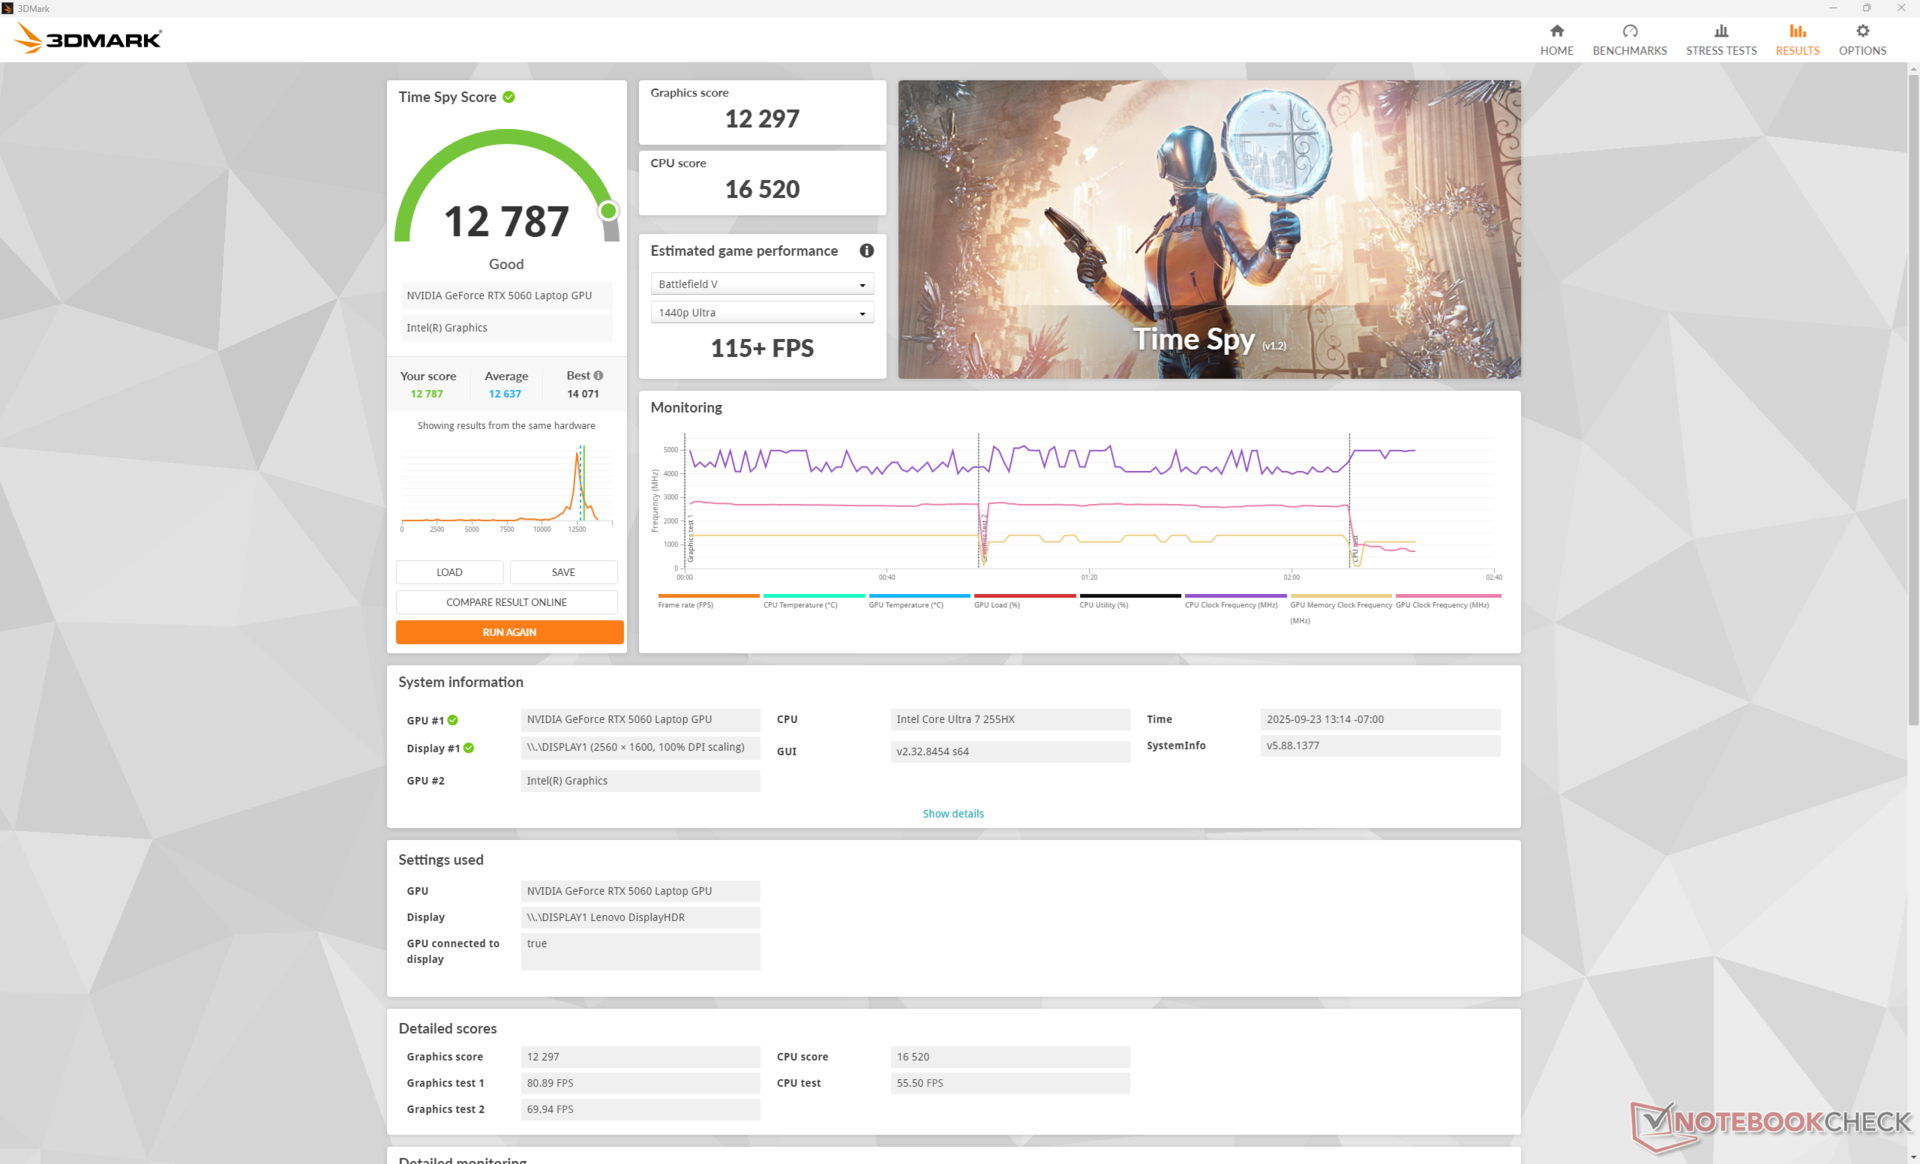
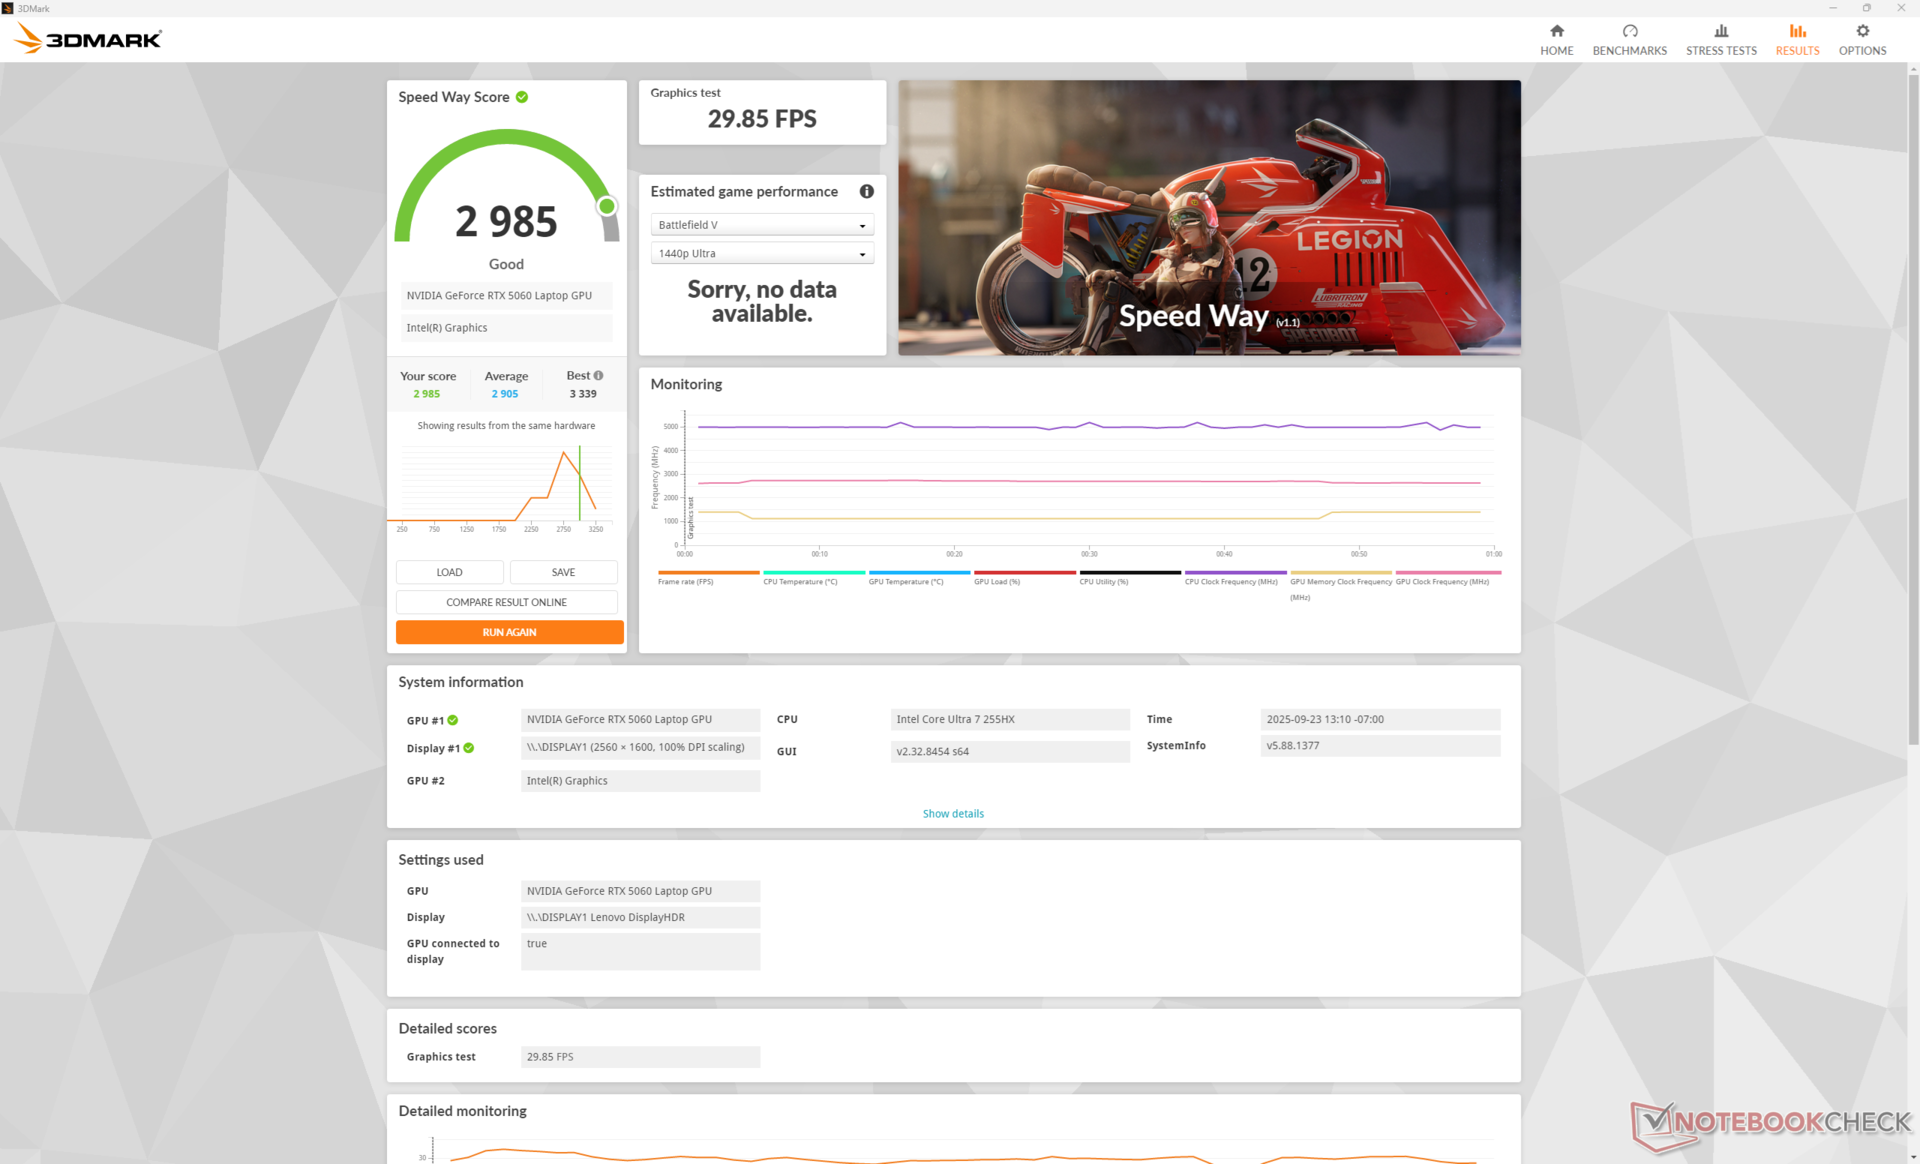
Die mobile GeForce RTX 5060 wurde ausgiebig in Benchmarks getestet, wie auf unserer speziellen GPU-Seite hier zu sehen ist. Beim Legion 7 16IAX10 stabilisiert sich die GPU bei 105 W im Performance-Modus oder bei nur 77 W im Balanced-Modus, was laut 3DMark Fire Strike ein Leistungsdefizit von etwa zehn Prozent bedeutet.
Beim Aufrüsten auf die mobile RTX-5070-Konfiguration wird die Grafikleistung um etwa 15 Prozent gesteigert. Leider gibt es keine RTX-5070-Ti-Optionen.
Benutzer, die einen älteren RTX 3060 Laptop aufrüsten, werden eine deutlichere Steigerung der Rohleistung von 30 bis 40 Prozent feststellen, bevor sie DLSS Upscaling oder Frame Generation Features anwenden.
| Leistungsprofil | Grafics-Punktzahl | Physics-Punktzahl | kombinierte Punktzahl |
| Performance-Modus (105-W-GPU) | 33.912 | 46.455 | 16.001 |
| Balanced Modus (77-W-GPU) | 30.456 (-10 %) | 44.872 (-3 %) | 14.652 (-8 %) |
| Akku-Leistung | 24.709 (-27 %) | 26.926 (-42 %) | 11.171 (-30 %) |
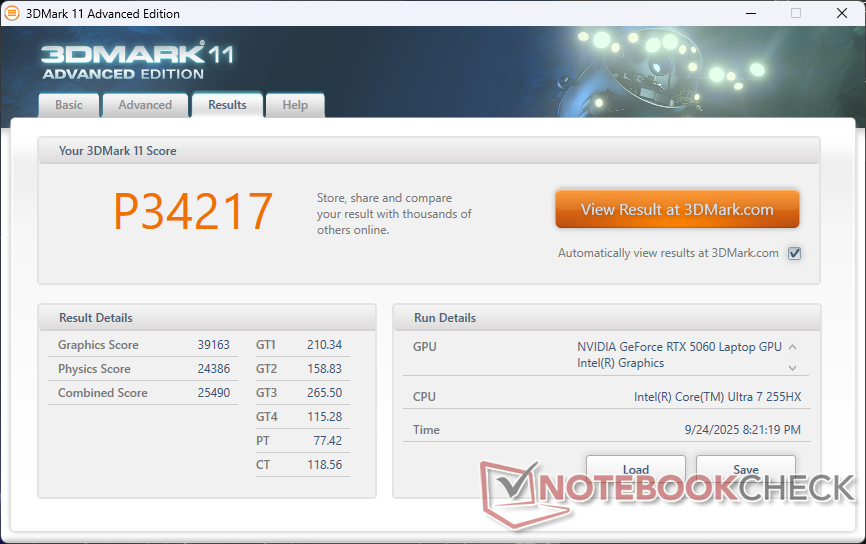


| 3DMark 11 Performance | 34217 Punkte | |
| 3DMark Cloud Gate Standard Score | 69955 Punkte | |
| 3DMark Fire Strike Score | 31650 Punkte | |
| 3DMark Time Spy Score | 12787 Punkte | |
| 3DMark Steel Nomad Score | 2806 Punkte | |
Hilfe | ||
* ... kleinere Werte sind besser
Gaming Performance
Unser Lenovo hat das Alienware 16 Aurora mit der gleichen RTX-5060-GPU bei einem niedrigeren TGP-Zielwert von 80 W durchweg übertroffen. Der Vorteil kann mit etwa 20 Prozent bei Titeln wie Cyberpunk 2077 oder sogar 30 Prozent bei Assassin's Creed Shadows je nach Einstellungen ziemlich signifikant sein. Unsere viel schnellere Arrow-Lake-HX-CPU spielt ebenfalls eine wichtige Rolle bei der Verbesserung der Gaming Performance.
Nichtsdestotrotz schränken die 8 GB VRAM das System immer noch ein, wenn es darum geht, die anspruchsvollsten Titel mit sehr hohen Einstellungen auszuführen. Alan Wake 2 zum Beispiel erreicht bei 2K-Auflösung und hohen RT-Einstellungen durchschnittlich nur 19,3 fps. Wenn man den DLSS-Qualitätsmodus und 2x Frame Generation aktiviert, wird der niedrige Durchschnitt von 19,3 fps auf glattere 61 fps angehoben, aber die hohe Eingangslatenz bleibt auch bei aktiviertem Reflex spürbar.
| Performance Rating - Percent | |
| Lenovo Legion 5 Pro 16IAX10H | |
| MSI Vector 16 HX AI A2XWHG -1! | |
| Lenovo Legion 7 16IAX10 | |
| Asus TUF Gaming A16 FA608UP | |
| Alienware 16 Aurora | |
| Gigabyte Gaming A16 GA6H | |
| Cyberpunk 2077 - 1920x1080 Ultra Preset (FSR off) | |
| Lenovo Legion 5 Pro 16IAX10H | |
| MSI Vector 16 HX AI A2XWHG | |
| Asus TUF Gaming A16 FA608UP | |
| Lenovo Legion 7 16IAX10 | |
| Gigabyte Gaming A16 GA6H | |
| Alienware 16 Aurora | |
| Baldur's Gate 3 - 1920x1080 Ultra Preset AA:T | |
| MSI Vector 16 HX AI A2XWHG | |
| Lenovo Legion 5 Pro 16IAX10H | |
| Asus TUF Gaming A16 FA608UP | |
| Lenovo Legion 7 16IAX10 | |
| Alienware 16 Aurora | |
| Gigabyte Gaming A16 GA6H | |
| GTA V - 1920x1080 Highest AA:4xMSAA + FX AF:16x | |
| Lenovo Legion 5 Pro 16IAX10H | |
| MSI Vector 16 HX AI A2XWHG | |
| Lenovo Legion 7 16IAX10 | |
| Asus TUF Gaming A16 FA608UP | |
| Alienware 16 Aurora | |
| Gigabyte Gaming A16 GA6H | |
| Final Fantasy XV Benchmark - 1920x1080 High Quality | |
| Lenovo Legion 5 Pro 16IAX10H | |
| MSI Vector 16 HX AI A2XWHG | |
| Asus TUF Gaming A16 FA608UP | |
| Lenovo Legion 7 16IAX10 | |
| Alienware 16 Aurora | |
| Gigabyte Gaming A16 GA6H | |
| Strange Brigade - 1920x1080 ultra AA:ultra AF:16 | |
| Lenovo Legion 5 Pro 16IAX10H | |
| Lenovo Legion 7 16IAX10 | |
| Asus TUF Gaming A16 FA608UP | |
| Gigabyte Gaming A16 GA6H | |
| Alienware 16 Aurora | |
| Dota 2 Reborn - 1920x1080 ultra (3/3) best looking | |
| Lenovo Legion 5 Pro 16IAX10H | |
| MSI Vector 16 HX AI A2XWHG | |
| Lenovo Legion 7 16IAX10 | |
| Alienware 16 Aurora | |
| Gigabyte Gaming A16 GA6H | |
| Asus TUF Gaming A16 FA608UP | |
| X-Plane 11.11 - 1920x1080 high (fps_test=3) | |
| Lenovo Legion 5 Pro 16IAX10H | |
| MSI Vector 16 HX AI A2XWHG | |
| Lenovo Legion 7 16IAX10 | |
| Gigabyte Gaming A16 GA6H | |
| Alienware 16 Aurora | |
| Asus TUF Gaming A16 FA608UP | |
| Monster Hunter Wilds | |
| 1920x1080 lowest, no upscaling | |
| Zotac GeForce RTX 5060 AMP | |
| Lenovo Legion 7 16IAX10 | |
| Durchschnittliche NVIDIA GeForce RTX 5060 Laptop (49.4 - 80.1, n=3) | |
| Alienware 16 Aurora | |
| 1920x1080 medium, no upscaling | |
| Alienware 16X Aurora, RTX 5070 | |
| Zotac GeForce RTX 5060 AMP | |
| Lenovo Legion 7 16IAX10 | |
| Durchschnittliche NVIDIA GeForce RTX 5060 Laptop (45.2 - 68.3, n=4) | |
| Alienware 16 Aurora | |
| 1920x1080 ultra, RT: high, no upscaling | |
| Razer Blade 16 RTX 5080 | |
| Zotac GeForce RTX 5060 AMP | |
| Alienware 16X Aurora, RTX 5070 | |
| Alienware 16 Aurora | |
| Durchschnittliche NVIDIA GeForce RTX 5060 Laptop (16.6 - 36.5, n=4) | |
| Lenovo Legion 7 16IAX10 | |
| 2560x1440 ultra, RT: high, no upscaling | |
| Razer Blade 16 RTX 5080 | |
| Alienware 16X Aurora, RTX 5070 | |
| Alienware 16 Aurora | |
| Durchschnittliche NVIDIA GeForce RTX 5060 Laptop (13.9 - 20.9, n=3) | |
| Lenovo Legion 7 16IAX10 | |
| 2560x1440 ultra, RT: high, DLSS3 quality | |
| Razer Blade 16 RTX 5080 | |
| Lenovo Legion 7 16IAX10 | |
| Durchschnittliche NVIDIA GeForce RTX 5060 Laptop (n=1) | |
Cyberpunk 2077 ultra fps-Grafik
| min. | mittel | hoch | max. | QHD DLSS | QHD | |
|---|---|---|---|---|---|---|
| GTA V (2015) | 184.7 | 181.9 | 142.9 | 115.2 | ||
| Dota 2 Reborn (2015) | 206 | 182.1 | 176.6 | 163.7 | ||
| Final Fantasy XV Benchmark (2018) | 228 | 177.6 | 133.6 | 95.8 | ||
| X-Plane 11.11 (2018) | 142.5 | 126.8 | 105.6 | |||
| Strange Brigade (2018) | 610 | 343 | 275 | 239 | 165 | |
| Baldur's Gate 3 (2023) | 173.3 | 144.6 | 112.8 | 111.2 | 119.1 | 78.4 |
| Cyberpunk 2077 (2023) | 153.3 | 125.1 | 104.4 | 94.9 | 69.6 | 59.2 |
| Alan Wake 2 (2023) | 79 | 71.6 | 66.6 | 36.7 | ||
| F1 24 (2024) | 273 | 268 | 219 | 71.6 | 71.4 | 45.7 |
| Black Myth: Wukong (2024) | 100 | 73 | 58 | 32 | 36 | 23 |
| Indiana Jones and the Great Circle (2024) | 127.7 | 52.8 | 6.3 | 4.2 | ||
| Monster Hunter Wilds (2025) | 80.1 | 68.3 | 16.6 | 25.1 | 13.9 | |
| Assassin's Creed Shadows (2025) | 66 | 61 | 53 | 40 | 41 | 34 |
| Battlefield 6 (2025) | 70.1 | 47.8 | 36 |
Emissionen
Systemrauschen
Das Lüftergeräusch ist gering und lethargisch, wenn das Leistungsprofil Leise eingestellt ist. Im Modus Ausbalanciert oder Performance treten jedoch häufiger pulsierende Geräusche auf, die bis zu 30 dB(A) erreichen können, während sie beim Surfen oder Streamen im Internet nur 24 dB(A) betragen.
Das Lüftergeräusch beim Spielen im Modus Ausgeglichen oder Performance pendelt sich bei 45,9 dB(A) bzw. 54,6 dB(A) ein. Dieses Delta ist enorm, was bedeutet, dass man den Modus "Ausbalanciert" in Erwägung ziehen sollte, um ein ruhigeres Spielerlebnis zu haben, auch wenn dies ein Leistungsdefizit von zehn Prozent mit sich bringt. Andernfalls werden Kopfhörer empfohlen, wenn man im Modus Performance spielt. Der mittlere Bereich von 50 dB(A) entspricht dem, was wir auf dem Asus TUF Gaming A16 gemessen haben, und ist gleichzeitig viel lauter als bei dem dickeren MSI Vector 16 HX.

Lautstärkediagramm
| Idle |
| 24 / 26 / 29.4 dB(A) |
| Last |
| 35.4 / 54.7 dB(A) |
 | ||
30 dB leise 40 dB(A) deutlich hörbar 50 dB(A) störend |
||
min: | ||
| Lenovo Legion 7 16IAX10 GeForce RTX 5060 Laptop, Ultra 7 255HX, WD PC SN7100S SDFPMSL-1T00-1101 | Alienware 16 Aurora GeForce RTX 5060 Laptop, Core 7 240H | Asus TUF Gaming A16 FA608UP GeForce RTX 5070 Laptop, R7 260, Western Digital PC SN5000S SDEQNSJ-1T00 | Gigabyte Gaming A16 GA6H GeForce RTX 5070 Laptop, i7-13620H, Kingston OM8PGP41024Q-A0 | MSI Vector 16 HX AI A2XWHG GeForce RTX 5070 Ti Laptop, Ultra 7 255HX, Micron 2400 MTFDKBA512QFM | Lenovo Legion 5 Pro 16IAX10H GeForce RTX 5070 Ti Laptop, Ultra 9 275HX, Western Digital PC SN8000S SDEPNRK-1T00 | |
|---|---|---|---|---|---|---|
| Geräuschentwicklung | -1% | -12% | -7% | -16% | -9% | |
| aus / Umgebung * (dB) | 23.9 | 22.9 4% | 25.1 -5% | 24 -0% | 25 -5% | 24 -0% |
| Idle min * (dB) | 24 | 24 -0% | 32.2 -34% | 25 -4% | 33 -38% | 24 -0% |
| Idle avg * (dB) | 26 | 25.6 2% | 32.2 -24% | 26 -0% | 34 -31% | 24 8% |
| Idle max * (dB) | 29.4 | 25.6 13% | 32.2 -10% | 27 8% | 38 -29% | 30.9 -5% |
| Last avg * (dB) | 35.4 | 46.8 -32% | 38.1 -8% | 54 -53% | 46 -30% | 55.9 -58% |
| Cyberpunk 2077 ultra * (dB) | 54.6 | 49.9 9% | 53.9 1% | 54 1% | 47 14% | 56.72 -4% |
| Last max * (dB) | 54.7 | 55.6 -2% | 57.1 -4% | 55 -1% | 49 10% | 56.72 -4% |
* ... kleinere Werte sind besser
Temperatur
Die Oberflächentemperaturen sind selbst im Leerlauf auf dem Desktop warm. Heiße Stellen beim Spielen können an der Ober- und Unterseite der Basis über 47 °C bzw. 41 !C erreichen, aber diese Bereiche befinden sich glücklicherweise in der Nähe des Power-Buttons, wo man mit den Fingern nicht so leicht hinkommt. Die durchschnittlichen Temperaturen sind dennoch wärmer als die, die wir beim Asus TUF Gaming A16 erlebt haben.
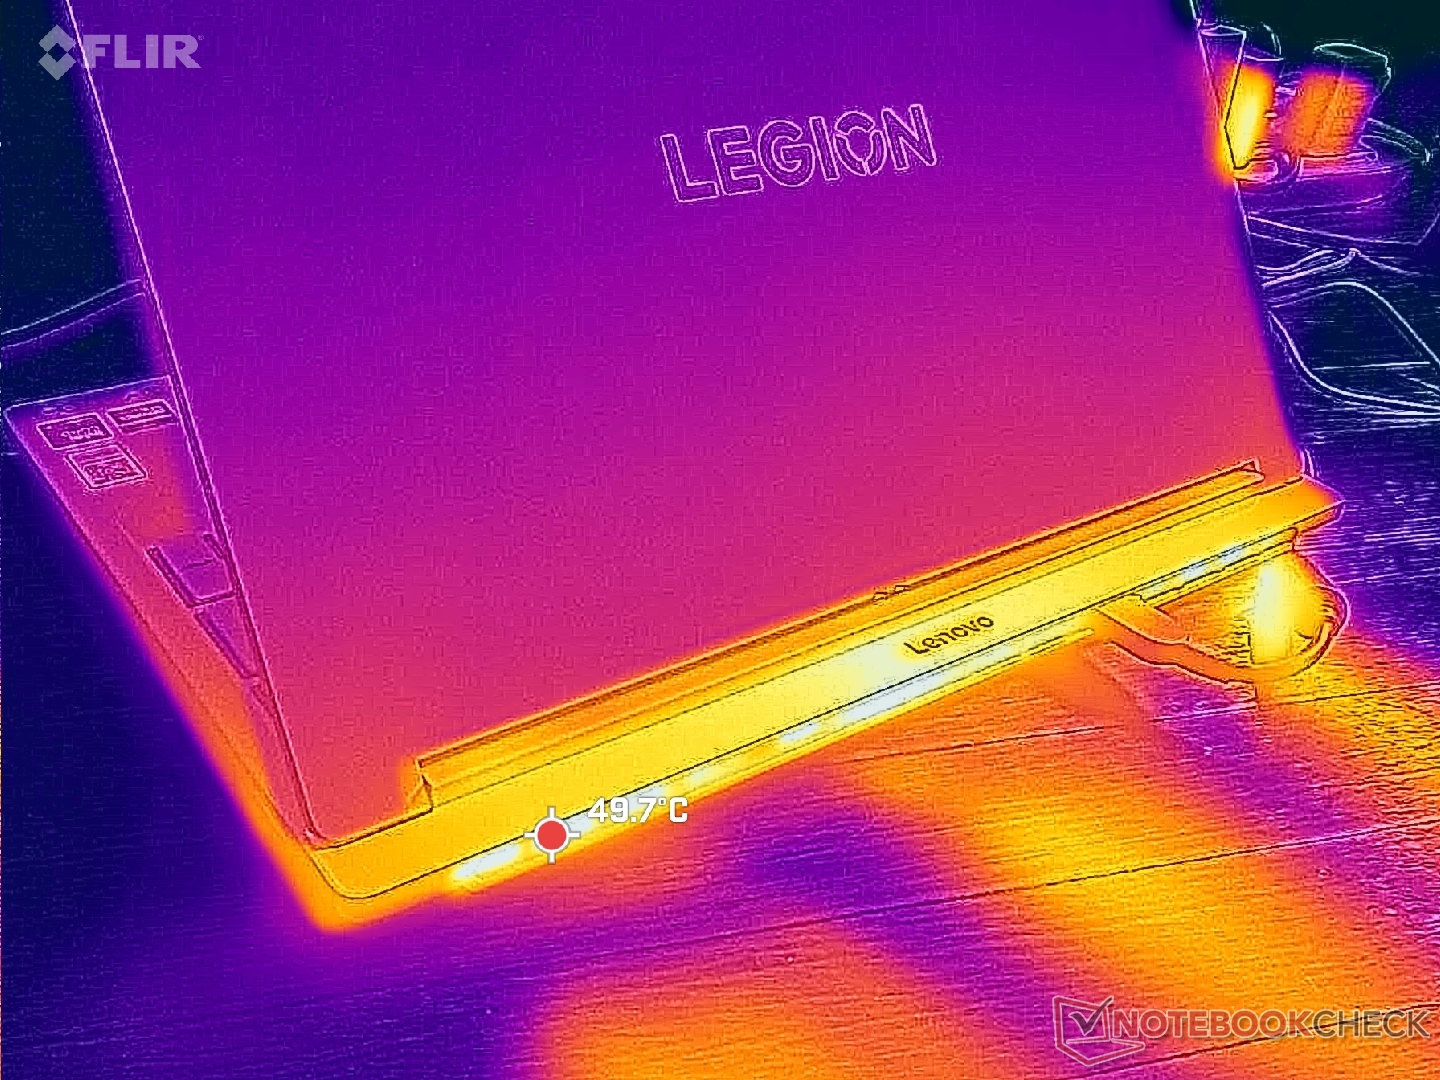

(-) Die maximale Temperatur auf der Oberseite ist 47 °C. Im Vergleich liegt der Klassendurchschnitt bei 40.4 °C (von 21.2 bis 68.8 °C für die Klasse Gaming).
(±) Auf der Unterseite messen wir eine maximalen Wert von 44 °C (im Vergleich zum Durchschnitt von 43.2 °C).
(+) Ohne Last messen wir eine durchschnittliche Temperatur von 30.5 °C auf der Oberseite. Der Klassendurchschnitt erreicht 33.9 °C.
(±) 3: The average temperature for the upper side is 36.3 °C / 97 F, compared to the average of 33.9 °C / 93 F for the class Gaming.
(+) Die Handballen und der Touchpad-Bereich sind mit gemessenen 31.4 °C kühler als die typische Hauttemperatur und fühlen sich dadurch kühl an.
(-) Die durchschnittliche Handballen-Temperatur anderer getesteter Geräte war 28.8 °C (-2.6 °C).


| Lenovo Legion 7 16IAX10 Intel Core Ultra 7 255HX, NVIDIA GeForce RTX 5060 Laptop | Alienware 16X Aurora, RTX 5070 Intel Core Ultra 9 275HX, NVIDIA GeForce RTX 5070 Laptop | Asus TUF Gaming A16 FA608UP AMD Ryzen 7 260, NVIDIA GeForce RTX 5070 Laptop | Gigabyte Gaming A16 GA6H Intel Core i7-13620H, NVIDIA GeForce RTX 5070 Laptop | MSI Vector 16 HX AI A2XWHG Intel Core Ultra 7 255HX, NVIDIA GeForce RTX 5070 Ti Laptop | Lenovo Legion 5 Pro 16IAX10H Intel Core Ultra 9 275HX, NVIDIA GeForce RTX 5070 Ti Laptop | |
|---|---|---|---|---|---|---|
| Hitze | 6% | 17% | -3% | -2% | -11% | |
| Last oben max * (°C) | 47 | 51 -9% | 39.5 16% | 50 -6% | 53 -13% | 48 -2% |
| Last unten max * (°C) | 44 | 45.6 -4% | 45.1 -3% | 49 -11% | 52 -18% | 50 -14% |
| Idle oben max * (°C) | 35.6 | 29.8 16% | 25.7 28% | 35 2% | 33 7% | 38 -7% |
| Idle unten max * (°C) | 35.2 | 27.4 22% | 25.5 28% | 34 3% | 29 18% | 42 -19% |
* ... kleinere Werte sind besser
Lautsprecher

Lenovo Legion 7 16IAX10 Audio Analyse
(±) | Mittelmäßig laut spielende Lautsprecher (77.6 dB)
Bass 100 - 315 Hz
(±) | abgesenkter Bass - 9.5% geringer als der Median
(±) | durchschnittlich lineare Bass-Wiedergabe (9.8% Delta zum Vorgänger)
Mitteltöne 400 - 2000 Hz
(+) | ausgeglichene Mitten, vom Median nur 1.5% abweichend
(+) | lineare Mitten (4% Delta zum Vorgänger)
Hochtöne 2 - 16 kHz
(+) | ausgeglichene Hochtöne, vom Median nur 3% abweichend
(+) | sehr lineare Hochtöne (4.9% Delta zum Vorgänger)
Gesamt im hörbaren Bereich 100 - 16.000 Hz
(+) | hörbarer Bereich ist sehr linear (11.5% Abstand zum Median
Im Vergleich zu allen Geräten derselben Klasse
» 10% aller getesteten Geräte dieser Klasse waren besser, 3% vergleichbar, 87% schlechter
» Das beste Gerät hat einen Delta-Wert von 6%, durchschnittlich ist 18%, das schlechteste Gerät hat 132%
Im Vergleich zu allen Geräten im Test
» 8% aller getesteten Geräte waren besser, 2% vergleichbar, 90% schlechter
» Das beste Gerät hat einen Delta-Wert von 4%, durchschnittlich ist 24%, das schlechteste Gerät hat 134%
Apple MacBook Pro 16 2021 M1 Pro Audio Analyse
(+) | Die Lautsprecher können relativ laut spielen (84.7 dB)
Bass 100 - 315 Hz
(+) | guter Bass - nur 3.8% Abweichung vom Median
(+) | lineare Bass-Wiedergabe (5.2% Delta zum Vorgänger)
Mitteltöne 400 - 2000 Hz
(+) | ausgeglichene Mitten, vom Median nur 1.3% abweichend
(+) | lineare Mitten (2.1% Delta zum Vorgänger)
Hochtöne 2 - 16 kHz
(+) | ausgeglichene Hochtöne, vom Median nur 1.9% abweichend
(+) | sehr lineare Hochtöne (2.7% Delta zum Vorgänger)
Gesamt im hörbaren Bereich 100 - 16.000 Hz
(+) | hörbarer Bereich ist sehr linear (4.6% Abstand zum Median
Im Vergleich zu allen Geräten derselben Klasse
» 0% aller getesteten Geräte dieser Klasse waren besser, 0% vergleichbar, 100% schlechter
» Das beste Gerät hat einen Delta-Wert von 5%, durchschnittlich ist 17%, das schlechteste Gerät hat 45%
Im Vergleich zu allen Geräten im Test
» 0% aller getesteten Geräte waren besser, 0% vergleichbar, 100% schlechter
» Das beste Gerät hat einen Delta-Wert von 4%, durchschnittlich ist 24%, das schlechteste Gerät hat 134%
Energieverwaltung
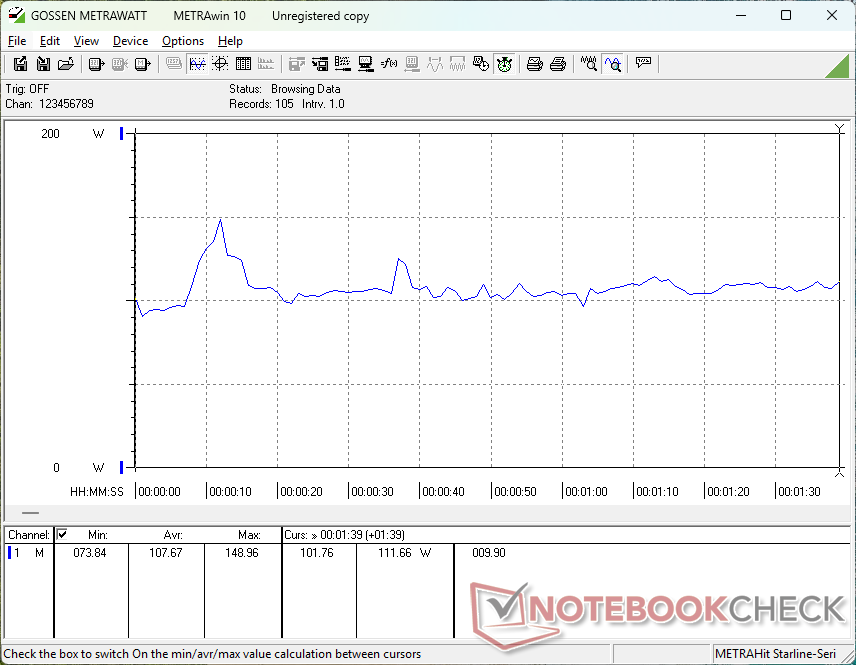
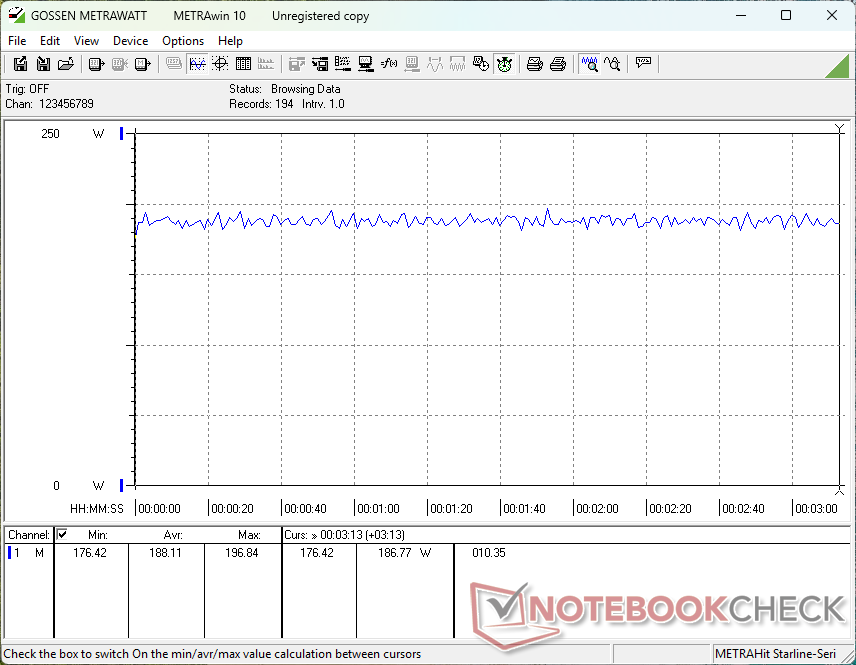
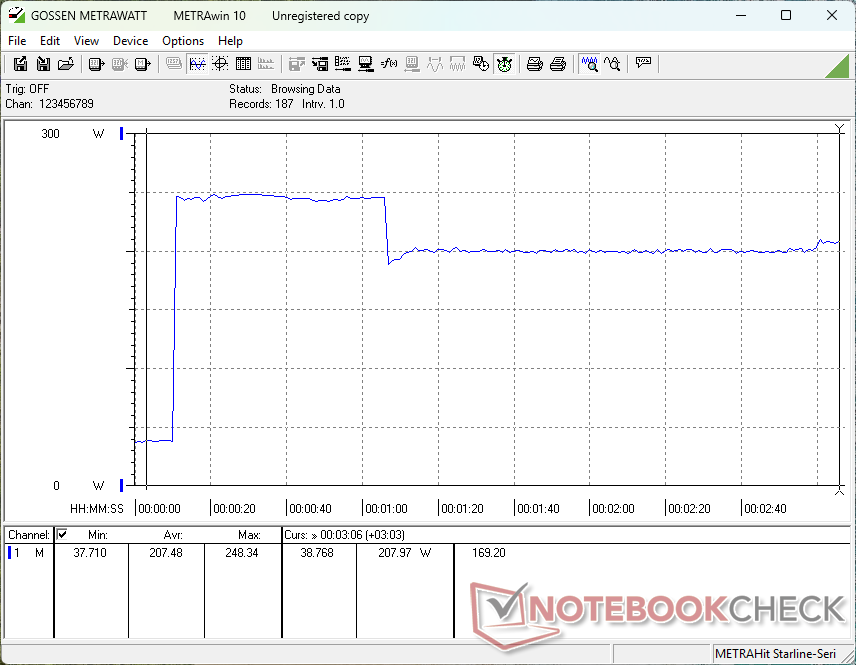
Stromverbrauch
Der Gesamtverbrauch ist für ein RTX-5060-Notebook recht anspruchsvoll, da die meisten anderen Notebooks mit der gleichen GPU in der Regel nicht mit CPUs der Core-HX-Serie ausgeliefert werden. Das Alienware 16 Aurora zum Beispiel verbraucht bei Cyberpunk 2077 nur 123 W, verglichen mit unseren 188 W. Selbst das AMD betriebene Razer Blade 16 mit seiner viel leistungsfähigeren RTX-5080-GPU benötigt nur vier Prozent mehr Strom, was einen massiven Anstieg von 60 bis 90 Prozent bei der Gaming Performance gegenüber unserem Legion 7 16 bedeutet.
Das System wird mit einem relativ kompakten 245-W-Netzteil ausgeliefert, das nur ~16,5 x 7,5 x 2,5 cm groß ist. Der maximale Verbrauch ist deutlich höher als beim Alienware 16 Aurora, Asus TUF Gaming A16 oder Gigabyte Gaming A16, obwohl das Asus auch mit einem ähnlichen 240-W-Netzteil ausgeliefert wird.

| Aus / Standby | |
| Idle | |
| Last |
|
Legende:
min: | |
| Lenovo Legion 7 16IAX10 Ultra 7 255HX, GeForce RTX 5060 Laptop, WD PC SN7100S SDFPMSL-1T00-1101, OLED, 2560x1600, 16" | Alienware 16 Aurora Core 7 240H, GeForce RTX 5060 Laptop, , IPS, 2560x1600, 16" | Asus TUF Gaming A16 FA608UP R7 260, GeForce RTX 5070 Laptop, Western Digital PC SN5000S SDEQNSJ-1T00, IPS, 2560x1600, 16" | Gigabyte Gaming A16 GA6H i7-13620H, GeForce RTX 5070 Laptop, Kingston OM8PGP41024Q-A0, IPS, 2560x1600, 16" | MSI Vector 16 HX AI A2XWHG Ultra 7 255HX, GeForce RTX 5070 Ti Laptop, Micron 2400 MTFDKBA512QFM, IPS, 2560x1600, 16" | Lenovo Legion 5 Pro 16IAX10H Ultra 9 275HX, GeForce RTX 5070 Ti Laptop, Western Digital PC SN8000S SDEPNRK-1T00, OLED, 2560x1600, 16" | |
|---|---|---|---|---|---|---|
| Stromverbrauch | 21% | 22% | 22% | -13% | -28% | |
| Idle min * (Watt) | 9.4 | 4.4 53% | 4.6 51% | 9 4% | 7.1 24% | 14 -49% |
| Idle avg * (Watt) | 10.6 | 18 -70% | 9.8 8% | 11 -4% | 15.9 -50% | 14.3 -35% |
| Idle max * (Watt) | 36.4 | 18.2 50% | 10.2 72% | 23 37% | 29.5 19% | 20.1 45% |
| Last avg * (Watt) | 107.7 | 87.1 19% | 76.1 29% | 91 16% | 124 -15% | 177 -64% |
| Cyberpunk 2077 ultra external monitor * (Watt) | 187.5 | 120.6 36% | 198.1 -6% | 130 31% | 217 -16% | 255 -36% |
| Cyberpunk 2077 ultra * (Watt) | 188 | 123 35% | 198.9 -6% | 132.5 30% | 222 -18% | 255 -36% |
| Last max * (Watt) | 247 | 183 26% | 235.2 5% | 155 37% | 336 -36% | 294 -19% |
* ... kleinere Werte sind besser
Stromverbrauch Cyberpunk/Stresstest
Stromverbrauch externer Monitor
Akkulaufzeit

Die Kombination aus einer CPU der HX-Serie, einem OLED-Display und einem für diese Kategorie etwas kleineren Akku hat zu kürzeren Laufzeiten beigetragen. WLAN-Browsing im Modus Balanced und iGPU dauert nur etwas mehr als 4,5 Stunden im Vergleich zu 7+ Stunden bei Alternativen wie dem Alienware 16 Aurora oder dem Gigabyte Gaming A16.
Das Aufladen von leerer zu voller Kapazität ist ansonsten mit unter 90 Minuten schnell.
| Lenovo Legion 7 16IAX10 Ultra 7 255HX, GeForce RTX 5060 Laptop, 84 Wh | Alienware 16 Aurora Core 7 240H, GeForce RTX 5060 Laptop, 96 Wh | Asus TUF Gaming A16 FA608UP R7 260, GeForce RTX 5070 Laptop, 90 Wh | Gigabyte Gaming A16 GA6H i7-13620H, GeForce RTX 5070 Laptop, 76 Wh | MSI Vector 16 HX AI A2XWHG Ultra 7 255HX, GeForce RTX 5070 Ti Laptop, 90 Wh | Lenovo Legion 5 Pro 16IAX10H Ultra 9 275HX, GeForce RTX 5070 Ti Laptop, 80 Wh | |
|---|---|---|---|---|---|---|
| Akkulaufzeit | 60% | 177% | 64% | 49% | 4% | |
| WLAN (h) | 4.7 | 7.5 60% | 13 177% | 7.7 64% | 7 49% | 4.9 4% |
| H.264 (h) | 4.8 | |||||
| Last (h) | 1.7 |
Notebookcheck Bewertung
Ultraleichter 16-Zoll-Gaming-Laptop, der eine schnelle CPU der Arrow-Lake-HX-Serie mit einer Mittelklasse-GPU GeForce RTX 5060 oder 5070 kombiniert.
Lenovo Legion 7 16IAX10
- 03.10.2025 v8
Allen Ngo
 Total Sustainability Score:
 Potenzielle Wettbewerber im Vergleich
Bild | Modell / Test | Preis ab | Gewicht | Dicke | Display |
|---|---|---|---|---|---|
1. 86.6%  | Lenovo Legion 7 16IAX10 Intel Core Ultra 7 255HX ⎘ NVIDIA GeForce RTX 5060 Laptop ⎘ 32 GB RAM, 1024 GB SSD | Amazon: 1.598,00 € Geizhals Suche | 2 kg | 17.9 mm | 16.00" 2560x1600 189 PPI OLED |
2. 76.2%  | Alienware 16 Aurora Intel Core 7 240H ⎘ NVIDIA GeForce RTX 5060 Laptop ⎘ 32 GB RAM | Amazon: 1.149,00 € Geizhals Suche | 2.6 kg | 15.2 mm | 16.00" 2560x1600 189 PPI IPS |
3. 83.8%  | Asus TUF Gaming A16 FA608UP AMD Ryzen 7 260 ⎘ NVIDIA GeForce RTX 5070 Laptop ⎘ 32 GB RAM, 1024 GB SSD | Amazon: Bestpreis 2299€ ONE.de | 2.2 kg | 25.7 mm | 16.00" 2560x1600 189 PPI IPS |
4. 80.1%  | Gigabyte Gaming A16 GA6H Intel Core i7-13620H ⎘ NVIDIA GeForce RTX 5070 Laptop ⎘ 16 GB RAM, 1024 GB SSD | Amazon: 1. Gigabyte Gaming A16 Gaming-L... 2. 1.576,31 € Gigabyte Gaming A16 CWH Gami... 3. Gigabyte Gaming A16 Laptop �... Bestpreis 1369€ simac_gmbh 2. 1399€ Coolblue 3. 1399€ Easynotebooks.de | 2.3 kg | 23 mm | 16.00" 2560x1600 189 PPI IPS |
5. 84%  | MSI Vector 16 HX AI A2XWHG Intel Core Ultra 7 255HX ⎘ NVIDIA GeForce RTX 5070 Ti Laptop ⎘ 16 GB RAM, 512 GB SSD | Amazon: 2.029,00 € Bestpreis 1898.99€ playox.de 2. 1899€ office-partner.de 3. 1914.95€ playox (AT) | 2.6 kg | 28.6 mm | 16.00" 2560x1600 189 PPI IPS |
6. 84.5% 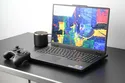 | Lenovo Legion 5 Pro 16IAX10H Intel Core Ultra 9 275HX ⎘ NVIDIA GeForce RTX 5070 Ti Laptop ⎘ 32 GB RAM, 1024 GB SSD | Amazon: 1. 2.799,00 € Lenovo Legion Pro 5 Gaming A... 2. 1.598,00 € Lenovo Legion Pro 5 16ADR10 ... 3. 2.163,20 € Lenovo Legion Pro 5 Gaming L... Listenpreis: 2500 Euro | 2.4 kg | 25.95 mm | 16.00" 2560x1600 189 PPI OLED |
Transparenz
Die Auswahl der zu testenden Geräte erfolgt innerhalb der Redaktion. Das vorliegende Testmuster wurde dem Autor vom Hersteller oder einem Shop zu Testzwecken leihweise zur Verfügung gestellt. Eine Einflussnahme des Leihstellers auf den Testbericht gab es nicht, der Hersteller erhielt keine Version des Reviews vor der Veröffentlichung. Es bestand keine Verpflichtung zur Publikation. Als eigenständiges, unabhängiges Unternehmen unterliegt Notebookcheck keiner Diktion von Herstellern, Shops und Verlagen.
So testet Notebookcheck
Pro Jahr werden von Notebookcheck hunderte Laptops und Smartphones unabhängig in von uns standardisierten technischen Verfahren getestet, um eine Vergleichbarkeit aller Testergebnisse zu gewährleisten. Seit rund 20 Jahren entwickeln wir diese Testmethoden kontinuierlich weiter und setzen damit Branchenstandards. In unseren Testlaboren kommt ausschließlich hochwertiges Messequipment in die Hände erfahrener Techniker und Redakteure. Die Tests unterliegen einer mehrstufigen Kontrolle. Unsere komplexe Gesamtbewertung basiert auf hunderten fundierten Messergebnissen und Benchmarks, womit Ihnen Objektivität garantiert ist. Weitere Informationen zu unseren Testmethoden gibt es hier.

