Fazit - Viel dünner als das 16X Aurora
Der Alienware 16 Aurora macht im Vergleich zum teureren 16X Aurora einige Kompromisse. Während die Leistungseinbußen zu erwarten sind, ist die Verschlechterung der Schwarz-Weiß-Reaktionszeiten für Gamer schwerer zu akzeptieren, da das Ghosting bei schnellen Spielen deutlich wahrnehmbar werden kann. In diesem wichtigen Aspekt schneiden Konkurrenten wie das Gigabyte Gaming A16 oder das Asus TUF Gaming A16 besser ab. Weitere kleinere Einsparungen betreffen das Fehlen von RGB-Tasten sowie die fehlende Unterstützung für G-Sync und Thunderbolt, wobei Gamer im Budget- bis Mittelklasse-Segment solche Extras jedoch eher weniger vermissen dürften.
Das Modell hat einige spürbare Vorteile. Da es mit weniger anspruchsvoller Hardware als das 16X Aurora ausgeliefert wird, ist das 16 Aurora dünner und hat sowohl eine längere Akkulaufzeit als auch ein kleineres Netzteil für einen leichteren Transport. Diese Vorteile sind bemerkenswert, da das 16X Aurora etwas sperrig sein kann.
Was die Gaming-Fähigkeiten betrifft, so kann das 16 Aurora bei anspruchsvollen Titeln mit der nativen 2K-Auflösung Probleme haben, da die mobile RTX-5060-GPU eher auf 1.080p ausgerichtet ist. Die Aktivierung von DLSS und Frame-Generierung bei niedrigeren Einstellungen ist der Schlüssel zur Maximierung des Potenzials der RTX-5060-GPU. Ansonsten ist Gaming Performance nur eine marginale Verbesserung gegenüber älteren RTX-4060-Optionen.
Pro
Contra
Preis und Verfügbarkeit
Dell liefert jetzt das Alienware 16 Aurora für 1.199 Euro aus, wie getestet. Kleinere Konfigurationen mit der RTX 4050 oder RTX 5050 sind ebenfalls erhältlich. Das getestete Modell und weitere Konfigurationen sind auch auf Amazon erhältlich.
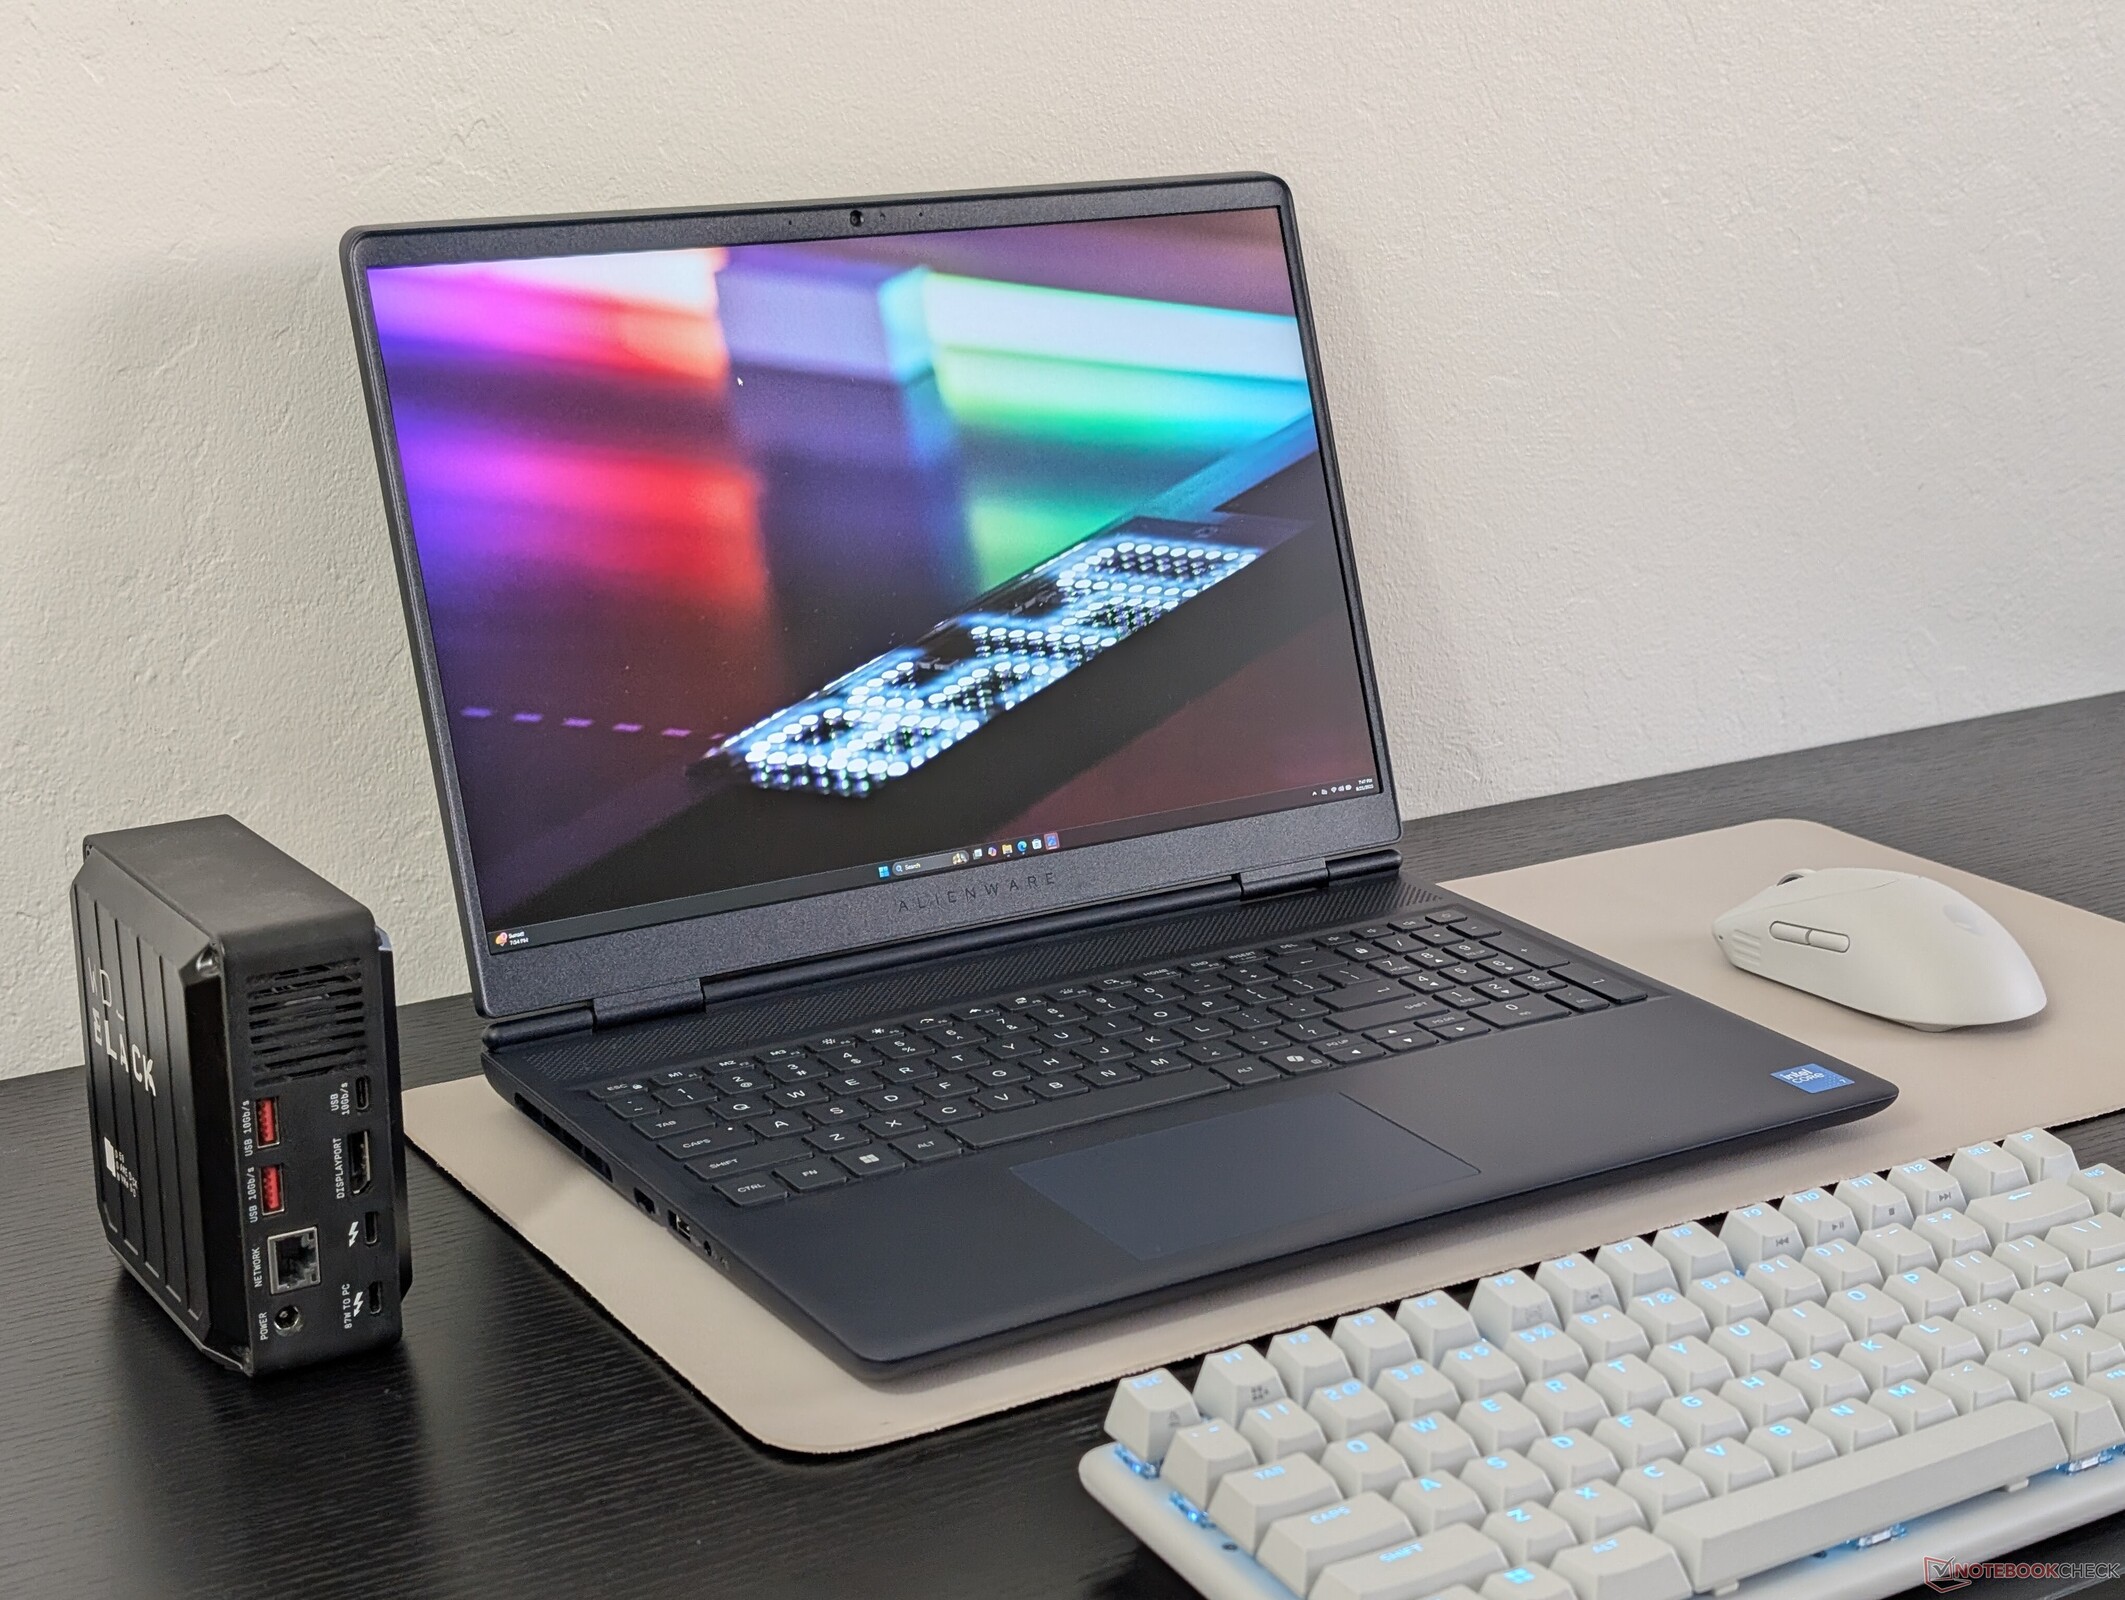
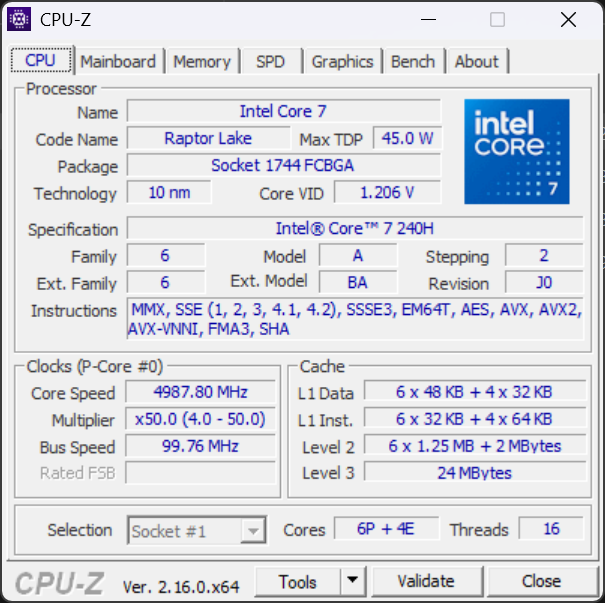
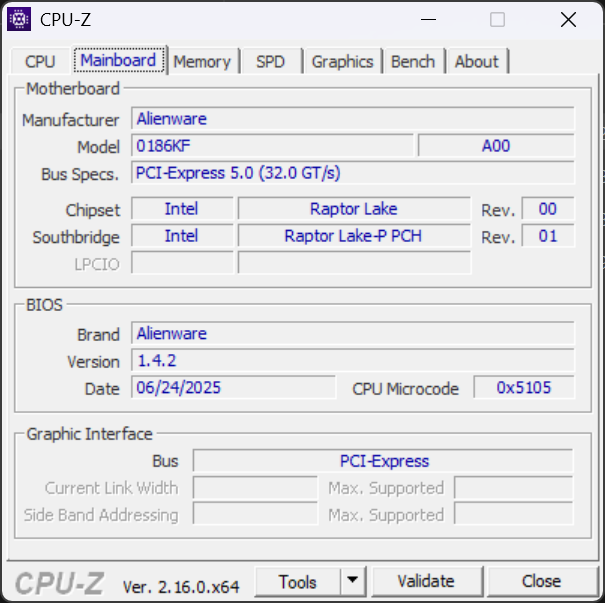
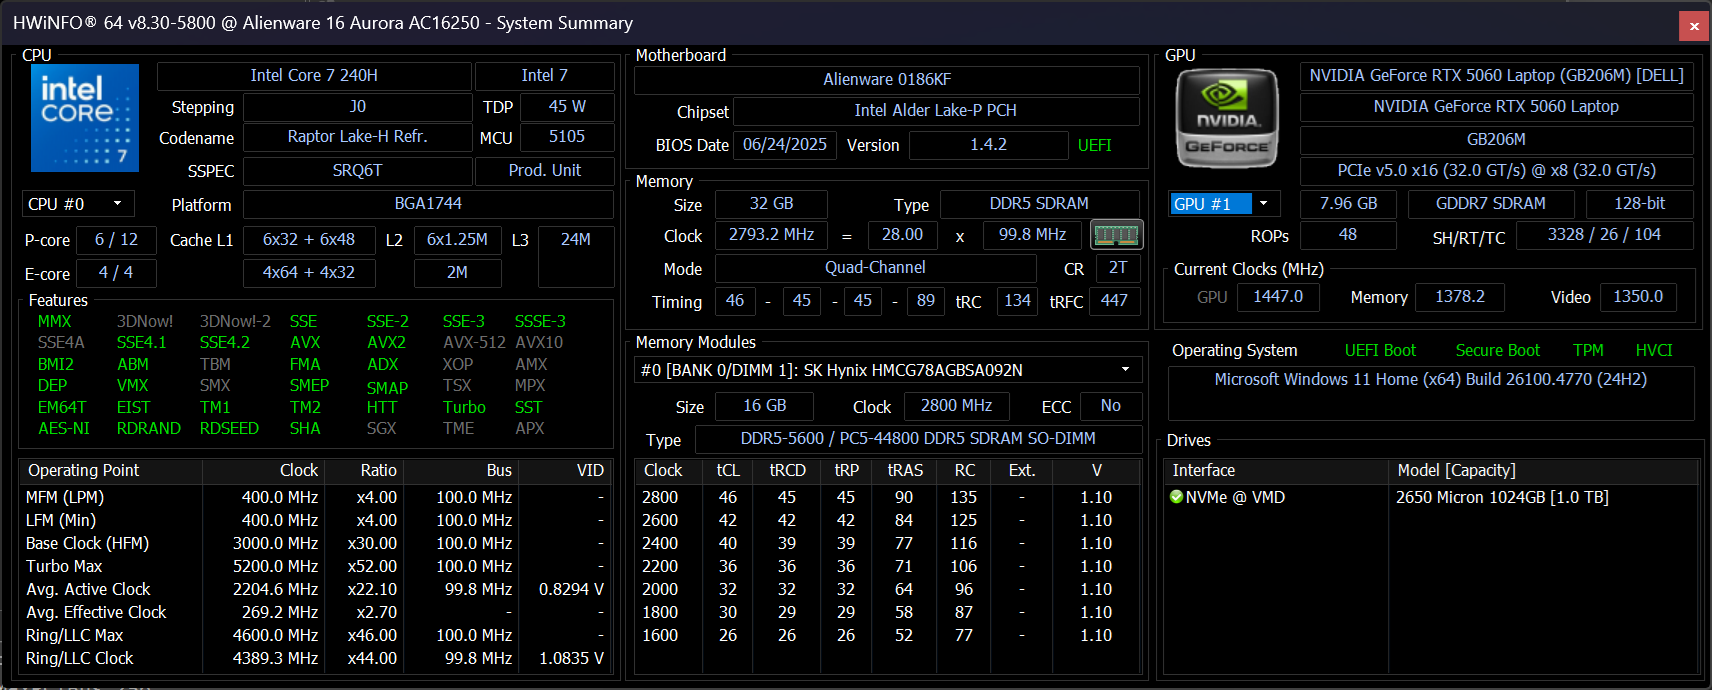
Das Alienware 16 Aurora ist die günstigere Version des Alienware 16X Aurora. Es wird mit der Raptor Lake Core 7 240H CPU, 80 W GeForce RTX 5060 GPU und 1.600p120-sRGB-Display anstelle von Arrow Lake Core Ultra 9 275HX, 115 W RTX 5070 und 1.600p240-P3-Display des 16X Aurora geliefert. Ansonsten ist das System optisch fast identisch mit dem 16X Aurora.
Wir empfehlen, einen Blick auf unsere bestehende Tests des 16X Aurora zu werfen, um mehr über die physischen Eigenschaften des 16 Aurora zu erfahren. Diese Seite konzentriert sich auf die wichtigsten Unterschiede zwischen den beiden Konfigurationen, die Benutzer erwarten können.
Zu den Konkurrenten des Alienware 16 Aurora gehören andere günstige 16-Zoll-Gaming-Laptops wie das Lenovo Legion 5 16, das MSI Sword 16 und die Asus-ROG-TUF-Serie.
Weitere Dell Bewertungen:
Spezifikationen
Gehäuse
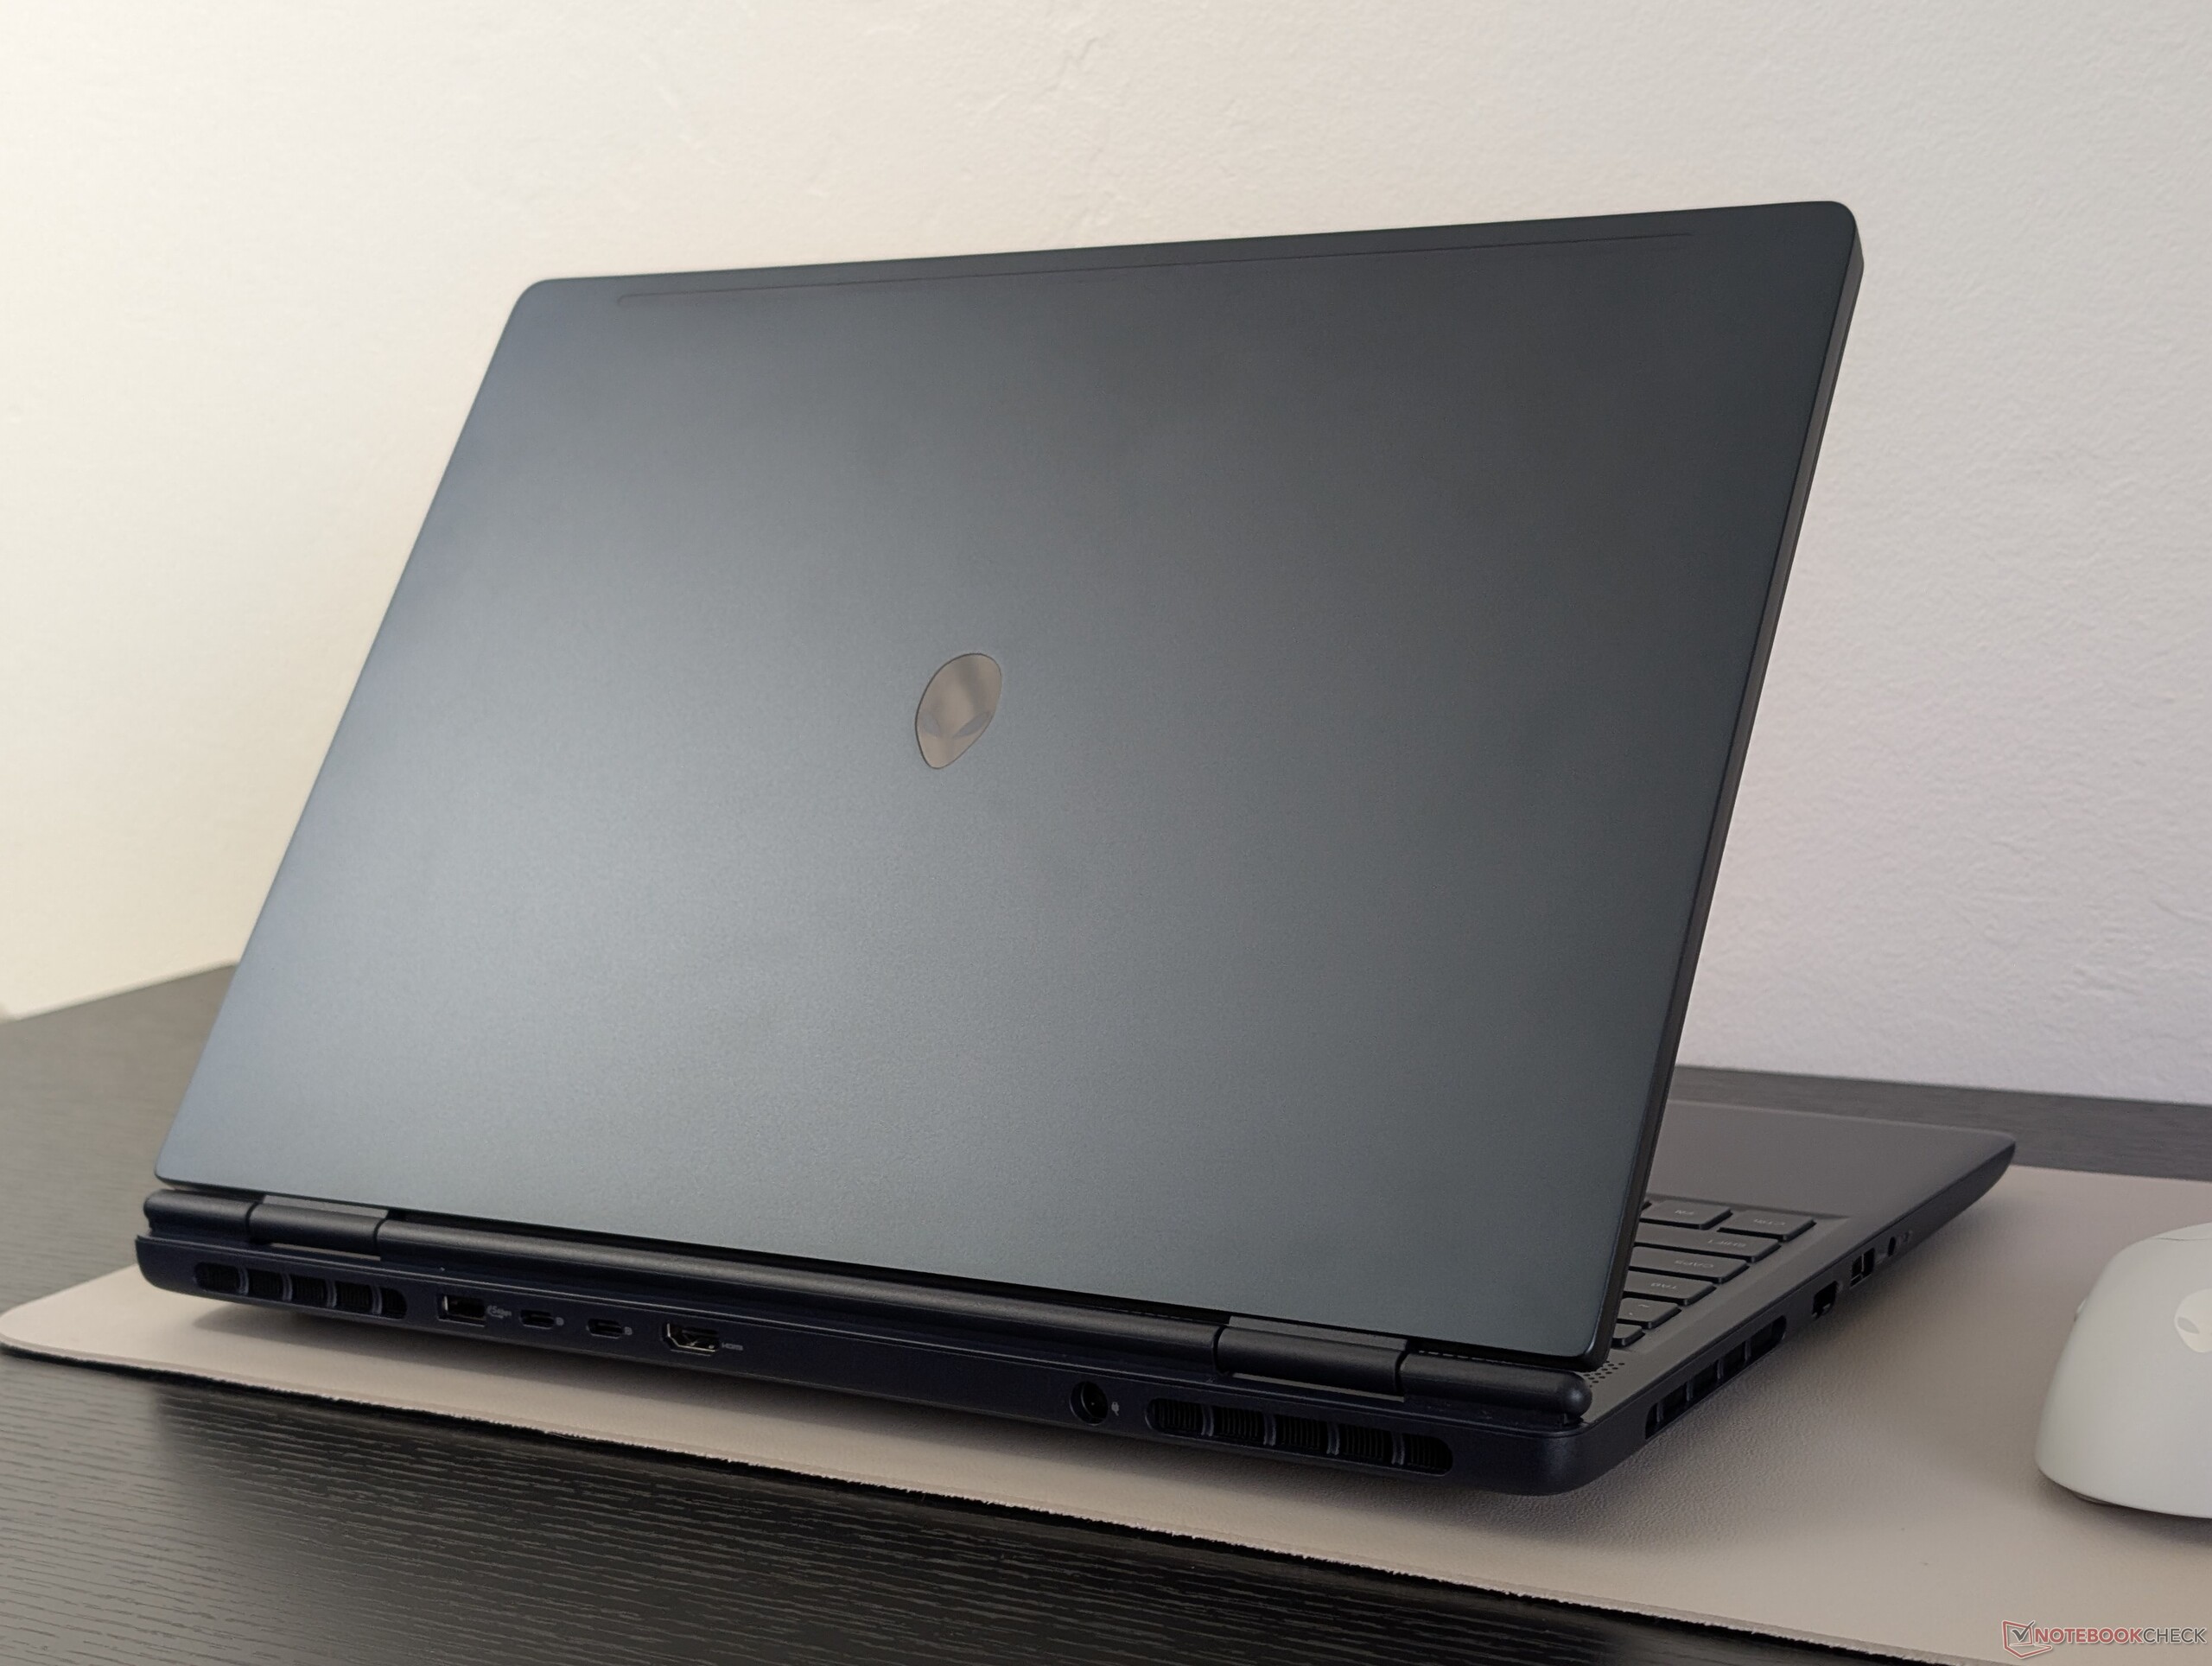
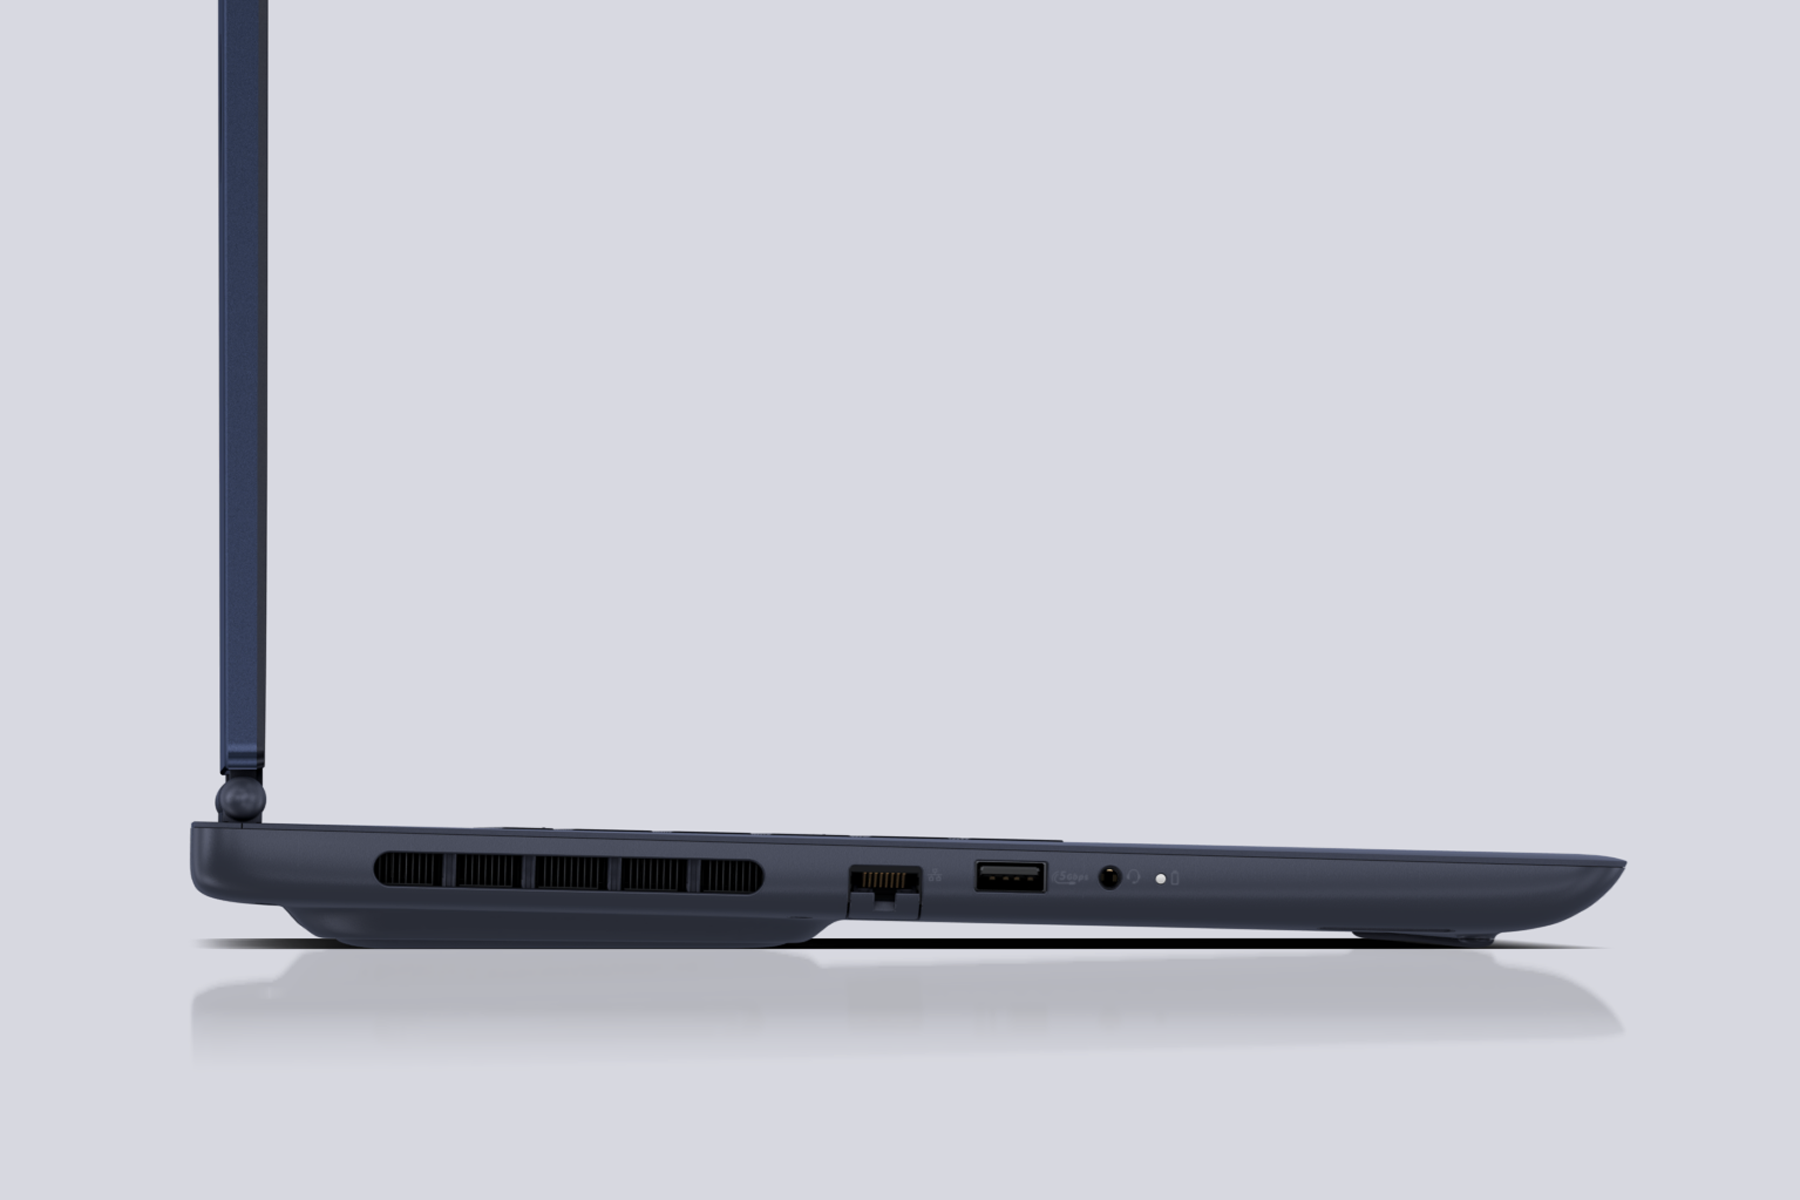
Während Gehäuse und Gewicht fast identisch mit denen des 16X Aurora sind, ist das 16 Aurora deutlich dünner (15,2 gegenüber 23,4 mm). Man sollte auch bedenken, dass das 16 Aurora keine Thunderbolt-Unterstützung bietet und daher nur eingeschränkt angedockt werden kann.
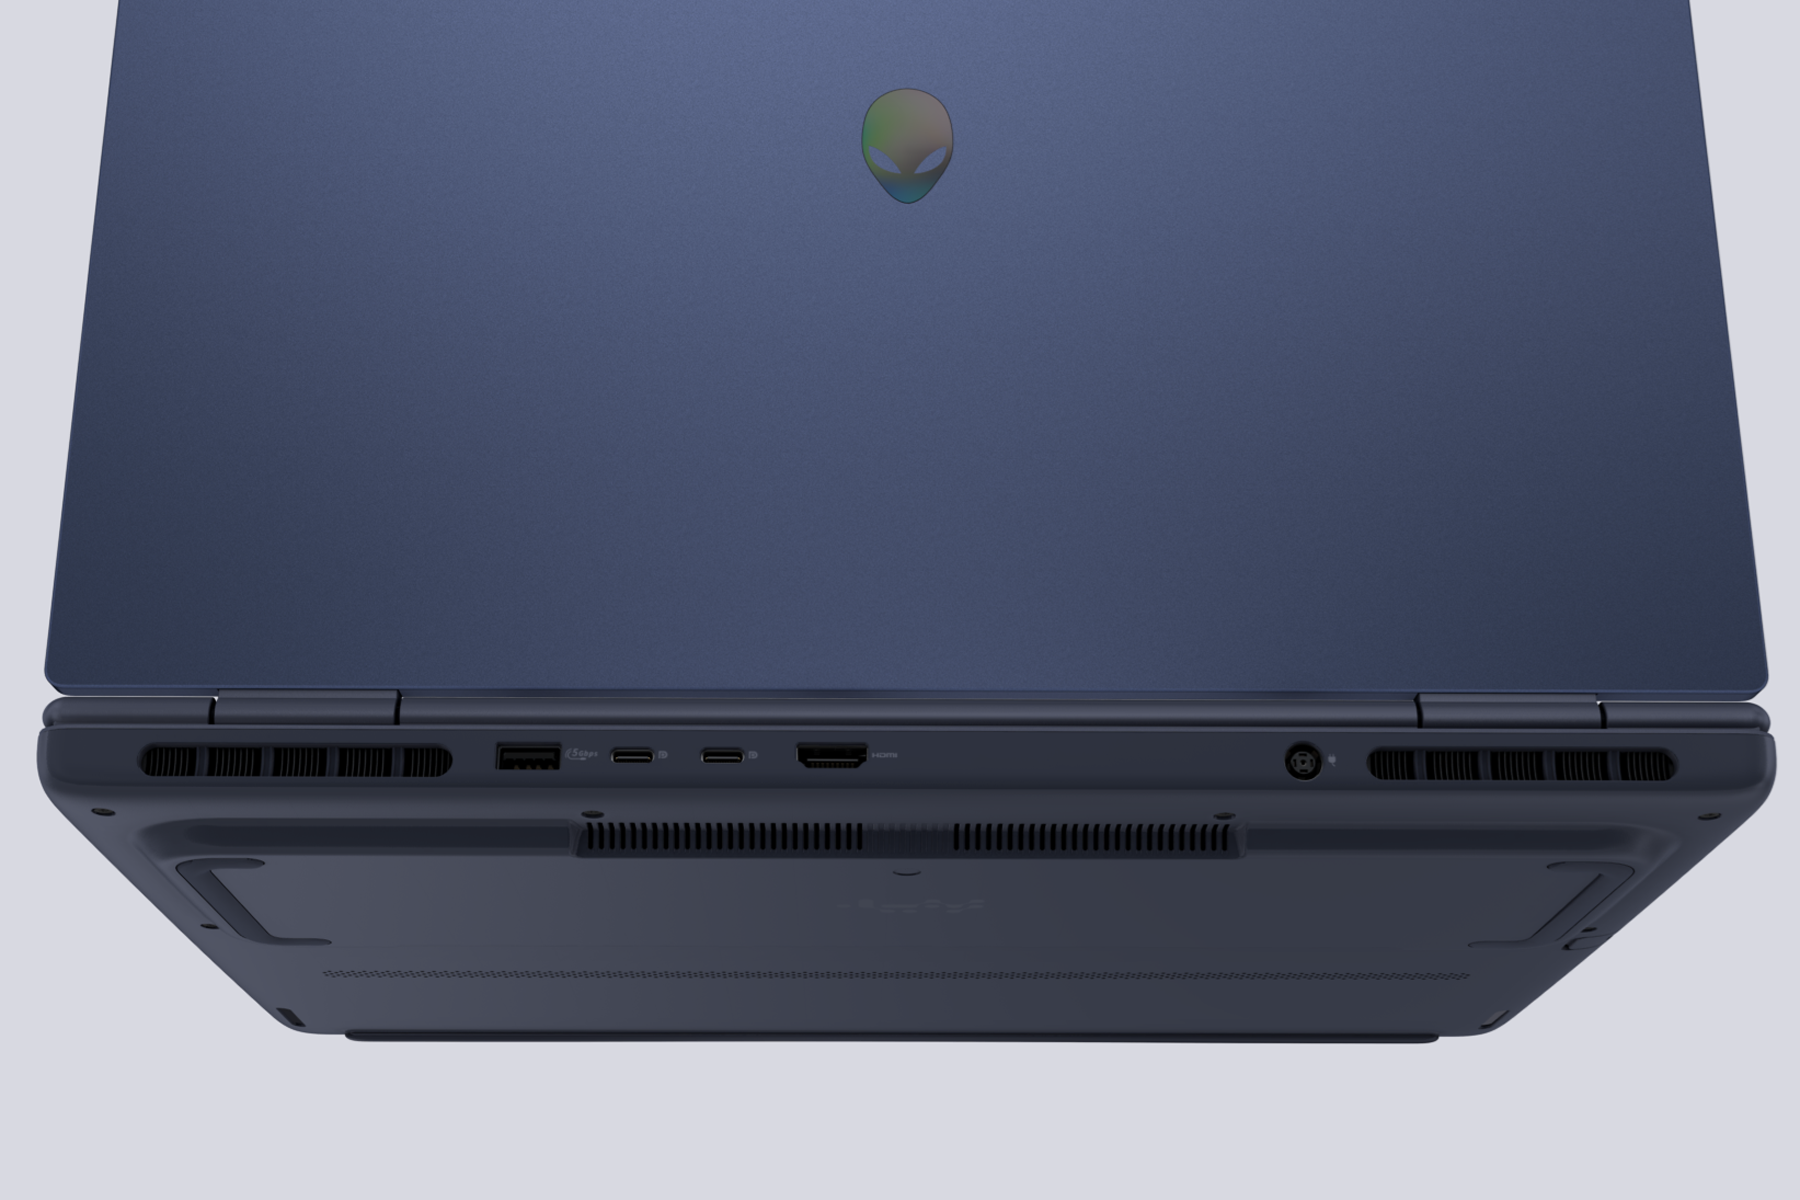
Anschlussausstattung
Wartung
Die Wartung ist identisch mit der des 16X Aurora, wenn auch mit moderaten Änderungen an der Kühllösung.

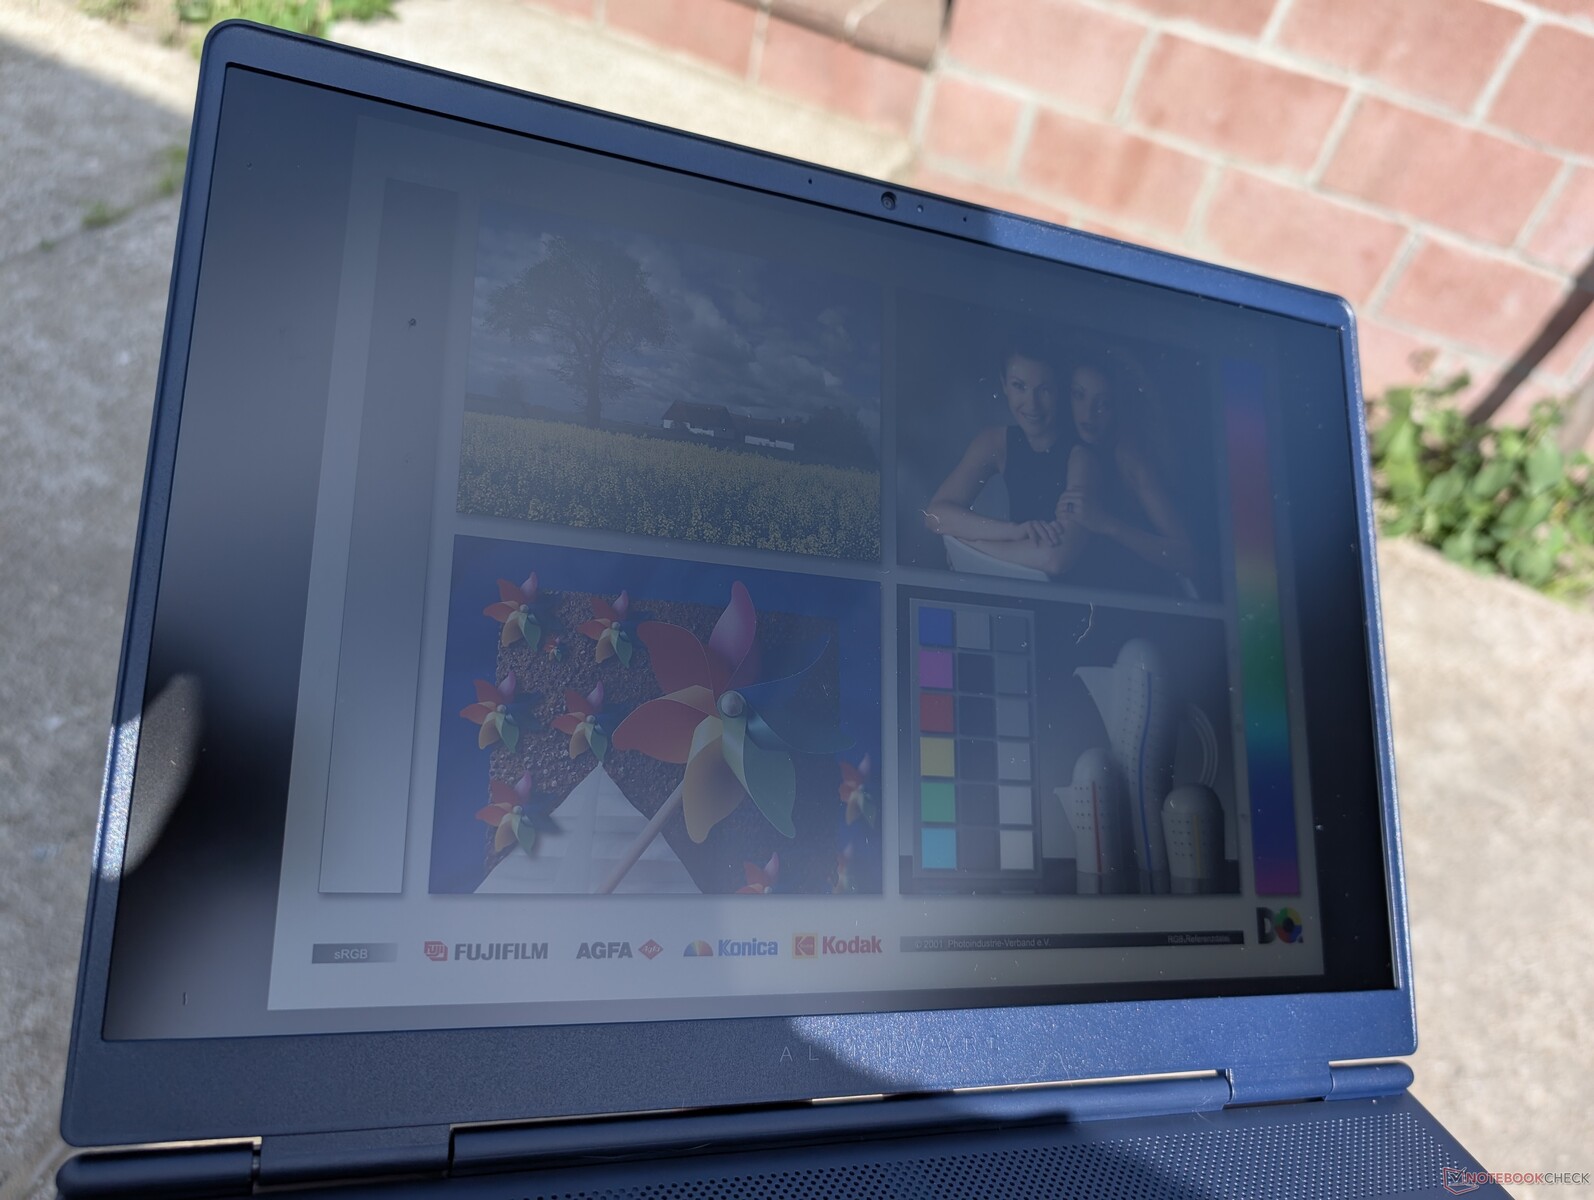
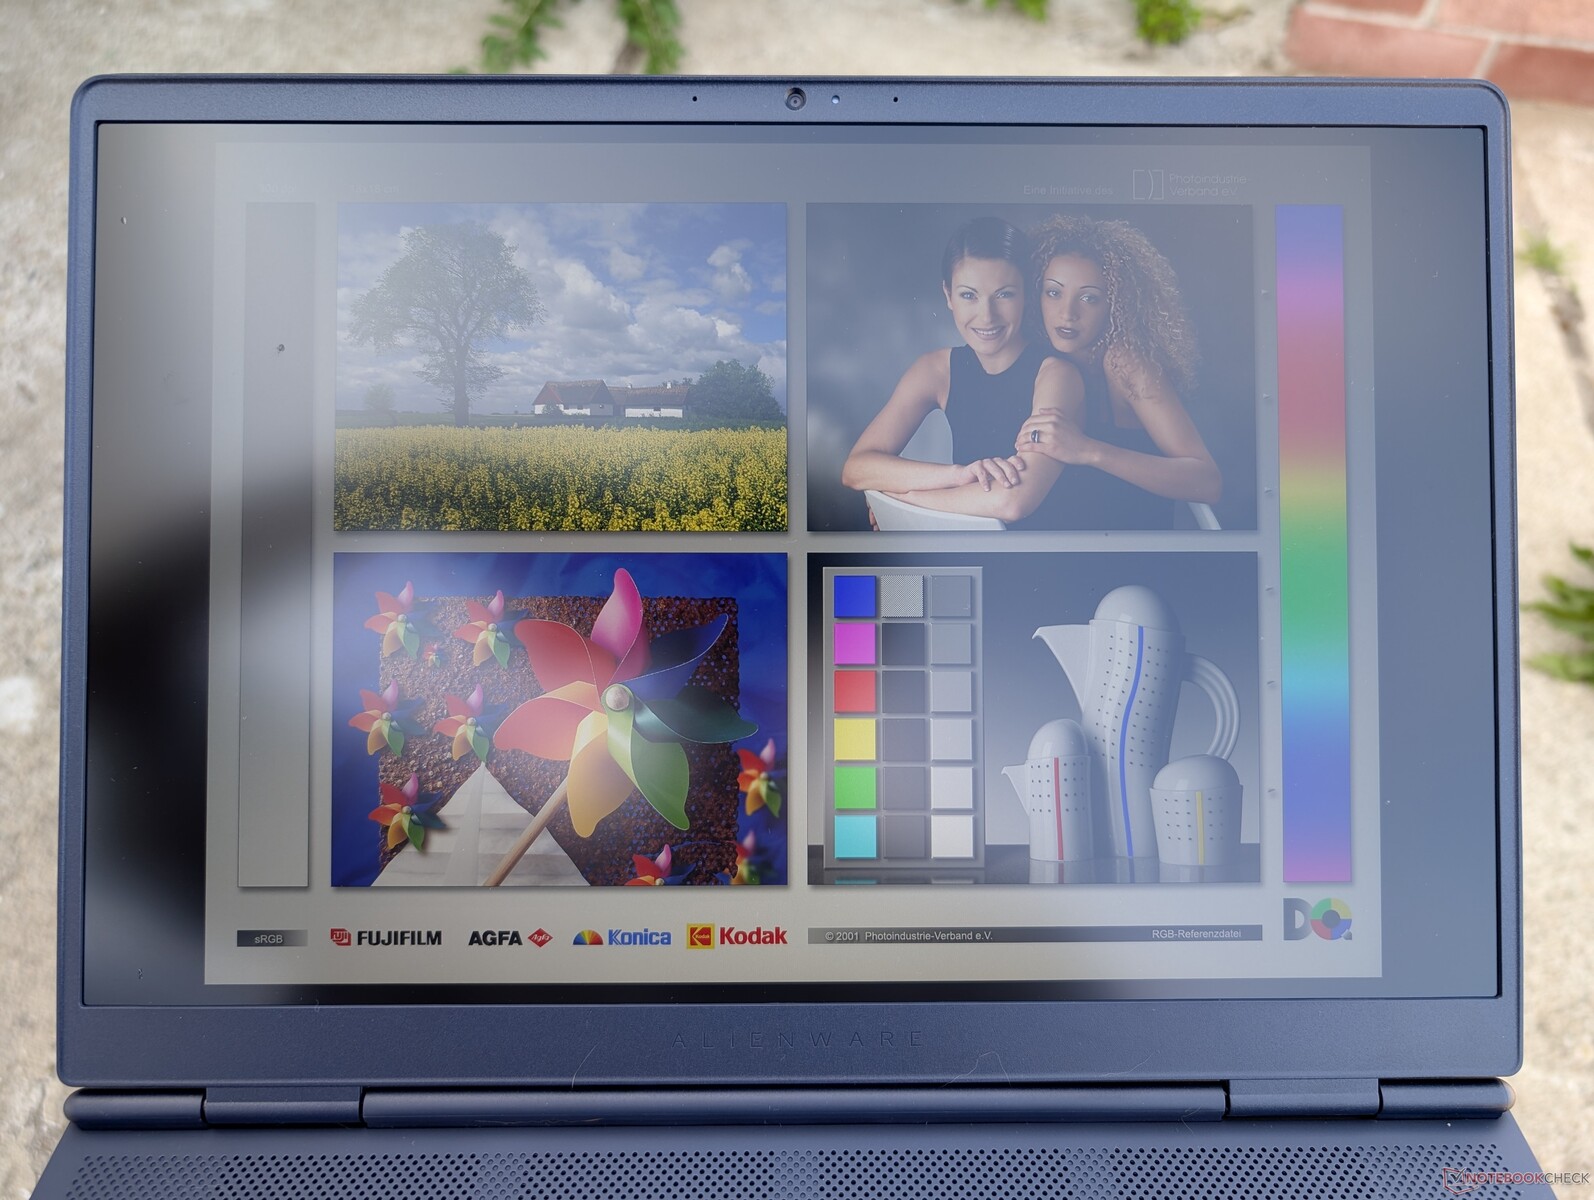
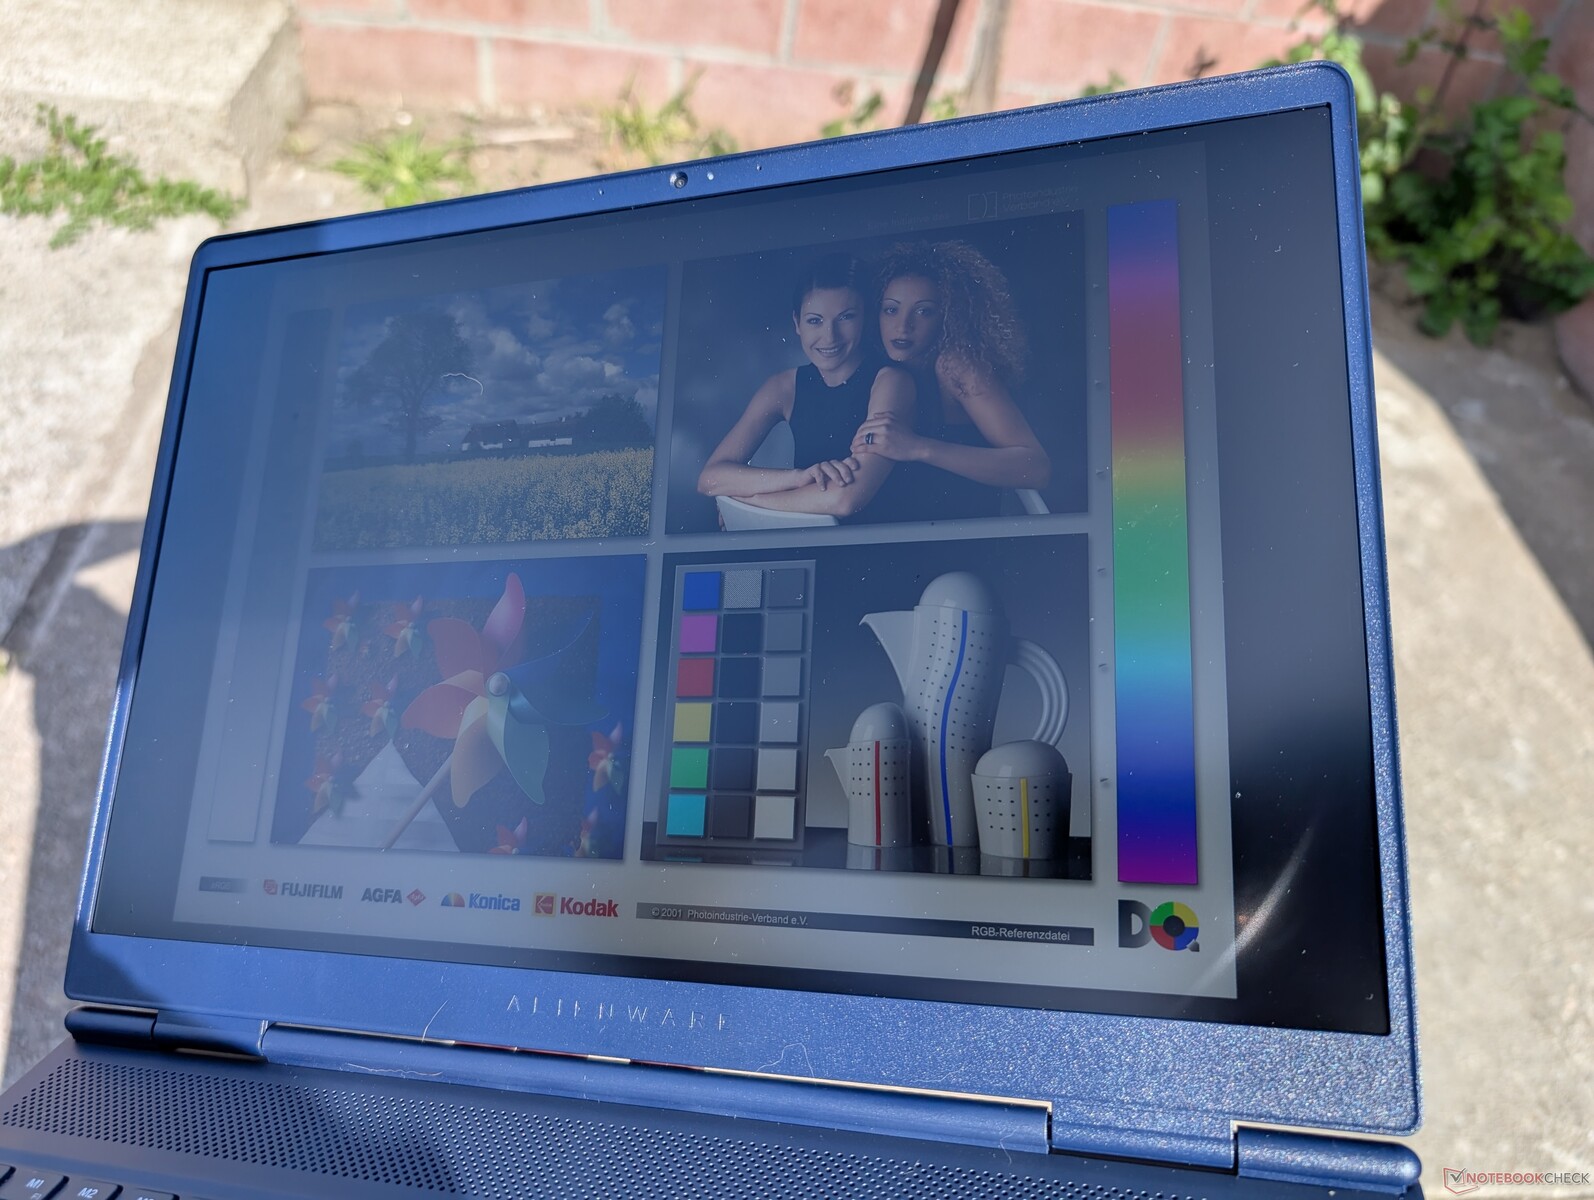
Display
Während das 16X Aurora mit einem 1.600p-240-Hz-G-Sync-Display mit vollen P3-Farben geliefert wird, verfügt das 16 Aurora über ein 1.600p-120-Hz-Display mit sRGB-Farben und ohne G-Sync. Zu den weiteren versteckten Verschlechterungen gehören ein dunklerer Bildschirm (~500 gegenüber ~350 Nits) mit deutlich langsameren Schwarz-Weiß- und Grau-Grau-Reaktionszeiten für mehr Ghosting beim Spielen. Letzteres macht sich leider bemerkbar, wenn man schnelle Rennspiele wie F1 24 oder fps-Titel spielt.


| |||||||||||||||||||||||||
Ausleuchtung: 88 %
Helligkeit Akku: 345.3 cd/m²
Kontrast: 1501:1 (Schwarzwert: 0.23 cd/m²)
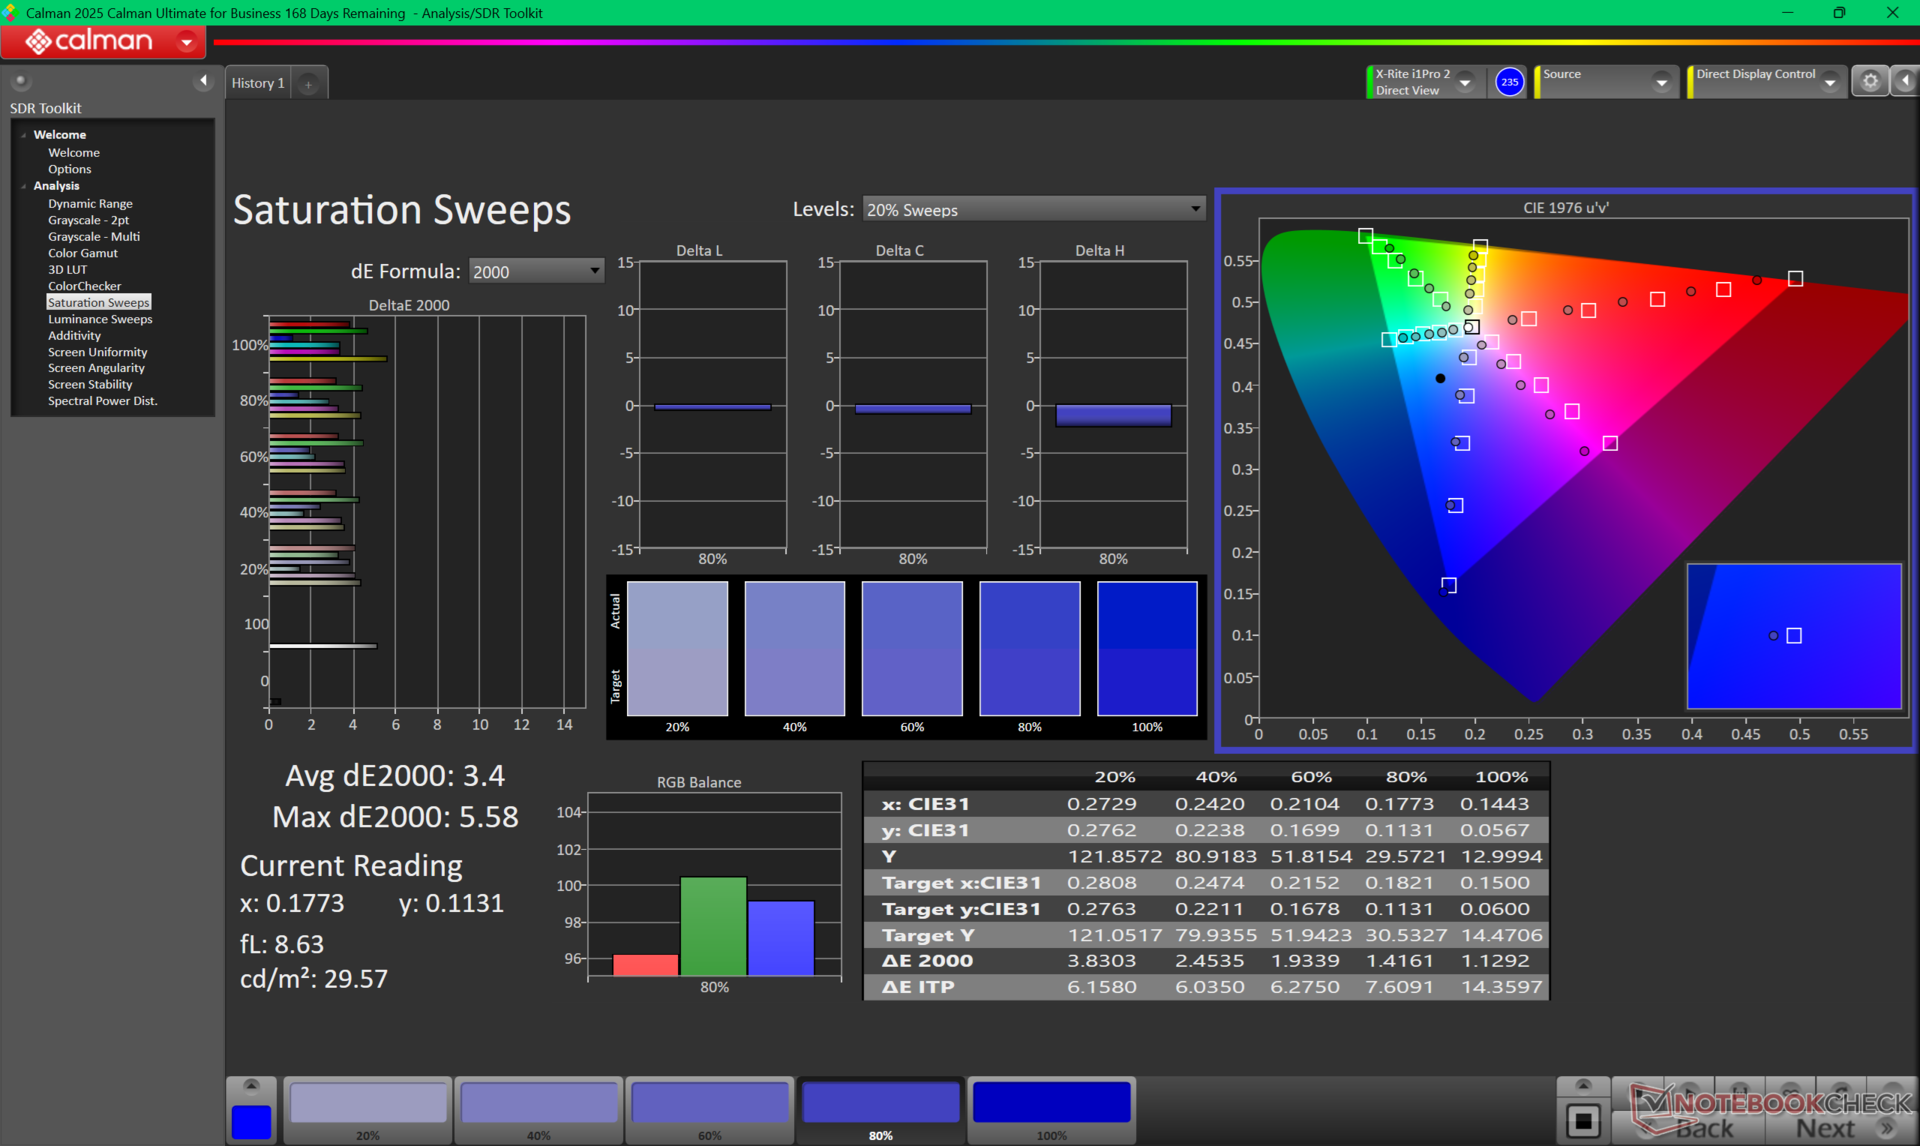
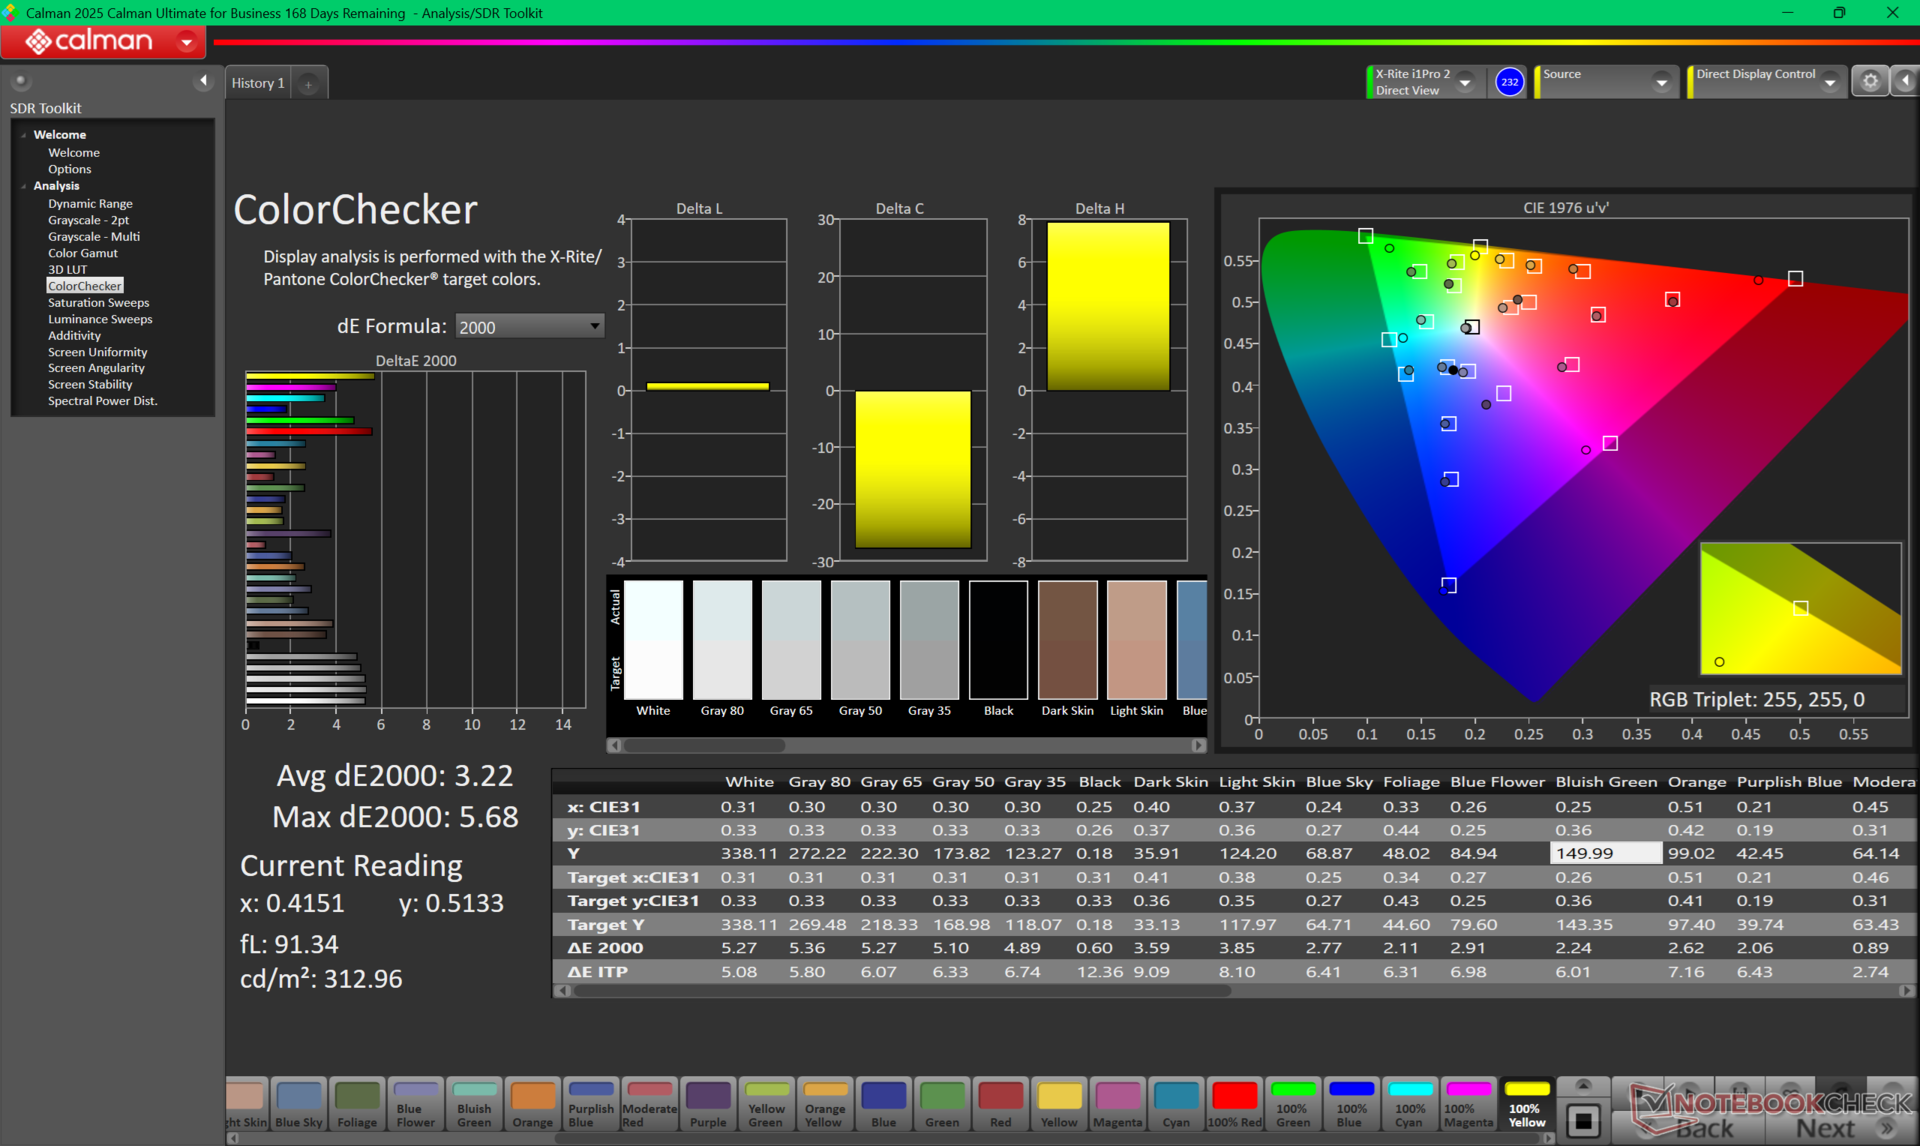
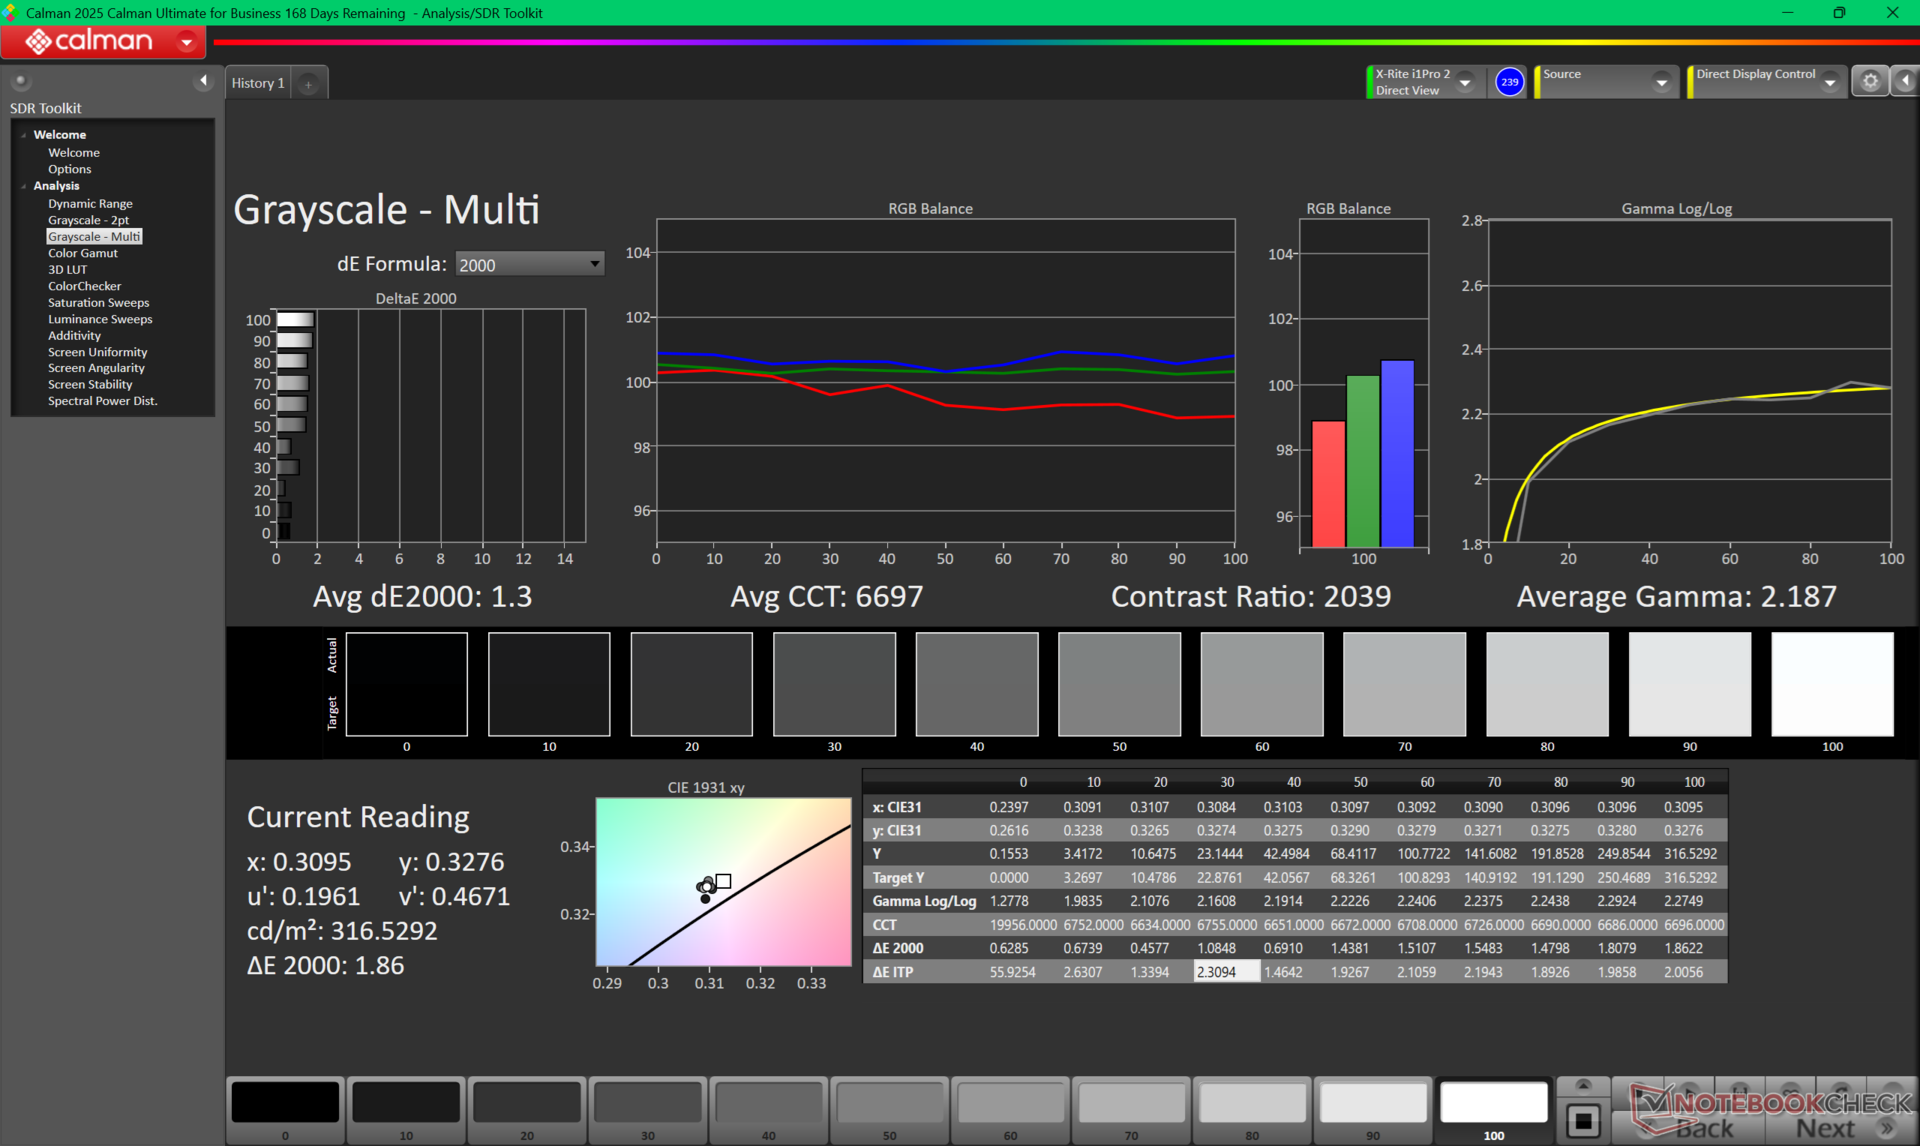
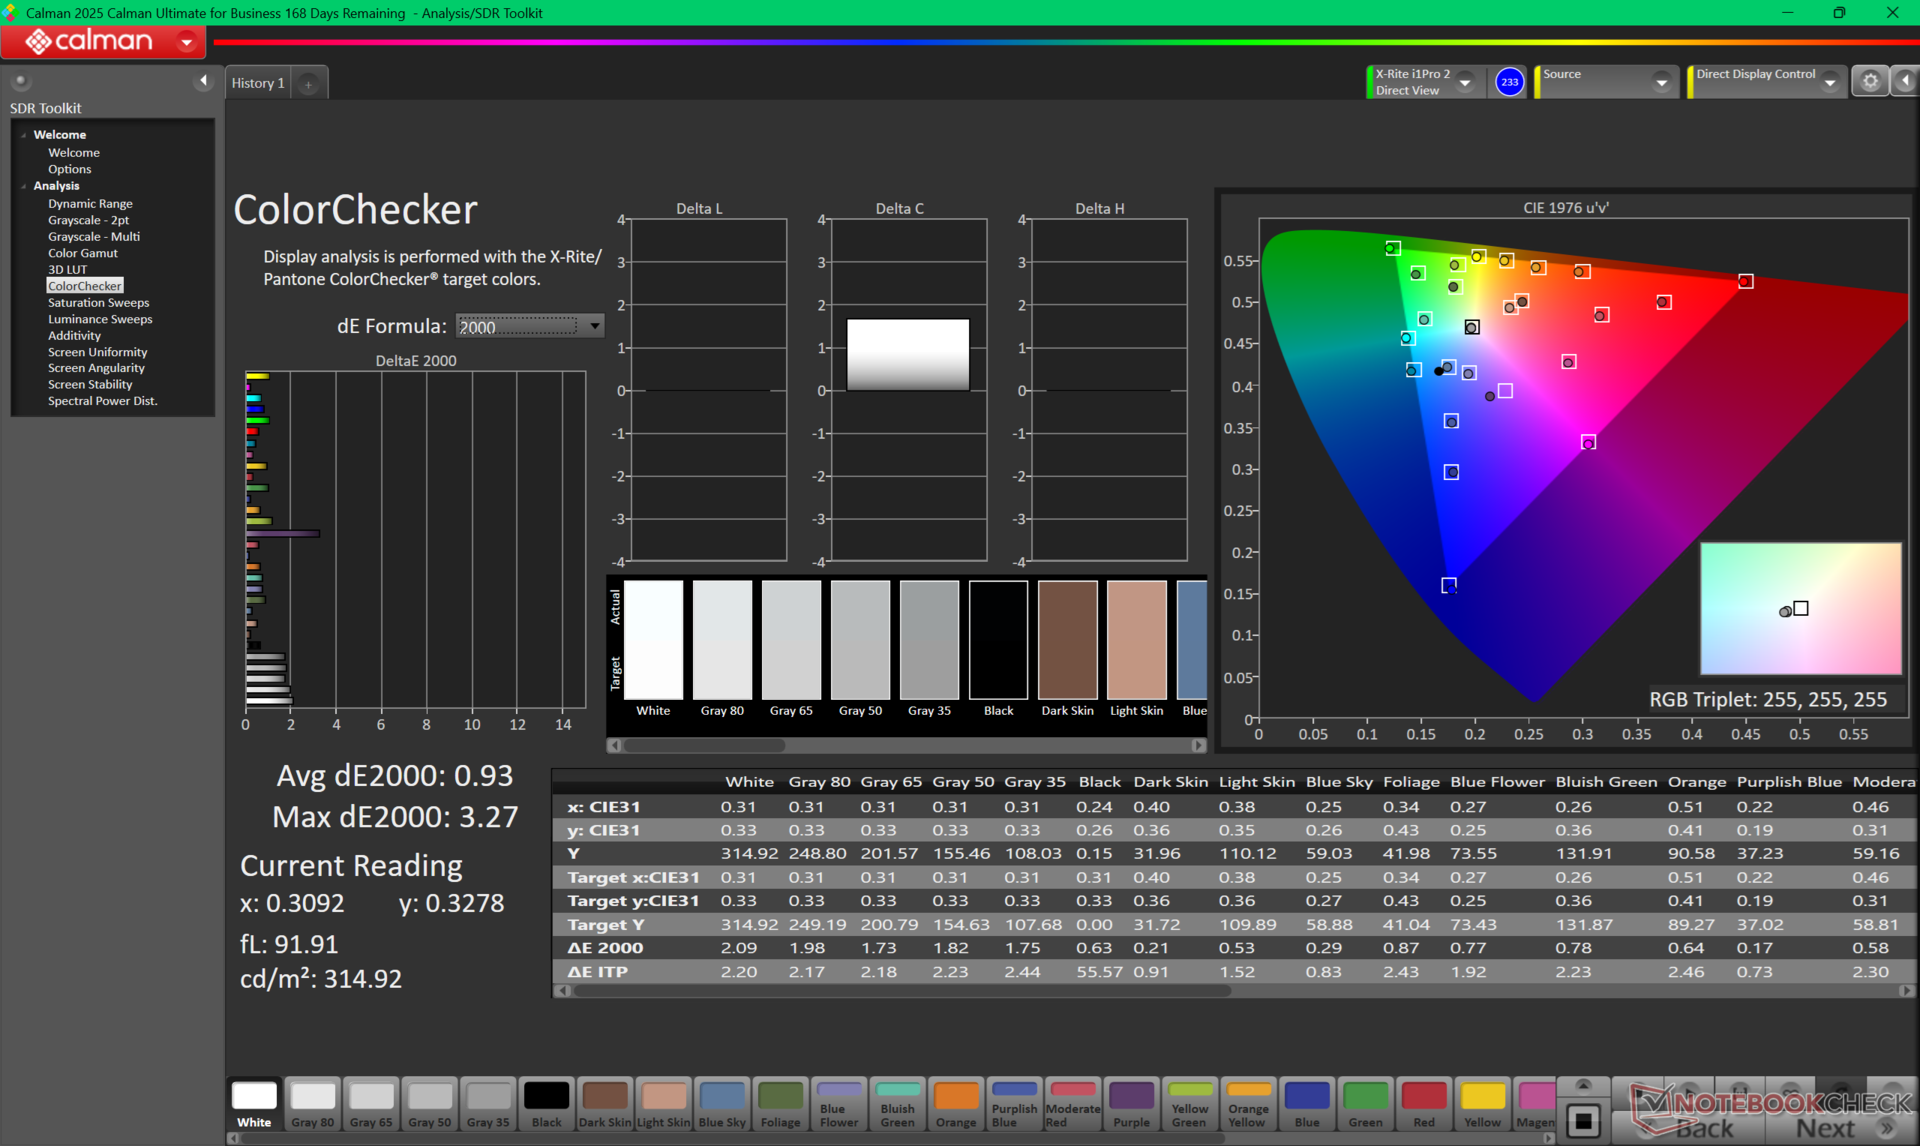
ΔE ColorChecker Calman: 3.22 | ∀{0.5-29.43 Ø4.72}
calibrated: 0.93
ΔE Greyscale Calman: 4.5 | ∀{0.09-98 Ø4.97}
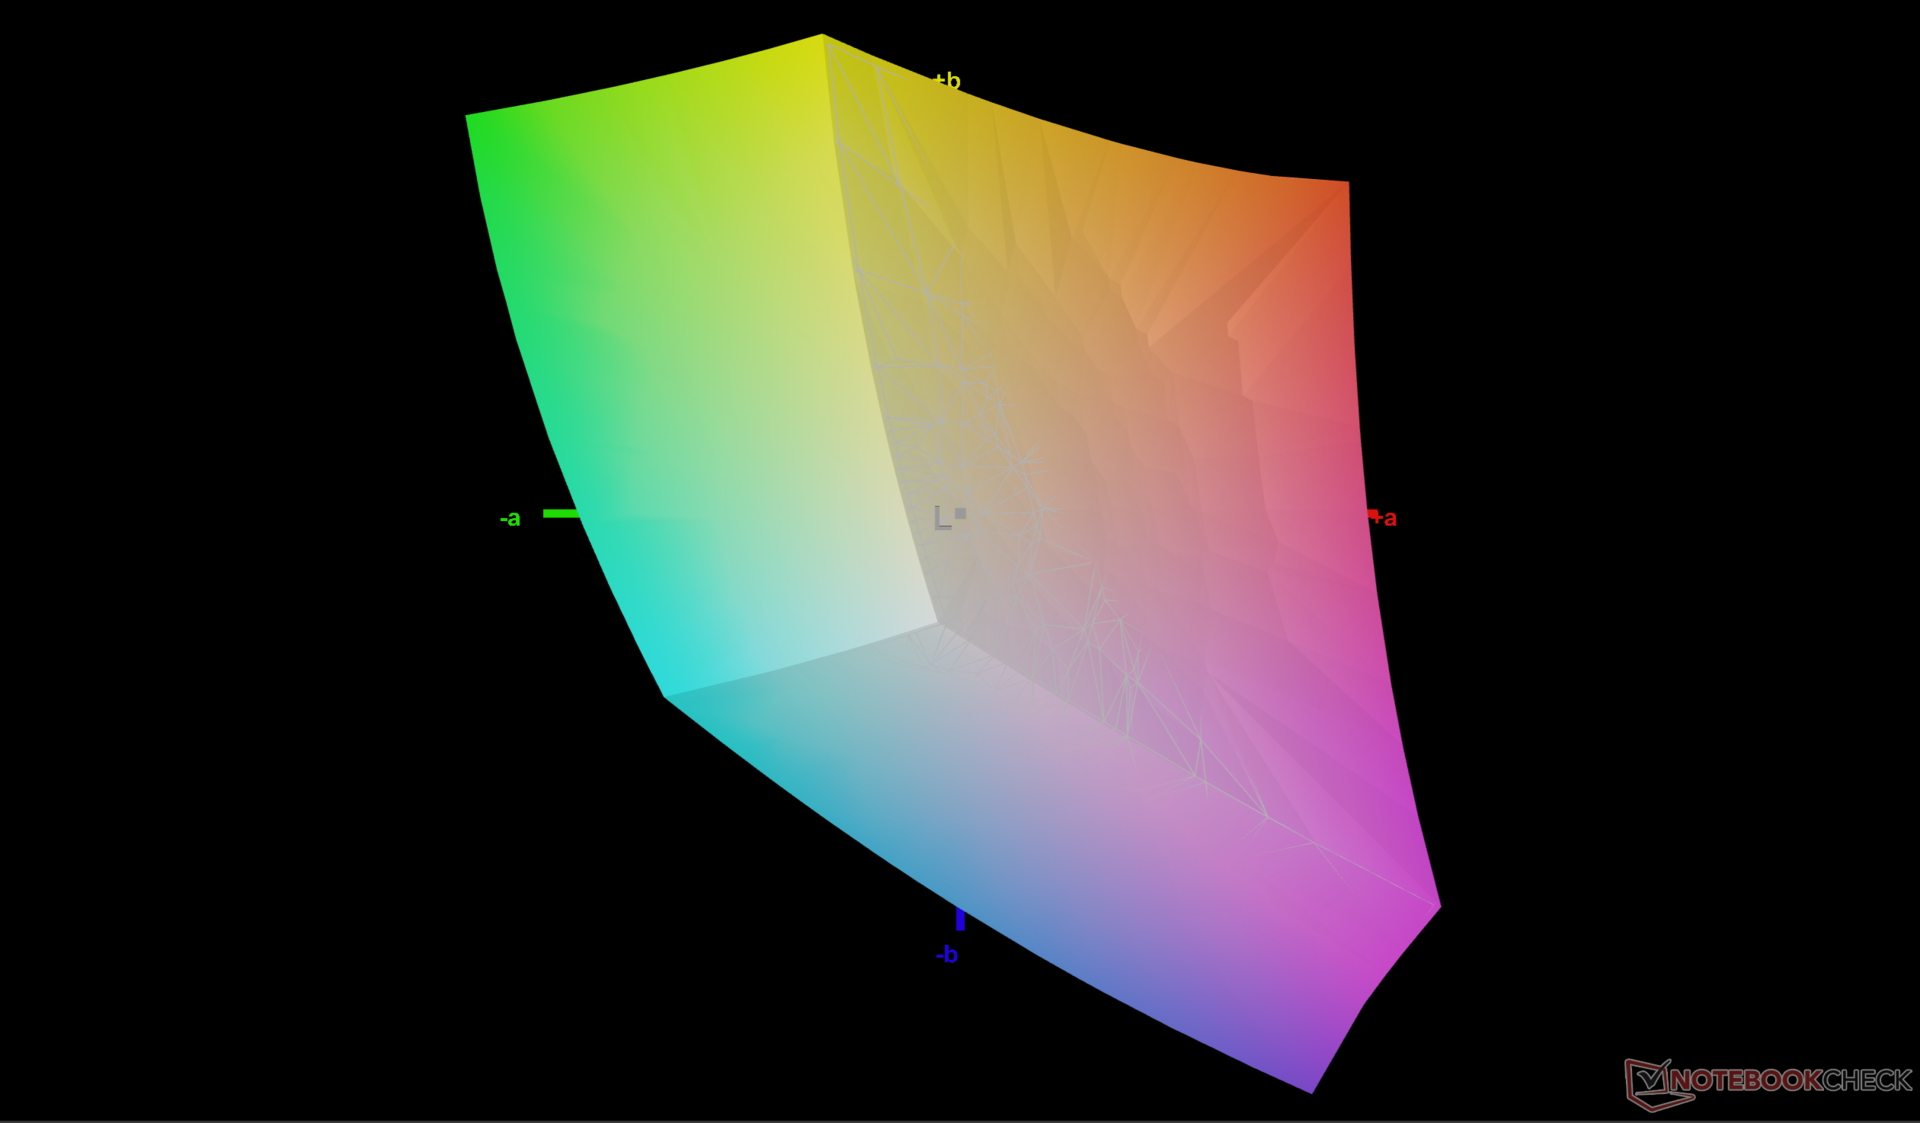
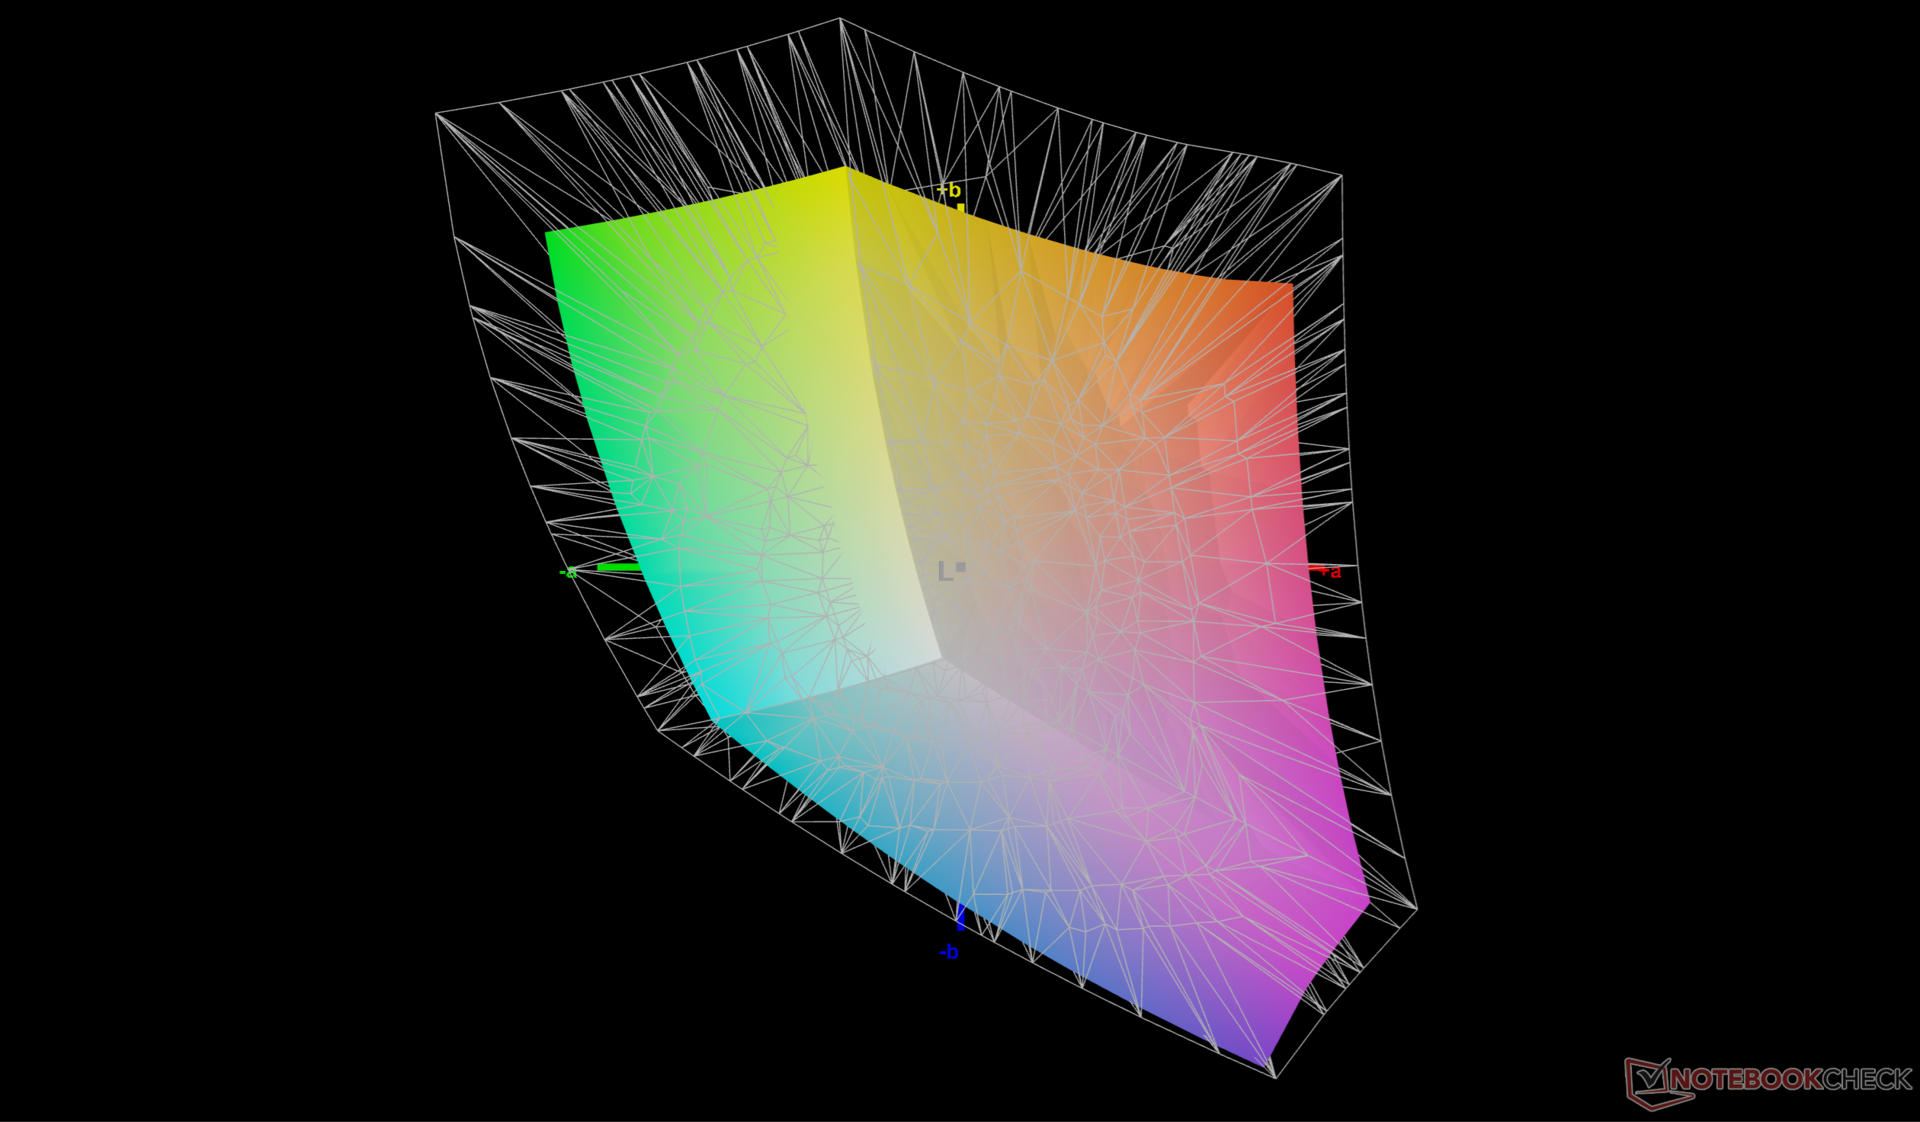
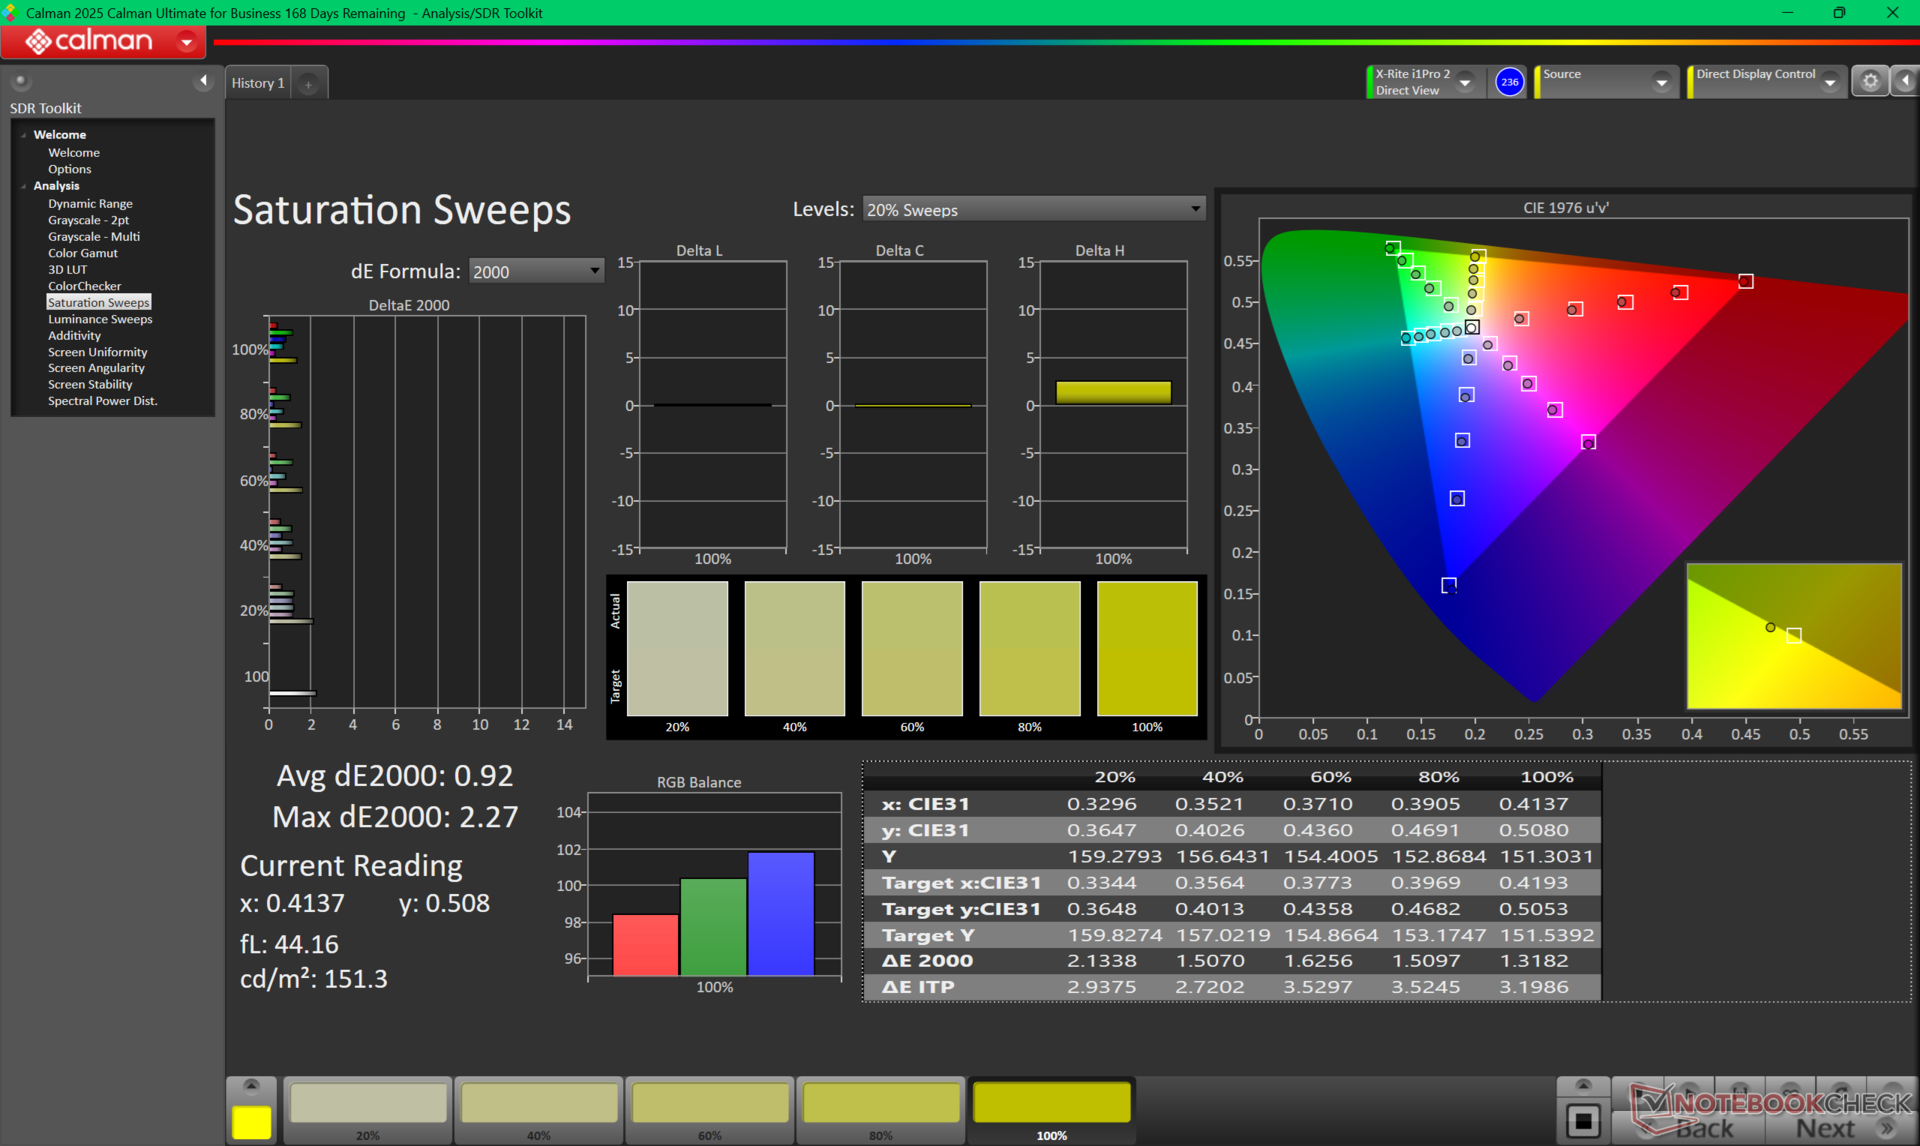
72.1% AdobeRGB 1998 (Argyll 3D)
99.9% sRGB (Argyll 3D)
70.8% Display P3 (Argyll 3D)
Gamma: 2.1
CCT: 7041 K
| Alienware 16 Aurora BOE NE16N41, IPS, 2560x1600, 16", 120 Hz | Alienware 16X Aurora, RTX 5070 LG Philips 160WQG, IPS, 2560x1600, 16", 240 Hz | Lenovo LOQ 15AHP10 CSOT MNF601BA1-4, IPS, 1920x1080, 15.6", 144 Hz | Gigabyte Gaming A16 GA6H NE160QDM-NYJ (BOE0C80), IPS, 2560x1600, 16", 165 Hz | Asus TUF Gaming A16 FA608WV B160UAN08.1 (AUO9BB0), IPS, 1920x1200, 16", 144 Hz | HP Victus 16 (2024) Chi Mei CMN163E, IPS, 1920x1080, 16.1", 144 Hz | |
|---|---|---|---|---|---|---|
| Display | 20% | -3% | -1% | -42% | -40% | |
| Display P3 Coverage (%) | 70.8 | 96.9 37% | 67.3 -5% | 69.4 -2% | 39.8 -44% | 41.3 -42% |
| sRGB Coverage (%) | 99.9 | 99.8 0% | 99.2 -1% | 99.5 0% | 59.7 -40% | 61.7 -38% |
| AdobeRGB 1998 Coverage (%) | 72.1 | 89.7 24% | 69.1 -4% | 71.6 -1% | 41.1 -43% | 42.7 -41% |
| Response Times | 81% | 30% | 74% | 72% | 39% | |
| Response Time Grey 50% / Grey 80% * (ms) | 49.5 ? | 4.3 ? 91% | 33.9 ? 32% | 14.3 ? 71% | 13.6 ? 73% | 28.6 ? 42% |
| Response Time Black / White * (ms) | 29.3 ? | 8.7 ? 70% | 21.2 ? 28% | 7 ? 76% | 8.4 ? 71% | 18.7 ? 36% |
| PWM Frequency (Hz) | ||||||
| Bildschirm | -5% | 16% | -21% | -81% | -69% | |
| Helligkeit Bildmitte (cd/m²) | 345.3 | 493.2 43% | 318 -8% | 432 25% | 347 0% | 287 -17% |
| Brightness (cd/m²) | 324 | 477 47% | 300 -7% | 425 31% | 321 -1% | 288 -11% |
| Brightness Distribution (%) | 88 | 93 6% | 89 1% | 91 3% | 88 0% | 86 -2% |
| Schwarzwert * (cd/m²) | 0.23 | 0.5 -117% | 0.2 13% | 0.37 -61% | 0.3 -30% | 0.19 17% |
| Kontrast (:1) | 1501 | 986 -34% | 1590 6% | 1168 -22% | 1157 -23% | 1511 1% |
| Delta E Colorchecker * | 3.22 | 3.57 -11% | 1.33 59% | 4.76 -48% | 5.89 -83% | 5.46 -70% |
| Colorchecker dE 2000 max. * | 5.68 | 7.03 -24% | 4.42 22% | 8.59 -51% | 19.26 -239% | 20.36 -258% |
| Colorchecker dE 2000 calibrated * | 0.93 | 0.68 27% | 0.94 -1% | 1.18 -27% | 4.3 -362% | 3.52 -278% |
| Delta E Graustufen * | 4.5 | 3.7 18% | 1.9 58% | 6.2 -38% | 4.27 5% | 4.8 -7% |
| Gamma | 2.1 105% | 2.16 102% | 2.187 101% | 2.079 106% | 2.47 89% | 2.108 104% |
| CCT | 7041 92% | 5876 111% | 6678 97% | 6690 97% | 7158 91% | 6442 101% |
| Durchschnitt gesamt (Programm / Settings) | 32% /
13% | 14% /
14% | 17% /
-3% | -17% /
-51% | -23% /
-48% |
* ... kleinere Werte sind besser

Reaktionszeiten (Response Times) des Displays
| ↔ Reaktionszeiten Schwarz zu Weiß | ||
|---|---|---|
| 29.3 ms ... steigend ↗ und fallend ↘ kombiniert | ↗ 14.2 ms steigend | 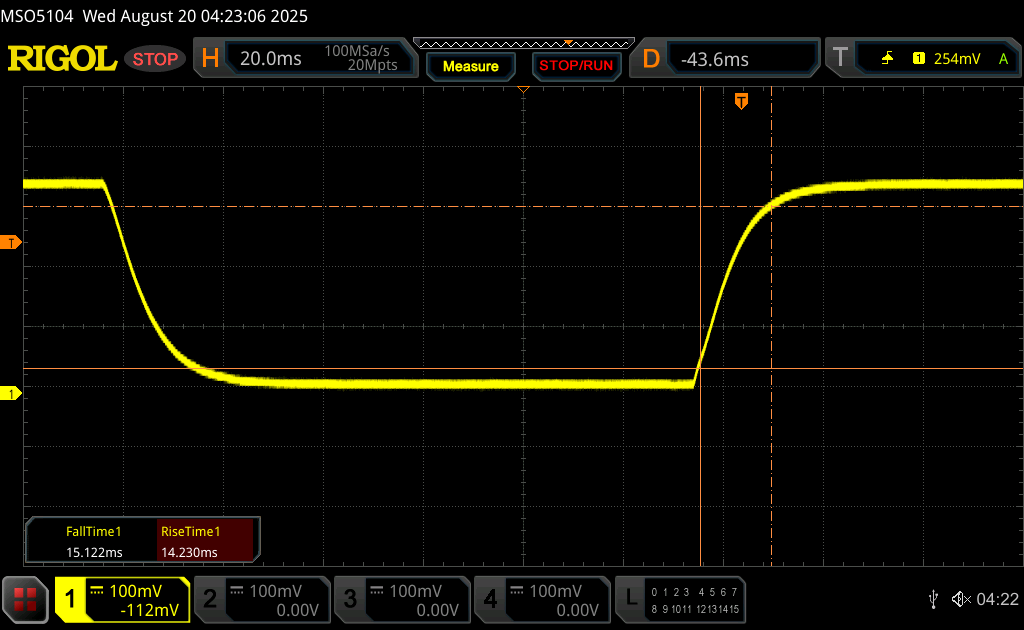 |
| ↘ 15.1 ms fallend | ||
| Die gemessenen Reaktionszeiten sind mittelmäßig und dadurch für Spieler eventuell zu langsam. Im Vergleich rangierten die bei uns getesteten Geräte von 0.1 (Minimum) zu 240 (Maximum) ms. » 79 % aller Screens waren schneller als der getestete. Daher sind die gemessenen Reaktionszeiten schlechter als der Durchschnitt aller vermessenen Geräte (19.8 ms). | ||
| ↔ Reaktionszeiten 50% Grau zu 80% Grau | ||
| 49.5 ms ... steigend ↗ und fallend ↘ kombiniert | ↗ 23.1 ms steigend | 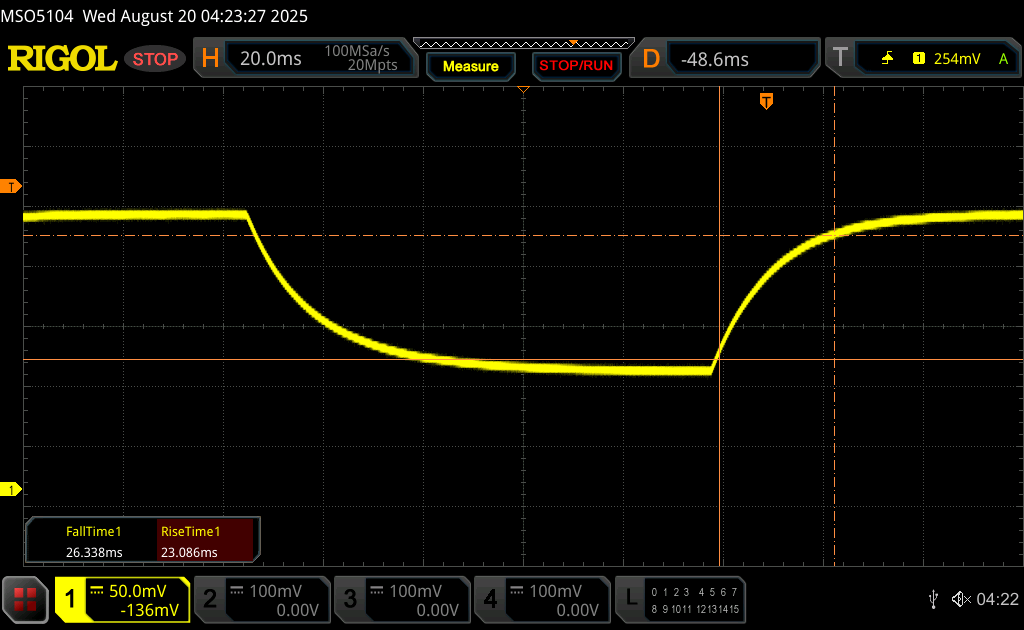 |
| ↘ 26.4 ms fallend | ||
| Die gemessenen Reaktionszeiten sind langsam und dadurch für viele Spieler wahrscheinlich zu langsam. Im Vergleich rangierten die bei uns getesteten Geräte von 0.165 (Minimum) zu 636 (Maximum) ms. » 85 % aller Screens waren schneller als der getestete. Daher sind die gemessenen Reaktionszeiten schlechter als der Durchschnitt aller vermessenen Geräte (31 ms). | ||
Bildschirm-Flackern / PWM (Pulse-Width Modulation)
| Flackern / PWM nicht festgestellt | 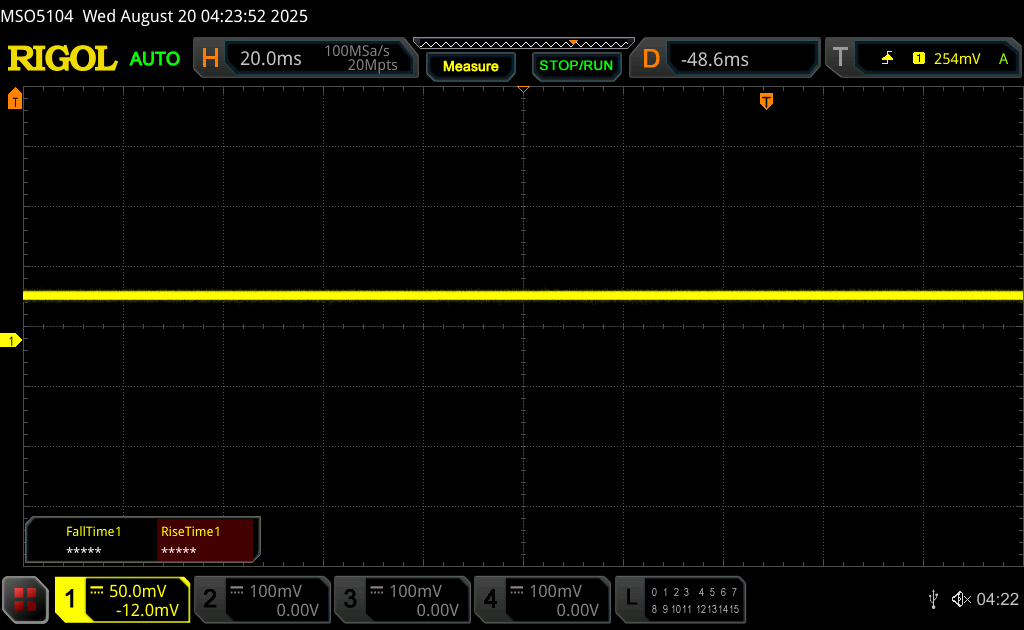 | ||
Im Vergleich: 52 % aller getesteten Geräte nutzten kein PWM um die Helligkeit zu reduzieren. Wenn PWM eingesetzt wurde, dann bei einer Frequenz von durchschnittlich 7781 (Minimum 5, Maximum 343500) Hz. | |||

Performance
Testbedingungen
Wir haben sowohl Windows als auch das Alienware Command Center in den Performance-Modus versetzt, bevor wir die untenstehenden Benchmarks durchgeführt haben.
Prozessor
Ein Abstieg vom Core Ultra 9 275HX in der 16X Aurora auf den Core 7 240H in unserem 16 Aurora führt zu einem deutlichen Rückgang der Multi-Thread-Leistung um fast 55 Prozent. Die Rohleistung ist etwas langsamer als die des Jahre alten Core i7-12700H.
Cinebench-R15-Mehrfachschleife
Cinebench R23: Multi Core | Single Core
Cinebench R20: CPU (Multi Core) | CPU (Single Core)
Cinebench R15: CPU Multi 64Bit | CPU Single 64Bit
Blender: v2.79 BMW27 CPU
7-Zip 18.03: 7z b 4 | 7z b 4 -mmt1
Geekbench 6.7: Multi-Core | Single-Core
Geekbench 5.5: Multi-Core | Single-Core
HWBOT x265 Benchmark v2.2: 4k Preset
LibreOffice : 20 Documents To PDF
R Benchmark 2.5: Overall mean
| Geekbench 6.7 / Multi-Core | |
| Alienware 16X Aurora, RTX 5070 | |
| Chuwi Gamebook, R9 9955HX | |
| Lenovo Legion 7 16 IRX G9 | |
| MSI Vector 16 HX AI A2XWHG | |
| Asus ROG Zephyrus G16 GA605WV | |
| Alienware 16 Aurora | |
| Asus ROG Zephyrus G16 2024 GU605M | |
| Durchschnittliche Intel Core 7 240H (9713 - 13681, n=6) | |
| Lenovo Legion Pro 5 16ARX8 (R5 7645HX, RTX 4050) | |
| Geekbench 6.7 / Single-Core | |
| Chuwi Gamebook, R9 9955HX | |
| Alienware 16X Aurora, RTX 5070 | |
| Lenovo Legion 7 16 IRX G9 | |
| MSI Vector 16 HX AI A2XWHG | |
| Asus ROG Zephyrus G16 GA605WV | |
| Lenovo Legion Pro 5 16ARX8 (R5 7645HX, RTX 4050) | |
| Alienware 16 Aurora | |
| Durchschnittliche Intel Core 7 240H (2348 - 2648, n=6) | |
| Asus ROG Zephyrus G16 2024 GU605M | |
Cinebench R23: Multi Core | Single Core
Cinebench R20: CPU (Multi Core) | CPU (Single Core)
Cinebench R15: CPU Multi 64Bit | CPU Single 64Bit
Blender: v2.79 BMW27 CPU
7-Zip 18.03: 7z b 4 | 7z b 4 -mmt1
Geekbench 6.7: Multi-Core | Single-Core
Geekbench 5.5: Multi-Core | Single-Core
HWBOT x265 Benchmark v2.2: 4k Preset
LibreOffice : 20 Documents To PDF
R Benchmark 2.5: Overall mean
* ... kleinere Werte sind besser
AIDA64: FP32 Ray-Trace | FPU Julia | CPU SHA3 | CPU Queen | FPU SinJulia | FPU Mandel | CPU AES | CPU ZLib | FP64 Ray-Trace | CPU PhotoWorxx
| Performance Rating | |
| Alienware 16X Aurora, RTX 5070 | |
| Asus TUF Gaming A16 FA608WV | |
| Lenovo LOQ 15AHP10 | |
| HP Victus 16 (2024) | |
| Alienware 16 Aurora | |
| Durchschnittliche Intel Core 7 240H | |
| Gigabyte Gaming A16 GA6H | |
| AIDA64 / FP32 Ray-Trace | |
| Asus TUF Gaming A16 FA608WV | |
| Alienware 16X Aurora, RTX 5070 | |
| Lenovo LOQ 15AHP10 | |
| HP Victus 16 (2024) | |
| Alienware 16 Aurora | |
| Durchschnittliche Intel Core 7 240H (11867 - 15972, n=5) | |
| Gigabyte Gaming A16 GA6H | |
| AIDA64 / FPU Julia | |
| Alienware 16X Aurora, RTX 5070 | |
| Asus TUF Gaming A16 FA608WV | |
| Lenovo LOQ 15AHP10 | |
| HP Victus 16 (2024) | |
| Alienware 16 Aurora | |
| Durchschnittliche Intel Core 7 240H (59260 - 80238, n=5) | |
| Gigabyte Gaming A16 GA6H | |
| AIDA64 / CPU SHA3 | |
| Alienware 16X Aurora, RTX 5070 | |
| Asus TUF Gaming A16 FA608WV | |
| Lenovo LOQ 15AHP10 | |
| HP Victus 16 (2024) | |
| Alienware 16 Aurora | |
| Durchschnittliche Intel Core 7 240H (2455 - 3287, n=5) | |
| Gigabyte Gaming A16 GA6H | |
| AIDA64 / CPU Queen | |
| Alienware 16X Aurora, RTX 5070 | |
| HP Victus 16 (2024) | |
| Lenovo LOQ 15AHP10 | |
| Asus TUF Gaming A16 FA608WV | |
| Alienware 16 Aurora | |
| Durchschnittliche Intel Core 7 240H (75356 - 86602, n=3) | |
| Gigabyte Gaming A16 GA6H | |
| AIDA64 / FPU SinJulia | |
| Asus TUF Gaming A16 FA608WV | |
| Lenovo LOQ 15AHP10 | |
| Alienware 16X Aurora, RTX 5070 | |
| HP Victus 16 (2024) | |
| Alienware 16 Aurora | |
| Durchschnittliche Intel Core 7 240H (7777 - 9366, n=5) | |
| Gigabyte Gaming A16 GA6H | |
| AIDA64 / FPU Mandel | |
| Alienware 16X Aurora, RTX 5070 | |
| Asus TUF Gaming A16 FA608WV | |
| Lenovo LOQ 15AHP10 | |
| HP Victus 16 (2024) | |
| Alienware 16 Aurora | |
| Durchschnittliche Intel Core 7 240H (29381 - 39967, n=5) | |
| Gigabyte Gaming A16 GA6H | |
| AIDA64 / CPU AES | |
| Alienware 16X Aurora, RTX 5070 | |
| HP Victus 16 (2024) | |
| Asus TUF Gaming A16 FA608WV | |
| Lenovo LOQ 15AHP10 | |
| Alienware 16 Aurora | |
| Durchschnittliche Intel Core 7 240H (50528 - 67855, n=5) | |
| Gigabyte Gaming A16 GA6H | |
| AIDA64 / CPU ZLib | |
| Alienware 16X Aurora, RTX 5070 | |
| Asus TUF Gaming A16 FA608WV | |
| HP Victus 16 (2024) | |
| Lenovo LOQ 15AHP10 | |
| Alienware 16 Aurora | |
| Durchschnittliche Intel Core 7 240H (725 - 951, n=5) | |
| Gigabyte Gaming A16 GA6H | |
| AIDA64 / FP64 Ray-Trace | |
| Asus TUF Gaming A16 FA608WV | |
| Alienware 16X Aurora, RTX 5070 | |
| Lenovo LOQ 15AHP10 | |
| HP Victus 16 (2024) | |
| Alienware 16 Aurora | |
| Durchschnittliche Intel Core 7 240H (6389 - 8569, n=5) | |
| Gigabyte Gaming A16 GA6H | |
| AIDA64 / CPU PhotoWorxx | |
| Alienware 16X Aurora, RTX 5070 | |
| Alienware 16 Aurora | |
| HP Victus 16 (2024) | |
| Durchschnittliche Intel Core 7 240H (21710 - 44874, n=5) | |
| Asus TUF Gaming A16 FA608WV | |
| Lenovo LOQ 15AHP10 | |
| Gigabyte Gaming A16 GA6H | |
| AIDA64 / Memory Copy | |
| Asus TUF Gaming A16 FA608WV | |
| Alienware 16X Aurora, RTX 5070 | |
| HP Victus 16 (2024) | |
| Alienware 16 Aurora | |
| Durchschnittliche Intel Core 7 240H (34965 - 69215, n=5) | |
| Lenovo LOQ 15AHP10 | |
| Gigabyte Gaming A16 GA6H | |
| AIDA64 / Memory Read | |
| Asus TUF Gaming A16 FA608WV | |
| Alienware 16X Aurora, RTX 5070 | |
| HP Victus 16 (2024) | |
| Alienware 16 Aurora | |
| Durchschnittliche Intel Core 7 240H (39706 - 71870, n=5) | |
| Gigabyte Gaming A16 GA6H | |
| Lenovo LOQ 15AHP10 | |
| AIDA64 / Memory Write | |
| Asus TUF Gaming A16 FA608WV | |
| Alienware 16X Aurora, RTX 5070 | |
| HP Victus 16 (2024) | |
| Durchschnittliche Intel Core 7 240H (33560 - 80488, n=5) | |
| Alienware 16 Aurora | |
| Lenovo LOQ 15AHP10 | |
| Gigabyte Gaming A16 GA6H | |
| AIDA64 / Memory Latency | |
| Alienware 16X Aurora, RTX 5070 | |
| Asus TUF Gaming A16 FA608WV | |
| Alienware 16 Aurora | |
| Durchschnittliche Intel Core 7 240H (97.1 - 125.6, n=5) | |
| Gigabyte Gaming A16 GA6H | |
| Lenovo LOQ 15AHP10 | |
| HP Victus 16 (2024) | |
* ... kleinere Werte sind besser
Stresstest
Beim Starten von Prime95 Stress stieg die CPU auf 4,3 GHz und 120 W, bevor sie kontinuierlich auf 3,7 GHz und 95 W fällt. Die Kerntemperatur stabilisiert sich ebenfalls bei 100 °C, so dass die CPU trotz der großen Leistungsunterschiede nicht kühler läuft als auf der 16X Aurora.
Die Leistungsaufnahme der GPU-Platine bei Cyberpunk 2077 beträgt im Durchschnitt 31 W, 58 W und 51 W im Modus Balanced, Performance bzw. Overdrive. Die Diskrepanz zwischen den Modi Performance und Overdrive scheint darauf hinzuweisen, dass der Overdrive-Modus die Leistung nicht unbedingt wesentlich verbessert, da die Taktraten noch immer sehr dynamisch sind.
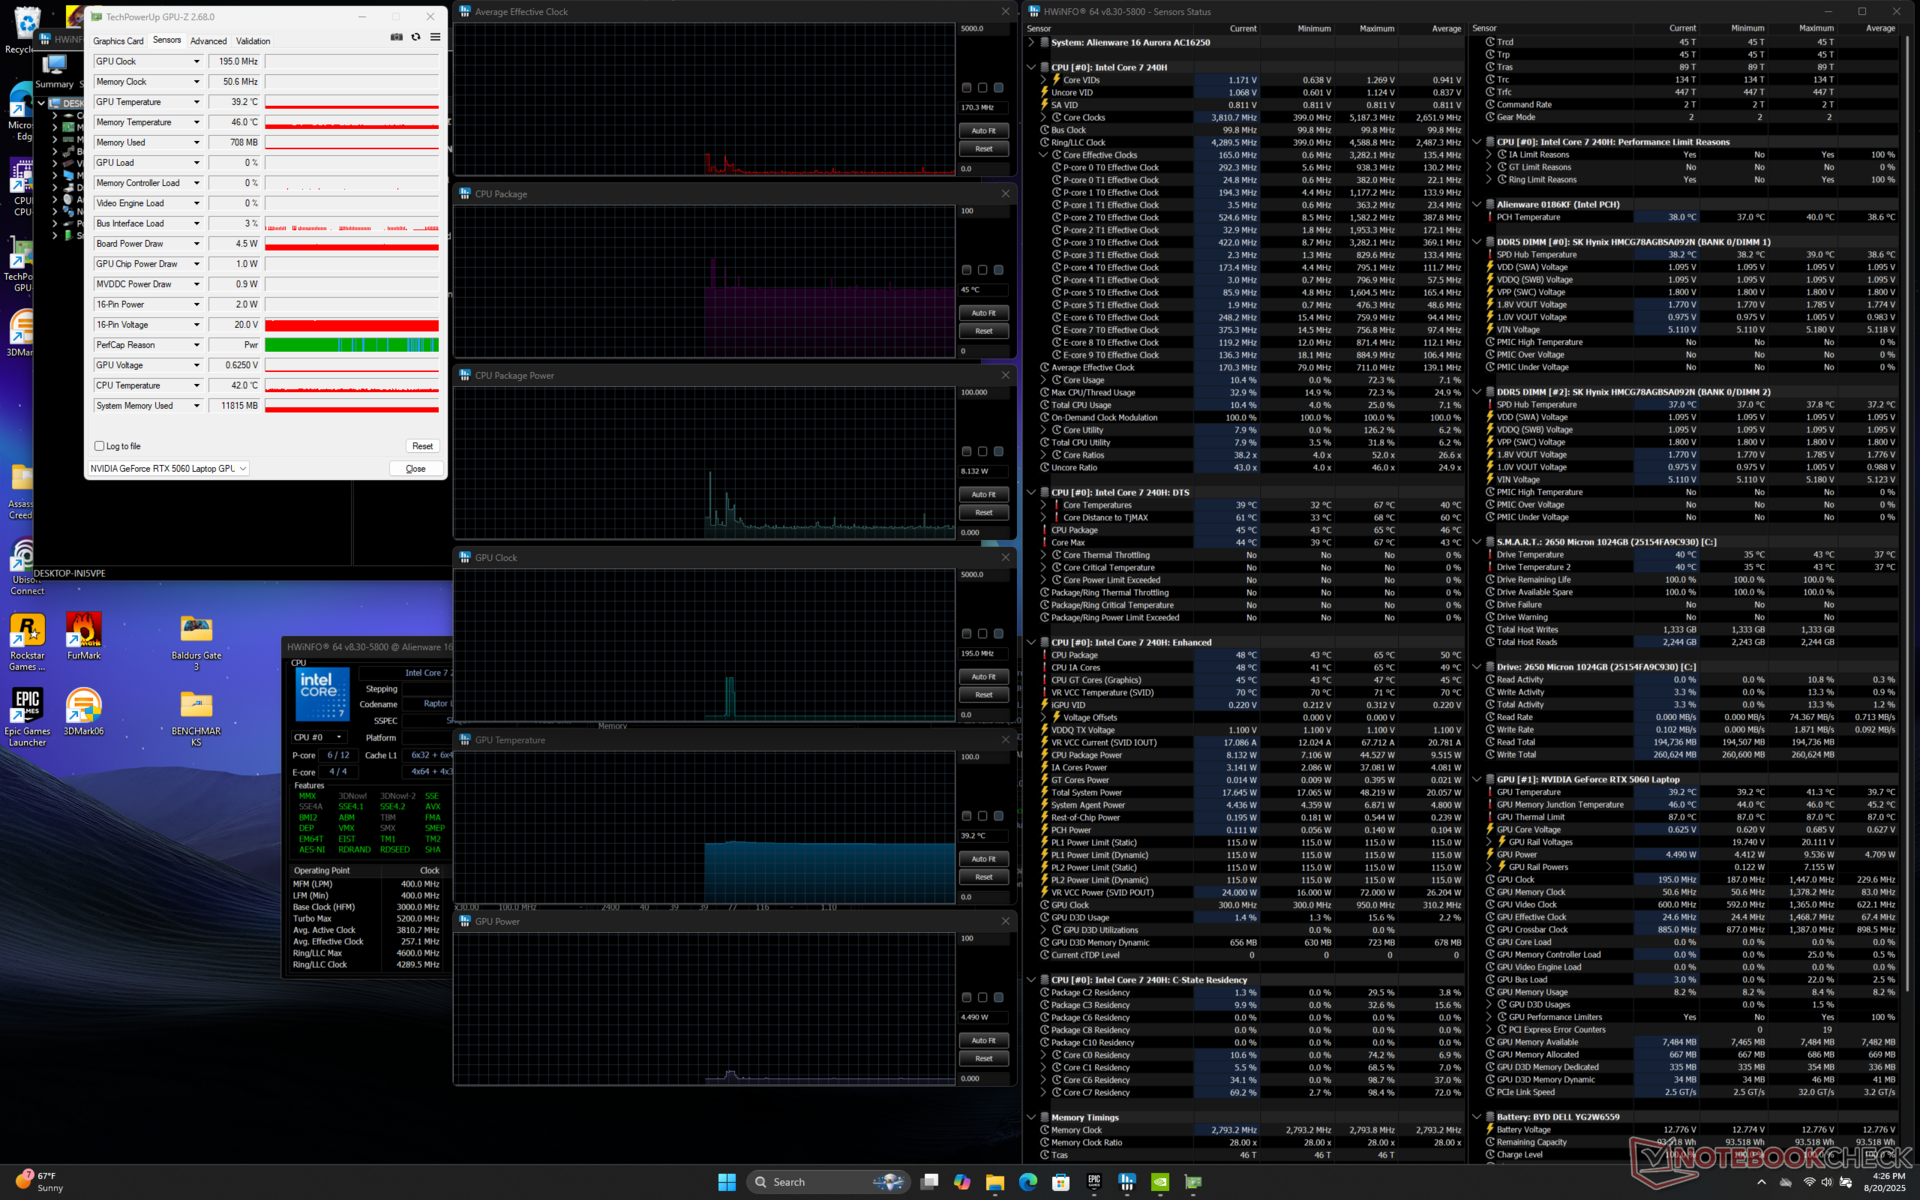
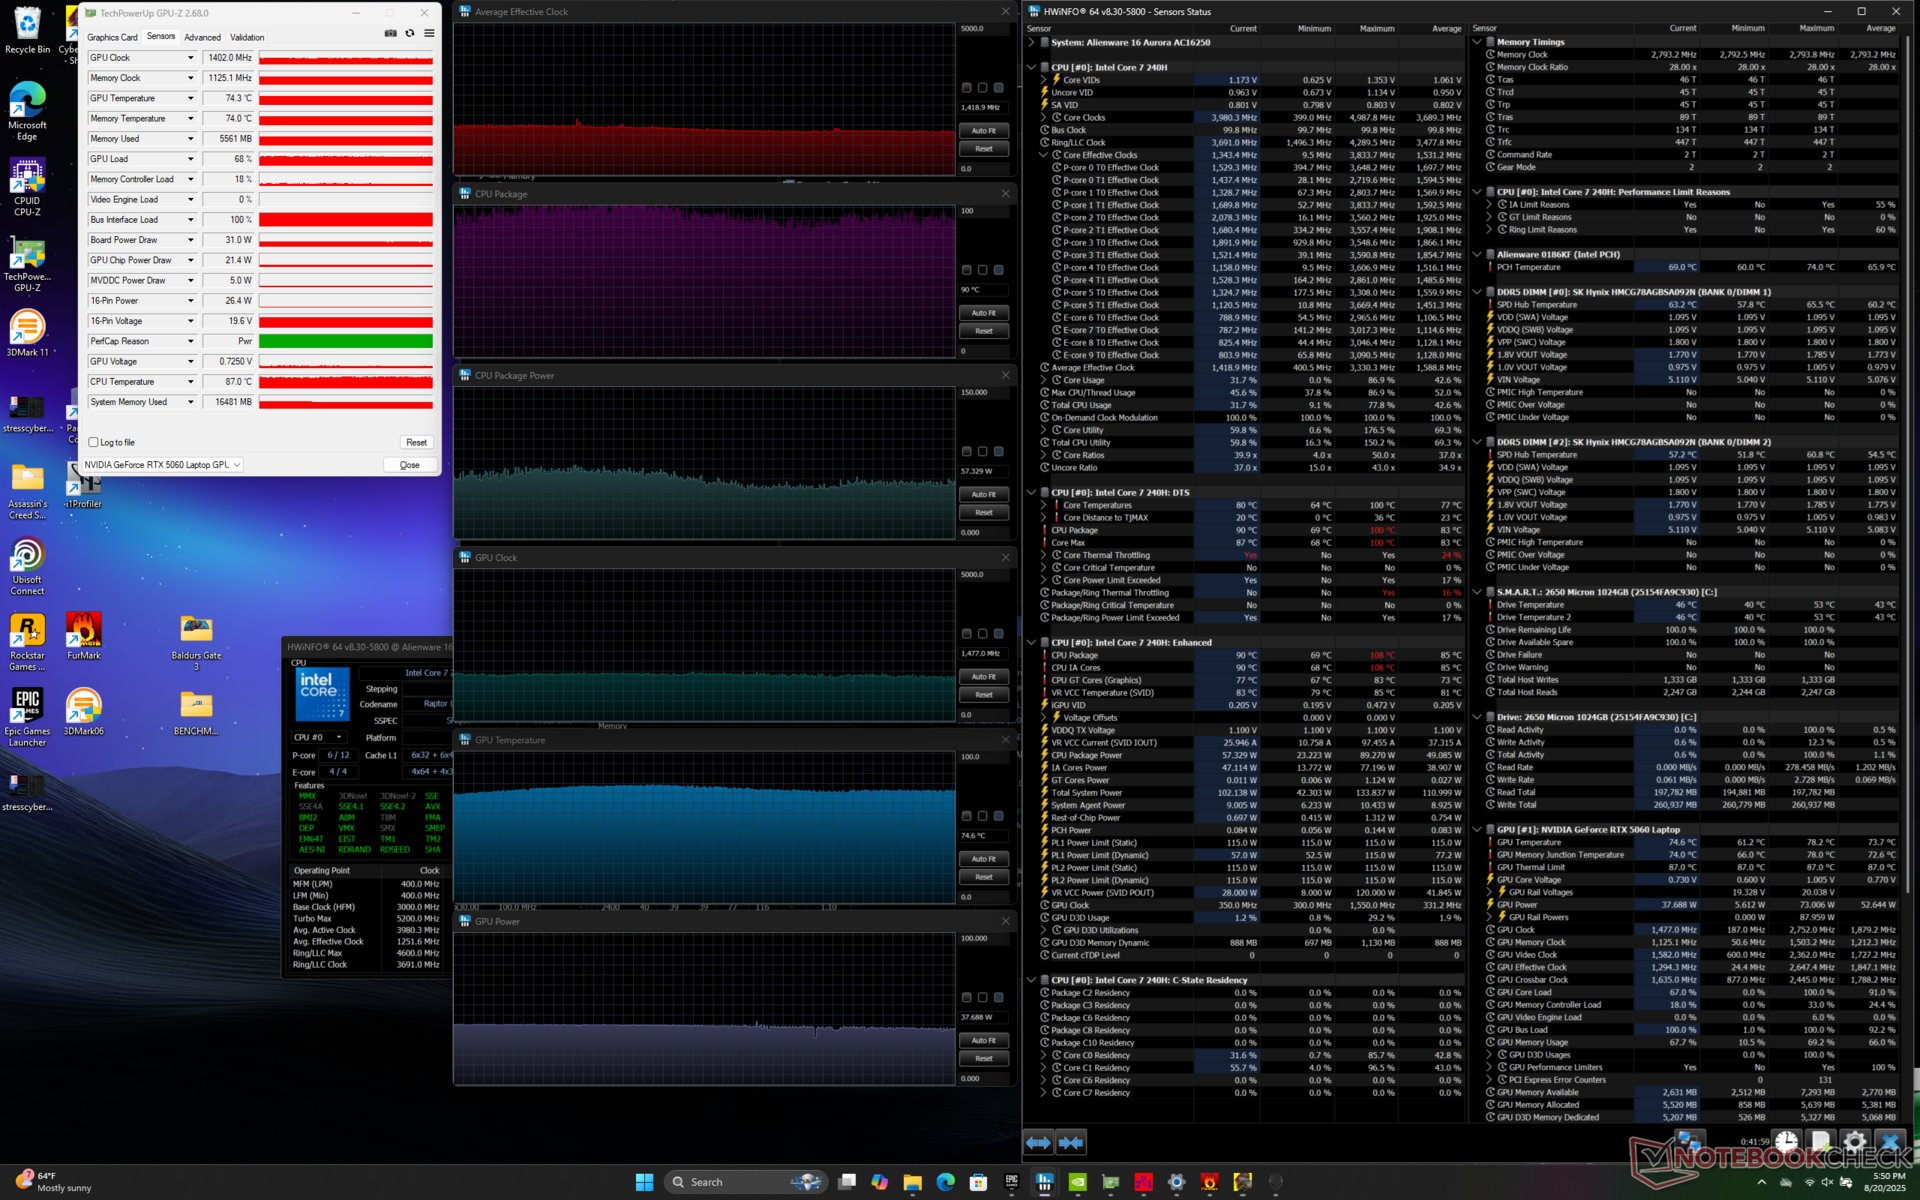
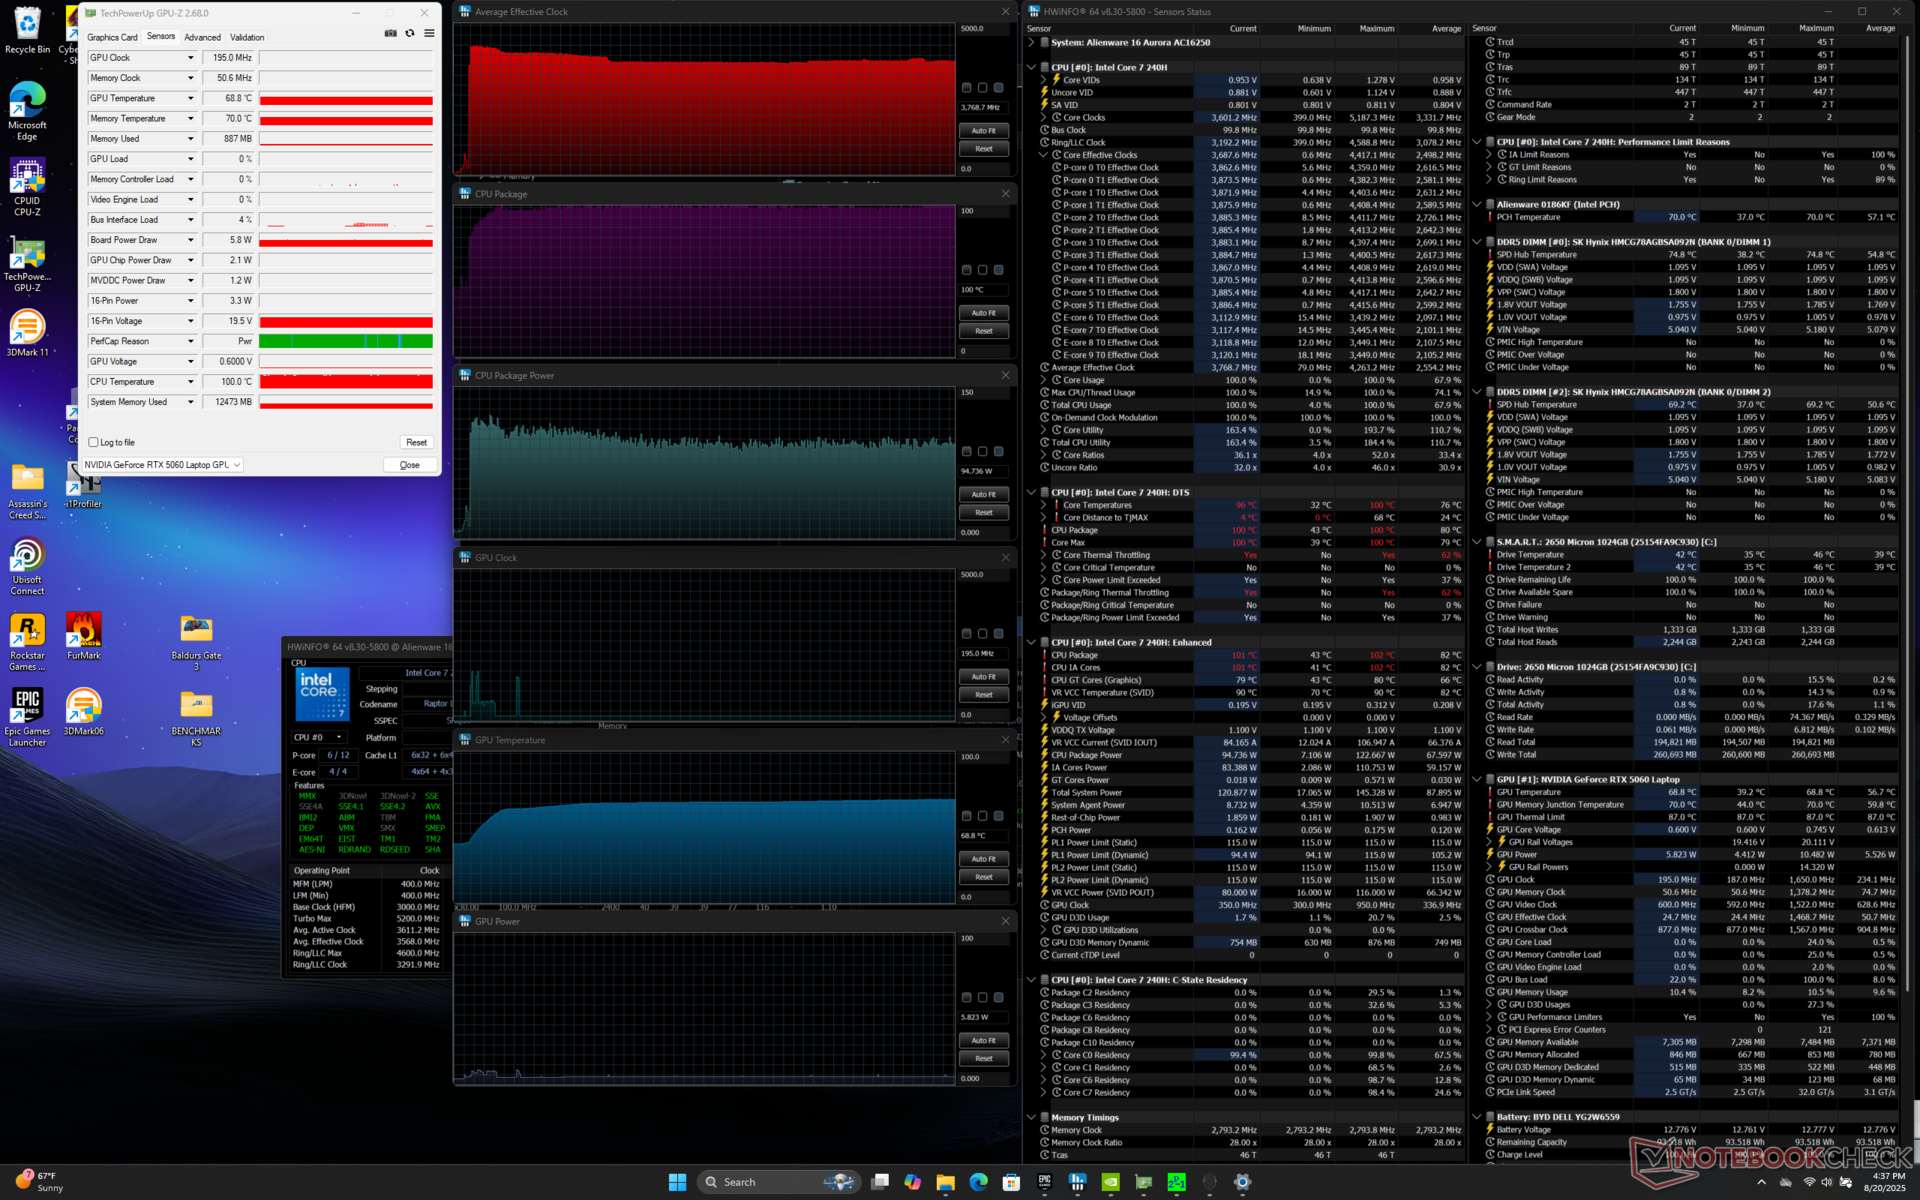
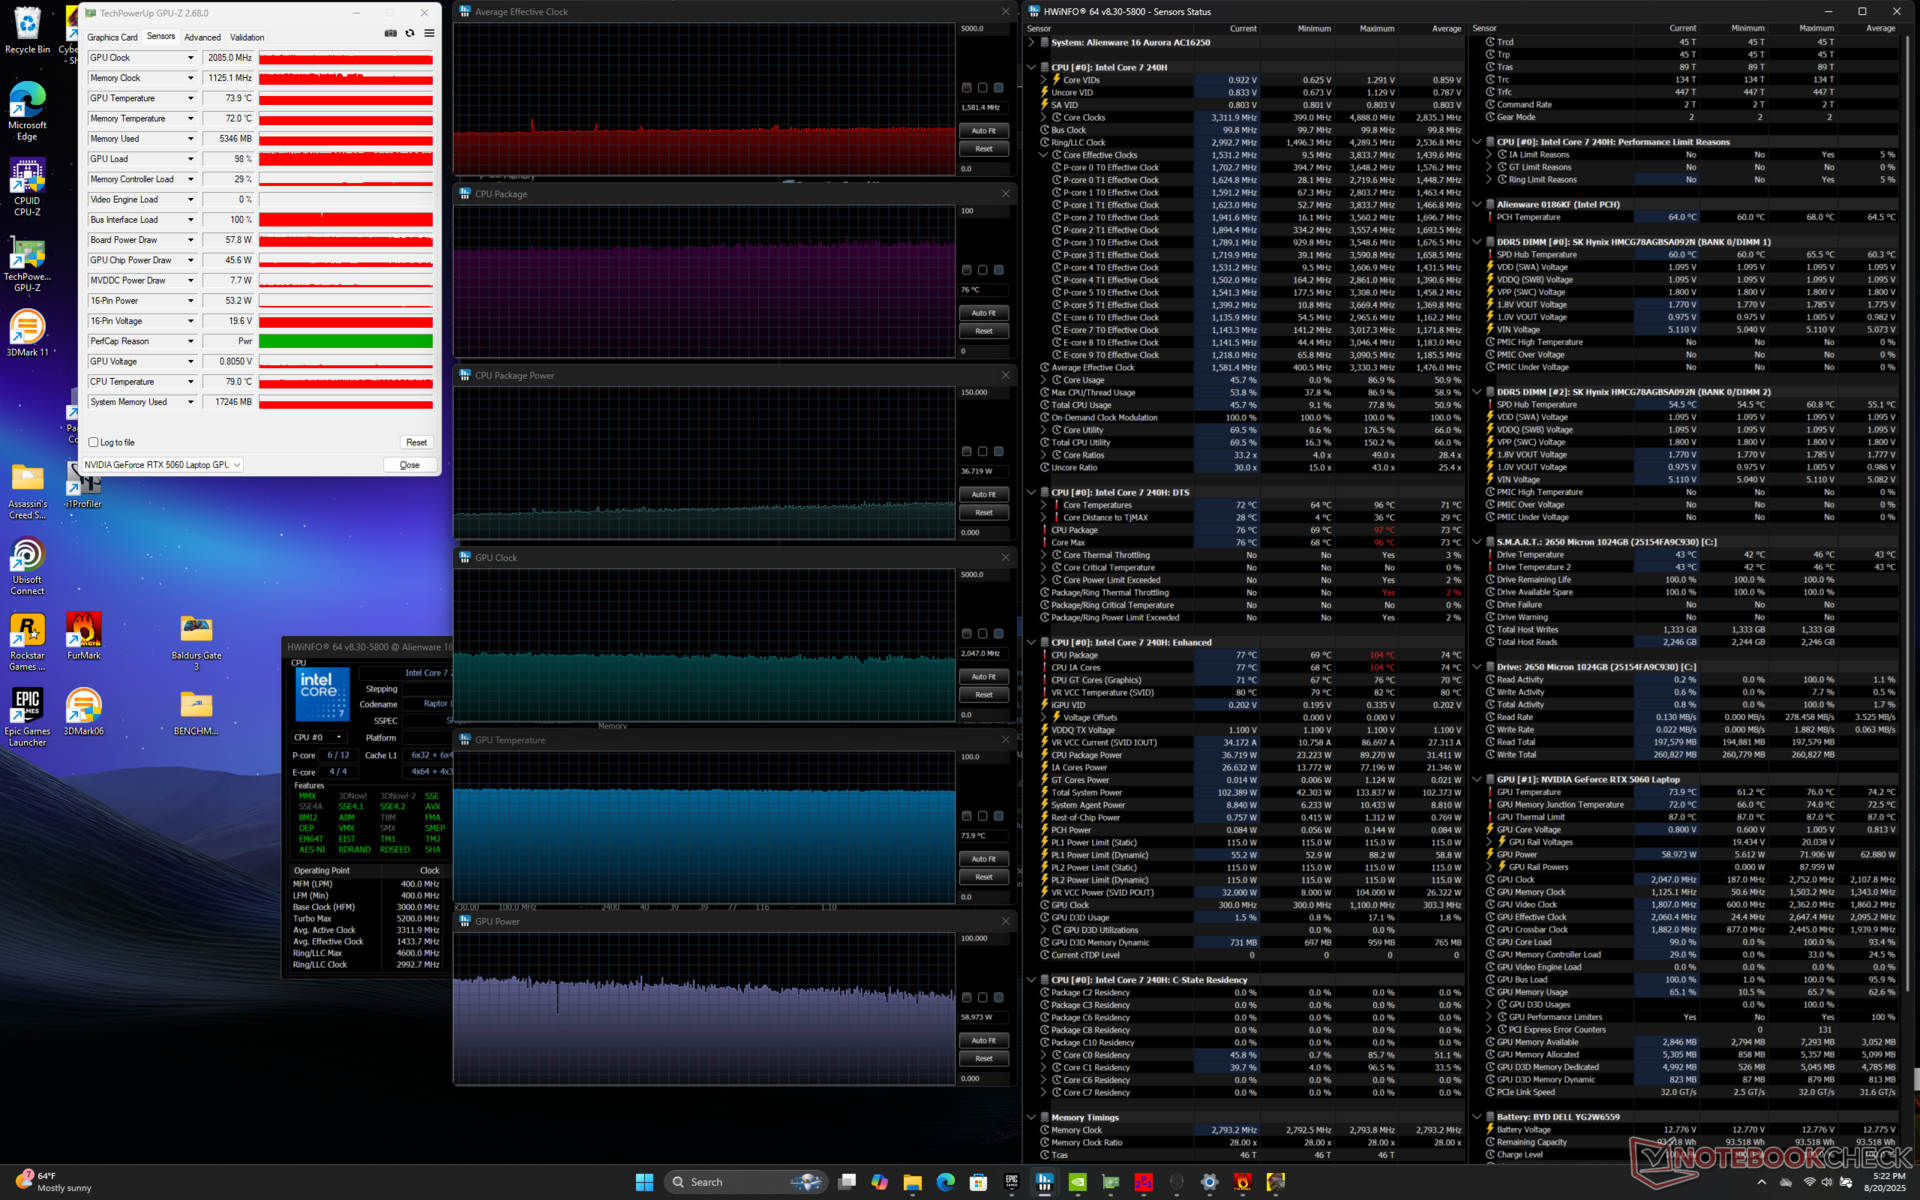
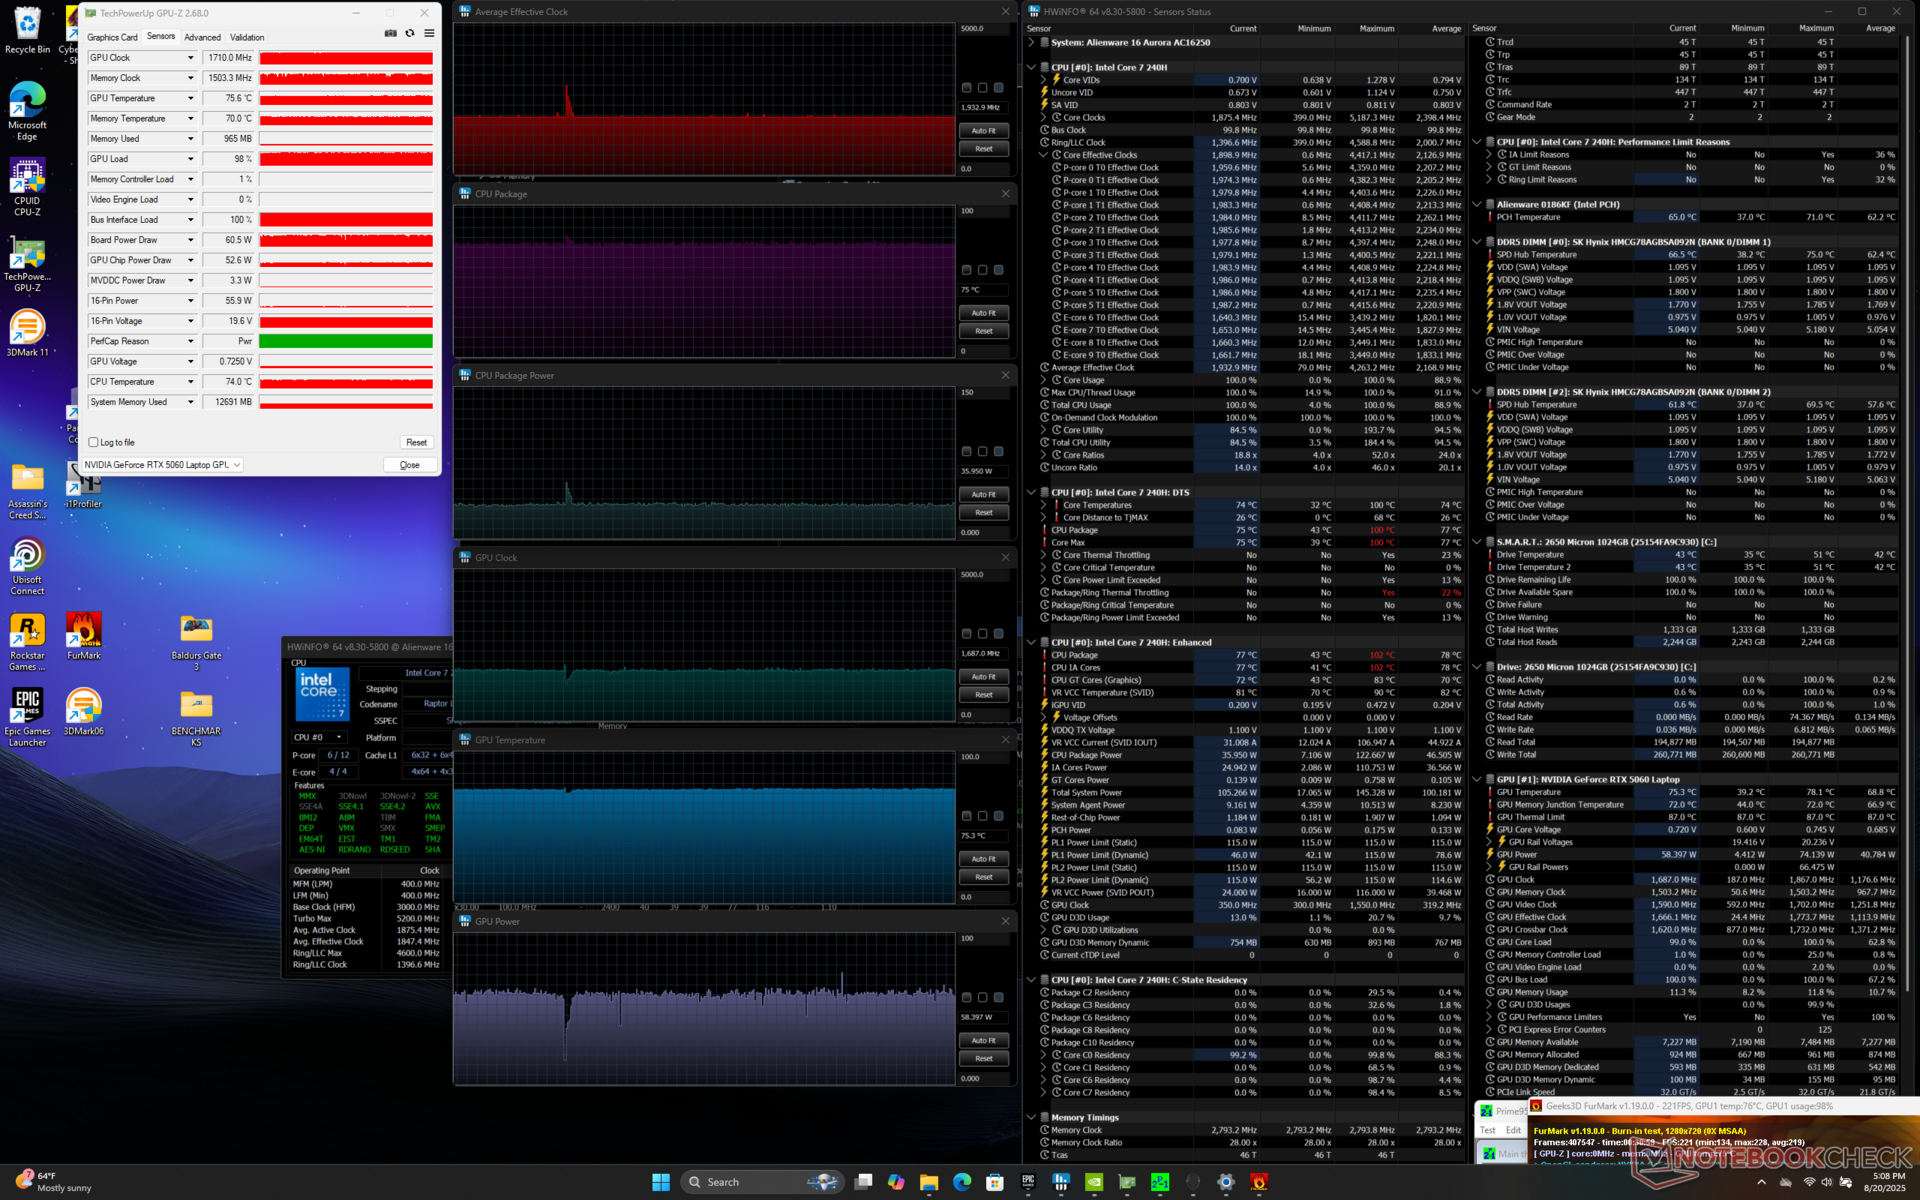
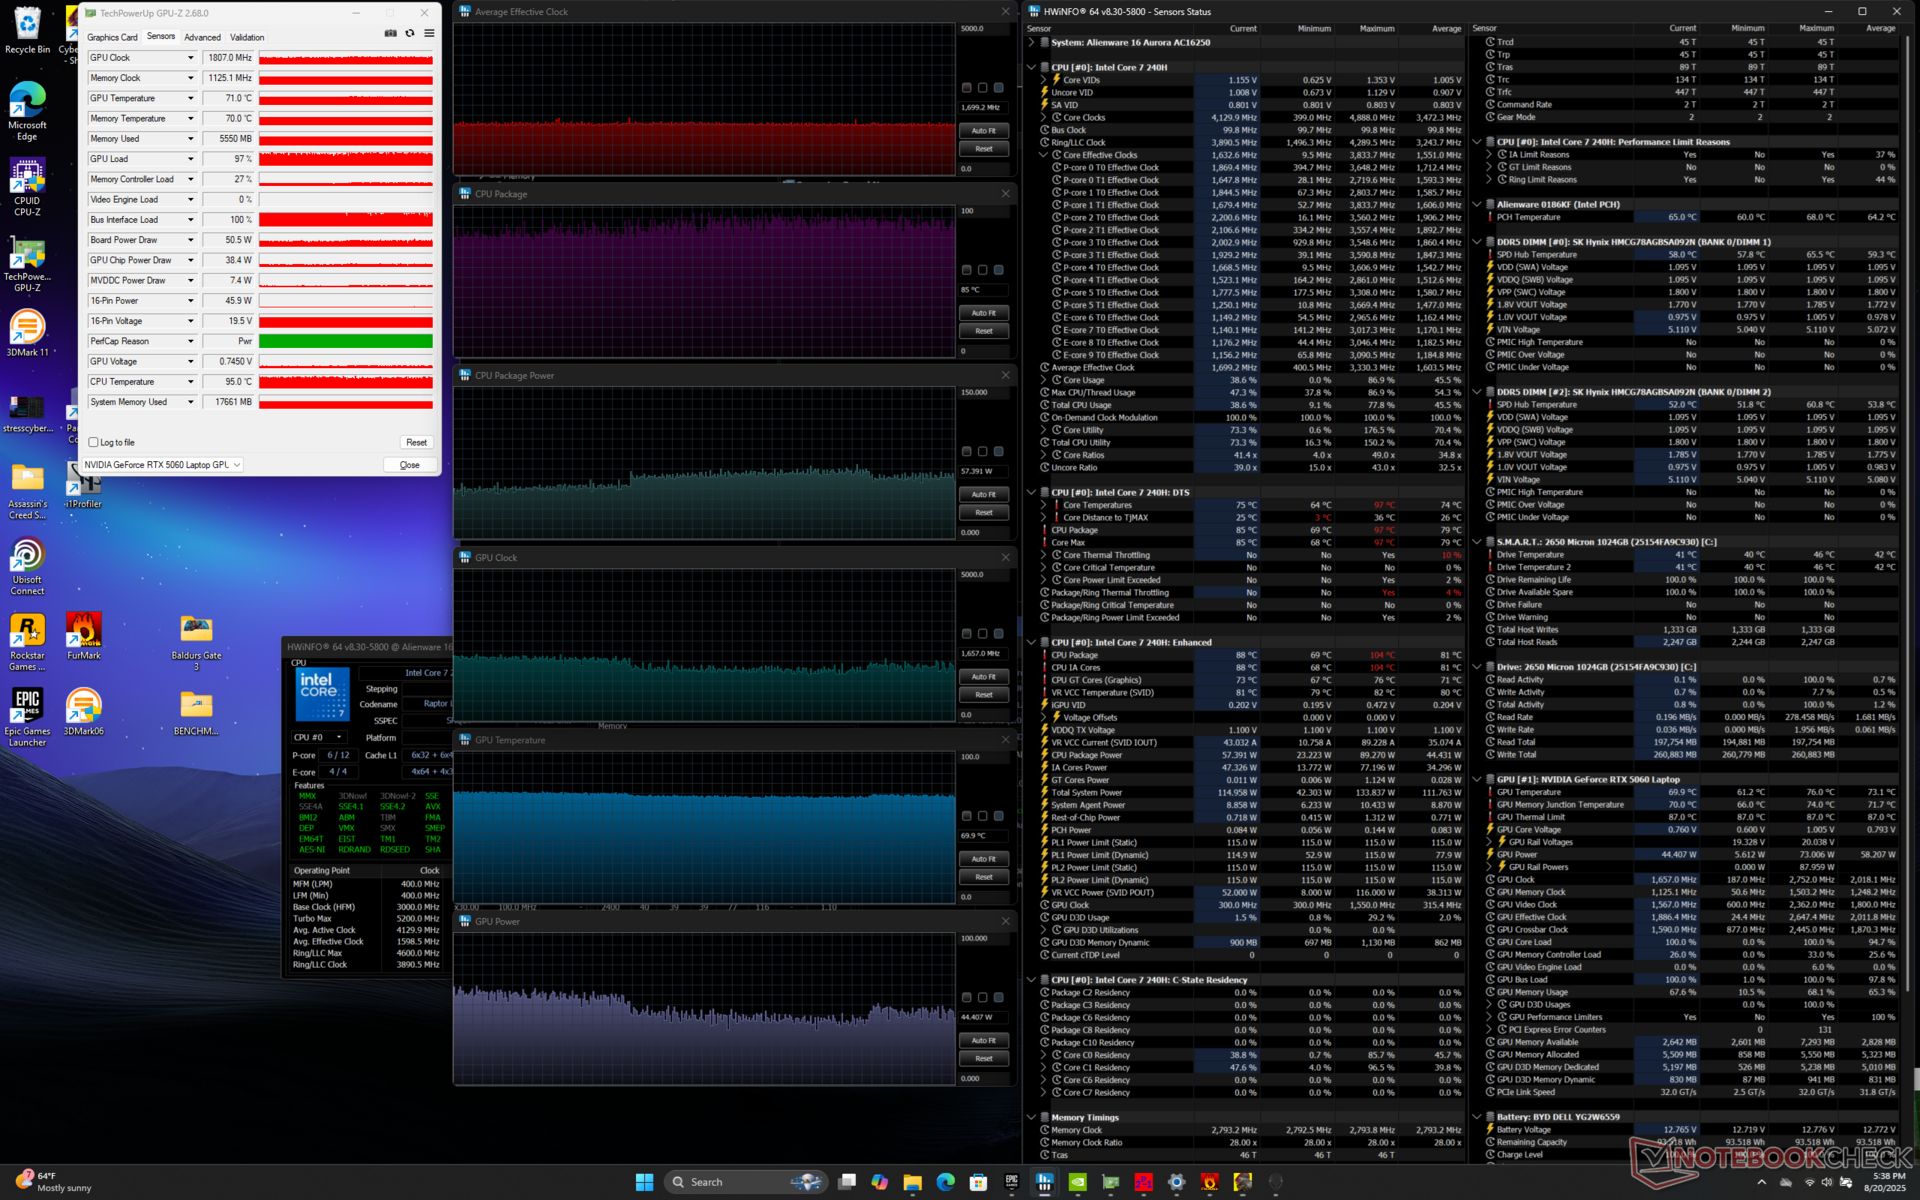
| Durchschnittlicher CPU-Takt (GHz) | GPU-Takt (MHz) | Durchschnittliche CPU-Temperatur (°C) | Durchschnittliche GPU-Temperatur (°C) | |
| System Leerlauf | -- | -- | 45 | 39 |
| Prime95 Stress | 3.8 | -- | 100 | 69 |
| Prime95 + FurMark Stress | 1.9 | 1710 | 75 | 75 |
| Cyberpunk 2077 Stress (Balanced Modus) | 1.4 | 1402 | 90 | 75 |
| Cyberpunk 2077 Stress (Performance Modus) | 1.6 | 2085 | 76 | 74 |
| Cyberpunk 2077 Stress (Turbo-Modus) | 1.7 | 1807 | 85 | 70 |
GPU Performance
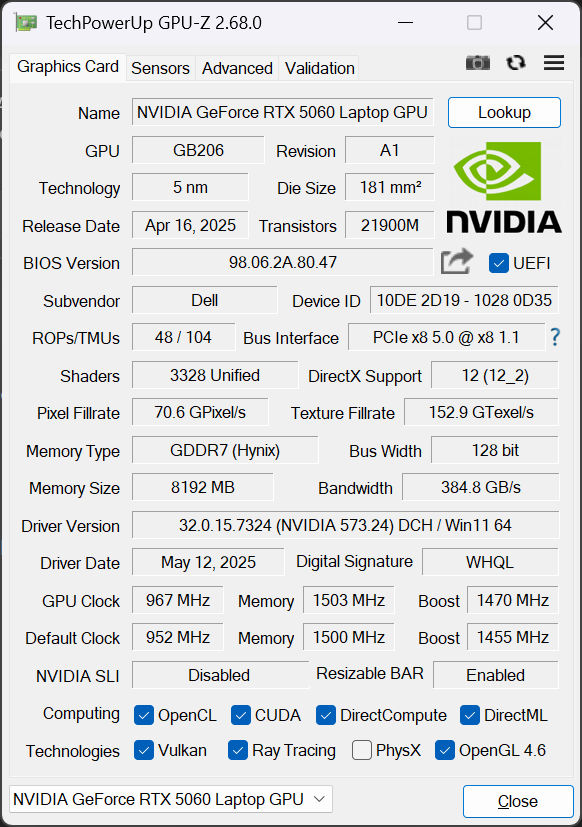
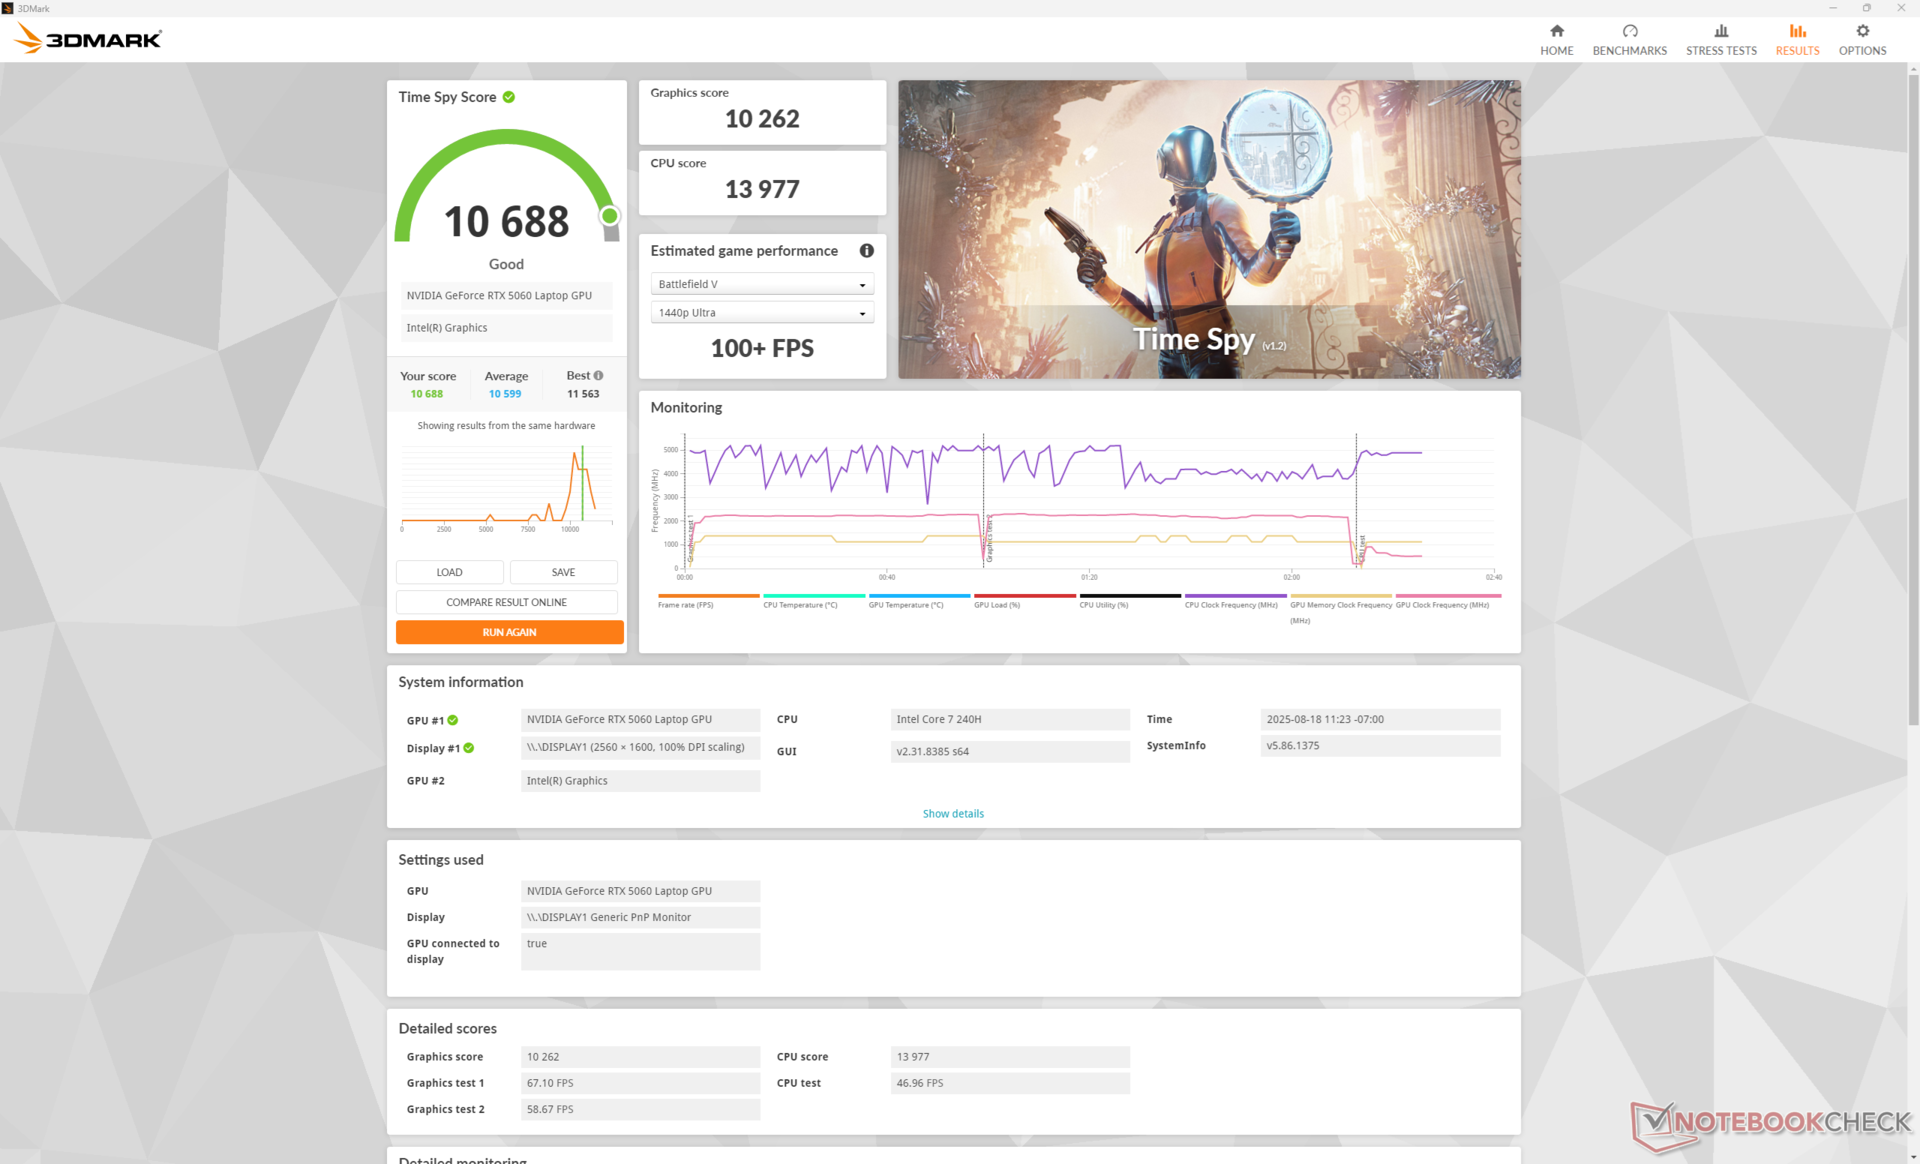
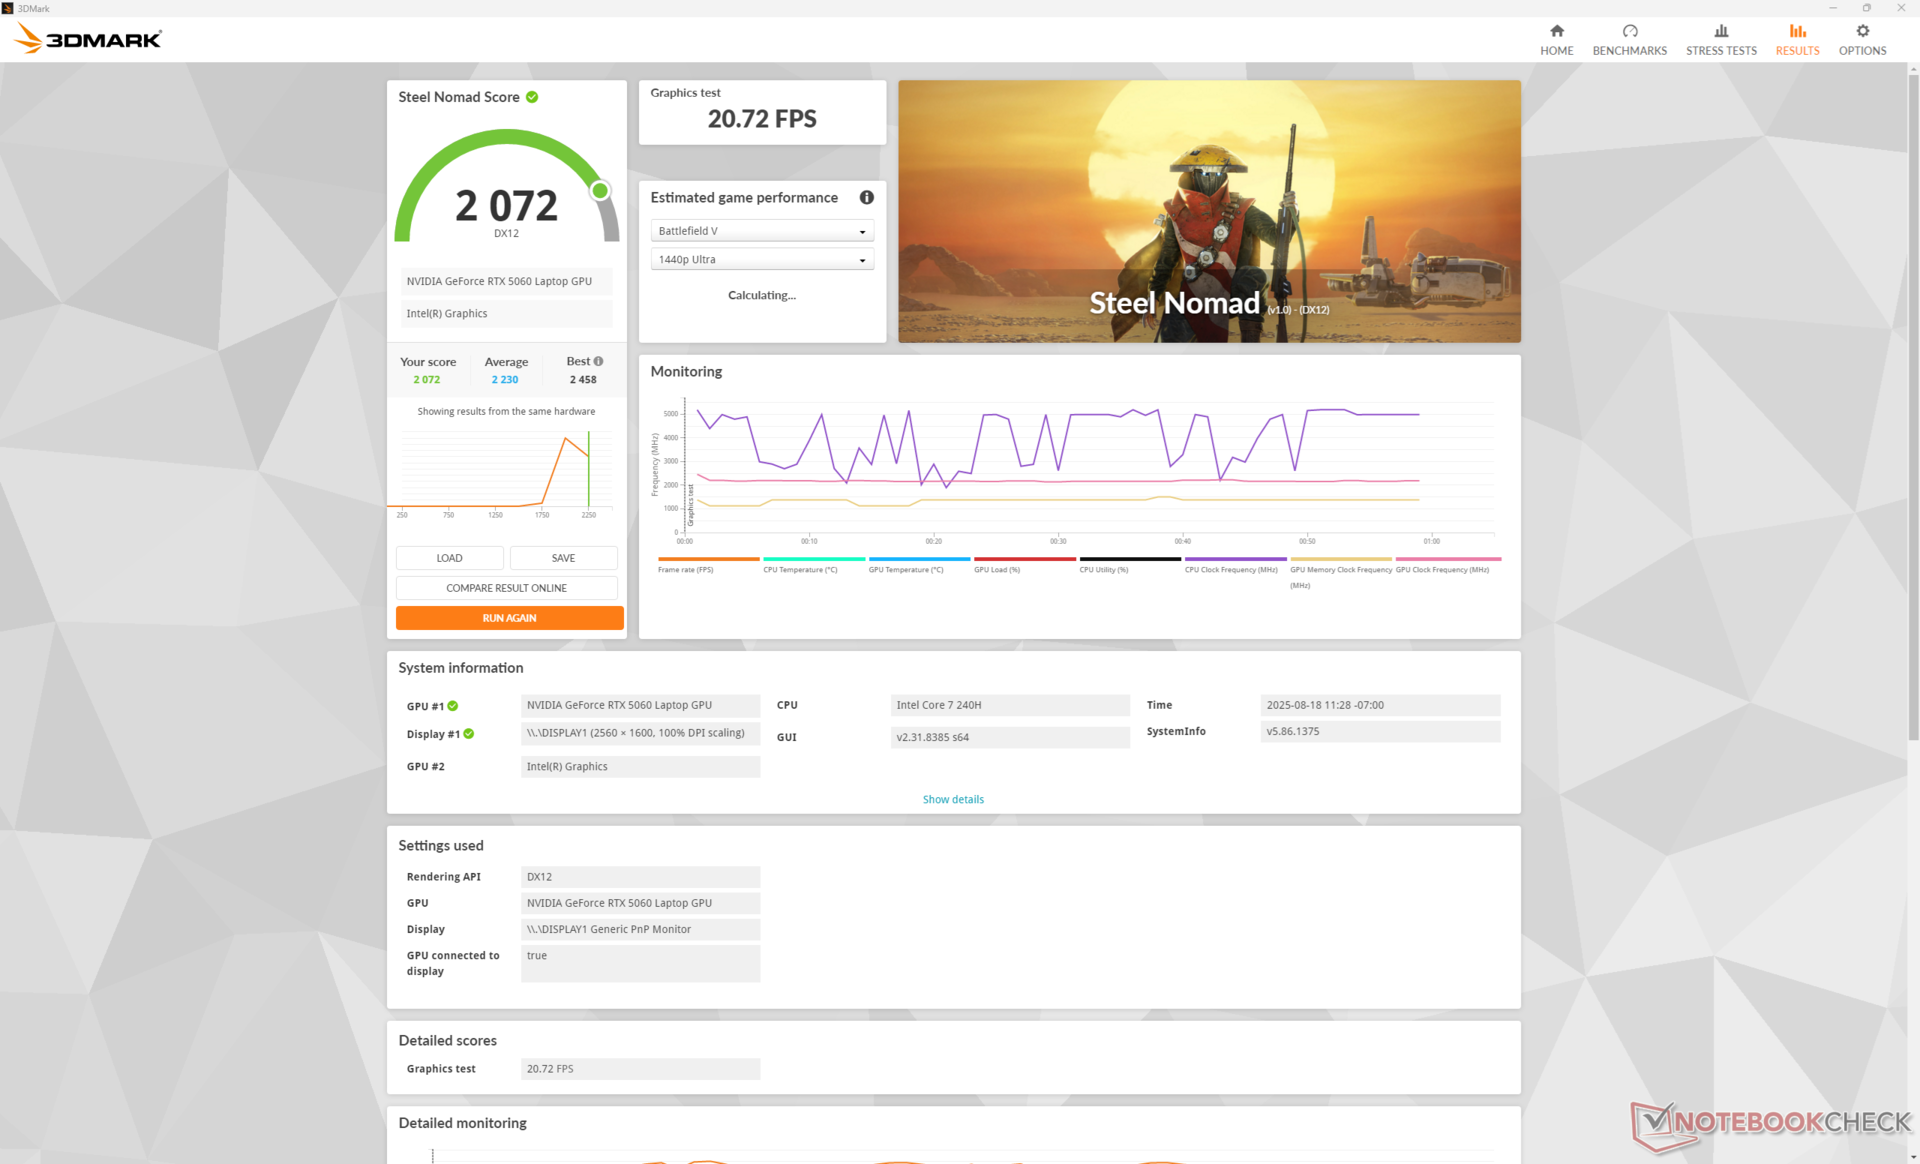
Die rohe Grafikleistung von unserer mobilen RTX 5060 ist etwa 20 bis 30 Prozent langsamer als die der mobilen RTX 5070 in der 16X Aurora. Das Leistungsdefizit zwischen der mobilen RTX 5060 und der Desktop-RTX-5060 ist mit bis zu 30 Prozent ebenfalls ähnlich.
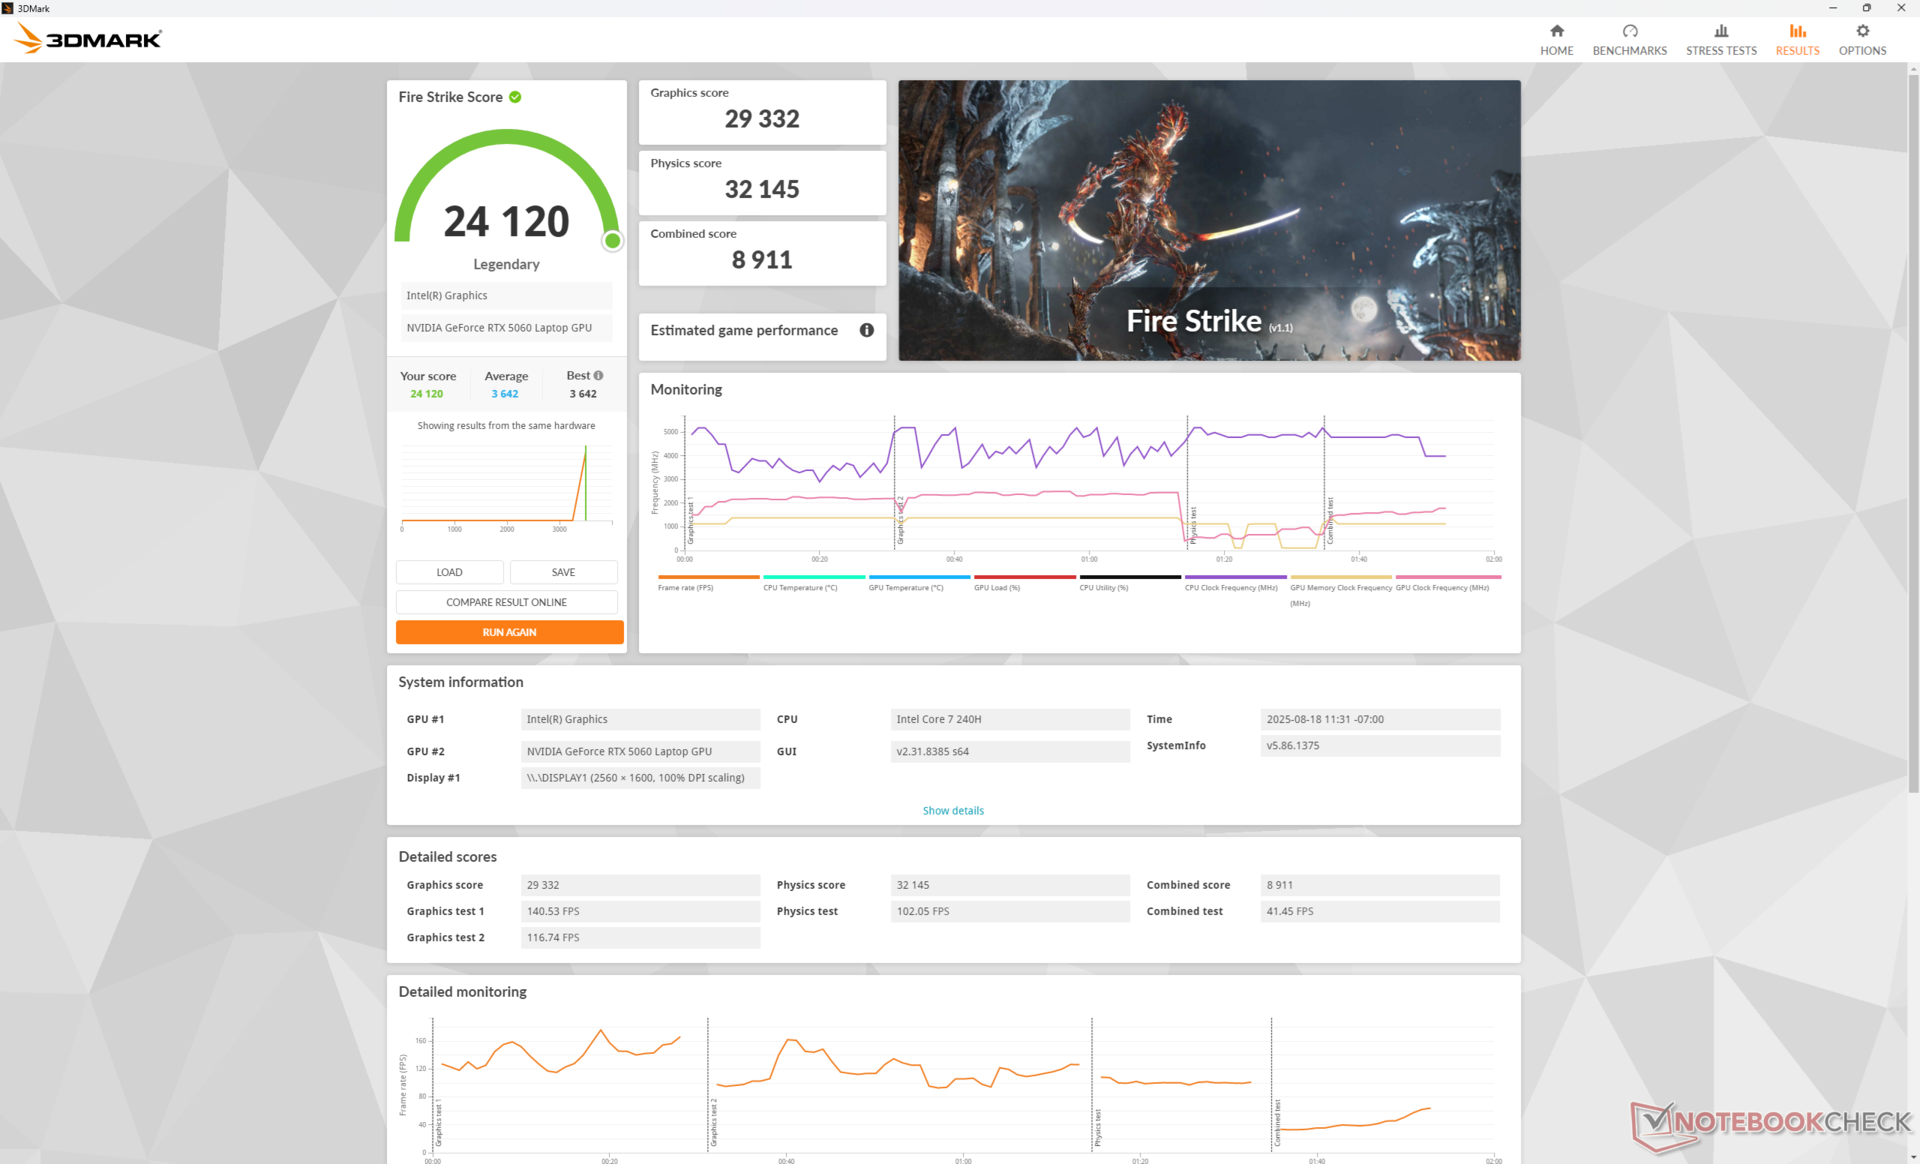
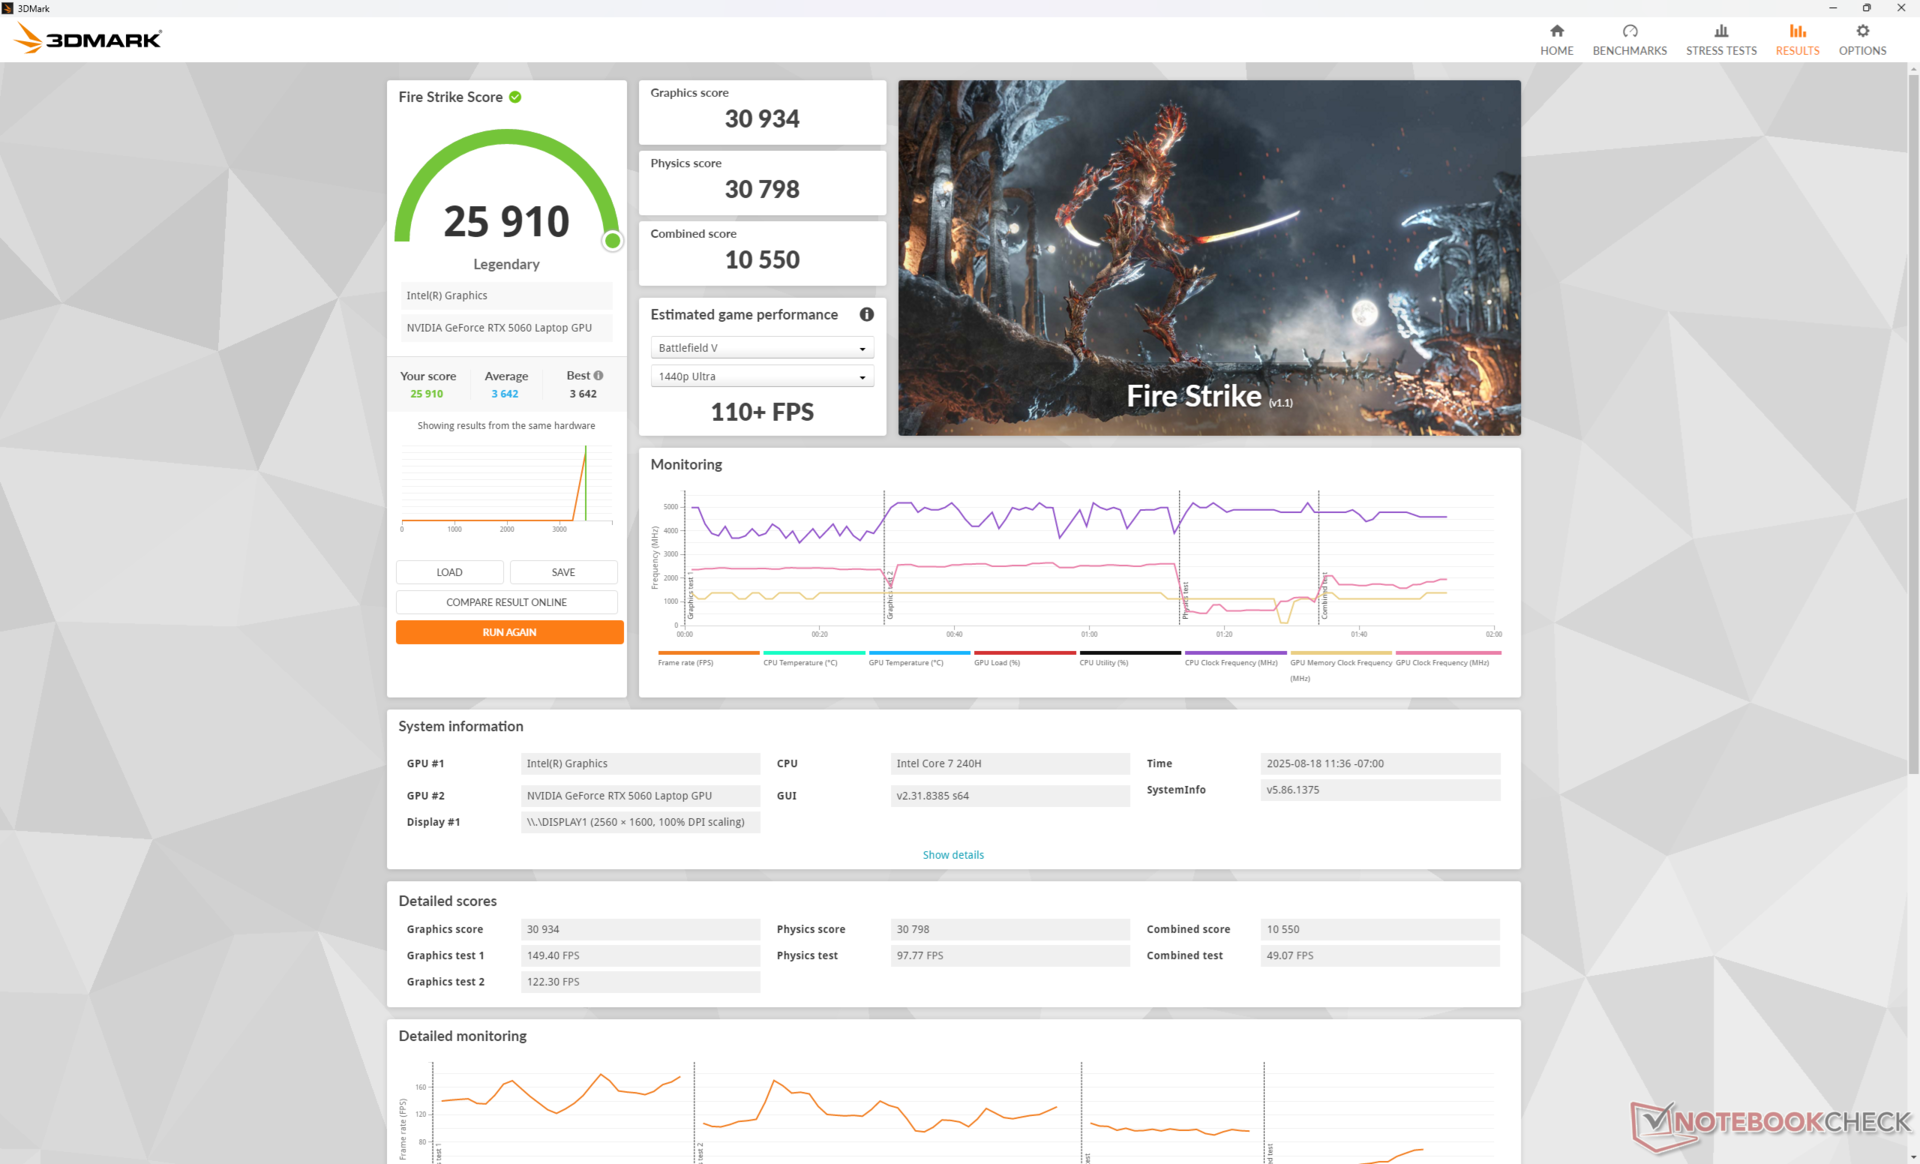
Die Ausführung im Overdrive-Modus kann die Grafikleistung auf Kosten der Prozessorleistung leicht verbessern, wie unsere Fire-Strike-Ergebnistabelle unten zeigt.
| Leistungsprofil | Grafics-Punktzahl | Physics-Punktzahl | kombinierte Punktzahl |
| Overdrive-Modus | 30.934 | 30.798 | 10.550 |
| Performance-Modus | 29.332 (-5 %) | 32.145 (+4 %) | 8.911 (-16 %) |
| Balanced-Modus | 28.162 (-9 %) | 31.743 (+3 %) | 9.795 (-7 %) |
| Akku-Leistung | 27.155 (-12 %) | 21.692 (-30 %) | 9.020 (-15 %) |
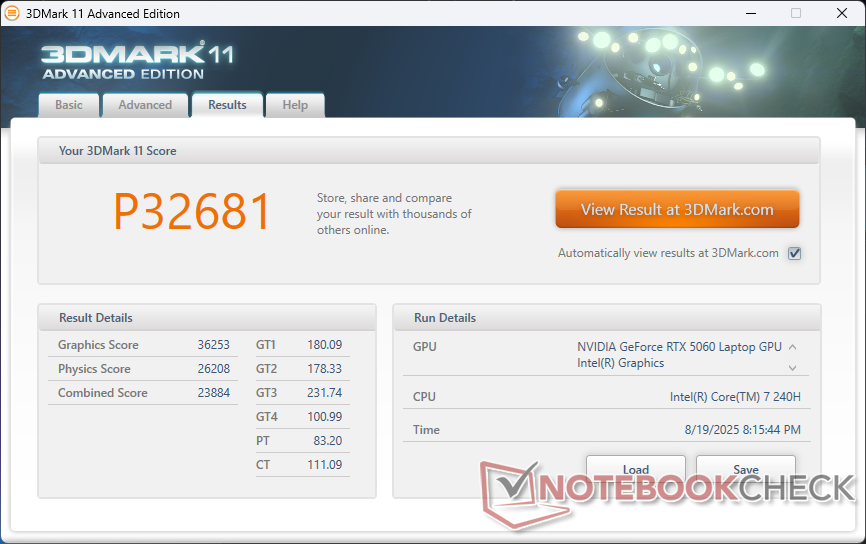
| 3DMark 11 Performance | 32681 Punkte | |
| 3DMark Fire Strike Score | 24120 Punkte | |
| 3DMark Time Spy Score | 10688 Punkte | |
| 3DMark Steel Nomad Score | 2072 Punkte | |
Hilfe | ||
* ... kleinere Werte sind besser
Spiele-Performance
Die mobile GeForce RTX 5060 ist fast ausschließlich für Spiele mit hohen 1.080p oder mittleren 1.440p geeignet, wenn man anspruchsvollere Titel spielt. Wechselt man beispielsweise bei Alan Wake 2 von 1.080p auf 1.440p und behält die Grafikeinstellungen bei, verringert sich die Bildrate um fast die Hälfte. Man sollte darauf eingestellt sein, die Einstellungen bei höheren Auflösungen stärker zu reduzieren.
DLSS und Frame Generation werden bei 1.080p empfohlen, wenn hohe Grafikeinstellungen gewünscht sind. Wenn man zum Beispiel Alan Wake 2 mit hohen 1.080p-Raytrace-Einstellungen spielt, ergibt sich eine durchschnittliche Bildrate von nur 24. Wenn man den DLSS-Qualitätsmodus und 2x FG aktiviert, erhöht sich die durchschnittliche Bildrate auf 76, allerdings mit einer beträchtlichen Eingabeverzögerung. Die meisten Einstellungen sollten im mittleren Bereich belassen werden, wenn man die native 2K-Auflösung des Bildschirms anstrebt.
| Performance Rating - Percent | |
| Alienware 16X Aurora, RTX 5070 | |
| Alienware 16 Aurora | |
| Gigabyte Gaming A16 GA6H | |
| Lenovo LOQ 15AHP10 | |
| HP Victus 16 (2024) -1! | |
| Asus TUF Gaming A16 FA608WV | |
| Cyberpunk 2077 - 1920x1080 Ultra Preset (FSR off) | |
| Alienware 16X Aurora, RTX 5070 | |
| Lenovo LOQ 15AHP10 | |
| Gigabyte Gaming A16 GA6H | |
| Alienware 16 Aurora | |
| Asus TUF Gaming A16 FA608WV | |
| HP Victus 16 (2024) | |
| Baldur's Gate 3 - 1920x1080 Ultra Preset AA:T | |
| Alienware 16X Aurora, RTX 5070 | |
| Alienware 16 Aurora | |
| Gigabyte Gaming A16 GA6H | |
| Lenovo LOQ 15AHP10 | |
| Asus TUF Gaming A16 FA608WV | |
| GTA V - 1920x1080 Highest AA:4xMSAA + FX AF:16x | |
| Alienware 16X Aurora, RTX 5070 | |
| Alienware 16 Aurora | |
| Asus TUF Gaming A16 FA608WV | |
| HP Victus 16 (2024) | |
| Lenovo LOQ 15AHP10 | |
| Gigabyte Gaming A16 GA6H | |
| Final Fantasy XV Benchmark - 1920x1080 High Quality | |
| Alienware 16X Aurora, RTX 5070 | |
| Lenovo LOQ 15AHP10 | |
| Alienware 16 Aurora | |
| Asus TUF Gaming A16 FA608WV | |
| HP Victus 16 (2024) | |
| Gigabyte Gaming A16 GA6H | |
| Strange Brigade - 1920x1080 ultra AA:ultra AF:16 | |
| Alienware 16X Aurora, RTX 5070 | |
| Lenovo LOQ 15AHP10 | |
| Gigabyte Gaming A16 GA6H | |
| Asus TUF Gaming A16 FA608WV | |
| Alienware 16 Aurora | |
| HP Victus 16 (2024) | |
| Dota 2 Reborn - 1920x1080 ultra (3/3) best looking | |
| Alienware 16X Aurora, RTX 5070 | |
| Alienware 16 Aurora | |
| HP Victus 16 (2024) | |
| Gigabyte Gaming A16 GA6H | |
| Asus TUF Gaming A16 FA608WV | |
| Lenovo LOQ 15AHP10 | |
| X-Plane 11.11 - 1920x1080 high (fps_test=3) | |
| Alienware 16X Aurora, RTX 5070 | |
| HP Victus 16 (2024) | |
| Gigabyte Gaming A16 GA6H | |
| Alienware 16 Aurora | |
| Lenovo LOQ 15AHP10 | |
| Asus TUF Gaming A16 FA608WV | |
| F1 24 | |
| 1920x1080 Ultra High Preset AA:T AF:16x | |
| Chuwi Gamebook, R9 9955HX | |
| Alienware 16X Aurora, RTX 5070 | |
| Zotac GeForce RTX 5060 AMP | |
| Durchschnittliche NVIDIA GeForce RTX 5060 Laptop (46.1 - 77.5, n=9) | |
| Alienware 16 Aurora | |
| 2560x1440 Ultra High Preset AA:T AF:16x | |
| Chuwi Gamebook, R9 9955HX | |
| Alienware 16X Aurora, RTX 5070 | |
| Zotac GeForce RTX 5060 AMP | |
| Durchschnittliche NVIDIA GeForce RTX 5060 Laptop (29.8 - 49.1, n=9) | |
| Alienware 16 Aurora | |
| 3840x2160 Ultra High Preset AA:T AF:16x | |
| Zotac GeForce RTX 5060 AMP | |
| Alienware 16X Aurora, RTX 5070 | |
| Alienware 16 Aurora | |
| Durchschnittliche NVIDIA GeForce RTX 5060 Laptop (n=1) | |
| 3840x2160 Ultra High Preset + Quality DLSS AF:16x | |
| Zotac GeForce RTX 5060 AMP | |
| Alienware 16X Aurora, RTX 5070 | |
| Alienware 16 Aurora | |
| Durchschnittliche NVIDIA GeForce RTX 5060 Laptop (n=1) | |
| 2560x1440 Ultra High Preset + Quality DLSS AF:16x | |
| Chuwi Gamebook, R9 9955HX | |
| Alienware 16X Aurora, RTX 5070 | |
| Zotac GeForce RTX 5060 AMP | |
| Durchschnittliche NVIDIA GeForce RTX 5060 Laptop (46 - 74.5, n=8) | |
| Alienware 16 Aurora | |
| Monster Hunter Wilds | |
| 1920x1080 medium, no upscaling | |
| Chuwi Gamebook, R9 9955HX | |
| Alienware 16X Aurora, RTX 5070 | |
| Zotac GeForce RTX 5060 AMP | |
| Durchschnittliche NVIDIA GeForce RTX 5060 Laptop (45.2 - 68.3, n=4) | |
| Alienware 16 Aurora | |
| 1920x1080 ultra, RT: high, no upscaling | |
| Chuwi Gamebook, R9 9955HX | |
| Zotac GeForce RTX 5060 AMP | |
| Alienware 16X Aurora, RTX 5070 | |
| Alienware 16 Aurora | |
| Durchschnittliche NVIDIA GeForce RTX 5060 Laptop (16.6 - 36.5, n=4) | |
| 2560x1440 ultra, RT: high, no upscaling | |
| Chuwi Gamebook, R9 9955HX | |
| Alienware 16X Aurora, RTX 5070 | |
| Alienware 16 Aurora | |
| Durchschnittliche NVIDIA GeForce RTX 5060 Laptop (13.9 - 20.9, n=3) | |
Cyberpunk 2077 ultra fps-Grafik
| min. | mittel | hoch | max. | QHD DLSS | QHD | 4K DLSS | 4K | |
|---|---|---|---|---|---|---|---|---|
| GTA V (2015) | 186.8 | 186.2 | 179.7 | 120 | 96.7 | 90.2 | ||
| Dota 2 Reborn (2015) | 195.1 | 178.3 | 171.9 | 156.1 | 105.2 | |||
| Final Fantasy XV Benchmark (2018) | 212 | 142 | 109.5 | 79.1 | 45 | |||
| X-Plane 11.11 (2018) | 125.4 | 105.2 | 93.6 | 62.9 | ||||
| Strange Brigade (2018) | 356 | 260 | 219 | 191.1 | 133.7 | 72.8 | ||
| Baldur's Gate 3 (2023) | 135.9 | 117 | 106 | 105.3 | 101.3 | 70.2 | 56.5 | 34.8 |
| Cyberpunk 2077 (2023) | 123.9 | 104.3 | 86.7 | 80.1 | 58.9 | 48.5 | 21.5 | |
| Alan Wake 2 (2023) | 66.2 | 59.1 | 54.6 | 31.2 | 12.1 | |||
| F1 24 (2024) | 181.2 | 176.8 | 154.3 | 46.1 | 46 | 29.8 | 9.21 | 10.7 |
| Black Myth: Wukong (2024) | 83 | 63 | 48 | 26 | 30 | 19 | 9 | |
| Indiana Jones and the Great Circle (2024) | 102.1 | 54.9 | 14.1 | 10.1 | 5.3 | |||
| Monster Hunter Wilds (2025) | 49.4 | 45.2 | 33.5 | 17.8 | 10.6 | |||
| Assassin's Creed Shadows (2025) | 50 | 47 | 45 | 31 | 24 | 26 | 14 |
Emissionen
Systemrauschen
Das Lüftergeräusch bei Cyberpunk 2077 stabilisiert sich bei 46,8 dB(A), 49,9 dB(A) und 55,6 dB(A) im Modus Balanced, Performance bzw. Overdrive. Die Pegel entsprechen in etwa dem, was wir bei der 16X Aurora beobachtet haben.
Lautstärkediagramm
| Idle |
| 24 / 25.6 / 25.6 dB(A) |
| Last |
| 46.8 / 55.6 dB(A) |
 | ||
30 dB leise 40 dB(A) deutlich hörbar 50 dB(A) störend |
||
min: | ||
| Alienware 16 Aurora GeForce RTX 5060 Laptop, Core 7 240H | Alienware 16X Aurora, RTX 5070 GeForce RTX 5070 Laptop, Ultra 9 275HX | Lenovo LOQ 15AHP10 GeForce RTX 5060 Laptop, R7 250, Micron 2500 1TB MTFDKBA1T0QGN | Gigabyte Gaming A16 GA6H GeForce RTX 5070 Laptop, i7-13620H, Kingston OM8PGP41024Q-A0 | Asus TUF Gaming A16 FA608WV GeForce RTX 4060 Laptop GPU, Ryzen AI 9 HX 370, Micron 2400 MTFDKBA1T0QFM | HP Victus 16 (2024) GeForce RTX 4060 Laptop GPU, i7-14700HX, Kioxia XG8 KXG80ZNV512G | |
|---|---|---|---|---|---|---|
| Geräuschentwicklung | 5% | -37% | -5% | 13% | -8% | |
| aus / Umgebung * (dB) | 22.9 | 23.7 -3% | 25 -9% | 24 -5% | 23 -0% | 25 -9% |
| Idle min * (dB) | 24 | 23.9 -0% | 43 -79% | 25 -4% | 23 4% | 28 -17% |
| Idle avg * (dB) | 25.6 | 23.9 7% | 45 -76% | 26 -2% | 23 10% | 29 -13% |
| Idle max * (dB) | 25.6 | 26.1 -2% | 48 -88% | 27 -5% | 29.11 -14% | 33 -29% |
| Last avg * (dB) | 46.8 | 26.8 43% | 53 -13% | 54 -15% | 31 34% | 45 4% |
| Cyberpunk 2077 ultra * (dB) | 49.9 | 51.8 -4% | 51 -2% | 54 -8% | 36.23 27% | |
| Last max * (dB) | 55.6 | 58 -4% | 53 5% | 55 1% | 39.44 29% | 48 14% |
| Witcher 3 ultra * (dB) | 43 |
* ... kleinere Werte sind besser
Energieverwaltung
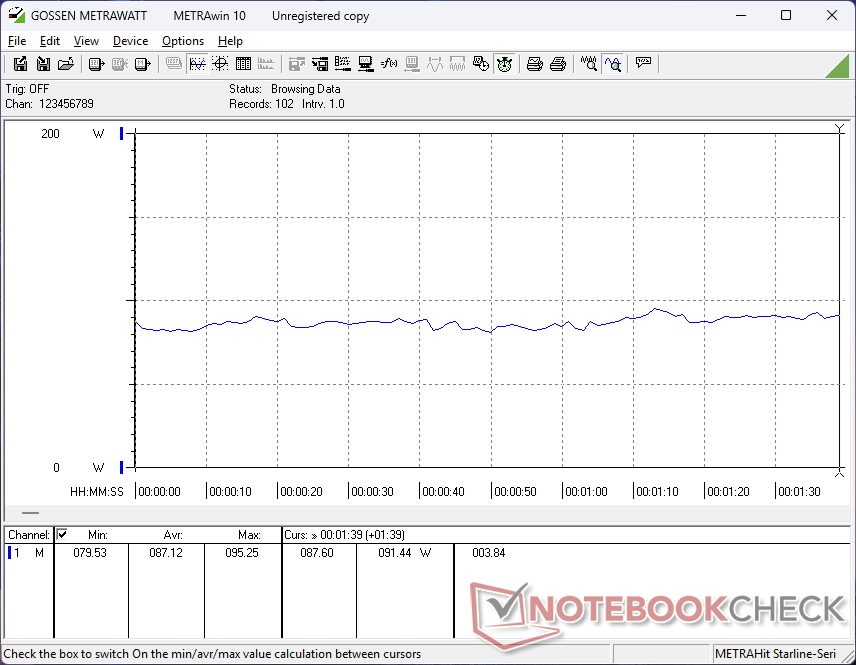
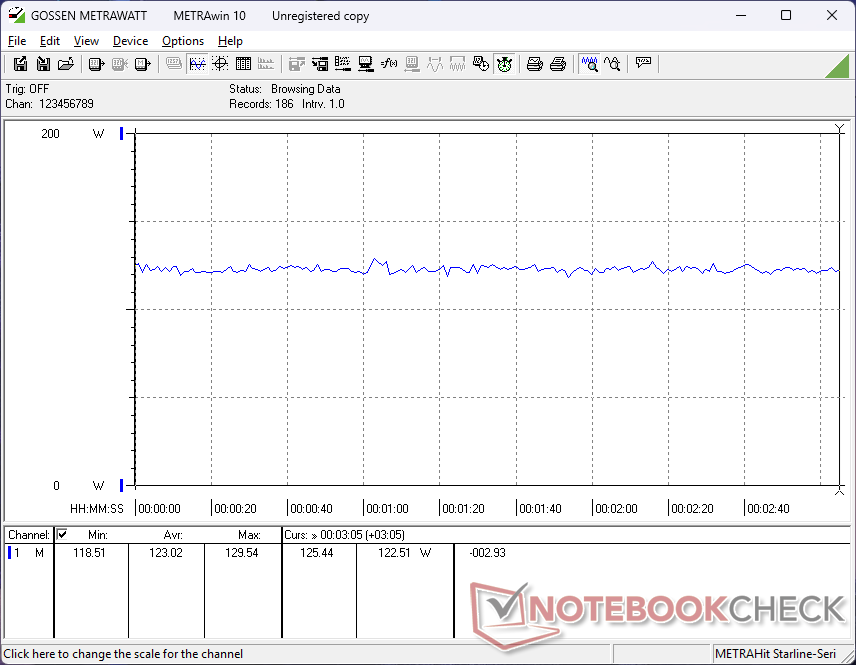
Stromverbrauch
Die langsameren Komponenten des 16 Aurora haben im Vergleich zum 16X Aurora zu einem deutlich niedrigeren Stromverbrauch geführt. Der Nachteil ist natürlich die um 30 Prozent geringere Grafikleistung als beim 16X Aurora mit RTX-5070-Option beim Spielen.
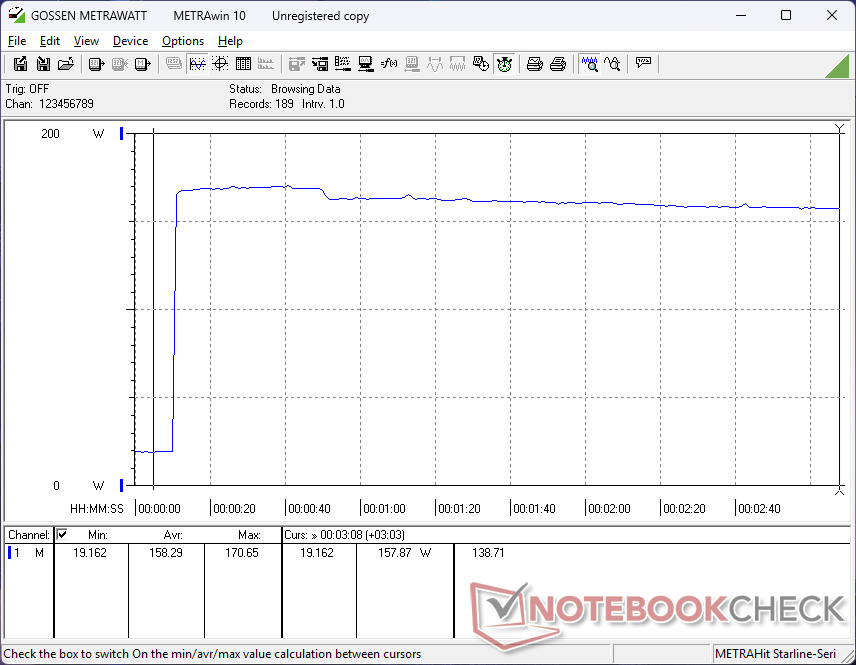
Am bemerkenswertesten ist vielleicht, dass die Ausführung von Prime95 auf dem 16 Aurora genauso viel Strom verbraucht wie auf dem 16X Aurora, obwohl die CPU im 16 Aurora etwa 50 Prozent langsamer ist. Das liegt daran, dass das 16 Aurora eine ältere Prozessorgeneration mit weniger als der Hälfte der Kerne der 16X Aurora verwendet.
Erwähnenswert ist auch, dass das 16 Aurora mit einem kompakteren 180-W-Netzteil geliefert wird, verglichen mit dem größeren 280-W-Netzteil, das dem 16X Aurora beiliegt (~15,5 x 7,5 x 3 cm bzw. ~20,5 x 10,5 x 2,5 cm).
| Aus / Standby | |
| Idle | |
| Last |
|
Legende:
min: | |
| Alienware 16 Aurora Core 7 240H, GeForce RTX 5060 Laptop, , IPS, 2560x1600, 16" | Alienware 16X Aurora, RTX 5070 Ultra 9 275HX, GeForce RTX 5070 Laptop, , IPS, 2560x1600, 16" | Lenovo LOQ 15AHP10 R7 250, GeForce RTX 5060 Laptop, Micron 2500 1TB MTFDKBA1T0QGN, IPS, 1920x1080, 15.6" | Gigabyte Gaming A16 GA6H i7-13620H, GeForce RTX 5070 Laptop, Kingston OM8PGP41024Q-A0, IPS, 2560x1600, 16" | Asus TUF Gaming A16 FA608WV Ryzen AI 9 HX 370, GeForce RTX 4060 Laptop GPU, Micron 2400 MTFDKBA1T0QFM, IPS, 1920x1200, 16" | HP Victus 16 (2024) i7-14700HX, GeForce RTX 4060 Laptop GPU, Kioxia XG8 KXG80ZNV512G, IPS, 1920x1080, 16.1" | |
|---|---|---|---|---|---|---|
| Stromverbrauch | -100% | -60% | -14% | -8% | -37% | |
| Idle min * (Watt) | 4.4 | 20.1 -357% | 20 -355% | 9 -105% | 6.8 -55% | 9 -105% |
| Idle avg * (Watt) | 18 | 27.6 -53% | 20.7 -15% | 11 39% | 12.7 29% | 15 17% |
| Idle max * (Watt) | 18.2 | 31.8 -75% | 22.7 -25% | 23 -26% | 15.2 16% | 23 -26% |
| Last avg * (Watt) | 87.1 | 102.7 -18% | 71 18% | 91 -4% | 85 2% | 123 -41% |
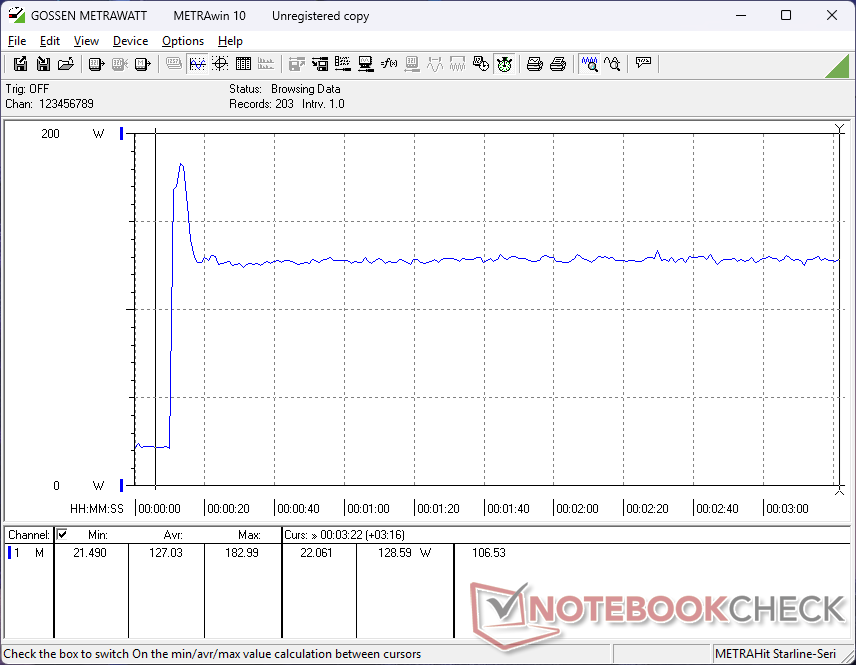
| Cyberpunk 2077 ultra external monitor * (Watt) | 120.6 | 192.3 -59% | 151.1 -25% | 130 -8% | 143 -19% | |
| Cyberpunk 2077 ultra * (Watt) | 123 | 217 -76% | 153.1 -24% | 132.5 -8% | 145 -18% | |
| Last max * (Watt) | 183 | 292 -60% | 172 6% | 155 15% | 199 -9% | 241 -32% |
| Witcher 3 ultra * (Watt) | 143.7 |
* ... kleinere Werte sind besser
Stromverbrauch Cyberpunk/Stresstest
Stromverbrauch externer Monitor
Akkulaufzeit
Die WLAN-Laufzeiten haben sich durch die oben erwähnten Stromeinsparungen um über drei Stunden verlängert.
| Alienware 16 Aurora Core 7 240H, GeForce RTX 5060 Laptop, 96 Wh | Alienware 16X Aurora, RTX 5070 Ultra 9 275HX, GeForce RTX 5070 Laptop, 96 Wh | Lenovo LOQ 15AHP10 R7 250, GeForce RTX 5060 Laptop, 60 Wh | Gigabyte Gaming A16 GA6H i7-13620H, GeForce RTX 5070 Laptop, 76 Wh | Asus TUF Gaming A16 FA608WV Ryzen AI 9 HX 370, GeForce RTX 4060 Laptop GPU, 90 Wh | HP Victus 16 (2024) i7-14700HX, GeForce RTX 4060 Laptop GPU, 83 Wh | |
|---|---|---|---|---|---|---|
| Akkulaufzeit | -43% | -40% | 3% | 89% | 13% | |
| WLAN (h) | 7.5 | 4.3 -43% | 4.5 -40% | 7.7 3% | 14.2 89% | 8.5 13% |
| Idle (h) | 6.9 | |||||
| Last (h) | 1.3 | 2.1 | ||||
| H.264 (h) | 14.7 |
Notebookcheck Bewertung
Das Alienware 16 Aurora vereint die Anforderungen für den Schul- oder Studienalltag, wie Akkulaufzeit und schlankes Design, mit der Leistung, die benötigt wird, um die neuesten Titel in 1.080p flüssig spielen zu können.
Alienware 16 Aurora
- 27.08.2025 v8
Allen Ngo
 Total Sustainability Score:
 Potenzielle Wettbewerber im Vergleich
Bild | Modell / Test | Preis ab | Gewicht | Dicke | Display |
|---|---|---|---|---|---|
1. 76.2%  | Alienware 16 Aurora Intel Core 7 240H ⎘ NVIDIA GeForce RTX 5060 Laptop ⎘ 32 GB RAM | Amazon: Geizhals Suche | 2.6 kg | 15.2 mm | 16.00" 2560x1600 189 PPI IPS |
2. 84.9%  | Alienware 16X Aurora, RTX 5070 Intel Core Ultra 9 275HX ⎘ NVIDIA GeForce RTX 5070 Laptop ⎘ 32 GB RAM | Amazon: 1.849,00 € Geizhals Suche | 2.5 kg | 23.4 mm | 16.00" 2560x1600 189 PPI IPS |
3. 85.9%  | Asus ROG Zephyrus G16 GA605WV AMD Ryzen AI 9 HX 370 ⎘ NVIDIA GeForce RTX 4060 Laptop GPU ⎘ 32 GB RAM, 1024 GB SSD | Amazon: Geizhals Suche | 1.8 kg | 17.2 mm | 16.00" 2560x1600 189 PPI OLED |
4. 89% v7 (old)  | Lenovo Legion Pro 5 16ARX8 (R5 7645HX, RTX 4050) AMD Ryzen 5 7645HX ⎘ NVIDIA GeForce RTX 4050 Laptop GPU ⎘ 16 GB RAM, 512 GB SSD | Amazon: 1. 2.163,20 € Lenovo Legion Pro 5 Gaming L... 2. 2.418,84 € Lenovo Legion Pro 5 Gaming L... 3. 1.999,00 € Lenovo Legion Pro 5 16ADR10 ... Listenpreis: 1500€ | 2.5 kg | 27.3 mm | 16.00" 2560x1600 189 PPI IPS |
5. 89.5% v7 (old)  | Acer Predator Helios 16 PH16-71-731Q Intel Core i7-13700HX ⎘ NVIDIA GeForce RTX 4060 Laptop GPU ⎘ 16 GB RAM, 1024 GB SSD | Amazon: 1. 1.697,49 € Acer Predator Helios Neo 16 ... 2. 64,99 € 330W Laptop Netzteil Ladeger... 3. 69,99 € Netzteil AC für Notebook 33... Listenpreis: 2099€ | 2.6 kg | 26.9 mm | 16.00" 2560x1600 189 PPI IPS-LED |
6. 81.9%  | HP Omen Max 16 ah000 Intel Core Ultra 9 275HX ⎘ NVIDIA GeForce RTX 5090 Laptop ⎘ 32 GB RAM, 2048 GB SSD | Amazon: 4.109,00 € Geizhals Suche | 2.8 kg | 24.9 mm | 16.00" 2560x1600 189 PPI OLED |
Transparenz
Die Auswahl der zu testenden Geräte erfolgt innerhalb der Redaktion. Das vorliegende Testmuster wurde dem Autor vom Hersteller oder einem Shop zu Testzwecken leihweise zur Verfügung gestellt. Eine Einflussnahme des Leihstellers auf den Testbericht gab es nicht, der Hersteller erhielt keine Version des Reviews vor der Veröffentlichung. Es bestand keine Verpflichtung zur Publikation. Als eigenständiges, unabhängiges Unternehmen unterliegt Notebookcheck keiner Diktion von Herstellern, Shops und Verlagen.
So testet Notebookcheck
Pro Jahr werden von Notebookcheck hunderte Laptops und Smartphones unabhängig in von uns standardisierten technischen Verfahren getestet, um eine Vergleichbarkeit aller Testergebnisse zu gewährleisten. Seit rund 20 Jahren entwickeln wir diese Testmethoden kontinuierlich weiter und setzen damit Branchenstandards. In unseren Testlaboren kommt ausschließlich hochwertiges Messequipment in die Hände erfahrener Techniker und Redakteure. Die Tests unterliegen einer mehrstufigen Kontrolle. Unsere komplexe Gesamtbewertung basiert auf hunderten fundierten Messergebnissen und Benchmarks, womit Ihnen Objektivität garantiert ist. Weitere Informationen zu unseren Testmethoden gibt es hier.

