Fazit - Gelungener Gaming-Creator-Hybrid
Wie es sich für ein "Pro"-Laptop gehört kann das etwas schlichtere Gaming-Design auch Content Creators ansprechen. Darüber hinaus überzeugt uns beim Legion Pro 5 16 vor allem das tolle OLED-Display und die starke 3D-Leistung. In der Kategorie 16-Zoll-Laptops mit RTX 5070 Ti ist das Legion Pro sicher einer der stärksten Vertreter, was Leistung und Verarbeitungsqualität angeht. Zudem sind die Kritikpunkte am Vorgänger beseitigt worden, wodurch die Eingangsfrage, ob Lenovo an den Schwächen gearbeitet und gleichzeitig die Stärken bewahrt hat, im positiven Sinne bejaht werden kann.
Man hat allerdings das Gefühl, dass Lenovo, vielleicht wegen des OLEDs, an anderer Stelle sparen musste und das passiert vor allem bei der Ausstattung, die teils nicht mehr ganz auf der Höhe der Zeit agiert. Zwei der drei USB-A-Ports übertragen nur mit 5 statt 10 Gbps, Thunderbolt 5 gibt es ebenso wenig (nur TB 4) wie Wi-Fi 6E oder gar Wi-Fi 7 und einen SD Reader gibt es auch nicht, was Creators wohl ähnlich stören dürfte wie die Dropped Frames beim Abspielen eines hochauflösenden YouTube-Videos oder die recht hohe Lautstärke bei hoher Leistung. Zudem nervt bei Lenovo die zunehmende Werbung in ihren diversen mehr oder weniger obligatorischen Softwarelösungen, hier sollte Lenovo im Sinne der Kundschaft einen Schritt zurückrudern!
Pro
Contra
- 2.775,00 €Lenovo Legion Pro 5 Gaming AI Laptop | 16" WQXGA OLED 240Hz | Intel Core Ultra 9 275HX | 32GB RAM | 1TB SSD | NVIDIA GeForce RTX 5070Ti | Windows 11 | QWERTZ | Schwarz | 3 Monate GamePass
- 1.999,00 €Lenovo Legion Pro 5 16ADR10 Gaming AI Laptop | 16" WQXGA 165 Hz OLED Display | NVIDIA GeForce RTX 5060 | AMD Ryzen 7 | 32GB RAM | 1TB SSD | Win11 | QWERTZ | Eclipse Black | 3 Monate GamePass
- 2.141,57 €Lenovo Legion Pro 5 Gaming Laptop | 16" WQXGA Display | 240Hz | AMD Ryzen 9 7945HX | 32GB RAM | 1TB SSD | NVIDIA GeForce RTX 4070 TGP 140W | G-Sync | Win11 Home | QWERTZ | grau | 3 Monate Premium Care
Inhaltsverzeichnis
- Fazit - Gelungener Gaming-Creator-Hybrid
- Spezifikationen
- Gehäuse - Eleganter Fingerabdruckmagnet
- Ausstattung - Etwas altbackenes Legion Pro
- Eingabegeräte - Gut für einen Gamer
- Display - Brillanter OLED
- Leistung - Starke 3D-Performance
- Emissionen - Recht lauter Pro-Laptop
- Energieverwaltung - Akku könnte größer sein
- Notebookcheck Gesamtbewertung
- Mögliche Alternativen im Vergleich
Im letzten Jahr zählte das Legion Pro 5 16 oder auch Legion Pro 5i zu den besten und beliebtesten Gaming-Laptops. Zu kritisieren gab es vor allem die thermisch drosselnde SSD, das hohe Gewicht sowie das etwas einseitige Kühlsystem. Die Leistung von CPU und GPU war hingegen überdurchschnittlich stark. Was hat Lenovo beim Nachfolger geändert?
Spezifikationen
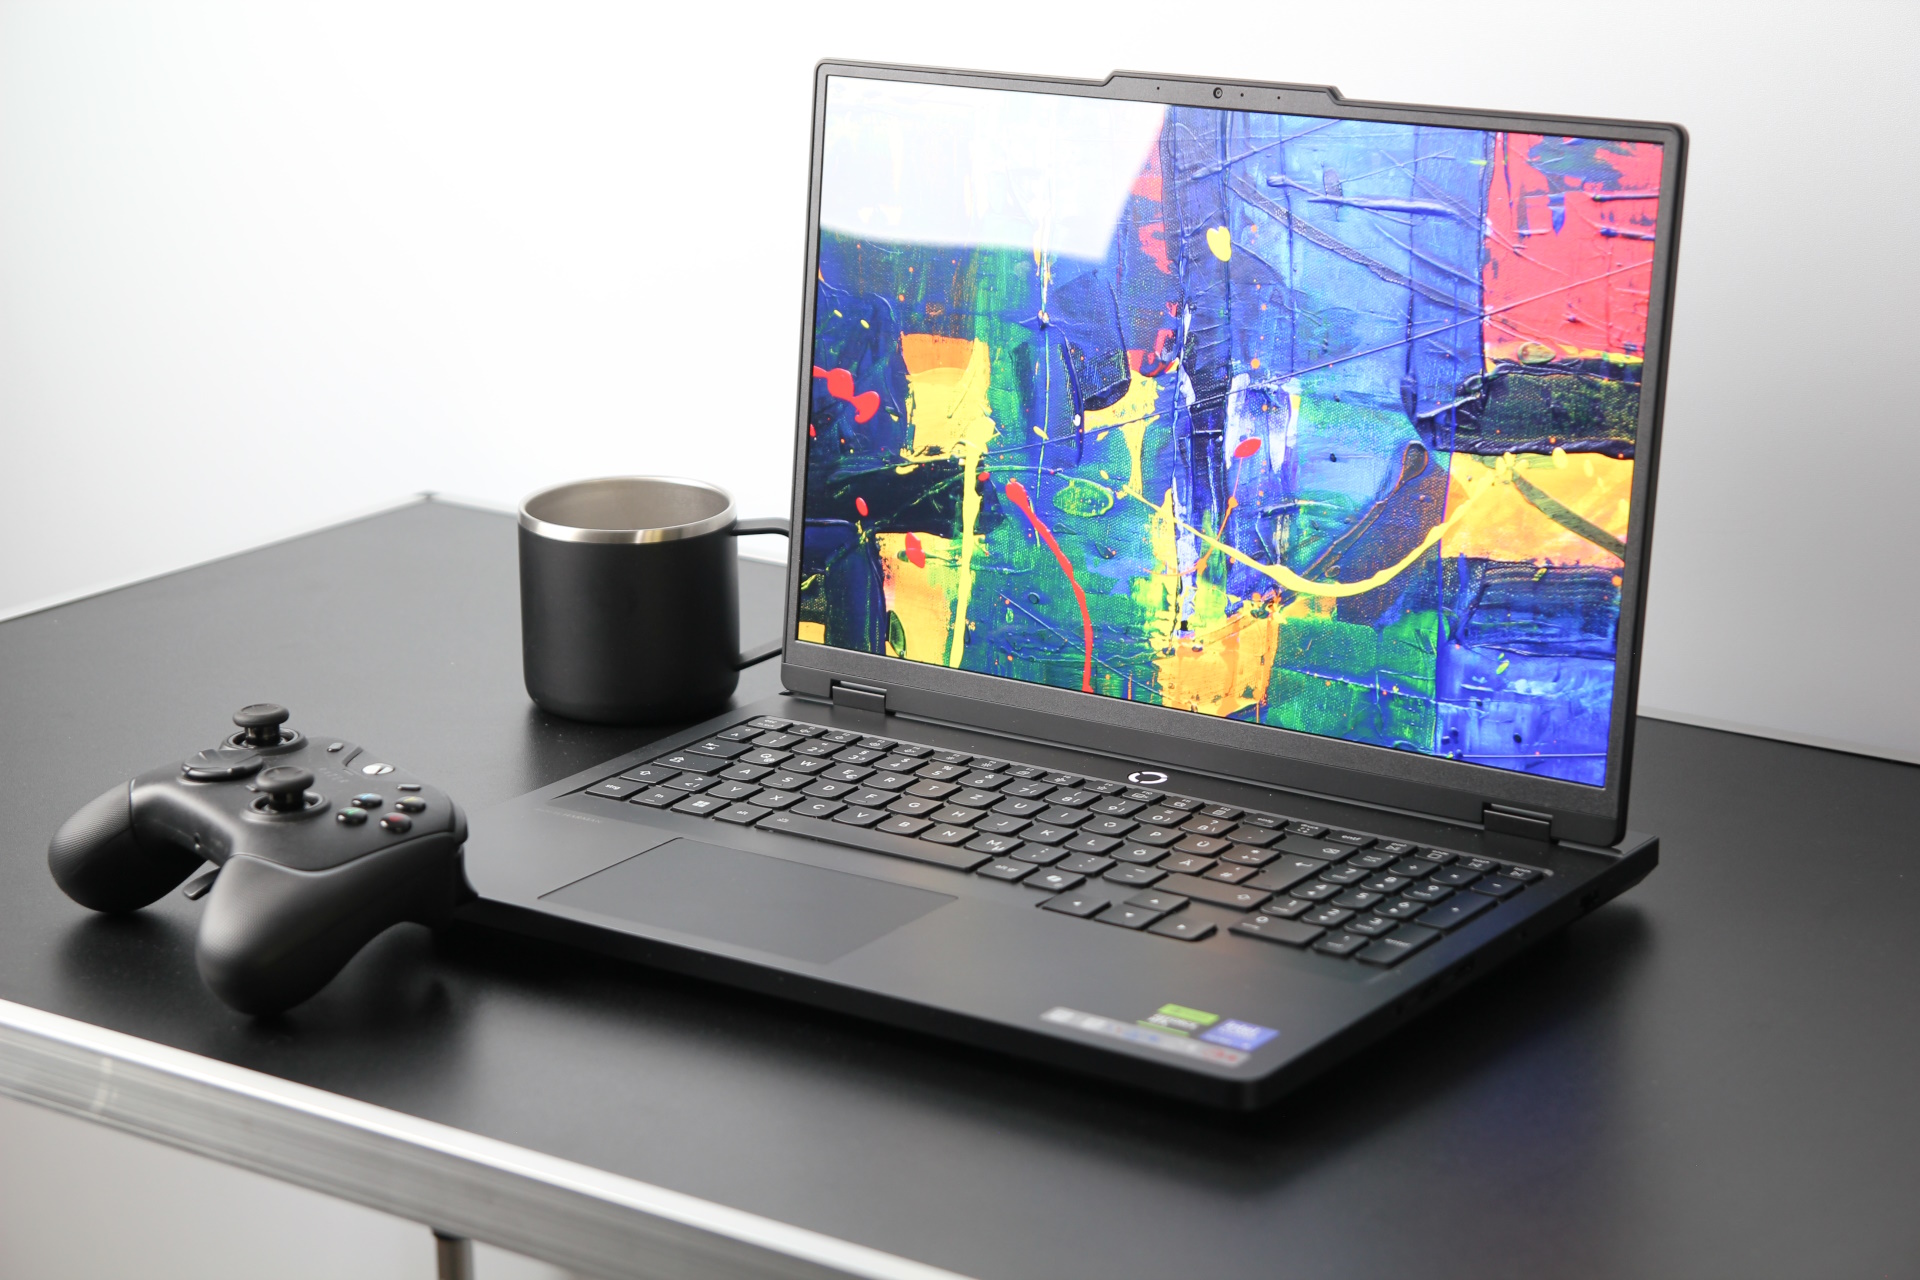
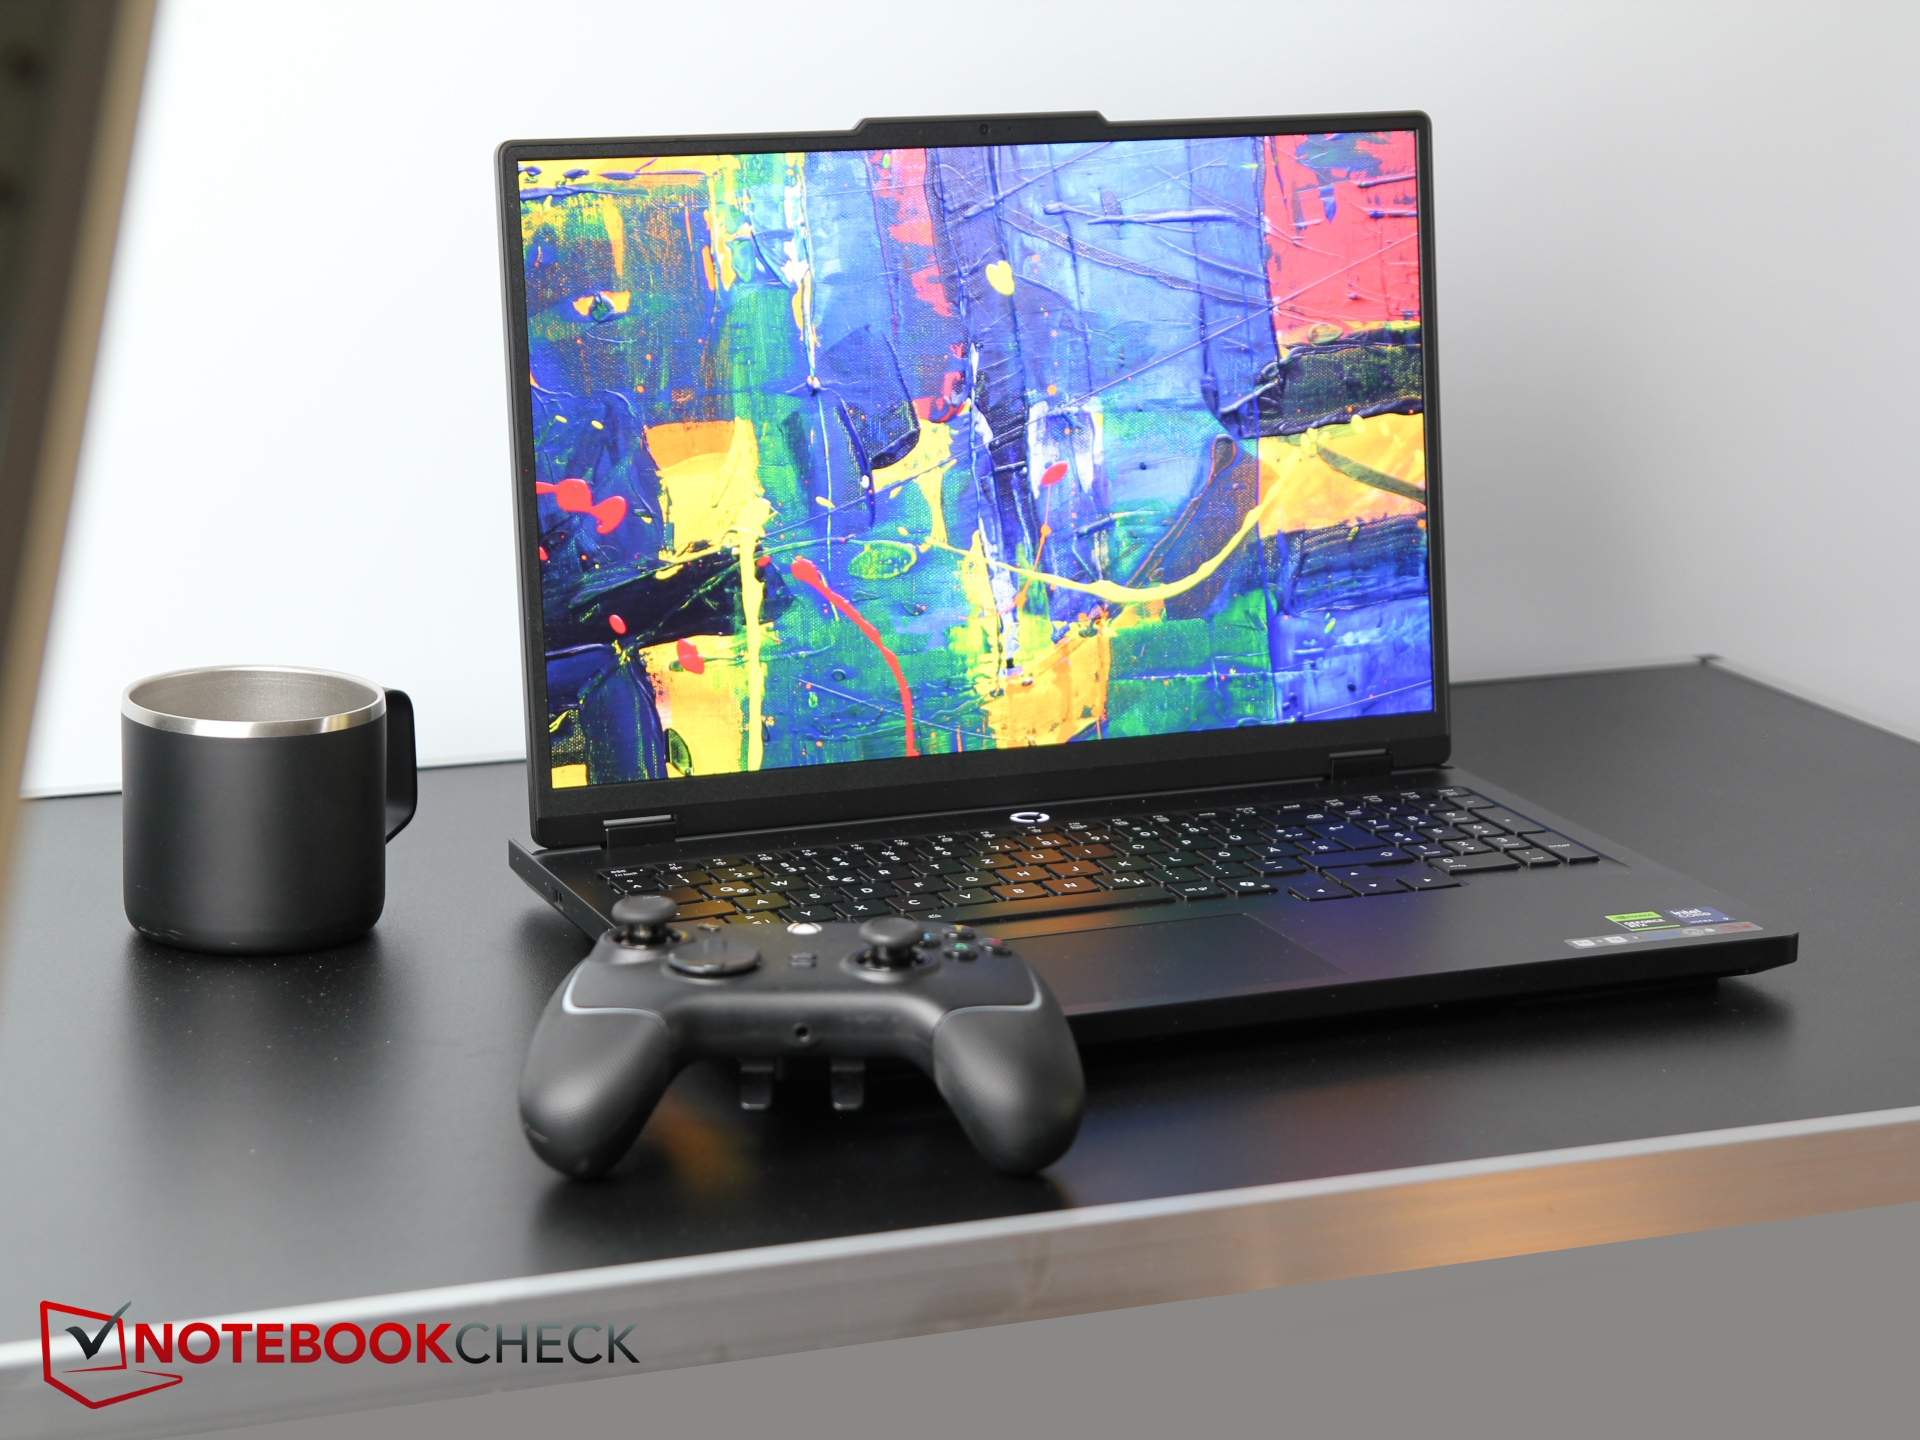
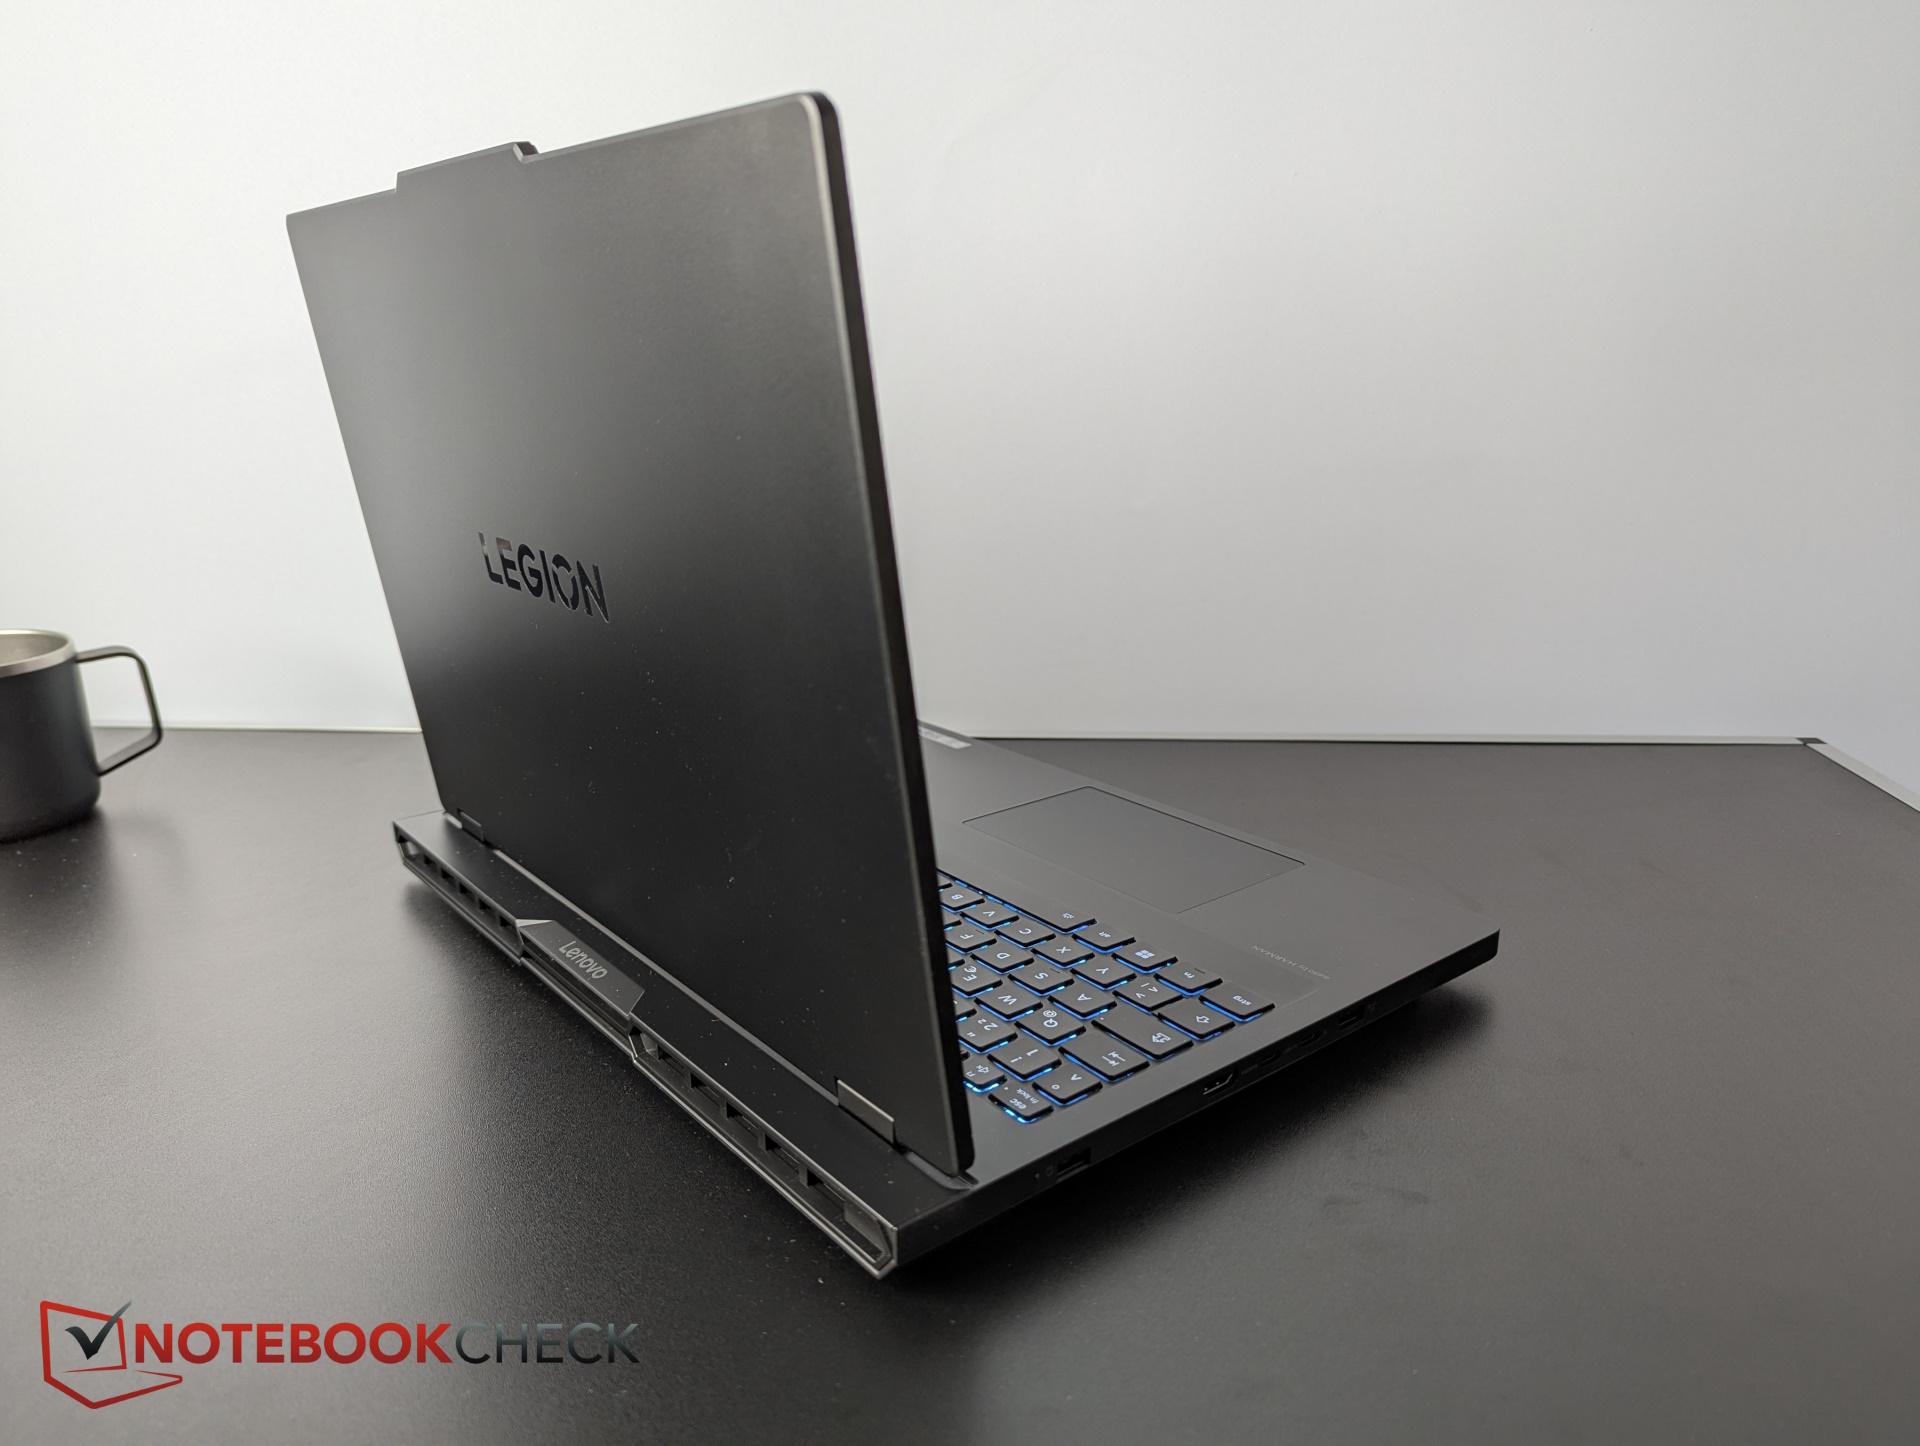
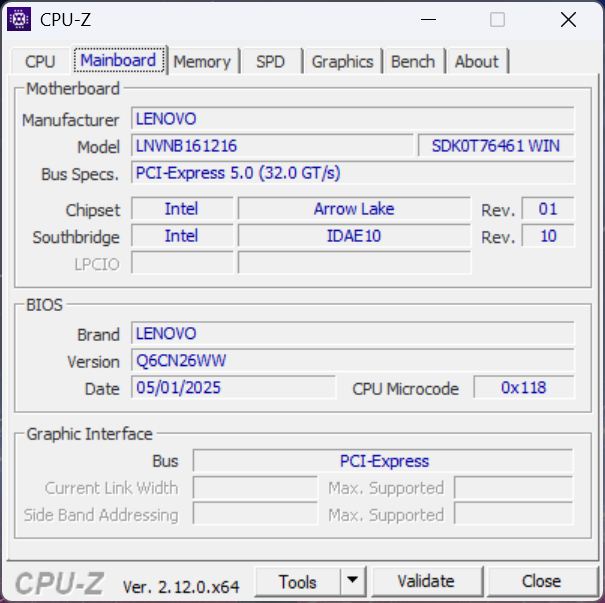
Gehäuse - Eleganter Fingerabdruckmagnet
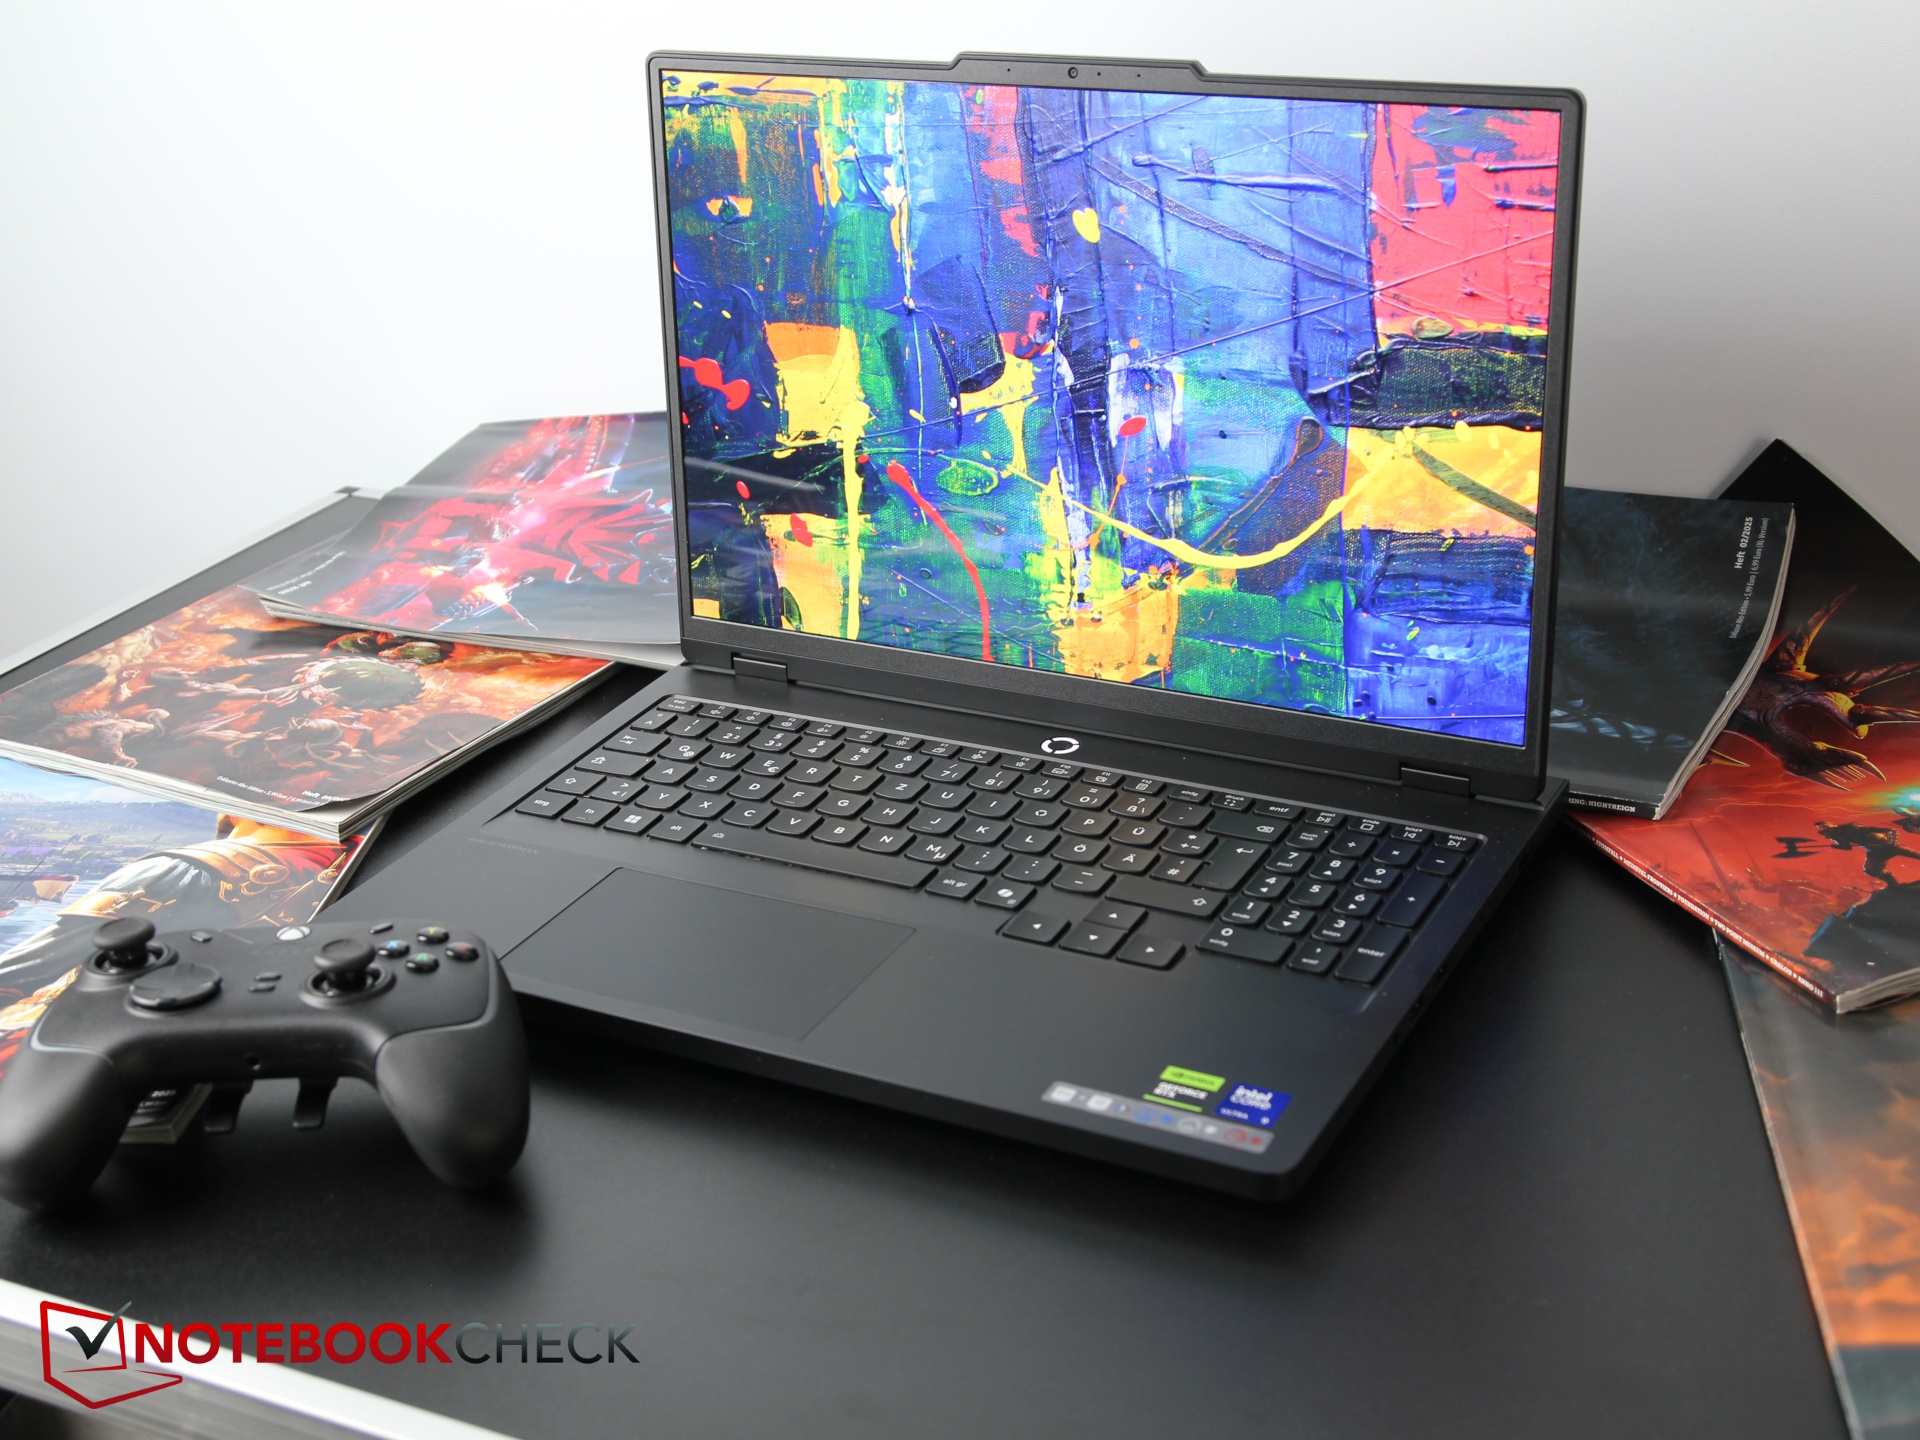
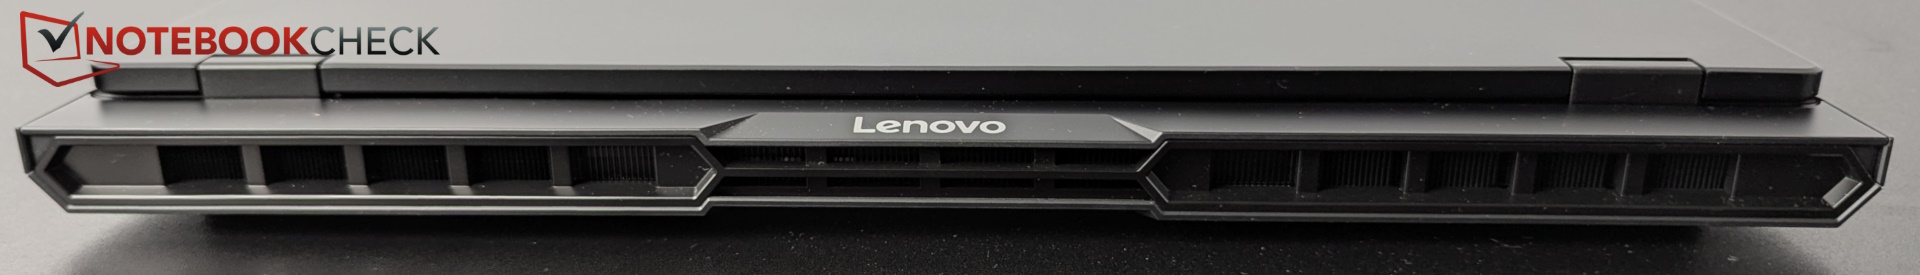
Das elegant-schwarze Kunststoffgehäuse mit stabilem Metalldeckel wurde für dieses Jahr überarbeitet. Die obere "Kameralasche" ist geblieben, aber sonst hat sich viel verändert. So gibt es hinten keinerlei Anschlüsse mehr, alle weichen auf die Seiten aus, hinten ist der ausströmenden Luft vorbehalten. Insgesamt gefällt uns das Design, es schafft einen guten Kompromiss zwischen Gaming- und Creator-Look.
Die Basis lässt sich minimal verwinden und gibt dabei auf der rechten Seite leichte Knarzgeräusche von sich und die 180-Grad-Scharniere dürften gerne noch etwas fester zupacken. An den Oberflächen sammeln sich schnell Fingerabdrücke an.


Im Vergleich zum Vorgänger ist das neue Gehäuse etwa 1 mm dünner, dafür aber 1 mm tiefer und 6 mm breiter. Alle anderen Laptops dieser Klasse sind weniger breit, dafür ist unser Legion Pro 5 mit der dünnste, wenn man Blade 16 und G16 außer Acht lässt. Zudem hat es 100 g abgespeckt.


Ausstattung - Etwas altbackenes Legion Pro
Netzanschluss und HDMI-Port sitzen jetzt links, der LAN- und ein USB-A-Anschluss rechts und auch andere Anschlüsse wurden von hinten auf die Seiten versetzt.
Allerdings sind gerade die USB-Anschlüsse nicht mehr ganz so modern: Es gibt kein Thunderbolt 5, sondern nur Version 4 und der zweite USB-C-Slot ist nicht Thunderbolt-fähig. Zwei der drei USB-A-Slots (die beiden rechts) laufen nur mit 5 Gbit/s und ein SD Reader fehlt komplett.
Die Verteilung der Anschlüsse geht in Ordnung, allerdings ist es jetzt natürlich an den Seiten voller als zuvor.


Kommunikation
Wi-Fi 6 und Bluetooth 5.2 hauen zu Zeiten von Wi-Fi 7 oder wenigstens Wi-Fi 6E niemanden mehr vom Hocker zumal Bluetooth 6 bereits seit September 2024 verfügbar ist, zumindest ist Bluetooth 5.4 längst Standard. Der Vorgänger hatte bereits Wi-Fi 6E, die direkte Konkurrenz ist ausnahmslos schneller. Immerhin ist das Modul wechselbar.
Webcam
Lenovo packt ein 5-MP-Modell in die breite Notch am oberen Gehäusedeckel. Die Schärfe der Bilder ist gut, die Farbabweichungen sind in Ordnung. An der rechten Seite gibt es einen Schiebeschalter für den elektronischen Shutter.


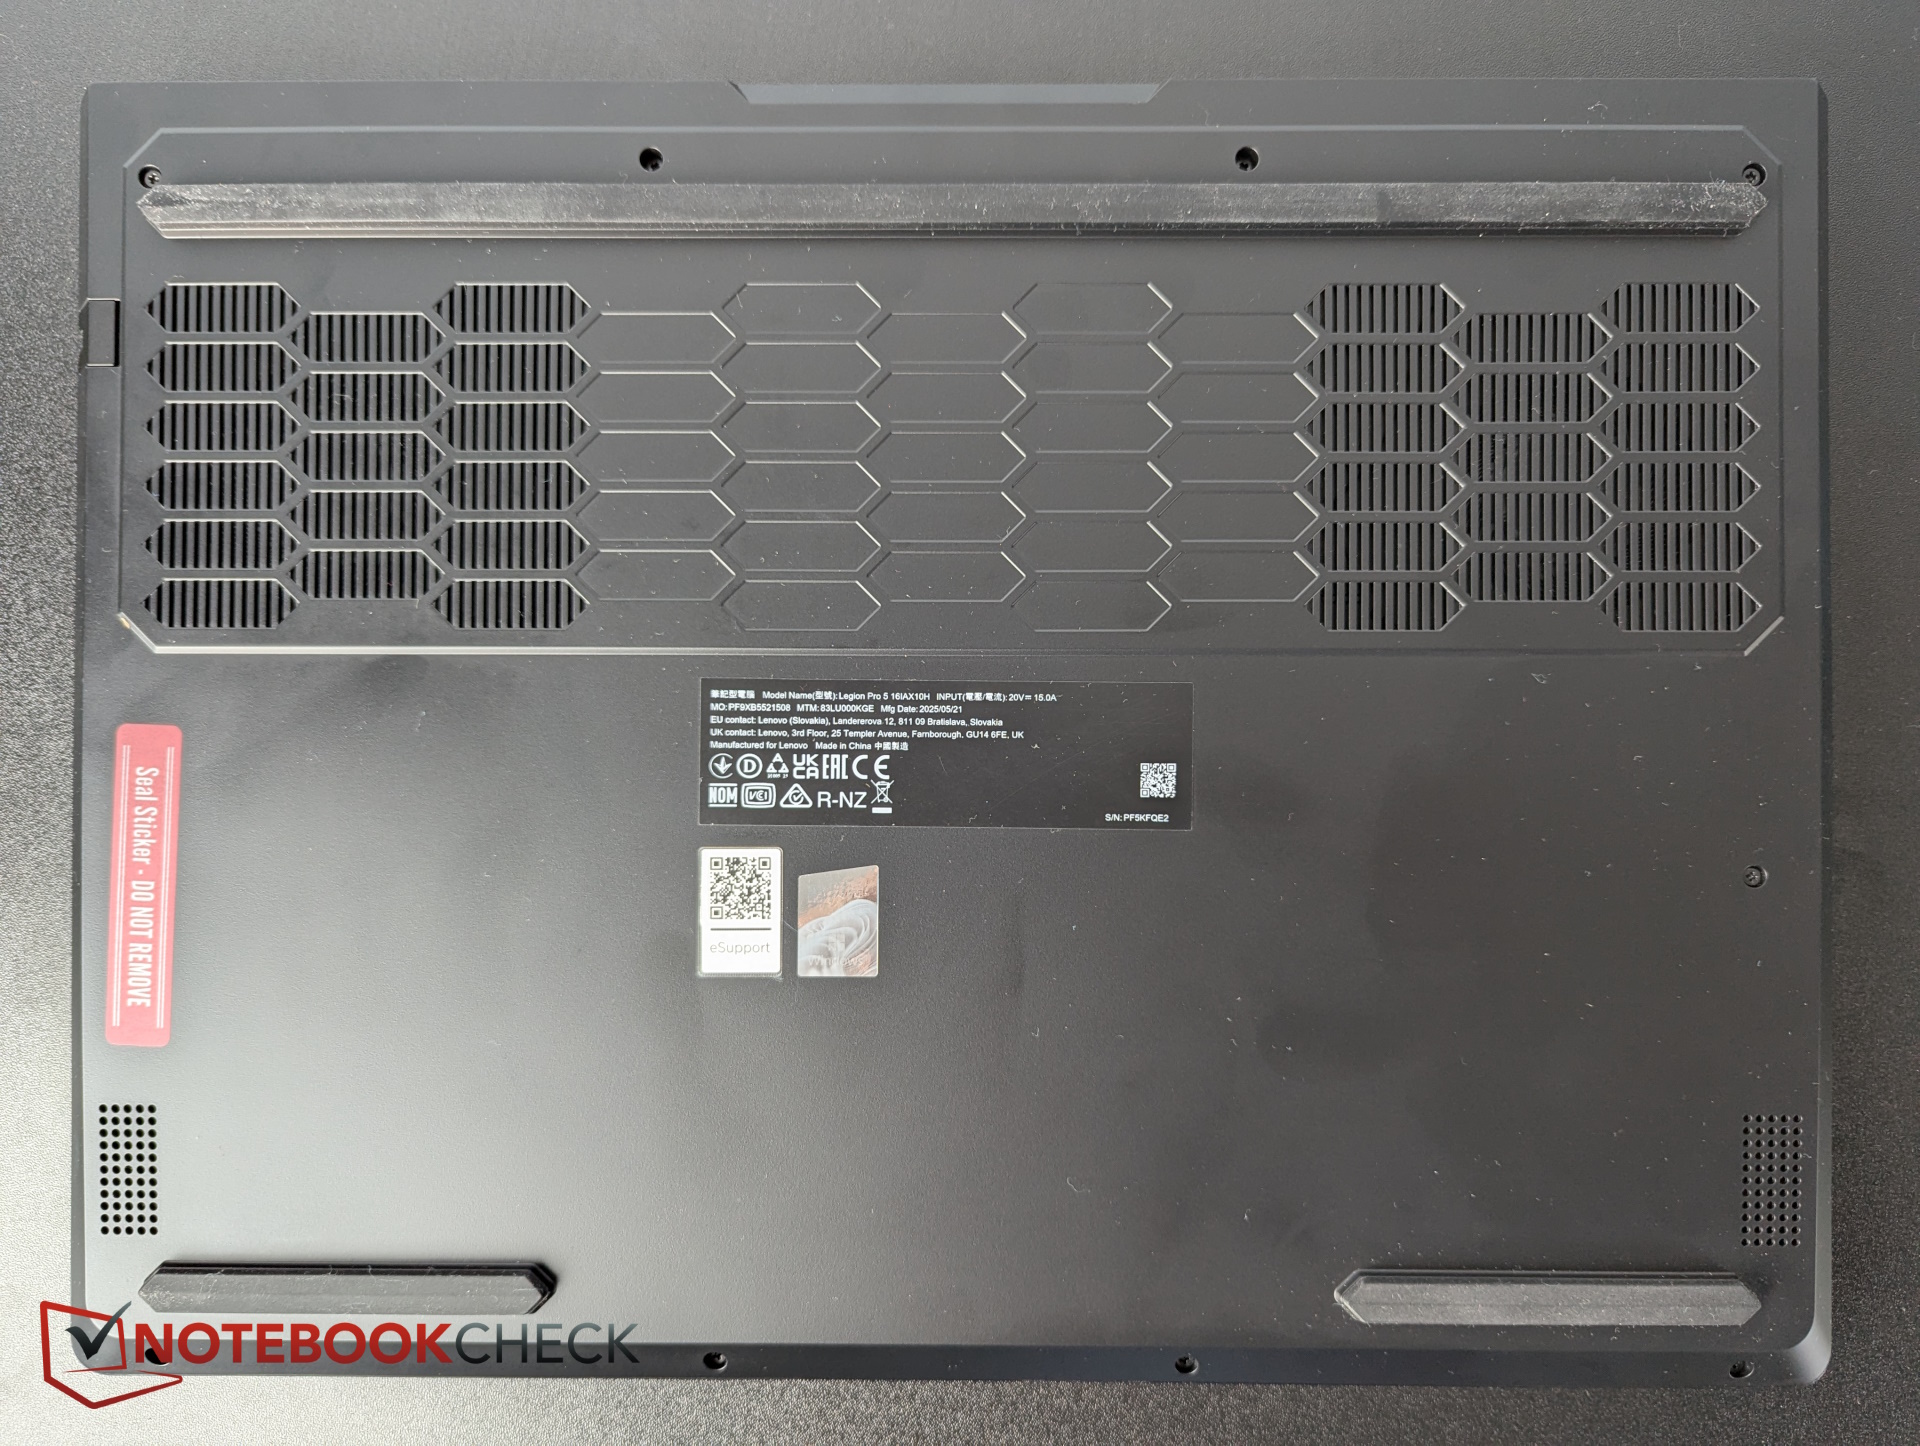
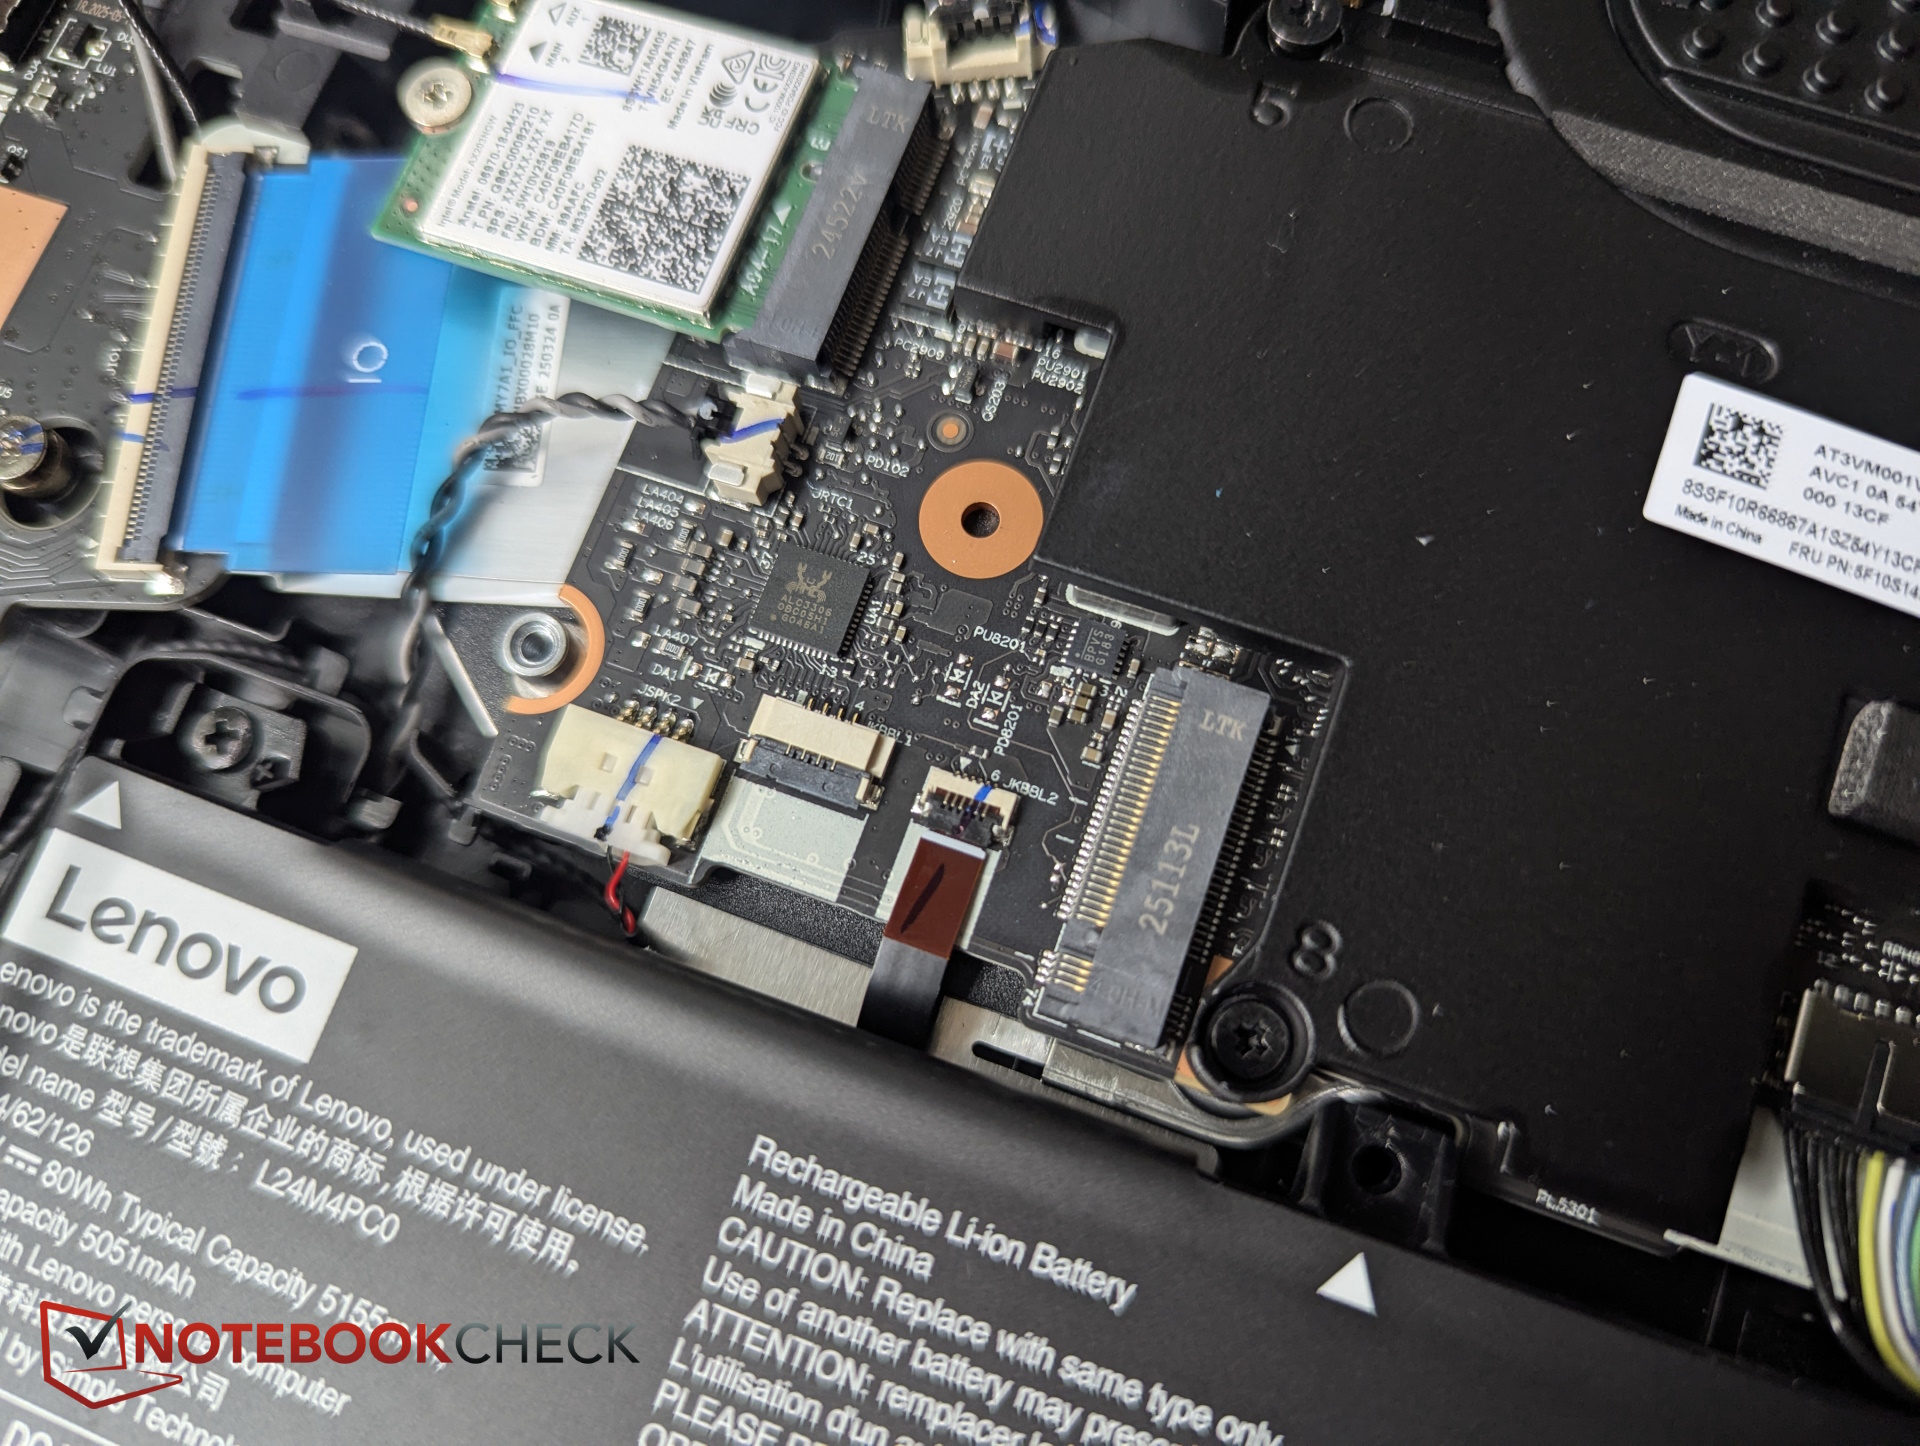
Wartung
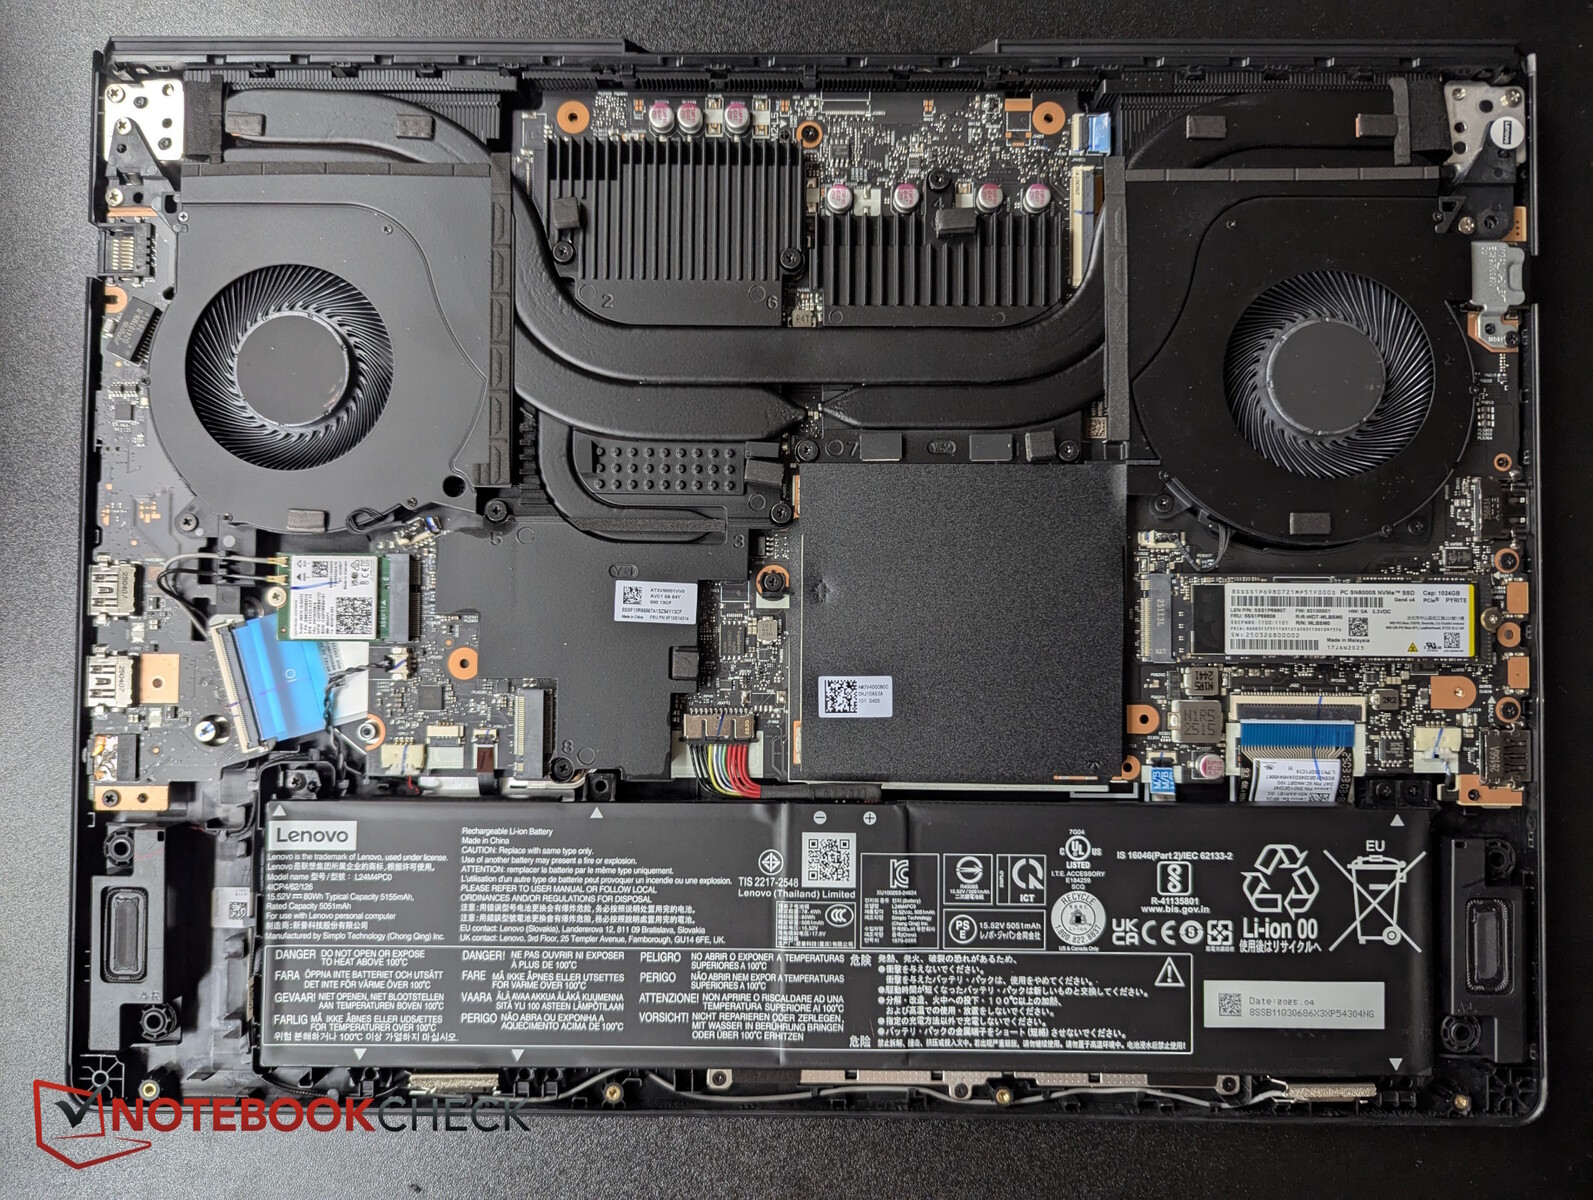
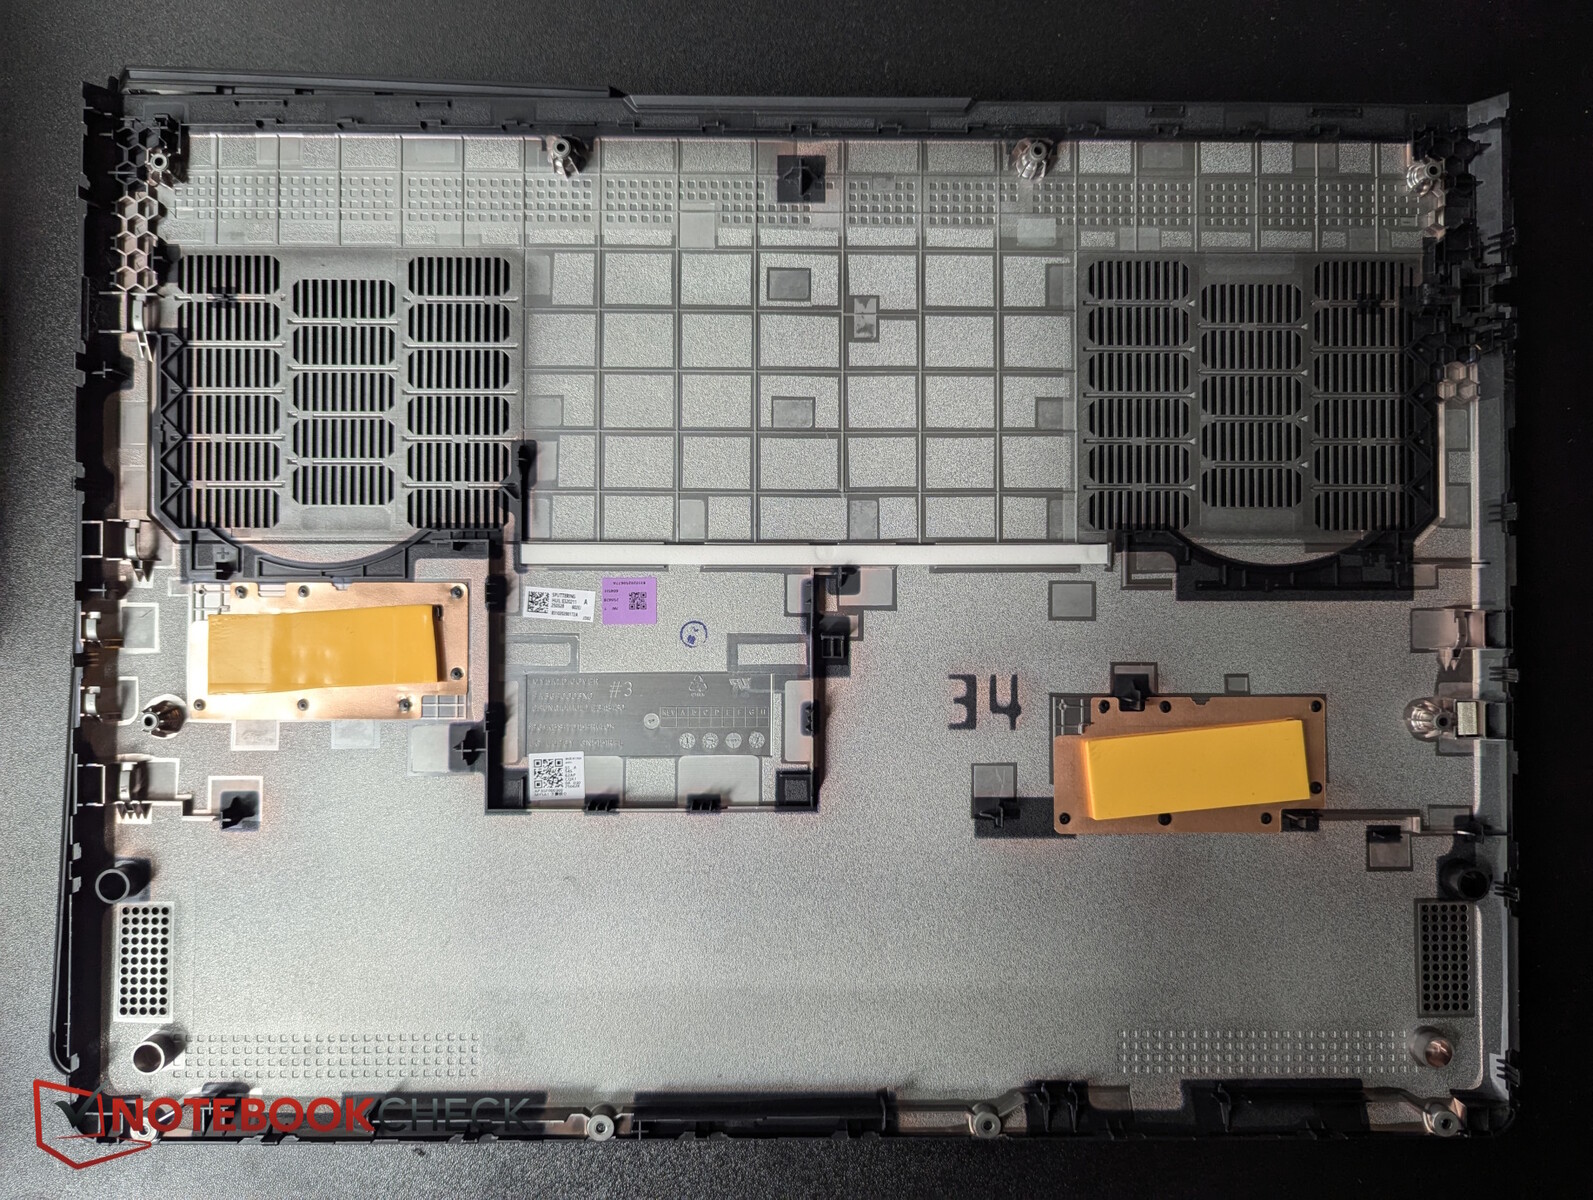
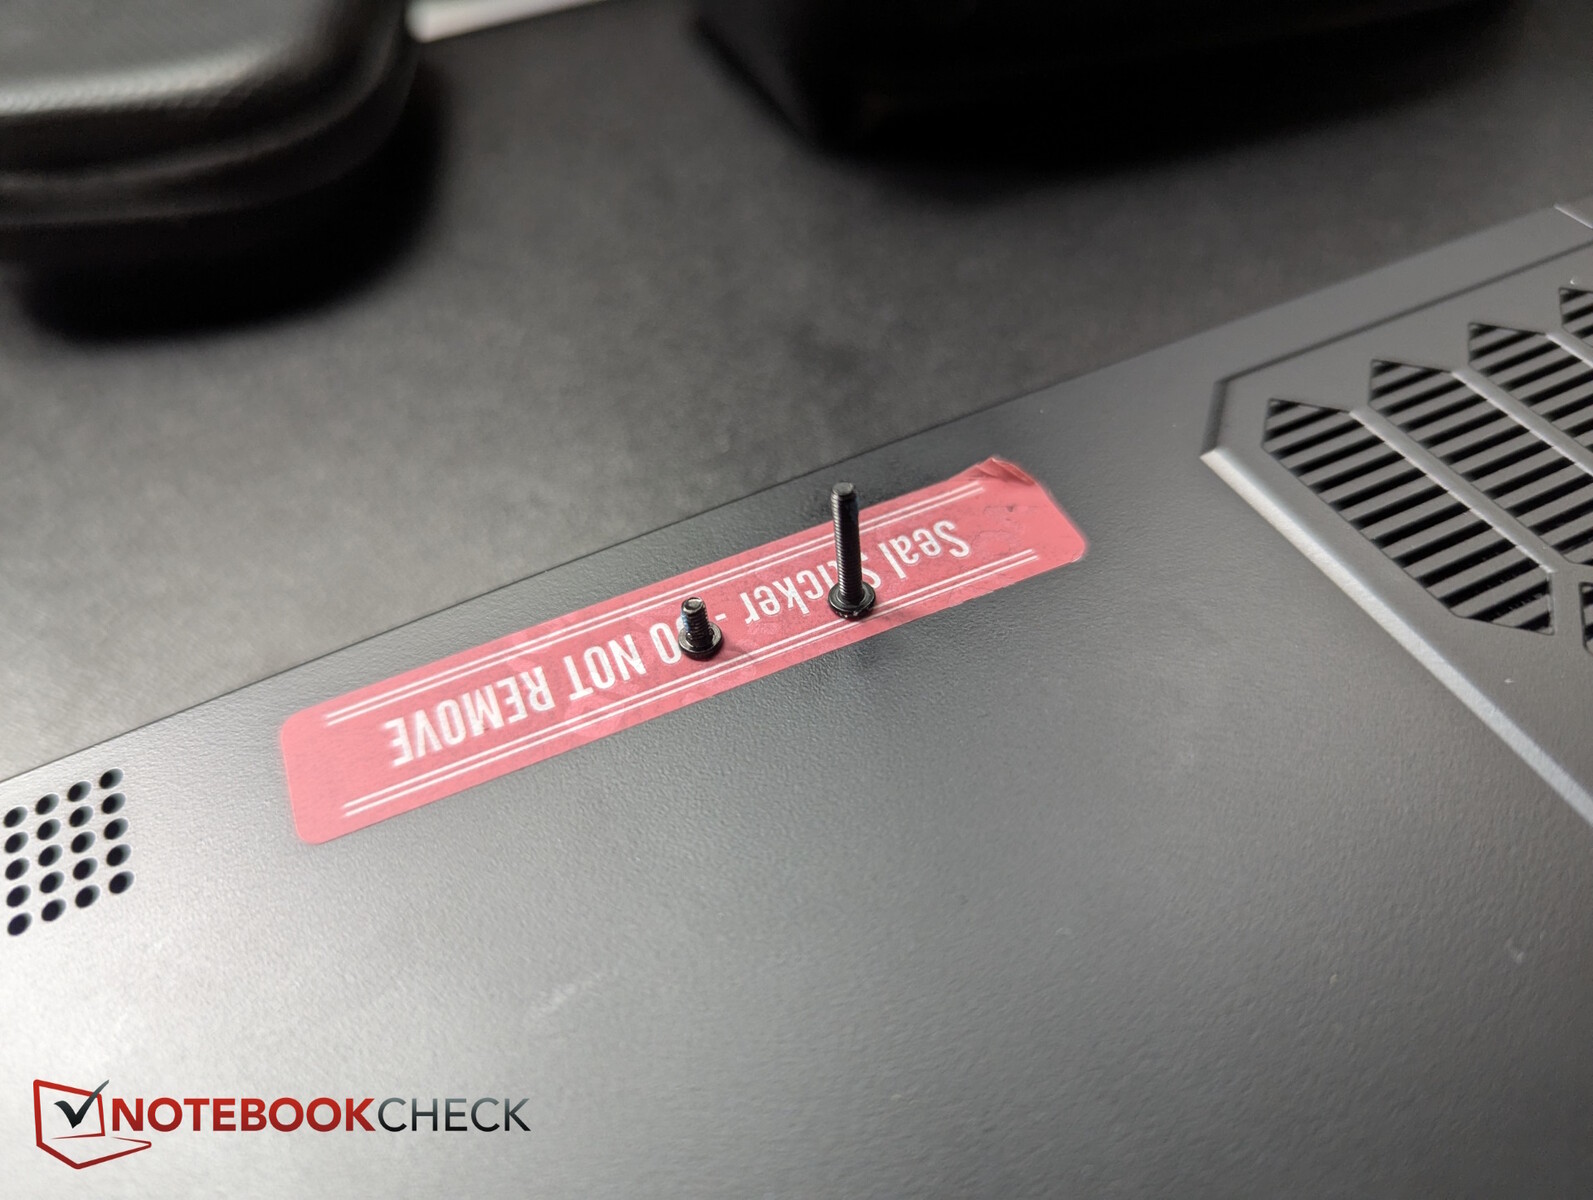
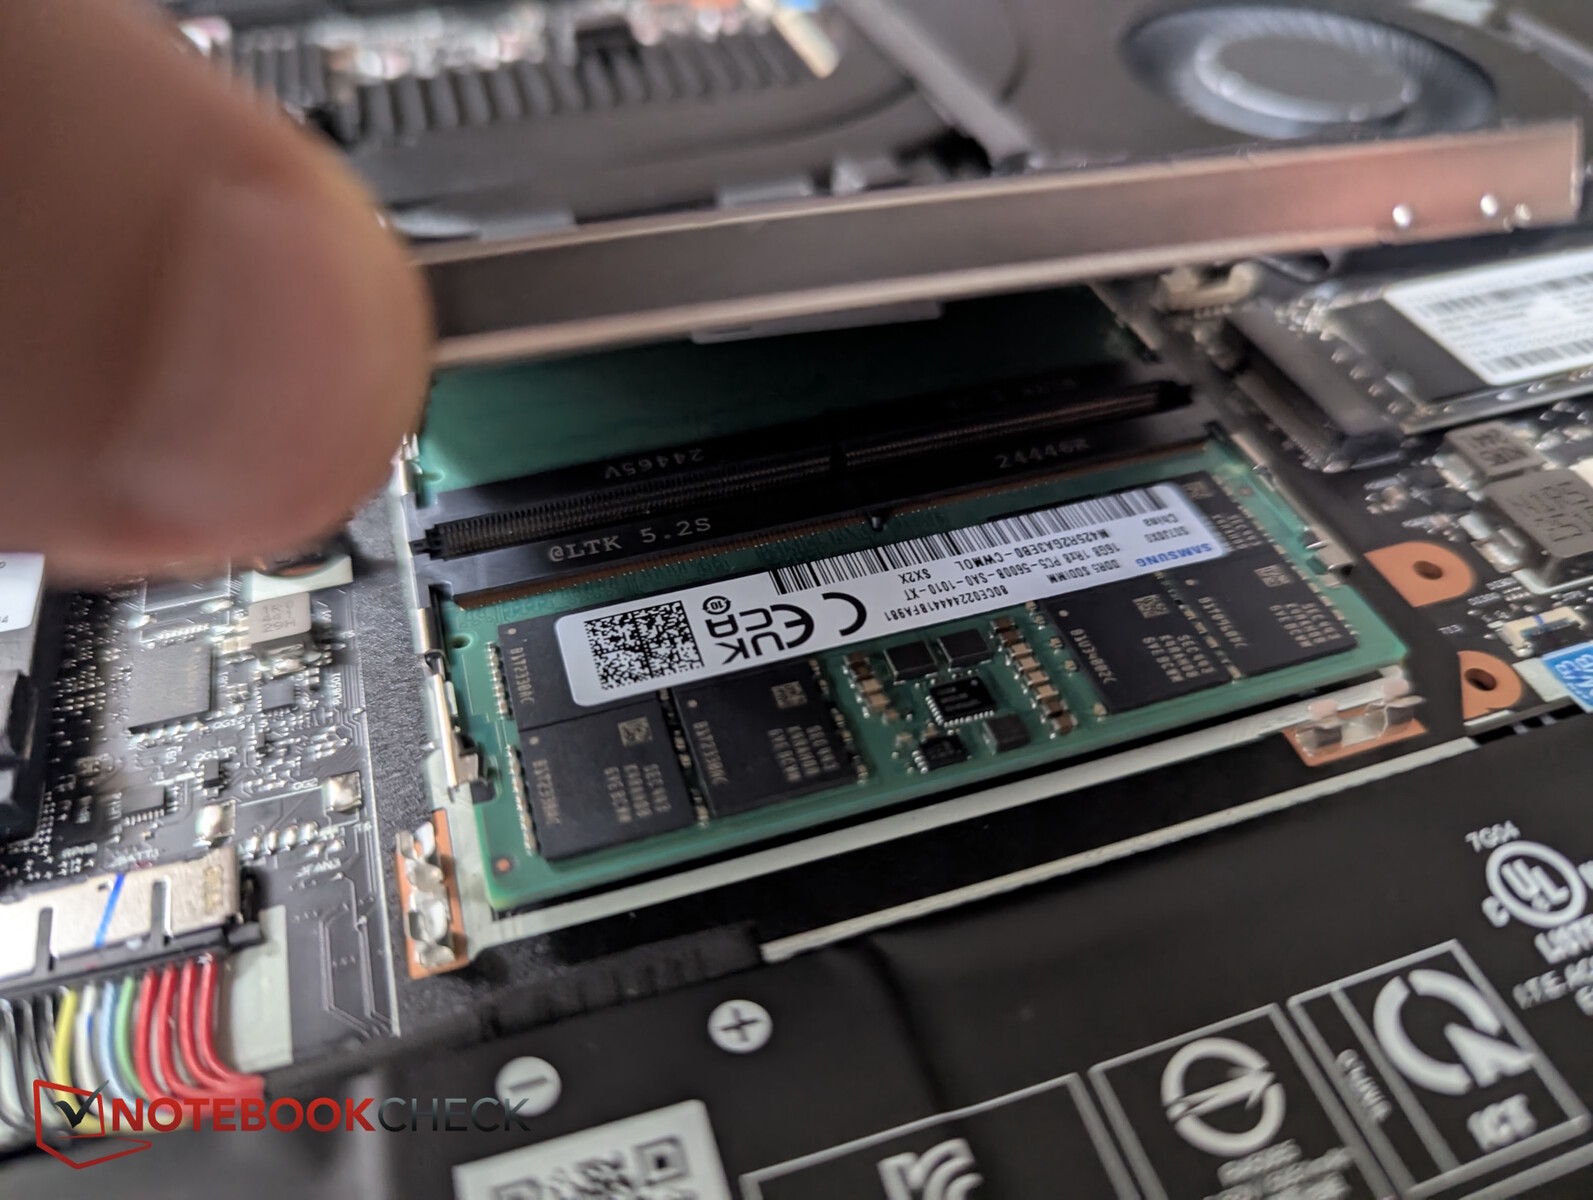
Die Unterseite ist durch 10 Schrauben (2 Längen) gesichert. Das Aufhebeln gelingt auch ohne Werkzeug recht leicht. Innen gibt es Zugang zu den beiden M.2-SSD-Slots, dem wechselbaren Wi-Fi-Modul, den beiden RAM-Slots, dem Akku und dem Kühlsystem.
Nachhaltigkeit
Die Verpackung ist ein Mix auf Pappe und Kunststoff. Letzteres kommt als Plastikbeutel, in dem das Legion sowie das Netzteil eingewickelt sind, als Klebestreifen um die Kanten des Legions herum sowie als Schaumstoff zur Dämmung zum Einsatz.
Zubehör und Garantie
Lenovo gewährt eine Garantie von zwei Jahren, inklusive Courier- oder Carry-in-Service. Zubehör befindet sich nicht in der Verpackung.
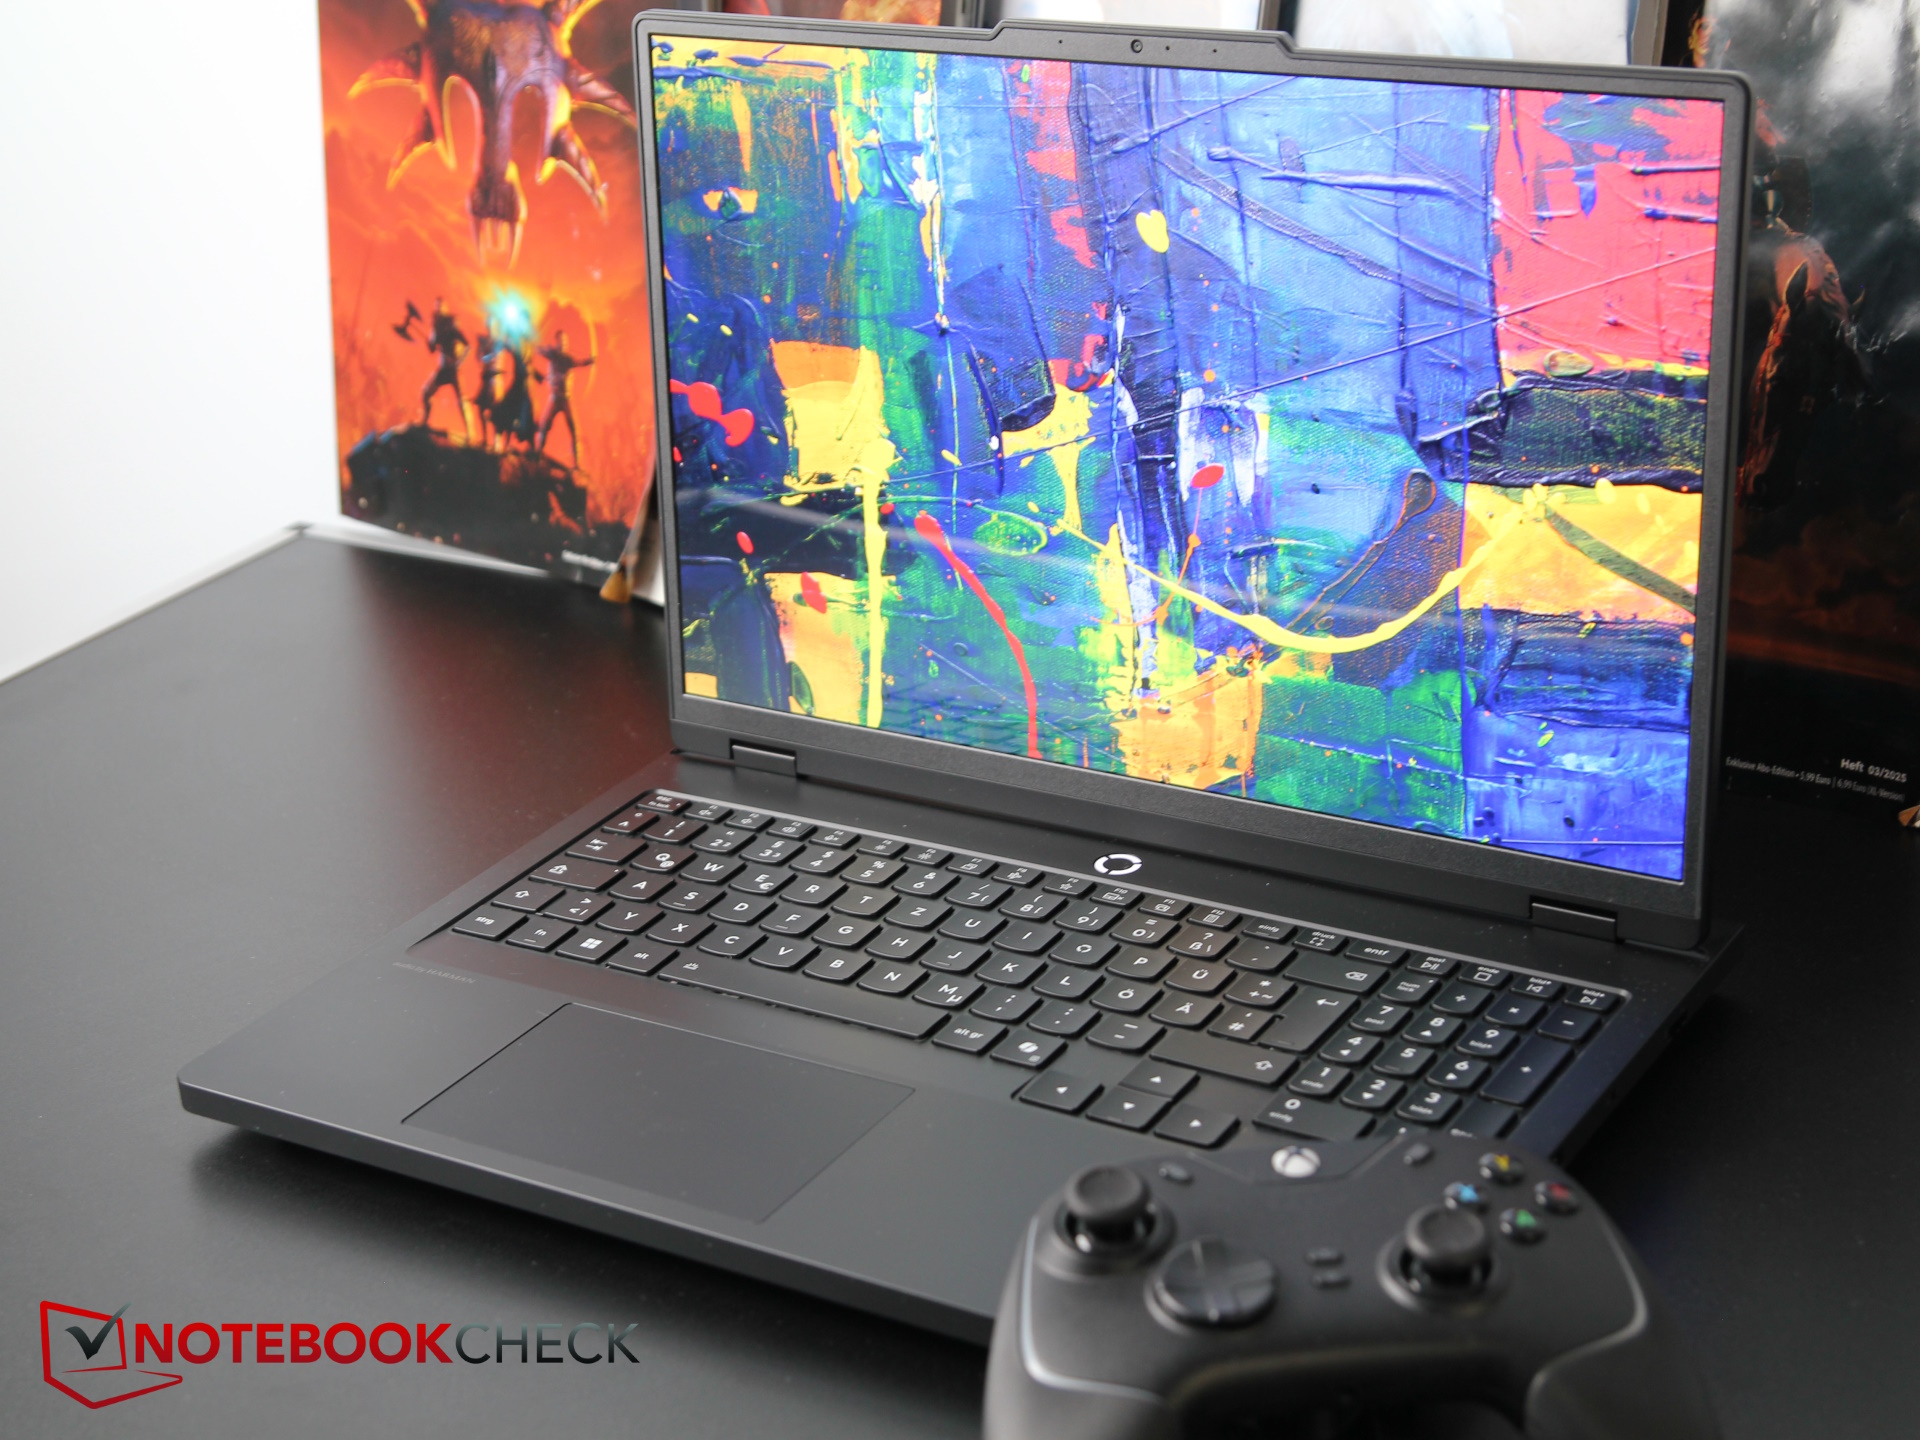
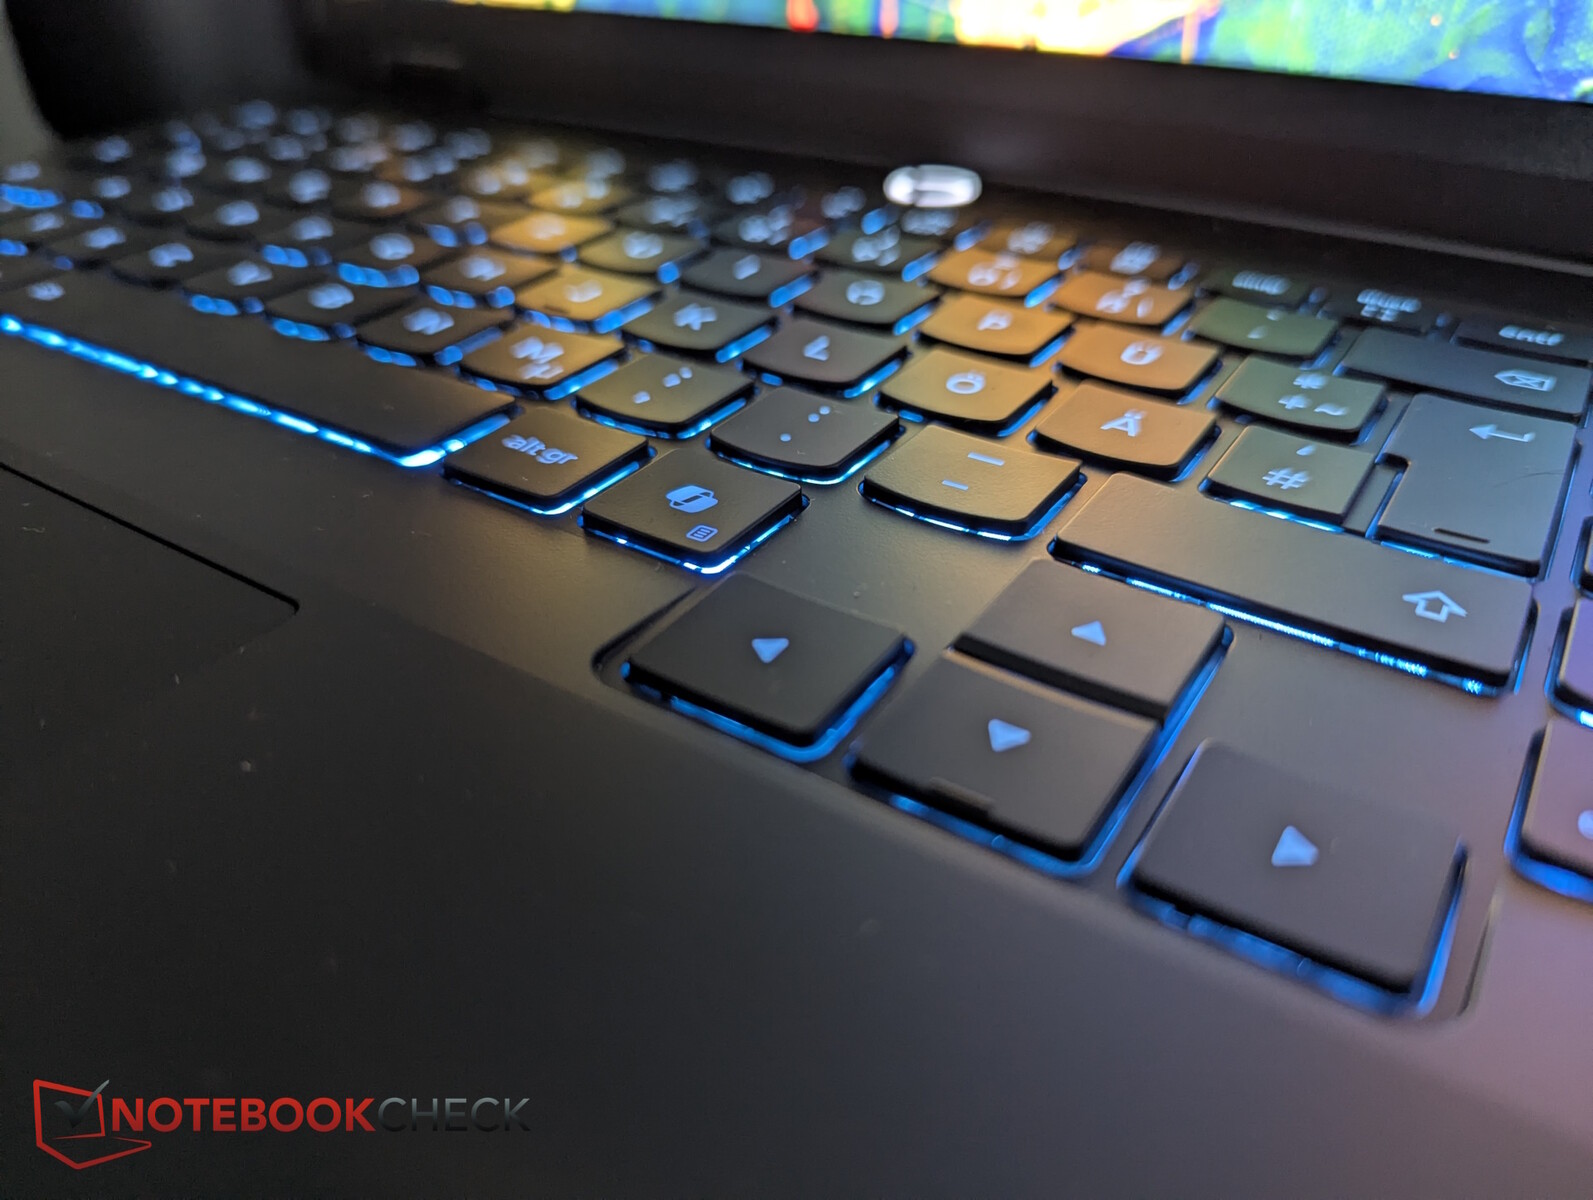
Eingabegeräte - Gut für einen Gamer
Tastatur
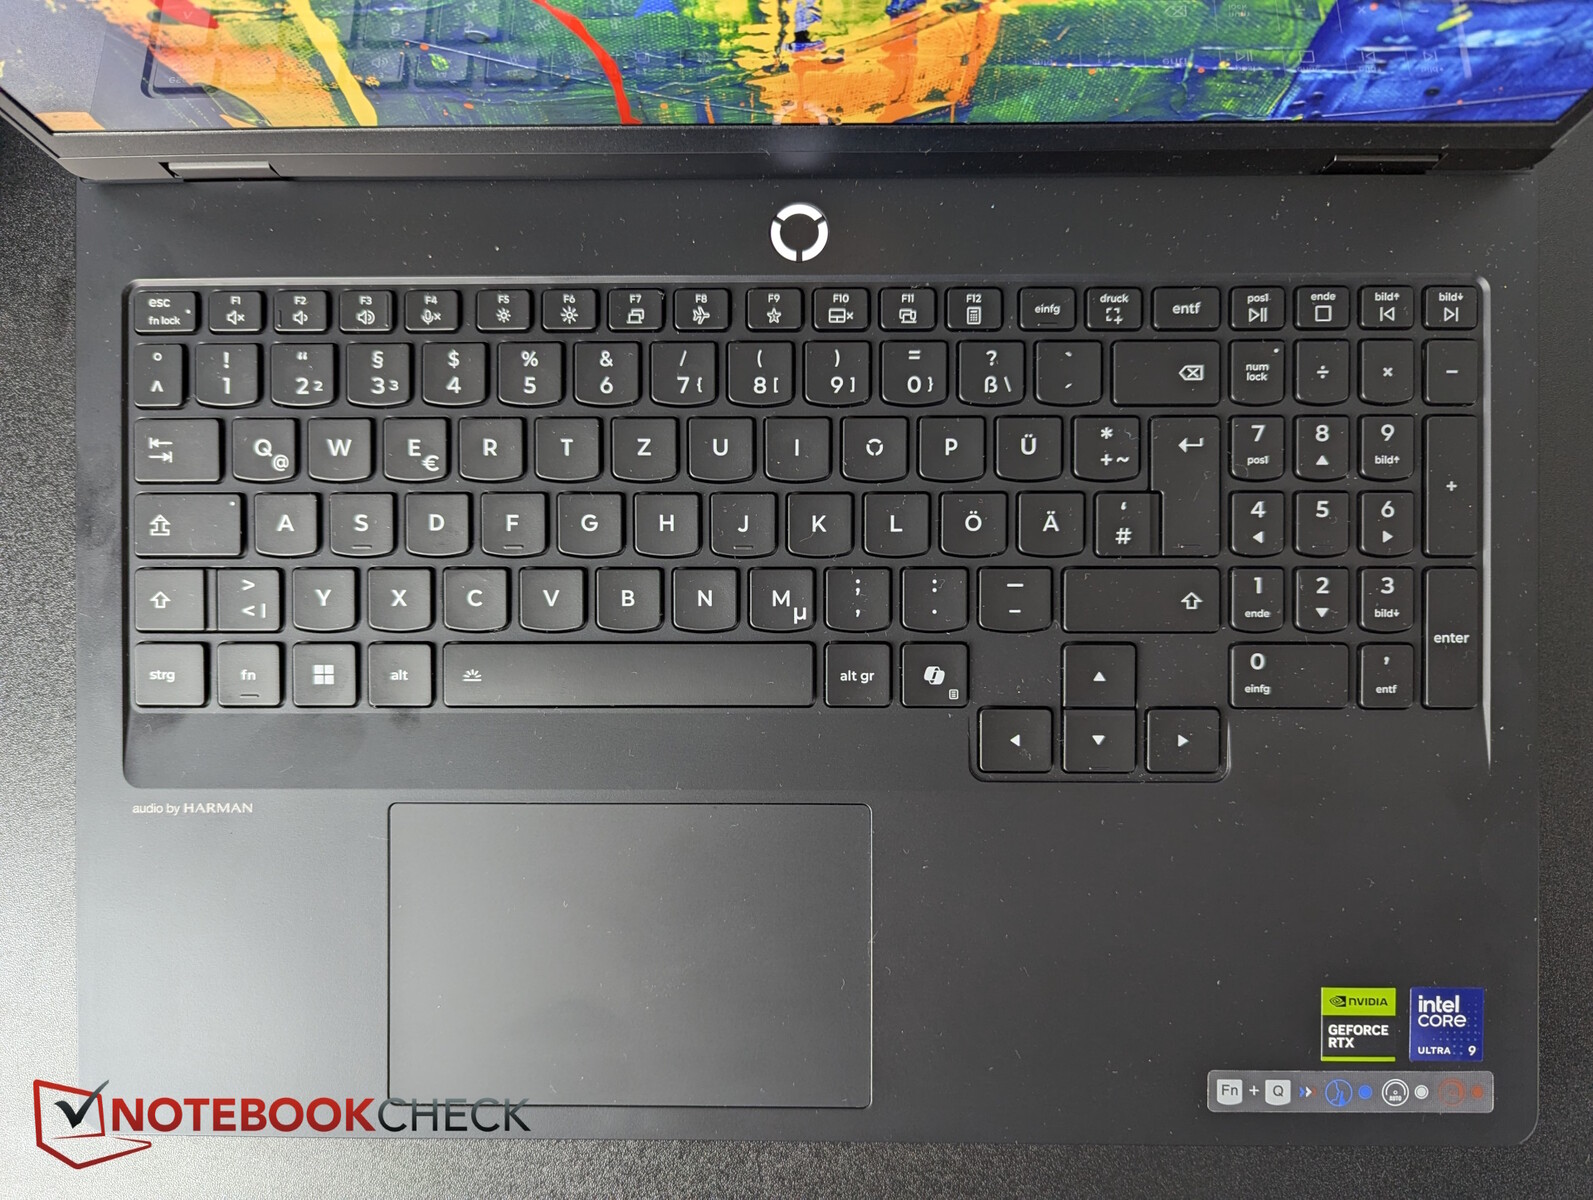
Sämtliche Tasten haben Abstand zueinander, rechts findet noch ein schmales Numpad Platz. Die vollgroßen Pfeiltasten sind räumlich etwas abgesetzt und der Power Button ist als separater Knopf oberhalb der Tastatur konzipiert - sehr gut. Eine RGB-Hintergrundbeleuchtung lässt sich in 24 Zonen konfigurieren.
Die Tasten überzeugen mit einem klaren Druckpunkt und dadurch gutem Feedback, auch wenn der Hub eher mittel bis kurz ist. Insgesamt lässt sich auf der Tastatur sehr gut und auch schnell tippen, die Anschlaggeräusche sind ruhig bis moderat.
Touchpad
Das Touchpad misst 12 x 7,5 cm und ist mit einer gleitfreudigen Mylar-Oberfläche überzogen. Multi-Touch-Eingaben werden problemlos umgesetzt. Die integrierten Tasten lösen zuverlässig und mit moderatem Klickgeräusch aus. "Getippte" Klicks wurden in unserem Test aber manchmal nicht richtig erkannt.
Display - Brillanter OLED
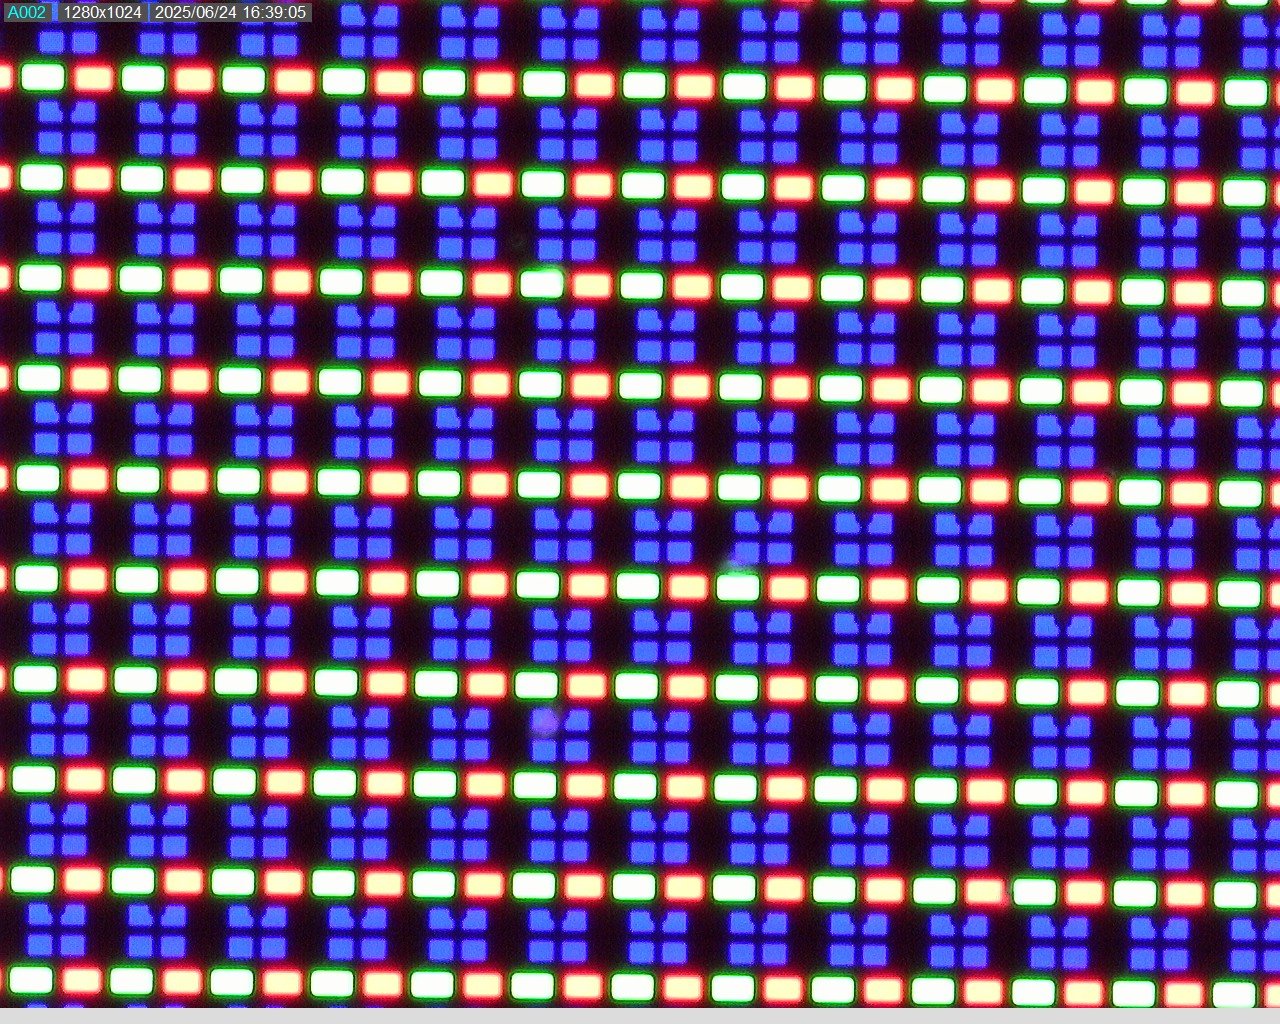
Lenovo spendiert dem Pro 5 einen spiegelnden OLED mit 16 Zoll und einer Auflösung von 2.560 x 1.600 Pixel. Das Display beherrscht DisplayHDR True Black 1000, Dolby Vision sowie G-SYNC.
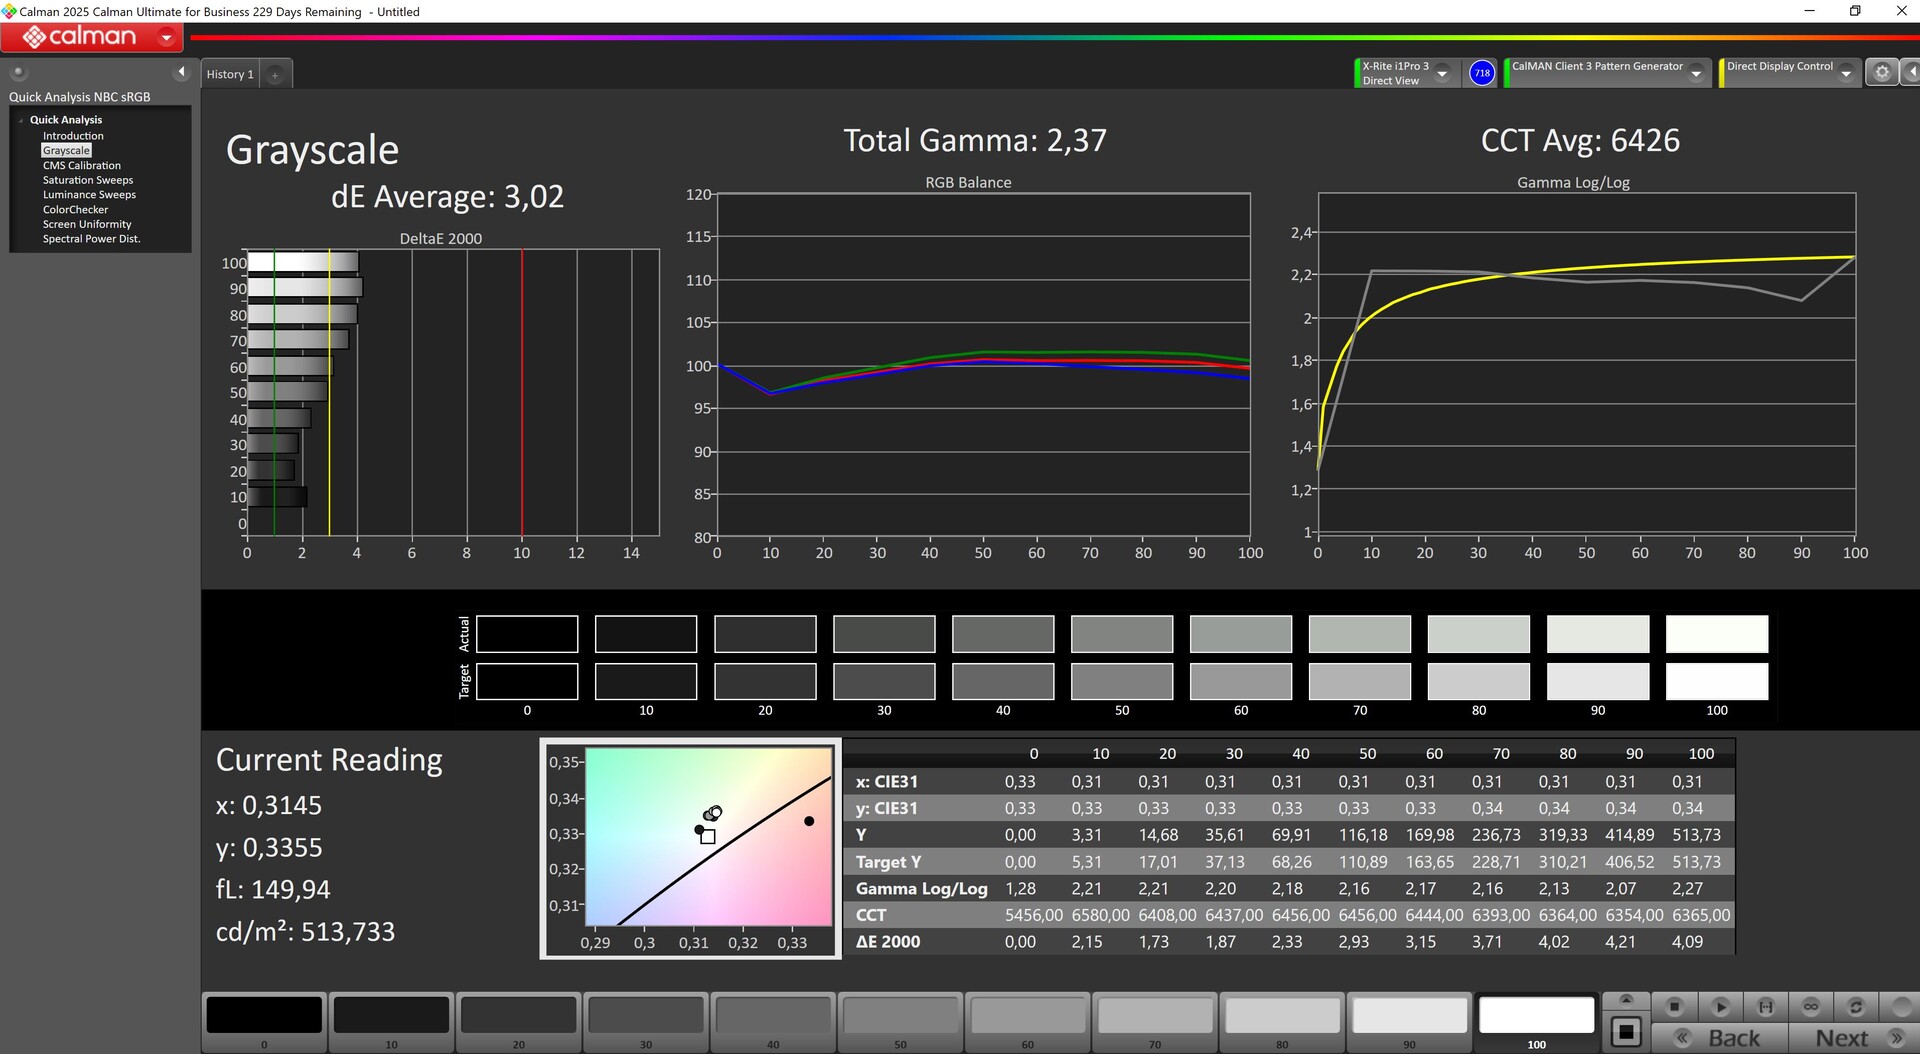
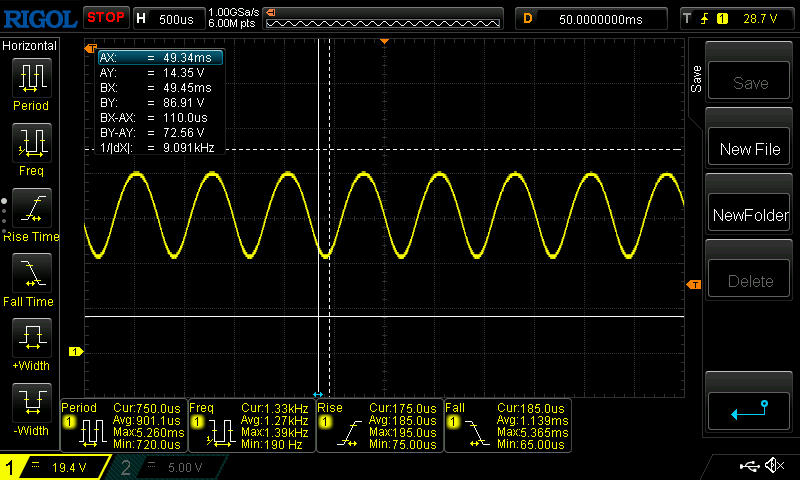
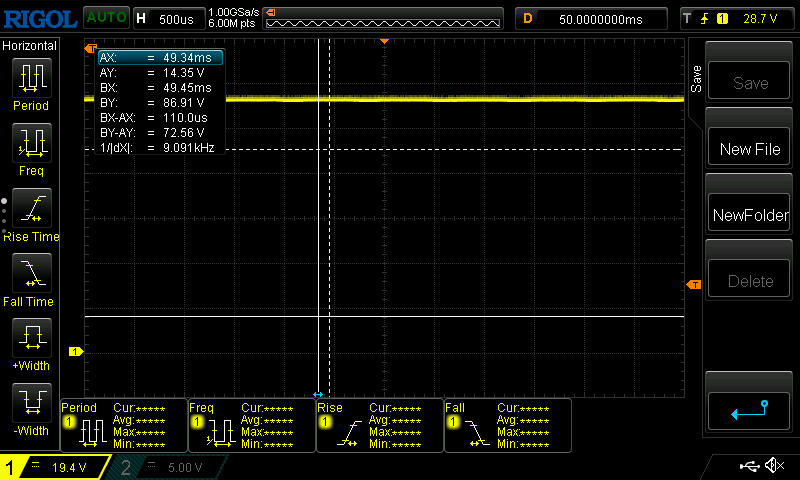
Wir messen eine mittlere Helligkeit von 522 Nits und eine hervorragende Ausleuchtung von 97 Prozent. Der Schwarzwert ist OLED-typisch quasi 0, was zu exzellenten Kontrasten führt. Lichthöfe gibt es dadurch auch nicht, zudem ist das Display extrem flott (um die 2 ms). Zwar flackert das Display, allerdings mit einer hohen Frequenz von 1,3 kHz, was auch empfindliche Personen nicht wahrnehmen dürften.
| |||||||||||||||||||||||||
Ausleuchtung: 97 %
Helligkeit Akku: 518 cd/m²
Kontrast: ∞:1 (Schwarzwert: 0 cd/m²)
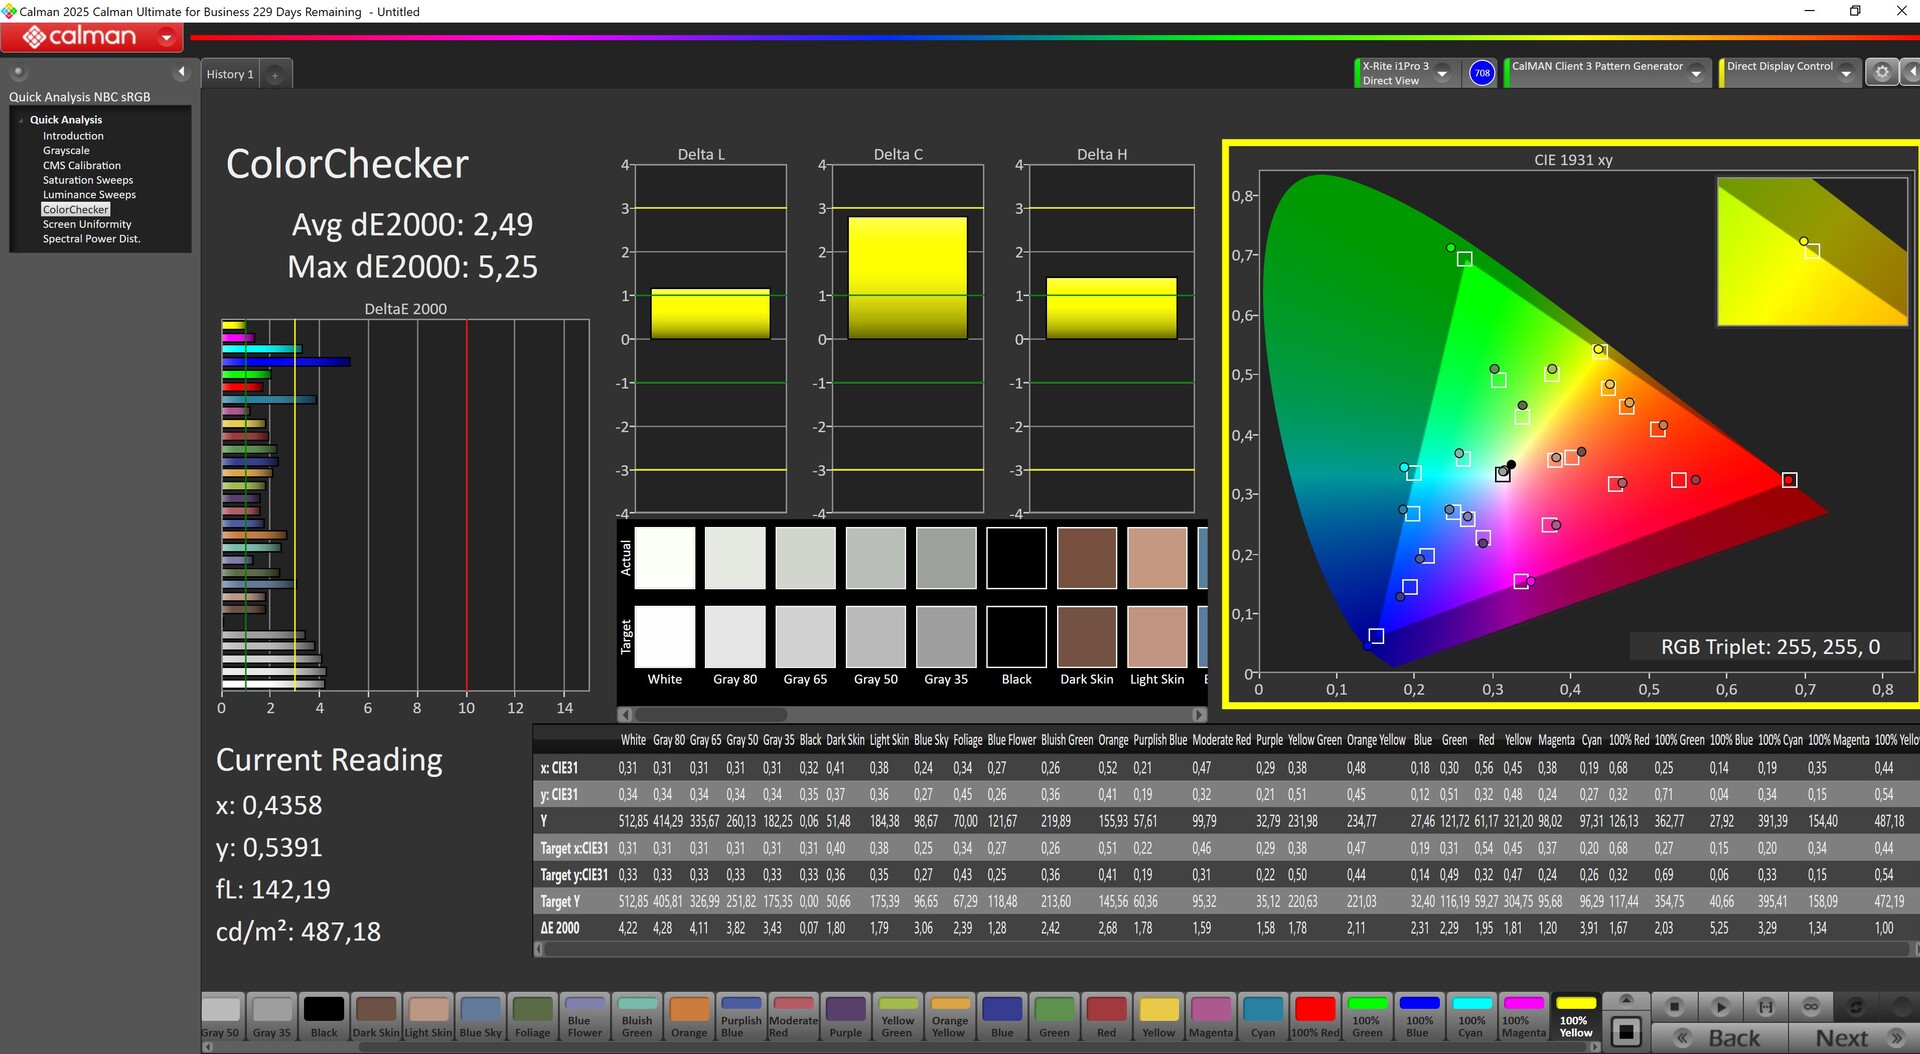
ΔE ColorChecker Calman: 2.49 | ∀{0.5-29.43 Ø4.72}
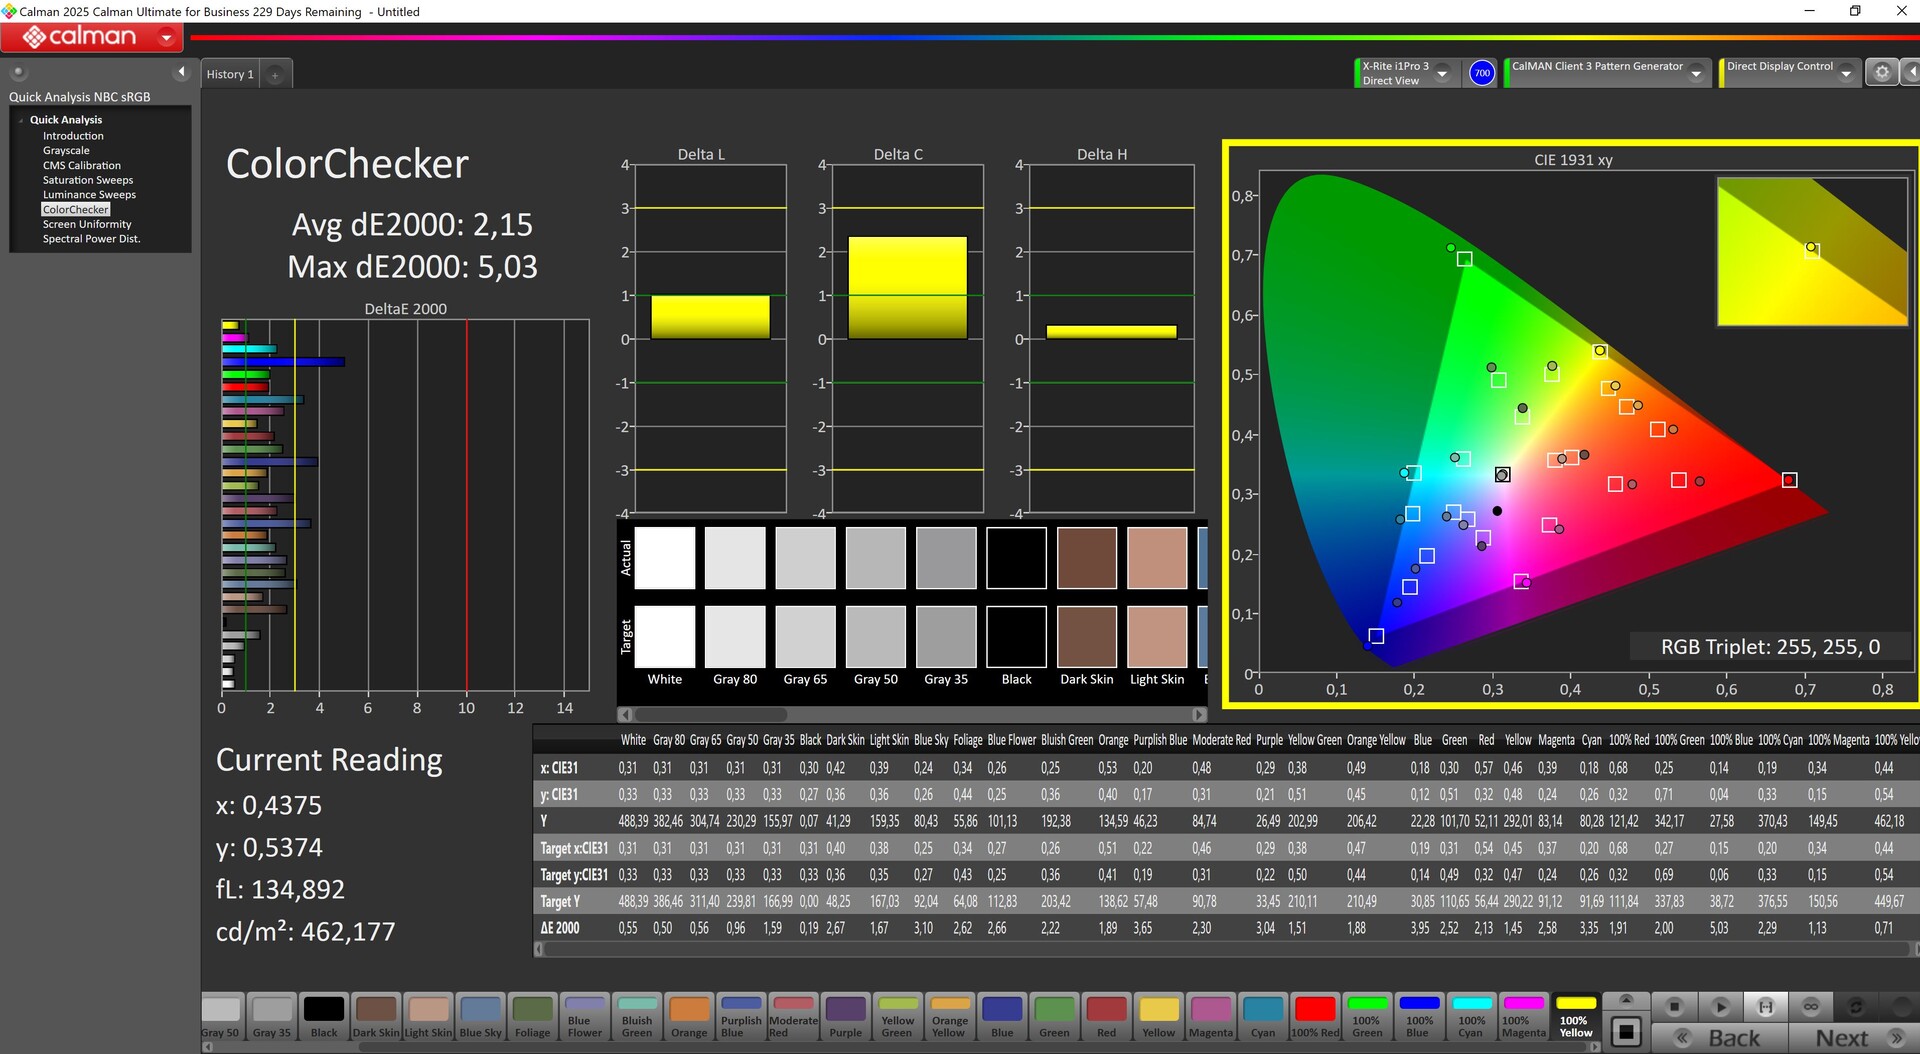
calibrated: 2.15
ΔE Greyscale Calman: 3.02 | ∀{0.09-98 Ø4.97}
94.1% AdobeRGB 1998 (Argyll 3D)
100% sRGB (Argyll 3D)
99.9% Display P3 (Argyll 3D)
Gamma: 2.37
CCT: 6426 K
| Lenovo Legion 5 Pro 16IAX10H ATNA60HS01-0 (Samsung SDC420A), OLED, 2560x1600, 16", 165 Hz | Lenovo Legion Pro 5 16IRX9 BOE NE160QDM-NYC, IPS, 2560x1600, 16", 165 Hz | Schenker XMG Neo 16 E25 RTX 5090 Laptop NE160QDM-NM9, Mini-LED, 2560x1600, 16", 300 Hz | Aorus MASTER 16 AM6H ATNA60DL03-0 (SDC41AB), OLED, 2560x1600, 16", 240 Hz | Schenker XMG Pro 16 (E25) NE160QDM-NZL, IPS, 2560x1600, 16", 300 Hz | Asus ROG Strix Scar 16 2025 NE160QDM-NM8, Mini-LED, 2560x1600, 16", 240 Hz | Lenovo Legion Pro 7i 16 Gen 10 Samsung ATNA60HU01-0, OLED, 2560x1600, 16", 240 Hz | |
|---|---|---|---|---|---|---|---|
| Display | -19% | -2% | -2% | -15% | -2% | 0% | |
| Display P3 Coverage (%) | 99.9 | 69.3 -31% | 99.9 0% | 95.3 -5% | 74.7 -25% | 99.9 0% | 99.5 0% |
| sRGB Coverage (%) | 100 | 99.4 -1% | 100 0% | 98.8 -1% | 99.8 0% | 100 0% | 100 0% |
| AdobeRGB 1998 Coverage (%) | 94.1 | 70.1 -26% | 88.5 -6% | 94.1 0% | 75.4 -20% | 88.4 -6% | 94.4 0% |
| Response Times | -516% | -649% | -8% | -356% | -375% | 27% | |
| Response Time Grey 50% / Grey 80% * (ms) | 2 ? | 11.9 ? -495% | 17.4 ? -770% | 0.24 ? 88% | 10.5 ? -425% | 7 ? -250% | 0.28 ? 86% |
| Response Time Black / White * (ms) | 1.4 ? | 8.9 ? -536% | 13 ? -829% | 0.43 ? 69% | 5.4 ? -286% | 8.4 ? -500% | 0.43 ? 69% |
| PWM Frequency (Hz) | 1300 | 20253 | 960 | 20555 ? | 1438 ? | ||
| PWM Amplitude * (%) | 16.7 | 75 -349% | 47 -181% | 29 -74% | |||
| Bildschirm | 21% | 14% | -3% | 9% | 46% | 11% | |
| Helligkeit Bildmitte (cd/m²) | 518 | 384 -26% | 888 71% | 435 -16% | 538 4% | 754 46% | 490.4 -5% |
| Brightness (cd/m²) | 522 | 366 -30% | 859 65% | 437 -16% | 508 -3% | 773 48% | 498 -5% |
| Brightness Distribution (%) | 97 | 91 -6% | 94 -3% | 96 -1% | 88 -9% | 91 -6% | 97 0% |
| Schwarzwert * (cd/m²) | 0.35 | 0.08 | 0.47 | 0.07 | |||
| Delta E Colorchecker * | 2.49 | 0.97 61% | 3.3 -33% | 2.42 3% | 1.9 24% | 1 60% | 3.2 -29% |
| Colorchecker dE 2000 max. * | 5.25 | 3.57 32% | 5.5 -5% | 4.81 8% | 4 24% | 2 62% | 6.04 -15% |
| Colorchecker dE 2000 calibrated * | 2.15 | 0.77 64% | 1.5 30% | 2.03 6% | 0.84 61% | ||
| Delta E Graustufen * | 3.02 | 1.5 50% | 3.8 -26% | 3.11 -3% | 2.7 11% | 1 67% | 1 67% |
| Gamma | 2.37 93% | 2.24 98% | 2.46 89% | 2.48 89% | 2.24 98% | 2.14 103% | 2.24 98% |
| CCT | 6426 101% | 6709 97% | 6267 104% | 6270 104% | 7027 93% | 6493 100% | 6373 102% |
| Kontrast (:1) | 1097 | 5438 | 1145 | 10771 | |||
| Durchschnitt gesamt (Programm / Settings) | -171% /
-79% | -212% /
-143% | -4% /
-4% | -121% /
-64% | -110% /
-44% | 13% /
12% |
* ... kleinere Werte sind besser
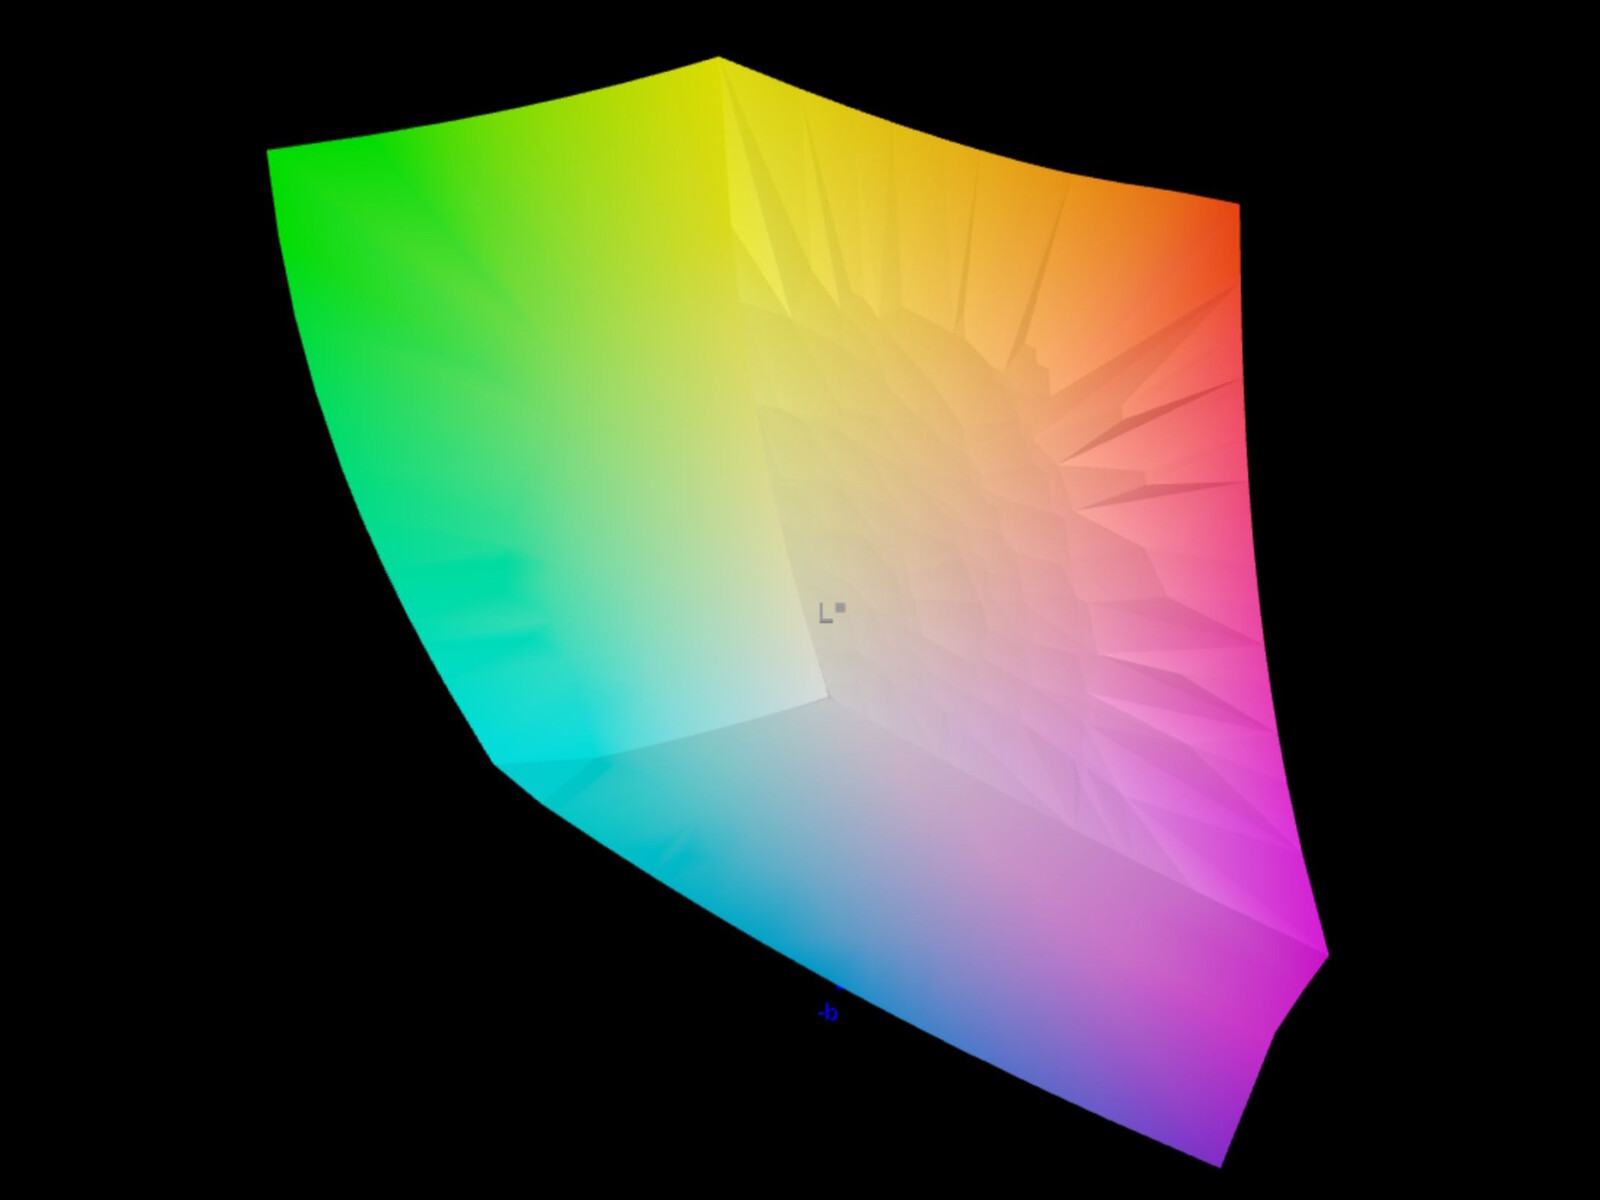
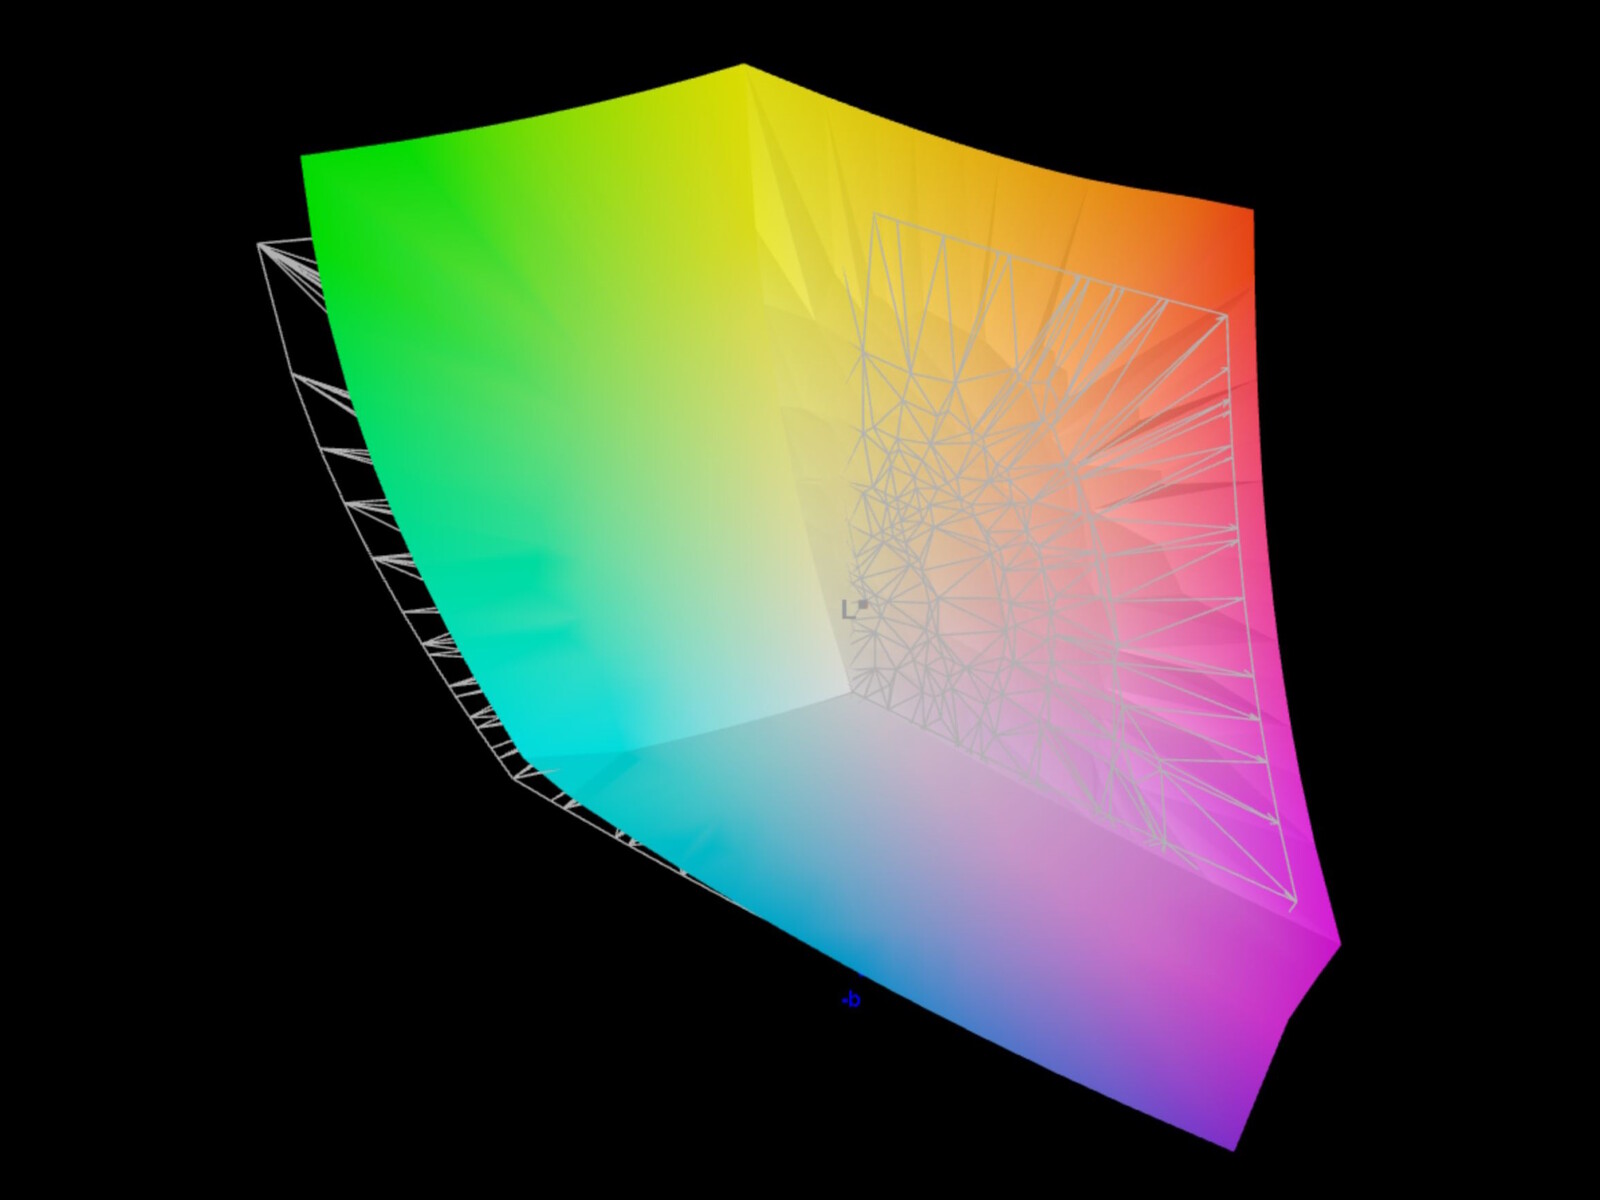
Der OLED bildet sRGB und Display P3 vollständig ab, selbst AdobeRGB wird noch zu 94 Prozent dargestellt.

Das Legion Pro 5 kommt mit kalibriertem Bildschirm aus dem Werk. Bei voller Helligkeit liegen die Abweichungen aber dennoch bei 2.49 (Farben) oder gar knapp über 3 (Graustufen). Unsere manuelle Kalibrierung kann die DeltaE-Werte noch minimal drücken.


Reaktionszeiten (Response Times) des Displays
| ↔ Reaktionszeiten Schwarz zu Weiß | ||
|---|---|---|
| 1.4 ms ... steigend ↗ und fallend ↘ kombiniert | ↗ 0.8 ms steigend | 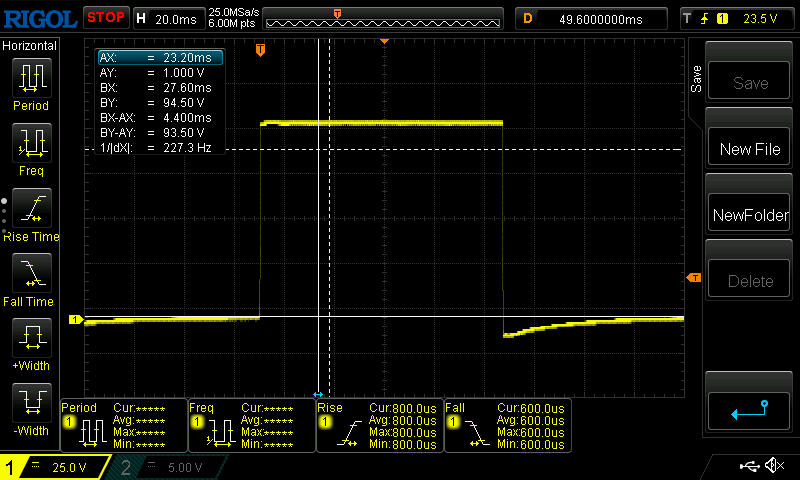 |
| ↘ 0.6 ms fallend | ||
| Die gemessenen Reaktionszeiten sind sehr kurz, wodurch sich der Bildschirm auch für schnelle 3D Spiele eignen sollte. Im Vergleich rangierten die bei uns getesteten Geräte von 0.1 (Minimum) zu 240 (Maximum) ms. » 8 % aller Screens waren schneller als der getestete. Daher sind die gemessenen Reaktionszeiten besser als der Durchschnitt aller vermessenen Geräte (19.8 ms). | ||
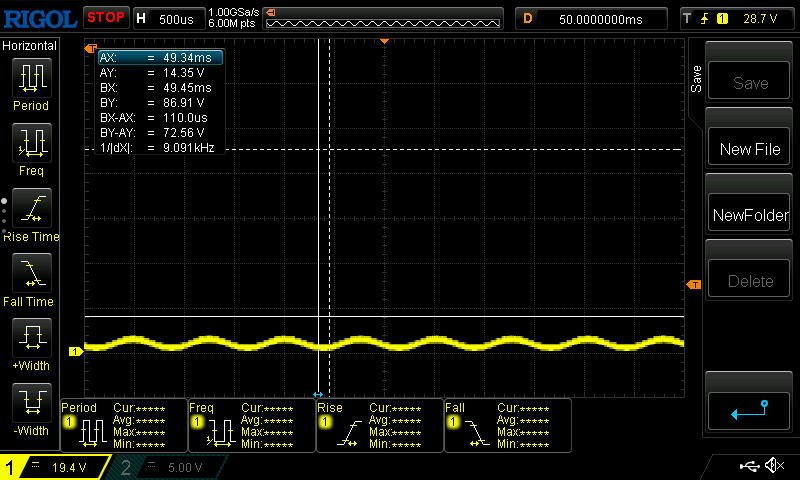
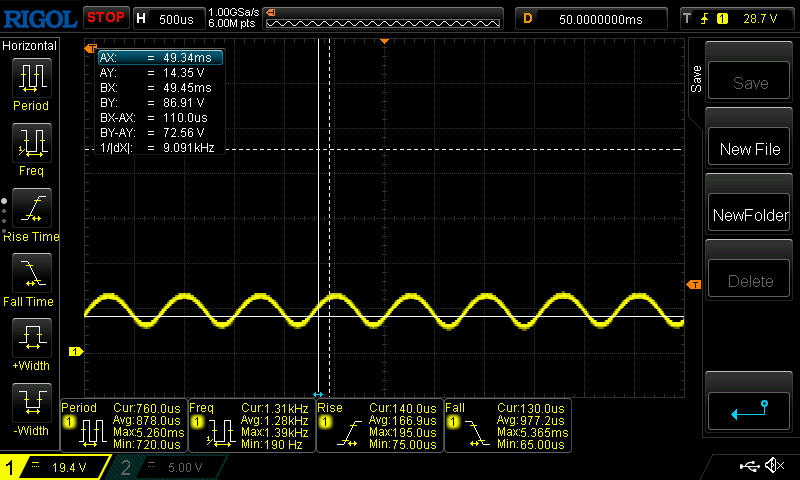
| ↔ Reaktionszeiten 50% Grau zu 80% Grau | ||
| 2 ms ... steigend ↗ und fallend ↘ kombiniert | ↗ 1 ms steigend | 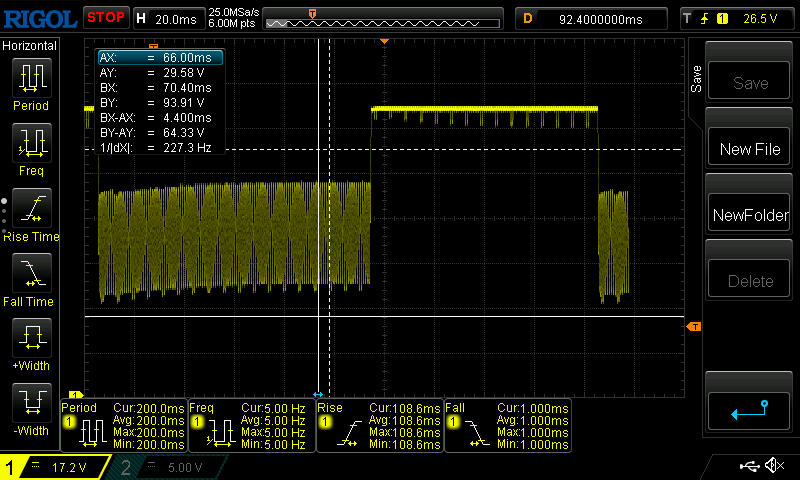 |
| ↘ 1 ms fallend | ||
| Die gemessenen Reaktionszeiten sind sehr kurz, wodurch sich der Bildschirm auch für schnelle 3D Spiele eignen sollte. Im Vergleich rangierten die bei uns getesteten Geräte von 0.165 (Minimum) zu 636 (Maximum) ms. » 10 % aller Screens waren schneller als der getestete. Daher sind die gemessenen Reaktionszeiten besser als der Durchschnitt aller vermessenen Geräte (31 ms). | ||
Bildschirm-Flackern / PWM (Pulse-Width Modulation)
| Flackern / PWM festgestellt | 1300 Hz Amplitude: 16.7 % | 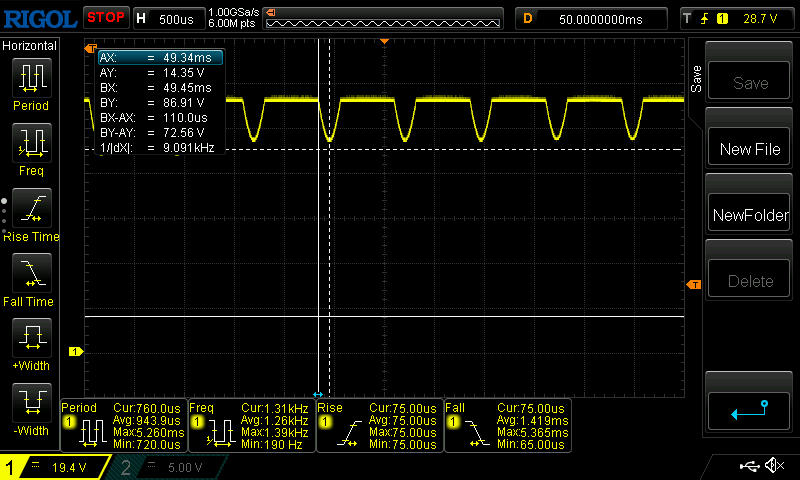 | |
Das Display flackert mit 1300 Hz (im schlimmsten Fall, eventuell durch Pulsweitenmodulation PWM) . Die Frequenz von 1300 Hz ist sehr hoch und sollte daher auch bei empfindlichen Personen zu keinen Problemen führen. Im Vergleich: 52 % aller getesteten Geräte nutzten kein PWM um die Helligkeit zu reduzieren. Wenn PWM eingesetzt wurde, dann bei einer Frequenz von durchschnittlich 7781 (Minimum 5, Maximum 343500) Hz. | |||

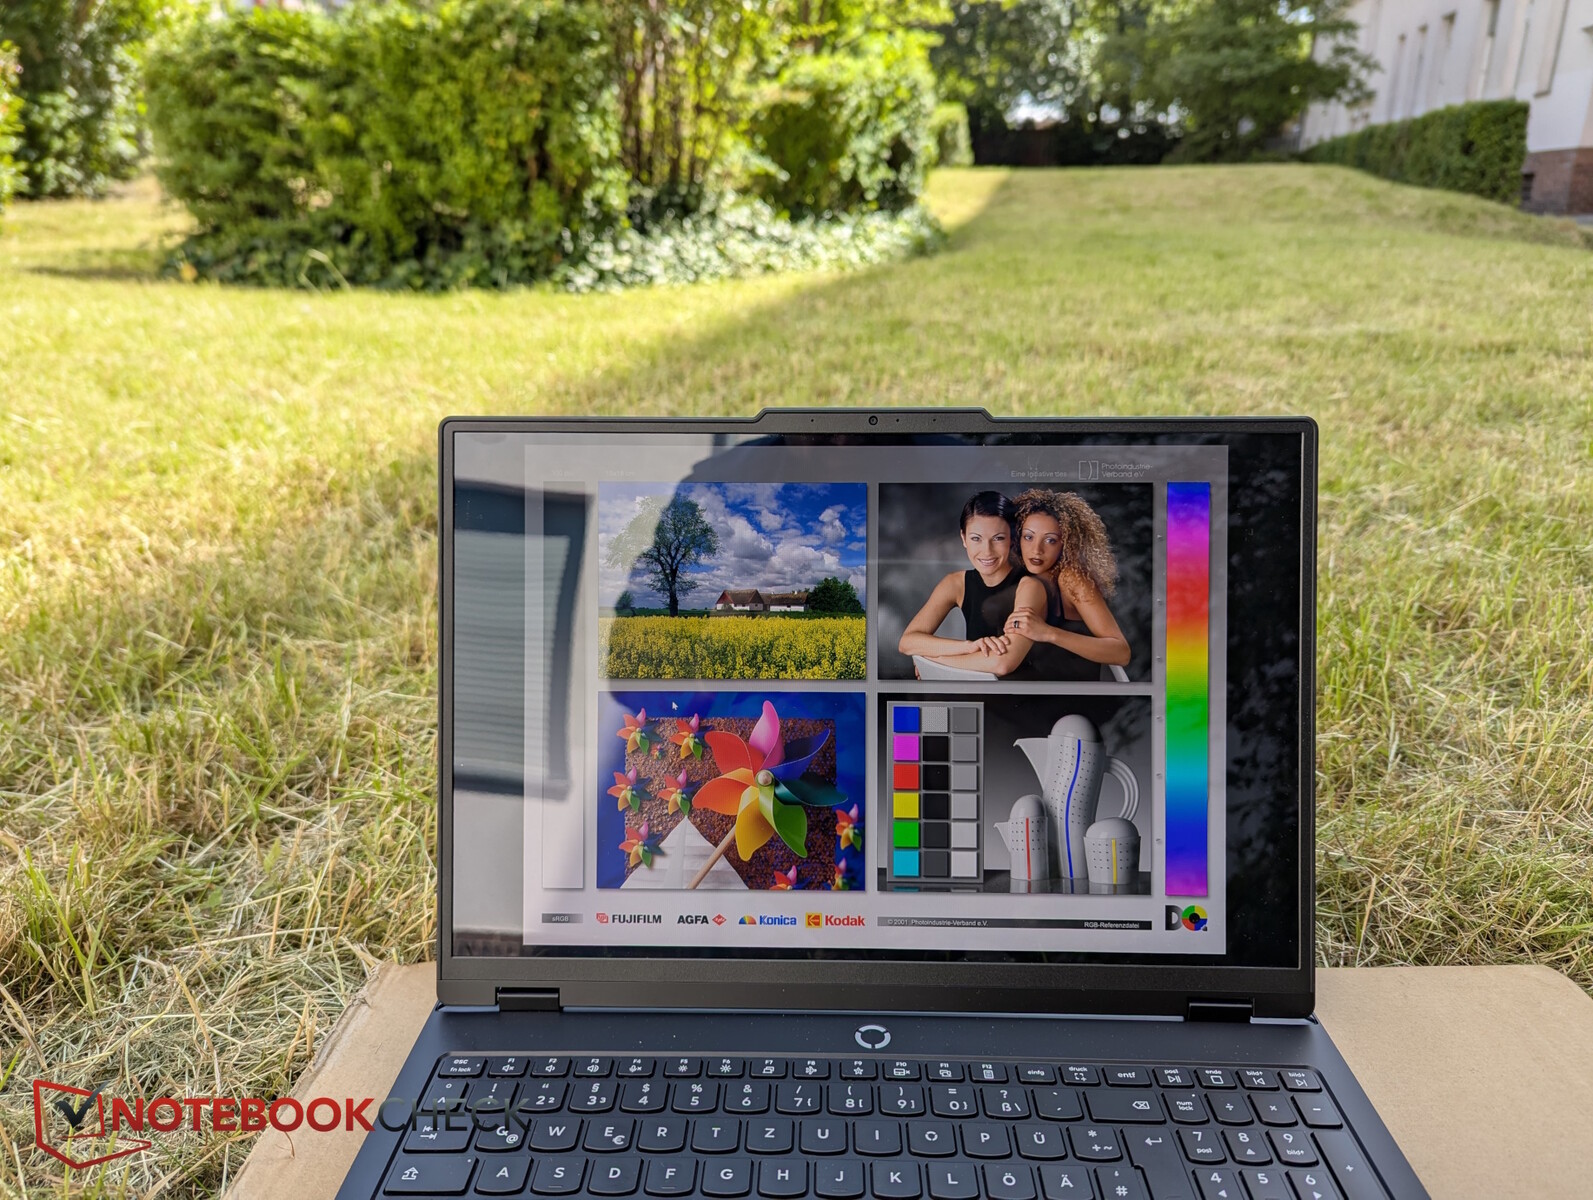
Im Freien stört zwar theoretisch das spiegelnde Panel, aber da es hell und sehr kontraststark ist, kann man dennoch gut darauf arbeiten, sofern man auf eine direkte Draufsicht und ein schattiges Plätzchen achtet.


Leistung - Starke 3D-Performance
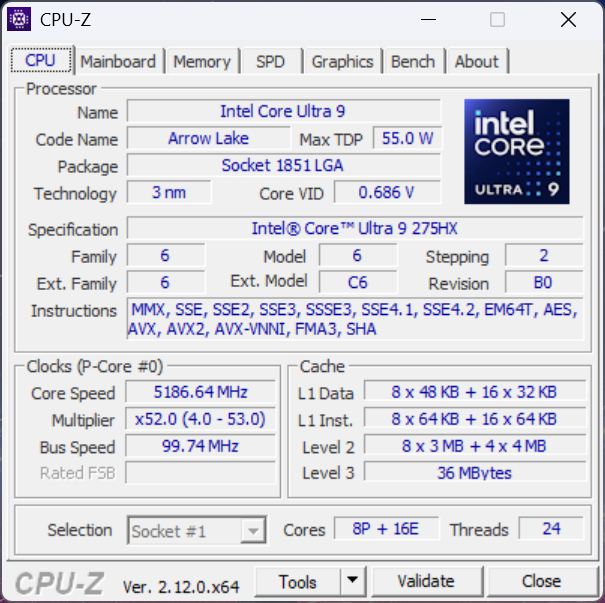
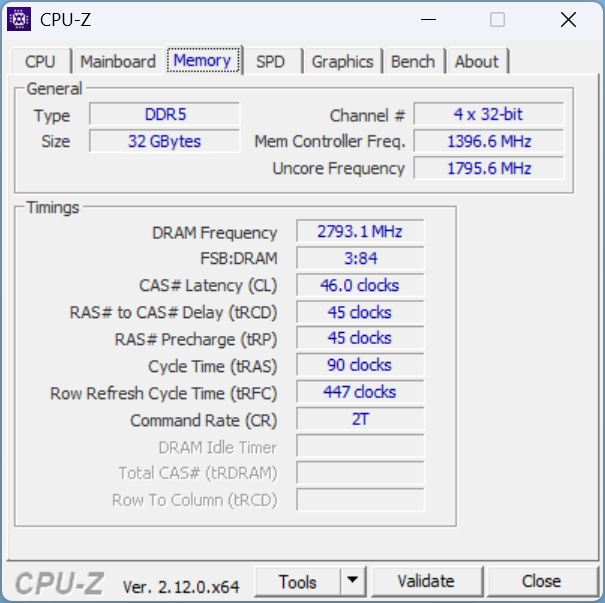
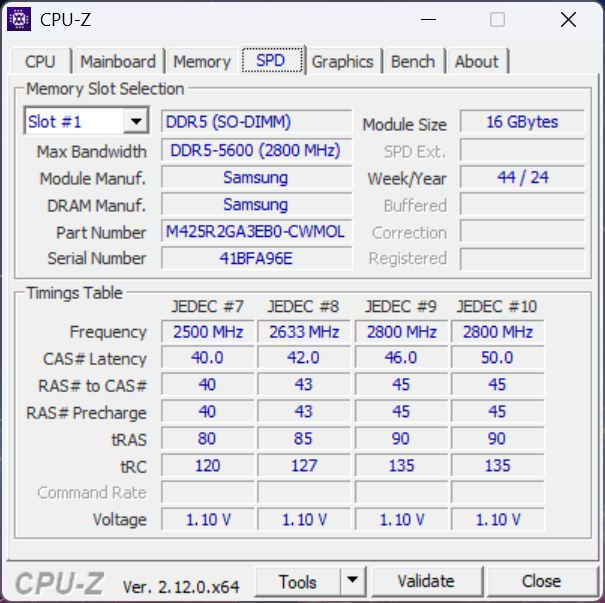
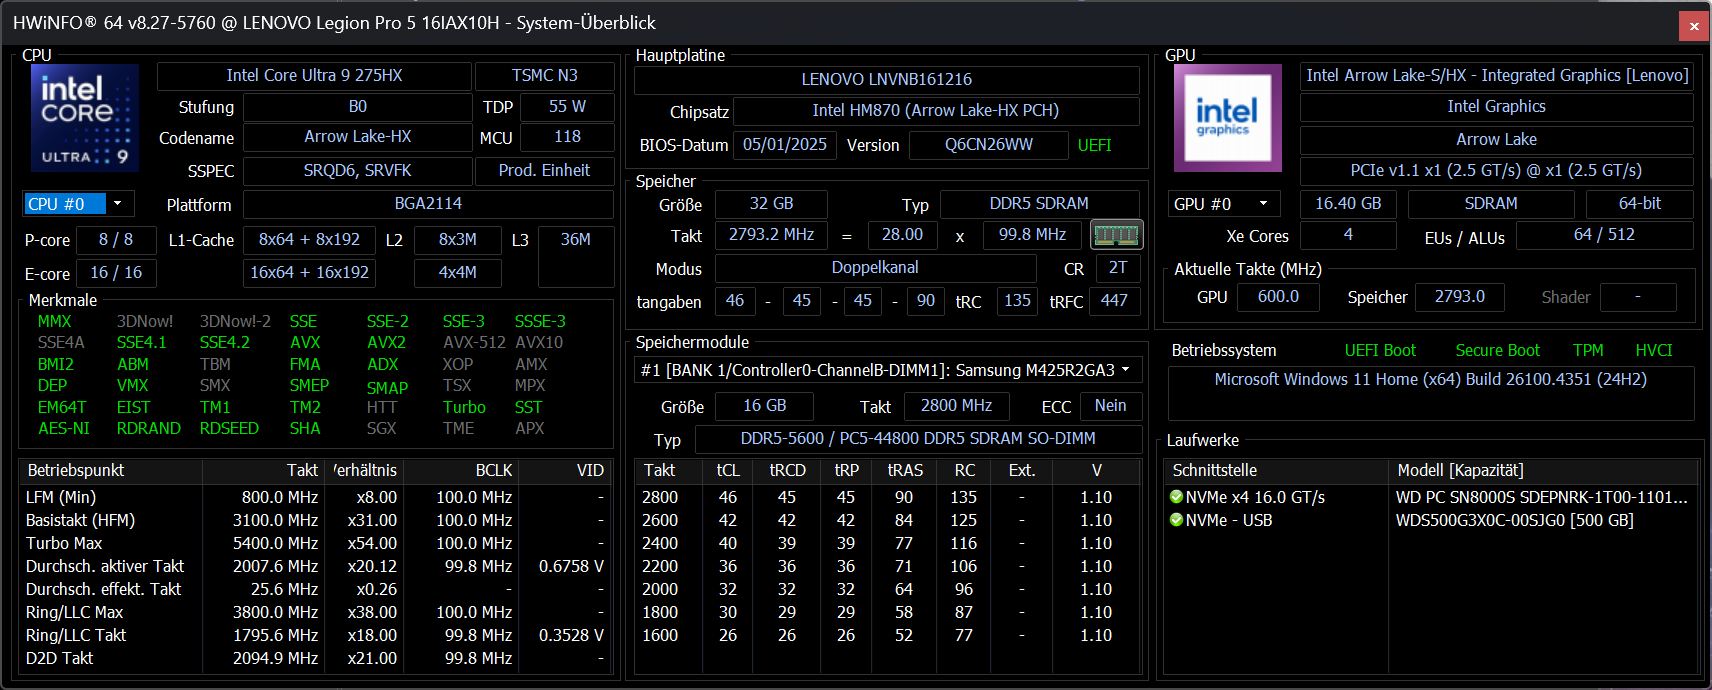
Mit dem Intel Core Ultra 9 275HX, einer RTX 5070 Ti Laptop, 32 GB RAM und einer 1-TB-SSD verortet sich das Legion einerseits als Gamer. Andererseits richtet sich das "Pro"(fessional)-Gerät durch seinen Look sowie dem brillanten OLED auch an Content Creators.
Testbedingungen
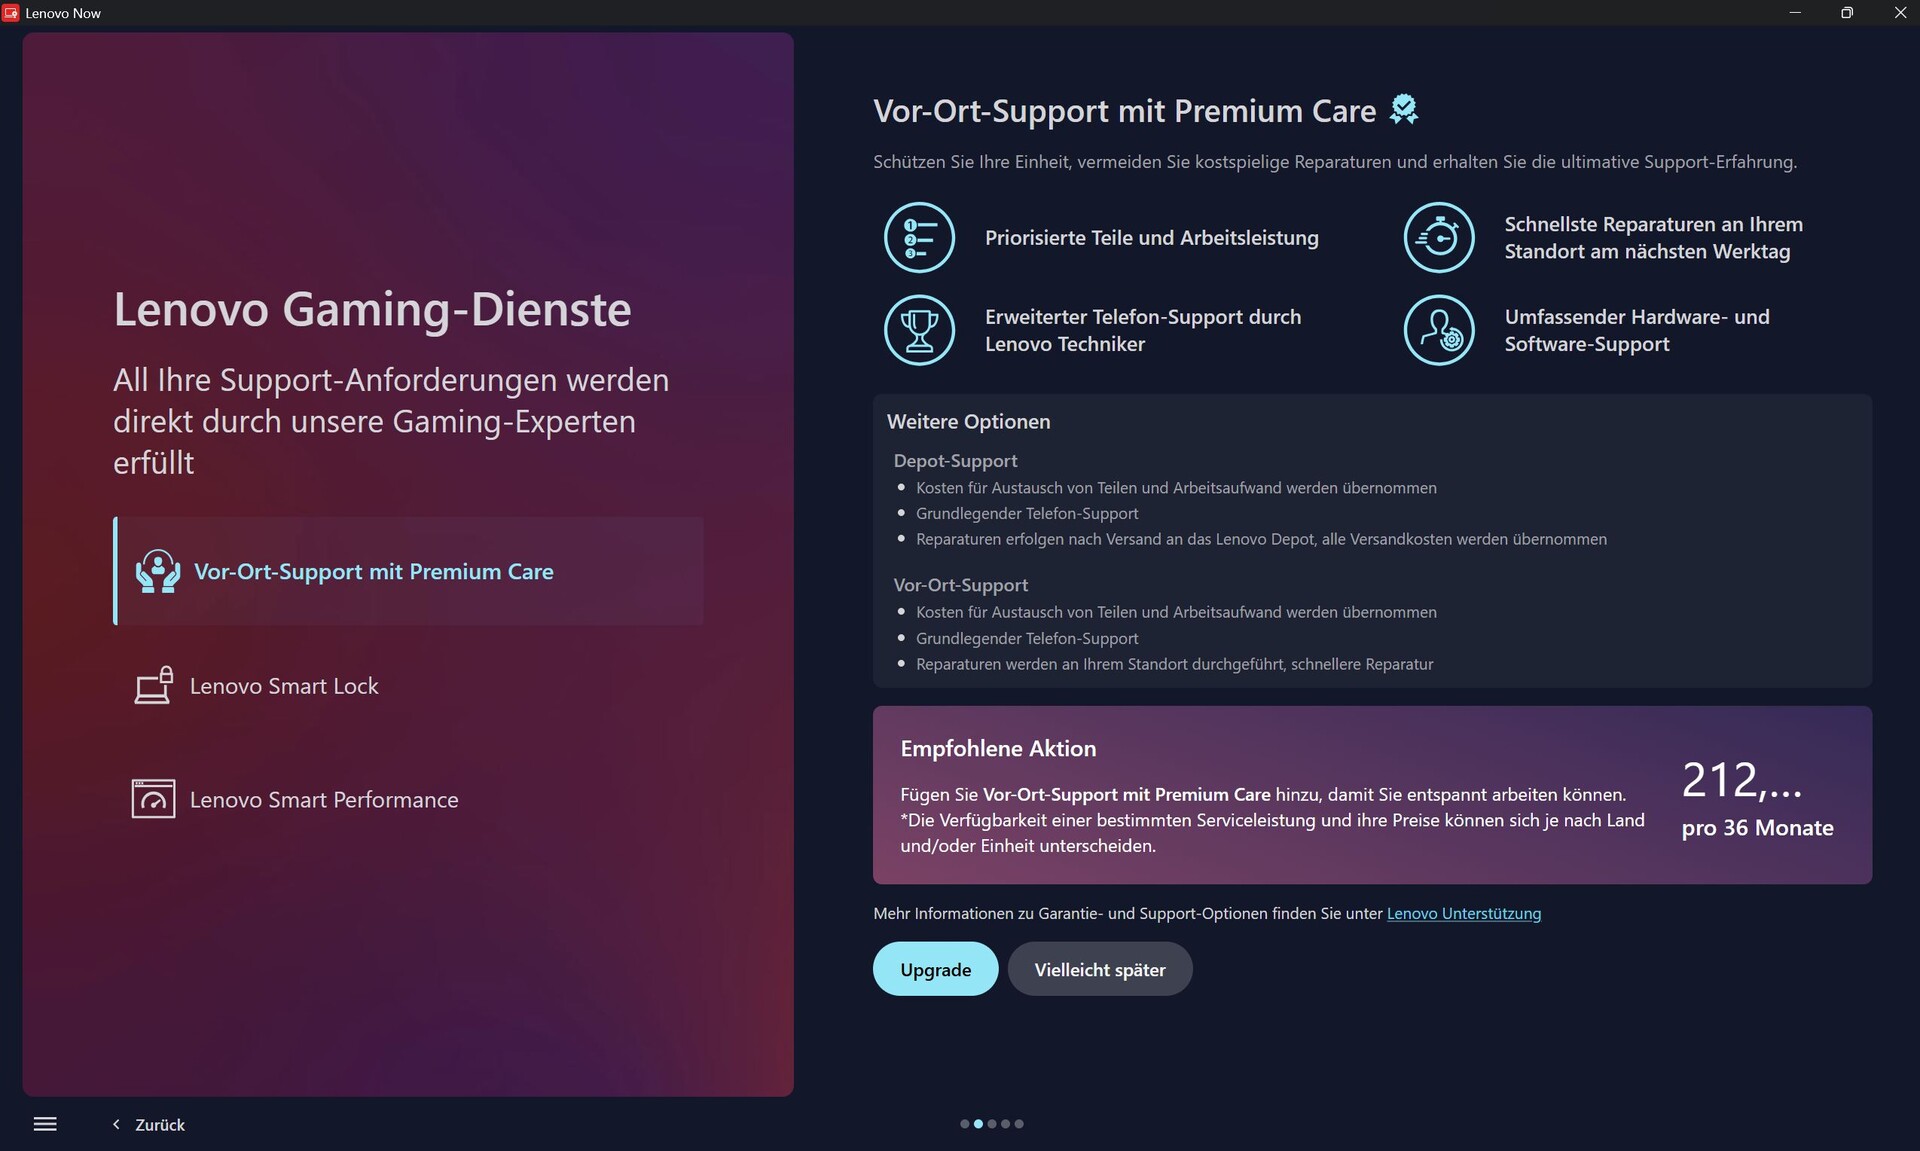
Leider verwendet Lenovo seine Software auch dazu dem Gaming-Nutzer Werbung anzuzeigen. So startet Lenovo LegionSpace, das man für die Einstellung der Leistungsmodi benötigt, stets im "Game Stores" Home Screen mit den neuesten Spiele-Angeboten. Die zweite Software Lenovo Vantage ist für Updates und Support zuständig, gängelt aber auch immer wieder mit Umfrageaufforderungen oder Werbung in eigener Sache. Zudem ist eine Testversion von McAffee vorinstalliert.
Interessierte Nutzer werden mit einem Browser-Link auf Lenovos allgemeingültige Datenschutzerklärung abgespeist. Welche Daten genau LegionSpace und Vantage erfassen, wird daraus für den normalen Kunden nicht ersichtlich.
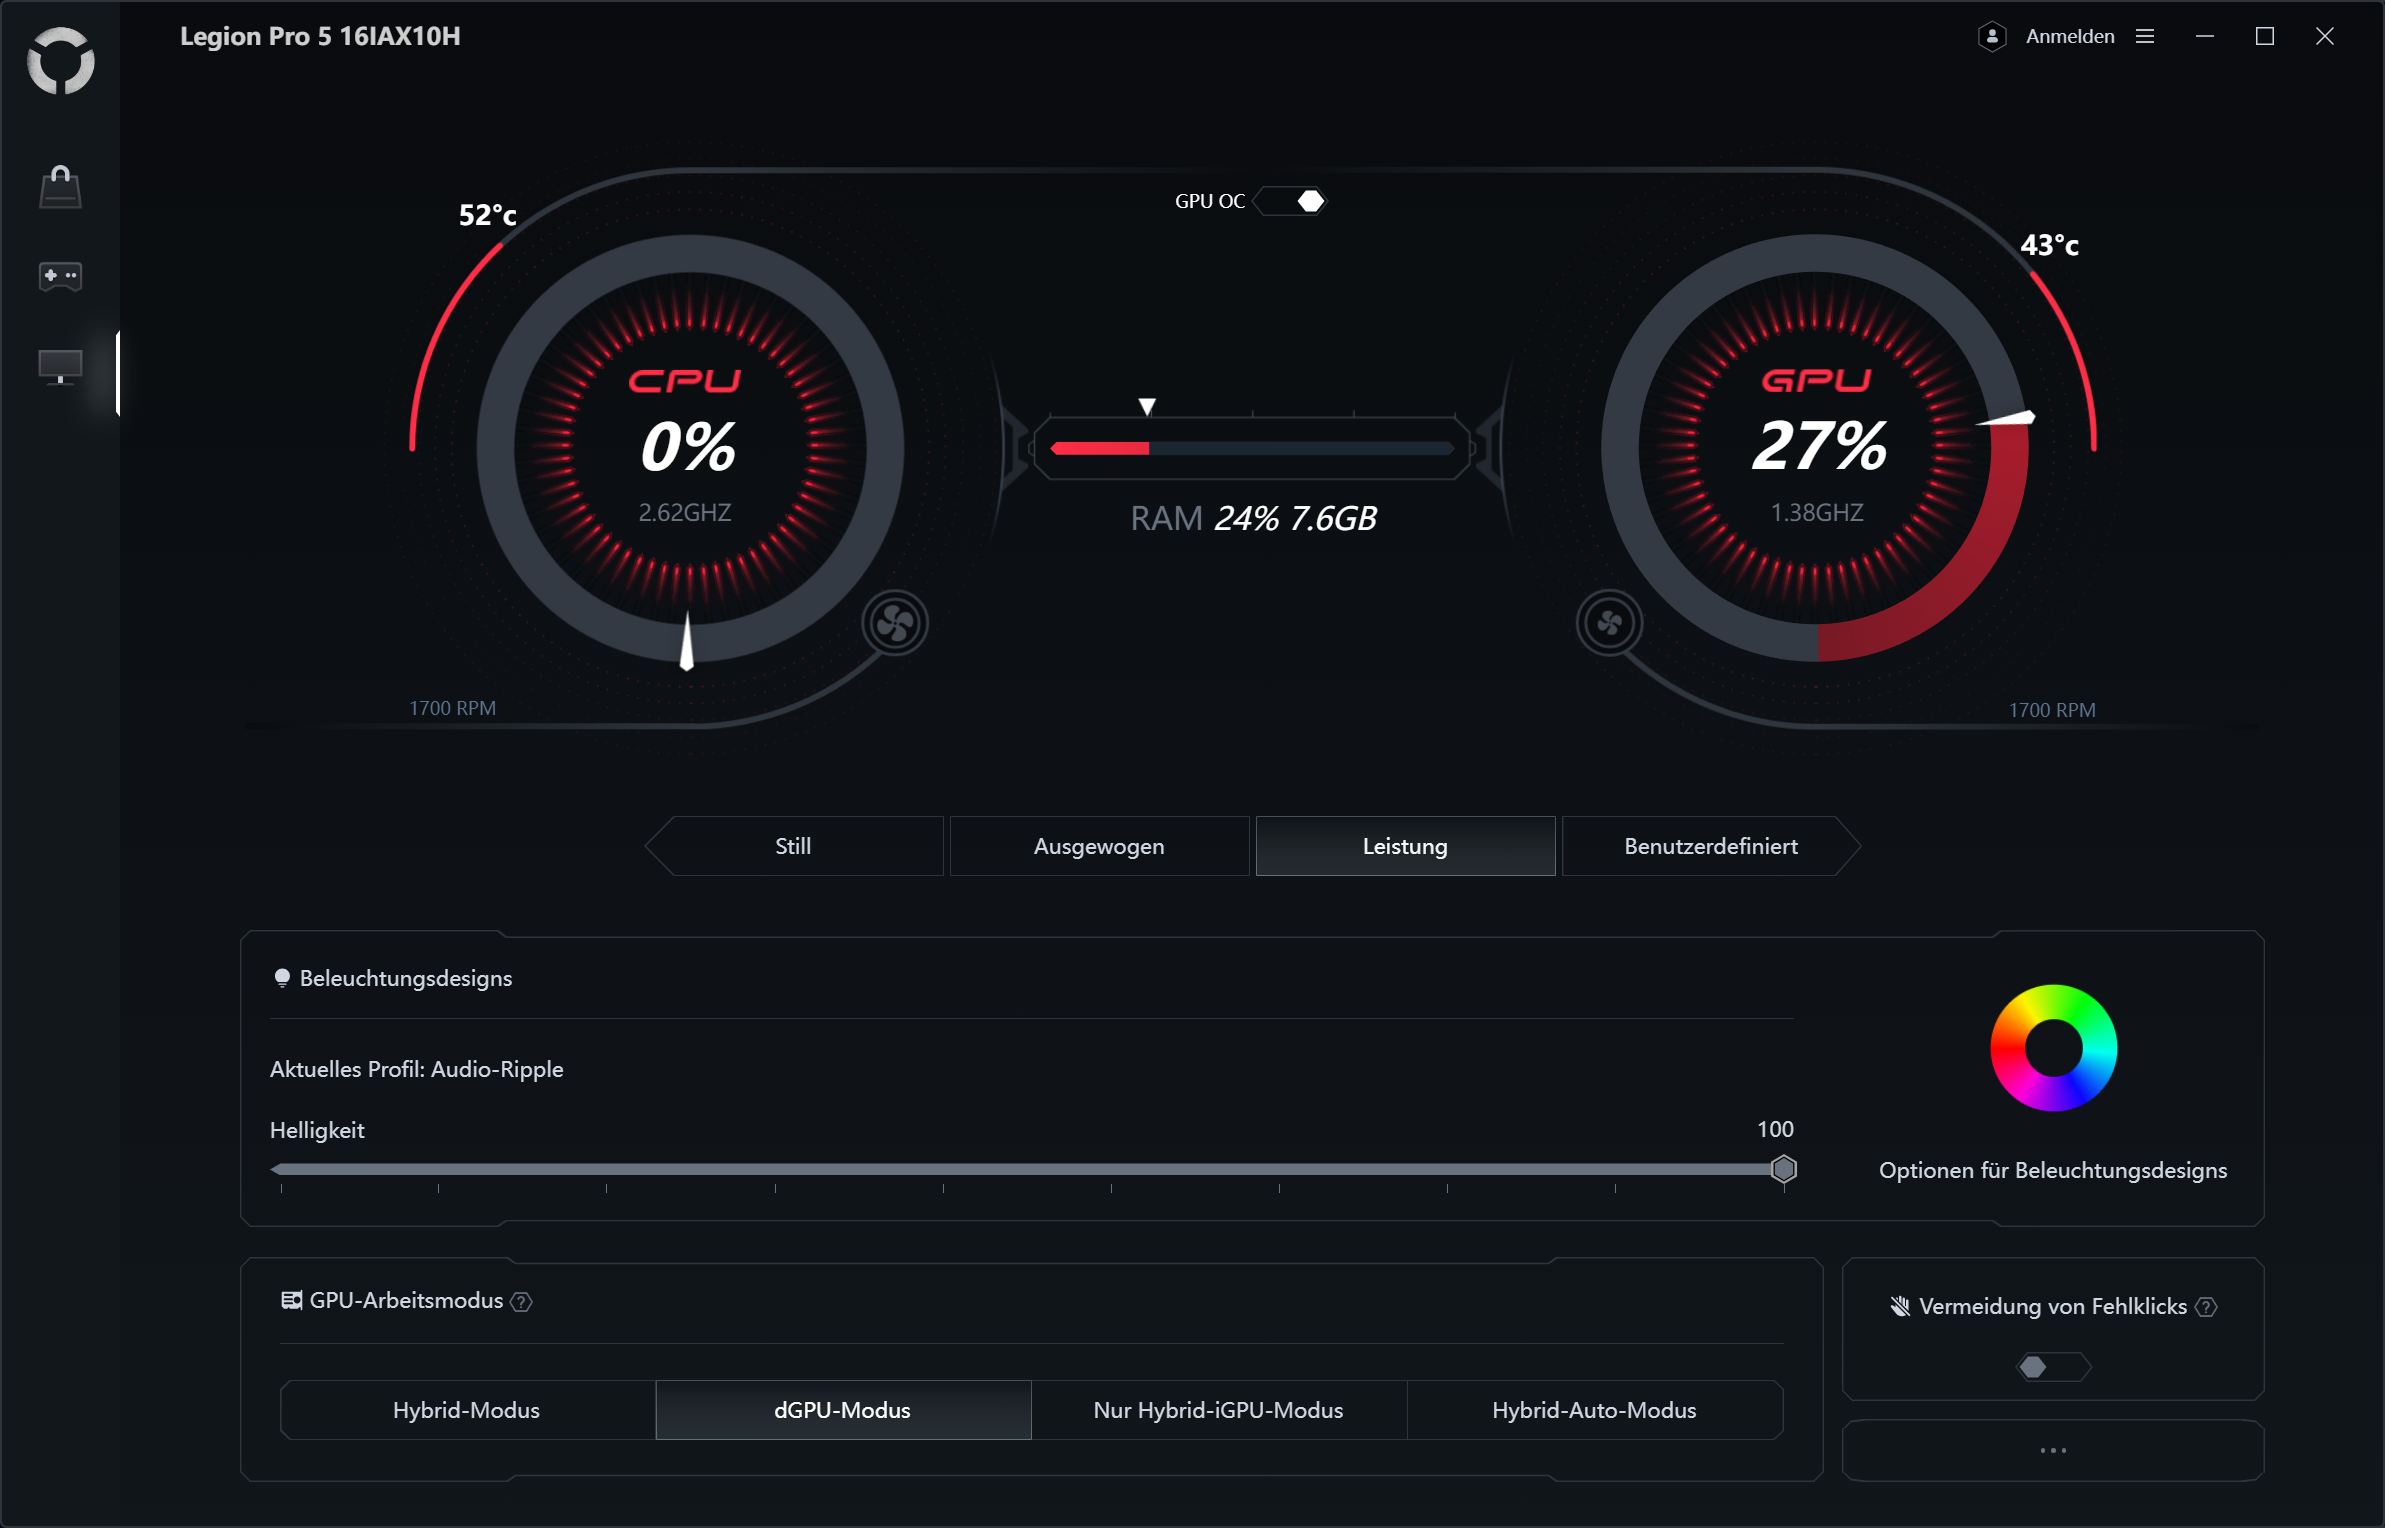
In LegionSpace gibt es drei automatische Leistungsmodi (Still, Ausgewogen, Leistung) plus den benutzerdefinierten Modus, der sich umfangreich konfigurieren lässt. Praktisch: Per fn + "Q" lassen sich die Modi umherschalten. Für unsere Benchmarks verwenden wir den Leistungsmodus. Das System verfügt über einen MUX-Grafikumschalter, der einen Neustart erfordert.


| Energieprofil | CPU TDP | CB 15 Multi | CP 2077 FHD Ultra | Assassin's Creed: Shadows FHD Ultra | max. Lüfterlautstärke |
|---|---|---|---|---|---|
| Still | 65/35 Watt | 4.076 Punkte | 90,6 fps | 43 fps | 40,68 dB(A) |
| Ausbalanciert | 130/70 Watt | 5.141 Punkte | 103 fps | 47 fps | 46,37 dB(A) |
| Leistung | 185/125 Watt | 5.885 Punkte | 132 fps | 53 fps | 56,72 dB(A) |
| Extrem (Benutzerdefiniert) | 202/135 W | 5.867 Punkte | 142 fps | 50 fps | 58,48 dB(A) |
| Akku (Ausbalanciert) | 55/45 Watt | 3.563 Punkte | 30 fps | 30 fps | 29 dB(A) |
Prozessor
Der Intel Core Ultra 9 275HX ist eine mobile High-End CPU. Seine 24 Kerne (8 P- und 16 E-Kerne) takten mit bis zu 5,4 GHz. Er integriert eine kleine NPU mit 13 TOPS sowie eine iGPU mit vier Xe-Kernen.
Beim Cinebench-R15 Loop zeigt unser Legion Pro 5 eine hohe Ausgangsleistung auf dem Niveau eines Asus Scar Strix 16 oder gar Neo 16 A25. Anders als bei der RTX 5090-Konkurrenz bleibt die Leistung jedoch nicht ganz so konstant und sinkt innerhalb von 5 bis 6 Durchgängen um insgesamt rund 8 Prozent und landet auf dem Niveau des XMG Pro 16.
Über alle CPU-Tests hinweg setzt sich das Legion knapp zwischen das Asus Strix Scar 16 (+1 %) und das XMG Pro 16 (-1 %). Der Abstand zwischen den Konkurrenten ist gering, das schnellste Gerät (Neo 16 E25) hat einen Vorsprung von 5 Prozent.
Abseits der Steckdose ist der Leistungsmodus nicht auswählbar, der Ausgewogene Modus ist aktiv. Im Cinebench R15 Multi sinkt der Score um ca. 37 Prozent.
Cinebench R15 Multi Dauertest
Cinebench R23: Multi Core | Single Core
Cinebench R20: CPU (Multi Core) | CPU (Single Core)
Cinebench R15: CPU Multi 64Bit | CPU Single 64Bit
Blender: v2.79 BMW27 CPU
7-Zip 18.03: 7z b 4 | 7z b 4 -mmt1
Geekbench 6.7: Multi-Core | Single-Core
Geekbench 5.5: Multi-Core | Single-Core
HWBOT x265 Benchmark v2.2: 4k Preset
LibreOffice : 20 Documents To PDF
R Benchmark 2.5: Overall mean
| CPU Performance Rating | |
| Schenker XMG Neo 16 E25 RTX 5090 Laptop | |
| Asus ROG Strix Scar 16 2025 | |
| Lenovo Legion 5 Pro 16IAX10H | |
| Schenker XMG Pro 16 (E25) | |
| Lenovo Legion Pro 7i 16 Gen 10 | |
| Aorus MASTER 16 AM6H | |
| Durchschnittliche Intel Core Ultra 9 275HX | |
| Lenovo Legion Pro 5 16IRX9 | |
| MSI Vector 16 HX AI A2XWHG | |
| Durchschnitt der Klasse Gaming | |
| Cinebench R23 / Multi Core | |
| Schenker XMG Neo 16 E25 RTX 5090 Laptop | |
| Asus ROG Strix Scar 16 2025 | |
| Lenovo Legion 5 Pro 16IAX10H | |
| Lenovo Legion Pro 7i 16 Gen 10 | |
| Schenker XMG Pro 16 (E25) | |
| Aorus MASTER 16 AM6H | |
| Durchschnittliche Intel Core Ultra 9 275HX (30712 - 40970, n=31) | |
| Lenovo Legion Pro 5 16IRX9 | |
| MSI Vector 16 HX AI A2XWHG | |
| Durchschnitt der Klasse Gaming (10488 - 40970, n=112, der letzten 2 Jahre) | |
| Cinebench R23 / Single Core | |
| Schenker XMG Neo 16 E25 RTX 5090 Laptop | |
| Lenovo Legion 5 Pro 16IAX10H | |
| Schenker XMG Pro 16 (E25) | |
| Aorus MASTER 16 AM6H | |
| Lenovo Legion Pro 7i 16 Gen 10 | |
| Durchschnittliche Intel Core Ultra 9 275HX (2009 - 2267, n=31) | |
| MSI Vector 16 HX AI A2XWHG | |
| Asus ROG Strix Scar 16 2025 | |
| Lenovo Legion Pro 5 16IRX9 | |
| Durchschnitt der Klasse Gaming (1166 - 2356, n=112, der letzten 2 Jahre) | |
| Cinebench R20 / CPU (Multi Core) | |
| Schenker XMG Neo 16 E25 RTX 5090 Laptop | |
| Asus ROG Strix Scar 16 2025 | |
| Lenovo Legion 5 Pro 16IAX10H | |
| Schenker XMG Pro 16 (E25) | |
| Aorus MASTER 16 AM6H | |
| Lenovo Legion Pro 7i 16 Gen 10 | |
| Durchschnittliche Intel Core Ultra 9 275HX (12026 - 16108, n=30) | |
| Lenovo Legion Pro 5 16IRX9 | |
| MSI Vector 16 HX AI A2XWHG | |
| Durchschnitt der Klasse Gaming (4029 - 16108, n=111, der letzten 2 Jahre) | |
| Cinebench R20 / CPU (Single Core) | |
| Schenker XMG Neo 16 E25 RTX 5090 Laptop | |
| Lenovo Legion 5 Pro 16IAX10H | |
| Schenker XMG Pro 16 (E25) | |
| Aorus MASTER 16 AM6H | |
| Durchschnittliche Intel Core Ultra 9 275HX (774 - 870, n=30) | |
| Asus ROG Strix Scar 16 2025 | |
| MSI Vector 16 HX AI A2XWHG | |
| Lenovo Legion Pro 7i 16 Gen 10 | |
| Lenovo Legion Pro 5 16IRX9 | |
| Durchschnitt der Klasse Gaming (442 - 895, n=111, der letzten 2 Jahre) | |
| Cinebench R15 / CPU Multi 64Bit | |
| Schenker XMG Neo 16 E25 RTX 5090 Laptop | |
| Asus ROG Strix Scar 16 2025 | |
| Lenovo Legion 5 Pro 16IAX10H | |
| Lenovo Legion Pro 7i 16 Gen 10 | |
| Aorus MASTER 16 AM6H | |
| Schenker XMG Pro 16 (E25) | |
| Durchschnittliche Intel Core Ultra 9 275HX (4737 - 6271, n=30) | |
| Lenovo Legion Pro 5 16IRX9 | |
| MSI Vector 16 HX AI A2XWHG | |
| Durchschnitt der Klasse Gaming (1578 - 6271, n=111, der letzten 2 Jahre) | |
| Cinebench R15 / CPU Single 64Bit | |
| Asus ROG Strix Scar 16 2025 | |
| Schenker XMG Neo 16 E25 RTX 5090 Laptop | |
| Lenovo Legion Pro 7i 16 Gen 10 | |
| Schenker XMG Pro 16 (E25) | |
| Lenovo Legion 5 Pro 16IAX10H | |
| Aorus MASTER 16 AM6H | |
| Durchschnittliche Intel Core Ultra 9 275HX (306 - 343, n=31) | |
| MSI Vector 16 HX AI A2XWHG | |
| Lenovo Legion Pro 5 16IRX9 | |
| Durchschnitt der Klasse Gaming (188.8 - 343, n=111, der letzten 2 Jahre) | |
| Blender / v2.79 BMW27 CPU | |
| Durchschnitt der Klasse Gaming (80 - 330, n=109, der letzten 2 Jahre) | |
| MSI Vector 16 HX AI A2XWHG | |
| Lenovo Legion Pro 5 16IRX9 | |
| Lenovo Legion 5 Pro 16IAX10H | |
| Durchschnittliche Intel Core Ultra 9 275HX (82 - 116, n=29) | |
| Aorus MASTER 16 AM6H | |
| Schenker XMG Pro 16 (E25) | |
| Lenovo Legion Pro 7i 16 Gen 10 | |
| Asus ROG Strix Scar 16 2025 | |
| Schenker XMG Neo 16 E25 RTX 5090 Laptop | |
| 7-Zip 18.03 / 7z b 4 | |
| Schenker XMG Neo 16 E25 RTX 5090 Laptop | |
| Asus ROG Strix Scar 16 2025 | |
| Lenovo Legion Pro 7i 16 Gen 10 | |
| Schenker XMG Pro 16 (E25) | |
| Lenovo Legion Pro 5 16IRX9 | |
| Durchschnittliche Intel Core Ultra 9 275HX (98236 - 124155, n=30) | |
| Lenovo Legion 5 Pro 16IAX10H | |
| Aorus MASTER 16 AM6H | |
| Durchschnitt der Klasse Gaming (33491 - 148086, n=110, der letzten 2 Jahre) | |
| MSI Vector 16 HX AI A2XWHG | |
| 7-Zip 18.03 / 7z b 4 -mmt1 | |
| Schenker XMG Neo 16 E25 RTX 5090 Laptop | |
| Schenker XMG Pro 16 (E25) | |
| Lenovo Legion Pro 5 16IRX9 | |
| Durchschnittliche Intel Core Ultra 9 275HX (6026 - 7149, n=30) | |
| Lenovo Legion 5 Pro 16IAX10H | |
| Aorus MASTER 16 AM6H | |
| Asus ROG Strix Scar 16 2025 | |
| Lenovo Legion Pro 7i 16 Gen 10 | |
| MSI Vector 16 HX AI A2XWHG | |
| Durchschnitt der Klasse Gaming (4199 - 7436, n=110, der letzten 2 Jahre) | |
| Geekbench 6.7 / Multi-Core | |
| Asus ROG Strix Scar 16 2025 | |
| Schenker XMG Neo 16 E25 RTX 5090 Laptop | |
| Schenker XMG Pro 16 (E25) | |
| Lenovo Legion 5 Pro 16IAX10H | |
| Durchschnittliche Intel Core Ultra 9 275HX (16033 - 21668, n=33) | |
| Aorus MASTER 16 AM6H | |
| Lenovo Legion Pro 7i 16 Gen 10 | |
| Lenovo Legion Pro 5 16IRX9 | |
| MSI Vector 16 HX AI A2XWHG | |
| Durchschnitt der Klasse Gaming (6625 - 22104, n=111, der letzten 2 Jahre) | |
| Geekbench 6.7 / Single-Core | |
| Schenker XMG Pro 16 (E25) | |
| Schenker XMG Neo 16 E25 RTX 5090 Laptop | |
| Lenovo Legion 5 Pro 16IAX10H | |
| Asus ROG Strix Scar 16 2025 | |
| Lenovo Legion Pro 7i 16 Gen 10 | |
| Aorus MASTER 16 AM6H | |
| Durchschnittliche Intel Core Ultra 9 275HX (2843 - 3160, n=33) | |
| MSI Vector 16 HX AI A2XWHG | |
| Lenovo Legion Pro 5 16IRX9 | |
| Durchschnitt der Klasse Gaming (1490 - 3259, n=111, der letzten 2 Jahre) | |
| Geekbench 5.5 / Multi-Core | |
| Schenker XMG Neo 16 E25 RTX 5090 Laptop | |
| Asus ROG Strix Scar 16 2025 | |
| Schenker XMG Pro 16 (E25) | |
| Durchschnittliche Intel Core Ultra 9 275HX (19105 - 25855, n=31) | |
| Lenovo Legion Pro 7i 16 Gen 10 | |
| Lenovo Legion 5 Pro 16IAX10H | |
| Aorus MASTER 16 AM6H | |
| Lenovo Legion Pro 5 16IRX9 | |
| MSI Vector 16 HX AI A2XWHG | |
| Durchschnitt der Klasse Gaming (6460 - 27010, n=110, der letzten 2 Jahre) | |
| Geekbench 5.5 / Single-Core | |
| Schenker XMG Neo 16 E25 RTX 5090 Laptop | |
| Schenker XMG Pro 16 (E25) | |
| Lenovo Legion 5 Pro 16IAX10H | |
| Asus ROG Strix Scar 16 2025 | |
| Aorus MASTER 16 AM6H | |
| Durchschnittliche Intel Core Ultra 9 275HX (2033 - 2292, n=31) | |
| Lenovo Legion Pro 7i 16 Gen 10 | |
| MSI Vector 16 HX AI A2XWHG | |
| Durchschnitt der Klasse Gaming (986 - 2474, n=110, der letzten 2 Jahre) | |
| Lenovo Legion Pro 5 16IRX9 | |
| HWBOT x265 Benchmark v2.2 / 4k Preset | |
| Schenker XMG Neo 16 E25 RTX 5090 Laptop | |
| Asus ROG Strix Scar 16 2025 | |
| Schenker XMG Pro 16 (E25) | |
| Lenovo Legion 5 Pro 16IAX10H | |
| Lenovo Legion Pro 7i 16 Gen 10 | |
| Durchschnittliche Intel Core Ultra 9 275HX (30.7 - 43.8, n=30) | |
| Aorus MASTER 16 AM6H | |
| MSI Vector 16 HX AI A2XWHG | |
| Lenovo Legion Pro 5 16IRX9 | |
| Durchschnitt der Klasse Gaming (11.5 - 44.3, n=110, der letzten 2 Jahre) | |
| LibreOffice / 20 Documents To PDF | |
| Durchschnitt der Klasse Gaming (19 - 88.8, n=110, der letzten 2 Jahre) | |
| Schenker XMG Pro 16 (E25) | |
| Durchschnittliche Intel Core Ultra 9 275HX (33.2 - 62.1, n=30) | |
| Lenovo Legion Pro 5 16IRX9 | |
| Schenker XMG Neo 16 E25 RTX 5090 Laptop | |
| Asus ROG Strix Scar 16 2025 | |
| Aorus MASTER 16 AM6H | |
| MSI Vector 16 HX AI A2XWHG | |
| Lenovo Legion Pro 7i 16 Gen 10 | |
| Lenovo Legion 5 Pro 16IAX10H | |
| R Benchmark 2.5 / Overall mean | |
| Aorus MASTER 16 AM6H | |
| Durchschnitt der Klasse Gaming (0.3439 - 0.759, n=111, der letzten 2 Jahre) | |
| MSI Vector 16 HX AI A2XWHG | |
| Durchschnittliche Intel Core Ultra 9 275HX (0.3943 - 0.4568, n=30) | |
| Asus ROG Strix Scar 16 2025 | |
| Lenovo Legion Pro 7i 16 Gen 10 | |
| Lenovo Legion 5 Pro 16IAX10H | |
| Schenker XMG Neo 16 E25 RTX 5090 Laptop | |
| Schenker XMG Pro 16 (E25) | |
| Lenovo Legion Pro 5 16IRX9 | |
* ... kleinere Werte sind besser
AIDA64: FP32 Ray-Trace | FPU Julia | CPU SHA3 | CPU Queen | FPU SinJulia | FPU Mandel | CPU AES | CPU ZLib | FP64 Ray-Trace | CPU PhotoWorxx
| Performance Rating | |
| Schenker XMG Neo 16 A25 5090 | |
| Schenker XMG Neo 16 E25 RTX 5090 Laptop | |
| Asus ROG Strix Scar 16 2025 | |
| Aorus MASTER 16 AM6H | |
| Lenovo Legion 5 Pro 16IAX10H | |
| Durchschnittliche Intel Core Ultra 9 275HX | |
| Schenker XMG Pro 16 (E25) | |
| Lenovo Legion Pro 5 16IRX9 | |
| Durchschnitt der Klasse Gaming | |
| AIDA64 / FP32 Ray-Trace | |
| Schenker XMG Neo 16 A25 5090 | |
| Schenker XMG Neo 16 E25 RTX 5090 Laptop | |
| Asus ROG Strix Scar 16 2025 | |
| Aorus MASTER 16 AM6H | |
| Durchschnittliche Intel Core Ultra 9 275HX (28039 - 39895, n=30) | |
| Lenovo Legion 5 Pro 16IAX10H | |
| Schenker XMG Pro 16 (E25) | |
| Durchschnitt der Klasse Gaming (10227 - 85542, n=109, der letzten 2 Jahre) | |
| Lenovo Legion Pro 5 16IRX9 | |
| AIDA64 / FPU Julia | |
| Schenker XMG Neo 16 A25 5090 | |
| Schenker XMG Neo 16 E25 RTX 5090 Laptop | |
| Asus ROG Strix Scar 16 2025 | |
| Aorus MASTER 16 AM6H | |
| Lenovo Legion 5 Pro 16IAX10H | |
| Durchschnittliche Intel Core Ultra 9 275HX (140254 - 200744, n=30) | |
| Schenker XMG Pro 16 (E25) | |
| Durchschnitt der Klasse Gaming (51376 - 238426, n=109, der letzten 2 Jahre) | |
| Lenovo Legion Pro 5 16IRX9 | |
| AIDA64 / CPU SHA3 | |
| Schenker XMG Neo 16 E25 RTX 5090 Laptop | |
| Schenker XMG Neo 16 A25 5090 | |
| Asus ROG Strix Scar 16 2025 | |
| Aorus MASTER 16 AM6H | |
| Durchschnittliche Intel Core Ultra 9 275HX (6710 - 9817, n=30) | |
| Schenker XMG Pro 16 (E25) | |
| Lenovo Legion 5 Pro 16IAX10H | |
| Lenovo Legion Pro 5 16IRX9 | |
| Durchschnitt der Klasse Gaming (2180 - 9817, n=109, der letzten 2 Jahre) | |
| AIDA64 / CPU Queen | |
| Schenker XMG Neo 16 A25 5090 | |
| Lenovo Legion Pro 5 16IRX9 | |
| Schenker XMG Neo 16 E25 RTX 5090 Laptop | |
| Lenovo Legion 5 Pro 16IAX10H | |
| Asus ROG Strix Scar 16 2025 | |
| Aorus MASTER 16 AM6H | |
| Durchschnittliche Intel Core Ultra 9 275HX (113887 - 140937, n=30) | |
| Schenker XMG Pro 16 (E25) | |
| Durchschnitt der Klasse Gaming (49785 - 173351, n=98, der letzten 2 Jahre) | |
| AIDA64 / FPU SinJulia | |
| Schenker XMG Neo 16 A25 5090 | |
| Lenovo Legion Pro 5 16IRX9 | |
| Durchschnitt der Klasse Gaming (4424 - 33636, n=109, der letzten 2 Jahre) | |
| Schenker XMG Neo 16 E25 RTX 5090 Laptop | |
| Schenker XMG Pro 16 (E25) | |
| Asus ROG Strix Scar 16 2025 | |
| Lenovo Legion 5 Pro 16IAX10H | |
| Aorus MASTER 16 AM6H | |
| Durchschnittliche Intel Core Ultra 9 275HX (11172 - 14425, n=30) | |
| AIDA64 / FPU Mandel | |
| Schenker XMG Neo 16 A25 5090 | |
| Asus ROG Strix Scar 16 2025 | |
| Schenker XMG Neo 16 E25 RTX 5090 Laptop | |
| Aorus MASTER 16 AM6H | |
| Durchschnittliche Intel Core Ultra 9 275HX (72596 - 104508, n=30) | |
| Schenker XMG Pro 16 (E25) | |
| Lenovo Legion 5 Pro 16IAX10H | |
| Durchschnitt der Klasse Gaming (25115 - 128721, n=109, der letzten 2 Jahre) | |
| Lenovo Legion Pro 5 16IRX9 | |
| AIDA64 / CPU AES | |
| Schenker XMG Neo 16 A25 5090 | |
| Schenker XMG Neo 16 E25 RTX 5090 Laptop | |
| Asus ROG Strix Scar 16 2025 | |
| Lenovo Legion 5 Pro 16IAX10H | |
| Durchschnittliche Intel Core Ultra 9 275HX (105608 - 247074, n=30) | |
| Aorus MASTER 16 AM6H | |
| Schenker XMG Pro 16 (E25) | |
| Lenovo Legion Pro 5 16IRX9 | |
| Durchschnitt der Klasse Gaming (39258 - 247074, n=109, der letzten 2 Jahre) | |
| AIDA64 / CPU ZLib | |
| Schenker XMG Neo 16 A25 5090 | |
| Schenker XMG Neo 16 E25 RTX 5090 Laptop | |
| Asus ROG Strix Scar 16 2025 | |
| Lenovo Legion 5 Pro 16IAX10H | |
| Aorus MASTER 16 AM6H | |
| Durchschnittliche Intel Core Ultra 9 275HX (1582 - 2263, n=30) | |
| Schenker XMG Pro 16 (E25) | |
| Lenovo Legion Pro 5 16IRX9 | |
| Durchschnitt der Klasse Gaming (574 - 2531, n=109, der letzten 2 Jahre) | |
| AIDA64 / FP64 Ray-Trace | |
| Schenker XMG Neo 16 A25 5090 | |
| Asus ROG Strix Scar 16 2025 | |
| Schenker XMG Neo 16 E25 RTX 5090 Laptop | |
| Aorus MASTER 16 AM6H | |
| Durchschnittliche Intel Core Ultra 9 275HX (14847 - 21854, n=30) | |
| Lenovo Legion 5 Pro 16IAX10H | |
| Schenker XMG Pro 16 (E25) | |
| Durchschnitt der Klasse Gaming (5509 - 45446, n=109, der letzten 2 Jahre) | |
| Lenovo Legion Pro 5 16IRX9 | |
| AIDA64 / CPU PhotoWorxx | |
| Asus ROG Strix Scar 16 2025 | |
| Schenker XMG Neo 16 E25 RTX 5090 Laptop | |
| Schenker XMG Pro 16 (E25) | |
| Durchschnittliche Intel Core Ultra 9 275HX (37482 - 62916, n=30) | |
| Lenovo Legion Pro 5 16IRX9 | |
| Lenovo Legion 5 Pro 16IAX10H | |
| Aorus MASTER 16 AM6H | |
| Durchschnitt der Klasse Gaming (12271 - 89891, n=109, der letzten 2 Jahre) | |
| Schenker XMG Neo 16 A25 5090 | |
System Performance
Im PCMark 10 und dem CrossMark ist der Unterschied zu den Konkurrenten vernachlässigbar gering. Die guten CrossMark-Ergebnisse machen den kleinen Nachteil beim PCMark 10 wieder wett, sodass sich unser Legion Pro insgesamt sogar an die Spitze setzen kann.
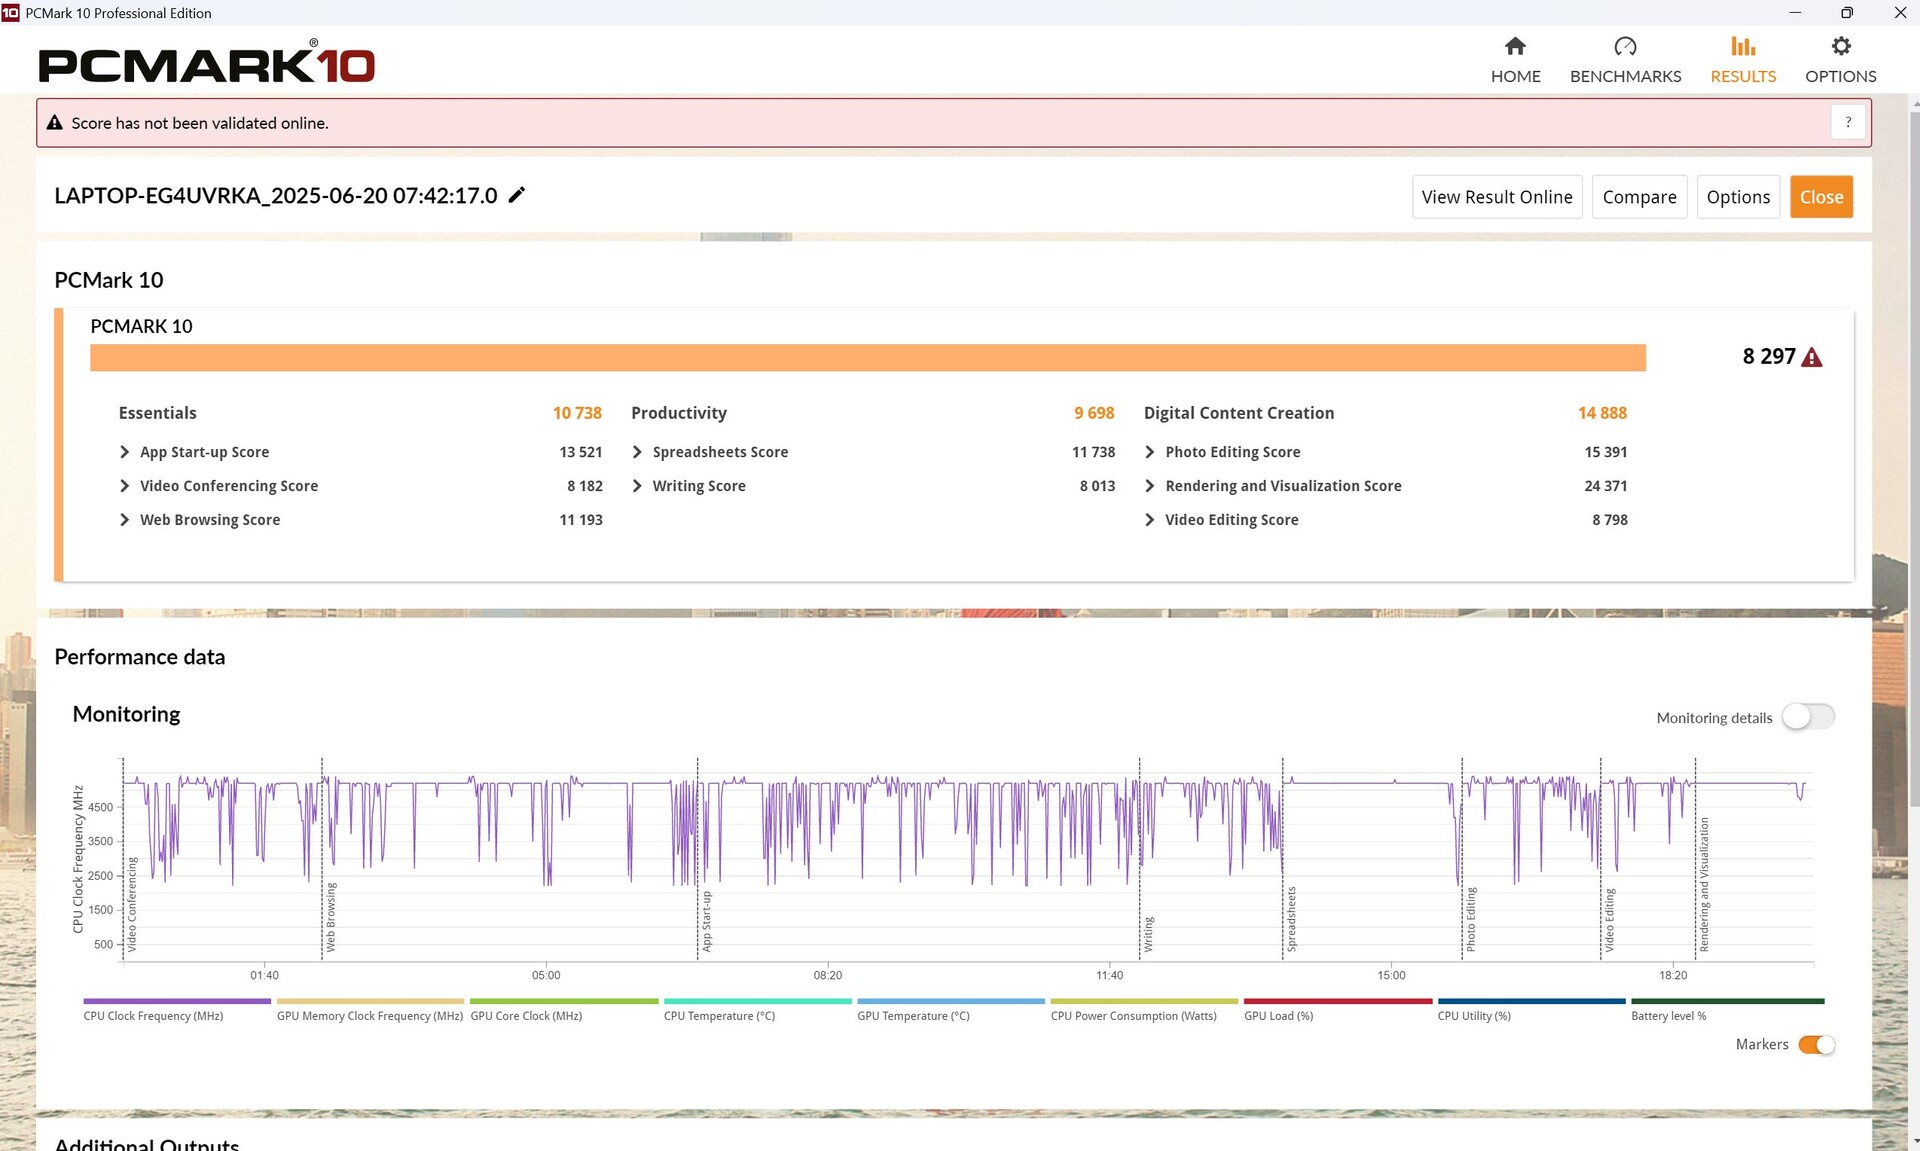
PCMark 10: Score | Essentials | Productivity | Digital Content Creation
CrossMark: Overall | Productivity | Creativity | Responsiveness
WebXPRT 3: Overall
WebXPRT 4: Overall
Mozilla Kraken 1.1: Total
| Performance Rating | |
| Lenovo Legion 5 Pro 16IAX10H | |
| Schenker XMG Pro 16 (E25) | |
| Durchschnittliche Intel Core Ultra 9 275HX, NVIDIA GeForce RTX 5070 Ti Laptop | |
| Lenovo Legion Pro 5 16IRX9 | |
| Medion Erazer Major 16 X1 MD62736 | |
| Durchschnitt der Klasse Gaming | |
| MSI Vector 16 HX AI A2XWHG | |
| PCMark 10 / Score | |
| Lenovo Legion Pro 5 16IRX9 | |
| Schenker XMG Pro 16 (E25) | |
| Durchschnittliche Intel Core Ultra 9 275HX, NVIDIA GeForce RTX 5070 Ti Laptop (8297 - 8550, n=3) | |
| Durchschnitt der Klasse Gaming (5828 - 11574, n=96, der letzten 2 Jahre) | |
| Lenovo Legion 5 Pro 16IAX10H | |
| Medion Erazer Major 16 X1 MD62736 | |
| MSI Vector 16 HX AI A2XWHG | |
| PCMark 10 / Essentials | |
| Schenker XMG Pro 16 (E25) | |
| Lenovo Legion Pro 5 16IRX9 | |
| Durchschnittliche Intel Core Ultra 9 275HX, NVIDIA GeForce RTX 5070 Ti Laptop (10738 - 11290, n=3) | |
| Medion Erazer Major 16 X1 MD62736 | |
| Lenovo Legion 5 Pro 16IAX10H | |
| MSI Vector 16 HX AI A2XWHG | |
| Durchschnitt der Klasse Gaming (8810 - 12600, n=100, der letzten 2 Jahre) | |
| PCMark 10 / Productivity | |
| Durchschnitt der Klasse Gaming (6845 - 21327, n=98, der letzten 2 Jahre) | |
| Lenovo Legion Pro 5 16IRX9 | |
| Lenovo Legion 5 Pro 16IAX10H | |
| Durchschnittliche Intel Core Ultra 9 275HX, NVIDIA GeForce RTX 5070 Ti Laptop (9591 - 9771, n=3) | |
| Schenker XMG Pro 16 (E25) | |
| MSI Vector 16 HX AI A2XWHG | |
| Medion Erazer Major 16 X1 MD62736 | |
| PCMark 10 / Digital Content Creation | |
| Schenker XMG Pro 16 (E25) | |
| Durchschnittliche Intel Core Ultra 9 275HX, NVIDIA GeForce RTX 5070 Ti Laptop (14812 - 15662, n=3) | |
| Lenovo Legion 5 Pro 16IAX10H | |
| Lenovo Legion Pro 5 16IRX9 | |
| Durchschnitt der Klasse Gaming (7602 - 19657, n=98, der letzten 2 Jahre) | |
| Medion Erazer Major 16 X1 MD62736 | |
| MSI Vector 16 HX AI A2XWHG | |
| CrossMark / Overall | |
| Schenker XMG Pro 16 (E25) | |
| Lenovo Legion 5 Pro 16IAX10H | |
| Durchschnittliche Intel Core Ultra 9 275HX, NVIDIA GeForce RTX 5070 Ti Laptop (2116 - 2193, n=3) | |
| Medion Erazer Major 16 X1 MD62736 | |
| Lenovo Legion Pro 5 16IRX9 | |
| Durchschnitt der Klasse Gaming (1366 - 2409, n=97, der letzten 2 Jahre) | |
| MSI Vector 16 HX AI A2XWHG | |
| CrossMark / Productivity | |
| Lenovo Legion 5 Pro 16IAX10H | |
| Schenker XMG Pro 16 (E25) | |
| Durchschnittliche Intel Core Ultra 9 275HX, NVIDIA GeForce RTX 5070 Ti Laptop (1967 - 2038, n=3) | |
| Medion Erazer Major 16 X1 MD62736 | |
| Durchschnitt der Klasse Gaming (1386 - 2254, n=97, der letzten 2 Jahre) | |
| MSI Vector 16 HX AI A2XWHG | |
| Lenovo Legion Pro 5 16IRX9 | |
| CrossMark / Creativity | |
| Schenker XMG Pro 16 (E25) | |
| Durchschnittliche Intel Core Ultra 9 275HX, NVIDIA GeForce RTX 5070 Ti Laptop (2430 - 2531, n=3) | |
| Lenovo Legion 5 Pro 16IAX10H | |
| Medion Erazer Major 16 X1 MD62736 | |
| Lenovo Legion Pro 5 16IRX9 | |
| MSI Vector 16 HX AI A2XWHG | |
| Durchschnitt der Klasse Gaming (1343 - 2729, n=97, der letzten 2 Jahre) | |
| CrossMark / Responsiveness | |
| Lenovo Legion 5 Pro 16IAX10H | |
| Schenker XMG Pro 16 (E25) | |
| Durchschnittliche Intel Core Ultra 9 275HX, NVIDIA GeForce RTX 5070 Ti Laptop (1740 - 1844, n=3) | |
| Lenovo Legion Pro 5 16IRX9 | |
| Medion Erazer Major 16 X1 MD62736 | |
| Durchschnitt der Klasse Gaming (1226 - 2334, n=97, der letzten 2 Jahre) | |
| MSI Vector 16 HX AI A2XWHG | |
| WebXPRT 3 / Overall | |
| Lenovo Legion 5 Pro 16IAX10H | |
| Durchschnittliche Intel Core Ultra 9 275HX, NVIDIA GeForce RTX 5070 Ti Laptop (328 - 532, n=3) | |
| Schenker XMG Pro 16 (E25) | |
| Medion Erazer Major 16 X1 MD62736 | |
| Lenovo Legion Pro 5 16IRX9 | |
| MSI Vector 16 HX AI A2XWHG | |
| Durchschnitt der Klasse Gaming (242 - 532, n=101, der letzten 2 Jahre) | |
| WebXPRT 4 / Overall | |
| Schenker XMG Pro 16 (E25) | |
| Lenovo Legion 5 Pro 16IAX10H | |
| Durchschnittliche Intel Core Ultra 9 275HX, NVIDIA GeForce RTX 5070 Ti Laptop (306 - 341, n=3) | |
| Medion Erazer Major 16 X1 MD62736 | |
| MSI Vector 16 HX AI A2XWHG | |
| Lenovo Legion Pro 5 16IRX9 | |
| Durchschnitt der Klasse Gaming (176.4 - 354, n=101, der letzten 2 Jahre) | |
| Mozilla Kraken 1.1 / Total | |
| Durchschnitt der Klasse Gaming (391 - 590, n=106, der letzten 2 Jahre) | |
| Lenovo Legion Pro 5 16IRX9 | |
| MSI Vector 16 HX AI A2XWHG | |
| Medion Erazer Major 16 X1 MD62736 | |
| Lenovo Legion 5 Pro 16IAX10H | |
| Durchschnittliche Intel Core Ultra 9 275HX, NVIDIA GeForce RTX 5070 Ti Laptop (405 - 414, n=3) | |
| Schenker XMG Pro 16 (E25) | |
* ... kleinere Werte sind besser
| PCMark 10 Score | 8297 Punkte | |
Hilfe | ||
| AIDA64 / Memory Copy | |
| Schenker XMG Pro 16 (E25) | |
| Durchschnittliche Intel Core Ultra 9 275HX (56003 - 94460, n=30) | |
| Lenovo Legion Pro 5 16IRX9 | |
| Lenovo Legion 5 Pro 16IAX10H | |
| Medion Erazer Major 16 X1 MD62736 | |
| Durchschnitt der Klasse Gaming (21750 - 129946, n=109, der letzten 2 Jahre) | |
| MSI Vector 16 HX AI A2XWHG | |
| AIDA64 / Memory Read | |
| Schenker XMG Pro 16 (E25) | |
| Lenovo Legion 5 Pro 16IAX10H | |
| Lenovo Legion Pro 5 16IRX9 | |
| Medion Erazer Major 16 X1 MD62736 | |
| Durchschnittliche Intel Core Ultra 9 275HX (55795 - 97151, n=30) | |
| MSI Vector 16 HX AI A2XWHG | |
| Durchschnitt der Klasse Gaming (22956 - 118858, n=109, der letzten 2 Jahre) | |
| AIDA64 / Memory Write | |
| Medion Erazer Major 16 X1 MD62736 | |
| Schenker XMG Pro 16 (E25) | |
| Durchschnittliche Intel Core Ultra 9 275HX (55663 - 116129, n=30) | |
| Lenovo Legion 5 Pro 16IAX10H | |
| Lenovo Legion Pro 5 16IRX9 | |
| Durchschnitt der Klasse Gaming (22297 - 135096, n=109, der letzten 2 Jahre) | |
| MSI Vector 16 HX AI A2XWHG | |
| AIDA64 / Memory Latency | |
| Durchschnittliche Intel Core Ultra 9 275HX (105.8 - 161.6, n=30) | |
| Lenovo Legion 5 Pro 16IAX10H | |
| Medion Erazer Major 16 X1 MD62736 | |
| MSI Vector 16 HX AI A2XWHG | |
| Durchschnitt der Klasse Gaming (75.3 - 259, n=109, der letzten 2 Jahre) | |
| Schenker XMG Pro 16 (E25) | |
| Lenovo Legion Pro 5 16IRX9 | |
* ... kleinere Werte sind besser
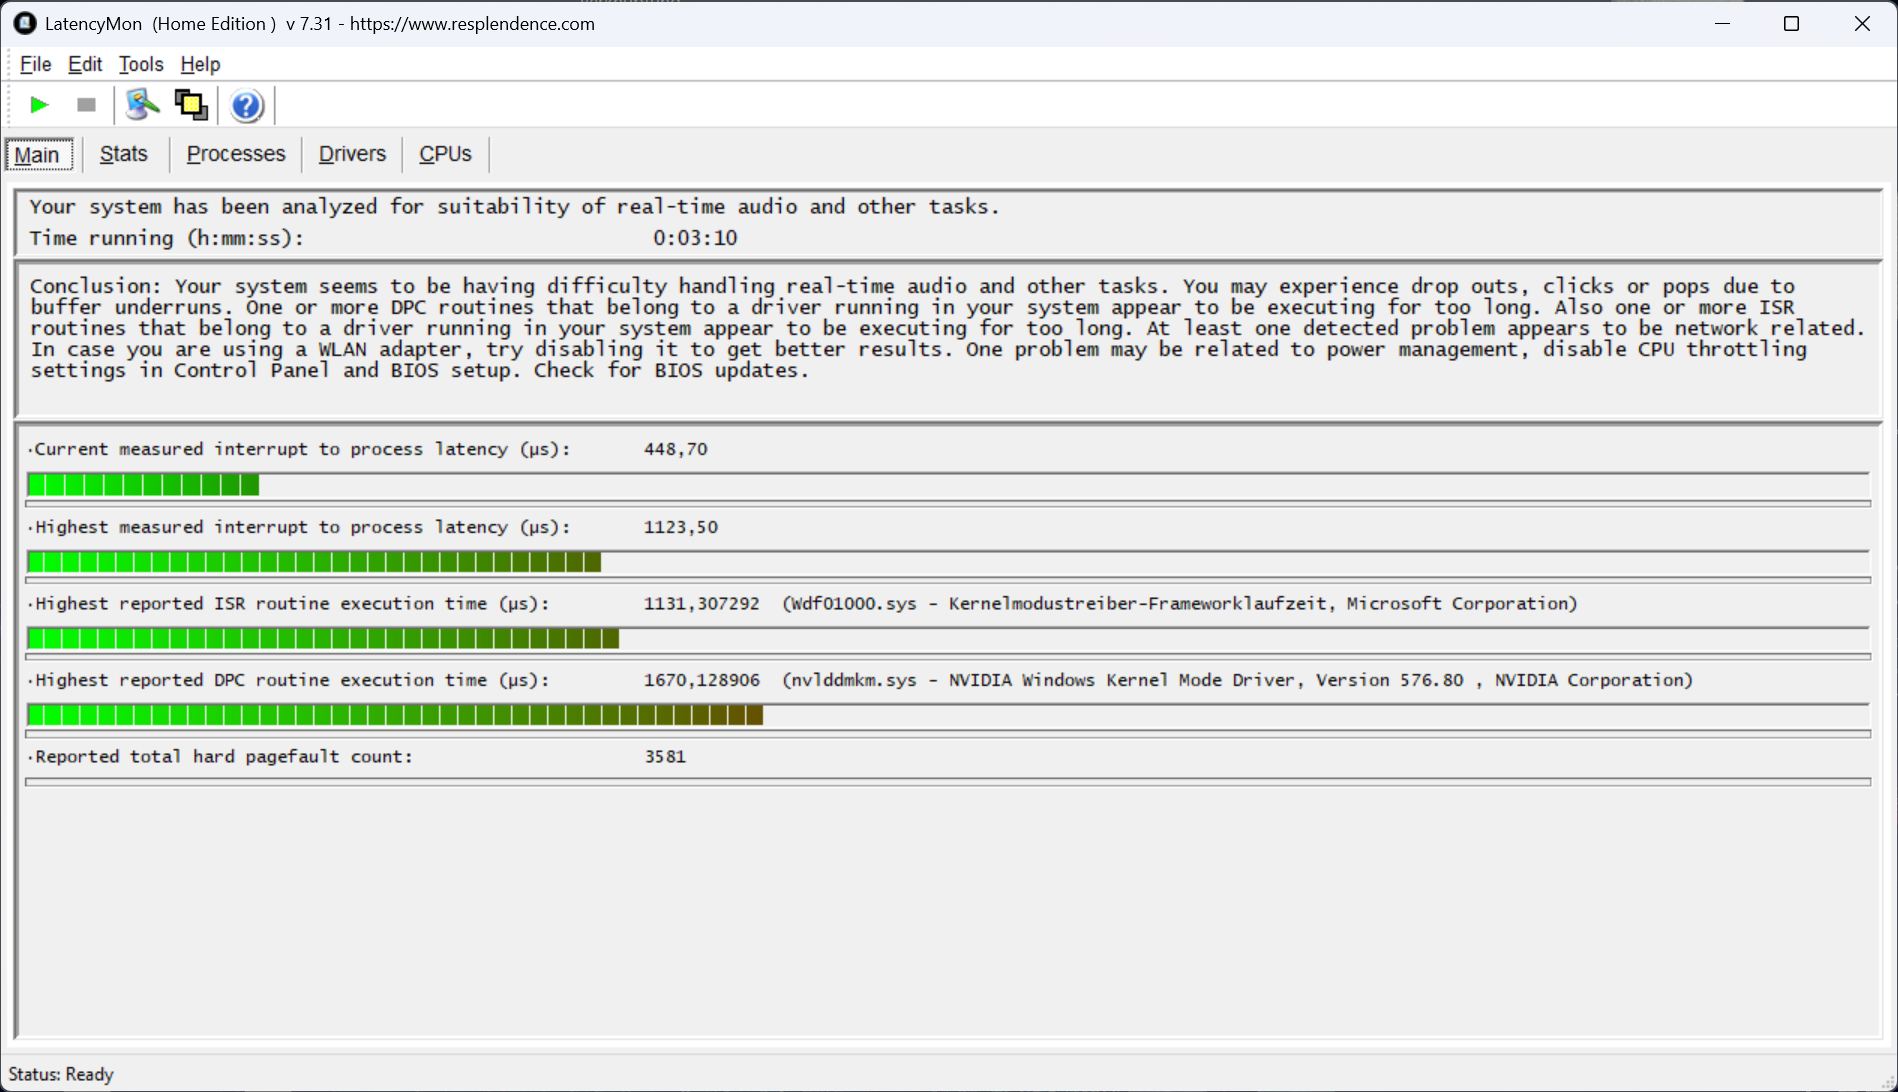
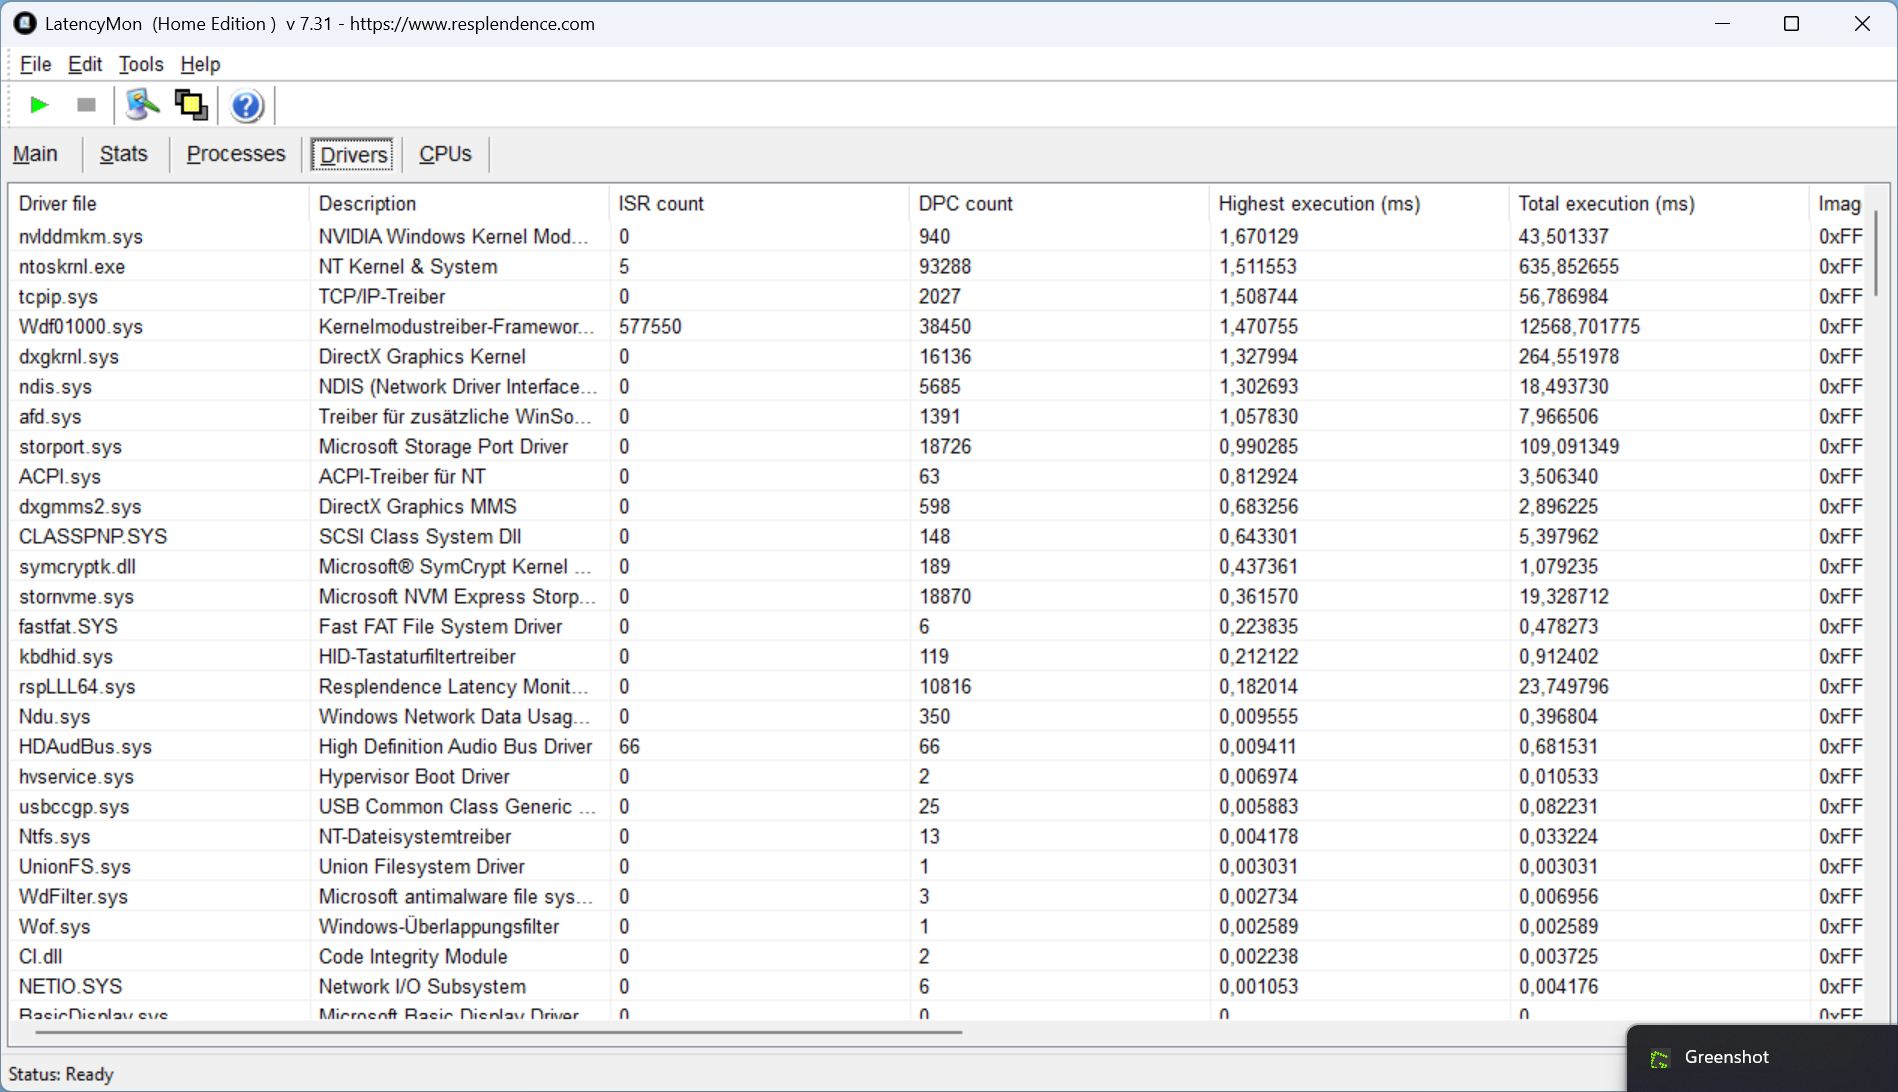
DPC-Latenzen
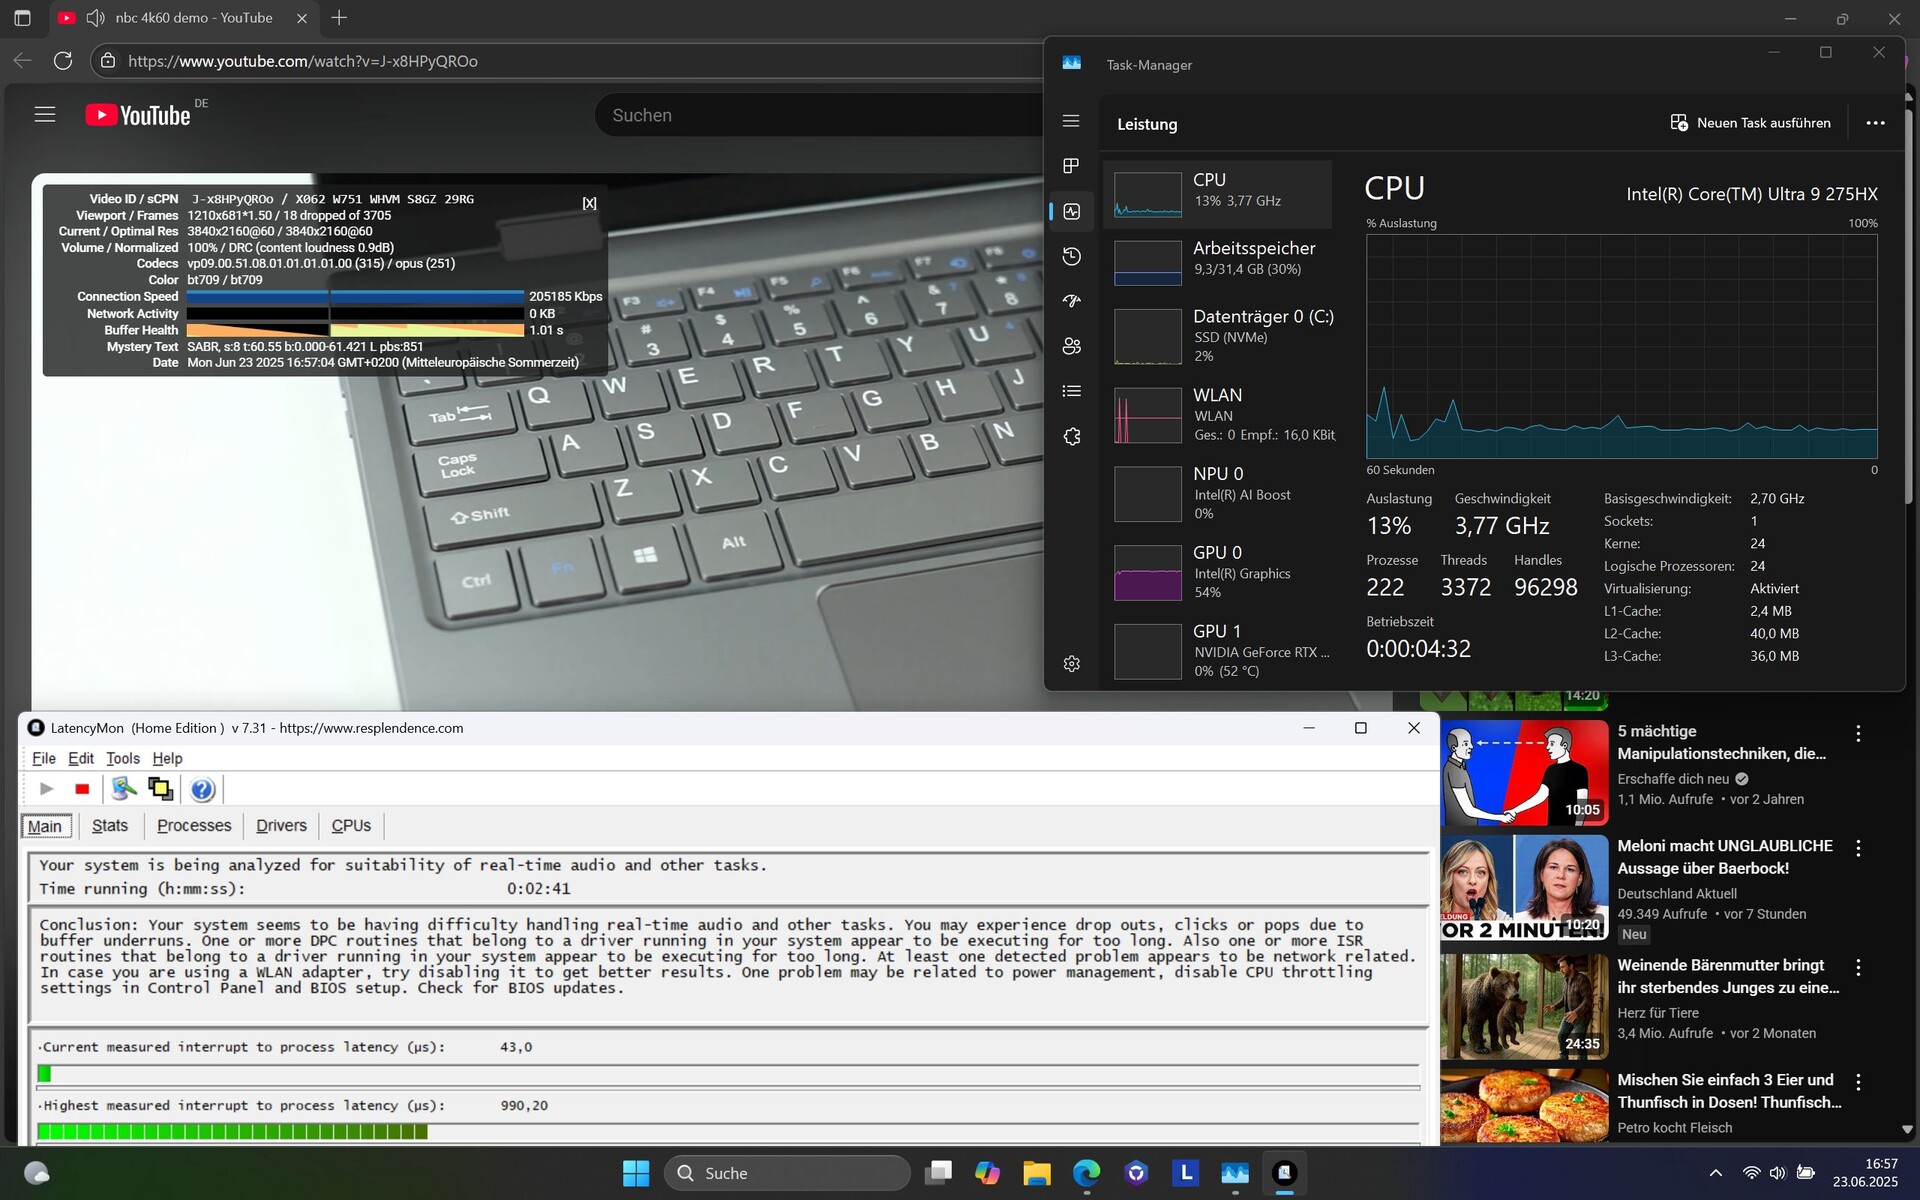
LatencyMon stellt schon beim Start erste Latenzen fest, der Wert erhöht sich beim Aufruf des Browsers, beim Öffnen mehrerer Tabs sowie unter Prime95. Auch unser 4K/60-fps-Testvideo wird leider nicht ohne ausgelassene Bilder (18 Dropped Frames) abgespielt.
Insgesamt ist der Latenzwert im Vergleich aber eher gering, die Konkurrenten kommen auf noch höhere Werte. Für Content Creator können die ausgelassenen Bilder aber einen Negativpunkt darstellen.
| DPC Latencies / LatencyMon - interrupt to process latency (max), Web, Youtube, Prime95 | |
| MSI Vector 16 HX AI A2XWHG | |
| Medion Erazer Major 16 X1 MD62736 | |
| Schenker XMG Pro 16 (E25) | |
| Lenovo Legion 5 Pro 16IAX10H | |
| Lenovo Legion Pro 5 16IRX9 | |
* ... kleinere Werte sind besser
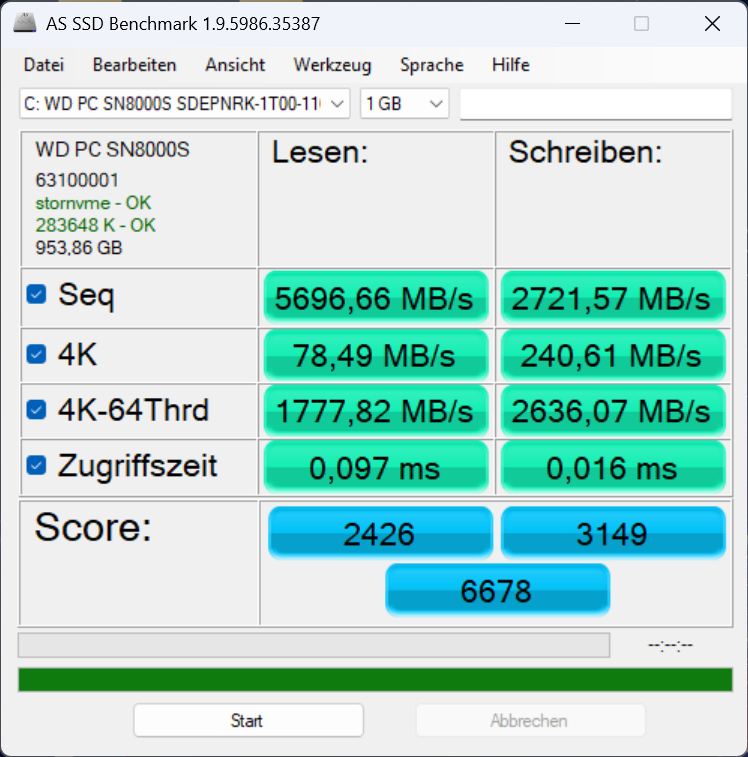
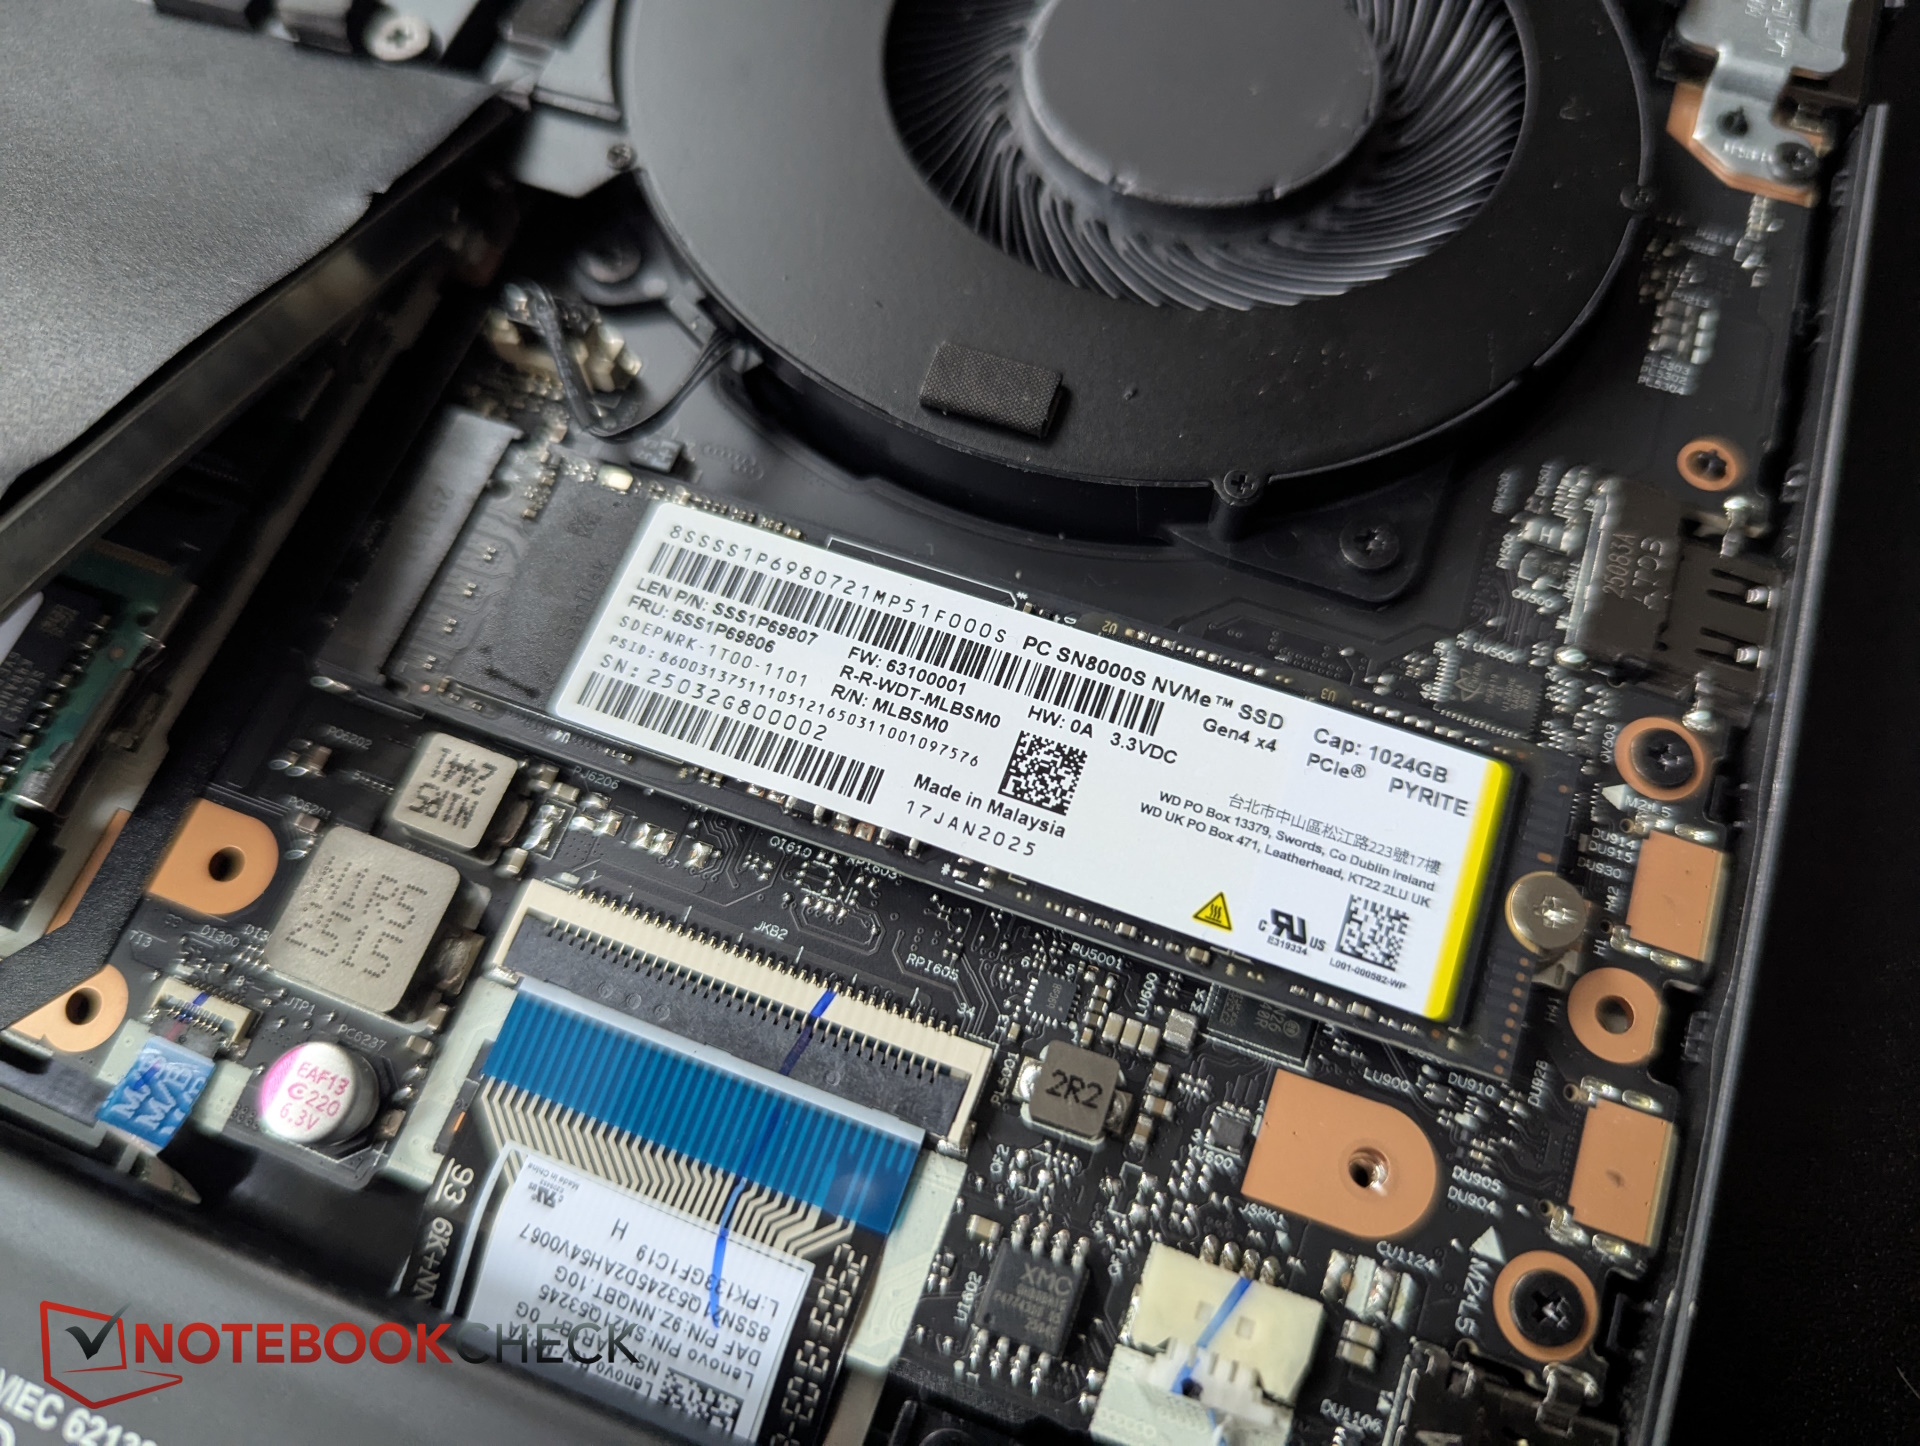
Massenspeicher
Es gibt zwei M.2-SSD-Slots, aber nur der Hauptslot ist mit PCIe 5.0 x4 angebunden, der unbesetzte zweite Slot mit PCIe 4.0 x4. Der 1-TB-Speicher von Western Digital erzielt ordentliche Transferraten, wenngleich er nicht zu den schnellsten Modellen gehört. In unserem Dauertest wird die SSD, anders als im Vorgänger, nicht gedrosselt.


* ... kleinere Werte sind besser
Dauerleistung Lesen: DiskSpd Read Loop, Queue Depth 8
GPU Leistung
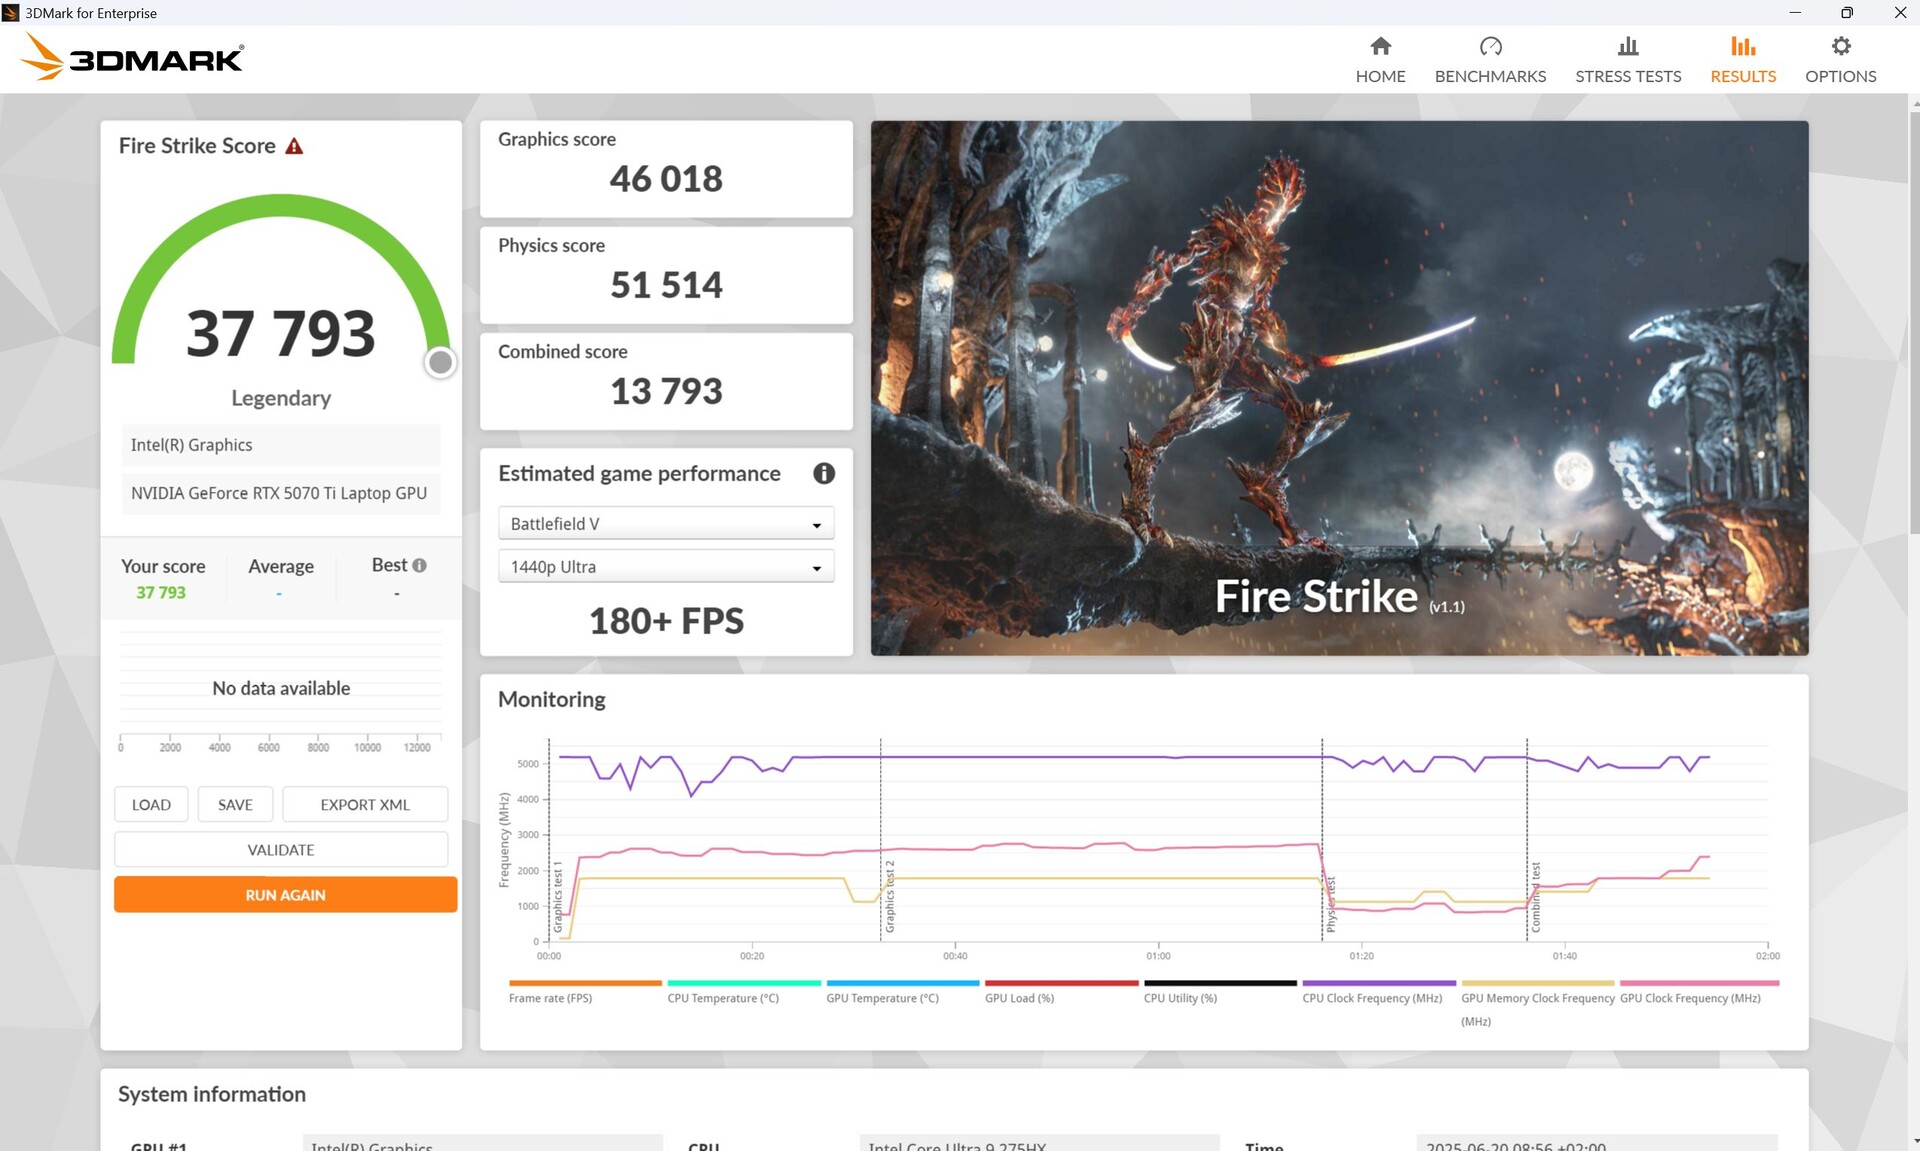
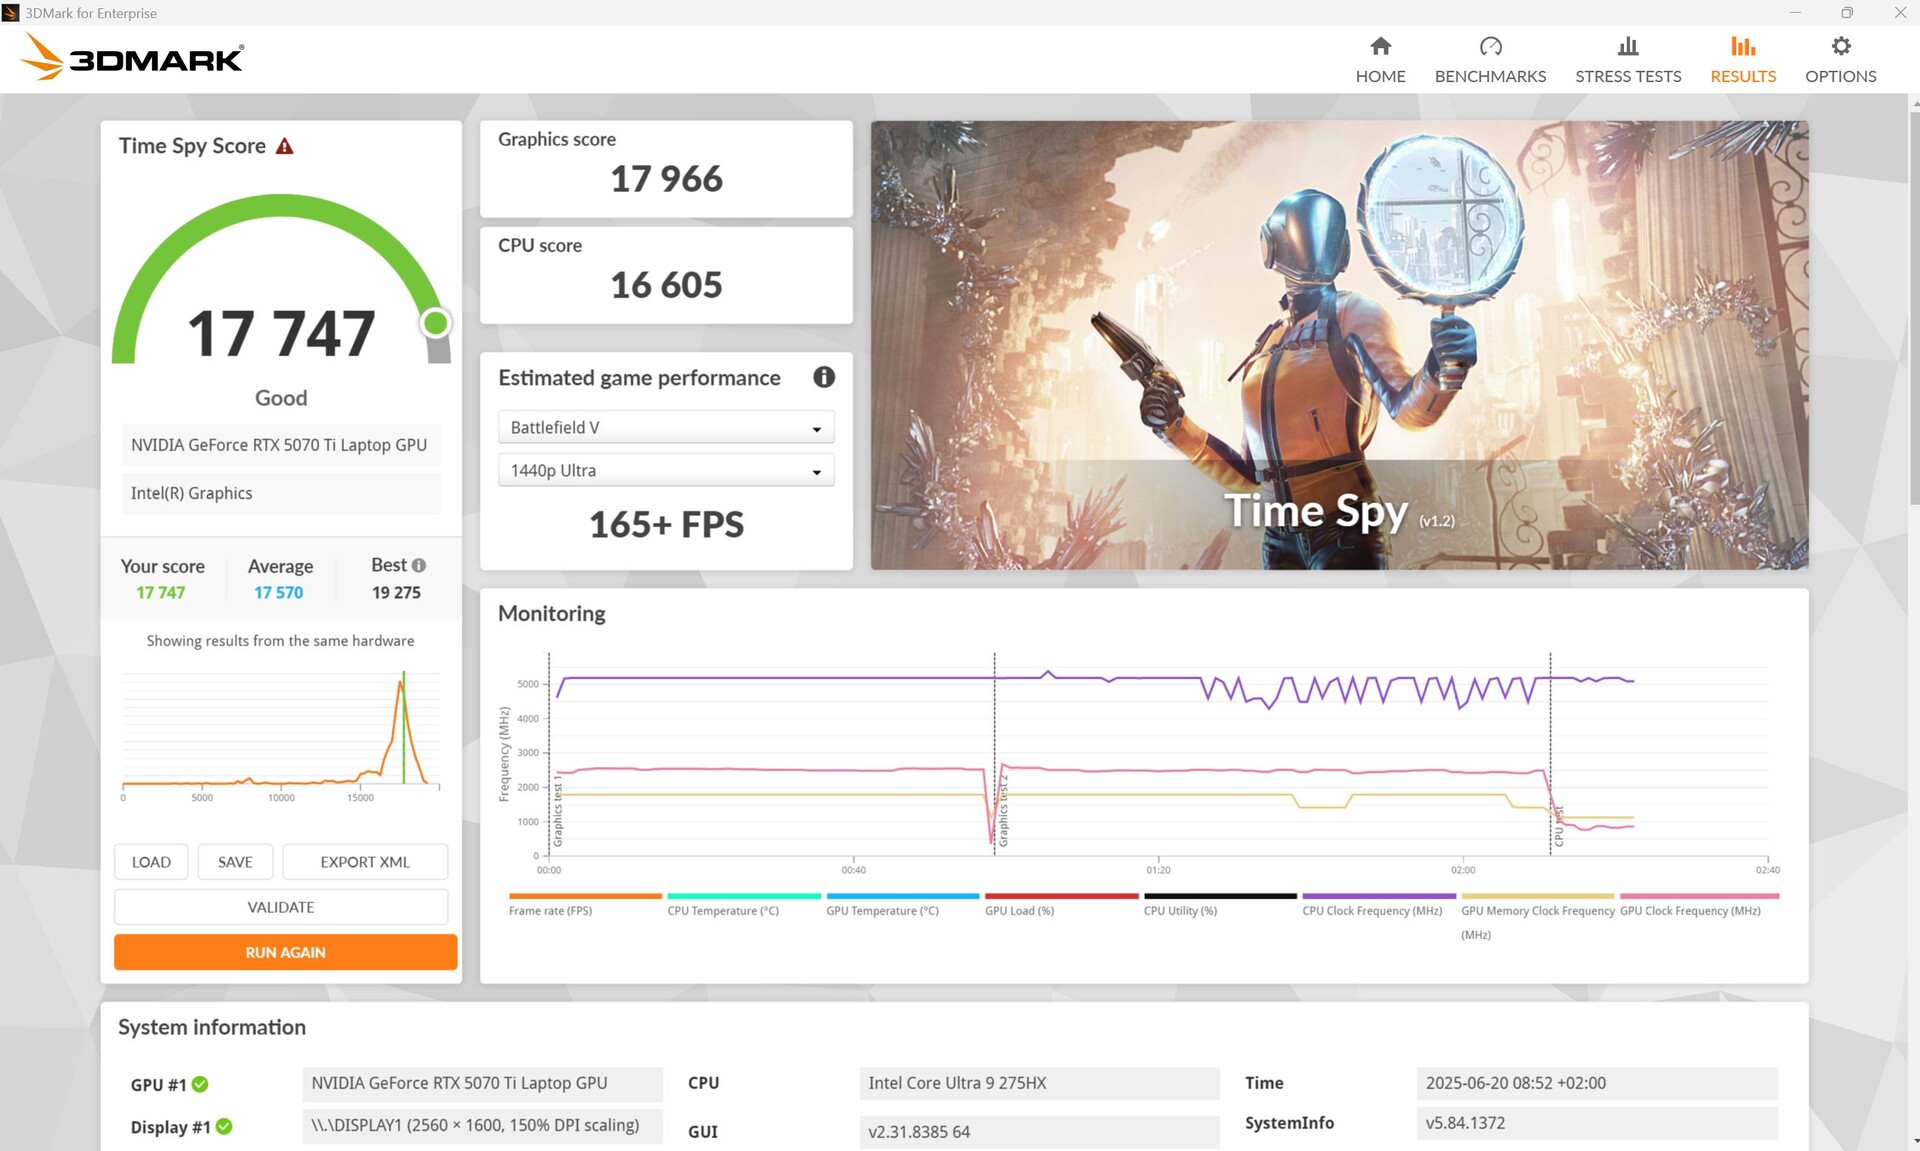
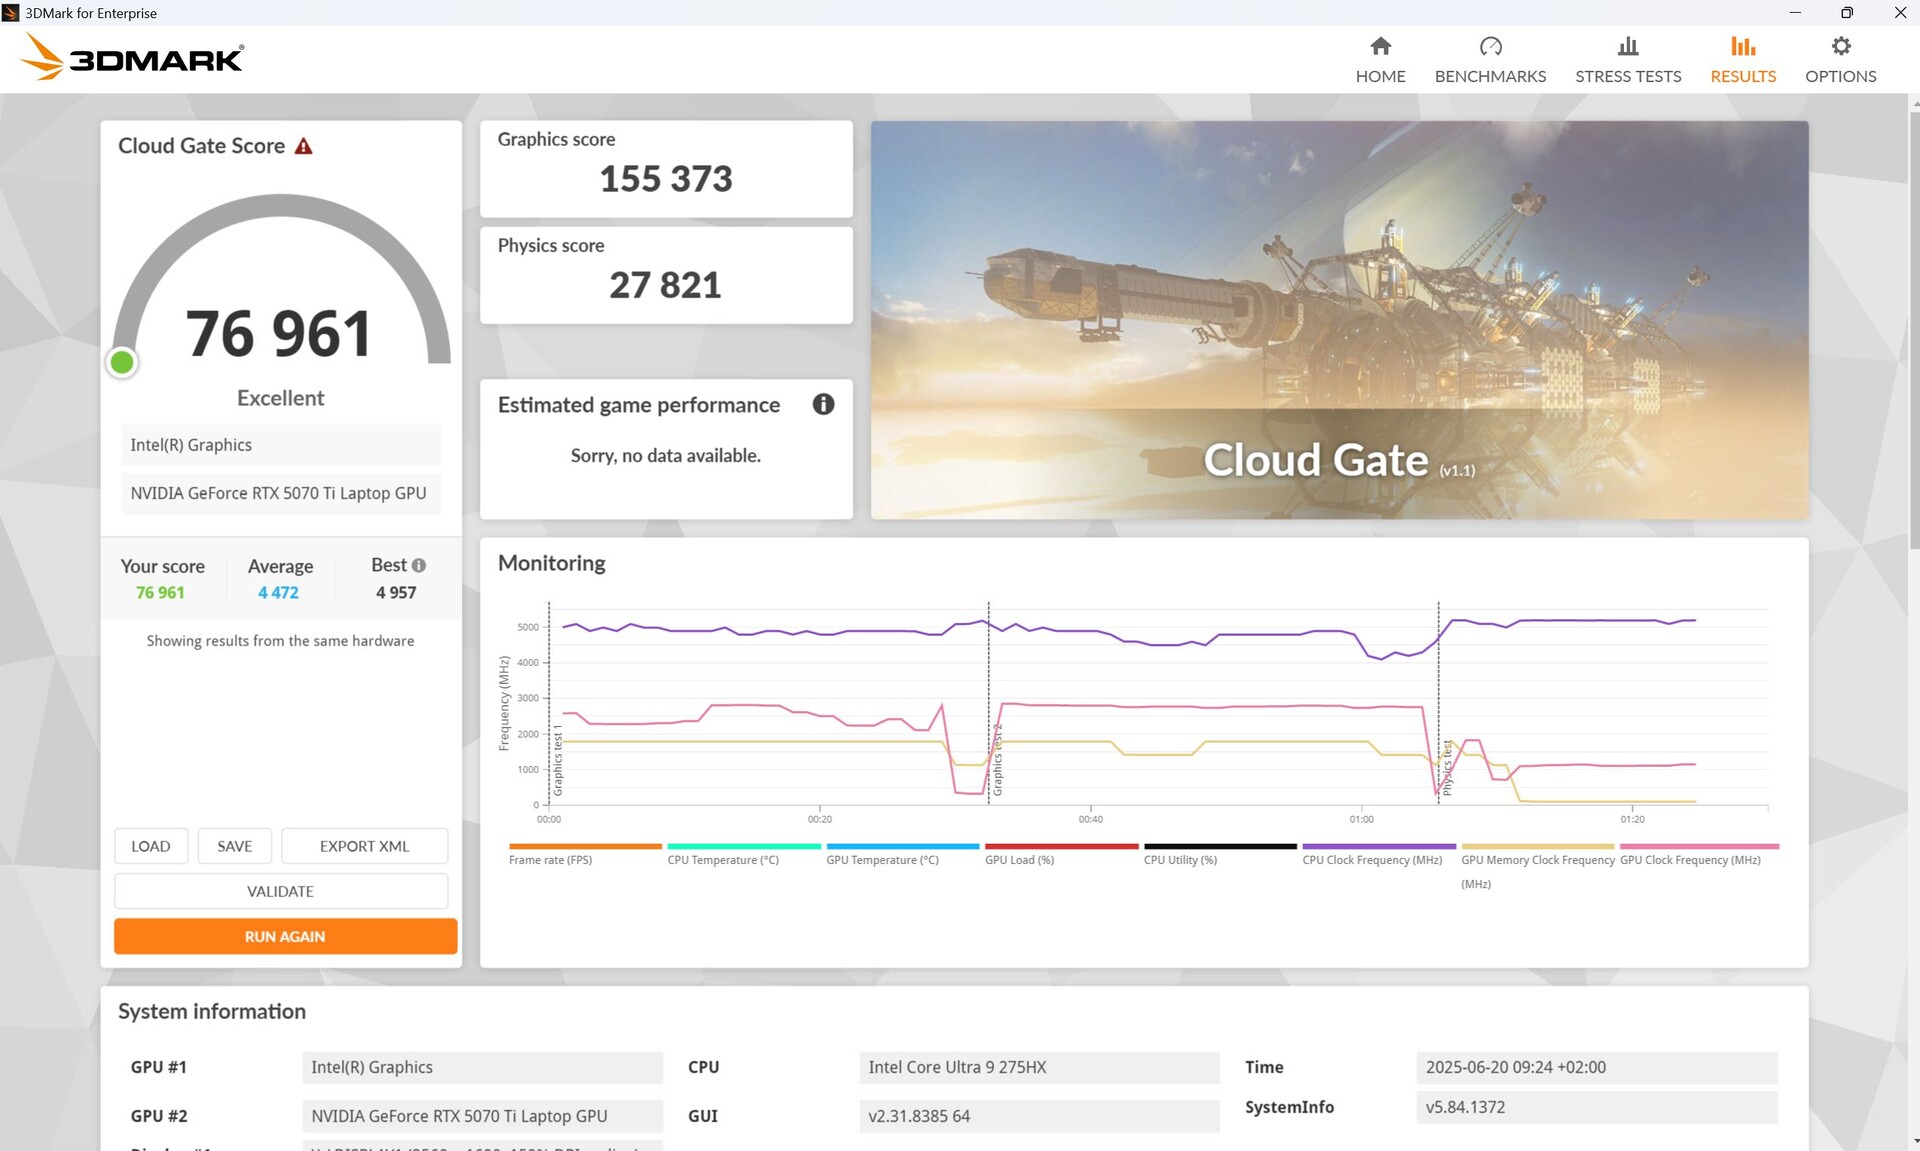
Die RTX 5070 Ti entstammt der Blackwell-Familie, unterstützt Multi-Frame-Generation und ist mit 12 GB GDDR7 (192-Bit-Speicherbus) ausgestattet.
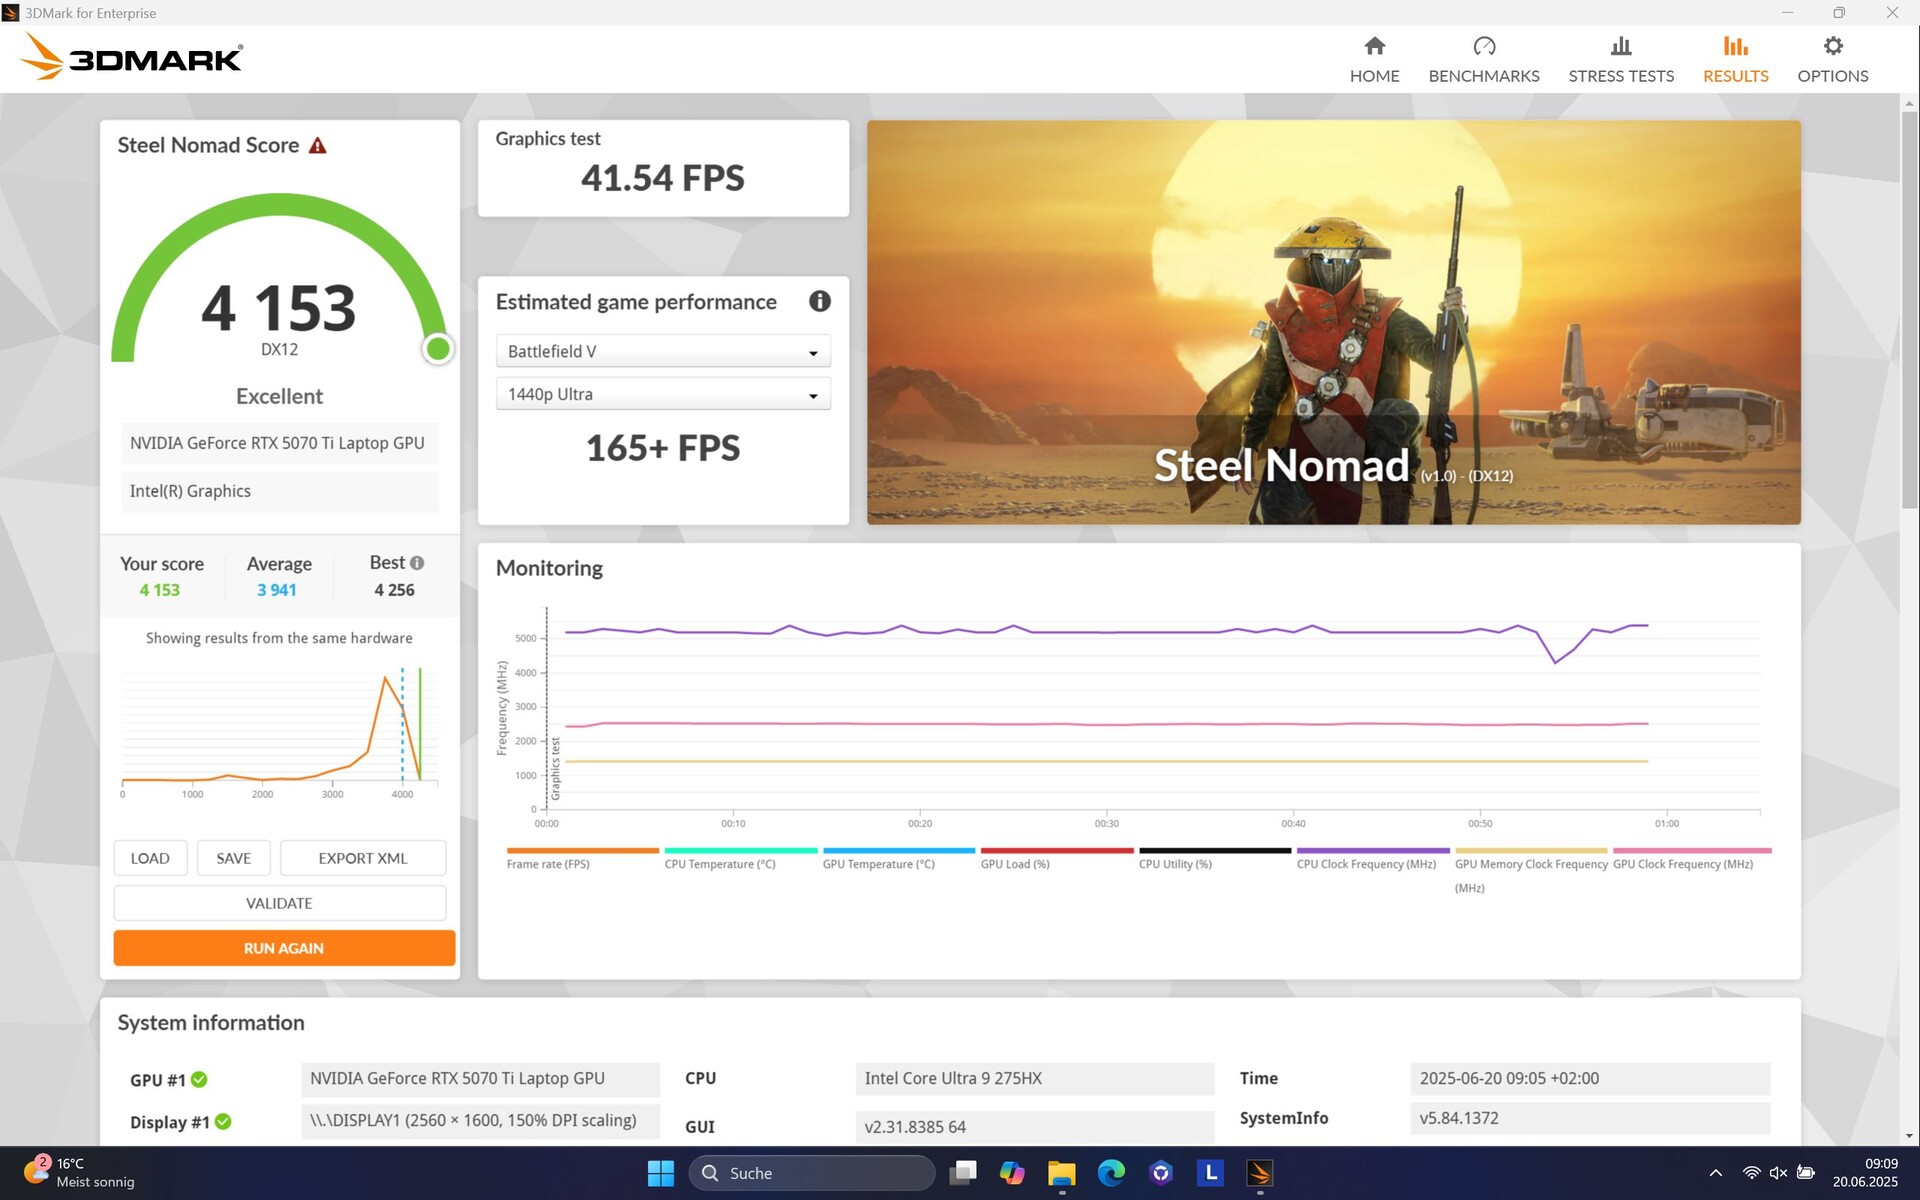
In den 3DMark-Tests rechnet sie etwa 5 Prozent über dem durchschnittlichen Laptop mit der gleichen GPU und schnappt sich so knapp die Leistungskrone gegenüber der direkten Konkurrenz. Das Alienware 16 Area-51 mit RTX 5080 hat etwa 9 Prozent Vorsprung.
Ist das Legion Pro nicht mit dem Stromnetz verbunden, so gehen im Fire Strike satte 85 Prozent an 3D-Leistung verloren!


| 3DMark 11 Performance | 47299 Punkte | |
| 3DMark Cloud Gate Standard Score | 76961 Punkte | |
| 3DMark Fire Strike Score | 37793 Punkte | |
| 3DMark Time Spy Score | 17747 Punkte | |
| 3DMark Steel Nomad Score | 4153 Punkte | |
Hilfe | ||
* ... kleinere Werte sind besser
Gaming Performance
Das Legion Pro 5 mit RTX 5070 Ti fühlt sich in FHD und QHD am wohlsten. Auch Gaming in 4K ist in vielen Titeln möglich, in etwas anspruchsvolleren Spielen wie Cyberpunk 2077 kann es aber eng werden, auch mit DLSS. Soll jedoch die Bildfrequenz des Monitors ausgereizt, so muss man in vielen Titeln auf Full-HD zurückgreifen.
Nur bei besonders anspruchsvollen Titeln wie F1 25 muss selbst in Full-HD Ultra schon auf DLSS zurückgegriffen werden. Dadurch steigen die fps-Werte in diesem Spiel von 35 auf 52. Beim hektischen Fahren haben wir dabei keine Fehldarstellungen erkennen können. Beim anschließenden Interview ist uns Kantenflimmern um die Figur herum aufgefallen. In Doom: The Dark Ages wiederum steigen die fps Dank DLSS und Frame Generation x4 (FG) von 46 auf 148, ohne FG immerhin noch auf 61, störende Latenzen sind uns dabei nicht aufgefallen.
Im direkten Vergleich liefert das Legion eine starke Leistung und übernimmt die Spitze der RTX-5070-Ti-Gamer in 16 Zoll. So rangiert das SCHENKER XMG Pro 16 (E25) beinahe 10 Prozent dahinter.
| Strange Brigade - 1920x1080 ultra AA:ultra AF:16 | |
| Alienware 16 Area-51 | |
| Lenovo Legion 5 Pro 16IAX10H | |
| Durchschnitt der Klasse Gaming (76.3 - 456, n=92, der letzten 2 Jahre) | |
| Asus ROG Zephyrus G16 2025 5070 Ti | |
| Lenovo Legion Pro 5 16IRX9 | |
| Schenker XMG Pro 16 (E25) | |
Unser Cyberpunk-2077-Graph sieht sehr konstant aus, Leistungseinbrüche gibt es nicht. Leistungstechnisch setzt sich das Legion Pro 5 vor das etwas langsamere XMG Pro 16 und die übrige RTX-5070-Ti-Konkurrenz.
Cyberpunk 2077 ultra FPS-Diagramm
| min. | mittel | hoch | max. | QHD DLSS | QHD | 4K DLSS | 4K | |
|---|---|---|---|---|---|---|---|---|
| GTA V (2015) | 185.8 | 185.4 | 180.2 | 147.6 | 123.8 | 124.2 | ||
| Dota 2 Reborn (2015) | 228 | 198.2 | 189.7 | 174 | 173.1 | |||
| Final Fantasy XV Benchmark (2018) | 234 | 230 | 181.4 | 139.2 | 78.8 | |||
| X-Plane 11.11 (2018) | 155.8 | 140.1 | 116 | 108.2 | ||||
| Strange Brigade (2018) | 643 | 479 | 403 | 353 | 250 | 138.1 | ||
| Baldur's Gate 3 (2023) | 167.7 | 131.1 | 108.1 | 138.9 | 130 | 91 | 72.4 | 46.6 |
| Cyberpunk 2077 (2023) | 175.1 | 133.9 | 132.4 | 91.2 | 84.3 | 35.9 | ||
| Assassin's Creed Shadows (2025) | 81 | 77 | 63 | 53 | 49 | 44 | ||
| Doom: The Dark Ages (2025) | 93 | 77.5 | 67.3 | 65 | 61 | 45.7 | ||
| F1 25 (2025) | 242 | 217 | 171.9 | 35 | 32 | 18 |
Emissionen - Recht lauter Pro-Laptop
Geräuschemissionen
Im Idle sind die Lüfter meistens aus, allerdings kann es im Leistungsmodus schon passieren, dass die Lüfter mal kurz laut hochtouren.
Bei Last agieren die Lüfter einerseits flexibel und responsiv, d.h. sie beruhigen sich nach einer Last auch schnell wieder, andererseits drehen sie auch bei mittleren Lasten wie dem 3DMark06 schnell hoch. Unter maximaler Last und beim Gaming messen wir über 56 dB im Leistungsmodus, was im Vergleich recht laut ist. Im Extrem-Modus sind es sogar über 58 dB. Das SCHENKER XMG Pro 16 (E25) oder auch das MSI Vector 16 agieren hörbar leiser. Content Creator dürften hier eher auf den Ausgewogenen Modus umschalten, der allerdings eine 13 (CPU) bis 22 Prozent (GPU) schwächere Leistung zur Folge hat.
Lautstärkediagramm
| Idle |
| 24 / 24 / 30.9 dB(A) |
| Last |
| 55.9 / 56.72 dB(A) |
 | ||
30 dB leise 40 dB(A) deutlich hörbar 50 dB(A) störend |
||
min: | ||
| Lenovo Legion 5 Pro 16IAX10H GeForce RTX 5070 Ti Laptop, Ultra 9 275HX, Western Digital PC SN8000S SDEPNRK-1T00 | Lenovo Legion Pro 5 16IRX9 GeForce RTX 4070 Laptop GPU, i9-14900HX, Samsung PM9A1 MZVL21T0HCLR | Schenker XMG Pro 16 (E25) GeForce RTX 5070 Ti Laptop, Ultra 9 275HX, Samsung 9100 Pro 1 TB | MSI Vector 16 HX AI A2XWHG GeForce RTX 5070 Ti Laptop, Ultra 7 255HX, Micron 2400 MTFDKBA512QFM | MSI Vector A18 HX A9W GeForce RTX 5070 Ti Laptop, R9 9955HX | Lenovo Legion Pro 7i 16 Gen 10 GeForce RTX 5080 Laptop, Ultra 9 275HX, SK Hynix HFS001TEJ9X115N | |
|---|---|---|---|---|---|---|
| Geräuschentwicklung | 4% | 6% | -8% | 1% | 13% | |
| aus / Umgebung * (dB) | 24 | 23.9 -0% | 23.3 3% | 25 -4% | 22.5 6% | 22.9 5% |
| Idle min * (dB) | 24 | 24.3 -1% | 25 -4% | 33 -38% | 26 -8% | 22.9 5% |
| Idle avg * (dB) | 24 | 24.3 -1% | 25 -4% | 34 -42% | 26 -8% | 22.9 5% |
| Idle max * (dB) | 30.9 | 28.9 6% | 25 19% | 38 -23% | 32 -4% | 26.3 15% |
| Last avg * (dB) | 55.9 | 45.8 18% | 45.5 19% | 46 18% | 44.4 21% | 27.8 50% |
| Cyberpunk 2077 ultra * (dB) | 56.72 | 53.3 6% | 47 17% | 49.8 12% | 54.2 4% | |
| Last max * (dB) | 56.72 | 56.6 -0% | 53.3 6% | 49 14% | 61.6 -9% | 53.9 5% |
| Witcher 3 ultra * (dB) | 51 |
* ... kleinere Werte sind besser
Temperatur.
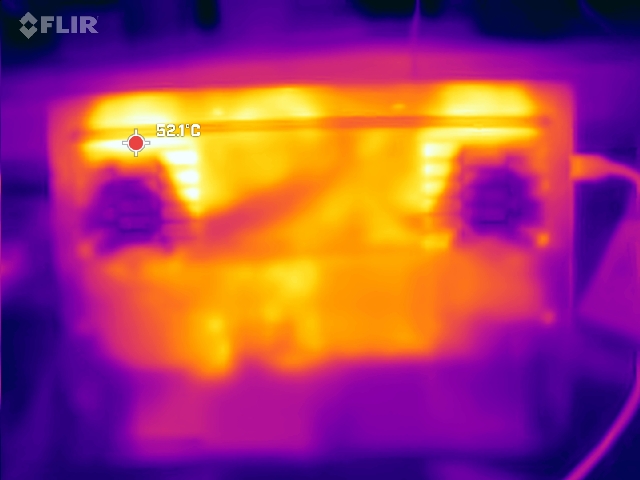
Unter starkem Stress können die Oberflächentemperaturen auf bis zu rund 50 °C steigen, vor allem an der Unterseite, während die WASD-Tasten noch vergleichsweise "kühl" bleiben (bis 39 °C). Die Lüfter scheinen jetzt deutlich gleichmäßiger zu kühlen als noch im Vorgänger.
(-) Die maximale Temperatur auf der Oberseite ist 48 °C. Im Vergleich liegt der Klassendurchschnitt bei 40.4 °C (von 21.2 bis 68.8 °C für die Klasse Gaming).
(-) Auf der Unterseite messen wir eine maximalen Wert von 50 °C (im Vergleich zum Durchschnitt von 43.2 °C).
(±) Ohne Last messen wir eine durchschnittliche Temperatur von 33.6 °C auf der Oberseite. Der Klassendurchschnitt erreicht 33.9 °C.
(-) 3: The average temperature for the upper side is 38.2 °C / 101 F, compared to the average of 33.9 °C / 93 F for the class Gaming.
(±) Die Handballen und der Touchpad-Bereich können sehr heiß werden mit maximal 37 °C.
(-) Die durchschnittliche Handballen-Temperatur anderer getesteter Geräte war 28.8 °C (-8.2 °C).

| Lenovo Legion 5 Pro 16IAX10H Intel Core Ultra 9 275HX, NVIDIA GeForce RTX 5070 Ti Laptop | Lenovo Legion Pro 5 16IRX9 Intel Core i9-14900HX, NVIDIA GeForce RTX 4070 Laptop GPU | Schenker XMG Pro 16 (E25) Intel Core Ultra 9 275HX, NVIDIA GeForce RTX 5070 Ti Laptop | Medion Erazer Major 16 X1 MD62736 Intel Core Ultra 7 255HX, NVIDIA GeForce RTX 5070 Ti Laptop | MSI Vector 16 HX AI A2XWHG Intel Core Ultra 7 255HX, NVIDIA GeForce RTX 5070 Ti Laptop | MSI Vector A18 HX A9W AMD Ryzen 9 9955HX, NVIDIA GeForce RTX 5070 Ti Laptop | Lenovo Legion Pro 7i 16 Gen 10 Intel Core Ultra 9 275HX, NVIDIA GeForce RTX 5080 Laptop | |
|---|---|---|---|---|---|---|---|
| Hitze | 7% | -121% | 4% | 8% | 16% | 17% | |
| Last oben max * (°C) | 48 | 43.8 9% | 43.2 10% | 49 -2% | 53 -10% | 46.6 3% | 42.6 11% |
| Last unten max * (°C) | 50 | 55.4 -11% | 46 8% | 50 -0% | 52 -4% | 45.6 9% | 41.2 18% |
| Idle oben max * (°C) | 38 | 32.8 14% | 27.7 27% | 36 5% | 33 13% | 31.2 18% | 32.6 14% |
| Idle unten max * (°C) | 42 | 36 14% | 264 -529% | 37 12% | 29 31% | 28.6 32% | 32.4 23% |
* ... kleinere Werte sind besser
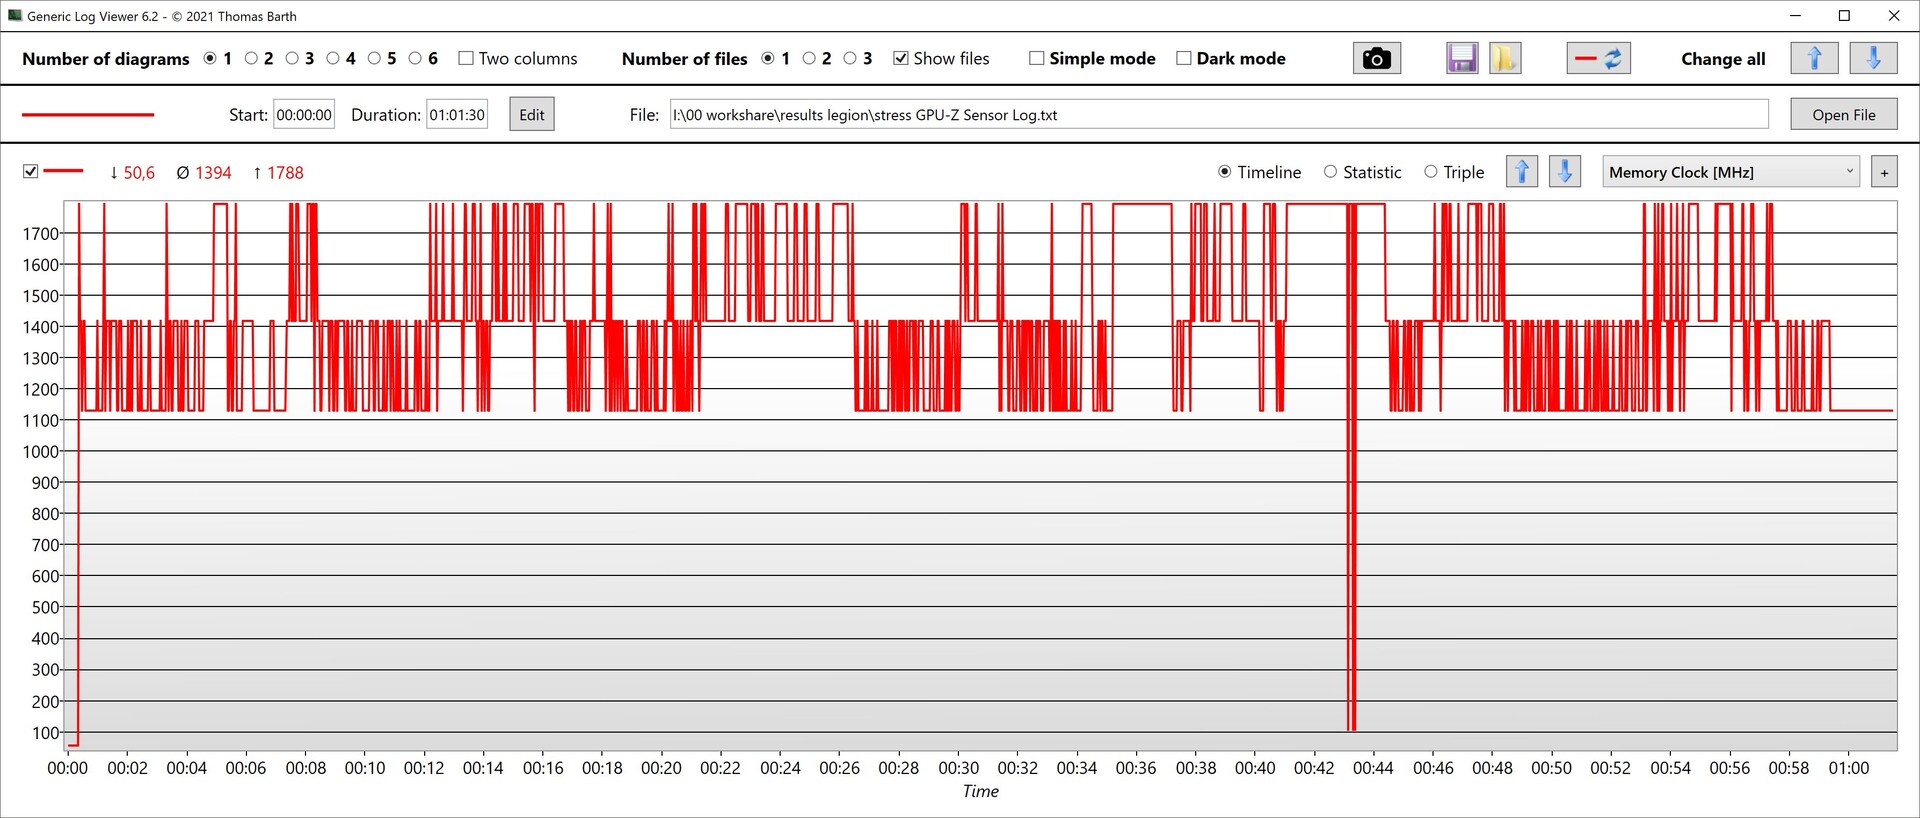
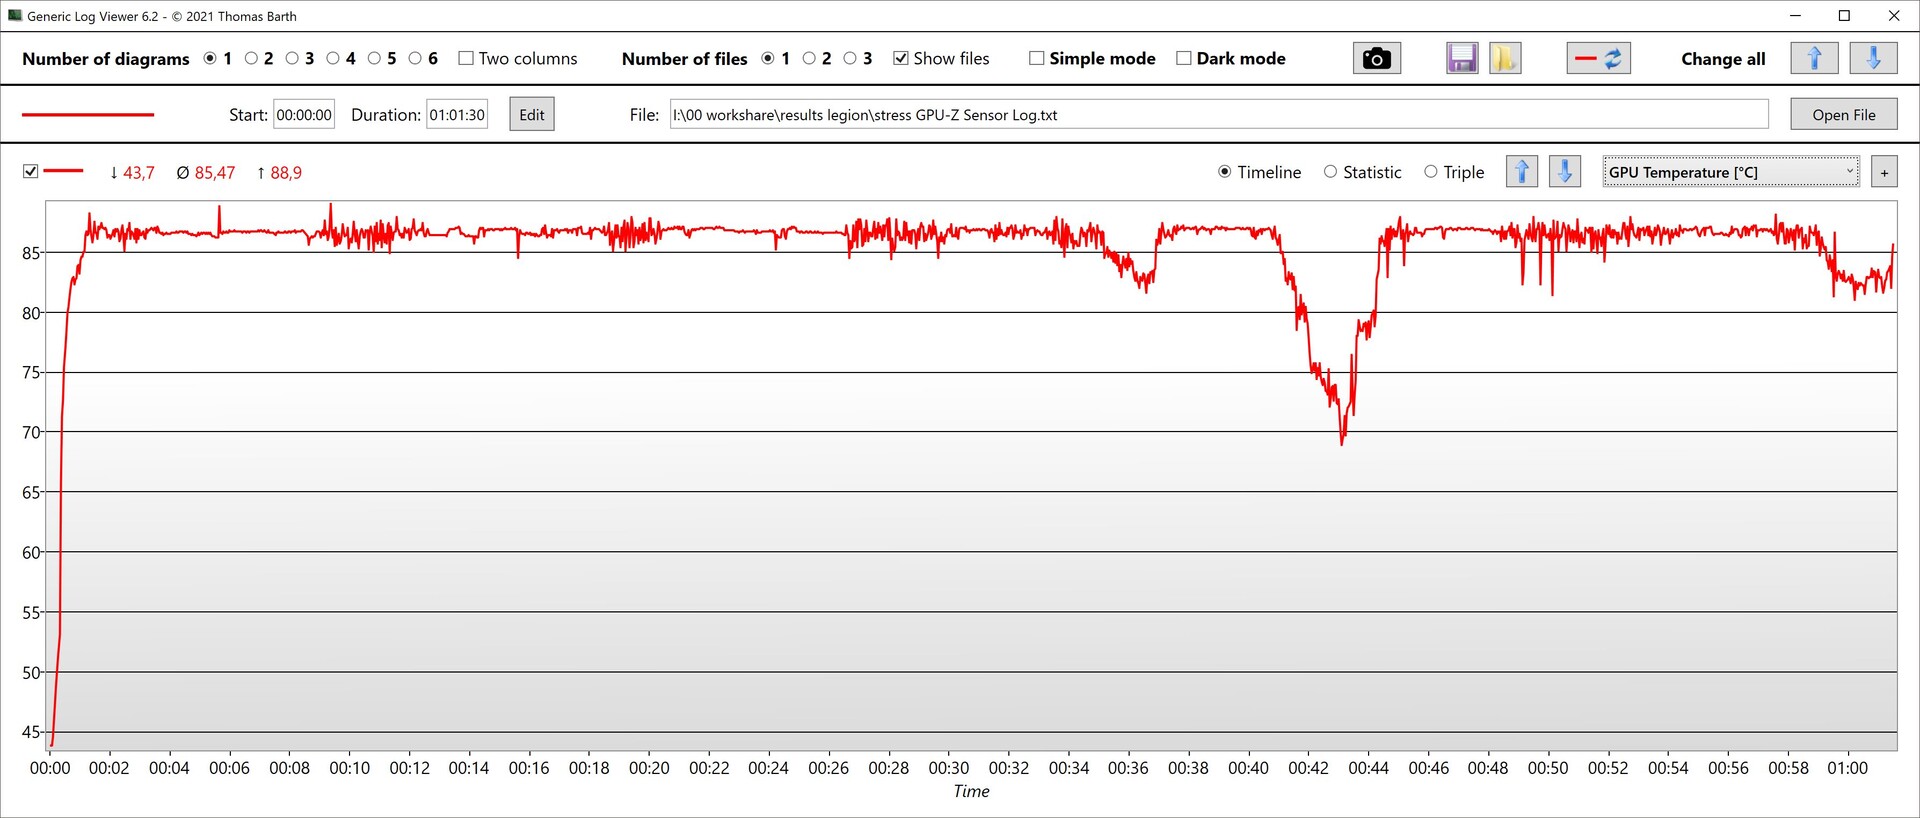
Stresstest
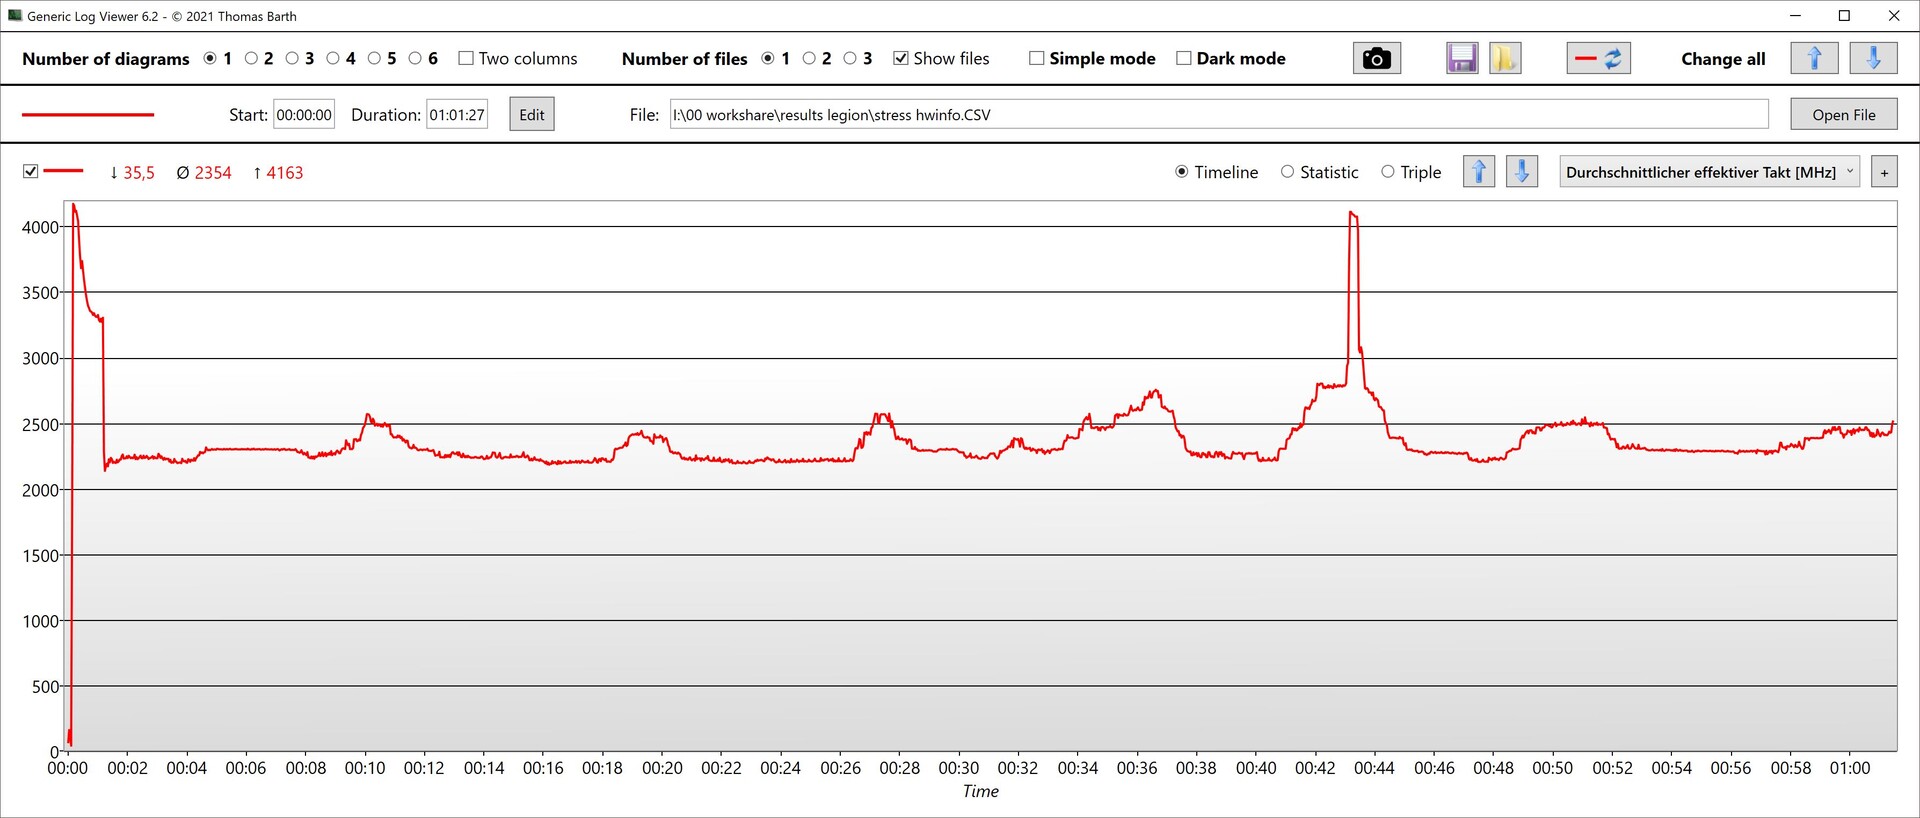
Den 1-stündigen Stresstest starten die CPU-Kerne nur kurz mit 4,1 GHz (195 W). Dabei überschreitet die CPU die Temperaturschwelle von 100 °C, woraufhin der Takt und die Leistungsaufnahme auf ca. 2,3 GHz und 60 W fallen und dann relativ konstant bleiben. Die Temperatur liegt dann bei um die 82 °C.
Währenddessen pendelt der GPU-Takt grob zwischen 2,2 und 2,5 GHz, der Speichertakt macht größere Sprünge zwischen 1,1 und 1,8 GHz. Dabei liegt die Temperatur bei um die 85 °C, die GPU zieht rund 125 W aus dem Netzteil.
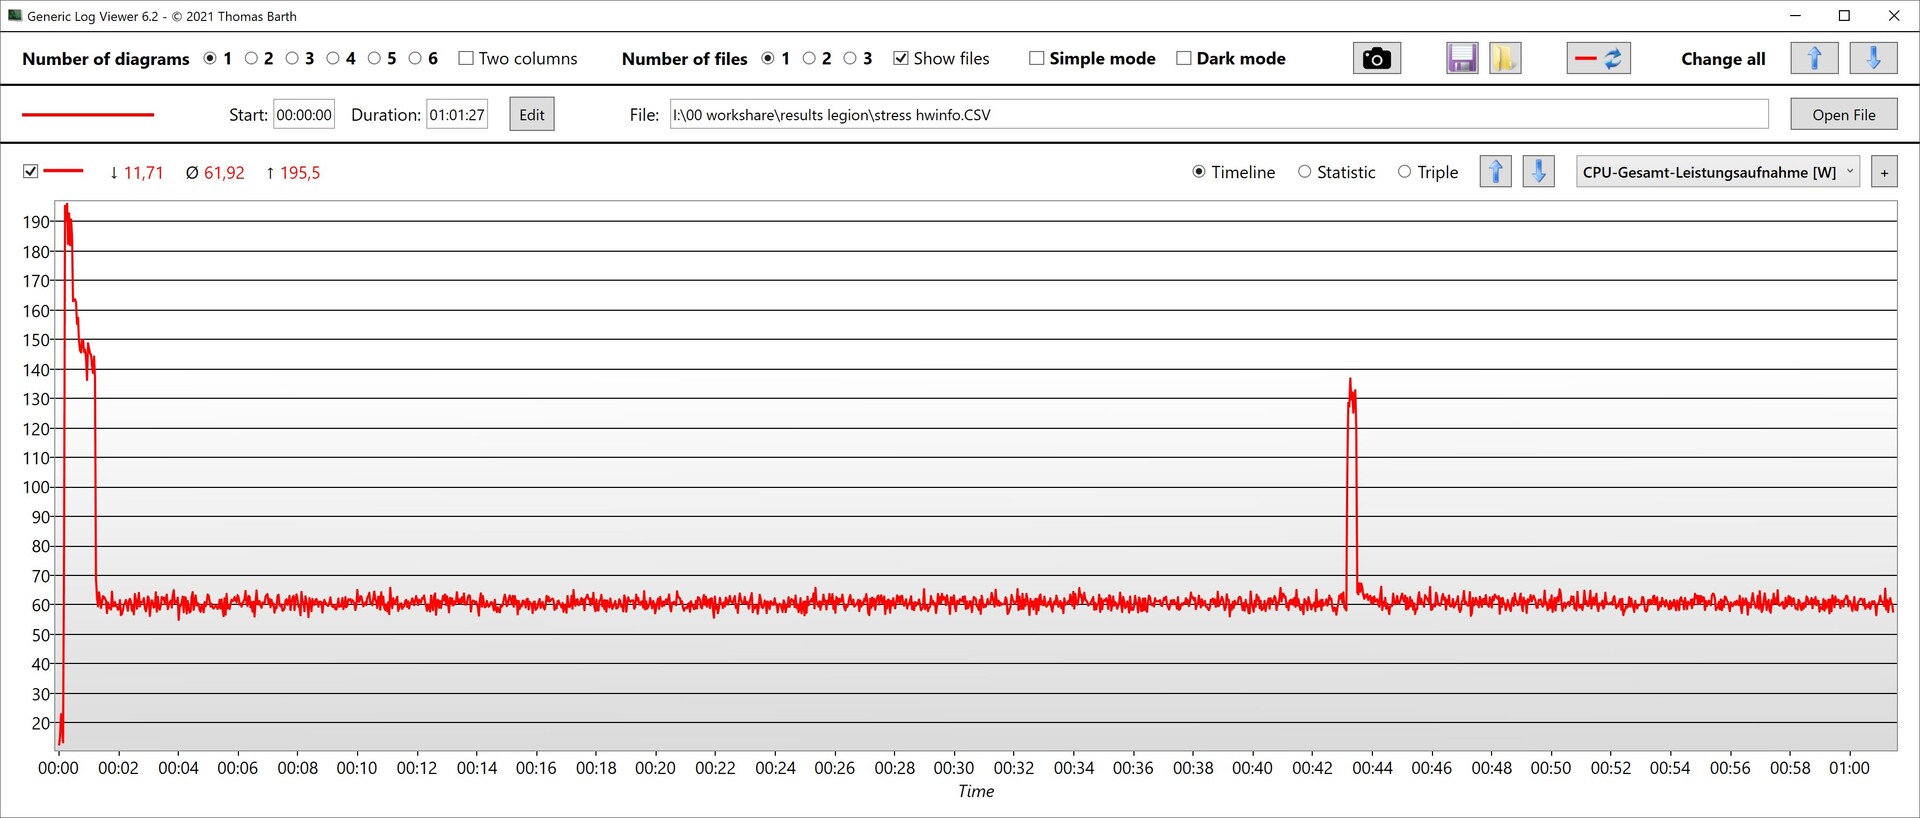

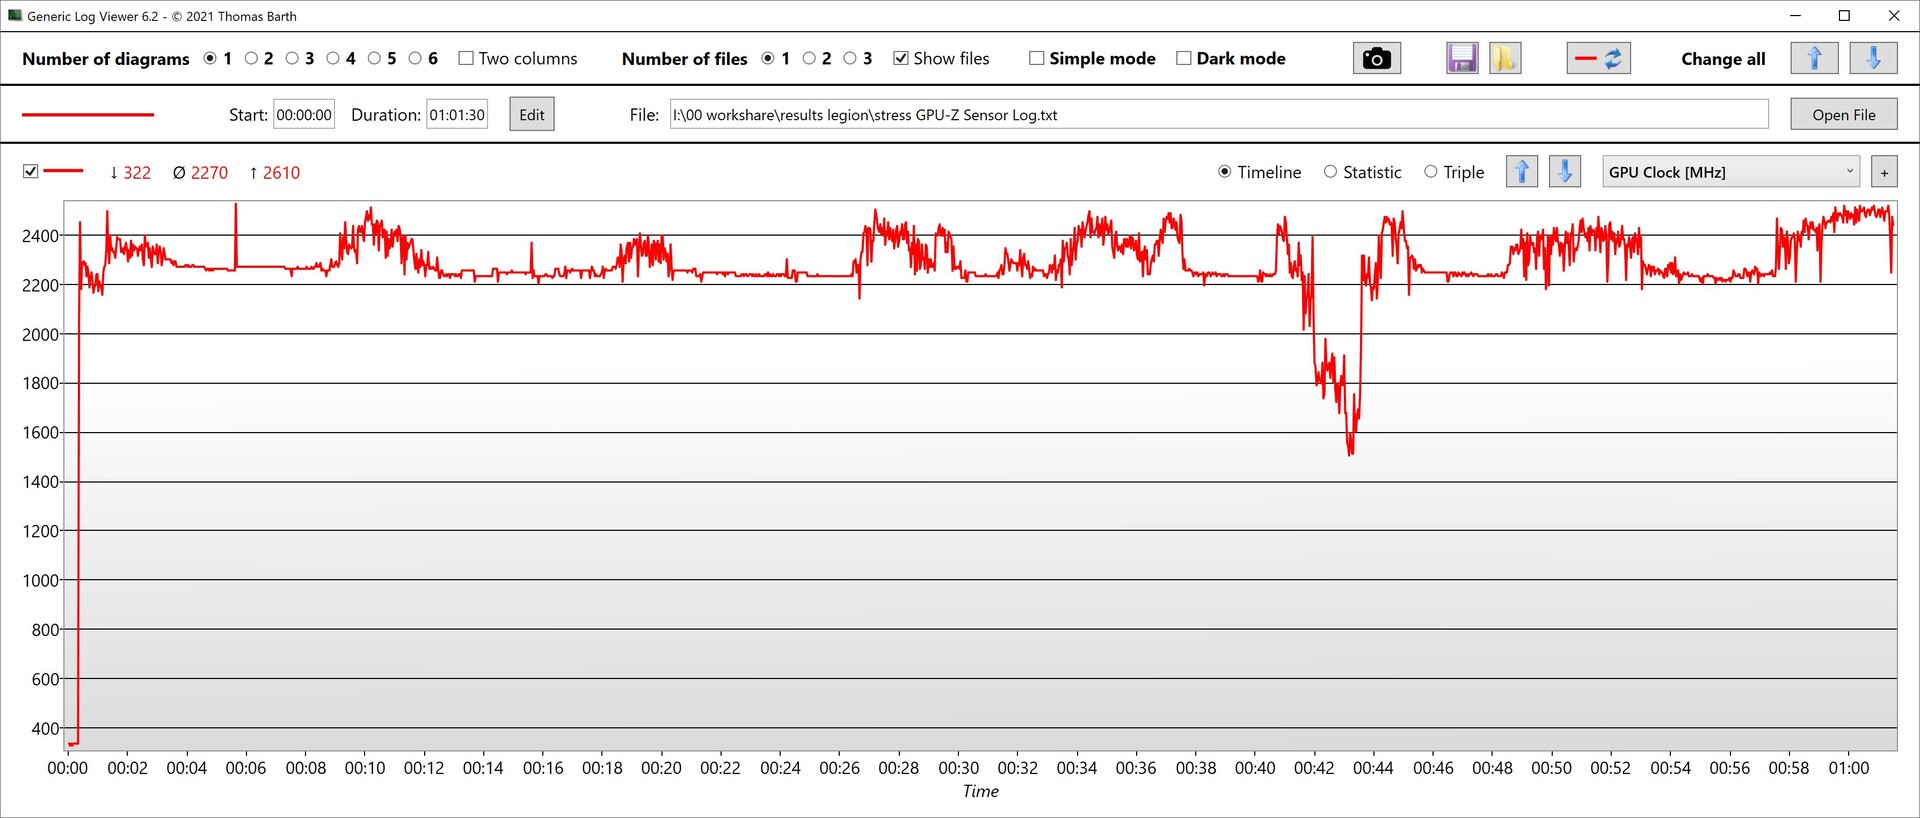
| CPU Clock (GHz) | GPU Clock (MHz) | Average CPU Temperature (°C) | Average GPU Temperature (°C) | |
| Prime95 + FurMark Stress | 2,354 | 2270 | 82 | 85 |
| Cyberpunk 2077 Stress | 1,862 | 2572 | 83 | 86 |
Lautsprecher
Die beiden Stereo-Lautsprecher sind eher zweckmäßig, sie verfügen über ausgeglichene Höhen, spielen aber nicht sonderlich laut auf und lassen Bass nahezu komplett vermissen. Ein Headset-Klinkenport steht für den Anschluss von Kopfhörern und anderen analogen Audiogeräten zur Verfügung.
Lenovo Legion 5 Pro 16IAX10H Audio Analyse
(±) | Mittelmäßig laut spielende Lautsprecher (78.2 dB)
Bass 100 - 315 Hz
(-) | kaum Bass - 21.1% niedriger als der Median
(±) | durchschnittlich lineare Bass-Wiedergabe (8% Delta zum Vorgänger)
Mitteltöne 400 - 2000 Hz
(±) | zu hohe Mitten, vom Median 6.3% abweichend
(+) | lineare Mitten (6.5% Delta zum Vorgänger)
Hochtöne 2 - 16 kHz
(+) | ausgeglichene Hochtöne, vom Median nur 1.6% abweichend
(+) | sehr lineare Hochtöne (4.9% Delta zum Vorgänger)
Gesamt im hörbaren Bereich 100 - 16.000 Hz
(±) | hörbarer Bereich ist durchschnittlich linear (18.3% Abstand zum Median)
Im Vergleich zu allen Geräten derselben Klasse
» 58% aller getesteten Geräte dieser Klasse waren besser, 9% vergleichbar, 33% schlechter
» Das beste Gerät hat einen Delta-Wert von 6%, durchschnittlich ist 18%, das schlechteste Gerät hat 132%
Im Vergleich zu allen Geräten im Test
» 40% aller getesteten Geräte waren besser, 8% vergleichbar, 52% schlechter
» Das beste Gerät hat einen Delta-Wert von 4%, durchschnittlich ist 24%, das schlechteste Gerät hat 134%
Schenker XMG Pro 16 (E25) Audio Analyse
(±) | Mittelmäßig laut spielende Lautsprecher (79.2 dB)
Bass 100 - 315 Hz
(±) | abgesenkter Bass - 14.2% geringer als der Median
(±) | durchschnittlich lineare Bass-Wiedergabe (10.6% Delta zum Vorgänger)
Mitteltöne 400 - 2000 Hz
(±) | zu hohe Mitten, vom Median 8.2% abweichend
(±) | Linearität der Mitten ist durchschnittlich (9.9% Delta zum Vorgänger)
Hochtöne 2 - 16 kHz
(+) | ausgeglichene Hochtöne, vom Median nur 3.8% abweichend
(+) | sehr lineare Hochtöne (5.9% Delta zum Vorgänger)
Gesamt im hörbaren Bereich 100 - 16.000 Hz
(±) | hörbarer Bereich ist durchschnittlich linear (18.5% Abstand zum Median)
Im Vergleich zu allen Geräten derselben Klasse
» 60% aller getesteten Geräte dieser Klasse waren besser, 8% vergleichbar, 32% schlechter
» Das beste Gerät hat einen Delta-Wert von 6%, durchschnittlich ist 18%, das schlechteste Gerät hat 132%
Im Vergleich zu allen Geräten im Test
» 41% aller getesteten Geräte waren besser, 8% vergleichbar, 51% schlechter
» Das beste Gerät hat einen Delta-Wert von 4%, durchschnittlich ist 24%, das schlechteste Gerät hat 134%
Energieverwaltung - Akku könnte größer sein
Energieaufnahme
Im Idealfall verbraucht das Legion Pro 5 recht wenig Energie im Idle. Allerdings gibt es über einen längeren Zeitraum betrachtet immer wieder Sprünge nach oben. Die meisten RTX-5000-Laptops kämpfen noch mit einem zu hohen Idle-Verbrauch. Mit externem Monitor am HDMI-Ausgang ist die dGPU aktiv.
Beim Gaming zeigt sich, dass das Legion Pro 5 angesichts seiner hohen Leistung etwas mehr verbraucht als die meisten anderen Konkurrenten. Der Unterschied ist aber eher gering und das MSI Vector 16 HX AI A2XWHG verbraucht nochmals mehr.
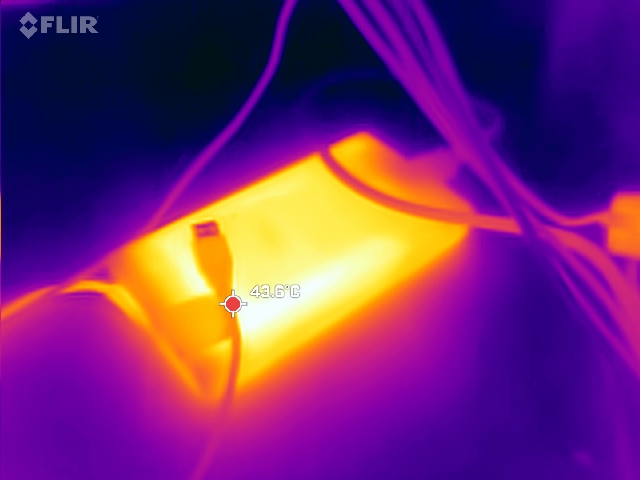
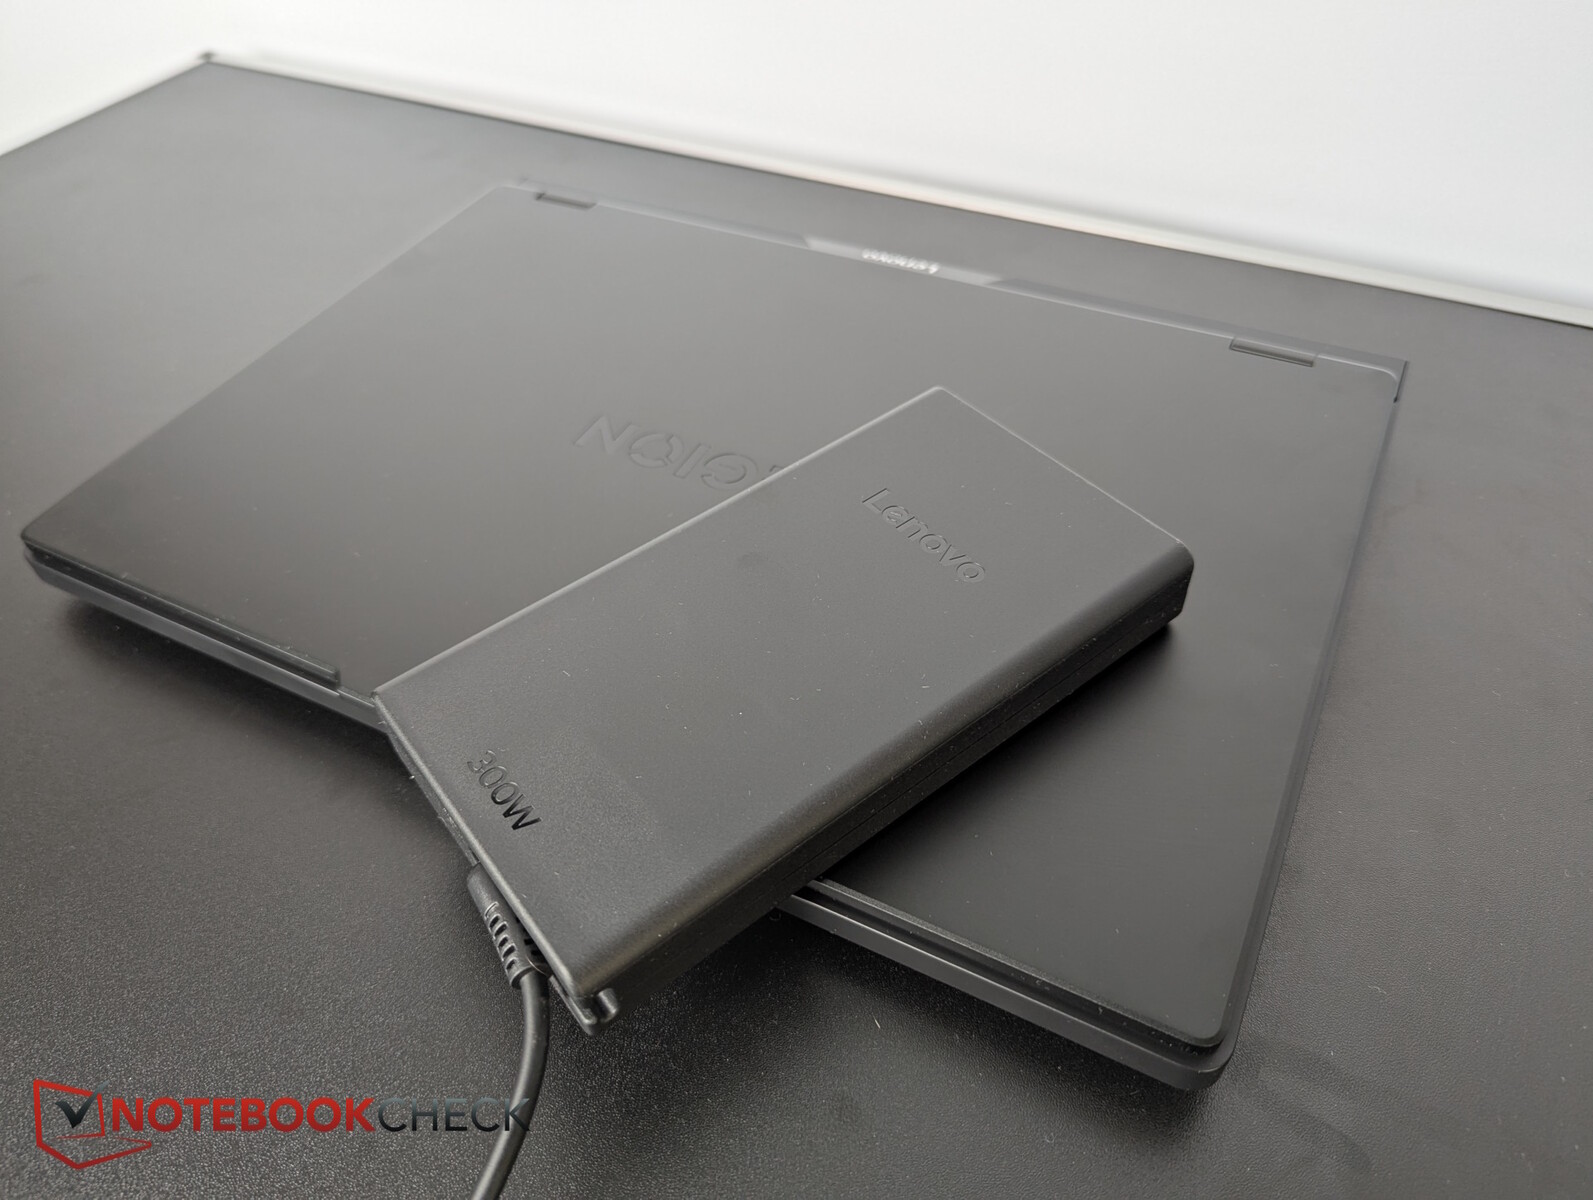
Wir messen kurzzeitige Lastspitzen von maximal 294 W aus dem großen, aber flachen Lenovo-Netzteil. Dieses ist für 300 W ausgelegt und sollte den Laptop somit in jeder Situation gut laden können.
| Aus / Standby | |
| Idle | |
| Last |
|
Legende:
min: | |
| Lenovo Legion 5 Pro 16IAX10H Ultra 9 275HX, GeForce RTX 5070 Ti Laptop, Western Digital PC SN8000S SDEPNRK-1T00, OLED, 2560x1600, 16" | Lenovo Legion Pro 5 16IRX9 i9-14900HX, GeForce RTX 4070 Laptop GPU, Samsung PM9A1 MZVL21T0HCLR, IPS, 2560x1600, 16" | Schenker XMG Pro 16 (E25) Ultra 9 275HX, GeForce RTX 5070 Ti Laptop, Samsung 9100 Pro 1 TB, IPS, 2560x1600, 16" | Medion Erazer Major 16 X1 MD62736 Ultra 7 255HX, GeForce RTX 5070 Ti Laptop, Phison E31 2 TB, IPS, 2560x1600, 16" | MSI Vector 16 HX AI A2XWHG Ultra 7 255HX, GeForce RTX 5070 Ti Laptop, Micron 2400 MTFDKBA512QFM, IPS, 2560x1600, 16" | MSI Vector A18 HX A9W R9 9955HX, GeForce RTX 5070 Ti Laptop, , IPS, 2560x1600, 18" | Lenovo Legion Pro 7i 16 Gen 10 Ultra 9 275HX, GeForce RTX 5080 Laptop, SK Hynix HFS001TEJ9X115N, OLED, 2560x1600, 16" | Durchschnittliche NVIDIA GeForce RTX 5070 Ti Laptop | Durchschnitt der Klasse Gaming | |
|---|---|---|---|---|---|---|---|---|---|
| Stromverbrauch | -9% | 8% | -5% | 5% | -71% | -65% | -3% | 1% | |
| Idle min * (Watt) | 14 | 12.5 11% | 11.7 16% | 17.8 -27% | 7.1 49% | 20.8 -49% | 28.5 -104% | 12.4 ? 11% | 13.1 ? 6% |
| Idle avg * (Watt) | 14.3 | 24.6 -72% | 16.6 -16% | 20.7 -45% | 15.9 -11% | 52.8 -269% | 38.8 -171% | 19.7 ? -38% | 18.7 ? -31% |
| Idle max * (Watt) | 20.1 | 24.8 -23% | 17.1 15% | 23.4 -16% | 29.5 -47% | 54.5 -171% | 45.6 -127% | 24.9 ? -24% | 24.4 ? -21% |
| Last avg * (Watt) | 177 | 109.6 38% | 122.4 31% | 110 38% | 124 30% | 146.6 17% | 132.2 25% | 123.6 ? 30% | 108.1 ? 39% |
| Cyberpunk 2077 ultra * (Watt) | 255 | 245 4% | 233 9% | 222 13% | 285 -12% | 318 -25% | |||
| Cyberpunk 2077 ultra external monitor * (Watt) | 255 | 241 5% | 232 9% | 217 15% | 278 -9% | 319 -25% | |||
| Last max * (Watt) | 294 | 284.9 3% | 291.5 1% | 297 -1% | 336 -14% | 297.3 -1% | 384 -31% | 272 ? 7% | 254 ? 14% |
| Witcher 3 ultra * (Watt) | 218 |
* ... kleinere Werte sind besser
Energieaufnahme Cyberpunk / Stresstest
Energieaufnahme mit externem Monitor
Akkulaufzeit
Zieht man beim Legion Pro 5 den Netzstecker, so wird die Bildwiederholfrequenz des OLEDs leider nicht automatisch auf stromsparendere 60 Hz abgesenkt. Mit einer manuellen Umstellung auf 60 Hz ergeben sich Video- und Wi-Fi-Laufzeiten von annähernd 5 Stunden bei auf 150 Nits verringerter Helligkeit. Die 80 Wh des Akkus werden von der Konkurrenz mit 90 Wh und mehr oft übertroffen.
| Lenovo Legion 5 Pro 16IAX10H Ultra 9 275HX, GeForce RTX 5070 Ti Laptop, 80 Wh | Lenovo Legion Pro 5 16IRX9 i9-14900HX, GeForce RTX 4070 Laptop GPU, 80 Wh | Schenker XMG Pro 16 (E25) Ultra 9 275HX, GeForce RTX 5070 Ti Laptop, 99.8 Wh | Medion Erazer Major 16 X1 MD62736 Ultra 7 255HX, GeForce RTX 5070 Ti Laptop, 80 Wh | MSI Vector 16 HX AI A2XWHG Ultra 7 255HX, GeForce RTX 5070 Ti Laptop, 90 Wh | Asus ROG Zephyrus G16 2025 5070 Ti Ultra 9 285H, GeForce RTX 5070 Ti Laptop, 90 Wh | Alienware 16 Area-51 Ultra 9 275HX, GeForce RTX 5080 Laptop, 96 Wh | Lenovo Legion Pro 7i 16 Gen 10 Ultra 9 275HX, GeForce RTX 5080 Laptop, 99 Wh | Durchschnitt der Klasse Gaming | |
|---|---|---|---|---|---|---|---|---|---|
| Akkulaufzeit | -19% | 86% | 29% | 43% | -43% | -22% | 34% | ||
| H.264 (h) | 4.8 | 8.26 ? 72% | |||||||
| WLAN (h) | 4.9 | 4.8 -2% | 9.1 86% | 6.3 29% | 7 43% | 2.8 -43% | 5.4 10% | 7.04 ? 44% | |
| Last (h) | 1.7 | 1.1 -35% | 0.8 -53% | 1.47 ? -14% | |||||
| Idle (h) | 6.7 | 3.1 | 8.71 ? |
Notebookcheck Gesamtbewertung
Beim Gaming lässt das Legion Pro 5 mit RTX 5070 Ti und brillantem OLED seine Muskeln spielen, Content Creators könnte das Legion 5 dabei etwas zu laut zu Werke gehen.
Lenovo Legion 5 Pro 16IAX10H
- 24.06.2025 v8
Christian Hintze
 Total Sustainability Score:
 Mögliche Alternativen im Vergleich
Bild | Modell / Test | Preis ab | Gewicht | Dicke | Display |
|---|---|---|---|---|---|
1. 84.5%  | Lenovo Legion 5 Pro 16IAX10H Intel Core Ultra 9 275HX ⎘ NVIDIA GeForce RTX 5070 Ti Laptop ⎘ 32 GB RAM, 1024 GB SSD | Amazon: 1. 2.775,00 € Lenovo Legion Pro 5 Gaming A... 2. 1.999,00 € Lenovo Legion Pro 5 16ADR10 ... 3. 2.141,57 € Lenovo Legion Pro 5 Gaming L... Listenpreis: 2500 Euro | 2.4 kg | 25.95 mm | 16.00" 2560x1600 189 PPI OLED |
2. 89.3% v7 (old)  | Lenovo Legion Pro 5 16IRX9 Intel Core i9-14900HX ⎘ NVIDIA GeForce RTX 4070 Laptop GPU ⎘ 32 GB RAM, 1024 GB SSD | Amazon: Geizhals Suche | 2.5 kg | 26.95 mm | 16.00" 2560x1600 189 PPI IPS |
3. 87.4%  | Schenker XMG Pro 16 (E25) Intel Core Ultra 9 275HX ⎘ NVIDIA GeForce RTX 5070 Ti Laptop ⎘ 32 GB RAM, 1024 GB SSD | Amazon: 1. 27,69 € atFoliX Displayfolie kompati... 2. 27,69 € atFoliX Schutzfolie kompatib... Listenpreis: 2480€ | 2.5 kg | 26.5 mm | 16.00" 2560x1600 189 PPI IPS |
4. 85.2%  | Medion Erazer Major 16 X1 MD62736 Intel Core Ultra 7 255HX ⎘ NVIDIA GeForce RTX 5070 Ti Laptop ⎘ 32 GB RAM, SSD | Amazon: Geizhals Suche | 2.5 kg | 22.7 mm | 16.00" 2560x1600 189 PPI IPS |
5. 84%  | MSI Vector 16 HX AI A2XWHG Intel Core Ultra 7 255HX ⎘ NVIDIA GeForce RTX 5070 Ti Laptop ⎘ 16 GB RAM, 512 GB SSD | Amazon: 2.029,00 € Bestpreis 1898.99€ playox.de 2. 1899€ office-partner.de 3. 1914.95€ playox (AT) | 2.6 kg | 28.6 mm | 16.00" 2560x1600 189 PPI IPS |
Transparenz
Die Auswahl der zu testenden Geräte erfolgt innerhalb der Redaktion. Das vorliegende Testmuster wurde dem Autor vom Hersteller oder einem Shop zu Testzwecken leihweise zur Verfügung gestellt. Eine Einflussnahme des Leihstellers auf den Testbericht gab es nicht, der Hersteller erhielt keine Version des Reviews vor der Veröffentlichung. Es bestand keine Verpflichtung zur Publikation. Als eigenständiges, unabhängiges Unternehmen unterliegt Notebookcheck keiner Diktion von Herstellern, Shops und Verlagen.
So testet Notebookcheck
Pro Jahr werden von Notebookcheck hunderte Laptops und Smartphones unabhängig in von uns standardisierten technischen Verfahren getestet, um eine Vergleichbarkeit aller Testergebnisse zu gewährleisten. Seit rund 20 Jahren entwickeln wir diese Testmethoden kontinuierlich weiter und setzen damit Branchenstandards. In unseren Testlaboren kommt ausschließlich hochwertiges Messequipment in die Hände erfahrener Techniker und Redakteure. Die Tests unterliegen einer mehrstufigen Kontrolle. Unsere komplexe Gesamtbewertung basiert auf hunderten fundierten Messergebnissen und Benchmarks, womit Ihnen Objektivität garantiert ist. Weitere Informationen zu unseren Testmethoden gibt es hier.
