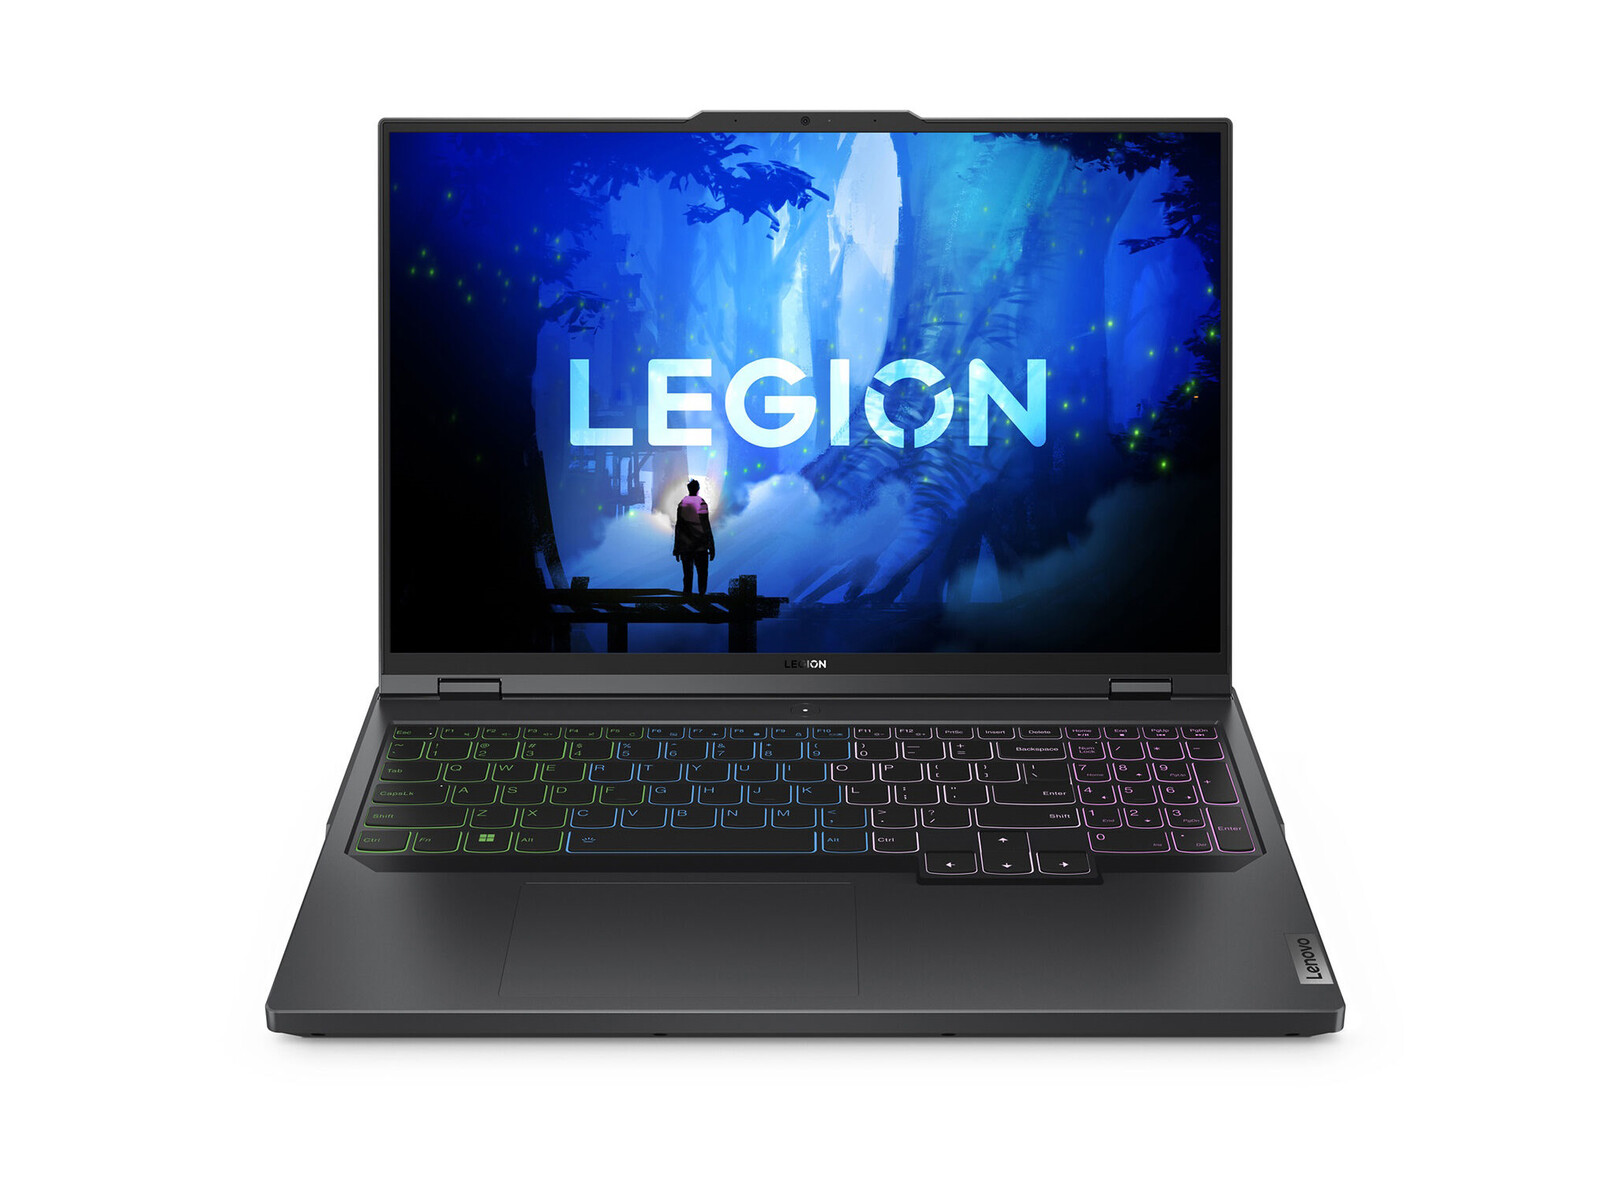
Lenovo Legion Pro 5 16IRX9 Laptop im Test: Tolle Leistung, dafür relativ schwer

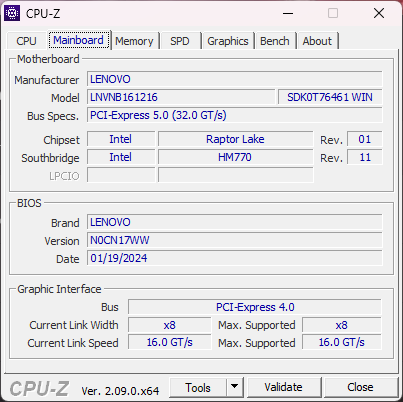
Das Legion Pro 5 16IRX9 ist der direkte Nachfolger des Legion Pro 5 16 IRX8 aus dem Vorjahr und darf nicht mit dem optisch abweichenden Legion 5 16IRX9 verwechselt werden. In dieser Neuauflage wurden die 2023-Raptor-Lake-HX-CPUs durch Vertreter der aufgefrischten 2024er-Raptor-Lake-HX-Serie ersetzt, kleine optische Veränderungen eingebaut und eine neue dritte Display-Option hinzugefügt.
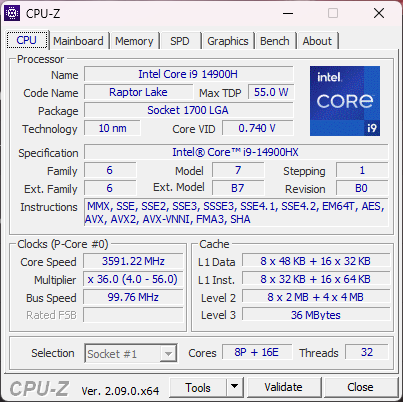
Unser Testgerät ist eine der besser ausgestatteten Konfigurationen mit einer Core-i9-14900HX-CPU, einer 140-W-GeForce-RTX-4070-GPU und einem 1600p-165-Hz-IPS-sRGB-Display, das im Handel für rund 2000 Euro erhältlich ist. Andere Konfigurationen sind ab einer Core i5-14500HX und RTX 4050 mit voller DCI-P3-Farbraumabdeckung erhältlich. Die native Auflösung von 1600 Pixeln bleibt bei allen Modellen gleich.
Alternativen zum Legion Pro 5 16 IRX9 wären weitere 16-Zoll-Gamer der oberen Mittelklasse wie das HP Omen Transcend 16, das Asus ROG Zephyrus G16 bzw. das MSI Stealth 16.
Weitere Lenovo-Testgeräte:
Mögliche Mitstreiter im Vergleich
Bew. | Datum | Modell | Gewicht | Dicke | Größe | Auflösung | Preis ab |
|---|---|---|---|---|---|---|---|
| 89.3 % v7 (old) | 04 / 2024 | Lenovo Legion Pro 5 16IRX9 i9-14900HX, GeForce RTX 4070 Laptop GPU | 2.5 kg | 26.95 mm | 16.00" | 2560x1600 | |
| 87.9 % v7 (old) | 05 / 2023 | Lenovo Legion Pro 5 16IRX8 i7-13700HX, GeForce RTX 4060 Laptop GPU | 2.5 kg | 26.8 mm | 16.00" | 2560x1600 | |
| 90.2 % v7 (old) | 03 / 2024 | Alienware m16 R2 Ultra 7 155H, GeForce RTX 4070 Laptop GPU | 2.5 kg | 23.5 mm | 16.00" | 2560x1600 | |
| 88.4 % v7 (old) | 02 / 2024 | HP Omen Transcend 16-u1095ng i9-14900HX, GeForce RTX 4070 Laptop GPU | 2.3 kg | 20 mm | 16.00" | 2560x1600 | |
| 92.3 % v7 (old) | 02 / 2024 | Asus ROG Zephyrus G16 2024 GU605M Ultra 7 155H, GeForce RTX 4070 Laptop GPU | 1.8 kg | 16.4 mm | 16.00" | 2560x1600 | |
| 89.1 % v7 (old) | 11 / 2023 | MSI Stealth 16 Mercedes-AMG Motorsport A13VG i9-13900H, GeForce RTX 4070 Laptop GPU | 1.9 kg | 20 mm | 16.00" | 3840x2400 |
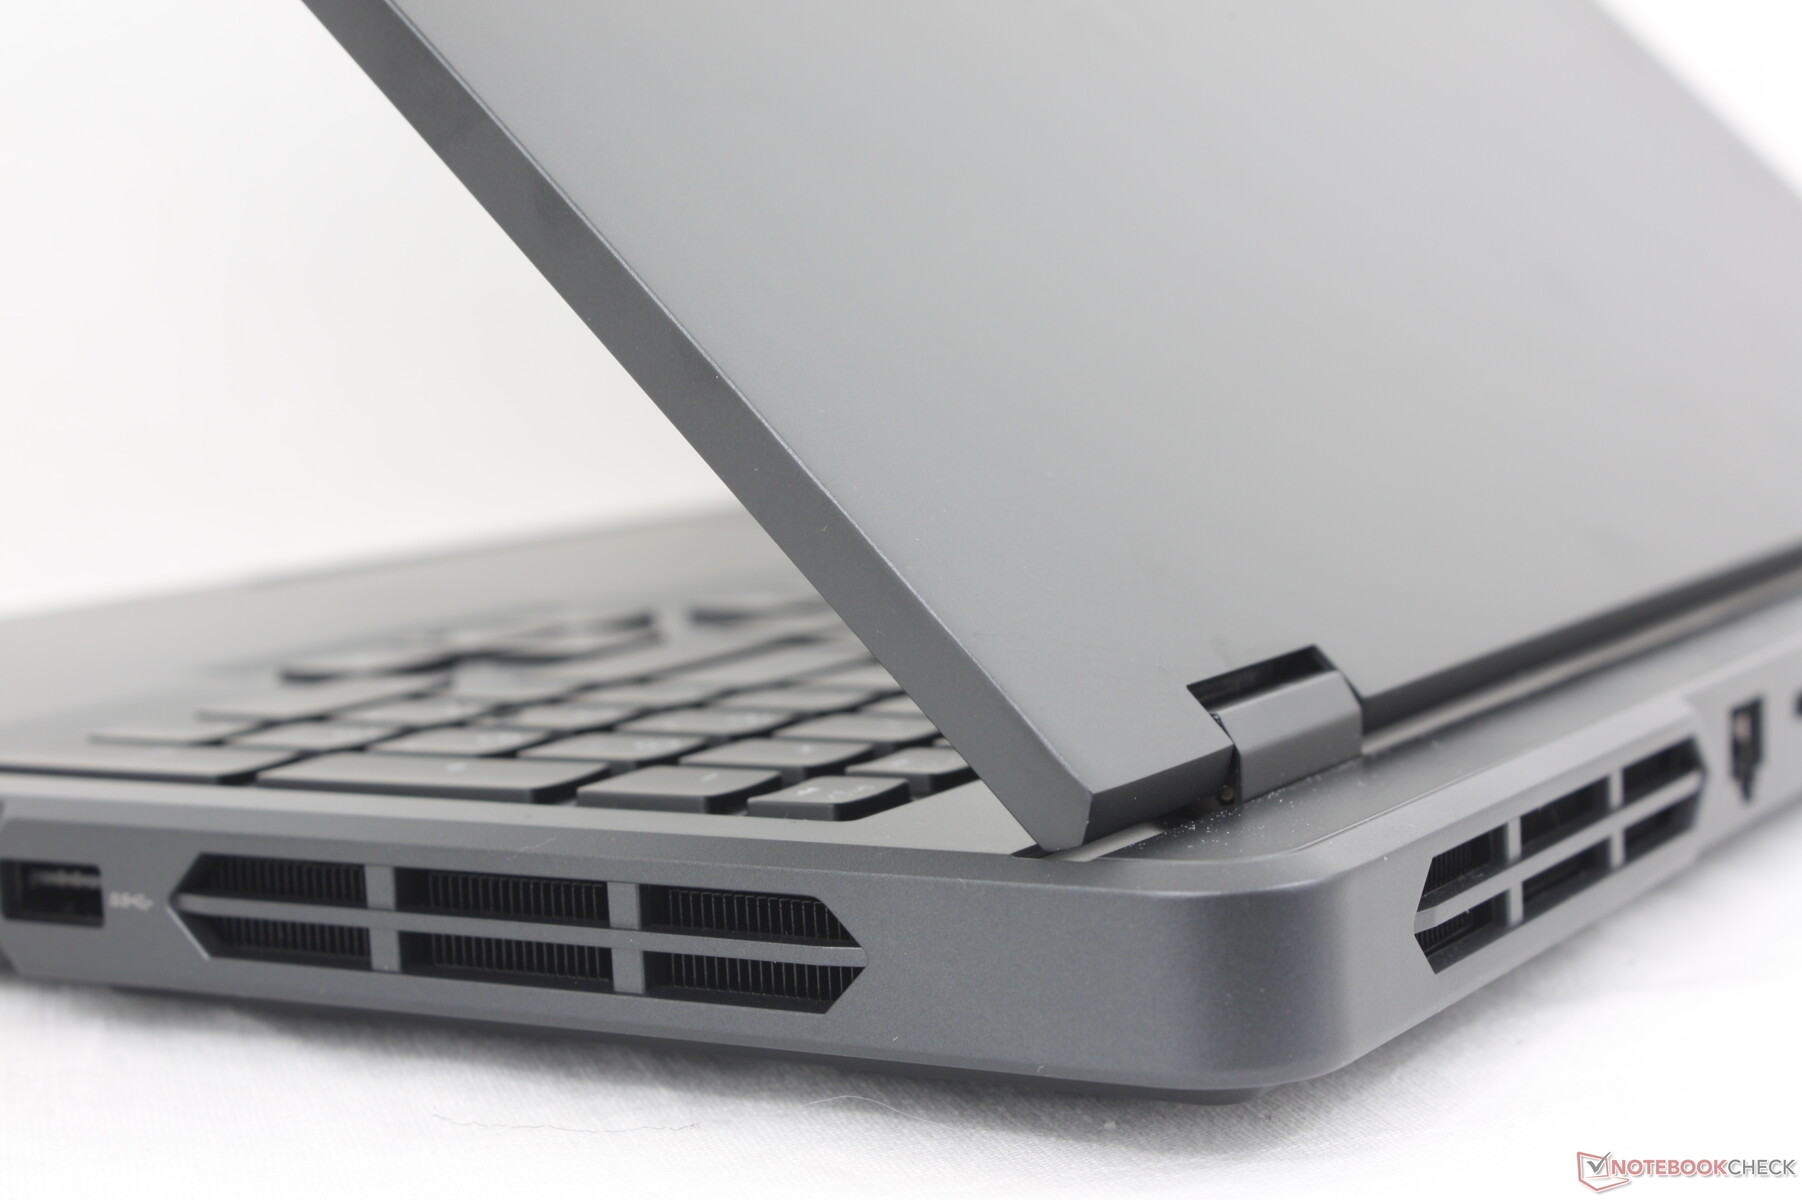
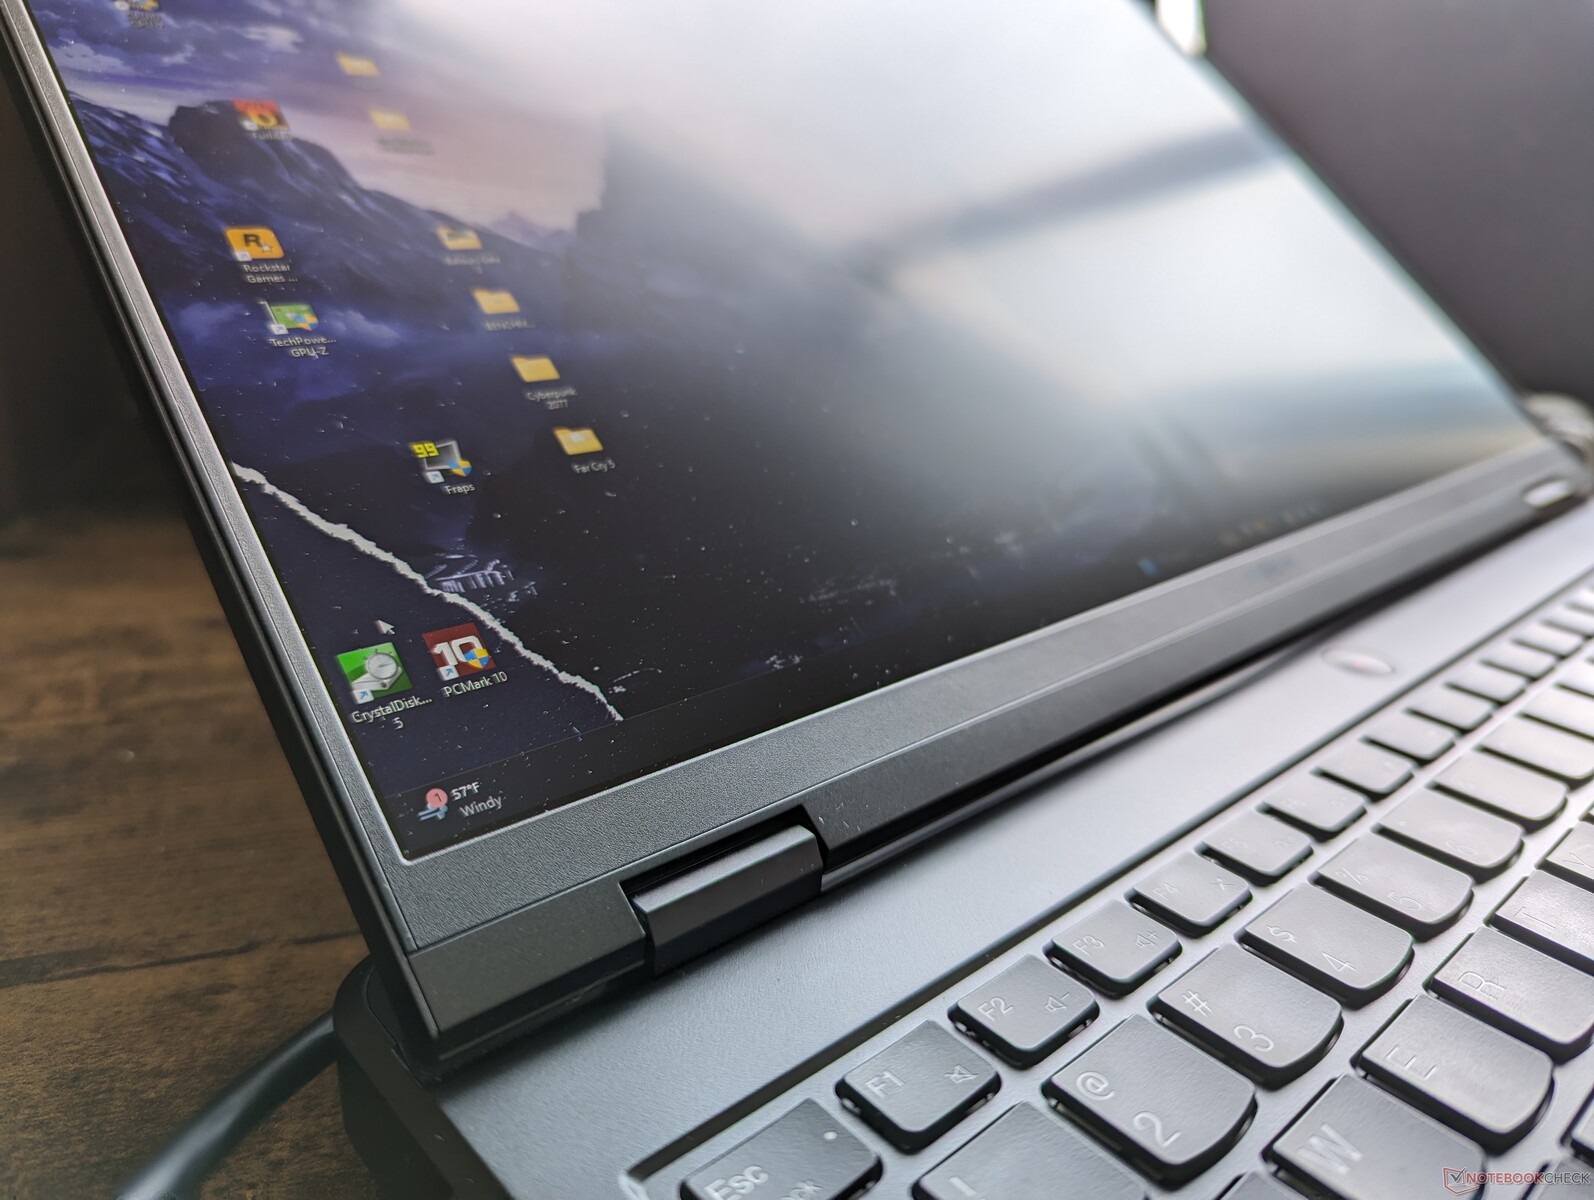
Gehäuse — kleine externe Veränderungen
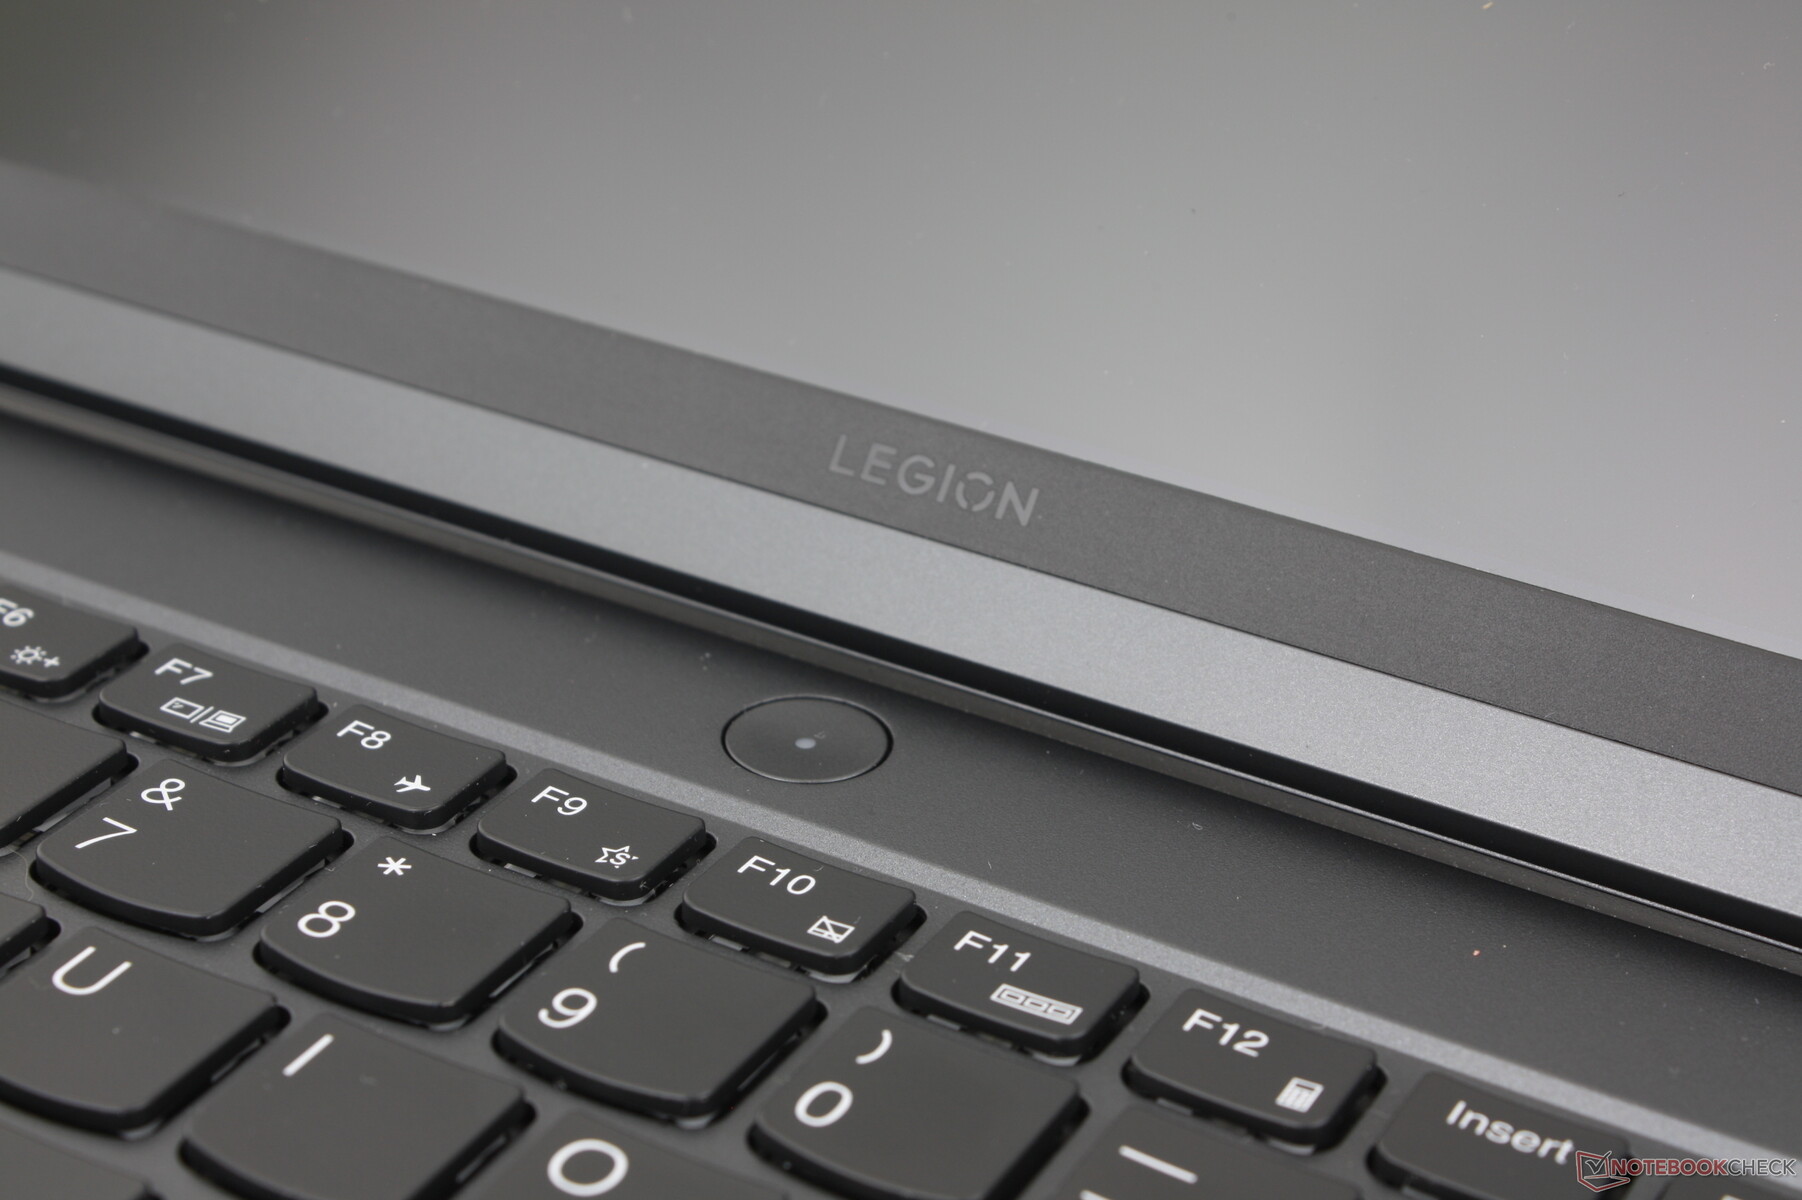
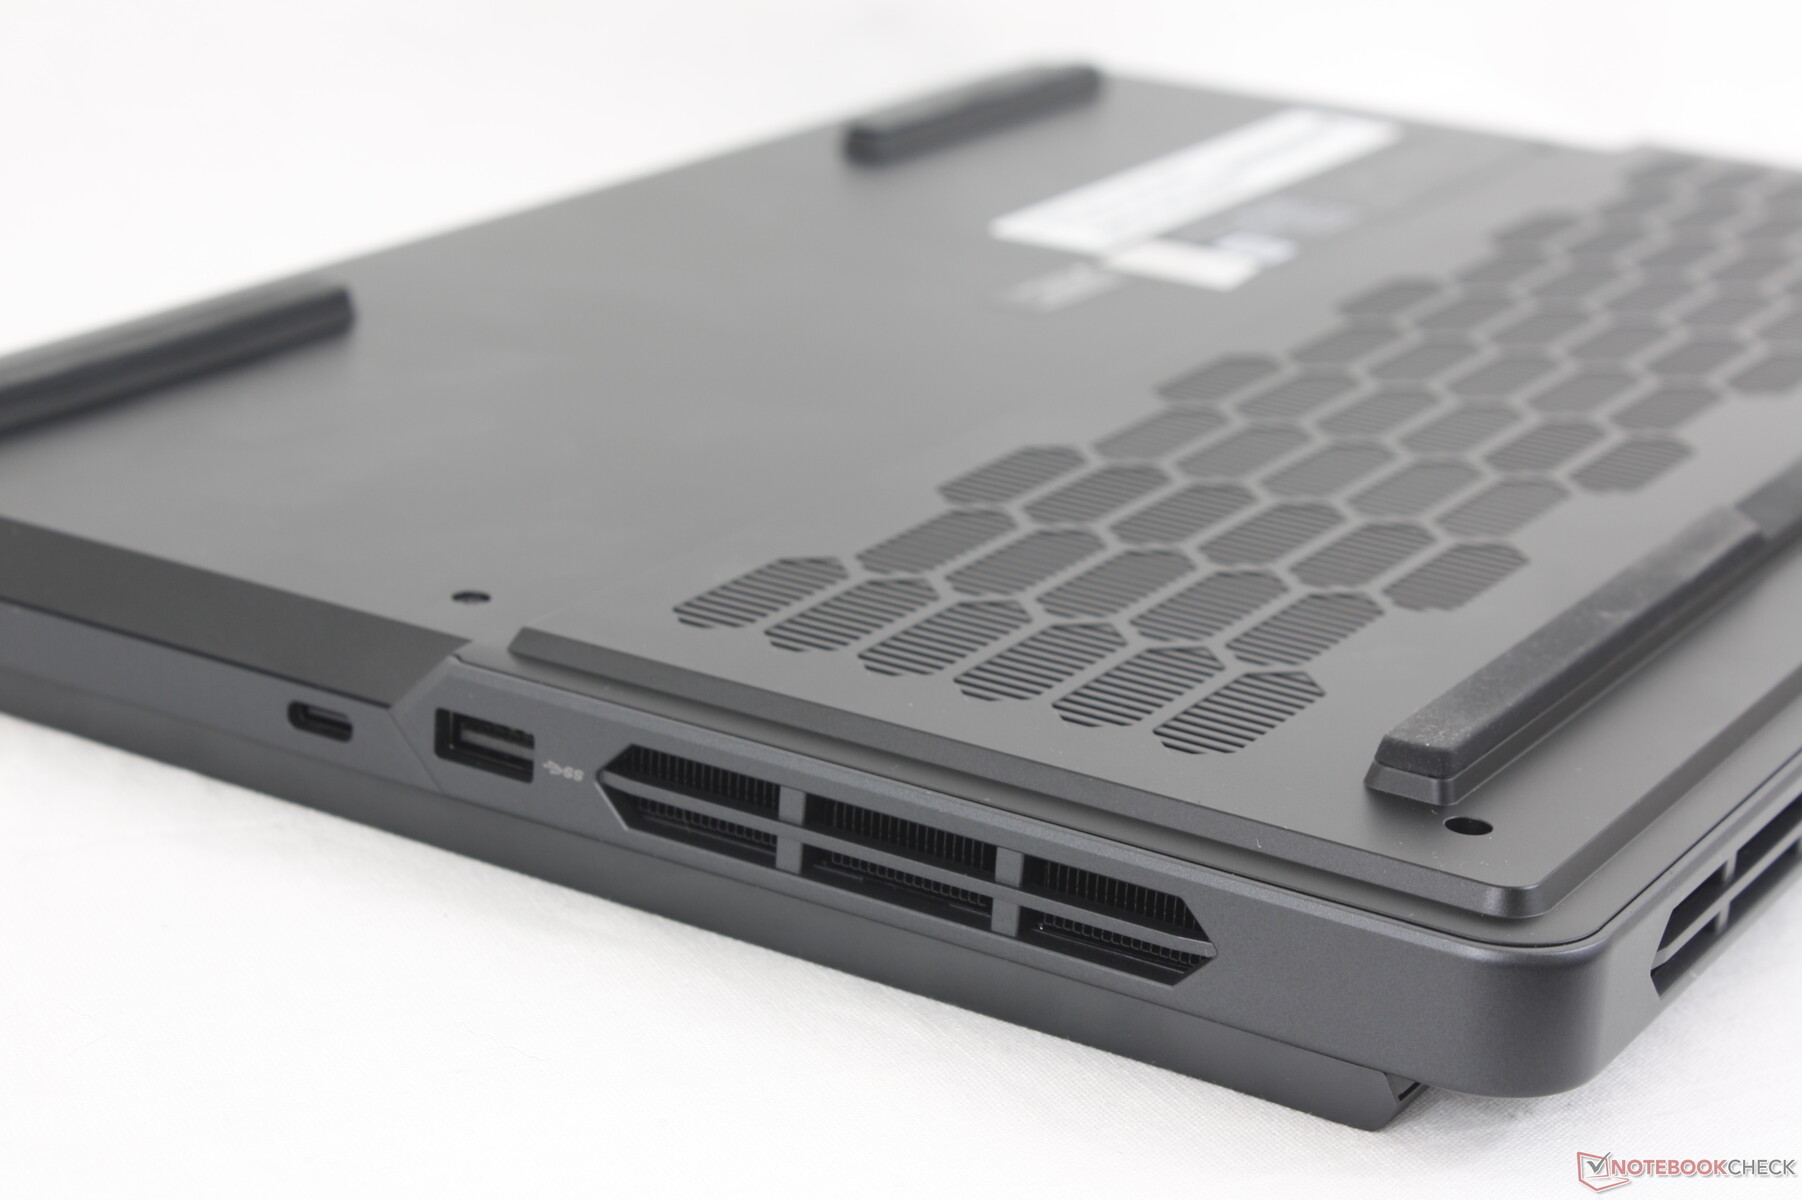
Lenovo verwendet für alle Modelle seiner Legion-Serie ein ähnliches Material aus grauem Aluminium. Dies ist auch beim Legion Pro 5 16IRX9 der Fall. Neu ist dieses Jahr das Design des Lüftungsgitters, das die Unterseite der Basiseinheit nun in Form von langgezogenen Hexagonen anstelle von Rechtecken ziert. Die Veränderung ist großteils oberflächlich und das restliche Gehäuse hat sich im Vergleich zum Legion Pro 6 16IRX8 nicht verändert.
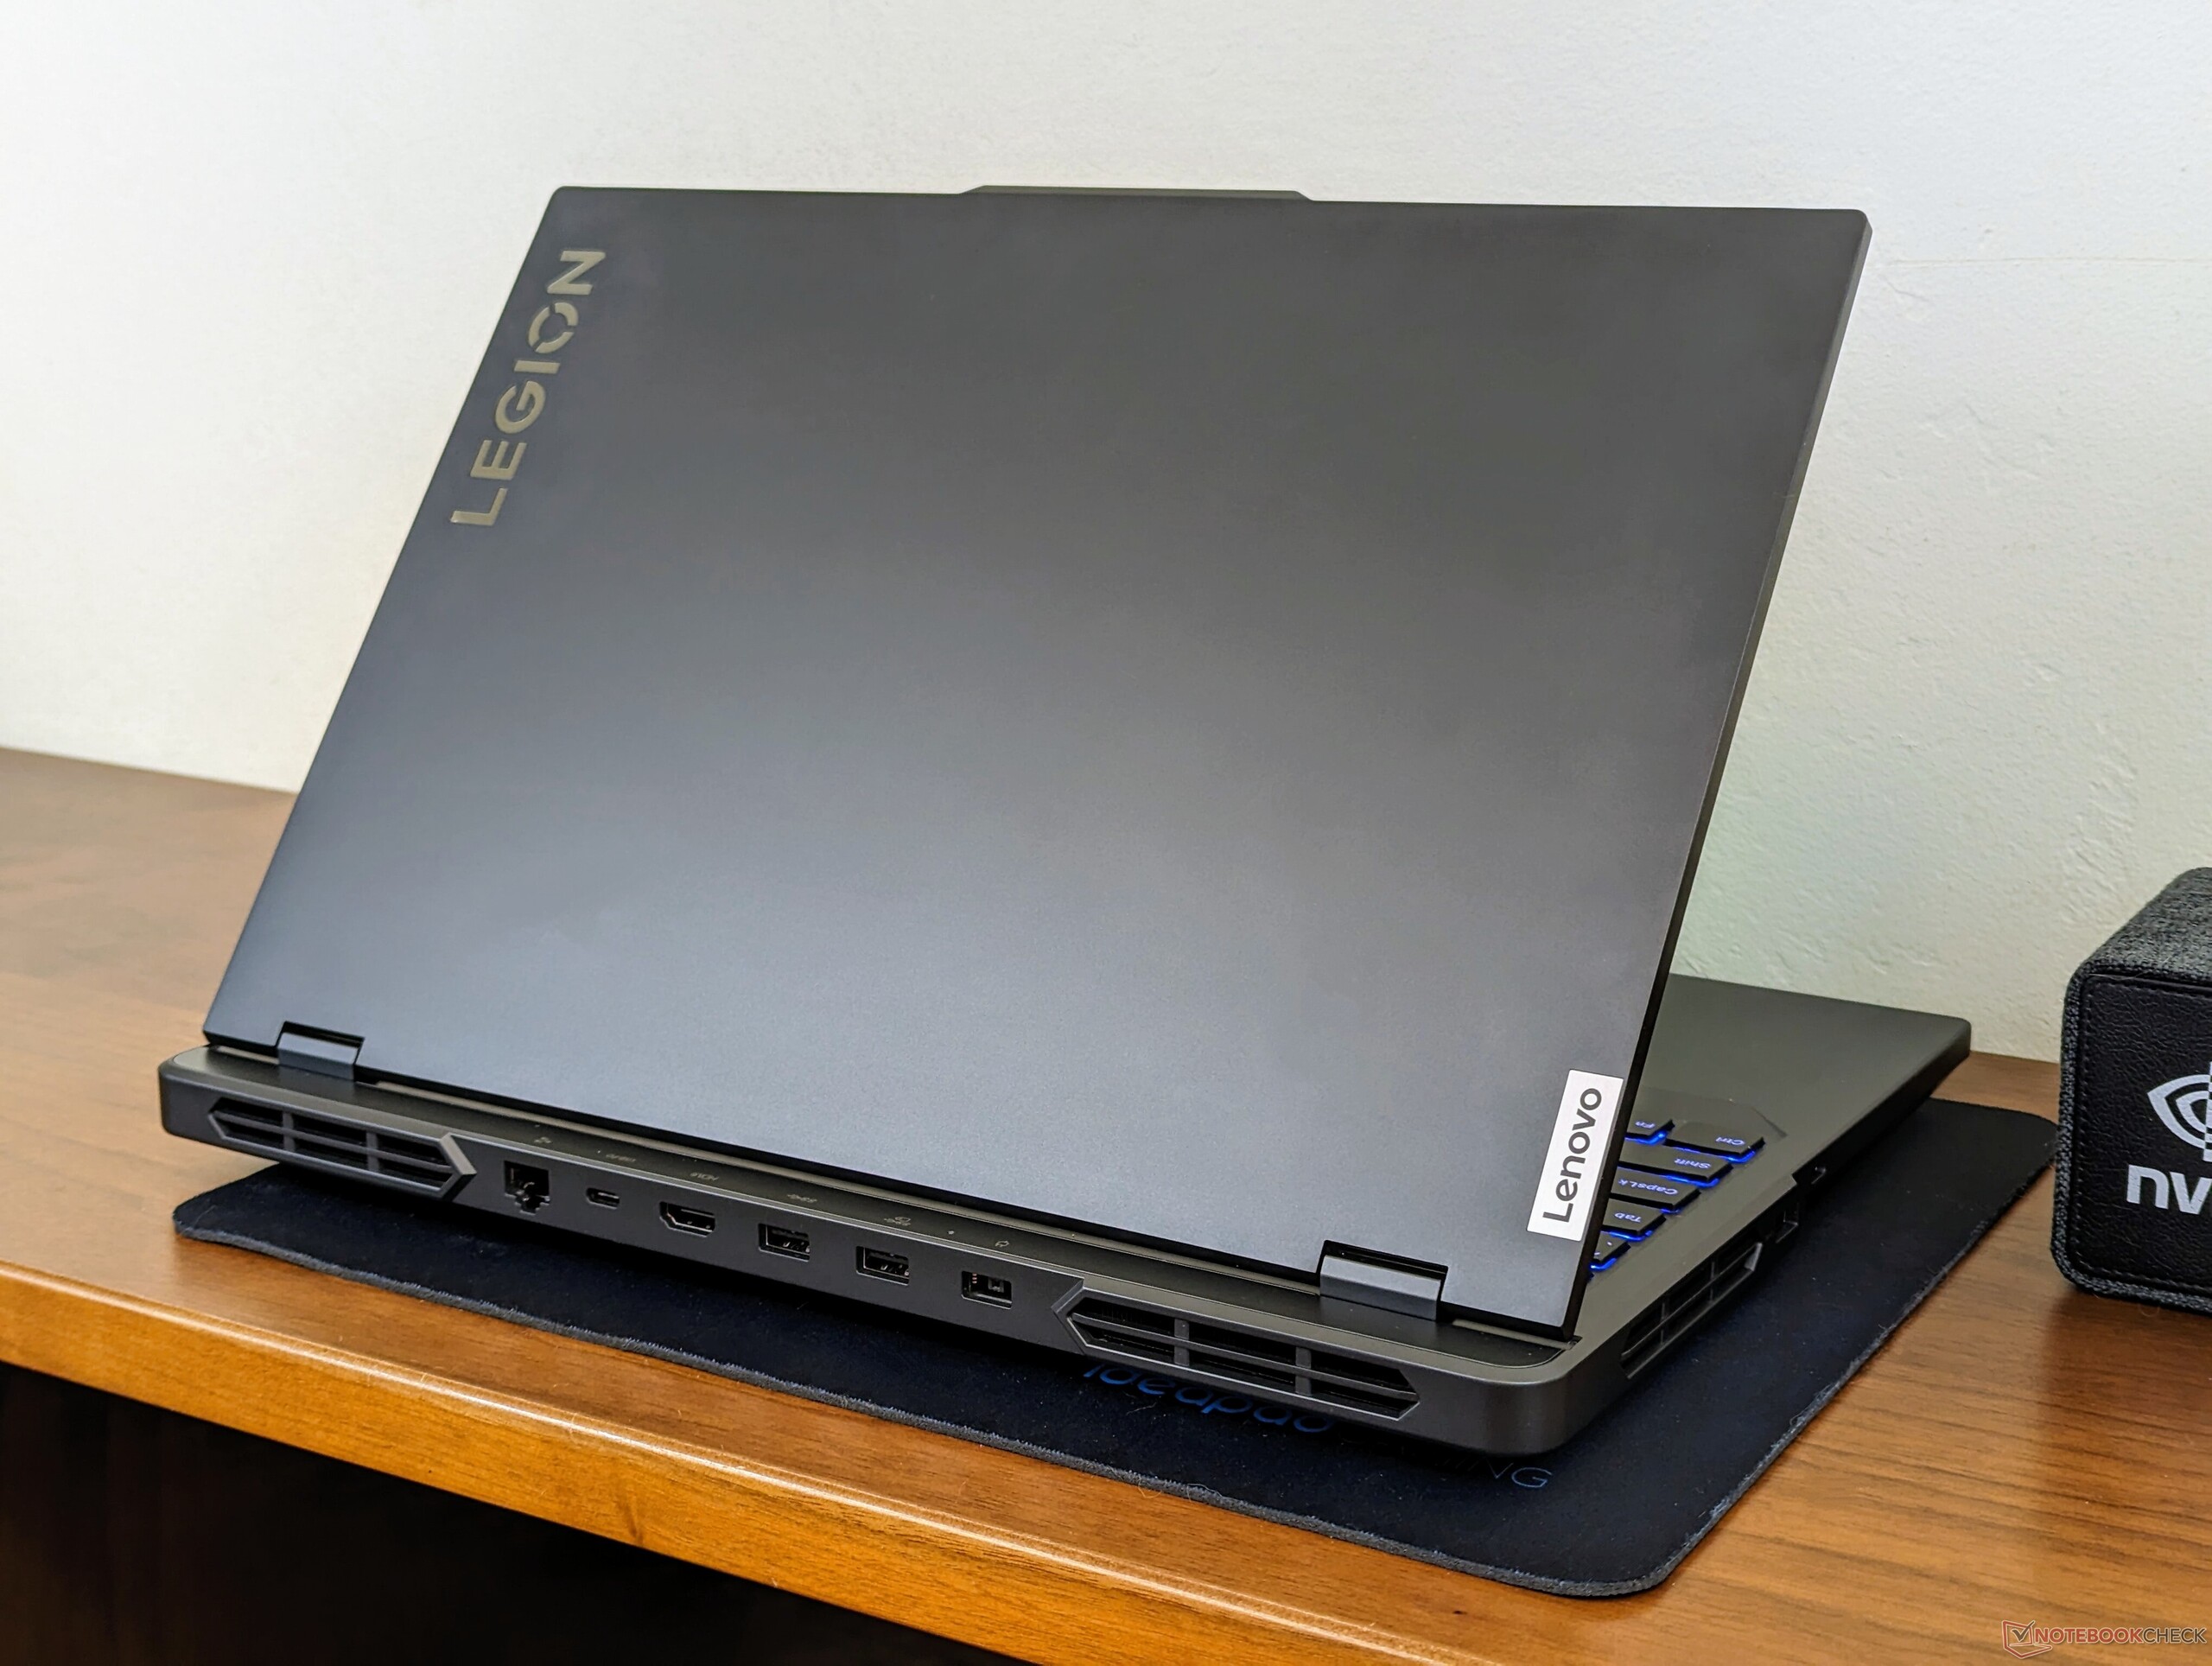
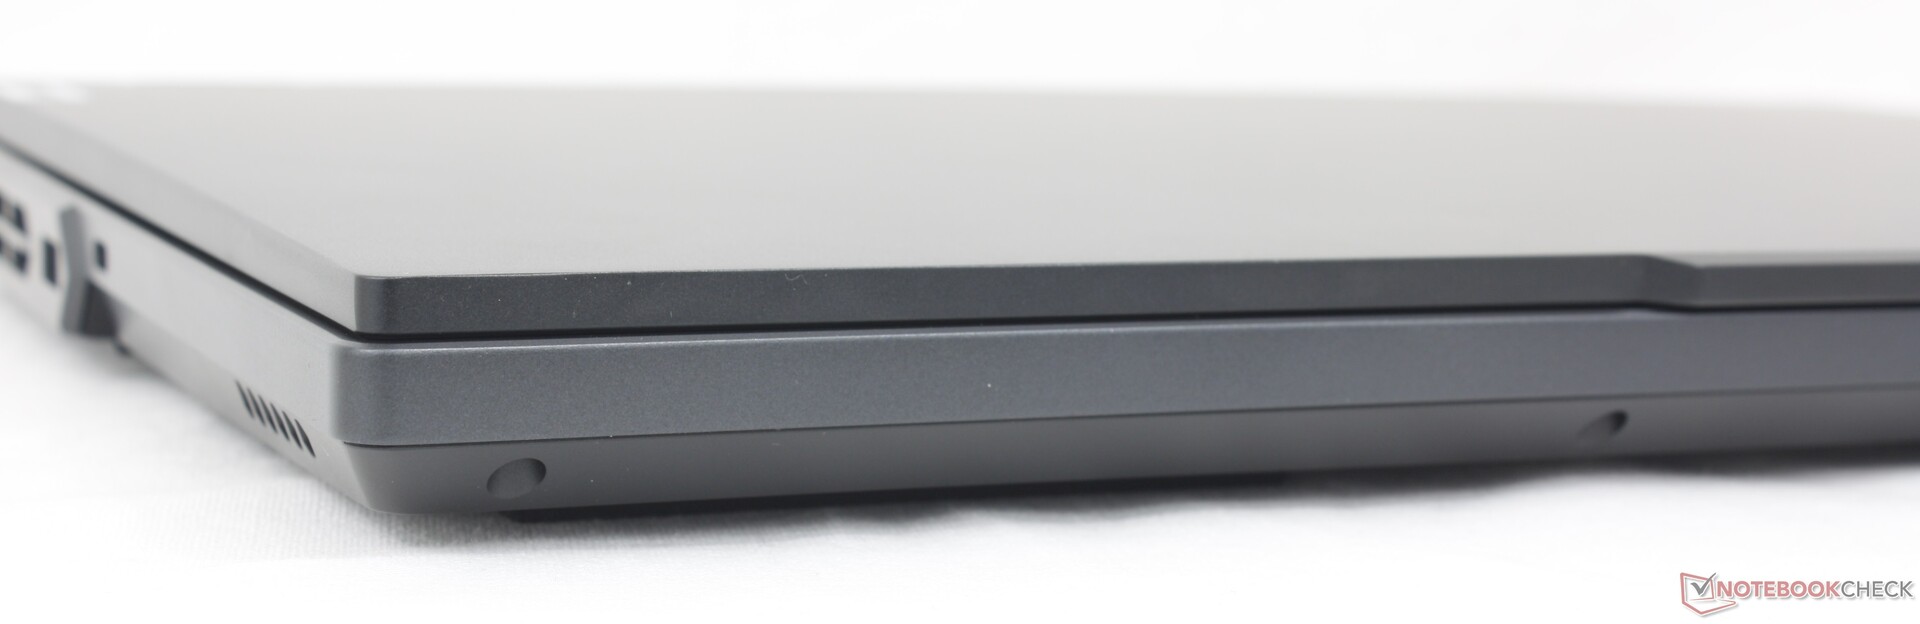
Das Legion Pro 5 16 ist und bleibt eines der größten und schwersten 16-Zoll-Gaming-Laptops und wiegt bis zu 600 Gramm mehr als einige seiner Mitstreiter. Immerhin hat dieser Größenunterschied eine Begründung: das Lenovo ist mit einer richtigen Core-HX-CPU ausgestattet, während kleinere und leichtere Alternativen wie das Alienware m16 R2 stattdessen mit langsameren Core-Ultra-CPUs ausgestattet sein könnten.
Ausstattung
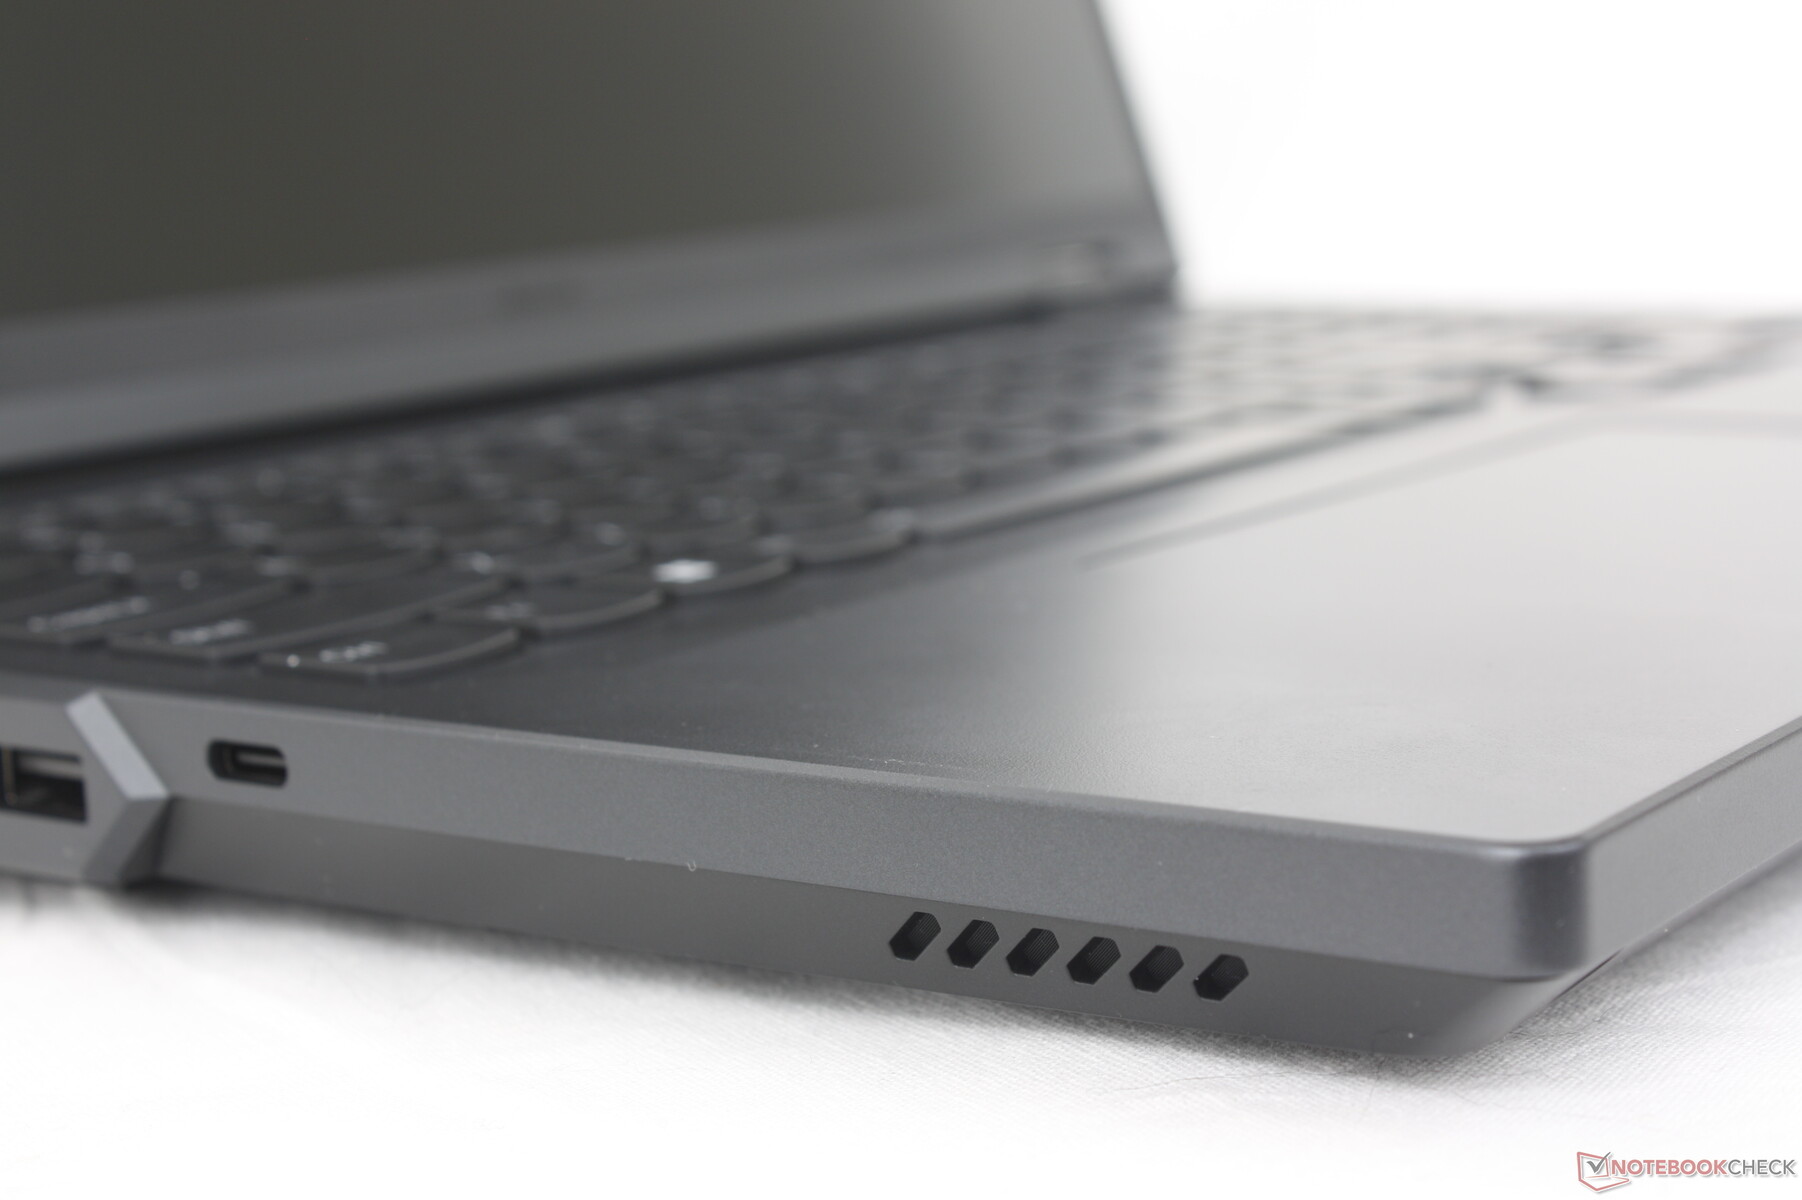
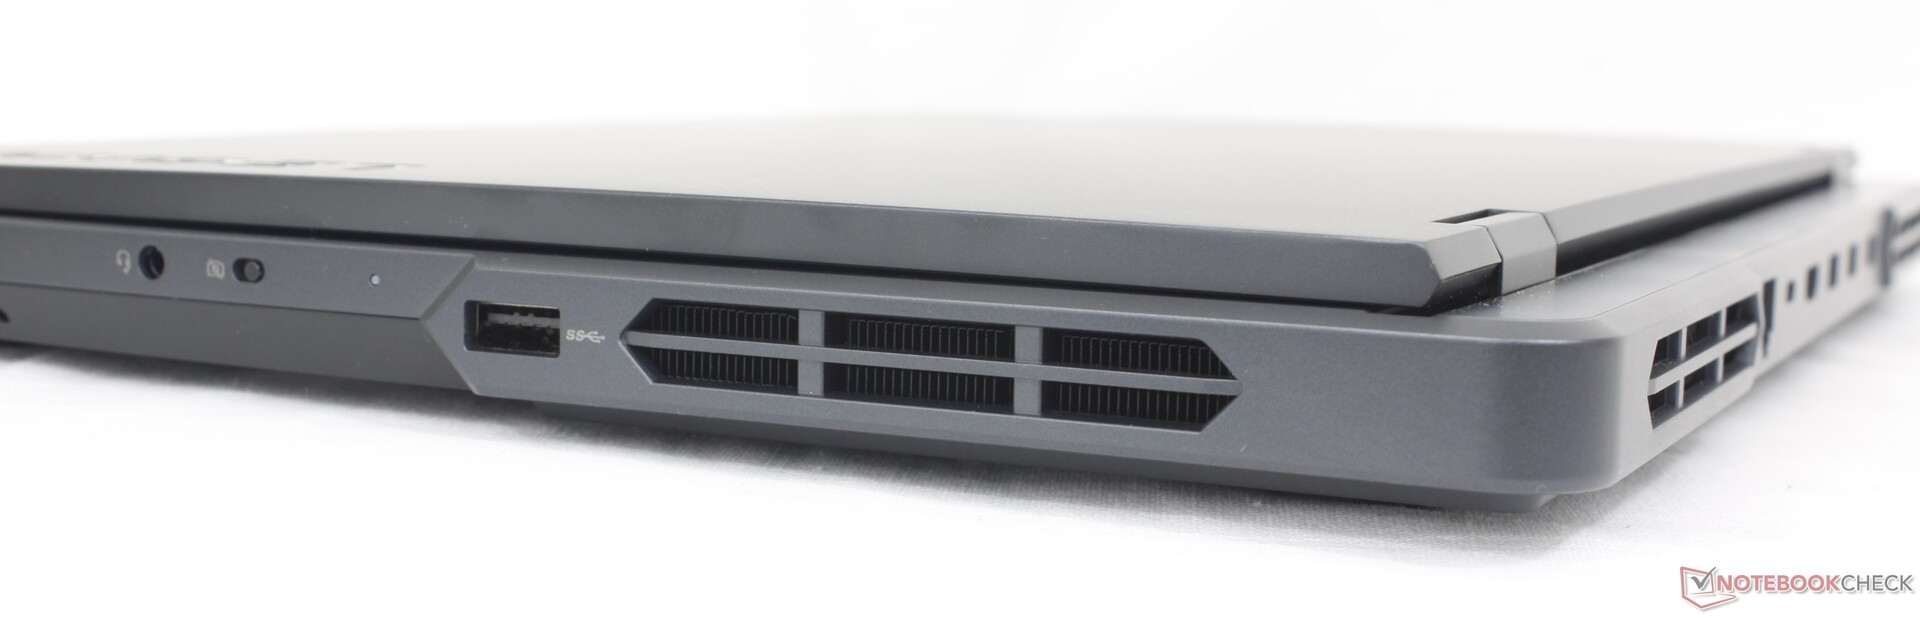
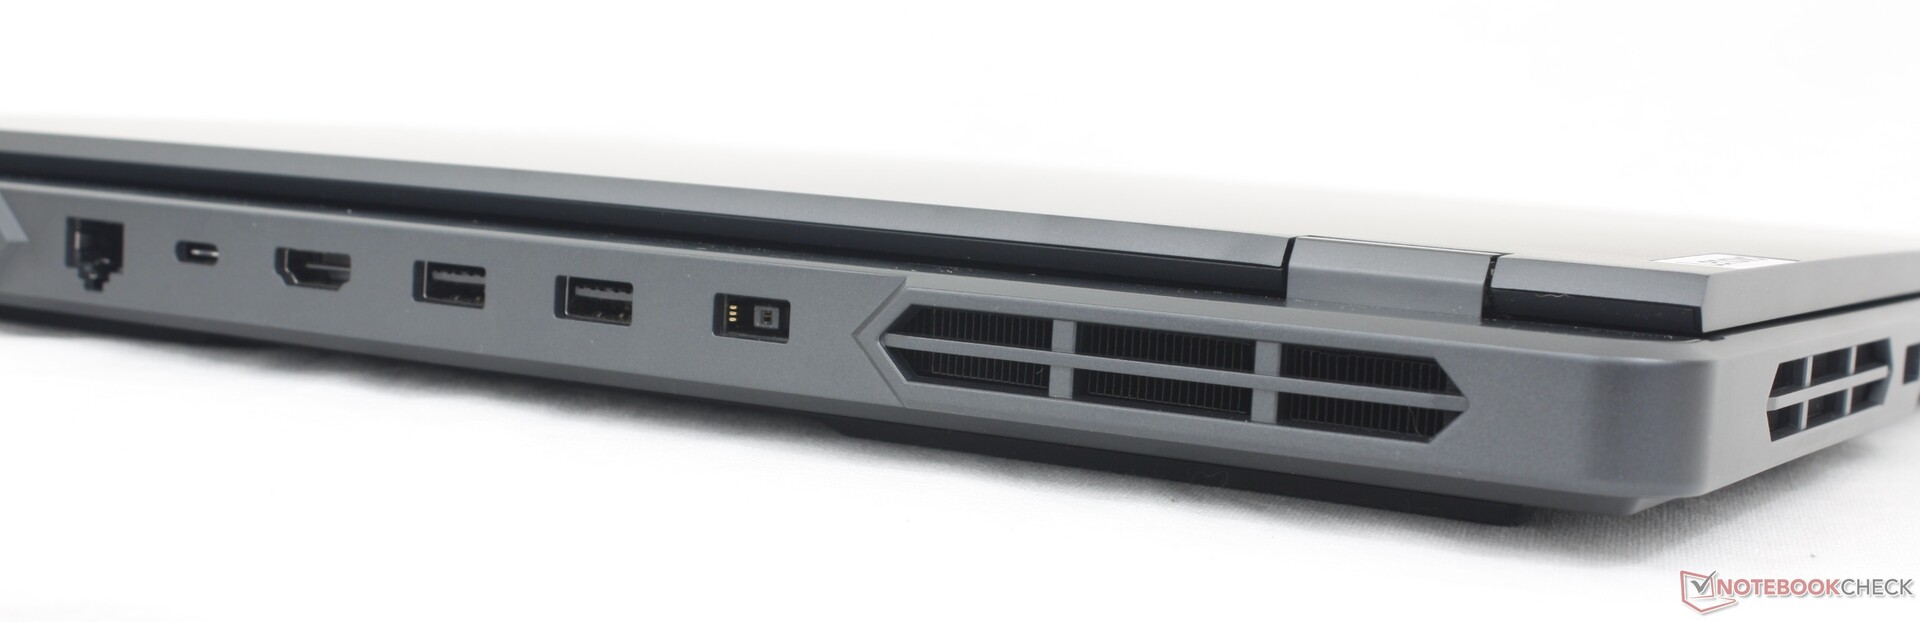
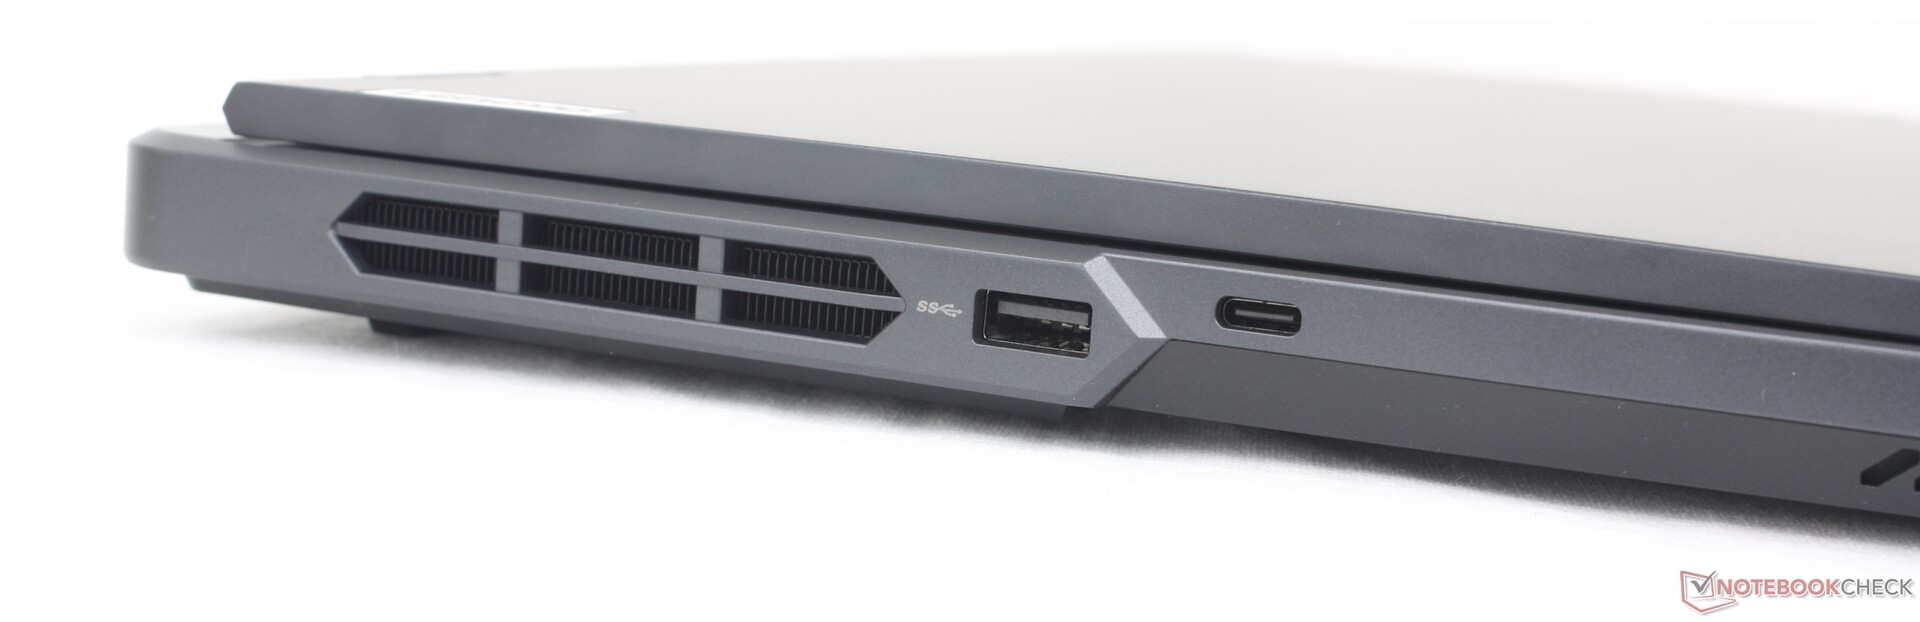
Die Anschlussoptionen bleiben wettbewerbsfähig, obwohl das Fehlen eines integrierten SD-Kartenlesers manche Content Creator stören könnte. Die gedruckten Anschlusssymbole erleichtern das Erkennen der Anschlüsse an der Rückseite im Vergleich zum Alienware m16 R2 oder dem HP Omen Transcend 16. Allerdings sind die Symbole im Gegensatz zum Legion Pro 7 nicht beleuchtet.
Während Laptops mit Thunderbolt 5 langsam auf dem Markt erscheinen, ist das Legion Pro 5 16 weiterhin nur mit Thunderbolt 4 ausgestattet.
Kommunikation
Das Intel AX211-Modul ist standardmäßig mit Wi-Fi 6E und Bluetooth 5.2 ausgestattet. Im Test mit unserem Asus-AXE11000-Referenzrouter kam es zu keinerlei Verbindungsproblemen.
Webcam
Unser Testgerät ist mit einer 2-MP-Webcam ausgestattet; bei andere Konfigurationen könnte die Auflösung auch auf 1 MP eingeschränkt sein. Ein elektronischer Kameraschieber ist integriert. IR ist nicht vorhanden.


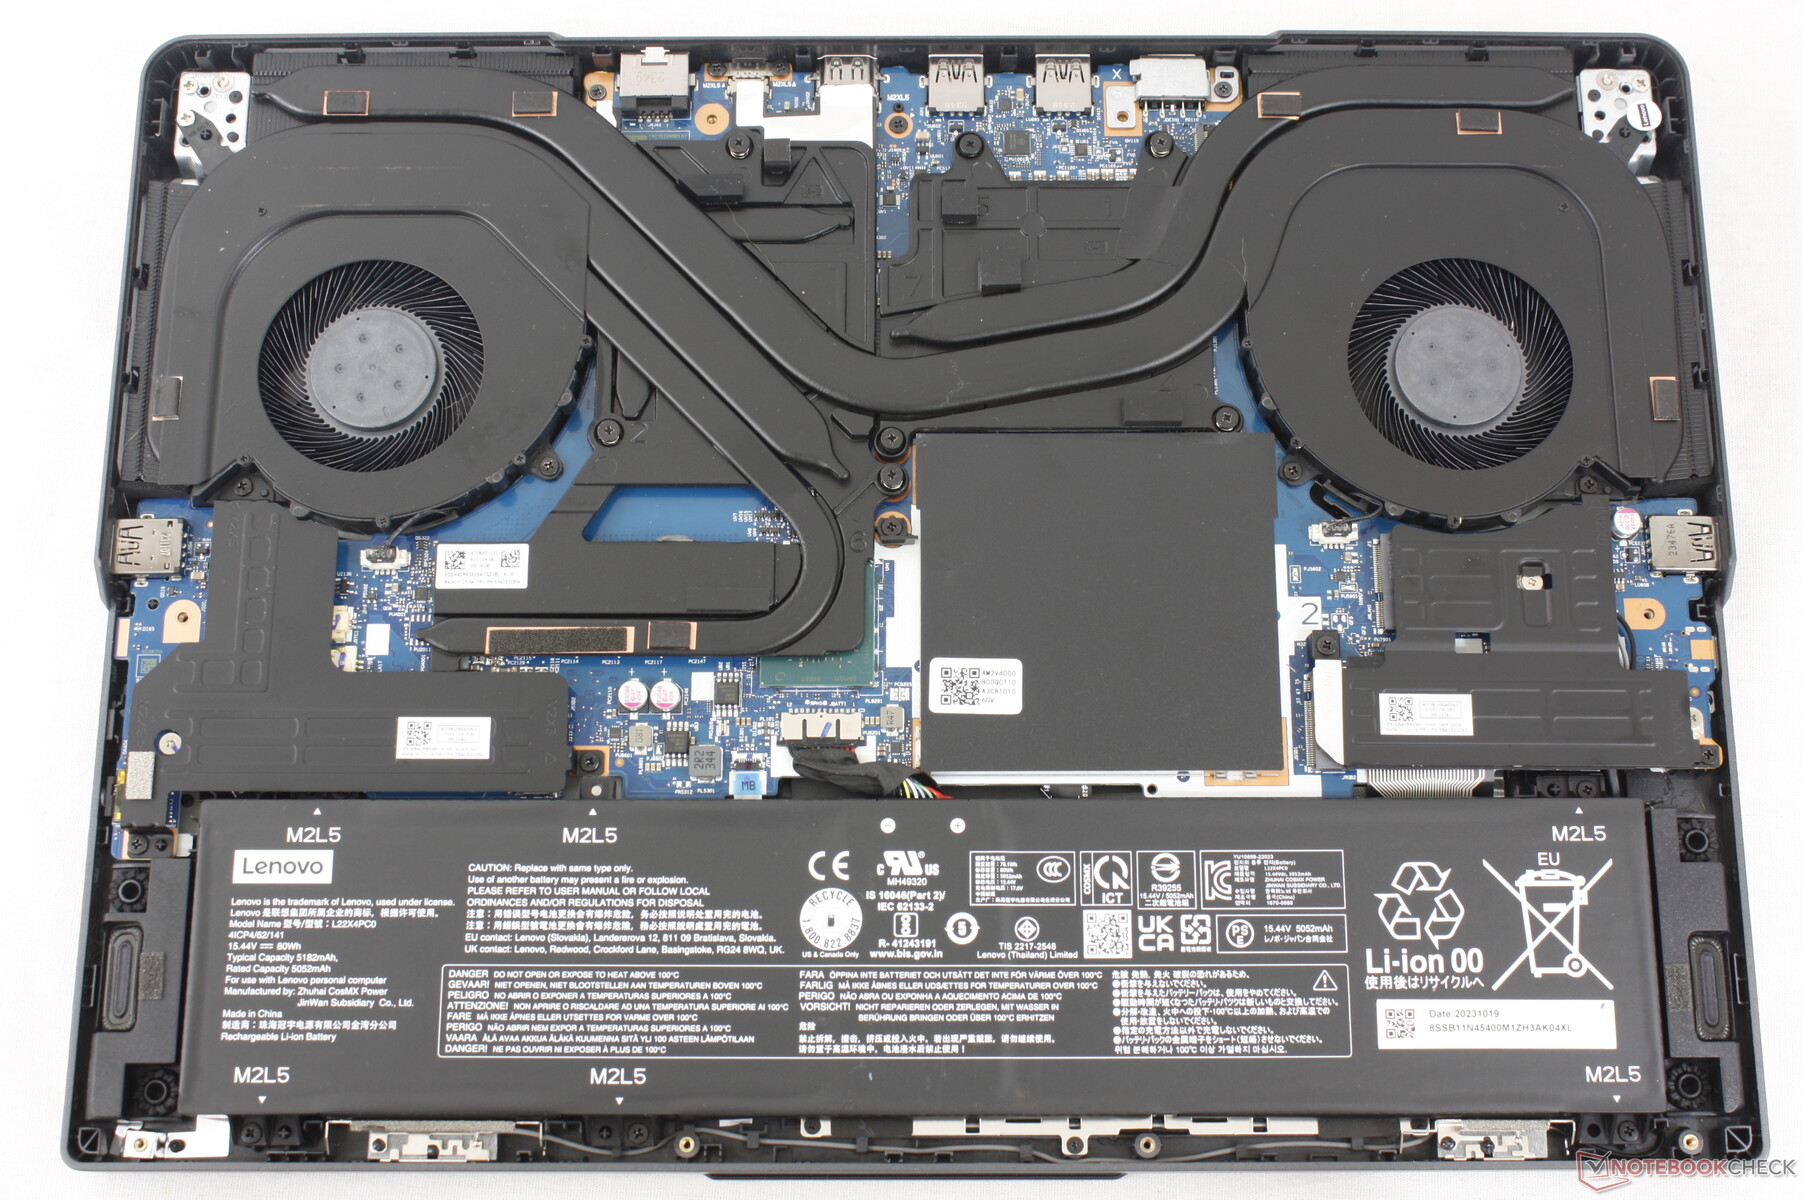
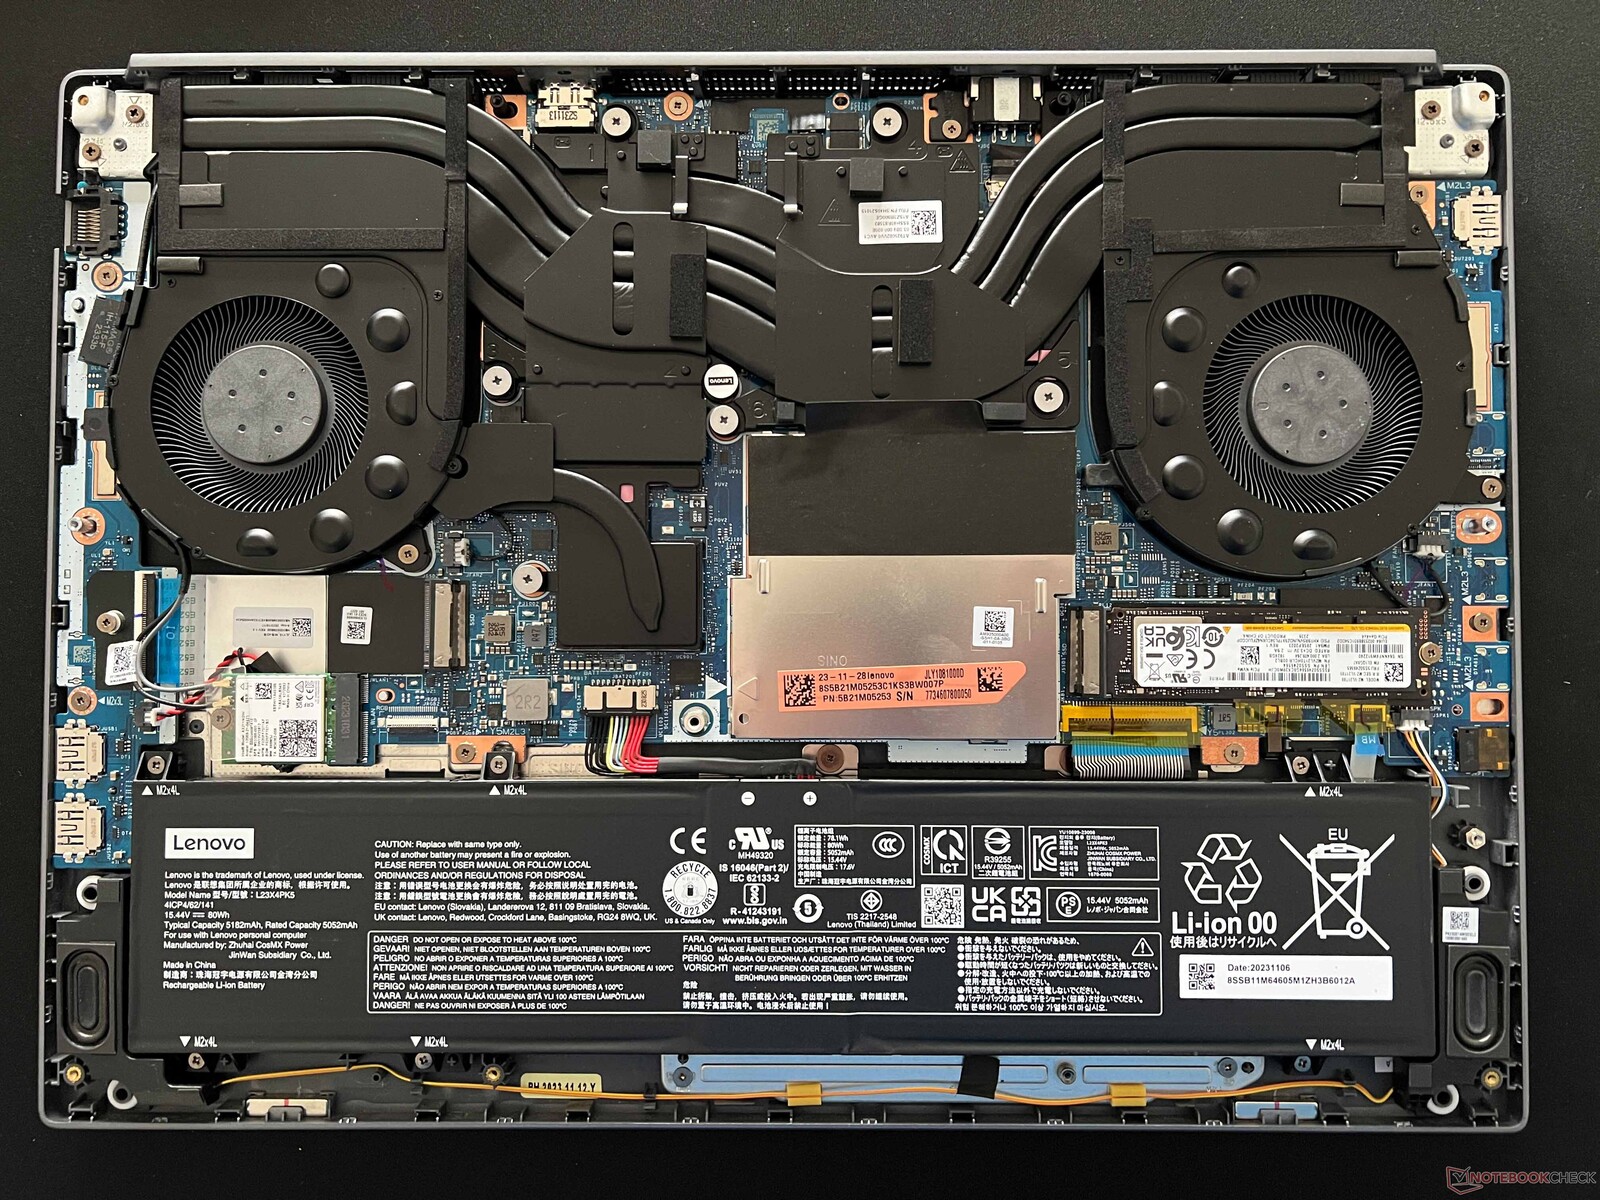
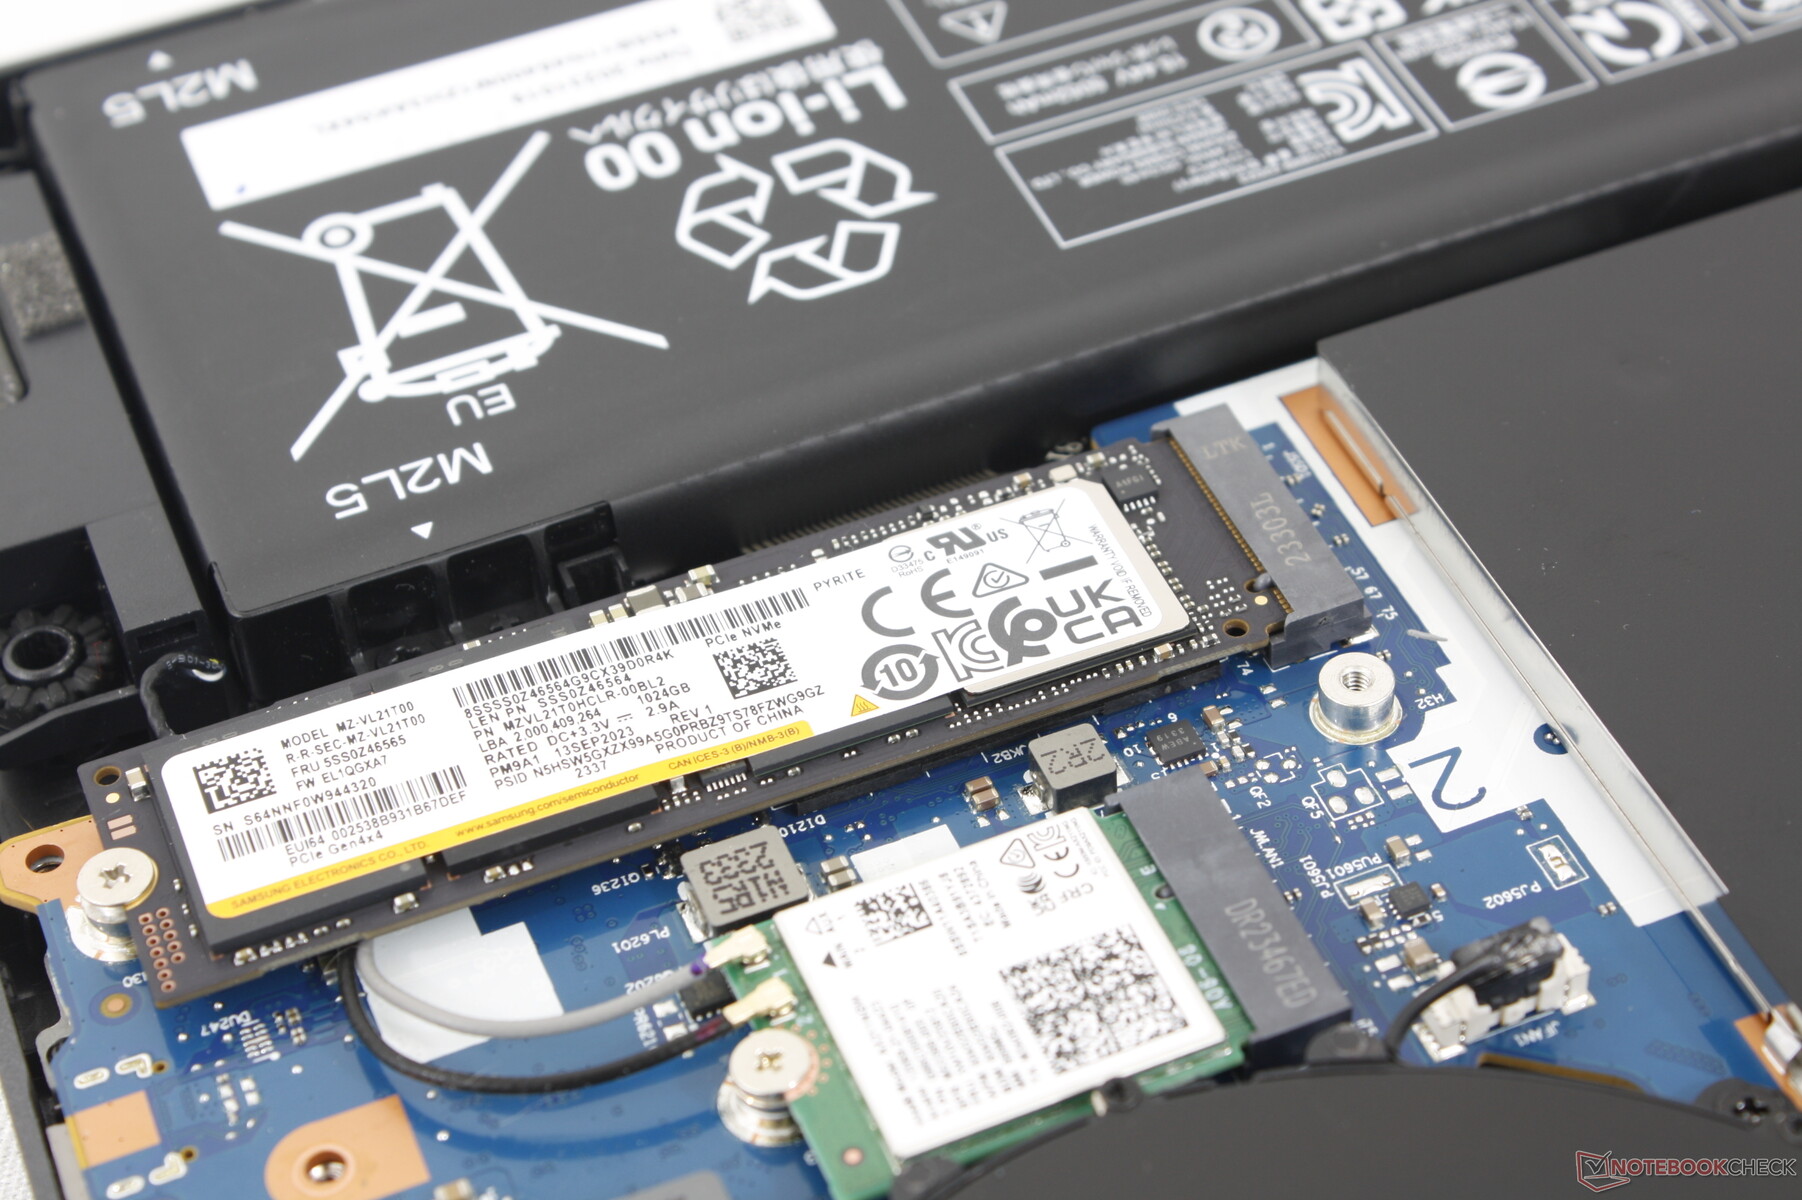
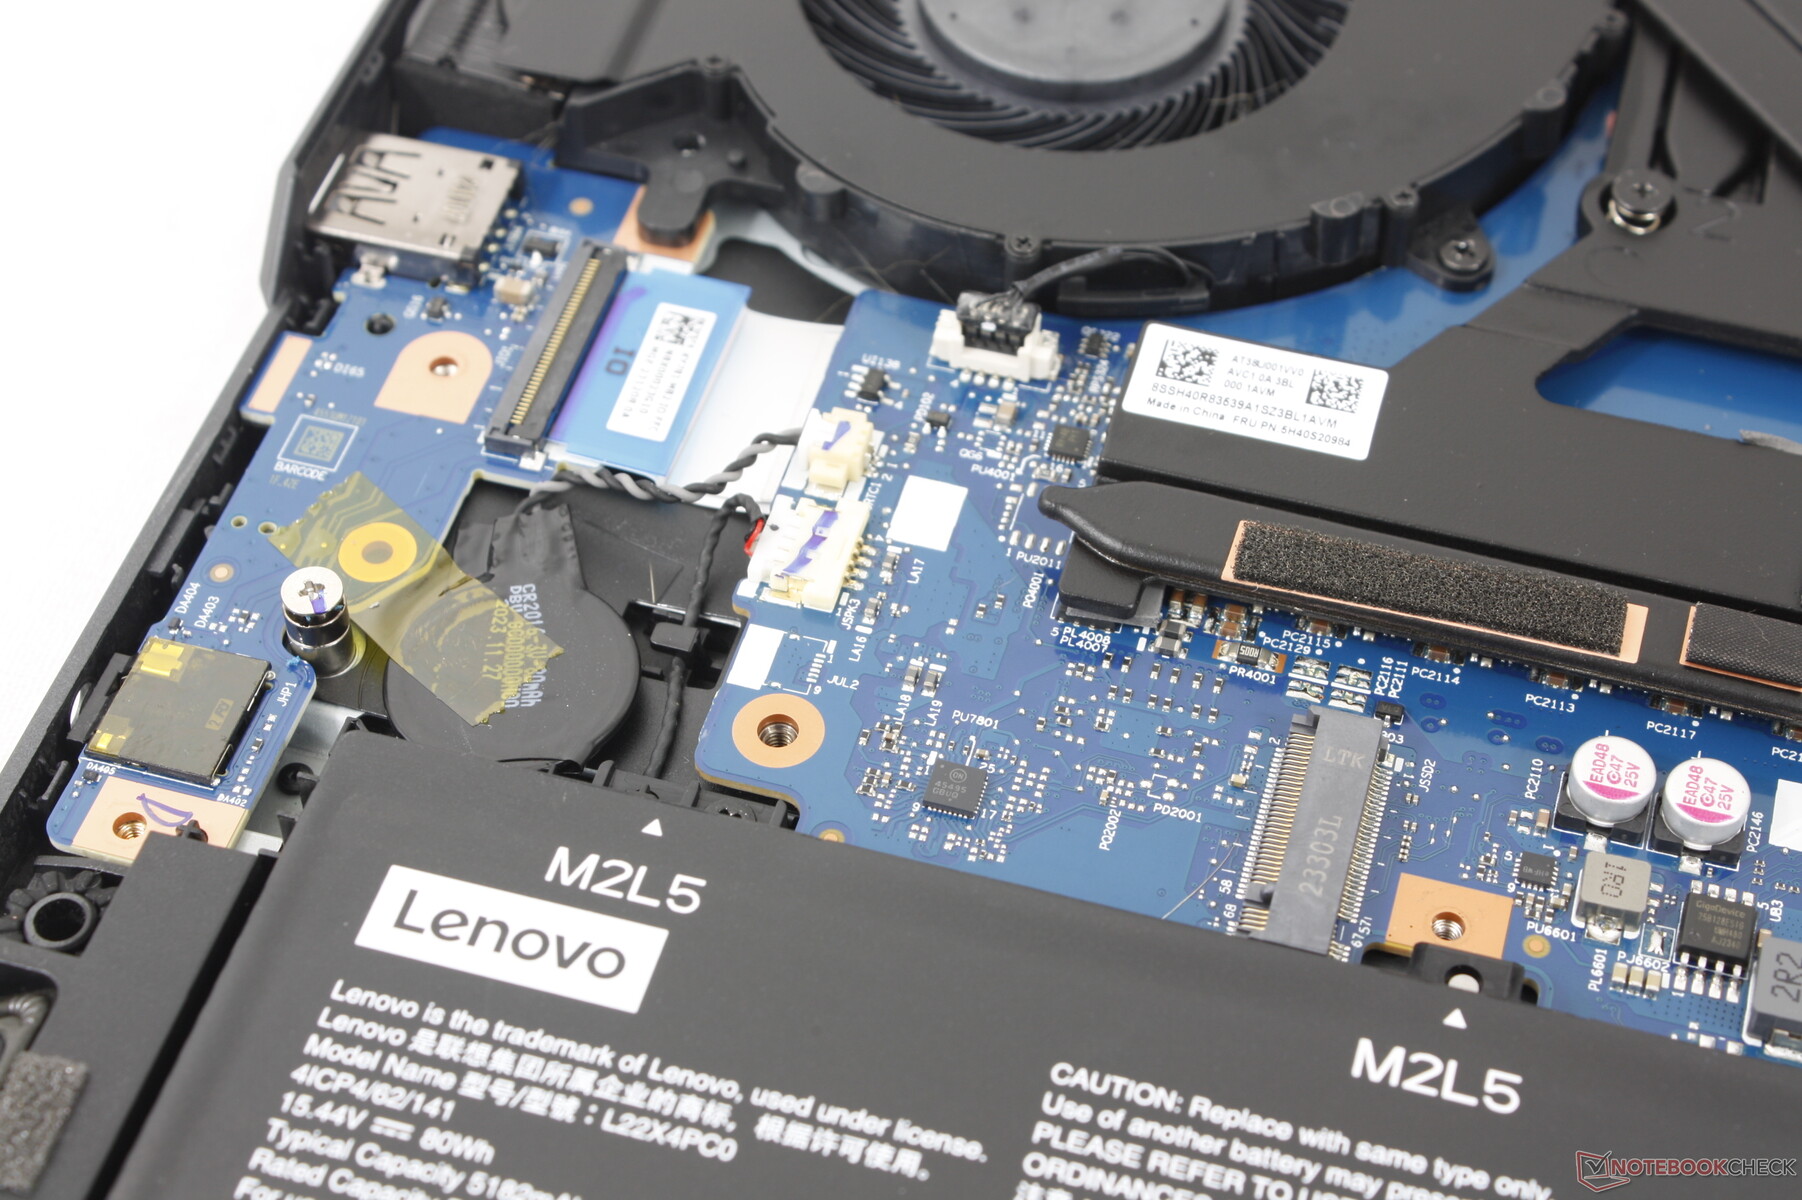
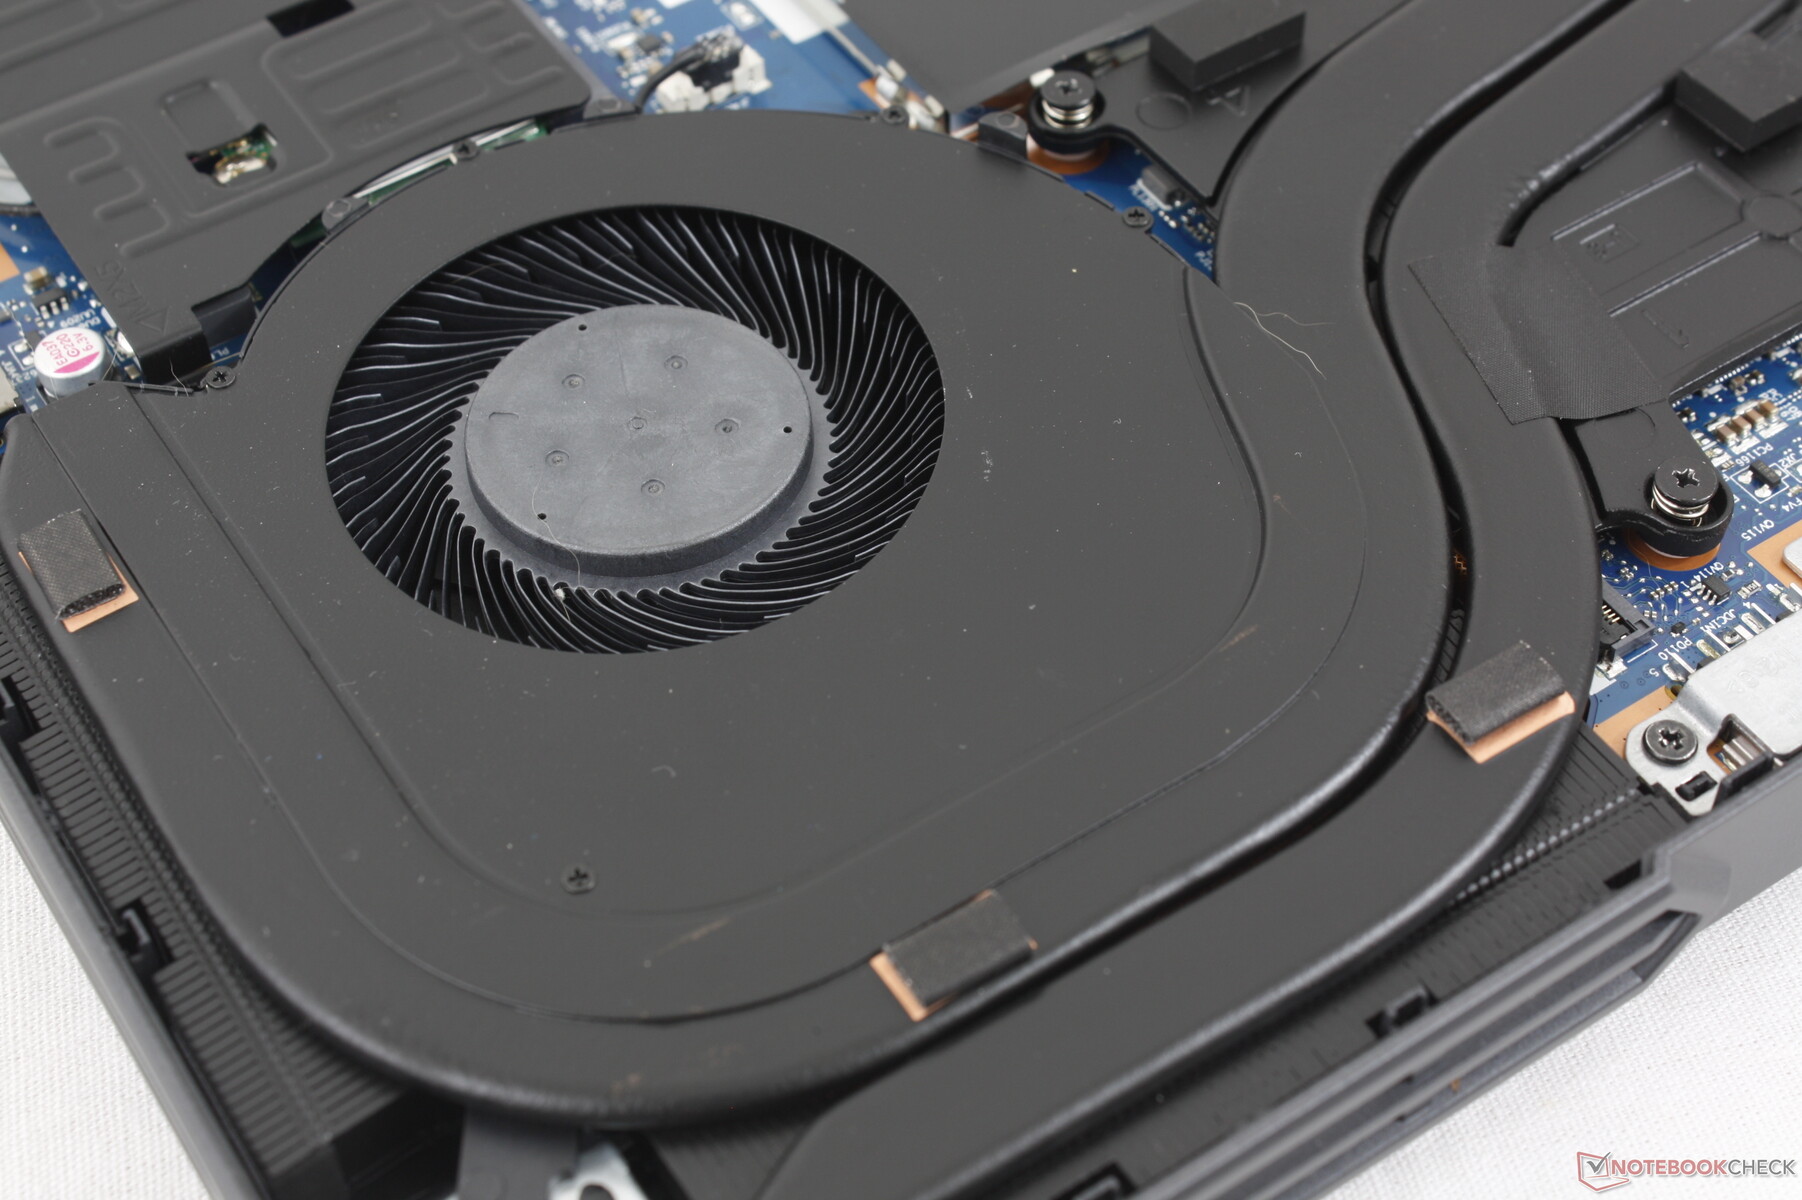
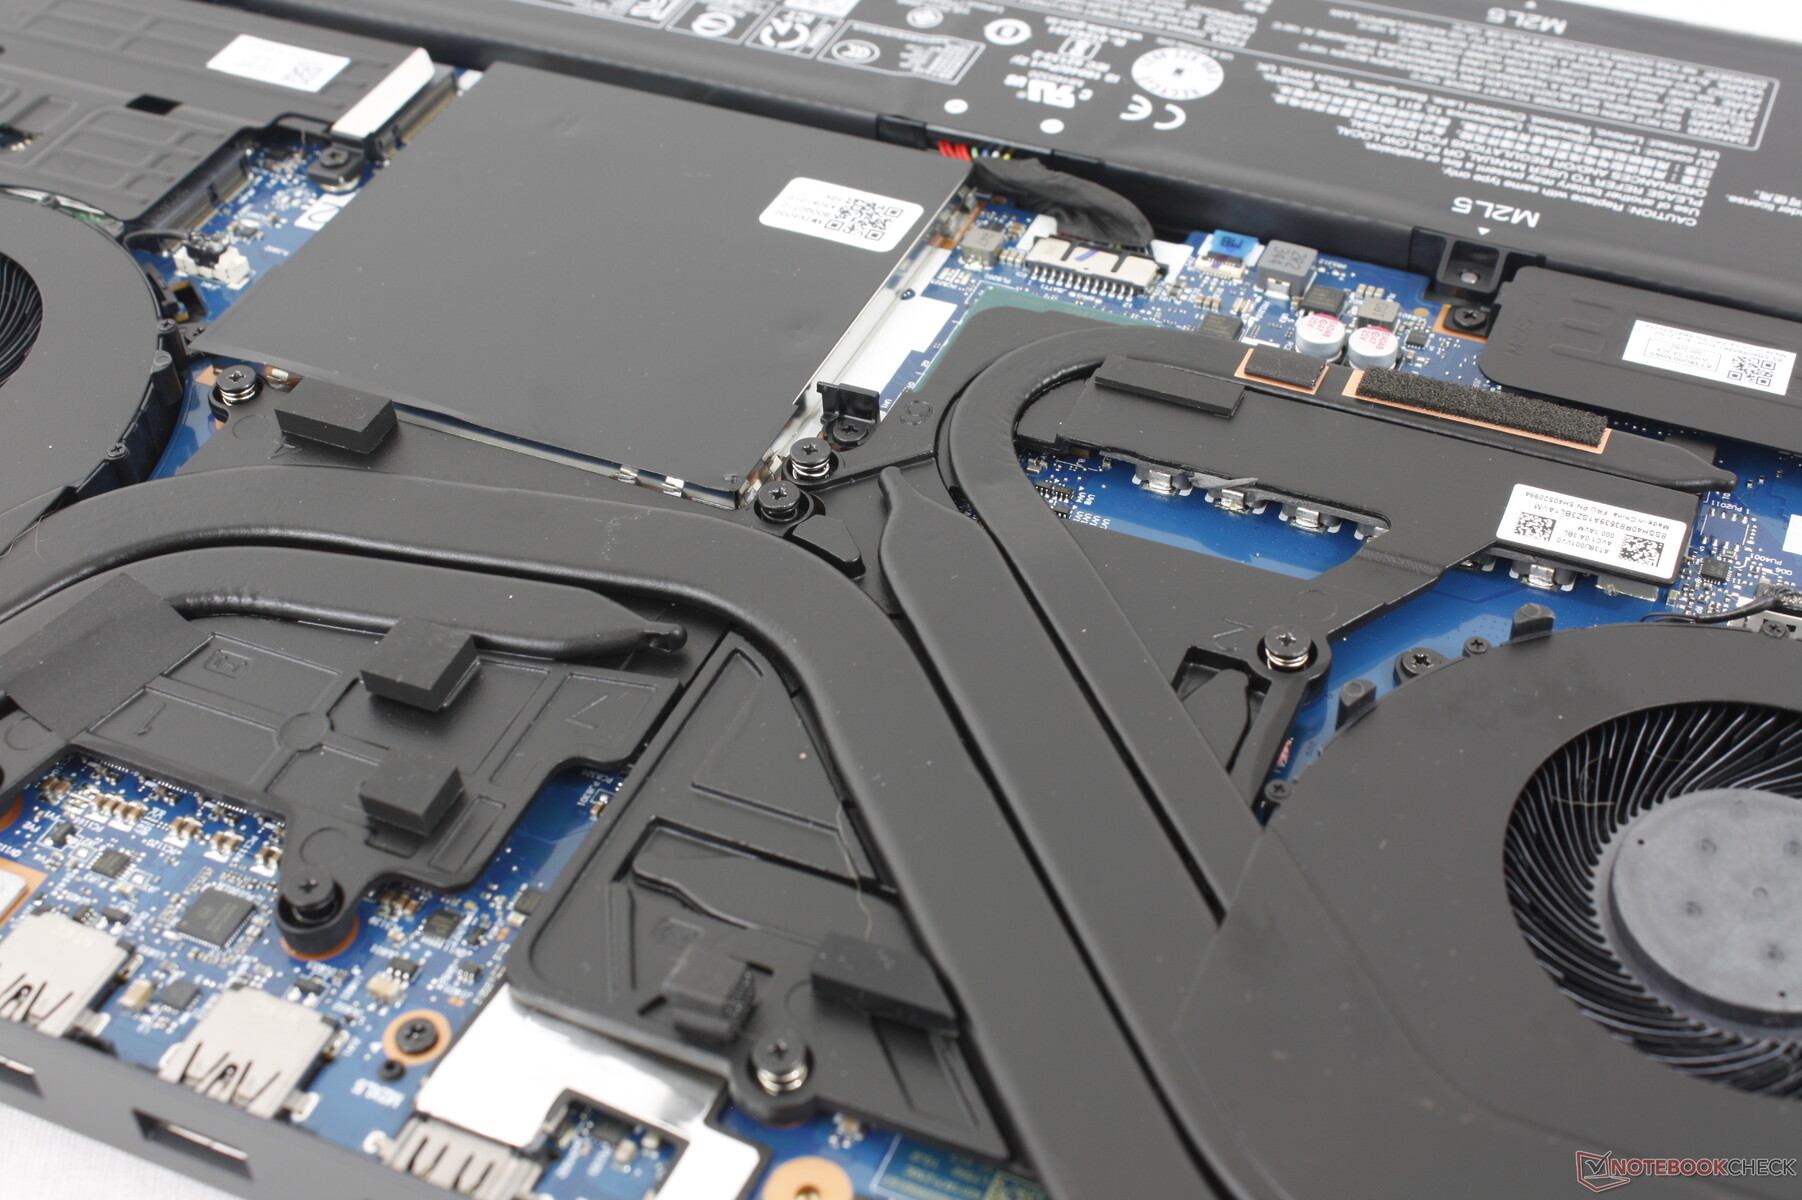
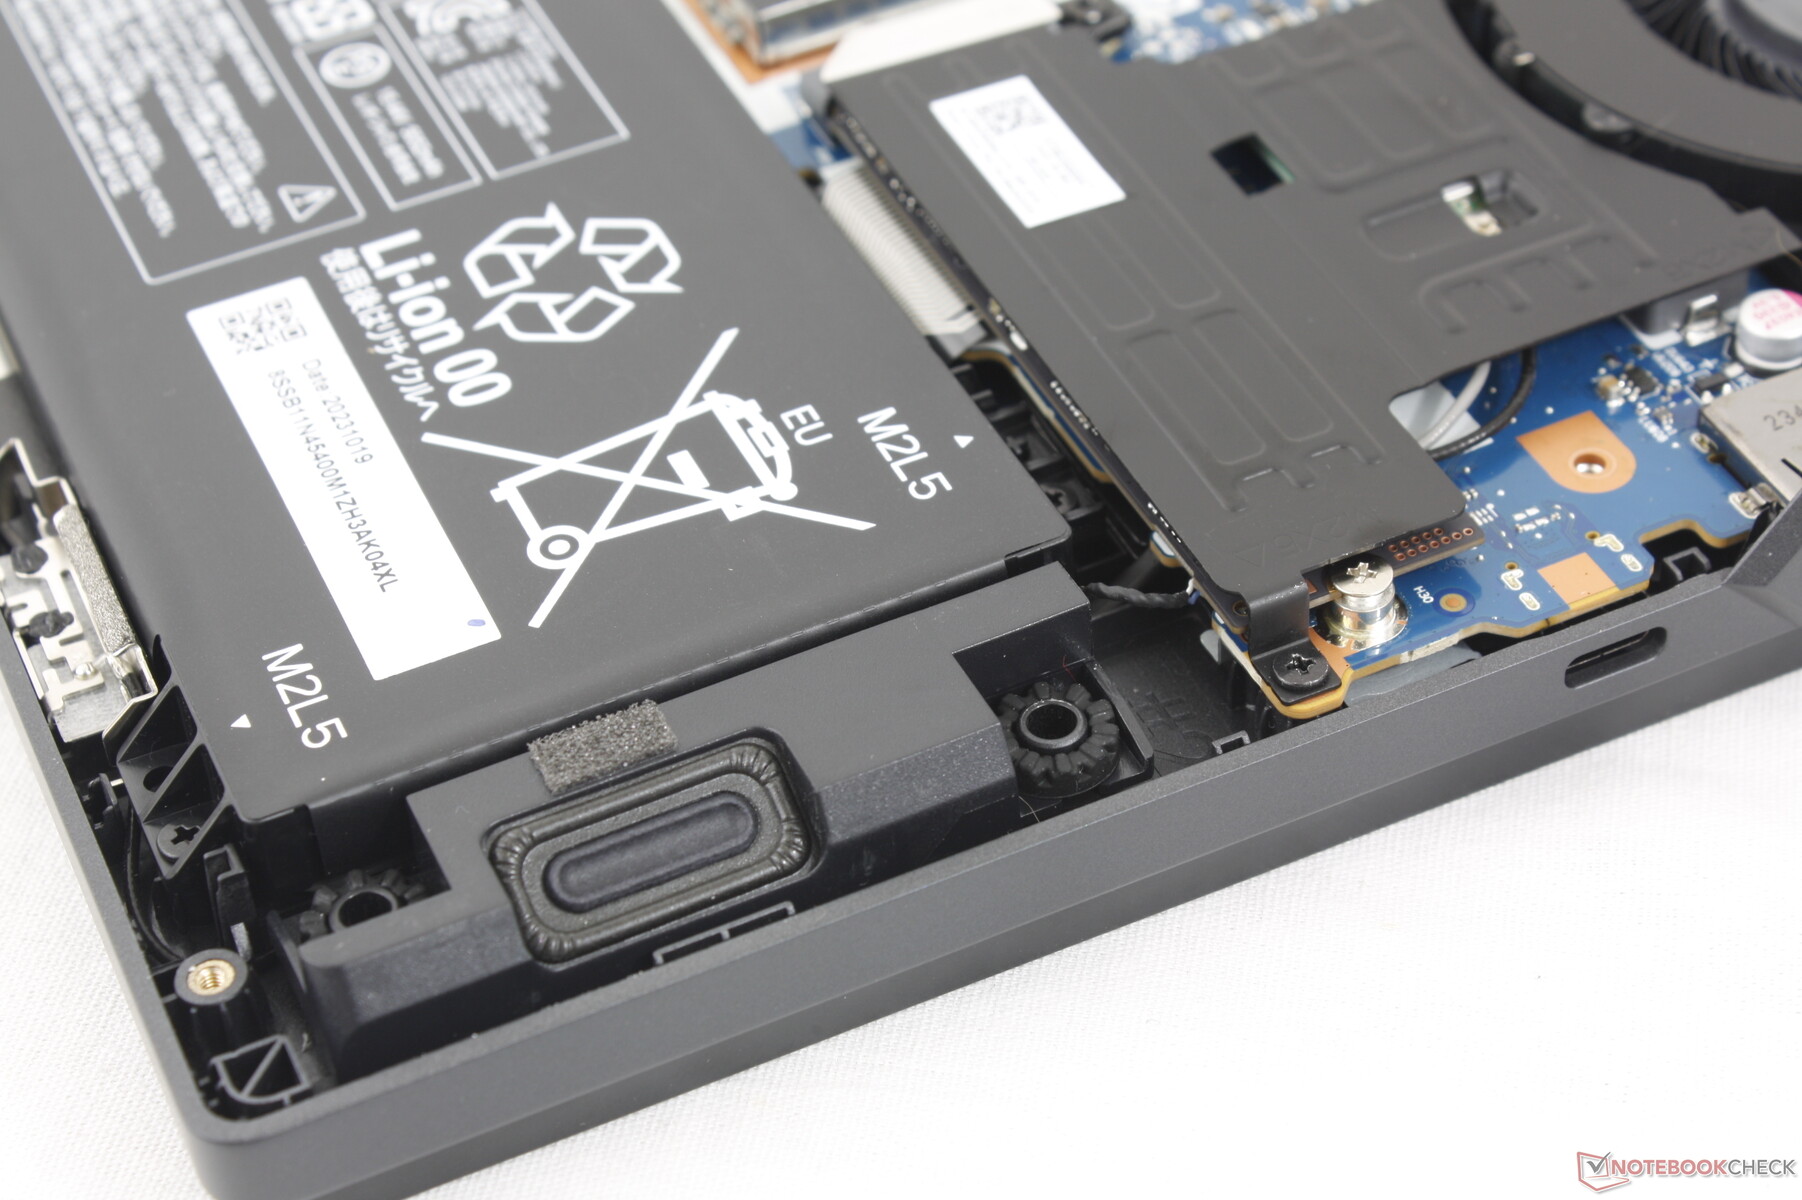
Wartung
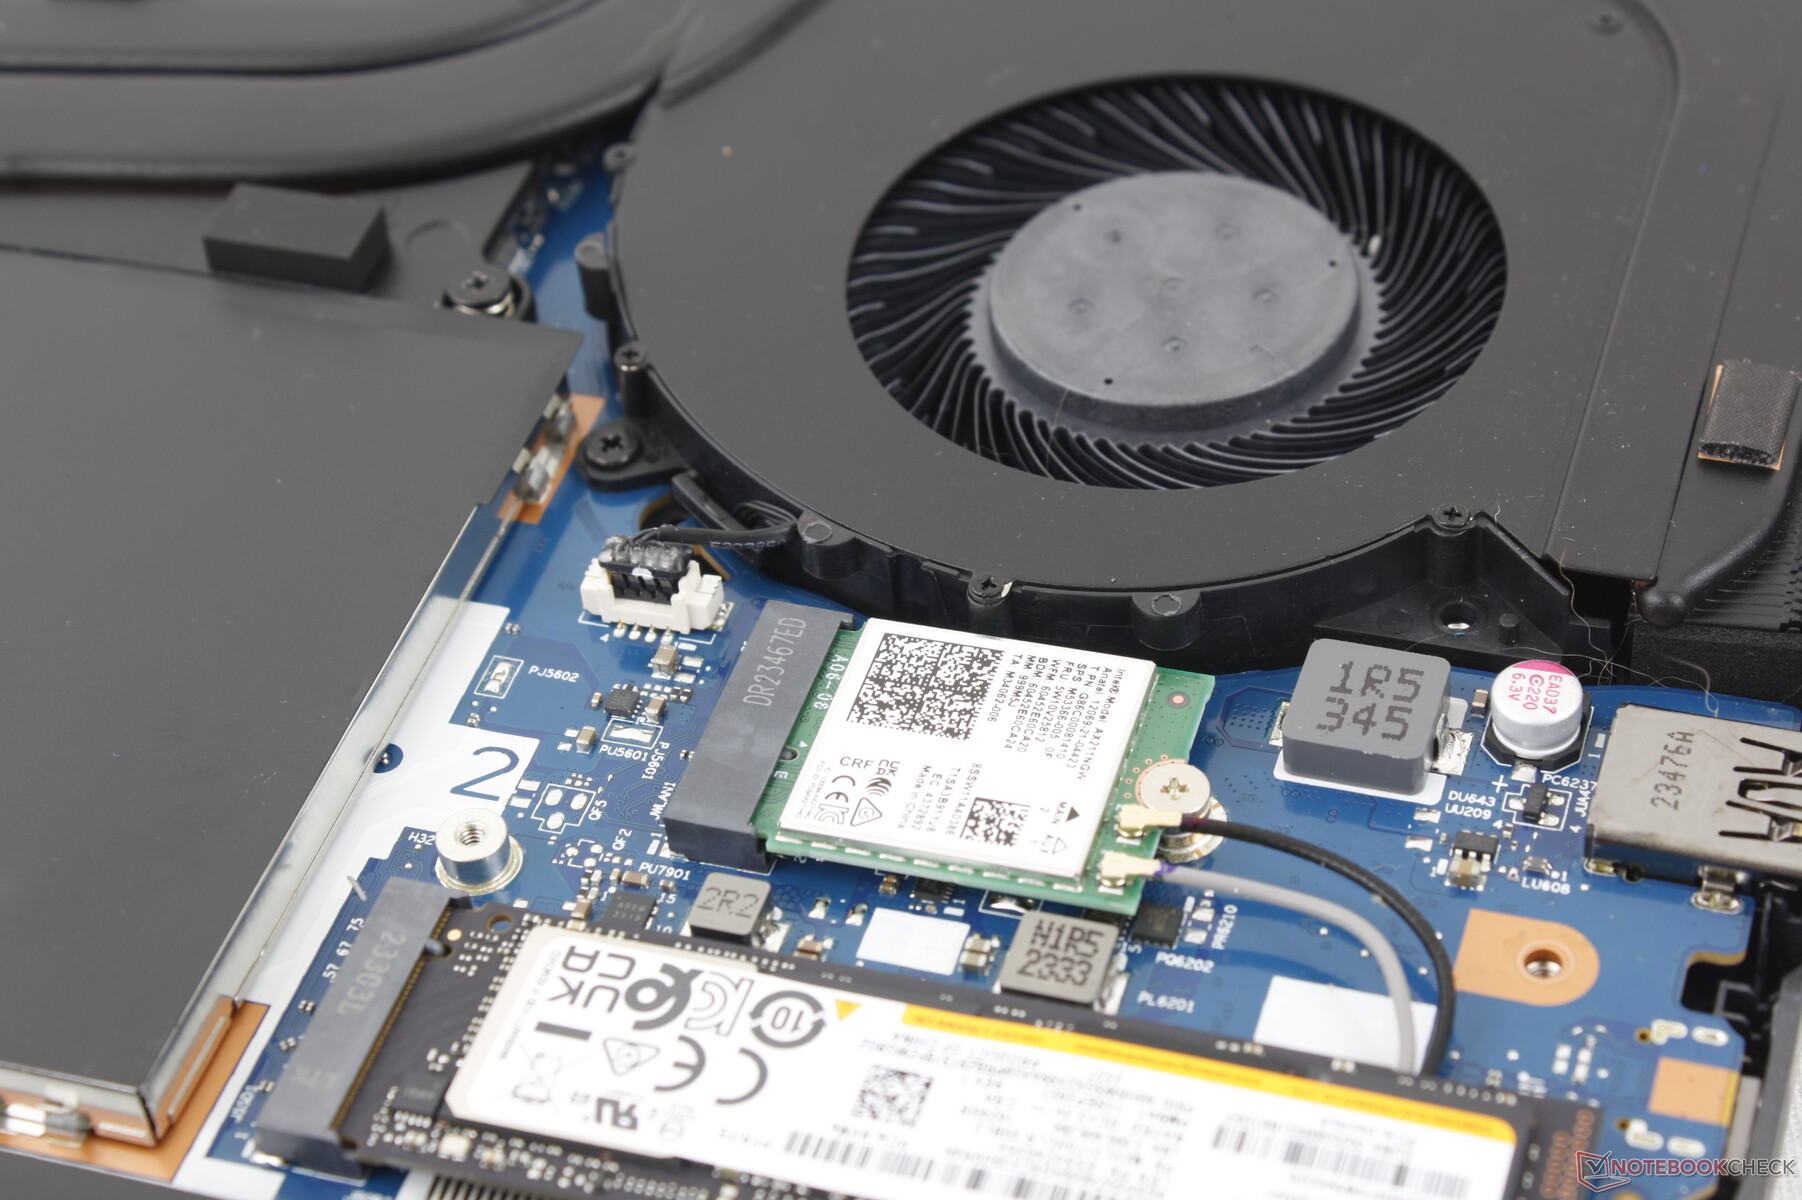
Am Motherboard hat sich im Vergleich zum Vorjahr nur wenig verändert. Das WLAN-Modul, RAM-Modul und zwei SSD-Slots werden durch zusätzliche Aluminium-Platten geschützt. Interessanterweise verwendet das Legion Pro 5 16 weniger und dafür dickere Heatpipes aus Kupfer als das Legion 5 16.
Zubehör und Garantie
Abgesehen von dem Netzteil und der Dokumentation wird das Gerät ohne Zubehör geliefert. Es gilt eine Garantie von zwei Jahren.
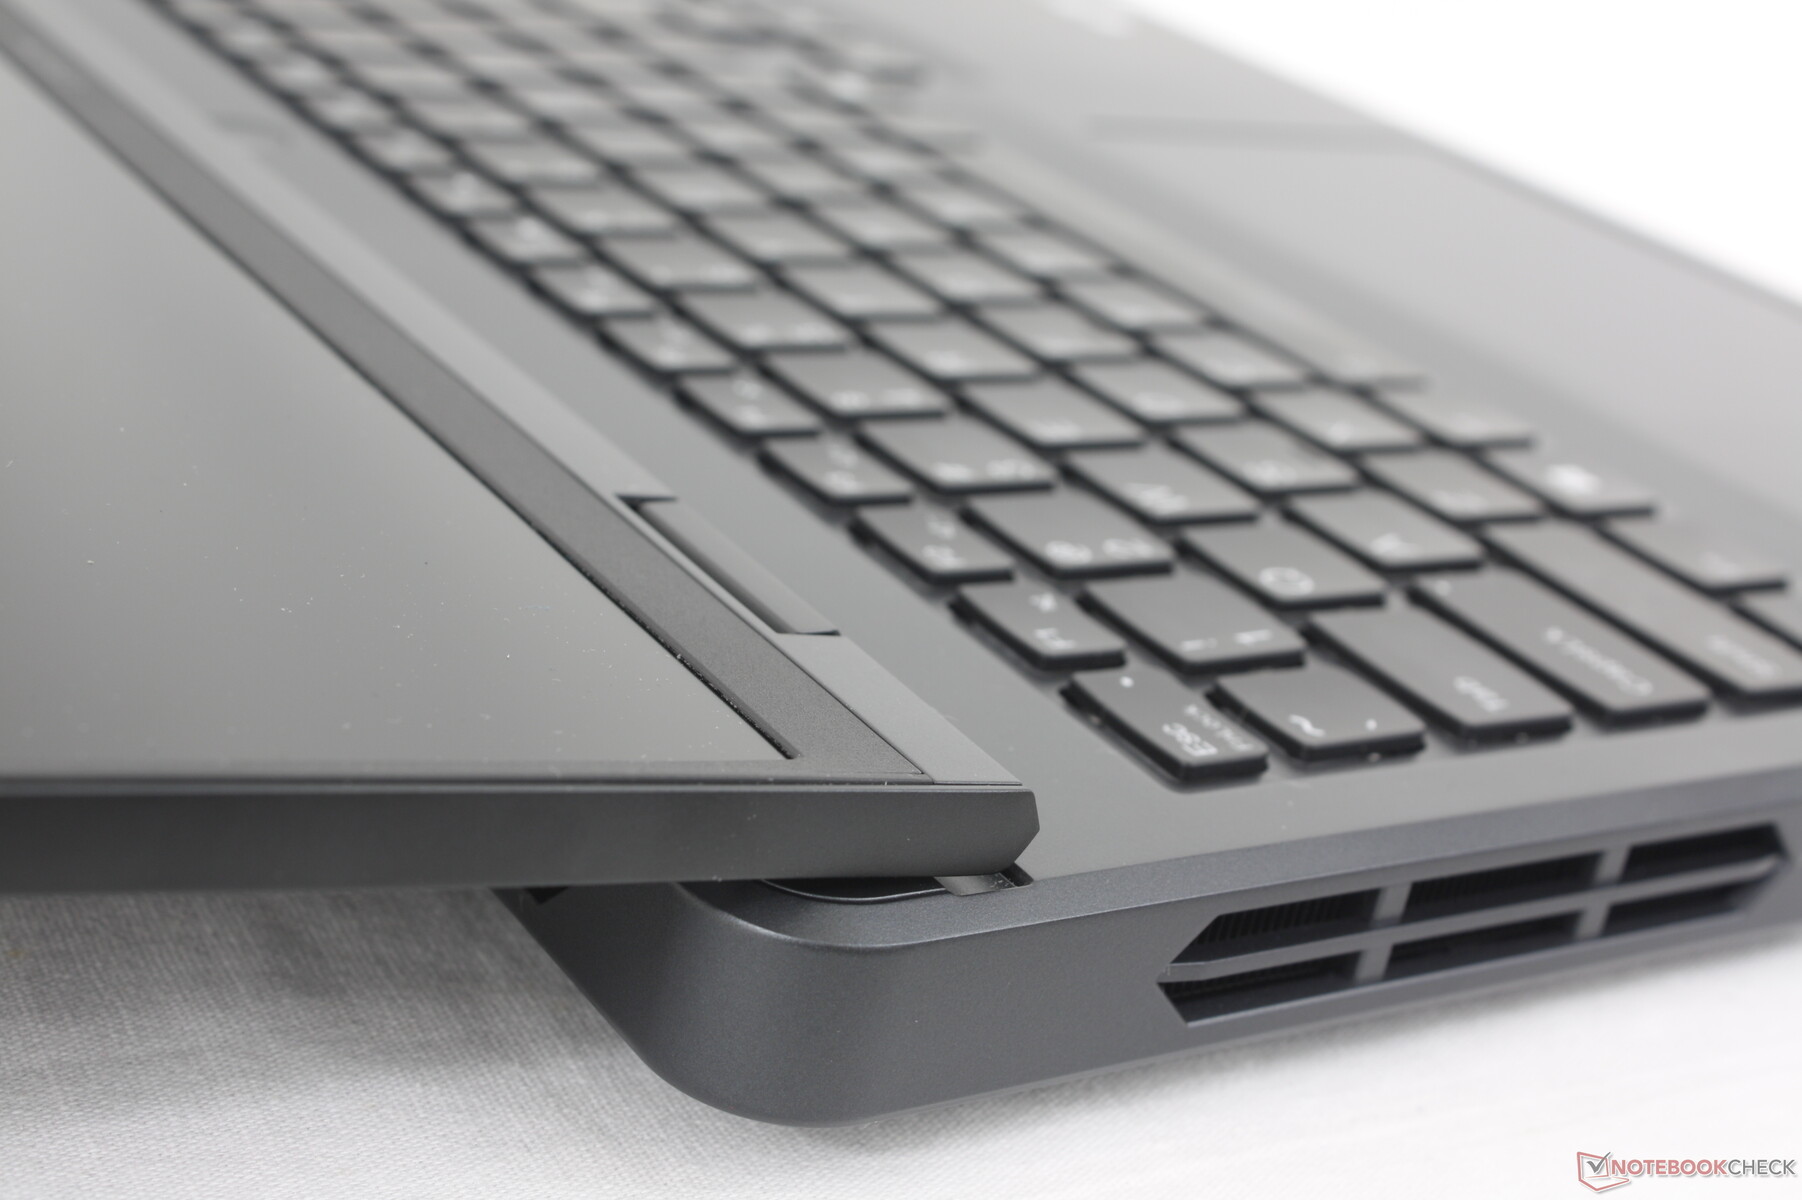
Eingabegeräte — bekannte Legion-Qualität
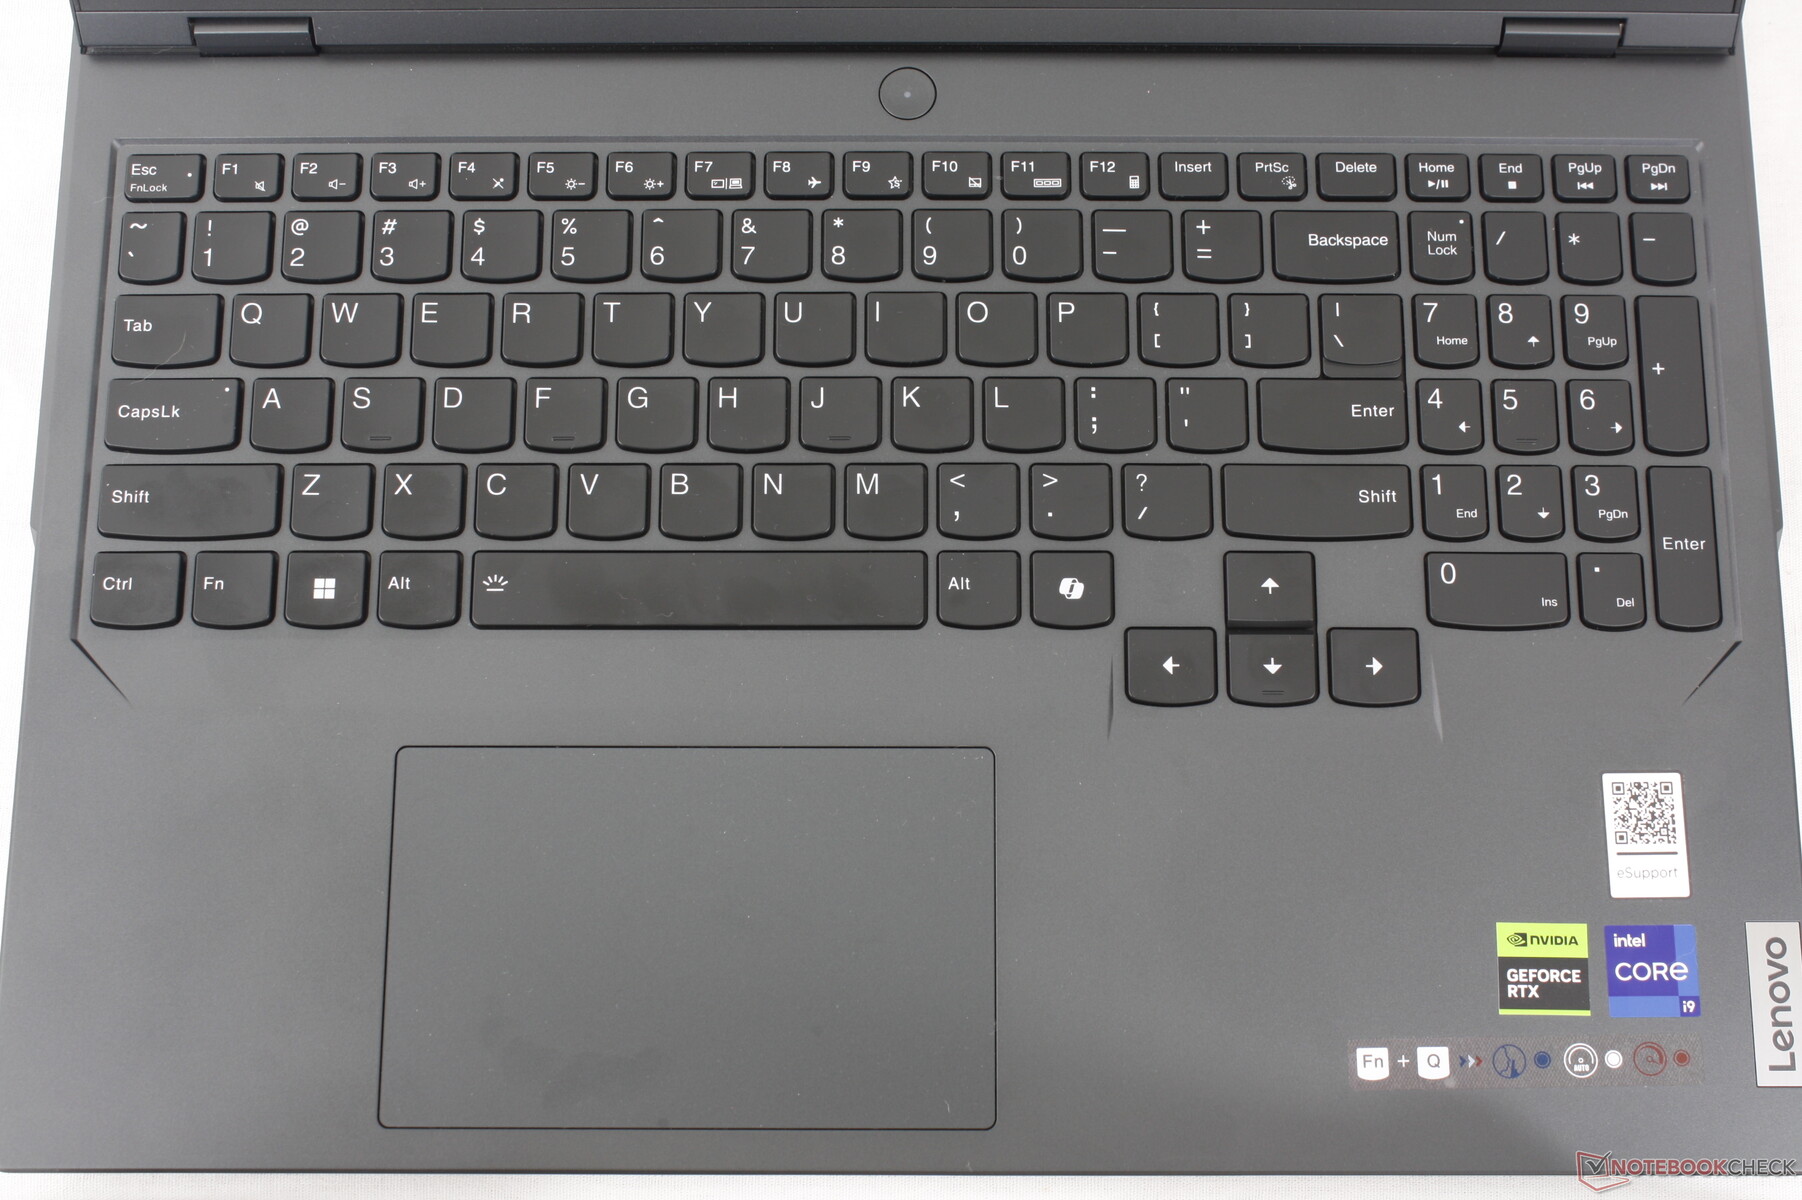
Tastatur
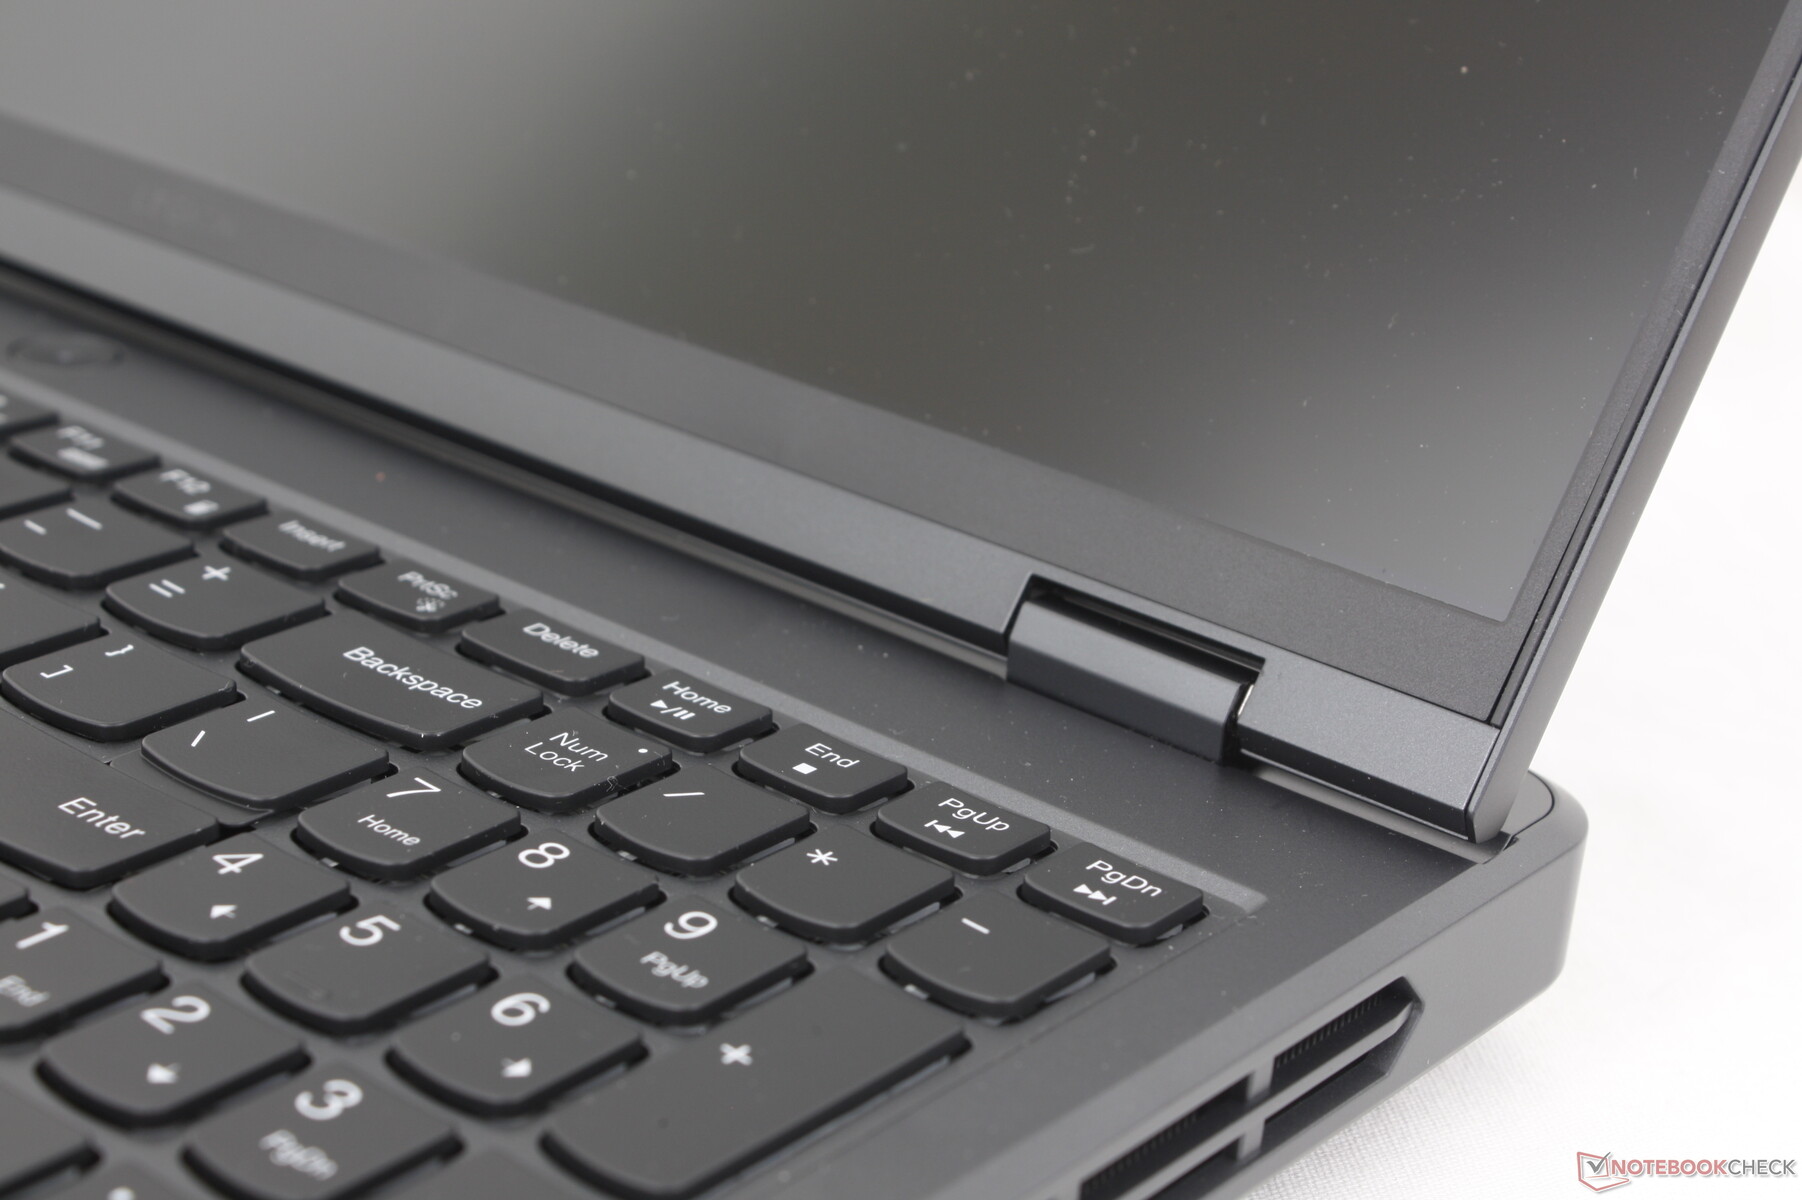
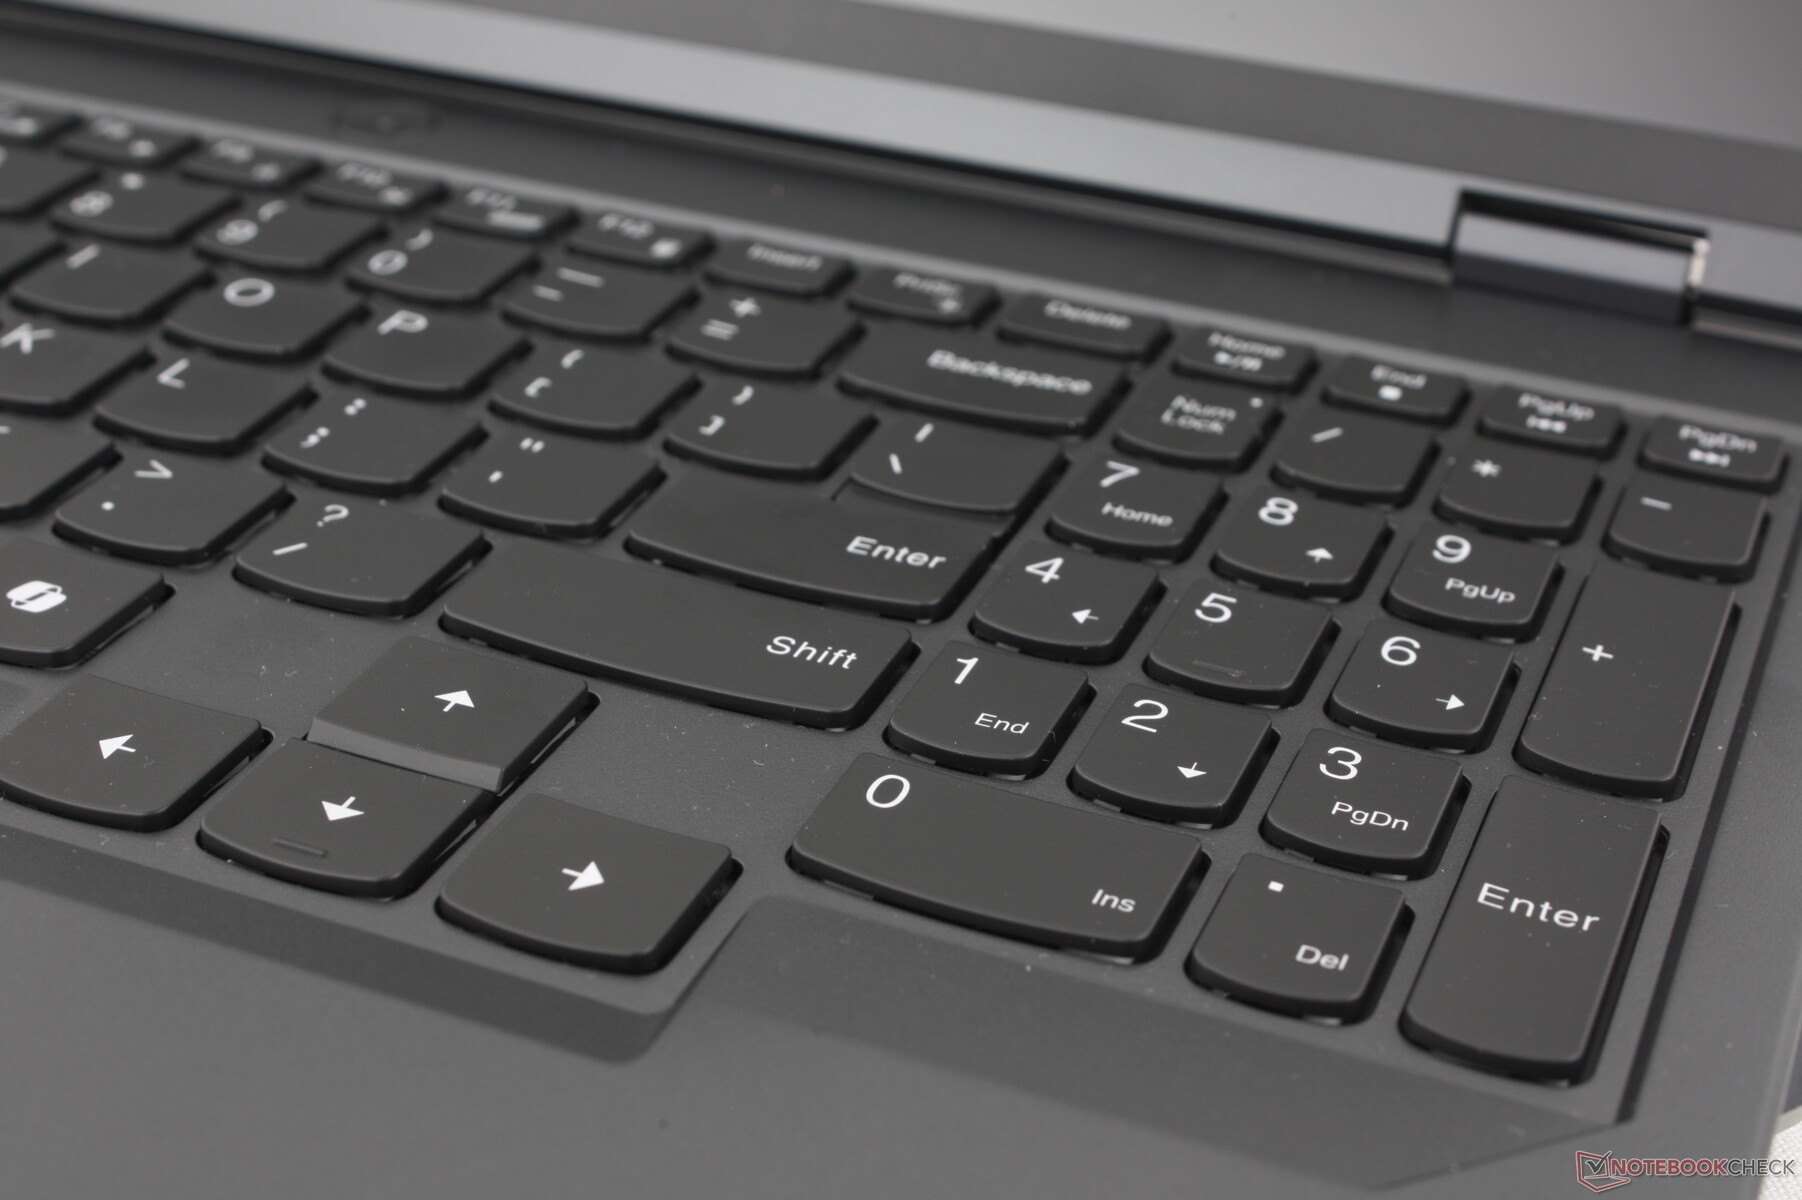
Ganz wie im neuen Yoga Slim 7 14 G9 ist auch beim Legion Pro 5 16 G9 die zweite Strg-Taste einer dedizierten Co-Pilot-Taste gewichen. Microsoft soll noch in diesem Jahr ein großes Update für Windows veröffentlichen, bei dem sich alles um KI dreht. Die neue Taste ist Lenovos Versuch, das Gerät zukunftsfähig zu machen.
Abgesehen davon entspricht das Tippgefühl dem Legion Pro 5 16 G8, da sich an der Tastengröße und den Symbolen nichts geändert hat. Legion-Modelle gehören weiterhin zu den wenigen Gaming-Laptops, die sowohl einen Ziffernblock als auch Pfeiltasten in voller Größe anbieten.
Die RGB-Hintergrundbeleuchtung der Tastatur kann entweder einheitlich oder in vier Zonen eingestellt werden. User, die sich eine individuelle RGB-Tastenbeleuchtung wünschen, werden sich das teurere Legion Pro 7 leisten müssen.
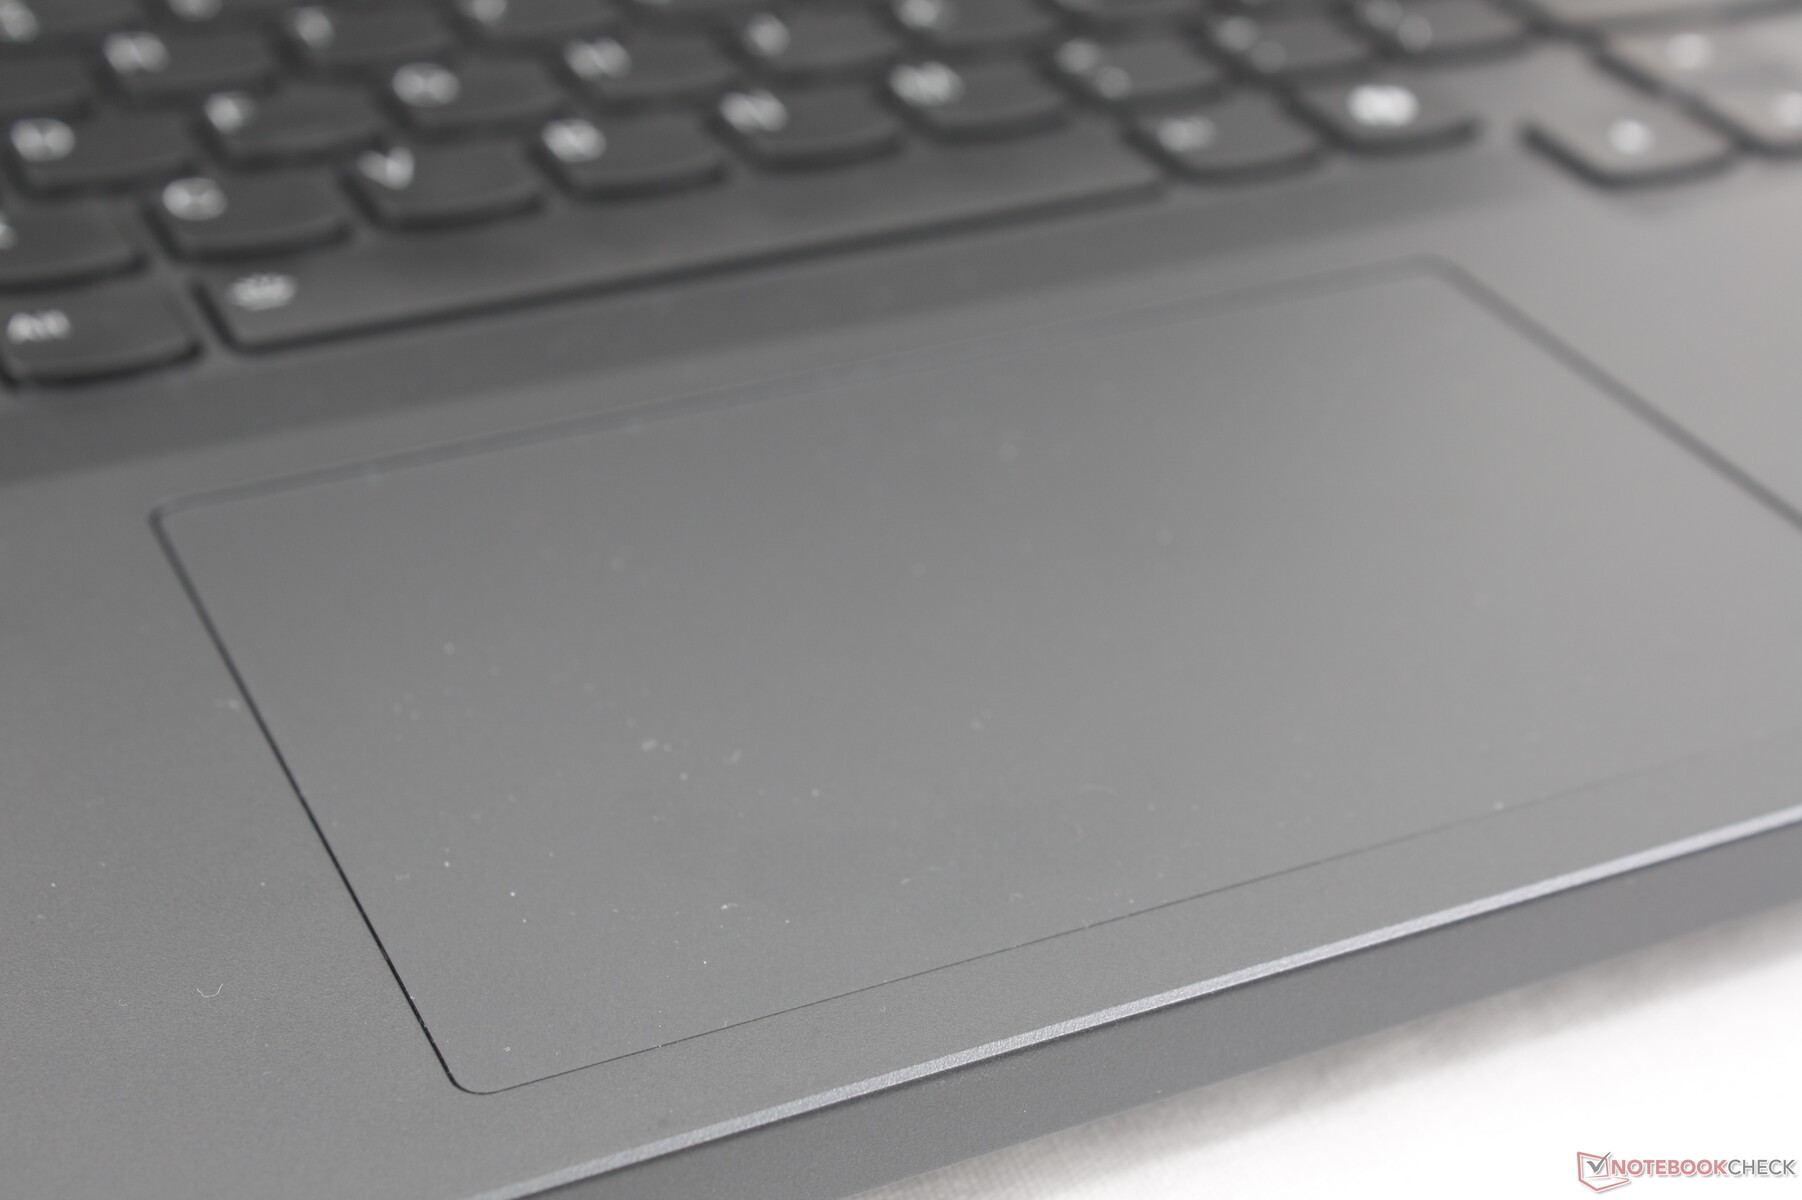
Touchpad
Das Mylar-Clickpad ist kleiner als das auf dem Razer Blade 16 (12 x 7,5 cm vs. 17 x 9,7 cm), ist aber für einfache Aufgaben wie das Surfen im Netz geräumig genug. Der Klickmechanismus hat weiterhin einen kurzen Hub und zu wenig Feedback, wodurch sich das Clickpad unangenehm schwammig anfühlt.

Display — volle sRGB-Abdeckung und schnelle Bildwiederholrate
Drei Displayoptionen sind dieses Jahr verfügbar — eine mehr als im Vorjahr. Es handelt sich dabei gänzlich um matte IPS-Panele mit Advanced-Optimus-Unterstützung. Nur zwei der drei Displays unterstützen HDR. Unser Testgerät ist mit dem fett gedruckten Panel ausgestattet.
- 2560 x 1600, 300 cd/m², 100 % sRGB, 165 Hz
- 2560 x 1600, 500 cd/m², 100 % DCI-P3, 240 Hz, HDR400
- 2560 x 1600, 500 cd/m², 100 % sRGB, 240 Hz, HDR400
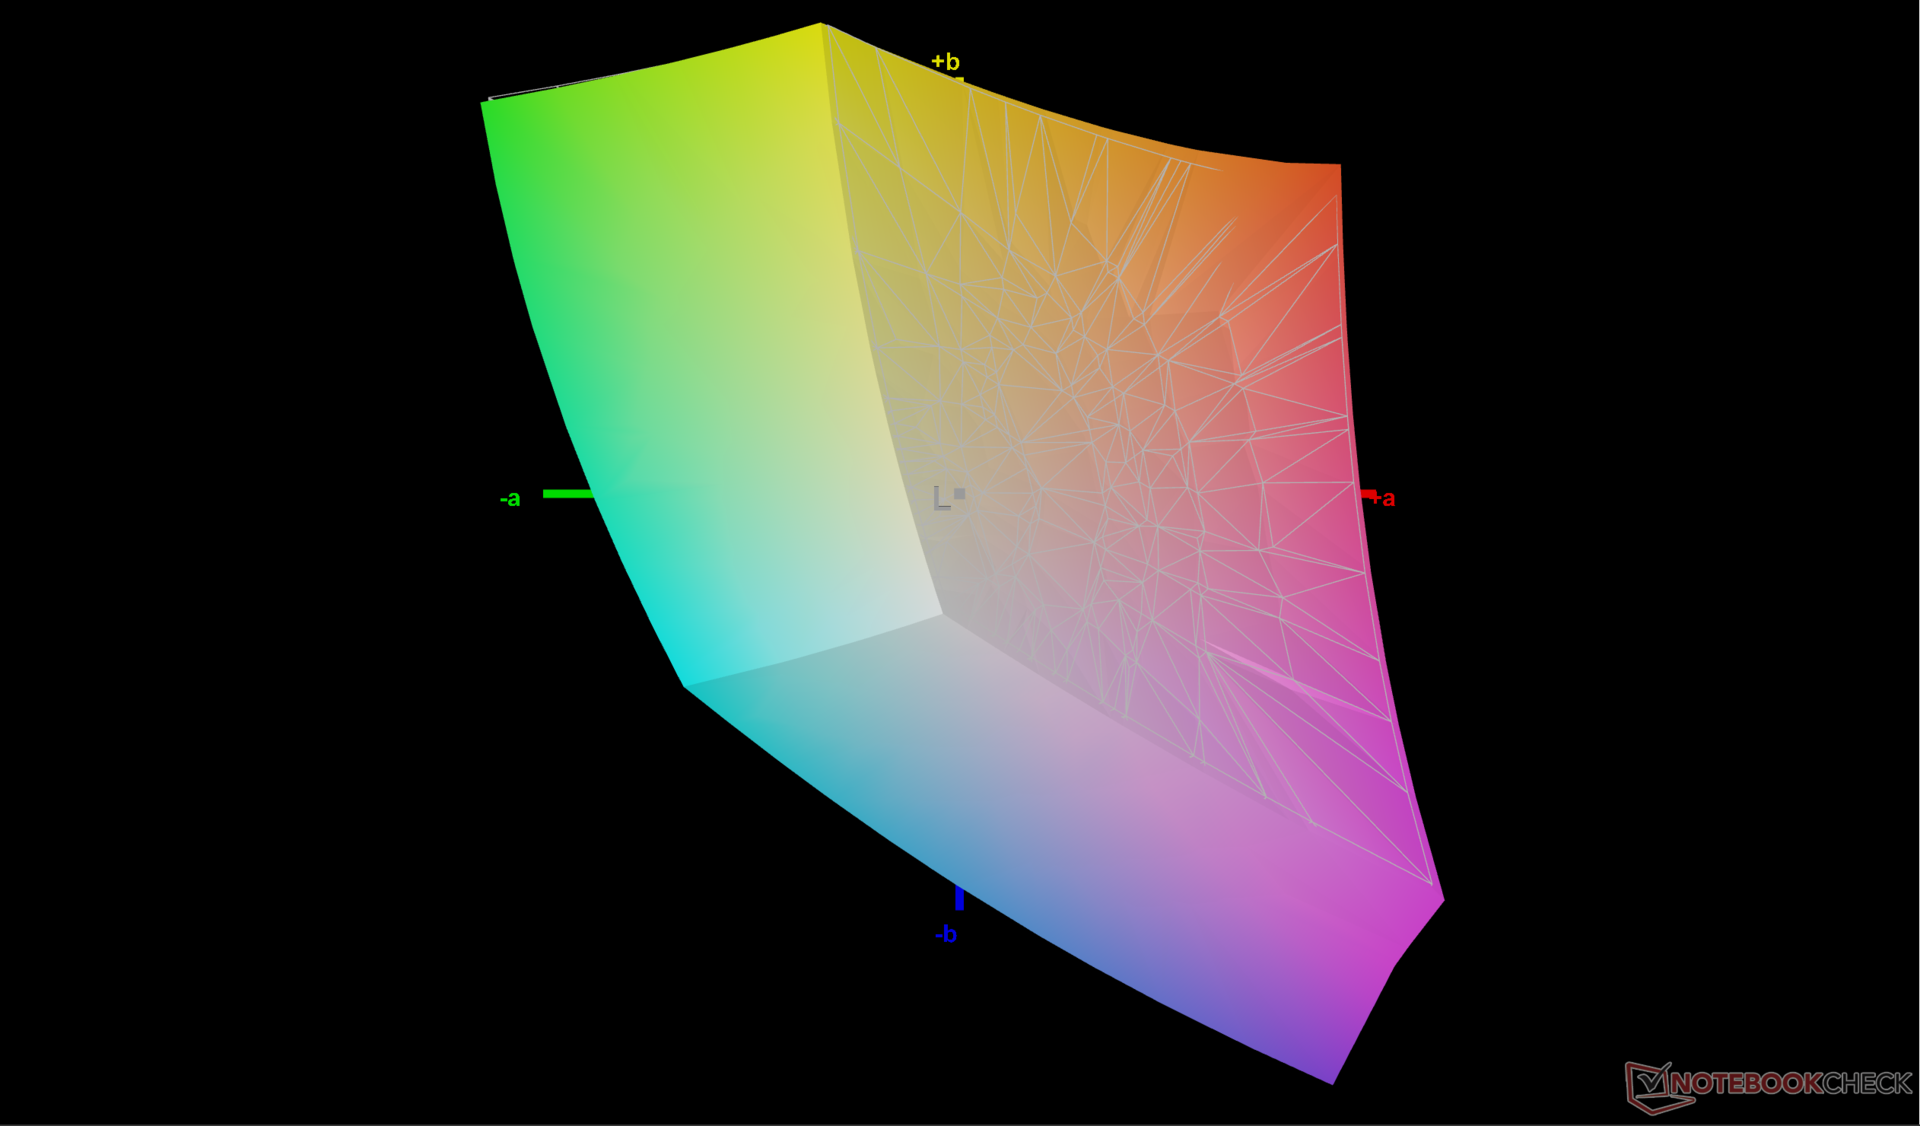
Interessanterweise ist in unserem Testgerät das BOE NE160QDM-NYC verbaut, während im Vorgängermodell ein AU Optronics B160QAN03.1 zu finden war. Beide Displays bieten die gleiche 165-Hz-Bildwiederholrate, schnelle Schwarz-Weiß-Reaktionszeiten und eine vollständige Abdeckung des sRGB-Farbraums. Dieses Panel eignet sich ausgezeichnet fürs Gamen und die gelegentliche Bildbearbeitung, bietet aber keine Unterstützung für die variable Bildwiederholrate von Windows, die bei anderen Laptops wie dem Framework Laptop 16 als neues Feature unterstützt wird. Auch HDR wirkt auf IPS-Panelen aufgrund des satteren Schwarzwerts und des helleren Weiß nicht so beeindruckend wie auf OLED oder mini-LED-Bildschirmen. Für diese hochwertigeren Features werden Nutzer stattdessen einen Blick auf das teurere Legion Pro 9 werfen müssen.


| |||||||||||||||||||||||||
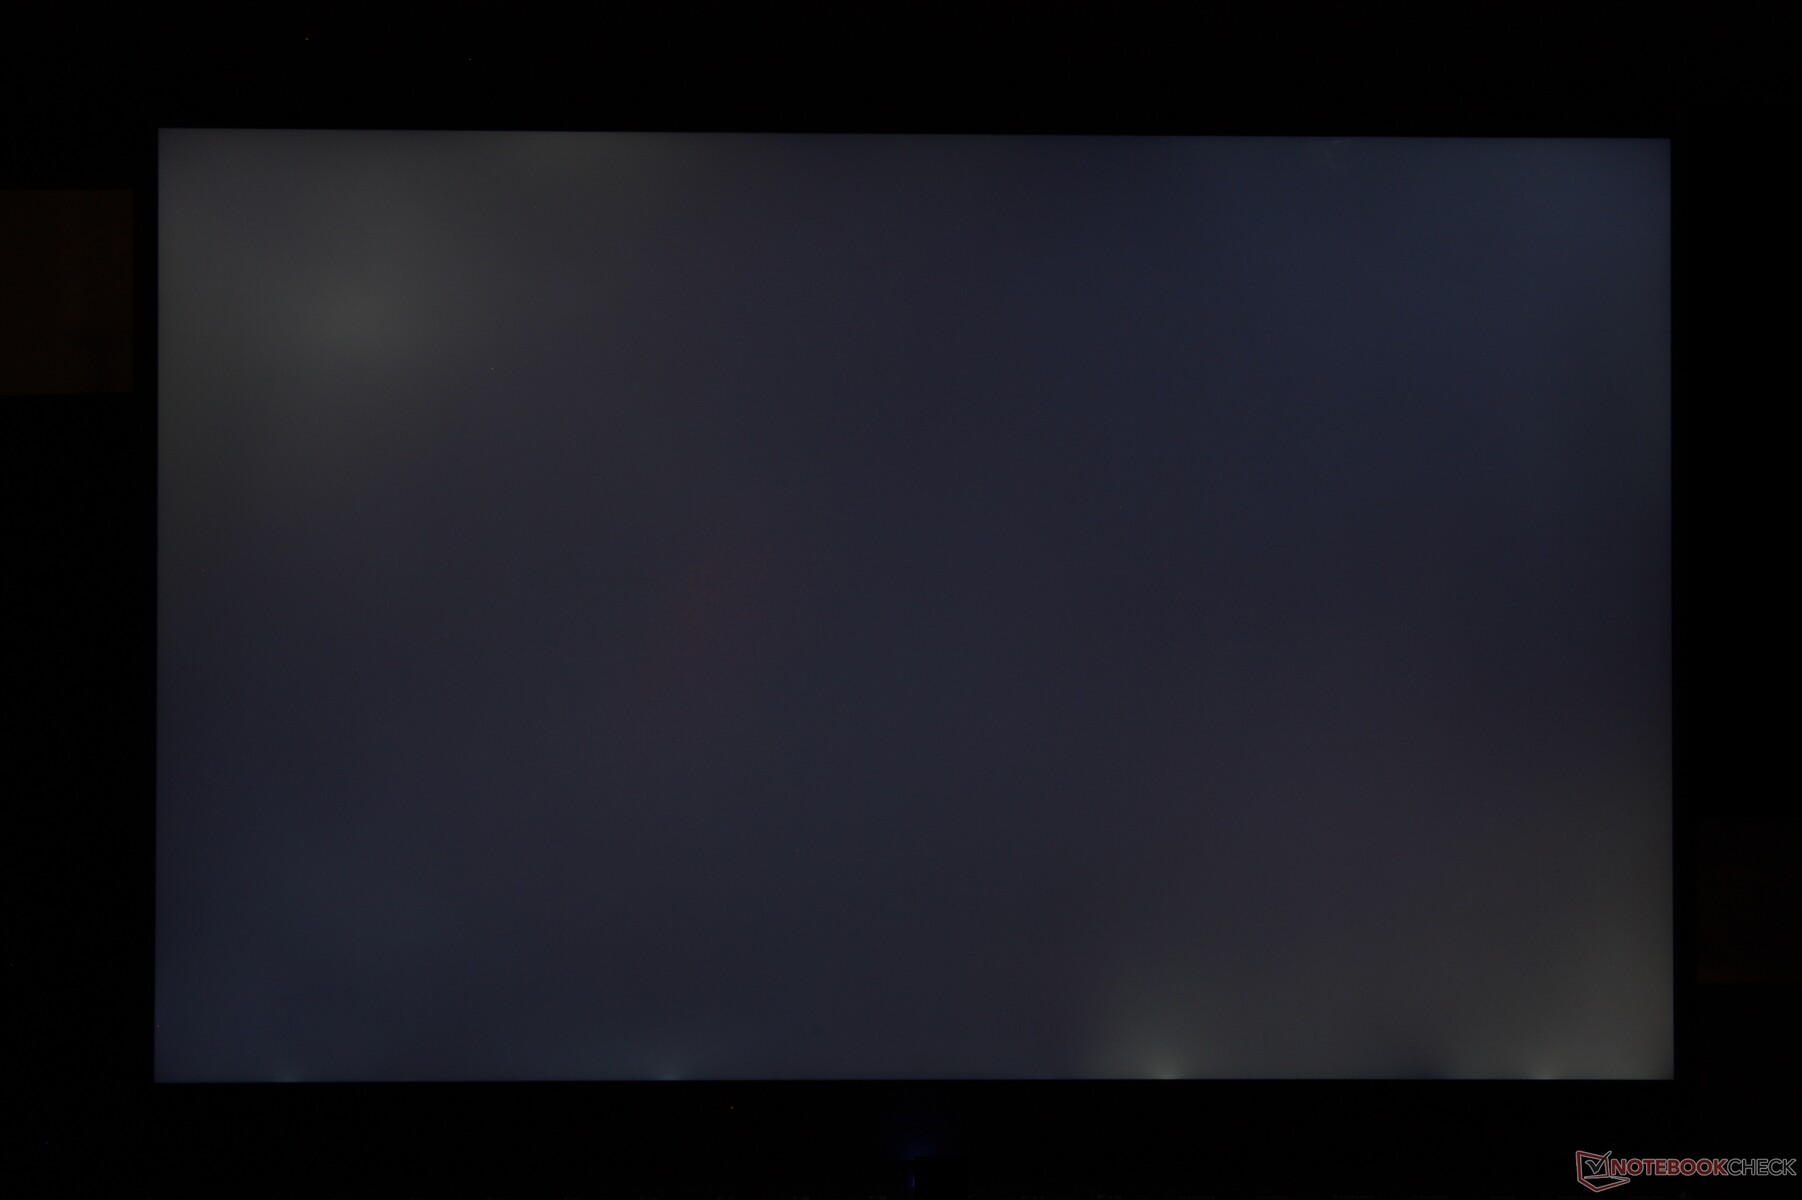
Ausleuchtung: 91 %
Helligkeit Akku: 384 cd/m²
Kontrast: 1097:1 (Schwarzwert: 0.35 cd/m²)
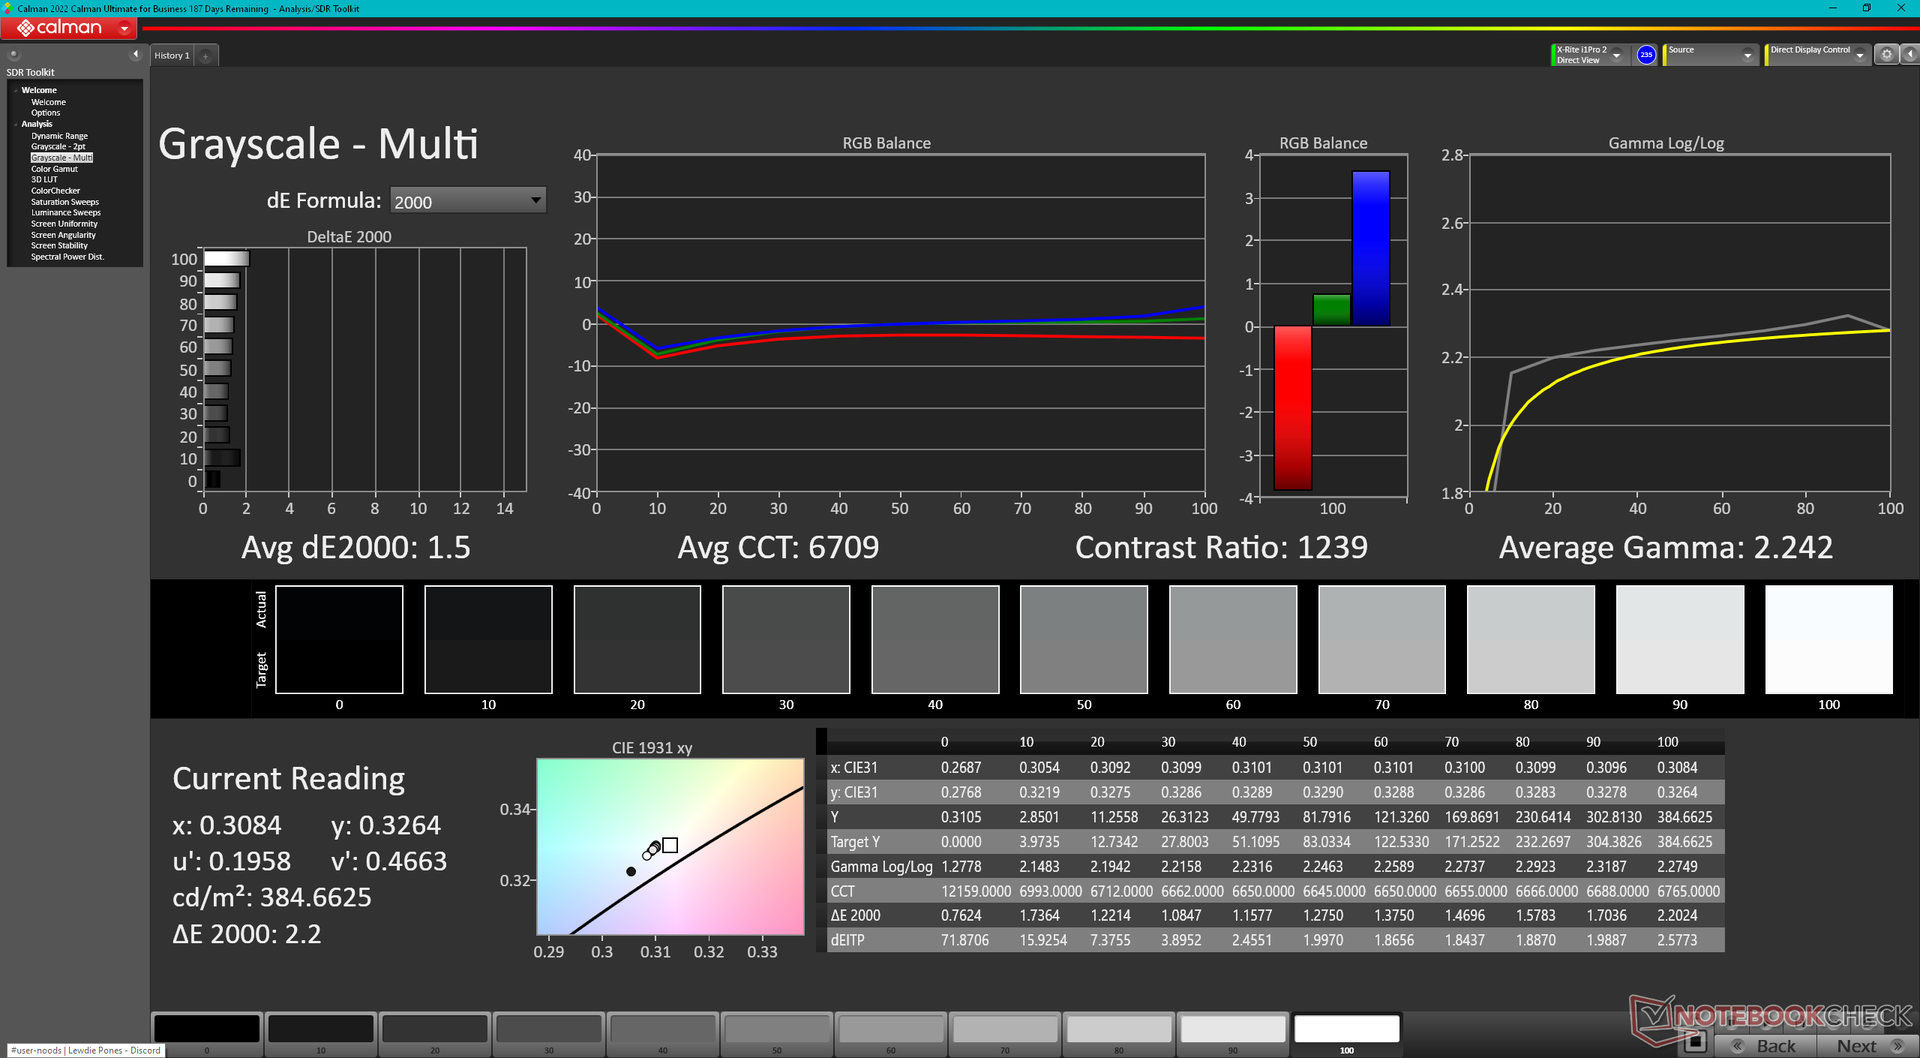
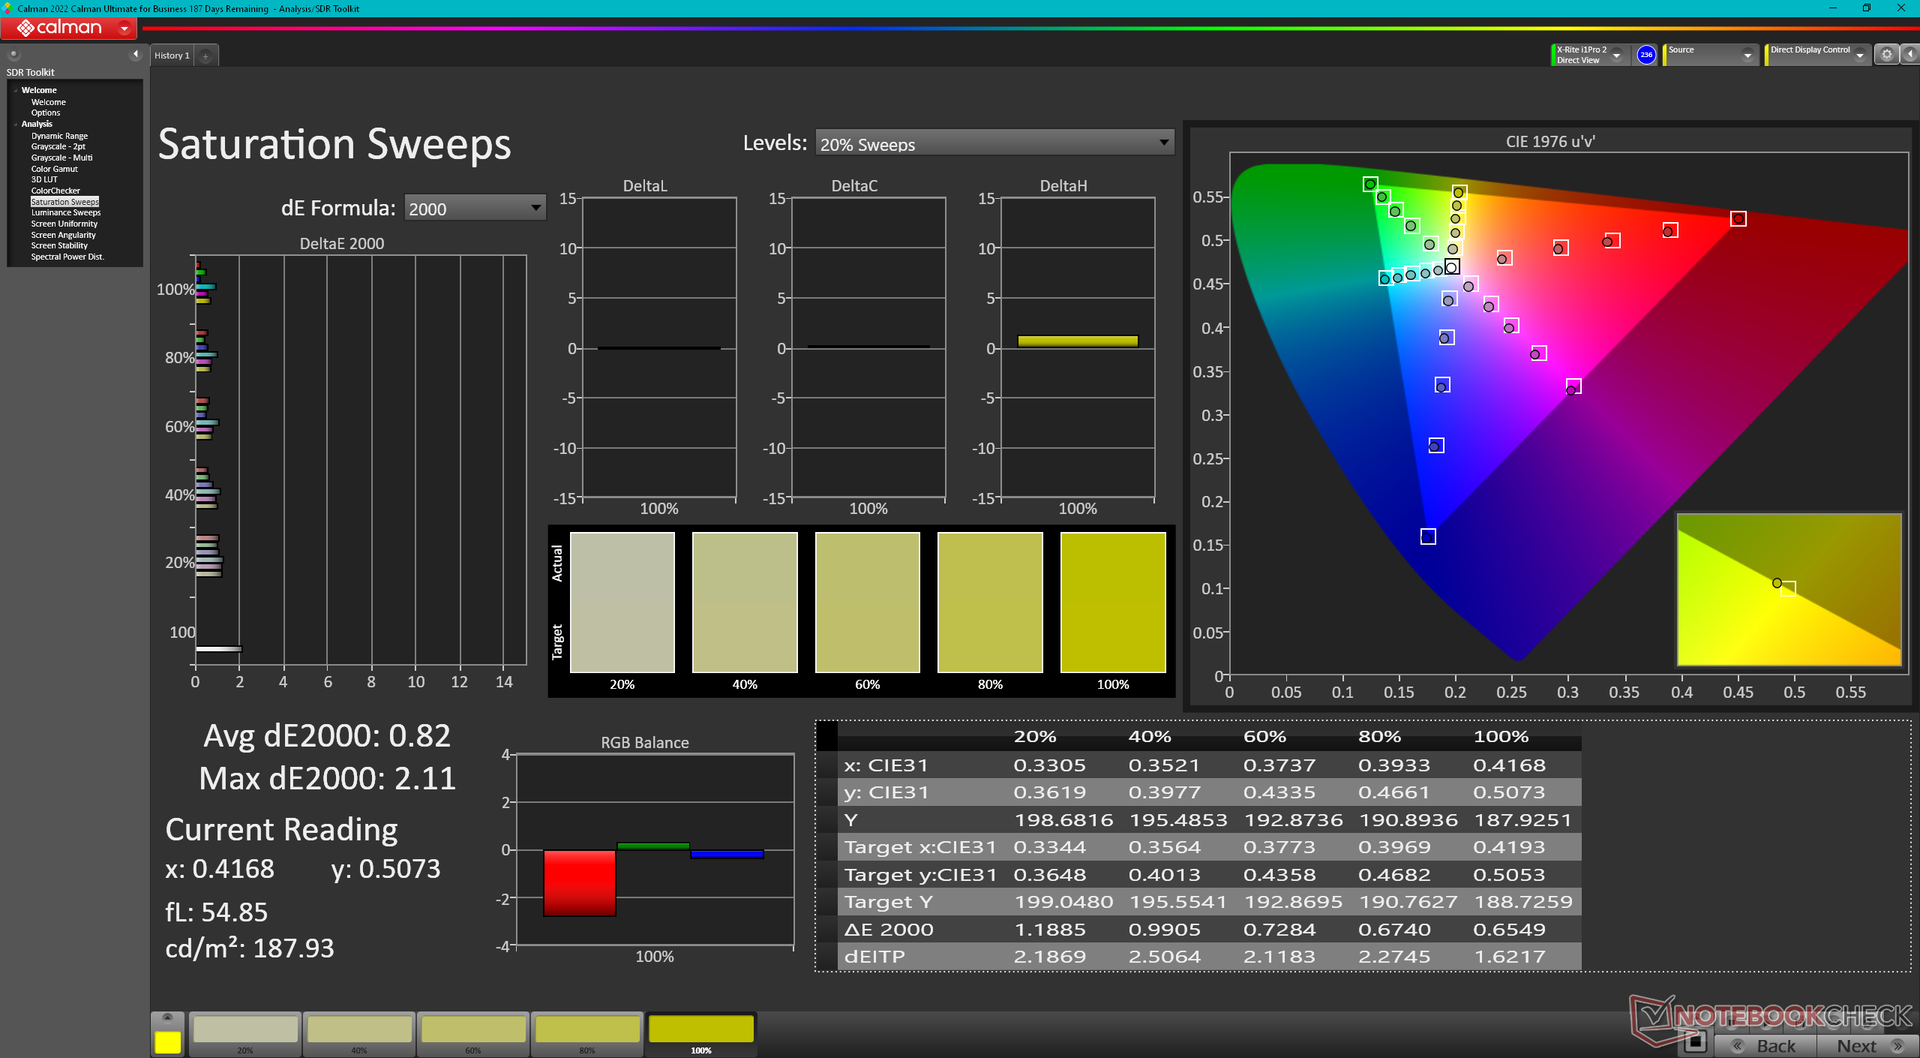
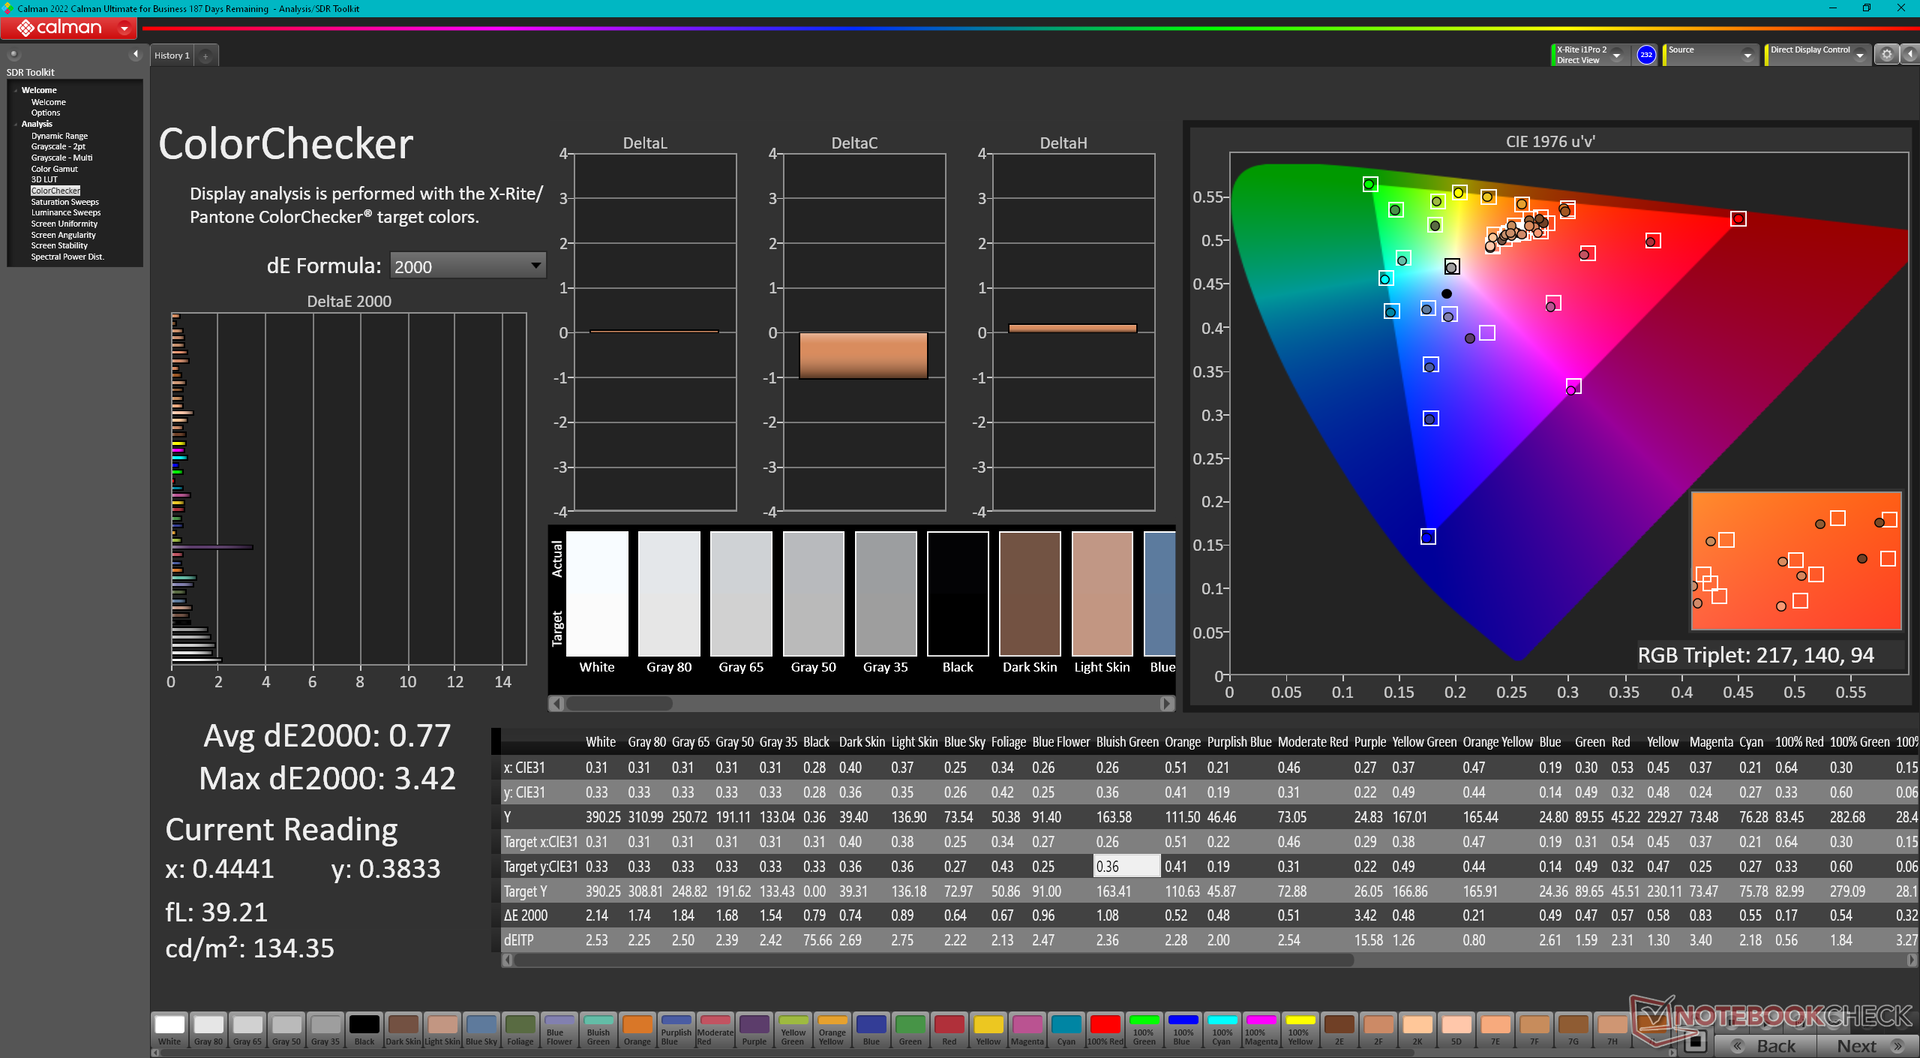
ΔE ColorChecker Calman: 0.97 | ∀{0.5-29.43 Ø4.72}
calibrated: 0.77
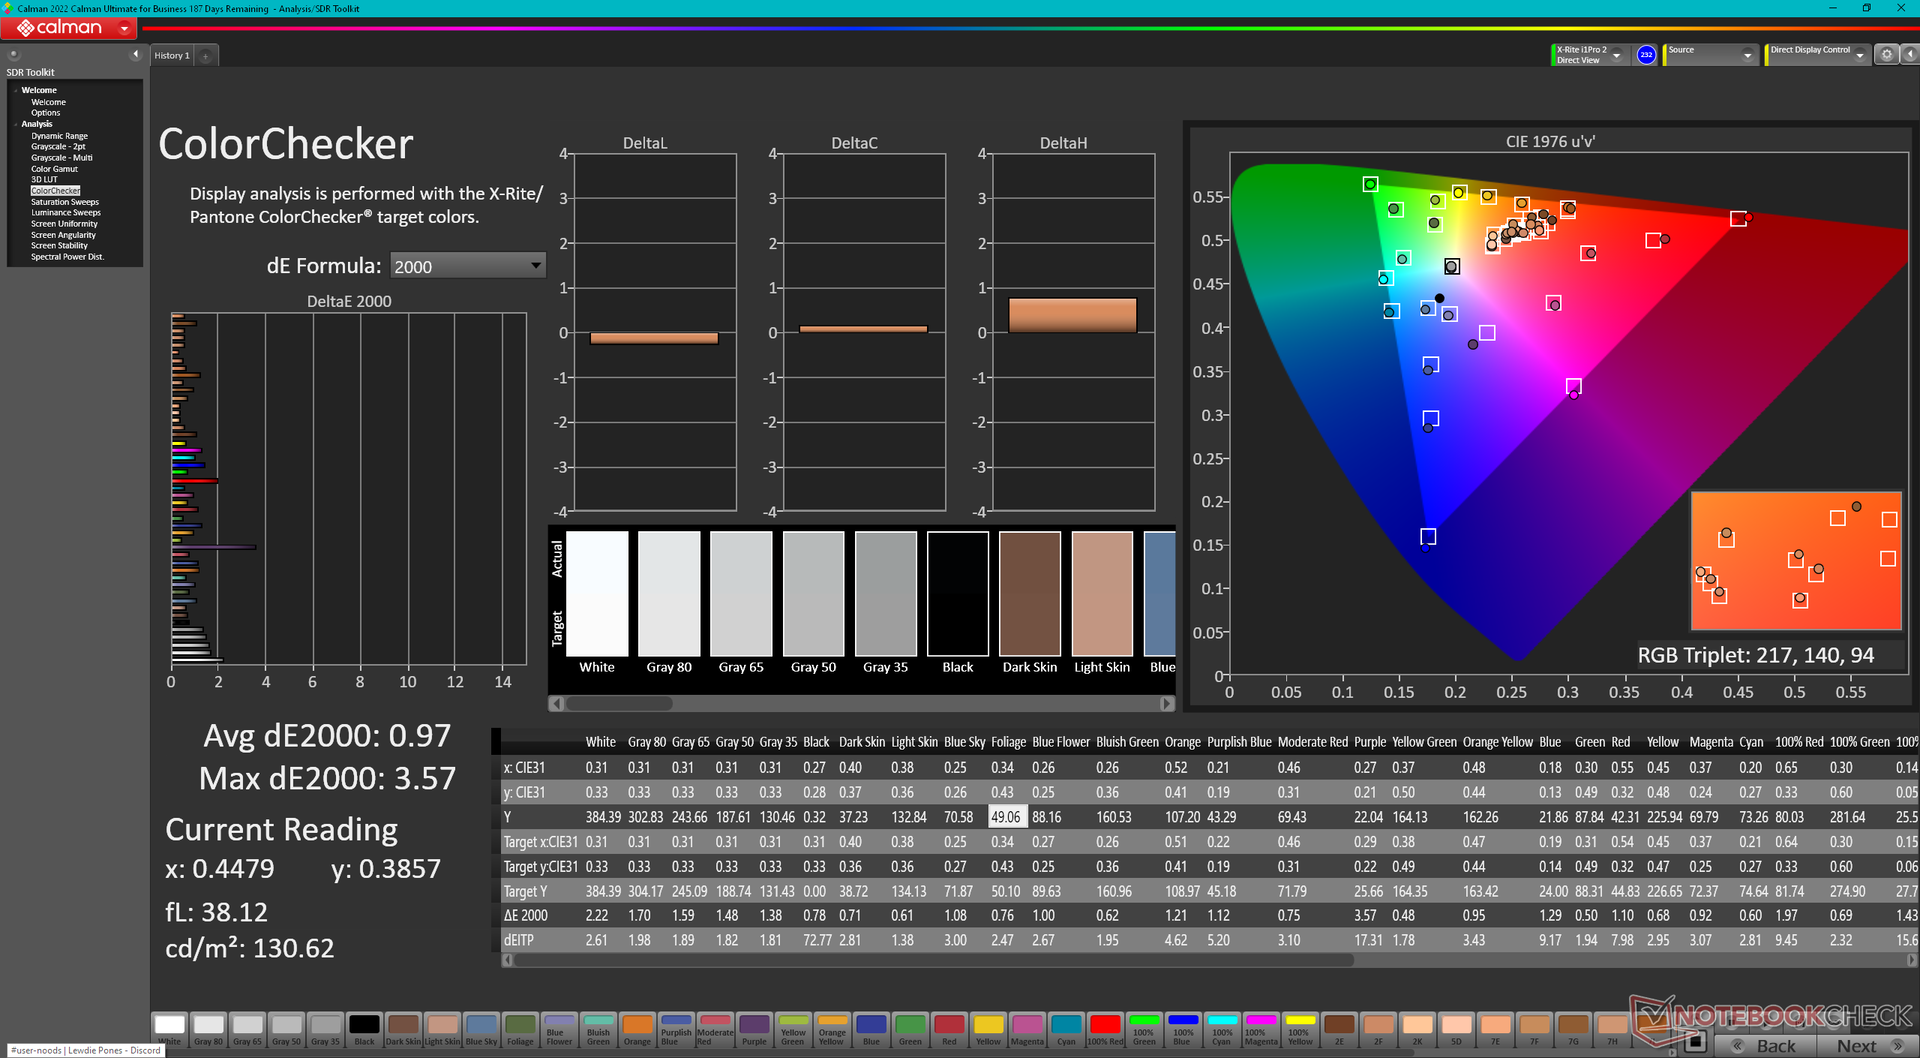
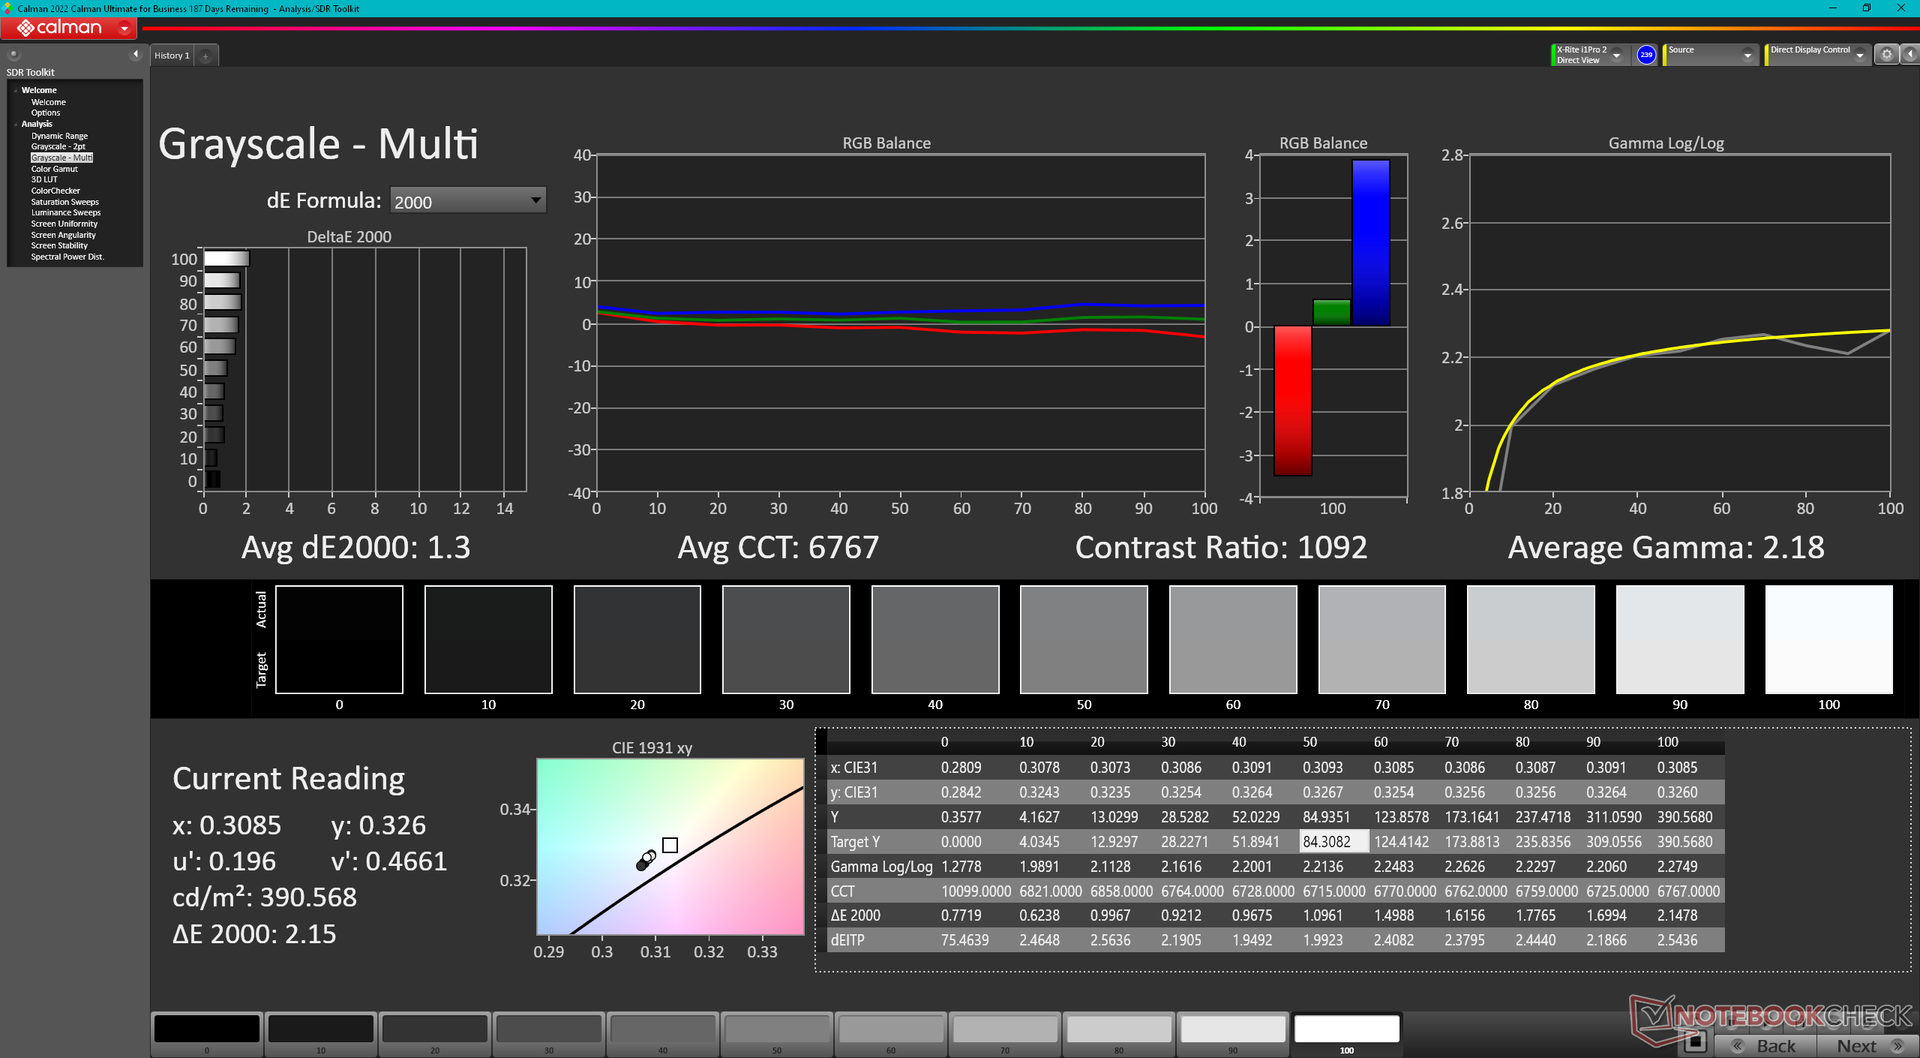
ΔE Greyscale Calman: 1.5 | ∀{0.09-98 Ø4.97}
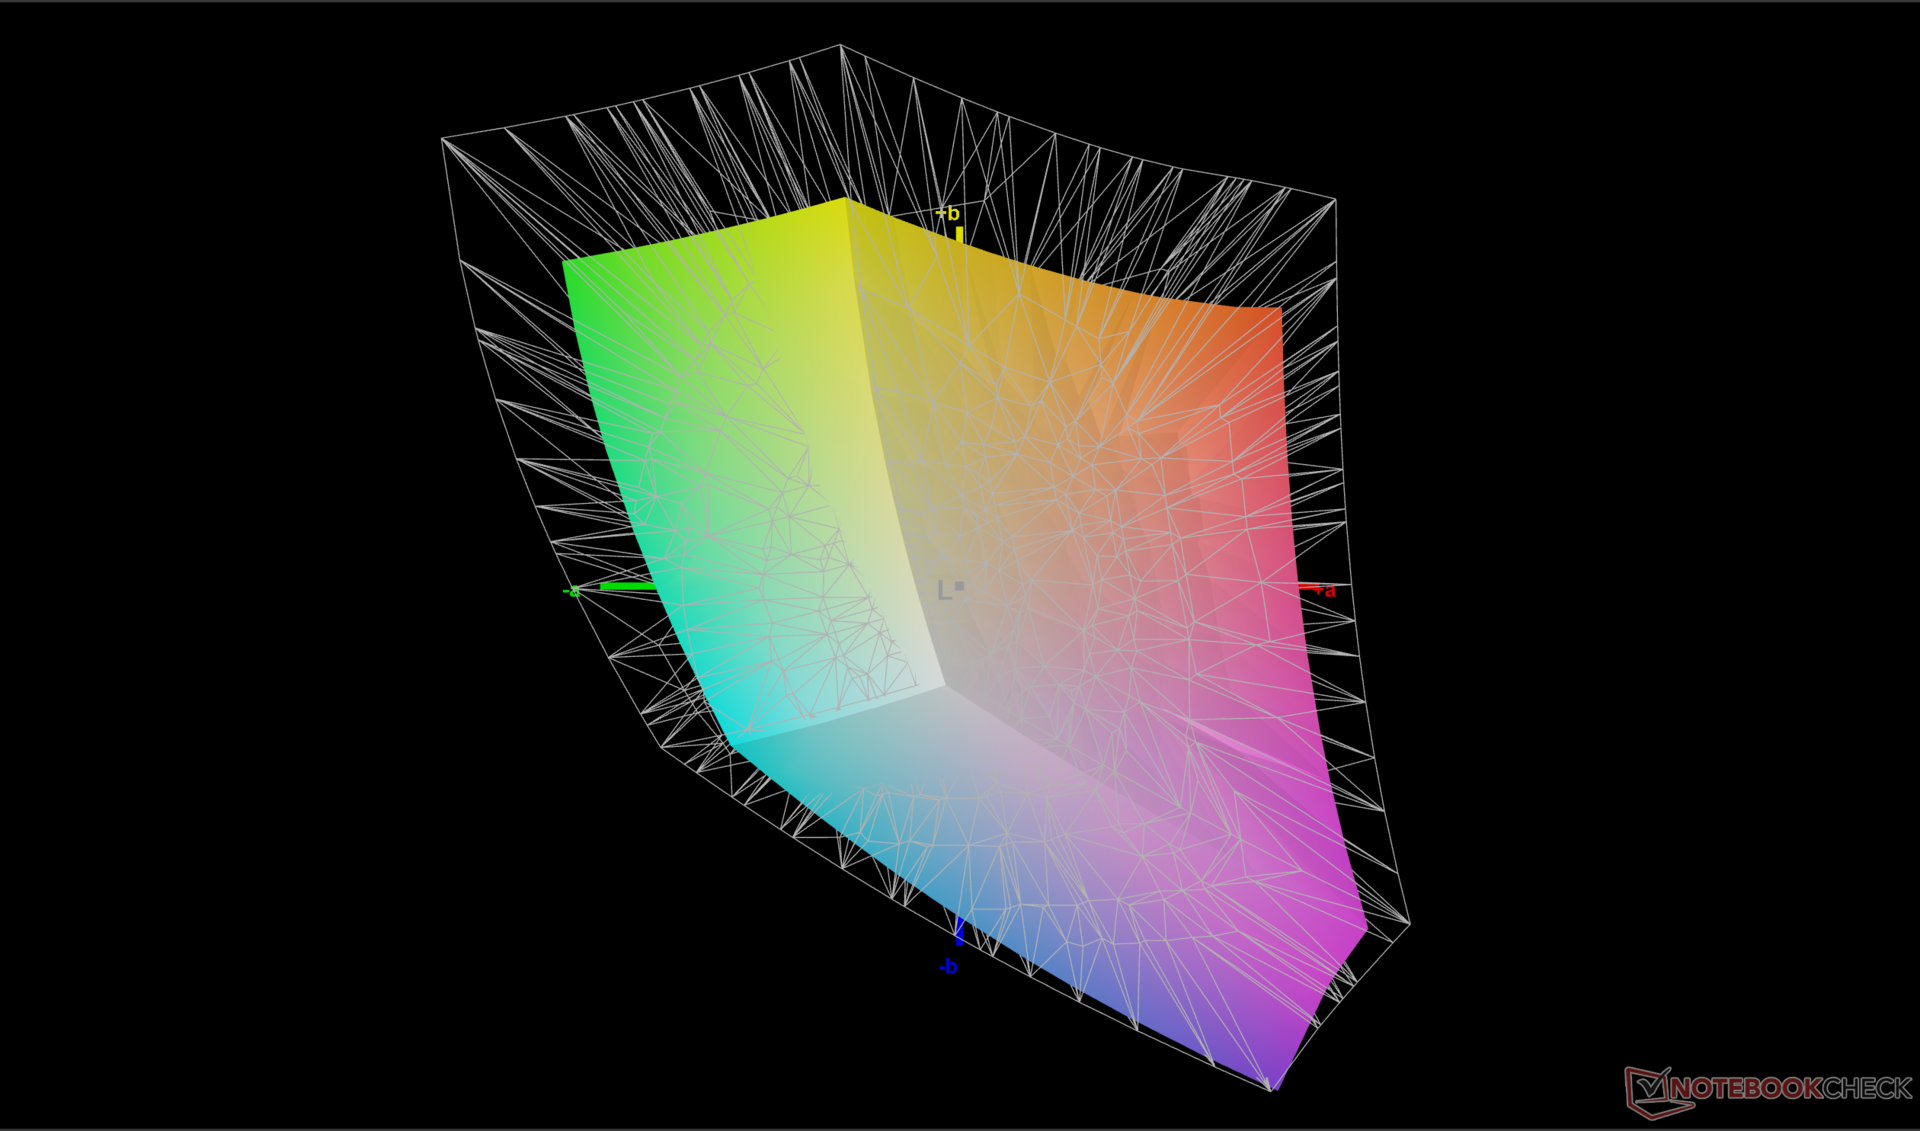
70.1% AdobeRGB 1998 (Argyll 3D)
99.4% sRGB (Argyll 3D)
69.3% Display P3 (Argyll 3D)
Gamma: 2.24
CCT: 6709 K
| Lenovo Legion Pro 5 16IRX9 BOE NE160QDM-NYC, IPS, 2560x1600, 16" | Lenovo Legion Pro 5 16IRX8 AU Optronics B160QAN03.1, IPS, 2560x1600, 16" | Alienware m16 R2 BOE NE16NYH, IPS, 2560x1600, 16" | HP Omen Transcend 16-u1095ng ATNA60DL02-0 (SDC41A4), OLED, 2560x1600, 16" | Asus ROG Zephyrus G16 2024 GU605M ATNA60DL01-0, OLED, 2560x1600, 16" | MSI Stealth 16 Mercedes-AMG Motorsport A13VG ATNA60YV09-0 (SDC4191), OLED, 3840x2400, 16" | |
|---|---|---|---|---|---|---|
| Display | 2% | 2% | 28% | 28% | 23% | |
| Display P3 Coverage (%) | 69.3 | 71.2 3% | 71 2% | 99.8 44% | 99.9 44% | 99.2 43% |
| sRGB Coverage (%) | 99.4 | 98.8 -1% | 100 1% | 100 1% | 100 1% | 99.9 1% |
| AdobeRGB 1998 Coverage (%) | 70.1 | 73.3 5% | 71.4 2% | 97 38% | 96.9 38% | 88.4 26% |
| Response Times | -20% | 27% | 98% | 98% | 87% | |
| Response Time Grey 50% / Grey 80% * (ms) | 11.9 ? | 14.5 ? -22% | 5.7 ? 52% | 0.2 ? 98% | 0.22 ? 98% | 1.5 ? 87% |
| Response Time Black / White * (ms) | 8.9 ? | 10.4 ? -17% | 8.7 ? 2% | 0.2 ? 98% | 0.25 ? 97% | 1.2 ? 87% |
| PWM Frequency (Hz) | 120 ? | 960 ? | 60 ? | |||
| Bildschirm | -5% | -14% | 136% | -13% | 5% | |
| Helligkeit Bildmitte (cd/m²) | 384 | 405.7 6% | 345.8 -10% | 390 2% | 416 8% | 382 -1% |
| Brightness (cd/m²) | 366 | 368 1% | 337 -8% | 392 7% | 418 14% | 383 5% |
| Brightness Distribution (%) | 91 | 87 -4% | 87 -4% | 98 8% | 96 5% | 96 5% |
| Schwarzwert * (cd/m²) | 0.35 | 0.38 -9% | 0.3 14% | 0.02 94% | ||
| Kontrast (:1) | 1097 | 1068 -3% | 1153 5% | 19500 1678% | ||
| Delta E Colorchecker * | 0.97 | 1.65 -70% | 1.99 -105% | 1.94 -100% | 1.6 -65% | 0.84 13% |
| Colorchecker dE 2000 max. * | 3.57 | 4.2 -18% | 3.52 1% | 4.26 -19% | 2.1 41% | 3.39 5% |
| Colorchecker dE 2000 calibrated * | 0.77 | 0.53 31% | 0.62 19% | 4.21 -447% | 0.8 -4% | |
| Delta E Graustufen * | 1.5 | 1.2 20% | 2.1 -40% | 1.5 -0% | 2.7 -80% | 1.3 13% |
| Gamma | 2.24 98% | 2.3 96% | 2.32 95% | 2.221 99% | 2.16 102% | 2.166 102% |
| CCT | 6709 97% | 6453 101% | 6369 102% | 6395 102% | 6331 103% | 6550 99% |
| Durchschnitt gesamt (Programm / Settings) | -8% /
-6% | 5% /
-5% | 87% /
107% | 38% /
18% | 38% /
23% |
* ... kleinere Werte sind besser
Das Display ist bereits im Lieferzustand vorkalibriert und hat durchschnittliche Graustufen- und Farb-DeltaE-Werte von nur 1,5 bis 0,97. Das ist für einen Mittelklasse-Gaming-Laptop überraschend gut. Die meisten User werden daher keine eigenen Kalibrierung durchführen müssen.

Reaktionszeiten (Response Times) des Displays
| ↔ Reaktionszeiten Schwarz zu Weiß | ||
|---|---|---|
| 8.9 ms ... steigend ↗ und fallend ↘ kombiniert | ↗ 4.8 ms steigend | 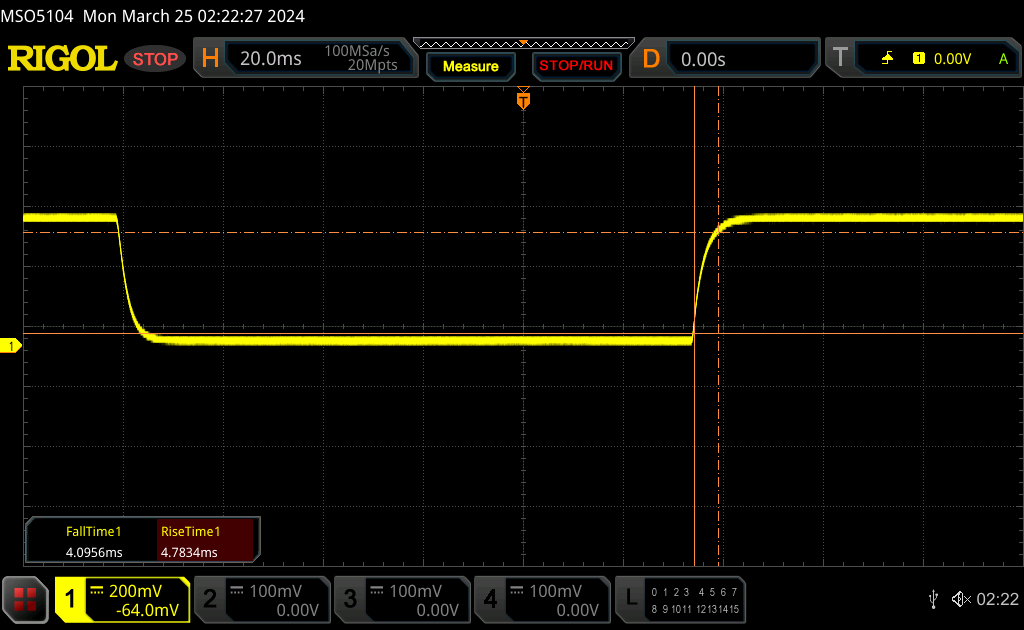 |
| ↘ 4.1 ms fallend | ||
| Die gemessenen Reaktionszeiten sind kurz wodurch sich der Bildschirm auch für Spiele gut eignen sollte. Im Vergleich rangierten die bei uns getesteten Geräte von 0.1 (Minimum) zu 240 (Maximum) ms. » 25 % aller Screens waren schneller als der getestete. Daher sind die gemessenen Reaktionszeiten besser als der Durchschnitt aller vermessenen Geräte (19.8 ms). | ||
| ↔ Reaktionszeiten 50% Grau zu 80% Grau | ||
| 11.9 ms ... steigend ↗ und fallend ↘ kombiniert | ↗ 5.5 ms steigend | 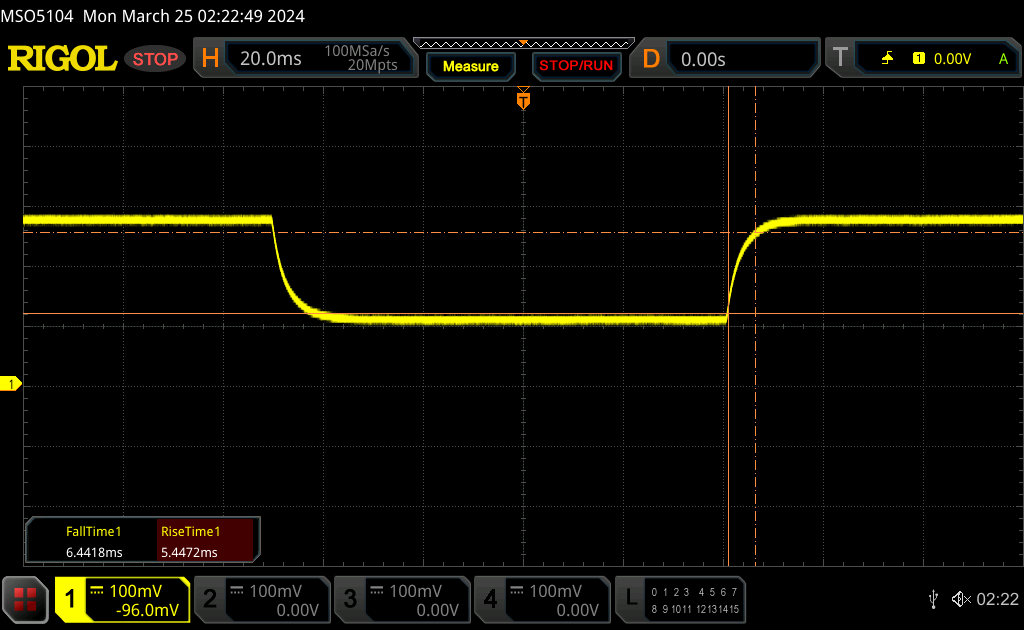 |
| ↘ 6.4 ms fallend | ||
| Die gemessenen Reaktionszeiten sind gut, für anspruchsvolle Spieler könnten der Bildschirm jedoch zu langsam sein. Im Vergleich rangierten die bei uns getesteten Geräte von 0.165 (Minimum) zu 636 (Maximum) ms. » 25 % aller Screens waren schneller als der getestete. Daher sind die gemessenen Reaktionszeiten besser als der Durchschnitt aller vermessenen Geräte (31 ms). | ||
Bildschirm-Flackern / PWM (Pulse-Width Modulation)
| Flackern / PWM nicht festgestellt |  | ||
Im Vergleich: 52 % aller getesteten Geräte nutzten kein PWM um die Helligkeit zu reduzieren. Wenn PWM eingesetzt wurde, dann bei einer Frequenz von durchschnittlich 7763 (Minimum 5, Maximum 343500) Hz. | |||
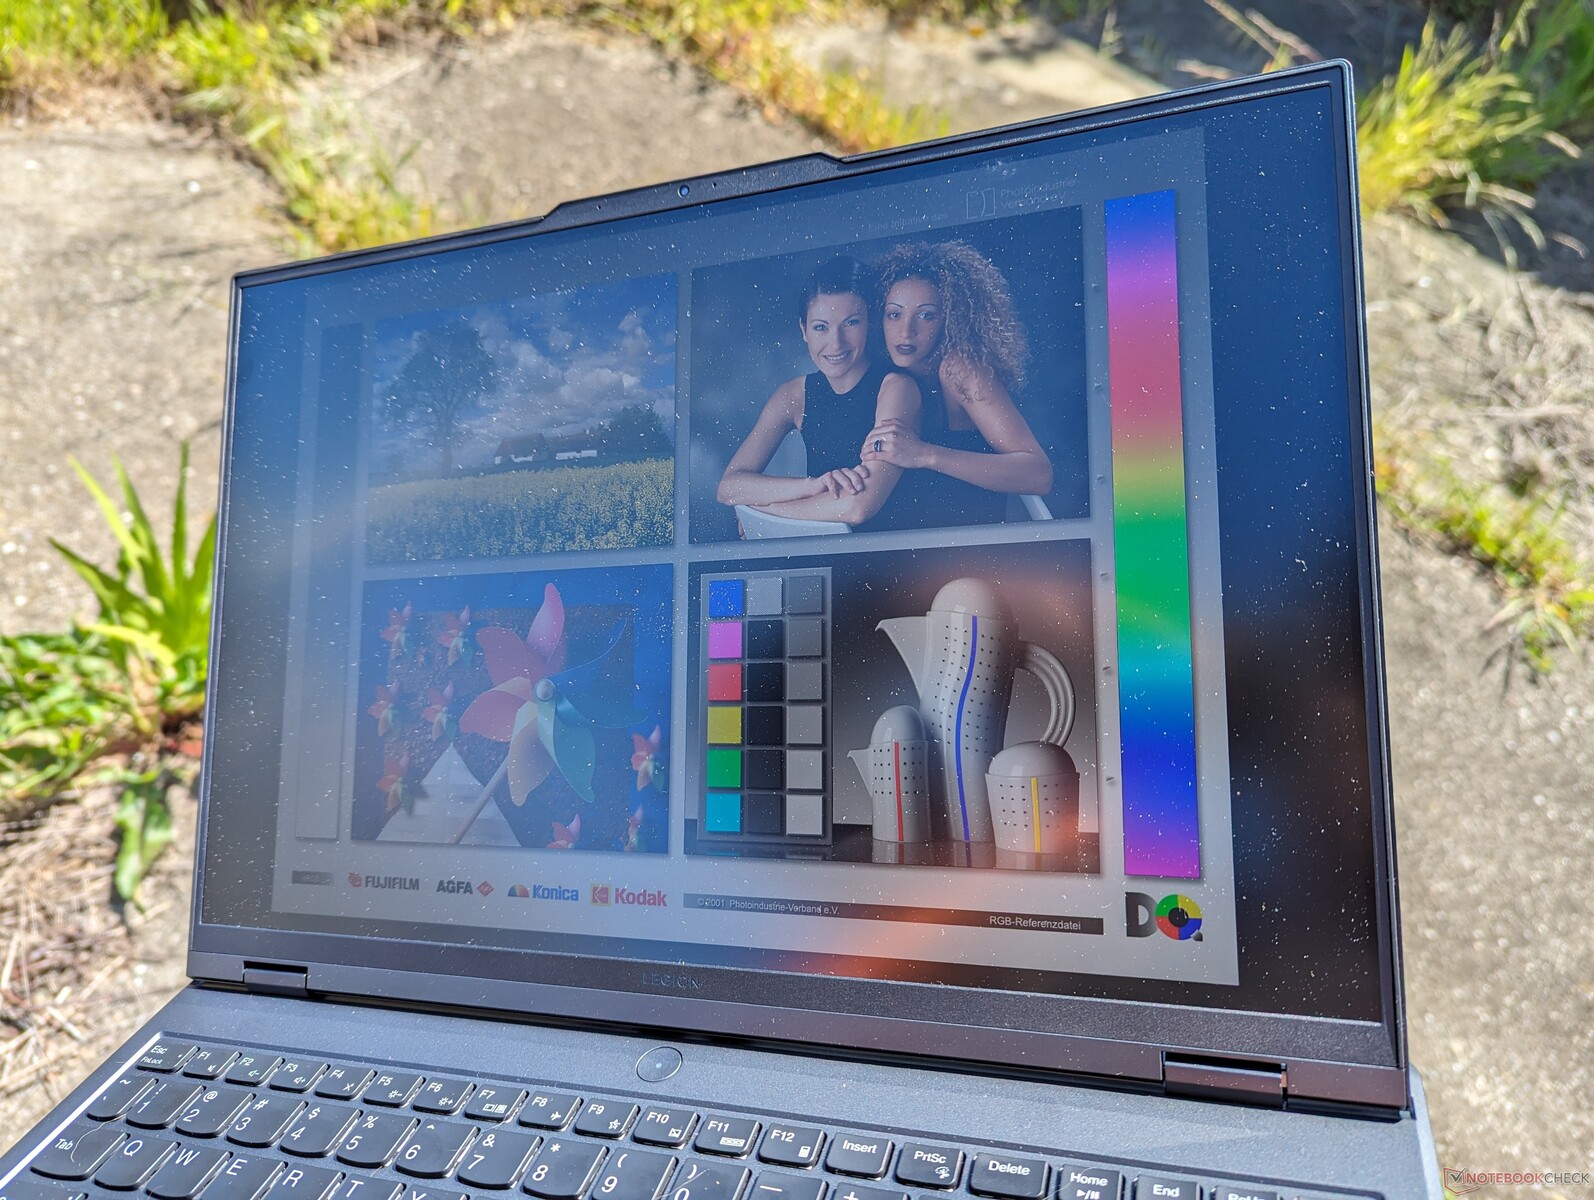
Die Sichtbarkeit im Freien hat sich im Vergleich zum Vorjahresmodell aufgrund der ähnlichen maximalen Helligkeit nicht verändert. Das Modell bietet zwar hellere Panele, der Unterschied ist aber nicht groß genug, um einen sichtbaren Unterschied zu machen.


Leistung — anderer Name, gleiche Leistung
Testbedingungen
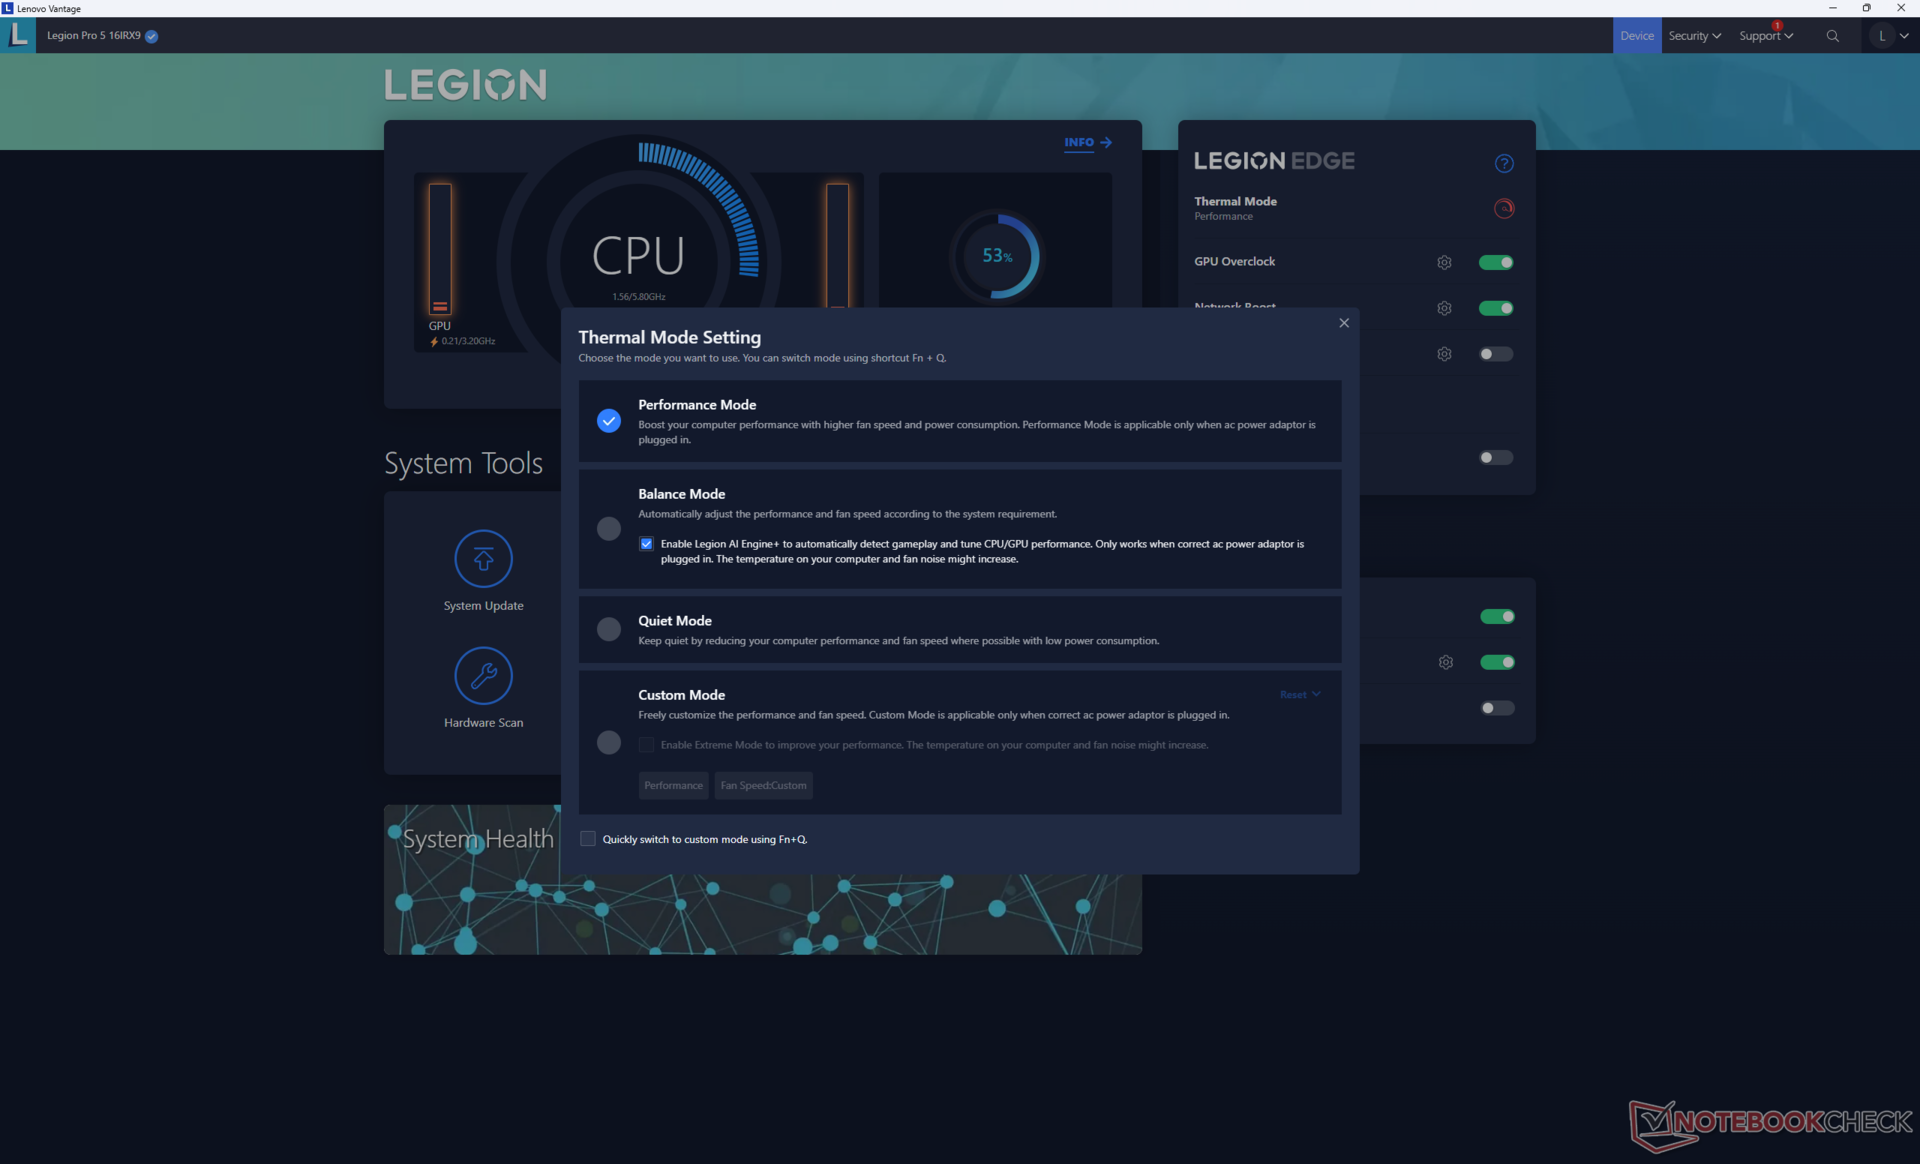
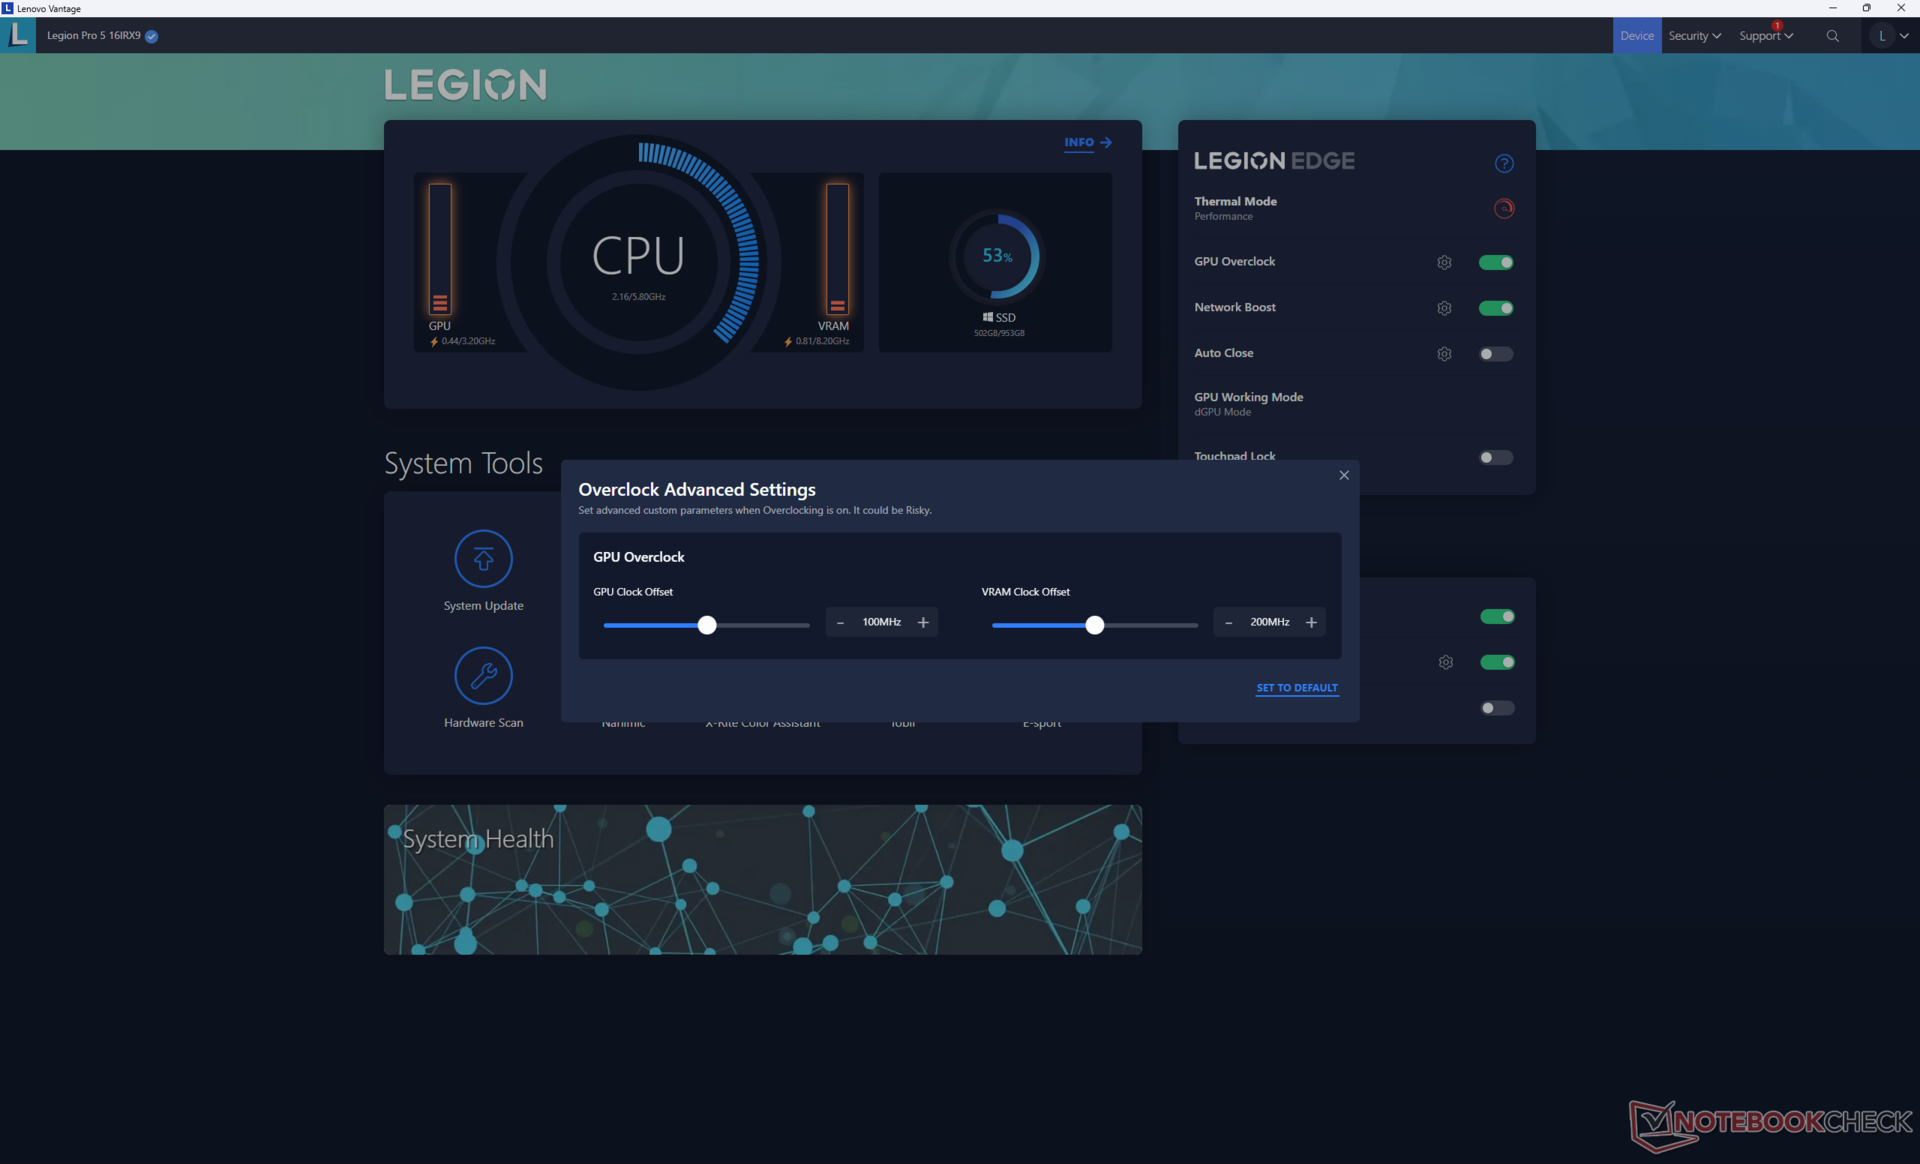
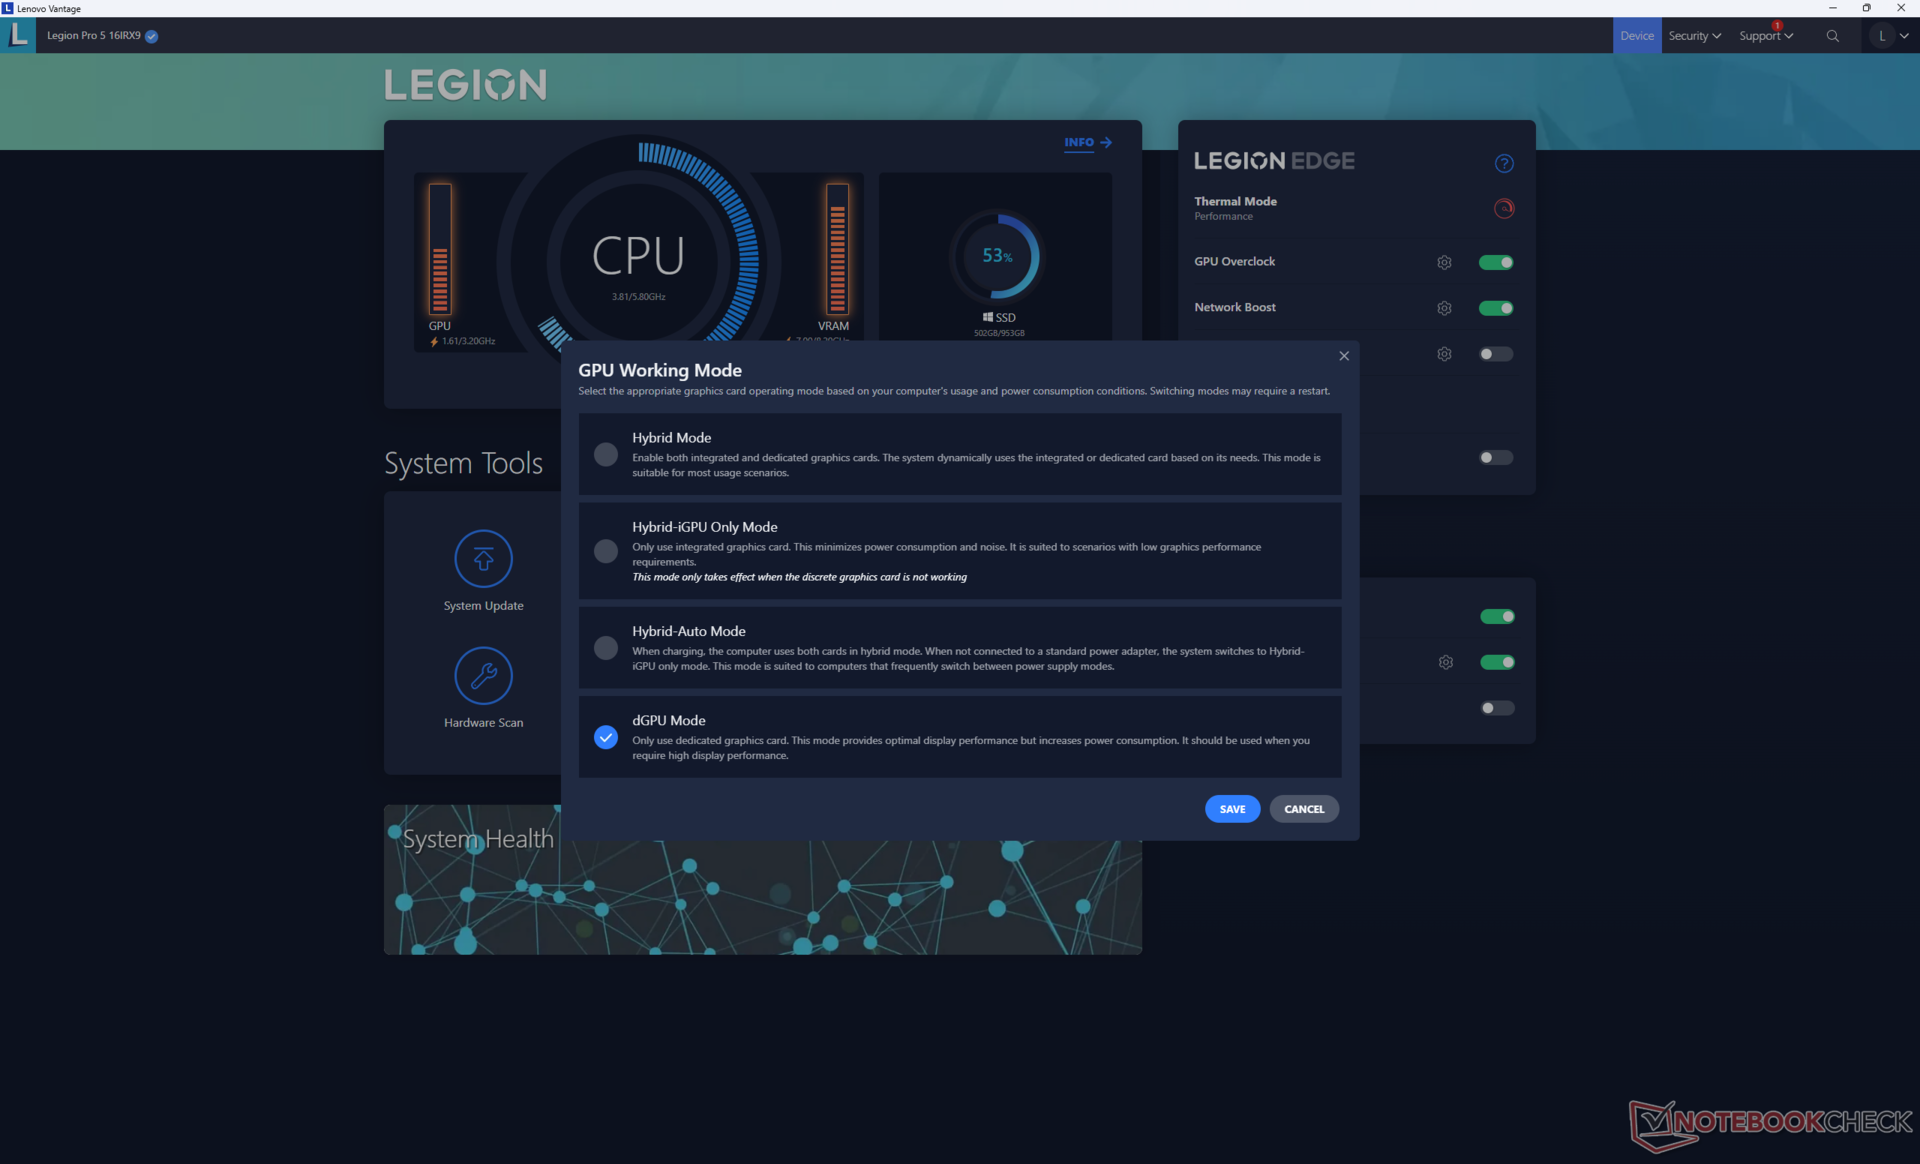
Vor der Durchführung der nachfolgenden Benchmarks haben wir in Lenovo Vantage den Leistungsmodus, den dGPU-Modus und in Windows den Leistungsmodus aktiviert. Auch die Übertaktung der GPU ist standardmäßig mit +100/+200 MHz Takt/VRAM aktiv.
Advanced Optimus wird unterstützt. Wie üblich ist G-Sync im dGPU-Modus nur für das Hauptdisplay aktiv.
Prozessor
Die CPU-Leistung ist insbesondere im Vergleich zum mit der gleichen Core i9-14900HX ausgestatteten HP Omen Transcend 16 ausgezeichnet, obwohl hier stärker gedrosselt wird. Der Leistungssprung ist mit fast 50 Prozent im Vergleich zum Core i7-13700HX in unserem älteren Legion 5 Pro 16IRX8 beträchtlich. Dennoch ist die Gesamtleistung mit der preiswerteren Core i9-13900HX vergleichbar, da es sich bei der i9-14900HX lediglich um eine Umfirmierung handelt.
Die langfristige Leistungserhaltung ist gut aber nicht perfekt. Beispielsweise reduziert sich die Leistung in der CineBench-R15-xT-Schleife um etwa 6 Prozent. Zum Glück ist dieser Einbruch nicht so schlimm wie im bereits erwähnten HP-Laptop (siehe Grafik unten).
Eine Herabstufung auf den i7-14700HX oder i5-14500HX wird die Leistung voraussichtlich um etwa 35 bis 45 Prozent verringern, da es sich hierbei ebenfalls um eine Neuauflage des älteren i7-13700HX bzw. i5-13500HX handelt.
Cinebench R15 Multi Schleife
Cinebench R23: Multi Core | Single Core
Cinebench R20: CPU (Multi Core) | CPU (Single Core)
Cinebench R15: CPU Multi 64Bit | CPU Single 64Bit
Blender: v2.79 BMW27 CPU
7-Zip 18.03: 7z b 4 | 7z b 4 -mmt1
Geekbench 6.7: Multi-Core | Single-Core
Geekbench 5.5: Multi-Core | Single-Core
HWBOT x265 Benchmark v2.2: 4k Preset
LibreOffice : 20 Documents To PDF
R Benchmark 2.5: Overall mean
* ... kleinere Werte sind besser
AIDA64: FP32 Ray-Trace | FPU Julia | CPU SHA3 | CPU Queen | FPU SinJulia | FPU Mandel | CPU AES | CPU ZLib | FP64 Ray-Trace | CPU PhotoWorxx
| Performance Rating | |
| Lenovo Legion Pro 5 16IRX9 | |
| Durchschnittliche Intel Core i9-14900HX | |
| Lenovo Legion Pro 5 16IRX8 | |
| HP Omen Transcend 16-u1095ng | |
| MSI Stealth 16 Mercedes-AMG Motorsport A13VG | |
| Alienware m16 R2 | |
| Asus ROG Zephyrus G16 2024 GU605M | |
| AIDA64 / FP32 Ray-Trace | |
| Lenovo Legion Pro 5 16IRX9 | |
| Durchschnittliche Intel Core i9-14900HX (13098 - 33474, n=36) | |
| Lenovo Legion Pro 5 16IRX8 | |
| MSI Stealth 16 Mercedes-AMG Motorsport A13VG | |
| Alienware m16 R2 | |
| HP Omen Transcend 16-u1095ng | |
| Asus ROG Zephyrus G16 2024 GU605M | |
| AIDA64 / FPU Julia | |
| Lenovo Legion Pro 5 16IRX9 | |
| Durchschnittliche Intel Core i9-14900HX (67573 - 166040, n=36) | |
| Lenovo Legion Pro 5 16IRX8 | |
| Alienware m16 R2 | |
| MSI Stealth 16 Mercedes-AMG Motorsport A13VG | |
| HP Omen Transcend 16-u1095ng | |
| Asus ROG Zephyrus G16 2024 GU605M | |
| AIDA64 / CPU SHA3 | |
| Lenovo Legion Pro 5 16IRX9 | |
| Durchschnittliche Intel Core i9-14900HX (3589 - 7979, n=36) | |
| Lenovo Legion Pro 5 16IRX8 | |
| HP Omen Transcend 16-u1095ng | |
| Alienware m16 R2 | |
| MSI Stealth 16 Mercedes-AMG Motorsport A13VG | |
| Asus ROG Zephyrus G16 2024 GU605M | |
| AIDA64 / CPU Queen | |
| Lenovo Legion Pro 5 16IRX9 | |
| Durchschnittliche Intel Core i9-14900HX (118405 - 148966, n=36) | |
| HP Omen Transcend 16-u1095ng | |
| MSI Stealth 16 Mercedes-AMG Motorsport A13VG | |
| Lenovo Legion Pro 5 16IRX8 | |
| Asus ROG Zephyrus G16 2024 GU605M | |
| Alienware m16 R2 | |
| AIDA64 / FPU SinJulia | |
| Lenovo Legion Pro 5 16IRX9 | |
| Durchschnittliche Intel Core i9-14900HX (10475 - 18517, n=36) | |
| Lenovo Legion Pro 5 16IRX8 | |
| HP Omen Transcend 16-u1095ng | |
| MSI Stealth 16 Mercedes-AMG Motorsport A13VG | |
| Asus ROG Zephyrus G16 2024 GU605M | |
| Alienware m16 R2 | |
| AIDA64 / FPU Mandel | |
| Lenovo Legion Pro 5 16IRX9 | |
| Durchschnittliche Intel Core i9-14900HX (32543 - 83662, n=36) | |
| Lenovo Legion Pro 5 16IRX8 | |
| Alienware m16 R2 | |
| MSI Stealth 16 Mercedes-AMG Motorsport A13VG | |
| HP Omen Transcend 16-u1095ng | |
| Asus ROG Zephyrus G16 2024 GU605M | |
| AIDA64 / CPU AES | |
| Durchschnittliche Intel Core i9-14900HX (86964 - 241777, n=36) | |
| Lenovo Legion Pro 5 16IRX9 | |
| Lenovo Legion Pro 5 16IRX8 | |
| HP Omen Transcend 16-u1095ng | |
| MSI Stealth 16 Mercedes-AMG Motorsport A13VG | |
| Alienware m16 R2 | |
| Asus ROG Zephyrus G16 2024 GU605M | |
| AIDA64 / CPU ZLib | |
| Lenovo Legion Pro 5 16IRX9 | |
| Durchschnittliche Intel Core i9-14900HX (1054 - 2292, n=36) | |
| Lenovo Legion Pro 5 16IRX8 | |
| HP Omen Transcend 16-u1095ng | |
| Alienware m16 R2 | |
| MSI Stealth 16 Mercedes-AMG Motorsport A13VG | |
| Asus ROG Zephyrus G16 2024 GU605M | |
| AIDA64 / FP64 Ray-Trace | |
| Lenovo Legion Pro 5 16IRX9 | |
| Durchschnittliche Intel Core i9-14900HX (6809 - 18349, n=36) | |
| Lenovo Legion Pro 5 16IRX8 | |
| MSI Stealth 16 Mercedes-AMG Motorsport A13VG | |
| Alienware m16 R2 | |
| HP Omen Transcend 16-u1095ng | |
| Asus ROG Zephyrus G16 2024 GU605M | |
| AIDA64 / CPU PhotoWorxx | |
| Lenovo Legion Pro 5 16IRX9 | |
| HP Omen Transcend 16-u1095ng | |
| Asus ROG Zephyrus G16 2024 GU605M | |
| MSI Stealth 16 Mercedes-AMG Motorsport A13VG | |
| Durchschnittliche Intel Core i9-14900HX (23903 - 54702, n=36) | |
| Alienware m16 R2 | |
| Lenovo Legion Pro 5 16IRX8 | |
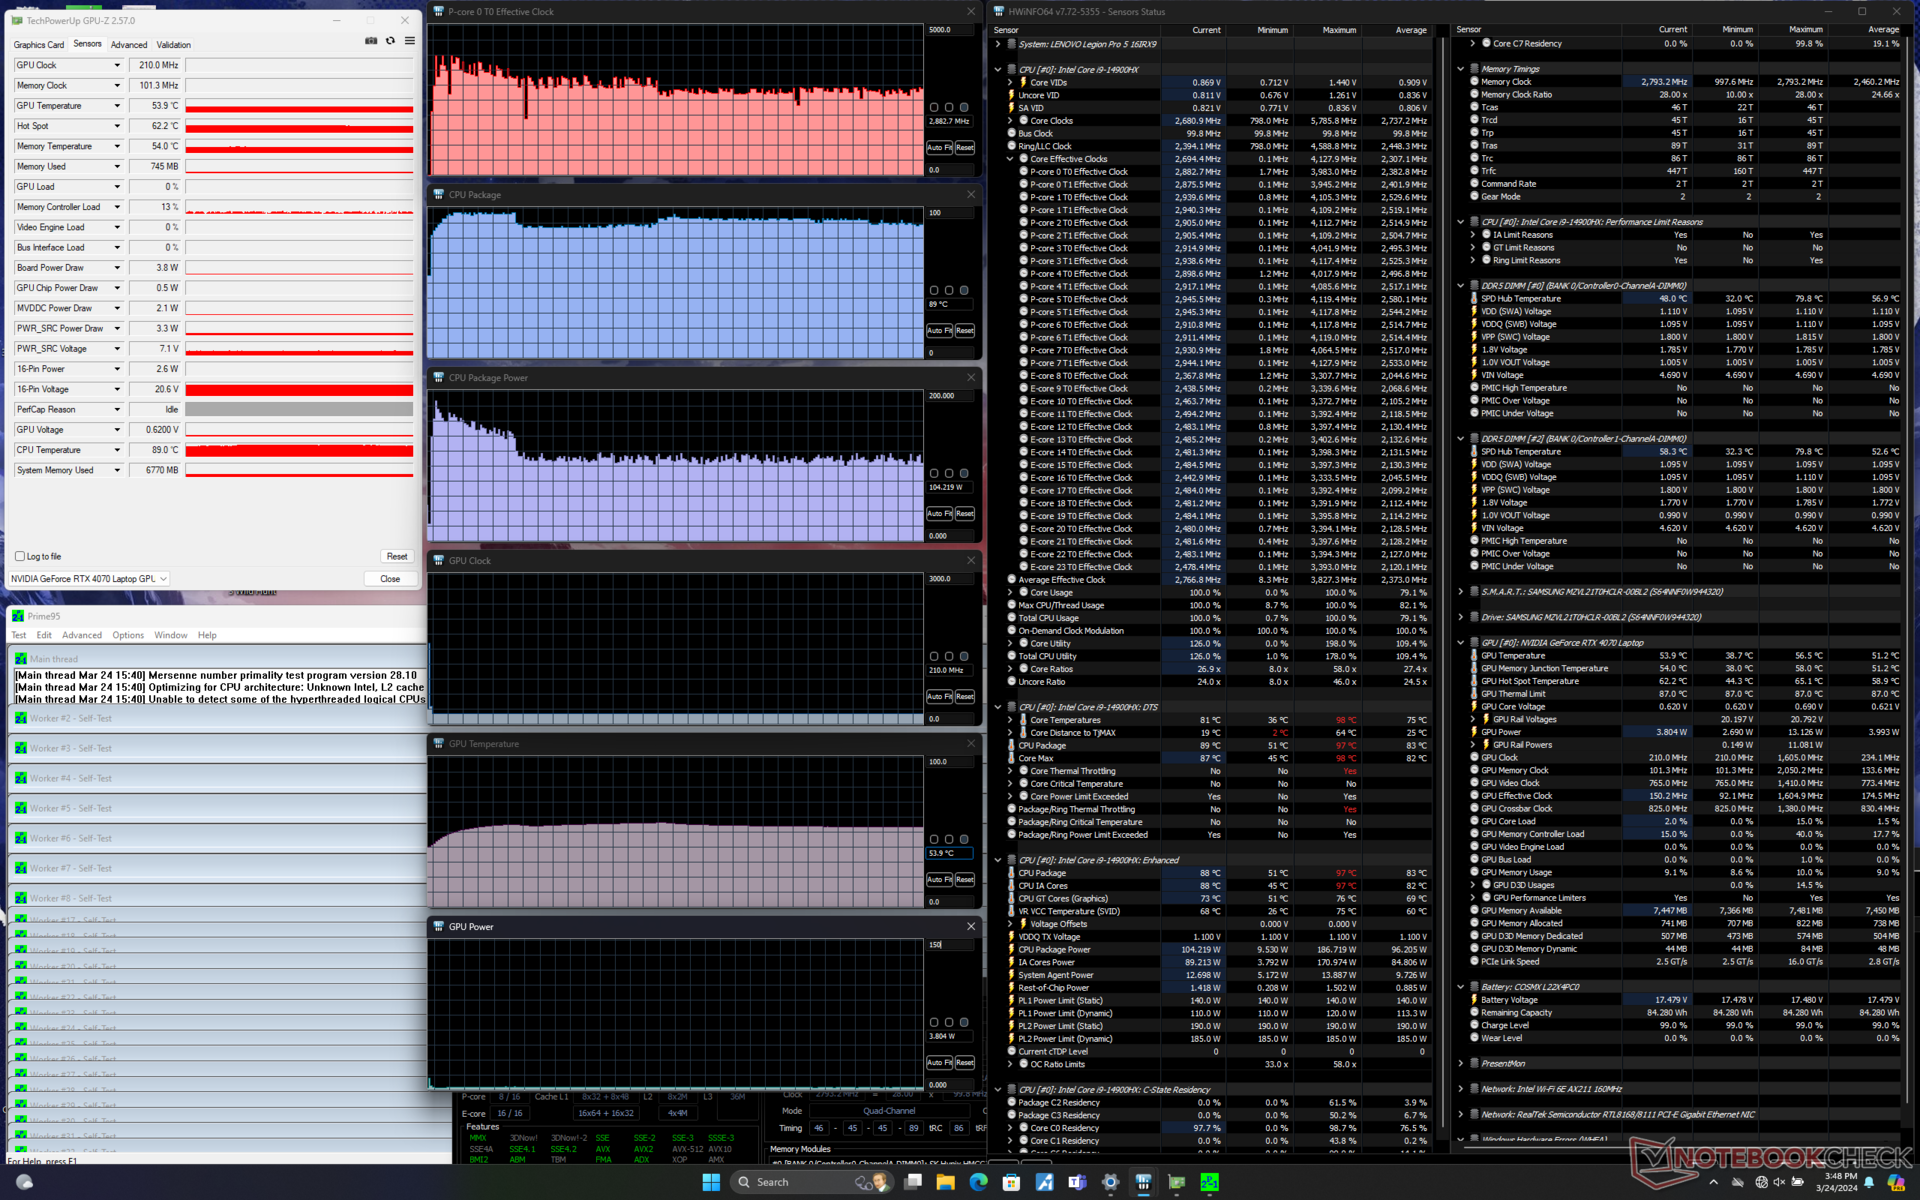
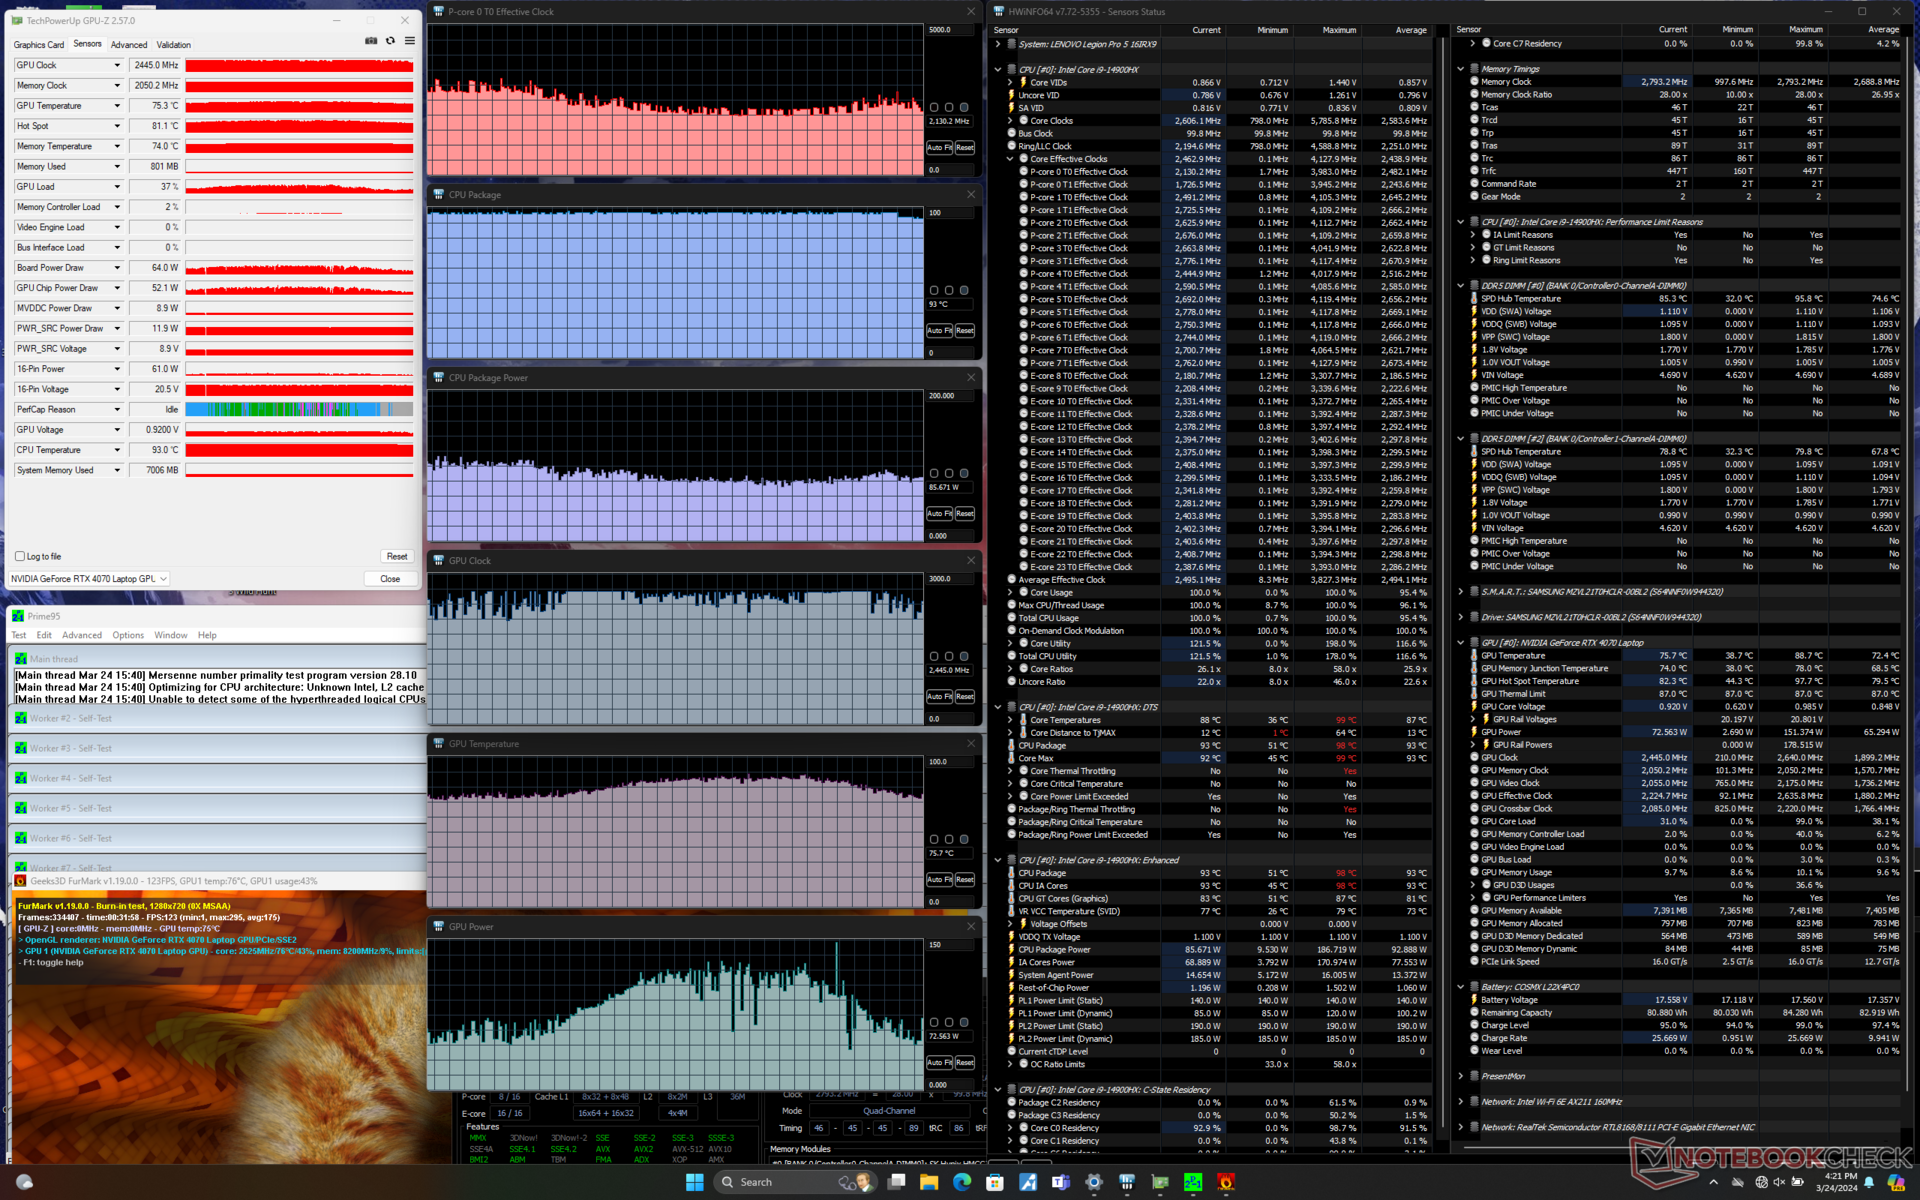
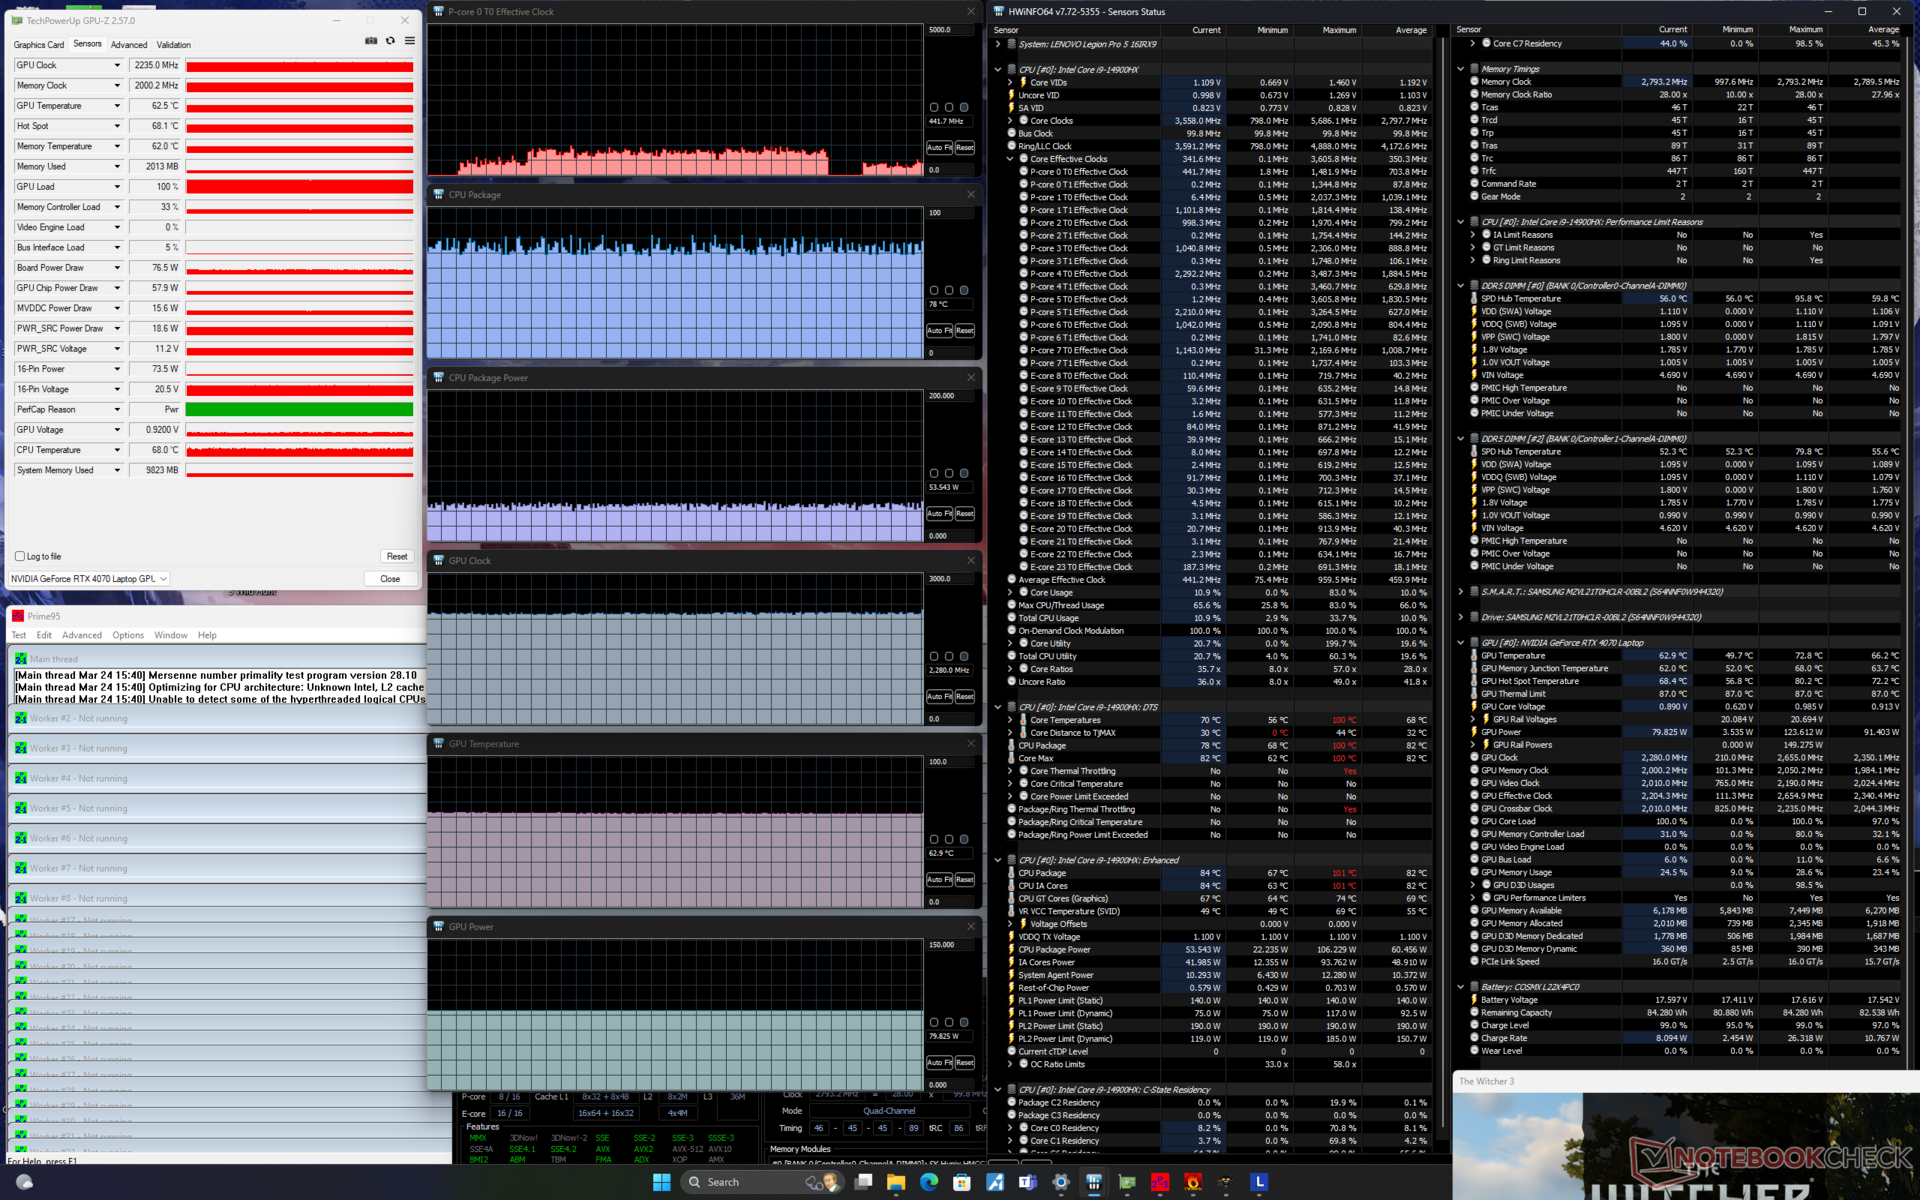
Stresstest
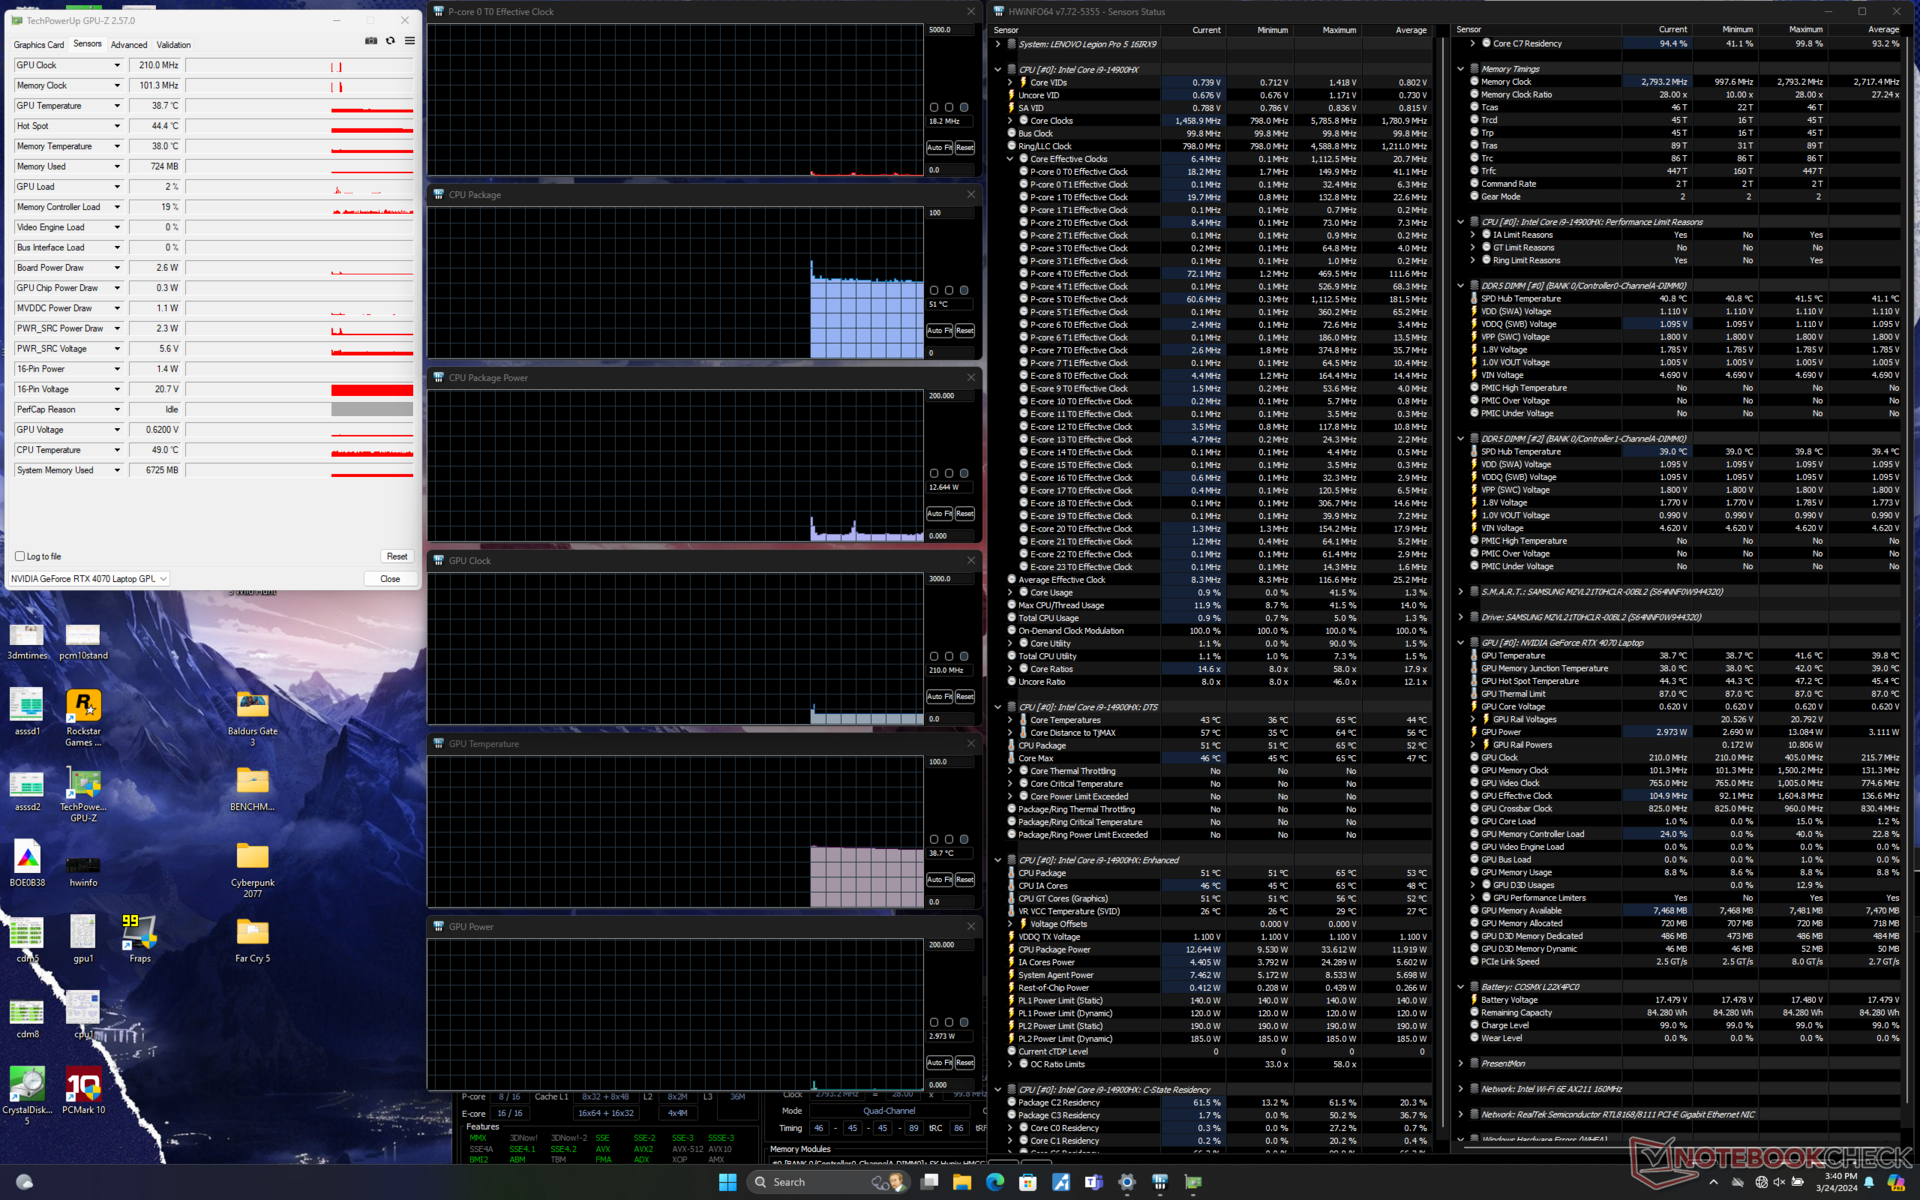
Die CPU kann ihre Leistung unter Prime95 auf 4 GHz und 187 W erhöhen. Sobald die Kerntemperatur wenige Sekunden später 97 °C erreicht, stabilisiert sich die CPU jedoch schnell bei 2,8 GHz bzw. 104 W, um so eine besser kontrollierbare Kerntemperatur von 89 °C zu erreichen. Das ist zwar etwas wärmer als beim letztjährigen Modell, die Kerntemperatur bleibt aber dennoch kühler als beim Alienware m16 R2 mit der langsameren Core Ultra 7.
Die Grafikleistung wird durch eine Umstellung vom Leistungsmodus in den ausgeglichenen Modus eingeschränkt. Darauf gehen wir im Abschnitt zur Grafikkarte näher ein. Hier fällt die Energieaufnahme der GPU sowie die Taktrate von 114 W bzw. 2640 MHz im Leistungsmodus auf 2280 MHz und 77 W im ausgeglichenen Modus zurück. Andererseits sind die Kerntemperaturen im ausgeglichenen Modus mit rund 10 °C Unterschied deutlich kühler, da die Leistung insgesamt geringer ist.
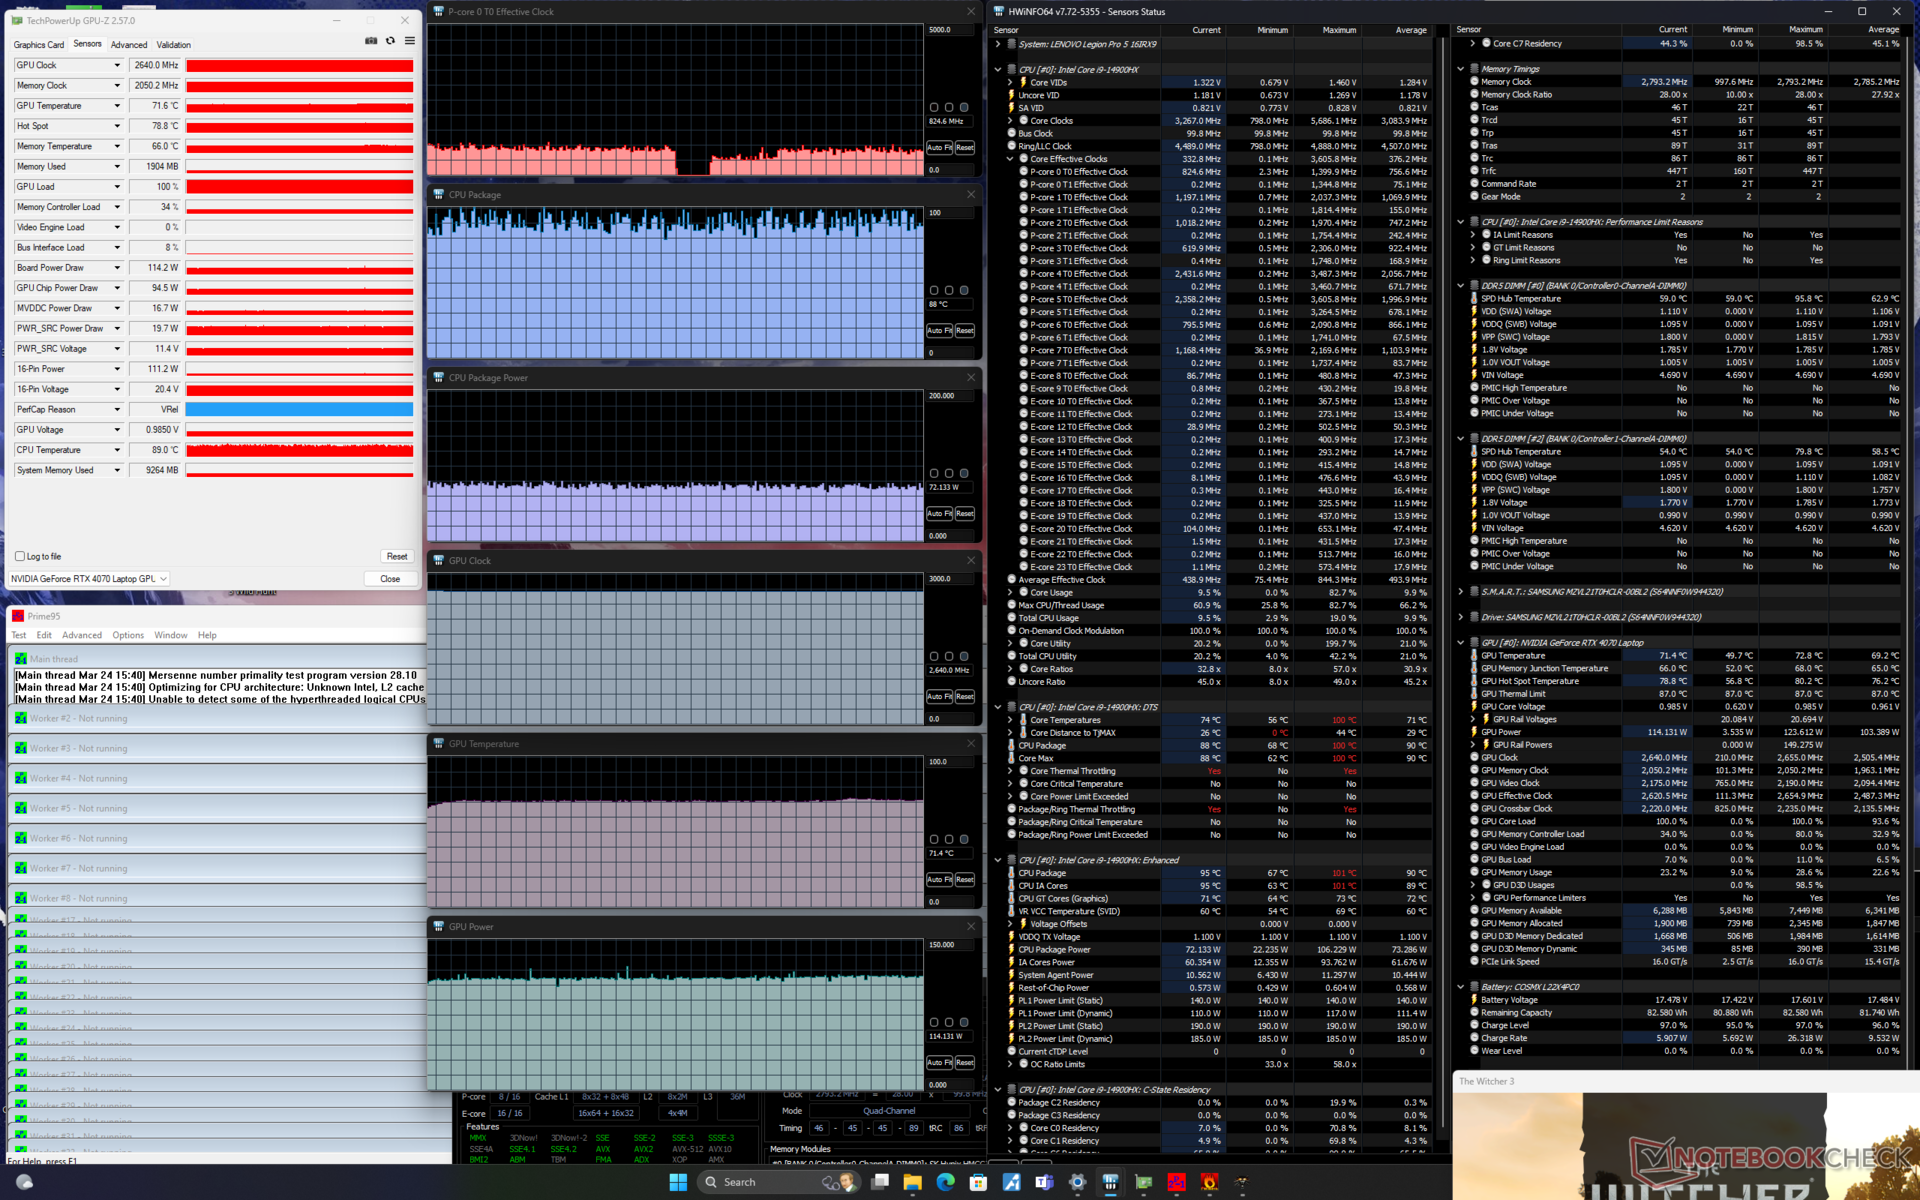
| CPU-Takt (GHz) | GPU-Takt (MHz) | Durchschn. CPU-Temperatur (°C) | Durchschn. GPU-Temperatur (°C) | |
| Leerlauf | -- | -- | 51 | 39 |
| Prime95-Last | 2,8 | -- | 89 | 54 |
| Prime95+FurMark-Last | ~2,1 | 2100 - 2700 | 95 | 70 - 88 |
| Witcher-3-Last (ausgeglichener Modus) | ~0,5 | 2280 | ~78 | 63 |
| Witcher-3-Last (Leistungsmodus) | ~0,9 | 2640 | ~88 | 72 |
Systemleistung
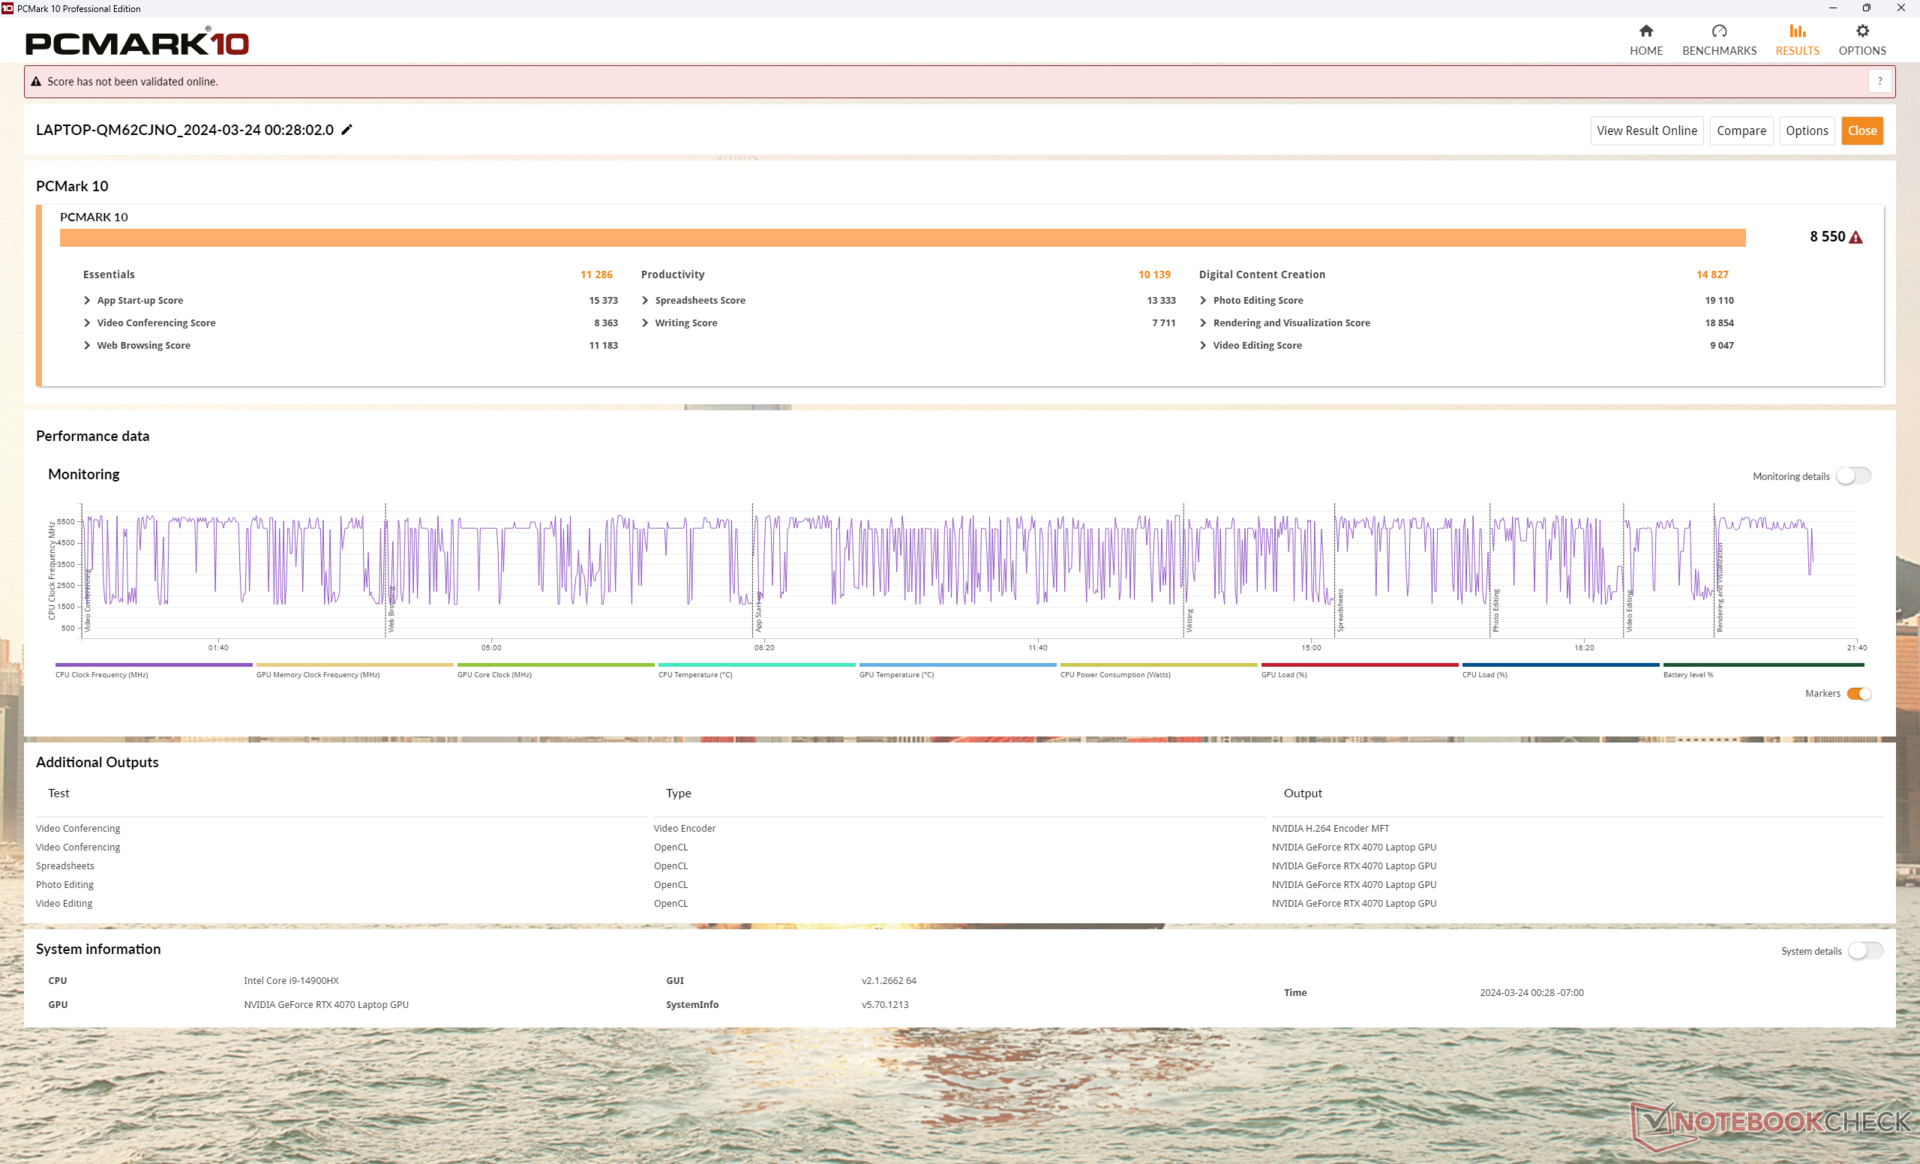
Die PCMark-Ergebnisse sind durchgehend höher als die des älteren Legion Pro 5 16IRX8, da unser Testgerät mit einer höherwertigen Core-i9 und GeForce RTX ausgestattet ist. Wir hatten auch keine Probleme beim Aufwachen aus dem Ruhezustand, wie wir das beim Alienware m16 R2 gesehen haben.
CrossMark: Overall | Productivity | Creativity | Responsiveness
WebXPRT 3: Overall
WebXPRT 4: Overall
Mozilla Kraken 1.1: Total
| PCMark 10 / Score | |
| Lenovo Legion Pro 5 16IRX9 | |
| Durchschnittliche Intel Core i9-14900HX, NVIDIA GeForce RTX 4070 Laptop GPU (7768 - 8550, n=8) | |
| HP Omen Transcend 16-u1095ng | |
| Alienware m16 R2 | |
| Lenovo Legion Pro 5 16IRX8 | |
| MSI Stealth 16 Mercedes-AMG Motorsport A13VG | |
| Asus ROG Zephyrus G16 2024 GU605M | |
| PCMark 10 / Essentials | |
| Lenovo Legion Pro 5 16IRX9 | |
| Durchschnittliche Intel Core i9-14900HX, NVIDIA GeForce RTX 4070 Laptop GPU (10104 - 11815, n=8) | |
| Lenovo Legion Pro 5 16IRX8 | |
| MSI Stealth 16 Mercedes-AMG Motorsport A13VG | |
| HP Omen Transcend 16-u1095ng | |
| Alienware m16 R2 | |
| Asus ROG Zephyrus G16 2024 GU605M | |
| PCMark 10 / Productivity | |
| Durchschnittliche Intel Core i9-14900HX, NVIDIA GeForce RTX 4070 Laptop GPU (9577 - 11103, n=8) | |
| HP Omen Transcend 16-u1095ng | |
| Lenovo Legion Pro 5 16IRX9 | |
| MSI Stealth 16 Mercedes-AMG Motorsport A13VG | |
| Alienware m16 R2 | |
| Asus ROG Zephyrus G16 2024 GU605M | |
| Lenovo Legion Pro 5 16IRX8 | |
| PCMark 10 / Digital Content Creation | |
| Lenovo Legion Pro 5 16IRX9 | |
| Durchschnittliche Intel Core i9-14900HX, NVIDIA GeForce RTX 4070 Laptop GPU (12114 - 14827, n=8) | |
| Alienware m16 R2 | |
| Lenovo Legion Pro 5 16IRX8 | |
| HP Omen Transcend 16-u1095ng | |
| Asus ROG Zephyrus G16 2024 GU605M | |
| MSI Stealth 16 Mercedes-AMG Motorsport A13VG | |
| CrossMark / Overall | |
| Durchschnittliche Intel Core i9-14900HX, NVIDIA GeForce RTX 4070 Laptop GPU (2002 - 2312, n=7) | |
| Lenovo Legion Pro 5 16IRX9 | |
| Alienware m16 R2 | |
| Asus ROG Zephyrus G16 2024 GU605M | |
| Lenovo Legion Pro 5 16IRX8 | |
| CrossMark / Productivity | |
| Durchschnittliche Intel Core i9-14900HX, NVIDIA GeForce RTX 4070 Laptop GPU (1827 - 2191, n=7) | |
| Lenovo Legion Pro 5 16IRX9 | |
| Alienware m16 R2 | |
| Asus ROG Zephyrus G16 2024 GU605M | |
| Lenovo Legion Pro 5 16IRX8 | |
| CrossMark / Creativity | |
| Durchschnittliche Intel Core i9-14900HX, NVIDIA GeForce RTX 4070 Laptop GPU (2258 - 2458, n=7) | |
| Lenovo Legion Pro 5 16IRX9 | |
| Asus ROG Zephyrus G16 2024 GU605M | |
| Alienware m16 R2 | |
| Lenovo Legion Pro 5 16IRX8 | |
| CrossMark / Responsiveness | |
| Durchschnittliche Intel Core i9-14900HX, NVIDIA GeForce RTX 4070 Laptop GPU (1734 - 2330, n=7) | |
| Lenovo Legion Pro 5 16IRX9 | |
| Lenovo Legion Pro 5 16IRX8 | |
| Alienware m16 R2 | |
| Asus ROG Zephyrus G16 2024 GU605M | |
| WebXPRT 3 / Overall | |
| HP Omen Transcend 16-u1095ng | |
| Lenovo Legion Pro 5 16IRX9 | |
| Durchschnittliche Intel Core i9-14900HX, NVIDIA GeForce RTX 4070 Laptop GPU (269 - 342, n=8) | |
| Alienware m16 R2 | |
| Asus ROG Zephyrus G16 2024 GU605M | |
| Lenovo Legion Pro 5 16IRX8 | |
| WebXPRT 4 / Overall | |
| Durchschnittliche Intel Core i9-14900HX, NVIDIA GeForce RTX 4070 Laptop GPU (291 - 304, n=6) | |
| Lenovo Legion Pro 5 16IRX9 | |
| Alienware m16 R2 | |
| Asus ROG Zephyrus G16 2024 GU605M | |
| Lenovo Legion Pro 5 16IRX8 | |
| Mozilla Kraken 1.1 / Total | |
| Asus ROG Zephyrus G16 2024 GU605M | |
| Alienware m16 R2 | |
| Lenovo Legion Pro 5 16IRX8 | |
| Lenovo Legion Pro 5 16IRX9 | |
| Durchschnittliche Intel Core i9-14900HX, NVIDIA GeForce RTX 4070 Laptop GPU (431 - 469, n=8) | |
| HP Omen Transcend 16-u1095ng | |
* ... kleinere Werte sind besser
| PCMark 10 Score | 8550 Punkte | |
Hilfe | ||
| AIDA64 / Memory Copy | |
| Asus ROG Zephyrus G16 2024 GU605M | |
| Lenovo Legion Pro 5 16IRX9 | |
| HP Omen Transcend 16-u1095ng | |
| Durchschnittliche Intel Core i9-14900HX (38028 - 83392, n=36) | |
| MSI Stealth 16 Mercedes-AMG Motorsport A13VG | |
| Alienware m16 R2 | |
| Lenovo Legion Pro 5 16IRX8 | |
| AIDA64 / Memory Read | |
| Asus ROG Zephyrus G16 2024 GU605M | |
| Lenovo Legion Pro 5 16IRX9 | |
| HP Omen Transcend 16-u1095ng | |
| Durchschnittliche Intel Core i9-14900HX (43306 - 87568, n=36) | |
| Alienware m16 R2 | |
| MSI Stealth 16 Mercedes-AMG Motorsport A13VG | |
| Lenovo Legion Pro 5 16IRX8 | |
| AIDA64 / Memory Write | |
| HP Omen Transcend 16-u1095ng | |
| Lenovo Legion Pro 5 16IRX9 | |
| Asus ROG Zephyrus G16 2024 GU605M | |
| MSI Stealth 16 Mercedes-AMG Motorsport A13VG | |
| Durchschnittliche Intel Core i9-14900HX (37146 - 80589, n=36) | |
| Alienware m16 R2 | |
| Lenovo Legion Pro 5 16IRX8 | |
| AIDA64 / Memory Latency | |
| Asus ROG Zephyrus G16 2024 GU605M | |
| Alienware m16 R2 | |
| MSI Stealth 16 Mercedes-AMG Motorsport A13VG | |
| HP Omen Transcend 16-u1095ng | |
| Durchschnittliche Intel Core i9-14900HX (76.1 - 105, n=36) | |
| Lenovo Legion Pro 5 16IRX9 | |
| Lenovo Legion Pro 5 16IRX8 | |
* ... kleinere Werte sind besser
DPC-Latenzen
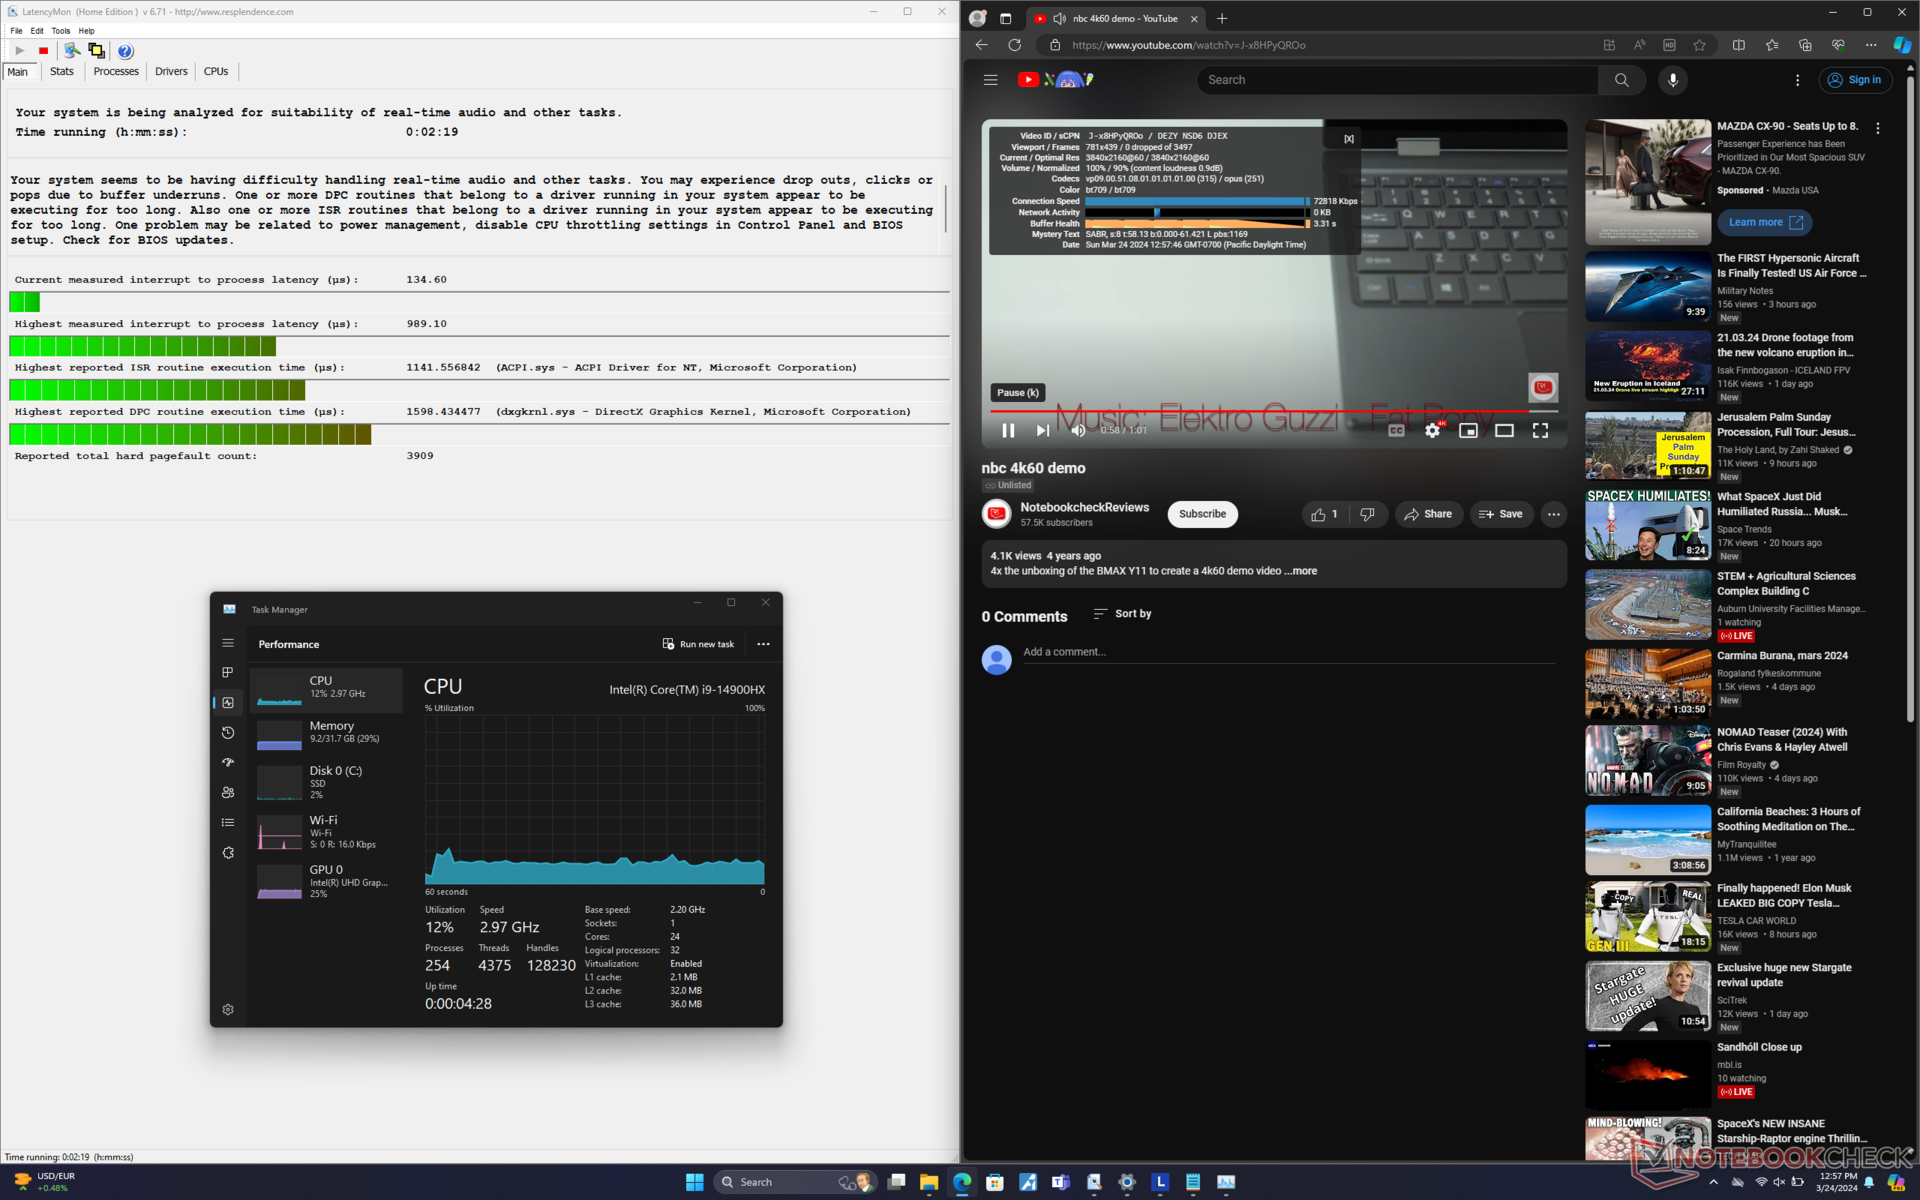
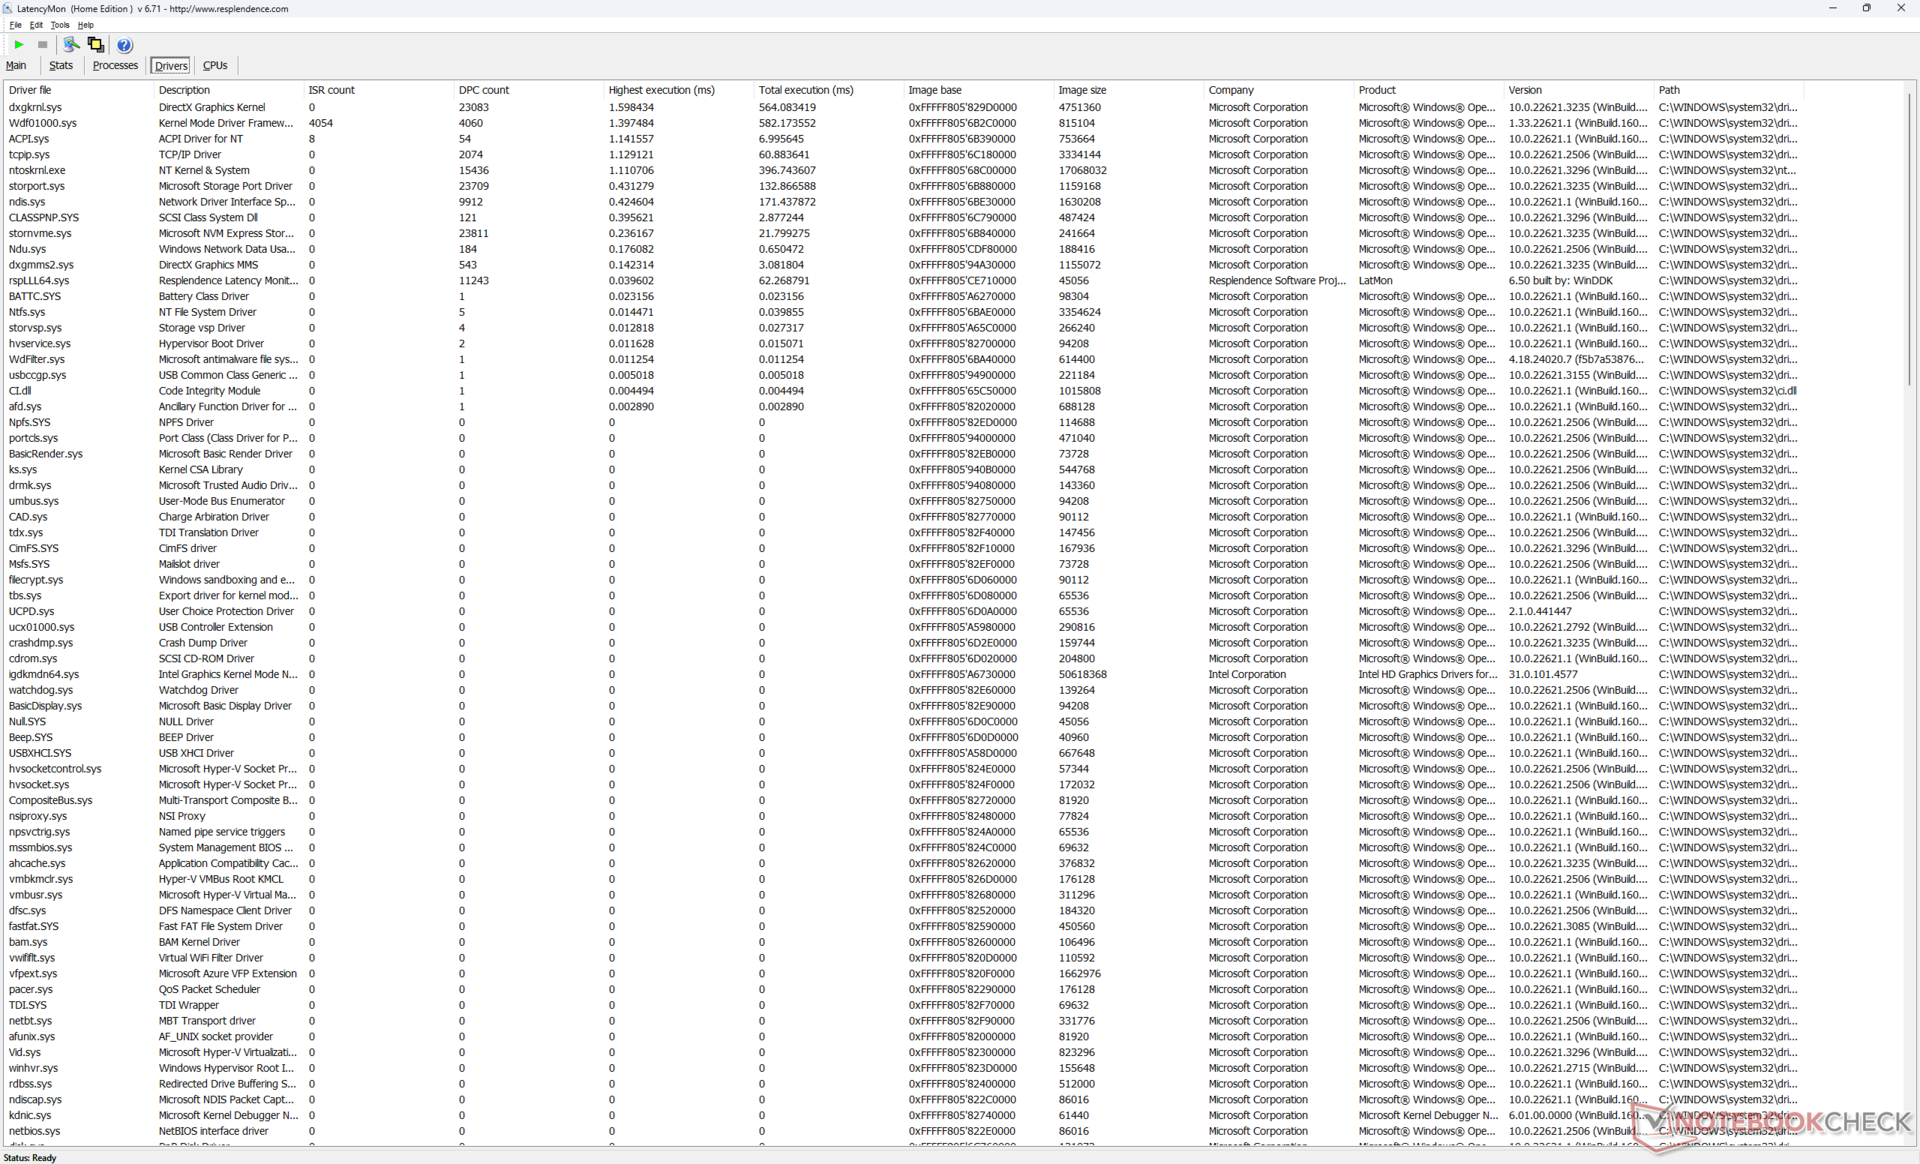
LatencyMon zeigt DPC-Probleme beim Öffnen mehrerer Browser-Tabs auf unsere Homepage. Das Abspielen von 4K-Videos mit 60 FPS im iGPU-Modus verläuft ansonsten fehlerfrei und ohne verlorengegangene Frames.
| DPC Latencies / LatencyMon - interrupt to process latency (max), Web, Youtube, Prime95 | |
| MSI Stealth 16 Mercedes-AMG Motorsport A13VG | |
| Asus ROG Zephyrus G16 2024 GU605M | |
| Alienware m16 R2 | |
| HP Omen Transcend 16-u1095ng | |
| Lenovo Legion Pro 5 16IRX9 | |
| Lenovo Legion Pro 5 16IRX8 | |
* ... kleinere Werte sind besser
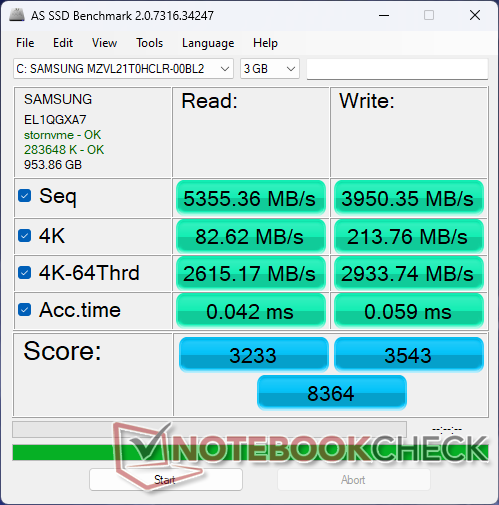
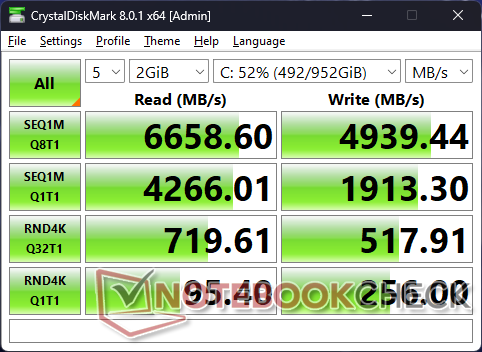
Massenspeicher
Unser Testgerät ist mit einer Samsung PM9A1 anstatt der SK Hynix PC801 im Vorjahresmodell Legion Pro 5 16IRX8 ausgestattet. Interessanterweise scheint unser Samsung-Gerät bei hohen Übertragungsraten mitten in unserer DispSpd-Schleife zu drosseln, wodurch die Geschwindigkeit von 6600 MB/s auf nur 3300 MB/s reduziert wird. Die SK Hynix aus dem Vorjahr hatte keine Probleme, deutlich höhere Übertragungsraten unter ähnlichen Umständen aufrechtzuhalten (siehe Grafik unten). Leider gibt es keine einfache Möglichkeit, vor dem Kauf festzustellen, mit welcher SSD das Modell ausgestattet sein wird.

* ... kleinere Werte sind besser
Dauerleistung Lesen: DiskSpd Read Loop, Queue Depth 8
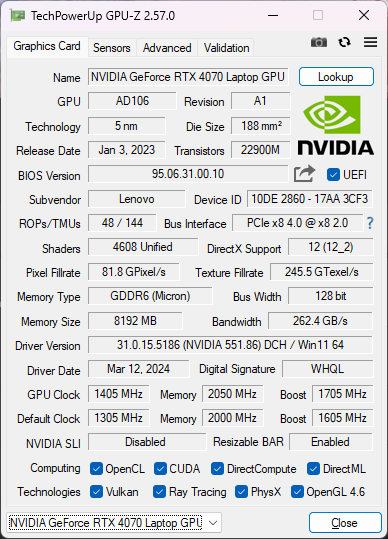
Grafikkarte
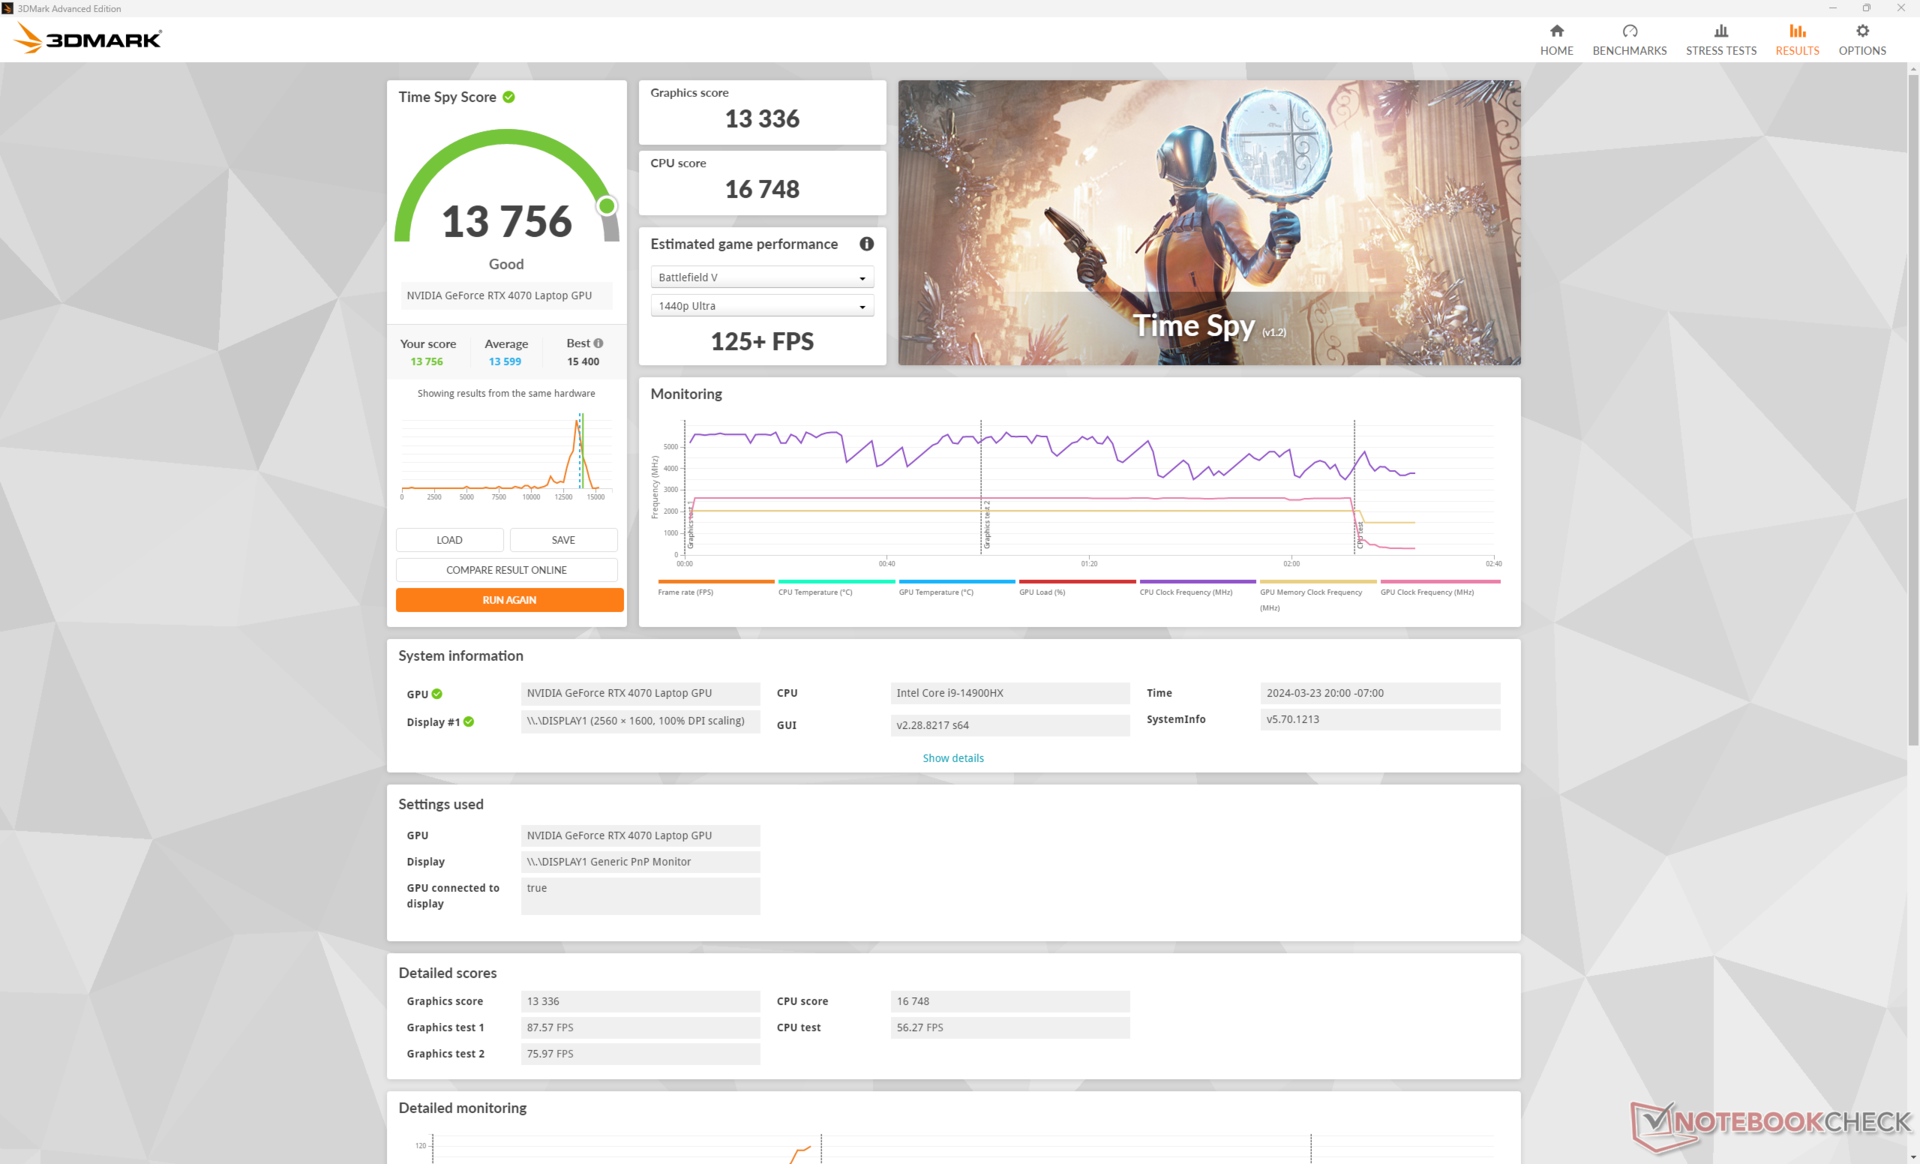
Zu den Grafikkartenoptionen gehören die GeForce RTX 4050, 4060 und 4070, die jeweils eine TGP von 140 W haben. Wir vermuten, dass dieses Modell angesichts seiner Größe auch mit den schnelleren Versionen RTX 4080 bzw. 4090 zurechtkommen würde. Diese höherwertigen Optionen sind allerdings für das teurere Legion Pro 7 reserviert. Nichtsdestotrotz läuft das RTX 4070 in unserem Legion Pro 5 16 sehr gut und ist um bis zu 15 Prozent schneller als der durchschnittliche mit dieser GPU ausgestattete Laptop in unserer Datenbank.
Ein Downgrade auf die RTX 4060- oder 4050-Konfiguration dürfte die Grafikleistung um etwa 10 bis 20 Prozent bzw. 25 bis 35 Prozent reduzieren. Benutzer, die von einem älteren RTX 3070 Ti-Laptop aufrüsten, werden keine signifikanten Vorteile bemerken — es sei denn, der Titel unterstützt DLSS 3. Diese Funktion ist weiterhin exklusiv bei RTX 40 Ada Lovelace GPUs verfügbar.
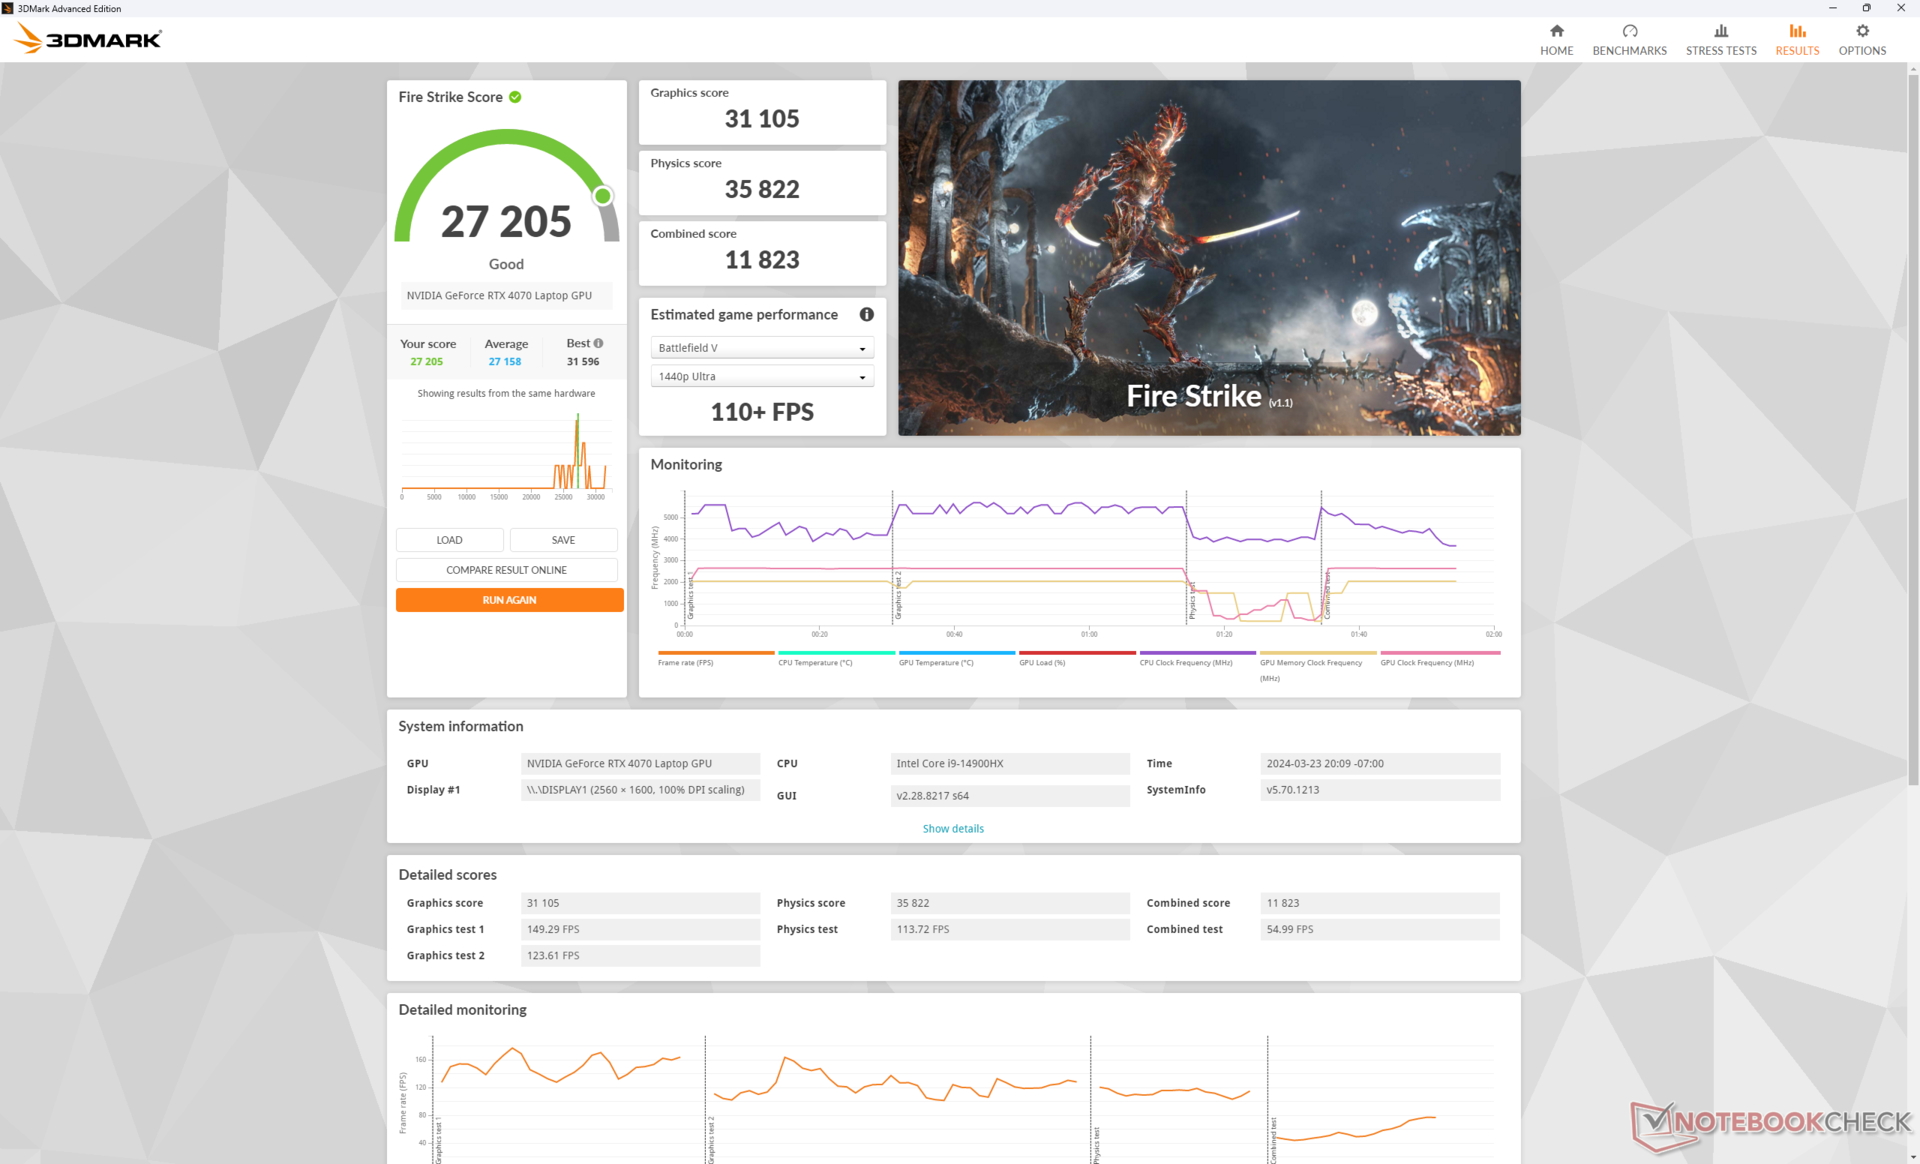
| Energieprofil | Graphics Score | Physics Score | Kombiniert |
| Leistungsmodus | 31105 | 35822 | 11823 |
| Ausgeglichener Modus | 29127 (-6 %) | 37119 (+4 %) | 11040 (-7 %) |
| Akkubetrieb | 21813 (-29 %) | 21747 (-39 %) | 6324 (-47 %) |
Wird das Gerät anstelle des Leistungsmodus in den ausgeglichenen Modus gestellt, reduziert sich die Grafikleistung um nur etwa 6 Prozent. Die Prozessorleistung wird dadurch nicht eingeschränkt.
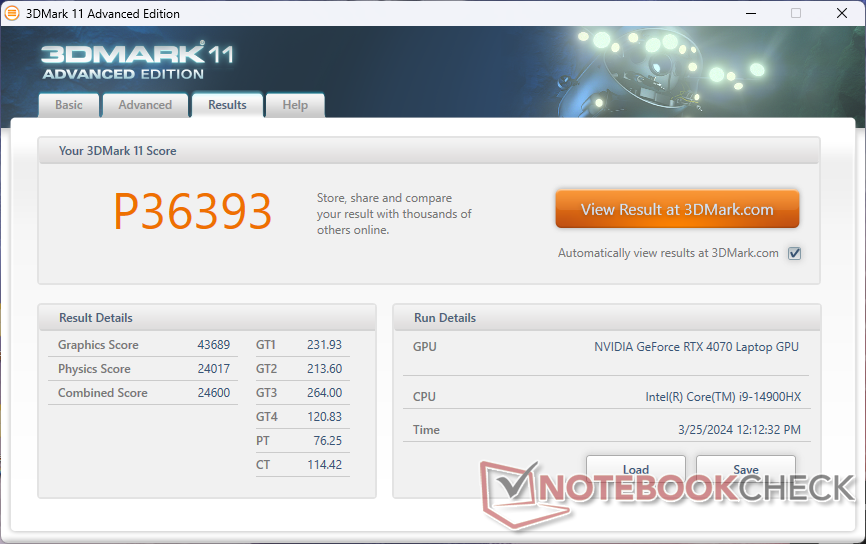
| 3DMark 11 Performance | 36393 Punkte | |
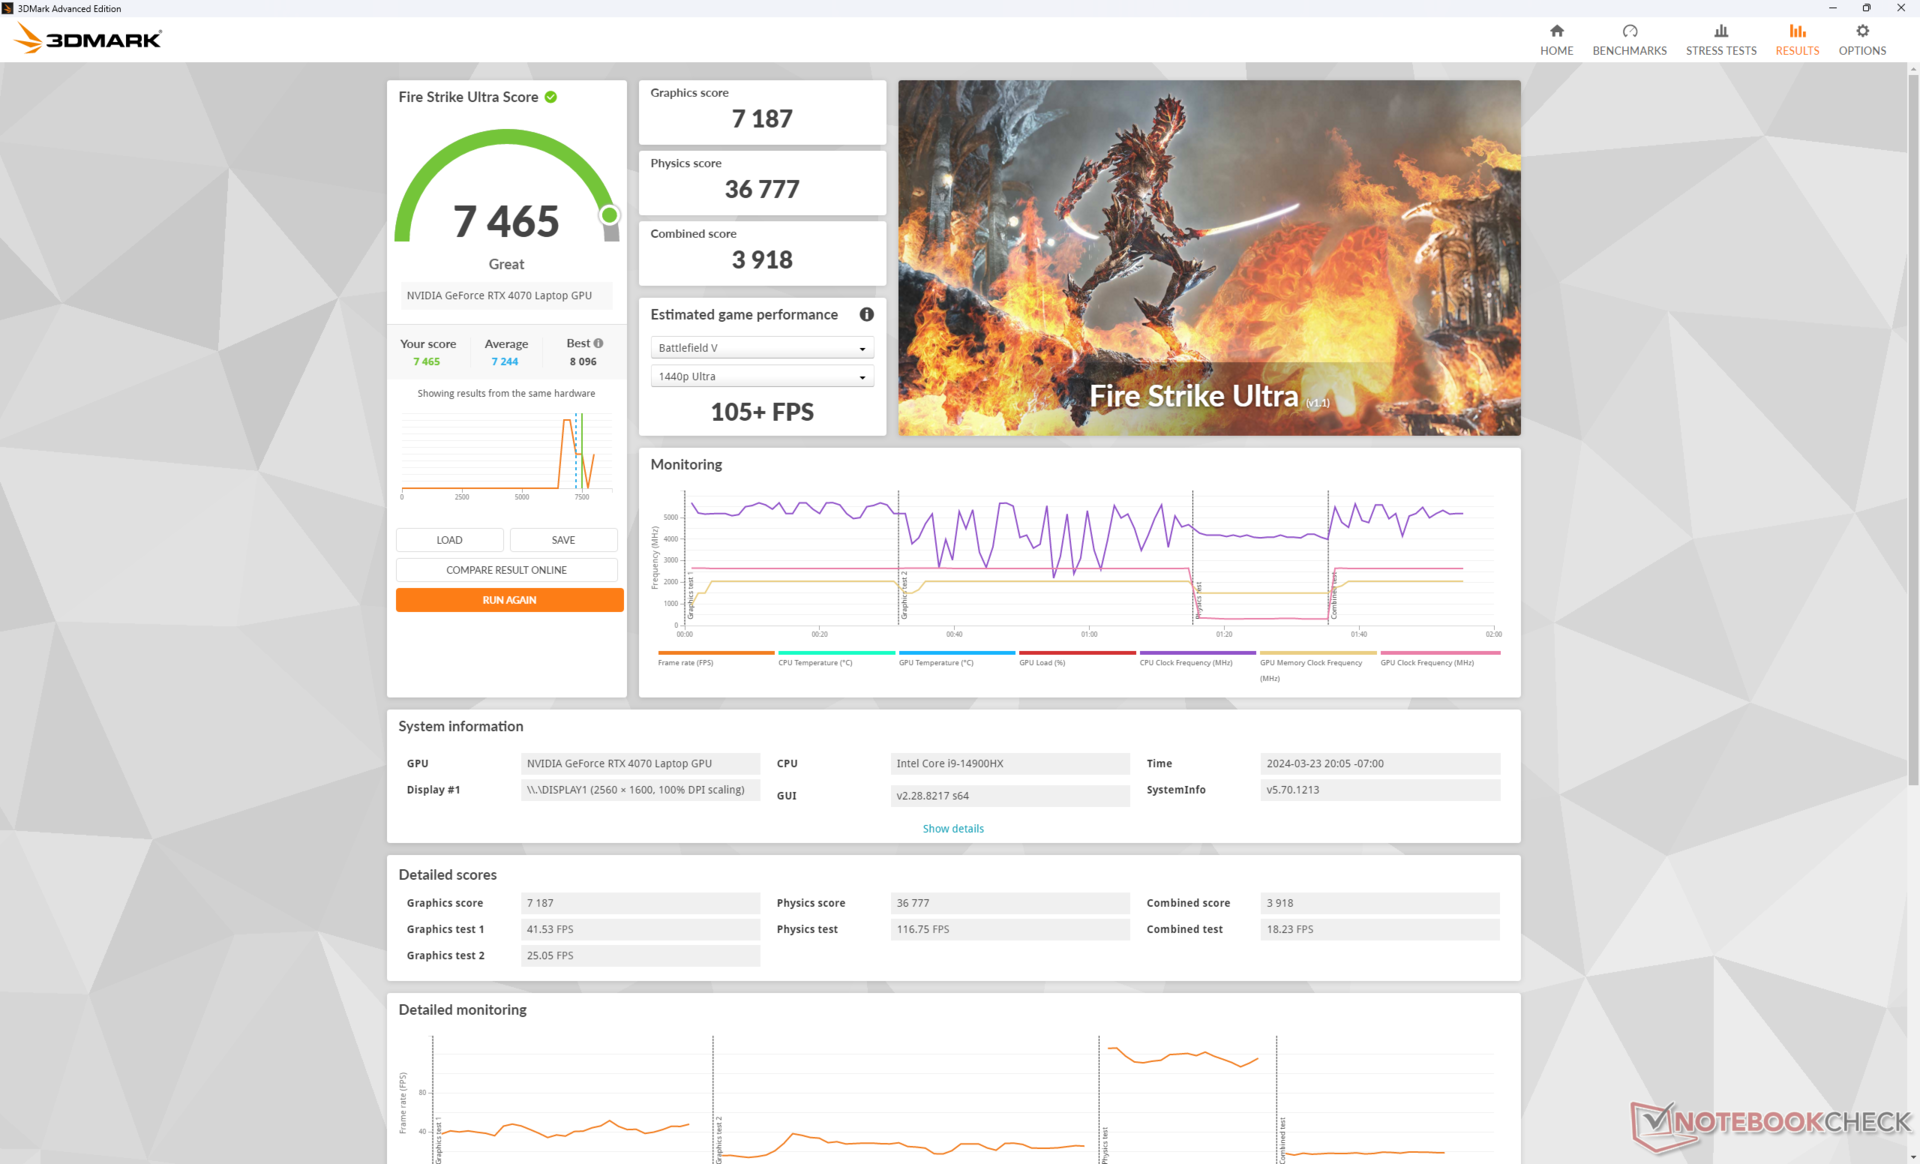
| 3DMark Fire Strike Score | 27205 Punkte | |
| 3DMark Time Spy Score | 13756 Punkte | |
Hilfe | ||
* ... kleinere Werte sind besser
Gamingleistung
Unser Lenovo schneidet fast durchweg besser ab als das Alienware m15 R2. Obwohl beide Modelle mit der gleichen 140-W-GeForce-RTX-4070-GPU ausgestattet sind, erreicht unser Testgerät um 5-10 Prozent bessere Ergebnisse. Dieser Unterschied liegt vermutlich an unserer schnelleren Core-i9-14900HX-CPU, während das Alienware stattdessen mit der Core-Ultra-7-155H ausgestattet ist.
Die mobile RTX 4070 bietet bei einer 4K-Auflösung eher schlechte Ergebnisse, da sie doch deutlich schwächer ist als eine "richtige" Desktop-RTX-4070. In diesen Szenarien empfiehlt es sich, DLSS 3 bzw. Frame Generation zu aktivieren, um flüssigere Bildraten zu erhalten. Beispielsweise ergibt das Spielen von Cyberpunk 2077 bei einer nativen Auflösung von 4K in Ultra-Einstellungen und ohne RT eine durchschnittliche Bildrate von nur 21. Ist DLSS 3 im ausgeglichenen Modus aktiv, springt die Bildrate hingegen auf 64.
Witcher-3-FPS-Tabelle
| min. | mittel | hoch | max. | QHD | 4K | |
|---|---|---|---|---|---|---|
| GTA V (2015) | 186.7 | 184.9 | 181.7 | 127.2 | 100.1 | 99.8 |
| The Witcher 3 (2015) | 607.3 | 448.7 | 268.3 | 133.7 | 83.5 | |
| Dota 2 Reborn (2015) | 231 | 205 | 196.7 | 185.3 | 153.3 | |
| Final Fantasy XV Benchmark (2018) | 205 | 185.9 | 131 | 95.1 | 52.8 | |
| X-Plane 11.11 (2018) | 188.3 | 173.3 | 137.6 | 120.3 | ||
| Far Cry 5 (2018) | 191 | 183 | 170 | 158 | 128 | 65 |
| Strange Brigade (2018) | 496 | 340 | 268 | 234 | 150.9 | 77.9 |
| Tiny Tina's Wonderlands (2022) | 283.4 | 230.6 | 151.4 | 115.9 | 79.5 | 36.9 |
| F1 22 (2022) | 320 | 312 | 245 | 88.7 | 58.8 | 27.6 |
| Baldur's Gate 3 (2023) | 176 | 150.8 | 128.5 | 125.6 | 89.6 | 45.2 |
| Cyberpunk 2077 (2023) | 143.4 | 124 | 102.2 | 87.1 | 52.8 | 23.5 |
Emissionen
Geräuschemissionen
Das Lüftergeräusch ist grundsätzlich lauter als im Vorjahresmodell mit Core i7 und RTX 4060, was eventuell an der schnelleren Konfiguration mit Core i9 und RTX 4070 liegen könnte. Bei anspruchsloser Belastung wie etwa beim Surfen oder Streamen liegt das Lüftergeräusch grundsätzlich knapp unter 30 B(A) und ist somit in den meisten Fällen fast lautlos. Läuft hingegen 3DMark 06, schnellt das Lüftergeräusch selbst im ausgeglichenen Modus rasch in die Höhe.
Interessanterweise unterscheidet sich das Lüftergeräusch beim Gamen im ausgeglichenen Modus nicht vom Leistungsmodus (51 dB(A)). Bei den Messungen im obigen Stresstest waren die Kerntemperaturen im ausgeglichenen Modus deutlich kühler. Da das Erlebnis im ausgeglichenen Modus nicht deutlich leiser ist, würden wir empfehlen, im Leistungsmodus zu gamen. Mit über 50 dB(A) ist das Lenovo so oder so lauter als die meisten anderen Gaming-Laptops.
Lautstärkediagramm
| Idle |
| 24.3 / 24.3 / 28.9 dB(A) |
| Last |
| 45.8 / 56.6 dB(A) |
 | ||
30 dB leise 40 dB(A) deutlich hörbar 50 dB(A) störend |
||
min: | ||
| Lenovo Legion Pro 5 16IRX9 GeForce RTX 4070 Laptop GPU, i9-14900HX, Samsung PM9A1 MZVL21T0HCLR | Lenovo Legion Pro 5 16IRX8 GeForce RTX 4060 Laptop GPU, i7-13700HX, SK hynix PC801 HFS512GEJ9X115N | Alienware m16 R2 GeForce RTX 4070 Laptop GPU, Ultra 7 155H, Samsung PM9A1 MZVL21T0HCLR | HP Omen Transcend 16-u1095ng GeForce RTX 4070 Laptop GPU, i9-14900HX, Kioxia XG8 KXG80ZNV1T02 | Asus ROG Zephyrus G16 2024 GU605M GeForce RTX 4070 Laptop GPU, Ultra 7 155H, WD PC SN560 SDDPNQE-1T00 | MSI Stealth 16 Mercedes-AMG Motorsport A13VG GeForce RTX 4070 Laptop GPU, i9-13900H, Samsung PM9A1 MZVL22T0HBLB | |
|---|---|---|---|---|---|---|
| Geräuschentwicklung | 8% | 2% | -2% | 5% | 4% | |
| aus / Umgebung * (dB) | 23.9 | 23 4% | 24.7 -3% | 24 -0% | 23.9 -0% | 25 -5% |
| Idle min * (dB) | 24.3 | 23.1 5% | 25.3 -4% | 29 -19% | 23.9 2% | 25 -3% |
| Idle avg * (dB) | 24.3 | 23.1 5% | 25.3 -4% | 30 -23% | 27.8 -14% | 26 -7% |
| Idle max * (dB) | 28.9 | 26.6 8% | 25.3 12% | 31 -7% | 30.1 -4% | 27 7% |
| Last avg * (dB) | 45.8 | 34.7 24% | 31.7 31% | 45 2% | 34.2 25% | 39 15% |
| Witcher 3 ultra * (dB) | 51 | 47.6 7% | 53.8 -5% | 44 14% | 46.4 9% | 45 12% |
| Last max * (dB) | 56.6 | 54.8 3% | 62 -10% | 47 17% | 46.4 18% | 51 10% |
* ... kleinere Werte sind besser
Temperatur
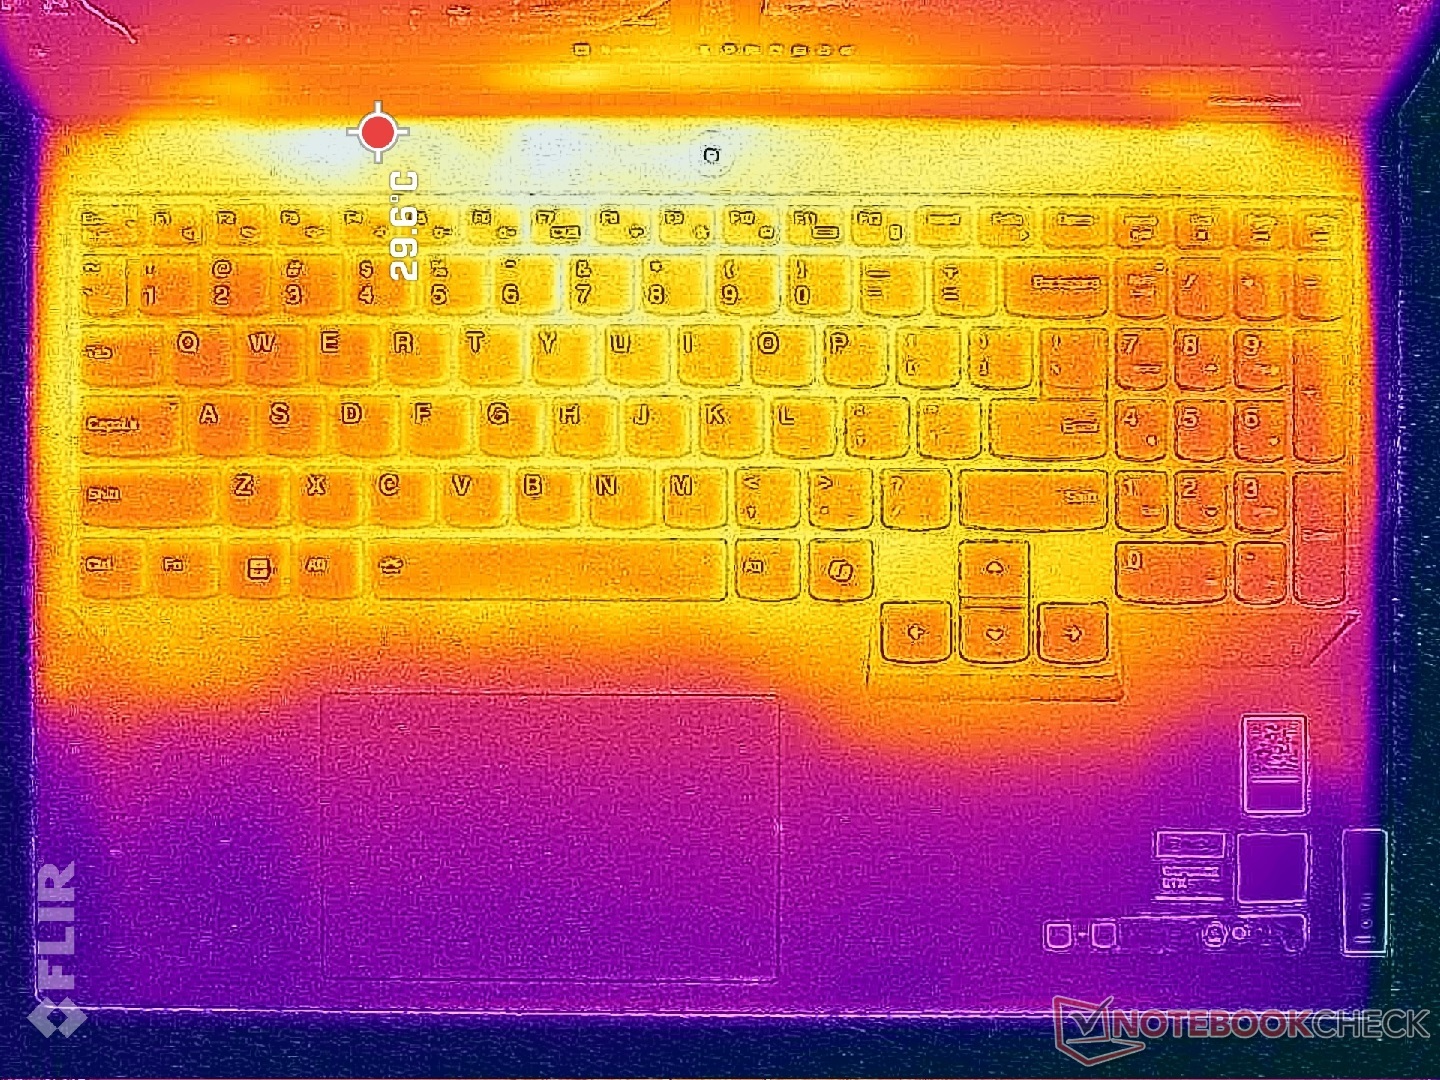
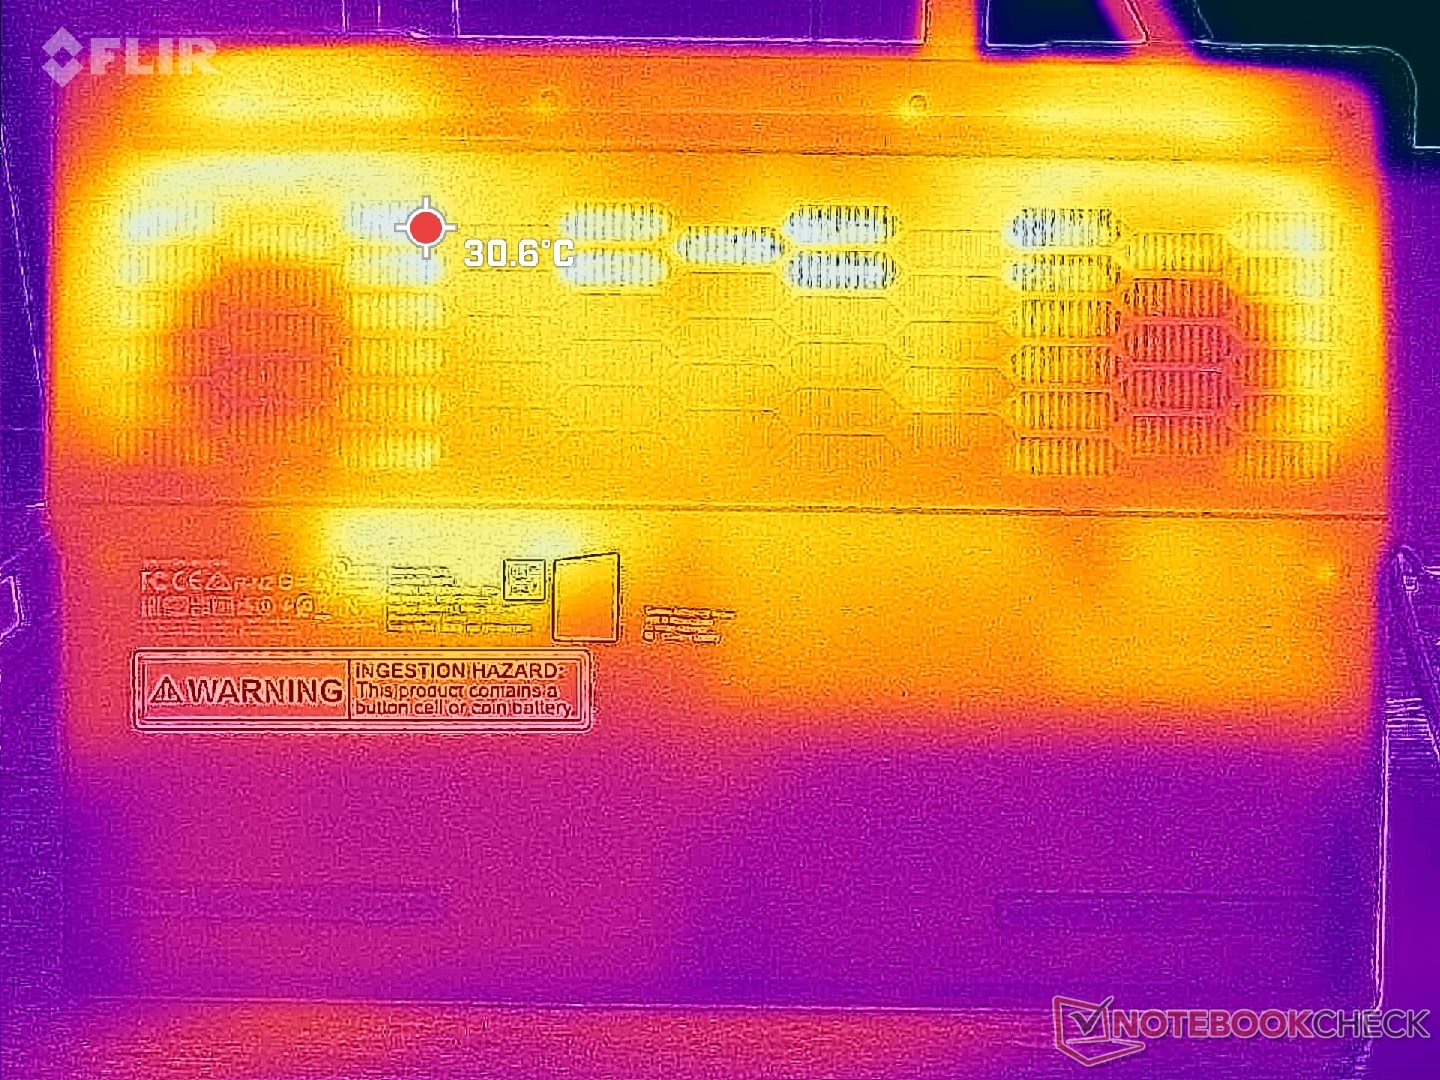
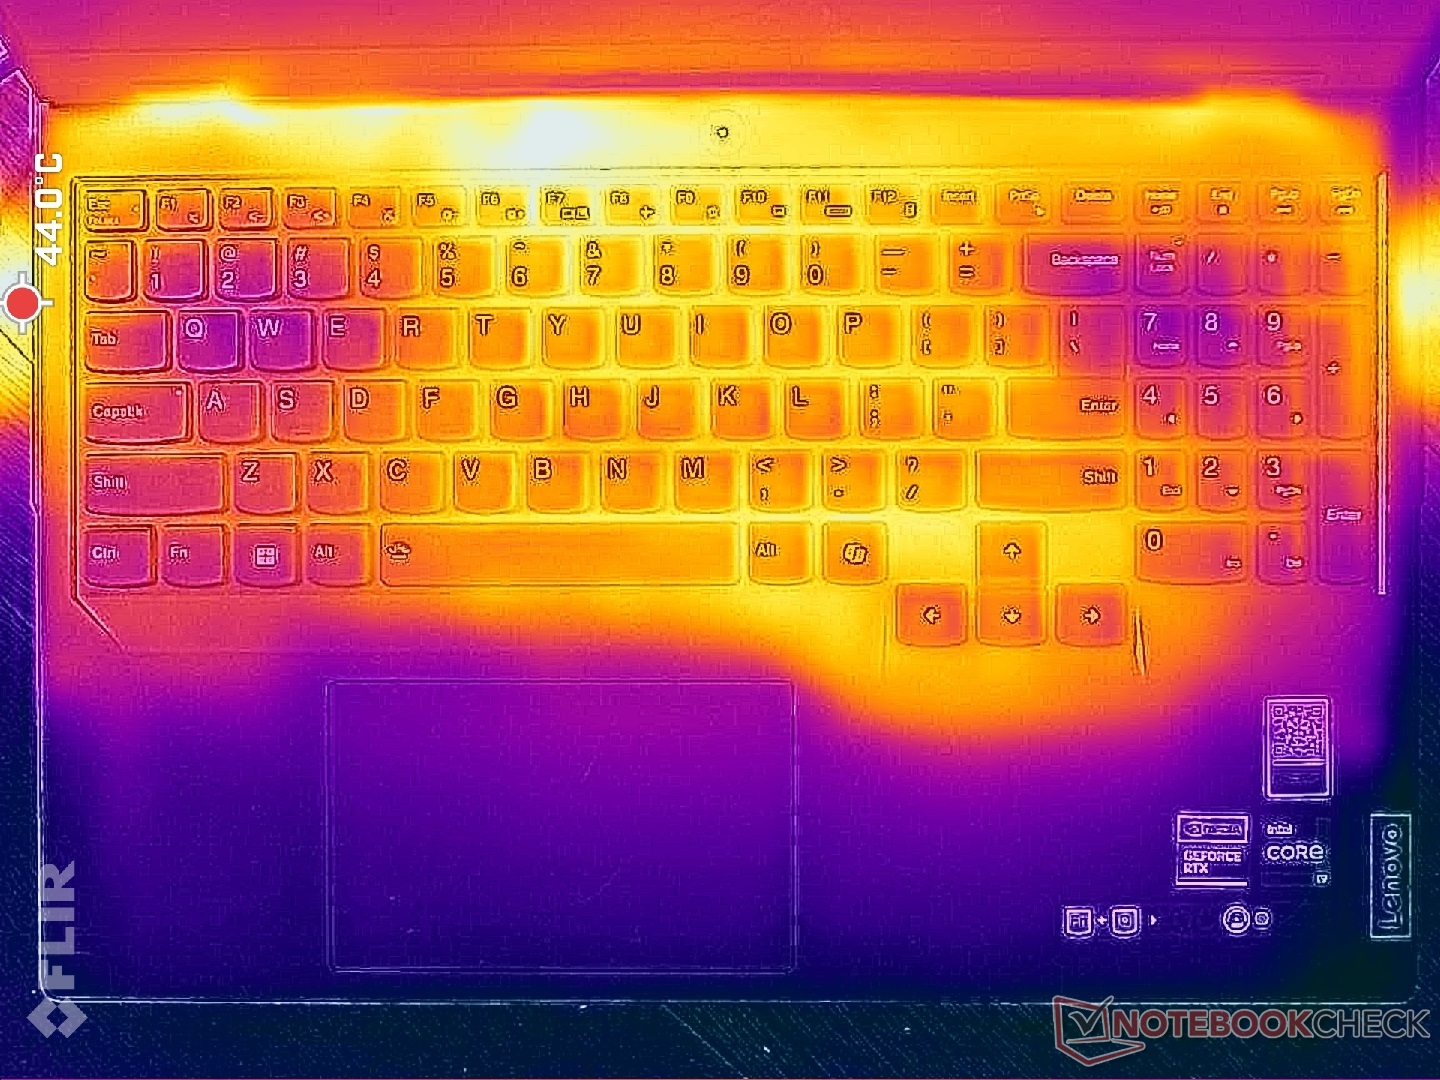
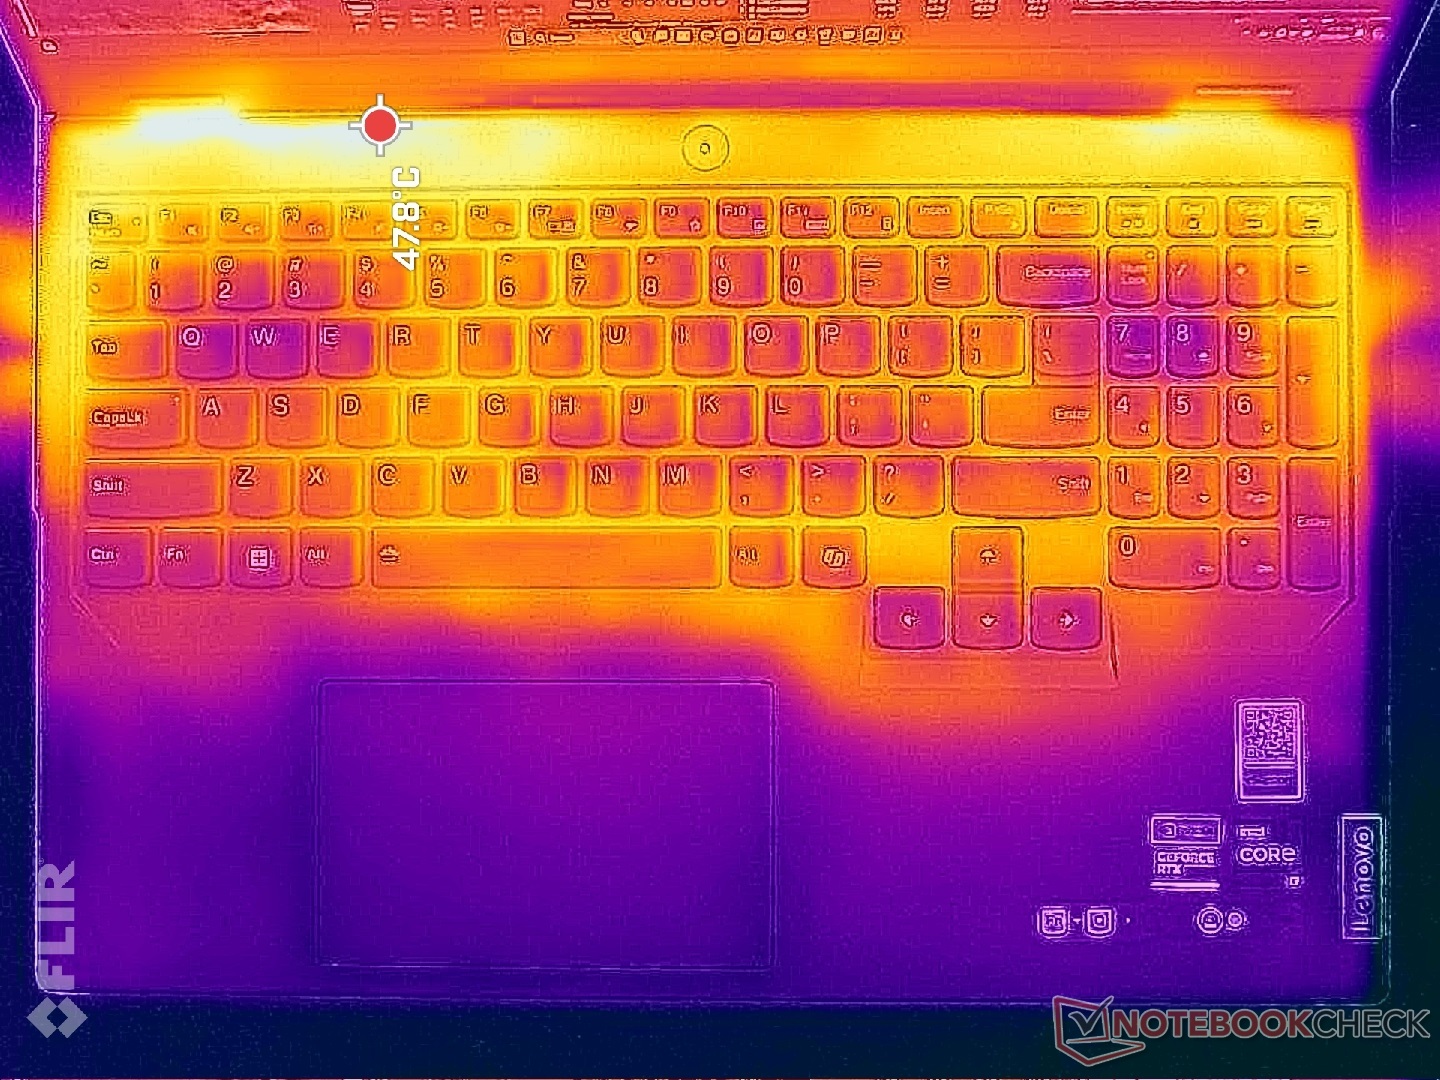
Die Oberflächentemperatur wird etwas wärmer als im Vorjahr. Beim Gamen erreicht fast die gesamte Tastatur Temperaturen von 40 °C, während es beim Legion Pro 5 16IRX8 noch 36 °C waren. Das Alienware m16 R2 bleibt mit 34 °C noch kühler. Die Handballenablage und WASD-Tasten sind etwas kühler, sodass die Hände auch beim Gamen noch angenehm aufliegen können. In anderen Bereichen wird der Laptop jedoch ziemlich warm.

(±) Die maximale Temperatur auf der Oberseite ist 43.8 °C. Im Vergleich liegt der Klassendurchschnitt bei 40.4 °C (von 21.2 bis 68.8 °C für die Klasse Gaming).
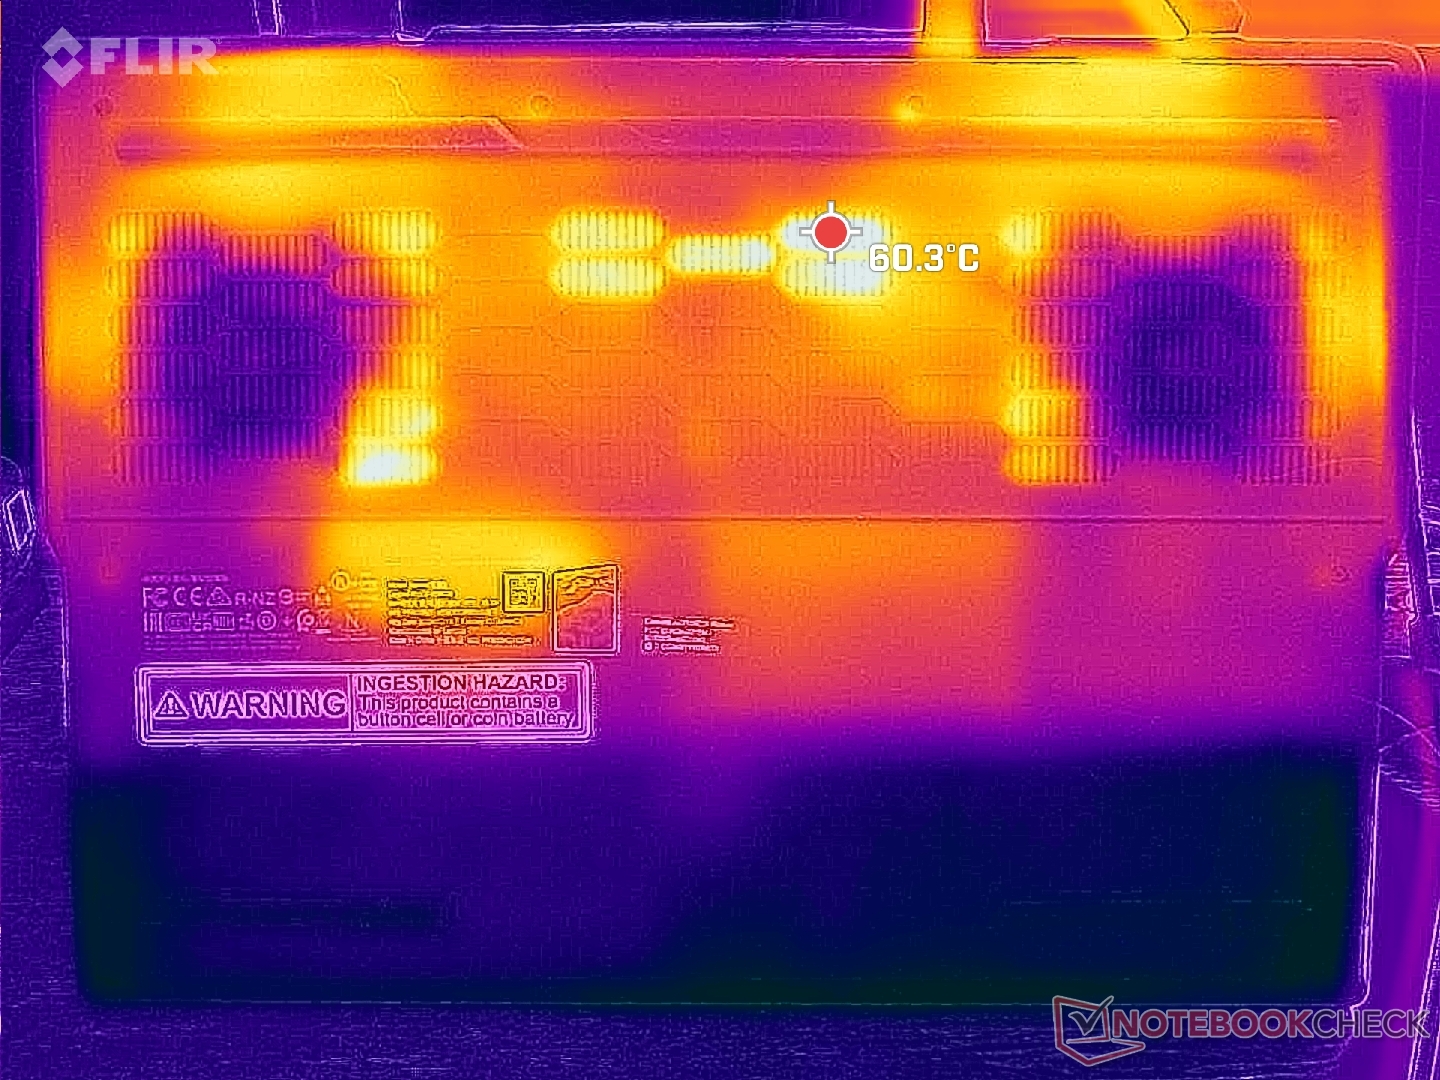
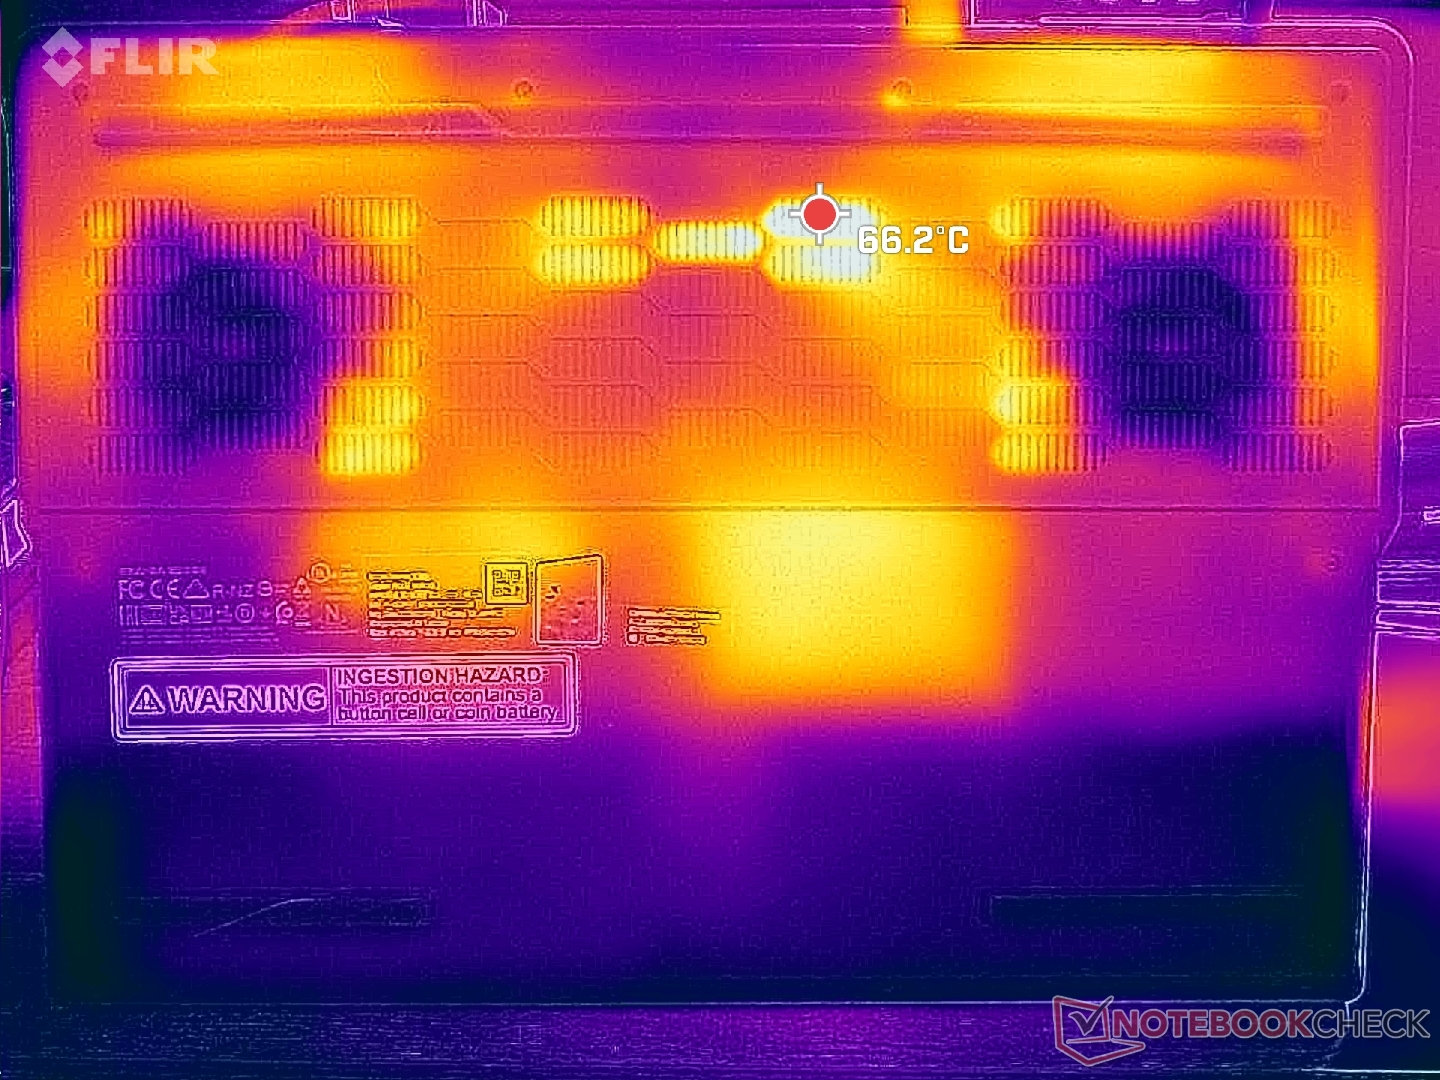
(-) Auf der Unterseite messen wir eine maximalen Wert von 55.4 °C (im Vergleich zum Durchschnitt von 43.2 °C).
(+) Ohne Last messen wir eine durchschnittliche Temperatur von 29.6 °C auf der Oberseite. Der Klassendurchschnitt erreicht 33.9 °C.
(±) Beim längeren Spielen von The Witcher 3 erhitzt sich das Gerät durchschnittlich auf 36.1 °C. Der Durchschnitt der Klasse ist derzeit 33.9 °C.
(+) Die Handballen und der Touchpad-Bereich sind mit gemessenen 28 °C kühler als die typische Hauttemperatur und fühlen sich dadurch kühl an.
(±) Die durchschnittliche Handballen-Temperatur anderer getesteter Geräte war 28.8 °C (+0.8 °C).
| Lenovo Legion Pro 5 16IRX9 Intel Core i9-14900HX, NVIDIA GeForce RTX 4070 Laptop GPU | Lenovo Legion Pro 5 16IRX8 Intel Core i7-13700HX, NVIDIA GeForce RTX 4060 Laptop GPU | Alienware m16 R2 Intel Core Ultra 7 155H, NVIDIA GeForce RTX 4070 Laptop GPU | HP Omen Transcend 16-u1095ng Intel Core i9-14900HX, NVIDIA GeForce RTX 4070 Laptop GPU | Asus ROG Zephyrus G16 2024 GU605M Intel Core Ultra 7 155H, NVIDIA GeForce RTX 4070 Laptop GPU | MSI Stealth 16 Mercedes-AMG Motorsport A13VG Intel Core i9-13900H, NVIDIA GeForce RTX 4070 Laptop GPU | |
|---|---|---|---|---|---|---|
| Hitze | 7% | -5% | 1% | 7% | 1% | |
| Last oben max * (°C) | 43.8 | 42.8 2% | 44.8 -2% | 49 -12% | 50.3 -15% | 49 -12% |
| Last unten max * (°C) | 55.4 | 50 10% | 48 13% | 63 -14% | 48 13% | 52 6% |
| Idle oben max * (°C) | 32.8 | 29.6 10% | 37.2 -13% | 30 9% | 28.8 12% | 32 2% |
| Idle unten max * (°C) | 36 | 34 6% | 42 -17% | 29 19% | 29.8 17% | 34 6% |
* ... kleinere Werte sind besser
Lautsprecher
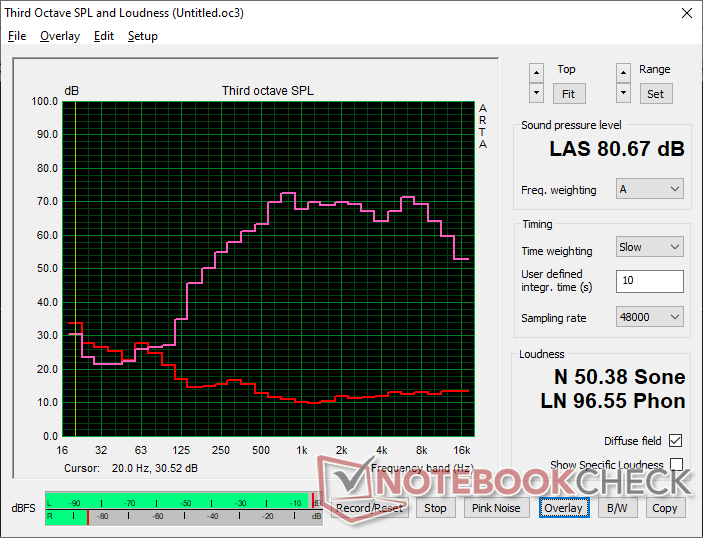
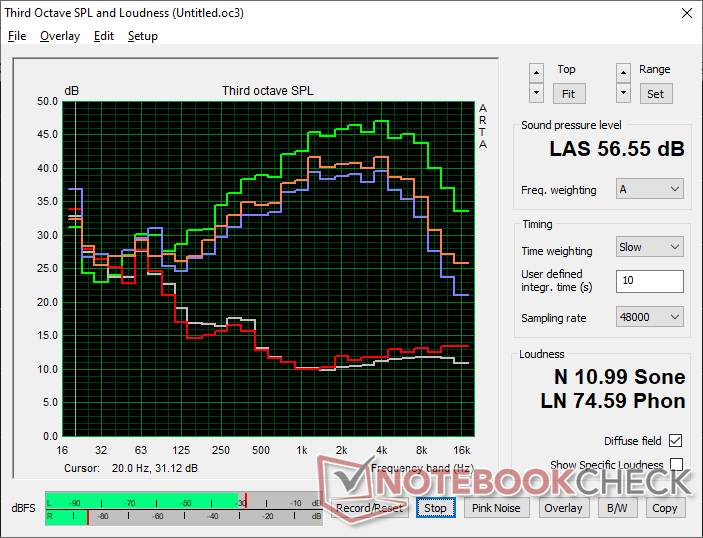
Lenovo Legion Pro 5 16IRX9 Audio Analyse
(±) | Mittelmäßig laut spielende Lautsprecher (80.7 dB)
Bass 100 - 315 Hz
(-) | kaum Bass - 19% niedriger als der Median
(±) | durchschnittlich lineare Bass-Wiedergabe (10.1% Delta zum Vorgänger)
Mitteltöne 400 - 2000 Hz
(+) | ausgeglichene Mitten, vom Median nur 4.7% abweichend
(+) | lineare Mitten (5.7% Delta zum Vorgänger)
Hochtöne 2 - 16 kHz
(+) | ausgeglichene Hochtöne, vom Median nur 3.3% abweichend
(+) | sehr lineare Hochtöne (5.6% Delta zum Vorgänger)
Gesamt im hörbaren Bereich 100 - 16.000 Hz
(±) | hörbarer Bereich ist durchschnittlich linear (17.2% Abstand zum Median)
Im Vergleich zu allen Geräten derselben Klasse
» 46% aller getesteten Geräte dieser Klasse waren besser, 11% vergleichbar, 42% schlechter
» Das beste Gerät hat einen Delta-Wert von 6%, durchschnittlich ist 18%, das schlechteste Gerät hat 132%
Im Vergleich zu allen Geräten im Test
» 32% aller getesteten Geräte waren besser, 8% vergleichbar, 60% schlechter
» Das beste Gerät hat einen Delta-Wert von 4%, durchschnittlich ist 23%, das schlechteste Gerät hat 134%
Apple MacBook Pro 16 2021 M1 Pro Audio Analyse
(+) | Die Lautsprecher können relativ laut spielen (84.7 dB)
Bass 100 - 315 Hz
(+) | guter Bass - nur 3.8% Abweichung vom Median
(+) | lineare Bass-Wiedergabe (5.2% Delta zum Vorgänger)
Mitteltöne 400 - 2000 Hz
(+) | ausgeglichene Mitten, vom Median nur 1.3% abweichend
(+) | lineare Mitten (2.1% Delta zum Vorgänger)
Hochtöne 2 - 16 kHz
(+) | ausgeglichene Hochtöne, vom Median nur 1.9% abweichend
(+) | sehr lineare Hochtöne (2.7% Delta zum Vorgänger)
Gesamt im hörbaren Bereich 100 - 16.000 Hz
(+) | hörbarer Bereich ist sehr linear (4.6% Abstand zum Median
Im Vergleich zu allen Geräten derselben Klasse
» 0% aller getesteten Geräte dieser Klasse waren besser, 0% vergleichbar, 100% schlechter
» Das beste Gerät hat einen Delta-Wert von 5%, durchschnittlich ist 17%, das schlechteste Gerät hat 45%
Im Vergleich zu allen Geräten im Test
» 0% aller getesteten Geräte waren besser, 0% vergleichbar, 100% schlechter
» Das beste Gerät hat einen Delta-Wert von 4%, durchschnittlich ist 23%, das schlechteste Gerät hat 134%
Energieverwaltung
Energieaufnahme
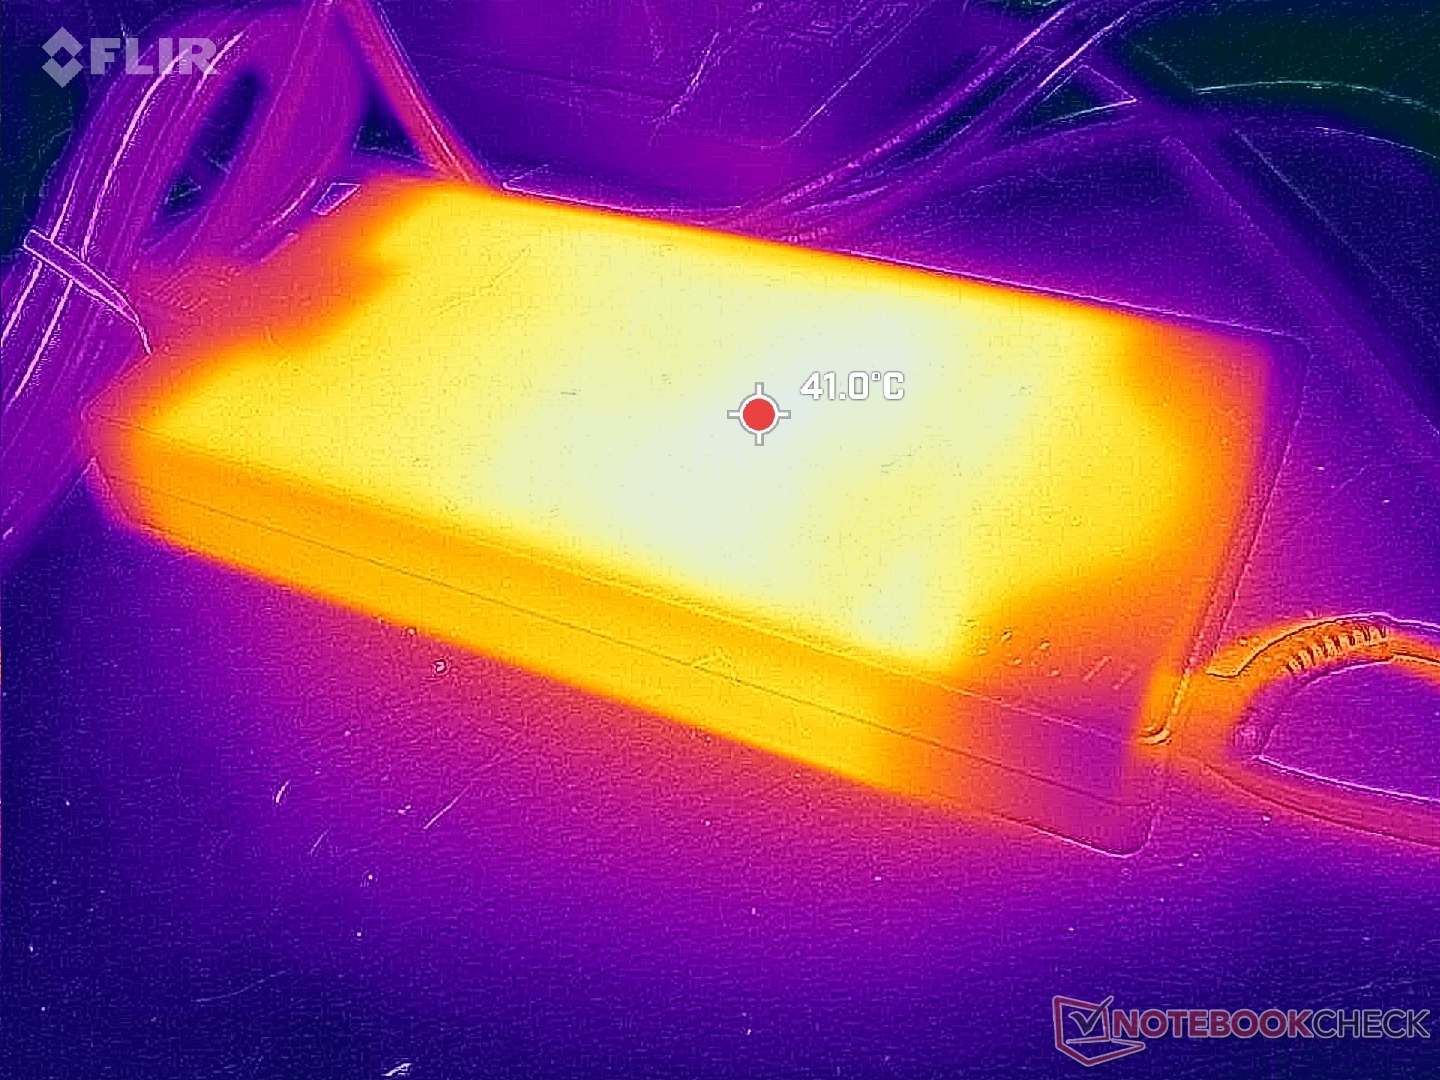
Beim Spielen von Witcher 3 liegt die Energieaufnahme bei rund 220 W und ist somit höher als beim Vorjahresmodell. Die Energieaufnahme ist auch deutlich höher als beim HP Omen Transcend 16, welches mit der gleichen CPU und GPU ausgestattet ist wie unser Lenovo. Dieser Unterschied lässt sich größtenteils auf die Core-i9-CPU im Lenovo zurückführen, die im Leistungsmodus eine höhere Leistungsstufe aufrechterhält.
Wir konnten bei vollständiger Auslastung von CPU und GPU eine maximale Energieaufnahme von 274 W messen. Das große (~19,9 x 9,9 x 2,6 cm) Netzteil wird auch mit dem Legion 5 15, dem Legion 5 17 und dem Legion 7 16 mitgeliefert.
(Hinweis: Dieser Abschnitt wird aktualisiert, sobald die Reparatur unseres Metrahit-Energy-Multimeters abgeschlossen ist. Wir entschuldigen uns für etwaige Unannehmlichkeiten.)
| Aus / Standby | |
| Idle | |
| Last |
|
Legende:
min: | |
| Lenovo Legion Pro 5 16IRX9 i9-14900HX, GeForce RTX 4070 Laptop GPU, Samsung PM9A1 MZVL21T0HCLR, IPS, 2560x1600, 16" | Lenovo Legion Pro 5 16IRX8 i7-13700HX, GeForce RTX 4060 Laptop GPU, SK hynix PC801 HFS512GEJ9X115N, IPS, 2560x1600, 16" | Alienware m16 R2 Ultra 7 155H, GeForce RTX 4070 Laptop GPU, Samsung PM9A1 MZVL21T0HCLR, IPS, 2560x1600, 16" | HP Omen Transcend 16-u1095ng i9-14900HX, GeForce RTX 4070 Laptop GPU, Kioxia XG8 KXG80ZNV1T02, OLED, 2560x1600, 16" | Asus ROG Zephyrus G16 2024 GU605M Ultra 7 155H, GeForce RTX 4070 Laptop GPU, WD PC SN560 SDDPNQE-1T00, OLED, 2560x1600, 16" | MSI Stealth 16 Mercedes-AMG Motorsport A13VG i9-13900H, GeForce RTX 4070 Laptop GPU, Samsung PM9A1 MZVL22T0HBLB, OLED, 3840x2400, 16" | |
|---|---|---|---|---|---|---|
| Stromverbrauch | -19% | 12% | 8% | 42% | 22% | |
| Idle min * (Watt) | 12.5 | 24.5 -96% | 8.1 35% | 10 20% | 8.3 34% | 11 12% |
| Idle avg * (Watt) | 24.6 | 29.2 -19% | 13 47% | 18 27% | 12.5 49% | 14 43% |
| Idle max * (Watt) | 24.8 | 34.3 -38% | 40.3 -62% | 32 -29% | 12.8 48% | 28 -13% |
| Last avg * (Watt) | 109.6 | 98.7 10% | 79 28% | 128 -17% | 71.3 35% | 83 24% |
| Witcher 3 ultra * (Watt) | 218 | 178.6 18% | 188.1 14% | 148.4 32% | 127.5 42% | 140 36% |
| Last max * (Watt) | 284.9 | 249.6 12% | 254.9 11% | 242 15% | 169.1 41% | 204 28% |
* ... kleinere Werte sind besser
Energieaufnahme Witcher 3 / Stresstest
Energieaufnahme externer Monitor
Akkulaufzeit
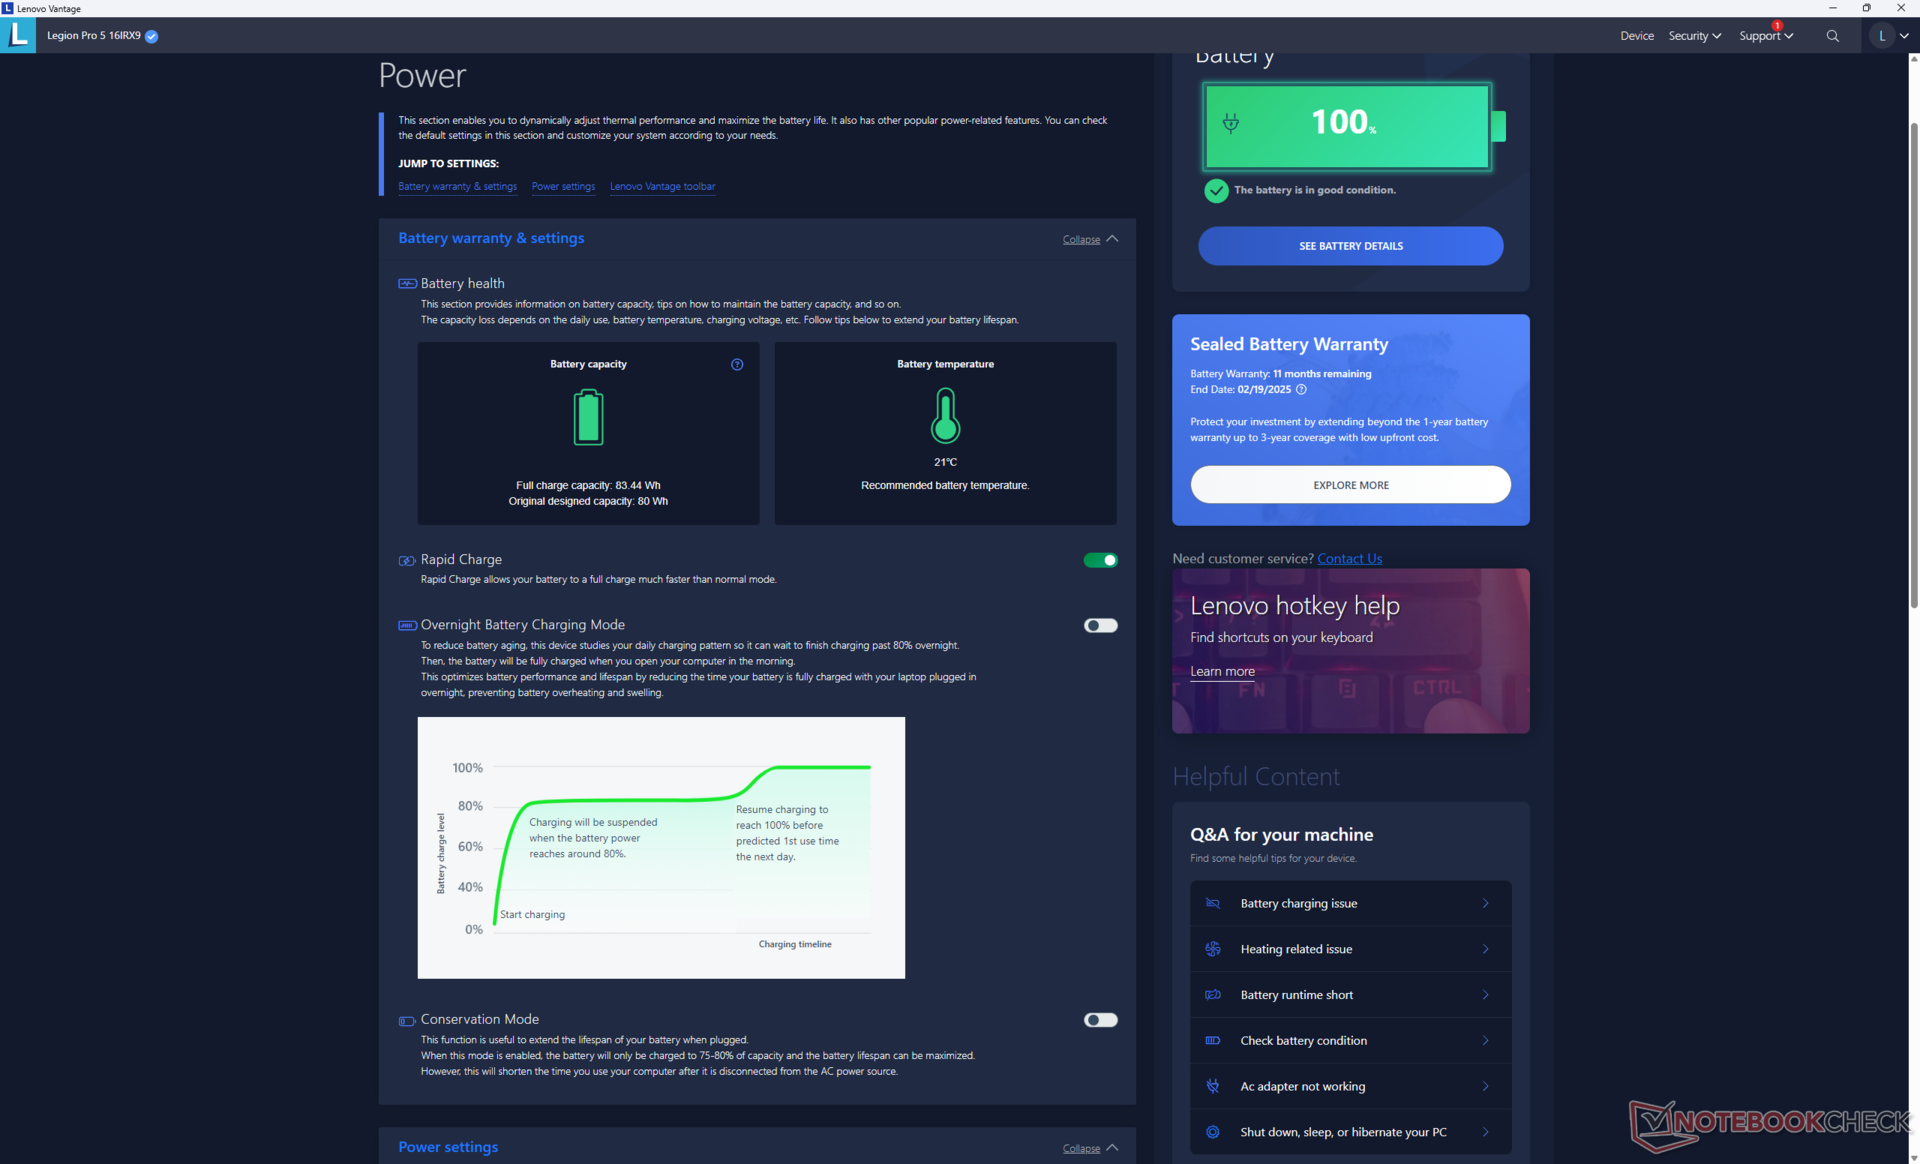
Mit 80 Wh ist die Akkukapazität kleiner als bei den meisten anderen 16-Zoll-Laptops, die üblicherweise mit 90 Wh oder mehr ausgestattet sind. Dennoch hält die Akkulaufzeit um fast 90 Minuten länger als im Legion Pro 5 16IRX8 aus dem Vorjahr. Das Zephyrus G16 und Alienware m16 R2 halten beide einige Stunden länger, sind dafür aber mit langsameren Core-Utra-7-CPUs ausgestattet.
Das vollständige Aufladen verläuft in knapp unter einer Stunde sehr schnell. Andere Laptops brauchen dafür im Schnitt 1,5 bis 2 Stunden. Lenovo Rapid Charge ist standardmäßig aktiv. Das Gerät kann über den USB-C-Anschluss auf der Rückseite auch mit USB-C-Lagegeräten von Drittanbietern aufgeladen werden.
| Lenovo Legion Pro 5 16IRX9 i9-14900HX, GeForce RTX 4070 Laptop GPU, 80 Wh | Lenovo Legion Pro 5 16IRX8 i7-13700HX, GeForce RTX 4060 Laptop GPU, 80 Wh | Alienware m16 R2 Ultra 7 155H, GeForce RTX 4070 Laptop GPU, 90 Wh | HP Omen Transcend 16-u1095ng i9-14900HX, GeForce RTX 4070 Laptop GPU, 97 Wh | Asus ROG Zephyrus G16 2024 GU605M Ultra 7 155H, GeForce RTX 4070 Laptop GPU, 90 Wh | MSI Stealth 16 Mercedes-AMG Motorsport A13VG i9-13900H, GeForce RTX 4070 Laptop GPU, 99.99 Wh | |
|---|---|---|---|---|---|---|
| Akkulaufzeit | -22% | 49% | 2% | 31% | 35% | |
| Idle (h) | 6.7 | 6.7 0% | 12.6 88% | |||
| WLAN (h) | 4.8 | 3.4 -29% | 8.1 69% | 4.9 2% | 7.3 52% | 6.5 35% |
| Last (h) | 1.1 | 0.7 -36% | 1 -9% | 1.2 9% | ||
| H.264 (h) | 11.2 |
Pro
Contra
Verdict — einfache Änderungen bringen ein ähnliches Ergebnis
Wie schon das neue Alienware m18 R2 bietet das Lenovo Legion Pro 5 G9 im Vergleich zum Vorjahresmodell keine ausreichenden Vorteile. Es ist genauso gut wie zuvor, aber tut nicht viel mehr als das. Grund dafür sind die gleichgebliebenen GPU-Optionen, die neben den umbenannten Raptor-Lake-HX-CPUs die Leistung bestimmen. Kurz gesagt: Das 2024er Legion Pro 5 16 bietet beim Gamen fast genau die gleiche Leistung wie das preiswertere 2023er Modell. Wir würden interessierten Lesern empfehlen, nach guten Angeboten für das Lenovo Legion Pro 5 aus 2023 zu suchen, bevor sie das neue Modell kaufen.
Das neue Modell beinhaltet viele kleinere Veränderungen und hat unter anderem ein neues DCI-P3-Panel, während das Vorjahresmodell noch auf sRGB-Farben eingeschränkt war. Inhärente Nachteile wie die große Größe, das große Netzteil und die lauten Lüfter bleiben jedoch unverändert.
Wenn Sie nicht unbedingt den DCI-P3-Farbraum benötigen, ist das 2024er Lenovo Legion Pro 5 16IRX9 mit dem weniger teuren 2023er Modell was die Leistung, Optionen und physischen Eigenschaften betrifft fast ident.
Für User, die eine Core-HX-CPU gegenüber den langsameren Core-Ultra-Optionen bevorzugen, könnte das Lenovo Legion Pro 5 G9 interessant sein. Ansonsten bieten kleinere, mobilere Alternativen wie das Asus ROG Zephyrus G16 oder das Alienware m16 R2 trotz eingeschränkter Prozessorleistung fast die gleiche Gamingleistung.
Preis und Verfügbarkeit
Das Legion 5 Pro 16 ist direkt bei Lenovo ab 1800 Euro zu haben. Bei Cyberport findet sich eine Konfiguration mit i7-14700HX und RTX 4060 um 1700 Euro.
Lenovo Legion Pro 5 16IRX9
- 28.03.2024 v7 (old)
Allen Ngo
Transparenz
Die Auswahl der zu testenden Geräte erfolgt innerhalb der Redaktion. Das vorliegende Testmuster wurde dem Autor vom Hersteller oder einem Shop zu Testzwecken leihweise zur Verfügung gestellt. Eine Einflussnahme des Leihstellers auf den Testbericht gab es nicht, der Hersteller erhielt keine Version des Reviews vor der Veröffentlichung. Es bestand keine Verpflichtung zur Publikation. Als eigenständiges, unabhängiges Unternehmen unterliegt Notebookcheck keiner Diktion von Herstellern, Shops und Verlagen.
So testet Notebookcheck
Pro Jahr werden von Notebookcheck hunderte Laptops und Smartphones unabhängig in von uns standardisierten technischen Verfahren getestet, um eine Vergleichbarkeit aller Testergebnisse zu gewährleisten. Seit rund 20 Jahren entwickeln wir diese Testmethoden kontinuierlich weiter und setzen damit Branchenstandards. In unseren Testlaboren kommt ausschließlich hochwertiges Messequipment in die Hände erfahrener Techniker und Redakteure. Die Tests unterliegen einer mehrstufigen Kontrolle. Unsere komplexe Gesamtbewertung basiert auf hunderten fundierten Messergebnissen und Benchmarks, womit Ihnen Objektivität garantiert ist. Weitere Informationen zu unseren Testmethoden gibt es hier.
Preisvergleich

