Notebookcheck Logo
Teaser

Schenker Key 18 Pro E25 im Test - High-End Workstation mit RTX 5090 und 256 GB RAM

Mehr geht aktuell nicht.

Mit dem Key 18 Pro hat Schenker eine mobile Workstation im Angebot, die sich an Enthusiasten richtet und umfangreich konfiguriert werden kann. Im Test ist das Top-Modell mit dem Core Ultra 9 275HX, der RTX 5090 Laptop, 256 GB RAM und 28 TB SSD-Speicher. Zudem gibt es PCIe 5.0, Thunderbolt 5 & zwei Netzwerk-Anschlüsse.
Andreas Osthoff 👁 Veröffentlicht am 🇺🇸 🇫🇷 ...
Arrow Lake Blackwell RTX 5000 Geforce Laptop / Notebook Wi-Fi 7 Windows Thunderbolt

Fazit - Key 18 Pro überzeugt mit Top-Ausstattung

Mit dem Key 18 Pro bietet Schenker eine sehr spezialisierte mobile Workstation, die vor allem bei der Ausstattung Maßstäbe setzte (4x RAM, 4x SSD inkl. PCIe 5.0, Dual-Ethernet, Thunderbolt 5). Sowohl beim RAM als auch bei der SSD-Kapazität ist das Key 18 hier praktisch konkurrenzlos. Die Leistung passt ebenfalls, obwohl beim Prozessor durchaus noch etwas Spielraum nach oben wäre.

Das schwarze Alu-Gehäuse ist sehr schlicht, qualitativ insgesamt aber in Ordnung. Lediglich das gelegentliche Knarzen des Deckels störe bei unserem Testgerät ein wenig. Zudem müssen wir beim Display etwas Kritik üben, da wir für den hohen Preis zumindest Farbprofile für sRGB sowie P3 erwartet hätten. 

Alles in allem ist das Key 18 Pro eine gute mobile Workstation mit sehr leistungsfähiger Hardware und wenn man von der Ausstattung Gebrauch machen kann, ist es derzeit praktisch alternativlos.

Pro

+ hervorragende Wartungsmöglichkeiten (4x RAM, 4x SSD)
+ hohe CPU/GPU-Leistung
+ Thunderbolt 5, Wi-Fi 7, PCIe 5.0
+ Dual-Ethernet (2.5 GBit/s)
+ 200-Hz-Display mit 4K-Auflösung
+ komfortable Tastatur
+ 5-MP Webcam mit mechanischer Blende

Contra

- keine Farbprofile für sRGB/P3
- laut unter Last
- gelegentliche Knarzgeräusche vom Deckel
- deutliche Leistungsreduzierung im Akkubetrieb

Preis und Verfügbarkeit

Das Schenker Key 18 Pro ist bei Bestware ab 3.199 Euro verfügbar. 

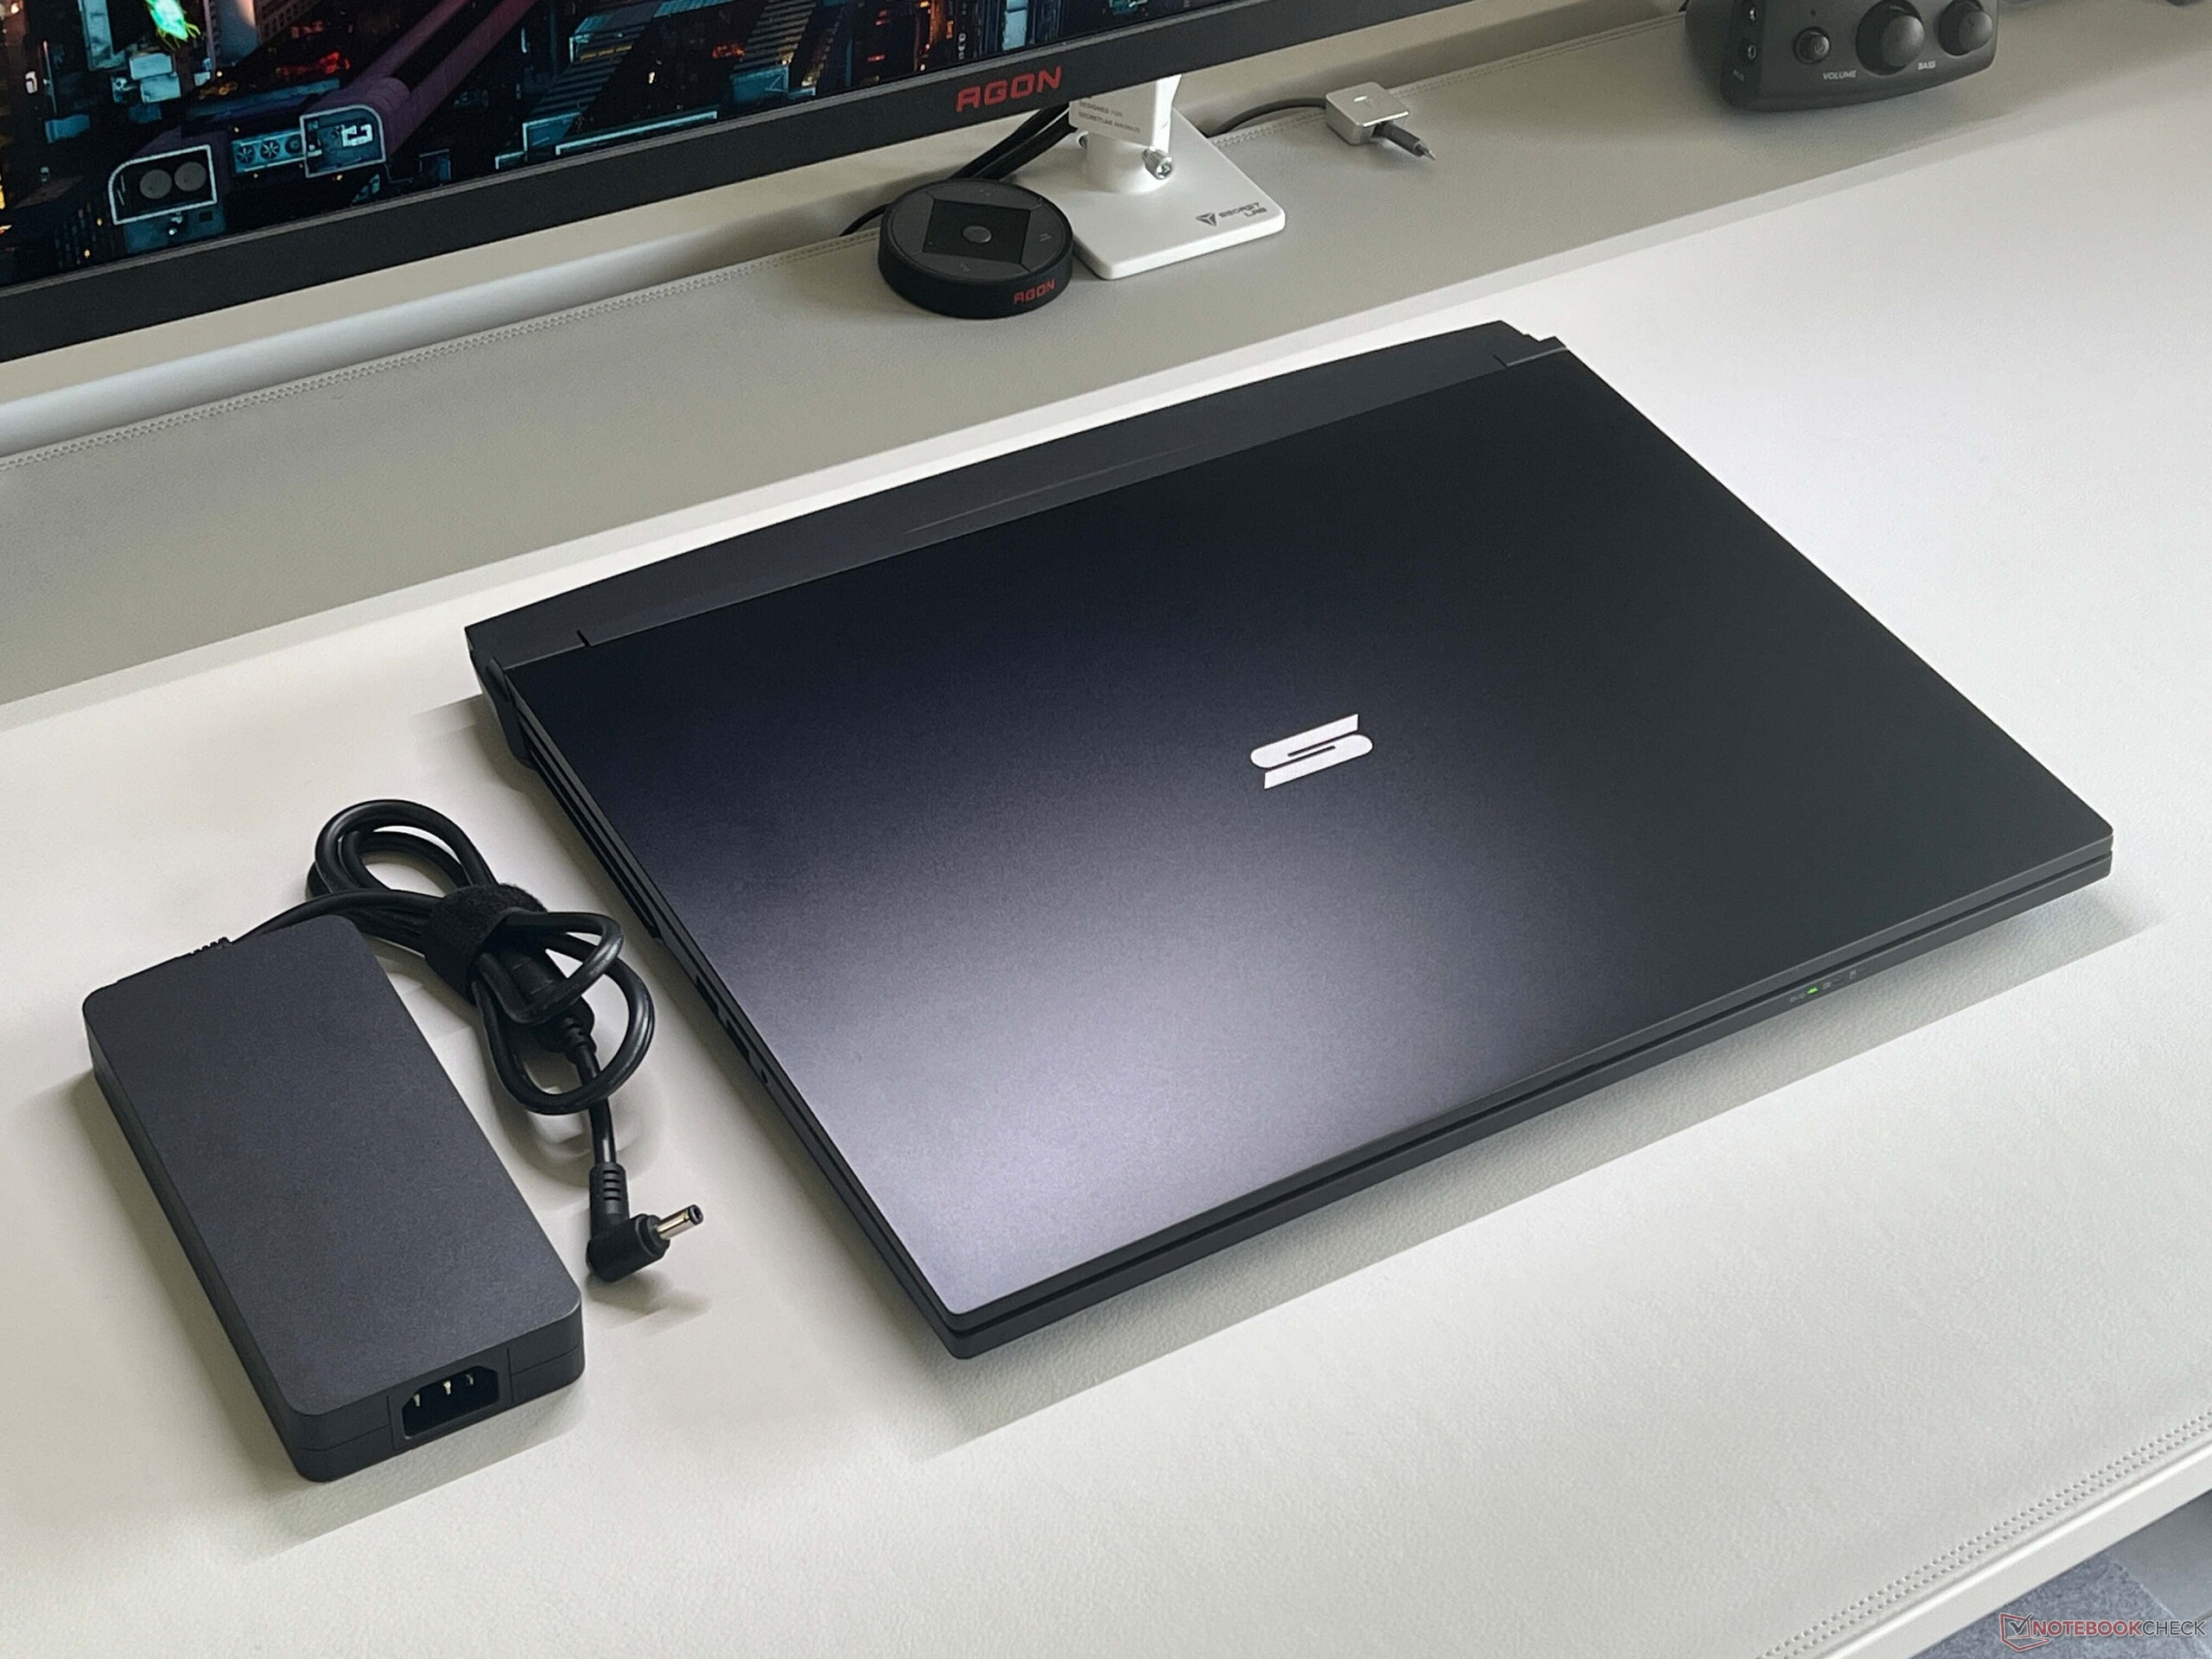
Mit dem Key 18 Pro hat Schenker eine große mobile Workstation im Angebot, die sich vor allem an kreative Enthusiasten richtet. Dank vier Steckplätzen für RAM & SSDs sind die Erweiterungsmöglichkeiten massiv und es stehen zudem die schnellsten mobile GPUs zur Verfügung. Wir testen die High-End-Variante mit dem Core Ultra 9 275HX, GeForce RTX 5090 Laptop, 4K-Display, 256 GB RAM und vier SSDs mit einer Speicherkapazität von insgesamt 28 TB. Das macht sich natürlich beim Preis bemerkbar, der für unser Testgerät bei 6.400 Euro liegt.

Spezifikationen

Schenker Key 18 Pro M25 RTX 5090
Prozessor
Intel Core Ultra 9 275HX 24 x 2.1 - 5.4 GHz, 145 W PL2 / Short Burst, 130 W PL1 / Sustained, Arrow Lake-HX
Grafikkarte
NVIDIA GeForce RTX 5090 Laptop - 24 GB VRAM, Kerntakt: 2370 MHz, Speichertakt: 1750 MHz, 175 W TDP ( beinhaltet 25 W Dynamic Boost), GDDR7, 580.88, Advanced Optimus
RAM
256 GB 
, DDR5-4133, Dual-Channel, 4 Slots, max. 256 GB
Bildschirm
18.00 Zoll 16:10, 3840 x 2400 Pixel 252 PPI, LQ180D1JW01, IPS, spiegelnd: nein, 200 Hz, Adaptive Sync
Mainboard
Intel HM870 (Arrow Lake-HX PCH)
Massenspeicher
Samsung 9100 Pro 4 TB, 4096 GB 
, +3x 8 TB WD Black SN850 X, 25900 GB verfügbar
Soundkarte
Intel Arrow Lake-S PCH - ACE (Audio Context Engine)
Anschlüsse
2 USB 3.1 Gen2, 2 USB4 40 Gbps, 2 Thunderbolt, USB-C Power Delivery (PD), 1 HDMI, 2 DisplayPort, 1 Kensington Lock, Audio Anschlüsse: 3.5 mm Audio, Card Reader: microSD
Netzwerk
Intel/Killer E3100X 2.5 Gigabit Ethernet Controller (10/100/1000/2500MBit/s), Intel Wi-Fi 7 BE200 320MHz (a/b/g/n = Wi-Fi 4/ac = Wi-Fi 5/ax = Wi-Fi 6/ Wi-Fi 6E 6 GHz be = Wi-Fi 7), Bluetooth 5.4
Abmessungen
Höhe x Breite x Tiefe (in mm): 29.5 x 402 x 320
Akku
98 Wh, 6280 mAh Lithium-Polymer
Betriebssystem
Microsoft Windows 11 Home
Kamera
Webcam: 5 MP with mechanical Shutter + IR
Primary Camera: 5 MPix
Sonstiges
Lautsprecher: Stereo + Woofer, Tastatur: Chiclet, Tastatur-Beleuchtung: ja, 330W PSU, 36 Monate Garantie
Gewicht
4.053 kg, Netzteil: 762 g
Preis
6400 Euro
Geizhals
Preisvergleich
Hinweis: Der Hersteller kann abweichende Bauteile wie Bildschirme, Laufwerke und Speicherriegel mit ähnlichen Spezifikationen unter dem gleichen Modellnamen einsetzen.


Gehäuse & Ausstattung

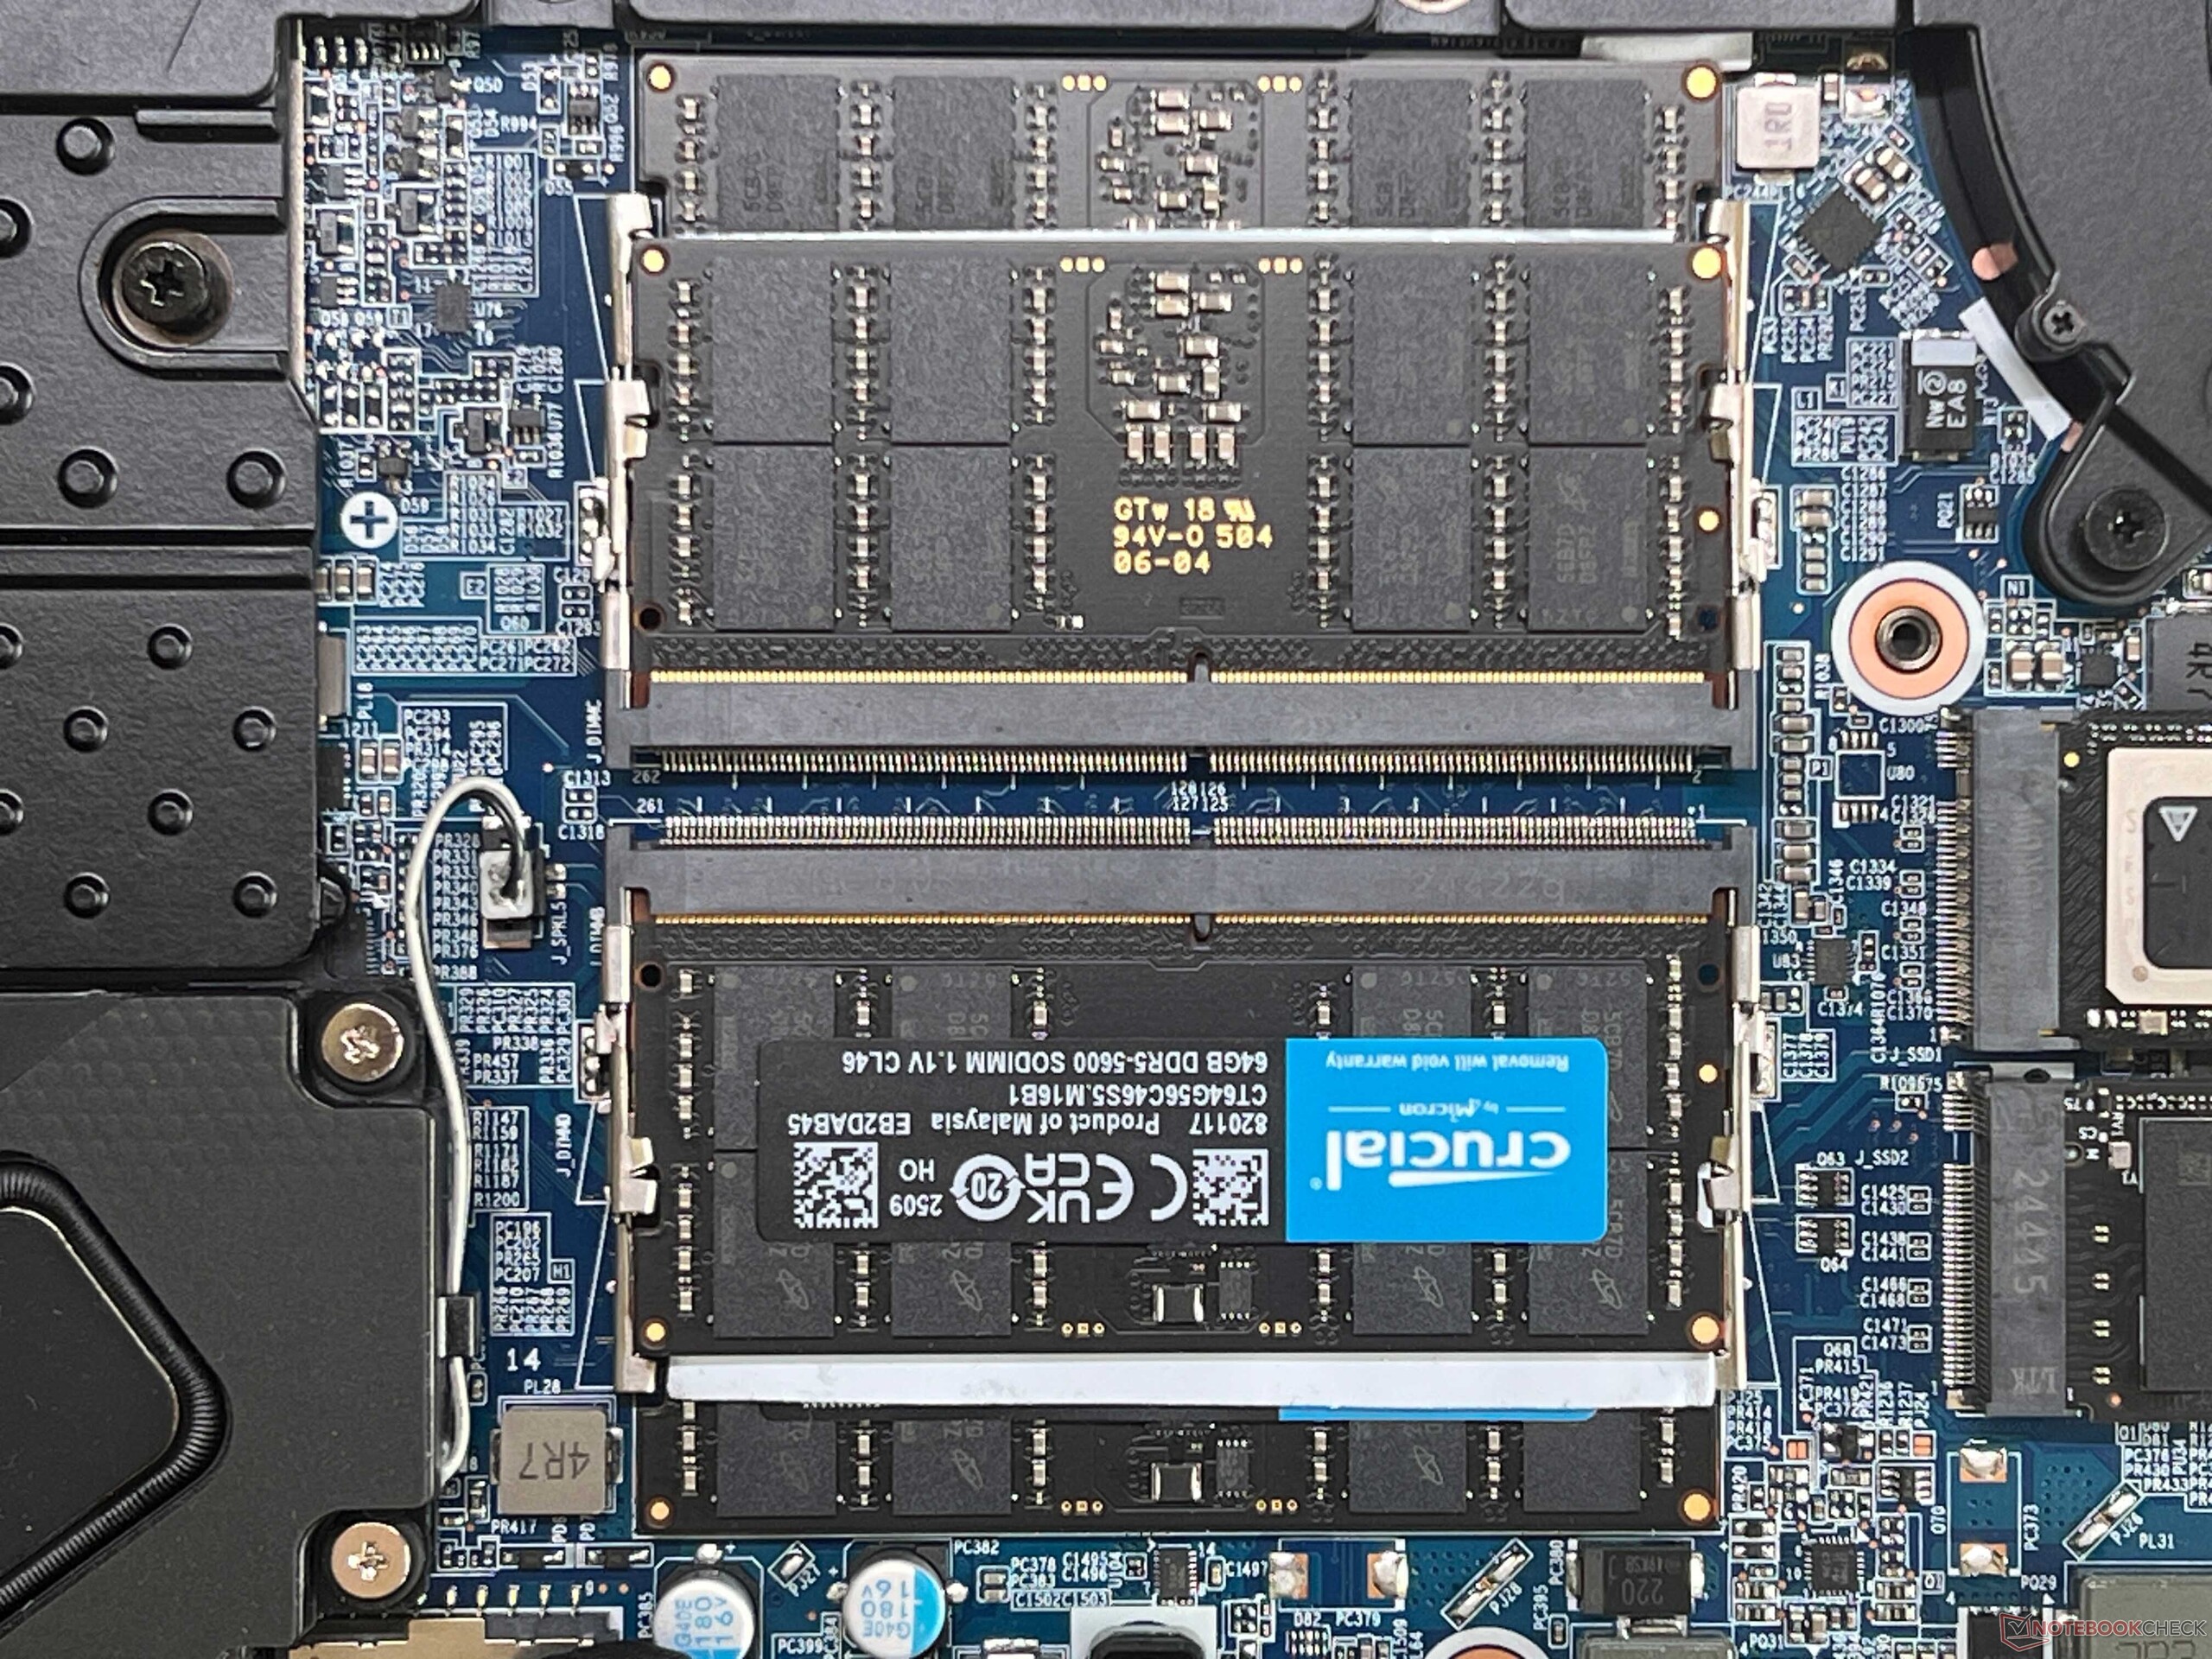
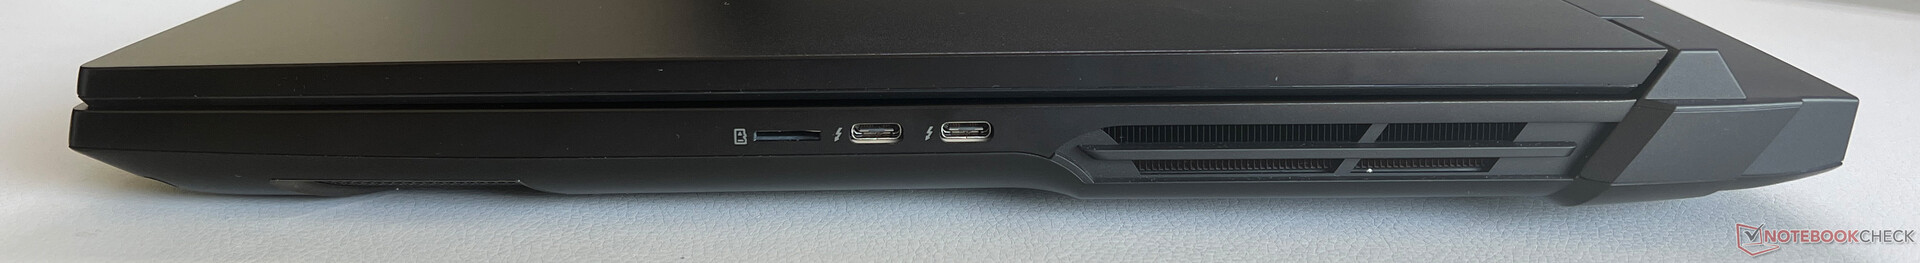
Das Alu-Gehäuse ist gut verarbeitet und stabil, vom Design her aber recht unspektakulär und der Deckel knarzt gelegentlich etwas. Die glatten Oberflächen sind nicht ganz so schmutzempfindlich wie befürchtet. Die Ausmaße und das Gewicht von 4 kg sollte man aber nicht unterschätzen. Die Wartungsmöglichkeiten sind hervorragend, denn es gibt jeweils vier Steckplätze für RAM und M.2-2280-SSDs (davon 1x PCIe 5.0). Bei den Anschlüssen gibt es neben 2x Ethernet (2,5 GBit/s) noch Wi-Fi 7 und zwei moderne Thunderbolt-5-Anschlüsse.

Größenvergleich

404 mm 307.5 mm 32.05 mm 3.6 kg410 mm 320 mm 24.32 mm 4.2 kg401 mm 287 mm 31 mm 3.4 kg402 mm 320 mm 29.5 mm 4.1 kg399 mm 298 mm 32 mm 3.3 kg400 mm 275.4 mm 27.9 mm 3.2 kg297 mm 210 mm 1 mm 5.7 g
Links: 2x USB-A 3.2 Gen.2 (10 GBit/s), 3,5-mm-Audio
Rechts: microSD-Kartenleser, 2x USB-C 4.0 mit Thunderbolt 5 (80 GBit/s, DisplayPort 2.1, 1x Power Delivery)
Rückseite: Kensington Lock, HDMI 2.1, 2x Ethernet (2.5 GBit/s), Strom
SD Card Reader
average JPG Copy Test (av. of 3 runs)
Razer Blade 18 2025 RTX 5090 Laptop
Intel Core Ultra 9 275HX (Angelbird AV Pro V60)
207 MB/s +148%
Alienware 18 Area-51
Intel Core Ultra 9 275HX (Toshiba Exceria Pro SDXC 64 GB UHS-II)
202.7 MB/s +143%
Aorus Master 18 AM8H
Intel Core Ultra 9 275HX (AV PRO microSD 128 GB V60)
186 MB/s +123%
Durchschnitt der Klasse Workstation
  (49.6 - 189.3, n=10, der letzten 2 Jahre)
95.8 MB/s +15%
Schenker Key 18 Pro M25 RTX 5090
Intel Core Ultra 9 275HX (Angelbird AV Pro V60)
83.3 MB/s
MSI Titan 18 HX AI A2XWJG
Intel Core Ultra 9 285HX (AV PRO microSD 128 GB V60)
72.7 (55.82min - 73.14max) MB/s -13%
maximum AS SSD Seq Read Test (1GB)
Alienware 18 Area-51
Intel Core Ultra 9 275HX (Toshiba Exceria Pro SDXC 64 GB UHS-II)
225.3 MB/s +154%
Razer Blade 18 2025 RTX 5090 Laptop
Intel Core Ultra 9 275HX (Angelbird AV Pro V60)
214.3 MB/s +142%
Aorus Master 18 AM8H
Intel Core Ultra 9 275HX (AV PRO microSD 128 GB V60)
202 MB/s +128%
Durchschnitt der Klasse Workstation
  (85.1 - 227, n=10, der letzten 2 Jahre)
116.4 MB/s +31%
MSI Titan 18 HX AI A2XWJG
Intel Core Ultra 9 285HX (AV PRO microSD 128 GB V60)
91.91 MB/s +4%
Schenker Key 18 Pro M25 RTX 5090
Intel Core Ultra 9 275HX (Angelbird AV Pro V60)
88.7 MB/s
Networking
Schenker Key 18 Pro M25 RTX 5090
Intel Wi-Fi 7 BE200 320MHz
iperf3 transmit AXE11000
1668 (min: 1600) MBit/s ∼100%
iperf3 receive AXE11000
1569 (min: 1522) MBit/s ∼90%
Razer Blade 18 2025 RTX 5090 Laptop
Intel Wi-Fi 7 BE202
iperf3 transmit AXE11000
1524 (min: 1324) MBit/s ∼91%
iperf3 receive AXE11000
1491 (min: 1392) MBit/s ∼86%
Alienware 18 Area-51
Intel Killer Wi-Fi 7 BE1750W 320 MHz (BE200NGW)
iperf3 transmit AXE11000
1472 (min: 1259) MBit/s ∼88%
iperf3 receive AXE11000
1393 (min: 1267) MBit/s ∼80%
iperf3 transmit AXE11000 6GHz
1449 (min: 1186) MBit/s ∼93%
iperf3 receive AXE11000 6GHz
1480 (min: 1367) MBit/s ∼86%
Aorus Master 18 AM8H
Intel Wi-Fi 7 BE200 320MHz
iperf3 transmit AXE11000
1342 (min: 1027) MBit/s ∼80%
iperf3 receive AXE11000
1736 (min: 1712) MBit/s ∼100%
MSI Titan 18 HX AI A2XWJG
Intel Killer Wi-Fi 7 BE1750x BE200NGW
iperf3 transmit AXE11000
1490 (min: 789) MBit/s ∼89%
iperf3 receive AXE11000
1696 (min: 869) MBit/s ∼98%
iperf3 transmit AXE11000 6GHz
1556 (min: 809) MBit/s ∼100%
iperf3 receive AXE11000 6GHz
1723 (min: 1677) MBit/s ∼100%
Asus Strix Scar 18 G835LX
Intel Wi-Fi 7 BE200 320MHz
iperf3 transmit AXE11000
1660 (min: 1544) MBit/s ∼100%
iperf3 receive AXE11000
1588 (min: 1563) MBit/s ∼91%
050100150200250300350400450500550600650700750800850900950100010501100115012001250130013501400145015001550160016501700Tooltip
Schenker Key 18 Pro M25 RTX 5090; iperf3 transmit AXE11000; iperf 3.1.3: Ø1668 (1600-1703)
Schenker Key 18 Pro M25 RTX 5090; iperf3 receive AXE11000; iperf 3.1.3: Ø1568 (1522-1615)
ColorChecker
15.6 ∆E
13.6 ∆E
19.2 ∆E
19.6 ∆E
14.3 ∆E
11.8 ∆E
9.8 ∆E
19.1 ∆E
11.4 ∆E
7.6 ∆E
11.7 ∆E
6.5 ∆E
8 ∆E
16.6 ∆E
8.2 ∆E
6.3 ∆E
7.8 ∆E
16.4 ∆E
2 ∆E
5.6 ∆E
7.9 ∆E
5.7 ∆E
1.9 ∆E
9.4 ∆E
ColorChecker Schenker Key 18 Pro M25 RTX 5090: 10.66 ∆E min: 1.91 - max: 19.61 ∆E

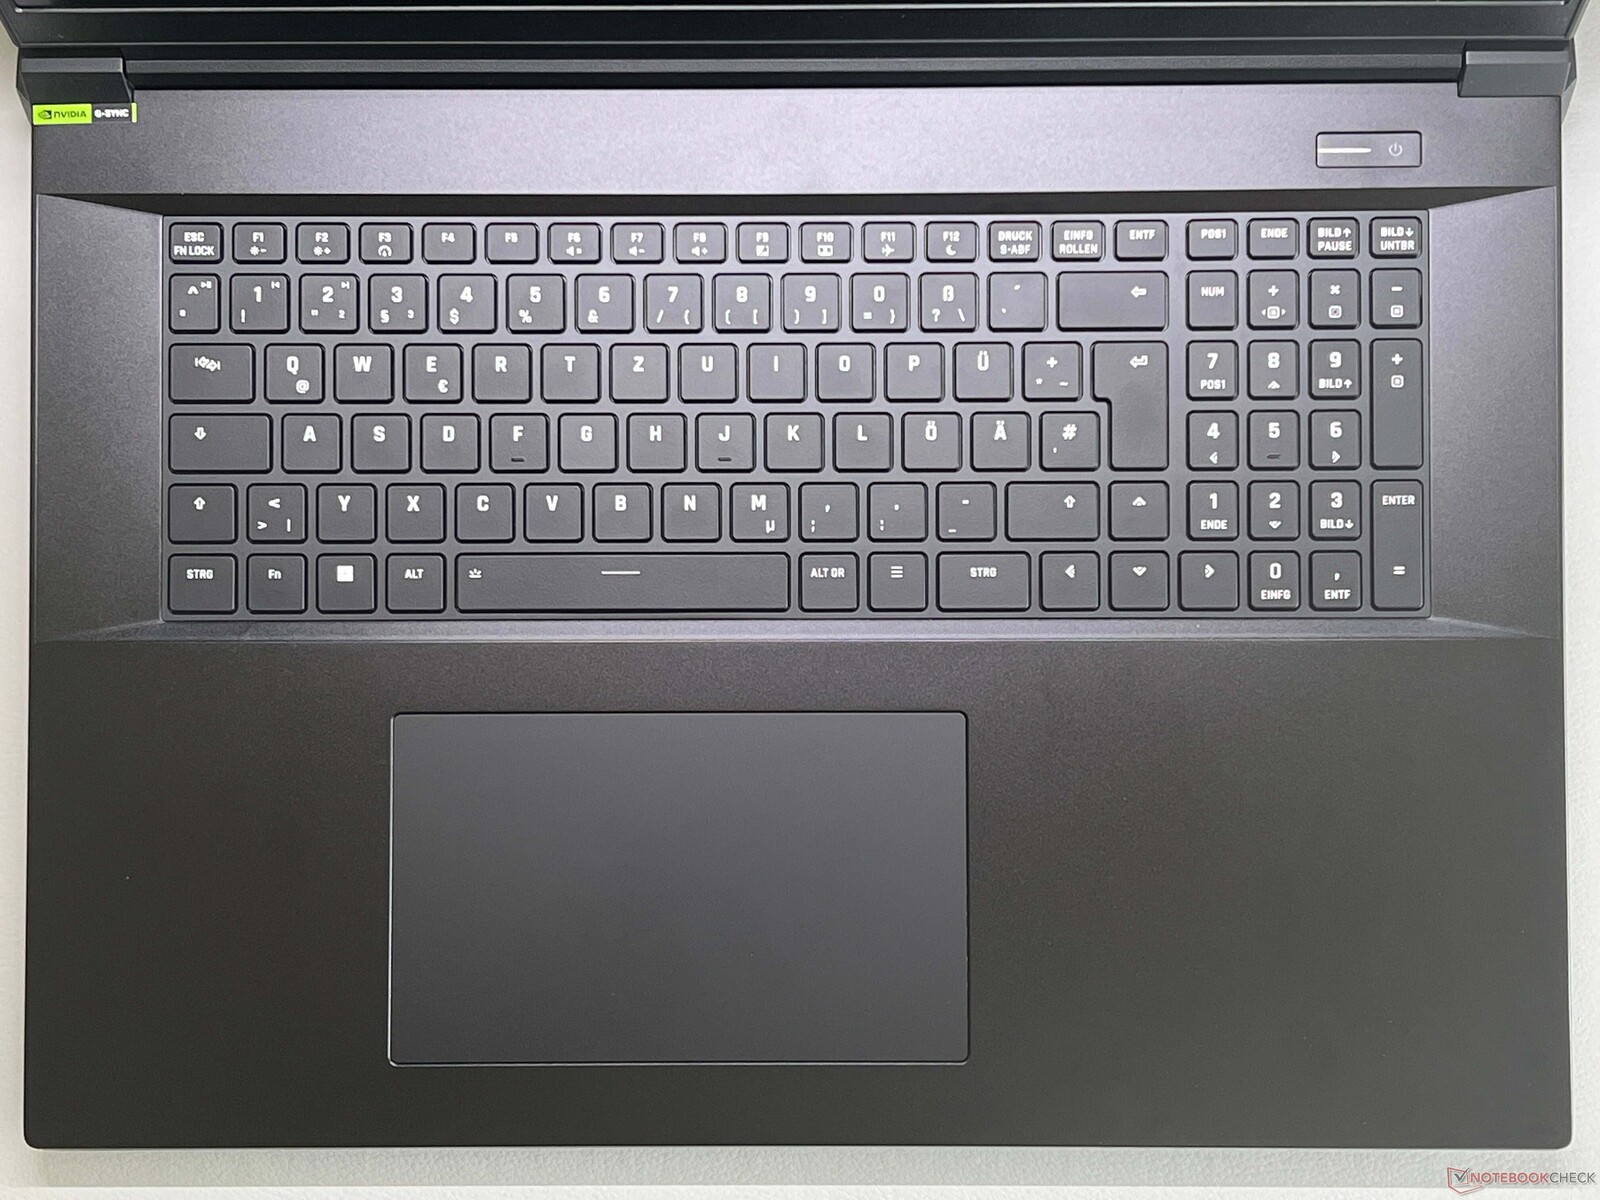
Eingabegeräte - Beleuchtete Tastatur

Die Tastatur bietet eine Einzeltastenbeleuchtung und einen dedizierten Nummernblock. Das Tippgefühl ist komfortabel und das ClickPad funktioniert einwandfrei, lediglich die mechanischen Klicks sind etwas laut.

Eingabegeräte
Eingabegeräte
Tastaturbeleuchtung
Tastaturbeleuchtung

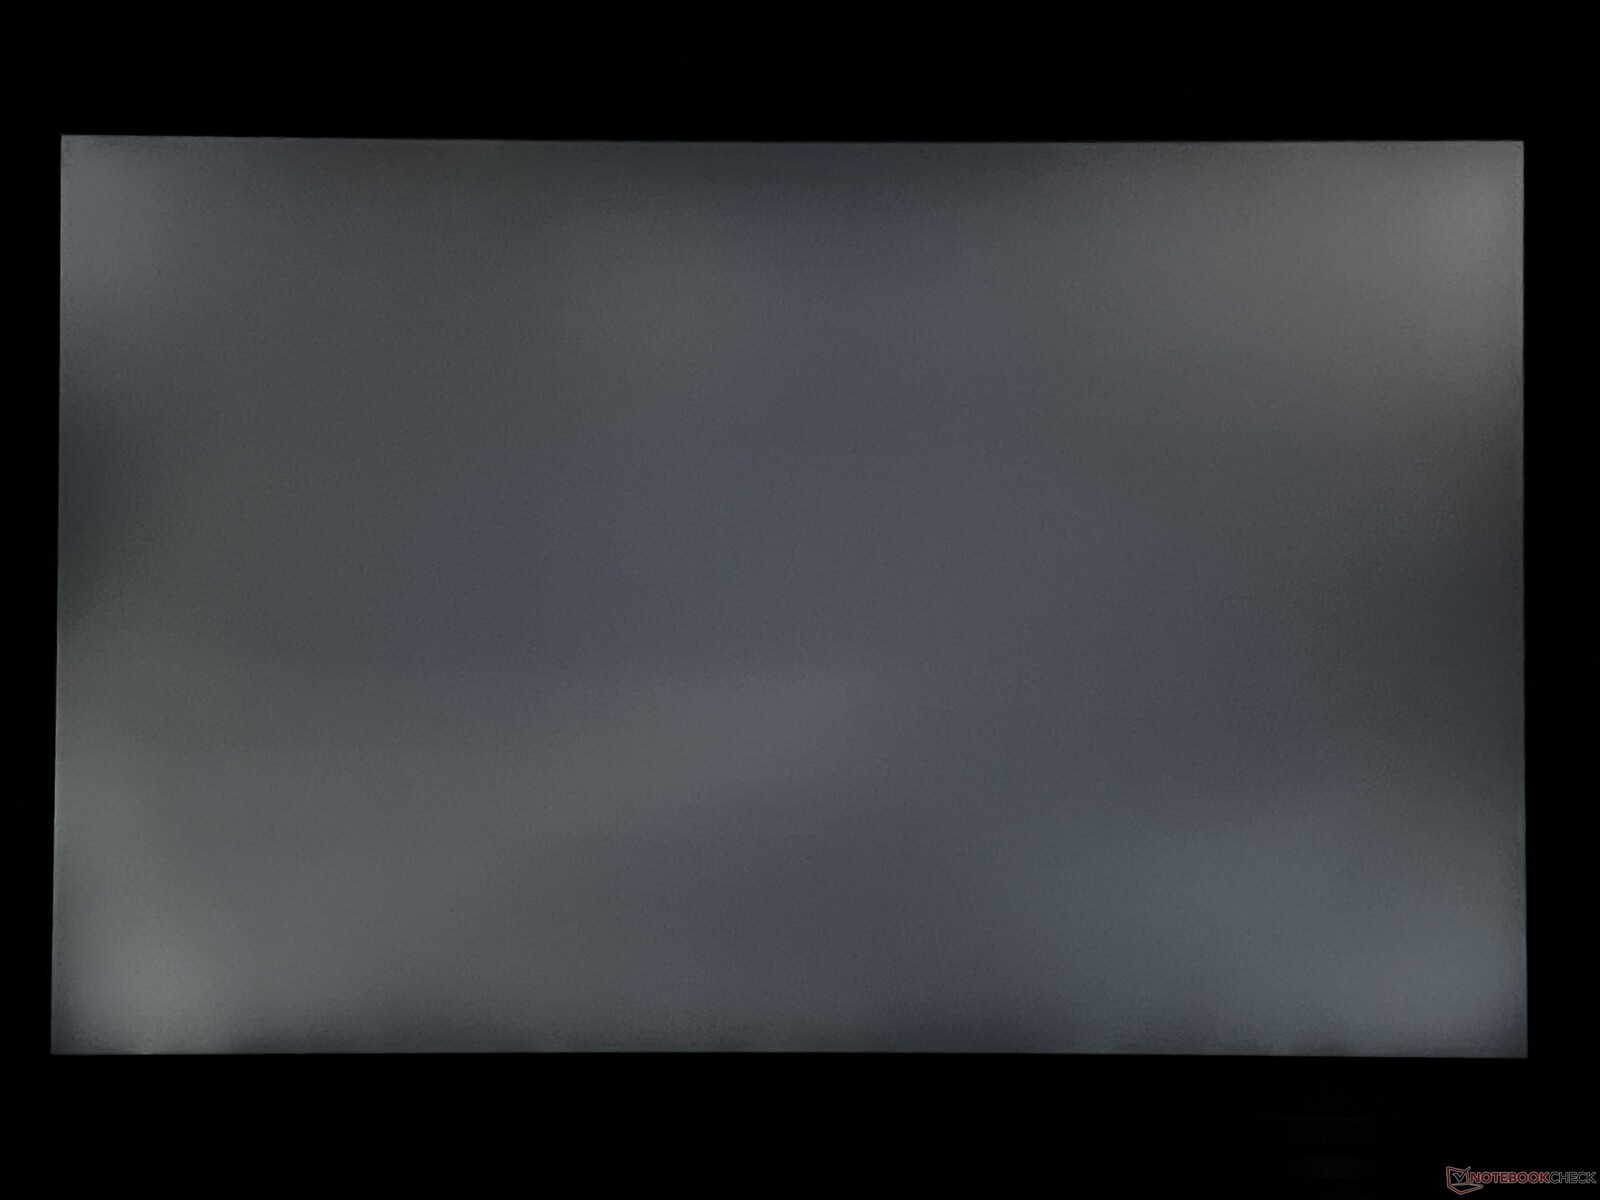
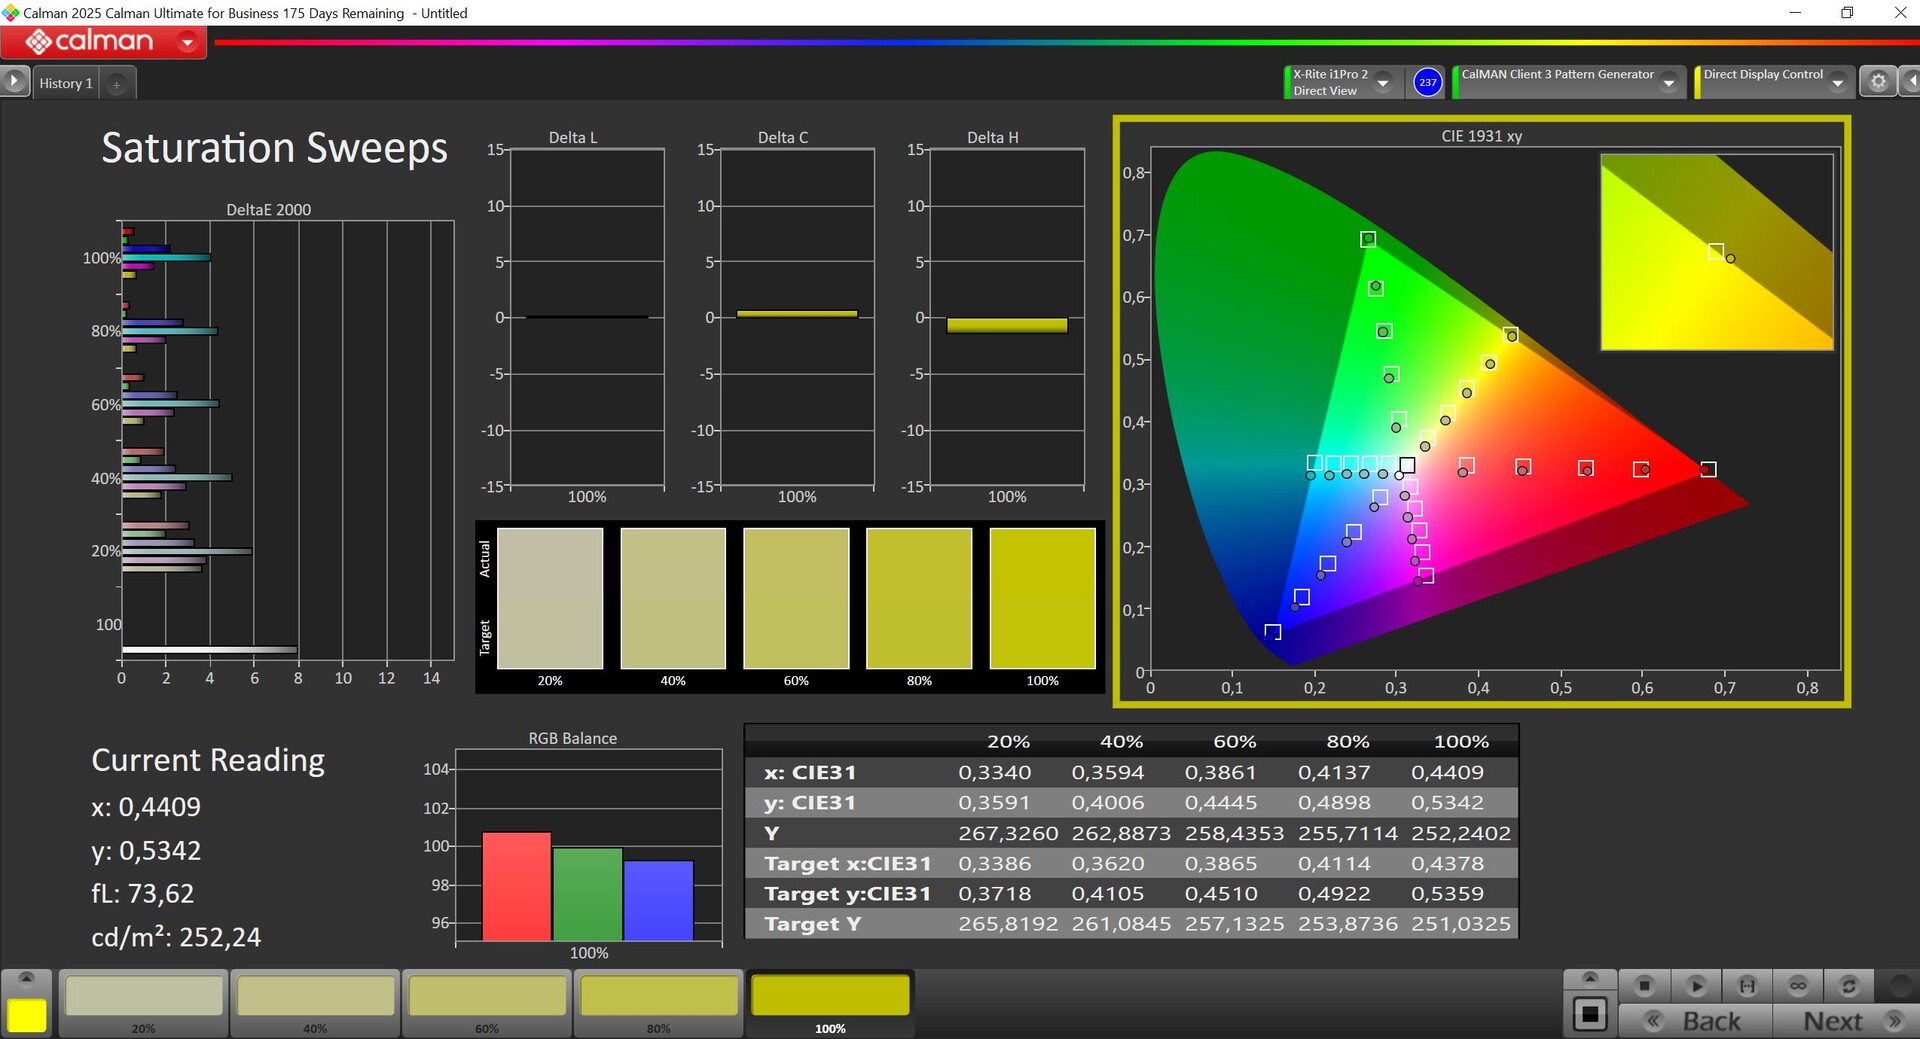
Display - 4K-IPS mit 200 Hz

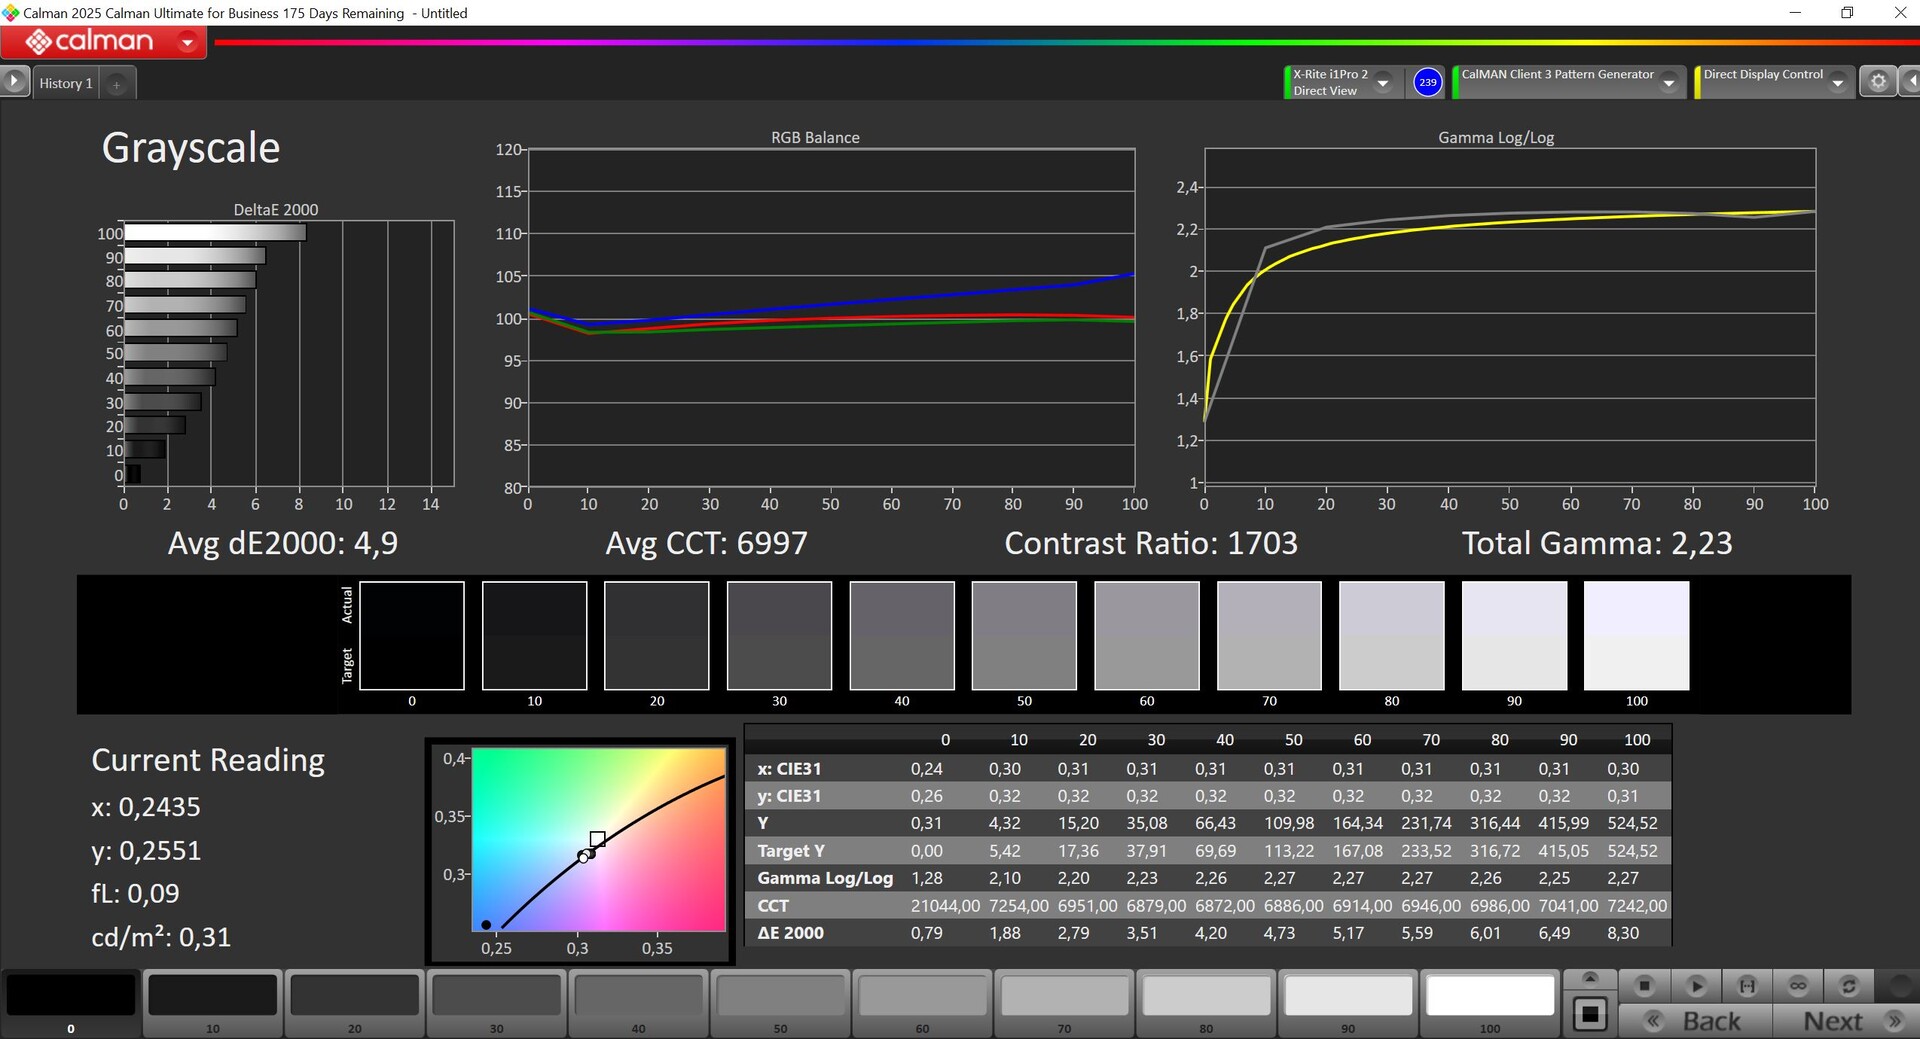
Unser Testgerät ist mit dem optionalen 4K-Panel ausgestattet (120/200 Hz), das eine gute subjektive Bildqualität bietet. PWM-Flackern ist nicht vorhanden und die Reaktionszeiten sind schnell. Die Helligkeit liegt bei mehr als 500 cd/m², das Werksprofil ist allerdings nicht sehr genau und es gibt auch kein sRGB-Profil. Mit unserer eigenen Kalibrierung können wir die Darstellung deutlich verbessern. 

Subpixel-Anordnung
Subpixel-Anordnung
Sichtbare Lichthöfe (hier etwas verstärkt dargestellt)
503
cd/m²
512
cd/m²
516
cd/m²
511
cd/m²
529
cd/m²
519
cd/m²
514
cd/m²
504
cd/m²
511
cd/m²
Ausleuchtung des Bildschirms
LQ180D1JW01 getestet mit X-Rite i1Pro 3
Maximal: 529 cd/m² (Nits) Durchschnitt: 513.2 cd/m² Minimum: 27.1 cd/m²
Ausleuchtung: 95 %
Helligkeit Akku: 529 cd/m²
Kontrast: 1706:1 (Schwarzwert: 0.31 cd/m²)
ΔE ColorChecker Calman: 2.7 | ∀{0.5-29.43 Ø4.79}
calibrated: 0.8
ΔE Greyscale Calman: 4.9 | ∀{0.09-98 Ø5}
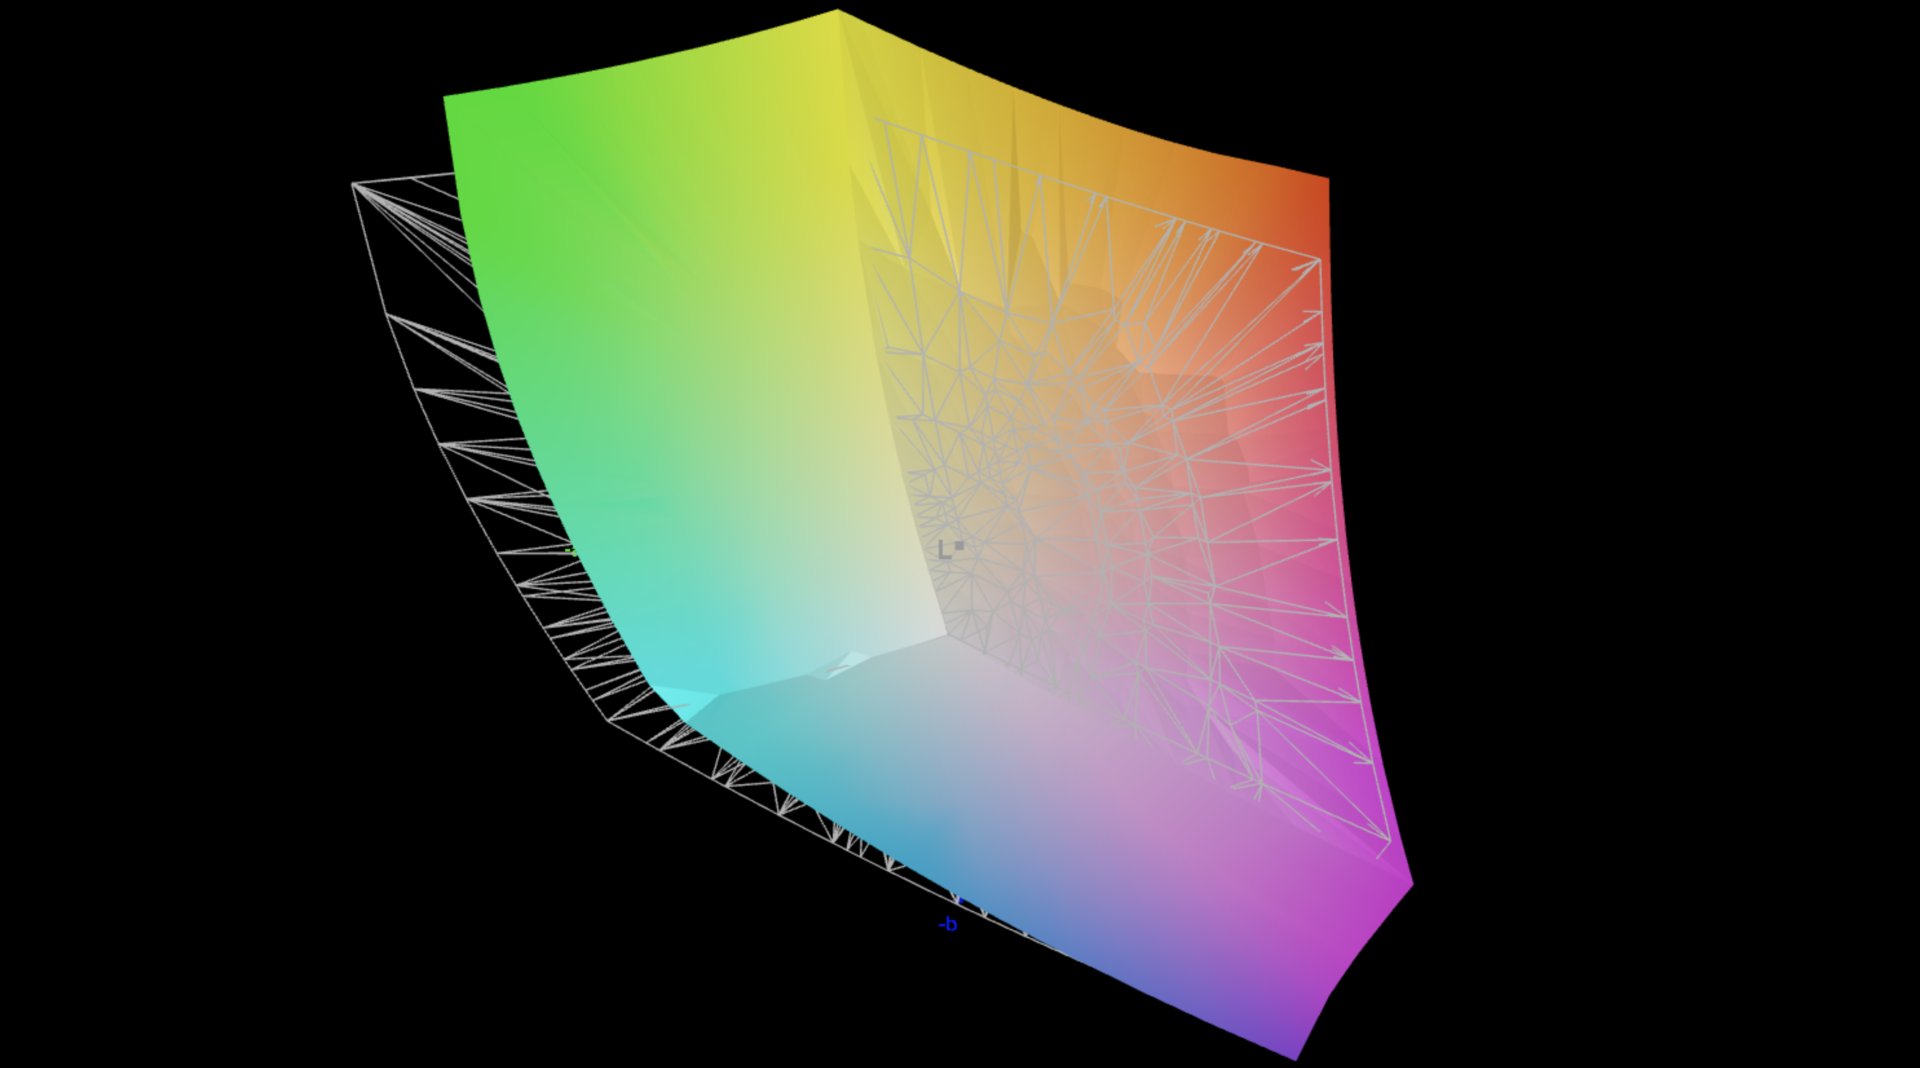
87.4% AdobeRGB 1998 (Argyll 3D)
100% sRGB (Argyll 3D)
90.5% Display P3 (Argyll 3D)
Gamma: 2.23
CCT: 6997 K
Schenker Key 18 Pro M25 RTX 5090
LQ180D1JW01, IPS, 3840x2400, 18", 200 Hz
Razer Blade 18 2025 RTX 5090 Laptop
NE180QAM-NZ1, IPS, 3840x2400, 18", 240 Hz
Alienware 18 Area-51
AU Optronics B180QAN, IPS, 2560x1600, 18", 300 Hz
Aorus Master 18 AM8H
NE180QDM-NM1 (BOE0C58), Mini-LED, 2560x1600, 18", 240 Hz
MSI Titan 18 HX AI A2XWJG
AU Optronics B180ZAN01.0, Mini-LED, 3840x2160, 18", 120 Hz
Asus Strix Scar 18 G835LX
N180QDM-NM2, Mini-LED, 2560x1600, 18", 240 Hz
Display
3%
3%
3%
4%
3%
Display P3 Coverage (%)
90.5
97
7%
96.1
6%
99.9
10%
99.7
10%
99
9%
sRGB Coverage (%)
100
100
0%
100
0%
100
0%
99.9
0%
100
0%
AdobeRGB 1998 Coverage (%)
87.4
89
2%
89.7
3%
87.7
0%
90.4
3%
87.2
0%
Response Times
-3%
-126%
-152%
-159%
-92%
Response Time Grey 50% / Grey 80% * (ms)
5.2 ?(2.4, 2.8)
5.1 ?(2.3, 2.8)
2%
13 ?(5.8, 7.2)
-150%
16.4 ?(16.4)
-215%
8.8 ?(3.8, 5)
-69%
7.4 ?(2.4, 5)
-42%
Response Time Black / White * (ms)
4.3 ?(1.4, 2.9)
4.6 ?(1.5, 3.1)
-7%
8.7 ?(4.4, 4.3)
-102%
8.1 ?(8.1)
-88%
15 ?(8.8, 6.2)
-249%
10.4 ?(0.6, 9.8)
-142%
PWM Frequency (Hz)
1398 ?(100)
15430 ?(100)
20610 ?(100)
PWM Amplitude * (%)
100
50
100
Bildschirm
-3%
-6%
35%
-27%
87%
Helligkeit Bildmitte (cd/m²)
529
545
3%
512.5
-3%
438
-17%
704
33%
764
44%
Brightness (cd/m²)
513
510
-1%
496
-3%
451
-12%
680
33%
747
46%
Brightness Distribution (%)
95
86
-9%
94
-1%
90
-5%
88
-7%
93
-2%
Schwarzwert * (cd/m²)
0.31
0.41
-32%
0.41
-32%
0.13
58%
0.1
68%
Kontrast (:1)
1706
1329
-22%
1250
-27%
3369
97%
7640
348%
Delta E Colorchecker *
2.7
2.2
19%
3.24
-20%
1.25
54%
4.11
-52%
1.2
56%
Colorchecker dE 2000 max. *
7.8
5.8
26%
8.4
-8%
4.93
37%
6.43
18%
2.8
64%
Colorchecker dE 2000 calibrated *
0.8
1.1
-38%
0.47
41%
2.5
-213%
Delta E Graustufen *
4.9
3.5
29%
5
-2%
1.7
65%
4.9
-0%
1.5
69%
Gamma
2.23 99%
2.18 101%
2.37 93%
2.173 101%
2.03 108%
2.17 101%
CCT
6997 93%
7027 93%
6417 101%
6518 100%
6331 103%
6556 99%
Durchschnitt gesamt (Programm / Settings)
-1% / -2%
-43% / -21%
-38% / -1%
-61% / -41%
-1% / 40%

* ... kleinere Werte sind besser

CalMAN Graustufen
CalMAN Graustufen
CalMAN Sättigung
CalMAN Sättigung
CalMAN ColorChecker
CalMAN ColorChecker
CalMAN Graustufen kalibriert
CalMAN Sättigung kalibriert
CalMAN ColorChecker kalibriert
vs. sRGB
vs. sRGB
vs. P3
vs. P3
vs. AdobeRGB
vs. AdobeRGB

Reaktionszeiten (Response Times) des Displays

Die Reaktionszeiten (Response Times) beschreiben wie schnell zwischen zwei Farben eines Pixels umgeschaltet werden kann. Langsame Response Times können zu einer verschwommenen Darstellung, Schlieren und Geisterbilder führen. Besonders bei schnellen 3D-Spielen sind kurze Umschaltzeiten wichtig.
       Reaktionszeiten Schwarz zu Weiß
4.3 ms ... steigend ↗ und fallend ↘ kombiniert↗ 1.4 ms steigend
↘ 2.9 ms fallend
Die gemessenen Reaktionszeiten sind sehr kurz, wodurch sich der Bildschirm auch für schnelle 3D Spiele eignen sollte.
Im Vergleich rangierten die bei uns getesteten Geräte von 0.1 (Minimum) zu 240 (Maximum) ms. » 16 % aller Screens waren schneller als der getestete.
Daher sind die gemessenen Reaktionszeiten besser als der Durchschnitt aller vermessenen Geräte (20.3 ms).
       Reaktionszeiten 50% Grau zu 80% Grau
5.2 ms ... steigend ↗ und fallend ↘ kombiniert↗ 2.4 ms steigend
↘ 2.8 ms fallend
Die gemessenen Reaktionszeiten sind sehr kurz, wodurch sich der Bildschirm auch für schnelle 3D Spiele eignen sollte.
Im Vergleich rangierten die bei uns getesteten Geräte von 0.165 (Minimum) zu 636 (Maximum) ms. » 16 % aller Screens waren schneller als der getestete.
Daher sind die gemessenen Reaktionszeiten besser als der Durchschnitt aller vermessenen Geräte (31.7 ms).

Bildschirm-Flackern / PWM (Pulse-Width Modulation)

Eine günstige Methode um die Helligkeit eines Bildschirms zu steuern, ist die Beleuchtung periodisch ein- und auszuschalten. Dies nennt sich PWM (Pulsweitenmodulation) Diese Umschaltung sollte mit einer hohen Frequenz stattfinden damit das menschliche Auge kein Flimmern wahrnimmt. Wenn die Frequenz zu niedrig ist, kann dies zu Ermüdungserscheinungen, Augenbrennen, Kopfweh und auch sichtbaren Flackern führen.
Flackern / PWM nicht festgestellt

Im Vergleich: 53 % aller getesteten Geräte nutzten kein PWM um die Helligkeit zu reduzieren. Wenn PWM eingesetzt wurde, dann bei einer Frequenz von durchschnittlich 8152 (Minimum 5, Maximum 343500) Hz.

In der Sonne
In der Sonne
Im Schatten
Im Schatten
Blickwinkelstabilität

Leistung - Core Ultra 9 275HX und 256 GB RAM

Das Key 18 Pro bietet vier RAM-Slots für bis zu 256 GB, die dann allerdings mit einer geringeren Geschwindigkeit laufen. Im Abschnitt Systemleistung haben wir zudem noch Ergebnisse für 32 GB RAM (5600 MHz) eingetragen.


Testbedingungen

Wir haben unsere Tests mit dem Energieprofil Leistung (Turbo) durchgeführt. Hinweis: Im Lautlos-Modus fällt die TGP nach wenigen Minuten immer weiter auf 105 Watt ab und die Oberflächentemperaturen sind einige Grad höher als im Leistungs-Modus.

Energieprofil CPU TDP CB24 Multi GPU TGP Time Spy Graphics CP2077 QHD Ultra max. Lüfterlautstärke
Lautlos 30/28 Watt 787 Punkte 150/105 Watt 22.539 Punkte 98,9 FPS 33,6 dB(A)
Unterhaltung 130/45 Watt 1.351 Punkte 150 Watt 22.999 Punkte 109,6 FPS 52,5 dB(A)
Leistung (Turbo) 145/130 Watt 2.049 Punkte 175 Watt 24.562 Punkte 116,6 FPS 58,6 dB(A)
Akku 34/32 Watt 919 Punkte 35 Watt 3.779 Punkte 13,4 FPS 33,6 dB(A)

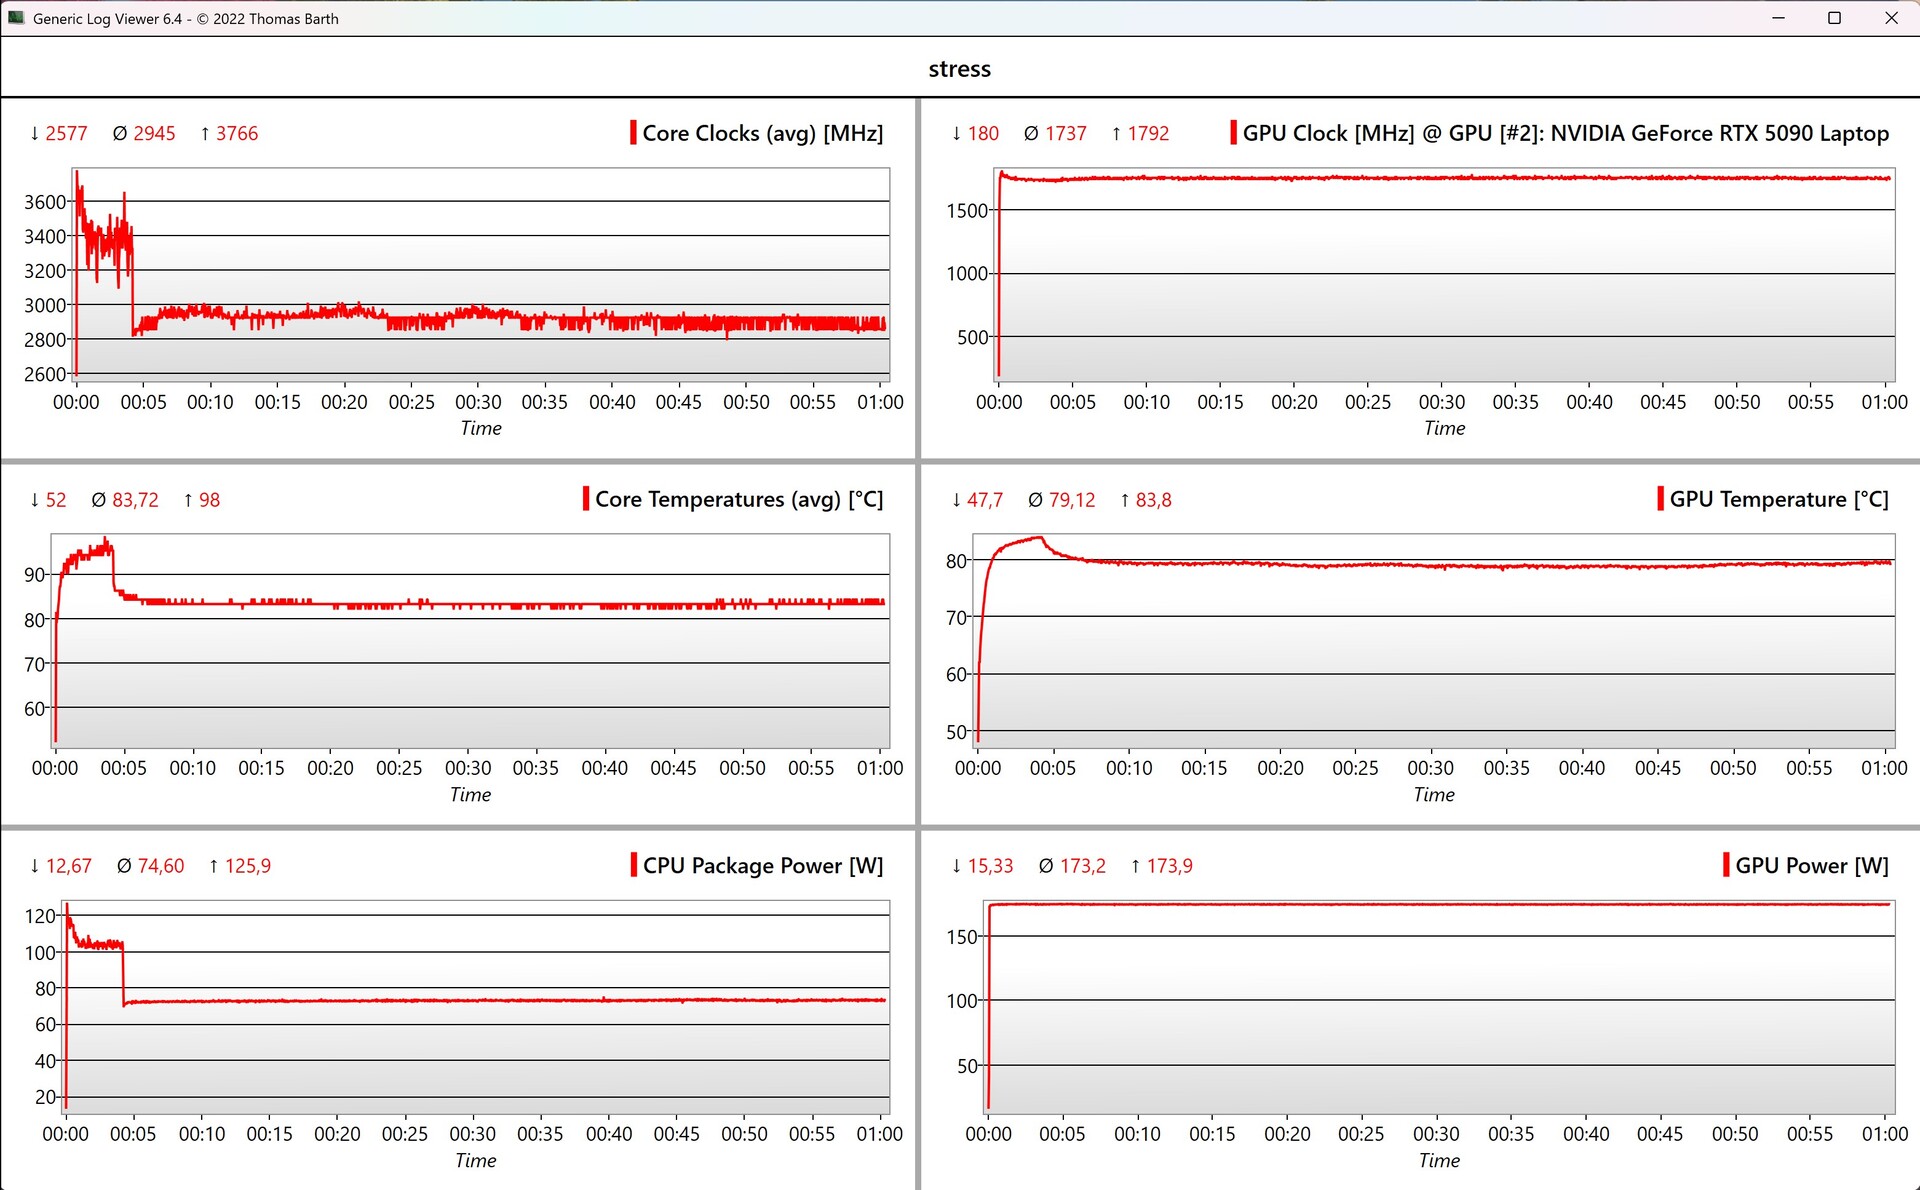
Prozessor - Intel Arrow Lake-HX

Mit Power Limits von 145/130 Watt kann man nicht das gesamte Leistungspotenzial des Core Ultra 9 275HX ausnutzen, insgesamt die CPU-Leistung aber trotzdem sehr gut und vor allem auch stabil.

Cinebench R15 Multi Dauertest

03156309451260157518902205252028353150346537804095441047255040535556705985Tooltip
Schenker Key 18 Pro M25 RTX 5090 Intel Core Ultra 9 275HX: Ø5430 (5381.41-5508.88)
Razer Blade 18 2025 RTX 5090 Laptop Intel Core Ultra 9 275HX: Ø5669 (5617.98-5714.29)
Alienware 18 Area-51 Intel Core Ultra 9 275HX: Ø5784 (5592.06-5827.51)
Aorus Master 18 AM8H Intel Core Ultra 9 275HX: Ø4952 (4898.36-5043.5)
MSI Titan 18 HX AI A2XWJG Intel Core Ultra 9 285HX: Ø6132 (6018.66-6231.5)
Asus Strix Scar 18 G835LX Intel Core Ultra 9 275HX: Ø5942 (5879.76-6059.69)
CPU Performance Rating: Percent
Cinebench 2024: CPU Multi Core | CPU Single Core
Cinebench R23: Multi Core | Single Core
Cinebench R20: CPU (Multi Core) | CPU (Single Core)
Cinebench R15: CPU Multi 64Bit | CPU Single 64Bit
Blender: v2.79 BMW27 CPU
7-Zip 18.03: 7z b 4 | 7z b 4 -mmt1
Geekbench 6.5: Multi-Core | Single-Core
Geekbench 5.5: Multi-Core | Single-Core
HWBOT x265 Benchmark v2.2: 4k Preset
LibreOffice : 20 Documents To PDF
R Benchmark 2.5: Overall mean
CPU Performance Rating
Asus Strix Scar 18 G835LX
Intel Core Ultra 9 275HX
87.1 pt
MSI Titan 18 HX AI A2XWJG
Intel Core Ultra 9 285HX
86.9 pt
Alienware 18 Area-51
Intel Core Ultra 9 275HX
84.4 pt
Razer Blade 18 2025 RTX 5090 Laptop
Intel Core Ultra 9 275HX
83.5 pt
Durchschnittliche Intel Core Ultra 9 275HX
 
81.4 pt
Schenker Key 18 Pro M25 RTX 5090
Intel Core Ultra 9 275HX
78.5 pt
Aorus Master 18 AM8H -2!
Intel Core Ultra 9 275HX
75.7 pt
Durchschnitt der Klasse Workstation
 
58.1 pt
Cinebench 2024 / CPU Multi Core
MSI Titan 18 HX AI A2XWJG
Intel Core Ultra 9 285HX
2298 Points +12%
Asus Strix Scar 18 G835LX
Intel Core Ultra 9 275HX
2223 Points +8%
Alienware 18 Area-51
Intel Core Ultra 9 275HX
2210 Points +8%
Razer Blade 18 2025 RTX 5090 Laptop
Intel Core Ultra 9 275HX
2168 Points +6%
Schenker Key 18 Pro M25 RTX 5090
Intel Core Ultra 9 275HX
2049 Points
Durchschnittliche Intel Core Ultra 9 275HX
  (1547 - 2288, n=22)
2026 Points -1%
Durchschnitt der Klasse Workstation
  (616 - 2049, n=15, der letzten 2 Jahre)
1189 Points -42%
Cinebench 2024 / CPU Single Core
Asus Strix Scar 18 G835LX
Intel Core Ultra 9 275HX
138 Points +8%
Alienware 18 Area-51
Intel Core Ultra 9 275HX
134.7 Points +5%
MSI Titan 18 HX AI A2XWJG
Intel Core Ultra 9 285HX
134.2 Points +5%
Durchschnittliche Intel Core Ultra 9 275HX
  (123.1 - 138.2, n=22)
133.9 Points +5%
Razer Blade 18 2025 RTX 5090 Laptop
Intel Core Ultra 9 275HX
133.1 Points +4%
Schenker Key 18 Pro M25 RTX 5090
Intel Core Ultra 9 275HX
127.9 Points
Durchschnitt der Klasse Workstation
  (101.6 - 127.9, n=14, der letzten 2 Jahre)
113.8 Points -11%
Cinebench R23 / Multi Core
MSI Titan 18 HX AI A2XWJG
Intel Core Ultra 9 285HX
40117 Points +9%
Asus Strix Scar 18 G835LX
Intel Core Ultra 9 275HX
39001 Points +6%
Alienware 18 Area-51
Intel Core Ultra 9 275HX
38431 (37240.9min - 38430.9max) Points +5%
Razer Blade 18 2025 RTX 5090 Laptop
Intel Core Ultra 9 275HX
37062 Points +1%
Schenker Key 18 Pro M25 RTX 5090
Intel Core Ultra 9 275HX
36692 Points
Durchschnittliche Intel Core Ultra 9 275HX
  (30712 - 40970, n=27)
35899 Points -2%
Aorus Master 18 AM8H
Intel Core Ultra 9 275HX
33497 Points -9%
Durchschnitt der Klasse Workstation
  (13971 - 36692, n=28, der letzten 2 Jahre)
20377 Points -44%
Cinebench R23 / Single Core
Asus Strix Scar 18 G835LX
Intel Core Ultra 9 275HX
2252 Points +2%
Schenker Key 18 Pro M25 RTX 5090
Intel Core Ultra 9 275HX
2206 Points
Razer Blade 18 2025 RTX 5090 Laptop
Intel Core Ultra 9 275HX
2194 Points -1%
Alienware 18 Area-51
Intel Core Ultra 9 275HX
2192 Points -1%
Durchschnittliche Intel Core Ultra 9 275HX
  (2009 - 2267, n=27)
2189 Points -1%
MSI Titan 18 HX AI A2XWJG
Intel Core Ultra 9 285HX
2185 Points -1%
Aorus Master 18 AM8H
Intel Core Ultra 9 275HX
2126 Points -4%
Durchschnitt der Klasse Workstation
  (1691 - 2206, n=28, der letzten 2 Jahre)
1916 Points -13%
Cinebench R20 / CPU (Multi Core)
MSI Titan 18 HX AI A2XWJG
Intel Core Ultra 9 285HX
15751 Points +10%
Asus Strix Scar 18 G835LX
Intel Core Ultra 9 275HX
15517 Points +8%
Alienware 18 Area-51
Intel Core Ultra 9 275HX
15149 Points +6%
Razer Blade 18 2025 RTX 5090 Laptop
Intel Core Ultra 9 275HX
14483 Points +1%
Schenker Key 18 Pro M25 RTX 5090
Intel Core Ultra 9 275HX
14341 Points
Durchschnittliche Intel Core Ultra 9 275HX
  (12026 - 16108, n=26)
14064 Points -2%
Aorus Master 18 AM8H
Intel Core Ultra 9 275HX
13223 Points -8%
Durchschnitt der Klasse Workstation
  (5327 - 14341, n=28, der letzten 2 Jahre)
7840 Points -45%
Cinebench R20 / CPU (Single Core)
Asus Strix Scar 18 G835LX
Intel Core Ultra 9 275HX
866 Points +2%
Schenker Key 18 Pro M25 RTX 5090
Intel Core Ultra 9 275HX
849 Points
Durchschnittliche Intel Core Ultra 9 275HX
  (774 - 870, n=26)
844 Points -1%
Alienware 18 Area-51
Intel Core Ultra 9 275HX
842 Points -1%
MSI Titan 18 HX AI A2XWJG
Intel Core Ultra 9 285HX
841 Points -1%
Razer Blade 18 2025 RTX 5090 Laptop
Intel Core Ultra 9 275HX
838 Points -1%
Aorus Master 18 AM8H
Intel Core Ultra 9 275HX
821 Points -3%
Durchschnitt der Klasse Workstation
  (651 - 849, n=28, der letzten 2 Jahre)
739 Points -13%
Cinebench R15 / CPU Multi 64Bit
MSI Titan 18 HX AI A2XWJG
Intel Core Ultra 9 285HX
6232 (6018.66min - 6231.5max) Points +13%
Asus Strix Scar 18 G835LX
Intel Core Ultra 9 275HX
6060 (5879.76min - 6059.69max) Points +10%
Alienware 18 Area-51
Intel Core Ultra 9 275HX
5828 (5592.06min - 5827.51max) Points +6%
Razer Blade 18 2025 RTX 5090 Laptop
Intel Core Ultra 9 275HX
5714 (5617.98min - 5714.29max) Points +4%
Durchschnittliche Intel Core Ultra 9 275HX
  (4756 - 6271, n=26)
5596 Points +2%
Schenker Key 18 Pro M25 RTX 5090
Intel Core Ultra 9 275HX
5509 (5381.41min - 5508.88max) Points
Aorus Master 18 AM8H
Intel Core Ultra 9 275HX
5044 (4898.36min - 5043.5max) Points -8%
Durchschnitt der Klasse Workstation
  (2240 - 5509, n=28, der letzten 2 Jahre)
3229 Points -41%
Cinebench R15 / CPU Single 64Bit
Asus Strix Scar 18 G835LX
Intel Core Ultra 9 275HX
343 Points +6%
Aorus Master 18 AM8H
Intel Core Ultra 9 275HX
331 Points +2%
Alienware 18 Area-51
Intel Core Ultra 9 275HX
331 Points +2%
Durchschnittliche Intel Core Ultra 9 275HX
  (306 - 343, n=27)
331 Points +2%
Razer Blade 18 2025 RTX 5090 Laptop
Intel Core Ultra 9 275HX
327 Points +1%
MSI Titan 18 HX AI A2XWJG
Intel Core Ultra 9 285HX
324 Points 0%
Schenker Key 18 Pro M25 RTX 5090
Intel Core Ultra 9 275HX
324 Points
Durchschnitt der Klasse Workstation
  (191.4 - 324, n=28, der letzten 2 Jahre)
281 Points -13%
Blender / v2.79 BMW27 CPU
Durchschnitt der Klasse Workstation
  (91 - 261, n=28, der letzten 2 Jahre)
177 Seconds * -95%
Aorus Master 18 AM8H
Intel Core Ultra 9 275HX
101 Seconds * -11%
Durchschnittliche Intel Core Ultra 9 275HX
  (82 - 116, n=25)
95.1 Seconds * -5%
Schenker Key 18 Pro M25 RTX 5090
Intel Core Ultra 9 275HX
91 Seconds *
Razer Blade 18 2025 RTX 5090 Laptop
Intel Core Ultra 9 275HX
89 Seconds * +2%
Alienware 18 Area-51
Intel Core Ultra 9 275HX
88 Seconds * +3%
Asus Strix Scar 18 G835LX
Intel Core Ultra 9 275HX
87 Seconds * +4%
MSI Titan 18 HX AI A2XWJG
Intel Core Ultra 9 285HX
83 Seconds * +9%
7-Zip 18.03 / 7z b 4
MSI Titan 18 HX AI A2XWJG
Intel Core Ultra 9 285HX
128778 MIPS +22%
Asus Strix Scar 18 G835LX
Intel Core Ultra 9 275HX
122818 MIPS +16%
Alienware 18 Area-51
Intel Core Ultra 9 275HX
121759 MIPS +15%
Razer Blade 18 2025 RTX 5090 Laptop
Intel Core Ultra 9 275HX
120234 MIPS +14%
Durchschnittliche Intel Core Ultra 9 275HX
  (98236 - 124155, n=26)
113567 MIPS +7%
Aorus Master 18 AM8H
Intel Core Ultra 9 275HX
109737 MIPS +4%
Schenker Key 18 Pro M25 RTX 5090
Intel Core Ultra 9 275HX
105744 MIPS
Durchschnitt der Klasse Workstation
  (53407 - 109760, n=28, der letzten 2 Jahre)
75973 MIPS -28%
7-Zip 18.03 / 7z b 4 -mmt1
Asus Strix Scar 18 G835LX
Intel Core Ultra 9 275HX
7027 MIPS +17%
MSI Titan 18 HX AI A2XWJG
Intel Core Ultra 9 285HX
6822 MIPS +13%
Aorus Master 18 AM8H
Intel Core Ultra 9 275HX
6822 MIPS +13%
Durchschnittliche Intel Core Ultra 9 275HX
  (6026 - 7149, n=26)
6691 MIPS +11%
Razer Blade 18 2025 RTX 5090 Laptop
Intel Core Ultra 9 275HX
6588 MIPS +9%
Alienware 18 Area-51
Intel Core Ultra 9 275HX
6585 MIPS +9%
Durchschnitt der Klasse Workstation
  (4981 - 6960, n=28, der letzten 2 Jahre)
6082 MIPS +1%
Schenker Key 18 Pro M25 RTX 5090
Intel Core Ultra 9 275HX
6026 MIPS
Geekbench 6.5 / Multi-Core
MSI Titan 18 HX AI A2XWJG
Intel Core Ultra 9 285HX
22104 Points +31%
Asus Strix Scar 18 G835LX
Intel Core Ultra 9 275HX
21668 Points +29%
Razer Blade 18 2025 RTX 5090 Laptop
Intel Core Ultra 9 275HX
20819 Points +24%
Alienware 18 Area-51
Intel Core Ultra 9 275HX
19869 Points +18%
Aorus Master 18 AM8H
Intel Core Ultra 9 275HX
19464 Points +16%
Durchschnittliche Intel Core Ultra 9 275HX
  (16033 - 21668, n=28)
19416 Points +15%
Schenker Key 18 Pro M25 RTX 5090
Intel Core Ultra 9 275HX
16832 Points
Durchschnitt der Klasse Workstation
  (10518 - 20630, n=27, der letzten 2 Jahre)
14459 Points -14%
Geekbench 6.5 / Single-Core
Asus Strix Scar 18 G835LX
Intel Core Ultra 9 275HX
3158 Points +10%
MSI Titan 18 HX AI A2XWJG
Intel Core Ultra 9 285HX
3088 Points +8%
Alienware 18 Area-51
Intel Core Ultra 9 275HX
3057 Points +7%
Aorus Master 18 AM8H
Intel Core Ultra 9 275HX
3033 Points +6%
Durchschnittliche Intel Core Ultra 9 275HX
  (2843 - 3160, n=28)
3032 Points +6%
Razer Blade 18 2025 RTX 5090 Laptop
Intel Core Ultra 9 275HX
2986 Points +4%
Schenker Key 18 Pro M25 RTX 5090
Intel Core Ultra 9 275HX
2863 Points
Durchschnitt der Klasse Workstation
  (2384 - 2939, n=27, der letzten 2 Jahre)
2685 Points -6%
Geekbench 5.5 / Multi-Core
MSI Titan 18 HX AI A2XWJG
Intel Core Ultra 9 285HX
27010 Points +39%
Asus Strix Scar 18 G835LX
Intel Core Ultra 9 275HX
25855 Points +33%
Razer Blade 18 2025 RTX 5090 Laptop
Intel Core Ultra 9 275HX
25068 Points +29%
Alienware 18 Area-51
Intel Core Ultra 9 275HX
23447 Points +21%
Durchschnittliche Intel Core Ultra 9 275HX
  (19105 - 25855, n=27)
22907 Points +18%
Aorus Master 18 AM8H
Intel Core Ultra 9 275HX
22794 Points +18%
Schenker Key 18 Pro M25 RTX 5090
Intel Core Ultra 9 275HX
19382 Points
Durchschnitt der Klasse Workstation
  (9968 - 24910, n=28, der letzten 2 Jahre)
14608 Points -25%
Geekbench 5.5 / Single-Core
Asus Strix Scar 18 G835LX
Intel Core Ultra 9 275HX
2292 Points +10%
Alienware 18 Area-51
Intel Core Ultra 9 275HX
2233 Points +7%
MSI Titan 18 HX AI A2XWJG
Intel Core Ultra 9 285HX
2232 Points +7%
Razer Blade 18 2025 RTX 5090 Laptop
Intel Core Ultra 9 275HX
2217 Points +6%
Durchschnittliche Intel Core Ultra 9 275HX
  (2033 - 2292, n=27)
2199 Points +6%
Aorus Master 18 AM8H
Intel Core Ultra 9 275HX
2186 Points +5%
Schenker Key 18 Pro M25 RTX 5090
Intel Core Ultra 9 275HX
2083 Points
Durchschnitt der Klasse Workstation
  (1740 - 2130, n=28, der letzten 2 Jahre)
1945 Points -7%
HWBOT x265 Benchmark v2.2 / 4k Preset
MSI Titan 18 HX AI A2XWJG
Intel Core Ultra 9 285HX
44.3 fps +20%
Asus Strix Scar 18 G835LX
Intel Core Ultra 9 275HX
41.2 fps +12%
Alienware 18 Area-51
Intel Core Ultra 9 275HX
40.5 fps +10%
Razer Blade 18 2025 RTX 5090 Laptop
Intel Core Ultra 9 275HX
39.7 fps +8%
Durchschnittliche Intel Core Ultra 9 275HX
  (30.7 - 43.8, n=26)
38.1 fps +4%
Schenker Key 18 Pro M25 RTX 5090
Intel Core Ultra 9 275HX
36.8 fps
Aorus Master 18 AM8H
Intel Core Ultra 9 275HX
35.7 fps -3%
Durchschnitt der Klasse Workstation
  (14.4 - 36.8, n=28, der letzten 2 Jahre)
22.7 fps -38%
LibreOffice / 20 Documents To PDF
Aorus Master 18 AM8H
Intel Core Ultra 9 275HX
62.1 s * -67%
Durchschnitt der Klasse Workstation
  (37.1 - 74.7, n=28, der letzten 2 Jahre)
49.3 s * -33%
MSI Titan 18 HX AI A2XWJG
Intel Core Ultra 9 285HX
47.4 s * -28%
Durchschnittliche Intel Core Ultra 9 275HX
  (33.2 - 62.1, n=26)
41.4 s * -12%
Asus Strix Scar 18 G835LX
Intel Core Ultra 9 275HX
41.3 s * -11%
Razer Blade 18 2025 RTX 5090 Laptop
Intel Core Ultra 9 275HX
39.5 s * -6%
Alienware 18 Area-51
Intel Core Ultra 9 275HX
37.4 s * -1%
Schenker Key 18 Pro M25 RTX 5090
Intel Core Ultra 9 275HX
37.1 s *
R Benchmark 2.5 / Overall mean
Durchschnitt der Klasse Workstation
  (0.3825 - 0.603, n=28, der letzten 2 Jahre)
0.4456 sec * -1%
Schenker Key 18 Pro M25 RTX 5090
Intel Core Ultra 9 275HX
0.4429 sec *
Razer Blade 18 2025 RTX 5090 Laptop
Intel Core Ultra 9 275HX
0.4174 sec * +6%
Durchschnittliche Intel Core Ultra 9 275HX
  (0.3943 - 0.4568, n=26)
0.416 sec * +6%
Aorus Master 18 AM8H
Intel Core Ultra 9 275HX
0.4139 sec * +7%
Alienware 18 Area-51
Intel Core Ultra 9 275HX
0.4088 sec * +8%
MSI Titan 18 HX AI A2XWJG
Intel Core Ultra 9 285HX
0.4012 sec * +9%
Asus Strix Scar 18 G835LX
Intel Core Ultra 9 275HX
0.3943 sec * +11%

* ... kleinere Werte sind besser

Cinebench R15 CPU Multi 64Bit
5509 Points
Cinebench R15 OpenGL 64Bit
272 fps
Cinebench R15 Ref. Match 64Bit
99.6 %
Cinebench R15 CPU Single 64Bit
324 Points
Cinebench R20 CPU (Multi Core)
14341 Points
Cinebench R20 CPU (Single Core)
849 Points
Cinebench R23 Single Core
2206 Points
Cinebench R23 Multi Core
36692 Points
Cinebench 2024 CPU Single Core
127.9 Points
Cinebench 2024 CPU Multi Core
2049 Points
Hilfe
Performance Rating
MSI Titan 18 HX AI A2XWJG
Intel Core Ultra 9 285HX, GeForce RTX 5090 Laptop
99.8 pt
Alienware 18 Area-51
Intel Core Ultra 9 275HX, GeForce RTX 5090 Laptop
96.9 pt
Asus Strix Scar 18 G835LX
Intel Core Ultra 9 275HX, GeForce RTX 5090 Laptop
95.8 pt
Razer Blade 18 2025 RTX 5090 Laptop
Intel Core Ultra 9 275HX, GeForce RTX 5090 Laptop
91.1 pt
Durchschnittliche Intel Core Ultra 9 275HX
 
88.7 pt
Schenker Key 18 Pro M25 RTX 5090
Intel Core Ultra 9 275HX, GeForce RTX 5090 Laptop
87.8 pt
Aorus Master 18 AM8H
Intel Core Ultra 9 275HX, GeForce RTX 5090 Laptop
82.6 pt
Durchschnitt der Klasse Workstation
 
63.9 pt
AIDA64 / FP32 Ray-Trace
MSI Titan 18 HX AI A2XWJG
Intel Core Ultra 9 285HX, GeForce RTX 5090 Laptop
42341 KRay/s +16%
Asus Strix Scar 18 G835LX
Intel Core Ultra 9 275HX, GeForce RTX 5090 Laptop
39458 KRay/s +8%
Alienware 18 Area-51
Intel Core Ultra 9 275HX, GeForce RTX 5090 Laptop
39149 KRay/s +8%
Schenker Key 18 Pro M25 RTX 5090
Intel Core Ultra 9 275HX, GeForce RTX 5090 Laptop
36385 KRay/s
Durchschnittliche Intel Core Ultra 9 275HX
  (28067 - 39895, n=26)
35741 KRay/s -2%
Razer Blade 18 2025 RTX 5090 Laptop
Intel Core Ultra 9 275HX, GeForce RTX 5090 Laptop
35004 KRay/s -4%
Aorus Master 18 AM8H
Intel Core Ultra 9 275HX, GeForce RTX 5090 Laptop
32615 KRay/s -10%
Durchschnitt der Klasse Workstation
  (10658 - 61611, n=28, der letzten 2 Jahre)
24515 KRay/s -33%
AIDA64 / FPU Julia
MSI Titan 18 HX AI A2XWJG
Intel Core Ultra 9 285HX, GeForce RTX 5090 Laptop
210885 Points +15%
Alienware 18 Area-51
Intel Core Ultra 9 275HX, GeForce RTX 5090 Laptop
200744 Points +9%
Asus Strix Scar 18 G835LX
Intel Core Ultra 9 275HX, GeForce RTX 5090 Laptop
194867 Points +6%
Razer Blade 18 2025 RTX 5090 Laptop
Intel Core Ultra 9 275HX, GeForce RTX 5090 Laptop
192982 Points +5%
Schenker Key 18 Pro M25 RTX 5090
Intel Core Ultra 9 275HX, GeForce RTX 5090 Laptop
184129 Points
Durchschnittliche Intel Core Ultra 9 275HX
  (140254 - 200744, n=26)
180287 Points -2%
Aorus Master 18 AM8H
Intel Core Ultra 9 275HX, GeForce RTX 5090 Laptop
166245 Points -10%
Durchschnitt der Klasse Workstation
  (56664 - 186971, n=28, der letzten 2 Jahre)
109253 Points -41%
AIDA64 / CPU SHA3
MSI Titan 18 HX AI A2XWJG
Intel Core Ultra 9 285HX, GeForce RTX 5090 Laptop
9815 MB/s +11%
Asus Strix Scar 18 G835LX
Intel Core Ultra 9 275HX, GeForce RTX 5090 Laptop
9482 MB/s +7%
Alienware 18 Area-51
Intel Core Ultra 9 275HX, GeForce RTX 5090 Laptop
9479 MB/s +7%
Razer Blade 18 2025 RTX 5090 Laptop
Intel Core Ultra 9 275HX, GeForce RTX 5090 Laptop
8964 MB/s +1%
Schenker Key 18 Pro M25 RTX 5090
Intel Core Ultra 9 275HX, GeForce RTX 5090 Laptop
8849 MB/s
Durchschnittliche Intel Core Ultra 9 275HX
  (6766 - 9817, n=26)
8655 MB/s -2%
Aorus Master 18 AM8H
Intel Core Ultra 9 275HX, GeForce RTX 5090 Laptop
7829 MB/s -12%
Durchschnitt der Klasse Workstation
  (2608 - 8975, n=28, der letzten 2 Jahre)
5050 MB/s -43%
AIDA64 / CPU Queen
MSI Titan 18 HX AI A2XWJG
Intel Core Ultra 9 285HX, GeForce RTX 5090 Laptop
141681 Points +5%
Alienware 18 Area-51
Intel Core Ultra 9 275HX, GeForce RTX 5090 Laptop
140937 Points +5%
Asus Strix Scar 18 G835LX
Intel Core Ultra 9 275HX, GeForce RTX 5090 Laptop
139608 Points +4%
Razer Blade 18 2025 RTX 5090 Laptop
Intel Core Ultra 9 275HX, GeForce RTX 5090 Laptop
135851 Points +1%
Schenker Key 18 Pro M25 RTX 5090
Intel Core Ultra 9 275HX, GeForce RTX 5090 Laptop
134793 Points
Durchschnittliche Intel Core Ultra 9 275HX
  (113887 - 140937, n=26)
133603 Points -1%
Aorus Master 18 AM8H
Intel Core Ultra 9 275HX, GeForce RTX 5090 Laptop
125013 Points -7%
Durchschnitt der Klasse Workstation
  (60778 - 144411, n=28, der letzten 2 Jahre)
104261 Points -23%
AIDA64 / FPU SinJulia
MSI Titan 18 HX AI A2XWJG
Intel Core Ultra 9 285HX, GeForce RTX 5090 Laptop
14431 Points +6%
Asus Strix Scar 18 G835LX
Intel Core Ultra 9 275HX, GeForce RTX 5090 Laptop
14112 Points +4%
Alienware 18 Area-51
Intel Core Ultra 9 275HX, GeForce RTX 5090 Laptop
13997 Points +3%
Razer Blade 18 2025 RTX 5090 Laptop
Intel Core Ultra 9 275HX, GeForce RTX 5090 Laptop
13643 Points 0%
Schenker Key 18 Pro M25 RTX 5090
Intel Core Ultra 9 275HX, GeForce RTX 5090 Laptop
13615 Points
Durchschnittliche Intel Core Ultra 9 275HX
  (11172 - 14425, n=26)
13521 Points -1%
Durchschnitt der Klasse Workstation
  (7906 - 29343, n=28, der letzten 2 Jahre)
13259 Points -3%
Aorus Master 18 AM8H
Intel Core Ultra 9 275HX, GeForce RTX 5090 Laptop
13238 Points -3%
AIDA64 / FPU Mandel
MSI Titan 18 HX AI A2XWJG
Intel Core Ultra 9 285HX, GeForce RTX 5090 Laptop
108922 Points +13%
Alienware 18 Area-51
Intel Core Ultra 9 275HX, GeForce RTX 5090 Laptop
104217 Points +8%
Asus Strix Scar 18 G835LX
Intel Core Ultra 9 275HX, GeForce RTX 5090 Laptop
104057 Points +8%
Razer Blade 18 2025 RTX 5090 Laptop
Intel Core Ultra 9 275HX, GeForce RTX 5090 Laptop
96990 Points +1%
Schenker Key 18 Pro M25 RTX 5090
Intel Core Ultra 9 275HX, GeForce RTX 5090 Laptop
96299 Points
Durchschnittliche Intel Core Ultra 9 275HX
  (72596 - 104508, n=26)
94125 Points -2%
Aorus Master 18 AM8H
Intel Core Ultra 9 275HX, GeForce RTX 5090 Laptop
87156 Points -9%
Durchschnitt der Klasse Workstation
  (27301 - 98153, n=28, der letzten 2 Jahre)
56282 Points -42%
AIDA64 / CPU AES
Asus Strix Scar 18 G835LX
Intel Core Ultra 9 275HX, GeForce RTX 5090 Laptop
134920 MB/s +3%
Alienware 18 Area-51
Intel Core Ultra 9 275HX, GeForce RTX 5090 Laptop
134887 MB/s +3%
MSI Titan 18 HX AI A2XWJG
Intel Core Ultra 9 285HX, GeForce RTX 5090 Laptop
134195 MB/s +2%
Durchschnittliche Intel Core Ultra 9 275HX
  (107195 - 247074, n=26)
131983 MB/s +1%
Razer Blade 18 2025 RTX 5090 Laptop
Intel Core Ultra 9 275HX, GeForce RTX 5090 Laptop
131331 MB/s 0%
Schenker Key 18 Pro M25 RTX 5090
Intel Core Ultra 9 275HX, GeForce RTX 5090 Laptop
130924 MB/s
Aorus Master 18 AM8H
Intel Core Ultra 9 275HX, GeForce RTX 5090 Laptop
119356 MB/s -9%
Durchschnitt der Klasse Workstation
  (56077 - 187841, n=28, der letzten 2 Jahre)
94026 MB/s -28%
AIDA64 / CPU ZLib
MSI Titan 18 HX AI A2XWJG
Intel Core Ultra 9 285HX, GeForce RTX 5090 Laptop
2267 MB/s +9%
Asus Strix Scar 18 G835LX
Intel Core Ultra 9 275HX, GeForce RTX 5090 Laptop
2220 MB/s +7%
Alienware 18 Area-51
Intel Core Ultra 9 275HX, GeForce RTX 5090 Laptop
2188 MB/s +5%
Razer Blade 18 2025 RTX 5090 Laptop
Intel Core Ultra 9 275HX, GeForce RTX 5090 Laptop
2109 MB/s +2%
Schenker Key 18 Pro M25 RTX 5090
Intel Core Ultra 9 275HX, GeForce RTX 5090 Laptop
2077 MB/s
Durchschnittliche Intel Core Ultra 9 275HX
  (1599 - 2263, n=26)
2040 MB/s -2%
Aorus Master 18 AM8H
Intel Core Ultra 9 275HX, GeForce RTX 5090 Laptop
1898 MB/s -9%
Durchschnitt der Klasse Workstation
  (742 - 2116, n=28, der letzten 2 Jahre)
1293 MB/s -38%
AIDA64 / FP64 Ray-Trace
MSI Titan 18 HX AI A2XWJG
Intel Core Ultra 9 285HX, GeForce RTX 5090 Laptop
22312 KRay/s +13%
Alienware 18 Area-51
Intel Core Ultra 9 275HX, GeForce RTX 5090 Laptop
21542 KRay/s +9%
Asus Strix Scar 18 G835LX
Intel Core Ultra 9 275HX, GeForce RTX 5090 Laptop
21372 KRay/s +8%
Schenker Key 18 Pro M25 RTX 5090
Intel Core Ultra 9 275HX, GeForce RTX 5090 Laptop
19832 KRay/s
Durchschnittliche Intel Core Ultra 9 275HX
  (14847 - 21854, n=26)
19268 KRay/s -3%
Razer Blade 18 2025 RTX 5090 Laptop
Intel Core Ultra 9 275HX, GeForce RTX 5090 Laptop
19038 KRay/s -4%
Aorus Master 18 AM8H
Intel Core Ultra 9 275HX, GeForce RTX 5090 Laptop
17631 KRay/s -11%
Durchschnitt der Klasse Workstation
  (5580 - 32891, n=28, der letzten 2 Jahre)
13116 KRay/s -34%
AIDA64 / CPU PhotoWorxx
Alienware 18 Area-51
Intel Core Ultra 9 275HX, GeForce RTX 5090 Laptop
62916 MPixel/s +68%
MSI Titan 18 HX AI A2XWJG
Intel Core Ultra 9 285HX, GeForce RTX 5090 Laptop
62274 MPixel/s +66%
Razer Blade 18 2025 RTX 5090 Laptop
Intel Core Ultra 9 275HX, GeForce RTX 5090 Laptop
56818 MPixel/s +52%
Asus Strix Scar 18 G835LX
Intel Core Ultra 9 275HX, GeForce RTX 5090 Laptop
56601 MPixel/s +51%
Durchschnittliche Intel Core Ultra 9 275HX
  (37482 - 62916, n=26)
50509 MPixel/s +35%
Aorus Master 18 AM8H
Intel Core Ultra 9 275HX, GeForce RTX 5090 Laptop
49511 MPixel/s +32%
Durchschnitt der Klasse Workstation
  (24325 - 93684, n=28, der letzten 2 Jahre)
47578 MPixel/s +27%
Schenker Key 18 Pro M25 RTX 5090
Intel Core Ultra 9 275HX, GeForce RTX 5090 Laptop
37482 MPixel/s

System Performance

Performance Rating: Percent
PCMark 10: Score | Essentials | Productivity | Digital Content Creation
CrossMark: Overall | Productivity | Creativity | Responsiveness
WebXPRT 3: Overall
WebXPRT 4: Overall
Mozilla Kraken 1.1: Total
Performance Rating
Alienware 18 Area-51
GeForce RTX 5090 Laptop, Ultra 9 275HX
91.9 pt
MSI Titan 18 HX AI A2XWJG
GeForce RTX 5090 Laptop, Ultra 9 285HX, 1x Samsung PM9E1 MZVLC2T0HBLD-00BT7 + 2x Samsung PM9A1 MZVL22T0HDLB-00BT7 (RAID 0)
85.7 pt
Aorus Master 18 AM8H
GeForce RTX 5090 Laptop, Ultra 9 275HX, Kingston KC3000 2048G SKC3000D2048G
85.6 pt
Asus Strix Scar 18 G835LX
GeForce RTX 5090 Laptop, Ultra 9 275HX, WD PC SN8000S 2TB
85.4 pt
Durchschnittliche Intel Core Ultra 9 275HX, NVIDIA GeForce RTX 5090 Laptop
 
84.9 pt
Razer Blade 18 2025 RTX 5090 Laptop
GeForce RTX 5090 Laptop, Ultra 9 275HX, Lexar NM790 2TB
84.4 pt
Schenker Key 18 Pro M25 RTX 5090
GeForce RTX 5090 Laptop, Ultra 9 275HX, Samsung 9100 Pro 4 TB
82.2 pt
Durchschnitt der Klasse Workstation
 
70.8 pt
PCMark 10 / Score
Alienware 18 Area-51
GeForce RTX 5090 Laptop, Ultra 9 275HX
9497 Points +11%
MSI Titan 18 HX AI A2XWJG
GeForce RTX 5090 Laptop, Ultra 9 285HX, 1x Samsung PM9E1 MZVLC2T0HBLD-00BT7 + 2x Samsung PM9A1 MZVL22T0HDLB-00BT7 (RAID 0)
8795 Points +3%
Asus Strix Scar 18 G835LX
GeForce RTX 5090 Laptop, Ultra 9 275HX, WD PC SN8000S 2TB
8623 Points +1%
Aorus Master 18 AM8H
GeForce RTX 5090 Laptop, Ultra 9 275HX, Kingston KC3000 2048G SKC3000D2048G
8608 Points +1%
Durchschnittliche Intel Core Ultra 9 275HX, NVIDIA GeForce RTX 5090 Laptop
  (7474 - 9497, n=11)
8577 Points +1%
Schenker Key 18 Pro M25 RTX 5090
GeForce RTX 5090 Laptop, Ultra 9 275HX, Samsung 9100 Pro 4 TB
8519 Points
Razer Blade 18 2025 RTX 5090 Laptop
GeForce RTX 5090 Laptop, Ultra 9 275HX, Lexar NM790 2TB
8221 Points -3%
Durchschnitt der Klasse Workstation
  (6436 - 8519, n=25, der letzten 2 Jahre)
7454 Points -13%
PCMark 10 / Essentials
Aorus Master 18 AM8H
GeForce RTX 5090 Laptop, Ultra 9 275HX, Kingston KC3000 2048G SKC3000D2048G
11081 Points +3%
Alienware 18 Area-51
GeForce RTX 5090 Laptop, Ultra 9 275HX
11062 Points +3%
Asus Strix Scar 18 G835LX
GeForce RTX 5090 Laptop, Ultra 9 275HX, WD PC SN8000S 2TB
10966 Points +2%
Durchschnittliche Intel Core Ultra 9 275HX, NVIDIA GeForce RTX 5090 Laptop
  (9994 - 11369, n=12)
10920 Points +2%
MSI Titan 18 HX AI A2XWJG
GeForce RTX 5090 Laptop, Ultra 9 285HX, 1x Samsung PM9E1 MZVLC2T0HBLD-00BT7 + 2x Samsung PM9A1 MZVL22T0HDLB-00BT7 (RAID 0)
10903 Points +2%
Schenker Key 18 Pro M25 RTX 5090
GeForce RTX 5090 Laptop, Ultra 9 275HX, Samsung 9100 Pro 4 TB
10740 Points
Razer Blade 18 2025 RTX 5090 Laptop
GeForce RTX 5090 Laptop, Ultra 9 275HX, Lexar NM790 2TB
10688 Points 0%
Durchschnitt der Klasse Workstation
  (9622 - 11195, n=25, der letzten 2 Jahre)
10571 Points -2%
PCMark 10 / Productivity
Alienware 18 Area-51
GeForce RTX 5090 Laptop, Ultra 9 275HX
10925 Points +9%
Schenker Key 18 Pro M25 RTX 5090
GeForce RTX 5090 Laptop, Ultra 9 275HX, Samsung 9100 Pro 4 TB
9993 Points
Razer Blade 18 2025 RTX 5090 Laptop
GeForce RTX 5090 Laptop, Ultra 9 275HX, Lexar NM790 2TB
9732 Points -3%
Durchschnittliche Intel Core Ultra 9 275HX, NVIDIA GeForce RTX 5090 Laptop
  (9122 - 10925, n=11)
9630 Points -4%
MSI Titan 18 HX AI A2XWJG
GeForce RTX 5090 Laptop, Ultra 9 285HX, 1x Samsung PM9E1 MZVLC2T0HBLD-00BT7 + 2x Samsung PM9A1 MZVL22T0HDLB-00BT7 (RAID 0)
9594 Points -4%
Durchschnitt der Klasse Workstation
  (8829 - 10548, n=25, der letzten 2 Jahre)
9543 Points -5%
Asus Strix Scar 18 G835LX
GeForce RTX 5090 Laptop, Ultra 9 275HX, WD PC SN8000S 2TB
9444 Points -5%
Aorus Master 18 AM8H
GeForce RTX 5090 Laptop, Ultra 9 275HX, Kingston KC3000 2048G SKC3000D2048G
9304 Points -7%
PCMark 10 / Digital Content Creation
Alienware 18 Area-51
GeForce RTX 5090 Laptop, Ultra 9 275HX
19234 Points +23%
MSI Titan 18 HX AI A2XWJG
GeForce RTX 5090 Laptop, Ultra 9 285HX, 1x Samsung PM9E1 MZVLC2T0HBLD-00BT7 + 2x Samsung PM9A1 MZVL22T0HDLB-00BT7 (RAID 0)
17647 Points +13%
Asus Strix Scar 18 G835LX
GeForce RTX 5090 Laptop, Ultra 9 275HX, WD PC SN8000S 2TB
16802 Points +7%
Aorus Master 18 AM8H
GeForce RTX 5090 Laptop, Ultra 9 275HX, Kingston KC3000 2048G SKC3000D2048G
16788 Points +7%
Durchschnittliche Intel Core Ultra 9 275HX, NVIDIA GeForce RTX 5090 Laptop
  (9952 - 19234, n=11)
16429 Points +5%
Schenker Key 18 Pro M25 RTX 5090
GeForce RTX 5090 Laptop, Ultra 9 275HX, Samsung 9100 Pro 4 TB
15631 Points
Razer Blade 18 2025 RTX 5090 Laptop
GeForce RTX 5090 Laptop, Ultra 9 275HX, Lexar NM790 2TB
14493 Points -7%
Durchschnitt der Klasse Workstation
  (7744 - 15631, n=25, der letzten 2 Jahre)
11279 Points -28%
CrossMark / Overall
Alienware 18 Area-51
GeForce RTX 5090 Laptop, Ultra 9 275HX
2339 Points +13%
Aorus Master 18 AM8H
GeForce RTX 5090 Laptop, Ultra 9 275HX, Kingston KC3000 2048G SKC3000D2048G
2282 Points +11%
Razer Blade 18 2025 RTX 5090 Laptop
GeForce RTX 5090 Laptop, Ultra 9 275HX, Lexar NM790 2TB
2269 Points +10%
MSI Titan 18 HX AI A2XWJG
GeForce RTX 5090 Laptop, Ultra 9 285HX, 1x Samsung PM9E1 MZVLC2T0HBLD-00BT7 + 2x Samsung PM9A1 MZVL22T0HDLB-00BT7 (RAID 0)
2223 Points +8%
Asus Strix Scar 18 G835LX
GeForce RTX 5090 Laptop, Ultra 9 275HX, WD PC SN8000S 2TB
2221 Points +8%
Durchschnittliche Intel Core Ultra 9 275HX, NVIDIA GeForce RTX 5090 Laptop
  (1995 - 2339, n=12)
2197 Points +7%
Schenker Key 18 Pro M25 RTX 5090
GeForce RTX 5090 Laptop, Ultra 9 275HX, Samsung 9100 Pro 4 TB
2062 Points
Durchschnitt der Klasse Workstation
  (1307 - 2208, n=27, der letzten 2 Jahre)
1794 Points -13%
CrossMark / Productivity
Alienware 18 Area-51
GeForce RTX 5090 Laptop, Ultra 9 275HX
2211 Points +10%
Aorus Master 18 AM8H
GeForce RTX 5090 Laptop, Ultra 9 275HX, Kingston KC3000 2048G SKC3000D2048G
2119 Points +5%
Razer Blade 18 2025 RTX 5090 Laptop
GeForce RTX 5090 Laptop, Ultra 9 275HX, Lexar NM790 2TB
2069 Points +3%
Durchschnittliche Intel Core Ultra 9 275HX, NVIDIA GeForce RTX 5090 Laptop
  (1847 - 2211, n=12)
2034 Points +1%
Asus Strix Scar 18 G835LX
GeForce RTX 5090 Laptop, Ultra 9 275HX, WD PC SN8000S 2TB
2025 Points +1%
Schenker Key 18 Pro M25 RTX 5090
GeForce RTX 5090 Laptop, Ultra 9 275HX, Samsung 9100 Pro 4 TB
2010 Points
MSI Titan 18 HX AI A2XWJG
GeForce RTX 5090 Laptop, Ultra 9 285HX, 1x Samsung PM9E1 MZVLC2T0HBLD-00BT7 + 2x Samsung PM9A1 MZVL22T0HDLB-00BT7 (RAID 0)
1999 Points -1%
Durchschnitt der Klasse Workstation
  (1130 - 2020, n=27, der letzten 2 Jahre)
1684 Points -16%
CrossMark / Creativity
MSI Titan 18 HX AI A2XWJG
GeForce RTX 5090 Laptop, Ultra 9 285HX, 1x Samsung PM9E1 MZVLC2T0HBLD-00BT7 + 2x Samsung PM9A1 MZVL22T0HDLB-00BT7 (RAID 0)
2688 Points +24%
Razer Blade 18 2025 RTX 5090 Laptop
GeForce RTX 5090 Laptop, Ultra 9 275HX, Lexar NM790 2TB
2642 Points +22%
Asus Strix Scar 18 G835LX
GeForce RTX 5090 Laptop, Ultra 9 275HX, WD PC SN8000S 2TB
2606 Points +20%
Alienware 18 Area-51
GeForce RTX 5090 Laptop, Ultra 9 275HX
2519 Points +16%
Durchschnittliche Intel Core Ultra 9 275HX, NVIDIA GeForce RTX 5090 Laptop
  (2170 - 2642, n=12)
2498 Points +15%
Aorus Master 18 AM8H
GeForce RTX 5090 Laptop, Ultra 9 275HX, Kingston KC3000 2048G SKC3000D2048G
2496 Points +15%
Schenker Key 18 Pro M25 RTX 5090
GeForce RTX 5090 Laptop, Ultra 9 275HX, Samsung 9100 Pro 4 TB
2170 Points
Durchschnitt der Klasse Workstation
  (1655 - 2575, n=27, der letzten 2 Jahre)
2049 Points -6%
CrossMark / Responsiveness
Alienware 18 Area-51
GeForce RTX 5090 Laptop, Ultra 9 275HX
2217 Points +16%
Aorus Master 18 AM8H
GeForce RTX 5090 Laptop, Ultra 9 275HX, Kingston KC3000 2048G SKC3000D2048G
2181 Points +14%
Schenker Key 18 Pro M25 RTX 5090
GeForce RTX 5090 Laptop, Ultra 9 275HX, Samsung 9100 Pro 4 TB
1908 Points
Razer Blade 18 2025 RTX 5090 Laptop
GeForce RTX 5090 Laptop, Ultra 9 275HX, Lexar NM790 2TB
1897 Points -1%
Durchschnittliche Intel Core Ultra 9 275HX, NVIDIA GeForce RTX 5090 Laptop
  (1673 - 2217, n=12)
1894 Points -1%
Asus Strix Scar 18 G835LX
GeForce RTX 5090 Laptop, Ultra 9 275HX, WD PC SN8000S 2TB
1813 Points -5%
MSI Titan 18 HX AI A2XWJG
GeForce RTX 5090 Laptop, Ultra 9 285HX, 1x Samsung PM9E1 MZVLC2T0HBLD-00BT7 + 2x Samsung PM9A1 MZVL22T0HDLB-00BT7 (RAID 0)
1728 Points -9%
Durchschnitt der Klasse Workstation
  (993 - 1908, n=27, der letzten 2 Jahre)
1464 Points -23%
WebXPRT 3 / Overall
MSI Titan 18 HX AI A2XWJG
GeForce RTX 5090 Laptop, Ultra 9 285HX, 1x Samsung PM9E1 MZVLC2T0HBLD-00BT7 + 2x Samsung PM9A1 MZVL22T0HDLB-00BT7 (RAID 0)
362 Points +6%
Alienware 18 Area-51
GeForce RTX 5090 Laptop, Ultra 9 275HX
362 Points +6%
Razer Blade 18 2025 RTX 5090 Laptop
GeForce RTX 5090 Laptop, Ultra 9 275HX, Lexar NM790 2TB
351 Points +3%
Durchschnittliche Intel Core Ultra 9 275HX, NVIDIA GeForce RTX 5090 Laptop
  (315 - 372, n=12)
347 Points +2%
Asus Strix Scar 18 G835LX
GeForce RTX 5090 Laptop, Ultra 9 275HX, WD PC SN8000S 2TB
346 Points +1%
Schenker Key 18 Pro M25 RTX 5090
GeForce RTX 5090 Laptop, Ultra 9 275HX, Samsung 9100 Pro 4 TB
341 Points
Aorus Master 18 AM8H
GeForce RTX 5090 Laptop, Ultra 9 275HX, Kingston KC3000 2048G SKC3000D2048G
315 Points -8%
Durchschnitt der Klasse Workstation
  (259 - 415, n=28, der letzten 2 Jahre)
308 Points -10%
WebXPRT 4 / Overall
Alienware 18 Area-51
GeForce RTX 5090 Laptop, Ultra 9 275HX
341 Points +9%
Asus Strix Scar 18 G835LX
GeForce RTX 5090 Laptop, Ultra 9 275HX, WD PC SN8000S 2TB
335 Points +7%
Durchschnittliche Intel Core Ultra 9 275HX, NVIDIA GeForce RTX 5090 Laptop
  (301 - 341, n=11)
326 Points +4%
Razer Blade 18 2025 RTX 5090 Laptop
GeForce RTX 5090 Laptop, Ultra 9 275HX, Lexar NM790 2TB
319 Points +2%
Aorus Master 18 AM8H
GeForce RTX 5090 Laptop, Ultra 9 275HX, Kingston KC3000 2048G SKC3000D2048G
317 Points +1%
MSI Titan 18 HX AI A2XWJG
GeForce RTX 5090 Laptop, Ultra 9 285HX, 1x Samsung PM9E1 MZVLC2T0HBLD-00BT7 + 2x Samsung PM9A1 MZVL22T0HDLB-00BT7 (RAID 0)
316 Points +1%
Schenker Key 18 Pro M25 RTX 5090
GeForce RTX 5090 Laptop, Ultra 9 275HX, Samsung 9100 Pro 4 TB
313 Points
Durchschnitt der Klasse Workstation
  (189.2 - 315, n=26, der letzten 2 Jahre)
270 Points -14%
Mozilla Kraken 1.1 / Total
Durchschnitt der Klasse Workstation
  (424 - 571, n=28, der letzten 2 Jahre)
489 ms * -15%
Schenker Key 18 Pro M25 RTX 5090
GeForce RTX 5090 Laptop, Ultra 9 275HX, Samsung 9100 Pro 4 TB
424 ms *
Aorus Master 18 AM8H
GeForce RTX 5090 Laptop, Ultra 9 275HX, Kingston KC3000 2048G SKC3000D2048G
420 ms * +1%
Durchschnittliche Intel Core Ultra 9 275HX, NVIDIA GeForce RTX 5090 Laptop
  (402 - 424, n=12)
412 ms * +3%
Razer Blade 18 2025 RTX 5090 Laptop
GeForce RTX 5090 Laptop, Ultra 9 275HX, Lexar NM790 2TB
411 ms * +3%
Asus Strix Scar 18 G835LX
GeForce RTX 5090 Laptop, Ultra 9 275HX, WD PC SN8000S 2TB
409 ms * +4%
MSI Titan 18 HX AI A2XWJG
GeForce RTX 5090 Laptop, Ultra 9 285HX, 1x Samsung PM9E1 MZVLC2T0HBLD-00BT7 + 2x Samsung PM9A1 MZVL22T0HDLB-00BT7 (RAID 0)
408 ms * +4%
Alienware 18 Area-51
GeForce RTX 5090 Laptop, Ultra 9 275HX
402 ms * +5%

* ... kleinere Werte sind besser

PCMark 10 Score
8519 Punkte
Hilfe
AIDA64 / Memory Copy
Alienware 18 Area-51
Intel Core Ultra 9 275HX, GeForce RTX 5090 Laptop, 65536
94460 MB/s +69%
MSI Titan 18 HX AI A2XWJG
Intel Core Ultra 9 285HX, GeForce RTX 5090 Laptop, 65536
93933 MB/s +68%
Asus Strix Scar 18 G835LX
Intel Core Ultra 9 275HX, GeForce RTX 5090 Laptop, 65536
84432 MB/s +51%
Razer Blade 18 2025 RTX 5090 Laptop
Intel Core Ultra 9 275HX, GeForce RTX 5090 Laptop, 65536
84391 MB/s +51%
Schenker Key 18 Pro M25 RTX 5090
Intel Core Ultra 9 275HX, GeForce RTX 5090 Laptop, 32768
82633 MB/s +48%
Durchschnittliche Intel Core Ultra 9 275HX
  (56003 - 94460, n=26)
79822 MB/s +43%
Durchschnitt der Klasse Workstation
  (34323 - 164795, n=28, der letzten 2 Jahre)
76738 MB/s +37%
Aorus Master 18 AM8H
Intel Core Ultra 9 275HX, GeForce RTX 5090 Laptop, 65536
74558 MB/s +33%
Schenker Key 18 Pro M25 RTX 5090
Intel Core Ultra 9 275HX, GeForce RTX 5090 Laptop, 262144
56003 MB/s
AIDA64 / Memory Read
MSI Titan 18 HX AI A2XWJG
Intel Core Ultra 9 285HX, GeForce RTX 5090 Laptop, 65536
97209 MB/s +74%
Alienware 18 Area-51
Intel Core Ultra 9 275HX, GeForce RTX 5090 Laptop, 65536
96990 MB/s +74%
Asus Strix Scar 18 G835LX
Intel Core Ultra 9 275HX, GeForce RTX 5090 Laptop, 65536
86194 MB/s +54%
Razer Blade 18 2025 RTX 5090 Laptop
Intel Core Ultra 9 275HX, GeForce RTX 5090 Laptop, 65536
84719 MB/s +52%
Durchschnittliche Intel Core Ultra 9 275HX
  (55795 - 97151, n=26)
84540 MB/s +52%
Schenker Key 18 Pro M25 RTX 5090
Intel Core Ultra 9 275HX, GeForce RTX 5090 Laptop, 32768
81977 MB/s +47%
Aorus Master 18 AM8H
Intel Core Ultra 9 275HX, GeForce RTX 5090 Laptop, 65536
74094 MB/s +33%
Durchschnitt der Klasse Workstation
  (30787 - 121563, n=28, der letzten 2 Jahre)
73077 MB/s +31%
Schenker Key 18 Pro M25 RTX 5090
Intel Core Ultra 9 275HX, GeForce RTX 5090 Laptop, 262144
55795 MB/s
AIDA64 / Memory Write
Razer Blade 18 2025 RTX 5090 Laptop
Intel Core Ultra 9 275HX, GeForce RTX 5090 Laptop, 65536
105456 MB/s +89%
Alienware 18 Area-51
Intel Core Ultra 9 275HX, GeForce RTX 5090 Laptop, 65536
90726 MB/s +63%
MSI Titan 18 HX AI A2XWJG
Intel Core Ultra 9 285HX, GeForce RTX 5090 Laptop, 65536
89392 MB/s +61%
Asus Strix Scar 18 G835LX
Intel Core Ultra 9 275HX, GeForce RTX 5090 Laptop, 65536
82198 MB/s +48%
Durchschnitt der Klasse Workstation
  (39362 - 214520, n=28, der letzten 2 Jahre)
82148 MB/s +48%
Durchschnittliche Intel Core Ultra 9 275HX
  (55663 - 106063, n=26)
80144 MB/s +44%
Aorus Master 18 AM8H
Intel Core Ultra 9 275HX, GeForce RTX 5090 Laptop, 65536
72929 MB/s +31%
Schenker Key 18 Pro M25 RTX 5090
Intel Core Ultra 9 275HX, GeForce RTX 5090 Laptop, 32768
69837 MB/s +25%
Schenker Key 18 Pro M25 RTX 5090
Intel Core Ultra 9 275HX, GeForce RTX 5090 Laptop, 262144
55663 MB/s
AIDA64 / Memory Latency
Schenker Key 18 Pro M25 RTX 5090
Intel Core Ultra 9 275HX, GeForce RTX 5090 Laptop, 262144
161.6 ns *
Schenker Key 18 Pro M25 RTX 5090
Intel Core Ultra 9 275HX, GeForce RTX 5090 Laptop, 32768
138.2 ns * +14%
Aorus Master 18 AM8H
Intel Core Ultra 9 275HX, GeForce RTX 5090 Laptop, 65536
125.1 ns * +23%
Durchschnitt der Klasse Workstation
  (84.5 - 165.2, n=28, der letzten 2 Jahre)
118.6 ns * +27%
Durchschnittliche Intel Core Ultra 9 275HX
  (105.8 - 161.6, n=26)
118.3 ns * +27%
Razer Blade 18 2025 RTX 5090 Laptop
Intel Core Ultra 9 275HX, GeForce RTX 5090 Laptop, 65536
116.8 ns * +28%
Alienware 18 Area-51
Intel Core Ultra 9 275HX, GeForce RTX 5090 Laptop, 65536
114.2 ns * +29%
Asus Strix Scar 18 G835LX
Intel Core Ultra 9 275HX, GeForce RTX 5090 Laptop, 65536
108.9 ns * +33%
MSI Titan 18 HX AI A2XWJG
Intel Core Ultra 9 285HX, GeForce RTX 5090 Laptop, 65536
104.8 ns * +35%

* ... kleinere Werte sind besser

DPC-Latenzen

LatencyMon - Übersicht
LatencyMon - Treiber
DPC Latencies / LatencyMon - interrupt to process latency (max), Web, Youtube, Prime95
Alienware 18 Area-51
GeForce RTX 5090 Laptop, Ultra 9 275HX
4449.9 μs * -67%
Schenker Key 18 Pro M25 RTX 5090
GeForce RTX 5090 Laptop, Ultra 9 275HX, Samsung 9100 Pro 4 TB
2666.5 μs *
Aorus Master 18 AM8H
GeForce RTX 5090 Laptop, Ultra 9 275HX, Kingston KC3000 2048G SKC3000D2048G
2122.9 μs * +20%
MSI Titan 18 HX AI A2XWJG
GeForce RTX 5090 Laptop, Ultra 9 285HX, 1x Samsung PM9E1 MZVLC2T0HBLD-00BT7 + 2x Samsung PM9A1 MZVL22T0HDLB-00BT7 (RAID 0)
1398.5 μs * +48%
Razer Blade 18 2025 RTX 5090 Laptop
GeForce RTX 5090 Laptop, Ultra 9 275HX, Lexar NM790 2TB
908.7 μs * +66%
Asus Strix Scar 18 G835LX
GeForce RTX 5090 Laptop, Ultra 9 275HX, WD PC SN8000S 2TB
810 μs * +70%

* ... kleinere Werte sind besser

Massenspeicher

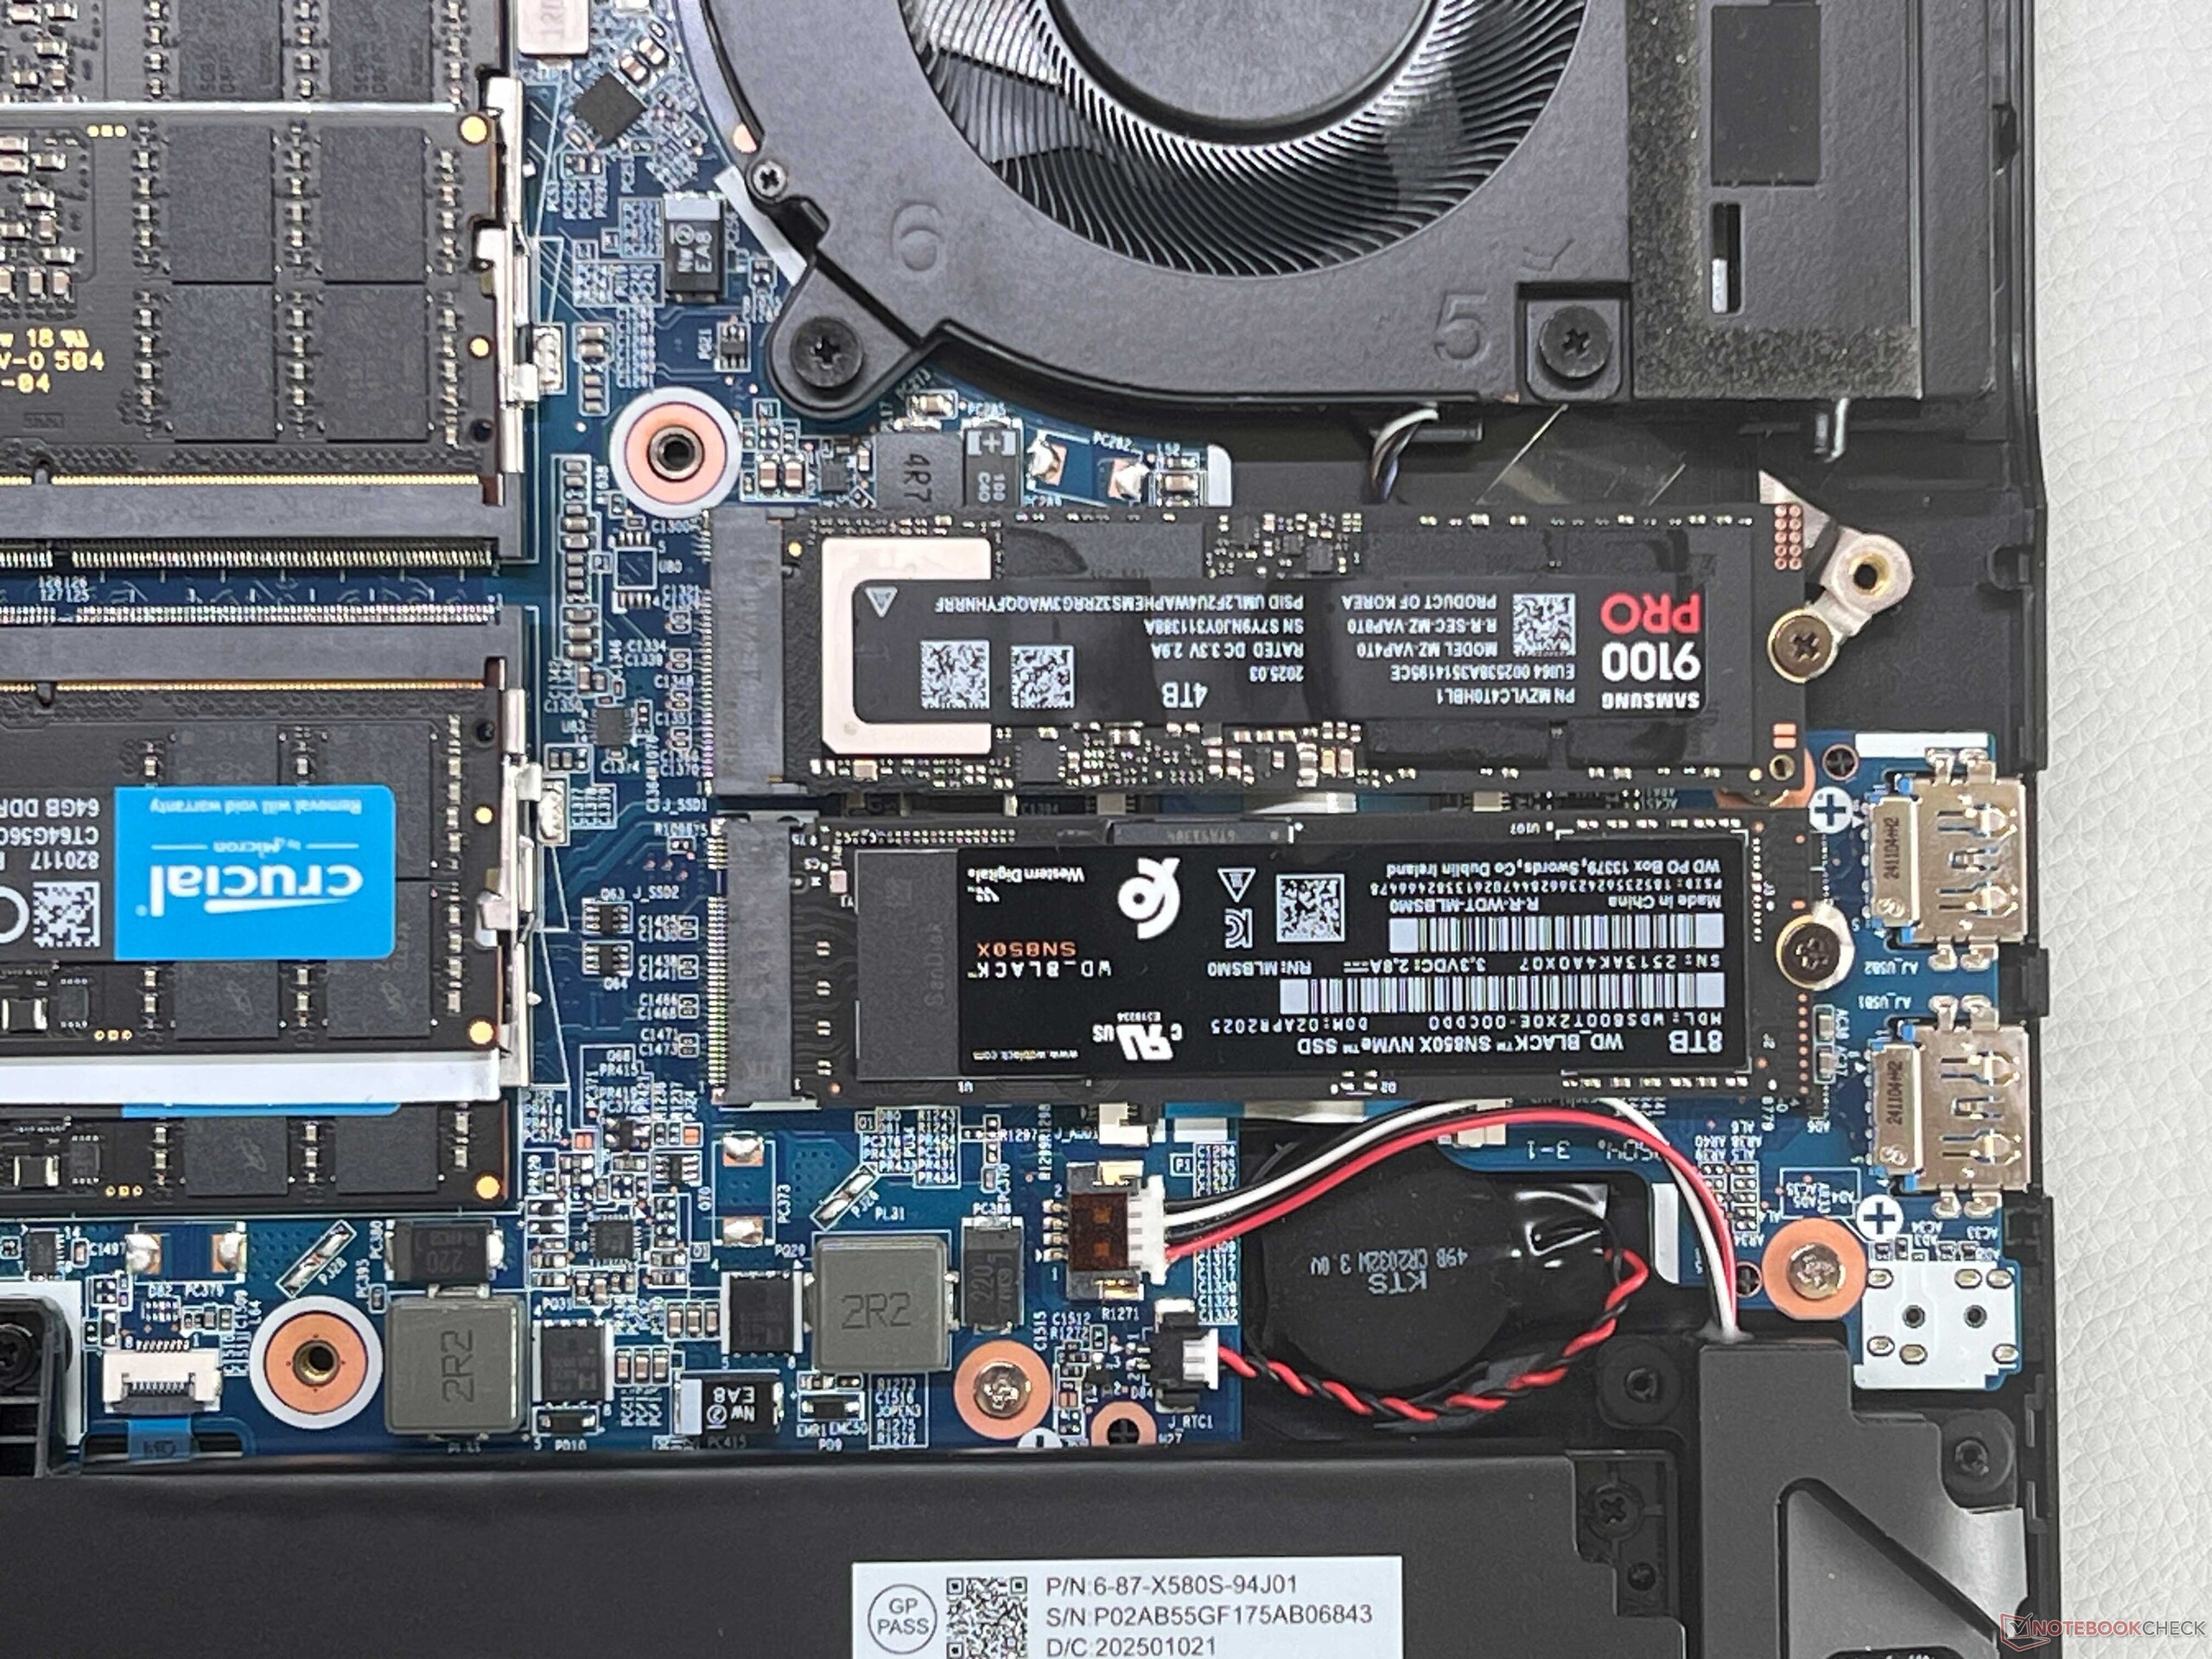
Das Key 18 bietet bereits einen schnellen PCIe-5.0-Seckplatz, der von der Samsung SSD 9100 Pro auch voll ausgereizt wird (Transferraten über 11 GB/s). Zudem bleibt die Leistung auch vollkommen stabil. Mit drei zusätzlichen M.2-2280-Slots (PCIe 4.0) lassen sich enorme Speicherkapazitäten realisieren, wie auch die insgesamt 28 TB bei unserem Testgerät.

Samsung 9100 Pro 4 TB
CDM 5/6 Read Seq Q32T1: 11853 MB/s
CDM 5/6 Write Seq Q32T1: 12374 MB/s
CDM 5/6 Read 4K Q32T1: 854 MB/s
CDM 5/6 Write 4K Q32T1: 540 MB/s
CDM 5/6 Read 4K: 96.6 MB/s
CDM 5/6 Write 4K: 311 MB/s
CDM 6 Write 4K Q8T8: 2813 MB/s
CDM 6 Read 4K Q8T8: 3784 MB/s
Drive Performance Rating - Percent
Alienware 18 Area-51
 
88.7 pt
Schenker Key 18 Pro M25 RTX 5090
Samsung 9100 Pro 4 TB
86.8 pt
Durchschnittliche Samsung 9100 Pro 4 TB
 
86.8 pt
Aorus Master 18 AM8H
Kingston KC3000 2048G SKC3000D2048G
73.6 pt
Razer Blade 18 2025 RTX 5090 Laptop
Lexar NM790 2TB
57.7 pt
Asus Strix Scar 18 G835LX
WD PC SN8000S 2TB
45.3 pt
Durchschnitt der Klasse Workstation
 
45.3 pt
MSI Titan 18 HX AI A2XWJG
1x Samsung PM9E1 MZVLC2T0HBLD-00BT7 + 2x Samsung PM9A1 MZVL22T0HDLB-00BT7 (RAID 0)
44 pt
DiskSpd
seq read
Alienware 18 Area-51
 
8300 (7871.23min - 8300.49max) MB/s +62%
Schenker Key 18 Pro M25 RTX 5090
Samsung 9100 Pro 4 TB
5112 (5086.54min - 5111.86max) MB/s
Durchschnittliche Samsung 9100 Pro 4 TB
  (n=1)
5112 MB/s 0%
Aorus Master 18 AM8H
Kingston KC3000 2048G SKC3000D2048G
4436 (4223.24min - 4435.83max) MB/s -13%
Durchschnitt der Klasse Workstation
  (2232 - 7054, n=28, der letzten 2 Jahre)
4124 MB/s -19%
Razer Blade 18 2025 RTX 5090 Laptop
Lexar NM790 2TB
4102 (3686.13min - 4101.79max) MB/s -20%
Asus Strix Scar 18 G835LX
WD PC SN8000S 2TB
3799 (23.02min - 3799.36max) MB/s -26%
MSI Titan 18 HX AI A2XWJG
1x Samsung PM9E1 MZVLC2T0HBLD-00BT7 + 2x Samsung PM9A1 MZVL22T0HDLB-00BT7 (RAID 0)
281 (131.86min - 280.81max) MB/s -95%
seq write
Alienware 18 Area-51
 
9699 (9652.56min - 9698.6max) MB/s +4%
Schenker Key 18 Pro M25 RTX 5090
Samsung 9100 Pro 4 TB
9328 (9213.86min - 9327.51max) MB/s
Durchschnittliche Samsung 9100 Pro 4 TB
  (n=1)
9328 MB/s 0%
Aorus Master 18 AM8H
Kingston KC3000 2048G SKC3000D2048G
5665 (5398.49min - 5664.61max) MB/s -39%
Razer Blade 18 2025 RTX 5090 Laptop
Lexar NM790 2TB
4576 (4478.11min - 4575.64max) MB/s -51%
Asus Strix Scar 18 G835LX
WD PC SN8000S 2TB
4437 (4373.88min - 4437.36max) MB/s -52%
Durchschnitt der Klasse Workstation
  (1309 - 9328, n=28, der letzten 2 Jahre)
3994 MB/s -57%
MSI Titan 18 HX AI A2XWJG
1x Samsung PM9E1 MZVLC2T0HBLD-00BT7 + 2x Samsung PM9A1 MZVL22T0HDLB-00BT7 (RAID 0)
3460 (2896.8min - 3460.09max) MB/s -63%
seq q8 t1 read
MSI Titan 18 HX AI A2XWJG
1x Samsung PM9E1 MZVLC2T0HBLD-00BT7 + 2x Samsung PM9A1 MZVL22T0HDLB-00BT7 (RAID 0)
15056 (12154.1min - 15056max) MB/s +32%
Alienware 18 Area-51
 
13801 (12080.4min - 13801.4max) MB/s +21%
Asus Strix Scar 18 G835LX
WD PC SN8000S 2TB
12470 (11207.2min - 12469.7max) MB/s +10%
Schenker Key 18 Pro M25 RTX 5090
Samsung 9100 Pro 4 TB
11381 (10329.7min - 11381.2max) MB/s
Durchschnittliche Samsung 9100 Pro 4 TB
  (n=1)
11381 MB/s 0%
Durchschnitt der Klasse Workstation
  (5539 - 16102, n=28, der letzten 2 Jahre)
7608 MB/s -33%
Aorus Master 18 AM8H
Kingston KC3000 2048G SKC3000D2048G
7041 (6553.91min - 7041.4max) MB/s -38%
Razer Blade 18 2025 RTX 5090 Laptop
Lexar NM790 2TB
6942 (5111.86min - 6941.99max) MB/s -39%
seq q8 t1 write
Schenker Key 18 Pro M25 RTX 5090
Samsung 9100 Pro 4 TB
12763 (12626.5min - 12763.3max) MB/s
Durchschnittliche Samsung 9100 Pro 4 TB
  (n=1)
12763 MB/s 0%
Alienware 18 Area-51
 
12495 (12375.7min - 12494.8max) MB/s -2%
MSI Titan 18 HX AI A2XWJG
1x Samsung PM9E1 MZVLC2T0HBLD-00BT7 + 2x Samsung PM9A1 MZVL22T0HDLB-00BT7 (RAID 0)
8988 (8900.34min - 8988.45max) MB/s -30%
Asus Strix Scar 18 G835LX
WD PC SN8000S 2TB
8696 (8611.54min - 8696.26max) MB/s -32%
Aorus Master 18 AM8H
Kingston KC3000 2048G SKC3000D2048G
6687 (6635.39min - 6687.03max) MB/s -48%
Durchschnitt der Klasse Workstation
  (3045 - 12763, n=28, der letzten 2 Jahre)
6220 MB/s -51%
Razer Blade 18 2025 RTX 5090 Laptop
Lexar NM790 2TB
5639 (5290.9min - 5638.82max) MB/s -56%
4k q1 t1 read
Alienware 18 Area-51
 
110.2 (96.01min - 110.18max) MB/s +11%
Schenker Key 18 Pro M25 RTX 5090
Samsung 9100 Pro 4 TB
99.2 (98.63min - 99.17max) MB/s
Durchschnittliche Samsung 9100 Pro 4 TB
  (n=1)
99.2 MB/s 0%
Aorus Master 18 AM8H
Kingston KC3000 2048G SKC3000D2048G
84.2 (81.84min - 84.15max) MB/s -15%
Razer Blade 18 2025 RTX 5090 Laptop
Lexar NM790 2TB
70.7 (69.52min - 70.73max) MB/s -29%
Durchschnitt der Klasse Workstation
  (38.9 - 99.2, n=28, der letzten 2 Jahre)
63.8 MB/s -36%
Asus Strix Scar 18 G835LX
WD PC SN8000S 2TB
63.4 (62.2min - 63.4max) MB/s -36%
MSI Titan 18 HX AI A2XWJG
1x Samsung PM9E1 MZVLC2T0HBLD-00BT7 + 2x Samsung PM9A1 MZVL22T0HDLB-00BT7 (RAID 0)
60.8 (60.51min - 60.8max) MB/s -39%
4k q1 t1 write
Alienware 18 Area-51
 
324 (313.38min - 324.26max) MB/s +7%
Aorus Master 18 AM8H
Kingston KC3000 2048G SKC3000D2048G
316 (303.42min - 316.13max) MB/s +4%
Schenker Key 18 Pro M25 RTX 5090
Samsung 9100 Pro 4 TB
304 (301.57min - 304.02max) MB/s
Durchschnittliche Samsung 9100 Pro 4 TB
  (n=1)
304 MB/s 0%
Razer Blade 18 2025 RTX 5090 Laptop
Lexar NM790 2TB
208 (195.06min - 207.75max) MB/s -32%
Durchschnitt der Klasse Workstation
  (82.4 - 316, n=28, der letzten 2 Jahre)
156.7 MB/s -48%
Asus Strix Scar 18 G835LX
WD PC SN8000S 2TB
136.4 (134.95min - 136.4max) MB/s -55%
MSI Titan 18 HX AI A2XWJG
1x Samsung PM9E1 MZVLC2T0HBLD-00BT7 + 2x Samsung PM9A1 MZVL22T0HDLB-00BT7 (RAID 0)
112.4 (111.75min - 112.4max) MB/s -63%
4k q32 t16 read
Alienware 18 Area-51
 
8067 (7938.61min - 8067.38max) MB/s +10%
Schenker Key 18 Pro M25 RTX 5090
Samsung 9100 Pro 4 TB
7342 (7210.21min - 7342.46max) MB/s
Durchschnittliche Samsung 9100 Pro 4 TB
  (n=1)
7342 MB/s 0%
Razer Blade 18 2025 RTX 5090 Laptop
Lexar NM790 2TB
3980 (3931.74min - 3980.4max) MB/s -46%
Aorus Master 18 AM8H
Kingston KC3000 2048G SKC3000D2048G
3875 (3785.96min - 3874.69max) MB/s -47%
Durchschnitt der Klasse Workstation
  (561 - 7342, n=28, der letzten 2 Jahre)
1535 MB/s -79%
Asus Strix Scar 18 G835LX
WD PC SN8000S 2TB
746 (519.37min - 746.01max) MB/s -90%
MSI Titan 18 HX AI A2XWJG
1x Samsung PM9E1 MZVLC2T0HBLD-00BT7 + 2x Samsung PM9A1 MZVL22T0HDLB-00BT7 (RAID 0)
746 (724.46min - 745.92max) MB/s -90%
4k q32 t16 write
Alienware 18 Area-51
 
5653 (5471.48min - 5652.63max) MB/s +19%
Aorus Master 18 AM8H
Kingston KC3000 2048G SKC3000D2048G
5588 (5220.61min - 5587.73max) MB/s +17%
Schenker Key 18 Pro M25 RTX 5090
Samsung 9100 Pro 4 TB
4763 (4716.72min - 4762.61max) MB/s
Durchschnittliche Samsung 9100 Pro 4 TB
  (n=1)
4763 MB/s 0%
Durchschnitt der Klasse Workstation
  (365 - 4763, n=28, der letzten 2 Jahre)
950 MB/s -80%
Razer Blade 18 2025 RTX 5090 Laptop
Lexar NM790 2TB
802 (759.72min - 801.55max) MB/s -83%
MSI Titan 18 HX AI A2XWJG
1x Samsung PM9E1 MZVLC2T0HBLD-00BT7 + 2x Samsung PM9A1 MZVL22T0HDLB-00BT7 (RAID 0)
509 (431.35min - 509.01max) MB/s -89%
Asus Strix Scar 18 G835LX
WD PC SN8000S 2TB
284 (254.39min - 283.58max) MB/s -94%
AS SSD
Score Total
Schenker Key 18 Pro M25 RTX 5090
Samsung 9100 Pro 4 TB
11169 Points
Durchschnittliche Samsung 9100 Pro 4 TB
  (n=1)
11169 Points 0%
Alienware 18 Area-51
 
11094 Points -1%
Aorus Master 18 AM8H
Kingston KC3000 2048G SKC3000D2048G
9943 Points -11%
Razer Blade 18 2025 RTX 5090 Laptop
Lexar NM790 2TB
8733 Points -22%
Durchschnitt der Klasse Workstation
  (3454 - 11169, n=26, der letzten 2 Jahre)
5832 Points -48%
Asus Strix Scar 18 G835LX
WD PC SN8000S 2TB
4764 Points -57%
MSI Titan 18 HX AI A2XWJG
1x Samsung PM9E1 MZVLC2T0HBLD-00BT7 + 2x Samsung PM9A1 MZVL22T0HDLB-00BT7 (RAID 0)
4431 Points -60%
Score Read
Schenker Key 18 Pro M25 RTX 5090
Samsung 9100 Pro 4 TB
4635 Points
Durchschnittliche Samsung 9100 Pro 4 TB
  (n=1)
4635 Points 0%
Aorus Master 18 AM8H
Kingston KC3000 2048G SKC3000D2048G
4308 Points -7%
Alienware 18 Area-51
 
3886 Points -16%
Razer Blade 18 2025 RTX 5090 Laptop
Lexar NM790 2TB
3198 Points -31%
MSI Titan 18 HX AI A2XWJG
1x Samsung PM9E1 MZVLC2T0HBLD-00BT7 + 2x Samsung PM9A1 MZVL22T0HDLB-00BT7 (RAID 0)
1811 Points -61%
Durchschnitt der Klasse Workstation
  (1162 - 4635, n=26, der letzten 2 Jahre)
1751 Points -62%
Asus Strix Scar 18 G835LX
WD PC SN8000S 2TB
1653 Points -64%
Score Write
Alienware 18 Area-51
 
5208 Points +25%
Schenker Key 18 Pro M25 RTX 5090
Samsung 9100 Pro 4 TB
4159 Points
Durchschnittliche Samsung 9100 Pro 4 TB
  (n=1)
4159 Points 0%
Razer Blade 18 2025 RTX 5090 Laptop
Lexar NM790 2TB
3919 Points -6%
Aorus Master 18 AM8H
Kingston KC3000 2048G SKC3000D2048G
3466 Points -17%
Durchschnitt der Klasse Workstation
  (1534 - 4852, n=26, der letzten 2 Jahre)
3267 Points -21%
Asus Strix Scar 18 G835LX
WD PC SN8000S 2TB
2267 Points -45%
MSI Titan 18 HX AI A2XWJG
1x Samsung PM9E1 MZVLC2T0HBLD-00BT7 + 2x Samsung PM9A1 MZVL22T0HDLB-00BT7 (RAID 0)
1774 Points -57%
Seq Read
Alienware 18 Area-51
 
9820.79 MB/s +7%
Schenker Key 18 Pro M25 RTX 5090
Samsung 9100 Pro 4 TB
9216 MB/s
Durchschnittliche Samsung 9100 Pro 4 TB
  (n=1)
9216 MB/s 0%
MSI Titan 18 HX AI A2XWJG
1x Samsung PM9E1 MZVLC2T0HBLD-00BT7 + 2x Samsung PM9A1 MZVL22T0HDLB-00BT7 (RAID 0)
7344.17 MB/s -20%
Razer Blade 18 2025 RTX 5090 Laptop
Lexar NM790 2TB
5795 MB/s -37%
Aorus Master 18 AM8H
Kingston KC3000 2048G SKC3000D2048G
5700.22 MB/s -38%
Asus Strix Scar 18 G835LX
WD PC SN8000S 2TB
5595 MB/s -39%
Durchschnitt der Klasse Workstation
  (4130 - 9216, n=26, der letzten 2 Jahre)
5483 MB/s -41%
Seq Write
Alienware 18 Area-51
 
9926.3 MB/s +5%
Schenker Key 18 Pro M25 RTX 5090
Samsung 9100 Pro 4 TB
9452 MB/s
Durchschnittliche Samsung 9100 Pro 4 TB
  (n=1)
9452 MB/s 0%
MSI Titan 18 HX AI A2XWJG
1x Samsung PM9E1 MZVLC2T0HBLD-00BT7 + 2x Samsung PM9A1 MZVL22T0HDLB-00BT7 (RAID 0)
5535.91 MB/s -41%
Razer Blade 18 2025 RTX 5090 Laptop
Lexar NM790 2TB
5456 MB/s -42%
Asus Strix Scar 18 G835LX
WD PC SN8000S 2TB
5305 MB/s -44%
Aorus Master 18 AM8H
Kingston KC3000 2048G SKC3000D2048G
4899.55 MB/s -48%
Durchschnitt der Klasse Workstation
  (1964 - 9452, n=26, der letzten 2 Jahre)
3584 MB/s -62%
4K Read
Aorus Master 18 AM8H
Kingston KC3000 2048G SKC3000D2048G
107.92 MB/s +17%
Alienware 18 Area-51
 
102.16 MB/s +11%
Schenker Key 18 Pro M25 RTX 5090
Samsung 9100 Pro 4 TB
92.1 MB/s
Durchschnittliche Samsung 9100 Pro 4 TB
  (n=1)
92.1 MB/s 0%
Razer Blade 18 2025 RTX 5090 Laptop
Lexar NM790 2TB
67.3 MB/s -27%
Asus Strix Scar 18 G835LX
WD PC SN8000S 2TB
65.1 MB/s -29%
MSI Titan 18 HX AI A2XWJG
1x Samsung PM9E1 MZVLC2T0HBLD-00BT7 + 2x Samsung PM9A1 MZVL22T0HDLB-00BT7 (RAID 0)
60.87 MB/s -34%
Durchschnitt der Klasse Workstation
  (46.5 - 92.1, n=26, der letzten 2 Jahre)
59.9 MB/s -35%
4K Write
Aorus Master 18 AM8H
Kingston KC3000 2048G SKC3000D2048G
299.9 MB/s +11%
Alienware 18 Area-51
 
297.02 MB/s +10%
Schenker Key 18 Pro M25 RTX 5090
Samsung 9100 Pro 4 TB
270 MB/s
Durchschnittliche Samsung 9100 Pro 4 TB
  (n=1)
270 MB/s 0%
Razer Blade 18 2025 RTX 5090 Laptop
Lexar NM790 2TB
198.5 MB/s -26%
Asus Strix Scar 18 G835LX
WD PC SN8000S 2TB
189.8 MB/s -30%
Durchschnitt der Klasse Workstation
  (108.1 - 270, n=26, der letzten 2 Jahre)
178.7 MB/s -34%
MSI Titan 18 HX AI A2XWJG
1x Samsung PM9E1 MZVLC2T0HBLD-00BT7 + 2x Samsung PM9A1 MZVL22T0HDLB-00BT7 (RAID 0)
133.55 MB/s -51%
4K-64 Read
Aorus Master 18 AM8H
Kingston KC3000 2048G SKC3000D2048G
3630.4 MB/s 0%
Schenker Key 18 Pro M25 RTX 5090
Samsung 9100 Pro 4 TB
3621 MB/s
Durchschnittliche Samsung 9100 Pro 4 TB
  (n=1)
3621 MB/s 0%
Alienware 18 Area-51
 
2801.97 MB/s -23%
Razer Blade 18 2025 RTX 5090 Laptop
Lexar NM790 2TB
2551 MB/s -30%
Durchschnitt der Klasse Workstation
  (637 - 3621, n=26, der letzten 2 Jahre)
1145 MB/s -68%
Asus Strix Scar 18 G835LX
WD PC SN8000S 2TB
1029 MB/s -72%
MSI Titan 18 HX AI A2XWJG
1x Samsung PM9E1 MZVLC2T0HBLD-00BT7 + 2x Samsung PM9A1 MZVL22T0HDLB-00BT7 (RAID 0)
1015.81 MB/s -72%
4K-64 Write
Alienware 18 Area-51
 
3918.24 MB/s +33%
Razer Blade 18 2025 RTX 5090 Laptop
Lexar NM790 2TB
3175 MB/s +8%
Schenker Key 18 Pro M25 RTX 5090
Samsung 9100 Pro 4 TB
2944 MB/s
Durchschnittliche Samsung 9100 Pro 4 TB
  (n=1)
2944 MB/s 0%
Durchschnitt der Klasse Workstation
  (879 - 4090, n=26, der letzten 2 Jahre)
2730 MB/s -7%
Aorus Master 18 AM8H
Kingston KC3000 2048G SKC3000D2048G
2676.31 MB/s -9%
Asus Strix Scar 18 G835LX
WD PC SN8000S 2TB
1546 MB/s -47%
MSI Titan 18 HX AI A2XWJG
1x Samsung PM9E1 MZVLC2T0HBLD-00BT7 + 2x Samsung PM9A1 MZVL22T0HDLB-00BT7 (RAID 0)
1087.18 MB/s -63%
Access Time Read
Asus Strix Scar 18 G835LX
WD PC SN8000S 2TB
0.067 ms * -109%
Durchschnitt der Klasse Workstation
  (0.017 - 0.105, n=26, der letzten 2 Jahre)
0.05677 ms * -77%
Alienware 18 Area-51
 
0.039 ms * -22%
MSI Titan 18 HX AI A2XWJG
1x Samsung PM9E1 MZVLC2T0HBLD-00BT7 + 2x Samsung PM9A1 MZVL22T0HDLB-00BT7 (RAID 0)
0.034 ms * -6%
Schenker Key 18 Pro M25 RTX 5090
Samsung 9100 Pro 4 TB
0.032 ms *
Durchschnittliche Samsung 9100 Pro 4 TB
  (n=1)
0.032 ms * -0%
Aorus Master 18 AM8H
Kingston KC3000 2048G SKC3000D2048G
0.029 ms * +9%
Razer Blade 18 2025 RTX 5090 Laptop
Lexar NM790 2TB
0.024 ms * +25%
Access Time Write
Alienware 18 Area-51
 
0.096 ms * -540%
Razer Blade 18 2025 RTX 5090 Laptop
Lexar NM790 2TB
0.061 ms * -307%
Durchschnitt der Klasse Workstation
  (0.015 - 0.092, n=26, der letzten 2 Jahre)
0.04573 ms * -205%
MSI Titan 18 HX AI A2XWJG
1x Samsung PM9E1 MZVLC2T0HBLD-00BT7 + 2x Samsung PM9A1 MZVL22T0HDLB-00BT7 (RAID 0)
0.029 ms * -93%
Asus Strix Scar 18 G835LX
WD PC SN8000S 2TB
0.019 ms * -27%
Schenker Key 18 Pro M25 RTX 5090
Samsung 9100 Pro 4 TB
0.015 ms *
Durchschnittliche Samsung 9100 Pro 4 TB
  (n=1)
0.015 ms * -0%
Aorus Master 18 AM8H
Kingston KC3000 2048G SKC3000D2048G
0.014 ms * +7%

* ... kleinere Werte sind besser

Dauerleistung Lesen: DiskSpd Read Loop, Queue Depth 8

058011601740232029003480406046405220580063806960754081208700928098601044011020Tooltip
Schenker Key 18 Pro M25 RTX 5090; diskspd 2.0.17 f: Ø11483 (10127.36-11533.29)

GPU Leistung

Die GeForce RTX 5090 Laptop ist derzeit die schnellste mobile Grafikkarte und die maximale TGP liegt bei 175 Watt. Advanced Optimus ist verfügbar und die GPU-Leistung ist grundsätzlich sehr gut, in manchen Benchmarks (vor allem etwas älteren) ist die Leistung jedoch etwas geringer als erwartet. Möglicherweise gibt es hier einen Zusammenhang mit der aktuellen Treiberversion von Nvidia, wo es in den letzten Monaten ja immer mal Schwierigkeiten gab. Grundsätzlich passt die Leistung aber, auch beim Spielen.

3DMark Performance Rating - Percent
Razer Blade 18 2025 RTX 5090 Laptop
NVIDIA GeForce RTX 5090 Laptop, Intel Core Ultra 9 275HX
97.3 pt
Alienware 18 Area-51
NVIDIA GeForce RTX 5090 Laptop, Intel Core Ultra 9 275HX
95.4 pt
Aorus Master 18 AM8H -2!
NVIDIA GeForce RTX 5090 Laptop, Intel Core Ultra 9 275HX
94.2 pt
MSI Titan 18 HX AI A2XWJG
NVIDIA GeForce RTX 5090 Laptop, Intel Core Ultra 9 285HX
93.8 pt
Durchschnittliche NVIDIA GeForce RTX 5090 Laptop
 
93.8 pt
Asus Strix Scar 18 G835LX
NVIDIA GeForce RTX 5090 Laptop, Intel Core Ultra 9 275HX
93.2 pt
Schenker Key 18 Pro M25 RTX 5090
NVIDIA GeForce RTX 5090 Laptop, Intel Core Ultra 9 275HX
86.5 pt
Durchschnitt der Klasse Workstation
 
42.7 pt
3DMark 11 - 1280x720 Performance GPU
Aorus Master 18 AM8H
NVIDIA GeForce RTX 5090 Laptop, Intel Core Ultra 9 275HX
72141 Points +49%
Durchschnittliche NVIDIA GeForce RTX 5090 Laptop
  (48548 - 80022, n=19)
67212 Points +38%
Razer Blade 18 2025 RTX 5090 Laptop
NVIDIA GeForce RTX 5090 Laptop, Intel Core Ultra 9 275HX
66617 Points +37%
Asus Strix Scar 18 G835LX
NVIDIA GeForce RTX 5090 Laptop, Intel Core Ultra 9 275HX
66337 Points +37%
MSI Titan 18 HX AI A2XWJG
NVIDIA GeForce RTX 5090 Laptop, Intel Core Ultra 9 285HX
65338 Points +35%
Alienware 18 Area-51
NVIDIA GeForce RTX 5090 Laptop, Intel Core Ultra 9 275HX
58943 Points +21%
Schenker Key 18 Pro M25 RTX 5090
NVIDIA GeForce RTX 5090 Laptop, Intel Core Ultra 9 275HX
48548 Points
Durchschnitt der Klasse Workstation
  (10748 - 68846, n=27, der letzten 2 Jahre)
30367 Points -37%
3DMark
1920x1080 Fire Strike Graphics
Razer Blade 18 2025 RTX 5090 Laptop
NVIDIA GeForce RTX 5090 Laptop, Intel Core Ultra 9 275HX
53282 Points +26%
Durchschnittliche NVIDIA GeForce RTX 5090 Laptop
  (42175 - 62849, n=22)
51612 Points +22%
MSI Titan 18 HX AI A2XWJG
NVIDIA GeForce RTX 5090 Laptop, Intel Core Ultra 9 285HX
50860 Points +21%
Alienware 18 Area-51
NVIDIA GeForce RTX 5090 Laptop, Intel Core Ultra 9 275HX
50772 Points +20%
Asus Strix Scar 18 G835LX
NVIDIA GeForce RTX 5090 Laptop, Intel Core Ultra 9 275HX
48863 Points +16%
Aorus Master 18 AM8H
NVIDIA GeForce RTX 5090 Laptop, Intel Core Ultra 9 275HX
47806 Points +13%
Schenker Key 18 Pro M25 RTX 5090
NVIDIA GeForce RTX 5090 Laptop, Intel Core Ultra 9 275HX
42175 Points
Durchschnitt der Klasse Workstation
  (7578 - 48162, n=27, der letzten 2 Jahre)
21693 Points -49%
2560x1440 Time Spy Graphics
Alienware 18 Area-51
NVIDIA GeForce RTX 5090 Laptop, Intel Core Ultra 9 275HX
25763 Points +5%
Razer Blade 18 2025 RTX 5090 Laptop
NVIDIA GeForce RTX 5090 Laptop, Intel Core Ultra 9 275HX
25198 Points +3%
Asus Strix Scar 18 G835LX
NVIDIA GeForce RTX 5090 Laptop, Intel Core Ultra 9 275HX
24599 Points 0%
Schenker Key 18 Pro M25 RTX 5090
NVIDIA GeForce RTX 5090 Laptop, Intel Core Ultra 9 275HX
24562 Points
Aorus Master 18 AM8H
NVIDIA GeForce RTX 5090 Laptop, Intel Core Ultra 9 275HX
23960 Points -2%
Durchschnittliche NVIDIA GeForce RTX 5090 Laptop
  (19216 - 25984, n=21)
23736 Points -3%
MSI Titan 18 HX AI A2XWJG
NVIDIA GeForce RTX 5090 Laptop, Intel Core Ultra 9 285HX
23165 Points -6%
Durchschnitt der Klasse Workstation
  (2725 - 24562, n=27, der letzten 2 Jahre)
9092 Points -63%
2560x1440 Port Royal Graphics
Alienware 18 Area-51
NVIDIA GeForce RTX 5090 Laptop, Intel Core Ultra 9 275HX
16978 Points +6%
Razer Blade 18 2025 RTX 5090 Laptop
NVIDIA GeForce RTX 5090 Laptop, Intel Core Ultra 9 275HX
16407 Points +2%
MSI Titan 18 HX AI A2XWJG
NVIDIA GeForce RTX 5090 Laptop, Intel Core Ultra 9 285HX
16222 Points +1%
Schenker Key 18 Pro M25 RTX 5090
NVIDIA GeForce RTX 5090 Laptop, Intel Core Ultra 9 275HX
16011 Points
Asus Strix Scar 18 G835LX
NVIDIA GeForce RTX 5090 Laptop, Intel Core Ultra 9 275HX
15946 Points 0%
Durchschnittliche NVIDIA GeForce RTX 5090 Laptop
  (12749 - 17063, n=16)
15923 Points -1%
Durchschnitt der Klasse Workstation
  (2649 - 16134, n=10, der letzten 2 Jahre)
8549 Points -47%
Steel Nomad Score
Alienware 18 Area-51
NVIDIA GeForce RTX 5090 Laptop, Intel Core Ultra 9 275HX
6329 Points +4%
Razer Blade 18 2025 RTX 5090 Laptop
NVIDIA GeForce RTX 5090 Laptop, Intel Core Ultra 9 275HX
6304 Points +3%
MSI Titan 18 HX AI A2XWJG
NVIDIA GeForce RTX 5090 Laptop, Intel Core Ultra 9 285HX
6163 Points +1%
Schenker Key 18 Pro M25 RTX 5090
NVIDIA GeForce RTX 5090 Laptop, Intel Core Ultra 9 275HX
6108 Points
Durchschnittliche NVIDIA GeForce RTX 5090 Laptop
  (4791 - 6329, n=16)
5899 Points -3%
Asus Strix Scar 18 G835LX
NVIDIA GeForce RTX 5090 Laptop, Intel Core Ultra 9 275HX
5883 Points -4%
Durchschnitt der Klasse Workstation
  (229 - 6108, n=9, der letzten 2 Jahre)
2844 Points -53%
3DMark 11 Performance
38921 Punkte
3DMark Fire Strike Score
35521 Punkte
3DMark Time Spy Score
22200 Punkte
3DMark Steel Nomad Score
6108 Punkte
3DMark Steel Nomad Light Score
26198 Punkte
Hilfe
Blender / v3.3 Classroom OPTIX/RTX
Durchschnitt der Klasse Workstation
  (10 - 95, n=20, der letzten 2 Jahre)
32.4 Seconds * -224%
Asus Strix Scar 18 G835LX
NVIDIA GeForce RTX 5090 Laptop, Intel Core Ultra 9 275HX
15 Seconds * -50%
Asus Strix Scar 18 G835LX
NVIDIA GeForce RTX 5090 Laptop, Intel Core Ultra 9 275HX
10 Seconds * -0%
Durchschnittliche NVIDIA GeForce RTX 5090 Laptop
  (9 - 18, n=19)
11.8 Seconds * -18%
Razer Blade 18 2025 RTX 5090 Laptop
NVIDIA GeForce RTX 5090 Laptop, Intel Core Ultra 9 275HX
11 Seconds * -10%
Alienware 18 Area-51
NVIDIA GeForce RTX 5090 Laptop, Intel Core Ultra 9 275HX
10 Seconds * -0%
Schenker Key 18 Pro M25 RTX 5090
NVIDIA GeForce RTX 5090 Laptop, Intel Core Ultra 9 275HX
10 Seconds *
MSI Titan 18 HX AI A2XWJG
NVIDIA GeForce RTX 5090 Laptop, Intel Core Ultra 9 285HX
9.9 Seconds * +1%
Blender / v3.3 Classroom CUDA
Durchschnitt der Klasse Workstation
  (16 - 256, n=21, der letzten 2 Jahre)
69.6 Seconds * -335%
Durchschnittliche NVIDIA GeForce RTX 5090 Laptop
  (15 - 37, n=17)
17.8 Seconds * -11%
Asus Strix Scar 18 G835LX
NVIDIA GeForce RTX 5090 Laptop, Intel Core Ultra 9 275HX
16 Seconds * -0%
MSI Titan 18 HX AI A2XWJG
NVIDIA GeForce RTX 5090 Laptop, Intel Core Ultra 9 285HX
16 Seconds * -0%
Schenker Key 18 Pro M25 RTX 5090
NVIDIA GeForce RTX 5090 Laptop, Intel Core Ultra 9 275HX
16 Seconds *
Alienware 18 Area-51
NVIDIA GeForce RTX 5090 Laptop, Intel Core Ultra 9 275HX
15 Seconds * +6%
Razer Blade 18 2025 RTX 5090 Laptop
NVIDIA GeForce RTX 5090 Laptop, Intel Core Ultra 9 275HX
15 Seconds * +6%
Blender / v3.3 Classroom CPU
Durchschnitt der Klasse Workstation
  (148 - 472, n=28, der letzten 2 Jahre)
300 Seconds * -103%
Aorus Master 18 AM8H
NVIDIA GeForce RTX 5090 Laptop, Intel Core Ultra 9 275HX
162 Seconds * -9%
Durchschnittliche NVIDIA GeForce RTX 5090 Laptop
  (123 - 259, n=18)
158.8 Seconds * -7%
Schenker Key 18 Pro M25 RTX 5090
NVIDIA GeForce RTX 5090 Laptop, Intel Core Ultra 9 275HX
148 Seconds *
Razer Blade 18 2025 RTX 5090 Laptop
NVIDIA GeForce RTX 5090 Laptop, Intel Core Ultra 9 275HX
143 Seconds * +3%
Alienware 18 Area-51
NVIDIA GeForce RTX 5090 Laptop, Intel Core Ultra 9 275HX
138 Seconds * +7%
Asus Strix Scar 18 G835LX
NVIDIA GeForce RTX 5090 Laptop, Intel Core Ultra 9 275HX
137 Seconds * +7%
MSI Titan 18 HX AI A2XWJG
NVIDIA GeForce RTX 5090 Laptop, Intel Core Ultra 9 285HX
132 Seconds * +11%

* ... kleinere Werte sind besser

Performance Rating - Percent
Alienware 18 Area-51 -1!
Intel Core Ultra 9 275HX, NVIDIA GeForce RTX 5090 Laptop
98.4 pt
Razer Blade 18 2025 RTX 5090 Laptop
Intel Core Ultra 9 275HX, NVIDIA GeForce RTX 5090 Laptop
97.3 pt
MSI Titan 18 HX AI A2XWJG
Intel Core Ultra 9 285HX, NVIDIA GeForce RTX 5090 Laptop
97.1 pt
Asus Strix Scar 18 G835LX
Intel Core Ultra 9 275HX, NVIDIA GeForce RTX 5090 Laptop
93.1 pt
Aorus Master 18 AM8H
Intel Core Ultra 9 275HX, NVIDIA GeForce RTX 5090 Laptop
91.5 pt
Schenker Key 18 Pro M25 RTX 5090
Intel Core Ultra 9 275HX, NVIDIA GeForce RTX 5090 Laptop
83.2 pt
Durchschnitt der Klasse Workstation
 
45.9 pt
Cyberpunk 2077 2.2 Phantom Liberty - 1920x1080 Ultra Preset (FSR off)
Alienware 18 Area-51
Intel Core Ultra 9 275HX, NVIDIA GeForce RTX 5090 Laptop
166.5 (132.2min, 120P1) fps +16%
Razer Blade 18 2025 RTX 5090 Laptop
Intel Core Ultra 9 275HX, NVIDIA GeForce RTX 5090 Laptop
163.4 fps +13%
MSI Titan 18 HX AI A2XWJG
Intel Core Ultra 9 285HX, NVIDIA GeForce RTX 5090 Laptop
157.5 (121.6min) fps +9%
Asus Strix Scar 18 G835LX
Intel Core Ultra 9 275HX, NVIDIA GeForce RTX 5090 Laptop
154.9 (126.3min) fps +8%
Aorus Master 18 AM8H
Intel Core Ultra 9 275HX, NVIDIA GeForce RTX 5090 Laptop
152.5 (120min) fps +6%
Schenker Key 18 Pro M25 RTX 5090
Intel Core Ultra 9 275HX, NVIDIA GeForce RTX 5090 Laptop
144 (106min) fps
Durchschnitt der Klasse Workstation
  (19.6 - 144, n=24, der letzten 2 Jahre)
62.3 fps -57%
Baldur's Gate 3 - 1920x1080 Ultra Preset AA:T
Alienware 18 Area-51
Intel Core Ultra 9 275HX, NVIDIA GeForce RTX 5090 Laptop
236.5 fps +27%
MSI Titan 18 HX AI A2XWJG
Intel Core Ultra 9 285HX, NVIDIA GeForce RTX 5090 Laptop
225.3 (158.5P0.1, 180.2P1) fps +21%
Razer Blade 18 2025 RTX 5090 Laptop
Intel Core Ultra 9 275HX, NVIDIA GeForce RTX 5090 Laptop
213 fps +14%
Aorus Master 18 AM8H
Intel Core Ultra 9 275HX, NVIDIA GeForce RTX 5090 Laptop
196.2 (73min, 121.6P0.1, 161.9P1) fps +5%
Asus Strix Scar 18 G835LX
Intel Core Ultra 9 275HX, NVIDIA GeForce RTX 5090 Laptop
193.7 fps +4%
Schenker Key 18 Pro M25 RTX 5090
Intel Core Ultra 9 275HX, NVIDIA GeForce RTX 5090 Laptop
186.3 fps
Durchschnitt der Klasse Workstation
  (23.7 - 204, n=22, der letzten 2 Jahre)
86.2 fps -54%
GTA V - 1920x1080 Highest Settings possible AA:4xMSAA + FX AF:16x
Razer Blade 18 2025 RTX 5090 Laptop
Intel Core Ultra 9 275HX, NVIDIA GeForce RTX 5090 Laptop
166.2 (3min, 111.1P1) fps +14%
Aorus Master 18 AM8H
Intel Core Ultra 9 275HX, NVIDIA GeForce RTX 5090 Laptop
166.1 (3.18min, 125P1) fps +14%
MSI Titan 18 HX AI A2XWJG
Intel Core Ultra 9 285HX, NVIDIA GeForce RTX 5090 Laptop
162.4 (5.01min, 111.1P1) fps +12%
Asus Strix Scar 18 G835LX
Intel Core Ultra 9 275HX, NVIDIA GeForce RTX 5090 Laptop
161.9 (2.78min, 111.1P1) fps +11%
Schenker Key 18 Pro M25 RTX 5090
Intel Core Ultra 9 275HX, NVIDIA GeForce RTX 5090 Laptop
145.6 (3.26min, 100P1) fps
Durchschnitt der Klasse Workstation
  (18.1 - 145.6, n=24, der letzten 2 Jahre)
79.9 fps -45%
Final Fantasy XV Benchmark - 1920x1080 High Quality
Razer Blade 18 2025 RTX 5090 Laptop
Intel Core Ultra 9 275HX, NVIDIA GeForce RTX 5090 Laptop
215 fps +18%
MSI Titan 18 HX AI A2XWJG
Intel Core Ultra 9 285HX, NVIDIA GeForce RTX 5090 Laptop
212 fps +17%
Alienware 18 Area-51
Intel Core Ultra 9 275HX, NVIDIA GeForce RTX 5090 Laptop
212 fps +17%
Aorus Master 18 AM8H
Intel Core Ultra 9 275HX, NVIDIA GeForce RTX 5090 Laptop
201 fps +11%
Asus Strix Scar 18 G835LX
Intel Core Ultra 9 275HX, NVIDIA GeForce RTX 5090 Laptop
199.3 fps +10%
Schenker Key 18 Pro M25 RTX 5090
Intel Core Ultra 9 275HX, NVIDIA GeForce RTX 5090 Laptop
181.9 fps
Durchschnitt der Klasse Workstation
  (25.2 - 184.2, n=27, der letzten 2 Jahre)
82 fps -55%
Strange Brigade - 1920x1080 ultra AA:ultra AF:16
Alienware 18 Area-51
Intel Core Ultra 9 275HX, NVIDIA GeForce RTX 5090 Laptop
456 (177min, 324P1) fps +24%
Razer Blade 18 2025 RTX 5090 Laptop
Intel Core Ultra 9 275HX, NVIDIA GeForce RTX 5090 Laptop
453 (129.8min, 324P1) fps +23%
MSI Titan 18 HX AI A2XWJG
Intel Core Ultra 9 285HX, NVIDIA GeForce RTX 5090 Laptop
437 (182.3min, 325P1) fps +19%
Aorus Master 18 AM8H
Intel Core Ultra 9 275HX, NVIDIA GeForce RTX 5090 Laptop
418 (112min, 292P1) fps +14%
Asus Strix Scar 18 G835LX
Intel Core Ultra 9 275HX, NVIDIA GeForce RTX 5090 Laptop
401 (103.4min, 236P1) fps +9%
Schenker Key 18 Pro M25 RTX 5090
Intel Core Ultra 9 275HX, NVIDIA GeForce RTX 5090 Laptop
368 (29.1min, 201P1) fps
Durchschnitt der Klasse Workstation
  (46.9 - 368, n=21, der letzten 2 Jahre)
166 fps -55%
Dota 2 Reborn - 1920x1080 ultra (3/3) best looking
Asus Strix Scar 18 G835LX
Intel Core Ultra 9 275HX, NVIDIA GeForce RTX 5090 Laptop
186.6 (157.4min) fps +21%
MSI Titan 18 HX AI A2XWJG
Intel Core Ultra 9 285HX, NVIDIA GeForce RTX 5090 Laptop
184.7 (156.6min) fps +19%
Razer Blade 18 2025 RTX 5090 Laptop
Intel Core Ultra 9 275HX, NVIDIA GeForce RTX 5090 Laptop
175.5 (149.3min) fps +13%
Alienware 18 Area-51
Intel Core Ultra 9 275HX, NVIDIA GeForce RTX 5090 Laptop
171.5 (139.4min) fps +11%
Aorus Master 18 AM8H
Intel Core Ultra 9 275HX, NVIDIA GeForce RTX 5090 Laptop
170.3 (143.1min) fps +10%
Schenker Key 18 Pro M25 RTX 5090
Intel Core Ultra 9 275HX, NVIDIA GeForce RTX 5090 Laptop
154.7 (127.9min) fps
Durchschnitt der Klasse Workstation
  (50.7 - 178.4, n=28, der letzten 2 Jahre)
121.7 fps -21%
X-Plane 11.11 - 1920x1080 high (fps_test=3)
Alienware 18 Area-51
Intel Core Ultra 9 275HX, NVIDIA GeForce RTX 5090 Laptop
122.9 fps +23%
Razer Blade 18 2025 RTX 5090 Laptop
Intel Core Ultra 9 275HX, NVIDIA GeForce RTX 5090 Laptop
122.1 fps +22%
Asus Strix Scar 18 G835LX
Intel Core Ultra 9 275HX, NVIDIA GeForce RTX 5090 Laptop
121.7 fps +22%
MSI Titan 18 HX AI A2XWJG
Intel Core Ultra 9 285HX, NVIDIA GeForce RTX 5090 Laptop
120.9 fps +21%
Aorus Master 18 AM8H
Intel Core Ultra 9 275HX, NVIDIA GeForce RTX 5090 Laptop
110 fps +10%
Schenker Key 18 Pro M25 RTX 5090
Intel Core Ultra 9 275HX, NVIDIA GeForce RTX 5090 Laptop
99.7 fps
Durchschnitt der Klasse Workstation
  (28 - 139.7, n=29, der letzten 2 Jahre)
73 fps -27%

Cyberpunk 2077 ultra FPS-Diagramm

0102030405060708090100110120130140150Tooltip
Schenker Key 18 Pro M25 RTX 5090 Ultra 9 275HX, GeForce RTX 5090 Laptop: Ø148.6 (141-151)
CPU/GPU-Daten Cyberpunk 2077 (1080p, Ultra-Settings)
min.mittelhochmax.QHD DLSSQHD4K DLSS4K
GTA V (2015) 145.6 146.8
Dota 2 Reborn (2015) 200 175 168.9 154.7 152.6
Final Fantasy XV Benchmark (2018) 226 217 181.9 169.7 104.2
X-Plane 11.11 (2018) 148.8 128.6 99.7 77.2
Strange Brigade (2018) 632 479 415 368 290 153.9
Baldur's Gate 3 (2023) 225.3 205.2 188.6 186.3 153.8 85.3
Cyberpunk 2077 2.2 Phantom Liberty (2023) 164.7 163.5 155.1 144 127.3 116.6
F1 24 (2024) 275 123.3 124.7 84.6 66.8 39.5
Assassin's Creed Shadows (2025) 107 101 88 72 61 44
F1 25 (2025) 221 207 200 49.4 53.2 30.9 25.4 13.2

Emissionen & Energie

Geräuschemissionen

Die beiden Lüfter arbeiten stets mit einem minimal hörbaren Rauschen und werden unter hoher Belastung auch sehr laut. Der Lautlos-Modus ist zwar sehr leise, eignet sich unter Last aber nur bedingt, da die CPU-Leistung sehr gering ist und auch die GPU-Leistung mit anhaltender Belastung reduziert wird. Sonstige elektronische Geräusche gab es beim Testgerät nicht.

Lautstärkediagramm

Idle
25.2 / 25.2 / 25.2 dB(A)
Last
47.8 / 58.6 dB(A)
  red to green bar
 
 
30 dB
leise
40 dB(A)
deutlich hörbar
50 dB(A)
störend
 
min: dark, med: mid, max: light   Earthworks M23R, Arta (aus 15 cm gemessen)   Umgebungsgeräusche: 23.9 dB(A)
dB(A) 0102030405060708090Deep BassMiddle BassHigh BassLower RangeMidsHigher MidsLower HighsMid HighsUpper HighsSuper Highs20393636.938.537.838.42530.726.534.429.933.229.23129.42933.42931.727.84028.729.329.327.528.927.85030.630.43133.730.4276327.325.428.325.625.525.4803033.625.221.824.321.410038.328.323.322.323.520.912530.727.126.218.419.718.816030.327.323.116.818.117.620034.531.126.918.92219.325035.631.727.221.421.820.531538.534.929.817.816.123.240040.435.831.314.412.818.950042.337.631.913.612.8206304541.835.914.410.422.480046.542.736.314.110.221100046.842.536.712.29.620.4125047.643.837.112.49.720.6160047.643.537.913.11019.3200045.942.336.411.210.317.7250046.942.636.311.810.717.1315047.542.836.213.211.116.1400048.744.637.111.7111950004641.834.71211.713.3630046.541.935.112.211.612.1800045.841.633.312.511.511.81000044.239.529.612.811.512.31250043.43928.713.111.712.51600037.733.929.712.911.412.4SPL58.654.447.825.223.930.4N12.99.86.20.70.51.3median 45median 41.6median 33.3median 13.1median 11.5median 18.9Delta4.54.64.31.82.72.6hearing rangehide median Fan NoiseSchenker Key 18 Pro M25 RTX 5090
Schenker Key 18 Pro M25 RTX 5090
GeForce RTX 5090 Laptop, Ultra 9 275HX, Samsung 9100 Pro 4 TB
Razer Blade 18 2025 RTX 5090 Laptop
GeForce RTX 5090 Laptop, Ultra 9 275HX, Lexar NM790 2TB
Alienware 18 Area-51
GeForce RTX 5090 Laptop, Ultra 9 275HX
Aorus Master 18 AM8H
GeForce RTX 5090 Laptop, Ultra 9 275HX, Kingston KC3000 2048G SKC3000D2048G
MSI Titan 18 HX AI A2XWJG
GeForce RTX 5090 Laptop, Ultra 9 285HX, 1x Samsung PM9E1 MZVLC2T0HBLD-00BT7 + 2x Samsung PM9A1 MZVL22T0HDLB-00BT7 (RAID 0)
Asus Strix Scar 18 G835LX
GeForce RTX 5090 Laptop, Ultra 9 275HX, WD PC SN8000S 2TB
Geräuschentwicklung
8%
-3%
-7%
-8%
-5%
aus / Umgebung * (dB)
23.9
23.4
2%
23.4
2%
25
-5%
25.56
-7%
23.3
3%
Idle min * (dB)
25.2
23.4
7%
30.2
-20%
26
-3%
27.68
-10%
29.8
-18%
Idle avg * (dB)
25.2
23.4
7%
30.6
-21%
29
-15%
27.68
-10%
29.8
-18%
Idle max * (dB)
25.2
23.4
7%
30.6
-21%
34
-35%
31.54
-25%
29.8
-18%
Last avg * (dB)
47.8
40.4
15%
38
21%
50
-5%
44
8%
42.9
10%
Cyberpunk 2077 ultra * (dB)
54.4
48.2
11%
48.9
10%
52
4%
58.7
-8%
53.7
1%
Last max * (dB)
58.6
53.5
9%
55.9
5%
53
10%
58.9
-1%
53.7
8%

* ... kleinere Werte sind besser

Temperatur

Bei hoher Belastung überschreiten liegt die Oberflächentemperatur an einigen Stellen bei u die 50 °C oder leicht darüber, aufgrund der Größe und dem Gewicht eignet sich das Key 18 aber sowieso nicht für die Nutzung auf den Oberschenkeln.

CPU/GPU-Daten Stresstest
Max. Last
 42.3 °C47 °C46.1 °C 
 41.4 °C47.5 °C47.2 °C 
 32 °C32.7 °C32.4 °C 
Maximal: 47.5 °C
Durchschnitt: 41 °C
52.8 °C49.8 °C49.3 °C
46.5 °C49.9 °C42.9 °C
34.1 °C33.5 °C31.3 °C
Maximal: 52.8 °C
Durchschnitt: 43.3 °C
Netzteil (max.)  54.1 °C | Raumtemperatur 22 °C | Fluke t3000FC (calibrated), Voltcraft IR-900
(-) Die Durchschnittstemperatur auf der Oberseite unter extremer Last ist 41 °C. Im Vergleich erhitzte sich der Durchschnitt der Geräteklasse Workstation auf 32 °C.
(-) Die maximale Temperatur auf der Oberseite ist 47.5 °C. Im Vergleich liegt der Klassendurchschnitt bei 38.2 °C (von 22.2 bis 69.8 °C für die Klasse Workstation).
(-) Auf der Unterseite messen wir eine maximalen Wert von 52.8 °C (im Vergleich zum Durchschnitt von 41.2 °C).
(+) Ohne Last messen wir eine durchschnittliche Temperatur von 27.6 °C auf der Oberseite. Der Klassendurchschnitt erreicht 32 °C.
(-) 3: The average temperature for the upper side is 39.9 °C / 104 F, compared to the average of 32 °C / 90 F for the class Workstation.
(+) Die Handballen und der Touchpad-Bereich erreichen maximal 32.7 °C und damit die typische Hauttemperatur und fühlen sich daher nicht heiß an.
(-) Die durchschnittliche Handballen-Temperatur anderer getesteter Geräte war 27.9 °C (-4.8 °C).
Oberflächentemperaturen Stresstest (Oberseite)
Oberflächentemperaturen Stresstest (Unterseite)
Schenker Key 18 Pro M25 RTX 5090
Intel Core Ultra 9 275HX, NVIDIA GeForce RTX 5090 Laptop
Razer Blade 18 2025 RTX 5090 Laptop
Intel Core Ultra 9 275HX, NVIDIA GeForce RTX 5090 Laptop
Alienware 18 Area-51
Intel Core Ultra 9 275HX, NVIDIA GeForce RTX 5090 Laptop
Aorus Master 18 AM8H
Intel Core Ultra 9 275HX, NVIDIA GeForce RTX 5090 Laptop
MSI Titan 18 HX AI A2XWJG
Intel Core Ultra 9 285HX, NVIDIA GeForce RTX 5090 Laptop
Asus Strix Scar 18 G835LX
Intel Core Ultra 9 275HX, NVIDIA GeForce RTX 5090 Laptop
Hitze
10%
12%
-9%
-17%
5%
Last oben max * (°C)
47.5
44.3
7%
36.8
23%
50
-5%
48.2
-1%
45.6
4%
Last unten max * (°C)
52.8
42
20%
35.8
32%
46
13%
53.6
-2%
46
13%
Idle oben max * (°C)
28.5
27.2
5%
30.6
-7%
36
-26%
37.2
-31%
28.9
-1%
Idle unten max * (°C)
30.1
27.5
9%
30.8
-2%
35
-16%
40.4
-34%
29.2
3%

* ... kleinere Werte sind besser

Lautsprecher

dB(A) 0102030405060708090Deep BassMiddle BassHigh BassLower RangeMidsHigher MidsLower HighsMid HighsUpper HighsSuper Highs2037.835.82533.226.73131.7294028.929.95030.431.66325.537.18024.34510023.55012519.755.316018.153.82002257.725021.861.231516.169.740012.866.950012.869.563010.469.880010.269.110009.669.912509.768.216001068.1200010.369250010.768.7315011.167.340001163.2500011.764.2630011.650.9800011.5521000011.549.21250011.748.71600011.448SPL23.979.1N0.545.4median 11.5median 64.2Delta2.78.135.63729.335.323.535.923.838.920.238.919.643.818.748.21653.21658.613.459.713.967.71569.214.37413.775.711.476.410.780.210.479.110.374.310.972.610.973.610.568.510.969.311.565.111.363.811.361.911.460.611.361.811.559.711.259.110.452.323.484.60.561.2median 11.3median 67.71.4735.532.835.524.922.624.923.325.423.324.821.224.831.522.331.526.622.226.627.422.727.431.921.331.940.719.640.758.122.158.163.721.563.767.223.367.270.223.470.272.924.272.972.622.872.677.520.677.577.921.277.975.421.375.477.919.677.976.819.876.87618767717.6777615.27677.614.477.67613.17671.912.671.971.112.371.170.612.170.664.311.964.363.310.963.387.930.687.978.61.478.6median 72.9median 19.6median 72.96.34.16.345.548.940.139.446.949.13034.124.328.623.93419.435.913.943.215.950.116.853.918.95816.864.115.266.415.771.116.369.913.96811.965.31162.110.763.411.764.711.864.211.861.813.261.114.761.314.368.214.966.114.566.114.460.113.657.11252.725.777.20.743.7median 14.3median 63.424.124.931.425.431.628.73823.132.825.832.228.537.428.335.724.334.825.63925.548.227.254.822.258.619.861.516.461.417.275.71482.21376.512.277.612.176.411.876.611.978.211.177.210.67110.469.51067.810.466.610.572.310.268.410.166.39.758.625.687.40.770.9median 12.1median 69.54.78.731.135.925.634.325.632.928.533.425.233.621.434.61842.618.848.917.85416.753.515.761.416.865.513.966.411.667.410.374.110.382.710.280.49.778.811.2779.974.110.26910.6641167.111.367.411.561.911.662.811.763.51263.411.760.212.249.823.386.30.563.3median 11.6median 65.51.75.6hearing rangehide median Pink NoiseSchenker Key 18 Pro M25 RTX 5090Razer Blade 18 2025 RTX 5090 LaptopAlienware 18 Area-51Aorus Master 18 AM8HMSI Titan 18 HX AI A2XWJGAsus Strix Scar 18 G835LX
Frequenzdiagramm (für Vergleiche die Checkboxen oben an-/abwählen)
Schenker Key 18 Pro M25 RTX 5090 Audio Analyse

(±) | Mittelmäßig laut spielende Lautsprecher (79.1 dB)
Bass 100 - 315 Hz
(±) | abgesenkter Bass - 8.1% geringer als der Median
(±) | durchschnittlich lineare Bass-Wiedergabe (8.8% Delta zum Vorgänger)
Mitteltöne 400 - 2000 Hz
(+) | ausgeglichene Mitten, vom Median nur 4.6% abweichend
(+) | lineare Mitten (2.4% Delta zum Vorgänger)
Hochtöne 2 - 16 kHz
(±) | verringerte Hochtöne, 7% geringer als der Median
(+) | sehr lineare Hochtöne (6.6% Delta zum Vorgänger)
Gesamt im hörbaren Bereich 100 - 16.000 Hz
(±) | hörbarer Bereich ist durchschnittlich linear (15.2% Abstand zum Median)
Im Vergleich zu allen Geräten derselben Klasse
» 31% aller getesteten Geräte dieser Klasse waren besser, 10% vergleichbar, 59% schlechter
» Das beste Gerät hat einen Delta-Wert von 7%, durchschnittlich ist 18%, das schlechteste Gerät hat 35%
Im Vergleich zu allen Geräten im Test
» 21% aller getesteten Geräte waren besser, 4% vergleichbar, 75% schlechter
» Das beste Gerät hat einen Delta-Wert von 4%, durchschnittlich ist 24%, das schlechteste Gerät hat 134%

Razer Blade 18 2025 RTX 5090 Laptop Audio Analyse

(+) | Die Lautsprecher können relativ laut spielen (84.6 dB)
Bass 100 - 315 Hz
(±) | abgesenkter Bass - 6.6% geringer als der Median
(±) | durchschnittlich lineare Bass-Wiedergabe (7.6% Delta zum Vorgänger)
Mitteltöne 400 - 2000 Hz
(±) | zu hohe Mitten, vom Median 7.4% abweichend
(+) | lineare Mitten (4.4% Delta zum Vorgänger)
Hochtöne 2 - 16 kHz
(±) | verringerte Hochtöne, 5% geringer als der Median
(+) | sehr lineare Hochtöne (3.2% Delta zum Vorgänger)
Gesamt im hörbaren Bereich 100 - 16.000 Hz
(+) | hörbarer Bereich ist sehr linear (12.8% Abstand zum Median
Im Vergleich zu allen Geräten derselben Klasse
» 16% aller getesteten Geräte dieser Klasse waren besser, 4% vergleichbar, 80% schlechter
» Das beste Gerät hat einen Delta-Wert von 6%, durchschnittlich ist 18%, das schlechteste Gerät hat 132%
Im Vergleich zu allen Geräten im Test
» 11% aller getesteten Geräte waren besser, 3% vergleichbar, 86% schlechter
» Das beste Gerät hat einen Delta-Wert von 4%, durchschnittlich ist 24%, das schlechteste Gerät hat 134%

Alienware 18 Area-51 Audio Analyse

(+) | Die Lautsprecher können relativ laut spielen (87.9 dB)
Bass 100 - 315 Hz
(-) | kaum Bass - 17.5% niedriger als der Median
(±) | durchschnittlich lineare Bass-Wiedergabe (13.4% Delta zum Vorgänger)
Mitteltöne 400 - 2000 Hz
(+) | ausgeglichene Mitten, vom Median nur 3.1% abweichend
(+) | lineare Mitten (3.6% Delta zum Vorgänger)
Hochtöne 2 - 16 kHz
(+) | ausgeglichene Hochtöne, vom Median nur 2.9% abweichend
(+) | sehr lineare Hochtöne (2.9% Delta zum Vorgänger)
Gesamt im hörbaren Bereich 100 - 16.000 Hz
(+) | hörbarer Bereich ist sehr linear (14.2% Abstand zum Median
Im Vergleich zu allen Geräten derselben Klasse
» 25% aller getesteten Geräte dieser Klasse waren besser, 7% vergleichbar, 68% schlechter
» Das beste Gerät hat einen Delta-Wert von 6%, durchschnittlich ist 18%, das schlechteste Gerät hat 132%
Im Vergleich zu allen Geräten im Test
» 16% aller getesteten Geräte waren besser, 4% vergleichbar, 80% schlechter
» Das beste Gerät hat einen Delta-Wert von 4%, durchschnittlich ist 24%, das schlechteste Gerät hat 134%

Aorus Master 18 AM8H Audio Analyse

(±) | Mittelmäßig laut spielende Lautsprecher (77 dB)
Bass 100 - 315 Hz
(±) | abgesenkter Bass - 8.7% geringer als der Median
(±) | durchschnittlich lineare Bass-Wiedergabe (10.3% Delta zum Vorgänger)
Mitteltöne 400 - 2000 Hz
(+) | ausgeglichene Mitten, vom Median nur 3% abweichend
(+) | lineare Mitten (4.3% Delta zum Vorgänger)
Hochtöne 2 - 16 kHz
(+) | ausgeglichene Hochtöne, vom Median nur 2.8% abweichend
(+) | sehr lineare Hochtöne (5.4% Delta zum Vorgänger)
Gesamt im hörbaren Bereich 100 - 16.000 Hz
(+) | hörbarer Bereich ist sehr linear (11.9% Abstand zum Median
Im Vergleich zu allen Geräten derselben Klasse
» 12% aller getesteten Geräte dieser Klasse waren besser, 4% vergleichbar, 84% schlechter
» Das beste Gerät hat einen Delta-Wert von 6%, durchschnittlich ist 18%, das schlechteste Gerät hat 132%
Im Vergleich zu allen Geräten im Test
» 8% aller getesteten Geräte waren besser, 2% vergleichbar, 89% schlechter
» Das beste Gerät hat einen Delta-Wert von 4%, durchschnittlich ist 24%, das schlechteste Gerät hat 134%

MSI Titan 18 HX AI A2XWJG Audio Analyse

(+) | Die Lautsprecher können relativ laut spielen (87.4 dB)
Bass 100 - 315 Hz
(-) | kaum Bass - 20% niedriger als der Median
(±) | durchschnittlich lineare Bass-Wiedergabe (8% Delta zum Vorgänger)
Mitteltöne 400 - 2000 Hz
(±) | zu hohe Mitten, vom Median 8.1% abweichend
(+) | lineare Mitten (6.7% Delta zum Vorgänger)
Hochtöne 2 - 16 kHz
(+) | ausgeglichene Hochtöne, vom Median nur 2.5% abweichend
(+) | sehr lineare Hochtöne (5.3% Delta zum Vorgänger)
Gesamt im hörbaren Bereich 100 - 16.000 Hz
(±) | hörbarer Bereich ist durchschnittlich linear (16.5% Abstand zum Median)
Im Vergleich zu allen Geräten derselben Klasse
» 42% aller getesteten Geräte dieser Klasse waren besser, 7% vergleichbar, 52% schlechter
» Das beste Gerät hat einen Delta-Wert von 6%, durchschnittlich ist 18%, das schlechteste Gerät hat 132%
Im Vergleich zu allen Geräten im Test
» 27% aller getesteten Geräte waren besser, 6% vergleichbar, 67% schlechter
» Das beste Gerät hat einen Delta-Wert von 4%, durchschnittlich ist 24%, das schlechteste Gerät hat 134%

Asus Strix Scar 18 G835LX Audio Analyse

(+) | Die Lautsprecher können relativ laut spielen (86.3 dB)
Bass 100 - 315 Hz
(±) | abgesenkter Bass - 7.5% geringer als der Median
(±) | durchschnittlich lineare Bass-Wiedergabe (7.7% Delta zum Vorgänger)
Mitteltöne 400 - 2000 Hz
(±) | zu hohe Mitten, vom Median 9.9% abweichend
(+) | lineare Mitten (6.9% Delta zum Vorgänger)
Hochtöne 2 - 16 kHz
(+) | ausgeglichene Hochtöne, vom Median nur 2.2% abweichend
(+) | sehr lineare Hochtöne (4.1% Delta zum Vorgänger)
Gesamt im hörbaren Bereich 100 - 16.000 Hz
(+) | hörbarer Bereich ist sehr linear (13.7% Abstand zum Median
Im Vergleich zu allen Geräten derselben Klasse
» 21% aller getesteten Geräte dieser Klasse waren besser, 7% vergleichbar, 73% schlechter
» Das beste Gerät hat einen Delta-Wert von 6%, durchschnittlich ist 18%, das schlechteste Gerät hat 132%
Im Vergleich zu allen Geräten im Test
» 14% aller getesteten Geräte waren besser, 4% vergleichbar, 82% schlechter
» Das beste Gerät hat einen Delta-Wert von 4%, durchschnittlich ist 24%, das schlechteste Gerät hat 134%

Energieaufnahme

Das mitgelieferte 330-Watt-Netzteil kann auch den kurzzeitigen Peak-Stromverbrauch abdecken und ist insgesamt ausreichend dimensioniert. Der Verbrauch im Standby sowie im ausgeschalteten Zustand ist mit 1,9 bzw. 1,4 Watt aber etwas hoch.

Stromverbrauch
Aus / Standbydarklight 1.4 / 1.9 Watt
Idledarkmidlight 14 / 21.9 / 22.3 Watt
Last midlight 149.5 / 415.4 Watt
 color bar
Legende: min: dark, med: mid, max: light        Metrahit Energy
Schenker Key 18 Pro M25 RTX 5090
Ultra 9 275HX, GeForce RTX 5090 Laptop, Samsung 9100 Pro 4 TB, IPS, 3840x2400, 18"
Razer Blade 18 2025 RTX 5090 Laptop
Ultra 9 275HX, GeForce RTX 5090 Laptop, Lexar NM790 2TB, IPS, 3840x2400, 18"
Alienware 18 Area-51
Ultra 9 275HX, GeForce RTX 5090 Laptop, , IPS, 2560x1600, 18"
Aorus Master 18 AM8H
Ultra 9 275HX, GeForce RTX 5090 Laptop, Kingston KC3000 2048G SKC3000D2048G, Mini-LED, 2560x1600, 18"
MSI Titan 18 HX AI A2XWJG
Ultra 9 285HX, GeForce RTX 5090 Laptop, 1x Samsung PM9E1 MZVLC2T0HBLD-00BT7 + 2x Samsung PM9A1 MZVL22T0HDLB-00BT7 (RAID 0), Mini-LED, 3840x2160, 18"
Asus Strix Scar 18 G835LX
Ultra 9 275HX, GeForce RTX 5090 Laptop, WD PC SN8000S 2TB, Mini-LED, 2560x1600, 18"
Durchschnittliche NVIDIA GeForce RTX 5090 Laptop
 
Durchschnitt der Klasse Workstation
 
Stromverbrauch
-7%
-65%
-31%
-12%
-19%
-13%
44%
Idle min * (Watt)
14
18.1
-29%
38.4
-174%
29
-107%
19.01
-36%
11.4
19%
Idle avg * (Watt)
21.9
27.9
-27%
45.6
-108%
33
-51%
30.92
-41%
39.2
-79%
26.1 ?(12.1 - 45.6, n=17)
-19%
Idle max * (Watt)
22.3
28.7
-29%
57.5
-158%
48
-115%
33.84
-52%
40.2
-80%
31.5 ?(12.5 - 57.5, n=17)
-41%
Last avg * (Watt)
149.5
108.3
28%
190.1
-27%
141
6%
105.4
29%
161.2
-8%
Cyberpunk 2077 ultra * (Watt)
333
338
-2%
340
-2%
283
15%
343
-3%
303
9%
Cyberpunk 2077 ultra external monitor * (Watt)
336
331
1%
333
1%
283
16%
330
2%
295
12%
Last max * (Watt)
415.4
366.7
12%
373.2
10%
340
18%
354
15%
430.9
-4%

* ... kleinere Werte sind besser

Energieaufnahme Cyberpunk / Stresstest

0255075100125150175200225250275300325350375400Tooltip
Schenker Key 18 Pro M25 RTX 5090; 1280x720 Prime95 28.10 and Furmark 1.25: Ø312 (256-415)
Schenker Key 18 Pro M25 RTX 5090; Idle 150cd/m2: Ø17.3 (14.3-44.1)
Schenker Key 18 Pro M25 RTX 5090; Cyberpunk 2077 FHD ultra no FSR 150cd: Ø333 (322-339)

Energieaufnahme mit externem Monitor

020406080100120140160180200220240260280300320340Tooltip
Schenker Key 18 Pro M25 RTX 5090; Prime95 V2810 Stress (external Monitor): Ø224 (162.9-241)
Schenker Key 18 Pro M25 RTX 5090; Cinebench R15 Multi (external Monitor): Ø228 (226-228)
Schenker Key 18 Pro M25 RTX 5090; Cinebench R23 Single (external Monitor): Ø80.5 (69.6-108)
Schenker Key 18 Pro M25 RTX 5090; Cinebench R23 Multi (external Monitor): Ø224 (221-227)
Schenker Key 18 Pro M25 RTX 5090; 1280x720 FurMark 1.19 GPU Stress Test (external Monitor): Ø246 (235-251)
Schenker Key 18 Pro M25 RTX 5090; Idle 1min (external Monitor): Ø55.3 (54.6-58.9)
Schenker Key 18 Pro M25 RTX 5090; Cyberpunk 2077 FHD ultra no FSR (external Monitor): Ø336 (329-342)

Akkulaufzeit

Akkulaufzeit
WiFi Websurfing
5h 47min
WiFi Websurfing max. Brightness
4h 33min
Battery Runtime
WiFi Websurfing
Durchschnitt der Klasse Workstation
  (2.47 - 15, n=26, der letzten 2 Jahre)
8.35 h +44%
Razer Blade 18 2025 RTX 5090 Laptop
Ultra 9 275HX, GeForce RTX 5090 Laptop, 99.99 Wh
7.8 h +34%
Schenker Key 18 Pro M25 RTX 5090
Ultra 9 275HX, GeForce RTX 5090 Laptop, 98 Wh
5.8 h
Asus Strix Scar 18 G835LX
Ultra 9 275HX, GeForce RTX 5090 Laptop, 90 Wh
5.5 h -5%
Aorus Master 18 AM8H
Ultra 9 275HX, GeForce RTX 5090 Laptop, 99 Wh
4.9 h -16%
MSI Titan 18 HX AI A2XWJG
Ultra 9 285HX, GeForce RTX 5090 Laptop, 99 Wh
4.3 h -26%
Alienware 18 Area-51
Ultra 9 275HX, GeForce RTX 5090 Laptop, 96 Wh
2 h -66%
WiFi Websurfing max. Brightness
Durchschnitt der Klasse Workstation
  (4.55 - 12.1, n=11, der letzten 2 Jahre)
7 h +52%
Schenker Key 18 Pro M25 RTX 5090
Ultra 9 275HX, GeForce RTX 5090 Laptop, 98 Wh
4.6 h
Razer Blade 18 2025 RTX 5090 Laptop
Ultra 9 275HX, GeForce RTX 5090 Laptop, 99.99 Wh
4.2 h -9%
Asus Strix Scar 18 G835LX
Ultra 9 275HX, GeForce RTX 5090 Laptop, 90 Wh
2.8 h -39%

Notebookcheck Gesamtbewertung

Schenker Key 18 Pro M25 RTX 5090 - 15.08.2025 v8
Andreas Osthoff

Gehäuse
82 / 98 → 83%
Tastatur
85%
Pointing Device
89%
Konnektivität
78 / 80 → 98%
Gewicht
49 / 10-66 → 70%
Akkulaufzeit
63 / 95 → 66%
Display
86%
Leistung Spiele
93%
Leistung Anwendungen
94%
Workstation
78%
AI Performance
99%
Temperatur
84 / 95 → 88%
Lautstärke
67 / 90 → 74%
Audio
78%
Kamera
38 / 75 → 51%
Durchschnitt
62%
85%
Workstation - gewichteter Durchschnitt
Weitere Informationen über unsere Bewertung finden Sie hier.
CO2 Emissions
No Data
Materials
0%
Packaging
50%
Power Use
64%
Repairability
40%
Software Updates
22.3%
Recycle Logo Total Sustainability Score: 29.4%

Mögliche Alternativen im Vergleich

Bild
Modell / Test
Preis ab
Gewicht
Dicke
Display
1.
84.6%
Schenker Key 18 Pro M25 RTX 5090
Intel Core Ultra 9 275HX ⎘
NVIDIA GeForce RTX 5090 Laptop ⎘
256 GB RAM, 4096 GB SSD
Bestpreis 4999€ notebooksbilliger.de
2. 5013€ computeruniverse.net
3. 5013€ Cyberport.de6400€
4.1 kg29.5 mm18.00"
3840x2400
252 PPI
IPS
2.
89.5%
Razer Blade 18 2025 RTX 5090 Laptop
Intel Core Ultra 9 275HX ⎘
NVIDIA GeForce RTX 5090 Laptop ⎘
64 GB RAM, 2048 GB SSD
Amazon: 5.299,00 €
Bestpreis 5299€ Media Markt.at
2. 5299€ computeruniverse.net
3. 5299€ shifter.shop
3.2 kg27.9 mm18.00"
3840x2400
252 PPI
IPS
3.
86.2%
Alienware 18 Area-51
Intel Core Ultra 9 275HX ⎘
NVIDIA GeForce RTX 5090 Laptop ⎘
64 GB RAM
Amazon:
1. 42,66 €
Laptophülle für 45,7 - 48,...
2. 109,99 €
Smatree CityShield Laptop Sc...
3. 67,99 €
Smatree Hard Eva Schutzhüll...
Geizhals Suche
4.2 kg24.32 mm18.00"
2560x1600
168 PPI
IPS
4.
86.8%
Aorus Master 18 AM8H
Intel Core Ultra 9 275HX ⎘
NVIDIA GeForce RTX 5090 Laptop ⎘
64 GB RAM, 2048 GB SSD
Amazon: 5.318,87 €
Bestpreis 4176€ Coolblue
2. 4349€ saturn
3. 4349€ Mediamarkt.de
3.4 kg31 mm18.00"
2560x1600
168 PPI
Mini-LED
5.
86.1%
MSI Titan 18 HX AI A2XWJG
Intel Core Ultra 9 285HX ⎘
NVIDIA GeForce RTX 5090 Laptop ⎘
64 GB RAM, 6000 GB SSD
Amazon: 6.383,81 €
Bestpreis 6399€ computeruniverse.net
2. 6399€ Cyberport Stores Deutschland
3. 6399€ Cyberport.de
3.6 kg32.05 mm18.00"
3840x2160
245 PPI
Mini-LED
6.
88%
Asus Strix Scar 18 G835LX
Intel Core Ultra 9 275HX ⎘
NVIDIA GeForce RTX 5090 Laptop ⎘
64 GB RAM, 2048 GB SSD
Amazon: 5.099,00 €
Bestpreis 5397€ ARLT Computer
2. 5399€ playox.de
3. 5399.01€ office-partner.de
3.3 kg32 mm18.00"
2560x1600
168 PPI
Mini-LED

Transparenz

Die Auswahl der zu testenden Geräte erfolgt innerhalb der Redaktion. Das vorliegende Testmuster wurde dem Autor vom Hersteller oder einem Shop zu Testzwecken leihweise zur Verfügung gestellt. Eine Einflussnahme des Leihstellers auf den Testbericht gab es nicht, der Hersteller erhielt keine Version des Reviews vor der Veröffentlichung. Es bestand keine Verpflichtung zur Publikation. Als eigenständiges, unabhängiges Unternehmen unterliegt Notebookcheck keiner Diktion von Herstellern, Shops und Verlagen.

So testet Notebookcheck

Pro Jahr werden von Notebookcheck hunderte Laptops und Smartphones unabhängig in von uns standardisierten technischen Verfahren getestet, um eine Vergleichbarkeit aller Testergebnisse zu gewährleisten. Seit rund 20 Jahren entwickeln wir diese Testmethoden kontinuierlich weiter und setzen damit Branchenstandards. In unseren Testlaboren kommt ausschließlich hochwertiges Messequipment in die Hände erfahrener Techniker und Redakteure. Die Tests unterliegen einer mehrstufigen Kontrolle. Unsere komplexe Gesamtbewertung basiert auf hunderten fundierten Messergebnissen und Benchmarks, womit Ihnen Objektivität garantiert ist. Weitere Informationen zu unseren Testmethoden gibt es hier.

Alle 7 Beträge lesen / Antworten
static version load dynamic
Loading Comments
Diesen Artikel kommentieren / Antworten
Teilen Sie diesen Artikel, um uns zu unterstützen. Jeder Link hilft!
Mail Logo
> Notebook Test, Laptop Test und News > Tests > Notebook Testberichte > Schenker Key 18 Pro E25 im Test - High-End Workstation mit RTX 5090 und 256 GB RAM
Autor: Andreas Osthoff, 15.08.2025 (Update: 15.08.2025)