18 Zoll Gamer mit tollem Mini-LED und RTX 5090 Laptop - Asus Strix SCAR 18 G835LX im Test
Für Gamer und Kreative zugleich.
Asus aktualisiert sein Gaming-Flagship Strix SCAR 18 mit dem Core Ultra 9 275HX, der GeForce RTX 5090 Laptop sowie dem hervorragenden Mini-LED-Display mit 240 Hz. Zudem wurde der Zugang zu den Komponenten massiv erleichtert und es gibt umfangreiche Beleuchtungselemente. Update: Zusätzliche Gaming-Benchmarks mit DLSS4, Raytracing & PathtracingAndreas Osthoff 👁 Veröffentlicht am 🇺🇸 🇫🇷 ...
Fazit - Mehr Leistung, schickeres Gehäuse und tolles Mini-LED-Panel
Das ROG Strix SCAR 18 ist das Gaming-Flagship von Asus und das sieht man an den technischen Daten auch. Mit dem neuen Core Ultra 9 275HX sowie der GeForce RTX 5090 Laptop sind die schnellsten Komponenten verbaut, wobei der Vorteil gegenüber der alten RTX 4090 Laptop beim Spielen relativ klein ist, vor allem in der nativen WQHD-Auflösung. Erst beim Einsatz von Upscaling-Features wie MFG4x kann sich die neue 5090 Laptop klar absetzen. Sinnvoller ist das Upgrade hier auf jeden Fall für Besitzer von Gaming-Laptops mit RTX-3000-GPUs.
Beim Gehäuse gab es einige Veränderungen und das Design ist nun insgesamt etwas aufgeräumter, zusätzlich wurden die Beleuchtungsoptionen mit der umlaufenden LED-Leiste sowie dem AniME-Vision-Display auf dem Deckel erweitert. Die Baseunit ist weiterhin aus Kunststoff gefertigt, wobei hier vor allem die glatte Oberfläche auf der Oberseite extrem schnell verschmutzt. Der Zugang zu den Komponenten ist nun ohne Schraubenzieher möglich und die Wartungsmöglichkeiten sind hervorragend, wobei unser Testgerät bereits ziemlich gut bestückt war. Der RAID-0-Verbund der SSDs ist nicht ganz ideal, hier wäre die Implementierung eines schnellen PCIe-5.0-Steckplatzes die bessere Wahl gewesen, denn dan hätte man mit einem einzelnen Laufwerk noch bessere Ergebnisse bekommen.
Das Mini-LED-Display mit 240 Hz überzeugt in fast jeder Hinsicht und neben den reinen Display-Specs sind auch die zusätzlichen Modi von Asus sehr interessant. Zunächst einmal stehen bereits sehr akkurate Werksprofile für P3 sowie sRGB zur Verfügung und das Local Dimming lässt sich für die Bildbearbeitung deaktivieren. Im HDR-Modus ist es zudem möglich, die blassen sRGB-Farben (wenn keine HDR-Inhalte gezeigt werden, beispielsweise der Windows-Desktop) in den P3-Farbraum zu konvertieren.
Zu den Nachteilen gehören die laute Kühlung in den Profilen Leistung sowie Turbo und natürlich auch der hohe Stromverbrauch. Dann wäre da noch der Preis, der vor allem bei unserer High-End-Variante mit 5.799 Euro extrem hoch ausfällt, zumindest gibt es einiges an Zubehör im Lieferumfang. Es macht aber mehr Sinn ein günstigeres Modell mit weniger Speicher zu kaufen und diesen dann bei Bedarf unkompliziert selbst zu erweitern.
Das Strix SCAR 18 ist das erste der neuen 18-Zoll Gaming-Notebooks bei uns im Test, die Konkurrenten werden aber sicherlich schon bald folgen und erst dann können wir abschließend sagen, wie gut sich das neue SCAR 18 schlägt.
Pro
Contra
Preis und Verfügbarkeit
Das neue Asus ROG Strix SCAR 18 ist voraussichtlich ab Ende April/Anfang Mai im Handel verfügbar.
Inhaltsverzeichnis
- Fazit - Mehr Leistung, schickeres Gehäuse und tolles Mini-LED-Panel
- Spezifikationen
- Gehäuse - Viel Licht, wenig Schatten
- Ausstattung - SCAR 18 mit Thunderbolt 5
- Eingabegeräte
- Display - Tolles Mini-LED-Panel mit 240 Hz
- Leistung - Arrow Lake-HX und RTX 5000 Laptop
- Emissionen
- Energieverwaltung - Kurze Akkulaufzeit
- Notebookcheck Gesamtbewertung
- Mögliche Alternativen im Vergleich
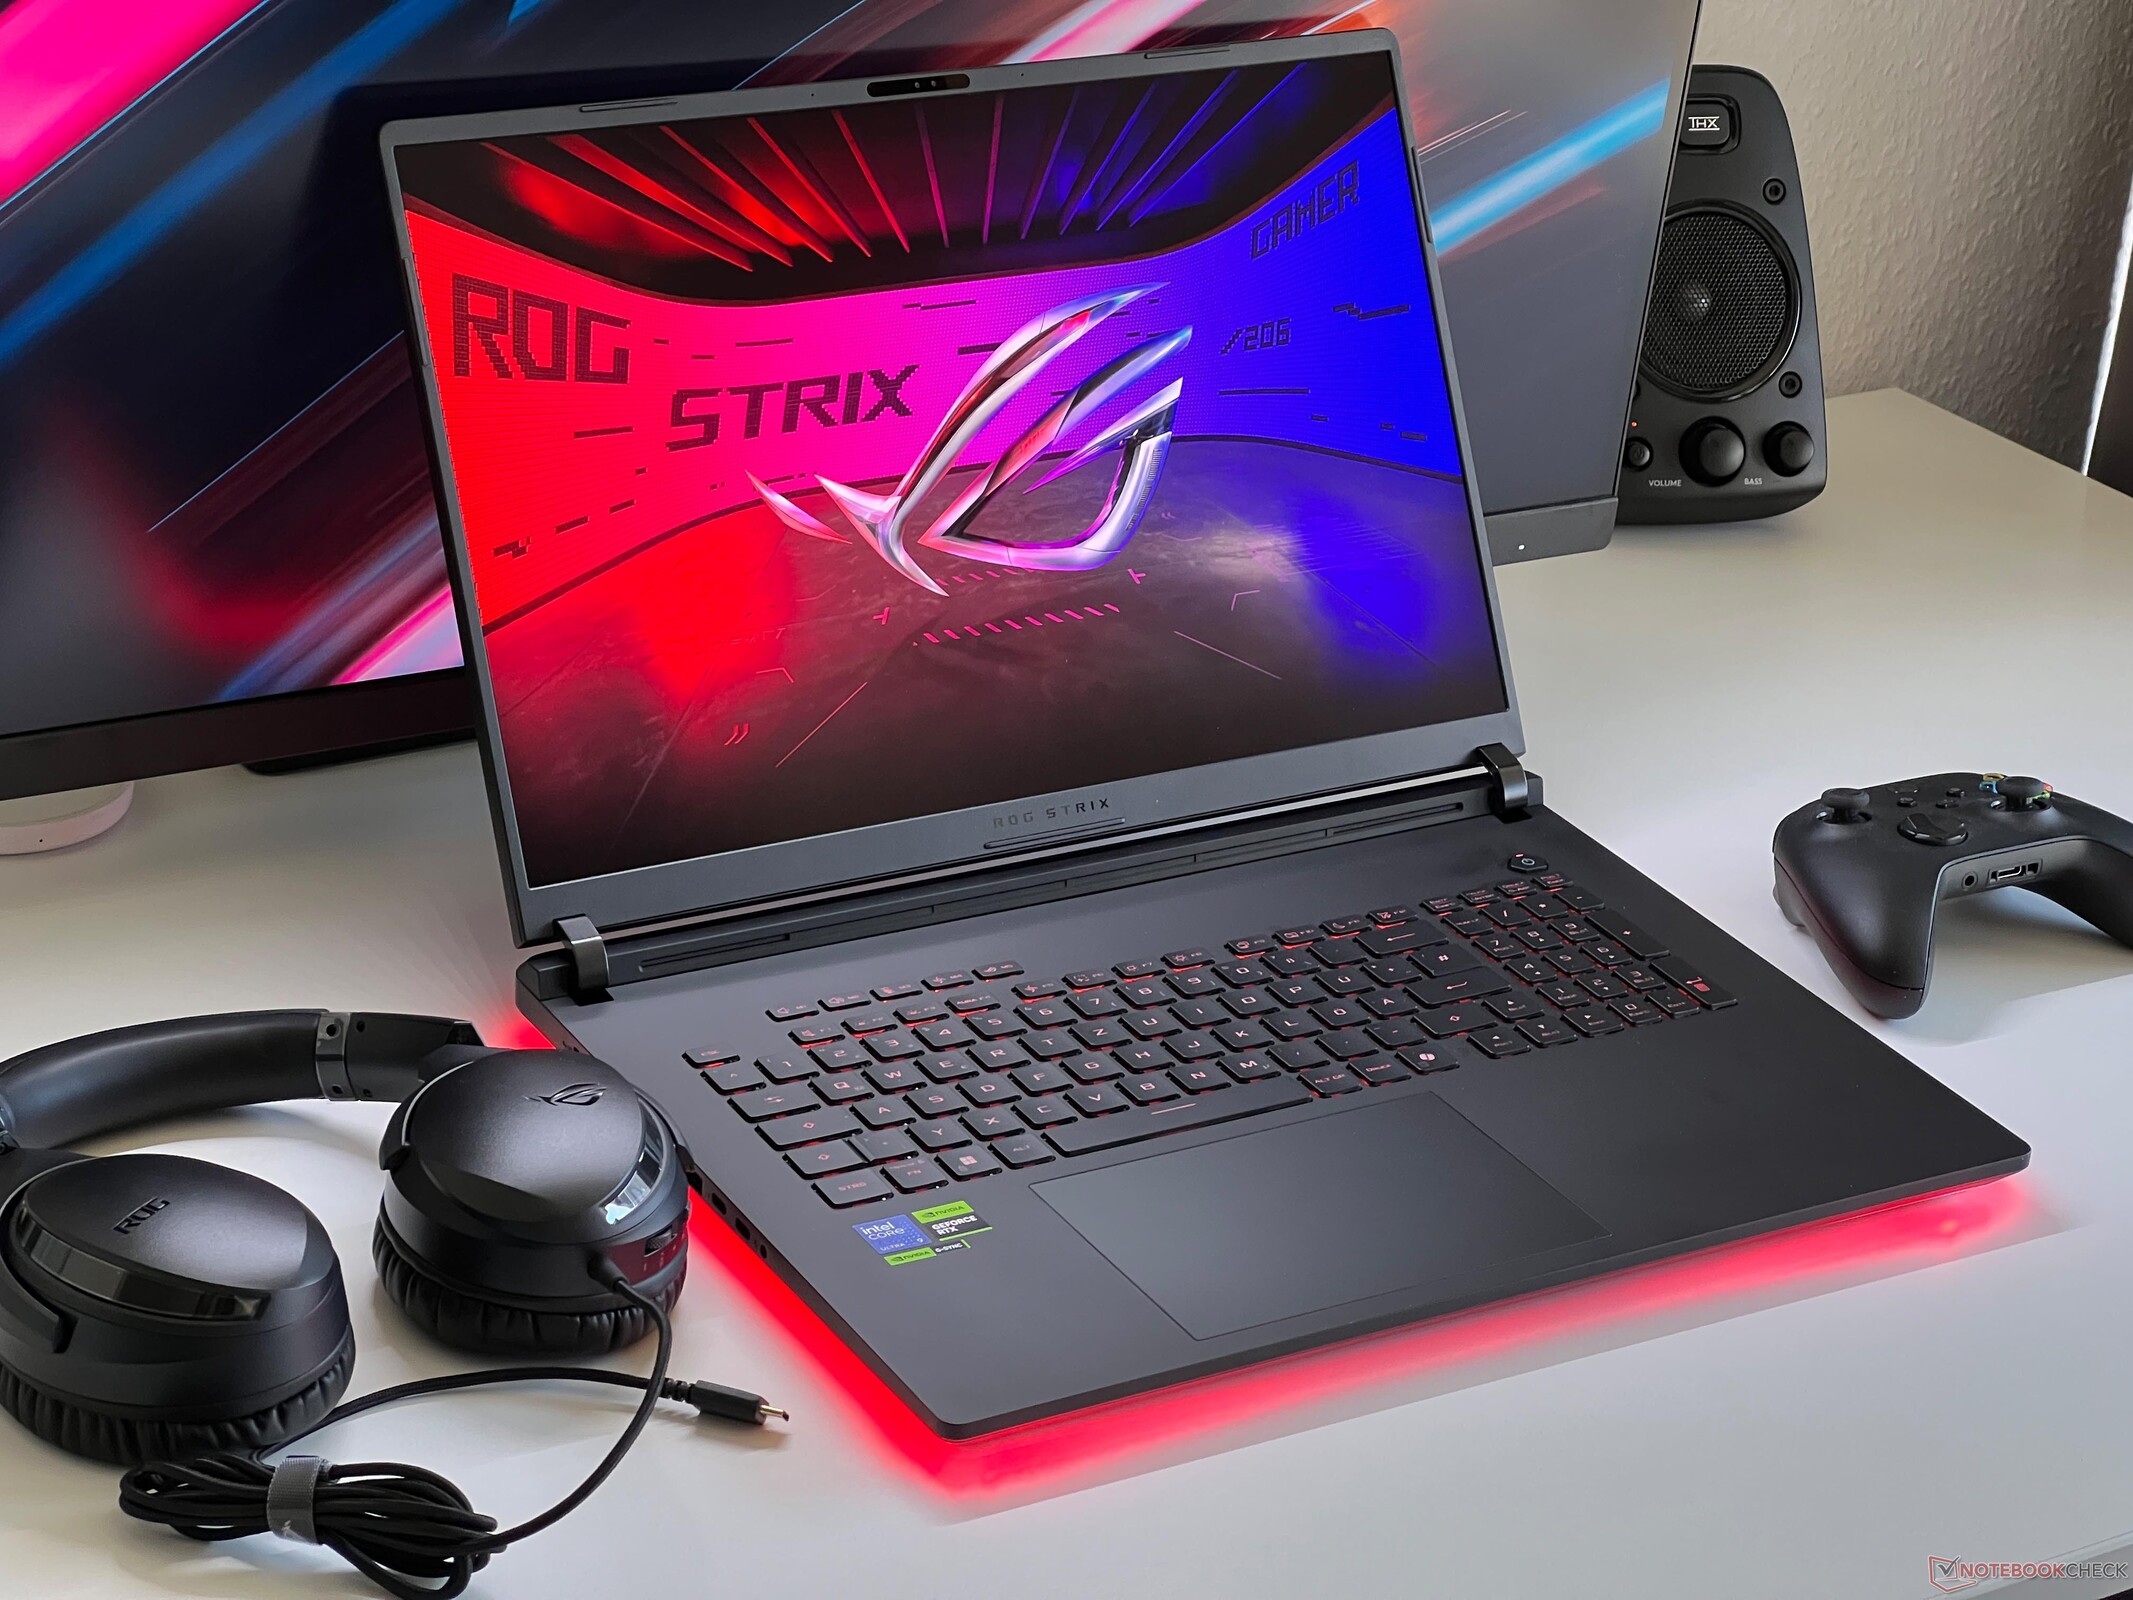
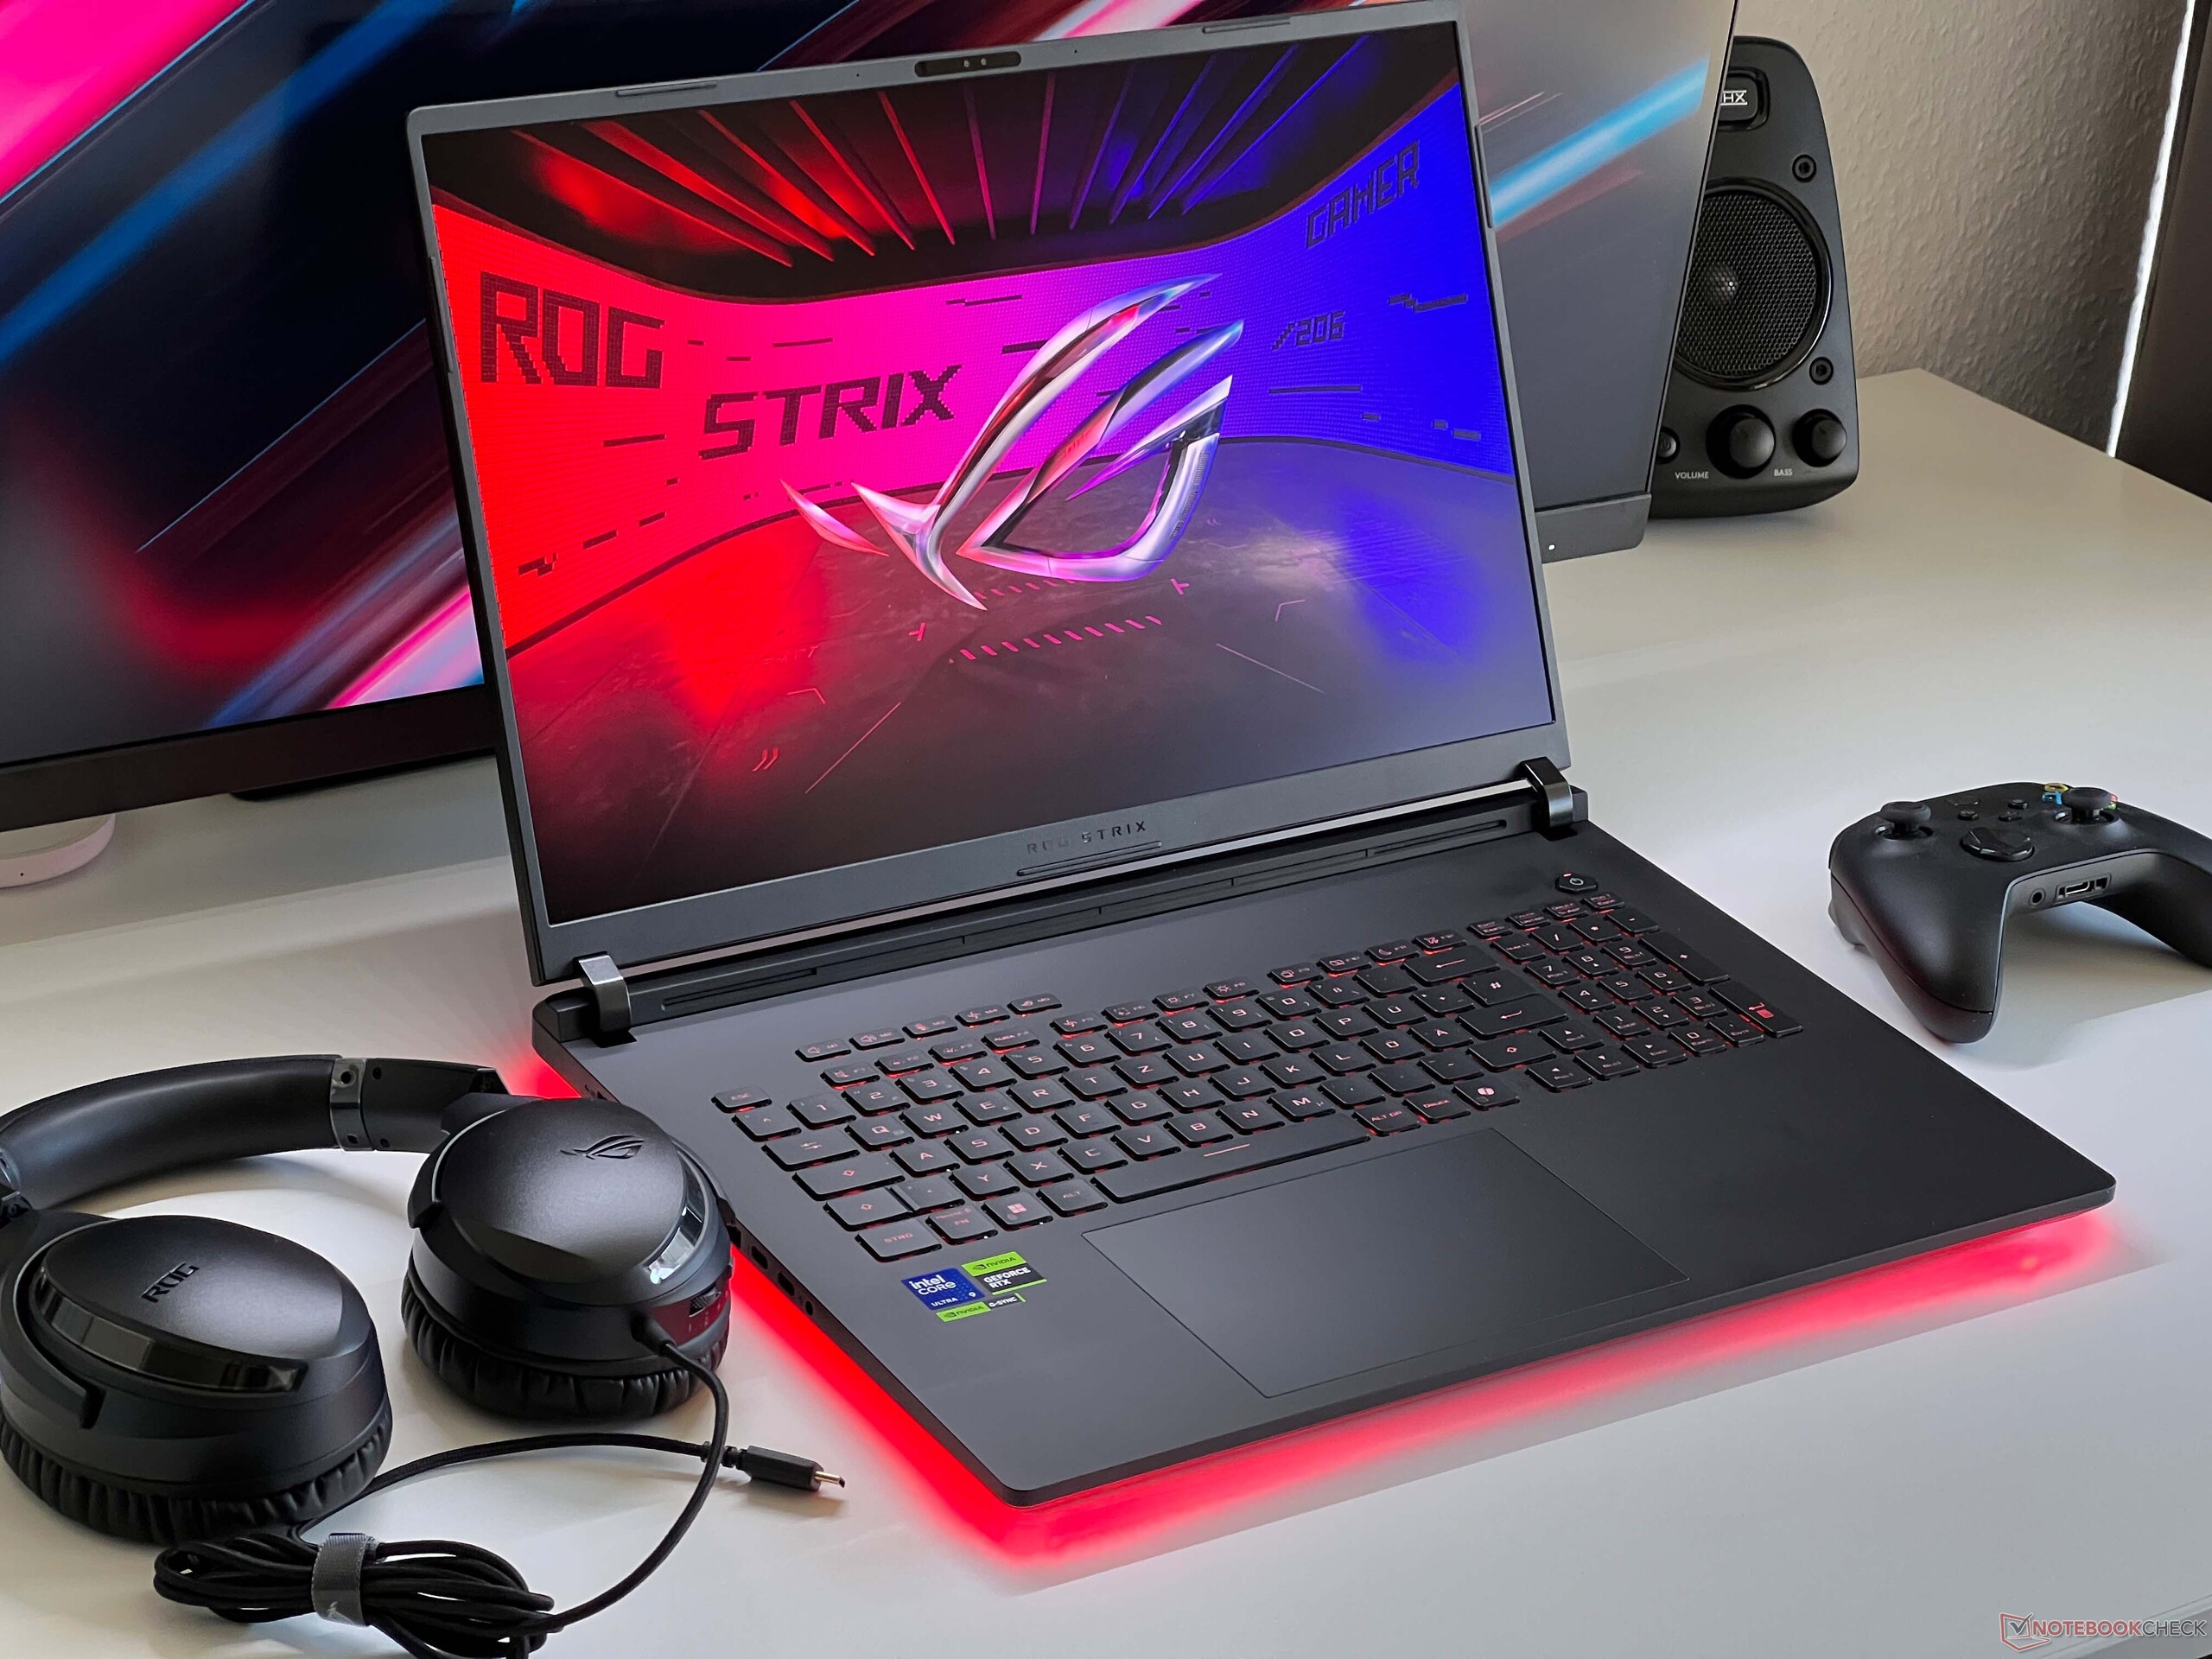
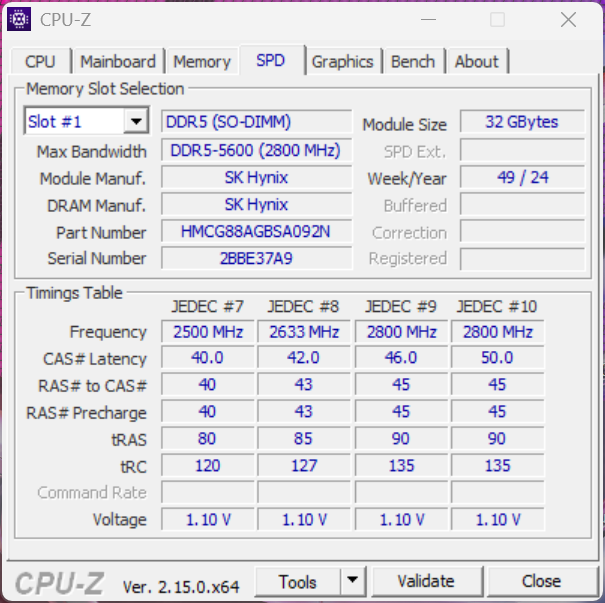
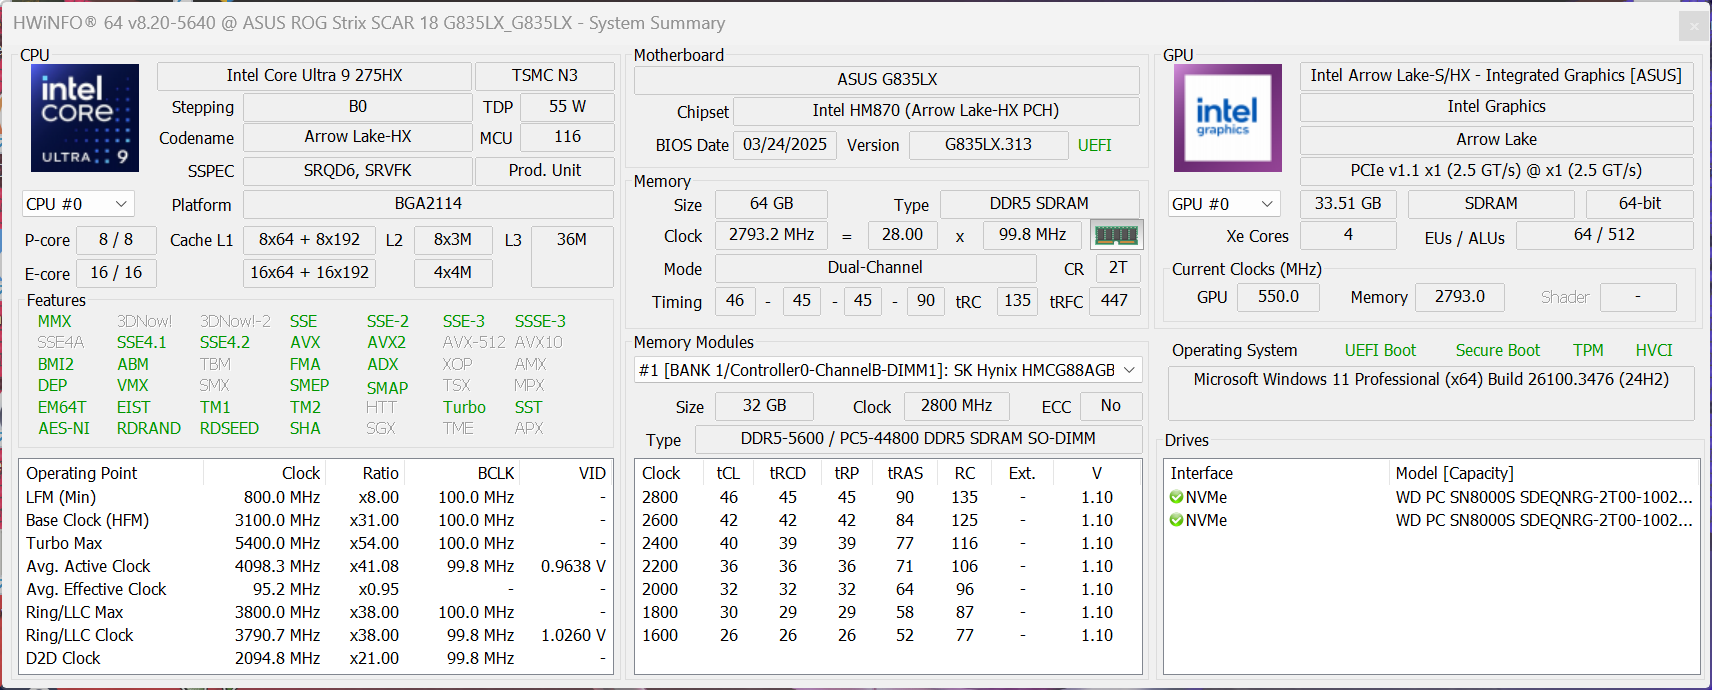
Das ROG Strix SCAR 18 G835LX ist der erste neue 18-Zoll Gaming-Laptop mit dem Intel Core Ultra 9 275HX sowie der Nvidia GeForce RTX 5090 Laptop und gleichzeitig das Gaming-Flagship von Asus für das Jahr 2025. Zusätzlich gibt es noch ein Mini-LED-Panel mit 240 Hz, 64 GB RAM sowie 4 TB SSD-Kapazität für eine UVP von 5.799 Euro.
Spezifikationen
Gehäuse - Viel Licht, wenig Schatten
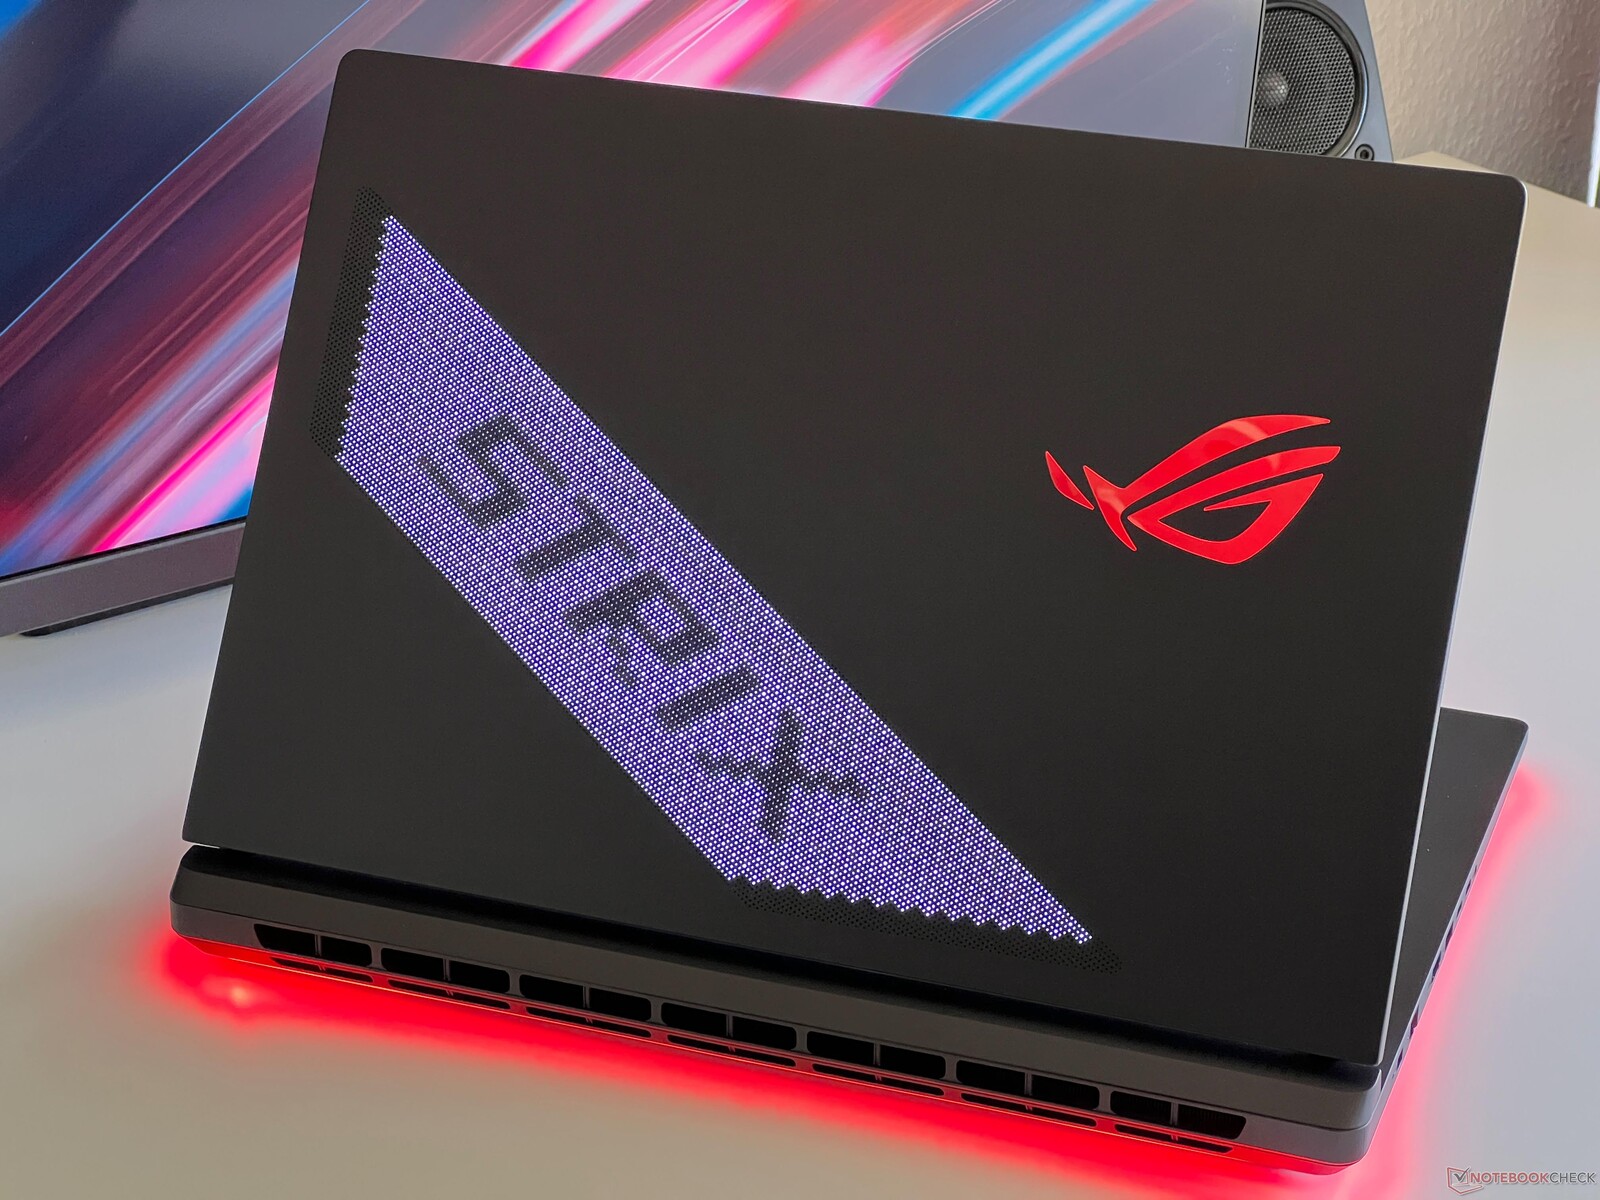
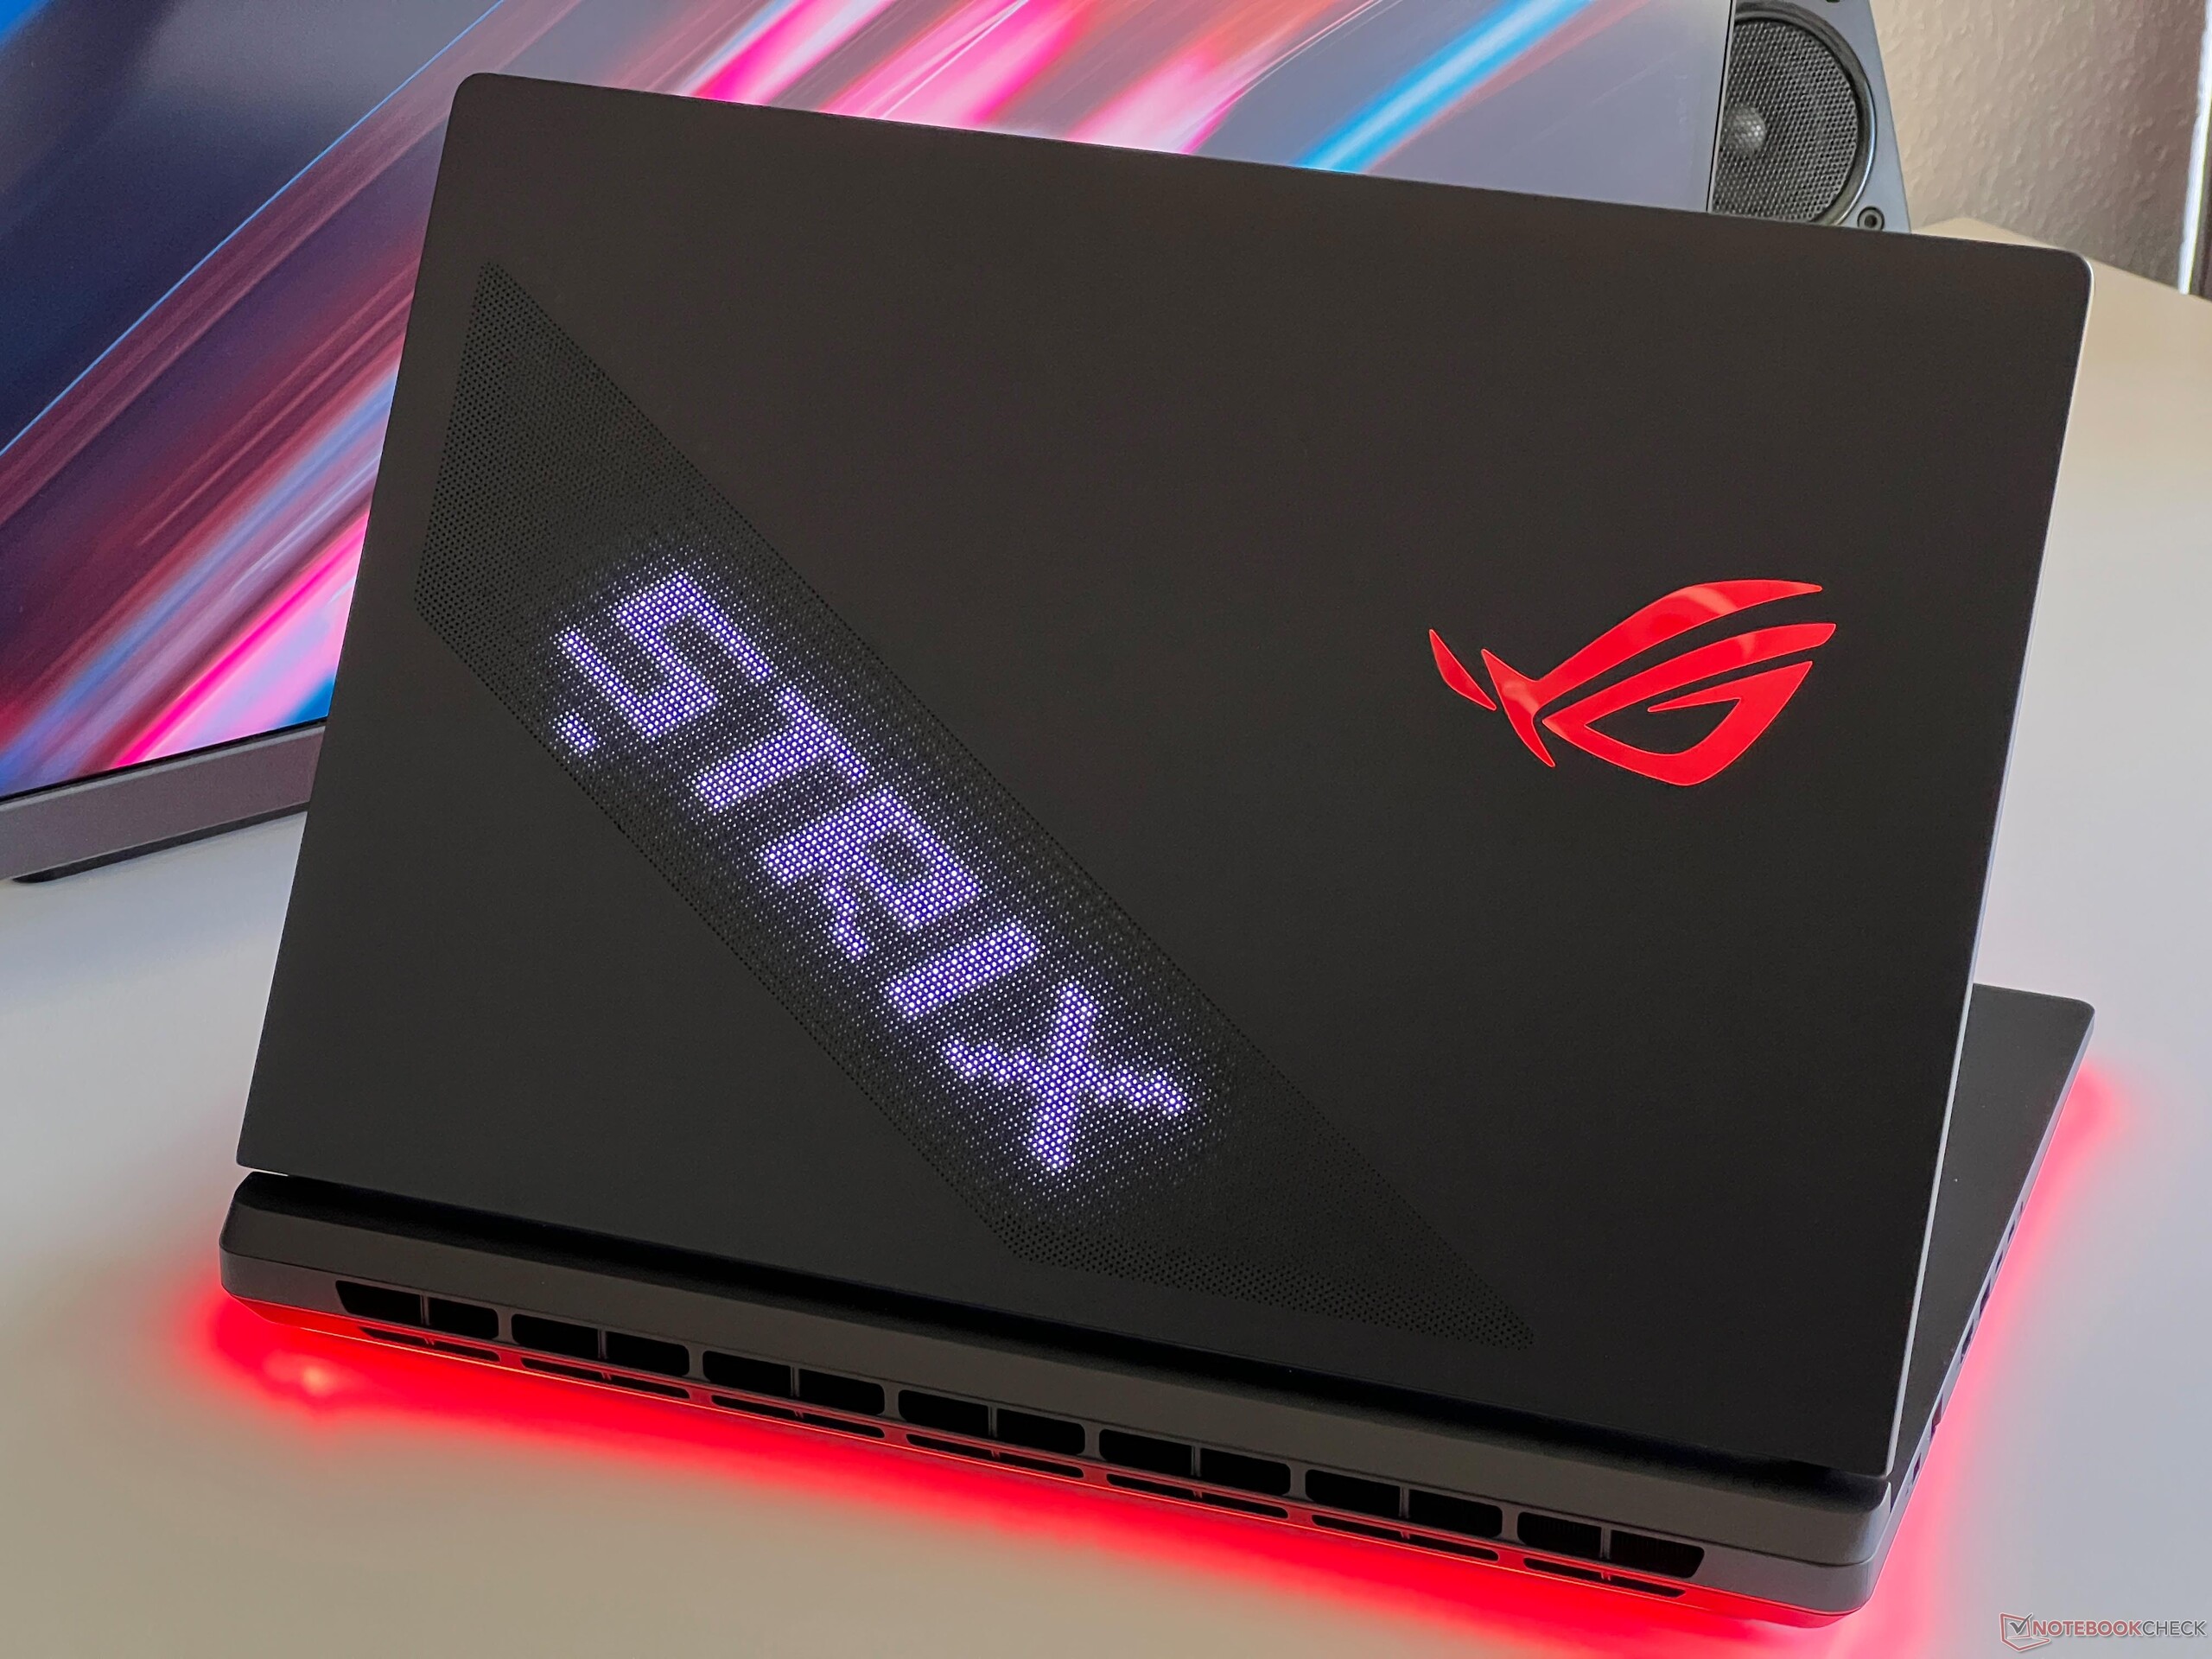
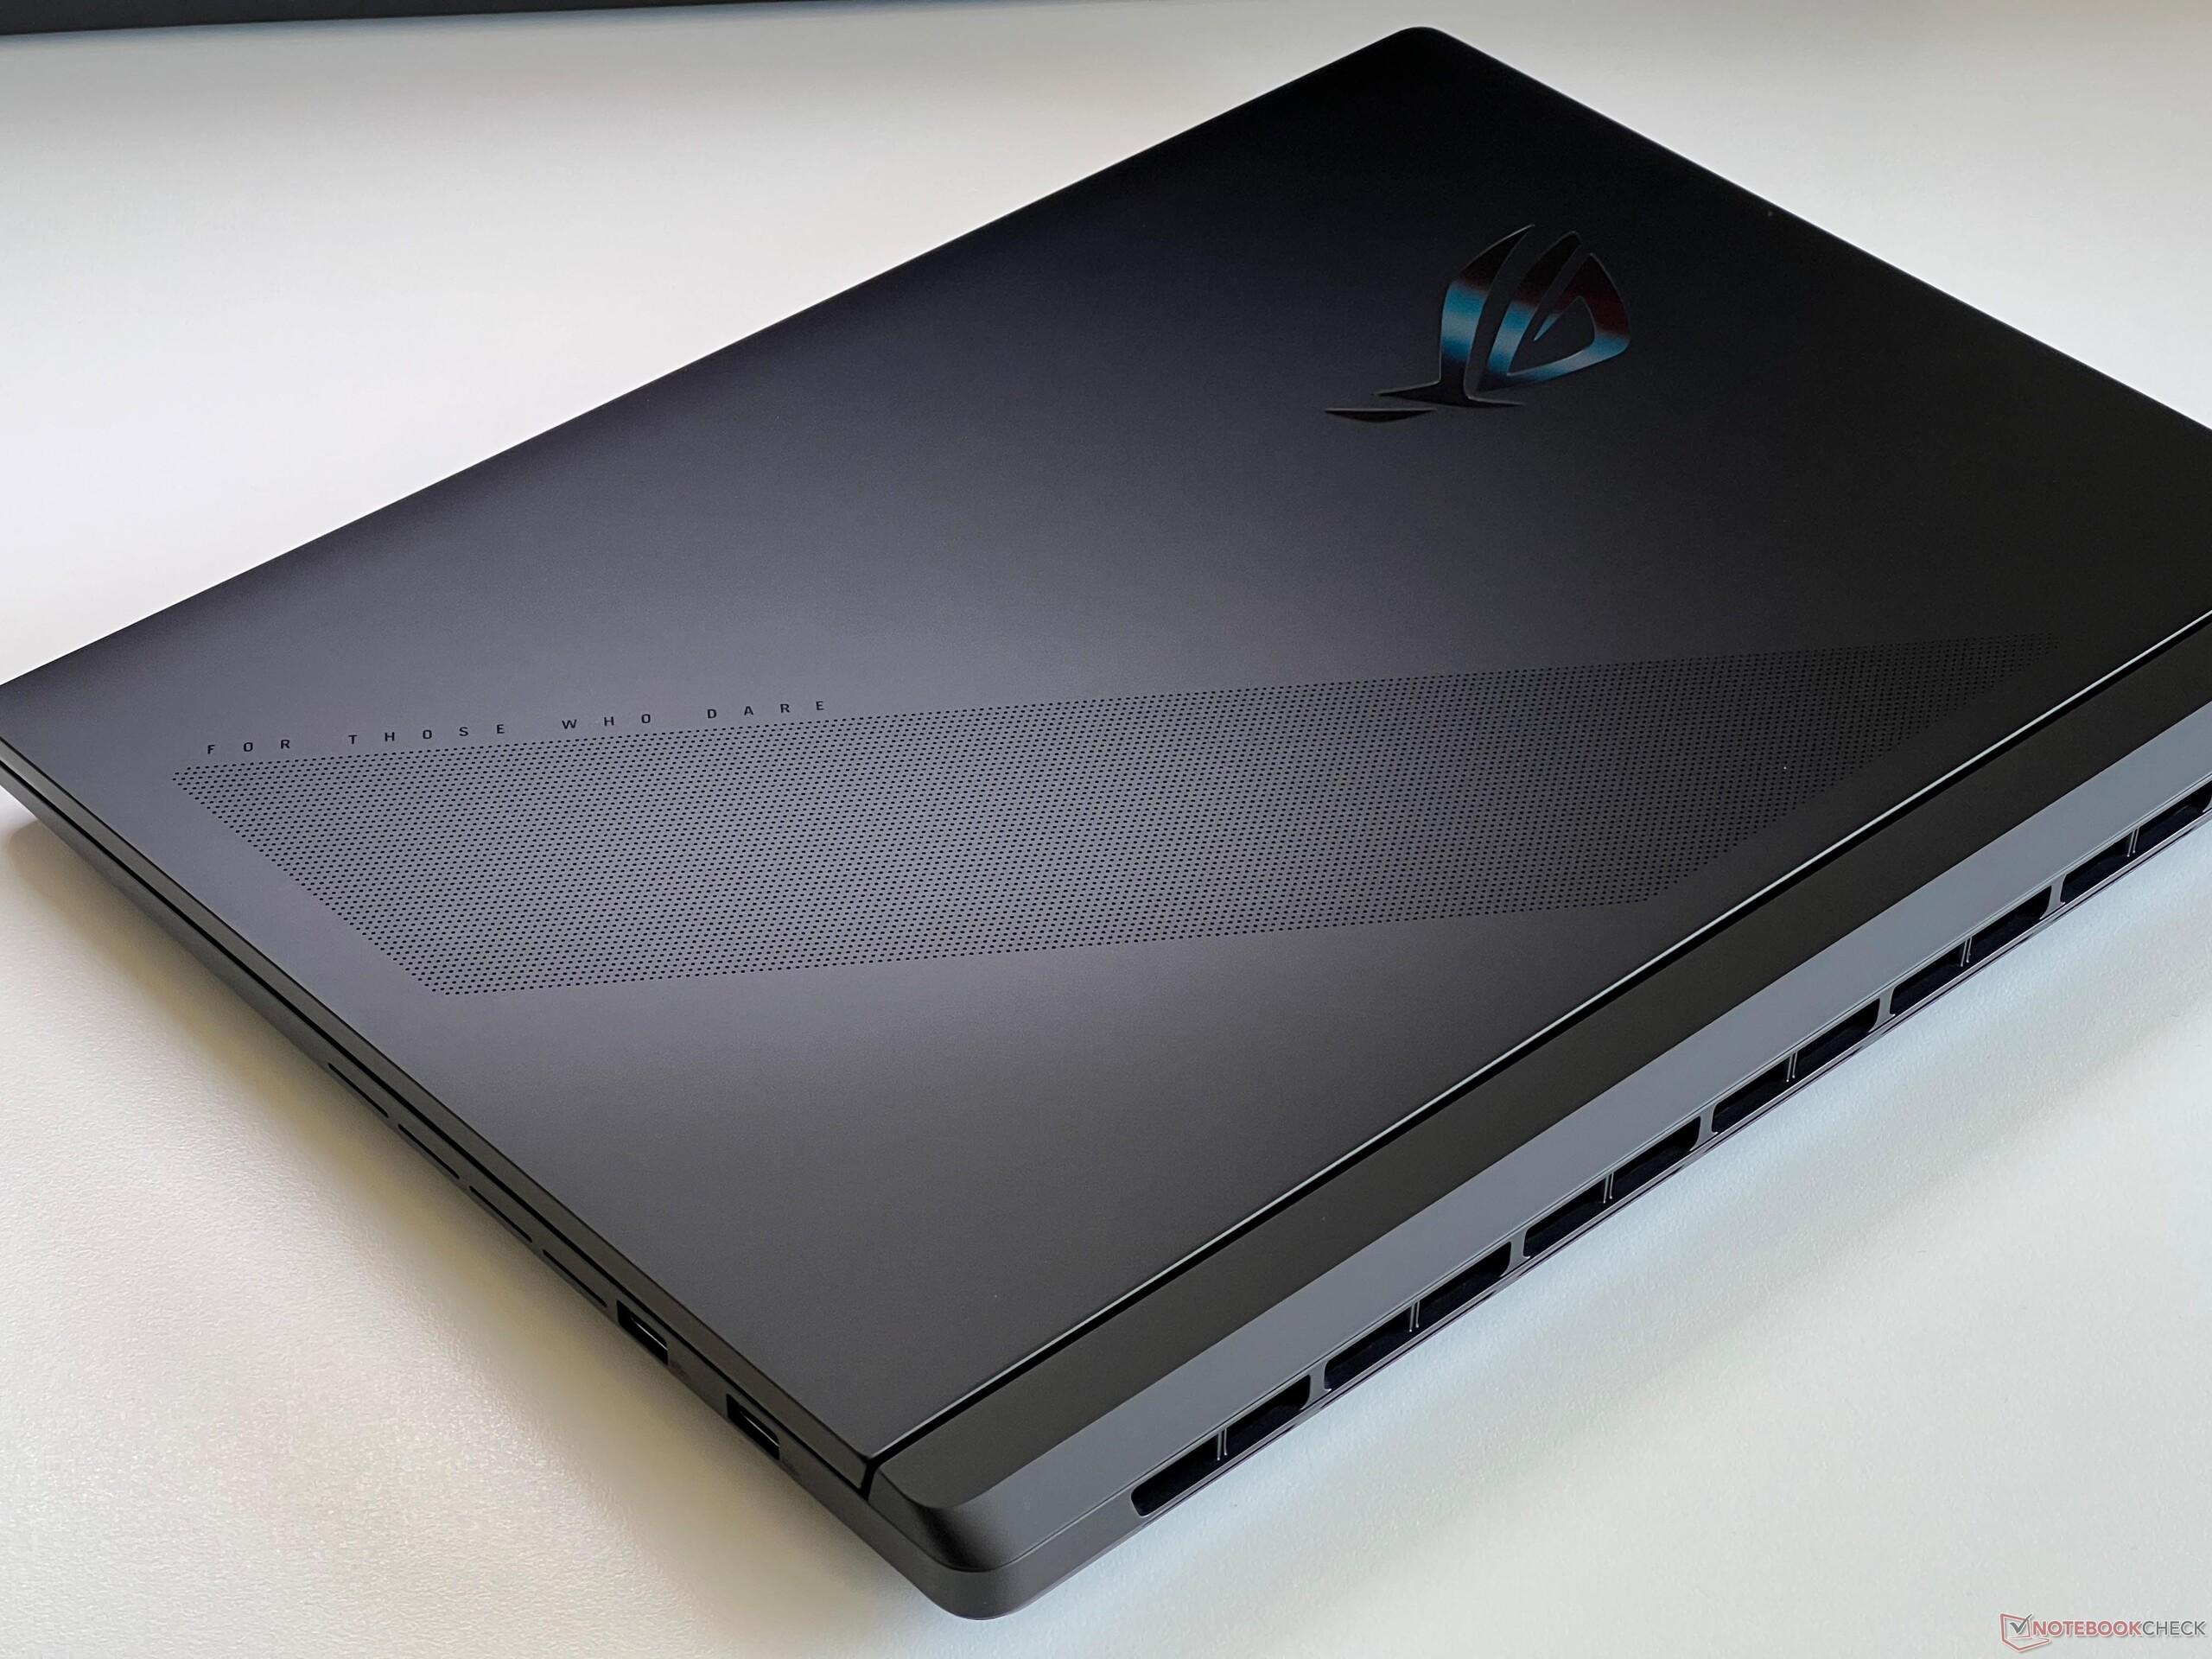
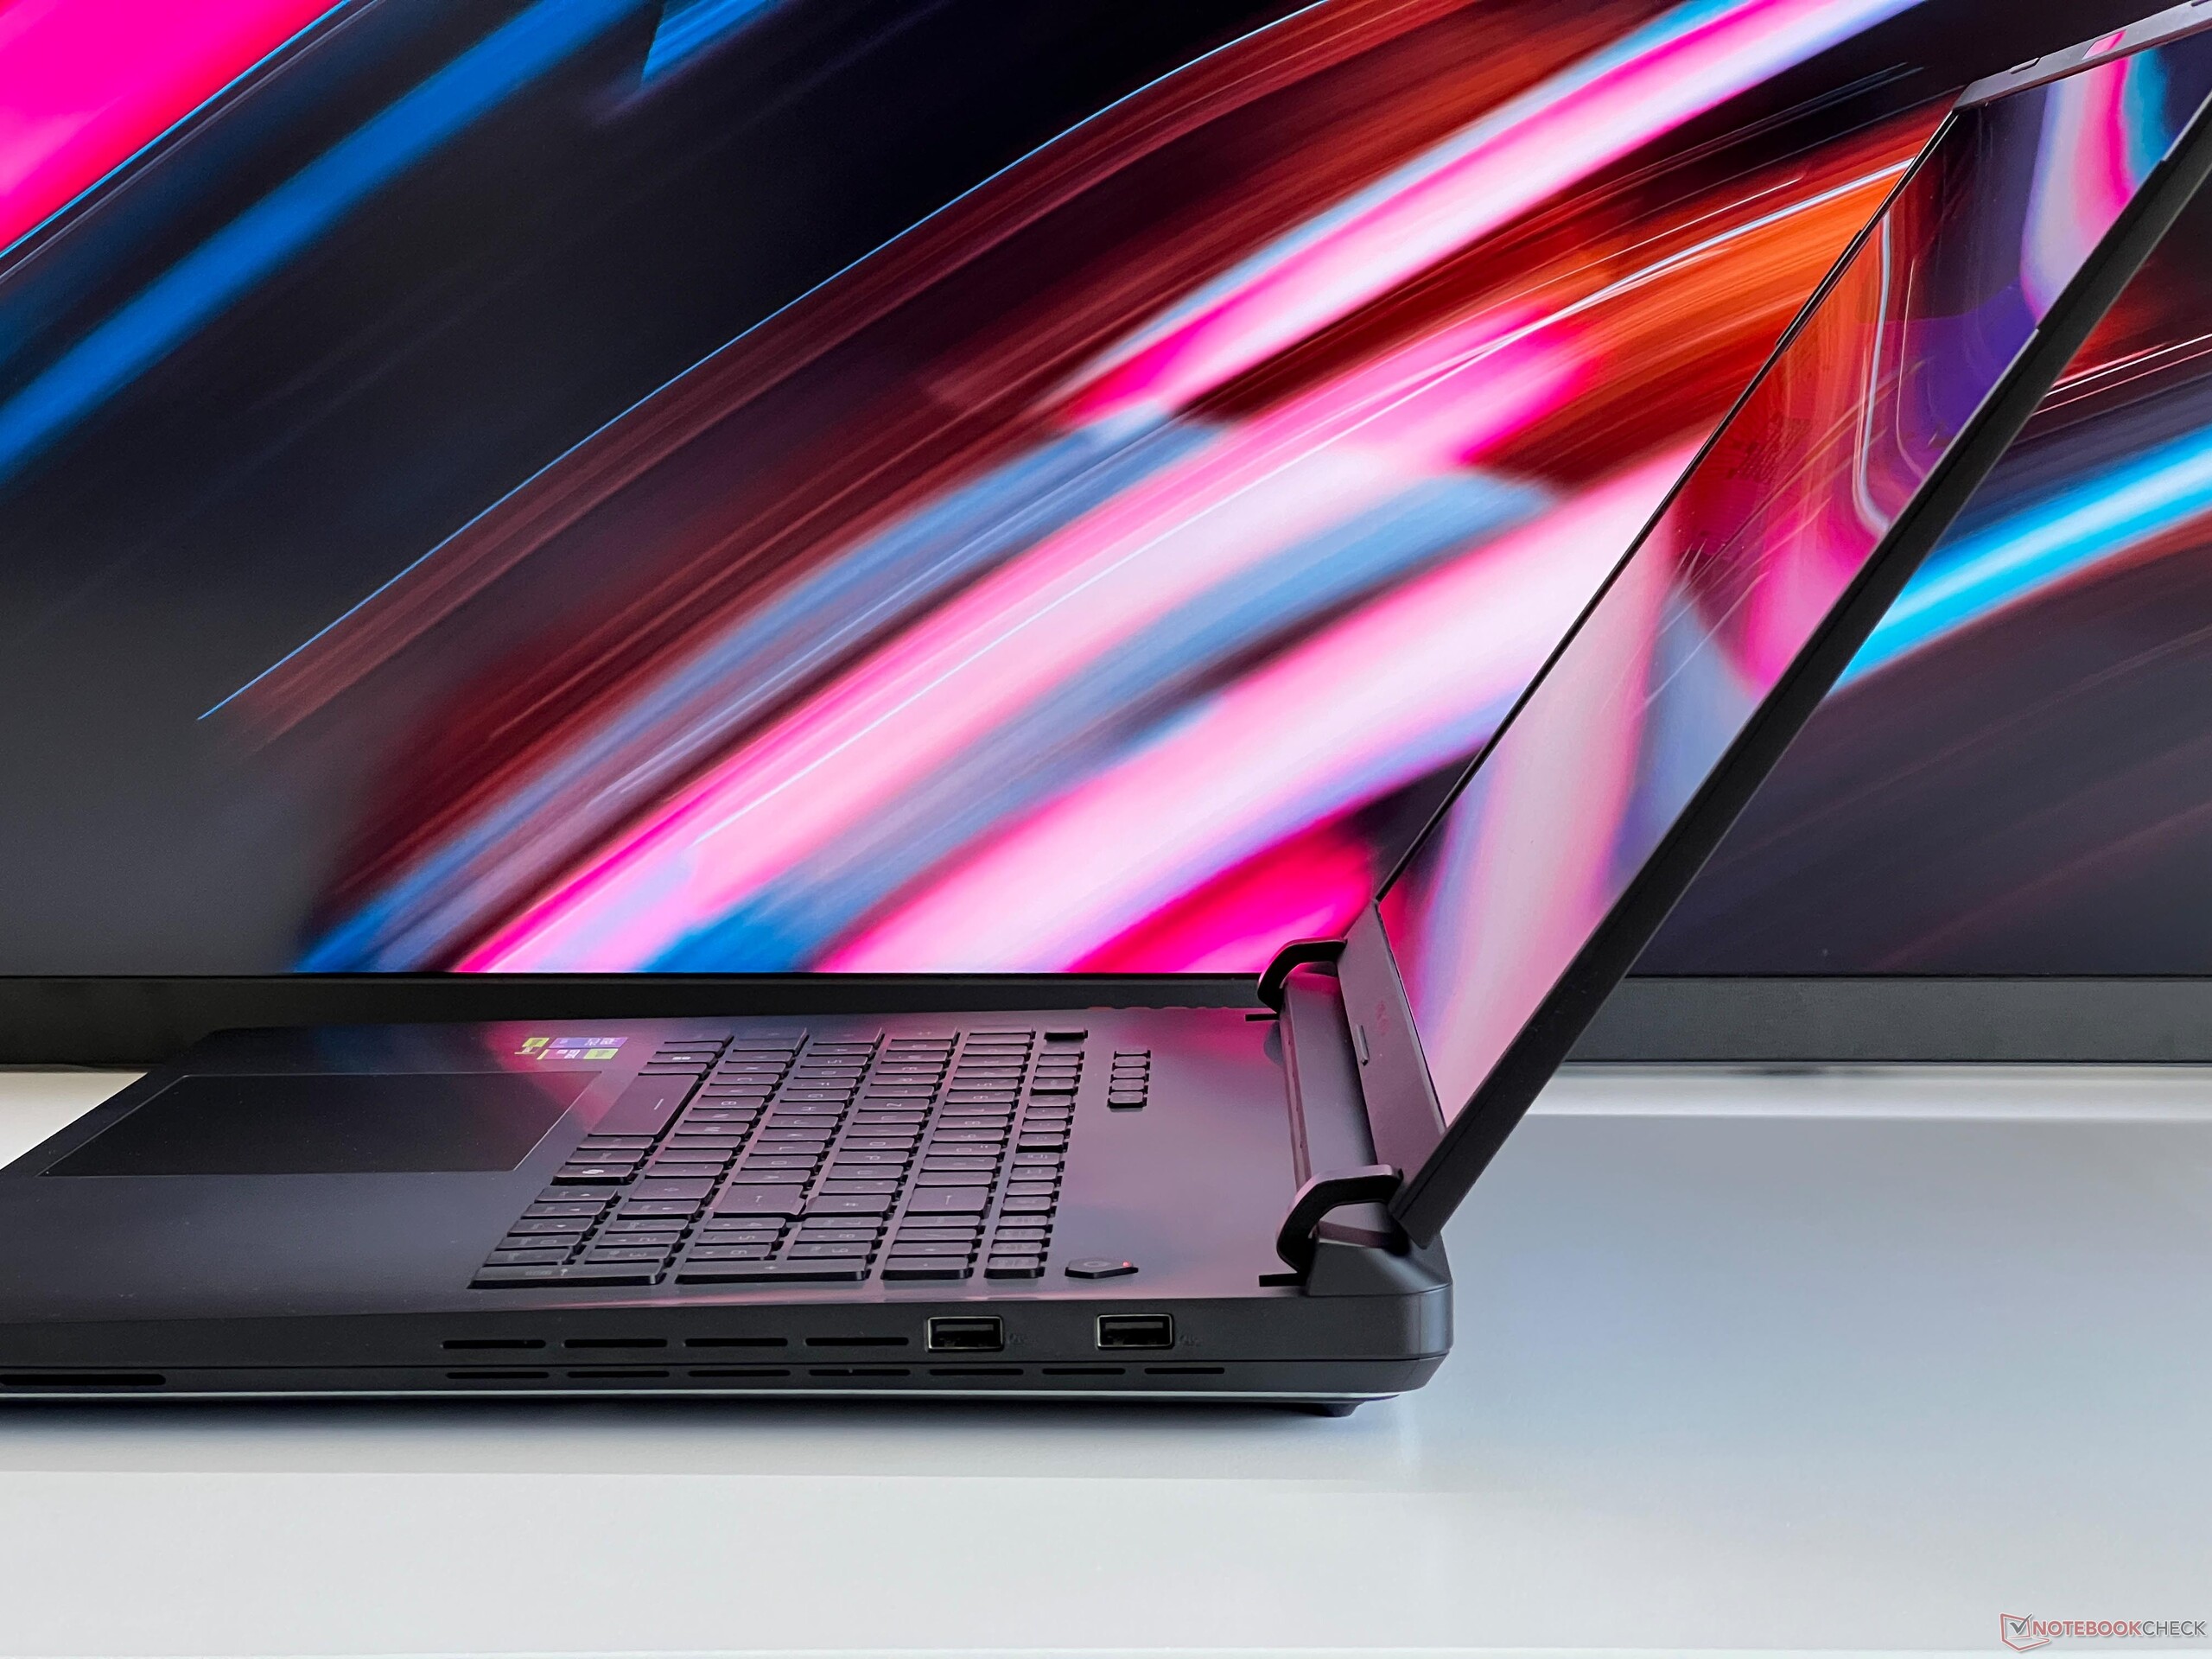
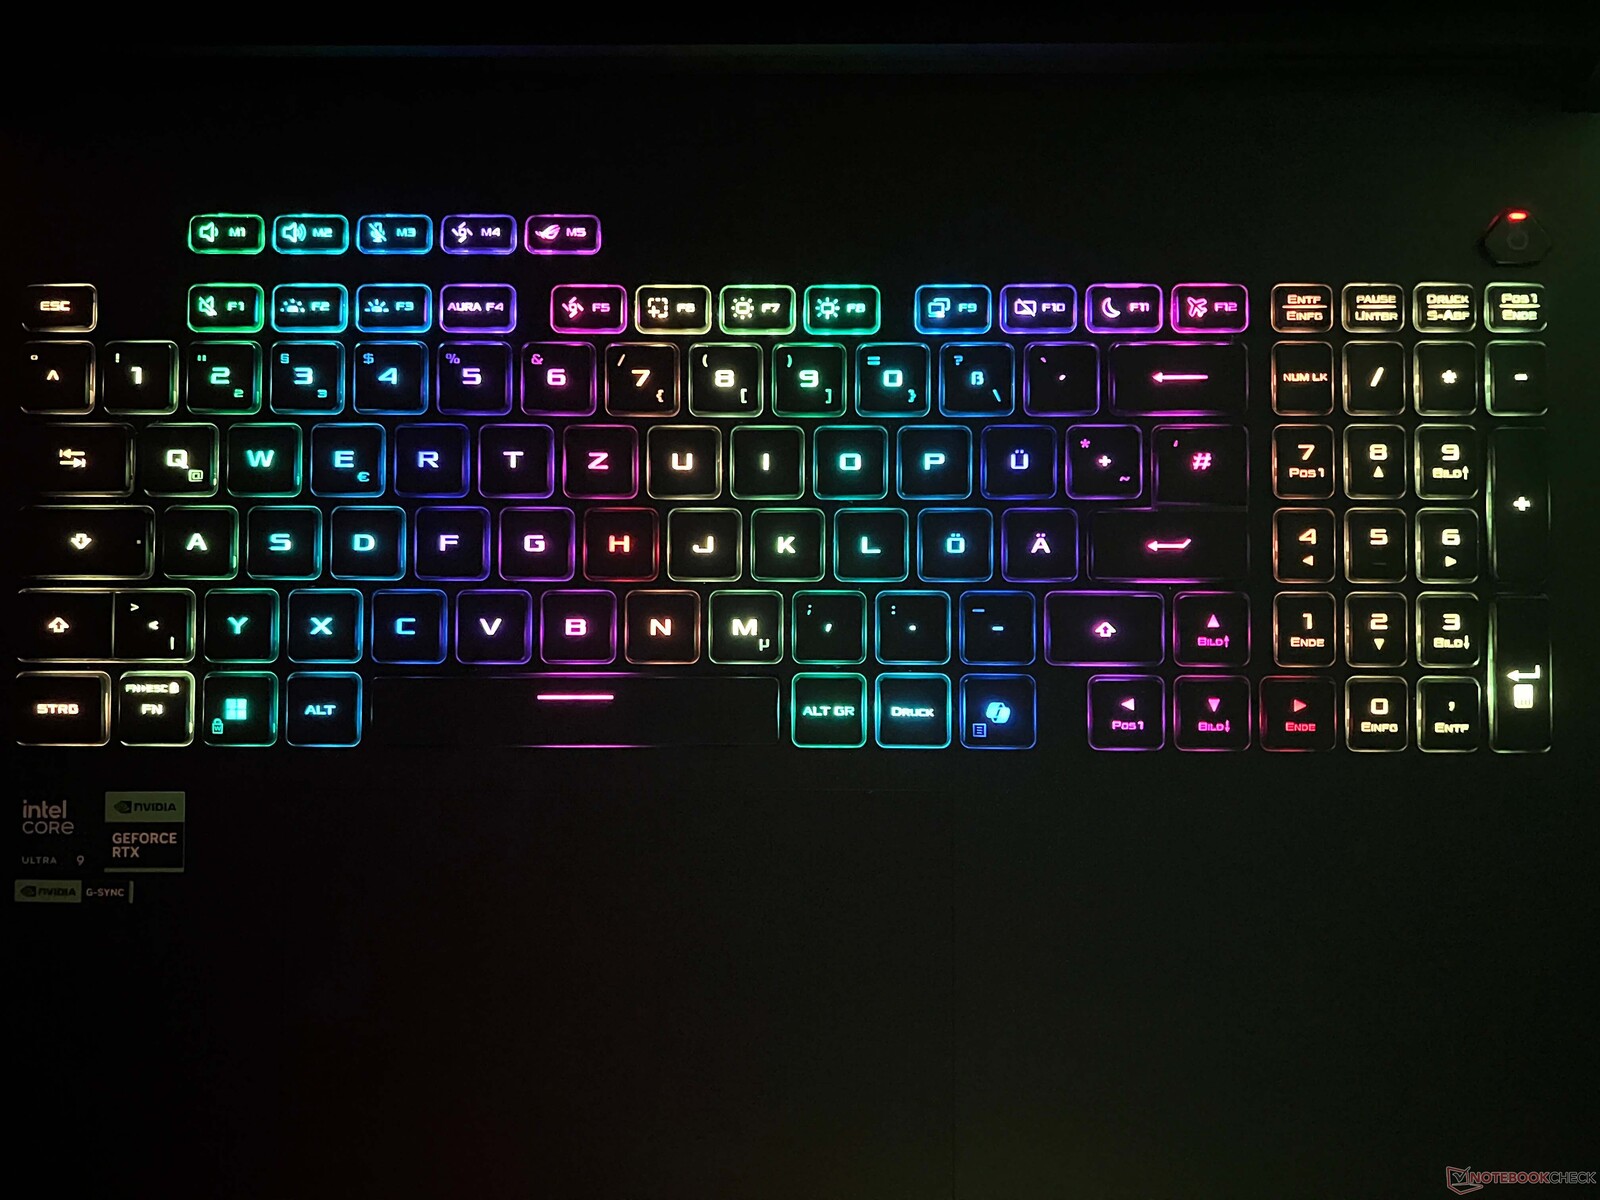
Asus hat das komplette Gehäuse überarbeitet und das Design wirkt nun deutlich stimmiger. Neu sind zudem die umlaufende LED-Leiste auf der Unterseite sowie das neue AniME-Vision Dot-Matrix-Display auf dem Bildschirmdeckel. Zusammen mit der RGB-Beleuchtung der Tastatur sowie des ROG-Logos kann man seiner Kreativität hier also freien Lauf lassen. Das AniME-Vison-Display ist eine nette Spielerei und neben vorgefertigten Schriftzügen bzw. Animationen lassen sich auch eigene Bilder als Animation verwenden.
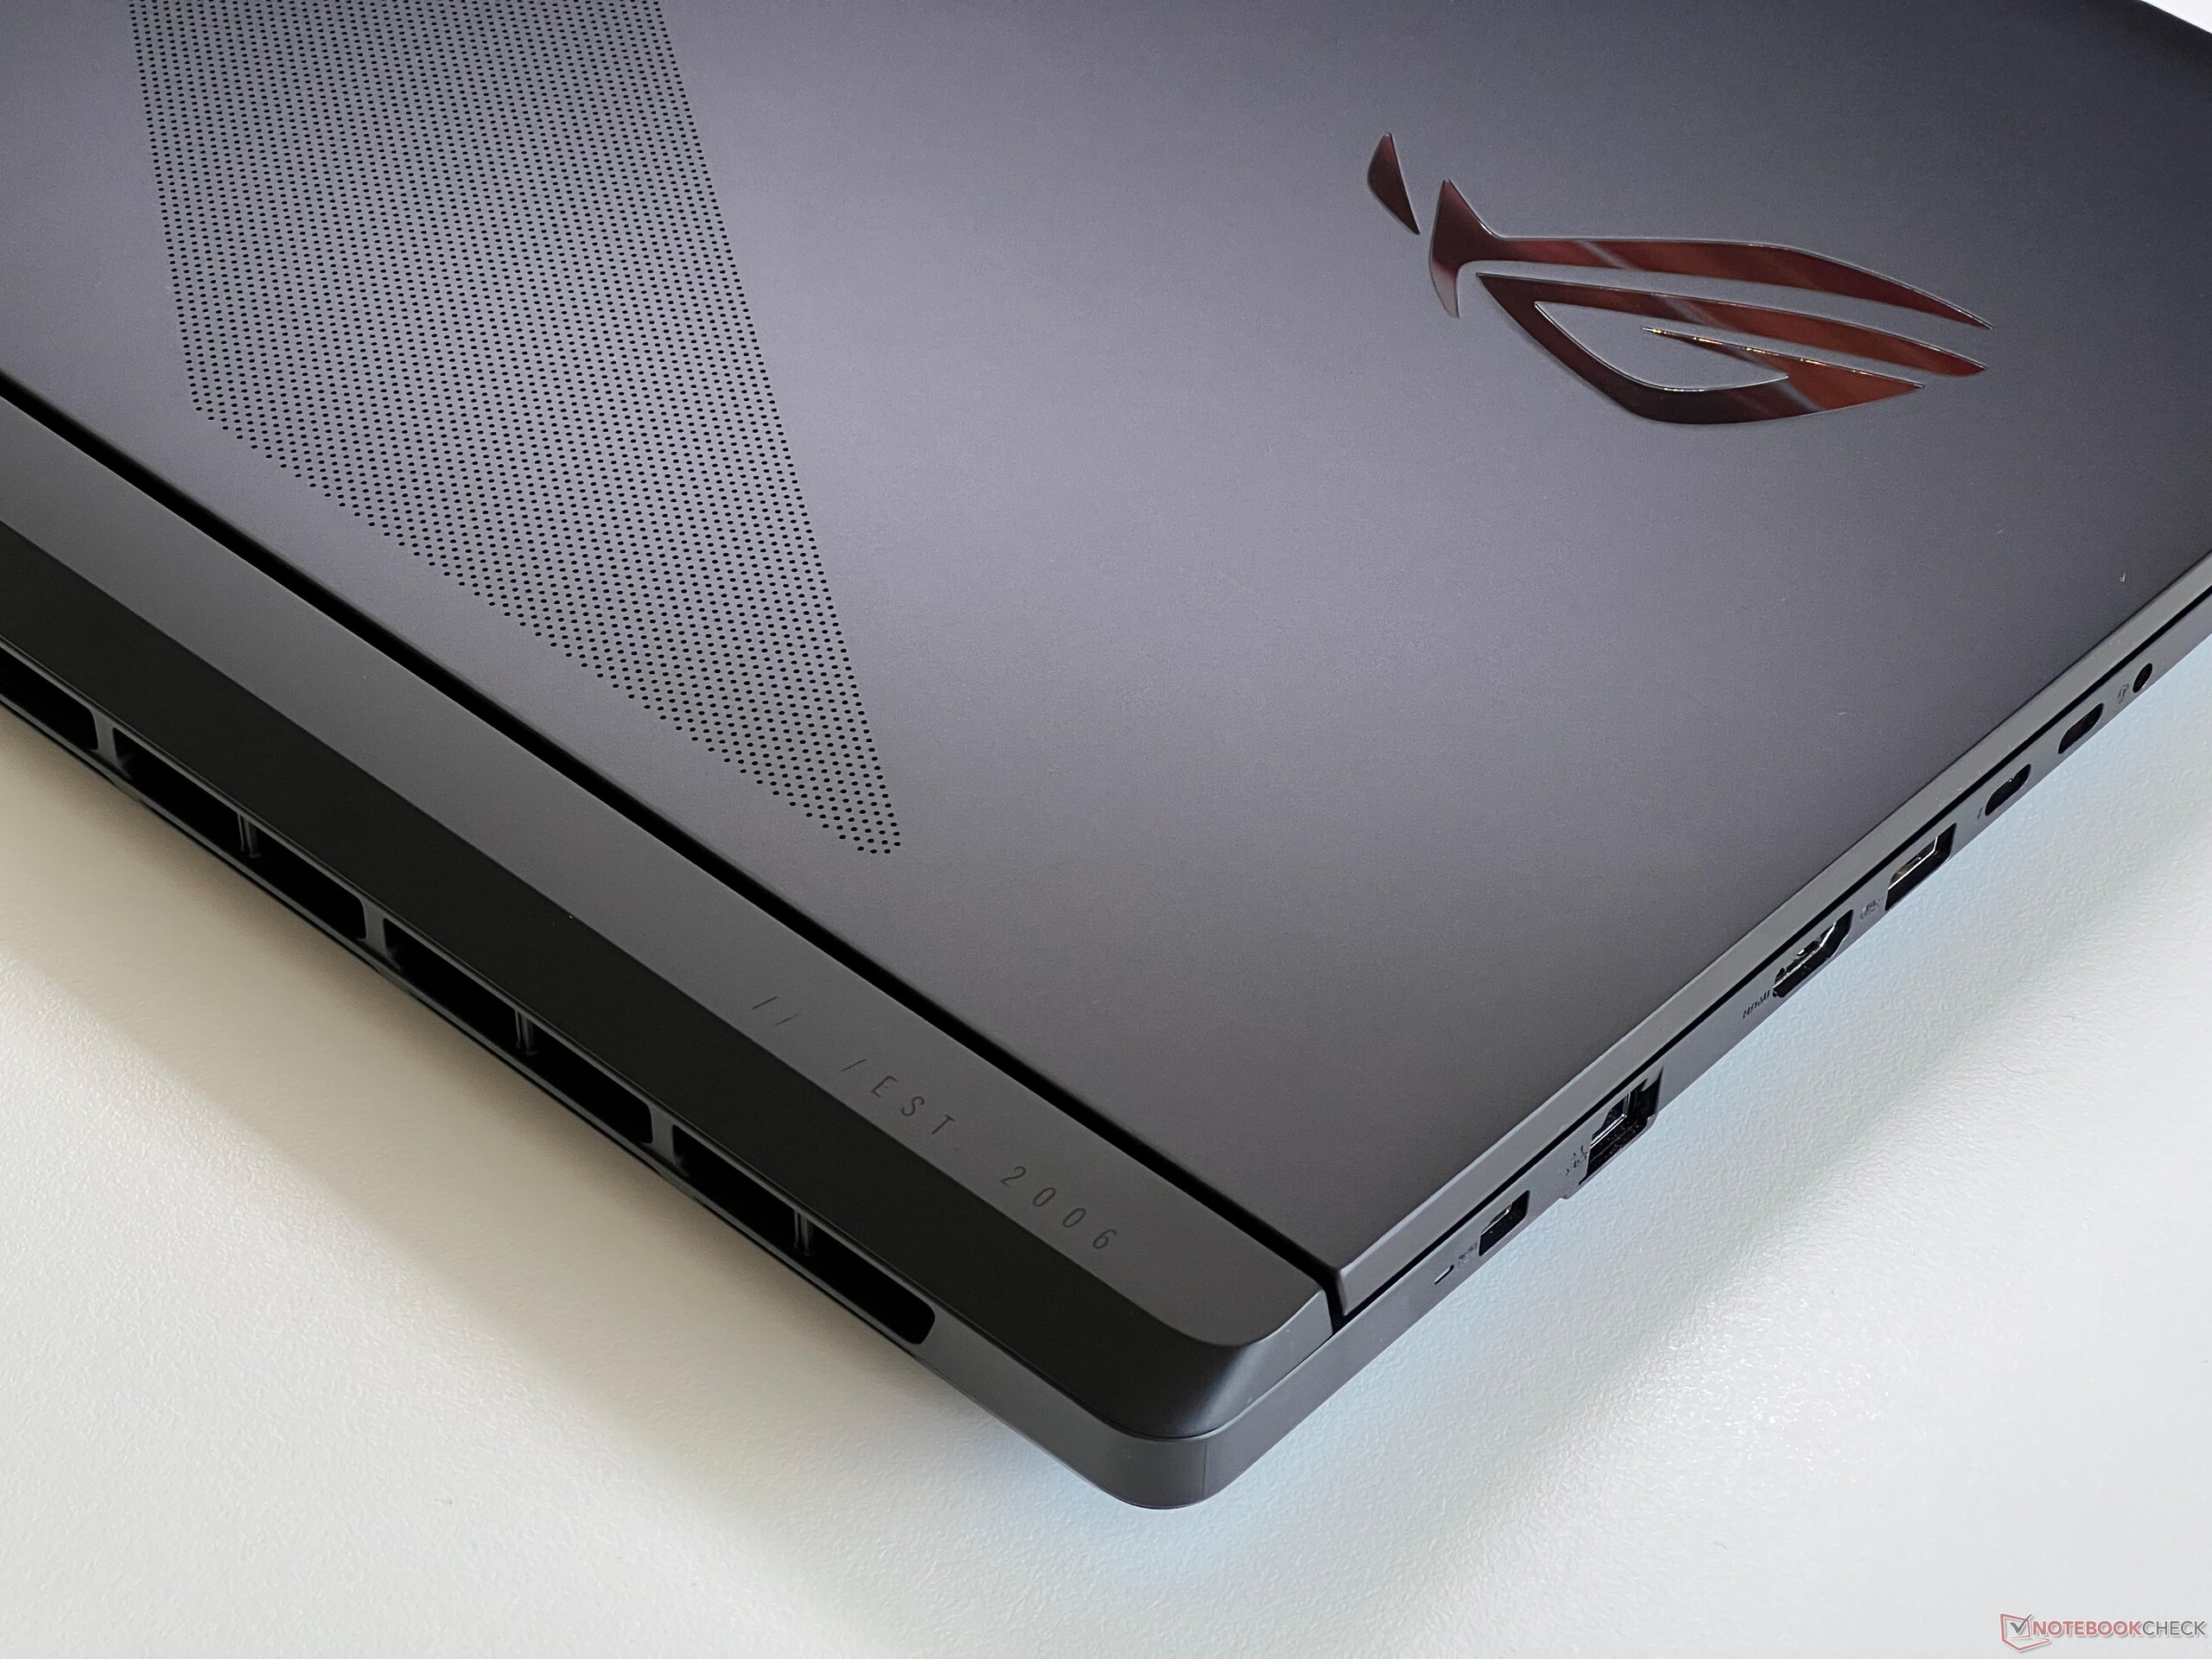
Für den Bildschirmdeckel kommt erneut Aluminium und für die Baseunit Kunststoff zum Einsatz. Die Stabilität ist insgesamt sehr gut, vor allem die glatte Oberfläche der Baseunit ist aber extrem empfindlich gegenüber Fingerabdrücken und muss regelmäßig mit einem feuchten Tuch abgewischt werden. Die Scharniere halten den Deckel ordentlich in Position (max. Öffnungswinkel 135 Grad), ein leichtes Nachwippen kann aber nicht verhindert werden. Alles in allem geht das Gehäuse in Ordnung, für ein High-End-Produkt dürfte aber auch gerne ein Voll-Metall-Gehäuse zum Einsatz kommen.
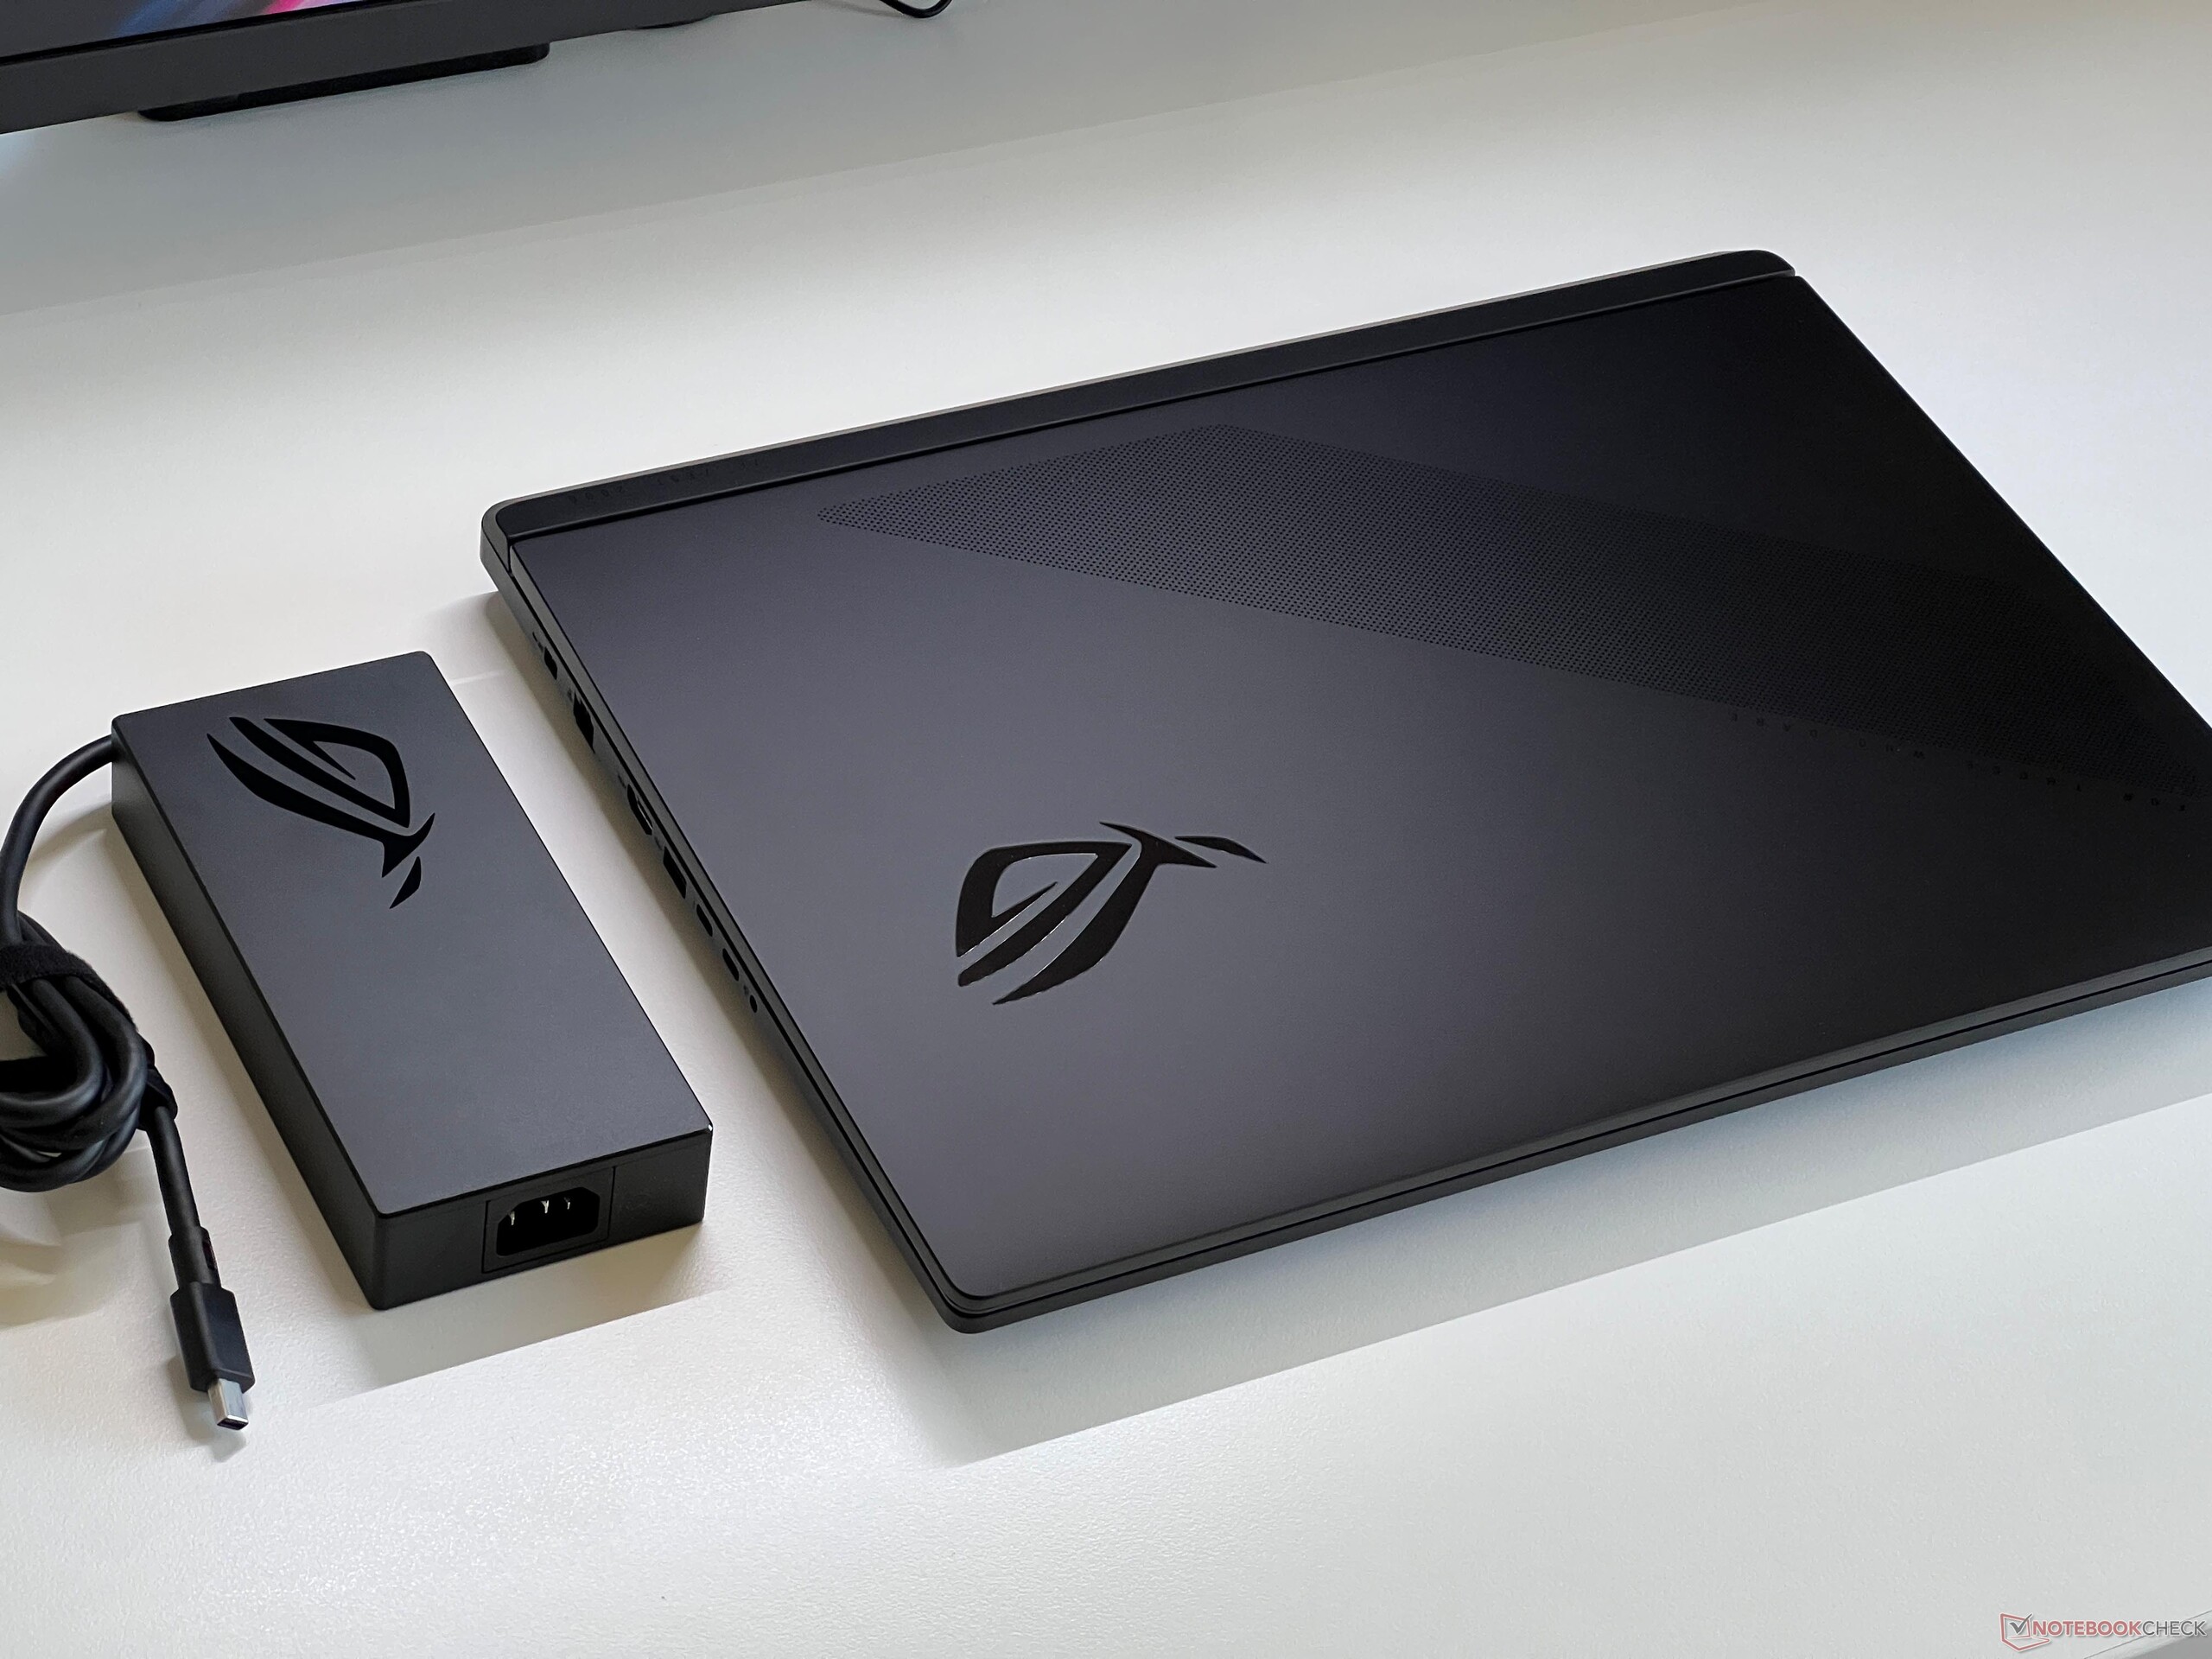
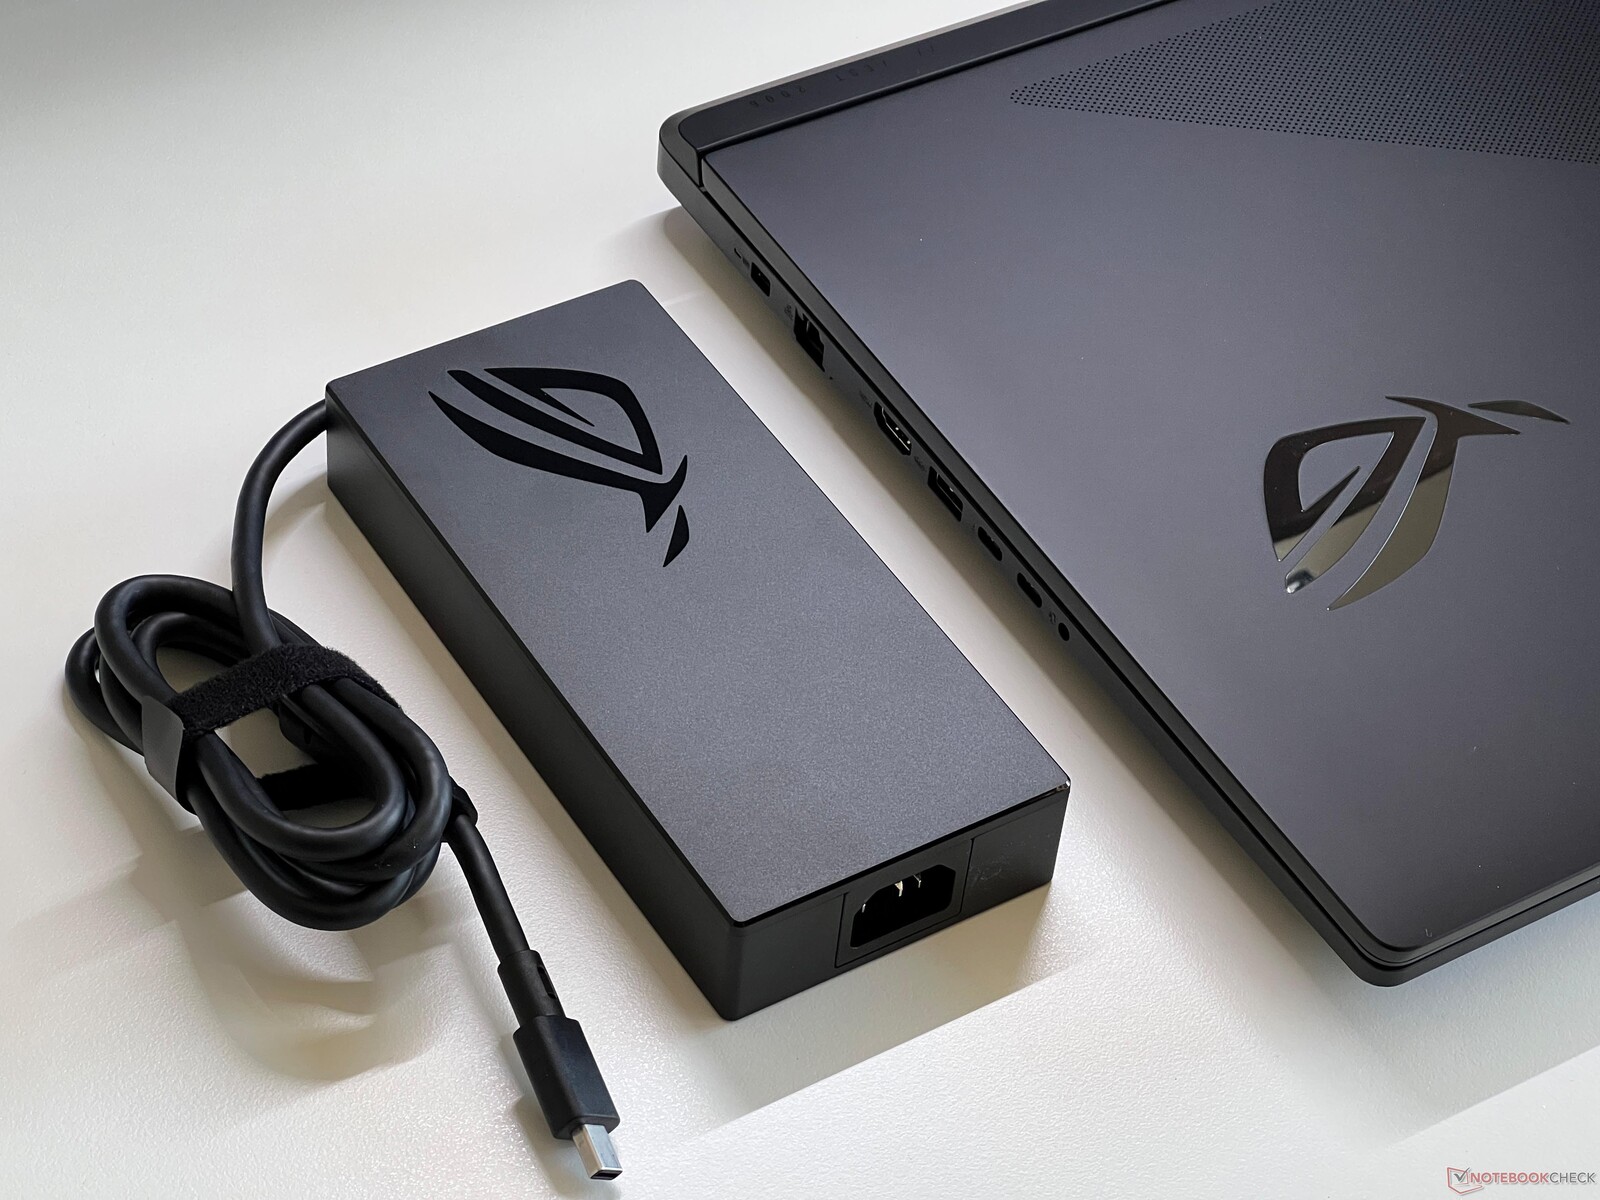
Unter den 18-Zoll-Gamern ist das neue Strix SCAR 18 noch relativ kompakt und mit 3,3 kg auch hier im Mittelfeld. Das 380-Watt-Netzteil 986 Gramm.
Ausstattung - SCAR 18 mit Thunderbolt 5
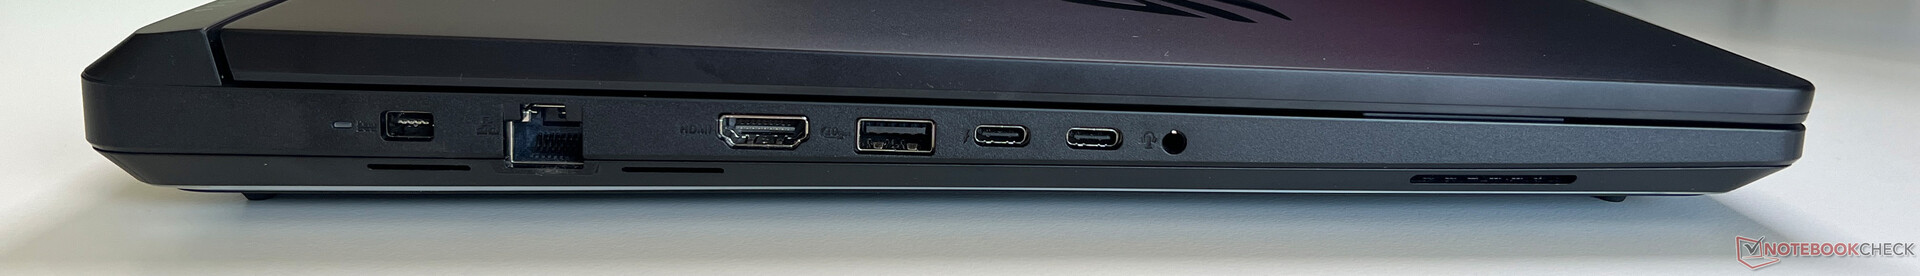
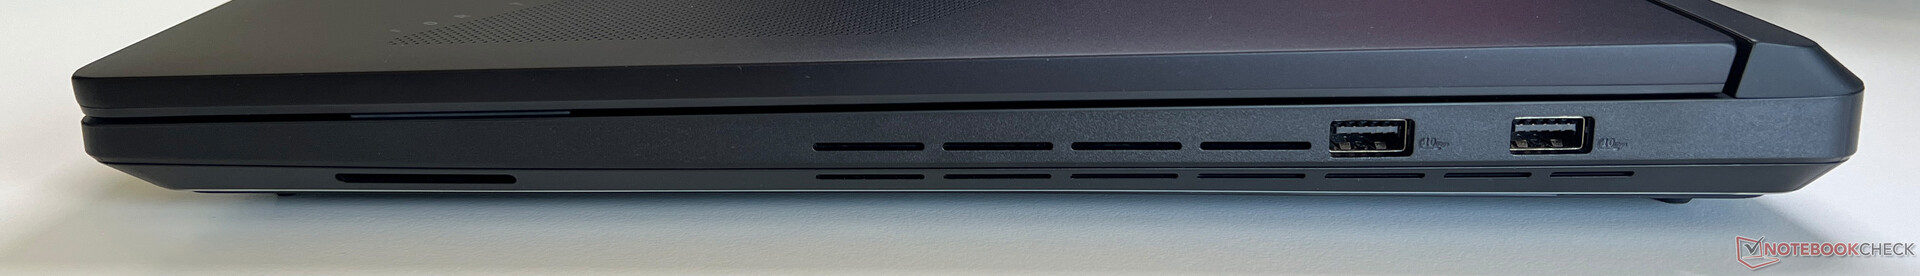
Die Anschlussverteilung hat sich nicht verändert, die beiden USB-C-Anschlüsse unterstützen nun aber Thunderbolt 5 mit bis zu 120 GB/s. Dass es keine Anschlüsse auf der Rückseite gibt (z. B. Power, Display, Ethernet) ist nicht ideal. Aufgrund der schwachen Arrow-Lake-NPU darf der Laptop nicht die Bezeichnung Copilot+ tragen, Funktionen wie die Studio-Effekte für die Webcam oder Live-Untertitel werden aber unterstützt.
Kommunikation
Das SCAR 18 bietet neben dem 2.5-Gbit/s-Ethernet-Anschluss ein modernes Wi-Fi-7-Modul inklusive Bluetooth 5.4. Die Transferraten in Verbindung mit unserem Referenzrouter von Asus waren hoch und auch stabil. Während des Tests gab es keine Probleme mit der Signalqualität.
| Networking | |
| Asus Strix Scar 18 G835LX | |
| iperf3 transmit AXE11000 | |
| iperf3 receive AXE11000 | |
| Razer Blade 18 2024 RZ09-0509 | |
| iperf3 transmit AXE11000 | |
| iperf3 receive AXE11000 | |
| iperf3 transmit AXE11000 6GHz | |
| iperf3 receive AXE11000 6GHz | |
| Alienware m18 R2 | |
| iperf3 transmit AXE11000 | |
| iperf3 receive AXE11000 | |
| iperf3 transmit AXE11000 6GHz | |
| iperf3 receive AXE11000 6GHz | |
| Acer Predator Helios 18 PH18-72-98MW | |
| iperf3 transmit AXE11000 | |
| iperf3 receive AXE11000 | |
| MSI Titan 18 HX A14VIG | |
| iperf3 transmit AXE11000 | |
| iperf3 receive AXE11000 | |
| iperf3 transmit AXE11000 6GHz | |
| iperf3 receive AXE11000 6GHz | |
| Schenker Key 17 Pro (M24) | |
| iperf3 transmit AXE11000 | |
| iperf3 receive AXE11000 | |
| iperf3 transmit AXE11000 6GHz | |
| iperf3 receive AXE11000 6GHz | |
| Asus ROG Strix Scar 18 G834JYR (2024) | |
| iperf3 transmit AXE11000 | |
| iperf3 receive AXE11000 | |
Webcam
Asus verbaut weiterhin eine 2-MP-Webcam ohne Blende, die ihren Zweck erfüllt, von der Bildqualität sollte man sich aber nicht zu viel erwarten. Ein IR-Kamera für die Gesichtserkennung via Windows Hello ist ebenfalls vorhanden.


Zubehör
Unserem Testgerät lag neben einem Rucksack auch das kabelgebundene Headset ROG Fusion II 300, die Gaming-Maus Gladius III sowie ein zusätzliches 100-Watt-USB-C-Netzteil bei.
Wartung
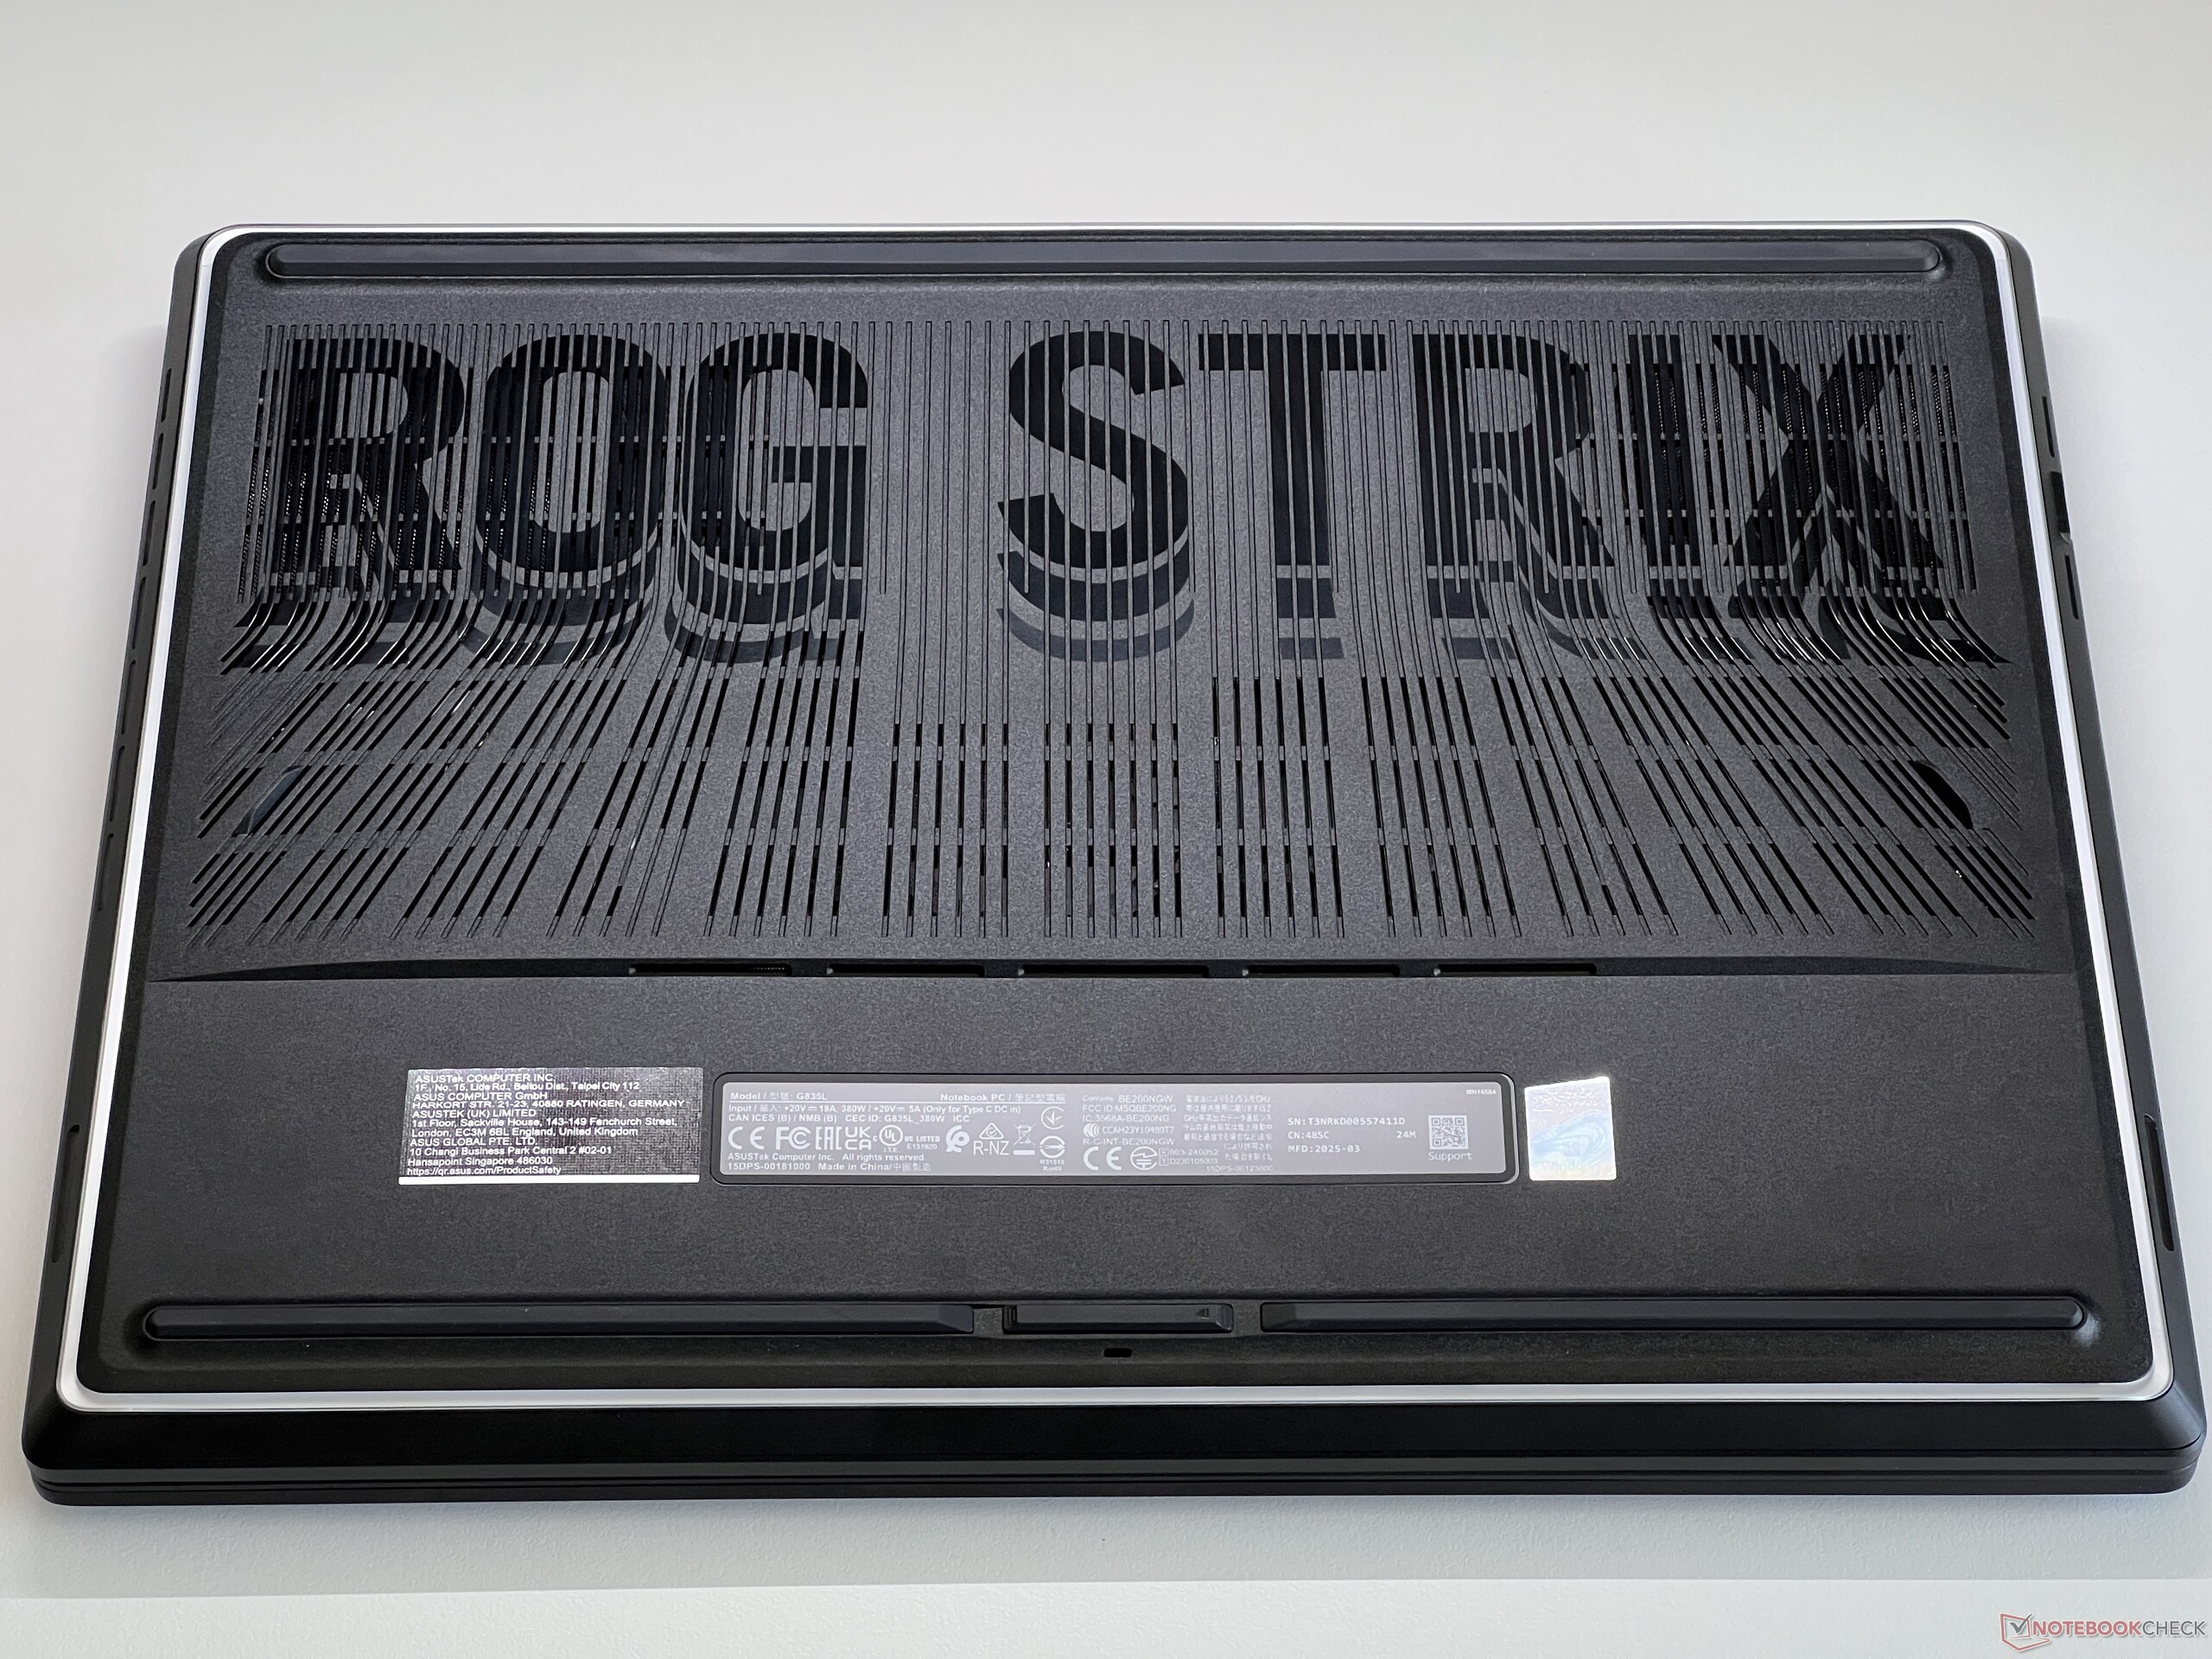
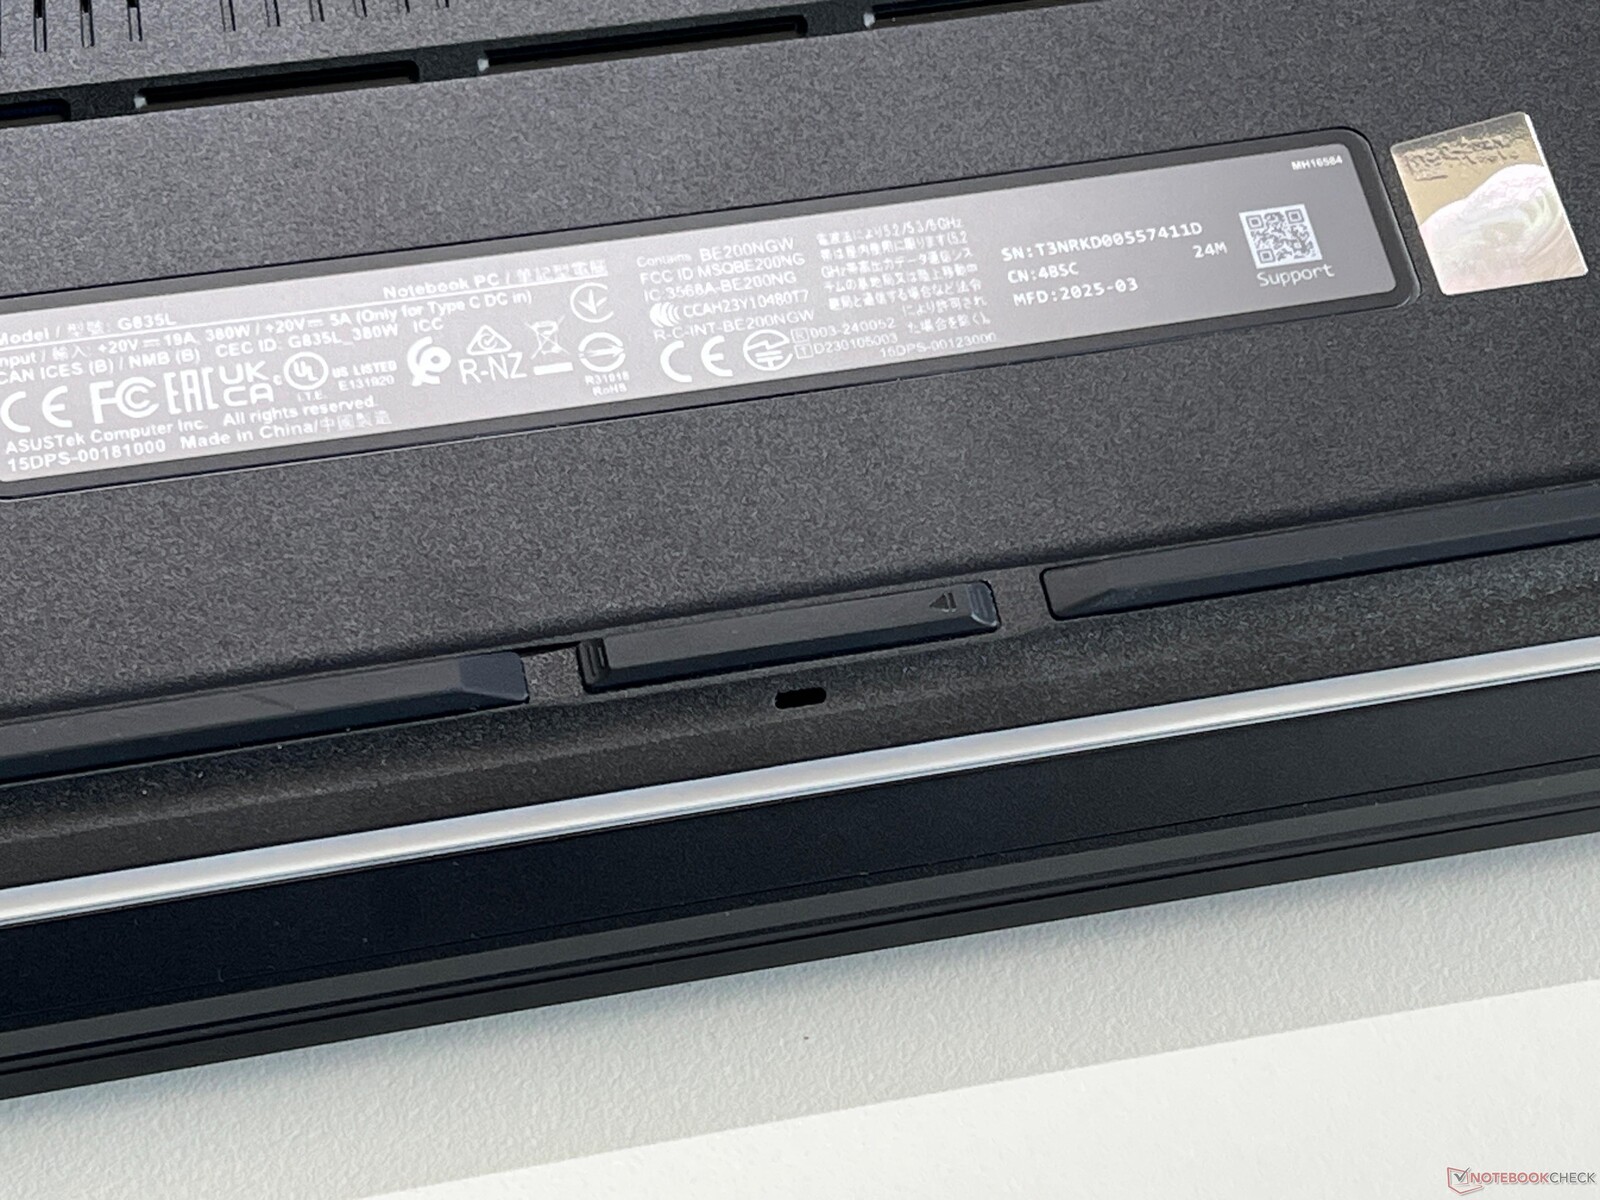
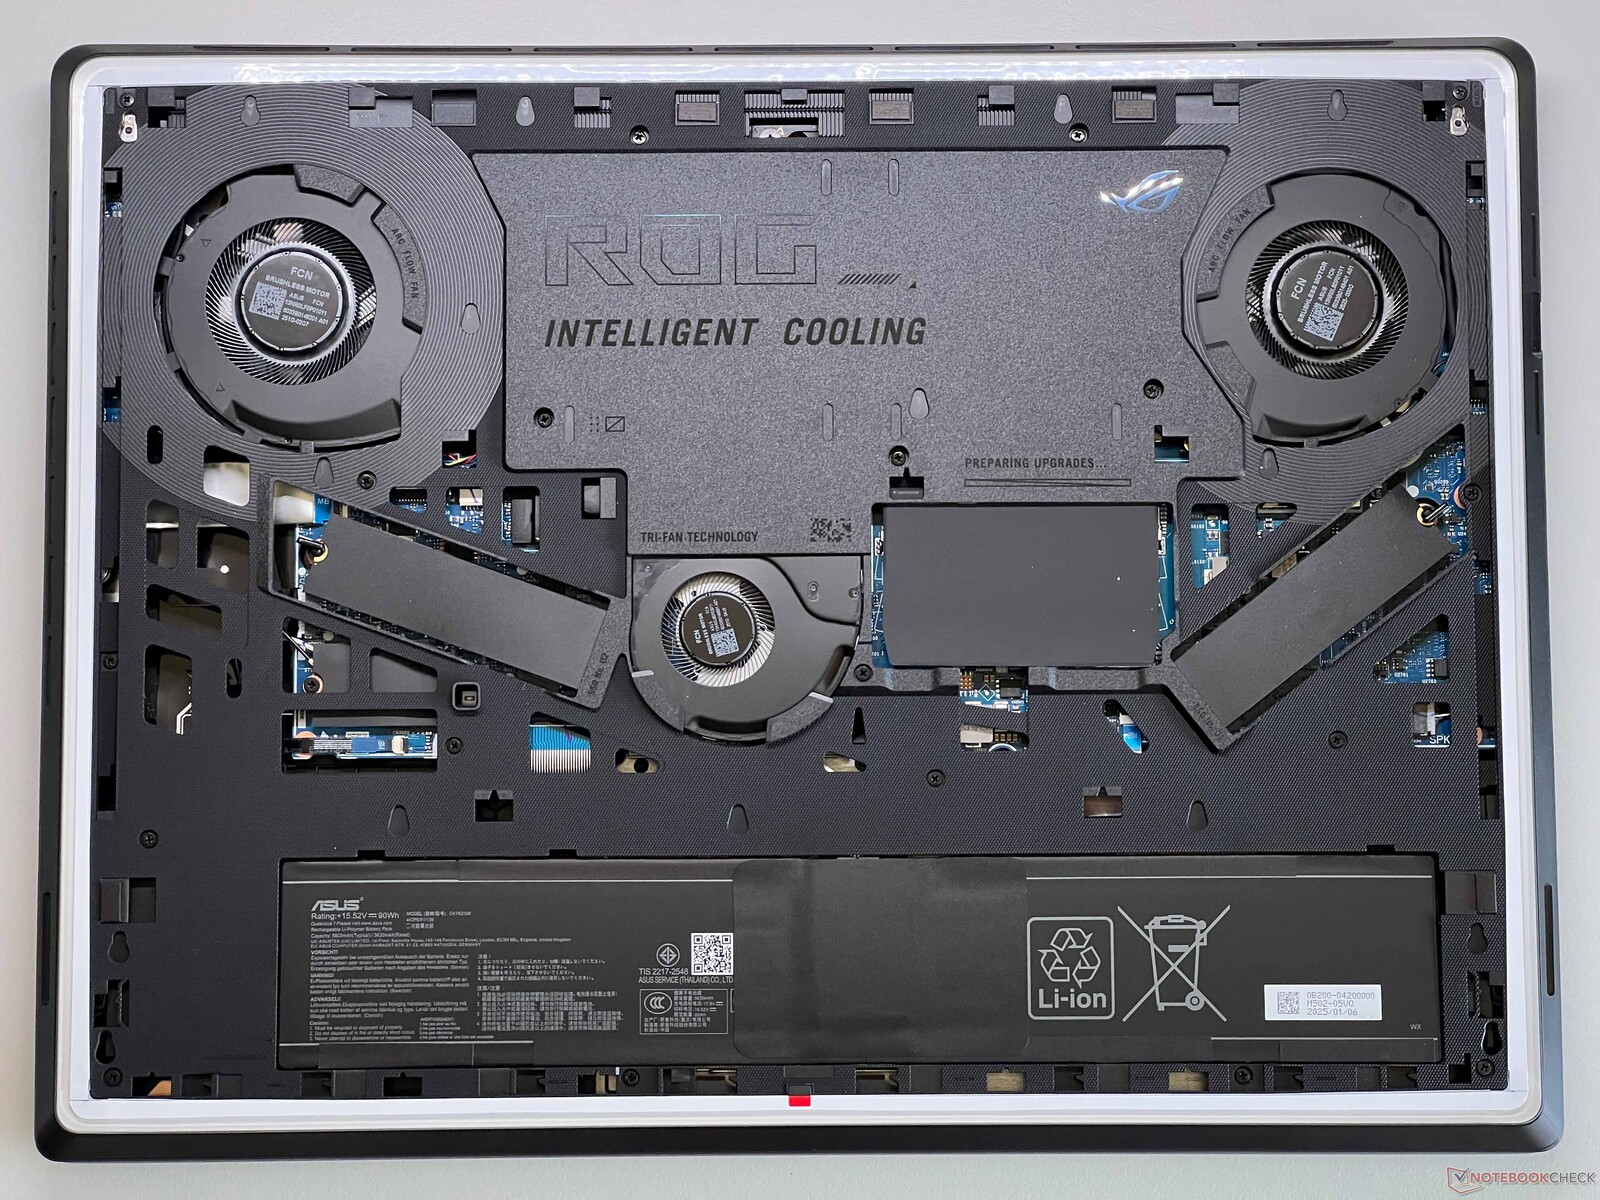
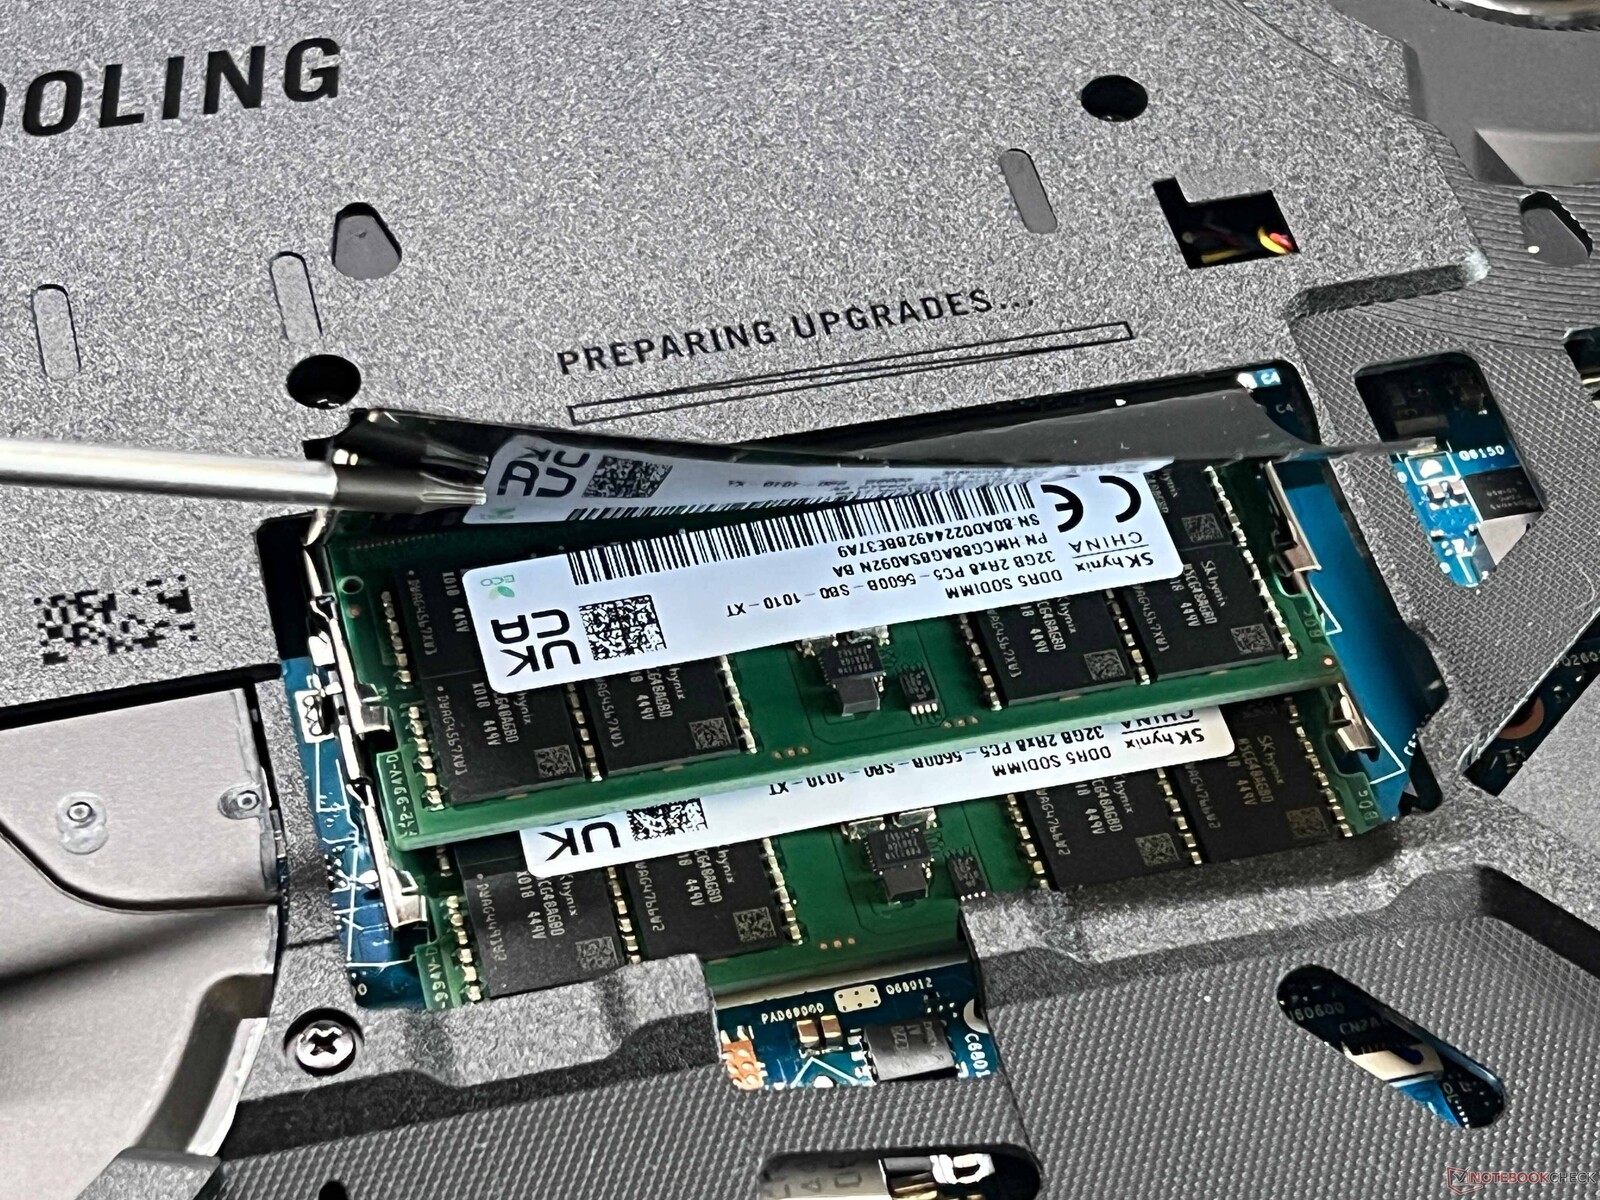
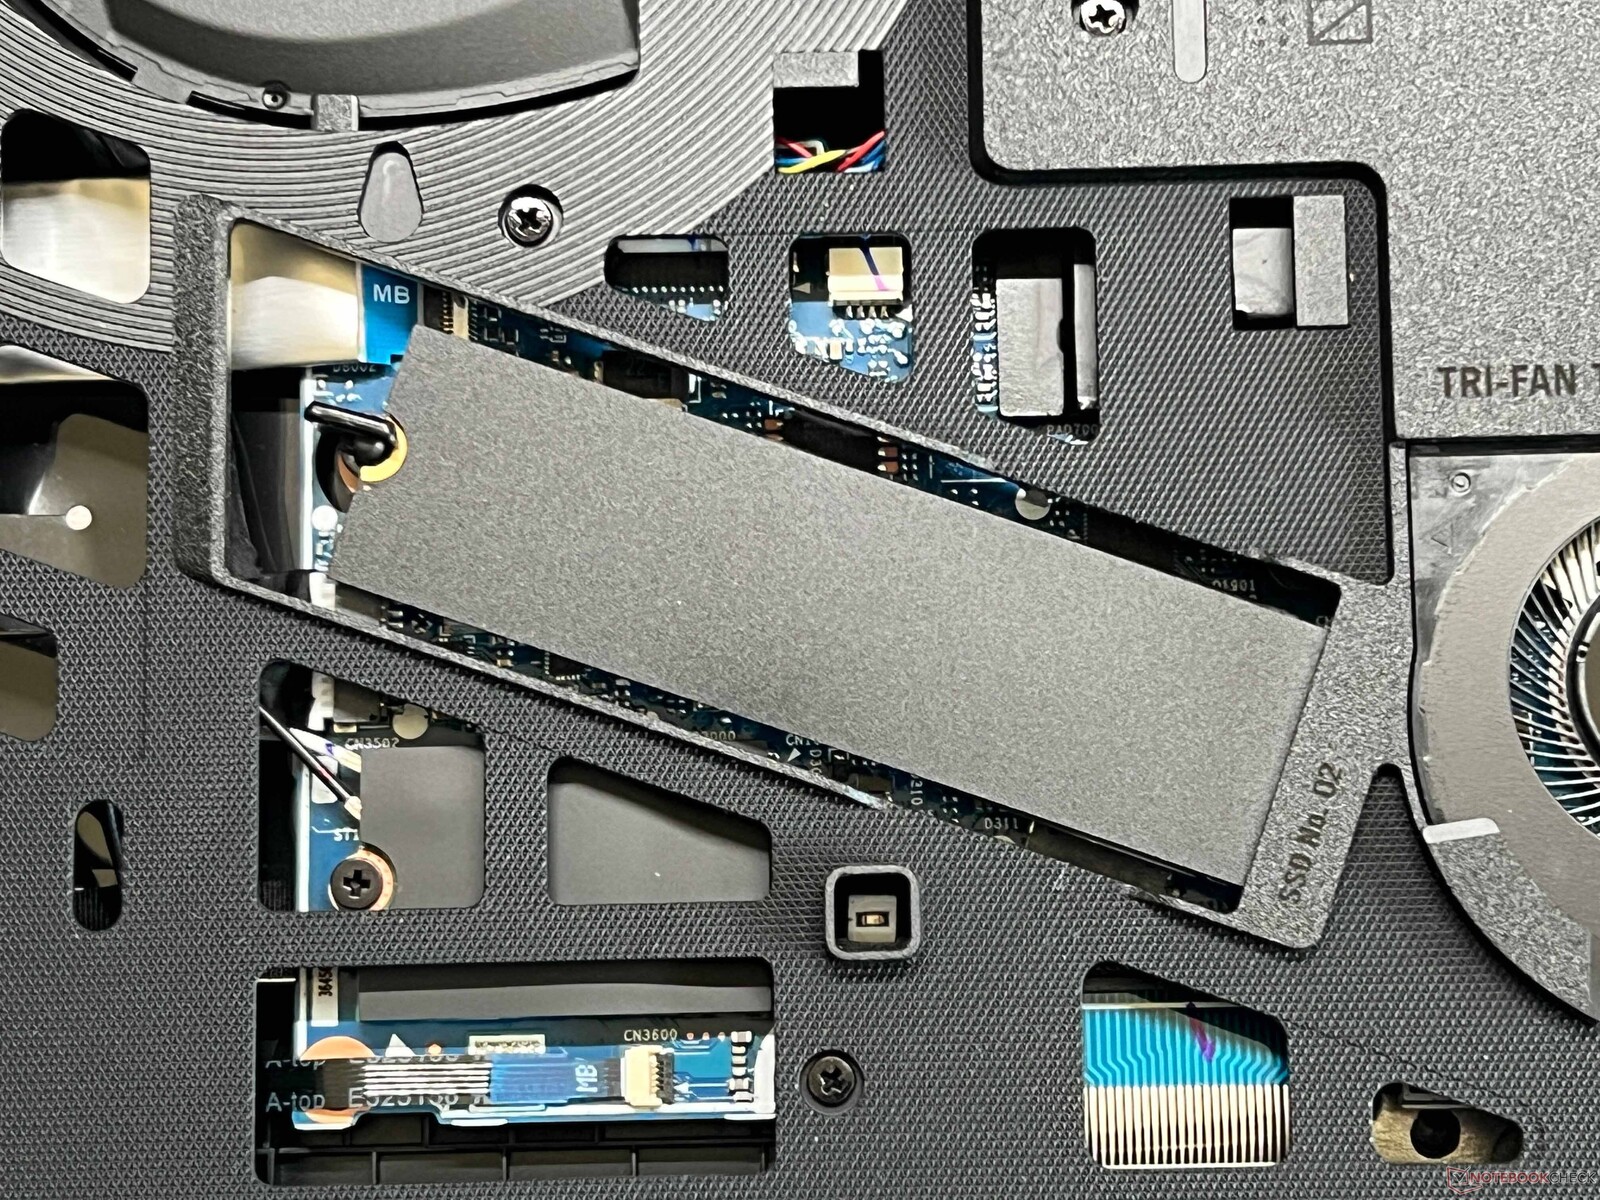
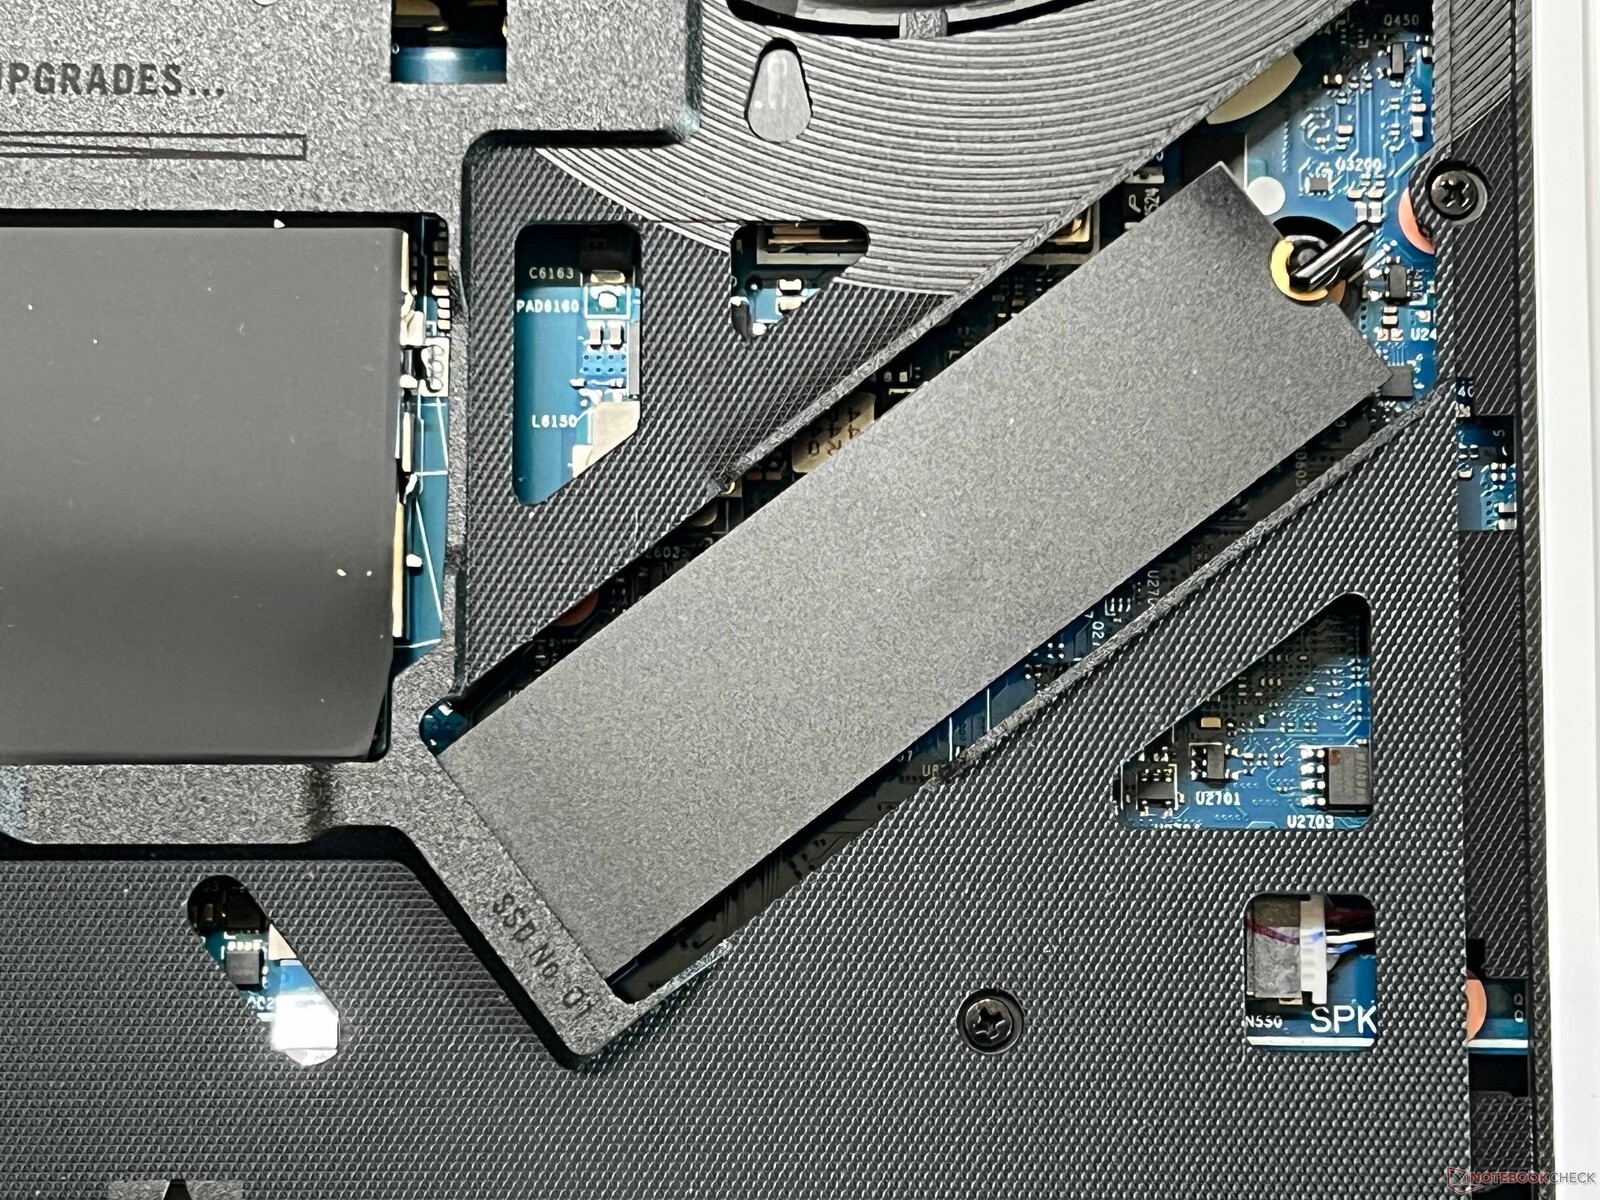
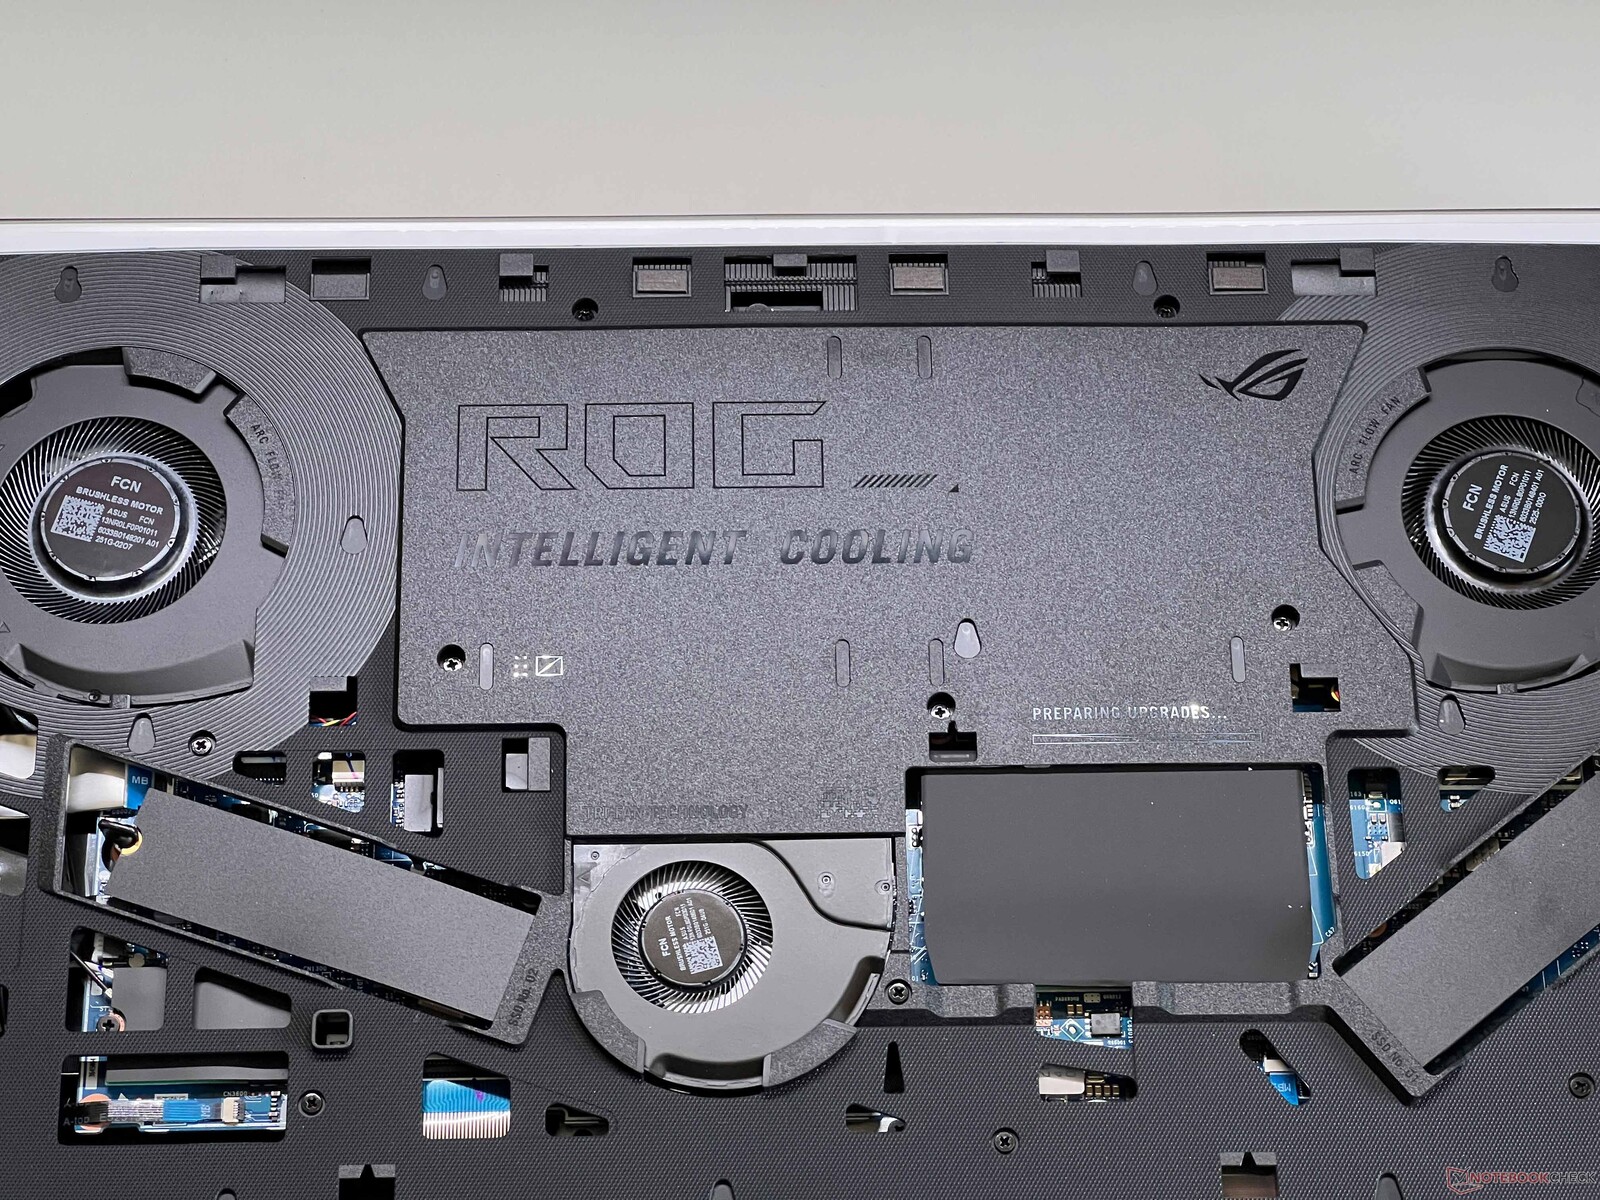
Asus hat den Zugang zu den Komponenten massiv erleichtert. Die untere Bodenplatte kann über einen Schieber entriegelt und einfach nach vorne gezogen werden. Damit erhält man Zugang zu den beiden M.2-2280-SSDs, den beiden SO-DIMM-Slots sowie den Lüftern. Der Tausch des geschraubten Akkus erfordert weitere Demontageschritte.
Nachhaltigkeit
Asus macht keine Angaben zum CO2-Fußabdruck oder dem Einsatz von recycleten Materialien. Die Verpackung besteht fast vollständig aus Papier und Pappe.
Eingabegeräte
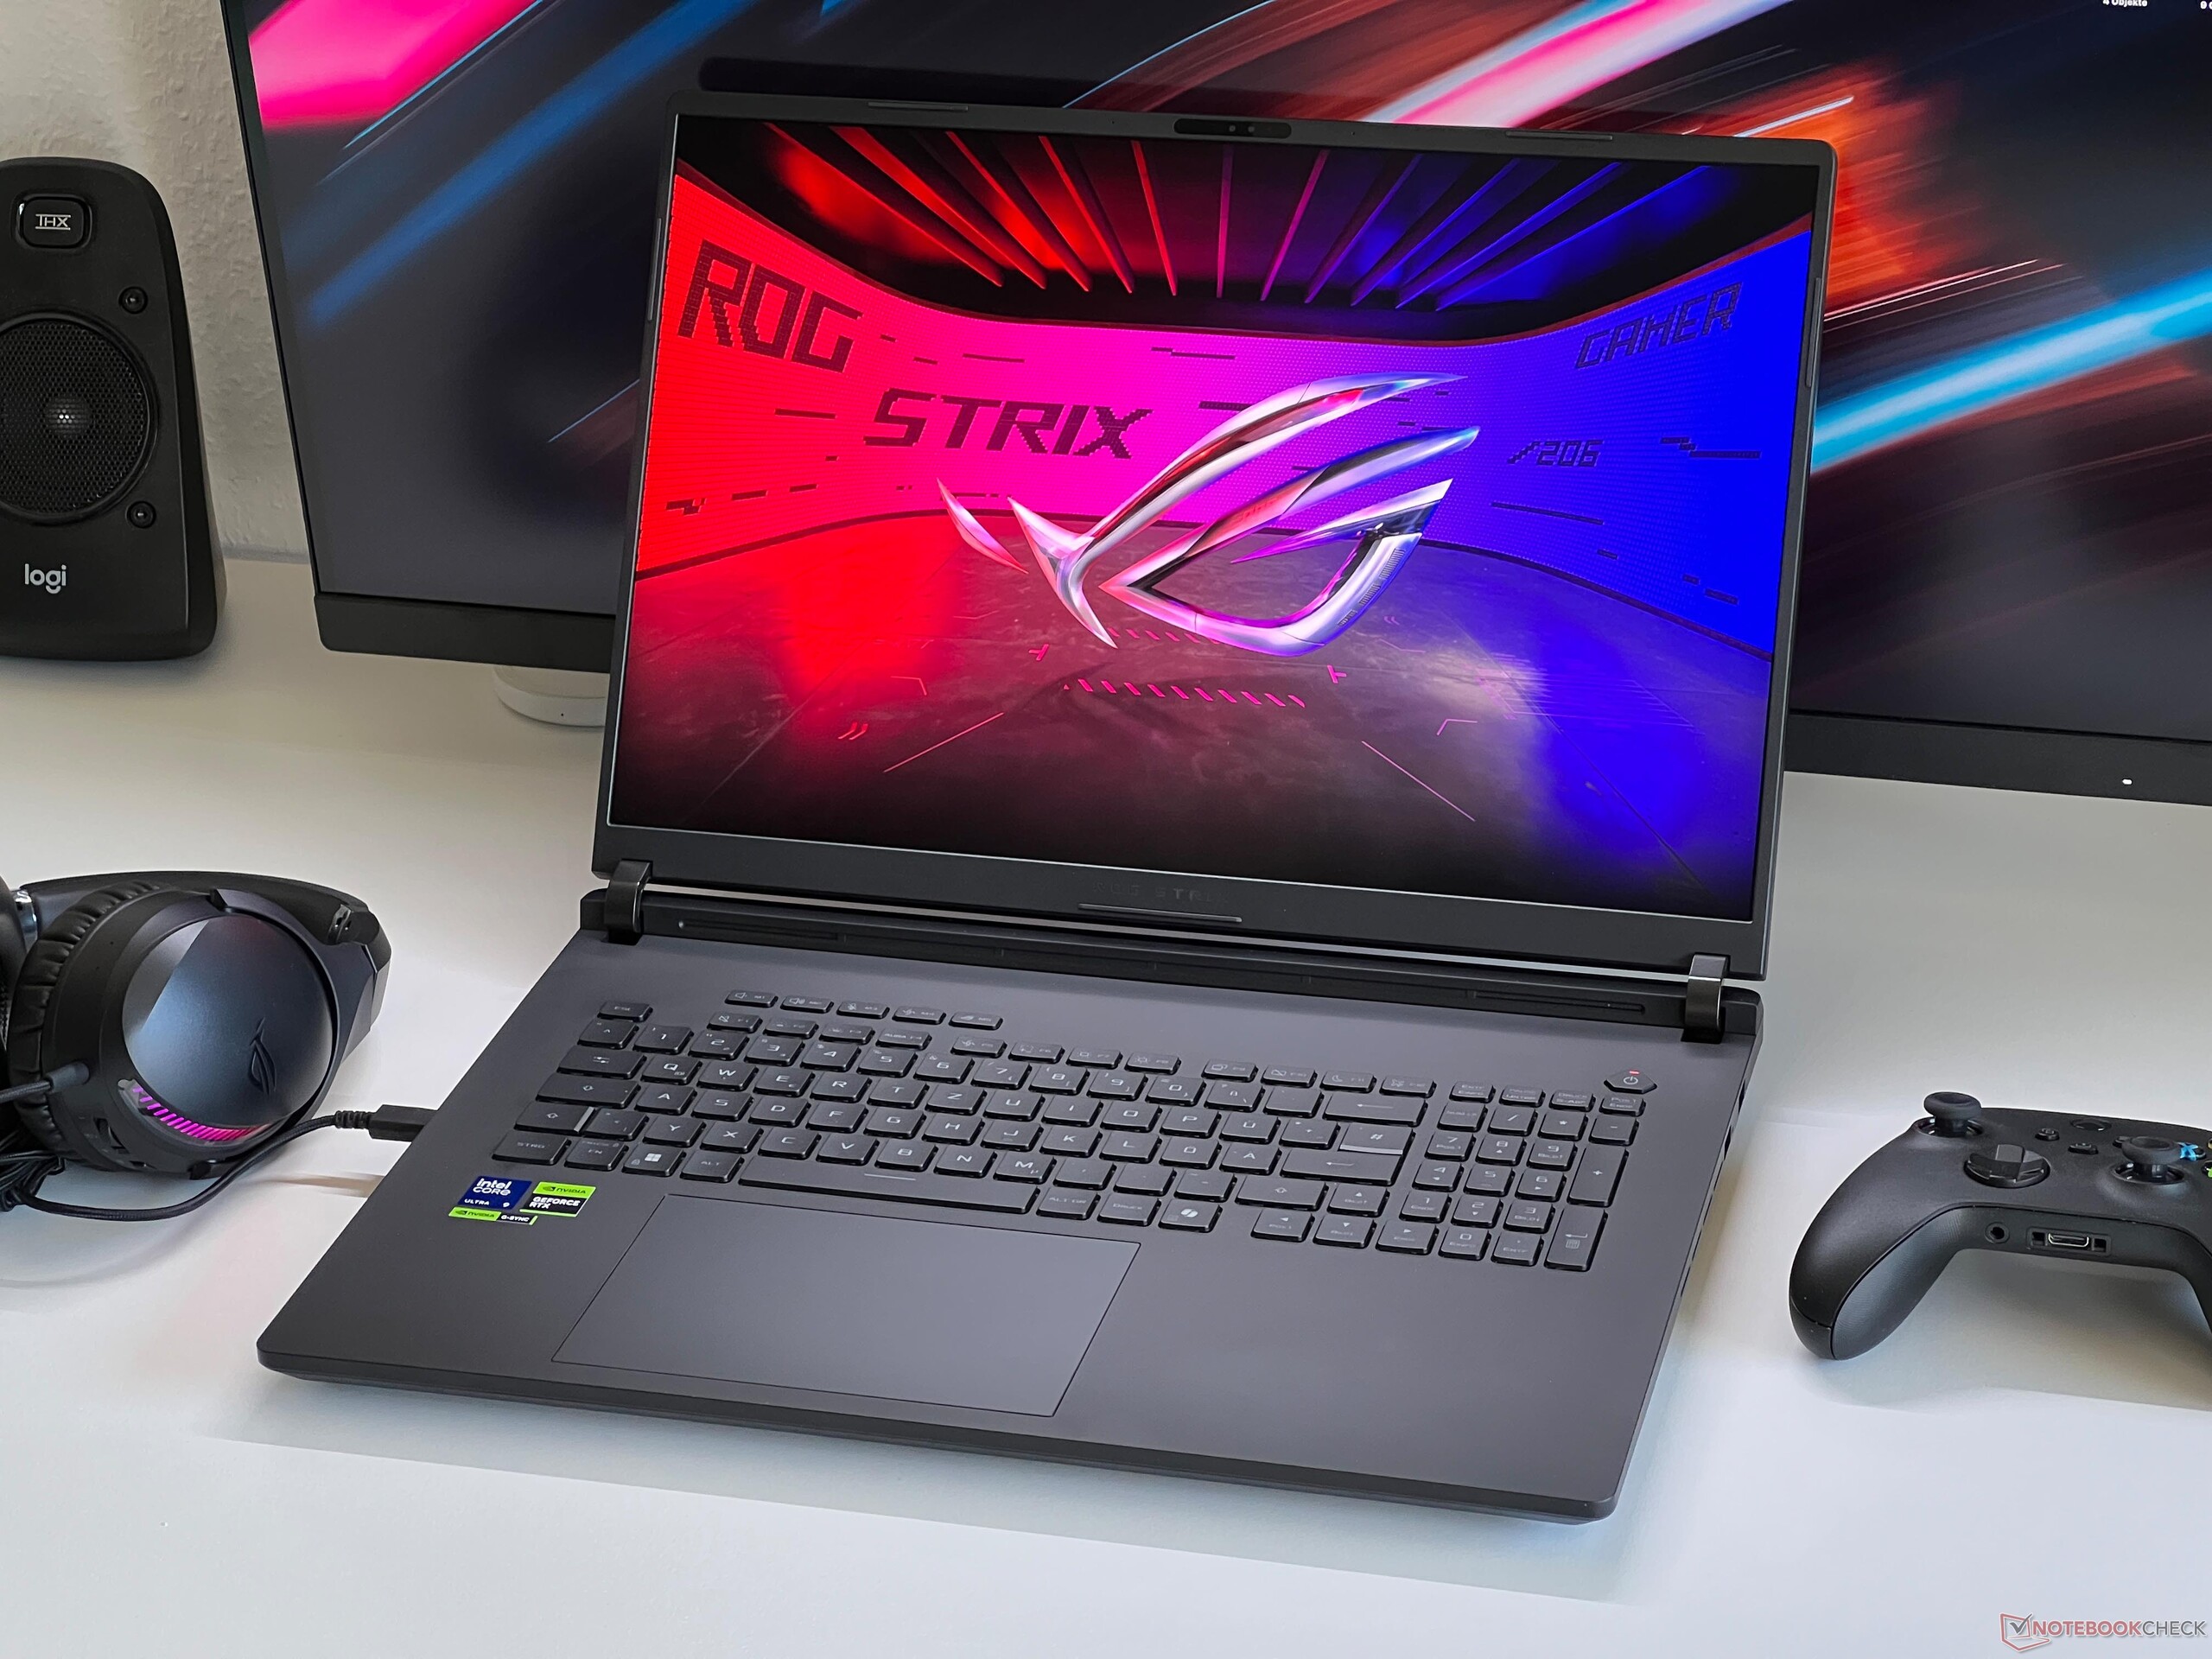
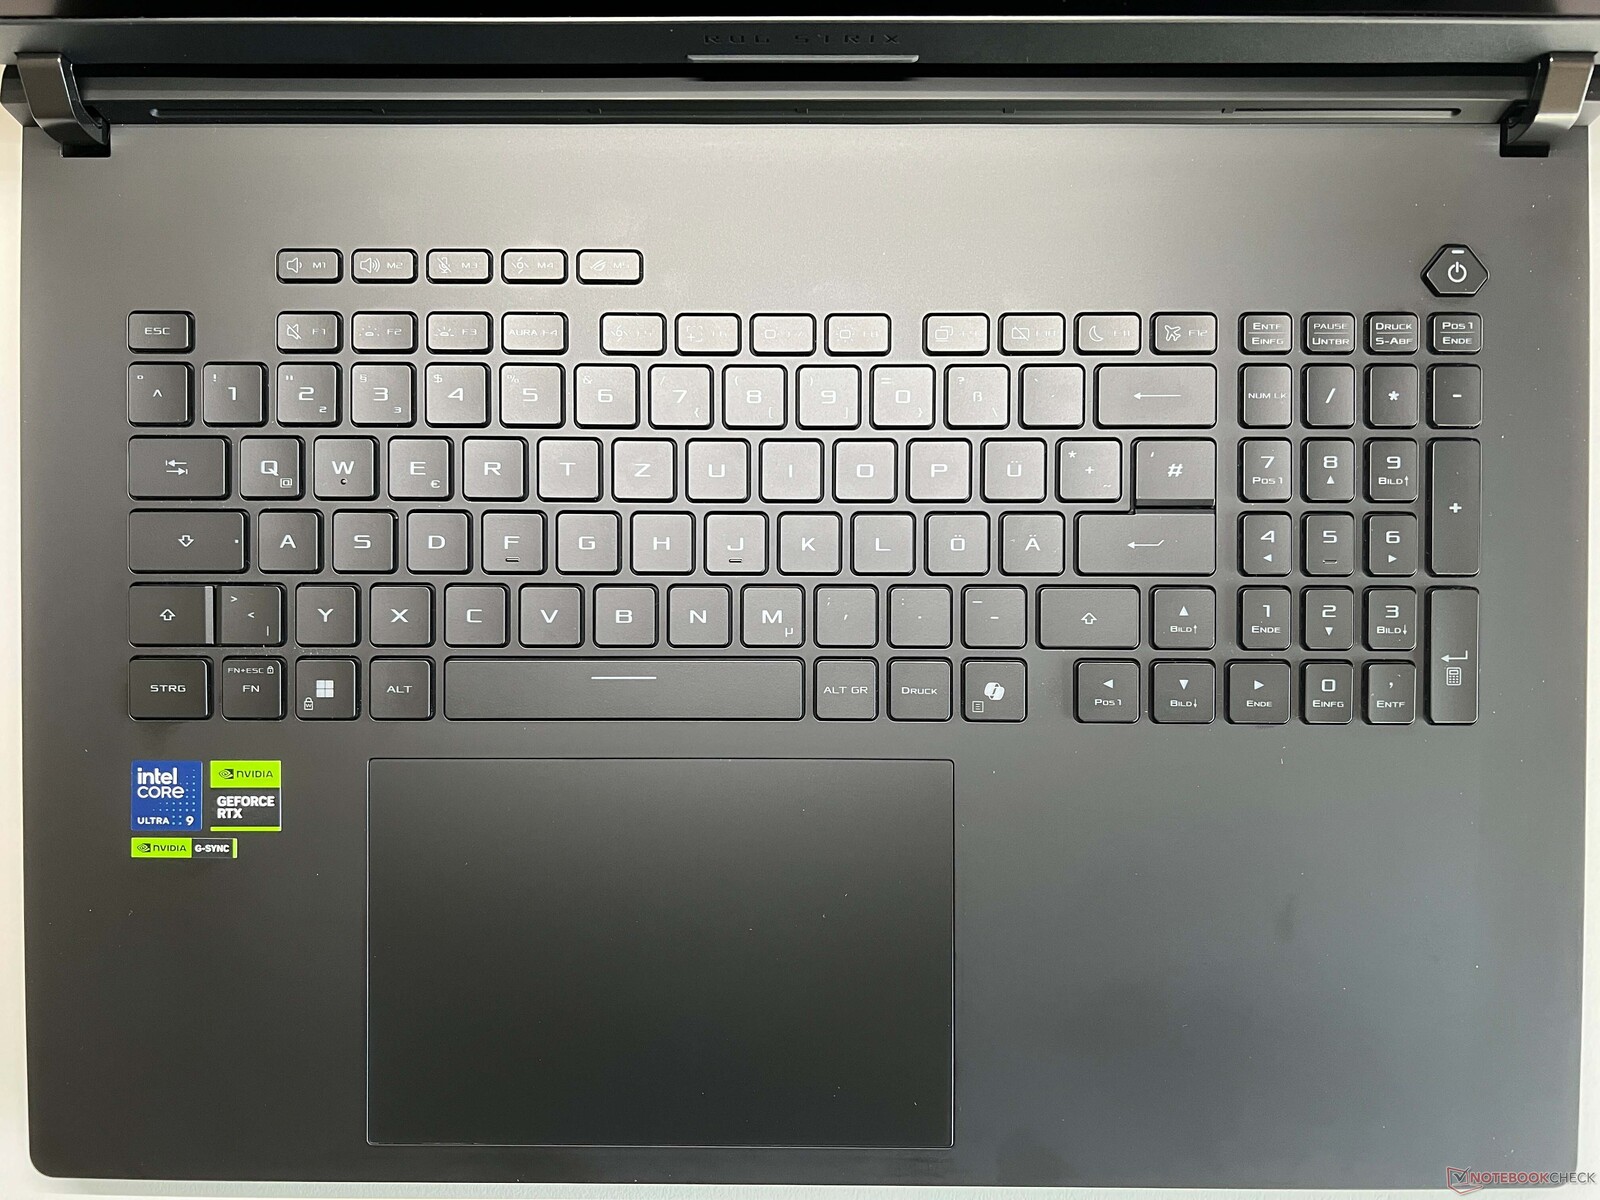
Die große Tastatur samt Nummernblock bietet ein komfortables Tippgefühl mit ausreichend Hubweg und präzisem Anschlag. Mechanische Tastaturen sind in dieser Hinsicht zwar überlegen, dafür ist die Tastatur des Strix SCAR 18 aber auch deutlich leiser. Die Beleuchtung kann für jede Taste einzeln eingestellt werden. Das große Glas-Touchpad (13,5 x 8 cm) bietet sehr gute Gleiteigenschaften sowie sehr klare und dumpfe Klicks im unteren Bereich.
Display - Tolles Mini-LED-Panel mit 240 Hz
Das Mini-LED-Panel des Strix SCAR 18 mit der Auflösung von 2.560 x 1.600 Pixeln (16:10) bietet eine hervorragende Bildqualität und auch helle Flächen wirken nicht körnig. Dank der Frequenz von 240 Hz sind Bewegungen zudem sehr flüssig. Die Bestimmung der Reaktionszeiten ist bei Mini-LED-Panels aufgrund des Flackerns der Hintergrundbeleuchtung mit unserer Messmethode nicht zuverlässig möglich, die ermittelten Werte sind daher nur Anhaltspunkte. Asus selbst spricht aber von 3 ms und wir hatten beim Spielen auch keinerlei Probleme.
Das Panel bietet einige interessante Eigenschaften und Betriebsmodi. Im SDR-Modus stehen drei Bildmodi zur Verfügung, die auch jeweils unterschiedliche maximale Helligkeiten erreichen. Neben der Voreinstellung Multi-Intensiv (Local Dimming aktiv, max. ~750 Nits) stehe noch Multi-Ausgeglichen (Local Dimming aktiv, max. ~490 Nits) sowie Einzelbildsteuerung (Local Dimming deaktiviert, max. ~611 Nits) zur Verfügung. Der Einzelbildmodus ist besonders für die Bildbearbeitung interessant, um eine gleichmäßige Helligkeit über die gesamte Bildschirmfläche zu gewährleisten. Im HDR-Modus (max. Helligkeit 1.450 Nits bei einem fast vollständig weißen Bild) steht neben dem normalen Modus auch der P3-Modus zur Verfügung, der nicht-HDR-Inhalte (beispielsweise den Desktop) automatisch von sRGB in den P3-Farbraum konvertiert (was aber die Farbgenauigkeit reduzieren kann). Damit kann man das Problem umgehen, dass nicht-HDR-Inhalte im HDR-Modus sehr blass aussehen.
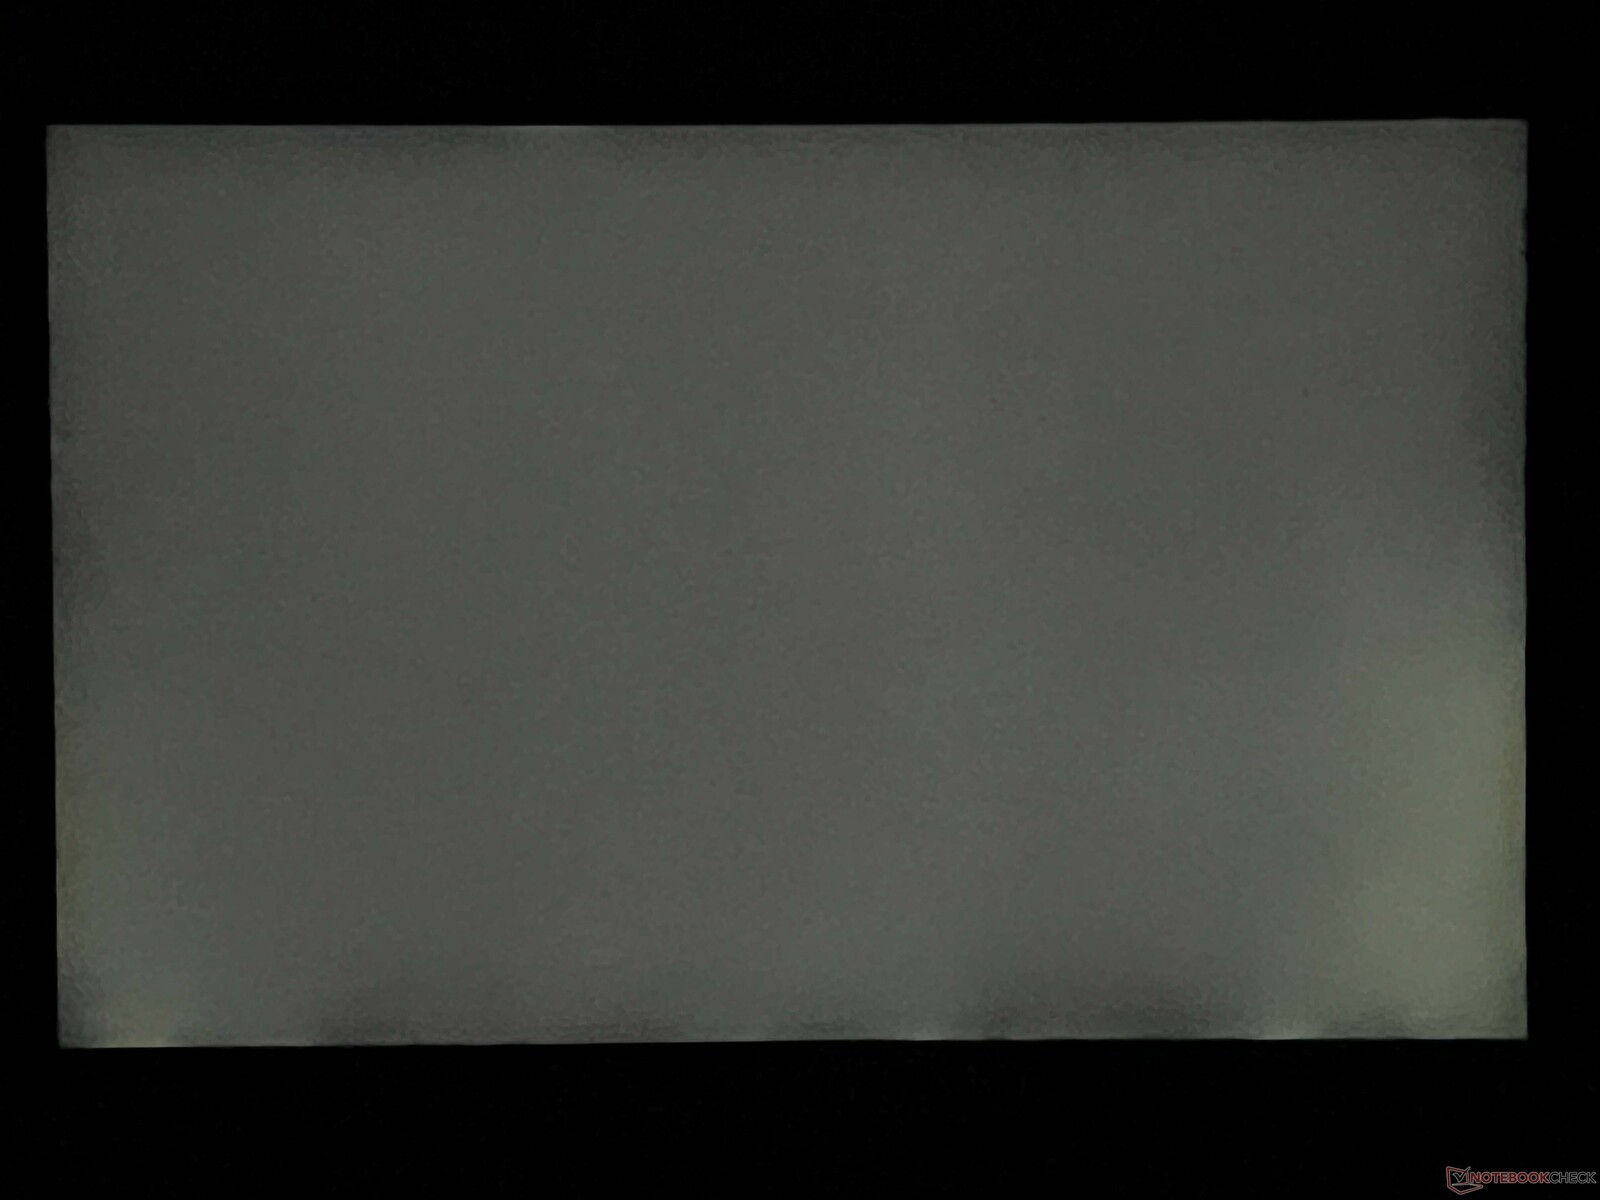
Eine weitere Besonderheit des Panels ist, dass der Schwarzwert im SDR-Modus nicht bei 0 liegt, auch wenn Local Dimming aktiv ist. Daher gibt es hier auch leichte Lichthöfe (mit Local Dimming allerdings schwächer als im Einzelbildmodus). Erst im HDR-Modus ist das Bild wirklich vollständig Schwarz (Schwarzwert 0).
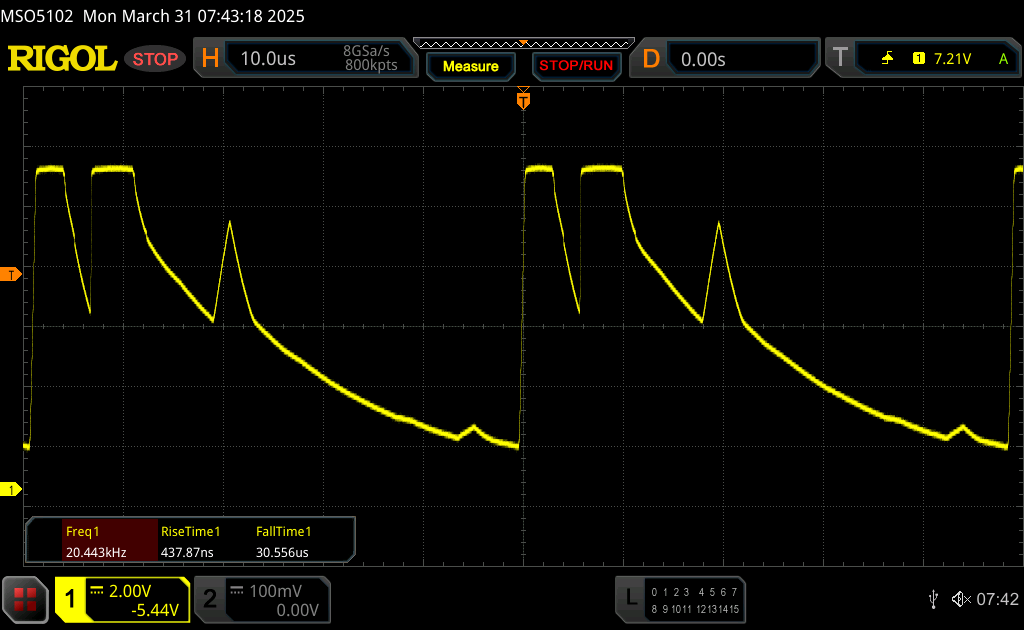
Die Helligkeit fällt mit rund 750 cd/m² etwas niedriger aus als im Vorjahr, ist aber immer noch sehr gut. Der Schwarzwert liegt bei 0,1 cd/m², was in einem hervorragenden Kontrastverhältnis von mehr als 7.000:1 resultiert. Im Akkubetrieb wird die Helligkeit nicht reduziert. Weder die Helligkeit noch die Farbtemperatur können allerdings automatisch per Sensor geregelt werden. Es gibt ein Flackern des Displays bei allen Helligkeitsleveln, die Frequenz ist mit 20 kHz aber sehr hoch und sollte keine Probleme verursachen.
| |||||||||||||||||||||||||
Ausleuchtung: 93 %
Helligkeit Akku: 764 cd/m²
Kontrast: 7640:1 (Schwarzwert: 0.1 cd/m²)
ΔE ColorChecker Calman: 1.2 | ∀{0.5-29.43 Ø4.72}
ΔE Greyscale Calman: 1.5 | ∀{0.09-98 Ø4.97}
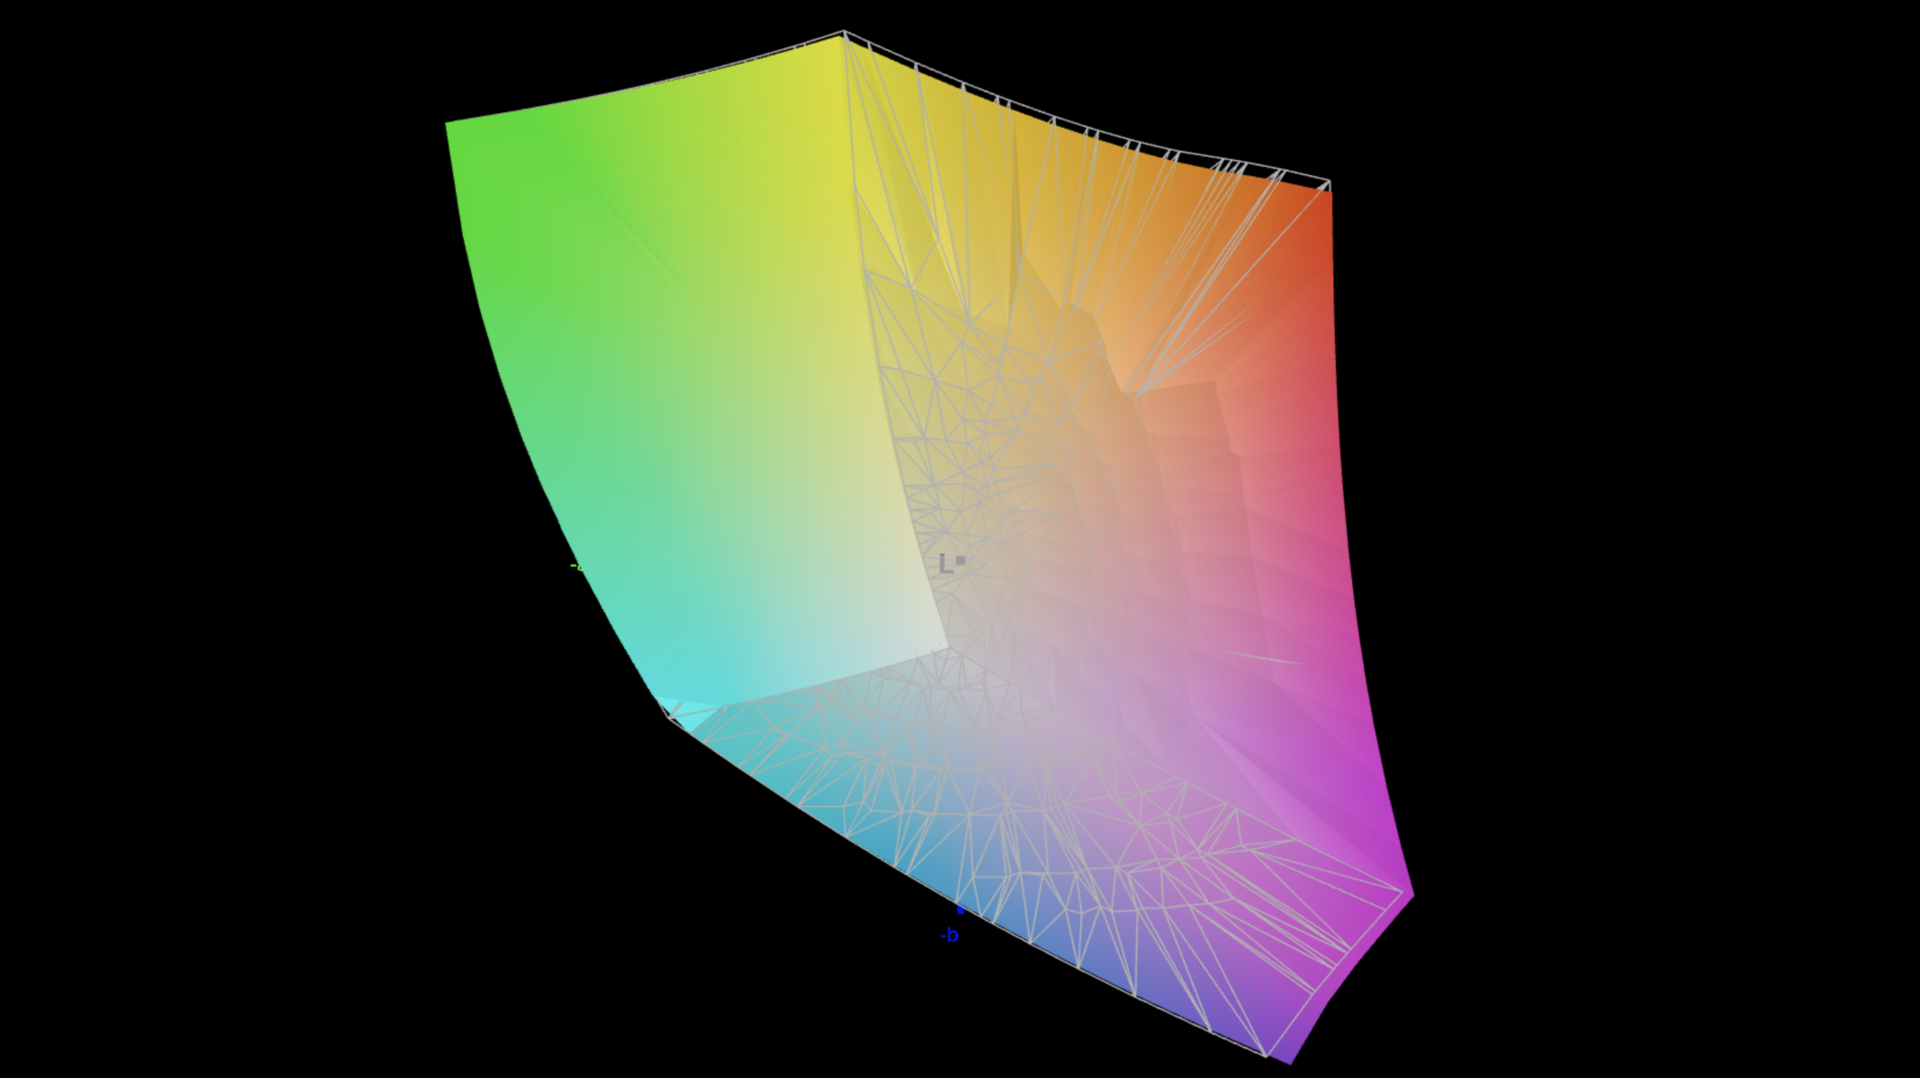
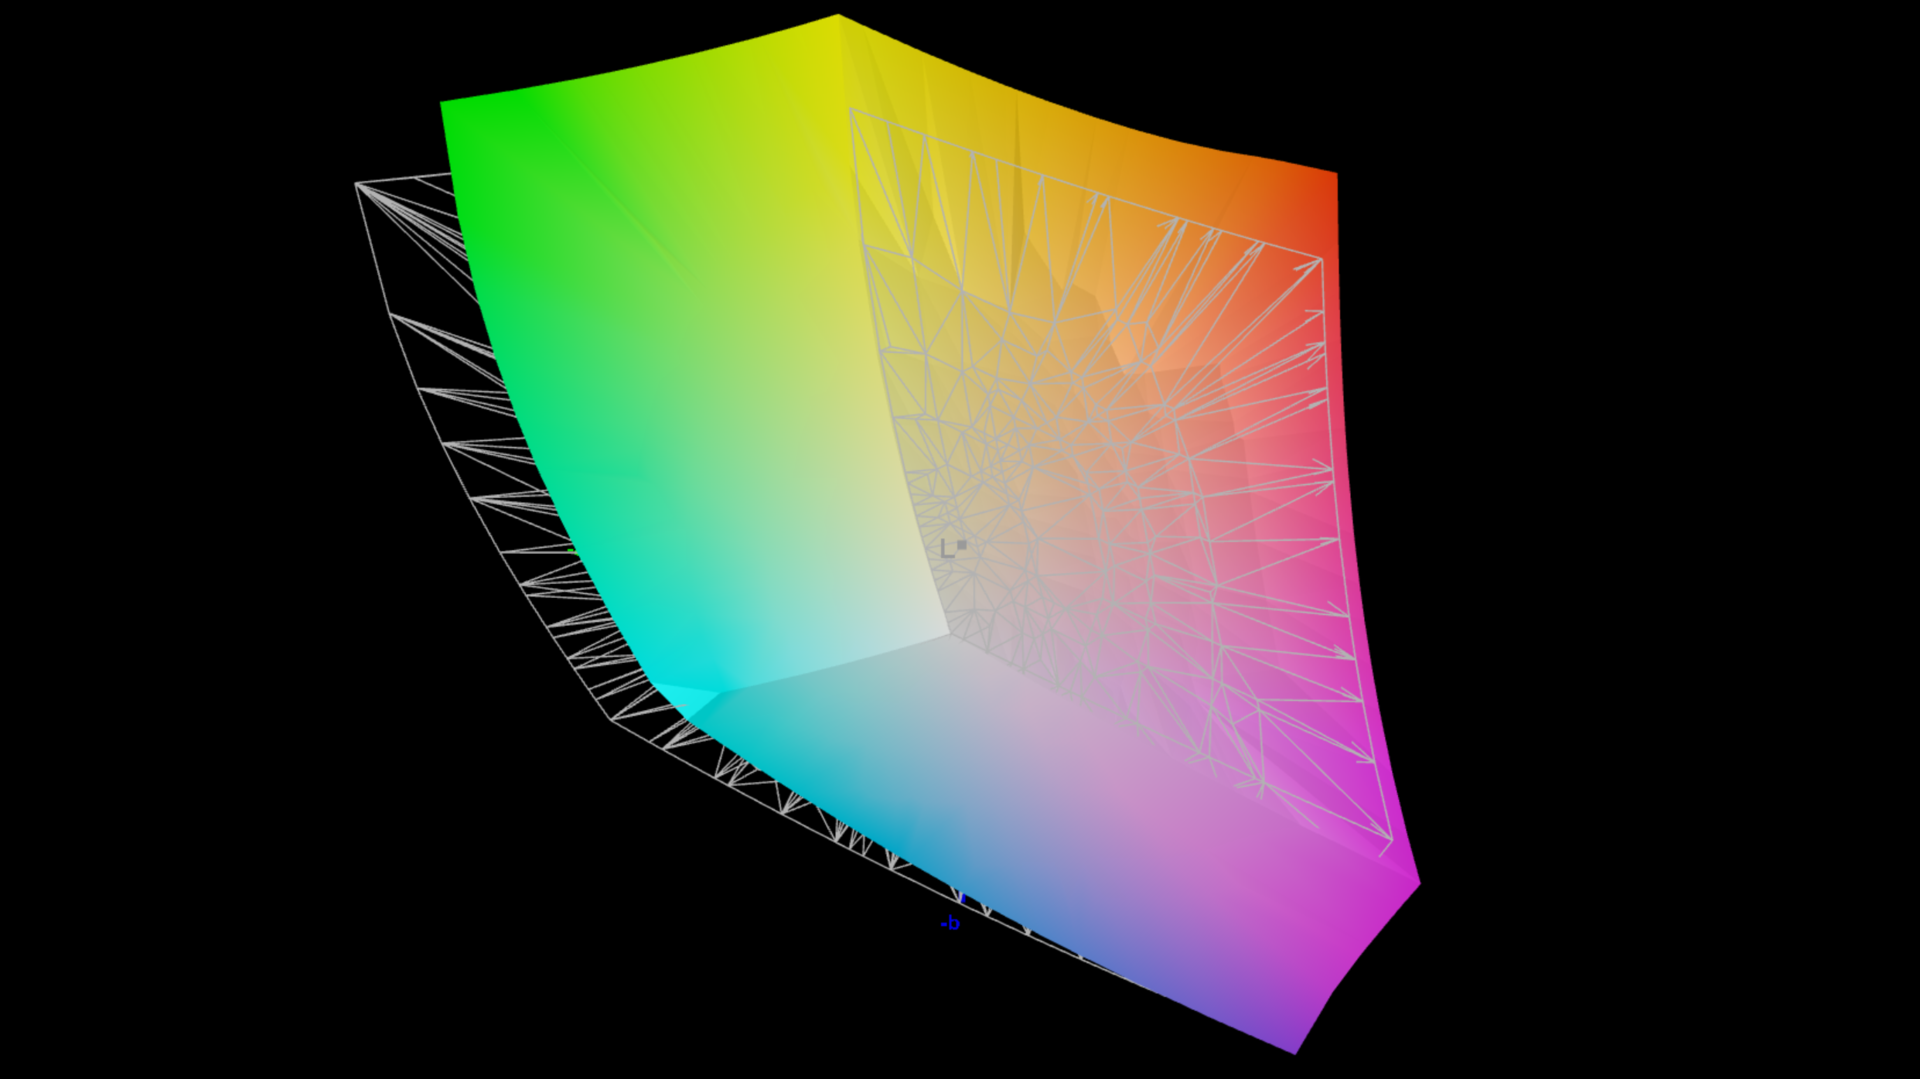
87.2% AdobeRGB 1998 (Argyll 3D)
100% sRGB (Argyll 3D)
99% Display P3 (Argyll 3D)
Gamma: 2.17
CCT: 6556 K
| Asus Strix Scar 18 G835LX N180QDM-NM2, Mini-LED, 2560x1600, 18", 240 Hz | Razer Blade 18 2024 RZ09-0509 BOE NE180QDM-NM1, Mini-LED, 2560x1600, 18", 300 Hz | Alienware m18 R2 BOE NE18NZ1, IPS, 2560x1600, 18", 165 Hz | Acer Predator Helios 18 PH18-72-98MW B180QAN01.2 (AUO45A8), Mini-LED, 2560x1600, 18", 250 Hz | MSI Titan 18 HX A14VIG AU Optronics B180ZAN01.0, Mini-LED, 3840x2400, 18", 120 Hz | Schenker Key 17 Pro (M24) BOE, IPS, 3840x2160, 17.3", 144 Hz | Asus ROG Strix Scar 18 G834JYR (2024) BOE NE180QDM-NM1, Mini LED, 2560x1600, 18", 240 Hz | |
|---|---|---|---|---|---|---|---|
| Display | 0% | 0% | 2% | -1% | -3% | 1% | |
| Display P3 Coverage (%) | 99 | 99 0% | 97.8 -1% | 99.7 1% | 98.1 -1% | 93.51 -6% | 99.9 1% |
| sRGB Coverage (%) | 100 | 100 0% | 99.5 0% | 100 0% | 99.8 0% | 99.86 0% | 100 0% |
| AdobeRGB 1998 Coverage (%) | 87.2 | 86.9 0% | 88.9 2% | 91.6 5% | 86.2 -1% | 84.33 -3% | 90 3% |
| Response Times | -19% | 14% | -39% | -352% | -8% | -33% | |
| Response Time Grey 50% / Grey 80% * (ms) | 7.4 ? | 7.6 ? -3% | 5.3 ? 28% | 8 ? -8% | 8.6 ? -16% | 11.593 ? -57% | 12 ? -62% |
| Response Time Black / White * (ms) | 10.4 ? | 14 ? -35% | 10.4 ? -0% | 17.6 ? -69% | 81.8 ? -687% | 6 ? 42% | 10.7 ? -3% |
| PWM Frequency (Hz) | 20610 ? | 26444 ? | 4832 ? | 2592 ? | 5733 ? | ||
| PWM Amplitude * (%) | 100 | ||||||
| Bildschirm | -99% | -94% | -30% | -88% | -157% | 15% | |
| Helligkeit Bildmitte (cd/m²) | 764 | 605.4 -21% | 271.8 -64% | 722 -5% | 467.5 -39% | 548 -28% | 937 23% |
| Brightness (cd/m²) | 747 | 600 -20% | 275 -63% | 724 -3% | 459 -39% | 505 -32% | 934 25% |
| Brightness Distribution (%) | 93 | 97 4% | 78 -16% | 93 0% | 90 -3% | 86 -8% | 89 -4% |
| Schwarzwert * (cd/m²) | 0.1 | 0.62 -520% | 0.27 -170% | 0.04 60% | 0.54 -440% | 0.066 34% | |
| Kontrast (:1) | 7640 | 976 -87% | 1007 -87% | 18050 136% | 1015 -87% | 14197 86% | |
| Delta E Colorchecker * | 1.2 | 1.53 -28% | 2.48 -107% | 3.4 -183% | 3.77 -214% | 3.81 -218% | 1.52 -27% |
| Colorchecker dE 2000 max. * | 2.8 | 4.15 -48% | 5.59 -100% | 5.32 -90% | 6.12 -119% | 7.9 -182% | 2.82 -1% |
| Delta E Graustufen * | 1.5 | 2.6 -73% | 3.7 -147% | 3.8 -153% | 3.2 -113% | 5.4 -260% | 1.7 -13% |
| Gamma | 2.17 101% | 2.22 99% | 2.2 100% | 2.383 92% | 2.43 91% | 2.062 107% | 2.042 108% |
| CCT | 6556 99% | 6843 95% | 6355 102% | 7051 92% | 6478 100% | 7224 90% | 6578 99% |
| Colorchecker dE 2000 calibrated * | 0.56 | 1.6 | 2.94 | 2.54 | 1.21 | ||
| Durchschnitt gesamt (Programm / Settings) | -39% /
-64% | -27% /
-56% | -22% /
-24% | -147% /
-112% | -56% /
-98% | -6% /
5% |
* ... kleinere Werte sind besser


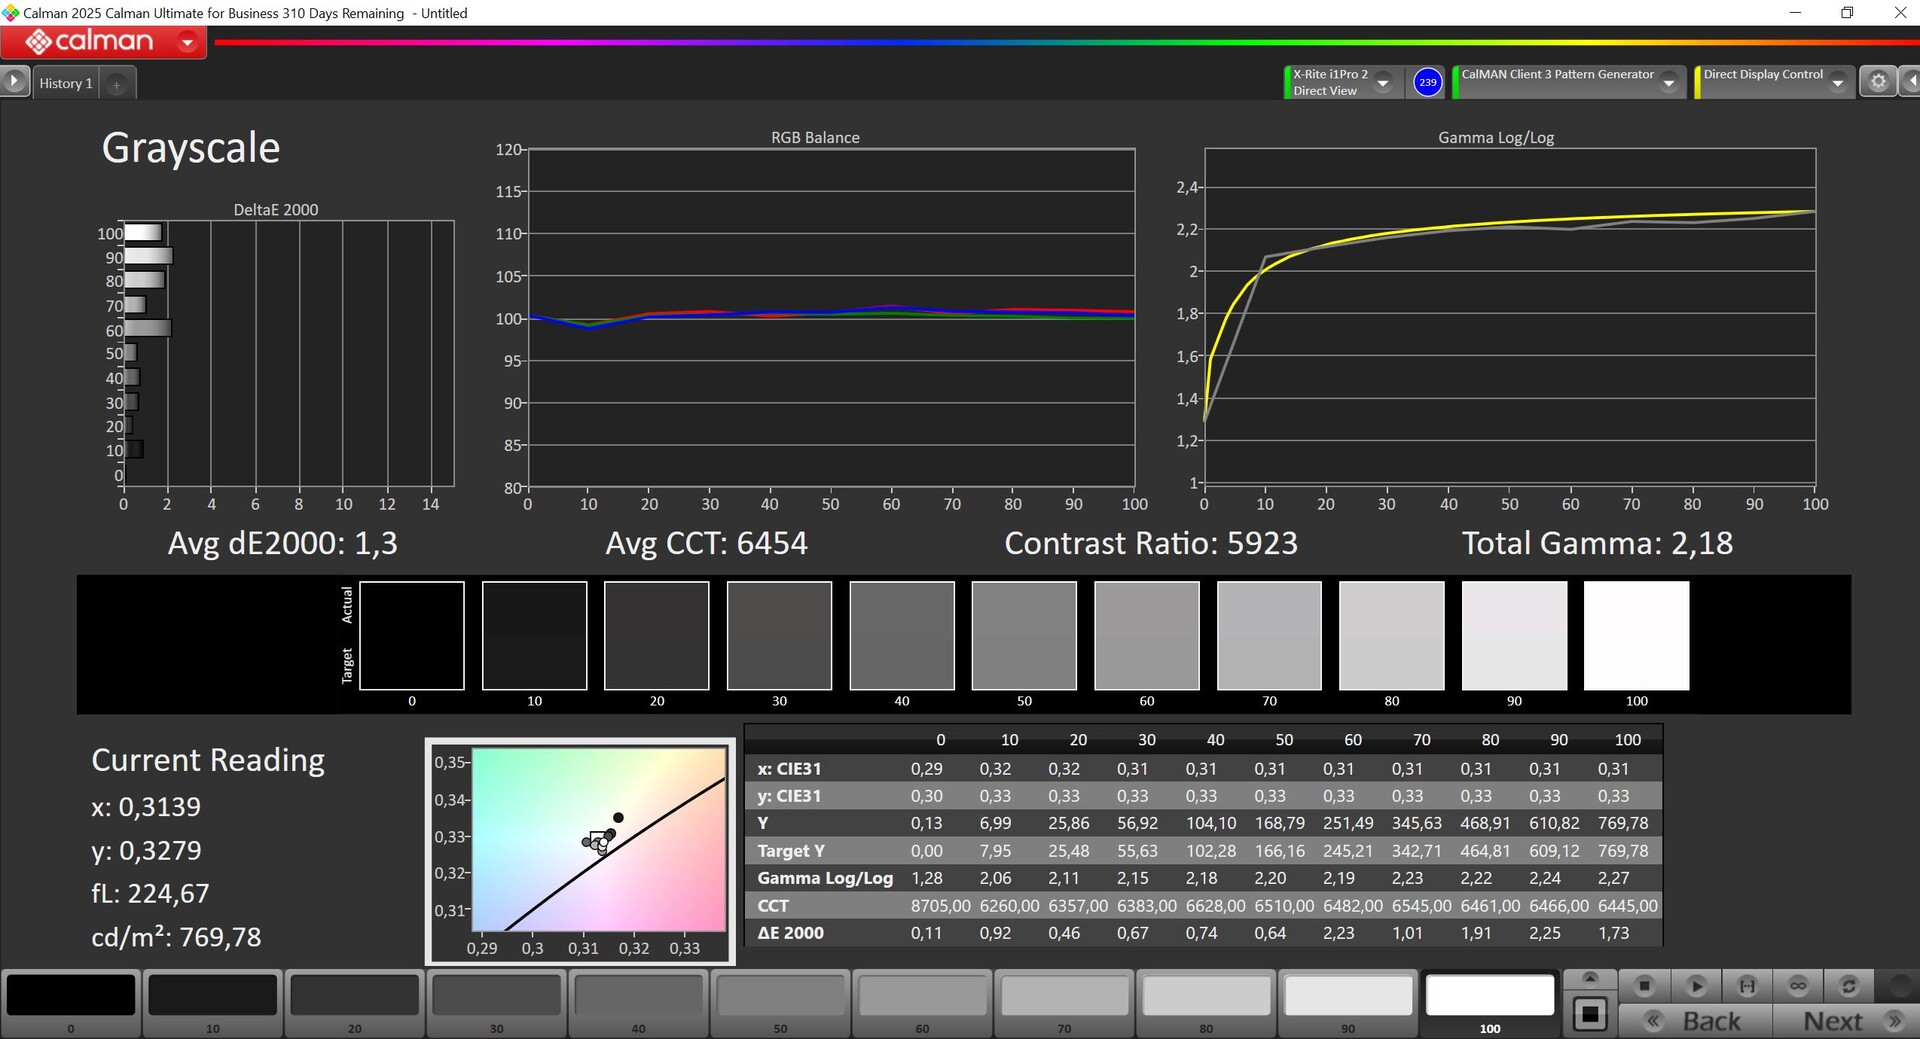


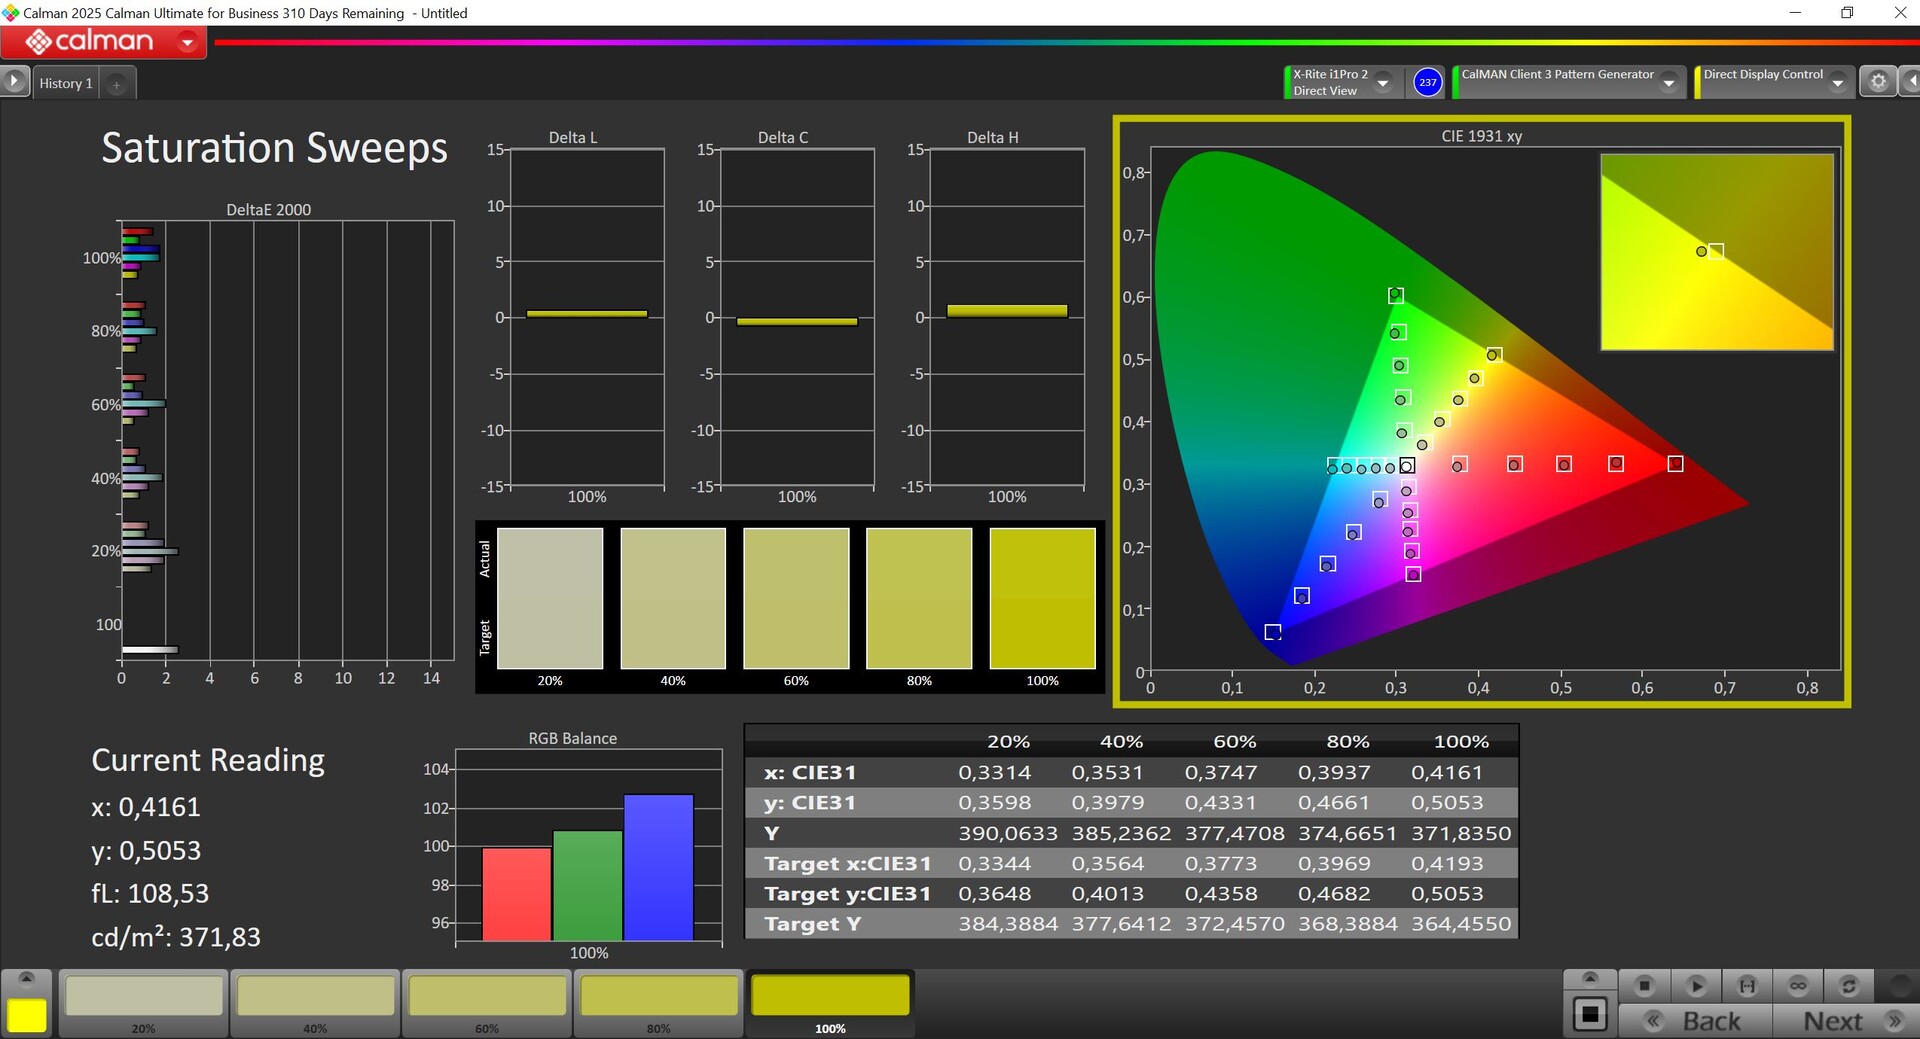
Wie gewohnt bietet Asus verschiedene Farbprofile für den SDR-Betrieb. Der native Modus ist etwas übersättigt, es stehen aber auch sehr akkurate Profile für P3 sowie sRGB zur Verfügung. Mit unserer eigenen Kalibrierung konnten wir die Darstellung nicht noch weiter verbessern.


Reaktionszeiten (Response Times) des Displays
| ↔ Reaktionszeiten Schwarz zu Weiß | ||
|---|---|---|
| 10.4 ms ... steigend ↗ und fallend ↘ kombiniert | ↗ 0.6 ms steigend | 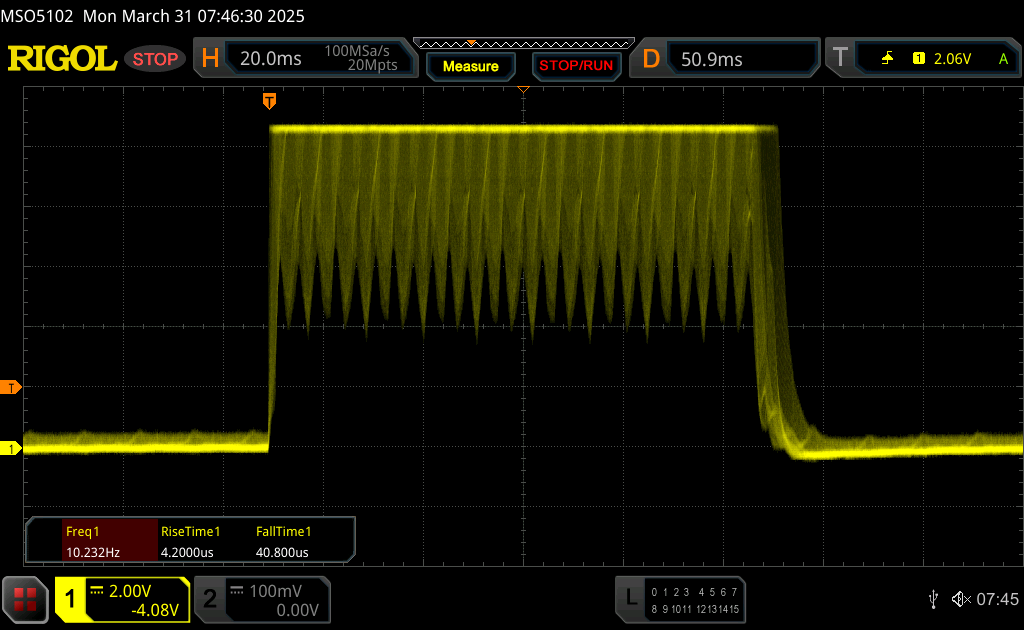 |
| ↘ 9.8 ms fallend | ||
| Die gemessenen Reaktionszeiten sind gut, für anspruchsvolle Spieler könnten der Bildschirm jedoch zu langsam sein. Im Vergleich rangierten die bei uns getesteten Geräte von 0.1 (Minimum) zu 240 (Maximum) ms. » 28 % aller Screens waren schneller als der getestete. Daher sind die gemessenen Reaktionszeiten besser als der Durchschnitt aller vermessenen Geräte (19.8 ms). | ||
| ↔ Reaktionszeiten 50% Grau zu 80% Grau | ||
| 7.4 ms ... steigend ↗ und fallend ↘ kombiniert | ↗ 2.4 ms steigend | 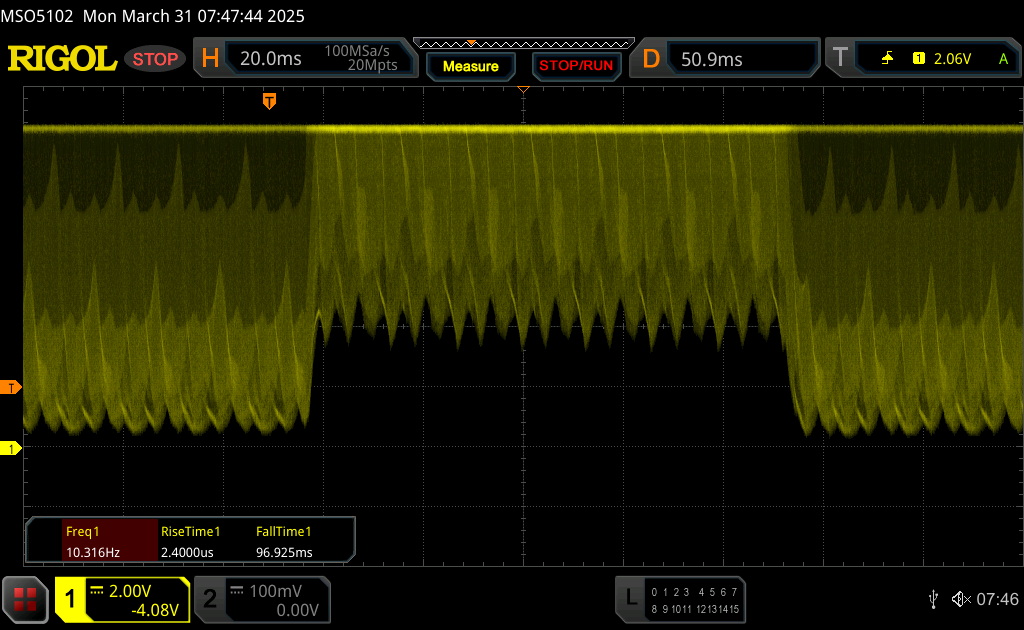 |
| ↘ 5 ms fallend | ||
| Die gemessenen Reaktionszeiten sind sehr kurz, wodurch sich der Bildschirm auch für schnelle 3D Spiele eignen sollte. Im Vergleich rangierten die bei uns getesteten Geräte von 0.165 (Minimum) zu 636 (Maximum) ms. » 20 % aller Screens waren schneller als der getestete. Daher sind die gemessenen Reaktionszeiten besser als der Durchschnitt aller vermessenen Geräte (31 ms). | ||
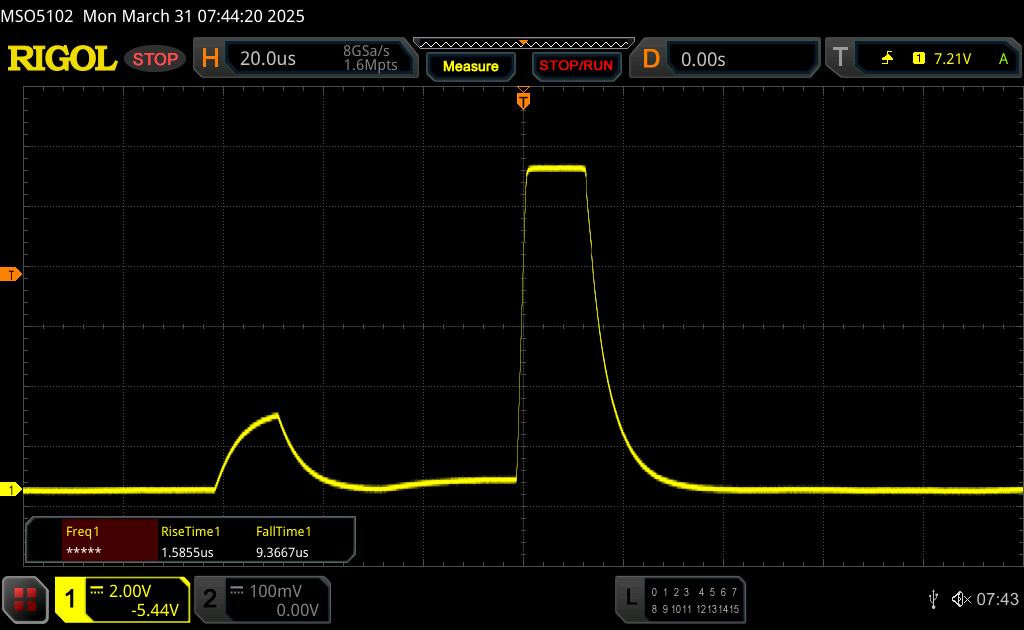
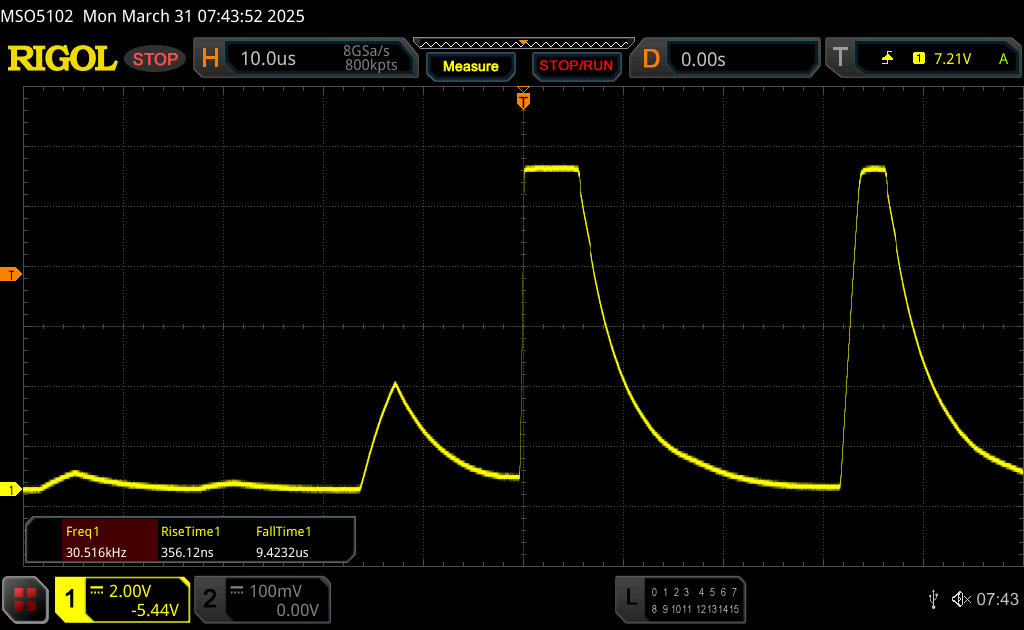
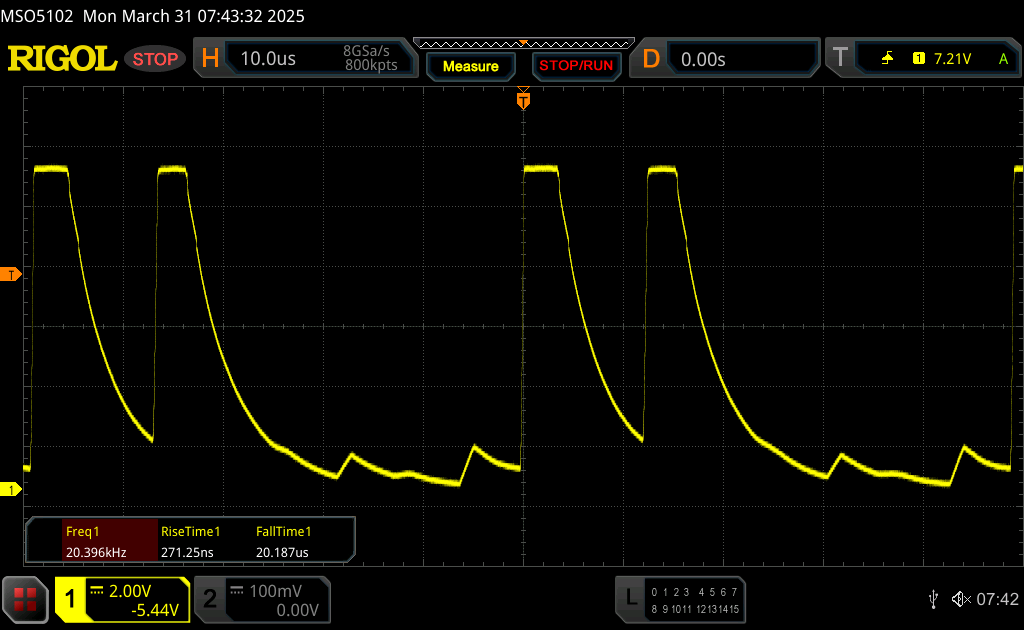
Bildschirm-Flackern / PWM (Pulse-Width Modulation)
| Flackern / PWM festgestellt | 20610 Hz Amplitude: 100 % | ≤ 100 % Helligkeit | 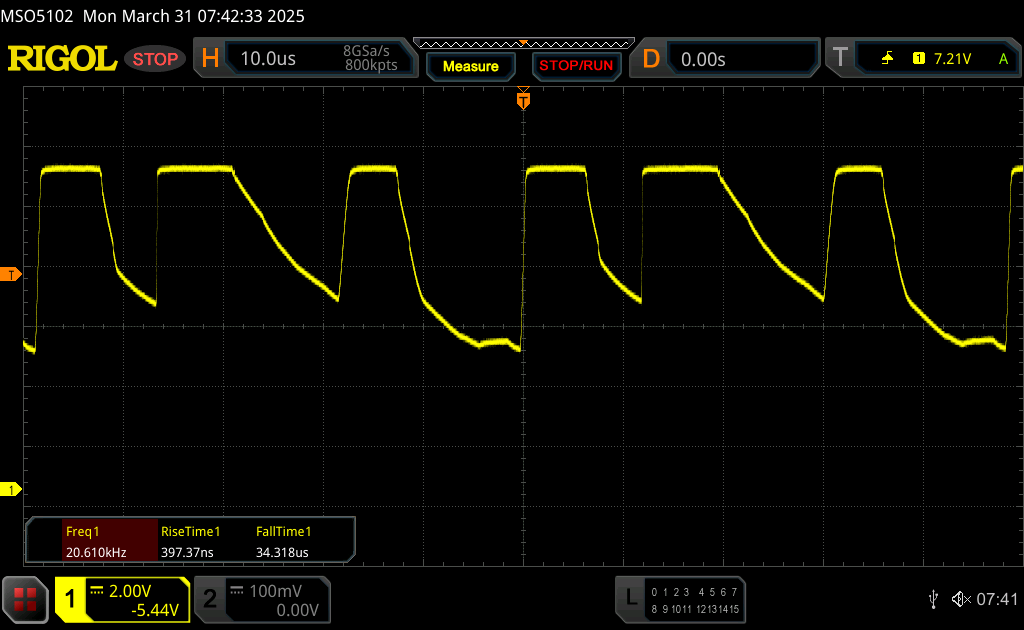 |
Das Display flackert mit 20610 Hz (im schlimmsten Fall, eventuell durch Pulsweitenmodulation PWM) bei einer eingestellten Helligkeit von 100 % und darunter. Darüber sollte es zu keinem Flackern kommen. Die Frequenz von 20610 Hz ist sehr hoch und sollte daher auch bei empfindlichen Personen zu keinen Problemen führen. Im Vergleich: 52 % aller getesteten Geräte nutzten kein PWM um die Helligkeit zu reduzieren. Wenn PWM eingesetzt wurde, dann bei einer Frequenz von durchschnittlich 7781 (Minimum 5, Maximum 343500) Hz. | |||


Leistung - Arrow Lake-HX und RTX 5000 Laptop
Testbedingungen
Asus bietet die drei Energieprofile Leise, Leistung sowie Turbo, den wir auch für die nachfolgenden Benchmarks und Messungen verwendet haben. Grundsätzlich würden wir uns zwischen Leistung & Turbo etwas mehr Spreizung wünschen. Ein manueller Modus steht ebenfalls zur Verfügung, bei dem man den Takt der GPU noch erhöhen und auch die Lüfterkurven beeinflussen kann. Im Akkubetrieb ist der Turbo-Modus nicht verfügbar.
| Energieprofil | CPU TDP | CB R24 Multi | GPU TGP | Time Spy Graphics | CP 2077 QHD | max. Lüfterlautstärke |
|---|---|---|---|---|---|---|
| Leise | 100/65 Watt | 1.825 Punkte | 55 Watt | 9.029 Punkte | 43,5 FPS | 34,8 dB(A) |
| Leistung | 120/105 Watt | 2.039 Punkte | 160 Watt | 23.300 Punkte | 102,7 FPS | 49 dB(A) |
| Turbo | 175/150 Watt | 2.223 Punkte | 175 Watt | 24.599 Punkte | 106,8 FPS | 53,7 dB(A) |
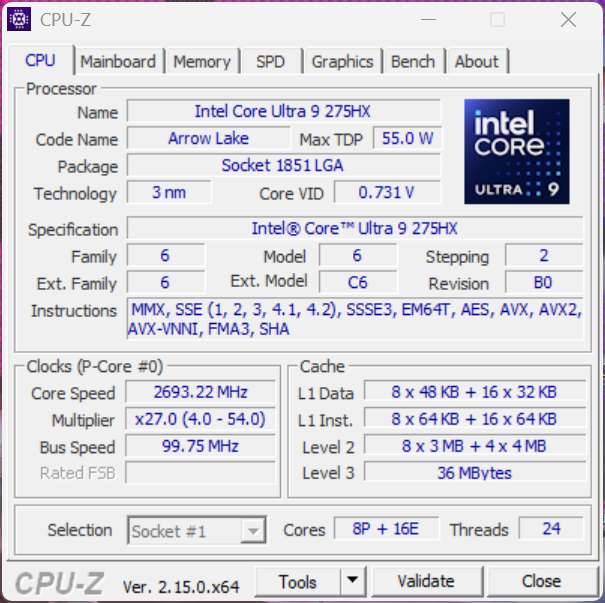
Prozessor - Core Ultra 9 275HX
Als Prozessor kommt der neue Core Ultra 9 275HX der Arrow-Lake-Generation zum Einsatz. Er bietet 24 Kerne (8x Performance, 16x Efficiency) ohne Hyperthreading und darf kurzzeitig bis zu 175 Watt und dauerhaft 150 Watt verbrauchen. Wie wir in unserer CPU-Analyse bereits gesehen haben sind die Ergebnisse in den synthetischen Benchmarks sehr gut und durchschnittlich liegt der Vorsprung gegenüber den Vergleichsmodellen bei mindestens 11 %, gegenüber dem Vorgängermodell sind es sogar 18 %. Im Akkubetrieb wird der Stromverbrauch massiv gedrosselt (54/34 Watt) und die Multi-Core-Leistung sinkt um 43 %.
Cinebench R15 Multi Dauertest
Cinebench R23: Multi Core | Single Core
Cinebench R20: CPU (Multi Core) | CPU (Single Core)
Cinebench R15: CPU Multi 64Bit | CPU Single 64Bit
Blender: v2.79 BMW27 CPU
7-Zip 18.03: 7z b 4 | 7z b 4 -mmt1
Geekbench 6.7: Multi-Core | Single-Core
Geekbench 5.5: Multi-Core | Single-Core
HWBOT x265 Benchmark v2.2: 4k Preset
LibreOffice : 20 Documents To PDF
R Benchmark 2.5: Overall mean
| CPU Performance Rating | |
| Asus Strix Scar 18 G835LX | |
| Durchschnittliche Intel Core Ultra 9 275HX | |
| Alienware m18 R2 | |
| MSI Titan 18 HX A14VIG | |
| Asus ROG Strix Scar 18 G834JYR (2024) | |
| Razer Blade 18 2024 RZ09-0509 | |
| Schenker Key 17 Pro (M24) | |
| Acer Predator Helios 18 PH18-72-98MW | |
| Durchschnitt der Klasse Gaming | |
| Cinebench R23 / Multi Core | |
| Asus Strix Scar 18 G835LX | |
| Durchschnittliche Intel Core Ultra 9 275HX (30712 - 40970, n=31) | |
| MSI Titan 18 HX A14VIG | |
| Alienware m18 R2 | |
| Asus ROG Strix Scar 18 G834JYR (2024) | |
| Razer Blade 18 2024 RZ09-0509 | |
| Schenker Key 17 Pro (M24) | |
| Acer Predator Helios 18 PH18-72-98MW | |
| Durchschnitt der Klasse Gaming (10488 - 40970, n=112, der letzten 2 Jahre) | |
| Cinebench R23 / Single Core | |
| Asus Strix Scar 18 G835LX | |
| Alienware m18 R2 | |
| Durchschnittliche Intel Core Ultra 9 275HX (2009 - 2267, n=31) | |
| Asus ROG Strix Scar 18 G834JYR (2024) | |
| Acer Predator Helios 18 PH18-72-98MW | |
| MSI Titan 18 HX A14VIG | |
| Razer Blade 18 2024 RZ09-0509 | |
| Schenker Key 17 Pro (M24) | |
| Durchschnitt der Klasse Gaming (1166 - 2356, n=112, der letzten 2 Jahre) | |
| Cinebench R20 / CPU (Multi Core) | |
| Asus Strix Scar 18 G835LX | |
| Durchschnittliche Intel Core Ultra 9 275HX (12026 - 16108, n=30) | |
| MSI Titan 18 HX A14VIG | |
| Alienware m18 R2 | |
| Razer Blade 18 2024 RZ09-0509 | |
| Asus ROG Strix Scar 18 G834JYR (2024) | |
| Schenker Key 17 Pro (M24) | |
| Durchschnitt der Klasse Gaming (4029 - 16108, n=111, der letzten 2 Jahre) | |
| Acer Predator Helios 18 PH18-72-98MW | |
| Cinebench R20 / CPU (Single Core) | |
| Asus Strix Scar 18 G835LX | |
| Alienware m18 R2 | |
| Durchschnittliche Intel Core Ultra 9 275HX (774 - 870, n=30) | |
| Asus ROG Strix Scar 18 G834JYR (2024) | |
| Acer Predator Helios 18 PH18-72-98MW | |
| MSI Titan 18 HX A14VIG | |
| Razer Blade 18 2024 RZ09-0509 | |
| Schenker Key 17 Pro (M24) | |
| Durchschnitt der Klasse Gaming (442 - 895, n=111, der letzten 2 Jahre) | |
| Cinebench R15 / CPU Multi 64Bit | |
| Asus Strix Scar 18 G835LX | |
| Durchschnittliche Intel Core Ultra 9 275HX (4737 - 6271, n=30) | |
| Alienware m18 R2 | |
| MSI Titan 18 HX A14VIG | |
| Acer Predator Helios 18 PH18-72-98MW | |
| Schenker Key 17 Pro (M24) | |
| Razer Blade 18 2024 RZ09-0509 | |
| Asus ROG Strix Scar 18 G834JYR (2024) | |
| Durchschnitt der Klasse Gaming (1578 - 6271, n=111, der letzten 2 Jahre) | |
| Cinebench R15 / CPU Single 64Bit | |
| Asus Strix Scar 18 G835LX | |
| Durchschnittliche Intel Core Ultra 9 275HX (306 - 343, n=31) | |
| Alienware m18 R2 | |
| Acer Predator Helios 18 PH18-72-98MW | |
| Razer Blade 18 2024 RZ09-0509 | |
| Asus ROG Strix Scar 18 G834JYR (2024) | |
| MSI Titan 18 HX A14VIG | |
| Durchschnitt der Klasse Gaming (188.8 - 343, n=111, der letzten 2 Jahre) | |
| Schenker Key 17 Pro (M24) | |
| Blender / v2.79 BMW27 CPU | |
| Durchschnitt der Klasse Gaming (80 - 330, n=109, der letzten 2 Jahre) | |
| Acer Predator Helios 18 PH18-72-98MW | |
| Schenker Key 17 Pro (M24) | |
| Asus ROG Strix Scar 18 G834JYR (2024) | |
| Razer Blade 18 2024 RZ09-0509 | |
| MSI Titan 18 HX A14VIG | |
| Alienware m18 R2 | |
| Durchschnittliche Intel Core Ultra 9 275HX (82 - 116, n=29) | |
| Asus Strix Scar 18 G835LX | |
| 7-Zip 18.03 / 7z b 4 | |
| Asus Strix Scar 18 G835LX | |
| Alienware m18 R2 | |
| MSI Titan 18 HX A14VIG | |
| Asus ROG Strix Scar 18 G834JYR (2024) | |
| Durchschnittliche Intel Core Ultra 9 275HX (98236 - 124155, n=30) | |
| Schenker Key 17 Pro (M24) | |
| Razer Blade 18 2024 RZ09-0509 | |
| Acer Predator Helios 18 PH18-72-98MW | |
| Durchschnitt der Klasse Gaming (33491 - 148086, n=110, der letzten 2 Jahre) | |
| 7-Zip 18.03 / 7z b 4 -mmt1 | |
| Asus ROG Strix Scar 18 G834JYR (2024) | |
| Alienware m18 R2 | |
| Asus Strix Scar 18 G835LX | |
| Schenker Key 17 Pro (M24) | |
| Durchschnittliche Intel Core Ultra 9 275HX (6026 - 7149, n=30) | |
| MSI Titan 18 HX A14VIG | |
| Razer Blade 18 2024 RZ09-0509 | |
| Durchschnitt der Klasse Gaming (4199 - 7436, n=110, der letzten 2 Jahre) | |
| Acer Predator Helios 18 PH18-72-98MW | |
| Geekbench 6.7 / Multi-Core | |
| Asus Strix Scar 18 G835LX | |
| Durchschnittliche Intel Core Ultra 9 275HX (16033 - 21668, n=33) | |
| Alienware m18 R2 | |
| Asus ROG Strix Scar 18 G834JYR (2024) | |
| Acer Predator Helios 18 PH18-72-98MW | |
| Razer Blade 18 2024 RZ09-0509 | |
| MSI Titan 18 HX A14VIG | |
| Schenker Key 17 Pro (M24) | |
| Durchschnitt der Klasse Gaming (6625 - 22104, n=111, der letzten 2 Jahre) | |
| Geekbench 6.7 / Single-Core | |
| Asus Strix Scar 18 G835LX | |
| Alienware m18 R2 | |
| Durchschnittliche Intel Core Ultra 9 275HX (2843 - 3160, n=33) | |
| Asus ROG Strix Scar 18 G834JYR (2024) | |
| Acer Predator Helios 18 PH18-72-98MW | |
| MSI Titan 18 HX A14VIG | |
| Razer Blade 18 2024 RZ09-0509 | |
| Durchschnitt der Klasse Gaming (1490 - 3259, n=111, der letzten 2 Jahre) | |
| Schenker Key 17 Pro (M24) | |
| Geekbench 5.5 / Multi-Core | |
| Asus Strix Scar 18 G835LX | |
| Durchschnittliche Intel Core Ultra 9 275HX (19105 - 25855, n=31) | |
| Alienware m18 R2 | |
| Acer Predator Helios 18 PH18-72-98MW | |
| Asus ROG Strix Scar 18 G834JYR (2024) | |
| Schenker Key 17 Pro (M24) | |
| Razer Blade 18 2024 RZ09-0509 | |
| MSI Titan 18 HX A14VIG | |
| Durchschnitt der Klasse Gaming (6460 - 27010, n=110, der letzten 2 Jahre) | |
| Geekbench 5.5 / Single-Core | |
| Asus Strix Scar 18 G835LX | |
| Durchschnittliche Intel Core Ultra 9 275HX (2033 - 2292, n=31) | |
| Alienware m18 R2 | |
| Asus ROG Strix Scar 18 G834JYR (2024) | |
| MSI Titan 18 HX A14VIG | |
| Durchschnitt der Klasse Gaming (986 - 2474, n=110, der letzten 2 Jahre) | |
| Razer Blade 18 2024 RZ09-0509 | |
| Acer Predator Helios 18 PH18-72-98MW | |
| Schenker Key 17 Pro (M24) | |
| HWBOT x265 Benchmark v2.2 / 4k Preset | |
| Asus Strix Scar 18 G835LX | |
| Durchschnittliche Intel Core Ultra 9 275HX (30.7 - 43.8, n=30) | |
| Alienware m18 R2 | |
| MSI Titan 18 HX A14VIG | |
| Acer Predator Helios 18 PH18-72-98MW | |
| Asus ROG Strix Scar 18 G834JYR (2024) | |
| Durchschnitt der Klasse Gaming (11.5 - 44.3, n=110, der letzten 2 Jahre) | |
| Razer Blade 18 2024 RZ09-0509 | |
| Schenker Key 17 Pro (M24) | |
| LibreOffice / 20 Documents To PDF | |
| Acer Predator Helios 18 PH18-72-98MW | |
| Durchschnitt der Klasse Gaming (19 - 88.8, n=110, der letzten 2 Jahre) | |
| Razer Blade 18 2024 RZ09-0509 | |
| Schenker Key 17 Pro (M24) | |
| MSI Titan 18 HX A14VIG | |
| Alienware m18 R2 | |
| Asus ROG Strix Scar 18 G834JYR (2024) | |
| Durchschnittliche Intel Core Ultra 9 275HX (33.2 - 62.1, n=30) | |
| Asus Strix Scar 18 G835LX | |
| R Benchmark 2.5 / Overall mean | |
| Durchschnitt der Klasse Gaming (0.3439 - 0.759, n=111, der letzten 2 Jahre) | |
| Acer Predator Helios 18 PH18-72-98MW | |
| Durchschnittliche Intel Core Ultra 9 275HX (0.3943 - 0.4568, n=30) | |
| Schenker Key 17 Pro (M24) | |
| Asus ROG Strix Scar 18 G834JYR (2024) | |
| Asus Strix Scar 18 G835LX | |
| Razer Blade 18 2024 RZ09-0509 | |
| MSI Titan 18 HX A14VIG | |
| Alienware m18 R2 | |
* ... kleinere Werte sind besser
AIDA64: FP32 Ray-Trace | FPU Julia | CPU SHA3 | CPU Queen | FPU SinJulia | FPU Mandel | CPU AES | CPU ZLib | FP64 Ray-Trace | CPU PhotoWorxx
| Performance Rating | |
| Asus Strix Scar 18 G835LX | |
| Durchschnittliche Intel Core Ultra 9 275HX | |
| MSI Titan 18 HX A14VIG | |
| Alienware m18 R2 | |
| Asus ROG Strix Scar 18 G834JYR (2024) | |
| Razer Blade 18 2024 RZ09-0509 | |
| Durchschnitt der Klasse Gaming | |
| Acer Predator Helios 18 PH18-72-98MW | |
| Schenker Key 17 Pro (M24) | |
| AIDA64 / FP32 Ray-Trace | |
| Asus Strix Scar 18 G835LX | |
| Durchschnittliche Intel Core Ultra 9 275HX (28039 - 39895, n=30) | |
| Durchschnitt der Klasse Gaming (10227 - 85542, n=109, der letzten 2 Jahre) | |
| MSI Titan 18 HX A14VIG | |
| Alienware m18 R2 | |
| Asus ROG Strix Scar 18 G834JYR (2024) | |
| Razer Blade 18 2024 RZ09-0509 | |
| Acer Predator Helios 18 PH18-72-98MW | |
| Schenker Key 17 Pro (M24) | |
| AIDA64 / FPU Julia | |
| Asus Strix Scar 18 G835LX | |
| Durchschnittliche Intel Core Ultra 9 275HX (140254 - 200744, n=30) | |
| MSI Titan 18 HX A14VIG | |
| Alienware m18 R2 | |
| Durchschnitt der Klasse Gaming (51376 - 238426, n=109, der letzten 2 Jahre) | |
| Asus ROG Strix Scar 18 G834JYR (2024) | |
| Razer Blade 18 2024 RZ09-0509 | |
| Acer Predator Helios 18 PH18-72-98MW | |
| Schenker Key 17 Pro (M24) | |
| AIDA64 / CPU SHA3 | |
| Asus Strix Scar 18 G835LX | |
| Durchschnittliche Intel Core Ultra 9 275HX (6710 - 9817, n=30) | |
| MSI Titan 18 HX A14VIG | |
| Alienware m18 R2 | |
| Asus ROG Strix Scar 18 G834JYR (2024) | |
| Durchschnitt der Klasse Gaming (2180 - 9817, n=109, der letzten 2 Jahre) | |
| Razer Blade 18 2024 RZ09-0509 | |
| Acer Predator Helios 18 PH18-72-98MW | |
| Schenker Key 17 Pro (M24) | |
| AIDA64 / CPU Queen | |
| MSI Titan 18 HX A14VIG | |
| Asus ROG Strix Scar 18 G834JYR (2024) | |
| Asus Strix Scar 18 G835LX | |
| Alienware m18 R2 | |
| Acer Predator Helios 18 PH18-72-98MW | |
| Schenker Key 17 Pro (M24) | |
| Razer Blade 18 2024 RZ09-0509 | |
| Durchschnittliche Intel Core Ultra 9 275HX (113887 - 140937, n=30) | |
| Durchschnitt der Klasse Gaming (49785 - 173351, n=98, der letzten 2 Jahre) | |
| AIDA64 / FPU SinJulia | |
| MSI Titan 18 HX A14VIG | |
| Alienware m18 R2 | |
| Asus ROG Strix Scar 18 G834JYR (2024) | |
| Razer Blade 18 2024 RZ09-0509 | |
| Acer Predator Helios 18 PH18-72-98MW | |
| Durchschnitt der Klasse Gaming (4424 - 33636, n=109, der letzten 2 Jahre) | |
| Asus Strix Scar 18 G835LX | |
| Schenker Key 17 Pro (M24) | |
| Durchschnittliche Intel Core Ultra 9 275HX (11172 - 14425, n=30) | |
| AIDA64 / FPU Mandel | |
| Asus Strix Scar 18 G835LX | |
| Durchschnittliche Intel Core Ultra 9 275HX (72596 - 104508, n=30) | |
| Alienware m18 R2 | |
| MSI Titan 18 HX A14VIG | |
| Durchschnitt der Klasse Gaming (25115 - 128721, n=109, der letzten 2 Jahre) | |
| Asus ROG Strix Scar 18 G834JYR (2024) | |
| Razer Blade 18 2024 RZ09-0509 | |
| Acer Predator Helios 18 PH18-72-98MW | |
| Schenker Key 17 Pro (M24) | |
| AIDA64 / CPU AES | |
| MSI Titan 18 HX A14VIG | |
| Asus Strix Scar 18 G835LX | |
| Alienware m18 R2 | |
| Durchschnittliche Intel Core Ultra 9 275HX (105608 - 247074, n=30) | |
| Asus ROG Strix Scar 18 G834JYR (2024) | |
| Razer Blade 18 2024 RZ09-0509 | |
| Acer Predator Helios 18 PH18-72-98MW | |
| Schenker Key 17 Pro (M24) | |
| Durchschnitt der Klasse Gaming (39258 - 247074, n=109, der letzten 2 Jahre) | |
| AIDA64 / CPU ZLib | |
| Asus Strix Scar 18 G835LX | |
| MSI Titan 18 HX A14VIG | |
| Alienware m18 R2 | |
| Durchschnittliche Intel Core Ultra 9 275HX (1582 - 2263, n=30) | |
| Razer Blade 18 2024 RZ09-0509 | |
| Asus ROG Strix Scar 18 G834JYR (2024) | |
| Acer Predator Helios 18 PH18-72-98MW | |
| Schenker Key 17 Pro (M24) | |
| Durchschnitt der Klasse Gaming (574 - 2531, n=109, der letzten 2 Jahre) | |
| AIDA64 / FP64 Ray-Trace | |
| Asus Strix Scar 18 G835LX | |
| Durchschnittliche Intel Core Ultra 9 275HX (14847 - 21854, n=30) | |
| Durchschnitt der Klasse Gaming (5509 - 45446, n=109, der letzten 2 Jahre) | |
| Alienware m18 R2 | |
| MSI Titan 18 HX A14VIG | |
| Razer Blade 18 2024 RZ09-0509 | |
| Asus ROG Strix Scar 18 G834JYR (2024) | |
| Acer Predator Helios 18 PH18-72-98MW | |
| Schenker Key 17 Pro (M24) | |
| AIDA64 / CPU PhotoWorxx | |
| Asus Strix Scar 18 G835LX | |
| Schenker Key 17 Pro (M24) | |
| Durchschnittliche Intel Core Ultra 9 275HX (37482 - 62916, n=30) | |
| Alienware m18 R2 | |
| Asus ROG Strix Scar 18 G834JYR (2024) | |
| Razer Blade 18 2024 RZ09-0509 | |
| Acer Predator Helios 18 PH18-72-98MW | |
| Durchschnitt der Klasse Gaming (12271 - 89891, n=109, der letzten 2 Jahre) | |
| MSI Titan 18 HX A14VIG | |
System Performance
Das Strix SCAR 18 ist ein sehr reaktionsschnelles System, die Benchmark-Ergebnisse sind allerdings nur durchschnittlich. Durch die Advanced-Optimus-Grafikumschaltung kommt es beim Starten von Spielen zu einem kurzen Hänger, das ist aber normal.
CrossMark: Overall | Productivity | Creativity | Responsiveness
WebXPRT 3: Overall
WebXPRT 4: Overall
Mozilla Kraken 1.1: Total
| PCMark 10 / Score | |
| Alienware m18 R2 | |
| MSI Titan 18 HX A14VIG | |
| Razer Blade 18 2024 RZ09-0509 | |
| Asus ROG Strix Scar 18 G834JYR (2024) | |
| Asus Strix Scar 18 G835LX | |
| Durchschnittliche Intel Core Ultra 9 275HX, NVIDIA GeForce RTX 5090 Laptop (7474 - 9497, n=11) | |
| Durchschnitt der Klasse Gaming (5828 - 11574, n=96, der letzten 2 Jahre) | |
| Schenker Key 17 Pro (M24) | |
| Acer Predator Helios 18 PH18-72-98MW | |
| PCMark 10 / Essentials | |
| MSI Titan 18 HX A14VIG | |
| Alienware m18 R2 | |
| Asus ROG Strix Scar 18 G834JYR (2024) | |
| Razer Blade 18 2024 RZ09-0509 | |
| Acer Predator Helios 18 PH18-72-98MW | |
| Asus Strix Scar 18 G835LX | |
| Durchschnittliche Intel Core Ultra 9 275HX, NVIDIA GeForce RTX 5090 Laptop (9994 - 11369, n=12) | |
| Schenker Key 17 Pro (M24) | |
| Durchschnitt der Klasse Gaming (8810 - 12600, n=100, der letzten 2 Jahre) | |
| PCMark 10 / Productivity | |
| Alienware m18 R2 | |
| Durchschnitt der Klasse Gaming (6845 - 21327, n=98, der letzten 2 Jahre) | |
| Asus ROG Strix Scar 18 G834JYR (2024) | |
| MSI Titan 18 HX A14VIG | |
| Razer Blade 18 2024 RZ09-0509 | |
| Acer Predator Helios 18 PH18-72-98MW | |
| Durchschnittliche Intel Core Ultra 9 275HX, NVIDIA GeForce RTX 5090 Laptop (9122 - 10925, n=11) | |
| Schenker Key 17 Pro (M24) | |
| Asus Strix Scar 18 G835LX | |
| PCMark 10 / Digital Content Creation | |
| Asus Strix Scar 18 G835LX | |
| MSI Titan 18 HX A14VIG | |
| Durchschnittliche Intel Core Ultra 9 275HX, NVIDIA GeForce RTX 5090 Laptop (9952 - 19234, n=11) | |
| Alienware m18 R2 | |
| Razer Blade 18 2024 RZ09-0509 | |
| Asus ROG Strix Scar 18 G834JYR (2024) | |
| Schenker Key 17 Pro (M24) | |
| Durchschnitt der Klasse Gaming (7602 - 19657, n=98, der letzten 2 Jahre) | |
| Acer Predator Helios 18 PH18-72-98MW | |
| CrossMark / Overall | |
| Asus Strix Scar 18 G835LX | |
| Asus ROG Strix Scar 18 G834JYR (2024) | |
| Durchschnittliche Intel Core Ultra 9 275HX, NVIDIA GeForce RTX 5090 Laptop (1995 - 2339, n=12) | |
| Alienware m18 R2 | |
| Razer Blade 18 2024 RZ09-0509 | |
| Durchschnitt der Klasse Gaming (1366 - 2409, n=97, der letzten 2 Jahre) | |
| MSI Titan 18 HX A14VIG | |
| CrossMark / Productivity | |
| Asus ROG Strix Scar 18 G834JYR (2024) | |
| Durchschnittliche Intel Core Ultra 9 275HX, NVIDIA GeForce RTX 5090 Laptop (1847 - 2211, n=12) | |
| Asus Strix Scar 18 G835LX | |
| Razer Blade 18 2024 RZ09-0509 | |
| Alienware m18 R2 | |
| Durchschnitt der Klasse Gaming (1386 - 2254, n=97, der letzten 2 Jahre) | |
| MSI Titan 18 HX A14VIG | |
| CrossMark / Creativity | |
| Asus Strix Scar 18 G835LX | |
| Durchschnittliche Intel Core Ultra 9 275HX, NVIDIA GeForce RTX 5090 Laptop (2170 - 2642, n=12) | |
| Asus ROG Strix Scar 18 G834JYR (2024) | |
| Alienware m18 R2 | |
| Razer Blade 18 2024 RZ09-0509 | |
| Durchschnitt der Klasse Gaming (1343 - 2729, n=97, der letzten 2 Jahre) | |
| MSI Titan 18 HX A14VIG | |
| CrossMark / Responsiveness | |
| Asus ROG Strix Scar 18 G834JYR (2024) | |
| Durchschnittliche Intel Core Ultra 9 275HX, NVIDIA GeForce RTX 5090 Laptop (1673 - 2217, n=12) | |
| Asus Strix Scar 18 G835LX | |
| Alienware m18 R2 | |
| Razer Blade 18 2024 RZ09-0509 | |
| Durchschnitt der Klasse Gaming (1226 - 2334, n=97, der letzten 2 Jahre) | |
| MSI Titan 18 HX A14VIG | |
| WebXPRT 3 / Overall | |
| Durchschnittliche Intel Core Ultra 9 275HX, NVIDIA GeForce RTX 5090 Laptop (315 - 372, n=12) | |
| Asus Strix Scar 18 G835LX | |
| Razer Blade 18 2024 RZ09-0509 | |
| MSI Titan 18 HX A14VIG | |
| Alienware m18 R2 | |
| Asus ROG Strix Scar 18 G834JYR (2024) | |
| Durchschnitt der Klasse Gaming (242 - 532, n=101, der letzten 2 Jahre) | |
| Schenker Key 17 Pro (M24) | |
| WebXPRT 4 / Overall | |
| Asus Strix Scar 18 G835LX | |
| Durchschnittliche Intel Core Ultra 9 275HX, NVIDIA GeForce RTX 5090 Laptop (301 - 341, n=11) | |
| Alienware m18 R2 | |
| Asus ROG Strix Scar 18 G834JYR (2024) | |
| MSI Titan 18 HX A14VIG | |
| Durchschnitt der Klasse Gaming (176.4 - 354, n=101, der letzten 2 Jahre) | |
| Schenker Key 17 Pro (M24) | |
| Mozilla Kraken 1.1 / Total | |
| Schenker Key 17 Pro (M24) | |
| Durchschnitt der Klasse Gaming (391 - 590, n=106, der letzten 2 Jahre) | |
| MSI Titan 18 HX A14VIG | |
| Asus ROG Strix Scar 18 G834JYR (2024) | |
| Razer Blade 18 2024 RZ09-0509 | |
| Acer Predator Helios 18 PH18-72-98MW | |
| Alienware m18 R2 | |
| Durchschnittliche Intel Core Ultra 9 275HX, NVIDIA GeForce RTX 5090 Laptop (402 - 424, n=12) | |
| Asus Strix Scar 18 G835LX | |
* ... kleinere Werte sind besser
| PCMark 10 Score | 8623 Punkte | |
Hilfe | ||
| AIDA64 / Memory Copy | |
| Asus Strix Scar 18 G835LX | |
| Asus ROG Strix Scar 18 G834JYR (2024) | |
| Durchschnittliche Intel Core Ultra 9 275HX (56003 - 94460, n=30) | |
| Alienware m18 R2 | |
| Schenker Key 17 Pro (M24) | |
| Acer Predator Helios 18 PH18-72-98MW | |
| Razer Blade 18 2024 RZ09-0509 | |
| Durchschnitt der Klasse Gaming (21750 - 129946, n=109, der letzten 2 Jahre) | |
| MSI Titan 18 HX A14VIG | |
| AIDA64 / Memory Read | |
| Asus ROG Strix Scar 18 G834JYR (2024) | |
| Asus Strix Scar 18 G835LX | |
| Alienware m18 R2 | |
| Schenker Key 17 Pro (M24) | |
| Acer Predator Helios 18 PH18-72-98MW | |
| Durchschnittliche Intel Core Ultra 9 275HX (55795 - 97151, n=30) | |
| Razer Blade 18 2024 RZ09-0509 | |
| Durchschnitt der Klasse Gaming (22956 - 118858, n=109, der letzten 2 Jahre) | |
| MSI Titan 18 HX A14VIG | |
| AIDA64 / Memory Write | |
| Asus Strix Scar 18 G835LX | |
| Durchschnittliche Intel Core Ultra 9 275HX (55663 - 116129, n=30) | |
| Asus ROG Strix Scar 18 G834JYR (2024) | |
| Schenker Key 17 Pro (M24) | |
| Alienware m18 R2 | |
| Durchschnitt der Klasse Gaming (22297 - 135096, n=109, der letzten 2 Jahre) | |
| Acer Predator Helios 18 PH18-72-98MW | |
| Razer Blade 18 2024 RZ09-0509 | |
| MSI Titan 18 HX A14VIG | |
| AIDA64 / Memory Latency | |
| Durchschnittliche Intel Core Ultra 9 275HX (105.8 - 161.6, n=30) | |
| Asus Strix Scar 18 G835LX | |
| Durchschnitt der Klasse Gaming (75.3 - 259, n=109, der letzten 2 Jahre) | |
| MSI Titan 18 HX A14VIG | |
| Razer Blade 18 2024 RZ09-0509 | |
| Alienware m18 R2 | |
| Schenker Key 17 Pro (M24) | |
| Acer Predator Helios 18 PH18-72-98MW | |
| Asus ROG Strix Scar 18 G834JYR (2024) | |
* ... kleinere Werte sind besser
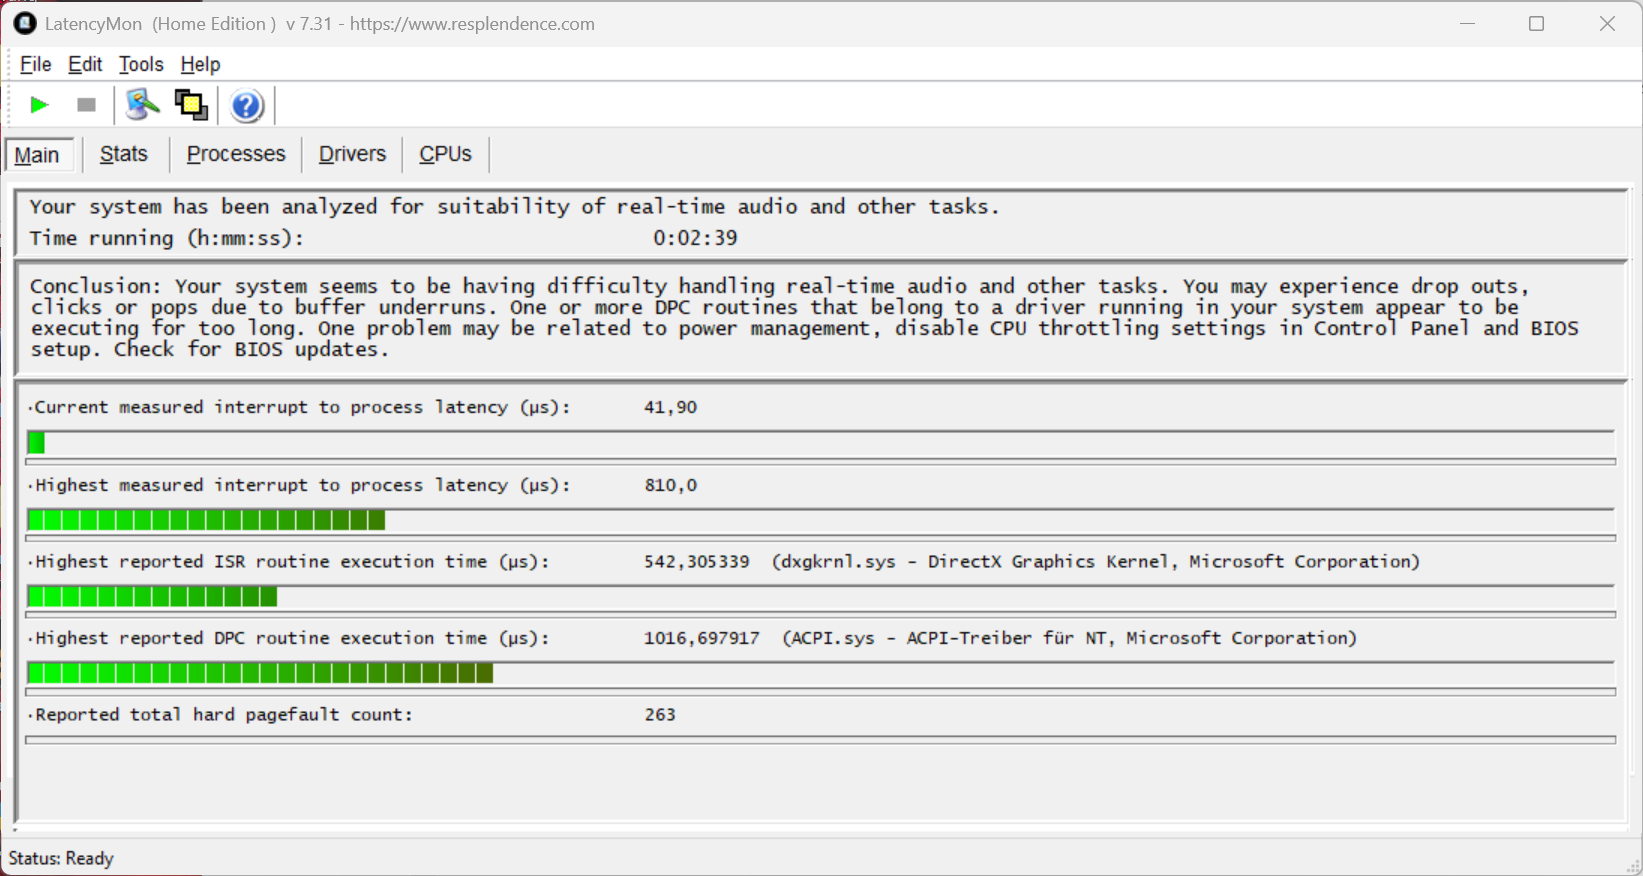
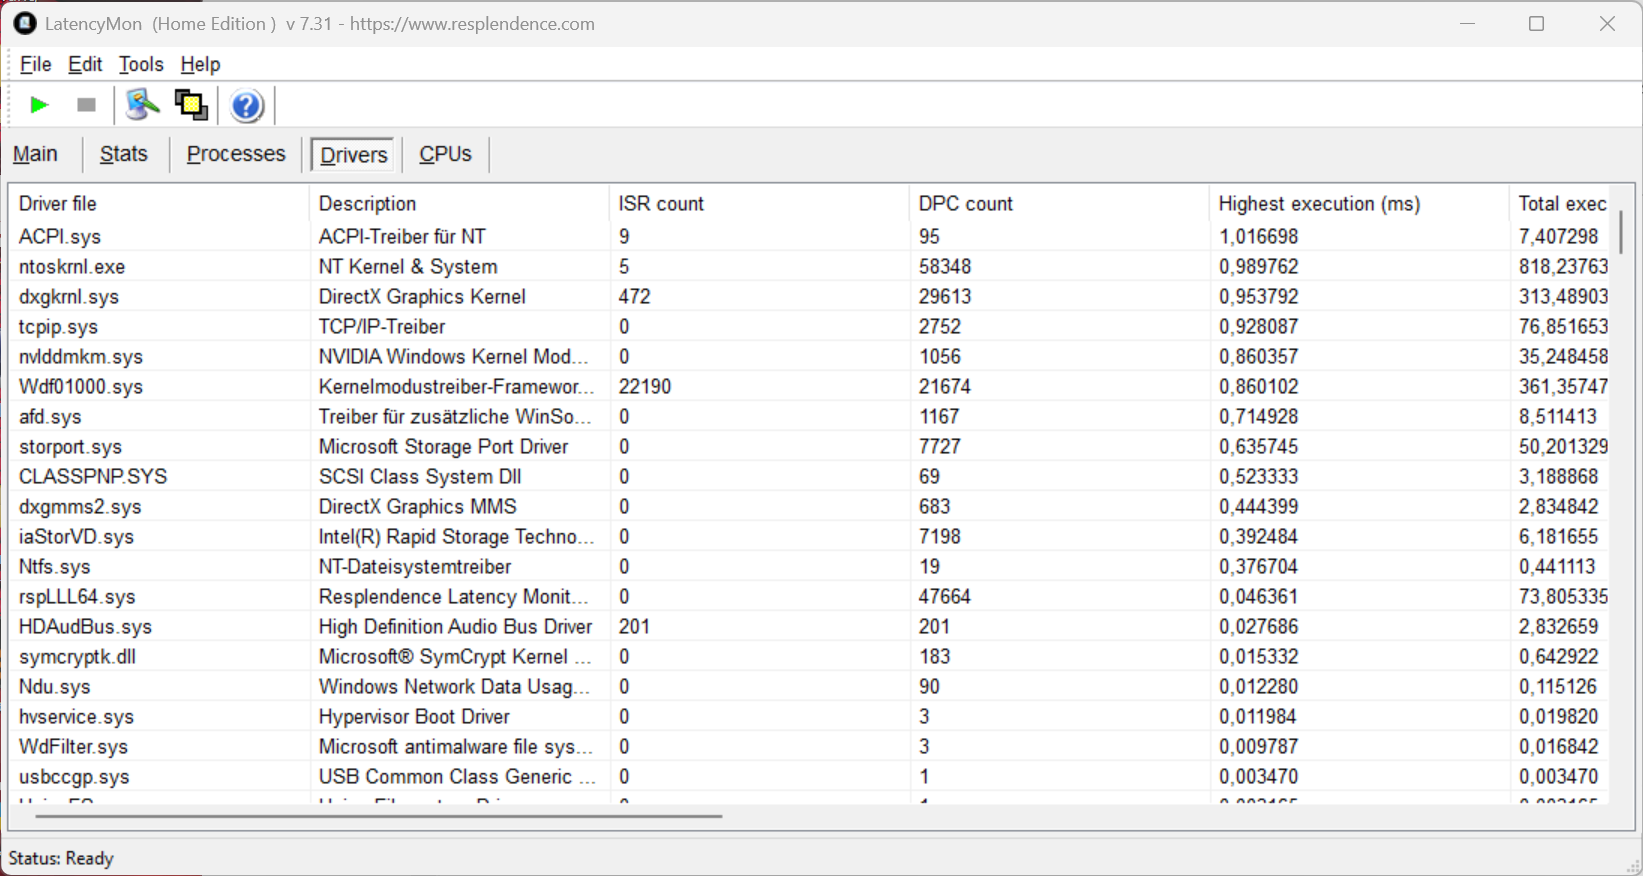
DPC-Latenzen
In unserem standardisierten Latency-Test (Surfen im Internet, 4K-YouTube-Wiedergabe, CPU-Last) zeigt das Testgerät mit der aktuellen BIOS-Version keine Einschränkungen. Ein Treiber schlägt zwar leicht aus, doch der wichtige "interrupt-to-process-latency"-Wert ist gering.
| DPC Latencies / LatencyMon - interrupt to process latency (max), Web, Youtube, Prime95 | |
| Acer Predator Helios 18 PH18-72-98MW | |
| Alienware m18 R2 | |
| MSI Titan 18 HX A14VIG | |
| Schenker Key 17 Pro (M24) | |
| Razer Blade 18 2024 RZ09-0509 | |
| Asus ROG Strix Scar 18 G834JYR (2024) | |
| Asus Strix Scar 18 G835LX | |
* ... kleinere Werte sind besser
Massenspeicher
Unsere Testkonfiguration ist mit zwei 2-TB-SSDs von WD ausgestattet, die in einem RAID-0-Verbund laufen (3,6 TB frei für den Nutzer). Dadurch kann die maximale Transferrate zwar erhöht werden, bei einigen Werten fällt das Gespann in den Benchmarks aber klar zurück. Der RAID-0-Verbund ist zudem nicht ideal, wenn mal eine der SSDs defekt ist. Hier wäre es besser gewesen, Asus hätte bereits einen PCIe-5.0-Steckplatz verbaut, denn dann hätte man auch mit einer einzelnen SSD bzw. ohne RAID eine bessere Leistung erhalten. Die Leistung der beiden SSDs bleibt bei dauerhafter Belastung aber stabil.

* ... kleinere Werte sind besser
Dauerleistung Lesen: DiskSpd Read Loop, Queue Depth 8
Grafikkarte

Das Strix SCAR 18 ist mit der neuen GeForce RTX 5090 Laptop ausgestattet, die 24 GB VRAM bietet und einen maximalen Takt von 2.340 MHz erreicht. Es handelt sich um die schnellste Variante mit einer TGP von 175 Watt (150 Watt + 25 Watt Dynamic Boost). Über die neuen Features der RTX-5000-Palette haben wir in unserer GPU-Analyse ausführlich berichtet. In den synthetischen Benchmarks liegt das neue SCAR 18 rund 20 % vor dem alten Modell. Im manuellen Modus lassen sich der Kern- und Speichertakt noch um bis zu 200 MHz erhöhen, womit wir in Time Spy Graphics rund 25.200 Punkte erhalten haben (+700 Punkte vs. Turbo). Die GPU-Leistung bleibt auch bei dauerhafter Belastung konstant, im Akkubetrieb darf die GPU aber maximal 55 Watt verbrauchen, weshalb die Leistung hier deutlich geringer ausfällt (-64 %).
| 3DMark 11 Performance | 48486 Punkte | |
| 3DMark Fire Strike Score | 38733 Punkte | |
| 3DMark Time Spy Score | 23130 Punkte | |
| 3DMark Steel Nomad Score | 5883 Punkte | |
| 3DMark Steel Nomad Light Score | 25244 Punkte | |
| 3DMark Steel Nomad Light Unlimited Score | 24960 Punkte | |
Hilfe | ||
| Blender / v3.3 Classroom OPTIX/RTX | |
| Durchschnitt der Klasse Gaming (9 - 32, n=111, der letzten 2 Jahre) | |
| Razer Blade 18 2024 RZ09-0509 | |
| Acer Predator Helios 18 PH18-72-98MW | |
| Schenker Key 17 Pro (M24) | |
| Asus ROG Strix Scar 18 G834JYR (2024) | |
| Alienware m18 R2 | |
| Durchschnittliche NVIDIA GeForce RTX 5090 Laptop (9 - 18, n=21) | |
| MSI Titan 18 HX A14VIG | |
| Asus Strix Scar 18 G835LX | |
| Blender / v3.3 Classroom CUDA | |
| Durchschnitt der Klasse Gaming (15 - 228, n=111, der letzten 2 Jahre) | |
| Razer Blade 18 2024 RZ09-0509 | |
| MSI Titan 18 HX A14VIG | |
| Acer Predator Helios 18 PH18-72-98MW | |
| Alienware m18 R2 | |
| Schenker Key 17 Pro (M24) | |
| Durchschnittliche NVIDIA GeForce RTX 5090 Laptop (15 - 37, n=20) | |
| Asus ROG Strix Scar 18 G834JYR (2024) | |
| Asus Strix Scar 18 G835LX | |
| Blender / v3.3 Classroom CPU | |
| Durchschnitt der Klasse Gaming (122 - 565, n=107, der letzten 2 Jahre) | |
| Acer Predator Helios 18 PH18-72-98MW | |
| Schenker Key 17 Pro (M24) | |
| Asus ROG Strix Scar 18 G834JYR (2024) | |
| Razer Blade 18 2024 RZ09-0509 | |
| Alienware m18 R2 | |
| MSI Titan 18 HX A14VIG | |
| Durchschnittliche NVIDIA GeForce RTX 5090 Laptop (123 - 282, n=21) | |
| Asus Strix Scar 18 G835LX | |
* ... kleinere Werte sind besser
Gaming Performance
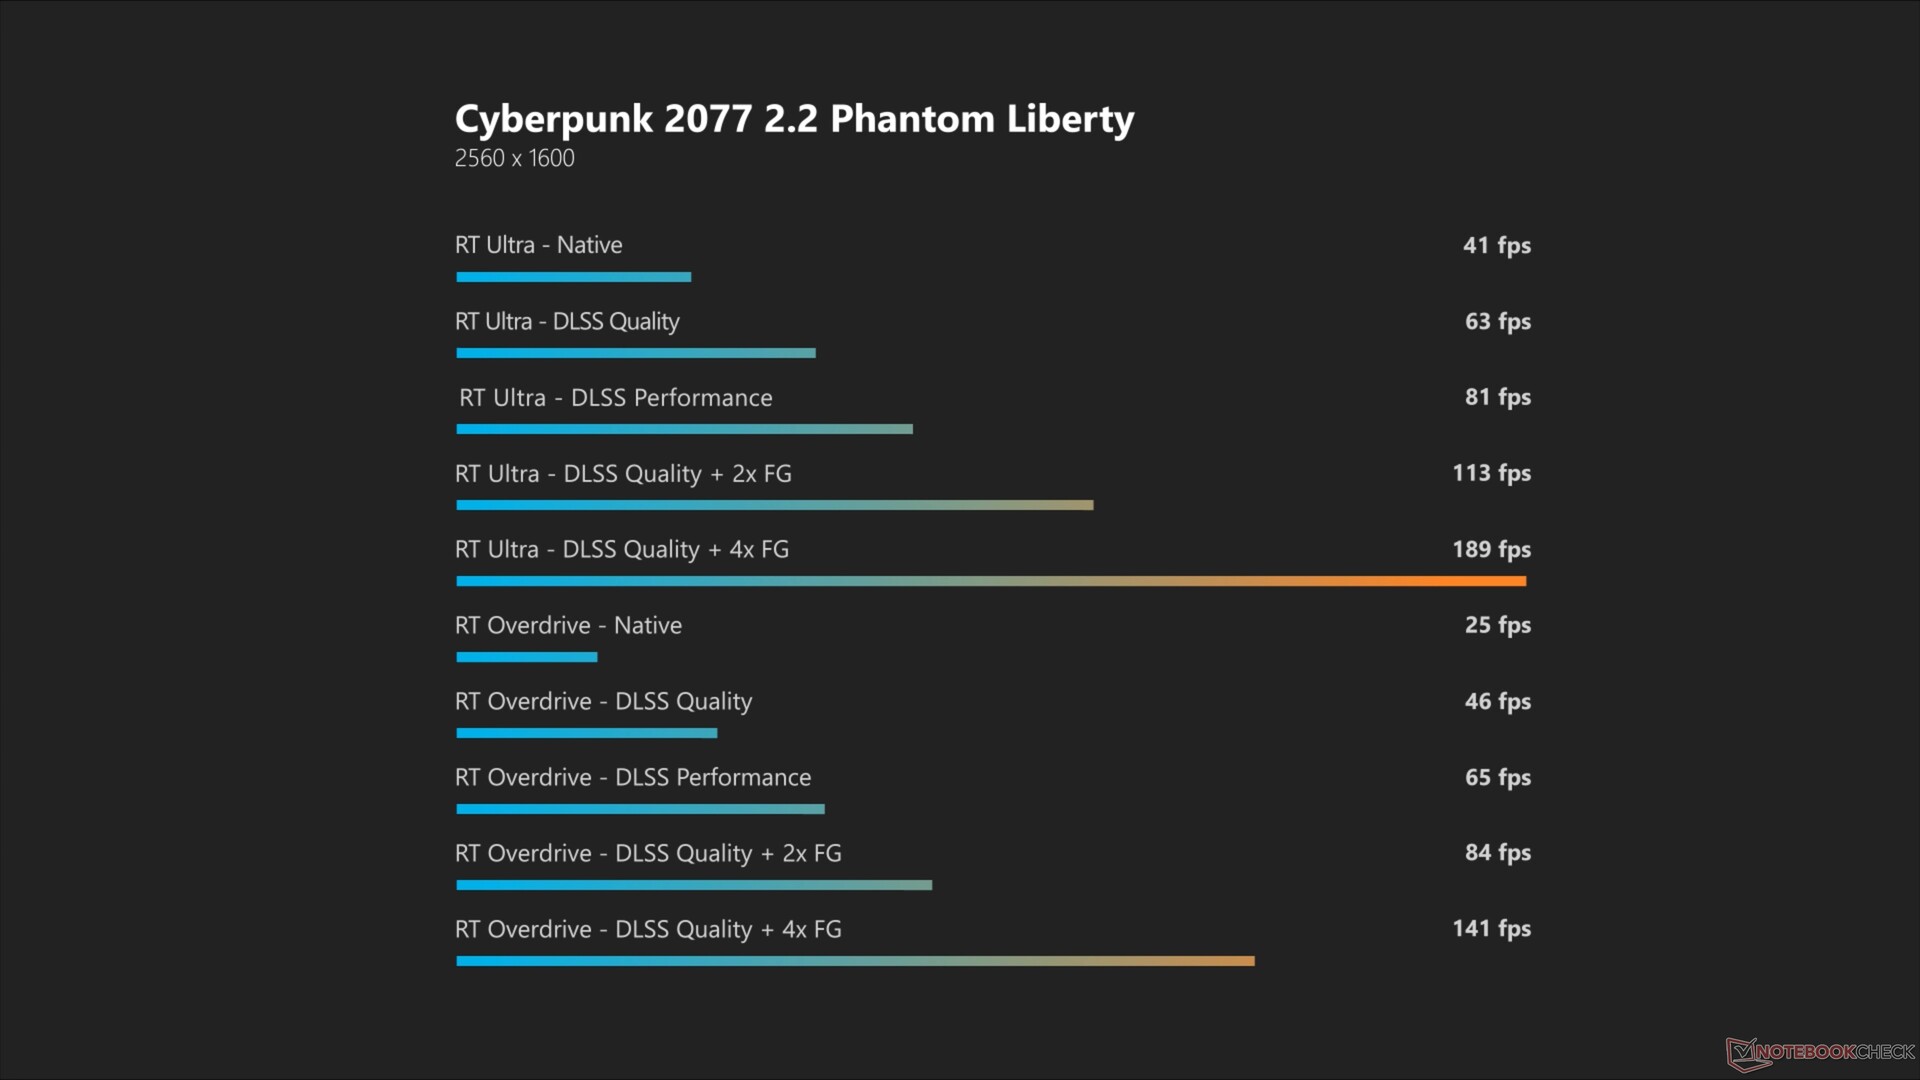
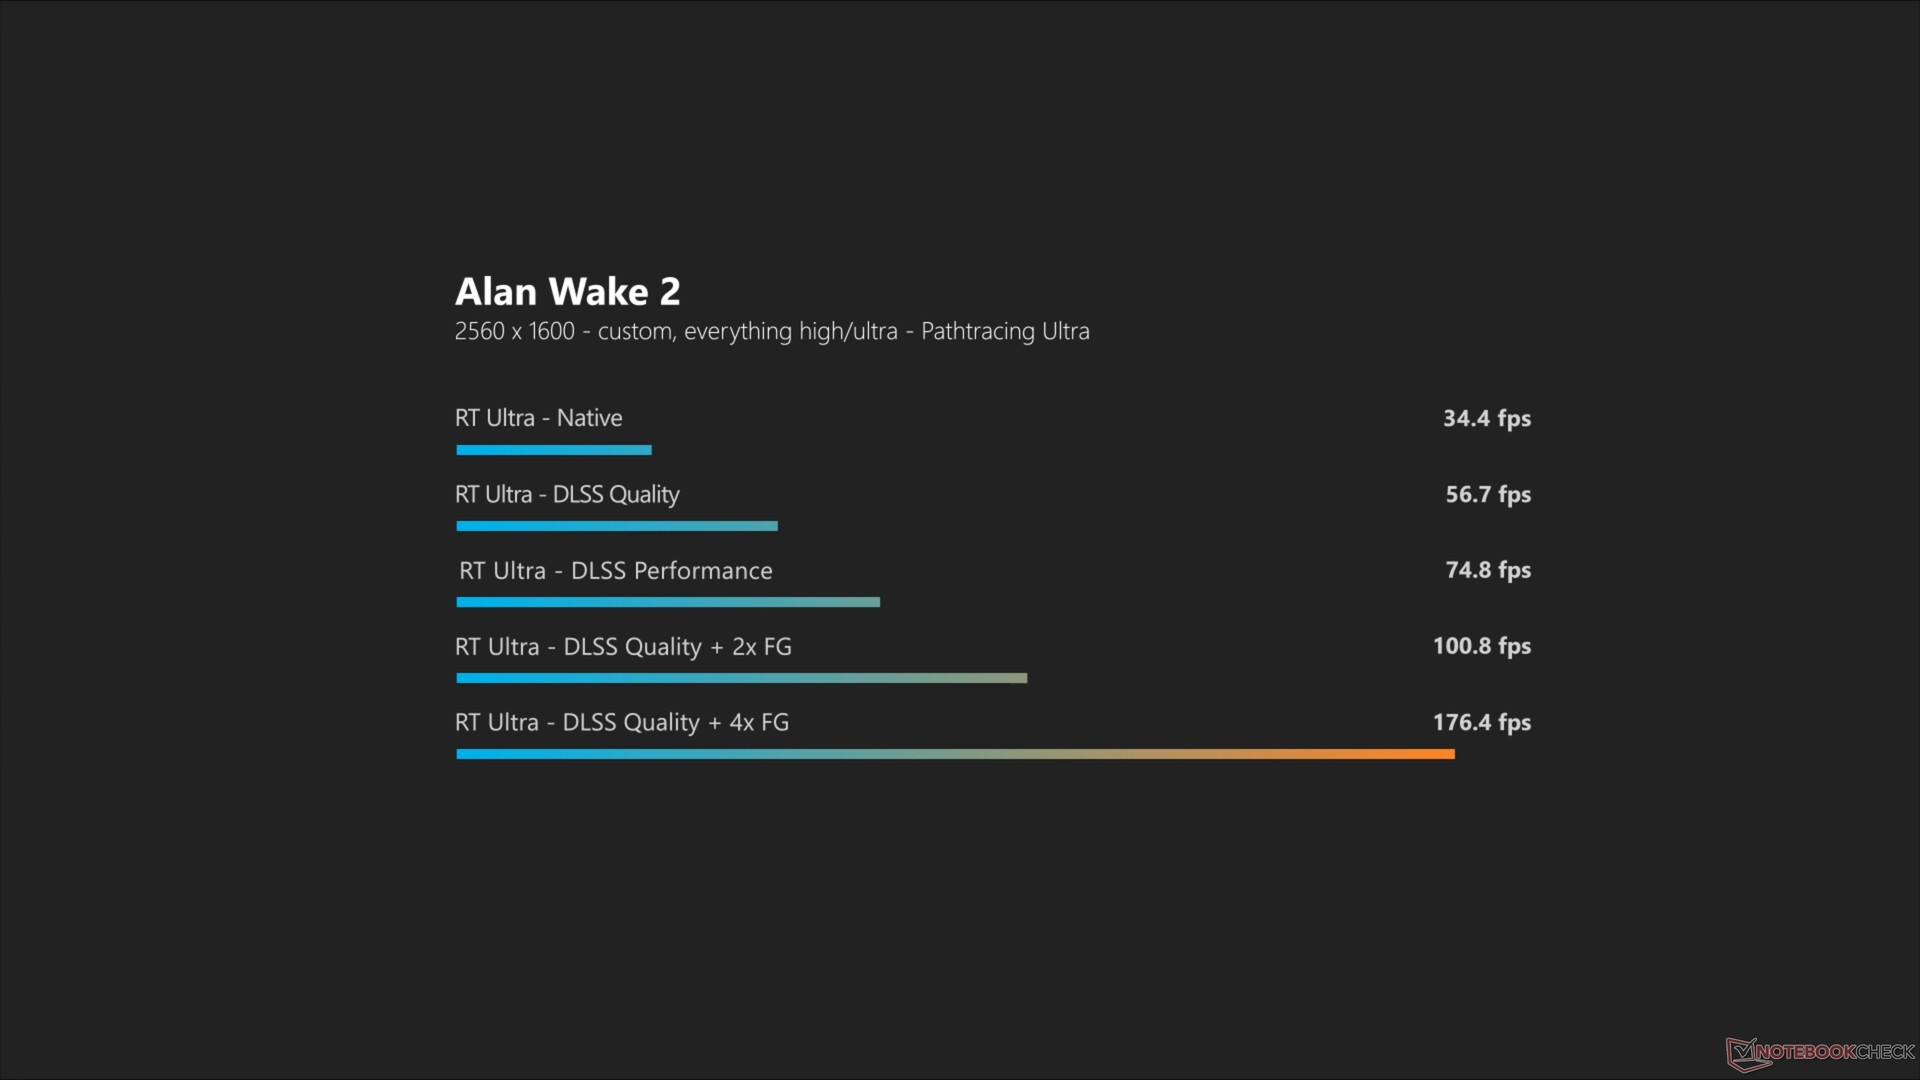
Die Gaming-Performance ist insgesamt sehr gut, doch der Vorteil bei der nativen Leistung ohne Upscaling ist vor allem im Vergleich zur alten GeForce RTX 4090 Laptop nicht riesig und ein Update macht hier nur wenig Sinn. Das ändert sich, wenn man noch mit einer GPU der RTX-3000-Generation wie der RTX 3080 Ti unterwegs ist. Wenn man in anspruchsvollen Titeln auch mit vollem Raytracing oder Pathtracing spielen möchte, beispielsweise in Cyberpunk oder Alan Wake, kommt man aber auch in der WQHD-Auflösung nicht um Upscaling durch DLSS4 herum. Mit Frame Generation lässt sich die Leistung noch deutlicher steigern, was wir auch ausführlich in unserer GPU-Analyse gezeigt haben.
| Baldur's Gate 3 - 1920x1080 Ultra Preset AA:T | |
| MSI Titan 18 HX A14VIG | |
| Alienware m18 R2 | |
| Asus Strix Scar 18 G835LX | |
| Schenker Key 17 Pro (M24) | |
| Razer Blade 18 2024 RZ09-0509 | |
| Durchschnitt der Klasse Gaming (59.4 - 246, n=107, der letzten 2 Jahre) | |
Cyberpunk 2077 ultra FPS-Diagramm
Update 06.04.2025: Wir haben noch zusätzliche Gaming-Benchmarks mit Cyberpunk 2077 sowie Alan Wake 2 in der nativen WQHD-Auflösung durchgeführt und dabei die Upscaling-Features wie DLSS4 und Multi-Frame-Generation mit vollen Raytracing-Settings überprüft.
| min. | mittel | hoch | max. | QHD | 4K DLSS | 4K | |
|---|---|---|---|---|---|---|---|
| GTA V (2015) | 161.9 | 156.8 | 179.5 | ||||
| Dota 2 Reborn (2015) | 240 | 210 | 200 | 186.6 | 179.9 | ||
| Final Fantasy XV Benchmark (2018) | 233 | 231 | 199.3 | 162.4 | 101.3 | ||
| X-Plane 11.11 (2018) | 163.4 | 158.1 | 121.7 | 94.8 | |||
| Strange Brigade (2018) | 563 | 431 | 418 | 401 | 330 | 187.2 | |
| Baldur's Gate 3 (2023) | 193.7 | 145.6 | 125.4 | 82.8 | |||
| Cyberpunk 2077 (2023) | 154.9 | 106.8 | 52.1 | ||||
| Alan Wake 2 (2023) | 116.4 | 82.4 | 46 | ||||
| F1 24 (2024) | 148 | 100 | 52 | ||||
| Call of Duty Black Ops 6 (2024) | 147 | 117 | 79 | ||||
| Indiana Jones and the Great Circle (2024) | 127.9 | 102.2 | 65 | ||||
| Monster Hunter Wilds (2025) | 87.6 | 72 | 46.3 | ||||
| Assassin's Creed Shadows (2025) | 65 | 51 | 36 |
Emissionen
Geräuschemissionen
Das Lüftergeräusch wird maßgeblich vom Energieprofil bestimmt und im Alltag empfehlen wir den Leise-Modus, da die Lüfter hier sehr oft stillstehen und auch Gaming ist hier mit maximal 34,8 dB(A) eine interessante Option, wenn es mal nicht so laut sein soll. Sobald man den Turbo-Modus aktiviert laufen die Lüfter immer mit mindestens knapp 30 dB(A). Beim Spielen und im Stresstest wird es mit 53,7 dB(A) dann richtig laut und man sollte Kopfhörer bzw. das beiliegende Headset verwenden, das gilt aber auch für den Leistungs-Modus (49 dB(A)). Allerdings muss man auch sagen, dass manche Konkurrenten sogar noch deutlich lauter werden. In einigen synthetische GPU-Benchmarks gab es leichte elektronische Geräusche, im Alltag und beim Spielen war das aber kein Problem.
Lautstärkediagramm
| Idle |
| 29.8 / 29.8 / 29.8 dB(A) |
| Last |
| 42.9 / 53.7 dB(A) |
 | ||
30 dB leise 40 dB(A) deutlich hörbar 50 dB(A) störend |
||
min: | ||
| Asus Strix Scar 18 G835LX GeForce RTX 5090 Laptop, Ultra 9 275HX, WD PC SN8000S 2TB | Razer Blade 18 2024 RZ09-0509 GeForce RTX 4090 Laptop GPU, i9-14900HX | Alienware m18 R2 GeForce RTX 4090 Laptop GPU, i9-14900HX, SK Hynix PC811 HFS002TEM9X152N | Acer Predator Helios 18 PH18-72-98MW GeForce RTX 4090 Laptop GPU, i9-14900HX, 2x SK Hynix HFS001TEJ9X115N (RAID 0) | MSI Titan 18 HX A14VIG GeForce RTX 4090 Laptop GPU, i9-14900HX, 2x Samsung PM9A1a MZVL22T0HDLB (RAID 0) | Schenker Key 17 Pro (M24) GeForce RTX 4090 Laptop GPU, i9-14900HX, Samsung 990 Pro 1 TB | Asus ROG Strix Scar 18 G834JYR (2024) GeForce RTX 4090 Laptop GPU, i9-14900HX, Samsung PM9A1a MZVL22T0HDLB | |
|---|---|---|---|---|---|---|---|
| Geräuschentwicklung | 5% | 8% | -14% | 7% | 5% | -2% | |
| aus / Umgebung * (dB) | 23.3 | 23.4 -0% | 23.6 -1% | 25 -7% | 22.8 2% | 23.41 -0% | 24 -3% |
| Idle min * (dB) | 29.8 | 23.9 20% | 23.8 20% | 30 -1% | 23.8 20% | 25.33 15% | 27 9% |
| Idle avg * (dB) | 29.8 | 28.2 5% | 26.1 12% | 36 -21% | 23.8 20% | 25.33 15% | 28 6% |
| Idle max * (dB) | 29.8 | 29 3% | 31.5 -6% | 44 -48% | 28 6% | 25.33 15% | 32 -7% |
| Last avg * (dB) | 42.9 | 36.8 14% | 31.5 27% | 48 -12% | 38 11% | 33.57 22% | 50 -17% |
| Cyberpunk 2077 ultra * (dB) | 53.7 | 61.97 -15% | |||||
| Last max * (dB) | 53.7 | 61.1 -14% | 56.6 -5% | 51 5% | 62.8 -17% | 62.14 -16% | 52 3% |
| Witcher 3 ultra * (dB) | 54.1 | 52.1 | 49 | 57.3 | 50 |
* ... kleinere Werte sind besser
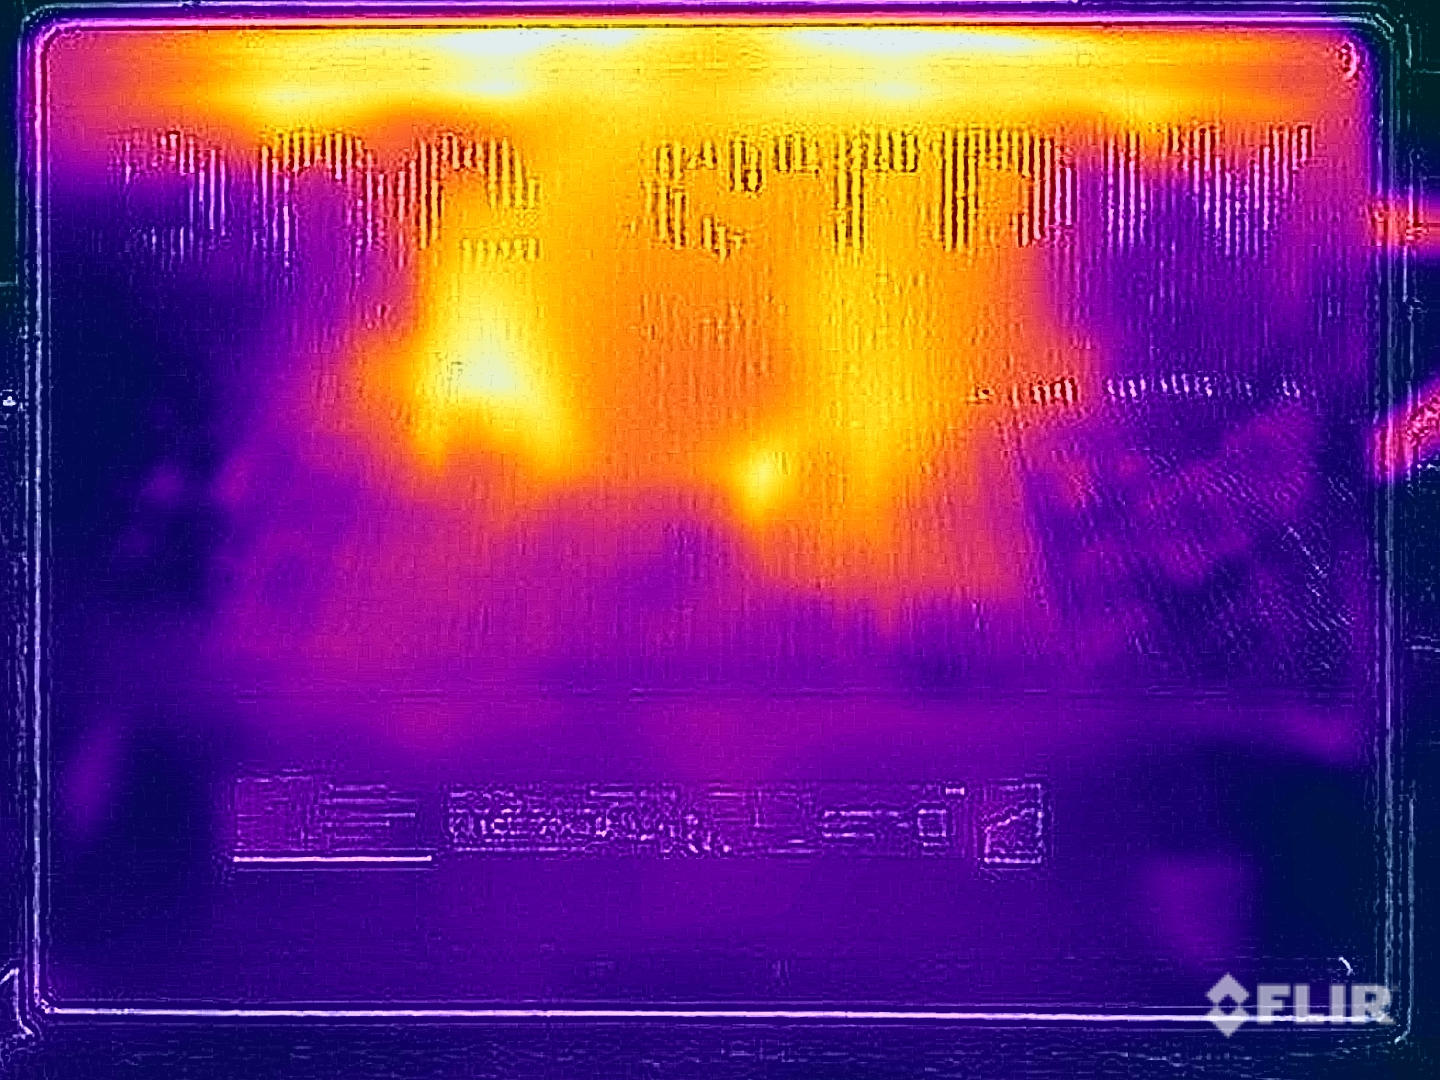
Temperatur
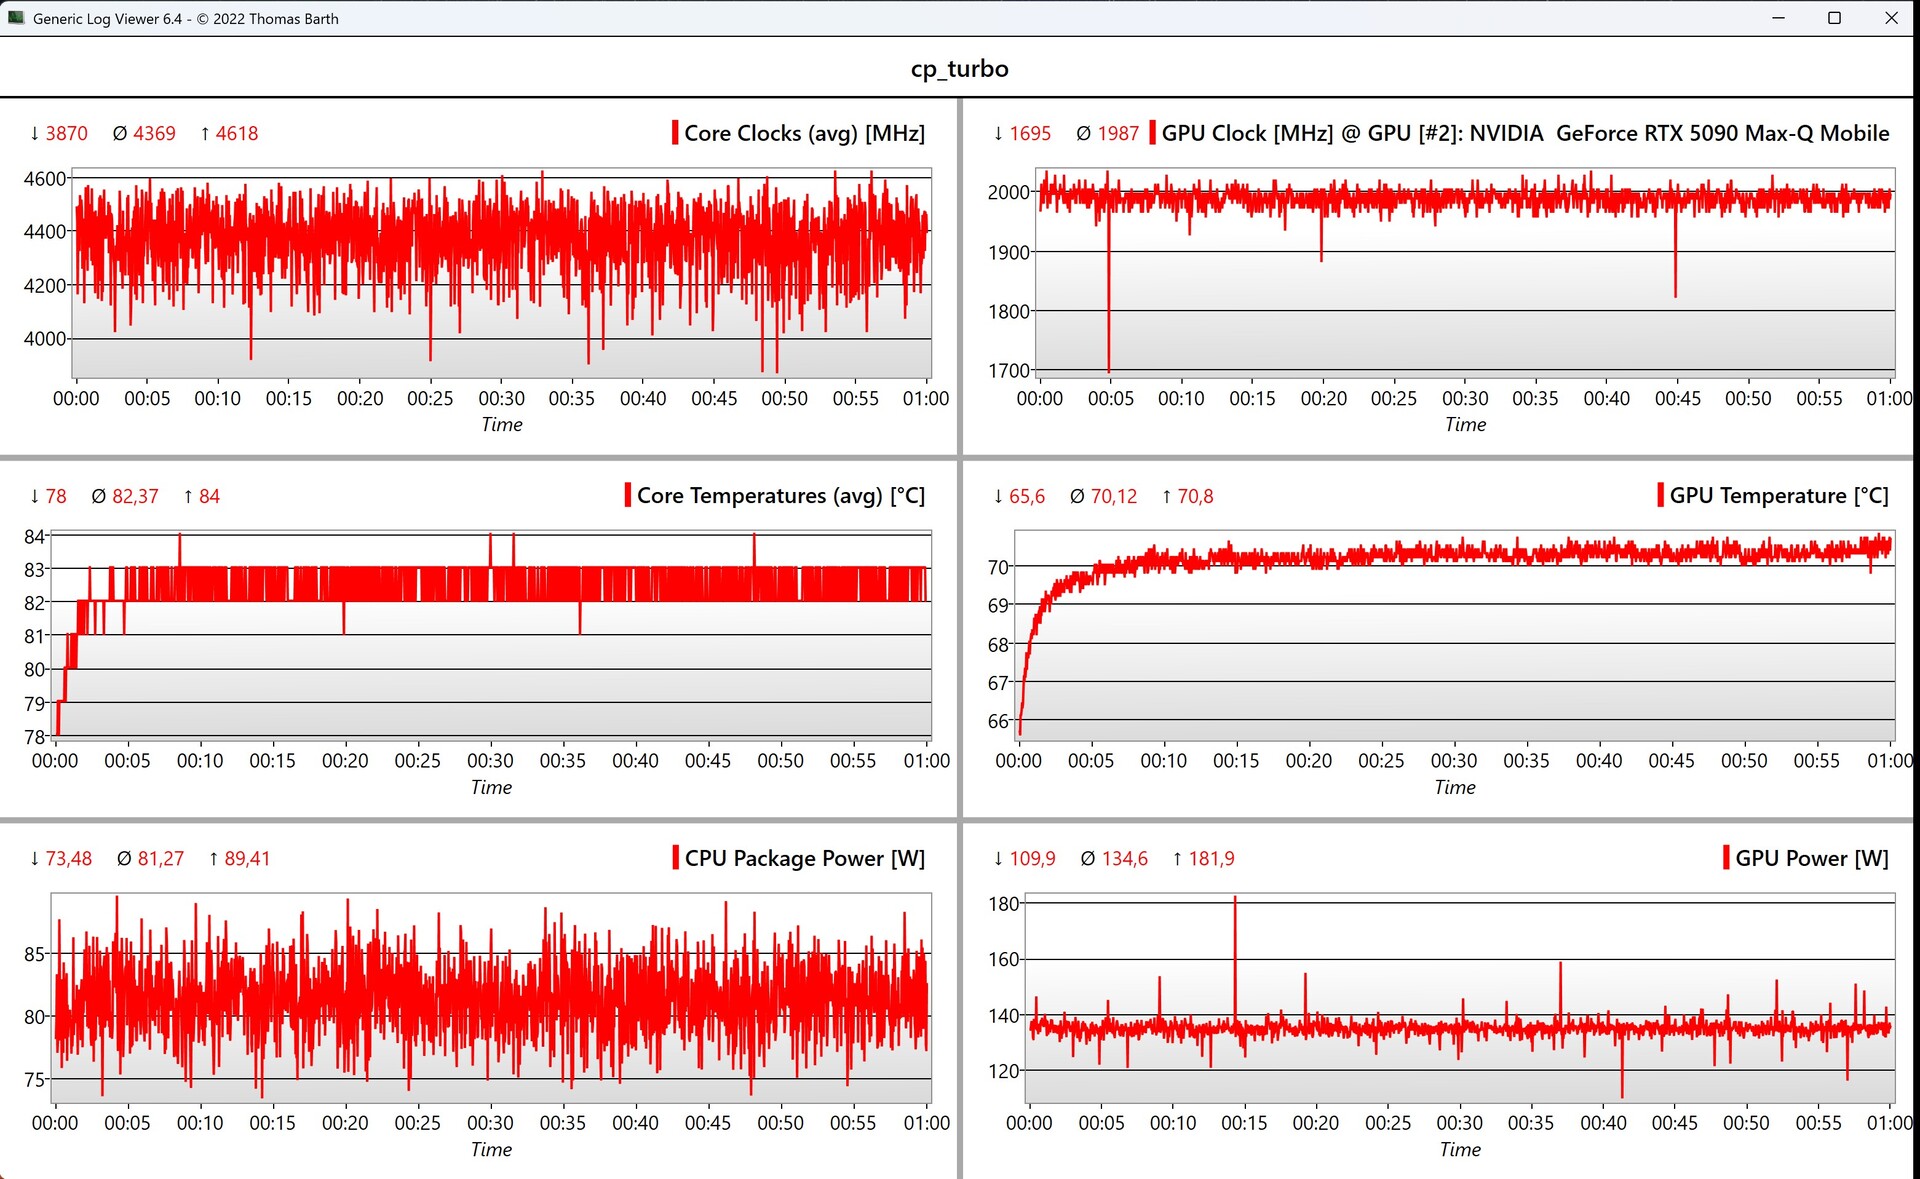
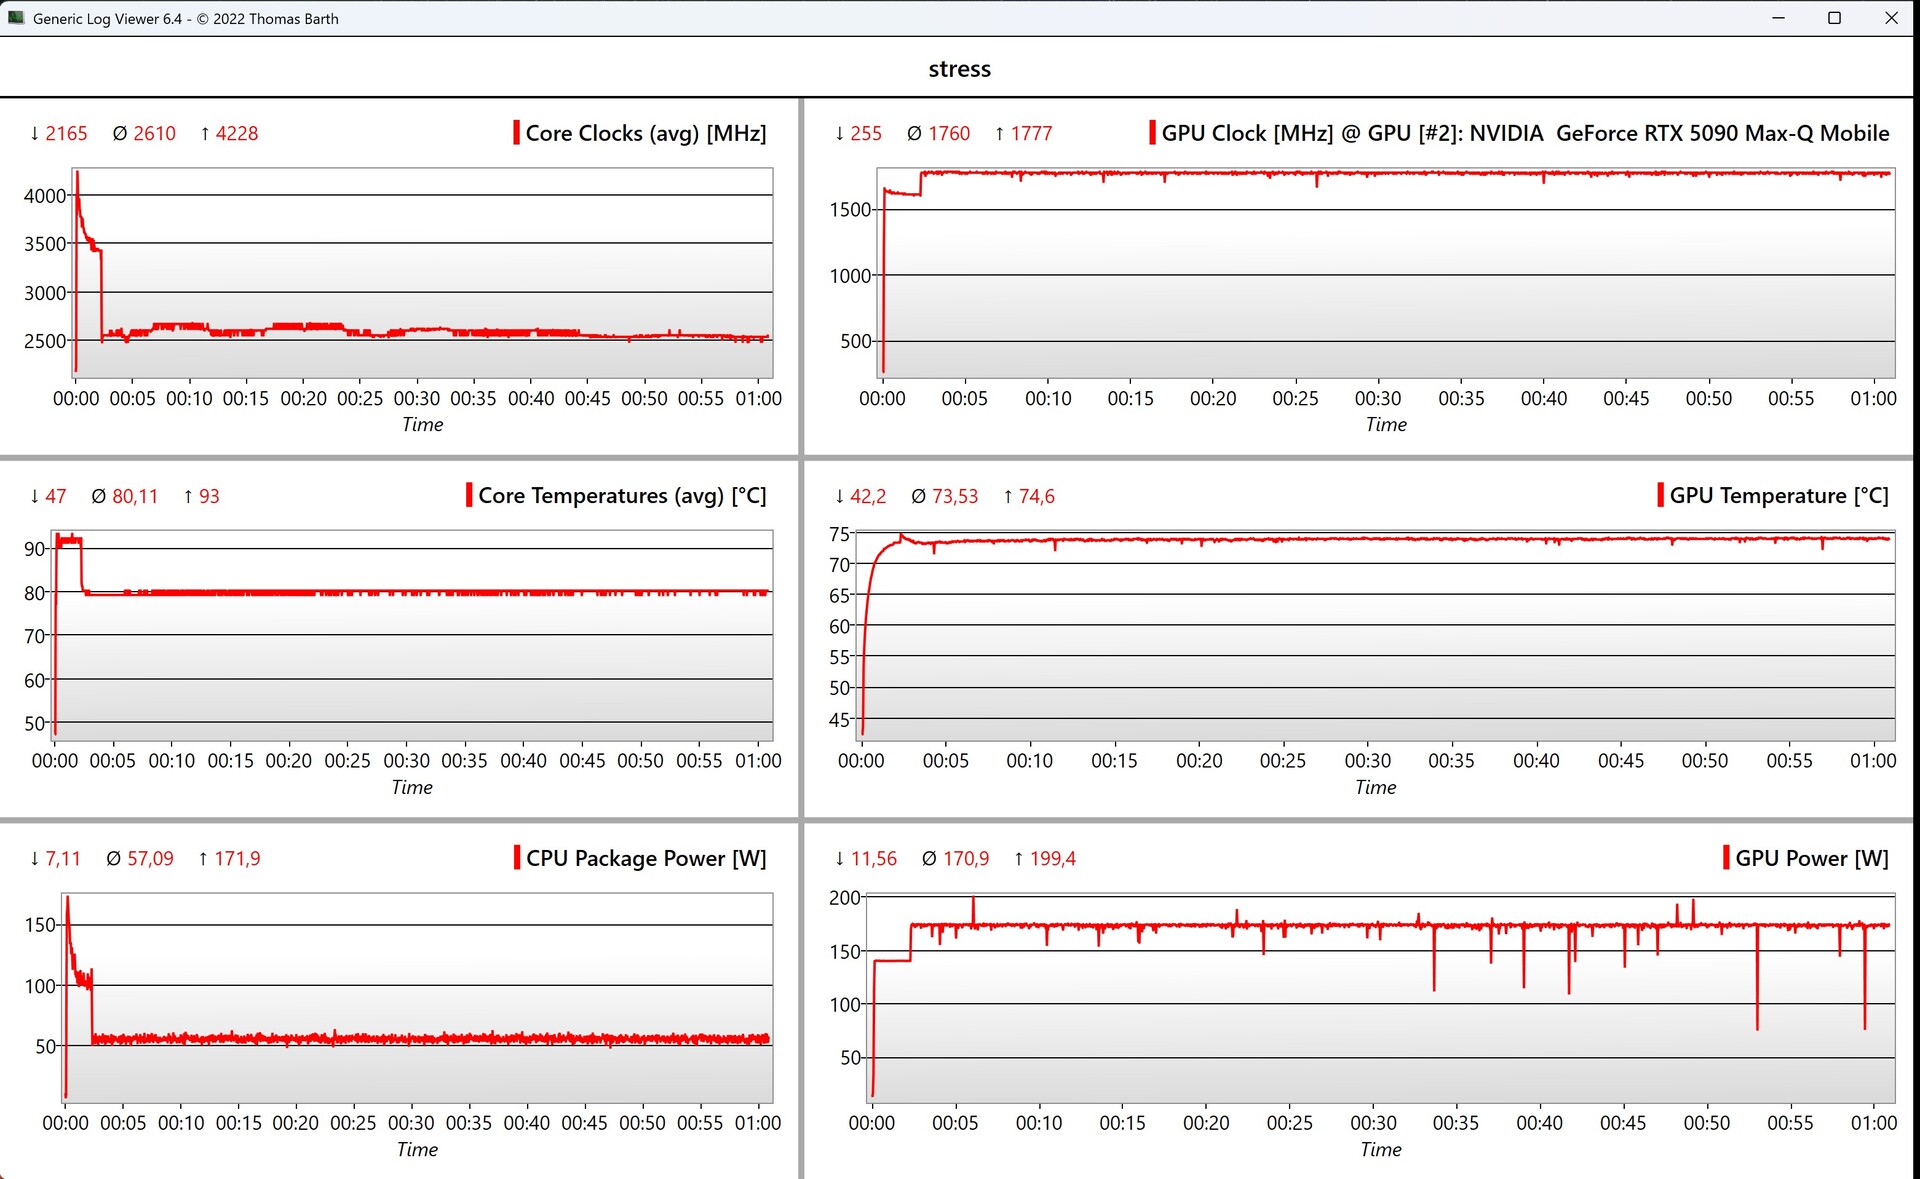
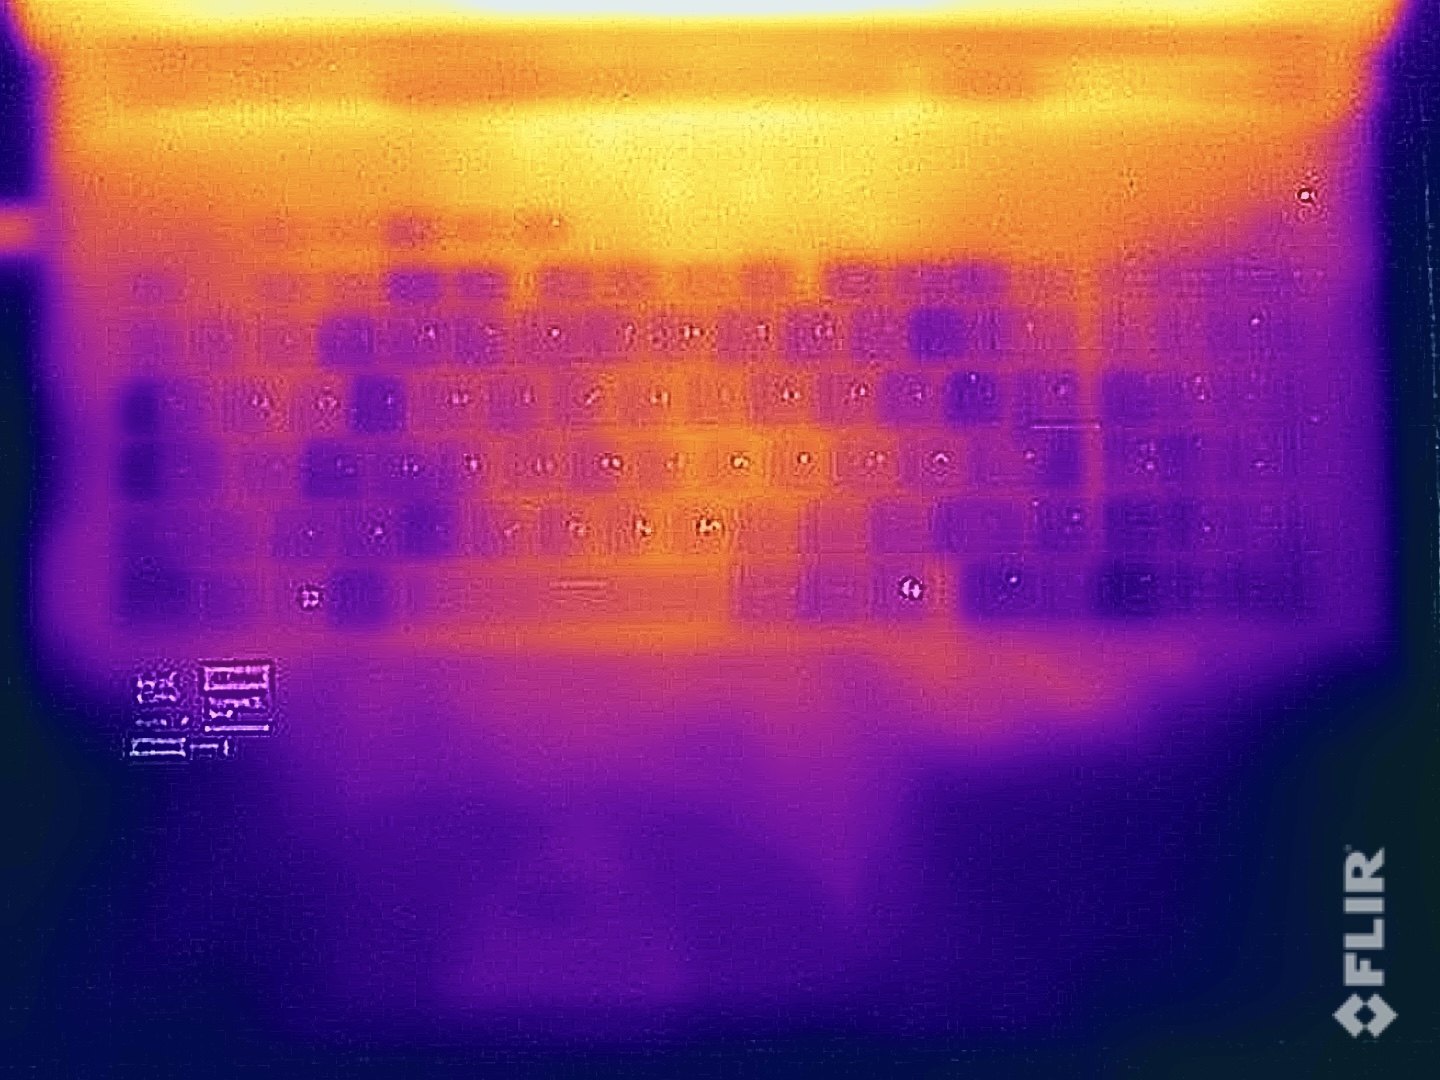
Bei den Oberflächentemperaturen gibt es keinerlei Probleme und lediglich an wenigen Stellen messen wir unter Volllast um die 45 °C. Die Tastatur (und vor allem der WASD-Bereich) wärmen sich aber nur leicht auf und beim Spielen bleiben die Hände kühl. Im Stresstest wird die GPU bevorzugt und liegt nach wenigen Minuten stabil bei 175 Watt (CPU ~57 Watt), wobei auch die Temperaturen unbedenklich bleiben.
(-) Die maximale Temperatur auf der Oberseite ist 45.6 °C. Im Vergleich liegt der Klassendurchschnitt bei 40.4 °C (von 21.2 bis 68.8 °C für die Klasse Gaming).
(-) Auf der Unterseite messen wir eine maximalen Wert von 46 °C (im Vergleich zum Durchschnitt von 43.2 °C).
(+) Ohne Last messen wir eine durchschnittliche Temperatur von 26.8 °C auf der Oberseite. Der Klassendurchschnitt erreicht 33.9 °C.
(±) 3: The average temperature for the upper side is 34.4 °C / 94 F, compared to the average of 33.9 °C / 93 F for the class Gaming.
(+) Die Handballen und der Touchpad-Bereich sind mit gemessenen 29.2 °C kühler als die typische Hauttemperatur und fühlen sich dadurch kühl an.
(±) Die durchschnittliche Handballen-Temperatur anderer getesteter Geräte war 28.8 °C (-0.4 °C).
| Asus Strix Scar 18 G835LX Intel Core Ultra 9 275HX, NVIDIA GeForce RTX 5090 Laptop | Razer Blade 18 2024 RZ09-0509 Intel Core i9-14900HX, NVIDIA GeForce RTX 4090 Laptop GPU | Alienware m18 R2 Intel Core i9-14900HX, NVIDIA GeForce RTX 4090 Laptop GPU | Acer Predator Helios 18 PH18-72-98MW Intel Core i9-14900HX, NVIDIA GeForce RTX 4090 Laptop GPU | MSI Titan 18 HX A14VIG Intel Core i9-14900HX, NVIDIA GeForce RTX 4090 Laptop GPU | Schenker Key 17 Pro (M24) Intel Core i9-14900HX, NVIDIA GeForce RTX 4090 Laptop GPU | Asus ROG Strix Scar 18 G834JYR (2024) Intel Core i9-14900HX, NVIDIA GeForce RTX 4090 Laptop GPU | |
|---|---|---|---|---|---|---|---|
| Hitze | -10% | -16% | -12% | -2% | -39% | -4% | |
| Last oben max * (°C) | 45.6 | 43.2 5% | 41.2 10% | 43 6% | 37.8 17% | 51 -12% | 49 -7% |
| Last unten max * (°C) | 46 | 42.6 7% | 34.6 25% | 59 -28% | 37.6 18% | 64 -39% | 47 -2% |
| Idle oben max * (°C) | 28.9 | 36 -25% | 42.8 -48% | 32 -11% | 34.8 -20% | 42.3 -46% | 29 -0% |
| Idle unten max * (°C) | 29.2 | 36.4 -25% | 43.6 -49% | 34 -16% | 36 -23% | 46 -58% | 31 -6% |
* ... kleinere Werte sind besser
Lautsprecher
Das Soundsystem besteht aus vier Modulen und die Leistung ist ordentlich, es gibt aber bessere Vergleichsgeräte in dieser Hinsicht. Beim Spielen bringen die Lautsprecher aber sowieso nicht viel, da die Lüfter zu laut sind.
Asus Strix Scar 18 G835LX Audio Analyse
(+) | Die Lautsprecher können relativ laut spielen (86.3 dB)
Bass 100 - 315 Hz
(±) | abgesenkter Bass - 7.5% geringer als der Median
(±) | durchschnittlich lineare Bass-Wiedergabe (7.7% Delta zum Vorgänger)
Mitteltöne 400 - 2000 Hz
(±) | zu hohe Mitten, vom Median 9.9% abweichend
(+) | lineare Mitten (6.9% Delta zum Vorgänger)
Hochtöne 2 - 16 kHz
(+) | ausgeglichene Hochtöne, vom Median nur 2.2% abweichend
(+) | sehr lineare Hochtöne (4.1% Delta zum Vorgänger)
Gesamt im hörbaren Bereich 100 - 16.000 Hz
(+) | hörbarer Bereich ist sehr linear (13.7% Abstand zum Median
Im Vergleich zu allen Geräten derselben Klasse
» 21% aller getesteten Geräte dieser Klasse waren besser, 7% vergleichbar, 72% schlechter
» Das beste Gerät hat einen Delta-Wert von 6%, durchschnittlich ist 18%, das schlechteste Gerät hat 132%
Im Vergleich zu allen Geräten im Test
» 15% aller getesteten Geräte waren besser, 4% vergleichbar, 81% schlechter
» Das beste Gerät hat einen Delta-Wert von 4%, durchschnittlich ist 24%, das schlechteste Gerät hat 134%
Razer Blade 18 2024 RZ09-0509 Audio Analyse
(+) | Die Lautsprecher können relativ laut spielen (85.2 dB)
Bass 100 - 315 Hz
(±) | abgesenkter Bass - 5.3% geringer als der Median
(+) | lineare Bass-Wiedergabe (6.5% Delta zum Vorgänger)
Mitteltöne 400 - 2000 Hz
(+) | ausgeglichene Mitten, vom Median nur 4.5% abweichend
(±) | Linearität der Mitten ist durchschnittlich (7.1% Delta zum Vorgänger)
Hochtöne 2 - 16 kHz
(+) | ausgeglichene Hochtöne, vom Median nur 2.9% abweichend
(+) | sehr lineare Hochtöne (4% Delta zum Vorgänger)
Gesamt im hörbaren Bereich 100 - 16.000 Hz
(+) | hörbarer Bereich ist sehr linear (9.3% Abstand zum Median
Im Vergleich zu allen Geräten derselben Klasse
» 3% aller getesteten Geräte dieser Klasse waren besser, 2% vergleichbar, 95% schlechter
» Das beste Gerät hat einen Delta-Wert von 6%, durchschnittlich ist 18%, das schlechteste Gerät hat 132%
Im Vergleich zu allen Geräten im Test
» 3% aller getesteten Geräte waren besser, 1% vergleichbar, 96% schlechter
» Das beste Gerät hat einen Delta-Wert von 4%, durchschnittlich ist 24%, das schlechteste Gerät hat 134%
Alienware m18 R2 Audio Analyse
(+) | Die Lautsprecher können relativ laut spielen (82.5 dB)
Bass 100 - 315 Hz
(-) | kaum Bass - 22.1% niedriger als der Median
(±) | durchschnittlich lineare Bass-Wiedergabe (14% Delta zum Vorgänger)
Mitteltöne 400 - 2000 Hz
(+) | ausgeglichene Mitten, vom Median nur 4.1% abweichend
(+) | lineare Mitten (3.3% Delta zum Vorgänger)
Hochtöne 2 - 16 kHz
(+) | ausgeglichene Hochtöne, vom Median nur 4% abweichend
(+) | sehr lineare Hochtöne (6.1% Delta zum Vorgänger)
Gesamt im hörbaren Bereich 100 - 16.000 Hz
(±) | hörbarer Bereich ist durchschnittlich linear (17% Abstand zum Median)
Im Vergleich zu allen Geräten derselben Klasse
» 45% aller getesteten Geräte dieser Klasse waren besser, 12% vergleichbar, 43% schlechter
» Das beste Gerät hat einen Delta-Wert von 6%, durchschnittlich ist 18%, das schlechteste Gerät hat 132%
Im Vergleich zu allen Geräten im Test
» 30% aller getesteten Geräte waren besser, 8% vergleichbar, 62% schlechter
» Das beste Gerät hat einen Delta-Wert von 4%, durchschnittlich ist 24%, das schlechteste Gerät hat 134%
Acer Predator Helios 18 PH18-72-98MW Audio Analyse
(+) | Die Lautsprecher können relativ laut spielen (85 dB)
Bass 100 - 315 Hz
(-) | kaum Bass - 21.1% niedriger als der Median
(±) | durchschnittlich lineare Bass-Wiedergabe (10.7% Delta zum Vorgänger)
Mitteltöne 400 - 2000 Hz
(+) | ausgeglichene Mitten, vom Median nur 2.9% abweichend
(+) | lineare Mitten (5.6% Delta zum Vorgänger)
Hochtöne 2 - 16 kHz
(+) | ausgeglichene Hochtöne, vom Median nur 2.7% abweichend
(+) | sehr lineare Hochtöne (3.6% Delta zum Vorgänger)
Gesamt im hörbaren Bereich 100 - 16.000 Hz
(+) | hörbarer Bereich ist sehr linear (13.6% Abstand zum Median
Im Vergleich zu allen Geräten derselben Klasse
» 20% aller getesteten Geräte dieser Klasse waren besser, 7% vergleichbar, 73% schlechter
» Das beste Gerät hat einen Delta-Wert von 6%, durchschnittlich ist 18%, das schlechteste Gerät hat 132%
Im Vergleich zu allen Geräten im Test
» 15% aller getesteten Geräte waren besser, 4% vergleichbar, 82% schlechter
» Das beste Gerät hat einen Delta-Wert von 4%, durchschnittlich ist 24%, das schlechteste Gerät hat 134%
MSI Titan 18 HX A14VIG Audio Analyse
(+) | Die Lautsprecher können relativ laut spielen (89.2 dB)
Bass 100 - 315 Hz
(-) | kaum Bass - 17.6% niedriger als der Median
(±) | durchschnittlich lineare Bass-Wiedergabe (8% Delta zum Vorgänger)
Mitteltöne 400 - 2000 Hz
(+) | ausgeglichene Mitten, vom Median nur 1.8% abweichend
(+) | lineare Mitten (3.7% Delta zum Vorgänger)
Hochtöne 2 - 16 kHz
(+) | ausgeglichene Hochtöne, vom Median nur 1.2% abweichend
(+) | sehr lineare Hochtöne (2% Delta zum Vorgänger)
Gesamt im hörbaren Bereich 100 - 16.000 Hz
(+) | hörbarer Bereich ist sehr linear (9.9% Abstand zum Median
Im Vergleich zu allen Geräten derselben Klasse
» 5% aller getesteten Geräte dieser Klasse waren besser, 2% vergleichbar, 94% schlechter
» Das beste Gerät hat einen Delta-Wert von 6%, durchschnittlich ist 18%, das schlechteste Gerät hat 132%
Im Vergleich zu allen Geräten im Test
» 4% aller getesteten Geräte waren besser, 1% vergleichbar, 95% schlechter
» Das beste Gerät hat einen Delta-Wert von 4%, durchschnittlich ist 24%, das schlechteste Gerät hat 134%
Schenker Key 17 Pro (M24) Audio Analyse
(±) | Mittelmäßig laut spielende Lautsprecher (80.9 dB)
Bass 100 - 315 Hz
(±) | abgesenkter Bass - 12.7% geringer als der Median
(±) | durchschnittlich lineare Bass-Wiedergabe (9.1% Delta zum Vorgänger)
Mitteltöne 400 - 2000 Hz
(+) | ausgeglichene Mitten, vom Median nur 2.3% abweichend
(+) | lineare Mitten (5.1% Delta zum Vorgänger)
Hochtöne 2 - 16 kHz
(+) | ausgeglichene Hochtöne, vom Median nur 2.9% abweichend
(±) | durchschnittlich lineare Hochtöne (8.9% Delta zum Vorgänger)
Gesamt im hörbaren Bereich 100 - 16.000 Hz
(+) | hörbarer Bereich ist sehr linear (11.2% Abstand zum Median
Im Vergleich zu allen Geräten derselben Klasse
» 13% aller getesteten Geräte dieser Klasse waren besser, 4% vergleichbar, 83% schlechter
» Das beste Gerät hat einen Delta-Wert von 7%, durchschnittlich ist 17%, das schlechteste Gerät hat 35%
Im Vergleich zu allen Geräten im Test
» 7% aller getesteten Geräte waren besser, 2% vergleichbar, 91% schlechter
» Das beste Gerät hat einen Delta-Wert von 4%, durchschnittlich ist 24%, das schlechteste Gerät hat 134%
Asus ROG Strix Scar 18 G834JYR (2024) Audio Analyse
(+) | Die Lautsprecher können relativ laut spielen (82 dB)
Bass 100 - 315 Hz
(±) | abgesenkter Bass - 5.6% geringer als der Median
(+) | lineare Bass-Wiedergabe (6.8% Delta zum Vorgänger)
Mitteltöne 400 - 2000 Hz
(±) | zu hohe Mitten, vom Median 5.7% abweichend
(+) | lineare Mitten (2.8% Delta zum Vorgänger)
Hochtöne 2 - 16 kHz
(±) | verringerte Hochtöne, 7.2% geringer als der Median
(±) | durchschnittlich lineare Hochtöne (7.2% Delta zum Vorgänger)
Gesamt im hörbaren Bereich 100 - 16.000 Hz
(+) | hörbarer Bereich ist sehr linear (13% Abstand zum Median
Im Vergleich zu allen Geräten derselben Klasse
» 18% aller getesteten Geräte dieser Klasse waren besser, 3% vergleichbar, 79% schlechter
» Das beste Gerät hat einen Delta-Wert von 6%, durchschnittlich ist 18%, das schlechteste Gerät hat 132%
Im Vergleich zu allen Geräten im Test
» 13% aller getesteten Geräte waren besser, 2% vergleichbar, 85% schlechter
» Das beste Gerät hat einen Delta-Wert von 4%, durchschnittlich ist 24%, das schlechteste Gerät hat 134%
Energieverwaltung - Kurze Akkulaufzeit
Energieaufnahme
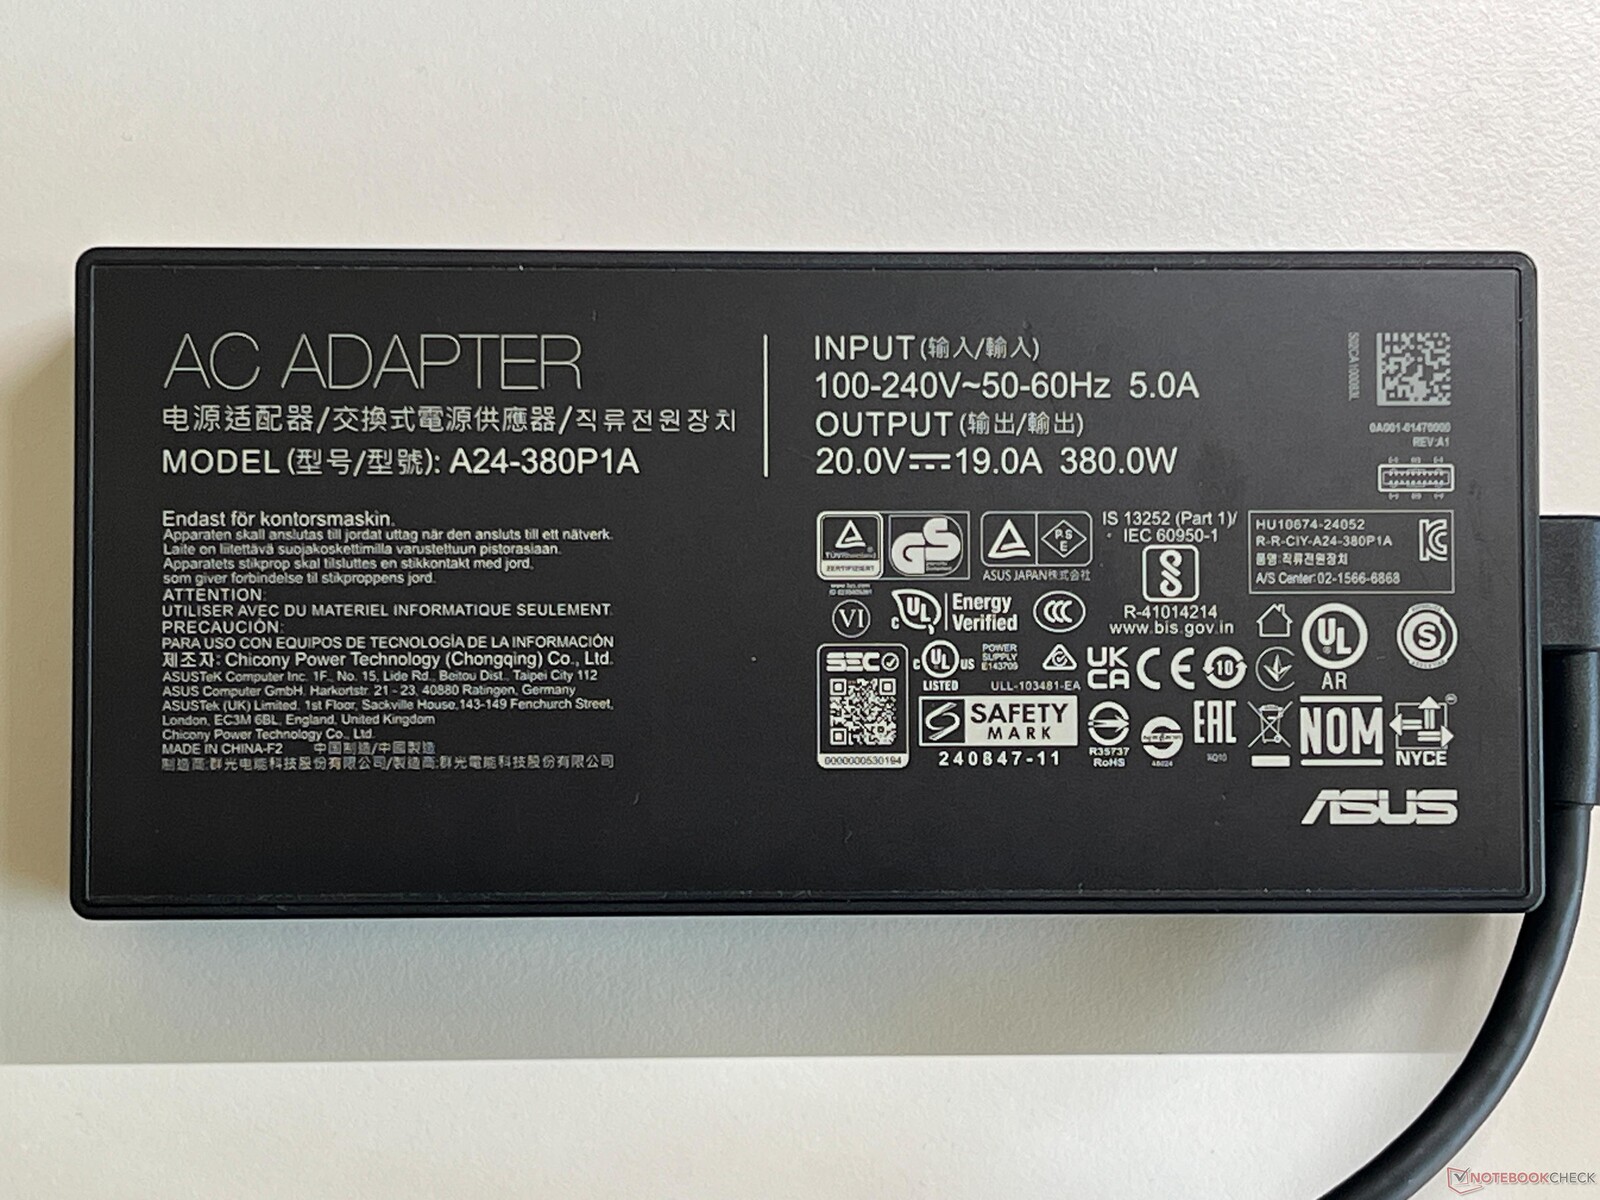
Das Strix SCAR 18 ist kein besonders effizienter Laptop und auch das helle Mini-LED-Panel benötigt bereits viel Strom, weshalb der maximale Idle-Verbrauch schon bei rund 40 Watt liegt. Unter Last sind es für eine Sekunde kurz 430 Watt, was sich dann aber sofort bei 320 Watt einpendelt. Das mitgelieferte 380-Watt-Netzteil reicht also aus. Der Standby-Verbrauch ist mit 1,9 Watt zu hoch, obwohl die komplette Beleuchtung bereits deaktiviert war.
| Aus / Standby | |
| Idle | |
| Last |
|
Legende:
min: | |
| Asus Strix Scar 18 G835LX Ultra 9 275HX, GeForce RTX 5090 Laptop, WD PC SN8000S 2TB, Mini-LED, 2560x1600, 18" | Razer Blade 18 2024 RZ09-0509 i9-14900HX, GeForce RTX 4090 Laptop GPU, , Mini-LED, 2560x1600, 18" | Alienware m18 R2 i9-14900HX, GeForce RTX 4090 Laptop GPU, SK Hynix PC811 HFS002TEM9X152N, IPS, 2560x1600, 18" | Acer Predator Helios 18 PH18-72-98MW i9-14900HX, GeForce RTX 4090 Laptop GPU, 2x SK Hynix HFS001TEJ9X115N (RAID 0), Mini-LED, 2560x1600, 18" | MSI Titan 18 HX A14VIG i9-14900HX, GeForce RTX 4090 Laptop GPU, 2x Samsung PM9A1a MZVL22T0HDLB (RAID 0), Mini-LED, 3840x2400, 18" | Schenker Key 17 Pro (M24) i9-14900HX, GeForce RTX 4090 Laptop GPU, Samsung 990 Pro 1 TB, IPS, 3840x2160, 17.3" | Asus ROG Strix Scar 18 G834JYR (2024) i9-14900HX, GeForce RTX 4090 Laptop GPU, Samsung PM9A1a MZVL22T0HDLB, Mini LED, 2560x1600, 18" | Durchschnittliche NVIDIA GeForce RTX 5090 Laptop | Durchschnitt der Klasse Gaming | |
|---|---|---|---|---|---|---|---|---|---|
| Stromverbrauch | -22% | 8% | -26% | 0% | 24% | 23% | 12% | 30% | |
| Idle min * (Watt) | 11.4 | 25.4 -123% | 10.6 7% | 31 -172% | 13.2 -16% | 12.16 -7% | 14 -23% | 16.2 ? -42% | 13.1 ? -15% |
| Idle avg * (Watt) | 39.2 | 37.7 4% | 20.9 47% | 35 11% | 25.4 35% | 15.97 59% | 17 57% | 24.3 ? 38% | 18.7 ? 52% |
| Idle max * (Watt) | 40.2 | 57.9 -44% | 40 -0% | 43 -7% | 53.5 -33% | 23.71 41% | 24 40% | 30.3 ? 25% | 24.4 ? 39% |
| Last avg * (Watt) | 161.2 | 128.4 20% | 201.1 -25% | 144 11% | 151.4 6% | 113.06 30% | 143 11% | 135.3 ? 16% | 108.1 ? 33% |
| Cyberpunk 2077 ultra * (Watt) | 303 | 274 10% | |||||||
| Cyberpunk 2077 ultra external monitor * (Watt) | 295 | 280 5% | |||||||
| Last max * (Watt) | 430.9 | 297.9 31% | 378.9 12% | 318 26% | 395.2 8% | 301 30% | 302 30% | 336 ? 22% | 254 ? 41% |
| Witcher 3 ultra * (Watt) | 273.1 | 358 | 228 | 336 | 251 |
* ... kleinere Werte sind besser
Energieaufnahme Cyberpunk / Stresstest
Energieaufnahme mit externem Monitor
Akkulaufzeit
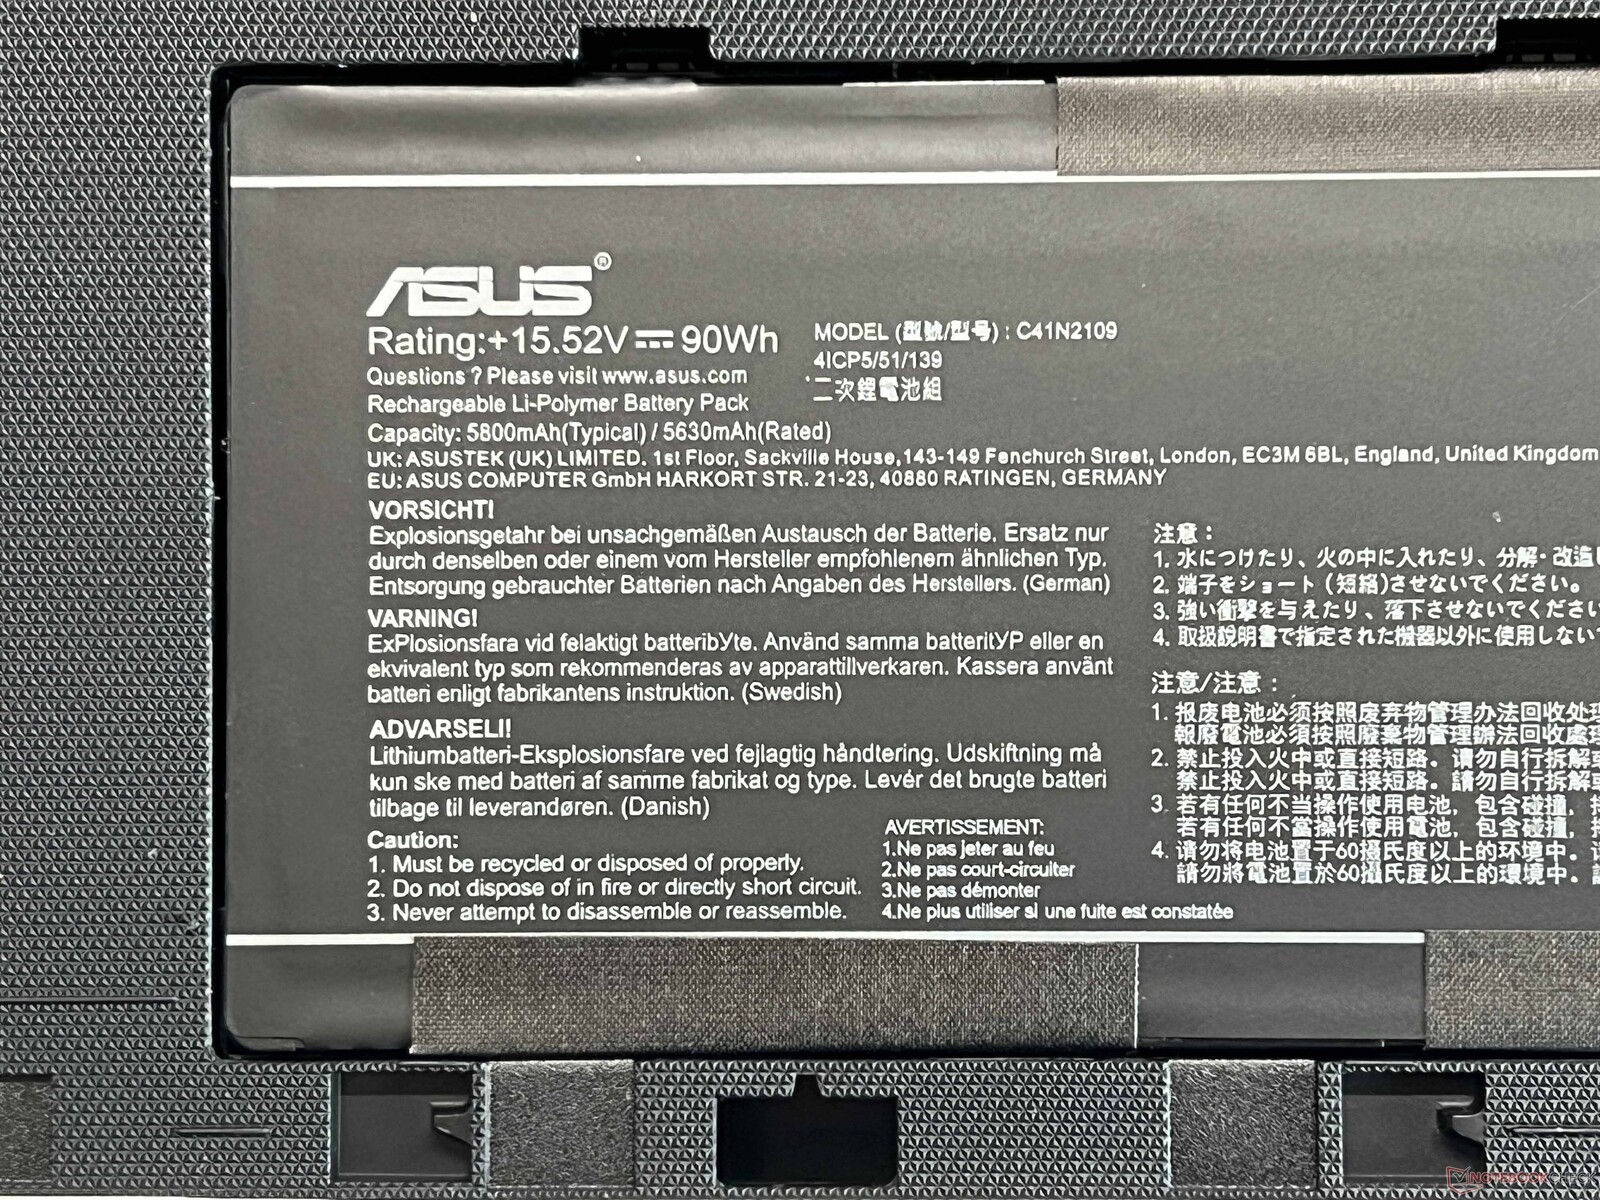
Der 90-Wh-Akku kann bei den hohen Verbrauchswerten auch nicht viel helfen. Im WLAN-Test mit 150 cd/m² ermitteln wir rund 5,5 Stunden, bei voller Helligkeit aber keine drei Stunden mehr (jeweils 60 Hz). Zumindest sind diese Ergebnisse noch besser als bei vielen direkten Konkurrenten, lediglich der Vorgänger hielt länger durch. Beim Spielen ist nach 44 Minuten Schluss.
| Asus Strix Scar 18 G835LX Ultra 9 275HX, GeForce RTX 5090 Laptop, 90 Wh | Razer Blade 18 2024 RZ09-0509 i9-14900HX, GeForce RTX 4090 Laptop GPU, 91.7 Wh | Alienware m18 R2 i9-14900HX, GeForce RTX 4090 Laptop GPU, 97 Wh | Acer Predator Helios 18 PH18-72-98MW i9-14900HX, GeForce RTX 4090 Laptop GPU, 90 Wh | MSI Titan 18 HX A14VIG i9-14900HX, GeForce RTX 4090 Laptop GPU, 99.9 Wh | Schenker Key 17 Pro (M24) i9-14900HX, GeForce RTX 4090 Laptop GPU, 99 Wh | Asus ROG Strix Scar 18 G834JYR (2024) i9-14900HX, GeForce RTX 4090 Laptop GPU, 90 Wh | Durchschnitt der Klasse Gaming | |
|---|---|---|---|---|---|---|---|---|
| Akkulaufzeit | -19% | -13% | -25% | -12% | 4% | 26% | 31% | |
| H.264 (h) | 5.8 | 7.5 29% | 8.26 ? 42% | |||||
| WLAN (h) | 5.5 | 4.4 -20% | 4.8 -13% | 3.2 -42% | 4.2 -24% | 3.4 -38% | 7.7 40% | 7.04 ? 28% |
| Cyberpunk 2077 ultra 150cd (h) | 0.7 | 1.1 57% | ||||||
| Last (h) | 1.2 | 1 -17% | 1.1 -8% | 1.2 0% | 1.1 -8% | 1.3 8% | 1.47 ? 23% |
Notebookcheck Gesamtbewertung
Asus Strix Scar 18 G835LX
- 31.03.2025 v8
Andreas Osthoff
 Total Sustainability Score:
 Mögliche Alternativen im Vergleich
Bild | Modell / Test | Preis ab | Gewicht | Dicke | Display |
|---|---|---|---|---|---|
1. 88% 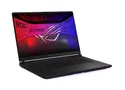 | Asus Strix Scar 18 G835LX Intel Core Ultra 9 275HX ⎘ NVIDIA GeForce RTX 5090 Laptop ⎘ 64 GB RAM, 2048 GB SSD | Amazon: 5.099,00 € Geizhals Suche | 3.3 kg | 32 mm | 18.00" 2560x1600 168 PPI Mini-LED |
2. 90.5% v7 (old)  | Razer Blade 18 2024 RZ09-0509 Intel Core i9-14900HX ⎘ NVIDIA GeForce RTX 4090 Laptop GPU ⎘ 32 GB RAM | Amazon: Geizhals Suche | 3.1 kg | 21.9 mm | 18.00" 2560x1600 168 PPI Mini-LED |
3. 89.5% v7 (old)  | Alienware m18 R2 Intel Core i9-14900HX ⎘ NVIDIA GeForce RTX 4090 Laptop GPU ⎘ 32 GB RAM, 2048 GB SSD | Amazon: 1. 1.980,80 € Alienware m18 R2 Gaming Lapt... 2. 1.849,00 € Alienware 16x Aurora Gaming ... 3. 1.899,00 € Alienware m16 R2 Gaming Lapt... Listenpreis: 3300 USD | 4 kg | 26.7 mm | 18.00" 2560x1600 168 PPI IPS |
4. 87.1% v7 (old)  | Acer Predator Helios 18 PH18-72-98MW Intel Core i9-14900HX ⎘ NVIDIA GeForce RTX 4090 Laptop GPU ⎘ 32 GB RAM, 2048 GB SSD | Amazon: 1. 2.714,63 € Acer Predator Helios 18 (PH1... 2. 1.837,64 € ACER Portable Predator Helio... 3. 2.649,00 € Acer Predator Helios Neo 18 ... | 3.3 kg | 29.5 mm | 18.00" 2560x1600 168 PPI Mini-LED |
5. 88.8% v7 (old)  | MSI Titan 18 HX A14VIG Intel Core i9-14900HX ⎘ NVIDIA GeForce RTX 4090 Laptop GPU ⎘ 128 GB RAM, 4096 GB SSD | Amazon: 1. 4.009,90 € MSI Titan 18 HX A14VIG-080ES... 2. 5.999,00 € MSI Titan 18 HX AI Gaming-La... 3. MSI Vector 18 HX AI Gaming-L... Listenpreis: 5000 USD | 3.6 kg | 32.1 mm | 18.00" 3840x2400 252 PPI Mini-LED |
6. 85.1%  | Schenker Key 17 Pro (M24) Intel Core i9-14900HX ⎘ NVIDIA GeForce RTX 4090 Laptop GPU ⎘ 32 GB RAM, 1024 GB SSD | Amazon: Listenpreis: 4273€ | 3.4 kg | 24.9 mm | 17.30" 3840x2160 255 PPI IPS |
Transparenz
Die Auswahl der zu testenden Geräte erfolgt innerhalb der Redaktion. Das vorliegende Testmuster wurde dem Autor vom Hersteller oder einem Shop zu Testzwecken leihweise zur Verfügung gestellt. Eine Einflussnahme des Leihstellers auf den Testbericht gab es nicht, der Hersteller erhielt keine Version des Reviews vor der Veröffentlichung. Es bestand keine Verpflichtung zur Publikation. Als eigenständiges, unabhängiges Unternehmen unterliegt Notebookcheck keiner Diktion von Herstellern, Shops und Verlagen.
So testet Notebookcheck
Pro Jahr werden von Notebookcheck hunderte Laptops und Smartphones unabhängig in von uns standardisierten technischen Verfahren getestet, um eine Vergleichbarkeit aller Testergebnisse zu gewährleisten. Seit rund 20 Jahren entwickeln wir diese Testmethoden kontinuierlich weiter und setzen damit Branchenstandards. In unseren Testlaboren kommt ausschließlich hochwertiges Messequipment in die Hände erfahrener Techniker und Redakteure. Die Tests unterliegen einer mehrstufigen Kontrolle. Unsere komplexe Gesamtbewertung basiert auf hunderten fundierten Messergebnissen und Benchmarks, womit Ihnen Objektivität garantiert ist. Weitere Informationen zu unseren Testmethoden gibt es hier.
